Embed Size (px)
Citation preview
Completed acquisition by Ausurus Group Limited through its subsidiary European Metal Recycling Limited of CuFe
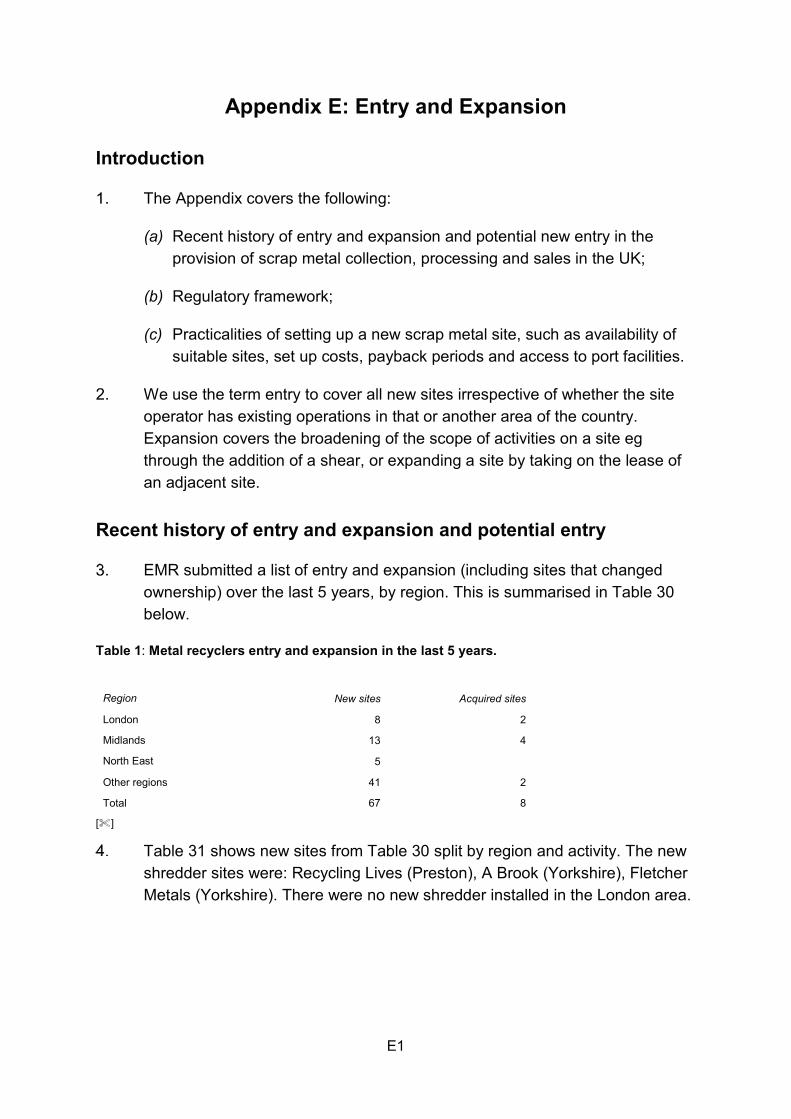
Investments Limited
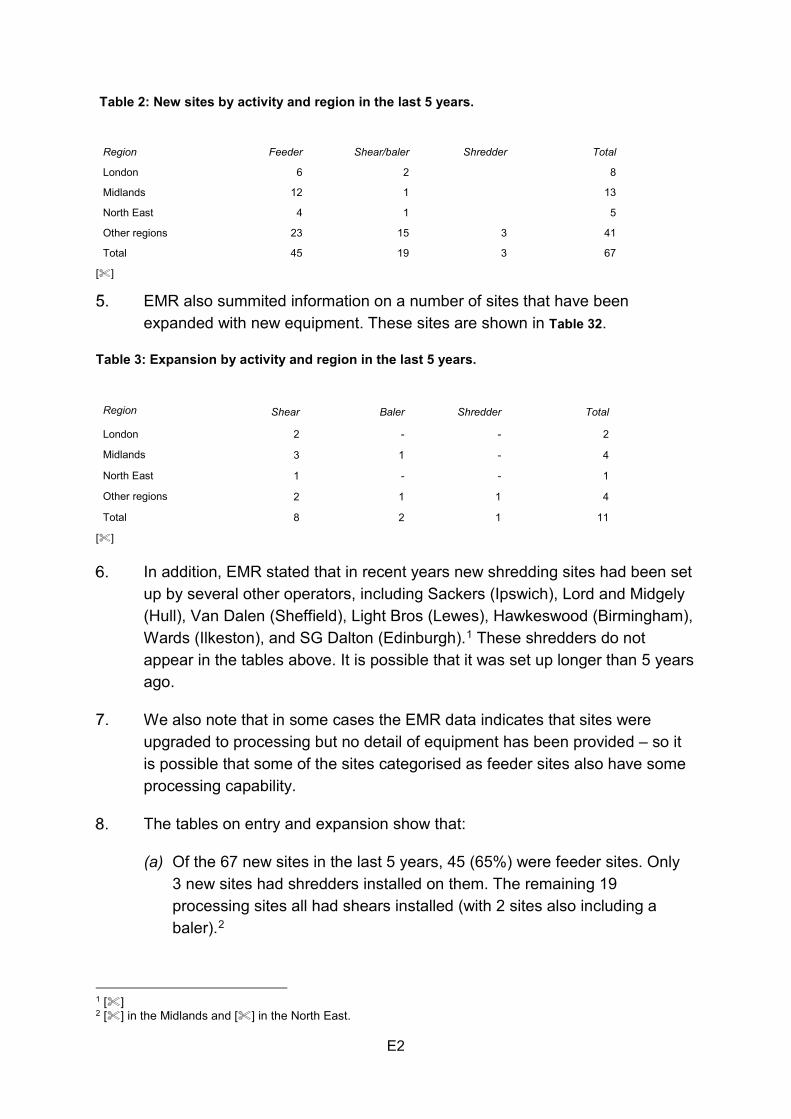
Provisional findings
Appendices and glossary
Appendix A: Terms of reference and conduct of the inquiry
Appendix B: The merging Parties
Appendix C: The Transaction
Appendix D: Market shares
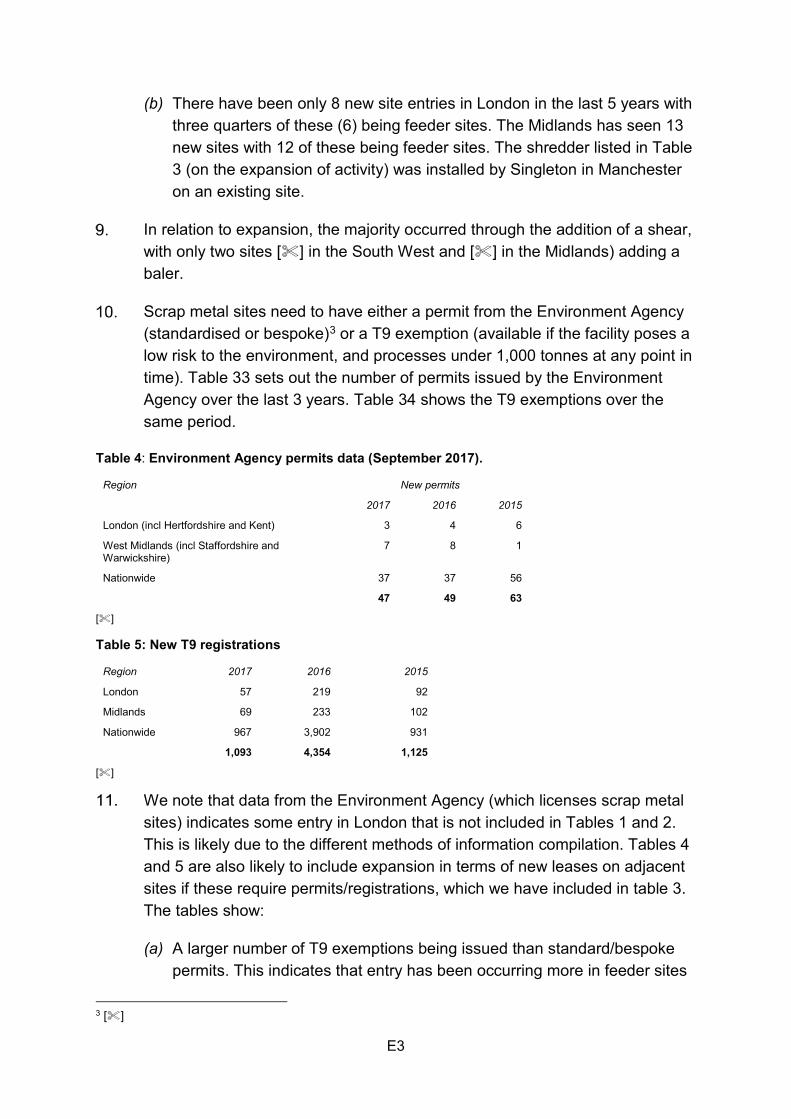
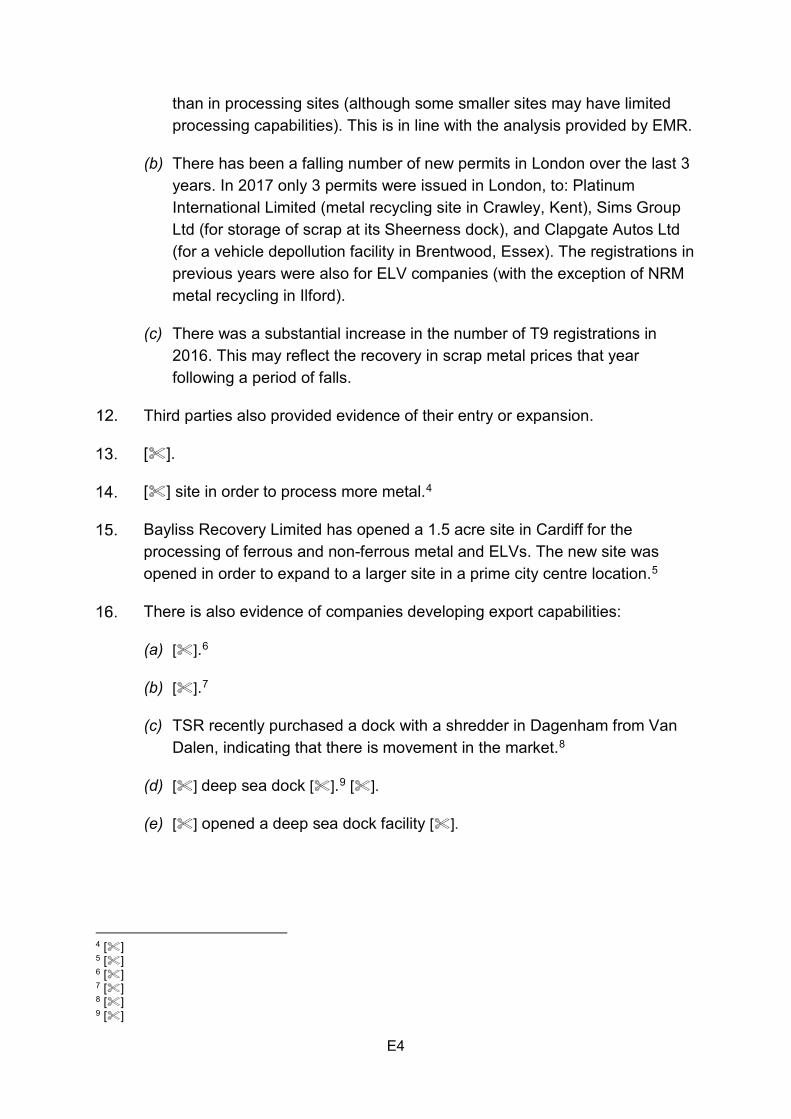
Appendix E: Entry and Expansion
Glossary


£'00
0
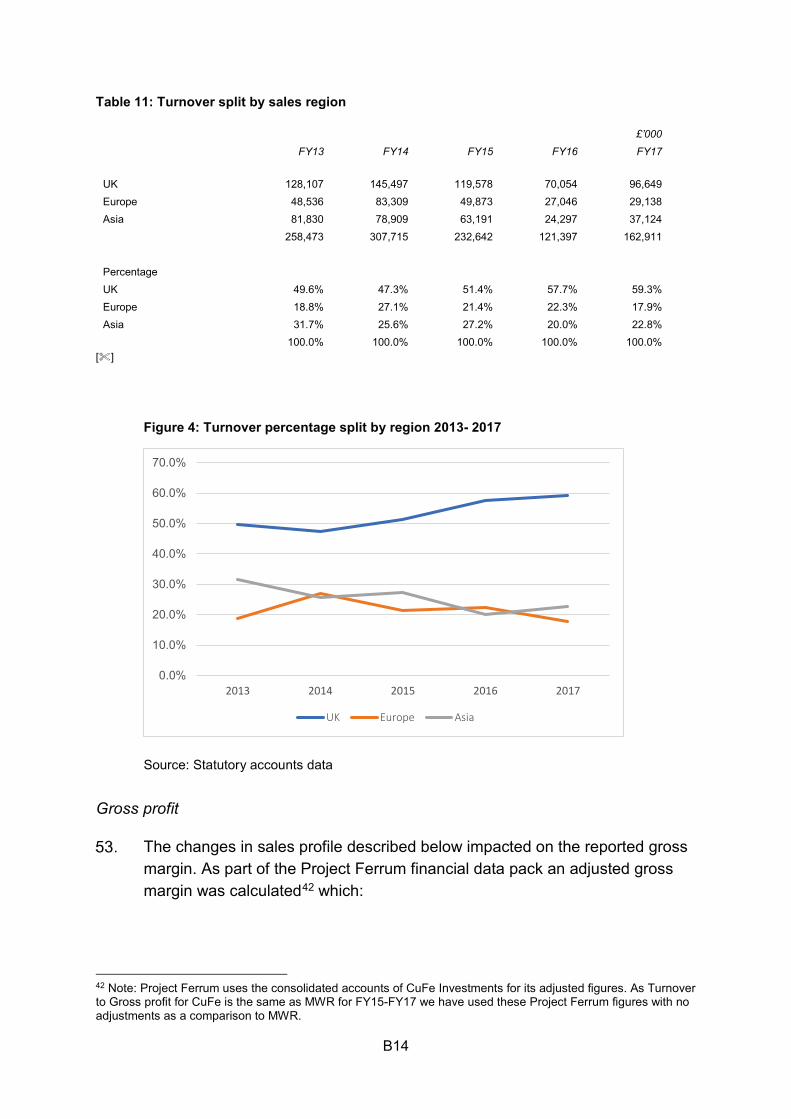
2013 2014 2015 2016 2017
UK Europe Asia
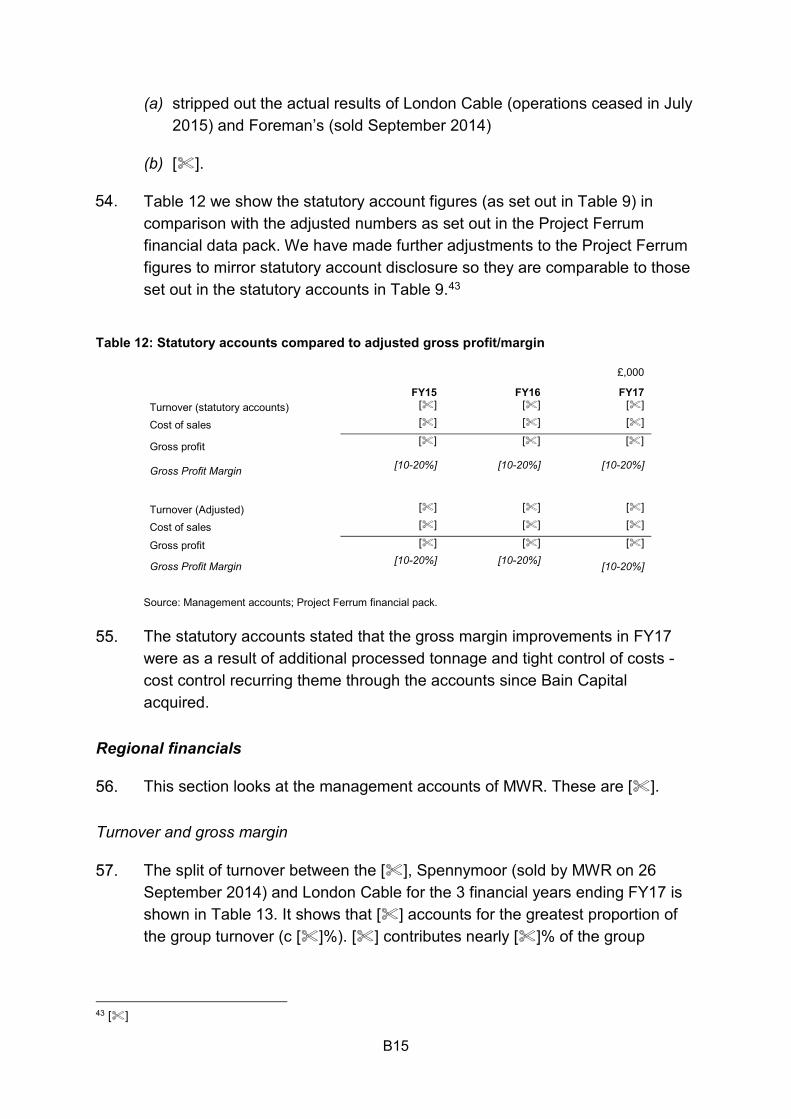

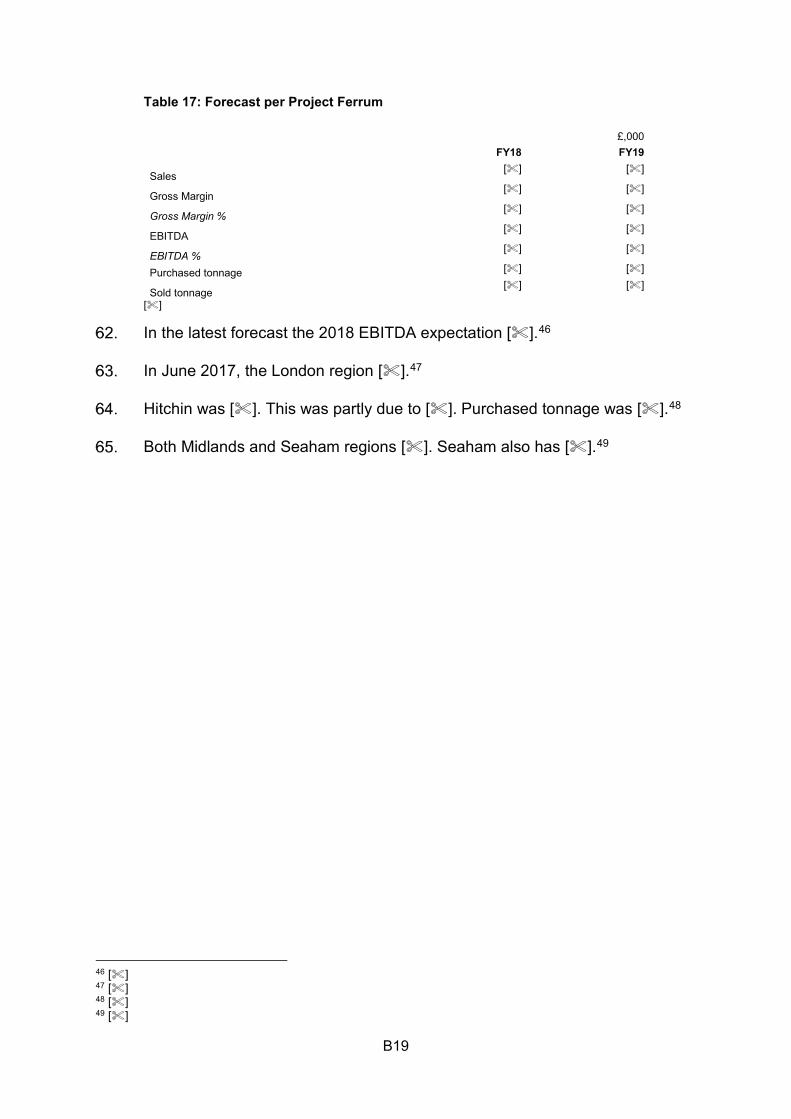
£,000
FFY14 FFY15 FFY16 FFY17
London
Hitchin
Midlands
Seaham
MWR Group
London Cable
Spennymoor
Inter-company
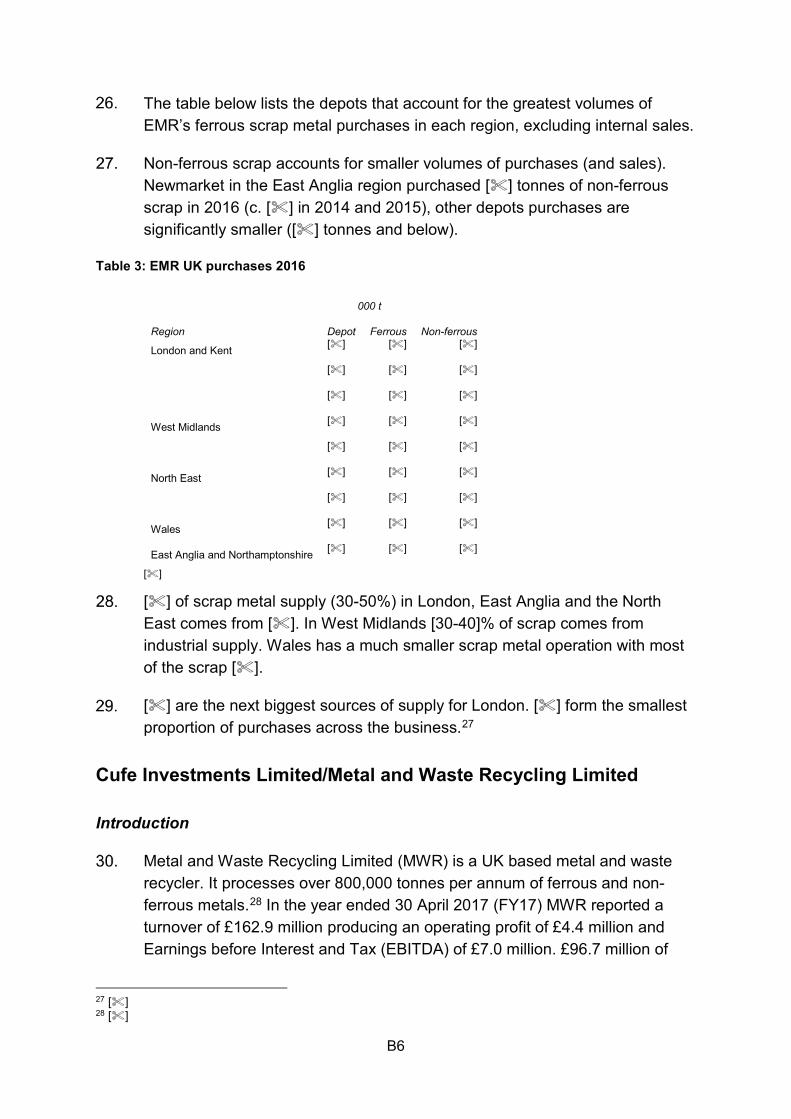
Consolidated sales
%
FFY14 FFY15 FFY16 FFY17
London
Hitchin
Midlands
Seaham
London Cable
Spennymoor
MWR
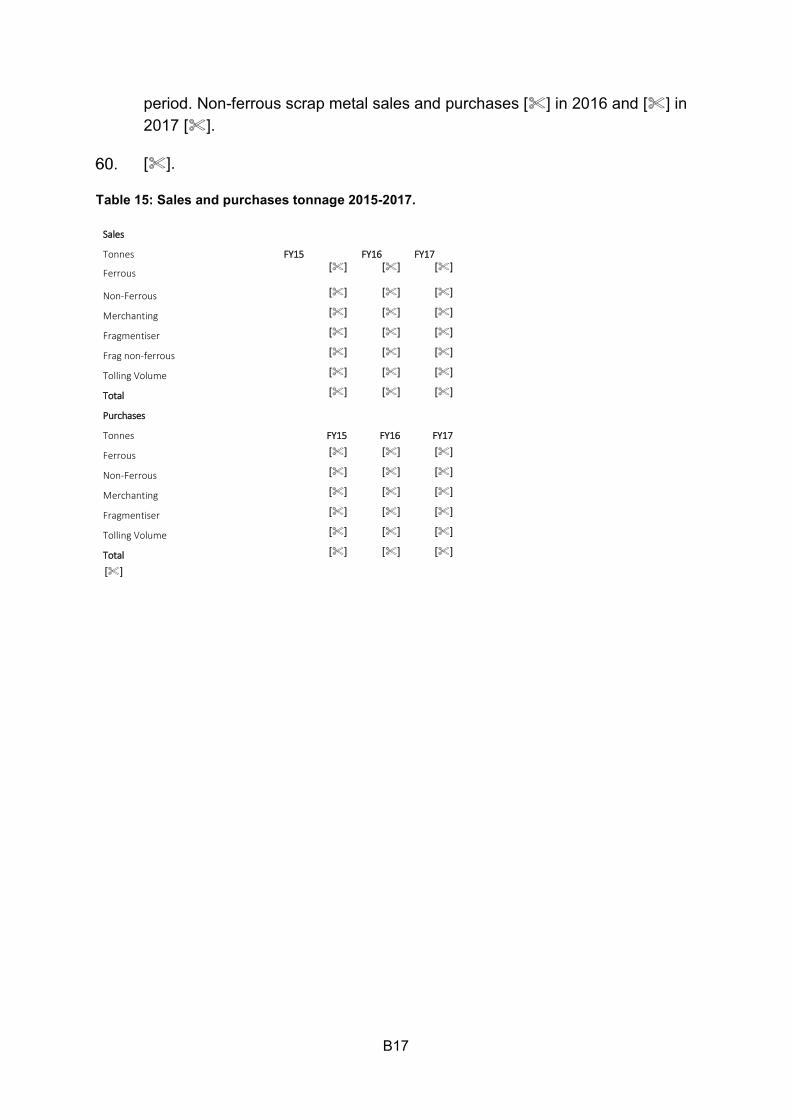
SSales
Tonnes FFY15 FFY16 FFY17
Ferrous
Non-Ferrous
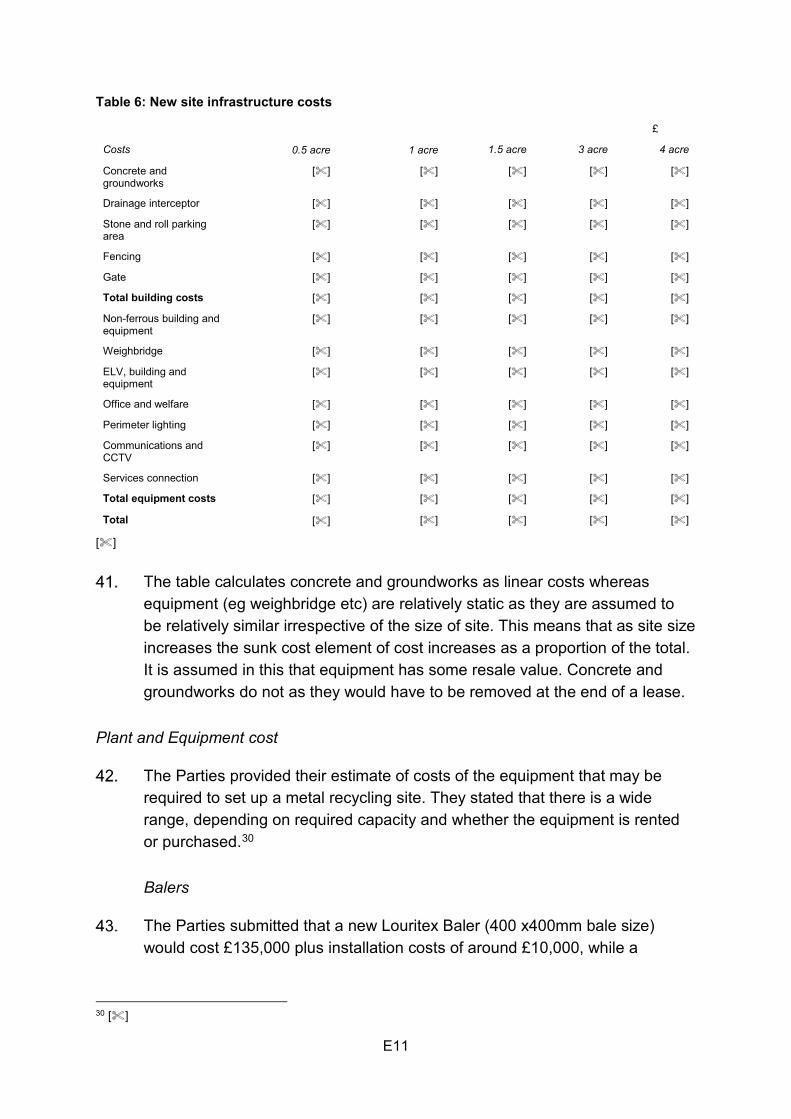
Merchanting
Fragmentiser
Frag non-ferrous
Tolling Volume
TTotal
PPurchases
Tonnes FFY15 FFY16 FFY17
Ferrous
Non-Ferrous
Merchanting
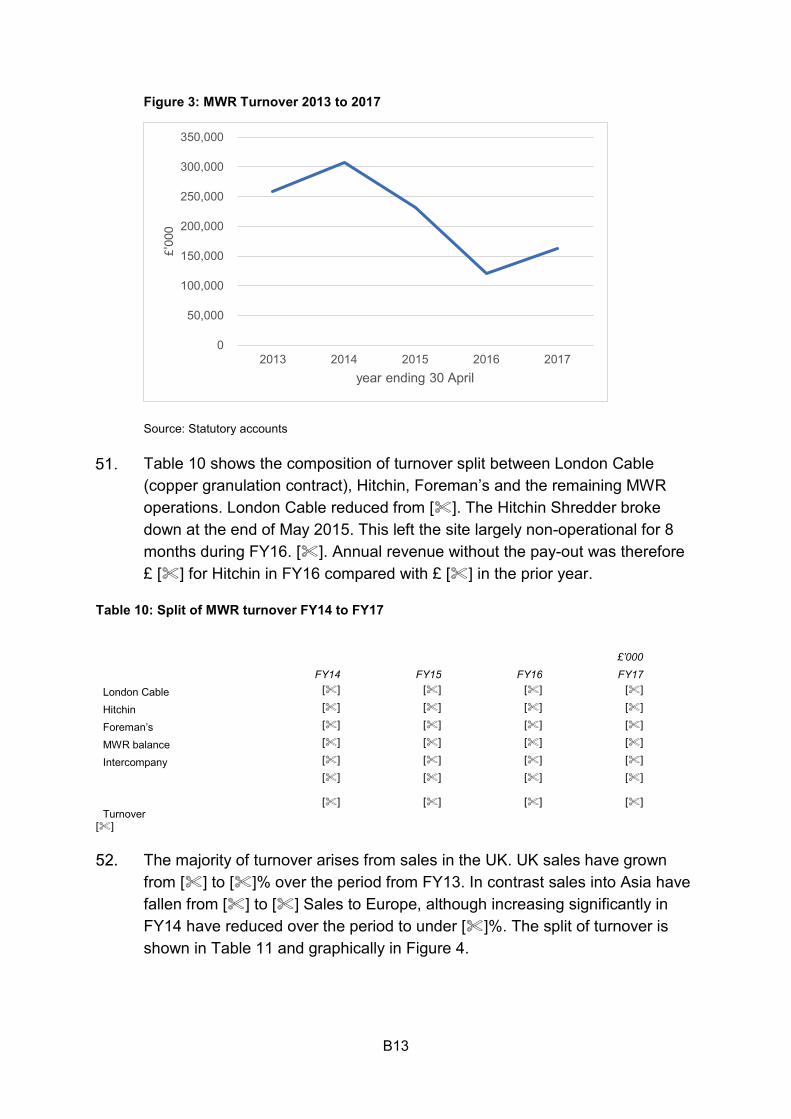
Fragmentiser
Tolling Volume
TTotal

BCC is a global credit specialist. BCC stated that its investment in MWR was part of its regular investment activities.5
We note in this context that no acquisitions were made in the period of BCC’s ownership.
invests across the full spectrum of credit strategies including leveraged loans, high-yield bonds, distressed debt and special situations, direct lending, structured products, non-performing loans and equities.

D1
Appendix D: Market shares
Introduction
1. This appendix sets out the methodology and results of our assessment of market shares. We calculated shares for the Parties and other metal recyclers based on volumes for:
(a) Non-new production steel (NPS) ferrous sales to UK final customers on a national basis;
(b) Non-ferrous sales to UK final customers on a national basis;
(c) Sales of NPS to UK final customers on a national basis;
(d) Purchase of shredder feed in the South East, including London; and
(e) Purchase of ferrous and non-ferrous (excluding shredder feed) in the London region;
(f) Purchase of all metals in the West Midlands, Wales and the North East regions.
2. This appendix is structured as follows:
(a) First, we describe the data used in our calculations;
(b) Second, we set out the methodology; and
(c) Finally, we present the Parties’ comments.
Data
3. We collected three main sets of data, as follows.
(a) From the Parties, we collected:
(i) High-level summaries of the total purchase and sales volumes at each of their sites in the 2017 calendar year.1 We received their total volume of purchases and sales and the value of these transactions, as well as subsets of the total; split into Ferrous Metals, Non-Ferrous Metals, New Production Steel, and Shredder Feed. For MWR this excluded transactions between their own sites and therefore
1 []
D2
represented only sales and purchases from other third parties, whereas for EMR it included these intra-firm transactions initially but EMR subsequently provided data with these intra-firm transactions removed.
(ii) Details of every transaction that involved the purchase of waste scrap and processed scrap metal made by the Parties in the calendar year 2017. This data set included the transaction date, value (£), weight (Metric Tonnes), metal grade, the site at which the metal was purchased, the supplier’s name, location, and a categorisation of the supplier’s type of business.
(iii) Details of every transaction that involved the sale of waste scrap and processed scrap metal made by the Parties in the calendar year 2017. This data set included the transaction date, value (£), weight (Metric Tonnes), metal grade, the site from which the metal was sold, the customer’s name, location, and a categorisation of the customer’s type of business.
(b) We collated questionnaire responses from competitors, suppliers and customers.
(i) The Parties provided us with an extensive list of competitors for their London and West Midlands sites at the outset of the Phase 2 investigation.2 We continued to use the list of main competitors provided in the Phase 1 investigation for Wales and the North East, and therefore these lists have not expanded.
(ii) We requested that competitors provide us with the total volume purchased and sold within the last financial year, and to break this down by site location and grade wherever possible. Throughout our calculation of market shares, we used the purchase and sales volumes provided by the competitor where these were available.
(iii) For suppliers of New Production Steel (NPS), we requested the total volumes of NPS that they supplied in 2017, and the identity of the Metal Recycler(s) to which they supplied it. This was used in the calculation of New Production Steel market shares.
(iv) From customers, we requested that they provide us with their purchase volumes from the Parties, their top list of suppliers, viable alternative suppliers, and a list of tender bids that they submitted. The
2 []

D3
responses of customers who bought NPS was used in the calculation of New Production Steel market shares.
(c) We used a data set collected by the Environment Agency (“EA”) which includes the site operator, address, contact information, and the waste received in 2016, 2015 and 2014. All operators of regulated waste management facilities have to provide the EA with details of the quantities and types of waste they deal with i.e. waste received into site and waste sent on from site to other facilities or processes.3 We have only used the 2016 volumes provided in this data set where other sources were not available. The Parties made a number of submissions regarding the accuracy of the EA data; these are discussed further in the Parties’ Comments section below.
Methodology and Results
4. To determine the set of relevant competitors within each geographic area, we requested that the Parties provide us with an extensive list of competitors for their London and West Midlands sites.4 We continued to use the list of main competitors provided in the Phase 1 investigation for Wales and the North East, and therefore these lists have not expanded. The total number of competitors identified by the parties are given in Table 20.
5. As set out in the chapter on market definition, we found that around feeder and processing sites, the large majority of volumes come from within a radius of 50km around the sites; for shredder sites this is 115km. Therefore, our calculation of market shares for purchasing in London, West Midlands, Wales and the North East is based on all competitor sites within 50km of one of the Parties’ sites. Our calculation of the market shares at shredder sites in the London area, similarly, includes all sites with a shredder within 115km of MWR Hitchin, EMR Willesden or EMR East Tilbury.
6. The purchase and sales shares are based on volume data for each site for each competitor. In calculating purchase volume share we have relied on responses to our information requests from metal recyclers where available, and EA values when not available. Table 20 details the number of competitors for which we used questionnaire responses.
3 [] 4 []
D4
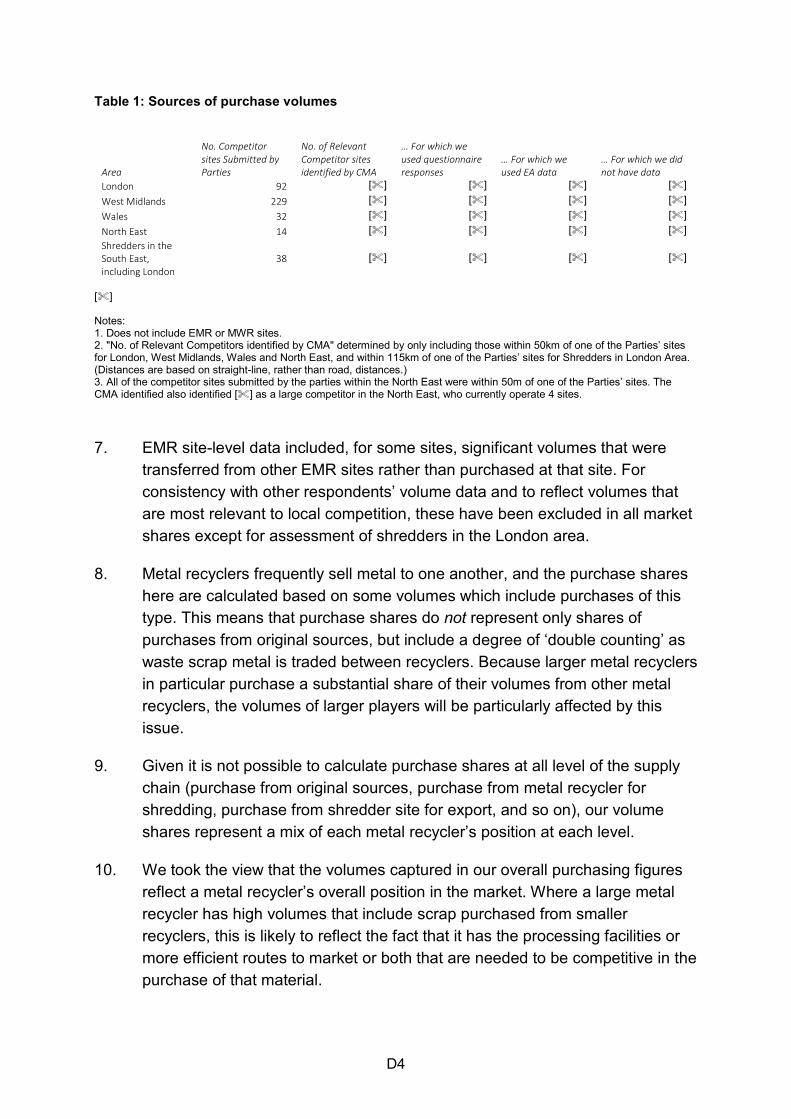
Table 1: Sources of purchase volumes
Area
No. Competitor sites Submitted by Parties
No. of Relevant Competitor sites identified by CMA
… For which we used questionnaire responses
… For which we used EA data
… For which we did not have data
London 92 [] [] [] [] West Midlands 229 [] [] [] [] Wales 32 [] [] [] [] North East 14 [] [] [] [] Shredders in the South East, including London
38
[]
[]
[]
[]
[] Notes: 1. Does not include EMR or MWR sites. 2. "No. of Relevant Competitors identified by CMA" determined by only including those within 50km of one of the Parties’ sites for London, West Midlands, Wales and North East, and within 115km of one of the Parties’ sites for Shredders in London Area. (Distances are based on straight-line, rather than road, distances.) 3. All of the competitor sites submitted by the parties within the North East were within 50m of one of the Parties’ sites. The CMA identified also identified [] as a large competitor in the North East, who currently operate 4 sites.
7. EMR site-level data included, for some sites, significant volumes that were transferred from other EMR sites rather than purchased at that site. For consistency with other respondents’ volume data and to reflect volumes that are most relevant to local competition, these have been excluded in all market shares except for assessment of shredders in the London area.
8. Metal recyclers frequently sell metal to one another, and the purchase shares here are calculated based on some volumes which include purchases of this type. This means that purchase shares do not represent only shares of purchases from original sources, but include a degree of ‘double counting’ as waste scrap metal is traded between recyclers. Because larger metal recyclers in particular purchase a substantial share of their volumes from other metal recyclers, the volumes of larger players will be particularly affected by this issue.
9. Given it is not possible to calculate purchase shares at all level of the supply chain (purchase from original sources, purchase from metal recycler for shredding, purchase from shredder site for export, and so on), our volume shares represent a mix of each metal recycler’s position at each level.
10. We took the view that the volumes captured in our overall purchasing figures reflect a metal recycler’s overall position in the market. Where a large metal recycler has high volumes that include scrap purchased from smaller recyclers, this is likely to reflect the fact that it has the processing facilities or more efficient routes to market or both that are needed to be competitive in the purchase of that material.
D5
National Ferrous Sales
11. To estimate the total volume of ferrous sales to UK customers, we used an estimate provided by the Parties.5 The total market size is based on figures from the EEF, which estimates that 3.6m tonnes of ferrous metal arising from recovered used steel scrap in the UK is supplied to UK steelworks. Of this, 1.6m tonnes arise within steelworks, rather than being traded on the open market.6 In our analysis of national ferrous sales we only include the total quantity of ferrous scrap traded on the open market, because arisings within steelworks is not a suitable alternative source for UK customers.7
12. In the calculation of the share of known ferrous sales to UK customers, we only included the Parties’ sales to final customers; excluding sales to other metal recyclers and metal trades. MWR and EMR submitted that although there are no accurate estimates, they believe most of their sales to traders are subsequently exported.8
13. Additionally, we calculated the share of non-nps ferrous sales to UK customers by only including the non-NPS ferrous grades. NPS sales was defined as a separate market and so we aimed to avoid conflating significant sales of NPS with other ferrous sales. We removed the NPS volumes for six large competitors and the Parties, from which we had received the relevant information on NPS sales in their questionnaire responses. Because we could not make this adjustment for the entire market, the Parties’ non-NPS ferrous market share would be under-estimated.
5 [] 6 EEF is the trade association for the UK Steel industry, []. Its source is Index Mundi, which is a data portal that gathers facts and statistics from multiple sources. 7 Note that within our assessment of the market share for the sale of New Production Steel, we calculate market shares including and excluding self-supply by steel manufacturers. 8 []

D6
Table 2: National market shares for Non-NPS ferrous sales to UK customers
Total volume of ferrous sales
Volume of ferrous sales to UK customers
Share of known ferrous sales to UK customers (%)
Volume of NPS sales to UK customers
Volume of non-nps ferrous sales to UK customers
Share of known ferrous non-NPS sales to UK customers (%)
EMR [] [] [30-40%] [] [] [20-30%]
MWR [] [] [0-5%] [] [] [0-5%]
Parties Combined [] [] [30-40%] [] [] [20-30%] [] [] [] [5-10%] [] [] [5-10%] [] [] [] [5-10%] [] [] [5-10%] [] [] [] [5-10%] [] [] [0-5%] [] [] [] [0-5%] [] [] [5-10%] [] [] [] [0-5%] [] [] [0-5%] [] [] [] [0-5%] [] [] [0-5%] [] [] [] [0-5%] [] [] [0-5%] [] [] [] [0-5%] [] [] [0-5%] [] [] [] [0-5%] [] [] [0-5%] [] [] [] [0-5%] [] [] [0-5%] [] [] [] [0-5%] [] [] [0-5%] [] [] [] [0-5%] [] [] [0-5%] [] [] [] [0-5%] [] [] [0-5%] [] [] [] [0-5%] [] [] [0-5%] [] [] [] [0-5%] [] [] [0-5%] [] [] [] [0-5%] [] [] [0-5%]
Other sites 65,000 688,793 34% - 688,793 39%
Total 7,778,788 2,000,000 100% 250,238 1,749,762 100% [] 1. Includes some sites for EMR and Sims which are outside of overlap areas. 2. Assumes a total size of UK non-ferrous sales to be 2,000,000MT. 3. "Volume of ferrous sales to UK customers" excludes sales to traders and metal recyclers for the Parties. 14. At Phase 1 we estimated that EMR’s share of ferrous sales was [20-30%], and
MWR’s share is [0-5%]. The lower, updated figures presented in Table 21, above are driven by the removal of sales to UK metal recyclers and metal traders from the “Volume of ferrous sales to UK customers” for the Parties.
National non-ferrous sales
15. The Parties provided an estimate for total sales of non-ferrous processed scrap metal. While there is no estimate of total domestic supply available, figures for total non-ferrous exports from the UK are available from the ISSB, which estimated these at 855,000 tonnes in 2016.9 EMR then used the same domestic-supply-to-export-ratio for the total market size as it applies to EMR, which exports [70-80%] of its supply. So EMR assumed that 855,000 tonnes total exports in 2016 equates to [70-80%] of the total market size. This would
9 [] ISSB is a leading supplier of global trade data for steel and raw materials.
D7
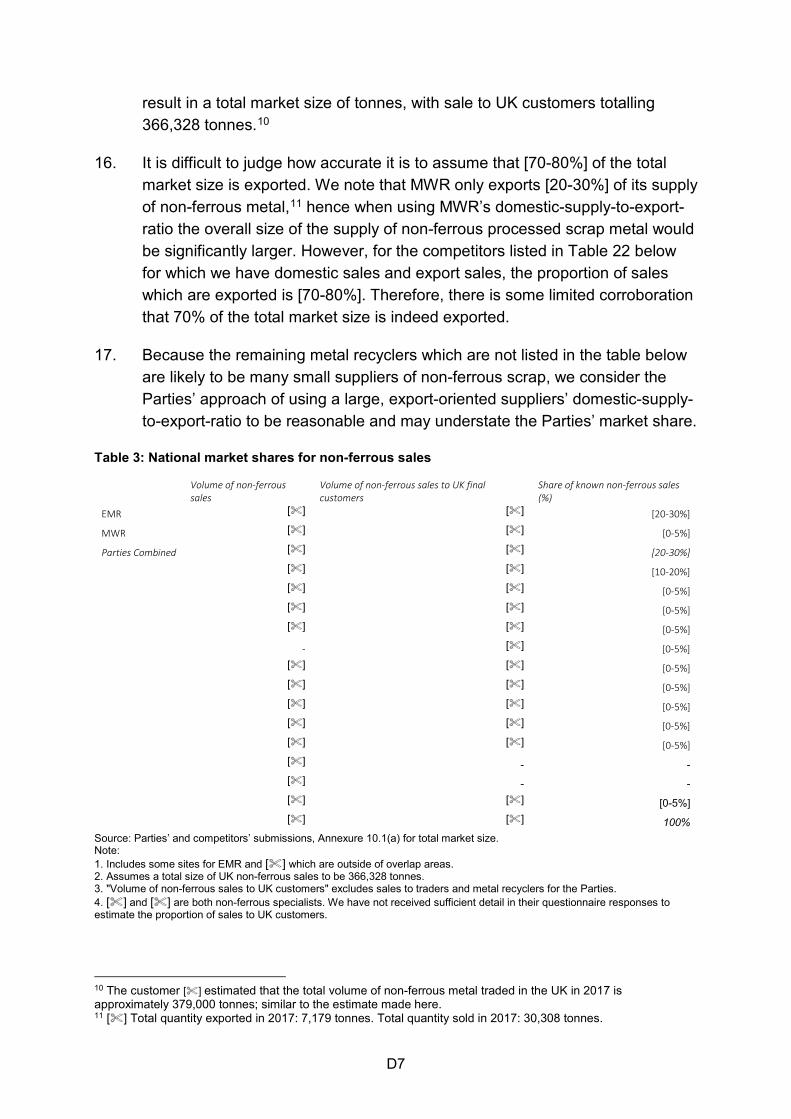
result in a total market size of tonnes, with sale to UK customers totalling 366,328 tonnes.10
16. It is difficult to judge how accurate it is to assume that [70-80%] of the total market size is exported. We note that MWR only exports [20-30%] of its supply of non-ferrous metal,11 hence when using MWR’s domestic-supply-to-export-ratio the overall size of the supply of non-ferrous processed scrap metal would be significantly larger. However, for the competitors listed in Table 22 below for which we have domestic sales and export sales, the proportion of sales which are exported is [70-80%]. Therefore, there is some limited corroboration that 70% of the total market size is indeed exported.
17. Because the remaining metal recyclers which are not listed in the table below are likely to be many small suppliers of non-ferrous scrap, we consider the Parties’ approach of using a large, export-oriented suppliers’ domestic-supply-to-export-ratio to be reasonable and may understate the Parties’ market share.
Table 3: National market shares for non-ferrous sales
Volume of non-ferrous sales
Volume of non-ferrous sales to UK final customers
Share of known non-ferrous sales (%)
EMR [] [] [20-30%]
MWR [] [] [0-5%]
Parties Combined [] [] [20-30%] [] [] [10-20%] [] [] [0-5%] [] [] [0-5%] [] [] [0-5%] - [] [0-5%] [] [] [0-5%] [] [] [0-5%] [] [] [0-5%] [] [] [0-5%] [] [] [0-5%] [] - - [] - - [] [] [0-5%] [] [] 100%
Source: Parties’ and competitors’ submissions, Annexure 10.1(a) for total market size. Note: 1. Includes some sites for EMR and [] which are outside of overlap areas. 2. Assumes a total size of UK non-ferrous sales to be 366,328 tonnes. 3. "Volume of non-ferrous sales to UK customers" excludes sales to traders and metal recyclers for the Parties. 4. [] and [] are both non-ferrous specialists. We have not received sufficient detail in their questionnaire responses to estimate the proportion of sales to UK customers.
10 The customer [] estimated that the total volume of non-ferrous metal traded in the UK in 2017 is approximately 379,000 tonnes; similar to the estimate made here. 11 [] Total quantity exported in 2017: 7,179 tonnes. Total quantity sold in 2017: 30,308 tonnes.
D8
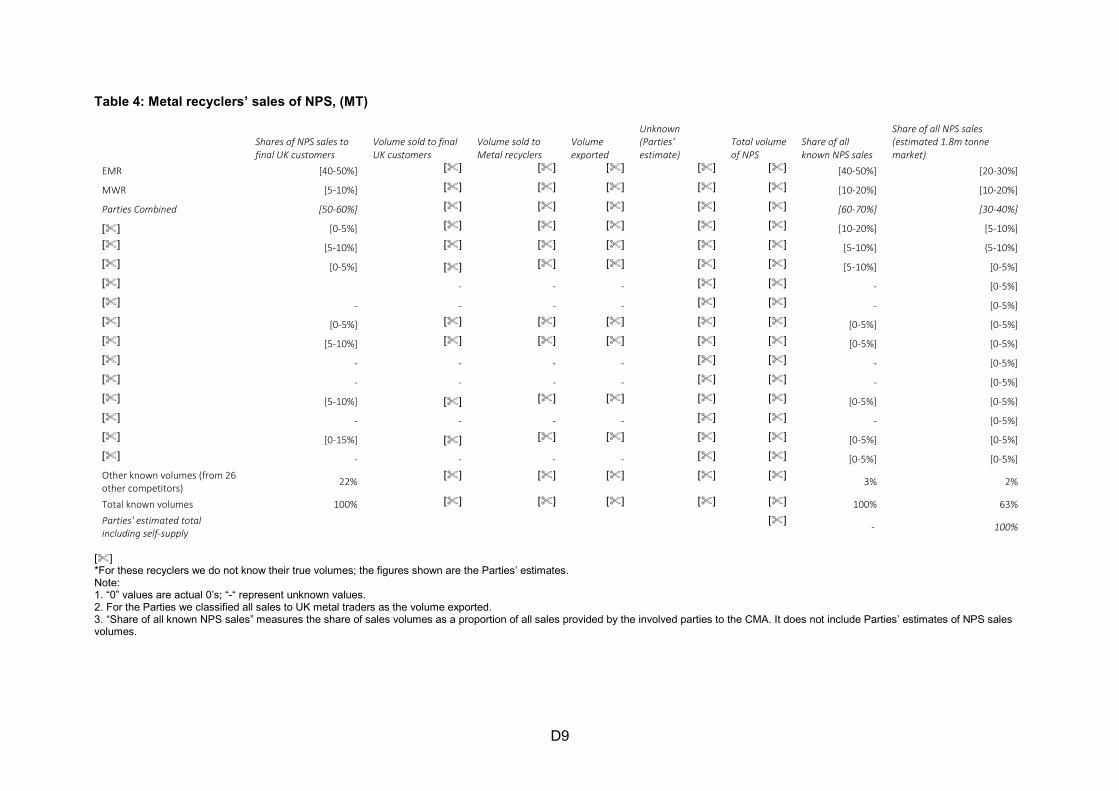
Sales of New Production Steel to UK customers
18. The CMA has collated New Production Steel (NPS) sales volumes for 39 competitors throughout the UK. Because NPS is not recorded separately in the EA data our estimates of these shares are based only on data we received directly from competitors, customers and suppliers.
19. For 12 metal recyclers, their sales volumes were provided directly by the metal recyclers; this allowed us to split their volumes between sales to UK customers, sales to other metal recyclers and exports. For 16 metal recyclers, we used data from customers’ NPS purchase data relating to their top five suppliers of NPS; this allowed us only to estimate their sales to UK customers. For the remaining 11 recyclers, we used the Parties’ estimates of NPS contracts held by those competitors.
20. Our market share estimates in the column “Share of all known NPS sales” are likely to overestimate the Parties’ shares, as we do not have full data on all competitors or all customers’ purchases. However, because we have received the purchase volumes directly from the largest metal recyclers, we expect that these shares are broadly representative of the Parties’ positions in the market.
21. EMR has estimated that the total arisings of NPS in the UK at approximately 1.8 million tonnes, which includes available and contestable arisings from steel manufacturers and their integrated downstream businesses (who may choose to self-supply). Therefore, we have also estimated each recyclers’ share of NPS sales using 1.8 million tonnes as the estimate of the total market size.
D9
Table 4: Metal recyclers’ sales of NPS, (MT)
Shares of NPS sales to final UK customers
Volume sold to final UK customers
Volume sold to Metal recyclers
Volume exported
Unknown (Parties’ estimate)
Total volume of NPS
Share of all known NPS sales
Share of all NPS sales (estimated 1.8m tonne market)
EMR [40-50%] [] [] [] [] [] [40-50%] [20-30%]
MWR [5-10%] [] [] [] [] [] [10-20%] [10-20%]
Parties Combined [50-60%] [] [] [] [] [] [60-70%] [30-40%]
[] [0-5%] [] [] [] [] [] [10-20%] [5-10%] [] [5-10%] [] [] [] [] [] [5-10%] {5-10%] [] [0-5%] [] [] [] [] [] [5-10%] [0-5%] [] - - - [] [] - [0-5%] [] - - - - [] [] - [0-5%] [] [0-5%] [] [] [] [] [] [0-5%] [0-5%] [] [5-10%] [] [] [] [] [] [0-5%] [0-5%] [] - - - - [] [] - [0-5%] [] - - - - [] [] - [0-5%] [] [5-10%] [] [] [] [] [] [0-5%] [0-5%] [] - - - - [] [] - [0-5%] [] [0-15%] [] [] [] [] [] [0-5%] [0-5%] [] - - - - [] [] [0-5%] [0-5%] Other known volumes (from 26 other competitors)
22% [] [] [] [] []
3% 2%
Total known volumes 100% [] [] [] [] [] 100% 63% Parties' estimated total including self-supply
[]
- 100%
[] *For these recyclers we do not know their true volumes; the figures shown are the Parties’ estimates. Note: 1. “0” values are actual 0’s; “-“ represent unknown values. 2. For the Parties we classified all sales to UK metal traders as the volume exported. 3. “Share of all known NPS sales” measures the share of sales volumes as a proportion of all sales provided by the involved parties to the CMA. It does not include Parties’ estimates of NPS sales volumes.
D10
22. As a sensitivity check, we estimated the shares for the sales of NPS to UK customers after excluding the NPS purchases from other metal recyclers. We could only exclude these volumes for the Parties, [], as we only received sufficiently detailed questionnaire responses for these competitors. After making this change, the Parties’ combined share decreases slightly to [40-50]% with a [5-10]% increment.
Market shares for regional purchasing markets
Shredders in the South East
23. The Parties submitted a list of 39 competing shredder sites across the UK.12 We based our market share calculations on all relevant competitor sites that are currently operating relevant shredders, and are within 115km of one of the Parties’ shredder sites at (MWR Hitchin, EMR Willesden, and EMR East Tilbury).
24. Having sent questionnaires to the main competitors to confirm that they indeed had a functioning shredder comparable to the those operated by the Parties, we excluded two competitors that responded that they did not operate such equipment - [] and []13 - from further analysis.
25. We expect that at shredder sites, shredder feed is unlikely to be the only scrap purchased. The Environment Agency data does not differentiate between shredder feed and other grades of scrap. Therefore, we estimated the size of shredder feed purchases at these sites using the following sources:
(a) For the Parties, we used the shredder feed purchase volumes provided to the CMA;
(b) For [], we used their questionnaire responses;
(c) For competitors which only have a shredder at their site, we assume that 100% of their purchases are shredder feed;
(d) For competitors which have other processing equipment at their site, we assume that 50% of their purchases are shredder feed.14
12 [] 13 [] do not own a shredder. [] have a low-powered shredder which currently mainly shreds aluminium and plastics, and therefore does not pose a strong competitive constraint on the Parties. 14 This is close to the proportion of purchases made by the Parties across their sites in the region which is shredder feed (52%).
D11
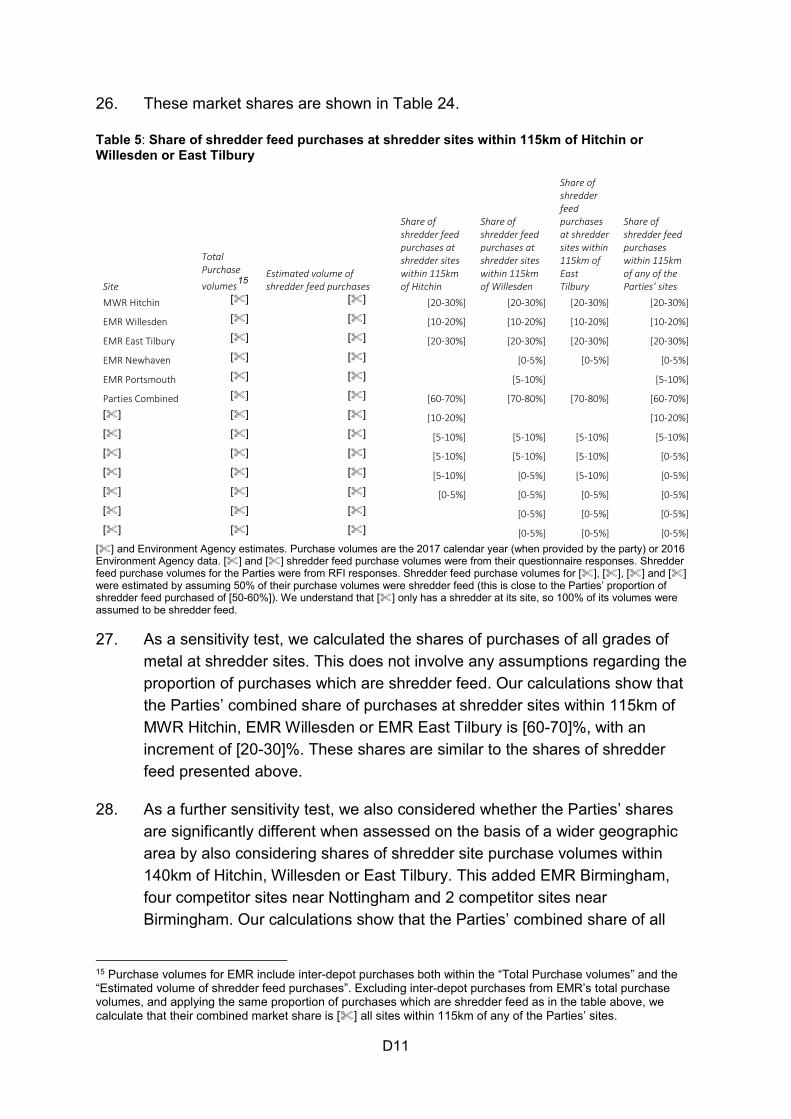
26. These market shares are shown in Table 24.
Table 5: Share of shredder feed purchases at shredder sites within 115km of Hitchin or Willesden or East Tilbury
Site
Total Purchase
volumes15 Estimated volume of shredder feed purchases
Share of shredder feed purchases at shredder sites within 115km of Hitchin
Share of shredder feed purchases at shredder sites within 115km of Willesden
Share of shredder feed purchases at shredder sites within 115km of East Tilbury
Share of shredder feed purchases within 115km of any of the Parties’ sites
MWR Hitchin [] [] [20-30%] [20-30%] [20-30%] [20-30%]
EMR Willesden [] [] [10-20%] [10-20%] [10-20%] [10-20%]
EMR East Tilbury [] [] [20-30%] [20-30%] [20-30%] [20-30%]
EMR Newhaven [] [] [0-5%] [0-5%] [0-5%]
EMR Portsmouth [] [] [5-10%] [5-10%]
Parties Combined [] [] [60-70%] [70-80%] [70-80%] [60-70%] [] [] [] [10-20%] [10-20%] [] [] [] [5-10%] [5-10%] [5-10%] [5-10%] [] [] [] [5-10%] [5-10%] [5-10%] [0-5%] [] [] [] [5-10%] [0-5%] [5-10%] [0-5%] [] [] [] [0-5%] [0-5%] [0-5%] [0-5%] [] [] [] [0-5%] [0-5%] [0-5%] [] [] [] [0-5%] [0-5%] [0-5%]
[] and Environment Agency estimates. Purchase volumes are the 2017 calendar year (when provided by the party) or 2016 Environment Agency data. [] and [] shredder feed purchase volumes were from their questionnaire responses. Shredder feed purchase volumes for the Parties were from RFI responses. Shredder feed purchase volumes for [], [], [] and [] were estimated by assuming 50% of their purchase volumes were shredder feed (this is close to the Parties’ proportion of shredder feed purchased of [50-60%]). We understand that [] only has a shredder at its site, so 100% of its volumes were assumed to be shredder feed. 27. As a sensitivity test, we calculated the shares of purchases of all grades of
metal at shredder sites. This does not involve any assumptions regarding the proportion of purchases which are shredder feed. Our calculations show that the Parties’ combined share of purchases at shredder sites within 115km of MWR Hitchin, EMR Willesden or EMR East Tilbury is [60-70]%, with an increment of [20-30]%. These shares are similar to the shares of shredder feed presented above.
28. As a further sensitivity test, we also considered whether the Parties’ shares are significantly different when assessed on the basis of a wider geographic area by also considering shares of shredder site purchase volumes within 140km of Hitchin, Willesden or East Tilbury. This added EMR Birmingham, four competitor sites near Nottingham and 2 competitor sites near Birmingham. Our calculations show that the Parties’ combined share of all
15 Purchase volumes for EMR include inter-depot purchases both within the “Total Purchase volumes” and the “Estimated volume of shredder feed purchases”. Excluding inter-depot purchases from EMR’s total purchase volumes, and applying the same proportion of purchases which are shredder feed as in the table above, we calculate that their combined market share is [] all sites within 115km of any of the Parties’ sites.
D12
purchases within 140km of Hitchin, Willesden or East Tilbury is [40-50%], with an increment of [10-20%]. Additionally, our calculations show that the Parties’ combined share of shredder feed purchases within 140km of Hitchin, Willesden or East Tilbury is [50-60%], with an increment of [10-20%].
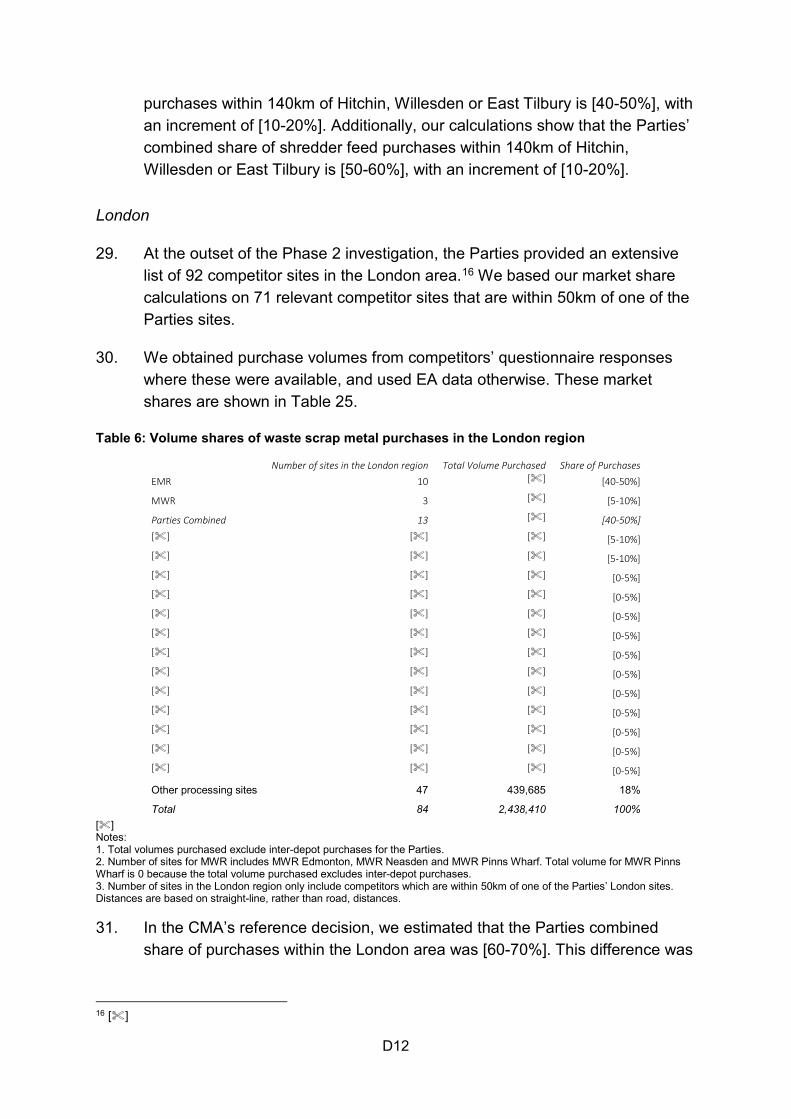
London
29. At the outset of the Phase 2 investigation, the Parties provided an extensive list of 92 competitor sites in the London area.16 We based our market share calculations on 71 relevant competitor sites that are within 50km of one of the Parties sites.
30. We obtained purchase volumes from competitors’ questionnaire responses where these were available, and used EA data otherwise. These market shares are shown in Table 25.
Table 6: Volume shares of waste scrap metal purchases in the London region
Number of sites in the London region Total Volume Purchased Share of Purchases EMR 10 [] [40-50%]
MWR 3 [] [5-10%]
Parties Combined 13 [] [40-50%] [] [] [] [5-10%] [] [] [] [5-10%] [] [] [] [0-5%] [] [] [] [0-5%] [] [] [] [0-5%] [] [] [] [0-5%] [] [] [] [0-5%] [] [] [] [0-5%] [] [] [] [0-5%] [] [] [] [0-5%] [] [] [] [0-5%] [] [] [] [0-5%] [] [] [] [0-5%]
Other processing sites 47 439,685 18%
Total 84 2,438,410 100% [] Notes: 1. Total volumes purchased exclude inter-depot purchases for the Parties. 2. Number of sites for MWR includes MWR Edmonton, MWR Neasden and MWR Pinns Wharf. Total volume for MWR Pinns Wharf is 0 because the total volume purchased excludes inter-depot purchases. 3. Number of sites in the London region only include competitors which are within 50km of one of the Parties’ London sites. Distances are based on straight-line, rather than road, distances. 31. In the CMA’s reference decision, we estimated that the Parties combined
share of purchases within the London area was [60-70%]. This difference was
16 []
D13
primarily due to the inclusion of inter-depot transactions within EMR’s purchase volumes, which we have now excluded.
32. As a sensitivity check, we calculated the market shares of London sites only including the estimated purchases of non-shredder feed scrap. In the London region, EMR operates two shredders, and LKM, Van Dalen, Charles Muddle and Spartan Metals operate one. We only included purchase volumes of non-shredder feed for EMR, Van Dalen and Charles Muddle, which were provided to us by those recyclers themselves. We made no adjustments to LKM’s volumes. The estimated combined share of purchases for the Parties after this adjustment is [40-50%] with an increment of [5-10%].17
West Midlands
33. At the outset of the Phase 2 investigation, the Parties provided an extended list of 229 competitor sites in the West Midlands.18 We based our market share calculations on 192 competitor sites that are within 50km of one of the Parties sites.
34. We obtained purchase volumes from competitors’ questionnaire responses where these were available, and used EA data otherwise. These market shares are shown in Table 26.
17 It is likely that a significant proportion of ASM and Total Waste Management’s purchases are shredder feed, as these metal recyclers sell substantial volumes of shredder feed to the Parties. However, we do not make any adjustments for these sites, and note that the Parties’ combined market shares would increase if we did. 18 []
D14
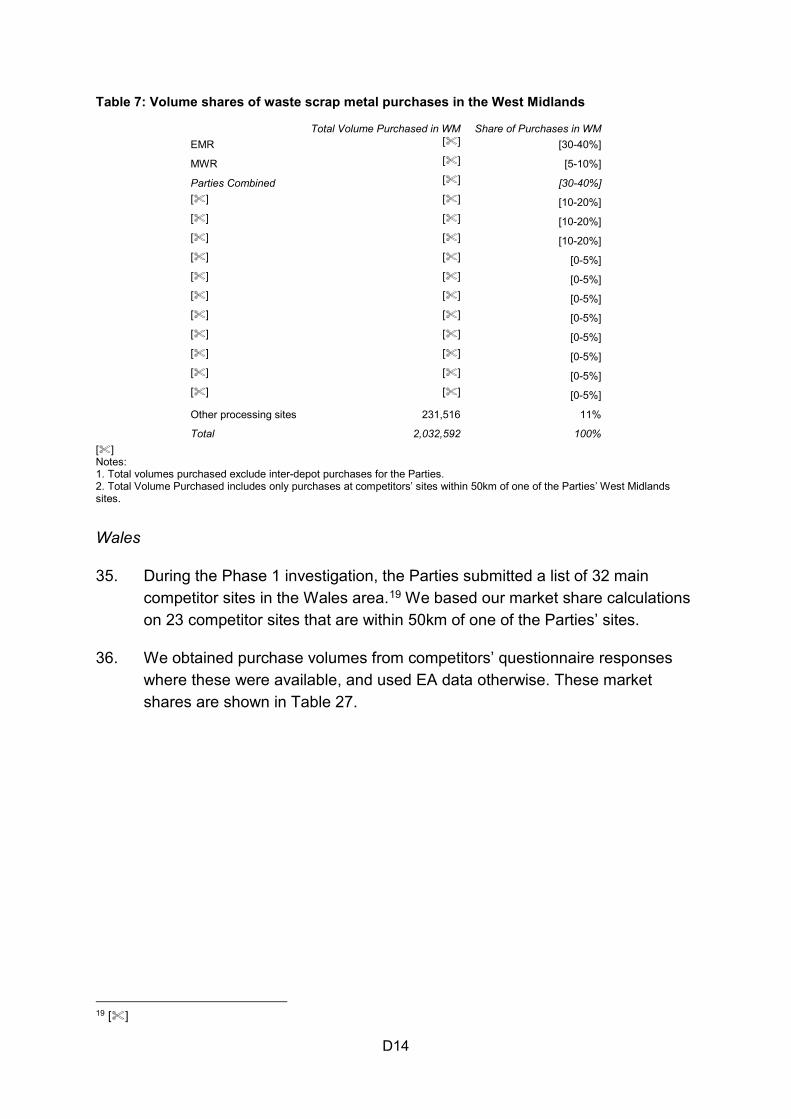
Table 7: Volume shares of waste scrap metal purchases in the West Midlands
Total Volume Purchased in WM Share of Purchases in WM EMR [] [30-40%]
MWR [] [5-10%]
Parties Combined [] [30-40%] [] [] [10-20%] [] [] [10-20%] [] [] [10-20%] [] [] [0-5%] [] [] [0-5%] [] [] [0-5%] [] [] [0-5%] [] [] [0-5%] [] [] [0-5%] [] [] [0-5%] [] [] [0-5%]
Other processing sites 231,516 11%
Total 2,032,592 100% [] Notes: 1. Total volumes purchased exclude inter-depot purchases for the Parties. 2. Total Volume Purchased includes only purchases at competitors’ sites within 50km of one of the Parties’ West Midlands sites.
Wales
35. During the Phase 1 investigation, the Parties submitted a list of 32 main competitor sites in the Wales area.19 We based our market share calculations on 23 competitor sites that are within 50km of one of the Parties’ sites.
36. We obtained purchase volumes from competitors’ questionnaire responses where these were available, and used EA data otherwise. These market shares are shown in Table 27.
19 []

D15
Table 8: Volume shares of waste scrap metal purchases in the Wales area
Total Volume Purchased Share of Purchases EMR [] [20-30%]
MWR [] [0-5%]
Parties Combined [] [20-30%]
[] [] [50-60%] [] [] [5-10%] [] [] [5-10%] [] [] [0-5%] [] [] [0-5%]
Other processing sites 23,301 3%
Total 779,622 100% [] Notes: 1. Total volumes purchased exclude inter-depot purchases for the Parties. 2. Total Volume Purchased includes only purchases at competitors’ sites within 50km of one of the Parties’ Welsh sites. 37. As a sensitivity check, we calculated market shares only for Party and
competitor sites which have postcodes inside of Wales. As a result, we excluded four competitor sites and one EMR site. Based on this approach, the Parties’ combined share of purchases within Wales are [40-50%] with an increment of [5-10%].
38. As an additional sensitivity check we included [a metal recycler’s] site, which is a processing site that has a shear, baler and ELV rig. It is 52km away from the closest Party site, and therefore just falls outside of our 50km market definition. After including this site, the Parties’ combined share of purchases fall to [20-25%] with an increment of [0-5%].
North East
39. During the Phase 1 investigation, the Parties submitted a list of 14 main competitor sites in the North East.20 All 14 of these sites were within 50km of one of the Parties’ North East sites. We additionally identified G O’Brien and Sons as a competitor in the North East, who operate 4 sites. Therefore, we assessed the market shares in the North East using 18 competitor sites in total.
40. We obtained purchase volumes from competitors’ questionnaire responses where these were available, and used EA data otherwise. These market shares are shown in Table 28.
20 []
D16
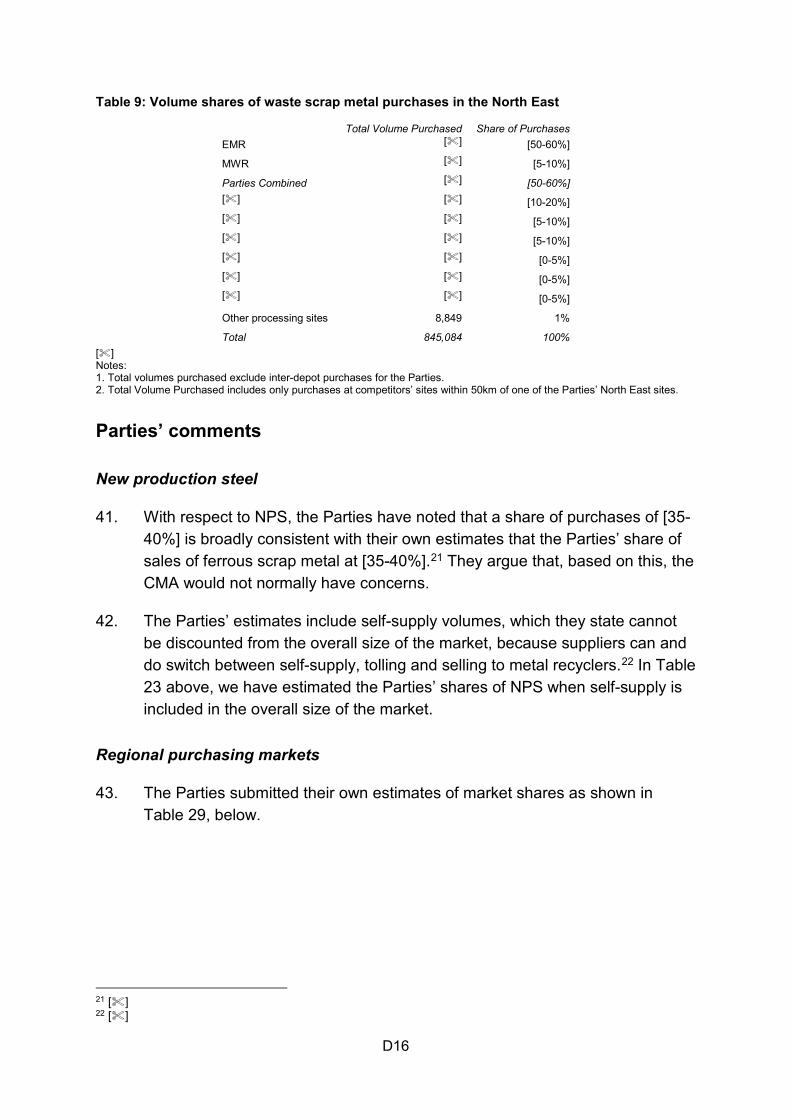
Table 9: Volume shares of waste scrap metal purchases in the North East
Total Volume Purchased Share of Purchases EMR [] [50-60%]
MWR [] [5-10%]
Parties Combined [] [50-60%] [] [] [10-20%] [] [] [5-10%] [] [] [5-10%] [] [] [0-5%] [] [] [0-5%] [] [] [0-5%]
Other processing sites 8,849 1%
Total 845,084 100% [] Notes: 1. Total volumes purchased exclude inter-depot purchases for the Parties. 2. Total Volume Purchased includes only purchases at competitors’ sites within 50km of one of the Parties’ North East sites.
Parties’ comments
New production steel
41. With respect to NPS, the Parties have noted that a share of purchases of [35-40%] is broadly consistent with their own estimates that the Parties’ share of sales of ferrous scrap metal at [35-40%].21 They argue that, based on this, the CMA would not normally have concerns.
42. The Parties’ estimates include self-supply volumes, which they state cannot be discounted from the overall size of the market, because suppliers can and do switch between self-supply, tolling and selling to metal recyclers.22 In Table 23 above, we have estimated the Parties’ shares of NPS when self-supply is included in the overall size of the market.
Regional purchasing markets
43. The Parties submitted their own estimates of market shares as shown in Table 29, below.
21 [] 22 []
D17
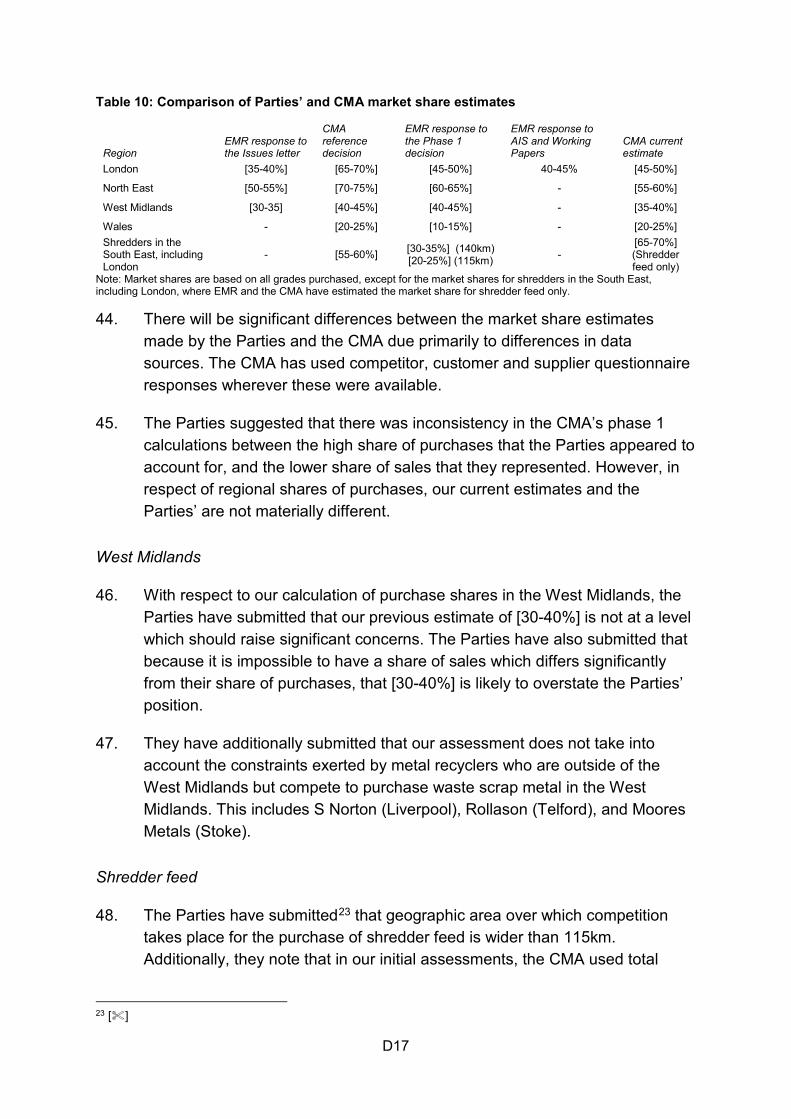
Table 10: Comparison of Parties’ and CMA market share estimates
Region EMR response to the Issues letter
CMA reference decision
EMR response to the Phase 1 decision
EMR response to AIS and Working Papers
CMA current estimate
London [35-40%] [65-70%] [45-50%] 40-45% [45-50%]
North East [50-55%] [70-75%] [60-65%] - [55-60%]
West Midlands [30-35] [40-45%] [40-45%] - [35-40%]
Wales - [20-25%] [10-15%] - [20-25%] Shredders in the South East, including London
- [55-60%] [30-35%] (140km) [20-25%] (115km) -
[65-70%] (Shredder feed only)
Note: Market shares are based on all grades purchased, except for the market shares for shredders in the South East, including London, where EMR and the CMA have estimated the market share for shredder feed only. 44. There will be significant differences between the market share estimates
made by the Parties and the CMA due primarily to differences in data sources. The CMA has used competitor, customer and supplier questionnaire responses wherever these were available.
45. The Parties suggested that there was inconsistency in the CMA’s phase 1 calculations between the high share of purchases that the Parties appeared to account for, and the lower share of sales that they represented. However, in respect of regional shares of purchases, our current estimates and the Parties’ are not materially different.
West Midlands
46. With respect to our calculation of purchase shares in the West Midlands, the Parties have submitted that our previous estimate of [30-40%] is not at a level which should raise significant concerns. The Parties have also submitted that because it is impossible to have a share of sales which differs significantly from their share of purchases, that [30-40%] is likely to overstate the Parties’ position.
47. They have additionally submitted that our assessment does not take into account the constraints exerted by metal recyclers who are outside of the West Midlands but compete to purchase waste scrap metal in the West Midlands. This includes S Norton (Liverpool), Rollason (Telford), and Moores Metals (Stoke).
Shredder feed
48. The Parties have submitted23 that geographic area over which competition takes place for the purchase of shredder feed is wider than 115km. Additionally, they note that in our initial assessments, the CMA used total
23 []
D18
volumes of purchases rather than the purchases of Shredder Feed. As described above, we have run sensitivity checks where we increase the catchment area to 140km, as suggested by the Parties, and estimated the shares of purchases based only on shredder feed.
London
49. With respect to the London area, the Parties submitted that the CMA’s market share assessment is likely to overstate the Parties’ position24 because:
(a) it does not take account of the volumes purchased by the remaining 37 (Greater London) – 92 (Wider London) competitor sites identified by the CMA;
(b) it is unclear whether the CMA’s share of supply figures include purchases by [a metal recycler];
(c) EMR has previously estimated and presented lower shares of purchases (40-45%).
50. The CMA’s decision to assess competition within a 50km-catchment area takes into account 71 competitor sites within the London area. This market shares assessment includes purchase volumes by two [] sites ([] and []), and does not include purchase volumes for its [] site (as this is a dock which just received inter-depot purchases). The purchase volumes for [] were provided directly by [] to the CMA.
Environment Agency data
51. The Parties have raised several issues with the Environment Agency data set:
(a) In this data, only scrap metal merchants operating a site under a licence are required to submit volume data to the Environment Agency. This will result in an underestimate of the total market size.
(b) The Parties submitted25 that that some sites appear to have not submitted data and others under-report volumes.
(c) It aims to record all volumes passing through sites, so may include some intra-company flows (which would tend to exaggerate the market shares of firms that have multiple sites). However, we think that this effect is limited given that we have received data directly from many of the largest
24 [] 25 []
D19
recyclers. Given that we have corrected the Parties’ and large competitors’ volumes for this effect, any remaining effect would be to overstate the volumes of small competitors and cause a resulting understatement of the Parties’ market shares.
52. We recognise that the EA data has limitations. However, the CMA’s analysis at Phase 1, which compared the volumes within the EA data set with data provided by metal recyclers showed that the average error was 11%. We therefore we have continued to use EA data where other data was not available.
53. Additionally, within our analysis of non-NPS ferrous sales and non-ferrous sales we use an estimate of the total market size agreed with the Parties. Within our local analysis of London, the West Midlands, Wales and the North East, we have included the purchase volumes for the largest competitors, and therefore it is unlikely that we have underestimated the size of the total market by a significant amount.
Glos-1
Glossary
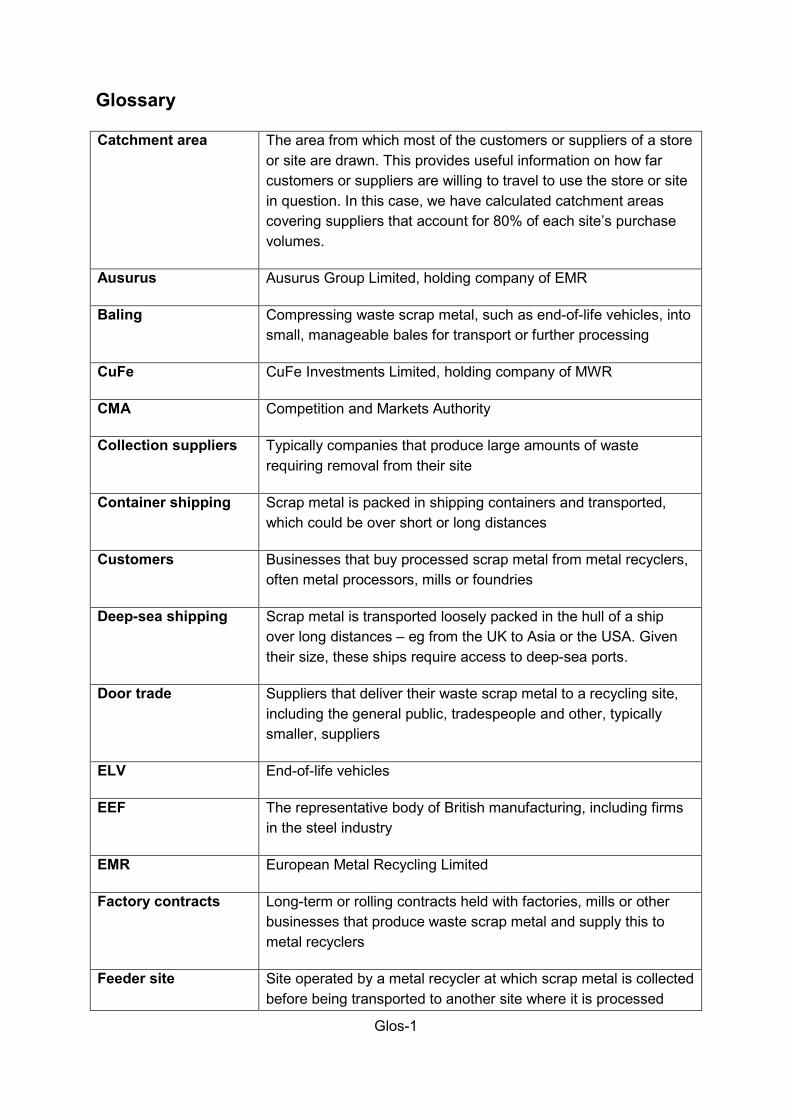
Catchment area The area from which most of the customers or suppliers of a store or site are drawn. This provides useful information on how far customers or suppliers are willing to travel to use the store or site in question. In this case, we have calculated catchment areas covering suppliers that account for 80% of each site’s purchase volumes.
Ausurus Ausurus Group Limited, holding company of EMR
Baling Compressing waste scrap metal, such as end-of-life vehicles, into small, manageable bales for transport or further processing
CuFe CuFe Investments Limited, holding company of MWR
CMA Competition and Markets Authority
Collection suppliers Typically companies that produce large amounts of waste requiring removal from their site
Container shipping Scrap metal is packed in shipping containers and transported, which could be over short or long distances
Customers Businesses that buy processed scrap metal from metal recyclers, often metal processors, mills or foundries
Deep-sea shipping Scrap metal is transported loosely packed in the hull of a ship over long distances – eg from the UK to Asia or the USA. Given their size, these ships require access to deep-sea ports.
Door trade Suppliers that deliver their waste scrap metal to a recycling site, including the general public, tradespeople and other, typically smaller, suppliers
ELV End-of-life vehicles
EEF The representative body of British manufacturing, including firms in the steel industry
EMR European Metal Recycling Limited
Factory contracts Long-term or rolling contracts held with factories, mills or other businesses that produce waste scrap metal and supply this to metal recyclers
Feeder site Site operated by a metal recycler at which scrap metal is collected before being transported to another site where it is processed

Glos-2
Feeder sites tend to be a smaller sites with little or no processing facilities
Ferrous Iron based (including steel)
FY Financial year
Grade Different specifications of ferrous and non-ferrous metal, distinguished, for example on the basis of metal composition, size and shape. Different grades of the same metal might have different prices.
ISSB International Steel Statistics Bureau
Local areas UK regions in which EMR and MWR overlap (ie London, West Midlands, Wales, North East, South East and East of England)
Metal recycler Businesses such as EMR or MWR that buy waste scrap metal and supply processed scrap metal
Mixed waste Waste that has large amounts of non-metal combined with the metal, for example ELVs, white goods and electronics
MT Metric tonnes
MWR Metal and Waste Recycling Limited
NPS New production steel. Steel which is newly produced and typically has little or no other metals or materials in it. Sources of NPS are typically factories that produce it as a by-product of their own manufacturing process, eg automotive manufacturers. It can come in bales, sheets, strips, cuttings and stampings.
Non-ferrous Non-iron based, including aluminium, copper, lead and zinc
Parties EMR and MWR are together referred to as the Parties
Processing Processing of scrap metals after collection involves sorting and weighing, and may also include shearing, shredding and baling/compacting - to improve ease of handling and transport, as well as to separate different materials.
Processing site Site operated by a metal recycler which has processing equipment, such as a shear or a baler.
Shearing Reducing the size of large pieces of metal by cutting them to parameters set by the US-based Institute of Scrap Recycling Industries
Glos-3
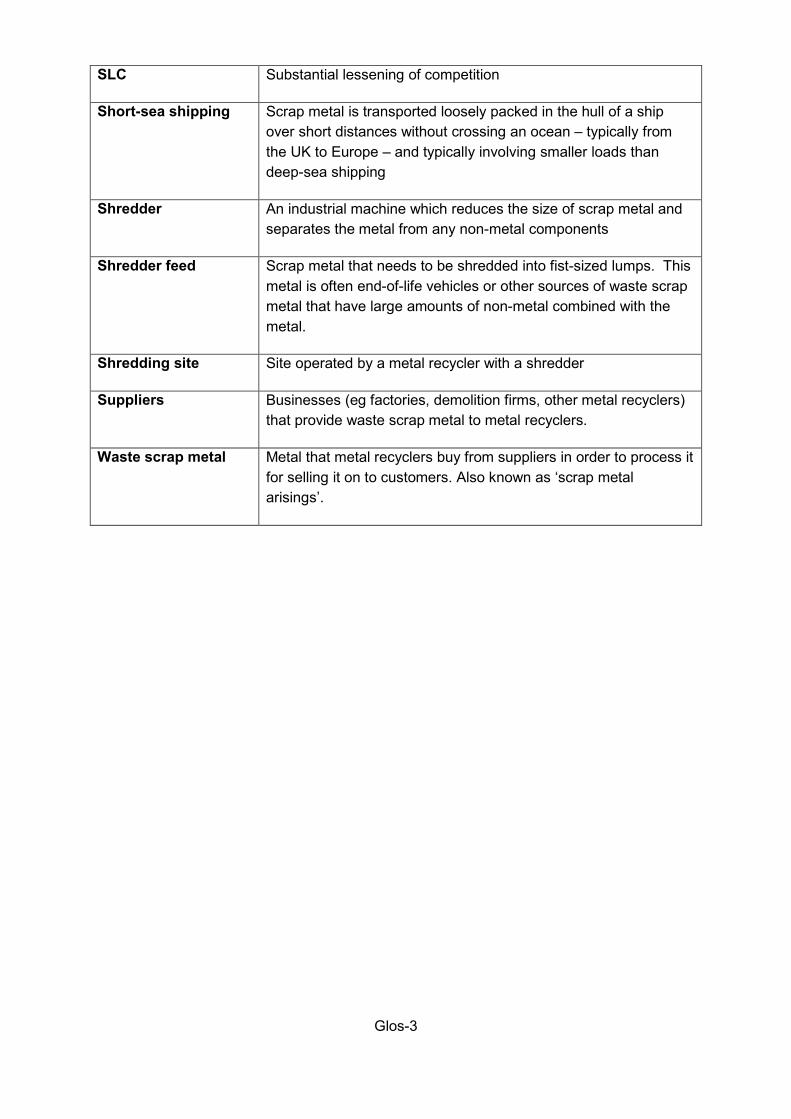
SLC Substantial lessening of competition
Short-sea shipping Scrap metal is transported loosely packed in the hull of a ship over short distances without crossing an ocean – typically from the UK to Europe – and typically involving smaller loads than deep-sea shipping
Shredder An industrial machine which reduces the size of scrap metal and separates the metal from any non-metal components
Shredder feed Scrap metal that needs to be shredded into fist-sized lumps. This metal is often end-of-life vehicles or other sources of waste scrap metal that have large amounts of non-metal combined with the metal.
Shredding site Site operated by a metal recycler with a shredder
Suppliers Businesses (eg factories, demolition firms, other metal recyclers) that provide waste scrap metal to metal recyclers.
Waste scrap metal Metal that metal recyclers buy from suppliers in order to process it for selling it on to customers. Also known as ‘scrap metal arisings’.