Embed Size (px)
Citation preview

i
Competitive Research Grant
Sub-Project Completion Report
on
Value Chain Analysis of Rice and its Byproducts in Bangladesh
Project Duration
May 2017 to September 2018
Agricultural Economics Division Bangladesh Rice Research Institute
Gazipur-1701, Bangladesh
Submitted to Project Implementation Unit-BARC, NATP 2
Bangladesh Agricultural Research Council Farmgate, Dhaka-1215
September 2018
Project ID # 700

ii
Competitive Research Grant
Sub-Project Completion Report
on
Value Chain Analysis of Rice and its Byproducts in Bangladesh
Project Duration
May 2017 to September 2018
Agricultural Economics Division Bangladesh Rice Research Institute
Gazipur-1701, Bangladesh
Submitted to Project Implementation Unit-BARC, NATP 2
Bangladesh Agricultural Research Council Farmgate, Dhaka-1215
September 2018

iii
Citation
Omar M. I. and Chowdhury A. (2018). Value Chain Analysis of Rice and its Byproducts in Bangladesh
Project Implementation Unit National Agricultural Technology Program- Phase II project (NATP-2)
Bangladesh Agricultural Research Council New Airport Road, Farmgate, Dhaka-1215 Bangladesh
Edited and published by:
Project Implementation Unit
National Agricultural Technology Program- Phase II project (NATP-2)
Bangladesh Agricultural Research Council
New Airport Road, Farmgate, Dhaka-1215
Bangladesh
Acknowledgement The execution of CRG sub-project has successfully been completed by the Agricultural Economics Division of BRRI using the research grant of USAID Trust Fund and GoB through Ministry of Agriculture. We would like to thanks to the World Bank for arranging the grand fund and supervising the CRGs by BARC. It is worthwhile to mention the cooperation and quick responses of PIU-BARC, NATP 2, in respect of field implementation of the sub-project in multiple sites. Preparing the project completion report required to contact a number of persons for collection of information and processing of research data. Without the help of those persons, the preparation of this document could not be made possible. All of them, who made it possible, deserve thanks. Our sincere gratitude to Director General, Bangladesh Rice Research Institute for his kind support, cooperation and encouragement to carry out this work. We feel proud to express our profound gratitude to Head of Agricultural Economics Division, BRRI for his technical, administrative support and continuous inspiration to carry out the study. Our thanks are also due to the Director PIU-BARC, NATP 2 and his team who given their whole hearted support to prepare this document. We hope this publication would be helpful to the agricultural scientists of the country for designing their future research projects in order to technology generation as well as increasing production and productivity for sustainable food and nutrition security in Bangladesh. It would also assist the policy makers of the agricultural sub-sectors for setting their future research directions.
Published in : September 2018
Printed by :

iv
Acronyms
BBS
BCR
=
=
Bangladesh Bureau of Statistics
Benefit Cost Ratio
BRKB = Bangladesh Rice Knowledge Bank
BRRI
BTC
=
=
Bangladesh Rice Research Institute
Bangladesh Tariff Commission
DAM = Department of Agricultural Marketing
DoRB
FC
=
=
De-oiled Rice Bran
Fixed Cost
FAO
FFA
=
=
Food and Agricultural Organization
Free Fatty Acid
FPMU = Food Planning and Monitoring Unit
GDP
GM
=
=
Gross Domestic Product
Gross Margin
GNI
MC
=
=
Gross National Income
Marketing Cost
MMT = Million Metric Tonne
MoA = Ministry of Agriculture
MoF = Ministry of Finance
MoFDM = Ministry of Food and Disaster Management
NI
NM
=
=
National Income
Net Margin
Qt = Quintal
RBO = Rice Bran Oil
Tk. = Taka
UN
VA
VC
TC
=
=
=
=
United Nations
Value Addition
Variable Cost
Total Cost
v
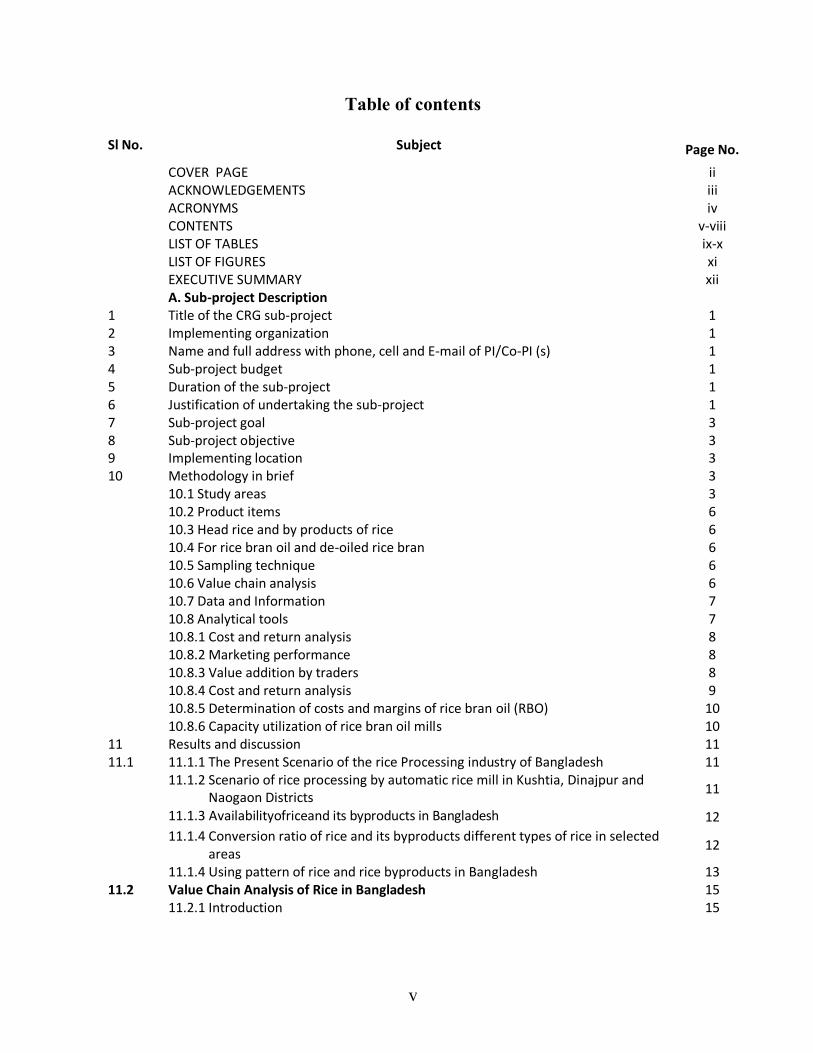
Table of contents
Sl No. Subject Page No.
COVER PAGE ii ACKNOWLEDGEMENTS iii ACRONYMS iv CONTENTS v-viii LIST OF TABLES ix-x LIST OF FIGURES xi EXECUTIVE SUMMARY xii A. Sub-project Description 1 Title of the CRG sub-project 1 2 Implementing organization 1 3 Name and full address with phone, cell and E-mail of PI/Co-PI (s) 1 4 Sub-project budget 1 5 Duration of the sub-project 1 6 Justification of undertaking the sub-project 1 7 Sub-project goal 3 8 Sub-project objective 3 9 Implementing location 3 10 Methodology in brief 3 10.1 Study areas 3 10.2 Product items 6 10.3 Head rice and by products of rice 6 10.4 For rice bran oil and de-oiled rice bran 6 10.5 Sampling technique 6 10.6 Value chain analysis 6 10.7 Data and Information 7 10.8 Analytical tools 7 10.8.1 Cost and return analysis 8 10.8.2 Marketing performance 8 10.8.3 Value addition by traders 8 10.8.4 Cost and return analysis 9 10.8.5 Determination of costs and margins of rice bran oil (RBO) 10 10.8.6 Capacity utilization of rice bran oil mills 10 11 Results and discussion 11 11.1 11.1.1 The Present Scenario of the rice Processing industry of Bangladesh 11 11.1.2 Scenario of rice processing by automatic rice mill in Kushtia, Dinajpur and
Naogaon Districts 11
11.1.3 Availabilityofriceand its byproducts in Bangladesh 12
11.1.4 Conversion ratio of rice and its byproducts different types of rice in selected areas
12
11.1.4 Using pattern of rice and rice byproducts in Bangladesh 13 11.2 Value Chain Analysis of Rice in Bangladesh 15 11.2.1 Introduction 15

vi
Sl No. Subject Page No. 11.2.2Inputs use pattern of rice cultivation 15
11.2.3 Costs of cultivation 16 11.2.4 Profitability 17 11.2.5 Average Selling price of paddy producer 17 11.2.6 Intermediaries in the paddy/rice marketing and their characteristics 18 11.2.6.1Faria and Bepari 18 11.2.6.2 Paddy Aratdar 18 11.2.6.3 Dalal 19 11.2.6.4 Rural retailer 19 11.2.6.5Marketing functions by rice millers 19 11.2.6.5.1 Rice millers as paddy purchaser 20 11.2.6.5.3 Distribution of rice from the major mills in the study areas 21 11.2.6.6Retailer 22 11.2.7 Supply chain of course and fine rice 23 11.2.8 Conversion ratio of rice and its byproducts course and fine types of rice in
selected areas 24
11.2.9 Marketing cost of bepari and aratder 24 11.2.10 Processing and marketing cost of the rice miller in the study areas 25 11.2.11 Marketing cost of rice traders (arathder, wholesaler and retailer) in the
study areas 25
11.2.12 Marketing margin of different actors of course rice 26 11.2.13 Marketing margin of different actors of fine rice 27 11.2.14 Producer share and farm-retail price spread of course and fine rice 27 11.2.15 Marketing constraints of paddy/rice 28 11.2.15.1 Producers’ constraints 28 11.2.15.2 Problems associated with the millers in the study areas 29 11.2.15.3 Problems associated with rice traders (aratdar, wholesaler and retailer) 30 11.2.16Conclusions and recommendations 30 11.3 Value Chain Analysis of Aromatic Rice in Bangladesh 11.3.1 Introduction 32 11.3.2 Production cost of aromatic rice (BRRI dhan34) 32
11.3.3Profitability 33 11.3.4 Supply chain of aromatic rice (BRRI dhan34) 34
11.3.5Supply system of aromatic rice in the domestic market 35
11.3.6 Ratio of clean rice and byproduct from BRRI dhan34 35 11.3.7 Marketing cost of (paddy traders) bepari and arathder 36
11.3.8 Processing and marketing cost of miller 37 11.3.9 Marketing cost of rice traders aratder, wholesaler and retailer 37 11.3.10 Marketing margin of different actors of aromatic rice (BRRI dhan34) 38 11.3.11 Producer share and farm retail price spread of aromatic rice (BRRI dhan34) 39 11.3.12 Farm level constraints faced by the farmers 39 11.3.13 Miller’s constraints 40 11.3.14 Conclusion 40 11.3.15 Suggestions 40 11.4 Value chain of Broken Rice

vii
11.4.1 Introduction 41 11.4.2 Scenario of broken rice processing from automatic rice mill in selected area 41
Sl No.
Subject
Page No. 11.4.3Supply chain of broken rice 41 11.4.3Supply system of broken rice in the domestic market 42 11.4.4 Marketing cost incurred by Aratder, wholesaler and retailer for broken rice 42 11.4.5 Value addition of different actors of broken rice 43 11.4.6 Conclusion 44 11.5 Value chain of Dead Rice 11.5.1 Introduction 45 11.5.2 Scenario of dead rice processing from automatic rice mill in Kushtia, Dinajpur
and Naogaon 45
11.5.3Supply chain of dead rice 45 11.5.4 Supply system of dead rice in the domestic market 46 11.5.5 Marketing cost of aratder, wholesaler and retailer 46 11.5.6 Marketing margin of different actors of dead rice 47 11.5.7 Conclusion 47 11.6 11.6 Value chain of Rice Bran 11.6.1 Introduction 48 11.6.2 Scenario of rice bran processing from automatic rice mill in Kushtia, Dinajpur
and Naogaon 48
11.6.3 Supply chain of rice bran 49 11.6.4 Supply system of rice bran 49 11.6.5 Marketing cost of rice bran party and retailer 49 11.6.6 Marketing margin of different actors of rice bran 49 11.6.7 Conclusion 50 11.7 Value chain of Rice Husk 52 11.7.2 Scenario of rice husk processing from automatic rice mill in Kushtia, Dinajpur
and Naogaon district 53
11.7.3 Supply system of rice husk in the Kushtia, Dinajpur and Naogaon district 53 11.7.4 Supply system of rice husk 54 11.7.5 Marketing cost of Husk party 54 11.7.6 Marketing margin of different actors of rice husk 55 11.7.7 Conclusion 55 11.8 Value Chain Analysis of Rice Bran Oil 56 11.8.1Introduction 56 11.8.2 Production capacity and actual production of rice bran oil in 2016 and 2017 57 11.8.3 Availability of rice bran and bran oil in Bangladesh 58 11.8.4 Cost of production of rice bran oil 59 11.8.5 Byproducts of rice bran oil 60 11.8.6 Total production cost 60 11.8.7 Disposal pattern of rice bran oil in domestic and foreign market 61 11.8.8 Supply system of rice bran oil in domestic market 63 11.8.9 Actors involved in rice bran oil value chain 63 11.8.10 Value chain of rice bran oil 64 11.8.11 Value addition for rice bran oil at different level of actors 64 11.8.12 Value addition of different actors involved in the chain 65 11.8.13 Quality of the rice bran oil 65

viii
11.8.14 Problems faced by rice bran oil millers in Bangladesh 66 Sl No.
Subject
Page No. 11.8.15Conclusion 66 11.8.16 Recommendations 67 11.9 Value chain of de-oiled rice bran in Bangladesh 11.9 .1 Introduction 68 11.9.2 Production scenario of de-oiled rice bran in Bangladesh 68 11.9.3 Actors involved in de-oiled rice bran value chain 70 11.9.5 Value chain of de-oiled rice bran 71 11.9.6 Disposal pattern of de-oiled rice bran in domestic and foreign market 72 11.9.7 Value addition for de-oiled rice bran at different level of actors 73 11.9.8 Value addition of different actors involved in the chain 74 11.9.9 Conclusion 74 11.9.10 Recommendations 74
12. Research highlight/findings 76 B. Implementation Position
1. Procurement 77
2. Establishment/renovation facilities 77
3. Training/study tour/ seminar/workshop/conference organized 78
C. Financial and physical progress 78
D. Achievement of Sub-project by objectives: (Tangible form) 79
E. Materials Development/Publication made under the Sub-project 80
F. Technology/Knowledge generation/Policy Support (as applied) 80
i. Generation of technology (Commodity & Non-commodity) 80
ii. Generation of new knowledge that help in developing more technology
in future 80
iii. Technology transferred that help increased agricultural productivity and
farmers’ income 80
iv. Policy Support 81
G. Information regarding desk and field monitoring 81
I. Lesson Learned/Challenges (if any) 82
J. Challenges (if any) 82
Literature review 83
References 86
Appendix 89 Some snapshots on data collections 94

ix
List of Tables
Sl No Title Page
Table 10.1 Sampling design for the proposed project 07
Table:11.1.1 Rice processing scenario of automatic rice mill in the study area in 2017 11
Table:11.1.2 Availability of rice and its byproducts in Bangladesh 12 Table:11.1.3 Conversion ratio of rice and its byproducts different types of rice in selected
areas 13
Table:11.2.1 Per hectare Input used for rice cultivation in different season of study area, 2017-18
15
Table:11.2.2 Per hectare cost of rice cultivation in different season of study area, 2017-18
16
Table:11.2.3 Per hectare cost and return of rice cultivation in different seasons in study area, 2017-18
17
Table 11.2.4 Average farmgate price of paddy in different districts under the study: 2017 17 Table 11.2.5.1 Sources of supply of paddy to rice mills in the study areas (%) 20
Table:11.2.5.2 Major differences of automatic and husky rice mills 21 Table:11.2.6 Trading scenario of parboiled and aromatic rice in the study areas (in ‘000’
tones) 22
Table:11.2.7 Conversion ratio of rice and its byproducts course and fine types of rice in selected areas
24
Table:11.2.8 Marketing costs handled by the of bepari and arathders 24-25
Table: 11.2.9 Stucture of pprocessing and marketing cost of rice millers in the study
areas;2017 25
Table: 11.2.10 Marketing cost of (rice traders) arathder, wholesaler and retailer 26
Table 11.2.11 Stucture of marketing margin of different actors of coarse rice (Tk/ql) 26
Table:11.2.12 Stucture of mmarketing margin of different actors of fine rice (Tk/ql) 27
Table:11.2.13 Producer share and farm-retail price spread of course and fine rice (Tk/ql) 27 Table11.2.14.1 Marketing and institutional problems faced by the farmers in the study
areas 28
Table 11.2.14.2 Problems faced by the rice millers in the study areas 29
Table 11.2.14.3 Problems faced by the rice traders in the study areas 30
Table11.3.1 Average pproduction cost of aromatic rice (BRRI dhan34) for three districts:
Kushtia, Dinajpur, and Naogaon 32
Table 11.3.2 Average pprofitability of aromatic rice (BRRI dhan34) for three districts:
Kushtia, Dinajpur, and Naogaon) 34
Table 11.3.3 Milling outturn and by-products generating from 1000 kg of paddy in
Kushtia, Dinajpur and Naogaon districts 35
Table:11.3.4 Marketing cost incurred by (paddy traders) bepari and arathder in the study
areas;2017 36
Table: 11.3.5 Processing and marketing cost incurred by the miller for aromatic rice;2017 37 Table: 11.3.6 Marketing cost incurred by aratder, wholesaler and retailer in the study
areas; 2017 37
Table:11.3.7 Marketing margin of different actors of aromatic rice (Tk/ql) 38

x
Sl No Title Page
Table: 11.3.8 Producer share and farm retail price spread of aromatic rice (BRRI dhan34) 38 Table: 11.3.9 Production, marketing and institutional problems of farmers in the study
areas 38
Table: 11.3.10 Stated problems commonly faced by the rice millers 39
Table:11.4.1 Scenario of broken rice processing from automatic rice mill in Kushtia, Dinajpur and Naogaon district in2017
41
Table: 11.4.2 Marketing cost incurred by the aratders, wholesalers and retailers in the
study areas (Tk/ql) 43
Table:11.4.3 Marketing margin of different actors of broken rice in the study areas
(Tk/ql) 43
Table 11.5.1 Scenario of dead rice processing from automatic rice mills in selected districts in 2017
44
Table:11.5.2 Marketing cost incurred by dead rice party and retailer (Tk/ql) 45
Table:11.5.3 Marketing margin of different actors of dead rice(Tk/ql) 46 Table 11.6.1 Scenario of rice bran processing from automatic rice mill in Kushtia,
Dinajpur and Naogaon district in2017 47
Table:11.6.2 Marketing cost of rice bran party and retailers in the study areas (Tk/ql) 49 Table:11.6.3 Marketing cost and margin of different actors of rice bran (Tk/ql) 49 Table:11.7.1 Rice husk processing from automatic rice mill in Kushtia, Dinajpur and
Naogaon district in 2017 52
Table:11.7.2 Marketing cost incurred by rice husk party in the study areas (Tk/ql) 54 Table:11.7.3 Marketing margin of different actors of rice husk (Tk/ql) 54 Table:11.8.1 Production capacity and actual production of rice bran oil mills in the year
of 2016 and 2017 55-56
Table:11.8.2 Availability of rice bran and rice bran oil in Bangladesh (million ton) 58 Table:11.8.3 Costs of bran oil production (Tk/ton) 59 Table:11.8.4 Total Production cost of per ton RBO in the mill after deducting of returns
of by products 59
Table 11.8.5 Supply of rice bran oil in domestic and foreign market 60 Table 11.8.6 Marketing costs of different actors involved in rice bran oil value chain (Tk.
/ton) 61
Table:11.8.7 Value addition of different intermediaries of rice bran oil (Tk/ton) 61 Table:11.9.1 Production scenario of De-oiled rice bran from producing rice bran oil mill in
Bangladesh (ton/yr) 66
Table:11.9.2 Supply of de-oiled rice bran in domestic and foreign market (ton /yr) 69 Table:11.9.3 Marketing costs of different actors involved in de-oiled rice bran value chain
(Tk. /qt) 70
Table:11.9.4 Value addition of different intermediaries of de-oiled rice bran (Tk/ql) 71

xi
List of Figures
Sl No Title Page
Fig No: 10.1 Map of Bangladesh showing high concentration of rice processing area 4 Fig No: 10.2 Map of Bangladesh showing location and number of Rice Bran Oil Mill 5 Fig: 11.1.1 Using pattern of rice and its byproducts 14 Figure 11.2.1 Supply chain of Rice in the Study Area 23 Figure 11.3.1 Supply chain of aromatic rice (BRRI dhan34) in the study areas, Bangladesh 35 Fig: 11.4.1 Supply chain of broken rice 42 Fig:11.5.1 Supply chain of Dead rice 45 Fig: 11.6.1 Supply chain of rice bran 48 Fig: 11.6.2 Purchase and sales price of rice bran at bran party and retailer level 50
Fig: 11.6.3 Gross margin, marketing cost and net margin of rice bran at bran party and retailer level
50
Fig: 11.7.1 Supply chain of Rice Husk 53 Fig: 11.8.1 Production capacity and actual production of rice bran oil in 2016 56 Fig: 11.8.2 Production capacity and actual production of rice bran oil in 2017 57
Fig: 11.8.3 Total production cost of per kg RBO in the mill after deducting of returns of by products
59
Fig: 11.8.4 Supply of rice bran oil in domestic and foreign market 61 Fig: 11.8.5 Supply chain of rice bran oil 62 Fig: 11.9.1 Production scenario of De-oiled rice bran in 2017 67 Fig: 11.9.2 Supply chain of de-oiled rice bran in Bangladesh 68 Fig: 11.9.3 Supply of de-oiled rice bran in domestic and foreign market 70

xii
Executive Summary The present study was conducted to identify value chains for rice and its by-products (broken rice, dead rice, rice bran, rice husk, rice bran oil and de-oiled rice bran), dominant supply chain, costs and margins and value addition of the different actors. The research project was carried out in ten districts namely; Dinajpur, Naogaon, Kushtia, Bogra, Mymensingh, Jamalpur, Pabna, Rangpur and Jessore in
which autometic and semi-autometic rice mills were selected from Dinajpur, Naogaon, Kushtia district
and ten rice bran oil mills were selected from remaining seven district where rice bran oil mills are
situated intensively. A total of 650 samples ( 90 farmers, 30 paddy traders, 75 automatic rice millers,
105 rice traders, 45 dead rice traders, 45 Broken rice traders, 45 rice bran traders, 45 rice husk party, 15 rice bran oil millers, 40 rice bran oil dealers, 75 rice bran oil retailers, 24 de-oiled rice bran oil dealers and 40 de-oiled rice bran oil retailers) were purposively chosen from selected district for collecting primary data. Besides, secondary data were collected from FAO, BBS and other secondary sources. Among the rice byproducts, dead rice, broken rice, rice bran and rice husk were found 4.42%, 7.44%, 8.56% and 20% respectively. The average recovery ratio for head rice, dead rice, broken rice, rice bran and husk were 61.00%, 3.51%, 6.49%,8.50% and 20.50% respectively from the automatic rice millers. Bangladesh has produced 52.50 million-tons of paddy, which earned 30.98 million-tons head rice. Other than the head rice, the byproducts are dead rice, broken rice, husk and rice bran which were 2.31, 3.89, 10.50 and 4.46 million-tons, respectively. In the domestic market, about 45% aromatic rice (unpacked) were supplied by millers with the help of aratder, wholesaler and retailer. On the other hand, different companies of Bangladesh (like: Pran, ACI, Pusti and Chashi) collected about 55% of aromatic rice from selected mills. After that these companies processed, packaged and leveled it and sold by their own brand name. Then they marketed about 30% aromatic rice in the domestic market and remaining 25% were exported to the foreign countries. Automatic rice millers supplied 55% of broken rice in the feed industry with the help of the broken rice party. About 90% rice bran were supplied by the millers with the help of bran party. After that bran party, about 65% best quality rice bran were supplied to the rice bran oil mills to produce the bran oil. On the other hand, 55% rice husk were purchased by the husk party from the mill and sold it in the briquettes factories to produce the briquettes. Total production capacity of fourteen surveyed rice bran oil mills was 258000 ton/year where as these mills utilized 67% of the capacity which produced 168,540 ton of rice bran oil. The manufacturing cost of rice bran oil was Tk.176, 206/ton; including value of byproducts (Tk. 89,187). After deducting the returns from by products; actual cost of rice bran oil was Tk. 87019/ton. Two dominant supply chains of rice bran oil (RBO) were:i) Miller > Dealer > Retailer> Consumer and ii) Rice Bran Oil Miller > Company (Pran, Pusti, ACI, Aristocrat > Dealer > Retailer > Consumer. During the period of 2017, fourteen rice bran oil mills produced 168,540-ton rice bran oil in our country where 64.04 % (107940 ton) were supplied in the domestic market and 35.96% (60600.00 ton) were exported to the international markets (specially India, China and Japan). The key problems of RBO were unavailability of adequate rice bran and lack of promotional activities at consumer level. During the period of 2017, fourteen rice bran oil mills produced 674160-ton de-oiled rice bran where 65.21 % (439620 ton) were supplied in the domestic market and 34.79% (234540 ton) were exported to the foreign countries (specially India, China and Thailand).
1
CRG Sub-Project Completion Report (PCR)
A. Sub-project Description
1. Title of the CRG sub-project: Value Chain Analysis of Rice and its Byproducts in Bangladesh
2. Implementing organization: Bangladesh Rice Research Institute BRRI Gazipur
3. Name and full address with phone, cell and E-mail of PI/Co-PI (s):
Principal Investigator Md. Imran Omar, Senior Scientific Officer (SSO), Agricultural Economics Division, Bangladesh Rice Research Institute (BRRI), Gazipur-1701. Cell: 01734128910, Tel: (88-02) 49272069, Email: [email protected]
Co-principal investigator:
Afroza Chowdhury, Scientific Officer (SO), Agricultural Economics Division, Bangladesh Rice Research Institute (BRRI), Gazipur-1701. Cell: 01777954474, Email: [email protected]
4. Sub-project budget (Tk):
4.1 Total: Tk. 25,00000 (Twenty-five lac Taka Only)
4.2 Revised (if any):
5. Duration of the sub-project:
5.1 Start date (based on LoA signed): 15 May 2017
5.2 End date: 30 September 2018
6. Justification of undertaking the sub-project:
Value chain analysis is the key framework for understanding how a product moves from the producer to
the ultimate users . It describes the full range of activities required to bring a product or service from
conception, through the different phases of production (involving a combination of physical transformation
and the input of various producer services), delivery to final consumers and final disposal after use
(Kaplinsky and Morris 2000). Value chain perspective provides an important means to understand the
business-business relationships, mechanisms for increasing efficiency, and ways to enable business to
increase productivity and value addition.
Rice is the dominant dietary and staple food in Bangladesh. More than 95% of the population consume
rice, which alone provides about 62% calorie and 46% protein of average daily intake (HIES, 2010). About
80 percent of the total arable land is devoted to rice production and it alone occupies 77% of total cropped
area in Bangladesh. Present population of the country is about 152.51 million and will swell progressively
to 190 million by the year 2030, which will require 42 million tons of food grain with per capita demand of
146 kg/year (BBS, 2016). In fact, rice is the driving force of the economy of Bangladesh. It also ensures
political stability for the country and provides a sense of food security to the people. Besides, rural income,
employment, nutrition and the market for the industrial output in the domestic economy as well as
government’s capacity and effectiveness of mobilizing domestic resources and savings are inextricably
linked with rice.
Bangladesh has made remarkable progress in rice production through escalating productivity using better
genotypes and expanding agrarian capacity which increased total production substantially from 9.77 million

2
metric tons in 19971/72 to 34.35 million metric tons by 2013/14 (BBS, 2014), in spite of the declining trend
of arable land.
Paddy, on an average, consists of about 72% of clean rice, 5-8% of bran and 20-22% of husk (Prasad et
al., 2000). Most of the paddy varieties produced in Bangladesh contains 60-67% whole rice, 22% husk, 5-
8% bran and 1-2.5% broken rice (BRRI, 2009). Bangladesh produced about 51.36 million tons of paddy
during 2013-14 from where approximately 34.41 million tons of head rice,3.60 million tons of bran and
12.32 million tons of husk as by-products are being produced (Quayum et al 2015). Rice and food are
synonym in Bangladesh and there are multiple uses and applications of its main and byproducts. There are
various uses and applications of the by-products of rice. Rice bran oil (RBO) is produced from rice bran
which is very useful and beneficial for human health. Rice husk ash which is prepared after burning of husk
is being used as a replacement/supplement of cement materials (Rashid, 2015).
Bangladesh is self-sufficient in main cereal-rice production but still huge deficit in edible oil production. It
imported 13.44 lakh metric tons edible oil during 2013/14, which was about 85% of total national demand
(BBS 2014). Bangladesh has commenced to produce rice bran oil besides oilseeds oil in order to increase
edible oil supply of the country. There were 15 rice bran oil mills in operation in the country from where
about 0.898 lakh ton of bran oil produced, which was only 35% of total potentiality of the mills due to
lack of supply of rice bran (Quayum et al 2015). Total demand for edible oil in Bangladesh is about 14 million
tons of which 2-2.5% is coming from rice bran oil (BBS, 2013).
Rice husk is another byproduct of rice which consists of the outermost covering of the rice kernels that
is separated from the rice grains during the milling process. In majority of rice producing countries, major
portion of rice husk is either burnt for heat or dumped as a waste. In Bangladesh, most of the husk from
the rice milling industry is being burnt or dumped as waste in open fields and a small amount is used as
fuel for boilers, electricity generation, etc. (RHA market study, 2003). But the usage of rice husk in
different sectors; such as power plant, cement and concrete industry, brick production, waste water
treatment plant, agricultural industry, cellulosic ethanol production is increasing (www.rmir.edu.au).It is
estimated that every ton of paddy produces about 0.20 tons of husk and every ton of husk produces
about 0.18 to 0.20 tons of ash, depending on the variety, climatic conditions and geographical location
(Prasad et al., 2000 and Bouzoubaa and Fournier, 2001). By-product of rice bran oil (de oiled rice bran oil-
DRBO) is used as fish, poultry and cattle feed. The use of aquaculture feeds in Bangladesh has grown
substantially in recent past, and now over 1 million tons of commercial pelleted feed are being formulated
for use by aquaculture farmers. Rapid growth in use of formulated feeds has helped many aquaculture
farmers intensify production and gaining financial benefit. Currently, there are 100 commercial feed mills
in operation and another 20 are in pipeline. In addition, about 600 small-scale noncommercial and on-farm
feed manufacturers producing feed for their own consumption (Ali, 2012) that uses rice bran and de oiled
rice bran as component with other ingredients.
From this study we will find out the proportion of head rice, broken rice, husk, rice bran etc. from paddy
under automatic rice mills, semi-automatic rice mills and other kinds of milling process. The proportion of
different milling process of total paddy production on country context. It will help us to find out the
production and marketing scenario of rice bran oil and de-oiled rice bran in our country. A large number
of stakeholders are involved with the value and supply chains of rice and rice byproducts in Bangladesh. If
the actors are known about the benefit of value chain; they would be able to harvest the gain from
improved value creation. Thus, a detailed analysis with the efficient utilization of these value chains would
have a potential contribution to the farmers, millers, traders, consumers as well as in the economy of

3
Bangladesh. However, the findings of this study would be very useful for the researchers and policy makers
as well.
7. Sub-project goal:
Document the opportunities and constraints of value chains of rice and its byproducts to explore the
consumers demand visualize the existing disposal scenario of rice its byproducts and to promote the
economy as well.
8. Sub-project objective (s):
i. To identify major value chains for rice and rice by-products (rice bran and bran oil, rice husk,
feeds) in Bangladesh.
ii. To map the different activities of the actors and value addition processes of the respective
chains focusing distributional issues as well as costs and margins of the actors involved in the
chains.
iii. Sketch the feasibilities and future prospects of value chains of rice byproducts as a new
dimension for the economy of Bangladesh.
9. Implementing location (s):
Agricultural Economics Division, Bangladesh Rice Research Institute, Gazipur
10. Methodology in brief: 10.1 Study areas:
The research project was conducted in three districts namely; Dinajpur, Naogaon, Kushtia, where autometic
and semi-autometic rice mills are intensively situated compared to other parts of Bangladesh. Ten rice bran
oil mills were seleted from seven districts (Bogra,Mymensingh,Jamalpur,Pabna,Naogaon Rangpur and
Jessore) where rice bran oil industry are situated intensively.

4
Fig No: 10.1. Map of Bangladesh showing high concentration of rice processing area

5
Fig No: 10.2. Map of Bangladesh showing location and number of Rice Bran Oil Mill
6
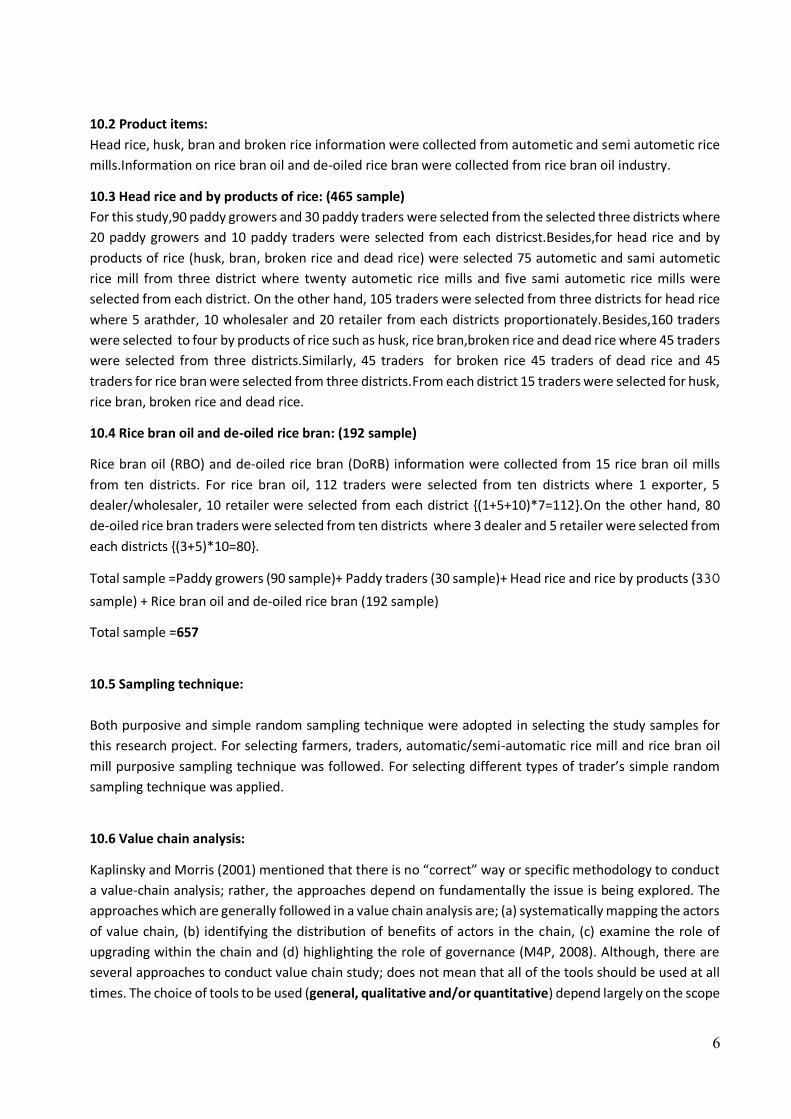
10.2 Product items:
Head rice, husk, bran and broken rice information were collected from autometic and semi autometic rice
mills.Information on rice bran oil and de-oiled rice bran were collected from rice bran oil industry.
10.3 Head rice and by products of rice: (465 sample)
For this study,90 paddy growers and 30 paddy traders were selected from the selected three districts where
20 paddy growers and 10 paddy traders were selected from each districst.Besides,for head rice and by
products of rice (husk, bran, broken rice and dead rice) were selected 75 autometic and sami autometic
rice mill from three district where twenty autometic rice mills and five sami autometic rice mills were
selected from each district. On the other hand, 105 traders were selected from three districts for head rice
where 5 arathder, 10 wholesaler and 20 retailer from each districts proportionately.Besides,160 traders
were selected to four by products of rice such as husk, rice bran,broken rice and dead rice where 45 traders
were selected from three districts.Similarly, 45 traders for broken rice 45 traders of dead rice and 45
traders for rice bran were selected from three districts.From each district 15 traders were selected for husk,
rice bran, broken rice and dead rice.
10.4 Rice bran oil and de-oiled rice bran: (192 sample)
Rice bran oil (RBO) and de-oiled rice bran (DoRB) information were collected from 15 rice bran oil mills
from ten districts. For rice bran oil, 112 traders were selected from ten districts where 1 exporter, 5
dealer/wholesaler, 10 retailer were selected from each district {(1+5+10)*7=112}.On the other hand, 80
de-oiled rice bran traders were selected from ten districts where 3 dealer and 5 retailer were selected from
each districts {(3+5)*10=80}.
Total sample =Paddy growers (90 sample)+ Paddy traders (30 sample)+ Head rice and rice by products (330 sample) + Rice bran oil and de-oiled rice bran (192 sample)
Total sample =657
10.5 Sampling technique:
Both purposive and simple random sampling technique were adopted in selecting the study samples for
this research project. For selecting farmers, traders, automatic/semi-automatic rice mill and rice bran oil
mill purposive sampling technique was followed. For selecting different types of trader’s simple random
sampling technique was applied.
10.6 Value chain analysis:
Kaplinsky and Morris (2001) mentioned that there is no “correct” way or specific methodology to conduct
a value-chain analysis; rather, the approaches depend on fundamentally the issue is being explored. The
approaches which are generally followed in a value chain analysis are; (a) systematically mapping the actors
of value chain, (b) identifying the distribution of benefits of actors in the chain, (c) examine the role of
upgrading within the chain and (d) highlighting the role of governance (M4P, 2008). Although, there are
several approaches to conduct value chain study; does not mean that all of the tools should be used at all
times. The choice of tools to be used (general, qualitative and/or quantitative) depend largely on the scope

7
and objective of the analysis itself. However, in the present study mainly survey method were employed to
collect data from different stakeholders of the value chains
Table 10.1. Sampling design for the proposed project
Items
Farmers
Pad
dy Trad
ers
Au
tom
etic mill
Semi-au
tom
etic mill
Arath
der
Wh
olesaler
Retailer
Bran p
arty
Hu
sk party
Bro
ken rice party
Expo
rter
Districts
Total Trad
ers
Total m
iller & farm
er
Total Sam
ple
A. Head rice
3
0 15 10 15
5 10 20
3
150
75(M)
&
90 (F)
B. Rice Bran - - - 15 - - 45
C. Rice husk 15 45
D. Broken rice 15 45
Head rice and rice by products 285 165 450
A. Rice Bran oil
10
5 10 1
7
112
10
B. De-oiled
rice bran 3 5 56
Rice Bran oil and de-oiled rice bran 168 10 178
Total sample 628
Note: M = Millers & F = Farmers.
10.7 Data and Information
Both primary and secondary data were used in this study. Primary data related to producer and traders were
gathered from field level through sample survey from the aforesaid locations. The data were collected on
production cost, profits, supply chain, marketing cost, marketing margins, marketing constraints, etc from
the millers and traders. Secondary data relating to different aspects of production, market development,
marketing constraints and other relevant data were gathered from various published sources (e.g. BBS,
FAOStat, journal, research reports, thesis, etc.) through in-depth literature review. In addition, focus group
discussion (FGD) following in-depth interview system were adopted to collect information from the farmers.
Individual key informant interview (KII) system were followed to collect information from other
stakeholders along with the value chains of rice with pre-tested, structured questionnaires for specific
stakeholders (Farmers, Rice millers, Rice bran oil millers, arathder, wholesaler, retailer, exporter, husk
party, bran party, broken rice party dead rice party). Relevant secondary information from various sources
were collected as per requirement.
10.8 Analytical tools:
Conventional profit model was used to evaluate the profitability of rice and rice by products
Cost and return analysis at millers’ level
Net marketing margin at traders’ level

8
‘Instantaneous’ costs margin method was followed to calculate marketing costs and margins and price
spread, etc.
10.8.1 Cost and return analysis
The following profit equation was employed to assess the profitability of paddy and head rice production.
𝛱 = 𝑃𝐹 . 𝑄𝐹 − (𝑇𝑉𝐶 + 𝑇𝐹𝐶)
Where, Π = Profit of producer per unit
𝑃𝐹 = Per unit price of paddy or head rice
𝑄𝐹 = Quantity of paddy or head rice
𝑇𝑉𝐶 = Total variable cost of paddy or head rice
𝑇𝐹𝐶 = Total fixed cost of paddy or head rice producer
10.8.2 Marketing performance
Marketing performance was evaluated using different measures of marketing efficiency as described by
Shepherd (1972), and Acharya and Agarwal (2004). In the present study, the efficiency of marketing was
investigated by examining price spread, Producer’s share, Acharya’s methods for estimating efficiency. The
methods for studying these estimates are given in the following.
𝐼. 𝑃𝑟𝑖𝑐𝑒 𝑠𝑝𝑟𝑒𝑎𝑑 = 𝑃𝑟𝑖𝑐𝑒 𝑝𝑎𝑖𝑑 𝑏𝑦 𝑐𝑜𝑛𝑠𝑢𝑚𝑒𝑟𝑠 – 𝑃𝑟𝑖𝑐𝑒 𝑟𝑒𝑐𝑒𝑖𝑣𝑒𝑑 𝑏𝑦 𝑡ℎ𝑒 𝑃𝑟𝑜𝑑𝑢𝑐𝑒𝑟
𝐼𝐼. 𝑃𝑟𝑜𝑑𝑢𝑐𝑒𝑟𝑠 𝑠ℎ𝑎𝑟𝑒 (%) = Price received by the Producer
Price paid by the consumerX 100
10.8.3 Value addition by traders
𝑉𝑎𝑙𝑢𝑒 𝐴𝑑𝑑𝑖𝑡𝑖𝑜𝑛 = 𝐺𝑟𝑜𝑠𝑠 𝑚𝑎𝑟𝑔𝑖𝑛 – 𝑀𝑎𝑟𝑘𝑒𝑡𝑖𝑛𝑔 𝑐𝑜𝑠𝑡
𝐺𝑟𝑜𝑠𝑠 𝑀𝑎𝑟𝑔𝑖𝑛 = 𝑆𝑎𝑙𝑒 𝑝𝑟𝑖𝑐𝑒 − 𝑃𝑢𝑟𝑐ℎ𝑎𝑠𝑒 𝑝𝑟𝑖𝑐𝑒
𝑅𝑃 = 𝑃𝑟𝑖𝑐𝑒 𝑝𝑎𝑖𝑑 𝑏𝑦 𝑡ℎ𝑒 𝑐𝑜𝑛𝑠𝑢𝑚𝑒𝑟𝑠
The farmer’s or producer’s share may be defined as the farm value of food expressed as a percentage of its
retail price and the ratio of gross marketing margin to retail price gives the share of the middlemen including
marketing costs in the consumers price.
𝒊𝒗) 𝑮𝒓𝒐𝒔𝒔 𝒎𝒂𝒓𝒌𝒆𝒕𝒊𝒏𝒈 𝒎𝒂𝒓𝒈𝒊𝒏 (𝑀) = 𝑅𝑒𝑡𝑎𝑖𝑙 𝑝𝑟𝑖𝑐𝑒 – 𝐹𝑎𝑟𝑚 ℎ𝑎𝑟𝑣𝑒𝑠𝑡 𝑝𝑟𝑖𝑐𝑒
(𝑀) = 𝑃𝑅 − 𝑃𝐹

9
𝑺𝒉𝒂𝒓𝒆 𝒐𝒇 𝒕𝒉𝒆 𝒎𝒊𝒅𝒅𝒍𝒆𝒎𝒆𝒏 𝒊𝒏 𝒄𝒐𝒏𝒔𝒖𝒎𝒆𝒓′𝒔 𝒑𝒓𝒊𝒄𝒆 (𝑀𝑠) =F
FR
PPP
We know, share of the producer in the consumer’s price (Ps) + Share of the middlemen in the consumer’s
price (Ms) = 1
So, the share of the producers in the consumer's price
(𝑃𝑠) = (1 – 𝑀𝑠)
Where,
𝑃𝑠 = 𝑃𝑟𝑜𝑑𝑢𝑐𝑒𝑟’𝑠 𝑠ℎ𝑎𝑟𝑒
𝑀𝑠 = 𝑀𝑖𝑑𝑑𝑙𝑒𝑚𝑒𝑛’𝑠 𝑠ℎ𝑎𝑟𝑒
Producer's share of rice, which is the ratio of net average price received by the producer to the weighted
average price of clean rice, bran and husk, was derived using the following formula:
Percentage of producer’s share = wr
wp
PP
x 100
Where, 𝑃𝑝𝑤 = Producer’s price (farm gate price)
𝑃𝑟𝑤 = Weighted average retail price of clean rice, bran and husk.
10.8.4 Cost and return analysis
The following profit equation was employed to assess the profitability of aromatic rice production of
producers.
TC-TR
Where,
∏= Net return (Tk/ha)
TR= Total return (Tk/ha)
TC= Total costs (Tk/ha)
∏ = ∑ Qy . Py + ∑ Qb . Pb − ∑(Xi. Pxi)
n
i=1
− TFC
Where, ∏= Net returns (Tk/ha);
yQ Total quantity of (paddy) output (kg/ha);
yP Per unit price of (paddy) output (Tk/kg);
bQ Total quantity of the concerned byproduct (kg/ha);
bP Per unit price of the relevant byproduct (Tk/kg);
iX Quantity of the concerned ith input;
xiP Per unit price of the relevant ith input;

10
TFC = Total fixed cost involved in production process;
ni ,...,3,2,1 (Number of inputs)
Value addition by traders
𝑉𝑎𝑙𝑢𝑒 𝐴𝑑𝑑𝑖𝑡𝑖𝑜𝑛 = 𝐺𝑟𝑜𝑠𝑠 𝑚𝑎𝑟𝑔𝑖𝑛 – 𝑀𝑎𝑟𝑘𝑒𝑡𝑖𝑛𝑔 𝑐𝑜𝑠𝑡
𝐺𝑟𝑜𝑠𝑠 𝑀𝑎𝑟𝑔𝑖𝑛 = 𝑆𝑎𝑙𝑒 𝑝𝑟𝑖𝑐𝑒 − 𝑃𝑢𝑟𝑐ℎ𝑎𝑠𝑒 𝑝𝑟𝑖𝑐𝑒
𝑅𝑃 = 𝑅𝑒𝑡𝑎𝑖𝑙 𝑝𝑟𝑖𝑐𝑒
10.8.5 Determination of costs and margins of rice bran oil (RBO)
Total costs of rice bran oil processing consist of fixed costs and variable costs, 𝑇𝐶 = 𝐹𝐶 + 𝑉𝐶.
Where,
𝑇𝐶 = 𝑇𝑜𝑡𝑎𝑙 𝑐𝑜𝑠𝑡𝑠
𝐹𝐶 = 𝐹𝑖𝑥𝑒𝑑 𝑐𝑜𝑠𝑡𝑠
𝑉𝐶 = 𝑉𝑎𝑟𝑖𝑎𝑏𝑙𝑒 𝑐𝑜𝑠𝑡𝑠
𝑭𝒊𝒙𝒆𝒅 𝒄𝒐𝒔𝒕 = 𝑂𝑝𝑝𝑜𝑟𝑡𝑢𝑛𝑖𝑡𝑦 𝑐𝑜𝑠𝑡 𝑜𝑓 𝑙𝑎𝑛𝑑 + 𝑆𝑡𝑎𝑓𝑓 𝑠𝑎𝑙𝑎𝑟𝑦/𝑎𝑑𝑚𝑖𝑛𝑖𝑠𝑡𝑟𝑎𝑡𝑖𝑣𝑒 (𝑚𝑎𝑛𝑎𝑔𝑒𝑚𝑒𝑛𝑡)𝑐𝑜𝑠𝑡
+ 𝐷𝑒𝑝𝑟𝑒𝑐𝑖𝑎𝑡𝑖𝑜𝑛 𝑜𝑓 𝑚𝑎𝑐ℎ𝑖𝑛𝑒𝑟𝑦 + 𝐷𝑒𝑝𝑟𝑒𝑐𝑖𝑎𝑡𝑖𝑜𝑛 𝑐𝑜𝑠𝑡 𝑜𝑓 𝑏𝑢𝑖𝑙𝑑𝑖𝑛𝑔
+ 𝐼𝑛𝑡𝑒𝑟𝑒𝑠𝑡 𝑜𝑛 𝑖𝑛𝑣𝑒𝑠𝑡𝑚𝑒𝑛𝑡 𝑜𝑓 𝑏𝑢𝑖𝑙𝑑𝑖𝑛𝑔 𝑐𝑜𝑠𝑡𝑠
+ 𝐶𝑜𝑠𝑡 𝑜𝑓 𝑖𝑛𝑡𝑒𝑟𝑒𝑠𝑡 𝑜𝑛 𝑜𝑝𝑒𝑟𝑎𝑡𝑖𝑛𝑔 𝑐𝑎𝑝𝑖𝑡𝑎𝑙
𝑽𝒂𝒓𝒊𝒂𝒃𝒍𝒆 𝑪𝒐𝒔𝒕𝒔
= 𝐶𝑜𝑠𝑡𝑠 𝑜𝑓 𝑏𝑟𝑎𝑛 + 𝐶ℎ𝑒𝑚𝑖𝑐𝑎𝑙 𝑐𝑜𝑠𝑡𝑠 + 𝐿𝑎𝑏𝑜𝑟 𝑐𝑜𝑠𝑡 + 𝑅𝑒𝑝𝑎𝑖𝑟 𝑎𝑛𝑑 𝑚𝑎𝑖𝑛𝑡𝑒𝑛𝑎𝑛𝑐𝑒 𝑐𝑜𝑠𝑡
+ 𝐸𝑙𝑒𝑐𝑡𝑟𝑖𝑐𝑖𝑡𝑦 𝑐𝑜𝑠𝑡 + 𝑇𝑎𝑥 + 𝐶𝑜𝑠𝑡 𝑜𝑓 𝑙𝑢𝑏𝑟𝑖𝑐𝑎𝑛𝑡𝑠
During the rice bran oil production, it produces some other byproducts; like de-oiled rice bran, wax, free
fatty acid and gum, etc. Some revenues are generated from these byproducts. So, to determine the final
cost of production, theses revenues should be deducted from the total costs of RBO.
Net 𝒄𝒐𝒔𝒕 𝒐𝒇 𝒓𝒊𝒄𝒆 𝒃𝒓𝒂𝒏 𝒐𝒊𝒍 (𝑹𝑩𝑶) = (𝐹𝑖𝑥𝑒𝑑 𝑐𝑜𝑠𝑡 + 𝑉𝑎𝑟𝑖𝑎𝑏𝑙𝑒 𝐶𝑜𝑠𝑡) – 𝑇𝑜𝑡𝑎𝑙 𝑟𝑒𝑣𝑒𝑛𝑢𝑒 𝑜𝑓 𝑏𝑦 𝑝𝑟𝑜𝑑𝑢𝑐𝑡𝑠
After production of RBO, it requires some marketing costs. So, these costs also should be included into the
total costs of rice bran oil.
𝑻𝒐𝒕𝒂𝒍 𝒑𝒓𝒐𝒅𝒖𝒄𝒕𝒊𝒐𝒏 𝒂𝒏𝒅 𝒎𝒂𝒓𝒌𝒆𝒕𝒊𝒏𝒈 𝒄𝒐𝒔𝒕𝒔 = 𝑃𝑟𝑜𝑑𝑢𝑐𝑡𝑖𝑜𝑛 𝐶𝑜𝑠𝑡 + 𝑀𝑎𝑟𝑘𝑒𝑡𝑖𝑛𝑔 𝐶𝑜𝑠𝑡
10.8.6 Capacity utilization of rice bran oil mill
% 𝒐𝒇 𝐂𝐚𝐩𝐚𝐜𝐢𝐭𝐲 𝐮𝐭𝐢𝐥𝐢𝐳𝐚𝐭𝐢𝐨𝐧 =(Actual production of rice bran oil mill)
Total production capacity of rice bran oil mill× 100

11
11 Results and discussion:
11.1.1 The Present Scenario of the Rice Processing Industry of Bangladesh
The rice milling or processing sector in Bangladesh is undergoing a revolution. Due to rise in the income levels,
people now prefer processed rice, which is less costly, looks glossy, takes less time to cook, is free from stones
and dead rice, and has longer shelf life. To match with the demand of the people, new automatic rice mills are
being set up at a mounting rate, increasing competition for thousands of small and medium husking mills.
Automatic rice mills may have an impact on the performance of the rice selling system. On the other hand,
many husking mills are withdrawing which is decreasing the market share for the small millers. Over the
previous decade, hundreds of automatic and semiautomatic rice mills have been established in different rice
producing regions of Bangladesh. Naogaon, Chapainawabganj, Dinajpur, Kushtia and Jessore are some districts
that have involved investment in establishing large automatic rice mills. More investments are coming up for
placing new auto rice mills (The Daily Star, 2011). In 2005, around 500 automatic and semi-automatic rice mills
together with 17000 husking mills had been in operations which were also involved in parboiling, drying and
crushing paddy bought from farmers. Of these mills, more than 350 operators had their own brand rice in the
market. Bangladesh Auto, Semi-auto and Husking Mills Association has around 17,000 members. These mills
process and market at least 60 percent or three crore tons of the five crore tons of paddy produced a year in
the country. The farmers keep the rest of the production for their own consumption. On average the cost of
milling and processing of rice stands at around Taka 50,000 crore in a year (The Daily Star, 2015). According to
the provisional data by the Bangladesh Bureau of Statistics (BBS), it has been reported that in FY2015, the
production of milled rice reached a record high of around 34.708 million tons, a little up from approximately
34.41 million tons in FY2014 (Rice Outlook, 2015).
11.1.2 Scenario of rice processing by automatic rice mill in Kushtia, Dinajpur and Naogaon Districts
It was evident from table 11.1.1 that, 75 auto rice mills processed 1960.00-thousand-ton paddy in Kushtia, Dinajpur and Naogaon districts where millers found head rice 1174.55 thousand-ton, dead rice 83.74 thousand-ton, broken rice 146.62 thousand-ton, rice bran 166.62 thousand-ton and husk 392.04 thousand-ton. On an average conversion ratio of head rice and rice byproducts were found 59.56% and 40.44%, respectively. Among the byproducts, dead rice, broken rice, rice bran and rice husk were found 4.42%, 7.44%, 8.56% and 20%, respectively. Table 11.1.1 Rice processing scenario of automatic rice mill in the study area in 2017
(000 ton/year)
Districts Types of
Paddy Paddy
Head
rice
Dead
Rice
Broken
rice Bran Husk
Kushtia (25 mill)
Parboiled 533.81 325.62 20.82 37.37 45.37 106.76
Aromatic 72.79 37.85 5.10 8.01 6.19 14.56
Sub total 606.60 363.47 25.91 45.37 51.56 121.32
Dinajpur (25 mill)
Parboiled 562.85 343.34 21.95 39.40 47.84 11.26
Aromatic 76.75 39.91 5.37 8.44 6.52 15.35
Sub total 639.60 383.25 27.32 47.84 54.37 127.92
Naogaon (25 mill)
Parboiled 628.32 383.28 24.50 43.98 53.41 125.66
Aromatic 85.68 44.55 6.00 9.42 7.28 17.14
Sub total 714.00 427.83 30.50 53.41 60.69 142.80
3 Districts (75 mill) Total 1960.20 1174.55 83.74 146.62 166.62 392.04
% share - 100% 59.56% 4.42% 7.44% 8.56% 20%
Source: Authors’ calculation. Rice mills survey 2017-18

12
11.1.3 Availability of rice and its by-products in Bangladesh
The availability of rice and its byproduct has been measured according to the estimated percentage share of
paddy found in the survey results of the study area. The percentage shares of head rice and rice byproducts are
in the bottom row of the table 11.1.1. This study used this share to the rice statistics of the Food and Agriculture
Organization (FAO) to find out the available amount of head rice and rice byproduct in Bangladesh.
Data in table 11.1.2 reveal that during 2016-17 period, Bangladesh has produced 52.50 million-tons paddy,
which earned 30.98 million-tons head rice. Other than the head rice, the byproducts are dead rice, broken
rice, husk and rice bran that produced 2.31, 3.89, 10.50 and 4.46 million-tons, respectively. The rice bran has
been used to produce crude rice bran oil. Here, 4.46 million-tons rice bran can produce 0.98 million-ton crude
rice bran oil, from which about 0.92 million-ton refined rice bran oil could be obtained.
Table 11.1.2: Availability of rice and its byproducts in Bangladesh
Items
Year
% of
share
2009-
10
2010-
11
2011-
12
2012-
13
2013-
14
2014-
15
2015-
16
2016-
17
Paddy 100 49.86 50.06 50.58 50.50 51.28 51.64 52.00 52.50
Rice 59.56 29.42 29.54 29.84 29.80 30.26 30.47 30.68 30.98
Dead rice 4.42 2.19 2.20 2.23 2.22 2.26 2.27 2.29 2.31
Broken Rice 7.44 3.69 3.70 3.74 3.74 3.79 3.82 3.85 3.89
Husk 20 9.97 10.01 10.12 10.10 10.26 10.33 10.40 10.50
Rice Bran (RB) 8.56 4.24 4.26 4.30 4.29 4.36 4.39 4.42 4.46
Crude rice bran
Oil (CRBO)
22 of
RB 0.93 0.94 0.95 0.94 0.96 0.97 0.97 0.98
Rice Bran Oil 94 of
CRBO 0.88 0.88 0.89 0.89 0.90 0.91 0.91 0.92
Data source: FAOSTAT, Authors’ calculation. Note: all figures are in million-ton unit.
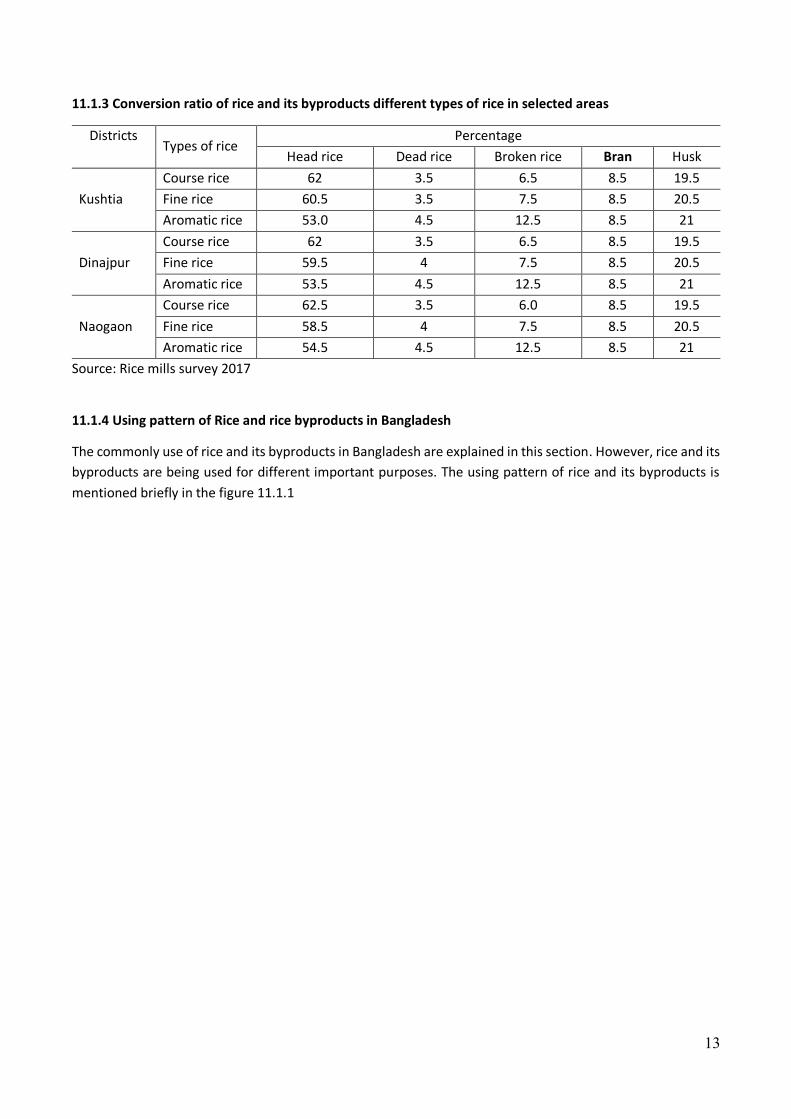
11.1.4 Conversion ratio of rice and its byproducts under different types of rice in selected areas
Although the conversion ratio of paddy in to head rice and rice byproduct are estimated in table 11.1.1, a
question has been raised about the conversion ratio according to the grain type. There is no doubt that the
conversion ratio in table 11.1.1 is enough to represent the national scenario. However, this study has shown
the conversion ratio according to the grain type in table 11.1.3 in addition. It was evident from table 11.1.3
that, in Kushtia district conversion ratio of course rice to head rice, dead rice, broken rice, rice bran and rice
husk were 62%, 3.50%, 6.50%, 8.5% and 19.50%, respectively. conversion ratio of fine rice to head rice, dead
rice, broken rice, rice bran and rice husk were 60.5%, 3.50%, 7.50%, 8.5% and 20.50%, respectively and that
of aromatic rice were 53.0%, 4.50%, 12.50%, 8.5% and 20.50%, respectively. On the other hand, on an average
same result was found in the Dinajpur and Naogaon districts. Broken kernels reduce milling yield. Broken
produced during milling are generally the result of immature, chalky, or fissured kernels, all of which are weak
and typically break during milling due to the substantial forces imparted to kernels in order to remove bran.
13
11.1.3 Conversion ratio of rice and its byproducts different types of rice in selected areas
Districts Types of rice
Percentage
Head rice Dead rice Broken rice Bran Husk
Kushtia
Course rice 62 3.5 6.5 8.5 19.5
Fine rice 60.5 3.5 7.5 8.5 20.5
Aromatic rice 53.0 4.5 12.5 8.5 21
Dinajpur
Course rice 62 3.5 6.5 8.5 19.5
Fine rice 59.5 4 7.5 8.5 20.5
Aromatic rice 53.5 4.5 12.5 8.5 21
Naogaon
Course rice 62.5 3.5 6.0 8.5 19.5
Fine rice 58.5 4 7.5 8.5 20.5
Aromatic rice 54.5 4.5 12.5 8.5 21
Source: Rice mills survey 2017
11.1.4 Using pattern of Rice and rice byproducts in Bangladesh
The commonly use of rice and its byproducts in Bangladesh are explained in this section. However, rice and its
byproducts are being used for different important purposes. The using pattern of rice and its byproducts is
mentioned briefly in the figure 11.1.1

14
Fig: 11.1.1 Using pattern of rice and its byproducts
Human Consumption
Rice mill
Husk
Dead
Rice
Rice Bran
Broken
Rice
Clean Rice
Briquette Factories
Rice Bran Oil Mill
Poultry & Feed
Industry
Feed Industry
Hotel &
Restaurants

15
11.2 Value Chain Analysis of Rice in Bangladesh
11.2.1 Introduction
Bangladesh is one of the world's top rice-consuming countries. The per capita rice consumption stood at 196.6
kilograms in 2016 and 196.3 kilograms in 2017 (The University of Arkansas, 2017). Rice is the most important
cereal and staple food which provide more than 70 percent of the total calorie intake in Bangladesh (Zaman,
Mishima, Hisano, & Gergely, 2001). In Bangladesh there are three seasons of rice production namely Aus
(summer), Aman (winter) and Boro (spring). The aggregated production of Aus (2.6 million MT), Aman (13.2
million MT) and Boro (18.7 million MT) paddies has been estimated to be 34.5 million metric tons (MT) in
FY2016 by using a total of 11.77 million hectares of land (Lagos & Hossain, 2016) which is more than 75 percent
of total cropped land (BARC, 2011). However, after harvesting paddy from the crops field, it needs to be
processed for consumption. The value chain of rice is the sequence of events from its production
to processing, then down to its marketing and consumption. The rice input suppliers, rice producers, and the
marketing channels usually compose the basic value chain processes for a rice subsector. The variety of seed
is the most important input of the rice industry. Rice is supplied mainly to retail markets, groceries, and to
public markets to make available to the consumers. The industry’s value chain uses wide-ranging labor. Upon
paddy production, a pre-requisite to a good and efficient marketing system is the ability of the producers to
decide on the best way to store and move their products down to their market destinations. Rice value chain
concentrates on the linkages between each of the actors (rice miller, Faria, Bepari, wholesaler, retailer, and
consumer) along with the value chain, from input supplies up to the ultimate consumers including actors
associated with marketing and processing. It also concentrates on a detailed breakdown of the costs, profits
and margins, the key constraints and linkages at each level of the chain. A long value chain and huge costs and
margins derived by the actors are the main causes for its price instability. The value chain analysis would
help making appropriate marketing strategy and pricing policy of rice in the country.
11.2.2 Inputs use pattern for rice cultivation
Farmers mainly use hired labor on contractual basis for the three major labor-intensive intercultural
operations such as transplanting, harvesting and carrying. They also hired labor on daily wage basis for other
intercultural operations such as land preparation, weeding, and post-harvest processing. Besides, most
farmers rely on power thresher for threshing rice on custom hired basis. The highest number of human labor
(121 man-days/ha) was used for Boro cultivation followed by T. Aman (103 man-days/ha) and Aus (101 man-
days/ha). The seed rates for Aus, T. Aman and Boro rice were 35, 36 and 40 kg/ha, respectively. Farmers’ rate
of urea application was much higher than the BRRI recommendation in all seasons. Rate of TSP application in
Aus season was much higher than BRRI recommendation, whereas, it was mostly accurate in Boro and Aman
season. On the other hand, farmers’ rate of MoP application was much lower than BRRI recommendation in
all seasons (Table11.2.1).

16
Table11.2.1. Per hectare Input used for rice cultivation in different seasons in the study area, 2017-18
Input Items Season
Aus Aman Boro
Human Labour (man-day/ha): 101 103 121
Hired 47 41 45
Family 16 17 18
Hired contract (transplanting and harvesting) 40 48 59
Seed (kg/ha) 35 36 40
Fertilizer (kg/ha):
Urea 157 (135) 176 (170) 234 (202)
TSP 77 (52) 88 (60) 110 (90)
MoP 62 (82) 74 (97) 128 (165)
DAP 23 9 25
Gypsum 26 37 48
ZnSo4 5 8 8
Mg 0 3 6
Theovit 3 3 4 Note: Figures in parentheses indicate BRRI recommended doses. Source: Field survey, 2017-18
11.2.3 Costs of Cultivation
Per hectare cost of hired labor were Tk. 15,750; Tk. 16,800 and Tk. 18,200 for Aus, T. Aman and Boro rice
cultivation, respectively. Fertilizer cost of Boro (Tk. 9,834/ha) was higher than that of Aus rice (Tk. 7,079/ha)
and T. Aman (Tk. 7,138/ha). Irrigation cost was much higher (Tk. 17,240/ha) for Boro rice than that of Aus (Tk.
2200/ha) and T. Aman (Tk. 1,485/ha). Per hectare variable costs was Tk. 61,749, Tk. 59,367 and Tk. 90,324 for
Aus, T. Aman and Boro rice cultivation, respectively (Table 11.2.2).

17
Table11.2.2. Per hectare cost of rice cultivation in different seasons in the study area, 2017-18
Input-wise cost (BDT/ha) Cost in Tk./ha
Aus Aman Boro
Seedling development 2,458 2,354 2,682
Seed 1,672 1,845 2,000
Tillage 5,960 5,960 5,960
Human labour 43,392 42,325 49,437
Hired 15,750 16,800 18,200
Family 6,300 7,000 7,350
Hired contract (transplanting and harvesting) 21,342 18,525 23,887
Fertilizer cost 7,079 7,138 11,034
Irrigation 2,200 1,485 17,240
Herbicide 340 442 720
Pesticides 2,060 1,843 3,955
Power thresher 4,560 4,820 7,846
Total variable cost 61,749 59,367 90,324
Interest on operating capital 1,029 989 1,505
Rental charge 14,320 22,330 22,320
Total fixed cost 21,649 30,319 31,175
Total cost 83,398 89,686 121,499
Source: Authors’ calculation
11.2.4 Profitability
The yield of Boro rice (5,883 kg/ha) was higher followed by T. Aman rice (4,621 kg/ha) and T. Aus rice (4,262
kg/ha). Despite of higher yield, gross margin of Boro rice (Tk. 21,391/ha) was lower than that of T. Aman rice
(Tk. 47,704/ha) and T. Aus rice (Tk. 29,803/ha). It can be noted that the farmers obtained higher return from
T. Aman and T. Aus rice due to low production cost and higher farm gate price of paddy. The benefit cost ratio
(BCR) on cash cost basis of T. Aman was higher (1.8) followed by T. Aus (1.5) and Boro (1.2) (Table11.2.3).

18
Table11.2.3. Per hectare cost and return of rice cultivation in different seasons in study area, 2017-18
Items Aus Aman Boro
Total costs (BDT/ha) 83,398 89,686 121,499
Total paid-out cost costs (BDT/ha) 61,749 59,367 90,324
Total imputed cost (BDT/ha) 21,649 30,319 31,175
Yield (kg/ha) 4,262 4,621 5,883
Market value of paddy (BDT/ha) 85,240 94,731 102,953
Market value of straw (BDT/ha) 6,312 12,340 8,762
Gross benefit (BDT/ha) 91,552 107,071 111,715
Gross margin (BDT/ha) 29,803 47,704 21,391
Net return (BDT/ha) 8,154 17,384 -9,785
Unit price of grain (BDT/kg) 20.0 20.5 19.5
Unit cost of production (BDT/kg) 19.6 19.4 20.7
BCR (cash cost basis) (Undiscounted) 1.5 1.8 1.2
BCR (full cost basis) (Undiscounted) 1.1 1.2 0.92
Source: Authors’ calculation
11.2.5 Average selling price of paddy producer
In data table 11.2.4 show the variety and season wise price of paddy in Kushtia Dinajpur and Naogaon district,
respectively, in different period (harvest season and off-season-two months later after harvest) at farmgate. It
is understood that considering the prices by variety would be more useful in comprehending how paddy prices
vary in Bangladesh depending on variety.
Table 11.2.4: Average farmgate price of paddy in different districts under the study: 2017
Districts Boro Aman
Coarse rice
(Tk./ql)
Fine rice
(Tk./ql)
Coarse rice
(Tk./ql)
Fine rice
(Tk./ql)
Aromatic rice
(Tk./ql)
Kushtia Harvest Season 2200 2570 2300 2625 3950
Off-season 2450 2780 2530 2800 4160
Dinajpur Harvest Season 2200 2570 2300 2625 3950
Off-season 2450 2780 2530 2800 4160
Naogaon Harvest Season 2200 2570 2300 2625 3950
Off-season 2450 2780 2530 2800 4160
Source: Field Survey 2017-2018
As it was evident from the tables, in both seasons (boro= dry season and aman= wet season) there was a
positive relationship between paddy prices and time of scale. This was true for all varieties. It was further
evident from the tables that, the prices of all varieties were not same. Price differences were more prominent
among varietal differences; such as course to medium or fine variety. Presumably, prices for the course were
the lowest and the prices for the fine variety were the highest.

19
11.2.6 Intermediaries in the paddy/rice marketing and their characteristics
Chains of intermediaries are often active in the paddy/rice marketing in Bangladesh. The actors of the
marketing chain are faria, bepari and paddy aratdars, rice millers, assembler, wholesalers and retailers. As
enough information are not available on these intermediaries due to their reluctance to provide the necessary
data, however, some major issues concerning them are discussed for the understanding of the role and
importance of these intermediaries in the marketing channel. The following discussion is mainly based on the
average data of Dinajpur, Naogaon and Dhaka city.
11.2.6.1 Faria and bepari
In Bangladesh/South Asian literature on food marketing, there is a slight distinction between faria and bepari
which is based on their scale of operation (Baulch et al. 1997). In some studies, they are categorized as different
kinds of agents, and in some studies, they are classified in the same category. There are no particular guidelines
from the Department of Agricultural Marketing (DAM) on their function for us to follow. In Dinajpur district
they use the term bepari and in Naogaon district both the term bepari and faria were used.
Faria/ beparis are the non-licensed small-scale paddy assemblers operating mainly in the village market. They
do not have permanent business premises, travel from village to village and purchase paddy from the growers
directly. Sometimes they also buy paddy from the village market. Some members of this group also work as
agents for the paddy aratdar. They are mostly seasonal. Some of them had other occupations such as small
size of farming, selling labors to others and similar activities. On average, they need Tk. 50,000 monthly to
operate. Generally, they operate their business with their own capital. Normally they sell their purchased
amount to the paddy aratdar at the same day of purchasing and sometimes they brought the paddy directly
to the millers. They use rickshaws and vans for transporting paddy from the grower’s house to their own house
and from their own house to the market if necessary and store paddy from two to six days (up to next hat day)
at their house. The monthly transactions of these paddy assemblers vary from 3-10 tonnes of paddy.
11.2.6.2 Paddy aratdar
Paddy aratdars are the commission agents who generally work for the millers. They have permanent business
premises in the upazila market. Generally, they purchase paddy from the upazila market. Some of the aratdars
buy paddy directly from the growers on the understanding that the growers can ask them for cash any time
when desired.
In general, aratdars get capital from the millers. They supply paddy to the millers within 3 to 7 days of taking
an order. Those aratdars who work for millers have little freedom in their purchasing and selling decisions.
They follow the decisions of the millers. All time they stay connected with the millers to take decision whether
they will purchase the paddy or not at the prevailing prices. They purchase about 25% of paddy from the
farmers and the rest from the bepari/paikar.
On average, aratdars get Tk. 1, 50,000 in advance from the millers for purchasing paddy and the rest, if any;
they receive after delivering the full quantity of paddy. Millers bear all the expenses of buying paddy. They
come to the aratdars premises for taking paddy for delivery and sometimes aratdars send the purchase volume

20
through truck or other vehicles along with the buying receipt and after that the millers pays the rest amount
of money. In return for the service, aratdars receive Tk.5 for each 40-kg of paddy as commission. The aratdars
store paddy for a few days, if undelivered, at their business premise. The average period of storage varies from
3 to 7 days. They handle more than 2500 tonnes of paddy annually and their annual income ranges between
Tk. 250000- Tk. 300000 after deducting their fixed costs and personal expenses.
11.2.6.3 Dalal
Dalals are the commission agents. They buy the paddy neither directly from the farmer nor from the other
traders. Instead, they act like an intermediary between the buyer and seller. They always charge a fixed
commission from both the parties (Tk. 2.0 – Tk. 3.0 per mound) for providing the services. Normally they act
between medium farmers and millers and between large framers and millers. In Dinajpur district they were
found but not in all the hat that were surveyed. Researcher found 9 dalals in two hats of that district.
11.2.6.4 Rural retailer
Rural retailers who are locally known as kutials in Naogaon district are the seasonal rice retailers. These small
traders purchase paddy from the growers directly at the village market. Parboiled and dried at the home yard
by family labor. The dried paddy is then taken to the small rice mills situated nearby close to the village market
for milling. For milling the paddy, rice millers charged tk.20 per mound from the kutials. After milling, they sell
the rice to the village consumers during the weekly (hat) and daily bazaar days. Their monthly transactions
vary from 0.9 to 1 tonne of paddy. In general, marginal and landless growers, and rickshaw or van pullers are
involved in this type of business. These rice retailers also work for the aratdars as daily laborers.
11.2.6.5 Marketing functions by rice millers
When the paddy is harvested from field, it needs to be processed for consumption. Parboiling, drying and
milling are the different stages of rice processing. These are done both at home (small scale) and at the rice
mills (large scale). Processing at home, the non-commercial sector of milling is perhaps the oldest and almost
obsolete form of rice processing method in Bangladesh. Paddy is also processd by dheki1 after it is parboiled
and dried. Paddy processing and milling in Bangladesh is mostly performed at the rice mills. These mills are
called commercial milling center. There are two kinds of commercial mills available in Bangladesh: one type is
the rice miller those purchase paddy directly or through their agents from the local bazaar or hat. In these
facilities, after parboiling, drying and milling the paddy, they usually supply the milled rice (finished products)
to the wholesalers and assemblers of the big cities. On the other side, after parboiling and drying the paddy at
home facility, the processed paddy is milled for finished rice in a small husking machine that situated in the
nearby village bazaar. These huskers also husk paddy for the small itinerants traders of the village. Recently
vendor huskers are also available in the villages.
Number of commercial rice millers is increasing over the years. These commercial- processing units have been
playing a significant role in the rice marketing system. Three types of rice mills are available in Bangladesh.
According to the Ministry of food (FPMU,1999), these are husky, major and automatic rice mills. For this study
1 A wooden made instrument, 2.5 meter long and 20-cm2, balanced like a seesaw on a bamboo fulcrum. This is the
Dheki, the tool the village women use to husk rice. During the husking, women push one end with her foot, so that the
other end, fitted with a wooden peg, rises and falls on the rice grains in a hole scooped in the kitchen’s earthen floor. The
pounding breaks the outer husks, leading the inner kernels intact (Hartmann and Boyce 1990)
21
a total of 11 mills were randomly selected from Pulhat (Dinajpur) and Naogaon Sadar Upazila (Naogaon) amog
them 7 were auto rice mill and the rest 4 were husky rice mill.
Data were collected on different aspects. It was difficult to receive data from the rice millers. Initially they were
suspicious about the purpose, after repeated request and explaining the purpose clearly to them they agreed
to talk with the researcher but in some cases the millers did not respond according to the need. To overcome
some of these problems, the researcher had also accumulated some detailed information from a single auto
rice miller. Though there might be some limitations in the analysis and the sample numbers might not
symbolize the whole Bangladesh, this efforts will provide a good overview on the functions and characteristics
of the commercial rice mills of the study area yet.
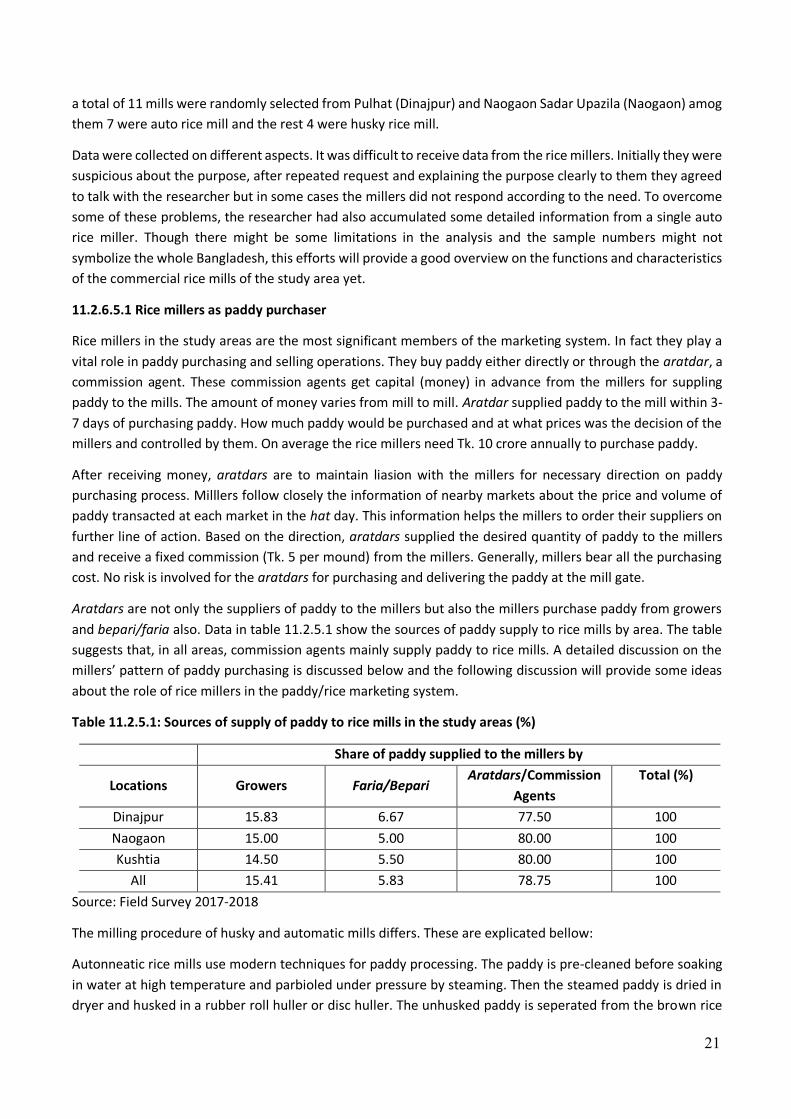
11.2.6.5.1 Rice millers as paddy purchaser
Rice millers in the study areas are the most significant members of the marketing system. In fact they play a
vital role in paddy purchasing and selling operations. They buy paddy either directly or through the aratdar, a
commission agent. These commission agents get capital (money) in advance from the millers for suppling
paddy to the mills. The amount of money varies from mill to mill. Aratdar supplied paddy to the mill within 3-
7 days of purchasing paddy. How much paddy would be purchased and at what prices was the decision of the
millers and controlled by them. On average the rice millers need Tk. 10 crore annually to purchase paddy.
After receiving money, aratdars are to maintain liasion with the millers for necessary direction on paddy
purchasing process. Milllers follow closely the information of nearby markets about the price and volume of
paddy transacted at each market in the hat day. This information helps the millers to order their suppliers on
further line of action. Based on the direction, aratdars supplied the desired quantity of paddy to the millers
and receive a fixed commission (Tk. 5 per mound) from the millers. Generally, millers bear all the purchasing
cost. No risk is involved for the aratdars for purchasing and delivering the paddy at the mill gate.
Aratdars are not only the suppliers of paddy to the millers but also the millers purchase paddy from growers
and bepari/faria also. Data in table 11.2.5.1 show the sources of paddy supply to rice mills by area. The table
suggests that, in all areas, commission agents mainly supply paddy to rice mills. A detailed discussion on the
millers’ pattern of paddy purchasing is discussed below and the following discussion will provide some ideas
about the role of rice millers in the paddy/rice marketing system.
Table 11.2.5.1: Sources of supply of paddy to rice mills in the study areas (%)
Share of paddy supplied to the millers by
Locations Growers Faria/Bepari Aratdars/Commission
Agents
Total (%)
Dinajpur 15.83 6.67 77.50 100
Naogaon 15.00 5.00 80.00 100
Kushtia 14.50 5.50 80.00 100
All 15.41 5.83 78.75 100
Source: Field Survey 2017-2018
The milling procedure of husky and automatic mills differs. These are explicated bellow:
Autonneatic rice mills use modern techniques for paddy processing. The paddy is pre-cleaned before soaking
in water at high temperature and parbioled under pressure by steaming. Then the steamed paddy is dried in
dryer and husked in a rubber roll huller or disc huller. The unhusked paddy is seperated from the brown rice

22
by a paddy seperator and is recycled back to the huller. Brown rice polished by a cone type polisher, engleberg
operated roller polisher. Milled rice is graded according to head rice, large broken, small broken rice and
processed at least 2 tonnes per hour.
Husky rice mills do some polishing in addition to husking mostly by using two or more passes through hullers
to grind off some of the bran after husking. These mills usually produce four types of products: milled rice,
some broken rice, rice bran and husks. Major differences among these mills are presented in table 11.2.5.2.
Table 11.2.5.2: Major differences between automatic and husky rice mills
Types Major components Capacity Power
Requirement
Hulling/Polishing Bran
Separation
and Grading
Automatic Pre-cleaner, Soaking
Tank Boiler, Steam,
Pressure Parboiled
Dryer, Rubber Roll
Sheller, Paddy
Separator Pollisher,
Bran Separator etc.
2
tonne/hour
65-100HP Separately by
different devices
All activities
mechanically
Husky Soaking Tank, Steam
Parboiled Drying
Floor, Engleberg
Huller.
0.6 to 1
tonne/hour
30-40HP 2 to 3 operations Manually
Source: Rahman (1998); Baqui, Miah and Ahmed (1994)
11.2.6.5.2 Distribution of rice from the major mills in the study areas
The millers generally market the milled rice through private commercial channels. When a miller enters into
the market, he sells the product directly to the assembler or wholesaler-cum- aratdar at the terminal market,
or sells to the visiting traders from outside the local market (Rahman 1998). In case of this study, the researcher
found that millers mainly sell rice to the wholesaler-cum- aratdar or to the rice assemblers of Dhaka,
Chittagong, Feni, Munshigong, Narayangong, Noakhali and Faridpur. In case of Dinajpur, most of the milled
rice was sold to Chittagong, Noakhali, Faridpur and Feni and in case of Naogaon district most of the rice was
sold to Dhaka (70%), Chittagong, Narayangong, Faridpur and Munshigong. From Dinajpur district not a
signicant amount of rice come to Dhaka. It is because, from Kustia, Naogaon, Mymensingh and Comilla a good
amount of rice come to Dhaka. The average distance between the millers and these areas varies from 200 to
680 kilometers (km). Rice is transported by truck in those areas because of good road conditions. There are
several reasons for selling rice in these areas, such as excellent transaction, opportunity to sell large volume at
a time. Moreover, traders usually come to the mill site; consequently, the millers are safe from the risk of hijack
at the road and other hazards.

23
Table: 11.2.5.3 Trading scenario of parboiled and aromatic rice in the study areas (in ‘000’ tones)
Districts
Parboiled rice Aromatic rice
Own District Other Districts Own District Other Districts
Kushtia 55356 (15%) 443061 (85%) 5678 (13%) 32174 (87%)
Dinajpur 58367 (17%) 467164 (83%) 5987 (15%) 33924 (85%)
Naogaon 65157 (14%) 521506 (86%) 6683 (14%) 37871 (86%)
Source: Mills Survey 2017. Note: Figures in parentheses indicate share in the district.
11.2.6. Retailers
Retailers are the last intermediary of the rice marketing system through which rice flows to the consumers. In
fact, retailers have permanent shops. Retailer in Dhaka city purchase rice from the Wholesalers-cum-aratdar
and from the wholesaler and sell directly to the consumers. In the study area, retailers buy rice directly from
the millers and sell to the consumers.
Figure 11.2.1: Supply chain of Rice in the Study Area
Note: ……........indicates less important channel.
Farmer
Faria Bepari
Miller
Local aratdar-cum-Wholesaler
Aratdar (Other districts)
Retailer Retailer
Consumer Consumer
Paddy aratdar
Wholesaler

24
11.2.7 Supply chain of course and fine rice
The Bangladesh rice marketing channel usually consist of two segments. First segment includes supplying
paddy from the farm level to the millers/processors and the second segment includes supplying rice from the
millers/processors to the ultimate consumers. The first segment in supplying paddy included Farias, Beparies,
Aratdar and rice millers. On the other hand, actors included in the second segment are rice miller, Aratdar,
Bepari or wholesaler and retailer. Various types of marketing channels are shown in Figure 11.2.1.
On the basis of the importance given by the respondents during their selling of paddy/rice in the study areas,
the following supply chains were identified in case of course and fine rice marketing.
𝐢: Farmer > Faria > Paddy arathder > Miller > Arathder (rice) > Wholesaler > Retailer
> Consumer
𝐢𝐢: Farmer > Bepari > Paddy arathder > Miller > Arathder(rice) > Wholesaler > Retailer
> Consumer
𝐢𝐢𝐢: Farmer > Paddy arathder > Miller > Arathder(rice) > Wholesaler > Retailer
> Consumer
𝐢𝐯: Farmer > Miller > Arathder(rice) > Wholesaler > Retailer > Consumer
11.2.8 Conversion ratio of rice and its byproducts according to course and fine types of rice in selected
areas
It was evident from table 11.2.7 that, in Kushtia district conversion ratio of course rice was found head rice,
dead rice, broken rice, rice bran and rice husk 62%, 3.50%, 6.50%, 8.5% and 19.50% respectively. Conversion
ratio of fine rice was found head rice, dead rice, broken rice, rice bran and rice husk 60.5%, 3.50%, 7.50%, 8.5%
and 20.50% respectively. On the other hand, on an average same result was found in the Dinajpur and
Naogaon district in table 11.2.7.
Table:11.2.7 Conversion ratio of rice to its byproducts for course and fine types of rice in selected areas
Districts Types of rice Head rice (%) Dead rice (%) Broken rice (%) Rice bran (%) Husk (%)
Kushtia Course rice 62 3.5 6.5 8.5 19.5
Fine rice 60.5 3.5 7.5 8.5 20.5
Dinajpur Course rice 62 3.5 6.5 8.5 19.5
Fine rice 59.5 4 7.5 8.5 20.5
Naogaon Course rice 62.5 3.5 6.0 8.5 19.5
Fine rice 58.5 4 7.5 8.5 20.5
Source: Field survey-2017
All the by-products that a mill produces have several possible applications. For example, bran and broken rice
are useful feed for poultry, livestock and fish, while rice husks have been utilized as fuel for millers and the
rural community.

25
11.2.8 Marketing cost of bepari and aratder
Data in table:11.2.8 reveals that marketing costs per quintal of bepari and aratdar in the study areas. The
marketing cost of baperi was a sum total of buying and selling cost. Total cost of bepari was Tk. 102.38 per
quintal among them 67.40% was buying cost. The highest cost (36.64%) incurred by Baperi was for
transportation followed by cost of bagging (29.30%).
Table:11.2.8 Marketing costs handled by the of bepari and arathders
Actors Baperi Arathder
Cost Items Cost (Tk/ql) % of Total Cost Cost (Tk/ql) % of Total Cost
A. Buying Cost
Transport cost 18.75 18.32 30 26.14
Loading and
unloading 7.50 7.33 7.5 6.54
Market toll 3.75 3.66 5.625 4.9
Sweepers 7.50 7.33 1.5 1.31
Cost of bagging 30.00 29.3 30 26.14
Personal expenses 1.50 1.47 1.5 1.31
Sub-total 69.00 67.4 76.125 66.34
B. Selling Cost
Transportation 18.75 18.32 18.75 16.34
Loading and
unloading 7.50 7.33 7.5 6.54
Personal expenses 1.50 1.47 1.5 1.31
Weighing charges 3.75 3.66 0 0
Electricity 0.00 0 0.75 0.65
Market toll 0.00 0 5.625 4.9
Others 1.88 1.83 4.5 3.92
Sub-total 33.38 32.6 38.625 33.66
Total cost 102.38 100 114.75 100
Source: Field Survey 2017-2018
The cost involved in performing these services includes transportation, loading and unloading, market tolls,
cost of bagging etc. Total cost of arathder was Tk. 114.75 per quintal among them 66.34% was buying cost.
The highest cost (36.64%) incurred by arathder was for transportation followed by cost of bagging (26.14%).
11.2.10 Processing and marketing cost of the rice miller in the study areas
Cost of processing included labor required for soaking, parboiling, drying and milling, electric bill, costs of bags
for packing, storage etc. Total cost of miller was Tk. 842.60 per quintal among them 23% and 26.11% buying
cost and selling cost. The total cost of processing was 51%of the total cost. Details of the cost of processing
and selling are provided in table 11.2.9.

26
Table: 11.2.9 Stucture of processing and marketing cost of rice millers in the study areas;2017
Cost Item Tk/ql % of cost
A. Buying
Cost
Labour (Buying, weighing & loading) 44.00 5.22
Market toll 8.25 0.98
Cost of bags 55.00 6.53
Rope (Sutli) 2.75 0.33
Helping man (Koyal) 5.50 0.65
Commission to Aratdar 27.50 3.26
Transportation 55.00 5.22
Unloading 5.50 0.65
Sub-total 199.10 22.85
B. Processing
Cost
Labour (Boiling, drying, milling
&processing) 192.50 22.85
Electricity cost 99.00 14.53
Personal expenses 2.37 0.28
Subscription for association 1.16 0.14
Telephone charge 0.22 0.03
Storage 11.00 1.31
Bagging cost 94.60 9.79
Others 22.00 2.61
Sub-total 410.74 51.53
C. Selling
Cost
Transportation cost for Dhaka 192.50 22.85
Commission to rice Aratdar 27.50 3.26
Sub-total 220.00 26.11
Total 842.60 100
Source: Authors’ calculation Source: Field Survey 2017-2018
11.2.11 Marketing cost of rice traders (arathder, wholesaler and retailer) in the study areas
Table 11.2.10 shows average costs per quintal of Aratdar, wholesaler and retailer. Arathder bear less cost
because of that they are commission agents. They are not responsible for transportation and labor costs in
this case. As commission agents’, the main costs of traders are salary of permanent staffs (43.61%) and rent
of the premise (18.69%). The transaction cost of a quintal of rice calculated for aratdars is Tk. 81.65.
The total marketing cost of wholesaler was Tk 108.60 per quintal. Of the total marketing cost, transportation
cost was the highest (34.13%) which was followed by cost of bagging (29.86%).

27
Table: 11.2.10 Marketing cost of (rice traders) arathder, wholesaler and retailer
Actors Arathder Wholesaler Retailer
Cost Items
Cost
(Tk/ql)
% of
Total
Cost
Cost
(Tk/ql)
% of
Total
Cost
Cost
(Tk/ql)
% of
Total
Cost
Unloading 12.50 15.58 15.00 12.80 15.00 16.53
Rent 15.00 18.69 2.50 2.13 1.00 1.10
Electricity charge 2.50 3.12 2.00 1.71 3.35 3.69
Labor charge-permanent 35.00 43.61 10.00 8.53 10.00 11.02
Transportation cost 0.00 - 40.00 34.13 35.00 38.57
Cost of bagging 35.00 29.86 35.00 29.86 15.00 16.53
Telephone charge 0.20 0.17 0.20 0.17 0.15 0.17
Market toll 0.40 0.49 7.50 6.40 7.50 8.26
Market search cost 0.25 0.31 0.00 - 0.00 -
Cost of lost in transportation &
handling 0.75 0.92 0.00 - 0.50 0.98
Personal Expenses 0.75 0.92 0.00 - 1.00 0.82
0thers 5.00 6.23 5.00 4.27 3.75 4.13
Total 81.65 100.00 108.60 100.00 87.88 100.00
Source: Authors’ calculation
Retailers have to incur costs like labor cost, loading and unloading charge, transportation cost etc. In Table
11.2.10 it was observed that the total cost of marketing incurred by retailers in the terminal market was
Tk.87.88/quintal among them transportation cost was the highest (38.57% of the total marketing cost)
followed by loading and unloading (16.53%) and cost of bagging (16.53%).
11.2.12 Marketing margin of different actors of coarse rice
Table 11.2.11 reveals that the miller shared highest cost (54.20 %) and captured highest percentage of total
value addition (45.80%) amongst the traders. The second highest cost was incurred by faria (7.21%) and
earned 7.37 % of the total value addition. The rice retailer captured 17.29 % of total value addition by incurring
5.70% of the total marketing cost.
Table 11.2.11: Stucture of marketing margin of different actors of coarse rice (Tk/ql)
Actors Purchase
Price Sale Price
Gross
Margin
% of
GM Cost of
marketing
% of
MC
Value
addition/Net
margin
% of
NM/VA
Faria/Baperi 2150 2337.5 187.5 7.19 102.38 7.21 85.13 7.37
Arathder
(paddy) 2337.5 2557.5 220 8.44 114.75 4.09 105.25 9.11
Miller 2557.5 4012.5 1455 55.8 842.60 54.2 612.40 45.8
Arathder 4012.5 4225 212.5 8.15 81.65 4.72 130.85 11.33
Wholesaler 4225 4470 245 9.4 108.60 6.58 136.40 11.81
Retailer 4470 4757.5 287.5 11.03 87.88 5.7 199.63 17.29
Source: Authors’ calculation

28
The wholesaler earned 11.81 % of the net marketing margin by incurring 6.58 % of the total marketing cost.
Share of value addition earned by the bepari, paddy aratdar, miller, aratdar(rice), wholesaler and retailer were
estimated at 7.37%, 9.11%, 45.80%, 11.33%, 12.00% and 17.30%, respectively.
11.2.13 Marketing margin of different actors of fine rice
Data in table 11.2.12 reveal that the miller shared highest cost (54.20 %) and captured highest percentage of
total net profit (45.80%) amongst the traders. The second highest cost was incurred by faria (7.21%) and
earned 7.37 % of the total net marketing margin. The rice retailer captured 17.29 % of total net marketing
margin by incurring 5.70% of the total marketing cost.
Table 11.2.12: Stucture of marketing margin of different actors of fine rice (Tk/ql)
Actors Purchase
Price Sale Price
Gross
Margin
% of
GM
Cost of
marketing
% of
MC
Value
addition/net
margin
% of
VA/NM
Faria/Baperi 2800 2987.5 187.5 7.19 102.38 7.05 85.13 7.37
Arathder
(paddy) 2987.5 3207.5 220 8.44 114.75 4.09 105.25 9.11
Miller 3207.5 4662.5 1455 55.8 842.60 54.2 612.40 45.8
Arathder 4662.5 4875 212.5 8.15 81.65 4.72 130.85 11.33
Wholesaler 4875 5120 245 9.4 108.60 6.58 136.40 11.81
Retailer 5120 5407.5 287.5 11.03 87.88 5.7 199.63 17.29
Source: Authors’ calculation
The wholesaler earned 11.81 % of the value addition by incurring 6.58 % of the total marketing cost. Share of
net profit earned by the bepari, paddy aratdar, miller, aratdar(rice), wholesaler and retailer were estimated
at 7.37%, 9.11%, 45.80%, 11.33%, 12.00% and 17.30%, respectively.
11.2.14 Producer share and farm-retail price spread of course and fine rice
Producer sharer in consumer’s taka is the price received by the producer expressed as percentage of the retail
price (price paid by the consumer). For the course and fine rice producer share and farm retail price spread
were 45.19% and 51.71%, respectively. For the course and fine rice farm retail price spread was Tk. 2607 and
Tk. 2807.50 per quintal, respectively (table 11.2.13). High producers share was taken as an evidence of
increase the efficiency of the marketing system in favor of the farmer, while low producer share was taken as
evidence of the fact that middlemen retained a large share.
Table:11.2.13 Producer share and farm retail price spread of course and fine rice (Tk/ql)
Item Course rice Fine rice
Producer price 2150.00 2800.00
Retail price 4757.50 5607.50
Producer share (%) 45.19 51.78
Farm retail price spread 2607.50 2807.50
Source: Authors’ calculation
11.2.15 Marketing constraints of paddy/rice
In Bangladesh, agricultural production and marketing system is not free from problems. From production to
selling all the channel members including growers are facing with different problems at different stages of
marketing. The problems that described below are only the case of the study area but it was assumed that

29
across the whole country, the problems faced by the farmers and the intermediaries of rice marketing
channel were more or less same as paddy/rice is a homogeneous product. The logic behind the discussion
of production and marketing constraints in this section was that, problems faced by the farmer and
intermediaries may be determiner of marketing efficiency, meaning that the more the problems the less the
efficiency.
11.2.15.1 Producers’ constraints
The producers’ in the study areas were asked to what sort of problems they were facing and they answered
that they were facing a lot of problems and a summary of these problem has been shown in Table11.2.15.1
with a brief description of the major problems.
Lack of market: About 25% of the respondents said that there were market problems associated with
maintenance of standards and grades. For Example, during husking, grains are broken in to pieces (farmer
usually used traditional threshing i.e. by beating with stick and using ox) and this broken grain decreases
market demand.
Transportation problem: About 21% of the sampled farmers were responding positively about transportation problem. The local markets were not well connected to the villages. Due to poor communication system, farmers could not transport their produce to the distant markets where higher prices prevailed.
Lack of capital and credit availability: About 45.8% of the sampled farmers complained about capital
shortage and 41.6% about unavailability of credit. Farmers have an urgent need for money immediately
after harvest.
Even if the price of paddy is always at lowest during that period, farmers badly needed cash during this
period in order to pay their rent and debts as well as to buy certain necessities. Most of the time, lack of
post-harvest credit forces farmers to sell their produce immediately after harvest, when prices are low.
Table11.2.14.1: Marketing and institutional problems faced by the farmers in the study areas
No. Description of the problems (%) of farmers
opined
A. Marketing aspect
1 Lack of market 25
2 Problem of price setting 45.8
3 Malpractice in selling method (scaling or weighing) 29.1
4 Information exchange problem 20.8
5 Problem of storage facilities 62.5
6 Problems of threshing machine or miller /quality 25
B. Financial and institutional aspect
1 Loan repayment problem 33.3
2 Lack of capital availability 45.8
3 Problems of credit facility 41.6
4 Transport problem 20.8
5 Lack of institutional support 37.5
6 Problem of theft 16.7
7 Problems of excess water (flooding) 8.3
Source: Field Survey 2017-2018

30
11.2.15.2 Problems associated with the millers in the study areas
The major problems of the rice millers in the study area were high transportation costs (100%), interruption in
electricity supply (100%), high marketing costs 72.7% (transportation costs plus others costs), capital shortage
and access of credit in due time (54.4%) and low quality of farmers’ rice due to problem of threshing (54.4%)
which is shown in Table 11.2.14.2.
They also complained that, the recent increase in fuel price (which occurred for several times in recent period)
was liable to increase the transportation cost for trading paddy in distant markets. The rice miller also said
that, frequent interruption in electricity and also the increase in the price of per unit electricity increased their
costs but decreased their total milling amount. So, they have to sell rice comparatively in high price than before
to cover their costs.
Table 11.2.14.2: Problems faced by the rice millers in the study areas
Types of problems Respond by (%) rice
millers (N = 75)
Price instability 45.4
High transportation cost 100
Capital shortage and credit access in due time 54.4
Lack of standardization and grading facilities 36.4
Absence of proper marketing facilities 27.3
Storage problem 18.2
Lack of market information 18.2
High marketing costs 72.7
Uncertainty in electricity supply 100
Milling problems 36.4
Farmers reluctant to sell due to low price 45.5
Quality problem 54.5
Adulteration 27.3
Information flow 18.2
Illegal charges 36.4
Note: N = Total sample size by each category for Dinajpur Kushtia and Naogaon. Source: Field Survey 2017-2018
11.2.15.3 Problems Associated with rice traders (rice aratdar, wholesaler and retailer)
As indicated in Table 11.2.14.3, the major problem of rice traders was also the transportation cost followed by
high marketing cost, capital shortage, credit access and price instability. The other important problems were
quality problems, competition with unlicensed traders etc.

31
Table 11.2.14.3: Problems faced by the rice traders in the study areas
Types of Problems
Respond by (figures in %)
Aratdar
(N = 30)
Wholesaler
(N = 45)
Retailer
(N = 60)
Price instability 37.5 50 60
High transportation cost 75 80
Capital shortage and credit access 62.5 50 60
Lack of standardization and grading facilities 25 25 30
Lack of market information 12.5 20
High marketing costs 37.5 75 70
Quality problem 37.5 25 20
Competition with licensed traders 25 25 30
Competition with unlicensed trader 37.5 25 30
Business management 25 25 20
Note: N = Total sample size by each category for Dinajpur, Naogaon and Dhaka district. Source: Field survey
2017-2018
11.2.16 Conclusions and recommendations
Conclusion: The milling of course rice produced head rice, dead rice, broken rice, rice bran and rice husk at
the rate of 62%, 3.50%, 6.50%, 8.5% and 19.50%, respectively and that of fine rice were 60.5%, 3.50%, 7.50%,
8.5% and 20.50%, respectively. This study found that, on an average costs of rice marketing for bepari, paddy
arathder, miller, rice arathder, wholesaler and retailers were estimated at Tk. 102.08, Tk. 114.75, Tk.842.60
Tk. 81.65, Tk.108.60, and Tk. 87.88 per quintal, respectively. Share of net profit earned by the faria/bepari,
paddy aratdar, miller, aratdar(rice), wholesaler and retailer were 7.37%, 9.11%, 45.80%, 11.33%, 12.00% and
17.30%, respectively. Producer share and farm retail price spread were 67.03% and Tk. 2613 per quintal,
respectively. For the course and fine rice, producer share was 45.19% and 51.71%, respectively. For the course
and fine rice farm retail price spread was Tk. 2607 and Tk. 2807.50 per quintal, respectively. The present study
identified some problems and constraints associated with aromatic rice marketing. The unavailability of labor,
pest (BPH) and disease (neck blast and sheath rot diseases) infestation, high costs of inputs, high cost of labor,
lodging problems were the major constraints in producing rice in Bangladesh. Whereas lack of storage
facilities, lack of information, lack of regulated and co-operative market etc. were the constraints of rice
marketing. Proper planning and measures from the government side to solve the problems in the production
and marketing would encourage farmers for better production of rice in the country.
However, the following recommendations are made by this study for the improvement of existing rice
marketing system:
At the harvesting period as there exist lowest price of the paddy, the government should increase the
direct purchase from the farmers at such a price that slightly more than the existing market price so that
the growers’ feel interest to sell to the government depot. Prices should be provided in cash not in credit
and instantly and temporary procurement center should be opened at the rural areas not in the upazila
market so that transportation cost could be minimum.
Public storage facilities should be increased in the rice producing area so that the producers’ can store
their produce during harvest period instead of selling immediately after the harvest. On the other hand,
storage cost should be kept lower than the private storage centers and hence seasonal fluctuations in the

32
prices of rice can be controlled. Farmers should have easy access to loan from the government’s credit
institution at easy terms and condition (lower interest rate) and if it is possible, they may not require
selling their paddy at lower prices to repay the loans that were taken from local mahajans or private banks.
Large number intermediaries are involved in the rice marketing system which increase the marketing cost
and margins and reduce the margins of the growers. So, the proper steps should be taken so that the
farmers can sell their produce through the efficient channel that was mention earlier that mean not only
the large and medium farmers but also the small farmers can sell directly to the millers.
Efficient and effective monitoring committee should be appointed who will monitor the markets, the
pricing strategy in each market, the storage condition of the millers and any other discrepancy in rice
marketing channels.
The government should ensure smooth supply of inputs, especially the supply of quality seeds and keeping
the price fluctuation of inputs at minimum level.
DAM and MoF as well as MoA and other concerned government organization may be entrusted with more
responsibilities of disseminating market and price information to the growers. The available information
should not be confined only in their web pages but it should be disseminated to the proper way because
most of the farmers are still illiterate about the present information technology.
Any form of illegal activities like collection of subscription by the road and transportation authority itself
and/or others (local mastans), hijacking/robbery of truck that are loaded with rice should be controlled in
an efficient manner by the concerned government agency.

33
11.3 Value Chain Analysis of Aromatic Rice in Bangladesh
11.3.1 Introduction
Though, Bangladesh achieved self-sufficiency in rice production but still need more aromatic rice to meet local
and foreign demand. Before release of BRRI dhan34 (1997), farmers of Bangladesh cultivated traditional
aromatic rice varieties like Kalizira, Chinigura and Kataribhog mainly for home consumption. The yield and
milling recovery of these traditional or indigenous varieties were very low and its use was very limited only in
Eid, marriage ceremony and other prestigious festivals. The aromatic rice is regarded as highly premium priced
compared to other coarse rice. In Bangladesh, about 54 aromatic and fine grain rice varieties are grown of
which most of them are grown at Aman season, quite a few are also grown in Boro season. Islam et al. (1996)
reported that the average area devoted to aromatic rice production in the Aman season was 12.5% of the
total rice area of the season, with an average yield of 2.0 tons/ha (clean rice). There are some pocket areas
which is more suitable for aromatic rice production. In Bangladesh, Kushtia, Dinajpur, and Naogaon district is
highly concentrated in aromatic rice production where ACI, Pran group and Square Company Ltd. established
aromatic rice processing plant. About 151,245 hectares of land was under BRRI dhan34 which was 26% of total
Aman area and from where 3,22,570 tons of clean rice was produced with an average yield of 2.10 t/ha during
2017-18. Bangladeshi aromatic rice is expected to have a good market demand in international context for its
nice aroma and fine grain quality. With low production cost and natural facilities, Bangladesh could enjoy a
good opportunity to export aromatic and fine grain rice to abroad under the circumstances as our product is
highly appreciated in the world market. BRRI dhan34 is a widely adopted higher yield potential aromatic rice
variety in Bangladesh. So, the present study was designed to examine the value chain of aromatic rice (BRRI
dhan34).
11.3.2 Production cost of aromatic rice (BRRI dhan34)
Table11.3.1 clearly shows input wise cultivation cost of BRRI dhan34 in selected districts of Bangladesh. Total
cost of cultivating aromatic rice (BRRI dhan34) was 92821 Tk./ha. Among the cost items, major share has been
captured by the labor (45.02% of the total production cost). Overall total input cost was found 72.22%
whereas total fixed cost was 25.94% of the total cost. Rental value of land was the highest among fixed costs
which was 32.99 percent of the total cost of cultivation.

34
Table11.3.1: Average pproduction cost of aromatic rice (BRRI dhan34) in for three districts: Kushtia,
Dinajpur, and Naogaon
Items Cost Tk./ha Total cost share
BRRI dhan34 (% )
Seedling development 2050 2.21
Seed 1863 2.01
Tillage 4901 5.28
Human labour 41821 45.06
Hired 10750 11.58
Family 6500 7.00
Hired contract (transplanting and harvesting) 24571 26.47
Fertilizer cost 5685 6.12
Irrigation 2400 2.59
Herbicide 944 1.02
Pesticides 2972 3.20
Power thresher 4400 4.74
Total variable cost 67035 72.22
Interest on operating capital 1708 1.84
Rental change of own land 24077 25.94
Total fixed cost 25785 27.78
Total cost 92821 100.00
Note: (Here, 2.47 acre= 1 hectare and 1 quintal= 100 kg.) Source: Field Survey 2017-2018
11.3.3 Profitability
It was evident from Table 11.3.2 that the yield of aromatic rice BRRI dhan34 was 2730.50 kg/ha and gross
return was 129915.00 Tk./ha where return of paddy and byproducts (straw) were Tk. 116015.00 and Tk.
13900.00 respectively. On full cost and current cost basis Benefit Cost Ratio (BCR) was found 1.40 and 1.94,
respectively. That means, current return on investment of the BRRI dhan34 production is 195 percent. Unit
cost of production and return from grain of BRRI dhan34 were 34.00 and 42.00 Tk./kg, respectively. That
means, farmers are getting benefit of 8.00 Tk./kg by producing of aromatic rice BRRI dhan34.

35
Table 11.3.2: Average pprofitability of aromatic rice (BRRI dhan34) for three districts; Kushtia, Dinajpur,
and Naogaon)
Items Aromatic rice (BRRI dhan34)
Total costs (BDT/ha) 92820.52
Total variable costs (BDT/ha) 67035.19
Total fixed cost (BDT/ha) 26084.74
Yield (kg/ha) 2730.00
Market value of paddy (BDT/ha) 116015.00
Market value of straw (BDT/ha) 13900.00
Gross benefit (BDT/ha) 129915.00
Gross margin (BDT/ha) 62879.81
Net return (BDT/ha) 37094.48
Unit price of (paddy) grain (BDT/kg) 42.50
Unit cost of production (BDT/kg) 34.00
BCR (cash cost basis) (Undiscounted) 1.94
BCR (full cost basis) (Undiscounted) 1.40
Note: (Here, 1 acre= 100 decimals, 2.47 acre= 1 hectare) Source: Field Survey 2017-2018
11.3.4 Supply chain of aromatic rice (BRRI dhan34)
The Bangladesh rice marketing channel has two segments. First segment includes supplying paddy from the
farm level to the millers/processors and the second segment includes supplying rice from the
millers/processors to the ultimate consumers. The first segment in supplying BRRI dhan34 paddy included
Farias, Beparies, Aratdar and rice millers. On the other hand, actors included in the second segment are rice
miller, Aratdar, Bepari or wholesaler and retailer. Moreover, the Bangladeshi fine rice is being exported in US,
UK and Middle-east Asian countries. Various types of marketing channels are shown in Figure 11.3.1.
On the basis of the importance given by the respondents during their selling of paddy/rice in the study areas,
the following supply chains were identified for marketing of BRRI dhan34.
𝐢: Farmer > Faria > Paddy arathder > Miller > Arathder (rice) > Wholesaler > Retailer
> Consumer
𝐢𝐢: Farmer > Bepari > Paddy arathder > Miller > Arathder(rice) > Wholesaler > Retailer
> Consumer
𝐢𝐢𝐢: Farmer > Bepari > Paddy arathder > Miller > Companies (Pran, ACI, Chachi) > Dealer
> > Retailer > Consumer
𝐢𝐯: Farmer > Bepari > Paddy arathder > Miller > Companies (Pran, ACI, Chachi)
> Foreign country

36
Figure 11.3.1: Supply chain of aromatic rice (BRRI dhan34) in the study areas, Bangladesh
11.3.5 Supply system of aromatic rice in the domestic market
In our domestic market, about 45% aromatic rice (unpacked) were supplied by millers with the help of
arathder, wholealer and retailer. Finally, retailers sold it to the consumers. On the other hand, Different
companies in Bangladesh (like: Pran, ACI, Pusti and Chashi) collected about 55% of aromatic rice from selected
mills. After that these companies processed, packaged and leveled it and sold by their own brand name. Then
they marketed about 30% aromatic rice in our domestic market and remaining 25% were exported in the
foreign countries.
11.3.6 Ratio of clean rice and by-product from BRRI dhan34
Rice mills can produce four kinds of by-products: these are rice husk, rice bran, dead rice and broken rice. The
ratios of these by-products are also different. The ratio of head rice, rice husk, rice bran and broken rice vary
by mill types. On average, the surveyed automatic mills in the study areas could generate 53, 20, 9, 10 and 8%
of head rice, rice husk, rice bran, broken rice and dead rice respectively (Table 11.3.3).

37
Table 11.3.3: Milling outturn and by-products generating from 1000 kg of paddy in Kushtia, Dinajpur and
Naogaon districts
Perticulars Amount Achieved of head rice and
byproducts (in %)
Milling Outturn (Kg) 530 53
Husk (Kg) 200 20
Rice Bran (Kg) 90 9
Broken Rice (Kg) 100 12
Dead Rice (Kg) 80 6
Source: Field survey -2017
All the by-products that a mill produces have several possible applications. For example, bran and broken rice
are useful feed for poultry, livestock and fish, while rice husks have been utilized as fuel for millers and the
rural community. The rice bran has high demand for producing rice bran oil.
11.3.7 Marketing cost of (paddy traders) bepari and arathder
Table 11.3.4 reveals that costs per quintal of bepari and aratdar. Baperi marketing cost was a sum total of
buying and selling cost. Total cost of Bepari was Tk. 102.38 per quintal among them 67.40% was buying cost.
The highest cost (36.64%) incurred by Baperi was for transportation followed by cost of bagging (29.30%).
Table 11.3.4: Marketing cost incurred by (paddy traders) bepari and arathder in the study areas;2017
Actors Baperi Arathder
Cost Items Cost (Tk/ql) % of Total Cost Cost (Tk/ql) % of Total Cost
A. Buying Cost
Transport cost 18.75 18.32 30 26.14
Loading and
unloading 7.50 7.33 7.5 6.54
Market toll 3.75 3.66 5.625 4.9
Sweepers 7.50 7.33 1.5 1.31
Cost of bagging 30.00 29.3 30 26.14
Personal expenses 1.50 1.47 1.5 1.31
Sub-total 69.00 67.4 76.125 66.34
B. Selling Cost
Transportation 18.75 18.32 18.75 16.34
Loading and
unloading 7.50 7.33 7.5 6.54
Personal expenses 1.50 1.47 1.5 1.31
Weighing charges 3.75 3.66 0 0
Electricity 0.00 0 0.75 0.65
Market toll 0.00 0 5.625 4.9
Others 1.88 1.83 4.5 3.92
Sub-total 33.38 32.6 38.625 33.66
Total cost 102.38 100 114.75 100

38
The cost involved in performing these services includes transportation, loading and unloading, market tolls,
cost of bagging etc. Total cost for arathder was Tk. 114.75 per quintal out of which 66.34% was buying cost.
The highest cost (36.64%) incurred by arathder was for transportation followed by cost of bagging (26.14%).
11.3.8 Processing and marketing cost of miller
Cost of processing included labor required for soaking, parboiling, drying and milling, electric bill, costs of bags
for packing, storage etc. were also included in the category of variable costs. Total cost of miller was Tk. 842.60
per quintal among them buying cost and selling cost shared 23% and 26% respectively. The cost of processing
was 51% of the total cost. Details of the cost of processing and selling are provided in Table 11.3.5.
Table 11.3.5: Processing and marketing cost incurred by the miller for aromatic rice;2017
Cost Item Tk/ql % of cost
A. Buying
Cost
Labour (Buying, weighing & loading) 44.00 5.22
Market toll 8.25 0.98
Cost of bags 55.00 6.53
Rope (Sutli) 2.75 0.33
Helping man (Koyal) 5.50 0.65
Commission to Aratdar 27.50 3.26
Transportation 55.00 5.22
Unloading 5.50 0.65
Sub-total 199.10 22.85
B. Processing
Cost
Labour (drying, milling &processing) 192.50 22.85
Electricity cost 99.00 14.53
Personal expenses 2.37 0.28
Subscription for association 1.16 0.14
Telephone charge 0.22 0.03
Storage 11.00 1.31
Bagging cost 94.60 9.79
Others 22.00 2.61
Sub-total 410.74 51.53
C. Selling
Cost
Transportation cost for Dhaka 192.50 22.85
Commission to rice Aratdar 27.50 3.26
Sub-total 220.00 26.11
Total 842.60 100
11.3.9 Marketing cost of rice traders arathder, wholesaler and retailer
Data in table 11.3.6 show average costs per quintal of Aratdar, wholesaler and retailer. Aratdars bear less cost
because of that they are commission agents. They are not responsible for transportation and labor costs in
this case. As commission agents’, the main costs of traders are salary of permanent staffs (43.61%) and rent
of the premise (18.69%). The transaction cost of a quintal of rice calculated for aratdars is Tk. 81.65.
The total marketing cost of wholesaler was Tk 108.60 per quintal. Of the total marketing cost, transportation
cost was the highest (34.13%) which was followed by cost of bagging (29.86%).
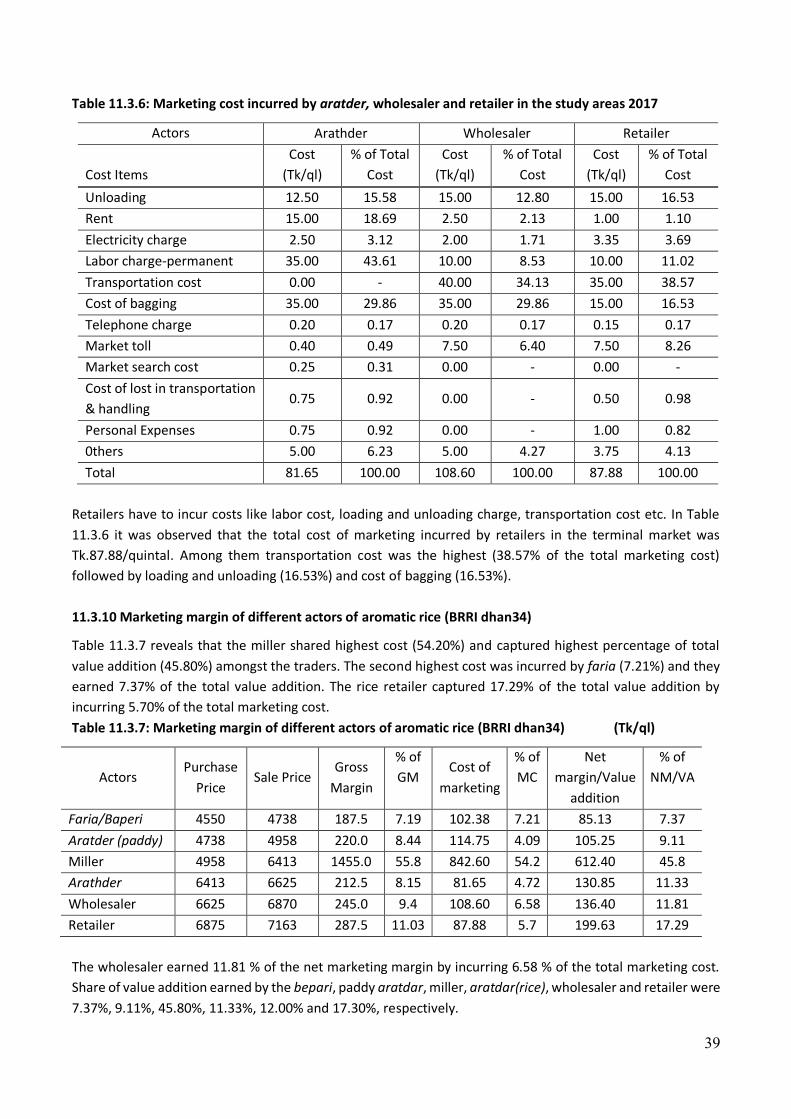
39
Table 11.3.6: Marketing cost incurred by aratder, wholesaler and retailer in the study areas 2017
Actors Arathder Wholesaler Retailer
Cost Items
Cost
(Tk/ql)
% of Total
Cost
Cost
(Tk/ql)
% of Total
Cost
Cost
(Tk/ql)
% of Total
Cost
Unloading 12.50 15.58 15.00 12.80 15.00 16.53
Rent 15.00 18.69 2.50 2.13 1.00 1.10
Electricity charge 2.50 3.12 2.00 1.71 3.35 3.69
Labor charge-permanent 35.00 43.61 10.00 8.53 10.00 11.02
Transportation cost 0.00 - 40.00 34.13 35.00 38.57
Cost of bagging 35.00 29.86 35.00 29.86 15.00 16.53
Telephone charge 0.20 0.17 0.20 0.17 0.15 0.17
Market toll 0.40 0.49 7.50 6.40 7.50 8.26
Market search cost 0.25 0.31 0.00 - 0.00 -
Cost of lost in transportation
& handling 0.75 0.92 0.00 - 0.50 0.98
Personal Expenses 0.75 0.92 0.00 - 1.00 0.82
0thers 5.00 6.23 5.00 4.27 3.75 4.13
Total 81.65 100.00 108.60 100.00 87.88 100.00
Retailers have to incur costs like labor cost, loading and unloading charge, transportation cost etc. In Table
11.3.6 it was observed that the total cost of marketing incurred by retailers in the terminal market was
Tk.87.88/quintal. Among them transportation cost was the highest (38.57% of the total marketing cost)
followed by loading and unloading (16.53%) and cost of bagging (16.53%).
11.3.10 Marketing margin of different actors of aromatic rice (BRRI dhan34)
Table 11.3.7 reveals that the miller shared highest cost (54.20%) and captured highest percentage of total
value addition (45.80%) amongst the traders. The second highest cost was incurred by faria (7.21%) and they
earned 7.37% of the total value addition. The rice retailer captured 17.29% of the total value addition by
incurring 5.70% of the total marketing cost.
Table 11.3.7: Marketing margin of different actors of aromatic rice (BRRI dhan34) (Tk/ql)
Actors Purchase
Price Sale Price
Gross
Margin
% of
GM Cost of
marketing
% of
MC
Net
margin/Value
addition
% of
NM/VA
Faria/Baperi 4550 4738 187.5 7.19 102.38 7.21 85.13 7.37
Aratder (paddy) 4738 4958 220.0 8.44 114.75 4.09 105.25 9.11
Miller 4958 6413 1455.0 55.8 842.60 54.2 612.40 45.8
Arathder 6413 6625 212.5 8.15 81.65 4.72 130.85 11.33
Wholesaler 6625 6870 245.0 9.4 108.60 6.58 136.40 11.81
Retailer 6875 7163 287.5 11.03 87.88 5.7 199.63 17.29
The wholesaler earned 11.81 % of the net marketing margin by incurring 6.58 % of the total marketing cost.
Share of value addition earned by the bepari, paddy aratdar, miller, aratdar(rice), wholesaler and retailer were
7.37%, 9.11%, 45.80%, 11.33%, 12.00% and 17.30%, respectively.

40
11.3.11 Producer share and farm retail price spread of aromatic rice (BRRI dhan34)
Producer sharers in consumers taka is the price received by the producer expressed as percentage of the retail
price (price paid by the consumer). For the aromatic rice (BRRI dhan34) producer share and farm retail price
spread were 67.03% and Tk. 2613 per quintal, respectively (table 11.3.8). High producers share was taken as
an evidence of increase the efficiency of the marketing system in favorer of the farmer, while low producer
share was taken as evidence of the fact that middlemen retained a large share.
Table 11.3.8: Producer share and farm retail price spread of aromatic rice (BRRI dhan34)
Items Tk/ql
Producer price 4550
Retail price 7163
Producer share (%) 67.03
Farm retail price spread 2613
11.3.12 Farm level constraints faced by the farmers
The constraints narrated by the respondents regarding production of aromatic rice are presented in table
11.3.9. Major constraints pertaining to cultivation of aromatic rice were high infestation of neck blast and
sheath rot diseases. Ninety five percent of the respondent farmers reported these as the most vulnerable
constraints. The other most exposed constraints were labor crisis on transplanting and harvesting period (85
percent), high price of pesticide and insecticide (80.66 per cent) etc. Lack of storage, rational price and capital
formation were the considerable constraints of aromatic rice production in the study areas.
Table 11.3.9: Production, marketing and institutional problems of farmers in the study areas
Source: Field Survey, 2017-2018
No. Description of the Problems Farmers opined (%)
A Production and Marketing aspect
1 Neck blast and sheath rot diseases 95.0
2 Labor crisis on transplanting and harvesting period 85.0
3 Lodging problems 83.0
4 High price of pesticide and insecticide 80.8
5 Problem of price setting 75.0
6 Problem of storage facilities 62.5
7 Lack of market 52.0
B Financial and Institutional aspect
1 Loan repayment problem 33.3
2 Lack of capital availability 45.8
3 Problems of credit facility 41.6
4 Transport problem 20.8
5 Lack of institutional support 37.5
6 Problem of theft 16.7
7 Problems of excess water (flooding) 8.3

41
11.3.13 Miller’s constraints
The major problems faced by the rice millers in the study areas were interruption in electricity supply (reported
by 96% respondents), high transportation costs (94%), high marketing costs (transportation costs plus others)
(72.7%), capital shortage and access to credit in due time (64.4%), price instability (65.40%), storage
unavailability (48.20%) etc. (Table 11.3.10).
Table 11.3.10: Stated problems commonly faced by the rice millers
Types of Problems Percent millers opined
Rice millers (N = 75)
Uncertainty in electricity supply 96.00
High transportation cost 94.00
High marketing costs 72.70
Capital shortage and access to credit in due time 64.40
Storage problem 48.20
Price instability 65.40
Milling problems 46.40
Illegal charges 56.40
Note: N = Total sample size by each category for Dinajpur. Source: Field Survey 2017-2018
11.3.14 Conclusion
Bangladesh produces several varieties of aromatic rice which command high prices in the country and also
believed to have export potential. In our domestic market about 75% aromatic rice were supplied by millers
and different companies and remaining 25% were exported in the foreign countries. This study found that on
an average costs of aromatic rice marketing for bepari, aratder(paddy), miller, aratder(rice), wholesaler and
retailers were Tk. 102.08, Tk. 114.75, Tk.842.60 Tk. 81.65, Tk.108.60, and Tk. 87.88 per quintal, respectively.
Share of net profit earned by the faria/bepari, paddy aratdar, miller, aratdar(rice), wholesaler and retailer
were 7.37%, 9.11%, 45.80%, 11.33%, 12.00% and 17.30%, respectively. Producer share and farm retail price
spread were 67.03% and Tk. 2613 per quintal, respectively. The present study identified some problems and
constraints associated with aromatic rice marketing. The unavailability of labor, pest (BPH) and disease (neck
blast and sheath rot diseases) infestation, high costs of inputs, high cost of labor, lodging problems were the
major constraints of producing aromatic rice in Bangladesh. Whereas lack of storage facilities, lack of
information, lack of regulated and co-operative market etc. were the constraints of aromatic rice marketing.
Proper planning and measures from the government side to solve the problems in the production and
marketing would encourage farmers for better production of aromatic rice in the country.
11.3.15 Suggestions
Rice production is highly labor intensive. As such, specific policies have to be developed by the
government for its availability during the peak period of crop production.
Disease (Blast & Sheath rot) and pest (BPH) resistant aromatic rice varieties should be introduced.
Marketing infrastructure and storage facilities should be developed.
Market regulatory authorities should address the issues of unfair deduction at the market places.

42
11.4 Value chain of Broken Rice in Bangladesh
11.4.1 Introduction:
One of the by-products of rice milling is broken rice. Broken rice has different uses such as feed for cattle
(dairy cow and beef cattle), poultry and as raw material of feed manufacturing mills. Sometimes it is also
used as food as the price is relatively lower and in some areas the hotels offer cooked broken rice with
pulse as breakfast item. Broken rice is being used to cook hotchpotch in street food shop as well. Therefore,
broken rice has significant economic value in the rice processing sector. The aim of this study also looked
into identifying the marketing scenario of broken rice in Bangladesh along with its supply chain.
11.4.2 Scenario of broken rice processing from automatic rice mill in Kushtia, Dinajpur and Naogaon
It was evident from table11.4.1 that, 75 auto rice mills processed 1960.00 thousand-ton raw rice in Kushtia,
Dinajpur and Naogaon districts during 2017, which produced 146.62 thousand-tons broken rice. On an average
conversion ratio of broken rice was 7.44%.
Table11.4.1: Scenario of broken rice processing from automatic rice mills in Kushtia, Dinajpur and Naogaon
districts in 2017
(000) ton/year
Districts No of mills
surveyed Types of Paddy Paddy Broken rice
Kushtia 25
Parboiled 533.81 37.37
Aromatic 72.79 8.01
Sub total 606.60 45.37
Dinajpur 25
Parboiled 562.85 39.40
Aromatic 76.75 8.44
Sub total 639.60 47.84
Naogaon 25
Parboiled 628.32 43.98
Aromatic 85.68 9.42
Sub total 714.00 53.41
Total 75 1960.20 146.62
% share 100% 7.44%
Source:2017-18 field survey
Supply chain of Broken Rice
On the basis of the importance given by the respondents during their selling of broken rice in the study areas,
the following supply chains were identified in case of broken rice marketing (Fig.11.4.1):
i. 𝑀𝑖𝑙𝑙𝑒𝑟 > 𝐴𝑟𝑎𝑡ℎ𝑑𝑒𝑟 > 𝑊ℎ𝑜𝑙𝑒𝑠𝑎𝑙𝑒𝑟 > 𝑅𝑒𝑡𝑎𝑖𝑙𝑒𝑟 > 𝐶𝑜𝑛𝑠𝑢𝑚𝑒𝑟
ii. 𝑅𝑖𝑐𝑒 𝑚𝑖𝑙𝑙𝑒𝑟 > 𝐵𝑟𝑜𝑘𝑒𝑛 𝑟𝑖𝑐𝑒 𝑝𝑎𝑟𝑡𝑦 > 𝐹𝑒𝑒𝑑 𝑖𝑛𝑑𝑢𝑠𝑡𝑟𝑦
iii. 𝑅𝑖𝑐𝑒 𝑚𝑖𝑙𝑙𝑒𝑟 > 𝑅𝑒𝑡𝑎𝑖𝑙𝑒𝑟 > 𝑅𝑢𝑟𝑎𝑙 𝑓𝑎𝑟𝑚𝑒𝑟

43
Fig: 11.4.1 Supply chain of broken rice in the study areas
11.4.3 Supply system of broken rice
Auto rice millers supplied 55% of broken rice in the feed industry with the help of the broken rice party. This
broken rice was used to produce feed for livestock, poultry and fisheries. Other than the feed industry, 10%
broken rice were used by the farmers as rural feed. About 35% broken rice was used for human consumption.
This amount has separate supply chain. The consumers get the broken rice from rice millers through a chain
of aratder, wholesaler and retailer.
11.4.4 Marketing cost incurred by Aratder, wholesaler and retailer for broken rice
Data in table 11.4.2 shows average costs per quintal of broken rice for Aratdar, wholesaler and retailer.
Aratders bears less cost as they are commission agents. They are not responsible for transportation and labor
costs in this case. As commission agent, the main costs of traders are salary of permanent staffs (31.50 %) and
rent of the premise (18.69%). The transaction cost of a quintal of broken rice calculated for aratdars is Tk.
73.49. The total marketing cost of wholesaler was Tk. 95.57 per quintal. The transportation cost was the
highest (34.13%) of total marketing cost, which was followed by cost of bagging (29.86%). On the other hand,
the total marketing cost of retailer was Tk. 75.57 per quintal, where, transportation cost was the highest
(30.10%), followed by cost of bagging (16.53 %).
Auto rice mill
Wholesaler
Broken rice party
Arathder
Arathder
Rural Market
Feed industry
Arathder
Retailer
Arathder
Consumer/Restaurant
Arathder
Rural Farmers (Dairy &
Poultry feed)
10%
10%
35% 55%
55% 35%
35%
35%
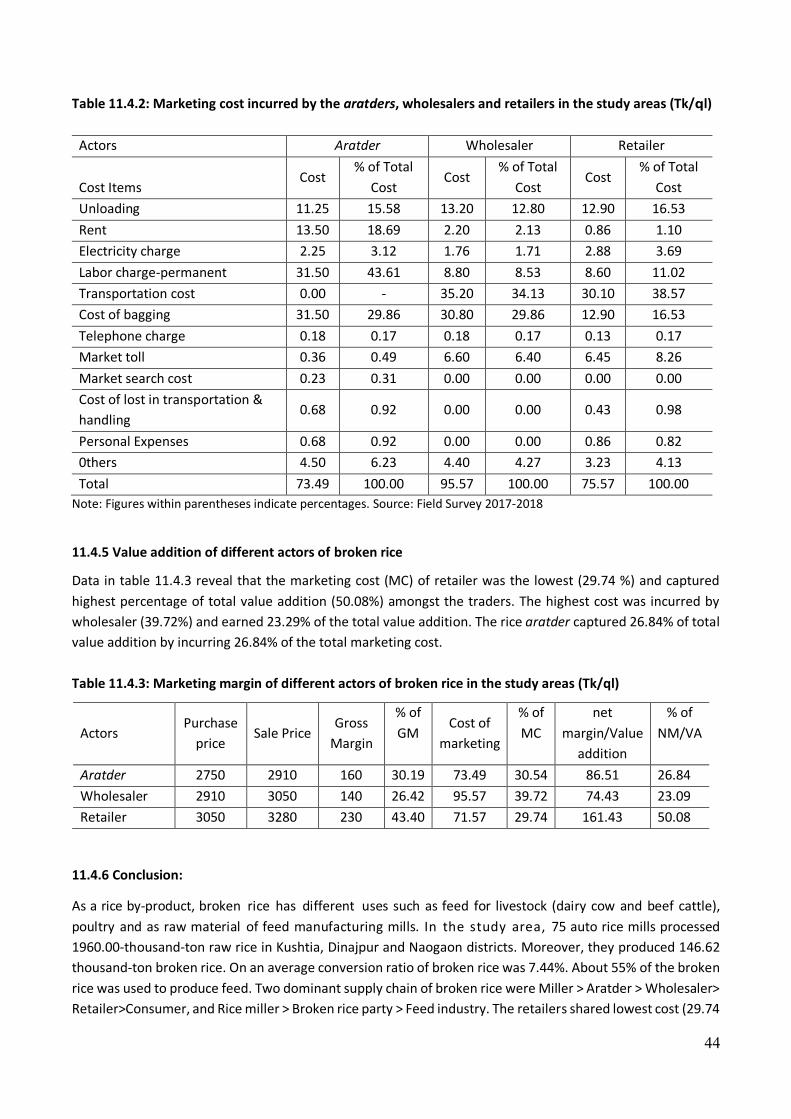
44
Table 11.4.2: Marketing cost incurred by the aratders, wholesalers and retailers in the study areas (Tk/ql)
Actors Aratder Wholesaler Retailer
Cost Items Cost
% of Total
Cost Cost
% of Total
Cost Cost
% of Total
Cost
Unloading 11.25 15.58 13.20 12.80 12.90 16.53
Rent 13.50 18.69 2.20 2.13 0.86 1.10
Electricity charge 2.25 3.12 1.76 1.71 2.88 3.69
Labor charge-permanent 31.50 43.61 8.80 8.53 8.60 11.02
Transportation cost 0.00 - 35.20 34.13 30.10 38.57
Cost of bagging 31.50 29.86 30.80 29.86 12.90 16.53
Telephone charge 0.18 0.17 0.18 0.17 0.13 0.17
Market toll 0.36 0.49 6.60 6.40 6.45 8.26
Market search cost 0.23 0.31 0.00 0.00 0.00 0.00
Cost of lost in transportation &
handling 0.68 0.92 0.00 0.00 0.43 0.98
Personal Expenses 0.68 0.92 0.00 0.00 0.86 0.82
0thers 4.50 6.23 4.40 4.27 3.23 4.13
Total 73.49 100.00 95.57 100.00 75.57 100.00
Note: Figures within parentheses indicate percentages. Source: Field Survey 2017-2018
11.4.5 Value addition of different actors of broken rice
Data in table 11.4.3 reveal that the marketing cost (MC) of retailer was the lowest (29.74 %) and captured
highest percentage of total value addition (50.08%) amongst the traders. The highest cost was incurred by
wholesaler (39.72%) and earned 23.29% of the total value addition. The rice aratder captured 26.84% of total
value addition by incurring 26.84% of the total marketing cost.
Table 11.4.3: Marketing margin of different actors of broken rice in the study areas (Tk/ql)
Actors Purchase
price Sale Price
Gross
Margin
% of
GM Cost of
marketing
% of
MC
net
margin/Value
addition
% of
NM/VA
Aratder 2750 2910 160 30.19 73.49 30.54 86.51 26.84
Wholesaler 2910 3050 140 26.42 95.57 39.72 74.43 23.09
Retailer 3050 3280 230 43.40 71.57 29.74 161.43 50.08
11.4.6 Conclusion:
As a rice by-product, broken rice has different uses such as feed for livestock (dairy cow and beef cattle),
poultry and as raw material of feed manufacturing mills. In the study area, 75 auto rice mills processed
1960.00-thousand-ton raw rice in Kushtia, Dinajpur and Naogaon districts. Moreover, they produced 146.62
thousand-ton broken rice. On an average conversion ratio of broken rice was 7.44%. About 55% of the broken
rice was used to produce feed. Two dominant supply chain of broken rice were Miller > Aratder > Wholesaler>
Retailer>Consumer, and Rice miller > Broken rice party > Feed industry. The retailers shared lowest cost (29.74

45
%) and captured highest percentage of total net profit (50.08%) amongst the traders. The highest cost was
incurred by wholesaler (39.72%) and earned 23.29 % of the total value addition. The aratder captured 26.84
% of total value addition by incurring 26.84 % of the total marketing cost.
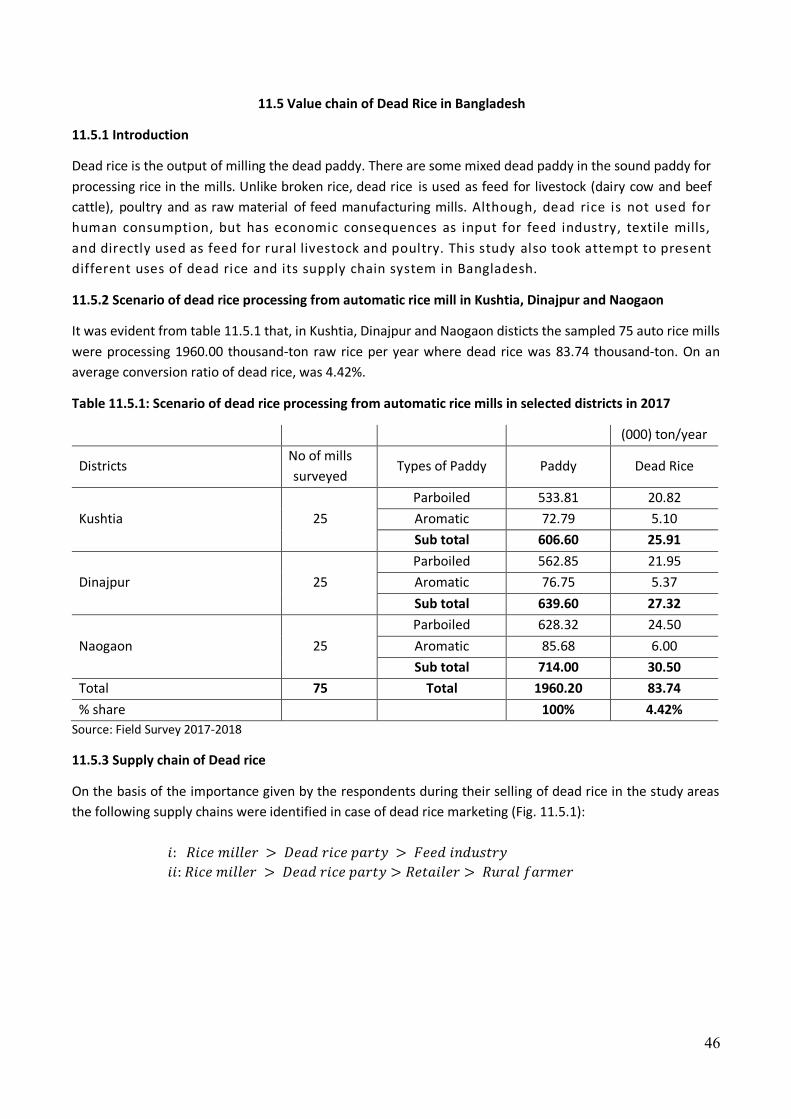
46
11.5 Value chain of Dead Rice in Bangladesh
11.5.1 Introduction
Dead rice is the output of milling the dead paddy. There are some mixed dead paddy in the sound paddy for
processing rice in the mills. Unlike broken rice, dead rice is used as feed for livestock (dairy cow and beef
cattle), poultry and as raw material of feed manufacturing mills. Although, dead rice is not used for
human consumption, but has economic consequences as input for feed industry, textile mills,
and directly used as feed for rural livestock and poultry. This study also took attempt to present
different uses of dead rice and its supply chain system in Bangladesh.
11.5.2 Scenario of dead rice processing from automatic rice mill in Kushtia, Dinajpur and Naogaon
It was evident from table 11.5.1 that, in Kushtia, Dinajpur and Naogaon disticts the sampled 75 auto rice mills
were processing 1960.00 thousand-ton raw rice per year where dead rice was 83.74 thousand-ton. On an
average conversion ratio of dead rice, was 4.42%.
Table 11.5.1: Scenario of dead rice processing from automatic rice mills in selected districts in 2017
(000) ton/year
Districts No of mills
surveyed Types of Paddy Paddy Dead Rice
Kushtia 25
Parboiled 533.81 20.82
Aromatic 72.79 5.10
Sub total 606.60 25.91
Dinajpur 25
Parboiled 562.85 21.95
Aromatic 76.75 5.37
Sub total 639.60 27.32
Naogaon 25
Parboiled 628.32 24.50
Aromatic 85.68 6.00
Sub total 714.00 30.50
Total 75 Total 1960.20 83.74
% share 100% 4.42%
Source: Field Survey 2017-2018
11.5.3 Supply chain of Dead rice
On the basis of the importance given by the respondents during their selling of dead rice in the study areas
the following supply chains were identified in case of dead rice marketing (Fig. 11.5.1):
𝑖: 𝑅𝑖𝑐𝑒 𝑚𝑖𝑙𝑙𝑒𝑟 > 𝐷𝑒𝑎𝑑 𝑟𝑖𝑐𝑒 𝑝𝑎𝑟𝑡𝑦 > 𝐹𝑒𝑒𝑑 𝑖𝑛𝑑𝑢𝑠𝑡𝑟𝑦
𝑖𝑖: 𝑅𝑖𝑐𝑒 𝑚𝑖𝑙𝑙𝑒𝑟 > 𝐷𝑒𝑎𝑑 𝑟𝑖𝑐𝑒 𝑝𝑎𝑟𝑡𝑦 > 𝑅𝑒𝑡𝑎𝑖𝑙𝑒𝑟 > 𝑅𝑢𝑟𝑎𝑙 𝑓𝑎𝑟𝑚𝑒𝑟

47
Fig: 11.5.1 Supply chain of Dead rice
11.5.4 Supply system of Dead rice in the domestic market
About 90% of dead rice was purchased by dead rice party from auto rice mills. After that dead rice party
supplied 55%, 25% and 10% dead rice in feed mill, Textile mill and Retailer, respectively. Remaining 10% was
supplied directly to the rural retailer to use as raw feed for the rural livestock and poultry.
11.5.5 Marketing cost of dead rice party and retailer
The average marketing cost of dead rice party and retailers are presented in the table 11.5.2. Dead rice party
have to incur costs like labor cost, loading and unloading charge, transportation cost etc. The total cost of
marketing incurred by dead rice party was Tk. 115.79 per quintal among them transportation cost was the
highest (43.82 % of the total marketing cost) followed by permanent labor charge (15.43%) and cost of bagging
(17.25%).
On the other hand, retailer have to incur costs like labor cost, loading and unloading charge, transportation
cost etc. The total cost of marketing incurred by retailer was Tk. 89.02 per quintal among them transportation
cost was the highest (37.36 % of the total marketing cost) followed by shop rent (12.94%) and cost of bagging
(11.12%).
Auto rice mill
Feed Industry
Dead rice Party Retailer
Textile mill
Arathder
Rural Farmers (Dairy &
Poultry feed)
10%
10%
55%
20%
25%
90%

48
Table 11.5.2 Marketing cost incurred by dead rice party and retailer (Tk/ql)
Actors Dead rice party Retailer
Cost Items Cost % of Total Cost Cost % of Total Cost
Loading & unloading 8.50 5.83 8.5 9.55
Rent 0.00 0.00 11.52 12.94
Electricity charge 0.00 0.00 3.25 3.65
Labor charge-permanent 12.50 15.43 7.52 8.45
Transportation cost 45.34 43.82 33.5 37.63
Cost of bagging 25.00 17.15 9.9 11.12
Telephone charge 2.05 1.41 2.25 2.53
Market toll 5.30 3.64 4.15 4.66
Market search cost 4.50 3.09 2.25 2.53
Cost of lost in transportation & handling 3.50 2.40 2.2 2.47
Personal Expenses 2.50 1.71 1.5 1.69
0thers 4.40 3.02 2.48 2.79
Total 115.79 100.00 89.02 100.00
Note: Figures within parentheses indicate percentages. Source: Field Survey 2017-2018
11.5.6 Marketing margin of different actors of dead rice
Data in table 11.5.3 represent that the dead rice party shared highest cost (57.09%) and captured highest
percentage of total value addition (58.08%) among the actors. The retailers received 42.92% of total net
marketing margin by incurring 42.91% of the total marketing cost.
Table 11.5.3: Marketing margin of different actors of dead rice (Tk/ql)
Actors Purchase
Price Sale Price
Gross
Margin
Cost of
marketing
% of
MC
Net margin/Value
addition
% of
NM
Dead rice party 2400 2650 250 115.79 57.09 104.21 58.08
Retailer 2650 2800 150 89.02 42.91 60.98 42.92
Source: Field Survey 2017-2018
11.5.7 Conclusion:
Dead rice has different uses such as feed for cattle (dairy cow and beef cattle), poultry and as raw material
of feed manufacturing mills. It is also used in the textile mills for processing fiber. The sampled 75
auto rice mills were processing 1960.00 thousand-ton raw rice in Kushtia, Dinajpur and Naogaon disticts in
2017 of which 83.74 thousand ton were dead rice. On an average conversion ratio of dead rice was 4.42%.
Dead rice party shared the highest cost (57.09%) and captured highest percentage of total net profit (58.08%).
The retailer captured 42.92% of total net marketing margin by incurring 42.91% of the total marketing cost.
Two dominant supply chain of dead rice were: Rice miller > Dead rice party > feed industry, and Rice miller
>Retailer> Rural farmer. About 90% of dead rice purchased by the dead rice party from auto rice mills. After
that dead rice party supplied 55%, 25% and 10% dead rice to the feed mills, Textile mills and Retailers,
respectively. Remaining 10% were supplied to the rural retailer as raw feed.

49
11.6 Value chain of Rice bran in Bangladesh
11.6.1 Introduction
One of the key by-products of rice milling is rice bran. Bran is a part of rice kernel obtained from milling.
Rice bran contains 20% extractible, but bran produced in commercial mills contains 13 to 18 % extractible.
Rice bran is the main raw material of rice bran oil mills. There are fourteen mills which are involved in
producing oil from rice bran in Bangladesh. In the rice milling process, first the outermost layer, the hull, is
removed to produce brown rice. This process is least damaging to the nutritional value of the rice and avoids
the unnecessary loss of nutrients that occurs with the further processing to produce white milled rice. Brown
rice would be considered whole grain. Normally, one hundred kilograms of paddy on milling yields 56 to 58 kg
white rice, 10 to 12 kg broken rice, 18 to 20 kg husk, and 10 to 12 kg rice bran. Rice bran, a byproduct of the
milling process, contains the enzyme lipase, which rapidly degrades the oil making the bran rancid and
inedible. In addition, a considerable portion of rice bran is also exported to other country that is earning
foreign currency. Stabilized rice bran (SRB) has an estimated shelf life of about six months and could
potentially be used as a food ingredient. Oil can be extracted from the bran and used as a healthful food
component. In each year, 63 to 76 million tons of rice bran (rice milling by-product) is produced in the world
and more than 90% of rice bran is sold cheaply as animal feed. The remainder is stabilized and could be used
as a value-added food product (…). Currently there are some markets for SRB as a horse-feed supplement. In
the United States, rice oil is being extracted from 15-20% of the rice bran. Parboiling, a steam treatment of
paddy, gelatinizes the starch beneath the bran layer of the rice kernel, and yields more white rice, less broken
rice, and higher fiber bran.
11.6.2 Scenario of rice bran processing from automatic rice mill in Kushtia, Dinajpur and Naogaon
It was evident from table 11.6.1 that, 75 auto rice mills processed 1960.00 thousand-ton raw rice in Kushtia,
Dinajpur and Naogaon disticts where millers were found rice bran 166.62 thousand ton. On an average
conversion ratio of rice bran was f8.56%.
Table 11.6.1 Rice bran processing from automatic rice mill in Kushtia, Dinajpur and Naogaon district in
2017
(000) ton/year
Districts
No of surveyed
mills Types of Paddy Paddy Bran
Kushtia 25
Parboiled 533.81 45.37
Aromatic 72.79 6.19
Sub total 606.60 51.56
Dinajpur 25
Parboiled 562.85 47.84
Aromatic 76.75 6.52
Sub total 639.60 54.37
Naogaon 25
Parboiled 628.32 53.41
Aromatic 85.68 7.28
Sub total 714.00 60.69
Total 75 Total 1960.20 166.62
% share 100% 8.56%
Source: Field Survey 2017-2018

50
11.6.3 Supply chain of rice bran
On the basis of the importance given by the respondents during their selling of rice bran in the study areas the
following supply chains were identified in case of rice bran marketing (Fig. 11.6.1).:
𝑖: 𝑅𝑖𝑐𝑒 𝑚𝑖𝑙𝑙𝑒𝑟 > 𝐵𝑟𝑎𝑛 𝑝𝑎𝑟𝑡𝑦 > 𝑅𝑖𝑐𝑒 𝑏𝑟𝑎𝑛 𝑜𝑖𝑙 𝑚𝑖𝑙𝑙
𝑖𝑖: 𝑅𝑖𝑐𝑒 𝑚𝑖𝑙𝑙𝑒𝑟 > 𝐵𝑟𝑎𝑛 𝑝𝑎𝑟𝑡𝑦 > 𝐹𝑒𝑒𝑑 𝑖𝑛𝑑𝑢𝑠𝑡𝑟𝑦
𝑖𝑖𝑖: 𝑅𝑖𝑐𝑒 𝑚𝑖𝑙𝑙𝑒𝑟 > 𝑅𝑒𝑡𝑎𝑖𝑙𝑒𝑟 > 𝑅𝑢𝑟𝑎𝑙 𝑓𝑎𝑟𝑚𝑒𝑟
𝑖𝑣: 𝑅𝑖𝑐𝑒 𝑚𝑖𝑙𝑙𝑒𝑟 > 𝑅𝑢𝑟𝑎𝑙 𝑓𝑎𝑟𝑚𝑒𝑟
Fig: 11.6.1 Supply chain of rice bran
11.6.4 Supply system of rice bran
From this supply chain of rice bran, about 90% rice bran were supplied by the millers with the help of bran
party. After that, rice bran party supplied about 65% best qualitative rice bran in the rice bran oil mill to
produce the bran oil. Remaining 25% of bran were supplied by bran party in the feed industry. On the other
hand, auto rice millers supplied remaining 10% of rice bran to the rural farmer through the rice bran retailers
as raw feed for fishery, livestock and poultry.
11.6.5 Marketing cost of Bran party and retailer
The average marketing cost incurred by the rice bran party and retailers are presented table 11.6.2. Rice bran
party have to incur costs like labor cost, loading and unloading charge, transportation cost etc. The total cost
of marketing incurred by bran party was Tk. 145.79 per quintal out of which them transportation cost was the
Auto rice mill
90%
25% 65%
10%
10%

51
highest (44.82% of the total marketing cost) followed by permanent labor charge (15.43%) and cost of bagging
(17.15%).
On the other hand, retailer have to incur costs like labor cost, loading and unloading charge, transportation
cost etc. In Table11.6.2 it was observed that the total cost of marketing incurred by retailer was Tk. 89.02 per
quintal out of which transportation cost was the highest (37.36 % of the total marketing cost) followed by
shop rent (12.94%) and cost of bagging (11.12%).
Table11.6.2: Marketing cost of rice bran party and retailers in the study areas (Tk/ql)
Actors Bran party Retailer
Cost Items Cost % of Total Cost Cost % of Total Cost
Loading & unloading 8.50 5.83 8.5 9.55
Rent 0.00 0.00 11.52 12.94
Electricity charge 0.00 1.51 3.25 3.65
Labor charge-permanent 22.50 15.43 7.52 8.45
Transportation cost 65.34 44.82 33.5 37.63
Cost of bagging 25.00 17.15 9.9 11.12
Telephone charge 2.05 1.41 2.25 2.53
Market toll 5.30 3.64 4.15 4.66
Market search cost 4.50 3.09 2.25 2.53
Cost of lost in transportation & handling 3.50 2.40 2.2 2.47
Personal Expenses 2.50 1.71 1.5 1.69
Others 4.40 3.02 2.48 2.79
Total 145.79 100.00 89.02 100.00
Source: Field Survey 2017-2018
11.6.6 Marketing margin of different actors of rice bran
It was evident from the analysis that the bran party shared the highest cost (62.09%) and captured highest
percentage of total value addition (63.08%) among the actors (Table 11.6.3). The bran retailer captured
36.92% of the total value addition by incurring 37.91% of the total marketing cost.
Table 11.6.3: Marketing cost and margin of different actors of rice bran (Tk/ql)
Actors Purchase
Price Sale Price
Gross
Margin
Cost of
marketing
% of
MC
Net
margin/Value
addition
% of
NM/VA
Barn party 2600 2850 250 145.79 62.09 104.21 63.08
Retailer 2850 3000 150 89.02 37.91 60.98 36.92
Source: Field Survey 2017-2018.

52
Fig: 11.6.2 Purchase and sales price of rice bran at bran party and retailer level
Fig: 11.6.3 Gross margin, marketing cost and net margin of rice bran at bran party and retailer level
11.6.7 Conclusion:
Bran is a part of rice kernel obtained from milling. Polish rice contains 0.3% fat whereas brown rice contains
2.2% fat on a moisture free basis. Rice bran contains 20% extractible, but bran produced in commercial
mills contains 13 to 18% extractible. Rice bran is the main raw material of rice bran oil producing mills.
The sampled 75 auto rice mills processed 1960.00 thousand tons raw rice in Kushtia, Dinajpur and Naogaon
disticts from which millers found 166.62 thousand-ton rice bran. On an average conversion ratio of rice bran
was found 8.56%. About 90% rice bran were supplied by millers with the help of bran party. After that bran
party supplied about 65% best qualitative rice bran in the rice bran oil mill to produce bran oil. Remaining 25%
bran were supplied by bran party in the feed industry. On the other hand, millers supplied 10% bran to the
rural farmer as raw feed for fisheries, livestock and poultry. The bran party shared highest cost (62.09%) and
2700
28672867
3000
Purchase Price Sale Price
Tk./
ql
Barn party Retailer
Gross Margin Cost of marketing Profit or net margin
167
71.85
95.15
133
5875
Tk./
ql
Barn party Retailer

53
obtained the highest percent of total net profit (63.08%) among the actors. The bran retailer captured 36.92%
of total net marketing margin by incurring 37.91% of the total marketing cost.
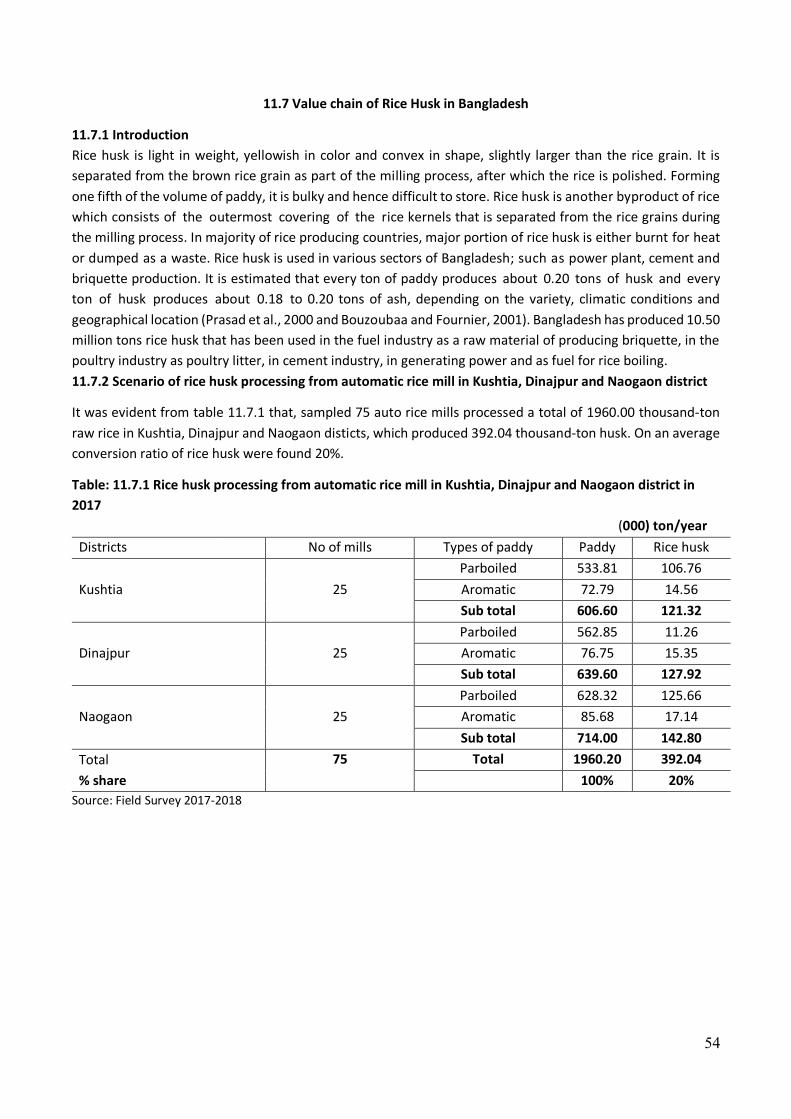
54
11.7 Value chain of Rice Husk in Bangladesh
11.7.1 Introduction
Rice husk is light in weight, yellowish in color and convex in shape, slightly larger than the rice grain. It is
separated from the brown rice grain as part of the milling process, after which the rice is polished. Forming
one fifth of the volume of paddy, it is bulky and hence difficult to store. Rice husk is another byproduct of rice
which consists of the outermost covering of the rice kernels that is separated from the rice grains during
the milling process. In majority of rice producing countries, major portion of rice husk is either burnt for heat
or dumped as a waste. Rice husk is used in various sectors of Bangladesh; such as power plant, cement and
briquette production. It is estimated that every ton of paddy produces about 0.20 tons of husk and every
ton of husk produces about 0.18 to 0.20 tons of ash, depending on the variety, climatic conditions and
geographical location (Prasad et al., 2000 and Bouzoubaa and Fournier, 2001). Bangladesh has produced 10.50
million tons rice husk that has been used in the fuel industry as a raw material of producing briquette, in the
poultry industry as poultry litter, in cement industry, in generating power and as fuel for rice boiling.
11.7.2 Scenario of rice husk processing from automatic rice mill in Kushtia, Dinajpur and Naogaon district
It was evident from table 11.7.1 that, sampled 75 auto rice mills processed a total of 1960.00 thousand-ton
raw rice in Kushtia, Dinajpur and Naogaon disticts, which produced 392.04 thousand-ton husk. On an average
conversion ratio of rice husk were found 20%.
Table: 11.7.1 Rice husk processing from automatic rice mill in Kushtia, Dinajpur and Naogaon district in
2017
(000) ton/year
Districts No of mills Types of paddy Paddy Rice husk
Kushtia 25
Parboiled 533.81 106.76
Aromatic 72.79 14.56
Sub total 606.60 121.32
Dinajpur 25
Parboiled 562.85 11.26
Aromatic 76.75 15.35
Sub total 639.60 127.92
Naogaon 25
Parboiled 628.32 125.66
Aromatic 85.68 17.14
Sub total 714.00 142.80
Total
% share
75 Total 1960.20 392.04
100% 20%
Source: Field Survey 2017-2018

55
11.7.3 Supply system of rice husk in the Kushtia, Dinajpur and Naogaon district
Fig: 11.7.1 Supply chain of Rice Husk
On the basis of the importance given by the respondents during their selling of rice husk in the study areas the
following supply chains were identified in case of rice husk marketing (Fig. 11.7.1).
𝑖: 𝑅𝑖𝑐𝑒 𝑚𝑖𝑙𝑙𝑒𝑟 > 𝐻𝑢𝑠𝑘 𝑝𝑎𝑟𝑡𝑦 > 𝐵𝑟𝑖𝑞𝑢𝑒𝑡𝑡𝑒𝑠 𝐹𝑎𝑐𝑡𝑜𝑟𝑦
𝑖𝑖: 𝑅𝑖𝑐𝑒 𝑚𝑖𝑙𝑙𝑒𝑟 > 𝑂𝑤𝑛 𝑐𝑜𝑛𝑠𝑢𝑚𝑝𝑡𝑖𝑜𝑛
𝑖𝑣: 𝑅𝑖𝑐𝑒 𝑚𝑖𝑙𝑙𝑒𝑟 > 𝑅𝑢𝑟𝑎𝑙 𝑓𝑎𝑟𝑚𝑒𝑟
11.7.4 Supply system of rice husk in Bangladesh
Analysis further indicated that, about 40% of rice husk were used in parboiling purposes of the rice mills. About
5% rural farmer purchased rice husk directly from the rice mill to use in the dairy and poultry purposes. On
the other hand, remaining 55% rice husk was purchased by husk party from the mills and sold it in the
Briquettes factory to produce the Briquettes.
11.7.5 Marketing cost of Husk party
The level of average marketing cost of husk party has been presented in table 11.7.2. Husk party had to incur
costs like labor cost, loading and unloading charge, cost of bagging, transportation cost etc. In Table 11.7.2 it
was observed that the total marketing cost of husk party was Tk.112.47/ql out of which transportation cost
was the highest (40.01% of the total marketing cost) followed by cost of bagging (27.39%) and permanent
labor charge (16.00%).
Auto rice mill
Husk Party
Rural Farmer
Boiler purpose in mill
Briquette factory
5% 55% 40%
55%

56
Table 11.7.2: Marketing cost incurred by rice husk party in the study areas (Tk/ql)
Actors Rice husk party
Cost Items Cost % of Total Cost
Loading & unloading 10 8.89
Electricity charge 2.2 1.96
Labor charge-permanent 18 16.00
Transportation cost 45 40.01
Cost of bagging 30.8 27.39
Telephone charge 0.18 0.16
Market toll 0.35 0.31
Market search cost 0.22 0.20
Cost of lost in transportation & handling 0.66 0.59
Personal Expenses 0.66 0.59
0thers 4.4 3.91
Total 112.47 100.00
11.7.6 Marketing margin of different actors of rice husk
Data in table 11.7.3 reveal that the husk party bear 47.32% cost and captured highest percentage of total net
profit (52.92%). In husk marketing system, husk party is the single actor.
Table:11.7.3 Marketing margin of different actors of rice husk (Tk/ql)
Actors Purchase
Price Sale Price
Gross
Margin
Cost of
marketing
% of
MC
Net
margin/Value
addition
% of
NM
Husk party 1050 1280 230 112.47 47.32 117.53 52.92
11.7.7 Conclusion
Rice husk is another byproduct of rice which consists of the outermost covering of the rice kernels that is
separated from the rice grains during the milling process. The husk party bear 47.32% cost and received
highest percent of total net profit (52.92%). In husk marketing system, husk party is the single actor. About
40% of rice husk were used in parboiling purposes of the rice mill. About 5% rural farmer purchased rice husk
directly from the rice mill to use in the dairy and poultry purposes. On the other hand, remaining 55% rice
husk were used in the Briquettes factory to produce the Briquettes. Two dominant supply chain of rice husk
were Rice miller > Husk party > Briquettes Factory and Rice miller > Rural farmer. Among this chain 60% husk
were supplied in the market.

57
11.8 Value Chain Analysis of Rice Bran Oil in Bangladesh
11.8.1 Introduction
Rice bran, an important byproduct of rice milling process is brown outer layer of rice kernel mainly
comprised of pericarp, aleurone, subaleurone layer and germ. It contains appreciable amount of nutrients like
protein, fat and dietary fiber (Singh et, al. 2013). The most useful by-products of rice milling industry is
undoubtedly the rice bran which has an immense importance to the rice mills as it is used for producing fat-
free edible oil and also as a raw material of solvent plant. Rice bran oil has a very good market value, which
can substantially increase the profitability of rice mills. The Rice Bran Oil is a new, infant and potential sector
in Bangladesh. This sector started its journey in our country since 2009. Currently there are fifteen industries
producing the Rice Bran Oil in the Country. Rice bran oil (RBO) has garnered attention from consumers in
recent years, owing to its high concentrations of health promoting compounds, ranging from tocopherols to
phytocotrienols, phytosterols and ʏ-goryzanol. Tocopherols and tocotrienolsare lipid antioxidants that
collectively constitute vitamin E and are found in rice bran oil (Sen et. al, 2006, Bakuta et. al, 2013). It also can
help to lower cholesterol level, fight against diseases, and enhance the immune system. The nutritional
qualities and health effects of rice bran oil are also established and are considered rich in unsaponifiable
fraction (unsap). Rice bran oil which is extremely light, versatile and delicious is popular in several countries
like Japan, India, Korea, China and Indonesia as edible oil. The demand for rice bran oil is increasing in
Bangladesh due to its nutritional as well as beneficial impact to human health. Consumers are now a days,
using rice bran oil as cooking oil side by side soybean oil and its production and marketing is increasing in
Bangladesh. Many investors are showing enthusiasm to invest in this sector. Bangladesh Tariff Commission
(BTC) in a study showed that per day per capita consumption of edible oil in Bangladesh is about 26.57 gm
(BTC, 2014). However, the total demand for edible oil in Bangladesh is about 1.44 million tons of which 2-2.5%
is coming from rice bran oil. At present, daily production of rice bran oil is about 250-300 tons in Bangladesh
and its demand is increasing by 5-10% per year (BBS, 2013). The present study also attempted to explore the
prospect and potentiality of this sector in the economy of Bangladesh.
11.8.2 Production capacity and actual production of rice bran oil mills in the year of 2016 and 2017
Data in table 11.8.1 showed the production capacity, actual production and capacity utilization of rice bran oil.
During the period of 2016, fourteen rice bran oil mills produced 154,020 of tons rice bran oil where 67% of
production capacity were utilized by these mills. Among the rice bran oil mills, highest amount (31160 tons)
was produced by Mazumder Products Ltd where 64.92% production capacity were utilized. Besides, in the
same year lowest amount of oil was produced by Krishani Rice Bran oil mill (7540 tons), where 50.27%
production capacity were utilized.

58
Table 11.8.1: Capacity utilization and actual production of rice bran oil mill (ton/year)
SL Rice bran oil mills Production
Capacity
2016 2017
Actual
production
%
capacity
utilization
Actual
production
%
capacity
utilization
1 KBC Agro Products Pvt. Ltd. 30000 17500 58.33 18000 60.00
2 Rashid Oil Mills Ltd 18000 13040 72.44 13740 76.33
3 Emerald Oil Industries Ltd. 18000 0 0.00 0 0.00
4 Mazumder Products Ltd. 48000 31160 64.92 31960 66.58
5 Green Oil & Poultry Feed
Ind.
15000 8550 57.00 9070 60.47
6 Ali Natural Oil Mills & Ind.
Ltd.
18000 10160 56.44 10760 59.78
7 Mazumder Bran Oil Mills Ltd 18000 9520 52.89 10020 55.67
8 Al Noor Oil Company Ltd. 15000 8150 54.33 8800 58.67
9 Weaster Agro Ltd. 15000 9750 65.00 10250 68.33
10 Jamuna Agro Products Ltd. 15000 8850 59.00 9370 62.47
11 Agrotech International 12000 8520 71.00 8970 74.75
12 Tamim Agro Ind. Ltd. 15000 9000 60.00 9420 62.80
13 Abdul Monem oil mill Ltd. 21000 12280 58.48 12800 60.95
14 Krishani Rice Bran Oil Mill 15000 7540 50.27 7960 53.07
15 Prodhan Oil Mill 15000 0 0.00 7420 49.47 Total 258,000 154,020 59.70 168,540 65.33
Source: Feld survey 2017
During the period of 2017, fourteen rice bran oil mills actually produced 168,540 tons of rice bran oil where
65.33% production capacity were utilized. Among the rice bran oil mills, highest amount (31960 tons) were
produced by Mazumder Products Ltd where 65.33% production capacity were utilized. Besides, in the same
year lowest amount of RBO was produced by Prodhan Oil Mill (7540 tons) where 49.47% production capacity
were utilized. Prodhan Oil Mill started its activities current year and only 08 months ran during survey periods.
Fig: 11.8.1 Production capacity and actual production of rice bran oil in 2016
0
10000
20000
30000
40000
50000
Ton
/yea
r
Capacity (ton/Yr.) Actual Production (ton/Yr)

59
Fig: 11.8.2 Production capacity and actual production of rice bran oil in 2017
11.8.3 Availability of rice bran and bran oil in Bangladesh
One of the important byproducts of rice milling process is rice bran which is used for production of rice bran
oil. Availability of rice bran depends on the supply of paddy. In Bangladesh, maximum rice mills are husking
type and most of the paddy is being processed into these types of mills, where quality and quantity of products
always not remain usual. Rice bran from such kind of husking mills could not produce maximum quantity and
better quality of bran oil. The quality of rice bran from semi auto and automatic rice mills are better than that
of normal husking mills in terms of oil extraction and quality. As the rice bran from semi auto and automatic
mills contained good quality and higher amount of oil, all of the husking type rice mills in our country should
be converted into semi auto and automatic mills to get maximum and better quality of bran for producing
RBO. Table 11.8.2 showed the availability of rice bran and bran oil in Bangladesh since 2009/10 to 2014/15. It
revealed that from 2009/10 to 2016/17 production of rice was almost static, so the availability of rice bran
was also more or less static, as there is a direct relationship between supply of paddy and rice bran. In 2005,
there were only 200 semi-automatic and automatic rice mills but now (2015) the figure is almost tripled (600).
So, it can be noted that if all the rice mills were to be converted into auto and semi-automatic mills, then there
is possibilities to obtain around 4.46 million tons of rice bran and would produce about 0.92 million tons of
rice bran oil (RBO) which is half of the total demand of domestic edible oil.
0
5000
10000
15000
20000
25000
30000
35000
40000
45000
50000
Ton
/yea
r
Capacity (ton/yr.) Actual Production (ton/yr.)
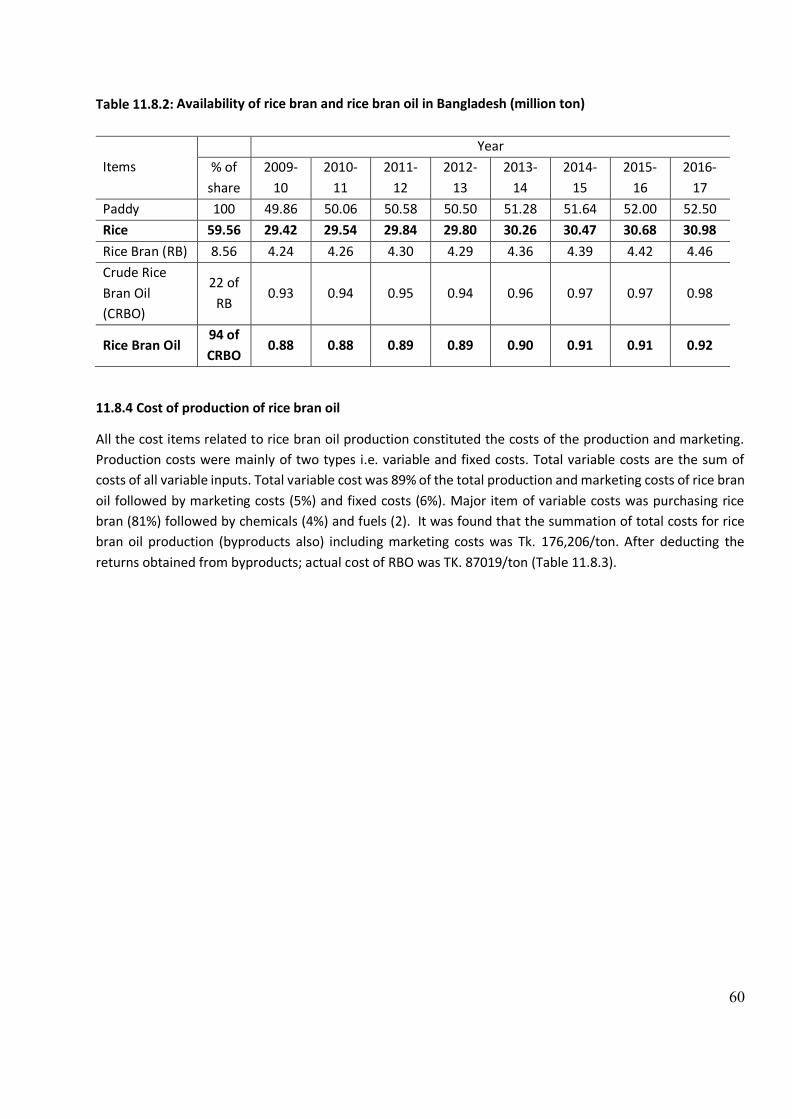
60
Table 11.8.2: Availability of rice bran and rice bran oil in Bangladesh (million ton)
Items
Year
% of
share
2009-
10
2010-
11
2011-
12
2012-
13
2013-
14
2014-
15
2015-
16
2016-
17
Paddy 100 49.86 50.06 50.58 50.50 51.28 51.64 52.00 52.50
Rice 59.56 29.42 29.54 29.84 29.80 30.26 30.47 30.68 30.98
Rice Bran (RB) 8.56 4.24 4.26 4.30 4.29 4.36 4.39 4.42 4.46
Crude Rice
Bran Oil
(CRBO)
22 of
RB 0.93 0.94 0.95 0.94 0.96 0.97 0.97 0.98
Rice Bran Oil 94 of
CRBO 0.88 0.88 0.89 0.89 0.90 0.91 0.91 0.92
11.8.4 Cost of production of rice bran oil
All the cost items related to rice bran oil production constituted the costs of the production and marketing.
Production costs were mainly of two types i.e. variable and fixed costs. Total variable costs are the sum of
costs of all variable inputs. Total variable cost was 89% of the total production and marketing costs of rice bran
oil followed by marketing costs (5%) and fixed costs (6%). Major item of variable costs was purchasing rice
bran (81%) followed by chemicals (4%) and fuels (2). It was found that the summation of total costs for rice
bran oil production (byproducts also) including marketing costs was Tk. 176,206/ton. After deducting the
returns obtained from byproducts; actual cost of RBO was TK. 87019/ton (Table 11.8.3).

61
Tables 11.8.3: Costs of bran oil production (Tk/ton)
Items Amount
(Tk.)
(% of total
production)
A. Total variable cost (Tk./ton) 156,375 88.746
a) Rice bran* 143,000 81.155
b) Chemicals* 7,202 4.087
c) Labors 740 0.420
d) Gas bill 3,600 2.043
e) Electricity 38 0.022
f) Lubricant 29 0.016
g) Income tax 100 0.057
h) Repair and maintenance 1,667 0.946
B. Total fixed cost (Tk./ton): 10,801 6.135
a) Opportunity cost of land 8 0.005
b) Staff salary 4,583 2.601
c) Depreciation of building 2 0.001
d) Depreciation of machines 92 0.052
e) Interest on investment for building 1,513 0.859
f) Interest on investment for machines 1,361 0.772
g) Tax 210 0.119
h) Insurance 38 0.022
Administrative cost* 2,994 1.699
C. Marketing Cost (Tk./ton) * 9,029 5.124
D. Total costs (A+B+C) 176,206 100
E. Returns from by-products (Tk./ton RBO production) * 89,187 50.615
F. Cost of production of rice bran oil (D - E) 87,019
G. Per Kg costs of production of rice bran oil 87.02
Source: field survey 2017. * Details are in Appendices. Appendix A-1 presents requirements of rice bran and chemicals
inputs, and their costs for per ton rice bran oil production. Appendix A-2 and A-3 detailing out the item wise administrative
and marketing costs of bran oil production. Finally, Appendix 4 shows the returns from the byproducts of rice bran oil
production process.
11.8.5 Byproducts of rice bran oil
During the rice bran oil production, it produces some other byproducts; like De-Oiled Rice Bran (DORB), wax,
Free Fatty Acid (FFA) and gum, etc. Some revenues are generated from these byproducts. Analysis revealed
that total byproducts revenue was Tk. 89187.00, where Tk. 81120 was for DORB, Tk. 550 was for wax, Tk. 6845
was for FFA and Tk. 672 was for gam, respectively (Appendix A- 4).
11.8.6 Production and marketing costs of RBO
Table 11.8.4 represents item wise production, and marketing cost of rice bran oil. Total production cost was
Tk. 87018.58/ton, it was the sum of production and marketing cost in the mill. Total production cost of per kg
RBO in the mill was Tk. 87.01.

62
Table 11.8.4: Total Production and marketing cost of RBO in the mill after deducting the returns of by
products
Items Tk/ton Tk/kg
Production cost 77989.91 77.98
Marketing cost 9028.67 9.03
Total cost of rice bran oil in mill gate 87018.59 87.02
Source: Feld survey 2017
Fig: 11.8.3Total production cost of per kg RBO in the mill after deducting of returns of by products
11.8.7 Disposal pattern of rice bran oil in domestic and foreign market
From table 11.8.5 it was found that during the period of 2017, fourteen rice bran oil mills produced a total of
168,540 tons rice bran oil in our country where 64.04 % (107940 tons) were supplied in the domestic market
and 35.96% (60600.00 tons) were exported to the foreign countries (specially India, China and Japan).
77.98
9.03
87.02
Production cost Marketing cost Total cost of rice bran oil inmill
Tk./k
g
Cost items

63
Table 11.8.5 Disposal patterns of rice bran oil in domestic and foreign market in 2017
Rice Bran oil Industries Actual
production
Supplied
in
domestic
market
(ton)
% of
Domestic
market
Supplied to
foreign
market
(ton)
% of
Foreign
market
Exporting
country
1 KBC Agro Products
Pvt. Ltd. 18000 18000 100.00 0.00 0.00
2 Rashid Oil Mills Ltd 13740 13740 100.00 0.00 0.00
3 Emerald Oil Industries
Ltd. 0 0 0.00 0.00 0.00
4 Mazumder Products
Ltd. 31960 10960 34.29 21000.00 65.71 India
5 Green Oil & Poultry
Feed Ind. 9070 9070 100.00 0.00 0.00
6 Ali Natural Oil Mills &
Ind. Ltd. 10760 10760 100.00 0.00 0.00
7 Mazumder Bran Oil
Mills Ltd 10020 3020 30.14 7000.00 69.86 India
8 Al Noor Oil Company
Ltd. 8800 4200 47.73 4600.00 52.27 India
9 Weaster Agro Ltd. 10250 6250 60.98 4000.00 39.02 India
10 Jamuna Agro Products
Ltd. 9370 9370 100.00 0.00 0.00
11 Agrotech International 8970 2970 33.11 6000.00 66.89 China &
Japan
12 Tamim Agro Ind. Ltd. 9420 4420 46.92 5000.00 53.08 India
13 Abdul Monem oil mill
Ltd. 12800 3800 29.69 9000.00 70.31 Thailand
14 Krishani Rice Bran Oil
Mill 7960 7960 100.00 0.00 0.00
15 Prodhan Oil Mill 7420 3420 46.09 4000.00 53.91 India Total 168,540 107940 64.04 60600.00 35.96
Source: Feld survey 2017
Among the mills, Rashid Oil Mills, Green Oil & Poultry Feed Ind, Ali Natural Oil Mills & Ind. Ltd., Jamuna Agro
Products Ltd., And Krishani Rice Bran Oil Mill Ltd supplied their total production to the domestic market. On
the other hand, Mazumder Products Ltd., Al Noor Oil Company Ltd., Mazumder Bran Oil Mills Ltd., Agrotech
International, Tamim Agro Ind. Ltd., Abdul Monem, and Prodhan Oil Mill exported 65.71%, 52.27%, 69.86%,
66.89%, 53.08%, 70.31% and 53.91% of their total production, respectively to the foreign countries.

64
Fig: 11.8.4 Supply of rice bran oil in domestic and foreign market
11.8.8 Supply system of rice bran oil in domestic market
In our country rice bran oil mills supplied their product in two ways. One way was rice bran oil miller sold their
product by their own with the help of their dealer and retailer in our domestic market with their own brand
name. In our national market currently these types of (White gold, Sorna, Kollani, Pure gold, Puriva, Dhani and
Krisani) branded rice bran oil were supplied by the rice bran oil mills with the help of their dealers and retailers.
Another way is; different company such as Pran, ACI, Pusti and Aristocrat collected bulky refined rice bran oil
from different rice bran oil mills. After collection of bulky rice bran Oil, Companies have done some kind of
activities such as processing, packaging, Leveling and marketing etc. After that, company (Pran, ACI, Aristrocate
and Pusti) sold these oil in our domestic market by their own brand name (Pran rice bran oil,ACI rice bran oil,
Aristrocate rice bran oil). Company supplied these oils in our domestic market with the help of their dealer
and retailer.
11.8.9 Actors involved in rice bran oil value chain
Actors are the main players of the value chain. The Rice Bran Oil value chain consists of the different actors
like producer, Company (Pran, ACI and Pusti and Aristrocate), dealer/wholesaler, retailer, and consumer. The
value chain below shows the flow chart of product distribution.
11.8.10 Value chain of rice bran oil
The value chain describes the full range of activities required to bring a product or service from conception,
through the different phases of production and delivery to final consumers (Porter, 1980; Kapilinsky and
Morris, 2000). Economic value chain analysis describes the range of activities required to bring a product to
the final consumer and, in the case of international products, the extent to which intermediaries/agents gain
from participating in the chain (Jacinto, 2004). The following value chains were identified in case of rice bran
oil marketing (Fig.11.8.5).
𝑽𝒂𝒍𝒖𝒆 𝒄𝒉𝒂𝒊𝒏 − 𝒊: 𝑅𝑖𝑐𝑒 𝐵𝑟𝑎𝑛 𝑂𝑖𝑙 𝑀𝑖𝑙𝑙𝑒𝑟 > 𝐷𝑒𝑎𝑙𝑒𝑟 > 𝑅𝑒𝑡𝑎𝑖𝑙𝑒𝑟 > 𝐶𝑜𝑛𝑠𝑢𝑚𝑒𝑟
Domestic Market64%
Foreign Market36%
Domestic Market Foreign Market

65
𝑽𝒂𝒍𝒖𝒆 𝒄𝒉𝒂𝒊𝒏 − 𝒊𝒊: 𝑅𝑖𝑐𝑒 𝐵𝑟𝑎𝑛 𝑂𝑖𝑙 𝑀𝑖𝑙𝑙𝑒𝑟 > 𝑪𝒐𝒎𝒑𝒂𝒏𝒚 (𝑷𝒓𝒂𝒏, 𝑷𝒖𝒔𝒕𝒊, 𝑨𝑪𝑰, 𝑨𝒓𝒊𝒔𝒕𝒓𝒄𝒂𝒕𝒆 > 𝐷𝑒𝑎𝑙𝑒𝑟
> 𝑅𝑒𝑡𝑎𝑖𝑙𝑒𝑟 > 𝐶𝑜𝑛𝑠𝑢𝑚𝑒𝑟
𝑽𝒂𝒍𝒖𝒆 𝒄𝒉𝒂𝒊𝒏 − 𝒊𝒊𝒊: 𝑅𝑖𝑐𝑒 𝐵𝑟𝑎𝑛 𝑂𝑖𝑙 𝑀𝑖𝑙𝑙𝑒𝑟 > 𝐸𝑥𝑝𝑜𝑟𝑡𝑒𝑟 > 𝐹𝑜𝑟𝑒𝑖𝑔𝑛 𝑐𝑜𝑢𝑛𝑡𝑟𝑦
𝑽𝒂𝒍𝒖𝒆 𝒄𝒉𝒂𝒊𝒏 − 𝒊𝒗: 𝑅𝑖𝑐𝑒 𝐵𝑟𝑎𝑛 𝑂𝑖𝑙 𝑀𝑖𝑙𝑙𝑒𝑟 > 𝐶𝑜𝑛𝑠𝑢𝑚𝑒𝑟
Fig: 11.8.5: Supply chain of rice bran oil
11.8.11 Value addition for rice bran oil at different level of actors
Item wise marketing cost of per ton rice bran oil at different levels of actors of value chain are presented in
table 11.8.6. Transportation cost and shop rent were the major items of marketing cost which covers about
29.35% and 11.18% of total marketing cost for dealer and retailer, respectively. The transportation cost varied
from area to area depending on distance coverage. On average, marketing cost of rice bran oil was higher for
dealer (Tk. 7360.00/ton), compared to that of retailer (Tk. 3130.00/ton).
Auto/Semi Rice Mill
Dealer
Retailer Consumer
Retailer
Rice Bran oil mill
Dealer
Companies (Pran, ACI, Pusti)
Exporters
Foreign Country
Rice Bran
35% 35%
30%
35%
30%
30%
35%
35%
35%

66
Table 11.8.6: Marketing costs of different actors involved in rice bran oil value chain (Tk. /ton)
Cost components Dealer % of dealer cost Retailer % of retailer cost
Transportation 2160.00 29.35 - -
Loading 250.00 3.40 - -
Unloading 280.00 3.80 - -
Wages & salaries 580.00 7.88 290.00 9.27
Shop rent 540.00 7.34 350.00 11.18
Commission 320.00 4.35 270.00 8.63
Khajna 400.00 5.43 250.00 7.99
Sweeper 250.00 3.40 150.00 4.79
Market toll 280.00 3.80 180.00 5.75
Weighing cost 330.00 4.48 220.00 7.03
Shopping Bag 350.00 4.76 250.00 7.99
Electricity 220.00 2.99 190.00 6.07
Night guard 420.00 5.71 300.00 9.58
Accountant cost 210.00 2.85 210.00 6.71
Telephone/Mobile 450.00 6.11 220.00 7.03
Entertainment 320.00 4.35 250.00 7.99
Total 7360.00 100.00 3130.00 100.00
Source: Feld survey 2016
11.8.12 Value addition of different actors involved in the chain
Data in table 11.8.7 present the total value addition of rice bran oil which was Tk. 24591 at different level of
actors. It was found that value addition of RBO were respectively 52.79%, 10.74% and 36.48% at miller, dealer
and retailer level.
Table 11.8.7: Value addition of different actors of rice bran oil (Tk/ton)
Different actors Sale price Purchase
price Gross
margin Marketing
cost Value
addition Value addition (%)
Miller 100000 87019 12981 0.00 12981 52.79
Dealer 110000 100000 10000 7360.0 2640 10.74
Retailer 122000 110000 12000 3130.0 8970 36.48
Total Value addition 24591 100.00
Source: Feld survey 2017
11.8.13 Quality of the rice bran oil
It was observed that the level of fatty acid increased if the millers preserved the rice bran in the open air. RBO
producer collected up to 13% fatty acid rice bran at their respective mill gates. In this regard, after producing
rice bran from auto rice mill, rice bran should be sent to RBO mill immediately but usually it takes more than
a week or 10 days for collection and RBO mills do not have ready storage facilities. Quality standard of the rice
bran is lost at the consequence of hydrolysis reaction by the lipase enzyme already exist in bran. About 10-
20% free fatty acid (FFA) is produced by enzyme. It should be noted that quantity of FFA should not be more
than 3% in edible oil and not more than 8% in crude Oil. Since there is no systematic collection system of rice

67
bran from auto and semi auto rice bran mills to RBO mills, they have suggested physical heat treatment and
chemical treatment for stabilizing the bran keeping FFA in ranges between 3-8%. However, RBO extraction,
dewaxing, degumming, bleaching and refining procedures were found satisfactory level other than
stabilization of rice bran.
11.8.14 Problems faced by rice bran oil millers in Bangladesh
Organization and managerial body of rice bran oil mills faced some problems, those are as follows:
a. Lack of public awareness about the nutritional status of rice bran oil: Since rice bran edible oil is
a new item in consumers market of Bangladesh, so people hesitate to buy it thinking that it is
beneficial for health or not.
b. High price of rice bran oil: Market price of rice bran oil is relatively higher than other edible oils
available in the market. It is because of higher manufacturing cost of rice bran oil. It also has a
negative impact on attracting consumers to purchase rice bran edible oil.
c. Interruption of power and gas supply: Gas and electricity supply is not smooth in Bangladesh. So,
millers frequently faced disruption from supply of gas and electricity which increased the costs of
production.
11.8.15 Conclusion
Rice bran oil as a cooking oil is extremely light, versatile, delicious and beneficial for human health getting
popularity among the consumers of Bangladesh. During the period of 2017, fourteen rice bran oil mills actually
produced 168,540 tons rice bran oil where 65.33% of production capacity were utilized by these mills. Among
the rice bran oil mills, highest amount (31960 tons) was produced by Mazumder Products Ltd., where 65.33%
production capacity were utilized. Fourteen rice bran oil mills produced 168,540 tons rice bran oil in our
country where 64.04% (107940 tons) was supplied to the domestic market and 35.96% (60600.00 tons) was
exported to the foreign countries (specially India, China and Japan). Average total costs of rice bran oil
production (byproducts also) including marketing and administrative costs was Tk. 176206/ton. After
deducting the returns from by products; actual cost of RBO was Tk. 87019/ton. Two dominant supply chain of
RBO were Miller > Dealer > Retailer > Consumer and Rice Bran Oil Miller > Company (Pran, Pusti, ACI,
Aristrcate > Dealer > Retailer > Consumer. Value additions by miller, dealer and retailer of the supply chain
were 14.92%, 10.00% and 10.91% and gross margin obtained by those actors were 37.11%, 28.59% and
34.30%, respectively. The key problems of RBO were unavailability of adequate rice bran and lack of
promotional activities at consumer level. Present production capacity of the fourteen-rice bran oil mills was
about 2.58 million tons of bran oil, but due to shortage of bran the current production level is about 1.68
million tons. Considering the importance of rice bran oil government should provide desired incentives to
the rice bran oil miller to increase the supply of bran oil which could save huge amount of foreign exchanges.
11.8.16 Recommendations
The following polices/ suggestion should be implemented which deserves immediate attention for improving
the existing production and marketing system of rice bran oil in Bangladesh:
Attempt can be made to convert the manual and husking rice mill to semi-auto (installation of rubber role
huller mills instead of anglebrug huller mill) and automated rice mill;
The owner of poultry and fish feed industries should be encouraged to use of de-oiled rice bran (DORB)
instead of rice bran;

68
Initiatives should be taken by the manufacturers to create demand of the consumers through the
promotional activities.
The consumers need to be awarded about the quality and benefit of bran oil and side by side fix up
reasonable price.
Effort should be made to ensure the maximum utilization of the production capacity and thereby decrease
the cost of production of rice bran oil;
Capacity building of skilled manpower should be strengthened in this sector. Improved to training
programs should be launched to train up the national technical personnel to replace the foreign expert.
69
11.9 Value chain of de-oiled rice bran (DoRB) in Bangladesh
11.9.1 Introduction
De-oiled rice bran is one of the important raw materials of feed production. After oil extraction from rice bran
de-oiled rice bran is produced. DORB is one of the main byproducts of rice bran oil and most widely used in
feed mills for feed processing. In Bangladesh more than hundred feed mills currently use de-oiled rice bran
(DORB) as a raw material of feed production. The importance of use DORB in feed is its protein content and
small percentage of oil content in it. Before using DORB rice bran is directly used with rice polish in feed
processing. But better-quality feed production is possible by using DORB with other raw materials such as
maize, wheat straw, soybean, fish feed, dry fish etc. Feed demand in cattle farm, poultry farm and fisheries
are increasingly high. A large number of people in Bangladesh are directly connected with these farms
for their livelihood. Ultimately DORB has potential for value addition and increased revenues at all levels of
the value chain. Based on the potential usages and demand, and priory of the key informants, the de-oiled
rice bran value chain was selected for detail investigation. De-oiled rice bran (DORB) is obtained after crude
oil has been extracted from rice bran. It is obtained in pellet form. After extraction DORB, contains 8%
Protein, 28% Fiber, 14.50% Sand & Silica and 10% Moisture. It is used as cattle feed, poultry feed, fish feed,
pig feed, dog feed and horse feed all over the world. In Bangladesh DORB is widely used in manufacturing
different feeds like of cattle, poultry and fish feeds etc.
11.9.2 Production scenario of De-oiled rice bran in Bangladesh
It is evident from table 11.9.1 that during the period of 2016, fourteen rice bran oil mills used 770100 tons rice
bran to produce rice bran oil. After oil extraction from rice bran, a total of 6,16,080 ton de-oiled rice bran were
produced in the country. Among the rice bran oil mills, Mazumder Products Ltd. the highest amount of DoRB
were produced (124640 ton of DoRB) where rice bran was used 155800 ton. In 2017 fourteen rice bran oil
mills used 842700-ton rice bran to produce rice bran oil. After oil extraction from rice bran, about 6,74,160
ton de-oiled rice bran in our country.

70
Table 11.9.1 Production scenario of de-oiled rice bran from rice bran oil mills in Bangladesh (ton/year)
:2016-2017
Rice bran oil mills
Production Production 2016 Production 2017
RBO
Capacity
Use of
bran RBO DoRB
Use of
bran RBO DoRB
KBC Agro Products Pvt. Ltd. 30000 87500 17500 70000 90000 18000 72000
Rashid Oil Mills Ltd 18000 65200 13040 52160 68700 13740 54960
Emerald Oil Industries Ltd. 18000 0 0 0 0 0 0
Mazumder Products Ltd. 48000 155800 31160 124640 159800 31960 127840
Green Oil & Poultry Feed Ind. 15000 42750 8550 34200 45350 9070 36280
Ali Natural Oil Mills & Ind.
Ltd. 18000 50800 10160 40640 53800 10760 43040
Mazumder Bran Oil Mills Ltd 18000 47600 9520 38080 50100 10020 40080
Al Noor Oil Company Ltd. 15000 40750 8150 32600 44000 8800 35200
Weaster Agro Ltd. 15000 48750 9750 39000 51250 10250 41000
Jamuna Agro Products Ltd. 15000 44250 8850 35400 46850 9370 37480
Agrotech International 12000 42600 8520 34080 44850 8970 35880
Tamim Agro Ind. Ltd. 15000 45000 9000 36000 47100 9420 37680
Abdul Monem Oil Mills Ltd 21000 61400 12280 49120 64000 12800 51200
Krishani Rice Bran Oil Mill 15000 37700 7540 30160 39800 7960 31840
Prodhan Oil Mill 15000 0 0 0 37100 7420 29680
Total: 258000 770100 154020 616080 842700 168540 674160
Source: Field survey 2017

71
Fig: 11.9.1 Production scenario of De-oiled rice bran in Bangladesh in 2017
11.9.3 Actors involved in de-oiled rice bran value chain
Actors are the main players of the value chain. The De-oiled rice bran value chain consists of the different
actors like producer, dealer/wholesaler, retailer, and consumer. The de-oiled rice bran value chain below
shows the flow chart of product distribution.
0
20000
40000
60000
80000
100000
120000
140000
160000
180000
200000
Ton
/Yea
r
Name Of the Rice Bran Oil Mill
Use of Bran Oil production De-oiled Rice bran

72
Fig: 11.9.2 Supply chain of de-oiled rice bran in Bangladesh
11.9.4 Value chain of de-oiled rice bran
The value chain describes the full range of activities which are required to bring a product or service from
conception, through the different phases of production and delivery to final consumers (Porter, 1980;
Kapilinsky and Morris, 2000). Economic value chain analysis describes the range of activities required to bring
a product to the final consumer and, in the case of international products, the extent to which
intermediaries/agents gain from participating in the chain (Jacinto, 2004). The following value chains were
identified in case of de-oiled rice bran marketing (Fig. 11.9.2).
𝒊: 𝐷𝑒 − 𝑜𝑖𝑙𝑒𝑑 𝑟𝑖𝑐𝑒 𝑏𝑟𝑎𝑛 𝑀𝑖𝑙𝑙𝑒𝑟 > 𝐷𝑒𝑎𝑙𝑒𝑟 > 𝑅𝑒𝑡𝑎𝑖𝑙𝑒𝑟
> 𝐶𝑜𝑛𝑠𝑢𝑚𝑒𝑟 (𝐹𝑎𝑟𝑚𝑒𝑟 𝑜𝑓 𝑃𝑜𝑢𝑙𝑡𝑟𝑦, 𝑑𝑎𝑖𝑟𝑦 𝑎𝑛𝑑 𝑓𝑖𝑠ℎ𝑒𝑟𝑖𝑒𝑠)
𝒊𝒊: 𝐷𝑒 − 𝑜𝑖𝑙𝑒𝑑 𝑟𝑖𝑐𝑒 𝑏𝑟𝑎𝑛 𝑀𝑖𝑙𝑙𝑒𝑟 > 𝐷𝑒𝑎𝑙𝑒𝑟 > 𝐹𝑒𝑒𝑑 𝑚𝑖𝑙𝑙𝑒𝑟
𝒊𝒊𝒊: 𝐷𝑒 − 𝑜𝑖𝑙𝑒𝑑 𝑟𝑖𝑐𝑒 𝑏𝑟𝑎𝑛 𝑀𝑖𝑙𝑙𝑒𝑟 > 𝐹𝑒𝑒𝑑 𝑚𝑖𝑙𝑙𝑒𝑟
𝒊𝒗: 𝐷𝑒 − 𝑜𝑖𝑙𝑒𝑑 𝑟𝑖𝑐𝑒 𝑏𝑟𝑎𝑛 𝑀𝑖𝑙𝑙𝑒𝑟 > 𝐹𝑜𝑟𝑒𝑖𝑔𝑛 𝑚𝑎𝑟𝑘𝑒𝑡
11.9.5 Disposal pattern of de-oiled rice bran in domestic and foreign market
It is evident in table 11.9.2 that during the period of 2017, fourteen rice bran oil mills produced a total of
674160 ton de-oiled rice bran in our country where 65.21 % (439620 ton) were supplied in the domestic
market and 34.79% (234540 ton) were exported in the foreign countries (specially India, China and Thailand).
Among the mills, Rashid Oil Mills, Green Oil & Poultry Feed Ind, Ali Natural Oil Mills & Ind. Ltd. Jamuna Agro
Rice Bran oil mill
DoRB
Rice Mill
Foreign Country Dealer
Feed mill
Retailer
Consumer
Rice bran
34% 44% 22%
30%
14%
14%

73
Products Ltd. And Krishani Rice Bran Oil Mill Ltd supplied their total production to the domestic market. On
the other hand, remaining nine rice bran oil mills exported 234540 ton of DoRB in the foreign countries. Among
the nine rice bran oil mills; the highest amount of DoRB 41000 ton (80.08%) was exported from Abdul Monem
oil Mills Ltd. Feed miller is dominant user of DoRB in our domestic market.
Table 11.9.2 Supply of de-oiled rice bran in domestic and foreign market (ton/year): 2017
Rice bran oil mills Actual
Production (ton)
Domestic Market
(ton)
% of Domestic Market
Foreign Market
(ton)
% of Foreign Market
Exporting Country
KBC Agro Products Pvt. Ltd. 72000 40000 55.56 32000 44.44 India
Rashid Oil Mills Ltd 54960 54960 100.00 0 0.00 Emerald Oil Industries Ltd. 0 0 0.00 0 0.00 India
Mazumder Products Ltd. 127840 77840 60.89 50000 39.11 China
Green Oil & Poultry Feed Ind. 36280 36280 100.00 0 0.00 India
Ali Natural Oil Mills & Ind. Ltd. 43040 7500 17.43 35540 82.57 Mazumder Bran Oil Mills Ltd 40080 15080 37.62 25000 62.38 India &
Thailand Al Noor Oil Company Ltd. 35200 20200 57.39 15000 42.61 India
Weaster Agro Ltd. 41000 41000 100.00 0 0.00 Jamuna Agro Products Ltd. 37480 37480 100.00 0 0.00 Agrotech International 35880 35880 100.00 0 0.00 Tamim Agro Ind. Ltd. 37680 20680 54.88 17000 45.12 Abdul Monem Oil Mills Ltd 51200 10200 19.92 41000 80.08 Thailand
Krishani Rice Bran Oil Mill 31840 31840 100.00 0 0.00 Prodhan Oil Mill 29680 10680 35.98 19000 64.02 Total 674160 439620 65.21 234540 34.79 Source: Feld survey 2018

74
Fig: 11.9.3 Supply of de-oiled rice bran in domestic and foreign market
11.9.6 Value addition for de-oiled rice bran at different level of actors
Data in table 11.9.2 represent item wise marketing cost of per quintal de-oiled rice bran at different level of actors
of value chain. Transportation cost was the major item of marketing cost which covers about 55.63% and 34.31%
of total marketing cost of dealer and retailer, respectively. The transportation cost varied from area to area
depending on distance coverage. On average, per quintal marketing cost of de-oiled rice bran was higher for
dealer (Tk. 117.2/ql), compared to that for the retailer (Tk. 73.5/ql).
Table 11.9.3: Marketing costs of different actors involved in de-oiled rice bran value chain (Tk. /ql)
Cost components Incurred by
Dealer Dealer’s Share (%)
Incurred by
Retailer Retailer’s Share (%)
Transportation 65.2 55.63 25 34.01
Loading 2.5 2.13 2.5 3.40
Unloading 2.8 2.39 2.8 3.81
Wages & salaries 5.8 4.95 8.7 11.84
Shop rent 5.4 4.61 2.4 3.27
Commission 3.2 2.73 3.2 4.35
Khajna 4.0 3.41 2.3 3.13
Sweeper 2.5 2.13 2.5 3.40
Market toll 2.8 2.39 2.8 3.81
Weighing cost 3.3 2.82 3.3 4.49
Shopping Bag 3.5 2.99 4.5 6.12
Electricity 2.2 1.88 2.2 2.99
Night guard 4.2 3.58 1.5 2.04
Accountant cost 2.1 1.79 2.1 2.86
Telephone/Mobile 4.5 3.84 4.5 6.12
Entertainment 3.2 2.73 3.2 4.35
Total 117.2 100.00 73.5 100.00
Domestic Market65%
Foreign Market35%
Domestic Market Foreign Market

75
Source: Feld survey 2017
11.9.7 Value addition of different actors involved in the chain
It is evident in table 11.9.4 that the total gross margin of de-oiled rice bran which was 360 Tk./ql at different
level of actors. It was found that gross margin of DoRB were respectively 52.78%, and 47.22% at dealer and
retailer level. On the other hand, Value addition of DoRB were respectively 43.00% and 57.00 % at dealer and
retailer level respectively.
Table 11.9.4: Value addition of different actors of de-oiled rice bran under the study (Tk/ql.)
Different
actors
Sale
price
Purchase
price Gross margin Marketing cost
Net margin/
Value addition
% of Value
addition
Dealer 2040 1850 190 (52.78%) 117.2 (61.46%) 72.8 43.00
Retailer 2210 2040 170 (47.22%) 73.5 (38.54%) 96.5 57.00
Source: Feld survey 2017
11.9.8 Conclusion
De-oiled rice bran is one of the important raw materials of feed production. After oil extraction from rice bran
de-oiled rice bran is produced. DORB is one of the main by- products of rice bran oil and most widely used
in feed mills for feed processing. During the period of 2017 fourteen rice bran oil mill produced 674160 ton
de-oiled rice bran in our country where 65.21 % (439620 ton) were supplied in the domestic market and
34.79% (234540 ton) were exported to the foreign countries (specially India, China and Thailand). Two
dominant supply chain of DoRB were De-oiled rice bran Miller > Dealer > Feed miller and De-oiled rice bran
Miller > Dealer > Retailer > Consumer (Farmer of Poultry, dairy and fisheries). Gross margin by dealer and
retailer of the supply chain were 52.78, and 47.22% and Value addition obtained by those actors were 43.00%
and 57.00 % respectively. The key problems faced by the rice bran oil miller’s unavailability of adequate rice
bran. Considering the importance of rice bran oil government should provide different incentives to the
rice bran oil millers to increase the supply of bran oil and de-oiled rice bran which could save huge amount of
foreign exchanges and fulfill the demand of dairy and poultry sector in our country.
11.9.9 Recommendations
The following polices/ suggestions were derived and these deserve immediate attention for improving the
existing production and marketing system of de-oiled rice bran in Bangladesh:
Public and private sector entrepreneurs need to come forward to establish modern technology
based several rice bran processing units in the country to increase the amount of oil production as
well as increase the amount of by products such as DORB, which is used as an ingredients of animal
feed that would save huge amount of foreign currency and create employment opportunity.
The government should have appropriate policies and regulations to ensure priority based continuous supply of gas and electricity for smooth running of the oil mills.
The government should develop appropriate policies and regulations to ensure that, artificial crisis
of products is not created in market, and to ensure right price of raw materials for all business traders.
Trade association should be established among the oil and feed mill owners to strengthen the business environment related to credit recovery. The government should have policies and regulations to stop the illegal supply of rice bran in foreign countries and save our national economy.

76
12 Research highlight/findings (Bullet point – max 10 nos.):
The average recovery ratio for head rice, dead rice, broken rice, rice bran and husk were 61.00%, 3.51%,
6.49%,8.50% and 20.50% respectively from the automatic rice millers. Bangladesh produced 52.50
million-tons of paddy, which earned 30.98 million-tons head rice. Other than the head rice, the
byproducts are dead rice, broken rice, husk and rice bran which stand at 2.31, 3.89, 10.50 and 4.46
million-tons, respectively during the period of 2017.
In our domestic market, about 45% aromatic rice (unpacked) were supplied by millers with the help of
arathder, wholesaler and retailer. On the other hand, Different companies of Bangladesh (like: Pran,
ACI, Pusti and Chashi) collected about 55% of aromatic rice from selected mills. After that these
companies processed, packaged and leveled it and sold by their own brand name. Then they marketed
about 30% aromatic rice in our domestic market and remaining 25% were exported to the foreign
countries.
Automatic rice millers supplied 55% of broken rice in the feed industry with the help of the broken rice
party. About 90% rice bran were supplied by millers with the help of bran party. After that, bran party
supplied best qualitative rice bran (65%) in the rice bran oil mills to produce the bran oil.
Rice husk party purchased about 55% rice husk from the automatic rice mills and sold it in the Briquettes
factory to produce the Briquettes.
Total production capacity of fourteen surveyed rice bran oil mills was258000 ton/year where as these
mills utilized 67% of the capacity which produced 168,540 ton of rice bran oil.
The manufacturing cost of rice bran oil was Tk.176, 206/ton; including value of byproducts (Tk. 89,187).
After deducting the returns of byproducts; actual cost of bran oil was Tk. 87019/ton.
Two dominant supply chains of rice bran oil (RBO):
Miller > Dealer > Retailer> Consumer and
Rice Bran Oil Miller > Company (Pran, Pusti, ACI, Aristocrat > Dealer > Retailer >
Consumer.
During the period of 2017, fourteen rice bran oil mills produced 168,540-ton rice bran oil in our country
where 64.04 % (107940 ton) were supplied to the domestic market and 35.96% (60600.00 ton) were
exported in the foreign countries (specially India, China and Japan).
During the period of 2017, fourteen rice bran oil mills produced 674160-ton de-oiled rice bran where
65.21 % (439620 ton) were supplied in the domestic market and 34.79% (234540 ton) were exported to
the foreign countries (specially India, China and Thailand).
The key problems of RBO production were unavailability of adequate rice bran and lack of promotional
activities at consumer level.

77
B. Implementation Position
1. Procurement:
Description of equipment and
capital items
PP Target Achievement Remarks
Phy (#) Fin (Tk) Phy (#) Fin (Tk)
(a)Office equipment
(furniture)
Executive Table 1 20000.0 1 20000.00
Required items
were
successfully
procured
Executive Chair 1 10000.0 1 10000.00
Steel almira 1 24000.0 1 24000.00
File cabinet 1 20000.0 1 20000.00
Front Chair 3 12000.0 3 11886.00
Computer table 2 10000.0 2 10000.00
Computer chair 2 7000.0 1 7000.00
(a)Office equipment
(Computer Accessories)
Laptop 1 60000.0 1 59950.0 Required items
were
successfully
procured
Desktop Computer 1 60000.0 1 59950.0
UPS 1 10000.0 1 10000.0
Scanner 1 10000.0 1 10000.0
Laser Printer 1 25000.0 1 19950.0
Large size Stapler machine 1 2000.0 1 1900.0
Camera (SLR 1 25000.0 1 25000.0
(b) Lab &field equipment
(c) Other capital items
2. Establishment/renovation facilities:
Description of facilities Newly established Upgraded/refurbished Remarks
PP Target Achievement PP Target Achievement

78
3. Training/study tour/ seminar/workshop/conference organized:
Description Number of participants Duration (Days/weeks/
months) Remarks
Male Female Total
(a) Training
(b) Workshop
C. Financial and physical progress
Fig in Tk
Items of
expenditure/activities
Total
approved
budget
Fund
received
Actual
expenditure
Balance/
unspent
Physical
progress
(%)
Reasons for
deviation
A. Contractual staff salary 531896 531896 531896 0 100.0
B. Field research/lab
expenses and supplies
822000 822000 822000 0 100.0
C. Operating expenses 244580 241162 240162 0 100.0 Needed extra
money for
operating the
project
D. Vehicle hire and fuel, oil &
maintenance
429972 388423 388423 0 100.0
E.
Training/workshop/seminar
etc.
0 0 0 0 0.0
F. Publications and printing 112800 0 0 0 0.0
G. Miscellaneous 74116 72037 72037 0 100.0
H. Capital expenses 284636 284636 284636 0 100.0

79
D. Achievement of Sub-project by objectives: (Tangible form)
Specific objectives of the sub-
project
Major technical
activities performed in
respect of the set
objectives
Output (i.e. product
obtained, visible,
measurable)
Outcome (short term
effect of the research)
To identify and examine major
value chains for rice and rice by-
products (rice bran and bran
oil, rice husk, feeds) in
Bangladesh.
Personal
Observation
FGD
Key Informant
Interview
Survey Research
Reiewing Previous
Wroks
Research Report
MS Thesis
Research Papers
in Peer Reviewed
Journal
Updated knowledge
of major value chains
for rice and rice by-
products
To map the different activities of
the actors and value addition
processes of the respective
chains focusing distributional
issues as well as costs and
margins of the actors involved
Personal
Observation
FGD
Key Informant
Interview
Survey Research
Research Report
MS Thesis
Research Papers
in Peer Reviewed
Journal
Updated knowledge
of value chain, value
addition, cost margin
of the different actors
of rice and its
byproduct
Sketch the feasibilities and
future prospects of value chains
of rice byproducts as a new
dimension for the economy of
Bangladesh.
Personal
Observation
FGD
Key Informant
Interview
Survey Research
Research Report
MS Thesis
Research Papers
in Peer Reviewed
Journal
Upated knowledge
about rice and its
byproducts (broken
rice,dead
rice,bran,husk
ricebran oil and
deoiled rice bran)
production and
marketing

80
E. Materials Development/Publication made under the Sub-project:
Publication
Number of publications Remarks (e.g.
paper title,
name of journal,
conference
name, etc.)
Under preparation Completed
and
published
Technology
bulletin/
booklet/leaflet/flyer
etc.
Journal publication
Information
development
Production and supply system of parboiled
rice and aromatic rice
The average recovery ratio for head rice,
dead rice, broken rice, rice bran and husk
from the automatic rice millers.
Using pattern of rice and its byproducts
Production and supply system of dead rice
and broken rice in Bangladesh
Using pattern and supply system of rice
bran in Bangladesh
Production scenario of rice bran oil in
Bangladesh
Total manufacturing cost of rice bran oil
Production scenario and disposal pattern
of rice bran oil in Bangladesh
Production scenario and disposal pattern
of De-oiled rice bran in Bangladesh
Using pattern and supply system of rice
husk in Bangladesh
Other publications,
if any
F. Technology/Knowledge generation/Policy Support (as applied):
i. Generation of technology (Commodity & Non-commodity)
The average recovery ratio for head rice, dead rice, broken rice, rice bran and husk were
61.00%, 3.51%, 6.49%,8.50% and 20.50% respectively from the automatic rice millers.

81
ii. Generation of new knowledge that help in developing more technology in future
iii. Technology transferred that help increased agricultural productivity and farmers’ income
iv. Policy Support
G. Information regarding desk and field monitoring
i) Desk monitoring [description & output of consultation meeting, monitoring,
workshops/seminars etc.): Not applicable
ii) Field monitoring (Time and no of visit, Team visit and output):
The average recovery ratio for head rice, dead rice, broken rice, rice bran and husk were 61.00%, 3.51%, 6.49%,8.50% and 20.50% respectively from the automatic rice millers.
Bangladesh has produced 52.50 million-tons paddy, which earned 30.98 million-tons head rice. Other than the head rice, the byproducts are dead rice, broken rice, husk and rice bran that produced 2.31, 3.89, 10.50 and 4.46 million-tons, respectively.
The rice bran has been used to produce crude rice bran oil. Here, 4.46 million-tons rice bran can produce 0.98 million-ton crude rice bran oil, which can be refined to 0.92 million-ton rice bran oil.
Total production capacity of fourteen surveyed rice bran oil mill was258000 ton/year where as these mills utilized 67% of the capacity which produced 168,540 ton of rice bran oil.
Total manufacturing cost of rice bran oil was Tk.176, 206/ton; including value (Tk. 89,187) of byproducts. After deducting the returns from by products; actual cost of bran oil was Tk. 87019/ton.
Considering the importance of rice bran oil, government should provide different incentives to the rice
bran oil miller to increase the supply of bran oil which could save huge amount of foreign exchanges.
Effort can be made to conversion of manual and husking rice mill to semi-auto (installation of rubber role huller mills instead of anglebrug huller mill) and automated rice mill;
Encourage owner of poultry and fish feed industry to use of DORB instead of rice bran; Initiatives should be taken by the manufacturers to create demand of the consumers through the
promotional activities. Effort can be made to ensure the maximum utilization of the production capacity and thereby
decrease the cost of production of rice bran oil; Capacity building of skilled manpower should be strengthened in this sector. Initiative to training program should be launched to train up national technical personnel to
replace the foreign expert.

82
Types of Audit Major observations
/issues/objections raised,
if any
Status at the sub-
project end
Time of visit
BARC \Team Verified and found correct 06/02/18
GoB audit (Foreign
aid)
Verified and found correct 28/10/18
I. Lesson Learned/Challenges (if any)
Production and supply system of parboiled rice and aromatic rice
The average recovery ratio for head rice, dead rice, broken rice, rice bran and husk from the
automatic rice millers.
Using pattern of rice and its byproducts
Production and supply system of dead rice and broken rice in Bangladesh
Using pattern of supply system of rice bran in Bangladesh
Production scenario of rice bran oil in Bangladesh
Total manufacturing cost of rice bran oil
Production scenario and disposal pattern of rice bran oil in Bangladesh
Production scenario and disposal pattern of De-oiled rice bran in Bangladesh
Using pattern of supply system of rice husk in Bangladesh
J. Challenges (if any)
The project is running well, but unable to purchase capital items due to delay in disbursing related
fund.
Delay of fund disbursement
Cheque payment system was complex
Sometimes faced shortage of trained enumerators for data collection
Signature of the Principal Investigator
Date ………………………….
Seal
Counter signature of the Head of the
organization/authorized representative
Date …………………………..
Seal

83
Literature review
Value chain analysis is a new concept in economic and marketing related research area. In home and abroad
the literature related to value chain is very scanty, especially on rice byproducts. However, some available
literature on rice and rice byproducts are furnished below:
Alam (2005) in this study found major value addition of husking mills as rice milling (51.59%), retailing
(26.58%) and wholesaling (13.49%) for parboiled rice. The profit margin at husking mill was found about
Taka 465.5 (28.65% of value addition at this level). In semi-automatic mills, rice milling (47.62%), retailing
(25.39%) and wholesaling (13.49%) constituted the major value addition for parboiled rice. For aromatic rice
the major value additions were- rice milling (54.46%), retailing (16.34%) and wholesaling (12.38%). The
profit margins were identified as Taka 715.75/ton (47.72% of value addition at this level) and Taka
865.75/ton (62.96% of value addition at this level) for parboiled and aromatic rice, respectively. In case of
parboiled rice, the profit margins per ton for husking, semi-automatic and automatic rice mills were found
Taka 466/ton, 716/ton and 1190/ton, respectively. The variation in profit margins was because of variation
in processing in different types of rice mills. The labour requirement per ton of rice processing at husking
mill (Taka 538/ton) was much higher than automatic (Taka 59/ton) and semi-automatic (Taka 338/ton) rice
mills. Moreover, high capacity and capacity utilization of automatic rice mills provided an edge over
processing cost of rice in husking and semi-automatic rice mills.
Kapur (2003) identified value addition of raw rice (Grade-A) mil ling unit as process c o s t w h i c h i n c l u d e s R s . 69.6 per q u i n t a l . (12%) for t a x e s a n d l e v i e s , cleaning, loading and miscellaneous costs (Vat-4%, Arat-2.5%, market fee-2%, process fee 2%, miscellaneous-1.5%), Rs. 9 per quintal for drying, Rs.20 per quintal for de-husking and polishing, Rs. 2 p e r quintal for grading. After grading yield of raw rice @ 67% accumulated value becomes Rs. 1015.8. Cost of rice bran (7%) at 500 per quintal. Cost of rice husk (19%) at Rs. 100 per quintal. was Rs.19. Overall gross profit was Rs. 79.2 per quintal. The author also found that percentage of gross profit on sale in respect of rice as 7.5% for raw rice and 6.2% for parboiled rice. In view of the quantum of work load given by purchasing agencies this profit margin appears to be rational. *Grade-A (Basmati rice and superfine quality). (*Here exchange rate of Rupee (and Bangladeshi Taka was 1 Rupee= 1.49 Taka)
Reardon et al. (2012) in this study found that rice value chains in Bangladesh and India were “geographically
long” and “intermediationally shorten” indicating involved an orientation from subsistence to commercial
agriculture in these zones near large cities, from selling to local final consumers toward selling to the big cities,
and from selling to village traders to selling to wholesale market traders and mills. The findings of the study
also revealed that the farmers captured about 60% of the final urban retail price of rice; which can be
compared to about 23% in the US in 1998 and 37% in 1980 (Elitzak 1999), but it can also be compared to a
much higher share of capture in traditional situations where farmers sold into local markets in their same
villages.
Stryker (2008) concluded that major advances were made in rice competitiveness through liberalization of
rice marketing and milling. This led to the introduction of small rice hullers, which were able to process

84
rice relatively inexpensively compared with larger mills. There were also substantial savings in the cost
of transporting paddy and the value for animal feed of the hulling byproducts. However, with rice prices
having risen on world markets and with advances in milling technology, it is time to revisit this question.
The imported rice with which domestic production competes is of a quality standard not met by most
small hullers, resulting in price discounts and lost profits. Evidence from Rwanda and a few other countries
suggests that milling technology currently exists that allows for upgrading of quality without necessarily
losing the advantages of operating on a relatively small scale. Better milling should take care of the
problems of impurities, lack of uniformity, and high percentage of broken grains. Complementary investment
in storage should also ensure that adequate supplies of local rice are available year-round. This will not
necessarily solve problems of taste, storability, cooking time, water absorption and other characteristics that
are not apparent to the eye.
Rice bran, a by-product of rice milling industry consists of 9-12% biomass of brown rice and about 8% of rough
rice (Houston, 1972). Rice bran is also sometimes called cargo or cow bran. Rice bran is commerce is a
considerable mixture of substances including the polish. The terms bran and polish, through according to the
suggestion of the FAO differ, however, bran includes a by-product from the milling of rice, consisting of the
outer bran layers of the kernel with part of germ; while „polish‟ or „polishing‟ a by-product from milling
rice consisting of the inner bran layers of the kernel with the part of the germ and small portion of the starchy
interior. According to (Juliano, 1985) polish (white bran) is a by-product of brown rice whitening process and
constitutes about 2-3% of rough rice.
Cicero et al. (2001) observed that the use of rice bran oil and gamma-orayzonol in the treatment of hypoproteinaemias and other condition.Rice bran oil and its main components (unsaturated fatty acids, triterpene alcohols, phytosterols, tocotrienols, and alpha-tocopherol) have demonstrated an ability to improve the plasma lipid pattern of rodents, rabbits, non-human primates and humans, reducing total plasma cholesterol and triglyceride concentration and increasing the high-density lipoprotein cholesterol level. Other potential properties of rice bran oil and gamma-oryzanol, studied both in vitro and in animal models, include modulation of pituitary secretion, inhibition of gastric acid secretion, antioxidant action and inhibition of platelet aggregation. This paper reviews the available data on the pharmacology and toxicology of rice bran oil and its main components with particular attention to those studies relating to plasma lipid altering effects.
Gopal-Krishna et al. (2001) studied on effect of refining of crude rice bran oil on the retention of oryzanol in
the refined oil. The effect of different processing steps of refining on retention or the availability of oryzanol
in refined oil and the oryzanol composition of 18 Indian paddy cultivars and commercial products of the rice
bran oil (RBO) industry were investigated. Degumming and de- waxing of crude RBO removed only 1.1 and
5.9% of oryzanol while the alkali treatment removed 93.0 to 94.6% of oryzanol from the original crude oil.
Rahman (2009) studied on the prospect of rice bran oil production in Rangpur district. In Rangpur district, 0.23
million tons of rice bran can be obtained from 3 million tons of paddy. In Bangladesh context, the study
observed that the potential bran oil production was found to be 0.134 million tonnes to 1.05 million tonnes
rice bran. The number of rice bran oil mills that can be established in Bangladesh was estimated to be 35 with
a minimum processing capacity of 100 tonnes bran per day with 300 days of operation per year. Such a rice
bran oil mill can produce about 12.8 tonnes edible oil per day.

85
Sharif (2009) studied on rice industrial by products management for oil extraction and value-added products.
From the present investigation it was concluded that rice bran has a potential to be used for oil extraction and
preparation of value-added products like cookies, leavened pan bread. The author also analyzed and evaluated
the physical and chemical characteristics of rice bran, fatty acid profile and antioxidants potential of rice bran
sample etc. After crude oil has been extracted from rice bran, De-Oiled Rice Bran (DORB) is obtained. It should
be in the pellet form. After extraction DORB must contain 8% Protein,28% Fiber, 14.50% Sand & Silica, 10%
Moisture. DORB is one of the most important raw materials of feed production. Feed mills of Bangladesh
mainly collect DORB from rice bran oil mills.
Mahmud (2010) worked on a project named an overview of a fish feed industry and it‟s operational
&management approaches. The author observed that a field level study on fish feed industry operation
(SHUSOMO feed limited) was carried out to know the feed formulation procedure and plant operation.
During manufacture of feed meat and bone meal, de-oiled rice bran, dry fish, fish meal, rape seed, soybean
meal having high content of protein are used as protein sources and rice polish, oil are used as lipid source
and flour is used as binder. Different types of vitamins are used: for example, fish grower contains vitamin A,
D, E, K, pantothenic acid, folic acid, biotin. The fish grower also contains mineral like copper, iron,
manganese, zinc, amino acid like lysine, all are used for growth promoter of fish.
Sasithorn Sunphorka et al. (2012) studied on protein and sugar extraction from rice bran and de-oiled rice
bran using subcritical water in a semi-continuous reactor: optimization by response surface methodology.
The extraction of protein and sugar from rice bran and de-oiled rice bran using subcritical water was
evaluated in a 30-ml semi-continuous reactor. The effects of the three main factors, operating temperature,
time and pressure, on the total sugar and protein yields obtained were investigated using analysis of variance
and response surface methodology. The developed models had a very high regression coefficient (R2) value
(0.94–0.98), and demonstrated that the three main factors investigated had a significant effect on the sugar
yield, whilst only time and its interaction with temperature were significant factors controlling the extracted
protein yield. Based on the response surface and contour plots, the optimum conditions were evaluated for
maximal extracted sugar and protein yields, which reached 100% for protein, from the two materials.

86
References
Acharya, S. S. and Agarwal, N. L. (1994). Agricultural Prices-Analysis and Policy, Oxford and IBH Publishing Co.
PVT. LTD, Calcuta
Ali, M. Z. 2012. Aquafeeds in Bangladesh: Status and Nutritional Quality of Commercial Feed Ingredients and
Feeds. Bangladesh Fisheries Research Institute, Mymensingh.
Alam, M.M. (2004). “Technical Performance of Some Selected Rice Mills of Bangladesh”. An M.S.
Thesis, Department of Farm Power and Machinery, Bangladesh Agricultural University, Mymensingh.
Baqui, M. A. Miah, M. A.K. and Ahmed, A. (1994), “Proceesing Technologies of Rice in Bangladesh, Suggested Technologies and Policy Issues Needed to Produce Finished Improved Quality of Rice both for Local and International market”, A Paper Presented in the National Workshop on Post Harvest Processing and Preservation of Agricultural Product, Its Present Status and Future Strategies in Bangladesh, held at BARC, 26-27 June.
Bangladesh Bureau of Statistics (2012), Statistical Yearbook of Bangladesh, Ministry of Planning, Government
of the People’s Republic of Bangladesh, Dhaka, Bangladesh.
Bangladesh Bureau of Statistics (2013), Statistical Yearbook of Bangladesh, Ministry of Planning, Government
of the People’s Republic of Bangladesh, Dhaka, Bangladesh.
Bangladesh Bureau of Statistics (2014), Statistical Yearbook of Bangladesh, Ministry of Planning, Government
of the People’s Republic of Bangladesh, Dhaka, Bangladesh.
Bangladesh Rice Research Institute, ‘Smart Technology Smart Dissemination’, 24th Rice Research and Extension
Workshop, 06 February 2016.
Baulch, B. Das, J. Jaim, W.M.H. Farid, N. and Zohir, S. (1997), “The Spatial Integration and Pricing Efficiency of the Private Sector Grain Trade in Bangladesh: Phase II Report”.
Bouzoubaa and Fournier, (2001) “Applications of rice husk ash as green and sustainable biomass” Journal of Cleaner Production Vol. 237:211-220.
Bakuta C.L, Sharma, R. K. (2013). “Extraction and refining of edible oil from extrusion-stabilized rice bran”
Journal of the American Oil Chemists' Society. Vol: 5:43-54.
Cicero and Gaddi, 2001.Rice bran oil and gamma-oryzanol in the treatment o f Hyperli poproteinaemias and
other conditions, University of Bologna, Italy.
Environmental Impacts of Alternative Uses of Rice Husks for Thailand, 2008. The 6th International Conference
on LCA in the Agri-Food Sector, Zurich.
HIES, 2010. Household Income and Expenditure Survey, Bangladesh Bureau of Statistics, Ministry of Planning,
Government of the People's Republic of Bangladesh, Dhaka.
Hartmann, B. and Boyce, J.K. (1990), “A Quiet Violence: View from Bangladesh Village”, University Press Limited, Dhaka.
Houston, D.F. 1972. Rice bran and Polish. In: Rice: Chemistry and Technology. 1st Ed., D.F. Houston, ed., Am.
Assoc. Cereal chem St.Paul, MN. pp. 272-300.
Islam, M. Z., Khalequzzaman, M., Bashar, M. K., Ivy, N. A., Mian, M. A. K., Pittendrigh, B. R., Haque, M. M. and Ali, M. P. (2018). Variability Assessment of Aromatic Rice Germplasm by Pheno-Genomic traits and Population Structure Analysis. Scientific Reports, 8:9911 DOI:10.1038/s41598-018-28001-z

87
Jacinto, G.J., Greenley, G.E., Cadogan, J.W. and Fahy, J. (2004) “The performance impact of marketing
resources”, Journal of Business Research, Vol 58 No 1, pp. 18-27.
Kaplinsky, R. and M. Morris, (2001). A Handbook for Value Chain Research. Brighton, United Kingdom, Institute
of Development Studies, University of Sussex.
Krishna, G. and Khatoon, S. (2001). Effect of refining crude rice bran oil on the retention of oryzanol in the
refined oil. Department of Lipid Science and Traditional Foods, Central Food Technological Research
Institute, Mysore 570013, India.
Krishnan, J.G. (2002). Effect of different supplementary feeds on the growth rate of Indian major Carp
Catlacatla reared under field conditions. Department of Zoology, Government College (Autonomous),
Kumbakonam 612 001, India. Environment and Ecology. 2002; 20(4): 833-838
Kapur, B.N, (2003). “A Diagnostic study report of rice milling industry at Karnal (Haryana), India”. Prepared
by: B.N.Kapur, Cluster Development Executive, Small Industries Service Institute. Karnal-132001,
(Haryana).
Krishna, G. and Khatoon, S. 2001. Effect of refining crude rice bran oil on the retention of oryzanol in the
refined oil. Department of Lipid Science and Traditional Foods, Central Food Technological Research
Institute, Mysore 570013, India.
Krishnan, J.G. (2002). Effect of different supplementary feeds on the growth rate of Indian major Carp
Catlacatla reared under field conditions. Department of Zoology, Government College (Autonomous),
Kumbakonam 612 001, India. Environment and Ecology. 2002; 20(4): 833-838
M4P, (2008). Making Value Chains Work Better for the Poor. A Toolbook for Practioners of Value Chain Analysis
Mahmud, M. S. (2010). An Overview of a Fish Feed Industry and its Operational & Management
Approaches. Aqua-Internship Program Report. Department of Fisheries, Bangladesh Agricultural
University, Mymensingh.
Prasad, C. S., Maiti, K. N., Venugopal, R. 2001 Effect of Rice Husk Ash in White Ware Compositions. Ceram. Int.,
27, 635-629 (2001). http://dx.doi.org/10.1016/S0272-8842 (01) 00010-4.
Porter, M.E. (1980) Competitive Strategy Techniques for Analyzing Industries and Competitors. Free Press,
New York.
Quayum and Latif (2015) Prospect of rice bran oil production in Bangladesh. Bangladesh Journal of Tariff and Trade, Issue (3):14-30.
Reardon. T., B. Minten., K. Z. Chen and L. Adriano (2012). The Transformation of Rice Value Chains in
Bangladesh and India: Implications for Food Security. Paper presented at the Food Security in Asia and
the Pacific Symposium, University of British Columbia, 17-18 September, 2012.
Rahman, S. (1998), “An Analysis of Market Structure, Conduct and Performance of Paddy Processing Industry in Some Selected Areas of Naogaon District”, MS Thesis, Submitted to Department of Cooperation and
Marketing, Bangladesh Agricultural University (BAU), Mymensingh, June.
Rahman, M. M. (2009). “Prospect of rice bran oil production in Rangpur District”. Department of Farm Power and Machinery, BAU, Mymensingh.

88
Rashid, M. H. (2015). Strength Behavior of Cement Mortar Assimilating Rice Husk Ash-Paper presented in 4th
World Conference on Applied Sciences, Engineering & Technology 24-26 October 2015, Kumamoto
University, Japan.
P. Singh, T.P. Singh, N. Gandhi (2013) “A Review on Rice Bran Protein: Its Properties and Extraction Methods”
Critical Reviews in Food Science and Nutrition Vol: 51:63-72.
Sharif, M. K. (2009). Rice industrial by products management for oil extraction and value-added products.
National Institute of Food Science and Technology. University of Agriculture, Faisalabad, Pakistan.
Sunphorka, S., Chavasiri, W., Oshima, Y. and Ngamprasertsith, S. ( 2012). Protein and Sugar Extraction
from Rice Bran and De-Oiled Rice Bran using Subcritical Water in a Semi-Continuous Reactor:
Optimization by Response Surface Methodology. International Journal of Food Engineering. Volume
8, Issue 3, ISSN (Online)1556-375

89
Appendix (A): Table
Appendix Table-1: Details of chemical costs incurred for producing rice bran oil (Tk./ton)
Cost Items Quantity (kg) Price (Tk/kg) Amount (Tk/ton)
Rice Bran Cost 6500 22 143000.00
Total Chemical Cost: 7202.28
i) Hexane 9.00 119 1710.00
ii) Citric acid 0.54 15 8.10
iii) Phosphoric acid 2.70 200 540.00
iv) Bleaching earth 60.00 62 3720.00
v) Activated carbon 10.14 105 1064.70
vi) Salt 6.30 25 157.50
vii) Caustic soda 0.06 33 1.98
Source: Field survey 2017
Appendix Table-2: Administrative cost of rice bran oil production (Tk/ton)
Cost Items Tk/ton
Audit Fees 28.75
Board Meeting Fees 1.75
Computer Accessories 18.42
Depreciation 804.10
Dish Bill 1.84
Donation & Subscription 49.18
Electricity Bill 27.03
Food & Entertainment 105.54
Consultancy & Other Fees 137.50
Internet & Server Expenses 48.32
MD’s Remuneration 56.25
Miscellaneous Expenses 66.45
Mobile & Telephone Bill 74.01
Newspaper & Periodicals 0.92
Office Maintenance 81.02
Office Rent 156.66
Postage & Courier 10.17
Printing & Stationery 36.83
Registration & Renewals 208.26
Salary & Allowances 593.98
Travelling & Conveyance 99.32
Vehicle Maintenance 219.78
Write off of Intangible Assets 166.38
Water Bill 1.75
Total Administrative Cost 2994.21
Source: Field survey 2017

90
Appendix Table-3: Marketing cost of rice bran oil production (Tk/ton)
Cost Items Tk/ton
Packing Material 3934.64
Stores & Spares 992.10
Advertisement 799.97
Delivery Expenses 497.08
Electricity Bill 8.30
Food & Entertainment 16.08
Office Rent 94.42
Printing & Stationery 12.99
Salary & Allowances 1610.95
Sales Promotion Expenses 679.28
Sample Expenses 13.19
Marketing Office Maintenance 26.47
Vehicle Maintenance 5.69
Trade Fair 321.47
Training Expenses 16.06
Total Marketing Cost 9028.67
Source: Field survey 2017
Appendix Table-4: Returns (Tk. /ton) from byproducts of rice bran oil
SI No: Items Quantity (kg) Price (Tk/Kg) Amount (Tk)
1 DORB 5070 16 81120
2 Wax 55 10 550
3 FFA 185 37 6845
4 Gam 24 28 672
Total returns from byproducts 89,187
Source: Field survey 2017

91
Appendix Figure: B
Fig 1: % share rice and its byproducts for parboiled fine rice
Fig 2: % share rice and its byproducts for parboiled course rice
Rice60%
Dead rice4%
Broken rice8%
Rice husk20%
Rice bran8%
Rice62%
Dead rice3%
Broken rice6%
Rice husk9%
Rice bran20%
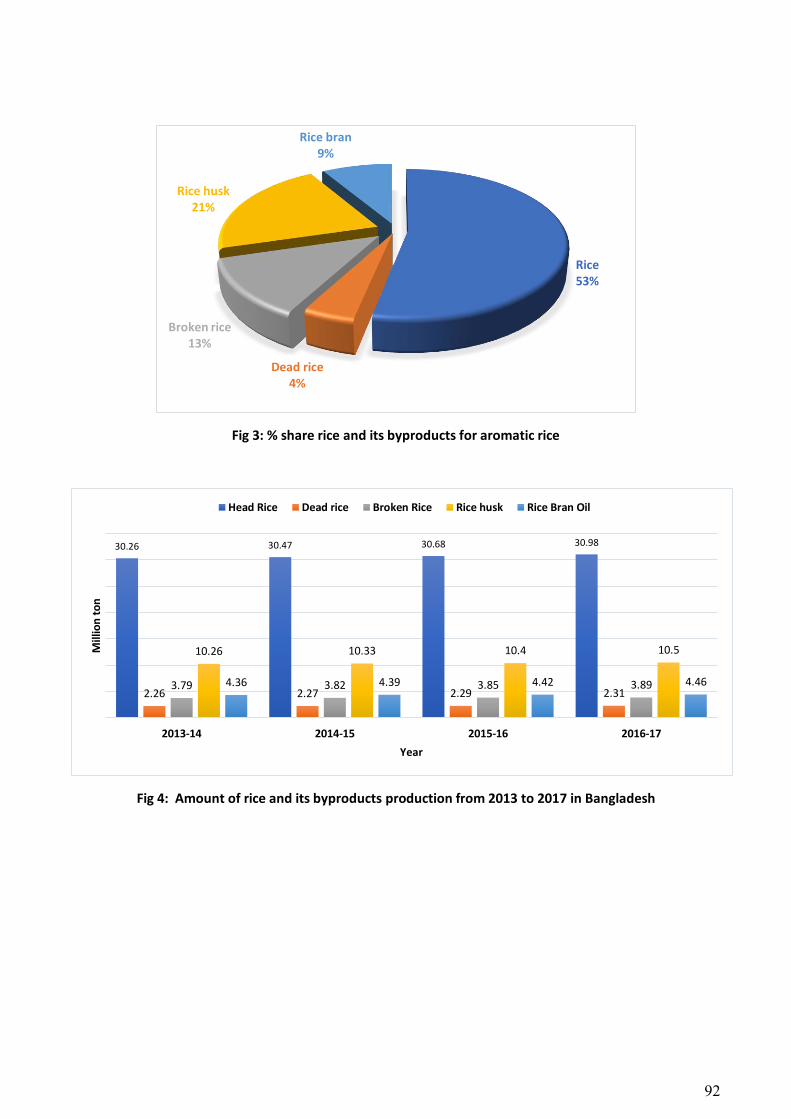
92
Fig 3: % share rice and its byproducts for aromatic rice
Fig 4: Amount of rice and its byproducts production from 2013 to 2017 in Bangladesh
Rice53%
Dead rice4%
Broken rice13%
Rice husk21%
Rice bran9%
30.26 30.47 30.68 30.98
2.26 2.27 2.29 2.313.79 3.82 3.85 3.89
10.26 10.33 10.4 10.5
4.36 4.39 4.42 4.46
2013-14 2014-15 2015-16 2016-17
Mill
ion
to
n
Year
Head Rice Dead rice Broken Rice Rice husk Rice Bran Oil

93
Fig 5: Share of paddy supplied to the millers by farmers, bepari and aratdars in the study areas
Fig 6: Trading scenario of parboiled and aromatic rice in the study areas (in ‘000’ tones) in 2017
Farmers15%
Bepari6%
Aratdars79%
55356 58367 65157
443061467164
521506
5678 5987 668332174 33924 37871
Kushtia Dinajpur Naogaon
Parboiled rice Own District Parboiled rice Other Districts Aromatic rice Own District Aromatic rice Other Districts

94
Some snapshots (Figs 1 to 9) on data collections are shown below.
Fig 1: Visiting Auto rice mill,
Mymensingh
Fig 2: Interviewing with Manager
at auto rice mill, Mymensingh
Fig 3: Focus group discussion with farmer,
Kustia
Fig 4: Interviewing with paddy
traders, Kustia
Fig 5: Interviewing with paddy
farmer, Kustia
Fig 6: : Interviewing rice bran party, Kustia
Fig 7: Interviewing rice bran party,
Kustia
Fig 8: Interviewing broken rice
party, Kustia
Fig 9: Interviewing husk party, Kustia
Fig 1: Visiting Auto rice mill,
Mymensingh
Fig 2: Interviewing with Manager
at auto rice mill, Mymensingh
Fig 3: Focus group discussion with farmer,
Kustia

95
Fig 4: Interviewing with paddy
traders, Kustia
Fig 5: Interviewing with paddy
farmer, Kustia
Fig 6: : Interviewing rice bran party, Kustia
Fig 7: Interviewing rice bran party,
Kustia
Fig 8: Interviewing broken rice
party, Kustia
Fig 9: Interviewing husk party, Kustia

96
Data collection from Auto rice mill Packaging of Head rice
Packaging head rice Head rice
Broken rice Dead rice

97
Data collection from Bran party Data collection from Husk party
Data collection from paddy traders (Faria) Data collection from paddy traders (bepari)
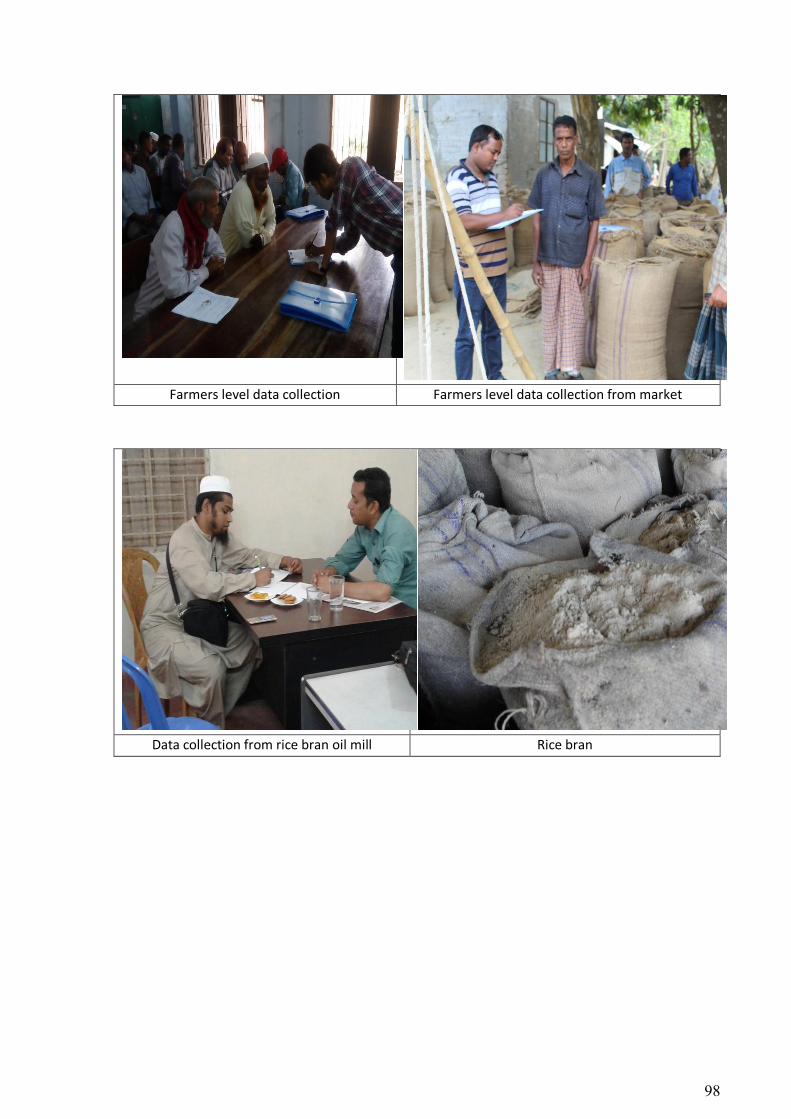
98
Farmers level data collection Farmers level data collection from market
Data collection from rice bran oil mill Rice bran

99
Rice bran oil mill Rice bran collection from auto rice mill