Embed Size (px)
Citation preview
Competition and complementarity in annual intercrops – the role
of plant available nutrients
Mette Klindt Andersen
Department of Agricultural Sciences
Environment, Resources and Technology
The Royal Veterinary and Agricultural University
Copenhagen, Denmark
Biosystems Department
RISØ National Laboratory
Roskilde, Denmark

Front page drawing by Anders Busse Nielsen
Summary In the developed regions of the world crops are today primarily grown as sole crops and monocultures. However, increasing awareness of the link between agricultural practise, environmental issues and long-term stability of existing food production systems has put focus on the role that greater crop diversity in time (crop rotation) and space (field size and mixed cropping systems) may play in reducing the extent of these problems. Intercropping represents one way of increasing crop diversity. As a result of differences in the way component crops respond to and affect the environment in which they are grown intercrops may use available growth resources (light, water and nutrients) more efficiently, reduce the prevalence of disease and pests and reduce weed infestation compared to sole crops. The greatest intercrop advantages are attained when the species that are mixed differ markedly either morphologically, phenologically or physiologically. The mixture of a nitrogen fixing legume and a non legume is the most common intercrop combination and in Denmark this is primarily in the form of the pea (Pisum sativum) – barley (Hordeum vulgare) mixture. In two field studies and one pot study the link between crop diversity, productivity and nutrient use was evaluated. The impact of crop density and the relative frequency of crop components in pea – barley intercrops was determined and the methods traditionally used to study the effects of intercropping compared to sole cropping were evaluated. The mixture of a nitrogen fixing crop and a non fixing crop gave rise to greater productivity than in comparable sole crops. As a result of the legumes ability to use atmospheric nitrogen, an ability that was strengthened through competition from barley and rape for soil nitrogen, the intercrops displayed complementarity with respect to nitrogen use. Increasing the functional diversity of an intercrop, as a result of increasing the number of intercrop components from two to three did not give rise to greater yields or resource use. The competitive dynamics at play between the component crops of an intercrop are to a large extent determined in the early growth phases. Barley was the fastest emerging crop component and thereby gained a head start on the growth of pea and rape. As growth tends to be selfcompounding early advantages will often lead to advantages throughout the growth season and may further be strengthened when competition for light sets in. However, conditions relating to the growth environment or cropping strategy may alter this picture. The soil nitrogen availability and cropping density had great impact on the relative competitive strength of the studied crops. At low soil nitrogen availability the pea crop had a great advantage and as cropping density was increased the pea crop became increasingly dominant. Under the given cropping condition, increased sulphur availability had very limited impact on the competitive dynamics of intercropped pea and barley.
Intercrop research has to a great extent used an experimental design that includes two crops grown as sole crops and in proportional mixtures that relate directly to sole crops (the proportional replacement design). This design has been the topic of much discussion. It is a simple design that has been valuable with respect to showing that
intercrops may be more resource use efficient and productive than comparable sole crops. However if the aim is to understand underlying mechanisms in order to construct the most “optimal” mixtures then it may not always be the most appropriate design. Experimental designs that include different crop densities and proportional mixtures of crop components (response surface design) could in that respect be valuable. In most intercrop studies conclusion about the relative competitive strength of crops are drawn on the basis of data from one final harvest which, limits the possibilities of pointing at specific structuring factors. This project shows that collecting data from several harvests throughout a growth season gave valuable indications of how competitive hierarchies were established and changed over time.
Sammendrag I den udviklede del af verden dyrkes landbrugsafgrøder i dag primært i renbestand og monokulturer. Der er imidlertid øget fokus på de miljøproblemer som intensivering kan medføre. Dette har øget opmærksomheden på den rolle en større afgrødediversitet i tid (sædskifte) og rum (markstørrelse og blandingssystemer) kan spille i forhold til at reducere omfanget af disse problemer. Dyrkning af blandingsafgrøder repræsenterer en måde hvorpå man kan øge afgrødediversiteten. Blandingsafgrøder har som følge af forskelle i den måde de enkelte afgrøde komponenter responderer og påvirker det miljø de vokser i en evne til at udnytte tilgængelige vækstressourcer (lys, vand og næringsstoffer) mere effektivt, at reducere forekomsten af sygdom og skadevoldere og at mindske ukrudtstrykket i forhold til sammenlignelige renbestande. De største samdyrkningsfordele opnås når de arter, der indgår i en blanding adskiller sig markant enten morfologisk, fænologisk eller fysiologisk. Blandingen af en kvælstoffikserende afgrøder og en ikke fikserende afgrøde er den mest almindelige samdyrkningskombination og i Danmark er det primært i form af ært (Pisum sativum) – byg (Hordeum vulgare) blandingen. Gennem to markforsøg og et potteforsøg blev koblingen mellem afgrødediversitet, produktivitet og næringsstofudnyttelsen belyst. Betydningen af afgrødetæthed og den relative fordeling af afgrøde komponenter i byg – ært blandinger blev behandlet og de metoder der traditionelt benyttes til at belyse effekter af samdyrkning i forhold til renbestande blev evalueret. Blandingen af en kvælstoffikserende og en ikke fikserende afgrøde gav ophav til en større produktivitet end i de tilsvarende renbestande. Som følge af ærtens evne til at udnytte atmosfærisk kvælstof, der blev fremmet gennem konkurrence fra byg og raps om jordens kvælstof, var blandingerne komplementære m.h.t. udnyttelsen af kvælstof. En øget forskellighed i en afgrødeblanding, som følge af, at antallet af blandingsafgrøde komponenter øges fra to til tre gav ikke større udbytte eller bedre ressourceudnyttelse. Den konkurrence dynamik, der er mellem arter i en samdyrket afgrøde bestemmes i høj grad i den tidlige vækstfase. Byg var den afgrødekomponent som spirede frem først og dermed fik et vækstforspring i forhold til ært og raps. Eftersom vækst er selvforstærkende
vil tidlige fordele ofte føre til fordele gennem hele vækstforløbet og kan endvidere forstærkes når konkurrencen om lys får betydning. Men vækstforhold, der har med vækstmiljøet eller dyrkningsstrategien at gøre kan ændre dette billede. Jordens indhold af plantetilgængeligt kvælstof og dyrkningstætheden havde stor indflydelse på afgrødekomponenternes relative konkurrence evne. Ved lav tilgængelighed af kvælstof i jorden fik ærterne en stor fordel og ærternes fordel steg også med stigende afgrøde tæthed. Øget svovl tilgængelighed havde derimod, under de givne vækstbetingelser, begrænset indflydelse på afgrødernes indbyrdes konkurrence evne.
Samdyrkningsforskningen har i høj grad benyttet sig af et eksperimentelt design der omfatter to afgrøder dyrket i renbestand og i proportionelle blandinger, der relaterer direkte til renbestandene (proportional replacement design). Dette design har været genstand for megen diskussion. Det er et simpelt design som har været værdifuldt i forhold til at vise at blandinger kan være mere ressourceeffektive og produktive end renbestande. Men hvis man ønsker at forstå de bagved liggende mekanismer for derved at konstruere de mest ”optimale” blandinger så er det design ikke altid det mest egnede. Eksperimentelle design der arbejder med forskellige afgrødetætheder og relative fordelinger af afgrødekomponenter (response surface design) kan i den sammenhæng være værdifulde. I de fleste samdyrkningsstudier er konklusioner om afgrødernes indbyrdes konkurrence evne baseret på data taget ved et endeligt høst, hvilket begrænser muligheden for at pege på specifikke strukturerende faktorer. Dette projekt viser at ved at indhente data fra flere høst i løbet af en vækstsæson er det i højere grad muligt at pege på hvordan konkurrenceforhold etableres og ændrer sig over tid.
Preface This Ph.D. thesis is submitted as partial fulfilment of the requirements for the degree of Philosophiae Doctor (Ph.D.) at the Royal Veterinary and Agricultural University (KVL), Copenhagen, Denmark. The thesis is based on four papers, of which one has been published, one accepted for publication and the remaining two submitted for publication. All four papers appear as appendices and will in the following be referred to by the numbers given below. 1. Andersen M.K., Hauggaard-Nielsen H., Ambus P. and Jensen E. S. 2004. Biomass
production, symbiotic nitrogen fixation and inorganic N use in dual and tri-component annual intercrops. Plant and Soil 266: 273-287.
2. Andersen MK, Hauggaard-Nielsen H, Weiner J and Jensen ES. Evaluating competitive dynamics in two and three component intercrops of Pisum sativum, Hordeum vulgare and Brassica napus. Submitted to Journal of Applied Ecology.
3. Andersen MK, Hauggaard-Nielsen H, Høgh-Jensen H and Jensen ES. Competition for and utilisation of sulphur in sole and intercrops of pea and barley. Submitted to Nutrient Cycling in Agroecosystems.
4. Hauggaard-Nielsen H, Andersen MK, Jørnsgaard B and Jensen ES. Density and relative frequency effects on competitive interactions and resource use in pea-barley intercrops. Accepted for publication in Field Crops Research.
During the course of the project I had my work base at two research institutions. In the first two thirds of the project period I was situated in the Department of Agricultural Science at the Royal Veterinary and Agricultural University, Copenhagen and in the last third in the Biosystems Department at RISØ National Laboratory.
My work has involved the help of many people and I would like to express my gratitude to those who deserve special attention. First and foremost a special thanks to my three supervisors, professor Erik Steen Jensen for showing me absolute confidence and support throughout the project, professor Jacob Weiner for guiding me through the ‘world’ of plant competition and assistant professor Henning Høgh-Jensen for stepping in as my KVL supervisor when Erik Steen Jensen moved to RISØ. A special thanks to my colleague Ph.D. Henrik Hauggaard-Nielsen, with whom I have had very close cooperation, many fruitful discussions and exchanged many ideas. I am grateful for the technical assistance that I received from especially Susanne Olsen and Britta Henriksen at the KVL experimental farm in Tåstrup, Per Ambus at RISØ and Jørgen Eriksen and Karin Dyrberg at Foulum.
Last but not least a special thanks to Flemming, Laust and Methea for keeping my attention on other aspects and qualities of life than intercropping.
Table of contents 1. Introduction 1 Objectives 3 2. Background 5 Intercropping 5 Intercrops and diversity 6 Interspecies interactions in intercrops 7 Interaction dynamics 9 Belowground interactions in legume-nonlegume intercrops 10 Methodology 11 Experimental designs for intercrop studies 11 Competition indices 13 3. Synthesis 17 Crop diversity, yield and nutrient use 17 Nitrogen use complementarity 18 Competitive dynamics 19 Methodology 20 4. Critical Reflections 21 Project relevance 21 Project planning 21 5. Outlook 23 Intercropping as a sustainable cropping practise 25 6. References 27 7. Papers 31 Biomass production, symbiotic nitrogen fixation and inorganic N
use in dual and tri-component annual intercrops 35
Evaluating competitive dynamics in two and three component intercrops of Pisum sativum, Hordeum vulgare and Brassica napus
57
Competition for and utilisation of sulphur in sole and intercrops of pea and barley
75
Density and relative frequency effects on competitive interactions and resource use in pea-barley intercrops
95

1INTRODUCTION
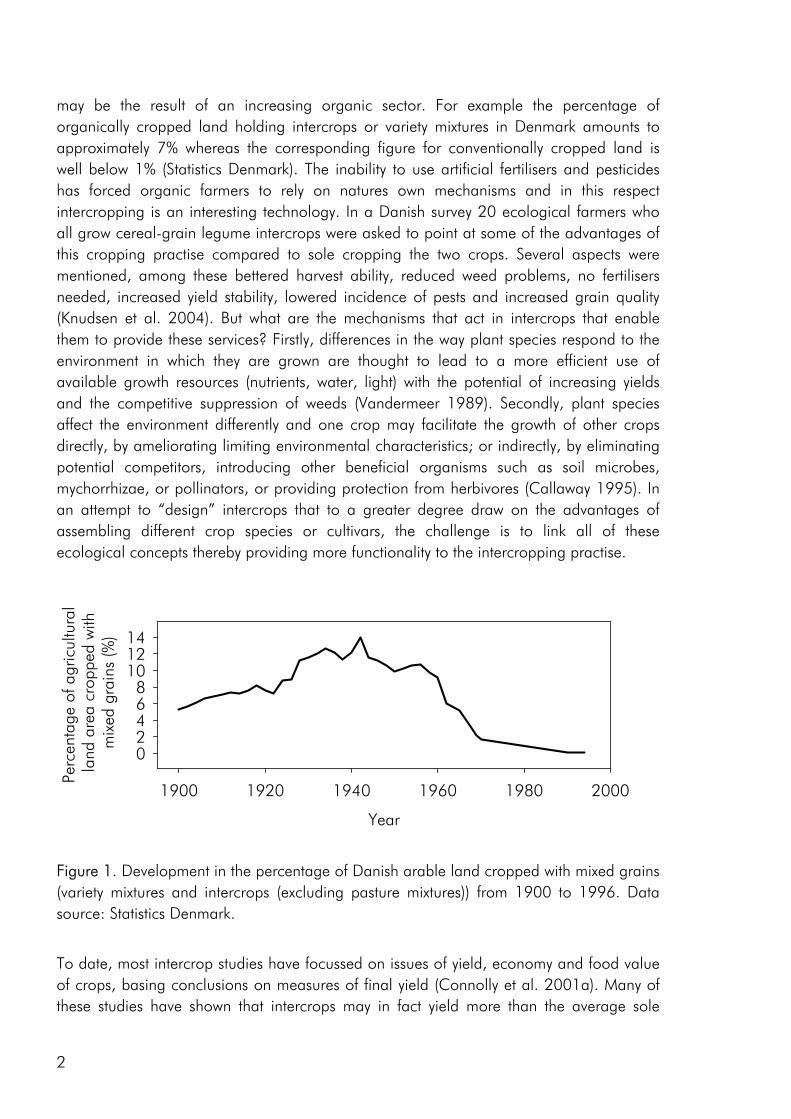
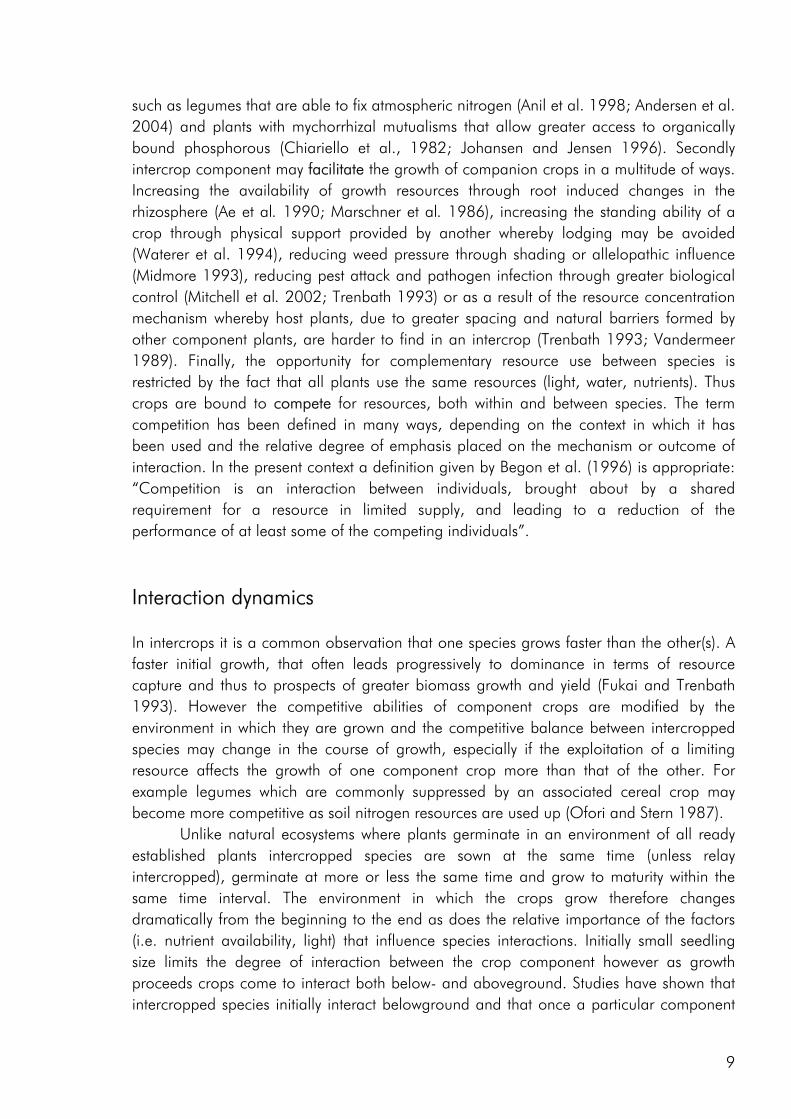
The switch from complex agricultural systems to less complex systems with lower species numbers was a major feature of agricultural development in the 20th century (Crews and Peoples 2004). As a consequence of the fossilisation of European agriculture, most crops are today grown very efficiently as sole crops (Cassman 1999). This is clearly exemplified by a strong decrease in the percentage of Danish arable land that has been cropped with intercrops (not including clover grass mixtures) and variety mixtures from the 1940es and up to present day (Fig. 1). The improvement of crop varieties and use of pesticides and fertilisers has resulted in a change from rotational cropping to the continuous cropping of high yielding crops (Crews and Peoples 2004), allowing us to a large extent to ignore issues of soil fertility, crop disease and weed infestation. Thus most present cropping systems are relatively independent of internal ecological functions and are to a great degree based on the supply of inputs from the outside (Gliessman 1998). However increasing awareness of the link between agricultural practise, environmental issues and long-term stability of existing food production systems has made an increasing number of farmers, researcher and policymakers conscious of the fact that farming systems should provide other services than the mere production of food and that increased agrobiodiversity may play a role in achieving this goal (Altieri 1999; Watson et al. 2002; Wolfe 2003).
Following an effective crop rotation, the simplest step forward for introducing diversity into cropping systems is to grow variety mixtures or intercrops. Intercropping, the simultaneous growing of two or more crop species on the same piece of land (Ofori and Stern, 1987) is a cropping practise that has been shown to have the potential of providing valuable ecosystem services such as improved pest control (Mitchell et al. 2002; Trenbath 1993), increased resource use efficiency (Hauggaard-Nielsen et al. 2001a; Keating and Carberry 1993; Morris and Garrity 1993), lowered weed infestation levels (Liebman and Dyck 1993; Midmore 1993), lower nitrate leaching (Hauggaard-Nielsen et al. 2001b) and improved product quality (Anil et al. 1998) compared to sole cropping. Intercrops are experiencing a renaissance in the developed regions of the world which, to a large extent
1
may be the result of an increasing organic sector. For example the percentage of organically cropped land holding intercrops or variety mixtures in Denmark amounts to approximately 7% whereas the corresponding figure for conventionally cropped land is well below 1% (Statistics Denmark). The inability to use artificial fertilisers and pesticides has forced organic farmers to rely on natures own mechanisms and in this respect intercropping is an interesting technology. In a Danish survey 20 ecological farmers who all grow cereal-grain legume intercrops were asked to point at some of the advantages of this cropping practise compared to sole cropping the two crops. Several aspects were mentioned, among these bettered harvest ability, reduced weed problems, no fertilisers needed, increased yield stability, lowered incidence of pests and increased grain quality (Knudsen et al. 2004). But what are the mechanisms that act in intercrops that enable them to provide these services? Firstly, differences in the way plant species respond to the environment in which they are grown are thought to lead to a more efficient use of available growth resources (nutrients, water, light) with the potential of increasing yields and the competitive suppression of weeds (Vandermeer 1989). Secondly, plant species affect the environment differently and one crop may facilitate the growth of other crops directly, by ameliorating limiting environmental characteristics; or indirectly, by eliminating potential competitors, introducing other beneficial organisms such as soil microbes, mychorrhizae, or pollinators, or providing protection from herbivores (Callaway 1995). In an attempt to “design” intercrops that to a greater degree draw on the advantages of assembling different crop species or cultivars, the challenge is to link all of these ecological concepts thereby providing more functionality to the intercropping practise.
Year
1900 1920 1940 1960 1980 2000
Perc
enta
ge o
f agr
icul
tura
l la
nd a
rea
crop
ped
with
mix
ed g
rain
s (%
)
02468
101214
Figure 1. Development in the percentage of Danish arable land cropped with mixed grains (variety mixtures and intercrops (excluding pasture mixtures)) from 1900 to 1996. Data source: Statistics Denmark.
To date, most intercrop studies have focussed on issues of yield, economy and food value of crops, basing conclusions on measures of final yield (Connolly et al. 2001a). Many of these studies have shown that intercrops may in fact yield more than the average sole
2
crop, be economically sustainable and produce products of superior quality. However, very little emphasis has been laid on the understanding of interspecific processes leading to these intercropping benefits (Connolly et al. 2001a). A greater understanding of how these benefits accrue over the course of growth, from establishment through the phase(s) of competitive interaction could lead to the ability to manipulate intercropping systems for greater benefits, whether in terms of crop yield, resource use efficiency, economic benefit or stability.
Objectives The overall objective of this thesis has been to link the issues of intercrop diversity, crop species interactions, nutrient resource use and productivity on the basis of dynamic datasets of crop growth and nutrient use in field and pot studies. More specifically the following three objectives form the basis of the four appended papers : 1. To evaluate the effect of crop diversity on the productivity and use of nitrogen and
sulphur as well as the competitive dynamics of an intercrop system.
2. To determine how complementarity and competition for growth resources are affected by density and relative frequency of intercropped crops.
3. To evaluate the methodology commonly used to analyse competitive interactions in intercrops, pointing at the strengths and weaknesses of common practise and giving recommendations for future focus.
In the following background chapter the theoretical basis of the four appended papers is presented, including sections on the intercrops as a source of planned agrobiodiversity, crop interactions in intercrops and the designs and indices used to evaluate species interactions in intercrops. A synthesis chapter summarizes the main results of the four appended papers and discusses them in relation to results from other intercrop studies and the theory associated with the intercropping practise. The reflections that a project of this size inevitably poses are presented and discussed in a chapter titled critical reflections. Finally issues of relevance to future intercropping research, as I see them, are brought up in the outlook chapter, a chapter that will also address the role that intercrops may play in the development of more sustainable cropping systems.
3

4
2BACKGROUND
Intercropping Intercropping is the growing of two or more crop species in the same field during a growing season (Ofori and Stern 1987). A large body of literature exists on intercropping, a considerable part of which deals with studies carried out in Africa, Asia and Latin America (Connolly et al. 2001a; Vandermeer 1989). Basic to all intercrop studies is the assumption that some advantage(s) is achieved from mixing crops opposed to growing them alone and that these advantages are the result of differences in the way species exploit or act in relation to the environment in which they are grown. Andrews and Kassam (1976) identified four main intercrop types:
1. Mixed intercrops:
Component crops grown simultaneously with no distinct row arrangement
2. Row intercrops: Component crops grown simultaneously in different rows
3. Strip intercrops: Component crops grown simultaneously in different strips to permit independent cultivation of each crop
4. Relay intercrops: Component crops grown in relay, so that growth cycles overlap
The data for the present thesis has been collected from a series of mixed pea (Pisum sativum) – barley (Hordeum vulgare) intercrop experiments carried out in Denmark. This intercrop combination is by far the most common in Denmark and has already been the focus of numerous Danish research studies (i.e. Hauggaard-Nielsen et al. 2001a, b & c; Jensen 1996; Mortensen and Eriksen 1994). In the following background discussion focus
5
will be on this intercrop however references are also made to studies that have focussed on intercrops consisting of other species, intercrop studies carried out under other climatic conditions and to studies of species interactions in natural ecosystems.
Intercrops and diversity Increasingly, research suggests that the level of internal regulation of function in agroecosystems is largely dependent on the level of plant and animal biodiversity present (Altieri 1999; Francis 1986; Vandermeer 1989). In agricultural systems, biodiversity performs ecosystem services beyond production of food, fibre and fuel (Altieri 1999; Björklund 2003) and according to Björklund (2003) these may be grouped into three categories:
1. Services that directly support agricultural production - such as upholding soil fertility, providing biotic regulation mechanisms such as pollination, pest regulation and weed competition.
2. Services that contribute directly to the quality of life of humans – through cultural, natural and aesthetic values of the landscape, creating conditions for subsistence, health and recreation.
3. Services that contribute towards global life supporting functions – for example the supply of clean water and maintenance of biogeochemical systems.
Intercropping is one way of introducing more biodiversity into agroecosystems and results from intercropping studies indicate that increased crop diversity may increase the number of ecosystem services provided. Higher species richness may be associated with nutrient cycling characteristics that can regulate soil fertility (Russell 2002) and limit nutrient leaching losses (Hauggaard-Nielsen et al. 2003) and may significantly reduce the negative impacts of pests (Bannon & Cooke 1998; Boudreau and Mundt 1994; Fininsa 1996) and weeds (Hauggaard-Nielsen 2001a; Liebman and Dyck 1993).
Concerns about the effects of the widespread loss of biodiversity have, within the field of ecology, prompted many studies investigating the relationship between biodiversity and ecosystem functioning. Recently, experimental approaches to the problem have been employed, resulting in data which are widely quoted as indicating a clear link between biodiversity (species number) and elements of ecosystem function (Naeem et al. 1994 & 1996; Tilman and Downing 1994; Tilman et al. 1996). Complementary use of growth resources in both time and space were seen as possible explanations. However these studies have generated considerable criticism (Aarsen 1997; Bengtsson 1998; Huston 1997; Loreau et al. 2001; Wardle et al. 2000). Huston (1997) argued that it is impossible to separate the effects of changing biodiversity from the effects of other ‘hidden treatments’ in the experiments, such as the impact of abiotic conditions, non-random selection of species or few species with a dominating positive or negative effect on the response variable being measured. Tilman’s findings were also questioned by Aarssen (1997) who
6
suggested that observed differences in function were more related to differences in individual species characteristics than diversity per se. And in line with this Bengtsson (1998) argued that as there is no direct mechanistic relationship between diversity and ecosystem function, the link goes via species and functional groups whose interactions provide most of the mechanisms of ecosystem function. This directly links to the role of diversity in intercrops as a mediator of function as intercrop component species are always chosen on the basis of assumed morphological (ex. deeply rooted vs. shallowly rooted species), physiological (ex. nitrogen fixers vs. non-nitrogen fixers) or phenological differences (early vs. late season species).
The experimentation on intercrops has largely been confined to two or three species mixtures, species diversity that is nowhere near that of the above mentioned studies. It may therefore rightly be questioned whether it is relevant to talk of diversity advantages in relation to intercrops. However, it may be hypothesized that at this minimum level of diversity the inclusion of any additional co-existent species inevitably has a significant effect on ecosystem function (Swift and Anderson 1993) and because the resource requirements of all annual crop plants are fairly similar, the effects of complementary resource use on ecosystem function could be expected to saturate at relatively low species number (Vitousek and Hooper 1993).
Interspecies interactions in intercrops Interspecies interaction may be seen as a conglomerate of all the ways that different species affect resource use and growth of one another, spanning from negative effects of resource competition to positive effects of resource facilitation. Goldberg (1990) has argued that most interactions between plants occur through some intermediary such as light, nutrients or microorganisms and that interactions between plants should be seen both with respect to the effect that each species has on the abundance of the intermediary, and to the response that each species has to changes in the abundance of the intermediary (Fig. 2). In this way Goldberg makes a clear link between the mechanism of interaction and its outcome. A crop may affect the intermediary in a negative or positive way, with respect to other crops. Lowering its abundance, for example through uptake of a growth limiting nutrient resource (Zhang and Li 2003) or the creation of shade (Berntsen et al. 2004) or facilitating the growth of other crops by increasing the availability of the intermediary as is the case when symbiotically fixed nitrogen (N) is transferred from intercropped legumes to intercropped non-legumes (Jensen, 1996a) or phosphorus is released from organic compounds through the work of extra-cellular enzymes extruded by one of the crop components (Dakora, 2002).
Through a more efficient use of available resources such as nutrients, water and space substantial yield advantages can be achieved by intercropping compared to sole cropping (Joliffe 1997; Katayama et al 1995; Morris and Garrity 1993; Willey 1979). Two principles are considered to be central to explaining these advantages. Firstly, the Competitive Production Principle (Vandermeer 1989) implies that differences with respect
7
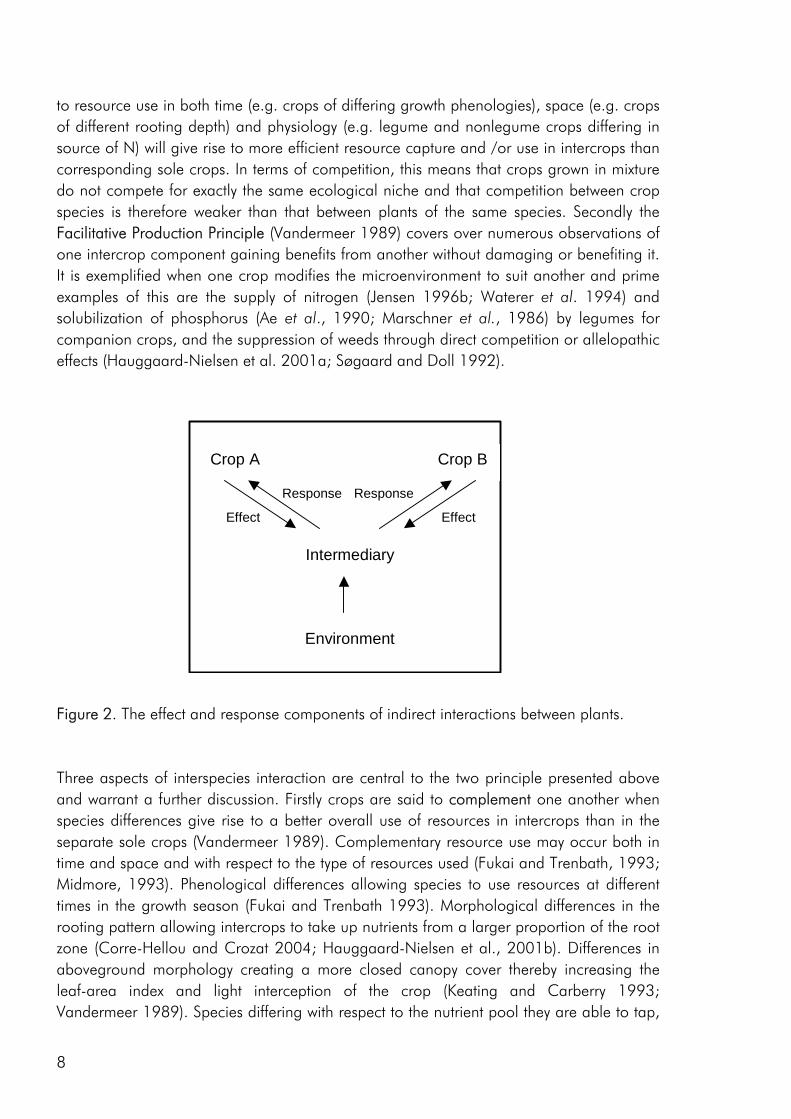
to resource use in both time (e.g. crops of differing growth phenologies), space (e.g. crops of different rooting depth) and physiology (e.g. legume and nonlegume crops differing in source of N) will give rise to more efficient resource capture and /or use in intercrops than corresponding sole crops. In terms of competition, this means that crops grown in mixture do not compete for exactly the same ecological niche and that competition between crop species is therefore weaker than that between plants of the same species. Secondly the Facilitative Production Principle (Vandermeer 1989) covers over numerous observations of one intercrop component gaining benefits from another without damaging or benefiting it. It is exemplified when one crop modifies the microenvironment to suit another and prime examples of this are the supply of nitrogen (Jensen 1996b; Waterer et al. 1994) and solubilization of phosphorus (Ae et al., 1990; Marschner et al., 1986) by legumes for companion crops, and the suppression of weeds through direct competition or allelopathic effects (Hauggaard-Nielsen et al. 2001a; Søgaard and Doll 1992).
Effect Effect
Crop A Crop B
Response Response
Intermediary
Environment
Figure 2. The effect and response components of indirect interactions between plants. Three aspects of interspecies interaction are central to the two principle presented above and warrant a further discussion. Firstly crops are said to complement one another when species differences give rise to a better overall use of resources in intercrops than in the separate sole crops (Vandermeer 1989). Complementary resource use may occur both in time and space and with respect to the type of resources used (Fukai and Trenbath, 1993; Midmore, 1993). Phenological differences allowing species to use resources at different times in the growth season (Fukai and Trenbath 1993). Morphological differences in the rooting pattern allowing intercrops to take up nutrients from a larger proportion of the root zone (Corre-Hellou and Crozat 2004; Hauggaard-Nielsen et al., 2001b). Differences in aboveground morphology creating a more closed canopy cover thereby increasing the leaf-area index and light interception of the crop (Keating and Carberry 1993; Vandermeer 1989). Species differing with respect to the nutrient pool they are able to tap,
8
such as legumes that are able to fix atmospheric nitrogen (Anil et al. 1998; Andersen et al. 2004) and plants with mychorrhizal mutualisms that allow greater access to organically bound phosphorous (Chiariello et al., 1982; Johansen and Jensen 1996). Secondly intercrop component may facilitate the growth of companion crops in a multitude of ways. Increasing the availability of growth resources through root induced changes in the rhizosphere (Ae et al. 1990; Marschner et al. 1986), increasing the standing ability of a crop through physical support provided by another whereby lodging may be avoided (Waterer et al. 1994), reducing weed pressure through shading or allelopathic influence (Midmore 1993), reducing pest attack and pathogen infection through greater biological control (Mitchell et al. 2002; Trenbath 1993) or as a result of the resource concentration mechanism whereby host plants, due to greater spacing and natural barriers formed by other component plants, are harder to find in an intercrop (Trenbath 1993; Vandermeer 1989). Finally, the opportunity for complementary resource use between species is restricted by the fact that all plants use the same resources (light, water, nutrients). Thus crops are bound to compete for resources, both within and between species. The term competition has been defined in many ways, depending on the context in which it has been used and the relative degree of emphasis placed on the mechanism or outcome of interaction. In the present context a definition given by Begon et al. (1996) is appropriate: “Competition is an interaction between individuals, brought about by a shared requirement for a resource in limited supply, and leading to a reduction of the performance of at least some of the competing individuals”.
Interaction dynamics In intercrops it is a common observation that one species grows faster than the other(s). A faster initial growth, that often leads progressively to dominance in terms of resource capture and thus to prospects of greater biomass growth and yield (Fukai and Trenbath 1993). However the competitive abilities of component crops are modified by the environment in which they are grown and the competitive balance between intercropped species may change in the course of growth, especially if the exploitation of a limiting resource affects the growth of one component crop more than that of the other. For example legumes which are commonly suppressed by an associated cereal crop may become more competitive as soil nitrogen resources are used up (Ofori and Stern 1987).
Unlike natural ecosystems where plants germinate in an environment of all ready established plants intercropped species are sown at the same time (unless relay intercropped), germinate at more or less the same time and grow to maturity within the same time interval. The environment in which the crops grow therefore changes dramatically from the beginning to the end as does the relative importance of the factors (i.e. nutrient availability, light) that influence species interactions. Initially small seedling size limits the degree of interaction between the crop component however as growth proceeds crops come to interact both below- and aboveground. Studies have shown that intercropped species initially interact belowground and that once a particular component
9
develops better access to the limiting resource and begins to deny supplies to the other, there is a tendency for a positive feedback mechanism to operate, so that the component tends to become progressively more dominant while the growth of other components may be increasingly suppressed. Towards the end of the growth, the canopies of intercrop components develop and the impact of competition for light becomes increasingly important. As competition for light favours the larger component, initial growth advantages may become strengthened towards the end of the growth (Weiner 1990). In pea-barley intercrops it is a common observation that faster emergence, root and shoot growth gives barley a head start on pea and that this initial advantage leads to dominance throughout growth of the intercrop (Hauggaard-Nielsen et al. 2001a & b) and in a model-based study by Berntsen et al. (2004), changes in canopy structure were found to have great influence on the competitive dynamics in a pea-barley intercrop.
Belowground interactions in legume-nonlegume intercrops The pattern and spatial extension of root growth displayed by a given crop is highly species and cultivar dependent however, cereals generally have much greater rooting densities than legumes (Anil et al. 1998). This difference has often lead to the conclusion that cereals are the most competitive with respect to the uptake of nutrients from the rhizosphere (Hauggaard-Nielsen et al. 2001a; Jensen 1996a), as both the supply of mobile nutrients and the ability of the roots to reach nutrients which are highly buffered and immobile in soil are more likely to be limited for crops with poor rooting systems. However, as a result of the varying strategies of plant species to further extend their rhizosphere through the development of root hairs and indirectly through mychorrhiza association (Hinsinger 1998) this pattern may not be conclusive. For example, Li et al. (1991) showed that phosphorous could be obtained from a distance of up to 12 cm by the hyphae of mychorrhizal fungi associated with white clover and Katayama et al. (1995) showed that pigeon pea developed a deeper rooting in response to competition from companion crops.
Some nutrient ions such as nitrate-N and sulphate-S are readily dissolved in water and thus move by means of mass flow, while other nutrients, such as potassium and phosphorous are easily absorbed on the surfaces of soil particles and thus move slowly in the soil. As roots absorb nutrients, an area around the absorbing root, the depletion zone, is formed. It is clear that the depletion zones in the case of mobile nutrients will be larger than those of non mobile nutrients, causing depletion zones of different plants to come into contact with one another generally sooner for mobile as opposed to non mobile nutrients (Trenbath, 1976), wherefore it may be expected that the effect of competition will be most pronounced when competition is for a mobile nutrient. However the existence of mychorrhiza, occurring in more than 80 % of flowering species, may well alter that picture. Reports of improved growth, health and stress resistance of mychorrhizal plants are widespread, particularly for plants growing under nutrient-limiting conditions (Bethlenfalvay 1992).
10
The most apparent gain from intercropping legumes and non-legumes is the opportunity for N-use complementarity (Anil et al. 1998; Fukai and Trenbath 1993; Jensen 1996a; Ofori and Stern 1987; Tofinga et al. 1993). The legume being forced to rely on N2 fixation when the non legume is more competitive for soil inorganic nitrogen (N). According to Tofinga et al. (1993) root competition from cereals decreased the mineral N concentration in the rhizosphere to an extent that the exposure concentration to pea inadvertently stimulated and augmented the proportion of N derived from rhizobial fixation. Jensen (1996a) pointed to pea-barley cropping as an opportunity of increasing the input of fixed N into the cropping system without compromising cereal N use or yield, as pea was much less competitive for soil inorganic N. However, a number of studies have produced less convincing results implying that the mechanism of N use complementarity is not clear cut (Waterer et al. 1994) and that N balances in grain legume-cereal rotations may be positive or negative depending on the choice of legume species or cultivar, the symbiotic performance, and agronomic factors such as sowing practice and relative planting dates (Chalk 1998).
An exciting aspect of N interactions in intercrops is whether non legumes intercropped with legumes may benefit from a direct transfer of fixed N. A process that has been shown to occur in a number of studies (Jensen, 1996b; Waterer et al., 1994) and has failed to be shown in others (Izaurralde et al. 1992; Jensen 1996a). Much attention has been focused on gaining an understanding of the magnitude and the mechanism of N transfer between intercropped crops, in a wide array of intercropping scenarios. For example Jensen (1996b) found that barley obtained 19% of its N from intercropped pea, in a split-root experiment. Transferred nitrogen has been proposed to stem from both the rapid mineralization of organic N deposited in the rhizosphere by the growing legume (Jensen 1996b; Paynel et al. 2001) and from decomposed foliage lost and mineralised within the growth period of the intercrop (Høgh-Jensen and Schjørring 2000). As suggested by Paul and Clark (1989) a substantial part of the transfer may be mediated by root associated mychorrhiza fungi. In line with this Waterer et al. (1994) suggested that the lack of N transfer that they observed from pea to a companion mustard crop was due to the non-mychorrhizal status of mustard.
Nitrogen is no doubt the nutrient that has been given most attention in temperate legume-nonlegume intercrop studies however some work has looked at the uptake of phosphorous in intercrops. Studies have shown that root exudates from intercropped legumes may increase phosphorous availability to an extent that exceeds the requirement of the legume, with the remainder being available to associated non legume crops (Ae et al. 1990; Marschner et al. 1986).
Methodology Experimental designs for intercrop studies Three basic experimental designs are commonly used in agricultural competition experiments. The essential features of each can be described by plotting the mixtures they
11
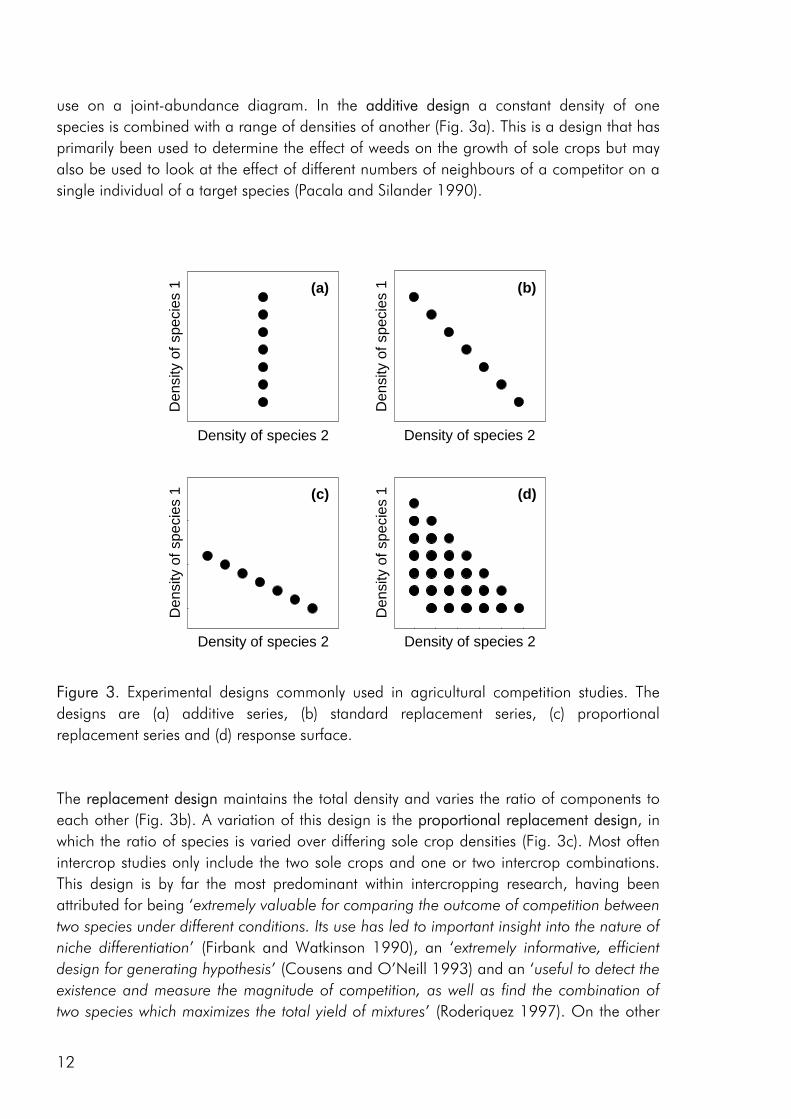
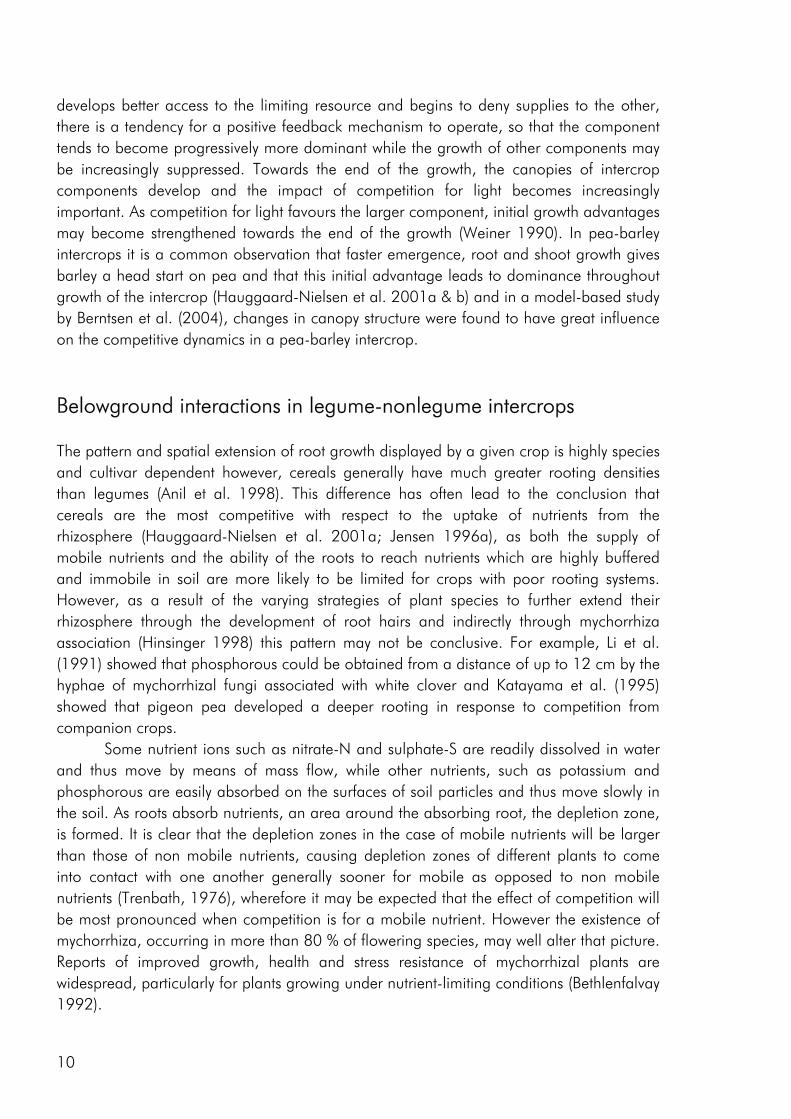
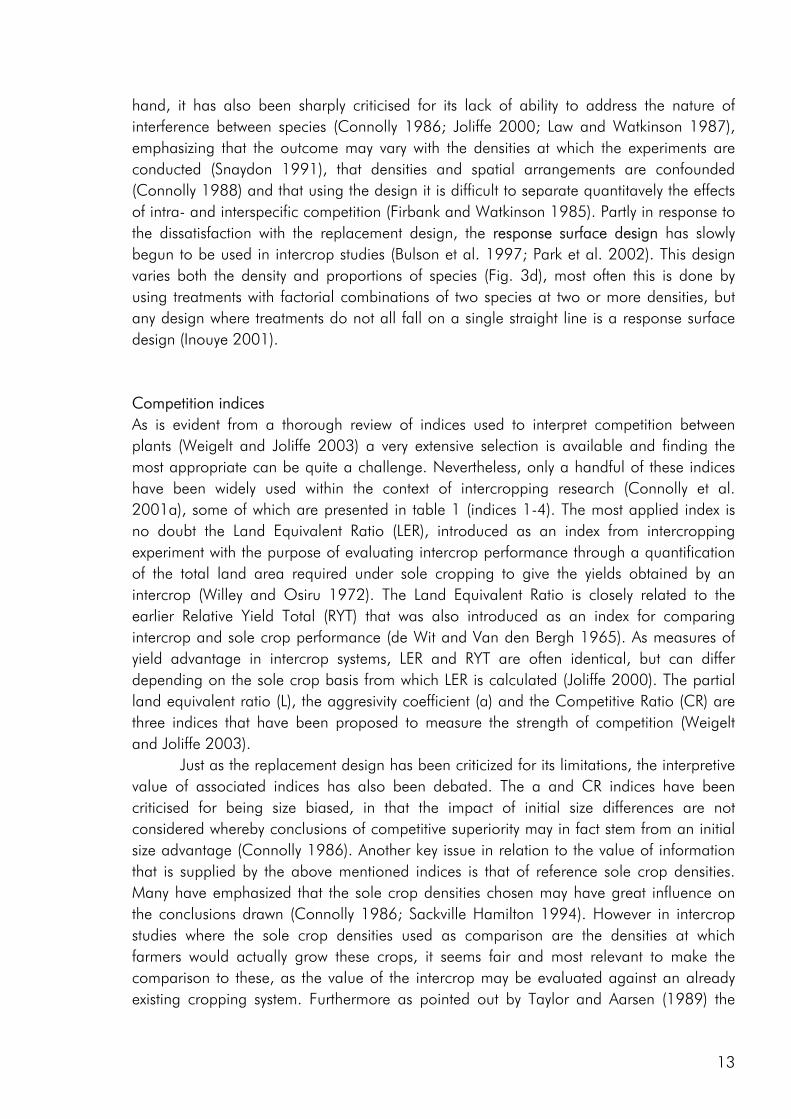
use on a joint-abundance diagram. In the additive design a constant density of one species is combined with a range of densities of another (Fig. 3a). This is a design that has primarily been used to determine the effect of weeds on the growth of sole crops but may also be used to look at the effect of different numbers of neighbours of a competitor on a single individual of a target species (Pacala and Silander 1990).
Density of species 2
Den
sity
of s
peci
es 1 (a)
Density of species 2
Den
sity
of s
peci
es 1 (b)
Density of species 2
Den
sity
of s
peci
es 1 (c)
Density of species 2
Den
sity
of s
peci
es 1 (d)
Figure 3. Experimental designs commonly used in agricultural competition studies. The designs are (a) additive series, (b) standard replacement series, (c) proportional replacement series and (d) response surface. The replacement design maintains the total density and varies the ratio of components to each other (Fig. 3b). A variation of this design is the proportional replacement design, in which the ratio of species is varied over differing sole crop densities (Fig. 3c). Most often intercrop studies only include the two sole crops and one or two intercrop combinations. This design is by far the most predominant within intercropping research, having been attributed for being ‘extremely valuable for comparing the outcome of competition between two species under different conditions. Its use has led to important insight into the nature of niche differentiation’ (Firbank and Watkinson 1990), an ‘extremely informative, efficient design for generating hypothesis’ (Cousens and O’Neill 1993) and an ‘useful to detect the existence and measure the magnitude of competition, as well as find the combination of two species which maximizes the total yield of mixtures’ (Roderiquez 1997). On the other
12
hand, it has also been sharply criticised for its lack of ability to address the nature of interference between species (Connolly 1986; Joliffe 2000; Law and Watkinson 1987), emphasizing that the outcome may vary with the densities at which the experiments are conducted (Snaydon 1991), that densities and spatial arrangements are confounded (Connolly 1988) and that using the design it is difficult to separate quantitavely the effects of intra- and interspecific competition (Firbank and Watkinson 1985). Partly in response to the dissatisfaction with the replacement design, the response surface design has slowly begun to be used in intercrop studies (Bulson et al. 1997; Park et al. 2002). This design varies both the density and proportions of species (Fig. 3d), most often this is done by using treatments with factorial combinations of two species at two or more densities, but any design where treatments do not all fall on a single straight line is a response surface design (Inouye 2001). Competition indices As is evident from a thorough review of indices used to interpret competition between plants (Weigelt and Joliffe 2003) a very extensive selection is available and finding the most appropriate can be quite a challenge. Nevertheless, only a handful of these indices have been widely used within the context of intercropping research (Connolly et al. 2001a), some of which are presented in table 1 (indices 1-4). The most applied index is no doubt the Land Equivalent Ratio (LER), introduced as an index from intercropping experiment with the purpose of evaluating intercrop performance through a quantification of the total land area required under sole cropping to give the yields obtained by an intercrop (Willey and Osiru 1972). The Land Equivalent Ratio is closely related to the earlier Relative Yield Total (RYT) that was also introduced as an index for comparing intercrop and sole crop performance (de Wit and Van den Bergh 1965). As measures of yield advantage in intercrop systems, LER and RYT are often identical, but can differ depending on the sole crop basis from which LER is calculated (Joliffe 2000). The partial land equivalent ratio (L), the aggresivity coefficient (a) and the Competitive Ratio (CR) are three indices that have been proposed to measure the strength of competition (Weigelt and Joliffe 2003).
Just as the replacement design has been criticized for its limitations, the interpretive value of associated indices has also been debated. The a and CR indices have been criticised for being size biased, in that the impact of initial size differences are not considered whereby conclusions of competitive superiority may in fact stem from an initial size advantage (Connolly 1986). Another key issue in relation to the value of information that is supplied by the above mentioned indices is that of reference sole crop densities. Many have emphasized that the sole crop densities chosen may have great influence on the conclusions drawn (Connolly 1986; Sackville Hamilton 1994). However in intercrop studies where the sole crop densities used as comparison are the densities at which farmers would actually grow these crops, it seems fair and most relevant to make the comparison to these, as the value of the intercrop may be evaluated against an already existing cropping system. Furthermore as pointed out by Taylor and Aarsen (1989) the
13
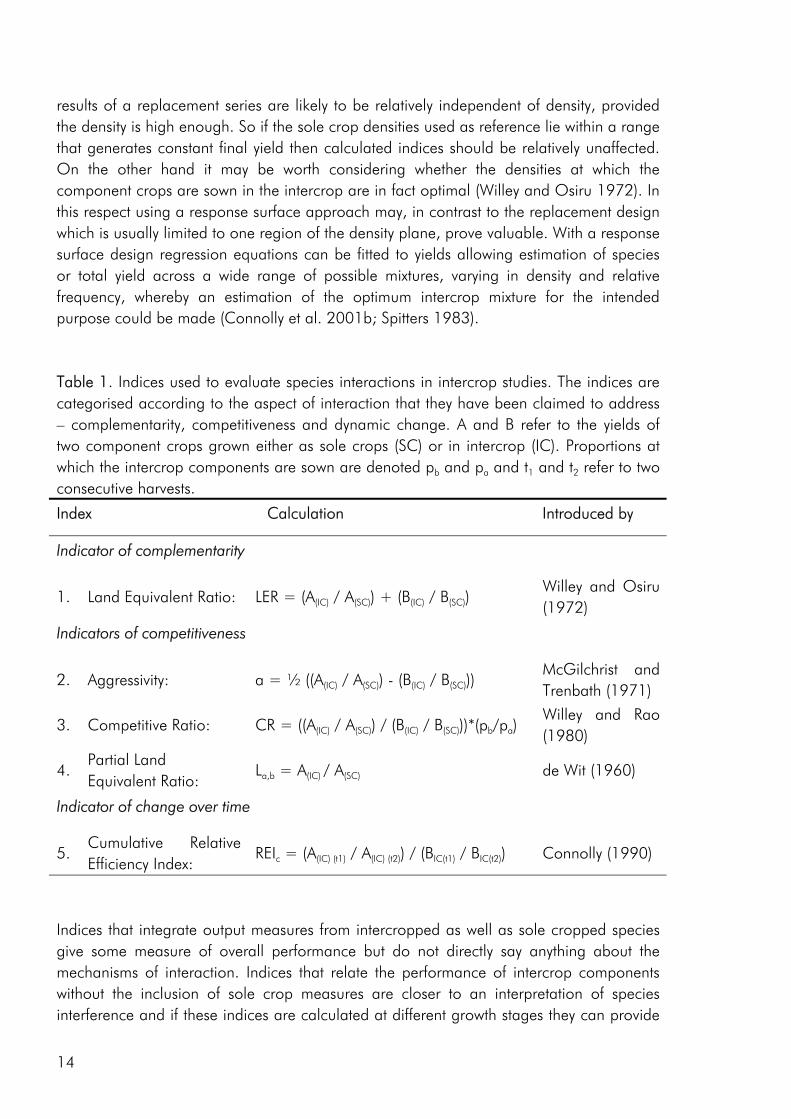
results of a replacement series are likely to be relatively independent of density, provided the density is high enough. So if the sole crop densities used as reference lie within a range that generates constant final yield then calculated indices should be relatively unaffected. On the other hand it may be worth considering whether the densities at which the component crops are sown in the intercrop are in fact optimal (Willey and Osiru 1972). In this respect using a response surface approach may, in contrast to the replacement design which is usually limited to one region of the density plane, prove valuable. With a response surface design regression equations can be fitted to yields allowing estimation of species or total yield across a wide range of possible mixtures, varying in density and relative frequency, whereby an estimation of the optimum intercrop mixture for the intended purpose could be made (Connolly et al. 2001b; Spitters 1983). Table 1. Indices used to evaluate species interactions in intercrop studies. The indices are categorised according to the aspect of interaction that they have been claimed to address – complementarity, competitiveness and dynamic change. A and B refer to the yields of two component crops grown either as sole crops (SC) or in intercrop (IC). Proportions at which the intercrop components are sown are denoted pb and pa and t1 and t2 refer to two consecutive harvests.
Index Calculation Introduced by
Indicator of complementarity
1. Land Equivalent Ratio: LER = (A(IC) / A(SC)) + (B(IC) / B(SC)) Willey and Osiru (1972)
Indicators of competitiveness
2. Aggressivity: a = ½ ((A(IC) / A(SC)) - (B(IC) / B(SC))) McGilchrist and Trenbath (1971)
3. Competitive Ratio: CR = ((A(IC) / A(SC)) / (B(IC) / B(SC)))*(pb/pa) Willey and Rao (1980)
4. Partial Land Equivalent Ratio:
La,b = A(IC) / A(SC) de Wit (1960)
Indicator of change over time
5. Cumulative Relative Efficiency Index:
REIc = (A(IC) (t1) / A(IC) (t2)) / (BIC(t1) / BIC(t2)) Connolly (1990)
Indices that integrate output measures from intercropped as well as sole cropped species give some measure of overall performance but do not directly say anything about the mechanisms of interaction. Indices that relate the performance of intercrop components without the inclusion of sole crop measures are closer to an interpretation of species interference and if these indices are calculated at different growth stages they can provide
14
valuable insight. The cumulative Relative Efficiency Index (REIc; table 1 (index 5)) is a good example of an index that compares the relative efficiency (growth, nutrient uptake) of one intercrop component to that of another over a time interval, an index that may be used to study changes in the performance of intercropped species over the course of growth.
As most intercrop studies only include one final harvest (Connolly et al. 2001a) the indices used evaluate the outcome of species interactions however, plant-plant interactions may vary temporally, as the individuals involved develop, modify one another, and use and modify the resource pool that supports them. Including sequential harvests spanning the growth of an intercrop could give valuable knowledge of the dynamic interactions that produce the final outcome (Connolly et al. 1990 & 2001b). Data from consecutive harvests allow for competition indices to be used to track the progress and results of species interaction over time and would also make it possible to fit data to growth models, providing more information on the mechanisms involved as species compete (Weigelt and Jolliffe 2003). Increased appreciation of competition as a process could potentially enable us to develop intercropping systems that to a greater degree utilise the advantages of interactions between crop species.
15

16
3SYNTHESIS
In this chapter the results of the experiments addressed in the four appended papers are summarized and discussed in relation to the objectives put forward in the introduction of this thesis (chapter 1). Firstly a discussion of the link between intercrop diversity, yield and nutrient use, secondly a discussion of the impact of crop diversity, density and the relative frequency of component crops as well as soil fertility on the observed competition dynamics and finally an evaluation of the methodology applied. In the text the field study that provided data for paper 1 and 2 is referred to as “the 2000 field study”, the pot study that formed the basis of paper 3 is denoted “the pot study” and finally the field study that supplied data for paper 4 as “the 2001 field study”.
Crop diversity, yield and nutrient use As a result of greater structural and functional versatility than individual crops intercrops have been found to exploit environmental resources more completely (Hauggaard-Nielsen et al. 2001a; Jensen 1996a), be less vulnerable to attack from insects and disease (Fukai and Trenbath 1993) and sustain productivity under varying environmental conditions (Anil et al. 1998). But do intercrops have the potential of outyielding (in absolute terms) the comparable sole crops? Evidence does exist that productivity can be enhanced in intercrops (Fukai and Trenbath 1993; Vandermeer 1989). However, in the majority of studies intercrop yields are intermediate to the two sole crops or comparable to those of the highest yielding sole crop (i.e. Ghanbari-Bonjar and Lee 2002; Hauggaard-Nielsen et al. 2001a; Jensen 1996a). In the three experimental studies, that form the basis of this thesis, intercrop biomass and grain yields were either intermediate or comparable to the yields of the higher yielding sole crop (i.e. paper 1: fig. 2). However when evaluating the performance of intercrops on the basis of Land Equivalent Ratio (LER) values calculated from dry matter data, benefits of intercropping were apparent for almost all intercrop
17
combinations included (i.e. paper 3: table 2), indicating that the included crop species complemented or facilitated the growth of one another.
As noted by Bengtsson (1998) the link between diversity and ecosystem function goes through the species and functional groups included. The three crops included in the experimental work of this thesis were chosen on the basis of assumed differences in their effect on and response to the growing environment. Among these the ability of pea to fix atmospheric nitrogen, the ability of barley and pea, unlike rape, to enter into a mychorrhizal symbiosis, difference in aboveground morphology and differences in phenological development, the time from germination to maturity of sole cropped rape exceeding that of pea and barley. As for dry matter production, LER values calculated on the basis of nitrogen (N) and sulphur (S) accumulation data indicated that there were intercrop benefits in the three studies included in this thesis (i.e. paper 4: fig. 4). And as for dry matter production the N and S accumulated by the intercrops was intermediate to that of the corresponding sole crops or comparable to one of the sole crops (i.e. paper 4: fig. 5).
Nitrogen use complementarity The legume-nonlegume intercrop is an intercrop combination that is unique in that the two components grown under the right conditions may use different N sources. It has been shown that the advantages of mixing a legume and non legume are greatest under N limiting growth conditions (Hauggaard-Nielsen et al. 2001a; Jensen 1996a; Ofori and Stern 1987), as was also the case in the present work. In all three studies, the N2 fixing ability of pea gave rise to N complementarity in the included intercrops and in the 2000 field study, competition from a nonlegume increased the percentage of pea N accumulation derived from fixation (%Ndfa), in almost all intercrops (paper 1: table 6) whereas in the 2001 field study, where corresponding intercrops of pea and barley were cropped at three densities, pea only increased %Ndfa when intercropped at low density (paper 4: fig. 6). Results from the 2000 field study, that included four intercrop combinations (pea-barley, pea-rape, barley-rape and pea-barley-rape), indicated that the benefits achieved from the association of a legume and nonlegume, in terms of N2 fixed may depend on the competitive impact of the nonlegume. Although differences were not significant pea fixed more N2 when grown with rape than in combination with the more competitive barley crop (paper 1: fig. 6), indicating that the benefits achieved from the association of a legume and nonlegume are partly lost if the nonlegumes is too strong a competitor. The barley-rape intercrop included in the 2000 field study attained an overall LER value (calculated on the basis of total aboveground biomass yield) comparable to that of the legume holding intercrops at the low level of N addition (paper 1: fig. 3), indicating the presence of complementarity between the two non-legumes. Complementarity was not for total N-uptake however rape, unlike barley, continued to accumulate N up to the end
18
of the studied growth period indicating that differences in the temporal development of the two crop species could be the explanation.
Competitive dynamics The three studies showed that the barley component of the intercrops had an initial growth advantage, barley seedlings emerging before those of pea and rape. The importance of emergence time in determining the competitive balance between plant sown at the same time has been emphasized in numerous studies (Bellostas et al. 2003; Hauggaard-Nielsen et al. 2001a; Tofinga et al. 1993). As growth proceeds and plants come into closer proximity, initial size differences may be strengthened through the impact of asymmetric competition for light (Weiner 1990). However growth conditions, whether relating to the growth environment or the cropping strategy employed, may alter this balance. In the 2001 field study the impact of cropping density clearly altered the competitive balance between pea and barley, the competitive impact of pea increasing with density (paper 4: figure 3). Intercrop dynamics may also be altered by the availability of nutrients in the growth medium. In a field study by Jensen (1996a), the addition of 40-50 kg N ha-1 altered the balance between intercropped pea and barley, strengthening the growth of barley at the expense of pea growth. In the 2000 field study a similar observation was made, the addition of 40 kg N ha-1 strengthening the growth of both nonlegumes, whereas the growth of intercropped pea was strongly suppressed. In the pot experiment limited soil N availability played a pivotal role in creating the nutrient and growth dynamics in the pea–barley intercrop. Initially barley was at an advantage however the ability of pea to fix atmospheric nitrogen became significant and by the end of the growth season pea had become dominant (paper 3: figure 1). In the pot experiment the role of S availability on the competitive balance between intercropped pea and barley was addressed. However, the overriding impact of low soil N availability appeared to predetermine that the pea component would become the stronger competitor for S.
In the 2000 field study, increasing the intercrop diversity from two to three species did not bring about an increase in intercrop performance, neither with respect to biomass production nor N accumulation, however the competitive and complementary interactions between species were altered by the presence of an additional crop component (paper 1). Barley was more competitive for soil N when grown in either of the two dual intercrops than in the tri-component intercrop, indicating that the presence of multi-species interactions diminished the impact of the dominant. As discussed by Vandermeer (1989) one component, call it A may have a positive indirect effect on component B through its competitive effect on component C. The depression of barley in the tri-component mixture may well be the result of the improved growth of both rape and pea as a result of indirect facilitation. A parallel can be made to the situation where one component of a dual intercrop exerts a strong competitive impact on the weeds growing in the system, thereby providing an environment of reduced weed biomass for the other crop (Vandermeer 1989). In the 2001 field study competition from barley had a significant effect on the
19
growth of weeds and in the pea-barley intercrops the pea component may well have benefited from this (paper 3).
Methodology The methodology used to evaluate competitive interactions has been widely discussed and much criticism has been laid on the replacement design and the associated indices. However there is increasing acknowledgement that albeit weaknesses, this design may have its justification for some purposes just as it is useless for others. Most intercrop studies with agronomic aims, are naturally concerned with the issue of yield and economy and in this respect the replacement design allows for a comparison with the established sole cropping practise. However a central concern with using the replacement design to evaluate the potential of intercrops is that it builds on the assumption that the optimal intercrop density is directly determined by the optimal sole crop densities. This may very well not be the case (Willey and Osiru 1972). Studies that employ the alternative response surface design, that varies both density and relative frequency of component crops should therefore be encouraged in search of the true optimal mixtures for a broad range of objectives (biomass productivity, quality of yield, weed competition etc.) (Park et al. 2002). A design that has been used in very few intercrop studies (Bulson et al. 1997; Park et al. 2002), among these the 2001 field study that is the basis of paper 4.
The multivariate nature of intercrop responses is generally ignored by combining the responses of different crop species into a single index such as the Land Equivalent Ratio (LER) or Competitive Ratio (CR) (Connolly et al. 2001a). Both measures are multi-component measure, being determined by numerous factors including density, competitive ability of component crops, crop morphology and duration as well as management variables. However the value of these indices is increased if they are used to track interaction dynamics over time (Weigelt and Joliffe 2003) or as a function of cropping density. All three experimental studies included in this thesis, included a minimum of three sequential harvests, giving valuable indications of how competitive hierarchies were established and changed over time, an issue that is commonly neglected in intercrop studies (Gibson et al. 1999; Connolly et al. 2001b). Including several harvests allowed for the fitting of data from the 2000 field study to a logistic growth model and for the use of the cumulative Relative Efficiency Index (REIc), to track changes in relative performance of intercropped species over the course of growth (paper 3 and 4).
20
4CRITICAL REFLECTIONS
Project relevance In the 2005 review of the 2001 Gothenburg Strategy for Sustainable Development (SEC(2005)225) the increasing pressure that we are putting on our natural resources and biodiversity is seen as one of the most serious threats to sustainable development in Europe and the world. In this light the theme of the present thesis appears to be very relevant, linking the questions of how crop diversity may benefit the performance of our cropping systems through a more efficient use of available growth resources. Most of the statements and declarations regarding biodiversity, that are put forward by the EU Commission and other European governing organs are primarily aimed at the diversity of natural habitats. However, I believe that the role of agriculture as a provider of diversity should be given more emphasis. We today have a farming system that supports very few species, on a global scale, only three crop species (wheat, rice and maize) provide half of the world’s plant derived calorie intake (Cromwell et al. 2000). This uniformity has created a system that is vulnerable to pests and disease (Altieri 1999) and that is utterly dependent on the supply of fertilisers and pesticides from the outside. More diverse cropping systems would introduce a greater degree of self-regulation (Tilman and Downing 1994) and make it possible for cropping systems to provide some of the ecosystem services that they are today accused of harming. For example closing nutrient cycles thereby limiting losses to the environment as is the case with nitrate-N leaching (Hauggaard-Nielsen 2001), regulation of undesirable organisms (Finckh and Wolfe 1998) and building soil fertility (Russell 2002).
Project planning A ph.d. is a learning process which has been reflected in a continued re-evaluation of the initial project planning. The initial project plan has not been greatly revised however the
21
issue of methodology used in intercrop research has received more focus than originally planned. I believe that this has strengthened the overall project, as the use of indicators and experimental methods should be carefully tailored to the specific objectives of the studies wherefore a good understanding of the limits and strengths of different approaches is a clear asset. Looking back on the studies that have formed the basis of this thesis the question of whether some things should have been done differently is raised. In general I am quite satisfied with the way the three experiments were carried out, from the planning phase and to the writing up of the papers however a few issues should be mentioned.
The main objective of the pot study was to evaluate the effect of sulphur (S) availability on the interspecies dynamics of a pea – barley intercrop. However, low soil nitrogen (N) availability became the structuring factor, strongly limiting the growth of the barley crop and giving rise to a strong dominance of the N2 fixing pea crop. In retrospect, we could have added N to limit the effects of N limitation whereby S effects could have become clearer. In the pot study we intended to measure nitrogen fixation by using the natural abundance technique, a technique that bases its calculations on the differences in the 15N enrichment of N2 fixing and non fixing crops, resulting from differences in the natural 15N enrichment of the soil N and atmospheric N pools, that they tap. However reliable calculations can only be made if the enrichment of the non fixing crop exceeds a set minimum value and in the pot study this was unfortunately not the case. As the natural abundance technique had not previously been used to determine N2 fixation of crops grown on the used soil, a better knowledge of the soil and N-dynamics at the site should have been established before the technique was applied.
In the 2001 field study the inclusion of eight replicates of each measured variable, opposed to four in the two other studies, can naturally been seen as a strength however, it covers over the fact that the study included two weed levels. Rape was sown as a model weed at two densities however as a result of pest attack the model weed was not well established and therefore not included as a factor in the analysis of data from the study.
Data for this thesis was collected from both field studies and a pot study which warrants a short discussion of why both experimental settings were included. The issue of S availability on species interaction dynamics was addressed in a pot study because we in this way believed that it would be easier to study the effects on competition of single factors when other variables were held constant. The soil was more homogeneous between experimental units, hand watering ensured that water availability was not limiting, lodging was avoided and the plant numbers intended in each treatment were attained. However as pointed out by Cousens (2000) hand watering can lead to large inequalities, light can vary considerably between units and is very different from that experienced in the field, and rooting space is restricted. Consequently crop growth in pots and on the field will be very different and it is important to acknowledge that a pot study may help point at issues that could be of importance under field condition but they may in part be artefacts of the conditions created.
22
5OUTLOOK
The purpose of much agricultural research is to optimise already existing systems (Weiner 2002) which in the context of cropping systems means striving for greater crop yields. However we may often be too conservative in the way we approach the challenge. As was exemplified by Weiner (2002) the situation may be seen as a multidimensional adaptive landscape, the axis of which represent the many structuring factors of a cropping system. A landscape that has both “hills” and “valleys”, corresponding to maximum and minimum yield situations. Most researchers are today reaching for one maximum however the true maximum could lie in an area of the landscape far away from present day practise. This is an interesting idea that calls for intercropping research to become increasingly explorative. For example through an increasing use of experimental designs such as the response surface, that includes intercrops sown at densities very different from those recommended for sole crops and possibly through an increasing diversification of the intercropping practise and cropping systems in general.
The intercropping advantages gained from assembling different species are the result of functional diversity. Few functional attributes have been the focus of most intercrop research – among these the ability of legumes to fix nitrogen has been predominant (Hauggaard-Nielsen et al. 2001a; Ofori and Stern 1987). However, other attributes could well prove valuable. As I see it, we need to identify those system functions that are currently suboptimal and then attempt to identify the suite of species that may support these functions. A good example is the issue of nitrate leaching in temperate cropping system, increased knowledge of differences in the rooting pattern and sink strength of varying crop species could help to assemble species that could counteract nitrate leaching. Similarly specific intercrop combinations have been found to limit the prevalence of specific pests and diseases (Trenbath 1993) through an array of mechanisms and further research in this area would be valuable. The ability of intercropped species to respond differently to the availability of growth resources or conditions of the growing environment could also be used to level out spatial variability. For example a legume-nonlegume intercrop may through compensatory growth among
23
species in response to the spatial variability in soil N availability across a field provide more homogeneous growth in space.
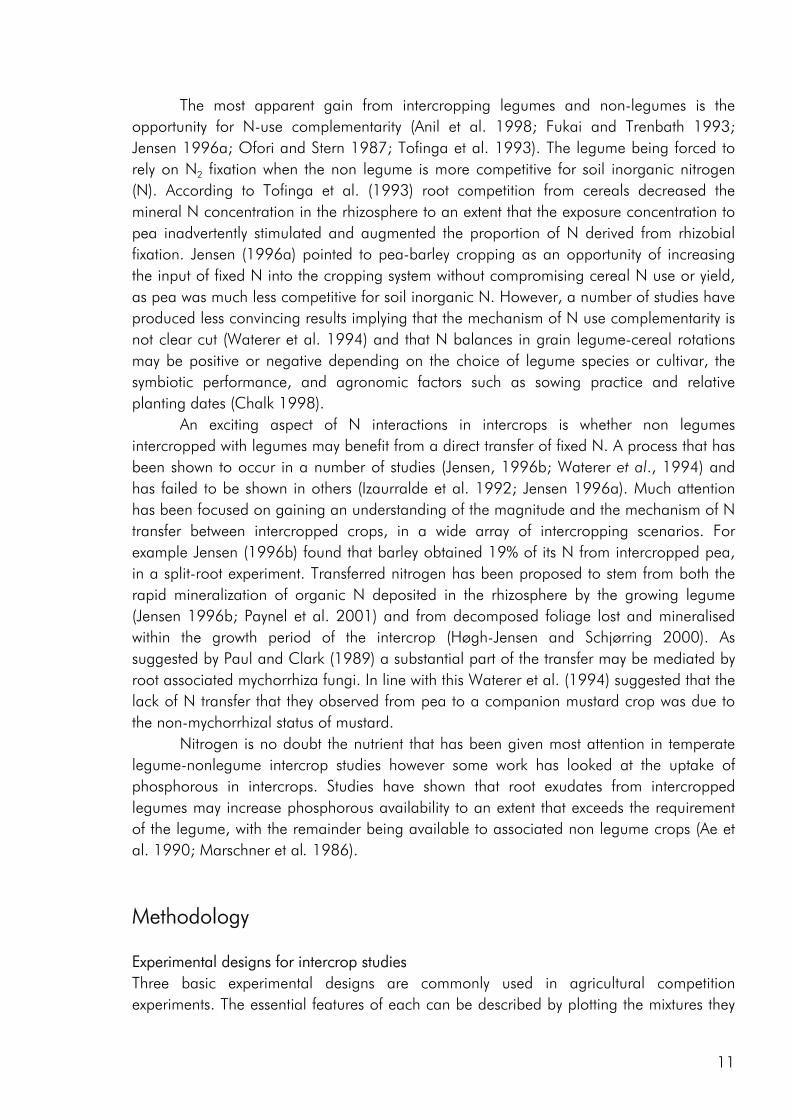
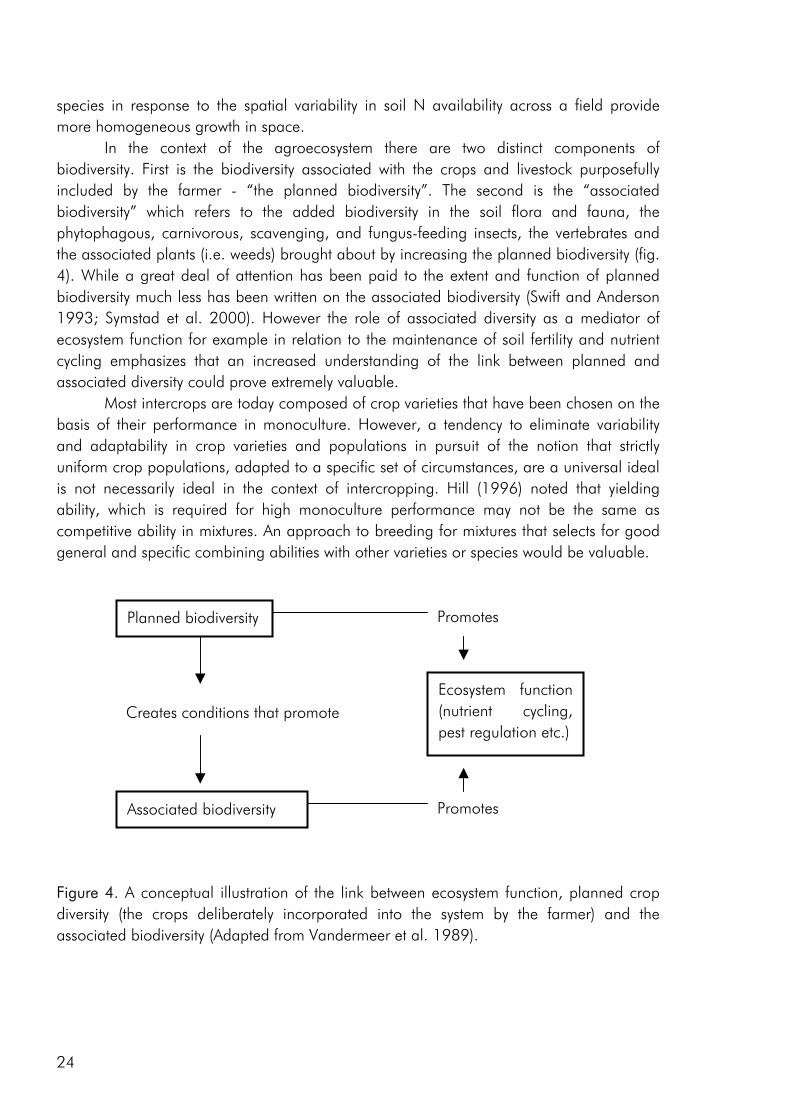
In the context of the agroecosystem there are two distinct components of biodiversity. First is the biodiversity associated with the crops and livestock purposefully included by the farmer - “the planned biodiversity”. The second is the “associated biodiversity” which refers to the added biodiversity in the soil flora and fauna, the phytophagous, carnivorous, scavenging, and fungus-feeding insects, the vertebrates and the associated plants (i.e. weeds) brought about by increasing the planned biodiversity (fig. 4). While a great deal of attention has been paid to the extent and function of planned biodiversity much less has been written on the associated biodiversity (Swift and Anderson 1993; Symstad et al. 2000). However the role of associated diversity as a mediator of ecosystem function for example in relation to the maintenance of soil fertility and nutrient cycling emphasizes that an increased understanding of the link between planned and associated diversity could prove extremely valuable.
Most intercrops are today composed of crop varieties that have been chosen on the basis of their performance in monoculture. However, a tendency to eliminate variability and adaptability in crop varieties and populations in pursuit of the notion that strictly uniform crop populations, adapted to a specific set of circumstances, are a universal ideal is not necessarily ideal in the context of intercropping. Hill (1996) noted that yielding ability, which is required for high monoculture performance may not be the same as competitive ability in mixtures. An approach to breeding for mixtures that selects for good general and specific combining abilities with other varieties or species would be valuable.
Promotes
Ecosystem function(nutrient cycling,pest regulation etc.)
Associated biodiversity Promotes
Planned biodiversity
Creates conditions that promote
Figure 4. A conceptual illustration of the link between ecosystem function, planned crop diversity (the crops deliberately incorporated into the system by the farmer) and the associated biodiversity (Adapted from Vandermeer et al. 1989).
24
Intercropping as a sustainable cropping practise The concept of sustainability is used in many contexts and means different things to different people with different perspectives – economical, social or ecological (Ayres et al. 2001). It is a concept that has been used increasingly over the last 20 to 30 years, to an extent that it has turned into a buzz word and according to some, with a conceptual erosion of the word as an effect (Gamborg and Sandø 2003). Concerns with the way many cropping systems are currently managed with a very low degree of planned diversity has increased interest in production systems of intermediate diversity and complexity, such as intercropping and agroforestry systems (Vandermeer 1989; Francis 1986; Huxley 1983), systems that are proposed to increase system sustainability: “knowledge of functional characteristics of component species could aid in sustainable management of low-diversity intercropping systems” (Hooper and Vitousek 1997); “The stability and sustainability of all systems may be enhanced by maintaining species and landscape diversity” (Jordan 1995). Discussions of sustainability in relation to role played by agrobiodiversity are often focussed on the issue of environmental sustainability however some have taken it further to include aspects of social and economical sustainability (i.e. Altieri 1999; Vandermeer et al. 1998). Environmental sustainability is commonly associated with the following three issues: i) stability – the capacity of the system to maintain a non-declining yield over time without causing environmental degradation; ii) resilience – the ability of a system to withstand stress and disturbance; iii) biotic diversity – both for its material and immaterial value. How does intercropping relate to this? Intercropping increases diversity directly (planned) and indirectly (associated), thereby increasing system complexity an aspect that has been argued to increase ecosystem functioning and resilience (Ehrlich 1988). Differences in the response of component crops to climate, soil conditions, disease etc. have been argued to increased yield stability (Altieri 1999) and facilitation and complementarity between species may give rise to a more efficient use of available resources and has been argued to keep nutrient cycles more closed (Hauggaard-Nielsen 2001).
Two issue of sustainability relating to the practical introduction of intercrops to the farmers field are worth mentioning, one relating to the issue of crop disease and the other to the practical handling of intercrops. When combining a grain legume and a cereal in an intercrop, as is common practice in Denmark, it is often observed that the relative protein yield of the grain legume component is reduced relative to the sole crop. To maintain grain legume yields a greater amount of these must be included in the rotation. However despite the general assumption that increased diversity of an intercrop relative to a sole crop will help to alleviate disease development, the inclusion of more grain legumes in a cereal rotation as either sole- or intercrops will shorten the interval between the growing of grain legumes, potentially giving problems with pathogen attacks. This issue has been and is being addressed in two danish research projects under DARCOF (Danish Research Centre for Organic Farming). In one of these differences in the specialisation, pathogenicity and importance of fungal species isolated from the grain legumes pea, faba bean and lupine are studied in order to elucidate the host range of soil-borne pathogens
25

among the grain legumes, identify resistant material, and propose a strategy to avoid unintended build up of pathogens. Another issue that has often been raised by farmers and relates to the sustainability of the practise, is the challenge of separating the seeds of the intercropped species following harvest, an important issue if the practise is to be accepted. However methods have been developed and this is no longer a serious hurdle but as a logistic obstacle to be solved by the involved industries acting on the market.
26
6REFERENCES
Aarssen LW (1997) High productivity in grassland ecosystems: effected by species diversity or
productive species? Oikos 80(1): 183-184. Ae N, Arihara J, Okada K, Yoshihara T and Johansen C (1990) Phosphorous uptake by pigeon
pea and its role in cropping systems of the Indian subcontinent. Science 248: 477-480.
Altieri MA (1990) Why study traditional agriculture? In: Carrol CR, Vandermeer JH and Rosset PM (Eds) Agroecology. McGraw Hill, New York, New York, USA.
Altieri MA (1999) The ecological role of biodiversity in agroecosystems. Agriculture, Ecosystems and Environment 74 (1-3): 19-31.
Andrews DJ and Kassam AH (1976) Importance of multiple cropping in increasing world food supplies. In: Papendick RI, Sanchez A and Triplett GB (Eds) Multiple cropping. American Society of Agronomy Spec. Pub. 27. Pp 1-10.
Anil L, Park RHP and Miller FA (1998) Temperate intercropping of cereals for forage: a review of the potential for growth and utilization with particular reference to the UK. Grass Forage Science 53: 301-317.
Ayres RU, van den Bergh JCJM and Gowdy JM (2001) Strong and Weak Sustainability: Economic, Natural Sciences, and “Consilience”. Environmental Ethics. 23 (2): 155-68.
Bannon FJ and Cooke BM (1998) Studies on dispersal of Septoria tritici pycnidiospores in wheat-clover intercrops. Plant Pathology 47(1): 49-56
Begon M, Harper JL and Townsend CR (1996) Ecology – individuals, populations and communities. Third Ed. Blackwell Science Ltd. Australia.
Bellostas N, Hauggaard-Nielsen H, Andersen M and Jensen ES (2003) Early interference dynamics in intercrops of pea, barley and oilseed rape. Biological Agriculture and Horticulture 21: 337-348.
Bengtsson J (1998) What species? What kind of diversity? Which ecosystem function? Some problems in studies of relations between biodiversity and ecosystem function. Applied Soil Ecology 10: 191-199.
Berntsen J, Hauggaard-Nielsen H, Olesen JE, Petersen BM, Jensen ES and Thomsen A (2004) Modelling dry matter production and ressource use in intercrops of pea and barley. Field Crops Research 88: 69-83.
27
Bethlenfalvay GW (1992) Mychorrhizae and crop productivity. In: Mychorrhiza in sustainable agriculture. Bethlenfalvay GW and Linderman RG (Eds). American Society of Agronomy. Pp. 1-27.
Björklund J (2003) Ecosystem services in an agricultural context. In Ecosystem services in European agriculture – theory and practice. Kungl. Skogs- och Lantbruksakademiens Tidskrift 1. International conference in Falkenberg September 14-16. Pp. 21-24.
Boudreau MA and Mundt CC (1992) Mechanisms of alteration in bean rust epidemiology due to intercropping with maize. Phytopathology 82(10): 1051-1060.
Bulson HAJ, Snaydon RW and Stopes CE (1997) Effects of plant density on intercropped wheat and field beans in an organic farming system. Science 128: 59-71.
Callaway RM (1995) Positive interactions among plants. The Botanical Review 61(4): 306-349. Cassman KG (1999) Ecological intensification of cereal production systems: Yield potential, soil
quality, and precision agriculture. Proceedings of the National Academy of Sciences of the United States of America 86: 5952-5959.
Chalk PM (1998) Dynamics of biologically fixed N in legume-cereal rotations: a review. Australian Journal of Agricultural Research 49: 303-316.
Chiariello N, Hickman JC and Mooney HA (1982) Endomycorrhizal role for interspecific transfer of phosphorous in a community of annual plants. Science 217: 941-943.
Connolly J, Goma HC and Rahim K (2001a) The information content of indicators in intercropping research. Agriculture, Ecosystems and Environment 87(2): 191-207.
Connolly J, Wayne P and Bazzaz F (2001b) Interspecific Competition in Plants: How Well Do Current Methods Answer Fundamental Questions? The American Naturalist 157(2): 107-125.
Connolly J, Wayne P and Murray R (1990) Time course of plant-plant interactions in experimental mixtures of annuals - density, frequency, and nutrient effects. Oecologia 82: 513-526.
Connolly J (1986) On difficulties with replacement-series methodology in mixture experiments. Journal of Applied Ecology 23: 125-137.
Connolly J (1988) Experimental methods in plant competition research in crop weed systems. Weed Research 28: 431-436.
Corre-Hellou G and Crozat Y (2004) Interspecific competition for soil N in pea-barley mixtures during the vegetative phase and consequences of N2 fixation. In: AEP (Ed.) 5th European Conference on Grain Legumes - Legumes for the benefit of agriculture, nutrition and the environment: their genomics, their products, and their improvement. Dijon, France, June 7-11, pp. 65-66.
Cousens R and O’Neill M (1993) Density-dependence of replacement series experiments Oikos 66: 347-352.
Cousens R (2000) Greenhouse studies of interactions between plants: the flaws are in interpretation rather than design. Journal of Ecology 88: 352-353.
Crews TE and Peoples MB (2004) Legume versus fertilizer sources of nitrogen: ecological tradeoffs and human needs. Agriculture, Ecosystems and Environment 102: 279-297.
Cromwell D, Cooper D and Molvany P (2000) Living off biodiversity: exploring livelihoods and biodiversity issues in natural resource management. Koziell I and Saunders J (Eds) IIED, London.
deWit CT (1960) On competition. Verslagen Landbouwkundige Onderzoekigen 66: 1-82. deWit CT and Van den Bergh JP (1965) Competition between herbage plants. Netherlands Journal
of Agricultural Science 13(2): 212-221. Dakora FD (2003) Defining new roles for plant and rhizobial molecules in sole and mixed plant
cultures involving symbiotic legumes. New Phytologist 158: 39-49. Ehrlich PR (1988) The loss of diversity: Causes and consequences. In: Wilson EO (Ed) Biodiversity.
National Academy Press, Washington. Pp. 21-27.
28
Finckh MR and Wolfe MS (1998) Diversification strategies. In: The epidemiology of plant diseases. Jones DG (Ed). Kluwer Publishers, Dordrecht.
Fininsa C (1996) Effect of intercropping bean with maize on bean common bacterial blight and rust diseases. International Journal of Pest Management 42(1): 51-54.
Firbank LG and Watkinson AR (1985) On the analysis of competition within 2-Species mixtures of plants. Journal of Applied Ecology 22: 503-517.
Folke C, Holling CS and Perrings C (1996) Biological diversity, ecosystems and the human scale. Ecological Applications 6: 1018-1024.
Francis CA (1986) Multiple cropping systems. MacMillan, NY, USA. Fukai S and Trenbath BR (1993) Processes determining intercrop productivity and yields of
component crops. Field Crops Research 34: 247-271. Gamborg C and Sandø P (2003) The making of sustainability in farm animal breeding and
reproduction. In: Liinamo AE and Neeteson-van-Nieuwenhoven AM (Eds) SEFABAR – Sustainable European Farm Animal Breeding and Reproduction QLG7-CT-2000-01368 Proceedings. Rome. Pp 89-106.
Ghanbari-Bonjar A and Lee HC (2002) Intercropped field beans (Vicia faba) and wheat (Triticum aestivum) for whole crop forage: effect of nitrogen on forage yield and quality. Journal of Agricultural Science 138: 311-315.
Gibson DJ, Connolly J, Hartnett DC and Weidenhamer JD (1999) Designs for greenhouse studies of interactions between plants. Journal of Ecology 87: 1-16.
Gliessman SR (1998) Agroecology: Ecological processes in sustainable agriculture. Sleeping Bear Press, Chelsea, MI.
Goldberg DE (1990) Components of resource competition in plant communities. In: Perspectives on plant competition. Grace JB and Tilman D (Eds) Academic Press, Inc.
Hauggaard-Nielsen H (2001) Competitive interactions, resource use and ntrogen dynamics in annual intercrops in low-input cropping systems. Ph.d. thesis. The Royal Veterinary and Agricultural University, Copenhagen, Denmark.
Hauggaard-Nielsen H, Ambus P and Jensen ES (2001a) Interspecific competition, N use and interference with weeds in pea-barley intercropping. Field Crops Research 70: 101-109.
Hauggaard-Nielsen H, Ambus P and Jensen ES (2001b) Temporal and spatial distribution of roots and competition for nitrogen in pea-barley intercrops - a field study employing P-32 technique. Plant and Soil 236: 63-74.
Hauggaard-Nielsen H and Jensen ES (2001c) Evaluating pea and barley cultivars for complementarity in intercropping at different levels of soil N availability. Field Crops Research 72: 185-196.
Hill J (1996) Breeding components for mixture performance. Euphytica 92: 135-138. Hinsinger P (1998) How do plant roots acquire mineral nutrients? Chemical processes involved in
the rhizosphere. Advances in Agronomy 64: 225-265. Hooper DU and Vitousek PM (1997) The effects of plant composition and diversity on ecosystem
processes. Science 277: 1302-1305. Huston MA (1997) Hidden treatments in ecological experiments: re-evaluating the ecosystem
function of biodiversity. Oecologia 110: 449-460. Høgh-Jensen H and Schjørring JK (2000) Below-ground nitrogen transfer between different
grassland species: Direct quantification by 15N leaf feeding compared with indirect dilution of soil 15N. Plant and Soil 227: 171-183.
Inouye BD (2001) Response surface experimental designs for investigating interspecific competition. Ecology 82: 2696-2706.
29
Izaurralde RC, McGill WB and Juma NG (1992) Nitrogen fixation efficiency, interspecies N transfer, and root growth in barley-field pea intercrops on a black chernozemic soil. Biology and Fertility of Soils 13: 11-16.
Jensen ES (1996a) Grain yield, symbiotic N2 fixation and interspecific competition for inorganic N in pea-barley intercrops. Plant and Soil 182: 25-38.
Jensen ES (1996b) Barley uptake of N deposited in the rhizosphere of associated field pea. Soil Biology and Biochemistry 28: 59-168.
Johansen A and Jensen ES (1996) Transfer of N and P from intact or decomposing roots of pea to barley interconnected by an arbuscular mycorrhizal fungus. Soil Biology and Biochemistry 28(1): 73-81.
Jolliffe PA (1997) Are mixtures of populations of plant species more productive than pure stands? Oikos 80: 595-602
Jolliffe PA (2000) The replacement series. Journal of Ecology 88: 371-385. Katayama K, Ito O, Matsunaga R, Adu-Gyamfi JJ, Rao TP, Anders MM and Lee KK (1995)
Nitrogen balance and root behavior in four pigeonpea-based intercropping systems. Fertilizer Research 42: 315-319.
Keating BA and Carberry PS (1993) Resource capture and use in intercropping - solar-radiation. Field Crops Research 34: 273-301.
Knudsen MT, Hauggaard-Nielsen H and Jensen ES (2004) Cereal-grain legume intercrops in organic farming – a Danish survey. Poster presentation and proceeding presented at VIII ESA Congress: European Agriculture in a Global Context, European Society of Agronomy, 11-15 July, Copenhagen, Denmark. Pp. 613-614.
Law R and Watkinson AR (1987) Response-surface analysis of two-species competition: an experiment on Phleum arenarium and Vulpia fasciculata. Journal of Ecology 75: 871-886.
Li XL, George E and Marschner H (1991) Extension of the phosphrous depletion zone in mychorrhizal white clover in calcerous soil. Plant and Soil 136: 41-48.
Liebman M and Dyck E (1993) Weed management. Ecological applications 3(1): 40-41 Loreau M, Naeem S, Inchausti P, Bengtsson J, Grime JP, Hector A, Hooper DU, Huston MA,
Raffaelli D, Schmid B, Tilman D and Wardle DA (2001) Biodiversity and ecosystem functioning: current knowledge and future challenges. Science 294: 804-808.
Marschner H, Römheld V, Horst WJ and Martin P (1986) Root induced changes in the rhizosphere: importance for the mineral nutrition of plants. Zeitschrift für Pflanzenernahrung und Bodenkunde 149: 441-456.
Naeem S, Thompson LJ, Lawler SP, Lawton JH and Woodfin RM (1994) Declining biodiversity can alter the performance of ecosystems. Nature 368: 734-737.
Naeem S, Håkansson K, Lawton JH, Crawley MJ and Thompson LJ (1996) Biodiversity and plant productivity in model assemblage of plant species 76: 259-264.
McGilchrist CA and Trenbath BR (1971) A revised analysis of plant competition experiments. Biometrics 27: 659-671.
Midmore DJ (1993) Agronomic modification of resource use and intercrop productivity. Field Crops Research 34: 357-380.
Mitchell CE, Tilman D and Groth JV (2002) Effects of grassland plant species diversity, abundance, and composition on foliar fungal disease. Ecology 83: 1713-1726.
Morris RA and Garrity DP (1993) Resource capture and utilization in intercropping – water. Field Crops Research 34(3-4): 303-317.
Mortensen J and Eriksen J (1994) Effect og sulphur deficiency on amino acid composition. Norwegian Journal of Agricultural Science 15: 135-142.
Ofori F and Stern WR (1987) Cereal-legume intercropping systems. Advances in Agronomy 41: 41-90.
30
Park SE, Benjamin LR and Watkinson AR (2002) Comparing biological productivity in cropping systems: a competition approach. Journal of Applied Ecology 39: 416-426.
Paul EA and Clark FE (1989) Soil Microbiology and Biochemistry. Academic Press San Diego. Pacala SW and Silander JAJ (1990) Field tests of neighbourhood population dynamic models of
two annual weed species. Ecological Monographs 60: 113-134. Paynel F, Murray PJ and Cliquet JB (2001) Root exudates: a pathway for short-term N transfer from
clover and ryegrass. Plant and Soil 229: 235-243. Roderiquez DJ (1997) A method to study competition dynamics using de Wit replacement series
experiments. Oikos 78: 411-415. Russell AE (2002) Relationship between crop-species diversity and soil characteristics in southwest
Indian agroecosystems. Agriculture, Ecosystems and Environment 92(2-3): 235-249. Søgaard B and Doll H (1992) A positive allelopathic effect of corn cockle, Agrostemma githago on
wheat, Triticum aestivum. Canadian Journal of Botany 70: 1916-1918. Sackville Hamilton NR (1994) Replacement and additive designs for competition studies. Journal
of Applied Ecology 31: 599-603. Snaydon R (1991) Replacement or additive designs for competition studies? Journal of Applied
Ecology 28: 930-946. Spitters CTJ (1983) An alternative approach to analysis of mixed cropping experiments. I.
Estimation of competitive effects. Netherlands Journal of Agricultural Science 31: 1-11. Swift MJ and Anderson JM (1993) Biodiversity and ecosystem function in agricultural systems. In:
Biodiversity and ecosystem function. Schulze ED and Mooney HA (Eds). Springer-Verlag, Berlin, Germany. Pp 15-41.
Symstad AJ, Siemann E and Haarstad J (2000) An experimental test of the effect of plant functional group diversity on arthropod diversity. Oikos 89: 243-253.
Taylor DR and Aarsen LW (1989) The density dependence of replacement-series competition experiments. Journal of Ecology 77: 975-988.
Tilman D and Downing JA (1994) Biodiversity and stability in grasslands. Nature 367: 363-365. Tilman D, Wedin D and Knops J (1996) Productivity and sustainability influenced by biodiversity in
grassland ecosystems. Nature 379: 718-720. Tofinga MP, Paolini R and Snaydon RW (1993) A study of root and shoot interactions between
cereals and peas in mixtures. Journal of Agricultural Science 120: 13-24. Trenbath BR (1976) Plant interactions in mixed crop communities. In: Multiple cropping. Papendick
RI, Sanchez PA and Triplett GB (Eds). ASA Special publication No. 27 ASA SSSA CSSA Madison WI USA. Pp. 129-169.
Trenbath BR (1993) Intercropping for the management of pests and diseases. Field Crops Research 34: 381-405.
Vandermeer JH (1989) The ecology of intercropping. Cambridge University Press, Cambridge, Great Britain.
Vandermeer J, van Noordwijk M, Anderson J, Ong C and Perfecto I (1998) Global change and multi-species agroecosystems: Concepts and issues. Agriculture, Ecosystems and Environment 67: 1-22.
Vitousek PM and Hooper DU (1993) Biological diversity and terrestrial ecosystem biogeochemistry. In: Schultze ED and Mooney HA (Eds) Biodiversity and eosystem function. Spriinger, Berlin. Pp. 3-14.
Wardle DA, Bonner KI and Barker GM (2000) Stability of ecosystem properties in response to above-ground functional group richness and composition. Oikos 89(1): 11-23
Waterer JG, Vessey JK, Stobbe EH and Soper RJ (1994) Yield and symbiotic nitrogen fixation in a pea-mustard intercrop as influenced by N fertilizer addition. Soil Biology and Biochemistry 26(4): 447-453.
31
Watson CA, Atkinson D, Gosling P, Jackson LR and Rayns FW (2002) Managing soil fertility in organic farming systems. Soil Use and Management 18 (suppl. S): 239-247.
Weigelt A and Jolliffe P (2003) Indices of plant competition. Journal of Ecology 91: 707-720. Weiner J (1990) Asymmetric Competition in Plant Populations. Tree 5 (11): 360-364. Weiner J (2002) Økologi – fremtidens jordbrugsvidenskab. In: Visioner for fremtidens jordbrug.
Jensen ES, Vejre H, Bügel SH and Emanuelsson J (Eds). Gads Forlag, København. Pp. 325-338.
Willey RW (1979) Intercropping - its importance and research needs: Part 1. Competition and yield advantages. Field Crop Abstracts 32: 1-10.
Willey RW and Osiru DSO (1972) Studies on Mixtures of Maize and Beans (Phaseolus-Vulgaris) with Particular Reference to Plant Population. Journal of Agricultural Science 79: 517-529.
Willey RW and Rao MR (1980) A competitive ratio for quantifying competition between intercrops. Experimental Agriculture 16: 117-125.
Wolfe M (2003) The art of mixing crops: multiunctionality at the farm level. In Ecosystem services in European agriculture – theory and practice. Kungl. Skogs- och Lantbruksakademiens Tidskrift 1. International conference in Falkenberg September 14-16. Pp. 14-16.
Zhang F and Li L (2003) Using competitive and facilitative interactions in intercropping systems enhances crop productivity and nutrient-use efficiency. Plant and Soil 248: 305-312
32
7PAPERS
Paper 1.
Mette Klindt Andersen, Henrik Hauggaard-Nielsen, Per Ambus and Erik Steen Jensen. 2004. Biomass production, symbiotic nitrogen fixation and inorganic N use in dual and tri-component intercrops. Plant and Soil 266: 273-287.
Paper 2.
Mette Klindt Andersen, Henrik Hauggaard-Nielsen, Jacob Weiner and Erik Steen Jensen. Evaluating competitive dynamics in two and three component intercrops of Pisum sativum, Hordeum vulgare and Brassica napus. Submitted to Journal of Applied Ecology.
Paper 3.
Mette Klindt Andersen, Henrik Hauggaard-Nielsen, Henning Høgh-Jensen and Erik Steen Jensen. Competition for and utilisation of sulphur in sole and intercrops of pea and barley. Submitted to Nutrient Cycling in Agroecosystems.
Paper 4.
Henrik Hauggaard-Nielsen, Mette Klindt Andersen, Bjarne Jørnsgaard and Erik Steen Jensen. Density and relative frequency effects on competitive interactions and resource use in pea-barley intercrops. Accepted for publication in Field Crops Research.
33

34
Biomass production, symbiotic nitrogen fixation and inorganic N use in dual and tri-component annual intercrops. Mette Klindt Andersen1,2, Henrik Hauggaard-Nielsen2, Per Ambus2 and Erik Steen Jensen2
1 Organic Farming Unit, Department of Agricultural Sciences, The Royal Veterinary and Agricultural University, Højbakkegård Alle 10, DK-2630 Taastrup, Denmark. 2 Plant Research Department, RISØ National Laboratory, DK-4000 Roskilde, Denmark.
Abstract The interspecific complementary and competitive interactions between pea (Pisum sativum L.), barley (Hordeum vulgare L.) and oilseed rape (Brassica napus L.), grown as dual and tri-component intercrops were assessed in a field study in Denmark. Total biomass production and N use at two levels of N fertilisation (0.5 and 4.0 g N / m2), were measured at five harvests throughout a growing season. All intercrops displayed land equivalent ratio values close to or exceeding unity, indicating complementary use of growth resources. Whereas both rape and barley responded positively to increased N fertilisation, irrespective of whether they were grown as sole- or intercrops, pea was strongly suppressed when grown in intercrop. Of the three crops barley was the strongest competitor for both soil and fertiliser N, rape intermediate and pea the weakest. Faster initial growth of barley than pea and rape gave barley an initial competitive advantage, an advantage that in the two dual intercrops was strengthened by the addition of N. Apparently the competitive superiority of barley was less strong in the tri-component intercrop, indicating that the impact of the dominant may, through improved growth of both rape and pea, have been diminished through indirect facilitation. Interspecific competition had a promoting effect on the percent of nitrogen derived from N2 fixation of pea, and most so at the low N fertilisation level. Results indicate that the benefits achieved from the association of a legume and nonlegume, in terms of N2 fixed were greatest when pea was grown in association with rape as opposed to barley which could indicate that the benefits achieved from the association of a legume and nonlegume are partly lost if the nonlegume is too strong a competitor. Keywords: Barley, competition, complementarity, diversity, pea, rape
Introduction Knowledge of how crop species diversity affects biomass production, nutrient cycling and use under temperate cropping conditions is relatively limited and the study of multi-species
35
crops rarely moves beyond two component intercrops. A few studies have adressed these questions in natural ecosystems (Naeem et al. 1996; Tilman and Downing 1994; Tilman et al. 1996). Increased diversity has been hypothesized to affect crop system functions through partitioning of resources (Trenbath 1974; Vandermeer 1990), whereby crops in more diverse communities may increase total resource capture, and thus increase net biomass production. Such complementary resource use could occur in space, in time, or in types of resources used (Fukai and Trenbath 1993; Midmore 1993). Species that are deeply rooted have access to water and nutrients not available to more shallow rooted species (Hauggaard-Nielsen et al. 2001b). Differences in shoot architecture may allow intercrops to attain a more complete canopy cover of the soil, thereby increasing the leaf-area index and light interception of the crop (Keating and Carberry 1993; Vandermeer 1990) and decreasing evaporation. Phenological differences may allow crops to utilise resources at different times in the growth season (Fukai and Trenbath 1993; Willey et al. 1983). Different species may also use different nutrient sources, such as legumes that can fix atmospheric nitrogen (Anil et al. 1998; Carruthers et al. 2000; Hauggaard-Nielsen et al. 2001a; Jensen 1996) or plants with mychorrhizal mutualisms that allow greater access to organically bound phosphorous (Chiariello et al. 1982; Johansen and Jensen 1996). These examples illustrate the potential of complementary resource use by intercrops, however plants also compete strongly for some resources (Tilman 1988; Vandermeer 1989) wherefore optimising intercrop advantage is achieved by maximizing complementarity and minimising competition between component crops (Vandermeer 1989; Willey 1979).
Many intercrop studies have dealt with the association of two annual crops and the degree of complementarity achieved when two crops are intersown as opposed to sole cropped (Hauggaard-Nielsen et al. 2001a; Jensen 1996; Li et al. 1999; Ofori and Stern 1987). The resulting reduction in competition has been suggested to be the primary reason for improved yields through intercropping (Vandermeer 1990). Apart from complementary resource use, facilitation has been suggested as a mechanism of obtaining greater yields in intercrops opposed to sole crops. Facilitation is the mechanism by which some plant species may have a positive impact on the performance of others. Such beneficial interactions could be the result of increased resource availability through root induced changes in the rhizosphere (Ae et al. 1990; Horst and Waschkies 1987; Marschner et al. 1986; Vandermeer 1990), increased standing ability brought about by the physical support provided by one species to the other, reduced weed pressure through shading or allelopathic influence (Midmore1993), reduced pest attack and pathogen infection through greater biological control in intercrops (Mitchell et al. 2002; Trenbath 1993) or as a result of the resource concentration mechanism whereby host plants, due to greater spacing and natural barriers formed by other component plants, are harder to find in an intercrop (Trenbath 1993; Vandermeer 1989).
There are few reports in the literature of how resource availability affects the relationship between diversity of an intercrop and its biomass productivity. Much experimental work has dealt with the impact of nitrogen availability on the complementarity and productivity of two component cereal-legume intercrops (Ghanbari-
36
Bonjar and Lee 2002; Hauggaard-Nielsen and Jensen 2001; Jensen 1996) and whereas an increase in the availability of N generally gives rise to increased biomass production, the degree of complementarity between component crops is often diminished as the legume becomes increasingly suppressed by the cereal component (Midmore 1993b; Ofori and Stern 1987). These studies clearly point at the significant role of the environment in modifying the competitive abilities of component crops. In agricultural research the study of non-legume holding mixtures has been very limited, however combining annual species with differences in length of their growing season has in terms of resource use been succesful in a number of studies (Rerkasem et al. 1980; Trenbath 1974).
The aims of this study were to determine: i) how the productivity of dual- and tri-component annual intercrops, compared to that of the individual sole crops is influenced by the availability of N; ii) to determine the partitioning of soil and fertiliser N among intercrop components including the recovery of fertiliser N; iii) to determine the effect of intercropping on N2 fixation and ultimately to evaluate whether the complementarity of resource use (N) increases with the number of intercrop components.
Materials and methods Site and soil
The field experiment was carried out from April to August 2000 at the experimental farm of the Royal Veterinary and Agricultural University, Denmark located 20 km west of Copenhagen (55°40'N, 12°18'E). The soil was a sandy loam with 18% clay, 18% silt, 55% finesand and 36% coarse sand, a pH (H20) of 6.7 and a 1,3% total C and 0.1% total N content in the topsoil (0-25 cm). The soil, sampled on the 10th of May, contained 0.34, 0.33 and 0.39 g KCl-extractable inorganic N m-2 in the 0-20, 20-40 and 40-70 cm depths of the soil profile, respectively. In the two years preeceding the trial red clover (1998) and spring barley undersown with rye grass (1999) were grown on the site. The soil contained efficient populations of Rhizobim leguminosarum bv. viciae. Actual and 30 year averages of rainfall and daily temperatures are shown in figure 1. Crop species and experimental design
Using a proportional replacement design Pisum sativum L. (field pea), Hordeum vulgare L. (spring barley) and Brassica napus L. (oilseed rape) were grown as sole crops (SC), in dual-component intercrops (IC) and in a tri-component IC, giving a total of seven crop treatments. Two levels of N fertilisation were employed, 0.5 and 4.0 g urea-N m-2 (N5 and N40, respectively) were applied. The experiment was organized as a randomized split-plot design with fertilisation level as main plot factor, crop treatment as subplot factor with four replicates. Each subplot (18m2) consisted of ten rows of length 12m, spaced 12.5 cm apart.
37
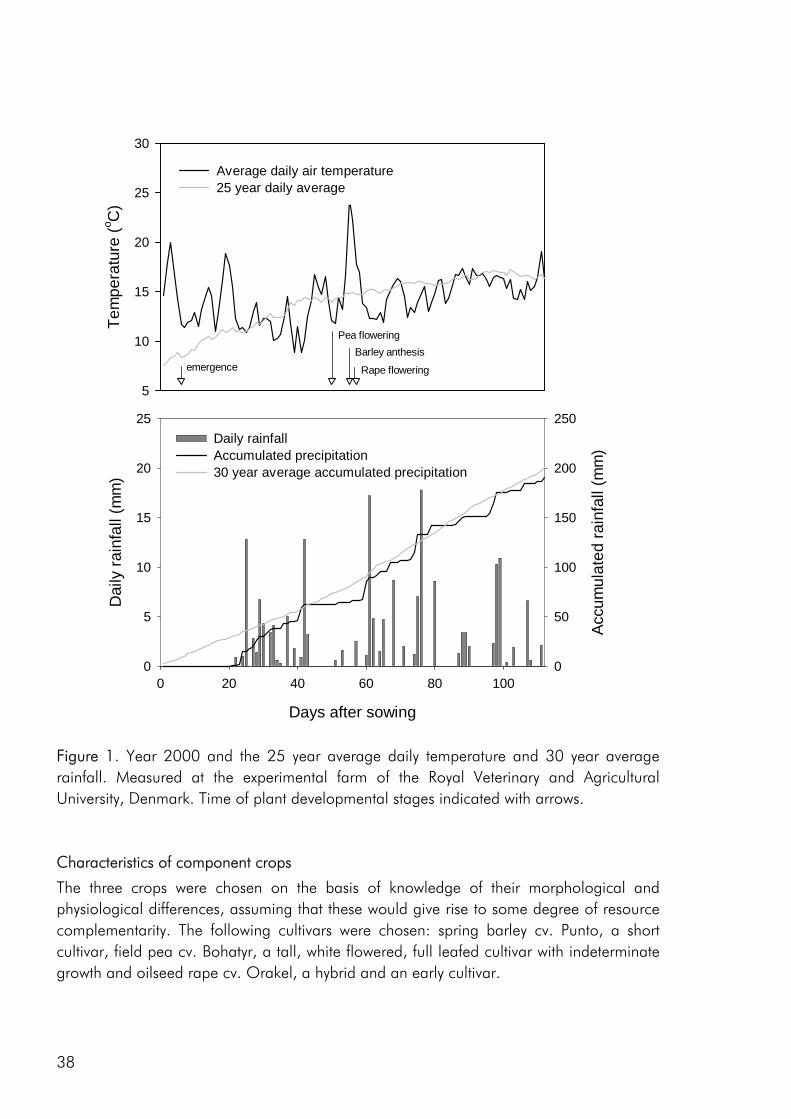
Days after sowing
0 20 40 60 80 100
Dai
ly ra
infa
ll (m
m)
0
5
10
15
20
25
Accu
mul
ated
rain
fall
(mm
)
0
50
100
150
200
250Daily rainfallAccumulated precipitation30 year average accumulated precipitation
Tem
pera
ture
(o C)
5
10
15
20
25
30
Average daily air temperature25 year daily average
emergence
Pea floweringBarley anthesis
Rape flowering
Figure 1. Year 2000 and the 25 year average daily temperature and 30 year average rainfall. Measured at the experimental farm of the Royal Veterinary and Agricultural University, Denmark. Time of plant developmental stages indicated with arrows. Characteristics of component crops
The three crops were chosen on the basis of knowledge of their morphological and physiological differences, assuming that these would give rise to some degree of resource complementarity. The following cultivars were chosen: spring barley cv. Punto, a short cultivar, field pea cv. Bohatyr, a tall, white flowered, full leafed cultivar with indeterminate growth and oilseed rape cv. Orakel, a hybrid and an early cultivar.
38
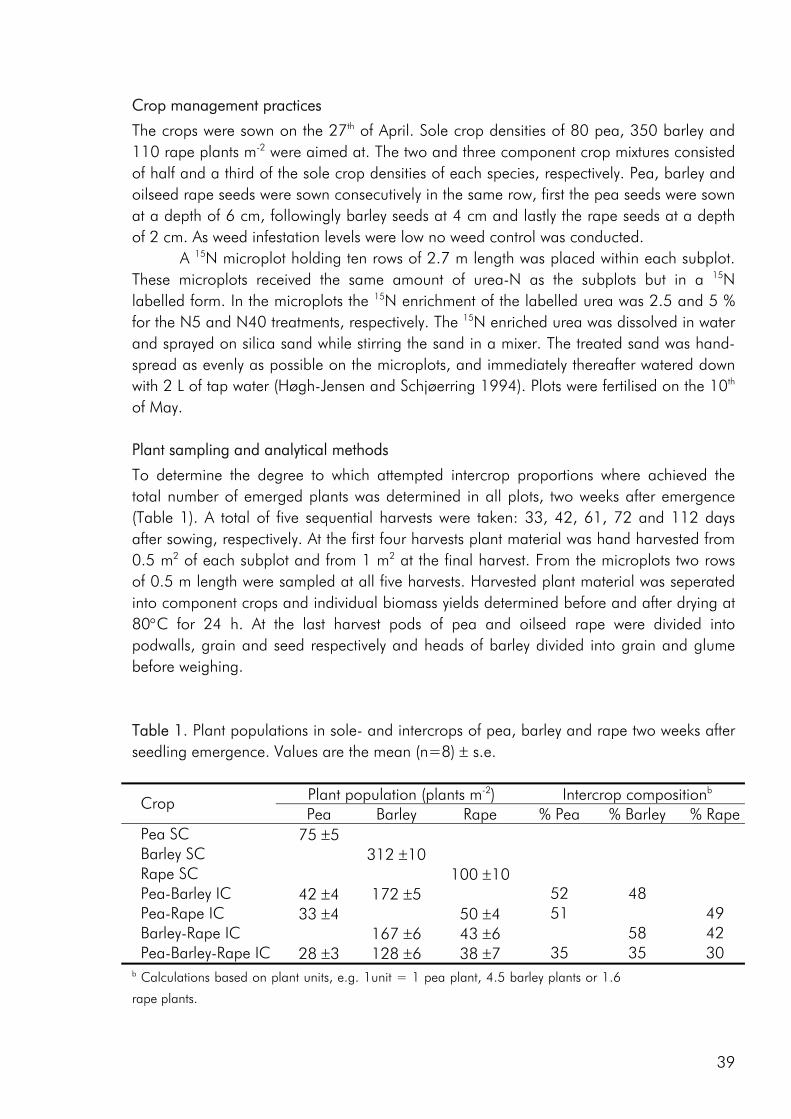
Crop management practices
The crops were sown on the 27th of April. Sole crop densities of 80 pea, 350 barley and 110 rape plants m-2 were aimed at. The two and three component crop mixtures consisted of half and a third of the sole crop densities of each species, respectively. Pea, barley and oilseed rape seeds were sown consecutively in the same row, first the pea seeds were sown at a depth of 6 cm, followingly barley seeds at 4 cm and lastly the rape seeds at a depth of 2 cm. As weed infestation levels were low no weed control was conducted. A 15N microplot holding ten rows of 2.7 m length was placed within each subplot. These microplots received the same amount of urea-N as the subplots but in a 15N labelled form. In the microplots the 15N enrichment of the labelled urea was 2.5 and 5 % for the N5 and N40 treatments, respectively. The 15N enriched urea was dissolved in water and sprayed on silica sand while stirring the sand in a mixer. The treated sand was hand-spread as evenly as possible on the microplots, and immediately thereafter watered down with 2 L of tap water (Høgh-Jensen and Schjøerring 1994). Plots were fertilised on the 10th of May. Plant sampling and analytical methods
To determine the degree to which attempted intercrop proportions where achieved the total number of emerged plants was determined in all plots, two weeks after emergence (Table 1). A total of five sequential harvests were taken: 33, 42, 61, 72 and 112 days after sowing, respectively. At the first four harvests plant material was hand harvested from 0.5 m2 of each subplot and from 1 m2 at the final harvest. From the microplots two rows of 0.5 m length were sampled at all five harvests. Harvested plant material was seperated into component crops and individual biomass yields determined before and after drying at 80°C for 24 h. At the last harvest pods of pea and oilseed rape were divided into podwalls, grain and seed respectively and heads of barley divided into grain and glume before weighing. Table 1. Plant populations in sole- and intercrops of pea, barley and rape two weeks after seedling emergence. Values are the mean (n=8) ± s.e.
Plant population (plants m-2) Intercrop compositionb
Crop Pea Barley Rape % Pea % Barley % Rape
Pea SC 75 ±5 Barley SC 312 ±10 Rape SC 100 ±10 Pea-Barley IC 42 ±4 172 ±5 52 48 Pea-Rape IC 33 ±4 50 ±4 51 49 Barley-Rape IC 167 ±6 43 ±6 58 42 Pea-Barley-Rape IC 28 ±3 128 ±6 38 ±7 35 35 30
b Calculations based on plant units, e.g. 1unit = 1 pea plant, 4.5 barley plants or 1.6
rape plants.
39
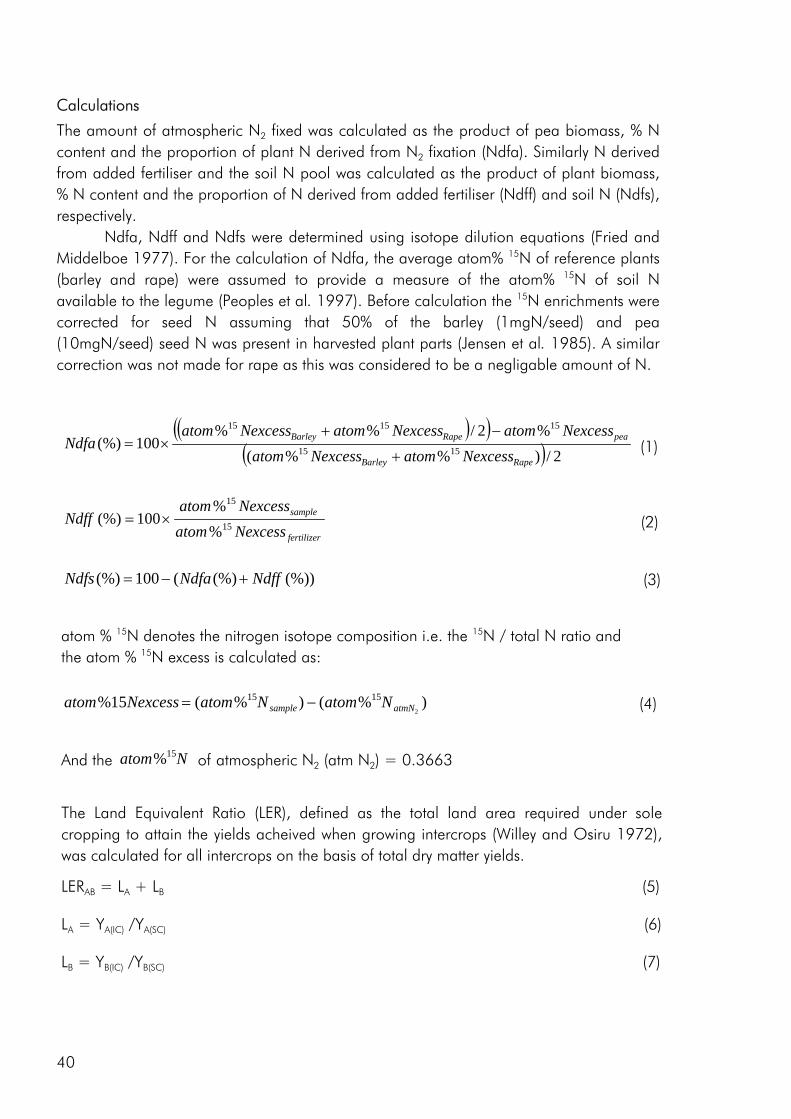
Calculations
The amount of atmospheric N2 fixed was calculated as the product of pea biomass, % N content and the proportion of plant N derived from N2 fixation (Ndfa). Similarly N derived from added fertiliser and the soil N pool was calculated as the product of plant biomass, % N content and the proportion of N derived from added fertiliser (Ndff) and soil N (Ndfs), respectively.
Ndfa, Ndff and Ndfs were determined using isotope dilution equations (Fried and Middelboe 1977). For the calculation of Ndfa, the average atom% 15N of reference plants (barley and rape) were assumed to provide a measure of the atom% 15N of soil N available to the legume (Peoples et al. 1997). Before calculation the 15N enrichments were corrected for seed N assuming that 50% of the barley (1mgN/seed) and pea (10mgN/seed) seed N was present in harvested plant parts (Jensen et al. 1985). A similar correction was not made for rape as this was considered to be a negligable amount of N.
( )( )( ) 2/)%%(
%2/%%100(%) 1515
151515
RapeBarley
peaRapeBarley
NexcessatomNexcessatomNexcessatomNexcessatomNexcessatom
Ndfa+
−+×= (1)
fertilizer
sample
NexcessatomNexcessatom
Ndff 15
15
%%
100(%) ×= (2)
(%))(%)(100(%) NdffNdfaNdfs +−= (3)
atom % 15N denotes the nitrogen isotope composition i.e. the 15N / total N ratio and the atom % 15N excess is calculated as:
)%()%(15%2
1515atmNsample NatomNatomNexcessatom −= (4)
And the of atmospheric NNatom 15% 2 (atm N2) = 0.3663
The Land Equivalent Ratio (LER), defined as the total land area required under sole cropping to attain the yields acheived when growing intercrops (Willey and Osiru 1972), was calculated for all intercrops on the basis of total dry matter yields. LERAB = LA + LB (5)
LA = YA(IC) /YA(SC) (6)
LB = YB(IC) /YB(SC) (7)
40
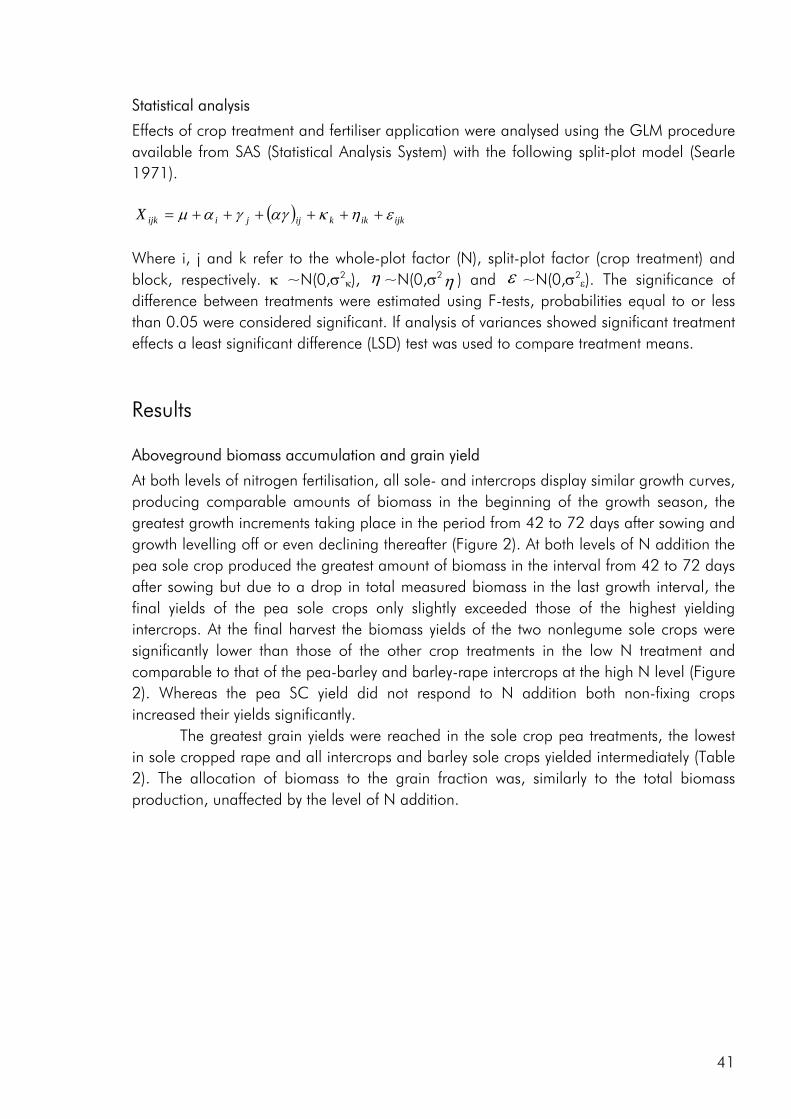
Statistical analysis
Effects of crop treatment and fertiliser application were analysed using the GLM procedure available from SAS (Statistical Analysis System) with the following split-plot model (Searle 1971).
( ) ijkikkijjiijkX εηκαγγαµ ++++++= Where i, j and k refer to the whole-plot factor (N), split-plot factor (crop treatment) and block, respectively. κ ~N(0,σ2
κ), η ~N(0,σ2η ) and ε ~N(0,σ2ε). The significance of
difference between treatments were estimated using F-tests, probabilities equal to or less than 0.05 were considered significant. If analysis of variances showed significant treatment effects a least significant difference (LSD) test was used to compare treatment means.
Results Aboveground biomass accumulation and grain yield
At both levels of nitrogen fertilisation, all sole- and intercrops display similar growth curves, producing comparable amounts of biomass in the beginning of the growth season, the greatest growth increments taking place in the period from 42 to 72 days after sowing and growth levelling off or even declining thereafter (Figure 2). At both levels of N addition the pea sole crop produced the greatest amount of biomass in the interval from 42 to 72 days after sowing but due to a drop in total measured biomass in the last growth interval, the final yields of the pea sole crops only slightly exceeded those of the highest yielding intercrops. At the final harvest the biomass yields of the two nonlegume sole crops were significantly lower than those of the other crop treatments in the low N treatment and comparable to that of the pea-barley and barley-rape intercrops at the high N level (Figure 2). Whereas the pea SC yield did not respond to N addition both non-fixing crops increased their yields significantly.
The greatest grain yields were reached in the sole crop pea treatments, the lowest in sole cropped rape and all intercrops and barley sole crops yielded intermediately (Table 2). The allocation of biomass to the grain fraction was, similarly to the total biomass production, unaffected by the level of N addition.
41
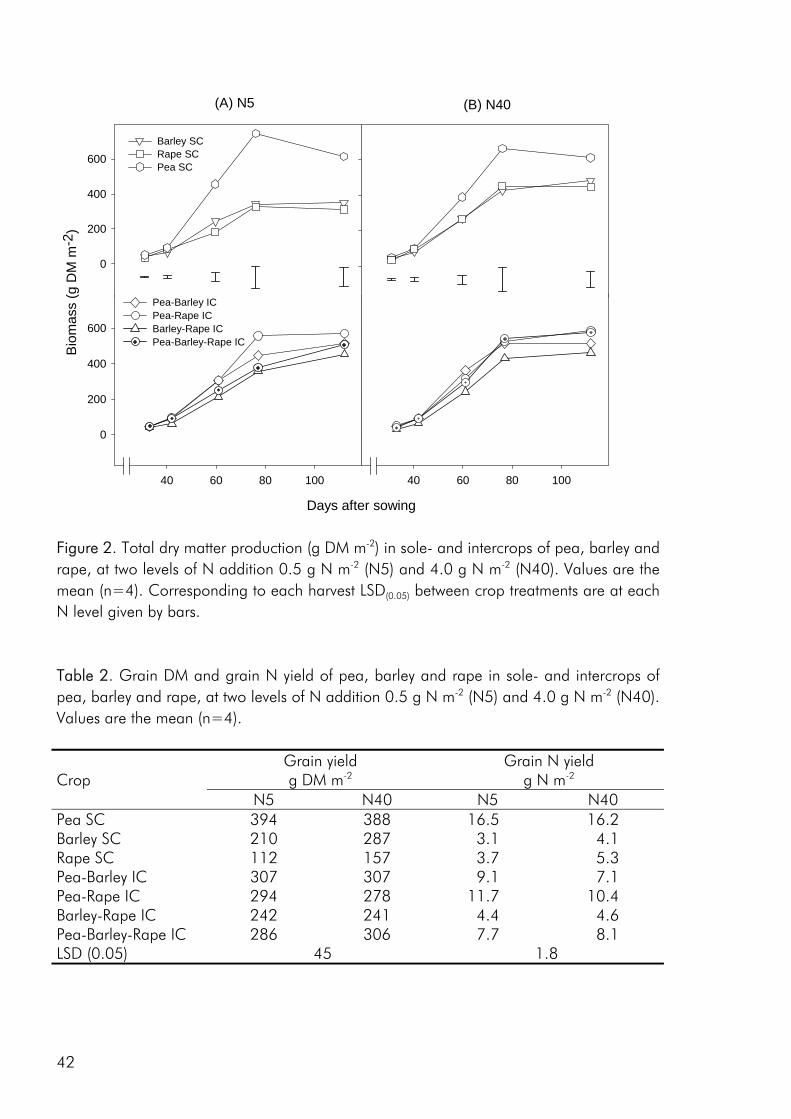
Bio
mas
s (g
DM
m-2
)
0
200
400
600Barley SCRape SCPea SC
(A) N5 (B) N40
Days after sowing
40 60 80 10040 60 80 100
0
200
400
600
Pea-Barley ICPea-Rape ICBarley-Rape ICPea-Barley-Rape IC
Figure 2. Total dry matter production (g DM m-2) in sole- and intercrops of pea, barley and rape, at two levels of N addition 0.5 g N m-2 (N5) and 4.0 g N m-2 (N40). Values are the mean (n=4). Corresponding to each harvest LSD(0.05) between crop treatments are at each N level given by bars. Table 2. Grain DM and grain N yield of pea, barley and rape in sole- and intercrops of pea, barley and rape, at two levels of N addition 0.5 g N m-2 (N5) and 4.0 g N m-2 (N40). Values are the mean (n=4). Grain yield Grain N yield Crop g DM m-2 g N m-2
N5 N40 N5 N40 Pea SC 394 388 16.5 16.2 Barley SC 210 287 3.1 4.1 Rape SC 112 157 3.7 5.3 Pea-Barley IC 307 307 9.1 7.1 Pea-Rape IC 294 278 11.7 10.4 Barley-Rape IC 242 241 4.4 4.6 Pea-Barley-Rape IC 286 306 7.7 8.1 LSD (0.05) 45 1.8
42
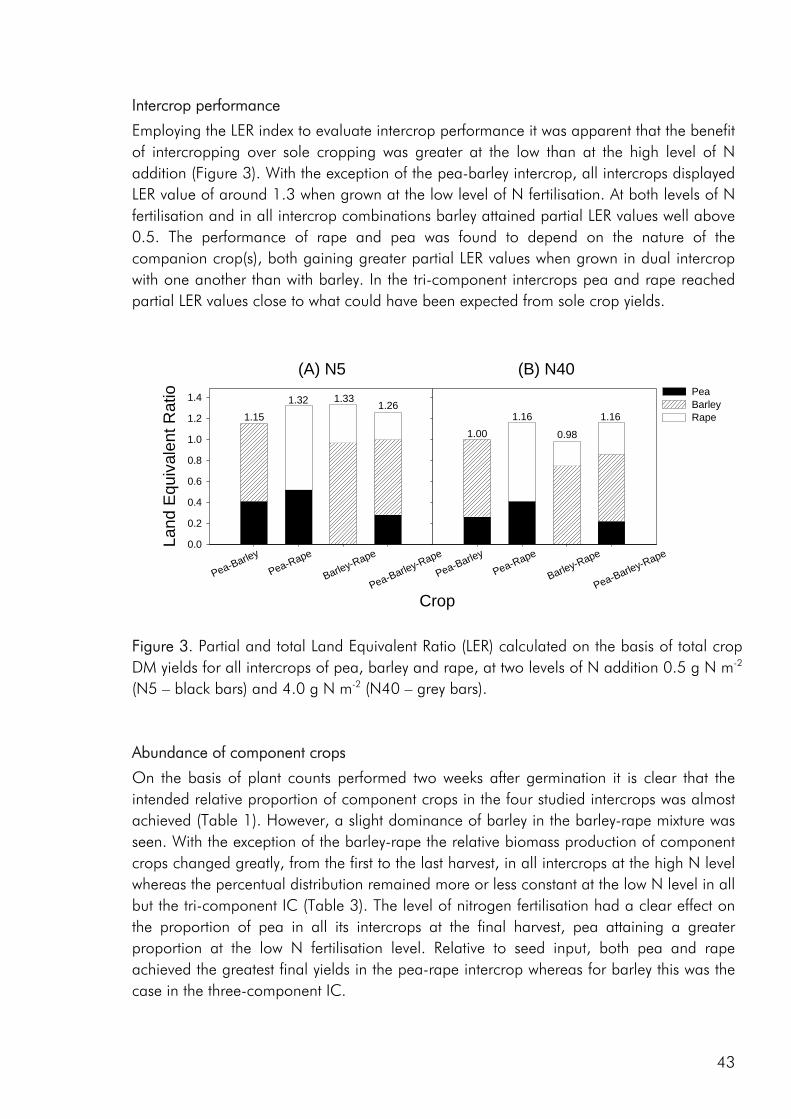
Intercrop performance
Employing the LER index to evaluate intercrop performance it was apparent that the benefit of intercropping over sole cropping was greater at the low than at the high level of N addition (Figure 3). With the exception of the pea-barley intercrop, all intercrops displayed LER value of around 1.3 when grown at the low level of N fertilisation. At both levels of N fertilisation and in all intercrop combinations barley attained partial LER values well above 0.5. The performance of rape and pea was found to depend on the nature of the companion crop(s), both gaining greater partial LER values when grown in dual intercrop with one another than with barley. In the tri-component intercrops pea and rape reached partial LER values close to what could have been expected from sole crop yields.
(A) N5
Crop
Land
Equ
ival
ent R
atio
0.0
0.2
0.4
0.6
0.8
1.0
1.2
1.4 PeaBarleyRape
Pea-Barley
Pea-Barley-Rape
Barley-Rape
Pea-Rape
(B) N40
Pea-Barley
Pea-Barley-Rape
Barley-Rape
Pea-Rape
1.151.32 1.33
1.26
1.001.16
0.98
1.16
Figure 3. Partial and total Land Equivalent Ratio (LER) calculated on the basis of total crop DM yields for all intercrops of pea, barley and rape, at two levels of N addition 0.5 g N m-2 (N5 – black bars) and 4.0 g N m-2 (N40 – grey bars). Abundance of component crops
On the basis of plant counts performed two weeks after germination it is clear that the intended relative proportion of component crops in the four studied intercrops was almost achieved (Table 1). However, a slight dominance of barley in the barley-rape mixture was seen. With the exception of the barley-rape the relative biomass production of component crops changed greatly, from the first to the last harvest, in all intercrops at the high N level whereas the percentual distribution remained more or less constant at the low N level in all but the tri-component IC (Table 3). The level of nitrogen fertilisation had a clear effect on the proportion of pea in all its intercrops at the final harvest, pea attaining a greater proportion at the low N fertilisation level. Relative to seed input, both pea and rape achieved the greatest final yields in the pea-rape intercrop whereas for barley this was the case in the three-component IC.
43
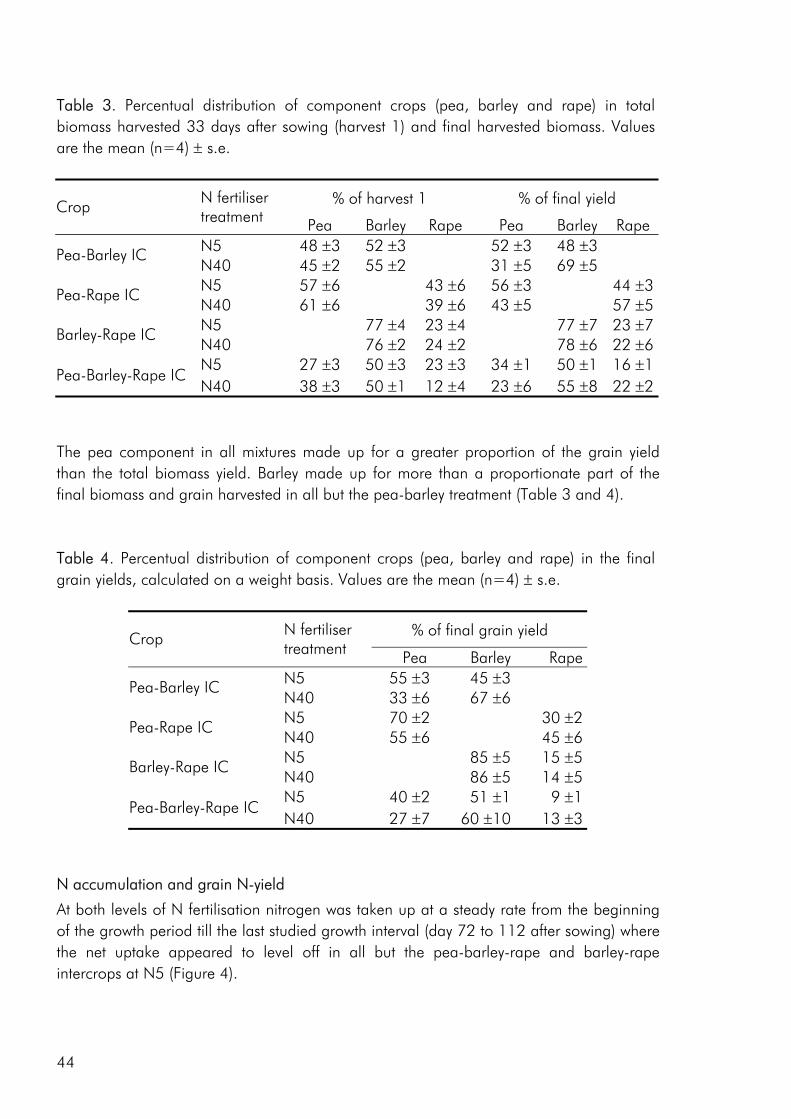
Table 3. Percentual distribution of component crops (pea, barley and rape) in total biomass harvested 33 days after sowing (harvest 1) and final harvested biomass. Values are the mean (n=4) ± s.e.
% of harvest 1 % of final yield Crop N fertiliser treatment Pea Barley Rape Pea Barley Rape N5 48 ±3 52 ±3 52 ±3 48 ±3
Pea-Barley IC N40 45 ±2 55 ±2 31 ±5 69 ±5 N5 57 ±6 43 ±6 56 ±3 44 ±3 Pea-Rape IC N40 61 ±6 39 ±6 43 ±5 57 ±5 N5 77 ±4 23 ±4 77 ±7 23 ±7 Barley-Rape IC N40 76 ±2 24 ±2 78 ±6 22 ±6 N5 27 ±3 50 ±3 23 ±3 34 ±1 50 ±1 16 ±1
Pea-Barley-Rape IC N40 38 ±3 50 ±1 12 ±4 23 ±6 55 ±8 22 ±2
The pea component in all mixtures made up for a greater proportion of the grain yield than the total biomass yield. Barley made up for more than a proportionate part of the final biomass and grain harvested in all but the pea-barley treatment (Table 3 and 4). Table 4. Percentual distribution of component crops (pea, barley and rape) in the final grain yields, calculated on a weight basis. Values are the mean (n=4) ± s.e.
% of final grain yield Crop N fertiliser treatment Pea Barley Rape N5 55 ±3 45 ±3
Pea-Barley IC N40 33 ±6 67 ±6 N5 70 ±2 30 ±2 Pea-Rape IC N40 55 ±6 45 ±6 N5 85 ±5 15 ±5 Barley-Rape IC N40 86 ±5 14 ±5 N5 40 ±2 51 ±1 9 ±1
Pea-Barley-Rape IC N40 27 ±7 60 ±10 13 ±3
N accumulation and grain N-yield
At both levels of N fertilisation nitrogen was taken up at a steady rate from the beginning of the growth period till the last studied growth interval (day 72 to 112 after sowing) where the net uptake appeared to level off in all but the pea-barley-rape and barley-rape intercrops at N5 (Figure 4).
44
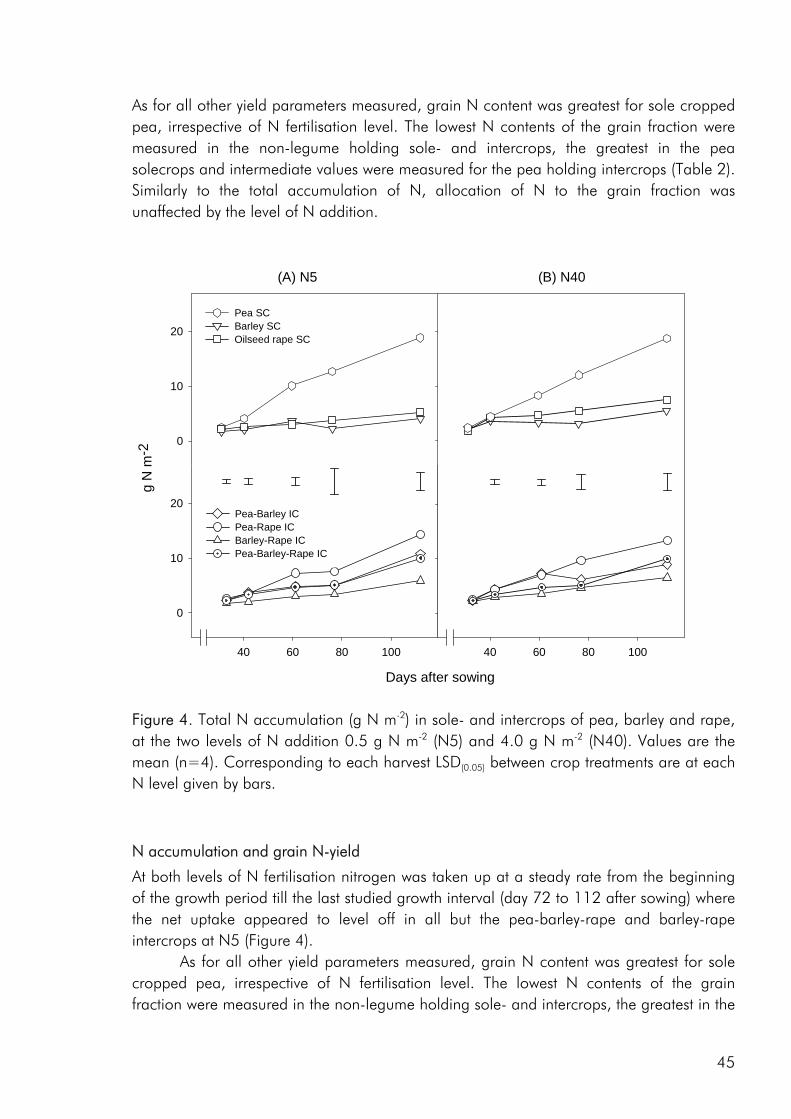
As for all other yield parameters measured, grain N content was greatest for sole cropped pea, irrespective of N fertilisation level. The lowest N contents of the grain fraction were measured in the non-legume holding sole- and intercrops, the greatest in the pea solecrops and intermediate values were measured for the pea holding intercrops (Table 2). Similarly to the total accumulation of N, allocation of N to the grain fraction was unaffected by the level of N addition.
g N
m-2
0
10
20Pea SCBarley SCOilseed rape SC
40 60 80 100
0
10
20Pea-Barley ICPea-Rape ICBarley-Rape ICPea-Barley-Rape IC
Days after sowing
40 60 80 100
(A) N5 (B) N40
Figure 4. Total N accumulation (g N m-2) in sole- and intercrops of pea, barley and rape, at the two levels of N addition 0.5 g N m-2 (N5) and 4.0 g N m-2 (N40). Values are the mean (n=4). Corresponding to each harvest LSD(0.05) between crop treatments are at each N level given by bars.
N accumulation and grain N-yield
At both levels of N fertilisation nitrogen was taken up at a steady rate from the beginning of the growth period till the last studied growth interval (day 72 to 112 after sowing) where the net uptake appeared to level off in all but the pea-barley-rape and barley-rape intercrops at N5 (Figure 4).
As for all other yield parameters measured, grain N content was greatest for sole cropped pea, irrespective of N fertilisation level. The lowest N contents of the grain fraction were measured in the non-legume holding sole- and intercrops, the greatest in the
45
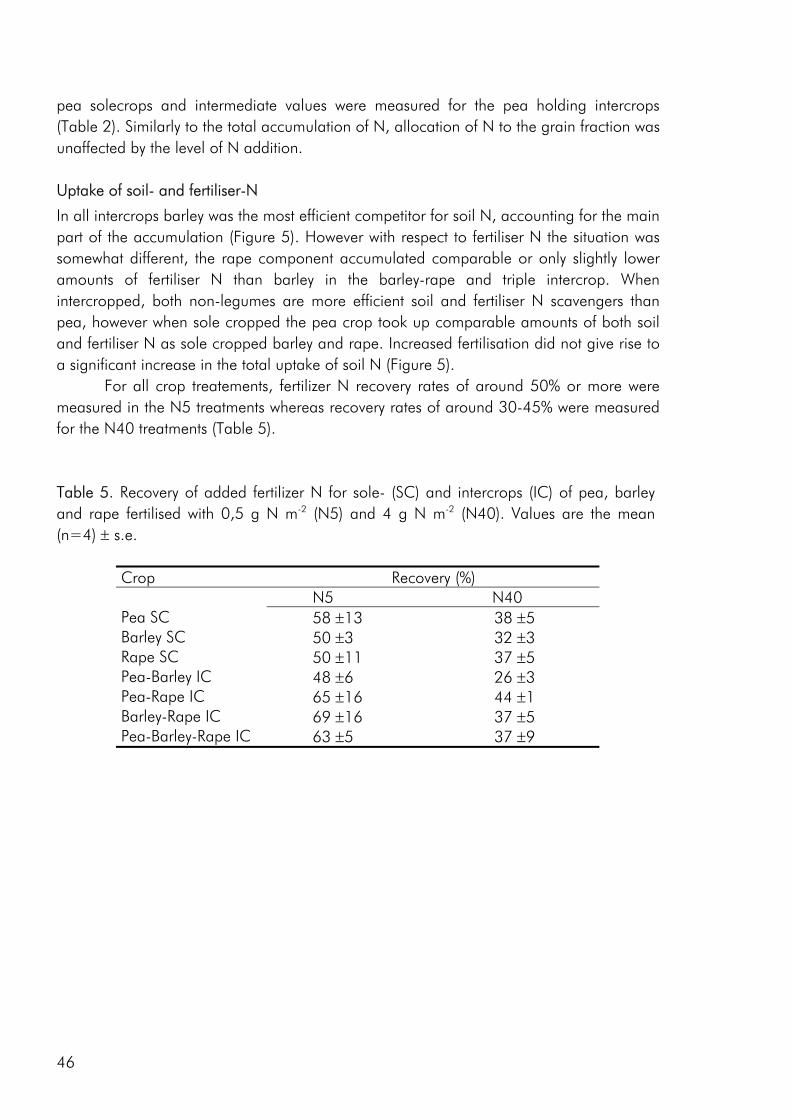
pea solecrops and intermediate values were measured for the pea holding intercrops (Table 2). Similarly to the total accumulation of N, allocation of N to the grain fraction was unaffected by the level of N addition. Uptake of soil- and fertiliser-N
In all intercrops barley was the most efficient competitor for soil N, accounting for the main part of the accumulation (Figure 5). However with respect to fertiliser N the situation was somewhat different, the rape component accumulated comparable or only slightly lower amounts of fertiliser N than barley in the barley-rape and triple intercrop. When intercropped, both non-legumes are more efficient soil and fertiliser N scavengers than pea, however when sole cropped the pea crop took up comparable amounts of both soil and fertiliser N as sole cropped barley and rape. Increased fertilisation did not give rise to a significant increase in the total uptake of soil N (Figure 5).
For all crop treatements, fertilizer N recovery rates of around 50% or more were measured in the N5 treatments whereas recovery rates of around 30-45% were measured for the N40 treatments (Table 5). Table 5. Recovery of added fertilizer N for sole- (SC) and intercrops (IC) of pea, barley and rape fertilised with 0,5 g N m-2 (N5) and 4 g N m-2 (N40). Values are the mean (n=4) ± s.e.
Crop Recovery (%) N5 N40 Pea SC 58 ±13 38 ±5 Barley SC 50 ±3 32 ±3 Rape SC 50 ±11 37 ±5 Pea-Barley IC 48 ±6 26 ±3 Pea-Rape IC 65 ±16 44 ±1 Barley-Rape IC 69 ±16 37 ±5 Pea-Barley-Rape IC 63 ±5 37 ±9
46
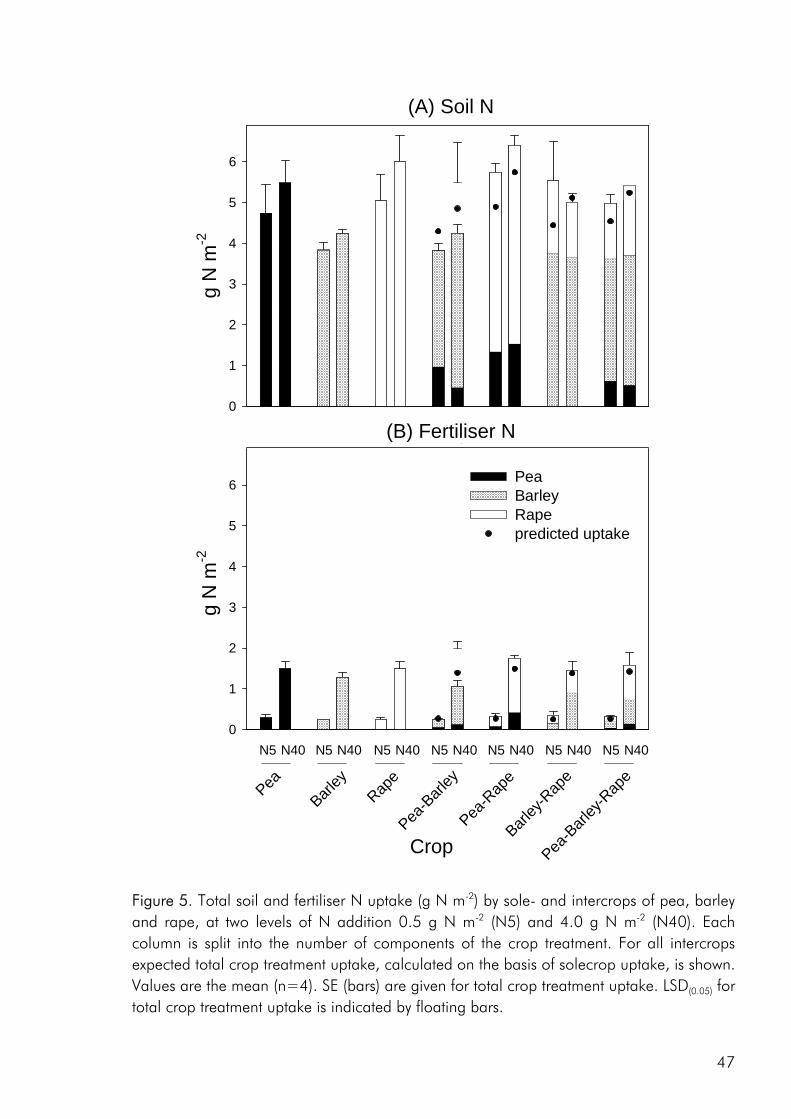
Crop
0
1
2
3
4
5
6
(B) Fertiliser N
(A) Soil N
g N
m-2
0
1
2
3
4
5
6
PeaBarleyRapepredicted uptake
g N
m-2
Barley
Pea-B
arley
-Rap
e
Barley
-Rap
e
Pea-R
ape
Pea-B
arley
Rape
Pea
N5 N40 N5 N40 N5 N40 N5 N40 N5 N40 N5 N40N5 N40
Figure 5. Total soil and fertiliser N uptake (g N m-2) by sole- and intercrops of pea, barley and rape, at two levels of N addition 0.5 g N m-2 (N5) and 4.0 g N m-2 (N40). Each column is split into the number of components of the crop treatment. For all intercrops expected total crop treatment uptake, calculated on the basis of solecrop uptake, is shown. Values are the mean (n=4). SE (bars) are given for total crop treatment uptake. LSD(0.05) for total crop treatment uptake is indicated by floating bars.
47
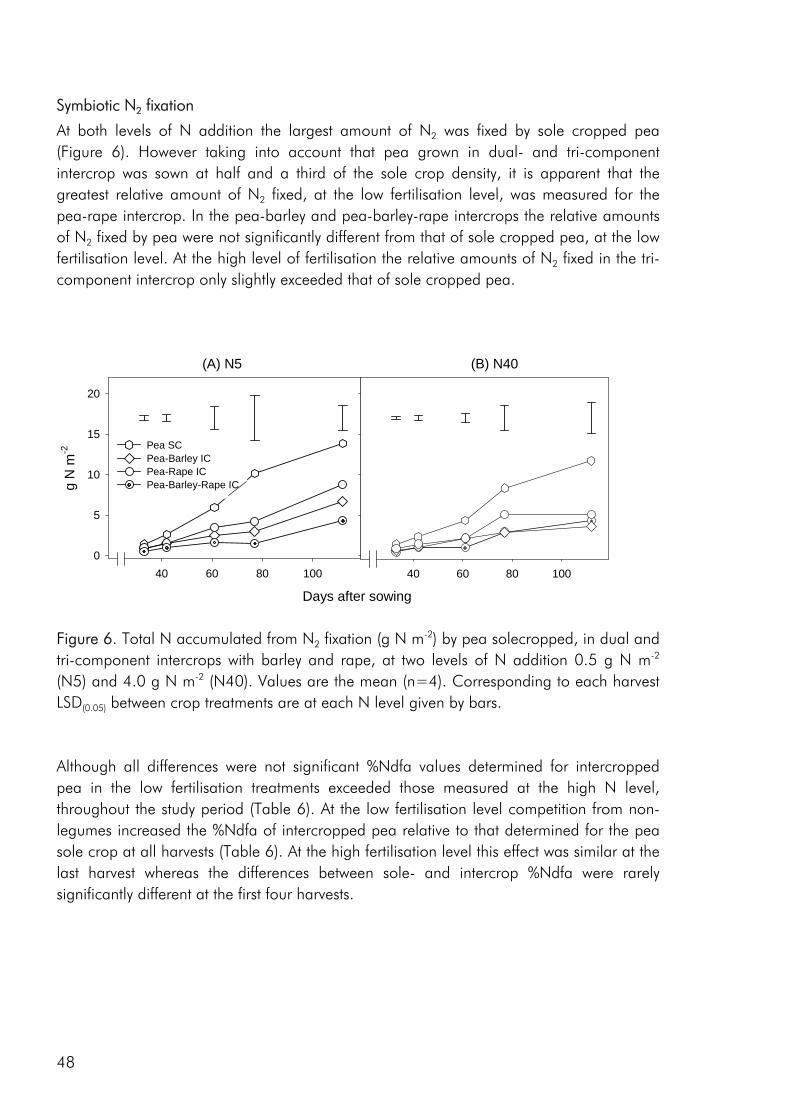
Symbiotic N2 fixation
At both levels of N addition the largest amount of N2 was fixed by sole cropped pea (Figure 6). However taking into account that pea grown in dual- and tri-component intercrop was sown at half and a third of the sole crop density, it is apparent that the greatest relative amount of N2 fixed, at the low fertilisation level, was measured for the pea-rape intercrop. In the pea-barley and pea-barley-rape intercrops the relative amounts of N2 fixed by pea were not significantly different from that of sole cropped pea, at the low fertilisation level. At the high level of fertilisation the relative amounts of N2 fixed in the tri-component intercrop only slightly exceeded that of sole cropped pea.
40 60 80 100
g N
m-2
0
5
10
15
20
Pea SCPea-Barley ICPea-Rape ICPea-Barley-Rape IC
(A) N5 (B) N40
Days after sowing
40 60 80 100
Figure 6. Total N accumulated from N2 fixation (g N m-2) by pea solecropped, in dual and tri-component intercrops with barley and rape, at two levels of N addition 0.5 g N m-2 (N5) and 4.0 g N m-2 (N40). Values are the mean (n=4). Corresponding to each harvest LSD(0.05) between crop treatments are at each N level given by bars. Although all differences were not significant %Ndfa values determined for intercropped pea in the low fertilisation treatments exceeded those measured at the high N level, throughout the study period (Table 6). At the low fertilisation level competition from non-legumes increased the %Ndfa of intercropped pea relative to that determined for the pea sole crop at all harvests (Table 6). At the high fertilisation level this effect was similar at the last harvest whereas the differences between sole- and intercrop %Ndfa were rarely significantly different at the first four harvests.
48
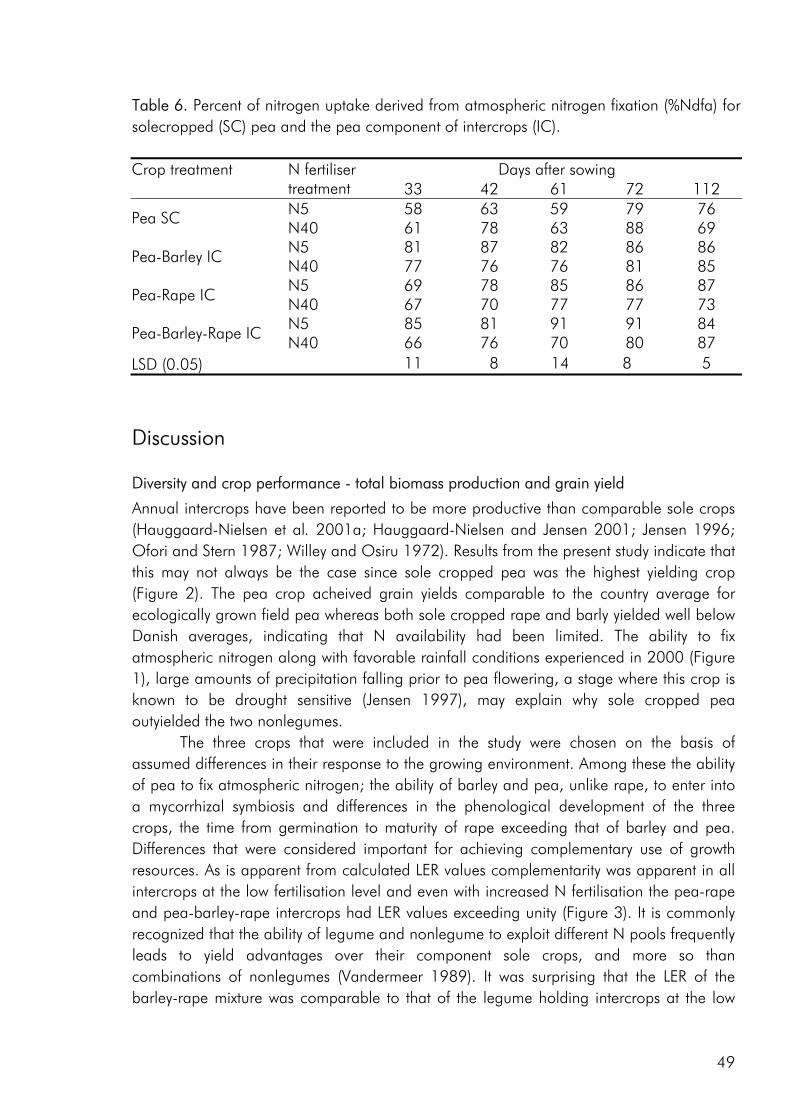
Table 6. Percent of nitrogen uptake derived from atmospheric nitrogen fixation (%Ndfa) for solecropped (SC) pea and the pea component of intercrops (IC).
Days after sowing Crop treatment N fertiliser treatment 33 42 61 72 112 N5 58 63 59 79 76 Pea SC N40 61 78 63 88 69 N5 81 87 82 86 86 Pea-Barley IC N40 77 76 76 81 85 N5 69 78 85 86 87 Pea-Rape IC N40 67 70 77 77 73 N5 85 81 91 91 84 Pea-Barley-Rape IC N40 66 76 70 80 87
LSD (0.05) 11 8 14 8 5
Discussion Diversity and crop performance - total biomass production and grain yield
Annual intercrops have been reported to be more productive than comparable sole crops (Hauggaard-Nielsen et al. 2001a; Hauggaard-Nielsen and Jensen 2001; Jensen 1996; Ofori and Stern 1987; Willey and Osiru 1972). Results from the present study indicate that this may not always be the case since sole cropped pea was the highest yielding crop (Figure 2). The pea crop acheived grain yields comparable to the country average for ecologically grown field pea whereas both sole cropped rape and barly yielded well below Danish averages, indicating that N availability had been limited. The ability to fix atmospheric nitrogen along with favorable rainfall conditions experienced in 2000 (Figure 1), large amounts of precipitation falling prior to pea flowering, a stage where this crop is known to be drought sensitive (Jensen 1997), may explain why sole cropped pea outyielded the two nonlegumes.
The three crops that were included in the study were chosen on the basis of assumed differences in their response to the growing environment. Among these the ability of pea to fix atmospheric nitrogen; the ability of barley and pea, unlike rape, to enter into a mycorrhizal symbiosis and differences in the phenological development of the three crops, the time from germination to maturity of rape exceeding that of barley and pea. Differences that were considered important for achieving complementary use of growth resources. As is apparent from calculated LER values complementarity was apparent in all intercrops at the low fertilisation level and even with increased N fertilisation the pea-rape and pea-barley-rape intercrops had LER values exceeding unity (Figure 3). It is commonly recognized that the ability of legume and nonlegume to exploit different N pools frequently leads to yield advantages over their component sole crops, and more so than combinations of nonlegumes (Vandermeer 1989). It was surprising that the LER of the barley-rape mixture was comparable to that of the legume holding intercrops at the low
49
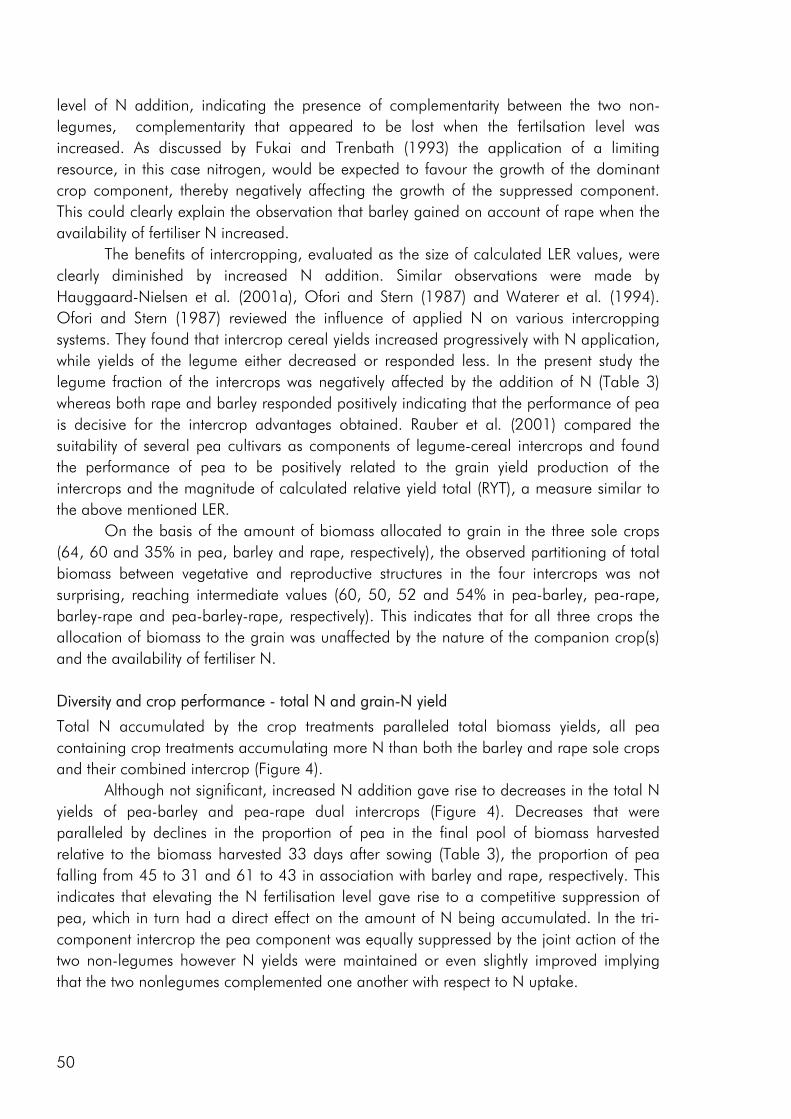
level of N addition, indicating the presence of complementarity between the two non-legumes, complementarity that appeared to be lost when the fertilsation level was increased. As discussed by Fukai and Trenbath (1993) the application of a limiting resource, in this case nitrogen, would be expected to favour the growth of the dominant crop component, thereby negatively affecting the growth of the suppressed component. This could clearly explain the observation that barley gained on account of rape when the availability of fertiliser N increased.
The benefits of intercropping, evaluated as the size of calculated LER values, were clearly diminished by increased N addition. Similar observations were made by Hauggaard-Nielsen et al. (2001a), Ofori and Stern (1987) and Waterer et al. (1994). Ofori and Stern (1987) reviewed the influence of applied N on various intercropping systems. They found that intercrop cereal yields increased progressively with N application, while yields of the legume either decreased or responded less. In the present study the legume fraction of the intercrops was negatively affected by the addition of N (Table 3) whereas both rape and barley responded positively indicating that the performance of pea is decisive for the intercrop advantages obtained. Rauber et al. (2001) compared the suitability of several pea cultivars as components of legume-cereal intercrops and found the performance of pea to be positively related to the grain yield production of the intercrops and the magnitude of calculated relative yield total (RYT), a measure similar to the above mentioned LER.
On the basis of the amount of biomass allocated to grain in the three sole crops (64, 60 and 35% in pea, barley and rape, respectively), the observed partitioning of total biomass between vegetative and reproductive structures in the four intercrops was not surprising, reaching intermediate values (60, 50, 52 and 54% in pea-barley, pea-rape, barley-rape and pea-barley-rape, respectively). This indicates that for all three crops the allocation of biomass to the grain was unaffected by the nature of the companion crop(s) and the availability of fertiliser N. Diversity and crop performance - total N and grain-N yield
Total N accumulated by the crop treatments paralleled total biomass yields, all pea containing crop treatments accumulating more N than both the barley and rape sole crops and their combined intercrop (Figure 4).
Although not significant, increased N addition gave rise to decreases in the total N yields of pea-barley and pea-rape dual intercrops (Figure 4). Decreases that were paralleled by declines in the proportion of pea in the final pool of biomass harvested relative to the biomass harvested 33 days after sowing (Table 3), the proportion of pea falling from 45 to 31 and 61 to 43 in association with barley and rape, respectively. This indicates that elevating the N fertilisation level gave rise to a competitive suppression of pea, which in turn had a direct effect on the amount of N being accumulated. In the tri-component intercrop the pea component was equally suppressed by the joint action of the two non-legumes however N yields were maintained or even slightly improved implying that the two nonlegumes complemented one another with respect to N uptake.
50
Apparently intercropped rape, irrespective of intercrop treatment, continued to accumulate N between the last two harvests, whereas uptake levelled off for both pea and barley (data not shown). Since the rape sole crops displayed similar accumulation patterns it is likely that the developmental time and pattern of N uptake of rape was different from that of both the pea and barley. Whatever the explanation these differences demonstrate the potential of rape holding intercrops to bring about more efficient resource use over time. Competition for and accumulation of soil N
Despite accounting for approximately half of the total biomass production, pea accumulated much less soil N when intercropped than could have been expected from sole crop uptake (Figure 5A). This clearly emphasizes the competitive superiority of rape and barley when focus is on soil N. Barley was the most competitive, accounting for more than a proportionate part of the total N accumulated in all intercrops of which it was a part. Jensen (1996) observed a similar superiority of the barley component of intercrops of pea and barley. This dominance was not predictable on the basis of the performance of the three crops in sole crop, where both pea and rape accumulated more soil N than barley, however in the initial growth phase, the common observation is that one species grows faster than the other(s), progressively leading to dominance in terms of resource acquisition and thus to greater biomass growth and yield (Fukai and Trenbath 1993). In a model-based study, early emergence and rapid growth in the first stages of development were found to increase competitive advantage of species (Radosevich and Roush 1990). The barley crop grew faster initially than rape, giving it a headstart in the competition for available growth resources, be it water, nutrients or light. Early advantages that resulted in its accumulation of a disproportionate fraction of the soil N acquired by the intercrops holding these two components (Figure 5A). In association with pea, barley did not dominate to the same degree but nevertheless accounted for a significantly greater proportion of soil N uptake. The data indicates that an initial competitive advantage of barley in the two dual intercrops was strengthened by the addition of N, the barley component accounting for a greater relative proportion of soil N accumulated at the high N level. In the triple intercrop, dominance of barley was less strong and not strengthened by the addition of N, indicating that the presence of multi-species interactions diminished the impact of the dominant. The presence of more than two crops in an intercrop opens for the possibility of indirect facilitation. As discussed by Vandermeer (1989) one component, call it A may have a positive indirect effect on component B through its competitive effect on component C. The depression of barley in the tri-component mixture may well be the result of the improved growth of both rape and pea as a result of indirect facilitation. Competition for and accumulation of fertiliser N
As for soil N uptake, the uptake of fertiliser N by pea was suppressed by both nonlegumes, however more so by barley than rape. A greater accumulation of both soil and fertiliser N in the pea-rape intercrop compared to the pea-barley intercrop could, in accordance with
51
Fukai and Trenbath (1993), indicate that the improved performance of a weak competitor may increase intercrop performance.
As fertilisation was increased from 5 to 40 kg N ha-1 the relative increase in fertiliser uptake was similar for barley grown as a sole crop and in dual intercrop with either pea or rape (Figure 5B). However the uptake by both rape and pea responded differently when intercropped with barley than in the other crop treatments. As fertilisation levels increased from 5 to 40 kg N ha-1, both rape and pea grown in dual intercrop with barley increased their relative uptake of fertiliser N about 3 times whereas in joint association and as sole crops their relative uptake increased more than 5 times. This clearly emphasizes that the competitive impact of barley on rape and pea.
Whereas barley was a stronger competitor than rape, rape was clearly less suppressed when competition was for fertiliser N than soil N. Part of the explanation for this may be that faster initial root growth gave barley an advantage in the pursuit of soil N, gaining access to pools in deeper soil layers than rape. This morphological advantage may be assumed to have been of lesser importance when competition was for fertiliser N as this was primarily available in the upper layer of the soil profile. Recovery of added fertiliser N was signifantly lower at the high level of fertilisation (Table 5), which could indicate that a greater relative proportion of the added urea-N was lost through ammonia volatilisation in the N40 compared to the N5 treatments and therefore not temporarily immobilised in the soil for later potential uptake. Effect of intercropping and N fertilisation on N2 fixation
As noted earlier the competitive pressure exerted by barley towards pea was clearly stronger than that of rape on pea when focus was on fertiliser and soil N. At the same time the greatest relative amount of N2 fixed at maturity was measured for the pea grown in association with rape under conditions of low N fertilisation whereas the two other pea-holding intercrops fixed amounts comparable to the pea sole crop (Figure 6). This may indicate that the benefits achieved from the association of a legume and nonlegume are partly lost if the nonlegume is too strong a competitor for inorganic N. As previously observed by Ofori and Stern (1987) the potential of the intercropping practise, as a means of increasing the contribution of N derived from atmospheric fixation was lost as fertilisation level was increased, the relative amounts of N2 fixed by pea in all intercrops being lower than could have been expected from the sole crop.
At the low N fertilisation level, the final total N accumulation by pea (data not shown, but available by combining %Ndfa (Table 6) and total N uptake of the pea crop (Figure 6)) was not significantly affected by competition from rape, yet suppressed by the impact of competition in the pea-barley and pea-barley-rape intercrops. So, despite the fact that competition from both rape and barley clearly increased the proportion of pea N derived from N2 fixation the competitive strength of the companion crop may clearly determined the actual degree of N complementarity achieved. Increasing the fertilisation level a somewhat different picture prevailed, there was no clear effect of competition on %Ndfa and in all intercrops total final N accumulation by pea was lower than that of sole cropped pea.
52
Intercrop species richness, productivity and N use
The diversity of opinion about the functions of diversity in agricultural cropping systems is high while the data on which a solid judgement could be formulated remains sparse (Giller et al. 1997; Swift and Anderson1993; Vandermeer et al. 1998). However many seem to agree that crop-species composition and diversity may among other things profoundly affect soil fertility (Hooper 1998; Russell 2002; Swift and Anderson 1993), increase nutrient and water-use efficiency and resistance to crop diseases (Mitchell et al. 2002), thereby providing stability to the cropping system (Swift and Anderson 1993; Trenbath 1999). As has been the focus of the present study most species-diversity studies have focussed on short term effects of low diversity (2-3 species) systems, often dominated by N2 fixers. In this study we anticipated that because of differences in structural and biogeochemical traits, the three studied crops would use limiting soil resources in a complementary way giving rise to a greater biomass productivity when diversity of the cropping treatment was increased. However, we did not find an absolute increase in productivity when species number was increased from 1 to 2 to 3 components. Parralleling this, results of numerous competition experiments, among these many intercropping studies (Trenbath 1974; Vandermeer 1990), lead to the conclusion that plant diversity does not necessarily result in absolute increases in net primary production, absolute yields frequently falling between those of the least and most productive species grown as sole crops (Hooper 1998). Nevertheless all intercrops, irrespective of composition displayed LER values close to or exceeding unity, indicating the complementary use of resources. The complementarity of the pea containing intercrops was to a certain degree the result of N-use complementarity through the ability of pea to fix atmospheric nitrogen. Overall N uptake of the studied cropping treatments was clearly influenced by the presence of pea, all pea containing crop treatments accumulating more N than barley and rape sole crops as well as their combined intercrop. Furthermore the pea crop proved valuable for increasing the quality of the harvested grain, the N content of the total grain fraction standing in direct relation to the proportion of pea in a given crop treatment. In the barley-rape intercrop LER values comparable to those of the pea intercrops indicate that these two non-legumes clearly complemented one another in some way or another. Complementarity was not for total N-uptake since uptake by the intercrop did not differ significantly from that of the two sole crops however differences in the temporal development of the two crop species, leading them to complement each other over time may explain the greater relative yield of the intercrop.
This study clearly points at some of the potential advantages of increasing the diversity of intercrops, be they through complementary use of N (through a N2 fixer), differences in phenological development or other differences. However, whether there are clear advantages of increasing the number of component crops from 2 to 3 species is not clear, but it is apparent that the competitive and complementary interactions between species are altered by the presence of an additional crop component. Furthermore, the results of the present study emphasize the importance of initial population dynamics for
53
structuring intercrop composition and the prevailing patterns of dominance and suppression.
Acknowledgements We thank Susanne Olsen and Britta Henriksen for skilled technical assistance. Associate Professor Svend Erik Jensen (Agrohydrology and Bioclimatology, Department of Agricultural Sciences, Royal Veterinary and Agricultural University, Copenhagen) kindly supplied the climatic data.
References Ae N, Arihara J, Okada K, Yoshihara T and Johansen C (1990) Phosphorus uptake by pigeon pea
and its role in cropping systems of the Indian subcontinent. Science 248: 477-480. Anil L, Park RHP and Miller FA (1998) Temperate intercropping of cereals for forage: a review of
the potential for growth and utilization with particular reference to the UK. Grass For. Sci. 53: 301-317.
Carruthers K, Prithiviraj B, Fe Q, Cloutier D, Martin RC and Smith DL (2000) Intercropping corn with soybean, lupin and forages: yield component responses. Eur. J. Agron. 12: 103-115.
Chiariello N, Hickman JC and Mooney HA (1982) Endomycorrhizal role for interspecific transfer of phosphorous in a community of annual plants. Science 217: 941-943.
Fried M and Middelboe V (1977) Measurement of amount of nitrogen fixed by a legume crop. Plant Soil 47: 713-715.
Fukai S and Trenbath BR (1993) Processes determining intercrop productivity and yields of component crops. Field Crop. Res. 34: 247-271.
Ghanbari-Bonjar A and Lee HC (2002) Intercropped field beans (Vicia faba) and wheat (Triticum aestivum) for whole crop forage: effect of nitrogen on forage yield and quality. J. Agr. Sci. 138: 311-315.
Giller KE, Beare MH, Lavelle P, Izac AMN and Swift MJ (1997) Agricultural intensification, soil biodiversity and agroecosystem function. Appl. Soil Ecol. 6: 3-16.
Hauggaard-Nielsen H, Ambus P and Jensen ES (2001a) Interspecific competition, N use and interference with weeds in pea-barley intercropping. Field Crop. Res. 70: 101-109.
Hauggaard-Nielsen H, Ambus P and Jensen ES (2001b) Temporal and spatial distribution of roots and competition for nitrogen in pea-barley intercrops - a field study employing P- 32 technique. Plant Soil 236: 63-74.
Hauggaard-Nielsen H and Jensen ES (2001c) Evaluating pea and barley cultivars for complementarity in intercropping at different levels of soil N availability. Field Crop. Res. 72: 185-196.
Høgh-Jensen H and Schjøerring JK (1994) Measurement of biological dinitrogen fixation in grassland - comparison of the enriched N-15 dilution and the natural N-15 abundance methods at different nitrogen application rates and defoliation frequencies. Plant Soil 166: 153-163.
Horst WJ and Waschkies C (1987) Phosphorus nutrition of spring wheat (triticum-aestivum L) in mixed culture with white lupin (lupinus-albus L). Z. Pflanzenernähr. Bodenk. 150: 1-8.
54
Jensen ES (1996) Grain yield, symbiotic N-2 fixation and interspecific competition for inorganic N in pea-barley intercrops. Plant Soil 182: 25-38.
Jensen ES (1997) The role of grain legume N2 fixation in the nitrogen cycling of temperate cropping systems. D. SC. Thesis Risø-R-885. Risø National Laboratory, DK-4000 Roskilde, Denmark.
Jensen ES, Andersen AJ and Thomsen JD (1985) The Influence of seed-borne N in 15N isotope dilution studies with legumes. Acta Agr. Scand. 35: 438-443.
Johansen A and Jensen ES (1996) Transfer of N and P from intact or decomposing roots of pea to barley interconnected by an arbuscular mycorrhizal fungus. Soil Biol. Biochem. 28: 73-81.
Keating BA and Carberry PS (1993) Resource capture and use in intercropping - solar-radiation. Field Crop. Res. 34: 273-301.
Li L, Yang SC, Li XL, Zhang FS and Christie P (1999) Interspecific complementary and competitive interactions between intercropped maize and faba bean. Plant Soil 212: 105-114.
Marschner H, Romheld V, Horst WJ and Martin P (1986) Root-induced changes in the rhizosphere - importance for the mineral-nutrition of plants. Z. Pflanzenernähr. Bodenk. 149: 441-456.
Midmore DJ (1993) Agronomic modification of resource use and intercrop productivity. Field Crop. Res. 34: 357-380.
Mitchell CE, Tilman D and Groth JV (2002) Effects of grassland plant species diversity, abundance, and composition on foliar fungal disease. Ecology 83: 1713-1726.
Naeem S, Hakansson K, Lawton JH, Crawley MJ and Thompson LJ (1996) Biodiversity and plant productivity in a model assemblage of plant species. Oikos 76: 259-264.
Ofori F and Stern WR (1987) Cereal-legume intercropping systems. Adv. Agron. 41: 41-90. Peoples MB, Turner GL, Shah Z, Shah SH, Aslam M, Ali S, Maskey SL, Bhattarai S, Afandi F,
Schwenke GD and Herridge DF (1997) Evaluation of the 15N natural abundance technique to measure N2 fixation in experimental plots and farmers' fields. In: Proceedings of the international workshop on managing legume nitrogen fixation in the cropping systems of Asia, Hyderabad, India, ICRISAT. Eds. O P Rupela, Johansen C and Herridge D F. pp 141-153.
Radosevich SR and Roush ML (1990) The role of competition in agriculture. In Perspectives on competition. Eds. Grace J and Tilman D. Academic Press, New York.
Rauber R, Schmidtke K and Kimpel-Freund H (2001) The performance of pea (pisum sativum L.) and its role in determining yield advantages in mixed stands of pea and oat (avena sativa L.). J. Agron. Crop Sci. 187: 137-144.
Rerkasem K, Stern WR and Goodchild NA (1980) Associated growth of wheat and annual ryegrass .3. Effects of early competition on wheat. Aust. J. Agric. Res. 31: 1057-1067.
Russell AE (2002) Relationships between crop-species diversity and soil characteristics in southwest Indian agroecosystems. Agric. Ecosyst. Environ. 92: 235-249.
Searle SR (1971) Linear models. Willey and Sons, New York, USA. 532 p. Swift MJ and Anderson JM (1993) Biodiversity and ecosystem function in agricultural systems. In
Biodiversity and ecosystem function. Eds. E D Schulze and Mooney H A. pp 15-41. Springer-Verlag, Berlin, Germany.
Tilman D (1988) Plant strategies and the dynamics and function of plant communities. Princeton University Press, Princeton, New Jersey, USA. 360 p.
Tilman D and Downing JA (1994) Biodiversity and stability in grasslands. Nature 367: 363-365. Tilman D, Wedin D and Knops J (1996) Productivity and sustainability influenced by biodiversity in
grassland ecosystems. Nature 379: 718-720. Trenbath BR (1974) Biomass productivity of mixtures. Adv. Agron. 26: 177-210.
55
Trenbath BR (1993) Intercropping for the management of pests and diseases. Field Crop. Res. 34: 381-405.
Trenbath BR (1999) Multispecies cropping systems in India - Predictions of their productivity, stability, resilience and ecological sustainability. Agroforest. Syst. 45: 81-107.
Vandermeer J, van Noordwijk M, Anderson J, Ong C and Perfecto I (1998) Global change and multi-species agroecosystems: Concepts and issues. Agric. Ecosyst. Environ. 67: 1-22.
Vandermeer JH (1989) The ecology of intercropping. Cambridge University Press, Cambridge, Great Britain. 237 p.
Vandermeer JH (1990) Intercropping. In Agroecology. Eds. Carrol CR, Vandermeer JH and Rosset PM. pp 481-516. McGraw-Hill, New York, USA.
Waterer JG, Vessey JK, Stobbe EH and Soper RJ (1994) Yield and symbiotic nitrogen-fixation in a pea - mustard intercrop as influenced by N fertiliser addition. Soil Biol. Biochem. 26: 447-453.
Willey RW (1979) Intercropping - its importance and research needs: Part 1. Competition and yield advantages. Field Crop Abstr. 32: 1-10.
Willey RW, Natarajan M, Reddy MS, Rao MR, Nambiar PTC, Kannaiyan J and Bhatnagar VS (1983) Intercropping studies with annual crops. In: Better crops for food, Ciba Foundation Symposia No. 97. Pitman, London, pp 83-100.
Willey RW and Osiru DSO (1972) Studies on mixtures of maize and beans (phaseolus-vulgaris) with particular reference to plant population. J. Agr. Sci. 79: 517-529.
56
Evaluating competitive dynamics in two and three component intercrops of Pisum sativum, Hordeum vulgare and Brassica napus Mette Klindt Andersen1,2, Henrik Hauggaard-Nielsen2, Jacob Weiner3 and Erik Steen Jensen2. 1Department of Agricultural Sciences, The Royal Veterinary and Agricultural University, Thorvaldsensvej 40, DK-1871 Frederiksberg, Denmark. 2Biosystems Department, RISØ National Laboratory, Frederiksborgvej 399, DK-4000 Roskilde, Denmark. 3The Department of Ecology, The Royal Veterinary and Agricultural University, Thorvaldsensvej 40, DK-1871 Frederiksberg, Denmark.
Summary
1. The intercropping practise is receiving increasing attention as a cropping strategy that can use available growth resources more efficiently than sole cropping. However knowledge of the mechanisms that are at play between intercropped species is limited and there is still much debate as to how competitive interactions between crop species are best evaluated, both with respect to experimental design, and the analysis and interpretation of experimental results.
2. Using a replacement design, we grew pea (Pisum sativum), barley (Hordeum vulgare) and rape (Brassica napus) as sole crops and intercrops under field conditions. We collected total dry matter data from sequential harvests and analysed them with commonly-used competition indices. To measure intercrop performance, the Land Equivalent Ratio (LER) and corresponding partial LER values for all crop treatments and components were compared to corresponding measures estimated by fitting the data to a logistic growth model. At each harvest we estimated the relative Competitive Strength (CS) of the three crops by fitting the data to a competition model, and compared these measures to the values of the Competitive Ratio (CR) estimated on the basis of actual biomass yields.
3. Fitting data to the logistic growth curve showed the importance of initial size differences for the studied intercrops. Barley was the dominant component of the intercrops because of its initial size advantage
4. LER values calculated on the basis of actual measures of final yield indicated that intercrops used available growth resources 15 to 40 % more efficiently than corresponding sole crops.
5. Tracking both CS and CR over the growing season it was apparent that the competitive impact of barley on its companion crops increased throughout most of the growing season, possibly as the impact of initial size differences were strengthened by size-asymmetric competition for light.
6. We conclude that LER and partial LER should be calculated on the basis of actual measures of yield when comparing measures of crop productivity. We found that
57
the value of using a competition model to estimate the relative competitive strength of the three crops opposed to calculating the ‘raw’ CR to be limited.
7. Including sequential harvests gave valuable indications of how competitive hierarchies were established and changed over time.
8. We recommend that more focus be put towards understanding the mechanisms that govern interactions between intercropped species. Most intercrop studies merely focus on some issue of final yield, giving very limited information on the underlying mechanisms. Our study indicates that increased understanding of the role of asymmetric competition and the resulting advantages of early germination and seedling emergence would be valuable in designing intercrops.
Keywords: Competition model, competitive ratio, complementarity, land equivalent
ratio, logistic growth, replacement design
Introduction The importance of interactions among plants in determining the structure and dynamics of plant communities is widely recognized (Loreau et al. 2001; Tilman 1988) and numerous intercropping studies have been carried out with the goal of shedding light on the mechanism involved in relation to agronomic benefits (Andersen et al. 2004; Hauggaard-Nielsen, Ambus & Jensen 2001a; Zhang & Li 2003). Interspecific competition, in which two individual plants or two populations interact such that at least one exerts a negative effect on the other, is no doubt the component of crop-crop interaction that has been most widely addressed within intercropping research (Andersen et al. 2004; Hauggaard-Nielsen, Ambus & Jensen 2001a; Jensen 1996). However, there has been and is still much debate about how interspecific competitive interactions are best evaluated, both with respect to experimental design, and methods of analysing and interpreting experimental results (Connolly, Goma & Rahim 2001; Cousens 1996; Weigelt & Jolliffe 2003).
A variety of experimental designs have been used to study competition in intercrops, but the replacement design introduced by de Wit (1960) is by far the most predominant. This design has been criticized for its interpretative limitations: results may vary with the total density at which a replacement study is conducted (Firbank & Watkinson 1985), densities and spatial arrangements are confounded (Connolly 1988; Snaydon 1994) and it is impossible to separate the effects of intra- and interspecific competition (Firbank & Watkinson 1985). Every experimental design has its limitation, and inferences from the results of any design should be made with respect to its limitations (Cousens 1996). The replacement design has been argued to be suitable for addressing questions relating to populations or community composition and dynamics (Cousens 1996).
Competition indices have been widely applied to quantify the degree of resource competition between intercropped species (Andersen et al. 2004; Bulson, Snaydon & Stopes 1997; Hauggaard-Nielsen, Ambus & Jensen 2001a) and a recent review
58
(Connolly, Goma & Rahim 2001) outlines the strengths and weaknesses of many of these in relation to intercropping research.
Despite the goal of understanding the nature of ecological interactions governing the outcome of an intercropping system, most intercrop studies have primarily dealt with plants at the end of some competitive period, even though most calculated indices do not capture the dynamic changes in species interactions over time as plants grow and compete (Connolly, Wayne & Murray 1990; Turkington & Jolliffe 1996). Studying the growth of intercrops more closely through the inclusion of data from sequential harvests would give a more detailed picture of how interspecies dynamics change over time, and of the effect of initial conditions on competitive interaction and output of intercrops (Connolly, Goma & Rahim 2001; Gibson et al. 1999). Data from consecutive harvests would also allow for competition indices to be used to track the progress and results of competition over time (Weigelt & Jolliffe 2003) and enable us to fit data to growth models, giving us more information on the mechanisms involved as species compete. Increased appreciation of competition as a process could potentially enable us to develop intercropping systems that to a greater degree utilise the advantages of interactions between crop species.
The objective of this study was to address the question of how competitive interactions between crop species in an intercrop, grown using a replacement series design, are best evaluated. Does the inclusion of data from several harvests through the growing season give insights about competition? Data from a pea-barley-rape intercrop experiment carried out under field conditions (Andersen et al. 2004) were analysed with commonly used competition indices. To study the outcome of competition, the Land Equivalent Ratio (LER) and corresponding partial LER values were used. Calculations were based on measured dry matter yield and corresponding measures estimated on the basis of growth model outputs. To evaluate the intensity of competition between crops, data was fitted to a competition model and the relative competitive strength (CS) of the crops estimated. These measures were compared to values of the Competitive Ratio (CR) estimated on the basis of measured dry matter yields.
Materials and methods The field study was conducted at the Royal Veterinary and Agricultural University’s research farm in Taastrup, Denmark (55°40'N, 12°18'E) from April to August 2000. The soil type was a sandy loam (Andersen et al. 2004). On site meteorological data were recorded on a daily basis.
Using a proportional replacement design (Willey 1979) we grew Pisum sativum L. (field pea), Hordeum vulgare L. (spring barley) and Brassica napus L. (oilseed rape) as sole crops (SC), in dual-component intercrops and in a tri-component intercrop (IC), giving a total of seven crop treatments. The study was organized as a randomized split-plot design with crop treatment as plot factor and using a total of four replicates. Each 18m2 plot consisted of ten rows of length 12 m spaced 15 cm apart. We tried to achieve sole crop densities of 80 pea, 350 barley and 110 rape plants m-2. The two and three component
59
intercrops consisted of half and a third of the sole crop densities of each species, respectively.
We sowed the crops on the 27th April 2000. Pea, barley and rape seeds were sown consecutively in the same row, first the pea seeds were sown at a depth of 6 cm, then barley seeds at 4 cm depth and lastly the rape seeds at a depth of 2 cm. We made a total of five harvests over the course of the growing season, at 33, 42, 61, 77 and 112 days after sowing. At each of the first 4 harvests, plant material from a 0.5m2 subplot of each plot was harvested at ground level. At the final harvest the harvested area was increased to 1 m2. Harvested plant material was sorted into component crops and individual biomass yields determined before and after drying at 80°C for 24 h. Analysis
Growth model
Biomass yield data, from all five harvests, were for each crop component of sole- and intercrops fitted to the logistic growth function (Hunt 1982) using least squares. Y = (a * exp b ( t – k )) / (1 + exp b (t – k)) (1) Y represents the biomass yield of a given crop species grown in a given crop treatment at a given time (t) during the growth season. The model has three parameters, a is a scale parameter, determining the vertical extent of the growth curve, b is a scale parameter determining the horizontal scaling of the growth curve and k is the inflection point of the curve. Using the NLIN procedure of SAS software (SAS 1999) all three parameters were estimated.
To test the validity of the model, the assumptions of normal distribution and of variance homogeneity were tested graphically using residual plots. The presence of systematic deviation from the model was similarly studied graphically. The presence of single points with large effects on regression estimates was revealed using Cook’s distance (Cook 1977). To attain variance homogeneity and normality, a transform-both-sides approach (TBS) with a log-transformation was used. More precisely, a power transformation (Box & Cox 1964) with power parameter λ was used to determine the most appropriate transformation.
Using an F-test for lack of fit (Weisberg 1985), no significant differences were found between the within-block and between block variances. The effect of crop species on the a, b and k parameters included in the model and the hypothesis of no differences among a, b and/or k among treatments, and consequently the possibility of reducing the model were tested by using the F-test for lack of fit. Land Equivalent Ratio (LER)
On the basis of model estimated a-values, Land Equivalent Ratio (LER) values for the 4 studied intercrops and partial LER values (L) of their component crops were calculated.
60
L for species i intercropped with j: Li(ij) = ai(ij)/ai(i) (2) L for species j intercropped with i:
Lj(ij) = aj(ij)/aj(j)
(3)
LER for the ij intercrop:
LER(ij) = Li(ij) + Lj(ij)
(4)
LER values were also calculated on the basis of actual measured dry matter yields at the final harvest. Substituting modelled a-values for DM yield measurements LER was calculated for each block using equations 2 to 4. The Land Equivalent Ratio is defined as the total land area required under sole cropping to attain the yields achieved when growing intercrops (Willey & Osiru 1972), implying that when LER values are greater than 1, the intercrop yield exceeds the average sole crop yields. Competition model
To determine the relative competitive ability of the three crops we formulated a competition model. Dual intercrops: Yi(ij) = Yi(i) * (pi*ci) / ((pi*ci) + (pj*cj)) (5) Triple intercrops: Yi(ijk) = Yi(i) * (pi*ci) / ((pi*ci) + (pj*cj) + (pk*ck)) (6) Here Y refers to the dry matter yield, p refers to the relative proportion of crops and c is the competitive coefficient for a given crop. The subscripts were introduced above. Applying the model to dry matter data from the first harvest, p values were taken as the proportions at which the crops were sown. Fitting data from the following harvests p values were based on the relative contribution of component to the total dry matter measured at the previous harvest. Using the NLIN procedure of SAS software (SAS 1999), we estimated the competitive coefficients corresponding to pea, barley and rape. The model assumes there is a general competitive effect of a given crop on another, i.e. cij (ij) = cij(ijk) . This assumption was tested with a T-test comparing the measured and model predicted yield measures.
As with the growth model, we validated the applied competition model through analysis of variance and normality. To attain variance homogeneity and normality we used a transform-both-sides approach (TBS) with a log-transformation.
On the basis of estimated c-values, we calculated the relative competitive strength (CS) of the crops, as the ratio of the competition coefficient of one species to the competition coefficient of the other. CSij = ci / cj (7) As this measure is based on the model it assumes that competitive ability is general, meaning that the competitive ability of a species does not change with the identity of the competitor. As a comparative measure of relative crop strength without the assumption
61
that competition is general, we used the Competitive Ratio (CR) (Willey and Rao 1980) index, based on measured dry matter yields at the final harvest. CRij = (Li(ij) / Lj(ij))*(pj(ij) / pi(ij)) (8)
CRij is a comparative measure of the competitive ability of one crop (i) relative to another (j). A competitive ratio of 1 indicates that the two crops exert a similar competitive pressure on one another whereas values exceeding and falling below 1 indicate the dominance of crop species i and j, respectively.
Results Crop growth and productivity
Dry matter data from the five harvests were successfully fitted to the logistic growth model for all crop components of sole- and intercrops (Eqn 1; P<0.0001). The final dry matter yields estimated using the model were well above those actually measured for each of the three sole crops whereas the corresponding values estimated for all components of the intercrops were well in line with the yields measured (Fig. 1). Following tests for reducing of the model, the growth curves of all sole- and intercrop components were found to be best described with the same initial growth rate (b = 0.092 (± 0.004 SE)) and the same point of inflexion (k = 58.9 (± 1.3 SE)). Differences in the modelled growth curves of all crop components could only be explained by differences in the value of the asymptote towards which they move (A; Fig. 1).
Table 1. Relative proportions (%) of component crops in the total biomass harvested from each of the four studied intercrops (Pea-Barley: PB, Pea-Rape: PR, Barley-Rape: BR and Pea-Barley-Rape: PBR) 33 and 112 days after sowing (DAS) and corresponding proportions estimated by the logistic growth model. Proportions based on measured biomass are the mean (n=4).
Intercrop treatment
Crop component PB PR BR PBR
Pea 45 56 29 33 DAS Barley 55 75 48 Rape 44 25 23 Pea 49 56 34 112 DAS Barley 51 75 50 Rape 44 25 16 Pea 47 56 33 Model Barley 53 80 47 Rape 44 20 20
62
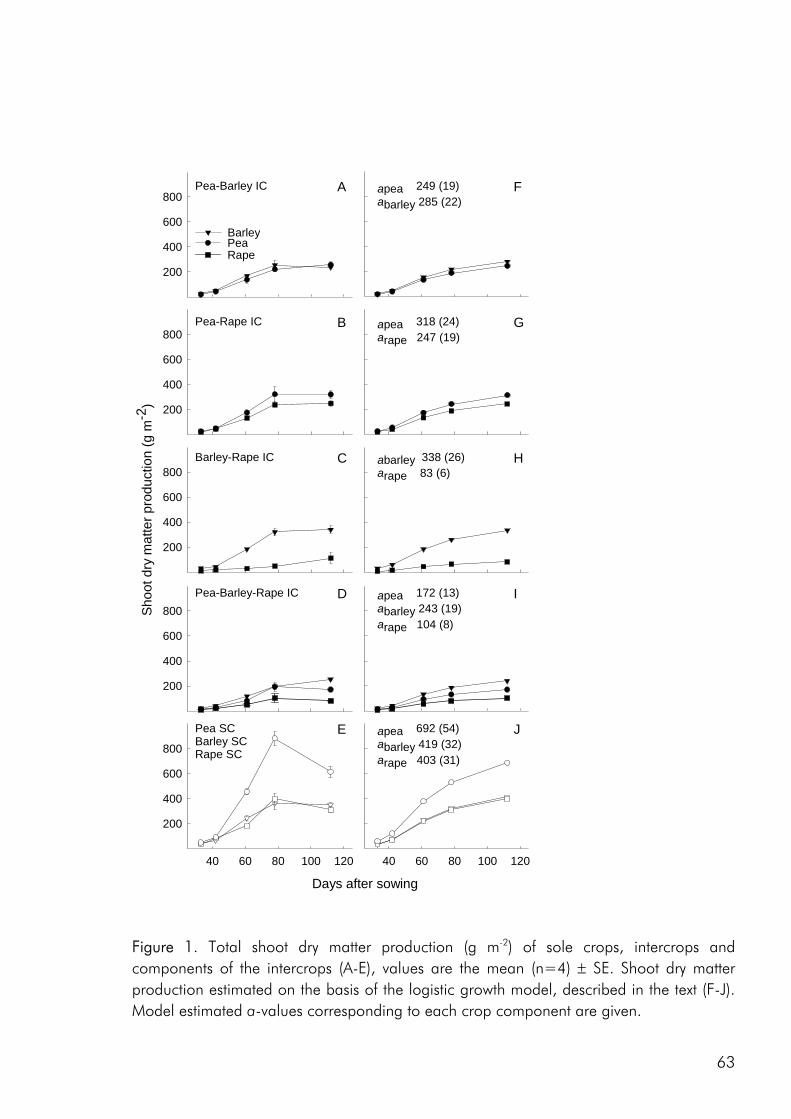
X Data
X Data
X Data
Days after sowing
40 60 80 100 120
200
400
600
800
X Data
200
400
600
800
X Data
Shoo
t dry
mat
ter p
rodu
ctio
n (g
m-2
)
200
400
600
800
X Data
200
400
600
800
40 60 80 100 120
200
400
600
800
A
B
F
G
HC
ID
JE
Pea-Barley IC
Pea-Rape IC
Barley-Rape IC
Pea-Barley-Rape IC
Pea SCBarley SCRape SC
apea 249 (19)abarley 285 (22)
apea 318 (24)arape 247 (19)
abarley 338 (26)arape 83 (6)
apea 172 (13)abarley 243 (19)arape 104 (8)
apea 692 (54)abarley 419 (32)arape 403 (31)
BarleyPeaRape
Figure 1. Total shoot dry matter production (g m-2) of sole crops, intercrops and components of the intercrops (A-E), values are the mean (n=4) ± SE. Shoot dry matter production estimated on the basis of the logistic growth model, described in the text (F-J). Model estimated a-values corresponding to each crop component are given.
63
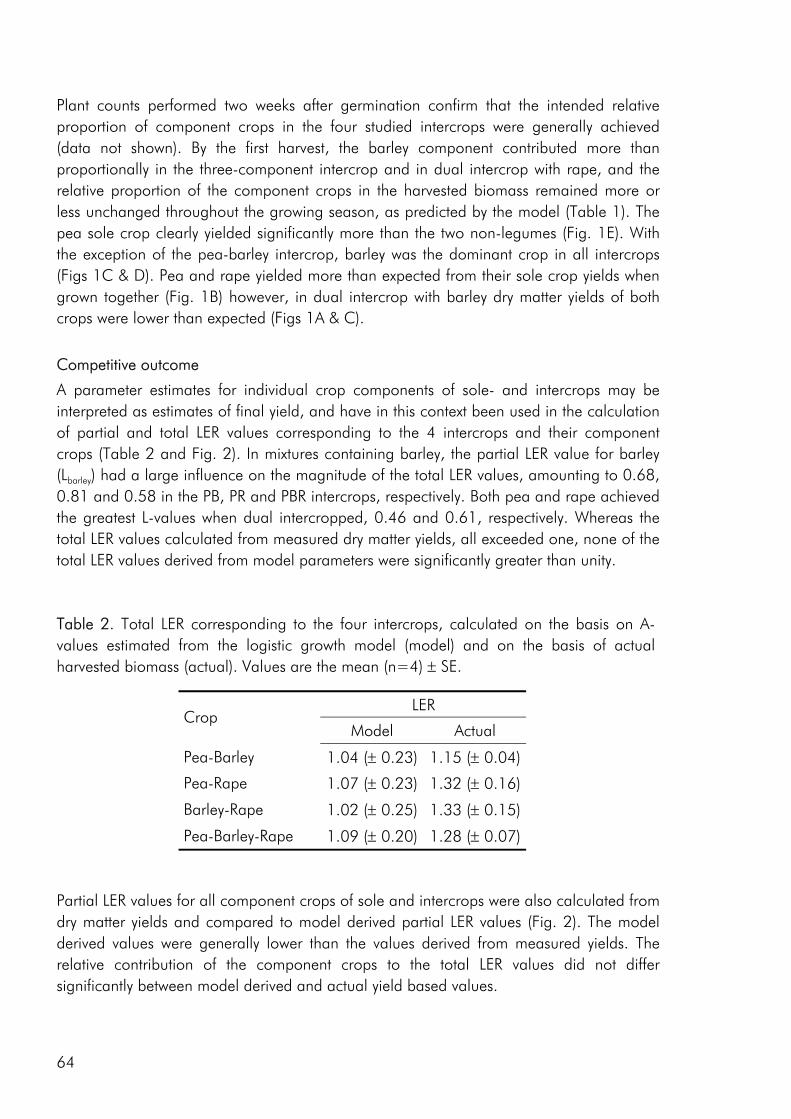
Plant counts performed two weeks after germination confirm that the intended relative proportion of component crops in the four studied intercrops were generally achieved (data not shown). By the first harvest, the barley component contributed more than proportionally in the three-component intercrop and in dual intercrop with rape, and the relative proportion of the component crops in the harvested biomass remained more or less unchanged throughout the growing season, as predicted by the model (Table 1). The pea sole crop clearly yielded significantly more than the two non-legumes (Fig. 1E). With the exception of the pea-barley intercrop, barley was the dominant crop in all intercrops (Figs 1C & D). Pea and rape yielded more than expected from their sole crop yields when grown together (Fig. 1B) however, in dual intercrop with barley dry matter yields of both crops were lower than expected (Figs 1A & C).
Competitive outcome
A parameter estimates for individual crop components of sole- and intercrops may be interpreted as estimates of final yield, and have in this context been used in the calculation of partial and total LER values corresponding to the 4 intercrops and their component crops (Table 2 and Fig. 2). In mixtures containing barley, the partial LER value for barley (Lbarley) had a large influence on the magnitude of the total LER values, amounting to 0.68, 0.81 and 0.58 in the PB, PR and PBR intercrops, respectively. Both pea and rape achieved the greatest L-values when dual intercropped, 0.46 and 0.61, respectively. Whereas the total LER values calculated from measured dry matter yields, all exceeded one, none of the total LER values derived from model parameters were significantly greater than unity. Table 2. Total LER corresponding to the four intercrops, calculated on the basis on A-values estimated from the logistic growth model (model) and on the basis of actual harvested biomass (actual). Values are the mean (n=4) ± SE.
LER Crop
Model Actual
Pea-Barley 1.04 (± 0.23) 1.15 (± 0.04)
Pea-Rape 1.07 (± 0.23) 1.32 (± 0.16)
Barley-Rape 1.02 (± 0.25) 1.33 (± 0.15)
Pea-Barley-Rape 1.09 (± 0.20) 1.28 (± 0.07)
Partial LER values for all component crops of sole and intercrops were also calculated from dry matter yields and compared to model derived partial LER values (Fig. 2). The model derived values were generally lower than the values derived from measured yields. The relative contribution of the component crops to the total LER values did not differ significantly between model derived and actual yield based values.
64
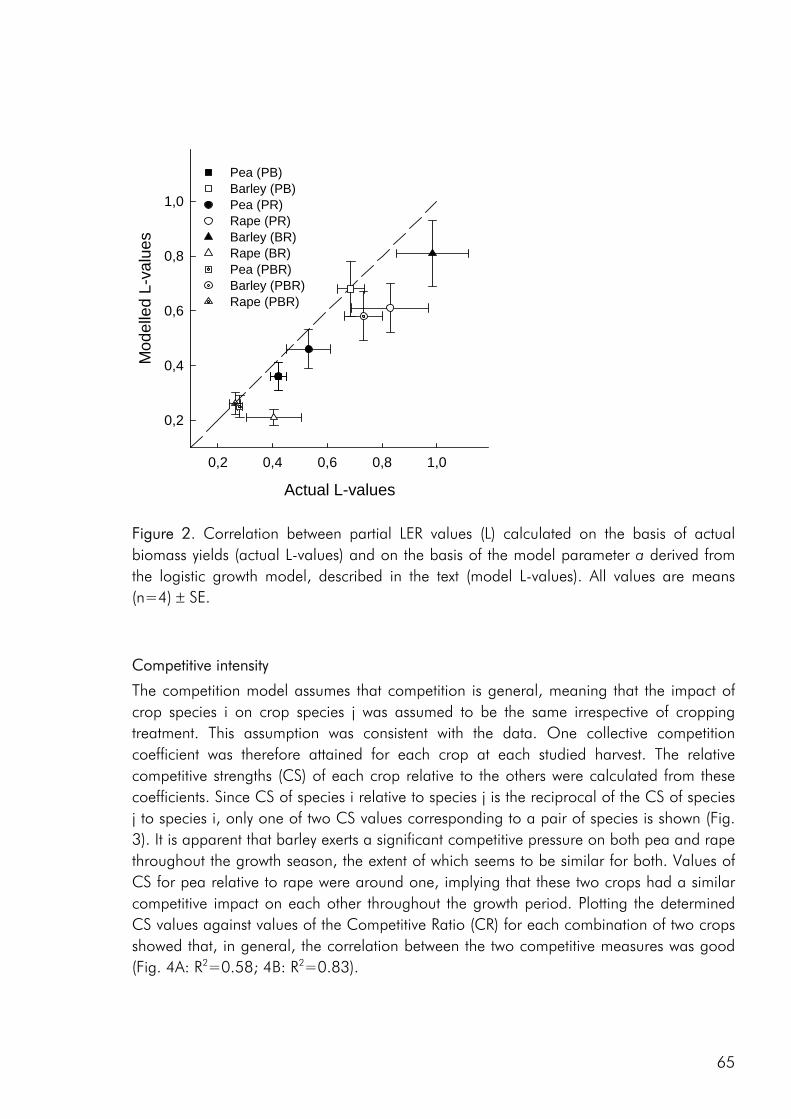
Actual L-values
0,2 0,4 0,6 0,8 1,0
Mod
elle
d L-
valu
es
0,2
0,4
0,6
0,8
1,0
Pea (PB)Barley (PB)Pea (PR)Rape (PR)Barley (BR)Rape (BR)Pea (PBR)Barley (PBR)Rape (PBR)
Figure 2. Correlation between partial LER values (L) calculated on the basis of actual biomass yields (actual L-values) and on the basis of the model parameter a derived from the logistic growth model, described in the text (model L-values). All values are means (n=4) ± SE.
Competitive intensity
The competition model assumes that competition is general, meaning that the impact of crop species i on crop species j was assumed to be the same irrespective of cropping treatment. This assumption was consistent with the data. One collective competition coefficient was therefore attained for each crop at each studied harvest. The relative competitive strengths (CS) of each crop relative to the others were calculated from these coefficients. Since CS of species i relative to species j is the reciprocal of the CS of species j to species i, only one of two CS values corresponding to a pair of species is shown (Fig. 3). It is apparent that barley exerts a significant competitive pressure on both pea and rape throughout the growth season, the extent of which seems to be similar for both. Values of CS for pea relative to rape were around one, implying that these two crops had a similar competitive impact on each other throughout the growth period. Plotting the determined CS values against values of the Competitive Ratio (CR) for each combination of two crops showed that, in general, the correlation between the two competitive measures was good (Fig. 4A: R2=0.58; 4B: R2=0.83).
65
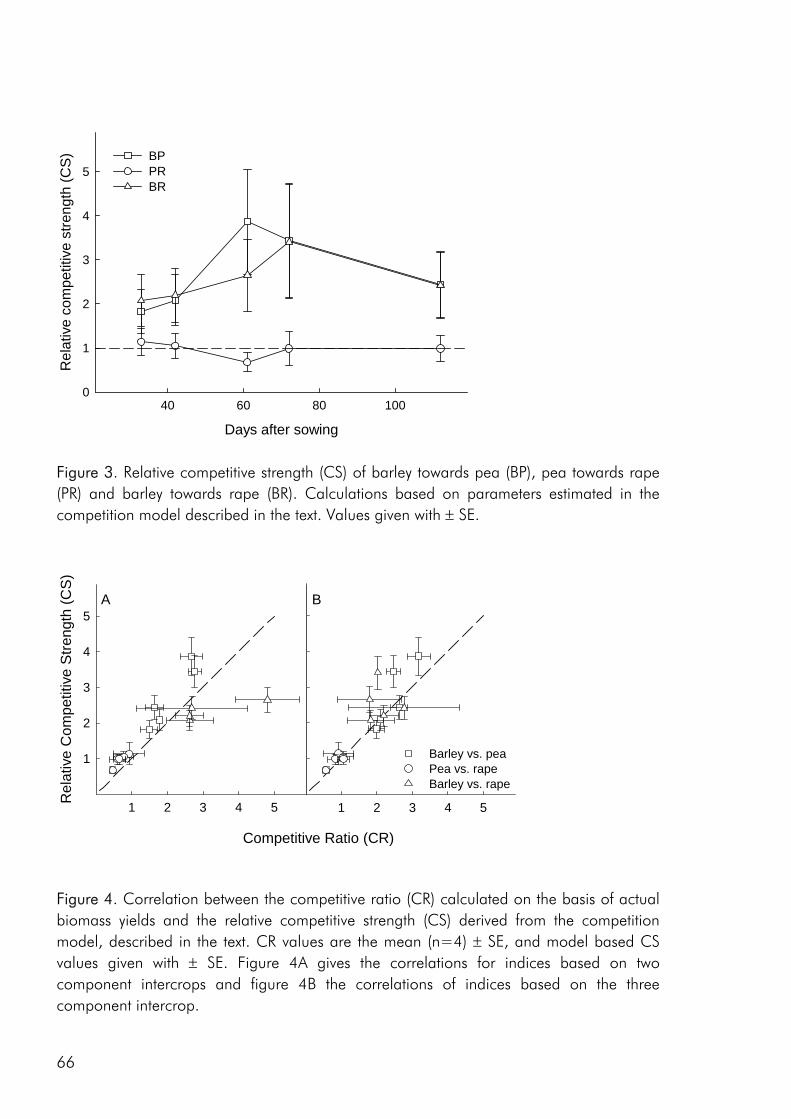
Days after sowing
40 60 80 100
Rel
ativ
e co
mpe
titiv
e st
reng
th (C
S)
0
1
2
3
4
5BPPRBR
Figure 3. Relative competitive strength (CS) of barley towards pea (BP), pea towards rape (PR) and barley towards rape (BR). Calculations based on parameters estimated in the competition model described in the text. Values given with ± SE.
1 2 3 4 5
1
2
3
4
5
B
Competitive Ratio (CR)
1 2 3 4 5Rel
ativ
e C
ompe
titiv
e S
treng
th (C
S)
1
2
3
4
5A
Barley vs. peaPea vs. rapeBarley vs. rape
Figure 4. Correlation between the competitive ratio (CR) calculated on the basis of actual biomass yields and the relative competitive strength (CS) derived from the competition model, described in the text. CR values are the mean (n=4) ± SE, and model based CS values given with ± SE. Figure 4A gives the correlations for indices based on two component intercrops and figure 4B the correlations of indices based on the three component intercrop.
66
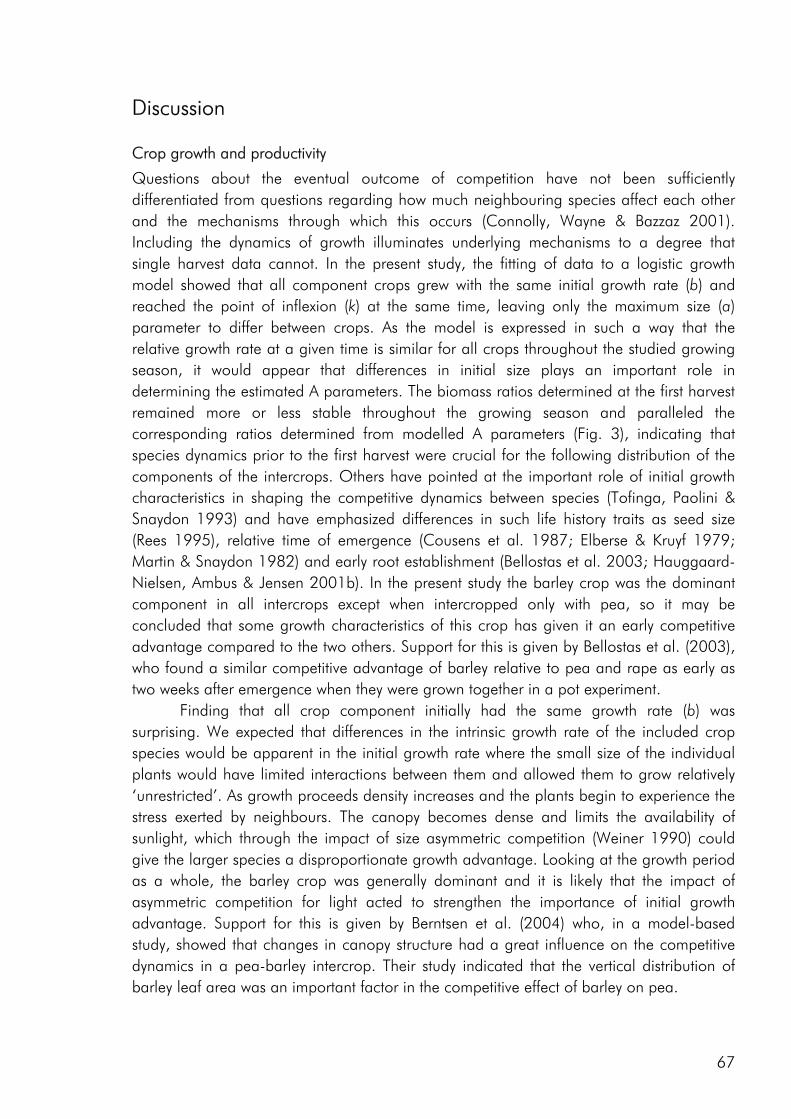
Discussion Crop growth and productivity
Questions about the eventual outcome of competition have not been sufficiently differentiated from questions regarding how much neighbouring species affect each other and the mechanisms through which this occurs (Connolly, Wayne & Bazzaz 2001). Including the dynamics of growth illuminates underlying mechanisms to a degree that single harvest data cannot. In the present study, the fitting of data to a logistic growth model showed that all component crops grew with the same initial growth rate (b) and reached the point of inflexion (k) at the same time, leaving only the maximum size (a) parameter to differ between crops. As the model is expressed in such a way that the relative growth rate at a given time is similar for all crops throughout the studied growing season, it would appear that differences in initial size plays an important role in determining the estimated A parameters. The biomass ratios determined at the first harvest remained more or less stable throughout the growing season and paralleled the corresponding ratios determined from modelled A parameters (Fig. 3), indicating that species dynamics prior to the first harvest were crucial for the following distribution of the components of the intercrops. Others have pointed at the important role of initial growth characteristics in shaping the competitive dynamics between species (Tofinga, Paolini & Snaydon 1993) and have emphasized differences in such life history traits as seed size (Rees 1995), relative time of emergence (Cousens et al. 1987; Elberse & Kruyf 1979; Martin & Snaydon 1982) and early root establishment (Bellostas et al. 2003; Hauggaard-Nielsen, Ambus & Jensen 2001b). In the present study the barley crop was the dominant component in all intercrops except when intercropped only with pea, so it may be concluded that some growth characteristics of this crop has given it an early competitive advantage compared to the two others. Support for this is given by Bellostas et al. (2003), who found a similar competitive advantage of barley relative to pea and rape as early as two weeks after emergence when they were grown together in a pot experiment.
Finding that all crop component initially had the same growth rate (b) was surprising. We expected that differences in the intrinsic growth rate of the included crop species would be apparent in the initial growth rate where the small size of the individual plants would have limited interactions between them and allowed them to grow relatively ‘unrestricted’. As growth proceeds density increases and the plants begin to experience the stress exerted by neighbours. The canopy becomes dense and limits the availability of sunlight, which through the impact of size asymmetric competition (Weiner 1990) could give the larger species a disproportionate growth advantage. Looking at the growth period as a whole, the barley crop was generally dominant and it is likely that the impact of asymmetric competition for light acted to strengthen the importance of initial growth advantage. Support for this is given by Berntsen et al. (2004) who, in a model-based study, showed that changes in canopy structure had a great influence on the competitive dynamics in a pea-barley intercrop. Their study indicated that the vertical distribution of barley leaf area was an important factor in the competitive effect of barley on pea.
67
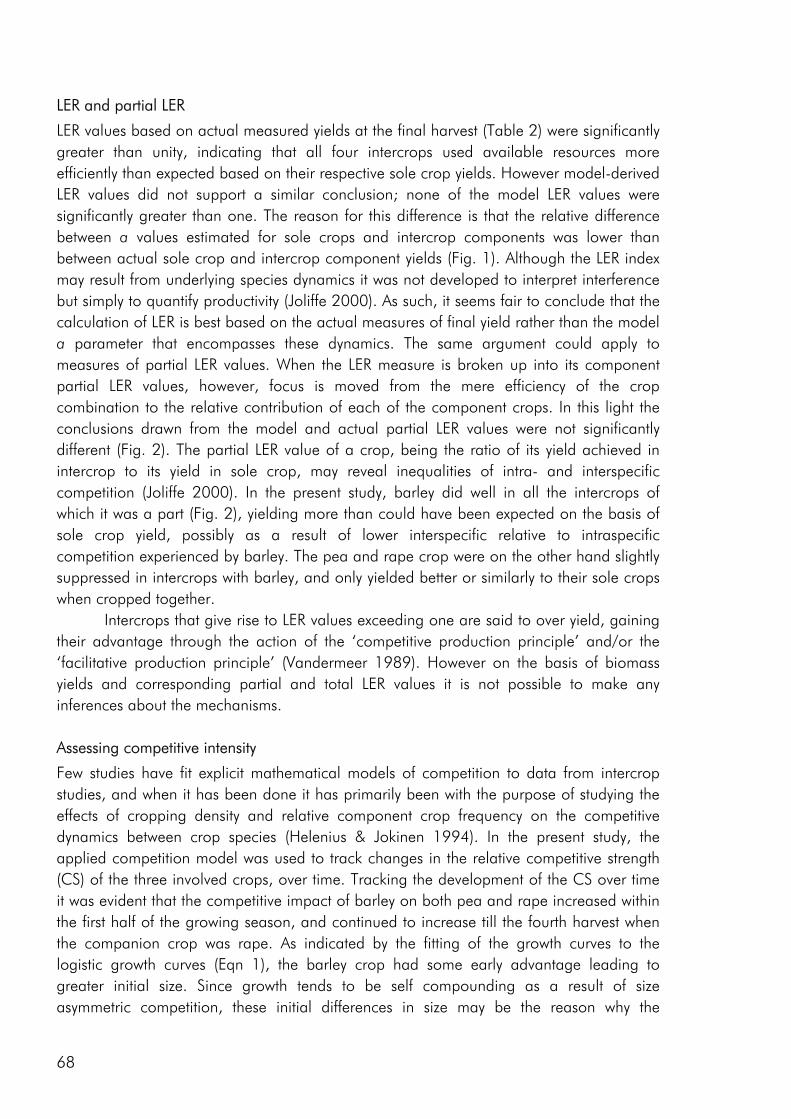
LER and partial LER
LER values based on actual measured yields at the final harvest (Table 2) were significantly greater than unity, indicating that all four intercrops used available resources more efficiently than expected based on their respective sole crop yields. However model-derived LER values did not support a similar conclusion; none of the model LER values were significantly greater than one. The reason for this difference is that the relative difference between a values estimated for sole crops and intercrop components was lower than between actual sole crop and intercrop component yields (Fig. 1). Although the LER index may result from underlying species dynamics it was not developed to interpret interference but simply to quantify productivity (Joliffe 2000). As such, it seems fair to conclude that the calculation of LER is best based on the actual measures of final yield rather than the model a parameter that encompasses these dynamics. The same argument could apply to measures of partial LER values. When the LER measure is broken up into its component partial LER values, however, focus is moved from the mere efficiency of the crop combination to the relative contribution of each of the component crops. In this light the conclusions drawn from the model and actual partial LER values were not significantly different (Fig. 2). The partial LER value of a crop, being the ratio of its yield achieved in intercrop to its yield in sole crop, may reveal inequalities of intra- and interspecific competition (Joliffe 2000). In the present study, barley did well in all the intercrops of which it was a part (Fig. 2), yielding more than could have been expected on the basis of sole crop yield, possibly as a result of lower interspecific relative to intraspecific competition experienced by barley. The pea and rape crop were on the other hand slightly suppressed in intercrops with barley, and only yielded better or similarly to their sole crops when cropped together.
Intercrops that give rise to LER values exceeding one are said to over yield, gaining their advantage through the action of the ‘competitive production principle’ and/or the ‘facilitative production principle’ (Vandermeer 1989). However on the basis of biomass yields and corresponding partial and total LER values it is not possible to make any inferences about the mechanisms. Assessing competitive intensity
Few studies have fit explicit mathematical models of competition to data from intercrop studies, and when it has been done it has primarily been with the purpose of studying the effects of cropping density and relative component crop frequency on the competitive dynamics between crop species (Helenius & Jokinen 1994). In the present study, the applied competition model was used to track changes in the relative competitive strength (CS) of the three involved crops, over time. Tracking the development of the CS over time it was evident that the competitive impact of barley on both pea and rape increased within the first half of the growing season, and continued to increase till the fourth harvest when the companion crop was rape. As indicated by the fitting of the growth curves to the logistic growth curves (Eqn 1), the barley crop had some early advantage leading to greater initial size. Since growth tends to be self compounding as a result of size asymmetric competition, these initial differences in size may be the reason why the
68
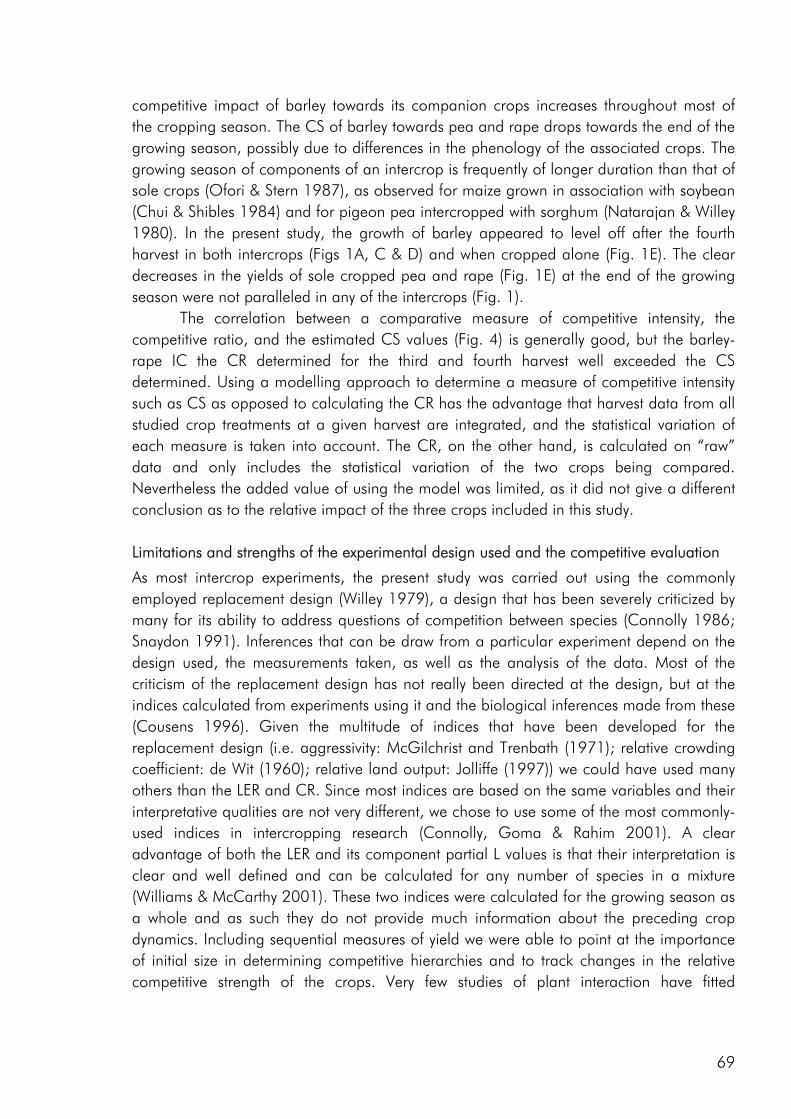
competitive impact of barley towards its companion crops increases throughout most of the cropping season. The CS of barley towards pea and rape drops towards the end of the growing season, possibly due to differences in the phenology of the associated crops. The growing season of components of an intercrop is frequently of longer duration than that of sole crops (Ofori & Stern 1987), as observed for maize grown in association with soybean (Chui & Shibles 1984) and for pigeon pea intercropped with sorghum (Natarajan & Willey 1980). In the present study, the growth of barley appeared to level off after the fourth harvest in both intercrops (Figs 1A, C & D) and when cropped alone (Fig. 1E). The clear decreases in the yields of sole cropped pea and rape (Fig. 1E) at the end of the growing season were not paralleled in any of the intercrops (Fig. 1).
The correlation between a comparative measure of competitive intensity, the competitive ratio, and the estimated CS values (Fig. 4) is generally good, but the barley-rape IC the CR determined for the third and fourth harvest well exceeded the CS determined. Using a modelling approach to determine a measure of competitive intensity such as CS as opposed to calculating the CR has the advantage that harvest data from all studied crop treatments at a given harvest are integrated, and the statistical variation of each measure is taken into account. The CR, on the other hand, is calculated on “raw” data and only includes the statistical variation of the two crops being compared. Nevertheless the added value of using the model was limited, as it did not give a different conclusion as to the relative impact of the three crops included in this study. Limitations and strengths of the experimental design used and the competitive evaluation
As most intercrop experiments, the present study was carried out using the commonly employed replacement design (Willey 1979), a design that has been severely criticized by many for its ability to address questions of competition between species (Connolly 1986; Snaydon 1991). Inferences that can be draw from a particular experiment depend on the design used, the measurements taken, as well as the analysis of the data. Most of the criticism of the replacement design has not really been directed at the design, but at the indices calculated from experiments using it and the biological inferences made from these (Cousens 1996). Given the multitude of indices that have been developed for the replacement design (i.e. aggressivity: McGilchrist and Trenbath (1971); relative crowding coefficient: de Wit (1960); relative land output: Jolliffe (1997)) we could have used many others than the LER and CR. Since most indices are based on the same variables and their interpretative qualities are not very different, we chose to use some of the most commonly-used indices in intercropping research (Connolly, Goma & Rahim 2001). A clear advantage of both the LER and its component partial L values is that their interpretation is clear and well defined and can be calculated for any number of species in a mixture (Williams & McCarthy 2001). These two indices were calculated for the growing season as a whole and as such they do not provide much information about the preceding crop dynamics. Including sequential measures of yield we were able to point at the importance of initial size in determining competitive hierarchies and to track changes in the relative competitive strength of the crops. Very few studies of plant interaction have fitted
69
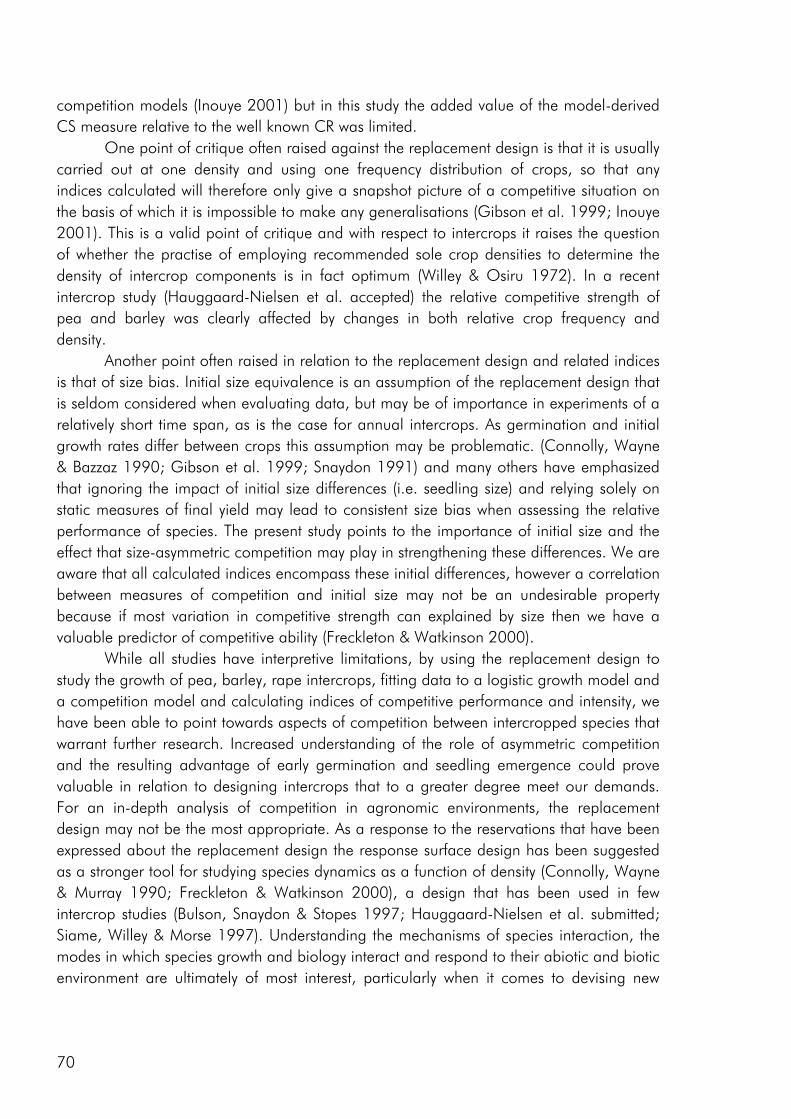
competition models (Inouye 2001) but in this study the added value of the model-derived CS measure relative to the well known CR was limited.
One point of critique often raised against the replacement design is that it is usually carried out at one density and using one frequency distribution of crops, so that any indices calculated will therefore only give a snapshot picture of a competitive situation on the basis of which it is impossible to make any generalisations (Gibson et al. 1999; Inouye 2001). This is a valid point of critique and with respect to intercrops it raises the question of whether the practise of employing recommended sole crop densities to determine the density of intercrop components is in fact optimum (Willey & Osiru 1972). In a recent intercrop study (Hauggaard-Nielsen et al. accepted) the relative competitive strength of pea and barley was clearly affected by changes in both relative crop frequency and density.
Another point often raised in relation to the replacement design and related indices is that of size bias. Initial size equivalence is an assumption of the replacement design that is seldom considered when evaluating data, but may be of importance in experiments of a relatively short time span, as is the case for annual intercrops. As germination and initial growth rates differ between crops this assumption may be problematic. (Connolly, Wayne & Bazzaz 1990; Gibson et al. 1999; Snaydon 1991) and many others have emphasized that ignoring the impact of initial size differences (i.e. seedling size) and relying solely on static measures of final yield may lead to consistent size bias when assessing the relative performance of species. The present study points to the importance of initial size and the effect that size-asymmetric competition may play in strengthening these differences. We are aware that all calculated indices encompass these initial differences, however a correlation between measures of competition and initial size may not be an undesirable property because if most variation in competitive strength can explained by size then we have a valuable predictor of competitive ability (Freckleton & Watkinson 2000).
While all studies have interpretive limitations, by using the replacement design to study the growth of pea, barley, rape intercrops, fitting data to a logistic growth model and a competition model and calculating indices of competitive performance and intensity, we have been able to point towards aspects of competition between intercropped species that warrant further research. Increased understanding of the role of asymmetric competition and the resulting advantage of early germination and seedling emergence could prove valuable in relation to designing intercrops that to a greater degree meet our demands. For an in-depth analysis of competition in agronomic environments, the replacement design may not be the most appropriate. As a response to the reservations that have been expressed about the replacement design the response surface design has been suggested as a stronger tool for studying species dynamics as a function of density (Connolly, Wayne & Murray 1990; Freckleton & Watkinson 2000), a design that has been used in few intercrop studies (Bulson, Snaydon & Stopes 1997; Hauggaard-Nielsen et al. submitted; Siame, Willey & Morse 1997). Understanding the mechanisms of species interaction, the modes in which species growth and biology interact and respond to their abiotic and biotic environment are ultimately of most interest, particularly when it comes to devising new
70
intercropping systems that to a greater extent, draw on the advantages of species interactions (Connolly, Goma & Rahim 2001).
Acknowledgement We thank the technical staff at the Research farm, Taastrup: Britta Henriksen, Danny Klysner and Susanne Olsen for help in executing the experiments and Professor Ib Skovgaard, The Royal Veterinary and Agricultural University, Copenhagen, Denmark, for valuable statistical advise.
References Andersen M, Hauggaard-Nielsen H, Ambus P & Jensen ES (2004) Biomass production, symbiotic
nitrogen fixation and inorganic N use in dual and tri-component annual intercrops. Plant and Soil 266: 273-287
Bellostas N, Hauggaard-Nielsen H, Andersen M and Jensen ES (2003) Early Interference Dynamics in Intercrops of Pea, Barley and Oilseed Rape. Biological Agriculture and Horticulture 21: 337-348
Berntsen J, Hauggaard-Nielsen H, Olesen JE, Petersen BM, Jensen ES and Thomsen A (2004) Modelling dry matter production and resource use in intercrops of pea and barley. Field Crops Research 88: 69-83
Box G and Cox D (1964) An analysis of transformations. Journal of the Royal Statistical Society Series B 26 (1): 211-246
Bulson HAJ, Snaydon RW and Stopes CE (1997) Effects of plant density on intercropped wheat and field beans in an organic farming system. Journal of Agricultural Science 128: 59-71
Chui JAN and Shibles R (1984) Influence of Spatial Arrangements of Maize on Performance of An Associated Soybean Intercrop. Field Crops Research 8: 187-198
Connolly J, Wayne P and Bazzaz F (2001) Interspecific Competition in Plants: How Well Do Current Methods Answer Fundamental Questions? The American Naturalist 157 (2): 107-125
Connolly J (1986) On Difficulties with Replacement-Series Methodology in Mixture Experiments. Journal of Applied Ecology 23: 125-137
Connolly J (1988) Experimental Methods in Plant Competition Research in Crop Weed Systems. Weed Research 28: 431-436
Connolly J, Goma HC and Rahim K (2001) The information content of indicators in intercropping research. Agriculture Ecosystems & Environment 87: 191-207
Connolly J, Wayne P and Murray R (1990) Time Course of Plant-Plant Interactions in Experimental Mixtures of Annuals - Density, Frequency, and Nutrient Effects. Oecologia 82: 513-526
Cook R (1977) Detection of influential observations in linear regression. Tecnometrics 19(1): 15-18
Cousens R (1996) Design and interpretation of interference studies: are some methods totally unacceptable? New Zealand Journal of Forestry Science 26 (1/2): 5-18
71
Cousens R, Brain P, O’donovan JT, and O’sullivan PA (1987) The Use of Biologically Realistic Equations to Describe the Effects of Weed Density and Relative-Time of Emergence on Crop Yield. Weed Science 35: 720-725
de Wit C (1960) On competition. Verslagen van Landbouwkundige onderzoekingen 66: 1-82 Elberse WT and Kruyf HND (1979) Competition Between Hordeum-Vulgare-l and Chenopodium-
Album l with Different Dates of Emergence of Chenopodium Album. Netherlands Journal of Agricultural Science 27: 13-26
Firbank LG and Watkinson AR (1985) On the Analysis of Competition Within 2-Species Mixtures of Plants. Journal of Applied Ecology 22: 503-517
Freckleton RP and Watkinson AR (2000) On detecting and measuring competition in spatially structured plant communities. Ecology Letters 3: 423-432
Gibson DJ, Connolly J, Hartnett DC and Weidenhamer JD (1999) Designs for greenhouse studies of interactions between plants. Journal of Ecology 87: 1-16
Hauggaard-Nielsen H, Ambus P and Jensen ES (2001a) Interspecific competition, N use and interference with weeds in pea-barley intercropping. Field Crops Research 70: 101-109
Hauggaard-Nielsen H, Ambus P and Jensen ES (2001b) Temporal and spatial distribution of roots and competition for nitrogen in pea-barley intercrops - a field study employing P-32 technique. Plant and Soil 236: 63-74
Hauggaard-Nielsen H, Andersen MK, Jørnsgaard B and Jensen ES Density and relative frequency effects on competitive interactions and resource use in pea-barley intercrops. Accepted for publication in Field Crops Research.
Helenius J and Jokinen K (1994) Yield Advantage and Competition in Intercropped Oats (Avena-Sativa L) and Faba Bean (Vicia-Faba L) - Application of the Hyperbolic Yield-Density Model. Field Crops Research 37: 85-94
Hunt R (1982) Plant Growth Curves - The Functional Approach to Plant Growth Analysis, First edn. Edward Arnold Limited, London
Inouye BD (2001) Response surface experimental designs for investigating interspecific competition. Ecology 82: 2696-2706
Jensen ES (1996) Grain yield, symbiotic N-2 fixation and interspecific competition for inorganic N in pea-barley intercrops. Plant and Soil 182: 25-38
Jolliffe PA (1997) Are mixed populations of plant species more productive than pure stands? Oikos 80: 595-602
Jolliffe PA (2000) The replacement series. Journal of Ecology 88: 371-385 Loreau M, Naeem S, Inchausti P, Bengtsson J, Grime JP, Hector A, Hooper DU, Huston MA,
Raffaelli D, Schmid B, Tilman D and Wardle DA (2001) Ecology - Biodiversity and ecosystem functioning: Current knowledge and future challenges. Science 294: 804-808
Martin MPLD and Snaydon RW (1982) Root and Shoot Interactions Between Barley and Field Beans When Intercropped. Journal of Applied Ecology 19: 263-272
McGilchrist CA and Trenbath BR (1971) A revised analysis of plant competition experiments. Biometrics 27: 659-671
Natarajan M and Willey RW (1980) Sorghum-Pigeonpea Intercropping and the Effects of Plant-Population Density .1. Growth and Yield. Journal of Agricultural Science 95: 51-58
Ofori F and Stern W (1987) Cereal-legume intercropping systems. Advances in Agronomy 41: 41-89
Rees M (1995) Community structure in sand dune annuals: is seed weight a key quantity? Journal of Ecology 83: 857-864
SAS. SAS/STAT Software (8.02). 1999. Cary, NC, USA, SAS institute Inc.
72
Siame J, Willey RW and Morse S (1997) A study of the partitioning of applied nitrogen between maize and beans in intercropping. Experimental Agriculture 33: 35-41
Snaydon R (1991) Replacement or additive designs for competition studies? Journal of Applied Ecology 28: 930-946
Snaydon R (1994) Replacement and additive designs revisited: comments on the review paper by N.R. Sackville Hamilton. Journal of Applied Ecology 31: 784-786
Tilman D (1988) Plant Strategies and the dynamics and structure of plant communities. Princeton University Press, Princeton, USA
Tofinga MP, Paolini R and Snaydon RW (1993) A Study of Root and Shoot Interactions Between Cereals and Peas in Mixtures. Journal of Agricultural Science 120: 13-24
Turkington R and Jolliffe PA (1996) Interference in Trifolium repens Lolium perenne mixtures: Short- and long-term relationships. Journal of Ecology 84: 563-571
Vandermeer J (1989) The Ecology of Intercropping. University Press, Cambridge, Great Britain Weigelt A and Jolliffe P (2003) Indices of plant competition. Journal of Ecology 91: 707-720 Weiner J (1990) Asymmetric Competition in Plant Populations. Tree 5 (11): 360-364 Weisberg S (1985) Applied Linear Regression, 2 edn. John Wiley & Sons, New York, USA Willey RW and Osiru DSO (1972) Studies on Mixtures of Maize and Beans (Phaseolus-Vulgaris)
with Particular Reference to Plant Population. Journal of Agricultural Science 79: 517-529
Willey R (1979) Intercropping - its importance and its research needs. I. Competition and yield advantages. Field Crop Abstracts 32: 1-10
Willey RW and Rao MR (1980) A competitive ratio for quantifying competition between intercrops. Experimental Agriculture 16: 117-125
Williams A and McCarthy B (2001) A new index of interspecific competition for replacement and additive designs. Ecological Research 16: 29-40
Zhang F and Li L (2003) Using competitive and facilitative interactions in intercropping systems enhances crop productivity and nutrient-use efficiency. Plant and Soil 248: 305-312
73
Competition for and utilisation of sulphur in sole and intercrops of pea and barley. Mette Klindt Andersen1,2, Henrik Hauggaard-Nielsen1, Henning Høgh-Jensen2 and Erik Steen Jensen1 1Biosystems Department, RISØ National Laboratory, Frederiksborgvej 399, DK-4000 Roskilde, Denmark. 2Department of Agricultural Sciences, The Royal Veterinary and Agricultural University, Højbakkegaard Allé 13, DK-2630 Taastrup, Denmark.
Abstract Deficiency of plant available sulphur has been recognised as a limiting factor for crop production in many region of the world however knowledge of the effect that low sulphur availability has on the growth dynamics and N use complementarity of cereal-legume intercrops is limited. Pea (Pisum sativum L.) and barley (Hordeum vulgare L.) were grown in a pot experiment as sole crops and intercrops with or without the addition of sulphur in the form of gypsum. At three consecutive harvests total aboveground biomass and corresponding soil samples were taken. The biomass was analysed for total S and N content and soil samples for sulphate-S content. The cumulative Relative Efficiency Index was used to study the interspecies growth, nitrogen and sulphur dynamics in the intercrops and the Land Equivalent Ratio to evaluate intercrop performance.
In the initial growth phase earlier germination gave barley a growth and nutrient use advantage compared to pea (REIc values < 1). However, shortly after this pioneer phase, the importance of initial size differences decreased relative to the effect of species identity in determining the competitive strength of the two species and by the end of the growth period pea was very dominant (REIc values > 1). The limited availability of soil N played a pivotal role in creating the nutrient and growth dynamics observed in the intercrop and increasing the availability of S did not change this markedly. As a result of its N2 fixing ability the pea component came to dominate the intercrop both with respect to yield and nutrient accumulation, accounting for 77% of total dry matter production, 90% of N uptake and 85% of S uptake, averaged across S treatments. LER values calculated on the basis of aboveground biomass, N and S accumulation all exceeded one, indicating that available growth resources were used more efficiently by the intercrop than the average sole crop.
Keywords: Biomass production, cumulative Relative Efficiency Index, grain yield, grain
quality, intercropping, Land Equivalent Ratio, nitrogen, N:S ratio, sulphur.
75
Introduction In Northern Europe soil sulphur (S) deficiency is becoming increasingly widespread (Eriksen 1997; Withers et al. 1995; Zhao et al. 1999b) and many have pointed at the impact that this may have on maintaining yield and quality of crops (Randall and Wrigley 1986; Withers et al. 1995; Zhao et al. 1999b).
Under conditions of limited nitrogen (N) availability the combination of an N demanding cereal like barley (Hordeum vulgare L.) and a N2 fixing legume like pea (Pisum sativum L.) has often been found to be ideal with respect to achieving an efficient use of available N resources (Andersen et al. 2004; Anil et al. 1998; Hauggaard-Nielsen et al. 2001a). The number of studies that have dealt with the impact of other nutrients on the performance of intercrops is more limited and of these the majority have dealt with the role of phosphorous (Ae et al. 1990; Li et al. 2003; Marschner et al. 1986).
The S requirement of plants is closely related to the N requirement (Eriksen et al. 2001; Reuveny et al. 1980) and plant N metabolism is strongly affected by the S status of the plant (Duke and Reisenauer 1986). Nitrogen-sulphur interactions have mainly been studied in sole crop studies (DeBoer and Duke 1982; Eriksen et al. 2001; Zhao et al. 1999b) but the effects of N-S interactions have only rarely been addressed in relation to annual intercrops grown under temperate conditions (Mortensen and Eriksen 1994).
In temperate cropping systems, it is a common observation that the cereal component of a cereal-legume dominates when soil N levels are high and that the relative competitive strength of the legume increases as soil N levels are lowered (Ofori and Stern, 1987). The ability of the legume to draw N from the atmosphere through fixation, thereby avoiding strong competition for soil N gives rise to N use complementarity and under N limited growth conditions cereal-legume intercrops commonly out yield the comparable sole crops (Andersen et al. 2004; Hauggaard-Nielsen et al. 2001a; Rauber et al. 2001). The impact of S deficiency on cereal-legume N complementarity is not well understood. In legumes S plays an important role in maintaining the functioning of the N2 fixing apparatus of legumes (DeBoer and Duke 1982), but whether the complementarity in N use will be maintained or one crop component be favoured, is unknown.
Compared to legumes, cereals are considered to be competitively superior with respect to the uptake of the mobile nitrate anion (Tofinga et al., 1993) and as the primary S source to growing plants is also a mobile anion (sulphate) and both these anions are taken up by the plants via proton cotransporters in the plasma membrane of root cells (Tischner, 2000), it is likely that cereals are also competitively superior with respect to S uptake. A cereal-legume intercrop, grown under S limitation, may consequently be hypothesized to favour the growth of the cereal, consequently having a negative impact on the growth and N2 fixing capacity of the legume and thereby limiting the degree of N complementarity attained under conditions of combined N and S limitation.
The nutritional quality of grain from both legumes and cereals is closely linked to their content of the S containing amino acids cysteine and methionine and is therefore intricately associated with the relative amounts of N and S in the seed (Sexton et al., 1998). Under conditions of S deficiency a decrease in the seed content of sulphur rich
76
amino acids has been observed for both cereals and legumes (Randall and Wrigley, 1986).
The objective of this study was to assess how single intercrop component species use and compete for N and S resources and how these dynamics are altered in response to changes in nutrient availability. We hypothesize that combined N and S limitation will reduce the N2 fixing capacity of pea and thereby favour the growth of the barley component of a barley-pea intercrop and that increasing S supply to the plants will strengthen the growth of the pea thereby altering N and S accumulation patterns as well as N and S concentrations of grain harvested from both crop species.
Materials and Methods Experimental site and setup
Soil was collected from the top 25 cm of a sandy loam (9 % clay) at the Royal Veterinary and Agricultural University’s experimental farm in Taastrup, Denmark (55°40'N, 12°18'E). Due to a prehistory of limited addition of animal manure, limited grass-clover cropping and no addition of phosphorus (P) or potassium (K), the soil was considered to be low in available nutrients. The soil contained 1.40 % total C, 0.06 % total N, had a water holding capacity (WHC) of 30.5 (w/w; dry basis), a pH(CaCl2) of 7.1 and contained 1.60 and 0.05 mg of inorganic N (NO3 and NH4-N) and S (SO4-S) per 100 g dry soil, respectively.
A pot experiment was conducted in the open in cylindrical PVC-pots with a surface area of 500 cm2 and a volume of 20 l. As the experiment held two levels of S availability i) no fertiliser S and ii) added fertiliser S, half of the soil was enriched with 9 mg gypsum-S (CaSO4⋅2H2O) per kg soil prior to filling each pot with 24 kg dry soil.
At each level of S pea (P; Pisum sativum L. Bohatyr) and barley (B; Hordeum vulgare L. Otira) were grown as sole crops at recommended density (corresponding to 18 barley plants and 6 pea plants per pot), at half of the recommended sole crop densities (½P and ½B, respectively) and as 50%:50% intercrop (BP), using a proportional replacement design. Each combination of crop and S treatment was sown in a total of 12 pots, allowing for three harvests of four replicates during the growing season. All pots were placed along a north–south axis and to avoid differences in temperature and incoming radiation between the two sides of this axis half of the replicates corresponding to each harvest were placed on either side. All crops were sown on the 3rd of May 2001, using a plastic template to ensure equal seed spacing. After seedling emergence all pots were checked to ensure that the intended number of plants were present and if not seedlings were transplanted from extra pots. Throughout the growing season the water status of each pot was monitored two to three times a week using a hand held Garta kombitester and watered to maintain humidity near to 80% of the soil water holding capacity. Lodging was avoided by wire frames supporting the plant stands.
77
Plant sampling and analysis
Three consecutive plant biomass harvests were made, corresponding to 27, 46 and 88 days after sowing (DAS). The intercrop biomass was split into its component crops and at the final harvest the grain of both barley and pea was separated from the remaining biomass in all crop treatments. After dry matter determination (80°C to constant weight), all samples were ground (<0.5mm) and the total N content determined on an elemental analyzer (ThermoQuest S.p.A., Milano, Italy). The total S content was determined by turbidimetry after wet-ashing with magnesium-nitrate and perchloric-acid (Nes, 1979). Soil sampling and analysis
Soil samples corresponding to each of the three harvests were analysed for contents of inorganic N and sulphate-S. For the determination of ammonium and nitrate soil samples were extracted with 2 M KCl (Keeney and Nelson, 1982) and extracts analyzed colourmetrically (AutoAnalyzer 3, Bran and Luebbe, GmbH, Germany). For the determination of sulphate-S soil samples were extracted in 0.01 M KH2PO4 (Lisle et al., 1994) and before turbidimetric analysis on a Flow Injection Analyzer (FIA) any organic compounds in the extract were eliminated by shaking the extracts with active coal (O’Donnell et al. 1994; Wu et al. 1994). Calculations
Land equivalent ratio Using the Land Equivalent Ratio (LER) the performance of the intercrop (IC) relative to corresponding sole crops (SC) was at each S level evaluated on the basis of total dry matter production, N and S accumulation. LER is calculated as the sum of the partial LER values (L) of each of the intercrop components (C1 and C2) (Willey 1979). LC1 = YC1(IC) / YC!(SC) ; LC2 = YC2(IC) / YC2(SC) and LERIC = LC1 + LC2 (1)
For DM based LER values Y refers to the total harvested aboveground dry matter (DM) yields and for N and S based LER values Y refers to the total N and S accumulation in aboveground DM, measured at the final harvest. The LER is a measure of the relative land area growing sole crops that is required to produce the yield or nutrient accumulation achieved by the intercrop. LER values exceeding one imply that the intercrop is more efficient than the average sole crop and values of less than one that intercrop efficiency is lower than the average sole crop. The Cumulative Relative Efficiency Index (REIc) As a measure of the relative performance of the components of the intercrops the Cumulative Relative Efficiency Index (REIc; Connolly, 1987) was calculated at each level of S addition on the basis of total aboveground dry matter production (REIc(DM)), S (REIc(S)) and N (REIc(N)) accumulation data. REIc is an index that compares the proportional
78
change (K) in total dry matter or nutrient accumulation within a given time interval (t1 to t2), of one species relative to another. Kpea = DMpea t(2) / DMpea t(1) ; Kpea = DMbarley t(2) / DMbarley t(1) and REIc = Kpea / Kbarley (2) The equations are given for calculations of REIc(DM). For calculation of REIc(S) and REIc(N) the DM variable in equation 2 is substituted with N and S accumulation. REIc values corresponding to three growth intervals were calculated, from sowing to the first harvest (0-27 DAS) and from the first to the second harvest (27-46 DAS) and from the second to the third harvest at maturity (46-88 DAS). At sowing the total seed weight and the total seed N and S contents were taken as initial (0 DAS) dry matter, N and S accumulation. Intercropped pea and barley were grown from a total seed weight of 0.8 and 0.4 g DM, respectively. The initial seed pool of pea had an N content of 30 mg and an S content of 1.03 mg and for barley the corresponding N and S content of the total seed pool was 5 and 0.75 mg, respectively. A REIc value of 1 means that both species have equal proportional growth or nutrient accumulation over a period of time. Examining growth based REIc values in conjunction with nutrient accumulation based REIc value may help us point at growth limiting nutrients. Statistical analysis
An analysis of variance was carried out on the data using the GLM procedure of the SAS software (SAS 1999). LSD (P=0.05) was used for comparison of treatment means if F-tests showed significant treatment effects. To obtain normality dry matter data and N:S ratios were log transformed prior to the statistical analysis.
Results Dynamics of biomass production
At the first harvest the addition of S resulted in a significant increase in dry matter production of both inter- and sole cropped pea and barley however, at the second and final harvest increases were not significant (Figure 1). Initially both pea and barley sole crop dry matter production was highly dependent on sowing density. At later growth stages the impact of sowing density decreased and at the last harvest yields did not differ between the two density treatments. At the beginning of the growing season the total dry matter production of the intercrop equalled that of either of the two sole crops grown at recommended density and continued to equal the pea sole crop whereas the intercrop clearly out yielded the barley sole crop by the final harvest.
79
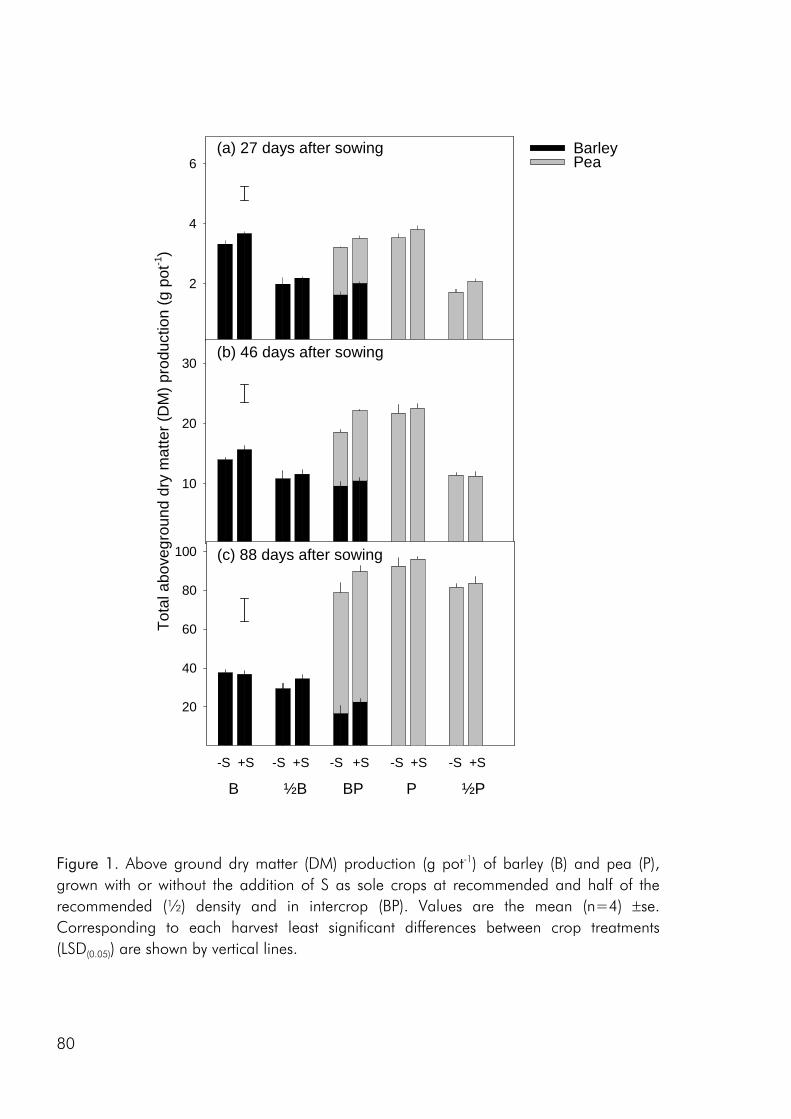
2
4
6To
tal a
bove
grou
nd d
ry m
atte
r (D
M) p
rodu
ctio
n (g
pot
-1)
10
20
30
20
40
60
80
100
B ½B BP P ½P
-S +S -S +S -S +S -S +S -S +S
(a) 27 days after sowing
(b) 46 days after sowing
(c) 88 days after sowing
BarleyPea
Figure 1. Above ground dry matter (DM) production (g pot-1) of barley (B) and pea (P), grown with or without the addition of S as sole crops at recommended and half of the recommended (½) density and in intercrop (BP). Values are the mean (n=4) ±se. Corresponding to each harvest least significant differences between crop treatments (LSD(0.05)) are shown by vertical lines.
80
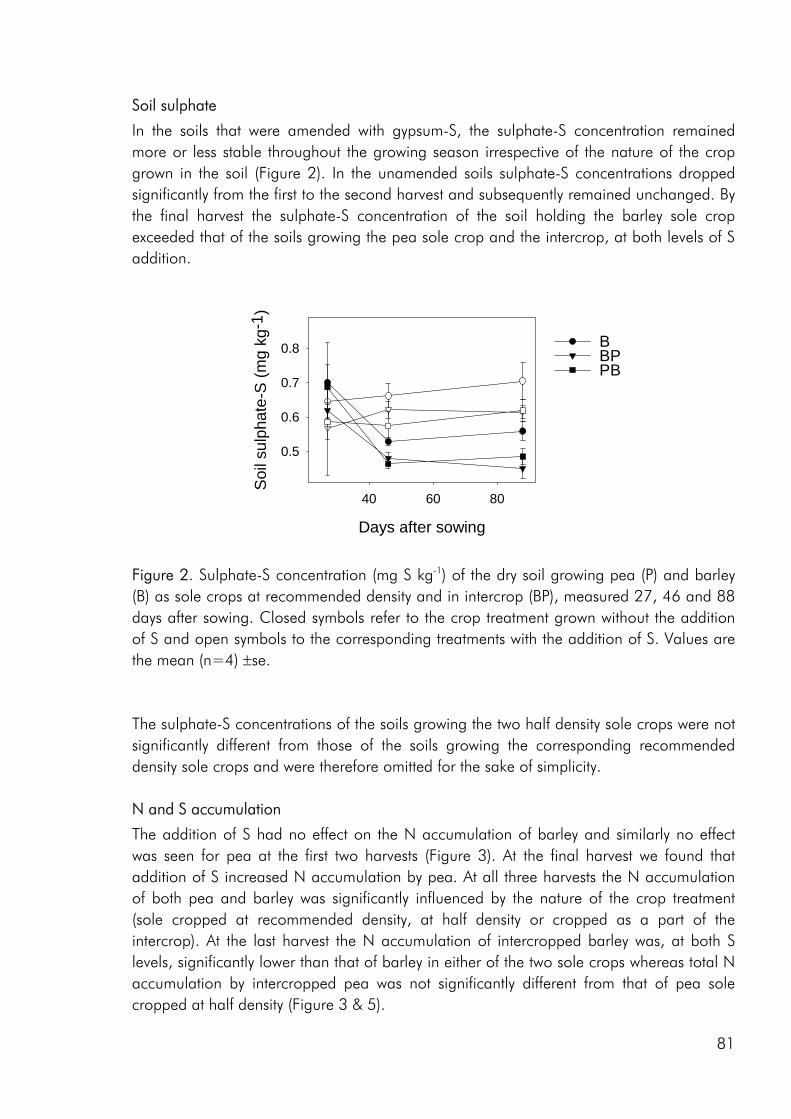
Soil sulphate
In the soils that were amended with gypsum-S, the sulphate-S concentration remained more or less stable throughout the growing season irrespective of the nature of the crop grown in the soil (Figure 2). In the unamended soils sulphate-S concentrations dropped significantly from the first to the second harvest and subsequently remained unchanged. By the final harvest the sulphate-S concentration of the soil holding the barley sole crop exceeded that of the soils growing the pea sole crop and the intercrop, at both levels of S addition.
Days after sowing
40 60 80
Soi
l sul
phat
e-S
(mg
kg-1
)
0.5
0.6
0.7
0.8 BBPPB
Figure 2. Sulphate-S concentration (mg S kg-1) of the dry soil growing pea (P) and barley (B) as sole crops at recommended density and in intercrop (BP), measured 27, 46 and 88 days after sowing. Closed symbols refer to the crop treatment grown without the addition of S and open symbols to the corresponding treatments with the addition of S. Values are the mean (n=4) ±se. The sulphate-S concentrations of the soils growing the two half density sole crops were not significantly different from those of the soils growing the corresponding recommended density sole crops and were therefore omitted for the sake of simplicity. N and S accumulation
The addition of S had no effect on the N accumulation of barley and similarly no effect was seen for pea at the first two harvests (Figure 3). At the final harvest we found that addition of S increased N accumulation by pea. At all three harvests the N accumulation of both pea and barley was significantly influenced by the nature of the crop treatment (sole cropped at recommended density, at half density or cropped as a part of the intercrop). At the last harvest the N accumulation of intercropped barley was, at both S levels, significantly lower than that of barley in either of the two sole crops whereas total N accumulation by intercropped pea was not significantly different from that of pea sole cropped at half density (Figure 3 & 5).
81
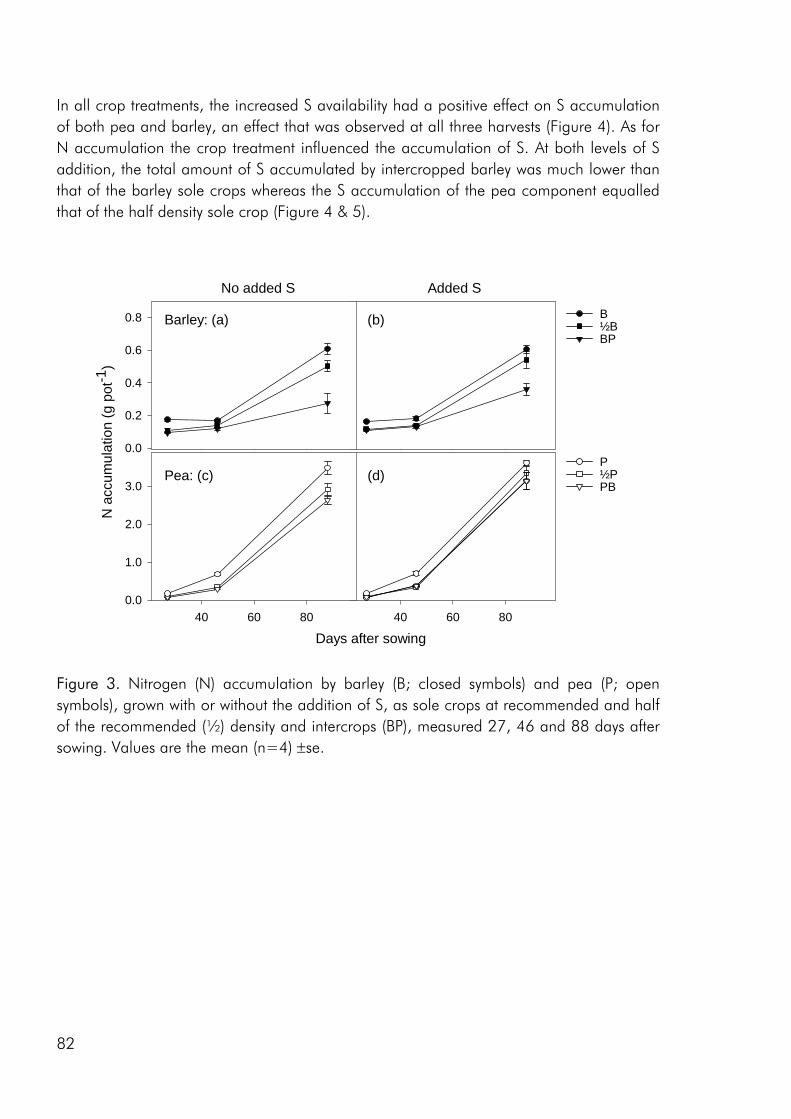
In all crop treatments, the increased S availability had a positive effect on S accumulation of both pea and barley, an effect that was observed at all three harvests (Figure 4). As for N accumulation the crop treatment influenced the accumulation of S. At both levels of S addition, the total amount of S accumulated by intercropped barley was much lower than that of the barley sole crops whereas the S accumulation of the pea component equalled that of the half density sole crop (Figure 4 & 5).
40 60 80
0.0
0.2
0.4
0.6
0.8
Days after sowing40 60 80
N a
ccum
ulat
ion
(g p
ot-1
)
0.0
1.0
2.0
3.0
No added S Added S
Barley: (a)
Pea: (c)P½PPB
B½BBP
(b)
(d)
Figure 3. Nitrogen (N) accumulation by barley (B; closed symbols) and pea (P; open symbols), grown with or without the addition of S, as sole crops at recommended and half of the recommended (½) density and intercrops (BP), measured 27, 46 and 88 days after sowing. Values are the mean (n=4) ±se.
82
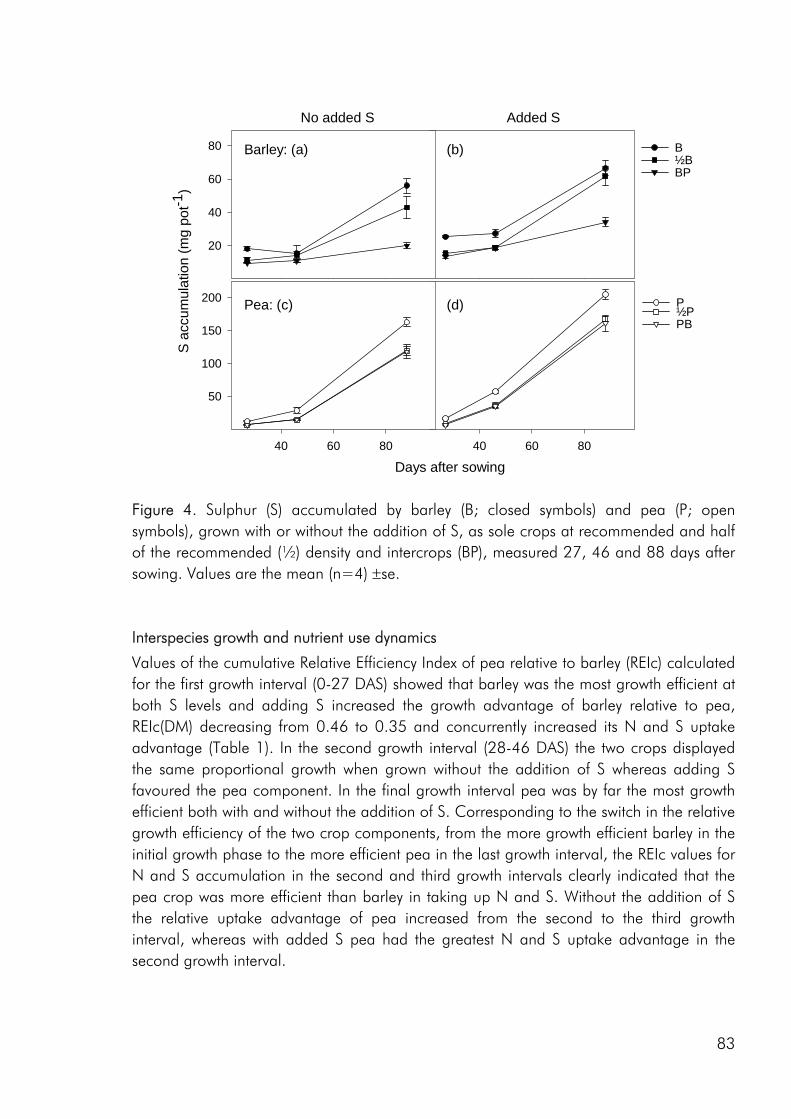
40 60 80
20
40
60
80
Days after sowing40 60 80
S ac
cum
ulat
ion
(mg
pot-1
)
50
100
150
200
No added S Added S
Barley: (a)
Pea: (c)
(b)
(d) P½PPB
B½BBP
Figure 4. Sulphur (S) accumulated by barley (B; closed symbols) and pea (P; open symbols), grown with or without the addition of S, as sole crops at recommended and half of the recommended (½) density and intercrops (BP), measured 27, 46 and 88 days after sowing. Values are the mean (n=4) ±se. Interspecies growth and nutrient use dynamics
Values of the cumulative Relative Efficiency Index of pea relative to barley (REIc) calculated for the first growth interval (0-27 DAS) showed that barley was the most growth efficient at both S levels and adding S increased the growth advantage of barley relative to pea, REIc(DM) decreasing from 0.46 to 0.35 and concurrently increased its N and S uptake advantage (Table 1). In the second growth interval (28-46 DAS) the two crops displayed the same proportional growth when grown without the addition of S whereas adding S favoured the pea component. In the final growth interval pea was by far the most growth efficient both with and without the addition of S. Corresponding to the switch in the relative growth efficiency of the two crop components, from the more growth efficient barley in the initial growth phase to the more efficient pea in the last growth interval, the REIc values for N and S accumulation in the second and third growth intervals clearly indicated that the pea crop was more efficient than barley in taking up N and S. Without the addition of S the relative uptake advantage of pea increased from the second to the third growth interval, whereas with added S pea had the greatest N and S uptake advantage in the second growth interval.
83
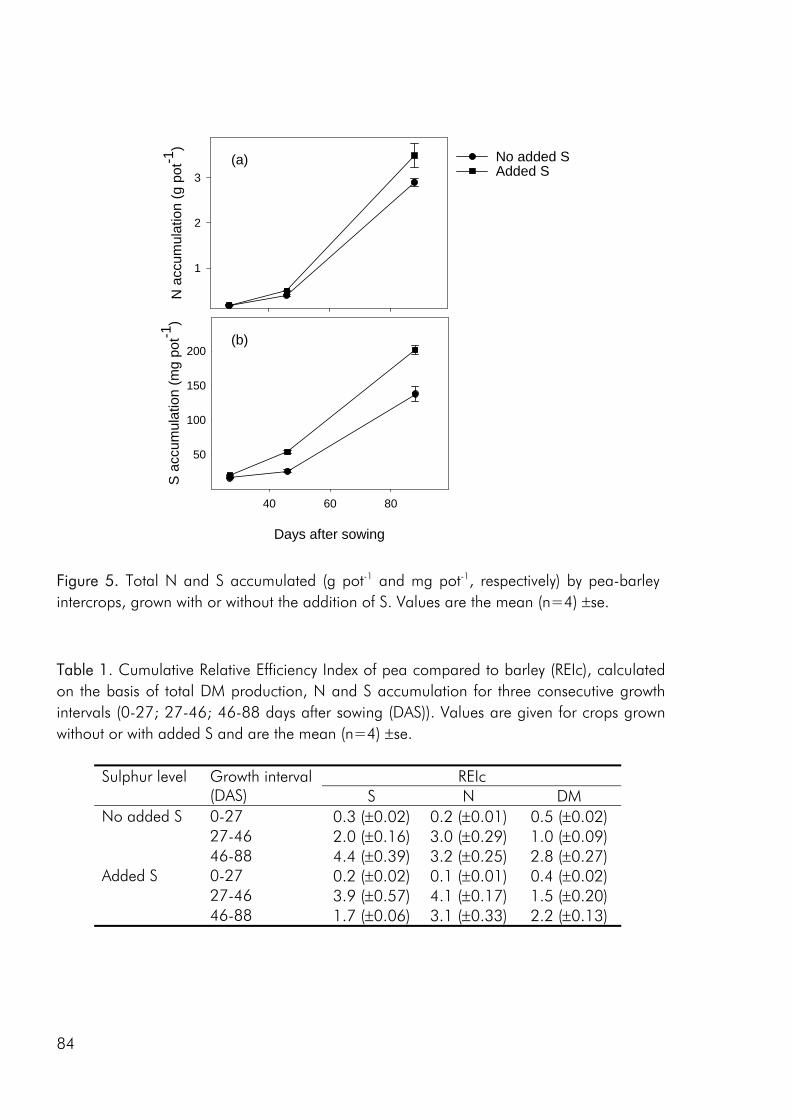
40 60 80
S a
ccum
ulat
ion
(mg
pot-1
)
50
100
150
200
Days after sowing
N a
ccum
ulat
ion
(g p
ot-1
)
1
2
3(a)
(b)
No added SAdded S
Figure 5. Total N and S accumulated (g pot-1 and mg pot-1, respectively) by pea-barley intercrops, grown with or without the addition of S. Values are the mean (n=4) ±se.
Table 1. Cumulative Relative Efficiency Index of pea compared to barley (REIc), calculated on the basis of total DM production, N and S accumulation for three consecutive growth intervals (0-27; 27-46; 46-88 days after sowing (DAS)). Values are given for crops grown without or with added S and are the mean (n=4) ±se.
REIc Sulphur level Growth interval (DAS) S N DM
No added S 0-27 0.3 (±0.02) 0.2 (±0.01) 0.5 (±0.02) 27-46 2.0 (±0.16) 3.0 (±0.29) 1.0 (±0.09) 46-88 4.4 (±0.39) 3.2 (±0.25) 2.8 (±0.27) Added S 0-27 0.2 (±0.02) 0.1 (±0.01) 0.4 (±0.02) 27-46 3.9 (±0.57) 4.1 (±0.17) 1.5 (±0.20) 46-88 1.7 (±0.06) 3.1 (±0.33) 2.2 (±0.13)
84
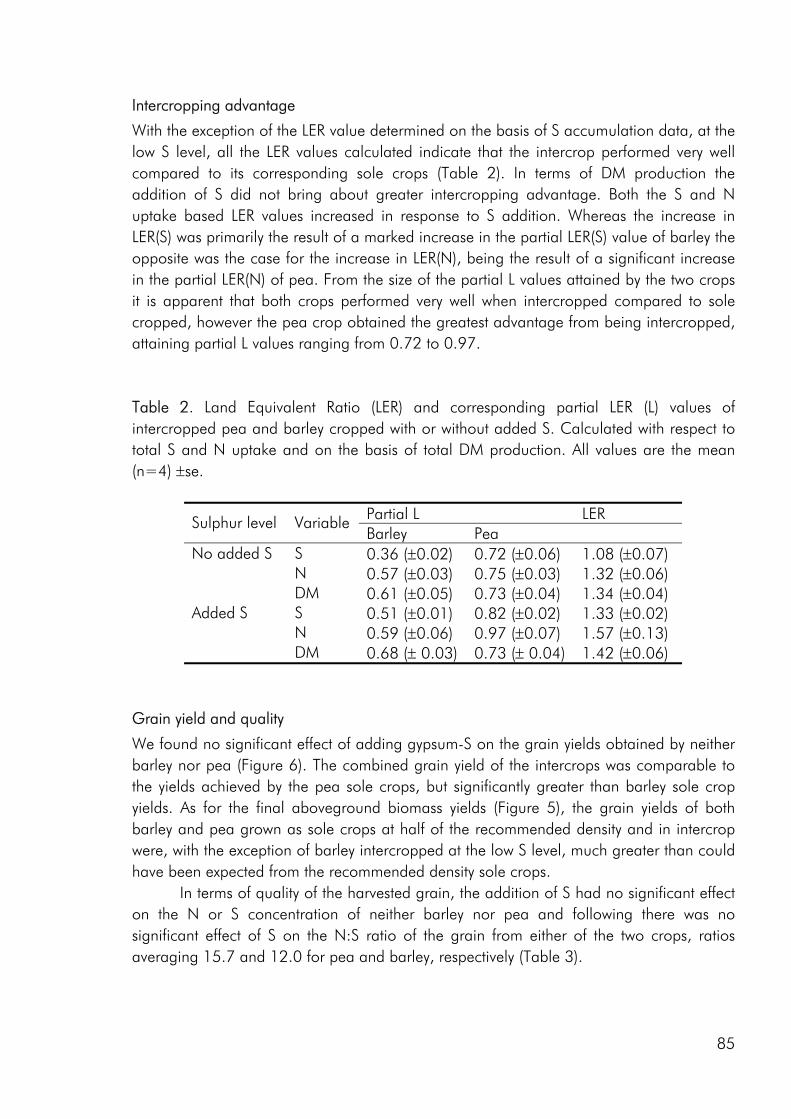
Intercropping advantage
With the exception of the LER value determined on the basis of S accumulation data, at the low S level, all the LER values calculated indicate that the intercrop performed very well compared to its corresponding sole crops (Table 2). In terms of DM production the addition of S did not bring about greater intercropping advantage. Both the S and N uptake based LER values increased in response to S addition. Whereas the increase in LER(S) was primarily the result of a marked increase in the partial LER(S) value of barley the opposite was the case for the increase in LER(N), being the result of a significant increase in the partial LER(N) of pea. From the size of the partial L values attained by the two crops it is apparent that both crops performed very well when intercropped compared to sole cropped, however the pea crop obtained the greatest advantage from being intercropped, attaining partial L values ranging from 0.72 to 0.97. Table 2. Land Equivalent Ratio (LER) and corresponding partial LER (L) values of intercropped pea and barley cropped with or without added S. Calculated with respect to total S and N uptake and on the basis of total DM production. All values are the mean (n=4) ±se.
Partial L LER Sulphur level Variable Barley Pea
No added S S 0.36 (±0.02) 0.72 (±0.06) 1.08 (±0.07) N 0.57 (±0.03) 0.75 (±0.03) 1.32 (±0.06) DM 0.61 (±0.05) 0.73 (±0.04) 1.34 (±0.04) Added S S 0.51 (±0.01) 0.82 (±0.02) 1.33 (±0.02) N 0.59 (±0.06) 0.97 (±0.07) 1.57 (±0.13) DM 0.68 (± 0.03) 0.73 (± 0.04) 1.42 (±0.06)
Grain yield and quality
We found no significant effect of adding gypsum-S on the grain yields obtained by neither barley nor pea (Figure 6). The combined grain yield of the intercrops was comparable to the yields achieved by the pea sole crops, but significantly greater than barley sole crop yields. As for the final aboveground biomass yields (Figure 5), the grain yields of both barley and pea grown as sole crops at half of the recommended density and in intercrop were, with the exception of barley intercropped at the low S level, much greater than could have been expected from the recommended density sole crops.
In terms of quality of the harvested grain, the addition of S had no significant effect on the N or S concentration of neither barley nor pea and following there was no significant effect of S on the N:S ratio of the grain from either of the two crops, ratios averaging 15.7 and 12.0 for pea and barley, respectively (Table 3).
85
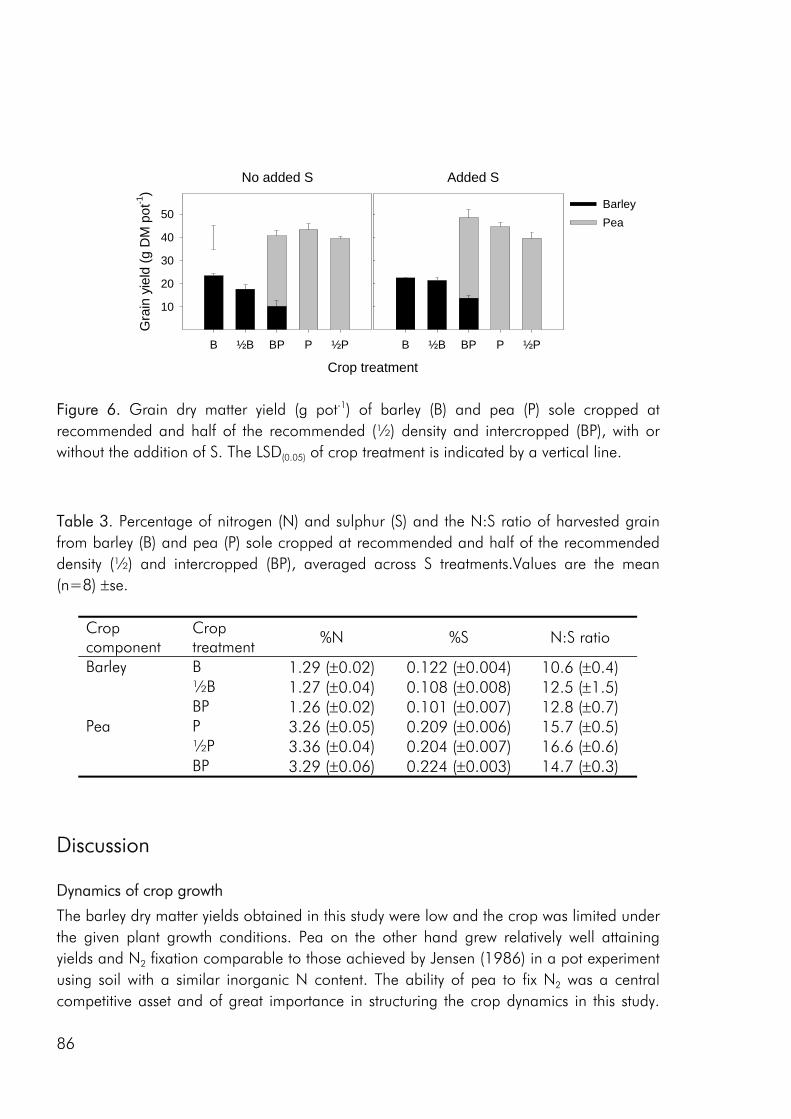
B ½B BP P ½P
Gra
in y
ield
(g D
M p
ot-1
)
10
20
30
40
50
No added S
Crop treatment
B ½B BP P ½P
Added S
PeaBarley
Figure 6. Grain dry matter yield (g pot-1) of barley (B) and pea (P) sole cropped at recommended and half of the recommended (½) density and intercropped (BP), with or without the addition of S. The LSD(0.05) of crop treatment is indicated by a vertical line.
Table 3. Percentage of nitrogen (N) and sulphur (S) and the N:S ratio of harvested grain from barley (B) and pea (P) sole cropped at recommended and half of the recommended density (½) and intercropped (BP), averaged across S treatments.Values are the mean (n=8) ±se.
Crop component
Crop treatment
%N %S N:S ratio
Barley B 1.29 (±0.02) 0.122 (±0.004) 10.6 (±0.4) ½B 1.27 (±0.04) 0.108 (±0.008) 12.5 (±1.5) BP 1.26 (±0.02) 0.101 (±0.007) 12.8 (±0.7) Pea P 3.26 (±0.05) 0.209 (±0.006) 15.7 (±0.5) ½P 3.36 (±0.04) 0.204 (±0.007) 16.6 (±0.6) BP 3.29 (±0.06) 0.224 (±0.003) 14.7 (±0.3)
Discussion Dynamics of crop growth
The barley dry matter yields obtained in this study were low and the crop was limited under the given plant growth conditions. Pea on the other hand grew relatively well attaining yields and N2 fixation comparable to those achieved by Jensen (1986) in a pot experiment using soil with a similar inorganic N content. The ability of pea to fix N2 was a central competitive asset and of great importance in structuring the crop dynamics in this study.
86
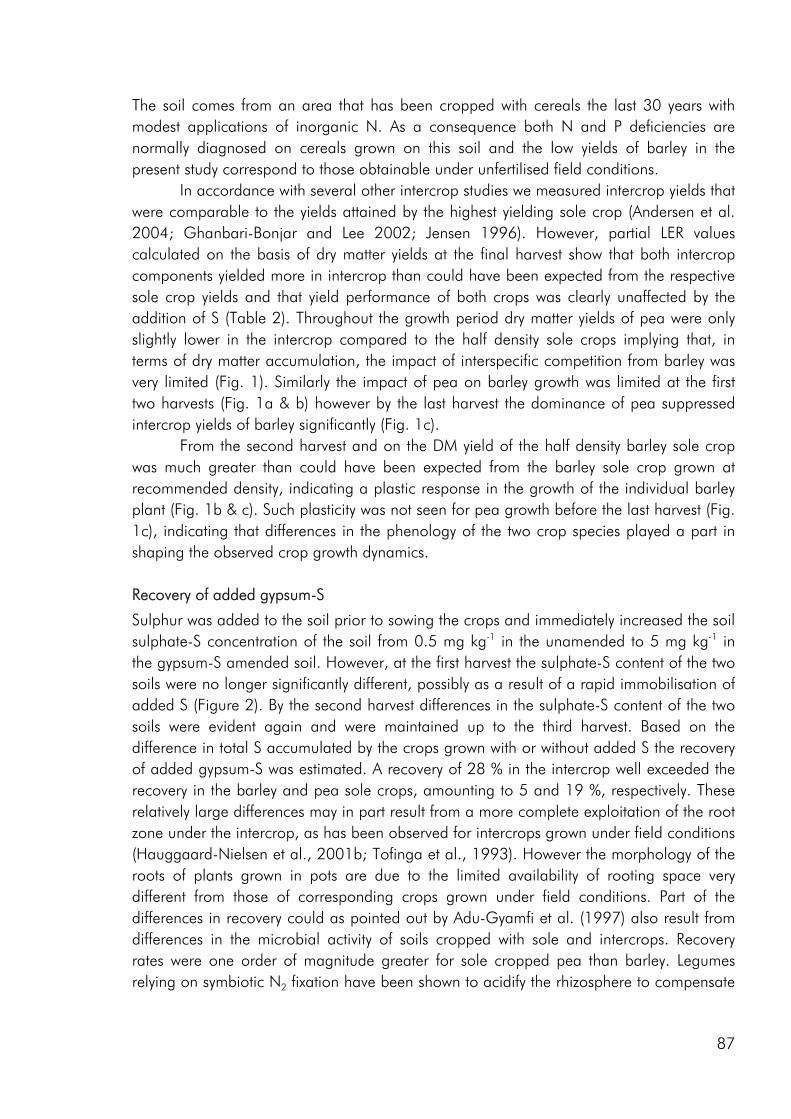
The soil comes from an area that has been cropped with cereals the last 30 years with modest applications of inorganic N. As a consequence both N and P deficiencies are normally diagnosed on cereals grown on this soil and the low yields of barley in the present study correspond to those obtainable under unfertilised field conditions.
In accordance with several other intercrop studies we measured intercrop yields that were comparable to the yields attained by the highest yielding sole crop (Andersen et al. 2004; Ghanbari-Bonjar and Lee 2002; Jensen 1996). However, partial LER values calculated on the basis of dry matter yields at the final harvest show that both intercrop components yielded more in intercrop than could have been expected from the respective sole crop yields and that yield performance of both crops was clearly unaffected by the addition of S (Table 2). Throughout the growth period dry matter yields of pea were only slightly lower in the intercrop compared to the half density sole crops implying that, in terms of dry matter accumulation, the impact of interspecific competition from barley was very limited (Fig. 1). Similarly the impact of pea on barley growth was limited at the first two harvests (Fig. 1a & b) however by the last harvest the dominance of pea suppressed intercrop yields of barley significantly (Fig. 1c). From the second harvest and on the DM yield of the half density barley sole crop was much greater than could have been expected from the barley sole crop grown at recommended density, indicating a plastic response in the growth of the individual barley plant (Fig. 1b & c). Such plasticity was not seen for pea growth before the last harvest (Fig. 1c), indicating that differences in the phenology of the two crop species played a part in shaping the observed crop growth dynamics. Recovery of added gypsum-S
Sulphur was added to the soil prior to sowing the crops and immediately increased the soil sulphate-S concentration of the soil from 0.5 mg kg-1 in the unamended to 5 mg kg-1 in the gypsum-S amended soil. However, at the first harvest the sulphate-S content of the two soils were no longer significantly different, possibly as a result of a rapid immobilisation of added S (Figure 2). By the second harvest differences in the sulphate-S content of the two soils were evident again and were maintained up to the third harvest. Based on the difference in total S accumulated by the crops grown with or without added S the recovery of added gypsum-S was estimated. A recovery of 28 % in the intercrop well exceeded the recovery in the barley and pea sole crops, amounting to 5 and 19 %, respectively. These relatively large differences may in part result from a more complete exploitation of the root zone under the intercrop, as has been observed for intercrops grown under field conditions (Hauggaard-Nielsen et al., 2001b; Tofinga et al., 1993). However the morphology of the roots of plants grown in pots are due to the limited availability of rooting space very different from those of corresponding crops grown under field conditions. Part of the differences in recovery could as pointed out by Adu-Gyamfi et al. (1997) also result from differences in the microbial activity of soils cropped with sole and intercrops. Recovery rates were one order of magnitude greater for sole cropped pea than barley. Legumes relying on symbiotic N2 fixation have been shown to acidify the rhizosphere to compensate
87
for an excess of cations being taken up (Raven, 1986), possibly making gypsum-S more plant available to pea than barley. Nitrogen and sulphur accumulation
Zhao et al. (1999b) found that adding S to an otherwise S deficient soil, increased total N accumulation in pea whereas a similar positive effect of S on the accumulation of N was not observed for cereals (McGrath and Zhao 1996; Zhao et al. 1999a). In line with these observations we found that only the legume responded positively to the addition of S, possibly as a result of increased N2 fixation (Figure 3). DeBoer and Duke (1982) found that S deficiency in lucerne significantly reduced N2 fixation capacity whereas other physiological functions remained relatively unaffected and Zhao et al. (1999) observed a doubling of N2 fixation rates following addition of S in amounts comparable to our study.
Throughout the cropping season the pea sole crop grown at recommended density accumulated most S, however by the last harvest IC accumulation was not much lower, amounting to 81% and 94% of S accumulated by the sole crop without and with added S, respectively (Figure 4). Similar to the N accumulation response of the individual pea plant to changes in cropping density (Fig. 3c & d), S accumulation per plant was much higher in the intercrop and half density sole crop than in the recommended density sole crop (Fig. 4c &d) and consequently pea partial LER values calculated on the basis of S accumulation measurements were high, amounting to 0.72 (no added S) and 0.82 (added S) (Table 2). Comparing the S accumulation of the barley crop in the intercrop with that attained in the half density sole crop at both S levels, it is evident that the impact of interspecific competition from the companion pea crop was significant, accumulation in intercrops falling well below half density sole crop accumulation (Figure 4a & b). The pea component was on the other hand unaffected by the companion barley crop (Figure 4c & d), IC pea accumulation being the same as in the half density sole crop.
Interspecies growth and nutrient use dynamics
Dry matter based REIc values corresponding to the first growth interval showed that both with and without the addition of S barley had an initial growth advantage. From a much lower seed weight barley grew to establishment at a greater relative rate, an initial growth advantage that corresponds well with observations of faster barley seedling emergence (Andersen et al., 2004) and root establishment (Bellostas et al. 2003; Corre-Hellou and Crozat 2004; Hauggaard-Nielsen et al. 2001) in other pea-barley intercrop studies. In intercrops initial growth advantages are often found to confer dominance throughout the growing season as initial size differences are increased as a result of asymmetric competition (Fukai and Trenbath, 1993; Weiner 1990). However in the present study the cropping conditions gave rise to a very clear dominance of pea by the last harvest. Grown without the addition of S, pea became the most growth efficient intercrop component in the third growth interval, whereas when improving the S supply a growth advantage was apparent already from the second growth interval. As the density of the crop canopy increases over the course of the growing season, the impact of competition for light increases and as competition for light has been shown to act asymmetrically (Weiner
88
1990) the dominance of pea may have been increasingly strengthened through competition for light. However as the study was carried out in pots the light requime experienced by the crops was very different from that of equivalent crops grown in the field and drawing direct parallels to theories based and observations made in field studies should only be tentative.
Corresponding to the growth advantage of barley at the beginning of the growing season, barley was also the most efficient crop with respect to nutrient uptake (Table 1). A comparison of the nutrient based REIc values with those based on dry matter data shows that the barley crop was in fact at a greater advantage with respect to nutrient accumulation than dry matter production, indicating that at this early stage of growth barley was neither S nor N limited. In the two following growth intervals the pea was at a clear advantage with respect to nutrient accumulation, REIc(N) and REIc(S) values all exceeding corresponding REIc(DM) values, indicating that nutrient accumulation advantages do not translate into equivalent growth advantages. Whereas REIc values based on nutrient accumulation data only address the issue of differences in the ability to extract nutrients from the soil, dry matter based REIc values also encompass the issue of differences in the efficiency with which the two crops use the nutrients to produce biomass. In the present study, calculations of the efficiency with which accumulated N and S was used to produce biomass by the two components of the intercrops show that both with and without the addition of S the barley crop was at an advantage producing on average 1.2 g DM mg-1 S and 95 g DM g-1 N compared to 0.6 g DM mg-1 S and 27 g DM g-1 N by pea. High utilisation efficiency could be expected to be a competitive asset under intercropping conditions and although intercropped barley was clearly suppressed by pea, a greater ability to convert accumulated nutrients into biomass will have strengthened the barley crop. Intercropping advantage
LER values calculated for DM production, N and S accumulation all indicated that intercrops performed better than the average sole crop (Table 2) and from the corresponding partial LER values it is apparent that both pea and barley performed better in intercrop than sole crop. Growing the pea-barley intercrop without the addition of S we found that the three partial LER values (DM, N and S) calculated for the pea crop were more or less equal. Adding S the increased nutrient accumulation did not translate into a corresponding increase in dry matter production. For barley the picture was somewhat different, at both S levels N accumulation was closely linked to dry matter production, whereas a low partial LER value for S accumulation, indicated that under the prevailing cropping conditions growth was linked to N uptake and not limited by S availability. Grain yield and quality
Alleviating S deficiency has been found to increase the seed yields of cereals (Scott et al. 1984; Withers et al. 1995) and legumes (Zhao et al. 1999b). However responses to S addition are usually greater when abundant amounts of N are available (McGrath and Zhao 1996). In the present study the addition of S had no significant effect on the grain
89
yield of neither barley nor pea. Given the cropping conditions, the barley crop, unlike pea, was severely N limited and the potential for response to S addition may therefore have been reduced, in accordance with the principle of limiting factors (Randall and Wrigley 1986). However an ample supply of N, through atmospheric fixation did not bring about increases in the grain yields of pea in response to the addition of S. The concentrations of N and S and the corresponding N:S ratios measured for pea and barley grain were in this study unaffected by cropping treatment (Table 3) It is nevertheless widely accepted that in addition to reducing yields of plants, sulphur deficiency also gives rise to changes in grain quality (Randall and Wrigley 1986) and results from other studies have displayed a positive effect of S addition on the S content of the grain harvested from cereals (Conry 1993; Randall and Wrigley 1986; Withers et al. 1995) and legumes (Conry 1993; Gayler and Sykes 1985; Naito et al. 1995). However from calculations of the S accumulation based harvest index for pea it was apparent that the addition of S actually lowered the proportion of total accumulated S that was allocated to the grain (data not shown).
Conclusions Earlier germination and emergence gave barley an initial growth and nutrient use advantage compared to pea. However, over the course of the growing season the importance of initial size differences decreased relative to the effect of species identity in determining the competitive strength of the two crops. Limited availability of soil N played a central role in shaping the nutrient and growth dynamics observed in the intercrop and increasing the availability of S did not change this markedly. As a result of its N2 fixing ability the pea component came to dominate the intercrop both with respect to yield and nutrient accumulation. Taken as a measure of intercrop advantage LER values calculated on the basis of aboveground biomass, N and S accumulation indicate that available growth resources were used more efficiently by the intercrop than the average sole crop.
Acknowledgements We thank Keld Skov Nielsen, Susanne Olsen and Britta Henriksen for skilled technical assistance, senior scientist Per Ambus for carrying out mass spectrometer N analysis, Jørgen Eriksen and Karin Dyrberg for giving valuable support in carrying out the S analysis.
90
References Adu-Gyamfi J.J., Ito O., Yoneyama T., Devi G. and Katayama K. 1997. Timing of N fertilization
on N2 fixation, N recovery and soil profile nitrate dynamics on sorghum/pigeonpea intercrops on Alfisols on the semi-arid tropics. Nutr. Cycl. Agroecosys. 48: 197-208.
Ae N., Arihara J., Okada K., Yoshihara T. and Johansen, C. 1990. Phosphorus uptake by pigeon pea and its role in cropping systems of the Indian subcontinent. Science 248: 477-480.
Andersen M.K., Hauggaard-Nielsen H., Ambus P. and Jensen E. S. 2004. Biomass production, symbiotic nitrogen fixation and inorganic N use in dual and tri-component annual intercrops. Plant Soil 266: 273-287.
Anil L., Park R. H. P. and Miller F. A. 1998. Temperate intercropping of cereals for forage: a review of the potential for growth and utilization with particular reference to the UK. Grass Forage Sci. 53: 301-317
Bellostas N., Hauggaard-Nielsen H., Andersen M. K. and Jensen E. S. 2003. Early interference dynamics in intercrops of pea, barley and oilseed rape. Biol. Agric. Hortic. 21: 337-348.
Connolly J.1987. On the use of response models in mixture experiments. Oecologia 72: 95-103. Connolly J., Wayne P. and Murray R. 1990. Time course of plant-plant interactions in experimental
mixtures of annuals: density, frequency, and nutrient effects. Oecologia 82: 513-526. Conry M.J. 1993. Response of winter barley grown on two contrasting soils in Ireland to foliar- and
soil-applied sulphur. Irish J. Agr. Food Res. 32: 177-183. Corre-Hellou G. and Crozat, Y. 2004. Interspecific competition for soil N in pea-barley mixtures
during the vegetative phase and consequences of N2 fixation. In: AEP (Ed.) 5th European Conference on Grain Legumes – Legumes for the benefit of agriculture, nutrition and the environment: their genomics, their products, and their improvement. Dijon, France, June 7-11, pp.65-66.
DeBoer D.L. and Duke S. H. 1982. Effects of sulphur nutrition on nitrogen and carbon metabolism in lucerne (Medicago sativa L.). Physiol. Plantarum 54: 343-350.
Duke S.H. and Reisenauer H. M. 1986. Roles and requirements of sulfur in plant nutrition. In: Tabatabai M.A. (Ed.) Sulfur in Agriculture. Soil Science Society of America, Madison, Wisconsin, U.S.A., pp. 123-168.
Eriksen J. 1997. Sulphur cycling in danish agricultural soils: inorganic sulphate dynamics and plant uptake. Soil Biol. Biochem. 29: 1379-1385.
Eriksen J., Nielsen M., Mortensen J. V. and Schjorring J. K. 2001. Redistribution of sulphur during generative growth of barley plants with different sulphur and nitrogen status. Plant Soil 230: 239-246.
Fukai S. and Trenbath B. R. 1993. Processes determining intercrop productivity and yields of component crops. Field Crops Res. 34: 247-271.
Ghanbari-Bonjar A. and Lee H.C. 2002. Intercropped field beans (Vicia faba) and wheat (Triticum aestivum) for whole crop forage: effect of nitrogen on forage yield and quality. J. Agr. Sci. 138: 311-315.
Gayler K.R. and Sykes G. E. 1985. Effects of Nutritional Stress on the Storage Proteins of Soybeans. Plant Physiol. 78: 582-585.
Hauggaard-Nielsen H., Ambus P. and Jensen E. S. 2001a. Interspecific competition, N use and interference with weeds in pea-barley intercropping. Field Crops Res. 70: 101-109.
Hauggaard-Nielsen H., Ambus P. and Jensen E.S., 2001b. Temporal and spatial distribution of roots and competition for nitrogen in pea-barley intercrops - a field study employing P- 32 technique. Plant Soil 236: 63-74.
91
Høgh-Jensen H. 2003. The effect of potassium deficiency on growth and N2-fixation in Trifolium repens. Physiol. Plantarum 119: 440-449.
Høgh-Jensen H and Schjoerring J. K. 2002. The influence of phosphorous deficiency on growth and nitrogen fixation of white clover plants. Ann. Bot. 90: 745-753.
Jensen E. S. 1986. The influence of rate and time of nitrate supply on nitrogen fixation and yield in pea (Pisum sativum L.). Fert. Res. 10: 193-202.
Jensen E. S. 1996. Grain yield, symbiotic N2 fixation and interspecific competition for inorganic N in pea-barley intercrops. Plant Soil 182: 25-38.
Keeney D.R. and Nelson D.W. 1982. Nitrogen - Inorganic forms. In: Page A.L. (Ed.) Methods of Soil Analysis Part 2. Chemical and Microbiological Properties. American Society of Agronomy, Madison, pp.643-698.
Li L., Yang S. C. Li X. L., Zhang F. S. and Christie P. 1999. Interspecific complementary and competitive interactions between intercropped maize and faba bean. Plant Soil 212: 105-114.
Li L., Zhang F. S., Li X. L., Christie P., Sun J. H. Yang, S. C. and Tang C. X. 2003. Interspecific facilitation of nutrient uptake by intercropped maize and faba bean. Nutr. Cycl. Agroecosys. 65: 61-71.
Marschner H., Romheld V., Horst W. J. and Martin P. 1986. Root-induced changes in the rhizosphere - importance for the mineral-nutrition of plants. Z. Pflanz. Bodenkunde 149: 441-456.
McGrath S.P. and Zhao F. J. 1996. Sulphur uptake, yield responses and the interactions between nitrogen and sulphur in winter oilseed rape (Brassica napus). J. Agr. Sci. 126: 53-62.
Mortensen J. and Eriksen J. 1994. Effect og sulphur deficiency on amino acid composition. Norw. J. Agr. Sci. 15: 135-142.
Naito S., Hirai M. Y., Inabahigano K., Nambara E., Fujiwara T., Hayashi H., Komeda Y. and Chino M. 1995. Expression of soybean seed storage protein genes in transgenic plants and their response to sulfur nutritional conditions. J. Plant Physiol. 145: 614-619.
Ofori F. and Stern W. R. 1986. Maize cowpea intercrop system - effect of nitrogen-fertilizer on productivity and efficiency. Field Crops Res. 14: 247-261.
Randall P.J. and Wrigley C. W. 1986. Effects of sulfur supply on the yield, composition, and quality of grain from cereals, oilseeds, and legumes. Adv. Cer. Sci. Technol. 8: 171-206.
Rauber R., Schmidtke K. and Kimpel-Freund H. 2001. The performance of Pea (Pisum sativum L.) and its role in determining yield advantages in mixed stands of pea and oat (Avena sativa L.). J. Agron. Crop Sci. 187: 137-144.
Raven J. A. 1986. Biochemical disposal of excess H+ in growing plants. New Phytol. 104 (2): 175-206.
Reuveny Z., Dougall D. K. and Trinity P. M. 1980. Regulatory coupling of nitrate and sulfate assimilation pathways in cultured tobacco cells. P. Natl. Acad. Sci. USA 77 (11): 6670-6672.
SAS. SAS/STAT Software (8.02). 1999. Cary, NC, USA, SAS institute Inc.
Scherer H.W. and Lange A. 1996. N fixation and growth of legumes as affected by sulphur fertilization. Biol. Fert. Soils 23: 449-453.
Scott N.M., Dyson P. W., Ross J. and Sharp G. S. 1984. The effect of sulphur on the yield and chemical composition of winter barley. J. Agr. Sci. 103: 699-702.
Sexton P. J., Paek N. C. and Shibles R. 1998. Soybean sulfur and nitrogen balance under varying levels of available sulfur. Crop Sci. 38: 975-982.
Tischner R. 2000. Nitrate uptake and reduction in higher and lower plants. Plant Cell Environ. 23: 1005-1024.
Tofinga M. P., Paolini R. and Snaydon R. W. 1993. A study of root and shoot interactions between cereals and peas in mixtures. J. Agr. Sci. 120: 13-24.
92
Weiner J. 1990. Asymmetric competition in plant-plant populations. Trends Ecol. Evol. 5 (11): 360-364.
Willey R. 1979. Intercropping - its importance and its research needs. I. Competition and yield advantages. Field Crop Abstr. 32, pp. 1-10
Withers P.J.A., Tytherleigh A. R. J. and O'Donnell F. M. 1995. Effect of sulphur fertilizers on the grain yield and sulphur content of cereals. J. Agr. Sci. 125: 317-324.
Zhang F.S. and Li L. 2003 Using competitive and facilitative interactions in intercropping systems enhances crop productivity and nutrient-use efficiency. Plant Soil 248: 305-312.
Zhao F.J., Hawkesford M. J. and McGrath S. P. 1999. Sulphur assimilation and effects on yield and quality of wheat. J. Cer. Sci. 30: 1-17.
Zhao F.J., Wood A. P. and McGrath S. P. 1999. Effects of sulphur nutrition on growth and nitrogen fixation of pea (Pisum sativum L.). Plant Soil 212: 209-219.
93

94
Density and relative frequency effects on competitive interactions and resource use in pea-barley intercrops. Henrik Hauggaard-Nielsen1, Mette Klindt Andersen1,2, Bjarne Jørnsgaard2 and Erik Steen Jensen1. 1Biosystems Department, RISØ National Laboratory, Frederiksborgvej 399, DK-4000 Roskilde, Denmark. 2 Plant Breeding and Crop Science, Department of Agricultural Sciences, The Royal Veterinary and Agricultural University, Højbakkegård Alle 10. DK-2630 Taastrup, Denmark.
Abstract Intercropping advantages may be influenced by both plant density and relative frequency of the intercrop components. In a field study barley (Hordeum vulgare L.) and pea (Pisum sativum L.) were sole cropped and intercropped at three densities, corresponding to i) half of the recommended, ii) the recommended and iii) twice the recommended plant density. Two intercrops combinations were included holding 1/3pea+2/3barley and 2/3pea+1/3barley relative to the sole crop densities employed.
For three growth intervals within the whole growing period, the relative performance of the two crops were assessed using the Relative Efficiency Index (REIc). The relative performance of the two species varied over the growing season and was influenced by cropping density and the relative frequency of pea and barley. Earlier seedling emergence gave barley an initial growth advantage whereas pea was in general more growth efficient once the initial growth phase had been passed. This reversal in relative growth efficiency along with the observation that early barley dominance did not appear to suppress pea growth indicates that differences in phenology played a role in shaping the prevailing dynamics. Whereas increases in plant density had a positive effect on the growth of pea, the growth of intercropped barley was severely limted by increases in density at the end of the growing period and more so in the pea dominated intercrop.
At the final harvest, Land Equivalent Ratios (LER) of 0.9 to 1.2 express resource complementarity in almost all studied intercrops, complementarity that was not directly affected by changes in plant density or relative frequency.
Intercropped pea did not increase its reliance on atmospheric nitrogen fixation compared to the pea sole crop. With respect to soil nitrogen uptake there were no effect of plant density but a strong effect of the relative frequency of pea in the intercrop, the greater the proportion the lower the uptake.
Changes in the competitive strength of the pea and barley crop over the growing season had a marked effect on the proportion of pea in the final grain yields of the intercrops.
95
At low and recommended density the proportions of pea and barley in the final grain yield was not markedly different from the expected 1/3pea:2/3barley and 2/3pea:1/3barley proportions sown, however at high density the suppression of barley strongly increased the proportion of pea in the final grain yield.
Weed infestation levels decreased as density was raised and the suppressing effect of density was clearly stronger the greater the frequency of barley in the crop. Earlier germination and tillering ability of barley are seen as likely explanations of lower weed load in the barley dominated crop treatments.
This study points at the potential of employing density and relative crop frequency as “regulators” when specific intercrop objectives such as increased competitiveness towards weeds or specific grain yield composition are wanted. Keywords: Competition dynamics, grain quality, Hordeum vulgare, intercropping, nitrogen use, organic farming, Pisum sativum, weeds, yield. Introduction Intercropping, the simultaneous growing of two or more species or cultivars on the same piece of land, is known to increase the size and stability of yields compared to sole cropping, especially under low input conditions (Willey, 1979; Ofori and Stern, 1987; Vandermeer, 1989).
Grain legume-cereal intercrops are common in temperate cropping systems and intercrops of pea and barley have been shown to use available growth resources more efficiently than their corresponding sole crops. The increased resources use may be explained by the fact that the two intercropped species do not compete for the exactly the same resource niche and thereby give rise to some degree of resource complementary (Snaydon and Satorre, 1989; Hauggaard-Nielsen et al., 2001b; 2001c). Barley has been shown to be much more competitive for soil inorganic N than pea (Jensen, 1996), most likely as a result of faster and deeper root growth of barley compared to pea (Hauggaard-Nielsen et al., 2001c, Bellostas et al., 2003, Corre-Hellou and Crozat, 2004), forcing the grain legume to increase its reliance on symbiotic N2-fixation (Jensen, 1996, Karpenstein-Machan and Stuelpnagel, 2000). A better utilization of growth resources through resource complementary may also result in reduced weed growth in intercrops compared to sole crops (Liebman and Dyck, 1993), an aspect that is of utmost relevance to low-input farming systems, such as organic farming (Hauggaard-Nielsen et al., 2001b).
In an intercrop the degree of resource complementarity attained, the total yield measured and the relative contribution of the individual components is determined by both inter- and intraspecific competition, which again is influenced by the availability of environmental resources and the relative frequency and density at which the component crops
96
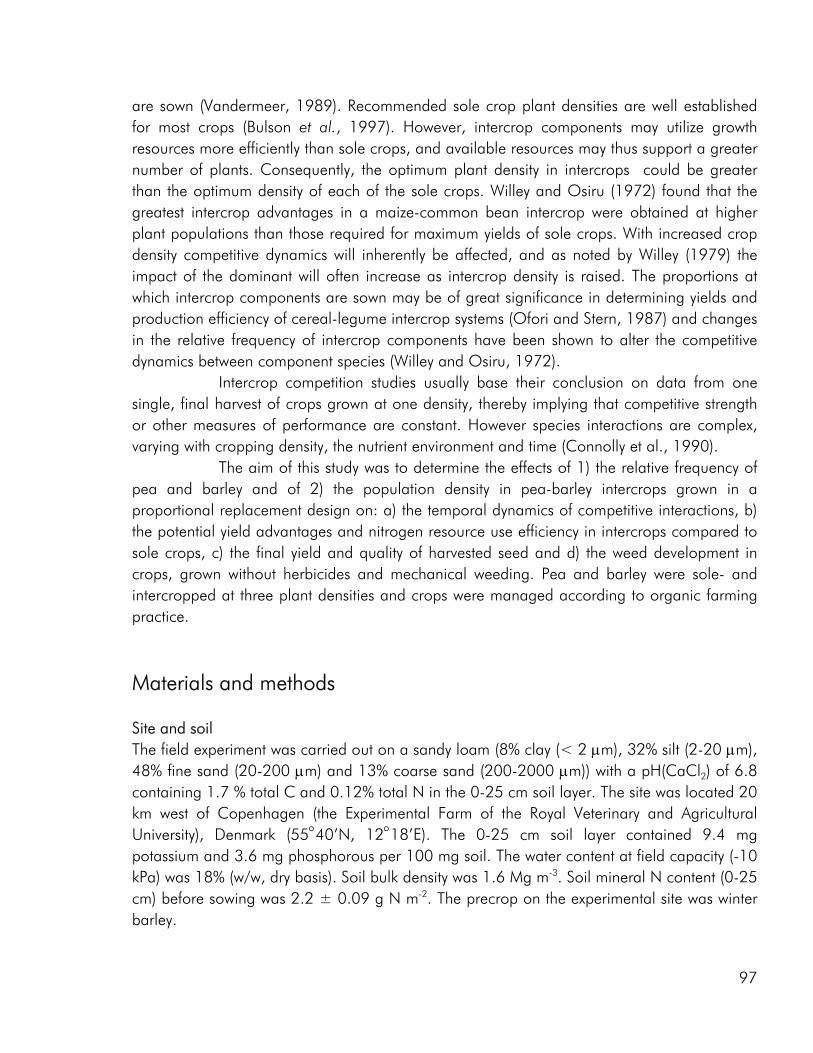
are sown (Vandermeer, 1989). Recommended sole crop plant densities are well established for most crops (Bulson et al., 1997). However, intercrop components may utilize growth resources more efficiently than sole crops, and available resources may thus support a greater number of plants. Consequently, the optimum plant density in intercrops could be greater than the optimum density of each of the sole crops. Willey and Osiru (1972) found that the greatest intercrop advantages in a maize-common bean intercrop were obtained at higher plant populations than those required for maximum yields of sole crops. With increased crop density competitive dynamics will inherently be affected, and as noted by Willey (1979) the impact of the dominant will often increase as intercrop density is raised. The proportions at which intercrop components are sown may be of great significance in determining yields and production efficiency of cereal-legume intercrop systems (Ofori and Stern, 1987) and changes in the relative frequency of intercrop components have been shown to alter the competitive dynamics between component species (Willey and Osiru, 1972).
Intercrop competition studies usually base their conclusion on data from one single, final harvest of crops grown at one density, thereby implying that competitive strength or other measures of performance are constant. However species interactions are complex, varying with cropping density, the nutrient environment and time (Connolly et al., 1990). The aim of this study was to determine the effects of 1) the relative frequency of pea and barley and of 2) the population density in pea-barley intercrops grown in a proportional replacement design on: a) the temporal dynamics of competitive interactions, b) the potential yield advantages and nitrogen resource use efficiency in intercrops compared to sole crops, c) the final yield and quality of harvested seed and d) the weed development in crops, grown without herbicides and mechanical weeding. Pea and barley were sole- and intercropped at three plant densities and crops were managed according to organic farming practice.
Materials and methods Site and soil The field experiment was carried out on a sandy loam (8% clay (< 2 µm), 32% silt (2-20 µm), 48% fine sand (20-200 µm) and 13% coarse sand (200-2000 µm)) with a pH(CaCl2) of 6.8 containing 1.7 % total C and 0.12% total N in the 0-25 cm soil layer. The site was located 20 km west of Copenhagen (the Experimental Farm of the Royal Veterinary and Agricultural University), Denmark (55°40’N, 12°18’E). The 0-25 cm soil layer contained 9.4 mg potassium and 3.6 mg phosphorous per 100 mg soil. The water content at field capacity (-10 kPa) was 18% (w/w, dry basis). Soil bulk density was 1.6 Mg m-3. Soil mineral N content (0-25 cm) before sowing was 2.2 ± 0.09 g N m-2. The precrop on the experimental site was winter barley.
97
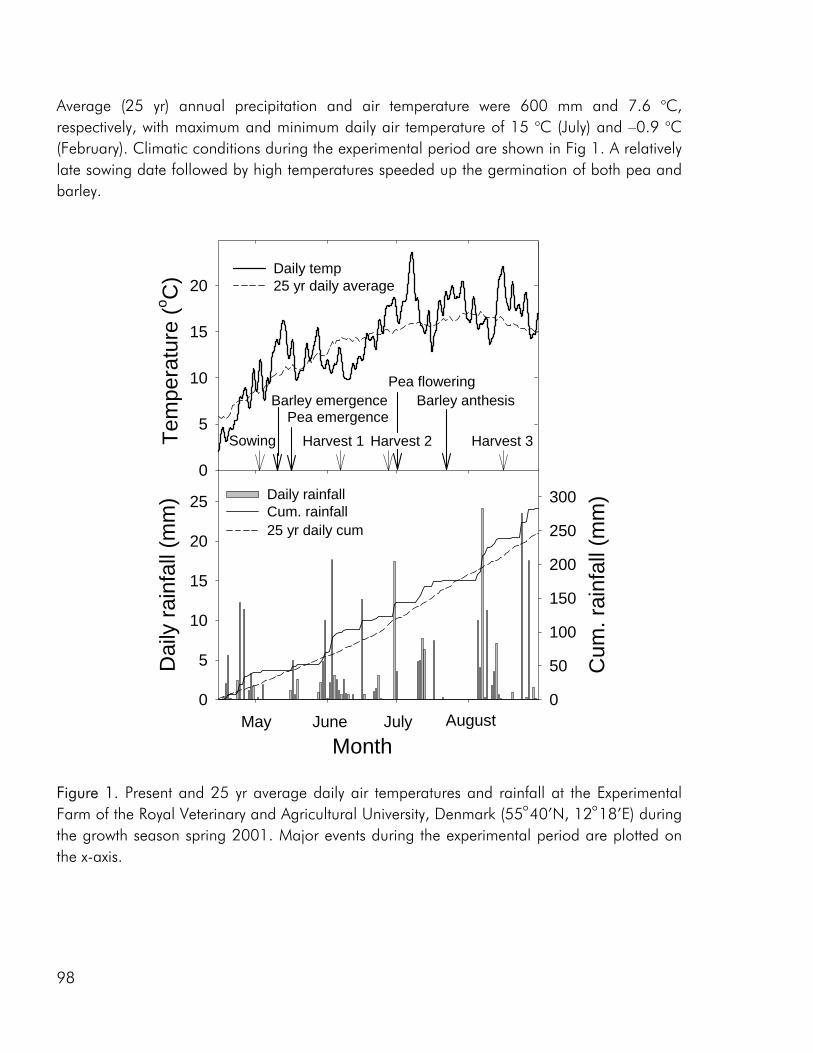
Average (25 yr) annual precipitation and air temperature were 600 mm and 7.6 oC, respectively, with maximum and minimum daily air temperature of 15 oC (July) and –0.9 oC (February). Climatic conditions during the experimental period are shown in Fig 1. A relatively late sowing date followed by high temperatures speeded up the germination of both pea and barley.
Month
Dai
ly ra
infa
ll (m
m)
0
5
10
15
20
25
Cum
. rai
nfal
l (m
m)
0
50
100
150
200
250
300
Tem
pera
ture
(o C)
0
5
10
15
20Daily temp25 yr daily average
Daily rainfallCum. rainfall25 yr daily cum
Sowing
Barley emergencePea emergence
Harvest 1 Harvest 2 Harvest 3
May June July August
Pea floweringBarley anthesis
Figure 1. Present and 25 yr average daily air temperatures and rainfall at the Experimental Farm of the Royal Veterinary and Agricultural University, Denmark (55°40’N, 12°18’E) during the growth season spring 2001. Major events during the experimental period are plotted on the x-axis.
98
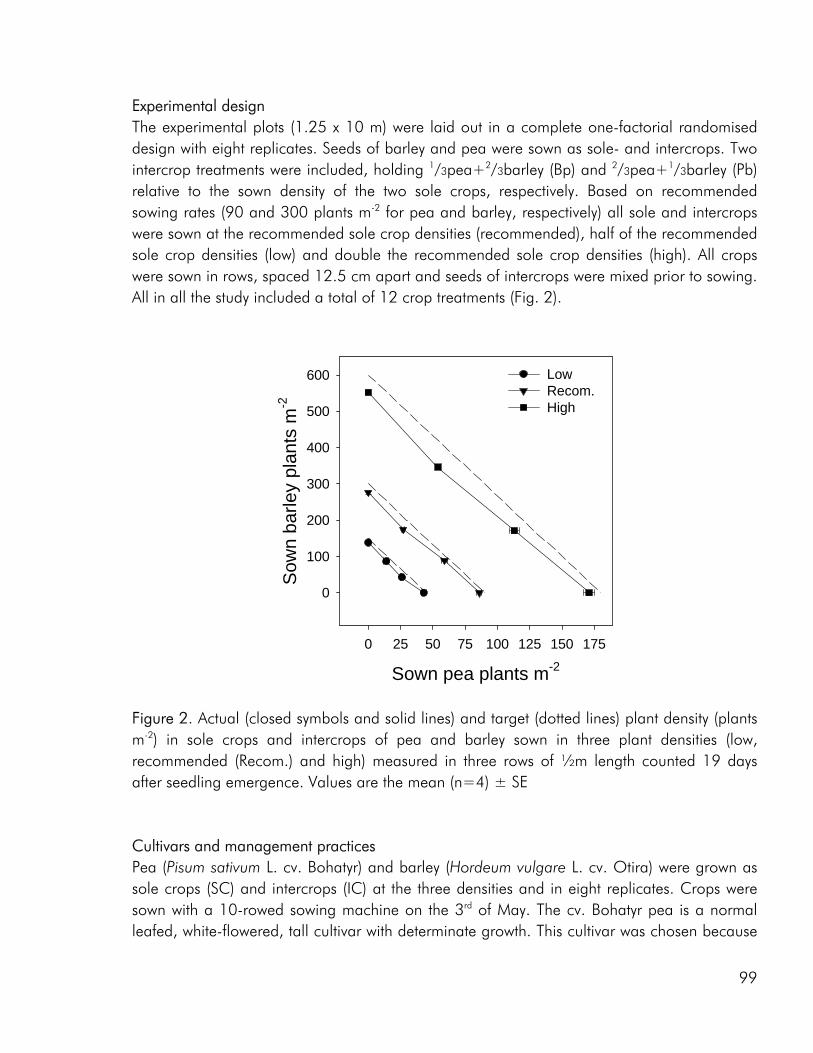
Experimental design The experimental plots (1.25 x 10 m) were laid out in a complete one-factorial randomised design with eight replicates. Seeds of barley and pea were sown as sole- and intercrops. Two intercrop treatments were included, holding 1/3pea+2/3barley (Bp) and 2/3pea+1/3barley (Pb) relative to the sown density of the two sole crops, respectively. Based on recommended sowing rates (90 and 300 plants m-2 for pea and barley, respectively) all sole and intercrops were sown at the recommended sole crop densities (recommended), half of the recommended sole crop densities (low) and double the recommended sole crop densities (high). All crops were sown in rows, spaced 12.5 cm apart and seeds of intercrops were mixed prior to sowing. All in all the study included a total of 12 crop treatments (Fig. 2).
Sown pea plants m-2
0 25 50 75 100 125 150 175
Sow
n ba
rley
plan
ts m
-2
0
100
200
300
400
500
600 LowRecom.High
Figure 2. Actual (closed symbols and solid lines) and target (dotted lines) plant density (plants m-2) in sole crops and intercrops of pea and barley sown in three plant densities (low, recommended (Recom.) and high) measured in three rows of ½m length counted 19 days after seedling emergence. Values are the mean (n=4) ± SE Cultivars and management practices Pea (Pisum sativum L. cv. Bohatyr) and barley (Hordeum vulgare L. cv. Otira) were grown as sole crops (SC) and intercrops (IC) at the three densities and in eight replicates. Crops were sown with a 10-rowed sowing machine on the 3rd of May. The cv. Bohatyr pea is a normal leafed, white-flowered, tall cultivar with determinate growth. This cultivar was chosen because
99
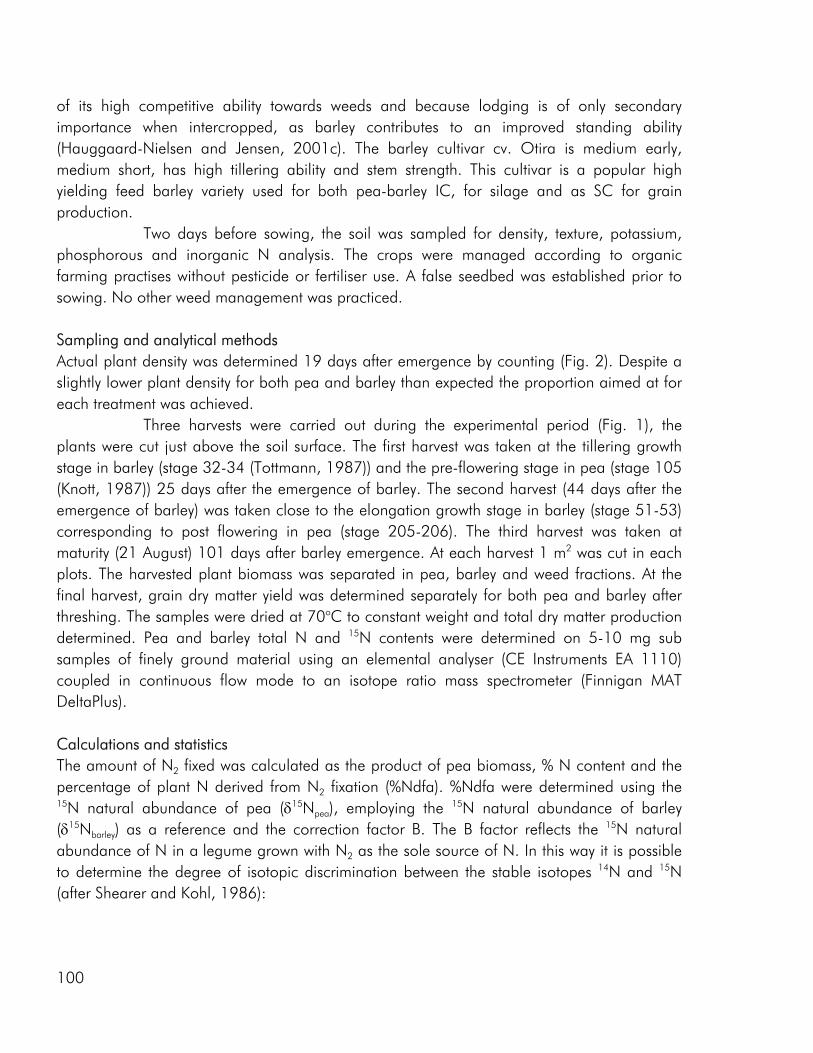
of its high competitive ability towards weeds and because lodging is of only secondary importance when intercropped, as barley contributes to an improved standing ability (Hauggaard-Nielsen and Jensen, 2001c). The barley cultivar cv. Otira is medium early, medium short, has high tillering ability and stem strength. This cultivar is a popular high yielding feed barley variety used for both pea-barley IC, for silage and as SC for grain production.
Two days before sowing, the soil was sampled for density, texture, potassium, phosphorous and inorganic N analysis. The crops were managed according to organic farming practises without pesticide or fertiliser use. A false seedbed was established prior to sowing. No other weed management was practiced. Sampling and analytical methods Actual plant density was determined 19 days after emergence by counting (Fig. 2). Despite a slightly lower plant density for both pea and barley than expected the proportion aimed at for each treatment was achieved.
Three harvests were carried out during the experimental period (Fig. 1), the plants were cut just above the soil surface. The first harvest was taken at the tillering growth stage in barley (stage 32-34 (Tottmann, 1987)) and the pre-flowering stage in pea (stage 105 (Knott, 1987)) 25 days after the emergence of barley. The second harvest (44 days after the emergence of barley) was taken close to the elongation growth stage in barley (stage 51-53) corresponding to post flowering in pea (stage 205-206). The third harvest was taken at maturity (21 August) 101 days after barley emergence. At each harvest 1 m2 was cut in each plots. The harvested plant biomass was separated in pea, barley and weed fractions. At the final harvest, grain dry matter yield was determined separately for both pea and barley after threshing. The samples were dried at 70oC to constant weight and total dry matter production determined. Pea and barley total N and 15N contents were determined on 5-10 mg sub samples of finely ground material using an elemental analyser (CE Instruments EA 1110) coupled in continuous flow mode to an isotope ratio mass spectrometer (Finnigan MAT DeltaPlus). Calculations and statistics The amount of N2 fixed was calculated as the product of pea biomass, % N content and the percentage of plant N derived from N2 fixation (%Ndfa). %Ndfa were determined using the 15N natural abundance of pea (δ15Npea), employing the 15N natural abundance of barley (δ15Nbarley) as a reference and the correction factor B. The B factor reflects the 15N natural abundance of N in a legume grown with N2 as the sole source of N. In this way it is possible to determine the degree of isotopic discrimination between the stable isotopes 14N and 15N (after Shearer and Kohl, 1986):
100
)N(
)NN(100(%) 15
1515
BNdfa
barley
peabarley
−
−×=
δδδ
(1)
A B-value of – 0.7‰ was determined on shoots of pea plants grown in pots containing N-free growth medium in a naturally lit, temperature-controlled glasshouse (Hauggaard-Nielsen et al., 2003).
The calculations assume that the δ15N of a reference plant (barley SC) provides a measure of the δ15N of soil mineral N available to pea (Peoples et al., 1998; Unkovich et al., 1994). The barley SC reference plant value was calculated as the total average of the three barley SC treatments in each replicate. Soil N uptake in pea was estimated as the difference between total N accumulated and the amount of N2 fixed.
The Land Equivalent Ratio (LER) is defined as the relative land area growing sole crops that is required to produce the yields achieved when growing intercrops. LER for a pea-barley intercrop is the sum of the partial LER values for barley (LB) and pea (LP), calculated on the basis of dry matter yields (DM), in accordance with De Wit and Van den Bergh, 1965:
barleySC
barleyICB DM
DML = (2)
peaSC
peaICP DM
DML = (3)
PB LLLER += (4)
LER values > 1 indicates an advantage from intercropping, in terms of the use of environmental resources for plant growth. When LER < 1, resources are used more efficiently by sole crops than by intercrops.
The relative performance of barley compared to pea was evaluated by calculating the cumulative relative efficiency index (REIc) (Connolly, 1987). A measure, that compares the proportional change in total dry matter (K) within a given time interval (t1 to t2), of one species relative to another. For the pea-barley intercrops REIc was calculated as:
pea
barley
KK
REIc = (5)
101
1
2
tDMtDM
KbarleyIC
barleyICbarley = (6)
1
2
tDMtDM
KpeaIC
peaICpea = (7)
REIc values corresponding to three growth interval were calculated, from sowing to the first harvest (25DAE), from the first to the second harvest (25-44 DAE) and from the second to the third harvest at maturity (44-101 DAE). At sowing the total seed weight was taken as total biomass. A REIc value of 1 means that both species have equal proportional growth over a period of time. Statistics Analysis of variance were carried out on data using the GLM procedure of the SAS software (SAS 1999). The significance of differences between treatments were estimated using F-tests and probabilities equal to or less than 0.05 considered significant. Assumptions of normal distribution and variance homogeneity were tested graphically using residual plots. The presence of single points with large effects on the statistical estimates of the model were revealed using Cook’s distance. Where variance homogeneity and normality was not present a transform both sides approach (TBS) with a log transformation was used. Results Total dry matter production At all three harvests (25 and 44 and 101 DAE) both sole cropped (SC) and intercropped (IC) pea dry matter production increased with increasing plant density whereas raising plant density only had a positive effect on the yield of solecropped and Pb intercropped barley, at the first two harvests. At the last harvest increasing density from recommended to high lowered the yields of intercropped barley and did not significantly affect the solecrop barley yield. At the first harvest (25 DAE) the pea solecrop was the lowest yielding crop treatment at low and recommended cropping density whereas at high cropping density the pea solecrop and the pea dominated intercrop attained the greatest yields. At the second and third harvest the total biomass production of the four cropping treatments were not significantly different at low and recommended density however at high density the pea solecrop outyielded the other three crop treatments (Fig. 3). At all harvests and cropping densities total dry matter production of the two intercrops were in general similar when grown at low and medium density. Whereas, in the high density treatment the Pb IC outyielded the Bp IC at the first harvest and vica versa
102
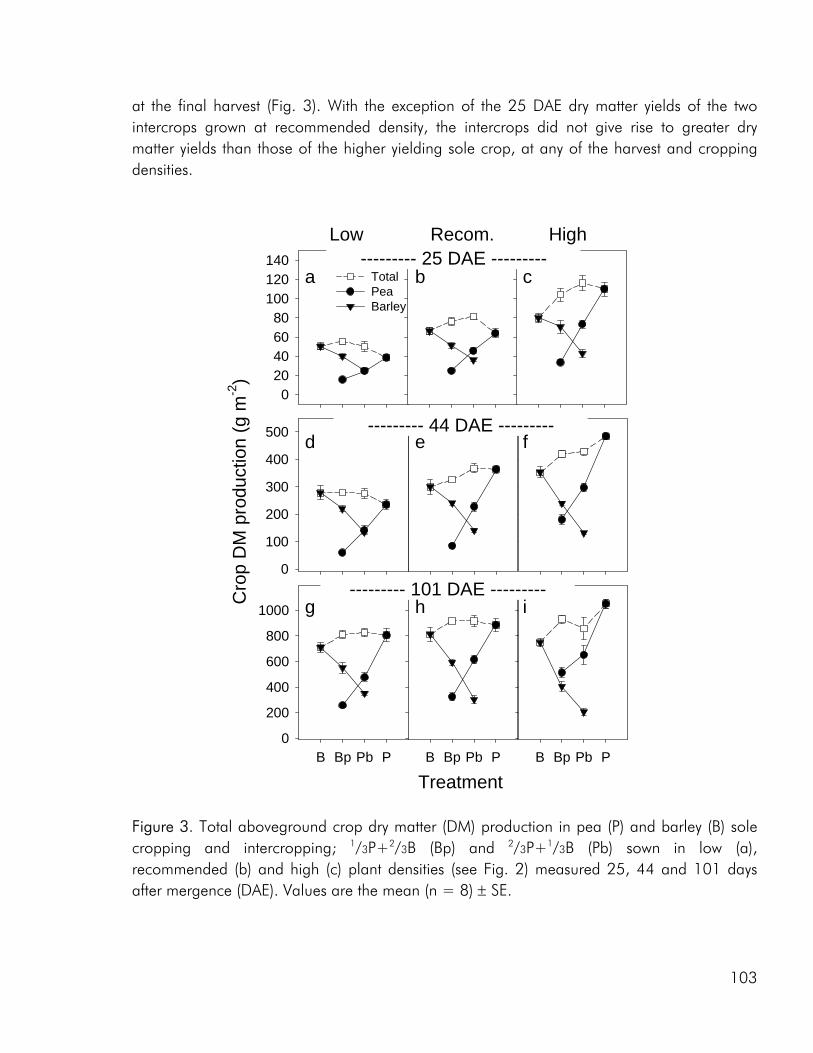
at the final harvest (Fig. 3). With the exception of the 25 DAE dry matter yields of the two intercrops grown at recommended density, the intercrops did not give rise to greater dry matter yields than those of the higher yielding sole crop, at any of the harvest and cropping densities.
Cro
p D
M p
rodu
ctio
n (g
m-2
)
0
100
200
300
400
500
Low Recom.
020406080
100120140
TotalPeaBarley
High
B Bp Pb P0
200
400
600
800
1000
TreatmentB Bp Pb P B Bp Pb P
--------- 44 DAE ---------
--------- 101 DAE ---------
--------- 25 DAE ---------a b c
d e f
g h i
Figure 3. Total aboveground crop dry matter (DM) production in pea (P) and barley (B) sole cropping and intercropping; 1/3P+2/3B (Bp) and 2/3P+1/3B (Pb) sown in low (a), recommended (b) and high (c) plant densities (see Fig. 2) measured 25, 44 and 101 days after mergence (DAE). Values are the mean (n = 8) ± SE.
103
Interspecies dynamics and intercropping advantage The relative efficiency of the two crops in terms of biomass accumulation was studied by calculating REIc values corresponding to each of the three growth intervals studied (Table 1). Barley emerged earlier than pea and in the initial growth phase (0-25 DAE) and was the most growth efficient, in all but the Pb IC grown at high density. The proportional dry matter increase of barley was 2.3 and 1.7 times greater than that of pea in the Bp and Pb intercrops, respectively. A growth advantage that was reduced as cropping density increased. In all intercrop treatments, with the exception of the Bp ICs grown at low and recommended density, the pea component grew at a greater rate than barley from 25 to 44 DAE and in the last growth interval (44-101 DAE) pea was the most growth efficient in all treatments, relatively unaffected by density. Table 1. The Relative Efficiency Index (REIc) of barley relative to pea when intercropped as 1/3pea+2/3barley (Bp) and 2/3pea+1/3barley (Pb) at low, recommended and high sowing plant density. Calculated on the basis of total crop dry matter production (see Fig. 3) from sowing to 25 days after emergence (DAE), 25-44 DAE and 44-101 DAE. In the 0-25 DAE calculation seed thousand-grain weight for pea and barley was set to 250 and 48 gram, respectively, and multiplied with plants m-2 to estimate crop dry matter 0 DAE. Values are the mean (n = 8) ± SE.
DAE Density
Relative frequency 0-25 25-44 44-101
Low Bp 2.27±0.25 1.32±0.20 0.66±0.15 Pb 1.73±0.16 0.86±0.09 0.86±0.15
Recom. Bp 1.65±0.11 1.53±0.20 0.68±0.09 Pb 1.29±0.11 0.81±0.09 0.85±0.14
High Bp 1.97±0.26 0.72±0.10 0.65±0.12 Pb 0.96±0.06 0.83±0.11 0.64±0.10
At the first and second harvest LER values of the intercrops averaged 1.21 and 1.08, respectively, indicating that growth resources were used 8 to 21 % more efficiently in intercrops than sole crops (Fig. 4a and b). Evidently neither density nor frequency treatments showed effects on the calculated partial LER values corresponding to the first two harvests. By the last harvest intercrops yields were equivalent to those of the sole crops, LER values averaging 1.02 (Fig. 4c), with a tendency for LER values to decrease as the proportion of pea in the crop increased. The partial LER values of pea and barley changed very little over time
104
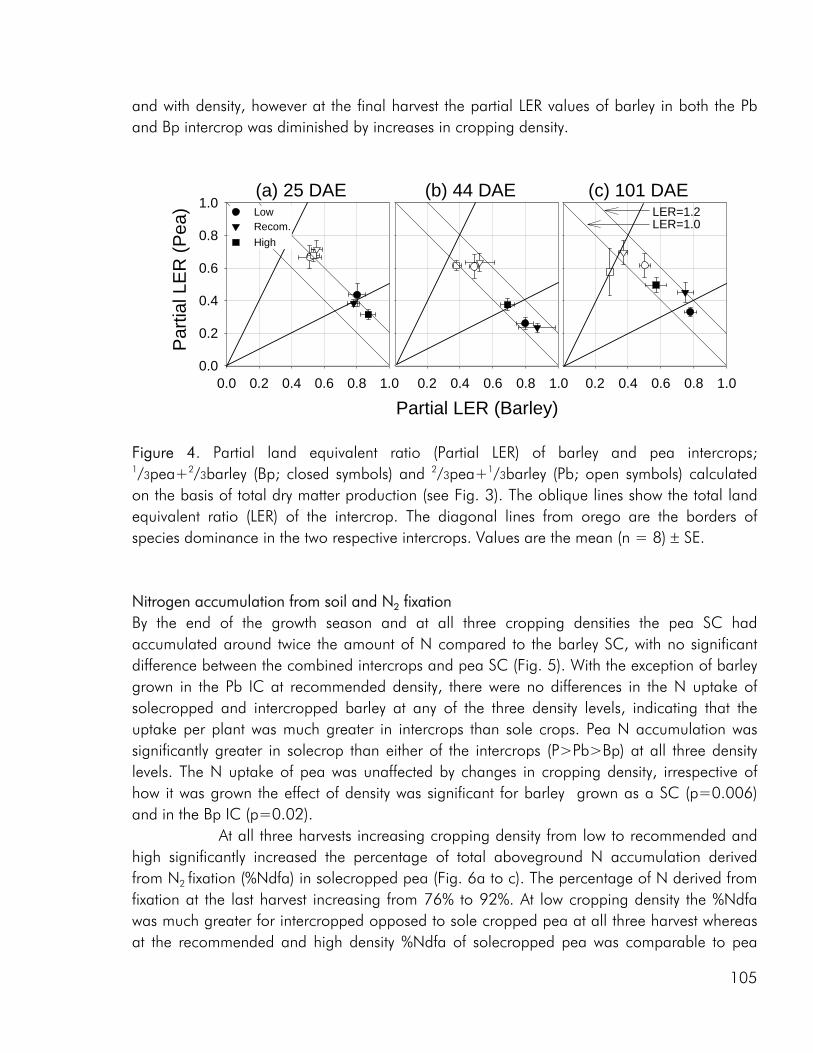
and with density, however at the final harvest the partial LER values of barley in both the Pb and Bp intercrop was diminished by increases in cropping density.
(a) 25 DAE
0.0 0.2 0.4 0.6 0.8 1.00.0
0.2
0.4
0.6
0.8
1.0(b) 44 DAE
Partial LER (Barley)0.2 0.4 0.6 0.8 1.0
(c) 101 DAE
0.2 0.4 0.6 0.8 1.0
LowRecom.High
LER=1.0LER=1.2
Par
tial L
ER
(Pea
)
Figure 4. Partial land equivalent ratio (Partial LER) of barley and pea intercrops; 1/3pea+2/3barley (Bp; closed symbols) and 2/3pea+1/3barley (Pb; open symbols) calculated on the basis of total dry matter production (see Fig. 3). The oblique lines show the total land equivalent ratio (LER) of the intercrop. The diagonal lines from orego are the borders of species dominance in the two respective intercrops. Values are the mean (n = 8) ± SE. Nitrogen accumulation from soil and N2 fixation By the end of the growth season and at all three cropping densities the pea SC had accumulated around twice the amount of N compared to the barley SC, with no significant difference between the combined intercrops and pea SC (Fig. 5). With the exception of barley grown in the Pb IC at recommended density, there were no differences in the N uptake of solecropped and intercropped barley at any of the three density levels, indicating that the uptake per plant was much greater in intercrops than sole crops. Pea N accumulation was significantly greater in solecrop than either of the intercrops (P>Pb>Bp) at all three density levels. The N uptake of pea was unaffected by changes in cropping density, irrespective of how it was grown the effect of density was significant for barley grown as a SC (p=0.006) and in the Bp IC (p=0.02).
At all three harvests increasing cropping density from low to recommended and high significantly increased the percentage of total aboveground N accumulation derived from N2 fixation (%Ndfa) in solecropped pea (Fig. 6a to c). The percentage of N derived from fixation at the last harvest increasing from 76% to 92%. At low cropping density the %Ndfa was much greater for intercropped opposed to sole cropped pea at all three harvest whereas at the recommended and high density %Ndfa of solecropped pea was comparable to pea
105
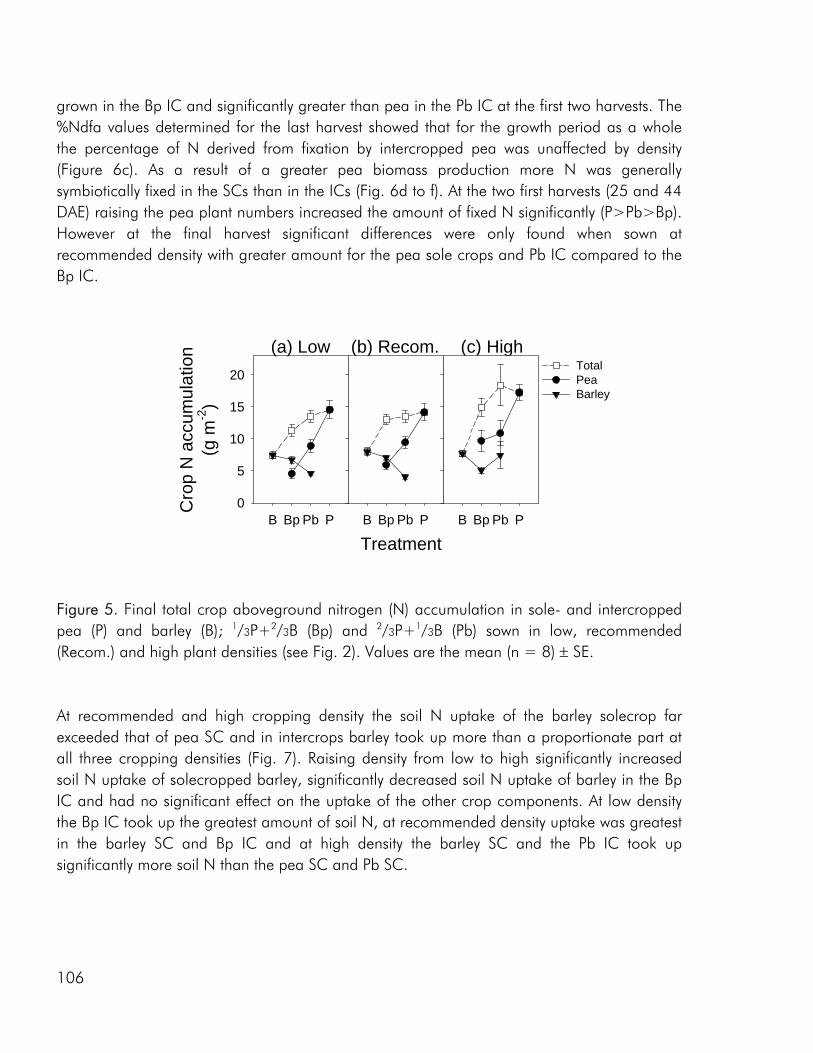
grown in the Bp IC and significantly greater than pea in the Pb IC at the first two harvests. The %Ndfa values determined for the last harvest showed that for the growth period as a whole the percentage of N derived from fixation by intercropped pea was unaffected by density (Figure 6c). As a result of a greater pea biomass production more N was generally symbiotically fixed in the SCs than in the ICs (Fig. 6d to f). At the two first harvests (25 and 44 DAE) raising the pea plant numbers increased the amount of fixed N significantly (P>Pb>Bp). However at the final harvest significant differences were only found when sown at recommended density with greater amount for the pea sole crops and Pb IC compared to the Bp IC.
(a) Low (b) Recom.
B Bp Pb P
Cro
p N
acc
umul
atio
n(g
m-2
)
0
5
10
15
20TotalPeaBarley
(c) High
B Bp Pb P
TreatmentB Bp Pb P
Figure 5. Final total crop aboveground nitrogen (N) accumulation in sole- and intercropped pea (P) and barley (B); 1/3P+2/3B (Bp) and 2/3P+1/3B (Pb) sown in low, recommended (Recom.) and high plant densities (see Fig. 2). Values are the mean (n = 8) ± SE. At recommended and high cropping density the soil N uptake of the barley solecrop far exceeded that of pea SC and in intercrops barley took up more than a proportionate part at all three cropping densities (Fig. 7). Raising density from low to high significantly increased soil N uptake of solecropped barley, significantly decreased soil N uptake of barley in the Bp IC and had no significant effect on the uptake of the other crop components. At low density the Bp IC took up the greatest amount of soil N, at recommended density uptake was greatest in the barley SC and Bp IC and at high density the barley SC and the Pb IC took up significantly more soil N than the pea SC and Pb SC.
106
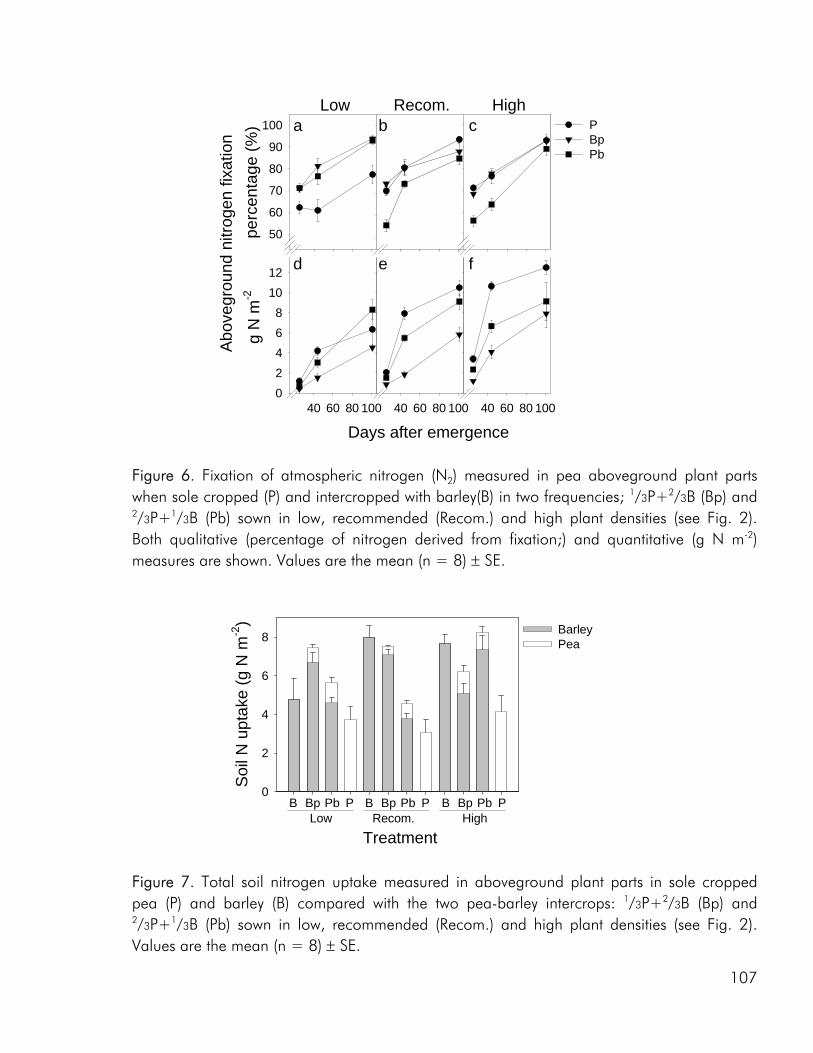
Recom. High
Abo
vegr
ound
nitr
ogen
fixa
tion
Days after emergence40 60 80 100
g N
m-2
02468
1012
40 60 80 100 40 60 80 100
perc
enta
ge (%
) a b c
d e f
Low
50
60
70
80
90
100 PBpPb
Figure 6. Fixation of atmospheric nitrogen (N2) measured in pea aboveground plant parts when sole cropped (P) and intercropped with barley(B) in two frequencies; 1/3P+2/3B (Bp) and 2/3P+1/3B (Pb) sown in low, recommended (Recom.) and high plant densities (see Fig. 2). Both qualitative (percentage of nitrogen derived from fixation;) and quantitative (g N m-2) measures are shown. Values are the mean (n = 8) ± SE.
Treatment
Soi
l N u
ptak
e (g
N m
-2)
0
2
4
6
8 BarleyPea
B Bp Pb PHigh
B Bp Pb PLow
B Bp Pb PRecom.
Figure 7. Total soil nitrogen uptake measured in aboveground plant parts in sole cropped pea (P) and barley (B) compared with the two pea-barley intercrops: 1/3P+2/3B (Bp) and 2 1/3P+ /3B (Pb) sown in low, recommended (Recom.) and high plant densities (see Fig. 2). Values are the mean (n = 8) ± SE.
107
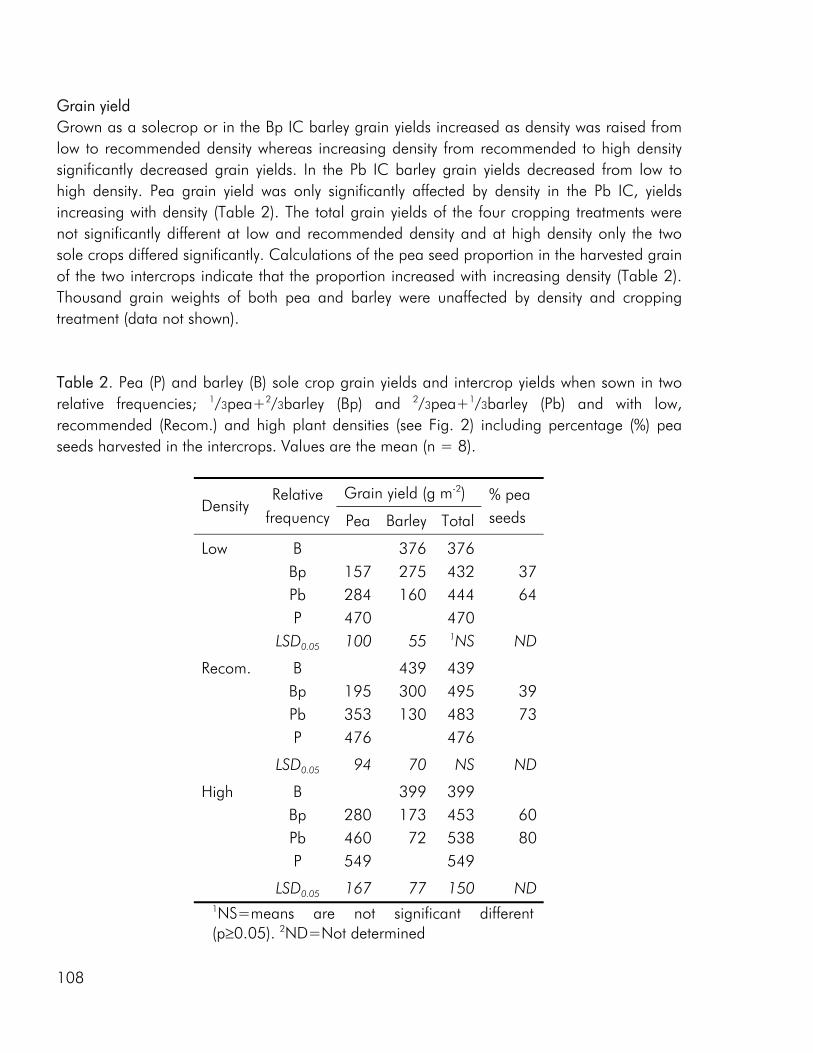
Grain yield Grown as a solecrop or in the Bp IC barley grain yields increased as density was raised from
mended density whereas increasing density from recommended to high density
able 2. Pea (P) and barley (B) sole crop grain yields and intercrop yields when sown in two lative frequencies; 1/3pea+2/3barley (Bp) and 2/3pea+1/3barley (Pb) and with low,
low to recomsignificantly decreased grain yields. In the Pb IC barley grain yields decreased from low to high density. Pea grain yield was only significantly affected by density in the Pb IC, yields increasing with density (Table 2). The total grain yields of the four cropping treatments were not significantly different at low and recommended density and at high density only the two sole crops differed significantly. Calculations of the pea seed proportion in the harvested grain of the two intercrops indicate that the proportion increased with increasing density (Table 2). Thousand grain weights of both pea and barley were unaffected by density and cropping treatment (data not shown). Trerecommended (Recom.) and high plant densities (see Fig. 2) including percentage (%) pea seeds harvested in the intercrops. Values are the mean (n = 8).
Grain yield (g m-2) Density
frequency Pea Barley Total
% pea seeds
Relative
Low B 376 376
284 64
LS
ecom. 439300 495
353 73
LS 05
399 2 173 453 460 80
LS 05
Bp 157 275 432 37 Pb 160 444 P 470 470 D0.05 100 55 1NS ND
R B 439 Bp 195 39 Pb 130 483 P 476 476
D0. 94 70 NS ND
High B 399 Bp 80 60 Pb 72 538 P 549 549
D0. 167 77 150 ND 1NS=means are not significant different (p≥0.05). o rmin 2ND=N t dete ed
108
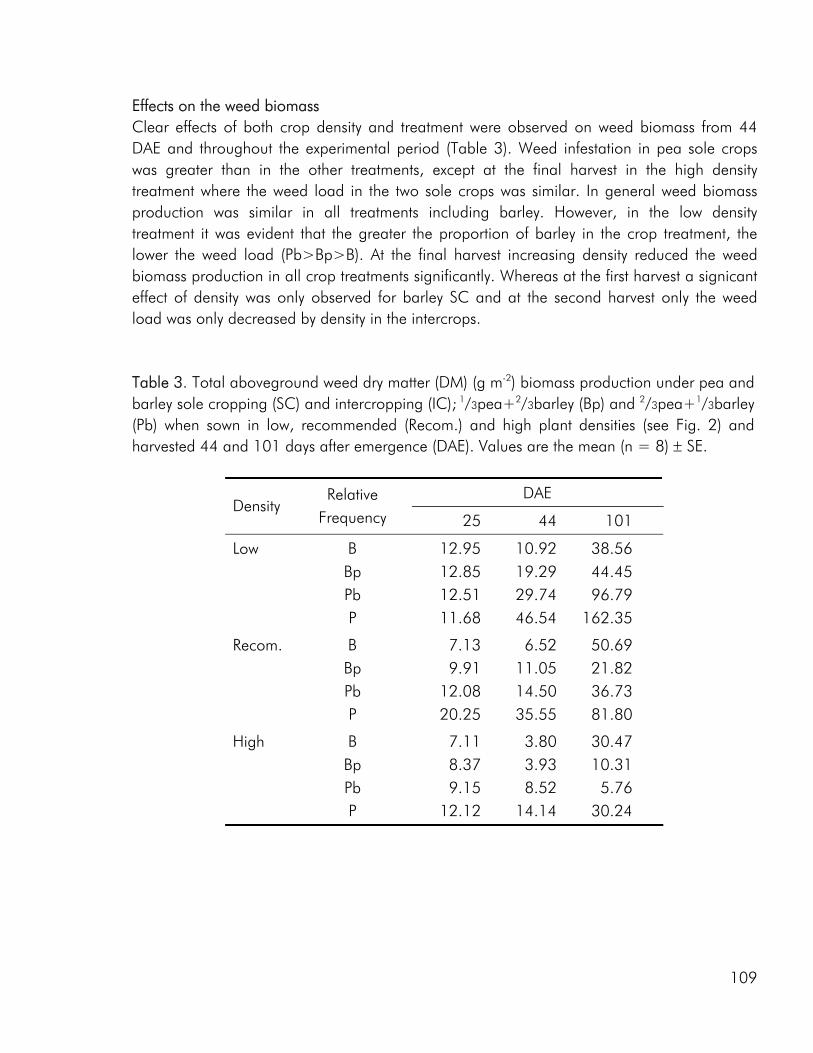
Effects on the weed bioClear effects of both c observed on weed biomass from 44
erimental period (Table 3). Weed infestation in pea sole crops
able 3. Total aboveground weed dry matter (DM) (g m-2) biomass production under pea and arley sole cropping (SC) and intercropping (IC); 1/3pea+2/3barley (Bp) and 2/3pea+1/3barley
mass rop density and treatment were
DAE and throughout the expwas greater than in the other treatments, except at the final harvest in the high density treatment where the weed load in the two sole crops was similar. In general weed biomass production was similar in all treatments including barley. However, in the low density treatment it was evident that the greater the proportion of barley in the crop treatment, the lower the weed load (Pb>Bp>B). At the final harvest increasing density reduced the weed biomass production in all crop treatments significantly. Whereas at the first harvest a signicant effect of density was only observed for barley SC and at the second harvest only the weed load was only decreased by density in the intercrops. Tb(Pb) when sown in low, recommended (Recom.) and high plant densities (see Fig. 2) and harvested 44 and 101 days after emergence (DAE). Values are the mean (n = 8) ± SE.
DAE Density
Frequency 25 44 101
Relative
Low B 12.95 10.92 38.56 Bp 12.85 19.29 44.45
162.35
Bp 12.08 14.50 36.73 20.25 35.55 81.80
12.12 14.14 30.24
Pb 12.51 29.74 96.79 P 11.68 46.54
Recom. B
7.13 9.91 11.05 21.82
6.52 50.69
Pb P
High B Bp
7.11 8.37
3.80 3.93
30.47 10.31
Pb 9.15 8.52 5.76 P
109
Discussion Interspecies dynamics Sequential measurements of crop growth provide the basis for a better understanding of competitive interactions and mechanism in inter- and sole crops than are available from single measurements of final yield (Connolly et al., 1990; Andersen et al., 2004). In this study we took three harvests over the course of the growing season and the following discussion of interspecies dynamics is largely organized by the individual time periods: sowing to 25 days after emergence (DAE), 25 to 44 DAE and 44 to 101 DAE.
Varying total crop density and the relative frequencies of intercropped pea and barley had a marked effect on the competitive dynamics of the two crops and it became clear that the relative performance of the two crops changed over time. Cumulative relative efficiency (REIc) values calculated for each of the intercrop treatments included in the study, clearly show that barley came off to a better start. From a lower seed weight barley grew to establishment at a greater relative rate than pea within the first 25 DAE, at all three cropping densities (data not shown). A significant part of this advantage was the result of a faster seedling emergence of barley relative to pea (Fig. 1), a headstart which is in accordance with observations of earlier seedling emergence and more rapid root growth of barley than pea, made in a number of other studies (Tofinga et al., 1993; Bellostas et. al., 2003, Corre-Hellou and Crozat, 2004). In the following two growth periods (25-44 and 44-101 DAE) the pea crop was the most growth efficient in almost all cropping treatments (Table 1). This clear reversal in the relative performance of the two species may indicate that differences in phenology play a central role in shaping the observed dynamics. This is supported by the fact that the proportional change in biomass for barley was highest in the first growth interval and declined thereafter whereas the greatest proportional biomass change for pea was, in all but one treatment, seen in the second growth period (data not shown).
Throughout the growth period there was a clear and positive effect of density on the growth of the pea crop irrespective of whether it was grown as a sole crop or intercrop (Fig. 3). The effect of increasing cropping density was less straight forward for barley, and by the last harvest increasing density from recommended to high did not increase the dry matter production of barley, irrespective of how it was grown (Fig. 3). By the last harvest intercropped barley was clearly suppressed at high cropping density, yields falling below those attained at recommended cropping density and more so in the barley dominated intercrop (Figure 3). The biomass yields of pea continued to increase with increasing cropping density at the end of the growing season, thereby creating a dense canopy, which could have had an adverse effect on the growth of barley. Using a model approach Berntsen et al. (2004) showed that changes in canopy structure had a great influence on the competitive dynamics in a pea-barley intercrop. Their study indicated that the vertical distribution of barley leaf area was an important factor in the competitive effect of barley towards pea, a factor that in the present study may have had limited impact at high cropping density.
110
Intercropping advantage The potential advantages gained from intercropping are determined by the degree of complementary resource use, as well as the relative strength of the intra- and interspecific competitive interactions acting within and between crops. If there was a significant degree of resource complementarity between components of an intercrop it could be postulated that the optimum density of the intercrop was greater than of the individual sole crops, implying that a given area of land would be able to support a greater number of plants (Willey and Osiru, 1972). Had this been the case in the present study we would expect LER values to exceed one and to remain more or less constant or increase as cropping density was increased. This was the case at the first two harvests whereas at the final harvest the lower partial LER values of barley in both intercrops at high cropping density indicate that this complementarity was impaired. At the final harvest the LER values corresponding to the recommended and high plant density decreased as the proportion of pea in the intercrop increased, and more so at high density where the drop in LER was primarily the result of a large decrease in the partial LER value of barley (Table 2). Nitrogen dynamics and use Legume-cereal intercropping advantages are often presumed to be associated with the complementary use of N sources by component crops (Ofori and Stern, 1987; Jensen, 1996) as the cereal, ideally should have assess to a more than proportional share of available soil inorganic N and the legume increase its reliance on symbiotic N2 fixation. Only at low cropping density did intercropped pea increase its reliance on N2 fixation relative to sole cropping (Fig. 6a). The attained levels of %Ndfa, reaching 80 to 95%, are high compared to what was reached in a study by Jensen (1996). However the two studies differ with respect to weed control. Whereas Jensen (1996) controlled weeds with herbicides, no weed reducing steps were taken in the present study. In other studies where weeds were not controlled (Hauggaard-Nielsen et al., 2001b; Hauggaard-Nielsen et al., 2001c) similar high percentages of N derived from fixation were measured. When present, the weed biomass standing in a crop, such as the pea SC, will function as an intercropped cereal in terms of competition for soil inorganic N and could thereby potentially increase the proportion of N derived from fixation in the pea.
The greatest amounts of N were fixed in the pea dominated crops, amounting to an average of 10 g N m-2, at recommended and high cropping density (Fig. 6e and f). As for the %Ndfa, these quantitative measures of N2 fixation are high compared to measures from earlier studies where N2 fixation in 50:50 pea-barley ICs only amounted to a fourth to a third of the fixation of the sole cropped pea (Jensen, 1996, Hauggaard-Nielsen et al., 2001b). Intercropping grain legumes with cereals has the potential of improving soil N resource use relative to that of grain legume sole crops, which in general have less competitive root systems. Several studies have shown that grain legumes such as pea may leave more inorganic N in the soil below the plough layer (Jensen, 1996) than cereals. More efficient use
111
of available soil N could result from complementarity in space, through differing rooting pattern and mechanisms of uptake, but could also result from complementarity in time whereby competitive interactions delay the phenological development of one of the IC components and thus prolong the growth period and the period of soil N uptake (Andersen et al. 2004). Previous studies have however only showed a slight positive effect on the utilisation of soil N sources (Jensen, 1996; Andersen et al. 2004). In the present study the intercrops accumulated significantly more N than the barley sole crops and amounts comparable to the pea sole crops and N accumulation was clearly unaffected by cropping density (Fig. 5). There was a clear relationship between the weed biomass load and the cropping density and relative frequency of pea, weed biomass decreasing with increasing density in all but the barley SC treatment and increasing with increasing relative frequency of pea (Table 3). Thus, there seems to be a clear relationship between the soil N use of a crop and the weed load, a relationship that is directly linked to density and relative frequency of pea. It could therefore be considered as “wasting” valuable soil N when peas are sole cropped in an organic cropping system, weeds taking up N that could have supported the growth of an intercropped cereal. Effect of intercropping on grain yields The grain yields of the two intercrops were not significantly greater than those of the corresponding sole crops at any of the cropping densities however moving from recommended to high density the competitive effect of the pea component on the growth of barley strongly decreased barley grain yield and. Intercropped pea had a strong competitive effect on the growth of barley at high cropping density, which was apparent from the low grain yield of barley, increasing the proportion of pea seed in the final harvest (Table 2). As mentioned earlier, the cropping conditions of the present study and the visual observations of crop growth in the field indicate that the competitive pressure exerted by pea in the late growth stages was conditioned by competition for light. This impact of competition had an effect on the N concentrations of barley grain, these being significantly greater for intercropped compared to sole cropped barley and concentrations increasing with increasing frequency of pea in the crop (data not shown). Similarly Bulson et al. (1997) found that grain N concentrations of wheat intercropped with beans increased as the density of beans increased. Effects on weeds The effect of crop density on the weed load of the studied crops is clear (Table 3). With the exception of the barley SC, weed infestation levels decreased as density was raised. Bulson et al. (1997) similarly showed that weed biomass in intercrops decreased as total stand density increased. The suppressing effect of density was clearly stronger, the greater the frequency barley in the crop. Early germination and rapid growth of barley as well as its tillering ability, enabling few barley plants to fill out their growing environment to a similar degree as a higher number of barley plants, may be the primary reason why the barley crop was a much stronger
112
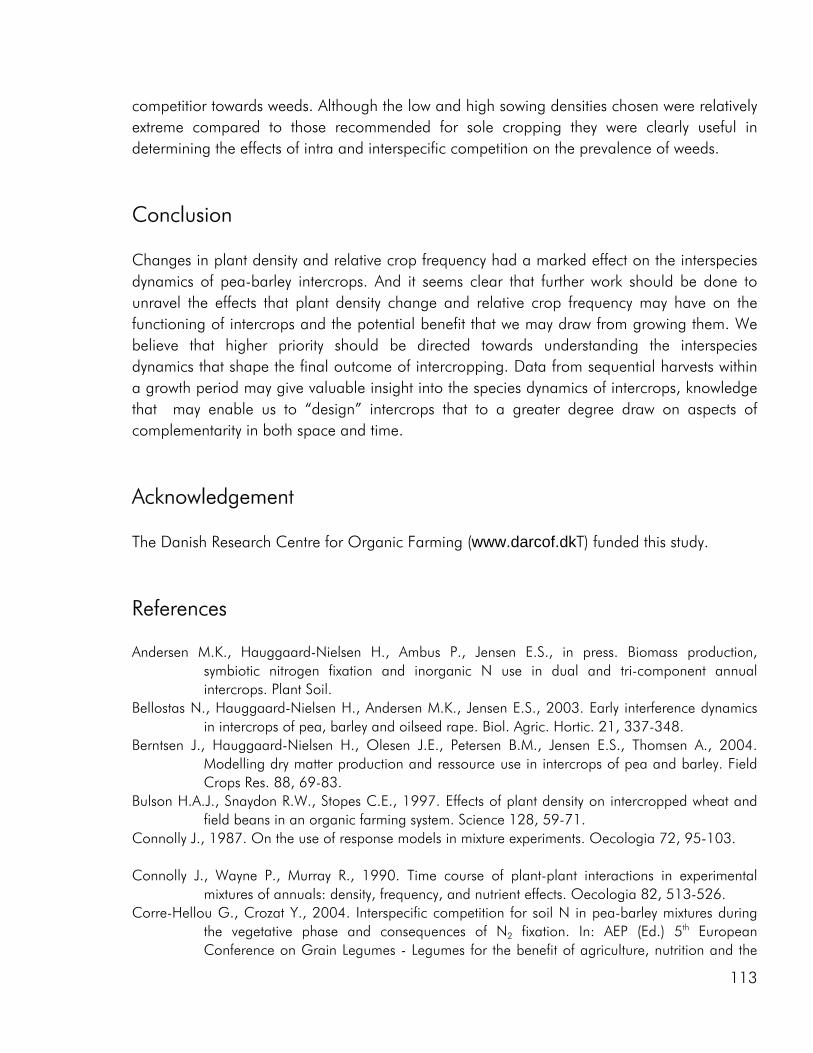
competitior towards weeds. Although the low and high sowing densities chosen were relatively extreme compared to those recommended for sole cropping they were clearly useful in determining the effects of intra and interspecific competition on the prevalence of weeds.
Conclusion Changes in plant density and relative crop frequency had a marked effect on the interspecies dynamics of pea-barley intercrops. And it seems clear that further work should be done to unravel the effects that plant density change and relative crop frequency may have on the functioning of intercrops and the potential benefit that we may draw from growing them. We believe that higher priority should be directed towards understanding the interspecies dynamics that shape the final outcome of intercropping. Data from sequential harvests within a growth period may give valuable insight into the species dynamics of intercrops, knowledge that may enable us to “design” intercrops that to a greater degree draw on aspects of complementarity in both space and time.
Acknowledgement The Danish Research Centre for Organic Farming (www.darcof.dkT) funded this study.
References Andersen M.K., Hauggaard-Nielsen H., Ambus P., Jensen E.S., in press. Biomass production,
symbiotic nitrogen fixation and inorganic N use in dual and tri-component annual intercrops. Plant Soil.
Bellostas N., Hauggaard-Nielsen H., Andersen M.K., Jensen E.S., 2003. Early interference dynamics in intercrops of pea, barley and oilseed rape. Biol. Agric. Hortic. 21, 337-348.
Berntsen J., Hauggaard-Nielsen H., Olesen J.E., Petersen B.M., Jensen E.S., Thomsen A., 2004. Modelling dry matter production and ressource use in intercrops of pea and barley. Field Crops Res. 88, 69-83.
Bulson H.A.J., Snaydon R.W., Stopes C.E., 1997. Effects of plant density on intercropped wheat and field beans in an organic farming system. Science 128, 59-71.
Connolly J., 1987. On the use of response models in mixture experiments. Oecologia 72, 95-103. Connolly J., Wayne P., Murray R., 1990. Time course of plant-plant interactions in experimental
mixtures of annuals: density, frequency, and nutrient effects. Oecologia 82, 513-526. Corre-Hellou G., Crozat Y., 2004. Interspecific competition for soil N in pea-barley mixtures during
the vegetative phase and consequences of N2 fixation. In: AEP (Ed.) 5th European Conference on Grain Legumes - Legumes for the benefit of agriculture, nutrition and the
113
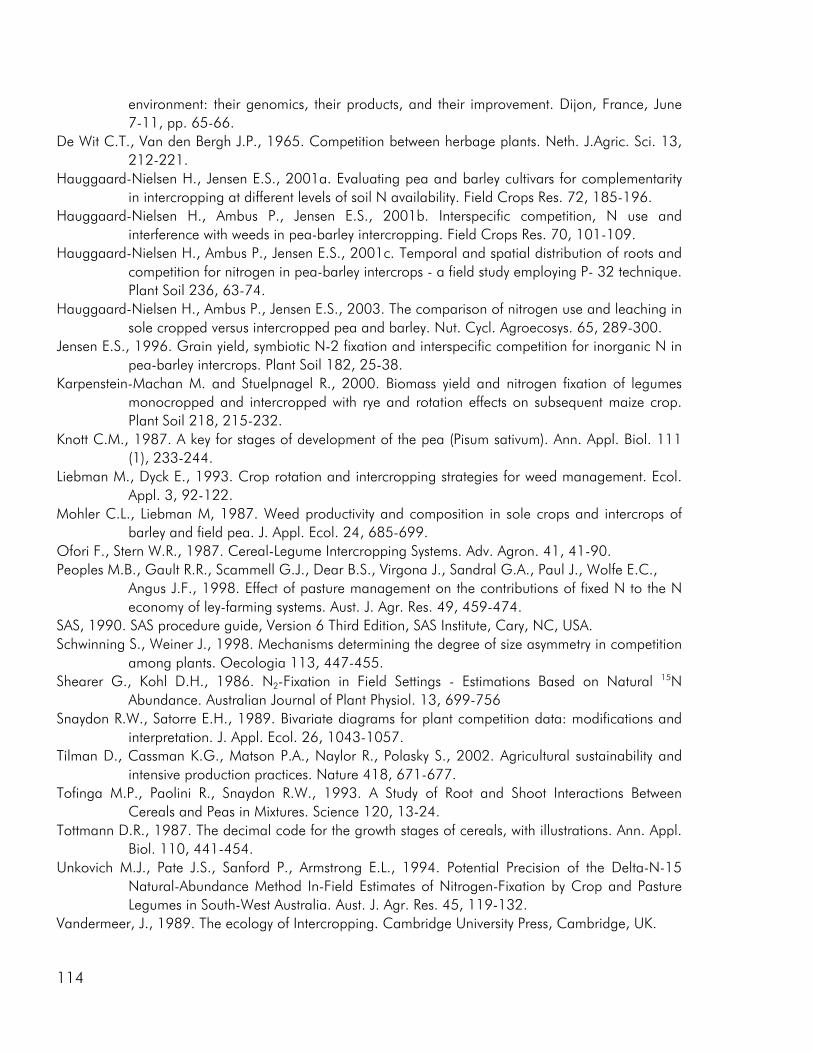
environment: their genomics, their products, and their improvement. Dijon, France, June 7-11, pp. 65-66.
De Wit C.T., Van den Bergh J.P., 1965. Competition between herbage plants. Neth. J.Agric. Sci. 13, 212-221.
Hauggaard-Nielsen H., Jensen E.S., 2001a. Evaluating pea and barley cultivars for complementarity in intercropping at different levels of soil N availability. Field Crops Res. 72, 185-196.
Hauggaard-Nielsen H., Ambus P., Jensen E.S., 2001b. Interspecific competition, N use and interference with weeds in pea-barley intercropping. Field Crops Res. 70, 101-109.
Hauggaard-Nielsen H., Ambus P., Jensen E.S., 2001c. Temporal and spatial distribution of roots and competition for nitrogen in pea-barley intercrops - a field study employing P- 32 technique. Plant Soil 236, 63-74.
Hauggaard-Nielsen H., Ambus P., Jensen E.S., 2003. The comparison of nitrogen use and leaching in sole cropped versus intercropped pea and barley. Nut. Cycl. Agroecosys. 65, 289-300.
Jensen E.S., 1996. Grain yield, symbiotic N-2 fixation and interspecific competition for inorganic N in pea-barley intercrops. Plant Soil 182, 25-38.
Karpenstein-Machan M. and Stuelpnagel R., 2000. Biomass yield and nitrogen fixation of legumes monocropped and intercropped with rye and rotation effects on subsequent maize crop. Plant Soil 218, 215-232.
Knott C.M., 1987. A key for stages of development of the pea (Pisum sativum). Ann. Appl. Biol. 111 (1), 233-244.
Liebman M., Dyck E., 1993. Crop rotation and intercropping strategies for weed management. Ecol. Appl. 3, 92-122.
Mohler C.L., Liebman M, 1987. Weed productivity and composition in sole crops and intercrops of barley and field pea. J. Appl. Ecol. 24, 685-699.
Ofori F., Stern W.R., 1987. Cereal-Legume Intercropping Systems. Adv. Agron. 41, 41-90. Peoples M.B., Gault R.R., Scammell G.J., Dear B.S., Virgona J., Sandral G.A., Paul J., Wolfe E.C.,
Angus J.F., 1998. Effect of pasture management on the contributions of fixed N to the N economy of ley-farming systems. Aust. J. Agr. Res. 49, 459-474.
SAS, 1990. SAS procedure guide, Version 6 Third Edition, SAS Institute, Cary, NC, USA. Schwinning S., Weiner J., 1998. Mechanisms determining the degree of size asymmetry in competition
among plants. Oecologia 113, 447-455. Shearer G., Kohl D.H., 1986. N2-Fixation in Field Settings - Estimations Based on Natural 15N
Abundance. Australian Journal of Plant Physiol. 13, 699-756 Snaydon R.W., Satorre E.H., 1989. Bivariate diagrams for plant competition data: modifications and
interpretation. J. Appl. Ecol. 26, 1043-1057. Tilman D., Cassman K.G., Matson P.A., Naylor R., Polasky S., 2002. Agricultural sustainability and
intensive production practices. Nature 418, 671-677. Tofinga M.P., Paolini R., Snaydon R.W., 1993. A Study of Root and Shoot Interactions Between
Cereals and Peas in Mixtures. Science 120, 13-24. Tottmann D.R., 1987. The decimal code for the growth stages of cereals, with illustrations. Ann. Appl.
Biol. 110, 441-454. Unkovich M.J., Pate J.S., Sanford P., Armstrong E.L., 1994. Potential Precision of the Delta-N-15
Natural-Abundance Method In-Field Estimates of Nitrogen-Fixation by Crop and Pasture Legumes in South-West Australia. Aust. J. Agr. Res. 45, 119-132.
Vandermeer, J., 1989. The ecology of Intercropping. Cambridge University Press, Cambridge, UK.
114
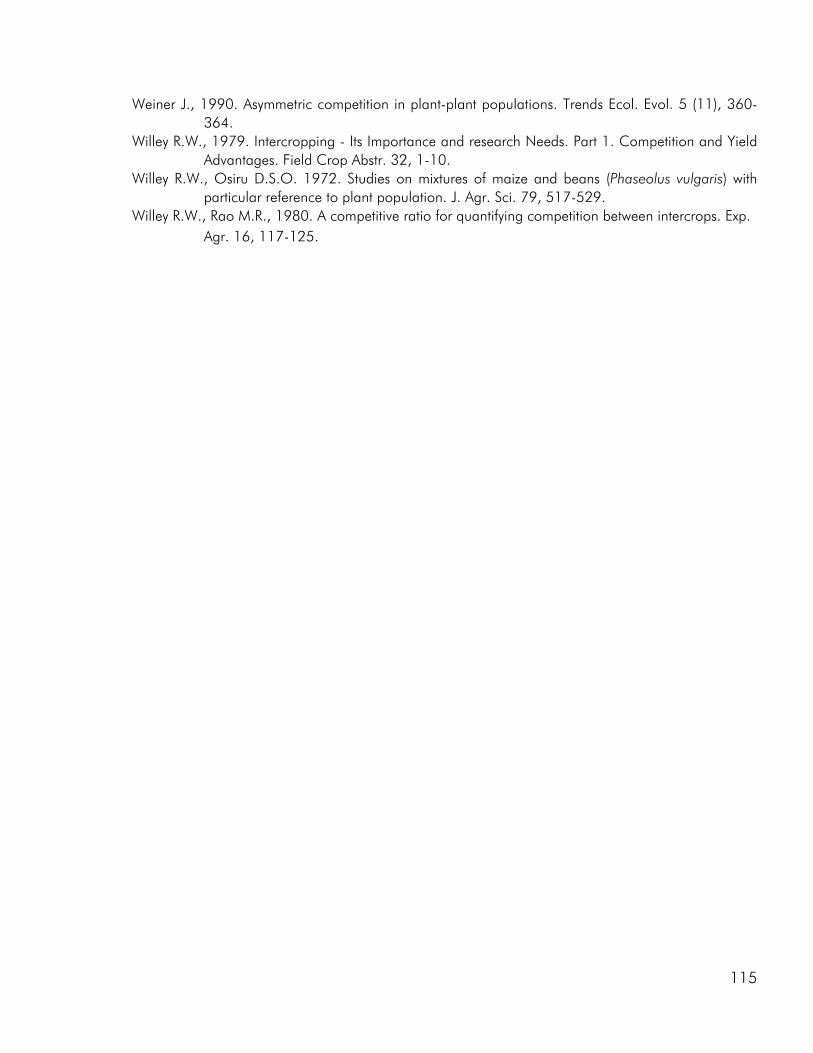
Weiner J., 1990. Asymmetric competition in plant-plant populations. Trends Ecol. Evol. 5 (11), 360-364.
Willey R.W., 1979. Intercropping - Its Importance and research Needs. Part 1. Competition and Yield Advantages. Field Crop Abstr. 32, 1-10.
Willey R.W., Osiru D.S.O. 1972. Studies on mixtures of maize and beans (Phaseolus vulgaris) with particular reference to plant population. J. Agr. Sci. 79, 517-529.
Willey R.W., Rao M.R., 1980. A competitive ratio for quantifying competition between intercrops. Exp. Agr. 16, 117-125.
115

116


![[2011] Political Competition](https://img.dokumen.tips/doc/110x75/6336f66a1c5ab7fce2057d03/2011-political-competition.jpg)


