Embed Size (px)
Citation preview
(
Available online at www.sciencedirect.com
Domestic Animal Endocrinology 41 (2011) 24–34
0d
Compensation for obesity-induced insulin resistance in dogs:assessment of the effects of leptin, adiponectin, and
glucagon-like peptide-1 using path analysis
K.R. Verkesta,*, L.M. Fleemana,1, J.M. Mortona,2, K. Ishiokab, J.S. Randa
a Centre for Companion Animal Health, School of Veterinary Science, The University of Queensland, Brisbane, Australiab School of Veterinary Nursing and Technology, Faculty of Veterinary Science, Nippon Veterinary and Life Science University, Tokyo, Japan
Received 27 October 2010; received in revised form 6 February 2011; accepted 11 February 2011
Abstract
The hormonal mediators of obesity-induced insulin resistance and compensatory hyperinsulinemia in dogs have not been identified.Plasma samples were obtained after a 24-h fast from 104 client-owned lean, overweight, and obese dogs. Plasma glucose and insulinconcentrations were used to calculate insulin sensitivity and �-cell function with the use of the homeostasis model assessment(HOMAinsulin sensitivity and HOMA�-cell function, respectively). Path analysis with multivariable linear regression was used toidentify whether fasting plasma leptin, adiponectin, or glucagon-like peptide-1 concentrations were associated with adiposity, insulinsensitivity, and basal insulin secretion. None of the dogs were hyperglycemic. In the final path model, adiposity was positively associatedwith leptin (P � 0.01) and glucagon-like peptide-1 (P � 0.04) concentrations. No significant total effect of adiposity on adiponectin indogs (P � 0.24) was observed. If there is a direct effect of leptin on adiponectin, then our results indicate that this is a positiverelationship, which at least partly counters a negative direct relationship between adiposity and adiponectin. Fasting plasma leptinconcentration was directly negatively associated with fasting insulin sensitivity (P � 0.01) and positively associated with �-cell function(P � 0.01), but no direct association was observed between adiponectin concentration and either insulin sensitivity or �-cell functionP � 0.42 and 0.11, respectively). We conclude that dogs compensate effectively for obesity-induced insulin resistance. Fasting plasma leptin
concentrations appear to be associated with obesity-associated changes in insulin sensitivity and compensatory hyperinsulinemia in naturallyoccurring obese dogs. Adiponectin does not appear to be involved in the pathophysiology of obesity-associated changes in insulin sensitivity.© 2011 Elsevier Inc. All rights reserved.
Keywords: Type 2 diabetes mellitus; Obesity; Insulin secretion; Adipokine, Insulin sensitivity
www.domesticanimalendo.com
1. Introduction
In human beings, laboratory rodents, and domesticdogs and cats, obesity causes insulin resistance [1]. To
1 L.M. Fleeman is currently at Animal Diabetes Australia inMelbourne, Australia.
2 J.M. Morton is currently the veterinary epidemiologic consul-tant at Jemora Pty Ltd, Geelong, Victoria, Australia.* Corresponding author. 1 Pak Tam Chung Road, Tai Mong Tsai,
Sai Kung, Hong Kong. Tel.: �852 6772 7936; fax: �852 2792 9113.
E-mail address: [email protected] (K.R. Verkest).739-7240/11/$ – see front matter © 2011 Elsevier Inc. All rights reservedoi:10.1016/j.domaniend.2011.02.001
compensate for obesity-induced insulin resistance,more insulin must be secreted [2]. It is not clear howinsulin secretion is increased to compensate for insulinresistance in obese dogs. Possible mediators includeinsulin secretagogues such as glucose, hormones andcytokines that are secreted by adipose tissue such asleptin, adiponectin, and tumor necrosis factor, or hor-mones secreted by the gut that alter insulin secretionsuch as the incretin hormone glucagon-like peptide-1(GLP-1). Studies in naturally occurring overweight and
obese dogs have shown that adiposity is positively.
obps
lkbghsapbdm[sppausaea
crs
fdbod[tdc[ciwaf
tr
oomsdmtd
2
2
capAacnpipolwwtflo1fa9c[hUHvid
tBf
25K.R. Verkest et al. / Domestic Animal Endocrinology 41 (2011) 24–34
associated with leptin [3], and negatively associated [4]r not associated with [5] adiponectin concentrations,ut no studies have examined the interactions betweenotential hormonal mediators and obesity-induced in-ulin resistance.
The mediators of compensatory fasting hyperinsu-inemia in naturally occurring obese dogs are notnown. Glucose is the main secretagogue for insulin,ut results from one study in fat-fed dogs indicate thatlucose is not involved in mediating compensatoryyperinsulinemia [6]. Adipokines include hormonesuch as leptin and adiponectin that are secreted bydipocytes. Some adipokines might have a role in theathogenesis of obesity-associated changes in meta-olic processes in human beings and laboratory ro-ents. Leptin signals the energy status of the body [7,8];ore leptin is secreted when there is increased fat mass
8] or when there is an influx of glucose into fat cellsuch as after meals [7]. Leptin receptors are present onancreatic � cells [9] and skeletal muscle [10], so it islausible that leptin might increase insulin secretion orlter insulin resistance in overweight or obese individ-als. Adiponectin is involved with changes in insulinensitivity [11,12] in human beings, laboratory rodents,nd cats [13]. Two different adiponectin receptors arexpressed on hepatocytes, skeletal muscle, and pancre-tic � cells [14], which might transduce changes in
insulin secretion and insulin sensitivity. Incretin hor-mones such as GLP-1 and glucose-dependent insulino-tropic polypeptide [15] are secreted by the gut aftermeals. These hormones increase the amount of insulinsecreted [15] in response to a rise in blood glucoseoncentration. Dogs being fed high-fat diets showed aise in GLP-1, which might be responsible for compen-atory glucose-stimulated hyperinsulinemia [15].
If insulin secretion does not adequately compensateor fasting insulin resistance, fasting hyperglycemiaevelops and is an important predictor for type 2 dia-etes mellitus in human beings [16]. Although aspectsf type 2 diabetes have been studied in dogs, type 2iabetes has not been definitively shown in this species17]. Obese dogs do not lose first-phase insulin secre-ion [18], an early marker of the development of type 2iabetes, and it is not clear whether fasting hypergly-emia occurs in dogs with naturally occurring obesity5]. In addition, many previous studies of insulin se-retion in obese dogs have had limitations. Many havencluded dogs with obesity induced over short periodsith the use of high-fat diets [15,19]. Induced obesity
llows less time for compensation to develop, and high-
at diets themselves impair insulin secretion [19], so what dogs with induced obesity might not adequatelyepresent dogs with naturally occurring obesity [19].
The aim of this study was to assess the importancef leptin, adiponectin, and GLP-1 in the pathophysiol-gy of adiposity-associated alterations in glucose ho-eostasis, plasma insulin concentration, and insulin
ensitivity in naturally occurring overweight and obeseogs with the use of path analysis. Path analysis is aethod for modeling complex interrelationships be-
ween multiple variables with the use of observationalata.
. Materials and methods
.1. Dogs, blood sampling, and sample handling
We enrolled 106 dogs and after post-enrollment ex-lusions included 104 client-owned lean, overweight,nd obese dogs from those examined at a small animal,rimary care, veterinary practice group in Brisbane,ustralia. Each dog’s blood was sampled once, �20 h
fter eating. Overweight and obese dogs were specifi-ally targeted for recruitment to ensure reasonableumbers of dogs in each BCS. Dogs were eligible forarticipation if they had no history or clinical signs ofllness or injury, had not undergone surgery within therevious 6 wk, were �1 yr old, and allowed collectionf the blood sample with gentle physical restraint. Noaboratory testing was conducted to assess health. Dogsere not eligible for enrollment if they were under-eight (BCS � 4/9), or had been diagnosed with sys-
emic disease present at the time they were consideredor enrollment. Neither osteoarthritis nor subcutaneousipomas precluded enrollment. Dogs that died (1 dog)r were diagnosed with systemic disease (1 dog) withinmo after blood sampling were subsequently excluded
rom the study. Dogs were examined by physical ex-mination, and adiposity was estimated by BCS on a-point scale [20] by one of the authors (K.R.V.). If theriteria for two contiguous condition scores were met20], the average score was assigned. All dogs wereandled in accordance with the Guide for the Care andse of Laboratory Animals, United States Publicealth Service. This study was approved by the Uni-ersity of Queensland’s Animal Ethics Committee, andnformed consent was obtained from the owner of eachog before blood sampling.
Blood samples were collected into EDTA with apro-inin (25 �L/mL of blood; Trasylol 100K IU/mL;ayer, Pymble, NSW, Australia). Samples were centri-
uged immediately; plasma was frozen at �20 °C
ithin 8 min of collection and transferred to a �80 °C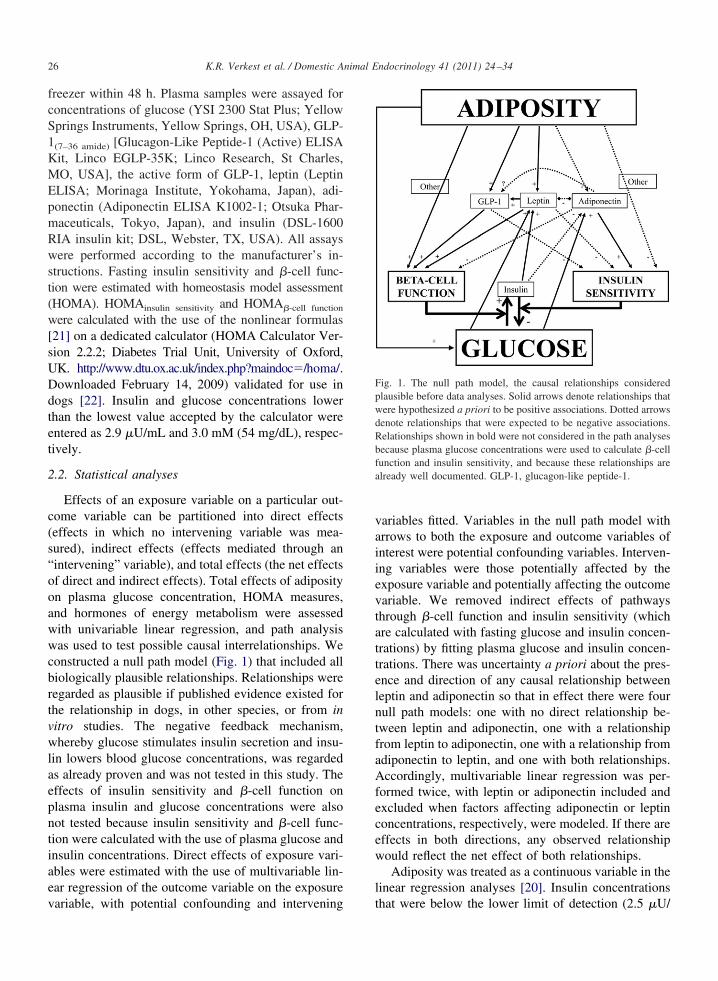
t(
Ddtet
2
c(s“ooawwcbrtvwlaepntiaev
vaiievtattelntfaAfecew
l
fa
26 K.R. Verkest et al. / Domestic Animal Endocrinology 41 (2011) 24–34
freezer within 48 h. Plasma samples were assayed forconcentrations of glucose (YSI 2300 Stat Plus; YellowSprings Instruments, Yellow Springs, OH, USA), GLP-1(7–36 amide) [Glucagon-Like Peptide-1 (Active) ELISAKit, Linco EGLP-35K; Linco Research, St Charles,MO, USA], the active form of GLP-1, leptin (LeptinELISA; Morinaga Institute, Yokohama, Japan), adi-ponectin (Adiponectin ELISA K1002-1; Otsuka Phar-maceuticals, Tokyo, Japan), and insulin (DSL-1600RIA insulin kit; DSL, Webster, TX, USA). All assayswere performed according to the manufacturer’s in-structions. Fasting insulin sensitivity and �-cell func-ion were estimated with homeostasis model assessmentHOMA). HOMAinsulin sensitivity and HOMA�-cell function
were calculated with the use of the nonlinear formulas[21] on a dedicated calculator (HOMA Calculator Ver-sion 2.2.2; Diabetes Trial Unit, University of Oxford,UK. http://www.dtu.ox.ac.uk/index.php?maindoc�/homa/.
ownloaded February 14, 2009) validated for use inogs [22]. Insulin and glucose concentrations lowerhan the lowest value accepted by the calculator werentered as 2.9 �U/mL and 3.0 mM (54 mg/dL), respec-ively.
.2. Statistical analyses
Effects of an exposure variable on a particular out-ome variable can be partitioned into direct effectseffects in which no intervening variable was mea-ured), indirect effects (effects mediated through anintervening” variable), and total effects (the net effectsf direct and indirect effects). Total effects of adiposityn plasma glucose concentration, HOMA measures,nd hormones of energy metabolism were assessedith univariable linear regression, and path analysisas used to test possible causal interrelationships. We
onstructed a null path model (Fig. 1) that included alliologically plausible relationships. Relationships wereegarded as plausible if published evidence existed forhe relationship in dogs, in other species, or from initro studies. The negative feedback mechanism,hereby glucose stimulates insulin secretion and insu-
in lowers blood glucose concentrations, was regardeds already proven and was not tested in this study. Theffects of insulin sensitivity and �-cell function onlasma insulin and glucose concentrations were alsoot tested because insulin sensitivity and �-cell func-ion were calculated with the use of plasma glucose andnsulin concentrations. Direct effects of exposure vari-bles were estimated with the use of multivariable lin-ar regression of the outcome variable on the exposure
ariable, with potential confounding and intervening tariables fitted. Variables in the null path model withrrows to both the exposure and outcome variables ofnterest were potential confounding variables. Interven-ng variables were those potentially affected by thexposure variable and potentially affecting the outcomeariable. We removed indirect effects of pathwayshrough �-cell function and insulin sensitivity (whichre calculated with fasting glucose and insulin concen-rations) by fitting plasma glucose and insulin concen-rations. There was uncertainty a priori about the pres-nce and direction of any causal relationship betweeneptin and adiponectin so that in effect there were fourull path models: one with no direct relationship be-ween leptin and adiponectin, one with a relationshiprom leptin to adiponectin, one with a relationship fromdiponectin to leptin, and one with both relationships.ccordingly, multivariable linear regression was per-
ormed twice, with leptin or adiponectin included andxcluded when factors affecting adiponectin or leptinoncentrations, respectively, were modeled. If there areffects in both directions, any observed relationshipould reflect the net effect of both relationships.Adiposity was treated as a continuous variable in the
inear regression analyses [20]. Insulin concentrations
Fig. 1. The null path model, the causal relationships consideredplausible before data analyses. Solid arrows denote relationships thatwere hypothesized a priori to be positive associations. Dotted arrowsdenote relationships that were expected to be negative associations.Relationships shown in bold were not considered in the path analysesbecause plasma glucose concentrations were used to calculate �-cellunction and insulin sensitivity, and because these relationships arelready well documented. GLP-1, glucagon-like peptide-1.
hat were below the lower limit of detection (2.5 �U/
w
H
nsmoap5w2
3
3
(a
fiadd(
3
tNt(clcmswoast3tapfwhdt
27K.R. Verkest et al. / Domestic Animal Endocrinology 41 (2011) 24–34
mL) of the insulin assay were treated as half the lowestdetectable concentration (1.25 �U/mL). Associations
ith P � 0.05 were retained in the final path model.Even though we postulated directions of effect for mostrelationships in our null path model, we used two-sidedP values for linear regression associations because wecould not exclude the possibility of effects in the re-verse direction to those postulated.
We defined important relationships as those with largeestimated changes in the outcome variable after standard-ized changes in the exposure variable [23], but we calcu-lated these with the use of the 10th to 90th percentiledifference in the exposure and outcome variable instead ofthe standard deviation. The 10th to 90th percentile differ-ence more clearly communicates the effect of the expo-sure variable across its observed range on the outcomevariable. The difference between the 10th and 90th per-centiles of the distributions of each exposure variable wasmultiplied by the regression coefficient to yield an esti-mated effect after a change in the exposure variable of thatmagnitude. To allow comparisons of importance betweenrelationships with different outcome variables, we also re-ported these changes as proportions of the interval widthfrom the 10th to 90th percentile of the outcome variabledistribution. The estimated effect was divided by the differ-ence between the 10th and 90th percentiles of the outcomevariable to estimate the percentage of the 10th to 90th per-centile range of the outcome variable attributable to the effectof the exposure variable. These same calculations were alsoperformed with each limit of the 95% confidence interv-als of the regression coefficients. The existence of a hyper-bolic relationship between HOMAinsulin sensitivity and
OMA�-cell function was tested with nonlinear regressionto the function K � HOMAinsulin sensitivity �HOMA�-cell function, where K is a constant and the
onlinear regression coefficient. Inadequate insulinecretion was defined as the presence of hyperglyce-ia or HOMA values below the 95% prediction band
f the hyperbolic regression curve. All statisticalnalyses except the nonlinear regression and 95%rediction bands (Prism 5 for Windows, Version.02; GraphPad Software Inc, La Jolla, CA, USA)ere performed with STATA (Stata IC Version 10:007;StataCorp, College Station, TX, USA).
. Results
.1. Study population
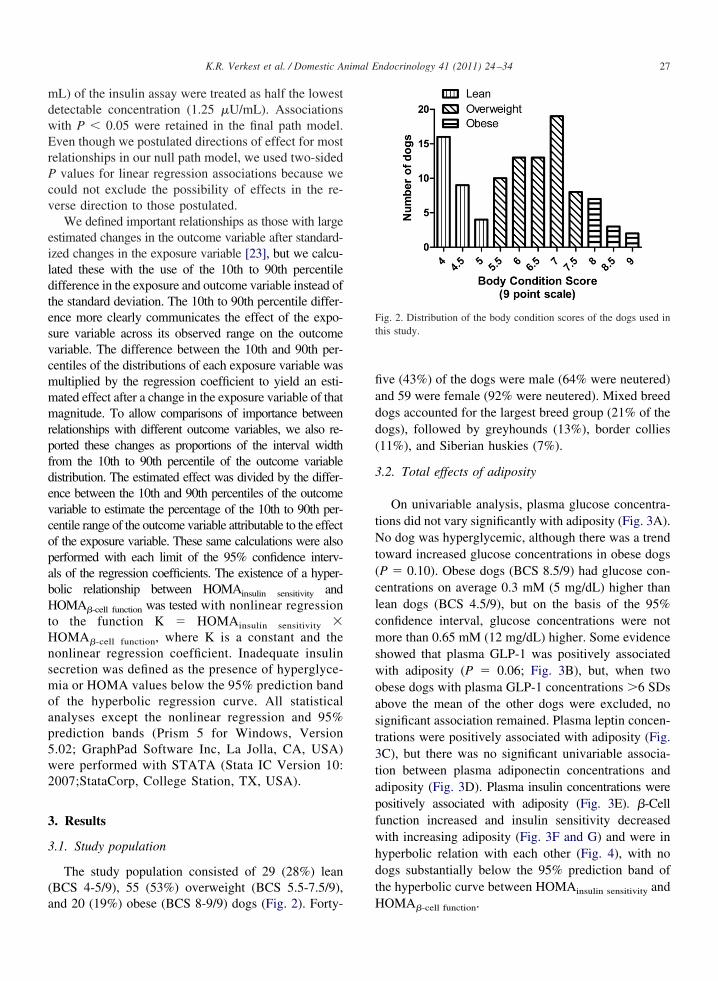
The study population consisted of 29 (28%) leanBCS 4-5/9), 55 (53%) overweight (BCS 5.5-7.5/9),
nd 20 (19%) obese (BCS 8-9/9) dogs (Fig. 2). Forty-ve (43%) of the dogs were male (64% were neutered)nd 59 were female (92% were neutered). Mixed breedogs accounted for the largest breed group (21% of theogs), followed by greyhounds (13%), border collies11%), and Siberian huskies (7%).
.2. Total effects of adiposity
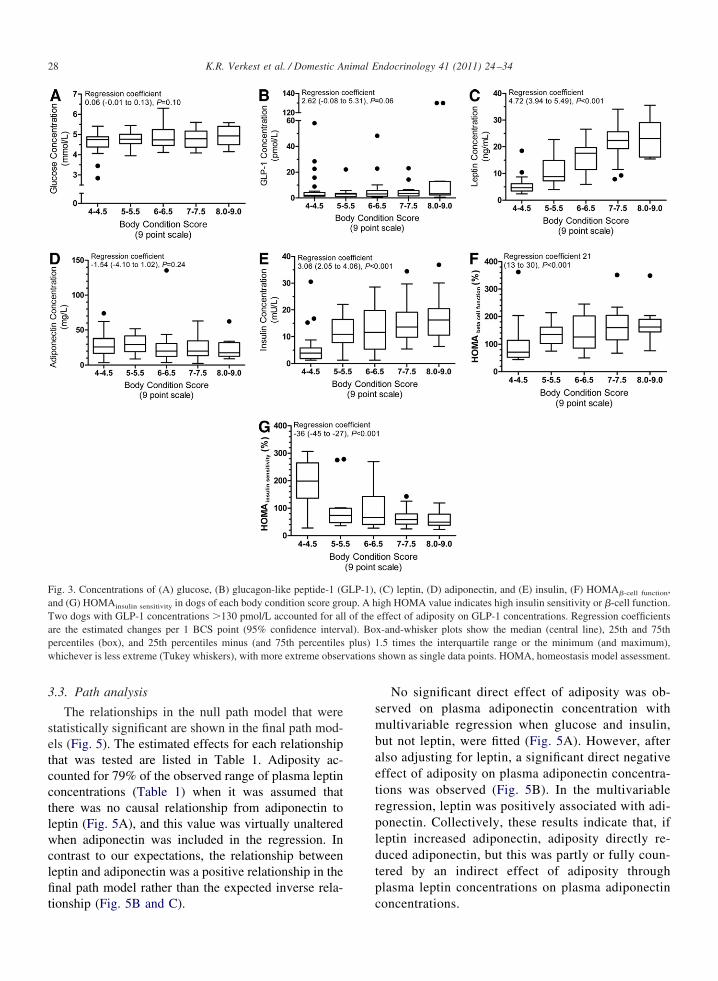
On univariable analysis, plasma glucose concentra-ions did not vary significantly with adiposity (Fig. 3A).o dog was hyperglycemic, although there was a trend
oward increased glucose concentrations in obese dogsP � 0.10). Obese dogs (BCS 8.5/9) had glucose con-entrations on average 0.3 mM (5 mg/dL) higher thanean dogs (BCS 4.5/9), but on the basis of the 95%onfidence interval, glucose concentrations were notore than 0.65 mM (12 mg/dL) higher. Some evidence
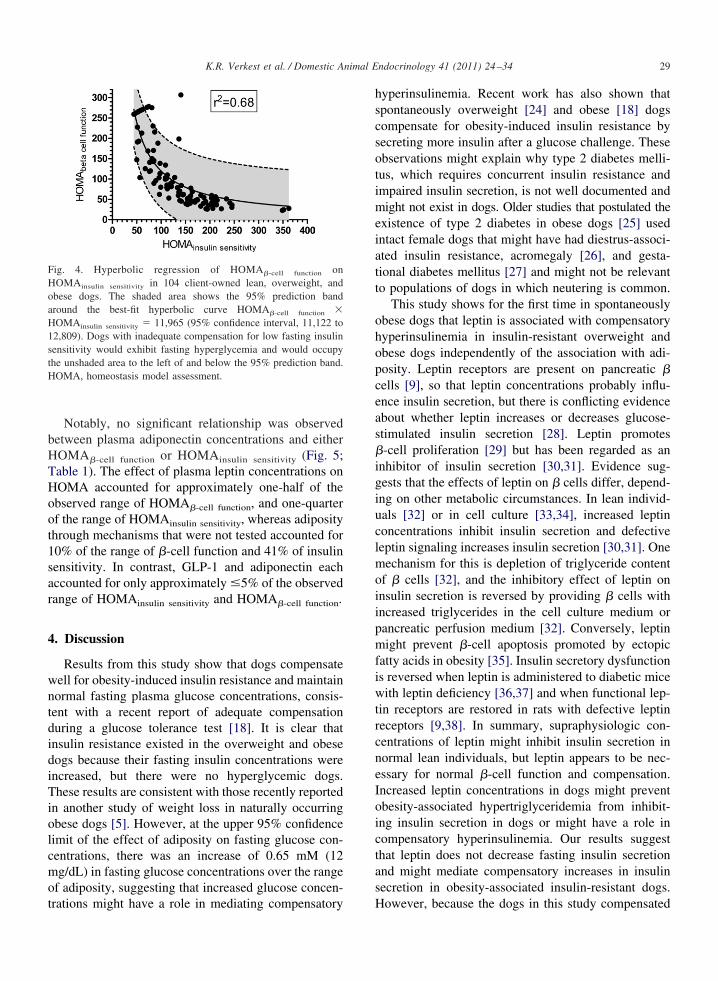
howed that plasma GLP-1 was positively associatedith adiposity (P � 0.06; Fig. 3B), but, when twobese dogs with plasma GLP-1 concentrations �6 SDsbove the mean of the other dogs were excluded, noignificant association remained. Plasma leptin concen-rations were positively associated with adiposity (Fig.C), but there was no significant univariable associa-ion between plasma adiponectin concentrations anddiposity (Fig. 3D). Plasma insulin concentrations wereositively associated with adiposity (Fig. 3E). �-Cellunction increased and insulin sensitivity decreasedith increasing adiposity (Fig. 3F and G) and were inyperbolic relation with each other (Fig. 4), with noogs substantially below the 95% prediction band ofhe hyperbolic curve between HOMAinsulin sensitivity and
Fig. 2. Distribution of the body condition scores of the dogs used inthis study.
HOMA�-cell function.
a
vations
28 K.R. Verkest et al. / Domestic Animal Endocrinology 41 (2011) 24–34
3.3. Path analysis
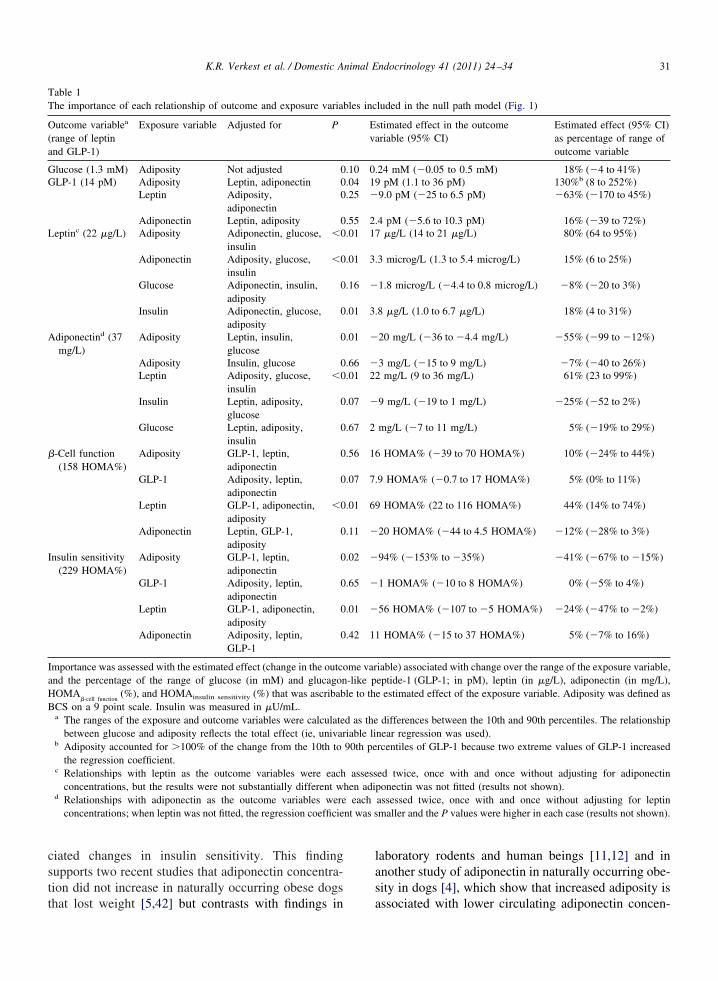
The relationships in the null path model that werestatistically significant are shown in the final path mod-els (Fig. 5). The estimated effects for each relationshipthat was tested are listed in Table 1. Adiposity ac-counted for 79% of the observed range of plasma leptinconcentrations (Table 1) when it was assumed thatthere was no causal relationship from adiponectin toleptin (Fig. 5A), and this value was virtually unalteredwhen adiponectin was included in the regression. Incontrast to our expectations, the relationship betweenleptin and adiponectin was a positive relationship in thefinal path model rather than the expected inverse rela-
Fig. 3. Concentrations of (A) glucose, (B) glucagon-like peptide-1 (Gnd (G) HOMAinsulin sensitivity in dogs of each body condition score gro
Two dogs with GLP-1 concentrations �130 pmol/L accounted for alare the estimated changes per 1 BCS point (95% confidence intervpercentiles (box), and 25th percentiles minus (and 75th percentileswhichever is less extreme (Tukey whiskers), with more extreme obser
tionship (Fig. 5B and C).
No significant direct effect of adiposity was ob-served on plasma adiponectin concentration withmultivariable regression when glucose and insulin,but not leptin, were fitted (Fig. 5A). However, afteralso adjusting for leptin, a significant direct negativeeffect of adiposity on plasma adiponectin concentra-tions was observed (Fig. 5B). In the multivariableregression, leptin was positively associated with adi-ponectin. Collectively, these results indicate that, ifleptin increased adiponectin, adiposity directly re-duced adiponectin, but this was partly or fully coun-tered by an indirect effect of adiposity throughplasma leptin concentrations on plasma adiponectin
(C) leptin, (D) adiponectin, and (E) insulin, (F) HOMA�-cell function,igh HOMA value indicates high insulin sensitivity or �-cell function.effect of adiposity on GLP-1 concentrations. Regression coefficientsx-and-whisker plots show the median (central line), 25th and 75th.5 times the interquartile range or the minimum (and maximum),shown as single data points. HOMA, homeostasis model assessment.
LP-1),up. A h
l of theal). Boplus) 1
concentrations.
t1sar
iuclmoiipmfiwtrcne
oaH1stH
29K.R. Verkest et al. / Domestic Animal Endocrinology 41 (2011) 24–34
Notably, no significant relationship was observedbetween plasma adiponectin concentrations and eitherHOMA�-cell function or HOMAinsulin sensitivity (Fig. 5;Table 1). The effect of plasma leptin concentrations onHOMA accounted for approximately one-half of theobserved range of HOMA�-cell function, and one-quarterof the range of HOMAinsulin sensitivity, whereas adiposityhrough mechanisms that were not tested accounted for0% of the range of �-cell function and 41% of insulinensitivity. In contrast, GLP-1 and adiponectin eachccounted for only approximately �5% of the observedange of HOMAinsulin sensitivity and HOMA�-cell function.
4. Discussion
Results from this study show that dogs compensatewell for obesity-induced insulin resistance and maintainnormal fasting plasma glucose concentrations, consis-tent with a recent report of adequate compensationduring a glucose tolerance test [18]. It is clear thatinsulin resistance existed in the overweight and obesedogs because their fasting insulin concentrations wereincreased, but there were no hyperglycemic dogs.These results are consistent with those recently reportedin another study of weight loss in naturally occurringobese dogs [5]. However, at the upper 95% confidencelimit of the effect of adiposity on fasting glucose con-centrations, there was an increase of 0.65 mM (12mg/dL) in fasting glucose concentrations over the rangeof adiposity, suggesting that increased glucose concen-
Fig. 4. Hyperbolic regression of HOMA�-cell function onHOMAinsulin sensitivity in 104 client-owned lean, overweight, andbese dogs. The shaded area shows the 95% prediction bandround the best-fit hyperbolic curve HOMA�-cell function �OMAinsulin sensitivity � 11,965 (95% confidence interval, 11,122 to2,809). Dogs with inadequate compensation for low fasting insulinensitivity would exhibit fasting hyperglycemia and would occupyhe unshaded area to the left of and below the 95% prediction band.OMA, homeostasis model assessment.
trations might have a role in mediating compensatory
hyperinsulinemia. Recent work has also shown thatspontaneously overweight [24] and obese [18] dogscompensate for obesity-induced insulin resistance bysecreting more insulin after a glucose challenge. Theseobservations might explain why type 2 diabetes melli-tus, which requires concurrent insulin resistance andimpaired insulin secretion, is not well documented andmight not exist in dogs. Older studies that postulated theexistence of type 2 diabetes in obese dogs [25] usedintact female dogs that might have had diestrus-associ-ated insulin resistance, acromegaly [26], and gesta-tional diabetes mellitus [27] and might not be relevantto populations of dogs in which neutering is common.
This study shows for the first time in spontaneouslyobese dogs that leptin is associated with compensatoryhyperinsulinemia in insulin-resistant overweight andobese dogs independently of the association with adi-posity. Leptin receptors are present on pancreatic �cells [9], so that leptin concentrations probably influ-ence insulin secretion, but there is conflicting evidenceabout whether leptin increases or decreases glucose-stimulated insulin secretion [28]. Leptin promotes�-cell proliferation [29] but has been regarded as aninhibitor of insulin secretion [30,31]. Evidence sug-gests that the effects of leptin on � cells differ, depend-ng on other metabolic circumstances. In lean individ-als [32] or in cell culture [33,34], increased leptinoncentrations inhibit insulin secretion and defectiveeptin signaling increases insulin secretion [30,31]. Oneechanism for this is depletion of triglyceride content
f � cells [32], and the inhibitory effect of leptin onnsulin secretion is reversed by providing � cells withncreased triglycerides in the cell culture medium orancreatic perfusion medium [32]. Conversely, leptinight prevent �-cell apoptosis promoted by ectopic
atty acids in obesity [35]. Insulin secretory dysfunctions reversed when leptin is administered to diabetic miceith leptin deficiency [36,37] and when functional lep-
in receptors are restored in rats with defective leptineceptors [9,38]. In summary, supraphysiologic con-entrations of leptin might inhibit insulin secretion inormal lean individuals, but leptin appears to be nec-ssary for normal �-cell function and compensation.
Increased leptin concentrations in dogs might preventobesity-associated hypertriglyceridemia from inhibit-ing insulin secretion in dogs or might have a role incompensatory hyperinsulinemia. Our results suggestthat leptin does not decrease fasting insulin secretionand might mediate compensatory increases in insulinsecretion in obesity-associated insulin-resistant dogs.
However, because the dogs in this study compensated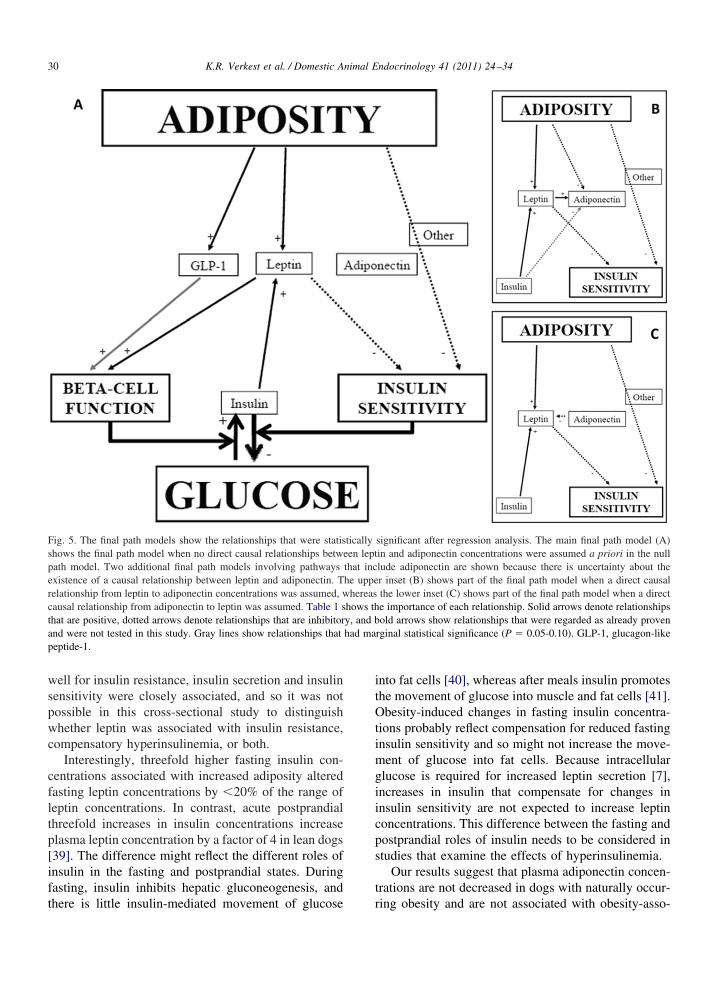
p
30 K.R. Verkest et al. / Domestic Animal Endocrinology 41 (2011) 24–34
well for insulin resistance, insulin secretion and insulinsensitivity were closely associated, and so it was notpossible in this cross-sectional study to distinguishwhether leptin was associated with insulin resistance,compensatory hyperinsulinemia, or both.
Interestingly, threefold higher fasting insulin con-centrations associated with increased adiposity alteredfasting leptin concentrations by �20% of the range ofleptin concentrations. In contrast, acute postprandialthreefold increases in insulin concentrations increaseplasma leptin concentration by a factor of 4 in lean dogs[39]. The difference might reflect the different roles ofinsulin in the fasting and postprandial states. Duringfasting, insulin inhibits hepatic gluconeogenesis, and
Fig. 5. The final path models show the relationships that were statisshows the final path model when no direct causal relationships betwpath model. Two additional final path models involving pathwaysexistence of a causal relationship between leptin and adiponectin. Trelationship from leptin to adiponectin concentrations was assumed, wcausal relationship from adiponectin to leptin was assumed. Table 1 sthat are positive, dotted arrows denote relationships that are inhibitorand were not tested in this study. Gray lines show relationships thateptide-1.
there is little insulin-mediated movement of glucose
into fat cells [40], whereas after meals insulin promotesthe movement of glucose into muscle and fat cells [41].Obesity-induced changes in fasting insulin concentra-tions probably reflect compensation for reduced fastinginsulin sensitivity and so might not increase the move-ment of glucose into fat cells. Because intracellularglucose is required for increased leptin secretion [7],increases in insulin that compensate for changes ininsulin sensitivity are not expected to increase leptinconcentrations. This difference between the fasting andpostprandial roles of insulin needs to be considered instudies that examine the effects of hyperinsulinemia.
Our results suggest that plasma adiponectin concen-trations are not decreased in dogs with naturally occur-
significant after regression analysis. The main final path model (A)in and adiponectin concentrations were assumed a priori in the nulllude adiponectin are shown because there is uncertainty about ther inset (B) shows part of the final path model when a direct causalthe lower inset (C) shows part of the final path model when a directe importance of each relationship. Solid arrows denote relationshipsold arrows show relationships that were regarded as already proven
rginal statistical significance (P � 0.05-0.10). GLP-1, glucagon-like
ticallyeen leptthat inche uppe
hereashows thy, and bhad ma
ring obesity and are not associated with obesity-asso-
GG
A
B
nt was s
31K.R. Verkest et al. / Domestic Animal Endocrinology 41 (2011) 24–34
ciated changes in insulin sensitivity. This findingsupports two recent studies that adiponectin concentra-tion did not increase in naturally occurring obese dogs
Table 1The importance of each relationship of outcome and exposure varia
Outcome variablea
(range of leptinand GLP-1)
Exposure variable Adjusted for P
lucose (1.3 mM) Adiposity Not adjusted 0LP-1 (14 pM) Adiposity Leptin, adiponectin 0
Leptin Adiposity,adiponectin
0
Adiponectin Leptin, adiposity 0Leptinc (22 �g/L) Adiposity Adiponectin, glucose,
insulin�0
Adiponectin Adiposity, glucose,insulin
�0
Glucose Adiponectin, insulin,adiposity
0
Insulin Adiponectin, glucose,adiposity
0
diponectind (37mg/L)
Adiposity Leptin, insulin,glucose
0
Adiposity Insulin, glucose 0Leptin Adiposity, glucose,
insulin�0
Insulin Leptin, adiposity,glucose
0
Glucose Leptin, adiposity,insulin
0
�-Cell function(158 HOMA%)
Adiposity GLP-1, leptin,adiponectin
0
GLP-1 Adiposity, leptin,adiponectin
0
Leptin GLP-1, adiponectin,adiposity
�0
Adiponectin Leptin, GLP-1,adiposity
0
Insulin sensitivity(229 HOMA%)
Adiposity GLP-1, leptin,adiponectin
0
GLP-1 Adiposity, leptin,adiponectin
0
Leptin GLP-1, adiponectin,adiposity
0
Adiponectin Adiposity, leptin,GLP-1
0
Importance was assessed with the estimated effect (change in the outcoand the percentage of the range of glucose (in mM) and glucagonHOMA
�-cell function(%), and HOMAinsulin sensitivity (%) that was ascribab
CS on a 9 point scale. Insulin was measured in �U/mL.a The ranges of the exposure and outcome variables were calculate
between glucose and adiposity reflects the total effect (ie, univarb Adiposity accounted for �100% of the change from the 10th to
the regression coefficient.c Relationships with leptin as the outcome variables were each
concentrations, but the results were not substantially different wd Relationships with adiponectin as the outcome variables were
concentrations; when leptin was not fitted, the regression coefficie
that lost weight [5,42] but contrasts with findings in
laboratory rodents and human beings [11,12] and inanother study of adiponectin in naturally occurring obe-sity in dogs [4], which show that increased adiposity is
luded in the null path model (Fig. 1)
stimated effect in the outcomeriable (95% CI)
Estimated effect (95% CI)as percentage of range ofoutcome variable
24 mM (�0.05 to 0.5 mM) 18% (�4 to 41%)pM (1.1 to 36 pM) 130%b (8 to 252%)
9.0 pM (�25 to 6.5 pM) �63% (�170 to 45%)
4 pM (�5.6 to 10.3 pM) 16% (�39 to 72%)�g/L (14 to 21 �g/L) 80% (64 to 95%)
3 microg/L (1.3 to 5.4 microg/L) 15% (6 to 25%)
1.8 microg/L (�4.4 to 0.8 microg/L) �8% (�20 to 3%)
8 �g/L (1.0 to 6.7 �g/L) 18% (4 to 31%)
20 mg/L (�36 to �4.4 mg/L) �55% (�99 to �12%)
3 mg/L (�15 to 9 mg/L) �7% (�40 to 26%)mg/L (9 to 36 mg/L) 61% (23 to 99%)
9 mg/L (�19 to 1 mg/L) �25% (�52 to 2%)
mg/L (�7 to 11 mg/L) 5% (�19% to 29%)
HOMA% (�39 to 70 HOMA%) 10% (�24% to 44%)
9 HOMA% (�0.7 to 17 HOMA%) 5% (0% to 11%)
HOMA% (22 to 116 HOMA%) 44% (14% to 74%)
20 HOMA% (�44 to 4.5 HOMA%) �12% (�28% to 3%)
94% (�153% to �35%) �41% (�67% to �15%)
1 HOMA% (�10 to 8 HOMA%) 0% (�5% to 4%)
56 HOMA% (�107 to �5 HOMA%) �24% (�47% to �2%)
HOMA% (�15 to 37 HOMA%) 5% (�7% to 16%)
iable) associated with change over the range of the exposure variable,eptide-1 (GLP-1; in pM), leptin (in �g/L), adiponectin (in mg/L),e estimated effect of the exposure variable. Adiposity was defined as
differences between the 10th and 90th percentiles. The relationshipnear regression was used).rcentiles of GLP-1 because two extreme values of GLP-1 increased
ed twice, once with and once without adjusting for adiponectinponectin was not fitted (results not shown).assessed twice, once with and once without adjusting for leptinmaller and the P values were higher in each case (results not shown).
bles inc
Eva
.10 0.
.04 19
.25 �
.55 2.
.01 17
.01 3.
.16 �
.01 3.
.01 �
.66 �
.01 22
.07 �
.67 2
.56 16
.07 7.
.01 69
.11 �
.02 �
.65 �
.01 �
.42 11
me var-like ple to th
d as theiable li90th pe
assesshen adi
each
associated with lower circulating adiponectin concen-
32 K.R. Verkest et al. / Domestic Animal Endocrinology 41 (2011) 24–34
trations. Our findings are supported by an extendedvalidation [43] and further strengthened by the absenceof a significant positive association between plasmaadiponectin concentrations and fasting insulin sensitiv-ity in this study. Unlike in other species, plasma adi-ponectin concentrations might not have a significantrole in dogs in the pathophysiology of obesity-associ-ated changes in insulin sensitivity.
This study showed no significant association be-tween adiposity and plasma adiponectin concentrationswith univariable linear regression, consistent with nototal effect of adiposity on adiponectin concentration.Multivariable regression results indicate two possibili-ties, depending on whether there is a causal relationshipwith leptin concentrations changing adiponectin con-centrations. If there is no causal effect of leptin onadiponectin concentrations, then multivariable regres-sion, like univariable regression, indicates that in dogsthere is no direct relationship between adiposity andadiponectin (Fig. 5A and C). If the alternative possi-bility is true (ie, that there is a causal effect of leptin onadiponectin), then the absence of a total effect of adi-posity on adiponectin might be the result of a strongdirect negative effect of adiposity on adiponectin coun-tered by a similarly strong, indirect, positive effectmediated by leptin (Fig. 5B). Because leptin increaseswith increasing adiposity, there would therefore beminimal overall change in adiponectin with increasedadiposity (ie, minimal total effect of adiposity on adi-ponectin). The null path model assumed that a causaleffect of leptin on adiponectin was plausible becauseadipocytes express functional leptin receptors [44].However, any causal effects of leptin on adiponectinconcentrations remains to be proven, and it is possiblethat leptin might not modulate adiponectin expressionor secretion [45], and its apparent effects in the multi-variable model might be spurious or because of otherobesity-related effects. If there is no causal effect ofleptin on adiponectin in dogs, our results indicate that,unlike the situation in other species, adiposity probablyhas little direct effect on adiponectin in dogs.
Plasma GLP-1 concentrations did not appear to bean important mediator of the increased plasma insulinconcentrations that were observed in overweight andobese dogs. Plasma GLP-1 concentrations were veryvariable and were high in individual dogs across therange of BCSs, including in two of the obese dogs. Ourresults did not indicate an effect of adiposity on fastingGLP-1 concentrations. Overall, only approximately 5%of the change in fasting �-cell function was attributable
to the effects of GLP-1. These findings contrast withthose of a study of fasting and postprandial insulinsecretion in dogs with induced obesity [15] whichfound that fasting GLP-1 concentrations were 2.5 timeshigher after the induction of obesity than before. In thatstudy, obesity was induced over 12 wk with greasefrom a cafeteria. It is possible that the increased fastingGLP-1 concentration in that study was the result of thatspecific high-fat diet rather than the result of obesity,and the results might not be uniformly applicable tospontaneously obese dogs. GLP-1 secretion is known tobe altered by diet, with increased secretion in responseto high-fat diets in other species [37]. However, GLP-1is secreted in response to meals, and the dogs in thisstudy had been in a fasting state �20 h, which shouldhave negated most of the effects that diet might havehad on GLP-1 concentrations.
By considering all the plausible interactions in acausal web, path analysis directs the use of multiplelinear regression, facilitates the selection of relevantcovariates, and overcomes the temptation to look for allstatistically significant associations in a set of dataregardless of a priori interest [46]. However, the resultsof path analysis depend on the null path model, so thisshould be defined carefully. Each relationship proposedin the null path model should be defensible with evi-dence from other sources. Thus, causal inference frompath analyses is based on, and builds on, evidence fromother studies. Path analysis with the use of cross-sec-tional type data, as in the present study, provide weakerevidence about direction of effects than either longitu-dinal studies with measures repeated sufficiently fre-quently over time or intervention studies. As with allobservational studies and small randomized controlledtrials, potential for confounding should also be consid-ered when interpreting results of path analyses. Thisstudy did not consider possible confounders such asage, sex, breed, and neuter status. Age and neuter statuswere found separately to confound the relationship be-tween adiposity and adiponectin concentrations [43].Age and neuter status are both known risk factors forthe development of obesity [47] and might alter othervariables considered in this study such as insulin sen-sitivity [24]. Although path analysis has been advo-cated by veterinary epidemiologists [48] and used inproduction animal and equine studies, examples of thistechnique in small animal veterinary research are lack-ing. To our knowledge, this study is the first in smallanimal medicine or veterinary endocrinology to adoptthis approach.
In conclusion, dogs compensate well for obesity-
induced insulin resistance by secreting more insulin.
[
[
[
[
[
[
[
[
[
[
[
[
[
[
[
[
[
[
[
33K.R. Verkest et al. / Domestic Animal Endocrinology 41 (2011) 24–34
This compensation prevents obesity-induced hypergly-cemia. Leptin appears to be involved in mediating in-creased insulin secretion in dogs. There does not appearto be an overall relationship between adiposity andadiponectin in dogs, although, if there is a direct effectof leptin on adiponectin, then our results indicate thatthis is a positive relationship, which at least partlycounters a negative direct relationship between adipos-ity and adiponectin. Adiponectin and GLP-1 do notappear to be associated with obesity-induced changes ininsulin sensitivity in dogs.
Acknowledgments
We thank Nestlé Purina PetCare, the Canine ControlCouncil’s Breeder’s Research Fund, and the NationalHealth and Medical Research Council for funding thisproject. We thank Haruki Shibata, Tsutomu Honjoh,and the Morinaga Institute of Biological Science Inc,Yokohama, Japan, for donating the canine leptinELISA kits.
More than 100 dog owners disrupted their lives tohelp with this project, in some cases despite illness,injury, or inclement weather. We appreciate their com-mitment to the understanding of naturally occurringobesity in dogs.
References
[1] Kil D, Swanson K. Endocrinology of obesity. Vet Clin NorthAm Small Anim Pract 2010;40:205–219.
[2] Bergman RN, Van Citters GW, et al. Central role of the adi-pocyte in the metabolic syndrome. J Investig Med 2001;49:119–126.
[3] Ishioka K, Soliman MM, Sagawa M, et al. Experimental andclinical studies on plasma leptin in obese dogs. J Vet Med Sci2002;64:349–353.
[4] Ishioka K, Omachi A, Sagawa M, et al. Canine adiponectin:cDNA structure, mRNA expression in adipose tissues and re-duced plasma levels in obesity. Res Vet Sci 2006;80:127–132.
[5] German AJ, Hervera M, Hunter L, et al. Improvement in insulinresistance and reduction in plasma inflammatory adipokinesafter weight loss in obese dogs. Domest Anim Endocrinol 2009;37:214–226.
[6] Mittelman SD, Van Citters GW, et al. Longitudinal compensa-tion for fat-induced insulin resistance includes reduced insulinclearance and enhanced beta-cell response. Diabetes 2000;49:2116–2125.
[7] Havel PJ. Peripheral signals conveying metabolic informationto the brain: short-term and long-term regulation of food intakeand energy homeostasis. Exp Biol Med 2001;226:963–977.
[8] Havel PJ. Control of energy homeostasis and insulin action byadipocyte hormones: leptin, acylation stimulating protein, andadiponectin. Curr Opin Lipidol 2002;13:51–59.
[9] Wang MY, Koyama K, Shimabukuro M, Mangelsdorf D, New-
gard CB, Unger RH. Overexpression of leptin receptors inpancreatic islets of zucker diabetic fatty rats restores GLUT-2,glucokinase, and glucose-stimulated insulin secretion. Proc NatlAcad Sci U S A 1998;95:11921–11926.
10] Tartaglia LA, Dembski M, Weng X, et al. Identification andexpression cloning of a leptin receptor, OB-R. Cell 1995;83:1263–1271.
11] Pajvani UB, Scherer PE. Adiponectin: systemic contributor toinsulin sensitivity. Curr Diab Rep 2003;3:207–213.
12] Tschritter O, Fritsche A, Thamer C, et al. Plasma adiponectinconcentrations predict insulin sensitivity of both glucose andlipid metabolism. Diabetes 2003;52:239–243.
13] Lusby AL. Characterization of feline adiponectin and its asso-ciation with metabolic indices in lean and obese cats (thesis).Knoxville: University of Tennessee, 2009.
14] Yamauchi T, Kamon J, Ito Y, et al. Cloning of adiponectinreceptors that mediate antidiabetic metabolic effects. Nature2003;423:762–769.
15] Van Citters GW, Kabir M, Kim SP, et al. Elevated glucagon-like peptide-1-(7-36)-amide, but not glucose, associated withhyperinsulinemic compensation for fat feeding. J Clin Endocri-nol Metab 2002;87:5191–5198.
16] The American Diabetes Association. Diagnosis and classifica-tion of diabetes mellitus. Diabetes Care 2008;31(suppl):S55–S60.
17] Rand JS, Fleeman LM, Farrow HA, Appleton DJ, Lederer R.Canine and feline diabetes mellitus: nature or nurture? J Nutr2004;134(8 Suppl):2072S–2080S.
18] Verkest KR, Fleeman LM, Rand JS, Morton JM. Evaluation ofbeta-cell sensitivity to glucose and first-phase insulin secretionin obese dogs. Am J Vet Res 2011;72:357–366.
19] Kaiyala KJ, Prigeon RL, Kahn SE, Woods SC, Porte D Jr,Schwartz MW. Reduced beta-cell function contributes to im-paired glucose tolerance in dogs made obese by high-fat feed-ing. Am J Physiol 1999;277(4 Pt 1):E659–E667.
20] Laflamme D. Development and validation of a body conditionscore system for dogs. Canine Practice 1997;22:10–15.
21] Levy JC, Matthews DR, Hermans MP. Correct homeostasismodel assessment (HOMA) evaluation uses the computer pro-gram. Diabetes Care 1998;21:2191–2192.
22] Verkest KR, Fleeman L, Rand JS, Morton J. Basal measures ofinsulin sensitivity and insulin secretion and simplified glucosetolerance tests in dogs. Domest Anim Endocrinol 2010;39:194–204.
23] Landis RS. Standardized regression coefficients. New York:John Wiley & Sons, Ltd, 2005.
24] Larson BT, Lawler DF, Spitznagel EL Jr, Kealy RD. Improvedglucose tolerance with lifetime diet restriction favorably affectsdisease and survival in dogs. J Nutr 2003;133:2887–2892.
25] Mattheeuws D, Rottiers R, Kaneko JJ, Vermeulen A. Diabetesmellitus in dogs: relationship of obesity to glucose tolerance andinsulin response. Am J Vet Res 1984;45:98–103.
26] Eigenmann JE, Eigenmann RY, Rijnberk A, Van Der Gaag I,Zapf J, Froesch ER. Progesterone-controlled growth hormoneoverproduction and naturally occurring canine diabetes and ac-romegaly. Acta Endocrinol (Copenh) 1983;104:167–176.
27] Fall T, Johansson Kreuger S, Juberget A, Bergstrom A, Hed-hammar A. Gestational diabetes mellitus in 13 dogs. J VetIntern Med 2008;22:12961130.
28] Ceddia RB, Koistinen HA, Zierath JR, Sweeney G. Analysis ofparadoxical observations on the association between leptin and
insulin resistance. FASEB J 2002;16:1163–1176.
[
[
[
[
[
[
[
[
[
[
[
[
[
[
[
[
[
34 K.R. Verkest et al. / Domestic Animal Endocrinology 41 (2011) 24–34
[29] Islam MS, Sjöholm Å, Emilsson V. Fetal pancreatic islets ex-press functional leptin receptors and leptin stimulates prolifer-ation of fetal islet cells. Int J Obes 2000;24:1246–1253.
[30] Gray SL, Donald C, Jetha A, Covey SD, Kieffer TJ. Hyperinsu-linemia precedes insulin resistance in mice lacking pancreatic {be-ta}-cell leptin signaling. Endocrinology 2010;151:4178–4186.
[31] Morioka T, Asilmaz E, Hu J, et al. Disruption of leptin receptorexpression in the pancreas directly affects � cell growth andfunction in mice. J Clin Invest 2007;117:2860–2868.
32] Koyama K, Chen G, Wang MY, et al. Beta-cell function innormal rats made chronically hyperleptinemic by adenovirus-leptin gene therapy. Diabetes 1997;46(8):1276–1280.
33] Emilsson V, Liu Y, Cawthorne M, Morton N, Davenport M.Expression of the functional leptin receptor mRNA in pancre-atic islets and direct inhibitory action of leptin on insulin secre-tion. Diabetes 1997;46(2):313–316.
34] Kieffer TJ, Heller RS, Leech CA, Holz GG, Habener JF. Leptinsuppression of insulin secretion by the activation of ATP-sen-sitive K� channels in pancreatic beta-cells. Diabetes 1997;46(6):1087–1093.
35] Shimabukuro M, Wang M-Y, Zhou Y-T, Newgard CB, UngerRH. Protection against lipoapoptosis of beta cells through lep-tin-dependent maintenance of BCL-2 expression. Proc NatlAcad Sci U S A 1998;95:9558–9561.
36] Pelleymounter M, Cullen M, Baker M, et al. Effects of the obesegene product on body weight regulation in ob/ob mice. Science1995;269:540–543.
37] Burcelin R, Serino M, Cabou C. A role for the gut-to-brainGLP-1-dependent axis in the control of metabolism. Curr OpinPharmacol 2009;9:744–752.
38] Wang MY, Koyama K, Shimabukuro M, Newgard CB, Unger RH.OB-Rb gene transfer to leptin-resistant islets reverses diabetogenicphenotype. Proc Natl Acad Sci U S A 1998;95:714–718.
39] Ishioka K, Hatai H, Komabayashi K, et al. Diurnal variation ofserum leptin in dogs - effects of fasting and refeeding. Vet J
2005;169:85–90.40] Abdul-Ghani MA, Tripathy D, Defronzo RA. Contributions of{beta}-cell dysfunction and insulin resistance to the pathogen-esis of impaired glucose tolerance and impaired fasting glucose.Diabetes Care 2006;29:1130–1139.
41] Levy J, Morris R, Hammersley M, Turner R. Discrimination,adjusted correlation, and equivalence of imprecise tests: appli-cation to glucose tolerance. Am J Physiol 1999;276:E365–E375.
42] Wakshlag J, Struble A, Levine C, Bushey J, Laflamme DP,Long G. Effects of weight loss on adipokines and markers ofinflammation in dogs (abstract). In: The WALTHAM Interna-tional Nutritional Sciences Symposium Pet Nutrition – Art orScience? Cambridge, UK: Waltham International NutritionalSciences. September 16–18 2010.
43] Verkest KR, Rose FJ, Fleeman LM, et al. Adiposity andadiponectin in dogs: investigation of causes of discrepantresults between two studies. Domest Anim Endocrinol 2011;41:35– 41.
44] Kielar D, Clark JSC, Ciechanowicz A, Kurzawski G, Su-likowski T, Naruszewicz M. Leptin receptor isoforms expressedin human adipose tissue. Metabolism 1998;47:844–847.
45] Gavrila A, Chan JL, Yiannakouris N, et al. Serum adiponectinlevels are inversely associated with overall and central fat dis-tribution but are not directly regulated by acute fasting or leptinadministration in humans: Cross-sectional and interventionalstudies. J Clin Endocrinol Metab 2003;88:4823–4831.
46] Greenland S, Brumback B. An overview of relations amongcausal modelling methods. Int J Epidemiol 2002;31:1030–1037.
47] Lund EM, Armstrong PJ, Kirk CA, Klausner JS. Prevalence andrisk factors for obesity in adult dogs from private US veterinarypractices. Intern J Appl Res Vet Med 2006;4:177–186.
48] Martin W. Linking causal concepts, study design, analysis andinference in support of one epidemiology for population health.
Prev Vet Med 2008;86:270–288.