Embed Size (px)
Citation preview
Comparison of performance using GA and FISin Spotting the aberration spot of Clinical
Data with the aid of NN and SVMC.R.Bharathi1,Dr.V. Shanthi2
1. Research Scholar, Sathyabama University, Asst.Prof, Department of ECE,, VelTech University, Avadi,Chennai, India.2. Professor, Department of MCA, St. Joseph’s College of Engineering, Chennai, India.
Abstract
Aim: The main concern of the present
investigation is to compare the performance
between (i) Neural Network (NN) and Support
Vector Machine (SVM) and (ii) Genetic
Algorithm (GA) and Fuzzy Inference System
(FIS) which were used to identify the
specific (acute) spots of the abnormal
children speech who need specific practise
in those identified spots to overcome
stuttering behaviour. Approach: In the
previous work, there are three phases
followed (i)Training Phase (ii)Testing phase
and (iii)Optimization phase for blemishing
the acute spot in which the speech practice
can be provided for the abnormal children.
The training and optimization in previous
works were implemented using (i) NN and GA
and (ii) SVM and FIS. In this study, the
comparison is done between the performance
of (i) NN and SVM and (ii) GA and FIS using
Mathews Correlation coefficient (MCC).
Results: Performance of the proposed system
is tested by the dataset generated by
abnormal and normal female children. The
proposed system is implemented using MATLAB
as working platform. Conclusion: This studyis to provide a system to identify the acute
spots in abnormal word where the stuttering
children need the practice. Comparison Study
is done between the performance of (i)
NN and SVM and (ii) GA and FIS.
Keywords: speech signal, stress, Mel Frequency CepstrumCoefficients (MFCC), Principal Component Analysis (PCA),Support Vector Machines (SVM) , Fuzzy Inference system(FIS),Genetic Algorithm (GA)
1. INTRODUCTION
In real-world environment, speech signalprocessing plays a vital role among theresearch communities in general and ithas a specific role in the case ofchildren who have the problem ofstuttering in particular. But, expertsfeel that the latter case is caused by acombination of various factors. First,genetics is believed to play a part. Itappears that stuttering results frominherited (genetic) abnormalities in thelanguage centres of the brain. Second,children who have developmental delaysor other speech problems are more likelyto stutter. Third, environmental factorscan have an influence. Speech synthesis
among the children helps in identifyingthe acute spot in the speech of abnormalchildren.
In this study, the abnormal childrenspeech is considered to enhance thespeech by comparing it with the normalchildren speech. This work is veryuseful for the speech practitioners toimprove the speech of the abnormalchildren by knowing where the speechpractice is required. The Mel FrequencyCepstrum Coefficients (MFCC) for abnormaland normal speeches were extracted.Principal component Analysis (PCA) isapplied to reduce the dimensionality ofMFCC features and are trained with theaid of Neural Network (NN) and SupportVector Machine (SVM) separately to identifythe abnormal word.(Bharathi andShanthi, 2012c). Through thethresholding operation acute word isidentified. Number of peaks and theamplitude is found from the Fast FourierTransform (FFT) of the acute word. Theamplitude and number of peaks areconverted into genes and optimized usingGenetic Algorithm (GA) . And also theamplitude and number of peaks areinputted to the Fuzzy InferenceSystem(FIS) for the optimization processseparately to identify the position inwhich the stress has to given. Thecomparison of performance between (i) NNand SVM and (ii) GA and FIS is done in thisstudy.
2. METHODOLOGY
2.1 Classification Process
2.1.1 Classification through NN
In the classification, the NN isutilized for the classification purposein order to separate the normal and foridentifying the abnormal dataset. Theseven MFCC features namely mean,standard deviation, maximum amplitudevalue and its id, minimum amplitudevalue and its id, MFCC length wereextracted and the same set of sevenfeatures were extracted from theoriginal word. These fourteen featuresare are trained using NN and SVMseparately.(Bharathi and Shanthi,2011a,.(Bharathi and Shanthi, 2012c)).This neural network has fourteen inputlayers which are the parameters of aword . hidden layers and one outputlayer to identify the word inputted iseither normal or abnormal.
2.1.2 Support Vector Machine (SVM)
An SVM is a concept in statistics andcomputer science for a set of relatedsupervised learning methods that analyzedata and recognize patterns, used forclassification and regression analysis.The standard SVM takes a set of inputdata and predicts, for each given input,which of two possible classes forms theinput, making the SVM a non-probabilistic binary linear classifier.Given a set of training examples, eachmarked as belonging to one of twocategories, an SVM training algorithmbuilds a model that assigns new examplesinto one category or the other
3. Identifying the acute spot ofaberration of abnormal childrenusing GA and FIS
3.1 Genetic Algorithm (GA)In Optimization Phase, thresholdingoperation on the identified abnormalword is done and then FFT is computedfor the acute word. The sudden changesin frequency can be seen in FFT bymaximum peaks. (Bharathi and Shanthi,2011b). The numbers of maximum peaks areanalyzed with its amplitude using FFT.For identifying the acute spot ofaberration for abnormal children, GA isused. This each peak is considered as agene. Number of Chromosomes obtainedfrom crossover and mutations arecombined and so population pool isfilled up. After crossover process, thefitness is applied on childrenchromosomes and hence highly deviatedchromosomes are replaced with new genes.The process is repeated until it reachesmaximum iteration. The indices, whichare obtained from genes of bestchromosomes, represent the acuteposition of abnormal word.(Bharathi andShanthi, 2012e)
3.2 Fuzzy Inference System (FIS)
Fuzzy knowledge -based systems are rulesthat built on fuzzy logic and fuzzy settheory. A fuzzy rule system is a rulesystem whose variables or part of itsvariables are linguistic variables. Itis well known that FIS can be used toapproximate closely any nonlinear inputoutput mapping by means of a series ofif–then rules. In the design of FIS,there are two major tasks, viz. thestructure identification and theparameter adjustment. The fuzzyinference system is comprised of threephases that are Fuzzification, Rules
Evaluation and Defuzzification. Theprocess of fuzzy inference involvesMembership Functions, LogicalOperations, and If-Then Rules. In thisFIS, the peaks of the abnormal words areutilized in order to identify theaberration spot.(Bharathi and Shanthi,2012f)
4. EXPERIMENTAL RESULTS
4.1 Related work
There are number of approaches and amongthem few approaches are detailed below.(Bharathi and Shanthi, 2012d)(i) Automatic detection method whichuses a new approach called the speechrecognition technology for syllablerepetition in read speech for objectiveassessment of stuttered disfluencies.Different steps were involved in findingthe number of repetitions from thespeech samples using MFCC featureextraction algorithm. The twelvedimensional MFCC obtained for eachsyllable are used to compute the anglebetween them which serve as local-distance and represent in the form ofmatrix. Using Dynamic Programming theminimum-cost path through matrix isfound and given to Decision logic. InDecision logic, Dynamic Time Warping(DTW) based score matching is done.(ii) Intelligent processing of stutteredspeech work reports results on automaticdetection of speech disorder events thatwere based on both rough sets andartificial neural networks. Rough set-based algorithm and Neural Networkalgorithm was applied in (a) Automaticdetection of stops-gaps, (b) Discerningvowel prolongations and (c) Detection of
syllable repetitions. During the tests,rough set system settings were selectedas follows: the value of quantizationwas from the range of 5 to 20 and thevalue of neutral point was from 0.6 to0.9. Better scores were obtained usingrough set-based system.(iii) In Optimal Curve Fitting methodthe amplitude profile of sampled speechdata were fitted by employing sum ofsine functions with a confidence level.Furthermore, amplitude correlationtechnique is applied between originalspeech signal samples of normal andpathological subjects and correlationtechnique is also applied between thecurve fit constant values for normal andpathological subjects. For the collectedsample space of children the curvefitting technique is applied and curvefitting constant values are obtained.Then correlation coefficient betweennormal and pathological curve fittingconstant values are calculated and it isobserved that if correlation coefficientvalue starts deviating from its expectedvalue 0.20, speech disability severityincreases in pathological subjects incomparison with normal child. In thepresent, investigation the scope of theproposed work is detailed below toovercome shortcomings observed in theabove existing methods.4.2 Feature Extraction
Initially, the words are extracted fromthe both normal and abnormal childrenand then the MFCC feature has beenextracted from it. Subsequently, the PCAis applied to reduce the dimensionalityof the words. Few speech samples which
are sent as input to MFCC FeatureExtraction.(Bharathi and Shanthi,2011d).
Discriminant analysis using SPSS modelwas implemented on fourteen extractedfeatures and around 80% classificationaccuracy was got.( Bharathi and Shanthi,2012b).
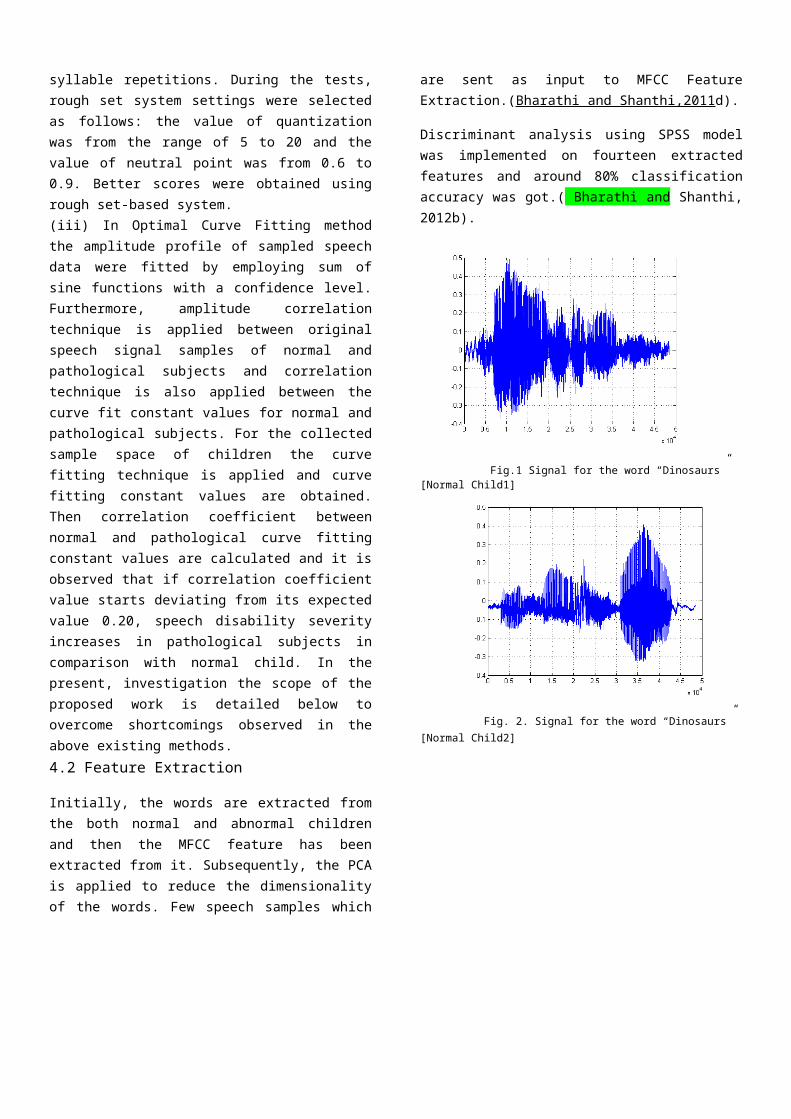
Fig.1 Signal for the word “Dinosaurs” [Normal Child1]
Fig. 2. Signal for the word “Dinosaurs” [Normal Child2]
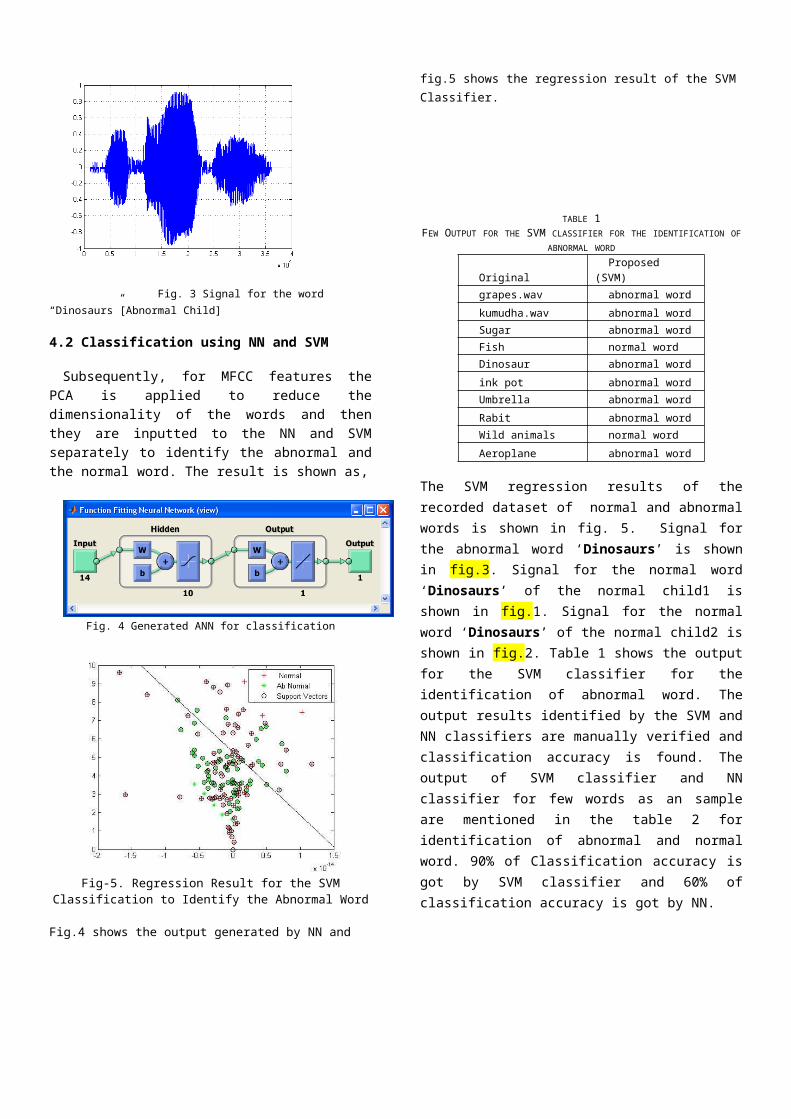
Fig. 3 Signal for the word “Dinosaurs”[Abnormal Child]
4.2 Classification using NN and SVM
Subsequently, for MFCC features thePCA is applied to reduce thedimensionality of the words and thenthey are inputted to the NN and SVMseparately to identify the abnormal andthe normal word. The result is shown as,
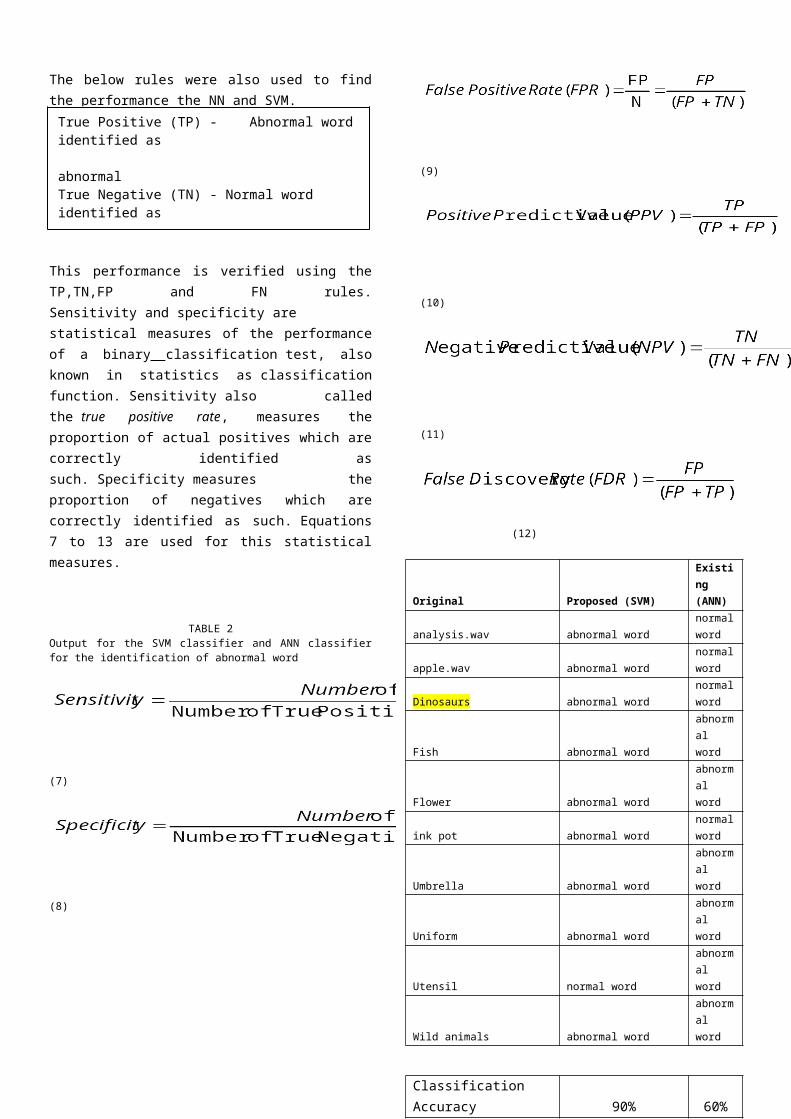
Fig. 4 Generated ANN for classification
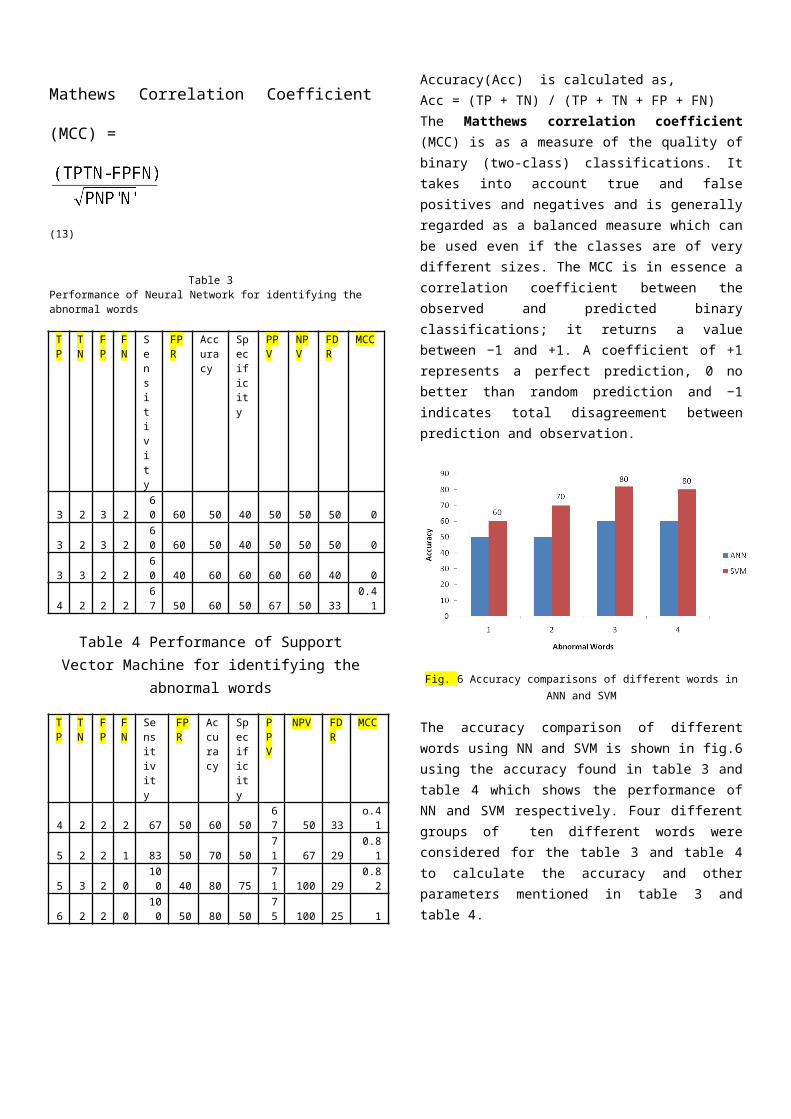
Fig-5. Regression Result for the SVMClassification to Identify the Abnormal Word
Fig.4 shows the output generated by NN and
fig.5 shows the regression result of the SVMClassifier.
TABLE 1FEW OUTPUT FOR THE SVM CLASSIFIER FOR THE IDENTIFICATION OF
ABNORMAL WORD
OriginalProposed
(SVM)grapes.wav abnormal wordkumudha.wav abnormal wordSugar abnormal wordFish normal wordDinosaur abnormal wordink pot abnormal wordUmbrella abnormal wordRabit abnormal wordWild animals normal wordAeroplane abnormal word
The SVM regression results of therecorded dataset of normal and abnormalwords is shown in fig. 5. Signal forthe abnormal word ‘Dinosaurs’ is shownin fig.3. Signal for the normal word‘Dinosaurs’ of the normal child1 isshown in fig.1. Signal for the normalword ‘Dinosaurs’ of the normal child2 isshown in fig.2. Table 1 shows the outputfor the SVM classifier for theidentification of abnormal word. Theoutput results identified by the SVM andNN classifiers are manually verified andclassification accuracy is found. Theoutput of SVM classifier and NNclassifier for few words as an sampleare mentioned in the table 2 foridentification of abnormal and normalword. 90% of Classification accuracy isgot by SVM classifier and 60% ofclassification accuracy is got by NN.
The below rules were also used to findthe performance the NN and SVM.
This performance is verified using theTP,TN,FP and FN rules.Sensitivity and specificity arestatistical measures of the performanceof a binary classification test, alsoknown in statistics as classificationfunction. Sensitivity also calledthe true positive rate, measures theproportion of actual positives which arecorrectly identified assuch. Specificity measures theproportion of negatives which arecorrectly identified as such. Equations7 to 13 are used for this statisticalmeasures.
TABLE 2Output for the SVM classifier and ANN classifierfor the identification of abnormal word
(7)
(8)
(9)
(10)
(11)
(12)
Original Proposed (SVM)
Existing (ANN)
analysis.wav abnormal wordnormalword
apple.wav abnormal wordnormalword
Dinosaurs abnormal wordnormalword
Fish abnormal word
abnormal word
Flower abnormal word
abnormal word
ink pot abnormal wordnormalword
Umbrella abnormal word
abnormal word
Uniform abnormal word
abnormal word
Utensil normal word
abnormal word
Wild animals abnormal word
abnormal word
Classification Accuracy 90% 60%
True Positive (TP) - Abnormal wordidentified as abnormalTrue Negative (TN) - Normal word identified as
True Positive (TP) - Abnormal wordidentified as abnormalTrue Negative (TN) - Normal word identified as
Mathews Correlation Coefficient
(MCC) =
(13)
Table 3Performance of Neural Network for identifying the abnormal words
TP
TN
FP
FN
Sensitivity
FPR
Accuracy
Specificity
PPV
NPV
FDR
MCC
3 2 3 260 60 50 40 50 50 50 0
3 2 3 260 60 50 40 50 50 50 0
3 3 2 260 40 60 60 60 60 40 0
4 2 2 267 50 60 50 67 50 33
0.41
Table 4 Performance of SupportVector Machine for identifying the
abnormal words
TP
TN
FP
FN
Sensitivity
FPR
Accuracy
Specificity
PPV
NPV FDR
MCC
4 2 2 2 67 50 60 5067 50 33
o.41
5 2 2 1 83 50 70 5071 67 29
0.81
5 3 2 0100 40 80 75
71 100 29
0.82
6 2 2 0100 50 80 50
75 100 25 1
Accuracy(Acc) is calculated as,Acc = (TP + TN) / (TP + TN + FP + FN)The Matthews correlation coefficient(MCC) is as a measure of the quality ofbinary (two-class) classifications. Ittakes into account true and falsepositives and negatives and is generallyregarded as a balanced measure which canbe used even if the classes are of verydifferent sizes. The MCC is in essence acorrelation coefficient between theobserved and predicted binaryclassifications; it returns a valuebetween −1 and +1. A coefficient of +1represents a perfect prediction, 0 nobetter than random prediction and −1indicates total disagreement betweenprediction and observation.
Fig. 6 Accuracy comparisons of different words inANN and SVM
The accuracy comparison of differentwords using NN and SVM is shown in fig.6using the accuracy found in table 3 andtable 4 which shows the performance ofNN and SVM respectively. Four differentgroups of ten different words wereconsidered for the table 3 and table 4to calculate the accuracy and otherparameters mentioned in table 3 andtable 4.
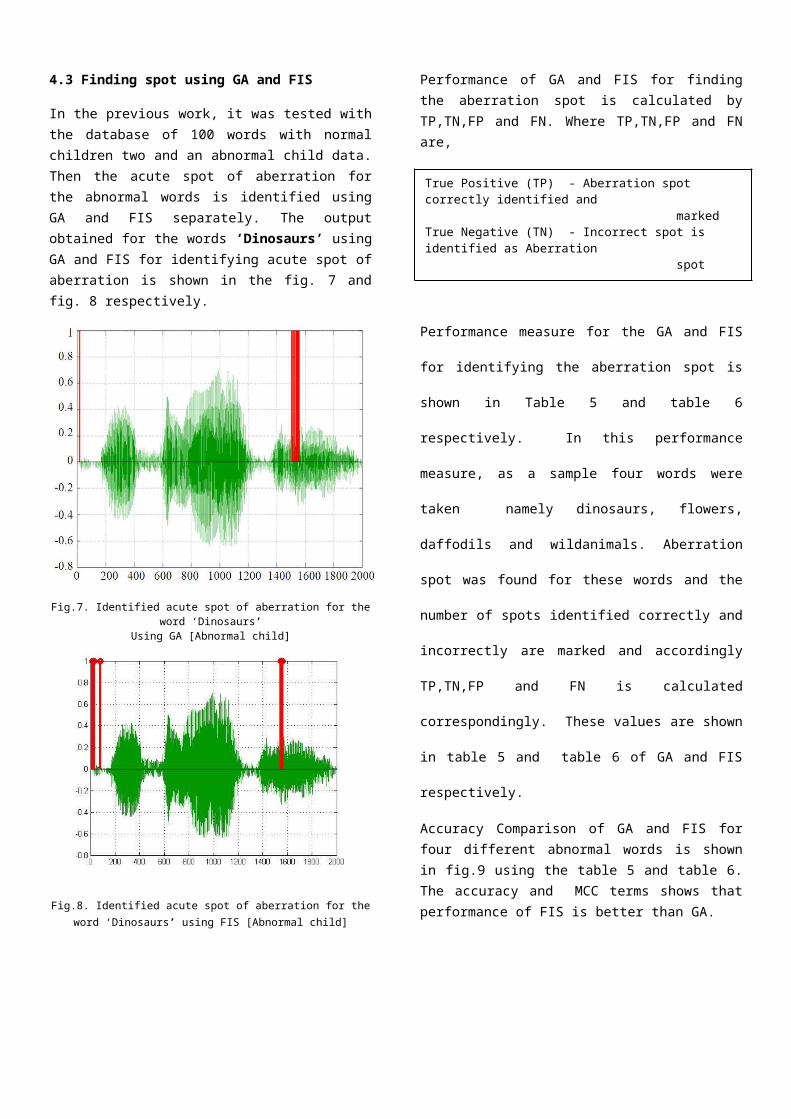
4.3 Finding spot using GA and FIS
In the previous work, it was tested withthe database of 100 words with normalchildren two and an abnormal child data.Then the acute spot of aberration forthe abnormal words is identified usingGA and FIS separately. The outputobtained for the words ‘Dinosaurs’ usingGA and FIS for identifying acute spot ofaberration is shown in the fig. 7 andfig. 8 respectively.
Fig.7. Identified acute spot of aberration for theword ‘Dinosaurs’
Using GA [Abnormal child]
Fig.8. Identified acute spot of aberration for theword ‘Dinosaurs’ using FIS [Abnormal child]
Performance of GA and FIS for findingthe aberration spot is calculated byTP,TN,FP and FN. Where TP,TN,FP and FNare,
Performance measure for the GA and FIS
for identifying the aberration spot is
shown in Table 5 and table 6
respectively. In this performance
measure, as a sample four words were
taken namely dinosaurs, flowers,
daffodils and wildanimals. Aberration
spot was found for these words and the
number of spots identified correctly and
incorrectly are marked and accordingly
TP,TN,FP and FN is calculated
correspondingly. These values are shown
in table 5 and table 6 of GA and FIS
respectively.
Accuracy Comparison of GA and FIS forfour different abnormal words is shownin fig.9 using the table 5 and table 6.The accuracy and MCC terms shows thatperformance of FIS is better than GA.
True Positive (TP) - Aberration spot correctly identified and markedTrue Negative (TN) - Incorrect spot is identified as Aberration spot False Positive (FP) - Normal spot is
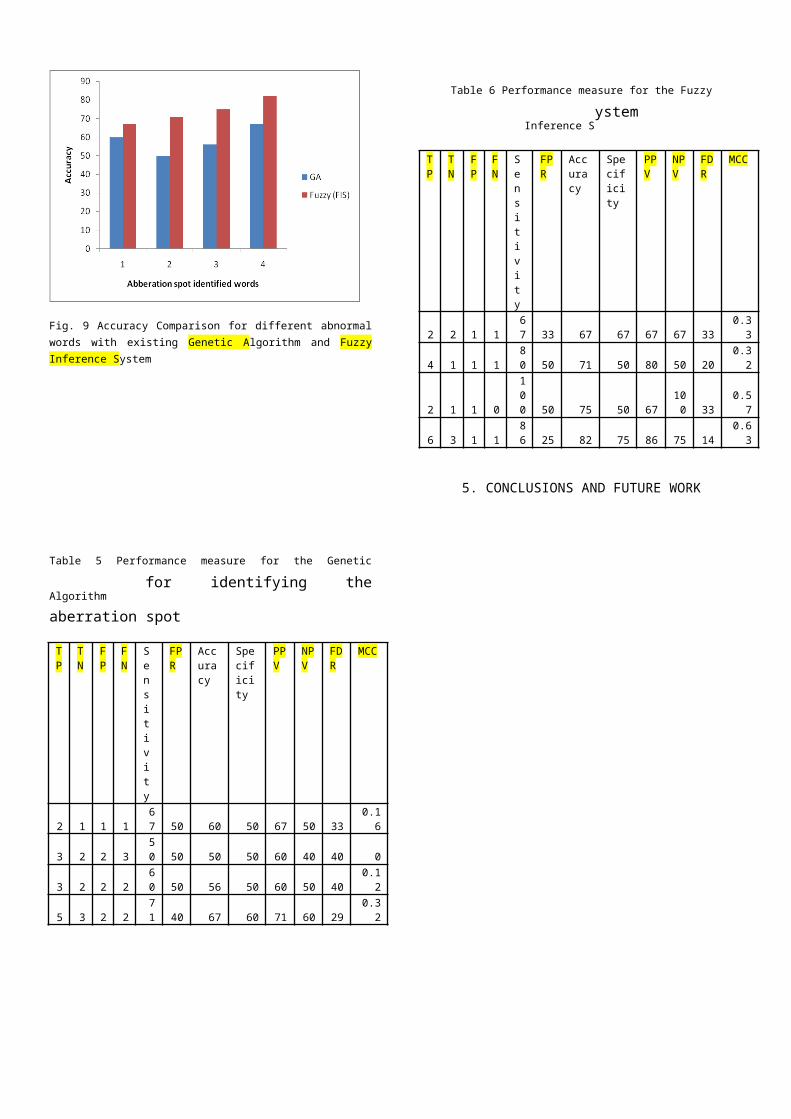
Fig. 9 Accuracy Comparison for different abnormalwords with existing Genetic Algorithm and FuzzyInference System
Table 5 Performance measure for the Genetic
Algorithm for identifying the
aberration spot
TP
TN
FP
FN
Sensitivity
FPR
Accuracy
Specificity
PPV
NPV
FDR
MCC
2 1 1 167 50 60 50 67 50 33
0.16
3 2 2 350 50 50 50 60 40 40 0
3 2 2 260 50 56 50 60 50 40
0.12
5 3 2 271 40 67 60 71 60 29
0.32
Table 6 Performance measure for the Fuzzy
Inference System
TP
TN
FP
FN
Sensitivity
FPR
Accuracy
Specificity
PPV
NPV
FDR
MCC
2 2 1 167 33 67 67 67 67 33
0.33
4 1 1 180 50 71 50 80 50 20
0.32
2 1 1 0
100 50 75 50 67
100 33
0.57
6 3 1 186 25 82 75 86 75 14
0.63
5. CONCLUSIONS AND FUTURE WORK
The proposed system was implemented inthe working platform of MATLAB (version7.11). In this with the aid of the FreeAudio Editor, the dataset with thenormal and abnormal female childrenwithin the age limit 6-10 yrs aregenerated. For 100 normal data (words) 2female children were utilized each andfor 100 abnormal data, a female childwas utilized for the system and theirnormal frequency range is from 20 –4kHz. The speech input is recorded at asampling rate of 44.1kHz. In this study,an effective system has been proposed toidentify the abnormal word and the spotin which the speech has to be improvedis also identified (Bharathi andShanthi, 2011b,2012d). The performancebetween ANN and SVM are compared andfound that 90% accuracy is got by SVMand the performance of FIS is foundbetter than GA.
REFERENCES(20)
Bharathi,C.R. and V. Shanthi, 2011a.Classification of speech for clinicaldata using artificial neural network.Int. J. Comput. Sci. Issues, 8: 359-365.http://www.ijcsi.org/papers/IJCSI-8-6-1-359-365.pdf Bharathi,C.R. and V.Shanthi, 2012a. Disorder SpeechClustering for Clinical Data Using FuzzyC - Means Clustering and Comparisonwith SVM Classification. Ind. J. ofComput. Sci. and Engg., Vol 3. Bharathi,C.R.and V. Shanthi, 2012b.Discriminant analysis of disorder speechfor clinical data. Eur. J. Sci. Res.,90: 188-195.Bharathi,C.R. and V.Shanthi, 2012c.Disorder Speech Classification forClinical Data using SVM. NationalConference, IETE.Proc. 201-204.
Bharathi,C.R. and V.Shanthi, 2011b.Finding acute Peaks and Amplitudes ofSpeech for Clinical Data using FFT.ICACM, Int. Conf., Elsevier. Proc. pp267-273.www.icacm.griet.ac.inBharathi, C.R. and V. Shanthi, 2011d.Feature extraction using MFCC and surveyon classification agorithms for clinicaldata. Proceedings of the InternationalConference on Computer ScienceEngineering, June 10-12, 2011, Shanghai,China. Bharathi,C.R. and V. Shanthi, 2012d.Survey on objective assessment ofstuttered speech signal for disabledchildren.. Proceedings of theInternational Conference on CloudComputing and eGovernance,. July 26-28,2012,. Bangkok, Thailand. Bharathi,C.R. and V. Shanthi, 2012e. Aneffective system for acute spottingaberration in the speech of abnormalchildren via artificial neural networkand genetic algorithm. Am. J. AppliedSci., 9: 1561-1570.Bharathi,C.R. and V. Shanthi, 2012f.Spotting the aberration spot in a speechwith the aid of fuzzy inference system..Indian J. Innovations Dev., 1: 795-802.
C.R.Bharathi received AMIE (ECE) andM.E.(Applied Electronics) in 2001 and2005. Since June 2002, she has been aAssistant Professor in an EngineeringCollege and at present working asAssistant Professor in Vel TechUniversity, Avadi, Chennai.She is anResearch scholar at SathyabamaUniversity.
Dr. V. Shanthi working as Professor inSt.Joseph’s College ofEngineering,Chennai. Her researchinterest includes ArtificialIntelligence, cloud computing. Dr. V.Shanthi is co-author.


