Embed Size (px)
Citation preview
�����������������
Citation: Dworak, Edyta, Maria
Magdalena Grzelak, and Elzbieta
Roszko-Wójtowicz. 2022.
Comparison of National Innovation
Systems in the European Union
Countries. Risks 10: 6. https://
doi.org/10.3390/risks10010006
Academic Editor: Ajay Subramanian
Received: 30 September 2021
Accepted: 22 December 2021
Published: 29 December 2021
Publisher’s Note: MDPI stays neutral
with regard to jurisdictional claims in
published maps and institutional affil-
iations.
Copyright: © 2021 by the authors.
Licensee MDPI, Basel, Switzerland.
This article is an open access article
distributed under the terms and
conditions of the Creative Commons
Attribution (CC BY) license (https://
creativecommons.org/licenses/by/
4.0/).
risks
Article
Comparison of National Innovation Systems in the EuropeanUnion CountriesEdyta Dworak 1, Maria Magdalena Grzelak 2 and Elzbieta Roszko-Wójtowicz 2,*
1 Department of Institutional Economics and Microeconomics, University of Lodz, Rewolucji 1905 r. Street,No. 41, 90-214 Łódz, Poland; [email protected]
2 Department of Economic and Social Statistics, University of Lodz, Rewolucji 1905 r. Street, No. 41,90-214 Łódz, Poland; [email protected]
* Correspondence: [email protected]
Abstract: The effective operation of national innovation systems can be a source of many oppor-tunities, but it cannot be forgotten that innovation in itself may mean limiting but also generatingvarious types of risks for the functioning of the local market. The main aim of the article is to presentthe concept and classification of national innovation systems in the world and to try to answerwhether the type of NIS determines the level of innovation of the economies of the European Unioncountries. The following research thesis was formulated in the study: the type of National InnovationSystem determines a certain level of innovation in the economy of an European Union country, i.e.,in countries belonging to a developed NIS, the level of innovation of the economy is higher than incountries belonging to developing systems. The results of the analysis confirm the research thesis.In the empirical part, the level of innovation in the European Union countries was assessed usingthe synthetic measure of development (SMD) by Z. Hellwig. Based on the obtained values of thesynthetic measure of development (innovation), a ranking of the innovation of the economies ofthe EU countries was compiled and groups of countries with a similar degree of innovation in theeconomy were distinguished. The developed ranking of the European Union countries was comparedwith the NSI classification presented in the theoretical part of the article. The study covered 2010and 2019.
Keywords: innovation; national innovation system (NIS); Hellwig method; linear ordering; standarddeviation method; European Union (EU); synthetic development measure (SDM)
1. Introduction
For several decades, the ability to create, apply and disseminate innovation has beentreated as the most important factor for sustainable economic growth and development(Dworak 2020). It is emphasized that innovation is the result of interactions between people,organizations and their environment (Swiadek and Goraczkowska 2020; Prokop et al.2021). This understanding of innovation is reflected in the concept of National InnovationSystem (NIS) that plays an important role in the innovation policy of all developed marketeconomies.
There is a great deal of risk associated with innovation activity, and this is seen as one ofthe main barriers to conducting such activity. A low level of innovation of the new MemberStates of the European Union (EU) stems from, among other factors, a low propensityfor risk taking. In a situation of relatively small financial resources, entrepreneurs’ fearsconcerning the return of expenditure on innovation activity diminish their willingness toconduct this activity. An insufficient level of innovativeness of enterprises results in a lowlevel of innovation in the economies of these countries.
The main aim of the article is to present the concept and classification of nationalinnovation systems in the world and to try to answer the question whether the type ofNational Innovation System determines the level of innovation of the economies of the
Risks 2022, 10, 6. https://doi.org/10.3390/risks10010006 https://www.mdpi.com/journal/risks
Risks 2022, 10, 6 2 of 20
European Union countries. The following research thesis was formulated in the study:the type of National Innovation System determines a certain level of innovation of theeconomy of an EU country, i.e., in countries belonging to developed National InnovationSystem the level of innovation of the economy is higher than in countries belonging todeveloping systems. The results of the analysis confirm the research thesis. In the context ofthe research conducted, it should be emphasized that the development through innovationincreases a country’s competitiveness and improves its position on the international arena.However, each development has its own economic and social consequences, which meansthat it is a source of potential risks.
The research originality of the article results primarily from making intergroup com-parisons (between groups of countries) based on the authors’ own concept of comparingthe means in individual groups for each variable with the total means and, on this basis,indicating factors with high, medium and low values within the groups. The authors’contribution to the research on the innovativeness of economies also results from the deter-mination of the relationship between the level of innovativeness of the European Unioneconomies and the type of NIS.
The article consists of the following sections: Introduction; Literature Review; Method-ology; Results and Discussion; and Conclusions. The Introduction presents, among othercontent, the aim of the paper and the research hypothesis, as well as demonstrates the needfor research in the field of national innovation systems. The theoretical part of the articlereviews the literature in the field of National Innovation System issues and presents thedefinitions and selected classifications of National Innovation Systems in the world. In theempirical part, the level of innovation in the EU countries was assessed using the syntheticmeasure of development by Z. Hellwig, called the synthetic measure of development(SMD). Based on the obtained values of the synthetic measure of development (innova-tion), a ranking of the innovation of the economies of the European Union countries wascompiled and groups of countries with a similar degree of innovation in the economy weredistinguished. The developed ranking of the EU countries was compared with the NationalInnovation Systems classification presented in the theoretical part of the article. The studycovered 2010 and 2019. The choice of years was dictated by taking into account the mostrecent statistical data and the need to show the studied phenomenon over a 10-year timehorizon. The data used in the study was obtained from the Eurostat and OECD databases.
Literature Review—The Concept and Classifications of the National Innovation System
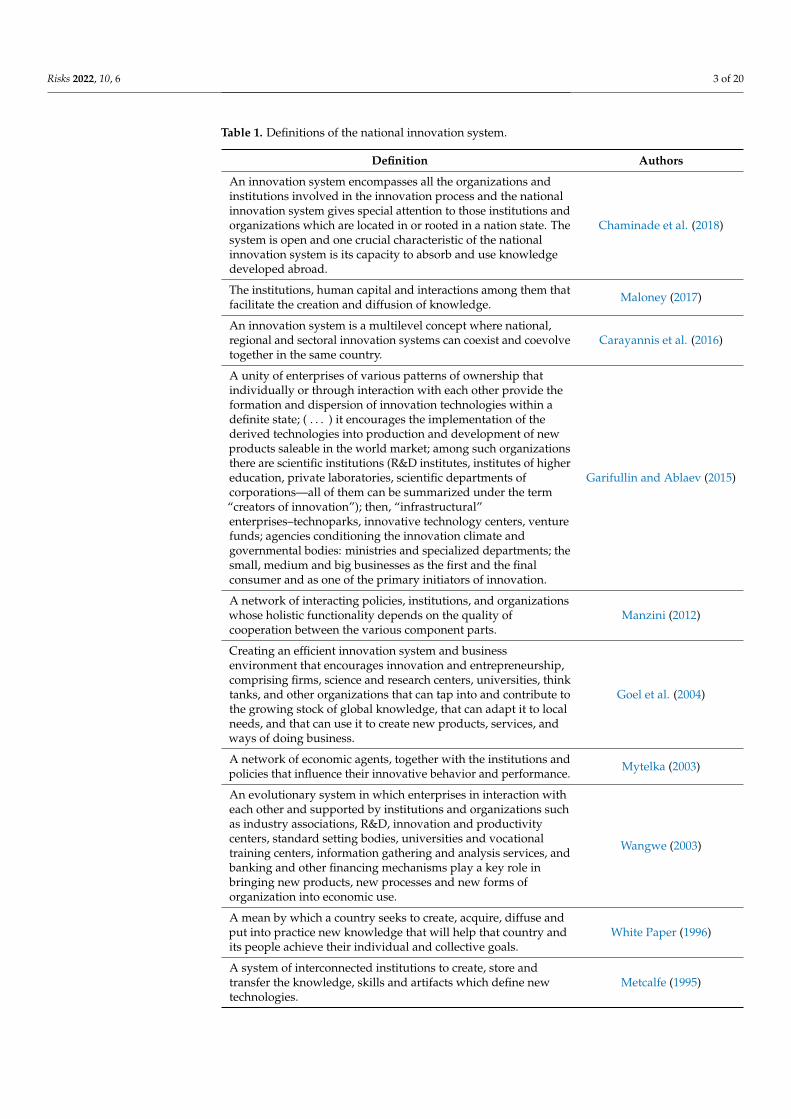
The concept of the national innovation system was created in the 1980s and 1990s(Lopez-Rubio et al. 2020; Alnafrah 2021; Lopez-Rubio et al. 2021). It has become the focusof the following economists: Ch. Freeman (Freeman 1992), R. Nelson and N. Rosenberg(Nelson and Rosenberg 1993), P. Patel and K. Pavitt (Patel and Pavitt 1994a, 1994b), C.Edquist (Edquist 1997) and B.A. Lundvall (Lundvall 1992). It should be emphasized thatthe problems concerning the determinants of innovative processes were discussed earlierin the economic literature. Nevertheless, they were treated as elements of considerationson the industrial, scientific and technical policy (Edquist 1997, p. 52). Various definitionsof the national innovation system exist in the economic literature. An overview of thesedefinitions is presented in Table 1.
Risks 2022, 10, 6 3 of 20
Table 1. Definitions of the national innovation system.
Definition Authors
An innovation system encompasses all the organizations andinstitutions involved in the innovation process and the nationalinnovation system gives special attention to those institutions andorganizations which are located in or rooted in a nation state. Thesystem is open and one crucial characteristic of the nationalinnovation system is its capacity to absorb and use knowledgedeveloped abroad.
Chaminade et al. (2018)
The institutions, human capital and interactions among them thatfacilitate the creation and diffusion of knowledge. Maloney (2017)
An innovation system is a multilevel concept where national,regional and sectoral innovation systems can coexist and coevolvetogether in the same country.
Carayannis et al. (2016)
A unity of enterprises of various patterns of ownership thatindividually or through interaction with each other provide theformation and dispersion of innovation technologies within adefinite state; ( . . . ) it encourages the implementation of thederived technologies into production and development of newproducts saleable in the world market; among such organizationsthere are scientific institutions (R&D institutes, institutes of highereducation, private laboratories, scientific departments ofcorporations—all of them can be summarized under the term“creators of innovation”); then, “infrastructural”enterprises–technoparks, innovative technology centers, venturefunds; agencies conditioning the innovation climate andgovernmental bodies: ministries and specialized departments; thesmall, medium and big businesses as the first and the finalconsumer and as one of the primary initiators of innovation.
Garifullin and Ablaev (2015)
A network of interacting policies, institutions, and organizationswhose holistic functionality depends on the quality ofcooperation between the various component parts.
Manzini (2012)
Creating an efficient innovation system and businessenvironment that encourages innovation and entrepreneurship,comprising firms, science and research centers, universities, thinktanks, and other organizations that can tap into and contribute tothe growing stock of global knowledge, that can adapt it to localneeds, and that can use it to create new products, services, andways of doing business.
Goel et al. (2004)
A network of economic agents, together with the institutions andpolicies that influence their innovative behavior and performance. Mytelka (2003)
An evolutionary system in which enterprises in interaction witheach other and supported by institutions and organizations suchas industry associations, R&D, innovation and productivitycenters, standard setting bodies, universities and vocationaltraining centers, information gathering and analysis services, andbanking and other financing mechanisms play a key role inbringing new products, new processes and new forms oforganization into economic use.
Wangwe (2003)
A mean by which a country seeks to create, acquire, diffuse andput into practice new knowledge that will help that country andits people achieve their individual and collective goals.
White Paper (1996)
A system of interconnected institutions to create, store andtransfer the knowledge, skills and artifacts which define newtechnologies.
Metcalfe (1995)
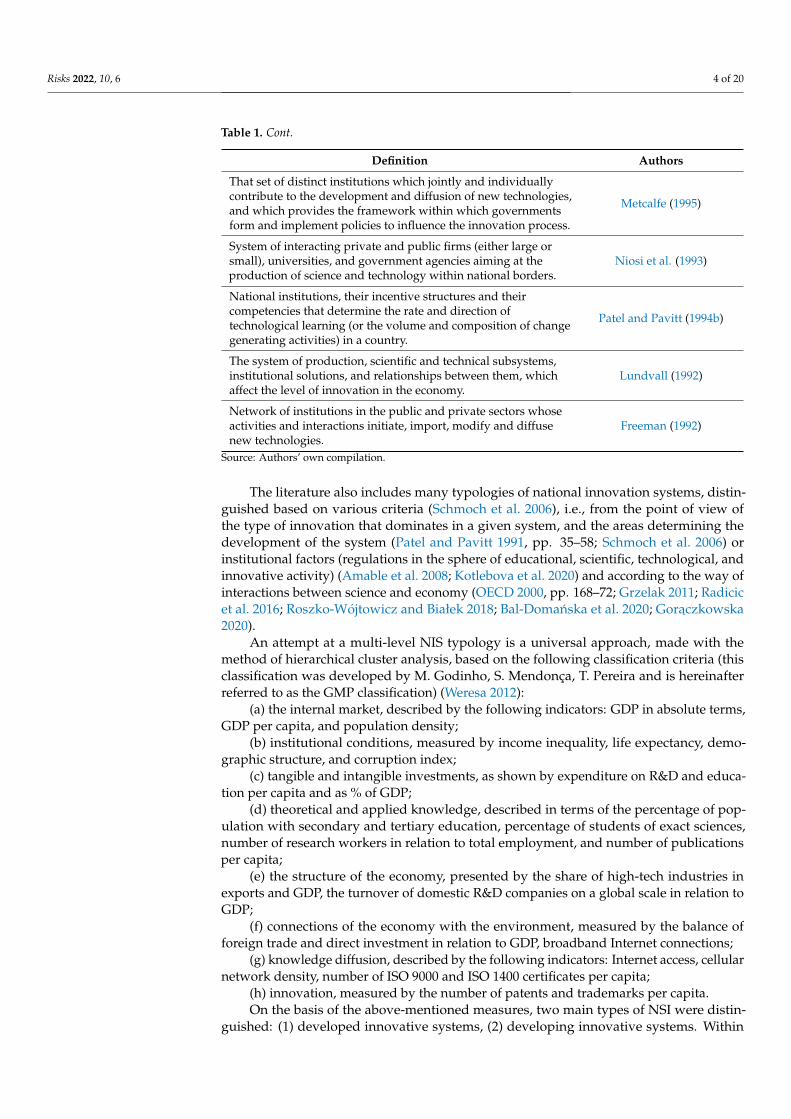
Risks 2022, 10, 6 4 of 20
Table 1. Cont.
Definition Authors
That set of distinct institutions which jointly and individuallycontribute to the development and diffusion of new technologies,and which provides the framework within which governmentsform and implement policies to influence the innovation process.
Metcalfe (1995)
System of interacting private and public firms (either large orsmall), universities, and government agencies aiming at theproduction of science and technology within national borders.
Niosi et al. (1993)
National institutions, their incentive structures and theircompetencies that determine the rate and direction oftechnological learning (or the volume and composition of changegenerating activities) in a country.
Patel and Pavitt (1994b)
The system of production, scientific and technical subsystems,institutional solutions, and relationships between them, whichaffect the level of innovation in the economy.
Lundvall (1992)
Network of institutions in the public and private sectors whoseactivities and interactions initiate, import, modify and diffusenew technologies.
Freeman (1992)
Source: Authors’ own compilation.
The literature also includes many typologies of national innovation systems, distin-guished based on various criteria (Schmoch et al. 2006), i.e., from the point of view ofthe type of innovation that dominates in a given system, and the areas determining thedevelopment of the system (Patel and Pavitt 1991, pp. 35–58; Schmoch et al. 2006) orinstitutional factors (regulations in the sphere of educational, scientific, technological, andinnovative activity) (Amable et al. 2008; Kotlebova et al. 2020) and according to the way ofinteractions between science and economy (OECD 2000, pp. 168–72; Grzelak 2011; Radicicet al. 2016; Roszko-Wójtowicz and Białek 2018; Bal-Domanska et al. 2020; Goraczkowska2020).
An attempt at a multi-level NIS typology is a universal approach, made with themethod of hierarchical cluster analysis, based on the following classification criteria (thisclassification was developed by M. Godinho, S. Mendonça, T. Pereira and is hereinafterreferred to as the GMP classification) (Weresa 2012):
(a) the internal market, described by the following indicators: GDP in absolute terms,GDP per capita, and population density;
(b) institutional conditions, measured by income inequality, life expectancy, demo-graphic structure, and corruption index;
(c) tangible and intangible investments, as shown by expenditure on R&D and educa-tion per capita and as % of GDP;
(d) theoretical and applied knowledge, described in terms of the percentage of pop-ulation with secondary and tertiary education, percentage of students of exact sciences,number of research workers in relation to total employment, and number of publicationsper capita;
(e) the structure of the economy, presented by the share of high-tech industries inexports and GDP, the turnover of domestic R&D companies on a global scale in relation toGDP;
(f) connections of the economy with the environment, measured by the balance offoreign trade and direct investment in relation to GDP, broadband Internet connections;
(g) knowledge diffusion, described by the following indicators: Internet access, cellularnetwork density, number of ISO 9000 and ISO 1400 certificates per capita;
(h) innovation, measured by the number of patents and trademarks per capita.On the basis of the above-mentioned measures, two main types of NSI were distin-
guished: (1) developed innovative systems, (2) developing innovative systems. Within
Risks 2022, 10, 6 5 of 20
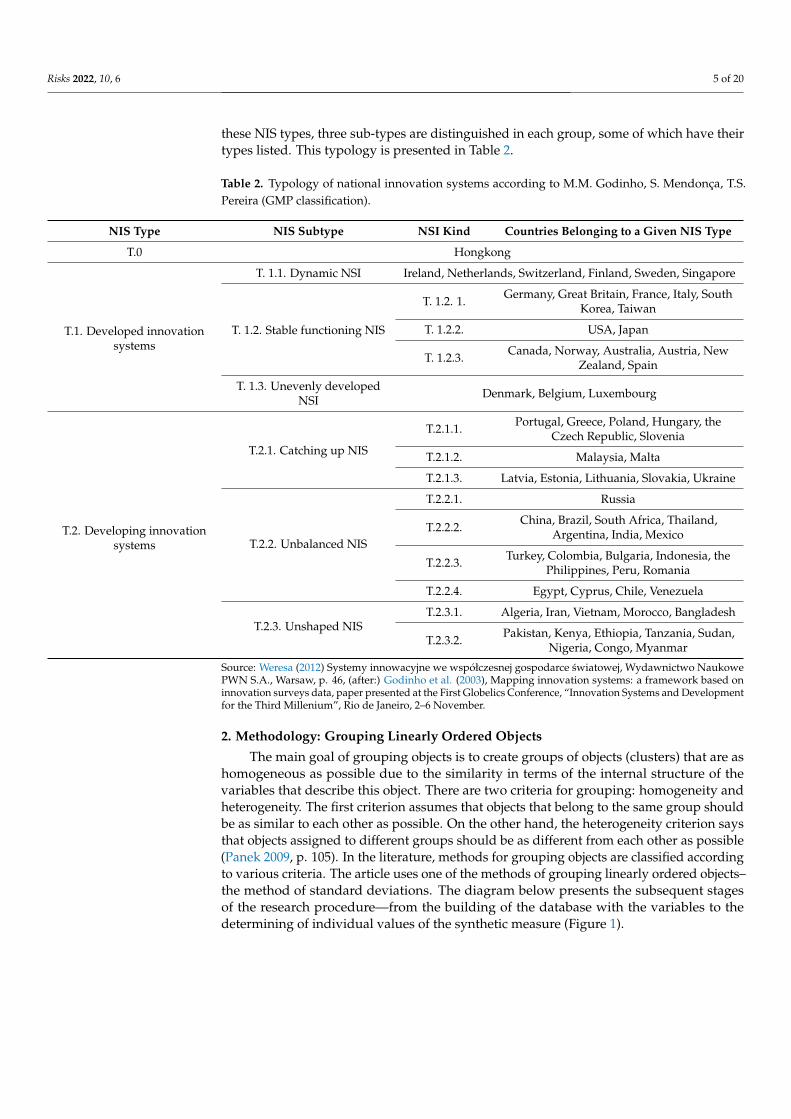
these NIS types, three sub-types are distinguished in each group, some of which have theirtypes listed. This typology is presented in Table 2.
Table 2. Typology of national innovation systems according to M.M. Godinho, S. Mendonça, T.S.Pereira (GMP classification).
NIS Type NIS Subtype NSI Kind Countries Belonging to a Given NIS Type
T.0 Hongkong
T.1. Developed innovationsystems
T. 1.1. Dynamic NSI Ireland, Netherlands, Switzerland, Finland, Sweden, Singapore
T. 1.2. Stable functioning NIS
T. 1.2. 1. Germany, Great Britain, France, Italy, SouthKorea, Taiwan
T. 1.2.2. USA, Japan
T. 1.2.3. Canada, Norway, Australia, Austria, NewZealand, Spain
T. 1.3. Unevenly developedNSI Denmark, Belgium, Luxembourg
T.2. Developing innovationsystems
T.2.1. Catching up NIS
T.2.1.1. Portugal, Greece, Poland, Hungary, theCzech Republic, Slovenia
T.2.1.2. Malaysia, Malta
T.2.1.3. Latvia, Estonia, Lithuania, Slovakia, Ukraine
T.2.2. Unbalanced NIS
T.2.2.1. Russia
T.2.2.2. China, Brazil, South Africa, Thailand,Argentina, India, Mexico
T.2.2.3. Turkey, Colombia, Bulgaria, Indonesia, thePhilippines, Peru, Romania
T.2.2.4. Egypt, Cyprus, Chile, Venezuela
T.2.3. Unshaped NIST.2.3.1. Algeria, Iran, Vietnam, Morocco, Bangladesh
T.2.3.2. Pakistan, Kenya, Ethiopia, Tanzania, Sudan,Nigeria, Congo, Myanmar
Source: Weresa (2012) Systemy innowacyjne we współczesnej gospodarce swiatowej, Wydawnictwo NaukowePWN S.A., Warsaw, p. 46, (after:) Godinho et al. (2003), Mapping innovation systems: a framework based oninnovation surveys data, paper presented at the First Globelics Conference, “Innovation Systems and Developmentfor the Third Millenium”, Rio de Janeiro, 2–6 November.
2. Methodology: Grouping Linearly Ordered Objects
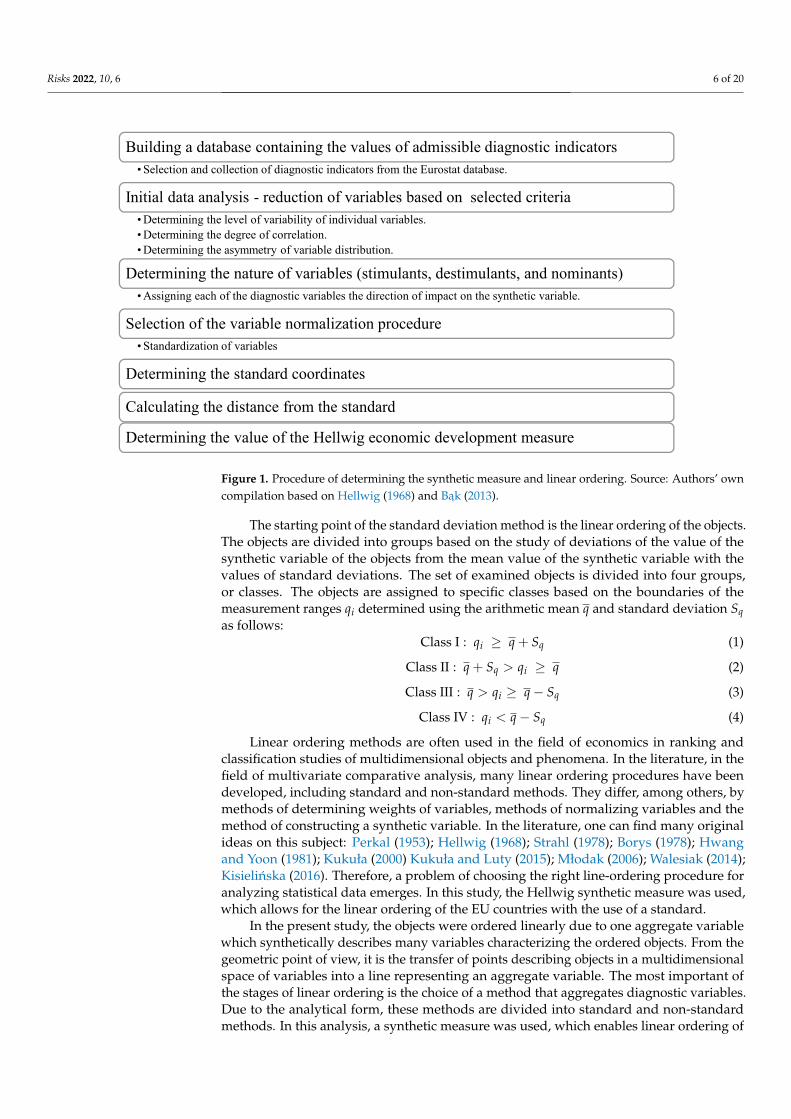
The main goal of grouping objects is to create groups of objects (clusters) that are ashomogeneous as possible due to the similarity in terms of the internal structure of thevariables that describe this object. There are two criteria for grouping: homogeneity andheterogeneity. The first criterion assumes that objects that belong to the same group shouldbe as similar to each other as possible. On the other hand, the heterogeneity criterion saysthat objects assigned to different groups should be as different from each other as possible(Panek 2009, p. 105). In the literature, methods for grouping objects are classified accordingto various criteria. The article uses one of the methods of grouping linearly ordered objects–the method of standard deviations. The diagram below presents the subsequent stagesof the research procedure—from the building of the database with the variables to thedetermining of individual values of the synthetic measure (Figure 1).
Risks 2022, 10, 6 6 of 20Risks 2022, 9, x FOR PEER REVIEW 6 of 20
Figure 1. Procedure of determining the synthetic measure and linear ordering. Source: Authors’ own compilation based on Hellwig (1968) and Bąk (2013).
The starting point of the standard deviation method is the linear ordering of the objects. The objects are divided into groups based on the study of deviations of the value of the synthetic variable of the objects from the mean value of the synthetic variable with the values of standard deviations. The set of examined objects is divided into four groups, or classes. The objects are assigned to specific classes based on the boundaries of the measurement ranges 푞 determined using the arithmetic mean 푞 and standard deviation 푆 as follows:
Class I: 푞 ≥ 푞 + 푆 (1)
Class II: 푞 + 푆 > 푞 ≥ 푞 (2)
Class III: 푞 > 푞 ≥ 푞 − 푆 (3)
Class IV: 푞 < 푞 − 푆 (4)
Linear ordering methods are often used in the field of economics in ranking and classification studies of multidimensional objects and phenomena. In the literature, in the field of multivariate comparative analysis, many linear ordering procedures have been developed, including standard and non-standard methods. They differ, among others, by methods of determining weights of variables, methods of normalizing variables and the method of constructing a synthetic variable. In the literature, one can find many original ideas on this subject: Perkal (1953); Hellwig (1968); Strahl (1978); Borys (1978); Hwang and Yoon (1981); Kukuła (2000) Kukuła and Luty (2015); Młodak (2006); Walesiak (2014); Kisielińska (2016). Therefore, a problem of choosing the right line-ordering procedure for analyzing statistical data emerges. In this study, the Hellwig synthetic measure was used, which allows for the linear ordering of the EU countries with the use of a standard.
In the present study, the objects were ordered linearly due to one aggregate variable which synthetically describes many variables characterizing the ordered objects. From the geometric point of view, it is the transfer of points describing objects in a multidimensional space of variables into a line representing an aggregate variable. The most important of the stages of linear ordering is the choice of a method that aggregates diagnostic variables. Due to the analytical form, these methods are divided into standard
Building a database containing the values of admissible diagnostic indicators• Selection and collection of diagnostic indicators from the Eurostat database.
Initial data analysis - reduction of variables based on selected criteria• Determining the level of variability of individual variables.• Determining the degree of correlation.• Determining the asymmetry of variable distribution.
Determining the nature of variables (stimulants, destimulants, and nominants)• Assigning each of the diagnostic variables the direction of impact on the synthetic variable.
Selection of the variable normalization procedure• Standardization of variables
Determining the standard coordinates
Calculating the distance from the standard
Determining the value of the Hellwig economic development measure
Figure 1. Procedure of determining the synthetic measure and linear ordering. Source: Authors’ owncompilation based on Hellwig (1968) and Bak (2013).
The starting point of the standard deviation method is the linear ordering of the objects.The objects are divided into groups based on the study of deviations of the value of thesynthetic variable of the objects from the mean value of the synthetic variable with thevalues of standard deviations. The set of examined objects is divided into four groups,or classes. The objects are assigned to specific classes based on the boundaries of themeasurement ranges qi determined using the arithmetic mean q and standard deviation Sqas follows:
Class I : qi ≥ q + Sq (1)
Class II : q + Sq > qi ≥ q (2)
Class III : q > qi ≥ q− Sq (3)
Class IV : qi < q− Sq (4)
Linear ordering methods are often used in the field of economics in ranking andclassification studies of multidimensional objects and phenomena. In the literature, in thefield of multivariate comparative analysis, many linear ordering procedures have beendeveloped, including standard and non-standard methods. They differ, among others, bymethods of determining weights of variables, methods of normalizing variables and themethod of constructing a synthetic variable. In the literature, one can find many originalideas on this subject: Perkal (1953); Hellwig (1968); Strahl (1978); Borys (1978); Hwangand Yoon (1981); Kukuła (2000) Kukuła and Luty (2015); Młodak (2006); Walesiak (2014);Kisielinska (2016). Therefore, a problem of choosing the right line-ordering procedure foranalyzing statistical data emerges. In this study, the Hellwig synthetic measure was used,which allows for the linear ordering of the EU countries with the use of a standard.
In the present study, the objects were ordered linearly due to one aggregate variablewhich synthetically describes many variables characterizing the ordered objects. From thegeometric point of view, it is the transfer of points describing objects in a multidimensionalspace of variables into a line representing an aggregate variable. The most important ofthe stages of linear ordering is the choice of a method that aggregates diagnostic variables.Due to the analytical form, these methods are divided into standard and non-standardmethods. In this analysis, a synthetic measure was used, which enables linear ordering of
Risks 2022, 10, 6 7 of 20
objects with the use of a pattern. This measure is the “measure of economic development”proposed by Z. Hellwig in 1968 (Bak 2013).
The basic stages of linear ordering using the Hellwig’s economic development measureare as follows (Bak 2013):
1. Building a database contaning the values of admissible diagnostic indicators;2. Initial data analysis: descriptive analysis of diagnostic indicators (measures of position,
variability), correlation analysis, reduction and selection of diagnostic variables;3. Determining the nature of variables (stimulants, destimulants, and nominants). A
variable is a stimulant if its growth positively affects the assessment of the subject. Avariable is a destimulant if its decreasing values have a positive effect on the object’sassessment. Nominant is a variable whose values have a positive effect on the objectup to a certain point, and when this threshold is exceeded, it adversely affects theassessment of the object;
4. Standardization of variables:
zij =xij − xj
S(xj) (5)
where:
xj—arithmetic mean of the next feature; Sj—standard deviation of another feature;zij—standardized value;
5. Calculation of pattern coordinates:
z0j =
maxi
{zij}
f orstimulants
mini
{zij}
f ordestimulants(6)
6. Calculation of the distance from the pattern:
di0 =
√√√√ m
∑j=1
(zij − z0j
)2 (7)
7. Determining the value of the measure of economic development:
qi (usually qi ∈ [0; 1]) − qi = 1− di0d0
(8)
where : d0 = d0 + 2sd, d0 =1n ∑ n
i=1di0, sd =
√∑ n
i=1
(di0 − d0
)2(9)
The results of the research carried out in accordance with the above-presented proce-dure are described in the next paragraph.
3. Results and Discussion: Classification of the European Union Countries in Terms ofthe Level of Innovation of the Economy
The aim of the empirical study is to classify the EU countries according to the levelof innovation of their economies in 2010 and 2019. One of the methods of multivariatestatistical analysis was used in the study: the method of standard deviations of linearlyordered objects. In the context of measuring and assessing the innovation of economies,apart from the problem of data availability for the analyzed period, there is also theproblem of selecting indicators that best describe this phenomenon. Economic literaturedevotes a great deal of space to determinants of NIS development (Seidel et al. 2013;Roszko-Wójtowicz and Grzelak 2020). Each of these determinants reflects an aspect of theinnovation system, and they may be grouped into three levels: a micro, meso and macrolevel. The micro level (i) consists of private and public institutions that provide support formain actors in the innovation system, while the meso level (ii) is considered as an important
Risks 2022, 10, 6 8 of 20
intermediary tool to convert policy decisions into practice. Generally, at the meso level,we find clusters, technology transfer centers, innovation service providers, and fundingagencies. Meanwhile, the macro level (iii) is a level of national policies: laws, regulations,training and education, and master plans.
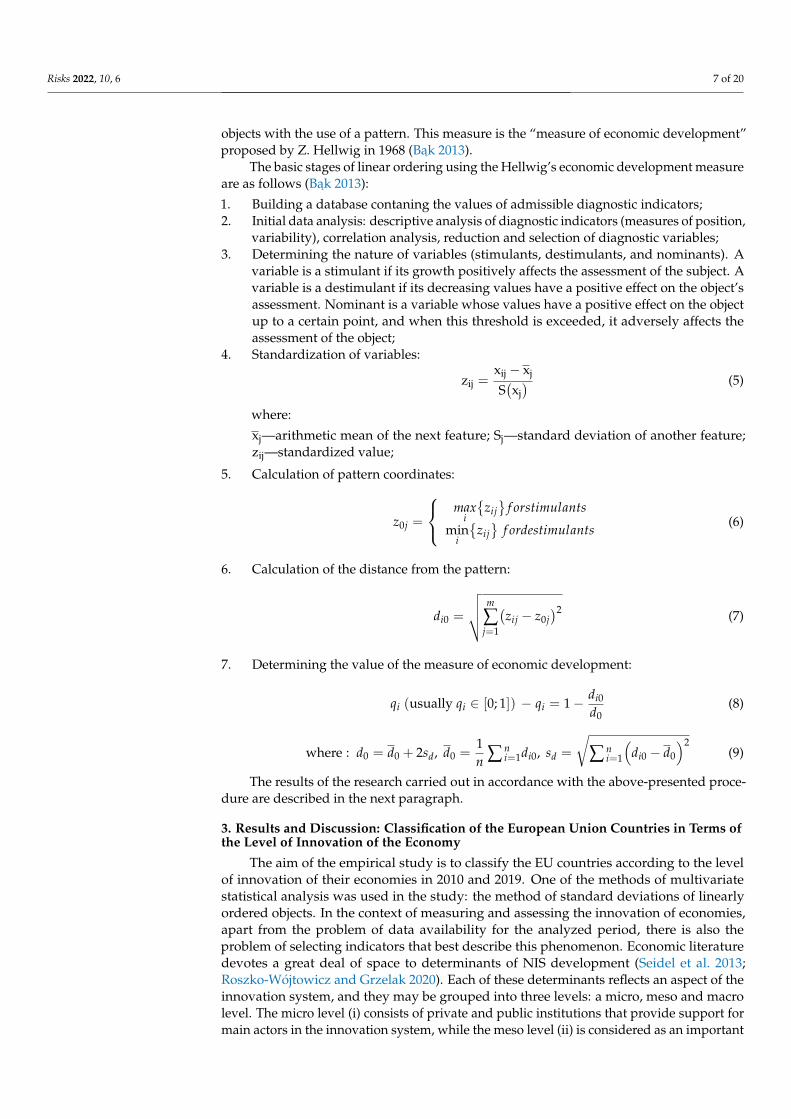
This study refers to the methodological proposals contained in the Oslo Manual(OECD/Eurostat 2018) which is the result of the joint work of Eurostat and OECD. Follow-ing the Oslo methodology, 13 variables, potential indicators of innovation, were included inthe input data set. The set of these variables is presented in Table 3. All potential indicatorsdescribing innovation were treated as stimulants, i.e., variables whose increasing valueshave a positive impact on the studied phenomenon.
Table 3. A set of potential diagnostic indicators of innovation.
Symbol Name of the Indicator
X1 R&D expenditure in euro per capita–all sectors
X2 R&D expenditure in euro per capita–business enterprise sector
X3 R&D expenditure in euro per capita–government sector
X4 R&D expenditure in euro per capita–high education sector
X5 High-tech patent applications to the EPO per million inhabitants
X6 EU trademark applications per million population
X7 Students in tertiary education by age groups as % of corresponding age population
X8 Total high-tech trade in million euro as % of total (imports)
X9 R&D personnel as % of the labor force
X10 High–tech exports as % of total exports
X11 Employment in knowledge-intensive activities as % of total employment
X12 Product or process innovative enterprises engaged in cooperation as % of innovativeenterprises
X13 Triadic patent families per million inhabitantsSource: Eurostat, accessed on 20 December 2020.
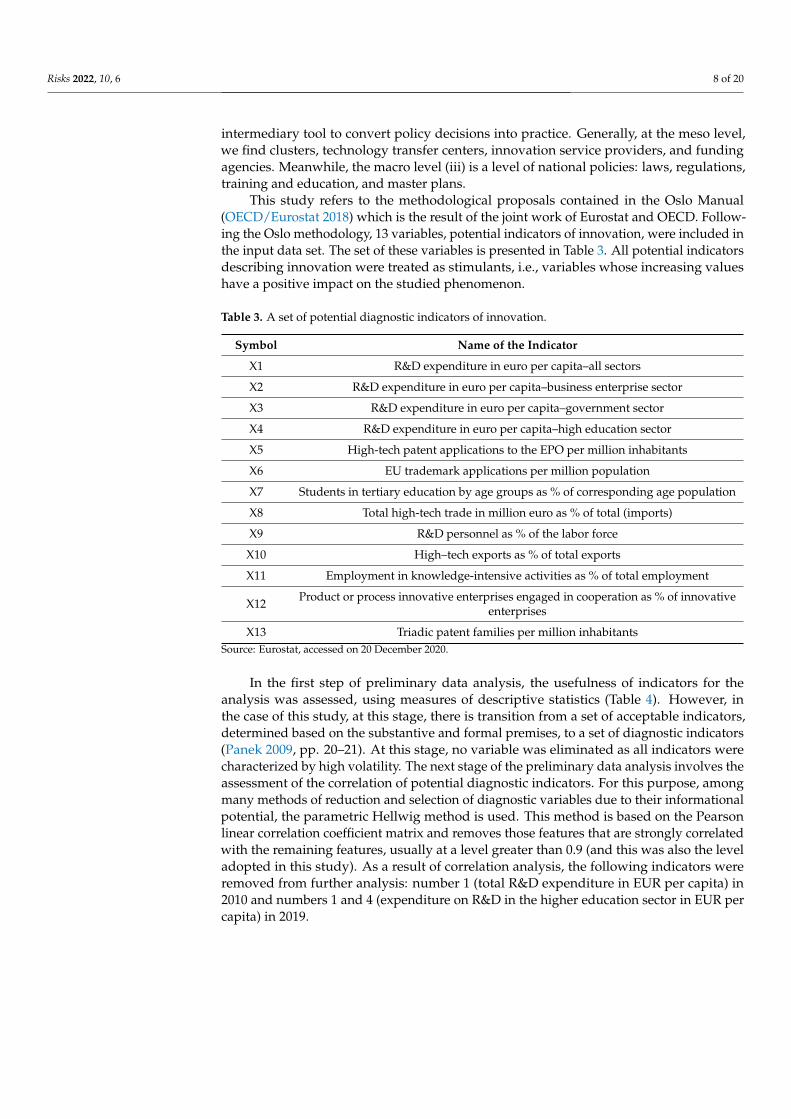
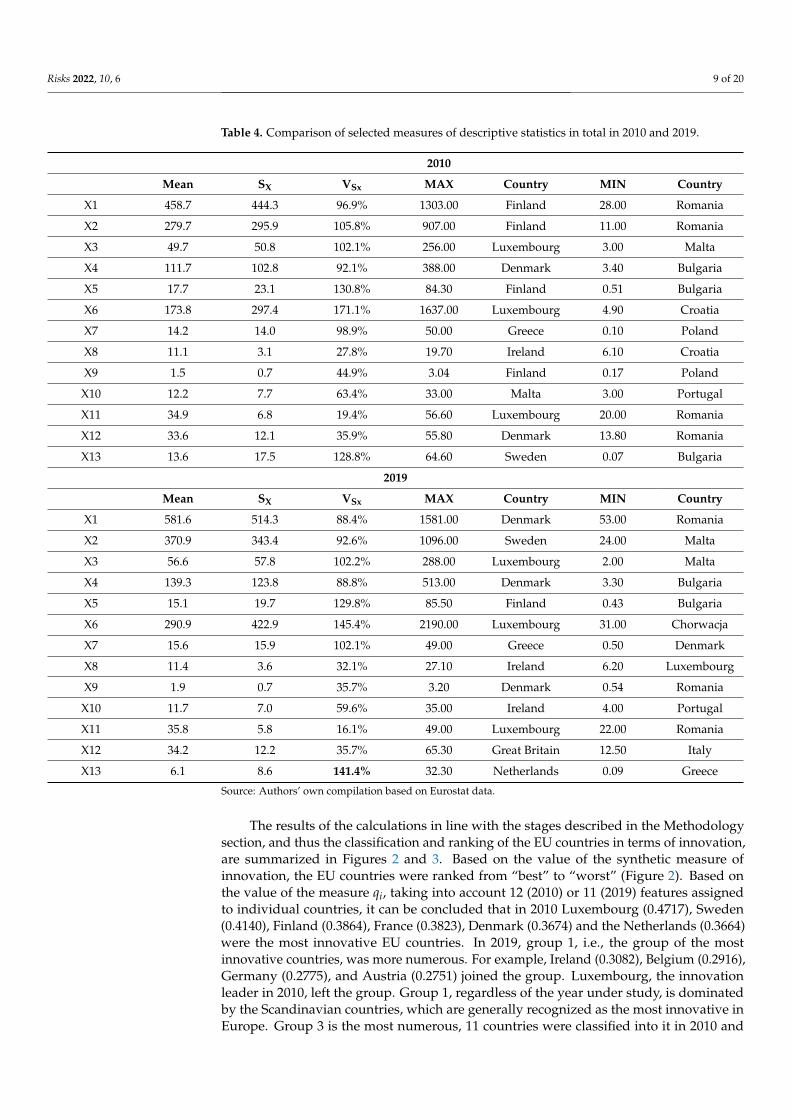
In the first step of preliminary data analysis, the usefulness of indicators for theanalysis was assessed, using measures of descriptive statistics (Table 4). However, inthe case of this study, at this stage, there is transition from a set of acceptable indicators,determined based on the substantive and formal premises, to a set of diagnostic indicators(Panek 2009, pp. 20–21). At this stage, no variable was eliminated as all indicators werecharacterized by high volatility. The next stage of the preliminary data analysis involves theassessment of the correlation of potential diagnostic indicators. For this purpose, amongmany methods of reduction and selection of diagnostic variables due to their informationalpotential, the parametric Hellwig method is used. This method is based on the Pearsonlinear correlation coefficient matrix and removes those features that are strongly correlatedwith the remaining features, usually at a level greater than 0.9 (and this was also the leveladopted in this study). As a result of correlation analysis, the following indicators wereremoved from further analysis: number 1 (total R&D expenditure in EUR per capita) in2010 and numbers 1 and 4 (expenditure on R&D in the higher education sector in EUR percapita) in 2019.
Risks 2022, 10, 6 9 of 20
Table 4. Comparison of selected measures of descriptive statistics in total in 2010 and 2019.
2010
Mean SX VSx MAX Country MIN Country
X1 458.7 444.3 96.9% 1303.00 Finland 28.00 Romania
X2 279.7 295.9 105.8% 907.00 Finland 11.00 Romania
X3 49.7 50.8 102.1% 256.00 Luxembourg 3.00 Malta
X4 111.7 102.8 92.1% 388.00 Denmark 3.40 Bulgaria
X5 17.7 23.1 130.8% 84.30 Finland 0.51 Bulgaria
X6 173.8 297.4 171.1% 1637.00 Luxembourg 4.90 Croatia
X7 14.2 14.0 98.9% 50.00 Greece 0.10 Poland
X8 11.1 3.1 27.8% 19.70 Ireland 6.10 Croatia
X9 1.5 0.7 44.9% 3.04 Finland 0.17 Poland
X10 12.2 7.7 63.4% 33.00 Malta 3.00 Portugal
X11 34.9 6.8 19.4% 56.60 Luxembourg 20.00 Romania
X12 33.6 12.1 35.9% 55.80 Denmark 13.80 Romania
X13 13.6 17.5 128.8% 64.60 Sweden 0.07 Bulgaria
2019
Mean SX VSx MAX Country MIN Country
X1 581.6 514.3 88.4% 1581.00 Denmark 53.00 Romania
X2 370.9 343.4 92.6% 1096.00 Sweden 24.00 Malta
X3 56.6 57.8 102.2% 288.00 Luxembourg 2.00 Malta
X4 139.3 123.8 88.8% 513.00 Denmark 3.30 Bulgaria
X5 15.1 19.7 129.8% 85.50 Finland 0.43 Bulgaria
X6 290.9 422.9 145.4% 2190.00 Luxembourg 31.00 Chorwacja
X7 15.6 15.9 102.1% 49.00 Greece 0.50 Denmark
X8 11.4 3.6 32.1% 27.10 Ireland 6.20 Luxembourg
X9 1.9 0.7 35.7% 3.20 Denmark 0.54 Romania
X10 11.7 7.0 59.6% 35.00 Ireland 4.00 Portugal
X11 35.8 5.8 16.1% 49.00 Luxembourg 22.00 Romania
X12 34.2 12.2 35.7% 65.30 Great Britain 12.50 Italy
X13 6.1 8.6 141.4% 32.30 Netherlands 0.09 Greece
Source: Authors’ own compilation based on Eurostat data.
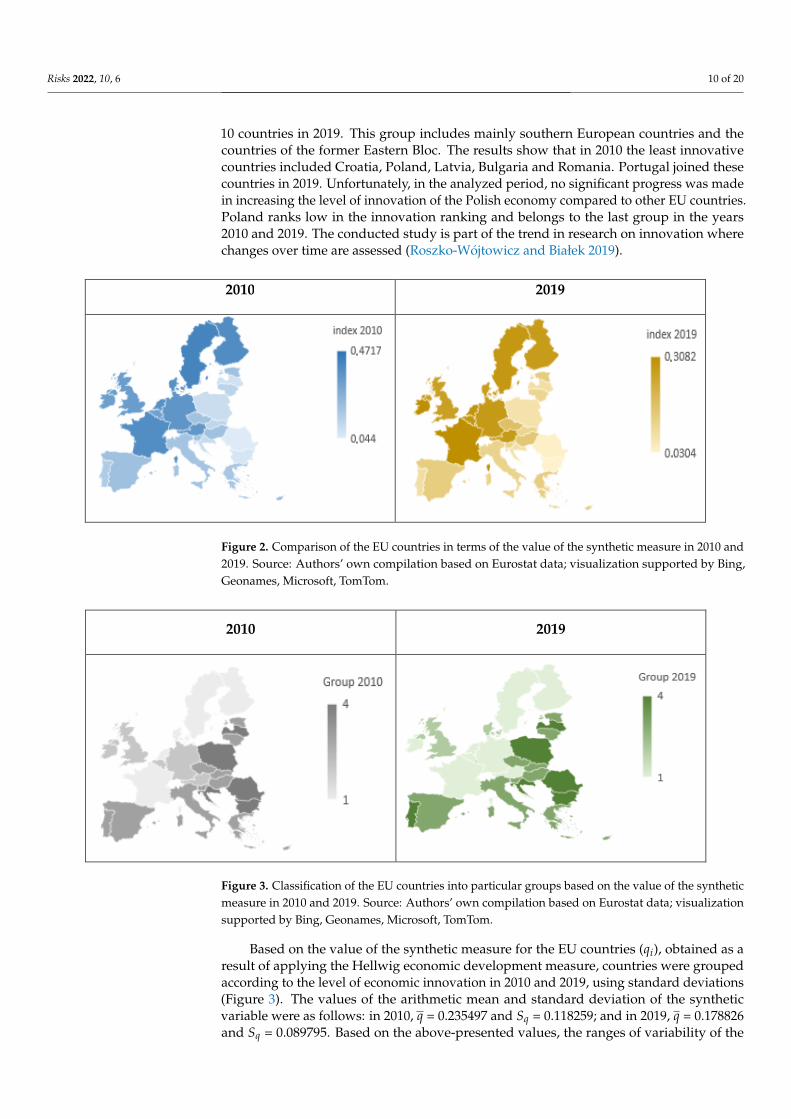
The results of the calculations in line with the stages described in the Methodologysection, and thus the classification and ranking of the EU countries in terms of innovation,are summarized in Figures 2 and 3. Based on the value of the synthetic measure ofinnovation, the EU countries were ranked from “best” to “worst” (Figure 2). Based onthe value of the measure qi, taking into account 12 (2010) or 11 (2019) features assignedto individual countries, it can be concluded that in 2010 Luxembourg (0.4717), Sweden(0.4140), Finland (0.3864), France (0.3823), Denmark (0.3674) and the Netherlands (0.3664)were the most innovative EU countries. In 2019, group 1, i.e., the group of the mostinnovative countries, was more numerous. For example, Ireland (0.3082), Belgium (0.2916),Germany (0.2775), and Austria (0.2751) joined the group. Luxembourg, the innovationleader in 2010, left the group. Group 1, regardless of the year under study, is dominatedby the Scandinavian countries, which are generally recognized as the most innovative inEurope. Group 3 is the most numerous, 11 countries were classified into it in 2010 and
Risks 2022, 10, 6 10 of 20
10 countries in 2019. This group includes mainly southern European countries and thecountries of the former Eastern Bloc. The results show that in 2010 the least innovativecountries included Croatia, Poland, Latvia, Bulgaria and Romania. Portugal joined thesecountries in 2019. Unfortunately, in the analyzed period, no significant progress was madein increasing the level of innovation of the Polish economy compared to other EU countries.Poland ranks low in the innovation ranking and belongs to the last group in the years2010 and 2019. The conducted study is part of the trend in research on innovation wherechanges over time are assessed (Roszko-Wójtowicz and Białek 2019).
Risks 2022, 9, x FOR PEER REVIEW 10 of 20
to other EU countries. Poland ranks low in the innovation ranking and belongs to the last group in the years 2010 and 2019. The conducted study is part of the trend in research on innovation where changes over time are assessed (Roszko-Wójtowicz and Białek 2019).
2010 2019
Figure 2. Comparison of the EU countries in terms of the value of the synthetic measure in 2010 and 2019. Source: Authors’ own compilation based on Eurostat data; visualization supported by Bing, Geonames, Microsoft, TomTom.
2010 2019
Figure 3. Classification of the EU countries into particular groups based on the value of the synthetic measure in 2010 and 2019. Source: Authors’ own compilation based on Eurostat data; visualization supported by Bing, Geonames, Microsoft, TomTom.
Based on the value of the synthetic measure for the EU countries (푞 ), obtained as a result of applying the Hellwig economic development measure, countries were grouped according to the level of economic innovation in 2010 and 2019, using standard deviations (Figure 3). The values of the arithmetic mean and standard deviation of the synthetic variable were as follows: in 2010, 푞 = 0.235497 and 푆 = 0.118259; and in 2019, 푞 = 0.178826 and 푆 = 0.089795. Based on the above-presented values, the ranges of variability of the synthetic measure were determined for groups of EU countries, which are summarized in Table 5.
Figure 2. Comparison of the EU countries in terms of the value of the synthetic measure in 2010 and2019. Source: Authors’ own compilation based on Eurostat data; visualization supported by Bing,Geonames, Microsoft, TomTom.
Risks 2022, 9, x FOR PEER REVIEW 10 of 20
to other EU countries. Poland ranks low in the innovation ranking and belongs to the last group in the years 2010 and 2019. The conducted study is part of the trend in research on innovation where changes over time are assessed (Roszko-Wójtowicz and Białek 2019).
2010 2019
Figure 2. Comparison of the EU countries in terms of the value of the synthetic measure in 2010 and 2019. Source: Authors’ own compilation based on Eurostat data; visualization supported by Bing, Geonames, Microsoft, TomTom.
2010 2019
Figure 3. Classification of the EU countries into particular groups based on the value of the synthetic measure in 2010 and 2019. Source: Authors’ own compilation based on Eurostat data; visualization supported by Bing, Geonames, Microsoft, TomTom.
Based on the value of the synthetic measure for the EU countries (푞 ), obtained as a result of applying the Hellwig economic development measure, countries were grouped according to the level of economic innovation in 2010 and 2019, using standard deviations (Figure 3). The values of the arithmetic mean and standard deviation of the synthetic variable were as follows: in 2010, 푞 = 0.235497 and 푆 = 0.118259; and in 2019, 푞 = 0.178826 and 푆 = 0.089795. Based on the above-presented values, the ranges of variability of the synthetic measure were determined for groups of EU countries, which are summarized in Table 5.
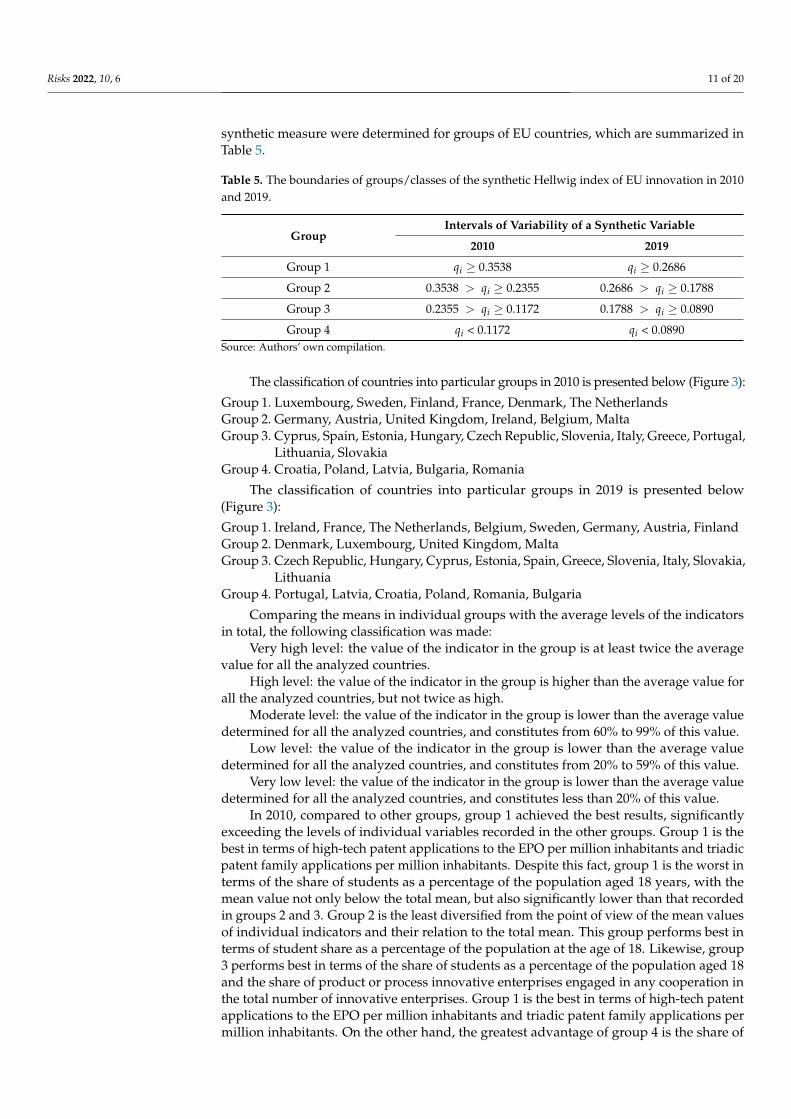
Figure 3. Classification of the EU countries into particular groups based on the value of the syntheticmeasure in 2010 and 2019. Source: Authors’ own compilation based on Eurostat data; visualizationsupported by Bing, Geonames, Microsoft, TomTom.
Based on the value of the synthetic measure for the EU countries (qi), obtained as aresult of applying the Hellwig economic development measure, countries were groupedaccording to the level of economic innovation in 2010 and 2019, using standard deviations(Figure 3). The values of the arithmetic mean and standard deviation of the syntheticvariable were as follows: in 2010, q = 0.235497 and Sq = 0.118259; and in 2019, q = 0.178826and Sq = 0.089795. Based on the above-presented values, the ranges of variability of the
Risks 2022, 10, 6 11 of 20
synthetic measure were determined for groups of EU countries, which are summarized inTable 5.
Table 5. The boundaries of groups/classes of the synthetic Hellwig index of EU innovation in 2010and 2019.
GroupIntervals of Variability of a Synthetic Variable
2010 2019
Group 1 qi ≥ 0.3538 qi ≥ 0.2686
Group 2 0.3538 > qi ≥ 0.2355 0.2686 > qi ≥ 0.1788
Group 3 0.2355 > qi ≥ 0.1172 0.1788 > qi ≥ 0.0890
Group 4 qi < 0.1172 qi < 0.0890Source: Authors’ own compilation.
The classification of countries into particular groups in 2010 is presented below (Figure 3):
Group 1. Luxembourg, Sweden, Finland, France, Denmark, The NetherlandsGroup 2. Germany, Austria, United Kingdom, Ireland, Belgium, MaltaGroup 3. Cyprus, Spain, Estonia, Hungary, Czech Republic, Slovenia, Italy, Greece, Portugal,
Lithuania, SlovakiaGroup 4. Croatia, Poland, Latvia, Bulgaria, Romania
The classification of countries into particular groups in 2019 is presented below(Figure 3):
Group 1. Ireland, France, The Netherlands, Belgium, Sweden, Germany, Austria, FinlandGroup 2. Denmark, Luxembourg, United Kingdom, MaltaGroup 3. Czech Republic, Hungary, Cyprus, Estonia, Spain, Greece, Slovenia, Italy, Slovakia,
LithuaniaGroup 4. Portugal, Latvia, Croatia, Poland, Romania, Bulgaria
Comparing the means in individual groups with the average levels of the indicatorsin total, the following classification was made:
Very high level: the value of the indicator in the group is at least twice the averagevalue for all the analyzed countries.
High level: the value of the indicator in the group is higher than the average value forall the analyzed countries, but not twice as high.
Moderate level: the value of the indicator in the group is lower than the average valuedetermined for all the analyzed countries, and constitutes from 60% to 99% of this value.
Low level: the value of the indicator in the group is lower than the average valuedetermined for all the analyzed countries, and constitutes from 20% to 59% of this value.
Very low level: the value of the indicator in the group is lower than the average valuedetermined for all the analyzed countries, and constitutes less than 20% of this value.
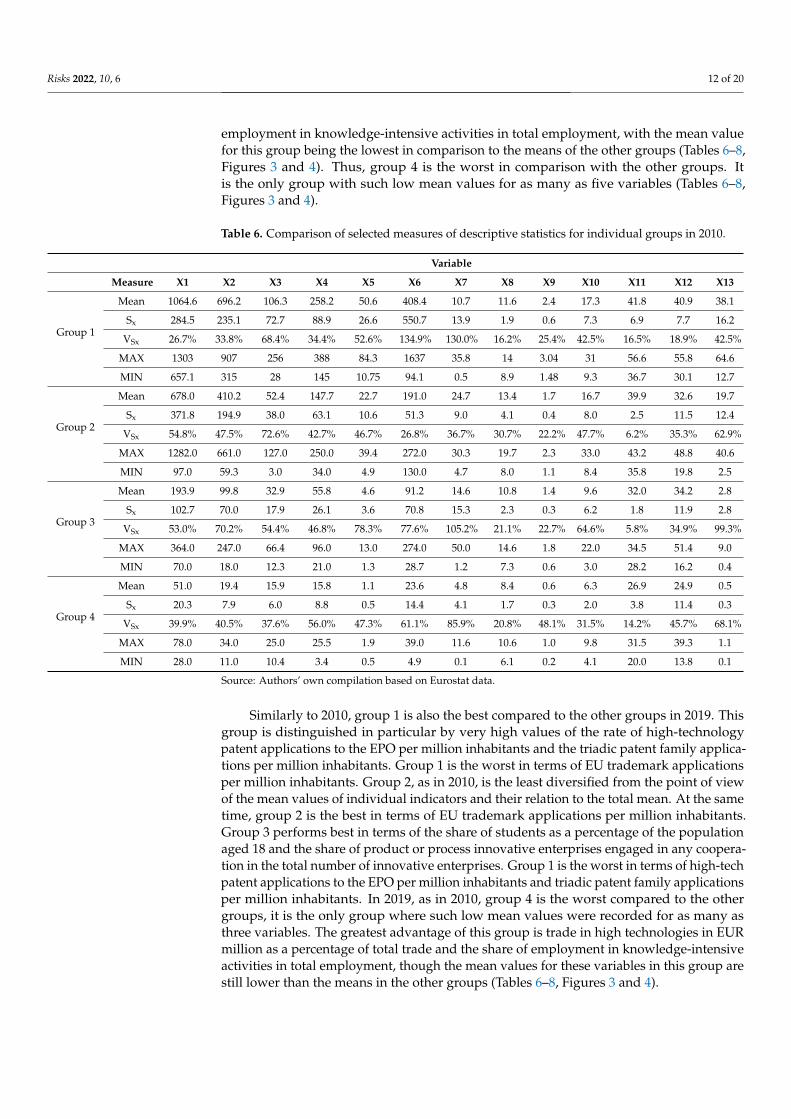
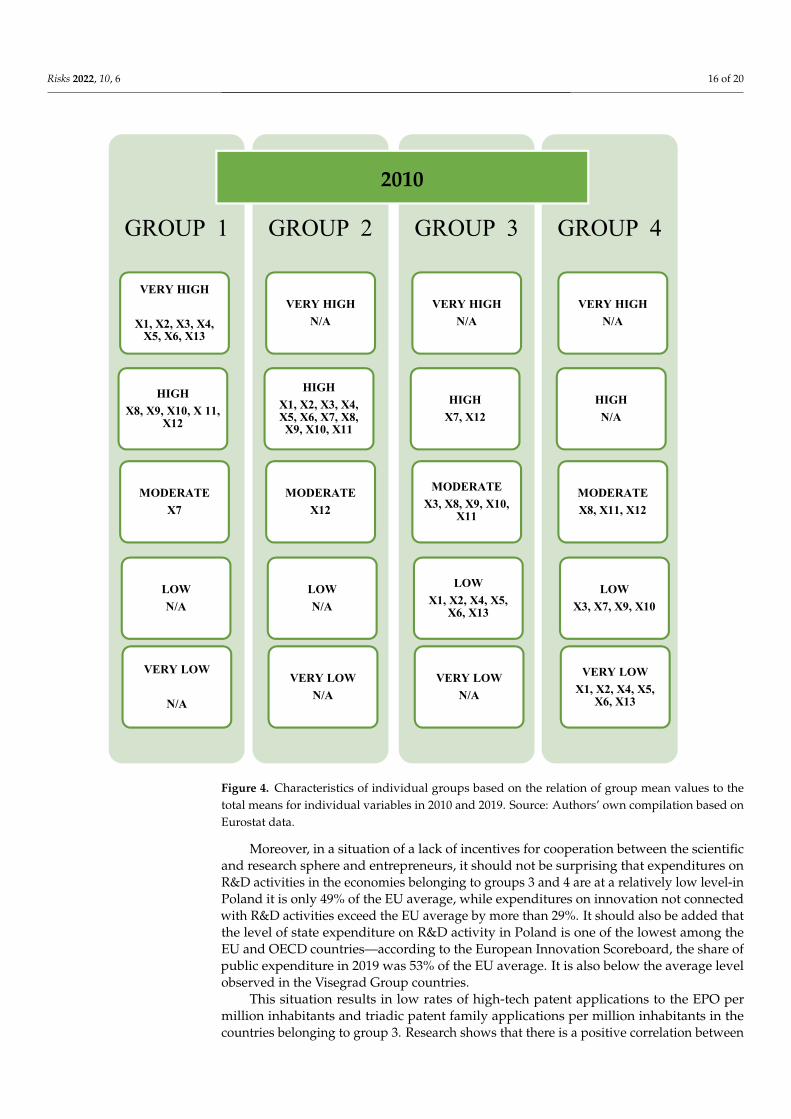
In 2010, compared to other groups, group 1 achieved the best results, significantlyexceeding the levels of individual variables recorded in the other groups. Group 1 is thebest in terms of high-tech patent applications to the EPO per million inhabitants and triadicpatent family applications per million inhabitants. Despite this fact, group 1 is the worst interms of the share of students as a percentage of the population aged 18 years, with themean value not only below the total mean, but also significantly lower than that recordedin groups 2 and 3. Group 2 is the least diversified from the point of view of the mean valuesof individual indicators and their relation to the total mean. This group performs best interms of student share as a percentage of the population at the age of 18. Likewise, group3 performs best in terms of the share of students as a percentage of the population aged 18and the share of product or process innovative enterprises engaged in any cooperation inthe total number of innovative enterprises. Group 1 is the best in terms of high-tech patentapplications to the EPO per million inhabitants and triadic patent family applications permillion inhabitants. On the other hand, the greatest advantage of group 4 is the share of
Risks 2022, 10, 6 12 of 20
employment in knowledge-intensive activities in total employment, with the mean valuefor this group being the lowest in comparison to the means of the other groups (Tables 6–8,Figures 3 and 4). Thus, group 4 is the worst in comparison with the other groups. Itis the only group with such low mean values for as many as five variables (Tables 6–8,Figures 3 and 4).
Table 6. Comparison of selected measures of descriptive statistics for individual groups in 2010.
Variable
Measure X1 X2 X3 X4 X5 X6 X7 X8 X9 X10 X11 X12 X13
Group 1
Mean 1064.6 696.2 106.3 258.2 50.6 408.4 10.7 11.6 2.4 17.3 41.8 40.9 38.1
Sx 284.5 235.1 72.7 88.9 26.6 550.7 13.9 1.9 0.6 7.3 6.9 7.7 16.2
VSx 26.7% 33.8% 68.4% 34.4% 52.6% 134.9% 130.0% 16.2% 25.4% 42.5% 16.5% 18.9% 42.5%
MAX 1303 907 256 388 84.3 1637 35.8 14 3.04 31 56.6 55.8 64.6
MIN 657.1 315 28 145 10.75 94.1 0.5 8.9 1.48 9.3 36.7 30.1 12.7
Group 2
Mean 678.0 410.2 52.4 147.7 22.7 191.0 24.7 13.4 1.7 16.7 39.9 32.6 19.7
Sx 371.8 194.9 38.0 63.1 10.6 51.3 9.0 4.1 0.4 8.0 2.5 11.5 12.4
VSx 54.8% 47.5% 72.6% 42.7% 46.7% 26.8% 36.7% 30.7% 22.2% 47.7% 6.2% 35.3% 62.9%
MAX 1282.0 661.0 127.0 250.0 39.4 272.0 30.3 19.7 2.3 33.0 43.2 48.8 40.6
MIN 97.0 59.3 3.0 34.0 4.9 130.0 4.7 8.0 1.1 8.4 35.8 19.8 2.5
Group 3
Mean 193.9 99.8 32.9 55.8 4.6 91.2 14.6 10.8 1.4 9.6 32.0 34.2 2.8
Sx 102.7 70.0 17.9 26.1 3.6 70.8 15.3 2.3 0.3 6.2 1.8 11.9 2.8
VSx 53.0% 70.2% 54.4% 46.8% 78.3% 77.6% 105.2% 21.1% 22.7% 64.6% 5.8% 34.9% 99.3%
MAX 364.0 247.0 66.4 96.0 13.0 274.0 50.0 14.6 1.8 22.0 34.5 51.4 9.0
MIN 70.0 18.0 12.3 21.0 1.3 28.7 1.2 7.3 0.6 3.0 28.2 16.2 0.4
Group 4
Mean 51.0 19.4 15.9 15.8 1.1 23.6 4.8 8.4 0.6 6.3 26.9 24.9 0.5
Sx 20.3 7.9 6.0 8.8 0.5 14.4 4.1 1.7 0.3 2.0 3.8 11.4 0.3
VSx 39.9% 40.5% 37.6% 56.0% 47.3% 61.1% 85.9% 20.8% 48.1% 31.5% 14.2% 45.7% 68.1%
MAX 78.0 34.0 25.0 25.5 1.9 39.0 11.6 10.6 1.0 9.8 31.5 39.3 1.1
MIN 28.0 11.0 10.4 3.4 0.5 4.9 0.1 6.1 0.2 4.1 20.0 13.8 0.1
Source: Authors’ own compilation based on Eurostat data.
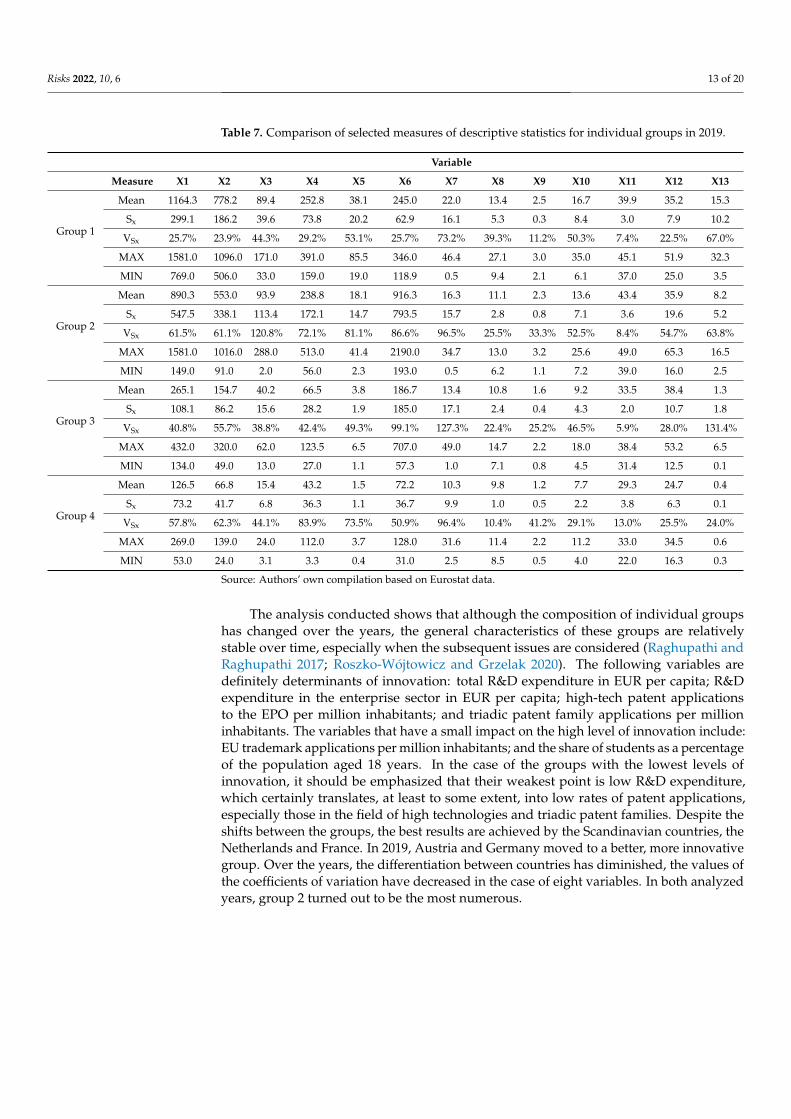
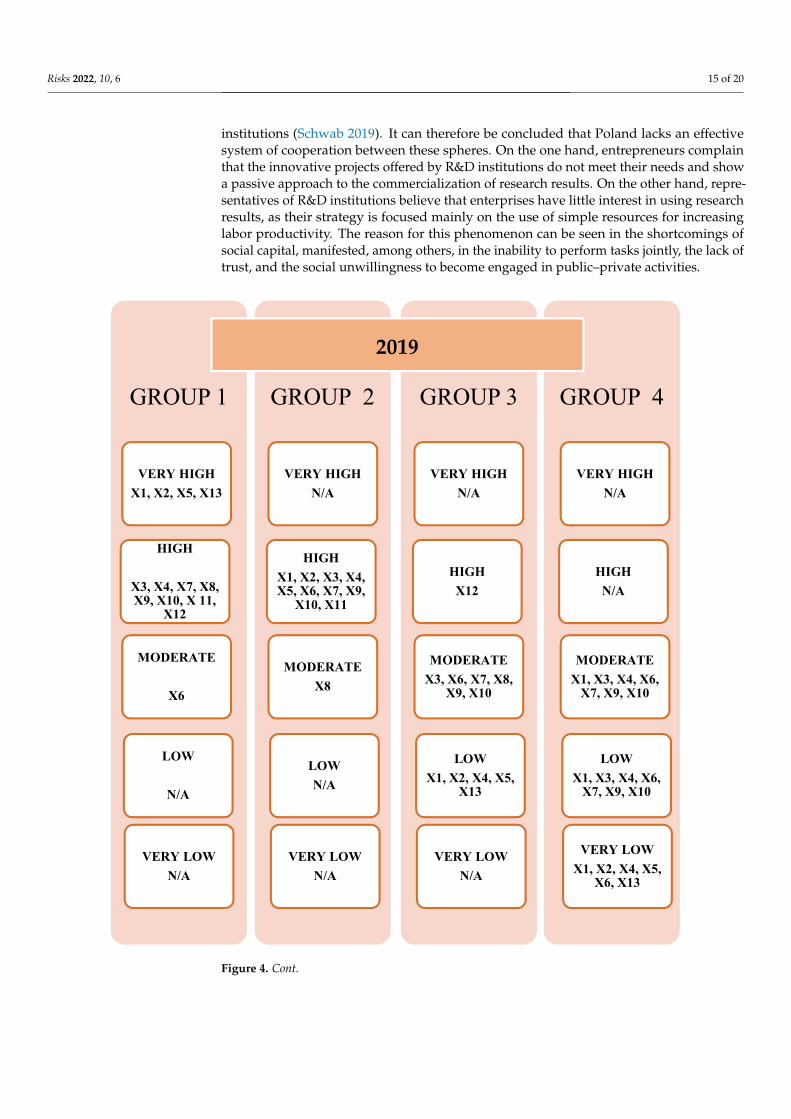
Similarly to 2010, group 1 is also the best compared to the other groups in 2019. Thisgroup is distinguished in particular by very high values of the rate of high-technologypatent applications to the EPO per million inhabitants and the triadic patent family applica-tions per million inhabitants. Group 1 is the worst in terms of EU trademark applicationsper million inhabitants. Group 2, as in 2010, is the least diversified from the point of viewof the mean values of individual indicators and their relation to the total mean. At the sametime, group 2 is the best in terms of EU trademark applications per million inhabitants.Group 3 performs best in terms of the share of students as a percentage of the populationaged 18 and the share of product or process innovative enterprises engaged in any coopera-tion in the total number of innovative enterprises. Group 1 is the worst in terms of high-techpatent applications to the EPO per million inhabitants and triadic patent family applicationsper million inhabitants. In 2019, as in 2010, group 4 is the worst compared to the othergroups, it is the only group where such low mean values were recorded for as many asthree variables. The greatest advantage of this group is trade in high technologies in EURmillion as a percentage of total trade and the share of employment in knowledge-intensiveactivities in total employment, though the mean values for these variables in this group arestill lower than the means in the other groups (Tables 6–8, Figures 3 and 4).
Risks 2022, 10, 6 13 of 20
Table 7. Comparison of selected measures of descriptive statistics for individual groups in 2019.
Variable
Measure X1 X2 X3 X4 X5 X6 X7 X8 X9 X10 X11 X12 X13
Group 1
Mean 1164.3 778.2 89.4 252.8 38.1 245.0 22.0 13.4 2.5 16.7 39.9 35.2 15.3
Sx 299.1 186.2 39.6 73.8 20.2 62.9 16.1 5.3 0.3 8.4 3.0 7.9 10.2
VSx 25.7% 23.9% 44.3% 29.2% 53.1% 25.7% 73.2% 39.3% 11.2% 50.3% 7.4% 22.5% 67.0%
MAX 1581.0 1096.0 171.0 391.0 85.5 346.0 46.4 27.1 3.0 35.0 45.1 51.9 32.3
MIN 769.0 506.0 33.0 159.0 19.0 118.9 0.5 9.4 2.1 6.1 37.0 25.0 3.5
Group 2
Mean 890.3 553.0 93.9 238.8 18.1 916.3 16.3 11.1 2.3 13.6 43.4 35.9 8.2
Sx 547.5 338.1 113.4 172.1 14.7 793.5 15.7 2.8 0.8 7.1 3.6 19.6 5.2
VSx 61.5% 61.1% 120.8% 72.1% 81.1% 86.6% 96.5% 25.5% 33.3% 52.5% 8.4% 54.7% 63.8%
MAX 1581.0 1016.0 288.0 513.0 41.4 2190.0 34.7 13.0 3.2 25.6 49.0 65.3 16.5
MIN 149.0 91.0 2.0 56.0 2.3 193.0 0.5 6.2 1.1 7.2 39.0 16.0 2.5
Group 3
Mean 265.1 154.7 40.2 66.5 3.8 186.7 13.4 10.8 1.6 9.2 33.5 38.4 1.3
Sx 108.1 86.2 15.6 28.2 1.9 185.0 17.1 2.4 0.4 4.3 2.0 10.7 1.8
VSx 40.8% 55.7% 38.8% 42.4% 49.3% 99.1% 127.3% 22.4% 25.2% 46.5% 5.9% 28.0% 131.4%
MAX 432.0 320.0 62.0 123.5 6.5 707.0 49.0 14.7 2.2 18.0 38.4 53.2 6.5
MIN 134.0 49.0 13.0 27.0 1.1 57.3 1.0 7.1 0.8 4.5 31.4 12.5 0.1
Group 4
Mean 126.5 66.8 15.4 43.2 1.5 72.2 10.3 9.8 1.2 7.7 29.3 24.7 0.4
Sx 73.2 41.7 6.8 36.3 1.1 36.7 9.9 1.0 0.5 2.2 3.8 6.3 0.1
VSx 57.8% 62.3% 44.1% 83.9% 73.5% 50.9% 96.4% 10.4% 41.2% 29.1% 13.0% 25.5% 24.0%
MAX 269.0 139.0 24.0 112.0 3.7 128.0 31.6 11.4 2.2 11.2 33.0 34.5 0.6
MIN 53.0 24.0 3.1 3.3 0.4 31.0 2.5 8.5 0.5 4.0 22.0 16.3 0.3
Source: Authors’ own compilation based on Eurostat data.
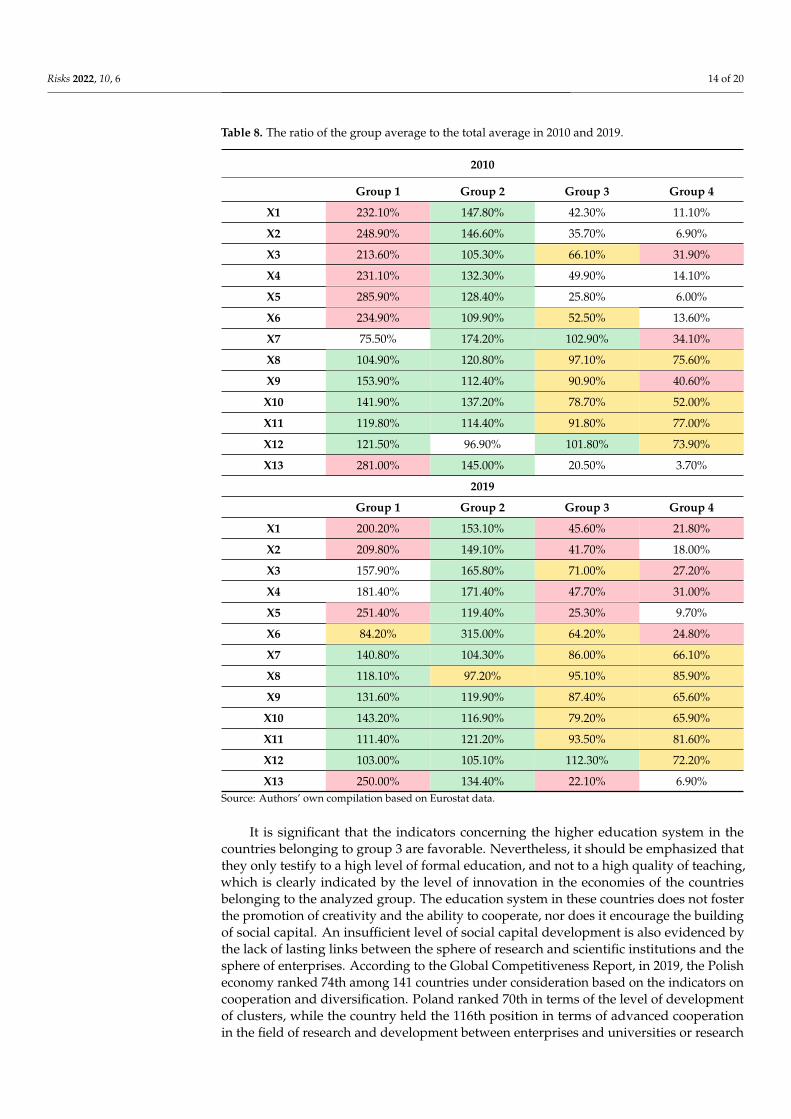
The analysis conducted shows that although the composition of individual groupshas changed over the years, the general characteristics of these groups are relativelystable over time, especially when the subsequent issues are considered (Raghupathi andRaghupathi 2017; Roszko-Wójtowicz and Grzelak 2020). The following variables aredefinitely determinants of innovation: total R&D expenditure in EUR per capita; R&Dexpenditure in the enterprise sector in EUR per capita; high-tech patent applicationsto the EPO per million inhabitants; and triadic patent family applications per millioninhabitants. The variables that have a small impact on the high level of innovation include:EU trademark applications per million inhabitants; and the share of students as a percentageof the population aged 18 years. In the case of the groups with the lowest levels ofinnovation, it should be emphasized that their weakest point is low R&D expenditure,which certainly translates, at least to some extent, into low rates of patent applications,especially those in the field of high technologies and triadic patent families. Despite theshifts between the groups, the best results are achieved by the Scandinavian countries, theNetherlands and France. In 2019, Austria and Germany moved to a better, more innovativegroup. Over the years, the differentiation between countries has diminished, the values ofthe coefficients of variation have decreased in the case of eight variables. In both analyzedyears, group 2 turned out to be the most numerous.
Risks 2022, 10, 6 14 of 20
Table 8. The ratio of the group average to the total average in 2010 and 2019.
2010
Group 1 Group 2 Group 3 Group 4
X1 232.10% 147.80% 42.30% 11.10%
X2 248.90% 146.60% 35.70% 6.90%
X3 213.60% 105.30% 66.10% 31.90%
X4 231.10% 132.30% 49.90% 14.10%
X5 285.90% 128.40% 25.80% 6.00%
X6 234.90% 109.90% 52.50% 13.60%
X7 75.50% 174.20% 102.90% 34.10%
X8 104.90% 120.80% 97.10% 75.60%
X9 153.90% 112.40% 90.90% 40.60%
X10 141.90% 137.20% 78.70% 52.00%
X11 119.80% 114.40% 91.80% 77.00%
X12 121.50% 96.90% 101.80% 73.90%
X13 281.00% 145.00% 20.50% 3.70%
2019
Group 1 Group 2 Group 3 Group 4
X1 200.20% 153.10% 45.60% 21.80%
X2 209.80% 149.10% 41.70% 18.00%
X3 157.90% 165.80% 71.00% 27.20%
X4 181.40% 171.40% 47.70% 31.00%
X5 251.40% 119.40% 25.30% 9.70%
X6 84.20% 315.00% 64.20% 24.80%
X7 140.80% 104.30% 86.00% 66.10%
X8 118.10% 97.20% 95.10% 85.90%
X9 131.60% 119.90% 87.40% 65.60%
X10 143.20% 116.90% 79.20% 65.90%
X11 111.40% 121.20% 93.50% 81.60%
X12 103.00% 105.10% 112.30% 72.20%
X13 250.00% 134.40% 22.10% 6.90%Source: Authors’ own compilation based on Eurostat data.
It is significant that the indicators concerning the higher education system in thecountries belonging to group 3 are favorable. Nevertheless, it should be emphasized thatthey only testify to a high level of formal education, and not to a high quality of teaching,which is clearly indicated by the level of innovation in the economies of the countriesbelonging to the analyzed group. The education system in these countries does not fosterthe promotion of creativity and the ability to cooperate, nor does it encourage the buildingof social capital. An insufficient level of social capital development is also evidenced bythe lack of lasting links between the sphere of research and scientific institutions and thesphere of enterprises. According to the Global Competitiveness Report, in 2019, the Polisheconomy ranked 74th among 141 countries under consideration based on the indicators oncooperation and diversification. Poland ranked 70th in terms of the level of developmentof clusters, while the country held the 116th position in terms of advanced cooperationin the field of research and development between enterprises and universities or research
Risks 2022, 10, 6 15 of 20
institutions (Schwab 2019). It can therefore be concluded that Poland lacks an effectivesystem of cooperation between these spheres. On the one hand, entrepreneurs complainthat the innovative projects offered by R&D institutions do not meet their needs and showa passive approach to the commercialization of research results. On the other hand, repre-sentatives of R&D institutions believe that enterprises have little interest in using researchresults, as their strategy is focused mainly on the use of simple resources for increasinglabor productivity. The reason for this phenomenon can be seen in the shortcomings ofsocial capital, manifested, among others, in the inability to perform tasks jointly, the lack oftrust, and the social unwillingness to become engaged in public–private activities.
Risks 2022, 9, x FOR PEER REVIEW 14 of 20
X3 157.90% 165.80% 71.00% 27.20% X4 181.40% 171.40% 47.70% 31.00% X5 251.40% 119.40% 25.30% 9.70% X6 84.20% 315.00% 64.20% 24.80% X7 140.80% 104.30% 86.00% 66.10% X8 118.10% 97.20% 95.10% 85.90% X9 131.60% 119.90% 87.40% 65.60%
X10 143.20% 116.90% 79.20% 65.90% X11 111.40% 121.20% 93.50% 81.60% X12 103.00% 105.10% 112.30% 72.20% X13 250.00% 134.40% 22.10% 6.90%
Source: Authors’ own compilation based on Eurostat data.
GROUP 1
VERY HIGHX1, X2, X5, X13
HIGH
X3, X4, X7, X8, X9, X10, X 11,
X12
MODERATE
X6
LOW
N/A
VERY LOWN/A
GROUP 2
VERY HIGHN/A
HIGHX1, X2, X3, X4, X5, X6, X7, X9,
X10, X11
MODERATEX8
LOWN/A
VERY LOWN/A
GROUP 3
VERY HIGHN/A
HIGHX12
MODERATEX3, X6, X7, X8,
X9, X10
LOWX1, X2, X4, X5,
X13
VERY LOWN/A
GROUP 4
VERY HIGHN/A
HIGHN/A
MODERATEX1, X3, X4, X6,
X7, X9, X10
LOWX1, X3, X4, X6,
X7, X9, X10
VERY LOWX1, X2, X4, X5,
X6, X13
2019
Figure 4. Cont.
Risks 2022, 10, 6 16 of 20Risks 2022, 9, x FOR PEER REVIEW 15 of 20
Figure 4. Characteristics of individual groups based on the relation of group mean values to the total means for individual variables in 2010 and 2019. Source: Authors’ own compilation based on Eurostat data.
The analysis conducted shows that although the composition of individual groups has changed over the years, the general characteristics of these groups are relatively stable over time, especially when the subsequent issues are considered (Raghupathi and Raghupathi 2017; Roszko-Wójtowicz and Grzelak 2020). The following variables are definitely determinants of innovation: total R&D expenditure in EUR per capita; R&D expenditure in the enterprise sector in EUR per capita; high-tech patent applications to the EPO per million inhabitants; and triadic patent family applications per million inhabitants. The variables that have a small impact on the high level of innovation include: EU trademark applications per million inhabitants; and the share of students as a percentage of the population aged 18 years. In the case of the groups with the lowest levels of innovation, it should be emphasized that their weakest point is low R&D expenditure, which certainly translates, at least to some extent, into low rates of patent applications,
GROUP 1
VERY HIGH
X1, X2, X3, X4, X5, X6, X13
HIGHX8, X9, X10, X 11,
X12
MODERATEX7
LOWN/A
VERY LOW
N/A
GROUP 2
VERY HIGHN/A
HIGHX1, X2, X3, X4, X5, X6, X7, X8, X9, X10, X11
MODERATEX12
LOWN/A
VERY LOWN/A
GROUP 3
VERY HIGHN/A
HIGHX7, X12
MODERATEX3, X8, X9, X10,
X11
LOWX1, X2, X4, X5,
X6, X13
VERY LOWN/A
GROUP 4
VERY HIGHN/A
HIGHN/A
MODERATEX8, X11, X12
LOWX3, X7, X9, X10
VERY LOWX1, X2, X4, X5,
X6, X13
2010
Figure 4. Characteristics of individual groups based on the relation of group mean values to thetotal means for individual variables in 2010 and 2019. Source: Authors’ own compilation based onEurostat data.
Moreover, in a situation of a lack of incentives for cooperation between the scientificand research sphere and entrepreneurs, it should not be surprising that expenditures onR&D activities in the economies belonging to groups 3 and 4 are at a relatively low level-inPoland it is only 49% of the EU average, while expenditures on innovation not connectedwith R&D activities exceed the EU average by more than 29%. It should also be added thatthe level of state expenditure on R&D activity in Poland is one of the lowest among theEU and OECD countries—according to the European Innovation Scoreboard, the share ofpublic expenditure in 2019 was 53% of the EU average. It is also below the average levelobserved in the Visegrad Group countries.
This situation results in low rates of high-tech patent applications to the EPO permillion inhabitants and triadic patent family applications per million inhabitants in thecountries belonging to group 3. Research shows that there is a positive correlation between
Risks 2022, 10, 6 17 of 20
patent activity and the level of development of the country (Vonortas 2009). In highlydeveloped countries, there is a traditional culture of inventiveness (e.g., Germany, theAnglo-Saxon countries and the Far East), and patent activity is a common phenomenon.Countries with a lower level of development, however, lack well-established traditions andinstitutions in this field, hence patent activity is weak.
4. Conclusions
Summarizing the considerations made so far, it must be stated that four groups of theEU countries were distinguished in the study according to the level of innovativeness ofthe economy (Figures 2 and 3). In order to answer the question whether the type of NISdetermines the level of innovation of the economies of the European Union countries, theclassification of countries in terms of the level of innovation of the economy should be com-pared with the NIS classification presented in Section 2 (GMP classification). Comparingthese classifications, one can see the compliance of the empirical classification with the NISclassification developed by Godinho, Mendoca, Pereira (GMP classification) (Table 2). Thisclassification lists two types of NIS–developed and developing, each of which has threesubtypes. In the study presented in the article, the EU countries were divided into fourgroups on the basis of a synthetic measure of innovation of the economy. A comparison ofthe results of both lists allows us to state that the first two groups of the EU countries in theranking of innovation of the economy correspond to the developed NIS in the classificationof Godinho, Mendoca, Pereira, while the last two to the developing NIS. The only excep-tions are Malta and Spain. Malta, belonging to the developing NIS in the GMP classification,was included in the group of countries with a relatively high level of innovation of theeconomy, and therefore among the developed NIS in the ranking based on the syntheticmeasure of innovation. On the other hand, Spain, classified in the GMP ranking amongdeveloped NSI, was in this ranking among the developing systems. It is worth notingthat the countries with the highest level of economic innovation (belonging to the firstgroup in the innovation ranking)—Ireland, the Netherlands, Finland, Sweden, Germany,Great Britain, Finland and Italy—took the highest places in the GMP classification, i.e.,they were among the dynamic and stably functioning national information systems in thisclassification. Summing up, it should be stated that the type of NIS determines the level ofinnovation in the EU economies.
In the context of the considerations made in the article, it should be stated that themain aim and the research hypothesis formulated in the introduction to the article havebeen positively verified; thus, the type of NIS determines the level of innovation of theeconomy in the EU countries. In 2010 and 2019, the countries included in the developedNIS represented a high level of innovation of the economy (except for Spain, which showeda relatively low level of innovation of the economy in the analyzed years), while thecountries belonging to the developing NIS show a relatively lower level of innovation (theexception is Malta, which recorded a relatively high level of innovation of the economy inthe analyzed years). The countries included in the first group are the founding countries ofthe EU and the countries admitted to the EU before 2004, the second group includes thecountries admitted to the EU in 2004 and later, which, despite many benefits resulting fromintegration with the EU, have still not closed the innovation gap and caught up to the mostdeveloped European economies.
As far as the research originality is concerned, it should be emphasized that it consistsmainly in noting the relationship between the level of innovativeness of the EU economiesand the type of NSI. Intergroup comparisons of countries based on the authors’ own con-cept constitute the added value of the presented study. The comparison of the group meanswith the total means allows us to identify indicators characterized by high, moderate andlow values in the individual groups. The basic limitation that the authors had to faceconcerns the data used in the article. The authors are aware that conducting primaryresearch (e.g., in enterprises) would certainly have enabled us to carry out more in-depthanalysis. Moreover, it is worth drawing attention to the fact that there is always the problem
Risks 2022, 10, 6 18 of 20
of selection and quality of variables in the case of research on multivariate phenomena. Itshould be noted that data from official statistics (Eurostat) have been used in this researchprocedure. Nevertheless, it can be assumed that the research results presented in thepaper may provide valuable insights that could be used in the type of economic policywhere innovation policy plays an important role. The analysis conducted indicates thatincreasing the efficiency of NSI results in a higher level of innovativeness of the economy.There is no doubt that the conducted research has confirmed that the countries with thehighest level of innovativeness are the countries characterized by a relatively high level ofvariables related to patents. Therefore, the most developed innovation systems are thosein which the applicable regulations, including patent law, are conducive to generatinginnovation. It is worth adding, however, that the propensity for commercializing theresults of creative works is a more complex issue resulting also from the general socialattitude and the need to legalize the results of conducted research. Hence, as part of recom-mendations concerning economic policy, in addition to changes in legislation (facilitationand limitation of procedural red tape), programs for entrepreneurs and citizens that willpromote the commercialization of research and scientific work should be mentioned. Thekey prerequisite for increasing the level of innovativeness of the economy is also to ensurea stable macroeconomic environment and an efficiently functioning institutional systemwhich affect the degree of utilizing the technological potential of the economy. Appropriateallocation of financial resources from the state budget and enterprise funds to R&D activityand implementation is also important. Changes in this area should primarily consist inincreasing enterprises’ expenditure on R&D by facilitating access to capital at all stagesof R&D project implementation. Budget expenditure on R&D ought to also be increased,provided that private enterprises’ expenditure on this type of activity grows faster as well.For financing innovative ventures in enterprises, the development of the venture capitalmarket (private equity, venture capital) is essential. Increasing the level of innovativenessof the economy requires also the development of permanent connections between entitiesfrom the R&D sphere and the business sphere, which is fostered by the growth of socialcapital.
Author Contributions: Conceptualization, E.D., M.M.G. and E.R.-W.; methodology, M.M.G., E.R.-W.;software, M.M.G., E.R.-W.; validation, E.D., M.M.G. and E.R.-W.; formal analysis, E.D., M.M.G. andE.R.-W.; investigation, E.D., M.M.G.; resources, E.R.-W.; data curation, E.R.-W.; writing—originaldraft preparation, E.D., M.M.G. and E.R.-W.; writing—review and editing, E.D., M.M.G. and E.R.-W.; visualization, E.R.-W.; supervision, E.D.; project administration, M.M.G. and E.R.-W.; fundingacquisition, E.D., M.M.G. and E.R.-W. All authors have read and agreed to the published version ofthe manuscript.
Funding: This research received no external funding.
Data Availability Statement: The empirical part is based on the Eurostat database, which is publiclyavailable.
Conflicts of Interest: The authors declare no conflict of interest.
ReferencesAlnafrah, Ibrahim. 2021. Efficiency evaluation of BRICS’s national innovation systems based on bias-corrected network data
development analysis. Journal of Innovation and Entrepreneurship 10: 1–28. [CrossRef]Amable, Bruno, Remy Barre, and Robert Boyer. 2008. Los sistemas de innovacion en la era de la globalizacion. Post-Print and Working
Papers hal-00368634, HAL. Paris: Université Paris1 Panthéon-Sorbonne.Bak, Andrzej. 2013. Metody porzadkowania liniowego w polskiej taksonomii–pakiet pllord. In Taksonomia 20. Klasyfikacja i anal-
iza danych–teoria i zastosowania. Edited by Krzysztof Jajuga and Marek Walesiak. Wrocław: Wydawnictwo UniwersytetuEkonomicznego we Wrocławiu.
Bal-Domanska, Beata, Elzbieta Sobczak, and Elzbieta Stanczyk. 2020. A multivariate approach to the identification of initial smartspecialisations of Polish voivodeships. Equilibrium. Quarterly Journal of Economics and Economic Policy 15: 785–810. [CrossRef]
Borys, Tadeusz. 1978. Metody normowania cech w statystycznych badaniach porównawczych (Methods of normalizing characteristicsin statistical comparative studies). Przeglad Statystyczny 2: 227–39.
Risks 2022, 10, 6 19 of 20
Carayannis, Elias, Evangelos Grigoroudis, and Yorgos Goletsis. 2016. A multilevel and multistage efficiency evaluation of innovationsystems: A multiobjective DEA approach. Expert Systems with Applications 62: 63–80. [CrossRef]
Chaminade, Cristina, Bengt-Ake Lundvall, and Shagufta Haneef. 2018. Advanced Introduction to National Innovation Systems. Cheltenhamand Northampton: Edward Elgar Publishing.
Dworak, Edyta. 2020. The Innovation Gap between the Polish Economy and the European Union, Comparative Economic Research.Central and Eastern Europe 23: 63–73. [CrossRef]
Edquist, Charles. 1997. Systems of Innovation. London: Technologies, Institutions and Organizations, Printer.Freeman, Christopher. 1992. The Economics of Hope. London: Pinter Publishers.Garifullin, Ildar N., and Ildar N. Ablaev. 2015. National Innovation System and Its Structure. Mediterranean Journal of Social Sciences 6:
426–29. [CrossRef]Godinho, Manuel Mira, Sandro Mendonça, and Tiago Santos Pereira. 2003. Mapping innovation systems: A framework based on
innovation surveys data. Paper presented at the First Globelics Conference “Innovation Systems and Development for the ThirdMillenium”, Rio de Janeiro, Brazil, November 2–6.
Goel, Vinod K., Ekaterina Koryukin, Madhulika Bhatia, and Priyanka Agarwal. 2004. Innovation Systems, World Bank Working Paper, No.32. Washington, DC: World Bank. [CrossRef]
Goraczkowska, Jadwiga. 2020. Enterprise innovation in technology incubators and university business incubators in the context ofPolish industry. Oeconomia Copernicana 11: 799–817. [CrossRef]
Grzelak, Maria Magdalena. 2011. Innowacyjnosc przemysłu spozywczego w Polsce. Ocena. In Uwarunkowania. Łódz: Rozwój,Wydawnictwo Uniwersytetu Łódzkiego. [CrossRef]
Hellwig, Zdzisław. 1968. Zastosowanie metody taksonomicznej do typologicznego podziału krajów ze wzgledu na poziom ich rozwojuoraz zasoby i strukture wykwalifikowanych kadr (Application of the taxonomic method to the typological division of countriesdue to the level of their development and the resources and structure of qualified personnel). Przeglad Statystyczny 4: 307–27.
Hwang, Ching-Lai, and Kwangsun Yoon. 1981. Multiple Attribute Decision Making: Methods and Applications. New York: Springer.Kisielinska, Joanna. 2016. Ranking panstw UE ze wzgledu na potencjalne mozliwosci zaspokojenia zapotrzebowania na produkty
rolnicze z wykorzystaniem metod porzadkowania liniowego (Ranking of EU countries due to the potential possibilities ofmeeting the demand for agricultural products using linear ordering methods). Problemy Rolnictwa Swiatowego 16: 142–52.
Kotlebova, Jana, Peter Arendas, and Bozena Chovancova. 2020. Government expenditures in the support of technological innovationsand impact on stock market and real economy: The empirical evidence from the US and Germany. Equilibrium. Quarterly Journalof Economics and Economic Policy 15: 717–34. [CrossRef]
Kukuła, Karol. 2000. Metoda unitaryzacji zerowanej (The Method of Zero-Standardization). Warszawa: PWN.Kukuła, Karol, and Lidia Luty. 2015. Propozycja procedury wspomagajacej wybór metody porzadkowania liniowego (Proposition of
procedures supporting the choice of the method of linear ordering). Przeglad Statystyczny 62: 219–31.Lopez-Rubio, Pedro, Norat Roig-Tierno, and Alicia Mas-Tur. 2020. Regional innovation system research trends: Toward knowledge
management and entrepreneurial ecosystems. International Journal of Quality Innovation 6: 1–16. [CrossRef]Lopez-Rubio, Pedro, Norat Roig-Tierno, and Francisco Mas-Verdu. 2021. Assessing the Origins, Evolution and Prospects of National
Innovation Systems. Journal of the Knowledge Economy, 1–24. [CrossRef]Lundvall, Bengt-Ake. 1992. National Systems of Innovation. London: Pinter Publishers.Maloney, William F. 2017. Revisiting the National Innovation System in Developing Countries. Policy Research Working Paper, No. 8219.
Washington, DC: World Bank. [CrossRef]Manzini, Sibusiso T. 2012. The national system of innovation concept: An ontological review and critique. South African Journal 108:
1–7. [CrossRef]Metcalfe, John Stanley. 1995. The economic foundations of technology policy: Equilibrium and evolutionary perspectives. In Handbook
of Economics of Innovation and Technological Change. Edited by Pauled Stoneman. Oxford: Blackwell.Młodak, Andrzej. 2006. Analiza Taksonomiczna w statystyce regionalnej (Taxonomic Anazlysis in Regional Statistics). Warszawa: Difin.Mytelka, Lynn. 2003. The dynamics of catching up: The relevance of an innovation system approach in Africa. In Putting Africa
First: The Making of African Innovation Systems. Edited by Mammo Muchie, Peter Gammeltoft and Bengt-Ake Lundvall. Aalborg:Aalborg University Press.
Nelson, Richard R., and Nathan Rosenberg. 1993. Technical Innovation and National Systems. In National Innovation Systems, aComparative Analysis. Edited by Richard R. Nelson. New York: Oxford University Press.
Niosi, Jorge, Paolo Saviotti, Bertrand Bellon, and Michael Crow. 1993. National systems of innovations. Search of a Workable Concept,Technology Society 15: 207–27. [CrossRef]
OECD. 2000. Science, Technology and Industry Outlook. Paris: OECD, pp. 168–72.OECD/Eurostat. 2018. Oslo Manual 2018: Guidelines for Collecting, Reporting and Using Data on Innovation, 4th ed. The Measurement of
Scientific, Technological and Innovation Activities. Paris: OECD Publishing, Luxembourg: Eurostat. [CrossRef]Panek, Tomasz. 2009. Statystyczne metody wielowymiarowej analizy porównawczej. Warszawa: SGH.Patel, Pari, and Keith Pavitt. 1991. Europe’s technological performance. In Technology and the Future of Europe: Global Competition and
Environment in the 1990s. Edited by Christopher Freeman, Margaret Sharp and William Walker. London: Printer.Patel, Pari, and Keith Pavitt. 1994a. National Innovation Systems: Why They Are Important, And How They Might Be Measured And
Compared. Economics of Innovations and New Technology 3: 77–95. [CrossRef]
Risks 2022, 10, 6 20 of 20
Patel, Pari, and Keith Pavitt. 1994b. The Nature and Economic Importance of National Innovation Systems, OECD STI Review No. 14. Paris:Organization for Economic Co-Operation and Development.
Perkal, Julian. 1953. Taksonomia wrocławska (Wrocław’s taxonomy). In Przeglad Antropologiczny, t. 19. Poznan: Polskie TowarzystwoAntropologiczne i Polskie Zakłady Antropologii, pp. 209–19.
Prokop, Viktor, Jan Stejskal, Viktorie Klimova, and Vladimir Zitek. 2021. The role of foreign technologies and R&D in innovationprocesses within catching-up CEE countries. PLoS ONE 16: e0250307. [CrossRef]
Radicic, Dragana, Geoffrey Pugh, Hugo Hollanders, René Wintjes, and Jon Fairburn. 2016. The impact of innovation support programson small and medium enterprises innovation in traditional manufacturing industries: An evaluation for seven European Unionregions. Environment and Planning C: Government and Policy 34: 1425–52. [CrossRef]
Raghupathi, Viju, and Wullianallur Raghupathi. 2017. Innovation at country-level: Association between economic development andpatents. Journal of Innovation and Entrepreneurship 6: 4. [CrossRef]
Roszko-Wójtowicz, Elzbieta, and Jacek Białek. 2018. Diverse approaches to the multidimensional assessment of innovation in theEuropean Union. Acta Oeconomica 68: 521–47. [CrossRef]
Roszko-Wójtowicz, Elzbieta, and Jacek Białek. 2019. Measurement of the average innovativeness change overtime in the EU memberstates. Journal of Business Economics and Management 20: 268–93. [CrossRef]
Roszko-Wójtowicz, Elzbieta, and Maria Magdalena Grzelak. 2020. Macroeconomic stability and the level of competitiveness in EUmember states: A comparative dynamic approach. Oeconomia Copernicana 11: 657–88. [CrossRef]
Schmoch, Ulrich, Christian Rammer, and Harald Legler. 2006. National Systems of Innovation in Comparison. In Structure andPerformance Indicators for Knowledge Societies. Chem: Springer. [CrossRef]
Schwab, Klaus, ed. 2019. Global Competitiveness Report. Geneva: World Economic Forum.Seidel, Stefan, Jan Recker, and J. Jan vom Brocke. 2013. Sensemaking and sustainable practicing: Functional affordances of information
systems in green transformations. MIS Quarterly 37: 1275–99. [CrossRef]Strahl, Danuta. 1978. Propozycja konstrukcji miary syntetycznej (A proposal for the construction of a synthetic measure). Przeglad
Statystyczny 25: 205–15.Swiadek, Arkadiusz, and Jadwiga Goraczkowska. 2020. The institutional support for an innovation cooperation in industry: The case
of Poland. Equilibrium. Quarterly Journal of Economics and Economic Policy 15: 811–31. [CrossRef]Vonortas, Nicholas S. 2009. European Research Framework Programmes in a global context; targets, impacts, lessons for the future. The
Innovation Imperative. In National Innovation Strategies in the Global Economy. Edited by Marklund Göran, Nicholas S. Vonortasand Charles Wessner. Cheltenham: Edward Elgar.
Walesiak, Marek. 2014. Przeglad formuł normalizacji wartosci zmiennych oraz ich własnosci w statystycznej analizie wielowymiarowej(Review of formulas for normalization of the values of variables and their properties in statistical multidimensional analysis).Przeglad Statystyczny 4: 363–72.
Wangwe, Samuel. M. 2003. African systems of innovation: Towards an interpretation of the development experience. In PuttingAfrica First: The Making of African Innovation Systems. Edited by Mammo Muchie, Peter Gammeltoft and Bengt-Ake A. Lundvall.Aalborg: Aalborg University Press.
Weresa, Marzenna Anna. 2012. Systemy innowacyjne we współczesnej gospodarce swiatowej. Warsaw: Wydawnictwo Naukowe PWN S.A.White Paper. 1996. White Paper on Science and Technology: Preparing for the 21st Century. Pretoria: Department of Arts, Culture, Science
and Technology (DACST).


