Embed Size (px)
Citation preview

Comparing translations of the EORTC QLQ-C30 using differential item
functioning analyses
N.W. Scott1, P.M. Fayers1, A. Bottomley2, N.K. Aaronson3, A de Graeff4, M. Groenvold5,6, M. Koller7,M.A. Petersen5 & M.A.G. Sprangers8 on behalf of the EORTC and the Quality of Life Cross-CulturalMeta-Analysis Group1Department of Public Health, University of Aberdeen, Foresterhill, Aberdeen, UK (E-mail: [email protected]); 2Quality of Life Unit, European Organisation for Research and Treatment of Cancer DataCenter, Brussels, Belgium; 3Division of Psychosocial Research and Epidemiology, Netherlands CancerInstitute, Amsterdam, The Netherlands; 4Division of Medical Oncology, Department of Internal Medicine,University Medical Centre, Utrecht, The Netherlands; 5Department of Palliative Medicine, BispebjergHospital, Copenhagen, Denmark; 6Institute of Public Health, University of Copenhagen, Copenhagen,Denmark; 7Centre for Clinical Studies, University Hospital Regensburg, Regensburg, Germany; 8Departmentof Medical Psychology, Academic Medical Centre, University of Amsterdam, Amsterdam, The Netherlands
Accepted in revised form 4 January 2006
Abstract
The European Organisation for Research and Treatment of Cancer (EORTC) QLQ-C30 is one of themost widely used quality of life instruments for cancer patients. The aim of this study was to assesswhether there were linguistic differences in the way an international sample answered the EORTC QLQ-C30 questionnaire. Thirteen translations of the EORTC QLQ-C30, representing 22 countries, wereinvestigated using a database of 27,891 respondents, incorporating 103 separate studies. Differential itemfunctioning (DIF) analyses were conducted using logistic regression to identify items which, after con-trolling for subscale, were answered differently by language of administration. Both uniform and non-uniform DIF were assessed. Although most languages showed similar results to English, at least oneinstance of statistically significant DIF was identified for each translation, and a few of these differenceswere large. In some cases, the patterns were supported by the results of qualitative interviews withbilingual people. Although, overall, there appeared to be good linguistic equivalence for most of theEORTC QLQ-C30 items, several scales showed strongly discrepant results for some translations. Some ofthese effects are large enough to impact on the results of clinical trials. Based on our experience in thisstudy, we suggest that validation of translations of health-related quality of life instruments shouldinclude exploration of DIF.
Key words: Cancer, Cross-cultural research, Differential item functioning, EORTC QLQ-C30, Translations
Introduction
The European Organisation for Research andTreatment of Cancer (EORTC) QLQ-C30 [1–3] isone of themost widely used instruments designed toassess the quality of life of cancer patients [4]. It is
now available in 59 languages and has been regis-tered for use in over 4000 studies around the world.
The core QLQ-C30 questionnaire includes 30items comprising five functional scales (physical(PF), role (RF), emotional (EF), cognitive (CF)and social (SF) functioning), three symptom scales
Quality of Life Research (2006) 15: 1103–1115 � Springer 2006DOI 10.1007/s11136-006-0040-x

(fatigue (FA), nausea/vomiting (NV) and pain(PA)), six single-item symptom items and one scalemeasuring global health status/quality of life (QL).These scales comprise between two and five itemseach. Since its general release in 1993, there havebeen four versions of the EORTC QLQ-C30 andnew versions of three scales (QL2, PF2 and RF2)have been created [5]. In the current version of thequestionnaire all items have four response cate-gories (not at all, a little, quite a bit and verymuch), except for the two items of the QL2 scalewhich use a seven-point scale.
In contrast to instruments that are initiallydeveloped in one country or language only, theEORTC Quality of Life Group has from theoutset employed a parallel approach and indi-viduals from many different countries have beeninvolved in all stages of the development of theEORTC QLQ-C30 questionnaire [6]. Althoughthe EORTC QLQ-C30 has been used innumerous international studies it is not certainto what extent translation and cultural differ-ences influence response. Each translation of thequestionnaire is produced using a rigorous pro-cess of forward and back translations followedby extensive pilot testing [7], but even the bestpossible translation may not be exactly equiva-lent to the original English version. In addition,even if the translation is perfect, cultural differ-ences between countries could result in markedlydifferent response patterns, even after controllingfor quality of life status. Such effects have thepotential to influence the results of internationalstudies such as multicentre clinical trials, wheretrial data from several countries are frequentlypooled together.
Differential item functioning (DIF) analysesoriginated in educational testing settings wherethey are commonly used to determine whetherindividual test items are unfair to particulargroups (e.g. females or ethnic minorities) evenafter allowing for overall test ability [8]. Manydifferent approaches for the conduct of DIFanalyses are available including contingency table,logistic regression and item response theory tech-niques [9–12]. DIF methodology is now starting tobe used in other fields, including for testing com-parability of translations [13–17], although DIFanalyses of quality of life instruments are stillrelatively uncommon.
An earlier report by the EORTC Quality of LifeGroup found statistically significant DIF for sometranslations of the EF scale of the EORTC QLQ-C30 [18]. The following paper aims to use DIFanalyses to identify differences in internationalresponse to all multi-item scales.
Methods
Datasets
One hundred and three datasets were receivedfrom a wide variety of sources. Anonymised datafrom 52 international clinical trials and otherstudies using the EORTC QLQ-C30 werereceived from the EORTC Data Center withpermission from the chairs of the relevantEORTC clinical groups and with the approval ofthe EORTC Board. A further 51 datasets werereceived from individuals and organisations fromaround the world. Although most datasets werestudies of cancer patients, four of the largest(from Norway, Denmark, Germany and Austria)were surveys of the general population. Thefollowing information was extracted for allrespondents in each study when available:country, translation used, primary disease site,cancer stage, age, gender, ethnic group andperformance status. Only baseline (pre-treat-ment) data were included, but data were alsoused if treatment status was not known. In themajority of cases, the translation of the EORTCQLQ-C30 had to be inferred from the geo-graphical location of the hospital involved. Datafrom all four versions of the EORTC QLQ-C30were included when possible, although onlyresults for the current versions of the subscalesare reported.
The analyses in this paper are restricted to datafor 27,891 respondents representing the 13 trans-lations with available baseline data for at least 200people. The original English version was used inthe United Kingdom, the United States, Canada,Australia, Singapore, Myanmar, New Zealandand Ireland; the Italian translation in Italy andSwitzerland; the French translation in France,Belgium, Canada and Switzerland; the Dutchtranslation in the Netherlands and Belgium; and
1104

the German translation in Germany, Austria andSwitzerland. The French Canadian translationdiffers from the standard French version for someitems; data from this version were therefore onlyused for the QL2, EF, FA, NV and PA scales. Twodifferent Chinese translations are represented, oneused in Singapore and one in Taiwan. A further sixtranslations of the EORTC QLQ-C30 were rep-resented by a single country (Table 1).
Analyses
DIF analyses were conducted for the nine multi-item subscales of the EORTC QLQ-C30 usingStata version 9.0. For consistency of interpreta-tion the coding of items 29 and 30, the onlypositively phrased questions in the EORTCQLQ-C30, was reversed so that higher scoresrepresented worse quality of life for these itemsalso. For every item within each subscale a
single ordinal logistic regression model predictingthe item response (using the proportional oddsmodel [19]) was used to derive a common oddsratios for each translation. Variables representingeach translation were entered into the modelsimultaneously with English used as the referencecategory. The overall scale score was included inthe model as the ‘‘matching’’ variable and analyseswere also adjusted for age, gender, cancer site andstage of disease (using the four categories: nocancer, Stage I–III, Stage IV/recurrent/metastaticand not known). It was not possible to adjustanalyses for performance status or ethnic group asthis information was often unavailable. Cancer sitewas classified using 18 categories and respondentswith unknown site were included in an ‘‘other site/not known’’ category. Respondents with missingage or gender were excluded from the analyses.Binary logistic regression (using ‘‘not at all’’ versusthe other three categories) was used instead ofordinal regression for the PF2 scale because forsome items relatively few respondents chose the‘‘quite a bit’’ and ‘‘very much’’ categories. Danishwas excluded from the QL2, PF2 and RF2 analysesbecause most of the available data for this trans-lation used the earlier versions of these scales.
For selected items graphs show log odds ratiosfor each translation derived from the logisticregression analyses with their 95% confidenceintervals. Log odds ratios greater than zero meanthat respondents using that translation were morelikely to assign a higher score (indicating worsehealth outcome) to that item compared withEnglish and relative to other items in the samescale. Log odds ratios less than zero imply thatrespondents using that language were less likely toscore highly on this item.
The above analyses are only designed to detectuniform DIF; non-uniform DIF occurs when thedirection and magnitude of DIF effects varyaccording to the level of the overall scale score. Inthis study the presence of non-uniform DIF wasassessed by adding interaction terms defined as theproduct of each language variable and the overallscale score into each logistic regression model.
Interpretation
Because of the large number of statistical testsconducted, a stricter cut-off for statistical
Table 1. Amount of available data by country
Translation Country Number of
respondents
Chinese (Singapore) Singapore 258
Chinese (Taiwan) Taiwan 208
Danish Denmark 795
Dutch Netherlands 3253
Belgium 559
French France 1426
Belgium 117
Canada 111
Switzerland 71
German Germany 7056
Austria 1450
Switzerland 200
Italian Italy 656
Switzerland 19
Norwegian Norway 4440
Polish Poland 373
Spanish Spain 917
Swedish Sweden 994
Turkish Turkey 242
English United Kingdom 2018
United States 1326
Canada 537
Australia 401
Singapore 262
Myanmar 103
New Zealand 72
Ireland 27
Total 27,891
1105
significance was used to confirm the presence ofboth uniform and non-uniform DIF (p<0.001).When interpreting the results, however, it is notsufficient to consider whether the results are sta-tistically significant; it should also be determinedwhether the magnitude of any DIF effect is ofpractical importance. Various systems exist forassessing the size of uniform DIF effects [13, 20,21]; we have used the convention that in order for aresult to be considered statistically significant theabsolute value of the log odds ratio should begreater than 0.64 as well as having a p-value lessthan 0.001 [13, 18]. Vertical lines have thereforebeen marked on the graphs at 0.64 and )0.64. Theuse of this cut-point, however, is somewhat arbi-trary and results are dependent on which languageis used as the reference category. In some situa-tions, it may be the reference category, English,that is inconsistent with other translations. Toassess the magnitude of non-uniform DIF thedifference in pseudo-R2 between two separatemodels was considered for each combination ofitem and translation: one including just the overallscale score and translation and one also includingthe interaction between these two variables. Non-uniform DIF effects were only considered signifi-cant if (a) the p-value was less than 0.001, and (b)the difference in R2 was at least 0.035 [22].
Because each subscale contains no more thanfive items it is important to realise that some DIFeffects may be due to ‘‘pseudo-DIF’’, e.g. if therewas a translation problem for only one item of atwo-item scale the results will typically show DIFfor both items in opposite directions and it will notbe possible to tell which item (or items) is causingthe DIF. Therefore, DIF results should not beconsidered in isolation and the results for all theitems that make up a scale should be interpretedtogether.
In addition, it is not possible to tell what is thecause of a significant DIF effect from the statisticalresults alone. To help explore whether DIF effectswere caused by translation issues we conducted anumber of structured interviews with bilingualpeople. For each item of the questionnaire, inter-viewees were asked to state whether a hypotheticalgroup of bilingual people would tend to obtainhigher or lower scores when using the translatedversion compared with the English version. Theequivalence of the translation of each item was
assessed using a seven-point Likert scale andqualitative comments were also recorded. As thenumber of interviewees per language was small,this was regarded as an exploratory exercise only.
Results
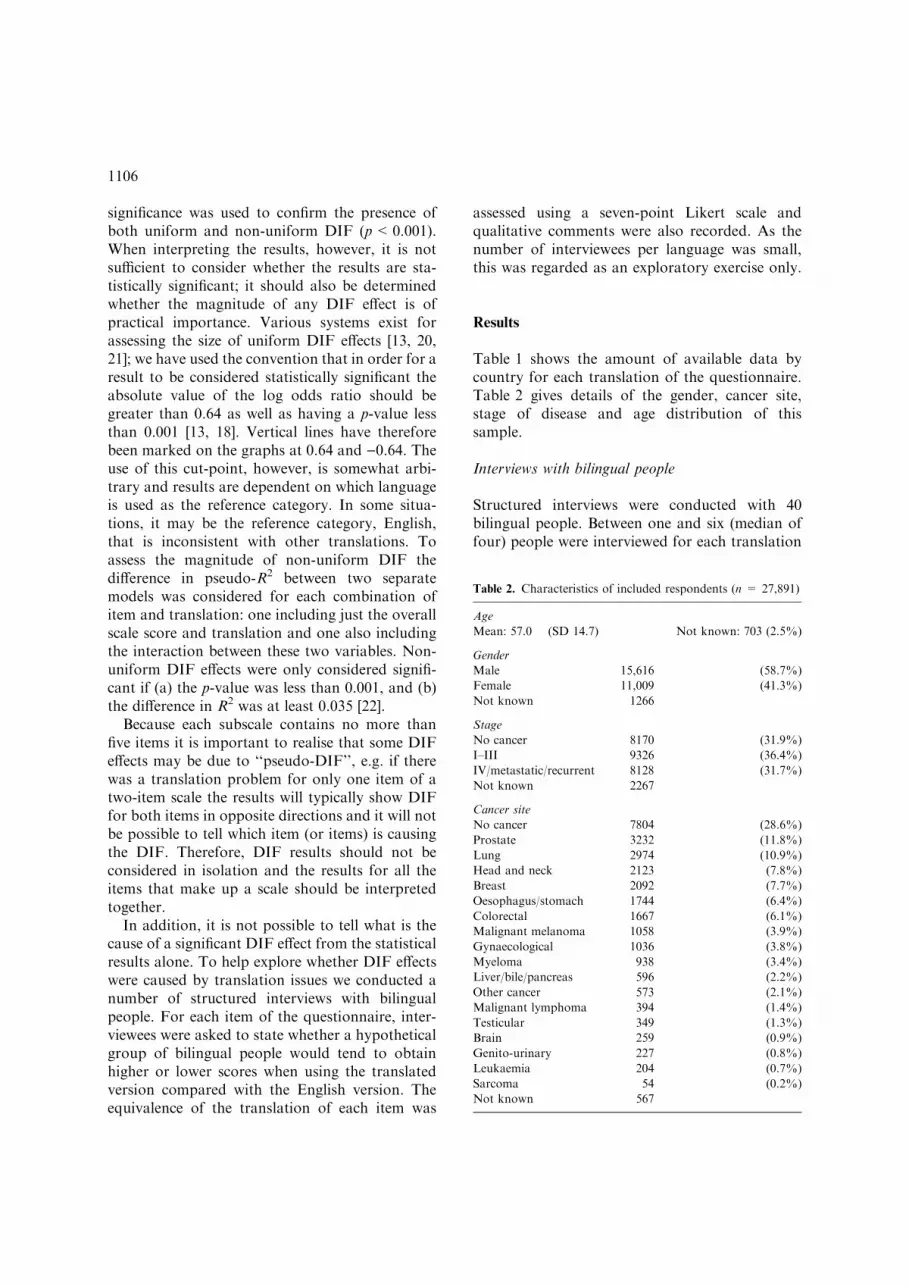
Table 1 shows the amount of available data bycountry for each translation of the questionnaire.Table 2 gives details of the gender, cancer site,stage of disease and age distribution of thissample.
Interviews with bilingual people
Structured interviews were conducted with 40bilingual people. Between one and six (median offour) people were interviewed for each translation
Table 2. Characteristics of included respondents (n = 27,891)
Age
Mean: 57.0 (SD 14.7) Not known: 703 (2.5%)
Gender
Male 15,616 (58.7%)
Female 11,009 (41.3%)
Not known 1266
Stage
No cancer 8170 (31.9%)
I–III 9326 (36.4%)
IV/metastatic/recurrent 8128 (31.7%)
Not known 2267
Cancer site
No cancer 7804 (28.6%)
Prostate 3232 (11.8%)
Lung 2974 (10.9%)
Head and neck 2123 (7.8%)
Breast 2092 (7.7%)
Oesophagus/stomach 1744 (6.4%)
Colorectal 1667 (6.1%)
Malignant melanoma 1058 (3.9%)
Gynaecological 1036 (3.8%)
Myeloma 938 (3.4%)
Liver/bile/pancreas 596 (2.2%)
Other cancer 573 (2.1%)
Malignant lymphoma 394 (1.4%)
Testicular 349 (1.3%)
Brain 259 (0.9%)
Genito-urinary 227 (0.8%)
Leukaemia 204 (0.7%)
Sarcoma 54 (0.2%)
Not known 567
1106

considered in this report. The majority of inter-viewees were staff or students at the University ofAberdeen, UK.
Results of the DIF analyses
DIF results for each subscale of the EORTC QLQ-C30 are presented separately. In general onlytranslations meeting both significance criteria foruniformDIF (p-value less than 0.001 and a log oddsratio coefficient with absolute value greater than0.64) will be commented on in the text. A summaryof the DIF results is provided in Table 3. Possibleinterpretation of the results derived from the inter-views is discussed in the text but only if the same
comment was made by at least two interviewees.Turkish translations could not be flagged in thiswaybecause only one interview was available.
Global Health Status/Quality of Life (revisedversion) (QL2) (two items)
For most languages the log odds ratios weresimilar, suggesting that there were few interna-tional differences in how these two questionswere answered. Although Italian speakers tendedto have relatively worse overall health and betterquality of life compared with English speakers,no translations met the criteria for significantDIF (Figure 1).
Table 3. Summary of uniform and non-uniform DIF results for each item by translation
Scale Item ZH(Sin) ZH(Tai) DA NL FR DE IT NO PL ES SV TR
QL2 Q29 nc
Q30 nc
PF2 Q1 nc )Q2 nc )Q3 nc + + +
Q4 + nc ) + + + ) + +
Q5 nc +
RF2 Q6 nc +
Q7 nc )
EF Q21 ) )Q22 ) ) + ) )Q23 ) )Q24 + + + + +
CF Q20 + +
Q25 ) )
SF Q26 + +
Q27 ) ) )
FA Q10 )Q12 + + +
Q18 ) ) )
NV Q14 ) )Q15 +
PA Q9 ) ) )Q19 + + +
Translations: Singapore Chinese (ZH(Sin)), Taiwan Chinese (ZH(Tai)), Danish (DA), Dutch (NL), French (FR), German (DE), Italian
(IT), Norwegian (NO), Polish (PL), Spanish (ES), Swedish (SV), Turkish (TR).
‘‘+’’ indicates that speakers of that language were more likely to report symptoms for that item compared with English and with other
items in the same scale (p<0.001 and |log odds ratio|> 0.64). ‘‘)’’ indicates that speakers of that language were less likely to score
highly on that item. ‘‘nc’’ indicates that DIF analyses were not conducted because of insufficient sample size.
Shaded cells indicate items with statistically significant (p<0.001) non-uniform DIF. None of these items also met the magnitude
criterion (R2 change of at least 0.035).
1107

Physical Functioning (revised version) (PF2)(five items)
For this scale there were a number of instances oftranslations with statistically significant DIFwhich also met the criterion of having absolute logodds ratios above 0.64 (Figure 2). Swedishrespondents were less likely to score highly on Q1(Do you have any trouble doing strenuous activi-ties?) compared with English speakers, whereasPolish speakers tended to have relatively fewerproblems with taking a long walk (Q2). Dutch,Norwegian and Turkish speakers reported rela-tively more difficulties compared with Englishspeakers for the question about taking a shortwalk (Q3). Q4 (Do you need to stay in bed or achair during the day?) showed the most variationof all the questions in this scale. Dutch andSpanish speaking respondents were less likely toscore highly; those using the Taiwan Chinese,Italian, Norwegian, Polish, Swedish and Turkishtranslations were relatively more likely to reportneeding to stay in bed or a chair. Finally, Turkishspeakers were relatively more likely to reportneeding help with eating, dressing, washing orusing the toilet (Q5).
All three Swedish interviewees thought thatSwedes would report higher scores for Q4because the Swedish translation of this item was
less likely to imply having to sit or lie down dueto ill health.
Role Functioning (revised version) (RF2)(two items)
There was some evidence that respondents usingGerman or Polish tended to have relatively morelimitations with work (Q6) and fewer limitationswith hobbies (Q7) than English speakers (data notshown).
Emotional Functioning (EF) (four items)
A number of instances of significant DIF were ob-served compared with English (Figure 3). Respon-dents using the Polish or Singapore Chinesetranslations tended to score lower on Q21 (Did youfeel tense?). Respondents using the Norwegian,Turkish or either of the Chinese translations tendedto score lower on Q22 (Did you worry?) and thoseusing German tended to report worrying moreoften. Those usingDutch or Spanish tended to scorelower on Q23 (Did you feel irritable?). Finally,respondents using the Norwegian, Swedish, Polishor either of the Chinese versions tended to scorerelatively higher on Q24 (Did you feel depressed?).
Three possible linguistic interpretations of theDIF results were identified from the interviews
English
Turkish
Swedish
Spanish
Polish
Norwegian
Italian
German
French
Dutch
Chinese(Taiwan)
Chinese(Singapore)
Lang
uage
–2 –1 0 1 2
Q29 (overall health)
English
Turkish
Swedish
Spanish
Polish
Norwegian
Italian
German
French
Dutch
Chinese(Taiwan)
Chinese(Singapore)
Lang
uage
– 2 – 1 0 1 2
Q30 (quality of life)
Log odds ratio Log odds ratio
Figure 1. Global Health Status/Quality of Life (version 2) (QL2).
1108

with bilingual people, two of which have beenpreviously identified [18]. Two out of the threeNorwegian interviewees mentioned that the Nor-wegian translation of Q22 may be a strongerstatement than English and may have a meaningcloser to ‘‘anxious’’ than ‘‘worry’’. All threeSwedish interviewees reported that the word for‘‘depressed’’ in the Swedish translation of Q24 wasweaker than English and could mean just ‘‘feeling
down’’. Similarly, two out of four Polish intervie-wees judged the Polish translation of Q24 to be aweaker statement than English.
Cognitive Functioning (CF) (two items)
Respondents using the Dutch and Swedish trans-lations tended to report relatively more difficultieswith concentrating (Q20) than with remembering
English
Turkish
Swedish
Spanish
Polish
Norwegian
Italian
German
French
Dutch
Chinese (Taiwan)
Chinese (Singapore)
Lang
uage
Lang
uage
–2 –1 0 1 2
Q1 (strenuous activities)
English
Turkish
Swedish
Spanish
Polish
Norwegian
Italian
German
French
Dutch
Chinese (Taiwan)
Chinese (Singapore)
–2 –1 0 1 2
Q2 (long walk)
Log odds ratio Log odds ratio
English
Turkish
Swedish
Spanish
Polish
Norwegian
Italian
German
French
Dutch
Chinese (Taiwan)
Chinese (Singapore)
Lang
uage
Lang
uage
–2 –1 0 1 2
Q3 (short walk)
English
Turkish
Swedish
Spanish
Polish
Norwegian
Italian
German
French
Dutch
Chinese (Taiwan)
Chinese (Singapore)
–2 –1 0 1 2
Q4 (stay in bed)
Log odds ratio Log odds ratio
Figure 2. Physical Functioning (version 2) (PF2). (Continued on p. 1110.)
1109

things (Q25) compared with English speakers(data not shown).
Social Functioning (SF) (two items)
Respondents using the Danish, German andSpanish translations tended to score relativelyhigher on the question about family life (Q26) andlower on the question about social activities (Q27)(Figure 4).
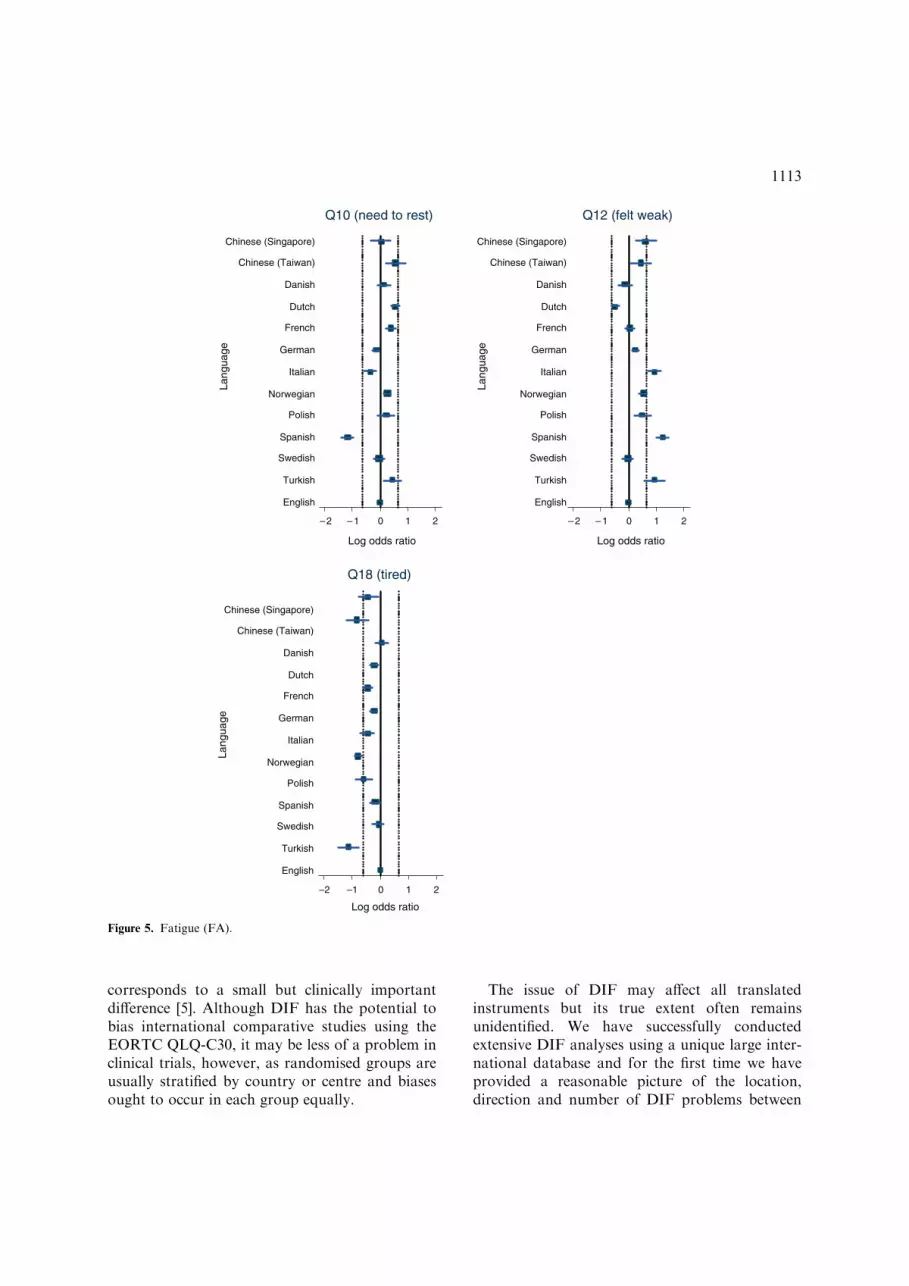
Fatigue (FA) (three items)
Spanish-speaking respondents tended to scorerelatively lower on Q10 (Did you need to rest?)compared with English speakers (Figure 5). Thoseusing the Italian, Spanish and Turkish translationswere relatively more likely to report feeling weak(Q12). Those using the Norwegian, Turkish andTaiwan Chinese versions tended to score lower onQ18 (Were you tired?).
Two bilingual interviewees thought that thelower scores for Spanish speakers on Q10 may bedue to the translation used: it means literally ‘‘Didyou stop to rest?’’.
Nausea/vomiting (NV) (two items)
There was evidence that respondents using theItalian and Singapore Chinese translations wereless likely to score highly on Q14 (Have you feltnauseated?) compared with English and relative toQ15 (Have you vomited?) (data not shown).
Pain (PA) (two items)
For this scale the reference language (English) wasthe most extreme with relatively lower scores onQ19 (Did pain interfere with your daily activities?)compared with Q9 (Have you had pain?). Therewas some evidence that, compared with Englishspeakers, those using the French, German, Nor-wegian and Taiwan Chinese translations tended toscore relatively lower on Q9 and higher on Q19(data not shown).
Non-uniform DIF
Twenty-five instances of statistically significantnon-uniform DIF (using p<0.001) were observed,nine of which involved the German translation(Table 3). None of the 25 instances of non-uniformDIF, however, met the magnitude criterion sinceall had an R2 difference of less than 0.035.
Discussion
The results show that although the results for mostcountries tended to be similar there was someevidence for DIF in at least one scale for each ofthe translations examined.
A variety of different methods have been used todetect DIF in the literature. We chose to uselogistic regression modelling due to its flexibilityand because this method has been shown to per-form similarly to other methods for the detectionof uniform and non-uniform DIF [18, 23–25]. Asingle model could be used for each item andanalyses could be adjusted for a number of otherpossible confounding variables.
There is still considerable debate about how tointerpret the results of DIF analyses. There is astrong consensus that items should only be flaggedas having DIF if they meet magnitude as well asstatistical significance criteria, but different criteria
English
Turkish
Swedish
Spanish
Polish
Norwegian
Italian
German
French
Dutch
Chinese (Taiwan)
Chinese (Singapore)
Lang
uage
– 2 – 1 0 1 2
Q5 (need he lp)
Log odds ratio
Figure 2. Continued.
1110

may result in very different numbers of items beingidentified [26]. Given the large number ofhypothesis tests involved in our study we chose touse a very conservative significance level of 0.001and to comment only on translations attaining thislevel and meeting a magnitude criterion of havingabsolute log odds ratios greater than 0.64. A
similar double significance criterion was appliedfor non-uniform DIF. Although there were noinstances of non-uniform DIF meeting the mag-nitude criterion, the cut-offs are currently still amatter of debate; as well as the 0.035 value used inthis paper, an R2 difference cut-off of 0.13 has also
English
Turkish
Swedish
Spanish
Polish
Norwegian
Italian
German
French
Dutch
Danish
Chinese (Taiwan)
Chinese (Singapore)
Lang
uage
- 2 - 1 0 1 2
Q21 (tense)
English
Turkish
Swedish
Spanish
Polish
Norwegian
Italian
German
French
Dutch
Danish
Chinese(Taiwan)
Chinese(Singapore)
Lang
uage
- 2 - 1 0 1 2
Q22 (worry)
Log odds ratio Log odds ratio
English
Turkish
Swedish
Spanish
Polish
Norwegian
Italian
German
French
Dutch
Danish
Chinese (Taiwan)
Chinese (Singapore)
Lang
uage
–2 –1 0 1 2
Q23 (irritable)
English
Turkish
Swedish
Spanish
Polish
Norwegian
Italian
German
French
Dutch
Danish
Chinese (Taiwan)
Chinese (Singapore)
Lang
uage
–2 –1 0 1 2
Q24 (depressed)
Log odds ratio Log odds ratio
Figure 3. Emotional Functioning (EF).
1111

been proposed [20] but in our study no itemswould have met either of these criteria.
If significant uniform DIF is present for an itemthen the interpretation of this result is notstraightforward. It could be due to a number ofreasons including influence of confounding fac-tors, pseudo-DIF caused by another item in thatscale, translation inequivalence (either for thewording of the item or for the response categorylabels) or it could be because of genuine culturaldifferences in response. In addition, the studiesthat contributed to the analyses were diverse andalthough we adjusted analyses for age, gender,cancer site and stage of disease the DIF resultsmay reflect other characteristics of those included.Data for some of the languages in this report camefrom a relatively small number of studies and it ispossible that some of our results may partly reflectshared characteristics of these patients.
An important additional difference between ourstudy and other DIF studies is that the scales areshort and contain between two and five items each.Therefore pseudo-DIF is much more of a problemthan for the longer scales more common in otherapplications such as educational testing. The use ofitem response theory scoring in logistic regressionDIF analyses has been suggested to avoid this issue
[12] but we chose to use unweighted scale scoring asthis is the standard method used for scoring theEORTC QLQ-C30 [27].
Others have tried to identify reasons for trans-lation DIF using a combination of statistical andjudgmental methods [28–31] but the use of sub-stantive analyses to try to identify the underlyingcauses of statistically identified DIF items hasoften been unsuccessful [32]. Our exploratoryinterviews with bilingual people were occasionallyuseful and suggested some possible translationreasons for the DIF results. Often, however, therewas no clear interpretation and sometimes theinterviews did not yield results consistent with theDIF analyses.
It can be difficult to quantify how much of aproblem the issue of DIF is for users of the QLQ-C30 as translating the log odds ratio into a clini-cally meaningful scale can only be done in thecontext of a specific scenario. As an example, weapplied our results to a real Norwegian study [33]and calculated the effect on the FA scale score ofusing the English translation instead of Norwegian,assuming true DIF existed for Q18 only and not forthe other two items of this scale. Our findingssuggested that this would result in FA scale scoresthat were around six points higher, which
English
Turkish
Swedish
Spanish
Polish
Norwegian
Italian
German
French
Dutch
Danish
Chinese (Taiwan)
Chinese (Singapore)
Lang
uage
Lang
uage
–2 –1 0 1 2
Q26 (family life)
English
Turkish
Swedish
Spanish
Polish
Norwegian
Italian
German
French
Dutch
Danish
Chinese (Taiwan)
Chinese (Singapore)
–2 –1 0 1 2
Q27 (social activities)
Log odds ratio Log odds ratio
Figure 4. Social Functioning (SF).
1112
corresponds to a small but clinically importantdifference [5]. Although DIF has the potential tobias international comparative studies using theEORTC QLQ-C30, it may be less of a problem inclinical trials, however, as randomised groups areusually stratified by country or centre and biasesought to occur in each group equally.
The issue of DIF may affect all translatedinstruments but its true extent often remainsunidentified. We have successfully conductedextensive DIF analyses using a unique large inter-national database and for the first time we haveprovided a reasonable picture of the location,direction and number of DIF problems between
English
Turkish
Swedish
Spanish
Polish
Norwegian
Italian
German
French
Dutch
Danish
Chinese (Taiwan)
Chinese (Singapore)
English
Turkish
Swedish
Spanish
Polish
Norwegian
Italian
German
French
Dutch
Danish
Chinese (Taiwan)
Chinese (Singapore)
Lang
uage
English
Turkish
Swedish
Spanish
Polish
Norwegian
Italian
German
French
Dutch
Danish
Chinese (Taiwan)
Chinese (Singapore)
Lang
uage
Lang
uage
– 2 – 1 0 1 2
Q10 (need to rest)
– 2 – 1 0 1 2
Q12 (felt weak)
Log odds ratio Log odds ratio
–2 –1 0 1 2
Q18 (tired)
Log odds ratio
Figure 5. Fatigue (FA).
1113

translations of the EORTC QLQ-C30. In generalthe translations were very good, as might beexpected because of the rigour of the translationprocess, but many instances of DIF were stillidentified. A small number of these effects werelarge and were substantiated by qualitative inter-views. As this might impact on trials and otherstudies, we plan to review these translations. Wealso recommend that other groups apply similarmethods to evaluate the translations of theirquality of life instruments.
Members of the Quality of Life Cross-CulturalMeta-Analysis Group
Australia: M King, S Leutenegger, N Spry; Aus-tria: E Greimel, B Holzner; Belgium: A Bottomley,C Coens, G de Castro, K West; Brazil: C de Souza;Canada: A Bezjak, M Whitehead; Denmark:M Groenvold, M Klee, M Petersen; France: ABredart, T Conroy, C Rodary; Germany: M Kol-ler, O Krauß, T Kuchler, B Malchow, R Schwarz;Greece: K Mystakidou; Iran: A Montazeri; Italy:C Brunelli, M Tamburini; Japan: H Zhao; Neth-erlands: N Aaronson, A de Graeff, R de Leeuw,M Muller, M Sprangers; Norway: K Bjordal,E Brenne, M Hjermstad, M Jordhøy, P Klepstad,S Sundstrøm, F Wisløff; Singapore: YB Cheung,SB Tan, J Thumboo, HB Wong; South Korea:YH Yun; Spain J Arraras; Sweden: M Ahlner-Elmqvist; Switzerland P Ballabeni, J Bernhard;Taiwan W-C Chie; Turkey U Abacioglu; UKJ Blazeby, J Bruce, A Davies, P Fayers, L Friend,Z Krukowski, T Massett, T Matsuoka, J Nicklin,J Ramage, N Scott, A Smyth-Cull, T Young; USAD Cella, D-L Esseltine, C Gotay, I Pagano.
Contributing groups
European Organisation for Research and Treat-ment of Cancer (EORTC) Brain Group, EORTCBreast Cancer Group, EORTC ChronotherapyGroup, EORTC Gastro-Intestinal Group, EO-RTC Genito-Urinary Group, EORTC Gynaeco-logical Group, EORTC Head and Neck Group,EORTC Leukaemia Group, EORTC Lung Group,EORTC Lymphoma Group, EORTC MelanomaGroup, EORTC Quality of Life Group, EORTCRadiotherapy Group, EORTC Soft Tissue Group,National Cancer Institute Grant CA60068,
National Cancer Institute of Canada (NCIC)Clinical Trials Group, Swiss Group for ClinicalCancer Research (SAKK).
Acknowledgements
We gratefully acknowledge the assistance of themany individuals who helped supply datasets forthis study. This work was funded by the EORTCQuality of Life Group and the University of Aber-deen and carried out under the auspices of the EO-RTC Quality of Life Group.
References
1. Aaronson NK, Ahmedzai S, Bergman B, et al. The
European Organization for Research and Treatment of
Cancer QLQ-C30: a quality-of-life instrument for use in
international clinical trials in oncology. J Natl Cancer Inst
1993; 85(5): 365–376.
2. Aaronson NK, Cull AM, Kaasa S, Sprangers MAG. The
European Organization for Research and Treatment of
Cancer EORTC) modular approach to quality of life
assessment in oncology: an update. In: Spilker B (ed.),
Quality of Life and Pharmacoeconomics in Clinical Trials,
2nd ed. Lippincott-Raven, Philadelphia, 1996: 179–189.
3. Fayers P, Bottomley A. Quality of life research within the
EORTC – the EORTC QLQ-C30. Eur J Cancer 2002;
38(Suppl 4): S125–S133.
4. Garratt A, Schmidt L, Mackintosh A, Fitzpatrick R.
Quality of life measurement: bibliographic study of patient
assessed health outcome measures. BMJ 2002; 324(7351):
1417–1419.
5. Fayers P, Aaronson N, Bjordal K, Groenvold M, Curran
D, Bottomley A. EORTC QLQ-C30 Scoring Manual. 3rd
ed., Brussels: European Organization for Research and
Treatment of Cancer; 2001.
6. Aaronson NK. Assessing the quality of life of patients with
cancer: East meets West. Eur J Cancer 1998; 34(6): 767–
769.
7. Cull A, Sprangers M, Bjordal K, Aaronson N, West K,
Bottomley A. EORTC Quality of Life Group translation
procedure. Brussels: European Organization for Research
and Treatment of Cancer, 2002.
8. Differential item functioning. Holland PW and Wainer H,
(eds), Hillsdale, New Jersey: Lawrence Erlbaum Associates,
1993.
9. Clauser BE, Mazor KM. Using statistical procedures to
identify differentially functioning test items. Educ Measure
Issues Pract 1998; 2: 31–44.
10. Benson J, Hutchinson SR. The state of the art in bias
research in the United States. Euro Rev Appl Psychol 1997;
47(4): 281–294.
11. Teresi JA. Statistical methods for examination of
differential item functioning (DIF) with applications to
1114
cross-cultural measurement of functional, physical and
mental health. J Mental Health Aging 2001; 7(1): 31–40.
12. Crane PK, van Belle G, Larson EB. Test bias in a cognitive
test: differential item functioning in the CASI. Stat Med
2004; 23(2): 241–256.
13. Bjorner JB, Kreiner S, Ware JE, Damsgaard MT, Bech P.
Differential item functioning in the Danish translation of
the SF-36. J Clin Epidemiol 1998; 51(11): 1189–1202.
14. Azocar F, Arean P, Miranda J, Munoz RF. Differential
item functioning in a Spanish translation of the Beck
Depression Inventory. J Clin Psychol 2001; 57(3): 355–365.
15. Orlando M, Marshall GN. Differential item functioning in
a Spanish translation of the PTSD checklist: detection and
evaluation of impact. Psychol Assess 2002; 14(1): 50–59.
16. Martin M, Blaisdell B, Kwong JW, Bjorner JB. The Short-
Form Headache Impact Test (HIT-6) was psychometrically
equivalent in nine languages. J Clin Epidemiol 2004; 57(12):
1271–1278.
17. Hahn EA, Holzner B, Kemmler G, Sperner-Unterweger B,
Hudgens SA, Cella D. Cross-cultural evaluation of health
status using item response theory: FACT-B comparisons
between Austrian and U.S. patients with breast cancer.
Eval Health Prof 2005; 28(2): 233–259.
18. Petersen MA, Groenvold M, Bjorner JB, et al. Use of
differential item functioning analysis to assess the equiva-
lence of translations of a questionnaire. Qual Life Res 2003;
12(4): 373–385.
19. Scott SC, Goldberg MS, Mayo NE. Statistical assessment
of ordinal outcomes in comparative studies. J Clin
Epidemiol 1997; 50(1): 45–55.
20. Zumbo BD. A Handbook on the Theory and Methods of
Differential Item Functioning (DIF): Logistic Regression
Modeling as a Unitary Framework for Binary and Likert-
type (ordinal) Item Scores. Ottawa: Directorate of Human
Resources Research and Evaluation, Department of
National Defense, 1999.
21. Cole SR, Kawachi I, Maller SJ, Berkman LF. Test of item-
response bias in the CES-D scale. experience from the New
Haven EPESE study. J Clin Epidemiol 2000; 53(3): 285–289.
22. Gierl M, Khaliq SN, Boughton K. Gender differential item
functioning in mathematics and science: prevalence and
policy implications. Presented at the Annual Meeting of the
Canadian Society for the Study of Education, Sherbrooke,
Quebec, 1999.
23. Rogers HJ, Swaminathan H. A comparison of logistic
regression and Mantel-Haenszel procedures for detecting
differential item functioning. Appl Psychol Measure 1993;
17(2): 105–116.
24. Welkenhuysen-Gybels J, Billiet J. A comparison of tech-
niques for detecting cross-cultural inequivalence at the item
level. Qual Quant 2002; 36: 197–218.
25. Hidalgo MD, Lopez-Pina JA. Differential item functioning
detection and effect size: a comparison obetween logistic
regression and Mantel-Haenszel procedures. Educ Psychol
Measure 2004; 64(6): 903–915.
26. Jodoin MG, Gierl MJ. Evaluating Type I error and power
rates using an effect size measure with the logistic regression
procedure for DIF detection. Appl Measure Educ 2001;
14(4): 329–349.
27. Petersen MA, Groenvold M, Aaronson N, Brenne E, et al.
Scoring based on item response theory did not alter the
measurement ability of EORTC QLQ-C30 scales. J Clin
Epi 2005; 58: 902–908.
28. Allalouf A, Hambleton R, Sireci S. Identifying the causes
of translation DIF on verbal items. J Educ Measure 1999;
36: 185–198.
29. Gierl MJ, Rogers WT, Klinger DA. Using statistical and
judgmental reviews to identify and interpret translation
differential item functioning. Alberta J Educ Res 1999;
45(4): 353–376.
30. Gierl MJ, Khaliq SN. Identifying sources of differential
item functioning on translated achievement tests: a confir-
matory analysis. Presented at the Annual Meeting of the
National Council on Measurement in Education, New
Orleans, 2000.
31. Puhan G, Gierl MJ. Evaluating the comparability of
English- and French-speaking examinees on a science
achievement test administered using two-stage testing.
Presented at the Annual Meeting of the National Council
on Measurement in Education, Chicago, 2003.
32. Roussos L, Stout W. A multidimensionality-based DIF
analysis paradigm. Appl Psychol Measure 1996; 20:
355–371.
33. Wisloff F, Hjorth M, Kaasa S, Westin J. Effect of
interferon on the health-related quality of life of multiple
myeloma patients: results of a Nordic randomized trial
comparing melphalan-prednisone to melphalan-prednisone
+a-interferon. Brit J Haematol 1996; 94: 324–332.
Address for correspondence: Peter Fayers, Department of Public
Health, University of Aberdeen, Polwarth Building, Forester-
hill, Aberdeen, AB25 2ZD, United Kingdom
Phone: +44-1224-559573; Fax: +44-1224-550925
E-mail: [email protected]
1115


