Embed Size (px)
Citation preview

Citation: Al-Adsani, A.M.; Barhoush,
S.A.; Bastaki, N.K.; Al-Bustan, S.A.;
Al-Qattan, K.K. Comparing and
Optimizing RNA Extraction from the
Pancreas of Diabetic and Healthy
Rats for Gene Expression Analyses.
Genes 2022, 13, 881. https://doi.org/
10.3390/genes13050881
Academic Editor: Hirokazu
Takahashi
Received: 21 April 2022
Accepted: 12 May 2022
Published: 14 May 2022
Publisher’s Note: MDPI stays neutral
with regard to jurisdictional claims in
published maps and institutional affil-
iations.
Copyright: © 2022 by the authors.
Licensee MDPI, Basel, Switzerland.
This article is an open access article
distributed under the terms and
conditions of the Creative Commons
Attribution (CC BY) license (https://
creativecommons.org/licenses/by/
4.0/).
genesG C A T
T A C G
G C A T
Article
Comparing and Optimizing RNA Extraction from the Pancreasof Diabetic and Healthy Rats for Gene Expression AnalysesAmani M. Al-Adsani * , Sahar A. Barhoush, Nasmah K. Bastaki , Suzanne A. Al-Bustanand Khaled K. Al-Qattan
Department of Biological Sciences, Faculty of Science, Kuwait University, Kuwait City 13060, Kuwait;[email protected] (S.A.B.); [email protected] (N.K.B.); [email protected] (S.A.A.-B.);[email protected] (K.K.A.-Q.)* Correspondence: [email protected]; Tel.: +965-94069044
Abstract: Advanced differential gene expression analysis requires high-quality RNA. However, iso-lating intact pancreatic RNA is challenging due to abundant pancreatic ribonucleases, which limitsefficient downstream gene expression analysis. RNAlater treatment reduces endogenous ribonucle-ases effects through either pre-organ excision via organ mass or bile duct direct injection or organmass injection post-isolation. We compared RNA extraction protocols to establish a reproducibleand effective pancreatic RNA extraction method to obtain high RNA integrity number (RIN) valuesfrom healthy and streptozotocin (STZ)-induced diabetic rats for gene expression analyses. Differentmethods were tested focusing on RNase activity inhibition using RNAlater (Qiagen) pre-harvest ofthe pancreatic tissue, and extracted RNA quality and concentration were analyzed using NanoDropspectrophotometer, Agilent Bioanalyzer, and RT-PCR. Inclusion of several pre- and post-excisionmodifications in the RNeasy Mini Kit (Qiagen) protocol resulted in RIN values more than two-foldhigher compared to those using the standard protocol. Additionally, RT-PCR amplification of thehousekeeping gene, β-actin, revealed no differences in extracted RNA quality from healthy andSTZ-induced diabetic rats. We compared and developed a more effective and reproducible pancreaticRNA extraction method from healthy and diabetic rats, which resulted in RNA of superior qualityand integrity and is suitable for complex molecular investigations.
Keywords: pancreas; RNA extraction; RNA isolation; RIN value; STZ-diabetic rat model
1. Introduction
Advanced differential gene expression analysis requires high-quality RNA. AlthoughRNA extraction from various tissues and cells is a straightforward process, isolating RNAwith a high RNA integrity number (RIN) from the pancreas is challenging, mainly becausethe pancreas is a dual-functioning gland comprising an endocrine and exocrine acinarportion that is rich in digestive enzymes, including ribonuclease (RNase) [1]. During thedissection of the pancreas, acinar cell granules are disrupted and release their contents,causing tissue autolysis and affecting the yield and quality of RNA. During an assessmentof total RNase activity in tissues from different organs in rodents, the pancreas showeda 181,000-fold increase in activity as compared to that in the liver, which in turn had a64-fold increase relative to that in the brain (Krosting, J. and Latham, G. (2005). RNaseActivity in Mouse Tissue: Classification, Hierarchy, and Methods for Control. AmbionTechNotes, 12 (3)).
Isolation methods for pancreatic RNA are inconsistent in their reproducibility andunstandardized, although several studies have reported the use of commercially availableextraction kits based on guanidinium thiocyanate-phenol-chloroform in combination withsilica column-based solid extraction methods [2] (Table 1). In this study, we aimed toestablish a reproducible and effective method for extracting RNA with high RIN values from
Genes 2022, 13, 881. https://doi.org/10.3390/genes13050881 https://www.mdpi.com/journal/genes
Genes 2022, 13, 881 2 of 11
the pancreas of healthy and streptozotocin (STZ)-induced diabetic rats, which is suitablefor microarray analyses. Several modifications in RNA extraction methods reported inprevious studies were combined to devise a single protocol for pre- and post-excision of ratpancreatic tissue samples using a commercially available kit. These modifications resultedin RNA with consistent and improved RIN values suitable for downstream RNA analysis.
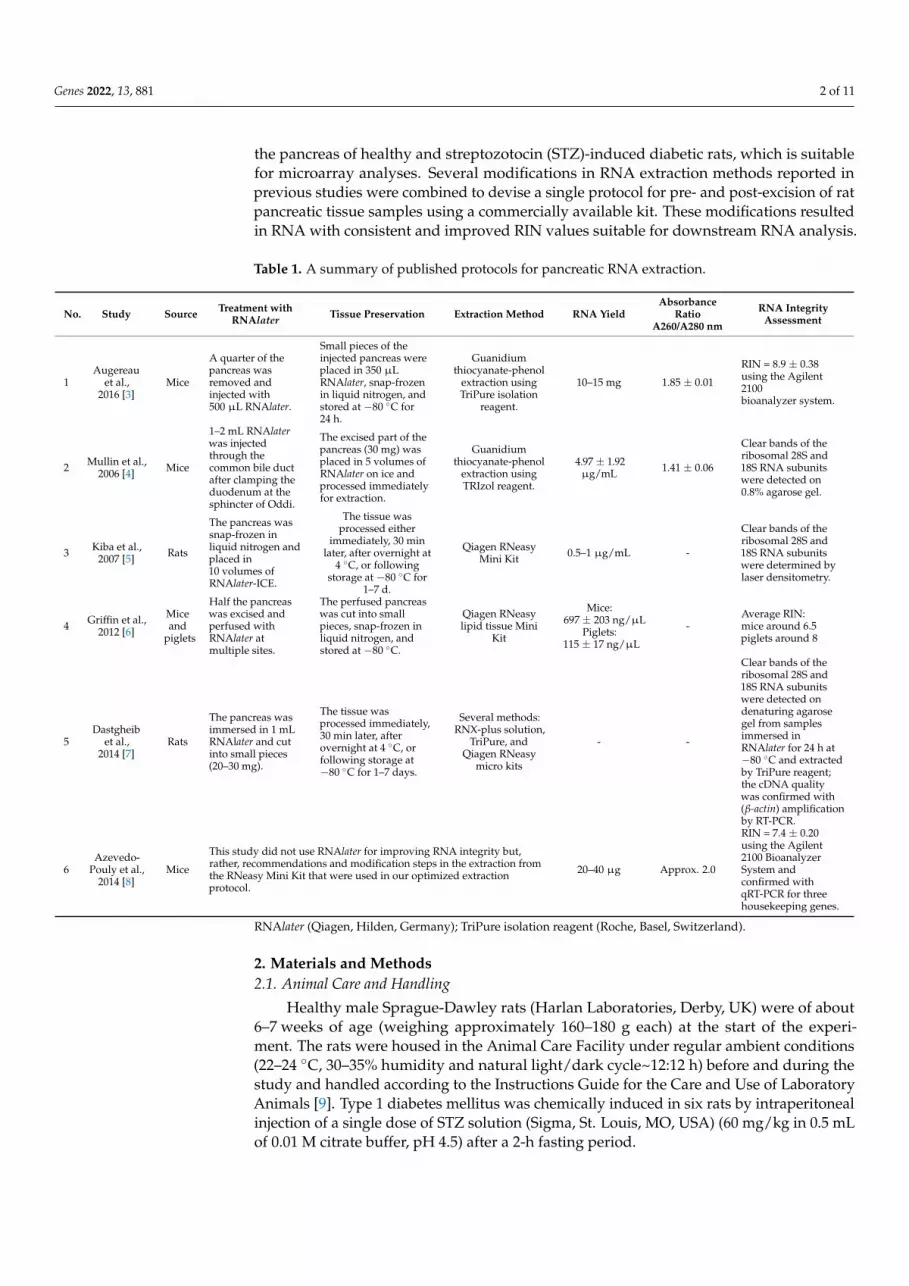
Table 1. A summary of published protocols for pancreatic RNA extraction.
No. Study Source Treatment withRNAlater Tissue Preservation Extraction Method RNA Yield
AbsorbanceRatio
A260/A280 nm
RNA IntegrityAssessment
1Augereau
et al.,2016 [3]
Mice
A quarter of thepancreas wasremoved andinjected with500 µL RNAlater.
Small pieces of theinjected pancreas wereplaced in 350 µLRNAlater, snap-frozenin liquid nitrogen, andstored at −80 ◦C for24 h.
Guanidiumthiocyanate-phenol
extraction usingTriPure isolation
reagent.
10–15 mg 1.85 ± 0.01
RIN = 8.9 ± 0.38using the Agilent2100bioanalyzer system.
2 Mullin et al.,2006 [4] Mice
1–2 mL RNAlaterwas injectedthrough thecommon bile ductafter clamping theduodenum at thesphincter of Oddi.
The excised part of thepancreas (30 mg) wasplaced in 5 volumes ofRNAlater on ice andprocessed immediatelyfor extraction.
Guanidiumthiocyanate-phenol
extraction usingTRIzol reagent.
4.97 ± 1.92µg/mL 1.41 ± 0.06
Clear bands of theribosomal 28S and18S RNA subunitswere detected on0.8% agarose gel.
3 Kiba et al.,2007 [5] Rats
The pancreas wassnap-frozen inliquid nitrogen andplaced in10 volumes ofRNAlater-ICE.
The tissue wasprocessed either
immediately, 30 minlater, after overnight at
4 ◦C, or followingstorage at −80 ◦C for
1–7 d.
Qiagen RNeasyMini Kit 0.5–1 µg/mL -
Clear bands of theribosomal 28S and18S RNA subunitswere determined bylaser densitometry.
4 Griffin et al.,2012 [6]
Miceand
piglets
Half the pancreaswas excised andperfused withRNAlater atmultiple sites.
The perfused pancreaswas cut into smallpieces, snap-frozen inliquid nitrogen, andstored at −80 ◦C.
Qiagen RNeasylipid tissue Mini
Kit
Mice:697 ± 203 ng/µL
Piglets:115 ± 17 ng/µL
-Average RIN:mice around 6.5piglets around 8
5Dastgheib
et al.,2014 [7]
Rats
The pancreas wasimmersed in 1 mLRNAlater and cutinto small pieces(20–30 mg).
The tissue wasprocessed immediately,30 min later, afterovernight at 4 ◦C, orfollowing storage at−80 ◦C for 1–7 days.
Several methods:RNX-plus solution,
TriPure, andQiagen RNeasy
micro kits
- -
Clear bands of theribosomal 28S and18S RNA subunitswere detected ondenaturing agarosegel from samplesimmersed inRNAlater for 24 h at−80 ◦C and extractedby TriPure reagent;the cDNA qualitywas confirmed with(β-actin) amplificationby RT-PCR.
6Azevedo-
Pouly et al.,2014 [8]
Mice
This study did not use RNAlater for improving RNA integrity but,rather, recommendations and modification steps in the extraction fromthe RNeasy Mini Kit that were used in our optimized extractionprotocol.
20–40 µg Approx. 2.0
RIN = 7.4 ± 0.20using the Agilent2100 BioanalyzerSystem andconfirmed withqRT-PCR for threehousekeeping genes.
RNAlater (Qiagen, Hilden, Germany); TriPure isolation reagent (Roche, Basel, Switzerland).
2. Materials and Methods2.1. Animal Care and Handling
Healthy male Sprague-Dawley rats (Harlan Laboratories, Derby, UK) were of about6–7 weeks of age (weighing approximately 160–180 g each) at the start of the experi-ment. The rats were housed in the Animal Care Facility under regular ambient conditions(22–24 ◦C, 30–35% humidity and natural light/dark cycle~12:12 h) before and during thestudy and handled according to the Instructions Guide for the Care and Use of LaboratoryAnimals [9]. Type 1 diabetes mellitus was chemically induced in six rats by intraperitonealinjection of a single dose of STZ solution (Sigma, St. Louis, MO, USA) (60 mg/kg in 0.5 mLof 0.01 M citrate buffer, pH 4.5) after a 2-h fasting period.

Genes 2022, 13, 881 3 of 11
2.2. Rat Sacrifice and Pancreatic Tissue Collection
Following anesthesia (0.2 mL/100 g) with a mixture of ketamine (9 mL, 10%, Dutchfarm Nedar, Host den Berg, Holland) and xylazine (1 mL, 10%, Interchemie, Vernary,Holland), 18 normal rats (NR) and six diabetic rats (DR) were prepped for pancreas pre-treatment and collection.
2.3. RNAlater Infusion
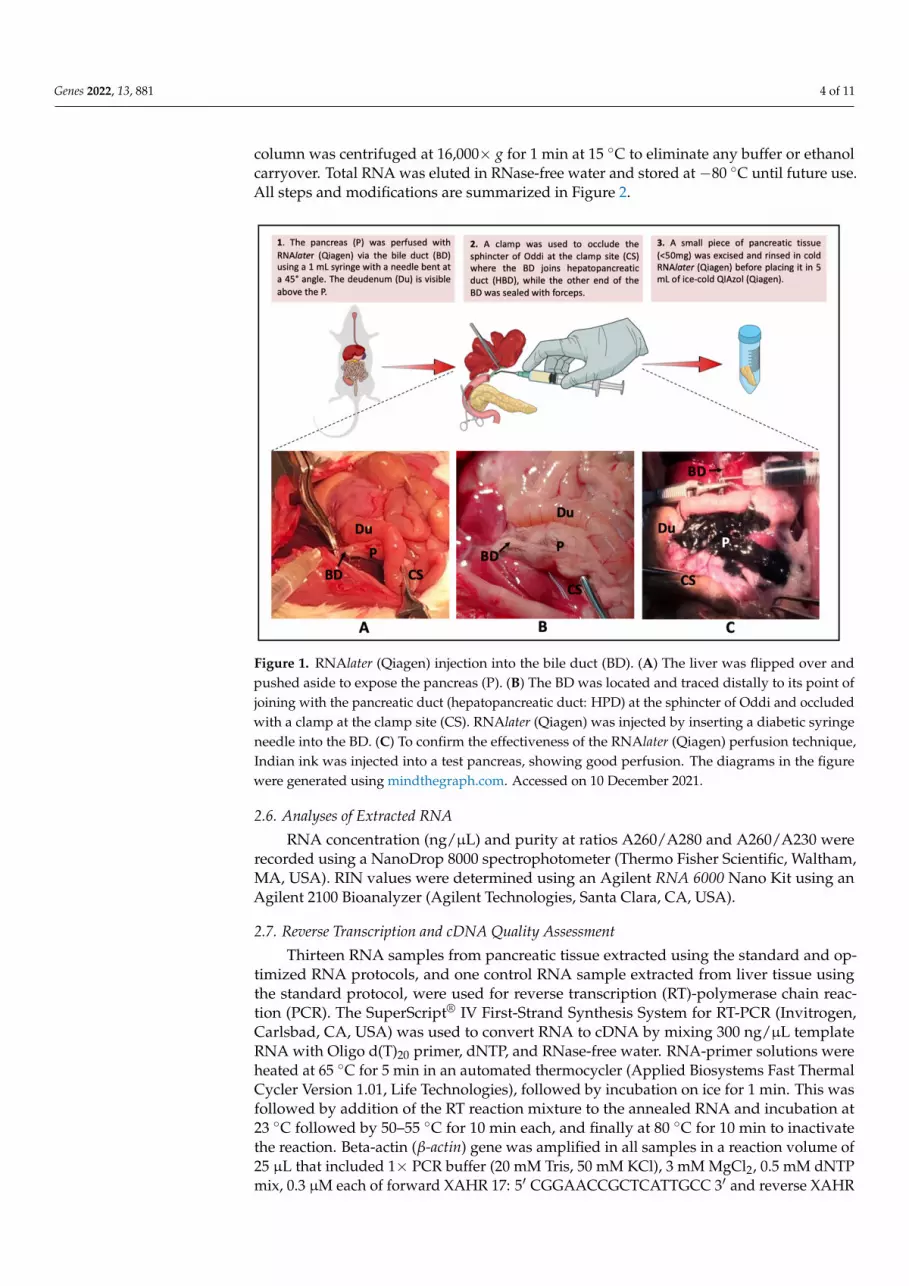
Each anesthetized rat was secured on its dorsal side and a thorough sterilization of itsventral side using 70% alcohol was performed before exposing the abdominal viscera by alongitudinal ventral incision. The liver was flipped over and pushed aside; the bile duct(BD, Franklin Lake, NJ, USA) was located and traced to its joining point with the pancreaticduct (hepatopancreatic duct [HPD], Figure 1A). Further, a 1-mL syringe (BD, FranklinLake, NJ, USA) with a 30-G needle (BD, Franklin Lake, NJ, USA) (bent to 45◦ angle) wasinserted into the lumen of the BD and the pancreas infused with RNAlater (Qiagen, Hilden,Germany) (Figure 1A). To ensure complete perfusion, the HPD was occluded with a clampjust above the region where it joins the duodenum (sphincter of Oddi). In addition, forcepswere used to hold and seal the other end of the BD to prevent retrograde perfusion of theliver (Figure 1A,B). The location of the RNAlater (Qiagen) infusion site and clamping ofthe sphincter of Oddi were performed as previously described [4] and resulted in goodperfusion, as indicated by the swelling of the pancreas (Figure 1B). Prior to administeringRNAlater (Qiagen), the perfusion technique was tested by infusing India ink (Loba Chemie,Colaba, India), which showed a very good distribution in the pancreas (Figure 1C).
2.4. Isolation of the Pancreas
All dissection and surgical tools were sterilized and washed with RNaseZAP (Sigma-Aldrich, St. Louis, MO, USA) prior to use for tissue collection. Extreme caution was takenwhen detaching the pancreas from the attached tissues to prevent rupture and subsequentrelease of ribonucleases. A small piece of tissue (<50 mg) was excised from the perfusedpancreas and immediately placed in 5 mL of ice-cold QIAzol (Qiagen, Hilden, Germany)contained in a sterile 50-mL centrifuge tube immersed in ice.
2.5. RNA Extraction
Initially, pancreatic RNA was extracted using the TriPure isolation reagent (Roche,Basel, Switzerland). RNeasy Mini Kit (Qiagen, Hilden, Germany) was also used followingthe manufacturer’s instructions and with modifications to improve RNA quality. Thetissue was rapidly homogenized using a TissueRuptor Ultra-Turrax T8 (IKA laboratories,Staufen, Germany) for 30–60 s on ice, pausing for a few seconds every 20 s to avoidheating, until the lysate was uniformly homogeneous. An additional centrifugation stepwas performed for 1 min at 12,000× g at 4 ◦C to remove any unhomogenized lysate, aspreviously described [8]. This step replaced another step in the standard protocol in whichthe homogenate was incubated at room temperature (between 21–22 ◦C) for 5 min. Thequick removal of undigested tissue at low temperature is critical to reduce any possiblesource of RNase contamination that could cause RNA degradation. The upper transparentaqueous layer was removed using a pipette and transferred to a sterilized microcentrifugetube following the manufacturer’s instructions for genomic DNA elimination. This wasfollowed by addition of chloroform to the samples, which were then centrifuged for 15 minat 12,000× g at 4 ◦C to separate the upper aqueous phase (~500 µL) containing the RNA.Then, the aqueous phase was transferred to a sterile microcentrifuge tube, and an equalvolume of 70% ethanol was added to it prior to being transferred to an RNeasy spin column.The addition of 70% ethanol provides ideal binding conditions for the silica membrane ofthe spin column. Following two centrifugations (≥8000× g at 15 ◦C) for 15 s to removethe ethanol, the column was washed once with 700 µL RWT washing buffer (Qiagen) andtwice with 500 µL RPE washing buffer (Qiagen). During each wash, the spin column wascentrifuged at ≥8000× g at 15 ◦C, and the flow-through was discarded. Afterward, the
Genes 2022, 13, 881 4 of 11
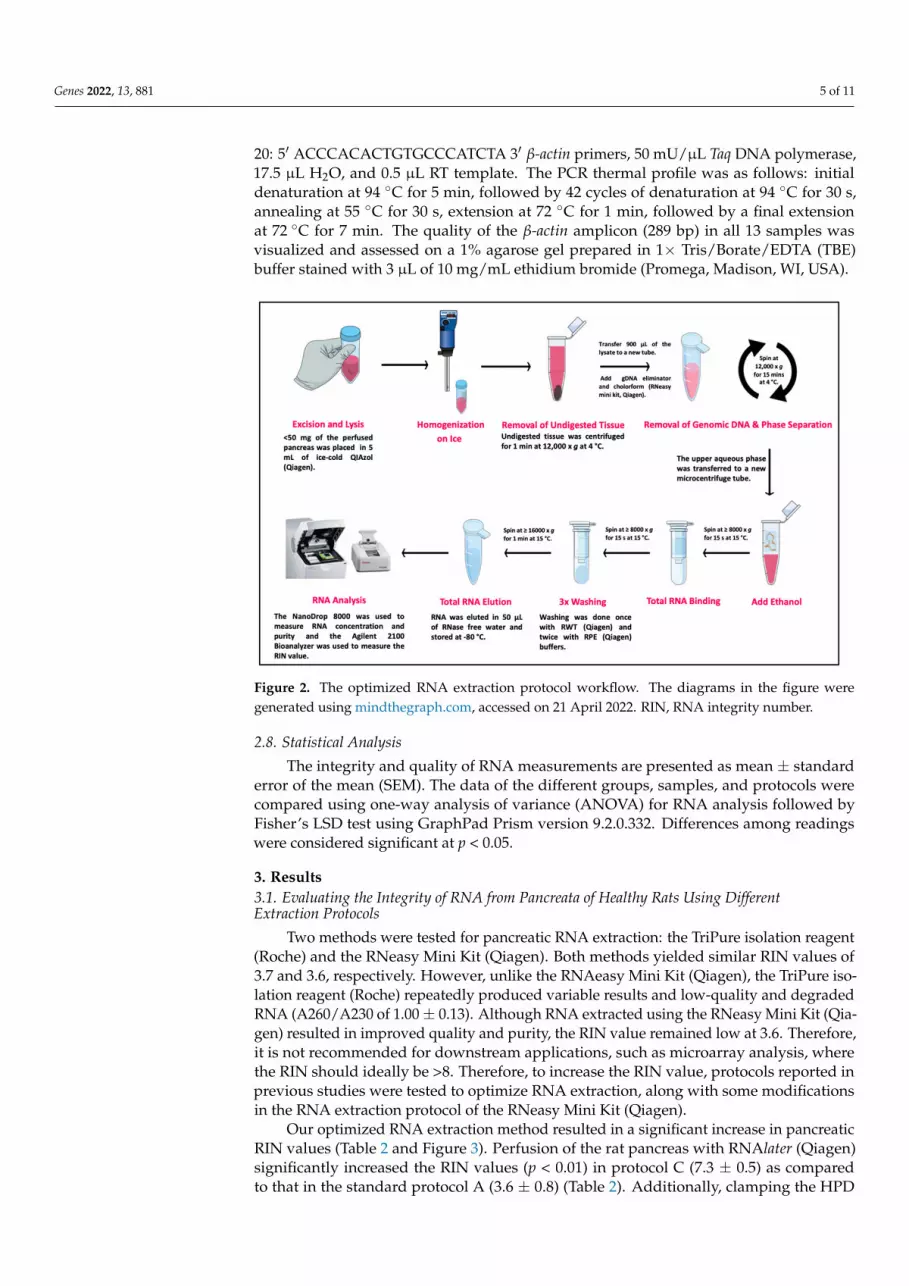
column was centrifuged at 16,000× g for 1 min at 15 ◦C to eliminate any buffer or ethanolcarryover. Total RNA was eluted in RNase-free water and stored at −80 ◦C until future use.All steps and modifications are summarized in Figure 2.
Genes 2022, 12, x FOR PEER REVIEW 4 of 12
Figure 1. RNAlater (Qiagen) injection into the bile duct (BD). (A) The liver was flipped over and pushed aside to expose the pancreas (P). (B) The BD was located and traced distally to its point of joining with the pancreatic duct (hepatopancreatic duct: HPD) at the sphincter of Oddi and occluded with a clamp at the clamp site (CS). RNAlater (Qiagen) was injected by inserting a diabetic syringe needle into the BD. (C) To confirm the effectiveness of the RNAlater (Qiagen) perfusion technique, Indian ink was injected into a test pancreas, showing good perfusion. The diagrams in the figure were generated using mindthegraph.com. Accessed on 10 December 2021.
2.4. Isolation of the Pancreas All dissection and surgical tools were sterilized and washed with RNaseZAP (Sigma-
Aldrich, USA) prior to use for tissue collection. Extreme caution was taken when detaching the pancreas from the attached tissues to prevent rupture and subsequent release of ribonucleases. A small piece of tissue (<50 mg) was excised from the perfused pancreas and immediately placed in 5 mL of ice-cold QIAzol (Qiagen, Hilden, Germany) contained in a sterile 50-mL centrifuge tube immersed in ice.
2.5. RNA Extraction Initially, pancreatic RNA was extracted using the TriPure isolation reagent (Roche,
Germany). RNeasy Mini Kit (Qiagen, Germany) was also used following the manufacturer’s instructions and with modifications to improve RNA quality. The tissue was rapidly homogenized using a TissueRuptor Ultra-Turrax T8 (IKA laboratories, Germany) for 30–60 s on ice, pausing for a few seconds every 20 s to avoid heating, until the lysate was uniformly homogeneous. An additional centrifugation step was performed for 1 min at 12,000× g at 4 °C to remove any unhomogenized lysate, as previously described [8]. This step replaced another step in the standard protocol in which the homogenate was incubated at room temperature (between 21–22 °C) for 5 min. The quick removal of undigested tissue at low temperature is critical to reduce any possible source of RNase contamination that could cause RNA degradation. The upper transparent aqueous layer was removed using a pipette and transferred to a sterilized microcentrifuge tube following the manufacturer’s instructions for genomic DNA elimination. This was followed by addition of chloroform to the samples, which were then centrifuged for 15 min at 12,000× g at 4 °C to separate the upper aqueous phase (~500 µL) containing the RNA. Then, the aqueous phase was transferred to a sterile microcentrifuge tube, and an equal volume of 70% ethanol was added to it prior to being transferred to an RNeasy spin
Figure 1. RNAlater (Qiagen) injection into the bile duct (BD). (A) The liver was flipped over andpushed aside to expose the pancreas (P). (B) The BD was located and traced distally to its point ofjoining with the pancreatic duct (hepatopancreatic duct: HPD) at the sphincter of Oddi and occludedwith a clamp at the clamp site (CS). RNAlater (Qiagen) was injected by inserting a diabetic syringeneedle into the BD. (C) To confirm the effectiveness of the RNAlater (Qiagen) perfusion technique,Indian ink was injected into a test pancreas, showing good perfusion. The diagrams in the figurewere generated using mindthegraph.com. Accessed on 10 December 2021.
2.6. Analyses of Extracted RNA
RNA concentration (ng/µL) and purity at ratios A260/A280 and A260/A230 wererecorded using a NanoDrop 8000 spectrophotometer (Thermo Fisher Scientific, Waltham,MA, USA). RIN values were determined using an Agilent RNA 6000 Nano Kit using anAgilent 2100 Bioanalyzer (Agilent Technologies, Santa Clara, CA, USA).
2.7. Reverse Transcription and cDNA Quality Assessment
Thirteen RNA samples from pancreatic tissue extracted using the standard and op-timized RNA protocols, and one control RNA sample extracted from liver tissue usingthe standard protocol, were used for reverse transcription (RT)-polymerase chain reac-tion (PCR). The SuperScript® IV First-Strand Synthesis System for RT-PCR (Invitrogen,Carlsbad, CA, USA) was used to convert RNA to cDNA by mixing 300 ng/µL templateRNA with Oligo d(T)20 primer, dNTP, and RNase-free water. RNA-primer solutions wereheated at 65 ◦C for 5 min in an automated thermocycler (Applied Biosystems Fast ThermalCycler Version 1.01, Life Technologies), followed by incubation on ice for 1 min. This wasfollowed by addition of the RT reaction mixture to the annealed RNA and incubation at23 ◦C followed by 50–55 ◦C for 10 min each, and finally at 80 ◦C for 10 min to inactivatethe reaction. Beta-actin (β-actin) gene was amplified in all samples in a reaction volume of25 µL that included 1× PCR buffer (20 mM Tris, 50 mM KCl), 3 mM MgCl2, 0.5 mM dNTPmix, 0.3 µM each of forward XAHR 17: 5′ CGGAACCGCTCATTGCC 3′ and reverse XAHR
Genes 2022, 13, 881 5 of 11
20: 5′ ACCCACACTGTGCCCATCTA 3′ β-actin primers, 50 mU/µL Taq DNA polymerase,17.5 µL H2O, and 0.5 µL RT template. The PCR thermal profile was as follows: initialdenaturation at 94 ◦C for 5 min, followed by 42 cycles of denaturation at 94 ◦C for 30 s,annealing at 55 ◦C for 30 s, extension at 72 ◦C for 1 min, followed by a final extensionat 72 ◦C for 7 min. The quality of the β-actin amplicon (289 bp) in all 13 samples wasvisualized and assessed on a 1% agarose gel prepared in 1× Tris/Borate/EDTA (TBE)buffer stained with 3 µL of 10 mg/mL ethidium bromide (Promega, Madison, WI, USA).
Genes 2022, 12, x FOR PEER REVIEW 5 of 12
column. The addition of 70% ethanol provides ideal binding conditions for the silica membrane of the spin column. Following two centrifugations (≥8000× g at 15 °C) for 15 s to remove the ethanol, the column was washed once with 700 µL RWT washing buffer (Qiagen) and twice with 500 µL RPE washing buffer (Qiagen). During each wash, the spin column was centrifuged at ≥8000× g at 15 °C, and the flow-through was discarded. Afterward, the column was centrifuged at 16,000× g for 1 min at 15 °C to eliminate any buffer or ethanol carryover. Total RNA was eluted in RNase-free water and stored at −80 °C until future use. All steps and modifications are summarized in Figure 2.
Figure 2. The optimized RNA extraction protocol workflow. The diagrams in the figure were generated using mindthegraph.com. RIN, RNA integrity number.
2.6. Analyses of Extracted RNA RNA concentration (ng/µL) and purity at ratios A260/A280 and A260/A230 were
recorded using a NanoDrop 8000 spectrophotometer (Thermo Fisher Scientific, Waltham, MA, USA). RIN values were determined using an Agilent RNA 6000 Nano Kit using an Agilent 2100 Bioanalyzer (Agilent Technologies, Santa Clara, CA, USA).
2.7. Reverse Transcription and cDNA Quality Assessment Thirteen RNA samples from pancreatic tissue extracted using the standard and
optimized RNA protocols, and one control RNA sample extracted from liver tissue using the standard protocol, were used for reverse transcription (RT)-polymerase chain reaction (PCR). The SuperScript® IV First-Strand Synthesis System for RT-PCR (Invitrogen, USA) was used to convert RNA to cDNA by mixing 300 ng/µL template RNA with Oligo d(T)20 primer, dNTP, and RNase-free water. RNA-primer solutions were heated at 65 °C for 5 min in an automated thermocycler (Applied Biosystems Fast Thermal Cycler Version 1.01, Life Technologies), followed by incubation on ice for 1 min. This was followed by addition of the RT reaction mixture to the annealed RNA and incubation at 23 °C followed by 50–55 °C for 10 min each, and finally at 80 °C for 10 min to inactivate the reaction. Beta-actin (β-actin) gene was amplified in all samples in a reaction volume of 25 µL that included 1× PCR buffer (20 mM Tris, 50 mM KCl), 3 mM MgCl2, 0.5 mM dNTP mix, 0.3 µM each of forward XAHR 17: 5′ CGGAACCGCTCATTGCC 3′ and reverse XAHR 20: 5′ ACCCACACTGTGCCCATCTA 3′ β-actin primers, 50 mU/µL Taq DNA polymerase, 17.5 µL H2O, and 0.5 µL RT template. The PCR thermal profile was as follows: initial denaturation at 94 °C for 5 min, followed by 42 cycles of denaturation at 94 °C for 30 s,
Figure 2. The optimized RNA extraction protocol workflow. The diagrams in the figure weregenerated using mindthegraph.com, accessed on 21 April 2022. RIN, RNA integrity number.
2.8. Statistical Analysis
The integrity and quality of RNA measurements are presented as mean ± standarderror of the mean (SEM). The data of the different groups, samples, and protocols werecompared using one-way analysis of variance (ANOVA) for RNA analysis followed byFisher’s LSD test using GraphPad Prism version 9.2.0.332. Differences among readingswere considered significant at p < 0.05.
3. Results3.1. Evaluating the Integrity of RNA from Pancreata of Healthy Rats Using DifferentExtraction Protocols
Two methods were tested for pancreatic RNA extraction: the TriPure isolation reagent(Roche) and the RNeasy Mini Kit (Qiagen). Both methods yielded similar RIN values of3.7 and 3.6, respectively. However, unlike the RNAeasy Mini Kit (Qiagen), the TriPure iso-lation reagent (Roche) repeatedly produced variable results and low-quality and degradedRNA (A260/A230 of 1.00± 0.13). Although RNA extracted using the RNeasy Mini Kit (Qia-gen) resulted in improved quality and purity, the RIN value remained low at 3.6. Therefore,it is not recommended for downstream applications, such as microarray analysis, wherethe RIN should ideally be >8. Therefore, to increase the RIN value, protocols reported inprevious studies were tested to optimize RNA extraction, along with some modificationsin the RNA extraction protocol of the RNeasy Mini Kit (Qiagen).
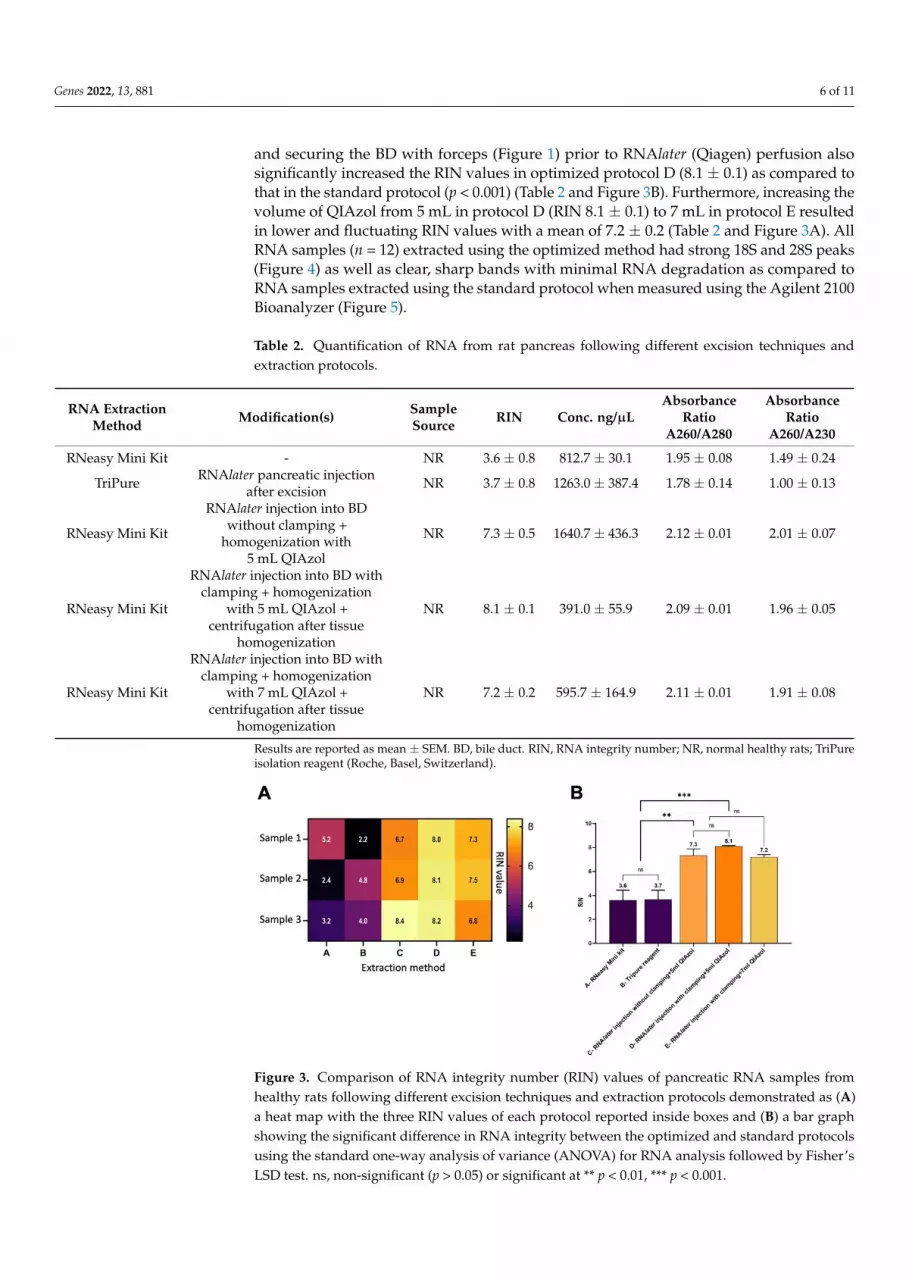
Our optimized RNA extraction method resulted in a significant increase in pancreaticRIN values (Table 2 and Figure 3). Perfusion of the rat pancreas with RNAlater (Qiagen)significantly increased the RIN values (p < 0.01) in protocol C (7.3 ± 0.5) as comparedto that in the standard protocol A (3.6 ± 0.8) (Table 2). Additionally, clamping the HPD
Genes 2022, 13, 881 6 of 11
and securing the BD with forceps (Figure 1) prior to RNAlater (Qiagen) perfusion alsosignificantly increased the RIN values in optimized protocol D (8.1 ± 0.1) as compared tothat in the standard protocol (p < 0.001) (Table 2 and Figure 3B). Furthermore, increasing thevolume of QIAzol from 5 mL in protocol D (RIN 8.1 ± 0.1) to 7 mL in protocol E resultedin lower and fluctuating RIN values with a mean of 7.2 ± 0.2 (Table 2 and Figure 3A). AllRNA samples (n = 12) extracted using the optimized method had strong 18S and 28S peaks(Figure 4) as well as clear, sharp bands with minimal RNA degradation as compared toRNA samples extracted using the standard protocol when measured using the Agilent 2100Bioanalyzer (Figure 5).
Table 2. Quantification of RNA from rat pancreas following different excision techniques andextraction protocols.
RNA ExtractionMethod Modification(s) Sample
Source RIN Conc. ng/µLAbsorbance
RatioA260/A280
AbsorbanceRatio
A260/A230
RNeasy Mini Kit - NR 3.6 ± 0.8 812.7 ± 30.1 1.95 ± 0.08 1.49 ± 0.24
TriPure RNAlater pancreatic injectionafter excision NR 3.7 ± 0.8 1263.0 ± 387.4 1.78 ± 0.14 1.00 ± 0.13
RNeasy Mini Kit
RNAlater injection into BDwithout clamping +
homogenization with5 mL QIAzol
NR 7.3 ± 0.5 1640.7 ± 436.3 2.12 ± 0.01 2.01 ± 0.07
RNeasy Mini Kit
RNAlater injection into BD withclamping + homogenization
with 5 mL QIAzol +centrifugation after tissue
homogenization
NR 8.1 ± 0.1 391.0 ± 55.9 2.09 ± 0.01 1.96 ± 0.05
RNeasy Mini Kit
RNAlater injection into BD withclamping + homogenization
with 7 mL QIAzol +centrifugation after tissue
homogenization
NR 7.2 ± 0.2 595.7 ± 164.9 2.11 ± 0.01 1.91 ± 0.08
Results are reported as mean ± SEM. BD, bile duct. RIN, RNA integrity number; NR, normal healthy rats; TriPureisolation reagent (Roche, Basel, Switzerland).
Genes 2022, 12, x FOR PEER REVIEW 7 of 12
RNeasy Mini Kit
RNAlater injection into BD with clamping + homogenization with 5 mL QIAzol + centrifugation after
tissue homogenization
NR 8.1 ± 0.1 391.0 ± 55.9 2.09 ± 0.01 1.96 ± 0.05
RNeasy Mini Kit
RNAlater injection into BD with clamping + homogenization with 7 mL QIAzol + centrifugation after
tissue homogenization
NR 7.2 ± 0.2 595.7 ± 164.9 2.11 ± 0.01 1.91 ± 0.08
Results are reported as mean ± SEM. BD, bile duct. RIN, RNA integrity number; NR, normal healthy rats; TriPure isolation reagent (Roche, Germany).
Figure 3. Comparison of RNA integrity number (RIN) values of pancreatic RNA samples from healthy rats following different excision techniques and extraction protocols demonstrated as (A) a heat map with the three RIN values of each protocol reported inside boxes and (B) a bar graph showing the significant difference in RNA integrity between the optimized and standard protocols using the standard one-way analysis of variance (ANOVA) for RNA analysis followed by Fisher’s LSD test. ns, non-significant (p > 0.05) or significant at ** p < 0.01, *** p < 0.001.
Figure 4. Electropherograms generated by an Agilent 2100 Bioanalyzer using the pico kit showing (A) RNA extracted using a standard protocol with an RIN = 3.6 and high peaks in the 5S and fast region, which indicates RNase degradation as compared with (B) RNA extracted using our
Figure 3. Comparison of RNA integrity number (RIN) values of pancreatic RNA samples fromhealthy rats following different excision techniques and extraction protocols demonstrated as (A)a heat map with the three RIN values of each protocol reported inside boxes and (B) a bar graphshowing the significant difference in RNA integrity between the optimized and standard protocolsusing the standard one-way analysis of variance (ANOVA) for RNA analysis followed by Fisher’sLSD test. ns, non-significant (p > 0.05) or significant at ** p < 0.01, *** p < 0.001.
Genes 2022, 13, 881 7 of 11
Genes 2022, 12, x FOR PEER REVIEW 7 of 12
RNeasy Mini Kit
RNAlater injection into BD with clamping + homogenization with 5 mL QIAzol + centrifugation after
tissue homogenization
NR 8.1 ± 0.1 391.0 ± 55.9 2.09 ± 0.01 1.96 ± 0.05
RNeasy Mini Kit
RNAlater injection into BD with clamping + homogenization with 7 mL QIAzol + centrifugation after
tissue homogenization
NR 7.2 ± 0.2 595.7 ± 164.9 2.11 ± 0.01 1.91 ± 0.08
Results are reported as mean ± SEM. BD, bile duct. RIN, RNA integrity number; NR, normal healthy rats; TriPure isolation reagent (Roche, Germany).
Figure 3. Comparison of RNA integrity number (RIN) values of pancreatic RNA samples from healthy rats following different excision techniques and extraction protocols demonstrated as (A) a heat map with the three RIN values of each protocol reported inside boxes and (B) a bar graph showing the significant difference in RNA integrity between the optimized and standard protocols using the standard one-way analysis of variance (ANOVA) for RNA analysis followed by Fisher’s LSD test. ns, non-significant (p > 0.05) or significant at ** p < 0.01, *** p < 0.001.
Figure 4. Electropherograms generated by an Agilent 2100 Bioanalyzer using the pico kit showing (A) RNA extracted using a standard protocol with an RIN = 3.6 and high peaks in the 5S and fast region, which indicates RNase degradation as compared with (B) RNA extracted using our
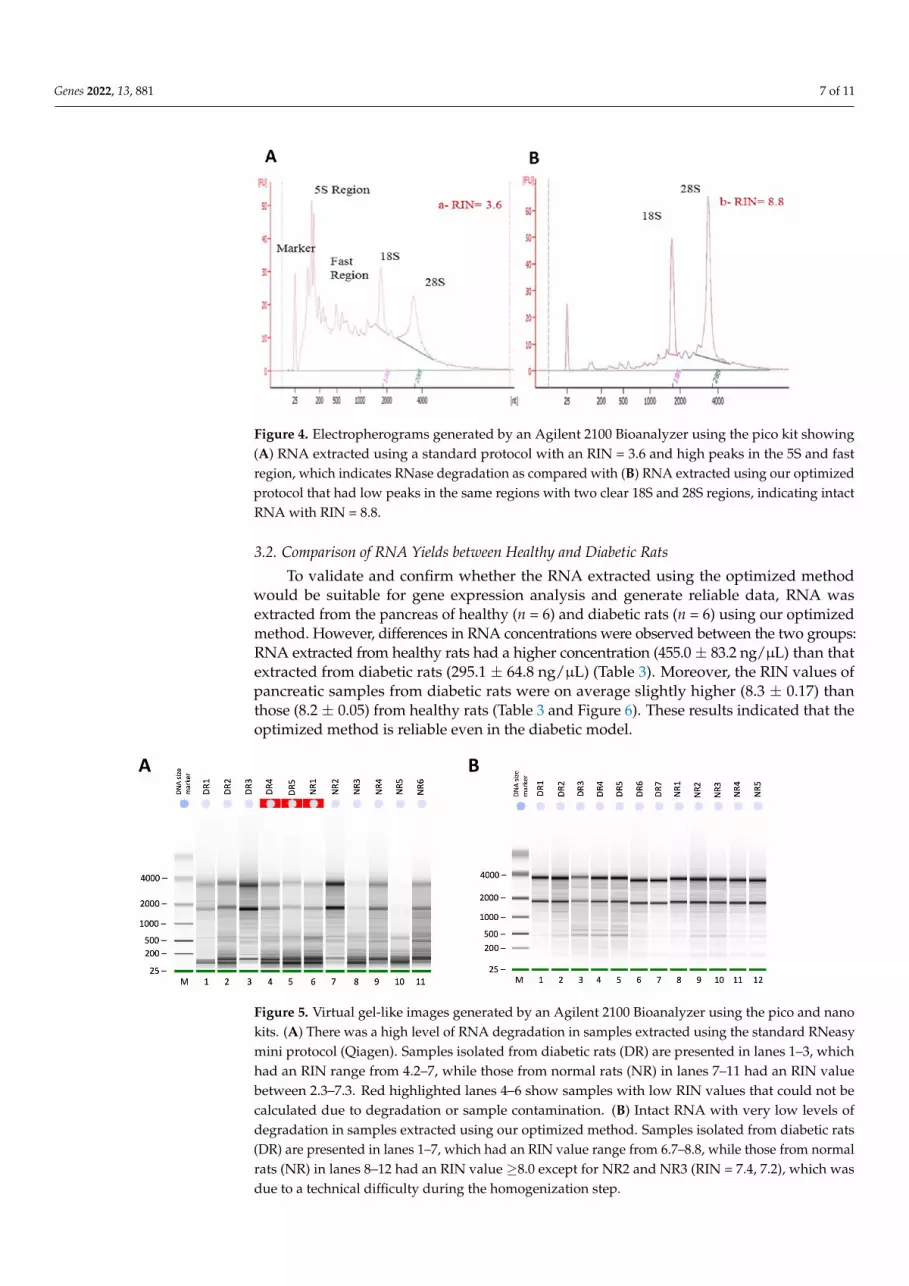
Figure 4. Electropherograms generated by an Agilent 2100 Bioanalyzer using the pico kit showing(A) RNA extracted using a standard protocol with an RIN = 3.6 and high peaks in the 5S and fastregion, which indicates RNase degradation as compared with (B) RNA extracted using our optimizedprotocol that had low peaks in the same regions with two clear 18S and 28S regions, indicating intactRNA with RIN = 8.8.
3.2. Comparison of RNA Yields between Healthy and Diabetic Rats
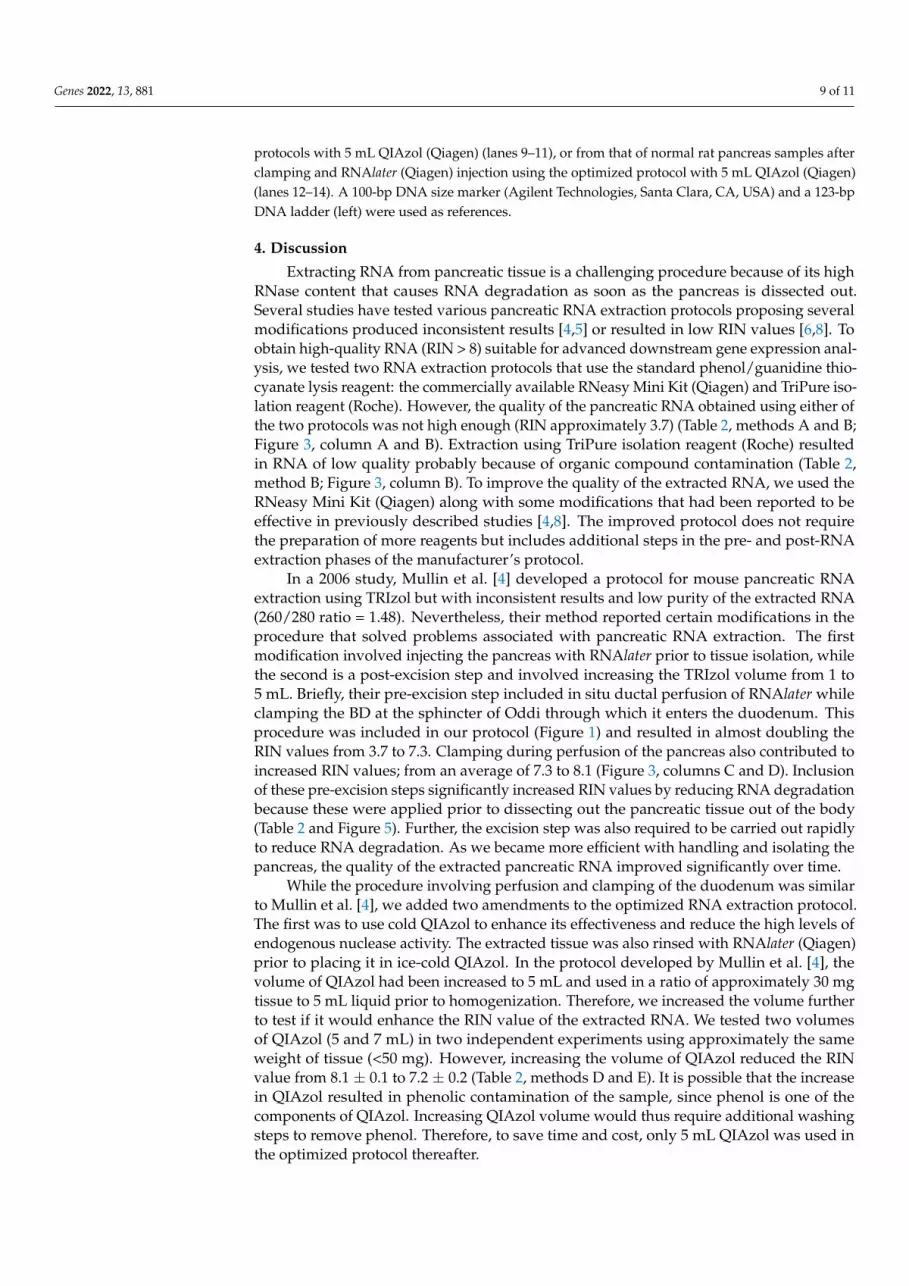
To validate and confirm whether the RNA extracted using the optimized methodwould be suitable for gene expression analysis and generate reliable data, RNA wasextracted from the pancreas of healthy (n = 6) and diabetic rats (n = 6) using our optimizedmethod. However, differences in RNA concentrations were observed between the two groups:RNA extracted from healthy rats had a higher concentration (455.0± 83.2 ng/µL) than thatextracted from diabetic rats (295.1 ± 64.8 ng/µL) (Table 3). Moreover, the RIN values ofpancreatic samples from diabetic rats were on average slightly higher (8.3 ± 0.17) thanthose (8.2 ± 0.05) from healthy rats (Table 3 and Figure 6). These results indicated that theoptimized method is reliable even in the diabetic model.
Genes 2022, 12, x FOR PEER REVIEW 8 of 12
optimized protocol that had low peaks in the same regions with two clear 18S and 28S regions, indicating intact RNA with RIN = 8.8.
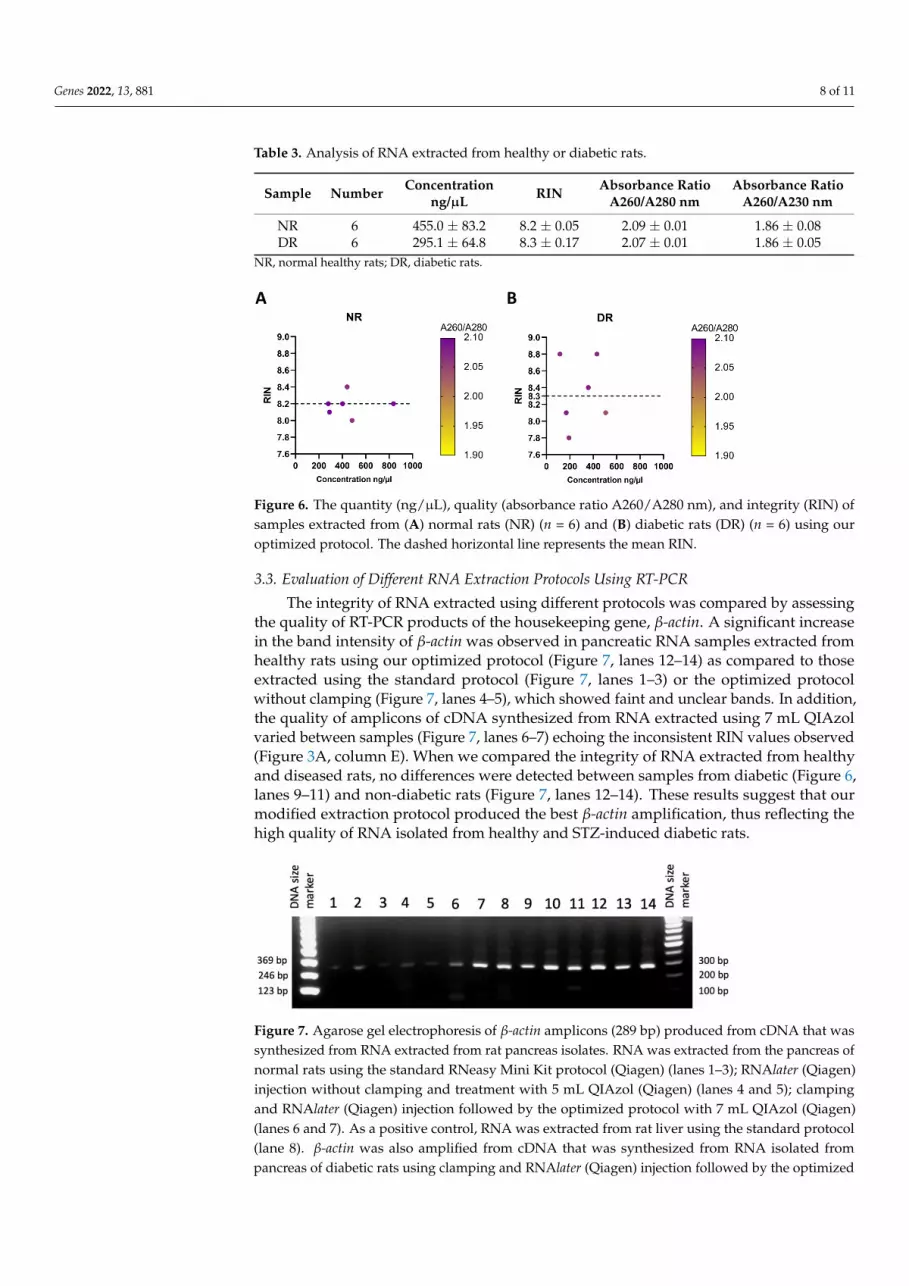
Figure 5. Virtual gel-like images generated by an Agilent 2100 Bioanalyzer using the pico and nano kits. (A) There was a high level of RNA degradation in samples extracted using the standard RNeasy mini protocol (Qiagen). Samples isolated from diabetic rats (DR) are presented in lanes 1–3, which had an RIN range from 4.2–7, while those from normal rats (NR) in lanes 7–11 had an RIN value between 2.3–7.3. Red highlighted lanes 4–6 show samples with low RIN values that could not be calculated due to degradation or sample contamination. (B) Intact RNA with very low levels of degradation in samples extracted using our optimized method. Samples isolated from diabetic rats (DR) are presented in lanes 1–7, which had an RIN value range from 6.7–8.8, while those from normal rats (NR) in lanes 8–12 had an RIN value ≥8.0 except for NR2 and NR3 (RIN = 7.4, 7.2), which was due to a technical difficulty during the homogenization step.
3.2. Comparison of RNA Yields between Healthy and Diabetic Rats To validate and confirm whether the RNA extracted using the optimized method
would be suitable for gene expression analysis and generate reliable data, RNA was extracted from the pancreas of healthy (n = 6) and diabetic rats (n = 6) using our optimized method. However, differences in RNA concentrations were observed between the two groups: RNA extracted from healthy rats had a higher concentration (455.0 ± 83.2 ng/µL) than that extracted from diabetic rats (295.1 ± 64.8 ng/µL) (Table 3). Moreover, the RIN values of pancreatic samples from diabetic rats were on average slightly higher (8.3 ± 0.17) than those (8.2 ± 0.05) from healthy rats (Table 3 and Figure 6). These results indicated that the optimized method is reliable even in the diabetic model.
Table 3. Analysis of RNA extracted from healthy or diabetic rats.
Sample Number Concentration ng/µL RIN Absorbance Ratio A260/A280 nm Absorbance Ratio A260/A230 nm NR 6 455.0 ± 83.2 8.2 ± 0.05 2.09 ± 0.01 1.86 ± 0.08 DR 6 295.1 ± 64.8 8.3 ± 0.17 2.07 ± 0.01 1.86 ± 0.05
NR, normal healthy rats; DR, diabetic rats.
A B
A B
Figure 5. Virtual gel-like images generated by an Agilent 2100 Bioanalyzer using the pico and nanokits. (A) There was a high level of RNA degradation in samples extracted using the standard RNeasymini protocol (Qiagen). Samples isolated from diabetic rats (DR) are presented in lanes 1–3, whichhad an RIN range from 4.2–7, while those from normal rats (NR) in lanes 7–11 had an RIN valuebetween 2.3–7.3. Red highlighted lanes 4–6 show samples with low RIN values that could not becalculated due to degradation or sample contamination. (B) Intact RNA with very low levels ofdegradation in samples extracted using our optimized method. Samples isolated from diabetic rats(DR) are presented in lanes 1–7, which had an RIN value range from 6.7–8.8, while those from normalrats (NR) in lanes 8–12 had an RIN value ≥8.0 except for NR2 and NR3 (RIN = 7.4, 7.2), which wasdue to a technical difficulty during the homogenization step.
Genes 2022, 13, 881 8 of 11
Table 3. Analysis of RNA extracted from healthy or diabetic rats.
Sample Number Concentrationng/µL RIN Absorbance Ratio
A260/A280 nmAbsorbance Ratio
A260/A230 nm
NR 6 455.0 ± 83.2 8.2 ± 0.05 2.09 ± 0.01 1.86 ± 0.08DR 6 295.1 ± 64.8 8.3 ± 0.17 2.07 ± 0.01 1.86 ± 0.05
NR, normal healthy rats; DR, diabetic rats.
Genes 2022, 12, x FOR PEER REVIEW 8 of 12
optimized protocol that had low peaks in the same regions with two clear 18S and 28S regions, indicating intact RNA with RIN = 8.8.
Figure 5. Virtual gel-like images generated by an Agilent 2100 Bioanalyzer using the pico and nano kits. (A) There was a high level of RNA degradation in samples extracted using the standard RNeasy mini protocol (Qiagen). Samples isolated from diabetic rats (DR) are presented in lanes 1–3, which had an RIN range from 4.2–7, while those from normal rats (NR) in lanes 7–11 had an RIN value between 2.3–7.3. Red highlighted lanes 4–6 show samples with low RIN values that could not be calculated due to degradation or sample contamination. (B) Intact RNA with very low levels of degradation in samples extracted using our optimized method. Samples isolated from diabetic rats (DR) are presented in lanes 1–7, which had an RIN value range from 6.7–8.8, while those from normal rats (NR) in lanes 8–12 had an RIN value ≥8.0 except for NR2 and NR3 (RIN = 7.4, 7.2), which was due to a technical difficulty during the homogenization step.
3.2. Comparison of RNA Yields between Healthy and Diabetic Rats To validate and confirm whether the RNA extracted using the optimized method
would be suitable for gene expression analysis and generate reliable data, RNA was extracted from the pancreas of healthy (n = 6) and diabetic rats (n = 6) using our optimized method. However, differences in RNA concentrations were observed between the two groups: RNA extracted from healthy rats had a higher concentration (455.0 ± 83.2 ng/µL) than that extracted from diabetic rats (295.1 ± 64.8 ng/µL) (Table 3). Moreover, the RIN values of pancreatic samples from diabetic rats were on average slightly higher (8.3 ± 0.17) than those (8.2 ± 0.05) from healthy rats (Table 3 and Figure 6). These results indicated that the optimized method is reliable even in the diabetic model.
Table 3. Analysis of RNA extracted from healthy or diabetic rats.
Sample Number Concentration ng/µL RIN Absorbance Ratio A260/A280 nm Absorbance Ratio A260/A230 nm NR 6 455.0 ± 83.2 8.2 ± 0.05 2.09 ± 0.01 1.86 ± 0.08 DR 6 295.1 ± 64.8 8.3 ± 0.17 2.07 ± 0.01 1.86 ± 0.05
NR, normal healthy rats; DR, diabetic rats.
A B
A B
Figure 6. The quantity (ng/µL), quality (absorbance ratio A260/A280 nm), and integrity (RIN) ofsamples extracted from (A) normal rats (NR) (n = 6) and (B) diabetic rats (DR) (n = 6) using ouroptimized protocol. The dashed horizontal line represents the mean RIN.
3.3. Evaluation of Different RNA Extraction Protocols Using RT-PCR
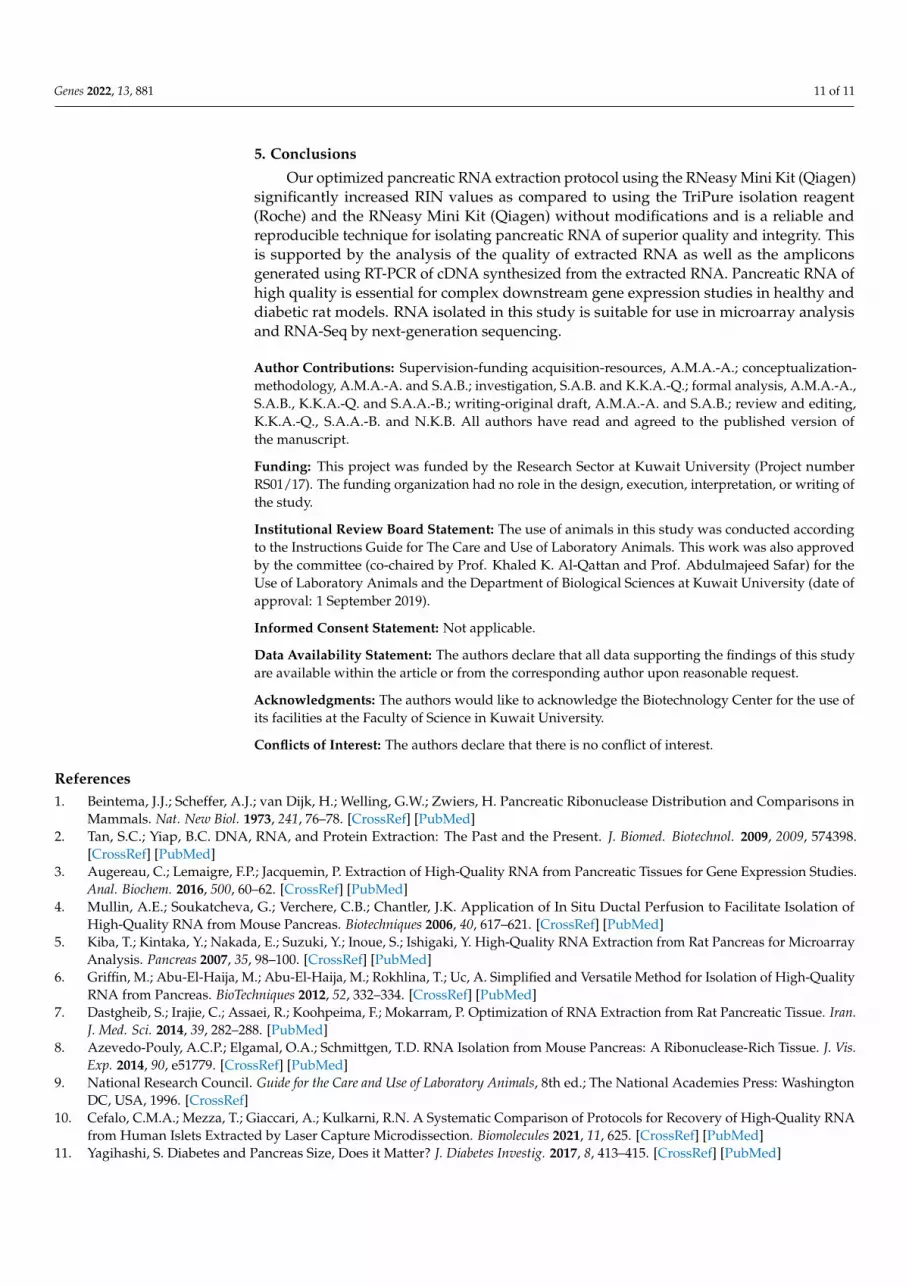
The integrity of RNA extracted using different protocols was compared by assessingthe quality of RT-PCR products of the housekeeping gene, β-actin. A significant increasein the band intensity of β-actin was observed in pancreatic RNA samples extracted fromhealthy rats using our optimized protocol (Figure 7, lanes 12–14) as compared to thoseextracted using the standard protocol (Figure 7, lanes 1–3) or the optimized protocolwithout clamping (Figure 7, lanes 4–5), which showed faint and unclear bands. In addition,the quality of amplicons of cDNA synthesized from RNA extracted using 7 mL QIAzolvaried between samples (Figure 7, lanes 6–7) echoing the inconsistent RIN values observed(Figure 3A, column E). When we compared the integrity of RNA extracted from healthyand diseased rats, no differences were detected between samples from diabetic (Figure 6,lanes 9–11) and non-diabetic rats (Figure 7, lanes 12–14). These results suggest that ourmodified extraction protocol produced the best β-actin amplification, thus reflecting thehigh quality of RNA isolated from healthy and STZ-induced diabetic rats.
Genes 2022, 12, x FOR PEER REVIEW 9 of 12
Figure 6. The quantity (ng/µL), quality (absorbance ratio A260/A280 nm), and integrity (RIN) of samples extracted from (A) normal rats (NR) (n = 6) and (B) diabetic rats (DR) (n = 6) using our optimized protocol. The dashed horizontal line represents the mean RIN.
3.3. Evaluation of Different RNA Extraction Protocols Using RT-PCR The integrity of RNA extracted using different protocols was compared by assessing
the quality of RT-PCR products of the housekeeping gene, β-actin. A significant increase in the band intensity of β-actin was observed in pancreatic RNA samples extracted from healthy rats using our optimized protocol (Figure 7, lanes 12–14) as compared to those extracted using the standard protocol (Figure 7, lanes 1–3) or the optimized protocol without clamping (Figure 7, lanes 4–5), which showed faint and unclear bands. In addition, the quality of amplicons of cDNA synthesized from RNA extracted using 7 mL QIAzol varied between samples (Figure 7, lanes 6–7) echoing the inconsistent RIN values observed (Figure 3A, column E). When we compared the integrity of RNA extracted from healthy and diseased rats, no differences were detected between samples from diabetic (Figure 6, lanes 9–11) and non-diabetic rats (Figure 7, lanes 12–14). These results suggest that our modified extraction protocol produced the best β-actin amplification, thus reflecting the high quality of RNA isolated from healthy and STZ-induced diabetic rats.
Figure 7. Agarose gel electrophoresis of β-actin amplicons (289 bp) produced from cDNA that was synthesized from RNA extracted from rat pancreas isolates. RNA was extracted from the pancreas of normal rats using the standard RNeasy Mini Kit protocol (Qiagen) (lanes 1–3); RNAlater (Qiagen) injection without clamping and treatment with 5 mL QIAzol (Qiagen) (lanes 4 and 5); clamping and RNAlater (Qiagen) injection followed by the optimized protocol with 7 mL QIAzol (Qiagen) (lanes 6 and 7). As a positive control, RNA was extracted from rat liver using the standard protocol (lane 8). β-actin was also amplified from cDNA that was synthesized from RNA isolated from pancreas of diabetic rats using clamping and RNAlater (Qiagen) injection followed by the optimized protocols with 5 mL QIAzol (Qiagen) (lanes 9–11), or from that of normal rat pancreas samples after clamping and RNAlater (Qiagen) injection using the optimized protocol with 5 mL QIAzol (Qiagen) (lanes 12–14). A 100-bp DNA size marker (Agilent Technologies, USA) and a 123-bp DNA ladder (left) were used as references.
4. Discussion Extracting RNA from pancreatic tissue is a challenging procedure because of its high
RNase content that causes RNA degradation as soon as the pancreas is dissected out. Several studies have tested various pancreatic RNA extraction protocols proposing several modifications produced inconsistent results [4,5] or resulted in low RIN values [6,8]. To obtain high-quality RNA (RIN > 8) suitable for advanced downstream gene expression analysis, we tested two RNA extraction protocols that use the standard phenol/guanidine thiocyanate lysis reagent: the commercially available RNeasy Mini Kit (Qiagen) and TriPure isolation reagent (Roche). However, the quality of the pancreatic RNA obtained using either of the two protocols was not high enough (RIN approximately 3.7) (Table 2, methods A and B; Figure 3, column A and B). Extraction using TriPure isolation reagent (Roche) resulted in RNA of low quality probably because of organic compound contamination (Table 2, method B; Figure 3, column B). To improve the quality of the extracted RNA, we used the RNeasy Mini Kit (Qiagen) along with some
Figure 7. Agarose gel electrophoresis of β-actin amplicons (289 bp) produced from cDNA that wassynthesized from RNA extracted from rat pancreas isolates. RNA was extracted from the pancreas ofnormal rats using the standard RNeasy Mini Kit protocol (Qiagen) (lanes 1–3); RNAlater (Qiagen)injection without clamping and treatment with 5 mL QIAzol (Qiagen) (lanes 4 and 5); clampingand RNAlater (Qiagen) injection followed by the optimized protocol with 7 mL QIAzol (Qiagen)(lanes 6 and 7). As a positive control, RNA was extracted from rat liver using the standard protocol(lane 8). β-actin was also amplified from cDNA that was synthesized from RNA isolated frompancreas of diabetic rats using clamping and RNAlater (Qiagen) injection followed by the optimized
Genes 2022, 13, 881 9 of 11
protocols with 5 mL QIAzol (Qiagen) (lanes 9–11), or from that of normal rat pancreas samples afterclamping and RNAlater (Qiagen) injection using the optimized protocol with 5 mL QIAzol (Qiagen)(lanes 12–14). A 100-bp DNA size marker (Agilent Technologies, Santa Clara, CA, USA) and a 123-bpDNA ladder (left) were used as references.
4. Discussion
Extracting RNA from pancreatic tissue is a challenging procedure because of its highRNase content that causes RNA degradation as soon as the pancreas is dissected out.Several studies have tested various pancreatic RNA extraction protocols proposing severalmodifications produced inconsistent results [4,5] or resulted in low RIN values [6,8]. Toobtain high-quality RNA (RIN > 8) suitable for advanced downstream gene expression anal-ysis, we tested two RNA extraction protocols that use the standard phenol/guanidine thio-cyanate lysis reagent: the commercially available RNeasy Mini Kit (Qiagen) and TriPure iso-lation reagent (Roche). However, the quality of the pancreatic RNA obtained using either ofthe two protocols was not high enough (RIN approximately 3.7) (Table 2, methods A and B;Figure 3, column A and B). Extraction using TriPure isolation reagent (Roche) resultedin RNA of low quality probably because of organic compound contamination (Table 2,method B; Figure 3, column B). To improve the quality of the extracted RNA, we used theRNeasy Mini Kit (Qiagen) along with some modifications that had been reported to beeffective in previously described studies [4,8]. The improved protocol does not requirethe preparation of more reagents but includes additional steps in the pre- and post-RNAextraction phases of the manufacturer’s protocol.
In a 2006 study, Mullin et al. [4] developed a protocol for mouse pancreatic RNAextraction using TRIzol but with inconsistent results and low purity of the extracted RNA(260/280 ratio = 1.48). Nevertheless, their method reported certain modifications in theprocedure that solved problems associated with pancreatic RNA extraction. The firstmodification involved injecting the pancreas with RNAlater prior to tissue isolation, whilethe second is a post-excision step and involved increasing the TRIzol volume from 1 to5 mL. Briefly, their pre-excision step included in situ ductal perfusion of RNAlater whileclamping the BD at the sphincter of Oddi through which it enters the duodenum. Thisprocedure was included in our protocol (Figure 1) and resulted in almost doubling theRIN values from 3.7 to 7.3. Clamping during perfusion of the pancreas also contributed toincreased RIN values; from an average of 7.3 to 8.1 (Figure 3, columns C and D). Inclusionof these pre-excision steps significantly increased RIN values by reducing RNA degradationbecause these were applied prior to dissecting out the pancreatic tissue out of the body(Table 2 and Figure 5). Further, the excision step was also required to be carried out rapidlyto reduce RNA degradation. As we became more efficient with handling and isolating thepancreas, the quality of the extracted pancreatic RNA improved significantly over time.
While the procedure involving perfusion and clamping of the duodenum was similarto Mullin et al. [4], we added two amendments to the optimized RNA extraction protocol.The first was to use cold QIAzol to enhance its effectiveness and reduce the high levels ofendogenous nuclease activity. The extracted tissue was also rinsed with RNAlater (Qiagen)prior to placing it in ice-cold QIAzol. In the protocol developed by Mullin et al. [4], thevolume of QIAzol had been increased to 5 mL and used in a ratio of approximately 30 mgtissue to 5 mL liquid prior to homogenization. Therefore, we increased the volume furtherto test if it would enhance the RIN value of the extracted RNA. We tested two volumesof QIAzol (5 and 7 mL) in two independent experiments using approximately the sameweight of tissue (<50 mg). However, increasing the volume of QIAzol reduced the RINvalue from 8.1 ± 0.1 to 7.2 ± 0.2 (Table 2, methods D and E). It is possible that the increasein QIAzol resulted in phenolic contamination of the sample, since phenol is one of thecomponents of QIAzol. Increasing QIAzol volume would thus require additional washingsteps to remove phenol. Therefore, to save time and cost, only 5 mL QIAzol was used inthe optimized protocol thereafter.

Genes 2022, 13, 881 10 of 11
The second modification was a centrifugation step performed after homogenizingthe tissue with the lysis reagent, which was adapted from Azevedo-Pouly et al. [8] whoreported that time could be saved if, instead of dissociating the entire tissue, the lysateis centrifuged to remove unhomogenized fragments, thus avoiding RNA degradation.Similarly, we included this centrifugation step to pellet out any undigested tissue, whichmight affect the quality of the extracted RNA as a modification of the RNA extractionmethod using the RNeasy Mini Kit (Qiagen) (Figure 2).
The concentration of RNA extracted from healthy and diabetic rats showed somevariation in our improved protocol (Table 3 and Figure 6A,B). Although both groups(healthy and diabetic rats) had approximately similar RIN values (8.2 and 8.3, respectively),the amount of RNA extracted from healthy rats was higher than that extracted from diabeticrats (455.0 ± 83.2 and 295.1 ± 64 ng/µL, respectively). Cefalo et al. [10] presented similarresults when comparing RNA extracted from frozen human pancreatic samples of non-diabetic and diabetic patients who had undergone partial pancreatectomy. By meansof the advanced technology of pancreatic imaging, it was revealed that the pancreas ofpatients with type 1 or type 2 diabetes had an overall reduced volume as compared tothat of healthy individuals [11], which might explain the difference in the amount of RNAobserved in this study.
The cDNA synthesized from pancreatic RNA isolated using different extraction pro-tocols was used in RT-PCR to amplify the housekeeping β-actin gene; the differences inits amplification reflected the effect of the modifications on the quality of the pancreaticRNA extracted. Following comparison with the control rat liver RNA that was extractedusing the standard RNeasy Mini Kit (Qiagen) (Figure 7, lane 8) with that extracted usingthe various published protocols, it was clear that our modified RNA protocol yielded thebest results (Figure 7, lanes 9–14), as compared to pancreatic RNA extracted using the stan-dard protocol that resulted in RNA of very low integrity and quality (Figure 7, lanes 1–3).Moreover, injecting RNAlater (Qiagen) without clamping the HPD, and increasing theQIAzol volume, hardly improved the intensity RT-PCR products (Figure 7, lanes 4 and 5).Additionally, injecting RNAlater with clamping the HPD and increasing the QIAzol vol-ume from 5 to 7 mL yielded inconsistent results with variable band intensities (Figure 7,lanes 6–7). The integrity of the RNA isolated from healthy and diabetic rats was similar,yielding consistent and reproducible RT-PCR results (Figure 7, lanes 9–14), reflecting theefficacy of our optimized pancreatic RNA extraction method under different pathologicalconditions. This method is thus valuable in studies related to diabetes, as it is reliable andsolves several challenges related to pancreatic RNA extraction.
Following our protocol, we were able to approximately double the RIN value of theextracted pancreatic RNA using the RNeasy Mini Kit (Qiagen) without any modifications.The improved RNA extraction protocol is reproducible and effective despite the additionalcost of the QIAzol step, which is necessary to inhibit the high level of endogenous pancreaticRNase activity. All modifications to the standard protocol performed in this study werecompared to those reported in other studies from which some steps were adapted (Table 4).
Table 4. Comparison of the experimental steps in the current study with that in two other studiesfrom which the steps were adapted.
Experimental Steps Current Protocol Mullin et al., 2006 [4] Azevedo-Pouly et al., 2014 [8]
Pancreas source Rats Mice MiceClamping of the HPD X X -
RNAlater injection Pre-excision Pre-excision -Weight of pancreas <50 mg 30 mg Entire pancreas was excised
Rinsing with RNAlater after excision X - -Volume of lysis buffer 5 mL ice-cold QIAzol 5 mL TRIzol 8 mL ice-cold QIAzol
Extra centrifugation step after homogenizationwith lysis buffer X - X
RIN value 8.2 ± 0.05 Not specified 7.4 ± 0.20
HPD, hepatopancreatic duct; RNAlater (Qiagen, Hilden, Germany); QIAzol (Qiagen, Hilden, Germany).
Genes 2022, 13, 881 11 of 11
5. Conclusions
Our optimized pancreatic RNA extraction protocol using the RNeasy Mini Kit (Qiagen)significantly increased RIN values as compared to using the TriPure isolation reagent(Roche) and the RNeasy Mini Kit (Qiagen) without modifications and is a reliable andreproducible technique for isolating pancreatic RNA of superior quality and integrity. Thisis supported by the analysis of the quality of extracted RNA as well as the ampliconsgenerated using RT-PCR of cDNA synthesized from the extracted RNA. Pancreatic RNA ofhigh quality is essential for complex downstream gene expression studies in healthy anddiabetic rat models. RNA isolated in this study is suitable for use in microarray analysisand RNA-Seq by next-generation sequencing.
Author Contributions: Supervision-funding acquisition-resources, A.M.A.-A.; conceptualization-methodology, A.M.A.-A. and S.A.B.; investigation, S.A.B. and K.K.A.-Q.; formal analysis, A.M.A.-A.,S.A.B., K.K.A.-Q. and S.A.A.-B.; writing-original draft, A.M.A.-A. and S.A.B.; review and editing,K.K.A.-Q., S.A.A.-B. and N.K.B. All authors have read and agreed to the published version ofthe manuscript.
Funding: This project was funded by the Research Sector at Kuwait University (Project numberRS01/17). The funding organization had no role in the design, execution, interpretation, or writing ofthe study.
Institutional Review Board Statement: The use of animals in this study was conducted accordingto the Instructions Guide for The Care and Use of Laboratory Animals. This work was also approvedby the committee (co-chaired by Prof. Khaled K. Al-Qattan and Prof. Abdulmajeed Safar) for theUse of Laboratory Animals and the Department of Biological Sciences at Kuwait University (date ofapproval: 1 September 2019).
Informed Consent Statement: Not applicable.
Data Availability Statement: The authors declare that all data supporting the findings of this studyare available within the article or from the corresponding author upon reasonable request.
Acknowledgments: The authors would like to acknowledge the Biotechnology Center for the use ofits facilities at the Faculty of Science in Kuwait University.
Conflicts of Interest: The authors declare that there is no conflict of interest.
References1. Beintema, J.J.; Scheffer, A.J.; van Dijk, H.; Welling, G.W.; Zwiers, H. Pancreatic Ribonuclease Distribution and Comparisons in
Mammals. Nat. New Biol. 1973, 241, 76–78. [CrossRef] [PubMed]2. Tan, S.C.; Yiap, B.C. DNA, RNA, and Protein Extraction: The Past and the Present. J. Biomed. Biotechnol. 2009, 2009, 574398.
[CrossRef] [PubMed]3. Augereau, C.; Lemaigre, F.P.; Jacquemin, P. Extraction of High-Quality RNA from Pancreatic Tissues for Gene Expression Studies.
Anal. Biochem. 2016, 500, 60–62. [CrossRef] [PubMed]4. Mullin, A.E.; Soukatcheva, G.; Verchere, C.B.; Chantler, J.K. Application of In Situ Ductal Perfusion to Facilitate Isolation of
High-Quality RNA from Mouse Pancreas. Biotechniques 2006, 40, 617–621. [CrossRef] [PubMed]5. Kiba, T.; Kintaka, Y.; Nakada, E.; Suzuki, Y.; Inoue, S.; Ishigaki, Y. High-Quality RNA Extraction from Rat Pancreas for Microarray
Analysis. Pancreas 2007, 35, 98–100. [CrossRef] [PubMed]6. Griffin, M.; Abu-El-Haija, M.; Abu-El-Haija, M.; Rokhlina, T.; Uc, A. Simplified and Versatile Method for Isolation of High-Quality
RNA from Pancreas. BioTechniques 2012, 52, 332–334. [CrossRef] [PubMed]7. Dastgheib, S.; Irajie, C.; Assaei, R.; Koohpeima, F.; Mokarram, P. Optimization of RNA Extraction from Rat Pancreatic Tissue. Iran.
J. Med. Sci. 2014, 39, 282–288. [PubMed]8. Azevedo-Pouly, A.C.P.; Elgamal, O.A.; Schmittgen, T.D. RNA Isolation from Mouse Pancreas: A Ribonuclease-Rich Tissue. J. Vis.
Exp. 2014, 90, e51779. [CrossRef] [PubMed]9. National Research Council. Guide for the Care and Use of Laboratory Animals, 8th ed.; The National Academies Press: Washington
DC, USA, 1996. [CrossRef]10. Cefalo, C.M.A.; Mezza, T.; Giaccari, A.; Kulkarni, R.N. A Systematic Comparison of Protocols for Recovery of High-Quality RNA
from Human Islets Extracted by Laser Capture Microdissection. Biomolecules 2021, 11, 625. [CrossRef] [PubMed]11. Yagihashi, S. Diabetes and Pancreas Size, Does it Matter? J. Diabetes Investig. 2017, 8, 413–415. [CrossRef] [PubMed]


