Embed Size (px)
Citation preview
Combining Latent Dirichlet Allocationand K-Means for Documents Clustering: Effect
of Probabilistic Based Distance Measures
Quang Vu Bui1,2, Karim Sayadi2(B), Soufian Ben Amor3,4, and Marc Bui2
1 Hue University of Sciences, Hue, Vietnam2 CHArt Laboratory EA 4004, EPHE, PSL Research University, Paris, France
[email protected] LI-PARAD Laboratory, University of Versailles-Saint- Quentin-en-Yvelines,
Versailles, France4 Paris-Saclay University, Paris, France
Abstract. This paper evaluates through an empirical study eight differ-ent distance measures used on the LDA + K-means model. We performedour analysis on two miscellaneous datasets that are commonly used.Our experimental results indicate that the probabilistic-based distancemeasures are better than the vector based distance measures includ-ing Euclidean when it comes to cluster a set of documents in the topicspace. Moreover, we investigate the implication of the number of topicsand show that K-means combined to the results of the Latent DirichletAllocation model allows us to have better results than the LDA + Naiveand Vector Space Model.
Keywords: Latent Dirichlet Allocation · Topic modeling · Documentclustering · K-means · Similarity measure · Probabilistic-based distance ·Clustering evaluation
1 Introduction
Clustering a set of documents is a standard problem addressed in data min-ing, machine learning, and statistical natural language processing. Documentclustering can automatically organize many documents into a small number ofmeaningful clusters and find latent structure in unlabeled document collections.
K-means is one of the most used partitioned-based clustering algorithms. Itbecame popular among information retrieval tasks [12]. For clustering a set ofdocuments with K-means, each document is firstly quantified as a vector whereeach component indicates a corresponding feature in the document. Then, adistance is used to measure the difference between two documents. The collec-tion of documents is represented by a sparse and high-dimensional matrix. Theuse of this matrix raises an issue known as the “curse of dimensionality” [14].Thus, using K-means require reducing the documents dimensionality and usinga “good” distance measure to get the most accurate clusters.c© Springer International Publishing AG 2017N.T. Nguyen et al. (Eds.): ACIIDS 2017, Part I, LNAI 10191, pp. 248–257, 2017.DOI: 10.1007/978-3-319-54472-4 24
Combining Latent Dirichlet Allocation and K-Means for Documents 249
In our work, we first reduce the dimensionality by decomposing the documentmatrix into latent components using the Latent Dirichlet Allocation (LDA) [2]method. Each document is represented by a probability distribution of topics andeach topic is characterized by a probability distribution over a finite vocabularyof words. We use the probability distribution of topics as the input for K-meansclustering. This approach called LDA + K-means was proposed by [3,17]. Wenote that [17] proposed LDA+ K-means but only used Euclidean distance.
We then compare the efficiency of eight distance measures [5]. These mea-sures are based on two approaches: (i) Vector based approach (VBM) withEuclidean distance, Sørensen distance, Tanimoto distance, Cosine distance and(ii) Probabilistic-based approach (PBM) with Bhattacharyya distance, Proba-bilistic Symmetric χ2 divergence, Jensen-Shannon divergence, Taneja divergence.
In order to come up with a sound conclusion, we have performed an empiricalevaluation of the eight distance measures according to a labeled clustering. Wecompared the clusters with the two evaluation criteria: Adjusted Rand Index(ARI) [9] and Adjusted Mutual Information (AMI) [16]. We used two commondatasets in the NLP community: the 20NewsGroup dataset contains newsgroupposts and the WebKB contains texts extracted from web pages.
Our experiments can be compared to the work of [8,11,17]. The key differ-ences are the following: In comparison with the VBM we conducted our experi-ments with a PBM, we show that in the case of LDA+ K-means where the inputis a probability distribution the use of PBM leads to better results. Then, ourresults show that the Euclidean distance may not be suitable for this kind ofapplication. Finally, by evaluating the results of the VBM and PBM with ARIand AMI criteria we have investigated the implication of the number of topicsin the clustering processing.
This paper is organized as follows. The next section describes the methodol-ogy in which we present K-means algorithms and document clustering, similaritymeasures in probabilistic spaces and evaluation indexes used in the experiments.We explain the experiment, discuss the results in Sect. 3 and also conclude ourwork in Sect. 4.
2 Methodology
2.1 Document Clustering
Vector Space Model. Most current document clustering methods choose toview text as a bag of words. In this method, each document is represented byword-frequency vector dwf = (wf1, wf2, . . . , wfn), where wfi is the frequency ofthe ith word in the document. This gives the model its name, the vector spacemodel (VSM) [15].
The two disadvances of VSM are the high dimensionality because of the highnumber of unique terms in text corpora and insufficient to capture all semantics.Latent Dirichlet Allocation [2] proposed a good solution to solve these issues.

250 Q.V. Bui et al.
Latent Dirichlet Allocation. Latent Dirichlet Allocation (LDA) [2] is a gen-erative probabilistic model for topic discovery. In LDA, each document may beconsidered as a mixture of different topics and each topic is characterized by aprobability distribution over a finite vocabulary of words. The generative modelof LDA, described with the probabilistic graphical model in Fig. 1, proceeds asfollows:
1. Choose distribution over topics θi from a Dirichlet distribution with parame-ter α for each document.
2. Choose distribution over words φk from a Dirichlet distribution with para-meter β for each topic.
3. For each of the word positions i, j:3.1. Choose a topic zi,j from a Multinomial distribution with parameter θi3.2. Choose a word wi,j from a Multinomial distribution with parameter φzi,j
Fig. 1. Probabilistic graphical model of LDA
For posterior inference, we need to solve the following equation:
p(θ, φ, z|w,α, β) =p(θ, φ, z, w|α, β)
p(w|α, β)
There are some inference algorithms available including variational inferenceused in the original paper [2] and Gibbs Sampling. Please refer to the work of[1] for more details.
K-Means Algorithm. K-means which proposed by Forgy [6] is one of themost popular clustering algorithms. It provides a simple and easy way to classifyobjects in k groups fixed a priori. The basic idea is to define k centroids andthen assign objects to the nearest centroid. A loop has been generated. In eachstep, we need to re-calculate k new centroids and re-assign objects until no morechanges are done. The algorithm works as follows:
1. Selecting k initial objects called centroids of the k clusters.2. Assigning each object to the cluster that has the closest centroid.3. Computing the new centroid of each cluster.4. Repeat step 2 and 3 until the objects in any cluster do no longer change.
Combining Latent Dirichlet Allocation and K-Means for Documents 251
2.2 Combining LDA and K-Means
The output of LDA is two probability distributions: the document-topic distribu-tion θ and the word-topic distribution φ. To use as much as possible informationfrom LDA result, we can combine Latent Dirichlet Allocation and K-means,denoted LDA + K-means, by using document-topic distributions θ extractedfrom LDA as the input for K-means clustering algorithms. For a matter of space,we invite the readers to find more details in the work of [3].
2.3 Similarity Measures
Since LDA represents documents as probability distributions, we need to con-sider the “good” way to choose a distance or similarity measure for comparingtwo probability distributions. Eight distances families as categorized by [5] wereused in K-means + LDA. These families can be divided into two groups:
– Vector-Based Measurements (VBM): Euclidean distance, Sørensen distance,Tanimoto distance, Cosine distance
– Probabilistic-Based Measurements (PBM): Bhattacharyya distance, Prob-abilistic Symmetric χ2 divergence, Jensen-Shannon divergence, Tanejadivergence
Let A = (a1, a2, . . . , ak) and B = (b1, b2, . . . , bk) be two vectors with k dimen-sions. The eight distances between A and B are defined as:
Euclidean distance: dEuc =
√k∑
i=1
|ai − bi|2
Sørensen distance: dSor =∑k
i=1 |ai−bi|∑ki=1(ai+bi)
Tanimoto distance: dTani =∑k
i=1(max(ai,bi)−min(ai,bi))∑ki=1 max(ai,bi)
Cosine distance: dCos = 1 − SimCos = 1 −∑k
i=1 aibi√∑ki=1 ai
2√∑k
i=1 bi2
Jensen-Shannon Divergence. The Jensen-Shannon (JS) divergence, knownas a total divergence to the average, is based on Kullback-Leibler (KL) diver-gence, which is related to Shannon’s concept of uncertainty or “entropy” H(A) =k∑
i=1
ailnai.
dJS =12
k∑i=1
ailn(2ai
ai + bi) +
12
k∑i=1
biln(2bi
ai + bi)
252 Q.V. Bui et al.
Bhattacharyya Distance. Bhattacharyya distance is a divergence-type mea-sure between distributions, defined as,
dBhat = −ln
k∑i=1
√aibi
Probabilistic Symmetric χ2 Divergence. Probabilistic Symmetric χ2 diver-gence is a special case of χ2 divergence. It is a combination of Pearson χ2 diver-gence and Newman χ2 divergence.
dPChi = 2k∑
i=1
(ai − bi)2
ai + bi
Taneja Divergence. Taneja divergence is a combination between KL diver-gence and Bhattacharyya distance, using KL-divergence with ai = ai+bi
2 , bi =√aibi
dTJ =k∑
i=1
(ai + bi
2)ln(
ai + bi
2√
aibi)
2.4 Evaluation Methods
For each dataset, we obtained a clustering result from the K-means algorithm.To measure the quality of the clustering results, we used two evaluation indexes:Adjusted Rand Index (ARI) [9] and Adjusted Mutual Information (AMI) [16],which are widely used to evaluate the performance of unsupervised learningalgorithms.
Adjusted Rand Index: Adjusted Rand Index (ARI) [9], an adjusted form ofRand Index (RI), is defined as:
ARI =
∑ij
(nij
2
) − [∑i
(ni◦2
) ∑j
(n◦j
2
)]/(n2
)12
[∑i
(ni◦2
)+
∑j
(n◦j
2
)] − [∑i
(ni◦2
) ∑j
(n◦j
2
)]/(n2
) (1)
where nij , ni◦, n◦j , n are values from the contingency Table 1.
Adjusted Mutual Information. The Adjusted Mutual Information (AMI)[16], an adjusted form of mutual information (MI), is defined:
AMI(P,Q) =MI(P,Q) − E{MI(P,Q)}
max {H(P ),H(Q)} − E{MI(P,Q)} (2)
where
H(P ) = −k∑
i=1
ni◦n
logni◦n
;MI(P,Q) =k∑
i=1
l∑j=1
nij
nlog
nij/n
ni◦n◦j/n2.

Combining Latent Dirichlet Allocation and K-Means for Documents 253
Table 1. The Contingency Table, nij = |Pi ∩ Qj |
P \ Q Q1 Q2 · · · Ql Sums
P1 n11 n12 · · · n1l n1◦P2 n21 n22 · · · n2l n2◦...
......
. . ....
...
Pk nk1 nk2 · · · nkl nk◦Sums n◦1 n◦2 · · · n◦l
∑
ij
nij = n
Both ARI and AMI have a boundary above by 1. Higher values of ARI orAMI indicate more agreement between the two partitions. Please refer to thework of [9], [16] for more details.
3 Experiments and Results
3.1 Datasets
The proposed methodology is evaluated on 2 miscellaneous datasets that arecommonly used for the NLP community regarding the task of document cluster-ing. Table 2 describes some statistics about the used datasets. The 20Newsgroupcollect has 18821 documents distributed across 20 different news categories. Eachdocument corresponds to one article with a header that contains the title, thesubject, and quoted text. The WebKB dataset contains 8230 web pages fromthe computer science department of different universities (e.g. Texas, Wisconsin,Cornell, etc.).
Table 2. Statistics of the datasets. Where #Docs refers to the number of documentsin the dataset, #Classes refers to the number of classes in the dataset and < Class, >Class, refers to the minimum number of documents and the maximum number ofdocument in a class.
Dataset #Docs #Classes < Class > Class
News20 18821 20 628 999
WebKB 8230 4 504 1641
3.2 Setup
In our experiments, we compared eight distances used with LDA + K-meansdivided into the two categories: the Probabilistic-Based Measurements (PBM)and the Vector-Based Measurements (VBM). We run LDA with Gibbs samplingmethod using the topicmodels R package1. The prior parameters α and β are1 https://cran.r-project.org/web/packages/topicmodels/index.html.

254 Q.V. Bui et al.
respectively set to 0.1 and 0.01. These parameters were chosen according to thestate-of-the-art standards [7]. The number of iterations of the Gibbs samplingis set to 5000. The input number of topics for the 20NewsGroups dataset is setto 30 and for the WebKB dataset is set to 8. This number of topics will beconfirmed in our experiments by testing different values. For each of the eightdistances, we run the K-means 20 times with a maximum number of iterationsequal to 1000. We compute the ARI and AMI on the results of each K-meansiteration and report the average values.
3.3 Results
Comparing Effectiveness of Eight Distance Measures for LDA +K-Means. The average values of the ARI and AMI are reported in Table 3. Theaverage ARI and AMI values of the PBM group are better than the averagevalues of the VBM group. We notice that the Euclidean distance has the worstresults regarding the ARI and AMI criteria. In the PBM group, the best averagevalues are obtained by the two distances Bhattacharyya and Taneja. Thus, wepropose to work with Taneja or Bhattacharyya distance for LDA + K-means.For a better understanding of the results, we additionally provide a bar plotillustrated in Fig. 2.
Table 3. The average values of ARI, AMI for VSM, LDA Naive, LDA + K-means witheight different distance measures for two datasets
Distances 20NewsGroups WebKB
ARI AMI ARI AMI
Euclidean 0,402 0,608 0,436 0,432
Sorensen 0,592 0,698 0,531 0,479
Tanimoto 0,582 0,691 0,531 0,48
Cosine 0,552 0,678 0,519 0,468
Bhattacharyya 0,619 0,722 0,557 0,495
ChiSquared 0,602 0,708 0,545 0,487
JensenShannon 0,614 0,717 0,551 0,488
Taneja 0,642 0,739 0,559 0,489
VSM 0,128 0,372 0,268 0,335
LDA + Naive 0,434 0,590 0,171 0,197
The Role Played by the Number of Topics for LDA+ K-Means. Wechose the number of topics based on the Harmonic mean of Log-Likelihood(HLK) [4]. We notice in the Fig. 3(a), that the best number of topics are in therange of [30, 50] of a maximum value of HLK. We run the LDA + K-means witha different number of topics and four distances: two from the PBM group, twofrom the VBM group including the Euclidean distance. We plot the evaluationwith AMI and ARI in the Fig. 3(b) and (c).

Combining Latent Dirichlet Allocation and K-Means for Documents 255
(a) AMI (b) ARI
Fig. 2. The average values of ARI, AMI for LDA + K-means with eight different dis-tance measures for two datasets
(a) Log-Likelihood(b) AMI (c) ARI
Fig. 3. The harmonic mean of the log-likelihood and ARI, AMI values with four dis-tances for 20NG dataset with different # of topics.
As the number of topics increases, the LDA + K-means with Euclidean dis-tance decreases in performance. The Euclidean distance is clearly not suit-able for the LDA+ K-means. The other three used distances (i.e. Sorensen,Bhattacharyya, and Taneja) kept a steady behavior with a slight advantagefor the Taneja distance. This is due to the fact that these distance were definedfor probability distribution and thus are more suitable for the kind of inputprovided by LDA. We notice that after 50 topics the performance of the threedistances decreases.
Comparing LDA +K-Means, LDA+ Naive, VSM. In order to study therole played by topic modeling, we compare three document clustering meth-ods. The first is Vector space model (VSM) that uses a word-frequency vectordwf = (wf1, wf2, . . . , wfn), where wfi is the frequency of the ith word in thedocument as input for K-means [13]. The second is proposed in [10], which
256 Q.V. Bui et al.
(a) AMI (b) ARI
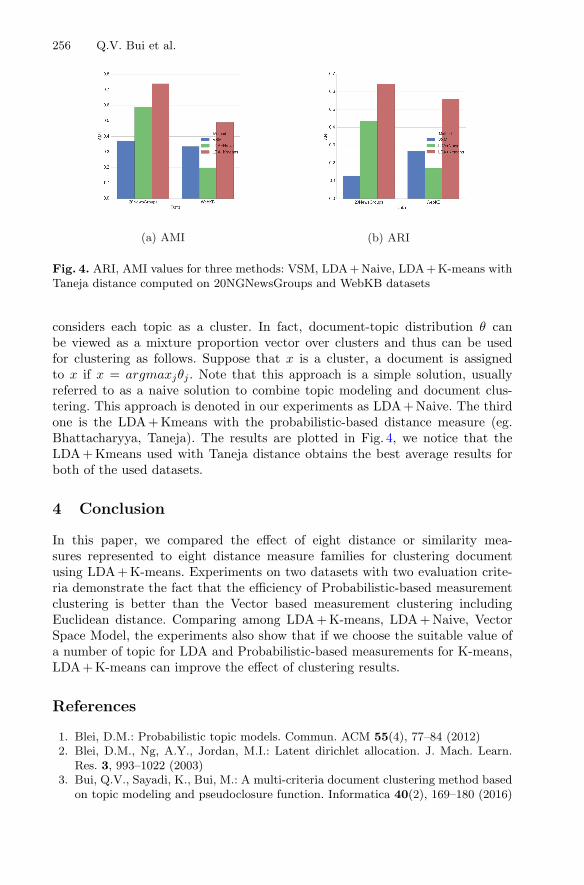
Fig. 4. ARI, AMI values for three methods: VSM, LDA + Naive, LDA + K-means withTaneja distance computed on 20NGNewsGroups and WebKB datasets
considers each topic as a cluster. In fact, document-topic distribution θ canbe viewed as a mixture proportion vector over clusters and thus can be usedfor clustering as follows. Suppose that x is a cluster, a document is assignedto x if x = argmaxjθj . Note that this approach is a simple solution, usuallyreferred to as a naive solution to combine topic modeling and document clus-tering. This approach is denoted in our experiments as LDA + Naive. The thirdone is the LDA+ Kmeans with the probabilistic-based distance measure (eg.Bhattacharyya, Taneja). The results are plotted in Fig. 4, we notice that theLDA+ Kmeans used with Taneja distance obtains the best average results forboth of the used datasets.
4 Conclusion
In this paper, we compared the effect of eight distance or similarity mea-sures represented to eight distance measure families for clustering documentusing LDA+ K-means. Experiments on two datasets with two evaluation crite-ria demonstrate the fact that the efficiency of Probabilistic-based measurementclustering is better than the Vector based measurement clustering includingEuclidean distance. Comparing among LDA+ K-means, LDA + Naive, VectorSpace Model, the experiments also show that if we choose the suitable value ofa number of topic for LDA and Probabilistic-based measurements for K-means,LDA+ K-means can improve the effect of clustering results.
References
1. Blei, D.M.: Probabilistic topic models. Commun. ACM 55(4), 77–84 (2012)2. Blei, D.M., Ng, A.Y., Jordan, M.I.: Latent dirichlet allocation. J. Mach. Learn.
Res. 3, 993–1022 (2003)3. Bui, Q.V., Sayadi, K., Bui, M.: A multi-criteria document clustering method based
on topic modeling and pseudoclosure function. Informatica 40(2), 169–180 (2016)

Combining Latent Dirichlet Allocation and K-Means for Documents 257
4. Buntine, W.: Estimating likelihoods for topic models. In: Zhou, Z.-H., Washio,T. (eds.) ACML 2009. LNCS (LNAI), vol. 5828, pp. 51–64. Springer, Heidelberg(2009). doi:10.1007/978-3-642-05224-8 6
5. Cha, S.-H.: Comprehensive survey on distance/similarity measures between prob-ability density functions. City 1(2), 1 (2007)
6. Gordon, A.: Classification. Chapman & Hall/CRC Monographs on Statistics &Applied Probability, 2nd edn. CRC Press, Boca Raton (1999)
7. Griffiths, T.L., Steyvers, M.: Finding scientific topics. Proc. Natl. Acad. Sci. U.S.A.101(Suppl 1), 5228–5235 (2004)
8. Huang, A.: Similarity measures for text document clustering. In: Proceedings of theSixth New Zealand Computer Science Research Student Conference (NZCSRSC2008), Christchurch, New Zealand, pp. 49–56 (2008)
9. Hubert, L., Arabie, P.: Comparing partitions. J. Classif. 2(1), 193–218 (1985)10. Lu, Y., Mei, Q., Zhai, C.: Investigating task performance of probabilistic topic
models: an empirical study of PLSA and LDA. Inf. Retrieval 14(2), 178–203 (2010)11. Maher, K., Joshi, M.S.: Effectiveness of different similarity measures for text clas-
sification and clustering. Int. J. Comput. Sci. Inf. Technol. 7(4), 1715–1720 (2016)12. Manning, C.D., Raghavan, P.: An Introduction to Information Retrieval.
Cambridge University Press, Cambridge (2009)13. Modha, D.S., Spangler, W.S.: Feature weighting in k-means clustering. Mach.
Learn. 52(3), 217–237 (2003)14. Pestov, V.: On the geometry of similarity search: dimensionality curse and concen-
tration of measure. Inf. Process. Lett. 73(1), 47–51 (2000)15. Salton, G., Buckley, C.: Term-weighting approaches in automatic text retrieval.
Inf. Process. Manage. 24(5), 513–523 (1988)16. Vinh, N.X., Epps, J., Bailey, J.: Information theoretic measures for clusterings
comparison: Variants, properties, normalization and correction for chance. J. Mach.Learn. Res. 11, 2837–2854 (2010)
17. Xie, P., Xing, E.P.: Integrating Document Clustering and Topic Modeling,September 2013. arXiv:1309.6874


![diendantoanhoc.net [VMF] Dirichlet s Theorem](https://img.dokumen.tips/doc/110x75/63375a079cfd42553e058455/diendantoanhocnet-vmf-dirichlet-s-theorem.jpg)