Embed Size (px)
Citation preview

407GEOSYNTHETICS INTERNATIONAL S 1996, VOL. 3, NO. 3
Technical Paper by T.M. Allen and R.J. Bathurst
COMBINED ALLOWABLE STRENGTH REDUCTIONFACTOR FOR GEOSYNTHETIC CREEP ANDINSTALLATION DAMAGE
ABSTRACT: The current practice to determine the combined geosynthetic strengthreduction due to installation damage and creep is to multiply the individual strength re-duction factors for damage and creep together. However, it is difficult to know if thisprocedure results in conservative design, nonconservative design, or is sufficiently ac-curate for practical purposes. The effect of synergism on the combined effect of poly-meric creep and installation damage is explored in the paper by reviewing publishedand unpublished constant load (creep) data for both undamaged and installation-dam-aged geosynthetic specimens. A methodology is developed that uses data from bothconstant load (creep) tests and index tests to reconstruct installation-damaged isochro-nous creep curves. Based on the limited data available and the interpretation of recon-structed isochronous curves, it is shown that multiplication of creep reduction andinstallation damage factors may be conservative and hence results in errors on the safeside for design.
KEYWORDS: Installation damage, Creep, Geosynthetic, Modulus, Strain.
AUTHORS: T.M. Allen, State Geotechnical Engineer, Washington State Departmentof Transportation, P.O. Box 47365, Olympia, Washington 98504-7365, USA,Telephone: 1/360-709-5450, Telefax: 1/360-709-5585, E-mail: [email protected];and R.J. Bathurst, Professor, Department of Civil Engineering, Royal Military Collegeof Canada, Kingston, Ontario, Canada, K7K 5L0, Telephone: 1/613-541-6000Extension 6479, Telefax: 1/613-541-6599, E-mail: [email protected].
PUBLICATION: Geosynthetics International is published by the Industrial FabricsAssociation International, 345 Cedar St., Suite 800, St. Paul, Minnesota 55101-1088,USA, Telephone: 1/612-222-2508, Telefax: 1/612-222-8215. GeosyntheticsInternational is registered under ISSN 1072-6349.
DATES: Original manuscript received 27 March 1996, revised version received 1 July1996 and accepted 5 July 1996. Discussion open until 1 March 1997.
REFERENCE: Allen, T.M. and Bathurst, R.J., 1996, “Combined Allowable StrengthReduction Factor for Geosynthetic Creep and Installation Damage”, GeosyntheticsInternational, Vol. 3, No. 3, pp. 407-439.
ALLEN AND BATHURST D Combined Creep and Installation Damage
408 GEOSYNTHETICS INTERNATIONAL S 1996, VOL. 3, NO. 3
1 INTRODUCTION
An important design issue regarding the use of geosynthetics in reinforcement ap-plications such as walls and slopes is the determination of long-term allowable geosyn-thetic strength. The current practice worldwide is to essentially determine separate re-duction factors representing the strength loss expected during the design life of thestructure due to different unrelated strength loss mechanisms (Bonaparte and Berg1987; Jewell and Greenwood 1988; Allen 1991; AASHTO 1992). The major strengthloss mechanisms are typically installation damage, creep and chemical degradation. InNorth America, the strength reduction factors are multiplied together to determine anoverall strength reduction factor which is applied to a reference strength value. TheNorth American approach for limit state design is illustrated by the following equation:
(1)Ta=Tult
RFID × RFCR × RFD
where Ta = long-term allowable strength; Tult = ultimate tensile strength (e.g. ASTM D4595 or GRI GG1); RFID = reduction factor for installation damage; RFCR = reductionfactor for creep; and RFD = reduction factor for chemical/microbiological degradation.Additional reduction factors are introduced for loss of strength due to seams and con-nections if applicable (GRI GG4a; GRI GG4b; Berg 1992).
Implicit in Equation 1 is the assumption that there are no synergistic effects betweenstrength loss mechanisms and hence strength reduction factors are uncorrelated. In theUnited Kingdom (UK) an approach that uses partial material factors to calculate designreinforcement strength has been proposed (BS 8006 1995; Ingold 1993). However, inthe UK approach, the creep strength at the end of the design life is also calculated inde-pendently of installation damage effects.
In practice, the numerically largest strength reduction factors for routine applica-tions are due to installation damage and creep. Because of the relatively large numericalvalues of installation damage and creep reduction factors, compared to other reductionfactors, particular attention is warranted to ensure that the appropriate values are used.Damage during installation can occur due to placement and compaction of backfill ma-terial on the geosynthetic. In some cases, rough handling may also cause damage. Theseverity of installation conditions has been categorized by Allen (1991), Christopherand Holtz (1984) and, Koerner and Koerner (1990). Creep of polymeric geosynthetics isthe visco-elastic response of the polymeric material(s) to a sustained tensile load result-ing in permanent time-dependent elongation.
This paper is focussed on the combined effect of installation damage and creep andinvestigates the hypothesis that the combined reduction factor, RFIDCR≠ RFID× RFCR .The results of the study are an initial step towards understanding whether the conven-tional practice of multiplying separate reduction factors for installation damage andcreep is conservative, nonconservative or sufficiently accurate for practical purposes.The paper explores this fundamental question by reviewing published and unpublisheddata and introduces an approach that can be used to estimate the combined reductionfactor for installation damage and creep, RFIDCR , from reconstructed site-damaged iso-chronous load-strain curves.
ALLEN AND BATHURST D Combined Creep and Installation Damage
409GEOSYNTHETICS INTERNATIONAL S 1996, VOL. 3, NO. 3
2 LOAD-STRAIN-TIME PERFORMANCE OF GEOSYNTHETICREINFORCEMENT
Geosynthetic creep can be characterized based on rupture properties or based oncreep strain behavior. Rupture based creep characterization focuses on the end result(rupture) whereas strain based creep characterization focuses on the behavior beforerupture. Both methods of creep characterization are intimately related. Regardless ofthe method of characterization, creep data must also be extrapolated to determine themaximum load level that will not result in rupture or exceed a maximum acceptablestrain over the design life of the structure.
Characterization of rupture loads, rupture strains and accumulated strain underconstant load fall into two categories as described in the following sections.
2.1 Strain Based Characterization
Strain based creep evaluation and extrapolation utilizes creep strain and strain ratedata at various load levels and temperatures to predict the time required to reach a givenstrain. Isochronous load-strain curves are a useful tool for strain based creep analysis.Isochronous curves can be used to represent a series of creep tests conducted for a givenmaterial at a given temperature (McGown et al. 1984). Isochronous curves can be ex-trapolated to greater times using rheological modeling. The parameters used in rheolog-ical models can be, for example, established using rate process theory (Wilding andWard 1978, 1981). Methods such as time-temperature superposition also appear to beuseful for extrapolating creep data (Bush 1990). Furthermore, as demonstrated in thispaper, isochronous curves can be useful for combining the effects of installation dam-age and creep through manipulation of the isochronous curves to include the effects ofinstallation damage on creep strain rate, stiffness, and rupture strain.
2.2 Rupture Based Characterization
Rupture based creep extrapolation utilizes stress rupture data obtained at multipleload levels to produce rupture times ranging from a few hours to thousands of hours.Such data is typically plotted as load level versus time to rupture using logarithmic axes.The stress rupture envelope plotted in this manner is typically nearly linear or bi-linear,depending on the polymer. Bi-linear envelopes are the result of a change in rupturemechanism (i.e. a ductile to brittle transition). Brittle behavior can result in reducedrupture strains, and therefore shorter times to rupture, as compared to ductile behavior.Therefore, visual or statistical extrapolation of short-term stress rupture data to long-term stress rupture behavior can be unreliable without corroborating evidence as to theexpected long-term behavior. Such evidence could include creep rupture data acceler-ated by higher temperatures, allowing time-temperature superposition to be used (Taka-ku 1981; Popelar et al. 1991), and/or trends observed in the rupture strain measured atvarious times to rupture (i.e. is the rupture strain increasing, remaining constant, or de-creasing with increasing time to rupture?). Based on observations made by the writers,increasing rupture strains with time (e.g. Allen 1991) appear to be indicative of ductilebehavior, whereas, rupture strains which decrease or remain constant with increasingtime to rupture appear to be indicative of brittle behavior (e.g. Figures 7 and 15 reported
ALLEN AND BATHURST D Combined Creep and Installation Damage
410 GEOSYNTHETICS INTERNATIONAL S 1996, VOL. 3, NO. 3
later in this paper and Takaku (1981)). Therefore the trend in strain at rupture data canbe used to assign a qualitative level of confidence to extrapolated rupture data.
Time-temperature superposition techniques can be used as an aid to extrapolatingstress rupture data for some polymers. Note that time-temperature superposition maynot be helpful for extrapolation of polyester (PET) creep, as PET creep is not very sensi-tive to temperature effects since, at typical in-service conditions, the temperature is be-low the glass transition temperature (Allen et al. 1983). Polyolefin creep, however, ismuch more sensitive to temperature effects since, at typical in-service conditions, thetemperature is above the glass transition temperature, and time-temperature superposi-tion has been used successfully for such materials (Takaku 1981; Popelar et al. 1991).
2.3 Inter-Relation
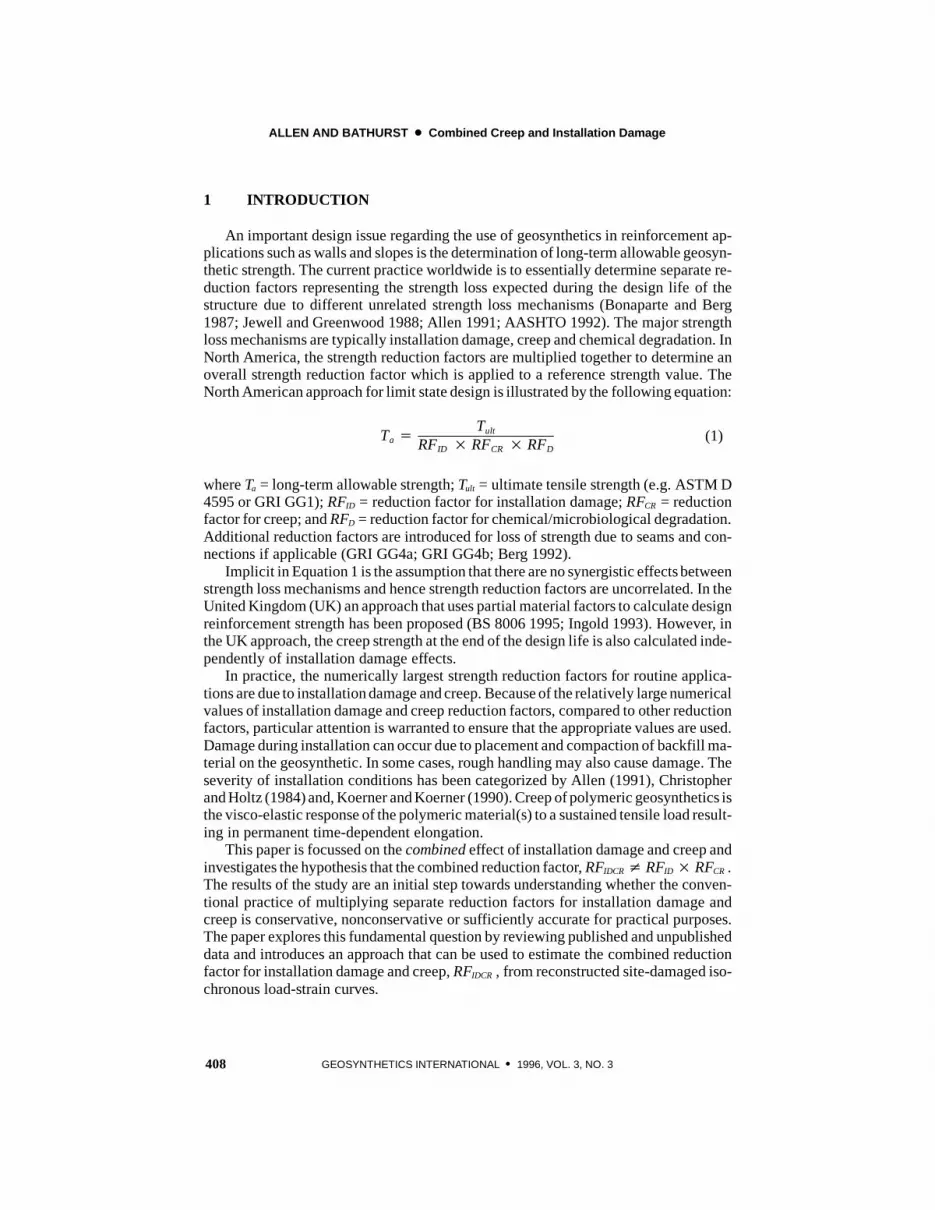
The effect of installation damage on the load-strain-time performance of polymericreinforcement can be referenced to Figure 1 which illustrates isochronous load-straincurves for undamaged and installation-damaged specimens of the same polymeric rein-forcement. The ability to estimate isochronous load-strain curves is complicated by therequirement to extrapolate the results of laboratory creep data to design life and the pos-sible synergistic effect of site-damage that may reduce the rupture strength and strain atrupture.
Strain, ε
t4
t1
t2
t3
From laboratory creep data
Extrapolatedperformance
Undamaged
Rupture
t4 > t3 > t2 > t1Time
Damaged
TTensileload,
Figure 1. Isochronous load-strain curves for undamaged and damaged geosyntheticreinforcement materials at constant temperature.

ALLEN AND BATHURST D Combined Creep and Installation Damage
411GEOSYNTHETICS INTERNATIONAL S 1996, VOL. 3, NO. 3
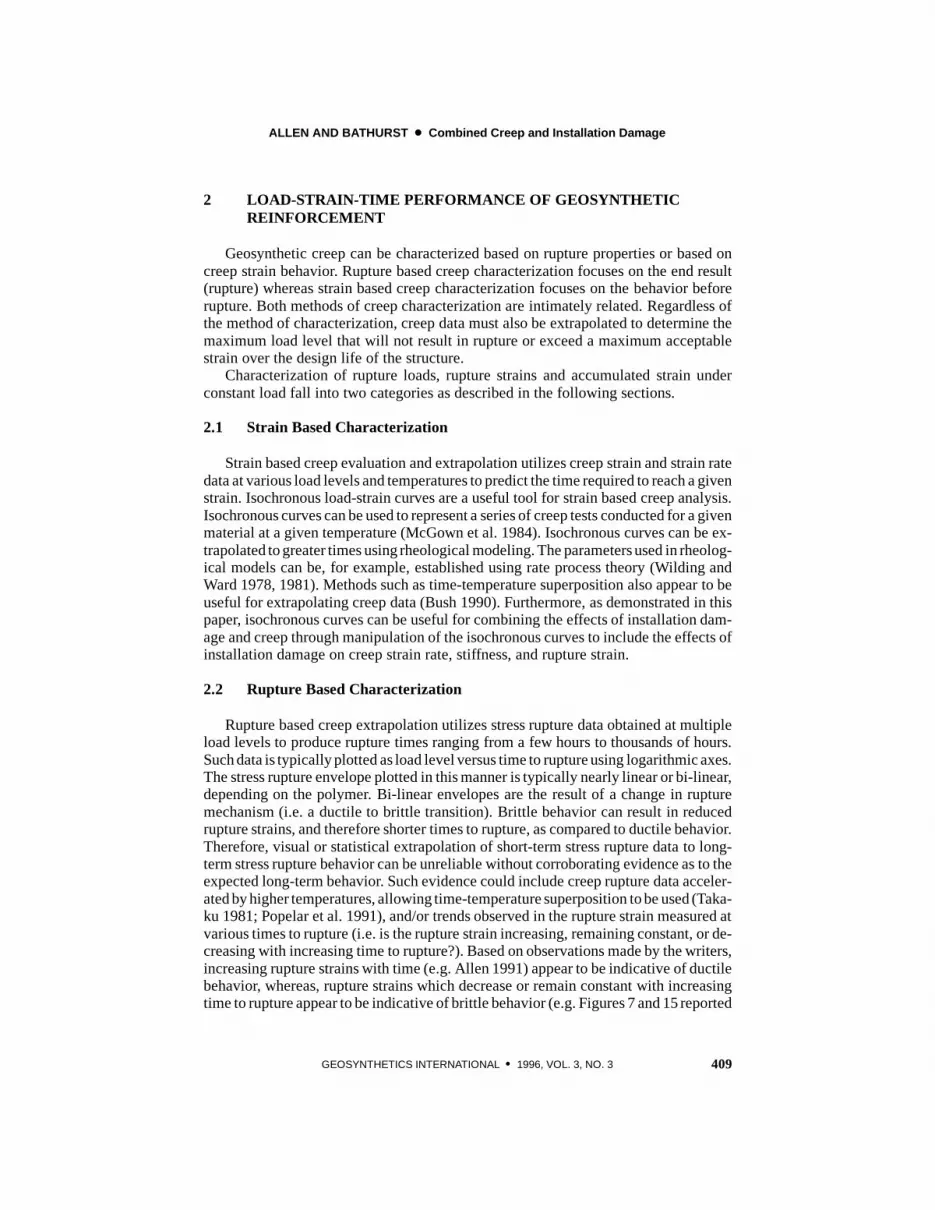
Strain based methods cannot be used alone to establish the long-term safe load levelto prevent creep rupture of undamaged or damaged polymeric reinforcement materials.Aknowledge of the expected rupture strain is needed to establish the safe load level. It isat the point of incipient rupture that rupture based and strain based creep characteriza-tion can be related as illustrated in Figures 2 and 3. These two categories of creep char-acterization simply approach creep extrapolation from opposite viewpoints. The endresult from both categories of creep characterization and extrapolation can be the same,depending on whether or not the creep tests are carried to rupture and depending on howrupture strain is defined.
The dashed lines in Figures 2 and 3 illustrate the influence of damage on the perfor-mance of polymeric reinforcement in load-strain-time space. Figure 3 illustrates theprocedure adopted later in the paper to truncate extrapolated isochronous load-straincurves using strain rupture curves (ε -- log t) in order to define failure points. Alterna-tively, a strain which is known to be safely below the rupture point from stress rupturedata, can be used to truncate the isochronous curves so that strains beyond the rupturepoint are not used in design.
It may appear then, that the simplest procedure to combine the effects of site damageand creep would be to carry out stress rupture tests on site-damaged specimens. Howev-er, this is not likely to be a practical approach because of the large number of tests re-
T
Log t
ε
UndamagedDamaged
Rupture(undamaged)
Rupture(damaged)
Isochronous plane
Figure 2. Relationship between isochronous load-strain data and stress rupture data forundamaged and damaged geosynthetic reinforcement materials at constant temperature.
ALLEN AND BATHURST D Combined Creep and Installation Damage
412 GEOSYNTHETICS INTERNATIONAL S 1996, VOL. 3, NO. 3
T
Log t
ε
UndamagedDamaged
Rupture (undamaged)
Rupture (damaged)Isochronous plane
Figure 3. Relationship between isochronous load-strain data and strain at rupture datafor undamaged and damaged geosynthetic reinforcement materials at constant tempera-ture.
quired and variability between nominally identical site-damaged specimens exhumedfrom field installations (Allen and Bathurst 1994). For example, in-isolation stress rup-ture testing of undamaged specimens will require a minimum of 12 to 18 tests in order toestablish the undamaged rupture envelope under laboratory conditions. Many moretests will be required if statistical confidence limits are to be established (Jewell andGreenwood 1988; ASTM D2837). The problem isexacerbated for samples subjected tosite installation damage since variation in stress rupture data can be expected to be muchlarger for specimens representing nominally identical site damage environments andhence many more tests would be required to establish a level of confidence matchingtest series with undamaged specimens of polymeric reinforcement materials.
3 PREVIOUS STUDIES ON THE EFFECT OF INSTALLATIONDAMAGEON INDEX PROPERTIES AND CREEP OF GEOSYNTHETICS
3.1 Allen and Bathurst (1994), Allen (1991)
The effects of installation damage on the short-term, load-strain behavior of differ-ent types of geosynthetics have been reported by Allen and Bathurst (1994). The effect
ALLEN AND BATHURST D Combined Creep and Installation Damage
413GEOSYNTHETICS INTERNATIONAL S 1996, VOL. 3, NO. 3
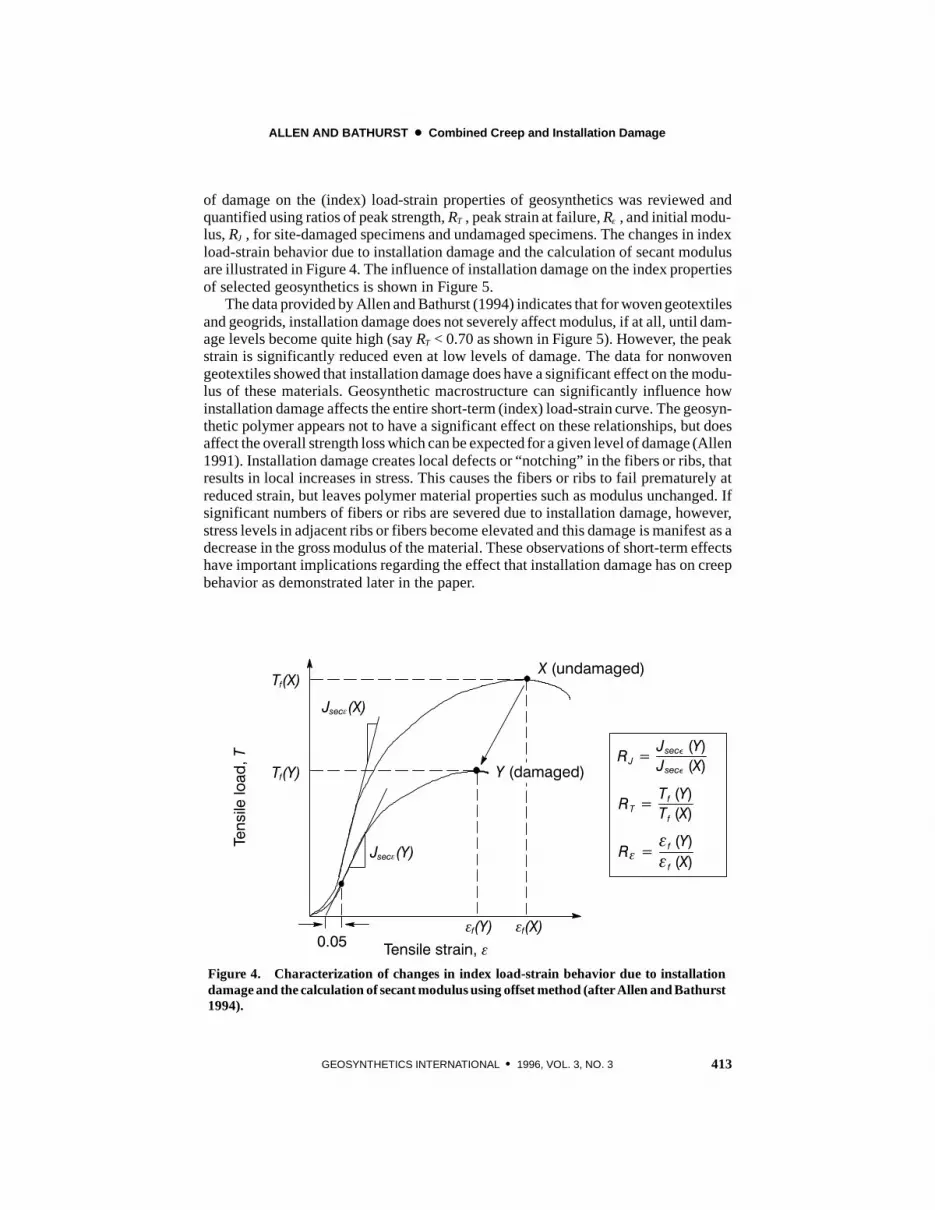
of damage on the (index) load-strain properties of geosynthetics was reviewed andquantified using ratios of peak strength, RT , peak strain at failure, Rε , and initial modu-lus, RJ , for site-damaged specimens and undamaged specimens. The changes in indexload-strain behavior due to installation damage and the calculation of secant modulusare illustrated in Figure 4. The influence of installation damage on the index propertiesof selected geosynthetics is shown in Figure 5.
The data provided by Allen and Bathurst (1994) indicates that for woven geotextilesand geogrids, installation damage does not severely affect modulus, if at all, until dam-age levels become quite high (say RT < 0.70 as shown in Figure 5). However, the peakstrain is significantly reduced even at low levels of damage. The data for nonwovengeotextiles showed that installation damage does have a significant effect on the modu-lus of these materials. Geosynthetic macrostructure can significantly influence howinstallation damage affects the entire short-term (index) load-strain curve. The geosyn-thetic polymer appears not to have a significant effect on these relationships, but doesaffect the overall strength loss which can be expected for a given level of damage (Allen1991). Installation damage creates local defects or “notching” in the fibers or ribs, thatresults in local increases in stress. This causes the fibers or ribs to fail prematurely atreduced strain, but leaves polymer material properties such as modulus unchanged. Ifsignificant numbers of fibers or ribs are severed due to installation damage, however,stress levels in adjacent ribs or fibers become elevated and this damage is manifest as adecrease in the gross modulus of the material. These observations of short-term effectshave important implications regarding the effect that installation damage has on creepbehavior as demonstrated later in the paper.
Figure 4. Characterization of changes in index load-strain behavior due to installationdamage and the calculation of secant modulus using offset method (afterAllen and Bathurst1994).
TTensileload,
X (undamaged)Tf(X)
Tf(Y)
εf(X)εf(Y)
Jsecε(X)
Jsecε(Y)
RJ=JsecÁ (Y)JsecÁ (X)
RT=Tf (Y)Tf (X)
Rε=εf (Y)εf (X)
Tensile strain, ε0.05
Y (damaged)
ALLEN AND BATHURST D Combined Creep and Installation Damage
414 GEOSYNTHETICS INTERNATIONAL S 1996, VOL. 3, NO. 3
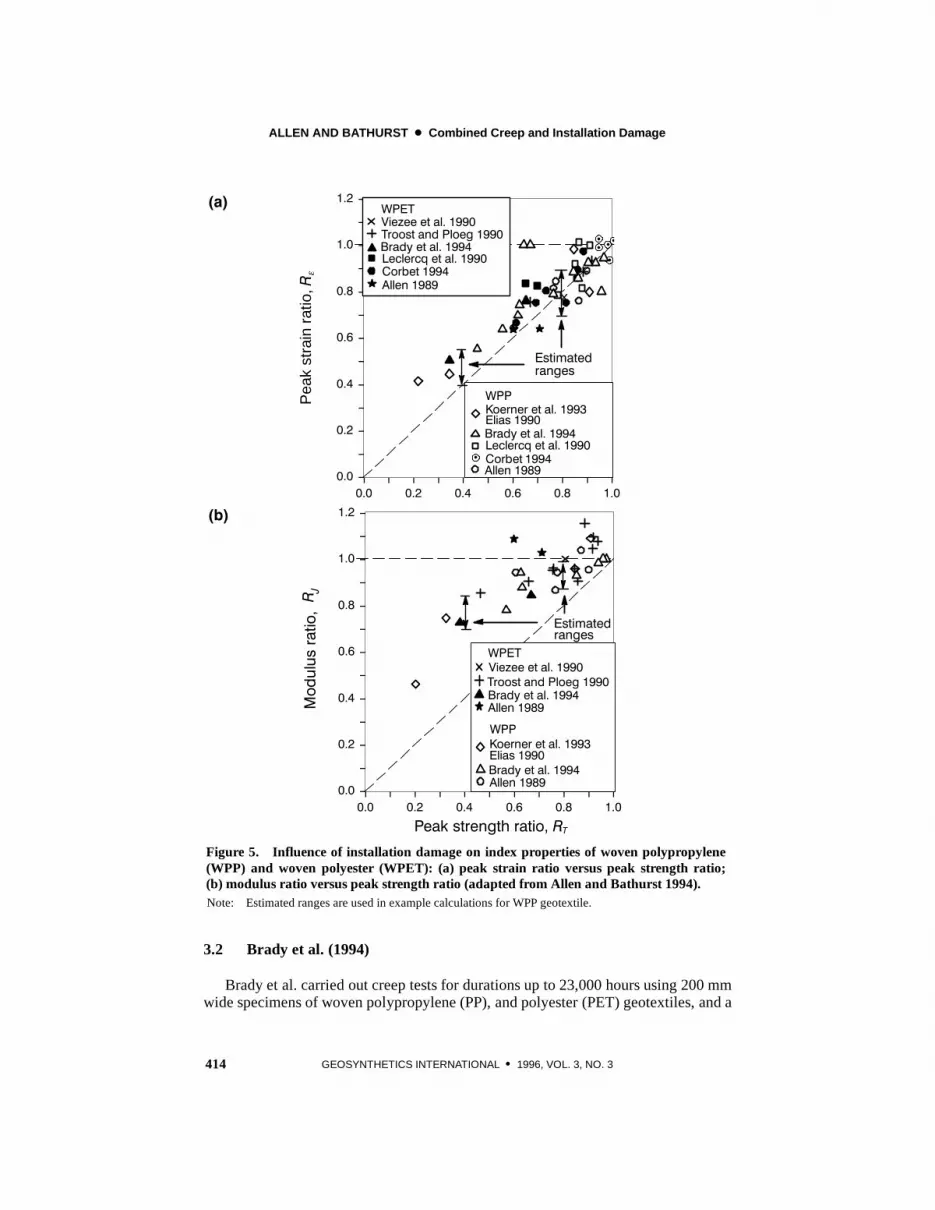
Figure 5. Influence of installation damage on index properties of woven polypropylene(WPP) and woven polyester (WPET): (a) peak strain ratio versus peak strength ratio;(b) modulus ratio versus peak strength ratio (adapted from Allen and Bathurst 1994).
0.0
0.2
0.4
0.6
0.8
1.0
1.2
0.0 0.2 0.4 0.6 0.8 1.0
Pea
kst
rain
ratio
,Rε
Allen 1989
Koerner et al. 1993Elias 1990Brady et al. 1994
WPP
Leclercq et al. 1990Corbet 1994
Brady et al. 1994Troost and Ploeg 1990Viezee et al. 1990WPET
Leclercq et al. 1990Corbet 1994Allen 1989
Estimatedranges
0.0
0.2
0.4
0.6
0.8
1.0
1.2
0.0 0.2 0.4 0.6 0.8 1.0
Modulusratio,R J
Allen 1989
Koerner et al. 1993Elias 1990Brady et al. 1994
WPP
Peak strength ratio, RT
Brady et al. 1994Troost and Ploeg 1990Viezee et al. 1990WPET
Allen 1989
Estimatedranges
(a)
(b)
Note: Estimated ranges are used in example calculations for WPP geotextile.
3.2 Brady et al. (1994)
Brady et al. carried out creep tests for durations up to 23,000 hours using 200 mmwide specimens of woven polypropylene (PP), and polyester (PET) geotextiles, and a
ALLEN AND BATHURST D Combined Creep and Installation Damage
415GEOSYNTHETICS INTERNATIONAL S 1996, VOL. 3, NO. 3
high density polyethylene (HDPE) geogrid. Tests were carried out on undamaged andexhumed specimens after controlled installation damage in limestone aggregate. Thefollowing are measured short-term strength losses due to installation damage using“standard compaction”: 5 to 10% for all of the PP geotextiles tested; approximately35% for the PET geotextile; and, 7 to 16% for the HDPE geogrid. In all cases, the mea-sured creep rates for recovered specimens did not differ from those measured for un-damaged specimens. They concluded that the number of broken filaments was toosmall to have an effect on the visco-elastic behavior of the geosynthetics over at least thefirst 1,000 hours. However, the initial strain in the geotextiles was reduced due tostretching during installation and exhumation as well as due to soil particles embeddedin the weave of the geotextiles. The creep rupture data for undamaged and exhumedspecimens of one of the PP geotextiles tested at a load level of 53% of ultimate showedthat damage resulted in a four fold reduction in time to rupture (23,000 to 5,800 hours)and a 25% reduction in the strain at rupture. For the same polypropylene geotextile sam-ple, the short-term strength loss based on index tensile tests was approximately 5 to 8%and the peak strain was about 80% of the undamaged specimen value. The number ofspecimens subjected to creep testing at each load level and in a damaged and virgin con-dition is not clear in the study by the authors. However, the authors indicated that theseresults must be interpreted with the expectation of a 10% variance in measured creepstrains that is usually observed in creep tests on the geotextile product tested.
3.3 Bush (1988); Bush and Swan (1988)
Bush (1988) reported the results of 1,000 hour creep tests on HDPE geogrid speci-mens subjected to installation damage. The geogrid was installed in a 75 mm minuscrushed limestone fill. The measured strength loss due to installation damage fromshort-term load-strain tests was on the order of 12%, with no reduction in modulus.Visual damage was light, with no severed ribs. The measured creep strains and creeprates for the geogrid were the same for undamaged and damaged samples. Similar re-sults were obtained in a second study on the same geogrid product installed in a large-scale wall test that used a coarse uniform sand and light-weight compaction equipment(Bush and Swan 1988).
3.4 Viezee et al. (1990); Krumm (1988)
Viezee et al. (1990) conducted 1,000 hour creep tests on yarns from a woven PETgeotextile specimen recovered from a sand backfill. Samples of woven geotextile 2.0m2 were placed and compacted in sand to simulate installation conditions. The geotex-tile installation was conducted in a manner such that uniformity of damage to the fiberswould be maintained. This was done by placing the geotextile sample on a 50 mm thicksand bed placed on a concrete floor. A 40 mm thick sand layer was then placed on thegeotextile sample and compacted using a small vibratory roller. Yarns were then re-moved carefully from a strip taken from the middle of the geotextile sample. Alternat-ing yarns were taken for creep and strength measurements. Strength lossesdue to instal-lation damage and based on index load-strain testing were on the order of 20% while thethe modulus of the material remained unchanged. The creep tests showed that the initialstrain and creep rate were unaffected by the damage, at least at load levels at or below

ALLEN AND BATHURST D Combined Creep and Installation Damage
416 GEOSYNTHETICS INTERNATIONAL S 1996, VOL. 3, NO. 3
the creep limit for undamaged material, but that the strain at creep rupture and time tobreak were reduced. Here, creep limit refers to a threshold load level below which per-manent strains accumulate at a diminishing rate with respect to log time.
Additional studies on the same PET geotextile yarns investigated by Viezee et al.(1990) are reported by Krumm (1988). The tensile testing of undamaged and damagedyarns resulted in measured tensile strengths of 78 N before installation and 63 N afterdamage (strength retained = 81% or RFID = 1.23). The corresponding measured peakstrains were 9.9 and 7.2%, respectively (peak strain retained = 73%).
Creep curves for undamaged PET yarn specimens as well as specimens subjected toinstallation damage are presented in Figure 6 and have been reconstructed from datareported by Krumm (1988) and Viezee et al. (1990). Plots of creep rupture strain versustime to rupture for both undamaged and damaged specimens are shown in Figure 7 forspecimens that ended in rupture (Krumm 1988). Figure 8 shows stress rupture enve-lopes developed from the same series of tests. The creep data shown in Figure 6 is pre-sented as isochronous load-strain curves in Figure 9, with each curve terminated at arupture point that is estimated from data presented in Figures 7 and 8. The data ex-amined here are based on the results of tests on yarns taken from woven geotextiles.However, it is reasonable to assume that the behavior of the woven product will be simi-
Figure 6. Constant load (creep) curves for undamaged and damaged PET yarns (datataken from Krumm 1988 and Viezee et al. 1990).

ALLEN AND BATHURST D Combined Creep and Installation Damage
417GEOSYNTHETICS INTERNATIONAL S 1996, VOL. 3, NO. 3
Figure 7. Rupture strain versus time to rupture for PET yarn specimens (data fromKrumm 1988).
lar because of the simple structure of the woven geosynthetics. Also shown on Figure 9is the reconstructed damaged (104 hours) isochronous curve using the conventional ap-proach which is to apply the partial factor for installation damage (RFID from short-termindex test) directly to the corresponding undamaged isochronous curve. The compari-son shows that the conventional approach is conservative at low strains (i.e. for workingstress design) but essentially equivalent at rupture strain (i.e. for ultimate state design).
4 DISCUSSION ON PREVIOUS WORK
The results of previous related work can be summarized as follows:
S The strain at rupture determined from index tensile tests and creep tests from undam-aged specimens is reduced due to installation damage.S The creep rate of geosynthetics at load levels at or below the creep limit for undam-
aged material (i.e. the load level below which failure is not likely to occur during thedesign life of the material) is unaffected by installation damage. Above the creep limitfor the undamaged material, installation damage may affect the creep rate dependingon the polymer. The reason for this appears to be that at high load levels the site-dam-

ALLEN AND BATHURST D Combined Creep and Installation Damage
418 GEOSYNTHETICS INTERNATIONAL S 1996, VOL. 3, NO. 3
Figure 8. Stress rupture data for PET yarn (adapted from Krumm 1988).
aged material is actually closer to its ultimate tensile strength due to load concentra-tion through a reduced cross-sectional area. When large loads are applied to thesespecimens they are more likely to go directly to the tertiary creep phase (i.e. creeprate increases rapidly resulting in rupture) without exhibiting the earlier phases ofcreep typically observed (i.e. primary and/or secondary creep), at least for PET geo-synthetics. Therefore, the deformation mechanism for the undamaged material is dif-ferent from that of the damaged material, even though they are both at the same loadlevel (load per unit width of specimen).S Isochronous load-strain curves for undamaged and damaged specimens of the same
geosynthetic are indistinguishable over a large range of strain, at least for individualyarns or geogrids. However, the isochronous curves for damaged specimens termi-nate in rupture at lower strains than undamaged specimens. A similar behavior hasbeen observed for the load-strain response of undamaged and damaged specimensduring index tensile tests. That is, the creep modulus and the tensile test secant modu-lus were unaffected by damage. A similar observation based on tensile tests con-ducted for other types of geosynthetics, depending on the amount of damage, is madeby Allen and Bathurst (1994).S Data reported by Brady et al. (1994) for PP specimens gives peak strain ratios of 0.80
and 0.75 from index tests and creep rupture tests respectively. Similar data reported

ALLEN AND BATHURST D Combined Creep and Installation Damage
419GEOSYNTHETICS INTERNATIONAL S 1996, VOL. 3, NO. 3
Figure 9. Isochronous load-strain curves for undamaged and damaged PET yarnspecimens (data from Krumm 1988 and Viezee et al. 1990).
by Krumm (1988) for PET yarns gives 0.73 and 0.68, respectively. It appears fromthis data that installation damage affects peak or rupture strain to a slightly greaterdegree in creep tests than it does in index tensile tests. For practical purposes, howev-er, the values may be considered similar for creep tests taken to rupture times greaterthan one hour.S Figure 7 shows that the creep rupture strain for PET yarn specimens decreases with
increasing time to rupture (for rupture times greater than 1 hour). For PP geosynthet-ics, the opposite appears to be true based on data presented by Takaku (1981) and Al-len (1991). Allen showed that rupture strain increases with time to rupture, at leastfor times to rupture under 104 hours. In general, it appears that rupture strain de-creases with increasing time to rupture for geosynthetics which exhibit brittle behav-ior and that rupture strain increases with time to rupture for geosynthetics which ex-hibit ductile behavior.
In summary, all five studies that reported creep data showed that installation damagedoes not affect the creep rate of polymeric specimens. However, installation damagedoes reduce the strain at failure for creep rupture tests and results in strain at rupturelosses that are comparable to those measured from short-term (index) load tests. Theeffect of installation damage on creep rate and strain at failure is similar for woven geo-

ALLEN AND BATHURST D Combined Creep and Installation Damage
420 GEOSYNTHETICS INTERNATIONAL S 1996, VOL. 3, NO. 3
textiles and geogrids, and for PP, PET, and HDPE geosynthetics. It can be concludedthat base polymer properties are unaffected by installation damage. Rather, installationdamage causes local defects in the fibers, yarns, or ribs that results in local elevatedstresses that in turn initiate premature failure at the defect.
Since the fibers/yarns/ribs were not severed during installation in the reported creeptests, it is difficult to estimate how severe installation damage may affect geosyntheticcreep rates. Certainly, based on the available data, the creep rate of the fibers/ribs them-selves will not be affected by installation damage. However, the creep rate is affected bythe load level applied to the fiber/rib, although to different degrees, depending on thegeosynthetic polymer. PET creep rates tend to be rather insensitive to load level unlessabove the creep limit (Viezee et al. 1990; Krumm 1988), whereas PP and HDPE creeprates are generally sensitive to load level at all load levels (Wilding and Ward 1981;Allen et al. 1983). This sensitivity or lack of sensitivity is obvious from the isochronousload-strain curves for the material in question, examples of which are provided later inthis paper.
The stress rupture data for undamaged and damaged PET yarns in Figure 8 togetherwith strength reduction values reported by Viezee and Krumm allow the quantitiesRFIDCR and RFID×RFCR to be calculated assuming that ultimate (limit) state design con-ditions apply. The solid lines in Figure 8 are best fit lines using linear regression analy-sis. The data shows that installation damage causes a parallel shift in the stress ruptureenvelope relative to the undamaged stress rupture envelope. For this example, at a timeto rupture of 1×10⁶ hours, the creep limit decreases from 58 to 43% of the indexstrength. Hence, RFCR = 1/0.58 = 1.72 and RFIDCR = 1/0.43 = 2.33. The strength loss dueto damage based on short-term tensile tests is reported to be 19% (therefore RFID =1/0.81 = 1.23). Hence, RFID × RFCR = 1.23× 1.72 = 2.12 which is only slightly lessthan RFIDCR = 2.33. A similar comparison can be carried out for shorter times to rupture.At 104 hours, for example, RFID×RFCR = 1.23× 1.52 = 1.87µ RFIDCR = 1.89. Conclu-sions must be made with caution due to the large extrapolation times used and inherenttest variability. However, at best (i.e. using the regressed data in Figure 8) it can be ar-gued that the difference between the conventional approach to calculate the combinedeffect of installation damage and creep, and actual measured installation damage-creepdata is small to negligible. At worst (i.e. considering 95% confidence limits on the datain Figure 8) it can be argued that the issue of whether the conventional approach is con-servative, nonconservative or sufficiently accurate for design remains unresolved forPET yarns for ultimate (limit) state design under the conditions tested.
The use of stress rupture data to calculate the combined installation damage andcreep reduction factor as demonstrated above is a simple concept for ultimate (limit)state design. However, the method requires at least one “damaged” curve representing asingle consistent amount of anticipated site damage (i.e. RFID the same for all exhumedspecimens). However, since a range of damage severity can be anticipated at a fieldinstallation then a set of damaged curves would be required (i.e. a series of parallel“damaged” curves in Figure 8). The problems associated with assigning specimens todifferent damage severity categories and the large number of specimens required togenerate a statistically accurate estimate of RFIDCR renders this approach impractical fordesign.

ALLEN AND BATHURST D Combined Creep and Installation Damage
421GEOSYNTHETICS INTERNATIONAL S 1996, VOL. 3, NO. 3
5 A METHODOLOGY TO COMBINE INSTALLATION DAMAGE ANDCREEP EFFECTS
The paucity of creep data on site-damaged specimens of polymeric reinforcementmaterials and the practical problems of obtaining this data mean that alternative strate-gies must be developed to estimate the combined installation and creep reduction factorRFIDCR for limit equilibrium (ultimate limit state) designs, and/or WSIDCR , for workingstrength or serviceability state designs.
5.1 Procedure
The procedure described here requires the following information: the undamagedshort-term (0.1 hour) isochronous load-strain curve; undamaged (extrapolated) long-term isochronous curve at the target design life; rupture strains estimated over the de-sign life of the project for undamaged specimens (from stress rupture data); and tensilestrength results for both undamaged and site-damaged specimens. The objective is toreconstruct the installation damage isochronous load strain curves that are conceptual-ized in Figure 1. The advantage of the procedure shown here is that the reconstructeddamaged isochronous load-strain curves can be used for serviceability state design. Theprocedure is illustrated in Figure 10 and involves a four step process. It is assumed thatinstallation damage has the same effect on the short-term (i.e. 0.1 hour) isochronousload-strain curve as it does on the index tensile test load-strain curve. This assumption ismade “a priori” but appears reasonable based on the interpretation data discussed in sec-tion 4. The four steps are as follows:
Step 1. Shift the short-term isochronous load-strain curve by reducing, or in somecases increasing, the modulus at the anticipated level of damage. Use the relationshipbetween strength retained and modulus retained after damage for the material usingproduct specific data. Modulus retained values for different types of geosynthetics canbe found in the paper by Allen and Bathurst (1994). Perform this shift at load levels atand below the undamaged material creep limit. A short-term damaged isochronousload-strain curve can then be constructed by drawing it with the same shape as the un-damaged curve but passing through point εD1 . If damage is light to moderate, this shiftmay not be necessary since the undamaged curve and damaged curve will plot on topof one another. Note that for low damage levels the modulus after damage may increaseslightly rather than decrease (Brady et al. 1994; Allen and Bathurst 1994).
Step 2. Shift the long-term isochronous curve assuming that the amount of creepstrain, εD , between the short-term and long-term damaged isochronous curves at a givenload level is equal to the amount of creep strain, εV , between the short-term and long-term undamaged (virgin) isochronous curves (i.e. εV = εD ; the creep rate is unaffectedby damage). Now the position of the long-term damaged isochronous load-strain curvecan be constructed. This second step should be modified if a significant modulus reduc-tion due to installation damage, say on the order of 10% or more, is observed from ten-sile test data at the anticipated level of damage. Such a modulus reduction would be anindicator of increased load applied to individual fibers/ribs. A technique to carry outthis procedure is given in the Appendix to this paper.

ALLEN AND BATHURST D Combined Creep and Installation Damage
422 GEOSYNTHETICS INTERNATIONAL S 1996, VOL. 3, NO. 3
Figure 10. Graphical procedure to develop long-term combined installation damage andcreep isochronous curves.
P
0 5 10 15 20 25
20
40
60
80
100
Strain (%)
εv
0.1 hour undamagedisochronous curve
30
εD=εv
P1
P2
Step 3: Truncate
Long-term undamagedisochronous curve
Long-term damagedisochronous curve
0.1 hour damagedisochronous curve
Step 1: Shift
Step 4: Truncate
Step 2: Shift
εD1 = (1/RJ)εV1
εD1εv1 εRV
εRD
εRD = Rε × εRV
Load(%ofultimate)
Notes: RFidcr = 100 / P2 ; RFcr =100 /P1 ;εV1 =strain onundamaged 0.1hour curveat undamaged long-termcreep limit, P1 ; εD1 = strain on damaged 0.1 hour curve at undamaged long-term creep limit, P1 ; RJ = ratioof damaged secant modulus to undamaged secant modulus (Allen and Bathurst 1994); εV = undamaged(virgin) long-term creep strain; εD = calculated damaged long-term creep strain (assume εV = εD if RJ = 1.0,i.e. no Step 1 shift required); εRV = undamaged (virgin) long-term rupture strain; εRD = damaged long-termrupture strain; Rε = ratio of damaged peak strain to undamaged (virgin) peak strain (Allen and Bathurst 1994).
0
Step 3. Determine the rupture strain for the long-term undamaged isochronous load-strain curve using available rupture strain versus rupture time data and truncate (e.g.Figure 6).
Step 4. Truncate the long-term isochronous damaged load-strain curve using the rela-tionship between tensile strength retained and peak strain retained after damage for thematerial at the anticipated level of damage using product specific data. This is accom-plished by multiplying the long-term undamaged creep rupture strain by the peak strainratio obtained from short-term tensile tests (i.e. the ratio of peak strain after damage topeak strain for the undamaged material, Rε ). Typical values of strain retained at differ-ent strength retained values have been reported by Allen and Bathurst (1994) and areillustrated in Figure 5. The inverse of the normalized load level corresponding to this

ALLEN AND BATHURST D Combined Creep and Installation Damage
423GEOSYNTHETICS INTERNATIONAL S 1996, VOL. 3, NO. 3
long-term creep rupture strain is the combined reduction factor for creep and installa-tion damage, RFIDCR .
Note that the curve shift at Step 1 accounts for changes in the elastic behavior of thegeosynthetic due to damage. The curve shift at Step 2, on the other hand, accounts forchanges in the time dependent behavior of the geosynthetic due to damage resultingfrom increases in fiber or rib stress. The effect that shifting and truncating of the iso-chronous curves has on the actual creep curves is illustrated in Figure 11. Note that theStep 1 shift could be due to reduced strain rather than increased strain at low levels ofstrength loss, as mentioned previously.
5.2 Examples
5.2.1 General
Three examples are provided to illustrate the methodology to calculate the com-bined installation and creep reduction factor RFIDCR for limit (ultimate) state design. Thefirst example (Figure 12) is based on data for the PET yarn reported by Krumm (1988)and Viezee et al. (1990). The second example (Figure 13) is for a PP slit-film wovengeotextile, and the third example (Figure 14) is for an HDPE geogrid. The PET materialrepresents a high creep limit material, whereas the PP material represents a very lowcreep limit material and the HDPE material an intermediate creep limit material.
The methodology has been applied to the 104 hour and 106 hour isochronous curves.Only minimal extrapolation of creep data was required to create the 104 hour isochrono-us curves, making trends observed at 104 hours for the undamaged materials relativelycertain. However, large extrapolations were required to create the 106 hour isochronouscurves in these examples. Hence, the results of curve reconstruction at 106 hours are less
Figure 11. Illustration of the effect of shifting and truncating undamaged isochronouscurves to construct damaged isochronous curves.
Strain(%)
Time (hours)
Damaged curve
Step 3:Truncate
UndamagedcurveεD
εV
Step 1: Shift εD
εV
10
5
0.1 1 10 100 1000 10000 1000000

ALLEN AND BATHURST D Combined Creep and Installation Damage
424 GEOSYNTHETICS INTERNATIONAL S 1996, VOL. 3, NO. 3
Figure 12. Undamaged isochronous load-strain curves for PET yarn with calculatedrupture points for damaged curves (adapted from Krumm 1988 and Viezee et al. 1990).
0
10
20
30
40
50
60
70
80
90
100
0 1 2 3 4 5 6 7 8 9 10
Strain (%)
10-1 hours104 hours106 hours
Calculated rupturepoints for damagedcurves
R
R
R
R = rupture point
Isochronous curves
R
R
Load(%ofultimate)
certain and serve primarily as an illustration of the general approach. The example cal-culations correspond to an installation damage factor of RFID = 1.23 for the PET yarn,and RFID = 1.25 for the PPslit-film geotextile and HDPE geogrid. An additional calcula-tion for a heavily damaged PP slit-film geotextile is also included (RFID = 2.5). A sum-mary of calculation results is given in Table 1.
5.2.2 PET Yarn (Figure 12)
Isochronous curves at loads and strains up to rupture (Figure 12) were constructedfrom data in Figure 6 for undamaged specimens. Log-linear extrapolation of the creepcurves was used to extend the curves to greater elapsed time. Log-linear extrapolationassumes that the creep rate remains constant until just before rupture (i.e. virtually noupswing in the creep curve). The validity of this assumption is supported by observedbehavior as well as the molecular nature of PET creep. Rupture points on the isochrono-us curves were determined based on log-linear extrapolation of rupture strain versusrupture time curves for the specimens as shown in Figure 7. Modulus and peak strainratios used for curve shifting were calculated directly from index test results on the PETyarns reported by Viezee et al. (1990). This data showed no reduction in short-term mo-dulus from index tests (i.e. RJ = 1), hence damaged and undamaged isochronous curvesare identical until rupture of the damaged specimens is achieved.

ALLEN AND BATHURST D Combined Creep and Installation Damage
425GEOSYNTHETICS INTERNATIONAL S 1996, VOL. 3, NO. 3
0
10
20
30
40
50
60
70
80
90
100
0 5 10 15 20 25 30 35 40 45Strain (%)
106 hours
10-1 hours
104 hours15.1
9.9
R
R
R
R
UndamagedDamagedR = rupture point
Isochronous curves
10-1 hours
104 hours
106 hours
Load(%ofultimate)
Figure 13. Undamaged and damaged isochronous load-strain curves for a PP slit-filmwoven geotextile (data adapted from Allen et al. 1983).Note: Damaged curves calculated at RFID = 2.5 (lower bound estimate).
5.2.3 PP Slit-Film Woven Geotextile (Figure 13)
Undamaged isochronous curves for the PP slit-film woven geotextile wereconstructed from data originally reported by (Allen et al. 1983). However, ductile be-havior was observed for this material, resulting in increasing rupture strain with time torupture. Rupture strains in this case were obtained for up to 3,100 hours, with short-termrupture strain of 20% and a 3,100 hour rupture strain of 43%. It was felt that one shouldnot rely upon a persistently increasing strain to rupture, and limited evidence suggeststhat the rupture strain stops increasing with time to rupture at moderate to long rupturetimes (Takaku 1981). Therefore, it was conservatively assumed in this case that thelong-term rupture strain was not greater than approximately 40%. Though data was notavailable to verify such behavior for this material, it was felt that this conservative ap-proach was warranted for the purposes of this example. Data presented in Figure 5 wasused to determine the modulus and peak strain ratios for the PP slit-film woven geotex-tile. Due to scatter in the Allen and Bathurst (1994) data, lower and upper bound esti-mates for the modulus and peak strain ratio for lightly damaged and heavily damagedspecimens were selected in order to give a range of possible values for RFIDCR . Forheavily damaged specimens, reconstructed damaged isochronous curves were gener-ated using the modification to Step 2 (Figure 10) described in the Appendix of the paper.

ALLEN AND BATHURST D Combined Creep and Installation Damage
426 GEOSYNTHETICS INTERNATIONAL S 1996, VOL. 3, NO. 3
0
10
20
30
40
50
60
70
80
90
100
0 2 4 6 8 10 12 14
Figure 14. Undamaged isochronous load-strain curves for an HDPE uniaxial geogrid withcalculated rupture points for damaged curves (adapted from Bush 1990).Note: Damaged isochronous curves calculated at RFID = 1.25 (lower bound estimate).
R
Strain (%)
36.5
28Load(%ofultimate) 10-1 hours undamaged
10-1 hours damaged
104 hours undamaged
104 hours damaged
106 hours undamaged
106 hours damaged
R
R = rupture
Table 1. Summary of calculated combined creep and installation damage partial factors us-ing conventional and isochronous approach methods.
Geo
synt
hetic
Tim
eto
rupt
ure
(hou
rs)
RF
ID(1
)
RF
CR
(2)
Mod
ulus
ratio
,RJ(3
)
Peak
stra
inra
tio,
Rε(3
)
Und
amag
edcr
eep
rupt
ure
stra
in(%
)
Cal
cula
ted
rang
eof
RF
IDC
Rus
ing
isoc
hron
ous
appr
oach
RF
IDC
Rus
ing
stre
ssru
ptur
ete
sts
onda
mag
edsp
ecim
ens
RF
IDR
FC
Rx
usin
gco
nven
tiona
lm
etho
d
PET Yarn 104 1.23 1.50 1.00 0.73* 8.3 1.7 1.89 1.85106 1.23 1.63 1.00 0.73* 7.6 2.1 2.33 2.00
PP 104 1.25 3.28 0.85 - 1.00 0.70 - 0.90 40 3.3 - 4.2 - 4.10Slit-film 106 1.25 5.88 0.85 - 1.00 0.70 - 0.90 40 5.6 - 6.9 - 7.35woven 104 2.50 3.28 0.70 - 0.85 0.40 - 0.55 40 4.6 - 6.6 - 8.20
106 2.50 5.88 0.70 - 0.85 0.40 - 0.55 40 7.7 - 10.1 - 14.7
HDPE 104 1.25 2.24 0.95 - 1.00 0.71 - 0.78 12.5 2.4 - 2.7 - 2.80Geogrid 106 1.25 2.72 0.95 - 1.00 0.71 - 0.78 10 3.1 - 3.6 - 3.40
Notes: (1) Partial factor for installation damage; (2) partial factor for creep; (3) from in-isolation index tensiletesting; * rupture strain ratio (i.e. damaged rupture strain/undamaged rupture strain) actually calculated fromcreep tests taken to rupture was on average 0.68.
ALLEN AND BATHURST D Combined Creep and Installation Damage
427GEOSYNTHETICS INTERNATIONAL S 1996, VOL. 3, NO. 3
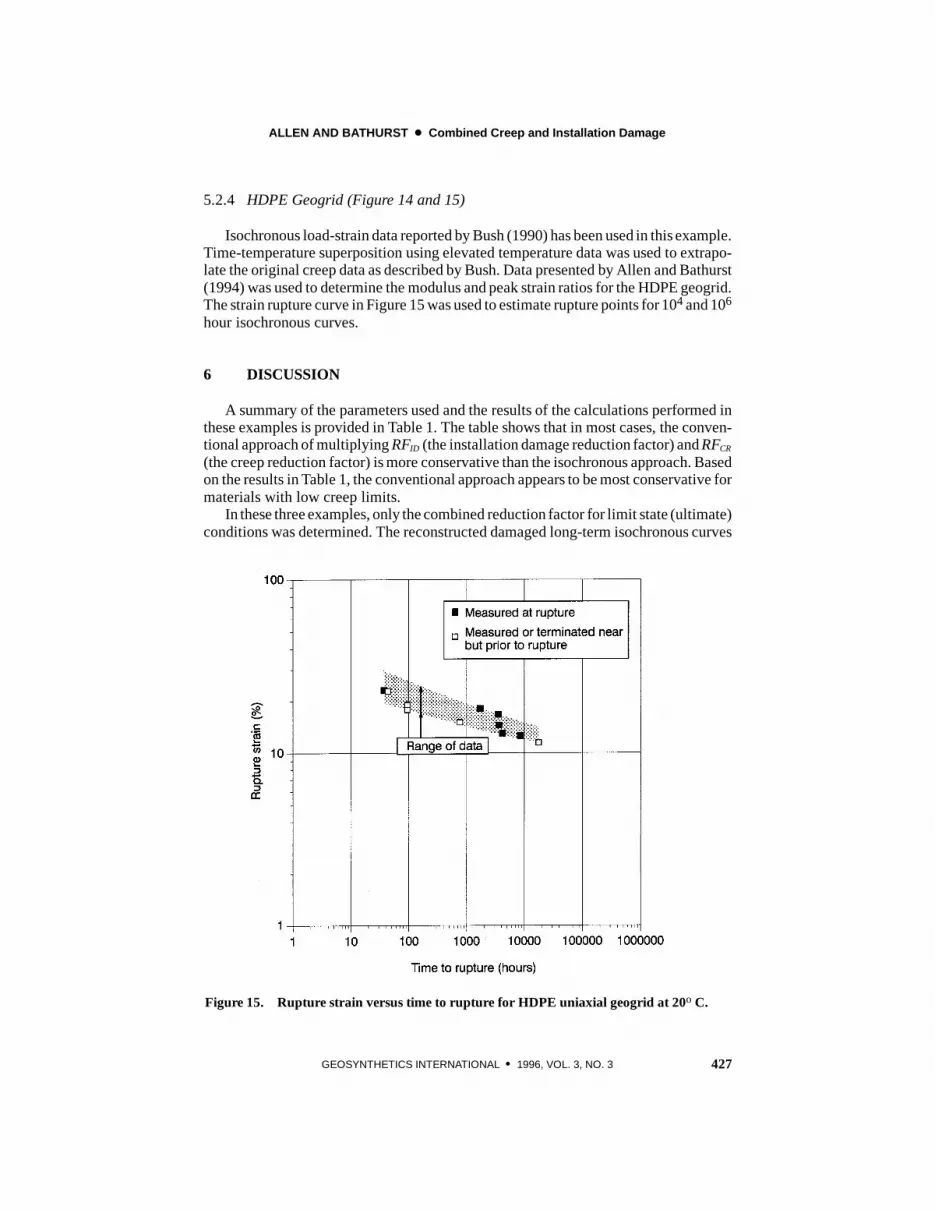
5.2.4 HDPE Geogrid (Figure 14 and 15)
Isochronous load-strain data reported by Bush (1990) has been used in this example.Time-temperature superposition using elevated temperature data was used to extrapo-late the original creep data as described by Bush. Data presented by Allen and Bathurst(1994) was used to determine the modulus and peak strain ratios for the HDPE geogrid.The strain rupture curve in Figure 15 was used to estimate rupture points for 104 and 106
hour isochronous curves.
6 DISCUSSION
A summary of the parameters used and the results of the calculations performed inthese examples is provided in Table 1. The table shows that in most cases, the conven-tional approach of multiplying RFID (the installation damage reduction factor) and RFCR
(the creep reduction factor) is more conservative than the isochronous approach. Basedon the results in Table 1, the conventional approach appears to be most conservative formaterials with low creep limits.
In these three examples, only the combined reduction factor for limit state (ultimate)conditions was determined. The reconstructed damaged long-term isochronous curves
Figure 15. Rupture strain versus time to rupture for HDPE uniaxial geogrid at 20o C.

ALLEN AND BATHURST D Combined Creep and Installation Damage
428 GEOSYNTHETICS INTERNATIONAL S 1996, VOL. 3, NO. 3
can also be used to determine WSIDCR , the combined reduction factor for creep andinstallation damage at working strength or serviceability state conditions. The workingstresses and strains in the geosynthetic must first be determined. This can be accom-plished through finite element or possibly other working stress analysis techniques. Al-ternatively, the design strain can be based on a serviceability strain criteria such as spe-cified in the AASHTO Specifications for Highway Bridges (AASHTO 1992), whichuses loads at a strain limit of 5%. Based on Figures 12, 13, and 14, at strains of 5% orless, it is obvious that installation damage has little or no effect on the magnitude ofWSIDCR for all three materials, except for the second example at a strength loss of 60%,where the long-term isochronous curve was shifted significantly due to the high level ofdamage.
Based on the results of the example calculations and the other presented data, the fol-lowing points can be made regarding the effect of installation damage on creep and theparameter RFIDCR (i.e. at the ultimate limit state):
S Based on Table 1, the conventional approach of multiplying RFID by RFCR to obtainthe combined reduction factor for installation damage and creep is generally conser-vative, but the conventional approach can be slightly nonconservative depending onthe product structure and polymer type, the level of damage, and the amount of vari-ability in the data.S In general, the conventional approach becomes more conservative relative to the pro-
posed isochronous approach as the undamaged creep limit decreases or as the levelof damage increases.S For the rupture condition, based on the example using PET yarns, the isochronous
approach appears to estimate a damaged rupture strength at long rupture times whichis approximately 15 to 20% greater than the measured rupture strength after damage(see Table 1). Note however that the conventional approach of multiplying RFID andRFCR together also over-estimates the as-damaged rupture strength based on the avail-able data. The majority of this prediction difference, when considering the isochrono-us approach, appears to be due to the difference between the peak strain ratio fromindex tensile tests and the rupture strain ratio measured from creep tests on damagedspecimens, as mentioned previously (see also Table 1). Based on the available data(Takaku 1981; Allen 1991) the peak strain from index tensile tests and the strain nearrupture from creep tests appear to be closely related. However, these differences instrain ratios could be the result of: visco-elastic effects which are not fully under-stood; the lack of a consistent definition for the rupture strain in a creep test; or simplyuncertainty caused by extrapolation of the creep rupture strains to long times or inher-ent scatter in the data.
The example calculations also indicate that the following generalizations can bemade regarding the effect of installation damage on creep at working stress levels (i.e.WSIDCR):
S The long-term isochronous curves for undamaged and damaged material plot on ornearly on top of one another at working stress levels for low to moderate levels ofdamage, at least when considering woven geotextiles and geogrids. In this case,therefore, the working strength for the geosynthetic is generally unaffected by instal-lation damage.
ALLEN AND BATHURST D Combined Creep and Installation Damage
429GEOSYNTHETICS INTERNATIONAL S 1996, VOL. 3, NO. 3
S For higher levels of damage great enough to cause a significant reduction in the short-term modulus obtained from tensile tests, the long-term isochronous load-straincurve for the damaged material theoretically shifts to higher strain relative to thecurve for the undamaged material. Therefore, in this case, the working strength is af-fected by installation damage, though not to the extent that the current practice(AASHTO1992) of using the full installation damage strength reduction factor in ser-viceability calculations would indicate.
The isochronous approach rests on the assumption that creep rates for a given geo-synthetic are not affected by damage, provided that the damage is not severe enough toreduce the short-term geosynthetic modulus. Based on the available data, this assump-tion appears to be valid for PET, HDPE, and PP geosynthetics. Most critical to the suc-cess of the isochronous approach is accurate knowledge of the expected long-termcreep rupture strains, both undamaged and damaged, and accurate knowledge of the ef-fects of damage on short-term load-strain behavior in terms of peak strain and modulusloss. The only damaged creep rupture strain data which is available is for specimenswhich did not suffer a significant change in modulus due to damage. There is no dataavailable to indicate what effect increases or decreases in initial creep strain due toshort-term modulus changes will have on the long-term damaged rupture strain. Thereis also a lack of undamaged and damaged long-term creep rupture strain data available.Obviously, additional research is needed to verify the validity of Step 2 (Figure 10), es-pecially if the level of damage is high enough to cause a significant modulus shift.
In the vast majority of cases, installation damage is not great enough for geosynthet-ics typically used for reinforcement applications to cause significant changes in theshort-term modulusof the material. Therefore, based on this analysis, the current proce-dure of multiplying creep and installation damage factors together is likely to be conser-vative for working strength calculations.
Working strains measured in geosynthetic reinforced structures, particularly wallsand slopes, have been on the order of 1 to 2% or less (Allen 1991; Bathurst et al. 1988).Based on the examples presented, at such low strains, the geosynthetic reinforcementwould seldom exhibit any effects of damage. Therefore, one does not need to accountfor installation damage when designing at the working stress level, unless the level ofdamage is high. The performance of a 12.6 m high geotextile wall built in Seattle, Wash-ington, USA appears to support this conclusion, as strength loss due to damage based ontensile testswason the order of 30 to 40%, yet strains remained low. In addition, the wallshowed no indication of being near a failure condition, even though the overall designsafety factor, which did not consider the effects of damage, was low (Allen et al. 1992).
The writers recognize that the available creep data obtained from installation-dam-aged specimens is limited, and that additional research is needed to verify the conclu-sions drawn herein. However, the observed load-strain-time behavior of geosyntheticsexposed to installation damage and/or sustained load is consistent as a whole, whichsupports the proposed methods to combine installation damage and creep advanced inthis paper.

ALLEN AND BATHURST D Combined Creep and Installation Damage
430 GEOSYNTHETICS INTERNATIONAL S 1996, VOL. 3, NO. 3
7 CONCLUSIONS AND RECOMMENDATIONS
The analysis of the load-strain-time behavior of undamaged and damaged geosyn-thetics as presented herein indicates that the multiplication of creep and installationdamage reduction factors together (i.e. the conventional approach) is generally conser-vative and hence results in errors on the safe side for design. Based on this analysis, itappears that users of geosynthetic reinforcement could benefit from a more rational ap-proach to combining the effects of installation damage and creep, especially if designat working stress levels is used together with moderate to heavy levels of damage (i.e.short-term strength losses due to damage of 10 to 15% or more). The main benefit toa more rational approach would be to increase the long-term design strength availablefor a given geosynthetic. The two approaches described in this paper to accomplish thisare:
S Obtain the combined reduction factor directly from creep tests conducted on installa-tion-damaged specimens.S Utilize both the undamaged and damaged load-strain-time behavior patterns ob-
served in geosynthetics to construct damaged isochronous curves from undamagedcurves (i.e. the isochronous approach).
It is believed that either approach can be used to provide a more rational and accu-rate estimate of long-term strength after damage, though both approaches have limita-tions. The first approach will provide the most direct estimate of long-term damagedstrength, but is not practical for design due to the large number of long-term creep testsrequired to account for the additional variability of the damage to exhumed samplesunder nominally identical site installation environments. The isochronous approach ap-pears to be more practical for use in design, but additional research is needed to improvethe accuracy of the model proposed, at least at the rupture (ultimate limit) state. Atworking stresses, the accuracy of the isochronous approach appears to be adequate,making the second approach the best choice for design at working stress conditions.
At rupture, installation damage has a more significant effect on the long-termstrength than at working stress conditions based on the available data. For polyolefingeosynthetics, the data supporting the proposed approaches indicates that the conven-tional approach is conservative at rupture, for damage levels typical in reinforcementapplications. For polyester geosynthetics, the conventional approach appears to predictthe long-term strength at rupture within the accuracy of the available data. Until re-search is performed to improve the accuracy of the isochronous approach near rupture,the conventional approach can be used to predict long-term rupture strength after dama-ge.
Attempting to apply the conventional approach at working stress conditions, basedon the data provided herein, results in a conservative estimate of long-term strength. Inmany cases, installation damage will have a negligible effect on the long-term strengthat working stress levels (i.e. the geosynthetic behaves as if it is not damaged). This find-ing has significant implications regarding the amount of geosynthetic needed in a givengeosynthetic structure once working stress design methodologies are more fully devel-oped and implemented for routine design use.

ALLEN AND BATHURST D Combined Creep and Installation Damage
431GEOSYNTHETICS INTERNATIONAL S 1996, VOL. 3, NO. 3
8 RECOMMENDATIONS FOR FURTHER RESEARCH
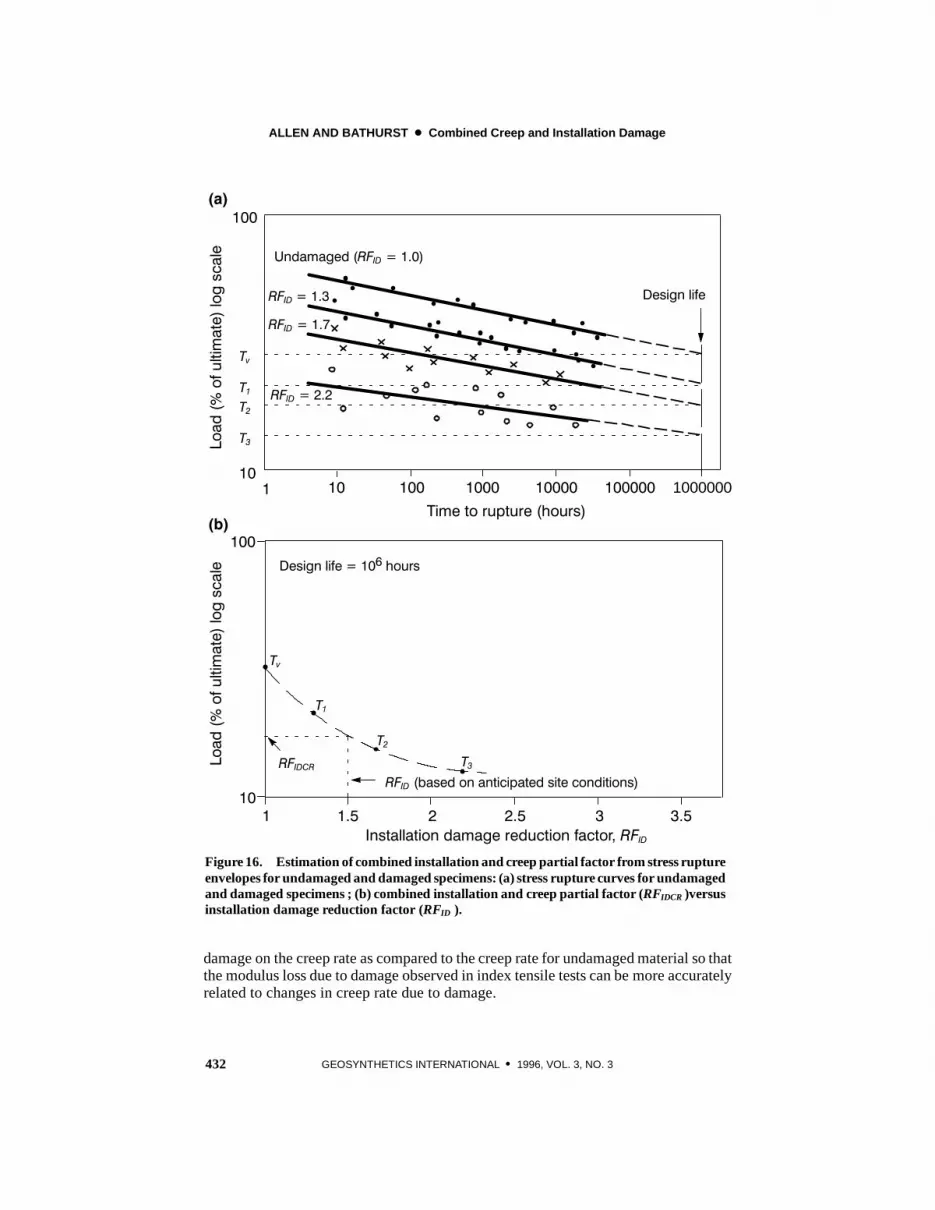
Although not practical as a design approach, the first approach, in which the com-bined reduction factor for installation damage and creep is obtained directly from creeptests conducted on installation-damaged specimens, is best suited for fundamental re-search on the installation damage/creep issue. However, even as a research approachthe variability caused by damage must be minimized (i.e. the level of damage through-out the exhumed samples must be as uniform as possible). One must remember that thefocus of installation damage exposure and testing in this case is not to define the level ofdamage, including variability, anticipated for a given level of installation conditions.Instead, the focus is on the load-strain-time behavior of the geosynthetic itself in a dam-aged condition, in which the relationship between strength retained, modulus retained,peak strain retained, and creep behavior is established. With this focus, stress ruptureenvelopes (if focusing on the rupture state) or isochronous curves (if focusing on work-ing stress conditions) are developed for several levels of short-term strength loss. Thisresults in a family of stress rupture envelopes or long-term isochronous curves, witheach envelope or isochronous curve representing a specific, constant level of damage.This is illustrated in Figure 16 for stress rupture envelopes. The relationship betweenRFID and RFIDCR based on this type of data is also conceptually illustrated in this figure.
Minimization of variability in the level of damage is in practice difficult to achieve.However, the following approaches to minimize this variability could be considered:
S Expose the sample of geosynthetic to installation damage under controlled conditionsin the laboratory. An example of this approach is provided by Krumm (1988) and Vie-zee et al. (1990). Alternatively, a specified number and pattern of holes or cuts couldbe artificially inflicted on the specimens in the laboratory to accomplish specifiedlevels of damage.S If samples must be obtained from full scale installations, where installation condi-
tions are not fully controlled, it is essential to reduce variability in the level of damagein the specimens selected through preliminary visual assessment and testing of thesample to aid the specimen selection process. Visual assessment of damage (countingthe cuts and holes, assessing the degree of abrasion) is by nature qualitative and oper-ator dependent (Brady et al. 1994). Provided that the same operator is used throughoutthe specimen selection process, visual assessment can be used as a first cut in theselection of creep test specimens with approximately the same level of damage. Indextest results (i.e. wide-width tensile strength) from specimens located adjacent to theproposed creep test specimens could then be used to fine tune the selection of speci-mens. Note that this preliminary visual assessment and testing technique may also beof value even if the sample is exposed to installation damage in a controlled laborato-ry environment, depending on how well the damage conditions are controlled.
Testing of installation-damaged specimens could be used to further develop and val-idate more practical approaches for design such as the isochronous approach. To ac-complish this, key issues that should be addressed include: an improved understandingof the rupture mechanism for geosynthetics in both an undamaged and damaged state;an improved and consistent definition of rupture for creep tests which can be consistent-ly related to the strain at peak strength in a wide-width test; improved extrapolation ofcreep rupture strains to long-term conditions; and, the effect of relatively high levels of
ALLEN AND BATHURST D Combined Creep and Installation Damage
432 GEOSYNTHETICS INTERNATIONAL S 1996, VOL. 3, NO. 3
Figure 16. Estimation of combined installation and creep partial factor from stress ruptureenvelopes for undamaged and damaged specimens: (a) stress rupture curves for undamagedand damaged specimens ; (b) combined installation and creep partial factor (RFIDCR )versusinstallation damage reduction factor (RFID ).
10
T3
T2T1
Tv
10 100 1000 10000 100000 1000000
Time to rupture (hours)
Undamaged (RFID = 1.0)
RFID = 1.3
RFID = 1.7
RFID = 2.2
1
100
Design life
Load(%ofultimate)logscale
Installation damage reduction factor, RFID1 1.5 2 2.5 3 3.5
10
100
Tv
T1
T2T3
RFID (based on anticipated site conditions)
Load(%ofultimate)logscale Design life = 106 hours
RFIDCR
(a)
(b)
damage on the creep rate as compared to the creep rate for undamaged material so thatthe modulus loss due to damage observed in index tensile tests can be more accuratelyrelated to changes in creep rate due to damage.

ALLEN AND BATHURST D Combined Creep and Installation Damage
433GEOSYNTHETICS INTERNATIONAL S 1996, VOL. 3, NO. 3
ACKNOWLEDGMENTS
The authors wish to thank Akzo Nobel Geosynthetics, Tensar Earth Technologies,Inc., and the Transport Research Laboratory for permission to use previously unpub-lished data. Thanks also go to W. Voskamp, G. den Hoedt, John Greenwood, and J. Col-lin for many valuable discussions and correspondences. The assistance of K. Labinaz atRMC in preparing the figures for this paper is also gratefully acknowledged.
REFERENCES
AASHTO, 1992, “Standard Specifications for Highway Bridges”, American Associa-tion of State Highway and Transportation Officials, Fifteenth Edition, Washington,DC, USA, 686 p.
Allen, T.M., 1989, “Strength Losses Occurring Due to Installation Damage for SeveralGeosynthetics (SR-90 Rainier Avenue Eastbound Preload Wall)”, Unpublished Re-port, Washington State Department of Transportation, USA, 81 p.
Allen, T.M., 1991, “Determination of Long-Term Strength of Geosynthetics: a State-of-the-Art Review”, Proceedings of Geosynthetics ’91, IFAI, Vol. 1, Atlanta, Geor-gia, USA, February 1991, pp. 351-379.
Allen, T.M. and Bathurst, R.J., 1994, “Characterization of Geosynthetic Load-StrainBehavior after Installation Damage”, Geosynthetics International, Vol. 1, No. 2, pp.181-199.
Allen, T.M., Bell, J.R. and Vinson, T.S., 1983, Properties of Geotextiles in Cold Re-gions Applications, Transportation Research Report No. 83-6, Oregon State Univer-sity, Corvallis, Oregon, USA, 275 p.
Allen, T.M., Christopher, B.R. and Holtz, R.D., 1992, “Performance of a 12.6 m HighGeotextile Wall in Seattle, Washington”, Geosynthetic Reinforced Soil RetainingWalls, Wu, J.T.H., Editor, Balkema, 1992, Proceedings of the International Sympo-sium on Geosynthetic-Reinforced Soil Retaining Walls, Denver, Colorado, USA, Au-gust 1991, pp. 81-100.
ASTM D 2837, “Method for Obtaining Hydrostatic Design Basis for ThermoplasticPipe Materials”, American Society for Testing and Materials, West Conshohocken,Pennsylvania, USA.
ASTM D 4595, “Standard Test Method for Tensile Properties of Geotextiles by theWide-Width Strip Method”, American Society for Testing and Materials, West Con-shohocken, Pennsylvania, USA.
Bathurst, R.J., Benjamin, D.J. and Jarrett, P.M., 1988, “Laboratory Study of GeogridReinforced Soil Walls”, Geosynthetics for Soil Improvement, Holtz, R.D., Editor,Geotechnical Special Publication No. 18, proceedings of the symposium sponsoredby the Geotechnical Engineering Division of the ASCE, Nashville, Tennessee, USA,May 1988, pp. 178-192

ALLEN AND BATHURST D Combined Creep and Installation Damage
434 GEOSYNTHETICS INTERNATIONAL S 1996, VOL. 3, NO. 3
Berg, R.R., 1992, ‘‘Guidelines for Design, Specification, and Contracting ofGeosynthetic Mechanically Stabilized Earth Slopes on Firm Foundations”, ReportNo. FHWA-SA-93-025, U.S. Department of Transportation, Federal HighwayAdministration, Washington, D.C., USA, October 1992, 88 p.
Bonaparte, R. and Berg, R., 1987, “Long-Term Allowable Design loads for Geosynthet-ic Soil Reinforcement”, Proceedings of Geosynthetics ’87, IFAI, Vol. 1, New Or-leans, Louisiana, USA, February 1987, pp. 181-192.
Brady, K.C., Watts, G.R.A., Nagarkatti, A.S. and Greenwood, J.H., 1994, “InstallationDamage on Geotextiles”, Bridges and Ground Engineering Transport ResearchCentre, Research Report 382, Crawthorne, Berkshire, RG11 6AU, UK, 56 p.
BS 8006, 1995, “Code of Practice for Strengthened/Reinforced Soils and Other Fills”,British Standards Institute, UK, 1995, 160 p.
Bush, D.I., 1988, “Evaluation of the Effects of Construction Activities on the PhysicalProperties of Soil Reinforcing Elements”, Theory and Practice of Earth Reinforce-ment, Yamanouchi, T., Miura, N. and Ochiai, H., Editors, Balkema, 1988, Proceed-ings of the International Geotechnical Symposium on Theory and Practice of EarthReinforcement, Fukuoka, Kyushu, Japan, October 1988, pp. 63-68.
Bush, D.I., 1990, “Variation of Long-Term Design Strength of Geosynthetics in Tem-peratures up to 40oC”, Proceedings of the Fourth International Conference on Geo-textiles, Geomembranes, and Related Products, Balkema, Vol. 2, The Hague, Nether-lands, May 1990, pp. 673-676.
Bush, D.I. and Swan, D.B.G., 1988, “An Assessment of the Resistance of Tensar SR2to Physical Damage During the Construction and Testing of a Reinforced Soil Wall”,The Application of Polymeric Reinforcement in Soil Retaining Structures, Jarrett,P.M. and McGown, A., Editors, Kluwer Academic Publishers, 1988, Proceedings ofthe NATO Advanced Research Workshop on Application of Polymeric Reinforce-ment in Soil Retaining Structures, Kingston, Ontario, Canada, June 1987, pp.173-180.
Christopher, B.R. and Holtz, R.D., 1984, Geotextile Engineering Manual, FHWADTFH 61-80-C-0094, Federal Highway Administration, National Highway Institute,Washington, DC, USA, 732 p.
Corbet, S., 1994, Personal Communication.Elias, V., 1990, “Durability/Corrosion of Soil Reinforced Structures”, Report to Federal
Highway Administration, U.S. Department of Transportation, No. FHWA/RD-89/186, Washington, DC, USA, 163 p.
GRI GG1, ‘‘GRI Test Method GG1-87: Geogrid Rib Tensile Strength”, GeosyntheticResearch Institute, Drexel University, Philadelphia, Pennsylvania, USA.
GRI GG4a, ‘‘GRI Test Method GG4a: Determination of Long-Term Design Strength ofStiff Geogrids”, Geosynthetic Research Institute, Drexel University, Philadelphia,Pennsylvania, USA.
GRI GG4b, ‘‘GRI Test Method GG4b: Determination of Long-Term Design Strength ofFlexible Geogrids”, Geosynthetic Research Institute, Drexel University,Philadelphia, Pennsylvania, USA.

ALLEN AND BATHURST D Combined Creep and Installation Damage
435GEOSYNTHETICS INTERNATIONAL S 1996, VOL. 3, NO. 3
Ingold, T.S., 1993, “Partial Material Factors for Polymer Wall Reinforcement”, Pro-ceedings of Geosynthetics ’93, IFAI, Vol. 1, Vancouver, British Columbia, Canada,March 1993, pp. 217-227.
Jewell, R.A. and Greenwood, J.H., 1988, “Long-Term Strength and Safety in Steep SoilSlopes Reinforced by Polymer Materials”, Geotextiles and Geomembranes, Vol. 7,Nos. 1 and 2, pp. 81-118.
Koerner, R.M. and Koerner, G.R., 1990, “A Quantification and Assessment of Installa-tion Damage to Geotextiles”, Proceedings of the Fourth International Conference onGeotextiles, Geomembranes, and Related Products, Balkema, Vol. 2, The Hague,Netherlands, May 1990, pp. 597-602.
Koerner, G.R., Koerner, R.M. and Elias, V., 1993, “Geosynthetic Installation DamageUnder Two Different Backfill Conditions”, Geosynthetic Soil Reinforcement TestingProcedures, Cheng, S.C.J., Editor, ASTM Special Technical Publication No. 1190,Proceedings of a symposium held in San Antonio, Texas, USA, January 1993, pp.163-183.
Krumm, G., 1988, Der einfluss mechanischer schadigung auf das kriechverhalten vontechnischem filament - garn aus polyethylenterephthalat, Diplomarbeit TU-Aachen.
Leclercq, B., Schaeffner, M., Delmas, P.H., Blivet, J.C. and Matichard, Y., 1990, “Du-rability of Geotextiles: Pragmatic Approach Used in France”, Proceedings of theFourth International Conference on Geotextiles, Geomembranes and Related Prod-ucts, Balkema, The Hague, Netherlands, May 1990, Vol. 2, pp. 679-684.
McGown, A., Paine, N. and DuBois, D.D., 1984, “Use of Geogrid Properties in LimitEquilibrium Analysis”, Polymer Grid Reinforcement, Thomas Telford, 1985, Pro-ceedings of a conference held in London, UK, March 1984, pp. 31-36.
Popelar, C.H., Kenner, V.H. and Wooster, J.P., 1991, “An Accelerated Method for Es-tablishing the Long Term Performance of Polyethylene GasPipe Materials”, PolymerEngineering and Science, Vol. 31, No. 24, pp. 1693-1700.
Takaku, A., 1981, “Effect of Drawing on Creep Fracture of Polypropylene Fibers”,Journal of Applied Polymer Science, Vol. 26, pp. 3565-3573.
Troost, G.H. and Ploeg, N.A., 1990, “Influence of Weaving Structure and Coating onthe Degree of Mechanical Damage of Reinforcing Mats and Woven Geogrids,Caused by Different Fills, During Installation”, Proceedings of the Fourth Interna-tional Conference on Geotextiles, Geomembranes and Related Products, Balkema,The Hague, Netherlands, May 1990, Vol. 2, pp. 609-614.
Viezee, D.J., Voskamp, W., den Hoedt, G., Troost, G.H. and Schmidt, H.M., 1990, “De-signing Soil Reinforcement with Woven Geotextiles - the Effect of Mechanical Dam-age and Chemical Aging on the Long-Term Performance of Polyester Fibres and Fab-rics”, Proceedings of the Fourth International Conference on Geotextiles,Geomembranes, and Related Products, Balkema, Vol. 2, The Hague, Netherlands,May 1990, pp. 651-656.
Wilding, M.A. and Ward, I.M., 1978, ”Tensile and Creep Recovery in Ultra-High Mo-dulus Polyethylenes”, Polymer, Vol. 19, pp. 969-976.
Wilding, M.A. and Ward, I.M., 1981, “Creep and Recovery of Ultra High ModulusPolyethylene”, Polymer, Vol. 22, pp. 870-876.

ALLEN AND BATHURST D Combined Creep and Installation Damage
436 GEOSYNTHETICS INTERNATIONAL S 1996, VOL. 3, NO. 3
NOTATIONS
Basic SI units are given in parentheses.
Jsecε = secant modulus (N/m)P = tensile load level (% of ultimate)P1 = undamaged long-term creep limit load (% of ultimate)P2 = damaged long-term creep limit load (% of ultimate)RFCR = reduction factor for creep (dimensionless)RFcr = 100/P1
RFD = reduction factor for chemical/microbiological degradation(dimensionless)
RFID = reduction factor for installation damage (dimensionless)RFIDCR = combined reduction factor for installation damage and creep
(ultimate limit state design)RFidcr = 100/P2
RJ = ratio of damaged secant modulus to undamaged secant modulus(dimensionless)
RT = ratio of damaged peak strength to undamaged peak strength(dimensionless)
Rε = ratio of damaged peak strain to undamaged peak strain(dimensionless)
T = tensile load (N)Tf = tensile load at failure (N)TV = creep extrapolated undamaged design load (% of ultimate )T1 , T2 , T3 = creep extrapolated damaged design load (% of ultimate )t = time (seconds)Ta = long-term allowable tensile strength (N/m)Tult = ultimate tensile strength (e.g. ASTM D 4595 or GRI GG1) (N/m)WSIDCR = combined installation damage and creep reduction factor for working
strength or serviceability state designs (dimensionless)∆ε = strain increase due to heavily damaged specimens (dimensionless)∆P = load increase applied to undamaged curve to give strain increase ∆ε
(% of ultimate)ε = strain (dimensionless)εD = calculated damaged long-term creep strain (dimensionless)εD1 = strain on damaged 0.1 hour curve at undamaged long-term creep limit,
P1 (dimensionless)εf = strain at failure (dimensionless)εRD = damaged long-term rupture strain (dimensionless)

ALLEN AND BATHURST D Combined Creep and Installation Damage
437GEOSYNTHETICS INTERNATIONAL S 1996, VOL. 3, NO. 3
εRV = undamaged (virgin) long-term rupture strain (dimensionless)εV = undamaged (virgin) long-term creep strain (dimensionless)εV1 = strain on undamaged 0.1 hour curve at undamaged long-term creep
limit, P1 (dimensionless)
ABBREVIATIONS
AASHTO American Association of State Highway and Transportation OfficialsASTM American Society for Testing and MaterialsBS British StandardHDPE high density polyethylenePP polypropylenePET polyesterWPP woven polypropylene (geotextile)WPET woven polyester (geotextile)
APPENDIX
This section outlines the procedure to calculate damaged isochronous curves forheavily damaged specimens.
The magnitude of load increase to individual fibers/ribs can be determined from theshort-term load-strain curves for the undamaged and damaged specimens. That is, theresulting increase in strain at a constant load level due to damage requires an increase inthe fiber/rib load level, as shown in Figure A1. The effect this increased load level perfiber or rib due to damage has on the creep strain between the short-term and long-termisochronous curves depends on the particular geosynthetic and the load level applied.PP and HDPE geosynthetics will tend to show greater creep strain increases due to in-creased fiber/rib load level than will PET geosynthetics.
This increase in creep strain of the geosynthetic due to fiber/rib severing in heavilydamaged material (see Section 3) can be estimated using the isochronous load-straincurves for the undamaged material. For a given load level, and the load level increasedetermined from Figure A1, the total creep strain, εD , for the damaged material can bedetermined as illustrated in Figure A2. Note that εV and εD both occur at load level P asshown on Figure 10, even though εD is calculated at load level P +∆P in Figure A2. Thisshift calculation should be performed at several load levels below the creep limit of theundamaged material to construct the full damaged isochronous curve.

ALLEN AND BATHURST D Combined Creep and Installation Damage
438 GEOSYNTHETICS INTERNATIONAL S 1996, VOL. 3, NO. 3
Figure A1. Illustration of equivalent increase in load applied to undamaged geosyntheticfibers/ribs to produce same increase in strain due to damage (applies to heavily damagedmaterialonly): (a) index load-strain curves for undamaged and damaged specimens; (b) loadincrease due to fiber/rib cuts.
LoadP
LoadP
Load/ribµP/4after rib cut
P
0 5 10 15 20
20
40
60
80
100
Strain (%)
∆εDamaged specimentensile test
Undamaged specimentensile test
Strain increase due to damage(load per fiber/rib increases, assumingfiber/rib modulus does not change)
ε
P + ∆P = (1/RJ)Pε+ ∆ε = (1/RJ)εwhere:ε+ ∆ε = εD1 isfrom Figure 10 atvirgin creep limit,RJ and P aredefined inFigure 10
0
∆PLoad increase applied toundamaged curve to givestrain increase ∆ε
Load(%ofultimate)
Load/ribµP/5before rib cut
(a) (b)

ALLEN AND BATHURST D Combined Creep and Installation Damage
439GEOSYNTHETICS INTERNATIONAL S 1996, VOL. 3, NO. 3
Figure A2. Use of undamaged isochronous curves to determine increase in creep strainresulting from increased fiber/rib load due to damage.
P ∆P
0 5 10 15 20 25
20
40
60
80
100
Strain (%)
Long-term undamaged isochronous curve
εD
εV
0.1 hour undamagedisochronous curve
Increased loaddeterminedfrom Figure A1
Rupture
0
Load(%ofultimate)


