Embed Size (px)
Citation preview
COLUMBIA COUNTY ASSESSOR’S
CERTIFIED RATIO STUDY
JANUARY 1, 2020
“Serving Columbia County through Engagement, Connection and Innovation”
Department of Revenue Property Tax Division
955 Center St NE PO Box 14380
Salem, OR 97309-5075 www.oregon.gov/dor
150-800-930 (Rev. 6/17)
July 28, 2020
Sue Martin, Assessor Columbia County 230 Strand Street Rm. 331 St. Helens, OR 97051
Columbia County 2020 Assessor’s Certified Ratio Study Acceptance
The Department’s Mass Appraisal Review team has completed its required review of your 2020 Assessor Certified Ratio Study report and accepts its findings.
In accordance with ORS 309.200 the county assessor has produced and timely filed a ratio study report and appraisal plan that documents achievement of the 100% real market value (RMV) standard for the forthcoming assessment roll as required by ORS 308.232. Any significant changes made to the reported RMV adjustment program must be documented and forwarded to the mass appraisal team at [email protected]
Your appraisal / valuation plan is yet to be received and is due on or before November 1, 2020.
In accordance with ORS 309.203(1) the Department recommends you continue to maintain accurate property records and values which are extremely important to the maintenance of the county’s property tax program.
Our mass appraisal team is available to assist with your real market value mass appraisal programs. If you have questions, please contact any of the CMART team members via email at [email protected].
Sincerely,
Roxanne Gillespie, MAI, Manager Program Assistance Property Tax Division
Tel: (503) 347-7536 Fax: (503) 945-8737 cc: County Governing Body
Table of Contents
Certification and Analysis of Valuation Methods and Procedures .................................................................. 1
Introduction: The purpose and description of the Ratio Study ..................................................................2-10
Appraisal Areas and County Map............................................................................................................. 11-13
Grouping Analysis and Study Area List .................................................................................................... 14-16
Sales Comparisons RMV Class 1XX and 4XX ............................................................................................ 17-23
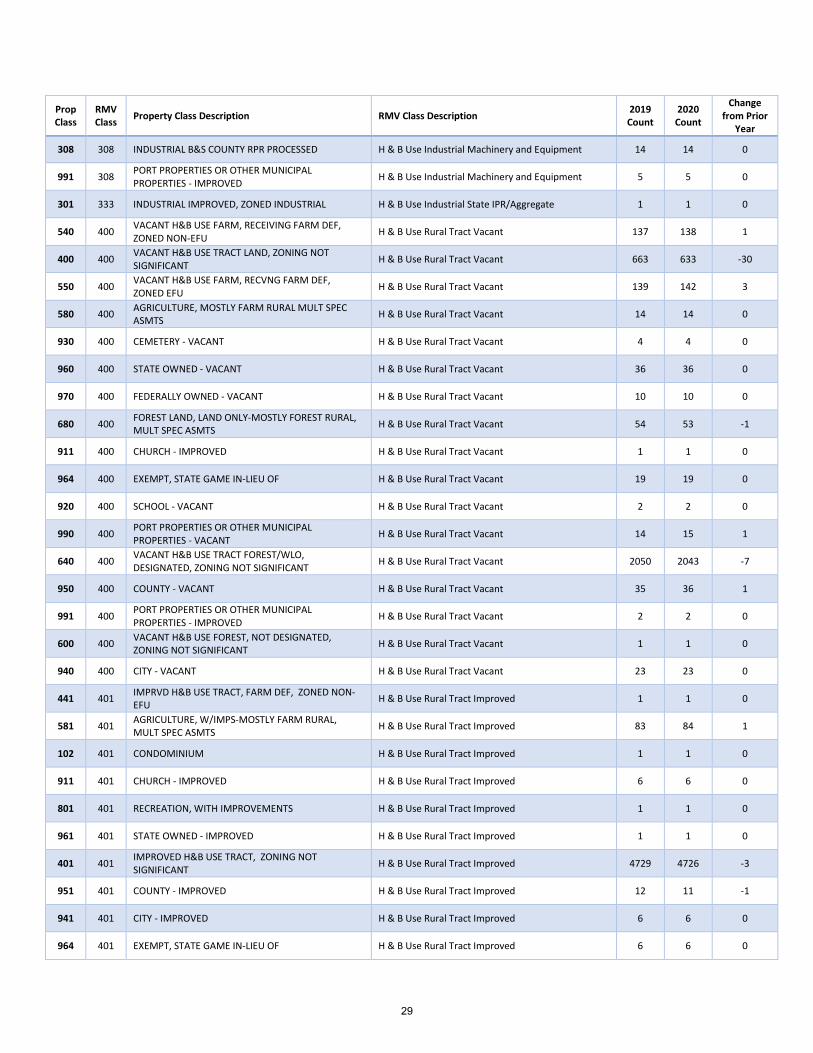
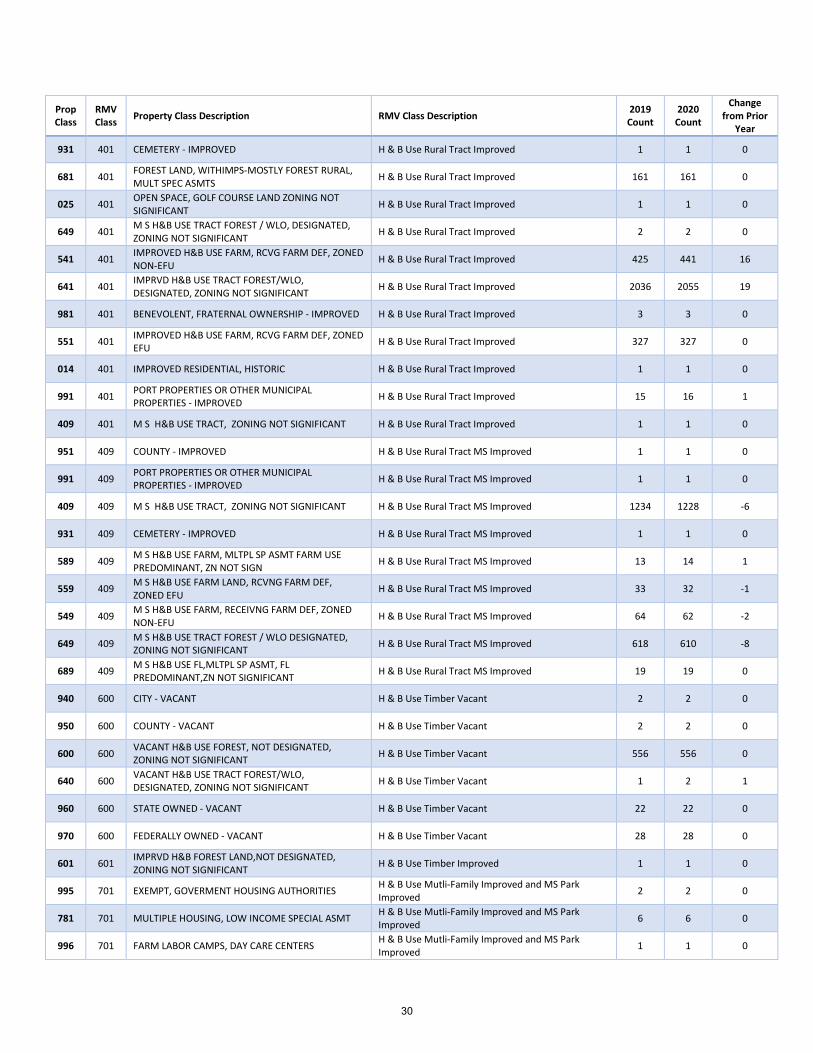
RMV and Property Class Descriptions and Counts .................................................................................. 24-31
Time Adjustment Studies ......................................................................................................................... 32-65
Supplemental Notes ................................................................................................................................. 66-67
Summary of Ratio Indications: COD and PRD .......................................................................................... 68-74
Market Area Adjustments and Conclusions:
Residential Property ................................................................................................................. 76-314
Maintenance Area 1: City of St. Helens ....................................................................... 77-104
Maintenance Area 2: Scappoose ............................................................................... 105-168
Maintenance Area 3: Vernonia .................................................................................. 169-190
Maintenance Area 4: Rainier ..................................................................................... 191-228
Maintenance Area 5: Clatskanie ................................................................................ 229-258
Maintenance Area 6: Rural St. Helens, Columbia City, Warren, Deer Island ............ 259-290
Maintenance Area 7: Personal Property Manufactured Structure ........................... 291-306
Personal Property: Floating Property ........................................................................ 307-314
Commercial (including MS Parks and Floating Property) ....................................................... 315-333
Industrial ................................................................................................................................. 334-350
Highest and Best Use Forestland ............................................................................................ 351-353
Multi-Family ............................................................................................................................ 354-356
Recreational land .................................................................................................................... 357-361
Odd Lot .................................................................................................................................... 362-370
Islands ..................................................................................................................................... 371-373
COD and PRD Areas of Concern ........................................................................................................... 374-377
Appendix A: Recalculation and Reappraisal Setups ..................................................................................... 378
[i]
COLUMBIA COUNTY
Assessor
State of Oregon ) ) SS.
County of Columbia )
Certification and Analysis of Valuation Methods and Procedures
ST. HELENS. OR 97051
230 Strand St. Direct (503) 397-2240
Fax(503)397 5153
www.co.co1urn bia.or. us
I, Sue Martin, Assessor of Columbia County, State of Oregon, do hereby certify that I have prepared a ratio study for the current tax year according to ORS 309.200 and the guidelines developed by the Department of Revenue. Additionally, the attached is a complete and accurate copy of the original now on file in my office.
I further certify that the ratios and adjustments identified in this study will achieve 100% of real market value for real property and manufactured structures for the current year. This report is given to the Department of Revenue and will be given to the Clerk of the Board of Property Tax Appeals to provide current knowledge of the adjustment program used by my office.
Sue Martin, Assessor
Joelle Leach, Analyst Preparer/Contact Person
Date
(503) 397-2240 ext. 8450Phone
Service - Engagement - ConnectJon - lnnovatJon
1
Introduction
The purpose of Ratio Study is to measure the level of appraised value in relation to the market value as of the assessment date of January 1. For 2020, this is the relationship between the base set-up real market values for all re-calculated or re-appraised areas.
Furthermore, the Ratio Study’s purpose is to document the analysis and to identify adjustment factors that will achieve 100% of Real Market Value (RMV). As an additional benefit, this study is a valuable tool for managing appraisal and adjustment programs.
Columbia County is divided into six (6) appraisal areas as illustrated on the County map included in this report. These appraisal areas are referred to as "Maintenance Areas" (MA). Properties within these areas are grouped together for market analysis and adjustment by using Study Areas and/or Property Class/RMV Class designations.
Also referenced on the area list is Maintenance Area 7. This area is not noted on the County Map but is designated for personal property manufactured structures located throughout Columbia County.
The Ratio Study
The format of the Ratio Study is intended to reflect the adjustment program as defined by Oregon Administrative Rule (OAR) 150-309-0230. Most notably are the “Summary of Ratio Indications” and the “Market Area Conclusions and Adjustments” sections of this study. The remaining sections lend additional support and provide further explanation of the adjustment .
Summary of Ratio Indications
This summarizes the adjustments by Maintenance Area (MA), Study Area (SA) and Neighborhood (NH). Adjustments are made in general categories by RMV class:
1. Residential Urban (RMV class 1XX); Rural Tract (RMV class 4XX or 8XX) - This includesresidential land, single family site built dwellings, real property manufacturedstructures, condominium’s, 2-4 unit multi-family properties within the city limits andrural properties which include small rural residential parcels to large farm and forestparcels.
2. Commercial (RMV class 2XX) and Industrial (RMV class 3XX) - This includes commercialand industrial properties appraised by the County in urban or rural locations.
3. Others: this is for properties that do not fit well into any of the categories, or theymay be better reported as a separate group.
Sales Trimming
When performing an analysis of the sales for a dataset, there may be ratios that are either very high or very low in the array. These are commonly referred to as “outliers”. These outlying ratios require further investigation to identify whether the sale is deemed “usable” for analysis. In addition, there may be other extreme circumstances surrounding the sale that would result in a skewed ratio.
If the sale is deemed not beneficial to the analysis, then the sale should be “trimmed” from the array. The two standard methods of trimming sales are "Trimmed Mean" and the "Interquartile Range".
2
Removing outliers is not a mandatory practice but is appropriate when drawing a conclusion about the sales data. If the decision is made to trim outliers, then this task must be performed before the process of analyzing the sale datasets. For this ratio study, a trimming method was not applied since all usable sales were deemed appropriate.
Time Study
The purpose for performing a time study is to measure the movement of value over a period of time. In this case, sales data is analyzed and an adjustment factor (shown as a percent) is developed to bring the sales price to the January 1 assessment date.
Three separate time studies have been performed: one for the RMV Class 1XX properties, another for the RMV Class 4XX properties, and one for Personal property Manufactured Structures. For Commercial, Industrial, and Floating property sales, no time adjustment study was performed.
For this Ratio Study, the Direct Calculation analysis was deemed as the best technique to adjust the sales price for movement over time. This method was applied to the RMV Class 1XX, 4XX, and 019 properties. The conclusion from the time study is applied to adjust the Sales Price to the January 1st assessment date for this ratio year, then a central tendency (Mean, Median, Weighted Mean or Geometric Mean) is selected as the best indicator for the trend results.
Market Area Conclusions and Adjustments
Following are the essential elements that embody the Ratio Study as outlined. They include the individual ratio study for an area, as well as the supporting sales listings and statistical data.
Market grouping - The assessment system provides for adjusting values by market group using stratification and combination. Stratification means splitting a large group of properties into separate groups based on market differences. Conversely, combination means combining properties from separate groups with similar market characteristics. Study Area and RMV Class groupings are the most common market groupings used in this report. They may define the market by location, type of property or by those that have a special use.
Study - each study is two or more pages in length and identifies the RMV Class, the study area, shows the calculation of the adjustment and explains how the factors used in the calculation were selected. Furthermore, each study includes a sales list with related statistics. Following are the main elements included in each study:
1. Market Identification. This describes the population for which the individual study is done.Typically, this is by the RMV class, Maintenance Area (MA) and Study Area (SA) followed by ageneral description. Most locally assessed properties are identified and a trend conclusion iscompleted whether or not a sales listing can be generated or a conclusion of “No Trend” isdetermined.
2. The Adjustment Calculation Summary. This section uses the data from the sales collection year(the certified values plus any roll correction values) and identifies the following:
a. The size of the sales sample used.
b. The total size of the population in the study, both in terms of absolute numbers and by apercent.
c. Identifies the values of the population by Land RMV, On-site Development RMV,
3
Residential Improvement RMV and Farm/Ancillary buildings RMV as it is documented in the Assessor file for the sales collection year. These certified are shown as dollar amounts and as a percentage of the total RMV for each population by category, both before adjustment and after and meet the request of the Department of Revenue.
i. Pre Trend Values – the total of the certified values by value item (Land RMV, OSDRMV, Improvement RMV and Farm Improvement RMV) from the sales collectionyear.
ii. Post Trend Values – the Pre-Trend Values multiplied by the Adjustment Factor foreach value item as determined in the study.
d. The “Selected Ratio from Sales” is the chosen Central Tendency after the TimeAdjustment conclusion has been applied to the Sales Price to bring the sales price to theJan 1st assessment date. This ratio is either the Mean, Median, Weighted Mean orGeometric Mean. Ratio selections are based on the following principles:
i. No single sale should have a large influence on the ratio indications. The objectiveis to avoid a Mean distorted by an extreme ratio, a Weighted Mean influenced byhigh valued properties and to avoid a Median when gaps exist in the middle ofthe frequency distribution.
ii. Ratios above and below 100 can be a result of being at or near market. A singletrend will result in half the properties being over market and half being undermarket. A single trend cannot reduce the distribution of ratios within the group.
iii. If an adjustment is clearly needed then it is applied. Similarly, the adjustment withthe greatest support is applied.
iv. Reliability fluctuates. It is dependent upon the size of the sample and thevariability within the sample. Therefore, the central tendencies will lie within arange of reliable conclusions.
e. The “Time Trend Adjustment” is conclusion from the time study as an annual adjustmentpercent.
f. The “Before Ratio” is the selected time adjusted central tendency.
g. The "Overall Adjustment Factor" is needed to bring the prior year RMV (or the currentyear re-calculated RMV) to the statutorily required 100% real market value as of theJanuary 1 assessment date. It is calculated by dividing 1 by the Before Ratio. For improvedproperties, the overall adjustment factor is separated into the following:
i. Land Adjustment Factor: the adjustment by which the land portion of a propertyis adjusted. It usually is the land adjustment factor used in the analysis ofunimproved land within the same MA and SA. However, the adjustment may befrom the analysis of the improved RMV class if an insufficient sales sample ofunimproved land is not available.
ii. OSD Adjustment Factor: the adjustment factor that brings the site improvementportion of the property to 100% of RMV. This value is available, as a separatecomponent for improved properties, but at this time remains as a 100adjustment.
iii. Residential Improvement Factor: the adjustment factor needed to bring theresidential and associated improvements to 100% of RMV as part of the overall
4

adjustment. iv. Farm Improvement Adjustment: the adjustment factor applied as part of the
overall adjustment that will bring outbuildings and other ancillary structures to100% real market value.
h. The “After Ratio” measures the valuation to be sure it meets 100% real market valuerequirements as outlined in statute. The After Ratio is calculated by applying theadjustment from the study to the base RMV on a value item basis (Land, OSD,Improvement and Farm Improvement). This value is referred to as the “After RMV”. Next,the After RMV is divided by the Time Adjusted Sales Price to return an After Ratio for eachsale in the array. Central tendencies are then calculated from the After Ratio’s to fulfill thestatutory requirements and to "test" the County's ratio study program.
i. Explanation: this is a written statement explaining which central tendency was selected inthe analysis. If other factors contributed to the conclusion, they may be mentioned hereas well.
3. Performance History. The following are historical displays of performance and valuation:
a. Coefficient of Dispersion (COD). The history of COD is shown at the bottom of the report.A COD higher than the maximum for the RMV class and type is an indication that the RMVClass and/or MA may have a valuation problem. The acceptable measurement ofuniformity ranges are when the COD percentages are between 10 and 20.
b. Price Related Differential (PRD). The PRD history measures vertical equity of the RMV. Themeasurements of vertical equity are defined as:
i. Regressive: a PRD above 1.00 suggests that the high-valued properties are under-appraised and the low-valued properties are over-appraised.
ii. Progressive: a PRD less than 1.00 suggests that high-value properties are over-appraised and low-valued properties are under-appraised.
iii. An ideal PRD is within the range of .98 to 1.03.
4. Performance Measures. To measure valuation, the following studies are performed:
a. For most studies, listings are used of sold properties that meet the definition of an arms-length sale. Each sale is identified by MA, SA, Neighborhood and RMV Class. Onceidentified, then additional details are provided to describe the individual sale properties.Next, a ratio is calculated for each sale then statistical data is calculated for the entiregrouping and displayed. The major components are as follows:
i. Maintenance Area (MA): one of the seven appraisal areas.
ii. Study Area (SA): market identification code.
iii. Neighborhood (NH): this identifier is not used at this time and the currentdesignation is “000”.
iv. Property Class (PRP CLS): a three-digit number identifying the type of property.
v. Stat Class (ST CLS): the type of main structure included in the sale (building type).
vi. Condition Code (CO CD): Sales are identified by a code illustrating whether a saleis confirmed or not confirmed. The current condition codes used are as follows:
5
01 Change of use 02 Deed does not show warranty of title 03 Grantee/Grantor is a political subdivision 04 Grantee/Grantor is a bank or other financial institution 05 Grantee/Grantor is a charitable, religious or other institution 06 Grantee/Grantor are related or business associates 07 Conveyance of partial or divided interest 08 Grantee/Grantor are the same, convenience 09 Exchange of properties (Trade 10 Short Sale or conveyance to avoid foreclosure 11 Grantor is Sheriff, Court Officer, Receiver, Guardian, Trustee 12 Contract payoff 13 Critical field on Deed or Document left blank 14 Prior year sale 16 Sale includes personal property not accurately extracted 17 Sale includes orchards, crops or other exempt property 20 Other errors or omissions 21 Property sold not same as assessed 22 Sale includes timber value 23 Sale of properties that had RMV adjudicated in the past 5 years 25 RMV needs updating due to new construction 27 Sales review requested 30 Unconfirmed and usable 33 Confirmed and usable 35 Assessment Clerk question 50 Special size change code for tracking only 80 Segregation
vii. Map Number (MAP NO.): the Assessor’s map and tax lot number (more than onetax lot may be involved in the sale but not displayed).
viii. Document Number (DOC NUM.): the calendar year in which the title transferdocument was recorded and the recording number of the title transferdocument.
ix. Acres (AC): the total land size expressed as acreage.
x. RMV Land: the base set up land value plus the on-site development value that isanalyzed and determined every year during the set-up study.
xi. RMV Imp: the base value using the current DOR Factor Book. The local costmodifier and depreciation conclusion is then applied. These are determined bythe yearly set-up analysis.
xii. Total RMV: the sum of the base RMV Land and the base RMV Imp.
6

xiii. Sale Price: the sale price of the property as of the date of sale.
xiv. Sale Date: the month and the year that the property sold.
xv. Sale Number (#): the sale data is arrayed in ascending order by ratio.
xvi. Ratio (RT): a comparison of the total appraised value to the sale price that isexpressed as a percentage without a decimal point (Total RMV/Sales Price =Ratio). This is an un-adjusted ratio.
5. Statistical data: As with all statistical analysis, the accuracy of each conclusion depends on asufficient sample size that properly represents the population of an area. Judgements aboutgrouping properties in order to gain reasonably accurate results are primarily based on creatingan adequate sample size of study areas that move similarly in the market. Descriptive statisticsare found on the second page of each ratio study and are split into two categories:
a. Statistics of Central Tendency – the center, middle or typical element in a dataset shownin two columns: the “Sales Ratio” and the “Sales After Ratio”. These are generallyassumed to reflect the level of appraised value (RMV) relative to the market value.However, the central tendency ratios must be analyzed in some detail to producereasonably accurate trend conclusions. The central tendency measurements arecomprised of the following:
i. The Sales Ratio column: reflects the ratios determined by taking the base RMVdivided by the time-adjusted sale price.
• Median: the middle ratio of an array. It is a positional ratio and if gaps arepresent near the center of the data set then the Median may be anunreliable measurement.
• Mean: traditionally referred to as the “average”, the Mean is the sum ofall the ratios divided by the number of ratios. Because it uses all the ratiosin an array, it is easily distorted by extreme high and low ratios.
• Weighted Mean: the sum of the total RMV divided by the sum or the totalSales Price. The sales with relatively high prices will have the most effecton this measure.
• Geometric Mean: the “Nth” root of the product of the ratios, where “N”is the number of ratios in the array.
ii. The “Sales After Ratio” column: these central tendencies depict the adjustedratios by using the following calculation: the adjusted base RMV divided by theadjusted Sale Price.
• Median: the middle ratio of an array. It is a positional ratio and if gaps arepresent near the center of the data set then the Median may be anunreliable measurement.
• Mean: traditionally referred to as the “average”, the Mean is the sum ofall the ratios divided by the number of ratios. Because it uses all the ratiosin an array, it is easily distorted by extreme high and low ratios.
• Weighted Mean: the sum of the total RMV divided by the sum or the totalSales Price. The sales with relatively high prices will have the most effecton this measure.
7
• Geometric Mean: the “Nth” root of the product of the ratios, where “N”is the number of ratios in the array.
iii. The Chart of Central Tendencies: This chart plots the number of using the un-adjusted ratios as calculated from taking the base RMV and dividing it the SalePrice.
b. Statistics of Distribution: this performance measurement describes how values aredistributed within the group; it illustrates how far the ratios are from the centraltendency. Care must be taken not to “read too much” into the distribution statistics butrather to use them as an indication of the accuracy or consistency of RMV within themarketplace. If the sample is relatively small, the conclusion of the distribution may beunreliable.
i. Frequency Distribution –this is a graph and numeric display of the distribution ofsales by ratio range. Both the Sales Ratio and After Sales Ratio are plotted.
ii. Average Deviation (AD) – the average of the differences between each ratio andthe Median for the entire grouping.
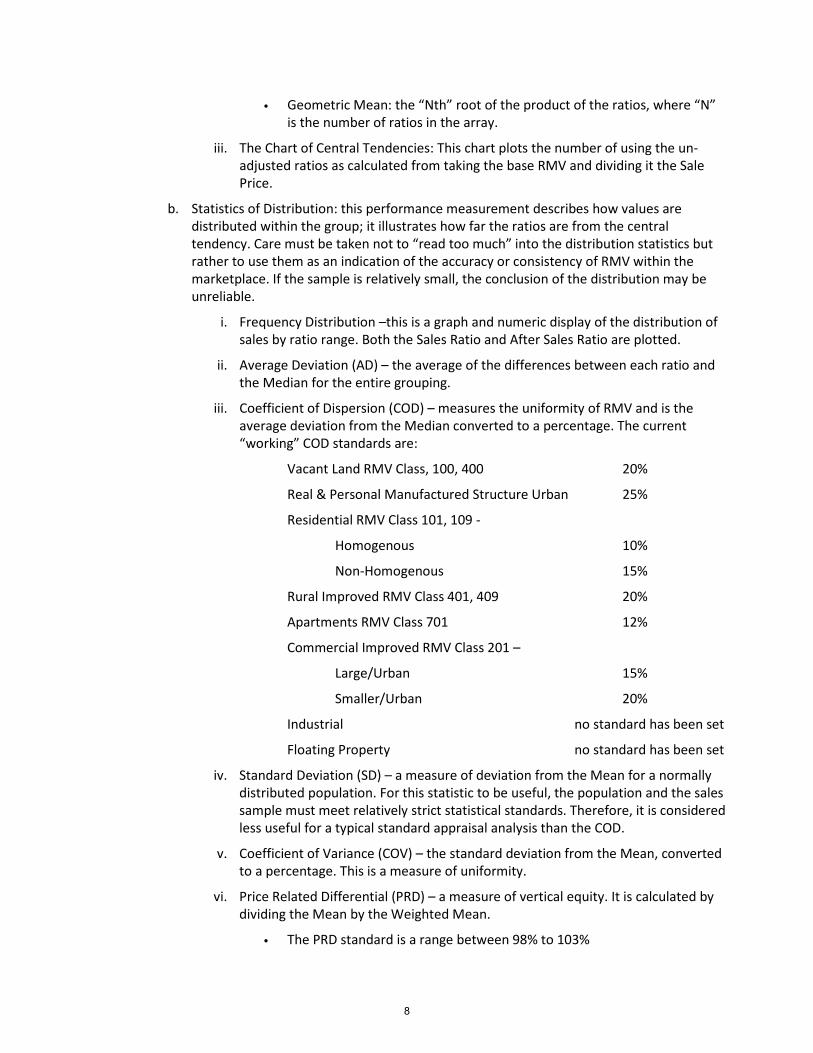
iii. Coefficient of Dispersion (COD) – measures the uniformity of RMV and is theaverage deviation from the Median converted to a percentage. The current“working” COD standards are:
Vacant Land RMV Class, 100, 400 20%
Real & Personal Manufactured Structure Urban 25%
Residential RMV Class 101, 109 -
Homogenous 10%
Non-Homogenous 15%
Rural Improved RMV Class 401, 409 20%
Apartments RMV Class 701 12%
Commercial Improved RMV Class 201 –
Large/Urban 15%
Smaller/Urban 20%
Industrial no standard has been set
Floating Property no standard has been set
iv. Standard Deviation (SD) – a measure of deviation from the Mean for a normallydistributed population. For this statistic to be useful, the population and the salessample must meet relatively strict statistical standards. Therefore, it is consideredless useful for a typical standard appraisal analysis than the COD.
v. Coefficient of Variance (COV) – the standard deviation from the Mean, convertedto a percentage. This is a measure of uniformity.
vi. Price Related Differential (PRD) – a measure of vertical equity. It is calculated bydividing the Mean by the Weighted Mean.
• The PRD standard is a range between 98% to 103%
8
vii. 95% Confidence Level – a calculation of uniformity used to determine thereliability that the sales array is representative of the population. This number isexpressed as a percentage. The lower the percentage the greater the reliability.Conversely, the higher the percentage the lower the reliability.
Special Processed Values
Not all assessed values are adjusted in the manner described in this report. Specially assessed values (Farm or Forest deferred), certain personal property values, and many industrial property values are recalculated or specially processed annually. The ratio study does not report these values. It does however, indicate how the RMV of farm and forest deferred properties will be adjusted.
Columbia County Assessor’s Annual Set-Up, Reappraisal and Recalculation:
Set-up
Every year, the Appraisal staff devotes approximately four to five months to analyzing and reviewing recent sales. During this time, land values, OSD values, local cost modifiers, and local market-based depreciation schedules are developed. In addition, class and condition benchmarks are established. These values are referred to as “base values” and are entered into the tables for January 1.
Reappraisal
An area (or property type) is selected each year for a physical reappraisal performed by the Appraisal staff. During this time, every property within the reappraisal area is visited, inspected, and reviewed for any changes such as; class, condition, topography, access, view, or any other factor that will have an influence on the value. Once the reappraisal is complete, the property is calculated electronically using the base values and factors developed in the Set-up study.
Recalculation
The Columbia County Assessor’s recalculation process is established from the base values and factors that are developed during Set-up and the existing inventory in our system. A physical inspection of the properties is not performed. Since the Set-up study is performed annually to develop base values, this recalculation method is a more reliable way to determine market trends rather than solely depending on the ratio study conclusions.
Please refer to Appendix A for further explanation on the Set-up, Reappraisal and Recalculation process and procedure.
Status of the Assessor’s Adjustment Program
The Columbia County Assessor and staff will continue to review market information until the actual changes are made to the roll. It is possible that additional data and further analysis will lead to conclusions different from those contained in this report.
The Assessor must make those adjustments that are indicated by reliable market data to produce the most accurate appraisals possible. Any future modification to the adjustment factors in this report will be reported to the Department of Revenue and will be documented in the modifications section of this study.
9
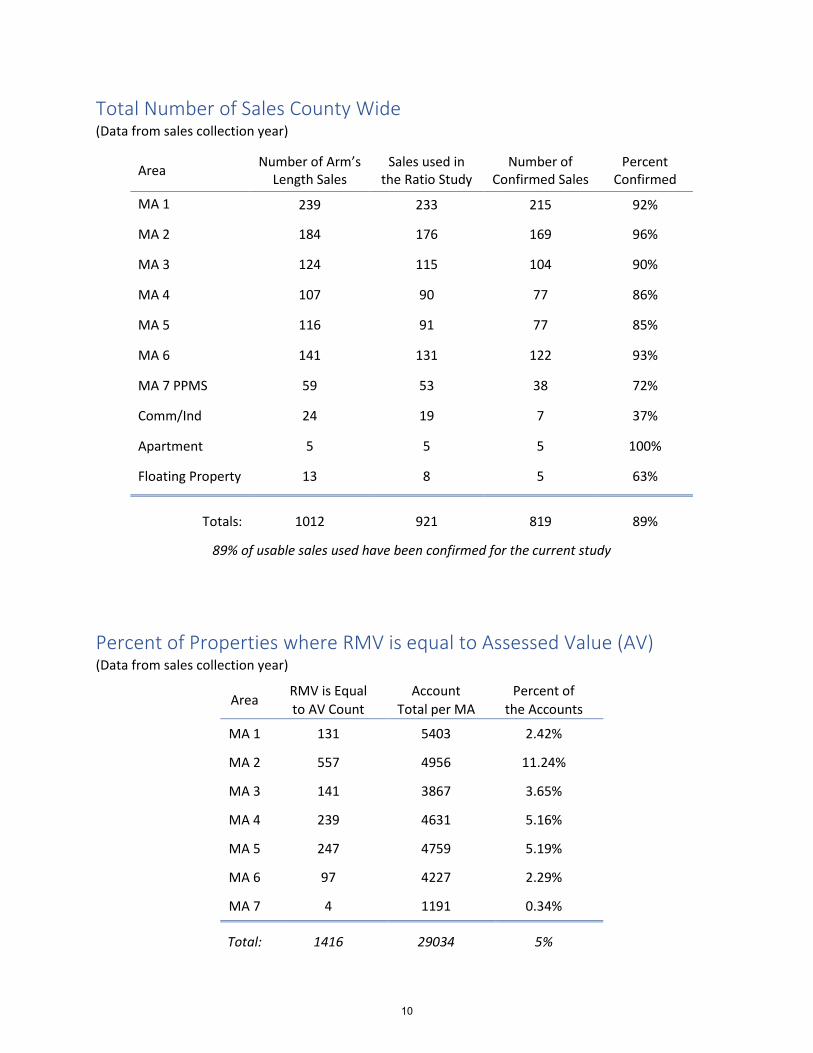
Total Number of Sales County Wide(Data from sales collection year)
Area Number of Arm’s Length Sales
Sales used in the Ratio Study
Number of Confirmed Sales
Percent Confirmed
MA 1 239 233 215 92%
MA 2 184 176 169 96%
MA 3 124 115 104 90%
MA 4 107 90 77 86%
MA 5 116 91 77 85%
MA 6 141 131 122 93%
MA 7 PPMS 59 53 38 72%
Comm/Ind 24 19 7 37%
Apartment 5 5 5 100%
Floating Property 13 8 5 63%
Totals: 1012 921 819 89%
89% of usable sales used have been confirmed for the current study
Percent of Properties where RMV is equal to Assessed Value (AV)(Data from sales collection year)
Area RMV is Equal to AV Count
Account Total per MA
Percent of the Accounts
MA 1 131 5403 2.42%
MA 2 557 4956 11.24%
MA 3 141 3867 3.65%
MA 4 239 4631 5.16%
MA 5 247 4759 5.19%
MA 6 97 4227 2.29%
MA 7 4 1191 0.34%
Total: 1416 29034 5%
10
MAINTENANCE AREA DESCRIPTIONS
AND MAP
11
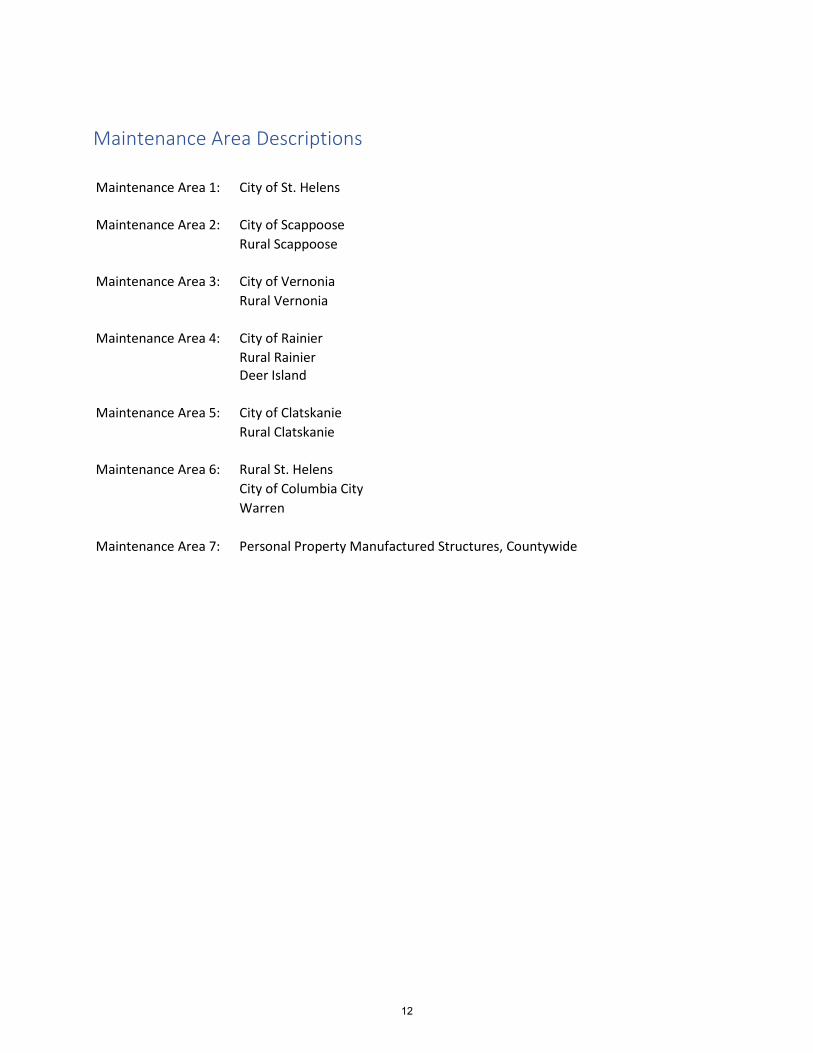
Maintenance Area Descriptions
Maintenance Area 1: City of St. Helens
Maintenance Area 2: City of Scappoose Rural Scappoose
Maintenance Area 3: City of Vernonia Rural Vernonia
Maintenance Area 4: City of Rainier Rural Rainier Deer Island
Maintenance Area 5: City of Clatskanie Rural Clatskanie
Maintenance Area 6: Rural St. Helens City of Columbia City Warren
Maintenance Area 7: Personal Property Manufactured Structures, Countywide
12
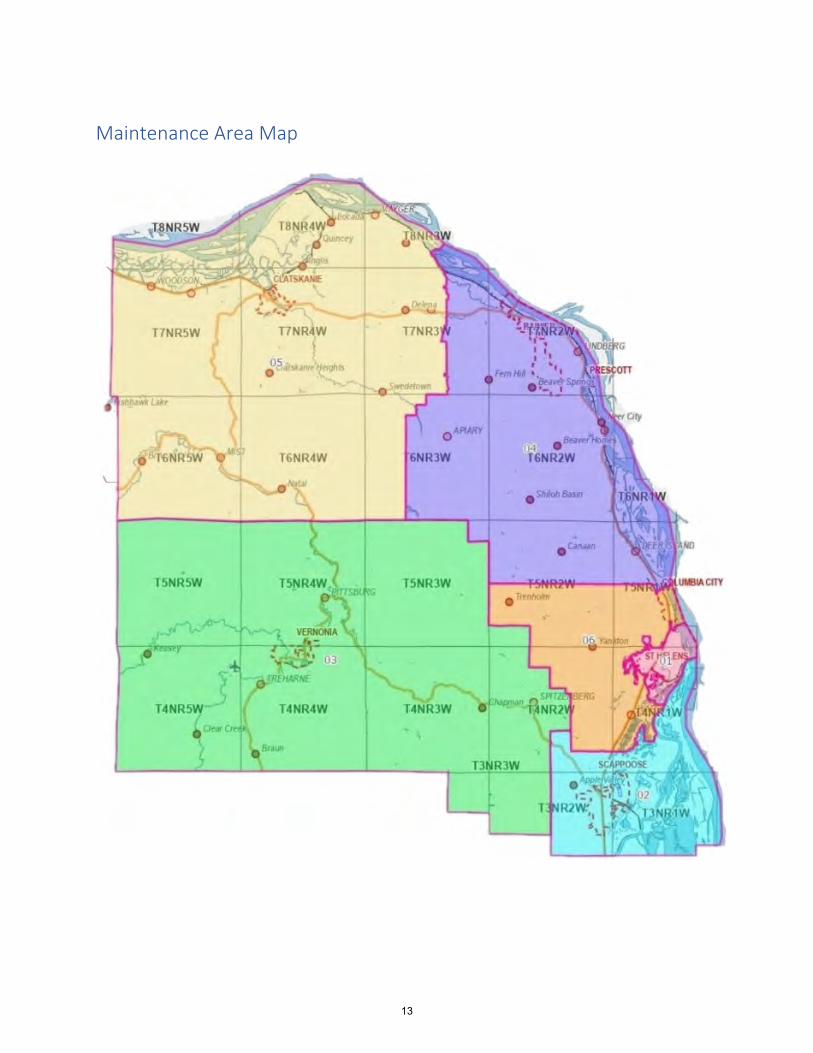
Maintenance Area Map
13
GROUPING ANALYSIS AND
STUDY AREA DESCRIPTIONS
14

Grouping Analysis
When performing an analysis, some Study Areas and/or property classes may move within the market in a similar manner. When this is observed, they may have been combined in one individual study. In addition, other study areas and/or property classes may have been combined to improve the sale sample in order to arrive at a more reliable conclusion.
Study areas and/or property classes were analyzed separately if:
• The data indicated that an individual SA and/or property class had sufficient data to arrive ata reliable conclusion, and
• The sales within those areas indicated that it would not be reasonable to combine them withanother area and/or classification.
If a study area and/or property classes were combined, then they have been identified in the individual Ratio study.
Study Area Descriptions Maintenance Area 1 – City or St. Helens 00 Undefined 73 Comm. use in Ind. area within Comm. corridor 15 River Front 74 Comm. use in Ind. area outside Comm. corridor 30 Duplex, Triplex, Fourplex 80 Yachts Landing PUE 43 Townhouse, Row House, Common Wall 90 Industrial – County Resp. 60 Island, Columbia River 95 Floating Home & Combinations 71 Comm. Hwy with Light 97 Boathouse & Misc. FP Imp. 72 Comm. Hwy without Light
Maintenance Area 2 – Scappoose 00 Undefined 71 Comm. Hwy with Light 06 Forest Value Zone, HBU 72 Comm. Hwy without Light 21 Rural Value Zone 1 73 Comm. use in Ind. area within Comm. corridor 25 Scappoose Dike Land 74 Comm. use in Ind. area outside Comm. corridor 28 Duplex, Triplex, Fourplex 77 Scappoose Industrial Air Park 33 Townhouse, Row House, Common Wall 79 Keys Landing, Keys Crest, Keys Orchard 41 Sauvie Island 80 Columbia River View Estates 45 Sauvie Island Dike Land 90 Industrial – County Resp. 60 Island, Columbia River 95 Floating Home & Combinations 62 Freeman Road 97 Boathouse & Misc. FP Imp. 64 Hillcrest, Columbia Acres 2020: MA 02 SA 25 (Scappoose Dike Land) - accounts that were located in MA 06 SA 65 (Rural Warren Dike
Land) moved here.
Maintenance Area 3 – Vernonia 00 Undefined 31 Rural Value Zone 1 03 Flood Zone Properties 40 Duplex, Triplex, Fourplex 06 Forest Value Zone, HBU 73 Comm. use in Ind. area within Comm. corridor 2020: MA 03 SA 38 (Roseview Heights) – moved to MA 03 SA 00
15
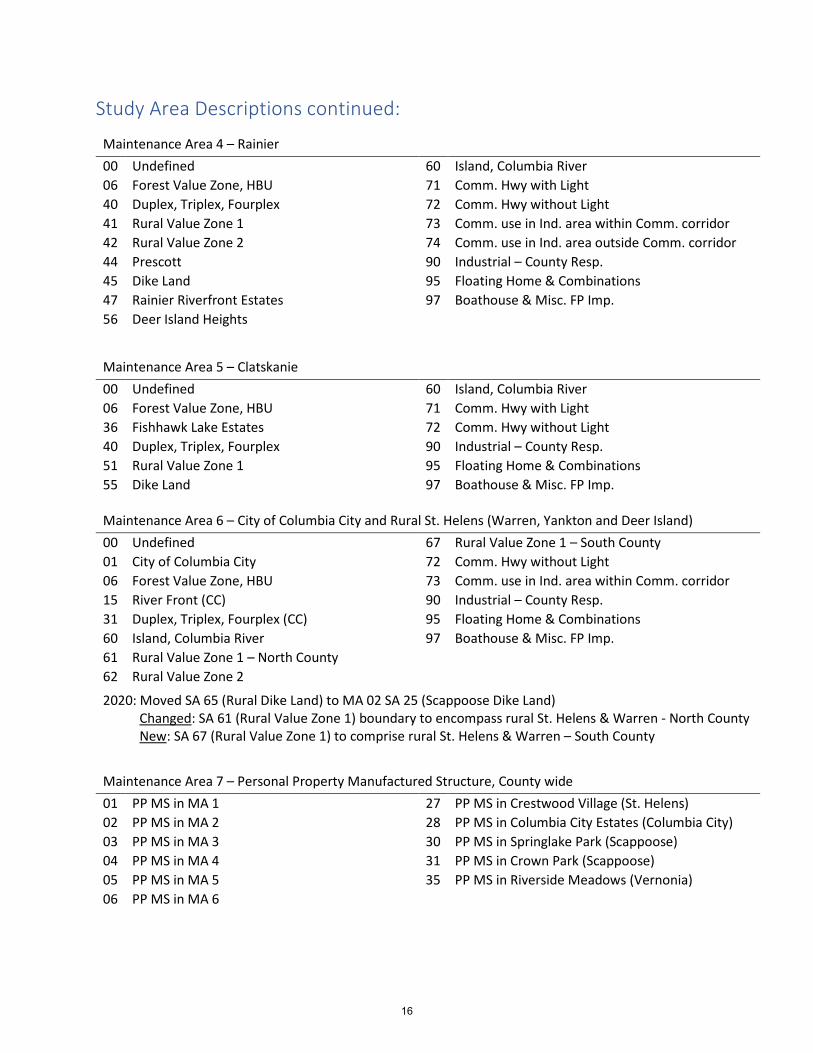
Study Area Descriptions continued:
Maintenance Area 4 – Rainier 00 Undefined 60 Island, Columbia River 06 Forest Value Zone, HBU 71 Comm. Hwy with Light 40 Duplex, Triplex, Fourplex 72 Comm. Hwy without Light 41 Rural Value Zone 1 73 Comm. use in Ind. area within Comm. corridor 42 Rural Value Zone 2 74 Comm. use in Ind. area outside Comm. corridor 44 Prescott 90 Industrial – County Resp. 45 Dike Land 95 Floating Home & Combinations 47 Rainier Riverfront Estates 97 Boathouse & Misc. FP Imp. 56 Deer Island Heights
Maintenance Area 5 – Clatskanie 00 Undefined 60 Island, Columbia River 06 Forest Value Zone, HBU 71 Comm. Hwy with Light 36 Fishhawk Lake Estates 72 Comm. Hwy without Light 40 Duplex, Triplex, Fourplex 90 Industrial – County Resp. 51 Rural Value Zone 1 95 Floating Home & Combinations 55 Dike Land 97 Boathouse & Misc. FP Imp.
Maintenance Area 6 – City of Columbia City and Rural St. Helens (Warren, Yankton and Deer Island) 00 Undefined 67 Rural Value Zone 1 – South County 01 City of Columbia City 72 Comm. Hwy without Light 06 Forest Value Zone, HBU 73 Comm. use in Ind. area within Comm. corridor 15 River Front (CC) 90 Industrial – County Resp. 31 Duplex, Triplex, Fourplex (CC) 95 Floating Home & Combinations 60 Island, Columbia River 97 Boathouse & Misc. FP Imp. 61 Rural Value Zone 1 – North County 62 Rural Value Zone 2
2020: Moved SA 65 (Rural Dike Land) to MA 02 SA 25 (Scappoose Dike Land) Changed: SA 61 (Rural Value Zone 1) boundary to encompass rural St. Helens & Warren - North County New: SA 67 (Rural Value Zone 1) to comprise rural St. Helens & Warren – South County
Maintenance Area 7 – Personal Property Manufactured Structure, County wide 01 PP MS in MA 1 27 PP MS in Crestwood Village (St. Helens) 02 PP MS in MA 2 28 PP MS in Columbia City Estates (Columbia City) 03 PP MS in MA 3 30 PP MS in Springlake Park (Scappoose) 04 PP MS in MA 4 31 PP MS in Crown Park (Scappoose) 05 PP MS in MA 5 35 PP MS in Riverside Meadows (Vernonia) 06 PP MS in MA 6
16
RMV CLASS 1XX AND 4XX
Sales Comparisons of Useable Arm’s Length
Transactions
17
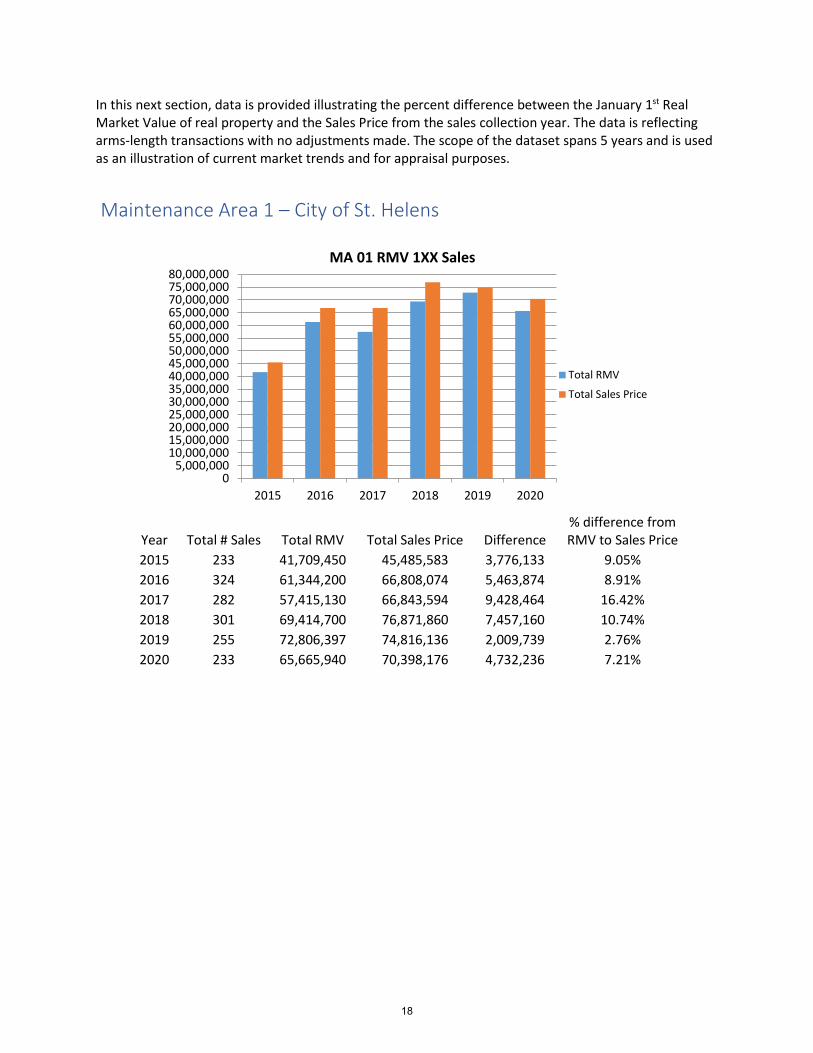
In this next section, data is provided illustrating the percent difference between the January 1st Real Market Value of real property and the Sales Price from the sales collection year. The data is reflecting arms-length transactions with no adjustments made. The scope of the dataset spans 5 years and is used as an illustration of current market trends and for appraisal purposes.
Maintenance Area 1 – City of St. Helens
% difference from RMV to Sales Price Year Total # Sales Total RMV Total Sales Price Difference
2015 233 41,709,450 45,485,583 3,776,133 9.05% 2016 324 61,344,200 66,808,074 5,463,874 8.91% 2017 282 57,415,130 66,843,594 9,428,464 16.42% 2018 301 69,414,700 76,871,860 7,457,160 10.74% 2019 255 72,806,397 74,816,136 2,009,739 2.76% 2020 233 65,665,940 70,398,176 4,732,236 7.21%
05,000,000
10,000,00015,000,00020,000,00025,000,00030,000,00035,000,00040,000,00045,000,00050,000,00055,000,00060,000,00065,000,00070,000,00075,000,00080,000,000
2015 2016 2017 2018 2019 2020
MA 01 RMV 1XX Sales
Total RMV
Total Sales Price
18
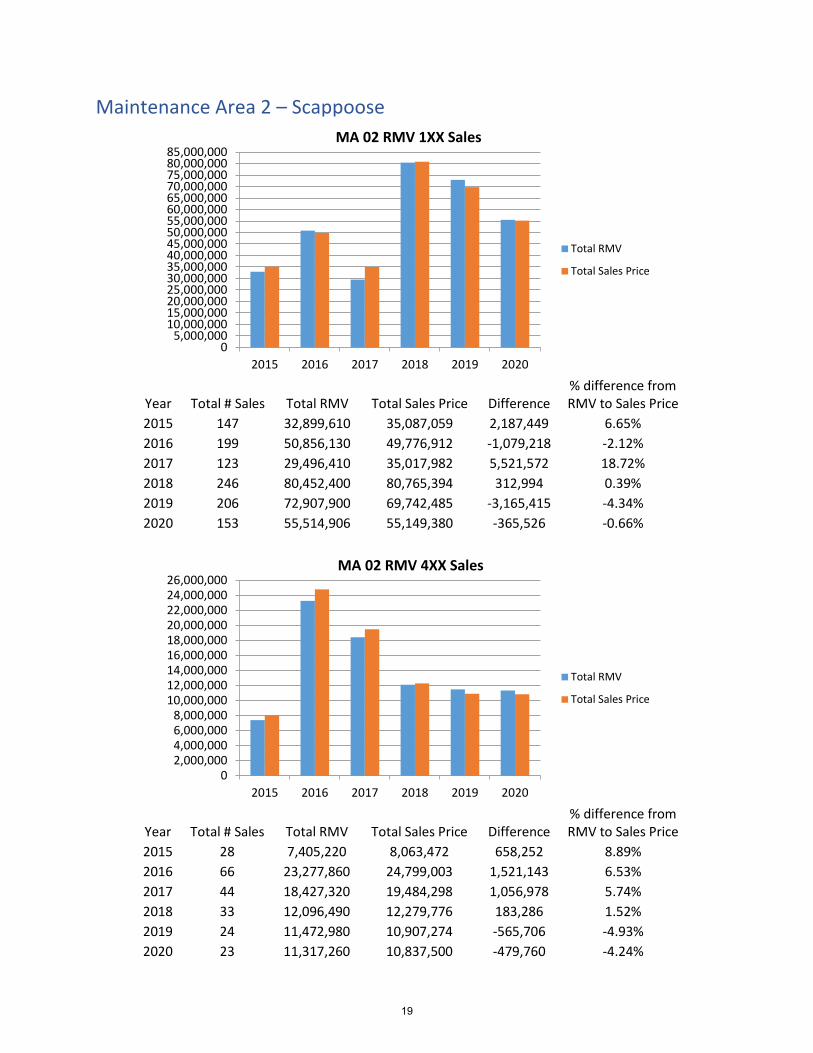
Maintenance Area 2 – Scappoose
% difference from RMV to Sales Price Year Total # Sales Total RMV Total Sales Price Difference
2015 147 32,899,610 35,087,059 2,187,449 6.65% 2016 199 50,856,130 49,776,912 -1,079,218 -2.12%2017 123 29,496,410 35,017,982 5,521,572 18.72%2018 246 80,452,400 80,765,394 312,994 0.39%2019 206 72,907,900 69,742,485 -3,165,415 -4.34%2020 153 55,514,906 55,149,380 -365,526 -0.66%
% difference from RMV to Sales Price Year Total # Sales Total RMV Total Sales Price Difference
2015 28 7,405,220 8,063,472 658,252 8.89% 2016 66 23,277,860 24,799,003 1,521,143 6.53% 2017 44 18,427,320 19,484,298 1,056,978 5.74% 2018 33 12,096,490 12,279,776 183,286 1.52% 2019 24 11,472,980 10,907,274 -565,706 -4.93%2020 23 11,317,260 10,837,500 -479,760 -4.24%
05,000,000
10,000,00015,000,00020,000,00025,000,00030,000,00035,000,00040,000,00045,000,00050,000,00055,000,00060,000,00065,000,00070,000,00075,000,00080,000,00085,000,000
2015 2016 2017 2018 2019 2020
MA 02 RMV 1XX Sales
Total RMV
Total Sales Price
02,000,0004,000,0006,000,0008,000,000
10,000,00012,000,00014,000,00016,000,00018,000,00020,000,00022,000,00024,000,00026,000,000
2015 2016 2017 2018 2019 2020
MA 02 RMV 4XX Sales
Total RMV
Total Sales Price
19
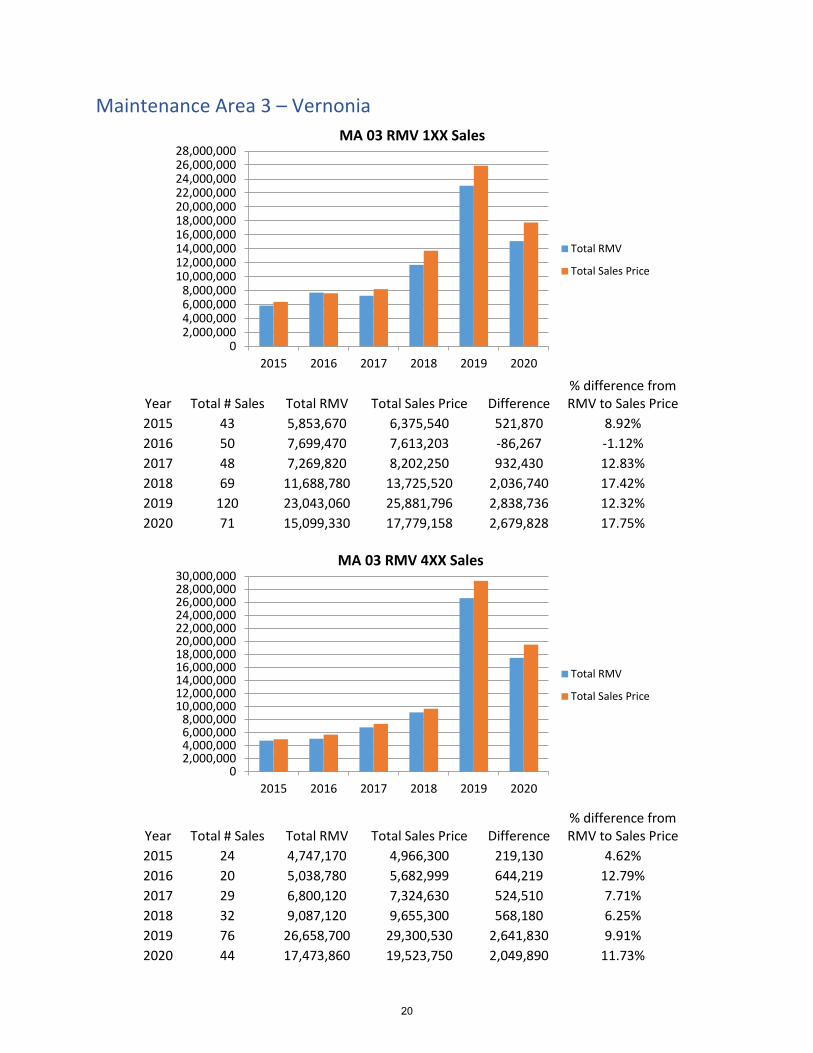
Maintenance Area 3 – Vernonia
% difference from RMV to Sales Price Year Total # Sales Total RMV Total Sales Price Difference
2015 43 5,853,670 6,375,540 521,870 8.92% 2016 50 7,699,470 7,613,203 -86,267 -1.12%2017 48 7,269,820 8,202,250 932,430 12.83%2018 69 11,688,780 13,725,520 2,036,740 17.42%2019 120 23,043,060 25,881,796 2,838,736 12.32%2020 71 15,099,330 17,779,158 2,679,828 17.75%
% difference from RMV to Sales Price Year Total # Sales Total RMV Total Sales Price Difference
2015 24 4,747,170 4,966,300 219,130 4.62% 2016 20 5,038,780 5,682,999 644,219 12.79% 2017 29 6,800,120 7,324,630 524,510 7.71% 2018 32 9,087,120 9,655,300 568,180 6.25% 2019 76 26,658,700 29,300,530 2,641,830 9.91% 2020 44 17,473,860 19,523,750 2,049,890 11.73%
02,000,0004,000,0006,000,0008,000,000
10,000,00012,000,00014,000,00016,000,00018,000,00020,000,00022,000,00024,000,00026,000,00028,000,000
2015 2016 2017 2018 2019 2020
MA 03 RMV 1XX Sales
Total RMV
Total Sales Price
02,000,0004,000,0006,000,0008,000,000
10,000,00012,000,00014,000,00016,000,00018,000,00020,000,00022,000,00024,000,00026,000,00028,000,00030,000,000
2015 2016 2017 2018 2019 2020
MA 03 RMV 4XX Sales
Total RMV
Total Sales Price
20
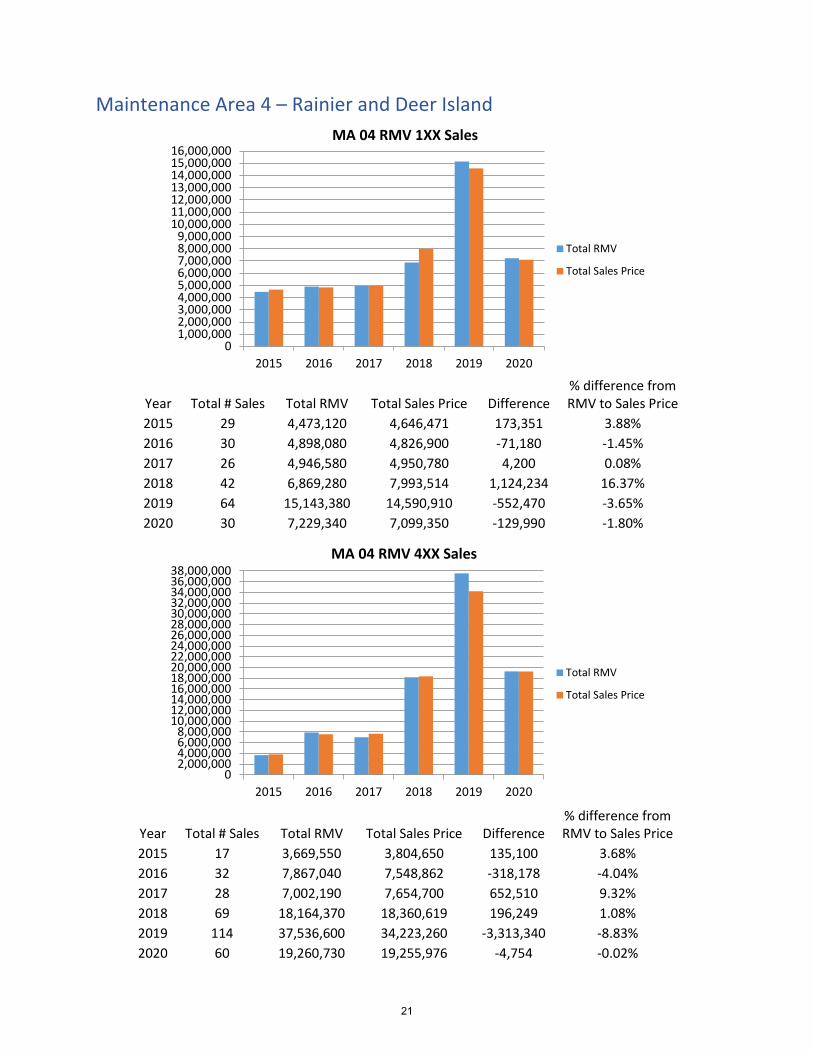
Maintenance Area 4 – Rainier and Deer Island
% difference from RMV to Sales Price Year Total # Sales Total RMV Total Sales Price Difference
2015 29 4,473,120 4,646,471 173,351 3.88% 2016 30 4,898,080 4,826,900 -71,180 -1.45%2017 26 4,946,580 4,950,780 4,200 0.08%2018 42 6,869,280 7,993,514 1,124,234 16.37%2019 64 15,143,380 14,590,910 -552,470 -3.65%2020 30 7,229,340 7,099,350 -129,990 -1.80%
% difference from RMV to Sales Price Year Total # Sales Total RMV Total Sales Price Difference
2015 17 3,669,550 3,804,650 135,100 3.68% 2016 32 7,867,040 7,548,862 -318,178 -4.04%2017 28 7,002,190 7,654,700 652,510 9.32%2018 69 18,164,370 18,360,619 196,249 1.08%2019 114 37,536,600 34,223,260 -3,313,340 -8.83%2020 60 19,260,730 19,255,976 -4,754 -0.02%
01,000,0002,000,0003,000,0004,000,0005,000,0006,000,0007,000,0008,000,0009,000,000
10,000,00011,000,00012,000,00013,000,00014,000,00015,000,00016,000,000
2015 2016 2017 2018 2019 2020
MA 04 RMV 1XX Sales
Total RMV
Total Sales Price
02,000,0004,000,0006,000,0008,000,000
10,000,00012,000,00014,000,00016,000,00018,000,00020,000,00022,000,00024,000,00026,000,00028,000,00030,000,00032,000,00034,000,00036,000,00038,000,000
2015 2016 2017 2018 2019 2020
MA 04 RMV 4XX Sales
Total RMV
Total Sales Price
21
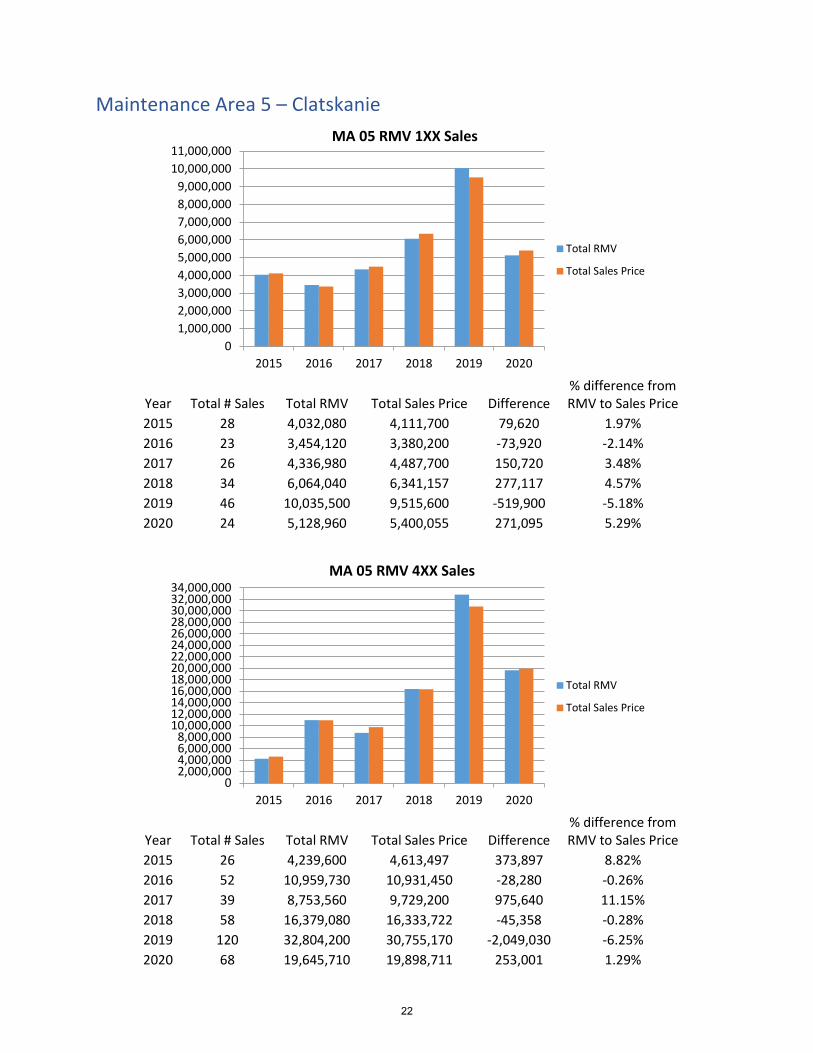
Maintenance Area 5 – Clatskanie
% difference from RMV to Sales Price Year Total # Sales Total RMV Total Sales Price Difference
2015 28 4,032,080 4,111,700 79,620 1.97% 2016 23 3,454,120 3,380,200 -73,920 -2.14%2017 26 4,336,980 4,487,700 150,720 3.48%2018 34 6,064,040 6,341,157 277,117 4.57%2019 46 10,035,500 9,515,600 -519,900 -5.18%2020 24 5,128,960 5,400,055 271,095 5.29%
% difference from RMV to Sales Price Year Total # Sales Total RMV Total Sales Price Difference
2015 26 4,239,600 4,613,497 373,897 8.82% 2016 52 10,959,730 10,931,450 -28,280 -0.26%2017 39 8,753,560 9,729,200 975,640 11.15%2018 58 16,379,080 16,333,722 -45,358 -0.28%2019 120 32,804,200 30,755,170 -2,049,030 -6.25%2020 68 19,645,710 19,898,711 253,001 1.29%
01,000,0002,000,0003,000,0004,000,0005,000,0006,000,0007,000,0008,000,0009,000,000
10,000,00011,000,000
2015 2016 2017 2018 2019 2020
MA 05 RMV 1XX Sales
Total RMV
Total Sales Price
02,000,0004,000,0006,000,0008,000,000
10,000,00012,000,00014,000,00016,000,00018,000,00020,000,00022,000,00024,000,00026,000,00028,000,00030,000,00032,000,00034,000,000
2015 2016 2017 2018 2019 2020
MA 05 RMV 4XX Sales
Total RMV
Total Sales Price
22
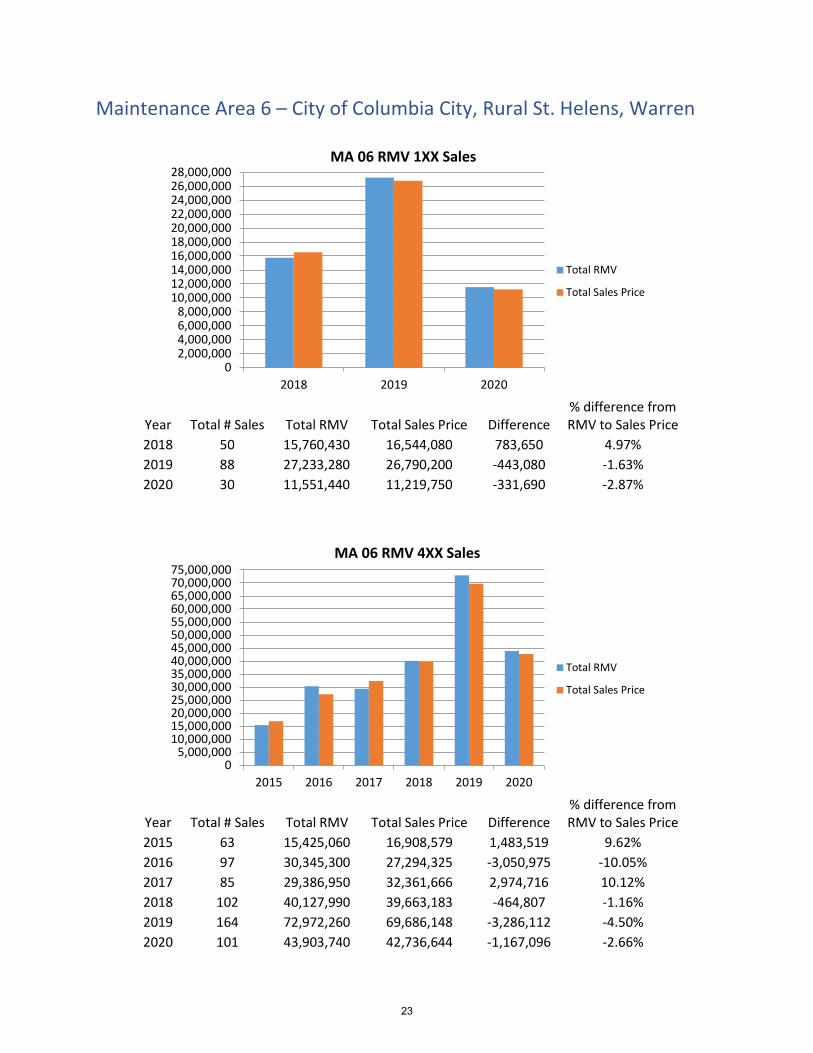
Maintenance Area 6 – City of Columbia City, Rural St. Helens, Warren
% difference from RMV to Sales Price Year Total # Sales Total RMV Total Sales Price Difference
2018 50 15,760,430 16,544,080 783,650 4.97% 2019 88 27,233,280 26,790,200 -443,080 -1.63%2020 30 11,551,440 11,219,750 -331,690 -2.87%
% difference from RMV to Sales Price Year Total # Sales Total RMV Total Sales Price Difference
2015 63 15,425,060 16,908,579 1,483,519 9.62% 2016 97 30,345,300 27,294,325 -3,050,975 -10.05%2017 85 29,386,950 32,361,666 2,974,716 10.12%2018 102 40,127,990 39,663,183 -464,807 -1.16%2019 164 72,972,260 69,686,148 -3,286,112 -4.50%2020 101 43,903,740 42,736,644 -1,167,096 -2.66%
02,000,0004,000,0006,000,0008,000,000
10,000,00012,000,00014,000,00016,000,00018,000,00020,000,00022,000,00024,000,00026,000,00028,000,000
2018 2019 2020
MA 06 RMV 1XX Sales
Total RMV
Total Sales Price
05,000,000
10,000,00015,000,00020,000,00025,000,00030,000,00035,000,00040,000,00045,000,00050,000,00055,000,00060,000,00065,000,00070,000,00075,000,000
2015 2016 2017 2018 2019 2020
MA 06 RMV 4XX Sales
Total RMV
Total Sales Price
23
PROPERTY CLASS RMV CLASS
DESCRIPTIONS AND COUNTS
24
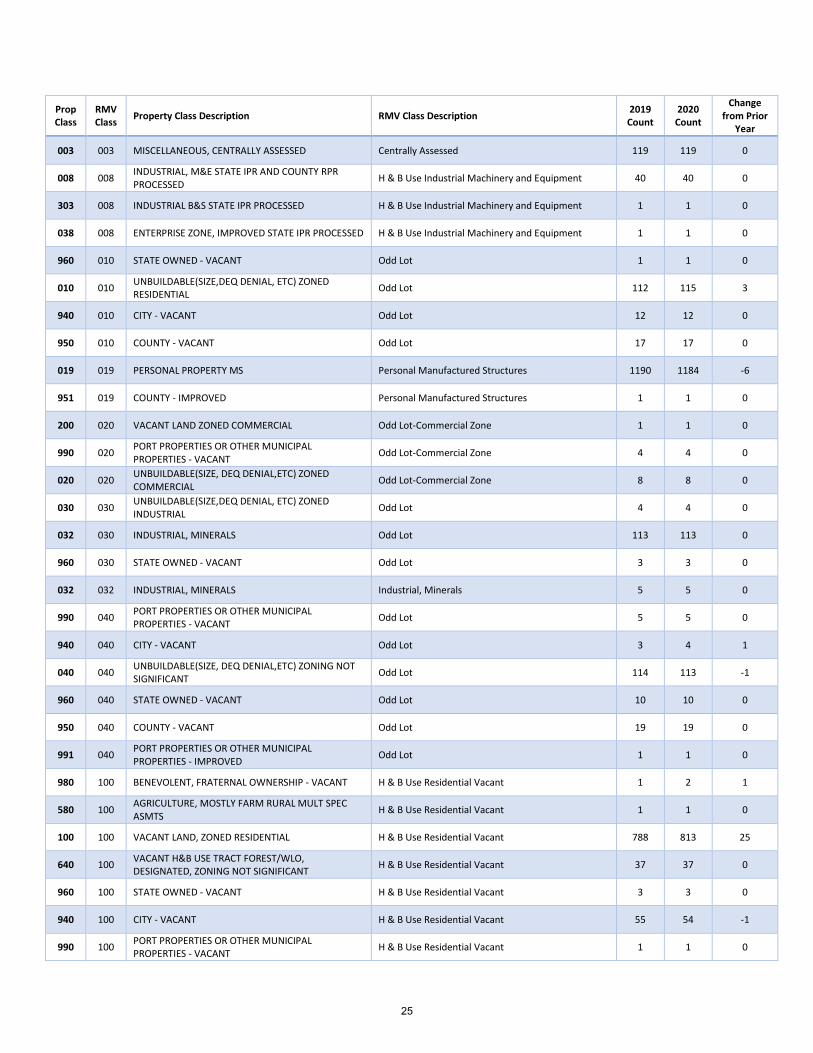
Prop Class
RMV Class Property Class Description RMV Class Description 2019
Count 2020 Count
Change from Prior
Year
003 003 MISCELLANEOUS, CENTRALLY ASSESSED Centrally Assessed 119 119 0
008 008 INDUSTRIAL, M&E STATE IPR AND COUNTY RPR PROCESSED H & B Use Industrial Machinery and Equipment 40 40 0
303 008 INDUSTRIAL B&S STATE IPR PROCESSED H & B Use Industrial Machinery and Equipment 1 1 0
038 008 ENTERPRISE ZONE, IMPROVED STATE IPR PROCESSED H & B Use Industrial Machinery and Equipment 1 1 0
960 010 STATE OWNED - VACANT Odd Lot 1 1 0
010 010 UNBUILDABLE(SIZE,DEQ DENIAL, ETC) ZONED RESIDENTIAL Odd Lot 112 115 3
940 010 CITY - VACANT Odd Lot 12 12 0
950 010 COUNTY - VACANT Odd Lot 17 17 0
019 019 PERSONAL PROPERTY MS Personal Manufactured Structures 1190 1184 -6
951 019 COUNTY - IMPROVED Personal Manufactured Structures 1 1 0
200 020 VACANT LAND ZONED COMMERCIAL Odd Lot-Commercial Zone 1 1 0
990 020 PORT PROPERTIES OR OTHER MUNICIPAL PROPERTIES - VACANT Odd Lot-Commercial Zone 4 4 0
020 020 UNBUILDABLE(SIZE, DEQ DENIAL,ETC) ZONED COMMERCIAL Odd Lot-Commercial Zone 8 8 0
030 030 UNBUILDABLE(SIZE,DEQ DENIAL, ETC) ZONED INDUSTRIAL Odd Lot 4 4 0
032 030 INDUSTRIAL, MINERALS Odd Lot 113 113 0
960 030 STATE OWNED - VACANT Odd Lot 3 3 0
032 032 INDUSTRIAL, MINERALS Industrial, Minerals 5 5 0
990 040 PORT PROPERTIES OR OTHER MUNICIPAL PROPERTIES - VACANT Odd Lot 5 5 0
940 040 CITY - VACANT Odd Lot 3 4 1
040 040 UNBUILDABLE(SIZE, DEQ DENIAL,ETC) ZONING NOT SIGNIFICANT Odd Lot 114 113 -1
960 040 STATE OWNED - VACANT Odd Lot 10 10 0
950 040 COUNTY - VACANT Odd Lot 19 19 0
991 040 PORT PROPERTIES OR OTHER MUNICIPAL PROPERTIES - IMPROVED Odd Lot 1 1 0
980 100 BENEVOLENT, FRATERNAL OWNERSHIP - VACANT H & B Use Residential Vacant 1 2 1
580 100 AGRICULTURE, MOSTLY FARM RURAL MULT SPEC ASMTS H & B Use Residential Vacant 1 1 0
100 100 VACANT LAND, ZONED RESIDENTIAL H & B Use Residential Vacant 788 813 25
640 100 VACANT H&B USE TRACT FOREST/WLO, DESIGNATED, ZONING NOT SIGNIFICANT H & B Use Residential Vacant 37 37 0
960 100 STATE OWNED - VACANT H & B Use Residential Vacant 3 3 0
940 100 CITY - VACANT H & B Use Residential Vacant 55 54 -1
990 100 PORT PROPERTIES OR OTHER MUNICIPAL PROPERTIES - VACANT H & B Use Residential Vacant 1 1 0
25
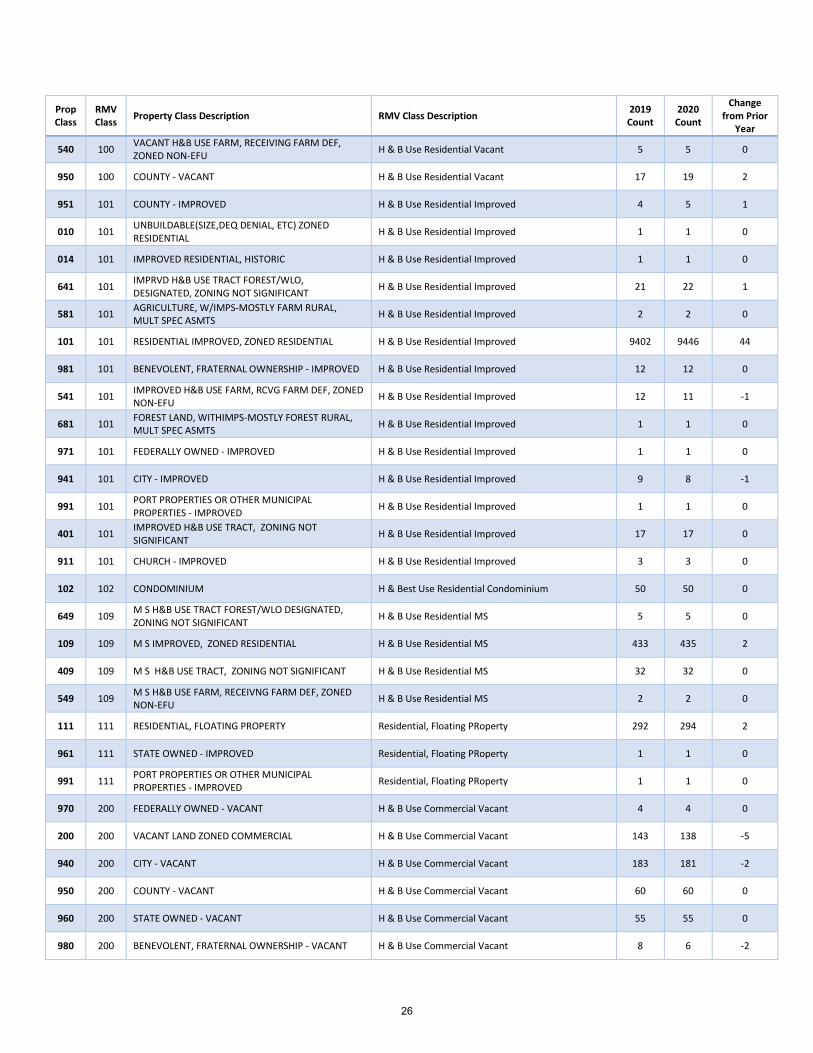
Prop Class
RMV Class Property Class Description RMV Class Description 2019
Count 2020 Count
Change from Prior
Year
540 100 VACANT H&B USE FARM, RECEIVING FARM DEF, ZONED NON-EFU H & B Use Residential Vacant 5 5 0
950 100 COUNTY - VACANT H & B Use Residential Vacant 17 19 2
951 101 COUNTY - IMPROVED H & B Use Residential Improved 4 5 1
010 101 UNBUILDABLE(SIZE,DEQ DENIAL, ETC) ZONED RESIDENTIAL H & B Use Residential Improved 1 1 0
014 101 IMPROVED RESIDENTIAL, HISTORIC H & B Use Residential Improved 1 1 0
641 101 IMPRVD H&B USE TRACT FOREST/WLO, DESIGNATED, ZONING NOT SIGNIFICANT H & B Use Residential Improved 21 22 1
581 101 AGRICULTURE, W/IMPS-MOSTLY FARM RURAL, MULT SPEC ASMTS H & B Use Residential Improved 2 2 0
101 101 RESIDENTIAL IMPROVED, ZONED RESIDENTIAL H & B Use Residential Improved 9402 9446 44
981 101 BENEVOLENT, FRATERNAL OWNERSHIP - IMPROVED H & B Use Residential Improved 12 12 0
541 101 IMPROVED H&B USE FARM, RCVG FARM DEF, ZONED NON-EFU H & B Use Residential Improved 12 11 -1
681 101 FOREST LAND, WITHIMPS-MOSTLY FOREST RURAL, MULT SPEC ASMTS H & B Use Residential Improved 1 1 0
971 101 FEDERALLY OWNED - IMPROVED H & B Use Residential Improved 1 1 0
941 101 CITY - IMPROVED H & B Use Residential Improved 9 8 -1
991 101 PORT PROPERTIES OR OTHER MUNICIPAL PROPERTIES - IMPROVED H & B Use Residential Improved 1 1 0
401 101 IMPROVED H&B USE TRACT, ZONING NOT SIGNIFICANT H & B Use Residential Improved 17 17 0
911 101 CHURCH - IMPROVED H & B Use Residential Improved 3 3 0
102 102 CONDOMINIUM H & Best Use Residential Condominium 50 50 0
649 109 M S H&B USE TRACT FOREST/WLO DESIGNATED, ZONING NOT SIGNIFICANT H & B Use Residential MS 5 5 0
109 109 M S IMPROVED, ZONED RESIDENTIAL H & B Use Residential MS 433 435 2
409 109 M S H&B USE TRACT, ZONING NOT SIGNIFICANT H & B Use Residential MS 32 32 0
549 109 M S H&B USE FARM, RECEIVNG FARM DEF, ZONED NON-EFU H & B Use Residential MS 2 2 0
111 111 RESIDENTIAL, FLOATING PROPERTY Residential, Floating PRoperty 292 294 2
961 111 STATE OWNED - IMPROVED Residential, Floating PRoperty 1 1 0
991 111 PORT PROPERTIES OR OTHER MUNICIPAL PROPERTIES - IMPROVED Residential, Floating PRoperty 1 1 0
970 200 FEDERALLY OWNED - VACANT H & B Use Commercial Vacant 4 4 0
200 200 VACANT LAND ZONED COMMERCIAL H & B Use Commercial Vacant 143 138 -5
940 200 CITY - VACANT H & B Use Commercial Vacant 183 181 -2
950 200 COUNTY - VACANT H & B Use Commercial Vacant 60 60 0
960 200 STATE OWNED - VACANT H & B Use Commercial Vacant 55 55 0
980 200 BENEVOLENT, FRATERNAL OWNERSHIP - VACANT H & B Use Commercial Vacant 8 6 -2
26
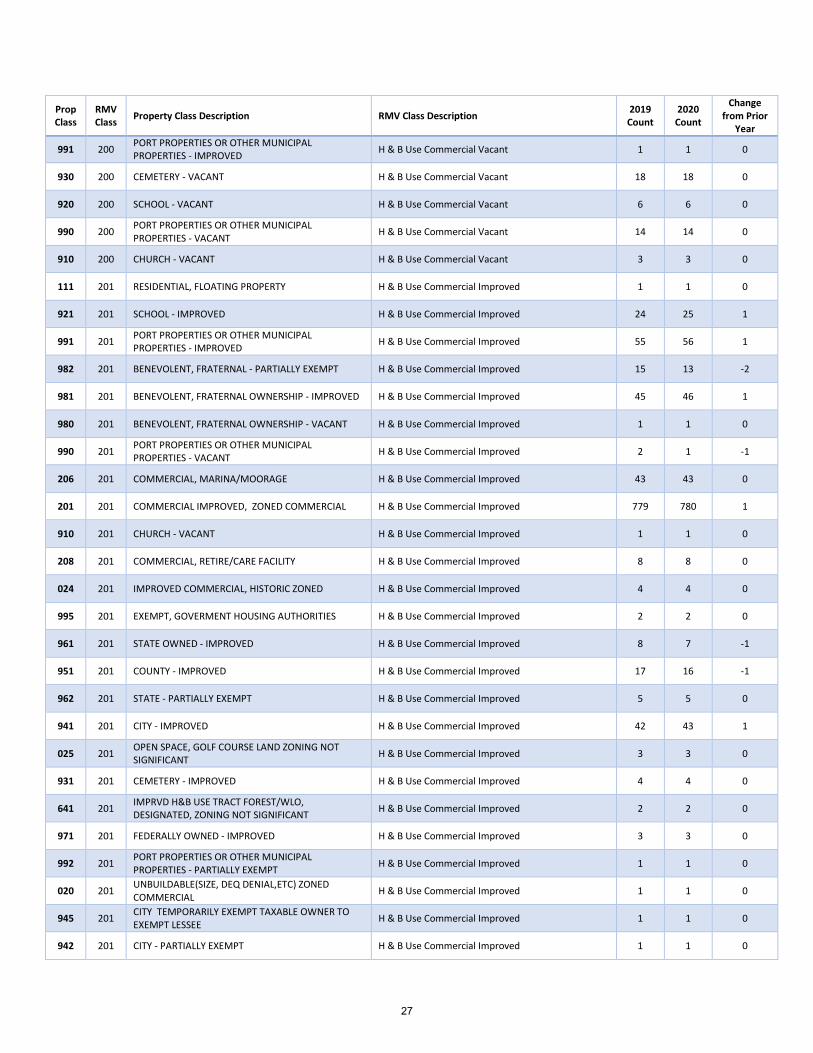
Prop Class
RMV Class Property Class Description RMV Class Description 2019
Count 2020 Count
Change from Prior
Year
991 200 PORT PROPERTIES OR OTHER MUNICIPAL PROPERTIES - IMPROVED H & B Use Commercial Vacant 1 1 0
930 200 CEMETERY - VACANT H & B Use Commercial Vacant 18 18 0
920 200 SCHOOL - VACANT H & B Use Commercial Vacant 6 6 0
990 200 PORT PROPERTIES OR OTHER MUNICIPAL PROPERTIES - VACANT H & B Use Commercial Vacant 14 14 0
910 200 CHURCH - VACANT H & B Use Commercial Vacant 3 3 0
111 201 RESIDENTIAL, FLOATING PROPERTY H & B Use Commercial Improved 1 1 0
921 201 SCHOOL - IMPROVED H & B Use Commercial Improved 24 25 1
991 201 PORT PROPERTIES OR OTHER MUNICIPAL PROPERTIES - IMPROVED H & B Use Commercial Improved 55 56 1
982 201 BENEVOLENT, FRATERNAL - PARTIALLY EXEMPT H & B Use Commercial Improved 15 13 -2
981 201 BENEVOLENT, FRATERNAL OWNERSHIP - IMPROVED H & B Use Commercial Improved 45 46 1
980 201 BENEVOLENT, FRATERNAL OWNERSHIP - VACANT H & B Use Commercial Improved 1 1 0
990 201 PORT PROPERTIES OR OTHER MUNICIPAL PROPERTIES - VACANT H & B Use Commercial Improved 2 1 -1
206 201 COMMERCIAL, MARINA/MOORAGE H & B Use Commercial Improved 43 43 0
201 201 COMMERCIAL IMPROVED, ZONED COMMERCIAL H & B Use Commercial Improved 779 780 1
910 201 CHURCH - VACANT H & B Use Commercial Improved 1 1 0
208 201 COMMERCIAL, RETIRE/CARE FACILITY H & B Use Commercial Improved 8 8 0
024 201 IMPROVED COMMERCIAL, HISTORIC ZONED H & B Use Commercial Improved 4 4 0
995 201 EXEMPT, GOVERMENT HOUSING AUTHORITIES H & B Use Commercial Improved 2 2 0
961 201 STATE OWNED - IMPROVED H & B Use Commercial Improved 8 7 -1
951 201 COUNTY - IMPROVED H & B Use Commercial Improved 17 16 -1
962 201 STATE - PARTIALLY EXEMPT H & B Use Commercial Improved 5 5 0
941 201 CITY - IMPROVED H & B Use Commercial Improved 42 43 1
025 201 OPEN SPACE, GOLF COURSE LAND ZONING NOT SIGNIFICANT H & B Use Commercial Improved 3 3 0
931 201 CEMETERY - IMPROVED H & B Use Commercial Improved 4 4 0
641 201 IMPRVD H&B USE TRACT FOREST/WLO, DESIGNATED, ZONING NOT SIGNIFICANT H & B Use Commercial Improved 2 2 0
971 201 FEDERALLY OWNED - IMPROVED H & B Use Commercial Improved 3 3 0
992 201 PORT PROPERTIES OR OTHER MUNICIPAL PROPERTIES - PARTIALLY EXEMPT H & B Use Commercial Improved 1 1 0
020 201 UNBUILDABLE(SIZE, DEQ DENIAL,ETC) ZONED COMMERCIAL H & B Use Commercial Improved 1 1 0
945 201 CITY TEMPORARILY EXEMPT TAXABLE OWNER TO EXEMPT LESSEE H & B Use Commercial Improved 1 1 0
942 201 CITY - PARTIALLY EXEMPT H & B Use Commercial Improved 1 1 0
27
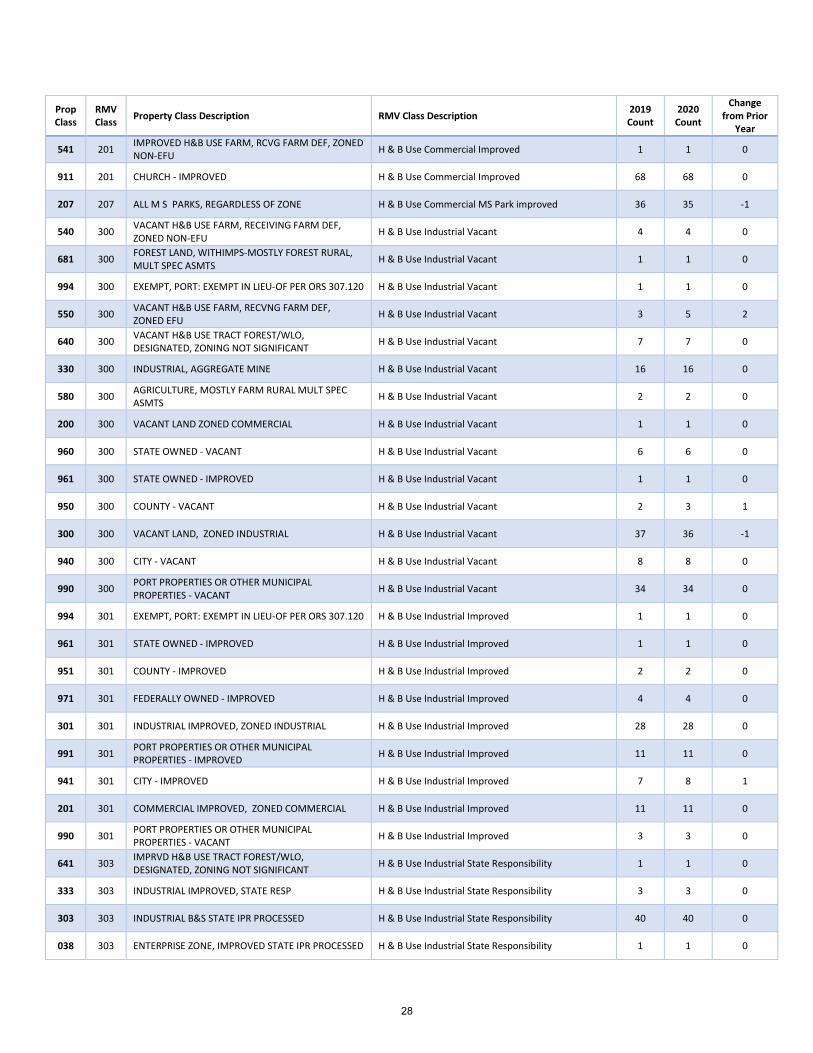
Prop Class
RMV Class Property Class Description RMV Class Description 2019
Count 2020 Count
Change from Prior
Year
541 201 IMPROVED H&B USE FARM, RCVG FARM DEF, ZONED NON-EFU H & B Use Commercial Improved 1 1 0
911 201 CHURCH - IMPROVED H & B Use Commercial Improved 68 68 0
207 207 ALL M S PARKS, REGARDLESS OF ZONE H & B Use Commercial MS Park improved 36 35 -1
540 300 VACANT H&B USE FARM, RECEIVING FARM DEF, ZONED NON-EFU H & B Use Industrial Vacant 4 4 0
681 300 FOREST LAND, WITHIMPS-MOSTLY FOREST RURAL, MULT SPEC ASMTS H & B Use Industrial Vacant 1 1 0
994 300 EXEMPT, PORT: EXEMPT IN LIEU-OF PER ORS 307.120 H & B Use Industrial Vacant 1 1 0
550 300 VACANT H&B USE FARM, RECVNG FARM DEF, ZONED EFU H & B Use Industrial Vacant 3 5 2
640 300 VACANT H&B USE TRACT FOREST/WLO, DESIGNATED, ZONING NOT SIGNIFICANT H & B Use Industrial Vacant 7 7 0
330 300 INDUSTRIAL, AGGREGATE MINE H & B Use Industrial Vacant 16 16 0
580 300 AGRICULTURE, MOSTLY FARM RURAL MULT SPEC ASMTS H & B Use Industrial Vacant 2 2 0
200 300 VACANT LAND ZONED COMMERCIAL H & B Use Industrial Vacant 1 1 0
960 300 STATE OWNED - VACANT H & B Use Industrial Vacant 6 6 0
961 300 STATE OWNED - IMPROVED H & B Use Industrial Vacant 1 1 0
950 300 COUNTY - VACANT H & B Use Industrial Vacant 2 3 1
300 300 VACANT LAND, ZONED INDUSTRIAL H & B Use Industrial Vacant 37 36 -1
940 300 CITY - VACANT H & B Use Industrial Vacant 8 8 0
990 300 PORT PROPERTIES OR OTHER MUNICIPAL PROPERTIES - VACANT H & B Use Industrial Vacant 34 34 0
994 301 EXEMPT, PORT: EXEMPT IN LIEU-OF PER ORS 307.120 H & B Use Industrial Improved 1 1 0
961 301 STATE OWNED - IMPROVED H & B Use Industrial Improved 1 1 0
951 301 COUNTY - IMPROVED H & B Use Industrial Improved 2 2 0
971 301 FEDERALLY OWNED - IMPROVED H & B Use Industrial Improved 4 4 0
301 301 INDUSTRIAL IMPROVED, ZONED INDUSTRIAL H & B Use Industrial Improved 28 28 0
991 301 PORT PROPERTIES OR OTHER MUNICIPAL PROPERTIES - IMPROVED H & B Use Industrial Improved 11 11 0
941 301 CITY - IMPROVED H & B Use Industrial Improved 7 8 1
201 301 COMMERCIAL IMPROVED, ZONED COMMERCIAL H & B Use Industrial Improved 11 11 0
990 301 PORT PROPERTIES OR OTHER MUNICIPAL PROPERTIES - VACANT H & B Use Industrial Improved 3 3 0
641 303 IMPRVD H&B USE TRACT FOREST/WLO, DESIGNATED, ZONING NOT SIGNIFICANT H & B Use Industrial State Responsibility 1 1 0
333 303 INDUSTRIAL IMPROVED, STATE RESP H & B Use Industrial State Responsibility 3 3 0
303 303 INDUSTRIAL B&S STATE IPR PROCESSED H & B Use Industrial State Responsibility 40 40 0
038 303 ENTERPRISE ZONE, IMPROVED STATE IPR PROCESSED H & B Use Industrial State Responsibility 1 1 0
28
Prop Class
RMV Class Property Class Description RMV Class Description 2019
Count 2020 Count
Change from Prior
Year
308 308 INDUSTRIAL B&S COUNTY RPR PROCESSED H & B Use Industrial Machinery and Equipment 14 14 0
991 308 PORT PROPERTIES OR OTHER MUNICIPAL PROPERTIES - IMPROVED H & B Use Industrial Machinery and Equipment 5 5 0
301 333 INDUSTRIAL IMPROVED, ZONED INDUSTRIAL H & B Use Industrial State IPR/Aggregate 1 1 0
540 400 VACANT H&B USE FARM, RECEIVING FARM DEF, ZONED NON-EFU H & B Use Rural Tract Vacant 137 138 1
400 400 VACANT H&B USE TRACT LAND, ZONING NOT SIGNIFICANT H & B Use Rural Tract Vacant 663 633 -30
550 400 VACANT H&B USE FARM, RECVNG FARM DEF, ZONED EFU H & B Use Rural Tract Vacant 139 142 3
580 400 AGRICULTURE, MOSTLY FARM RURAL MULT SPEC ASMTS H & B Use Rural Tract Vacant 14 14 0
930 400 CEMETERY - VACANT H & B Use Rural Tract Vacant 4 4 0
960 400 STATE OWNED - VACANT H & B Use Rural Tract Vacant 36 36 0
970 400 FEDERALLY OWNED - VACANT H & B Use Rural Tract Vacant 10 10 0
680 400 FOREST LAND, LAND ONLY-MOSTLY FOREST RURAL, MULT SPEC ASMTS H & B Use Rural Tract Vacant 54 53 -1
911 400 CHURCH - IMPROVED H & B Use Rural Tract Vacant 1 1 0
964 400 EXEMPT, STATE GAME IN-LIEU OF H & B Use Rural Tract Vacant 19 19 0
920 400 SCHOOL - VACANT H & B Use Rural Tract Vacant 2 2 0
990 400 PORT PROPERTIES OR OTHER MUNICIPAL PROPERTIES - VACANT H & B Use Rural Tract Vacant 14 15 1
640 400 VACANT H&B USE TRACT FOREST/WLO, DESIGNATED, ZONING NOT SIGNIFICANT H & B Use Rural Tract Vacant 2050 2043 -7
950 400 COUNTY - VACANT H & B Use Rural Tract Vacant 35 36 1
991 400 PORT PROPERTIES OR OTHER MUNICIPAL PROPERTIES - IMPROVED H & B Use Rural Tract Vacant 2 2 0
600 400 VACANT H&B USE FOREST, NOT DESIGNATED, ZONING NOT SIGNIFICANT H & B Use Rural Tract Vacant 1 1 0
940 400 CITY - VACANT H & B Use Rural Tract Vacant 23 23 0
441 401 IMPRVD H&B USE TRACT, FARM DEF, ZONED NON-EFU H & B Use Rural Tract Improved 1 1 0
581 401 AGRICULTURE, W/IMPS-MOSTLY FARM RURAL, MULT SPEC ASMTS H & B Use Rural Tract Improved 83 84 1
102 401 CONDOMINIUM H & B Use Rural Tract Improved 1 1 0
911 401 CHURCH - IMPROVED H & B Use Rural Tract Improved 6 6 0
801 401 RECREATION, WITH IMPROVEMENTS H & B Use Rural Tract Improved 1 1 0
961 401 STATE OWNED - IMPROVED H & B Use Rural Tract Improved 1 1 0
401 401 IMPROVED H&B USE TRACT, ZONING NOT SIGNIFICANT H & B Use Rural Tract Improved 4729 4726 -3
951 401 COUNTY - IMPROVED H & B Use Rural Tract Improved 12 11 -1
941 401 CITY - IMPROVED H & B Use Rural Tract Improved 6 6 0
964 401 EXEMPT, STATE GAME IN-LIEU OF H & B Use Rural Tract Improved 6 6 0
29
Prop Class
RMV Class Property Class Description RMV Class Description 2019
Count 2020 Count
Change from Prior
Year
931 401 CEMETERY - IMPROVED H & B Use Rural Tract Improved 1 1 0
681 401 FOREST LAND, WITHIMPS-MOSTLY FOREST RURAL, MULT SPEC ASMTS H & B Use Rural Tract Improved 161 161 0
025 401 OPEN SPACE, GOLF COURSE LAND ZONING NOT SIGNIFICANT H & B Use Rural Tract Improved 1 1 0
649 401 M S H&B USE TRACT FOREST / WLO, DESIGNATED, ZONING NOT SIGNIFICANT H & B Use Rural Tract Improved 2 2 0
541 401 IMPROVED H&B USE FARM, RCVG FARM DEF, ZONED NON-EFU H & B Use Rural Tract Improved 425 441 16
641 401 IMPRVD H&B USE TRACT FOREST/WLO, DESIGNATED, ZONING NOT SIGNIFICANT H & B Use Rural Tract Improved 2036 2055 19
981 401 BENEVOLENT, FRATERNAL OWNERSHIP - IMPROVED H & B Use Rural Tract Improved 3 3 0
551 401 IMPROVED H&B USE FARM, RCVG FARM DEF, ZONED EFU H & B Use Rural Tract Improved 327 327 0
014 401 IMPROVED RESIDENTIAL, HISTORIC H & B Use Rural Tract Improved 1 1 0
991 401 PORT PROPERTIES OR OTHER MUNICIPAL PROPERTIES - IMPROVED H & B Use Rural Tract Improved 15 16 1
409 401 M S H&B USE TRACT, ZONING NOT SIGNIFICANT H & B Use Rural Tract Improved 1 1 0
951 409 COUNTY - IMPROVED H & B Use Rural Tract MS Improved 1 1 0
991 409 PORT PROPERTIES OR OTHER MUNICIPAL PROPERTIES - IMPROVED H & B Use Rural Tract MS Improved 1 1 0
409 409 M S H&B USE TRACT, ZONING NOT SIGNIFICANT H & B Use Rural Tract MS Improved 1234 1228 -6
931 409 CEMETERY - IMPROVED H & B Use Rural Tract MS Improved 1 1 0
589 409 M S H&B USE FARM, MLTPL SP ASMT FARM USE PREDOMINANT, ZN NOT SIGN H & B Use Rural Tract MS Improved 13 14 1
559 409 M S H&B USE FARM LAND, RCVNG FARM DEF, ZONED EFU H & B Use Rural Tract MS Improved 33 32 -1
549 409 M S H&B USE FARM, RECEIVNG FARM DEF, ZONED NON-EFU H & B Use Rural Tract MS Improved 64 62 -2
649 409 M S H&B USE TRACT FOREST / WLO DESIGNATED, ZONING NOT SIGNIFICANT H & B Use Rural Tract MS Improved 618 610 -8
689 409 M S H&B USE FL,MLTPL SP ASMT, FL PREDOMINANT,ZN NOT SIGNIFICANT H & B Use Rural Tract MS Improved 19 19 0
940 600 CITY - VACANT H & B Use Timber Vacant 2 2 0
950 600 COUNTY - VACANT H & B Use Timber Vacant 2 2 0
600 600 VACANT H&B USE FOREST, NOT DESIGNATED, ZONING NOT SIGNIFICANT H & B Use Timber Vacant 556 556 0
640 600 VACANT H&B USE TRACT FOREST/WLO, DESIGNATED, ZONING NOT SIGNIFICANT H & B Use Timber Vacant 1 2 1
960 600 STATE OWNED - VACANT H & B Use Timber Vacant 22 22 0
970 600 FEDERALLY OWNED - VACANT H & B Use Timber Vacant 28 28 0
601 601 IMPRVD H&B FOREST LAND,NOT DESIGNATED, ZONING NOT SIGNIFICANT H & B Use Timber Improved 1 1 0
995 701 EXEMPT, GOVERMENT HOUSING AUTHORITIES H & B Use Mutli-Family Improved and MS Park Improved 2 2 0
781 701 MULTIPLE HOUSING, LOW INCOME SPECIAL ASMT H & B Use Mutli-Family Improved and MS Park Improved 6 6 0
996 701 FARM LABOR CAMPS, DAY CARE CENTERS H & B Use Mutli-Family Improved and MS Park Improved 1 1 0
30

Prop Class
RMV Class Property Class Description RMV Class Description 2019
Count 2020 Count
Change from Prior
Year
701 701 IMPROVED 5 OR MORE UNITS, ZONED MULTI-FAMILY AND MS PARK IMPROVED
H & B Use Mutli-Family Improved and MS Park Improved 79 79 0
930 800 CEMETERY - VACANT Recreation, Land Only 3 3 0
940 800 CITY - VACANT Recreation, Land Only 7 7 0
960 800 STATE OWNED - VACANT Recreation, Land Only 7 7 0
970 800 FEDERALLY OWNED - VACANT Recreation, Land Only 2 2 0
973 800 FEDERALLY OWNED -TAXABLE LEASED-PROPERTY, EXEMPT LESSOR TO TAXABLE LESSEE Recreation, Land Only 1 1 0
800 800 RECREATION, LAND ONLY Recreation, Land Only 119 119 0
950 800 COUNTY - VACANT Recreation, Land Only 5 5 0
951 801 COUNTY - IMPROVED Recreation, with Improvements 2 2 0
801 801 RECREATION, WITH IMPROVEMENTS Recreation, with Improvements 1 1 0
941 801 CITY - IMPROVED Recreation, with Improvements 6 7 1
890 890 RECREATION, HILLCREST/COL ACRES POTENTIAL DEVELOPMENT Recreational Hillcrest/Columbia Hills 252 247 -5
31

TIME ADJUSTMENT
STUDY
32
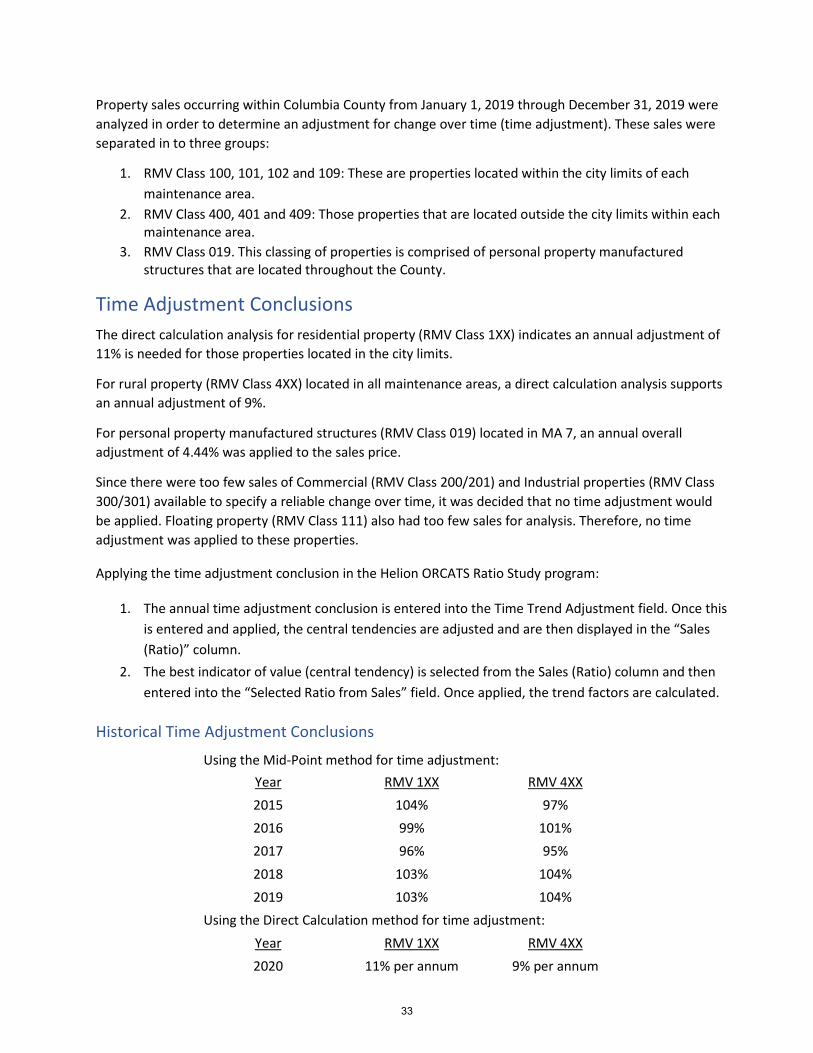
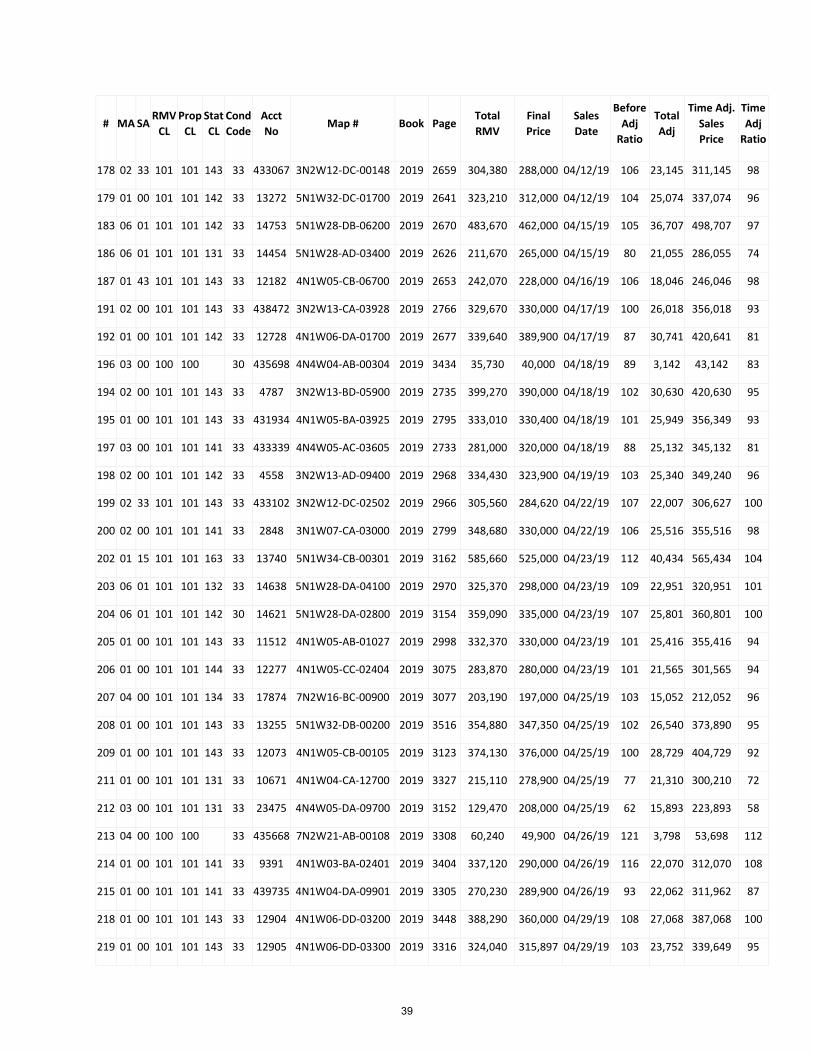
Property sales occurring within Columbia County from January 1, 2019 through December 31, 2019 were analyzed in order to determine an adjustment for change over time (time adjustment). These sales were separated in to three groups:
1. RMV Class 100, 101, 102 and 109: These are properties located within the city limits of eachmaintenance area.
2. RMV Class 400, 401 and 409: Those properties that are located outside the city limits within eachmaintenance area.
3. RMV Class 019. This classing of properties is comprised of personal property manufacturedstructures that are located throughout the County.
Time Adjustment Conclusions
The direct calculation analysis for residential property (RMV Class 1XX) indicates an annual adjustment of 11% is needed for those properties located in the city limits.
For rural property (RMV Class 4XX) located in all maintenance areas, a direct calculation analysis supports an annual adjustment of 9%.
For personal property manufactured structures (RMV Class 019) located in MA 7, an annual overall adjustment of 4.44% was applied to the sales price.
Since there were too few sales of Commercial (RMV Class 200/201) and Industrial properties (RMV Class 300/301) available to specify a reliable change over time, it was decided that no time adjustment would be applied. Floating property (RMV Class 111) also had too few sales for analysis. Therefore, no time adjustment was applied to these properties.
Applying the time adjustment conclusion in the Helion ORCATS Ratio Study program:
1. The annual time adjustment conclusion is entered into the Time Trend Adjustment field. Once thisis entered and applied, the central tendencies are adjusted and are then displayed in the “Sales(Ratio)” column.
2. The best indicator of value (central tendency) is selected from the Sales (Ratio) column and thenentered into the “Selected Ratio from Sales” field. Once applied, the trend factors are calculated.
Historical Time Adjustment Conclusions
Using the Mid-Point method for time adjustment: Year RMV 1XX RMV 4XX 2015 104% 97% 2016 99% 101% 2017 96% 95% 2018 103% 104% 2019 103% 104%
Using the Direct Calculation method for time adjustment: Year RMV 1XX RMV 4XX 2020 11% per annum 9% per annum
33
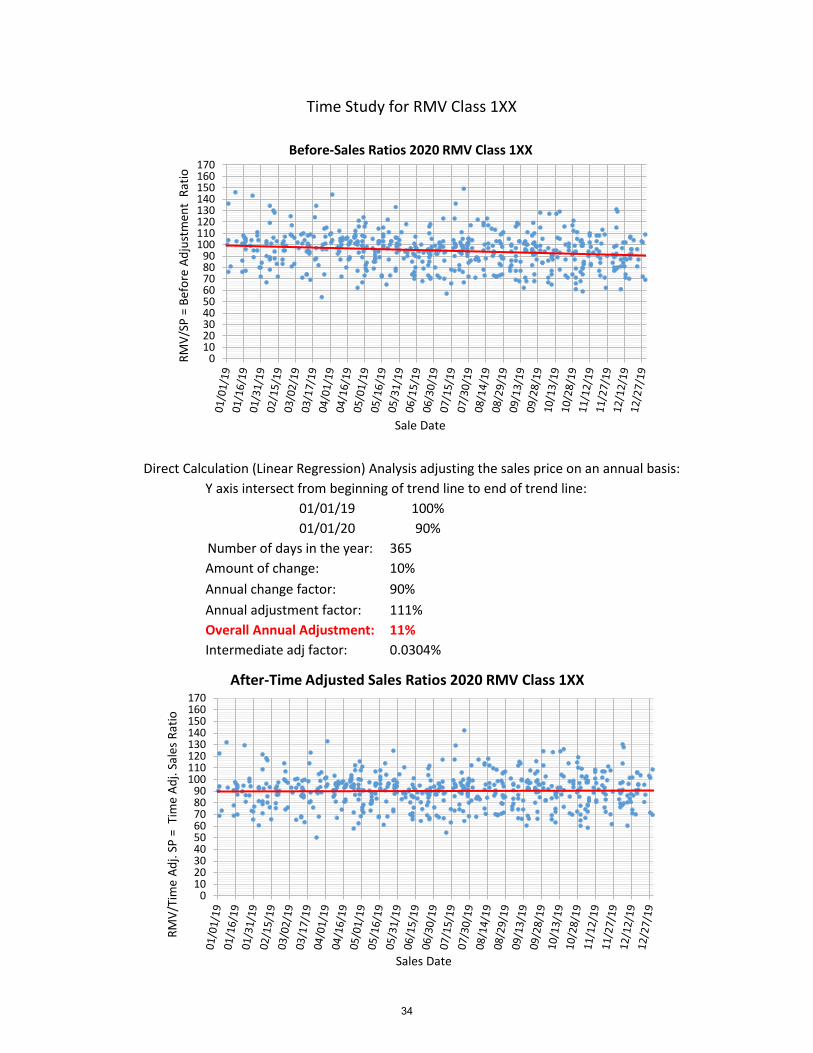
Time Study for RMV Class 1XX
Direct Calculation (Linear Regression) Analysis adjusting the sales price on an annual basis: Y axis intersect from beginning of trend line to end of trend line:
01/01/19 100% 01/01/20 90%
Number of days in the year: 365 Amount of change: 10% Annual change factor: 90% Annual adjustment factor: 111% Overall Annual Adjustment: 11% Intermediate adj factor: 0.0304%
0102030405060708090
100110120130140150160170
RMV/
Tim
e Ad
j. SP
= T
ime
Adj.
Sale
s Rat
io
Sales Date
After-Time Adjusted Sales Ratios 2020 RMV Class 1XX
0102030405060708090
100110120130140150160170
RMV/
SP =
Bef
ore
Adju
stm
ent
Ratio
Sale Date
Before-Sales Ratios 2020 RMV Class 1XX
34
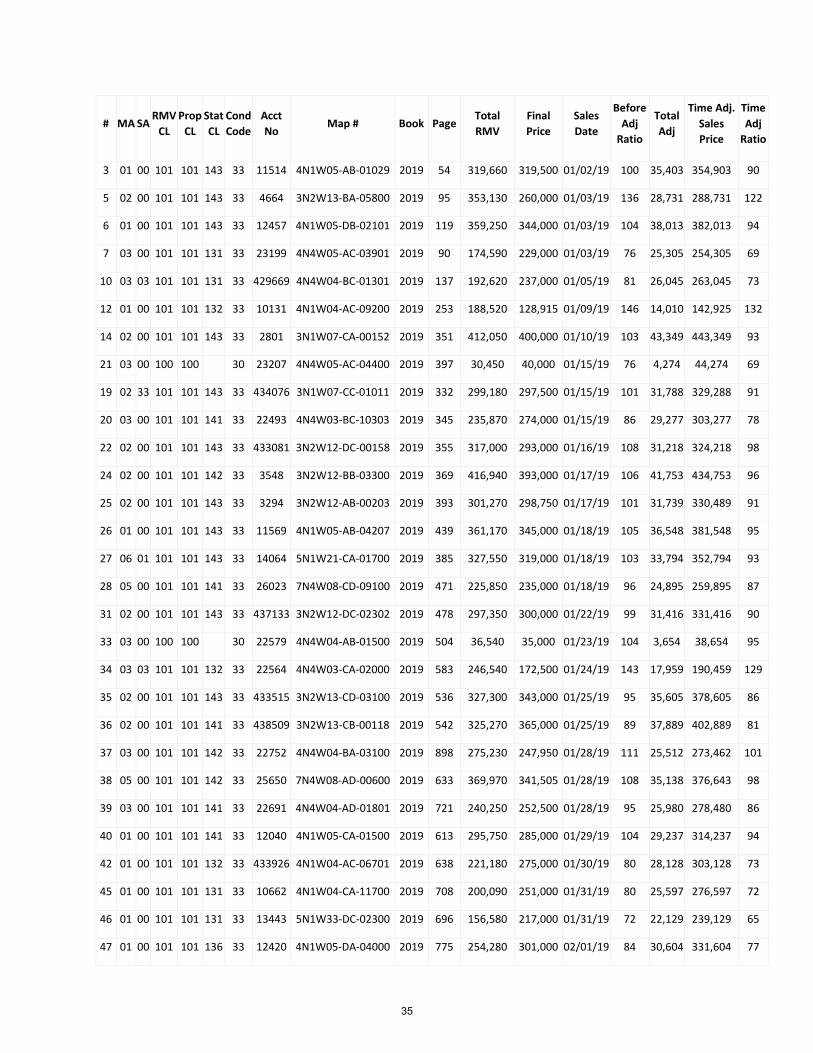
# MA SA RMV
CL Prop
CL Stat CL
Cond Code
Acct No
Map # Book Page Total RMV
Final Price
Sales Date
Before Adj
Ratio
Total Adj
Time Adj. Sales Price
Time Adj
Ratio
3 01 00 101 101 143 33 11514 4N1W05-AB-01029 2019 54 319,660 319,500 01/02/19 100 35,403 354,903 90
5 02 00 101 101 143 33 4664 3N2W13-BA-05800 2019 95 353,130 260,000 01/03/19 136 28,731 288,731 122
6 01 00 101 101 143 33 12457 4N1W05-DB-02101 2019 119 359,250 344,000 01/03/19 104 38,013 382,013 94
7 03 00 101 101 131 33 23199 4N4W05-AC-03901 2019 90 174,590 229,000 01/03/19 76 25,305 254,305 69
10 03 03 101 101 131 33 429669 4N4W04-BC-01301 2019 137 192,620 237,000 01/05/19 81 26,045 263,045 73
12 01 00 101 101 132 33 10131 4N1W04-AC-09200 2019 253 188,520 128,915 01/09/19 146 14,010 142,925 132
14 02 00 101 101 143 33 2801 3N1W07-CA-00152 2019 351 412,050 400,000 01/10/19 103 43,349 443,349 93
21 03 00 100 100 30 23207 4N4W05-AC-04400 2019 397 30,450 40,000 01/15/19 76 4,274 44,274 69
19 02 33 101 101 143 33 434076 3N1W07-CC-01011 2019 332 299,180 297,500 01/15/19 101 31,788 329,288 91
20 03 00 101 101 141 33 22493 4N4W03-BC-10303 2019 345 235,870 274,000 01/15/19 86 29,277 303,277 78
22 02 00 101 101 143 33 433081 3N2W12-DC-00158 2019 355 317,000 293,000 01/16/19 108 31,218 324,218 98
24 02 00 101 101 142 33 3548 3N2W12-BB-03300 2019 369 416,940 393,000 01/17/19 106 41,753 434,753 96
25 02 00 101 101 143 33 3294 3N2W12-AB-00203 2019 393 301,270 298,750 01/17/19 101 31,739 330,489 91
26 01 00 101 101 143 33 11569 4N1W05-AB-04207 2019 439 361,170 345,000 01/18/19 105 36,548 381,548 95
27 06 01 101 101 143 33 14064 5N1W21-CA-01700 2019 385 327,550 319,000 01/18/19 103 33,794 352,794 93
28 05 00 101 101 141 33 26023 7N4W08-CD-09100 2019 471 225,850 235,000 01/18/19 96 24,895 259,895 87
31 02 00 101 101 143 33 437133 3N2W12-DC-02302 2019 478 297,350 300,000 01/22/19 99 31,416 331,416 90
33 03 00 100 100 30 22579 4N4W04-AB-01500 2019 504 36,540 35,000 01/23/19 104 3,654 38,654 95
34 03 03 101 101 132 33 22564 4N4W03-CA-02000 2019 583 246,540 172,500 01/24/19 143 17,959 190,459 129
35 02 00 101 101 143 33 433515 3N2W13-CD-03100 2019 536 327,300 343,000 01/25/19 95 35,605 378,605 86
36 02 00 101 101 141 33 438509 3N2W13-CB-00118 2019 542 325,270 365,000 01/25/19 89 37,889 402,889 81
37 03 00 101 101 142 33 22752 4N4W04-BA-03100 2019 898 275,230 247,950 01/28/19 111 25,512 273,462 101
38 05 00 101 101 142 33 25650 7N4W08-AD-00600 2019 633 369,970 341,505 01/28/19 108 35,138 376,643 98
39 03 00 101 101 141 33 22691 4N4W04-AD-01801 2019 721 240,250 252,500 01/28/19 95 25,980 278,480 86
40 01 00 101 101 141 33 12040 4N1W05-CA-01500 2019 613 295,750 285,000 01/29/19 104 29,237 314,237 94
42 01 00 101 101 132 33 433926 4N1W04-AC-06701 2019 638 221,180 275,000 01/30/19 80 28,128 303,128 73
45 01 00 101 101 131 33 10662 4N1W04-CA-11700 2019 708 200,090 251,000 01/31/19 80 25,597 276,597 72
46 01 00 101 101 131 33 13443 5N1W33-DC-02300 2019 696 156,580 217,000 01/31/19 72 22,129 239,129 65
47 01 00 101 101 136 33 12420 4N1W05-DA-04000 2019 775 254,280 301,000 02/01/19 84 30,604 331,604 77
35
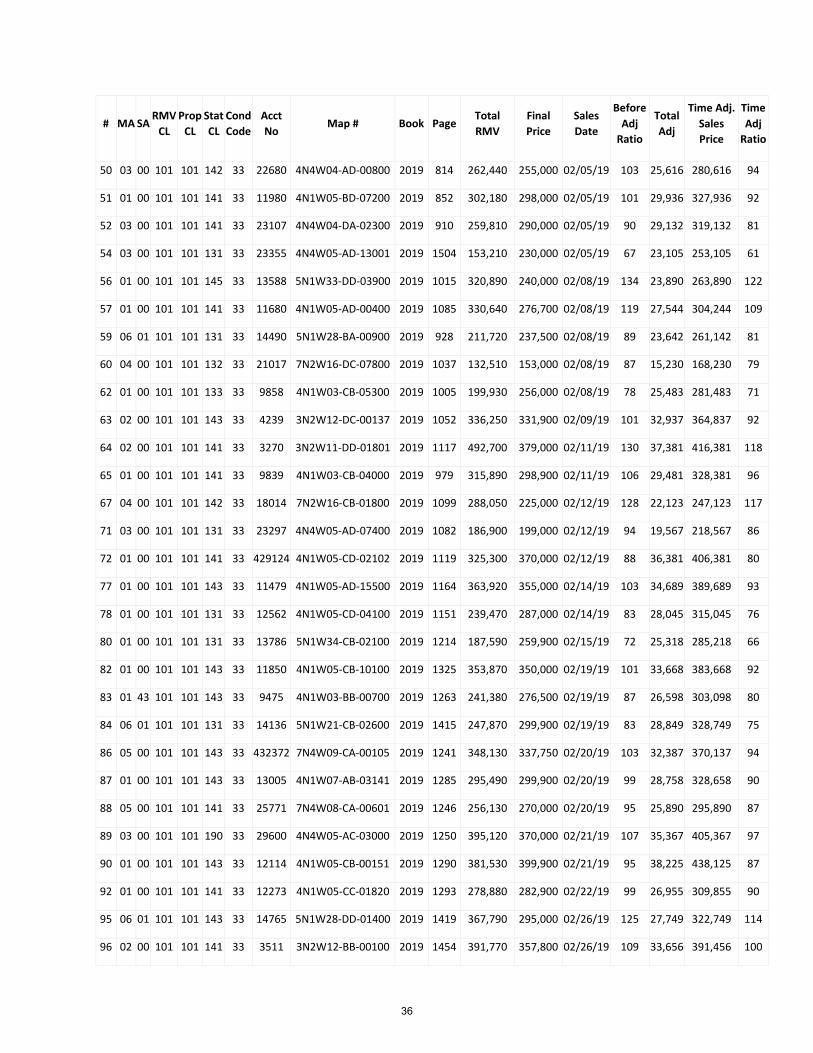
# MA SA RMV
CL Prop
CL Stat CL
Cond Code
Acct No
Map # Book Page Total RMV
Final Price
Sales Date
Before Adj
Ratio
Total Adj
Time Adj. Sales Price
Time Adj
Ratio
50 03 00 101 101 142 33 22680 4N4W04-AD-00800 2019 814 262,440 255,000 02/05/19 103 25,616 280,616 94
51 01 00 101 101 141 33 11980 4N1W05-BD-07200 2019 852 302,180 298,000 02/05/19 101 29,936 327,936 92
52 03 00 101 101 141 33 23107 4N4W04-DA-02300 2019 910 259,810 290,000 02/05/19 90 29,132 319,132 81
54 03 00 101 101 131 33 23355 4N4W05-AD-13001 2019 1504 153,210 230,000 02/05/19 67 23,105 253,105 61
56 01 00 101 101 145 33 13588 5N1W33-DD-03900 2019 1015 320,890 240,000 02/08/19 134 23,890 263,890 122
57 01 00 101 101 141 33 11680 4N1W05-AD-00400 2019 1085 330,640 276,700 02/08/19 119 27,544 304,244 109
59 06 01 101 101 131 33 14490 5N1W28-BA-00900 2019 928 211,720 237,500 02/08/19 89 23,642 261,142 81
60 04 00 101 101 132 33 21017 7N2W16-DC-07800 2019 1037 132,510 153,000 02/08/19 87 15,230 168,230 79
62 01 00 101 101 133 33 9858 4N1W03-CB-05300 2019 1005 199,930 256,000 02/08/19 78 25,483 281,483 71
63 02 00 101 101 143 33 4239 3N2W12-DC-00137 2019 1052 336,250 331,900 02/09/19 101 32,937 364,837 92
64 02 00 101 101 141 33 3270 3N2W11-DD-01801 2019 1117 492,700 379,000 02/11/19 130 37,381 416,381 118
65 01 00 101 101 141 33 9839 4N1W03-CB-04000 2019 979 315,890 298,900 02/11/19 106 29,481 328,381 96
67 04 00 101 101 142 33 18014 7N2W16-CB-01800 2019 1099 288,050 225,000 02/12/19 128 22,123 247,123 117
71 03 00 101 101 131 33 23297 4N4W05-AD-07400 2019 1082 186,900 199,000 02/12/19 94 19,567 218,567 86
72 01 00 101 101 141 33 429124 4N1W05-CD-02102 2019 1119 325,300 370,000 02/12/19 88 36,381 406,381 80
77 01 00 101 101 143 33 11479 4N1W05-AD-15500 2019 1164 363,920 355,000 02/14/19 103 34,689 389,689 93
78 01 00 101 101 131 33 12562 4N1W05-CD-04100 2019 1151 239,470 287,000 02/14/19 83 28,045 315,045 76
80 01 00 101 101 131 33 13786 5N1W34-CB-02100 2019 1214 187,590 259,900 02/15/19 72 25,318 285,218 66
82 01 00 101 101 143 33 11850 4N1W05-CB-10100 2019 1325 353,870 350,000 02/19/19 101 33,668 383,668 92
83 01 43 101 101 143 33 9475 4N1W03-BB-00700 2019 1263 241,380 276,500 02/19/19 87 26,598 303,098 80
84 06 01 101 101 131 33 14136 5N1W21-CB-02600 2019 1415 247,870 299,900 02/19/19 83 28,849 328,749 75
86 05 00 101 101 143 33 432372 7N4W09-CA-00105 2019 1241 348,130 337,750 02/20/19 103 32,387 370,137 94
87 01 00 101 101 143 33 13005 4N1W07-AB-03141 2019 1285 295,490 299,900 02/20/19 99 28,758 328,658 90
88 05 00 101 101 141 33 25771 7N4W08-CA-00601 2019 1246 256,130 270,000 02/20/19 95 25,890 295,890 87
89 03 00 101 101 190 33 29600 4N4W05-AC-03000 2019 1250 395,120 370,000 02/21/19 107 35,367 405,367 97
90 01 00 101 101 143 33 12114 4N1W05-CB-00151 2019 1290 381,530 399,900 02/21/19 95 38,225 438,125 87
92 01 00 101 101 141 33 12273 4N1W05-CC-01820 2019 1293 278,880 282,900 02/22/19 99 26,955 309,855 90
95 06 01 101 101 143 33 14765 5N1W28-DD-01400 2019 1419 367,790 295,000 02/26/19 125 27,749 322,749 114
96 02 00 101 101 141 33 3511 3N2W12-BB-00100 2019 1454 391,770 357,800 02/26/19 109 33,656 391,456 100
36
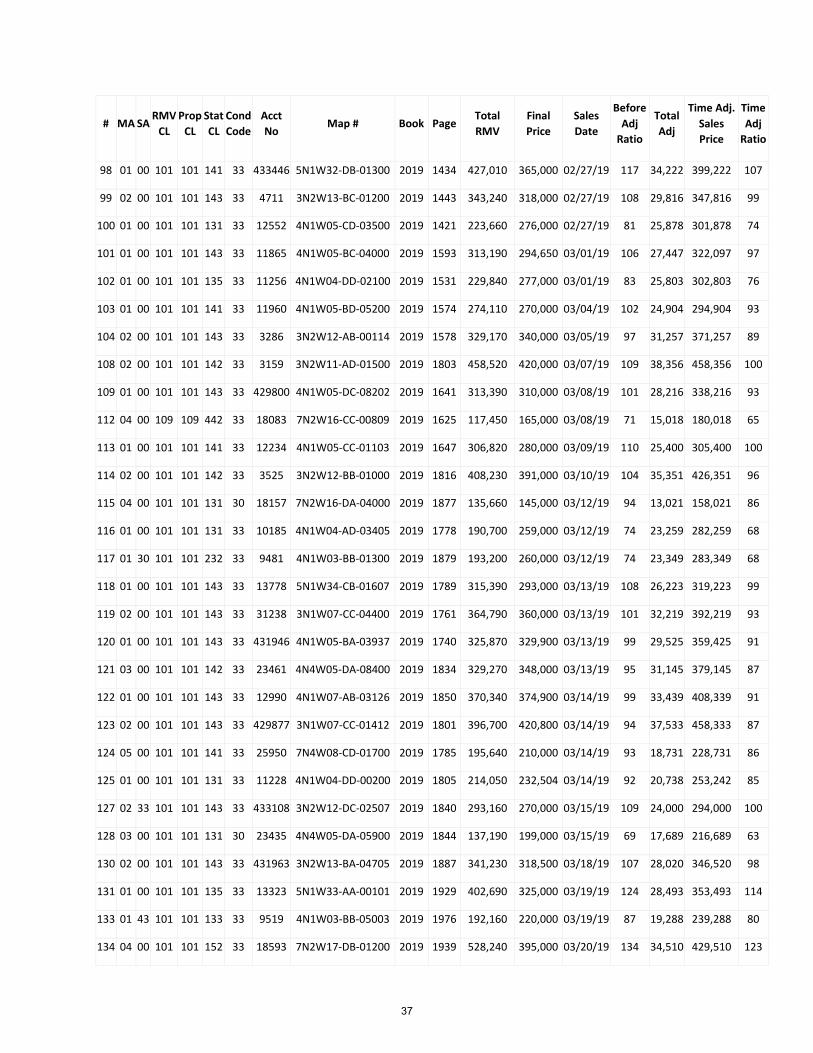
# MA SA RMV
CL Prop
CL Stat CL
Cond Code
Acct No
Map # Book Page Total RMV
Final Price
Sales Date
Before Adj
Ratio
Total Adj
Time Adj. Sales Price
Time Adj
Ratio
98 01 00 101 101 141 33 433446 5N1W32-DB-01300 2019 1434 427,010 365,000 02/27/19 117 34,222 399,222 107
99 02 00 101 101 143 33 4711 3N2W13-BC-01200 2019 1443 343,240 318,000 02/27/19 108 29,816 347,816 99
100 01 00 101 101 131 33 12552 4N1W05-CD-03500 2019 1421 223,660 276,000 02/27/19 81 25,878 301,878 74
101 01 00 101 101 143 33 11865 4N1W05-BC-04000 2019 1593 313,190 294,650 03/01/19 106 27,447 322,097 97
102 01 00 101 101 135 33 11256 4N1W04-DD-02100 2019 1531 229,840 277,000 03/01/19 83 25,803 302,803 76
103 01 00 101 101 141 33 11960 4N1W05-BD-05200 2019 1574 274,110 270,000 03/04/19 102 24,904 294,904 93
104 02 00 101 101 143 33 3286 3N2W12-AB-00114 2019 1578 329,170 340,000 03/05/19 97 31,257 371,257 89
108 02 00 101 101 142 33 3159 3N2W11-AD-01500 2019 1803 458,520 420,000 03/07/19 109 38,356 458,356 100
109 01 00 101 101 143 33 429800 4N1W05-DC-08202 2019 1641 313,390 310,000 03/08/19 101 28,216 338,216 93
112 04 00 109 109 442 33 18083 7N2W16-CC-00809 2019 1625 117,450 165,000 03/08/19 71 15,018 180,018 65
113 01 00 101 101 141 33 12234 4N1W05-CC-01103 2019 1647 306,820 280,000 03/09/19 110 25,400 305,400 100
114 02 00 101 101 142 33 3525 3N2W12-BB-01000 2019 1816 408,230 391,000 03/10/19 104 35,351 426,351 96
115 04 00 101 101 131 30 18157 7N2W16-DA-04000 2019 1877 135,660 145,000 03/12/19 94 13,021 158,021 86
116 01 00 101 101 131 33 10185 4N1W04-AD-03405 2019 1778 190,700 259,000 03/12/19 74 23,259 282,259 68
117 01 30 101 101 232 33 9481 4N1W03-BB-01300 2019 1879 193,200 260,000 03/12/19 74 23,349 283,349 68
118 01 00 101 101 143 33 13778 5N1W34-CB-01607 2019 1789 315,390 293,000 03/13/19 108 26,223 319,223 99
119 02 00 101 101 143 33 31238 3N1W07-CC-04400 2019 1761 364,790 360,000 03/13/19 101 32,219 392,219 93
120 01 00 101 101 143 33 431946 4N1W05-BA-03937 2019 1740 325,870 329,900 03/13/19 99 29,525 359,425 91
121 03 00 101 101 142 33 23461 4N4W05-DA-08400 2019 1834 329,270 348,000 03/13/19 95 31,145 379,145 87
122 01 00 101 101 143 33 12990 4N1W07-AB-03126 2019 1850 370,340 374,900 03/14/19 99 33,439 408,339 91
123 02 00 101 101 143 33 429877 3N1W07-CC-01412 2019 1801 396,700 420,800 03/14/19 94 37,533 458,333 87
124 05 00 101 101 141 33 25950 7N4W08-CD-01700 2019 1785 195,640 210,000 03/14/19 93 18,731 228,731 86
125 01 00 101 101 131 33 11228 4N1W04-DD-00200 2019 1805 214,050 232,504 03/14/19 92 20,738 253,242 85
127 02 33 101 101 143 33 433108 3N2W12-DC-02507 2019 1840 293,160 270,000 03/15/19 109 24,000 294,000 100
128 03 00 101 101 131 30 23435 4N4W05-DA-05900 2019 1844 137,190 199,000 03/15/19 69 17,689 216,689 63
130 02 00 101 101 143 33 431963 3N2W13-BA-04705 2019 1887 341,230 318,500 03/18/19 107 28,020 346,520 98
131 01 00 101 101 135 33 13323 5N1W33-AA-00101 2019 1929 402,690 325,000 03/19/19 124 28,493 353,493 114
133 01 43 101 101 133 33 9519 4N1W03-BB-05003 2019 1976 192,160 220,000 03/19/19 87 19,288 239,288 80
134 04 00 101 101 152 33 18593 7N2W17-DB-01200 2019 1939 528,240 395,000 03/20/19 134 34,510 429,510 123
37
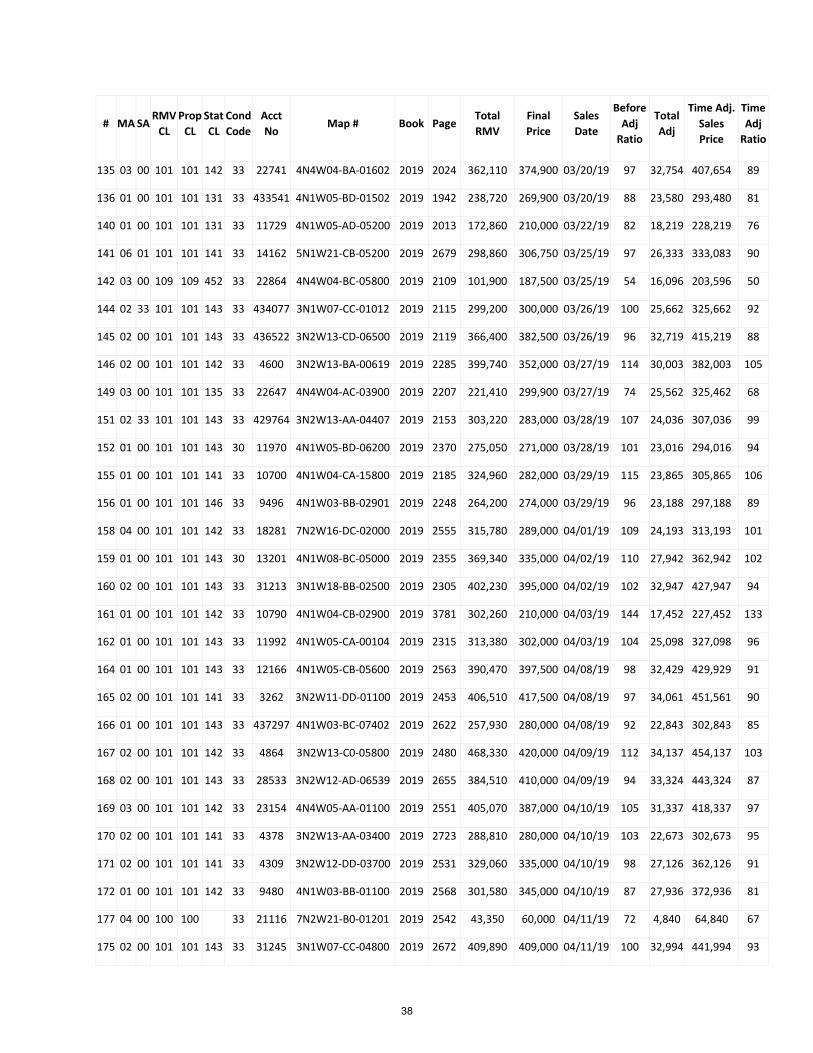
# MA SA RMV
CL Prop
CL Stat CL
Cond Code
Acct No
Map # Book Page Total RMV
Final Price
Sales Date
Before Adj
Ratio
Total Adj
Time Adj. Sales Price
Time Adj
Ratio
135 03 00 101 101 142 33 22741 4N4W04-BA-01602 2019 2024 362,110 374,900 03/20/19 97 32,754 407,654 89
136 01 00 101 101 131 33 433541 4N1W05-BD-01502 2019 1942 238,720 269,900 03/20/19 88 23,580 293,480 81
140 01 00 101 101 131 33 11729 4N1W05-AD-05200 2019 2013 172,860 210,000 03/22/19 82 18,219 228,219 76
141 06 01 101 101 141 33 14162 5N1W21-CB-05200 2019 2679 298,860 306,750 03/25/19 97 26,333 333,083 90
142 03 00 109 109 452 33 22864 4N4W04-BC-05800 2019 2109 101,900 187,500 03/25/19 54 16,096 203,596 50
144 02 33 101 101 143 33 434077 3N1W07-CC-01012 2019 2115 299,200 300,000 03/26/19 100 25,662 325,662 92
145 02 00 101 101 143 33 436522 3N2W13-CD-06500 2019 2119 366,400 382,500 03/26/19 96 32,719 415,219 88
146 02 00 101 101 142 33 4600 3N2W13-BA-00619 2019 2285 399,740 352,000 03/27/19 114 30,003 382,003 105
149 03 00 101 101 135 33 22647 4N4W04-AC-03900 2019 2207 221,410 299,900 03/27/19 74 25,562 325,462 68
151 02 33 101 101 143 33 429764 3N2W13-AA-04407 2019 2153 303,220 283,000 03/28/19 107 24,036 307,036 99
152 01 00 101 101 143 30 11970 4N1W05-BD-06200 2019 2370 275,050 271,000 03/28/19 101 23,016 294,016 94
155 01 00 101 101 141 33 10700 4N1W04-CA-15800 2019 2185 324,960 282,000 03/29/19 115 23,865 305,865 106
156 01 00 101 101 146 33 9496 4N1W03-BB-02901 2019 2248 264,200 274,000 03/29/19 96 23,188 297,188 89
158 04 00 101 101 142 33 18281 7N2W16-DC-02000 2019 2555 315,780 289,000 04/01/19 109 24,193 313,193 101
159 01 00 101 101 143 30 13201 4N1W08-BC-05000 2019 2355 369,340 335,000 04/02/19 110 27,942 362,942 102
160 02 00 101 101 143 33 31213 3N1W18-BB-02500 2019 2305 402,230 395,000 04/02/19 102 32,947 427,947 94
161 01 00 101 101 142 33 10790 4N1W04-CB-02900 2019 3781 302,260 210,000 04/03/19 144 17,452 227,452 133
162 01 00 101 101 143 33 11992 4N1W05-CA-00104 2019 2315 313,380 302,000 04/03/19 104 25,098 327,098 96
164 01 00 101 101 143 33 12166 4N1W05-CB-05600 2019 2563 390,470 397,500 04/08/19 98 32,429 429,929 91
165 02 00 101 101 141 33 3262 3N2W11-DD-01100 2019 2453 406,510 417,500 04/08/19 97 34,061 451,561 90
166 01 00 101 101 143 33 437297 4N1W03-BC-07402 2019 2622 257,930 280,000 04/08/19 92 22,843 302,843 85
167 02 00 101 101 142 33 4864 3N2W13-C0-05800 2019 2480 468,330 420,000 04/09/19 112 34,137 454,137 103
168 02 00 101 101 143 33 28533 3N2W12-AD-06539 2019 2655 384,510 410,000 04/09/19 94 33,324 443,324 87
169 03 00 101 101 142 33 23154 4N4W05-AA-01100 2019 2551 405,070 387,000 04/10/19 105 31,337 418,337 97
170 02 00 101 101 141 33 4378 3N2W13-AA-03400 2019 2723 288,810 280,000 04/10/19 103 22,673 302,673 95
171 02 00 101 101 141 33 4309 3N2W12-DD-03700 2019 2531 329,060 335,000 04/10/19 98 27,126 362,126 91
172 01 00 101 101 142 33 9480 4N1W03-BB-01100 2019 2568 301,580 345,000 04/10/19 87 27,936 372,936 81
177 04 00 100 100 33 21116 7N2W21-B0-01201 2019 2542 43,350 60,000 04/11/19 72 4,840 64,840 67
175 02 00 101 101 143 33 31245 3N1W07-CC-04800 2019 2672 409,890 409,000 04/11/19 100 32,994 441,994 93
38
# MA SA RMV
CL Prop
CL Stat CL
Cond Code
Acct No
Map # Book Page Total RMV
Final Price
Sales Date
Before Adj
Ratio
Total Adj
Time Adj. Sales Price
Time Adj
Ratio
178 02 33 101 101 143 33 433067 3N2W12-DC-00148 2019 2659 304,380 288,000 04/12/19 106 23,145 311,145 98
179 01 00 101 101 142 33 13272 5N1W32-DC-01700 2019 2641 323,210 312,000 04/12/19 104 25,074 337,074 96
183 06 01 101 101 142 33 14753 5N1W28-DB-06200 2019 2670 483,670 462,000 04/15/19 105 36,707 498,707 97
186 06 01 101 101 131 33 14454 5N1W28-AD-03400 2019 2626 211,670 265,000 04/15/19 80 21,055 286,055 74
187 01 43 101 101 143 33 12182 4N1W05-CB-06700 2019 2653 242,070 228,000 04/16/19 106 18,046 246,046 98
191 02 00 101 101 143 33 438472 3N2W13-CA-03928 2019 2766 329,670 330,000 04/17/19 100 26,018 356,018 93
192 01 00 101 101 142 33 12728 4N1W06-DA-01700 2019 2677 339,640 389,900 04/17/19 87 30,741 420,641 81
196 03 00 100 100 30 435698 4N4W04-AB-00304 2019 3434 35,730 40,000 04/18/19 89 3,142 43,142 83
194 02 00 101 101 143 33 4787 3N2W13-BD-05900 2019 2735 399,270 390,000 04/18/19 102 30,630 420,630 95
195 01 00 101 101 143 33 431934 4N1W05-BA-03925 2019 2795 333,010 330,400 04/18/19 101 25,949 356,349 93
197 03 00 101 101 141 33 433339 4N4W05-AC-03605 2019 2733 281,000 320,000 04/18/19 88 25,132 345,132 81
198 02 00 101 101 142 33 4558 3N2W13-AD-09400 2019 2968 334,430 323,900 04/19/19 103 25,340 349,240 96
199 02 33 101 101 143 33 433102 3N2W12-DC-02502 2019 2966 305,560 284,620 04/22/19 107 22,007 306,627 100
200 02 00 101 101 141 33 2848 3N1W07-CA-03000 2019 2799 348,680 330,000 04/22/19 106 25,516 355,516 98
202 01 15 101 101 163 33 13740 5N1W34-CB-00301 2019 3162 585,660 525,000 04/23/19 112 40,434 565,434 104
203 06 01 101 101 132 33 14638 5N1W28-DA-04100 2019 2970 325,370 298,000 04/23/19 109 22,951 320,951 101
204 06 01 101 101 142 30 14621 5N1W28-DA-02800 2019 3154 359,090 335,000 04/23/19 107 25,801 360,801 100
205 01 00 101 101 143 33 11512 4N1W05-AB-01027 2019 2998 332,370 330,000 04/23/19 101 25,416 355,416 94
206 01 00 101 101 144 33 12277 4N1W05-CC-02404 2019 3075 283,870 280,000 04/23/19 101 21,565 301,565 94
207 04 00 101 101 134 33 17874 7N2W16-BC-00900 2019 3077 203,190 197,000 04/25/19 103 15,052 212,052 96
208 01 00 101 101 143 33 13255 5N1W32-DB-00200 2019 3516 354,880 347,350 04/25/19 102 26,540 373,890 95
209 01 00 101 101 143 33 12073 4N1W05-CB-00105 2019 3123 374,130 376,000 04/25/19 100 28,729 404,729 92
211 01 00 101 101 131 33 10671 4N1W04-CA-12700 2019 3327 215,110 278,900 04/25/19 77 21,310 300,210 72
212 03 00 101 101 131 33 23475 4N4W05-DA-09700 2019 3152 129,470 208,000 04/25/19 62 15,893 223,893 58
213 04 00 100 100 33 435668 7N2W21-AB-00108 2019 3308 60,240 49,900 04/26/19 121 3,798 53,698 112
214 01 00 101 101 141 33 9391 4N1W03-BA-02401 2019 3404 337,120 290,000 04/26/19 116 22,070 312,070 108
215 01 00 101 101 141 33 439735 4N1W04-DA-09901 2019 3305 270,230 289,900 04/26/19 93 22,062 311,962 87
218 01 00 101 101 143 33 12904 4N1W06-DD-03200 2019 3448 388,290 360,000 04/29/19 108 27,068 387,068 100
219 01 00 101 101 143 33 12905 4N1W06-DD-03300 2019 3316 324,040 315,897 04/29/19 103 23,752 339,649 95
39

# MA SA RMV
CL Prop
CL Stat CL
Cond Code
Acct No
Map # Book Page Total RMV
Final Price
Sales Date
Before Adj
Ratio
Total Adj
Time Adj. Sales Price
Time Adj
Ratio
220 01 00 101 101 141 33 13844 5N1W34-CB-07500 2019 3182 326,870 330,000 04/29/19 99 24,813 354,813 92
221 01 00 101 101 141 33 12146 4N1W05-CB-03600 2019 3325 289,110 293,000 04/29/19 99 22,031 315,031 92
222 03 00 101 101 142 33 433337 4N4W05-AC-03603 2019 3382 280,030 315,000 04/29/19 89 23,685 338,685 83
223 03 00 109 109 462 33 23478 4N4W05-DA-10000 2019 3366 149,600 223,000 04/29/19 67 16,767 239,767 62
224 04 00 101 101 142 33 18622 7N2W17-DC-00102 2019 3392 590,980 476,000 04/30/19 124 35,646 511,646 116
225 02 00 101 101 131 33 3430 3N2W12-AD-03200 2019 3357 275,310 294,000 04/30/19 94 22,016 316,016 87
226 02 00 101 101 141 33 2999 3N2W02-DD-00608 2019 3436 365,380 315,000 05/01/19 116 23,493 338,493 108
227 01 00 101 101 131 33 13583 5N1W33-DA-03600 2019 3481 192,850 180,000 05/01/19 107 13,425 193,425 100
228 01 00 101 101 131 33 10986 4N1W04-DB-02400 2019 3521 162,690 221,500 05/01/19 73 16,520 238,020 68
230 04 00 101 101 141 33 17975 7N2W16-CA-07800 2019 3506 285,830 240,000 05/02/19 119 17,826 257,826 111
232 02 00 101 101 143 33 4666 3N2W13-BA-06000 2019 3489 349,900 360,000 05/02/19 97 26,740 386,740 90
234 01 00 101 101 131 33 13429 5N1W33-DC-01200 2019 3456 236,630 290,000 05/02/19 82 21,540 311,540 76
235 03 00 101 101 141 33 22726 4N4W04-BA-00201 2019 3501 266,790 337,500 05/02/19 79 25,068 362,568 74
237 01 00 101 101 141 33 12737 4N1W06-DA-02600 2019 3536 321,150 329,000 05/03/19 98 24,337 353,337 91
239 01 00 101 101 121 33 10620 4N1W04-CB-10800 2019 3498 218,300 260,000 05/03/19 84 19,233 279,233 78
240 06 01 101 101 131 33 14482 5N1W28-BA-00200 2019 3491 200,940 261,700 05/03/19 77 19,359 281,059 71
245 01 00 101 101 143 33 12991 4N1W07-AB-03127 2019 3549 361,330 345,000 05/08/19 105 24,995 369,995 98
246 02 00 101 101 143 33 4735 3N2W13-BD-01100 2019 3936 323,160 333,650 05/08/19 97 24,173 357,823 90
248 02 00 101 101 141 33 3064 3N2W11-AA-00125 2019 3665 326,270 385,000 05/09/19 85 27,776 412,776 79
249 01 00 101 101 121 33 13668 5N1W33-DD-09900 2019 3608 137,340 174,900 05/09/19 79 12,618 187,518 73
252 01 00 101 101 143 33 13268 5N1W32-DC-01300 2019 3697 306,870 325,000 05/10/19 94 23,349 348,349 88
253 02 00 101 101 131 33 3305 3N2W12-AB-00400 2019 3708 289,030 317,500 05/10/19 91 22,810 340,310 85
254 02 00 101 101 141 33 438523 3N2W13-CB-00132 2019 3706 319,430 364,500 05/10/19 88 26,186 390,686 82
255 03 00 101 101 142 33 433336 4N4W05-AC-03602 2019 3772 280,020 319,900 05/10/19 88 22,982 342,882 82
256 01 00 101 101 136 33 10962 4N1W04-AD-10600 2019 3823 251,800 294,900 05/10/19 85 21,186 316,086 80
259 04 00 101 101 141 33 18452 7N2W17-AC-02000 2019 3693 257,220 225,000 05/13/19 114 15,959 240,959 107
260 01 00 101 101 141 33 12720 4N1W06-DA-00900 2019 3681 319,080 308,900 05/13/19 103 21,910 330,810 96
261 01 00 101 101 143 33 13275 5N1W32-DC-02501 2019 4211 413,410 408,000 05/13/19 101 28,939 436,939 95
262 01 00 101 101 141 30 12119 4N1W05-CB-00400 2019 3794 361,430 385,000 05/13/19 94 27,307 412,307 88
40
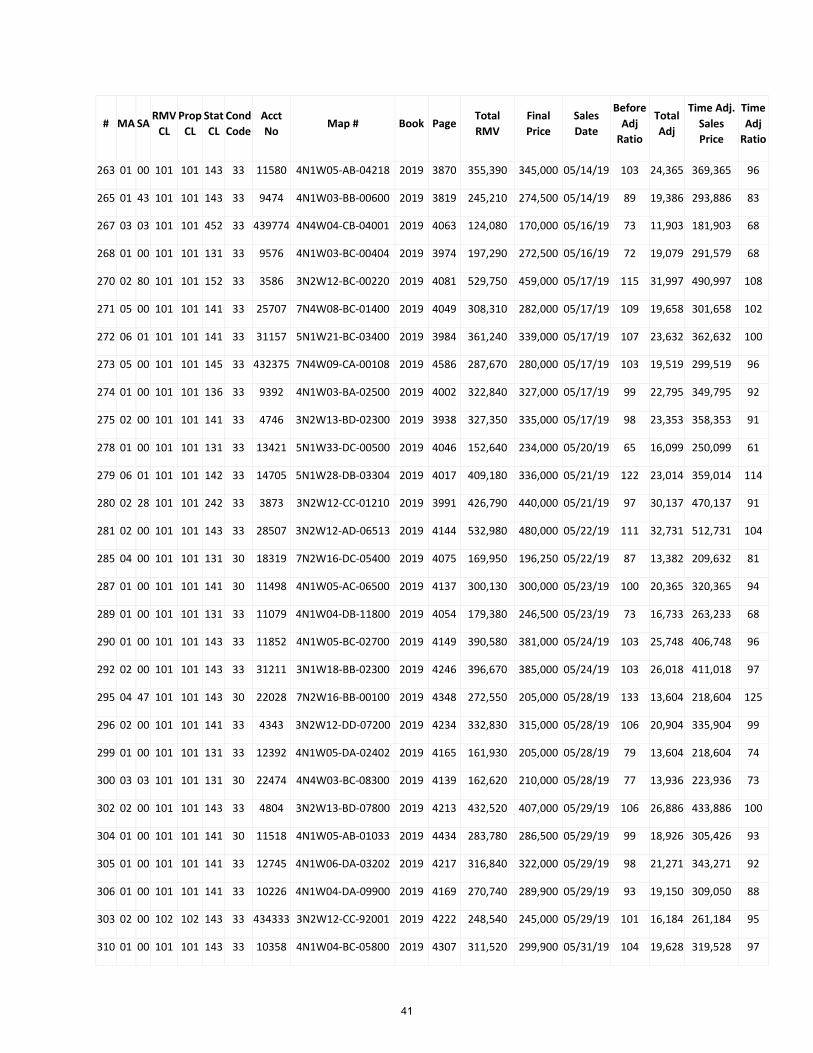
# MA SA RMV
CL Prop
CL Stat CL
Cond Code
Acct No
Map # Book Page Total RMV
Final Price
Sales Date
Before Adj
Ratio
Total Adj
Time Adj. Sales Price
Time Adj
Ratio
263 01 00 101 101 143 33 11580 4N1W05-AB-04218 2019 3870 355,390 345,000 05/14/19 103 24,365 369,365 96
265 01 43 101 101 143 33 9474 4N1W03-BB-00600 2019 3819 245,210 274,500 05/14/19 89 19,386 293,886 83
267 03 03 101 101 452 33 439774 4N4W04-CB-04001 2019 4063 124,080 170,000 05/16/19 73 11,903 181,903 68
268 01 00 101 101 131 33 9576 4N1W03-BC-00404 2019 3974 197,290 272,500 05/16/19 72 19,079 291,579 68
270 02 80 101 101 152 33 3586 3N2W12-BC-00220 2019 4081 529,750 459,000 05/17/19 115 31,997 490,997 108
271 05 00 101 101 141 33 25707 7N4W08-BC-01400 2019 4049 308,310 282,000 05/17/19 109 19,658 301,658 102
272 06 01 101 101 141 33 31157 5N1W21-BC-03400 2019 3984 361,240 339,000 05/17/19 107 23,632 362,632 100
273 05 00 101 101 145 33 432375 7N4W09-CA-00108 2019 4586 287,670 280,000 05/17/19 103 19,519 299,519 96
274 01 00 101 101 136 33 9392 4N1W03-BA-02500 2019 4002 322,840 327,000 05/17/19 99 22,795 349,795 92
275 02 00 101 101 141 33 4746 3N2W13-BD-02300 2019 3938 327,350 335,000 05/17/19 98 23,353 358,353 91
278 01 00 101 101 131 33 13421 5N1W33-DC-00500 2019 4046 152,640 234,000 05/20/19 65 16,099 250,099 61
279 06 01 101 101 142 33 14705 5N1W28-DB-03304 2019 4017 409,180 336,000 05/21/19 122 23,014 359,014 114
280 02 28 101 101 242 33 3873 3N2W12-CC-01210 2019 3991 426,790 440,000 05/21/19 97 30,137 470,137 91
281 02 00 101 101 143 33 28507 3N2W12-AD-06513 2019 4144 532,980 480,000 05/22/19 111 32,731 512,731 104
285 04 00 101 101 131 30 18319 7N2W16-DC-05400 2019 4075 169,950 196,250 05/22/19 87 13,382 209,632 81
287 01 00 101 101 141 30 11498 4N1W05-AC-06500 2019 4137 300,130 300,000 05/23/19 100 20,365 320,365 94
289 01 00 101 101 131 33 11079 4N1W04-DB-11800 2019 4054 179,380 246,500 05/23/19 73 16,733 263,233 68
290 01 00 101 101 143 33 11852 4N1W05-BC-02700 2019 4149 390,580 381,000 05/24/19 103 25,748 406,748 96
292 02 00 101 101 143 33 31211 3N1W18-BB-02300 2019 4246 396,670 385,000 05/24/19 103 26,018 411,018 97
295 04 47 101 101 143 30 22028 7N2W16-BB-00100 2019 4348 272,550 205,000 05/28/19 133 13,604 218,604 125
296 02 00 101 101 141 33 4343 3N2W12-DD-07200 2019 4234 332,830 315,000 05/28/19 106 20,904 335,904 99
299 01 00 101 101 131 33 12392 4N1W05-DA-02402 2019 4165 161,930 205,000 05/28/19 79 13,604 218,604 74
300 03 03 101 101 131 30 22474 4N4W03-BC-08300 2019 4139 162,620 210,000 05/28/19 77 13,936 223,936 73
302 02 00 101 101 143 33 4804 3N2W13-BD-07800 2019 4213 432,520 407,000 05/29/19 106 26,886 433,886 100
304 01 00 101 101 141 30 11518 4N1W05-AB-01033 2019 4434 283,780 286,500 05/29/19 99 18,926 305,426 93
305 01 00 101 101 141 33 12745 4N1W06-DA-03202 2019 4217 316,840 322,000 05/29/19 98 21,271 343,271 92
306 01 00 101 101 141 33 10226 4N1W04-DA-09900 2019 4169 270,740 289,900 05/29/19 93 19,150 309,050 88
303 02 00 102 102 143 33 434333 3N2W12-CC-92001 2019 4222 248,540 245,000 05/29/19 101 16,184 261,184 95
310 01 00 101 101 143 33 10358 4N1W04-BC-05800 2019 4307 311,520 299,900 05/31/19 104 19,628 319,528 97
41
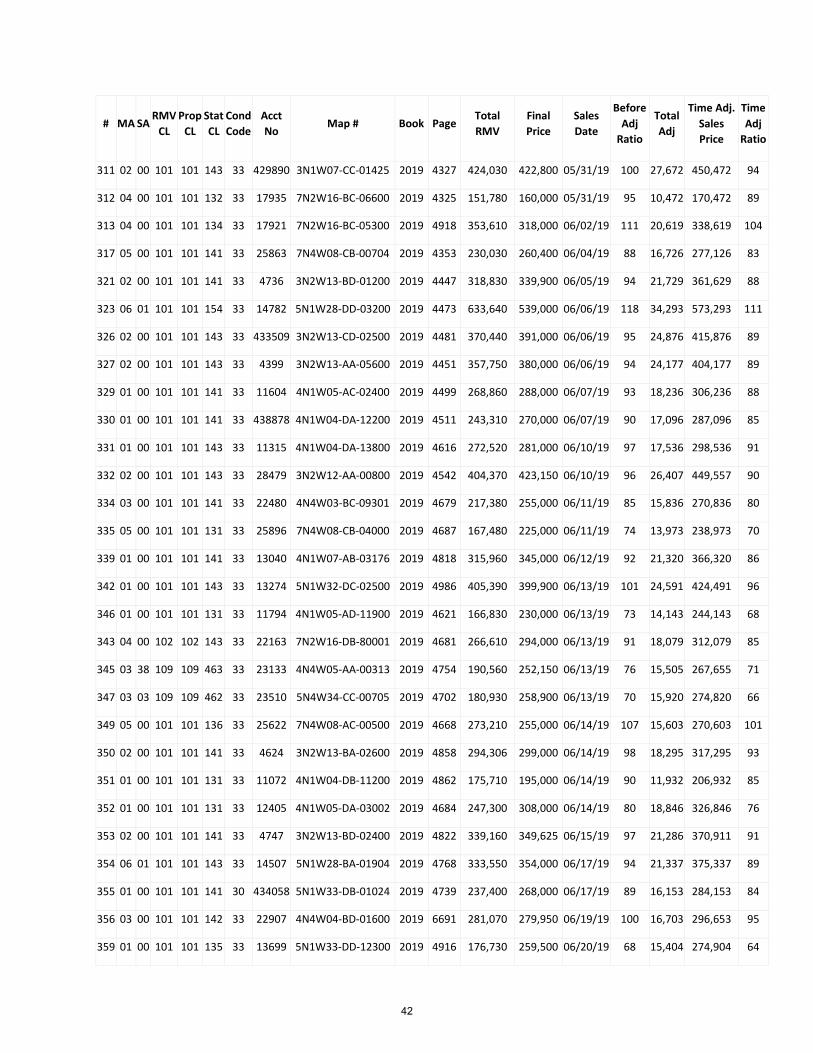
# MA SA RMV
CL Prop
CL Stat CL
Cond Code
Acct No
Map # Book Page Total RMV
Final Price
Sales Date
Before Adj
Ratio
Total Adj
Time Adj. Sales Price
Time Adj
Ratio
311 02 00 101 101 143 33 429890 3N1W07-CC-01425 2019 4327 424,030 422,800 05/31/19 100 27,672 450,472 94
312 04 00 101 101 132 33 17935 7N2W16-BC-06600 2019 4325 151,780 160,000 05/31/19 95 10,472 170,472 89
313 04 00 101 101 134 33 17921 7N2W16-BC-05300 2019 4918 353,610 318,000 06/02/19 111 20,619 338,619 104
317 05 00 101 101 141 33 25863 7N4W08-CB-00704 2019 4353 230,030 260,400 06/04/19 88 16,726 277,126 83
321 02 00 101 101 141 33 4736 3N2W13-BD-01200 2019 4447 318,830 339,900 06/05/19 94 21,729 361,629 88
323 06 01 101 101 154 33 14782 5N1W28-DD-03200 2019 4473 633,640 539,000 06/06/19 118 34,293 573,293 111
326 02 00 101 101 143 33 433509 3N2W13-CD-02500 2019 4481 370,440 391,000 06/06/19 95 24,876 415,876 89
327 02 00 101 101 143 33 4399 3N2W13-AA-05600 2019 4451 357,750 380,000 06/06/19 94 24,177 404,177 89
329 01 00 101 101 141 33 11604 4N1W05-AC-02400 2019 4499 268,860 288,000 06/07/19 93 18,236 306,236 88
330 01 00 101 101 141 33 438878 4N1W04-DA-12200 2019 4511 243,310 270,000 06/07/19 90 17,096 287,096 85
331 01 00 101 101 143 33 11315 4N1W04-DA-13800 2019 4616 272,520 281,000 06/10/19 97 17,536 298,536 91
332 02 00 101 101 143 33 28479 3N2W12-AA-00800 2019 4542 404,370 423,150 06/10/19 96 26,407 449,557 90
334 03 00 101 101 141 33 22480 4N4W03-BC-09301 2019 4679 217,380 255,000 06/11/19 85 15,836 270,836 80
335 05 00 101 101 131 33 25896 7N4W08-CB-04000 2019 4687 167,480 225,000 06/11/19 74 13,973 238,973 70
339 01 00 101 101 141 33 13040 4N1W07-AB-03176 2019 4818 315,960 345,000 06/12/19 92 21,320 366,320 86
342 01 00 101 101 143 33 13274 5N1W32-DC-02500 2019 4986 405,390 399,900 06/13/19 101 24,591 424,491 96
346 01 00 101 101 131 33 11794 4N1W05-AD-11900 2019 4621 166,830 230,000 06/13/19 73 14,143 244,143 68
343 04 00 102 102 143 33 22163 7N2W16-DB-80001 2019 4681 266,610 294,000 06/13/19 91 18,079 312,079 85
345 03 38 109 109 463 33 23133 4N4W05-AA-00313 2019 4754 190,560 252,150 06/13/19 76 15,505 267,655 71
347 03 03 109 109 462 33 23510 5N4W34-CC-00705 2019 4702 180,930 258,900 06/13/19 70 15,920 274,820 66
349 05 00 101 101 136 33 25622 7N4W08-AC-00500 2019 4668 273,210 255,000 06/14/19 107 15,603 270,603 101
350 02 00 101 101 141 33 4624 3N2W13-BA-02600 2019 4858 294,306 299,000 06/14/19 98 18,295 317,295 93
351 01 00 101 101 131 33 11072 4N1W04-DB-11200 2019 4862 175,710 195,000 06/14/19 90 11,932 206,932 85
352 01 00 101 101 131 33 12405 4N1W05-DA-03002 2019 4684 247,300 308,000 06/14/19 80 18,846 326,846 76
353 02 00 101 101 141 33 4747 3N2W13-BD-02400 2019 4822 339,160 349,625 06/15/19 97 21,286 370,911 91
354 06 01 101 101 143 33 14507 5N1W28-BA-01904 2019 4768 333,550 354,000 06/17/19 94 21,337 375,337 89
355 01 00 101 101 141 30 434058 5N1W33-DB-01024 2019 4739 237,400 268,000 06/17/19 89 16,153 284,153 84
356 03 00 101 101 142 33 22907 4N4W04-BD-01600 2019 6691 281,070 279,950 06/19/19 100 16,703 296,653 95
359 01 00 101 101 135 33 13699 5N1W33-DD-12300 2019 4916 176,730 259,500 06/20/19 68 15,404 274,904 64
42
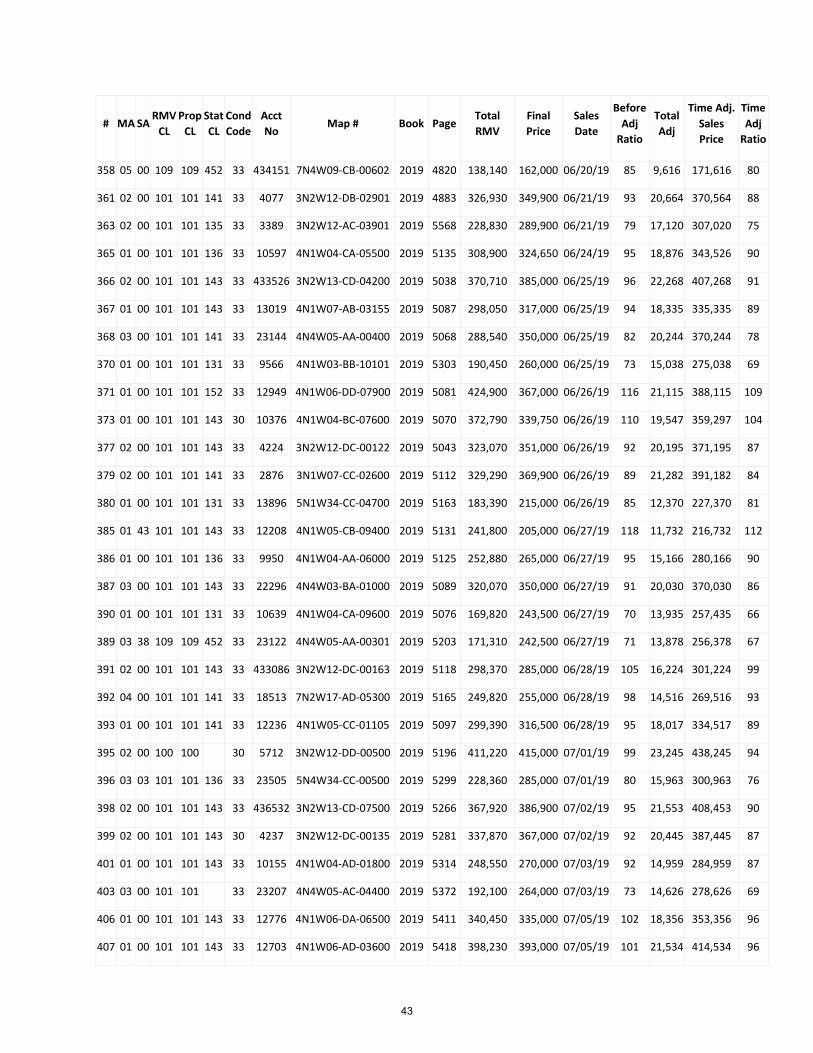
# MA SA RMV
CL Prop
CL Stat CL
Cond Code
Acct No
Map # Book Page Total RMV
Final Price
Sales Date
Before Adj
Ratio
Total Adj
Time Adj. Sales Price
Time Adj
Ratio
358 05 00 109 109 452 33 434151 7N4W09-CB-00602 2019 4820 138,140 162,000 06/20/19 85 9,616 171,616 80
361 02 00 101 101 141 33 4077 3N2W12-DB-02901 2019 4883 326,930 349,900 06/21/19 93 20,664 370,564 88
363 02 00 101 101 135 33 3389 3N2W12-AC-03901 2019 5568 228,830 289,900 06/21/19 79 17,120 307,020 75
365 01 00 101 101 136 33 10597 4N1W04-CA-05500 2019 5135 308,900 324,650 06/24/19 95 18,876 343,526 90
366 02 00 101 101 143 33 433526 3N2W13-CD-04200 2019 5038 370,710 385,000 06/25/19 96 22,268 407,268 91
367 01 00 101 101 143 33 13019 4N1W07-AB-03155 2019 5087 298,050 317,000 06/25/19 94 18,335 335,335 89
368 03 00 101 101 141 33 23144 4N4W05-AA-00400 2019 5068 288,540 350,000 06/25/19 82 20,244 370,244 78
370 01 00 101 101 131 33 9566 4N1W03-BB-10101 2019 5303 190,450 260,000 06/25/19 73 15,038 275,038 69
371 01 00 101 101 152 33 12949 4N1W06-DD-07900 2019 5081 424,900 367,000 06/26/19 116 21,115 388,115 109
373 01 00 101 101 143 30 10376 4N1W04-BC-07600 2019 5070 372,790 339,750 06/26/19 110 19,547 359,297 104
377 02 00 101 101 143 33 4224 3N2W12-DC-00122 2019 5043 323,070 351,000 06/26/19 92 20,195 371,195 87
379 02 00 101 101 141 33 2876 3N1W07-CC-02600 2019 5112 329,290 369,900 06/26/19 89 21,282 391,182 84
380 01 00 101 101 131 33 13896 5N1W34-CC-04700 2019 5163 183,390 215,000 06/26/19 85 12,370 227,370 81
385 01 43 101 101 143 33 12208 4N1W05-CB-09400 2019 5131 241,800 205,000 06/27/19 118 11,732 216,732 112
386 01 00 101 101 136 33 9950 4N1W04-AA-06000 2019 5125 252,880 265,000 06/27/19 95 15,166 280,166 90
387 03 00 101 101 143 33 22296 4N4W03-BA-01000 2019 5089 320,070 350,000 06/27/19 91 20,030 370,030 86
390 01 00 101 101 131 33 10639 4N1W04-CA-09600 2019 5076 169,820 243,500 06/27/19 70 13,935 257,435 66
389 03 38 109 109 452 33 23122 4N4W05-AA-00301 2019 5203 171,310 242,500 06/27/19 71 13,878 256,378 67
391 02 00 101 101 143 33 433086 3N2W12-DC-00163 2019 5118 298,370 285,000 06/28/19 105 16,224 301,224 99
392 04 00 101 101 141 33 18513 7N2W17-AD-05300 2019 5165 249,820 255,000 06/28/19 98 14,516 269,516 93
393 01 00 101 101 141 33 12236 4N1W05-CC-01105 2019 5097 299,390 316,500 06/28/19 95 18,017 334,517 89
395 02 00 100 100 30 5712 3N2W12-DD-00500 2019 5196 411,220 415,000 07/01/19 99 23,245 438,245 94
396 03 03 101 101 136 33 23505 5N4W34-CC-00500 2019 5299 228,360 285,000 07/01/19 80 15,963 300,963 76
398 02 00 101 101 143 33 436532 3N2W13-CD-07500 2019 5266 367,920 386,900 07/02/19 95 21,553 408,453 90
399 02 00 101 101 143 30 4237 3N2W12-DC-00135 2019 5281 337,870 367,000 07/02/19 92 20,445 387,445 87
401 01 00 101 101 143 33 10155 4N1W04-AD-01800 2019 5314 248,550 270,000 07/03/19 92 14,959 284,959 87
403 03 00 101 101 33 23207 4N4W05-AC-04400 2019 5372 192,100 264,000 07/03/19 73 14,626 278,626 69
406 01 00 101 101 143 33 12776 4N1W06-DA-06500 2019 5411 340,450 335,000 07/05/19 102 18,356 353,356 96
407 01 00 101 101 143 33 12703 4N1W06-AD-03600 2019 5418 398,230 393,000 07/05/19 101 21,534 414,534 96
43

# MA SA RMV
CL Prop
CL Stat CL
Cond Code
Acct No
Map # Book Page Total RMV
Final Price
Sales Date
Before Adj
Ratio
Total Adj
Time Adj. Sales Price
Time Adj
Ratio
408 06 01 101 101 143 33 14080 5N1W21-CA-03600 2019 5476 314,460 325,000 07/05/19 97 17,808 342,808 92
409 05 00 101 101 132 30 25929 7N4W08-CB-07300 2019 5322 213,860 225,000 07/05/19 95 12,329 237,329 90
412 01 00 101 101 131 33 9583 4N1W03-BC-00411 2019 5406 196,050 275,000 07/05/19 71 15,068 290,068 68
413 02 00 101 101 144 33 2946 3N2W01-CC-00112 2019 5374 377,940 382,000 07/06/19 99 20,815 402,815 94
414 02 00 101 101 142 33 3068 3N2W11-AA-00129 2019 5378 447,500 363,000 07/08/19 123 19,559 382,559 117
415 01 00 101 101 141 33 12579 4N1W05-DC-03400 2019 5539 325,270 315,000 07/08/19 103 16,973 331,973 98
416 01 00 101 101 141 33 11973 4N1W05-BD-06500 2019 5386 273,990 279,900 07/08/19 98 15,081 294,981 93
417 01 00 101 101 143 33 12532 4N1W05-DB-05600 2019 5474 346,440 374,000 07/09/19 93 20,038 394,038 88
418 01 43 101 101 143 33 433917 4N1W03-BB-00702 2019 5441 235,850 272,900 07/09/19 86 14,621 287,521 82
419 01 00 101 101 131 33 11326 4N1W04-DD-07400 2019 5462 186,210 265,000 07/09/19 70 14,198 279,198 67
422 01 00 101 101 141 33 12129 4N1W05-CB-01401 2019 5448 281,400 300,000 07/10/19 94 15,982 315,982 89
425 03 00 101 101 121 33 23240 4N4W05-AD-01700 2019 5580 117,590 206,000 07/11/19 57 10,911 216,911 54
430 01 00 101 101 132 33 10211 4N1W04-AD-04610 2019 5573 211,550 269,900 07/15/19 78 13,967 283,867 75
433 02 00 101 101 142 33 3103 3N2W11-AA-01004 2019 5935 365,520 350,000 07/17/19 104 17,900 367,900 99
434 05 00 101 101 141 33 25812 7N4W08-CA-03600 2019 5839 236,890 243,500 07/17/19 97 12,453 255,953 93
437 03 03 101 101 131 33 23079 4N4W04-CB-06500 2019 5735 166,020 135,000 07/18/19 123 6,863 141,863 117
438 01 00 101 101 151 33 11709 4N1W05-AD-03300 2019 5738 413,080 408,255 07/18/19 101 20,755 429,010 96
439 04 00 101 101 136 33 17999 7N2W16-CB-00200 2019 5961 189,080 210,000 07/18/19 90 10,676 220,676 86
441 01 00 101 101 132 33 10451 4N1W04-BD-03600 2019 5667 176,970 230,000 07/18/19 77 11,693 241,693 73
442 01 00 101 101 153 33 11837 4N1W05-BC-01100 2019 5730 563,240 415,000 07/19/19 136 20,971 435,971 129
443 01 00 101 101 143 33 13146 4N1W08-BB-05900 2019 5702 324,490 325,000 07/19/19 100 16,423 341,423 95
444 03 00 101 101 141 33 433341 4N4W05-AC-03607 2019 6040 330,930 337,000 07/19/19 98 17,030 354,030 93
446 02 00 101 101 141 33 4525 3N2W13-AD-06100 2019 5835 334,170 356,000 07/22/19 94 17,665 373,665 89
448 04 00 101 101 141 33 21074 7N2W21-A0-00300 2019 5736 254,170 309,000 07/22/19 82 15,332 324,332 78
449 04 00 101 101 143 33 18492 7N2W17-AD-03500 2019 5980 233,740 300,000 07/22/19 78 14,886 314,886 74
450 01 43 101 101 143 33 29001 4N1W08-BA-01608 2019 5899 253,890 249,000 07/23/19 102 12,279 261,279 97
451 02 00 101 101 143 33 31168 3N1W07-CC-05200 2019 5800 396,540 424,900 07/23/19 93 20,954 445,854 89
454 02 00 101 101 143 33 433097 3N2W12-DC-00174 2019 5872 304,000 273,300 07/24/19 111 13,395 286,695 106
456 01 00 101 101 143 33 13267 5N1W32-DC-01200 2019 5855 316,810 319,000 07/24/19 99 15,634 334,634 95
44
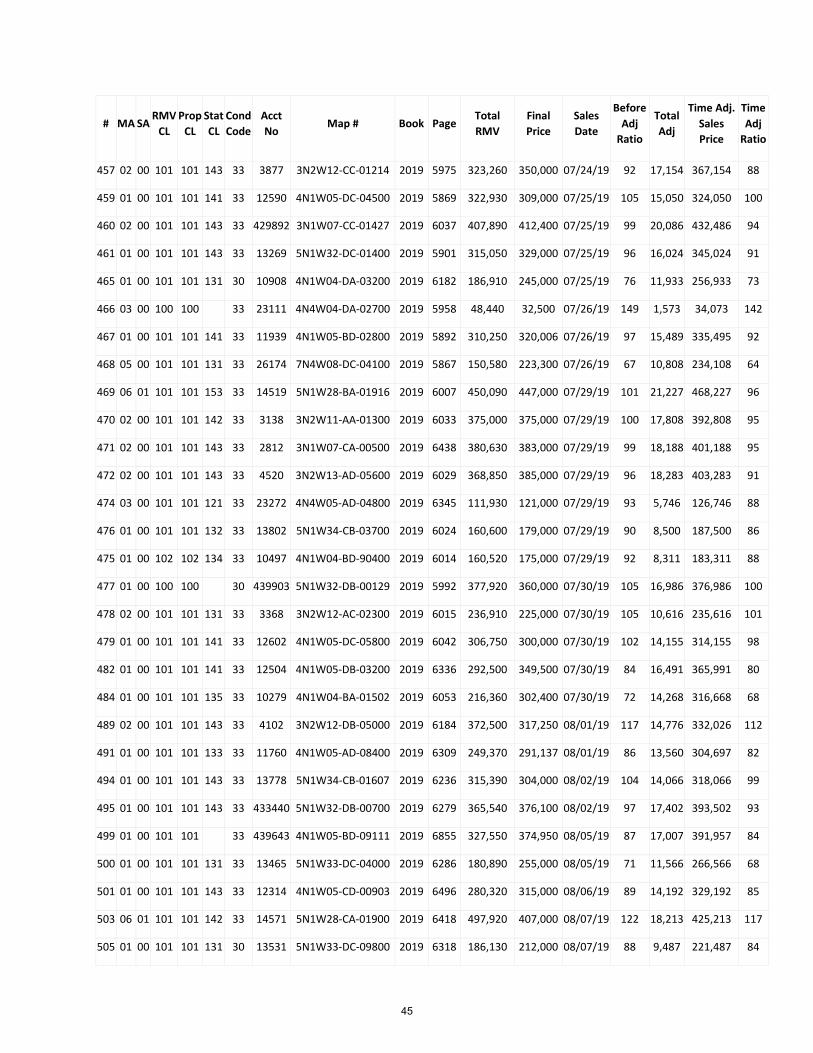
# MA SA RMV
CL Prop
CL Stat CL
Cond Code
Acct No
Map # Book Page Total RMV
Final Price
Sales Date
Before Adj
Ratio
Total Adj
Time Adj. Sales Price
Time Adj
Ratio
457 02 00 101 101 143 33 3877 3N2W12-CC-01214 2019 5975 323,260 350,000 07/24/19 92 17,154 367,154 88
459 01 00 101 101 141 33 12590 4N1W05-DC-04500 2019 5869 322,930 309,000 07/25/19 105 15,050 324,050 100
460 02 00 101 101 143 33 429892 3N1W07-CC-01427 2019 6037 407,890 412,400 07/25/19 99 20,086 432,486 94
461 01 00 101 101 143 33 13269 5N1W32-DC-01400 2019 5901 315,050 329,000 07/25/19 96 16,024 345,024 91
465 01 00 101 101 131 30 10908 4N1W04-DA-03200 2019 6182 186,910 245,000 07/25/19 76 11,933 256,933 73
466 03 00 100 100 33 23111 4N4W04-DA-02700 2019 5958 48,440 32,500 07/26/19 149 1,573 34,073 142
467 01 00 101 101 141 33 11939 4N1W05-BD-02800 2019 5892 310,250 320,006 07/26/19 97 15,489 335,495 92
468 05 00 101 101 131 33 26174 7N4W08-DC-04100 2019 5867 150,580 223,300 07/26/19 67 10,808 234,108 64
469 06 01 101 101 153 33 14519 5N1W28-BA-01916 2019 6007 450,090 447,000 07/29/19 101 21,227 468,227 96
470 02 00 101 101 142 33 3138 3N2W11-AA-01300 2019 6033 375,000 375,000 07/29/19 100 17,808 392,808 95
471 02 00 101 101 143 33 2812 3N1W07-CA-00500 2019 6438 380,630 383,000 07/29/19 99 18,188 401,188 95
472 02 00 101 101 143 33 4520 3N2W13-AD-05600 2019 6029 368,850 385,000 07/29/19 96 18,283 403,283 91
474 03 00 101 101 121 33 23272 4N4W05-AD-04800 2019 6345 111,930 121,000 07/29/19 93 5,746 126,746 88
476 01 00 101 101 132 33 13802 5N1W34-CB-03700 2019 6024 160,600 179,000 07/29/19 90 8,500 187,500 86
475 01 00 102 102 134 33 10497 4N1W04-BD-90400 2019 6014 160,520 175,000 07/29/19 92 8,311 183,311 88
477 01 00 100 100 30 439903 5N1W32-DB-00129 2019 5992 377,920 360,000 07/30/19 105 16,986 376,986 100
478 02 00 101 101 131 33 3368 3N2W12-AC-02300 2019 6015 236,910 225,000 07/30/19 105 10,616 235,616 101
479 01 00 101 101 141 33 12602 4N1W05-DC-05800 2019 6042 306,750 300,000 07/30/19 102 14,155 314,155 98
482 01 00 101 101 141 33 12504 4N1W05-DB-03200 2019 6336 292,500 349,500 07/30/19 84 16,491 365,991 80
484 01 00 101 101 135 33 10279 4N1W04-BA-01502 2019 6053 216,360 302,400 07/30/19 72 14,268 316,668 68
489 02 00 101 101 143 33 4102 3N2W12-DB-05000 2019 6184 372,500 317,250 08/01/19 117 14,776 332,026 112
491 01 00 101 101 133 33 11760 4N1W05-AD-08400 2019 6309 249,370 291,137 08/01/19 86 13,560 304,697 82
494 01 00 101 101 143 33 13778 5N1W34-CB-01607 2019 6236 315,390 304,000 08/02/19 104 14,066 318,066 99
495 01 00 101 101 143 33 433440 5N1W32-DB-00700 2019 6279 365,540 376,100 08/02/19 97 17,402 393,502 93
499 01 00 101 101 33 439643 4N1W05-BD-09111 2019 6855 327,550 374,950 08/05/19 87 17,007 391,957 84
500 01 00 101 101 131 33 13465 5N1W33-DC-04000 2019 6286 180,890 255,000 08/05/19 71 11,566 266,566 68
501 01 00 101 101 143 33 12314 4N1W05-CD-00903 2019 6496 280,320 315,000 08/06/19 89 14,192 329,192 85
503 06 01 101 101 142 33 14571 5N1W28-CA-01900 2019 6418 497,920 407,000 08/07/19 122 18,213 425,213 117
505 01 00 101 101 131 30 13531 5N1W33-DC-09800 2019 6318 186,130 212,000 08/07/19 88 9,487 221,487 84
45

# MA SA RMV
CL Prop
CL Stat CL
Cond Code
Acct No
Map # Book Page Total RMV
Final Price
Sales Date
Before Adj
Ratio
Total Adj
Time Adj. Sales Price
Time Adj
Ratio
506 01 00 101 101 141 33 11016 4N1W04-DB-05101 2019 6446 241,790 275,000 08/07/19 88 12,306 287,306 84
507 01 00 101 101 141 33 11742 4N1W05-AD-06500 2019 6384 255,170 295,000 08/08/19 86 13,111 308,111 83
509 06 01 101 101 152 33 14522 5N1W28-BD-00601 2019 6541 555,430 467,500 08/12/19 119 20,209 487,709 114
510 04 00 101 101 131 33 18453 7N2W17-AC-02200 2019 6458 193,700 165,000 08/12/19 117 7,132 172,132 113
511 02 80 101 101 153 33 3572 3N2W12-BC-00206 2019 6512 500,730 527,500 08/12/19 95 22,802 550,302 91
512 03 00 101 101 143 33 23523 5N4W34-CD-00600 2019 6476 297,240 379,750 08/12/19 78 16,415 396,165 75
513 01 00 101 101 143 33 12824 4N1W06-DC-02300 2019 6467 327,100 328,000 08/13/19 100 14,079 342,079 96
515 01 00 101 101 131 33 10878 4N1W04-DA-00500 2019 6529 190,540 260,000 08/13/19 73 11,160 271,160 70
517 01 00 101 101 133 33 438773 5N1W33-DD-05201 2019 6526 224,610 256,000 08/14/19 88 10,910 266,910 84
518 02 79 101 101 162 33 431994 3N2W11-DB-02100 2019 6651 640,970 522,000 08/15/19 123 22,088 544,088 118
522 03 00 100 100 33 22672 4N4W04-AD-00200 2019 6648 67,790 70,000 08/16/19 97 2,941 72,941 93
519 01 00 101 101 132 33 437177 4N1W04-AC-06502 2019 6624 180,930 155,000 08/16/19 117 6,511 161,511 112
521 02 00 101 101 143 33 3422 3N2W12-AD-02423 2019 6628 336,420 333,000 08/16/19 101 13,989 346,989 97
524 01 00 101 101 142 33 11043 4N1W04-DB-07900 2019 6694 338,980 297,000 08/19/19 114 12,205 309,205 110
527 02 00 101 101 131 33 3841 3N2W12-CC-00304 2019 6696 219,150 221,000 08/20/19 99 9,015 230,015 95
528 02 00 101 101 141 33 438432 3N1W18-BB-01137 2019 6772 384,190 429,000 08/20/19 90 17,500 446,500 86
532 02 00 101 101 143 33 438397 3N1W18-BB-01102 2019 6782 432,310 459,000 08/21/19 94 18,584 477,584 91
533 02 00 101 101 131 33 3738 3N2W12-CA-04800 2019 6733 282,520 307,500 08/21/19 92 12,450 319,950 88
534 01 00 101 101 131 33 10916 4N1W04-DA-04000 2019 6946 197,280 270,000 08/21/19 73 10,932 280,932 70
536 01 00 101 101 142 33 12721 4N1W06-DA-01000 2019 6867 416,510 369,900 08/22/19 113 14,864 384,764 108
537 01 00 101 101 143 33 12083 4N1W05-CB-00116 2019 6900 384,600 375,200 08/23/19 103 14,962 390,162 99
538 01 00 101 101 132 33 10594 4N1W04-CA-05000 2019 6801 147,620 205,000 08/23/19 72 8,175 213,175 69
539 03 03 101 101 131 33 22379 4N4W03-BC-11500 2019 6850 177,470 245,000 08/23/19 72 9,770 254,770 70
541 01 00 100 100 30 439871 5N1W32-DC-00904 2019 6936 238,280 288,000 08/26/19 83 11,222 299,222 80
540 01 00 101 101 141 33 433461 5N1W32-DB-02800 2019 6822 338,710 330,000 08/26/19 103 12,858 342,858 99
542 01 00 101 101 131 33 13381 5N1W33-DB-00602 2019 6865 208,400 285,000 08/26/19 73 11,105 296,105 70
544 01 43 101 101 143 33 11904 4N1W05-BD-01108 2019 6891 256,500 235,000 08/27/19 109 9,085 244,085 105
545 02 00 101 101 141 33 4404 3N2W13-AA-06100 2019 7072 300,750 299,000 08/27/19 101 11,560 310,560 97
546 02 28 101 101 242 30 3506 3N2W12-BA-03100 2019 6863 323,510 360,000 08/27/19 90 13,918 373,918 87
46

# MA SA RMV
CL Prop
CL Stat CL
Cond Code
Acct No
Map # Book Page Total RMV
Final Price
Sales Date
Before Adj
Ratio
Total Adj
Time Adj. Sales Price
Time Adj
Ratio
547 06 01 101 101 141 33 14305 5N1W28-AA-02800 2019 6919 328,310 400,000 08/27/19 82 15,464 415,464 79
548 02 00 101 101 142 33 4040 3N2W12-DD-07800 2019 7137 496,070 450,000 08/28/19 110 17,260 467,260 106
551 02 00 101 101 143 33 429880 3N1W07-CC-01415 2019 6934 385,690 395,000 08/28/19 98 15,151 410,151 94
552 01 00 101 101 143 33 12569 4N1W05-DC-03000 2019 6909 403,720 454,200 08/28/19 89 17,421 471,621 86
553 02 00 101 101 33 438408 3N1W18-BB-01113 2019 7004 383,510 438,000 08/28/19 88 16,800 454,800 84
555 01 00 101 101 131 33 9704 4N1W03-BC-10800 2019 6998 189,500 255,000 08/28/19 74 9,781 264,781 72
557 02 00 101 101 141 30 4318 3N2W12-DD-04600 2019 7159 313,450 283,000 08/29/19 111 10,769 293,769 107
562 01 00 101 101 141 33 433451 5N1W32-DB-01800 2019 7221 342,750 388,500 08/29/19 88 14,783 403,283 85
567 02 00 101 101 141 33 4008 3N2W12-DD-08000 2019 7081 397,180 379,960 09/03/19 105 13,880 393,840 101
569 02 00 101 101 33 438409 3N1W18-BB-01114 2019 7439 350,710 440,000 09/04/19 80 15,939 455,939 77
570 01 00 101 101 132 33 9773 4N1W03-BD-04800 2019 7150 211,480 275,000 09/04/19 77 9,962 284,962 74
572 05 00 100 100 33 432382 7N4W09-CA-00115 2019 7392 49,680 49,900 09/05/19 100 1,792 51,692 96
573 05 00 100 100 33 432373 7N4W09-CA-00106 2019 7226 49,280 49,900 09/05/19 99 1,792 51,692 95
574 02 00 101 101 142 33 3168 3N2W11-DB-00800 2019 7218 529,010 562,500 09/05/19 94 20,205 582,705 91
575 03 00 101 101 141 33 22739 4N4W04-BA-01600 2019 7345 280,860 325,500 09/05/19 86 11,692 337,192 83
576 06 01 101 101 131 33 14190 5N1W21-CD-01201 2019 7224 225,140 275,000 09/05/19 82 9,878 284,878 79
578 02 79 101 101 162 33 431993 3N2W11-DB-02000 2019 7448 744,990 644,000 09/09/19 116 22,349 666,349 112
579 01 00 101 101 143 33 12859 4N1W06-DC-05800 2019 7343 336,650 347,000 09/09/19 97 12,042 359,042 94
581 01 00 101 101 33 439644 4N1W05-BD-09112 2019 8092 358,470 399,950 09/09/19 90 13,880 413,830 87
582 04 00 101 101 136 33 17899 7N2W16-BC-03100 2019 7441 250,710 290,000 09/09/19 86 10,064 300,064 84
583 03 03 101 101 131 33 22377 4N4W03-BC-11300 2019 7904 143,710 187,000 09/09/19 77 6,489 193,489 74
584 03 00 109 109 462 33 22545 4N4W03-CA-00201 2019 7334 199,360 288,500 09/09/19 69 10,012 298,512 67
586 02 00 101 101 143 33 4648 3N2W13-BA-04400 2019 7414 369,140 310,000 09/10/19 119 10,664 320,664 115
590 02 79 101 101 154 33 3228 3N2W11-DA-02607 2019 7487 617,390 525,000 09/11/19 118 17,900 542,900 114
592 02 00 101 101 141 30 3080 3N2W11-AA-00141 2019 7518 420,720 410,000 09/12/19 103 13,854 423,854 99
593 01 00 101 101 142 33 11575 4N1W05-AB-04213 2019 8281 377,110 365,000 09/12/19 103 12,333 377,333 100
596 01 00 101 101 135 33 9747 4N1W03-BD-02700 2019 7568 174,080 255,000 09/12/19 68 8,616 263,616 66
597 05 00 101 101 143 33 434293 7N4W09-CA-00125 2019 7566 250,240 295,500 09/13/19 85 9,895 305,395 82
598 01 00 101 101 135 33 12496 4N1W05-DB-02603 2019 7640 213,290 278,500 09/13/19 77 9,326 287,826 74
47
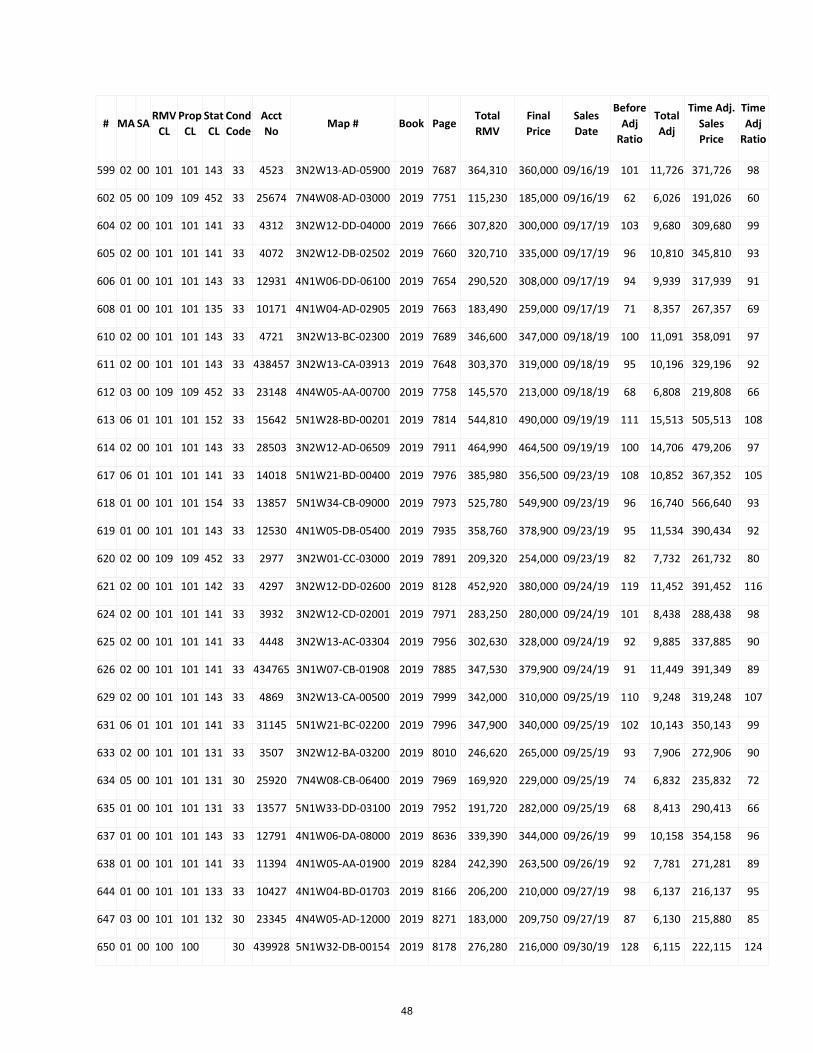
# MA SA RMV
CL Prop
CL Stat CL
Cond Code
Acct No
Map # Book Page Total RMV
Final Price
Sales Date
Before Adj
Ratio
Total Adj
Time Adj. Sales Price
Time Adj
Ratio
599 02 00 101 101 143 33 4523 3N2W13-AD-05900 2019 7687 364,310 360,000 09/16/19 101 11,726 371,726 98
602 05 00 109 109 452 33 25674 7N4W08-AD-03000 2019 7751 115,230 185,000 09/16/19 62 6,026 191,026 60
604 02 00 101 101 141 33 4312 3N2W12-DD-04000 2019 7666 307,820 300,000 09/17/19 103 9,680 309,680 99
605 02 00 101 101 141 33 4072 3N2W12-DB-02502 2019 7660 320,710 335,000 09/17/19 96 10,810 345,810 93
606 01 00 101 101 143 33 12931 4N1W06-DD-06100 2019 7654 290,520 308,000 09/17/19 94 9,939 317,939 91
608 01 00 101 101 135 33 10171 4N1W04-AD-02905 2019 7663 183,490 259,000 09/17/19 71 8,357 267,357 69
610 02 00 101 101 143 33 4721 3N2W13-BC-02300 2019 7689 346,600 347,000 09/18/19 100 11,091 358,091 97
611 02 00 101 101 143 33 438457 3N2W13-CA-03913 2019 7648 303,370 319,000 09/18/19 95 10,196 329,196 92
612 03 00 109 109 452 33 23148 4N4W05-AA-00700 2019 7758 145,570 213,000 09/18/19 68 6,808 219,808 66
613 06 01 101 101 152 33 15642 5N1W28-BD-00201 2019 7814 544,810 490,000 09/19/19 111 15,513 505,513 108
614 02 00 101 101 143 33 28503 3N2W12-AD-06509 2019 7911 464,990 464,500 09/19/19 100 14,706 479,206 97
617 06 01 101 101 141 33 14018 5N1W21-BD-00400 2019 7976 385,980 356,500 09/23/19 108 10,852 367,352 105
618 01 00 101 101 154 33 13857 5N1W34-CB-09000 2019 7973 525,780 549,900 09/23/19 96 16,740 566,640 93
619 01 00 101 101 143 33 12530 4N1W05-DB-05400 2019 7935 358,760 378,900 09/23/19 95 11,534 390,434 92
620 02 00 109 109 452 33 2977 3N2W01-CC-03000 2019 7891 209,320 254,000 09/23/19 82 7,732 261,732 80
621 02 00 101 101 142 33 4297 3N2W12-DD-02600 2019 8128 452,920 380,000 09/24/19 119 11,452 391,452 116
624 02 00 101 101 141 33 3932 3N2W12-CD-02001 2019 7971 283,250 280,000 09/24/19 101 8,438 288,438 98
625 02 00 101 101 141 33 4448 3N2W13-AC-03304 2019 7956 302,630 328,000 09/24/19 92 9,885 337,885 90
626 02 00 101 101 141 33 434765 3N1W07-CB-01908 2019 7885 347,530 379,900 09/24/19 91 11,449 391,349 89
629 02 00 101 101 143 33 4869 3N2W13-CA-00500 2019 7999 342,000 310,000 09/25/19 110 9,248 319,248 107
631 06 01 101 101 141 33 31145 5N1W21-BC-02200 2019 7996 347,900 340,000 09/25/19 102 10,143 350,143 99
633 02 00 101 101 131 33 3507 3N2W12-BA-03200 2019 8010 246,620 265,000 09/25/19 93 7,906 272,906 90
634 05 00 101 101 131 30 25920 7N4W08-CB-06400 2019 7969 169,920 229,000 09/25/19 74 6,832 235,832 72
635 01 00 101 101 131 33 13577 5N1W33-DD-03100 2019 7952 191,720 282,000 09/25/19 68 8,413 290,413 66
637 01 00 101 101 143 33 12791 4N1W06-DA-08000 2019 8636 339,390 344,000 09/26/19 99 10,158 354,158 96
638 01 00 101 101 141 33 11394 4N1W05-AA-01900 2019 8284 242,390 263,500 09/26/19 92 7,781 271,281 89
644 01 00 101 101 133 33 10427 4N1W04-BD-01703 2019 8166 206,200 210,000 09/27/19 98 6,137 216,137 95
647 03 00 101 101 132 30 23345 4N4W05-AD-12000 2019 8271 183,000 209,750 09/27/19 87 6,130 215,880 85
650 01 00 100 100 30 439928 5N1W32-DB-00154 2019 8178 276,280 216,000 09/30/19 128 6,115 222,115 124
48
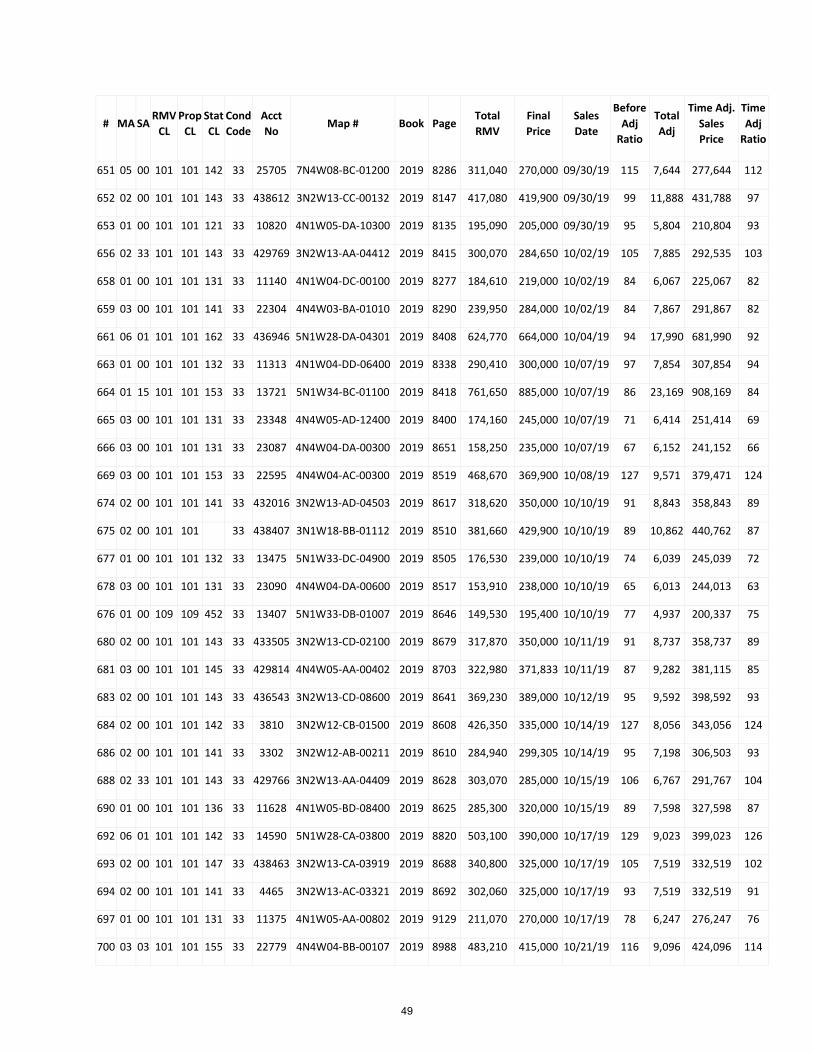
# MA SA RMV
CL Prop
CL Stat CL
Cond Code
Acct No
Map # Book Page Total RMV
Final Price
Sales Date
Before Adj
Ratio
Total Adj
Time Adj. Sales Price
Time Adj
Ratio
651 05 00 101 101 142 33 25705 7N4W08-BC-01200 2019 8286 311,040 270,000 09/30/19 115 7,644 277,644 112
652 02 00 101 101 143 33 438612 3N2W13-CC-00132 2019 8147 417,080 419,900 09/30/19 99 11,888 431,788 97
653 01 00 101 101 121 33 10820 4N1W05-DA-10300 2019 8135 195,090 205,000 09/30/19 95 5,804 210,804 93
656 02 33 101 101 143 33 429769 3N2W13-AA-04412 2019 8415 300,070 284,650 10/02/19 105 7,885 292,535 103
658 01 00 101 101 131 33 11140 4N1W04-DC-00100 2019 8277 184,610 219,000 10/02/19 84 6,067 225,067 82
659 03 00 101 101 141 33 22304 4N4W03-BA-01010 2019 8290 239,950 284,000 10/02/19 84 7,867 291,867 82
661 06 01 101 101 162 33 436946 5N1W28-DA-04301 2019 8408 624,770 664,000 10/04/19 94 17,990 681,990 92
663 01 00 101 101 132 33 11313 4N1W04-DD-06400 2019 8338 290,410 300,000 10/07/19 97 7,854 307,854 94
664 01 15 101 101 153 33 13721 5N1W34-BC-01100 2019 8418 761,650 885,000 10/07/19 86 23,169 908,169 84
665 03 00 101 101 131 33 23348 4N4W05-AD-12400 2019 8400 174,160 245,000 10/07/19 71 6,414 251,414 69
666 03 00 101 101 131 33 23087 4N4W04-DA-00300 2019 8651 158,250 235,000 10/07/19 67 6,152 241,152 66
669 03 00 101 101 153 33 22595 4N4W04-AC-00300 2019 8519 468,670 369,900 10/08/19 127 9,571 379,471 124
674 02 00 101 101 141 33 432016 3N2W13-AD-04503 2019 8617 318,620 350,000 10/10/19 91 8,843 358,843 89
675 02 00 101 101 33 438407 3N1W18-BB-01112 2019 8510 381,660 429,900 10/10/19 89 10,862 440,762 87
677 01 00 101 101 132 33 13475 5N1W33-DC-04900 2019 8505 176,530 239,000 10/10/19 74 6,039 245,039 72
678 03 00 101 101 131 33 23090 4N4W04-DA-00600 2019 8517 153,910 238,000 10/10/19 65 6,013 244,013 63
676 01 00 109 109 452 33 13407 5N1W33-DB-01007 2019 8646 149,530 195,400 10/10/19 77 4,937 200,337 75
680 02 00 101 101 143 33 433505 3N2W13-CD-02100 2019 8679 317,870 350,000 10/11/19 91 8,737 358,737 89
681 03 00 101 101 145 33 429814 4N4W05-AA-00402 2019 8703 322,980 371,833 10/11/19 87 9,282 381,115 85
683 02 00 101 101 143 33 436543 3N2W13-CD-08600 2019 8641 369,230 389,000 10/12/19 95 9,592 398,592 93
684 02 00 101 101 142 33 3810 3N2W12-CB-01500 2019 8608 426,350 335,000 10/14/19 127 8,056 343,056 124
686 02 00 101 101 141 33 3302 3N2W12-AB-00211 2019 8610 284,940 299,305 10/14/19 95 7,198 306,503 93
688 02 33 101 101 143 33 429766 3N2W13-AA-04409 2019 8628 303,070 285,000 10/15/19 106 6,767 291,767 104
690 01 00 101 101 136 33 11628 4N1W05-BD-08400 2019 8625 285,300 320,000 10/15/19 89 7,598 327,598 87
692 06 01 101 101 142 33 14590 5N1W28-CA-03800 2019 8820 503,100 390,000 10/17/19 129 9,023 399,023 126
693 02 00 101 101 147 33 438463 3N2W13-CA-03919 2019 8688 340,800 325,000 10/17/19 105 7,519 332,519 102
694 02 00 101 101 141 33 4465 3N2W13-AC-03321 2019 8692 302,060 325,000 10/17/19 93 7,519 332,519 91
697 01 00 101 101 131 33 11375 4N1W05-AA-00802 2019 9129 211,070 270,000 10/17/19 78 6,247 276,247 76
700 03 03 101 101 155 33 22779 4N4W04-BB-00107 2019 8988 483,210 415,000 10/21/19 116 9,096 424,096 114
49
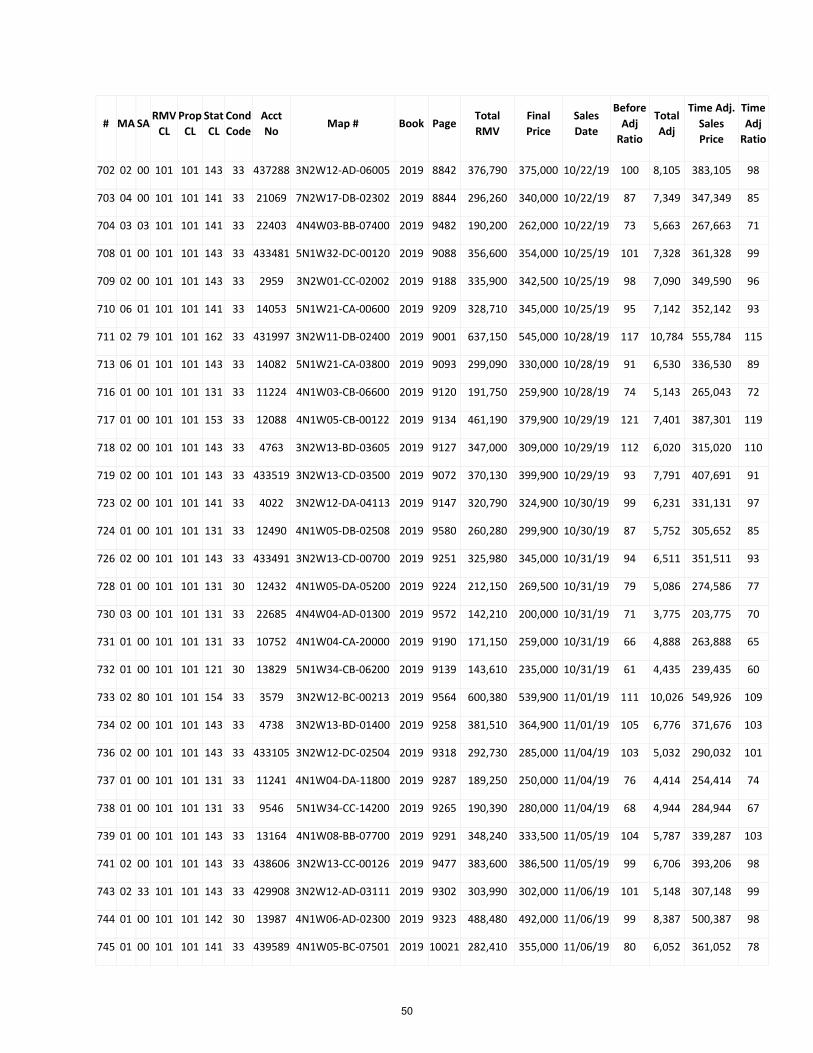
# MA SA RMV
CL Prop
CL Stat CL
Cond Code
Acct No
Map # Book Page Total RMV
Final Price
Sales Date
Before Adj
Ratio
Total Adj
Time Adj. Sales Price
Time Adj
Ratio
702 02 00 101 101 143 33 437288 3N2W12-AD-06005 2019 8842 376,790 375,000 10/22/19 100 8,105 383,105 98
703 04 00 101 101 141 33 21069 7N2W17-DB-02302 2019 8844 296,260 340,000 10/22/19 87 7,349 347,349 85
704 03 03 101 101 141 33 22403 4N4W03-BB-07400 2019 9482 190,200 262,000 10/22/19 73 5,663 267,663 71
708 01 00 101 101 143 33 433481 5N1W32-DC-00120 2019 9088 356,600 354,000 10/25/19 101 7,328 361,328 99
709 02 00 101 101 143 33 2959 3N2W01-CC-02002 2019 9188 335,900 342,500 10/25/19 98 7,090 349,590 96
710 06 01 101 101 141 33 14053 5N1W21-CA-00600 2019 9209 328,710 345,000 10/25/19 95 7,142 352,142 93
711 02 79 101 101 162 33 431997 3N2W11-DB-02400 2019 9001 637,150 545,000 10/28/19 117 10,784 555,784 115
713 06 01 101 101 143 33 14082 5N1W21-CA-03800 2019 9093 299,090 330,000 10/28/19 91 6,530 336,530 89
716 01 00 101 101 131 33 11224 4N1W03-CB-06600 2019 9120 191,750 259,900 10/28/19 74 5,143 265,043 72
717 01 00 101 101 153 33 12088 4N1W05-CB-00122 2019 9134 461,190 379,900 10/29/19 121 7,401 387,301 119
718 02 00 101 101 143 33 4763 3N2W13-BD-03605 2019 9127 347,000 309,000 10/29/19 112 6,020 315,020 110
719 02 00 101 101 143 33 433519 3N2W13-CD-03500 2019 9072 370,130 399,900 10/29/19 93 7,791 407,691 91
723 02 00 101 101 141 33 4022 3N2W12-DA-04113 2019 9147 320,790 324,900 10/30/19 99 6,231 331,131 97
724 01 00 101 101 131 33 12490 4N1W05-DB-02508 2019 9580 260,280 299,900 10/30/19 87 5,752 305,652 85
726 02 00 101 101 143 33 433491 3N2W13-CD-00700 2019 9251 325,980 345,000 10/31/19 94 6,511 351,511 93
728 01 00 101 101 131 30 12432 4N1W05-DA-05200 2019 9224 212,150 269,500 10/31/19 79 5,086 274,586 77
730 03 00 101 101 131 33 22685 4N4W04-AD-01300 2019 9572 142,210 200,000 10/31/19 71 3,775 203,775 70
731 01 00 101 101 131 33 10752 4N1W04-CA-20000 2019 9190 171,150 259,000 10/31/19 66 4,888 263,888 65
732 01 00 101 101 121 30 13829 5N1W34-CB-06200 2019 9139 143,610 235,000 10/31/19 61 4,435 239,435 60
733 02 80 101 101 154 33 3579 3N2W12-BC-00213 2019 9564 600,380 539,900 11/01/19 111 10,026 549,926 109
734 02 00 101 101 143 33 4738 3N2W13-BD-01400 2019 9258 381,510 364,900 11/01/19 105 6,776 371,676 103
736 02 00 101 101 143 33 433105 3N2W12-DC-02504 2019 9318 292,730 285,000 11/04/19 103 5,032 290,032 101
737 01 00 101 101 131 33 11241 4N1W04-DA-11800 2019 9287 189,250 250,000 11/04/19 76 4,414 254,414 74
738 01 00 101 101 131 33 9546 5N1W34-CC-14200 2019 9265 190,390 280,000 11/04/19 68 4,944 284,944 67
739 01 00 101 101 143 33 13164 4N1W08-BB-07700 2019 9291 348,240 333,500 11/05/19 104 5,787 339,287 103
741 02 00 101 101 143 33 438606 3N2W13-CC-00126 2019 9477 383,600 386,500 11/05/19 99 6,706 393,206 98
743 02 33 101 101 143 33 429908 3N2W12-AD-03111 2019 9302 303,990 302,000 11/06/19 101 5,148 307,148 99
744 01 00 101 101 142 30 13987 4N1W06-AD-02300 2019 9323 488,480 492,000 11/06/19 99 8,387 500,387 98
745 01 00 101 101 141 33 439589 4N1W05-BC-07501 2019 10021 282,410 355,000 11/06/19 80 6,052 361,052 78
50
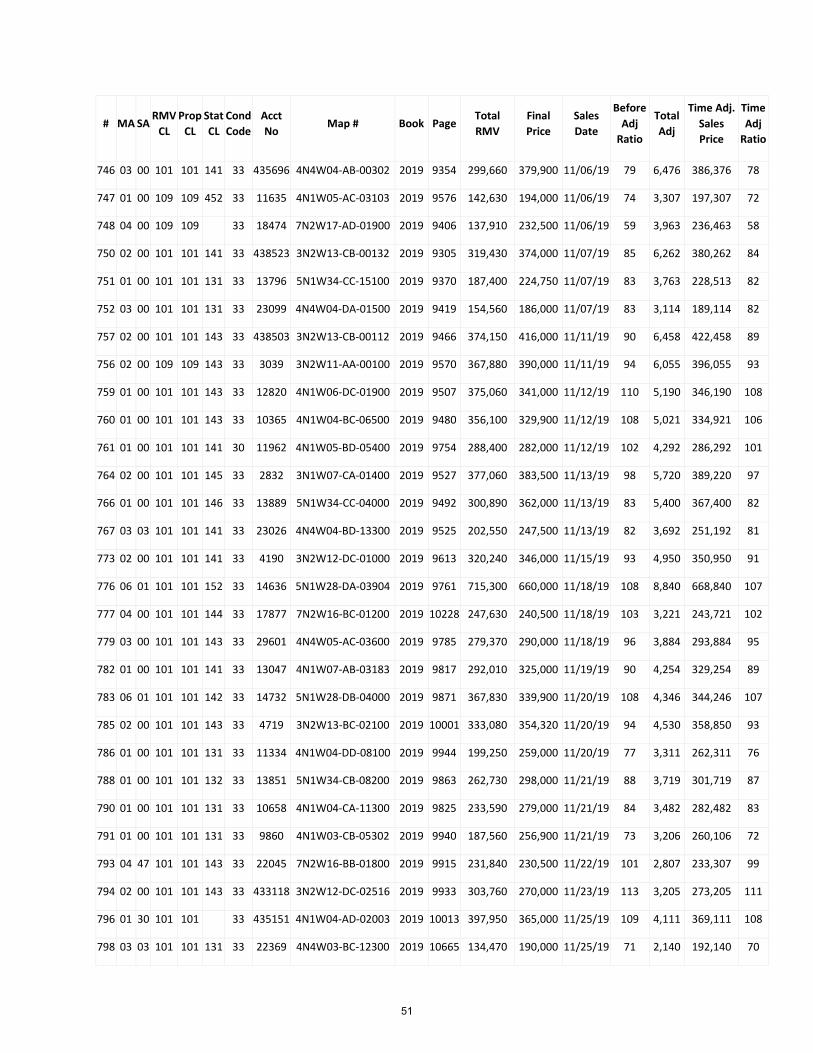
# MA SA RMV
CL Prop
CL Stat CL
Cond Code
Acct No
Map # Book Page Total RMV
Final Price
Sales Date
Before Adj
Ratio
Total Adj
Time Adj. Sales Price
Time Adj
Ratio
746 03 00 101 101 141 33 435696 4N4W04-AB-00302 2019 9354 299,660 379,900 11/06/19 79 6,476 386,376 78
747 01 00 109 109 452 33 11635 4N1W05-AC-03103 2019 9576 142,630 194,000 11/06/19 74 3,307 197,307 72
748 04 00 109 109 33 18474 7N2W17-AD-01900 2019 9406 137,910 232,500 11/06/19 59 3,963 236,463 58
750 02 00 101 101 141 33 438523 3N2W13-CB-00132 2019 9305 319,430 374,000 11/07/19 85 6,262 380,262 84
751 01 00 101 101 131 33 13796 5N1W34-CC-15100 2019 9370 187,400 224,750 11/07/19 83 3,763 228,513 82
752 03 00 101 101 131 33 23099 4N4W04-DA-01500 2019 9419 154,560 186,000 11/07/19 83 3,114 189,114 82
757 02 00 101 101 143 33 438503 3N2W13-CB-00112 2019 9466 374,150 416,000 11/11/19 90 6,458 422,458 89
756 02 00 109 109 143 33 3039 3N2W11-AA-00100 2019 9570 367,880 390,000 11/11/19 94 6,055 396,055 93
759 01 00 101 101 143 33 12820 4N1W06-DC-01900 2019 9507 375,060 341,000 11/12/19 110 5,190 346,190 108
760 01 00 101 101 143 33 10365 4N1W04-BC-06500 2019 9480 356,100 329,900 11/12/19 108 5,021 334,921 106
761 01 00 101 101 141 30 11962 4N1W05-BD-05400 2019 9754 288,400 282,000 11/12/19 102 4,292 286,292 101
764 02 00 101 101 145 33 2832 3N1W07-CA-01400 2019 9527 377,060 383,500 11/13/19 98 5,720 389,220 97
766 01 00 101 101 146 33 13889 5N1W34-CC-04000 2019 9492 300,890 362,000 11/13/19 83 5,400 367,400 82
767 03 03 101 101 141 33 23026 4N4W04-BD-13300 2019 9525 202,550 247,500 11/13/19 82 3,692 251,192 81
773 02 00 101 101 141 33 4190 3N2W12-DC-01000 2019 9613 320,240 346,000 11/15/19 93 4,950 350,950 91
776 06 01 101 101 152 33 14636 5N1W28-DA-03904 2019 9761 715,300 660,000 11/18/19 108 8,840 668,840 107
777 04 00 101 101 144 33 17877 7N2W16-BC-01200 2019 10228 247,630 240,500 11/18/19 103 3,221 243,721 102
779 03 00 101 101 143 33 29601 4N4W05-AC-03600 2019 9785 279,370 290,000 11/18/19 96 3,884 293,884 95
782 01 00 101 101 141 33 13047 4N1W07-AB-03183 2019 9817 292,010 325,000 11/19/19 90 4,254 329,254 89
783 06 01 101 101 142 33 14732 5N1W28-DB-04000 2019 9871 367,830 339,900 11/20/19 108 4,346 344,246 107
785 02 00 101 101 143 33 4719 3N2W13-BC-02100 2019 10001 333,080 354,320 11/20/19 94 4,530 358,850 93
786 01 00 101 101 131 33 11334 4N1W04-DD-08100 2019 9944 199,250 259,000 11/20/19 77 3,311 262,311 76
788 01 00 101 101 132 33 13851 5N1W34-CB-08200 2019 9863 262,730 298,000 11/21/19 88 3,719 301,719 87
790 01 00 101 101 131 33 10658 4N1W04-CA-11300 2019 9825 233,590 279,000 11/21/19 84 3,482 282,482 83
791 01 00 101 101 131 33 9860 4N1W03-CB-05302 2019 9940 187,560 256,900 11/21/19 73 3,206 260,106 72
793 04 47 101 101 143 33 22045 7N2W16-BB-01800 2019 9915 231,840 230,500 11/22/19 101 2,807 233,307 99
794 02 00 101 101 143 33 433118 3N2W12-DC-02516 2019 9933 303,760 270,000 11/23/19 113 3,205 273,205 111
796 01 30 101 101 33 435151 4N1W04-AD-02003 2019 10013 397,950 365,000 11/25/19 109 4,111 369,111 108
798 03 03 101 101 131 33 22369 4N4W03-BC-12300 2019 10665 134,470 190,000 11/25/19 71 2,140 192,140 70
51
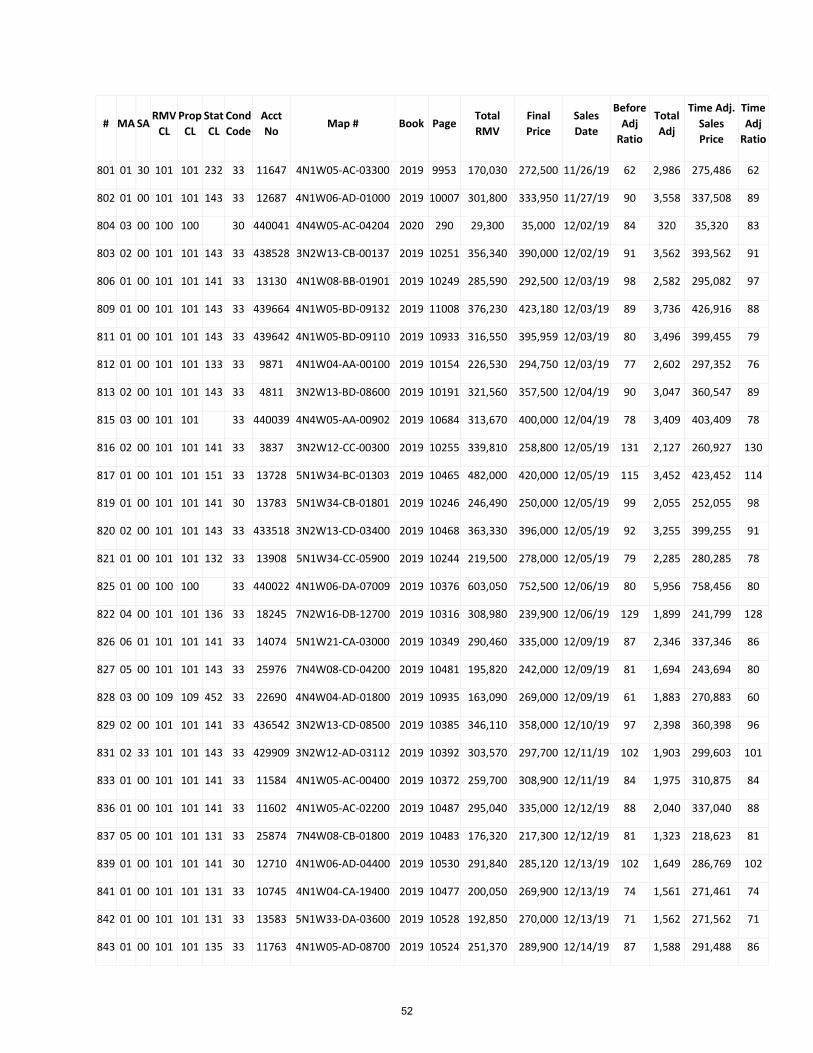
# MA SA RMV
CL Prop
CL Stat CL
Cond Code
Acct No
Map # Book Page Total RMV
Final Price
Sales Date
Before Adj
Ratio
Total Adj
Time Adj. Sales Price
Time Adj
Ratio
801 01 30 101 101 232 33 11647 4N1W05-AC-03300 2019 9953 170,030 272,500 11/26/19 62 2,986 275,486 62
802 01 00 101 101 143 33 12687 4N1W06-AD-01000 2019 10007 301,800 333,950 11/27/19 90 3,558 337,508 89
804 03 00 100 100 30 440041 4N4W05-AC-04204 2020 290 29,300 35,000 12/02/19 84 320 35,320 83
803 02 00 101 101 143 33 438528 3N2W13-CB-00137 2019 10251 356,340 390,000 12/02/19 91 3,562 393,562 91
806 01 00 101 101 141 33 13130 4N1W08-BB-01901 2019 10249 285,590 292,500 12/03/19 98 2,582 295,082 97
809 01 00 101 101 143 33 439664 4N1W05-BD-09132 2019 11008 376,230 423,180 12/03/19 89 3,736 426,916 88
811 01 00 101 101 143 33 439642 4N1W05-BD-09110 2019 10933 316,550 395,959 12/03/19 80 3,496 399,455 79
812 01 00 101 101 133 33 9871 4N1W04-AA-00100 2019 10154 226,530 294,750 12/03/19 77 2,602 297,352 76
813 02 00 101 101 143 33 4811 3N2W13-BD-08600 2019 10191 321,560 357,500 12/04/19 90 3,047 360,547 89
815 03 00 101 101 33 440039 4N4W05-AA-00902 2019 10684 313,670 400,000 12/04/19 78 3,409 403,409 78
816 02 00 101 101 141 33 3837 3N2W12-CC-00300 2019 10255 339,810 258,800 12/05/19 131 2,127 260,927 130
817 01 00 101 101 151 33 13728 5N1W34-BC-01303 2019 10465 482,000 420,000 12/05/19 115 3,452 423,452 114
819 01 00 101 101 141 30 13783 5N1W34-CB-01801 2019 10246 246,490 250,000 12/05/19 99 2,055 252,055 98
820 02 00 101 101 143 33 433518 3N2W13-CD-03400 2019 10468 363,330 396,000 12/05/19 92 3,255 399,255 91
821 01 00 101 101 132 33 13908 5N1W34-CC-05900 2019 10244 219,500 278,000 12/05/19 79 2,285 280,285 78
825 01 00 100 100 33 440022 4N1W06-DA-07009 2019 10376 603,050 752,500 12/06/19 80 5,956 758,456 80
822 04 00 101 101 136 33 18245 7N2W16-DB-12700 2019 10316 308,980 239,900 12/06/19 129 1,899 241,799 128
826 06 01 101 101 141 33 14074 5N1W21-CA-03000 2019 10349 290,460 335,000 12/09/19 87 2,346 337,346 86
827 05 00 101 101 143 33 25976 7N4W08-CD-04200 2019 10481 195,820 242,000 12/09/19 81 1,694 243,694 80
828 03 00 109 109 452 33 22690 4N4W04-AD-01800 2019 10935 163,090 269,000 12/09/19 61 1,883 270,883 60
829 02 00 101 101 141 33 436542 3N2W13-CD-08500 2019 10385 346,110 358,000 12/10/19 97 2,398 360,398 96
831 02 33 101 101 143 33 429909 3N2W12-AD-03112 2019 10392 303,570 297,700 12/11/19 102 1,903 299,603 101
833 01 00 101 101 141 33 11584 4N1W05-AC-00400 2019 10372 259,700 308,900 12/11/19 84 1,975 310,875 84
836 01 00 101 101 141 33 11602 4N1W05-AC-02200 2019 10487 295,040 335,000 12/12/19 88 2,040 337,040 88
837 05 00 101 101 131 33 25874 7N4W08-CB-01800 2019 10483 176,320 217,300 12/12/19 81 1,323 218,623 81
839 01 00 101 101 141 30 12710 4N1W06-AD-04400 2019 10530 291,840 285,120 12/13/19 102 1,649 286,769 102
841 01 00 101 101 131 33 10745 4N1W04-CA-19400 2019 10477 200,050 269,900 12/13/19 74 1,561 271,461 74
842 01 00 101 101 131 33 13583 5N1W33-DA-03600 2019 10528 192,850 270,000 12/13/19 71 1,562 271,562 71
843 01 00 101 101 135 33 11763 4N1W05-AD-08700 2019 10524 251,370 289,900 12/14/19 87 1,588 291,488 86
52
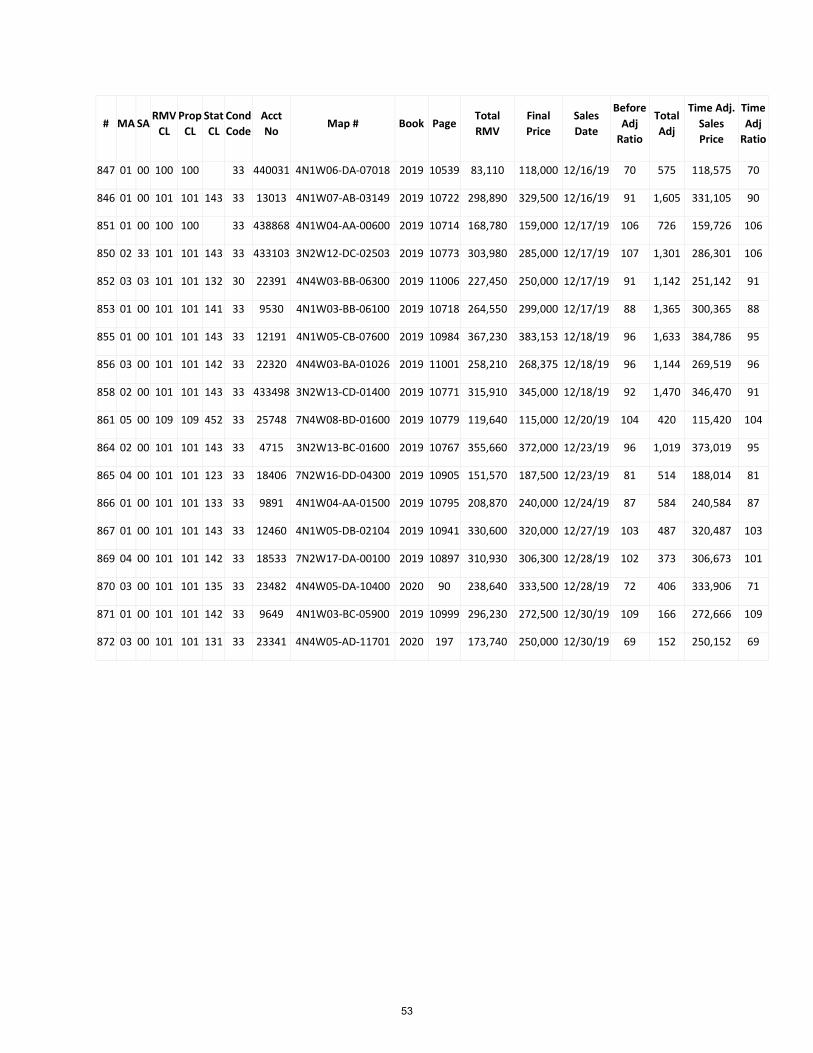
# MA SA RMV
CL Prop
CL Stat CL
Cond Code
Acct No
Map # Book Page Total RMV
Final Price
Sales Date
Before Adj
Ratio
Total Adj
Time Adj. Sales Price
Time Adj
Ratio
847 01 00 100 100 33 440031 4N1W06-DA-07018 2019 10539 83,110 118,000 12/16/19 70 575 118,575 70
846 01 00 101 101 143 33 13013 4N1W07-AB-03149 2019 10722 298,890 329,500 12/16/19 91 1,605 331,105 90
851 01 00 100 100 33 438868 4N1W04-AA-00600 2019 10714 168,780 159,000 12/17/19 106 726 159,726 106
850 02 33 101 101 143 33 433103 3N2W12-DC-02503 2019 10773 303,980 285,000 12/17/19 107 1,301 286,301 106
852 03 03 101 101 132 30 22391 4N4W03-BB-06300 2019 11006 227,450 250,000 12/17/19 91 1,142 251,142 91
853 01 00 101 101 141 33 9530 4N1W03-BB-06100 2019 10718 264,550 299,000 12/17/19 88 1,365 300,365 88
855 01 00 101 101 143 33 12191 4N1W05-CB-07600 2019 10984 367,230 383,153 12/18/19 96 1,633 384,786 95
856 03 00 101 101 142 33 22320 4N4W03-BA-01026 2019 11001 258,210 268,375 12/18/19 96 1,144 269,519 96
858 02 00 101 101 143 33 433498 3N2W13-CD-01400 2019 10771 315,910 345,000 12/18/19 92 1,470 346,470 91
861 05 00 109 109 452 33 25748 7N4W08-BD-01600 2019 10779 119,640 115,000 12/20/19 104 420 115,420 104
864 02 00 101 101 143 33 4715 3N2W13-BC-01600 2019 10767 355,660 372,000 12/23/19 96 1,019 373,019 95
865 04 00 101 101 123 33 18406 7N2W16-DD-04300 2019 10905 151,570 187,500 12/23/19 81 514 188,014 81
866 01 00 101 101 133 33 9891 4N1W04-AA-01500 2019 10795 208,870 240,000 12/24/19 87 584 240,584 87
867 01 00 101 101 143 33 12460 4N1W05-DB-02104 2019 10941 330,600 320,000 12/27/19 103 487 320,487 103
869 04 00 101 101 142 33 18533 7N2W17-DA-00100 2019 10897 310,930 306,300 12/28/19 102 373 306,673 101
870 03 00 101 101 135 33 23482 4N4W05-DA-10400 2020 90 238,640 333,500 12/28/19 72 406 333,906 71
871 01 00 101 101 142 33 9649 4N1W03-BC-05900 2019 10999 296,230 272,500 12/30/19 109 166 272,666 109
872 03 00 101 101 131 33 23341 4N4W05-AD-11701 2020 197 173,740 250,000 12/30/19 69 152 250,152 69
53

Time Study for RMV Class 4XX
Direct Calculation (Linear Regression) Analysis adjusting the sales price on an annual basis: Y axis intersect from beginning of trend line to end of trend line:
01/01/19 104% 01/01/20 96%
Number of days in the year: 365 Amount of change: 8% Annual change factor: 92% Annual adjustment factor: 109% Overall Annual Adjustment: 9% Intermediate adj factor: 0.0238%
0102030405060708090
100110120130140150160170
RMV/
SP =
Bef
ore
Adju
stm
ent
Ratio
Sales Date
Before-Sales Ratios 2020 RMV Class 4XX
0102030405060708090
100110120130140150160170
RMV/
Tim
e Ad
j. SP
= T
ime
Adj.
Sale
s Rat
io
Sales Date
After-Time Adjusted Sales Ratios 2020 RMV Class 4XX
54
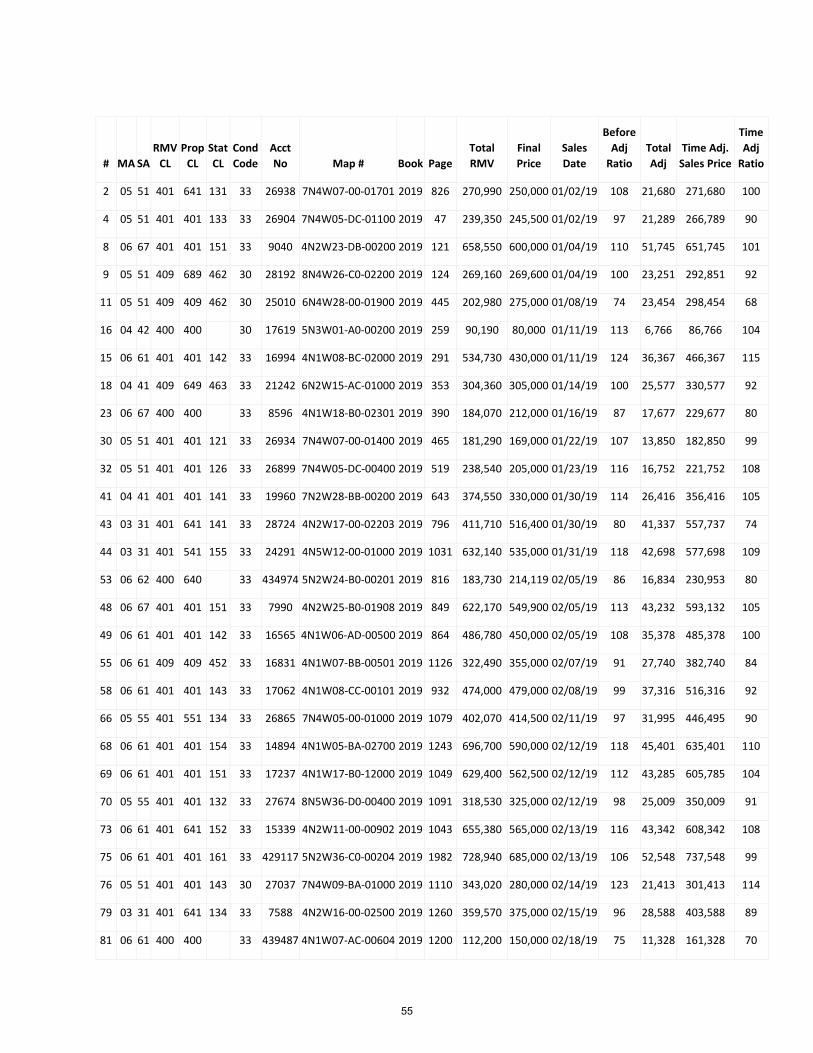
# MA SA RMV
CL Prop
CL Stat CL
Cond Code
Acct No Map # Book Page
Total RMV
Final Price
Sales Date
Before Adj
Ratio Total Adj
Time Adj. Sales Price
Time Adj
Ratio
2 05 51 401 641 131 33 26938 7N4W07-00-01701 2019 826 270,990 250,000 01/02/19 108 21,680 271,680 100
4 05 51 401 401 133 33 26904 7N4W05-DC-01100 2019 47 239,350 245,500 01/02/19 97 21,289 266,789 90
8 06 67 401 401 151 33 9040 4N2W23-DB-00200 2019 121 658,550 600,000 01/04/19 110 51,745 651,745 101
9 05 51 409 689 462 30 28192 8N4W26-C0-02200 2019 124 269,160 269,600 01/04/19 100 23,251 292,851 92
11 05 51 409 409 462 30 25010 6N4W28-00-01900 2019 445 202,980 275,000 01/08/19 74 23,454 298,454 68
16 04 42 400 400 30 17619 5N3W01-A0-00200 2019 259 90,190 80,000 01/11/19 113 6,766 86,766 104
15 06 61 401 401 142 33 16994 4N1W08-BC-02000 2019 291 534,730 430,000 01/11/19 124 36,367 466,367 115
18 04 41 409 649 463 33 21242 6N2W15-AC-01000 2019 353 304,360 305,000 01/14/19 100 25,577 330,577 92
23 06 67 400 400 33 8596 4N1W18-B0-02301 2019 390 184,070 212,000 01/16/19 87 17,677 229,677 80
30 05 51 401 401 121 33 26934 7N4W07-00-01400 2019 465 181,290 169,000 01/22/19 107 13,850 182,850 99
32 05 51 401 401 126 33 26899 7N4W05-DC-00400 2019 519 238,540 205,000 01/23/19 116 16,752 221,752 108
41 04 41 401 401 141 33 19960 7N2W28-BB-00200 2019 643 374,550 330,000 01/30/19 114 26,416 356,416 105
43 03 31 401 641 141 33 28724 4N2W17-00-02203 2019 796 411,710 516,400 01/30/19 80 41,337 557,737 74
44 03 31 401 541 155 33 24291 4N5W12-00-01000 2019 1031 632,140 535,000 01/31/19 118 42,698 577,698 109
53 06 62 400 640 33 434974 5N2W24-B0-00201 2019 816 183,730 214,119 02/05/19 86 16,834 230,953 80
48 06 67 401 401 151 33 7990 4N2W25-B0-01908 2019 849 622,170 549,900 02/05/19 113 43,232 593,132 105
49 06 61 401 401 142 33 16565 4N1W06-AD-00500 2019 864 486,780 450,000 02/05/19 108 35,378 485,378 100
55 06 61 409 409 452 33 16831 4N1W07-BB-00501 2019 1126 322,490 355,000 02/07/19 91 27,740 382,740 84
58 06 61 401 401 143 33 17062 4N1W08-CC-00101 2019 932 474,000 479,000 02/08/19 99 37,316 516,316 92
66 05 55 401 551 134 33 26865 7N4W05-00-01000 2019 1079 402,070 414,500 02/11/19 97 31,995 446,495 90
68 06 61 401 401 154 33 14894 4N1W05-BA-02700 2019 1243 696,700 590,000 02/12/19 118 45,401 635,401 110
69 06 61 401 401 151 33 17237 4N1W17-B0-12000 2019 1049 629,400 562,500 02/12/19 112 43,285 605,785 104
70 05 55 401 401 132 33 27674 8N5W36-D0-00400 2019 1091 318,530 325,000 02/12/19 98 25,009 350,009 91
73 06 61 401 641 152 33 15339 4N2W11-00-00902 2019 1043 655,380 565,000 02/13/19 116 43,342 608,342 108
75 06 61 401 401 161 33 429117 5N2W36-C0-00204 2019 1982 728,940 685,000 02/13/19 106 52,548 737,548 99
76 05 51 401 401 143 30 27037 7N4W09-BA-01000 2019 1110 343,020 280,000 02/14/19 123 21,413 301,413 114
79 03 31 401 641 134 33 7588 4N2W16-00-02500 2019 1260 359,570 375,000 02/15/19 96 28,588 403,588 89
81 06 61 400 400 33 439487 4N1W07-AC-00604 2019 1200 112,200 150,000 02/18/19 75 11,328 161,328 70
55
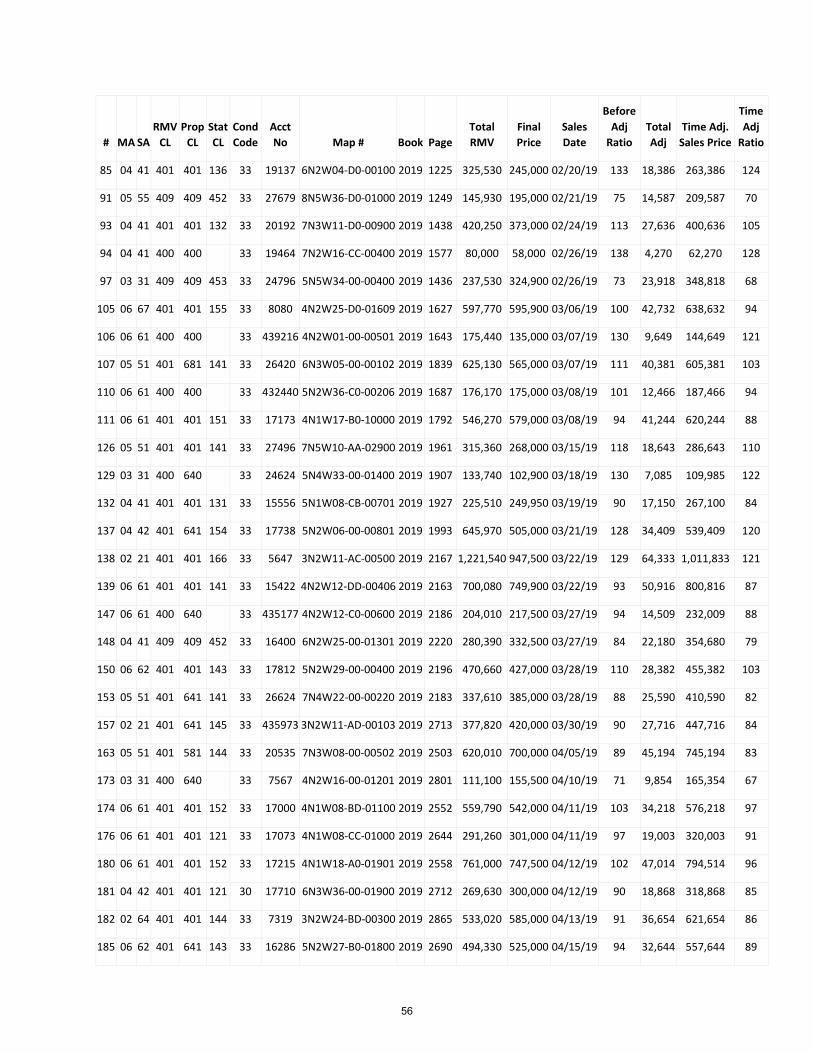
# MA SA RMV
CL Prop
CL Stat CL
Cond Code
Acct No Map # Book Page
Total RMV
Final Price
Sales Date
Before Adj
Ratio Total Adj
Time Adj. Sales Price
Time Adj
Ratio
85 04 41 401 401 136 33 19137 6N2W04-D0-00100 2019 1225 325,530 245,000 02/20/19 133 18,386 263,386 124
91 05 55 409 409 452 33 27679 8N5W36-D0-01000 2019 1249 145,930 195,000 02/21/19 75 14,587 209,587 70
93 04 41 401 401 132 33 20192 7N3W11-D0-00900 2019 1438 420,250 373,000 02/24/19 113 27,636 400,636 105
94 04 41 400 400 33 19464 7N2W16-CC-00400 2019 1577 80,000 58,000 02/26/19 138 4,270 62,270 128
97 03 31 409 409 453 33 24796 5N5W34-00-00400 2019 1436 237,530 324,900 02/26/19 73 23,918 348,818 68
105 06 67 401 401 155 33 8080 4N2W25-D0-01609 2019 1627 597,770 595,900 03/06/19 100 42,732 638,632 94
106 06 61 400 400 33 439216 4N2W01-00-00501 2019 1643 175,440 135,000 03/07/19 130 9,649 144,649 121
107 05 51 401 681 141 33 26420 6N3W05-00-00102 2019 1839 625,130 565,000 03/07/19 111 40,381 605,381 103
110 06 61 400 400 33 432440 5N2W36-C0-00206 2019 1687 176,170 175,000 03/08/19 101 12,466 187,466 94
111 06 61 401 401 151 33 17173 4N1W17-B0-10000 2019 1792 546,270 579,000 03/08/19 94 41,244 620,244 88
126 05 51 401 401 141 33 27496 7N5W10-AA-02900 2019 1961 315,360 268,000 03/15/19 118 18,643 286,643 110
129 03 31 400 640 33 24624 5N4W33-00-01400 2019 1907 133,740 102,900 03/18/19 130 7,085 109,985 122
132 04 41 401 401 131 33 15556 5N1W08-CB-00701 2019 1927 225,510 249,950 03/19/19 90 17,150 267,100 84
137 04 42 401 641 154 33 17738 5N2W06-00-00801 2019 1993 645,970 505,000 03/21/19 128 34,409 539,409 120
138 02 21 401 401 166 33 5647 3N2W11-AC-00500 2019 2167 1,221,540 947,500 03/22/19 129 64,333 1,011,833 121
139 06 61 401 401 141 33 15422 4N2W12-DD-00406 2019 2163 700,080 749,900 03/22/19 93 50,916 800,816 87
147 06 61 400 640 33 435177 4N2W12-C0-00600 2019 2186 204,010 217,500 03/27/19 94 14,509 232,009 88
148 04 41 409 409 452 33 16400 6N2W25-00-01301 2019 2220 280,390 332,500 03/27/19 84 22,180 354,680 79
150 06 62 401 401 143 33 17812 5N2W29-00-00400 2019 2196 470,660 427,000 03/28/19 110 28,382 455,382 103
153 05 51 401 641 141 33 26624 7N4W22-00-00220 2019 2183 337,610 385,000 03/28/19 88 25,590 410,590 82
157 02 21 401 641 145 33 435973 3N2W11-AD-00103 2019 2713 377,820 420,000 03/30/19 90 27,716 447,716 84
163 05 51 401 581 144 33 20535 7N3W08-00-00502 2019 2503 620,010 700,000 04/05/19 89 45,194 745,194 83
173 03 31 400 640 33 7567 4N2W16-00-01201 2019 2801 111,100 155,500 04/10/19 71 9,854 165,354 67
174 06 61 401 401 152 33 17000 4N1W08-BD-01100 2019 2552 559,790 542,000 04/11/19 103 34,218 576,218 97
176 06 61 401 401 121 33 17073 4N1W08-CC-01000 2019 2644 291,260 301,000 04/11/19 97 19,003 320,003 91
180 06 61 401 401 152 33 17215 4N1W18-A0-01901 2019 2558 761,000 747,500 04/12/19 102 47,014 794,514 96
181 04 42 401 401 121 30 17710 6N3W36-00-01900 2019 2712 269,630 300,000 04/12/19 90 18,868 318,868 85
182 02 64 401 401 144 33 7319 3N2W24-BD-00300 2019 2865 533,020 585,000 04/13/19 91 36,654 621,654 86
185 06 62 401 641 143 33 16286 5N2W27-B0-01800 2019 2690 494,330 525,000 04/15/19 94 32,644 557,644 89
56
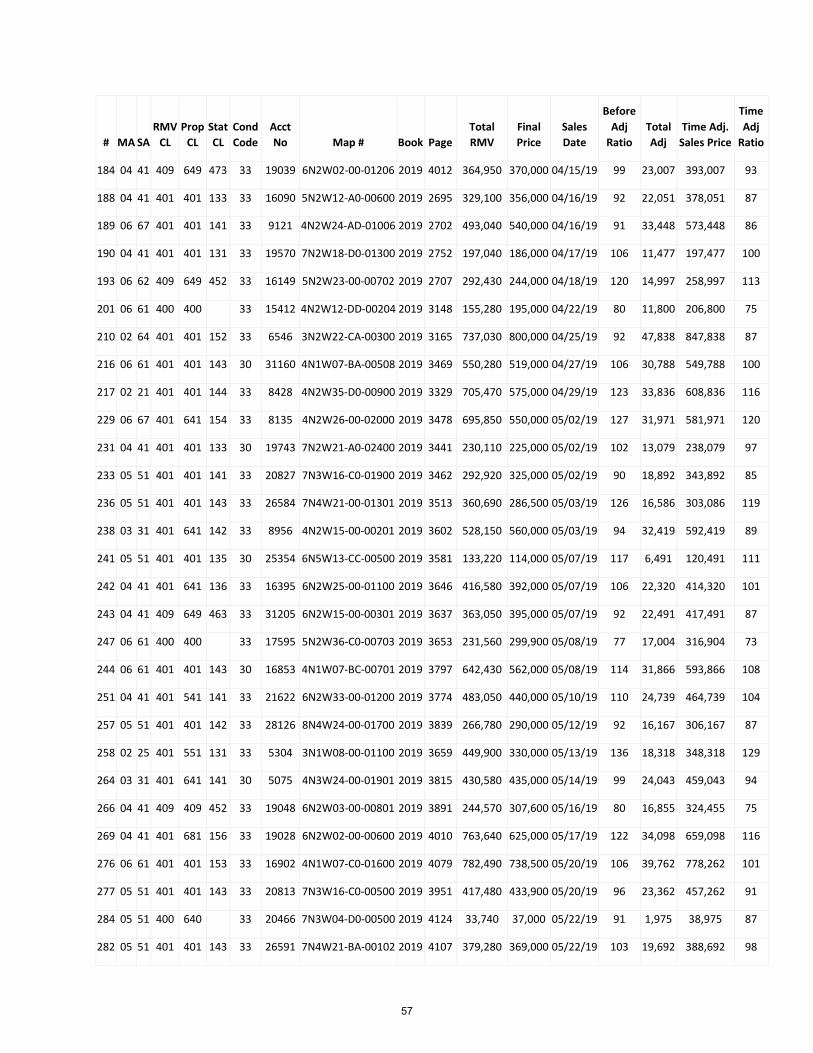
# MA SA RMV
CL Prop
CL Stat CL
Cond Code
Acct No Map # Book Page
Total RMV
Final Price
Sales Date
Before Adj
Ratio Total Adj
Time Adj. Sales Price
Time Adj
Ratio
184 04 41 409 649 473 33 19039 6N2W02-00-01206 2019 4012 364,950 370,000 04/15/19 99 23,007 393,007 93
188 04 41 401 401 133 33 16090 5N2W12-A0-00600 2019 2695 329,100 356,000 04/16/19 92 22,051 378,051 87
189 06 67 401 401 141 33 9121 4N2W24-AD-01006 2019 2702 493,040 540,000 04/16/19 91 33,448 573,448 86
190 04 41 401 401 131 33 19570 7N2W18-D0-01300 2019 2752 197,040 186,000 04/17/19 106 11,477 197,477 100
193 06 62 409 649 452 33 16149 5N2W23-00-00702 2019 2707 292,430 244,000 04/18/19 120 14,997 258,997 113
201 06 61 400 400 33 15412 4N2W12-DD-00204 2019 3148 155,280 195,000 04/22/19 80 11,800 206,800 75
210 02 64 401 401 152 33 6546 3N2W22-CA-00300 2019 3165 737,030 800,000 04/25/19 92 47,838 847,838 87
216 06 61 401 401 143 30 31160 4N1W07-BA-00508 2019 3469 550,280 519,000 04/27/19 106 30,788 549,788 100
217 02 21 401 401 144 33 8428 4N2W35-D0-00900 2019 3329 705,470 575,000 04/29/19 123 33,836 608,836 116
229 06 67 401 641 154 33 8135 4N2W26-00-02000 2019 3478 695,850 550,000 05/02/19 127 31,971 581,971 120
231 04 41 401 401 133 30 19743 7N2W21-A0-02400 2019 3441 230,110 225,000 05/02/19 102 13,079 238,079 97
233 05 51 401 401 141 33 20827 7N3W16-C0-01900 2019 3462 292,920 325,000 05/02/19 90 18,892 343,892 85
236 05 51 401 401 143 33 26584 7N4W21-00-01301 2019 3513 360,690 286,500 05/03/19 126 16,586 303,086 119
238 03 31 401 641 142 33 8956 4N2W15-00-00201 2019 3602 528,150 560,000 05/03/19 94 32,419 592,419 89
241 05 51 401 401 135 30 25354 6N5W13-CC-00500 2019 3581 133,220 114,000 05/07/19 117 6,491 120,491 111
242 04 41 401 641 136 33 16395 6N2W25-00-01100 2019 3646 416,580 392,000 05/07/19 106 22,320 414,320 101
243 04 41 409 649 463 33 31205 6N2W15-00-00301 2019 3637 363,050 395,000 05/07/19 92 22,491 417,491 87
247 06 61 400 400 33 17595 5N2W36-C0-00703 2019 3653 231,560 299,900 05/08/19 77 17,004 316,904 73
244 06 61 401 401 143 30 16853 4N1W07-BC-00701 2019 3797 642,430 562,000 05/08/19 114 31,866 593,866 108
251 04 41 401 541 141 33 21622 6N2W33-00-01200 2019 3774 483,050 440,000 05/10/19 110 24,739 464,739 104
257 05 51 401 401 142 33 28126 8N4W24-00-01700 2019 3839 266,780 290,000 05/12/19 92 16,167 306,167 87
258 02 25 401 551 131 33 5304 3N1W08-00-01100 2019 3659 449,900 330,000 05/13/19 136 18,318 348,318 129
264 03 31 401 641 141 30 5075 4N3W24-00-01901 2019 3815 430,580 435,000 05/14/19 99 24,043 459,043 94
266 04 41 409 409 452 33 19048 6N2W03-00-00801 2019 3891 244,570 307,600 05/16/19 80 16,855 324,455 75
269 04 41 401 681 156 33 19028 6N2W02-00-00600 2019 4010 763,640 625,000 05/17/19 122 34,098 659,098 116
276 06 61 401 401 153 33 16902 4N1W07-C0-01600 2019 4079 782,490 738,500 05/20/19 106 39,762 778,262 101
277 05 51 401 401 143 33 20813 7N3W16-C0-00500 2019 3951 417,480 433,900 05/20/19 96 23,362 457,262 91
284 05 51 400 640 33 20466 7N3W04-D0-00500 2019 4124 33,740 37,000 05/22/19 91 1,975 38,975 87
282 05 51 401 401 143 33 26591 7N4W21-BA-00102 2019 4107 379,280 369,000 05/22/19 103 19,692 388,692 98
57
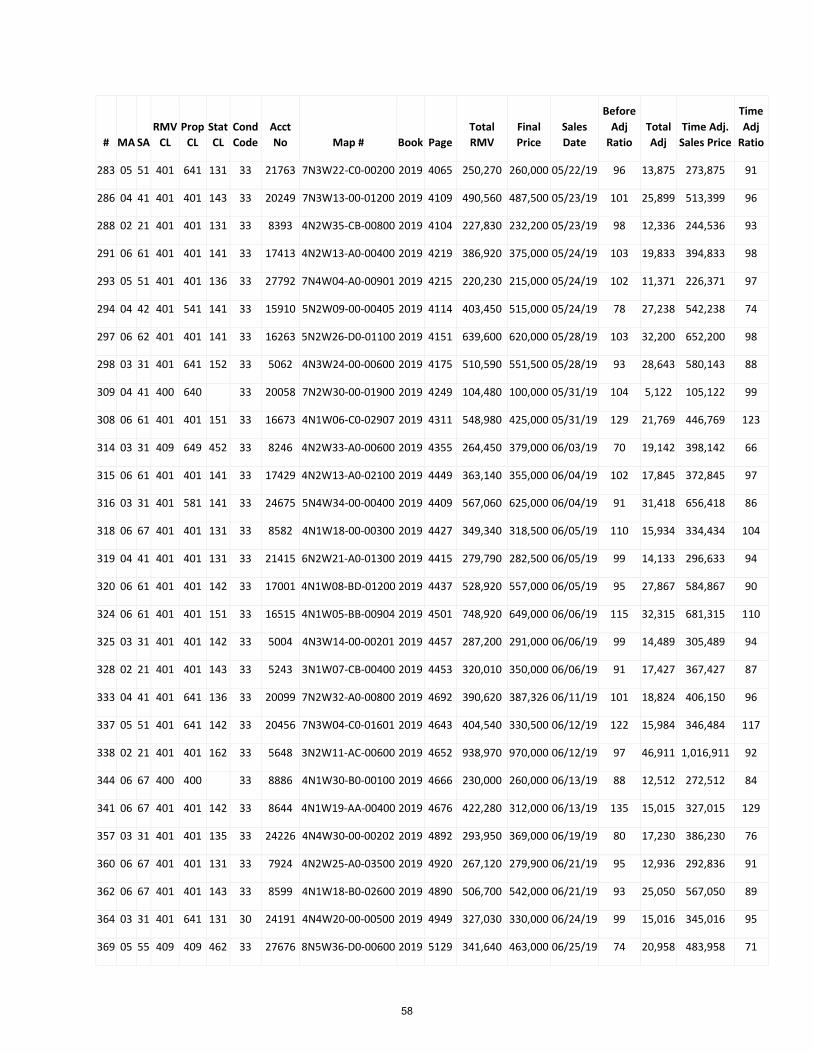
# MA SA RMV
CL Prop
CL Stat CL
Cond Code
Acct No Map # Book Page
Total RMV
Final Price
Sales Date
Before Adj
Ratio Total Adj
Time Adj. Sales Price
Time Adj
Ratio
283 05 51 401 641 131 33 21763 7N3W22-C0-00200 2019 4065 250,270 260,000 05/22/19 96 13,875 273,875 91
286 04 41 401 401 143 33 20249 7N3W13-00-01200 2019 4109 490,560 487,500 05/23/19 101 25,899 513,399 96
288 02 21 401 401 131 33 8393 4N2W35-CB-00800 2019 4104 227,830 232,200 05/23/19 98 12,336 244,536 93
291 06 61 401 401 141 33 17413 4N2W13-A0-00400 2019 4219 386,920 375,000 05/24/19 103 19,833 394,833 98
293 05 51 401 401 136 33 27792 7N4W04-A0-00901 2019 4215 220,230 215,000 05/24/19 102 11,371 226,371 97
294 04 42 401 541 141 33 15910 5N2W09-00-00405 2019 4114 403,450 515,000 05/24/19 78 27,238 542,238 74
297 06 62 401 401 141 33 16263 5N2W26-D0-01100 2019 4151 639,600 620,000 05/28/19 103 32,200 652,200 98
298 03 31 401 641 152 33 5062 4N3W24-00-00600 2019 4175 510,590 551,500 05/28/19 93 28,643 580,143 88
309 04 41 400 640 33 20058 7N2W30-00-01900 2019 4249 104,480 100,000 05/31/19 104 5,122 105,122 99
308 06 61 401 401 151 33 16673 4N1W06-C0-02907 2019 4311 548,980 425,000 05/31/19 129 21,769 446,769 123
314 03 31 409 649 452 33 8246 4N2W33-A0-00600 2019 4355 264,450 379,000 06/03/19 70 19,142 398,142 66
315 06 61 401 401 141 33 17429 4N2W13-A0-02100 2019 4449 363,140 355,000 06/04/19 102 17,845 372,845 97
316 03 31 401 581 141 33 24675 5N4W34-00-00400 2019 4409 567,060 625,000 06/04/19 91 31,418 656,418 86
318 06 67 401 401 131 33 8582 4N1W18-00-00300 2019 4427 349,340 318,500 06/05/19 110 15,934 334,434 104
319 04 41 401 401 131 33 21415 6N2W21-A0-01300 2019 4415 279,790 282,500 06/05/19 99 14,133 296,633 94
320 06 61 401 401 142 33 17001 4N1W08-BD-01200 2019 4437 528,920 557,000 06/05/19 95 27,867 584,867 90
324 06 61 401 401 151 33 16515 4N1W05-BB-00904 2019 4501 748,920 649,000 06/06/19 115 32,315 681,315 110
325 03 31 401 401 142 33 5004 4N3W14-00-00201 2019 4457 287,200 291,000 06/06/19 99 14,489 305,489 94
328 02 21 401 401 143 33 5243 3N1W07-CB-00400 2019 4453 320,010 350,000 06/06/19 91 17,427 367,427 87
333 04 41 401 641 136 33 20099 7N2W32-A0-00800 2019 4692 390,620 387,326 06/11/19 101 18,824 406,150 96
337 05 51 401 641 142 33 20456 7N3W04-C0-01601 2019 4643 404,540 330,500 06/12/19 122 15,984 346,484 117
338 02 21 401 401 162 33 5648 3N2W11-AC-00600 2019 4652 938,970 970,000 06/12/19 97 46,911 1,016,911 92
344 06 67 400 400 33 8886 4N1W30-B0-00100 2019 4666 230,000 260,000 06/13/19 88 12,512 272,512 84
341 06 67 401 401 142 33 8644 4N1W19-AA-00400 2019 4676 422,280 312,000 06/13/19 135 15,015 327,015 129
357 03 31 401 401 135 33 24226 4N4W30-00-00202 2019 4892 293,950 369,000 06/19/19 80 17,230 386,230 76
360 06 67 401 401 131 33 7924 4N2W25-A0-03500 2019 4920 267,120 279,900 06/21/19 95 12,936 292,836 91
362 06 67 401 401 143 33 8599 4N1W18-B0-02600 2019 4890 506,700 542,000 06/21/19 93 25,050 567,050 89
364 03 31 401 641 131 30 24191 4N4W20-00-00500 2019 4949 327,030 330,000 06/24/19 99 15,016 345,016 95
369 05 55 409 409 462 33 27676 8N5W36-D0-00600 2019 5129 341,640 463,000 06/25/19 74 20,958 483,958 71
58
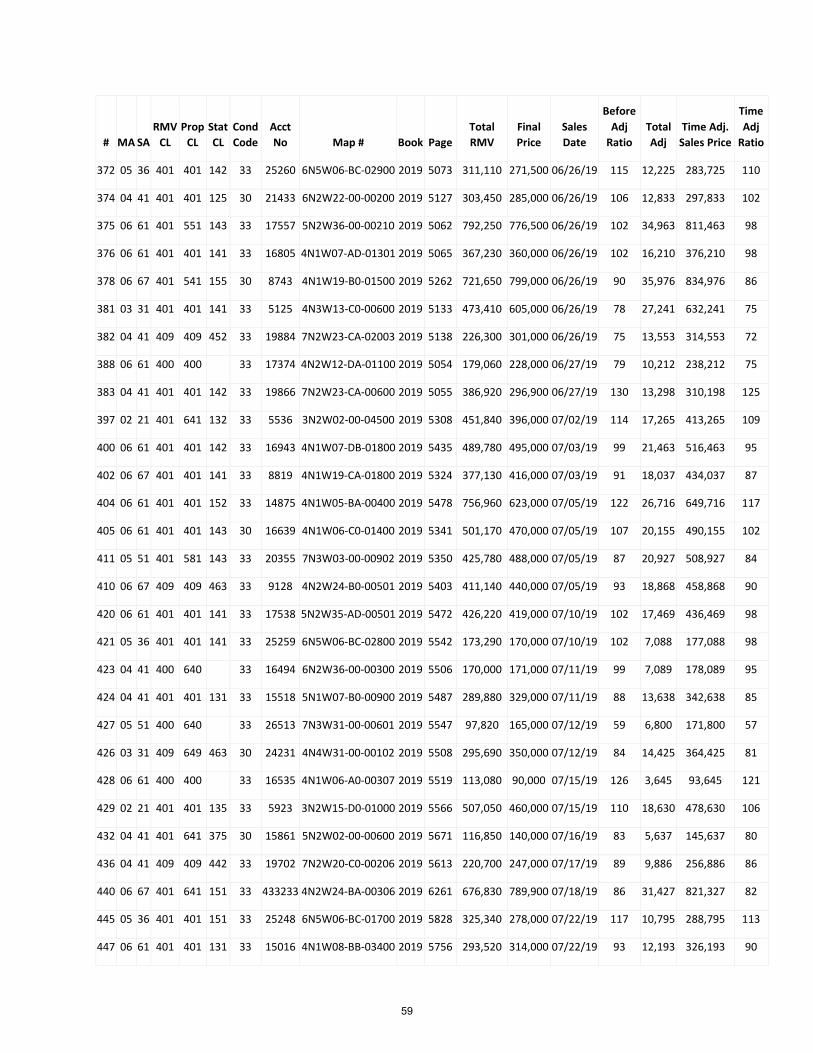
# MA SA RMV
CL Prop
CL Stat CL
Cond Code
Acct No Map # Book Page
Total RMV
Final Price
Sales Date
Before Adj
Ratio Total Adj
Time Adj. Sales Price
Time Adj
Ratio
372 05 36 401 401 142 33 25260 6N5W06-BC-02900 2019 5073 311,110 271,500 06/26/19 115 12,225 283,725 110
374 04 41 401 401 125 30 21433 6N2W22-00-00200 2019 5127 303,450 285,000 06/26/19 106 12,833 297,833 102
375 06 61 401 551 143 33 17557 5N2W36-00-00210 2019 5062 792,250 776,500 06/26/19 102 34,963 811,463 98
376 06 61 401 401 141 33 16805 4N1W07-AD-01301 2019 5065 367,230 360,000 06/26/19 102 16,210 376,210 98
378 06 67 401 541 155 30 8743 4N1W19-B0-01500 2019 5262 721,650 799,000 06/26/19 90 35,976 834,976 86
381 03 31 401 401 141 33 5125 4N3W13-C0-00600 2019 5133 473,410 605,000 06/26/19 78 27,241 632,241 75
382 04 41 409 409 452 33 19884 7N2W23-CA-02003 2019 5138 226,300 301,000 06/26/19 75 13,553 314,553 72
388 06 61 400 400 33 17374 4N2W12-DA-01100 2019 5054 179,060 228,000 06/27/19 79 10,212 238,212 75
383 04 41 401 401 142 33 19866 7N2W23-CA-00600 2019 5055 386,920 296,900 06/27/19 130 13,298 310,198 125
397 02 21 401 641 132 33 5536 3N2W02-00-04500 2019 5308 451,840 396,000 07/02/19 114 17,265 413,265 109
400 06 61 401 401 142 33 16943 4N1W07-DB-01800 2019 5435 489,780 495,000 07/03/19 99 21,463 516,463 95
402 06 67 401 401 141 33 8819 4N1W19-CA-01800 2019 5324 377,130 416,000 07/03/19 91 18,037 434,037 87
404 06 61 401 401 152 33 14875 4N1W05-BA-00400 2019 5478 756,960 623,000 07/05/19 122 26,716 649,716 117
405 06 61 401 401 143 30 16639 4N1W06-C0-01400 2019 5341 501,170 470,000 07/05/19 107 20,155 490,155 102
411 05 51 401 581 143 33 20355 7N3W03-00-00902 2019 5350 425,780 488,000 07/05/19 87 20,927 508,927 84
410 06 67 409 409 463 33 9128 4N2W24-B0-00501 2019 5403 411,140 440,000 07/05/19 93 18,868 458,868 90
420 06 61 401 401 141 33 17538 5N2W35-AD-00501 2019 5472 426,220 419,000 07/10/19 102 17,469 436,469 98
421 05 36 401 401 141 33 25259 6N5W06-BC-02800 2019 5542 173,290 170,000 07/10/19 102 7,088 177,088 98
423 04 41 400 640 33 16494 6N2W36-00-00300 2019 5506 170,000 171,000 07/11/19 99 7,089 178,089 95
424 04 41 401 401 131 33 15518 5N1W07-B0-00900 2019 5487 289,880 329,000 07/11/19 88 13,638 342,638 85
427 05 51 400 640 33 26513 7N3W31-00-00601 2019 5547 97,820 165,000 07/12/19 59 6,800 171,800 57
426 03 31 409 649 463 30 24231 4N4W31-00-00102 2019 5508 295,690 350,000 07/12/19 84 14,425 364,425 81
428 06 61 400 400 33 16535 4N1W06-A0-00307 2019 5519 113,080 90,000 07/15/19 126 3,645 93,645 121
429 02 21 401 401 135 33 5923 3N2W15-D0-01000 2019 5566 507,050 460,000 07/15/19 110 18,630 478,630 106
432 04 41 401 641 375 30 15861 5N2W02-00-00600 2019 5671 116,850 140,000 07/16/19 83 5,637 145,637 80
436 04 41 409 409 442 33 19702 7N2W20-C0-00206 2019 5613 220,700 247,000 07/17/19 89 9,886 256,886 86
440 06 67 401 641 151 33 433233 4N2W24-BA-00306 2019 6261 676,830 789,900 07/18/19 86 31,427 821,327 82
445 05 36 401 401 151 33 25248 6N5W06-BC-01700 2019 5828 325,340 278,000 07/22/19 117 10,795 288,795 113
447 06 61 401 401 131 33 15016 4N1W08-BB-03400 2019 5756 293,520 314,000 07/22/19 93 12,193 326,193 90
59
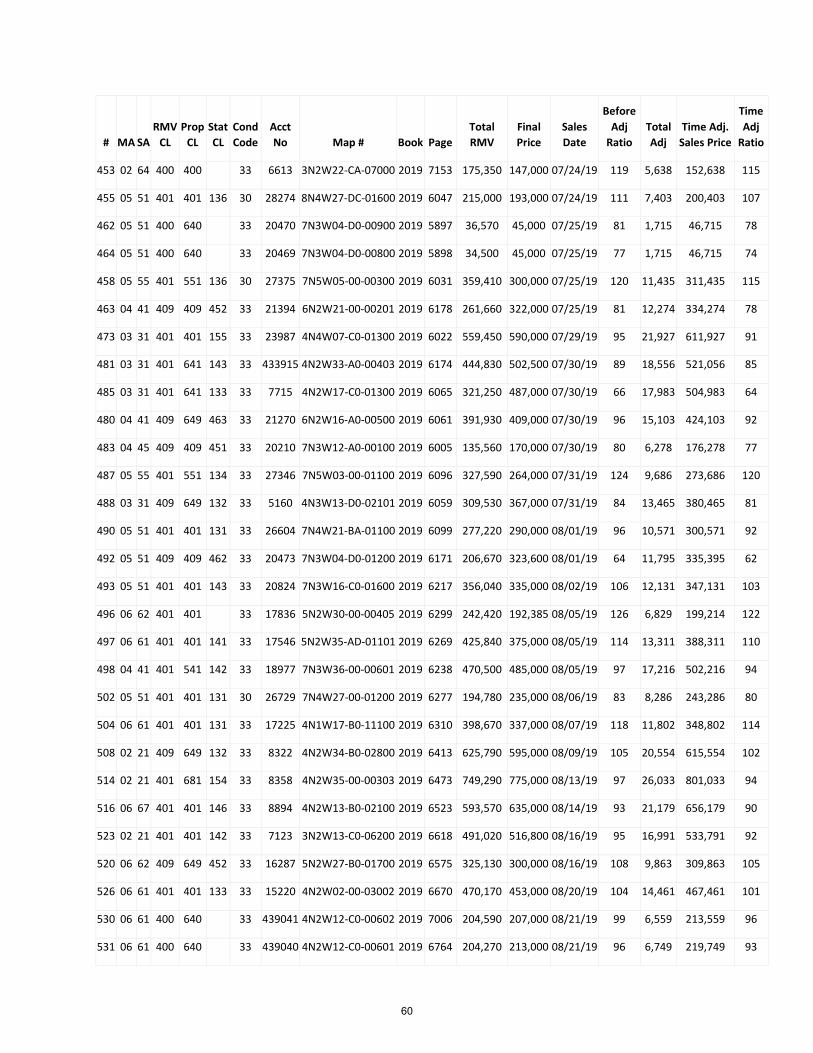
# MA SA RMV
CL Prop
CL Stat CL
Cond Code
Acct No Map # Book Page
Total RMV
Final Price
Sales Date
Before Adj
Ratio Total Adj
Time Adj. Sales Price
Time Adj
Ratio
453 02 64 400 400 33 6613 3N2W22-CA-07000 2019 7153 175,350 147,000 07/24/19 119 5,638 152,638 115
455 05 51 401 401 136 30 28274 8N4W27-DC-01600 2019 6047 215,000 193,000 07/24/19 111 7,403 200,403 107
462 05 51 400 640 33 20470 7N3W04-D0-00900 2019 5897 36,570 45,000 07/25/19 81 1,715 46,715 78
464 05 51 400 640 33 20469 7N3W04-D0-00800 2019 5898 34,500 45,000 07/25/19 77 1,715 46,715 74
458 05 55 401 551 136 30 27375 7N5W05-00-00300 2019 6031 359,410 300,000 07/25/19 120 11,435 311,435 115
463 04 41 409 409 452 33 21394 6N2W21-00-00201 2019 6178 261,660 322,000 07/25/19 81 12,274 334,274 78
473 03 31 401 401 155 33 23987 4N4W07-C0-01300 2019 6022 559,450 590,000 07/29/19 95 21,927 611,927 91
481 03 31 401 641 143 33 433915 4N2W33-A0-00403 2019 6174 444,830 502,500 07/30/19 89 18,556 521,056 85
485 03 31 401 641 133 33 7715 4N2W17-C0-01300 2019 6065 321,250 487,000 07/30/19 66 17,983 504,983 64
480 04 41 409 649 463 33 21270 6N2W16-A0-00500 2019 6061 391,930 409,000 07/30/19 96 15,103 424,103 92
483 04 45 409 409 451 33 20210 7N3W12-A0-00100 2019 6005 135,560 170,000 07/30/19 80 6,278 176,278 77
487 05 55 401 551 134 33 27346 7N5W03-00-01100 2019 6096 327,590 264,000 07/31/19 124 9,686 273,686 120
488 03 31 409 649 132 33 5160 4N3W13-D0-02101 2019 6059 309,530 367,000 07/31/19 84 13,465 380,465 81
490 05 51 401 401 131 33 26604 7N4W21-BA-01100 2019 6099 277,220 290,000 08/01/19 96 10,571 300,571 92
492 05 51 409 409 462 33 20473 7N3W04-D0-01200 2019 6171 206,670 323,600 08/01/19 64 11,795 335,395 62
493 05 51 401 401 143 33 20824 7N3W16-C0-01600 2019 6217 356,040 335,000 08/02/19 106 12,131 347,131 103
496 06 62 401 401 33 17836 5N2W30-00-00405 2019 6299 242,420 192,385 08/05/19 126 6,829 199,214 122
497 06 61 401 401 141 33 17546 5N2W35-AD-01101 2019 6269 425,840 375,000 08/05/19 114 13,311 388,311 110
498 04 41 401 541 142 33 18977 7N3W36-00-00601 2019 6238 470,500 485,000 08/05/19 97 17,216 502,216 94
502 05 51 401 401 131 30 26729 7N4W27-00-01200 2019 6277 194,780 235,000 08/06/19 83 8,286 243,286 80
504 06 61 401 401 131 33 17225 4N1W17-B0-11100 2019 6310 398,670 337,000 08/07/19 118 11,802 348,802 114
508 02 21 409 649 132 33 8322 4N2W34-B0-02800 2019 6413 625,790 595,000 08/09/19 105 20,554 615,554 102
514 02 21 401 681 154 33 8358 4N2W35-00-00303 2019 6473 749,290 775,000 08/13/19 97 26,033 801,033 94
516 06 67 401 401 146 33 8894 4N2W13-B0-02100 2019 6523 593,570 635,000 08/14/19 93 21,179 656,179 90
523 02 21 401 401 142 33 7123 3N2W13-C0-06200 2019 6618 491,020 516,800 08/16/19 95 16,991 533,791 92
520 06 62 409 649 452 33 16287 5N2W27-B0-01700 2019 6575 325,130 300,000 08/16/19 108 9,863 309,863 105
526 06 61 401 401 133 33 15220 4N2W02-00-03002 2019 6670 470,170 453,000 08/20/19 104 14,461 467,461 101
530 06 61 400 640 33 439041 4N2W12-C0-00602 2019 7006 204,590 207,000 08/21/19 99 6,559 213,559 96
531 06 61 400 640 33 439040 4N2W12-C0-00601 2019 6764 204,270 213,000 08/21/19 96 6,749 219,749 93
60
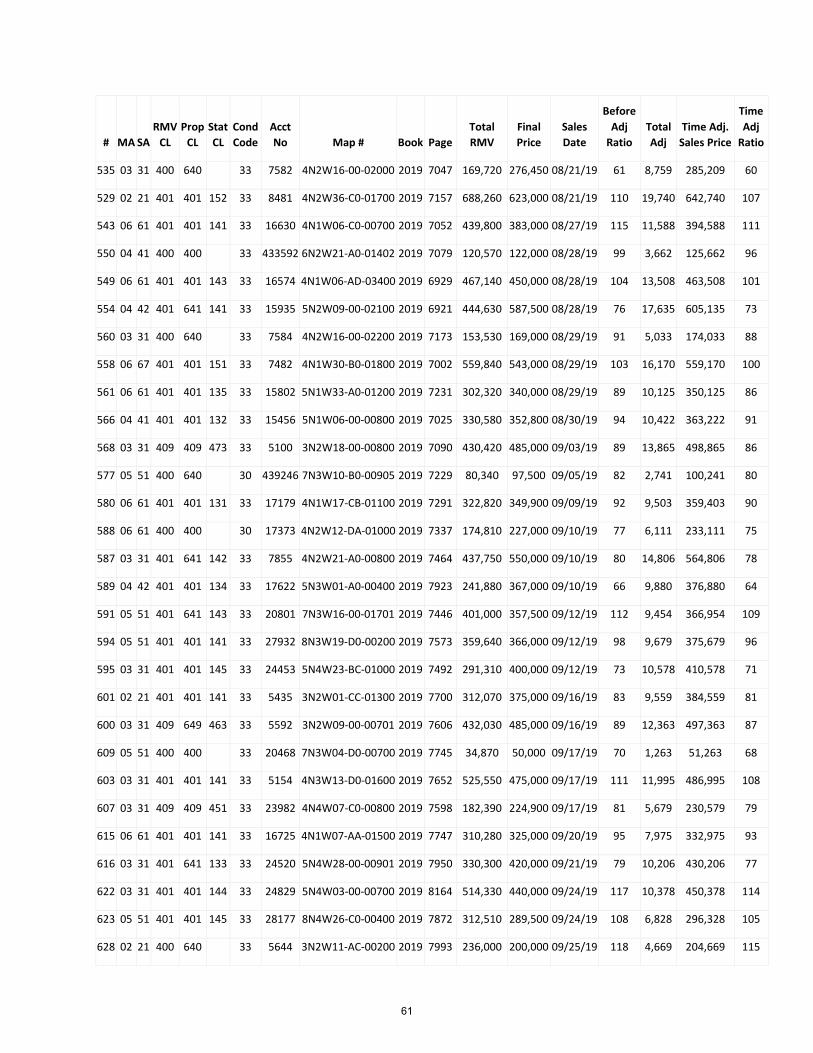
# MA SA RMV
CL Prop
CL Stat CL
Cond Code
Acct No Map # Book Page
Total RMV
Final Price
Sales Date
Before Adj
Ratio Total Adj
Time Adj. Sales Price
Time Adj
Ratio
535 03 31 400 640 33 7582 4N2W16-00-02000 2019 7047 169,720 276,450 08/21/19 61 8,759 285,209 60
529 02 21 401 401 152 33 8481 4N2W36-C0-01700 2019 7157 688,260 623,000 08/21/19 110 19,740 642,740 107
543 06 61 401 401 141 33 16630 4N1W06-C0-00700 2019 7052 439,800 383,000 08/27/19 115 11,588 394,588 111
550 04 41 400 400 33 433592 6N2W21-A0-01402 2019 7079 120,570 122,000 08/28/19 99 3,662 125,662 96
549 06 61 401 401 143 33 16574 4N1W06-AD-03400 2019 6929 467,140 450,000 08/28/19 104 13,508 463,508 101
554 04 42 401 641 141 33 15935 5N2W09-00-02100 2019 6921 444,630 587,500 08/28/19 76 17,635 605,135 73
560 03 31 400 640 33 7584 4N2W16-00-02200 2019 7173 153,530 169,000 08/29/19 91 5,033 174,033 88
558 06 67 401 401 151 33 7482 4N1W30-B0-01800 2019 7002 559,840 543,000 08/29/19 103 16,170 559,170 100
561 06 61 401 401 135 33 15802 5N1W33-A0-01200 2019 7231 302,320 340,000 08/29/19 89 10,125 350,125 86
566 04 41 401 401 132 33 15456 5N1W06-00-00800 2019 7025 330,580 352,800 08/30/19 94 10,422 363,222 91
568 03 31 409 409 473 33 5100 3N2W18-00-00800 2019 7090 430,420 485,000 09/03/19 89 13,865 498,865 86
577 05 51 400 640 30 439246 7N3W10-B0-00905 2019 7229 80,340 97,500 09/05/19 82 2,741 100,241 80
580 06 61 401 401 131 33 17179 4N1W17-CB-01100 2019 7291 322,820 349,900 09/09/19 92 9,503 359,403 90
588 06 61 400 400 30 17373 4N2W12-DA-01000 2019 7337 174,810 227,000 09/10/19 77 6,111 233,111 75
587 03 31 401 641 142 33 7855 4N2W21-A0-00800 2019 7464 437,750 550,000 09/10/19 80 14,806 564,806 78
589 04 42 401 401 134 33 17622 5N3W01-A0-00400 2019 7923 241,880 367,000 09/10/19 66 9,880 376,880 64
591 05 51 401 641 143 33 20801 7N3W16-00-01701 2019 7446 401,000 357,500 09/12/19 112 9,454 366,954 109
594 05 51 401 401 141 33 27932 8N3W19-D0-00200 2019 7573 359,640 366,000 09/12/19 98 9,679 375,679 96
595 03 31 401 401 145 33 24453 5N4W23-BC-01000 2019 7492 291,310 400,000 09/12/19 73 10,578 410,578 71
601 02 21 401 401 141 33 5435 3N2W01-CC-01300 2019 7700 312,070 375,000 09/16/19 83 9,559 384,559 81
600 03 31 409 649 463 33 5592 3N2W09-00-00701 2019 7606 432,030 485,000 09/16/19 89 12,363 497,363 87
609 05 51 400 400 33 20468 7N3W04-D0-00700 2019 7745 34,870 50,000 09/17/19 70 1,263 51,263 68
603 03 31 401 401 141 33 5154 4N3W13-D0-01600 2019 7652 525,550 475,000 09/17/19 111 11,995 486,995 108
607 03 31 409 409 451 33 23982 4N4W07-C0-00800 2019 7598 182,390 224,900 09/17/19 81 5,679 230,579 79
615 06 61 401 401 141 33 16725 4N1W07-AA-01500 2019 7747 310,280 325,000 09/20/19 95 7,975 332,975 93
616 03 31 401 641 133 33 24520 5N4W28-00-00901 2019 7950 330,300 420,000 09/21/19 79 10,206 430,206 77
622 03 31 401 401 144 33 24829 5N4W03-00-00700 2019 8164 514,330 440,000 09/24/19 117 10,378 450,378 114
623 05 51 401 401 145 33 28177 8N4W26-C0-00400 2019 7872 312,510 289,500 09/24/19 108 6,828 296,328 105
628 02 21 400 640 33 5644 3N2W11-AC-00200 2019 7993 236,000 200,000 09/25/19 118 4,669 204,669 115
61
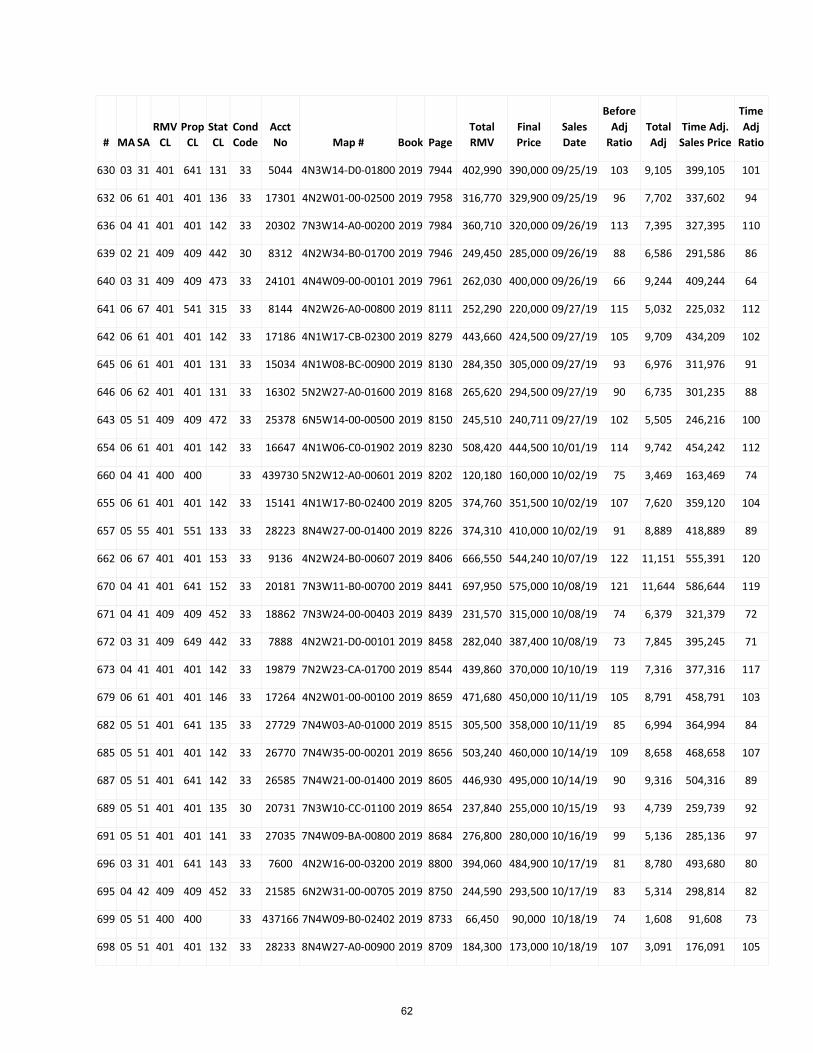
# MA SA RMV
CL Prop
CL Stat CL
Cond Code
Acct No Map # Book Page
Total RMV
Final Price
Sales Date
Before Adj
Ratio Total Adj
Time Adj. Sales Price
Time Adj
Ratio
630 03 31 401 641 131 33 5044 4N3W14-D0-01800 2019 7944 402,990 390,000 09/25/19 103 9,105 399,105 101
632 06 61 401 401 136 33 17301 4N2W01-00-02500 2019 7958 316,770 329,900 09/25/19 96 7,702 337,602 94
636 04 41 401 401 142 33 20302 7N3W14-A0-00200 2019 7984 360,710 320,000 09/26/19 113 7,395 327,395 110
639 02 21 409 409 442 30 8312 4N2W34-B0-01700 2019 7946 249,450 285,000 09/26/19 88 6,586 291,586 86
640 03 31 409 409 473 33 24101 4N4W09-00-00101 2019 7961 262,030 400,000 09/26/19 66 9,244 409,244 64
641 06 67 401 541 315 33 8144 4N2W26-A0-00800 2019 8111 252,290 220,000 09/27/19 115 5,032 225,032 112
642 06 61 401 401 142 33 17186 4N1W17-CB-02300 2019 8279 443,660 424,500 09/27/19 105 9,709 434,209 102
645 06 61 401 401 131 33 15034 4N1W08-BC-00900 2019 8130 284,350 305,000 09/27/19 93 6,976 311,976 91
646 06 62 401 401 131 33 16302 5N2W27-A0-01600 2019 8168 265,620 294,500 09/27/19 90 6,735 301,235 88
643 05 51 409 409 472 33 25378 6N5W14-00-00500 2019 8150 245,510 240,711 09/27/19 102 5,505 246,216 100
654 06 61 401 401 142 33 16647 4N1W06-C0-01902 2019 8230 508,420 444,500 10/01/19 114 9,742 454,242 112
660 04 41 400 400 33 439730 5N2W12-A0-00601 2019 8202 120,180 160,000 10/02/19 75 3,469 163,469 74
655 06 61 401 401 142 33 15141 4N1W17-B0-02400 2019 8205 374,760 351,500 10/02/19 107 7,620 359,120 104
657 05 55 401 551 133 33 28223 8N4W27-00-01400 2019 8226 374,310 410,000 10/02/19 91 8,889 418,889 89
662 06 67 401 401 153 33 9136 4N2W24-B0-00607 2019 8406 666,550 544,240 10/07/19 122 11,151 555,391 120
670 04 41 401 641 152 33 20181 7N3W11-B0-00700 2019 8441 697,950 575,000 10/08/19 121 11,644 586,644 119
671 04 41 409 409 452 33 18862 7N3W24-00-00403 2019 8439 231,570 315,000 10/08/19 74 6,379 321,379 72
672 03 31 409 649 442 33 7888 4N2W21-D0-00101 2019 8458 282,040 387,400 10/08/19 73 7,845 395,245 71
673 04 41 401 401 142 33 19879 7N2W23-CA-01700 2019 8544 439,860 370,000 10/10/19 119 7,316 377,316 117
679 06 61 401 401 146 33 17264 4N2W01-00-00100 2019 8659 471,680 450,000 10/11/19 105 8,791 458,791 103
682 05 51 401 641 135 33 27729 7N4W03-A0-01000 2019 8515 305,500 358,000 10/11/19 85 6,994 364,994 84
685 05 51 401 401 142 33 26770 7N4W35-00-00201 2019 8656 503,240 460,000 10/14/19 109 8,658 468,658 107
687 05 51 401 641 142 33 26585 7N4W21-00-01400 2019 8605 446,930 495,000 10/14/19 90 9,316 504,316 89
689 05 51 401 401 135 30 20731 7N3W10-CC-01100 2019 8654 237,840 255,000 10/15/19 93 4,739 259,739 92
691 05 51 401 401 141 33 27035 7N4W09-BA-00800 2019 8684 276,800 280,000 10/16/19 99 5,136 285,136 97
696 03 31 401 641 143 33 7600 4N2W16-00-03200 2019 8800 394,060 484,900 10/17/19 81 8,780 493,680 80
695 04 42 409 409 452 33 21585 6N2W31-00-00705 2019 8750 244,590 293,500 10/17/19 83 5,314 298,814 82
699 05 51 400 400 33 437166 7N4W09-B0-02402 2019 8733 66,450 90,000 10/18/19 74 1,608 91,608 73
698 05 51 401 401 132 33 28233 8N4W27-A0-00900 2019 8709 184,300 173,000 10/18/19 107 3,091 176,091 105
62
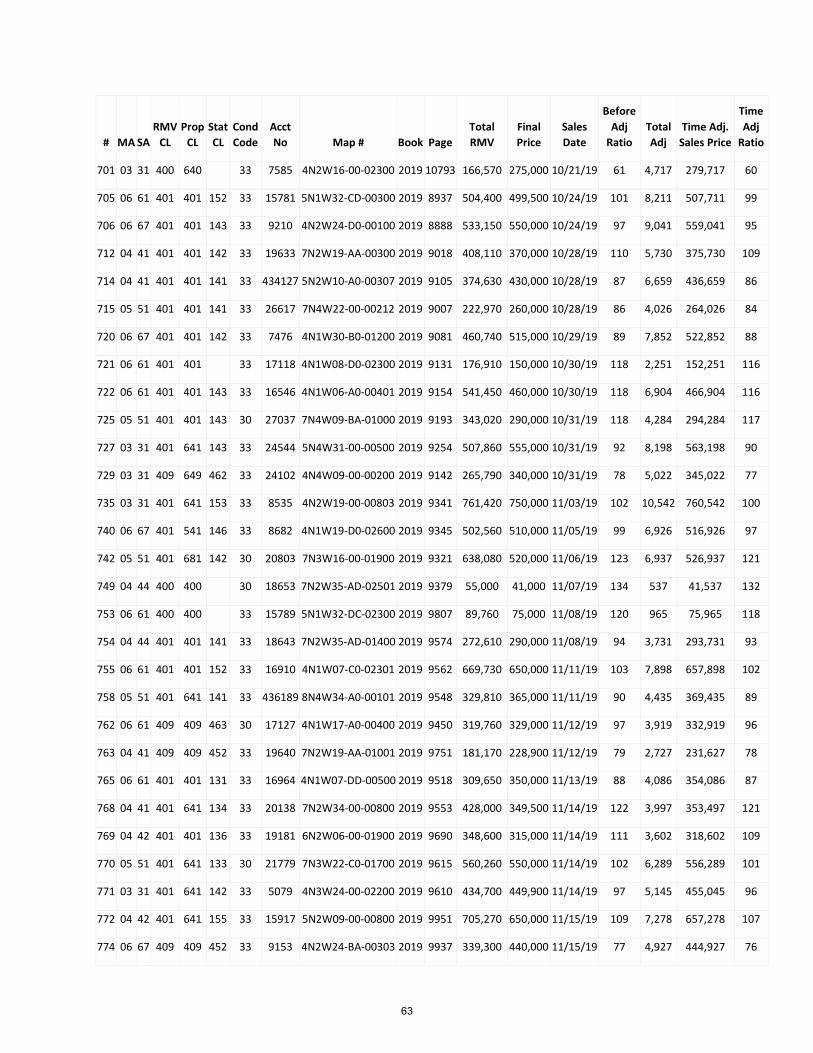
# MA SA RMV
CL Prop
CL Stat CL
Cond Code
Acct No Map # Book Page
Total RMV
Final Price
Sales Date
Before Adj
Ratio Total Adj
Time Adj. Sales Price
Time Adj
Ratio
701 03 31 400 640 33 7585 4N2W16-00-02300 2019 10793 166,570 275,000 10/21/19 61 4,717 279,717 60
705 06 61 401 401 152 33 15781 5N1W32-CD-00300 2019 8937 504,400 499,500 10/24/19 101 8,211 507,711 99
706 06 67 401 401 143 33 9210 4N2W24-D0-00100 2019 8888 533,150 550,000 10/24/19 97 9,041 559,041 95
712 04 41 401 401 142 33 19633 7N2W19-AA-00300 2019 9018 408,110 370,000 10/28/19 110 5,730 375,730 109
714 04 41 401 401 141 33 434127 5N2W10-A0-00307 2019 9105 374,630 430,000 10/28/19 87 6,659 436,659 86
715 05 51 401 401 141 33 26617 7N4W22-00-00212 2019 9007 222,970 260,000 10/28/19 86 4,026 264,026 84
720 06 67 401 401 142 33 7476 4N1W30-B0-01200 2019 9081 460,740 515,000 10/29/19 89 7,852 522,852 88
721 06 61 401 401 33 17118 4N1W08-D0-02300 2019 9131 176,910 150,000 10/30/19 118 2,251 152,251 116
722 06 61 401 401 143 33 16546 4N1W06-A0-00401 2019 9154 541,450 460,000 10/30/19 118 6,904 466,904 116
725 05 51 401 401 143 30 27037 7N4W09-BA-01000 2019 9193 343,020 290,000 10/31/19 118 4,284 294,284 117
727 03 31 401 641 143 33 24544 5N4W31-00-00500 2019 9254 507,860 555,000 10/31/19 92 8,198 563,198 90
729 03 31 409 649 462 33 24102 4N4W09-00-00200 2019 9142 265,790 340,000 10/31/19 78 5,022 345,022 77
735 03 31 401 641 153 33 8535 4N2W19-00-00803 2019 9341 761,420 750,000 11/03/19 102 10,542 760,542 100
740 06 67 401 541 146 33 8682 4N1W19-D0-02600 2019 9345 502,560 510,000 11/05/19 99 6,926 516,926 97
742 05 51 401 681 142 30 20803 7N3W16-00-01900 2019 9321 638,080 520,000 11/06/19 123 6,937 526,937 121
749 04 44 400 400 30 18653 7N2W35-AD-02501 2019 9379 55,000 41,000 11/07/19 134 537 41,537 132
753 06 61 400 400 33 15789 5N1W32-DC-02300 2019 9807 89,760 75,000 11/08/19 120 965 75,965 118
754 04 44 401 401 141 33 18643 7N2W35-AD-01400 2019 9574 272,610 290,000 11/08/19 94 3,731 293,731 93
755 06 61 401 401 152 33 16910 4N1W07-C0-02301 2019 9562 669,730 650,000 11/11/19 103 7,898 657,898 102
758 05 51 401 641 141 33 436189 8N4W34-A0-00101 2019 9548 329,810 365,000 11/11/19 90 4,435 369,435 89
762 06 61 409 409 463 30 17127 4N1W17-A0-00400 2019 9450 319,760 329,000 11/12/19 97 3,919 332,919 96
763 04 41 409 409 452 33 19640 7N2W19-AA-01001 2019 9751 181,170 228,900 11/12/19 79 2,727 231,627 78
765 06 61 401 401 131 33 16964 4N1W07-DD-00500 2019 9518 309,650 350,000 11/13/19 88 4,086 354,086 87
768 04 41 401 641 134 33 20138 7N2W34-00-00800 2019 9553 428,000 349,500 11/14/19 122 3,997 353,497 121
769 04 42 401 401 136 33 19181 6N2W06-00-01900 2019 9690 348,600 315,000 11/14/19 111 3,602 318,602 109
770 05 51 401 641 133 30 21779 7N3W22-C0-01700 2019 9615 560,260 550,000 11/14/19 102 6,289 556,289 101
771 03 31 401 641 142 33 5079 4N3W24-00-02200 2019 9610 434,700 449,900 11/14/19 97 5,145 455,045 96
772 04 42 401 641 155 33 15917 5N2W09-00-00800 2019 9951 705,270 650,000 11/15/19 109 7,278 657,278 107
774 06 67 409 409 452 33 9153 4N2W24-BA-00303 2019 9937 339,300 440,000 11/15/19 77 4,927 444,927 76
63
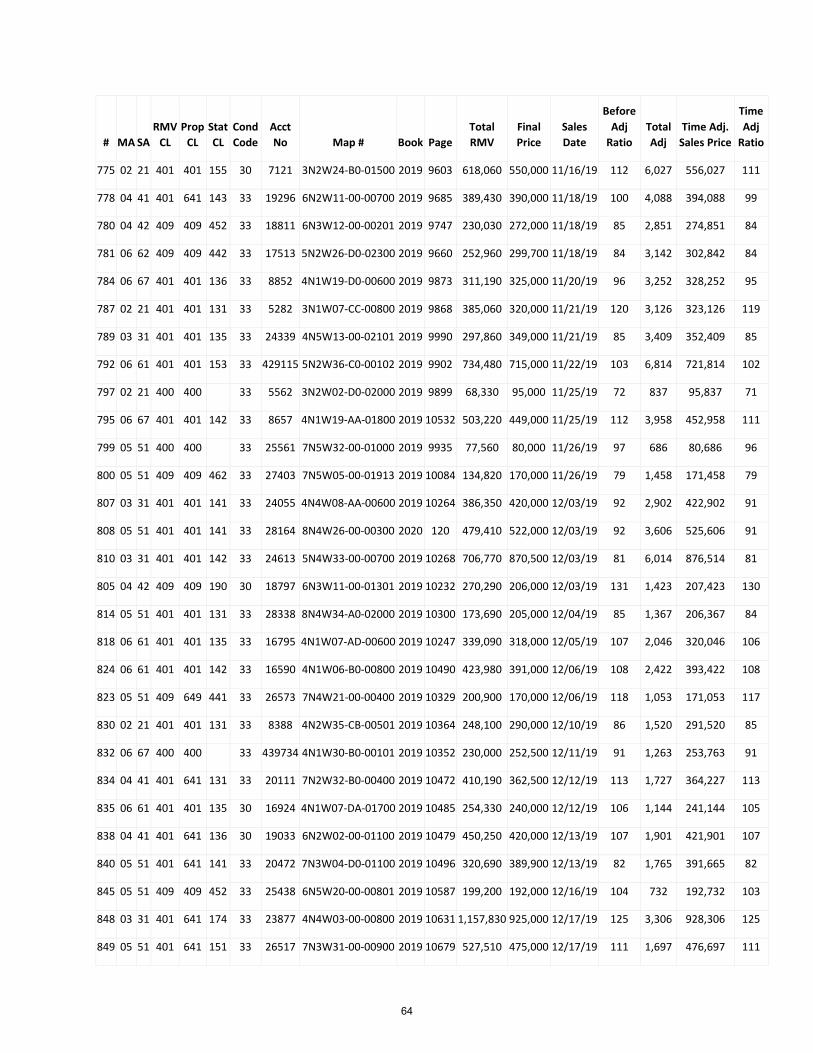
# MA SA RMV
CL Prop
CL Stat CL
Cond Code
Acct No Map # Book Page
Total RMV
Final Price
Sales Date
Before Adj
Ratio Total Adj
Time Adj. Sales Price
Time Adj
Ratio
775 02 21 401 401 155 30 7121 3N2W24-B0-01500 2019 9603 618,060 550,000 11/16/19 112 6,027 556,027 111
778 04 41 401 641 143 33 19296 6N2W11-00-00700 2019 9685 389,430 390,000 11/18/19 100 4,088 394,088 99
780 04 42 409 409 452 33 18811 6N3W12-00-00201 2019 9747 230,030 272,000 11/18/19 85 2,851 274,851 84
781 06 62 409 409 442 33 17513 5N2W26-D0-02300 2019 9660 252,960 299,700 11/18/19 84 3,142 302,842 84
784 06 67 401 401 136 33 8852 4N1W19-D0-00600 2019 9873 311,190 325,000 11/20/19 96 3,252 328,252 95
787 02 21 401 401 131 33 5282 3N1W07-CC-00800 2019 9868 385,060 320,000 11/21/19 120 3,126 323,126 119
789 03 31 401 401 135 33 24339 4N5W13-00-02101 2019 9990 297,860 349,000 11/21/19 85 3,409 352,409 85
792 06 61 401 401 153 33 429115 5N2W36-C0-00102 2019 9902 734,480 715,000 11/22/19 103 6,814 721,814 102
797 02 21 400 400 33 5562 3N2W02-D0-02000 2019 9899 68,330 95,000 11/25/19 72 837 95,837 71
795 06 67 401 401 142 33 8657 4N1W19-AA-01800 2019 10532 503,220 449,000 11/25/19 112 3,958 452,958 111
799 05 51 400 400 33 25561 7N5W32-00-01000 2019 9935 77,560 80,000 11/26/19 97 686 80,686 96
800 05 51 409 409 462 33 27403 7N5W05-00-01913 2019 10084 134,820 170,000 11/26/19 79 1,458 171,458 79
807 03 31 401 401 141 33 24055 4N4W08-AA-00600 2019 10264 386,350 420,000 12/03/19 92 2,902 422,902 91
808 05 51 401 401 141 33 28164 8N4W26-00-00300 2020 120 479,410 522,000 12/03/19 92 3,606 525,606 91
810 03 31 401 401 142 33 24613 5N4W33-00-00700 2019 10268 706,770 870,500 12/03/19 81 6,014 876,514 81
805 04 42 409 409 190 30 18797 6N3W11-00-01301 2019 10232 270,290 206,000 12/03/19 131 1,423 207,423 130
814 05 51 401 401 131 33 28338 8N4W34-A0-02000 2019 10300 173,690 205,000 12/04/19 85 1,367 206,367 84
818 06 61 401 401 135 33 16795 4N1W07-AD-00600 2019 10247 339,090 318,000 12/05/19 107 2,046 320,046 106
824 06 61 401 401 142 33 16590 4N1W06-B0-00800 2019 10490 423,980 391,000 12/06/19 108 2,422 393,422 108
823 05 51 409 649 441 33 26573 7N4W21-00-00400 2019 10329 200,900 170,000 12/06/19 118 1,053 171,053 117
830 02 21 401 401 131 33 8388 4N2W35-CB-00501 2019 10364 248,100 290,000 12/10/19 86 1,520 291,520 85
832 06 67 400 400 33 439734 4N1W30-B0-00101 2019 10352 230,000 252,500 12/11/19 91 1,263 253,763 91
834 04 41 401 641 131 33 20111 7N2W32-B0-00400 2019 10472 410,190 362,500 12/12/19 113 1,727 364,227 113
835 06 61 401 401 135 30 16924 4N1W07-DA-01700 2019 10485 254,330 240,000 12/12/19 106 1,144 241,144 105
838 04 41 401 641 136 30 19033 6N2W02-00-01100 2019 10479 450,250 420,000 12/13/19 107 1,901 421,901 107
840 05 51 401 641 141 33 20472 7N3W04-D0-01100 2019 10496 320,690 389,900 12/13/19 82 1,765 391,665 82
845 05 51 409 409 452 33 25438 6N5W20-00-00801 2019 10587 199,200 192,000 12/16/19 104 732 192,732 103
848 03 31 401 641 174 33 23877 4N4W03-00-00800 2019 10631 1,157,830 925,000 12/17/19 125 3,306 928,306 125
849 05 51 401 641 151 33 26517 7N3W31-00-00900 2019 10679 527,510 475,000 12/17/19 111 1,697 476,697 111
64
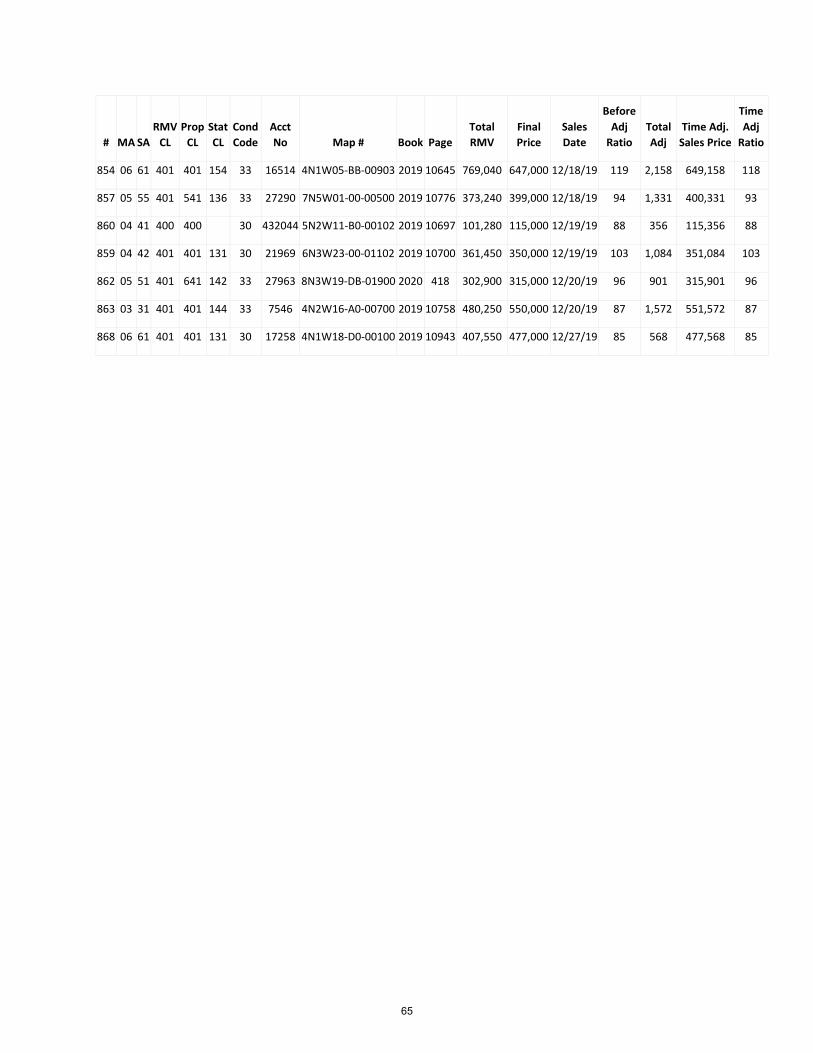
# MA SA RMV
CL Prop
CL Stat CL
Cond Code
Acct No Map # Book Page
Total RMV
Final Price
Sales Date
Before Adj
Ratio Total Adj
Time Adj. Sales Price
Time Adj
Ratio
854 06 61 401 401 154 33 16514 4N1W05-BB-00903 2019 10645 769,040 647,000 12/18/19 119 2,158 649,158 118
857 05 55 401 541 136 33 27290 7N5W01-00-00500 2019 10776 373,240 399,000 12/18/19 94 1,331 400,331 93
860 04 41 400 400 30 432044 5N2W11-B0-00102 2019 10697 101,280 115,000 12/19/19 88 356 115,356 88
859 04 42 401 401 131 30 21969 6N3W23-00-01102 2019 10700 361,450 350,000 12/19/19 103 1,084 351,084 103
862 05 51 401 641 142 33 27963 8N3W19-DB-01900 2020 418 302,900 315,000 12/20/19 96 901 315,901 96
863 03 31 401 401 144 33 7546 4N2W16-A0-00700 2019 10758 480,250 550,000 12/20/19 87 1,572 551,572 87
868 06 61 401 401 131 30 17258 4N1W18-D0-00100 2019 10943 407,550 477,000 12/27/19 85 568 477,568 85
65
SUPPLEMENTAL NOTES
66
Areas of Reappraisal
For this Ratio year, all areas have undergone a recalculation. No physical re-appraisals were performed due to limited staffing and an increase in new construction site visits.
Areas of Recalculation
Maintenance Area 1 City of St. Helens Maintenance Area 2 Scappoose Maintenance Area 3 Vernonia Maintenance Area 4 Rainier Maintenance Area 5 Clatskanie Maintenance Area 6 Rural St. Helens, City of Columbia City, Warren and Deer Island Maintenance Area 7 Personal Property Manufactured Structures; Countywide Floating Property Personal Property Floating Homes, Boathouses and Combinations; Countywide
Changed Study Areas
MA 03 SA 38: This area is a small subdivision of vacant and improved lots located in the City of Vernonia. Market indicators have illustrated that this area moves similarly to those properties located in the general area (SA 00) within the city. Since market perception and indicators no longer view this area as unique, it has been combined with MA 03 SA 00.
MA 06 SA 67: This is a new study area that was created for the 2020 year. This area is comprised of developed and undeveloped rural properties located in Warren and surrounding the City of St. Helens. These unique properties are found around the Columbia Slough and the Columbia River Highway and have been shown to move differently on the market than those properties located in MA 06 SA 61. However, due to this area not existing for the 2019 sales collection year, both MA 06 SA 61 and SA 67 were analyzed together. For the next ratio year, these studies will be ran individually.
67
SUMMARY OF RATIO INDICATIONS
68
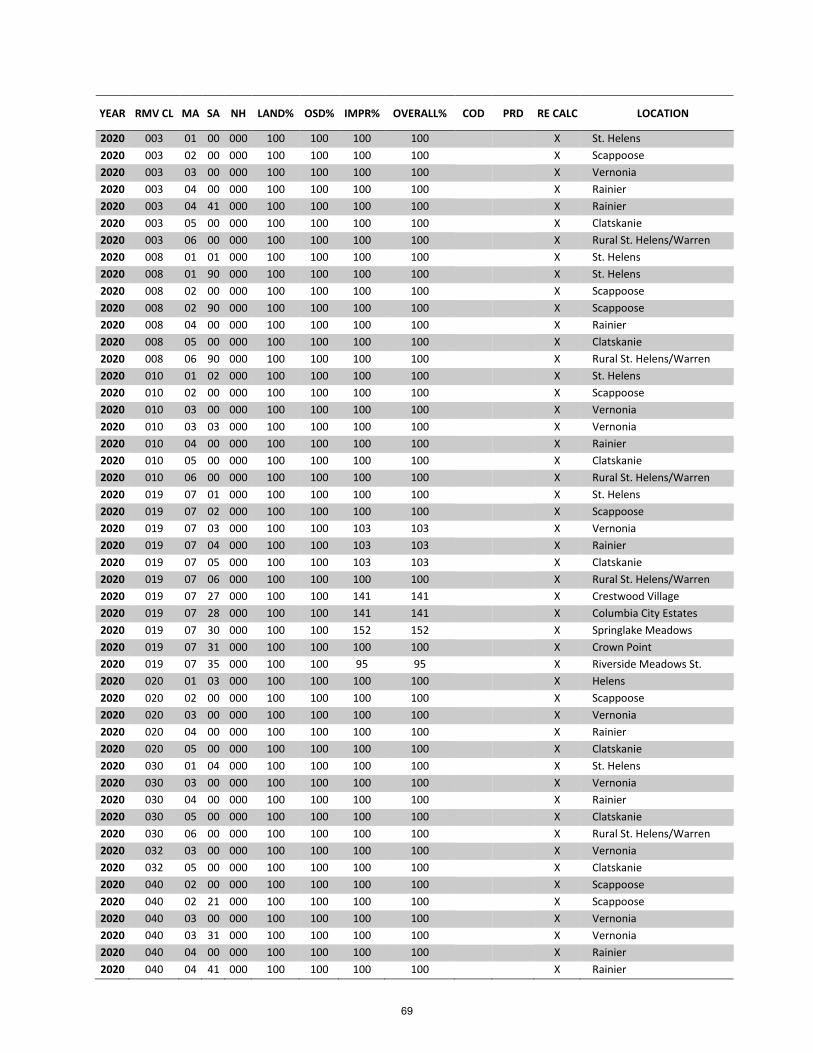
YEAR RMV CL MA SA NH LAND% OSD% IMPR% OVERALL% COD PRD RE CALC LOCATION
2020 003 01 00 000 100 100 100 100 X 2020 003 02 00 000 100 100 100 100 X 2020 003 03 00 000 100 100 100 100 X 2020 003 04 00 000 100 100 100 100 X 2020 003 04 41 000 100 100 100 100 X 2020 003 05 00 000 100 100 100 100 X 2020 003 06 00 000 100 100 100 100 X 2020 008 01 01 000 100 100 100 100 X 2020 008 01 90 000 100 100 100 100 X 2020 008 02 00 000 100 100 100 100 X 2020 008 02 90 000 100 100 100 100 X 2020 008 04 00 000 100 100 100 100 X 2020 008 05 00 000 100 100 100 100 X 2020 008 06 90 000 100 100 100 100 X 2020 010 01 02 000 100 100 100 100 X 2020 010 02 00 000 100 100 100 100 X 2020 010 03 00 000 100 100 100 100 X 2020 010 03 03 000 100 100 100 100 X 2020 010 04 00 000 100 100 100 100 X 2020 010 05 00 000 100 100 100 100 X 2020 010 06 00 000 100 100 100 100 X 2020 019 07 01 000 100 100 100 100 X 2020 019 07 02 000 100 100 100 100 X 2020 019 07 03 000 100 100 103 103 X 2020 019 07 04 000 100 100 103 103 X 2020 019 07 05 000 100 100 103 103 X 2020 019 07 06 000 100 100 100 100 X 2020 019 07 27 000 100 100 141 141 X 2020 019 07 28 000 100 100 141 141 X 2020 019 07 30 000 100 100 152 152 X 2020 019 07 31 000 100 100 100 100 X 2020 019 07 35 000 100 100 95 95 X 2020 020 01 03 000 100 100 100 100 X 2020 020 02 00 000 100 100 100 100 X 2020 020 03 00 000 100 100 100 100 X 2020 020 04 00 000 100 100 100 100 X 2020 020 05 00 000 100 100 100 100 X 2020 030 01 04 000 100 100 100 100 X 2020 030 03 00 000 100 100 100 100 X 2020 030 04 00 000 100 100 100 100 X 2020 030 05 00 000 100 100 100 100 X 2020 030 06 00 000 100 100 100 100 X 2020 032 03 00 000 100 100 100 100 X 2020 032 05 00 000 100 100 100 100 X 2020 040 02 00 000 100 100 100 100 X 2020 040 02 21 000 100 100 100 100 X 2020 040 03 00 000 100 100 100 100 X 2020 040 03 31 000 100 100 100 100 X 2020 040 04 00 000 100 100 100 100 X 2020 040 04 41 000 100 100 100 100 X
St. Helens Scappoose Vernonia Rainier Rainier Clatskanie Rural St. Helens/Warren St. Helens St. Helens Scappoose Scappoose Rainier Clatskanie Rural St. Helens/Warren St. Helens Scappoose Vernonia Vernonia Rainier Clatskanie Rural St. Helens/Warren St. Helens Scappoose Vernonia Rainier Clatskanie Rural St. Helens/Warren Crestwood Village Columbia City Estates Springlake Meadows Crown Point Riverside Meadows St. Helens Scappoose Vernonia Rainier Clatskanie St. Helens Vernonia Rainier Clatskanie Rural St. Helens/Warren Vernonia Clatskanie Scappoose Scappoose Vernonia Vernonia Rainier Rainier
69
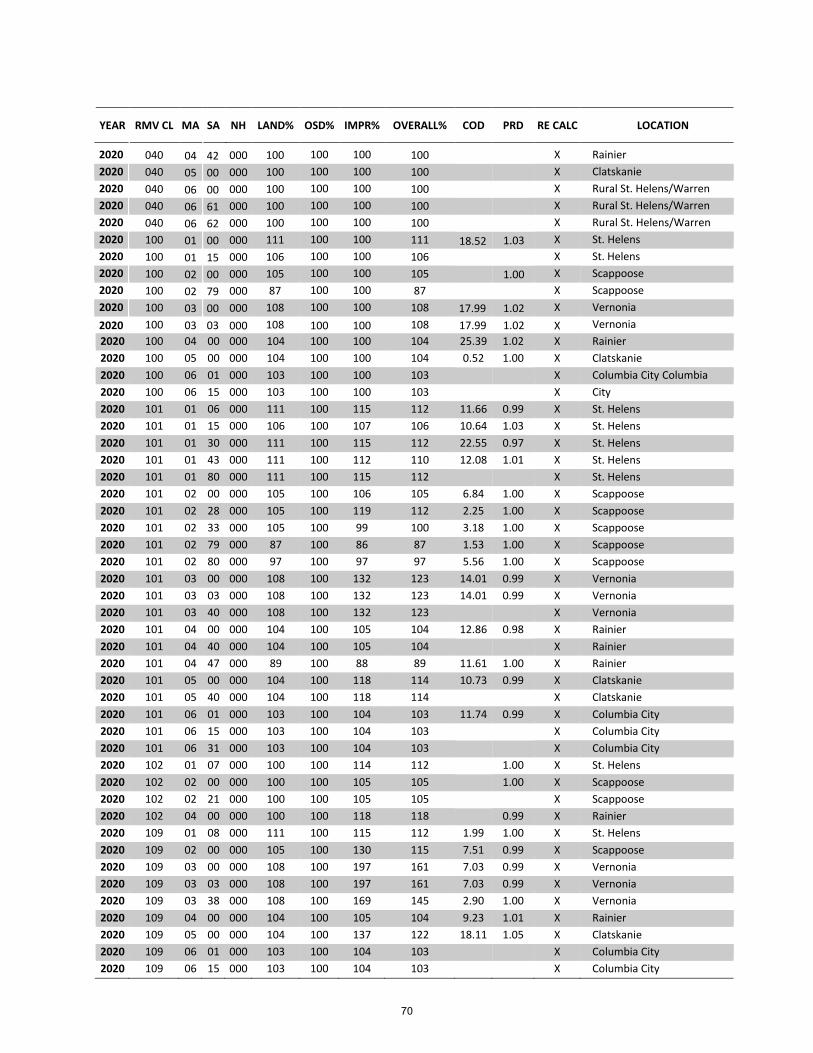
YEAR RMV CL MA SA NH LAND% OSD% IMPR% OVERALL% COD PRD RE CALC LOCATION
2020 100 04 00 000 104 100 100 104 25.39 1.02 X 2020 100 05 00 000 104 100 100 104 0.52 1.00 X 2020 100 06 01 000 103 100 100 103 X 2020 100 06 15 000 103 100 100 103 X 2020 101 01 06 000 111 100 115 112 11.66 0.99 X 2020 101 01 15 000 106 100 107 106 10.64 1.03 X St. Helens 2020 101 01 30 000 111 100 115 112 22.55 0.97 X St. Helens 2020 101 01 43 000 111 100 112 110 12.08 1.01 X St. Helens 2020 101 01 80 000 111 100 115 112 X St. Helens 2020 101 02 00 000 105 100 106 105 6.84 1.00 X Scappoose 2020 101 02 28 000 105 100 119 112 2.25 1.00 X Scappoose 2020 101 02 33 000 105 100 99 100 3.18 1.00 X Scappoose 2020 101 02 79 000 87 100 86 87 1.53 1.00 X Scappoose 2020 101 02 80 000 97 100 97 97 5.56 1.00 X Scappoose 2020 101 03 00 000 108 100 132 123 14.01 0.99 X Vernonia 2020 101 03 03 000 108 100 132 123 14.01 0.99 X Vernonia 2020 101 03 40 000 108 100 132 123 X Vernonia 2020 101 04 00 000 104 100 105 104 12.86 0.98 X Rainier 2020 101 04 40 000 104 100 105 104 X Rainier 2020 101 04 47 000 89 100 88 89 11.61 1.00 X Rainier 2020 101 05 00 000 104 100 118 114 10.73 0.99 X Clatskanie 2020 101 05 40 000 104 100 118 114 X Clatskanie 2020 101 06 01 000 103 100 104 103 11.74 0.99 X Columbia City 2020 101 06 15 000 103 100 104 103 X Columbia City 2020 101 06 31 000 103 100 104 103 X Columbia City 2020 102 01 07 000 100 100 114 112 1.00 X St. Helens 2020 102 02 00 000 100 100 105 105 1.00 X Scappoose 2020 102 02 21 000 100 100 105 105 X Scappoose 2020 102 04 00 000 100 100 118 118 0.99 X Rainier 2020 109 01 08 000 111 100 115 112 1.99 1.00 X St. Helens 2020 109 02 00 000 105 100 130 115 7.51 0.99 X Scappoose 2020 109 03 00 000 108 100 197 161 7.03 0.99 X Vernonia 2020 109 03 03 000 108 100 197 161 7.03 0.99 X Vernonia 2020 109 03 38 000 108 100 169 145 2.90 1.00 X Vernonia 2020 109 04 00 000 104 100 105 104 9.23 1.01 X Rainier 2020 109 05 00 000 104 100 137 122 18.11 1.05 X Clatskanie 2020 109 06 01 000 103 100 104 103 X Columbia City 2020 109 06 15 000 103 100 104 103 X Columbia City
2020 000 100 100 X 2020 000 100 100 X 2020 000 100 100 X 2020 000 100 100 X 2020 000 100 100 X 2020 000 100 100 X 2020 000 100 100 X 2020 000 100 100 X 2020 000 100 100 X 2020 000 100 100 X
040 040 040 040 040 100 100 100 100 100 100
04 05 06 06 06 01 01 02 02 03 03
42 00 00 61 62 00 15 00 79 00 03 000 2020
100 100 100 100 100 111 106 105 87
108 108 100 100
100 100 100 100 100 111 106 105 87
108 108
18.52
17.99 17.99
1.03
1.00
1.02 1.02 X
Rainier Clatskanie Rural St. Helens/Warren Rural St. Helens/Warren Rural St. Helens/Warren St. Helens St. Helens Scappoose ScappooseVernonia VernoniaRainier Clatskanie Columbia City Columbia City St. Helens
70
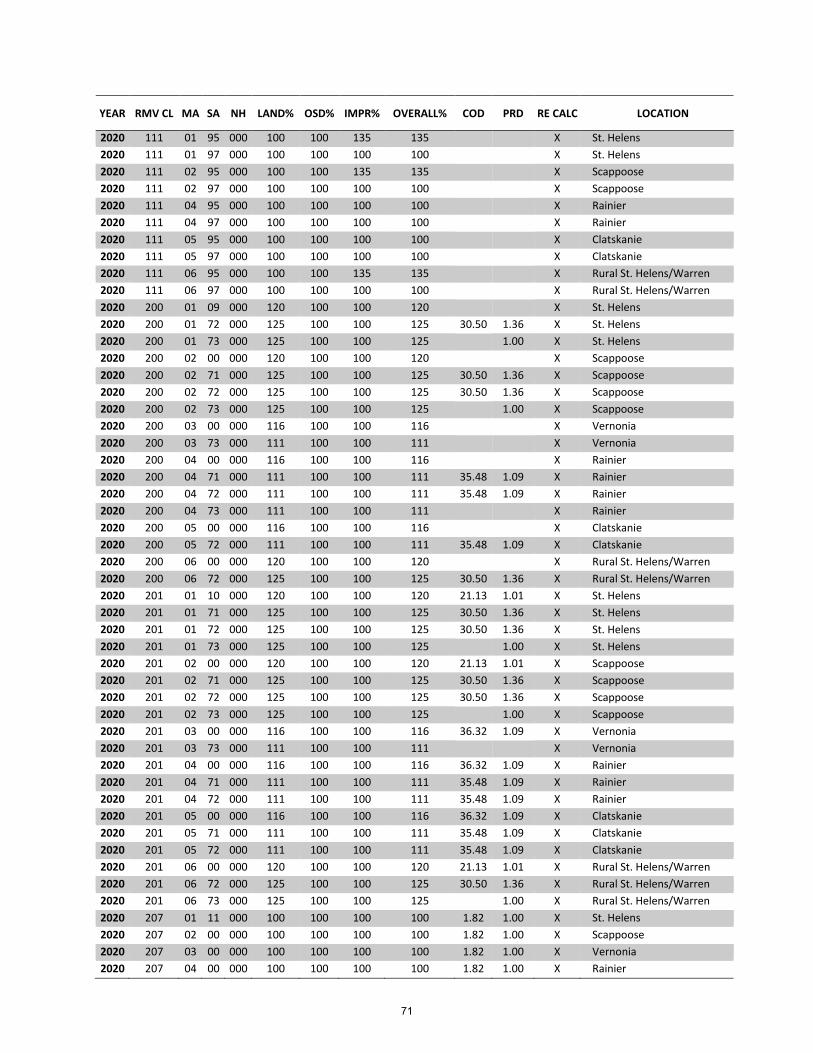
YEAR RMV CL MA SA NH LAND% OSD% IMPR% OVERALL% COD PRD RE CALC LOCATION
2020 111 01 95 000 100 100 135 135 X 2020 111 01 97 000 100 100 100 100 X 2020 111 02 95 000 100 100 135 135 X 2020 111 02 97 000 100 100 100 100 X 2020 111 04 95 000 100 100 100 100 X 2020 111 04 97 000 100 100 100 100 X 2020 111 05 95 000 100 100 100 100 X 2020 111 05 97 000 100 100 100 100 X 2020 111 06 95 000 100 100 135 135 X 2020 111 06 97 000 100 100 100 100 X 2020 200 01 09 000 120 100 100 120 X 2020 200 01 72 000 125 100 100 125 30.50 1.36 X 2020 200 01 73 000 125 100 100 125 1.00 X
St. Helens St. Helens Scappoose Scappoose Rainier Rainier Clatskanie Clatskanie Rural St. Helens/Warren Rural St. Helens/Warren St. Helens St. Helens St. Helens
2020 200 02 00 000 120 100 100 120 X 2020 200 02 71 000 125 100 100 125 30.50 1.36 X 2020 200 02 72 000 125 100 100 125 30.50 1.36 X 2020 200 02 73 000 125 100 100 125 1.00 X
Scappoose Scappoose Scappoose Scappoose
2020 200 03 00 000 116 100 100 116 X 2020 200 03 73 000 111 100 100 111 X 2020 200 04 00 000 116 100 100 116 X
Vernonia Vernonia Rainier
2020 200 04 71 000 111 100 100 111 35.48 1.09 X 2020 200 04 72 000 111 100 100 111 35.48 1.09 X 2020 200 04 73 000 111 100 100 111 X
Rainier Rainier Rainier
2020 200 05 00 000 116 100 100 116 X 2020 200 05 72 000 111 100 100 111 35.48 1.09 X 2020 200 06 00 000 120 100 100 120 X 2020 200 06 72 000 125 100 100 125 30.50 1.36 X 2020 201 01 10 000 120 100 100 120 21.13 1.01 X 2020 201 01 71 000 125 100 100 125 30.50 1.36 X 2020 201 01 72 000 125 100 100 125 30.50 1.36 X 2020 201 01 73 000 125 100 100 125 1.00 X
Clatskanie Clatskanie Rural St. Helens/Warren Rural St. Helens/Warren St. Helens St. Helens St. Helens St. Helens
2020 201 02 00 000 120 100 100 120 21.13 1.01 X 2020 201 02 71 000 125 100 100 125 30.50 1.36 X 2020 201 02 72 000 125 100 100 125 30.50 1.36 X 2020 201 02 73 000 125 100 100 125 1.00 X
Scappoose Scappoose Scappoose Scappoose
2020 201 03 00 000 116 100 100 116 36.32 1.09 X 2020 201 03 73 000 111 100 100 111 X 2020 201 04 00 000 116 100 100 116 36.32 1.09 X 2020 201 04 71 000 111 100 100 111 35.48 1.09 X 2020 201 04 72 000 111 100 100 111 35.48 1.09 X 2020 201 05 00 000 116 100 100 116 36.32 1.09 X
Vernonia Vernonia Rainier Rainier Rainier Clatskanie
2020 201 05 71 000 111 100 100 111 35.48 1.09 X Clatskanie 2020 201 05 72 000 111 100 100 111 35.48 1.09 X Clatskanie 2020 201 06 00 000 120 100 100 120 21.13 1.01 X 2020 201 06 72 000 125 100 100 125 30.50 1.36 X 2020 201 06 73 000 125 100 100 125 1.00 X 2020 207 01 11 000 100 100 100 100 1.82 1.00 X 2020 207 02 00 000 100 100 100 100 1.82 1.00 X 2020 207 03 00 000 100 100 100 100 1.82 1.00 X 2020 207 04 00 000 100 100 100 100 1.82 1.00 X
Rural St. Helens/Warren Rural St. Helens/Warren Rural St. Helens/Warren St. Helens Scappoose Vernonia Rainier
71
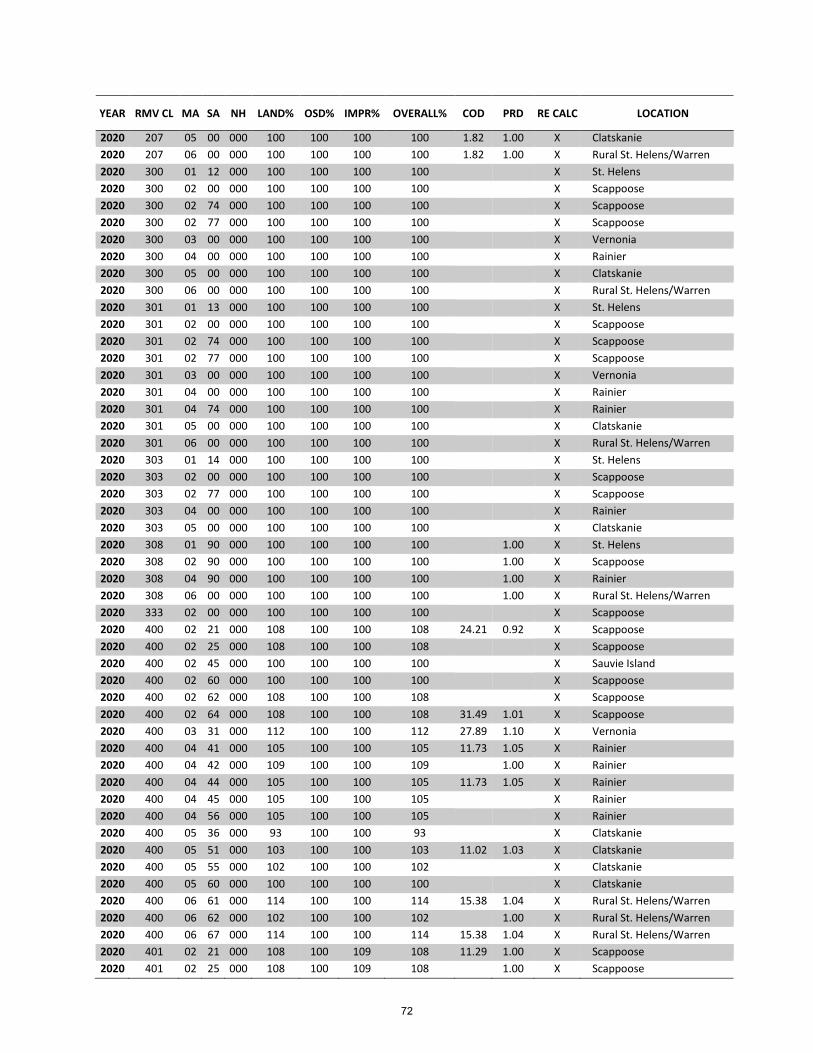
YEAR RMV CL MA SA NH LAND% OSD% IMPR% OVERALL% COD PRD RE CALC LOCATION
2020 207 05 00 000 100 100 100 100 1.82 1.00 X 2020 207 06 00 000 100 100 100 100 1.82 1.00 X 2020 300 01 12 000 100 100 100 100 X 2020 300 02 00 000 100 100 100 100 X 2020 300 02 74 000 100 100 100 100 X 2020 300 02 77 000 100 100 100 100 X 2020 300 03 00 000 100 100 100 100 X 2020 300 04 00 000 100 100 100 100 X 2020 300 05 00 000 100 100 100 100 X 2020 300 06 00 000 100 100 100 100 X 2020 301 01 13 000 100 100 100 100 X 2020 301 02 00 000 100 100 100 100 X 2020 301 02 74 000 100 100 100 100 X 2020 301 02 77 000 100 100 100 100 X 2020 301 03 00 000 100 100 100 100 X 2020 301 04 00 000 100 100 100 100 X 2020 301 04 74 000 100 100 100 100 X 2020 301 05 00 000 100 100 100 100 X 2020 301 06 00 000 100 100 100 100 X 2020 303 01 14 000 100 100 100 100 X 2020 303 02 00 000 100 100 100 100 X 2020 303 02 77 000 100 100 100 100 X 2020 303 04 00 000 100 100 100 100 X 2020 303 05 00 000 100 100 100 100 X 2020 308 01 90 000 100 100 100 100 1.00 X 2020 308 02 90 000 100 100 100 100 1.00 X 2020 308 04 90 000 100 100 100 100 1.00 X 2020 308 06 00 000 100 100 100 100 1.00 X 2020 333 02 00 000 100 100 100 100 X 2020 400 02 21 000 108 100 100 108 24.21 0.92 X 2020 400 02 25 000 108 100 100 108 X 2020 400 02 45 000 100 100 100 100 X
Clatskanie Rural St. Helens/Warren St. Helens Scappoose Scappoose Scappoose Vernonia Rainier Clatskanie Rural St. Helens/Warren St. Helens Scappoose Scappoose Scappoose Vernonia Rainier Rainier Clatskanie Rural St. Helens/Warren St. Helens Scappoose Scappoose Rainier Clatskanie St. Helens Scappoose Rainier Rural St. Helens/Warren Scappoose Scappoose Scappoose Sauvie Island
2020 400 02 60 000 100 100 100 100 X Scappoose 2020 400 02 62 000 108 100 100 108 X Scappoose 2020 400 02 64 000 108 100 100 108 31.49 1.01 X Scappoose 2020 400 03 31 000 112 100 100 112 27.89 1.10 X Vernonia 2020 400 04 41 000 105 100 100 105 11.73 1.05 X Rainier 2020 400 04 42 000 109 100 100 109 1.00 X Rainier 2020 400 04 44 000 105 100 100 105 11.73 1.05 X Rainier 2020 400 04 45 000 105 100 100 105 X Rainier 2020 400 04 56 000 105 100 100 105 X Rainier 2020 400 05 36 000 93 100 100 93 X Clatskanie 2020 400 05 51 000 103 100 100 103 11.02 1.03 X Clatskanie 2020 400 05 55 000 102 100 100 102 X Clatskanie 2020 400 05 60 000 100 100 100 100 X Clatskanie 2020 400 06 61 000 114 100 100 114 15.38 1.04 X Rural St. Helens/Warren 2020 400 06 62 000 102 100 100 102 1.00 X Rural St. Helens/Warren 2020 400 06 67 000 114 100 100 114 15.38 1.04 X Rural St. Helens/Warren 2020 401 02 21 000 108 100 109 108 11.29 1.00 X Scappoose 2020 401 02 25 000 108 100 109 108 1.00 X Scappoose
72

YEAR RMV CL MA SA NH LAND% OSD% IMPR% OVERALL% COD PRD RE CALC LOCATION
2020 401 02 41 000 100 100 100 100 X Sauvie Island 2020 401 02 45 000 100 100 100 100 X Sauvie Island 2020 401 02 62 000 108 100 109 108 X Scappoose 2020 401 02 64 000 108 100 109 108 0.55 1.00 X Scappoose 2020 401 03 31 000 112 100 115 112 11.27 0.99 X Vernonia 2020 401 04 41 000 105 100 96 100 10.21 0.99 X Rainier 2020 401 04 42 000 109 100 111 109 19.12 0.99 X Rainier 2020 401 04 44 000 105 100 96 100 10.21 0.99 X Rainier 2020 401 04 45 000 105 100 96 100 X Rainier 2020 401 05 36 000 93 100 92 93 4.59 0.99 X Clatskanie 2020 401 05 51 000 103 100 104 103 10.04 1.01 X Clatskanie 2020 401 05 55 000 102 100 103 102 10.51 1.02 X Clatskanie 2020 401 06 61 000 114 100 90 100 8.33 1.00 X Rural St. Helens/Warren 2020 401 06 62 000 102 100 103 102 10.00 1.02 X Rural St. Helens/Warren 2020 401 06 67 000 114 100 90 100 8.33 1.00 X Rural St. Helens/Warren 2020 409 02 21 000 108 100 109 108 11.56 0.96 X Scappoose 2020 409 02 25 000 108 100 109 108 X Scappoose 2020 409 02 41 000 100 100 100 100 X Sauvie Island 2020 409 02 45 000 100 100 100 100 X Sauvie Island 2020 409 02 62 000 108 100 109 108 X Scappoose 2020 409 02 64 000 108 100 109 108 X Scappoose 2020 409 03 31 000 112 100 153 128 8.33 0.99 X Vernonia 2020 409 04 41 000 105 100 148 120 8.63 0.99 X Rainier 2020 409 04 42 000 105 100 115 108 16.57 1.01 X Rainier 2020 409 04 44 000 105 100 148 120 8.63 0.99 X Rainier 2020 409 04 45 000 105 100 115 108 16.57 1.01 X Rainier 2020 409 04 56 000 105 100 148 120 X Rainier 2020 409 05 51 000 103 100 129 112 17.24 1.04 X 2020 409 05 55 000 102 100 129 112 0.72 0.99 X 2020 409 06 61 000 114 100 123 115 7.23 1.00 X 2020 409 06 62 000 102 100 95 99 9.21 1.01 X 2020 409 06 67 000 114 100 123 115 7.23 1.00 X 2020 600 03 06 000 100 100 100 100 X 2020 600 04 06 000 100 100 100 100 X 2020 600 05 06 000 100 100 100 100 X 2020 601 04 06 000 100 100 100 100 X 2020 701 01 15 000 172 100 100 172 16.55 1.17 X 2020 701 02 00 000 172 100 100 172 16.55 1.17 X 2020 701 03 00 000 172 100 100 172 16.55 1.17 X 2020 701 04 00 000 172 100 100 172 16.55 1.17 X 2020 701 05 00 000 172 100 100 172 16.55 1.17 X 2020 701 06 00 000 172 100 100 172 16.55 1.17 X 2020 800 01 15 000 100 100 100 100 X 2020 800 01 16 000 100 100 100 100 X 2020 800 02 00 000 100 100 100 100 X
Clatskanie Clatskanie Rural St. Helens/Warren Rural St. Helens/Warren Rural St. Helens/Warren Vernonia Rainier Clatskanie Rainier St. Helens Scappoose Vernonia Rainier Clatskanie Rural St. Helens/Warren St. Helens St. Helens Scappoose
2020 800 02 60 000 100 100 100 100 X Scappoose 2020 800 02 64 000 100 100 100 100 X Scappoose 2020 800 02 72 000 100 100 100 100 X Scappoose 2020 800 02 73 000 100 100 100 100 X Scappoose 2020 800 04 00 000 100 100 100 100 X Rainier
73

YEAR RMV CL MA SA NH LAND% OSD% IMPR% OVERALL% COD PRD RE CALC LOCATION
2020 800 04 44 000 100 100 100 100 X Rainier 2020 800 04 60 000 100 100 100 100 X Rainier 2020 800 05 00 000 100 100 100 100 X Clatskanie 2020 800 05 51 000 100 100 100 100 X Clatskanie 2020 800 05 55 000 100 100 100 100 X Clatskanie 2020 800 05 60 000 100 100 100 100 X Clatskanie 2020 800 06 61 000 100 100 100 100 X Rural St. Helens/Warren 2020 801 01 17 000 100 100 100 100 X St. Helens 2020 801 02 00 000 100 100 100 100 X Scappoose 2020 801 03 31 000 100 100 100 100 X Vernonia 2020 801 04 00 000 100 100 100 100 X Rainier 2020 801 05 36 000 100 100 100 100 X Clatskanie 2020 890 02 64 000 100 100 100 100 X Scappoose
74
MARKET AREA ANALYSIS
ADJUSTMENTS & CONCLUSIONS
75

RESIDENTIAL PROPERTY
76
MAINTENANCE AREA 1
CITY OF ST. HELENS
77
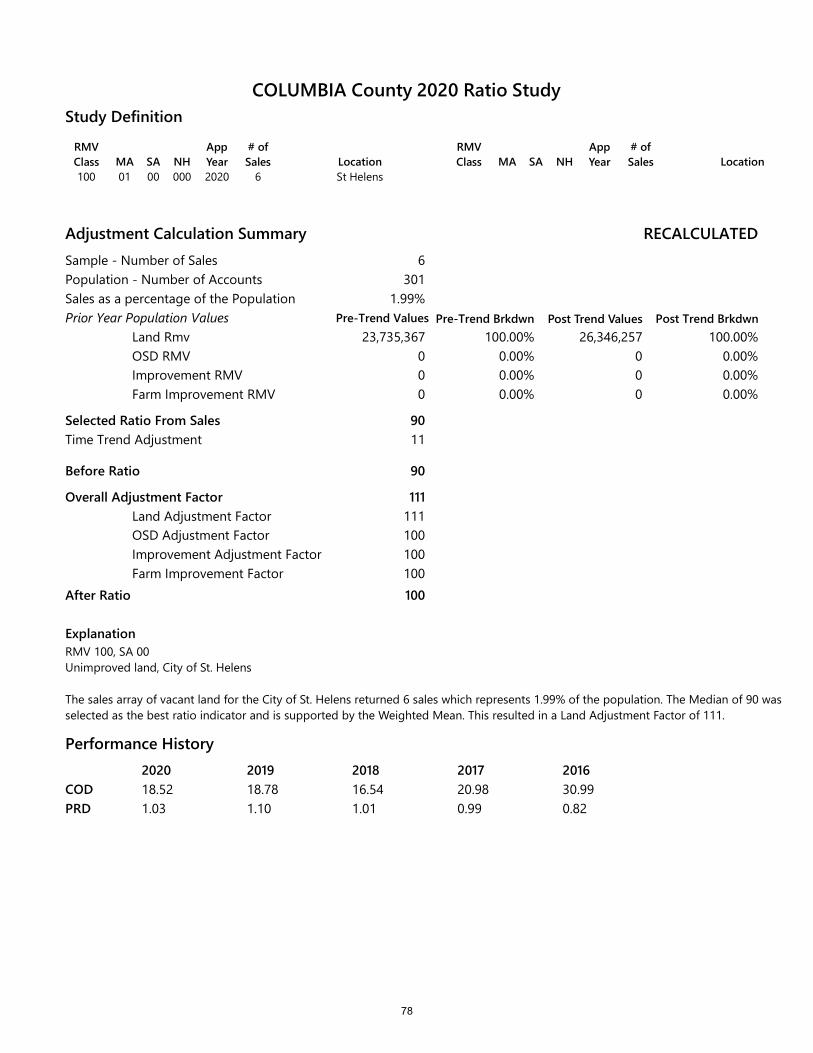
RMV Class MA SA NH
App Year
# of Sales Location
100 01 00 000 2020 6 St Helens
RMV Class MA SA NH
App Year
# of Sales Location
Study Definition
Adjustment Calculation SummarySample - Number of SalesPopulation - Number of AccountsSales as a percentage of the PopulationPrior Year Population Values
Land RmvOSD RMVImprovement RMVFarm Improvement RMV
Selected Ratio From Sales
Before Ratio
Overall Adjustment FactorLand Adjustment FactorOSD Adjustment FactorImprovement Adjustment FactorFarm Improvement Factor
After Ratio
ExplanationRMV 100, SA 00Unimproved land, City of St. Helens
The sales array of vacant land for the City of St. Helens returned 6 sales which represents 1.99% of the population. The Median of 90 was selected as the best ratio indicator and is supported by the Weighted Mean. This resulted in a Land Adjustment Factor of 111.
RECALCULATED
Pre-Trend Brkdwn Post Trend Values Post Trend Brkdwn
6301
1.99%
23,735,367 100.00% 26,346,257 100.00%000
0.00% 0 0.00%0.00% 0 0.00%0.00% 0 0.00%
90
90
111111100100100100
Time Trend Adjustment 11
Performance History2020 2019 2018 2017 201618.52 18.78 16.54 20.98 30.991.03 1.10 1.01 0.99 0.82
CODPRD
COLUMBIA County 2020 Ratio Study
Pre-Trend Values
78

RMV LANDSA NH PRP CLS
ST CLS
CO CD
MAP NO. DOC NUM.MA AC RMV IMP TOTAL RMV SALE PRICE
SALE DATE
# RT
Included Sales
01 00 000 100 33 4N1W06DA 07018
2019-10539 0.16 83,110 0 83,110 118,566 Dec-19 1 70
01 00 000 100 30 5N1W32DC 00904
2019-6936 0.67 238,280 0 238,280 299,117 Aug-19 2 80
01 00 000 100 33 4N1W06DA 07009
2019-10376 1.19 603,050 0 603,050 758,370 Dec-19 3 80
01 00 000 100 30 5N1W32DB 00129
2019-5992 1.12 377,920 0 377,920 376,812 Jul-19 4 100
01 00 000 100 33 4N1W04AA 00600
2019-10714 0.40 168,780 0 168,780 159,716 Dec-19 5 106
01 00 000 100 30 5N1W32DB 00154
2019-8178 0.58 276,280 0 276,280 222,048 Sep-19 6 124
0
0.5
1
1.5
2
2.5Sales(Ratio) Sales(After Ratio)
Frequency60 0 0
70 1 1
80 2 2
90 0 0
100 2 0
110 0 2
120 1 0
130 0 1
140 0 0
Median 90 100
AD 16.67 18.67
COD 18.52 18.76Mean 93 103SD 20.23 22.62COV 21.67 21.89Wtd Mean 90 100GeoMean 92 101PRD 1.03 1.0395% Confidence 16.18 18.10
Number Of Sales 6
70
80
90
100
110
120
130Mean Median Mean Trend Median Trend
Central Tendencies Month Mean Median SalesJul-19 100 100 1
Aug-19 80 80 1
Sep-19 124 124 1
Dec-19 85 80 3
Sales(Ratio)
Sales(After Ratio)
COLUMBIA County 2020 Ratio Study
79

RMV Class MA SA NH
App Year
# of Sales Location
101 01 00 000 2020 211 St Helens
RMV Class MA SA NH
App Year
# of Sales Location
Study Definition
Adjustment Calculation SummarySample - Number of SalesPopulation - Number of AccountsSales as a percentage of the PopulationPrior Year Population Values
Land RmvOSD RMVImprovement RMVFarm Improvement RMV
Selected Ratio From Sales
Before Ratio
Overall Adjustment FactorLand Adjustment FactorOSD Adjustment FactorImprovement Adjustment FactorFarm Improvement Factor
After Ratio
ExplanationRMV 101: SA 00Improved property, City of St. Helens
RECALCULATED
Pre-Trend Brkdwn Post Trend Values Post Trend Brkdwn
2113834
5.50%
279,194,480 28.09% 309,905,873 27.78%109,771,010601,220,140
3,849,980
11.04% 109,771,010 9.84%60.48% 691,403,161 61.98%0.39% 4,427,477 0.40%
89
89
112111100115115100
Time Trend Adjustment 11
For this analysis, the Median and Weighted Mean returned the same ratio of 89. This is further supported by the Mean of 88. Therefore, the Median (89) was selected and applied to this grouping of residential properties located in the City of St. Helens.
Performance History2020 2019 2018 2017 201611.66 11.65 10.50 8.65 11.230.99 1.00 0.99 0.99 1.01
CODPRD
COLUMBIA County 2020 Ratio Study
Pre-Trend Values
80
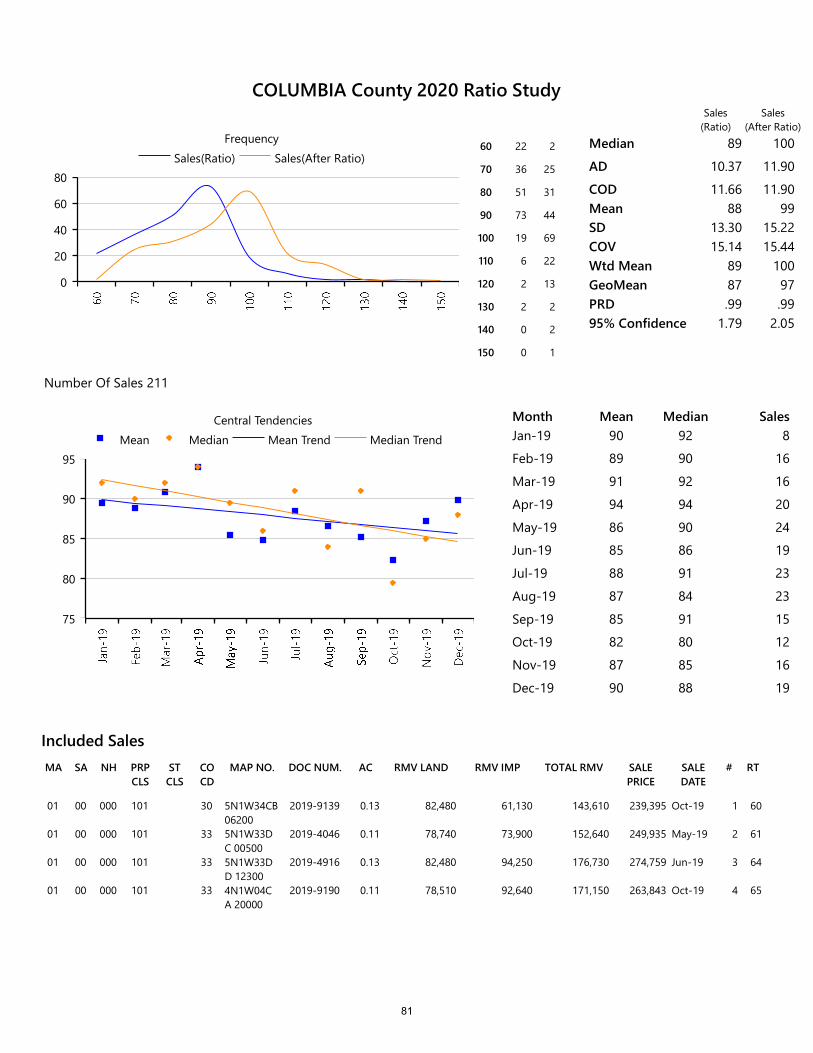
RMV LANDSA NH PRP CLS
ST CLS
CO CD
MAP NO. DOC NUM.MA AC RMV IMP TOTAL RMV SALE PRICE
SALE DATE
# RT
Included Sales
01 00 000 101 30 5N1W34CB 06200
2019-9139 0.13 82,480 61,130 143,610 239,395 Oct-19 1 60
01 00 000 101 33 5N1W33DC 00500
2019-4046 0.11 78,740 73,900 152,640 249,935 May-19 2 61
01 00 000 101 33 5N1W33DD 12300
2019-4916 0.13 82,480 94,250 176,730 274,759 Jun-19 3 64
01 00 000 101 33 4N1W04CA 20000
2019-9190 0.11 78,510 92,640 171,150 263,843 Oct-19 4 65
0
20
40
60
80Sales(Ratio) Sales(After Ratio)
Frequency60 22 2
70 36 25
80 51 31
90 73 44
100 19 69
110 6 22
120 2 13
130 2 2
140 0 2
150 0 1
Median 89 100
AD 10.37 11.90
COD 11.66 11.90Mean 88 99SD 13.30 15.22COV 15.14 15.44Wtd Mean 89 100GeoMean 87 97PRD .99 .9995% Confidence 1.79 2.05
Number Of Sales 211
75
80
85
90
95Mean Median Mean Trend Median Trend
Central Tendencies Month Mean Median SalesJan-19 90 92 8
Feb-19 89 90 16
Mar-19 91 92 16
Apr-19 94 94 20
May-19 86 90 24
Jun-19 85 86 19
Jul-19 88 91 23
Aug-19 87 84 23
Sep-19 85 91 15
Oct-19 82 80 12
Nov-19 87 85 16
Dec-19 90 88 19
Sales(Ratio)
Sales(After Ratio)
COLUMBIA County 2020 Ratio Study
81
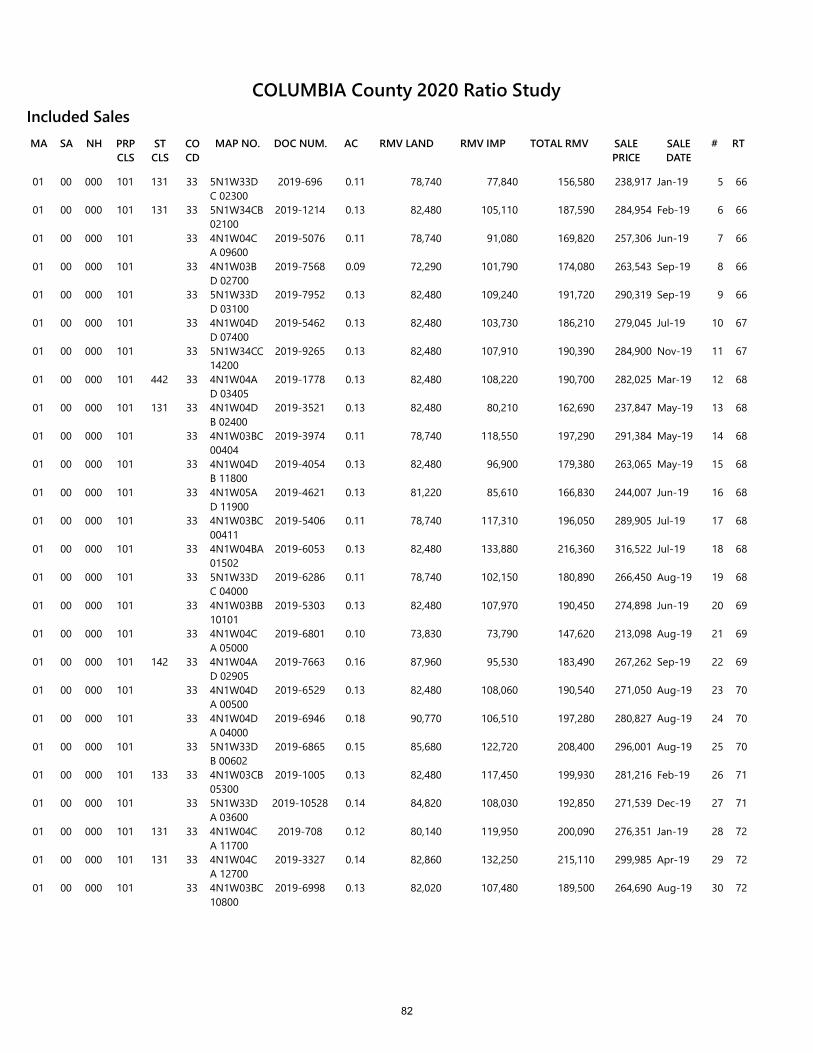
RMV LANDSA NH PRP CLS
ST CLS
CO CD
MAP NO. DOC NUM.MA AC RMV IMP TOTAL RMV SALE PRICE
SALE DATE
# RT
Included Sales
01 00 000 101 131 33 5N1W33DC 02300
2019-696 0.11 78,740 77,840 156,580 238,917 Jan-19 5 66
01 00 000 101 131 33 5N1W34CB 02100
2019-1214 0.13 82,480 105,110 187,590 284,954 Feb-19 6 66
01 00 000 101 33 4N1W04CA 09600
2019-5076 0.11 78,740 91,080 169,820 257,306 Jun-19 7 66
01 00 000 101 33 4N1W03BD 02700
2019-7568 0.09 72,290 101,790 174,080 263,543 Sep-19 8 66
01 00 000 101 33 5N1W33DD 03100
2019-7952 0.13 82,480 109,240 191,720 290,319 Sep-19 9 66
01 00 000 101 33 4N1W04DD 07400
2019-5462 0.13 82,480 103,730 186,210 279,045 Jul-19 10 67
01 00 000 101 33 5N1W34CC 14200
2019-9265 0.13 82,480 107,910 190,390 284,900 Nov-19 11 67
01 00 000 101 442 33 4N1W04AD 03405
2019-1778 0.13 82,480 108,220 190,700 282,025 Mar-19 12 68
01 00 000 101 131 33 4N1W04DB 02400
2019-3521 0.13 82,480 80,210 162,690 237,847 May-19 13 68
01 00 000 101 33 4N1W03BC 00404
2019-3974 0.11 78,740 118,550 197,290 291,384 May-19 14 68
01 00 000 101 33 4N1W04DB 11800
2019-4054 0.13 82,480 96,900 179,380 263,065 May-19 15 68
01 00 000 101 33 4N1W05AD 11900
2019-4621 0.13 81,220 85,610 166,830 244,007 Jun-19 16 68
01 00 000 101 33 4N1W03BC 00411
2019-5406 0.11 78,740 117,310 196,050 289,905 Jul-19 17 68
01 00 000 101 33 4N1W04BA 01502
2019-6053 0.13 82,480 133,880 216,360 316,522 Jul-19 18 68
01 00 000 101 33 5N1W33DC 04000
2019-6286 0.11 78,740 102,150 180,890 266,450 Aug-19 19 68
01 00 000 101 33 4N1W03BB 10101
2019-5303 0.13 82,480 107,970 190,450 274,898 Jun-19 20 69
01 00 000 101 33 4N1W04CA 05000
2019-6801 0.10 73,830 73,790 147,620 213,098 Aug-19 21 69
01 00 000 101 142 33 4N1W04AD 02905
2019-7663 0.16 87,960 95,530 183,490 267,262 Sep-19 22 69
01 00 000 101 33 4N1W04DA 00500
2019-6529 0.13 82,480 108,060 190,540 271,050 Aug-19 23 70
01 00 000 101 33 4N1W04DA 04000
2019-6946 0.18 90,770 106,510 197,280 280,827 Aug-19 24 70
01 00 000 101 33 5N1W33DB 00602
2019-6865 0.15 85,680 122,720 208,400 296,001 Aug-19 25 70
01 00 000 101 133 33 4N1W03CB 05300
2019-1005 0.13 82,480 117,450 199,930 281,216 Feb-19 26 71
01 00 000 101 33 5N1W33DA 03600
2019-10528 0.14 84,820 108,030 192,850 271,539 Dec-19 27 71
01 00 000 101 131 33 4N1W04CA 11700
2019-708 0.12 80,140 119,950 200,090 276,351 Jan-19 28 72
01 00 000 101 131 33 4N1W04CA 12700
2019-3327 0.14 82,860 132,250 215,110 299,985 Apr-19 29 72
01 00 000 101 33 4N1W03BC 10800
2019-6998 0.13 82,020 107,480 189,500 264,690 Aug-19 30 72
COLUMBIA County 2020 Ratio Study
82

RMV LANDSA NH PRP CLS
ST CLS
CO CD
MAP NO. DOC NUM.MA AC RMV IMP TOTAL RMV SALE PRICE
SALE DATE
# RT
Included Sales
01 00 000 101 33 5N1W33DC 04900
2019-8505 0.11 78,740 97,790 176,530 244,975 Oct-19 31 72
01 00 000 101 33 4N1W03CB 06600
2019-9120 0.13 82,480 109,270 191,750 264,994 Oct-19 32 72
01 00 000 101 33 4N1W03CB 05302
2019-9940 0.13 82,480 105,080 187,560 260,086 Nov-19 33 72
01 00 000 101 132 33 4N1W04AC 06701
2019-638 0.12 78,790 142,390 221,180 302,858 Jan-19 34 73
01 00 000 101 121 33 5N1W33DD 09900
2019-3608 0.13 82,480 54,860 137,340 187,388 May-19 35 73
01 00 000 101 33 4N1W04BD 03600
2019-5667 0.11 78,740 98,230 176,970 241,569 Jul-19 36 73
01 00 000 101 30 4N1W04DA 03200
2019-6182 0.13 82,480 104,430 186,910 256,809 Jul-19 37 73
01 00 000 101 131 33 4N1W05CD 03500
2019-1421 0.19 92,190 131,470 223,660 301,613 Feb-19 38 74
01 00 000 101 33 4N1W05DA 02402
2019-4165 0.15 86,180 75,750 161,930 218,469 May-19 39 74
01 00 000 101 33 4N1W03BD 04800
2019-7150 0.15 86,420 125,060 211,480 284,873 Sep-19 40 74
01 00 000 101 33 4N1W05DB 02603
2019-7640 0.15 86,080 127,210 213,290 287,746 Sep-19 41 74
01 00 000 101 33 4N1W04DA 11800
2019-9287 0.16 86,920 102,330 189,250 254,375 Nov-19 42 74
01 00 000 101 33 4N1W04CA 19400
2019-10477 0.11 78,760 121,290 200,050 271,438 Dec-19 43 74
01 00 000 101 33 4N1W04AD 04610
2019-5573 0.13 82,480 129,070 211,550 283,719 Jul-19 44 75
01 00 000 101 131 33 4N1W05CD 04100
2019-1151 0.33 114,400 125,070 239,470 314,753 Feb-19 45 76
01 00 000 101 135 33 4N1W04DD 02100
2019-1531 0.13 82,480 147,360 229,840 302,539 Mar-19 46 76
01 00 000 101 131 33 4N1W05AD 05200
2019-2013 0.11 78,740 94,120 172,860 228,039 Mar-19 47 76
01 00 000 101 131 33 5N1W33DC 01200
2019-3456 0.12 80,460 156,170 236,630 311,315 May-19 48 76
01 00 000 101 33 4N1W05DA 03002
2019-4684 0.16 113,280 134,020 247,300 326,665 Jun-19 49 76
01 00 000 101 33 4N1W05AA 00802
2019-9129 0.23 99,620 111,450 211,070 276,183 Oct-19 50 76
01 00 000 101 33 4N1W04DD 08100
2019-9944 0.13 82,480 116,770 199,250 262,289 Nov-19 51 76
01 00 000 101 33 4N1W04AA 00100
2019-10154 0.13 82,480 144,050 226,530 297,314 Dec-19 52 76
01 00 000 101 136 33 4N1W05DA 04000
2019-775 0.18 90,550 163,730 254,280 331,311 Feb-19 53 77
01 00 000 101 30 4N1W05DA 05200
2019-9224 0.20 94,340 117,810 212,150 274,540 Oct-19 54 77
01 00 000 101 121 33 4N1W04CB 10800
2019-3498 0.29 110,450 107,850 218,300 279,032 May-19 55 78
01 00 000 101 33 4N1W05BC 07501
2019-10021 0.12 100,110 182,300 282,410 361,000 Nov-19 56 78
COLUMBIA County 2020 Ratio Study
83
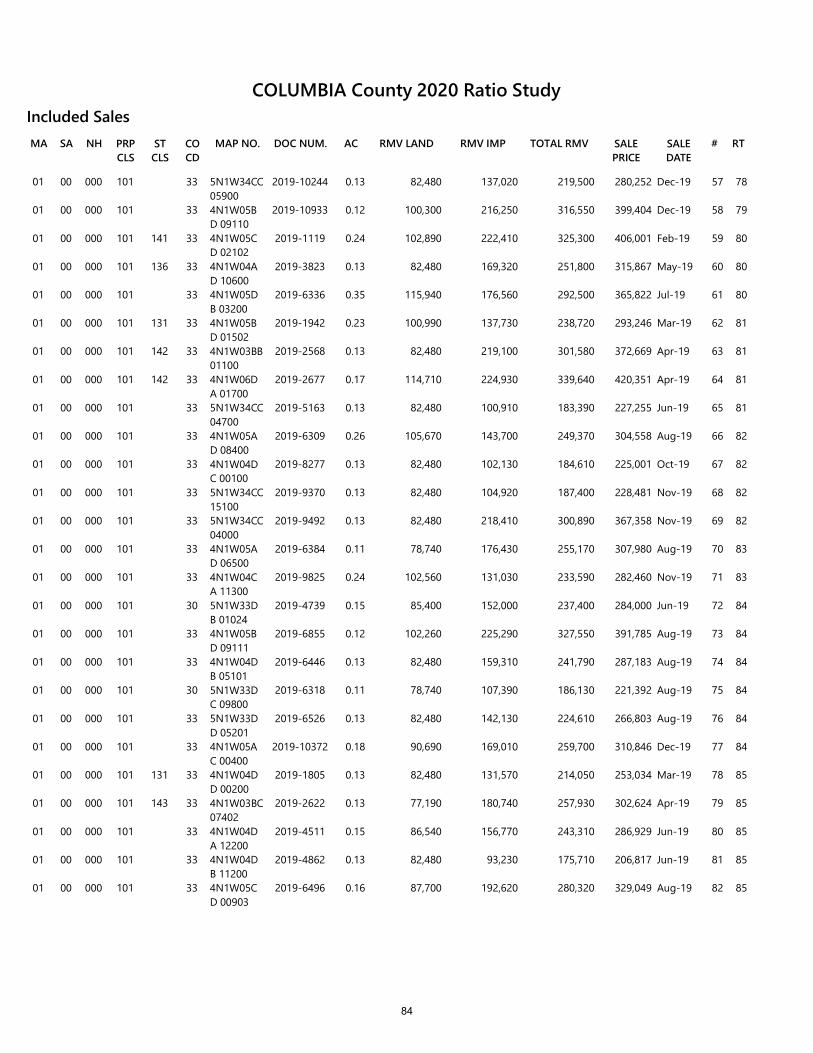
RMV LANDSA NH PRP CLS
ST CLS
CO CD
MAP NO. DOC NUM.MA AC RMV IMP TOTAL RMV SALE PRICE
SALE DATE
# RT
Included Sales
01 00 000 101 33 5N1W34CC 05900
2019-10244 0.13 82,480 137,020 219,500 280,252 Dec-19 57 78
01 00 000 101 33 4N1W05BD 09110
2019-10933 0.12 100,300 216,250 316,550 399,404 Dec-19 58 79
01 00 000 101 141 33 4N1W05CD 02102
2019-1119 0.24 102,890 222,410 325,300 406,001 Feb-19 59 80
01 00 000 101 136 33 4N1W04AD 10600
2019-3823 0.13 82,480 169,320 251,800 315,867 May-19 60 80
01 00 000 101 33 4N1W05DB 03200
2019-6336 0.35 115,940 176,560 292,500 365,822 Jul-19 61 80
01 00 000 101 131 33 4N1W05BD 01502
2019-1942 0.23 100,990 137,730 238,720 293,246 Mar-19 62 81
01 00 000 101 142 33 4N1W03BB 01100
2019-2568 0.13 82,480 219,100 301,580 372,669 Apr-19 63 81
01 00 000 101 142 33 4N1W06DA 01700
2019-2677 0.17 114,710 224,930 339,640 420,351 Apr-19 64 81
01 00 000 101 33 5N1W34CC 04700
2019-5163 0.13 82,480 100,910 183,390 227,255 Jun-19 65 81
01 00 000 101 33 4N1W05AD 08400
2019-6309 0.26 105,670 143,700 249,370 304,558 Aug-19 66 82
01 00 000 101 33 4N1W04DC 00100
2019-8277 0.13 82,480 102,130 184,610 225,001 Oct-19 67 82
01 00 000 101 33 5N1W34CC 15100
2019-9370 0.13 82,480 104,920 187,400 228,481 Nov-19 68 82
01 00 000 101 33 5N1W34CC 04000
2019-9492 0.13 82,480 218,410 300,890 367,358 Nov-19 69 82
01 00 000 101 33 4N1W05AD 06500
2019-6384 0.11 78,740 176,430 255,170 307,980 Aug-19 70 83
01 00 000 101 33 4N1W04CA 11300
2019-9825 0.24 102,560 131,030 233,590 282,460 Nov-19 71 83
01 00 000 101 30 5N1W33DB 01024
2019-4739 0.15 85,400 152,000 237,400 284,000 Jun-19 72 84
01 00 000 101 33 4N1W05BD 09111
2019-6855 0.12 102,260 225,290 327,550 391,785 Aug-19 73 84
01 00 000 101 33 4N1W04DB 05101
2019-6446 0.13 82,480 159,310 241,790 287,183 Aug-19 74 84
01 00 000 101 30 5N1W33DC 09800
2019-6318 0.11 78,740 107,390 186,130 221,392 Aug-19 75 84
01 00 000 101 33 5N1W33DD 05201
2019-6526 0.13 82,480 142,130 224,610 266,803 Aug-19 76 84
01 00 000 101 33 4N1W05AC 00400
2019-10372 0.18 90,690 169,010 259,700 310,846 Dec-19 77 84
01 00 000 101 131 33 4N1W04DD 00200
2019-1805 0.13 82,480 131,570 214,050 253,034 Mar-19 78 85
01 00 000 101 143 33 4N1W03BC 07402
2019-2622 0.13 77,190 180,740 257,930 302,624 Apr-19 79 85
01 00 000 101 33 4N1W04DA 12200
2019-4511 0.15 86,540 156,770 243,310 286,929 Jun-19 80 85
01 00 000 101 33 4N1W04DB 11200
2019-4862 0.13 82,480 93,230 175,710 206,817 Jun-19 81 85
01 00 000 101 33 4N1W05CD 00903
2019-6496 0.16 87,700 192,620 280,320 329,049 Aug-19 82 85
COLUMBIA County 2020 Ratio Study
84
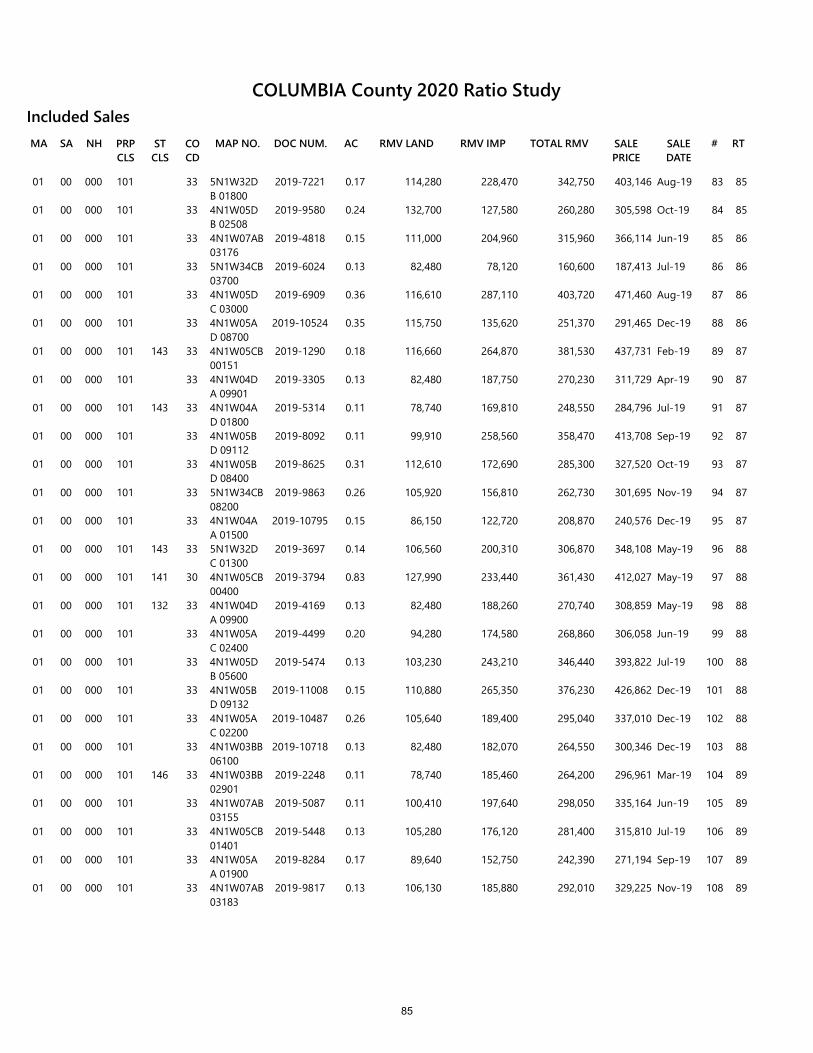
RMV LANDSA NH PRP CLS
ST CLS
CO CD
MAP NO. DOC NUM.MA AC RMV IMP TOTAL RMV SALE PRICE
SALE DATE
# RT
Included Sales
01 00 000 101 33 5N1W32DB 01800
2019-7221 0.17 114,280 228,470 342,750 403,146 Aug-19 83 85
01 00 000 101 33 4N1W05DB 02508
2019-9580 0.24 132,700 127,580 260,280 305,598 Oct-19 84 85
01 00 000 101 33 4N1W07AB 03176
2019-4818 0.15 111,000 204,960 315,960 366,114 Jun-19 85 86
01 00 000 101 33 5N1W34CB 03700
2019-6024 0.13 82,480 78,120 160,600 187,413 Jul-19 86 86
01 00 000 101 33 4N1W05DC 03000
2019-6909 0.36 116,610 287,110 403,720 471,460 Aug-19 87 86
01 00 000 101 33 4N1W05AD 08700
2019-10524 0.35 115,750 135,620 251,370 291,465 Dec-19 88 86
01 00 000 101 143 33 4N1W05CB 00151
2019-1290 0.18 116,660 264,870 381,530 437,731 Feb-19 89 87
01 00 000 101 33 4N1W04DA 09901
2019-3305 0.13 82,480 187,750 270,230 311,729 Apr-19 90 87
01 00 000 101 143 33 4N1W04AD 01800
2019-5314 0.11 78,740 169,810 248,550 284,796 Jul-19 91 87
01 00 000 101 33 4N1W05BD 09112
2019-8092 0.11 99,910 258,560 358,470 413,708 Sep-19 92 87
01 00 000 101 33 4N1W05BD 08400
2019-8625 0.31 112,610 172,690 285,300 327,520 Oct-19 93 87
01 00 000 101 33 5N1W34CB 08200
2019-9863 0.26 105,920 156,810 262,730 301,695 Nov-19 94 87
01 00 000 101 33 4N1W04AA 01500
2019-10795 0.15 86,150 122,720 208,870 240,576 Dec-19 95 87
01 00 000 101 143 33 5N1W32DC 01300
2019-3697 0.14 106,560 200,310 306,870 348,108 May-19 96 88
01 00 000 101 141 30 4N1W05CB 00400
2019-3794 0.83 127,990 233,440 361,430 412,027 May-19 97 88
01 00 000 101 132 33 4N1W04DA 09900
2019-4169 0.13 82,480 188,260 270,740 308,859 May-19 98 88
01 00 000 101 33 4N1W05AC 02400
2019-4499 0.20 94,280 174,580 268,860 306,058 Jun-19 99 88
01 00 000 101 33 4N1W05DB 05600
2019-5474 0.13 103,230 243,210 346,440 393,822 Jul-19 100 88
01 00 000 101 33 4N1W05BD 09132
2019-11008 0.15 110,880 265,350 376,230 426,862 Dec-19 101 88
01 00 000 101 33 4N1W05AC 02200
2019-10487 0.26 105,640 189,400 295,040 337,010 Dec-19 102 88
01 00 000 101 33 4N1W03BB 06100
2019-10718 0.13 82,480 182,070 264,550 300,346 Dec-19 103 88
01 00 000 101 146 33 4N1W03BB 02901
2019-2248 0.11 78,740 185,460 264,200 296,961 Mar-19 104 89
01 00 000 101 33 4N1W07AB 03155
2019-5087 0.11 100,410 197,640 298,050 335,164 Jun-19 105 89
01 00 000 101 33 4N1W05CB 01401
2019-5448 0.13 105,280 176,120 281,400 315,810 Jul-19 106 89
01 00 000 101 33 4N1W05AA 01900
2019-8284 0.17 89,640 152,750 242,390 271,194 Sep-19 107 89
01 00 000 101 33 4N1W07AB 03183
2019-9817 0.13 106,130 185,880 292,010 329,225 Nov-19 108 89
COLUMBIA County 2020 Ratio Study
85
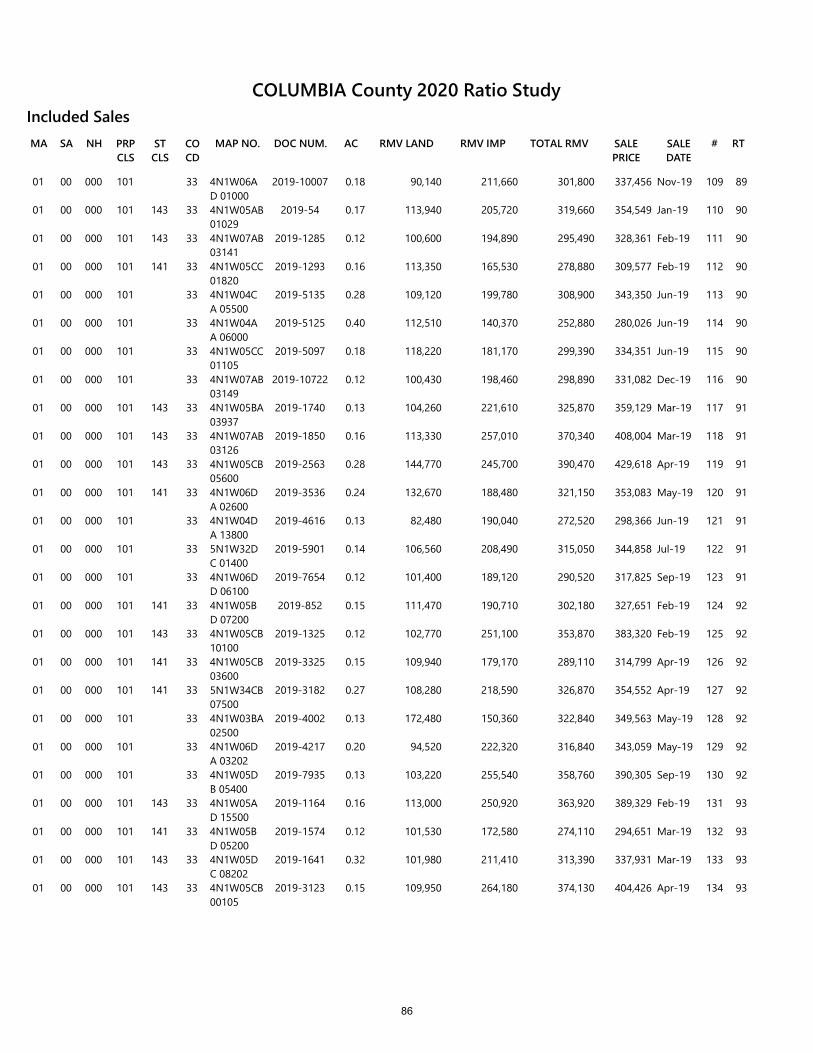
RMV LANDSA NH PRP CLS
ST CLS
CO CD
MAP NO. DOC NUM.MA AC RMV IMP TOTAL RMV SALE PRICE
SALE DATE
# RT
Included Sales
01 00 000 101 33 4N1W06AD 01000
2019-10007 0.18 90,140 211,660 301,800 337,456 Nov-19 109 89
01 00 000 101 143 33 4N1W05AB 01029
2019-54 0.17 113,940 205,720 319,660 354,549 Jan-19 110 90
01 00 000 101 143 33 4N1W07AB 03141
2019-1285 0.12 100,600 194,890 295,490 328,361 Feb-19 111 90
01 00 000 101 141 33 4N1W05CC 01820
2019-1293 0.16 113,350 165,530 278,880 309,577 Feb-19 112 90
01 00 000 101 33 4N1W04CA 05500
2019-5135 0.28 109,120 199,780 308,900 343,350 Jun-19 113 90
01 00 000 101 33 4N1W04AA 06000
2019-5125 0.40 112,510 140,370 252,880 280,026 Jun-19 114 90
01 00 000 101 33 4N1W05CC 01105
2019-5097 0.18 118,220 181,170 299,390 334,351 Jun-19 115 90
01 00 000 101 33 4N1W07AB 03149
2019-10722 0.12 100,430 198,460 298,890 331,082 Dec-19 116 90
01 00 000 101 143 33 4N1W05BA 03937
2019-1740 0.13 104,260 221,610 325,870 359,129 Mar-19 117 91
01 00 000 101 143 33 4N1W07AB 03126
2019-1850 0.16 113,330 257,010 370,340 408,004 Mar-19 118 91
01 00 000 101 143 33 4N1W05CB 05600
2019-2563 0.28 144,770 245,700 390,470 429,618 Apr-19 119 91
01 00 000 101 141 33 4N1W06DA 02600
2019-3536 0.24 132,670 188,480 321,150 353,083 May-19 120 91
01 00 000 101 33 4N1W04DA 13800
2019-4616 0.13 82,480 190,040 272,520 298,366 Jun-19 121 91
01 00 000 101 33 5N1W32DC 01400
2019-5901 0.14 106,560 208,490 315,050 344,858 Jul-19 122 91
01 00 000 101 33 4N1W06DD 06100
2019-7654 0.12 101,400 189,120 290,520 317,825 Sep-19 123 91
01 00 000 101 141 33 4N1W05BD 07200
2019-852 0.15 111,470 190,710 302,180 327,651 Feb-19 124 92
01 00 000 101 143 33 4N1W05CB 10100
2019-1325 0.12 102,770 251,100 353,870 383,320 Feb-19 125 92
01 00 000 101 141 33 4N1W05CB 03600
2019-3325 0.15 109,940 179,170 289,110 314,799 Apr-19 126 92
01 00 000 101 141 33 5N1W34CB 07500
2019-3182 0.27 108,280 218,590 326,870 354,552 Apr-19 127 92
01 00 000 101 33 4N1W03BA 02500
2019-4002 0.13 172,480 150,360 322,840 349,563 May-19 128 92
01 00 000 101 33 4N1W06DA 03202
2019-4217 0.20 94,520 222,320 316,840 343,059 May-19 129 92
01 00 000 101 33 4N1W05DB 05400
2019-7935 0.13 103,220 255,540 358,760 390,305 Sep-19 130 92
01 00 000 101 143 33 4N1W05AD 15500
2019-1164 0.16 113,000 250,920 363,920 389,329 Feb-19 131 93
01 00 000 101 141 33 4N1W05BD 05200
2019-1574 0.12 101,530 172,580 274,110 294,651 Mar-19 132 93
01 00 000 101 143 33 4N1W05DC 08202
2019-1641 0.32 101,980 211,410 313,390 337,931 Mar-19 133 93
01 00 000 101 143 33 4N1W05CB 00105
2019-3123 0.15 109,950 264,180 374,130 404,426 Apr-19 134 93
COLUMBIA County 2020 Ratio Study
86
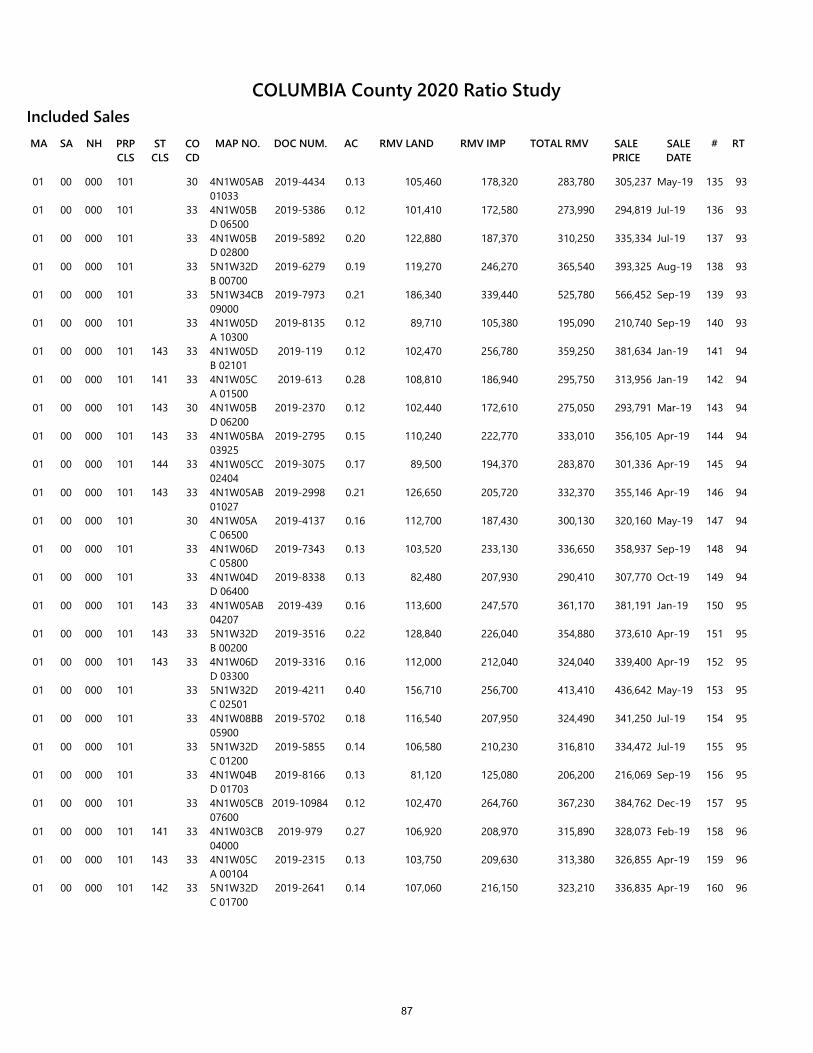
RMV LANDSA NH PRP CLS
ST CLS
CO CD
MAP NO. DOC NUM.MA AC RMV IMP TOTAL RMV SALE PRICE
SALE DATE
# RT
Included Sales
01 00 000 101 30 4N1W05AB 01033
2019-4434 0.13 105,460 178,320 283,780 305,237 May-19 135 93
01 00 000 101 33 4N1W05BD 06500
2019-5386 0.12 101,410 172,580 273,990 294,819 Jul-19 136 93
01 00 000 101 33 4N1W05BD 02800
2019-5892 0.20 122,880 187,370 310,250 335,334 Jul-19 137 93
01 00 000 101 33 5N1W32DB 00700
2019-6279 0.19 119,270 246,270 365,540 393,325 Aug-19 138 93
01 00 000 101 33 5N1W34CB 09000
2019-7973 0.21 186,340 339,440 525,780 566,452 Sep-19 139 93
01 00 000 101 33 4N1W05DA 10300
2019-8135 0.12 89,710 105,380 195,090 210,740 Sep-19 140 93
01 00 000 101 143 33 4N1W05DB 02101
2019-119 0.12 102,470 256,780 359,250 381,634 Jan-19 141 94
01 00 000 101 141 33 4N1W05CA 01500
2019-613 0.28 108,810 186,940 295,750 313,956 Jan-19 142 94
01 00 000 101 143 30 4N1W05BD 06200
2019-2370 0.12 102,440 172,610 275,050 293,791 Mar-19 143 94
01 00 000 101 143 33 4N1W05BA 03925
2019-2795 0.15 110,240 222,770 333,010 356,105 Apr-19 144 94
01 00 000 101 144 33 4N1W05CC 02404
2019-3075 0.17 89,500 194,370 283,870 301,336 Apr-19 145 94
01 00 000 101 143 33 4N1W05AB 01027
2019-2998 0.21 126,650 205,720 332,370 355,146 Apr-19 146 94
01 00 000 101 30 4N1W05AC 06500
2019-4137 0.16 112,700 187,430 300,130 320,160 May-19 147 94
01 00 000 101 33 4N1W06DC 05800
2019-7343 0.13 103,520 233,130 336,650 358,937 Sep-19 148 94
01 00 000 101 33 4N1W04DD 06400
2019-8338 0.13 82,480 207,930 290,410 307,770 Oct-19 149 94
01 00 000 101 143 33 4N1W05AB 04207
2019-439 0.16 113,600 247,570 361,170 381,191 Jan-19 150 95
01 00 000 101 143 33 5N1W32DB 00200
2019-3516 0.22 128,840 226,040 354,880 373,610 Apr-19 151 95
01 00 000 101 143 33 4N1W06DD 03300
2019-3316 0.16 112,000 212,040 324,040 339,400 Apr-19 152 95
01 00 000 101 33 5N1W32DC 02501
2019-4211 0.40 156,710 256,700 413,410 436,642 May-19 153 95
01 00 000 101 33 4N1W08BB 05900
2019-5702 0.18 116,540 207,950 324,490 341,250 Jul-19 154 95
01 00 000 101 33 5N1W32DC 01200
2019-5855 0.14 106,580 210,230 316,810 334,472 Jul-19 155 95
01 00 000 101 33 4N1W04BD 01703
2019-8166 0.13 81,120 125,080 206,200 216,069 Sep-19 156 95
01 00 000 101 33 4N1W05CB 07600
2019-10984 0.12 102,470 264,760 367,230 384,762 Dec-19 157 95
01 00 000 101 141 33 4N1W03CB 04000
2019-979 0.27 106,920 208,970 315,890 328,073 Feb-19 158 96
01 00 000 101 143 33 4N1W05CA 00104
2019-2315 0.13 103,750 209,630 313,380 326,855 Apr-19 159 96
01 00 000 101 142 33 5N1W32DC 01700
2019-2641 0.14 107,060 216,150 323,210 336,835 Apr-19 160 96
COLUMBIA County 2020 Ratio Study
87
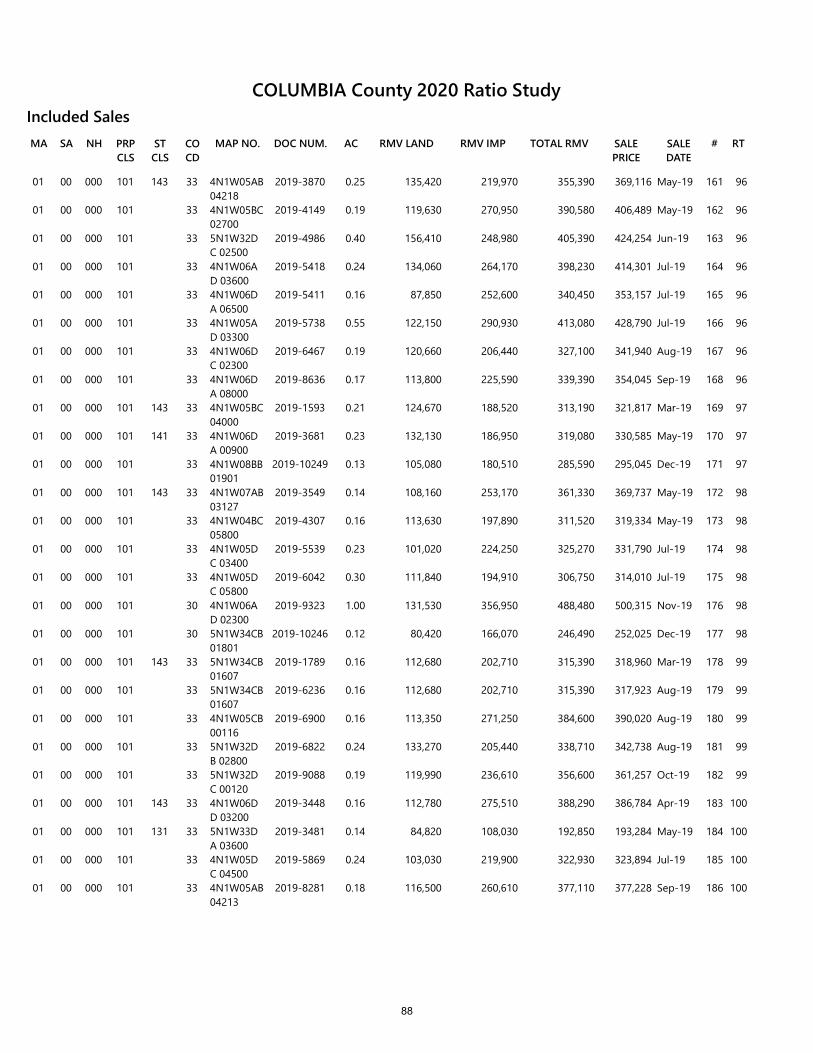
RMV LANDSA NH PRP CLS
ST CLS
CO CD
MAP NO. DOC NUM.MA AC RMV IMP TOTAL RMV SALE PRICE
SALE DATE
# RT
Included Sales
01 00 000 101 143 33 4N1W05AB 04218
2019-3870 0.25 135,420 219,970 355,390 369,116 May-19 161 96
01 00 000 101 33 4N1W05BC 02700
2019-4149 0.19 119,630 270,950 390,580 406,489 May-19 162 96
01 00 000 101 33 5N1W32DC 02500
2019-4986 0.40 156,410 248,980 405,390 424,254 Jun-19 163 96
01 00 000 101 33 4N1W06AD 03600
2019-5418 0.24 134,060 264,170 398,230 414,301 Jul-19 164 96
01 00 000 101 33 4N1W06DA 06500
2019-5411 0.16 87,850 252,600 340,450 353,157 Jul-19 165 96
01 00 000 101 33 4N1W05AD 03300
2019-5738 0.55 122,150 290,930 413,080 428,790 Jul-19 166 96
01 00 000 101 33 4N1W06DC 02300
2019-6467 0.19 120,660 206,440 327,100 341,940 Aug-19 167 96
01 00 000 101 33 4N1W06DA 08000
2019-8636 0.17 113,800 225,590 339,390 354,045 Sep-19 168 96
01 00 000 101 143 33 4N1W05BC 04000
2019-1593 0.21 124,670 188,520 313,190 321,817 Mar-19 169 97
01 00 000 101 141 33 4N1W06DA 00900
2019-3681 0.23 132,130 186,950 319,080 330,585 May-19 170 97
01 00 000 101 33 4N1W08BB 01901
2019-10249 0.13 105,080 180,510 285,590 295,045 Dec-19 171 97
01 00 000 101 143 33 4N1W07AB 03127
2019-3549 0.14 108,160 253,170 361,330 369,737 May-19 172 98
01 00 000 101 33 4N1W04BC 05800
2019-4307 0.16 113,630 197,890 311,520 319,334 May-19 173 98
01 00 000 101 33 4N1W05DC 03400
2019-5539 0.23 101,020 224,250 325,270 331,790 Jul-19 174 98
01 00 000 101 33 4N1W05DC 05800
2019-6042 0.30 111,840 194,910 306,750 314,010 Jul-19 175 98
01 00 000 101 30 4N1W06AD 02300
2019-9323 1.00 131,530 356,950 488,480 500,315 Nov-19 176 98
01 00 000 101 30 5N1W34CB 01801
2019-10246 0.12 80,420 166,070 246,490 252,025 Dec-19 177 98
01 00 000 101 143 33 5N1W34CB 01607
2019-1789 0.16 112,680 202,710 315,390 318,960 Mar-19 178 99
01 00 000 101 33 5N1W34CB 01607
2019-6236 0.16 112,680 202,710 315,390 317,923 Aug-19 179 99
01 00 000 101 33 4N1W05CB 00116
2019-6900 0.16 113,350 271,250 384,600 390,020 Aug-19 180 99
01 00 000 101 33 5N1W32DB 02800
2019-6822 0.24 133,270 205,440 338,710 342,738 Aug-19 181 99
01 00 000 101 33 5N1W32DC 00120
2019-9088 0.19 119,990 236,610 356,600 361,257 Oct-19 182 99
01 00 000 101 143 33 4N1W06DD 03200
2019-3448 0.16 112,780 275,510 388,290 386,784 Apr-19 183 100
01 00 000 101 131 33 5N1W33DA 03600
2019-3481 0.14 84,820 108,030 192,850 193,284 May-19 184 100
01 00 000 101 33 4N1W05DC 04500
2019-5869 0.24 103,030 219,900 322,930 323,894 Jul-19 185 100
01 00 000 101 33 4N1W05AB 04213
2019-8281 0.18 116,500 260,610 377,110 377,228 Sep-19 186 100
COLUMBIA County 2020 Ratio Study
88
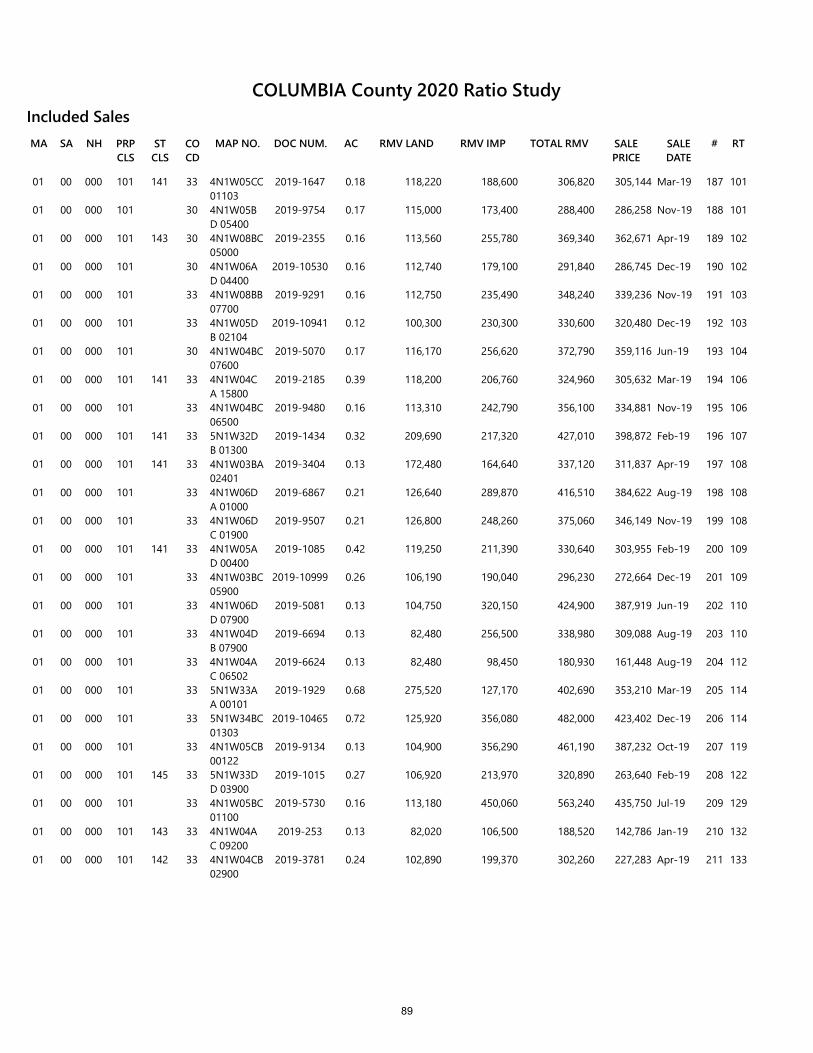
RMV LANDSA NH PRP CLS
ST CLS
CO CD
MAP NO. DOC NUM.MA AC RMV IMP TOTAL RMV SALE PRICE
SALE DATE
# RT
Included Sales
01 00 000 101 141 33 4N1W05CC 01103
2019-1647 0.18 118,220 188,600 306,820 305,144 Mar-19 187 101
01 00 000 101 30 4N1W05BD 05400
2019-9754 0.17 115,000 173,400 288,400 286,258 Nov-19 188 101
01 00 000 101 143 30 4N1W08BC 05000
2019-2355 0.16 113,560 255,780 369,340 362,671 Apr-19 189 102
01 00 000 101 30 4N1W06AD 04400
2019-10530 0.16 112,740 179,100 291,840 286,745 Dec-19 190 102
01 00 000 101 33 4N1W08BB 07700
2019-9291 0.16 112,750 235,490 348,240 339,236 Nov-19 191 103
01 00 000 101 33 4N1W05DB 02104
2019-10941 0.12 100,300 230,300 330,600 320,480 Dec-19 192 103
01 00 000 101 30 4N1W04BC 07600
2019-5070 0.17 116,170 256,620 372,790 359,116 Jun-19 193 104
01 00 000 101 141 33 4N1W04CA 15800
2019-2185 0.39 118,200 206,760 324,960 305,632 Mar-19 194 106
01 00 000 101 33 4N1W04BC 06500
2019-9480 0.16 113,310 242,790 356,100 334,881 Nov-19 195 106
01 00 000 101 141 33 5N1W32DB 01300
2019-1434 0.32 209,690 217,320 427,010 398,872 Feb-19 196 107
01 00 000 101 141 33 4N1W03BA 02401
2019-3404 0.13 172,480 164,640 337,120 311,837 Apr-19 197 108
01 00 000 101 33 4N1W06DA 01000
2019-6867 0.21 126,640 289,870 416,510 384,622 Aug-19 198 108
01 00 000 101 33 4N1W06DC 01900
2019-9507 0.21 126,800 248,260 375,060 346,149 Nov-19 199 108
01 00 000 101 141 33 4N1W05AD 00400
2019-1085 0.42 119,250 211,390 330,640 303,955 Feb-19 200 109
01 00 000 101 33 4N1W03BC 05900
2019-10999 0.26 106,190 190,040 296,230 272,664 Dec-19 201 109
01 00 000 101 33 4N1W06DD 07900
2019-5081 0.13 104,750 320,150 424,900 387,919 Jun-19 202 110
01 00 000 101 33 4N1W04DB 07900
2019-6694 0.13 82,480 256,500 338,980 309,088 Aug-19 203 110
01 00 000 101 33 4N1W04AC 06502
2019-6624 0.13 82,480 98,450 180,930 161,448 Aug-19 204 112
01 00 000 101 33 5N1W33AA 00101
2019-1929 0.68 275,520 127,170 402,690 353,210 Mar-19 205 114
01 00 000 101 33 5N1W34BC 01303
2019-10465 0.72 125,920 356,080 482,000 423,402 Dec-19 206 114
01 00 000 101 33 4N1W05CB 00122
2019-9134 0.13 104,900 356,290 461,190 387,232 Oct-19 207 119
01 00 000 101 145 33 5N1W33DD 03900
2019-1015 0.27 106,920 213,970 320,890 263,640 Feb-19 208 122
01 00 000 101 33 4N1W05BC 01100
2019-5730 0.16 113,180 450,060 563,240 435,750 Jul-19 209 129
01 00 000 101 143 33 4N1W04AC 09200
2019-253 0.13 82,020 106,500 188,520 142,786 Jan-19 210 132
01 00 000 101 142 33 4N1W04CB 02900
2019-3781 0.24 102,890 199,370 302,260 227,283 Apr-19 211 133
COLUMBIA County 2020 Ratio Study
89

RMV Class MA SA NH
App Year
# of Sales Location
102 01 00 000 2020 1 St Helens
RMV Class MA SA NH
App Year
# of Sales Location
Study Definition
Adjustment Calculation SummarySample - Number of SalesPopulation - Number of AccountsSales as a percentage of the PopulationPrior Year Population Values
Land RmvOSD RMVImprovement RMVFarm Improvement RMV
Selected Ratio From Sales
Before Ratio
Overall Adjustment FactorLand Adjustment FactorOSD Adjustment FactorImprovement Adjustment FactorFarm Improvement Factor
After Ratio
ExplanationRMV 102: SA 00Improved property - Condominium, City of St. Helens
A single sale was identified in this study period, which is a sample too small to use as a determination of the current market for Condominiums located in the City of St. Helens. Therefore, it is recommended that the conclusion from the MA 01 SA 00 for improved property study be applied here (Selected Ratio of 89).
RECALCULATED
Pre-Trend Brkdwn Post Trend Values Post Trend Brkdwn
127
3.70%
0 0.00% 0 0.00%0
5,719,2800
0.00% 0.00%100.00% 100.00%
0.00% 0.00%
89
89
112100100115115100
Time Trend Adjustment 0
Performance History2020 2019 2018 2017 2016- 4.10 5.39 11.11 2.881.00 1.00 0.98 1.02 0.99
CODPRD
COLUMBIA County 2020 Ratio Study
Pre-Trend Values
06,577,172
0
90
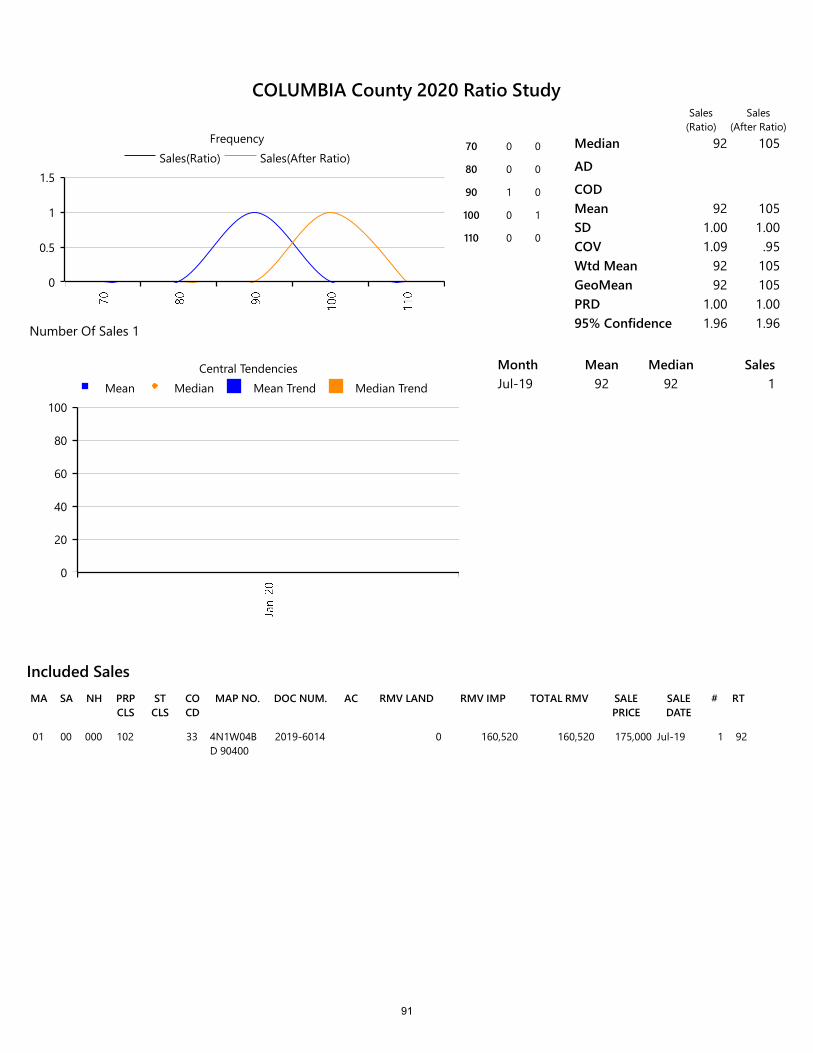
RMV LANDSA NH PRP CLS
ST CLS
CO CD
MAP NO. DOC NUM.MA AC RMV IMP TOTAL RMV SALE PRICE
SALE DATE
# RT
Included Sales
01 00 000 102 33 4N1W04BD 90400
2019-6014 0 160,520 160,520 175,000 Jul-19 1 92
0
0.5
1
1.5Sales(Ratio) Sales(After Ratio)
Frequency70 0 0
80 0 0
90 1 0
100 0 1
110 0 0
Median 92 105
AD
CODMean 92 105SD 1.00 1.00COV 1.09 .95Wtd Mean 92 105GeoMean 92 105PRD 1.00 1.0095% Confidence 1.96 1.96Number Of Sales 1
0
20
40
60
80
100Mean Median Mean Trend Median Trend
Central Tendencies Month Mean Median SalesJul-19 92 92 1
Sales(Ratio)
Sales(After Ratio)
COLUMBIA County 2020 Ratio Study
91
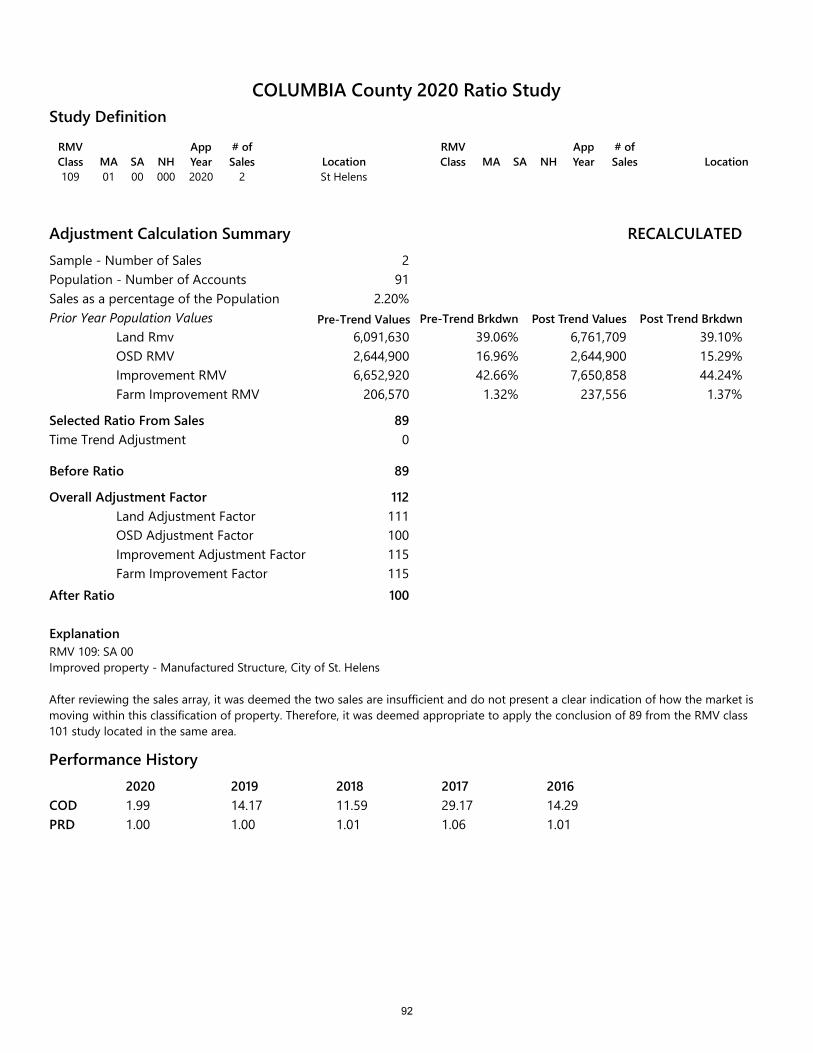
RMV Class MA SA NH
App Year
# of Sales Location
109 01 00 000 2020 2 St Helens
RMV Class MA SA NH
App Year
# of Sales Location
Study Definition
Adjustment Calculation SummarySample - Number of SalesPopulation - Number of AccountsSales as a percentage of the PopulationPrior Year Population Values
Land RmvOSD RMVImprovement RMVFarm Improvement RMV
Selected Ratio From Sales
Before Ratio
Overall Adjustment FactorLand Adjustment FactorOSD Adjustment FactorImprovement Adjustment FactorFarm Improvement Factor
After Ratio
ExplanationRMV 109: SA 00Improved property - Manufactured Structure, City of St. Helens
RECALCULATED
Pre-Trend Brkdwn Post Trend Values Post Trend Brkdwn
291
2.20%
6,091,630 39.06% 6,761,709 39.10%2,644,9006,652,920
206,570
16.96% 2,644,900 15.29%42.66% 7,650,858 44.24%1.32% 237,556 1.37%
89
89
112111100115115100
Time Trend Adjustment 0
After reviewing the sales array, it was deemed the two sales are insufficient and do not present a clear indication of how the market is moving within this classification of property. Therefore, it was deemed appropriate to apply the conclusion of 89 from the RMV class 101 study located in the same area.
Performance History2020 2019 2018 2017 20161.99 14.17 11.59 29.17 14.291.00 1.00 1.01 1.06 1.01
CODPRD
COLUMBIA County 2020 Ratio Study
Pre-Trend Values
92
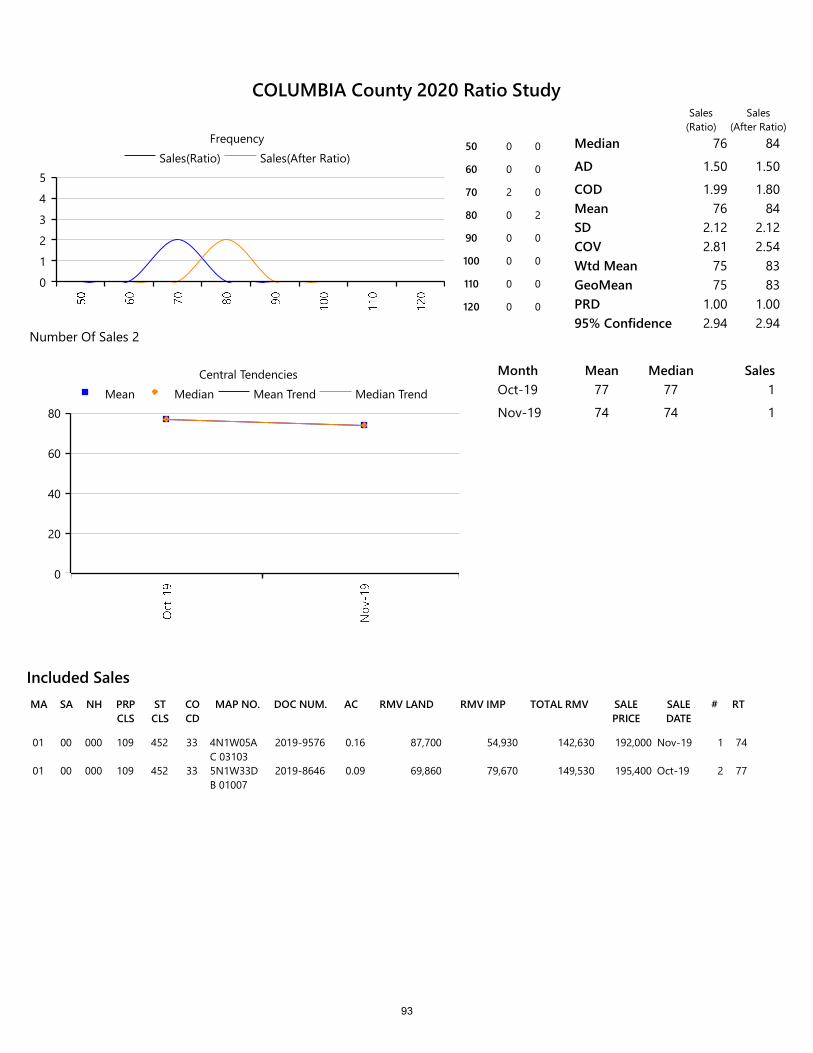
RMV LANDSA NH PRP CLS
ST CLS
CO CD
MAP NO. DOC NUM.MA AC RMV IMP TOTAL RMV SALE PRICE
SALE DATE
# RT
Included Sales
01 00 000 109 452 33 4N1W05AC 03103
2019-9576 0.16 87,700 54,930 142,630 192,000 Nov-19 1 74
01 00 000 109 452 33 5N1W33DB 01007
2019-8646 0.09 69,860 79,670 149,530 195,400 Oct-19 2 77
0
1
2
3
4
5Sales(Ratio) Sales(After Ratio)
Frequency50 0 0
60 0 0
70 2 0
80 0 2
90 0 0
100 0 0
110 0 0
120 0 0
Median 76 84
AD 1.50 1.50
COD 1.99 1.80Mean 76 84SD 2.12 2.12COV 2.81 2.54Wtd Mean 75 83GeoMean 75 83PRD 1.00 1.0095% Confidence 2.94 2.94
Number Of Sales 2
0
20
40
60
80Mean Median Mean Trend Median Trend
Central Tendencies Month Mean Median SalesOct-19 77 77 1
Nov-19 74 74 1
Sales(Ratio)
Sales(After Ratio)
COLUMBIA County 2020 Ratio Study
93
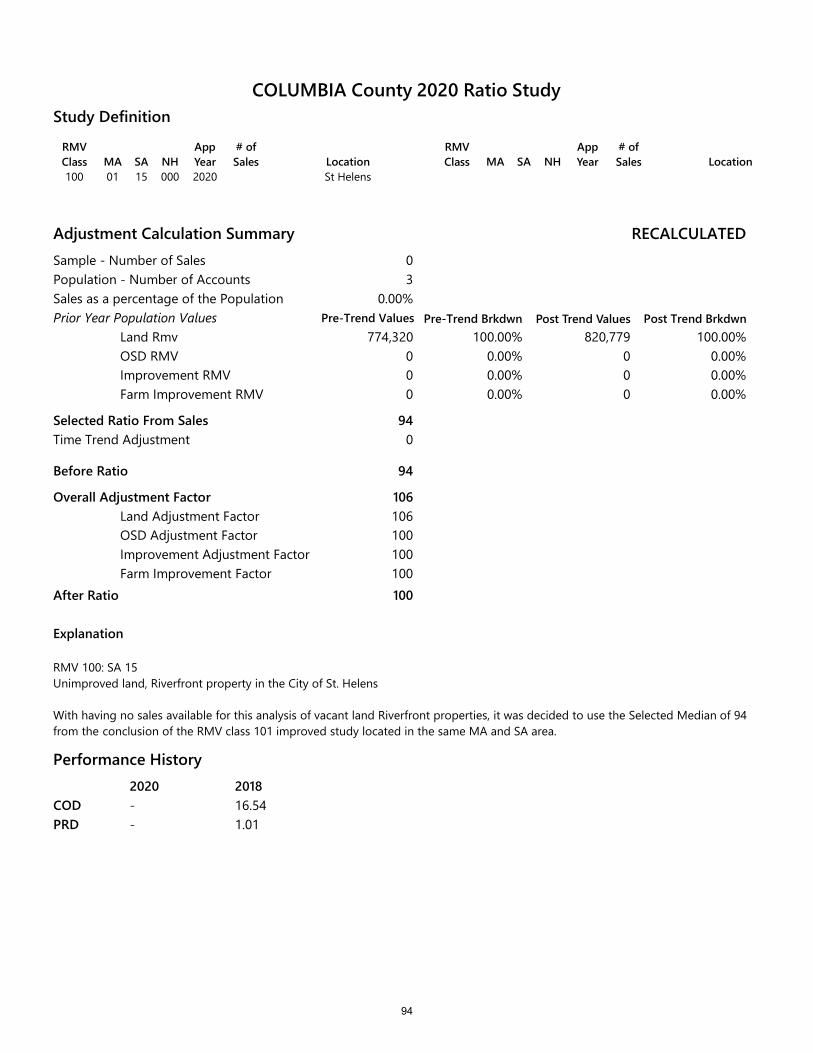
RMV Class MA SA NH
App Year
# of Sales Location
100 01 15 000 2020 St Helens
RMV Class MA SA NH
App Year
# of Sales Location
Study Definition
Adjustment Calculation SummarySample - Number of SalesPopulation - Number of AccountsSales as a percentage of the PopulationPrior Year Population Values
Land RmvOSD RMVImprovement RMVFarm Improvement RMV
Selected Ratio From Sales
Before Ratio
Overall Adjustment FactorLand Adjustment FactorOSD Adjustment FactorImprovement Adjustment FactorFarm Improvement Factor
After Ratio
RECALCULATED
Pre-Trend Brkdwn Post Trend Values Post Trend Brkdwn
03
0.00%
774,320 100.00% 820,779 100.00%000
0.00% 0 0.00%0.00% 0 0.00%0.00% 0 0.00%
94
94
106106100100100100
Time Trend Adjustment 0
Explanation
RMV 100: SA 15Unimproved land, Riverfront property in the City of St. Helens
With having no sales available for this analysis of vacant land Riverfront properties, it was decided to use the Selected Median of 94 from the conclusion of the RMV class 101 improved study located in the same MA and SA area.
Performance History2020 2018- 16.54- 1.01
CODPRD
COLUMBIA County 2020 Ratio Study
Pre-Trend Values
94

0
1Sales(Ratio) Sales(After Ratio)
Frequency Median
AD
CODMeanSDCOVWtd MeanGeoMeanPRD95% ConfidenceNumber Of Sales 0
0
1Mean Median Mean Trend Median Trend
Central Tendencies Month Mean Median Sales
Sales(Ratio)
Sales(After Ratio)
COLUMBIA County 2020 Ratio Study
95
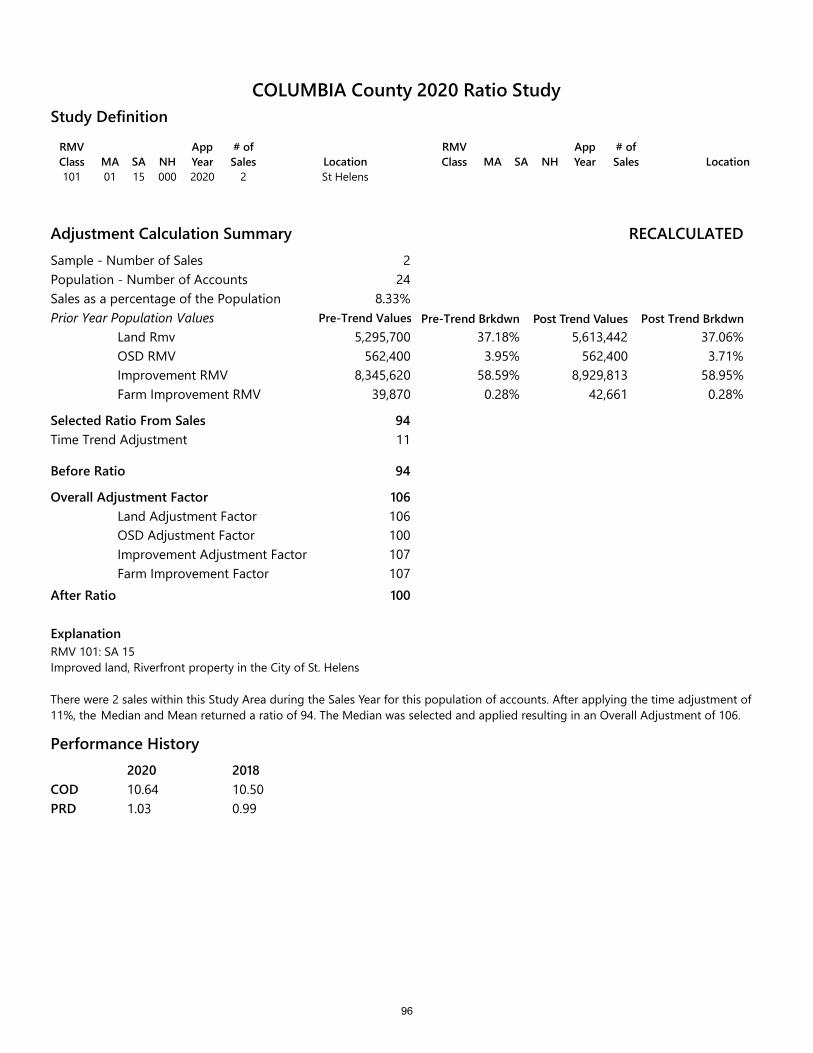
RMV Class MA SA NH
App Year
# of Sales Location
101 01 15 000 2020 2 St Helens
RMV Class MA SA NH
App Year
# of Sales Location
Study Definition
Adjustment Calculation SummarySample - Number of SalesPopulation - Number of AccountsSales as a percentage of the PopulationPrior Year Population Values
Land RmvOSD RMVImprovement RMVFarm Improvement RMV
Selected Ratio From Sales
Before Ratio
Overall Adjustment FactorLand Adjustment FactorOSD Adjustment FactorImprovement Adjustment FactorFarm Improvement Factor
After Ratio
ExplanationRMV 101: SA 15Improved land, Riverfront property in the City of St. Helens
RECALCULATED
Pre-Trend Brkdwn Post Trend Values Post Trend Brkdwn
224
8.33%
5,295,700 37.18% 5,613,442 37.06%562,400
8,345,62039,870
3.95% 562,400 3.71%58.59% 8,929,813 58.95%0.28% 42,661 0.28%
94
94
106106100107107100
Time Trend Adjustment 11
There were 2 sales within this Study Area during the Sales Year for this population of accounts. After applying the time adjustment of 11%, the Median and Mean returned a ratio of 94. The Median was selected and applied resulting in an Overall Adjustment of 106.
Performance History2020 201810.64 10.501.03 0.99
CODPRD
COLUMBIA County 2020 Ratio Study
Pre-Trend Values
96
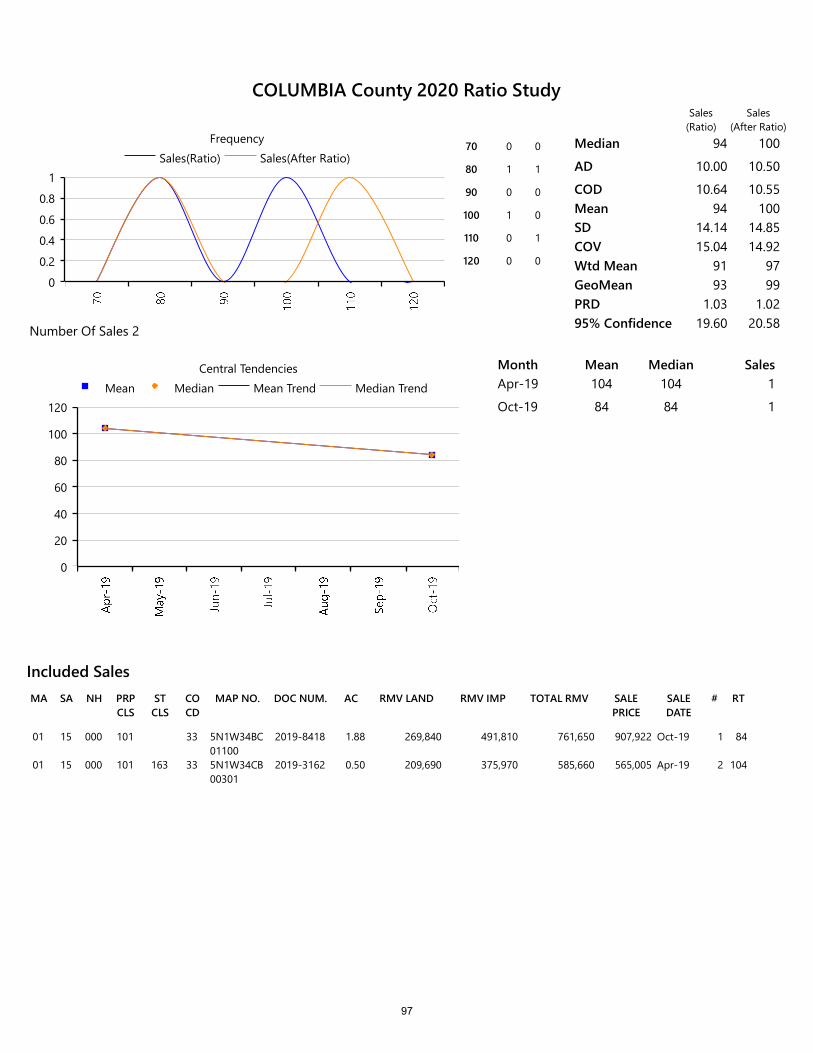
RMV LANDSA NH PRP CLS
ST CLS
CO CD
MAP NO. DOC NUM.MA AC RMV IMP TOTAL RMV SALE PRICE
SALE DATE
# RT
Included Sales
01 15 000 101 33 5N1W34BC 01100
2019-8418 1.88 269,840 491,810 761,650 907,922 Oct-19 1 84
01 15 000 101 163 33 5N1W34CB 00301
2019-3162 0.50 209,690 375,970 585,660 565,005 Apr-19 2 104
0
0.2
0.4
0.6
0.8
1Sales(Ratio) Sales(After Ratio)
Frequency70 0 0
80 1 1
90 0 0
100 1 0
110 0 1
120 0 0
Median 94 100
AD 10.00 10.50
COD 10.64 10.55Mean 94 100SD 14.14 14.85COV 15.04 14.92Wtd Mean 91 97GeoMean 93 99PRD 1.03 1.0295% Confidence 19.60 20.58Number Of Sales 2
0
20
40
60
80
100
120Mean Median Mean Trend Median Trend
Central Tendencies Month Mean Median SalesApr-19 104 104 1
Oct-19 84 84 1
Sales(Ratio)
Sales(After Ratio)
COLUMBIA County 2020 Ratio Study
97
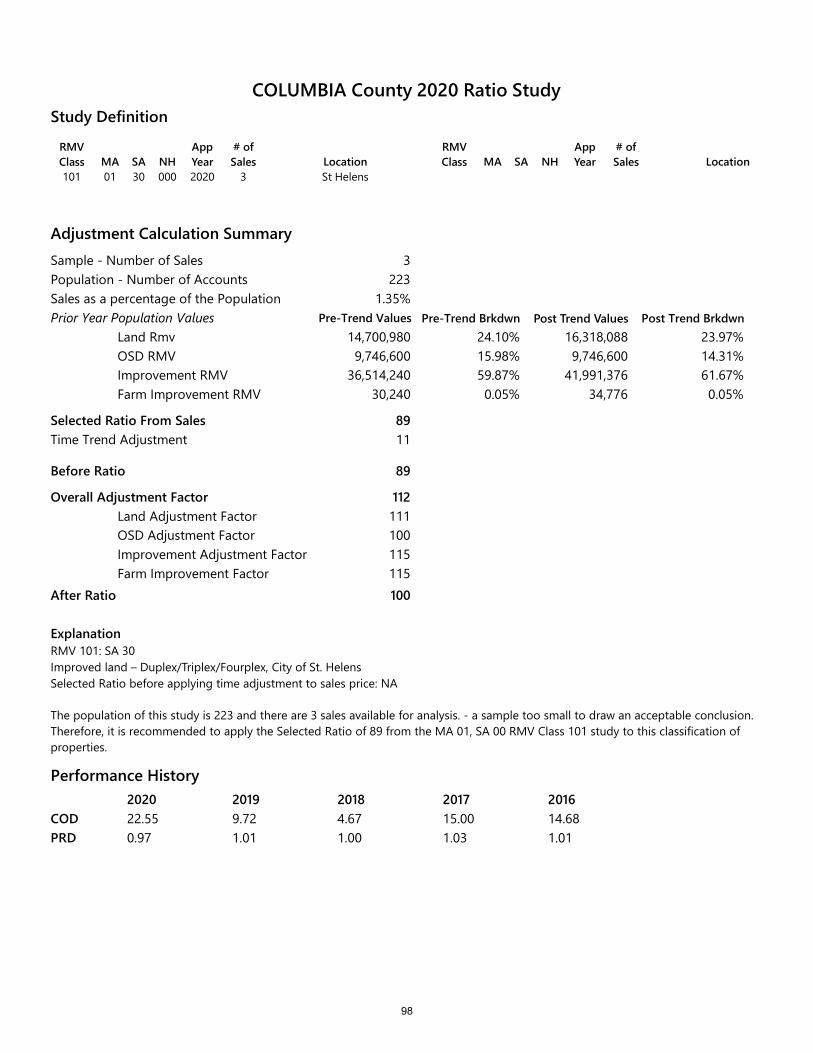
RMV Class MA SA NH
App Year
# of Sales Location
101 01 30 000 2020 3 St Helens
RMV Class MA SA NH
App Year
# of Sales Location
Study Definition
Adjustment Calculation SummarySample - Number of SalesPopulation - Number of AccountsSales as a percentage of the PopulationPrior Year Population Values
Land RmvOSD RMVImprovement RMVFarm Improvement RMV
Selected Ratio From Sales
Before Ratio
Overall Adjustment FactorLand Adjustment FactorOSD Adjustment FactorImprovement Adjustment FactorFarm Improvement Factor
After Ratio
Pre-Trend Brkdwn Post Trend Values Post Trend Brkdwn
3223
1.35%
14,700,980 24.10% 16,318,088 23.97%9,746,600
36,514,24030,240
15.98% 9,746,600 14.31%59.87% 41,991,376 61.67%0.05% 34,776 0.05%
89
89
112111100115115100
Time Trend Adjustment 11
ExplanationRMV 101: SA 30Improved land – Duplex/Triplex/Fourplex, City of St. HelensSelected Ratio before applying time adjustment to sales price: NA
The population of this study is 223 and there are 3 sales available for analysis. - a sample too small to draw an acceptable conclusion. Therefore, it is recommended to apply the Selected Ratio of 89 from the MA 01, SA 00 RMV Class 101 study to this classification of properties.
Performance History2020 2019 2018 2017 201622.55 9.72 4.67 15.00 14.680.97 1.01 1.00 1.03 1.01
CODPRD
COLUMBIA County 2020 Ratio Study
Pre-Trend Values
98
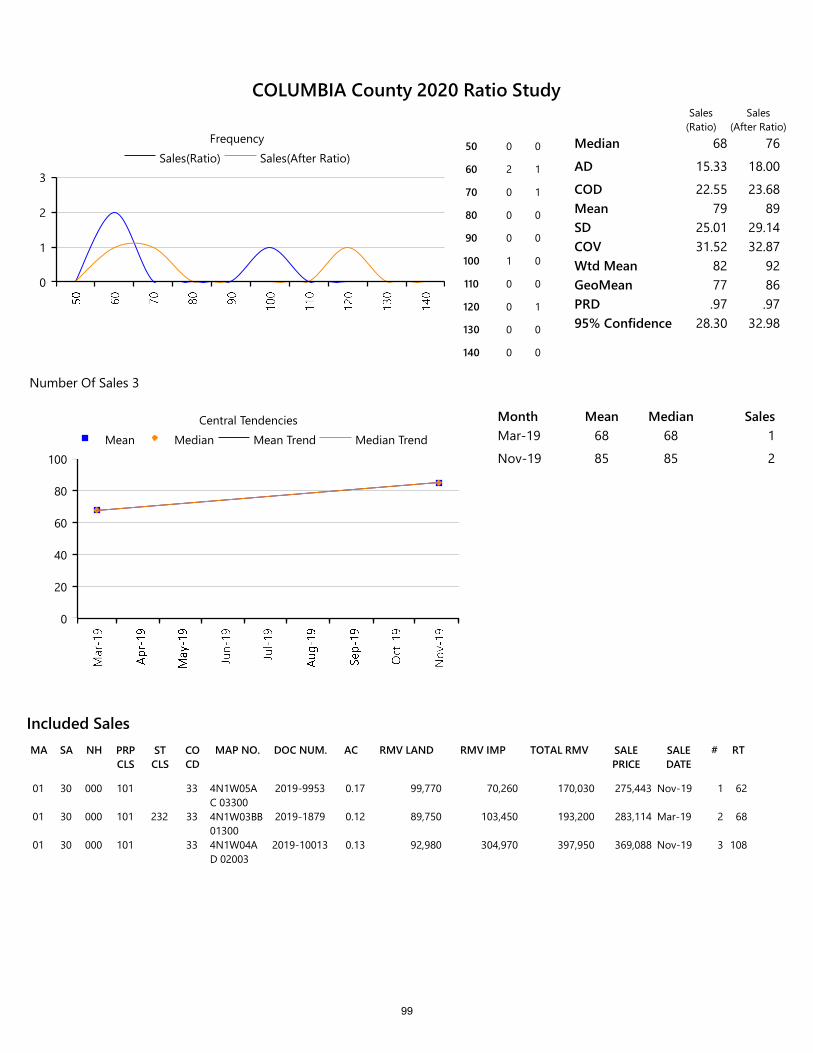
RMV LANDSA NH PRP CLS
ST CLS
CO CD
MAP NO. DOC NUM.MA AC RMV IMP TOTAL RMV SALE PRICE
SALE DATE
# RT
Included Sales
01 30 000 101 33 4N1W05AC 03300
2019-9953 0.17 99,770 70,260 170,030 275,443 Nov-19 1 62
01 30 000 101 232 33 4N1W03BB 01300
2019-1879 0.12 89,750 103,450 193,200 283,114 Mar-19 2 68
01 30 000 101 33 4N1W04AD 02003
2019-10013 0.13 92,980 304,970 397,950 369,088 Nov-19 3 108
0
1
2
3Sales(Ratio) Sales(After Ratio)
Frequency50 0 0
60 2 1
70 0 1
80 0 0
90 0 0
100 1 0
110 0 0
120 0 1
130 0 0
140 0 0
Median 68 76
AD 15.33 18.00
COD 22.55 23.68Mean 79 89SD 25.01 29.14COV 31.52 32.87Wtd Mean 82 92GeoMean 77 86PRD .97 .9795% Confidence 28.30 32.98
Number Of Sales 3
0
20
40
60
80
100Mean Median Mean Trend Median Trend
Central Tendencies Month Mean Median SalesMar-19 68 68 1
Nov-19 85 85 2
Sales(Ratio)
Sales(After Ratio)
COLUMBIA County 2020 Ratio Study
99

RMV Class MA SA NH
App Year
# of Sales Location
101 01 43 000 2020 8 St Helens
RMV Class MA SA NH
App Year
# of Sales Location
Study Definition
Adjustment Calculation SummarySample - Number of SalesPopulation - Number of AccountsSales as a percentage of the PopulationPrior Year Population Values
Land RmvOSD RMVImprovement RMVFarm Improvement RMV
Selected Ratio From Sales
Before Ratio
Overall Adjustment FactorLand Adjustment FactorOSD Adjustment FactorImprovement Adjustment FactorFarm Improvement Factor
After Ratio
ExplanationRMV 101: SA 43Improved land - Town house/Row house, City of St. Helens
RECALCULATED
Pre-Trend Brkdwn Post Trend Values Post Trend Brkdwn
8108
7.41%
4,457,920 19.09% 4,948,291 19.24%3,196,800
15,693,5400
13.69% 3,196,800 12.43%67.22% 17,576,765 68.33%0.00% 0 0.00%
91
91
110111100112112100
Time Trend Adjustment 11
For this grouping of properties, the Weighted Mean and Geometric Mean both returned a ratio of 91. These ratio indicators were further supported by the Median (90) and the Mean (92). Therefore, the Weighted Mean of 91 was selected resulting in an Overall Adjustment Factor of 110.
Performance History2020 2019 2018 2017 201612.08 12.26 8.45 13.47 14.681.01 1.01 1.01 1.03 1.01
CODPRD
COLUMBIA County 2020 Ratio Study
Pre-Trend Values
100
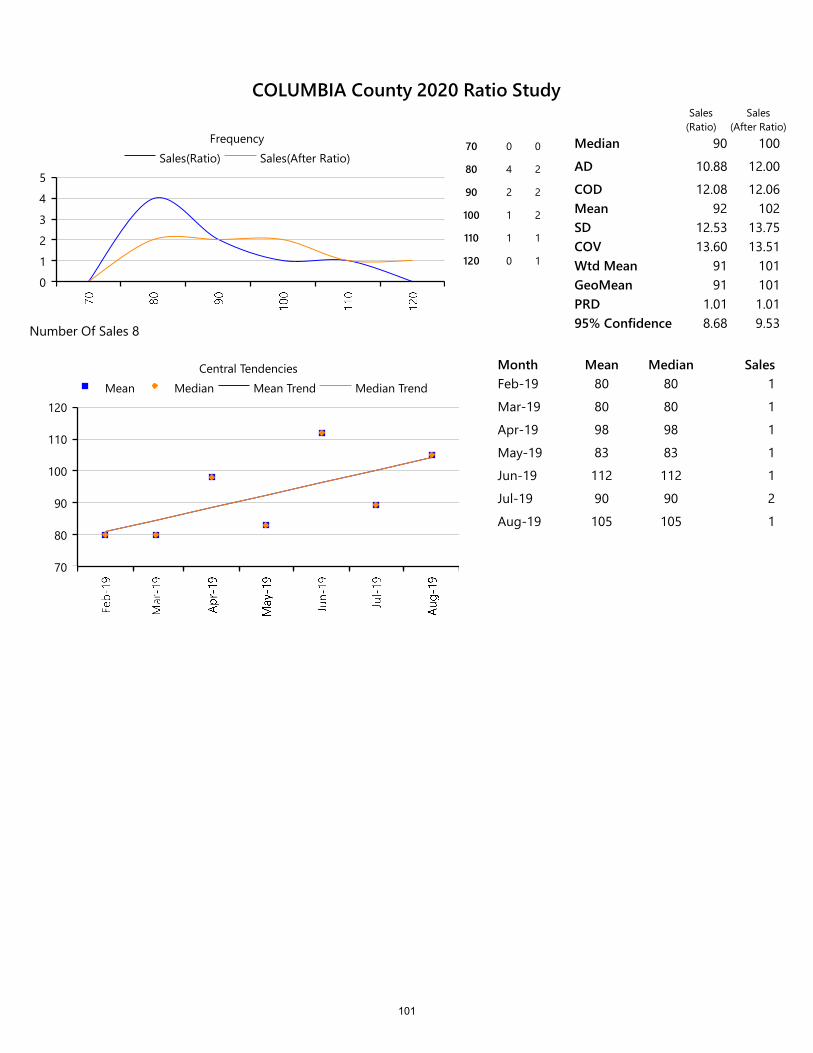
0
1
2
3
4
5Sales(Ratio) Sales(After Ratio)
Frequency70 0 0
80 4 2
90 2 2
100 1 2
110 1 1
120 0 1
Median 90 100
AD 10.88 12.00
COD 12.08 12.06Mean 92 102SD 12.53 13.75COV 13.60 13.51Wtd Mean 91 101GeoMean 91 101PRD 1.01 1.0195% Confidence 8.68 9.53Number Of Sales 8
70
80
90
100
110
120Mean Median Mean Trend Median Trend
Central Tendencies Month Mean Median SalesFeb-19 80 80 1
Mar-19 80 80 1
Apr-19 98 98 1
May-19 83 83 1
Jun-19 112 112 1
Jul-19 90 90 2
Aug-19 105 105 1
Sales(Ratio)
Sales(After Ratio)
COLUMBIA County 2020 Ratio Study
101
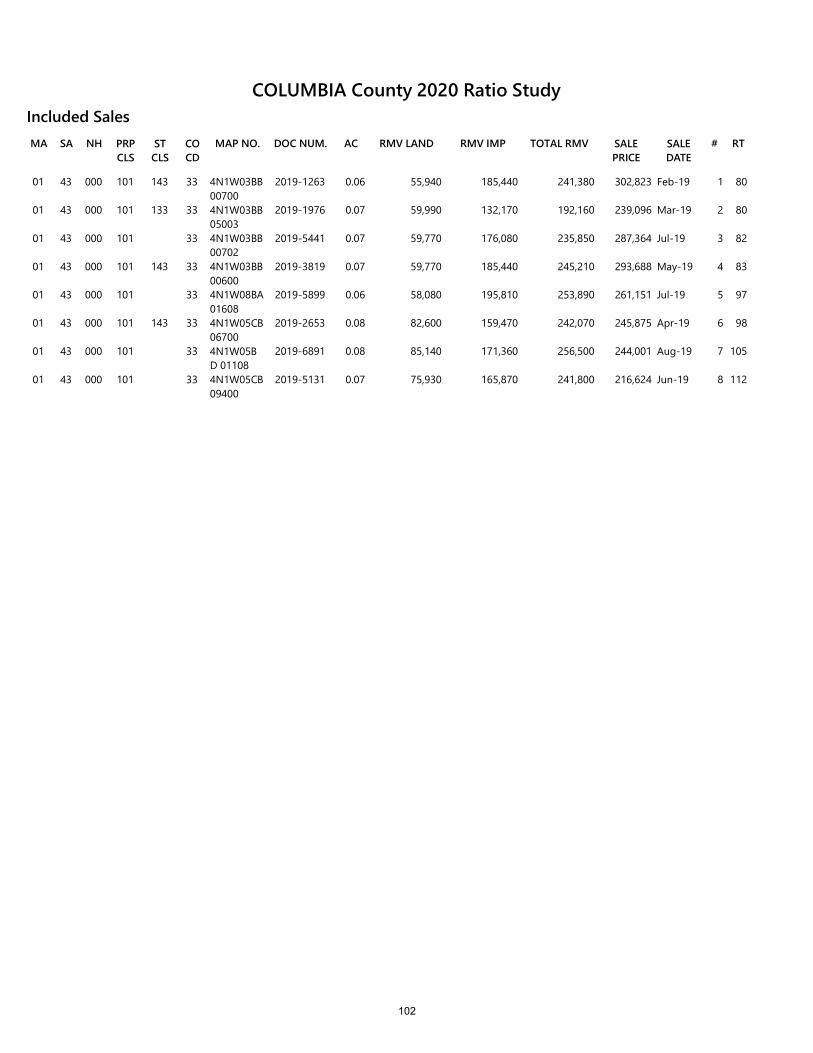
RMV LANDSA NH PRP CLS
ST CLS
CO CD
MAP NO. DOC NUM.MA AC RMV IMP TOTAL RMV SALE PRICE
SALE DATE
# RT
Included Sales
01 43 000 101 143 33 4N1W03BB 00700
2019-1263 0.06 55,940 185,440 241,380 302,823 Feb-19 1 80
01 43 000 101 133 33 4N1W03BB 05003
2019-1976 0.07 59,990 132,170 192,160 239,096 Mar-19 2 80
01 43 000 101 33 4N1W03BB 00702
2019-5441 0.07 59,770 176,080 235,850 287,364 Jul-19 3 82
01 43 000 101 143 33 4N1W03BB 00600
2019-3819 0.07 59,770 185,440 245,210 293,688 May-19 4 83
01 43 000 101 33 4N1W08BA 01608
2019-5899 0.06 58,080 195,810 253,890 261,151 Jul-19 5 97
01 43 000 101 143 33 4N1W05CB 06700
2019-2653 0.08 82,600 159,470 242,070 245,875 Apr-19 6 98
01 43 000 101 33 4N1W05BD 01108
2019-6891 0.08 85,140 171,360 256,500 244,001 Aug-19 7 105
01 43 000 101 33 4N1W05CB 09400
2019-5131 0.07 75,930 165,870 241,800 216,624 Jun-19 8 112
COLUMBIA County 2020 Ratio Study
102
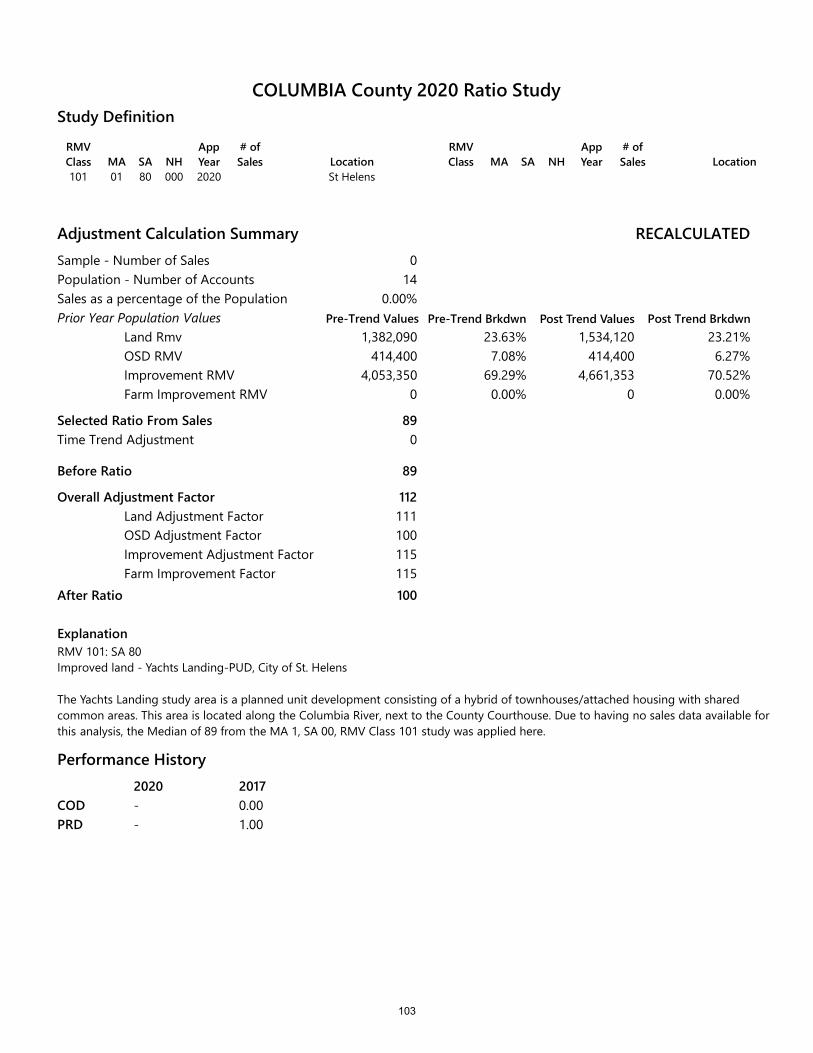
RMV Class MA SA NH
App Year
# of Sales Location
101 01 80 000 2020 St Helens
RMV Class MA SA NH
App Year
# of Sales Location
Study Definition
Adjustment Calculation SummarySample - Number of SalesPopulation - Number of AccountsSales as a percentage of the PopulationPrior Year Population Values
Land RmvOSD RMVImprovement RMVFarm Improvement RMV
Selected Ratio From Sales
Before Ratio
Overall Adjustment FactorLand Adjustment FactorOSD Adjustment FactorImprovement Adjustment FactorFarm Improvement Factor
After Ratio
ExplanationRMV 101: SA 80Improved land - Yachts Landing-PUD, City of St. Helens
RECALCULATED
Pre-Trend Brkdwn Post Trend Values Post Trend Brkdwn
014
0.00%
1,382,090 23.63% 1,534,120 23.21%414,400
4,053,3500
7.08% 414,400 6.27%69.29% 4,661,353 70.52%0.00% 0 0.00%
89
89
112111100115115100
Time Trend Adjustment 0
The Yachts Landing study area is a planned unit development consisting of a hybrid of townhouses/attached housing with shared common areas. This area is located along the Columbia River, next to the County Courthouse. Due to having no sales data available for this analysis, the Median of 89 from the MA 1, SA 00, RMV Class 101 study was applied here.
Performance History2020 2017- 0.00- 1.00
CODPRD
COLUMBIA County 2020 Ratio Study
Pre-Trend Values
103

0
1Sales(Ratio) Sales(After Ratio)
Frequency Median
AD
CODMeanSDCOVWtd MeanGeoMeanPRD95% ConfidenceNumber Of Sales 0
0
1Mean Median Mean Trend Median Trend
Central Tendencies Month Mean Median Sales
Sales(Ratio)
Sales(After Ratio)
COLUMBIA County 2020 Ratio Study
104
MAINTENANCE AREA 2
SCAPPOOSE
105

RMV Class MA SA NH
App Year
# of Sales Location
100 02 00 000 2020 1 Scappoose
RMV Class MA SA NH
App Year
# of Sales Location
Study Definition
Adjustment Calculation SummarySample - Number of SalesPopulation - Number of AccountsSales as a percentage of the PopulationPrior Year Population Values
Land RmvOSD RMVImprovement RMVFarm Improvement RMV
Selected Ratio From Sales
Before Ratio
Overall Adjustment FactorLand Adjustment FactorOSD Adjustment FactorImprovement Adjustment FactorFarm Improvement Factor
After Ratio
ExplanationRMV 100: SA 00Undeveloped land, City of Scappoose
RECALCULATED
Pre-Trend Brkdwn Post Trend Values Post Trend Brkdwn
175
1.33%
13,323,640 100.00% 13,989,822 100.00%000
0.00% 0 0.00%0.00% 0 0.00%0.00% 0 0.00%
95
95
105105100100100100
Time Trend Adjustment 0
For this analysis of vacant land in the City of Scappoose, only one sale was found which is comprised of city acreage. Although it is a valid sale, it does not represent the current market for a base city lot that is ready for development. Therefore, it was decided to use the Mean of 95 from the improved study located in the same maintenance and study area (RMV 101 MA 02, SA 00).
Performance History2020 2019 2018- 9.60 8.411.00 1.15 1.01
CODPRD
COLUMBIA County 2020 Ratio Study
Pre-Trend Values
106

RMV LANDSA NH PRP CLS
ST CLS
CO CD
MAP NO. DOC NUM.MA AC RMV IMP TOTAL RMV SALE PRICE
SALE DATE
# RT
Included Sales
02 00 000 100 30 3N2W12DD 00500
2019-5196 3.44 411,220 0 411,220 415,000 Jul-19 1 99
-0.2
0
0.2
0.4
0.6
0.8
1Sales(Ratio) Sales(After Ratio)
Frequency80 0 0
90 1 0
100 0 1
110 0 0
Median 99 104
AD
CODMean 99 104SD 1.00 1.00COV 1.01 .96Wtd Mean 99 104GeoMean 99 104PRD 1.00 1.0095% Confidence 1.96 1.96Number Of Sales 1
0
20
40
60
80
100Mean Median Mean Trend Median Trend
Central Tendencies Month Mean Median SalesJul-19 99 99 1
Sales(Ratio)
Sales(After Ratio)
COLUMBIA County 2020 Ratio Study
107
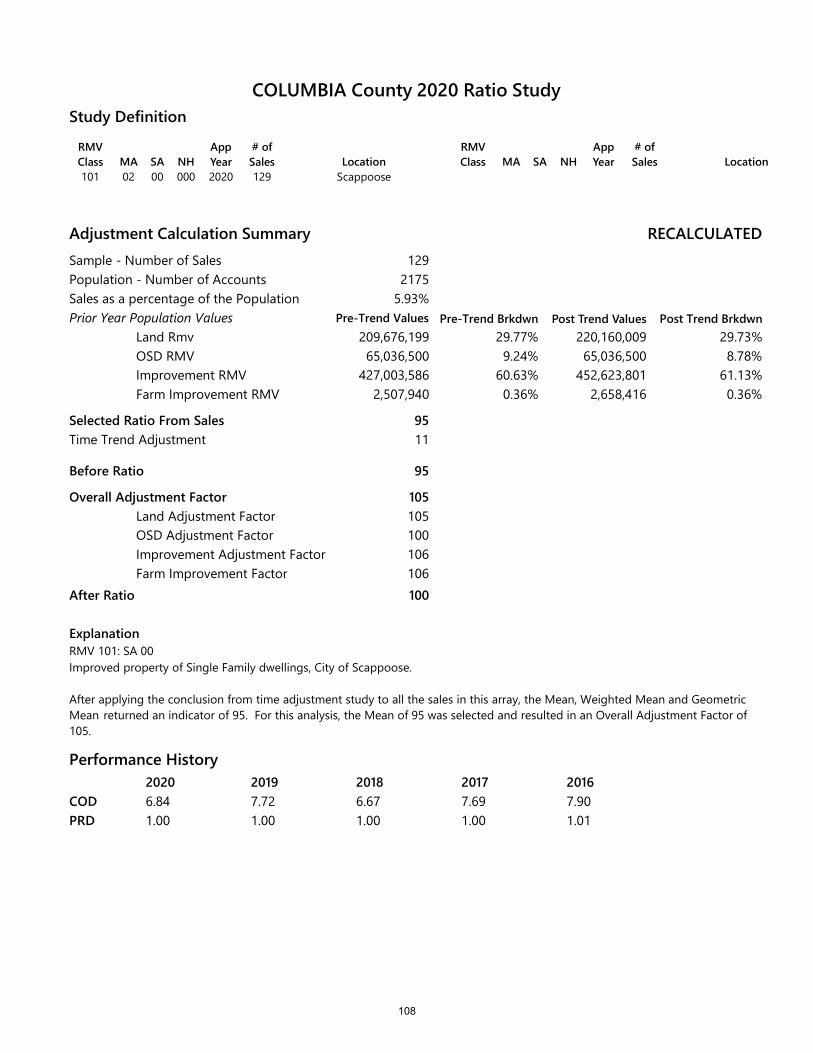
RMV Class MA SA NH
App Year
# of Sales Location
101 02 00 000 2020 129 Scappoose
RMV Class MA SA NH
App Year
# of Sales Location
Study Definition
Adjustment Calculation SummarySample - Number of SalesPopulation - Number of AccountsSales as a percentage of the PopulationPrior Year Population Values
Land RmvOSD RMVImprovement RMVFarm Improvement RMV
Selected Ratio From Sales
Before Ratio
Overall Adjustment FactorLand Adjustment FactorOSD Adjustment FactorImprovement Adjustment FactorFarm Improvement Factor
After Ratio
RECALCULATED
Pre-Trend Brkdwn Post Trend Values Post Trend Brkdwn
1292175
5.93%
209,676,199 29.77% 220,160,009 29.73%65,036,500
427,003,5862,507,940
9.24% 65,036,500 8.78%60.63% 452,623,801 61.13%0.36% 2,658,416 0.36%
95
95
105105100106106100
Time Trend Adjustment 11
ExplanationRMV 101: SA 00Improved property of Single Family dwellings, City of Scappoose.
After applying the conclusion from time adjustment study to all the sales in this array, the Mean, Weighted Mean and Geometric Mean returned an indicator of 95. For this analysis, the Mean of 95 was selected and resulted in an Overall Adjustment Factor of 105.
Performance History2020 2019 2018 2017 20166.84 7.72 6.67 7.69 7.901.00 1.00 1.00 1.00 1.01
CODPRD
COLUMBIA County 2020 Ratio Study
Pre-Trend Values
108

RMV LANDSA NH PRP CLS
ST CLS
CO CD
MAP NO. DOC NUM.MA AC RMV IMP TOTAL RMV SALE PRICE
SALE DATE
# RT
Included Sales
02 00 000 101 33 3N2W12AC 03901
2019-5568 0.11 123,860 104,970 228,830 306,859 Jun-19 1 75
02 00 000 101 33 3N1W18BB 01114
2019-7439 0.17 141,260 209,450 350,710 455,796 Sep-19 2 77
02 00 000 101 141 33 3N2W11AA 00125
2019-3665 0.19 144,030 182,240 326,270 412,489 May-19 3 79
02 00 000 101 141 33 3N2W13CB 00118
2019-542 0.14 130,890 194,380 325,270 402,522 Jan-19 4 81
02 00 000 101 141 33 3N2W13CB 00132
2019-3706 0.12 125,050 194,380 319,430 390,416 May-19 5 82
02 00 000 101 33 3N1W07CC 02600
2019-5112 0.17 140,130 189,160 329,290 390,984 Jun-19 6 84
0
20
40
60
80
Sales(Ratio) Sales(After Ratio)Frequency
70 3 1
80 29 8
90 71 62
100 16 41
110 7 10
120 2 5
130 1 2
Median 93 98
AD 6.36 6.74
COD 6.84 6.87Mean 95 100SD 8.97 9.50COV 9.42 9.50Wtd Mean 95 100GeoMean 95 100PRD 1.00 1.0095% Confidence 1.55 1.64Number Of Sales 129
85
90
95
100
105Mean Median Mean Trend Median Trend
Central Tendencies Month Mean Median SalesJan-19 95 92 8
Feb-19 102 100 4
Mar-19 95 95 8
Apr-19 94 94 12
May-19 93 93 12
Jun-19 89 89 12
Jul-19 96 94 14
Aug-19 96 95 11
Sep-19 97 97 18
Oct-19 97 93 14
Nov-19 96 97 9
Dec-19 98 91 7
Sales(Ratio)
Sales(After Ratio)
COLUMBIA County 2020 Ratio Study
109

RMV LANDSA NH PRP CLS
ST CLS
CO CD
MAP NO. DOC NUM.MA AC RMV IMP TOTAL RMV SALE PRICE
SALE DATE
# RT
Included Sales
02 00 000 101 33 3N1W18BB 01113
2019-7004 0.17 140,650 242,860 383,510 454,644 Aug-19 7 84
02 00 000 101 33 3N2W13CB 00132
2019-9305 0.12 125,050 194,380 319,430 380,208 Nov-19 8 84
02 00 000 101 131 33 3N2W12AB 00400
2019-3708 0.50 187,240 101,790 289,030 340,074 May-19 9 85
02 00 000 101 33 3N1W18BB 01137
2019-6772 0.17 140,630 243,560 384,190 446,332 Aug-19 10 86
02 00 000 101 143 33 3N2W13CD 03100
2019-536 0.14 131,410 195,890 327,300 378,260 Jan-19 11 87
02 00 000 101 143 33 3N1W07CC 01412
2019-1801 0.14 130,510 266,190 396,700 457,957 Mar-19 12 87
02 00 000 101 143 33 3N2W12AD 06539
2019-2655 0.14 130,370 254,140 384,510 443,005 Apr-19 13 87
02 00 000 101 131 33 3N2W12AD 03200
2019-3357 0.18 143,380 131,930 275,310 315,785 Apr-19 14 87
02 00 000 101 33 3N2W12DC 00122
2019-5043 0.14 131,230 191,840 323,070 371,007 Jun-19 15 87
02 00 000 101 30 3N2W12DC 00135
2019-5281 0.14 130,470 207,400 337,870 387,258 Jul-19 16 87
02 00 000 101 33 3N1W18BB 01112
2019-8510 0.18 143,400 238,260 381,660 440,648 Oct-19 17 87
02 00 000 101 143 33 3N2W13CD 06500
2019-2119 0.14 131,110 235,290 366,400 414,898 Mar-19 18 88
02 00 000 101 33 3N2W13BD 01200
2019-4447 0.14 130,470 188,360 318,830 361,416 Jun-19 19 88
02 00 000 101 33 3N2W12DB 02901
2019-4883 0.17 139,480 187,450 326,930 370,369 Jun-19 20 88
02 00 000 101 33 3N2W12CC 01214
2019-5975 0.17 139,410 183,850 323,260 366,975 Jul-19 21 88
02 00 000 101 33 3N2W12CA 04800
2019-6733 0.14 151,620 130,900 282,520 319,831 Aug-19 22 88
02 00 000 101 143 33 3N2W12AB 00114
2019-1578 0.14 131,740 197,430 329,170 370,940 Mar-19 23 89
02 00 000 101 33 3N2W13CD 02500
2019-4481 0.17 138,320 232,120 370,440 415,633 Jun-19 24 89
02 00 000 101 33 3N2W13AA 05600
2019-4451 0.15 134,040 223,710 357,750 403,940 Jun-19 25 89
02 00 000 101 33 3N2W13AD 06100
2019-5835 0.16 135,360 198,810 334,170 373,480 Jul-19 26 89
02 00 000 101 33 3N1W07CC 05200
2019-5800 0.14 130,390 266,150 396,540 445,635 Jul-19 27 89
02 00 000 101 33 3N1W07CB 01908
2019-7885 0.18 142,420 205,110 347,530 391,221 Sep-19 28 89
02 00 000 101 33 3N2W13AD 04503
2019-8617 0.15 133,010 185,610 318,620 358,750 Oct-19 29 89
02 00 000 101 33 3N2W13CD 02100
2019-8679 0.14 130,500 187,370 317,870 358,645 Oct-19 30 89
02 00 000 101 33 3N2W13CB 00112
2019-9466 0.13 127,540 246,610 374,150 422,406 Nov-19 31 89
02 00 000 101 33 3N2W13BD 08600
2019-10191 0.16 136,880 184,680 321,560 360,503 Dec-19 32 89
COLUMBIA County 2020 Ratio Study
110
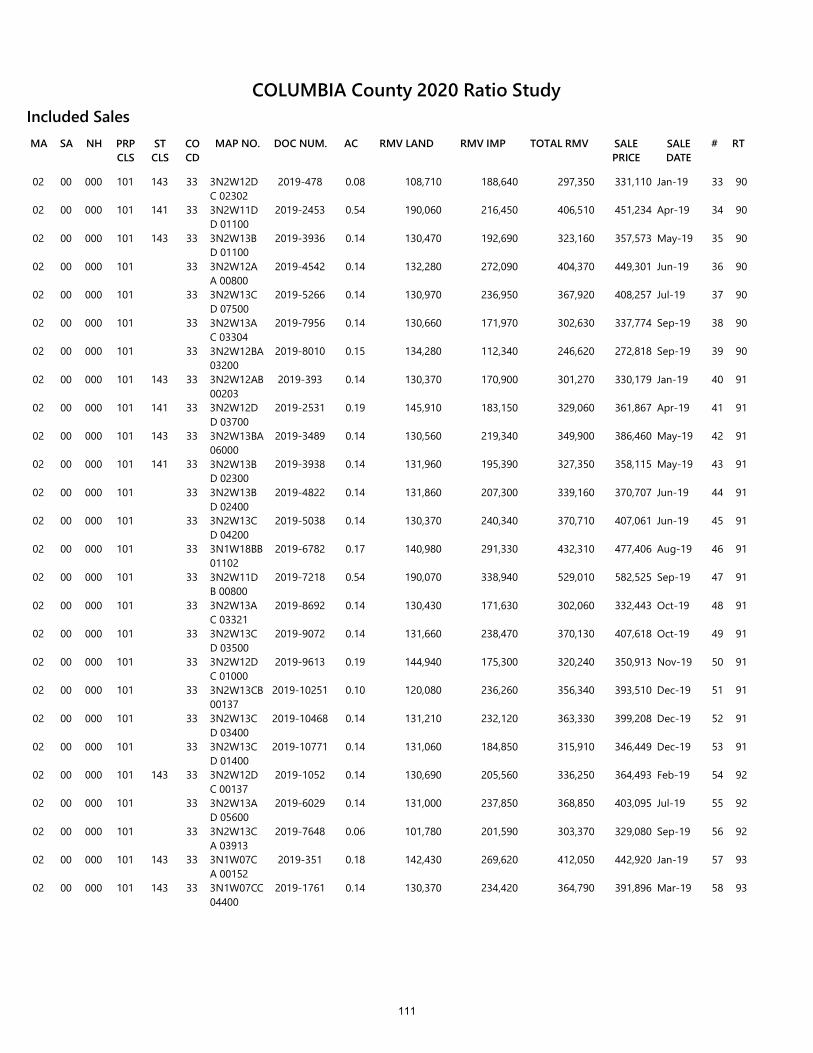
RMV LANDSA NH PRP CLS
ST CLS
CO CD
MAP NO. DOC NUM.MA AC RMV IMP TOTAL RMV SALE PRICE
SALE DATE
# RT
Included Sales
02 00 000 101 143 33 3N2W12DC 02302
2019-478 0.08 108,710 188,640 297,350 331,110 Jan-19 33 90
02 00 000 101 141 33 3N2W11DD 01100
2019-2453 0.54 190,060 216,450 406,510 451,234 Apr-19 34 90
02 00 000 101 143 33 3N2W13BD 01100
2019-3936 0.14 130,470 192,690 323,160 357,573 May-19 35 90
02 00 000 101 33 3N2W12AA 00800
2019-4542 0.14 132,280 272,090 404,370 449,301 Jun-19 36 90
02 00 000 101 33 3N2W13CD 07500
2019-5266 0.14 130,970 236,950 367,920 408,257 Jul-19 37 90
02 00 000 101 33 3N2W13AC 03304
2019-7956 0.14 130,660 171,970 302,630 337,774 Sep-19 38 90
02 00 000 101 33 3N2W12BA 03200
2019-8010 0.15 134,280 112,340 246,620 272,818 Sep-19 39 90
02 00 000 101 143 33 3N2W12AB 00203
2019-393 0.14 130,370 170,900 301,270 330,179 Jan-19 40 91
02 00 000 101 141 33 3N2W12DD 03700
2019-2531 0.19 145,910 183,150 329,060 361,867 Apr-19 41 91
02 00 000 101 143 33 3N2W13BA 06000
2019-3489 0.14 130,560 219,340 349,900 386,460 May-19 42 91
02 00 000 101 141 33 3N2W13BD 02300
2019-3938 0.14 131,960 195,390 327,350 358,115 May-19 43 91
02 00 000 101 33 3N2W13BD 02400
2019-4822 0.14 131,860 207,300 339,160 370,707 Jun-19 44 91
02 00 000 101 33 3N2W13CD 04200
2019-5038 0.14 130,370 240,340 370,710 407,061 Jun-19 45 91
02 00 000 101 33 3N1W18BB 01102
2019-6782 0.17 140,980 291,330 432,310 477,406 Aug-19 46 91
02 00 000 101 33 3N2W11DB 00800
2019-7218 0.54 190,070 338,940 529,010 582,525 Sep-19 47 91
02 00 000 101 33 3N2W13AC 03321
2019-8692 0.14 130,430 171,630 302,060 332,443 Oct-19 48 91
02 00 000 101 33 3N2W13CD 03500
2019-9072 0.14 131,660 238,470 370,130 407,618 Oct-19 49 91
02 00 000 101 33 3N2W12DC 01000
2019-9613 0.19 144,940 175,300 320,240 350,913 Nov-19 50 91
02 00 000 101 33 3N2W13CB 00137
2019-10251 0.10 120,080 236,260 356,340 393,510 Dec-19 51 91
02 00 000 101 33 3N2W13CD 03400
2019-10468 0.14 131,210 232,120 363,330 399,208 Dec-19 52 91
02 00 000 101 33 3N2W13CD 01400
2019-10771 0.14 131,060 184,850 315,910 346,449 Dec-19 53 91
02 00 000 101 143 33 3N2W12DC 00137
2019-1052 0.14 130,690 205,560 336,250 364,493 Feb-19 54 92
02 00 000 101 33 3N2W13AD 05600
2019-6029 0.14 131,000 237,850 368,850 403,095 Jul-19 55 92
02 00 000 101 33 3N2W13CA 03913
2019-7648 0.06 101,780 201,590 303,370 329,080 Sep-19 56 92
02 00 000 101 143 33 3N1W07CA 00152
2019-351 0.18 142,430 269,620 412,050 442,920 Jan-19 57 93
02 00 000 101 143 33 3N1W07CC 04400
2019-1761 0.14 130,370 234,420 364,790 391,896 Mar-19 58 93
COLUMBIA County 2020 Ratio Study
111
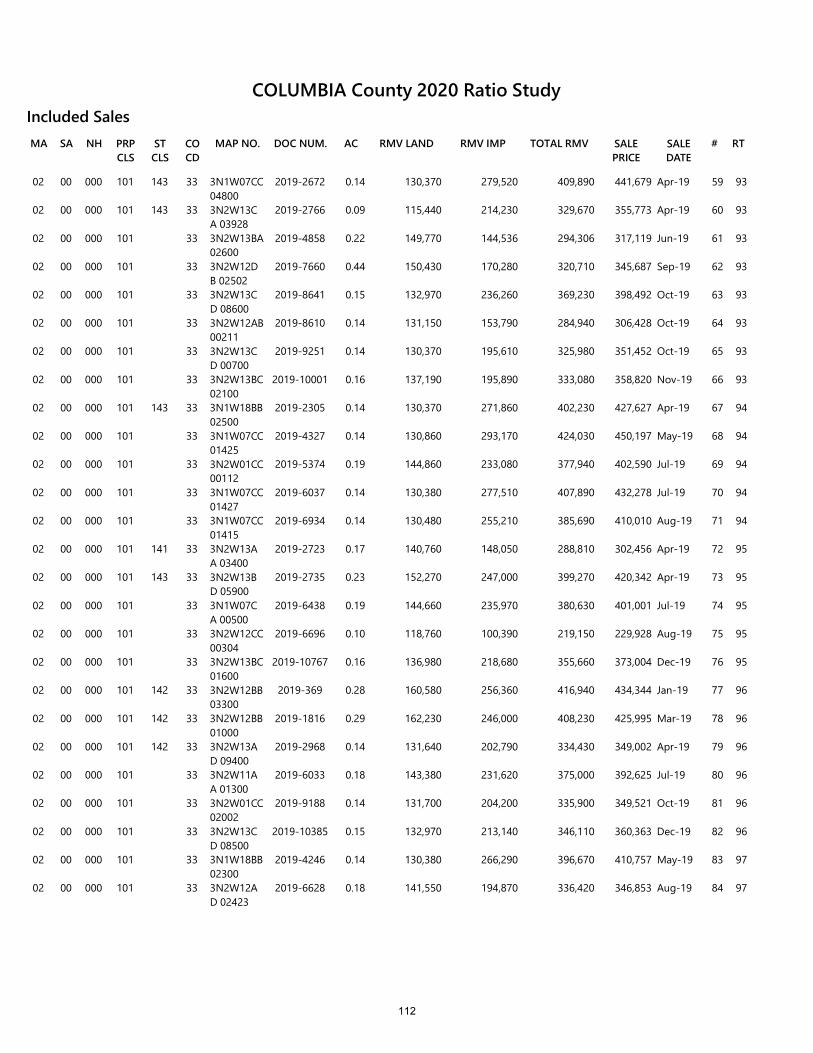
RMV LANDSA NH PRP CLS
ST CLS
CO CD
MAP NO. DOC NUM.MA AC RMV IMP TOTAL RMV SALE PRICE
SALE DATE
# RT
Included Sales
02 00 000 101 143 33 3N1W07CC 04800
2019-2672 0.14 130,370 279,520 409,890 441,679 Apr-19 59 93
02 00 000 101 143 33 3N2W13CA 03928
2019-2766 0.09 115,440 214,230 329,670 355,773 Apr-19 60 93
02 00 000 101 33 3N2W13BA 02600
2019-4858 0.22 149,770 144,536 294,306 317,119 Jun-19 61 93
02 00 000 101 33 3N2W12DB 02502
2019-7660 0.44 150,430 170,280 320,710 345,687 Sep-19 62 93
02 00 000 101 33 3N2W13CD 08600
2019-8641 0.15 132,970 236,260 369,230 398,492 Oct-19 63 93
02 00 000 101 33 3N2W12AB 00211
2019-8610 0.14 131,150 153,790 284,940 306,428 Oct-19 64 93
02 00 000 101 33 3N2W13CD 00700
2019-9251 0.14 130,370 195,610 325,980 351,452 Oct-19 65 93
02 00 000 101 33 3N2W13BC 02100
2019-10001 0.16 137,190 195,890 333,080 358,820 Nov-19 66 93
02 00 000 101 143 33 3N1W18BB 02500
2019-2305 0.14 130,370 271,860 402,230 427,627 Apr-19 67 94
02 00 000 101 33 3N1W07CC 01425
2019-4327 0.14 130,860 293,170 424,030 450,197 May-19 68 94
02 00 000 101 33 3N2W01CC 00112
2019-5374 0.19 144,860 233,080 377,940 402,590 Jul-19 69 94
02 00 000 101 33 3N1W07CC 01427
2019-6037 0.14 130,380 277,510 407,890 432,278 Jul-19 70 94
02 00 000 101 33 3N1W07CC 01415
2019-6934 0.14 130,480 255,210 385,690 410,010 Aug-19 71 94
02 00 000 101 141 33 3N2W13AA 03400
2019-2723 0.17 140,760 148,050 288,810 302,456 Apr-19 72 95
02 00 000 101 143 33 3N2W13BD 05900
2019-2735 0.23 152,270 247,000 399,270 420,342 Apr-19 73 95
02 00 000 101 33 3N1W07CA 00500
2019-6438 0.19 144,660 235,970 380,630 401,001 Jul-19 74 95
02 00 000 101 33 3N2W12CC 00304
2019-6696 0.10 118,760 100,390 219,150 229,928 Aug-19 75 95
02 00 000 101 33 3N2W13BC 01600
2019-10767 0.16 136,980 218,680 355,660 373,004 Dec-19 76 95
02 00 000 101 142 33 3N2W12BB 03300
2019-369 0.28 160,580 256,360 416,940 434,344 Jan-19 77 96
02 00 000 101 142 33 3N2W12BB 01000
2019-1816 0.29 162,230 246,000 408,230 425,995 Mar-19 78 96
02 00 000 101 142 33 3N2W13AD 09400
2019-2968 0.14 131,640 202,790 334,430 349,002 Apr-19 79 96
02 00 000 101 33 3N2W11AA 01300
2019-6033 0.18 143,380 231,620 375,000 392,625 Jul-19 80 96
02 00 000 101 33 3N2W01CC 02002
2019-9188 0.14 131,700 204,200 335,900 349,521 Oct-19 81 96
02 00 000 101 33 3N2W13CD 08500
2019-10385 0.15 132,970 213,140 346,110 360,363 Dec-19 82 96
02 00 000 101 33 3N1W18BB 02300
2019-4246 0.14 130,380 266,290 396,670 410,757 May-19 83 97
02 00 000 101 33 3N2W12AD 02423
2019-6628 0.18 141,550 194,870 336,420 346,853 Aug-19 84 97
COLUMBIA County 2020 Ratio Study
112
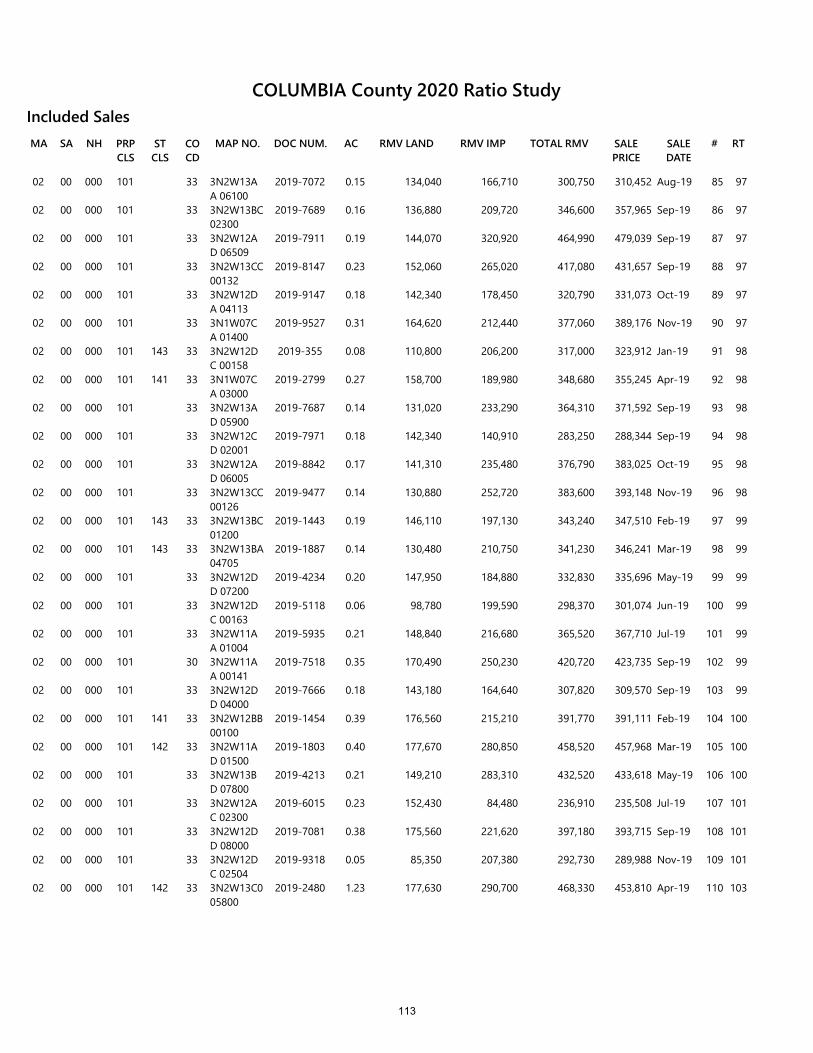
RMV LANDSA NH PRP CLS
ST CLS
CO CD
MAP NO. DOC NUM.MA AC RMV IMP TOTAL RMV SALE PRICE
SALE DATE
# RT
Included Sales
02 00 000 101 33 3N2W13AA 06100
2019-7072 0.15 134,040 166,710 300,750 310,452 Aug-19 85 97
02 00 000 101 33 3N2W13BC 02300
2019-7689 0.16 136,880 209,720 346,600 357,965 Sep-19 86 97
02 00 000 101 33 3N2W12AD 06509
2019-7911 0.19 144,070 320,920 464,990 479,039 Sep-19 87 97
02 00 000 101 33 3N2W13CC 00132
2019-8147 0.23 152,060 265,020 417,080 431,657 Sep-19 88 97
02 00 000 101 33 3N2W12DA 04113
2019-9147 0.18 142,340 178,450 320,790 331,073 Oct-19 89 97
02 00 000 101 33 3N1W07CA 01400
2019-9527 0.31 164,620 212,440 377,060 389,176 Nov-19 90 97
02 00 000 101 143 33 3N2W12DC 00158
2019-355 0.08 110,800 206,200 317,000 323,912 Jan-19 91 98
02 00 000 101 141 33 3N1W07CA 03000
2019-2799 0.27 158,700 189,980 348,680 355,245 Apr-19 92 98
02 00 000 101 33 3N2W13AD 05900
2019-7687 0.14 131,020 233,290 364,310 371,592 Sep-19 93 98
02 00 000 101 33 3N2W12CD 02001
2019-7971 0.18 142,340 140,910 283,250 288,344 Sep-19 94 98
02 00 000 101 33 3N2W12AD 06005
2019-8842 0.17 141,310 235,480 376,790 383,025 Oct-19 95 98
02 00 000 101 33 3N2W13CC 00126
2019-9477 0.14 130,880 252,720 383,600 393,148 Nov-19 96 98
02 00 000 101 143 33 3N2W13BC 01200
2019-1443 0.19 146,110 197,130 343,240 347,510 Feb-19 97 99
02 00 000 101 143 33 3N2W13BA 04705
2019-1887 0.14 130,480 210,750 341,230 346,241 Mar-19 98 99
02 00 000 101 33 3N2W12DD 07200
2019-4234 0.20 147,950 184,880 332,830 335,696 May-19 99 99
02 00 000 101 33 3N2W12DC 00163
2019-5118 0.06 98,780 199,590 298,370 301,074 Jun-19 100 99
02 00 000 101 33 3N2W11AA 01004
2019-5935 0.21 148,840 216,680 365,520 367,710 Jul-19 101 99
02 00 000 101 30 3N2W11AA 00141
2019-7518 0.35 170,490 250,230 420,720 423,735 Sep-19 102 99
02 00 000 101 33 3N2W12DD 04000
2019-7666 0.18 143,180 164,640 307,820 309,570 Sep-19 103 99
02 00 000 101 141 33 3N2W12BB 00100
2019-1454 0.39 176,560 215,210 391,770 391,111 Feb-19 104 100
02 00 000 101 142 33 3N2W11AD 01500
2019-1803 0.40 177,670 280,850 458,520 457,968 Mar-19 105 100
02 00 000 101 33 3N2W13BD 07800
2019-4213 0.21 149,210 283,310 432,520 433,618 May-19 106 100
02 00 000 101 33 3N2W12AC 02300
2019-6015 0.23 152,430 84,480 236,910 235,508 Jul-19 107 101
02 00 000 101 33 3N2W12DD 08000
2019-7081 0.38 175,560 221,620 397,180 393,715 Sep-19 108 101
02 00 000 101 33 3N2W12DC 02504
2019-9318 0.05 85,350 207,380 292,730 289,988 Nov-19 109 101
02 00 000 101 142 33 3N2W13C0 05800
2019-2480 1.23 177,630 290,700 468,330 453,810 Apr-19 110 103
COLUMBIA County 2020 Ratio Study
113
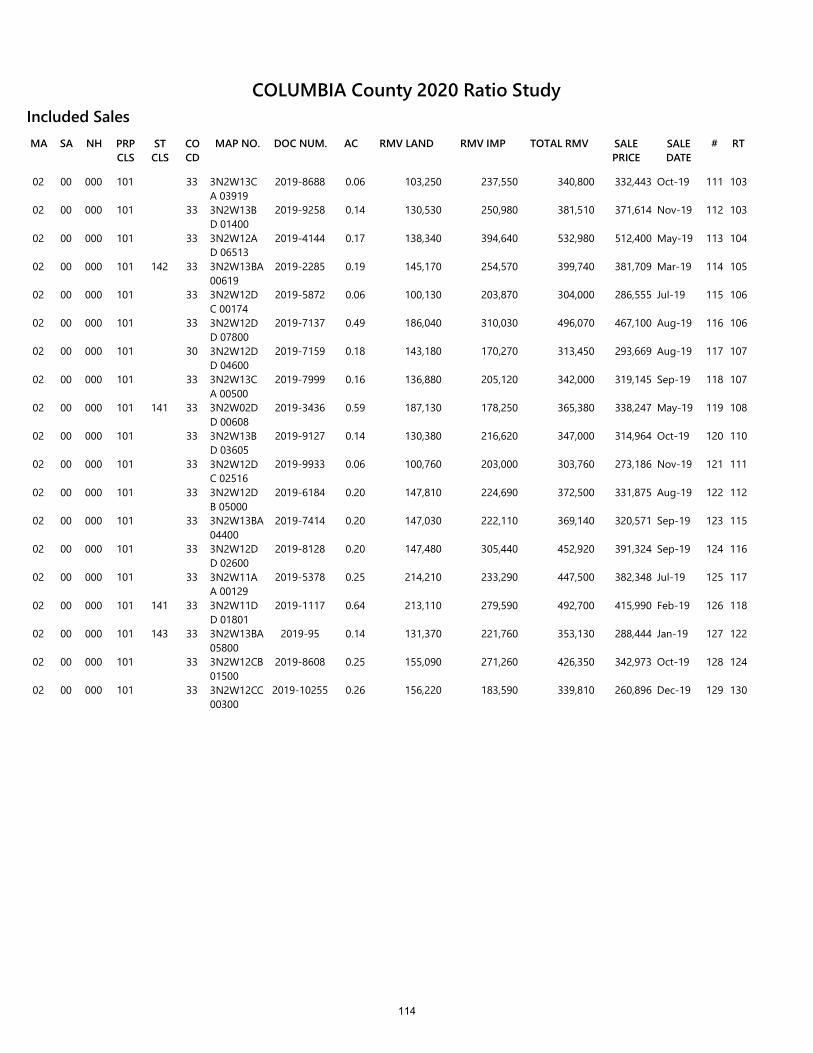
RMV LANDSA NH PRP CLS
ST CLS
CO CD
MAP NO. DOC NUM.MA AC RMV IMP TOTAL RMV SALE PRICE
SALE DATE
# RT
Included Sales
02 00 000 101 33 3N2W13CA 03919
2019-8688 0.06 103,250 237,550 340,800 332,443 Oct-19 111 103
02 00 000 101 33 3N2W13BD 01400
2019-9258 0.14 130,530 250,980 381,510 371,614 Nov-19 112 103
02 00 000 101 33 3N2W12AD 06513
2019-4144 0.17 138,340 394,640 532,980 512,400 May-19 113 104
02 00 000 101 142 33 3N2W13BA 00619
2019-2285 0.19 145,170 254,570 399,740 381,709 Mar-19 114 105
02 00 000 101 33 3N2W12DC 00174
2019-5872 0.06 100,130 203,870 304,000 286,555 Jul-19 115 106
02 00 000 101 33 3N2W12DD 07800
2019-7137 0.49 186,040 310,030 496,070 467,100 Aug-19 116 106
02 00 000 101 30 3N2W12DD 04600
2019-7159 0.18 143,180 170,270 313,450 293,669 Aug-19 117 107
02 00 000 101 33 3N2W13CA 00500
2019-7999 0.16 136,880 205,120 342,000 319,145 Sep-19 118 107
02 00 000 101 141 33 3N2W02DD 00608
2019-3436 0.59 187,130 178,250 365,380 338,247 May-19 119 108
02 00 000 101 33 3N2W13BD 03605
2019-9127 0.14 130,380 216,620 347,000 314,964 Oct-19 120 110
02 00 000 101 33 3N2W12DC 02516
2019-9933 0.06 100,760 203,000 303,760 273,186 Nov-19 121 111
02 00 000 101 33 3N2W12DB 05000
2019-6184 0.20 147,810 224,690 372,500 331,875 Aug-19 122 112
02 00 000 101 33 3N2W13BA 04400
2019-7414 0.20 147,030 222,110 369,140 320,571 Sep-19 123 115
02 00 000 101 33 3N2W12DD 02600
2019-8128 0.20 147,480 305,440 452,920 391,324 Sep-19 124 116
02 00 000 101 33 3N2W11AA 00129
2019-5378 0.25 214,210 233,290 447,500 382,348 Jul-19 125 117
02 00 000 101 141 33 3N2W11DD 01801
2019-1117 0.64 213,110 279,590 492,700 415,990 Feb-19 126 118
02 00 000 101 143 33 3N2W13BA 05800
2019-95 0.14 131,370 221,760 353,130 288,444 Jan-19 127 122
02 00 000 101 33 3N2W12CB 01500
2019-8608 0.25 155,090 271,260 426,350 342,973 Oct-19 128 124
02 00 000 101 33 3N2W12CC 00300
2019-10255 0.26 156,220 183,590 339,810 260,896 Dec-19 129 130
COLUMBIA County 2020 Ratio Study
114
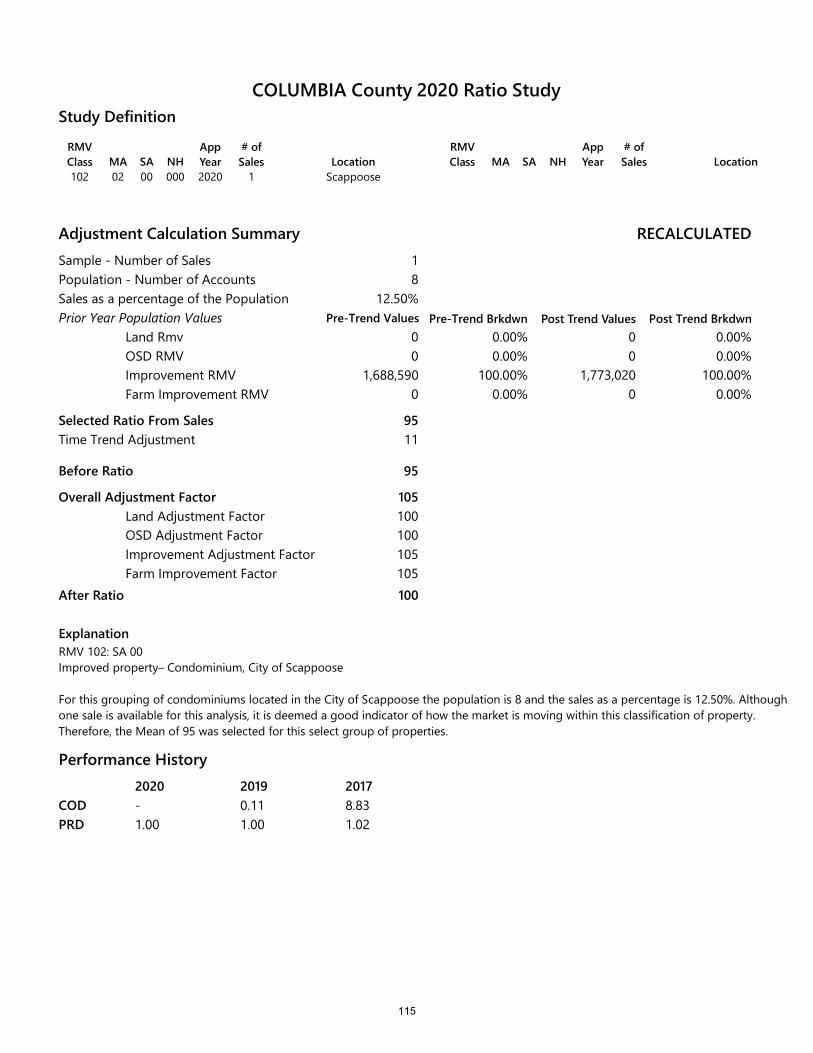
RMV Class MA SA NH
App Year
# of Sales Location
102 02 00 000 2020 1 Scappoose
RMV Class MA SA NH
App Year
# of Sales Location
Study Definition
Adjustment Calculation SummarySample - Number of SalesPopulation - Number of AccountsSales as a percentage of the PopulationPrior Year Population Values
Land RmvOSD RMVImprovement RMVFarm Improvement RMV
Selected Ratio From Sales
Before Ratio
Overall Adjustment FactorLand Adjustment FactorOSD Adjustment FactorImprovement Adjustment FactorFarm Improvement Factor
After Ratio
ExplanationRMV 102: SA 00 Improved property– Condominium, City of Scappoose
For this grouping of condominiums located in the City of Scappoose the population is 8 and the sales as a percentage is 12.50%. Although one sale is available for this analysis, it is deemed a good indicator of how the market is moving within this classification of property. Therefore, the Mean of 95 was selected for this select group of properties.
RECALCULATED
Pre-Trend Brkdwn Post Trend Values Post Trend Brkdwn
18
12.50%
0 0.00% 0 0.00%0
1,688,5900
0.00% 0 0.00%100.00% 1,773,020 100.00%
0.00% 0 0.00%
95
95
105100100105105100
Time Trend Adjustment 11
Performance History2020 2019 2017- 0.11 8.831.00 1.00 1.02
CODPRD
COLUMBIA County 2020 Ratio Study
Pre-Trend Values
115
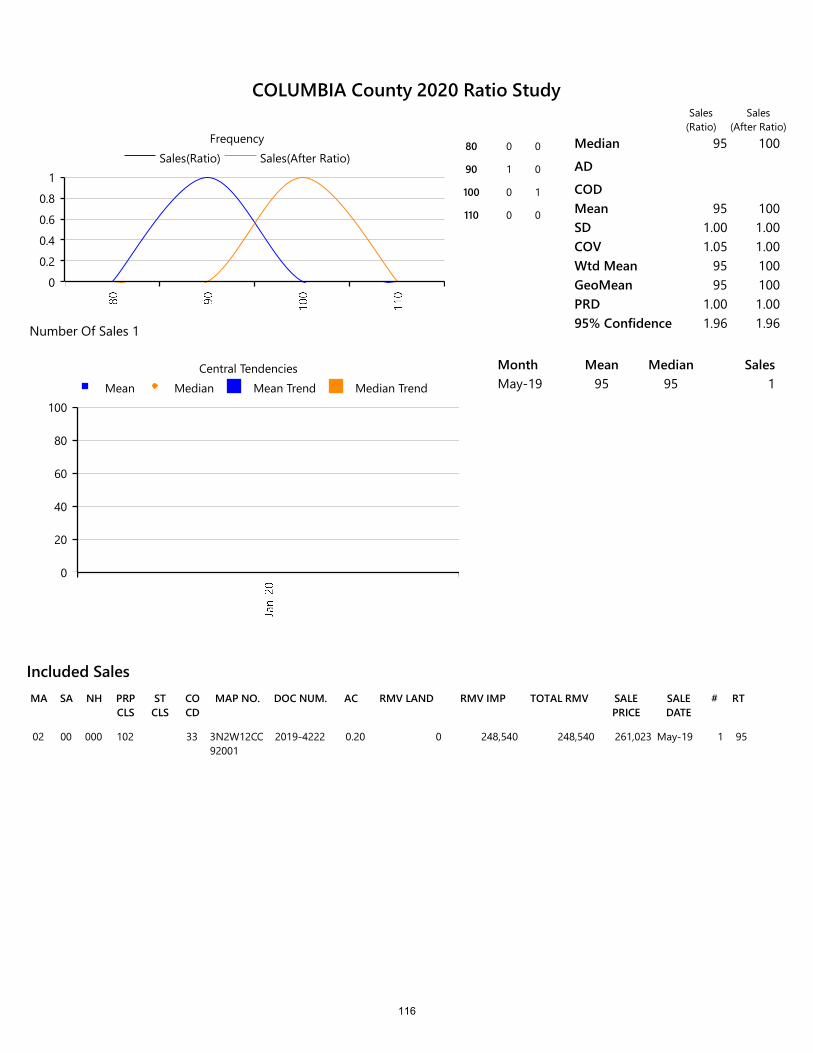
RMV LANDSA NH PRP CLS
ST CLS
CO CD
MAP NO. DOC NUM.MA AC RMV IMP TOTAL RMV SALE PRICE
SALE DATE
# RT
Included Sales
02 00 000 102 33 3N2W12CC 92001
2019-4222 0.20 0 248,540 248,540 261,023 May-19 1 95
0
0.2
0.4
0.6
0.8
1Sales(Ratio) Sales(After Ratio)
Frequency80 0 0
90 1 0
100 0 1
110 0 0
Median 95 100
AD
CODMean 95 100SD 1.00 1.00COV 1.05 1.00Wtd Mean 95 100GeoMean 95 100PRD 1.00 1.0095% Confidence 1.96 1.96Number Of Sales 1
0
20
40
60
80
100Mean Median Mean Trend Median Trend
Central Tendencies Month Mean Median SalesMay-19 95 95 1
Sales(Ratio)
Sales(After Ratio)
COLUMBIA County 2020 Ratio Study
116
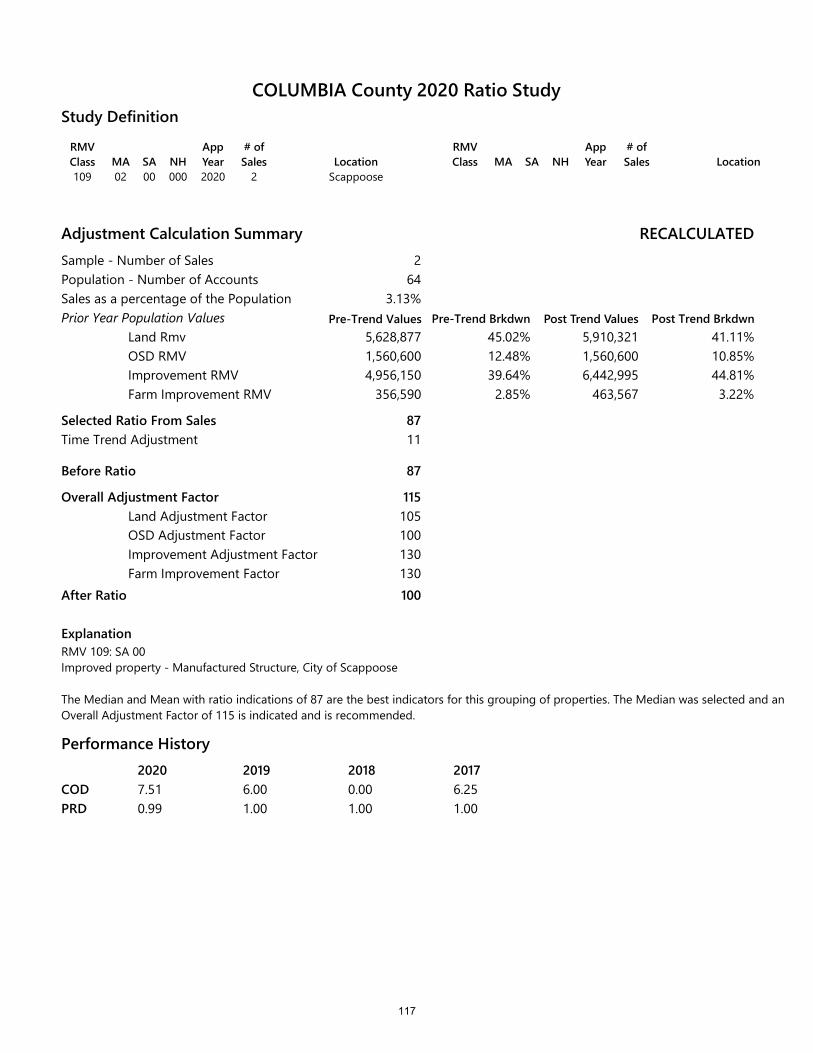
RMV Class MA SA NH
App Year
# of Sales Location
109 02 00 000 2020 2 Scappoose
RMV Class MA SA NH
App Year
# of Sales Location
Study Definition
Adjustment Calculation SummarySample - Number of SalesPopulation - Number of AccountsSales as a percentage of the PopulationPrior Year Population Values
Land RmvOSD RMVImprovement RMVFarm Improvement RMV
Selected Ratio From Sales
Before Ratio
Overall Adjustment FactorLand Adjustment FactorOSD Adjustment FactorImprovement Adjustment FactorFarm Improvement Factor
After Ratio
ExplanationRMV 109: SA 00Improved property - Manufactured Structure, City of Scappoose
The Median and Mean with ratio indications of 87 are the best indicators for this grouping of properties. The Median was selected and an Overall Adjustment Factor of 115 is indicated and is recommended.
RECALCULATED
Pre-Trend Brkdwn Post Trend Values Post Trend Brkdwn
264
3.13%
5,628,877 45.02% 5,910,321 41.11%1,560,6004,956,150
356,590
12.48% 1,560,600 10.85%39.64% 6,442,995 44.81%2.85% 463,567 3.22%
87
87
115105100130130100
Time Trend Adjustment 11
Performance History2020 2019 2018 20177.51 6.00 0.00 6.250.99 1.00 1.00 1.00
CODPRD
COLUMBIA County 2020 Ratio Study
Pre-Trend Values
117
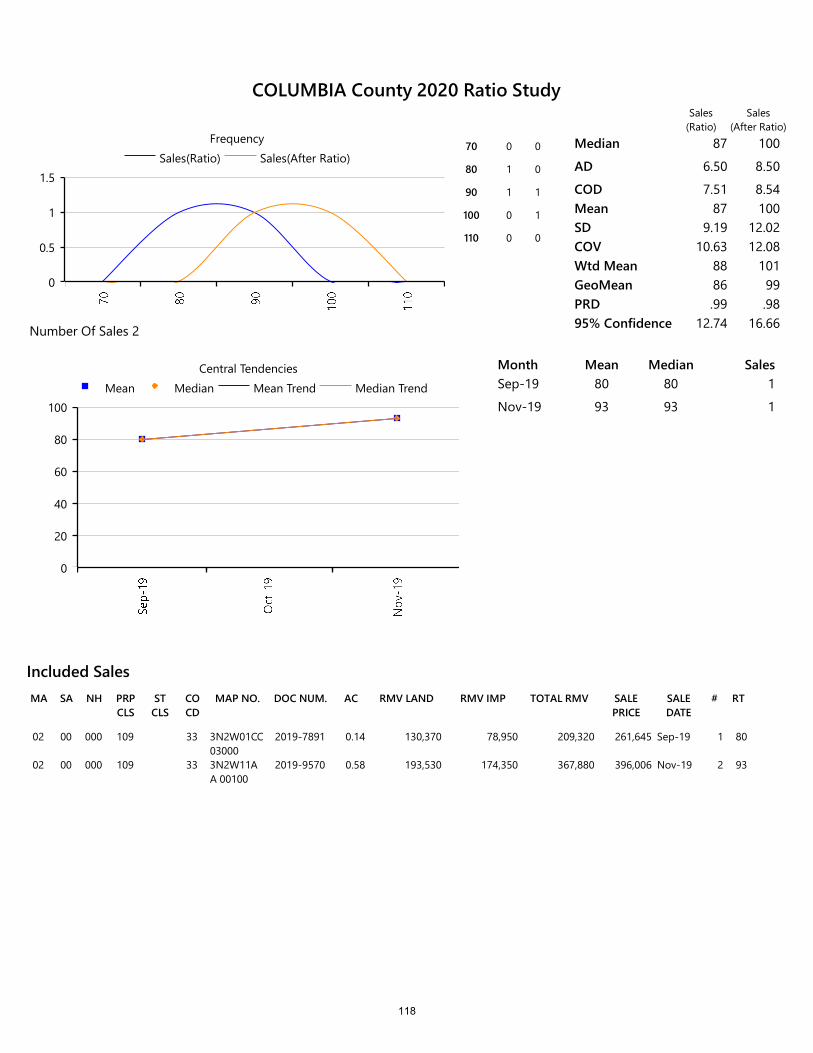
RMV LANDSA NH PRP CLS
ST CLS
CO CD
MAP NO. DOC NUM.MA AC RMV IMP TOTAL RMV SALE PRICE
SALE DATE
# RT
Included Sales
02 00 000 109 33 3N2W01CC 03000
2019-7891 0.14 130,370 78,950 209,320 261,645 Sep-19 1 80
02 00 000 109 33 3N2W11AA 00100
2019-9570 0.58 193,530 174,350 367,880 396,006 Nov-19 2 93
0
0.5
1
1.5Sales(Ratio) Sales(After Ratio)
Frequency70 0 0
80 1 0
90 1 1
100 0 1
110 0 0
Median 87 100
AD 6.50 8.50
COD 7.51 8.54Mean 87 100SD 9.19 12.02COV 10.63 12.08Wtd Mean 88 101GeoMean 86 99PRD .99 .9895% Confidence 12.74 16.66Number Of Sales 2
0
20
40
60
80
100Mean Median Mean Trend Median Trend
Central Tendencies Month Mean Median SalesSep-19 80 80 1
Nov-19 93 93 1
Sales(Ratio)
Sales(After Ratio)
COLUMBIA County 2020 Ratio Study
118

RMV Class MA SA NH
App Year
# of Sales Location
102 02 21 000 2020 Scappoose
RMV Class MA SA NH
App Year
# of Sales Location
Study Definition
Adjustment Calculation SummarySample - Number of SalesPopulation - Number of AccountsSales as a percentage of the PopulationPrior Year Population Values
Land RmvOSD RMVImprovement RMVFarm Improvement RMV
Selected Ratio From Sales
Before Ratio
Overall Adjustment FactorLand Adjustment FactorOSD Adjustment FactorImprovement Adjustment FactorFarm Improvement Factor
After Ratio
RECALCULATED
Pre-Trend Brkdwn Post Trend Values Post Trend Brkdwn
04
0.00%
0 0.00% 0 0.00%0
739,7400
0.00% 0 0.00%100.00% 776,727 100.00%
0.00% 0 0.00%
95
95
105100100105105100
Time Trend Adjustment 11
ExplanationRMV 102, SA 21Improved land – Condominium, Rural Value Zone 1, Rural Scappoose
No sales were identified for this study of Condominium properties located in the rural areas of Scappoose (SA 21, Value Zone 1), just beyond the city limits of Scappoose. Therefore, the Selected Ratio (95) from the analysis of properties located in MA02 SA 00 RMV Class 102 was applied here.
Performance History2020--
CODPRD
COLUMBIA County 2020 Ratio Study
Pre-Trend Values
119

0
1Sales(Ratio) Sales(After Ratio)
Frequency Median
AD
CODMeanSDCOVWtd MeanGeoMeanPRD95% ConfidenceNumber Of Sales 0
0
1Mean Median Mean Trend Median Trend
Central Tendencies Month Mean Median Sales
Sales(Ratio)
Sales(After Ratio)
COLUMBIA County 2020 Ratio Study
120
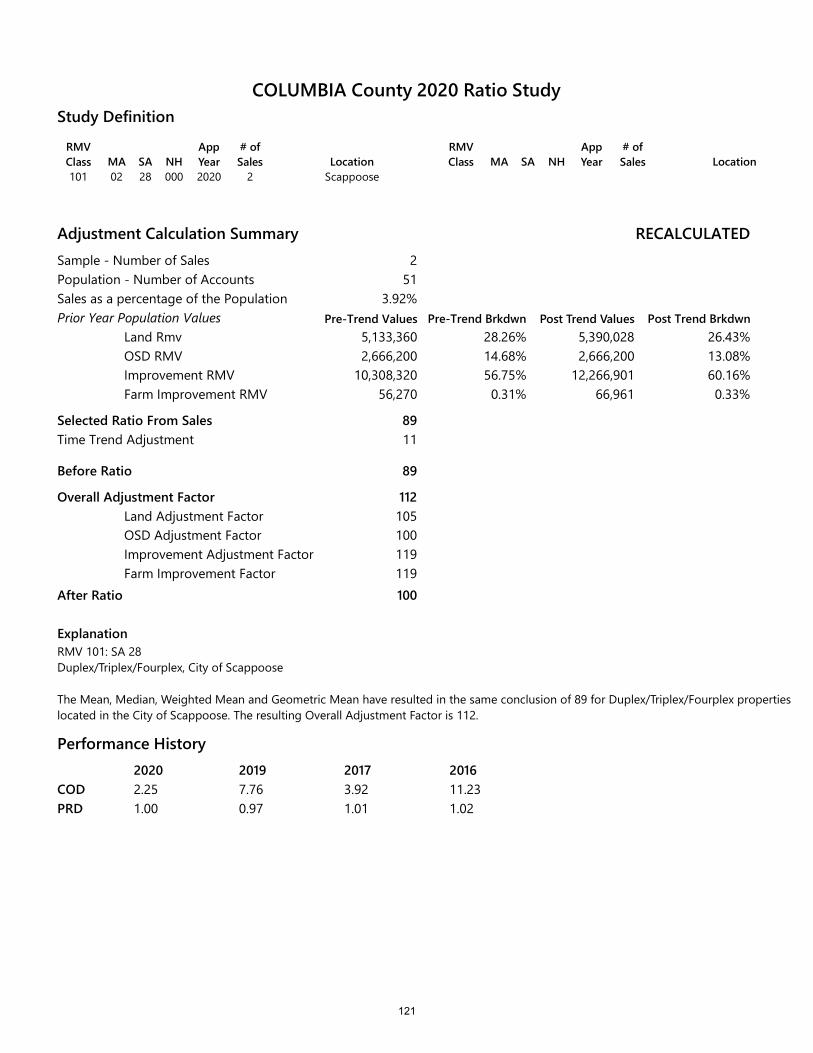
RMV Class MA SA NH
App Year
# of Sales Location
101 02 28 000 2020 2 Scappoose
RMV Class MA SA NH
App Year
# of Sales Location
Study Definition
Adjustment Calculation SummarySample - Number of SalesPopulation - Number of AccountsSales as a percentage of the PopulationPrior Year Population Values
Land RmvOSD RMVImprovement RMVFarm Improvement RMV
Selected Ratio From Sales
Before Ratio
Overall Adjustment FactorLand Adjustment FactorOSD Adjustment FactorImprovement Adjustment FactorFarm Improvement Factor
After Ratio
ExplanationRMV 101: SA 28 Duplex/Triplex/Fourplex, City of Scappoose
The Mean, Median, Weighted Mean and Geometric Mean have resulted in the same conclusion of 89 for Duplex/Triplex/Fourplex properties located in the City of Scappoose. The resulting Overall Adjustment Factor is 112.
RECALCULATED
Pre-Trend Brkdwn Post Trend Values Post Trend Brkdwn
251
3.92%
5,133,360 28.26% 5,390,028 26.43%2,666,200
10,308,32056,270
14.68% 2,666,200 13.08%56.75% 12,266,901 60.16%0.31% 66,961 0.33%
89
89
112105100119119100
Time Trend Adjustment 11
Performance History2020 2019 2017 20162.25 7.76 3.92 11.231.00 0.97 1.01 1.02
CODPRD
COLUMBIA County 2020 Ratio Study
Pre-Trend Values
121

RMV LANDSA NH PRP CLS
ST CLS
CO CD
MAP NO. DOC NUM.MA AC RMV IMP TOTAL RMV SALE PRICE
SALE DATE
# RT
Included Sales
02 28 000 101 30 3N2W12BA 03100
2019-6863 0.38 189,510 134,000 323,510 373,788 Aug-19 1 87
02 28 000 101 33 3N2W12CC 01210
2019-3991 0.21 162,620 264,170 426,790 469,832 May-19 2 91
0
0.5
1
1.5
2Sales(Ratio) Sales(After Ratio)
Frequency70 0 0
80 1 0
90 1 1
100 0 1
110 0 0
Median 89 99
AD 2.00 4.00
COD 2.25 4.04Mean 89 99SD 2.83 5.66COV 3.18 5.71Wtd Mean 89 99GeoMean 89 99PRD 1.00 1.0095% Confidence 3.92 7.84Number Of Sales 2
0
20
40
60
80
100Mean Median Mean Trend Median Trend
Central Tendencies Month Mean Median SalesMay-19 91 91 1
Aug-19 87 87 1
Sales(Ratio)
Sales(After Ratio)
COLUMBIA County 2020 Ratio Study
122
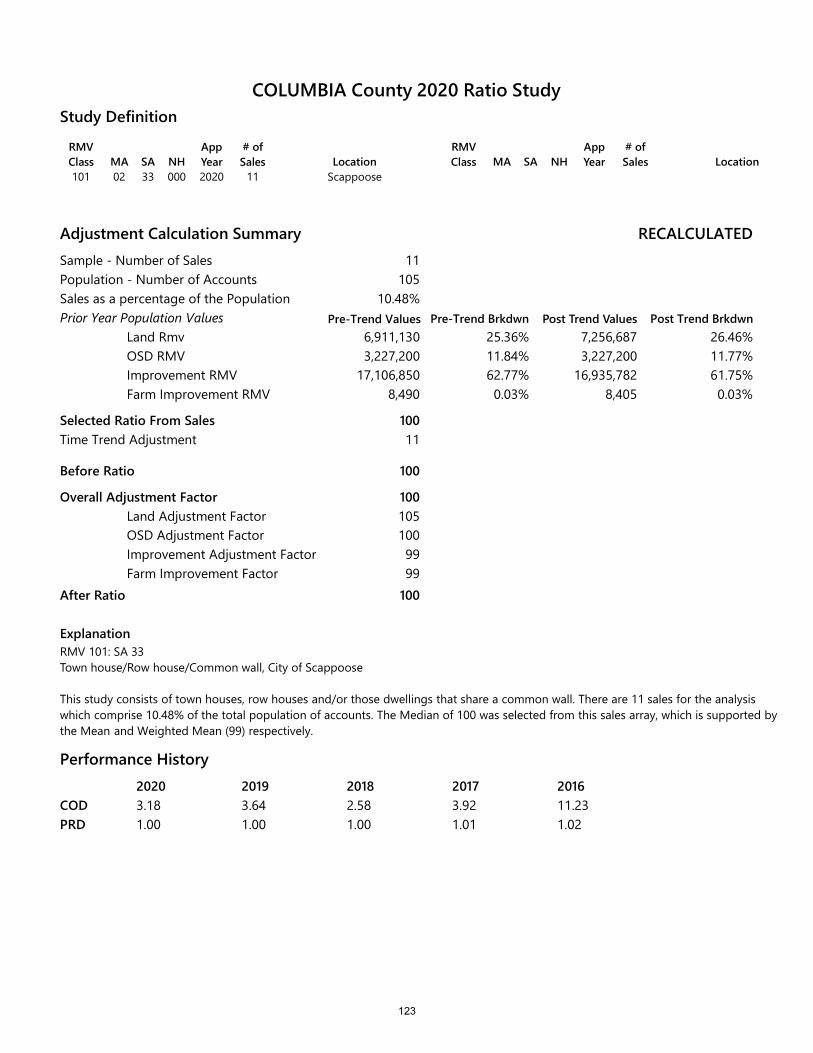
RMV Class MA SA NH
App Year
# of Sales Location
101 02 33 000 2020 11 Scappoose
RMV Class MA SA NH
App Year
# of Sales Location
Study Definition
Adjustment Calculation SummarySample - Number of SalesPopulation - Number of AccountsSales as a percentage of the PopulationPrior Year Population Values
Land RmvOSD RMVImprovement RMVFarm Improvement RMV
Selected Ratio From Sales
Before Ratio
Overall Adjustment FactorLand Adjustment FactorOSD Adjustment FactorImprovement Adjustment FactorFarm Improvement Factor
After Ratio
ExplanationRMV 101: SA 33Town house/Row house/Common wall, City of Scappoose
RECALCULATED
Pre-Trend Brkdwn Post Trend Values Post Trend Brkdwn
11105
10.48%
6,911,130 25.36% 7,256,687 26.46%3,227,200
17,106,8508,490
11.84% 3,227,200 11.77%62.77% 16,935,782 61.75%0.03% 8,405 0.03%
100
100
1001051009999
100
Time Trend Adjustment 11
This study consists of town houses, row houses and/or those dwellings that share a common wall. There are 11 sales for the analysis which comprise 10.48% of the total population of accounts. The Median of 100 was selected from this sales array, which is supported by the Mean and Weighted Mean (99) respectively.
Performance History2020 2019 2018 2017 20163.18 3.64 2.58 3.92 11.231.00 1.00 1.00 1.01 1.02
CODPRD
COLUMBIA County 2020 Ratio Study
Pre-Trend Values
123
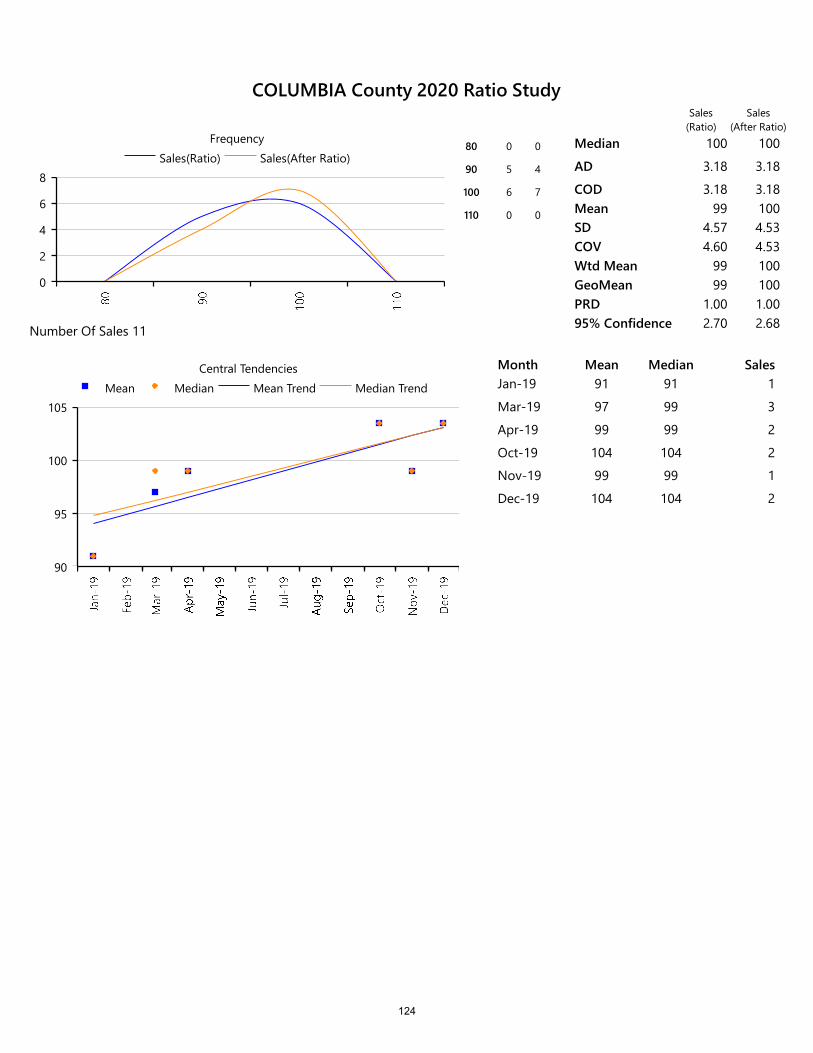
0
2
4
6
8Sales(Ratio) Sales(After Ratio)
Frequency80 0 0
90 5 4
100 6 7
110 0 0
Median 100 100
AD 3.18 3.18
COD 3.18 3.18Mean 99 100SD 4.57 4.53COV 4.60 4.53Wtd Mean 99 100GeoMean 99 100PRD 1.00 1.0095% Confidence 2.70 2.68Number Of Sales 11
90
95
100
105Mean Median Mean Trend Median Trend
Central Tendencies Month Mean Median SalesJan-19 91 91 1
Mar-19 97 99 3
Apr-19 99 99 2
Oct-19 104 104 2
Nov-19 99 99 1
Dec-19 104 104 2
Sales(Ratio)
Sales(After Ratio)
COLUMBIA County 2020 Ratio Study
124
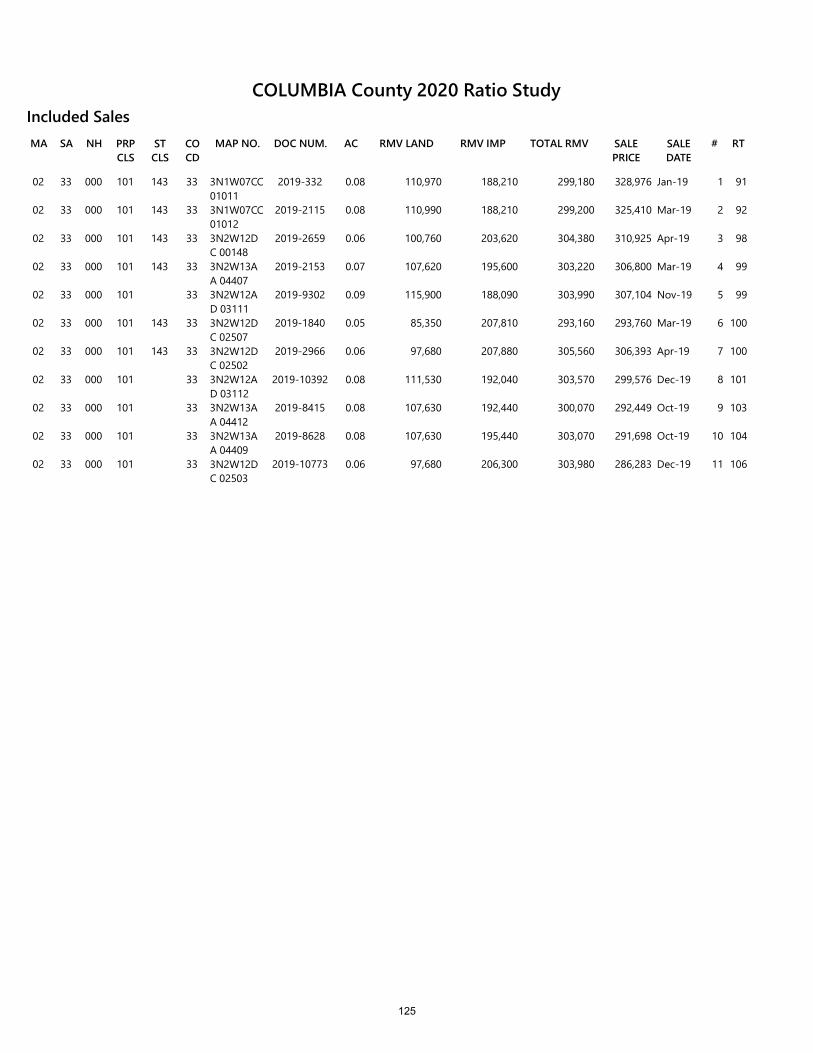
RMV LANDSA NH PRP CLS
ST CLS
CO CD
MAP NO. DOC NUM.MA AC RMV IMP TOTAL RMV SALE PRICE
SALE DATE
# RT
Included Sales
02 33 000 101 143 33 3N1W07CC 01011
2019-332 0.08 110,970 188,210 299,180 328,976 Jan-19 1 91
02 33 000 101 143 33 3N1W07CC 01012
2019-2115 0.08 110,990 188,210 299,200 325,410 Mar-19 2 92
02 33 000 101 143 33 3N2W12DC 00148
2019-2659 0.06 100,760 203,620 304,380 310,925 Apr-19 3 98
02 33 000 101 143 33 3N2W13AA 04407
2019-2153 0.07 107,620 195,600 303,220 306,800 Mar-19 4 99
02 33 000 101 33 3N2W12AD 03111
2019-9302 0.09 115,900 188,090 303,990 307,104 Nov-19 5 99
02 33 000 101 143 33 3N2W12DC 02507
2019-1840 0.05 85,350 207,810 293,160 293,760 Mar-19 6 100
02 33 000 101 143 33 3N2W12DC 02502
2019-2966 0.06 97,680 207,880 305,560 306,393 Apr-19 7 100
02 33 000 101 33 3N2W12AD 03112
2019-10392 0.08 111,530 192,040 303,570 299,576 Dec-19 8 101
02 33 000 101 33 3N2W13AA 04412
2019-8415 0.08 107,630 192,440 300,070 292,449 Oct-19 9 103
02 33 000 101 33 3N2W13AA 04409
2019-8628 0.08 107,630 195,440 303,070 291,698 Oct-19 10 104
02 33 000 101 33 3N2W12DC 02503
2019-10773 0.06 97,680 206,300 303,980 286,283 Dec-19 11 106
COLUMBIA County 2020 Ratio Study
125
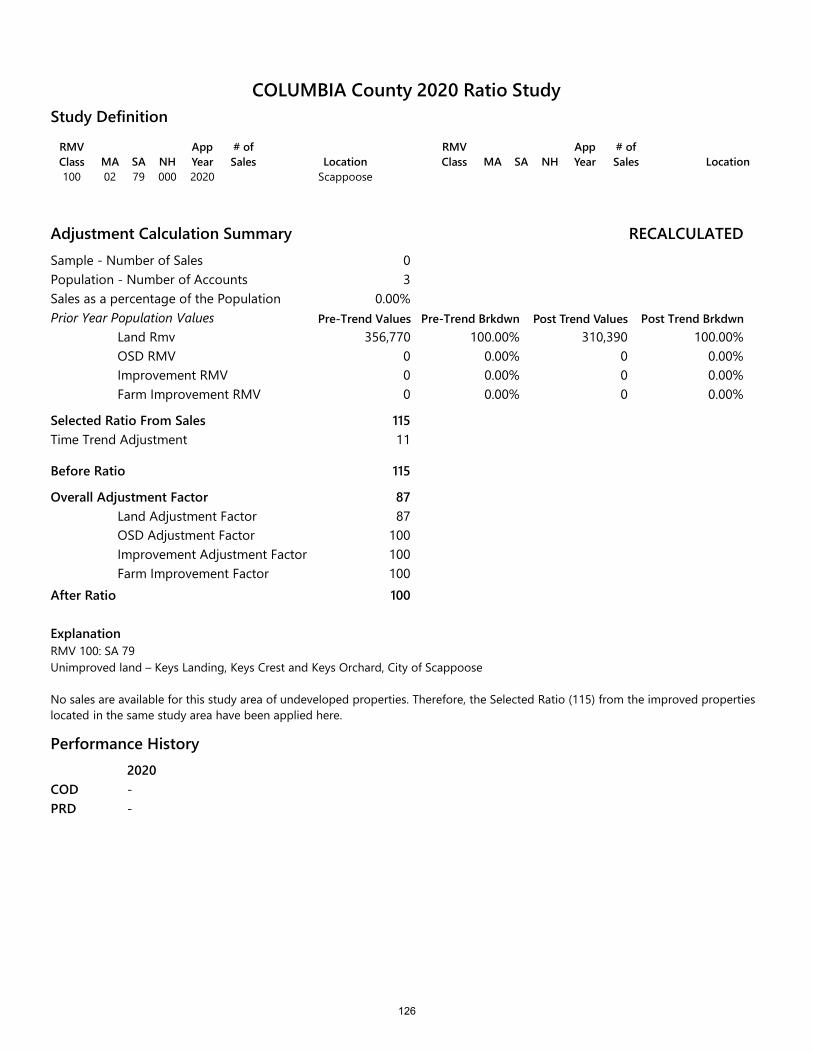
RMV Class MA SA NH
App Year
# of Sales Location
100 02 79 000 2020 Scappoose
RMV Class MA SA NH
App Year
# of Sales Location
Study Definition
Adjustment Calculation SummarySample - Number of SalesPopulation - Number of AccountsSales as a percentage of the PopulationPrior Year Population Values
Land RmvOSD RMVImprovement RMVFarm Improvement RMV
Selected Ratio From Sales
Before Ratio
Overall Adjustment FactorLand Adjustment FactorOSD Adjustment FactorImprovement Adjustment FactorFarm Improvement Factor
After Ratio
RECALCULATED
Pre-Trend Brkdwn Post Trend Values Post Trend Brkdwn
03
0.00%
356,770 100.00% 310,390 100.00%000
0.00% 0 0.00%0.00% 0 0.00%0.00% 0 0.00%
115
115
8787
100100100100
Time Trend Adjustment 11
ExplanationRMV 100: SA 79Unimproved land – Keys Landing, Keys Crest and Keys Orchard, City of Scappoose
No sales are available for this study area of undeveloped properties. Therefore, the Selected Ratio (115) from the improved properties located in the same study area have been applied here.
Performance History2020--
CODPRD
COLUMBIA County 2020 Ratio Study
Pre-Trend Values
126

0
1Sales(Ratio) Sales(After Ratio)
Frequency Median
AD
CODMeanSDCOVWtd MeanGeoMeanPRD95% ConfidenceNumber Of Sales 0
0
1Mean Median Mean Trend Median Trend
Central Tendencies Month Mean Median Sales
Sales(Ratio)
Sales(After Ratio)
COLUMBIA County 2020 Ratio Study
127
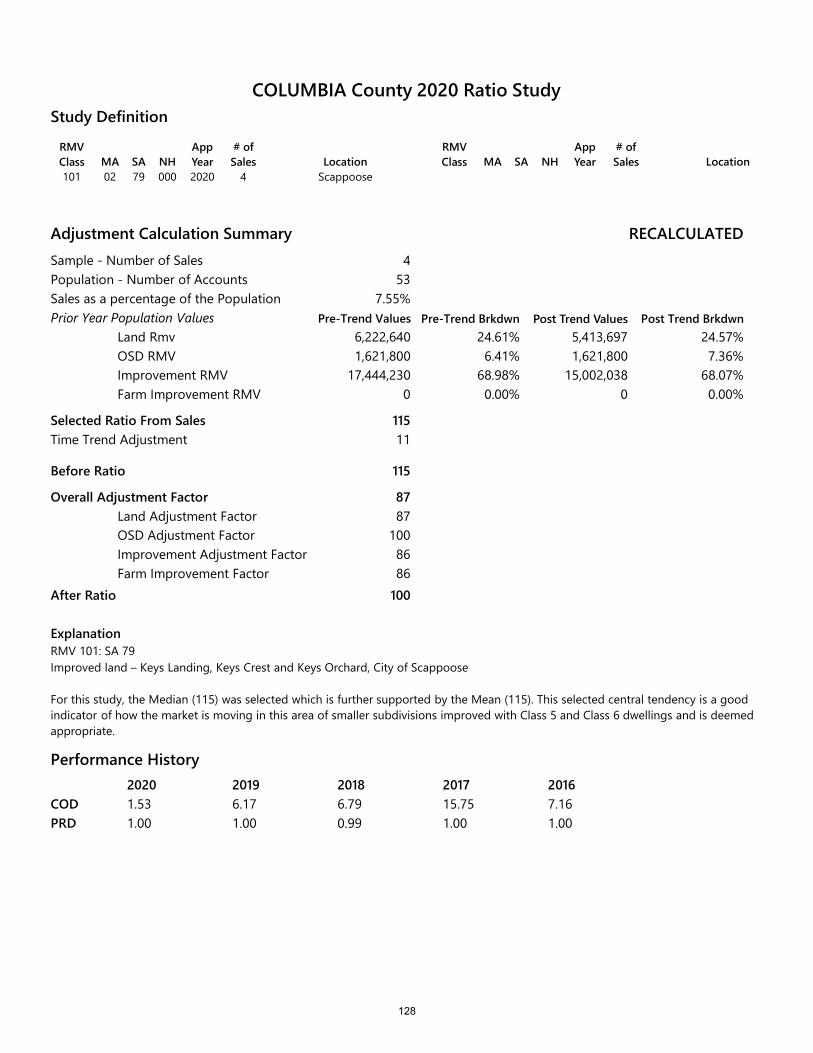
RMV Class MA SA NH
App Year
# of Sales Location
101 02 79 000 2020 4 Scappoose
RMV Class MA SA NH
App Year
# of Sales Location
Study Definition
Adjustment Calculation SummarySample - Number of SalesPopulation - Number of AccountsSales as a percentage of the PopulationPrior Year Population Values
Land RmvOSD RMVImprovement RMVFarm Improvement RMV
Selected Ratio From Sales
Before Ratio
Overall Adjustment FactorLand Adjustment FactorOSD Adjustment FactorImprovement Adjustment FactorFarm Improvement Factor
After Ratio
RECALCULATED
Pre-Trend Brkdwn Post Trend Values Post Trend Brkdwn
453
7.55%
6,222,640 24.61% 5,413,697 24.57%1,621,800
17,444,2300
6.41% 1,621,800 7.36%68.98% 15,002,038 68.07%0.00% 0 0.00%
115
115
8787
1008686
100
Time Trend Adjustment 11
ExplanationRMV 101: SA 79Improved land – Keys Landing, Keys Crest and Keys Orchard, City of Scappoose
For this study, the Median (115) was selected which is further supported by the Mean (115). This selected central tendency is a good indicator of how the market is moving in this area of smaller subdivisions improved with Class 5 and Class 6 dwellings and is deemed appropriate.
Performance History2020 2019 2018 2017 20161.53 6.17 6.79 15.75 7.161.00 1.00 0.99 1.00 1.00
CODPRD
COLUMBIA County 2020 Ratio Study
Pre-Trend Values
128
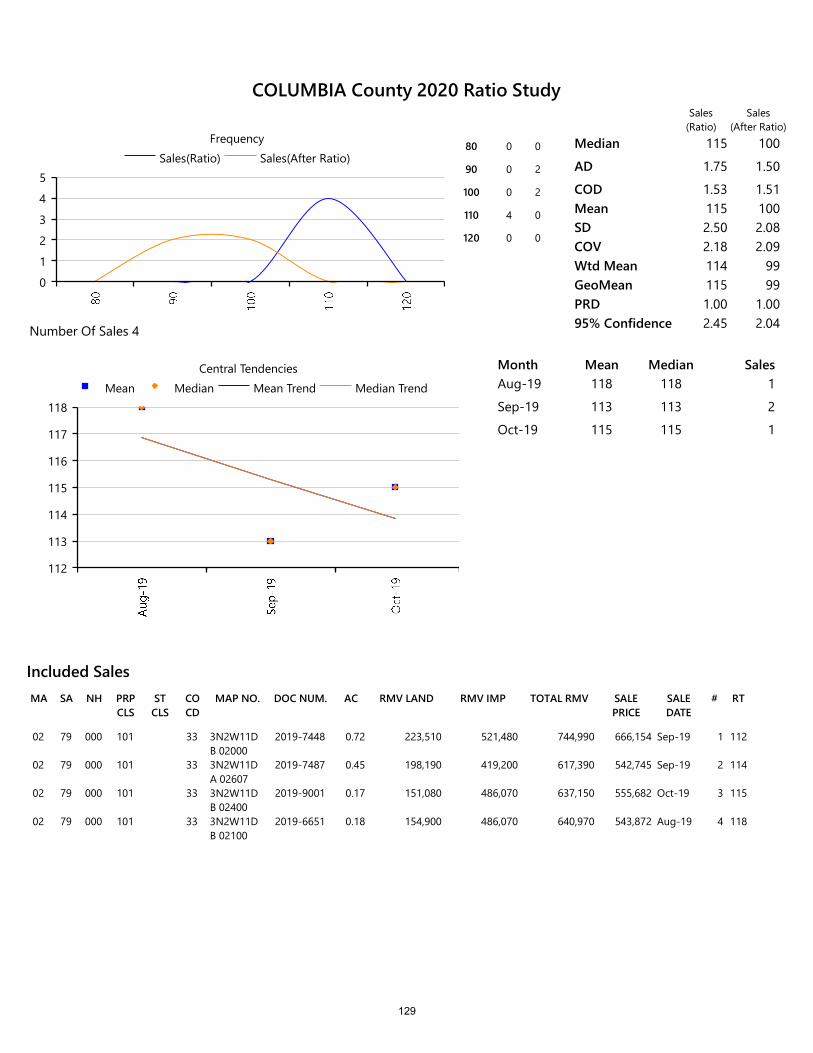
RMV LANDSA NH PRP CLS
ST CLS
CO CD
MAP NO. DOC NUM.MA AC RMV IMP TOTAL RMV SALE PRICE
SALE DATE
# RT
Included Sales
02 79 000 101 33 3N2W11DB 02000
2019-7448 0.72 223,510 521,480 744,990 666,154 Sep-19 1 112
02 79 000 101 33 3N2W11DA 02607
2019-7487 0.45 198,190 419,200 617,390 542,745 Sep-19 2 114
02 79 000 101 33 3N2W11DB 02400
2019-9001 0.17 151,080 486,070 637,150 555,682 Oct-19 3 115
02 79 000 101 33 3N2W11DB 02100
2019-6651 0.18 154,900 486,070 640,970 543,872 Aug-19 4 118
0
1
2
3
4
5Sales(Ratio) Sales(After Ratio)
Frequency80 0 0
90 0 2
100 0 2
110 4 0
120 0 0
Median 115 100
AD 1.75 1.50
COD 1.53 1.51Mean 115 100SD 2.50 2.08COV 2.18 2.09Wtd Mean 114 99GeoMean 115 99PRD 1.00 1.0095% Confidence 2.45 2.04Number Of Sales 4
112
113
114
115
116
117
118Mean Median Mean Trend Median Trend
Central Tendencies Month Mean Median SalesAug-19 118 118 1
Sep-19 113 113 2
Oct-19 115 115 1
Sales(Ratio)
Sales(After Ratio)
COLUMBIA County 2020 Ratio Study
129
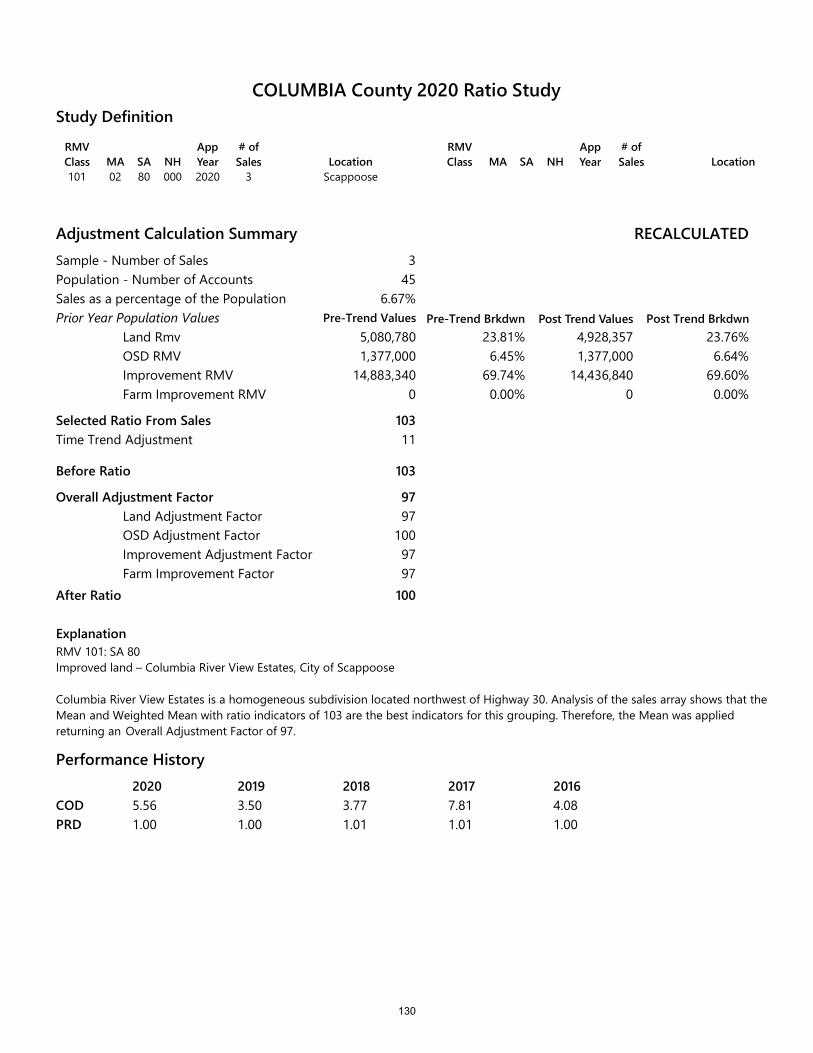
RMV Class MA SA NH
App Year
# of Sales Location
101 02 80 000 2020 3 Scappoose
RMV Class MA SA NH
App Year
# of Sales Location
Study Definition
Adjustment Calculation SummarySample - Number of SalesPopulation - Number of AccountsSales as a percentage of the PopulationPrior Year Population Values
Land RmvOSD RMVImprovement RMVFarm Improvement RMV
Selected Ratio From Sales
Before Ratio
Overall Adjustment FactorLand Adjustment FactorOSD Adjustment FactorImprovement Adjustment FactorFarm Improvement Factor
After Ratio
ExplanationRMV 101: SA 80Improved land – Columbia River View Estates, City of Scappoose
RECALCULATED
Pre-Trend Brkdwn Post Trend Values Post Trend Brkdwn
345
6.67%
5,080,780 23.81% 4,928,357 23.76%1,377,000
14,883,3400
6.45% 1,377,000 6.64%69.74% 14,436,840 69.60%0.00% 0 0.00%
103
103
9797
1009797
100
Time Trend Adjustment 11
Columbia River View Estates is a homogeneous subdivision located northwest of Highway 30. Analysis of the sales array shows that the Mean and Weighted Mean with ratio indicators of 103 are the best indicators for this grouping. Therefore, the Mean was applied returning an Overall Adjustment Factor of 97.
Performance History2020 2019 2018 2017 20165.56 3.50 3.77 7.81 4.081.00 1.00 1.01 1.01 1.00
CODPRD
COLUMBIA County 2020 Ratio Study
Pre-Trend Values
130
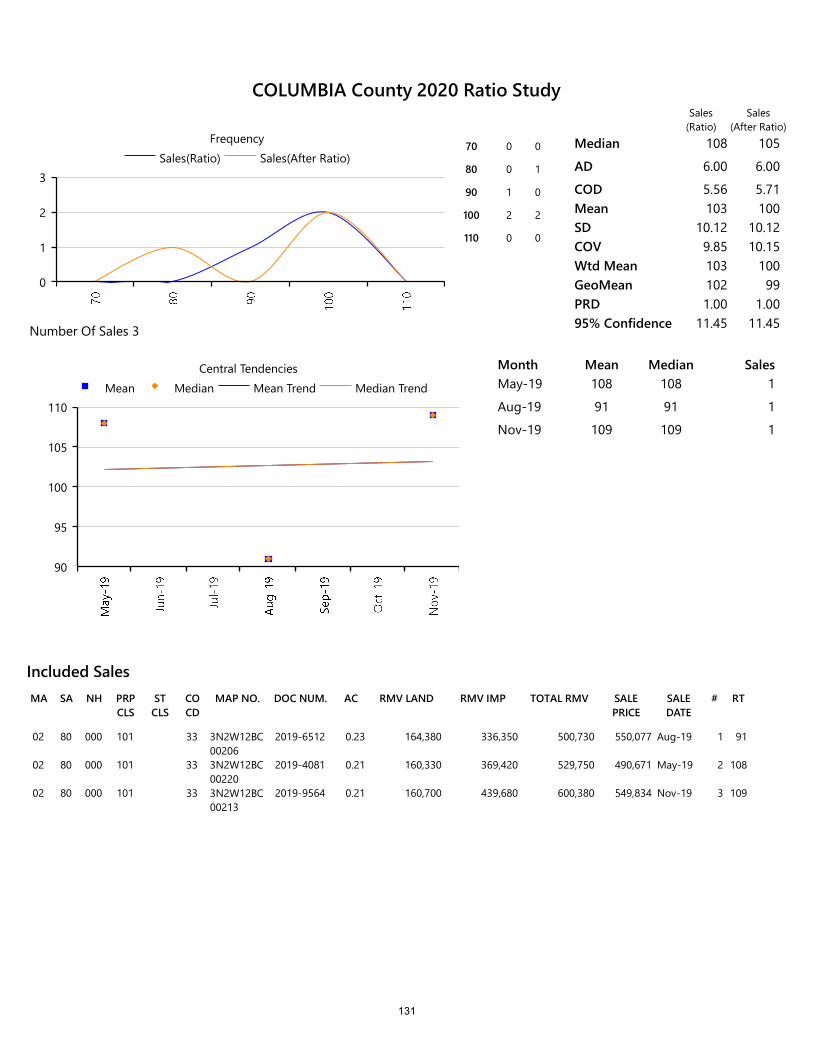
RMV LANDSA NH PRP CLS
ST CLS
CO CD
MAP NO. DOC NUM.MA AC RMV IMP TOTAL RMV SALE PRICE
SALE DATE
# RT
Included Sales
02 80 000 101 33 3N2W12BC 00206
2019-6512 0.23 164,380 336,350 500,730 550,077 Aug-19 1 91
02 80 000 101 33 3N2W12BC 00220
2019-4081 0.21 160,330 369,420 529,750 490,671 May-19 2 108
02 80 000 101 33 3N2W12BC 00213
2019-9564 0.21 160,700 439,680 600,380 549,834 Nov-19 3 109
0
1
2
3Sales(Ratio) Sales(After Ratio)
Frequency70 0 0
80 0 1
90 1 0
100 2 2
110 0 0
Median 108 105
AD 6.00 6.00
COD 5.56 5.71Mean 103 100SD 10.12 10.12COV 9.85 10.15Wtd Mean 103 100GeoMean 102 99PRD 1.00 1.0095% Confidence 11.45 11.45Number Of Sales 3
90
95
100
105
110Mean Median Mean Trend Median Trend
Central Tendencies Month Mean Median SalesMay-19 108 108 1
Aug-19 91 91 1
Nov-19 109 109 1
Sales(Ratio)
Sales(After Ratio)
COLUMBIA County 2020 Ratio Study
131

RMV Class MA SA NH
App Year
# of Sales Location
400 02 21 000 2020 2 Scappoose
RMV Class MA SA NH
App Year
# of Sales Location
Study Definition
Adjustment Calculation SummarySample - Number of SalesPopulation - Number of AccountsSales as a percentage of the PopulationPrior Year Population Values
Land RmvOSD RMVImprovement RMVFarm Improvement RMV
Selected Ratio From Sales
Before Ratio
Overall Adjustment FactorLand Adjustment FactorOSD Adjustment FactorImprovement Adjustment FactorFarm Improvement Factor
After Ratio
ExplanationRMV 400, SA 21Unimproved land – Value Zone 1 in Rural Scappoose.
RECALCULATED
Pre-Trend Brkdwn Post Trend Values Post Trend Brkdwn
2162
1.23%
27,601,610 100.00% 29,809,739 100.00%000
0.00% 0 0.00%0.00% 0 0.00%0.00% 0 0.00%
93
93
108108100100100100
Time Trend Adjustment 0
There were only two usable sales available for undeveloped land located in rural Scappoose. These sales did not provide a significant sampling or a clear indication of the market for these properties. Therefore, the Selected Ratio of 93 from the improved rural properties study located in MA 02, SA 21 was applied here.
Performance History2020 2019 2018 2017 201624.21 32.76 20.06 11.39 0.000.92 1.39 1.07 1.01 1.00
CODPRD
COLUMBIA County 2020 Ratio Study
Pre-Trend Values
132
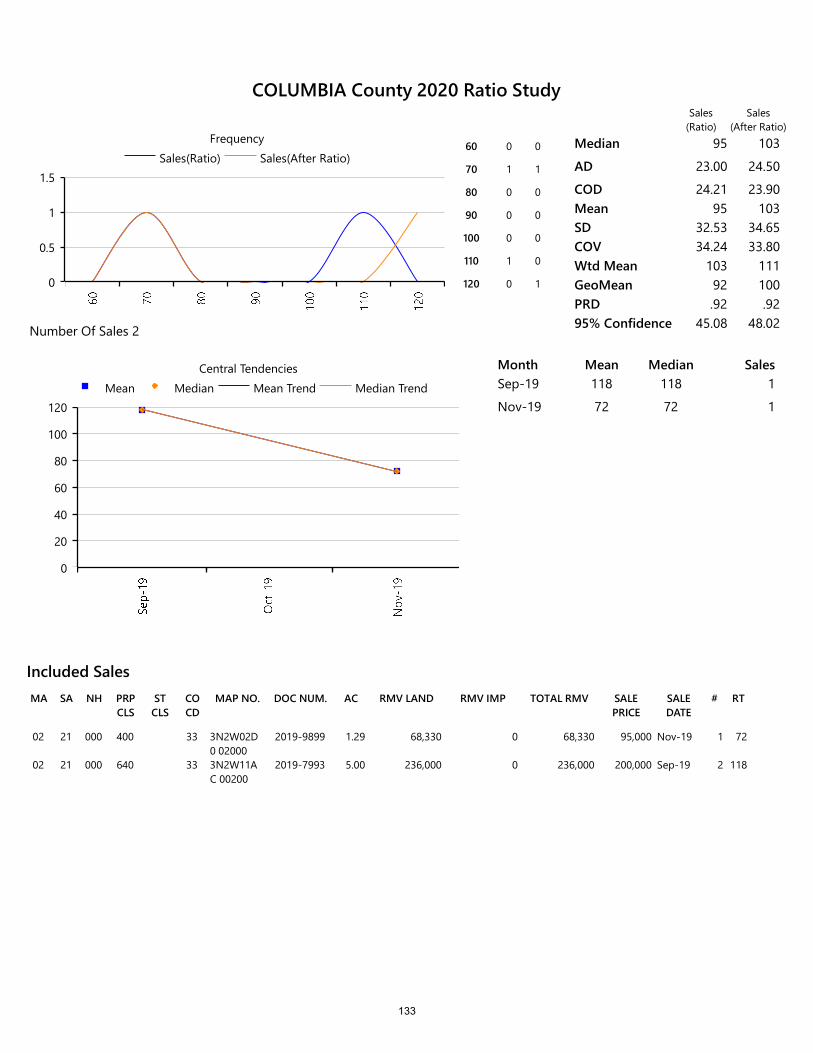
RMV LANDSA NH PRP CLS
ST CLS
CO CD
MAP NO. DOC NUM.MA AC RMV IMP TOTAL RMV SALE PRICE
SALE DATE
# RT
Included Sales
02 21 000 400 33 3N2W02D0 02000
2019-9899 1.29 68,330 0 68,330 95,000 Nov-19 1 72
02 21 000 640 33 3N2W11AC 00200
2019-7993 5.00 236,000 0 236,000 200,000 Sep-19 2 118
0
0.5
1
1.5Sales(Ratio) Sales(After Ratio)
Frequency60 0 0
70 1 1
80 0 0
90 0 0
100 0 0
110 1 0
120 0 1
Median 95 103
AD 23.00 24.50
COD 24.21 23.90Mean 95 103SD 32.53 34.65COV 34.24 33.80Wtd Mean 103 111GeoMean 92 100PRD .92 .9295% Confidence 45.08 48.02Number Of Sales 2
0
20
40
60
80
100
120Mean Median Mean Trend Median Trend
Central Tendencies Month Mean Median SalesSep-19 118 118 1
Nov-19 72 72 1
Sales(Ratio)
Sales(After Ratio)
COLUMBIA County 2020 Ratio Study
133

RMV Class MA SA NH
App Year
# of Sales Location
401 02 21 000 2020 14 Scappoose
RMV Class MA SA NH
App Year
# of Sales Location
Study Definition
Adjustment Calculation SummarySample - Number of SalesPopulation - Number of AccountsSales as a percentage of the PopulationPrior Year Population Values
Land RmvOSD RMVImprovement RMVFarm Improvement RMV
Selected Ratio From Sales
Before Ratio
Overall Adjustment FactorLand Adjustment FactorOSD Adjustment FactorImprovement Adjustment FactorFarm Improvement Factor
After Ratio
ExplanationRMV 401, SA 21 Improved land – Value Zone 1, in Rural Scappoose.
RECALCULATED
Pre-Trend Brkdwn Post Trend Values Post Trend Brkdwn
14752
1.86%
106,097,229 33.60% 114,585,007 33.73%37,039,510
154,670,71017,918,810
11.73% 37,039,510 10.90%48.99% 168,591,074 49.62%5.68% 19,531,503 5.75%
93
93
108108100109109100
Time Trend Adjustment 9
For this analysis of improved rural properties located in Scappoose, the Median of 93 was selected as the best ratio indicator for this grouping of properties. Thus, the Overall Adjustment Factor is 108.
Performance History2020 2019 2018 2017 201611.29 15.88 9.43 9.96 13.441.00 1.01 1.00 1.00 1.02
CODPRD
COLUMBIA County 2020 Ratio Study
Pre-Trend Values
134
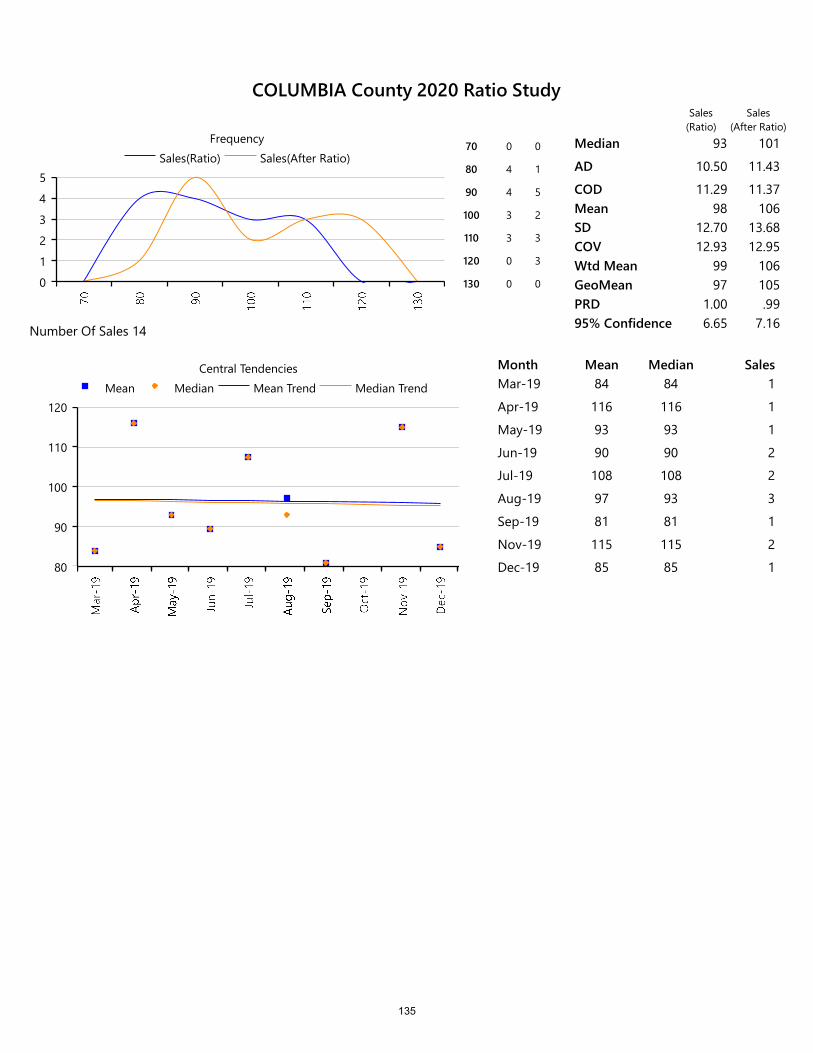
0
1
2
3
4
5Sales(Ratio) Sales(After Ratio)
Frequency70 0 0
80 4 1
90 4 5
100 3 2
110 3 3
120 0 3
130 0 0
Median 93 101
AD 10.50 11.43
COD 11.29 11.37Mean 98 106SD 12.70 13.68COV 12.93 12.95Wtd Mean 99 106GeoMean 97 105PRD 1.00 .9995% Confidence 6.65 7.16Number Of Sales 14
80
90
100
110
120Mean Median Mean Trend Median Trend
Central Tendencies Month Mean Median SalesMar-19 84 84 1
Apr-19 116 116 1
May-19 93 93 1
Jun-19 90 90 2
Jul-19 108 108 2
Aug-19 97 93 3
Sep-19 81 81 1
Nov-19 115 115 2
Dec-19 85 85 1
Sales(Ratio)
Sales(After Ratio)
COLUMBIA County 2020 Ratio Study
135
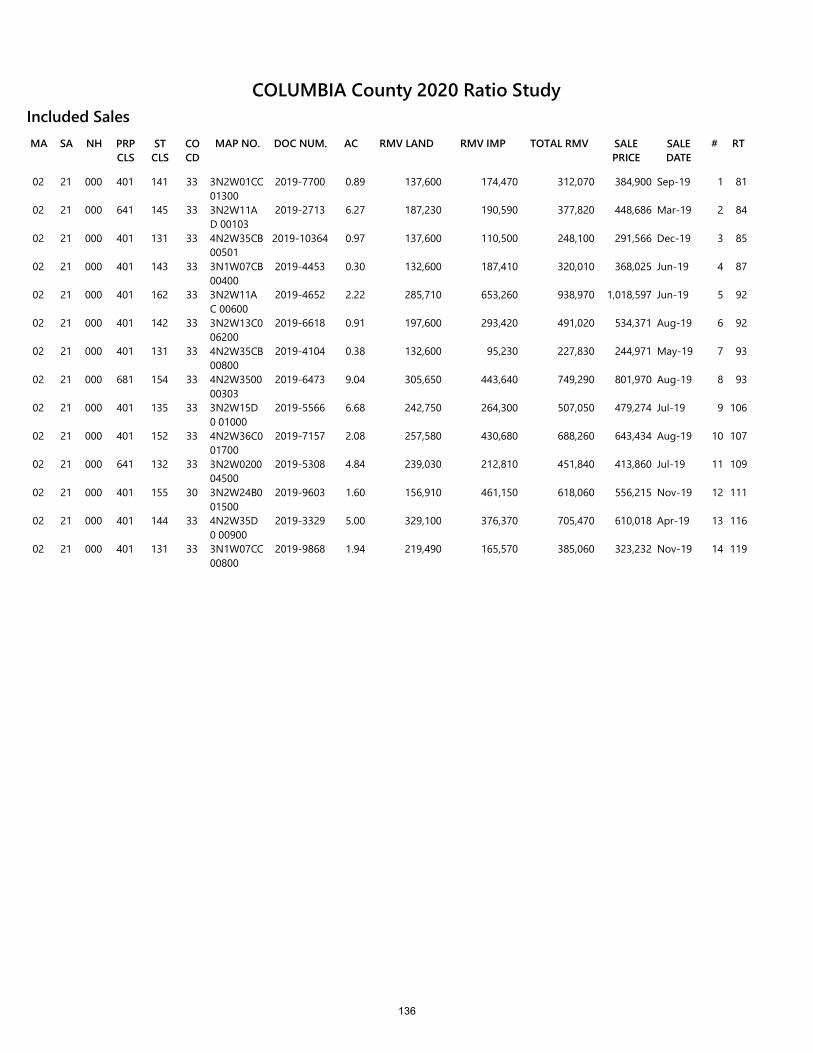
RMV LANDSA NH PRP CLS
ST CLS
CO CD
MAP NO. DOC NUM.MA AC RMV IMP TOTAL RMV SALE PRICE
SALE DATE
# RT
Included Sales
02 21 000 401 141 33 3N2W01CC 01300
2019-7700 0.89 137,600 174,470 312,070 384,900 Sep-19 1 81
02 21 000 641 145 33 3N2W11AD 00103
2019-2713 6.27 187,230 190,590 377,820 448,686 Mar-19 2 84
02 21 000 401 131 33 4N2W35CB 00501
2019-10364 0.97 137,600 110,500 248,100 291,566 Dec-19 3 85
02 21 000 401 143 33 3N1W07CB 00400
2019-4453 0.30 132,600 187,410 320,010 368,025 Jun-19 4 87
02 21 000 401 162 33 3N2W11AC 00600
2019-4652 2.22 285,710 653,260 938,970 1,018,597 Jun-19 5 92
02 21 000 401 142 33 3N2W13C0 06200
2019-6618 0.91 197,600 293,420 491,020 534,371 Aug-19 6 92
02 21 000 401 131 33 4N2W35CB 00800
2019-4104 0.38 132,600 95,230 227,830 244,971 May-19 7 93
02 21 000 681 154 33 4N2W3500 00303
2019-6473 9.04 305,650 443,640 749,290 801,970 Aug-19 8 93
02 21 000 401 135 33 3N2W15D0 01000
2019-5566 6.68 242,750 264,300 507,050 479,274 Jul-19 9 106
02 21 000 401 152 33 4N2W36C0 01700
2019-7157 2.08 257,580 430,680 688,260 643,434 Aug-19 10 107
02 21 000 641 132 33 3N2W0200 04500
2019-5308 4.84 239,030 212,810 451,840 413,860 Jul-19 11 109
02 21 000 401 155 30 3N2W24B0 01500
2019-9603 1.60 156,910 461,150 618,060 556,215 Nov-19 12 111
02 21 000 401 144 33 4N2W35D0 00900
2019-3329 5.00 329,100 376,370 705,470 610,018 Apr-19 13 116
02 21 000 401 131 33 3N1W07CC 00800
2019-9868 1.94 219,490 165,570 385,060 323,232 Nov-19 14 119
COLUMBIA County 2020 Ratio Study
136
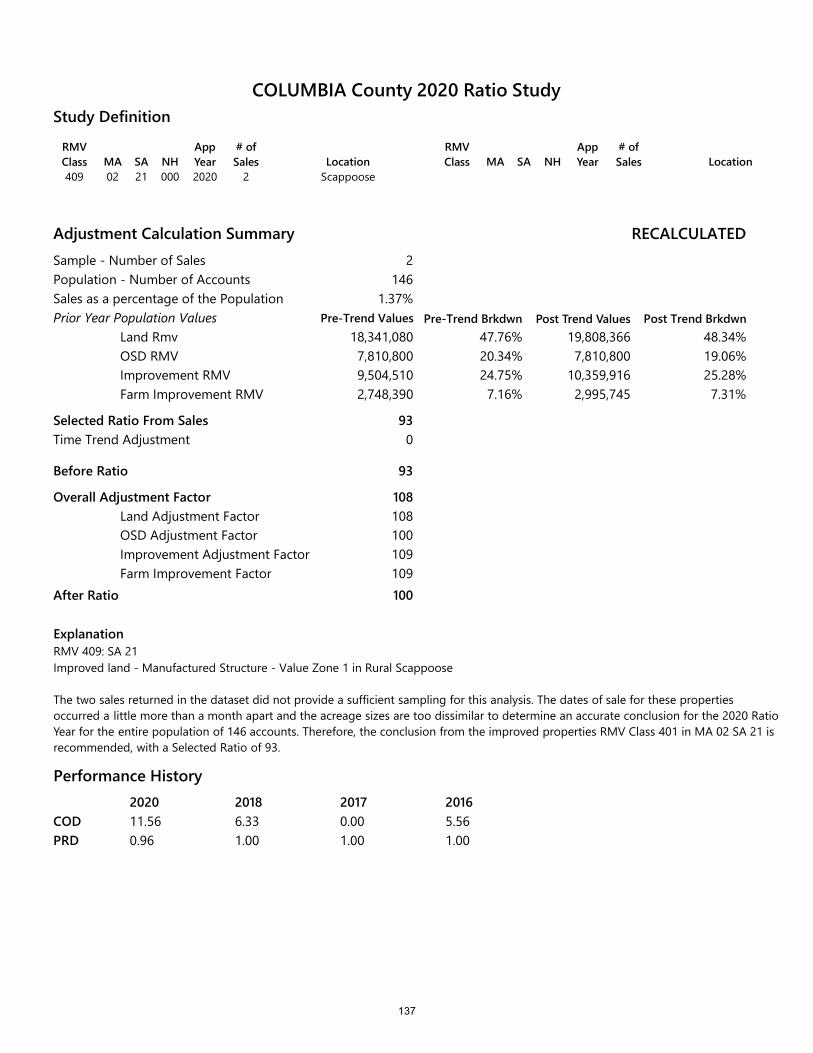
RMV Class MA SA NH
App Year
# of Sales Location
409 02 21 000 2020 2 Scappoose
RMV Class MA SA NH
App Year
# of Sales Location
Study Definition
Adjustment Calculation SummarySample - Number of SalesPopulation - Number of AccountsSales as a percentage of the PopulationPrior Year Population Values
Land RmvOSD RMVImprovement RMVFarm Improvement RMV
Selected Ratio From Sales
Before Ratio
Overall Adjustment FactorLand Adjustment FactorOSD Adjustment FactorImprovement Adjustment FactorFarm Improvement Factor
After Ratio
RECALCULATED
Pre-Trend Brkdwn Post Trend Values Post Trend Brkdwn
2146
1.37%
18,341,080 47.76% 19,808,366 48.34%7,810,8009,504,5102,748,390
20.34% 7,810,800 19.06%24.75% 10,359,916 25.28%7.16% 2,995,745 7.31%
93
93
108108100109109100
Time Trend Adjustment 0
ExplanationRMV 409: SA 21Improved land - Manufactured Structure - Value Zone 1 in Rural Scappoose
The two sales returned in the dataset did not provide a sufficient sampling for this analysis. The dates of sale for these properties occurred a little more than a month apart and the acreage sizes are too dissimilar to determine an accurate conclusion for the 2020 Ratio Year for the entire population of 146 accounts. Therefore, the conclusion from the improved properties RMV Class 401 in MA 02 SA 21 is recommended, with a Selected Ratio of 93.
Performance History2020 2018 2017 201611.56 6.33 0.00 5.560.96 1.00 1.00 1.00
CODPRD
COLUMBIA County 2020 Ratio Study
Pre-Trend Values
137

RMV LANDSA NH PRP CLS
ST CLS
CO CD
MAP NO. DOC NUM.MA AC RMV IMP TOTAL RMV SALE PRICE
SALE DATE
# RT
Included Sales
02 21 000 409 442 30 4N2W34B0 01700
2019-7946 1.47 164,450 85,000 249,450 285,000 Sep-19 1 88
02 21 000 649 132 33 4N2W34B0 02800
2019-6413 7.60 243,880 417,540 661,420 595,000 Aug-19 2 111
-0.2
0
0.2
0.4
0.6
0.8
1Sales(Ratio) Sales(After Ratio)
Frequency80 1 0
90 0 1
100 0 0
110 1 0
120 0 1
Median 100 107
AD 11.50 13.50
COD 11.56 12.68Mean 100 107SD 16.26 19.09COV 16.35 17.93Wtd Mean 104 111GeoMean 99 106PRD .96 .9695% Confidence 22.54 26.46Number Of Sales 2
0
20
40
60
80
100
120Mean Median Mean Trend Median Trend
Central Tendencies Month Mean Median SalesAug-19 111 111 1
Sep-19 88 88 1
Sales(Ratio)
Sales(After Ratio)
COLUMBIA County 2020 Ratio Study
138
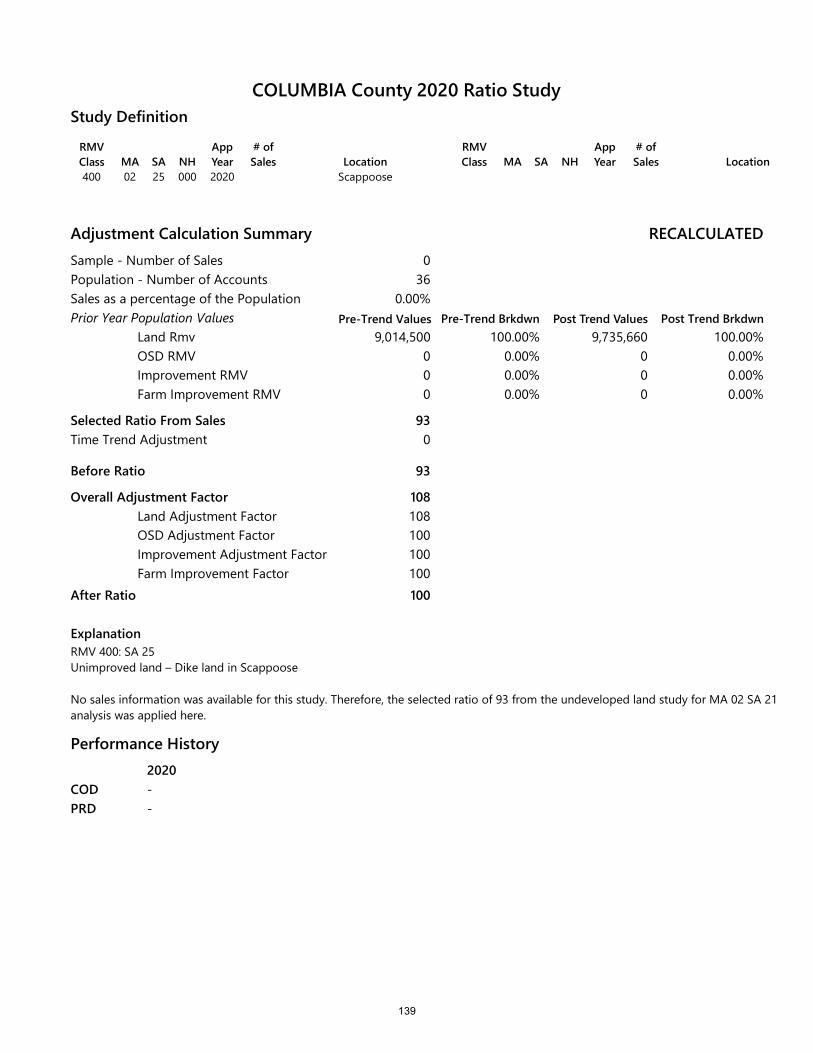
RMV Class MA SA NH
App Year
# of Sales Location
400 02 25 000 2020 Scappoose
RMV Class MA SA NH
App Year
# of Sales Location
Study Definition
Adjustment Calculation SummarySample - Number of SalesPopulation - Number of AccountsSales as a percentage of the PopulationPrior Year Population Values
Land RmvOSD RMVImprovement RMVFarm Improvement RMV
Selected Ratio From Sales
Before Ratio
Overall Adjustment FactorLand Adjustment FactorOSD Adjustment FactorImprovement Adjustment FactorFarm Improvement Factor
After Ratio
ExplanationRMV 400: SA 25 Unimproved land – Dike land in Scappoose
No sales information was available for this study. Therefore, the selected ratio of 93 from the undeveloped land study for MA 02 SA 21 analysis was applied here.
RECALCULATED
Pre-Trend Brkdwn Post Trend Values Post Trend Brkdwn
036
0.00%
9,014,500 100.00% 9,735,660 100.00%000
0.00% 0 0.00%0.00% 0 0.00%0.00% 0 0.00%
93
93
108108100100100100
Time Trend Adjustment 0
Performance History2020--
CODPRD
COLUMBIA County 2020 Ratio Study
Pre-Trend Values
139

0
1Sales(Ratio) Sales(After Ratio)
Frequency Median
AD
CODMeanSDCOVWtd MeanGeoMeanPRD95% ConfidenceNumber Of Sales 0
0
1Mean Median Mean Trend Median Trend
Central Tendencies Month Mean Median Sales
Sales(Ratio)
Sales(After Ratio)
COLUMBIA County 2020 Ratio Study
140
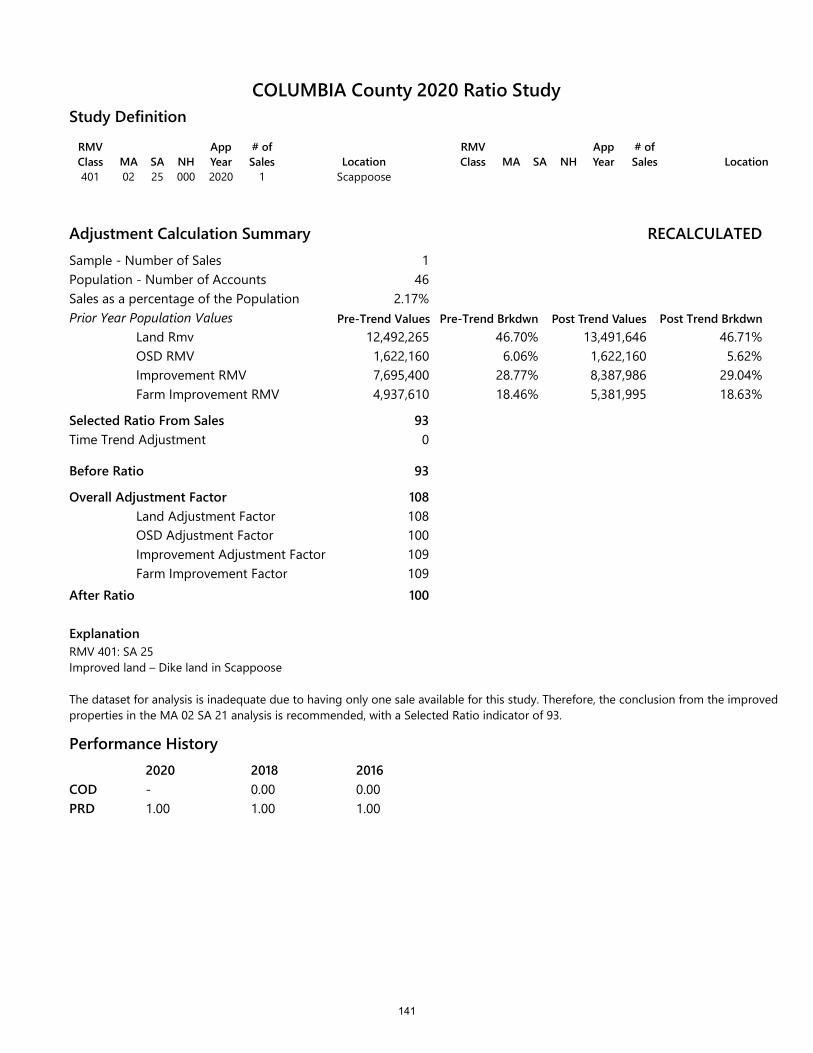
RMV Class MA SA NH
App Year
# of Sales Location
401 02 25 000 2020 1 Scappoose
RMV Class MA SA NH
App Year
# of Sales Location
Study Definition
Adjustment Calculation SummarySample - Number of SalesPopulation - Number of AccountsSales as a percentage of the PopulationPrior Year Population Values
Land RmvOSD RMVImprovement RMVFarm Improvement RMV
Selected Ratio From Sales
Before Ratio
Overall Adjustment FactorLand Adjustment FactorOSD Adjustment FactorImprovement Adjustment FactorFarm Improvement Factor
After Ratio
ExplanationRMV 401: SA 25Improved land – Dike land in Scappoose
The dataset for analysis is inadequate due to having only one sale available for this study. Therefore, the conclusion from the improved properties in the MA 02 SA 21 analysis is recommended, with a Selected Ratio indicator of 93.
RECALCULATED
Pre-Trend Brkdwn Post Trend Values Post Trend Brkdwn
146
2.17%
12,492,265 46.70% 13,491,646 46.71%1,622,1607,695,4004,937,610
6.06% 1,622,160 5.62%28.77% 8,387,986 29.04%18.46% 5,381,995 18.63%
93
93
108108100109109100
Time Trend Adjustment 0
Performance History2020 2018 2016- 0.00 0.001.00 1.00 1.00
CODPRD
COLUMBIA County 2020 Ratio Study
Pre-Trend Values
141
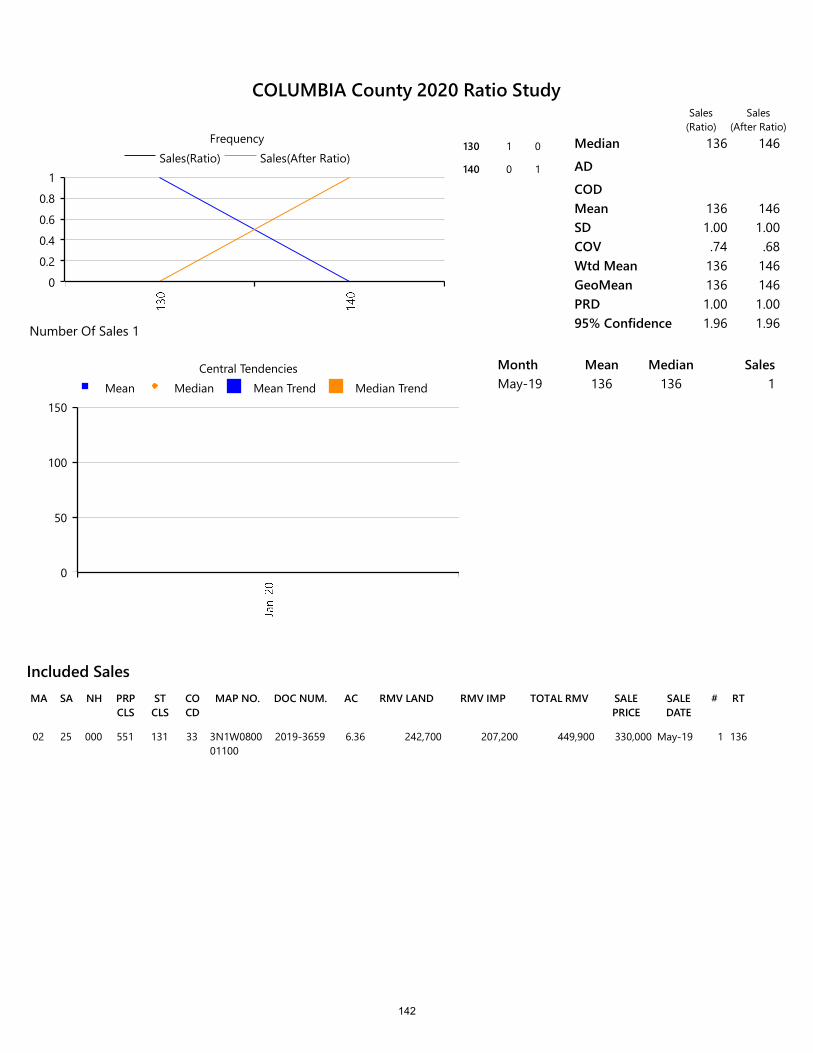
RMV LANDSA NH PRP CLS
ST CLS
CO CD
MAP NO. DOC NUM.MA AC RMV IMP TOTAL RMV SALE PRICE
SALE DATE
# RT
Included Sales
02 25 000 551 131 33 3N1W0800 01100
2019-3659 6.36 242,700 207,200 449,900 330,000 May-19 1 136
0
0.2
0.4
0.6
0.8
1Sales(Ratio) Sales(After Ratio)
Frequency130 1 0
140 0 1
Median 136 146
AD
CODMean 136 146SD 1.00 1.00COV .74 .68Wtd Mean 136 146GeoMean 136 146PRD 1.00 1.0095% Confidence 1.96 1.96Number Of Sales 1
0
50
100
150Mean Median Mean Trend Median Trend
Central Tendencies Month Mean Median SalesMay-19 136 136 1
Sales(Ratio)
Sales(After Ratio)
COLUMBIA County 2020 Ratio Study
142
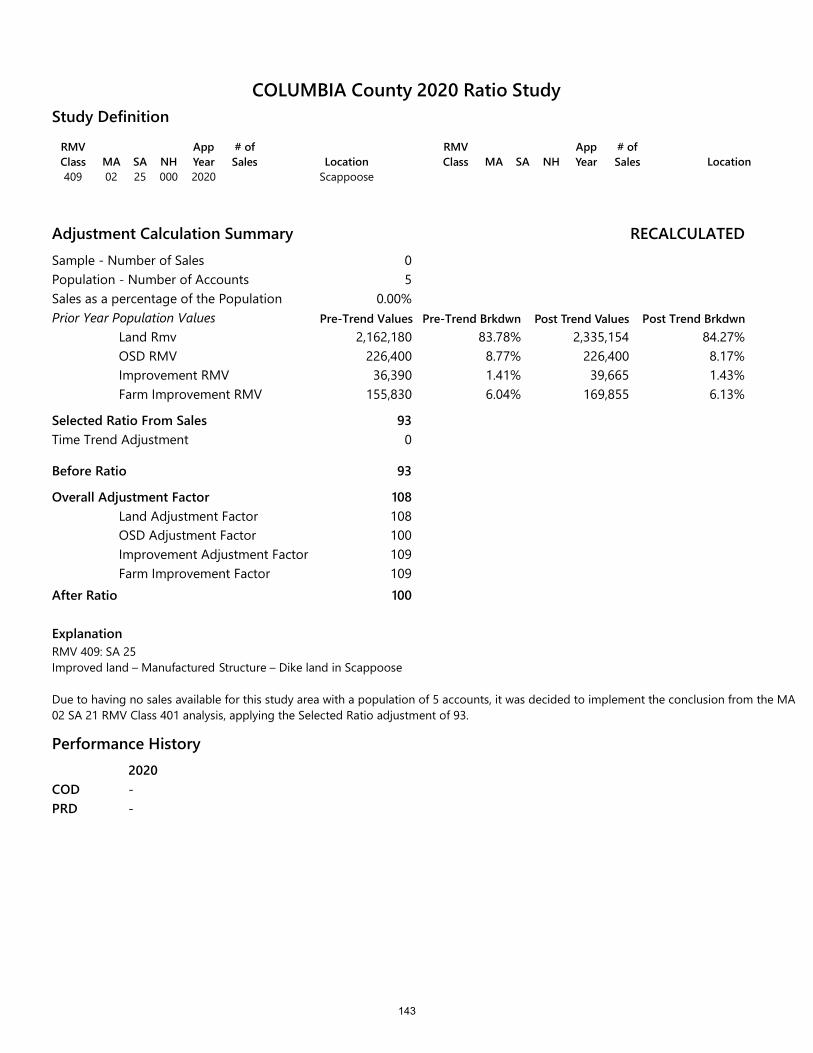
RMV Class MA SA NH
App Year
# of Sales Location
409 02 25 000 2020 Scappoose
RMV Class MA SA NH
App Year
# of Sales Location
Study Definition
Adjustment Calculation SummarySample - Number of SalesPopulation - Number of AccountsSales as a percentage of the PopulationPrior Year Population Values
Land RmvOSD RMVImprovement RMVFarm Improvement RMV
Selected Ratio From Sales
Before Ratio
Overall Adjustment FactorLand Adjustment FactorOSD Adjustment FactorImprovement Adjustment FactorFarm Improvement Factor
After Ratio
ExplanationRMV 409: SA 25 Improved land – Manufactured Structure – Dike land in Scappoose
Due to having no sales available for this study area with a population of 5 accounts, it was decided to implement the conclusion from the MA 02 SA 21 RMV Class 401 analysis, applying the Selected Ratio adjustment of 93.
RECALCULATED
Pre-Trend Brkdwn Post Trend Values Post Trend Brkdwn
05
0.00%
2,162,180 83.78% 2,335,154 84.27%226,40036,390
155,830
8.77% 226,400 8.17%1.41% 39,665 1.43%6.04% 169,855 6.13%
93
93
108108100109109100
Time Trend Adjustment 0
Performance History2020--
CODPRD
COLUMBIA County 2020 Ratio Study
Pre-Trend Values
143

0
1Sales(Ratio) Sales(After Ratio)
Frequency Median
AD
CODMeanSDCOVWtd MeanGeoMeanPRD95% ConfidenceNumber Of Sales 0
0
1Mean Median Mean Trend Median Trend
Central Tendencies Month Mean Median Sales
Sales(Ratio)
Sales(After Ratio)
COLUMBIA County 2020 Ratio Study
144

RMV Class MA SA NH
App Year
# of Sales Location
401 02 41 000 2020 Sauvie Island
RMV Class MA SA NH
App Year
# of Sales Location
Study Definition
Adjustment Calculation SummarySample - Number of SalesPopulation - Number of AccountsSales as a percentage of the PopulationPrior Year Population Values
Land RmvOSD RMVImprovement RMVFarm Improvement RMV
Selected Ratio From Sales
Before Ratio
Overall Adjustment FactorLand Adjustment FactorOSD Adjustment FactorImprovement Adjustment FactorFarm Improvement Factor
After Ratio
ExplanationRMV 401, SA 41 Sauvies Island in Rural Scappoose.
RECALCULATED
Pre-Trend Brkdwn Post Trend Values Post Trend Brkdwn
06
0.00%
2,219,720 41.96% 2,219,720 41.96%339,600
2,663,46067,300
6.42% 339,600 6.42%50.35% 2,663,460 50.35%1.27% 67,300 1.27%
100
100
100100100100100100
Time Trend Adjustment 0
With having no sales available for this analysis of rural properties in SA 41, it was decided to apply no adjustment to this small group of properties for this ratio year.
Performance History2020 2018 2017 2016- 9.43 9.96 13.44- 1.00 1.00 1.02
CODPRD
COLUMBIA County 2020 Ratio Study
Pre-Trend Values
145

0
1Sales(Ratio) Sales(After Ratio)
Frequency Median
AD
CODMeanSDCOVWtd MeanGeoMeanPRD95% ConfidenceNumber Of Sales 0
0
1Mean Median Mean Trend Median Trend
Central Tendencies Month Mean Median Sales
Sales(Ratio)
Sales(After Ratio)
COLUMBIA County 2020 Ratio Study
146
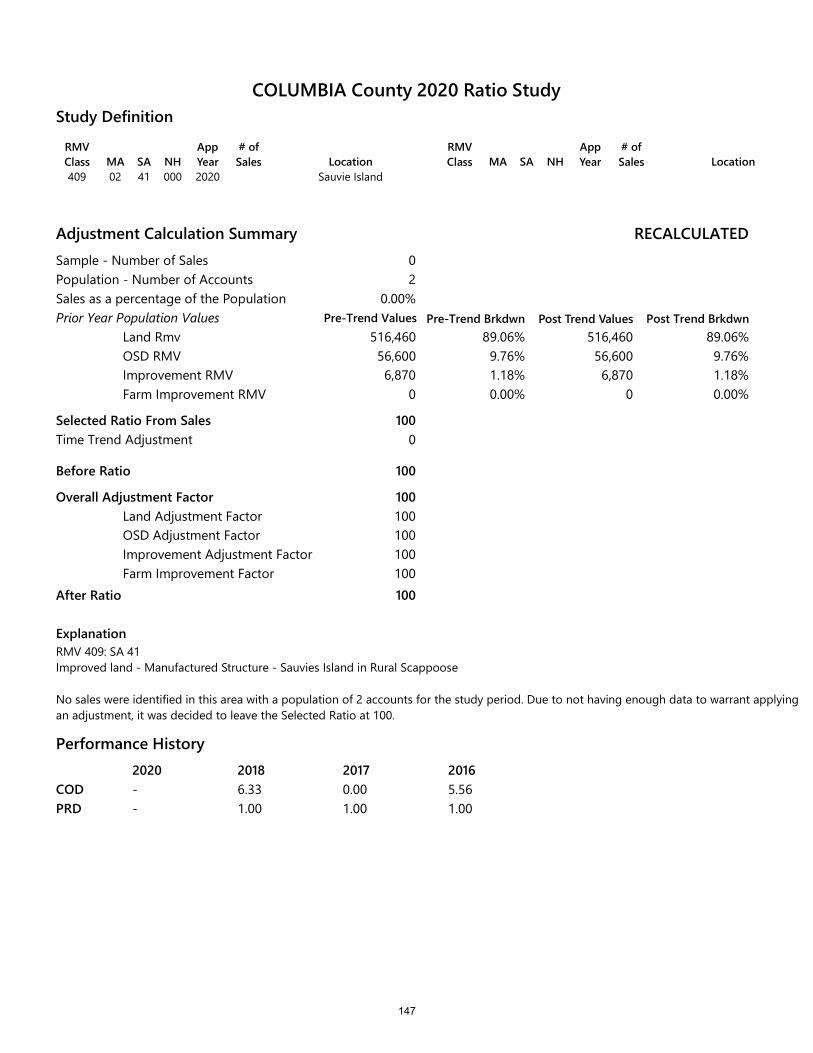
RMV Class MA SA NH
App Year
# of Sales Location
409 02 41 000 2020 Sauvie Island
RMV Class MA SA NH
App Year
# of Sales Location
Study Definition
Adjustment Calculation SummarySample - Number of SalesPopulation - Number of AccountsSales as a percentage of the PopulationPrior Year Population Values
Land RmvOSD RMVImprovement RMVFarm Improvement RMV
Selected Ratio From Sales
Before Ratio
Overall Adjustment FactorLand Adjustment FactorOSD Adjustment FactorImprovement Adjustment FactorFarm Improvement Factor
After Ratio
ExplanationRMV 409: SA 41Improved land - Manufactured Structure - Sauvies Island in Rural Scappoose
No sales were identified in this area with a population of 2 accounts for the study period. Due to not having enough data to warrant applying an adjustment, it was decided to leave the Selected Ratio at 100.
RECALCULATED
Pre-Trend Brkdwn Post Trend Values Post Trend Brkdwn
02
0.00%
516,460 89.06% 516,460 89.06%56,6006,870
0
9.76% 56,600 9.76%1.18% 6,870 1.18%0.00% 0 0.00%
100
100
100100100100100100
Time Trend Adjustment 0
Performance History2020 2018 2017 2016- 6.33 0.00 5.56- 1.00 1.00 1.00
CODPRD
COLUMBIA County 2020 Ratio Study
Pre-Trend Values
147

0
1Sales(Ratio) Sales(After Ratio)
Frequency Median
AD
CODMeanSDCOVWtd MeanGeoMeanPRD95% ConfidenceNumber Of Sales 0
0
1Mean Median Mean Trend Median Trend
Central Tendencies Month Mean Median Sales
Sales(Ratio)
Sales(After Ratio)
COLUMBIA County 2020 Ratio Study
148
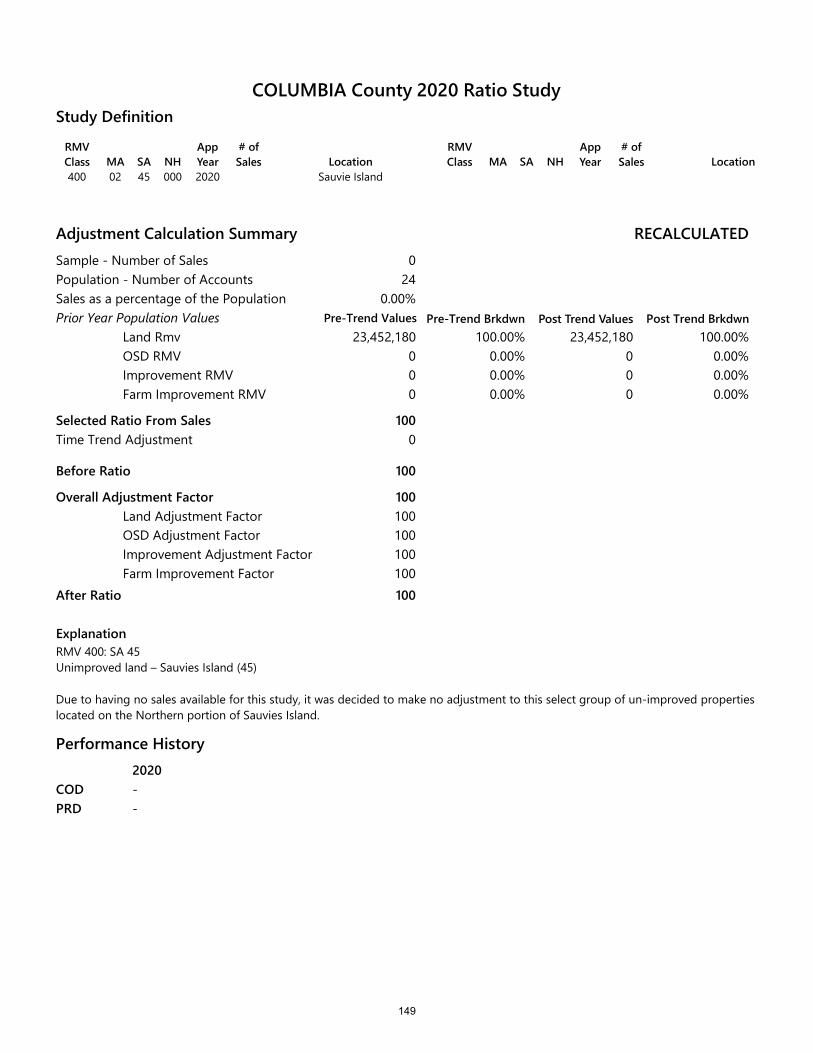
RMV Class MA SA NH
App Year
# of Sales Location
400 02 45 000 2020 Sauvie Island
RMV Class MA SA NH
App Year
# of Sales Location
Study Definition
Adjustment Calculation SummarySample - Number of SalesPopulation - Number of AccountsSales as a percentage of the PopulationPrior Year Population Values
Land RmvOSD RMVImprovement RMVFarm Improvement RMV
Selected Ratio From Sales
Before Ratio
Overall Adjustment FactorLand Adjustment FactorOSD Adjustment FactorImprovement Adjustment FactorFarm Improvement Factor
After Ratio
ExplanationRMV 400: SA 45Unimproved land – Sauvies Island (45)
RECALCULATED
Pre-Trend Brkdwn Post Trend Values Post Trend Brkdwn
024
0.00%
23,452,180 100.00% 23,452,180 100.00%000
0.00% 0 0.00%0.00% 0 0.00%0.00% 0 0.00%
100
100
100100100100100100
Time Trend Adjustment 0
Due to having no sales available for this study, it was decided to make no adjustment to this select group of un-improved properties located on the Northern portion of Sauvies Island.
Performance History2020--
CODPRD
COLUMBIA County 2020 Ratio Study
Pre-Trend Values
149

0
1Sales(Ratio) Sales(After Ratio)
Frequency Median
AD
CODMeanSDCOVWtd MeanGeoMeanPRD95% ConfidenceNumber Of Sales 0
0
1Mean Median Mean Trend Median Trend
Central Tendencies Month Mean Median Sales
Sales(Ratio)
Sales(After Ratio)
COLUMBIA County 2020 Ratio Study
150

RMV Class MA SA NH
App Year
# of Sales Location
401 02 45 000 2020 Sauvie Island
RMV Class MA SA NH
App Year
# of Sales Location
Study Definition
Adjustment Calculation SummarySample - Number of SalesPopulation - Number of AccountsSales as a percentage of the PopulationPrior Year Population Values
Land RmvOSD RMVImprovement RMVFarm Improvement RMV
Selected Ratio From Sales
Before Ratio
Overall Adjustment FactorLand Adjustment FactorOSD Adjustment FactorImprovement Adjustment FactorFarm Improvement Factor
After Ratio
ExplanationRMV 401: SA 45Improved land – Sauvies Island
No adjustment was made to this population of 13 accounts due to having insufficient sales data available for this this analysis.
RECALCULATED
Pre-Trend Brkdwn Post Trend Values Post Trend Brkdwn
013
0.00%
47,521,955 94.12% 47,521,955 94.12%594,300
1,830,840545,500
1.18% 594,300 1.18%3.63% 1,830,840 3.63%1.08% 545,500 1.08%
100
100
100100100100100100
Time Trend Adjustment 0
Performance History2020 2018 2016- 0.00 0.00- 1.00 1.00
CODPRD
COLUMBIA County 2020 Ratio Study
Pre-Trend Values
151

0
1Sales(Ratio) Sales(After Ratio)
Frequency Median
AD
CODMeanSDCOVWtd MeanGeoMeanPRD95% ConfidenceNumber Of Sales 0
0
1Mean Median Mean Trend Median Trend
Central Tendencies Month Mean Median Sales
Sales(Ratio)
Sales(After Ratio)
COLUMBIA County 2020 Ratio Study
152
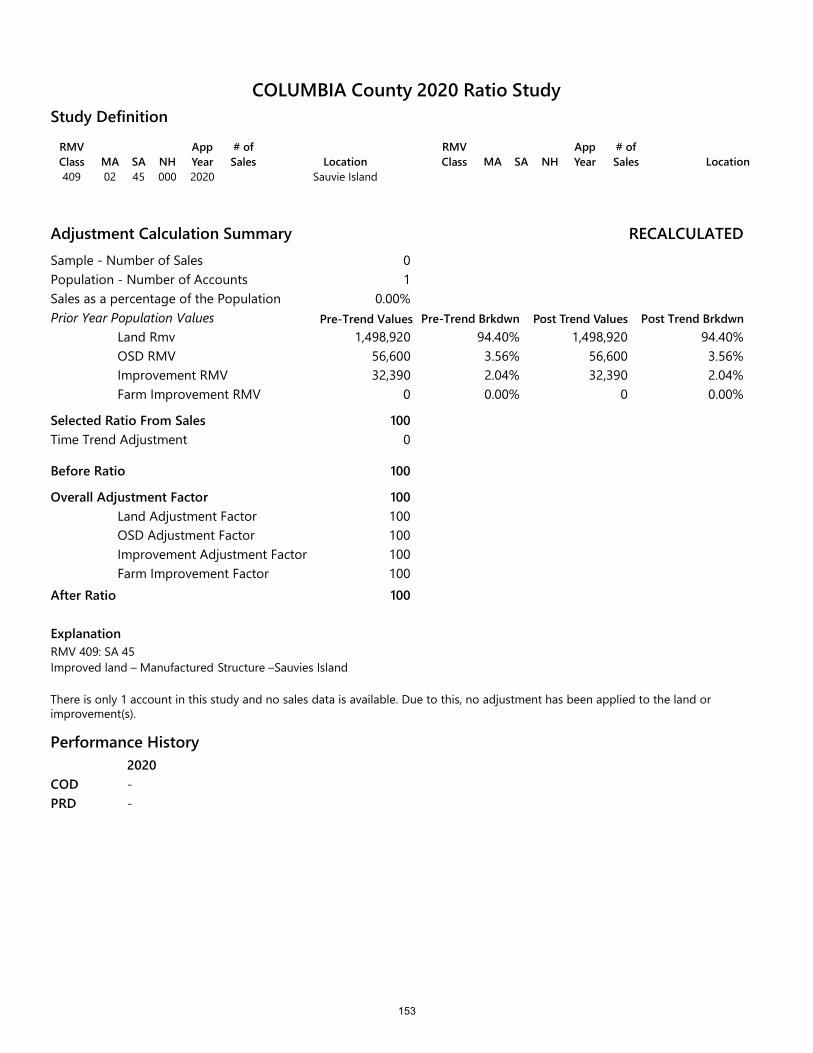
RMV Class MA SA NH
App Year
# of Sales Location
409 02 45 000 2020 Sauvie Island
RMV Class MA SA NH
App Year
# of Sales Location
Study Definition
Adjustment Calculation SummarySample - Number of SalesPopulation - Number of AccountsSales as a percentage of the PopulationPrior Year Population Values
Land RmvOSD RMVImprovement RMVFarm Improvement RMV
Selected Ratio From Sales
Before Ratio
Overall Adjustment FactorLand Adjustment FactorOSD Adjustment FactorImprovement Adjustment FactorFarm Improvement Factor
After Ratio
ExplanationRMV 409: SA 45Improved land – Manufactured Structure –Sauvies Island
RECALCULATED
Pre-Trend Brkdwn Post Trend Values Post Trend Brkdwn
01
0.00%
1,498,920 94.40% 1,498,920 94.40%56,60032,390
0
3.56% 56,600 3.56%2.04% 32,390 2.04%0.00% 0 0.00%
100
100
100100100100100100
Time Trend Adjustment 0
There is only 1 account in this study and no sales data is available. Due to this, no adjustment has been applied to the land or improvement(s).
Performance History2020--
CODPRD
COLUMBIA County 2020 Ratio Study
Pre-Trend Values
153

0
1Sales(Ratio) Sales(After Ratio)
Frequency Median
AD
CODMeanSDCOVWtd MeanGeoMeanPRD95% ConfidenceNumber Of Sales 0
0
1Mean Median Mean Trend Median Trend
Central Tendencies Month Mean Median Sales
Sales(Ratio)
Sales(After Ratio)
COLUMBIA County 2020 Ratio Study
154
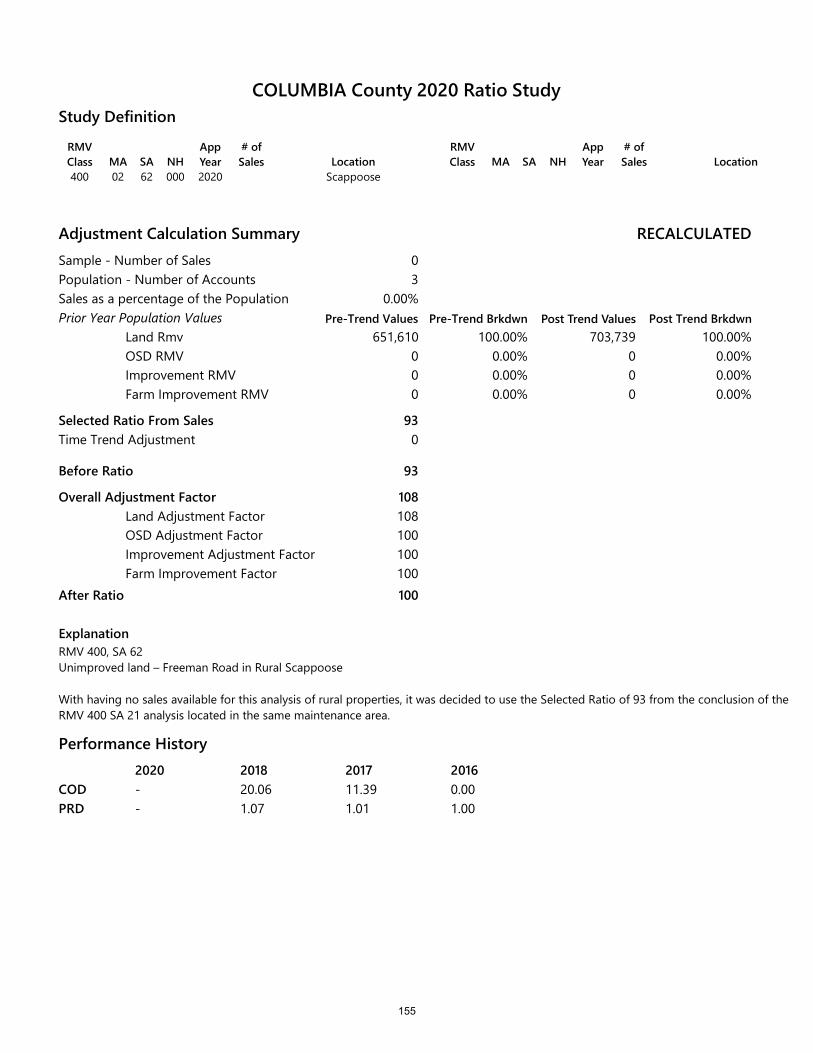
RMV Class MA SA NH
App Year
# of Sales Location
400 02 62 000 2020 Scappoose
RMV Class MA SA NH
App Year
# of Sales Location
Study Definition
Adjustment Calculation SummarySample - Number of SalesPopulation - Number of AccountsSales as a percentage of the PopulationPrior Year Population Values
Land RmvOSD RMVImprovement RMVFarm Improvement RMV
Selected Ratio From Sales
Before Ratio
Overall Adjustment FactorLand Adjustment FactorOSD Adjustment FactorImprovement Adjustment FactorFarm Improvement Factor
After Ratio
ExplanationRMV 400, SA 62Unimproved land – Freeman Road in Rural Scappoose
With having no sales available for this analysis of rural properties, it was decided to use the Selected Ratio of 93 from the conclusion of the RMV 400 SA 21 analysis located in the same maintenance area.
RECALCULATED
Pre-Trend Brkdwn Post Trend Values Post Trend Brkdwn
03
0.00%
651,610 100.00% 703,739 100.00%000
0.00% 0 0.00%0.00% 0 0.00%0.00% 0 0.00%
93
93
108108100100100100
Time Trend Adjustment 0
Performance History2020 2018 2017 2016- 20.06 11.39 0.00- 1.07 1.01 1.00
CODPRD
COLUMBIA County 2020 Ratio Study
Pre-Trend Values
155

0
1Sales(Ratio) Sales(After Ratio)
Frequency Median
AD
CODMeanSDCOVWtd MeanGeoMeanPRD95% ConfidenceNumber Of Sales 0
0
1Mean Median Mean Trend Median Trend
Central Tendencies Month Mean Median Sales
Sales(Ratio)
Sales(After Ratio)
COLUMBIA County 2020 Ratio Study
156

RMV Class MA SA NH
App Year
# of Sales Location
401 02 62 000 2020 Scappoose
RMV Class MA SA NH
App Year
# of Sales Location
Study Definition
Adjustment Calculation SummarySample - Number of SalesPopulation - Number of AccountsSales as a percentage of the PopulationPrior Year Population Values
Land RmvOSD RMVImprovement RMVFarm Improvement RMV
Selected Ratio From Sales
Before Ratio
Overall Adjustment FactorLand Adjustment FactorOSD Adjustment FactorImprovement Adjustment FactorFarm Improvement Factor
After Ratio
ExplanationRMV 401, SA 62Improved land - Freeman Road in Rural Scappoose
This location is next to the Scappoose Airport and also surrounded by properties located in Study Area 21. Due to having no sales data available, the Selected Ratio (93) from the improved sales analysis for RMV Class 401 MA 02, SA 21 has been applied to this area.
RECALCULATED
Pre-Trend Brkdwn Post Trend Values Post Trend Brkdwn
017
0.00%
2,081,900 37.71% 2,248,452 38.04%962,200
2,127,110349,610
17.43% 962,200 16.28%38.53% 2,318,550 39.23%6.33% 381,075 6.45%
93
93
108108100109109100
Time Trend Adjustment 0
Performance History2020 2018 2017 2016- 9.43 9.96 13.44- 1.00 1.00 1.02
CODPRD
COLUMBIA County 2020 Ratio Study
Pre-Trend Values
157

0
1Sales(Ratio) Sales(After Ratio)
Frequency Median
AD
CODMeanSDCOVWtd MeanGeoMeanPRD95% ConfidenceNumber Of Sales 0
0
1Mean Median Mean Trend Median Trend
Central Tendencies Month Mean Median Sales
Sales(Ratio)
Sales(After Ratio)
COLUMBIA County 2020 Ratio Study
158
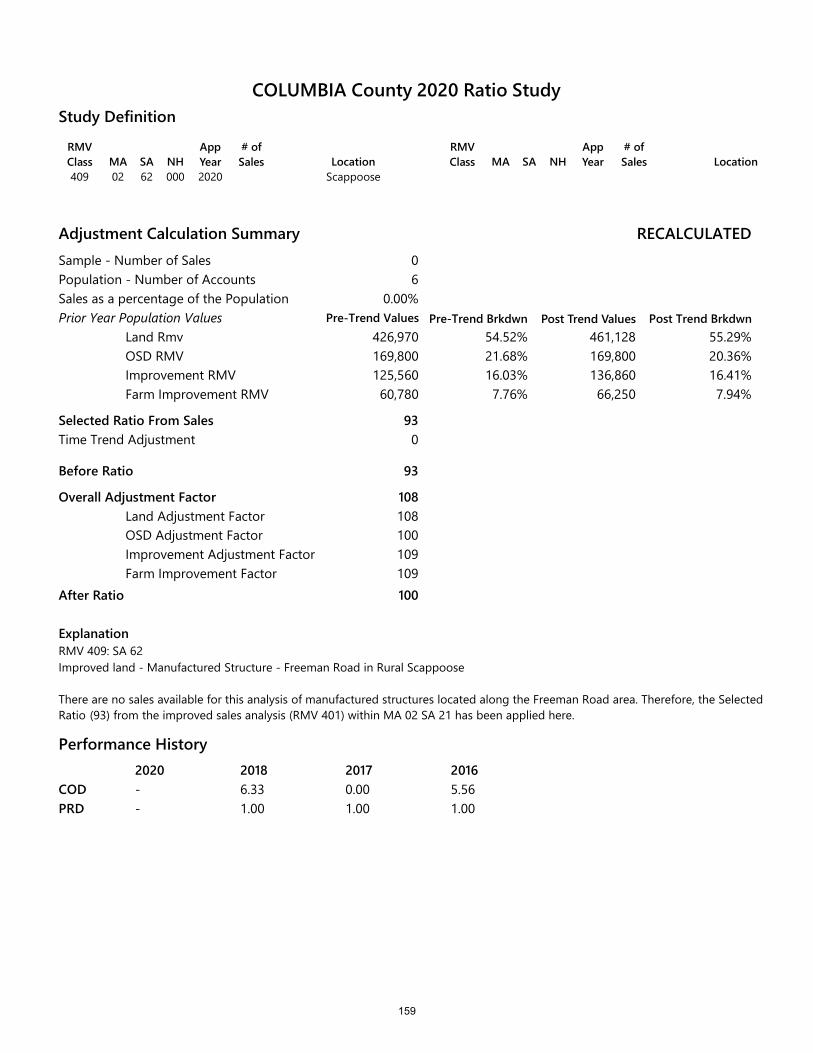
RMV Class MA SA NH
App Year
# of Sales Location
409 02 62 000 2020 Scappoose
RMV Class MA SA NH
App Year
# of Sales Location
Study Definition
Adjustment Calculation SummarySample - Number of SalesPopulation - Number of AccountsSales as a percentage of the PopulationPrior Year Population Values
Land RmvOSD RMVImprovement RMVFarm Improvement RMV
Selected Ratio From Sales
Before Ratio
Overall Adjustment FactorLand Adjustment FactorOSD Adjustment FactorImprovement Adjustment FactorFarm Improvement Factor
After Ratio
RECALCULATED
Pre-Trend Brkdwn Post Trend Values Post Trend Brkdwn
06
0.00%
426,970 54.52% 461,128 55.29%169,800125,56060,780
21.68% 169,800 20.36%16.03% 136,860 16.41%7.76% 66,250 7.94%
93
93
108108100109109100
Time Trend Adjustment 0
ExplanationRMV 409: SA 62 Improved land - Manufactured Structure - Freeman Road in Rural Scappoose
There are no sales available for this analysis of manufactured structures located along the Freeman Road area. Therefore, the Selected Ratio (93) from the improved sales analysis (RMV 401) within MA 02 SA 21 has been applied here.
Performance History2020 2018 2017 2016- 6.33 0.00 5.56- 1.00 1.00 1.00
CODPRD
COLUMBIA County 2020 Ratio Study
Pre-Trend Values
159

0
1Sales(Ratio) Sales(After Ratio)
Frequency Median
AD
CODMeanSDCOVWtd MeanGeoMeanPRD95% ConfidenceNumber Of Sales 0
0
1Mean Median Mean Trend Median Trend
Central Tendencies Month Mean Median Sales
Sales(Ratio)
Sales(After Ratio)
COLUMBIA County 2020 Ratio Study
160
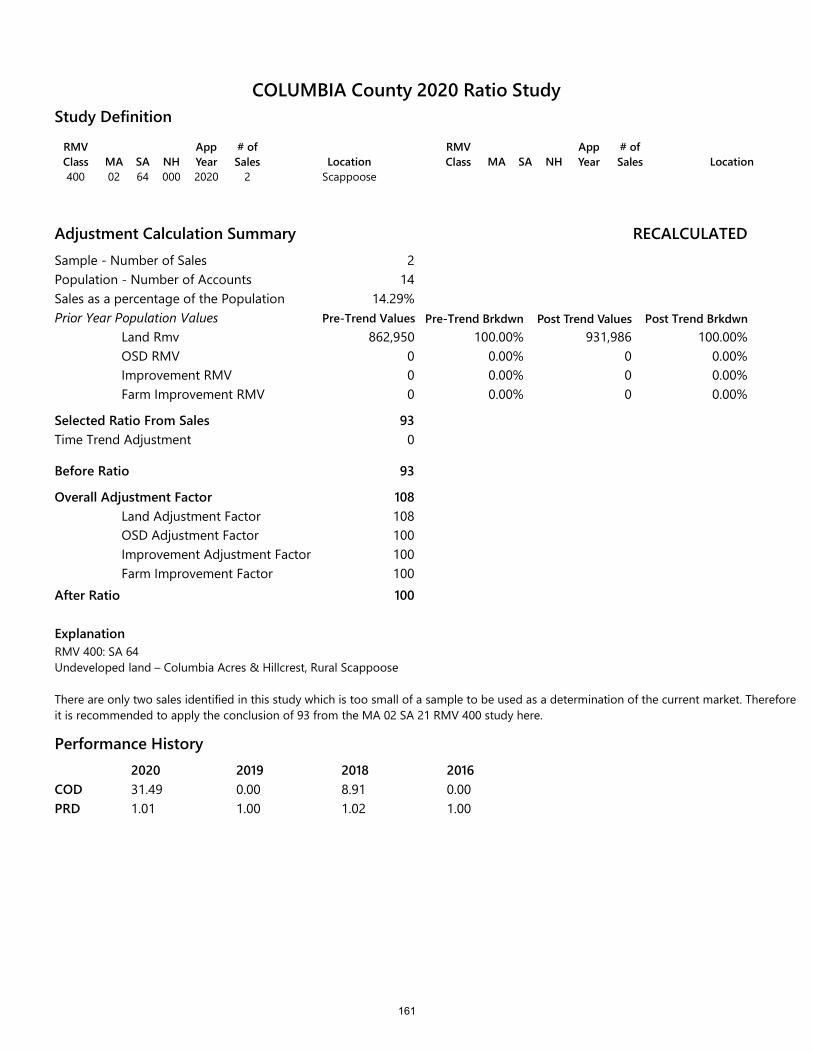
RMV Class MA SA NH
App Year
# of Sales Location
400 02 64 000 2020 2 Scappoose
RMV Class MA SA NH
App Year
# of Sales Location
Study Definition
Adjustment Calculation SummarySample - Number of SalesPopulation - Number of AccountsSales as a percentage of the PopulationPrior Year Population Values
Land RmvOSD RMVImprovement RMVFarm Improvement RMV
Selected Ratio From Sales
Before Ratio
Overall Adjustment FactorLand Adjustment FactorOSD Adjustment FactorImprovement Adjustment FactorFarm Improvement Factor
After Ratio
ExplanationRMV 400: SA 64Undeveloped land – Columbia Acres & Hillcrest, Rural Scappoose
There are only two sales identified in this study which is too small of a sample to be used as a determination of the current market. Therefore it is recommended to apply the conclusion of 93 from the MA 02 SA 21 RMV 400 study here.
RECALCULATED
Pre-Trend Brkdwn Post Trend Values Post Trend Brkdwn
214
14.29%
862,950 100.00% 931,986 100.00%000
0.00% 0 0.00%0.00% 0 0.00%0.00% 0 0.00%
93
93
108108100100100100
Time Trend Adjustment 0
Performance History2020 2019 2018 201631.49 0.00 8.91 0.001.01 1.00 1.02 1.00
CODPRD
COLUMBIA County 2020 Ratio Study
Pre-Trend Values
161
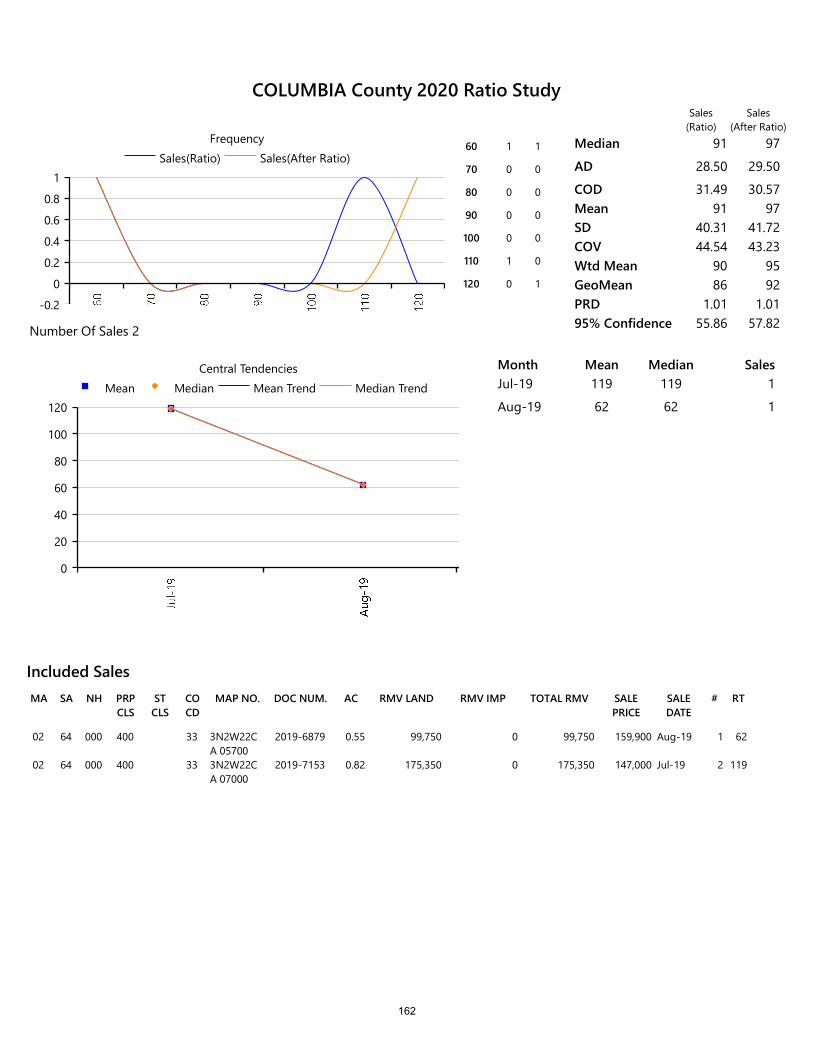
RMV LANDSA NH PRP CLS
ST CLS
CO CD
MAP NO. DOC NUM.MA AC RMV IMP TOTAL RMV SALE PRICE
SALE DATE
# RT
Included Sales
02 64 000 400 33 3N2W22CA 05700
2019-6879 0.55 99,750 0 99,750 159,900 Aug-19 1 62
02 64 000 400 33 3N2W22CA 07000
2019-7153 0.82 175,350 0 175,350 147,000 Jul-19 2 119
-0.2
0
0.2
0.4
0.6
0.8
1Sales(Ratio) Sales(After Ratio)
Frequency60 1 1
70 0 0
80 0 0
90 0 0
100 0 0
110 1 0
120 0 1
Median 91 97
AD 28.50 29.50
COD 31.49 30.57Mean 91 97SD 40.31 41.72COV 44.54 43.23Wtd Mean 90 95GeoMean 86 92PRD 1.01 1.0195% Confidence 55.86 57.82Number Of Sales 2
0
20
40
60
80
100
120Mean Median Mean Trend Median Trend
Central Tendencies Month Mean Median SalesJul-19 119 119 1
Aug-19 62 62 1
Sales(Ratio)
Sales(After Ratio)
COLUMBIA County 2020 Ratio Study
162
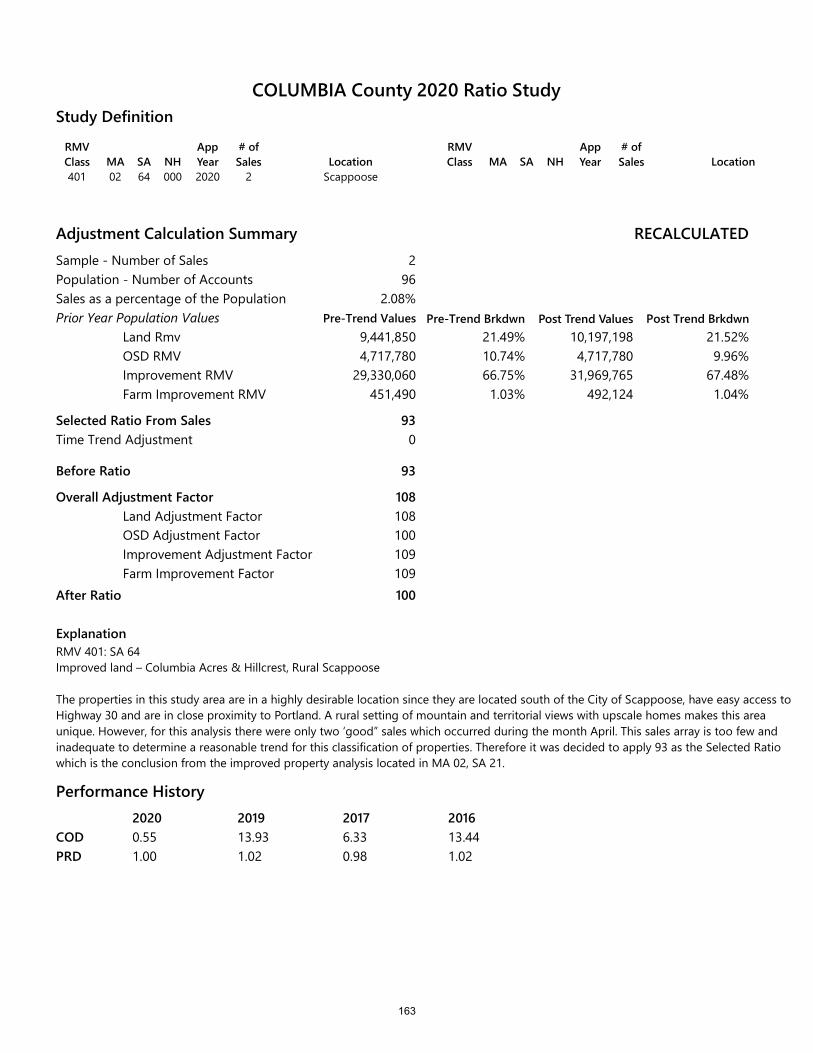
RMV Class MA SA NH
App Year
# of Sales Location
401 02 64 000 2020 2 Scappoose
RMV Class MA SA NH
App Year
# of Sales Location
Study Definition
Adjustment Calculation SummarySample - Number of SalesPopulation - Number of AccountsSales as a percentage of the PopulationPrior Year Population Values
Land RmvOSD RMVImprovement RMVFarm Improvement RMV
Selected Ratio From Sales
Before Ratio
Overall Adjustment FactorLand Adjustment FactorOSD Adjustment FactorImprovement Adjustment FactorFarm Improvement Factor
After Ratio
ExplanationRMV 401: SA 64Improved land – Columbia Acres & Hillcrest, Rural Scappoose
The properties in this study area are in a highly desirable location since they are located south of the City of Scappoose, have easy access to Highway 30 and are in close proximity to Portland. A rural setting of mountain and territorial views with upscale homes makes this area unique. However, for this analysis there were only two ‘good” sales which occurred during the month April. This sales array is too few and inadequate to determine a reasonable trend for this classification of properties. Therefore it was decided to apply 93 as the Selected Ratio which is the conclusion from the improved property analysis located in MA 02, SA 21.
RECALCULATED
Pre-Trend Brkdwn Post Trend Values Post Trend Brkdwn
296
2.08%
9,441,850 21.49% 10,197,198 21.52%4,717,780
29,330,060451,490
10.74% 4,717,780 9.96%66.75% 31,969,765 67.48%1.03% 492,124 1.04%
93
93
108108100109109100
Time Trend Adjustment 0
Performance History2020 2019 2017 20160.55 13.93 6.33 13.441.00 1.02 0.98 1.02
CODPRD
COLUMBIA County 2020 Ratio Study
Pre-Trend Values
163

RMV LANDSA NH PRP CLS
ST CLS
CO CD
MAP NO. DOC NUM.MA AC RMV IMP TOTAL RMV SALE PRICE
SALE DATE
# RT
Included Sales
02 64 000 401 144 33 3N2W24BD 00300
2019-2865 0.79 165,850 367,170 533,020 585,000 Apr-19 1 91
02 64 000 401 152 33 3N2W22CA 00300
2019-3165 1.91 224,660 512,370 737,030 800,000 Apr-19 2 92
0
0.5
1
1.5
2Sales(Ratio) Sales(After Ratio)
Frequency90 2 1
100 0 1
Median 92 99
AD .50 1.00
COD .55 1.01Mean 92 99SD .71 1.41COV .77 1.43Wtd Mean 92 99GeoMean 91 99PRD 1.00 1.0095% Confidence .98 1.96Number Of Sales 2
0
20
40
60
80
100Mean Median Mean Trend Median Trend
Central Tendencies Month Mean Median SalesApr-19 92 92 2
Sales(Ratio)
Sales(After Ratio)
COLUMBIA County 2020 Ratio Study
164
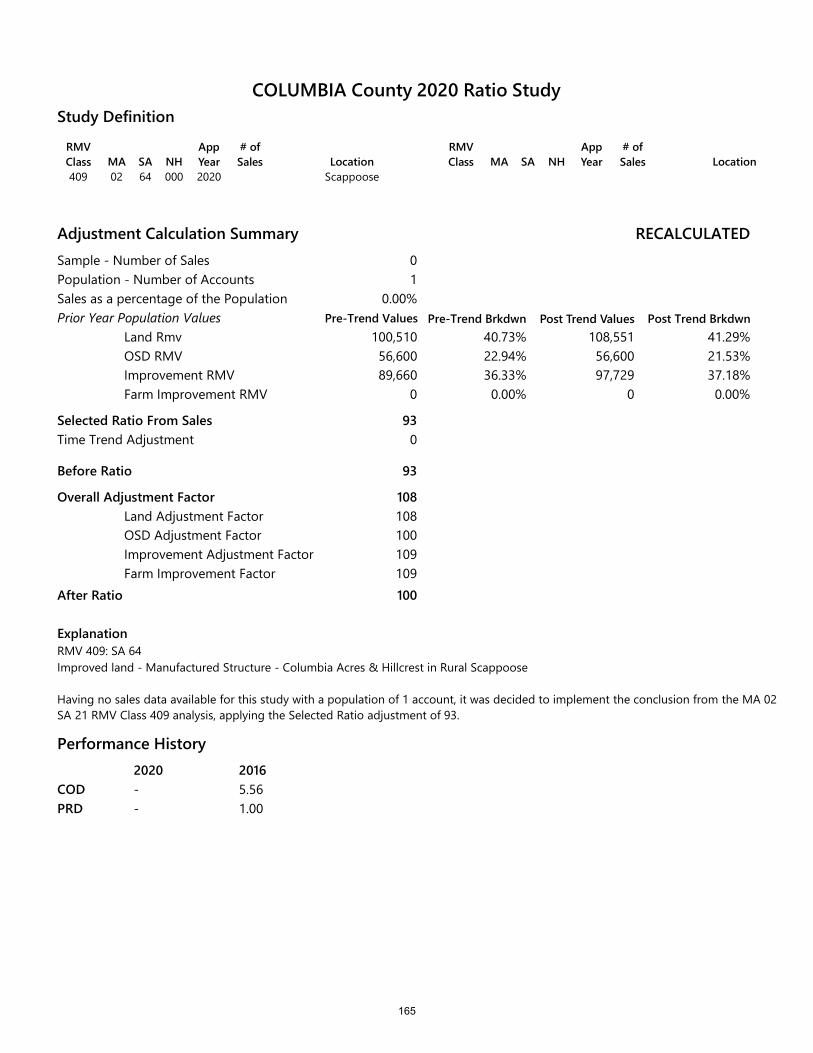
RMV Class MA SA NH
App Year
# of Sales Location
409 02 64 000 2020 Scappoose
RMV Class MA SA NH
App Year
# of Sales Location
Study Definition
Adjustment Calculation SummarySample - Number of SalesPopulation - Number of AccountsSales as a percentage of the PopulationPrior Year Population Values
Land RmvOSD RMVImprovement RMVFarm Improvement RMV
Selected Ratio From Sales
Before Ratio
Overall Adjustment FactorLand Adjustment FactorOSD Adjustment FactorImprovement Adjustment FactorFarm Improvement Factor
After Ratio
RECALCULATED
Pre-Trend Brkdwn Post Trend Values Post Trend Brkdwn
01
0.00%
100,510 40.73% 108,551 41.29%56,60089,660
0
22.94% 56,600 21.53%36.33% 97,729 37.18%0.00% 0 0.00%
93
93
108108100109109100
Time Trend Adjustment 0
ExplanationRMV 409: SA 64Improved land - Manufactured Structure - Columbia Acres & Hillcrest in Rural Scappoose
Having no sales data available for this study with a population of 1 account, it was decided to implement the conclusion from the MA 02 SA 21 RMV Class 409 analysis, applying the Selected Ratio adjustment of 93.
Performance History2020 2016- 5.56- 1.00
CODPRD
COLUMBIA County 2020 Ratio Study
Pre-Trend Values
165

0
1Sales(Ratio) Sales(After Ratio)
Frequency Median
AD
CODMeanSDCOVWtd MeanGeoMeanPRD95% ConfidenceNumber Of Sales 0
0
1Mean Median Mean Trend Median Trend
Central Tendencies Month Mean Median Sales
Sales(Ratio)
Sales(After Ratio)
COLUMBIA County 2020 Ratio Study
166
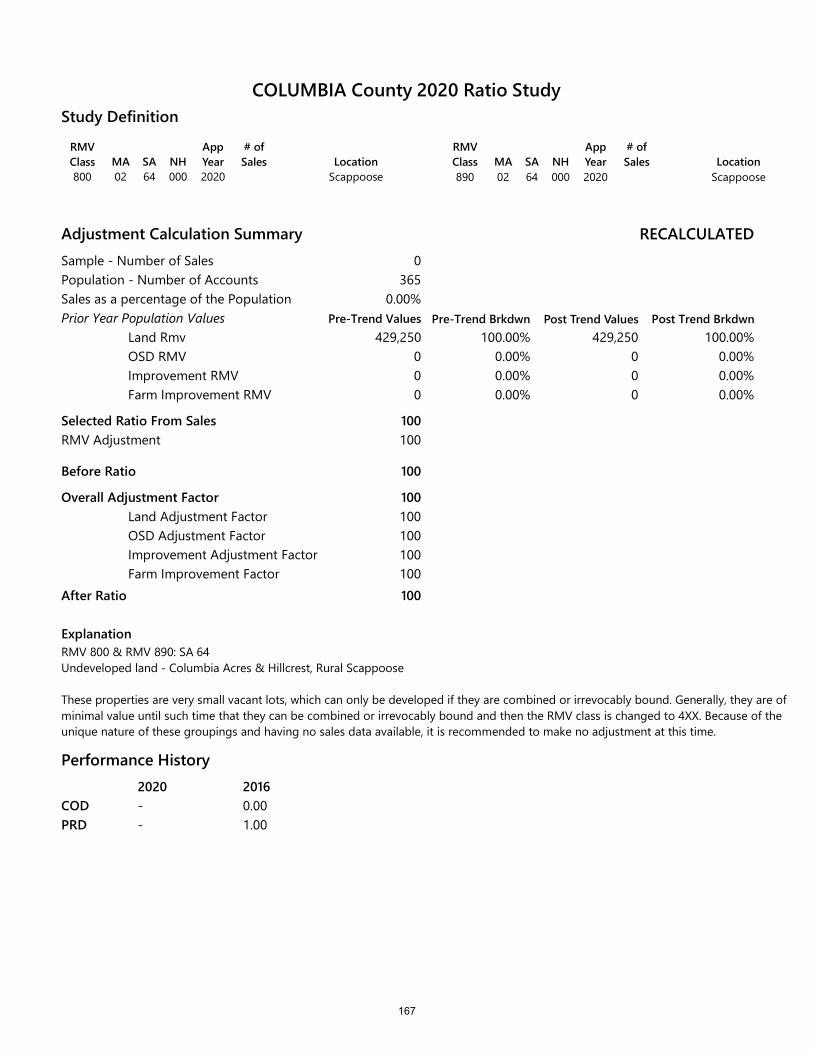
RMV Class MA SA NH
App Year
# of Sales Location
800 02 64 000 2020 Scappoose
RMV Class MA SA NH
App Year
# of Sales Location
890 02 64 000 2020 Scappoose
Study Definition
Adjustment Calculation SummarySample - Number of SalesPopulation - Number of AccountsSales as a percentage of the PopulationPrior Year Population Values
Land RmvOSD RMVImprovement RMVFarm Improvement RMV
Selected Ratio From SalesRMV Adjustment
Before Ratio
Overall Adjustment FactorLand Adjustment FactorOSD Adjustment FactorImprovement Adjustment FactorFarm Improvement Factor
After Ratio
ExplanationRMV 800 & RMV 890: SA 64Undeveloped land - Columbia Acres & Hillcrest, Rural Scappoose
These properties are very small vacant lots, which can only be developed if they are combined or irrevocably bound. Generally, they are of minimal value until such time that they can be combined or irrevocably bound and then the RMV class is changed to 4XX. Because of the unique nature of these groupings and having no sales data available, it is recommended to make no adjustment at this time.
RECALCULATED
Pre-Trend Brkdwn Post Trend Values Post Trend Brkdwn
0365
0.00%
429,250 100.00% 429,250 100.00%000
0.00% 0 0.00%0.00% 0 0.00%0.00% 0 0.00%
100100
100
100100100100100100
Performance History2020 2016- 0.00- 1.00
CODPRD
COLUMBIA County 2020 Ratio Study
Pre-Trend Values
167

0
1Sales(Ratio) Sales(After Ratio)
Frequency Median
AD
CODMeanSDCOVWtd MeanGeoMeanPRD95% ConfidenceNumber Of Sales 0
0
1Mean Median Mean Trend Median Trend
Central Tendencies Month Mean Median Sales
Sales(Ratio)
Sales(After Ratio)
COLUMBIA County 2020 Ratio Study
168
MAINTENANCE AREA 3
VERNONIA
169
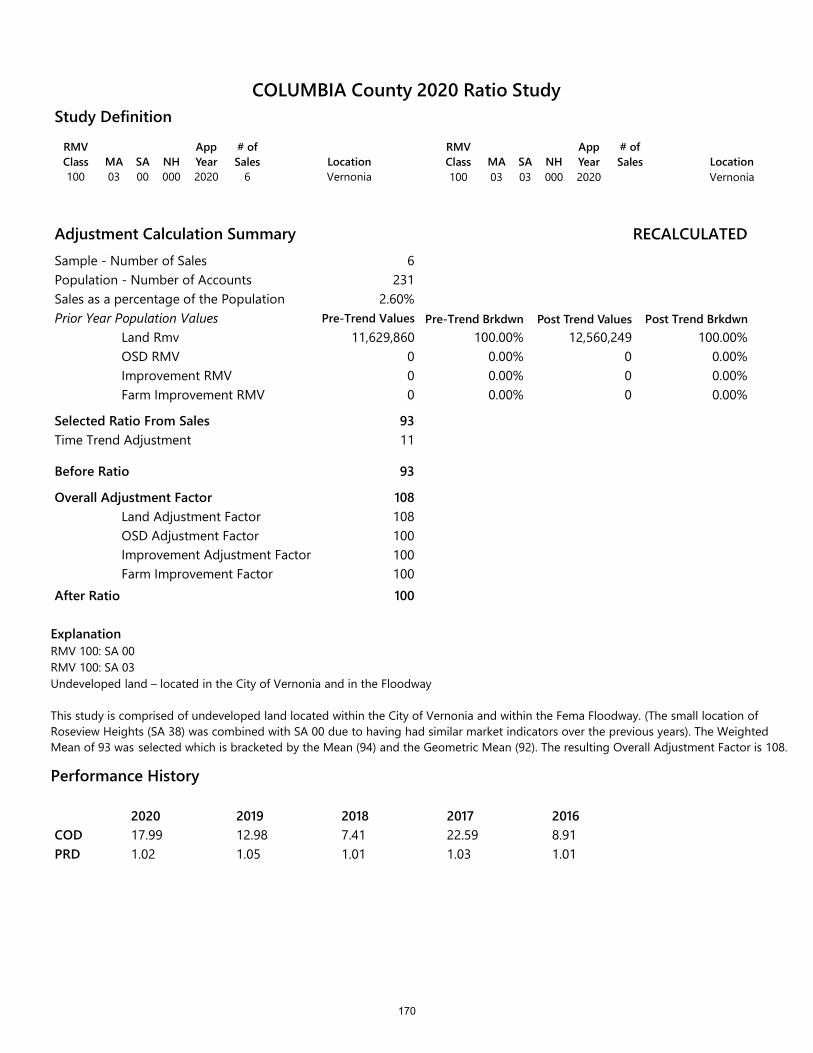
RMV Class MA SA NH
App Year
# of Sales Location
100 03 00 000 2020 6 Vernonia
RMV Class MA SA NH
App Year
# of Sales Location
100 03 03 000 2020 Vernonia
Study Definition
Adjustment Calculation SummarySample - Number of SalesPopulation - Number of AccountsSales as a percentage of the PopulationPrior Year Population Values
Land RmvOSD RMVImprovement RMVFarm Improvement RMV
Selected Ratio From Sales
Before Ratio
Overall Adjustment FactorLand Adjustment FactorOSD Adjustment FactorImprovement Adjustment FactorFarm Improvement Factor
After Ratio
RECALCULATED
Pre-Trend Brkdwn Post Trend Values Post Trend Brkdwn
6231
2.60%
11,629,860 100.00% 12,560,249 100.00%000
0.00% 0 0.00%0.00% 0 0.00%0.00% 0 0.00%
93
93
108108100100100100
Time Trend Adjustment 11
ExplanationRMV 100: SA 00RMV 100: SA 03Undeveloped land – located in the City of Vernonia and in the Floodway
This study is comprised of undeveloped land located within the City of Vernonia and within the Fema Floodway. (The small location of Roseview Heights (SA 38) was combined with SA 00 due to having had similar market indicators over the previous years). The WeightedMean of 93 was selected which is bracketed by the Mean (94) and the Geometric Mean (92). The resulting Overall Adjustment Factor is 108.
Performance History
2020 2019 2018 2017 201617.99 12.98 7.41 22.59 8.911.02 1.05 1.01 1.03 1.01
CODPRD
COLUMBIA County 2020 Ratio Study
Pre-Trend Values
170
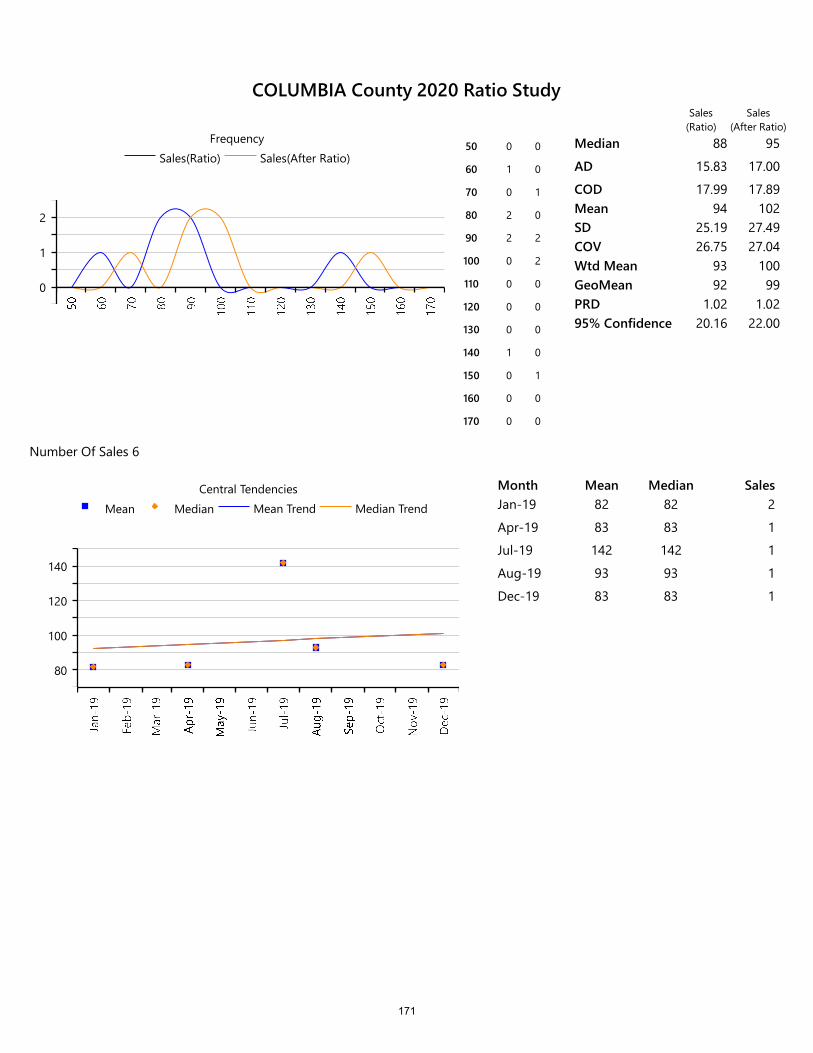
0
1
2
Sales(Ratio) Sales(After Ratio)Frequency
50 0 0
60 1 0
70 0 1
80 2 0
90 2 2
100 0 2
110 0 0
120 0 0
130 0 0
140 1 0
150 0 1
160 0 0
170 0 0
Median 88 95
AD 15.83 17.00
COD 17.99 17.89Mean 94 102SD 25.19 27.49COV 26.75 27.04Wtd Mean 93 100GeoMean 92 99PRD 1.02 1.0295% Confidence 20.16 22.00
Number Of Sales 6
80
100
120
140
Mean Median Mean Trend Median TrendCentral Tendencies Month Mean Median Sales
Jan-19 82 82 2
Apr-19 83 83 1
Jul-19 142 142 1
Aug-19 93 93 1
Dec-19 83 83 1
Sales(Ratio)
Sales(After Ratio)
COLUMBIA County 2020 Ratio Study
171
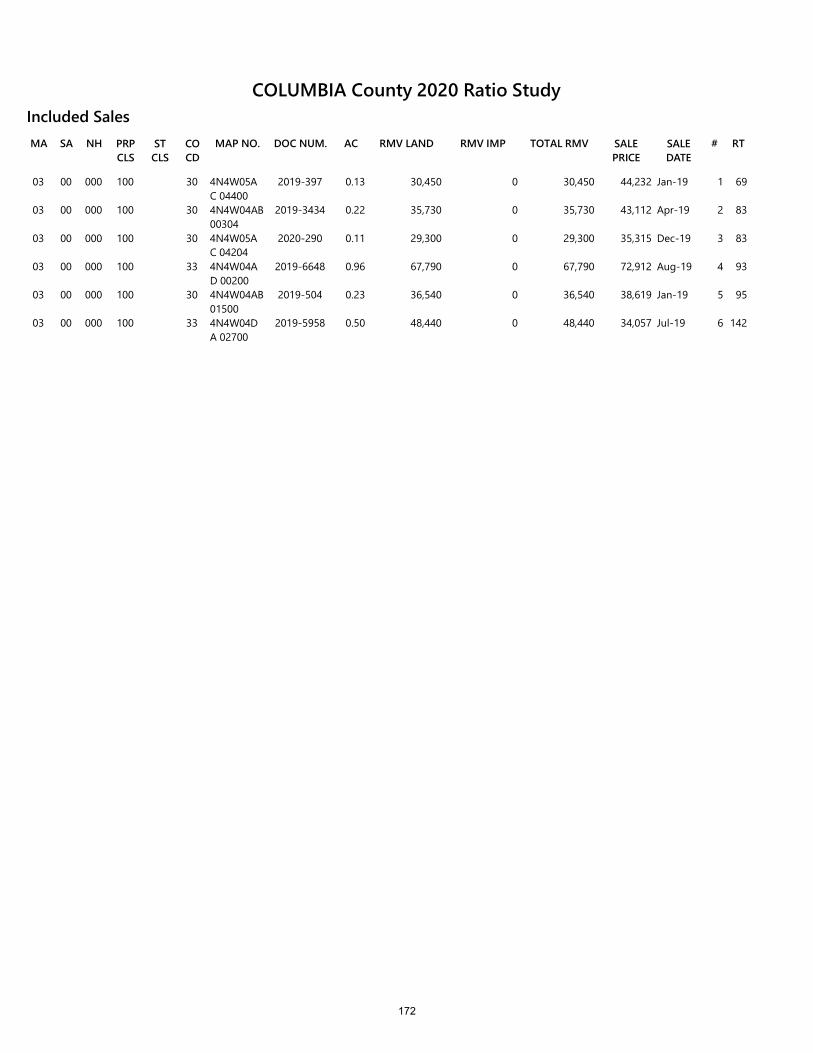
RMV LANDSA NH PRP CLS
ST CLS
CO CD
MAP NO. DOC NUM.MA AC RMV IMP TOTAL RMV SALE PRICE
SALE DATE
# RT
Included Sales
03 00 000 100 30 4N4W05AC 04400
2019-397 0.13 30,450 0 30,450 44,232 Jan-19 1 69
03 00 000 100 30 4N4W04AB 00304
2019-3434 0.22 35,730 0 35,730 43,112 Apr-19 2 83
03 00 000 100 30 4N4W05AC 04204
2020-290 0.11 29,300 0 29,300 35,315 Dec-19 3 83
03 00 000 100 33 4N4W04AD 00200
2019-6648 0.96 67,790 0 67,790 72,912 Aug-19 4 93
03 00 000 100 30 4N4W04AB 01500
2019-504 0.23 36,540 0 36,540 38,619 Jan-19 5 95
03 00 000 100 33 4N4W04DA 02700
2019-5958 0.50 48,440 0 48,440 34,057 Jul-19 6 142
COLUMBIA County 2020 Ratio Study
172

RMV Class MA SA NH
App Year
# of Sales Location
101 03 00 000 2020 44 Vernonia
RMV Class MA SA NH
App Year
# of Sales Location
101 03 03 000 2020 13 Vernonia
Study Definition
Adjustment Calculation SummarySample - Number of SalesPopulation - Number of AccountsSales as a percentage of the PopulationPrior Year Population Values
Land RmvOSD RMVImprovement RMVFarm Improvement RMV
Selected Ratio From Sales
Before Ratio
Overall Adjustment FactorLand Adjustment FactorOSD Adjustment FactorImprovement Adjustment FactorFarm Improvement Factor
After Ratio
ExplanationRMV 101: SA 00RMV 101: SA 03Improved land, City of Vernonia and improved land located in the Floodway
There are 57 sales returned in this array of residential properties which is 7.18% of the population. As a clear indication of the market, the Median of 81 was selected and applied here. This indicator is further supported by the Mean (82) and Weighted Mean (83).
RECALCULATED
Pre-Trend Brkdwn Post Trend Values Post Trend Brkdwn
57794
7.18%
31,595,930 20.04% 34,123,604 17.56%19,305,750
104,382,2702,384,400
12.24% 19,305,750 9.93%66.20% 137,784,596 70.89%1.51% 3,147,408 1.62%
81
81
123108100132132100
Time Trend Adjustment 11
Performance History2020 2019 2018 2017 201614.01 12.47 - - -0.99 1.00 - - -
CODPRD
COLUMBIA County 2020 Ratio Study
Pre-Trend Values
173
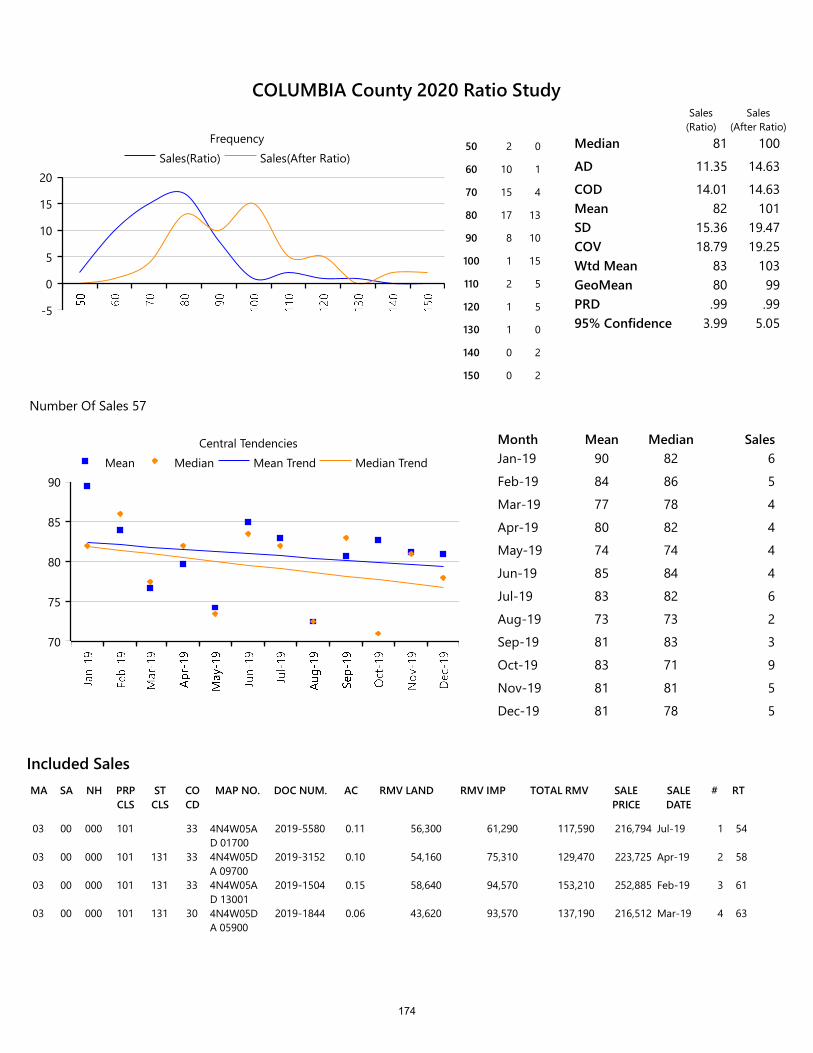
RMV LANDSA NH PRP CLS
ST CLS
CO CD
MAP NO. DOC NUM.MA AC RMV IMP TOTAL RMV SALE PRICE
SALE DATE
# RT
Included Sales
03 00 000 101 33 4N4W05AD 01700
2019-5580 0.11 56,300 61,290 117,590 216,794 Jul-19 1 54
03 00 000 101 131 33 4N4W05DA 09700
2019-3152 0.10 54,160 75,310 129,470 223,725 Apr-19 2 58
03 00 000 101 131 33 4N4W05AD 13001
2019-1504 0.15 58,640 94,570 153,210 252,885 Feb-19 3 61
03 00 000 101 131 30 4N4W05DA 05900
2019-1844 0.06 43,620 93,570 137,190 216,512 Mar-19 4 63
-5
0
5
10
15
20Sales(Ratio) Sales(After Ratio)
Frequency50 2 0
60 10 1
70 15 4
80 17 13
90 8 10
100 1 15
110 2 5
120 1 5
130 1 0
140 0 2
150 0 2
Median 81 100
AD 11.35 14.63
COD 14.01 14.63Mean 82 101SD 15.36 19.47COV 18.79 19.25Wtd Mean 83 103GeoMean 80 99PRD .99 .9995% Confidence 3.99 5.05
Number Of Sales 57
70
75
80
85
90Mean Median Mean Trend Median Trend
Central Tendencies Month Mean Median SalesJan-19 90 82 6
Feb-19 84 86 5
Mar-19 77 78 4
Apr-19 80 82 4
May-19 74 74 4
Jun-19 85 84 4
Jul-19 83 82 6
Aug-19 73 73 2
Sep-19 81 83 3
Oct-19 83 71 9
Nov-19 81 81 5
Dec-19 81 78 5
Sales(Ratio)
Sales(After Ratio)
COLUMBIA County 2020 Ratio Study
174
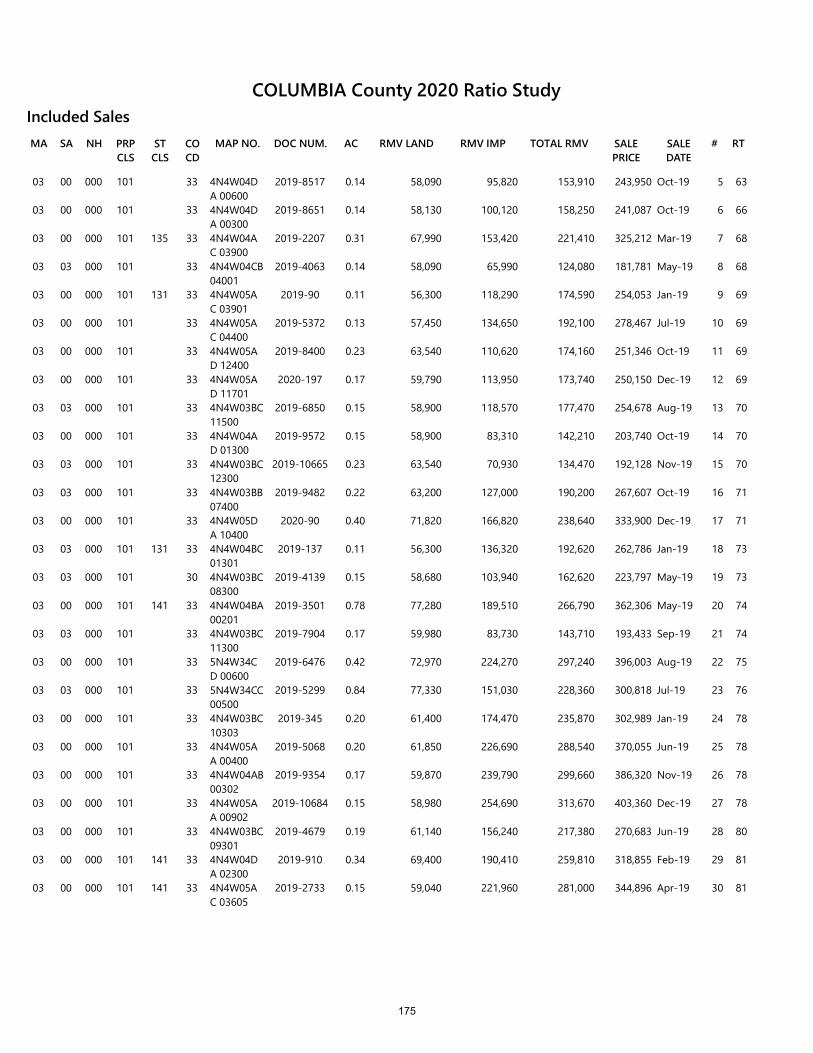
RMV LANDSA NH PRP CLS
ST CLS
CO CD
MAP NO. DOC NUM.MA AC RMV IMP TOTAL RMV SALE PRICE
SALE DATE
# RT
Included Sales
03 00 000 101 33 4N4W04DA 00600
2019-8517 0.14 58,090 95,820 153,910 243,950 Oct-19 5 63
03 00 000 101 33 4N4W04DA 00300
2019-8651 0.14 58,130 100,120 158,250 241,087 Oct-19 6 66
03 00 000 101 135 33 4N4W04AC 03900
2019-2207 0.31 67,990 153,420 221,410 325,212 Mar-19 7 68
03 03 000 101 33 4N4W04CB 04001
2019-4063 0.14 58,090 65,990 124,080 181,781 May-19 8 68
03 00 000 101 131 33 4N4W05AC 03901
2019-90 0.11 56,300 118,290 174,590 254,053 Jan-19 9 69
03 00 000 101 33 4N4W05AC 04400
2019-5372 0.13 57,450 134,650 192,100 278,467 Jul-19 10 69
03 00 000 101 33 4N4W05AD 12400
2019-8400 0.23 63,540 110,620 174,160 251,346 Oct-19 11 69
03 00 000 101 33 4N4W05AD 11701
2020-197 0.17 59,790 113,950 173,740 250,150 Dec-19 12 69
03 03 000 101 33 4N4W03BC 11500
2019-6850 0.15 58,900 118,570 177,470 254,678 Aug-19 13 70
03 00 000 101 33 4N4W04AD 01300
2019-9572 0.15 58,900 83,310 142,210 203,740 Oct-19 14 70
03 03 000 101 33 4N4W03BC 12300
2019-10665 0.23 63,540 70,930 134,470 192,128 Nov-19 15 70
03 03 000 101 33 4N4W03BB 07400
2019-9482 0.22 63,200 127,000 190,200 267,607 Oct-19 16 71
03 00 000 101 33 4N4W05DA 10400
2020-90 0.40 71,820 166,820 238,640 333,900 Dec-19 17 71
03 03 000 101 131 33 4N4W04BC 01301
2019-137 0.11 56,300 136,320 192,620 262,786 Jan-19 18 73
03 03 000 101 30 4N4W03BC 08300
2019-4139 0.15 58,680 103,940 162,620 223,797 May-19 19 73
03 00 000 101 141 33 4N4W04BA 00201
2019-3501 0.78 77,280 189,510 266,790 362,306 May-19 20 74
03 03 000 101 33 4N4W03BC 11300
2019-7904 0.17 59,980 83,730 143,710 193,433 Sep-19 21 74
03 00 000 101 33 5N4W34CD 00600
2019-6476 0.42 72,970 224,270 297,240 396,003 Aug-19 22 75
03 03 000 101 33 5N4W34CC 00500
2019-5299 0.84 77,330 151,030 228,360 300,818 Jul-19 23 76
03 00 000 101 33 4N4W03BC 10303
2019-345 0.20 61,400 174,470 235,870 302,989 Jan-19 24 78
03 00 000 101 33 4N4W05AA 00400
2019-5068 0.20 61,850 226,690 288,540 370,055 Jun-19 25 78
03 00 000 101 33 4N4W04AB 00302
2019-9354 0.17 59,870 239,790 299,660 386,320 Nov-19 26 78
03 00 000 101 33 4N4W05AA 00902
2019-10684 0.15 58,980 254,690 313,670 403,360 Dec-19 27 78
03 00 000 101 33 4N4W03BC 09301
2019-4679 0.19 61,140 156,240 217,380 270,683 Jun-19 28 80
03 00 000 101 141 33 4N4W04DA 02300
2019-910 0.34 69,400 190,410 259,810 318,855 Feb-19 29 81
03 00 000 101 141 33 4N4W05AC 03605
2019-2733 0.15 59,040 221,960 281,000 344,896 Apr-19 30 81
COLUMBIA County 2020 Ratio Study
175
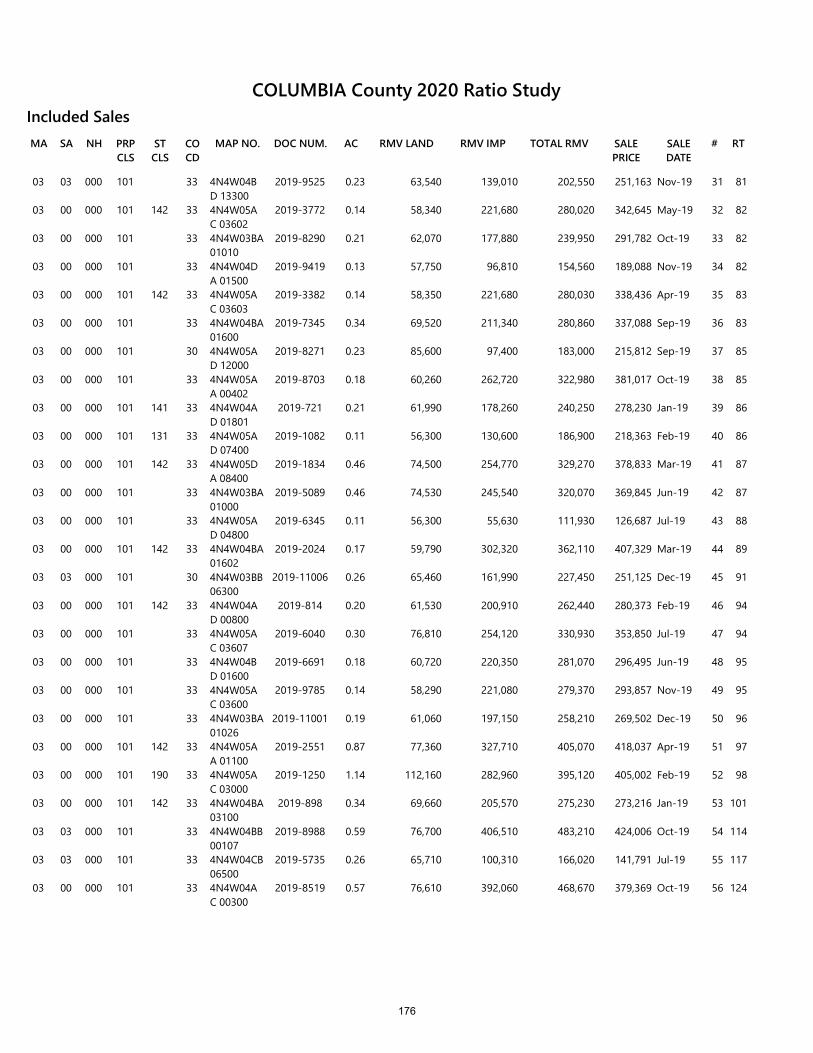
RMV LANDSA NH PRP CLS
ST CLS
CO CD
MAP NO. DOC NUM.MA AC RMV IMP TOTAL RMV SALE PRICE
SALE DATE
# RT
Included Sales
03 03 000 101 33 4N4W04BD 13300
2019-9525 0.23 63,540 139,010 202,550 251,163 Nov-19 31 81
03 00 000 101 142 33 4N4W05AC 03602
2019-3772 0.14 58,340 221,680 280,020 342,645 May-19 32 82
03 00 000 101 33 4N4W03BA 01010
2019-8290 0.21 62,070 177,880 239,950 291,782 Oct-19 33 82
03 00 000 101 33 4N4W04DA 01500
2019-9419 0.13 57,750 96,810 154,560 189,088 Nov-19 34 82
03 00 000 101 142 33 4N4W05AC 03603
2019-3382 0.14 58,350 221,680 280,030 338,436 Apr-19 35 83
03 00 000 101 33 4N4W04BA 01600
2019-7345 0.34 69,520 211,340 280,860 337,088 Sep-19 36 83
03 00 000 101 30 4N4W05AD 12000
2019-8271 0.23 85,600 97,400 183,000 215,812 Sep-19 37 85
03 00 000 101 33 4N4W05AA 00402
2019-8703 0.18 60,260 262,720 322,980 381,017 Oct-19 38 85
03 00 000 101 141 33 4N4W04AD 01801
2019-721 0.21 61,990 178,260 240,250 278,230 Jan-19 39 86
03 00 000 101 131 33 4N4W05AD 07400
2019-1082 0.11 56,300 130,600 186,900 218,363 Feb-19 40 86
03 00 000 101 142 33 4N4W05DA 08400
2019-1834 0.46 74,500 254,770 329,270 378,833 Mar-19 41 87
03 00 000 101 33 4N4W03BA 01000
2019-5089 0.46 74,530 245,540 320,070 369,845 Jun-19 42 87
03 00 000 101 33 4N4W05AD 04800
2019-6345 0.11 56,300 55,630 111,930 126,687 Jul-19 43 88
03 00 000 101 142 33 4N4W04BA 01602
2019-2024 0.17 59,790 302,320 362,110 407,329 Mar-19 44 89
03 03 000 101 30 4N4W03BB 06300
2019-11006 0.26 65,460 161,990 227,450 251,125 Dec-19 45 91
03 00 000 101 142 33 4N4W04AD 00800
2019-814 0.20 61,530 200,910 262,440 280,373 Feb-19 46 94
03 00 000 101 33 4N4W05AC 03607
2019-6040 0.30 76,810 254,120 330,930 353,850 Jul-19 47 94
03 00 000 101 33 4N4W04BD 01600
2019-6691 0.18 60,720 220,350 281,070 296,495 Jun-19 48 95
03 00 000 101 33 4N4W05AC 03600
2019-9785 0.14 58,290 221,080 279,370 293,857 Nov-19 49 95
03 00 000 101 33 4N4W03BA 01026
2019-11001 0.19 61,060 197,150 258,210 269,502 Dec-19 50 96
03 00 000 101 142 33 4N4W05AA 01100
2019-2551 0.87 77,360 327,710 405,070 418,037 Apr-19 51 97
03 00 000 101 190 33 4N4W05AC 03000
2019-1250 1.14 112,160 282,960 395,120 405,002 Feb-19 52 98
03 00 000 101 142 33 4N4W04BA 03100
2019-898 0.34 69,660 205,570 275,230 273,216 Jan-19 53 101
03 03 000 101 33 4N4W04BB 00107
2019-8988 0.59 76,700 406,510 483,210 424,006 Oct-19 54 114
03 03 000 101 33 4N4W04CB 06500
2019-5735 0.26 65,710 100,310 166,020 141,791 Jul-19 55 117
03 00 000 101 33 4N4W04AC 00300
2019-8519 0.57 76,610 392,060 468,670 379,369 Oct-19 56 124
COLUMBIA County 2020 Ratio Study
176
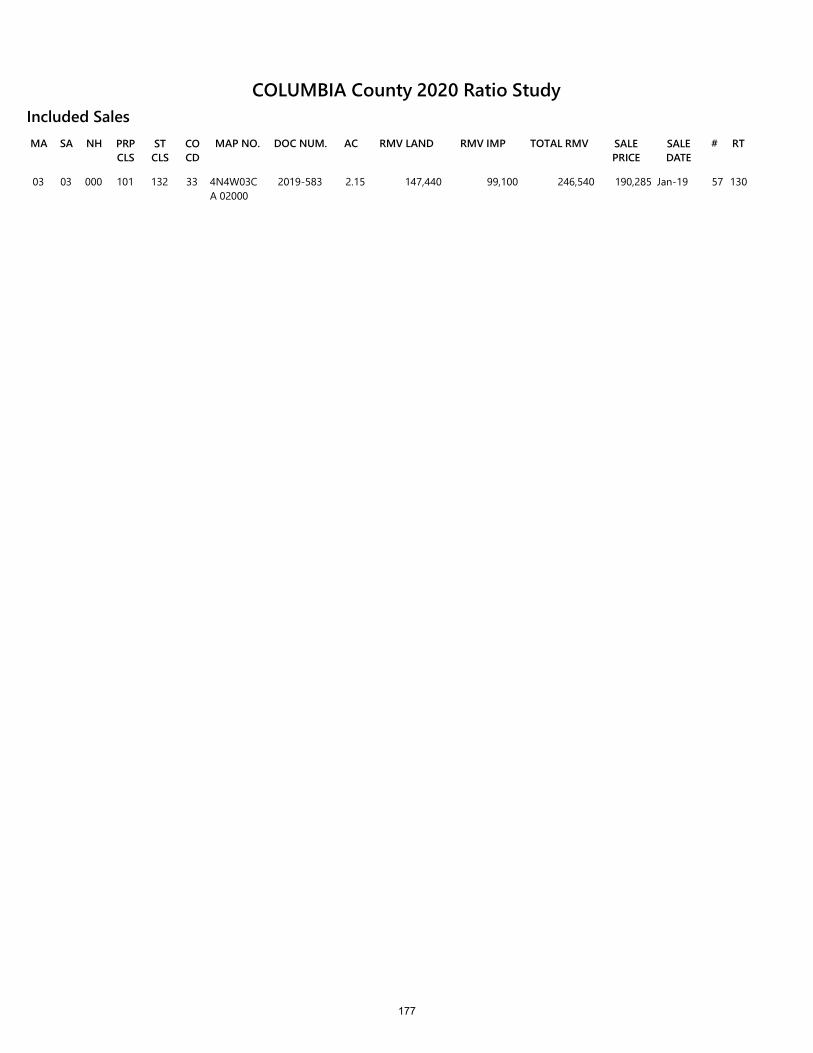
RMV LANDSA NH PRP CLS
ST CLS
CO CD
MAP NO. DOC NUM.MA AC RMV IMP TOTAL RMV SALE PRICE
SALE DATE
# RT
Included Sales
03 03 000 101 132 33 4N4W03CA 02000
2019-583 2.15 147,440 99,100 246,540 190,285 Jan-19 57 130
COLUMBIA County 2020 Ratio Study
177
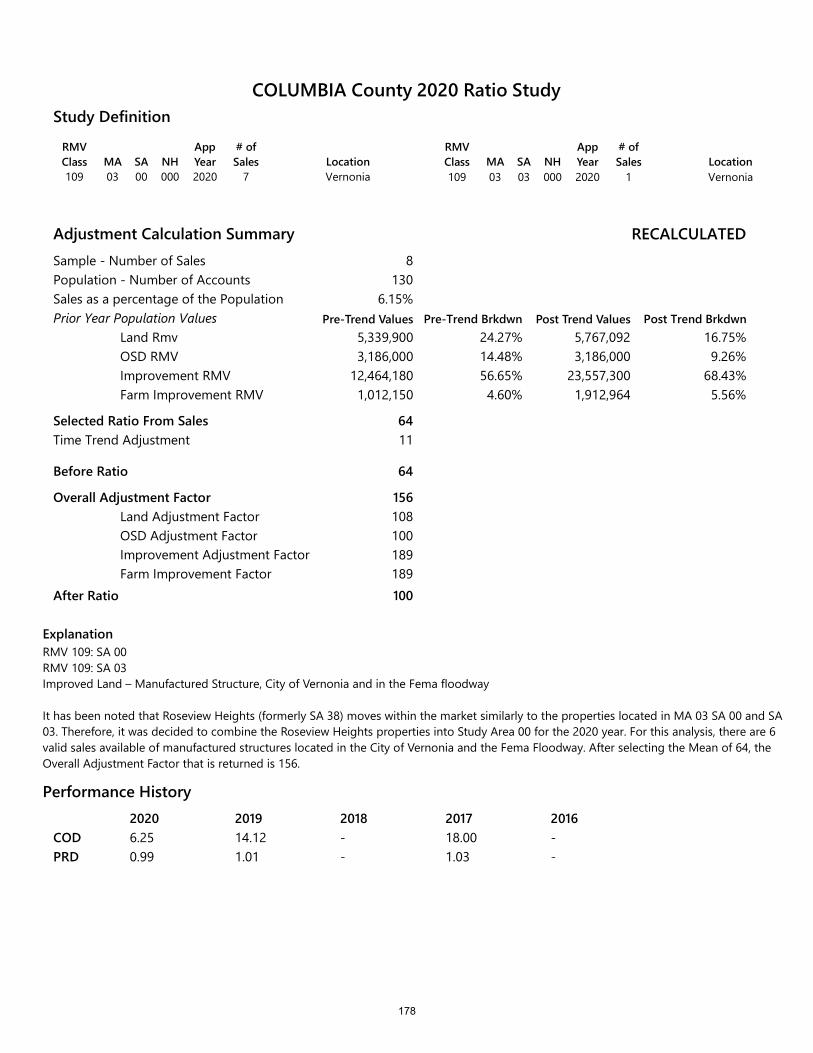
RMV Class MA SA NH
App Year
# of Sales Location
109 03 00 000 2020 7 Vernonia
RMV Class MA SA NH
App Year
# of Sales Location
109 03 03 000 2020 1 Vernonia
Study Definition
Adjustment Calculation SummarySample - Number of SalesPopulation - Number of AccountsSales as a percentage of the PopulationPrior Year Population Values
Land RmvOSD RMVImprovement RMVFarm Improvement RMV
Selected Ratio From Sales
Before Ratio
Overall Adjustment FactorLand Adjustment FactorOSD Adjustment FactorImprovement Adjustment FactorFarm Improvement Factor
After Ratio
ExplanationRMV 109: SA 00RMV 109: SA 03Improved Land – Manufactured Structure, City of Vernonia and in the Fema floodway
It has been noted that Roseview Heights (formerly SA 38) moves within the market similarly to the properties located in MA 03 SA 00 and SA 03. Therefore, it was decided to combine the Roseview Heights properties into Study Area 00 for the 2020 year. For this analysis, there are 6valid sales available of manufactured structures located in the City of Vernonia and the Fema Floodway. After selecting the Mean of 64, theOverall Adjustment Factor that is returned is 156.
RECALCULATED
Pre-Trend Brkdwn Post Trend Values Post Trend Brkdwn
8130
6.15%
5,339,900 24.27% 5,767,092 16.75%3,186,000
12,464,1801,012,150
14.48% 3,186,000 9.26%56.65% 23,557,300 68.43%4.60% 1,912,964 5.56%
64
64
156108100189189100
Time Trend Adjustment 11
Pre-Trend Values
Performance History2020 2019 2018 2017 20166.25 14.12 - 18.00 -0.99 1.01 - 1.03 -
CODPRD
COLUMBIA County 2020 Ratio Study
178
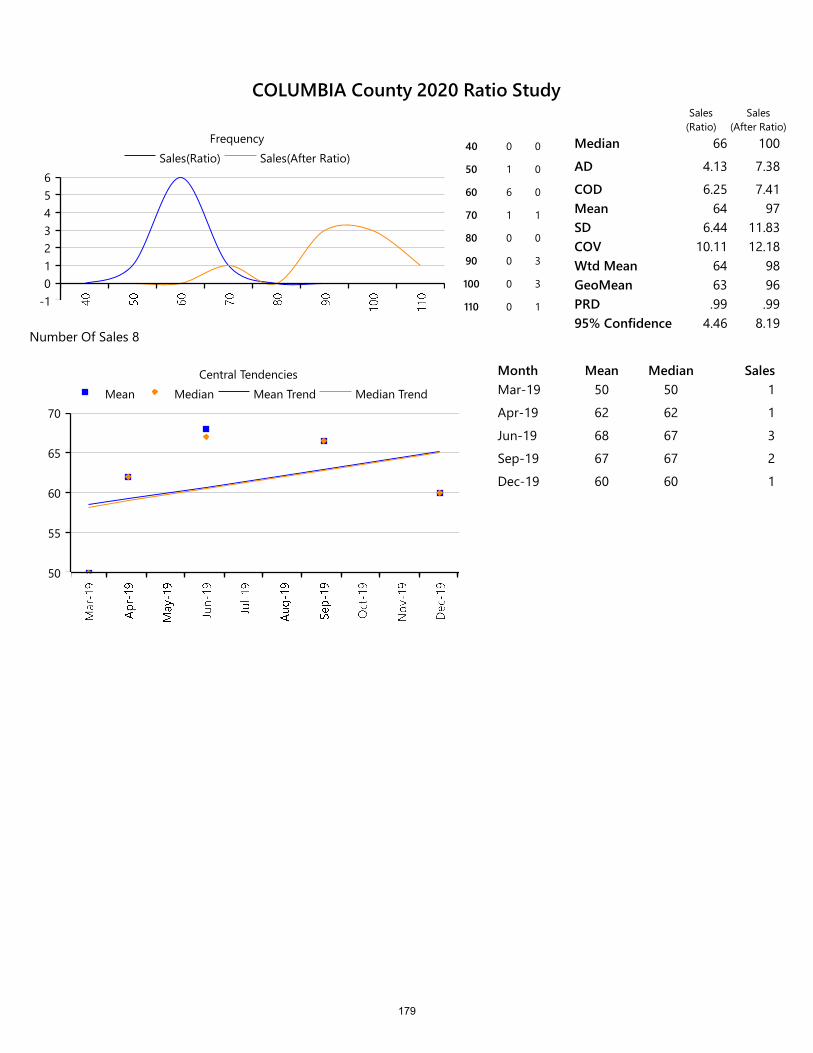
-10123456
Sales(Ratio) Sales(After Ratio)Frequency
40 0 0
50 1 0
60 6 0
70 1 1
80 0 0
90 0 3
100 0 3
110 0 1
Median 66 100
AD 4.13 7.38
COD 6.25 7.41Mean 64 97SD 6.44 11.83COV 10.11 12.18Wtd Mean 64 98GeoMean 63 96PRD .99 .9995% Confidence 4.46 8.19
Number Of Sales 8
50
55
60
65
70Mean Median Mean Trend Median Trend
Central Tendencies Month Mean Median SalesMar-19 50 50 1
Apr-19 62 62 1
Jun-19 68 67 3
Sep-19 67 67 2
Dec-19 60 60 1
Sales(Ratio)
Sales(After Ratio)
COLUMBIA County 2020 Ratio Study
179
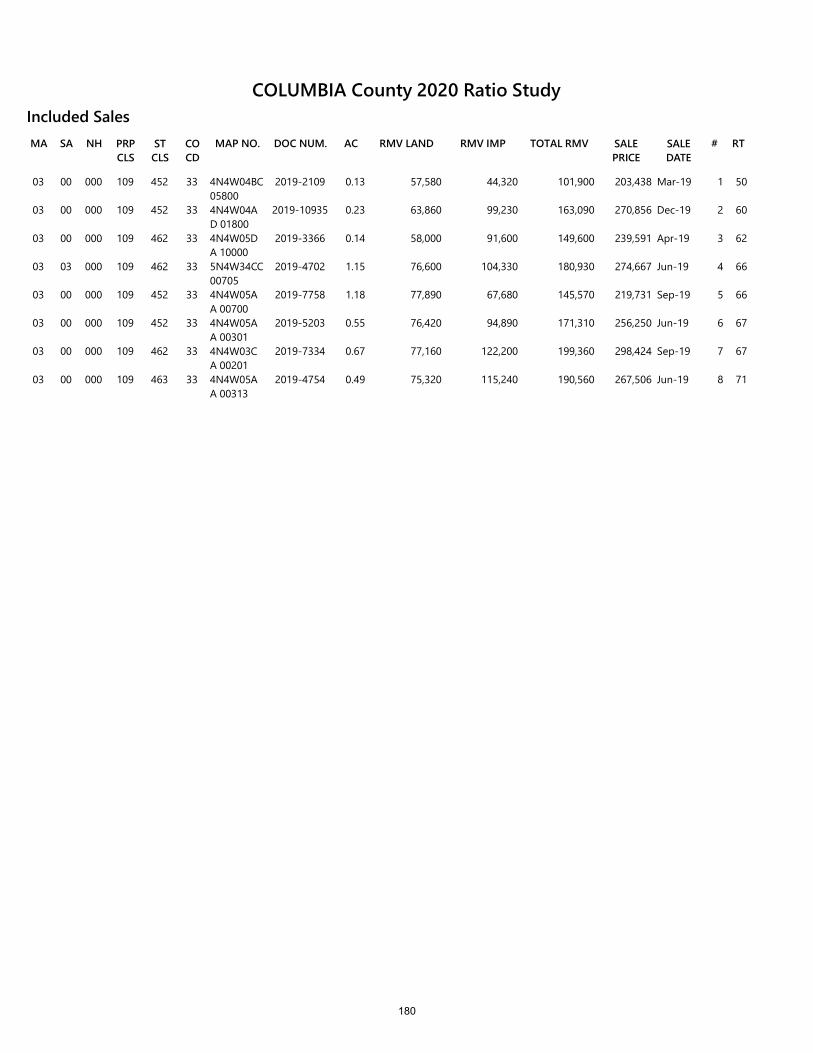
RMV LANDSA NH PRP CLS
ST CLS
CO CD
MAP NO. DOC NUM.MA AC RMV IMP TOTAL RMV SALE PRICE
SALE DATE
# RT
Included Sales
03 00 000 109 452 33 4N4W04BC 05800
2019-2109 0.13 57,580 44,320 101,900 203,438 Mar-19 1 50
03 00 000 109 452 33 4N4W04AD 01800
2019-10935 0.23 63,860 99,230 163,090 270,856 Dec-19 2 60
03 00 000 109 462 33 4N4W05DA 10000
2019-3366 0.14 58,000 91,600 149,600 239,591 Apr-19 3 62
03 03 000 109 462 33 5N4W34CC 00705
2019-4702 1.15 76,600 104,330 180,930 274,667 Jun-19 4 66
03 00 000 109 452 33 4N4W05AA 00700
2019-7758 1.18 77,890 67,680 145,570 219,731 Sep-19 5 66
03 00 000 109 452 33 4N4W05AA 00301
2019-5203 0.55 76,420 94,890 171,310 256,250 Jun-19 6 67
03 00 000 109 462 33 4N4W03CA 00201
2019-7334 0.67 77,160 122,200 199,360 298,424 Sep-19 7 67
03 00 000 109 463 33 4N4W05AA 00313
2019-4754 0.49 75,320 115,240 190,560 267,506 Jun-19 8 71
COLUMBIA County 2020 Ratio Study
180

RMV Class MA SA NH
App Year
# of Sales Location
101 03 40 000 2020 Vernonia
RMV Class MA SA NH
App Year
# of Sales Location
Study Definition
Adjustment Calculation SummarySample - Number of SalesPopulation - Number of AccountsSales as a percentage of the PopulationPrior Year Population Values
Land RmvOSD RMVImprovement RMVFarm Improvement RMV
Selected Ratio From Sales
Before Ratio
Overall Adjustment FactorLand Adjustment FactorOSD Adjustment FactorImprovement Adjustment FactorFarm Improvement Factor
After Ratio
ExplanationRMV 101: SA 40Improved land – Duplex/Triplex/Fourplex, City of Vernonia
RECALCULATED
Pre-Trend Brkdwn Post Trend Values Post Trend Brkdwn
010
0.00%
316,520 15.09% 341,842 13.33%399,000
1,377,8004,400
19.02% 399,000 15.55%65.68% 1,818,696 70.89%0.21% 5,808 0.23%
81
81
123108100132132100
Time Trend Adjustment 0
With having no sales data available for this study, the Selected Ratio of 81 from the analysis of improved properties in the general area of the City of Vernonia was deemed appropriate to apply here.
Performance History2020 2016- 0.00- 1.00
CODPRD
COLUMBIA County 2020 Ratio Study
Pre-Trend Values
181

0
1Sales(Ratio) Sales(After Ratio)
Frequency Median
AD
CODMeanSDCOVWtd MeanGeoMeanPRD95% ConfidenceNumber Of Sales 0
0
1Mean Median Mean Trend Median Trend
Central Tendencies Month Mean Median Sales
Sales(Ratio)
Sales(After Ratio)
COLUMBIA County 2020 Ratio Study
182
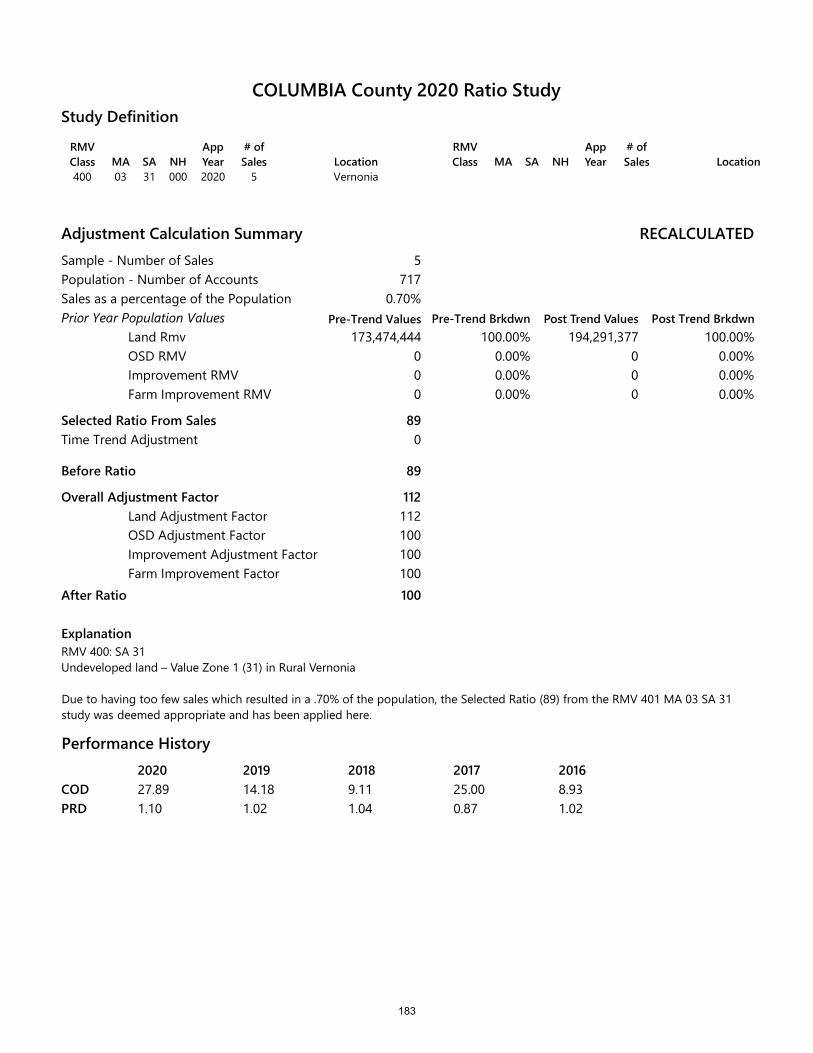
RMV Class MA SA NH
App Year
# of Sales Location
400 03 31 000 2020 5 Vernonia
RMV Class MA SA NH
App Year
# of Sales Location
Study Definition
Adjustment Calculation SummarySample - Number of SalesPopulation - Number of AccountsSales as a percentage of the PopulationPrior Year Population Values
Land RmvOSD RMVImprovement RMVFarm Improvement RMV
Selected Ratio From Sales
Before Ratio
Overall Adjustment FactorLand Adjustment FactorOSD Adjustment FactorImprovement Adjustment FactorFarm Improvement Factor
After Ratio
ExplanationRMV 400: SA 31Undeveloped land – Value Zone 1 (31) in Rural Vernonia
RECALCULATED
Pre-Trend Brkdwn Post Trend Values Post Trend Brkdwn
5717
0.70%
173,474,444 100.00% 194,291,377 100.00%000
0.00% 0 0.00%0.00% 0 0.00%0.00% 0 0.00%
89
89
112112100100100100
Time Trend Adjustment 0
Due to having too few sales which resulted in a .70% of the population, the Selected Ratio (89) from the RMV 401 MA 03 SA 31 study was deemed appropriate and has been applied here.
Performance History2020 2019 2018 2017 201627.89 14.18 9.11 25.00 8.931.10 1.02 1.04 0.87 1.02
CODPRD
COLUMBIA County 2020 Ratio Study
Pre-Trend Values
183
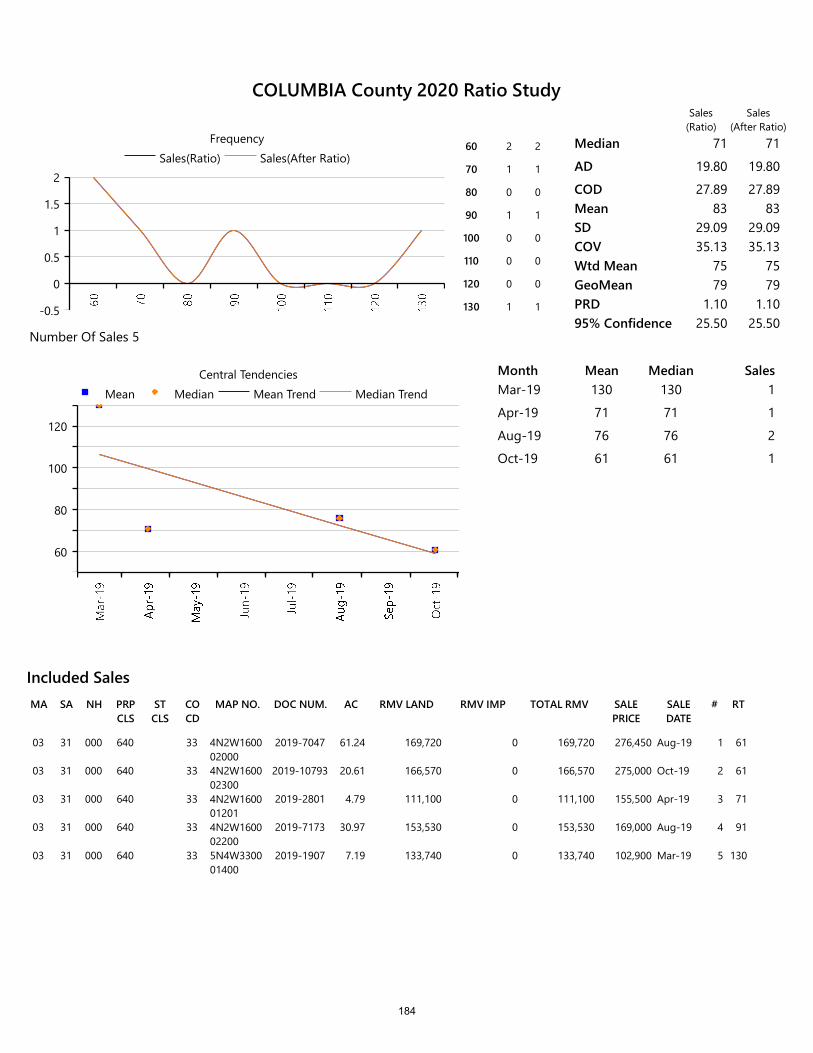
RMV LANDSA NH PRP CLS
ST CLS
CO CD
MAP NO. DOC NUM.MA AC RMV IMP TOTAL RMV SALE PRICE
SALE DATE
# RT
Included Sales
03 31 000 640 33 4N2W1600 02000
2019-7047 61.24 169,720 0 169,720 276,450 Aug-19 1 61
03 31 000 640 33 4N2W1600 02300
2019-10793 20.61 166,570 0 166,570 275,000 Oct-19 2 61
03 31 000 640 33 4N2W1600 01201
2019-2801 4.79 111,100 0 111,100 155,500 Apr-19 3 71
03 31 000 640 33 4N2W1600 02200
2019-7173 30.97 153,530 0 153,530 169,000 Aug-19 4 91
03 31 000 640 33 5N4W3300 01400
2019-1907 7.19 133,740 0 133,740 102,900 Mar-19 5 130
-0.5
0
0.5
1
1.5
2Sales(Ratio) Sales(After Ratio)
Frequency60 2 2
70 1 1
80 0 0
90 1 1
100 0 0
110 0 0
120 0 0
130 1 1
Median 71 71
AD 19.80 19.80
COD 27.89 27.89Mean 83 83SD 29.09 29.09COV 35.13 35.13Wtd Mean 75 75GeoMean 79 79PRD 1.10 1.1095% Confidence 25.50 25.50
Number Of Sales 5
60
80
100
120
Mean Median Mean Trend Median TrendCentral Tendencies Month Mean Median Sales
Mar-19 130 130 1
Apr-19 71 71 1
Aug-19 76 76 2
Oct-19 61 61 1
Sales(Ratio)
Sales(After Ratio)
COLUMBIA County 2020 Ratio Study
184
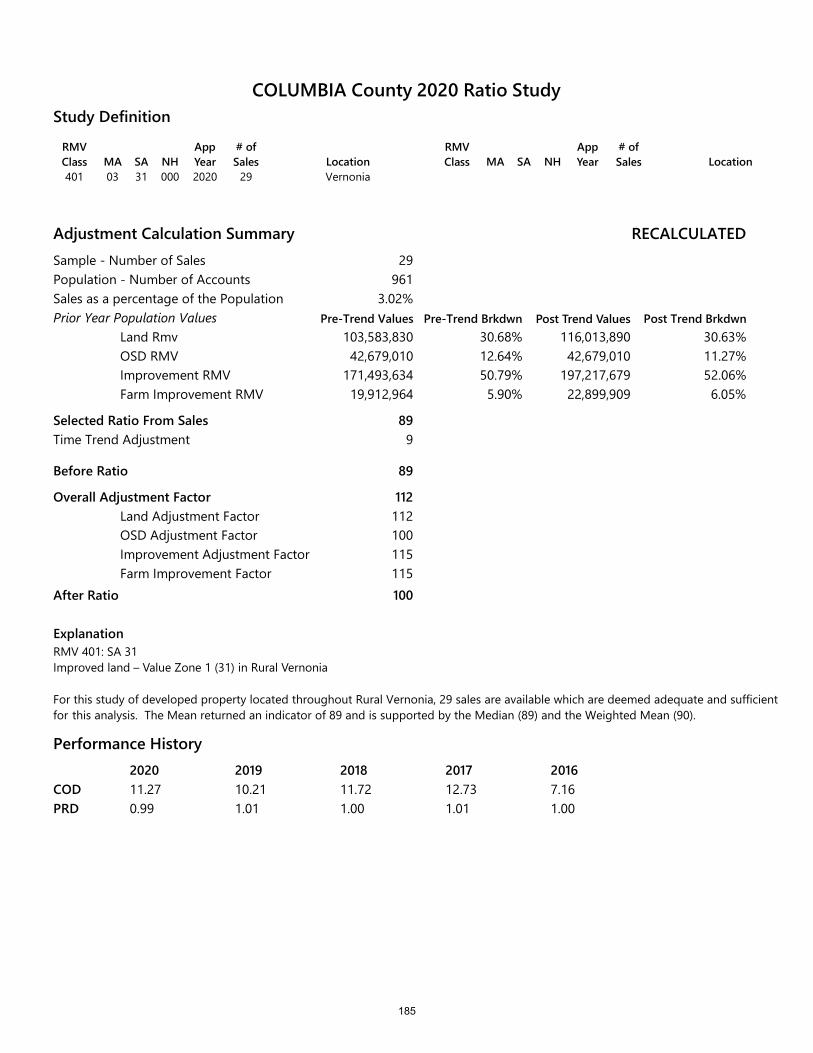
RMV Class MA SA NH
App Year
# of Sales Location
401 03 31 000 2020 29 Vernonia
RMV Class MA SA NH
App Year
# of Sales Location
Study Definition
Adjustment Calculation SummarySample - Number of SalesPopulation - Number of AccountsSales as a percentage of the PopulationPrior Year Population Values
Land RmvOSD RMVImprovement RMVFarm Improvement RMV
Selected Ratio From Sales
Before Ratio
Overall Adjustment FactorLand Adjustment FactorOSD Adjustment FactorImprovement Adjustment FactorFarm Improvement Factor
After Ratio
ExplanationRMV 401: SA 31Improved land – Value Zone 1 (31) in Rural Vernonia
RECALCULATED
Pre-Trend Brkdwn Post Trend Values Post Trend Brkdwn
29961
3.02%
103,583,830 30.68% 116,013,890 30.63%42,679,010
171,493,63419,912,964
12.64% 42,679,010 11.27%50.79% 197,217,679 52.06%5.90% 22,899,909 6.05%
89
89
112112100115115100
Time Trend Adjustment 9
For this study of developed property located throughout Rural Vernonia, 29 sales are available which are deemed adequate and sufficient for this analysis. The Mean returned an indicator of 89 and is supported by the Median (89) and the Weighted Mean (90).
Performance History2020 2019 2018 2017 201611.27 10.21 11.72 12.73 7.160.99 1.01 1.00 1.01 1.00
CODPRD
COLUMBIA County 2020 Ratio Study
Pre-Trend Values
185
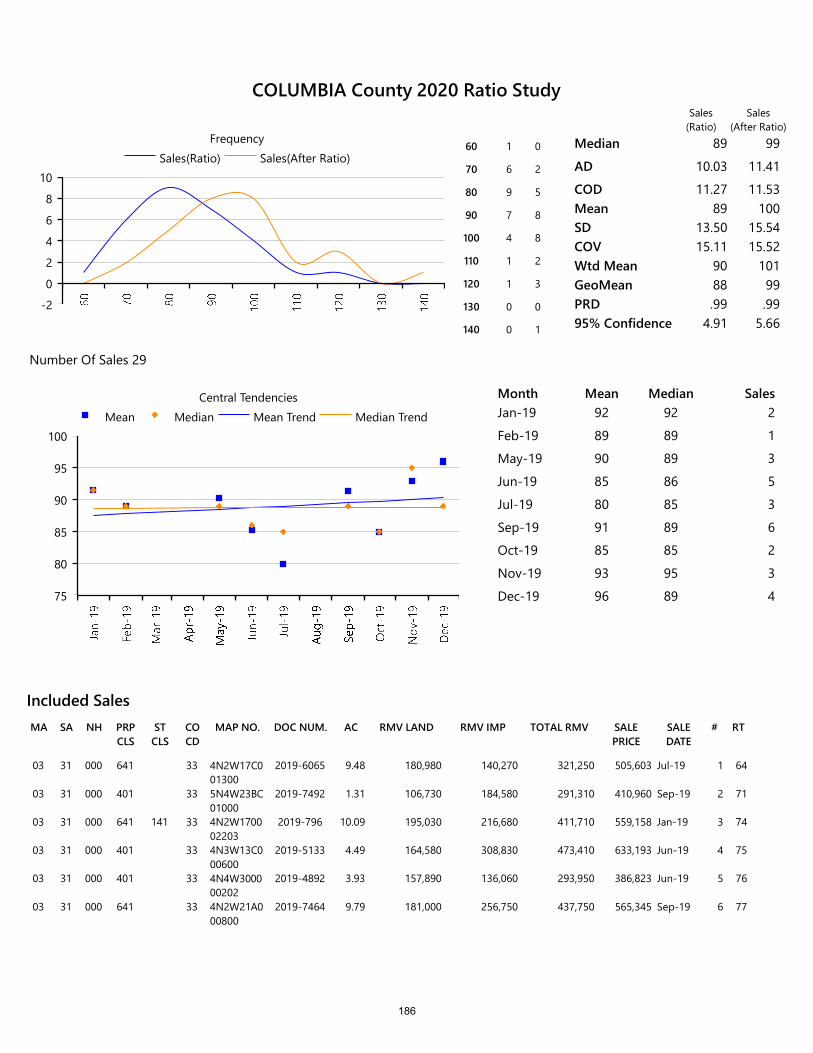
RMV LANDSA NH PRP CLS
ST CLS
CO CD
MAP NO. DOC NUM.MA AC RMV IMP TOTAL RMV SALE PRICE
SALE DATE
# RT
Included Sales
03 31 000 641 33 4N2W17C0 01300
2019-6065 9.48 180,980 140,270 321,250 505,603 Jul-19 1 64
03 31 000 401 33 5N4W23BC 01000
2019-7492 1.31 106,730 184,580 291,310 410,960 Sep-19 2 71
03 31 000 641 141 33 4N2W1700 02203
2019-796 10.09 195,030 216,680 411,710 559,158 Jan-19 3 74
03 31 000 401 33 4N3W13C0 00600
2019-5133 4.49 164,580 308,830 473,410 633,193 Jun-19 4 75
03 31 000 401 33 4N4W3000 00202
2019-4892 3.93 157,890 136,060 293,950 386,823 Jun-19 5 76
03 31 000 641 33 4N2W21A0 00800
2019-7464 9.79 181,000 256,750 437,750 565,345 Sep-19 6 77
-2
0
2
4
6
8
10Sales(Ratio) Sales(After Ratio)
Frequency60 1 0
70 6 2
80 9 5
90 7 8
100 4 8
110 1 2
120 1 3
130 0 0
140 0 1
Median 89 99
AD 10.03 11.41
COD 11.27 11.53Mean 89 100SD 13.50 15.54COV 15.11 15.52Wtd Mean 90 101GeoMean 88 99PRD .99 .9995% Confidence 4.91 5.66
Number Of Sales 29
75
80
85
90
95
100Mean Median Mean Trend Median Trend
Central Tendencies Month Mean Median SalesJan-19 92 92 2
Feb-19 89 89 1
May-19 90 89 3
Jun-19 85 86 5
Jul-19 80 85 3
Sep-19 91 89 6
Oct-19 85 85 2
Nov-19 93 95 3
Dec-19 96 89 4
Sales(Ratio)
Sales(After Ratio)
COLUMBIA County 2020 Ratio Study
186
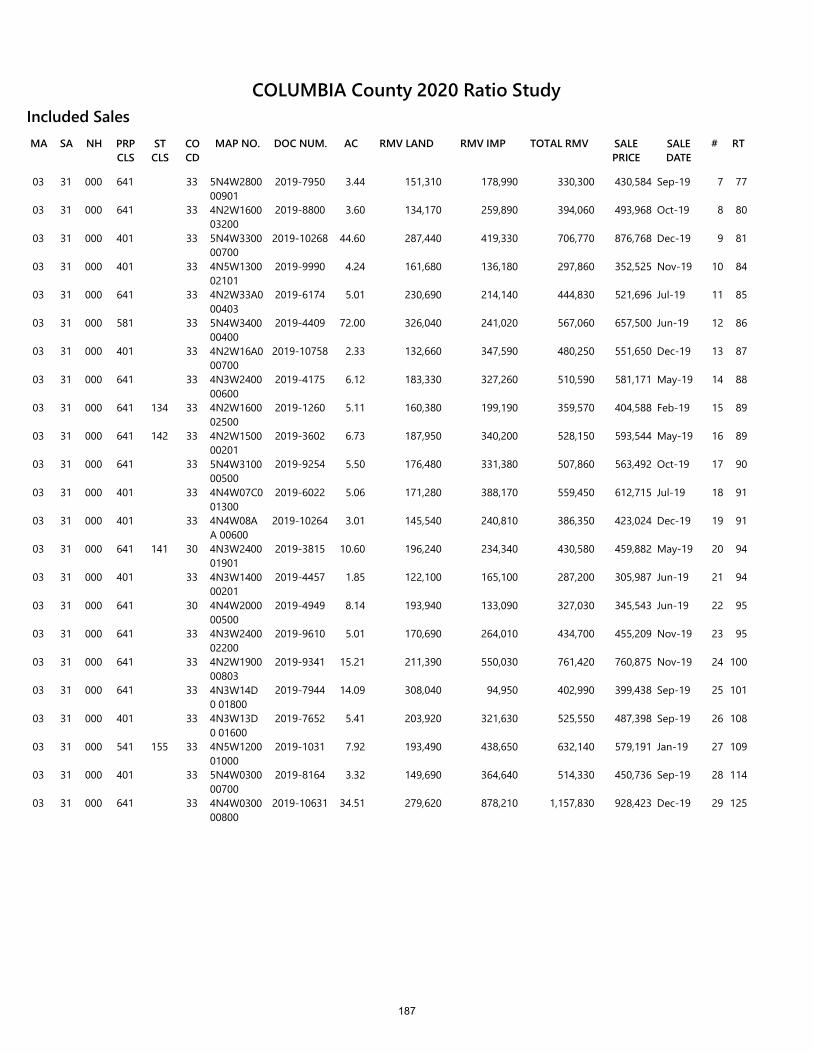
RMV LANDSA NH PRP CLS
ST CLS
CO CD
MAP NO. DOC NUM.MA AC RMV IMP TOTAL RMV SALE PRICE
SALE DATE
# RT
Included Sales
03 31 000 641 33 5N4W2800 00901
2019-7950 3.44 151,310 178,990 330,300 430,584 Sep-19 7 77
03 31 000 641 33 4N2W1600 03200
2019-8800 3.60 134,170 259,890 394,060 493,968 Oct-19 8 80
03 31 000 401 33 5N4W3300 00700
2019-10268 44.60 287,440 419,330 706,770 876,768 Dec-19 9 81
03 31 000 401 33 4N5W1300 02101
2019-9990 4.24 161,680 136,180 297,860 352,525 Nov-19 10 84
03 31 000 641 33 4N2W33A0 00403
2019-6174 5.01 230,690 214,140 444,830 521,696 Jul-19 11 85
03 31 000 581 33 5N4W3400 00400
2019-4409 72.00 326,040 241,020 567,060 657,500 Jun-19 12 86
03 31 000 401 33 4N2W16A0 00700
2019-10758 2.33 132,660 347,590 480,250 551,650 Dec-19 13 87
03 31 000 641 33 4N3W2400 00600
2019-4175 6.12 183,330 327,260 510,590 581,171 May-19 14 88
03 31 000 641 134 33 4N2W1600 02500
2019-1260 5.11 160,380 199,190 359,570 404,588 Feb-19 15 89
03 31 000 641 142 33 4N2W1500 00201
2019-3602 6.73 187,950 340,200 528,150 593,544 May-19 16 89
03 31 000 641 33 5N4W3100 00500
2019-9254 5.50 176,480 331,380 507,860 563,492 Oct-19 17 90
03 31 000 401 33 4N4W07C0 01300
2019-6022 5.06 171,280 388,170 559,450 612,715 Jul-19 18 91
03 31 000 401 33 4N4W08AA 00600
2019-10264 3.01 145,540 240,810 386,350 423,024 Dec-19 19 91
03 31 000 641 141 30 4N3W2400 01901
2019-3815 10.60 196,240 234,340 430,580 459,882 May-19 20 94
03 31 000 401 33 4N3W1400 00201
2019-4457 1.85 122,100 165,100 287,200 305,987 Jun-19 21 94
03 31 000 641 30 4N4W2000 00500
2019-4949 8.14 193,940 133,090 327,030 345,543 Jun-19 22 95
03 31 000 641 33 4N3W2400 02200
2019-9610 5.01 170,690 264,010 434,700 455,209 Nov-19 23 95
03 31 000 641 33 4N2W1900 00803
2019-9341 15.21 211,390 550,030 761,420 760,875 Nov-19 24 100
03 31 000 641 33 4N3W14D0 01800
2019-7944 14.09 308,040 94,950 402,990 399,438 Sep-19 25 101
03 31 000 401 33 4N3W13D0 01600
2019-7652 5.41 203,920 321,630 525,550 487,398 Sep-19 26 108
03 31 000 541 155 33 4N5W1200 01000
2019-1031 7.92 193,490 438,650 632,140 579,191 Jan-19 27 109
03 31 000 401 33 5N4W0300 00700
2019-8164 3.32 149,690 364,640 514,330 450,736 Sep-19 28 114
03 31 000 641 33 4N4W0300 00800
2019-10631 34.51 279,620 878,210 1,157,830 928,423 Dec-19 29 125
COLUMBIA County 2020 Ratio Study
187
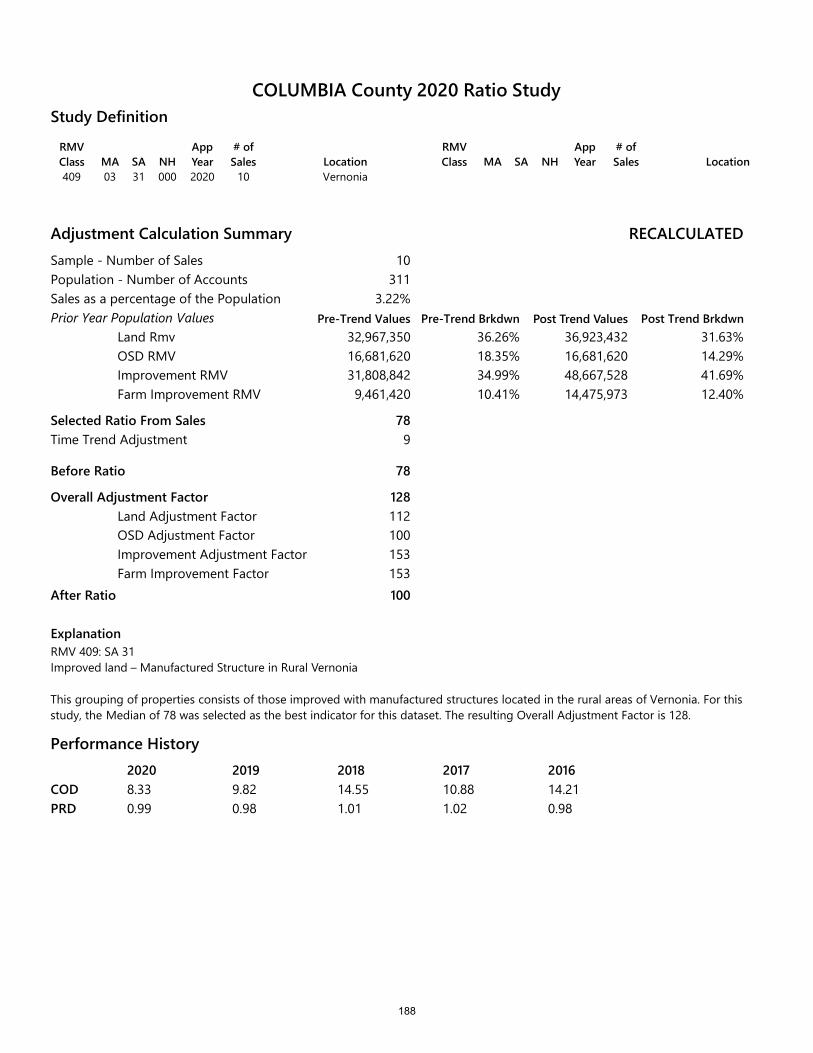
RMV Class MA SA NH
App Year
# of Sales Location
409 03 31 000 2020 10 Vernonia
RMV Class MA SA NH
App Year
# of Sales Location
Study Definition
Adjustment Calculation SummarySample - Number of SalesPopulation - Number of AccountsSales as a percentage of the PopulationPrior Year Population Values
Land RmvOSD RMVImprovement RMVFarm Improvement RMV
Selected Ratio From Sales
Before Ratio
Overall Adjustment FactorLand Adjustment FactorOSD Adjustment FactorImprovement Adjustment FactorFarm Improvement Factor
After Ratio
ExplanationRMV 409: SA 31Improved land – Manufactured Structure in Rural Vernonia
RECALCULATED
Pre-Trend Brkdwn Post Trend Values Post Trend Brkdwn
10311
3.22%
32,967,350 36.26% 36,923,432 31.63%16,681,62031,808,8429,461,420
18.35% 16,681,620 14.29%34.99% 48,667,528 41.69%10.41% 14,475,973 12.40%
78
78
128112100153153100
Time Trend Adjustment 9
This grouping of properties consists of those improved with manufactured structures located in the rural areas of Vernonia. For this study, the Median of 78 was selected as the best indicator for this dataset. The resulting Overall Adjustment Factor is 128.
Performance History2020 2019 2018 2017 20168.33 9.82 14.55 10.88 14.210.99 0.98 1.01 1.02 0.98
CODPRD
COLUMBIA County 2020 Ratio Study
Pre-Trend Values
188
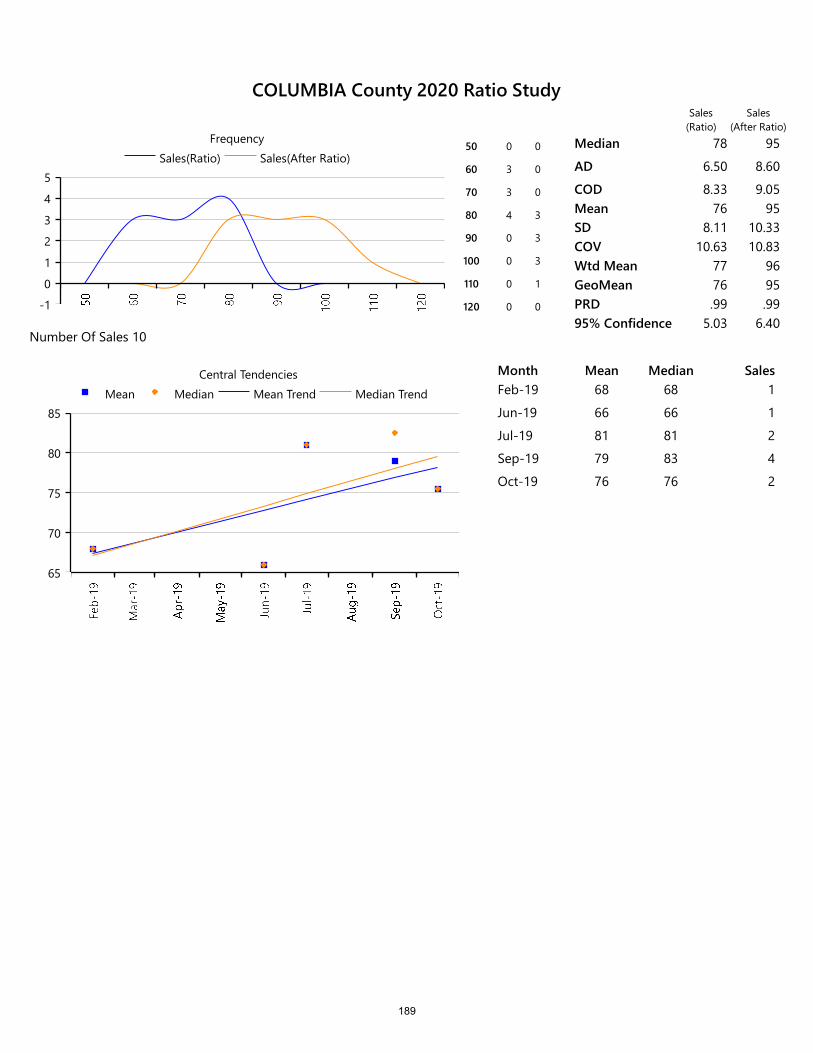
-1
0
1
2
3
4
5Sales(Ratio) Sales(After Ratio)
Frequency50 0 0
60 3 0
70 3 0
80 4 3
90 0 3
100 0 3
110 0 1
120 0 0
Median 78 95
AD 6.50 8.60
COD 8.33 9.05Mean 76 95SD 8.11 10.33COV 10.63 10.83Wtd Mean 77 96GeoMean 76 95PRD .99 .9995% Confidence 5.03 6.40
Number Of Sales 10
65
70
75
80
85Mean Median Mean Trend Median Trend
Central Tendencies Month Mean Median SalesFeb-19 68 68 1
Jun-19 66 66 1
Jul-19 81 81 2
Sep-19 79 83 4
Oct-19 76 76 2
Sales(Ratio)
Sales(After Ratio)
COLUMBIA County 2020 Ratio Study
189
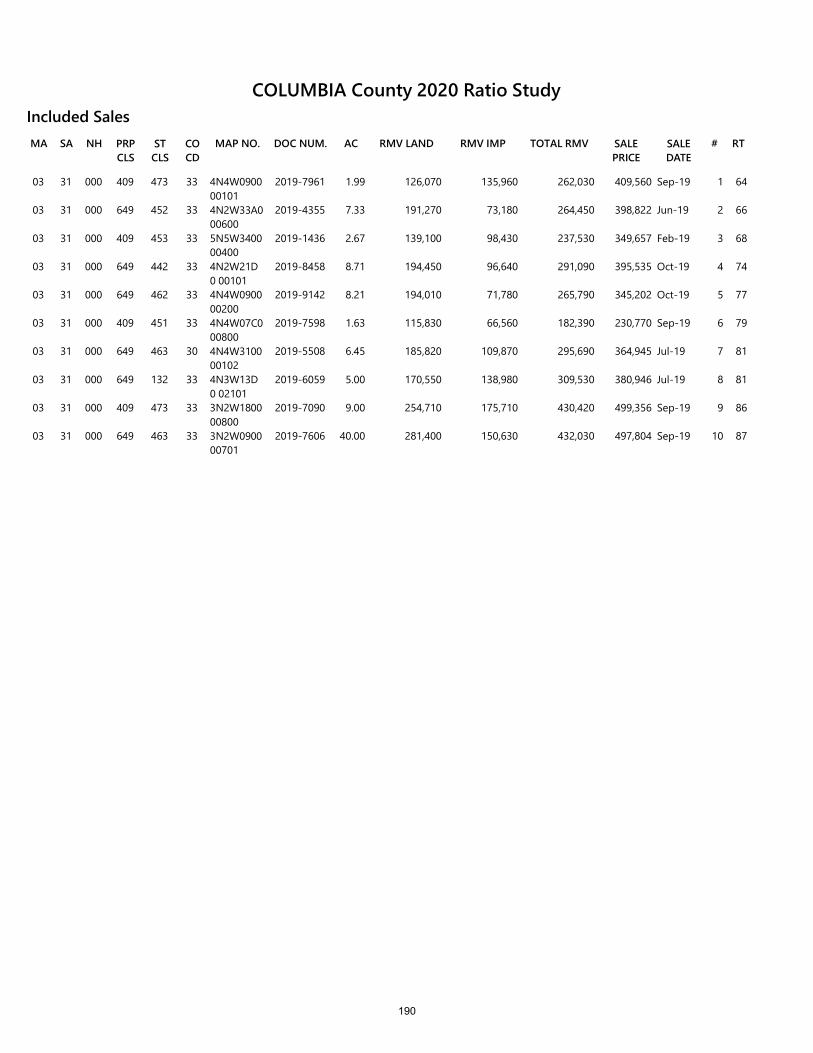
RMV LANDSA NH PRP CLS
ST CLS
CO CD
MAP NO. DOC NUM.MA AC RMV IMP TOTAL RMV SALE PRICE
SALE DATE
# RT
Included Sales
03 31 000 409 473 33 4N4W0900 00101
2019-7961 1.99 126,070 135,960 262,030 409,560 Sep-19 1 64
03 31 000 649 452 33 4N2W33A0 00600
2019-4355 7.33 191,270 73,180 264,450 398,822 Jun-19 2 66
03 31 000 409 453 33 5N5W3400 00400
2019-1436 2.67 139,100 98,430 237,530 349,657 Feb-19 3 68
03 31 000 649 442 33 4N2W21D0 00101
2019-8458 8.71 194,450 96,640 291,090 395,535 Oct-19 4 74
03 31 000 649 462 33 4N4W0900 00200
2019-9142 8.21 194,010 71,780 265,790 345,202 Oct-19 5 77
03 31 000 409 451 33 4N4W07C0 00800
2019-7598 1.63 115,830 66,560 182,390 230,770 Sep-19 6 79
03 31 000 649 463 30 4N4W3100 00102
2019-5508 6.45 185,820 109,870 295,690 364,945 Jul-19 7 81
03 31 000 649 132 33 4N3W13D0 02101
2019-6059 5.00 170,550 138,980 309,530 380,946 Jul-19 8 81
03 31 000 409 473 33 3N2W1800 00800
2019-7090 9.00 254,710 175,710 430,420 499,356 Sep-19 9 86
03 31 000 649 463 33 3N2W0900 00701
2019-7606 40.00 281,400 150,630 432,030 497,804 Sep-19 10 87
COLUMBIA County 2020 Ratio Study
190

MAINTENANCE AREA 4
RAINIER & DEER ISLAND
191
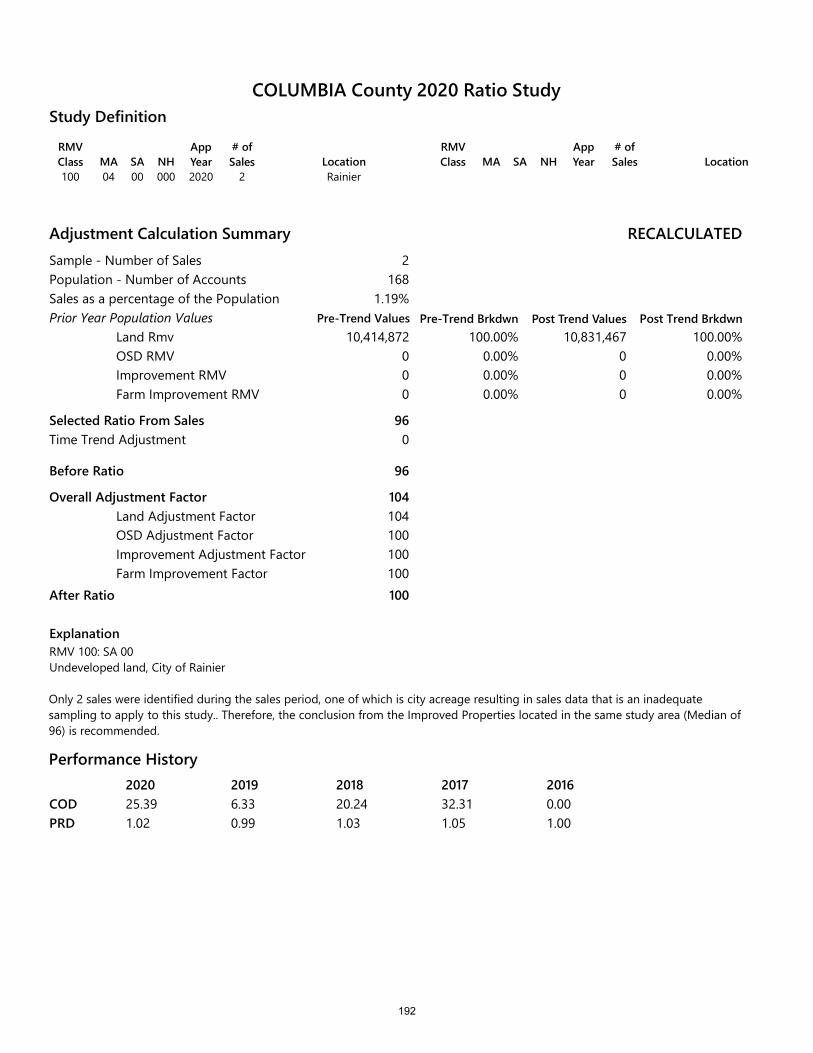
RMV Class MA SA NH
App Year
# of Sales Location
100 04 00 000 2020 2 Rainier
RMV Class MA SA NH
App Year
# of Sales Location
Study Definition
Adjustment Calculation SummarySample - Number of SalesPopulation - Number of AccountsSales as a percentage of the PopulationPrior Year Population Values
Land RmvOSD RMVImprovement RMVFarm Improvement RMV
Selected Ratio From Sales
Before Ratio
Overall Adjustment FactorLand Adjustment FactorOSD Adjustment FactorImprovement Adjustment FactorFarm Improvement Factor
After Ratio
ExplanationRMV 100: SA 00Undeveloped land, City of Rainier
RECALCULATED
Pre-Trend Brkdwn Post Trend Values Post Trend Brkdwn
2168
1.19%
10,414,872 100.00% 10,831,467 100.00%000
0.00% 0 0.00%0.00% 0 0.00%0.00% 0 0.00%
96
96
104104100100100100
Time Trend Adjustment 0
Only 2 sales were identified during the sales period, one of which is city acreage resulting in sales data that is an inadequate sampling to apply to this study.. Therefore, the conclusion from the Improved Properties located in the same study area (Median of 96) is recommended.
Performance History2020 2019 2018 2017 201625.39 6.33 20.24 32.31 0.001.02 0.99 1.03 1.05 1.00
CODPRD
COLUMBIA County 2020 Ratio Study
Pre-Trend Values
192
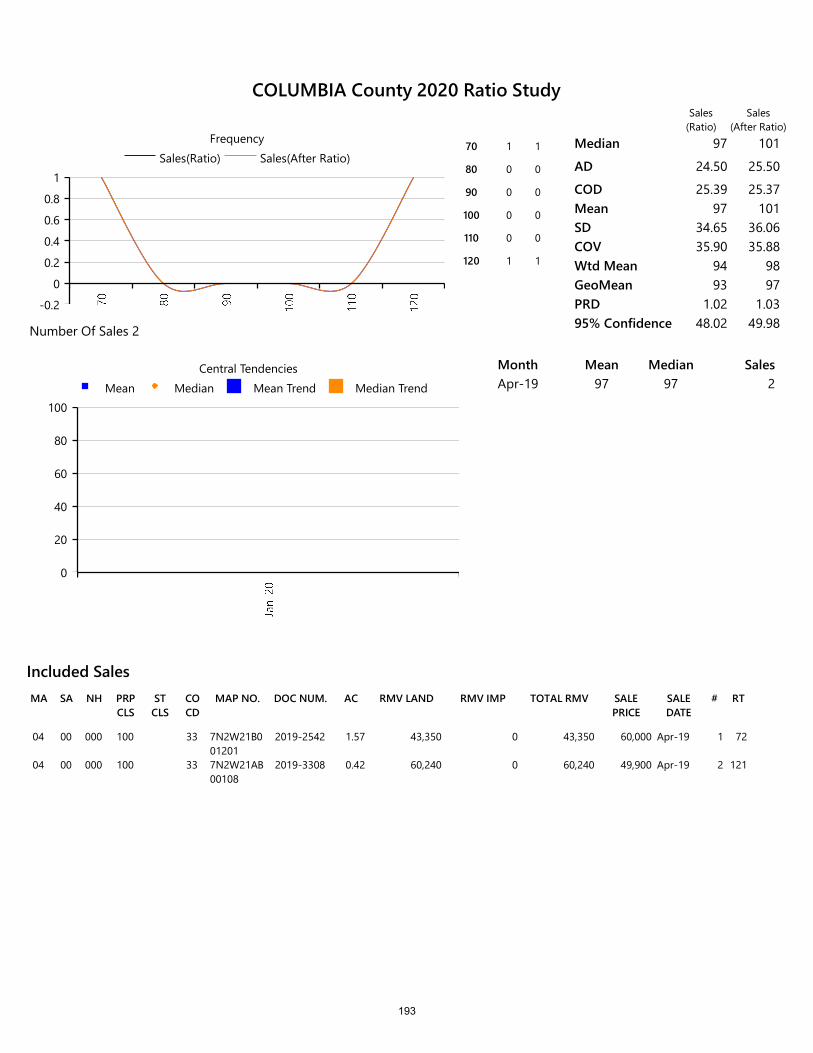
RMV LANDSA NH PRP CLS
ST CLS
CO CD
MAP NO. DOC NUM.MA AC RMV IMP TOTAL RMV SALE PRICE
SALE DATE
# RT
Included Sales
04 00 000 100 33 7N2W21B0 01201
2019-2542 1.57 43,350 0 43,350 60,000 Apr-19 1 72
04 00 000 100 33 7N2W21AB 00108
2019-3308 0.42 60,240 0 60,240 49,900 Apr-19 2 121
-0.2
0
0.2
0.4
0.6
0.8
1Sales(Ratio) Sales(After Ratio)
Frequency70 1 1
80 0 0
90 0 0
100 0 0
110 0 0
120 1 1
Median 97 101
AD 24.50 25.50
COD 25.39 25.37Mean 97 101SD 34.65 36.06COV 35.90 35.88Wtd Mean 94 98GeoMean 93 97PRD 1.02 1.0395% Confidence 48.02 49.98Number Of Sales 2
0
20
40
60
80
100Mean Median Mean Trend Median Trend
Central Tendencies Month Mean Median SalesApr-19 97 97 2
Sales(Ratio)
Sales(After Ratio)
COLUMBIA County 2020 Ratio Study
193
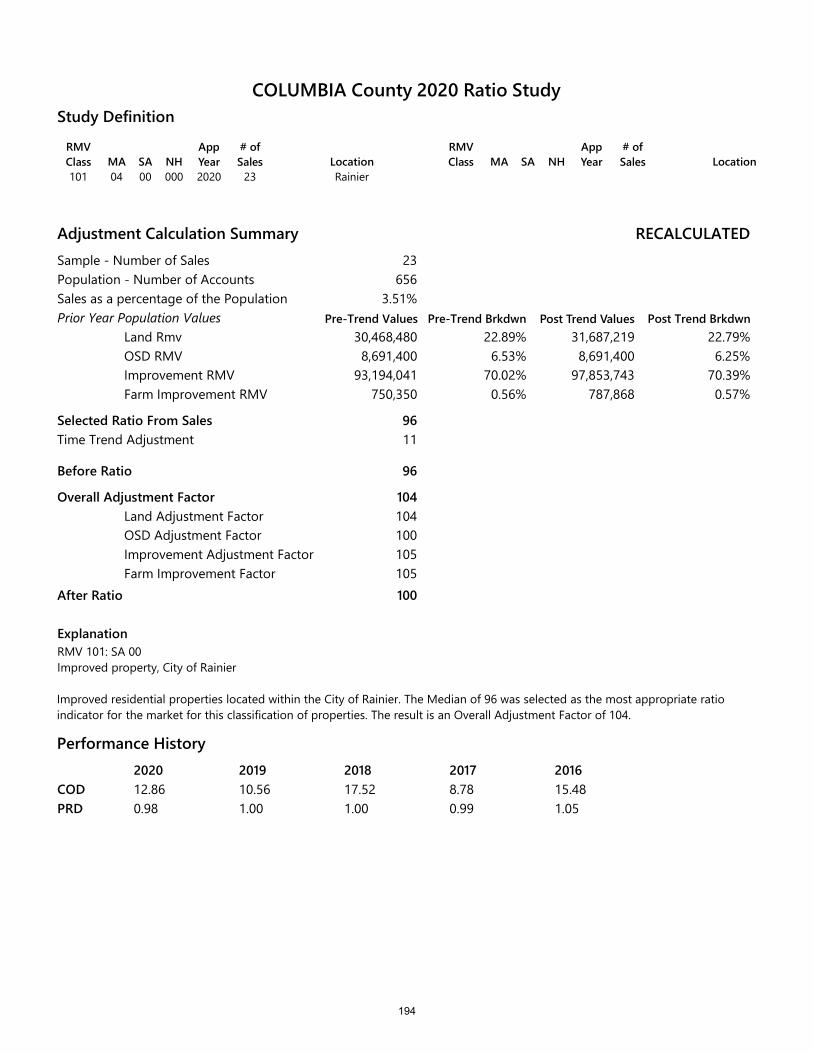
RMV Class MA SA NH
App Year
# of Sales Location
101 04 00 000 2020 23 Rainier
RMV Class MA SA NH
App Year
# of Sales Location
Study Definition
Adjustment Calculation SummarySample - Number of SalesPopulation - Number of AccountsSales as a percentage of the PopulationPrior Year Population Values
Land RmvOSD RMVImprovement RMVFarm Improvement RMV
Selected Ratio From Sales
Before Ratio
Overall Adjustment FactorLand Adjustment FactorOSD Adjustment FactorImprovement Adjustment FactorFarm Improvement Factor
After Ratio
ExplanationRMV 101: SA 00Improved property, City of Rainier
RECALCULATED
Pre-Trend Brkdwn Post Trend Values Post Trend Brkdwn
23656
3.51%
30,468,480 22.89% 31,687,219 22.79%8,691,400
93,194,041750,350
6.53% 8,691,400 6.25%70.02% 97,853,743 70.39%0.56% 787,868 0.57%
96
96
104104100105105100
Time Trend Adjustment 11
Improved residential properties located within the City of Rainier. The Median of 96 was selected as the most appropriate ratio indicator for the market for this classification of properties. The result is an Overall Adjustment Factor of 104.
Performance History2020 2019 2018 2017 201612.86 10.56 17.52 8.78 15.480.98 1.00 1.00 0.99 1.05
CODPRD
COLUMBIA County 2020 Ratio Study
Pre-Trend Values
194

0
2
4
6
8Sales(Ratio) Sales(After Ratio)
Frequency60 0 0
70 3 1
80 7 7
90 2 3
100 6 6
110 4 3
120 1 3
130 0 0
Median 96 100
AD 12.35 12.91
COD 12.86 12.91Mean 96 100SD 14.31 14.93COV 14.88 14.87Wtd Mean 98 102GeoMean 95 99PRD .98 .9895% Confidence 5.85 6.10
Number Of Sales 23
70
80
90
100
110
120Mean Median Mean Trend Median Trend
Central Tendencies Month Mean Median SalesFeb-19 98 98 2
Mar-19 105 105 2
Apr-19 104 101 3
May-19 97 98 4
Jun-19 99 99 2
Jul-19 79 78 3
Aug-19 113 113 1
Sep-19 84 84 1
Oct-19 85 85 1
Nov-19 102 102 1
Dec-19 96 101 3
Sales(Ratio)
Sales(After Ratio)
COLUMBIA County 2020 Ratio Study
195
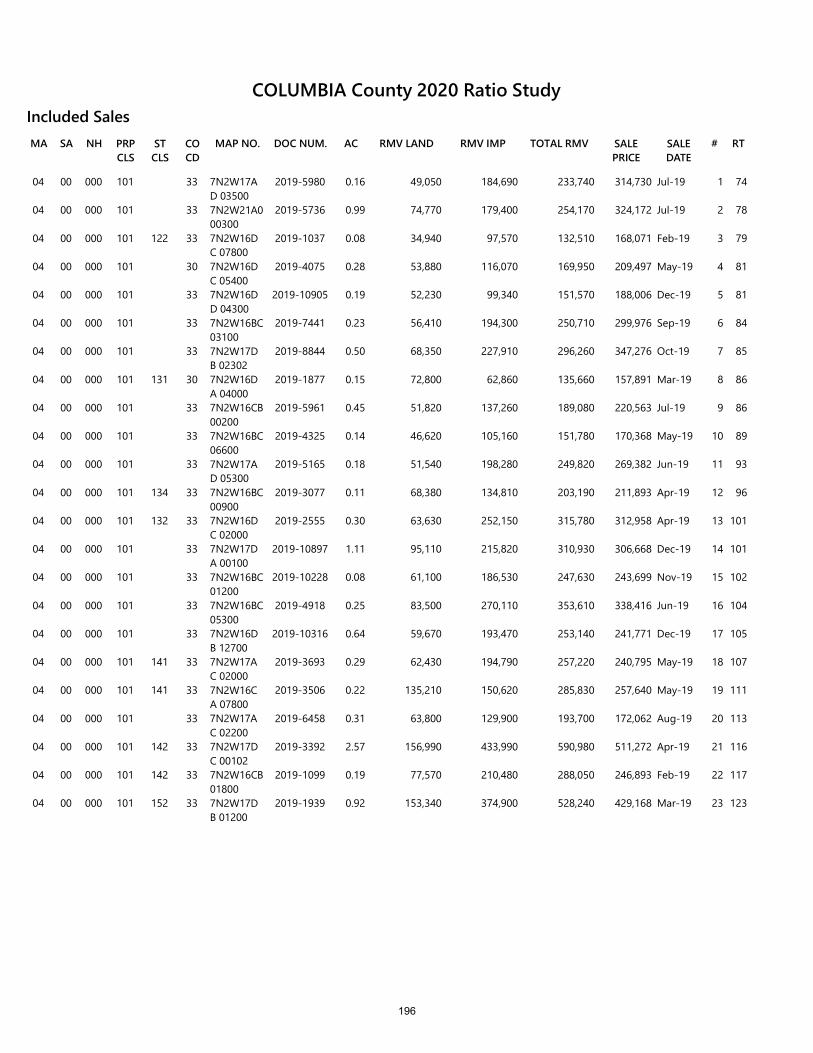
RMV LANDSA NH PRP CLS
ST CLS
CO CD
MAP NO. DOC NUM.MA AC RMV IMP TOTAL RMV SALE PRICE
SALE DATE
# RT
Included Sales
04 00 000 101 33 7N2W17AD 03500
2019-5980 0.16 49,050 184,690 233,740 314,730 Jul-19 1 74
04 00 000 101 33 7N2W21A0 00300
2019-5736 0.99 74,770 179,400 254,170 324,172 Jul-19 2 78
04 00 000 101 122 33 7N2W16DC 07800
2019-1037 0.08 34,940 97,570 132,510 168,071 Feb-19 3 79
04 00 000 101 30 7N2W16DC 05400
2019-4075 0.28 53,880 116,070 169,950 209,497 May-19 4 81
04 00 000 101 33 7N2W16DD 04300
2019-10905 0.19 52,230 99,340 151,570 188,006 Dec-19 5 81
04 00 000 101 33 7N2W16BC 03100
2019-7441 0.23 56,410 194,300 250,710 299,976 Sep-19 6 84
04 00 000 101 33 7N2W17DB 02302
2019-8844 0.50 68,350 227,910 296,260 347,276 Oct-19 7 85
04 00 000 101 131 30 7N2W16DA 04000
2019-1877 0.15 72,800 62,860 135,660 157,891 Mar-19 8 86
04 00 000 101 33 7N2W16CB 00200
2019-5961 0.45 51,820 137,260 189,080 220,563 Jul-19 9 86
04 00 000 101 33 7N2W16BC 06600
2019-4325 0.14 46,620 105,160 151,780 170,368 May-19 10 89
04 00 000 101 33 7N2W17AD 05300
2019-5165 0.18 51,540 198,280 249,820 269,382 Jun-19 11 93
04 00 000 101 134 33 7N2W16BC 00900
2019-3077 0.11 68,380 134,810 203,190 211,893 Apr-19 12 96
04 00 000 101 132 33 7N2W16DC 02000
2019-2555 0.30 63,630 252,150 315,780 312,958 Apr-19 13 101
04 00 000 101 33 7N2W17DA 00100
2019-10897 1.11 95,110 215,820 310,930 306,668 Dec-19 14 101
04 00 000 101 33 7N2W16BC 01200
2019-10228 0.08 61,100 186,530 247,630 243,699 Nov-19 15 102
04 00 000 101 33 7N2W16BC 05300
2019-4918 0.25 83,500 270,110 353,610 338,416 Jun-19 16 104
04 00 000 101 33 7N2W16DB 12700
2019-10316 0.64 59,670 193,470 253,140 241,771 Dec-19 17 105
04 00 000 101 141 33 7N2W17AC 02000
2019-3693 0.29 62,430 194,790 257,220 240,795 May-19 18 107
04 00 000 101 141 33 7N2W16CA 07800
2019-3506 0.22 135,210 150,620 285,830 257,640 May-19 19 111
04 00 000 101 33 7N2W17AC 02200
2019-6458 0.31 63,800 129,900 193,700 172,062 Aug-19 20 113
04 00 000 101 142 33 7N2W17DC 00102
2019-3392 2.57 156,990 433,990 590,980 511,272 Apr-19 21 116
04 00 000 101 142 33 7N2W16CB 01800
2019-1099 0.19 77,570 210,480 288,050 246,893 Feb-19 22 117
04 00 000 101 152 33 7N2W17DB 01200
2019-1939 0.92 153,340 374,900 528,240 429,168 Mar-19 23 123
COLUMBIA County 2020 Ratio Study
196
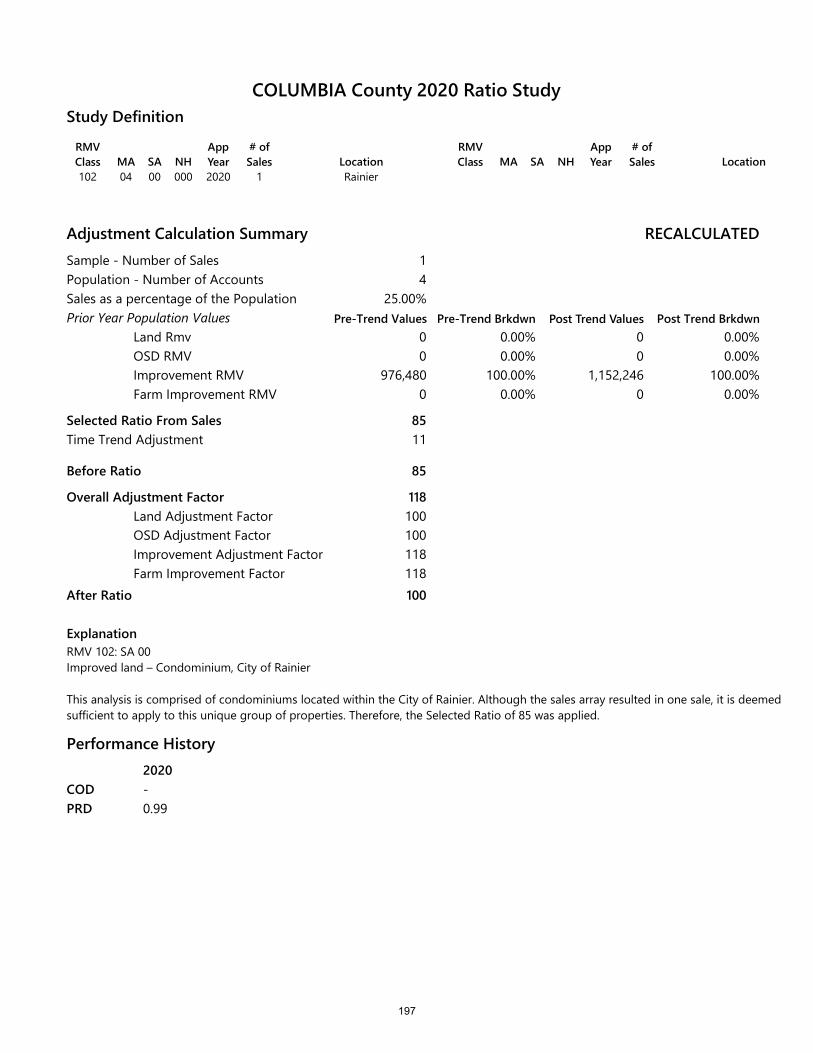
RMV Class MA SA NH
App Year
# of Sales Location
102 04 00 000 2020 1 Rainier
RMV Class MA SA NH
App Year
# of Sales Location
Study Definition
Adjustment Calculation SummarySample - Number of SalesPopulation - Number of AccountsSales as a percentage of the PopulationPrior Year Population Values
Land RmvOSD RMVImprovement RMVFarm Improvement RMV
Selected Ratio From Sales
Before Ratio
Overall Adjustment FactorLand Adjustment FactorOSD Adjustment FactorImprovement Adjustment FactorFarm Improvement Factor
After Ratio
ExplanationRMV 102: SA 00Improved land – Condominium, City of Rainier
This analysis is comprised of condominiums located within the City of Rainier. Although the sales array resulted in one sale, it is deemed sufficient to apply to this unique group of properties. Therefore, the Selected Ratio of 85 was applied.
RECALCULATED
Pre-Trend Brkdwn Post Trend Values Post Trend Brkdwn
14
25.00%
0 0.00% 0 0.00%0
976,4800
0.00% 0 0.00%100.00% 1,152,246 100.00%
0.00% 0 0.00%
85
85
118100100118118100
Time Trend Adjustment 11
Performance History2020-0.99
CODPRD
COLUMBIA County 2020 Ratio Study
Pre-Trend Values
197
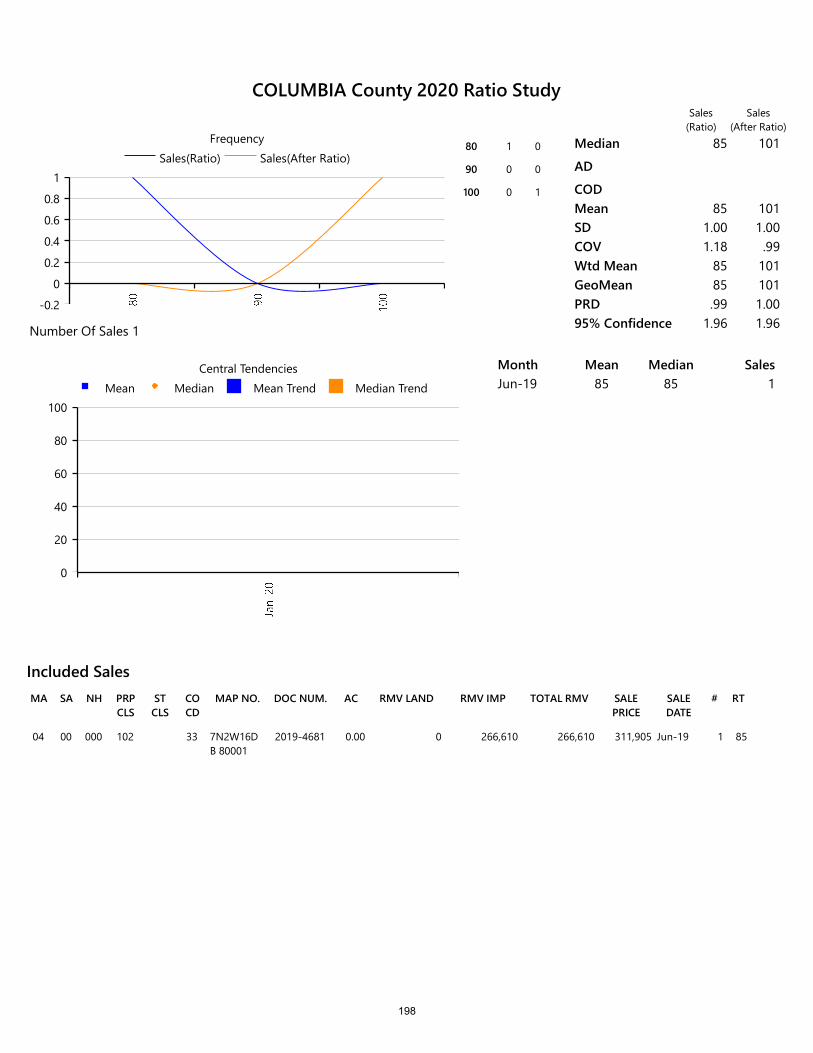
RMV LANDSA NH PRP CLS
ST CLS
CO CD
MAP NO. DOC NUM.MA AC RMV IMP TOTAL RMV SALE PRICE
SALE DATE
# RT
Included Sales
04 00 000 102 33 7N2W16DB 80001
2019-4681 0.00 0 266,610 266,610 311,905 Jun-19 1 85
-0.2
0
0.2
0.4
0.6
0.8
1Sales(Ratio) Sales(After Ratio)
Frequency80 1 0
90 0 0
100 0 1
Median 85 101
AD
CODMean 85 101SD 1.00 1.00COV 1.18 .99Wtd Mean 85 101GeoMean 85 101PRD .99 1.0095% Confidence 1.96 1.96Number Of Sales 1
0
20
40
60
80
100Mean Median Mean Trend Median Trend
Central Tendencies Month Mean Median SalesJun-19 85 85 1
Sales(Ratio)
Sales(After Ratio)
COLUMBIA County 2020 Ratio Study
198
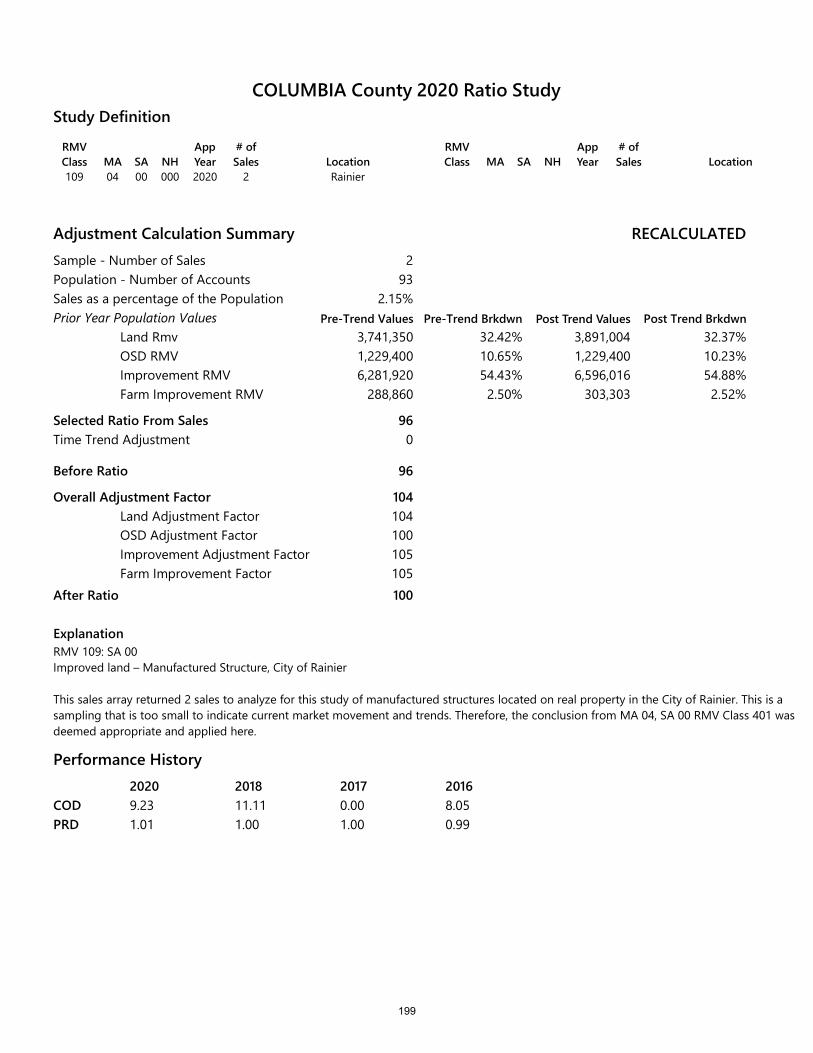
RMV Class MA SA NH
App Year
# of Sales Location
109 04 00 000 2020 2 Rainier
RMV Class MA SA NH
App Year
# of Sales Location
Study Definition
Adjustment Calculation SummarySample - Number of SalesPopulation - Number of AccountsSales as a percentage of the PopulationPrior Year Population Values
Land RmvOSD RMVImprovement RMVFarm Improvement RMV
Selected Ratio From Sales
Before Ratio
Overall Adjustment FactorLand Adjustment FactorOSD Adjustment FactorImprovement Adjustment FactorFarm Improvement Factor
After Ratio
ExplanationRMV 109: SA 00Improved land – Manufactured Structure, City of Rainier
This sales array returned 2 sales to analyze for this study of manufactured structures located on real property in the City of Rainier. This is a sampling that is too small to indicate current market movement and trends. Therefore, the conclusion from MA 04, SA 00 RMV Class 401 was deemed appropriate and applied here.
RECALCULATED
Pre-Trend Brkdwn Post Trend Values Post Trend Brkdwn
293
2.15%
3,741,350 32.42% 3,891,004 32.37%1,229,4006,281,920
288,860
10.65% 1,229,400 10.23%54.43% 6,596,016 54.88%2.50% 303,303 2.52%
96
96
104104100105105100
Time Trend Adjustment 0
Performance History2020 2018 2017 20169.23 11.11 0.00 8.051.01 1.00 1.00 0.99
CODPRD
COLUMBIA County 2020 Ratio Study
Pre-Trend Values
199
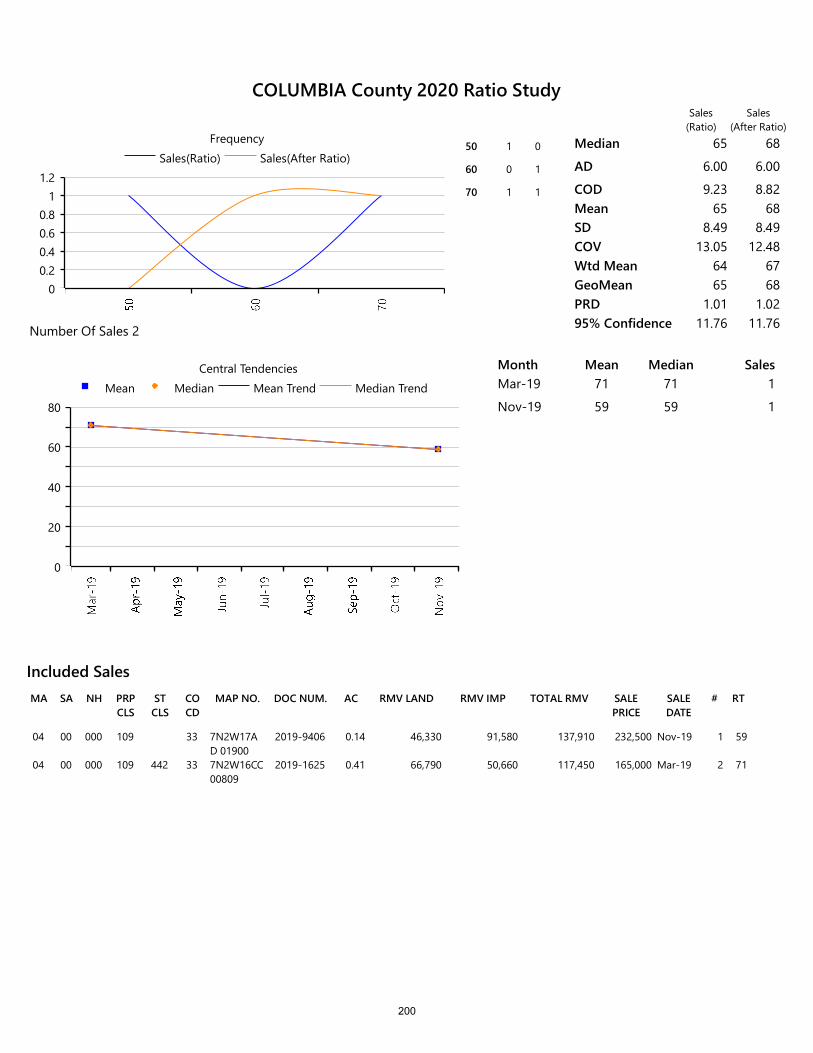
RMV LANDSA NH PRP CLS
ST CLS
CO CD
MAP NO. DOC NUM.MA AC RMV IMP TOTAL RMV SALE PRICE
SALE DATE
# RT
Included Sales
04 00 000 109 33 7N2W17AD 01900
2019-9406 0.14 46,330 91,580 137,910 232,500 Nov-19 1 59
04 00 000 109 442 33 7N2W16CC 00809
2019-1625 0.41 66,790 50,660 117,450 165,000 Mar-19 2 71
00.20.40.60.8
11.2
Sales(Ratio) Sales(After Ratio)Frequency
50 1 0
60 0 1
70 1 1
Median 65 68
AD 6.00 6.00
COD 9.23 8.82Mean 65 68SD 8.49 8.49COV 13.05 12.48Wtd Mean 64 67GeoMean 65 68PRD 1.01 1.0295% Confidence 11.76 11.76Number Of Sales 2
0
20
40
60
80Mean Median Mean Trend Median Trend
Central Tendencies Month Mean Median SalesMar-19 71 71 1
Nov-19 59 59 1
Sales(Ratio)
Sales(After Ratio)
COLUMBIA County 2020 Ratio Study
200
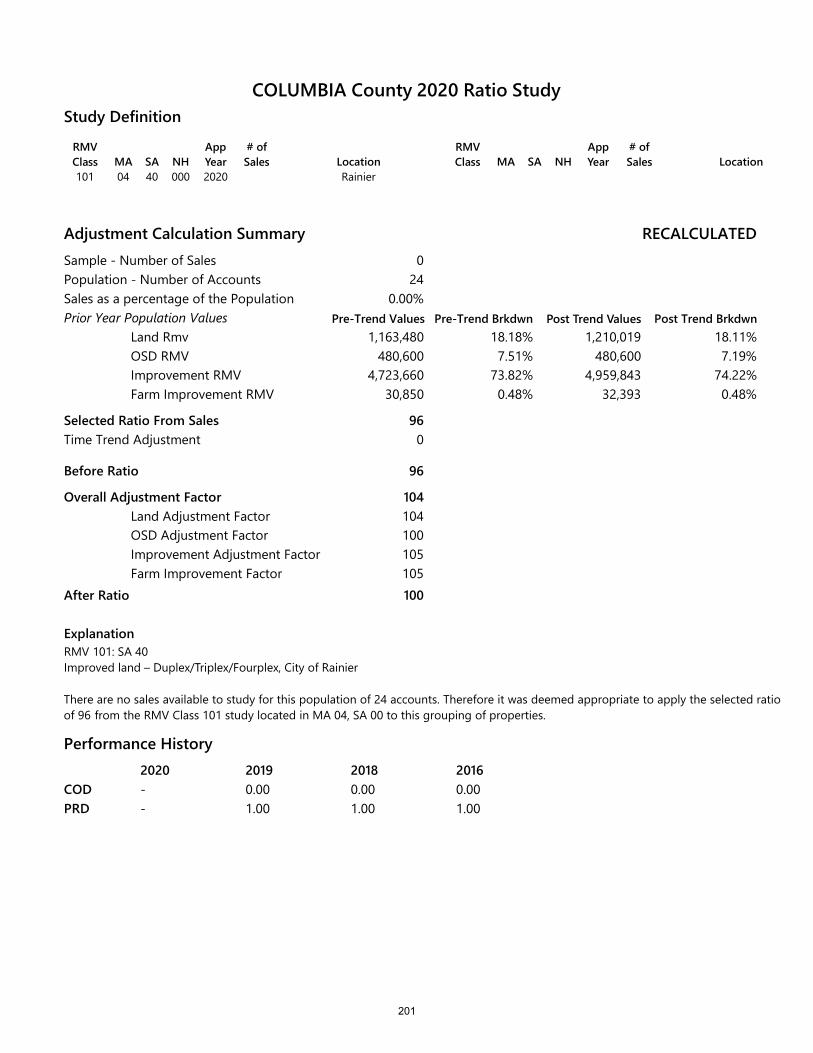
RMV Class MA SA NH
App Year
# of Sales Location
101 04 40 000 2020 Rainier
RMV Class MA SA NH
App Year
# of Sales Location
Study Definition
Adjustment Calculation SummarySample - Number of SalesPopulation - Number of AccountsSales as a percentage of the PopulationPrior Year Population Values
Land RmvOSD RMVImprovement RMVFarm Improvement RMV
Selected Ratio From Sales
Before Ratio
Overall Adjustment FactorLand Adjustment FactorOSD Adjustment FactorImprovement Adjustment FactorFarm Improvement Factor
After Ratio
ExplanationRMV 101: SA 40Improved land – Duplex/Triplex/Fourplex, City of Rainier
RECALCULATED
Pre-Trend Brkdwn Post Trend Values Post Trend Brkdwn
024
0.00%
1,163,480 18.18% 1,210,019 18.11%480,600
4,723,66030,850
7.51% 480,600 7.19%73.82% 4,959,843 74.22%0.48% 32,393 0.48%
96
96
104104100105105100
Time Trend Adjustment 0
There are no sales available to study for this population of 24 accounts. Therefore it was deemed appropriate to apply the selected ratio of 96 from the RMV Class 101 study located in MA 04, SA 00 to this grouping of properties.
Performance History2020 2019 2018 2016- 0.00 0.00 0.00- 1.00 1.00 1.00
CODPRD
COLUMBIA County 2020 Ratio Study
Pre-Trend Values
201

0
1Sales(Ratio) Sales(After Ratio)
Frequency Median
AD
CODMeanSDCOVWtd MeanGeoMeanPRD95% ConfidenceNumber Of Sales 0
0
1Mean Median Mean Trend Median Trend
Central Tendencies Month Mean Median Sales
Sales(Ratio)
Sales(After Ratio)
COLUMBIA County 2020 Ratio Study
202
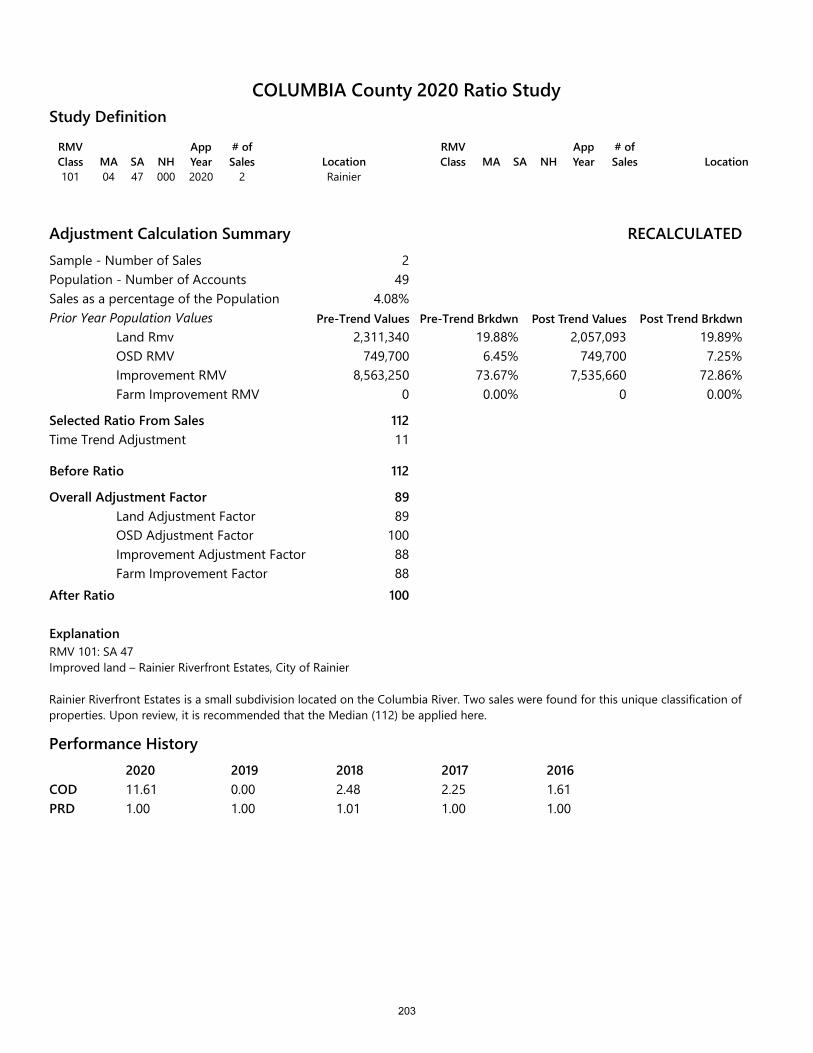
RMV Class MA SA NH
App Year
# of Sales Location
101 04 47 000 2020 2 Rainier
RMV Class MA SA NH
App Year
# of Sales Location
Study Definition
Adjustment Calculation SummarySample - Number of SalesPopulation - Number of AccountsSales as a percentage of the PopulationPrior Year Population Values
Land RmvOSD RMVImprovement RMVFarm Improvement RMV
Selected Ratio From Sales
Before Ratio
Overall Adjustment FactorLand Adjustment FactorOSD Adjustment FactorImprovement Adjustment FactorFarm Improvement Factor
After Ratio
ExplanationRMV 101: SA 47Improved land – Rainier Riverfront Estates, City of Rainier
RECALCULATED
Pre-Trend Brkdwn Post Trend Values Post Trend Brkdwn
249
4.08%
2,311,340 19.88% 2,057,093 19.89%749,700
8,563,2500
6.45% 749,700 7.25%73.67% 7,535,660 72.86%0.00% 0 0.00%
112
112
8989
1008888
100
Time Trend Adjustment 11
Rainier Riverfront Estates is a small subdivision located on the Columbia River. Two sales were found for this unique classification of properties. Upon review, it is recommended that the Median (112) be applied here.
Performance History2020 2019 2018 2017 201611.61 0.00 2.48 2.25 1.611.00 1.00 1.01 1.00 1.00
CODPRD
COLUMBIA County 2020 Ratio Study
Pre-Trend Values
203
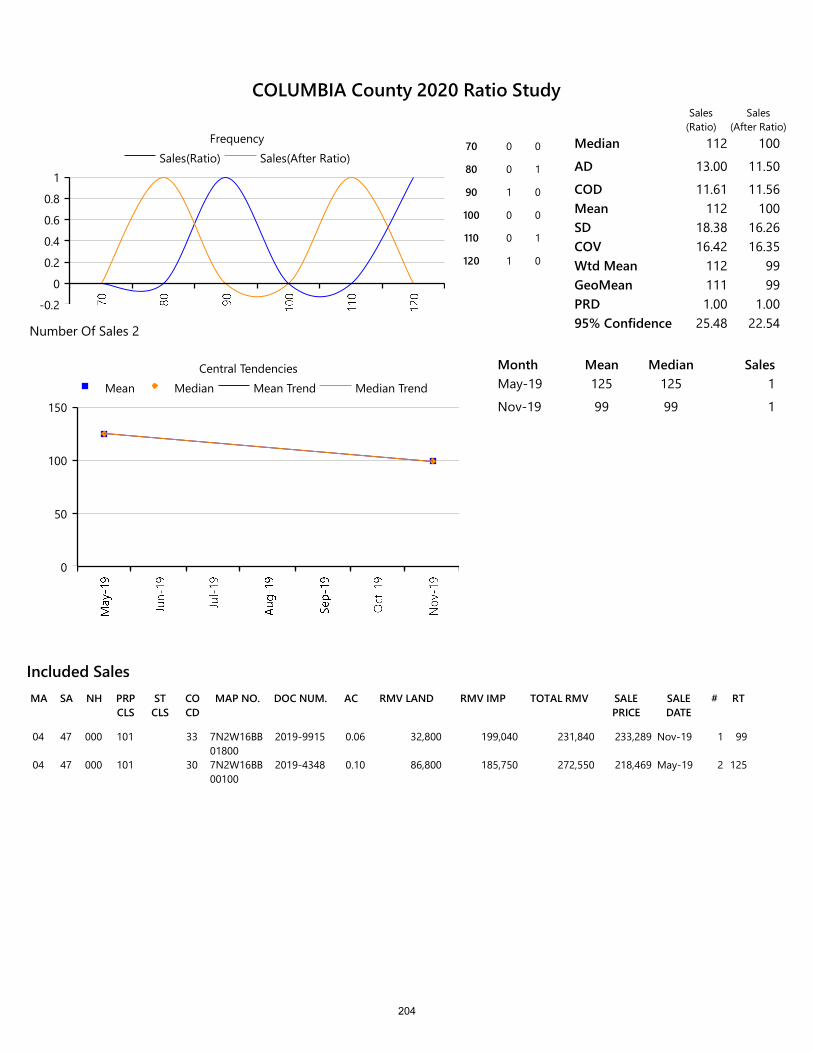
RMV LANDSA NH PRP CLS
ST CLS
CO CD
MAP NO. DOC NUM.MA AC RMV IMP TOTAL RMV SALE PRICE
SALE DATE
# RT
Included Sales
04 47 000 101 33 7N2W16BB 01800
2019-9915 0.06 32,800 199,040 231,840 233,289 Nov-19 1 99
04 47 000 101 30 7N2W16BB 00100
2019-4348 0.10 86,800 185,750 272,550 218,469 May-19 2 125
-0.2
0
0.2
0.4
0.6
0.8
1Sales(Ratio) Sales(After Ratio)
Frequency70 0 0
80 0 1
90 1 0
100 0 0
110 0 1
120 1 0
Median 112 100
AD 13.00 11.50
COD 11.61 11.56Mean 112 100SD 18.38 16.26COV 16.42 16.35Wtd Mean 112 99GeoMean 111 99PRD 1.00 1.0095% Confidence 25.48 22.54Number Of Sales 2
0
50
100
150Mean Median Mean Trend Median Trend
Central Tendencies Month Mean Median SalesMay-19 125 125 1
Nov-19 99 99 1
Sales(Ratio)
Sales(After Ratio)
COLUMBIA County 2020 Ratio Study
204
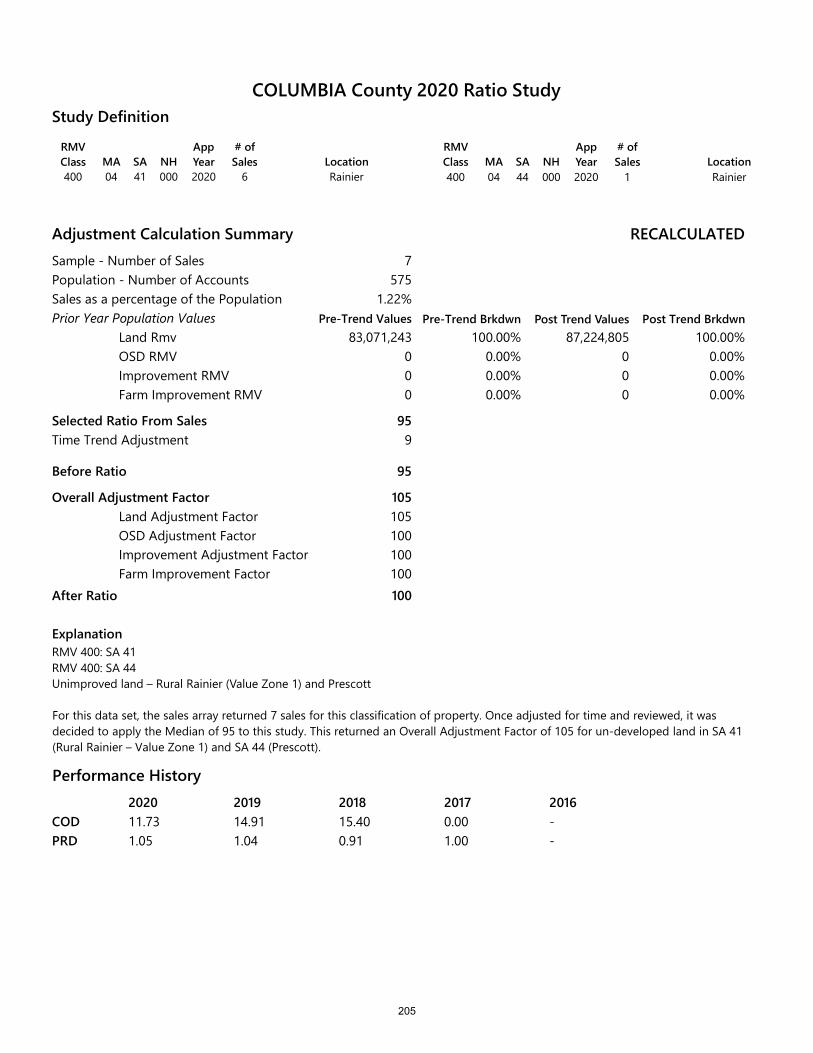
RMV Class MA SA NH
App Year
# of Sales Location
400 04 41 000 2020 6 Rainier
RMV Class MA SA NH
App Year
# of Sales Location
400 04 44 000 2020 1 Rainier
Study Definition
Adjustment Calculation SummarySample - Number of SalesPopulation - Number of AccountsSales as a percentage of the PopulationPrior Year Population Values
Land RmvOSD RMVImprovement RMVFarm Improvement RMV
Selected Ratio From Sales
Before Ratio
Overall Adjustment FactorLand Adjustment FactorOSD Adjustment FactorImprovement Adjustment FactorFarm Improvement Factor
After Ratio
ExplanationRMV 400: SA 41 RMV 400: SA 44Unimproved land – Rural Rainier (Value Zone 1) and Prescott
RECALCULATED
Pre-Trend Brkdwn Post Trend Values Post Trend Brkdwn
7575
1.22%
83,071,243 100.00% 87,224,805 100.00%000
0.00% 0 0.00%0.00% 0 0.00%0.00% 0 0.00%
95
95
105105100100100100
Time Trend Adjustment 9
For this data set, the sales array returned 7 sales for this classification of property. Once adjusted for time and reviewed, it was decided to apply the Median of 95 to this study. This returned an Overall Adjustment Factor of 105 for un-developed land in SA 41 (Rural Rainier – Value Zone 1) and SA 44 (Prescott).
Performance History2020 2019 2018 2017 201611.73 14.91 15.40 0.00 -1.05 1.04 0.91 1.00 -
CODPRD
COLUMBIA County 2020 Ratio Study
Pre-Trend Values
205
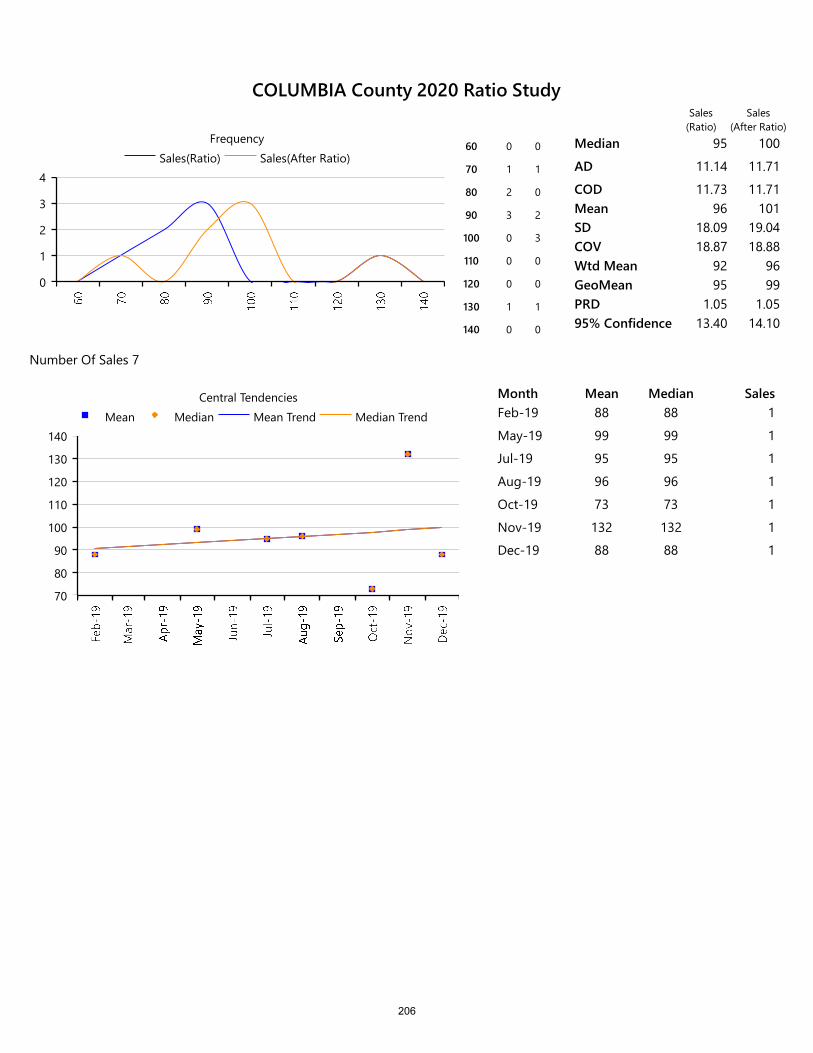
0
1
2
3
4Sales(Ratio) Sales(After Ratio)
Frequency60 0 0
70 1 1
80 2 0
90 3 2
100 0 3
110 0 0
120 0 0
130 1 1
140 0 0
Median 95 100
AD 11.14 11.71
COD 11.73 11.71Mean 96 101SD 18.09 19.04COV 18.87 18.88Wtd Mean 92 96GeoMean 95 99PRD 1.05 1.0595% Confidence 13.40 14.10
Number Of Sales 7
70
80
90
100
110
120
130
140Mean Median Mean Trend Median Trend
Central Tendencies Month Mean Median SalesFeb-19 88 88 1
May-19 99 99 1
Jul-19 95 95 1
Aug-19 96 96 1
Oct-19 73 73 1
Nov-19 132 132 1
Dec-19 88 88 1
Sales(Ratio)
Sales(After Ratio)
COLUMBIA County 2020 Ratio Study
206
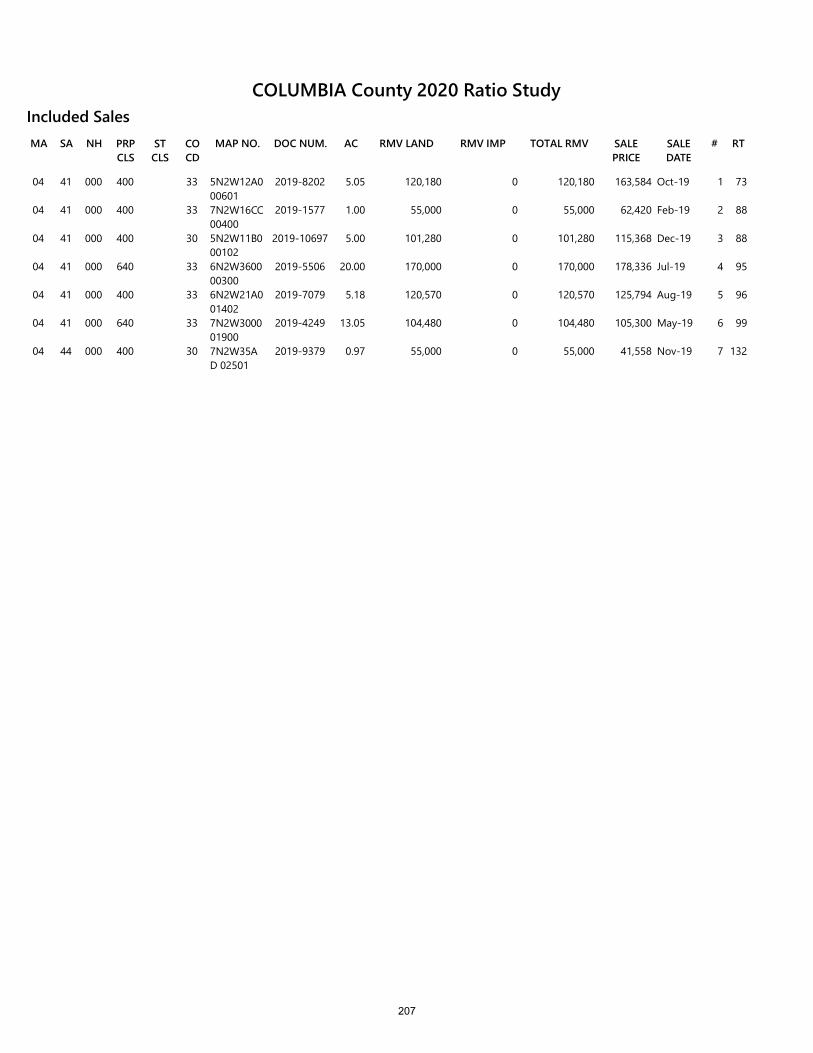
RMV LANDSA NH PRP CLS
ST CLS
CO CD
MAP NO. DOC NUM.MA AC RMV IMP TOTAL RMV SALE PRICE
SALE DATE
# RT
Included Sales
04 41 000 400 33 5N2W12A0 00601
2019-8202 5.05 120,180 0 120,180 163,584 Oct-19 1 73
04 41 000 400 33 7N2W16CC 00400
2019-1577 1.00 55,000 0 55,000 62,420 Feb-19 2 88
04 41 000 400 30 5N2W11B0 00102
2019-10697 5.00 101,280 0 101,280 115,368 Dec-19 3 88
04 41 000 640 33 6N2W3600 00300
2019-5506 20.00 170,000 0 170,000 178,336 Jul-19 4 95
04 41 000 400 33 6N2W21A0 01402
2019-7079 5.18 120,570 0 120,570 125,794 Aug-19 5 96
04 41 000 640 33 7N2W3000 01900
2019-4249 13.05 104,480 0 104,480 105,300 May-19 6 99
04 44 000 400 30 7N2W35AD 02501
2019-9379 0.97 55,000 0 55,000 41,558 Nov-19 7 132
COLUMBIA County 2020 Ratio Study
207

RMV Class MA SA NH
App Year
# of Sales Location
401 04 41 000 2020 28 Rainier
RMV Class MA SA NH
App Year
# of Sales Location
401 04 44 000 2020 1 Rainier
Study Definition
Adjustment Calculation SummarySample - Number of SalesPopulation - Number of AccountsSales as a percentage of the PopulationPrior Year Population Values
Land RmvOSD RMVImprovement RMVFarm Improvement RMV
Selected Ratio From Sales
Before Ratio
Overall Adjustment FactorLand Adjustment FactorOSD Adjustment FactorImprovement Adjustment FactorFarm Improvement Factor
After Ratio
Explanation
RECALCULATED
Pre-Trend Brkdwn Post Trend Values Post Trend Brkdwn
291299
2.23%
132,921,917 35.54% 139,568,013 37.39%56,109,990
165,090,48619,923,423
15.00% 56,109,990 15.03%44.14% 158,486,867 42.46%5.33% 19,126,486 5.12%
100
100
1001051009696
100
Time Trend Adjustment 9
Performance History2020 2019 2018 2017 201610.21 - 17.73 5.78 13.270.99 - 1.01 1.01 0.98
CODPRD
COLUMBIA County 2020 Ratio Study
RMV 401: SA 41RMV 401: SA 44Improved land – Rural Rainier (Value Zone 1) and City of Prescott
For this analysis, the SA 41 (Rural Rainier-Value Zone I) and SA 44 (Prescott) have been analyzed together due to the similar way that they move on the market. Prescott, a former mill-town community, resembles a small subdivision located on the Columbia River in South Rural Rainier. For this analysis the Median returned a ratio indicator of 100. This ratio was selected and applied.
Pre-Trend Values
208
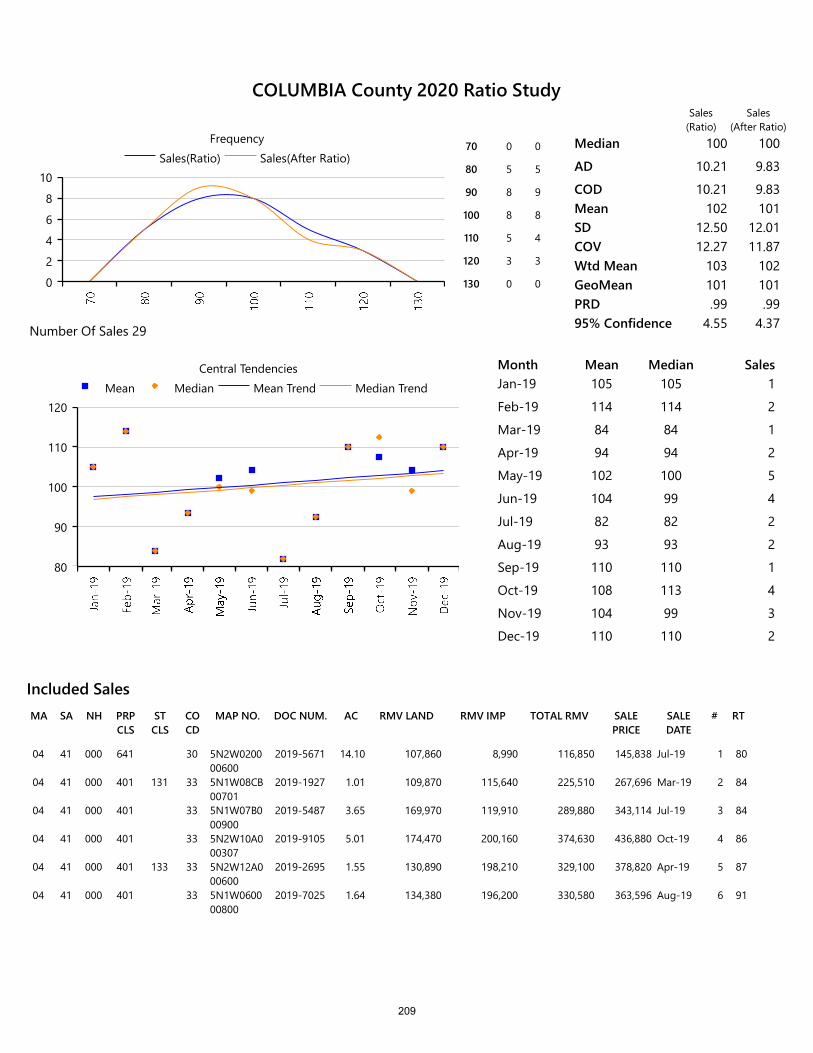
RMV LANDSA NH PRP CLS
ST CLS
CO CD
MAP NO. DOC NUM.MA AC RMV IMP TOTAL RMV SALE PRICE
SALE DATE
# RT
Included Sales
04 41 000 641 30 5N2W0200 00600
2019-5671 14.10 107,860 8,990 116,850 145,838 Jul-19 1 80
04 41 000 401 131 33 5N1W08CB 00701
2019-1927 1.01 109,870 115,640 225,510 267,696 Mar-19 2 84
04 41 000 401 33 5N1W07B0 00900
2019-5487 3.65 169,970 119,910 289,880 343,114 Jul-19 3 84
04 41 000 401 33 5N2W10A0 00307
2019-9105 5.01 174,470 200,160 374,630 436,880 Oct-19 4 86
04 41 000 401 133 33 5N2W12A0 00600
2019-2695 1.55 130,890 198,210 329,100 378,820 Apr-19 5 87
04 41 000 401 33 5N1W0600 00800
2019-7025 1.64 134,380 196,200 330,580 363,596 Aug-19 6 91
0
2
4
6
8
10Sales(Ratio) Sales(After Ratio)
Frequency70 0 0
80 5 5
90 8 9
100 8 8
110 5 4
120 3 3
130 0 0
Median 100 100
AD 10.21 9.83
COD 10.21 9.83Mean 102 101SD 12.50 12.01COV 12.27 11.87Wtd Mean 103 102GeoMean 101 101PRD .99 .9995% Confidence 4.55 4.37Number Of Sales 29
80
90
100
110
120Mean Median Mean Trend Median Trend
Central Tendencies Month Mean Median SalesJan-19 105 105 1
Feb-19 114 114 2
Mar-19 84 84 1
Apr-19 94 94 2
May-19 102 100 5
Jun-19 104 99 4
Jul-19 82 82 2
Aug-19 93 93 2
Sep-19 110 110 1
Oct-19 108 113 4
Nov-19 104 99 3
Dec-19 110 110 2
Sales(Ratio)
Sales(After Ratio)
COLUMBIA County 2020 Ratio Study
209
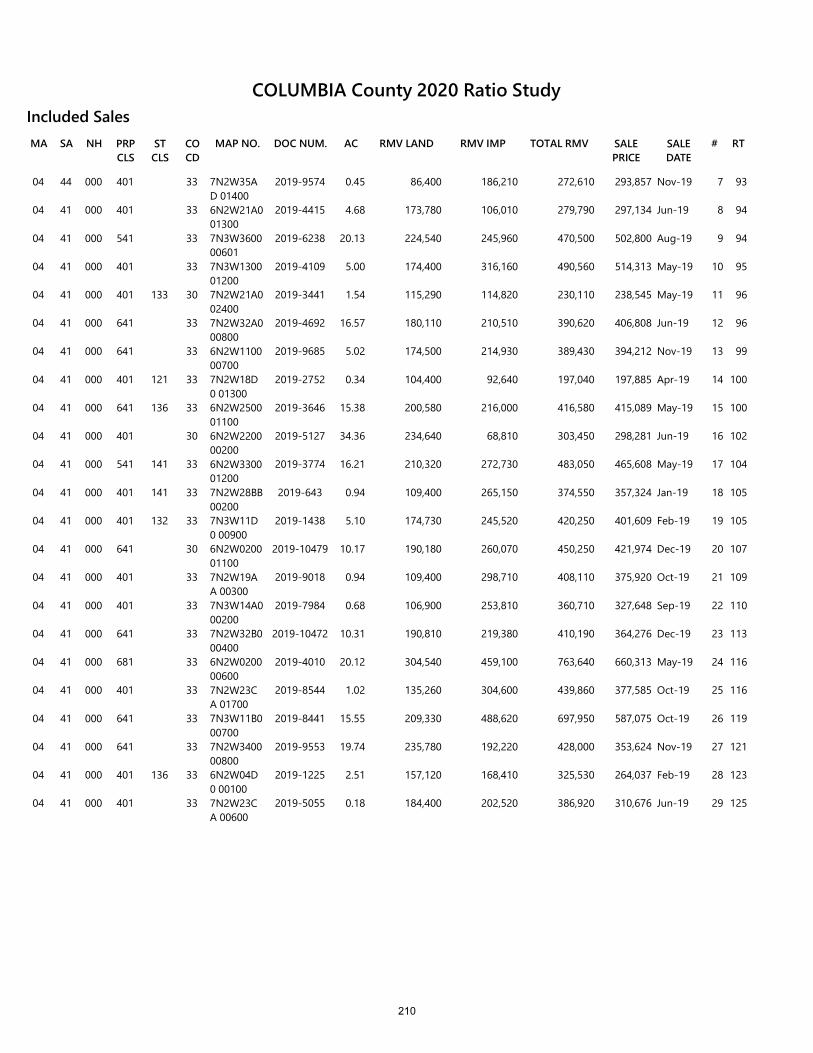
RMV LANDSA NH PRP CLS
ST CLS
CO CD
MAP NO. DOC NUM.MA AC RMV IMP TOTAL RMV SALE PRICE
SALE DATE
# RT
Included Sales
04 44 000 401 33 7N2W35AD 01400
2019-9574 0.45 86,400 186,210 272,610 293,857 Nov-19 7 93
04 41 000 401 33 6N2W21A0 01300
2019-4415 4.68 173,780 106,010 279,790 297,134 Jun-19 8 94
04 41 000 541 33 7N3W3600 00601
2019-6238 20.13 224,540 245,960 470,500 502,800 Aug-19 9 94
04 41 000 401 33 7N3W1300 01200
2019-4109 5.00 174,400 316,160 490,560 514,313 May-19 10 95
04 41 000 401 133 30 7N2W21A0 02400
2019-3441 1.54 115,290 114,820 230,110 238,545 May-19 11 96
04 41 000 641 33 7N2W32A0 00800
2019-4692 16.57 180,110 210,510 390,620 406,808 Jun-19 12 96
04 41 000 641 33 6N2W1100 00700
2019-9685 5.02 174,500 214,930 389,430 394,212 Nov-19 13 99
04 41 000 401 121 33 7N2W18D0 01300
2019-2752 0.34 104,400 92,640 197,040 197,885 Apr-19 14 100
04 41 000 641 136 33 6N2W2500 01100
2019-3646 15.38 200,580 216,000 416,580 415,089 May-19 15 100
04 41 000 401 30 6N2W2200 00200
2019-5127 34.36 234,640 68,810 303,450 298,281 Jun-19 16 102
04 41 000 541 141 33 6N2W3300 01200
2019-3774 16.21 210,320 272,730 483,050 465,608 May-19 17 104
04 41 000 401 141 33 7N2W28BB 00200
2019-643 0.94 109,400 265,150 374,550 357,324 Jan-19 18 105
04 41 000 401 132 33 7N3W11D0 00900
2019-1438 5.10 174,730 245,520 420,250 401,609 Feb-19 19 105
04 41 000 641 30 6N2W0200 01100
2019-10479 10.17 190,180 260,070 450,250 421,974 Dec-19 20 107
04 41 000 401 33 7N2W19AA 00300
2019-9018 0.94 109,400 298,710 408,110 375,920 Oct-19 21 109
04 41 000 401 33 7N3W14A0 00200
2019-7984 0.68 106,900 253,810 360,710 327,648 Sep-19 22 110
04 41 000 641 33 7N2W32B0 00400
2019-10472 10.31 190,810 219,380 410,190 364,276 Dec-19 23 113
04 41 000 681 33 6N2W0200 00600
2019-4010 20.12 304,540 459,100 763,640 660,313 May-19 24 116
04 41 000 401 33 7N2W23CA 01700
2019-8544 1.02 135,260 304,600 439,860 377,585 Oct-19 25 116
04 41 000 641 33 7N3W11B0 00700
2019-8441 15.55 209,330 488,620 697,950 587,075 Oct-19 26 119
04 41 000 641 33 7N2W3400 00800
2019-9553 19.74 235,780 192,220 428,000 353,624 Nov-19 27 121
04 41 000 401 136 33 6N2W04D0 00100
2019-1225 2.51 157,120 168,410 325,530 264,037 Feb-19 28 123
04 41 000 401 33 7N2W23CA 00600
2019-5055 0.18 184,400 202,520 386,920 310,676 Jun-19 29 125
COLUMBIA County 2020 Ratio Study
210
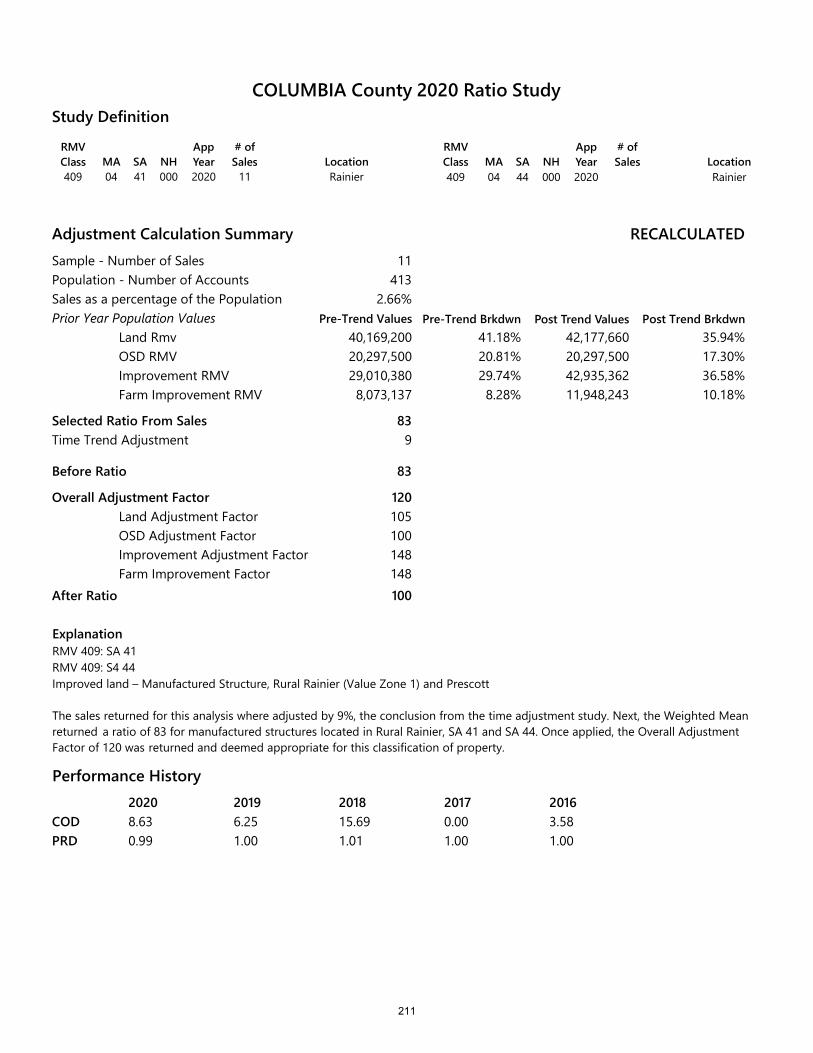
RMV Class MA SA NH
App Year
# of Sales Location
409 04 41 000 2020 11 Rainier
RMV Class MA SA NH
App Year
# of Sales Location
409 04 44 000 2020 Rainier
Study Definition
Adjustment Calculation SummarySample - Number of SalesPopulation - Number of AccountsSales as a percentage of the PopulationPrior Year Population Values
Land RmvOSD RMVImprovement RMVFarm Improvement RMV
Selected Ratio From Sales
Before Ratio
Overall Adjustment FactorLand Adjustment FactorOSD Adjustment FactorImprovement Adjustment FactorFarm Improvement Factor
After Ratio
RECALCULATED
Pre-Trend Brkdwn Post Trend Values Post Trend Brkdwn
11413
2.66%
40,169,200 41.18% 42,177,660 35.94%20,297,50029,010,3808,073,137
20.81% 20,297,500 17.30%29.74% 42,935,362 36.58%8.28% 11,948,243 10.18%
83
83
120105100148148100
Time Trend Adjustment 9
ExplanationRMV 409: SA 41RMV 409: S4 44Improved land – Manufactured Structure, Rural Rainier (Value Zone 1) and Prescott
The sales returned for this analysis where adjusted by 9%, the conclusion from the time adjustment study. Next, the Weighted Mean returned a ratio of 83 for manufactured structures located in Rural Rainier, SA 41 and SA 44. Once applied, the Overall Adjustment Factor of 120 was returned and deemed appropriate for this classification of property.
Performance History2020 2019 2018 2017 20168.63 6.25 15.69 0.00 3.580.99 1.00 1.01 1.00 1.00
CODPRD
COLUMBIA County 2020 Ratio Study
Pre-Trend Values
211
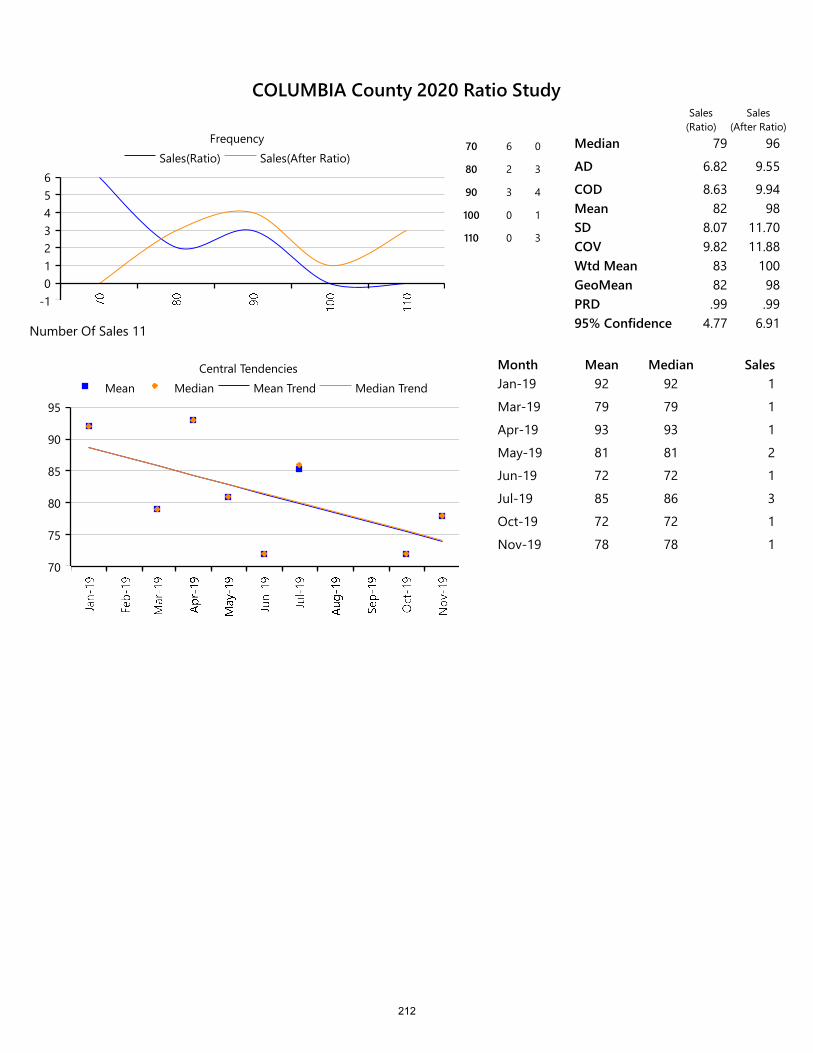
-10123456
Sales(Ratio) Sales(After Ratio)Frequency
70 6 0
80 2 3
90 3 4
100 0 1
110 0 3
Median 79 96
AD 6.82 9.55
COD 8.63 9.94Mean 82 98SD 8.07 11.70COV 9.82 11.88Wtd Mean 83 100GeoMean 82 98PRD .99 .9995% Confidence 4.77 6.91Number Of Sales 11
70
75
80
85
90
95Mean Median Mean Trend Median Trend
Central Tendencies Month Mean Median SalesJan-19 92 92 1
Mar-19 79 79 1
Apr-19 93 93 1
May-19 81 81 2
Jun-19 72 72 1
Jul-19 85 86 3
Oct-19 72 72 1
Nov-19 78 78 1
Sales(Ratio)
Sales(After Ratio)
COLUMBIA County 2020 Ratio Study
212
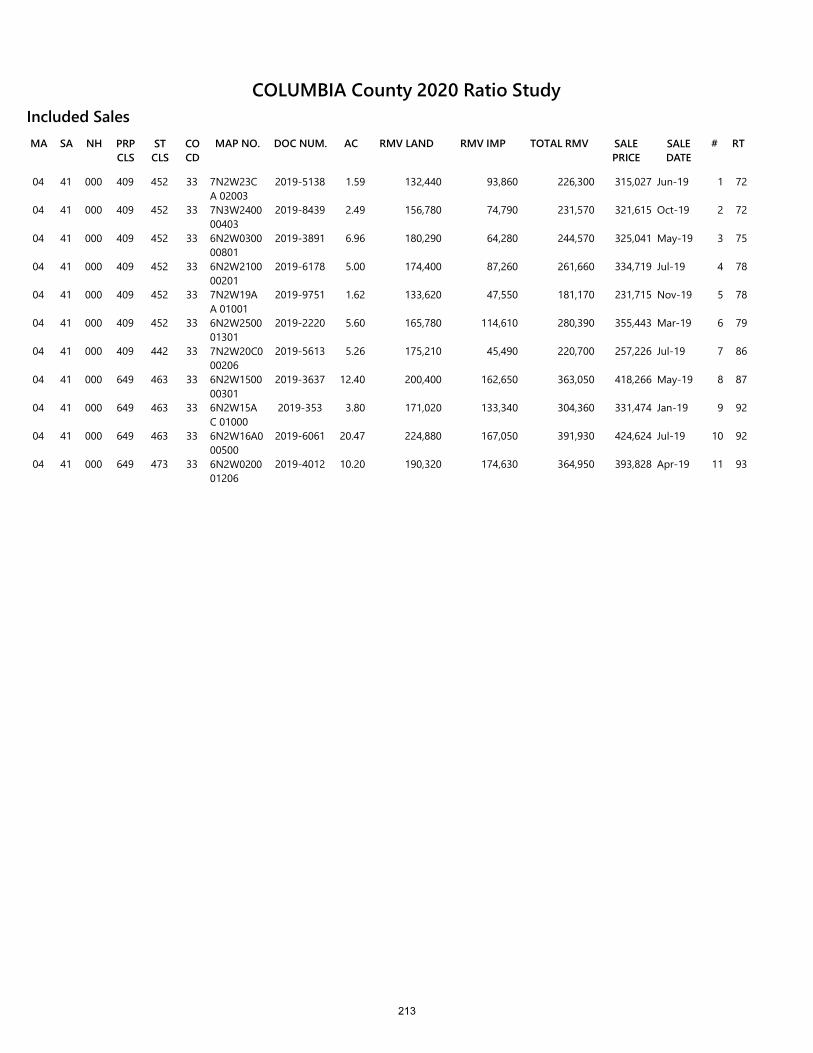
RMV LANDSA NH PRP CLS
ST CLS
CO CD
MAP NO. DOC NUM.MA AC RMV IMP TOTAL RMV SALE PRICE
SALE DATE
# RT
Included Sales
04 41 000 409 452 33 7N2W23CA 02003
2019-5138 1.59 132,440 93,860 226,300 315,027 Jun-19 1 72
04 41 000 409 452 33 7N3W2400 00403
2019-8439 2.49 156,780 74,790 231,570 321,615 Oct-19 2 72
04 41 000 409 452 33 6N2W0300 00801
2019-3891 6.96 180,290 64,280 244,570 325,041 May-19 3 75
04 41 000 409 452 33 6N2W2100 00201
2019-6178 5.00 174,400 87,260 261,660 334,719 Jul-19 4 78
04 41 000 409 452 33 7N2W19AA 01001
2019-9751 1.62 133,620 47,550 181,170 231,715 Nov-19 5 78
04 41 000 409 452 33 6N2W2500 01301
2019-2220 5.60 165,780 114,610 280,390 355,443 Mar-19 6 79
04 41 000 409 442 33 7N2W20C0 00206
2019-5613 5.26 175,210 45,490 220,700 257,226 Jul-19 7 86
04 41 000 649 463 33 6N2W1500 00301
2019-3637 12.40 200,400 162,650 363,050 418,266 May-19 8 87
04 41 000 649 463 33 6N2W15AC 01000
2019-353 3.80 171,020 133,340 304,360 331,474 Jan-19 9 92
04 41 000 649 463 33 6N2W16A0 00500
2019-6061 20.47 224,880 167,050 391,930 424,624 Jul-19 10 92
04 41 000 649 473 33 6N2W0200 01206
2019-4012 10.20 190,320 174,630 364,950 393,828 Apr-19 11 93
COLUMBIA County 2020 Ratio Study
213

RMV Class MA SA NH
App Year
# of Sales Location
400 04 42 000 2020 1 Rainier
RMV Class MA SA NH
App Year
# of Sales Location
Study Definition
Adjustment Calculation SummarySample - Number of SalesPopulation - Number of AccountsSales as a percentage of the PopulationPrior Year Population Values
Land RmvOSD RMVImprovement RMVFarm Improvement RMV
Selected Ratio From Sales
Before Ratio
Overall Adjustment FactorLand Adjustment FactorOSD Adjustment FactorImprovement Adjustment FactorFarm Improvement Factor
After Ratio
ExplanationRMV 400: SA 42Unimproved land – Rural Rainier (Value Zone 2)
RECALCULATED
Pre-Trend Brkdwn Post Trend Values Post Trend Brkdwn
1235
0.43%
59,549,450 100.00% 64,908,901 100.00%000
0.00% 0 0.00%0.00% 0 0.00%0.00% 0 0.00%
92
92
109109100100100100
Time Trend Adjustment 9
A single sale was identified in this study period, which is a sample too small to use as a determination of the current market. Therefore, it is recommended that the conclusion from the RMV 401-Improved Property conclusion that is located in the same study area be applied here (Selected Ratio of 92).
Performance History2020 2019 2018 2017 2016- 14.91 17.22 22.92 11.761.00 1.04 0.99 1.11 1.00
CODPRD
COLUMBIA County 2020 Ratio Study
Pre-Trend Values
214
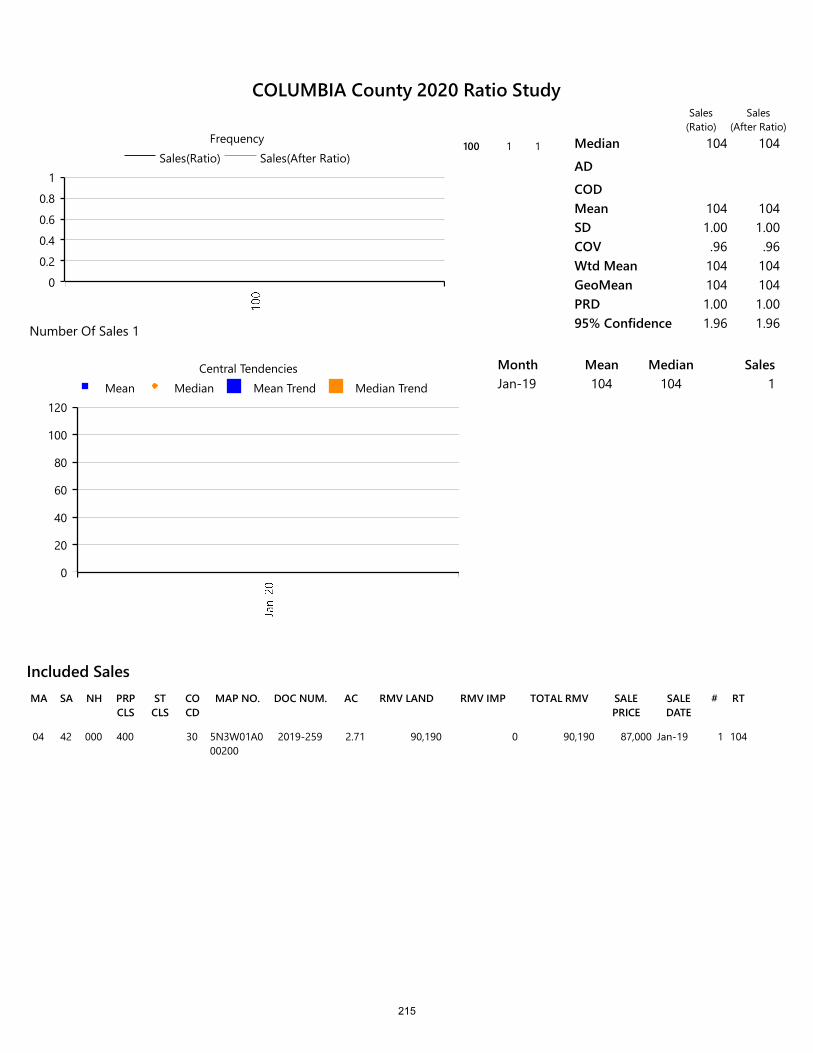
RMV LANDSA NH PRP CLS
ST CLS
CO CD
MAP NO. DOC NUM.MA AC RMV IMP TOTAL RMV SALE PRICE
SALE DATE
# RT
Included Sales
04 42 000 400 30 5N3W01A0 00200
2019-259 2.71 90,190 0 90,190 87,000 Jan-19 1 104
0
0.2
0.4
0.6
0.8
1Sales(Ratio) Sales(After Ratio)
Frequency100 1 1 Median 104 104
AD
CODMean 104 104SD 1.00 1.00COV .96 .96Wtd Mean 104 104GeoMean 104 104PRD 1.00 1.0095% Confidence 1.96 1.96Number Of Sales 1
0
20
40
60
80
100
120Mean Median Mean Trend Median Trend
Central Tendencies Month Mean Median SalesJan-19 104 104 1
Sales(Ratio)
Sales(After Ratio)
COLUMBIA County 2020 Ratio Study
215

RMV Class MA SA NH
App Year
# of Sales Location
401 04 42 000 2020 8 Rainier
RMV Class MA SA NH
App Year
# of Sales Location
Study Definition
Adjustment Calculation SummarySample - Number of SalesPopulation - Number of AccountsSales as a percentage of the PopulationPrior Year Population Values
Land RmvOSD RMVImprovement RMVFarm Improvement RMV
Selected Ratio From Sales
Before Ratio
Overall Adjustment FactorLand Adjustment FactorOSD Adjustment FactorImprovement Adjustment FactorFarm Improvement Factor
After Ratio
ExplanationRMV 401: SA 42Improved land – Rural Rainier (Value Zone 2)
RECALCULATED
Pre-Trend Brkdwn Post Trend Values Post Trend Brkdwn
8319
2.51%
35,886,370 37.05% 39,116,143 37.20%15,004,25040,757,8005,215,560
15.49% 15,004,250 14.27%42.08% 45,241,158 43.03%5.38% 5,789,272 5.51%
92
92
109109100111111100
Time Trend Adjustment 9
This grouping of improved rural residential sales contains a sampling of 8 to study. After some review, the Mean of 92 was selected as the most appropriate indicator resulting in an Overall Adjustment Factor of 109.
Performance History2020 2019 2018 2017 201619.12 11.29 9.58 14.89 13.270.99 1.00 1.00 1.02 0.98
CODPRD
COLUMBIA County 2020 Ratio Study
Pre-Trend Values
216

-1
0
1
2
3
4Sales(Ratio) Sales(After Ratio)
Frequency60 1 1
70 2 0
80 1 2
90 0 1
100 3 0
110 1 3
120 0 0
130 0 1
Median 94 101
AD 17.88 20.00
COD 19.12 19.80Mean 92 100SD 20.34 22.72COV 22.20 22.72Wtd Mean 92 100GeoMean 90 98PRD .99 1.0095% Confidence 14.09 15.74
Number Of Sales 8
60
70
80
90
100
110
120Mean Median Mean Trend Median Trend
Central Tendencies Month Mean Median SalesMar-19 119 119 1
Apr-19 84 84 1
May-19 74 74 1
Aug-19 73 73 1
Sep-19 64 64 1
Nov-19 108 108 2
Dec-19 103 103 1
Sales(Ratio)
Sales(After Ratio)
COLUMBIA County 2020 Ratio Study
217
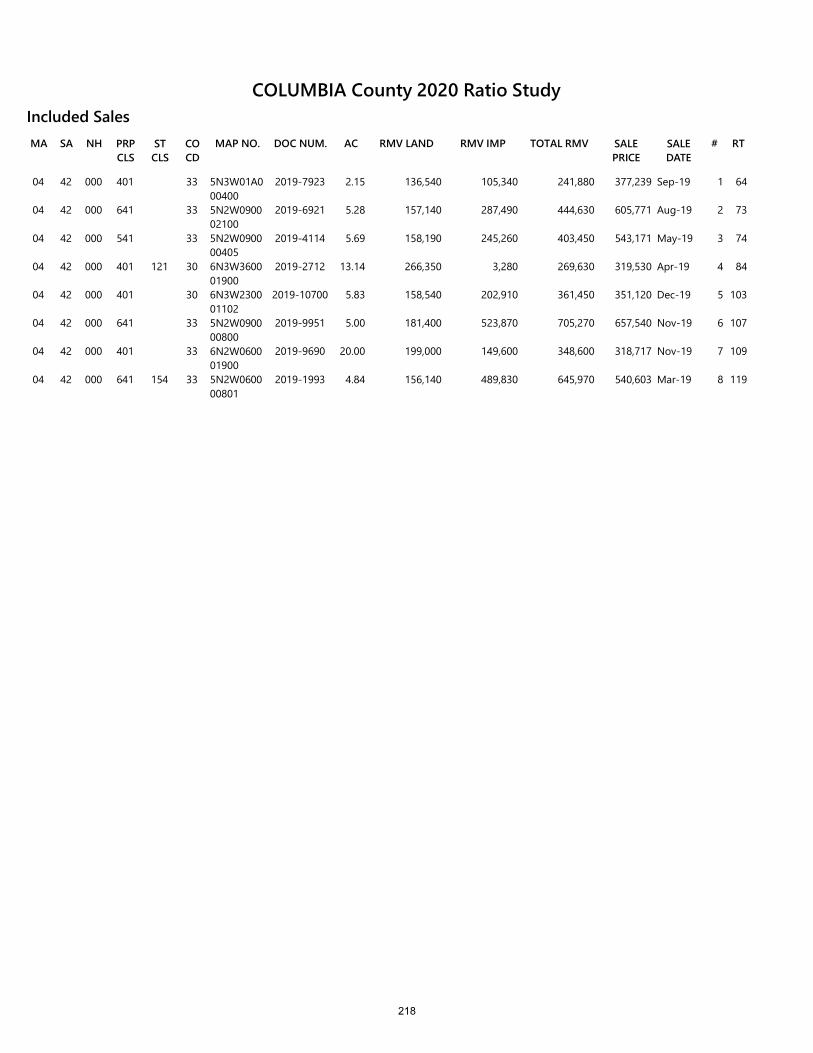
RMV LANDSA NH PRP CLS
ST CLS
CO CD
MAP NO. DOC NUM.MA AC RMV IMP TOTAL RMV SALE PRICE
SALE DATE
# RT
Included Sales
04 42 000 401 33 5N3W01A0 00400
2019-7923 2.15 136,540 105,340 241,880 377,239 Sep-19 1 64
04 42 000 641 33 5N2W0900 02100
2019-6921 5.28 157,140 287,490 444,630 605,771 Aug-19 2 73
04 42 000 541 33 5N2W0900 00405
2019-4114 5.69 158,190 245,260 403,450 543,171 May-19 3 74
04 42 000 401 121 30 6N3W3600 01900
2019-2712 13.14 266,350 3,280 269,630 319,530 Apr-19 4 84
04 42 000 401 30 6N3W2300 01102
2019-10700 5.83 158,540 202,910 361,450 351,120 Dec-19 5 103
04 42 000 641 33 5N2W0900 00800
2019-9951 5.00 181,400 523,870 705,270 657,540 Nov-19 6 107
04 42 000 401 33 6N2W0600 01900
2019-9690 20.00 199,000 149,600 348,600 318,717 Nov-19 7 109
04 42 000 641 154 33 5N2W0600 00801
2019-1993 4.84 156,140 489,830 645,970 540,603 Mar-19 8 119
COLUMBIA County 2020 Ratio Study
218

RMV Class MA SA NH
App Year
# of Sales Location
409 04 42 000 2020 3 Rainier
RMV Class MA SA NH
App Year
# of Sales Location
409 04 45 000 2020 1 Rainier
Study Definition
Adjustment Calculation SummarySample - Number of SalesPopulation - Number of AccountsSales as a percentage of the PopulationPrior Year Population Values
Land RmvOSD RMVImprovement RMVFarm Improvement RMV
Selected Ratio From Sales
Before Ratio
Overall Adjustment FactorLand Adjustment FactorOSD Adjustment FactorImprovement Adjustment FactorFarm Improvement Factor
After Ratio
ExplanationRMV 409: SA 42RMV 409: SA 45Improved land – Improved land – Manufactured Structure, Rural Rainier (Value Zone 2) and Dike Land
The Mean of 93 was selected as the best indicator for this grouping of properties. This selected central tendency is further supported by the Weighted Mean (92) and the GeoMean (91). The resulting Overall Adjustment Factor is 108 for this classification.
RECALCULATED
Pre-Trend Brkdwn Post Trend Values Post Trend Brkdwn
4154
2.60%
12,931,090 39.01% 13,577,645 38.07%7,787,9009,531,2602,900,110
23.49% 7,787,900 21.84%28.75% 10,960,949 30.74%8.75% 3,335,127 9.35%
93
93
108105100115115100
Time Trend Adjustment 9
Performance History2020 2019 2018 2017 201616.57 6.25 13.19 6.77 3.581.01 1.00 0.99 0.99 1.00
CODPRD
COLUMBIA County 2020 Ratio Study
Pre-Trend Values
219
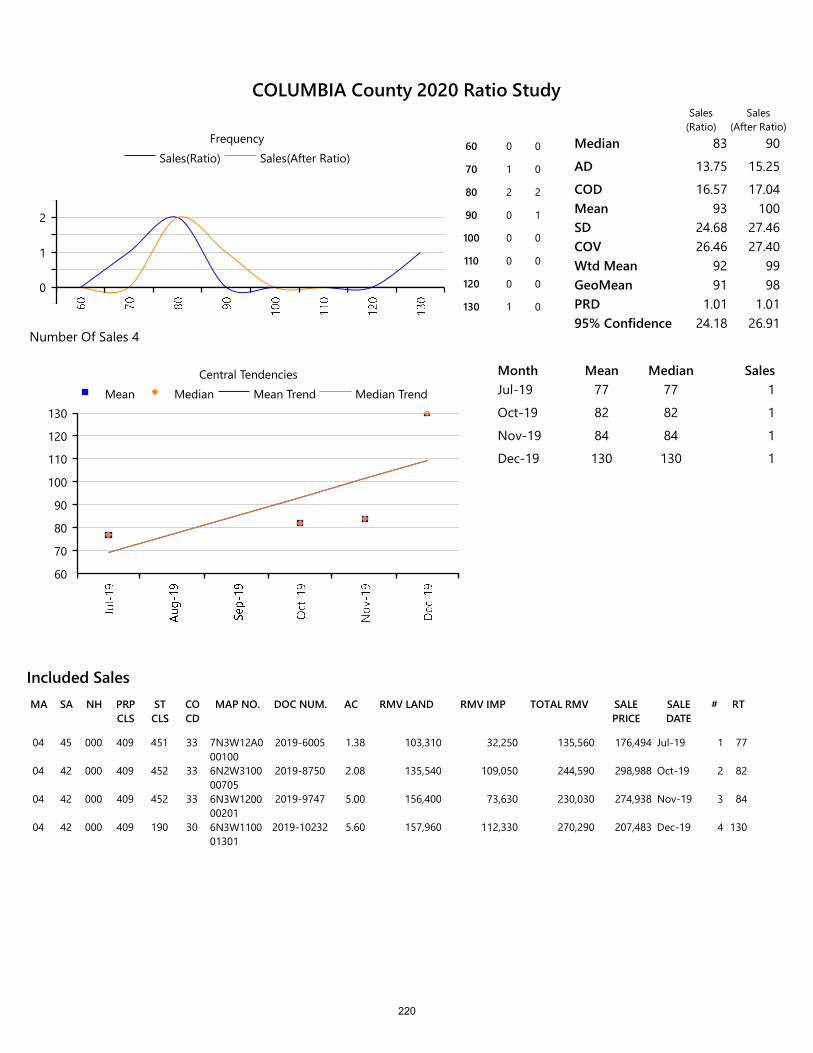
RMV LANDSA NH PRP CLS
ST CLS
CO CD
MAP NO. DOC NUM.MA AC RMV IMP TOTAL RMV SALE PRICE
SALE DATE
# RT
Included Sales
04 45 000 409 451 33 7N3W12A0 00100
2019-6005 1.38 103,310 32,250 135,560 176,494 Jul-19 1 77
04 42 000 409 452 33 6N2W3100 00705
2019-8750 2.08 135,540 109,050 244,590 298,988 Oct-19 2 82
04 42 000 409 452 33 6N3W1200 00201
2019-9747 5.00 156,400 73,630 230,030 274,938 Nov-19 3 84
04 42 000 409 190 30 6N3W1100 01301
2019-10232 5.60 157,960 112,330 270,290 207,483 Dec-19 4 130
0
1
2
Sales(Ratio) Sales(After Ratio)Frequency
60 0 0
70 1 0
80 2 2
90 0 1
100 0 0
110 0 0
120 0 0
130 1 0
Median 83 90
AD 13.75 15.25
COD 16.57 17.04Mean 93 100SD 24.68 27.46COV 26.46 27.40Wtd Mean 92 99GeoMean 91 98PRD 1.01 1.0195% Confidence 24.18 26.91
Number Of Sales 4
60
70
80
90
100
110
120
130Mean Median Mean Trend Median Trend
Central Tendencies Month Mean Median SalesJul-19 77 77 1
Oct-19 82 82 1
Nov-19 84 84 1
Dec-19 130 130 1
Sales(Ratio)
Sales(After Ratio)
COLUMBIA County 2020 Ratio Study
220

RMV Class MA SA NH
App Year
# of Sales Location
400 04 45 000 2020 Rainier
RMV Class MA SA NH
App Year
# of Sales Location
Study Definition
Adjustment Calculation SummarySample - Number of SalesPopulation - Number of AccountsSales as a percentage of the PopulationPrior Year Population Values
Land RmvOSD RMVImprovement RMVFarm Improvement RMV
Selected Ratio From Sales
Before Ratio
Overall Adjustment FactorLand Adjustment FactorOSD Adjustment FactorImprovement Adjustment FactorFarm Improvement Factor
After Ratio
ExplanationRMV 400: SA 45Unimproved land – Dike Land, Rural Rainier
No sales are available. Therefore, the RMV Class 400 analysis located in Study Area 41 and 44 was applied here (Selected Ratio of 95).
RECALCULATED
Pre-Trend Brkdwn Post Trend Values Post Trend Brkdwn
021
0.00%
1,628,700 100.00% 1,710,135 100.00%000
0.00% 0 0.00%0.00% 0 0.00%0.00% 0 0.00%
95
95
105105100100100100
Time Trend Adjustment 0
Performance History2020--
CODPRD
COLUMBIA County 2020 Ratio Study
Pre-Trend Values
221

0
1Sales(Ratio) Sales(After Ratio)
Frequency Median
AD
CODMeanSDCOVWtd MeanGeoMeanPRD95% ConfidenceNumber Of Sales 0
0
1Mean Median Mean Trend Median Trend
Central Tendencies Month Mean Median Sales
Sales(Ratio)
Sales(After Ratio)
COLUMBIA County 2020 Ratio Study
222

RMV Class MA SA NH
App Year
# of Sales Location
401 04 45 000 2020 Rainier
RMV Class MA SA NH
App Year
# of Sales Location
Study Definition
Adjustment Calculation SummarySample - Number of SalesPopulation - Number of AccountsSales as a percentage of the PopulationPrior Year Population Values
Land RmvOSD RMVImprovement RMVFarm Improvement RMV
Selected Ratio From Sales
Before Ratio
Overall Adjustment FactorLand Adjustment FactorOSD Adjustment FactorImprovement Adjustment FactorFarm Improvement Factor
After Ratio
ExplanationRMV 401: SA 45Improved land – Dike Land, Rural Rainier
No sales were identified for this classification of properties for the study period. Therefore, the improved properties conclusion from SA 41 and SA 44 is recommended and has been applied here (Selected Ratio of 100).
RECALCULATED
Pre-Trend Brkdwn Post Trend Values Post Trend Brkdwn
096
0.00%
15,022,600 53.30% 15,773,730 55.28%3,129,0008,044,8801,989,340
11.10% 3,129,000 10.97%28.54% 7,723,085 27.06%7.06% 1,909,766 6.69%
100
100
1001051009696
100
Time Trend Adjustment 0
Performance History2020 2019 2016- 3.77 22.48- 1.00 1.01
CODPRD
COLUMBIA County 2020 Ratio Study
Pre-Trend Values
223

0
1Sales(Ratio) Sales(After Ratio)
Frequency Median
AD
CODMeanSDCOVWtd MeanGeoMeanPRD95% ConfidenceNumber Of Sales 0
0
1Mean Median Mean Trend Median Trend
Central Tendencies Month Mean Median Sales
Sales(Ratio)
Sales(After Ratio)
COLUMBIA County 2020 Ratio Study
224
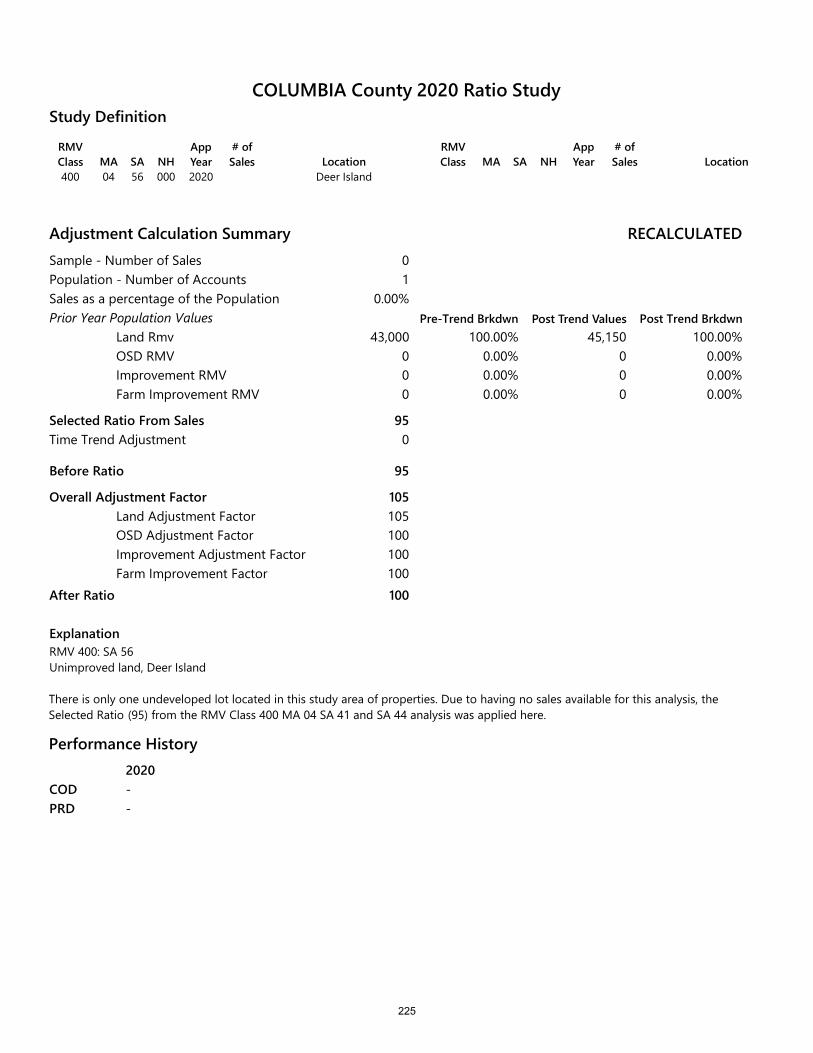
RMV Class MA SA NH
App Year
# of Sales Location
400 04 56 000 2020 Deer Island
RMV Class MA SA NH
App Year
# of Sales Location
Study Definition
Adjustment Calculation SummarySample - Number of SalesPopulation - Number of AccountsSales as a percentage of the PopulationPrior Year Population Values
Land RmvOSD RMVImprovement RMVFarm Improvement RMV
Selected Ratio From Sales
Before Ratio
Overall Adjustment FactorLand Adjustment FactorOSD Adjustment FactorImprovement Adjustment FactorFarm Improvement Factor
After Ratio
ExplanationRMV 400: SA 56Unimproved land, Deer Island
RECALCULATED
Pre-Trend Brkdwn Post Trend Values Post Trend Brkdwn
01
0.00%
43,000 100.00% 45,150 100.00%000
0.00% 0 0.00%0.00% 0 0.00%0.00% 0 0.00%
95
95
105105100100100100
Time Trend Adjustment 0
There is only one undeveloped lot located in this study area of properties. Due to having no sales available for this analysis, the Selected Ratio (95) from the RMV Class 400 MA 04 SA 41 and SA 44 analysis was applied here.
Performance History2020--
CODPRD
COLUMBIA County 2020 Ratio Study
225

0
1Sales(Ratio) Sales(After Ratio)
Frequency Median
AD
CODMeanSDCOVWtd MeanGeoMeanPRD95% ConfidenceNumber Of Sales 0
0
1Mean Median Mean Trend Median Trend
Central Tendencies Month Mean Median Sales
Sales(Ratio)
Sales(After Ratio)
COLUMBIA County 2020 Ratio Study
226
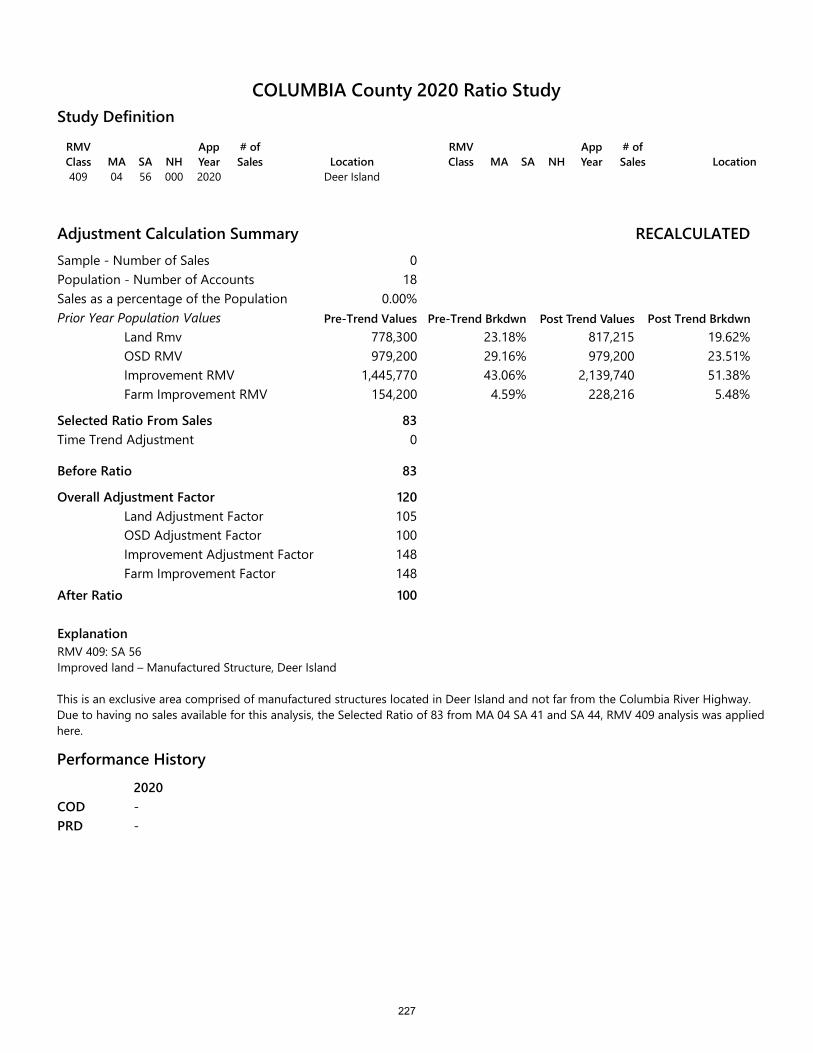
RMV Class MA SA NH
App Year
# of Sales Location
409 04 56 000 2020 Deer Island
RMV Class MA SA NH
App Year
# of Sales Location
Study Definition
Adjustment Calculation SummarySample - Number of SalesPopulation - Number of AccountsSales as a percentage of the PopulationPrior Year Population Values
Land RmvOSD RMVImprovement RMVFarm Improvement RMV
Selected Ratio From Sales
Before Ratio
Overall Adjustment FactorLand Adjustment FactorOSD Adjustment FactorImprovement Adjustment FactorFarm Improvement Factor
After Ratio
ExplanationRMV 409: SA 56Improved land – Manufactured Structure, Deer Island
RECALCULATED
Pre-Trend Brkdwn Post Trend Values Post Trend Brkdwn
018
0.00%
778,300 23.18% 817,215 19.62%979,200
1,445,770154,200
29.16% 979,200 23.51%43.06% 2,139,740 51.38%4.59% 228,216 5.48%
83
83
120105100148148100
Time Trend Adjustment 0
This is an exclusive area comprised of manufactured structures located in Deer Island and not far from the Columbia River Highway. Due to having no sales available for this analysis, the Selected Ratio of 83 from MA 04 SA 41 and SA 44, RMV 409 analysis was applied here.
Performance History
2020--
CODPRD
COLUMBIA County 2020 Ratio Study
Pre-Trend Values
227

0
1Sales(Ratio) Sales(After Ratio)
Frequency Median
AD
CODMeanSDCOVWtd MeanGeoMeanPRD95% ConfidenceNumber Of Sales 0
0
1Mean Median Mean Trend Median Trend
Central Tendencies Month Mean Median Sales
Sales(Ratio)
Sales(After Ratio)
COLUMBIA County 2020 Ratio Study
228
MAINTENANCE AREA 5
CLATSKANIE
229
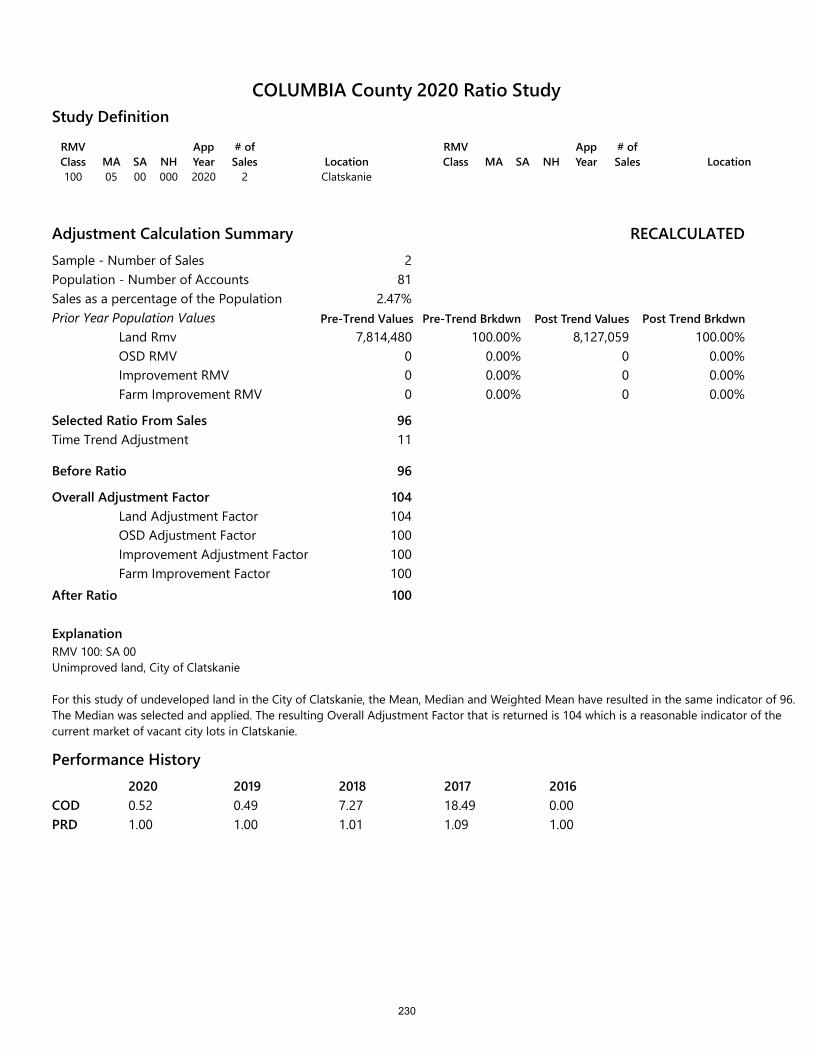
RMV Class MA SA NH
App Year
# of Sales Location
100 05 00 000 2020 2 Clatskanie
RMV Class MA SA NH
App Year
# of Sales Location
Study Definition
Adjustment Calculation SummarySample - Number of SalesPopulation - Number of AccountsSales as a percentage of the PopulationPrior Year Population Values
Land RmvOSD RMVImprovement RMVFarm Improvement RMV
Selected Ratio From Sales
Before Ratio
Overall Adjustment FactorLand Adjustment FactorOSD Adjustment FactorImprovement Adjustment FactorFarm Improvement Factor
After Ratio
ExplanationRMV 100: SA 00Unimproved land, City of Clatskanie
For this study of undeveloped land in the City of Clatskanie, the Mean, Median and Weighted Mean have resulted in the same indicator of 96. The Median was selected and applied. The resulting Overall Adjustment Factor that is returned is 104 which is a reasonable indicator of the current market of vacant city lots in Clatskanie.
RECALCULATED
Pre-Trend Brkdwn Post Trend Values Post Trend Brkdwn
281
2.47%
7,814,480 100.00% 8,127,059 100.00%000
0.00% 0 0.00%0.00% 0 0.00%0.00% 0 0.00%
96
96
104104100100100100
Time Trend Adjustment 11
Performance History2020 2019 2018 2017 20160.52 0.49 7.27 18.49 0.001.00 1.00 1.01 1.09 1.00
CODPRD
COLUMBIA County 2020 Ratio Study
Pre-Trend Values
230
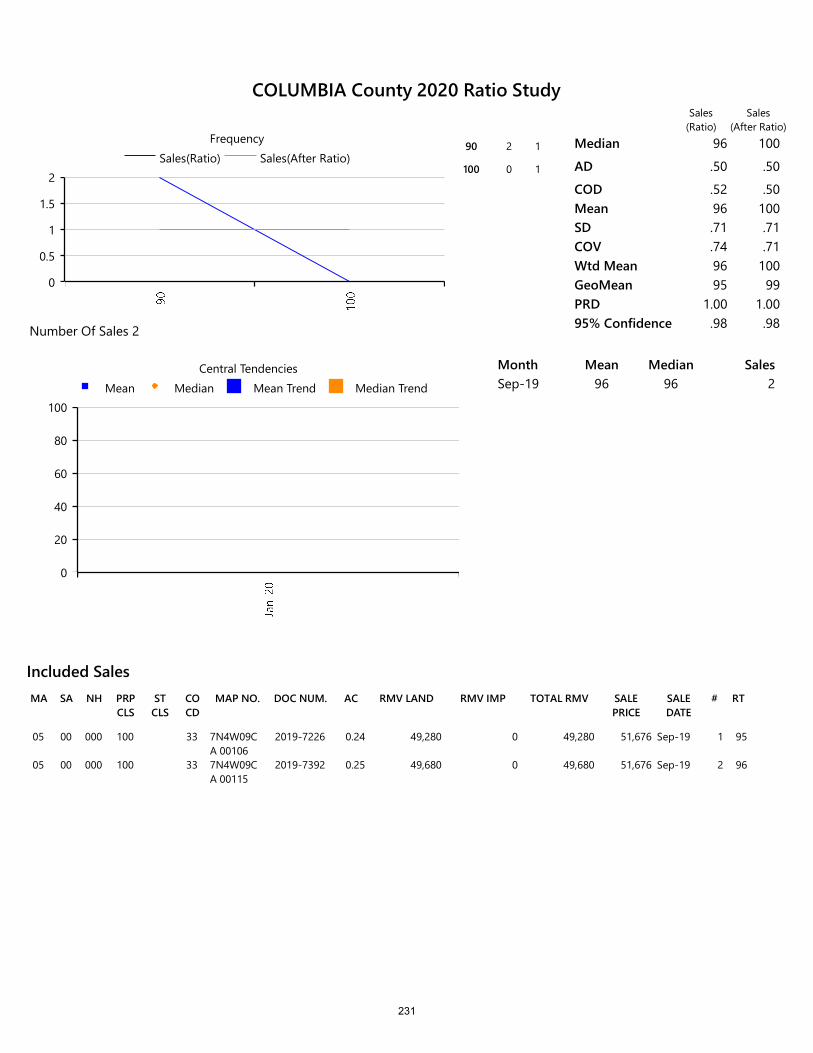
RMV LANDSA NH PRP CLS
ST CLS
CO CD
MAP NO. DOC NUM.MA AC RMV IMP TOTAL RMV SALE PRICE
SALE DATE
# RT
Included Sales
05 00 000 100 33 7N4W09CA 00106
2019-7226 0.24 49,280 0 49,280 51,676 Sep-19 1 95
05 00 000 100 33 7N4W09CA 00115
2019-7392 0.25 49,680 0 49,680 51,676 Sep-19 2 96
0
0.5
1
1.5
2Sales(Ratio) Sales(After Ratio)
Frequency90 2 1
100 0 1
Median 96 100
AD .50 .50
COD .52 .50Mean 96 100SD .71 .71COV .74 .71Wtd Mean 96 100GeoMean 95 99PRD 1.00 1.0095% Confidence .98 .98Number Of Sales 2
0
20
40
60
80
100Mean Median Mean Trend Median Trend
Central Tendencies Month Mean Median SalesSep-19 96 96 2
Sales(Ratio)
Sales(After Ratio)
COLUMBIA County 2020 Ratio Study
231

RMV Class MA SA NH
App Year
# of Sales Location
101 05 00 000 2020 18 Clatskanie
RMV Class MA SA NH
App Year
# of Sales Location
Study Definition
Adjustment Calculation SummarySample - Number of SalesPopulation - Number of AccountsSales as a percentage of the PopulationPrior Year Population Values
Land RmvOSD RMVImprovement RMVFarm Improvement RMV
Selected Ratio From Sales
Before Ratio
Overall Adjustment FactorLand Adjustment FactorOSD Adjustment FactorImprovement Adjustment FactorFarm Improvement Factor
After Ratio
ExplanationRMV 101: SA 00Improved property, City of Clatskanie
All single-family site built residential properties located in the City of Clatskanie. The time adjustment of 11% was applied to the sales array. The ratios returned after adjustment were the Median (87), Mean (88), Weighted Mean (89), and the Geometric Mean (87). The Mean was selected as the best indicator and applied here.
RECALCULATED
Pre-Trend Brkdwn Post Trend Values Post Trend Brkdwn
18523
3.44%
25,167,200 23.42% 26,173,888 21.44%6,609,450
75,004,020690,180
6.15% 6,609,450 5.41%69.79% 88,504,744 72.48%0.64% 814,412 0.67%
88
88
114104100118118100
Time Trend Adjustment 11
Performance History2020 2019 2018 2017 201610.73 11.18 12.28 13.32 9.390.99 0.99 1.00 1.01 1.01
CODPRD
COLUMBIA County 2020 Ratio Study
Pre-Trend Values
232
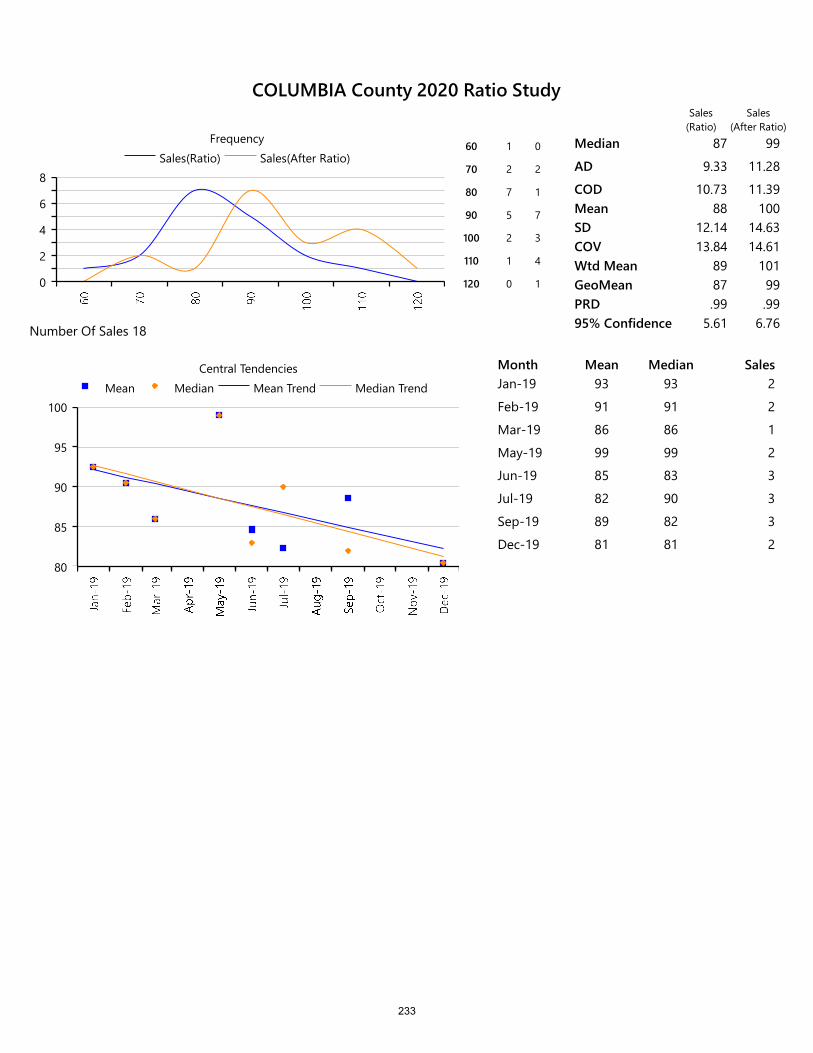
0
2
4
6
8Sales(Ratio) Sales(After Ratio)
Frequency60 1 0
70 2 2
80 7 1
90 5 7
100 2 3
110 1 4
120 0 1
Median 87 99
AD 9.33 11.28
COD 10.73 11.39Mean 88 100SD 12.14 14.63COV 13.84 14.61Wtd Mean 89 101GeoMean 87 99PRD .99 .9995% Confidence 5.61 6.76Number Of Sales 18
80
85
90
95
100Mean Median Mean Trend Median Trend
Central Tendencies Month Mean Median SalesJan-19 93 93 2
Feb-19 91 91 2
Mar-19 86 86 1
May-19 99 99 2
Jun-19 85 83 3
Jul-19 82 90 3
Sep-19 89 82 3
Dec-19 81 81 2
Sales(Ratio)
Sales(After Ratio)
COLUMBIA County 2020 Ratio Study
233
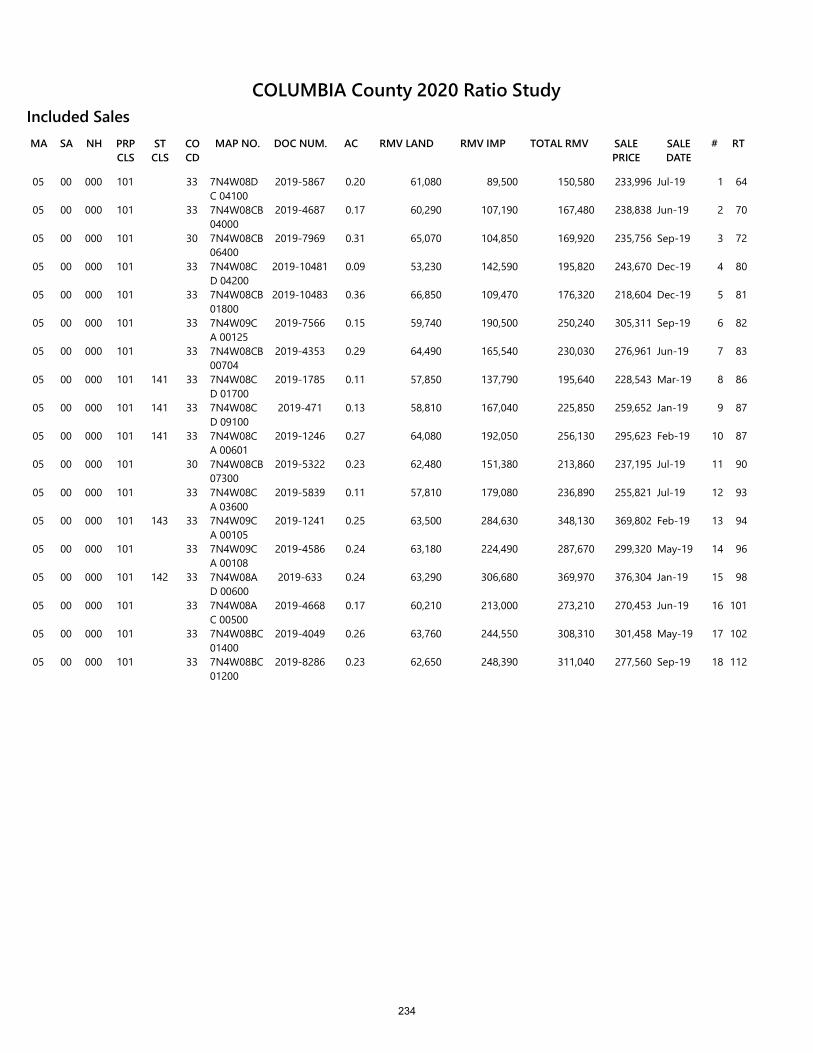
RMV LANDSA NH PRP CLS
ST CLS
CO CD
MAP NO. DOC NUM.MA AC RMV IMP TOTAL RMV SALE PRICE
SALE DATE
# RT
Included Sales
05 00 000 101 33 7N4W08DC 04100
2019-5867 0.20 61,080 89,500 150,580 233,996 Jul-19 1 64
05 00 000 101 33 7N4W08CB 04000
2019-4687 0.17 60,290 107,190 167,480 238,838 Jun-19 2 70
05 00 000 101 30 7N4W08CB 06400
2019-7969 0.31 65,070 104,850 169,920 235,756 Sep-19 3 72
05 00 000 101 33 7N4W08CD 04200
2019-10481 0.09 53,230 142,590 195,820 243,670 Dec-19 4 80
05 00 000 101 33 7N4W08CB 01800
2019-10483 0.36 66,850 109,470 176,320 218,604 Dec-19 5 81
05 00 000 101 33 7N4W09CA 00125
2019-7566 0.15 59,740 190,500 250,240 305,311 Sep-19 6 82
05 00 000 101 33 7N4W08CB 00704
2019-4353 0.29 64,490 165,540 230,030 276,961 Jun-19 7 83
05 00 000 101 141 33 7N4W08CD 01700
2019-1785 0.11 57,850 137,790 195,640 228,543 Mar-19 8 86
05 00 000 101 141 33 7N4W08CD 09100
2019-471 0.13 58,810 167,040 225,850 259,652 Jan-19 9 87
05 00 000 101 141 33 7N4W08CA 00601
2019-1246 0.27 64,080 192,050 256,130 295,623 Feb-19 10 87
05 00 000 101 30 7N4W08CB 07300
2019-5322 0.23 62,480 151,380 213,860 237,195 Jul-19 11 90
05 00 000 101 33 7N4W08CA 03600
2019-5839 0.11 57,810 179,080 236,890 255,821 Jul-19 12 93
05 00 000 101 143 33 7N4W09CA 00105
2019-1241 0.25 63,500 284,630 348,130 369,802 Feb-19 13 94
05 00 000 101 33 7N4W09CA 00108
2019-4586 0.24 63,180 224,490 287,670 299,320 May-19 14 96
05 00 000 101 142 33 7N4W08AD 00600
2019-633 0.24 63,290 306,680 369,970 376,304 Jan-19 15 98
05 00 000 101 33 7N4W08AC 00500
2019-4668 0.17 60,210 213,000 273,210 270,453 Jun-19 16 101
05 00 000 101 33 7N4W08BC 01400
2019-4049 0.26 63,760 244,550 308,310 301,458 May-19 17 102
05 00 000 101 33 7N4W08BC 01200
2019-8286 0.23 62,650 248,390 311,040 277,560 Sep-19 18 112
COLUMBIA County 2020 Ratio Study
234

RMV Class MA SA NH
App Year
# of Sales Location
109 05 00 000 2020 3 Clatskanie
RMV Class MA SA NH
App Year
# of Sales Location
Study Definition
Adjustment Calculation SummarySample - Number of SalesPopulation - Number of AccountsSales as a percentage of the PopulationPrior Year Population Values
Land RmvOSD RMVImprovement RMVFarm Improvement RMV
Selected Ratio From Sales
Before Ratio
Overall Adjustment FactorLand Adjustment FactorOSD Adjustment FactorImprovement Adjustment FactorFarm Improvement Factor
After Ratio
ExplanationRMV 109: SA 00Improved property – Manufactured Structures, City of Clatskanie
The Mean with a ratio of 82 has been selected as the best indicator for this grouping of properties that have manufactured structures as the main residence. The Mean is closely supported by the Median (81) and the Geo Mean (80). After applying the Mean, the Overall Adjustment Factor returned a ratio of 122.
RECALCULATED
Pre-Trend Brkdwn Post Trend Values Post Trend Brkdwn
353
5.66%
3,328,140 37.16% 3,461,266 31.71%695,000
4,697,540235,290
7.76% 695,000 6.37%52.45% 6,435,630 58.97%2.63% 322,347 2.95%
82
82
122104100137137100
Time Trend Adjustment 11
Performance History2020 2019 2018 201618.11 16.02 0.00 0.001.05 0.99 1.00 1.00
CODPRD
COLUMBIA County 2020 Ratio Study
Pre-Trend Values
235
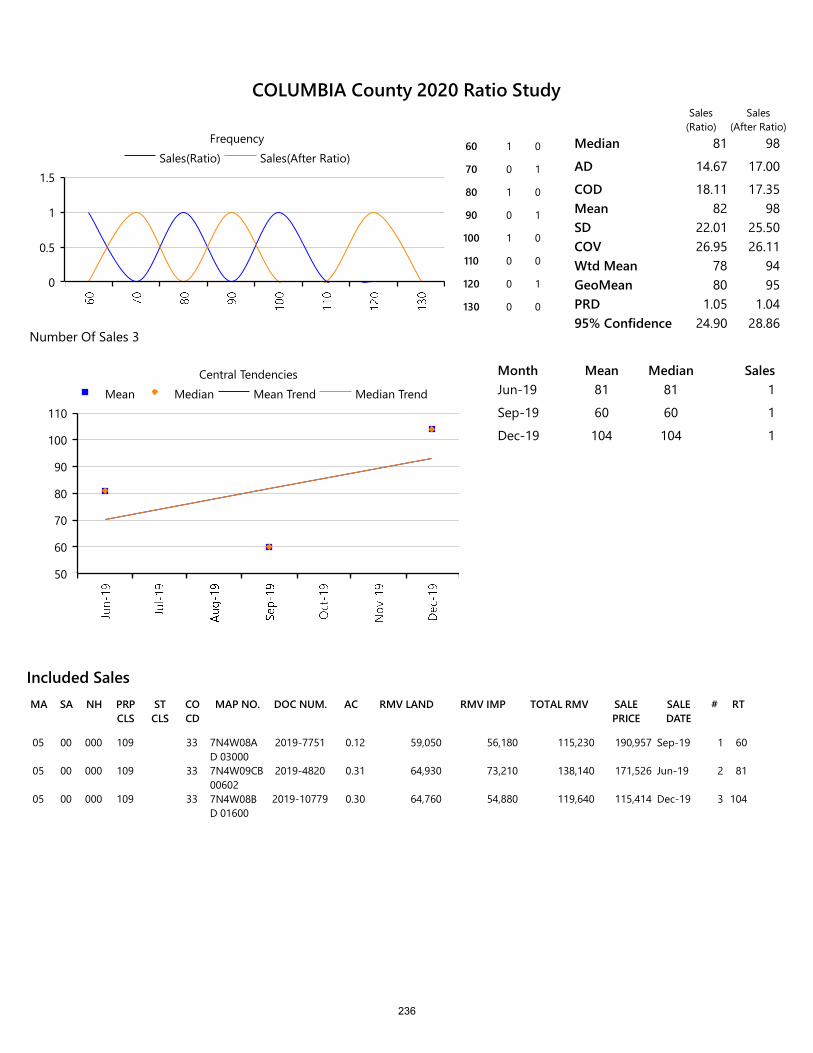
RMV LANDSA NH PRP CLS
ST CLS
CO CD
MAP NO. DOC NUM.MA AC RMV IMP TOTAL RMV SALE PRICE
SALE DATE
# RT
Included Sales
05 00 000 109 33 7N4W08AD 03000
2019-7751 0.12 59,050 56,180 115,230 190,957 Sep-19 1 60
05 00 000 109 33 7N4W09CB 00602
2019-4820 0.31 64,930 73,210 138,140 171,526 Jun-19 2 81
05 00 000 109 33 7N4W08BD 01600
2019-10779 0.30 64,760 54,880 119,640 115,414 Dec-19 3 104
0
0.5
1
1.5Sales(Ratio) Sales(After Ratio)
Frequency60 1 0
70 0 1
80 1 0
90 0 1
100 1 0
110 0 0
120 0 1
130 0 0
Median 81 98
AD 14.67 17.00
COD 18.11 17.35Mean 82 98SD 22.01 25.50COV 26.95 26.11Wtd Mean 78 94GeoMean 80 95PRD 1.05 1.0495% Confidence 24.90 28.86
Number Of Sales 3
50
60
70
80
90
100
110Mean Median Mean Trend Median Trend
Central Tendencies Month Mean Median SalesJun-19 81 81 1
Sep-19 60 60 1
Dec-19 104 104 1
Sales(Ratio)
Sales(After Ratio)
COLUMBIA County 2020 Ratio Study
236

RMV Class MA SA NH
App Year
# of Sales Location
101 05 40 000 2020 Clatskanie
RMV Class MA SA NH
App Year
# of Sales Location
Study Definition
Adjustment Calculation SummarySample - Number of SalesPopulation - Number of AccountsSales as a percentage of the PopulationPrior Year Population Values
Land RmvOSD RMVImprovement RMVFarm Improvement RMV
Selected Ratio From Sales
Before Ratio
Overall Adjustment FactorLand Adjustment FactorOSD Adjustment FactorImprovement Adjustment FactorFarm Improvement Factor
After Ratio
ExplanationRMV 101: SA 40Improved land – Duplex/Triplex/Fourplex, City of Clatskanie
The query did not return any sales for this analysis of Duplex/Triplex/Fourplex properties. Because of this, it was decided to use the Selected Ratio of 88 from the single-family residential study in the same area and to apply it here.
RECALCULATED
Pre-Trend Brkdwn Post Trend Values Post Trend Brkdwn
020
0.00%
968,940 22.54% 1,007,698 20.70%379,800
2,944,9204,770
8.84% 379,800 7.80%68.51% 3,475,006 71.38%0.11% 5,629 0.12%
88
88
114104100118118100
Time Trend Adjustment 0
Performance History2020 2016- 3.30- 1.00
CODPRD
COLUMBIA County 2020 Ratio Study
Pre-Trend Values
237

0
1Sales(Ratio) Sales(After Ratio)
Frequency Median
AD
CODMeanSDCOVWtd MeanGeoMeanPRD95% ConfidenceNumber Of Sales 0
0
1Mean Median Mean Trend Median Trend
Central Tendencies Month Mean Median Sales
Sales(Ratio)
Sales(After Ratio)
COLUMBIA County 2020 Ratio Study
238

RMV Class MA SA NH
App Year
# of Sales Location
400 05 36 000 2020 Clatskanie
RMV Class MA SA NH
App Year
# of Sales Location
Study Definition
Adjustment Calculation SummarySample - Number of SalesPopulation - Number of AccountsSales as a percentage of the PopulationPrior Year Population Values
Land RmvOSD RMVImprovement RMVFarm Improvement RMV
Selected Ratio From Sales
Before Ratio
Overall Adjustment FactorLand Adjustment FactorOSD Adjustment FactorImprovement Adjustment FactorFarm Improvement Factor
After Ratio
ExplanationRMV 400: SA 36 Unimproved land – Fishhawk Lake in Rural Clatskanie
RECALCULATED
Pre-Trend Brkdwn Post Trend Values Post Trend Brkdwn
027
0.00%
940,400 100.00% 874,572 100.00%000
0.00% 0 0.00%0.00% 0 0.00%0.00% 0 0.00%
107
107
9393
100100100100
Time Trend Adjustment 0
For this area, no sales data was returned. Therefore, it was decided to apply the Mean of 107 from the RMV 401 analysis located in MA 05 SA 36.
Performance History2020 2019- 5.33- 0.98
CODPRD
COLUMBIA County 2020 Ratio Study
Pre-Trend Values
239

0
1Sales(Ratio) Sales(After Ratio)
Frequency Median
AD
CODMeanSDCOVWtd MeanGeoMeanPRD95% ConfidenceNumber Of Sales 0
0
1Mean Median Mean Trend Median Trend
Central Tendencies Month Mean Median Sales
Sales(Ratio)
Sales(After Ratio)
COLUMBIA County 2020 Ratio Study
240

RMV Class MA SA NH
App Year
# of Sales Location
401 05 36 000 2020 3 Clatskanie
RMV Class MA SA NH
App Year
# of Sales Location
Study Definition
Adjustment Calculation SummarySample - Number of SalesPopulation - Number of AccountsSales as a percentage of the PopulationPrior Year Population Values
Land RmvOSD RMVImprovement RMVFarm Improvement RMV
Selected Ratio From Sales
Before Ratio
Overall Adjustment FactorLand Adjustment FactorOSD Adjustment FactorImprovement Adjustment FactorFarm Improvement Factor
After Ratio
ExplanationRMV 401: SA 36 Improved land – Fishhawk Lake in Rural Clatskanie
RECALCULATED
Pre-Trend Brkdwn Post Trend Values Post Trend Brkdwn
359
5.08%
2,751,760 22.60% 2,559,137 22.53%1,653,0007,724,020
45,280
13.58% 1,653,000 14.55%63.45% 7,106,098 62.55%0.37% 41,658 0.37%
107
107
9393
1009292
100
Time Trend Adjustment 9
This study is comprised of properties located in Fishhawk Lake Estates area. This location is a private community that surrounds a 100-acre man-made lake. It is distinctive due to the nature of the market it encompasses: recreational lake, vacation get-a-way and second home type properties. For this analysis, the Selected Ratio of 107 (Mean) was applied as the best indicator for this population of accounts.
Performance History2020 2019 20184.59 8.98 14.770.99 0.98 1.01
CODPRD
COLUMBIA County 2020 Ratio Study
Pre-Trend Values
241
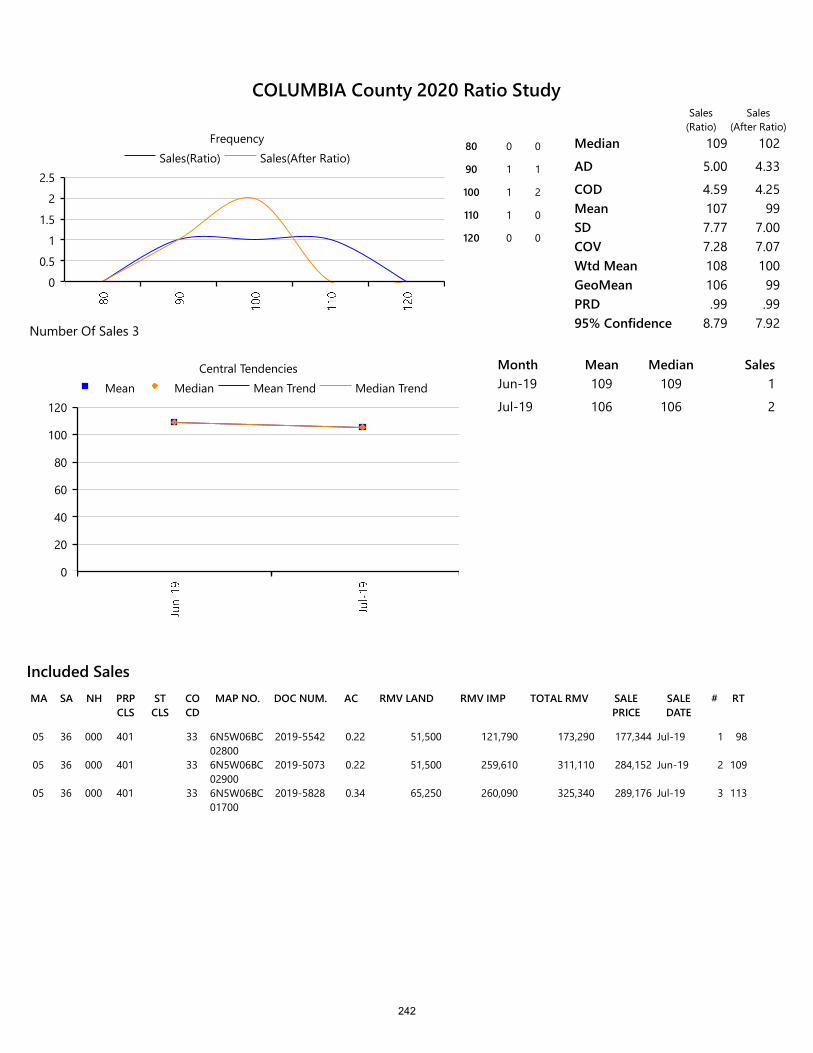
RMV LANDSA NH PRP CLS
ST CLS
CO CD
MAP NO. DOC NUM.MA AC RMV IMP TOTAL RMV SALE PRICE
SALE DATE
# RT
Included Sales
05 36 000 401 33 6N5W06BC 02800
2019-5542 0.22 51,500 121,790 173,290 177,344 Jul-19 1 98
05 36 000 401 33 6N5W06BC 02900
2019-5073 0.22 51,500 259,610 311,110 284,152 Jun-19 2 109
05 36 000 401 33 6N5W06BC 01700
2019-5828 0.34 65,250 260,090 325,340 289,176 Jul-19 3 113
0
0.5
1
1.5
2
2.5Sales(Ratio) Sales(After Ratio)
Frequency80 0 0
90 1 1
100 1 2
110 1 0
120 0 0
Median 109 102
AD 5.00 4.33
COD 4.59 4.25Mean 107 99SD 7.77 7.00COV 7.28 7.07Wtd Mean 108 100GeoMean 106 99PRD .99 .9995% Confidence 8.79 7.92Number Of Sales 3
0
20
40
60
80
100
120Mean Median Mean Trend Median Trend
Central Tendencies Month Mean Median SalesJun-19 109 109 1
Jul-19 106 106 2
Sales(Ratio)
Sales(After Ratio)
COLUMBIA County 2020 Ratio Study
242

RMV Class MA SA NH
App Year
# of Sales Location
400 05 51 000 2020 8 Clatskanie
RMV Class MA SA NH
App Year
# of Sales Location
Study Definition
Adjustment Calculation SummarySample - Number of SalesPopulation - Number of AccountsSales as a percentage of the PopulationPrior Year Population Values
Land RmvOSD RMVImprovement RMVFarm Improvement RMV
Selected Ratio From Sales
Before Ratio
Overall Adjustment FactorLand Adjustment FactorOSD Adjustment FactorImprovement Adjustment FactorFarm Improvement Factor
After Ratio
ExplanationRMV 400: SA 51 Unimproved land, Rural Clatskanie (Value Zone 1)
This dataset is too small to perform a thorough analysis with having only 8 sales available out of a population of 814 accounts (.98% of the population). Therefore it was decided to use the Selected Ratio of 97 from the improved properties (RMV 401) located in the same maintenance and study area.
RECALCULATED
Pre-Trend Brkdwn Post Trend Values Post Trend Brkdwn
8814
0.98%
182,958,820 100.00% 188,447,585 100.00%000
0.00% 0 0.00%0.00% 0 0.00%0.00% 0 0.00%
97
97
103103100100100100
Time Trend Adjustment 9
Performance History2020 2019 2018 2017 201611.02 11.83 16.00 19.55 12.311.03 1.05 1.01 1.06 1.06
CODPRD
COLUMBIA County 2020 Ratio Study
Pre-Trend Values
243
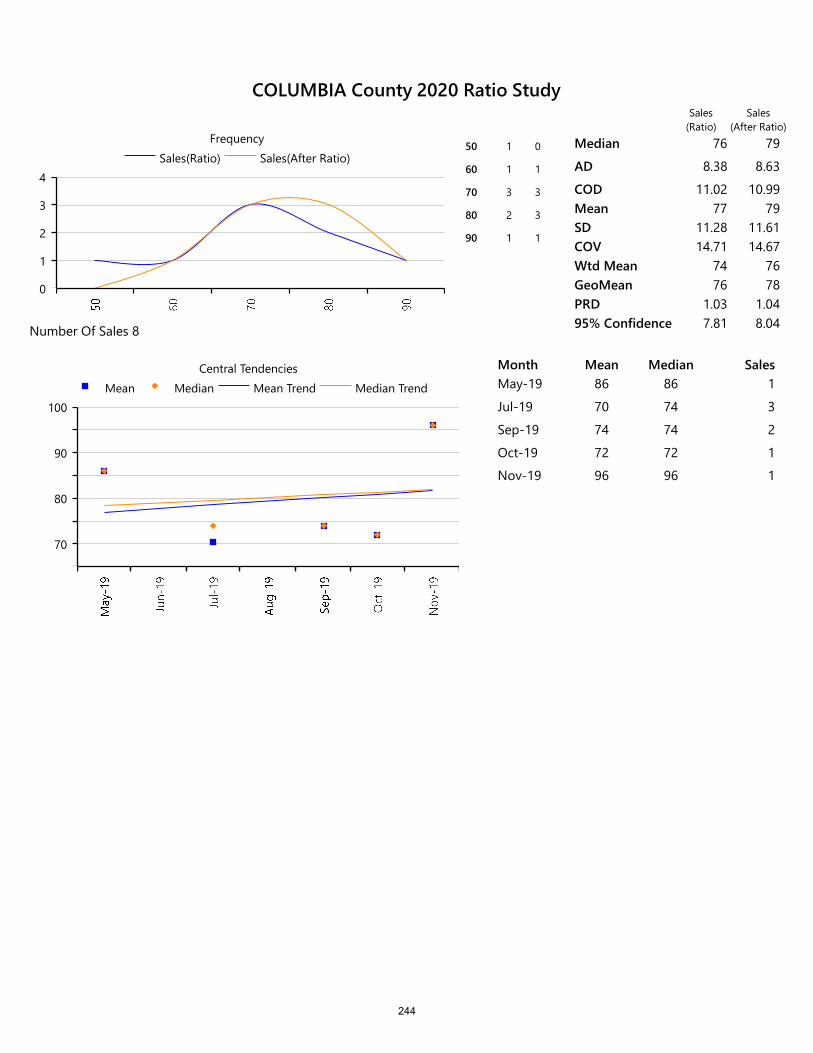
0
1
2
3
4Sales(Ratio) Sales(After Ratio)
Frequency50 1 0
60 1 1
70 3 3
80 2 3
90 1 1
Median 76 79
AD 8.38 8.63
COD 11.02 10.99Mean 77 79SD 11.28 11.61COV 14.71 14.67Wtd Mean 74 76GeoMean 76 78PRD 1.03 1.0495% Confidence 7.81 8.04Number Of Sales 8
70
80
90
100Mean Median Mean Trend Median Trend
Central Tendencies Month Mean Median SalesMay-19 86 86 1
Jul-19 70 74 3
Sep-19 74 74 2
Oct-19 72 72 1
Nov-19 96 96 1
Sales(Ratio)
Sales(After Ratio)
COLUMBIA County 2020 Ratio Study
244
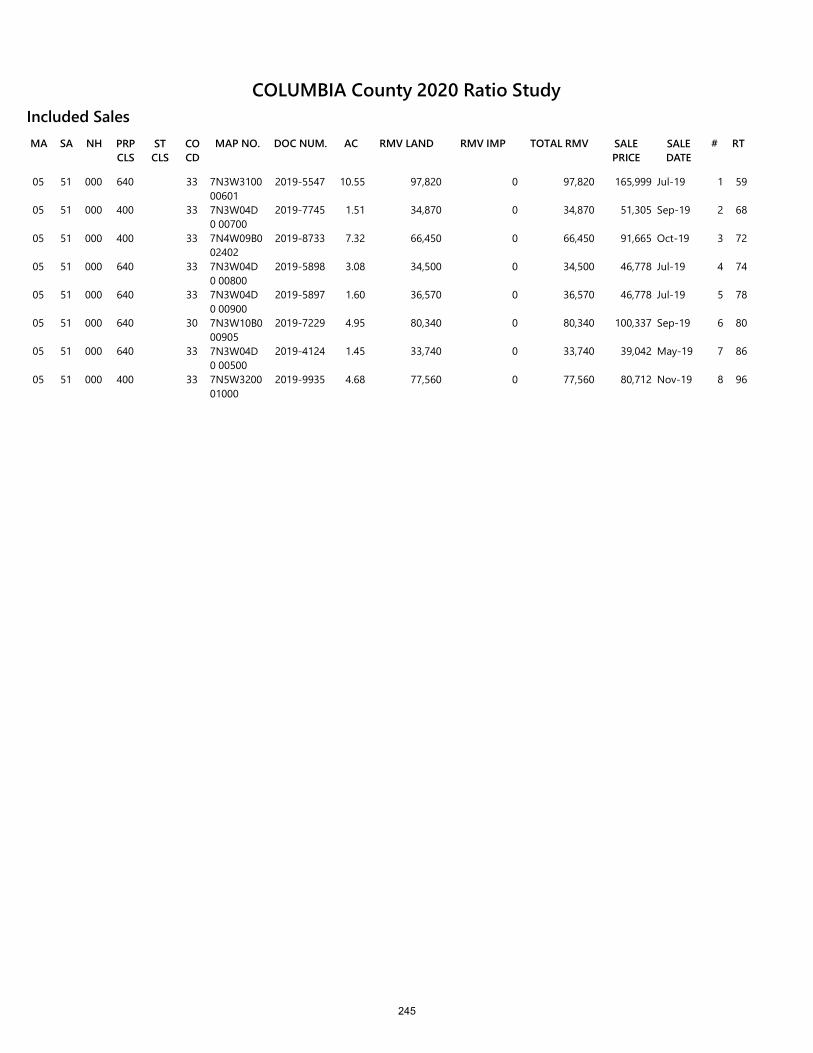
RMV LANDSA NH PRP CLS
ST CLS
CO CD
MAP NO. DOC NUM.MA AC RMV IMP TOTAL RMV SALE PRICE
SALE DATE
# RT
Included Sales
05 51 000 640 33 7N3W3100 00601
2019-5547 10.55 97,820 0 97,820 165,999 Jul-19 1 59
05 51 000 400 33 7N3W04D0 00700
2019-7745 1.51 34,870 0 34,870 51,305 Sep-19 2 68
05 51 000 400 33 7N4W09B0 02402
2019-8733 7.32 66,450 0 66,450 91,665 Oct-19 3 72
05 51 000 640 33 7N3W04D0 00800
2019-5898 3.08 34,500 0 34,500 46,778 Jul-19 4 74
05 51 000 640 33 7N3W04D0 00900
2019-5897 1.60 36,570 0 36,570 46,778 Jul-19 5 78
05 51 000 640 30 7N3W10B0 00905
2019-7229 4.95 80,340 0 80,340 100,337 Sep-19 6 80
05 51 000 640 33 7N3W04D0 00500
2019-4124 1.45 33,740 0 33,740 39,042 May-19 7 86
05 51 000 400 33 7N5W3200 01000
2019-9935 4.68 77,560 0 77,560 80,712 Nov-19 8 96
COLUMBIA County 2020 Ratio Study
245

RMV Class MA SA NH
App Year
# of Sales Location
401 05 51 000 2020 42 Clatskanie
RMV Class MA SA NH
App Year
# of Sales Location
Study Definition
Adjustment Calculation SummarySample - Number of SalesPopulation - Number of AccountsSales as a percentage of the PopulationPrior Year Population Values
Land RmvOSD RMVImprovement RMVFarm Improvement RMV
Selected Ratio From Sales
Before Ratio
Overall Adjustment FactorLand Adjustment FactorOSD Adjustment FactorImprovement Adjustment FactorFarm Improvement Factor
After Ratio
ExplanationRMV 401: SA 51Improved property, Rural Clatskanie (Value Zone 1)
RECALCULATED
Pre-Trend Brkdwn Post Trend Values Post Trend Brkdwn
421467
2.86%
116,357,040 27.47% 119,847,751 27.44%62,001,210
219,414,39025,754,820
14.64% 62,001,210 14.19%51.81% 228,190,966 52.24%6.08% 26,785,013 6.13%
97
97
103103100104104100
Time Trend Adjustment 9
For this sales array of improved property within rural Clatskanie, the Median, Weighted Mean and Geometric Mean returned a ratio of 97. The Median was selected and applied to the analysis. The result is an Overall Adjustment Factor of 103.
Performance History2020 2019 2018 2017 201610.04 15.65 10.08 9.18 13.041.01 1.03 1.00 1.01 1.00
CODPRD
COLUMBIA County 2020 Ratio Study
Pre-Trend Values
246
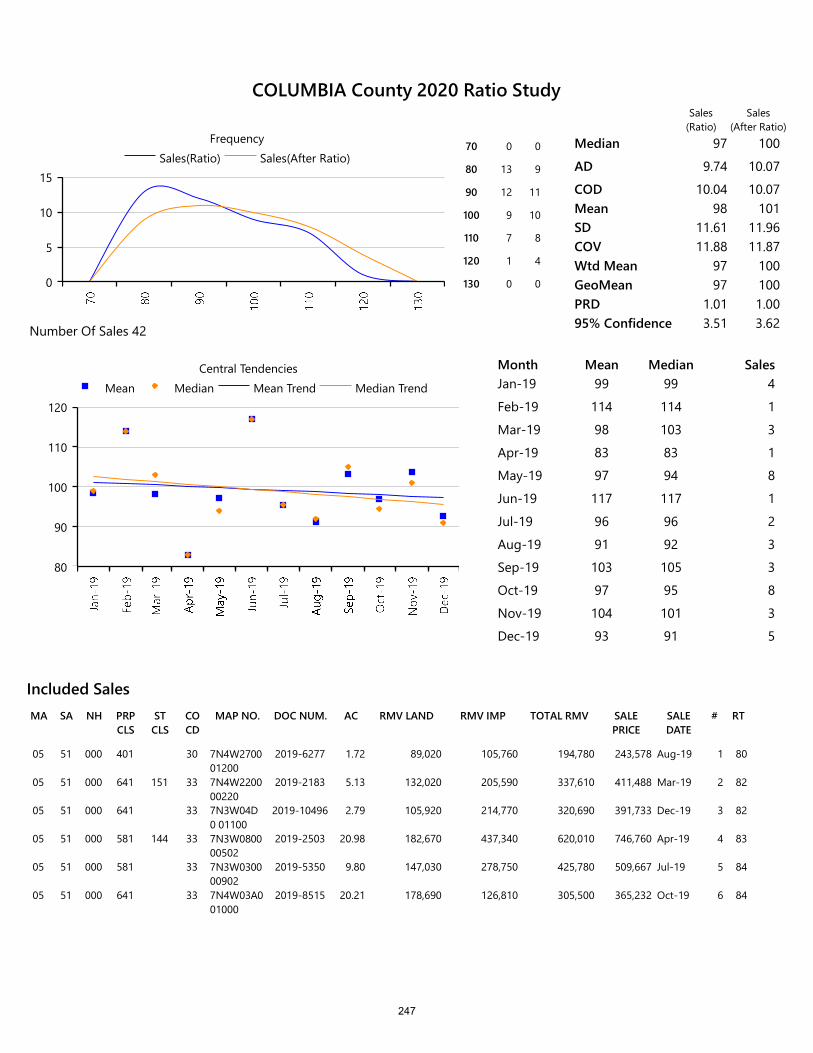
RMV LANDSA NH PRP CLS
ST CLS
CO CD
MAP NO. DOC NUM.MA AC RMV IMP TOTAL RMV SALE PRICE
SALE DATE
# RT
Included Sales
05 51 000 401 30 7N4W2700 01200
2019-6277 1.72 89,020 105,760 194,780 243,578 Aug-19 1 80
05 51 000 641 151 33 7N4W2200 00220
2019-2183 5.13 132,020 205,590 337,610 411,488 Mar-19 2 82
05 51 000 641 33 7N3W04D0 01100
2019-10496 2.79 105,920 214,770 320,690 391,733 Dec-19 3 82
05 51 000 581 144 33 7N3W0800 00502
2019-2503 20.98 182,670 437,340 620,010 746,760 Apr-19 4 83
05 51 000 581 33 7N3W0300 00902
2019-5350 9.80 147,030 278,750 425,780 509,667 Jul-19 5 84
05 51 000 641 33 7N4W03A0 01000
2019-8515 20.21 178,690 126,810 305,500 365,232 Oct-19 6 84
0
5
10
15Sales(Ratio) Sales(After Ratio)
Frequency70 0 0
80 13 9
90 12 11
100 9 10
110 7 8
120 1 4
130 0 0
Median 97 100
AD 9.74 10.07
COD 10.04 10.07Mean 98 101SD 11.61 11.96COV 11.88 11.87Wtd Mean 97 100GeoMean 97 100PRD 1.01 1.0095% Confidence 3.51 3.62Number Of Sales 42
80
90
100
110
120Mean Median Mean Trend Median Trend
Central Tendencies Month Mean Median SalesJan-19 99 99 4
Feb-19 114 114 1
Mar-19 98 103 3
Apr-19 83 83 1
May-19 97 94 8
Jun-19 117 117 1
Jul-19 96 96 2
Aug-19 91 92 3
Sep-19 103 105 3
Oct-19 97 95 8
Nov-19 104 101 3
Dec-19 93 91 5
Sales(Ratio)
Sales(After Ratio)
COLUMBIA County 2020 Ratio Study
247
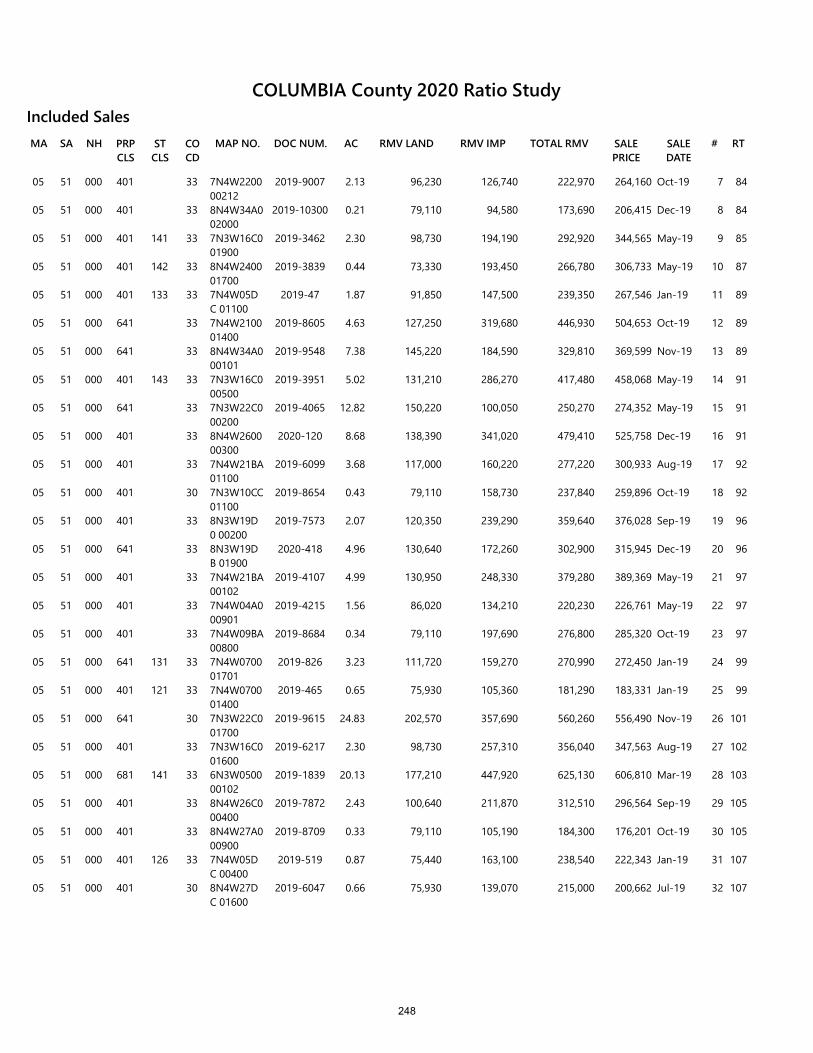
RMV LANDSA NH PRP CLS
ST CLS
CO CD
MAP NO. DOC NUM.MA AC RMV IMP TOTAL RMV SALE PRICE
SALE DATE
# RT
Included Sales
05 51 000 401 33 7N4W2200 00212
2019-9007 2.13 96,230 126,740 222,970 264,160 Oct-19 7 84
05 51 000 401 33 8N4W34A0 02000
2019-10300 0.21 79,110 94,580 173,690 206,415 Dec-19 8 84
05 51 000 401 141 33 7N3W16C0 01900
2019-3462 2.30 98,730 194,190 292,920 344,565 May-19 9 85
05 51 000 401 142 33 8N4W2400 01700
2019-3839 0.44 73,330 193,450 266,780 306,733 May-19 10 87
05 51 000 401 133 33 7N4W05DC 01100
2019-47 1.87 91,850 147,500 239,350 267,546 Jan-19 11 89
05 51 000 641 33 7N4W2100 01400
2019-8605 4.63 127,250 319,680 446,930 504,653 Oct-19 12 89
05 51 000 641 33 8N4W34A0 00101
2019-9548 7.38 145,220 184,590 329,810 369,599 Nov-19 13 89
05 51 000 401 143 33 7N3W16C0 00500
2019-3951 5.02 131,210 286,270 417,480 458,068 May-19 14 91
05 51 000 641 33 7N3W22C0 00200
2019-4065 12.82 150,220 100,050 250,270 274,352 May-19 15 91
05 51 000 401 33 8N4W2600 00300
2020-120 8.68 138,390 341,020 479,410 525,758 Dec-19 16 91
05 51 000 401 33 7N4W21BA 01100
2019-6099 3.68 117,000 160,220 277,220 300,933 Aug-19 17 92
05 51 000 401 30 7N3W10CC 01100
2019-8654 0.43 79,110 158,730 237,840 259,896 Oct-19 18 92
05 51 000 401 33 8N3W19D0 00200
2019-7573 2.07 120,350 239,290 359,640 376,028 Sep-19 19 96
05 51 000 641 33 8N3W19DB 01900
2020-418 4.96 130,640 172,260 302,900 315,945 Dec-19 20 96
05 51 000 401 33 7N4W21BA 00102
2019-4107 4.99 130,950 248,330 379,280 389,369 May-19 21 97
05 51 000 401 33 7N4W04A0 00901
2019-4215 1.56 86,020 134,210 220,230 226,761 May-19 22 97
05 51 000 401 33 7N4W09BA 00800
2019-8684 0.34 79,110 197,690 276,800 285,320 Oct-19 23 97
05 51 000 641 131 33 7N4W0700 01701
2019-826 3.23 111,720 159,270 270,990 272,450 Jan-19 24 99
05 51 000 401 121 33 7N4W0700 01400
2019-465 0.65 75,930 105,360 181,290 183,331 Jan-19 25 99
05 51 000 641 30 7N3W22C0 01700
2019-9615 24.83 202,570 357,690 560,260 556,490 Nov-19 26 101
05 51 000 401 33 7N3W16C0 01600
2019-6217 2.30 98,730 257,310 356,040 347,563 Aug-19 27 102
05 51 000 681 141 33 6N3W0500 00102
2019-1839 20.13 177,210 447,920 625,130 606,810 Mar-19 28 103
05 51 000 401 33 8N4W26C0 00400
2019-7872 2.43 100,640 211,870 312,510 296,564 Sep-19 29 105
05 51 000 401 33 8N4W27A0 00900
2019-8709 0.33 79,110 105,190 184,300 176,201 Oct-19 30 105
05 51 000 401 126 33 7N4W05DC 00400
2019-519 0.87 75,440 163,100 238,540 222,343 Jan-19 31 107
05 51 000 401 30 8N4W27DC 01600
2019-6047 0.66 75,930 139,070 215,000 200,662 Jul-19 32 107
COLUMBIA County 2020 Ratio Study
248

RMV LANDSA NH PRP CLS
ST CLS
CO CD
MAP NO. DOC NUM.MA AC RMV IMP TOTAL RMV SALE PRICE
SALE DATE
# RT
Included Sales
05 51 000 401 33 7N4W3500 00201
2019-8656 6.76 143,080 360,160 503,240 468,970 Oct-19 33 107
05 51 000 641 33 7N3W1600 01701
2019-7446 4.80 128,990 272,010 401,000 367,296 Sep-19 34 109
05 51 000 401 131 33 7N5W10AA 02900
2019-1961 0.39 79,110 236,250 315,360 287,296 Mar-19 35 110
05 51 000 401 135 30 6N5W13CC 00500
2019-3581 0.32 73,330 59,890 133,220 120,715 May-19 36 110
05 51 000 641 33 7N3W3100 00900
2019-10679 17.74 168,030 359,480 527,510 476,758 Dec-19 37 111
05 51 000 401 143 30 7N4W09BA 01000
2019-1110 0.36 79,110 263,910 343,020 302,176 Feb-19 38 114
05 51 000 641 33 7N3W04C0 01601
2019-4643 5.08 131,650 272,890 404,540 347,058 Jun-19 39 117
05 51 000 401 30 7N4W09BA 01000
2019-9193 0.36 79,110 263,910 343,020 294,437 Oct-19 40 117
05 51 000 401 33 7N4W2100 01301
2019-3513 4.29 123,760 236,930 360,690 303,661 May-19 41 119
05 51 000 681 30 7N3W1600 01900
2019-9321 38.19 259,210 378,870 638,080 527,176 Nov-19 42 121
COLUMBIA County 2020 Ratio Study
249

RMV Class MA SA NH
App Year
# of Sales Location
409 05 51 000 2020 7 Clatskanie
RMV Class MA SA NH
App Year
# of Sales Location
Study Definition
Adjustment Calculation SummarySample - Number of SalesPopulation - Number of AccountsSales as a percentage of the PopulationPrior Year Population Values
Land RmvOSD RMVImprovement RMVFarm Improvement RMV
Selected Ratio From Sales
Before Ratio
Overall Adjustment FactorLand Adjustment FactorOSD Adjustment FactorImprovement Adjustment FactorFarm Improvement Factor
After Ratio
ExplanationRMV 409: SA 51 Improved property – Manufactured Structure, Rural Clatskanie (Value Zone 1)
For this grouping of rural Clatskanie properties improved with manufactured structures, the sales array returned a sample of 7 sales. After applying the time adjustment of 9%, the Mean (89) was selected and applied as the best indicator for this classification of properties.
RECALCULATED
Pre-Trend Brkdwn Post Trend Values Post Trend Brkdwn
7504
1.39%
36,281,460 36.95% 37,369,904 33.87%23,746,60029,503,1338,650,290
24.19% 23,746,600 21.52%30.05% 38,059,042 34.49%8.81% 11,158,874 10.11%
89
89
112103100129129100
Time Trend Adjustment 9
Performance History2020 2019 2018 2017 201617.24 25.92 13.92 13.82 10.241.04 0.97 1.01 0.97 1.01
CODPRD
COLUMBIA County 2020 Ratio Study
Pre-Trend Values
250
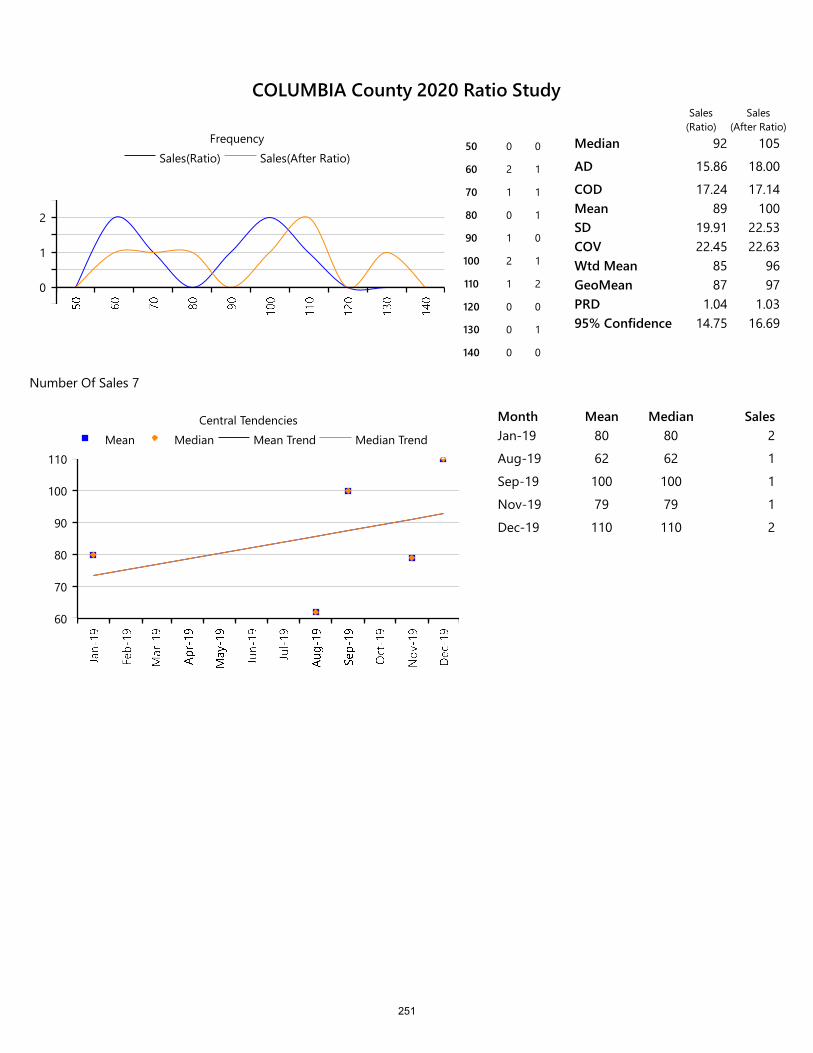
0
1
2
Sales(Ratio) Sales(After Ratio)Frequency
50 0 0
60 2 1
70 1 1
80 0 1
90 1 0
100 2 1
110 1 2
120 0 0
130 0 1
140 0 0
Median 92 105
AD 15.86 18.00
COD 17.24 17.14Mean 89 100SD 19.91 22.53COV 22.45 22.63Wtd Mean 85 96GeoMean 87 97PRD 1.04 1.0395% Confidence 14.75 16.69
Number Of Sales 7
60
70
80
90
100
110Mean Median Mean Trend Median Trend
Central Tendencies Month Mean Median SalesJan-19 80 80 2
Aug-19 62 62 1
Sep-19 100 100 1
Nov-19 79 79 1
Dec-19 110 110 2
Sales(Ratio)
Sales(After Ratio)
COLUMBIA County 2020 Ratio Study
251
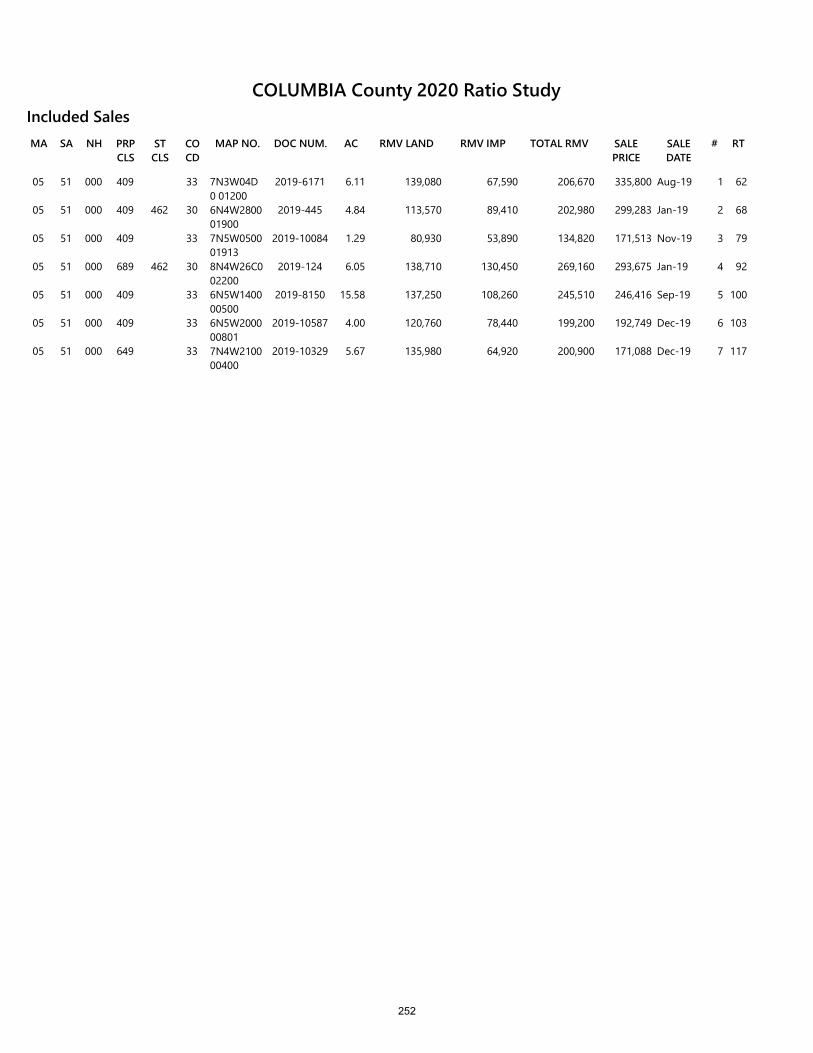
RMV LANDSA NH PRP CLS
ST CLS
CO CD
MAP NO. DOC NUM.MA AC RMV IMP TOTAL RMV SALE PRICE
SALE DATE
# RT
Included Sales
05 51 000 409 33 7N3W04D0 01200
2019-6171 6.11 139,080 67,590 206,670 335,800 Aug-19 1 62
05 51 000 409 462 30 6N4W2800 01900
2019-445 4.84 113,570 89,410 202,980 299,283 Jan-19 2 68
05 51 000 409 33 7N5W0500 01913
2019-10084 1.29 80,930 53,890 134,820 171,513 Nov-19 3 79
05 51 000 689 462 30 8N4W26C0 02200
2019-124 6.05 138,710 130,450 269,160 293,675 Jan-19 4 92
05 51 000 409 33 6N5W1400 00500
2019-8150 15.58 137,250 108,260 245,510 246,416 Sep-19 5 100
05 51 000 409 33 6N5W2000 00801
2019-10587 4.00 120,760 78,440 199,200 192,749 Dec-19 6 103
05 51 000 649 33 7N4W2100 00400
2019-10329 5.67 135,980 64,920 200,900 171,088 Dec-19 7 117
COLUMBIA County 2020 Ratio Study
252
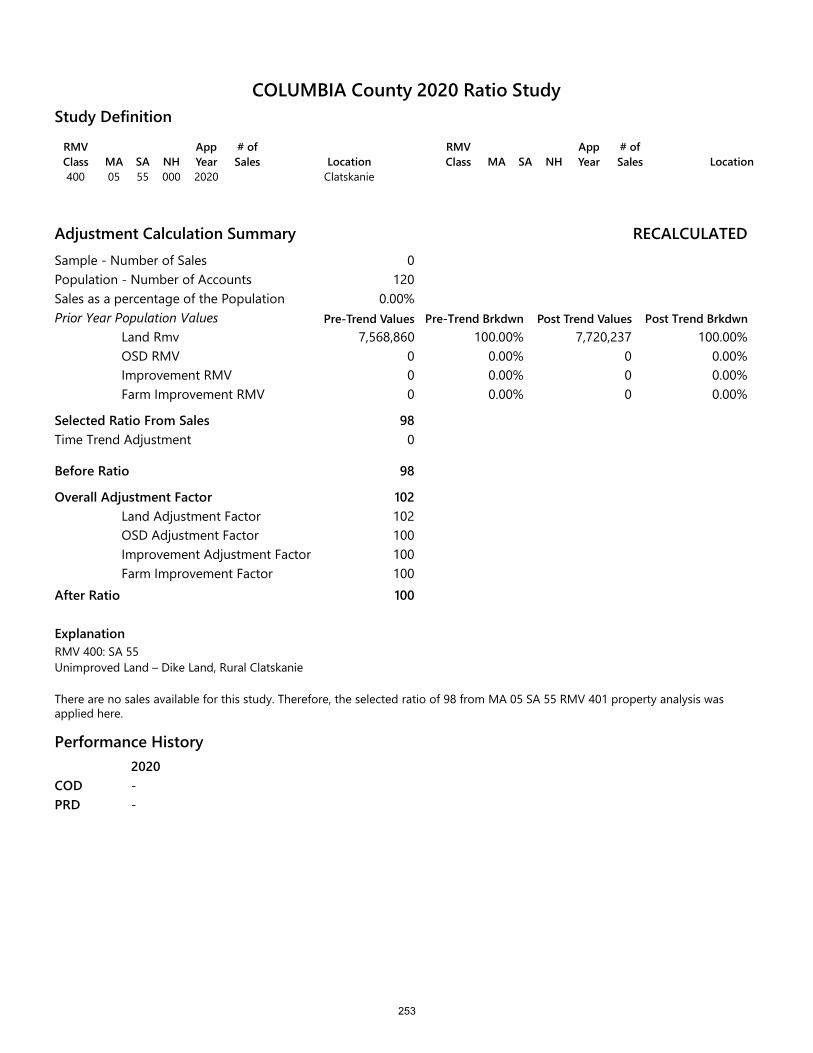
RMV Class MA SA NH
App Year
# of Sales Location
400 05 55 000 2020 Clatskanie
RMV Class MA SA NH
App Year
# of Sales Location
Study Definition
Adjustment Calculation SummarySample - Number of SalesPopulation - Number of AccountsSales as a percentage of the PopulationPrior Year Population Values
Land RmvOSD RMVImprovement RMVFarm Improvement RMV
Selected Ratio From Sales
Before Ratio
Overall Adjustment FactorLand Adjustment FactorOSD Adjustment FactorImprovement Adjustment FactorFarm Improvement Factor
After Ratio
ExplanationRMV 400: SA 55Unimproved Land – Dike Land, Rural Clatskanie
RECALCULATED
Pre-Trend Brkdwn Post Trend Values Post Trend Brkdwn
0120
0.00%
7,568,860 100.00% 7,720,237 100.00%000
0.00% 0 0.00%0.00% 0 0.00%0.00% 0 0.00%
98
98
102102100100100100
Time Trend Adjustment 0
Pre-Trend Values
There are no sales available for this study. Therefore, the selected ratio of 98 from MA 05 SA 55 RMV 401 property analysis was applied here.
Performance History2020--
CODPRD
COLUMBIA County 2020 Ratio Study
253

0
1Sales(Ratio) Sales(After Ratio)
Frequency Median
AD
CODMeanSDCOVWtd MeanGeoMeanPRD95% ConfidenceNumber Of Sales 0
0
1Mean Median Mean Trend Median Trend
Central Tendencies Month Mean Median Sales
Sales(Ratio)
Sales(After Ratio)
COLUMBIA County 2020 Ratio Study
254

RMV Class MA SA NH
App Year
# of Sales Location
401 05 55 000 2020 6 Clatskanie
RMV Class MA SA NH
App Year
# of Sales Location
Study Definition
Adjustment Calculation SummarySample - Number of SalesPopulation - Number of AccountsSales as a percentage of the PopulationPrior Year Population Values
Land RmvOSD RMVImprovement RMVFarm Improvement RMV
Selected Ratio From Sales
Before Ratio
Overall Adjustment FactorLand Adjustment FactorOSD Adjustment FactorImprovement Adjustment FactorFarm Improvement Factor
After Ratio
ExplanationRMV 401: SA 55Improved Land – Dike Land, Rural Clatskanie
RECALCULATED
Pre-Trend Brkdwn Post Trend Values Post Trend Brkdwn
6266
2.26%
18,635,930 32.97% 19,008,649 32.89%8,123,370
23,822,0905,941,698
14.37% 8,123,370 14.06%42.15% 24,536,753 42.46%10.51% 6,119,949 10.59%
98
98
102102100103103100
Time Trend Adjustment 9
For this grouping of improved properties located in the Clatskanie dike area, the Weighted Mean of 98 was selected. This selected central tendency is further supported by the Mean (100) and the Geometric Mean (99). Once applied, the Overall Adjustment Factor returned a ratio of 102 which is a reasonable indicator of how the current market is moving in this rural area.
Performance History2020 2019 2018 2017 201610.51 8.34 8.47 11.48 11.211.02 1.02 1.00 1.02 0.98
CODPRD
COLUMBIA County 2020 Ratio Study
Pre-Trend Values
255
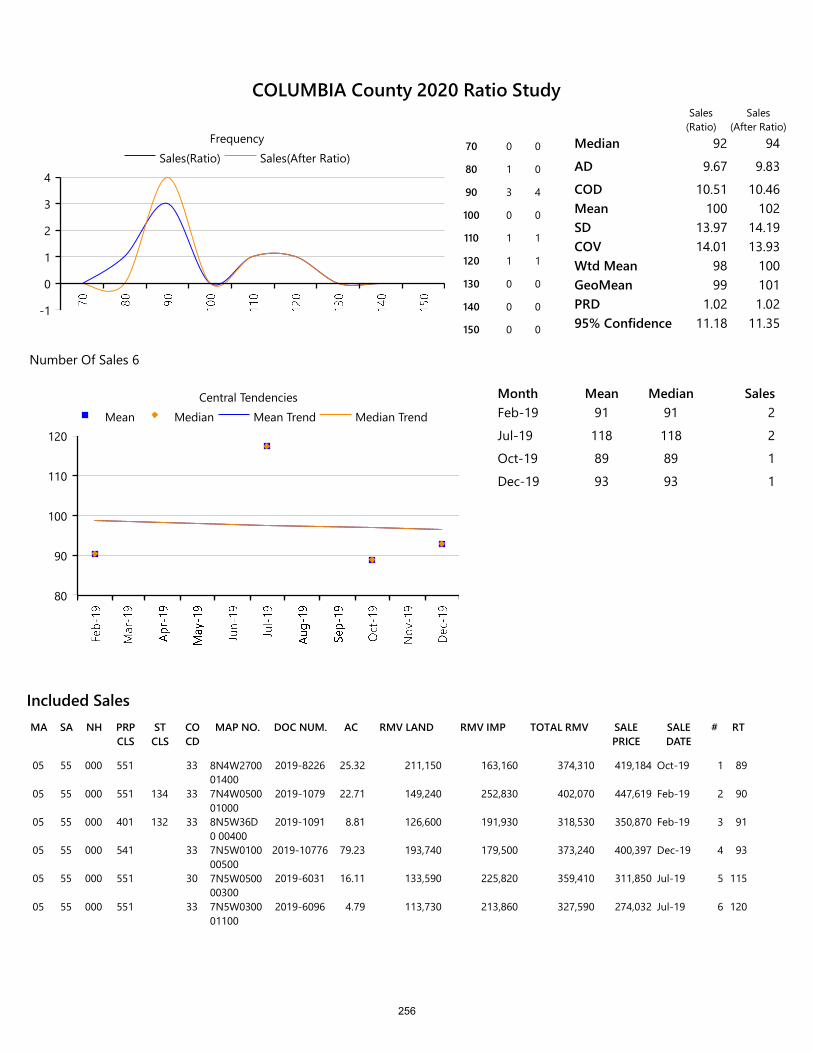
RMV LANDSA NH PRP CLS
ST CLS
CO CD
MAP NO. DOC NUM.MA AC RMV IMP TOTAL RMV SALE PRICE
SALE DATE
# RT
Included Sales
05 55 000 551 33 8N4W2700 01400
2019-8226 25.32 211,150 163,160 374,310 419,184 Oct-19 1 89
05 55 000 551 134 33 7N4W0500 01000
2019-1079 22.71 149,240 252,830 402,070 447,619 Feb-19 2 90
05 55 000 401 132 33 8N5W36D0 00400
2019-1091 8.81 126,600 191,930 318,530 350,870 Feb-19 3 91
05 55 000 541 33 7N5W0100 00500
2019-10776 79.23 193,740 179,500 373,240 400,397 Dec-19 4 93
05 55 000 551 30 7N5W0500 00300
2019-6031 16.11 133,590 225,820 359,410 311,850 Jul-19 5 115
05 55 000 551 33 7N5W0300 01100
2019-6096 4.79 113,730 213,860 327,590 274,032 Jul-19 6 120
-1
0
1
2
3
4Sales(Ratio) Sales(After Ratio)
Frequency70 0 0
80 1 0
90 3 4
100 0 0
110 1 1
120 1 1
130 0 0
140 0 0
150 0 0
Median 92 94
AD 9.67 9.83
COD 10.51 10.46Mean 100 102SD 13.97 14.19COV 14.01 13.93Wtd Mean 98 100GeoMean 99 101PRD 1.02 1.0295% Confidence 11.18 11.35
Number Of Sales 6
80
90
100
110
120Mean Median Mean Trend Median Trend
Central Tendencies Month Mean Median SalesFeb-19 91 91 2
Jul-19 118 118 2
Oct-19 89 89 1
Dec-19 93 93 1
Sales(Ratio)
Sales(After Ratio)
COLUMBIA County 2020 Ratio Study
256
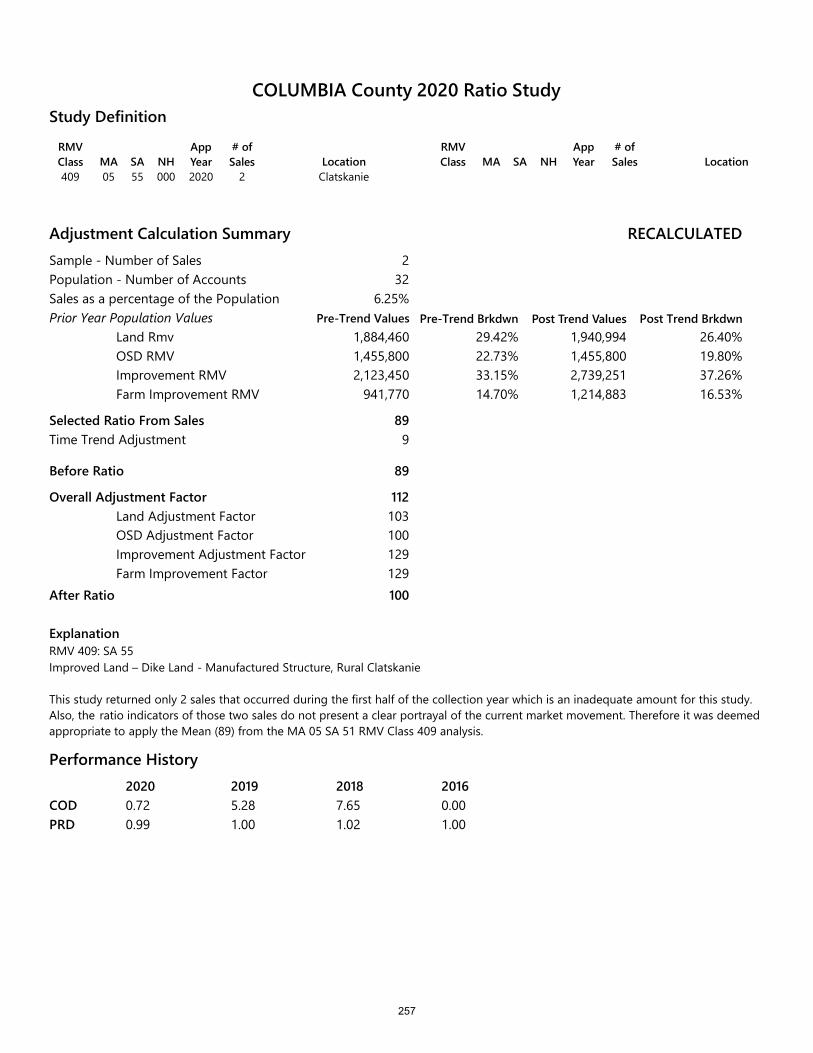
RMV Class MA SA NH
App Year
# of Sales Location
409 05 55 000 2020 2 Clatskanie
RMV Class MA SA NH
App Year
# of Sales Location
Study Definition
Adjustment Calculation SummarySample - Number of SalesPopulation - Number of AccountsSales as a percentage of the PopulationPrior Year Population Values
Land RmvOSD RMVImprovement RMVFarm Improvement RMV
Selected Ratio From Sales
Before Ratio
Overall Adjustment FactorLand Adjustment FactorOSD Adjustment FactorImprovement Adjustment FactorFarm Improvement Factor
After Ratio
RECALCULATED
Pre-Trend Brkdwn Post Trend Values Post Trend Brkdwn
232
6.25%
1,884,460 29.42% 1,940,994 26.40%1,455,8002,123,450
941,770
22.73% 1,455,800 19.80%33.15% 2,739,251 37.26%14.70% 1,214,883 16.53%
89
89
112103100129129100
Time Trend Adjustment 9
ExplanationRMV 409: SA 55Improved Land – Dike Land - Manufactured Structure, Rural Clatskanie
This study returned only 2 sales that occurred during the first half of the collection year which is an inadequate amount for this study. Also, the ratio indicators of those two sales do not present a clear portrayal of the current market movement. Therefore it was deemed appropriate to apply the Mean (89) from the MA 05 SA 51 RMV Class 409 analysis.
Performance History2020 2019 2018 20160.72 5.28 7.65 0.000.99 1.00 1.02 1.00
CODPRD
COLUMBIA County 2020 Ratio Study
Pre-Trend Values
257

RMV LANDSA NH PRP CLS
ST CLS
CO CD
MAP NO. DOC NUM.MA AC RMV IMP TOTAL RMV SALE PRICE
SALE DATE
# RT
Included Sales
05 55 000 409 452 33 8N5W36D0 01000
2019-1249 1.16 72,770 73,160 145,930 210,093 Feb-19 1 69
05 55 000 409 33 8N5W36D0 00600
2019-5129 8.22 151,320 190,320 341,640 484,668 Jun-19 2 70
-0.5
0
0.5
1
1.5
2Sales(Ratio) Sales(After Ratio)
Frequency50 0 0
60 1 0
70 1 0
80 0 2
90 0 0
100 0 0
110 0 0
Median 70 82
AD .50 1.50
COD .72 1.84Mean 70 82SD .71 2.12COV 1.02 2.60Wtd Mean 70 82GeoMean 69 81PRD .99 1.0095% Confidence .98 2.94Number Of Sales 2
0
20
40
60
80Mean Median Mean Trend Median Trend
Central Tendencies Month Mean Median SalesFeb-19 69 69 1
Jun-19 70 70 1
Sales(Ratio)
Sales(After Ratio)
COLUMBIA County 2020 Ratio Study
258

MAINTENANCE AREA 6
RURAL ST. HELENS, CITY OF COLUMBIA CITY
& WARREN
259

RMV Class MA SA NH
App Year
# of Sales Location
100 06 01 000 2020 Columbia City
RMV Class MA SA NH
App Year
# of Sales Location
Study Definition
Adjustment Calculation SummarySample - Number of SalesPopulation - Number of AccountsSales as a percentage of the PopulationPrior Year Population Values
Land RmvOSD RMVImprovement RMVFarm Improvement RMV
Selected Ratio From Sales
Before Ratio
Overall Adjustment FactorLand Adjustment FactorOSD Adjustment FactorImprovement Adjustment FactorFarm Improvement Factor
After Ratio
ExplanationRMV 100: SA 01Unimproved land, City of Columbia City General Area
RECALCULATED
Pre-Trend Brkdwn Post Trend Values Post Trend Brkdwn
029
0.00%
3,193,960 100.00% 3,289,779 100.00%000
0.00% 0 0.00%0.00% 0 0.00%0.00% 0 0.00%
97
97
103103100100100100
Time Trend Adjustment 0
This study is comprised of vacant land located within the small bedroom community of Columbia City. There were no sales available for the analysis within the study period. Because of this, it was decided to apply the Selected Ratio of 97 from the Improved RMV Class 101 study (MA 6, SA 01).
Performance History2020 2019 2018- 19.39 0.00- 0.95 1.00
CODPRD
COLUMBIA County 2020 Ratio Study
Pre-Trend Values
260

0
1Sales(Ratio) Sales(After Ratio)
Frequency Median
AD
CODMeanSDCOVWtd MeanGeoMeanPRD95% ConfidenceNumber Of Sales 0
0
1Mean Median Mean Trend Median Trend
Central Tendencies Month Mean Median Sales
Sales(Ratio)
Sales(After Ratio)
COLUMBIA County 2020 Ratio Study
261
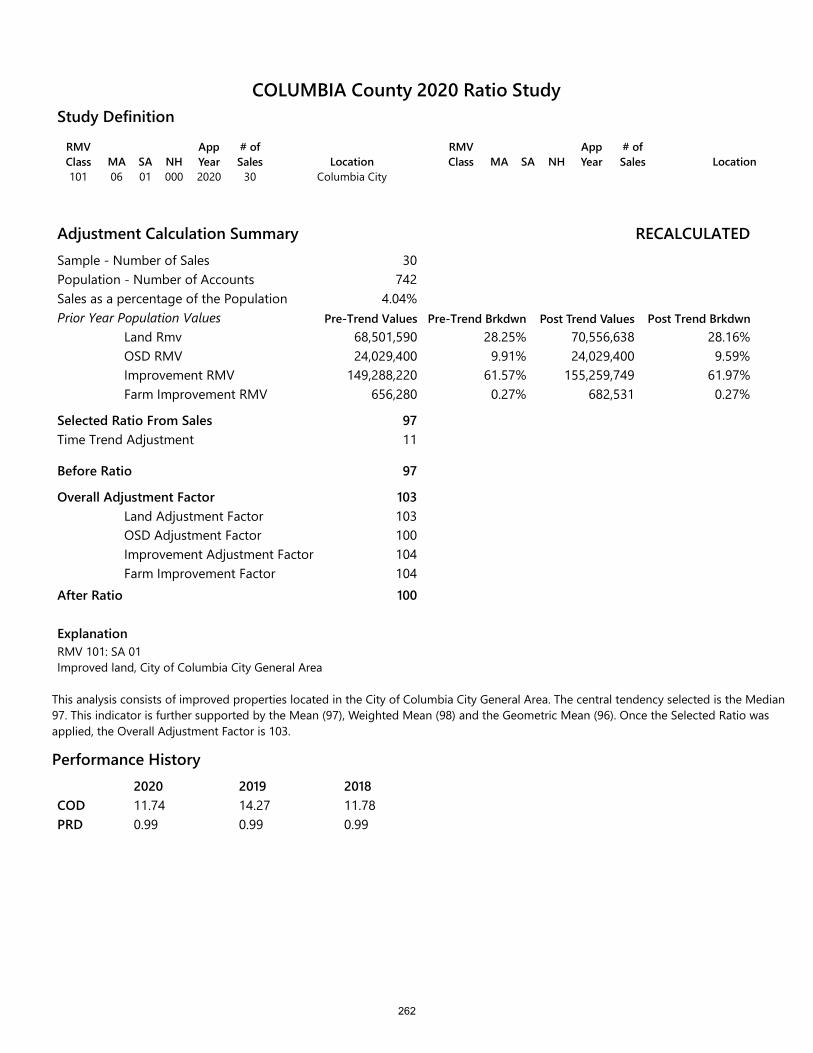
RMV Class MA SA NH
App Year
# of Sales Location
101 06 01 000 2020 30 Columbia City
RMV Class MA SA NH
App Year
# of Sales Location
Study Definition
Adjustment Calculation SummarySample - Number of SalesPopulation - Number of AccountsSales as a percentage of the PopulationPrior Year Population Values
Land RmvOSD RMVImprovement RMVFarm Improvement RMV
Selected Ratio From Sales
Before Ratio
Overall Adjustment FactorLand Adjustment FactorOSD Adjustment FactorImprovement Adjustment FactorFarm Improvement Factor
After Ratio
ExplanationRMV 101: SA 01Improved land, City of Columbia City General Area
This analysis consists of improved properties located in the City of Columbia City General Area. The central tendency selected is the Median 97. This indicator is further supported by the Mean (97), Weighted Mean (98) and the Geometric Mean (96). Once the Selected Ratio wasapplied, the Overall Adjustment Factor is 103.
RECALCULATED
Pre-Trend Brkdwn Post Trend Values Post Trend Brkdwn
30742
4.04%
68,501,590 28.25% 70,556,638 28.16%24,029,400
149,288,220656,280
9.91% 24,029,400 9.59%61.57% 155,259,749 61.97%0.27% 682,531 0.27%
97
97
103103100104104100
Time Trend Adjustment 11
Performance History2020 2019 201811.74 14.27 11.780.99 0.99 0.99
CODPRD
COLUMBIA County 2020 Ratio Study
Pre-Trend Values
262
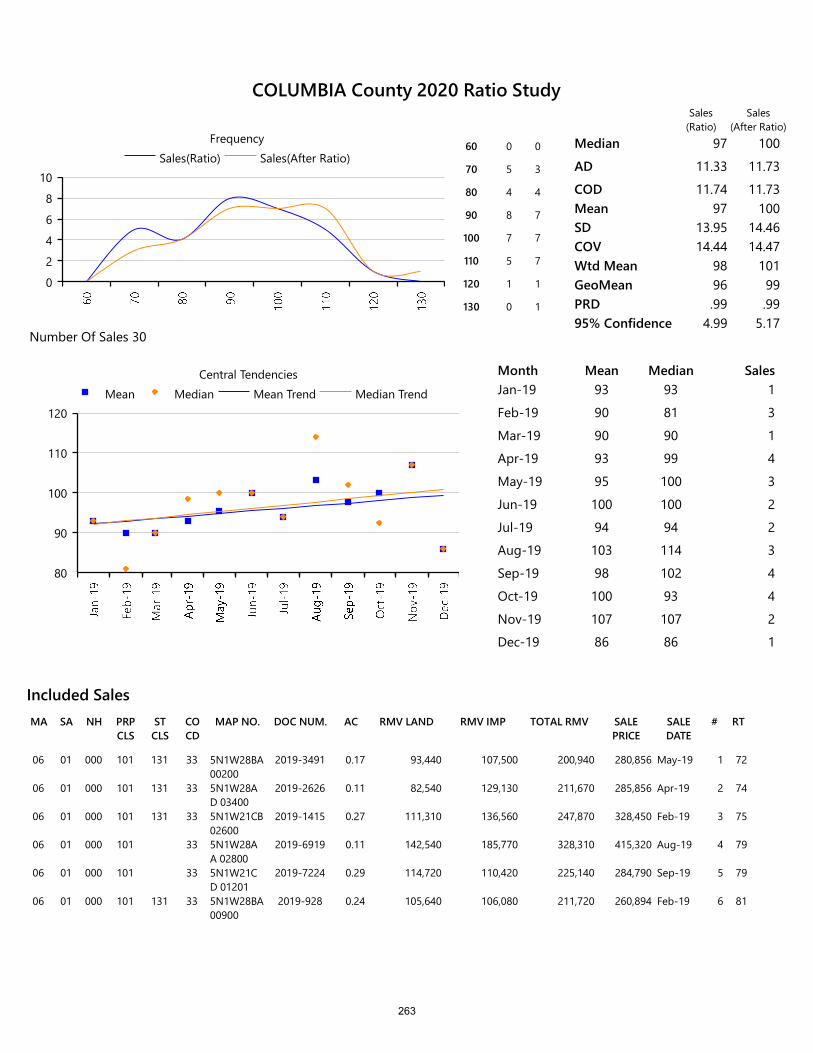
RMV LANDSA NH PRP CLS
ST CLS
CO CD
MAP NO. DOC NUM.MA AC RMV IMP TOTAL RMV SALE PRICE
SALE DATE
# RT
Included Sales
06 01 000 101 131 33 5N1W28BA 00200
2019-3491 0.17 93,440 107,500 200,940 280,856 May-19 1 72
06 01 000 101 131 33 5N1W28AD 03400
2019-2626 0.11 82,540 129,130 211,670 285,856 Apr-19 2 74
06 01 000 101 131 33 5N1W21CB 02600
2019-1415 0.27 111,310 136,560 247,870 328,450 Feb-19 3 75
06 01 000 101 33 5N1W28AA 02800
2019-6919 0.11 142,540 185,770 328,310 415,320 Aug-19 4 79
06 01 000 101 33 5N1W21CD 01201
2019-7224 0.29 114,720 110,420 225,140 284,790 Sep-19 5 79
06 01 000 101 131 33 5N1W28BA 00900
2019-928 0.24 105,640 106,080 211,720 260,894 Feb-19 6 81
0
2
4
6
8
10Sales(Ratio) Sales(After Ratio)
Frequency60 0 0
70 5 3
80 4 4
90 8 7
100 7 7
110 5 7
120 1 1
130 0 1
Median 97 100
AD 11.33 11.73
COD 11.74 11.73Mean 97 100SD 13.95 14.46COV 14.44 14.47Wtd Mean 98 101GeoMean 96 99PRD .99 .9995% Confidence 4.99 5.17
Number Of Sales 30
80
90
100
110
120Mean Median Mean Trend Median Trend
Central Tendencies Month Mean Median SalesJan-19 93 93 1
Feb-19 90 81 3
Mar-19 90 90 1
Apr-19 93 99 4
May-19 95 100 3
Jun-19 100 100 2
Jul-19 94 94 2
Aug-19 103 114 3
Sep-19 98 102 4
Oct-19 100 93 4
Nov-19 107 107 2
Dec-19 86 86 1
Sales(Ratio)
Sales(After Ratio)
COLUMBIA County 2020 Ratio Study
263
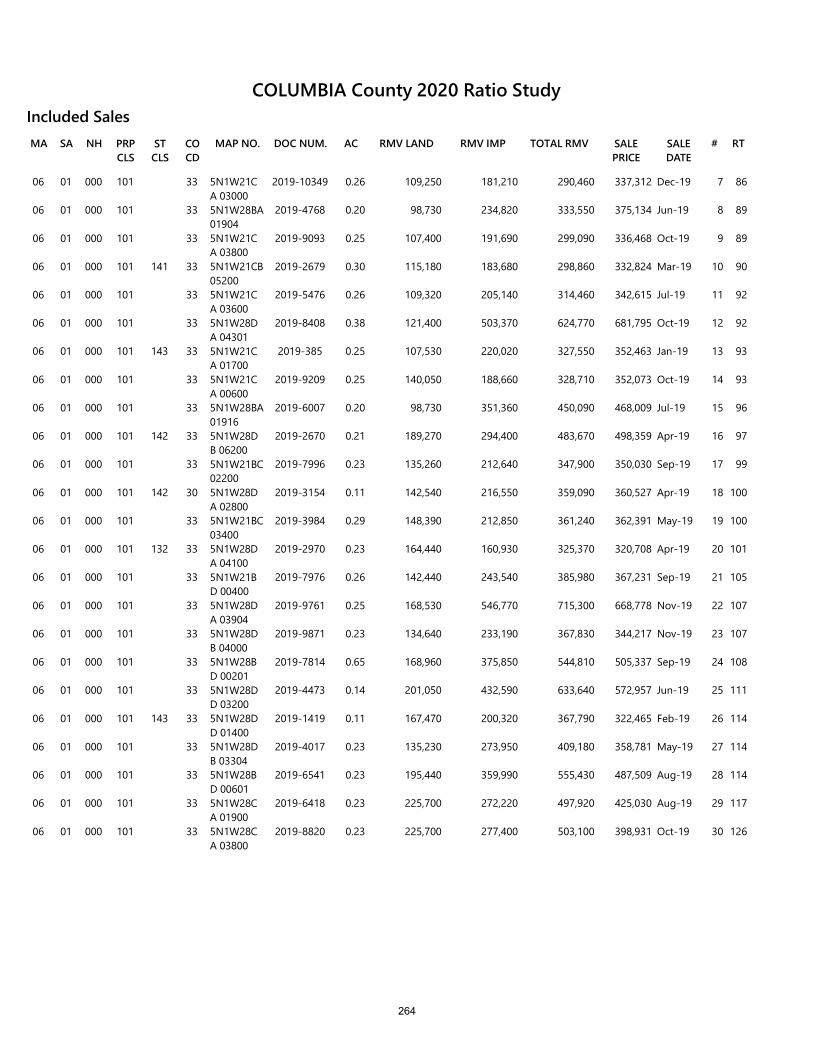
RMV LANDSA NH PRP CLS
ST CLS
CO CD
MAP NO. DOC NUM.MA AC RMV IMP TOTAL RMV SALE PRICE
SALE DATE
# RT
Included Sales
06 01 000 101 33 5N1W21CA 03000
2019-10349 0.26 109,250 181,210 290,460 337,312 Dec-19 7 86
06 01 000 101 33 5N1W28BA 01904
2019-4768 0.20 98,730 234,820 333,550 375,134 Jun-19 8 89
06 01 000 101 33 5N1W21CA 03800
2019-9093 0.25 107,400 191,690 299,090 336,468 Oct-19 9 89
06 01 000 101 141 33 5N1W21CB 05200
2019-2679 0.30 115,180 183,680 298,860 332,824 Mar-19 10 90
06 01 000 101 33 5N1W21CA 03600
2019-5476 0.26 109,320 205,140 314,460 342,615 Jul-19 11 92
06 01 000 101 33 5N1W28DA 04301
2019-8408 0.38 121,400 503,370 624,770 681,795 Oct-19 12 92
06 01 000 101 143 33 5N1W21CA 01700
2019-385 0.25 107,530 220,020 327,550 352,463 Jan-19 13 93
06 01 000 101 33 5N1W21CA 00600
2019-9209 0.25 140,050 188,660 328,710 352,073 Oct-19 14 93
06 01 000 101 33 5N1W28BA 01916
2019-6007 0.20 98,730 351,360 450,090 468,009 Jul-19 15 96
06 01 000 101 142 33 5N1W28DB 06200
2019-2670 0.21 189,270 294,400 483,670 498,359 Apr-19 16 97
06 01 000 101 33 5N1W21BC 02200
2019-7996 0.23 135,260 212,640 347,900 350,030 Sep-19 17 99
06 01 000 101 142 30 5N1W28DA 02800
2019-3154 0.11 142,540 216,550 359,090 360,527 Apr-19 18 100
06 01 000 101 33 5N1W21BC 03400
2019-3984 0.29 148,390 212,850 361,240 362,391 May-19 19 100
06 01 000 101 132 33 5N1W28DA 04100
2019-2970 0.23 164,440 160,930 325,370 320,708 Apr-19 20 101
06 01 000 101 33 5N1W21BD 00400
2019-7976 0.26 142,440 243,540 385,980 367,231 Sep-19 21 105
06 01 000 101 33 5N1W28DA 03904
2019-9761 0.25 168,530 546,770 715,300 668,778 Nov-19 22 107
06 01 000 101 33 5N1W28DB 04000
2019-9871 0.23 134,640 233,190 367,830 344,217 Nov-19 23 107
06 01 000 101 33 5N1W28BD 00201
2019-7814 0.65 168,960 375,850 544,810 505,337 Sep-19 24 108
06 01 000 101 33 5N1W28DD 03200
2019-4473 0.14 201,050 432,590 633,640 572,957 Jun-19 25 111
06 01 000 101 143 33 5N1W28DD 01400
2019-1419 0.11 167,470 200,320 367,790 322,465 Feb-19 26 114
06 01 000 101 33 5N1W28DB 03304
2019-4017 0.23 135,230 273,950 409,180 358,781 May-19 27 114
06 01 000 101 33 5N1W28BD 00601
2019-6541 0.23 195,440 359,990 555,430 487,509 Aug-19 28 114
06 01 000 101 33 5N1W28CA 01900
2019-6418 0.23 225,700 272,220 497,920 425,030 Aug-19 29 117
06 01 000 101 33 5N1W28CA 03800
2019-8820 0.23 225,700 277,400 503,100 398,931 Oct-19 30 126
COLUMBIA County 2020 Ratio Study
264
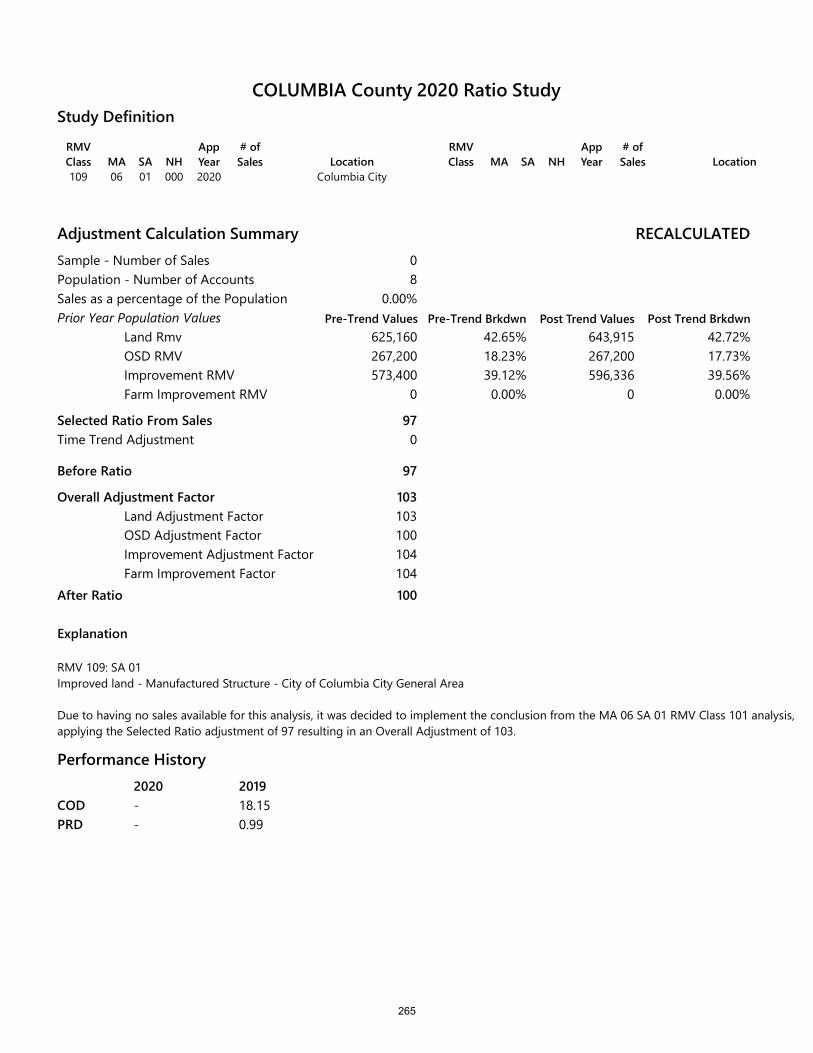
RMV Class MA SA NH
App Year
# of Sales Location
109 06 01 000 2020 Columbia City
RMV Class MA SA NH
App Year
# of Sales Location
Study Definition
Adjustment Calculation SummarySample - Number of SalesPopulation - Number of AccountsSales as a percentage of the PopulationPrior Year Population Values
Land RmvOSD RMVImprovement RMVFarm Improvement RMV
Selected Ratio From Sales
Before Ratio
Overall Adjustment FactorLand Adjustment FactorOSD Adjustment FactorImprovement Adjustment FactorFarm Improvement Factor
After Ratio
Explanation
RMV 109: SA 01Improved land - Manufactured Structure - City of Columbia City General Area
Due to having no sales available for this analysis, it was decided to implement the conclusion from the MA 06 SA 01 RMV Class 101 analysis, applying the Selected Ratio adjustment of 97 resulting in an Overall Adjustment of 103.
RECALCULATED
Pre-Trend Brkdwn Post Trend Values Post Trend Brkdwn
08
0.00%
625,160 42.65% 643,915 42.72%267,200573,400
0
18.23% 267,200 17.73%39.12% 596,336 39.56%0.00% 0 0.00%
97
97
103103100104104100
Time Trend Adjustment 0
Performance History2020 2019- 18.15- 0.99
CODPRD
COLUMBIA County 2020 Ratio Study
Pre-Trend Values
265

0
1Sales(Ratio) Sales(After Ratio)
Frequency Median
AD
CODMeanSDCOVWtd MeanGeoMeanPRD95% ConfidenceNumber Of Sales 0
0
1Mean Median Mean Trend Median Trend
Central Tendencies Month Mean Median Sales
Sales(Ratio)
Sales(After Ratio)
COLUMBIA County 2020 Ratio Study
266
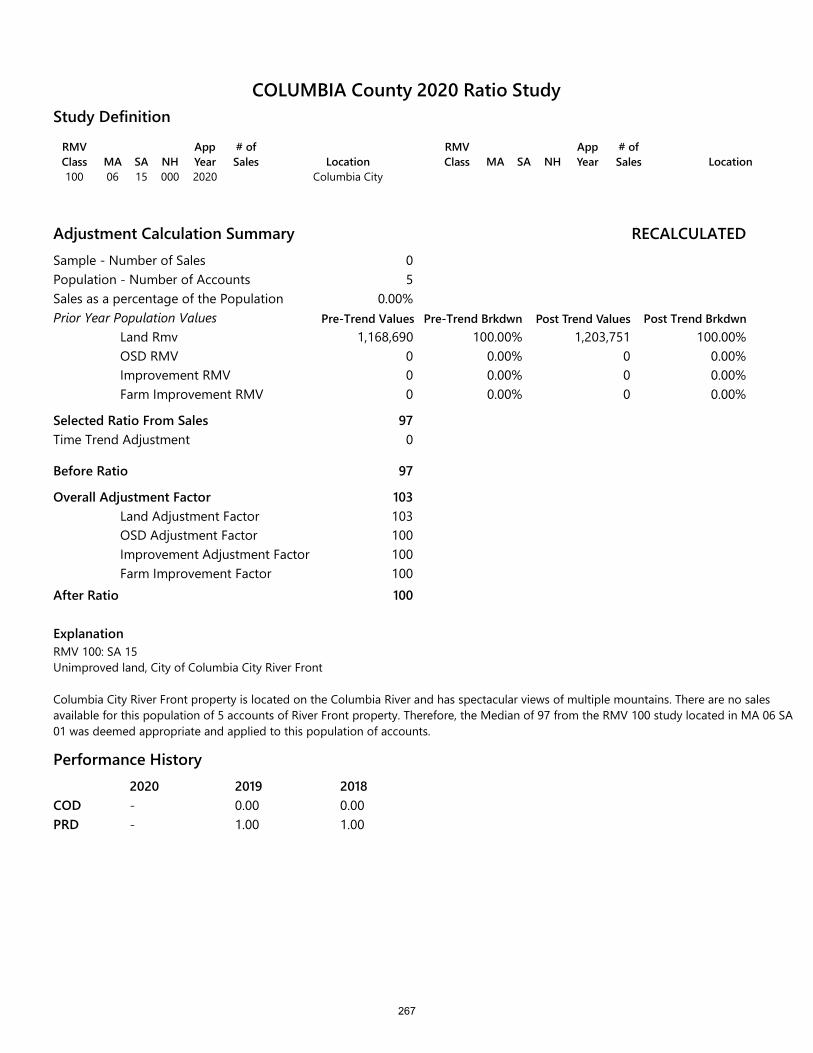
RMV Class MA SA NH
App Year
# of Sales Location
100 06 15 000 2020 Columbia City
RMV Class MA SA NH
App Year
# of Sales Location
Study Definition
Adjustment Calculation SummarySample - Number of SalesPopulation - Number of AccountsSales as a percentage of the PopulationPrior Year Population Values
Land RmvOSD RMVImprovement RMVFarm Improvement RMV
Selected Ratio From Sales
Before Ratio
Overall Adjustment FactorLand Adjustment FactorOSD Adjustment FactorImprovement Adjustment FactorFarm Improvement Factor
After Ratio
ExplanationRMV 100: SA 15Unimproved land, City of Columbia City River Front
Columbia City River Front property is located on the Columbia River and has spectacular views of multiple mountains. There are no sales available for this population of 5 accounts of River Front property. Therefore, the Median of 97 from the RMV 100 study located in MA 06 SA 01 was deemed appropriate and applied to this population of accounts.
RECALCULATED
Pre-Trend Brkdwn Post Trend Values Post Trend Brkdwn
05
0.00%
1,168,690 100.00% 1,203,751 100.00%000
0.00% 0 0.00%0.00% 0 0.00%0.00% 0 0.00%
97
97
103103100100100100
Time Trend Adjustment 0
Performance History2020 2019 2018- 0.00 0.00- 1.00 1.00
CODPRD
COLUMBIA County 2020 Ratio Study
Pre-Trend Values
267

0
1Sales(Ratio) Sales(After Ratio)
Frequency Median
AD
CODMeanSDCOVWtd MeanGeoMeanPRD95% ConfidenceNumber Of Sales 0
0
1Mean Median Mean Trend Median Trend
Central Tendencies Month Mean Median Sales
Sales(Ratio)
Sales(After Ratio)
COLUMBIA County 2020 Ratio Study
268
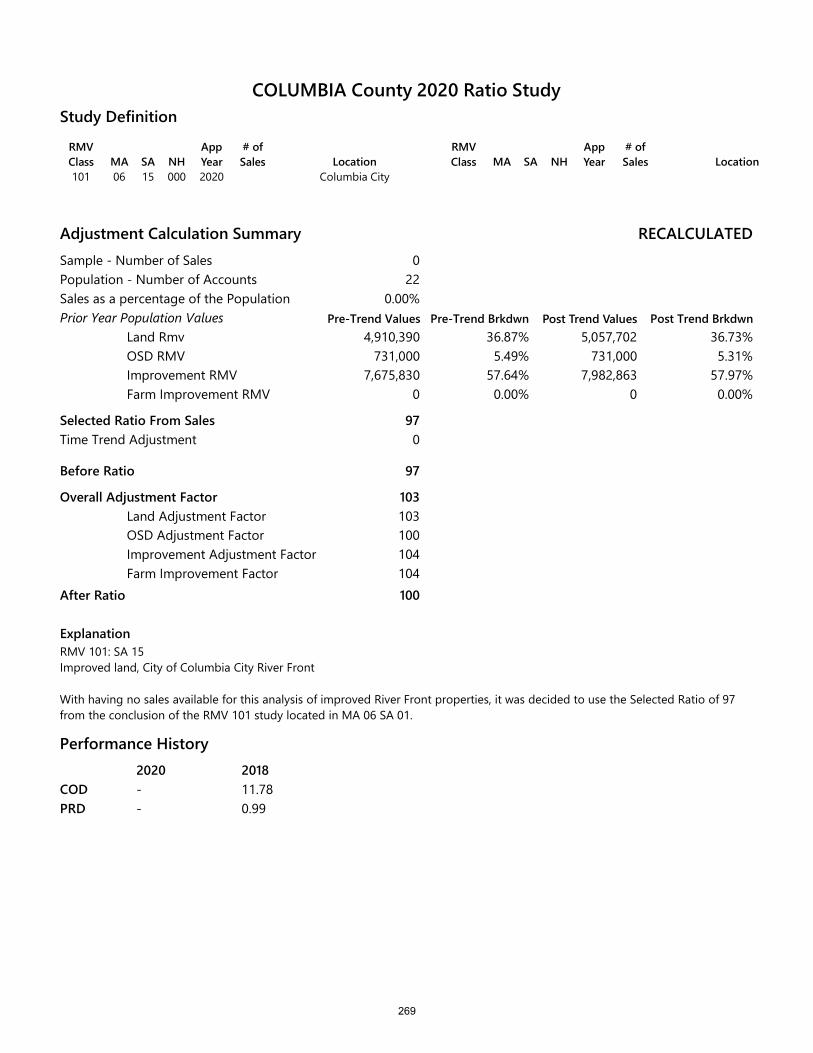
RMV Class MA SA NH
App Year
# of Sales Location
101 06 15 000 2020 Columbia City
RMV Class MA SA NH
App Year
# of Sales Location
Study Definition
Adjustment Calculation SummarySample - Number of SalesPopulation - Number of AccountsSales as a percentage of the PopulationPrior Year Population Values
Land RmvOSD RMVImprovement RMVFarm Improvement RMV
Selected Ratio From Sales
Before Ratio
Overall Adjustment FactorLand Adjustment FactorOSD Adjustment FactorImprovement Adjustment FactorFarm Improvement Factor
After Ratio
ExplanationRMV 101: SA 15Improved land, City of Columbia City River Front
RECALCULATED
Pre-Trend Brkdwn Post Trend Values Post Trend Brkdwn
022
0.00%
4,910,390 36.87% 5,057,702 36.73%731,000
7,675,8300
5.49% 731,000 5.31%57.64% 7,982,863 57.97%0.00% 0 0.00%
97
97
103103100104104100
Time Trend Adjustment 0
With having no sales available for this analysis of improved River Front properties, it was decided to use the Selected Ratio of 97 from the conclusion of the RMV 101 study located in MA 06 SA 01.
Performance History2020 2018- 11.78- 0.99
CODPRD
COLUMBIA County 2020 Ratio Study
Pre-Trend Values
269
0
1Sales(Ratio) Sales(After Ratio)
Frequency Median
AD
CODMeanSDCOVWtd MeanGeoMeanPRD95% ConfidenceNumber Of Sales 0
0
1Mean Median Mean Trend Median Trend
Central Tendencies Month Mean Median Sales
Sales(Ratio)
Sales(After Ratio)
COLUMBIA County 2020 Ratio Study
270
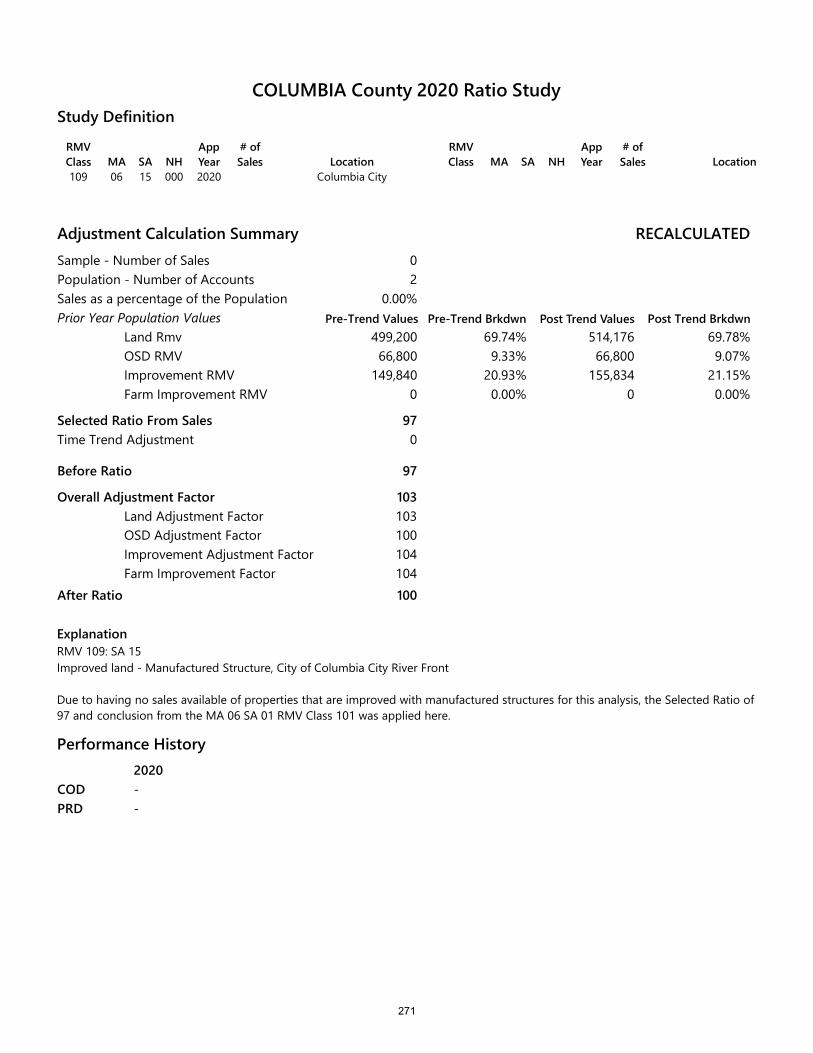
RMV Class MA SA NH
App Year
# of Sales Location
109 06 15 000 2020 Columbia City
RMV Class MA SA NH
App Year
# of Sales Location
Study Definition
Adjustment Calculation SummarySample - Number of SalesPopulation - Number of AccountsSales as a percentage of the PopulationPrior Year Population Values
Land RmvOSD RMVImprovement RMVFarm Improvement RMV
Selected Ratio From Sales
Before Ratio
Overall Adjustment FactorLand Adjustment FactorOSD Adjustment FactorImprovement Adjustment FactorFarm Improvement Factor
After Ratio
RECALCULATED
Pre-Trend Brkdwn Post Trend Values Post Trend Brkdwn
02
0.00%
499,200 69.74% 514,176 69.78%66,800
149,8400
9.33% 66,800 9.07%20.93% 155,834 21.15%0.00% 0 0.00%
97
97
103103100104104100
Time Trend Adjustment 0
ExplanationRMV 109: SA 15Improved land - Manufactured Structure, City of Columbia City River Front
Due to having no sales available of properties that are improved with manufactured structures for this analysis, the Selected Ratio of 97 and conclusion from the MA 06 SA 01 RMV Class 101 was applied here.
Performance History2020--
CODPRD
COLUMBIA County 2020 Ratio Study
Pre-Trend Values
271

0
1Sales(Ratio) Sales(After Ratio)
Frequency Median
AD
CODMeanSDCOVWtd MeanGeoMeanPRD95% ConfidenceNumber Of Sales 0
0
1Mean Median Mean Trend Median Trend
Central Tendencies Month Mean Median Sales
Sales(Ratio)
Sales(After Ratio)
COLUMBIA County 2020 Ratio Study
272

RMV Class MA SA NH
App Year
# of Sales Location
101 06 31 000 2020 Columbia City
RMV Class MA SA NH
App Year
# of Sales Location
Study Definition
Adjustment Calculation SummarySample - Number of SalesPopulation - Number of AccountsSales as a percentage of the PopulationPrior Year Population Values
Land RmvOSD RMVImprovement RMVFarm Improvement RMV
Selected Ratio From Sales
Before Ratio
Overall Adjustment FactorLand Adjustment FactorOSD Adjustment FactorImprovement Adjustment FactorFarm Improvement Factor
After Ratio
RECALCULATED
Pre-Trend Brkdwn Post Trend Values Post Trend Brkdwn
09
0.00%
918,050 27.99% 945,592 27.94%433,800
1,912,80014,700
13.23% 433,800 12.82%58.33% 1,989,312 58.79%0.45% 15,288 0.45%
97
97
103103100104104100
Time Trend Adjustment 0
ExplanationRMV 101: SA 31Improved study of Duplex/Triplex/Fourplex properties located in the City of Columbia City
The population of this study area is 9 and there are no sales available for this study period. Therefore, the Median of 97 from the RMV Class 101 MA 06 SA 01 analysis applied here.
Performance History2020 2019- 0.00- 1.00
CODPRD
COLUMBIA County 2020 Ratio Study
Pre-Trend Values
273

0
1Sales(Ratio) Sales(After Ratio)
Frequency Median
AD
CODMeanSDCOVWtd MeanGeoMeanPRD95% ConfidenceNumber Of Sales 0
0
1Mean Median Mean Trend Median Trend
Central Tendencies Month Mean Median Sales
Sales(Ratio)
Sales(After Ratio)
COLUMBIA County 2020 Ratio Study
274
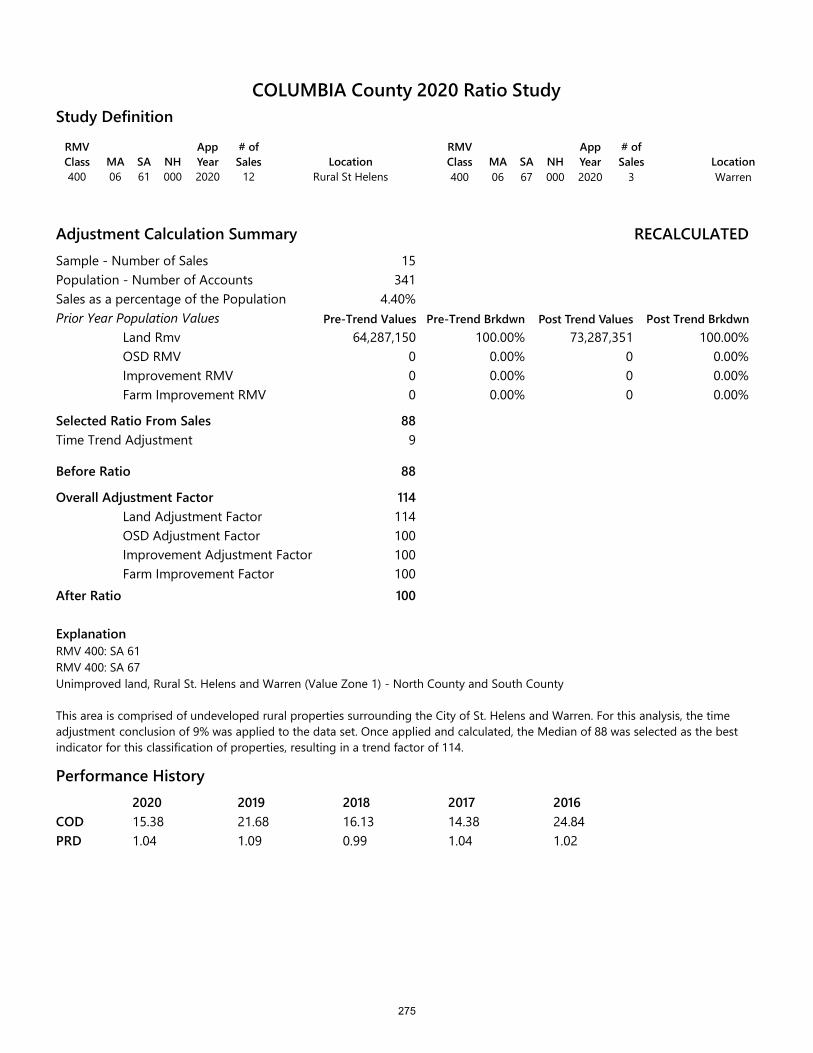
RMV Class MA SA NH
App Year
# of Sales Location
400 06 61 000 2020 12 Rural St Helens
RMV Class MA SA NH
App Year
# of Sales Location
400 06 67 000 2020 3 Warren
Study Definition
Adjustment Calculation SummarySample - Number of SalesPopulation - Number of AccountsSales as a percentage of the PopulationPrior Year Population Values
Land RmvOSD RMVImprovement RMVFarm Improvement RMV
Selected Ratio From Sales
Before Ratio
Overall Adjustment FactorLand Adjustment FactorOSD Adjustment FactorImprovement Adjustment FactorFarm Improvement Factor
After Ratio
RECALCULATED
Pre-Trend Brkdwn Post Trend Values Post Trend Brkdwn
15341
4.40%
64,287,150 100.00% 73,287,351 100.00%000
0.00% 0 0.00%0.00% 0 0.00%0.00% 0 0.00%
88
88
114114100100100100
Time Trend Adjustment 9
ExplanationRMV 400: SA 61 RMV 400: SA 67Unimproved land, Rural St. Helens and Warren (Value Zone 1) - North County and South County
This area is comprised of undeveloped rural properties surrounding the City of St. Helens and Warren. For this analysis, the time adjustment conclusion of 9% was applied to the data set. Once applied and calculated, the Median of 88 was selected as the best indicator for this classification of properties, resulting in a trend factor of 114.
Performance History2020 2019 2018 2017 201615.38 21.68 16.13 14.38 24.841.04 1.09 0.99 1.04 1.02
CODPRD
COLUMBIA County 2020 Ratio Study
Pre-Trend Values
275
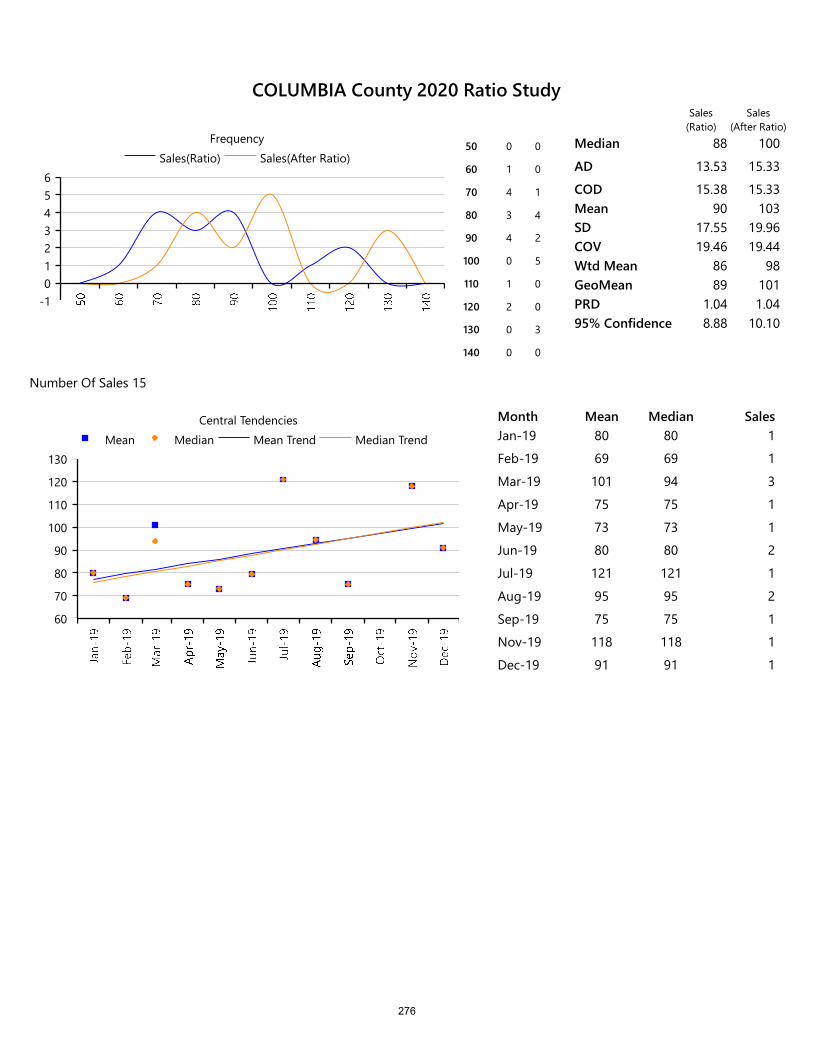
-10123456
Sales(Ratio) Sales(After Ratio)Frequency
50 0 0
60 1 0
70 4 1
80 3 4
90 4 2
100 0 5
110 1 0
120 2 0
130 0 3
140 0 0
Median 88 100
AD 13.53 15.33
COD 15.38 15.33Mean 90 103SD 17.55 19.96COV 19.46 19.44Wtd Mean 86 98GeoMean 89 101PRD 1.04 1.0495% Confidence 8.88 10.10
Number Of Sales 15
60
70
80
90
100
110
120
130Mean Median Mean Trend Median Trend
Central Tendencies Month Mean Median SalesJan-19 80 80 1
Feb-19 69 69 1
Mar-19 101 94 3
Apr-19 75 75 1
May-19 73 73 1
Jun-19 80 80 2
Jul-19 121 121 1
Aug-19 95 95 2
Sep-19 75 75 1
Nov-19 118 118 1
Dec-19 91 91 1
Sales(Ratio)
Sales(After Ratio)
COLUMBIA County 2020 Ratio Study
276
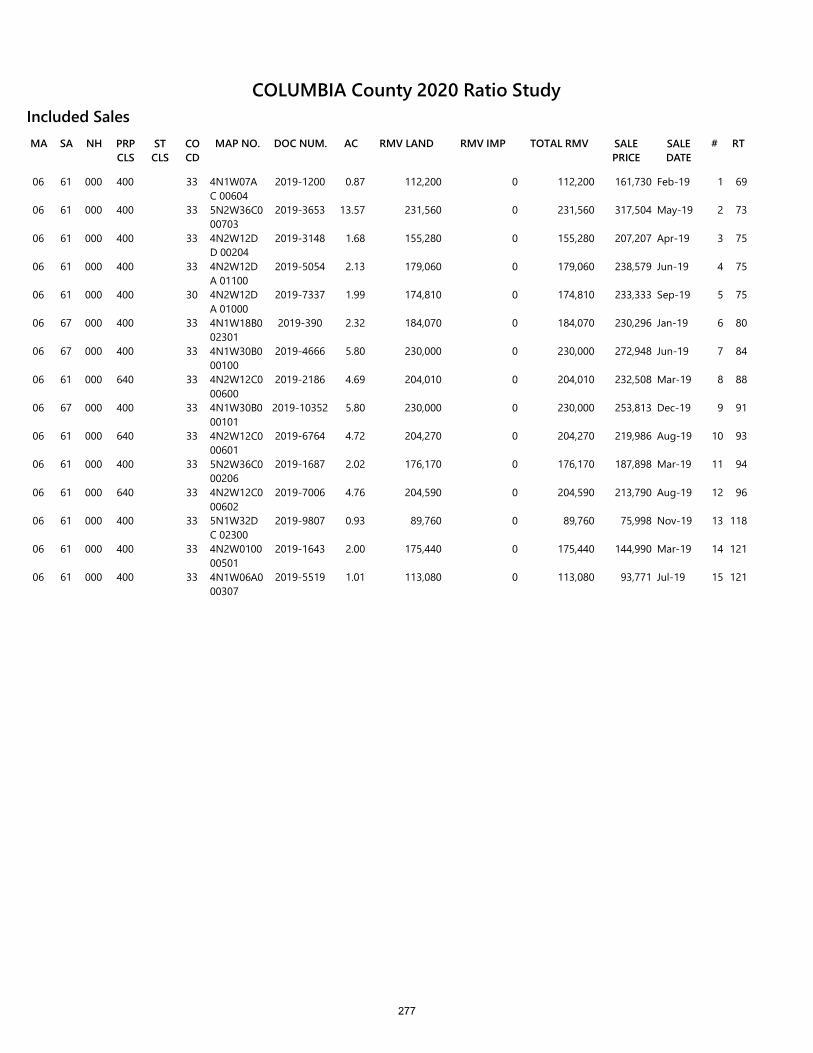
RMV LANDSA NH PRP CLS
ST CLS
CO CD
MAP NO. DOC NUM.MA AC RMV IMP TOTAL RMV SALE PRICE
SALE DATE
# RT
Included Sales
06 61 000 400 33 4N1W07AC 00604
2019-1200 0.87 112,200 0 112,200 161,730 Feb-19 1 69
06 61 000 400 33 5N2W36C0 00703
2019-3653 13.57 231,560 0 231,560 317,504 May-19 2 73
06 61 000 400 33 4N2W12DD 00204
2019-3148 1.68 155,280 0 155,280 207,207 Apr-19 3 75
06 61 000 400 33 4N2W12DA 01100
2019-5054 2.13 179,060 0 179,060 238,579 Jun-19 4 75
06 61 000 400 30 4N2W12DA 01000
2019-7337 1.99 174,810 0 174,810 233,333 Sep-19 5 75
06 67 000 400 33 4N1W18B0 02301
2019-390 2.32 184,070 0 184,070 230,296 Jan-19 6 80
06 67 000 400 33 4N1W30B0 00100
2019-4666 5.80 230,000 0 230,000 272,948 Jun-19 7 84
06 61 000 640 33 4N2W12C0 00600
2019-2186 4.69 204,010 0 204,010 232,508 Mar-19 8 88
06 67 000 400 33 4N1W30B0 00101
2019-10352 5.80 230,000 0 230,000 253,813 Dec-19 9 91
06 61 000 640 33 4N2W12C0 00601
2019-6764 4.72 204,270 0 204,270 219,986 Aug-19 10 93
06 61 000 400 33 5N2W36C0 00206
2019-1687 2.02 176,170 0 176,170 187,898 Mar-19 11 94
06 61 000 640 33 4N2W12C0 00602
2019-7006 4.76 204,590 0 204,590 213,790 Aug-19 12 96
06 61 000 400 33 5N1W32DC 02300
2019-9807 0.93 89,760 0 89,760 75,998 Nov-19 13 118
06 61 000 400 33 4N2W0100 00501
2019-1643 2.00 175,440 0 175,440 144,990 Mar-19 14 121
06 61 000 400 33 4N1W06A0 00307
2019-5519 1.01 113,080 0 113,080 93,771 Jul-19 15 121
COLUMBIA County 2020 Ratio Study
277

RMV Class MA SA NH
App Year
# of Sales Location
401 06 61 000 2020 52 Rural St Helens
RMV Class MA SA NH
App Year
# of Sales Location
401 06 67 000 2020 21 Warren
Study Definition
Adjustment Calculation SummarySample - Number of SalesPopulation - Number of AccountsSales as a percentage of the PopulationPrior Year Population Values
Land RmvOSD RMVImprovement RMVFarm Improvement RMV
Selected Ratio From Sales
Before Ratio
Overall Adjustment FactorLand Adjustment FactorOSD Adjustment FactorImprovement Adjustment FactorFarm Improvement Factor
After Ratio
RECALCULATED
Pre-Trend Brkdwn Post Trend Values Post Trend Brkdwn
732143
3.41%
325,809,120 36.91% 371,422,397 42.03%111,551,730408,134,54937,224,982
12.64% 111,551,730 12.62%46.24% 367,321,094 41.56%4.22% 33,502,484 3.79%
100
100
1001141009090
100
Time Trend Adjustment 9
ExplanationRMV 401: SA 61RMV 401: SA 67 Improved land, Rural St. Helens and Warren (Value Zone 1) - North County and South County
For this analysis of property improved with conventionally built dwellings, the Median (100) was selected as the best ratio indicator. This central tendency is further supported by the Weighted Mean, and the Geometric Mean. The Median was applied, resulting in an Overall Adjustment Factor of 100.
Performance History2020 2019 2018 2017 20168.33 11.59 7.92 11.22 17.031.00 1.01 1.01 1.01 1.03
CODPRD
COLUMBIA County 2020 Ratio Study
Pre-Trend Values
278
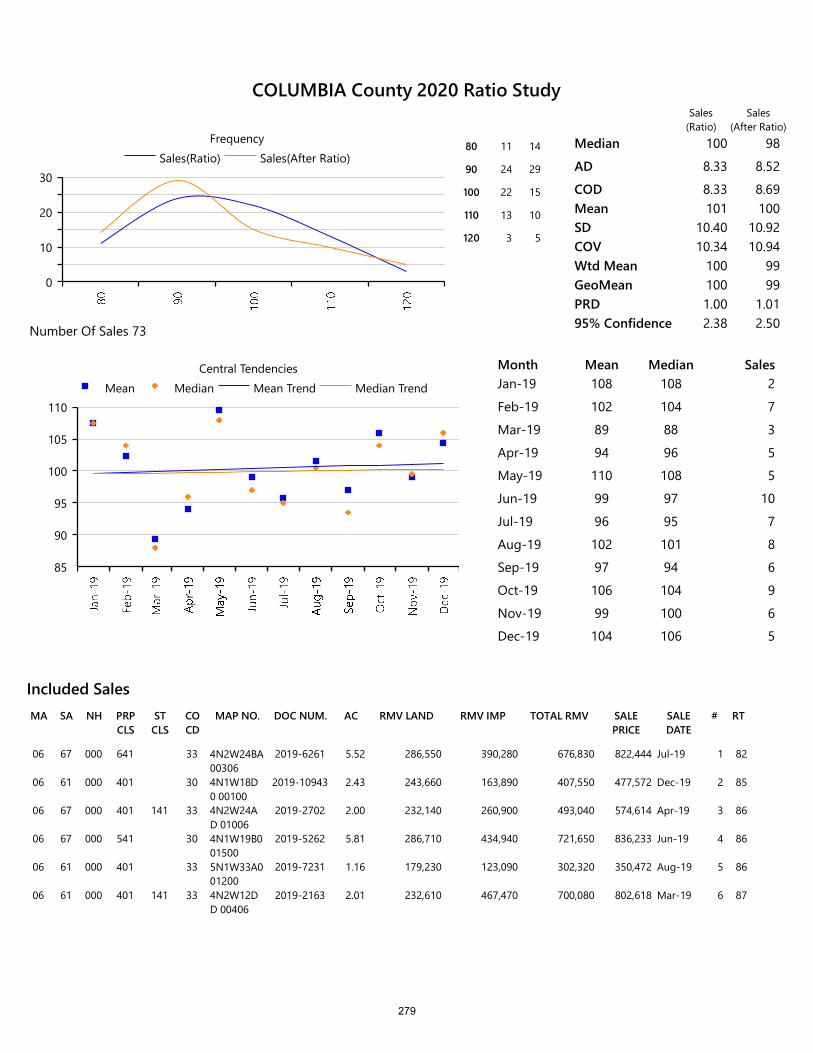
RMV LANDSA NH PRP CLS
ST CLS
CO CD
MAP NO. DOC NUM.MA AC RMV IMP TOTAL RMV SALE PRICE
SALE DATE
# RT
Included Sales
06 67 000 641 33 4N2W24BA 00306
2019-6261 5.52 286,550 390,280 676,830 822,444 Jul-19 1 82
06 61 000 401 30 4N1W18D0 00100
2019-10943 2.43 243,660 163,890 407,550 477,572 Dec-19 2 85
06 67 000 401 141 33 4N2W24AD 01006
2019-2702 2.00 232,140 260,900 493,040 574,614 Apr-19 3 86
06 67 000 541 30 4N1W19B0 01500
2019-5262 5.81 286,710 434,940 721,650 836,233 Jun-19 4 86
06 61 000 401 33 5N1W33A0 01200
2019-7231 1.16 179,230 123,090 302,320 350,472 Aug-19 5 86
06 61 000 401 141 33 4N2W12DD 00406
2019-2163 2.01 232,610 467,470 700,080 802,618 Mar-19 6 87
0
10
20
30Sales(Ratio) Sales(After Ratio)
Frequency80 11 14
90 24 29
100 22 15
110 13 10
120 3 5
Median 100 98
AD 8.33 8.52
COD 8.33 8.69Mean 101 100SD 10.40 10.92COV 10.34 10.94Wtd Mean 100 99GeoMean 100 99PRD 1.00 1.0195% Confidence 2.38 2.50Number Of Sales 73
85
90
95
100
105
110Mean Median Mean Trend Median Trend
Central Tendencies Month Mean Median SalesJan-19 108 108 2
Feb-19 102 104 7
Mar-19 89 88 3
Apr-19 94 96 5
May-19 110 108 5
Jun-19 99 97 10
Jul-19 96 95 7
Aug-19 102 101 8
Sep-19 97 94 6
Oct-19 106 104 9
Nov-19 99 100 6
Dec-19 104 106 5
Sales(Ratio)
Sales(After Ratio)
COLUMBIA County 2020 Ratio Study
279
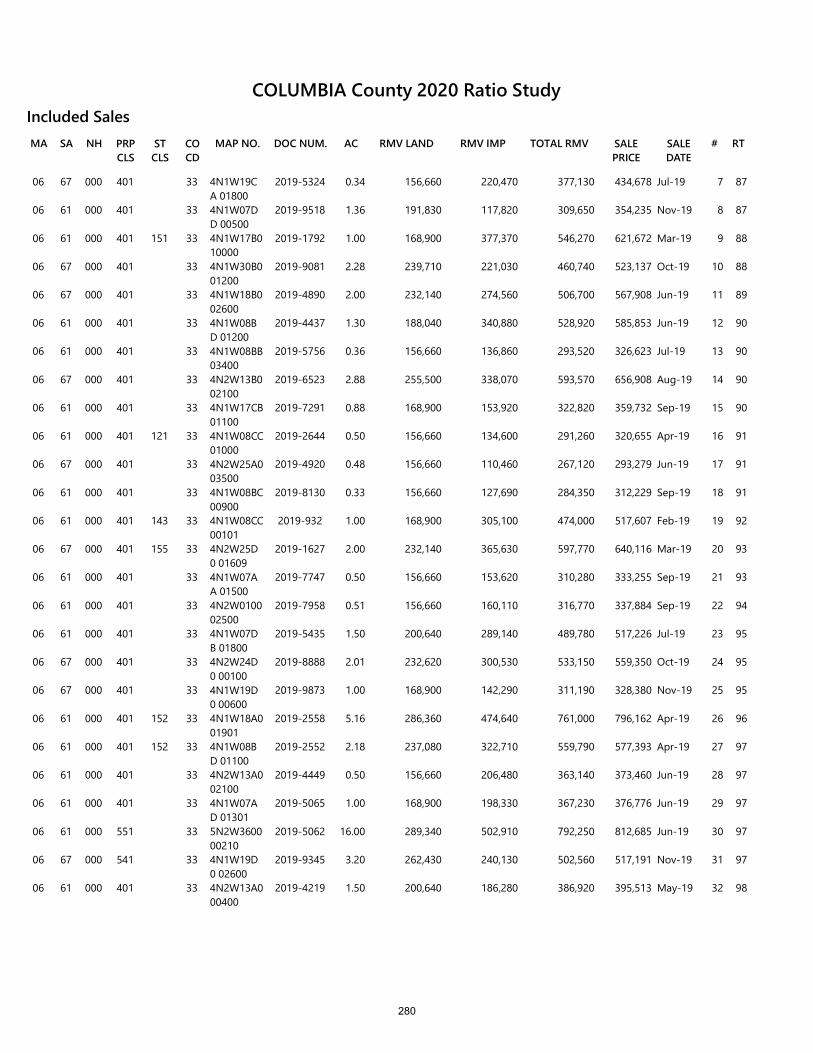
RMV LANDSA NH PRP CLS
ST CLS
CO CD
MAP NO. DOC NUM.MA AC RMV IMP TOTAL RMV SALE PRICE
SALE DATE
# RT
Included Sales
06 67 000 401 33 4N1W19CA 01800
2019-5324 0.34 156,660 220,470 377,130 434,678 Jul-19 7 87
06 61 000 401 33 4N1W07DD 00500
2019-9518 1.36 191,830 117,820 309,650 354,235 Nov-19 8 87
06 61 000 401 151 33 4N1W17B0 10000
2019-1792 1.00 168,900 377,370 546,270 621,672 Mar-19 9 88
06 67 000 401 33 4N1W30B0 01200
2019-9081 2.28 239,710 221,030 460,740 523,137 Oct-19 10 88
06 67 000 401 33 4N1W18B0 02600
2019-4890 2.00 232,140 274,560 506,700 567,908 Jun-19 11 89
06 61 000 401 33 4N1W08BD 01200
2019-4437 1.30 188,040 340,880 528,920 585,853 Jun-19 12 90
06 61 000 401 33 4N1W08BB 03400
2019-5756 0.36 156,660 136,860 293,520 326,623 Jul-19 13 90
06 67 000 401 33 4N2W13B0 02100
2019-6523 2.88 255,500 338,070 593,570 656,908 Aug-19 14 90
06 61 000 401 33 4N1W17CB 01100
2019-7291 0.88 168,900 153,920 322,820 359,732 Sep-19 15 90
06 61 000 401 121 33 4N1W08CC 01000
2019-2644 0.50 156,660 134,600 291,260 320,655 Apr-19 16 91
06 67 000 401 33 4N2W25A0 03500
2019-4920 0.48 156,660 110,460 267,120 293,279 Jun-19 17 91
06 61 000 401 33 4N1W08BC 00900
2019-8130 0.33 156,660 127,690 284,350 312,229 Sep-19 18 91
06 61 000 401 143 33 4N1W08CC 00101
2019-932 1.00 168,900 305,100 474,000 517,607 Feb-19 19 92
06 67 000 401 155 33 4N2W25D0 01609
2019-1627 2.00 232,140 365,630 597,770 640,116 Mar-19 20 93
06 61 000 401 33 4N1W07AA 01500
2019-7747 0.50 156,660 153,620 310,280 333,255 Sep-19 21 93
06 61 000 401 33 4N2W0100 02500
2019-7958 0.51 156,660 160,110 316,770 337,884 Sep-19 22 94
06 61 000 401 33 4N1W07DB 01800
2019-5435 1.50 200,640 289,140 489,780 517,226 Jul-19 23 95
06 67 000 401 33 4N2W24D0 00100
2019-8888 2.01 232,620 300,530 533,150 559,350 Oct-19 24 95
06 67 000 401 33 4N1W19D0 00600
2019-9873 1.00 168,900 142,290 311,190 328,380 Nov-19 25 95
06 61 000 401 152 33 4N1W18A0 01901
2019-2558 5.16 286,360 474,640 761,000 796,162 Apr-19 26 96
06 61 000 401 152 33 4N1W08BD 01100
2019-2552 2.18 237,080 322,710 559,790 577,393 Apr-19 27 97
06 61 000 401 33 4N2W13A0 02100
2019-4449 0.50 156,660 206,480 363,140 373,460 Jun-19 28 97
06 61 000 401 33 4N1W07AD 01301
2019-5065 1.00 168,900 198,330 367,230 376,776 Jun-19 29 97
06 61 000 551 33 5N2W3600 00210
2019-5062 16.00 289,340 502,910 792,250 812,685 Jun-19 30 97
06 67 000 541 33 4N1W19D0 02600
2019-9345 3.20 262,430 240,130 502,560 517,191 Nov-19 31 97
06 61 000 401 33 4N2W13A0 00400
2019-4219 1.50 200,640 186,280 386,920 395,513 May-19 32 98
COLUMBIA County 2020 Ratio Study
280
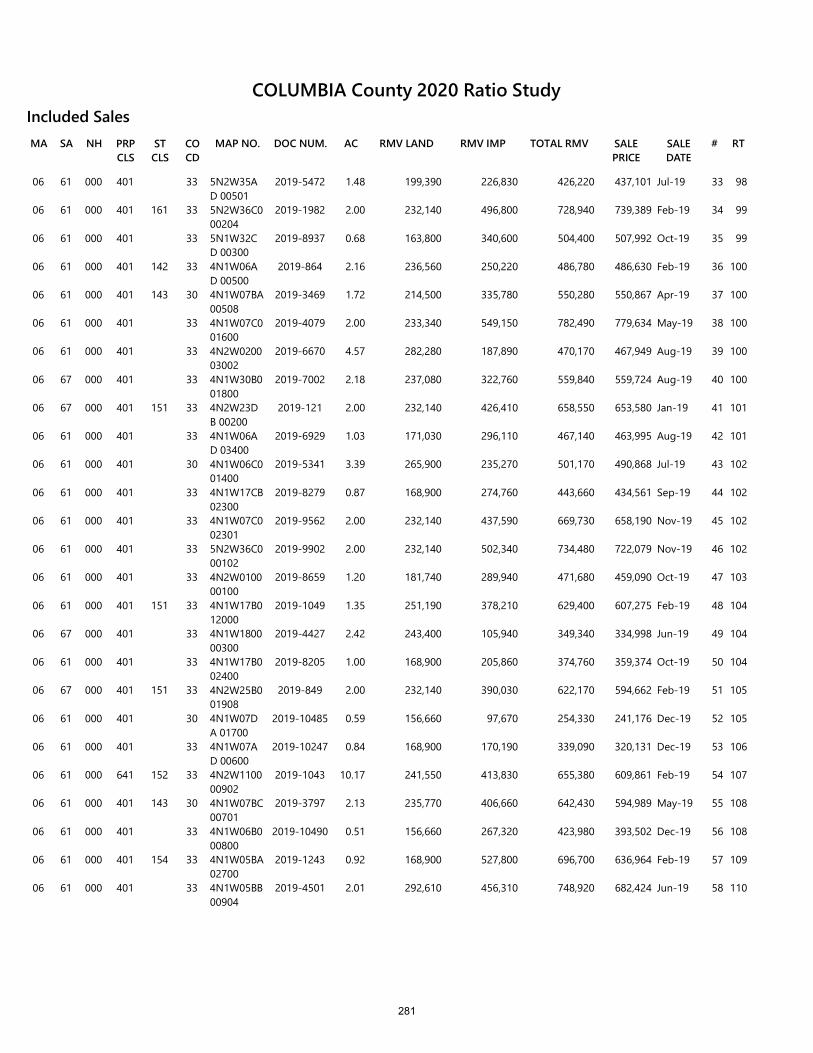
RMV LANDSA NH PRP CLS
ST CLS
CO CD
MAP NO. DOC NUM.MA AC RMV IMP TOTAL RMV SALE PRICE
SALE DATE
# RT
Included Sales
06 61 000 401 33 5N2W35AD 00501
2019-5472 1.48 199,390 226,830 426,220 437,101 Jul-19 33 98
06 61 000 401 161 33 5N2W36C0 00204
2019-1982 2.00 232,140 496,800 728,940 739,389 Feb-19 34 99
06 61 000 401 33 5N1W32CD 00300
2019-8937 0.68 163,800 340,600 504,400 507,992 Oct-19 35 99
06 61 000 401 142 33 4N1W06AD 00500
2019-864 2.16 236,560 250,220 486,780 486,630 Feb-19 36 100
06 61 000 401 143 30 4N1W07BA 00508
2019-3469 1.72 214,500 335,780 550,280 550,867 Apr-19 37 100
06 61 000 401 33 4N1W07C0 01600
2019-4079 2.00 233,340 549,150 782,490 779,634 May-19 38 100
06 61 000 401 33 4N2W0200 03002
2019-6670 4.57 282,280 187,890 470,170 467,949 Aug-19 39 100
06 67 000 401 33 4N1W30B0 01800
2019-7002 2.18 237,080 322,760 559,840 559,724 Aug-19 40 100
06 67 000 401 151 33 4N2W23DB 00200
2019-121 2.00 232,140 426,410 658,550 653,580 Jan-19 41 101
06 61 000 401 33 4N1W06AD 03400
2019-6929 1.03 171,030 296,110 467,140 463,995 Aug-19 42 101
06 61 000 401 30 4N1W06C0 01400
2019-5341 3.39 265,900 235,270 501,170 490,868 Jul-19 43 102
06 61 000 401 33 4N1W17CB 02300
2019-8279 0.87 168,900 274,760 443,660 434,561 Sep-19 44 102
06 61 000 401 33 4N1W07C0 02301
2019-9562 2.00 232,140 437,590 669,730 658,190 Nov-19 45 102
06 61 000 401 33 5N2W36C0 00102
2019-9902 2.00 232,140 502,340 734,480 722,079 Nov-19 46 102
06 61 000 401 33 4N2W0100 00100
2019-8659 1.20 181,740 289,940 471,680 459,090 Oct-19 47 103
06 61 000 401 151 33 4N1W17B0 12000
2019-1049 1.35 251,190 378,210 629,400 607,275 Feb-19 48 104
06 67 000 401 33 4N1W1800 00300
2019-4427 2.42 243,400 105,940 349,340 334,998 Jun-19 49 104
06 61 000 401 33 4N1W17B0 02400
2019-8205 1.00 168,900 205,860 374,760 359,374 Oct-19 50 104
06 67 000 401 151 33 4N2W25B0 01908
2019-849 2.00 232,140 390,030 622,170 594,662 Feb-19 51 105
06 61 000 401 30 4N1W07DA 01700
2019-10485 0.59 156,660 97,670 254,330 241,176 Dec-19 52 105
06 61 000 401 33 4N1W07AD 00600
2019-10247 0.84 168,900 170,190 339,090 320,131 Dec-19 53 106
06 61 000 641 152 33 4N2W1100 00902
2019-1043 10.17 241,550 413,830 655,380 609,861 Feb-19 54 107
06 61 000 401 143 30 4N1W07BC 00701
2019-3797 2.13 235,770 406,660 642,430 594,989 May-19 55 108
06 61 000 401 33 4N1W06B0 00800
2019-10490 0.51 156,660 267,320 423,980 393,502 Dec-19 56 108
06 61 000 401 154 33 4N1W05BA 02700
2019-1243 0.92 168,900 527,800 696,700 636,964 Feb-19 57 109
06 61 000 401 33 4N1W05BB 00904
2019-4501 2.01 292,610 456,310 748,920 682,424 Jun-19 58 110
COLUMBIA County 2020 Ratio Study
281
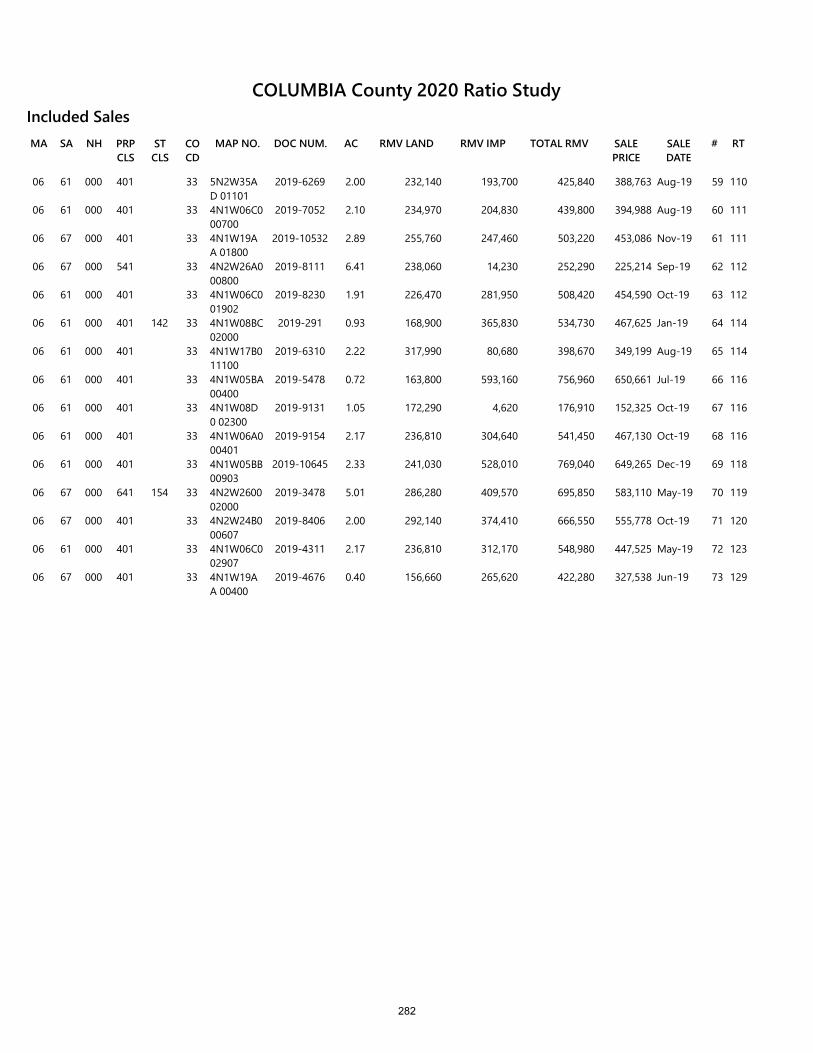
RMV LANDSA NH PRP CLS
ST CLS
CO CD
MAP NO. DOC NUM.MA AC RMV IMP TOTAL RMV SALE PRICE
SALE DATE
# RT
Included Sales
06 61 000 401 33 5N2W35AD 01101
2019-6269 2.00 232,140 193,700 425,840 388,763 Aug-19 59 110
06 61 000 401 33 4N1W06C0 00700
2019-7052 2.10 234,970 204,830 439,800 394,988 Aug-19 60 111
06 67 000 401 33 4N1W19AA 01800
2019-10532 2.89 255,760 247,460 503,220 453,086 Nov-19 61 111
06 67 000 541 33 4N2W26A0 00800
2019-8111 6.41 238,060 14,230 252,290 225,214 Sep-19 62 112
06 61 000 401 33 4N1W06C0 01902
2019-8230 1.91 226,470 281,950 508,420 454,590 Oct-19 63 112
06 61 000 401 142 33 4N1W08BC 02000
2019-291 0.93 168,900 365,830 534,730 467,625 Jan-19 64 114
06 61 000 401 33 4N1W17B0 11100
2019-6310 2.22 317,990 80,680 398,670 349,199 Aug-19 65 114
06 61 000 401 33 4N1W05BA 00400
2019-5478 0.72 163,800 593,160 756,960 650,661 Jul-19 66 116
06 61 000 401 33 4N1W08D0 02300
2019-9131 1.05 172,290 4,620 176,910 152,325 Oct-19 67 116
06 61 000 401 33 4N1W06A0 00401
2019-9154 2.17 236,810 304,640 541,450 467,130 Oct-19 68 116
06 61 000 401 33 4N1W05BB 00903
2019-10645 2.33 241,030 528,010 769,040 649,265 Dec-19 69 118
06 67 000 641 154 33 4N2W2600 02000
2019-3478 5.01 286,280 409,570 695,850 583,110 May-19 70 119
06 67 000 401 33 4N2W24B0 00607
2019-8406 2.00 292,140 374,410 666,550 555,778 Oct-19 71 120
06 61 000 401 33 4N1W06C0 02907
2019-4311 2.17 236,810 312,170 548,980 447,525 May-19 72 123
06 67 000 401 33 4N1W19AA 00400
2019-4676 0.40 156,660 265,620 422,280 327,538 Jun-19 73 129
COLUMBIA County 2020 Ratio Study
282
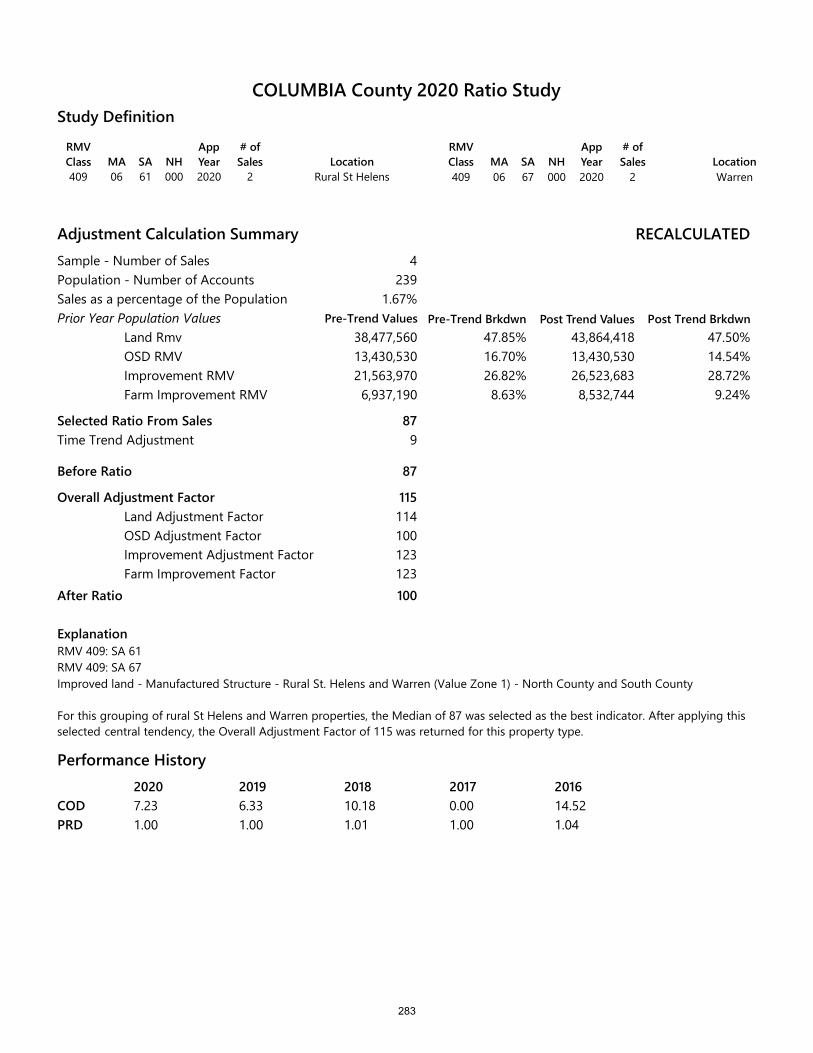
RMV Class MA SA NH
App Year
# of Sales Location
409 06 61 000 2020 2 Rural St Helens
RMV Class MA SA NH
App Year
# of Sales Location
409 06 67 000 2020 2 Warren
Study Definition
Adjustment Calculation SummarySample - Number of SalesPopulation - Number of AccountsSales as a percentage of the PopulationPrior Year Population Values
Land RmvOSD RMVImprovement RMVFarm Improvement RMV
Selected Ratio From Sales
Before Ratio
Overall Adjustment FactorLand Adjustment FactorOSD Adjustment FactorImprovement Adjustment FactorFarm Improvement Factor
After Ratio
RECALCULATED
Pre-Trend Brkdwn Post Trend Values Post Trend Brkdwn
4239
1.67%
38,477,560 47.85% 43,864,418 47.50%13,430,53021,563,9706,937,190
16.70% 13,430,530 14.54%26.82% 26,523,683 28.72%8.63% 8,532,744 9.24%
87
87
115114100123123100
Time Trend Adjustment 9
ExplanationRMV 409: SA 61 RMV 409: SA 67Improved land - Manufactured Structure - Rural St. Helens and Warren (Value Zone 1) - North County and South County
For this grouping of rural St Helens and Warren properties, the Median of 87 was selected as the best indicator. After applying this selected central tendency, the Overall Adjustment Factor of 115 was returned for this property type.
Performance History2020 2019 2018 2017 20167.23 6.33 10.18 0.00 14.521.00 1.00 1.01 1.00 1.04
CODPRD
COLUMBIA County 2020 Ratio Study
Pre-Trend Values
283
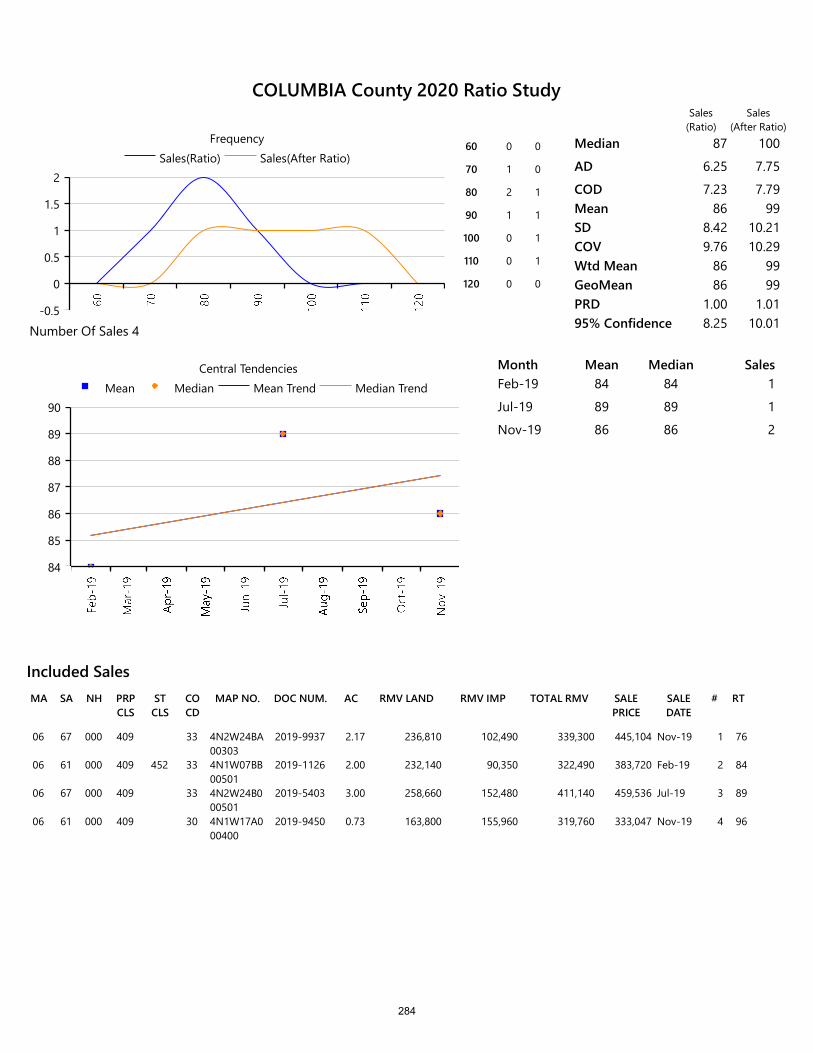
RMV LANDSA NH PRP CLS
ST CLS
CO CD
MAP NO. DOC NUM.MA AC RMV IMP TOTAL RMV SALE PRICE
SALE DATE
# RT
Included Sales
06 67 000 409 33 4N2W24BA 00303
2019-9937 2.17 236,810 102,490 339,300 445,104 Nov-19 1 76
06 61 000 409 452 33 4N1W07BB 00501
2019-1126 2.00 232,140 90,350 322,490 383,720 Feb-19 2 84
06 67 000 409 33 4N2W24B0 00501
2019-5403 3.00 258,660 152,480 411,140 459,536 Jul-19 3 89
06 61 000 409 30 4N1W17A0 00400
2019-9450 0.73 163,800 155,960 319,760 333,047 Nov-19 4 96
-0.5
0
0.5
1
1.5
2Sales(Ratio) Sales(After Ratio)
Frequency60 0 0
70 1 0
80 2 1
90 1 1
100 0 1
110 0 1
120 0 0
Median 87 100
AD 6.25 7.75
COD 7.23 7.79Mean 86 99SD 8.42 10.21COV 9.76 10.29Wtd Mean 86 99GeoMean 86 99PRD 1.00 1.0195% Confidence 8.25 10.01Number Of Sales 4
84
85
86
87
88
89
90Mean Median Mean Trend Median Trend
Central Tendencies Month Mean Median SalesFeb-19 84 84 1
Jul-19 89 89 1
Nov-19 86 86 2
Sales(Ratio)
Sales(After Ratio)
COLUMBIA County 2020 Ratio Study
284

RMV Class MA SA NH
App Year
# of Sales Location
400 06 62 000 2020 1 Rural St Helens
RMV Class MA SA NH
App Year
# of Sales Location
Study Definition
Adjustment Calculation SummarySample - Number of SalesPopulation - Number of AccountsSales as a percentage of the PopulationPrior Year Population Values
Land RmvOSD RMVImprovement RMVFarm Improvement RMV
Selected Ratio From Sales
Before Ratio
Overall Adjustment FactorLand Adjustment FactorOSD Adjustment FactorImprovement Adjustment FactorFarm Improvement Factor
After Ratio
ExplanationRMV 400: SA 62Unimproved land, Rural St. Helens, Warren (Value Zone 2)
A single sale was identified in this study period, which is a sample too small to use as a determination of the current market. Therefore, it was decided to apply the Selected Ratio of 98 from the improved study located in MA 06 SA 62 for this property classification.
RECALCULATED
Pre-Trend Brkdwn Post Trend Values Post Trend Brkdwn
1109
0.92%
26,261,200 100.00% 26,786,424 100.00%000
0.00% 0 0.00%0.00% 0 0.00%0.00% 0 0.00%
98
98
102102100100100100
Time Trend Adjustment 0
Performance History2020 2019 2018 2017 2016- 0.00 0.00 0.00 24.841.00 1.00 1.00 1.00 1.02
CODPRD
COLUMBIA County 2020 Ratio Study
Pre-Trend Values
285

RMV LANDSA NH PRP CLS
ST CLS
CO CD
MAP NO. DOC NUM.MA AC RMV IMP TOTAL RMV SALE PRICE
SALE DATE
# RT
Included Sales
06 62 000 640 33 5N2W24B0 00201
2019-816 9.80 183,730 0 183,730 214,119 Feb-19 1 86
0
0.2
0.4
0.6
0.8
1Sales(Ratio) Sales(After Ratio)
Frequency80 1 1 Median 86 88
AD
CODMean 86 88SD 1.00 1.00COV 1.16 1.14Wtd Mean 86 88GeoMean 86 88PRD 1.00 1.0195% Confidence 1.96 1.96Number Of Sales 1
0
20
40
60
80
100Mean Median Mean Trend Median Trend
Central Tendencies Month Mean Median SalesFeb-19 86 86 1
Sales(Ratio)
Sales(After Ratio)
COLUMBIA County 2020 Ratio Study
286

RMV Class MA SA NH
App Year
# of Sales Location
401 06 62 000 2020 5 Rural St Helens
RMV Class MA SA NH
App Year
# of Sales Location
Study Definition
Adjustment Calculation SummarySample - Number of SalesPopulation - Number of AccountsSales as a percentage of the PopulationPrior Year Population Values
Land RmvOSD RMVImprovement RMVFarm Improvement RMV
Selected Ratio From Sales
Before Ratio
Overall Adjustment FactorLand Adjustment FactorOSD Adjustment FactorImprovement Adjustment FactorFarm Improvement Factor
After Ratio
ExplanationRMV 401: SA 62Improved land, Rural St. Helens and Warren (Value Zone 2)
RECALCULATED
Pre-Trend Brkdwn Post Trend Values Post Trend Brkdwn
5257
1.95%
37,284,420 37.39% 38,030,108 37.30%12,601,77043,955,9705,866,930
12.64% 12,601,770 12.36%44.08% 45,274,649 44.41%5.88% 6,042,938 5.93%
98
98
102102100103103100
Time Trend Adjustment 9
This sales analysis returned 5 sales which was deemed appropriate data for this classification of properties. The Median of 98 was selected and is further supported by the Mean (100), the Weighted Mean (97) and the Geometric Mean (99). The result is an Overall Adjustment of 102.
Performance History2020 2018 2017 201610.00 8.63 10.20 17.031.02 1.01 1.03 1.03
CODPRD
COLUMBIA County 2020 Ratio Study
Pre-Trend Values
287

RMV LANDSA NH PRP CLS
ST CLS
CO CD
MAP NO. DOC NUM.MA AC RMV IMP TOTAL RMV SALE PRICE
SALE DATE
# RT
Included Sales
06 62 000 641 143 33 5N2W27B0 01800
2019-2690 4.25 237,330 257,000 494,330 558,810 Apr-19 1 88
06 62 000 401 33 5N2W27A0 01600
2019-8168 0.71 135,100 130,520 265,620 301,480 Sep-19 2 88
06 62 000 401 33 5N2W26D0 01100
2019-4151 8.49 239,930 399,670 639,600 653,356 May-19 3 98
06 62 000 401 143 33 5N2W2900 00400
2019-2196 3.95 236,100 234,560 470,660 456,378 Mar-19 4 103
06 62 000 401 33 5N2W3000 00405
2019-6299 15.94 242,420 0 242,420 199,446 Aug-19 5 122
0
1
2
Sales(Ratio) Sales(After Ratio)Frequency
80 2 0
90 1 2
100 1 2
110 0 0
120 1 1
Median 98 100
AD 9.80 9.60
COD 10.00 9.60Mean 100 102SD 14.01 13.61COV 14.04 13.40Wtd Mean 97 100GeoMean 99 101PRD 1.02 1.0295% Confidence 12.28 11.93Number Of Sales 5
80
90
100
110
120
130Mean Median Mean Trend Median Trend
Central Tendencies Month Mean Median SalesMar-19 103 103 1
Apr-19 88 88 1
May-19 98 98 1
Aug-19 122 122 1
Sep-19 88 88 1
Sales(Ratio)
Sales(After Ratio)
COLUMBIA County 2020 Ratio Study
288
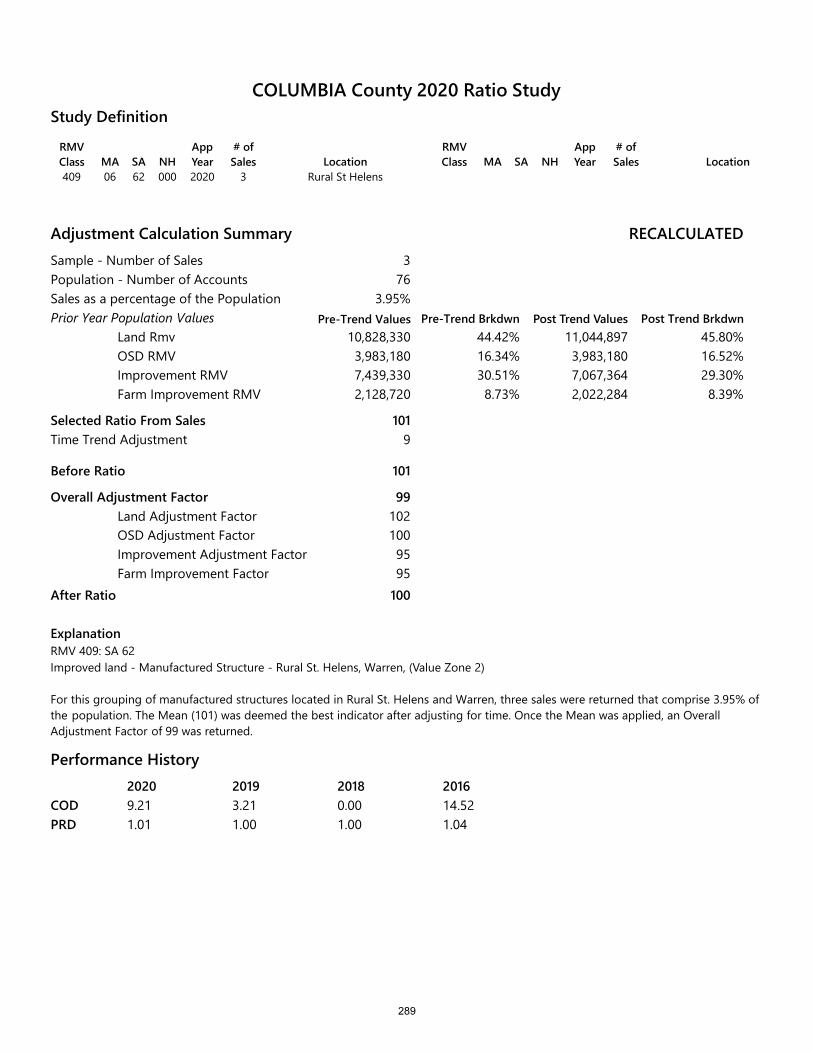
RMV Class MA SA NH
App Year
# of Sales Location
409 06 62 000 2020 3 Rural St Helens
RMV Class MA SA NH
App Year
# of Sales Location
Study Definition
Adjustment Calculation SummarySample - Number of SalesPopulation - Number of AccountsSales as a percentage of the PopulationPrior Year Population Values
Land RmvOSD RMVImprovement RMVFarm Improvement RMV
Selected Ratio From Sales
Before Ratio
Overall Adjustment FactorLand Adjustment FactorOSD Adjustment FactorImprovement Adjustment FactorFarm Improvement Factor
After Ratio
RECALCULATED
Pre-Trend Brkdwn Post Trend Values Post Trend Brkdwn
376
3.95%
10,828,330 44.42% 11,044,897 45.80%3,983,1807,439,3302,128,720
16.34% 3,983,180 16.52%30.51% 7,067,364 29.30%8.73% 2,022,284 8.39%
101
101
991021009595
100
Time Trend Adjustment 9
ExplanationRMV 409: SA 62Improved land - Manufactured Structure - Rural St. Helens, Warren, (Value Zone 2)
For this grouping of manufactured structures located in Rural St. Helens and Warren, three sales were returned that comprise 3.95% of the population. The Mean (101) was deemed the best indicator after adjusting for time. Once the Mean was applied, an Overall Adjustment Factor of 99 was returned.
Performance History2020 2019 2018 20169.21 3.21 0.00 14.521.01 1.00 1.00 1.04
CODPRD
COLUMBIA County 2020 Ratio Study
Pre-Trend Values
289
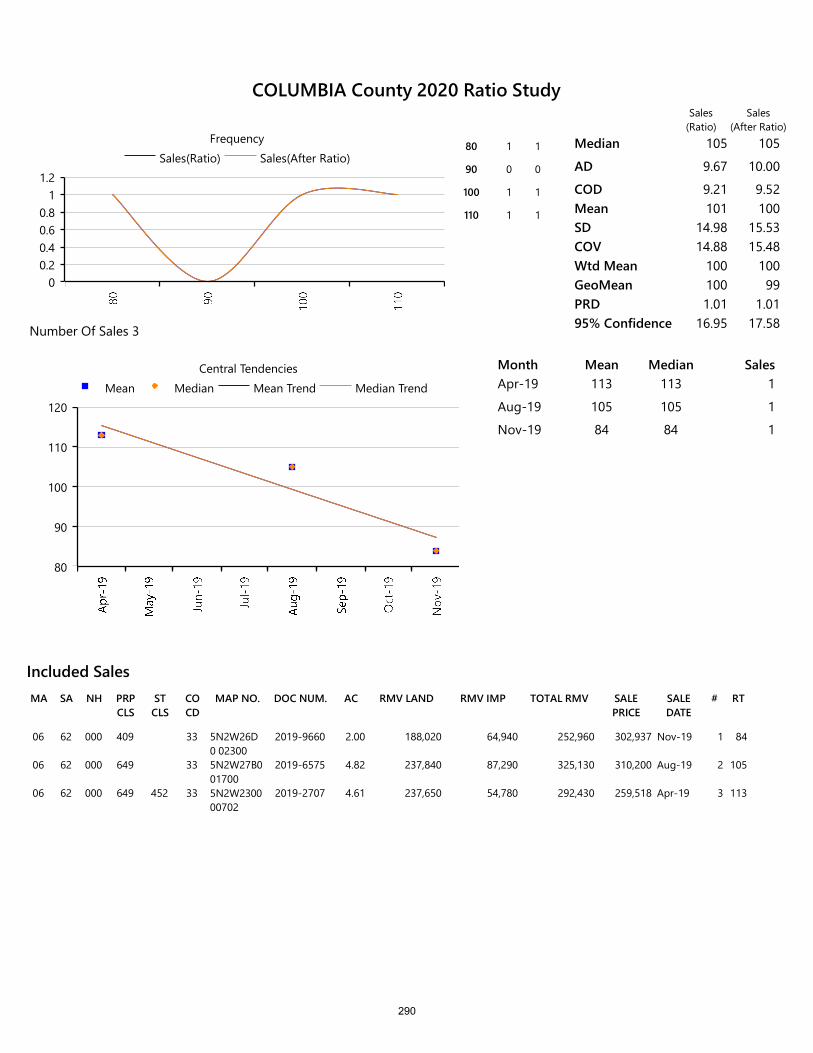
RMV LANDSA NH PRP CLS
ST CLS
CO CD
MAP NO. DOC NUM.MA AC RMV IMP TOTAL RMV SALE PRICE
SALE DATE
# RT
Included Sales
06 62 000 409 33 5N2W26D0 02300
2019-9660 2.00 188,020 64,940 252,960 302,937 Nov-19 1 84
06 62 000 649 33 5N2W27B0 01700
2019-6575 4.82 237,840 87,290 325,130 310,200 Aug-19 2 105
06 62 000 649 452 33 5N2W2300 00702
2019-2707 4.61 237,650 54,780 292,430 259,518 Apr-19 3 113
00.20.40.60.8
11.2
Sales(Ratio) Sales(After Ratio)Frequency
80 1 1
90 0 0
100 1 1
110 1 1
Median 105 105
AD 9.67 10.00
COD 9.21 9.52Mean 101 100SD 14.98 15.53COV 14.88 15.48Wtd Mean 100 100GeoMean 100 99PRD 1.01 1.0195% Confidence 16.95 17.58Number Of Sales 3
80
90
100
110
120Mean Median Mean Trend Median Trend
Central Tendencies Month Mean Median SalesApr-19 113 113 1
Aug-19 105 105 1
Nov-19 84 84 1
Sales(Ratio)
Sales(After Ratio)
COLUMBIA County 2020 Ratio Study
290

MAINTENANCE AREA 7
PERSONAL PROPERTY MANUFACTURED
STRUCTURES
291

Year RMV Class MA SA Park Name Count RMV Total2019 019 07 01 GENERAL AREA - ST. HELENS 2 $163,5202019 019 07 02 GENERAL AREA - SCAPPOOSE 55 $1,367,2702019 019 07 02 CEDAR TREE 22 $322,1802019 019 07 02 COUNTRY VILLA 30 $308,5002019 019 07 02 GOSS MANUFACTURED HOME PARK 15 $224,2902019 019 07 02 GREEN MEADOWS 37 $788,4802019 019 07 02 RUDDS 26 $392,8202019 019 07 02 SUNVIEW 5 $72,1102019 019 07 02 TAMARACK 39 $824,7802019 019 07 02 WALLER'S 1 $11,0702019 019 07 03 GENERAL AREA - VERNONIA 21 $628,1802019 019 07 03 BOULDER RIDGE 7 $112,1002019 019 07 04 GENERAL AREA - RAINIER 58 $1,294,7102019 019 07 04 CLOVER HILL 4 $78,4402019 019 07 04 DEER ISLAND HEIGHTS 4 $100,2802019 019 07 04 DEER ISLAND VILLAGE 51 $1,017,9402019 019 07 04 FERNVIEW 24 $394,1102019 019 07 04 RAINIER HEIGHTS 9 $129,4602019 019 07 04 RIVERS EDGE 15 $138,1202019 019 07 04 RIVERWOOD 27 $237,1402019 019 07 04 WESTERN HILLS 81 $1,182,0602019 019 07 05 GENERAL AREA - CLATSKANIE 73 $1,920,9702019 019 07 05 DEER POINTE 36 $627,1702019 019 07 05 DRAKES J/M 28 $328,4702019 019 07 05 RIVERBEND 27 $564,6802019 019 07 05 SWEDETOWN VILLAGE 25 $657,7302019 019 07 06 GENERAL AREA - WARREN, RURAL ST. HELENS 28 $794,1702019 019 07 06 MAPLE TERRACE 23 $489,4502019 019 07 06 MOUNTIAN VIEW 12 $172,3202019 019 07 06 ROSE MANOR 30 $522,0902019 019 07 06 WESTWIND 6 $270,7002019 019 07 27 CRESTWOOD VILLAGE 123 $5,375,1202019 019 07 28 COLUMBIA CITY ESTATES 42 $1,722,2802019 019 07 30 SPRINGLAKE PARK 145 $9,167,7802019 019 07 31 CROWN PARK 22 $1,000,0102019 019 07 35 RIVERSIDE MEADOWS 22 $237,430
Total Count: 1,175Total RMV: 33,637,930
Because of the unique way these properties move within the market, Maintenance Area 07 was developed in 2012 to better identify and track these properties. This maintenance area consists of manufactured structures which are considered personal property (RMV Class 019) and are located throughout Columbia County either in a manufactured home park or where the land is not owned by the same titled owner of the manufactured structure.
MA 07 – Personal Property Manufactured Structures
292
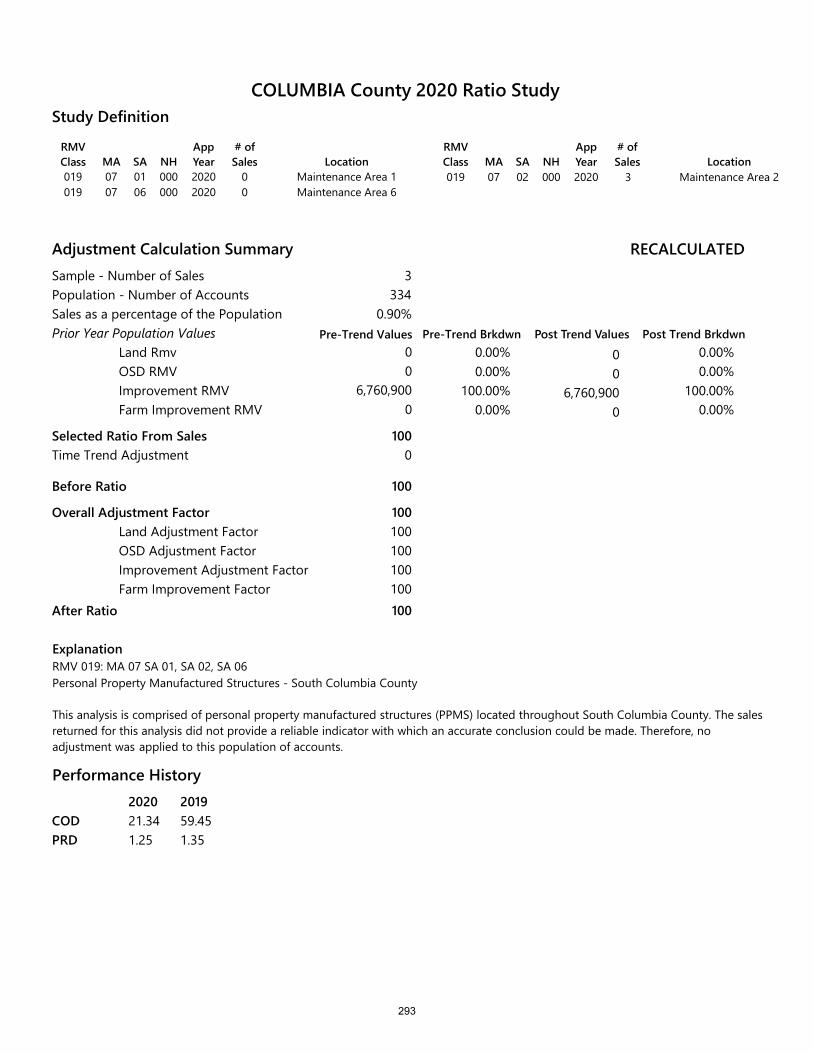
RMV Class MA SA NH
App Year
# of Sales Location
019 07 01 000 2020 Maintenance Area 1019 07 06 000 2020 Maintenance Area 6
RMV Class MA SA NH
App Year
# of Sales Location
019 07 02 000 2020 Maintenance Area 2
Study Definition
Adjustment Calculation SummarySample - Number of SalesPopulation - Number of AccountsSales as a percentage of the PopulationPrior Year Population Values
Land RmvOSD RMVImprovement RMVFarm Improvement RMV
Selected Ratio From Sales
Before Ratio
Overall Adjustment FactorLand Adjustment FactorOSD Adjustment FactorImprovement Adjustment FactorFarm Improvement Factor
After Ratio
RECALCULATED
Pre-Trend Brkdwn Post Trend Values Post Trend Brkdwn
3334
0.90%
0.00% 0.00%0.00%
100.00%0.00%
100.00%0.00% 0.00%
100
100
100100100100100100
Time Trend Adjustment 0
ExplanationRMV 019: MA 07 SA 01, SA 02, SA 06 Personal Property Manufactured Structures - South Columbia County
This analysis is comprised of personal property manufactured structures (PPMS) located throughout South Columbia County. The sales returned for this analysis did not provide a reliable indicator with which an accurate conclusion could be made. Therefore, no adjustment was applied to this population of accounts.
Performance History202021.341.25
CODPRD
COLUMBIA County 2020 Ratio Study
00
3
00
6,760,9000
00
6,760,9000
Pre-Trend Values
201959.451.35
293

Sales Sales20 0 0 (Ratio) (After Ratio)30 0 0 Median 67 6740 1 1 AD 14.25 14.2550 0 0 COD 21.34 21.3460 1 170 0 0 Mean 67 6780 1 1 SD 21.37 21.3790 0 0 COV 32.08 32.08100 0 0110 0 0 Wtd. Mean 53 53120 0 0 GeoMean 64 64130 0 0 PRD 1.25 1.25140 0 0 95% Confidence 24.19 24.19150 0 0160 0 0170 0 0180 0 0
3 190 0 0
Month Mean Median SalesJul-19 68 68 1Oct-19 46 46 1Nov-19 89 89 1
MA SA NH PRP ST CO CD ACCT NO. SALE DATE # RATIO7 2 000 019 451 33 397 07/31/19 1 687 2 000 019 452 33 529 10/14/19 2 467 2 000 019 441 30 596 11/06/19 3 89
Number Of Sales:
20,480 20,480 30,000
Included Sales
RMV IMP TOTAL RMV SALE PRICE
36,540 36,540 80,0006,200 6,200 7,000
0
20
40
60
80
100
120
140
160
Jan-
19
Feb-
19
Mar
-19
Apr-
19
May
-19
Jun-
19
Jul-1
9
Aug-
19
Sep-
19
Oct
-19
Nov
-19
Dec-
19Central Tendencies
Mean Median Linear (Mean) Linear (Median)
0
1
2
3
4
5
6
30 40 50 60 70 80 90
FrequencyBefore After
COLUMBIA County 2020 Ratio Study
294
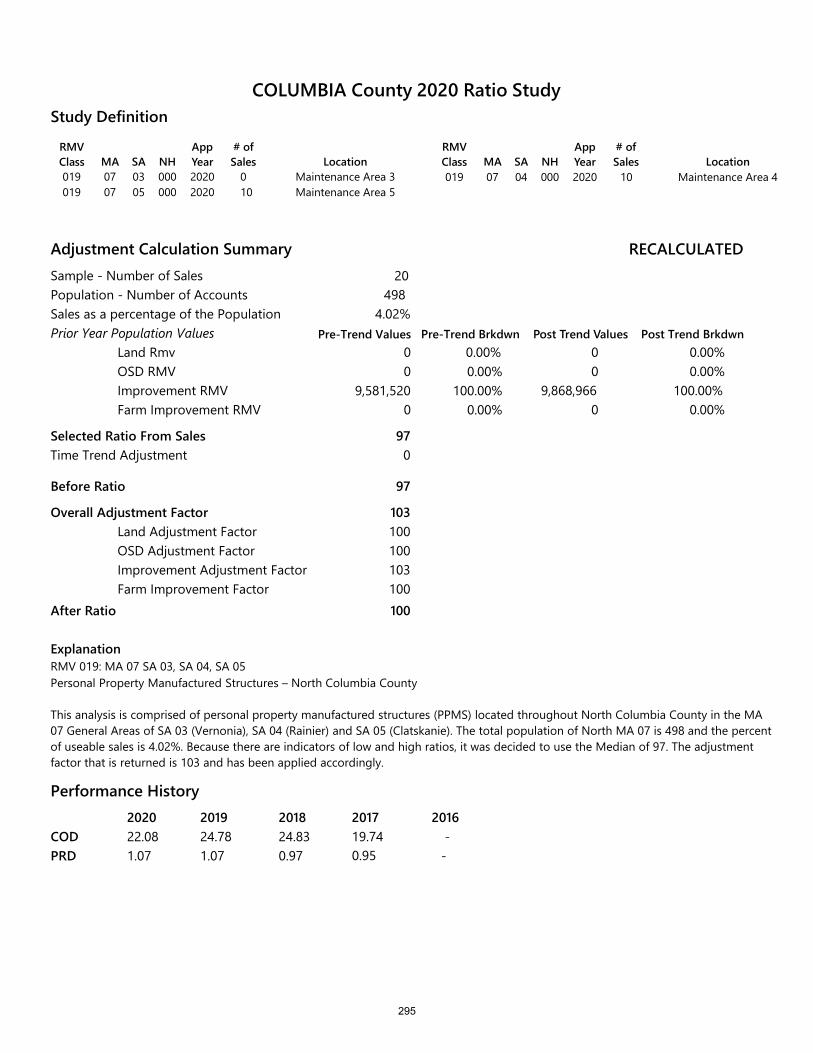
RMV Class MA SA NH
App Year
# of Sales Location
019 07 03 000 2020 Maintenance Area 3019 07 05 000 2020 Maintenance Area 5
RMV Class MA SA NH
App Year
# of Sales Location
019 07 04 000 2020 Maintenance Area 4
Study Definition
Adjustment Calculation SummarySample - Number of SalesPopulation - Number of AccountsSales as a percentage of the PopulationPrior Year Population Values
Land RmvOSD RMVImprovement RMVFarm Improvement RMV
Selected Ratio From Sales
Before Ratio
Overall Adjustment FactorLand Adjustment FactorOSD Adjustment FactorImprovement Adjustment FactorFarm Improvement Factor
After Ratio
RECALCULATED
Pre-Trend Brkdwn Post Trend Values Post Trend Brkdwn
204984.02%
0.00% 0.00%0.00%
100.00%0.00%
100.00%0.00% 0.00%
97
97
103100100103100100
Time Trend Adjustment 0
ExplanationRMV 019: MA 07 SA 03, SA 04, SA 05Personal Property Manufactured Structures – North Columbia County
This analysis is comprised of personal property manufactured structures (PPMS) located throughout North Columbia County in the MA 07 General Areas of SA 03 (Vernonia), SA 04 (Rainier) and SA 05 (Clatskanie). The total population of North MA 07 is 498 and the percent of useable sales is 4.02%. Because there are indicators of low and high ratios, it was decided to use the Median of 97. The adjustment factor that is returned is 103 and has been applied accordingly.
Performance History202022.081.07
CODPRD
COLUMBIA County 2020 Ratio Study
010
10
00
9,868,9660
00
9,581,5200
201924.781.07
201824.830.97
201719.740.95
2016--
Pre-Trend Values
295
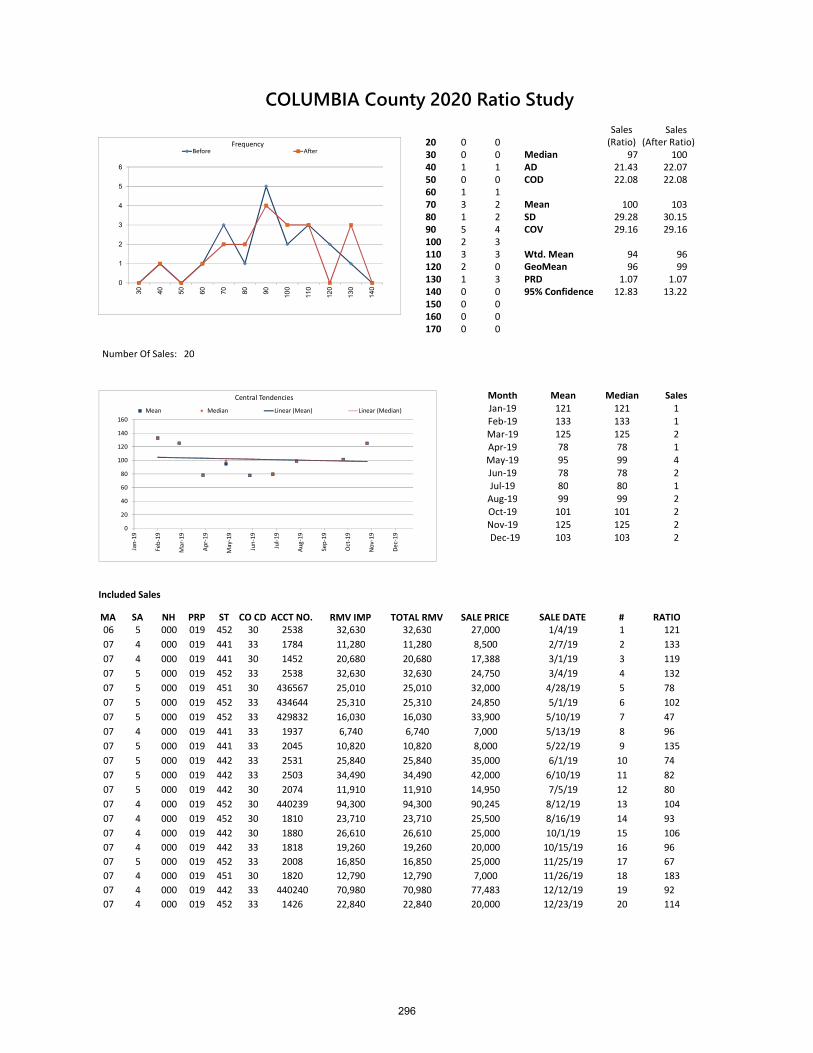
Sales Sales20 0 0 (Ratio) (After Ratio)30 0 0 Median 97 10040 1 1 AD 21.43 22.0750 0 0 COD 22.08 22.0860 1 170 3 2 Mean 100 10380 1 2 SD 29.28 30.1590 5 4 COV 29.16 29.16100 2 3110 3 3 Wtd. Mean 94 96120 2 0 GeoMean 96 99130 1 3 PRD 1.07 1.07140 0 0 95% Confidence 12.83 13.22150 0 0160 0 0170 0 0
20
Month Mean Median SalesJan-19 121 121 1Feb-19 133 133 1Mar-19 125 125 2Apr-19 78 78 1May-19 95 99 4Jun-19 78 78 2Jul-19 80 80 1
Aug-19 99 99 2Oct-19 101 101 2Nov-19 125 125 2Dec-19 103 103 2
MA SA NH PRP ST CO CD ACCT NO. SALE DATE # RATIO06 5 000 019 452 30 2538 1/4/19 1 12107 4 000 019 441 33 1784 2/7/19 2 13307 4 000 019 441 30 1452 3/1/19 3 11907 5 000 019 452 33 2538 3/4/19 4 13207 5 000 019 451 30 436567 4/28/19 5 7807 5 000 019 452 33 434644 5/1/19 6 10207 5 000 019 452 33 429832 5/10/19 7 4707 4 000 019 441 33 1937 5/13/19 8 9607 5 000 019 441 33 2045 5/22/19 9 13507 5 000 019 442 33 2531 6/1/19 10 7407 5 000 019 442 33 2503 6/10/19 11 8207 5 000 019 442 30 2074 7/5/19 12 8007 4 000 019 452 30 440239 8/12/19 13 10407 4 000 019 452 30 1810 8/16/19 14 9307 4 000 019 442 30 1880 10/1/19 15 10607 4 000 019 442 33 1818 10/15/19 16 9607 5 000 019 452 33 2008 11/25/19 17 6707 4 000 019 451 30 1820 11/26/19 18 18307 4 000 019 442 33 440240 12/12/19 19 9207 4 000 019 452 33 1426 12/23/19 20 114
Number Of Sales:
11,280 11,280 8,500
Included Sales
RMV IMP TOTAL RMV SALE PRICE
25,310 25,310 24,85016,030 16,030 33,900
32,630 32,630 24,75025,010 25,010 32,000
25,840 25,840 35,00034,490 34,490 42,000
6,740 6,740 7,00010,820 10,820 8,000
94,300 94,300 90,24523,710 23,710 25,500
11,910 11,910 14,950
20,000
17,38820,68020,680
32,630 32,630 27,000
22,840
19,26016,85012,79070,98022,840
19,26016,85012,79070,980
20,00025,0007,000
77,483
26,610 26,610 25,000
0
20
40
60
80
100
120
140
160
Jan-
19
Feb-
19
Mar
-19
Apr-
19
May
-19
Jun-
19
Jul-1
9
Aug-
19
Sep-
19
Oct
-19
Nov
-19
Dec-
19Central Tendencies
Mean Median Linear (Mean) Linear (Median)
0
1
2
3
4
5
6
30 40 50 60 70 80 90 100
110
120
130
140
FrequencyBefore After
COLUMBIA County 2020 Ratio Study
296
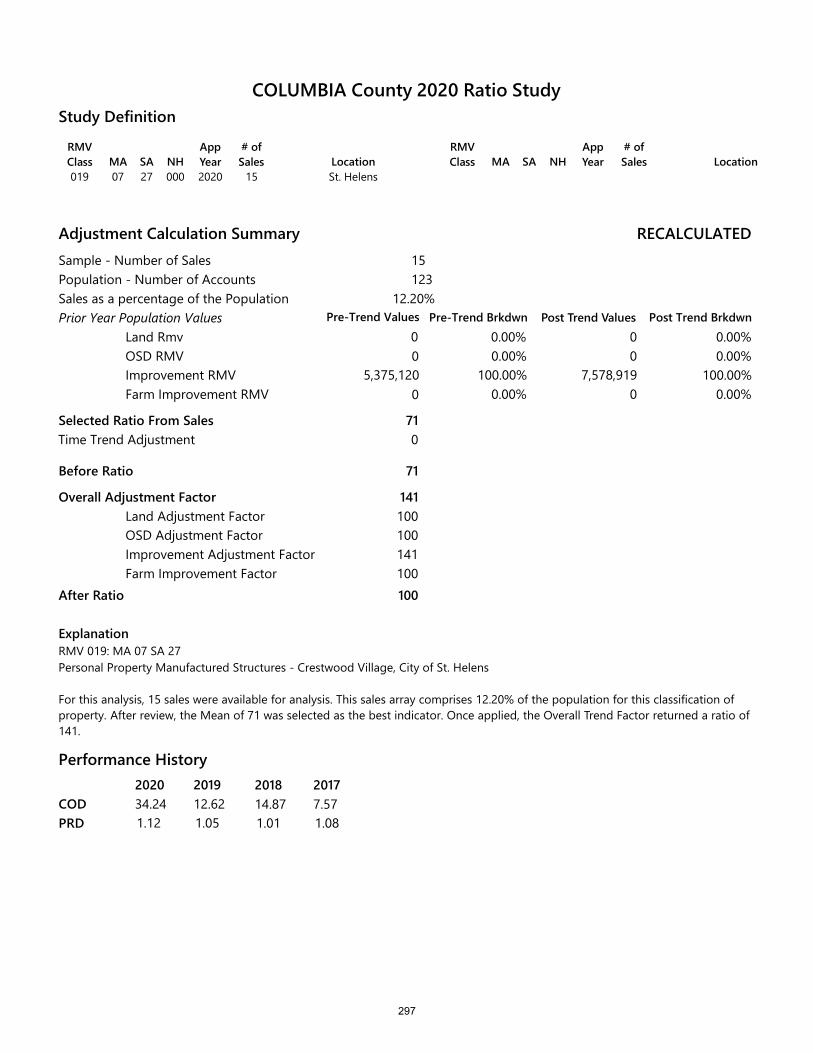
RMV Class MA SA NH
App Year
# of Sales Location
019 07 27 000 2020 St. Helens
RMV Class MA SA NH
App Year
# of Sales Location
Study Definition
Adjustment Calculation SummarySample - Number of SalesPopulation - Number of AccountsSales as a percentage of the PopulationPrior Year Population Values
Land RmvOSD RMVImprovement RMVFarm Improvement RMV
Selected Ratio From Sales
Before Ratio
Overall Adjustment FactorLand Adjustment FactorOSD Adjustment FactorImprovement Adjustment FactorFarm Improvement Factor
After Ratio
RECALCULATED
Pre-Trend Brkdwn Post Trend Values Post Trend Brkdwn
15123
12.20%
0.00% 0.00%0.00%
0.00%
71
71
141100100141100100
Time Trend Adjustment 0
ExplanationRMV 019: MA 07 SA 27Personal Property Manufactured Structures - Crestwood Village, City of St. Helens
For this analysis, 15 sales were available for analysis. This sales array comprises 12.20% of the population for this classification of property. After review, the Mean of 71 was selected as the best indicator. Once applied, the Overall Trend Factor returned a ratio of 141.
Performance History202034.241.12
CODPRD
COLUMBIA County 2020 Ratio Study
15
00
7,578,9190
0.00%100.00%
0.00%
05,375,120
0
0
100.00%
201912.621.05
201814.871.01
20177.571.08
Pre-Trend Values
297
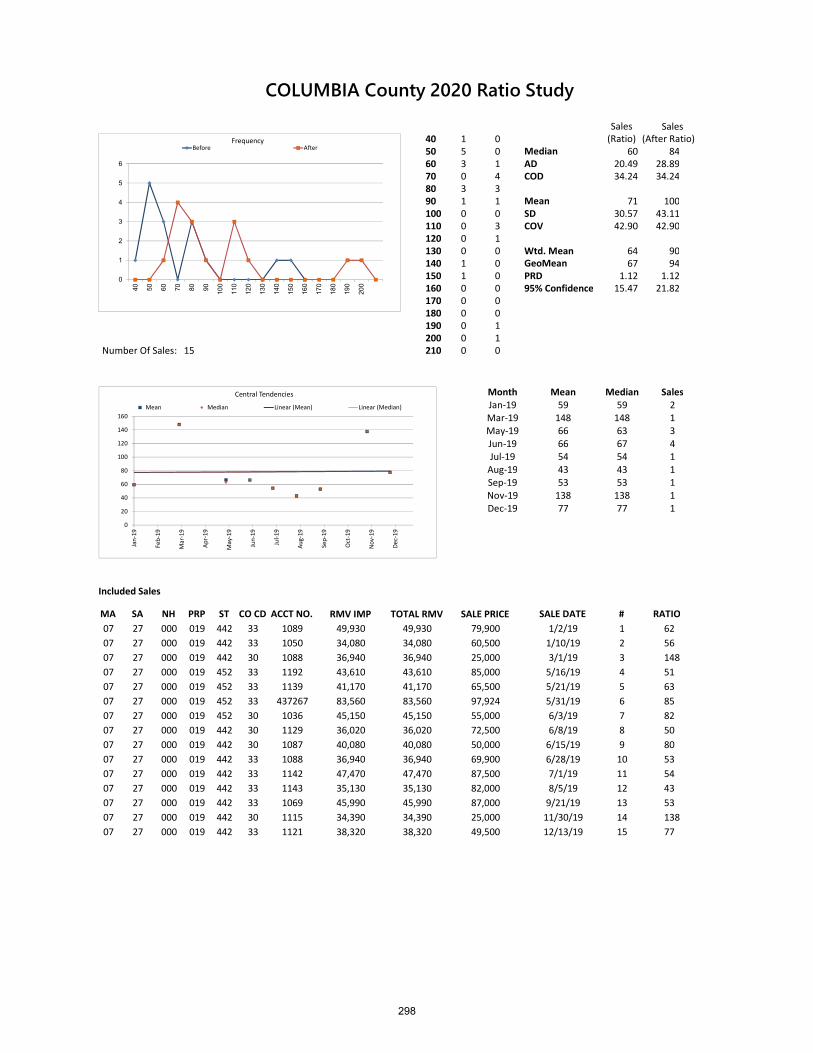
Sales Sales40 1 0 (Ratio) (After Ratio)50 5 0 Median 60 8460 3 1 AD 20.49 28.8970 0 4 COD 34.24 34.2480 3 390 1 1 Mean 71 100100 0 0 SD 30.57 43.11110 0 3 COV 42.90 42.90120 0 1130 0 0 Wtd. Mean 64 90140 1 0 GeoMean 67 94150 1 0 PRD 1.12 1.12160 0 0 95% Confidence 15.47 21.82170 0 0180 0 0190 0 1200 0 1
15 210 0 0
Month Mean Median SalesJan-19 59 59 2Mar-19 148 148 1May-19 66 63 3Jun-19 66 67 4Jul-19 54 54 1
Aug-19 43 43 1Sep-19 53 53 1Nov-19 138 138 1Dec-19 77 77 1
MA SA NH PRP ST CO CD ACCT NO. SALE DATE # RATIO07 27 000 019 442 33 1089 1/2/19 1 6207 27 000 019 442 33 1050 1/10/19 2 5607 27 000 019 442 30 1088 3/1/19 3 14807 27 000 019 452 33 1192 5/16/19 4 5107 27 000 019 452 33 1139 5/21/19 5 6307 27 000 019 452 33 437267 5/31/19 6 8507 27 000 019 452 30 1036 6/3/19 7 8207 27 000 019 442 30 1129 6/8/19 8 5007 27 000 019 442 30 1087 6/15/19 9 8007 27 000 019 442 33 1088 6/28/19 10 5307 27 000 019 442 33 1142 7/1/19 11 5407 27 000 019 442 33 1143 8/5/19 12 4307 27 000 019 442 33 1069 9/21/19 13 5307 27 000 019 442 30 1115 11/30/19 14 13807 27 000 019 442 33 1121 12/13/19 15 77
49,930
41,170
RMV IMP
38,32034,39045,99035,13047,47036,94040,08036,02045,15083,56041,17043,61036,94034,080
TOTAL RMV
49,50025,00087,00082,00087,500
38,32034,39045,99035,13047,47036,94040,08036,02045,15083,560
79,900
43,61036,94034,08049,930
SALE PRICE
69,90050,00072,50055,00097,92465,50085,00025,00060,500
Number Of Sales:
Included Sales
0
20
40
60
80
100
120
140
160
Jan-
19
Feb-
19
Mar
-19
Apr-
19
May
-19
Jun-
19
Jul-1
9
Aug-
19
Sep-
19
Oct
-19
Nov
-19
Dec-
19Central Tendencies
Mean Median Linear (Mean) Linear (Median)
0
1
2
3
4
5
6
40 50 60 70 80 90 100
110
120
130
140
150
160
170
180
190
200
FrequencyBefore After
COLUMBIA County 2020 Ratio Study
298
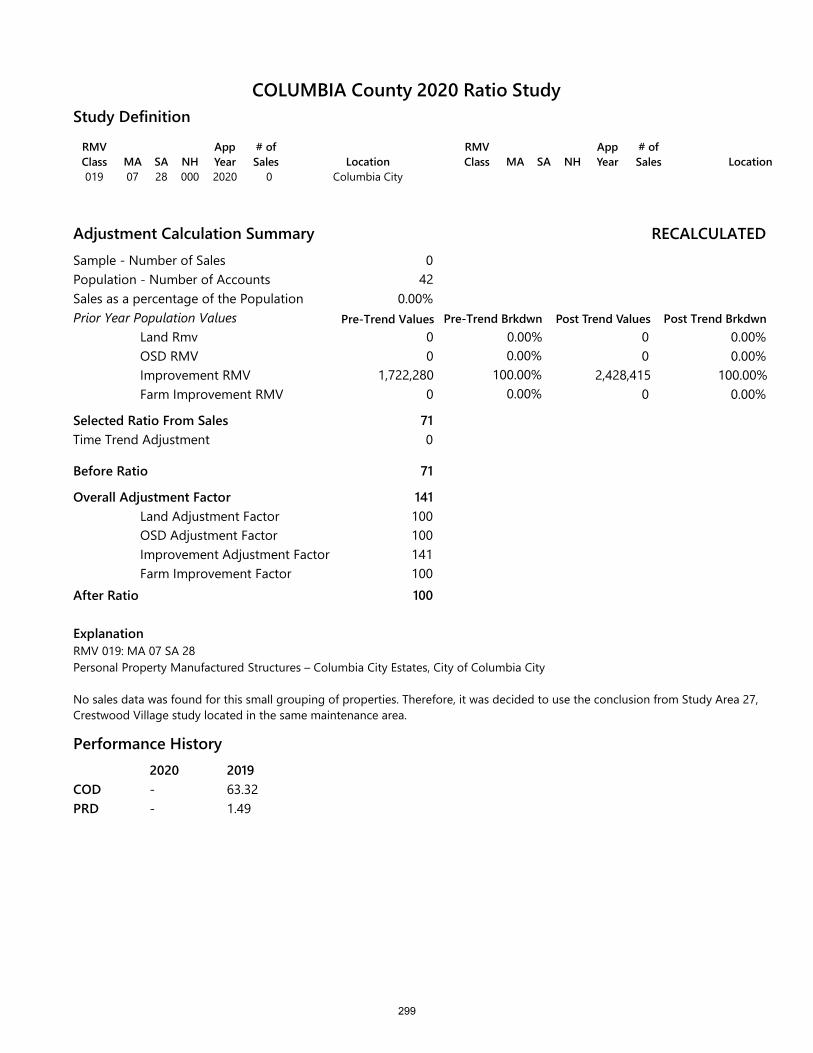
RMV Class MA SA NH
App Year
# of Sales Location
019 07 28 000 2020 Columbia City
RMV Class MA SA NH
App Year
# of Sales Location
Study Definition
Adjustment Calculation SummarySample - Number of SalesPopulation - Number of AccountsSales as a percentage of the PopulationPrior Year Population Values
Land RmvOSD RMVImprovement RMVFarm Improvement RMV
Selected Ratio From Sales
Before Ratio
Overall Adjustment FactorLand Adjustment FactorOSD Adjustment FactorImprovement Adjustment FactorFarm Improvement Factor
After Ratio
RECALCULATED
Pre-Trend Brkdwn Post Trend Values Post Trend Brkdwn
042
0.00%
0.00% 0.00%0.00%
100.00%0.00%
100.00%0.00% 0.00%
71
71
141100100141100100
Time Trend Adjustment 0
ExplanationRMV 019: MA 07 SA 28Personal Property Manufactured Structures – Columbia City Estates, City of Columbia City
No sales data was found for this small grouping of properties. Therefore, it was decided to use the conclusion from Study Area 27, Crestwood Village study located in the same maintenance area.
Performance History2020--
CODPRD
COLUMBIA County 2020 Ratio Study
0
00
2,428,4150
00
1,722,2800
201963.321.49
Pre-Trend Values
299

0
1Sales(Ratio) Sales(After Ratio)
Frequency Median
AD
CODMeanSDCOVWtd MeanGeoMeanPRD95% ConfidenceNumber Of Sales 0
0
1Mean Median Mean Trend Median Trend
Central Tendencies Month Mean Median Sales
Sales(Ratio)
Sales(After Ratio)
COLUMBIA County 2020 Ratio Study
300
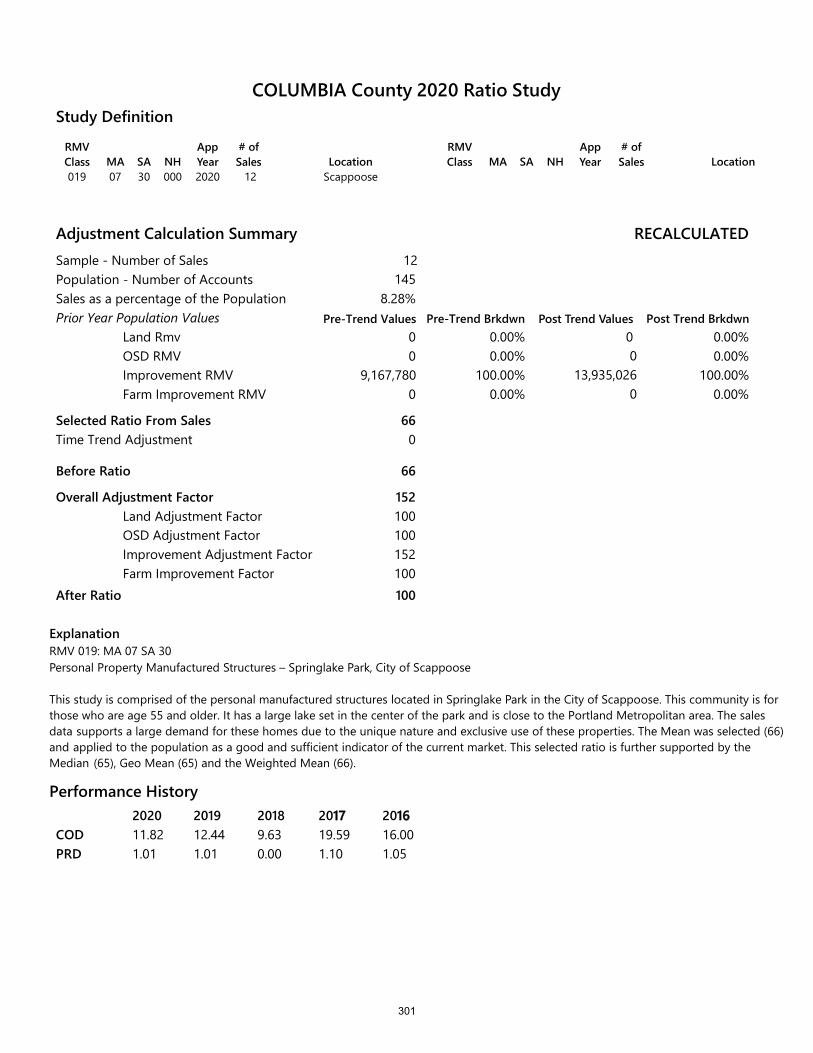
RMV Class MA SA NH
App Year
# of Sales Location
019 07 30 000 2020 Scappoose
RMV Class MA SA NH
App Year
# of Sales Location
Study Definition
Adjustment Calculation SummarySample - Number of SalesPopulation - Number of AccountsSales as a percentage of the PopulationPrior Year Population Values
Land RmvOSD RMVImprovement RMVFarm Improvement RMV
Selected Ratio From Sales
Before Ratio
Overall Adjustment FactorLand Adjustment FactorOSD Adjustment FactorImprovement Adjustment FactorFarm Improvement Factor
After Ratio
RECALCULATED
Pre-Trend Brkdwn Post Trend Values Post Trend Brkdwn
12145
8.28%
0 0.00% 0 0.00%0
9,167,7800
0.00% 0.00%100.00% 100.00%
0.00%
0 13,935,026
0 0.00%
66
66
152100100152100100
Time Trend Adjustment 0
ExplanationRMV 019: MA 07 SA 30Personal Property Manufactured Structures – Springlake Park, City of Scappoose
This study is comprised of the personal manufactured structures located in Springlake Park in the City of Scappoose. This community is for those who are age 55 and older. It has a large lake set in the center of the park and is close to the Portland Metropolitan area. The sales data supports a large demand for these homes due to the unique nature and exclusive use of these properties. The Mean was selected (66)and applied to the population as a good and sufficient indicator of the current market. This selected ratio is further supported by theMedian (65), Geo Mean (65) and the Weighted Mean (66).
Performance History
COLUMBIA County 2020 Ratio Study
12
202011.821.01
CODPRD
201912.441.01
20189.630.00
201719.591.10
201616.001.05
Pre-Trend Values
301
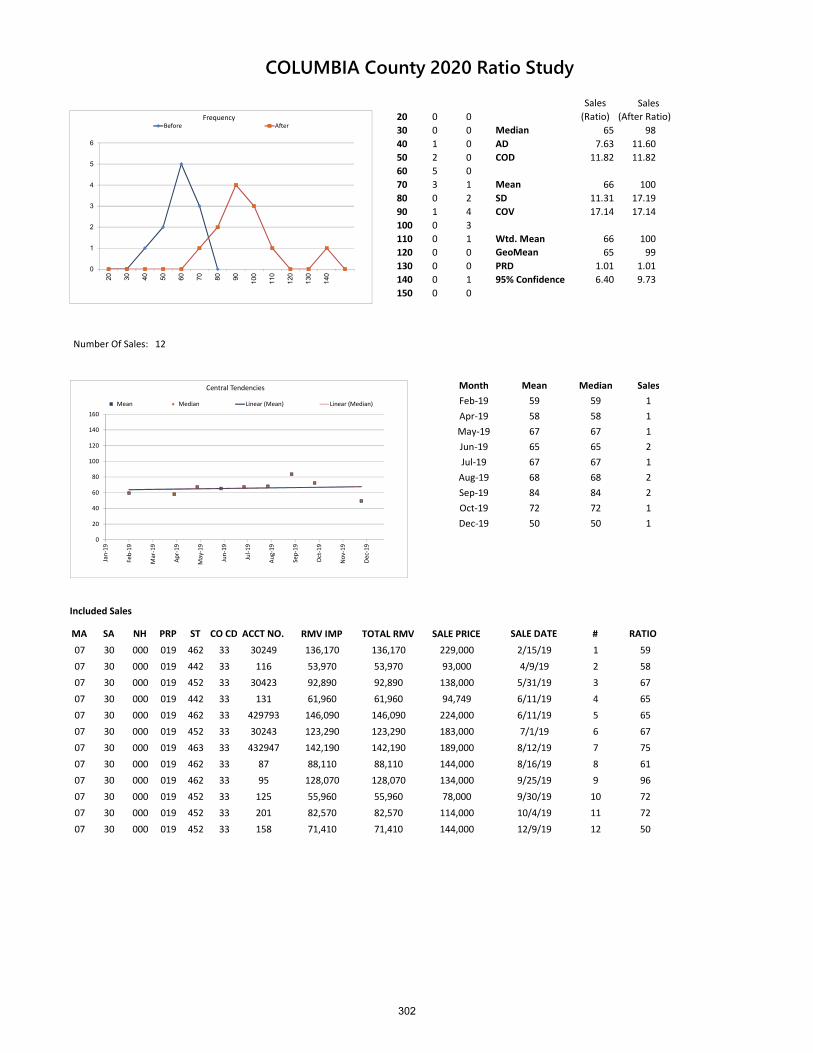
Sales Sales20 0 0 (Ratio) (After Ratio)30 0 0 Median 65 9840 1 0 AD 7.63 11.6050 2 0 COD 11.82 11.8260 5 070 3 1 Mean 66 10080 0 2 SD 11.31 17.1990 1 4 COV 17.14 17.14100 0 3110 0 1 Wtd. Mean 66 100120 0 0 GeoMean 65 99130 0 0 PRD 1.01 1.01140 0 1 95% Confidence 6.40 9.73150 0 0
12
Month Mean Median SalesFeb-19 59 59 1Apr-19 58 58 1May-19 67 67 1Jun-19 65 65 2Jul-19 67 67 1
Aug-19 68 68 2Sep-19 84 84 2Oct-19 72 72 1Dec-19 50 50 1
MA SA NH PRP ST CO CD ACCT NO. SALE DATE # RATIO
07 30 000 019 462 33 30249 2/15/19 1 59
07 30 000 019 442 33 116 4/9/19 2 58
07 30 000 019 452 33 30423 5/31/19 3 67
07 30 000 019 442 33 131 6/11/19 4 65
07 30 000 019 462 33 429793 6/11/19 5 65
07 30 000 019 452 33 30243 7/1/19 6 67
07 30 000 019 463 33 432947 8/12/19 7 75
07 30 000 019 462 33 87 8/16/19 8 61
07 30 000 019 462 33 95 9/25/19 9 96
07 30 000 019 452 33 125 9/30/19 10 72
07 30 000 019 452 33 201 10/4/19 11 72
07 30 000 019 452 33 158 12/9/19 12 50
Included Sales
RMV IMP TOTAL RMV SALE PRICE
Number Of Sales:
92,890 92,890 138,000
61,960 61,960 94,749
136,170 136,170 229,000
53,970 53,970 93,000
142,190 142,190 189,000
88,110 88,110 144,000
146,090 146,090 224,000
123,290 123,290 183,000
82,570 82,570 114,000
71,410 71,410 144,000
128,070 128,070 134,000
55,960 55,960 78,000
0
20
40
60
80
100
120
140
160
Jan-
19
Feb-
19
Mar
-19
Apr-
19
May
-19
Jun-
19
Jul-1
9
Aug-
19
Sep-
19
Oct
-19
Nov
-19
Dec
-19
Central Tendencies
Mean Median Linear (Mean) Linear (Median)
0
1
2
3
4
5
6
20 30 40 50 60 70 80 90
100
110
120
130
140
FrequencyBefore After
COLUMBIA County 2020 Ratio Study
302
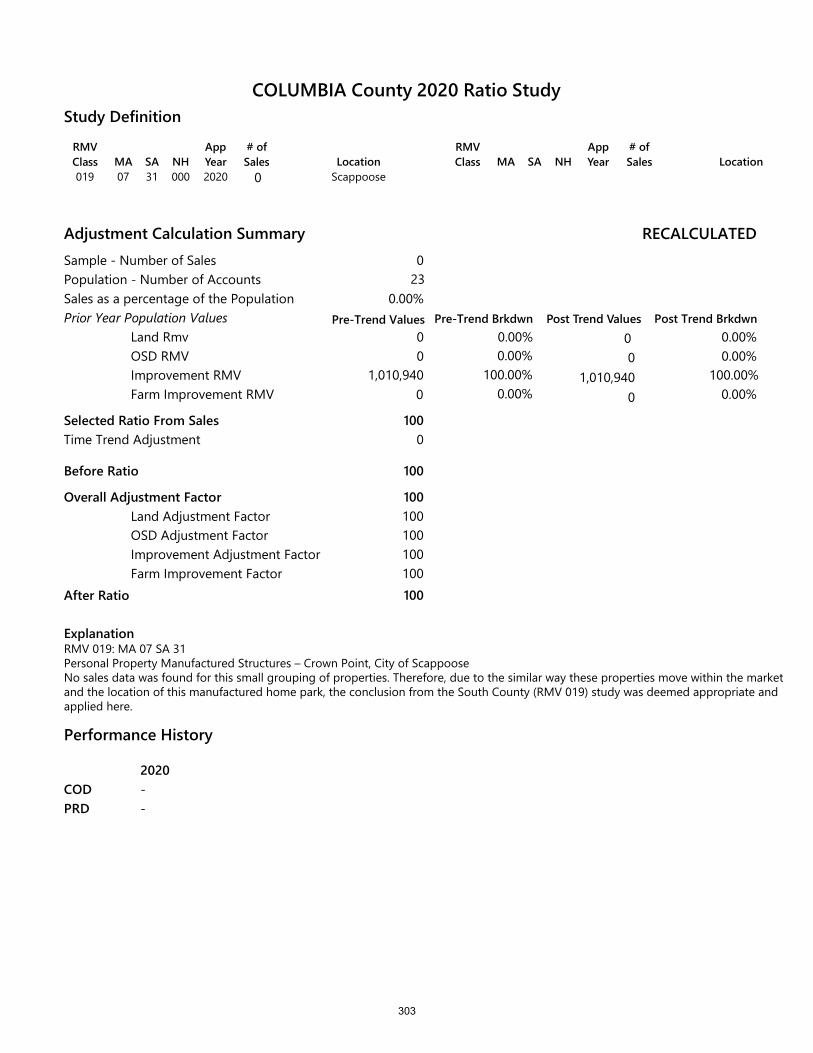
RMV Class MA SA NH
App Year
# of Sales Location
019 07 31 000 2020 Scappoose
RMV Class MA SA NH
App Year
# of Sales Location
Study Definition
Adjustment Calculation SummarySample - Number of SalesPopulation - Number of AccountsSales as a percentage of the PopulationPrior Year Population Values
Land RmvOSD RMVImprovement RMVFarm Improvement RMV
Selected Ratio From Sales
Before Ratio
Overall Adjustment FactorLand Adjustment FactorOSD Adjustment FactorImprovement Adjustment FactorFarm Improvement Factor
After Ratio
RECALCULATED
Pre-Trend Brkdwn Post Trend Values Post Trend Brkdwn
023
0.00%
0.00% 0.00%0.00%
100.00%0.00%
100.00%0.00% 0.00%
100
100
100100100100100100
Time Trend Adjustment 0
ExplanationRMV 019: MA 07 SA 31Personal Property Manufactured Structures – Crown Point, City of ScappooseNo sales data was found for this small grouping of properties. Therefore, due to the similar way these properties move within the market and the location of this manufactured home park, the conclusion from the South County (RMV 019) study was deemed appropriate and applied here.
Performance History
2020--
CODPRD
COLUMBIA County 2020 Ratio Study
0
00
1,010,9400
00
1,010,9400
Pre-Trend Values
303

0
1Sales(Ratio) Sales(After Ratio)
Frequency Median
AD
CODMeanSDCOVWtd MeanGeoMeanPRD95% ConfidenceNumber Of Sales 0
0
1Mean Median Mean Trend Median Trend
Central Tendencies Month Mean Median Sales
Sales(Ratio)
Sales(After Ratio)
COLUMBIA County 2020 Ratio Study
304
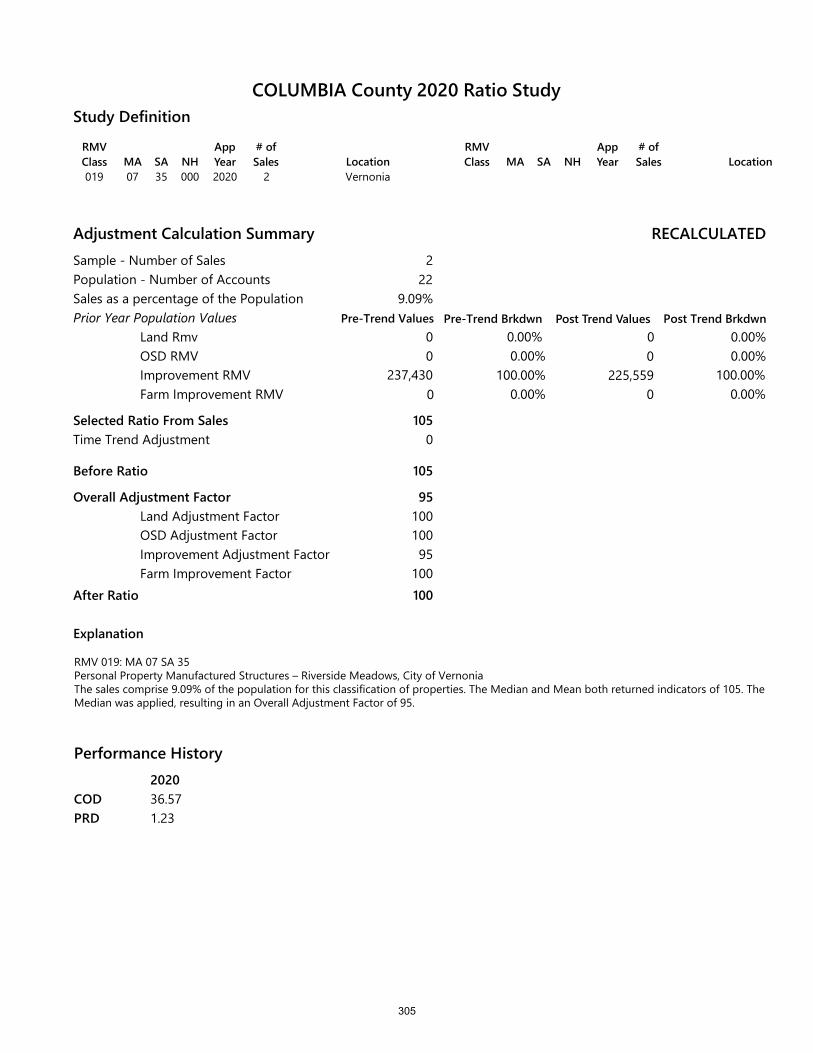
RMV Class MA SA NH
App Year
# of Sales Location
019 07 35 000 2020 Vernonia
RMV Class MA SA NH
App Year
# of Sales Location
Study Definition
Adjustment Calculation SummarySample - Number of SalesPopulation - Number of AccountsSales as a percentage of the PopulationPrior Year Population Values
Land RmvOSD RMVImprovement RMVFarm Improvement RMV
Selected Ratio From Sales
Before Ratio
Overall Adjustment FactorLand Adjustment FactorOSD Adjustment FactorImprovement Adjustment FactorFarm Improvement Factor
After Ratio
Explanation
RECALCULATED
Post Trend Values Post Trend Brkdwn
222
9.09%
0 0 0.00%0
237,4300
0.00%100.00%
Pre-Trend Brkdwn 0.00%0.00%
100.00%0.00%
0 225,559
0 0.00%
105
105
9510010095
100100
Time Trend Adjustment 0
Performance History202036.571.23
CODPRD
COLUMBIA County 2020 Ratio Study
2
RMV 019: MA 07 SA 35Personal Property Manufactured Structures – Riverside Meadows, City of VernoniaThe sales comprise 9.09% of the population for this classification of properties. The Median and Mean both returned indicators of 105. The Median was applied, resulting in an Overall Adjustment Factor of 95.
Pre-Trend Values
305

Sales Sales20 0 0 (Ratio) (After Ratio)30 0 0 Median 105 10040 0 0 AD 38.56 36.6350 0 0 COD 36.57 36.5760 1 170 0 0 Mean 105 10080 0 0 SD 54.53 51.8090 0 0 COV 51.71 51.71100 0 0110 0 0 Wtd. Mean 86 81120 0 0 GeoMean 98 93130 0 1 PRD 1.23 1.23140 1 0 95% Confidence 75.57 71.79150 0 0160 0 0170 0 0180 0 0
2 190 0 0
Month Mean Median SalesJul-19 147 147 1
Dec-19 67 67 1
MA SA NH PRP ST CO CD ACCT NO. SALE DATE # RATIO06 35 000 019 442 30 2345 7/25/19 1 14707 35 000 019 452 33 2342 12/13/19 2 67
Number Of Sales:
13,910 13,910 9,45020,140 20,140 30,000
Included Sales
RMV IMP TOTAL RMV SALE PRICE
0
20
40
60
80
100
120
140
160
Jan-
19
Feb-
19
Mar
-19
Apr-
19
May
-19
Jun-
19
Jul-1
9
Aug-
19
Sep-
19
Oct
-19
Nov
-19
Dec-
19Central Tendencies
Mean Median Linear (Mean) Linear (Median)
0
1
2
3
4
5
6
50 60 70 80 90 100
110
120
130
140
150
FrequencyBefore After
COLUMBIA County 2020 Ratio Study
306

RMV CLASS 111
FLOATING HOMES, BOAT HOUSES AND
COMBINATIONS
307

Year RMV Class MA SA Location Count RMV Total2019 111 01 95 City of St. Helens - Combination/Floating Home 24 $3,207,1502019 111 01 97 City of St. Helens - Boathouse 21 $531,1002019 111 02 95 Scappoose - Combination/Floating Home 123 $13,871,4202019 111 02 97 Scappoose - Boathouse 36 $1,523,3202019 111 04 95 Rainier - Combination/Floating Home 2 $20,0202019 111 04 97 Rainier - Boathouse 5 $76,6502019 111 05 95 Clatskanie - Combination/Floating Home 2 $120,4202019 111 05 97 Clatskanie - Boathouse 48 $1,021,3902019 111 06 95 Warren & Rural St. Helens- Combination/Floating Home 3 $374,6502019 111 06 97 Warren & Rural St. Helens- Boathouse 30 $762,840
140$3,915,300
15417,593,660$
294$21,508,960Total RMV:
Combination and/or Floating Property Count:Combination and/or Floating Property RMV:
Total Floating Property Count:
Boathouses and Combinations/Floating Homeslocated throughout the County
Boathouse CountBoathouse RMV
308

RMV Class MA SA NH
App Year
# of Sales Location
111 01 95 000 2020 St. Helens111 06 95 000 2020 Rural St Helens
RMV Class MA SA NH
App Year
# of Sales Location
111 02 95 000 2020 Scappoose
Study Definition
Adjustment Calculation SummarySample - Number of SalesPopulation - Number of AccountsSales as a percentage of the PopulationPrior Year Population Values
Land RmvOSD RMVImprovement RMVFarm Improvement RMV
Selected Ratio From Sales
Before Ratio
Overall Adjustment FactorLand Adjustment FactorOSD Adjustment FactorImprovement Adjustment FactorFarm Improvement Factor
After Ratio
RECALCULATED
Pre-Trend Brkdwn Post Trend Values Post Trend Brkdwn
3150
2.00%
0.00% 0.00%0.00%
100.00%0.00%
100.00%0.00% 0.00%
74
74
135100100135100100
Time Trend Adjustment 0
ExplanationRMV 111: SA 95 MA 01, MA 02 and MA 06 Floating Homes and Combinations - St. Helens, Scappoose, Warren and Columbia City
This analysis is comprised of floating homes and combination homes, which are located along the Multnomah Channel in Scappoose (MA 02) and along the Columbia River (MA 01 and MA 06). This is a larger body of water and the moorages and marinas along it are highly sought after due to their proximity to Portland and peaceful “country” setting. The Mean of 74 was selected as the best indicator for this unique grouping of properties.
Performance History202031.191.09
CODPRD
COLUMBIA County 2020 Ratio Study
3
0.000.00
23,561,8470.00
0.000.00
17,453,2200.00
201911.330.99
201811.001.02
Pre-Trend Values
309
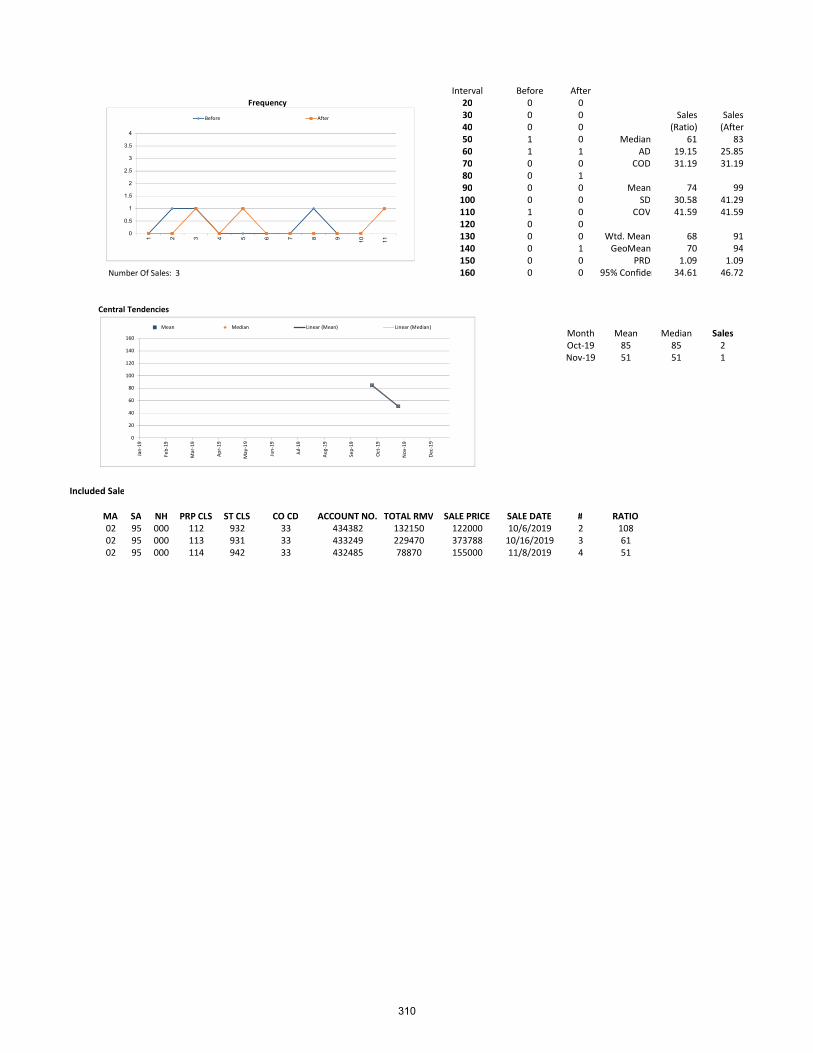
Interval Before After20 0 030 0 0 Sales Sales40 0 0 (Ratio) (After 50 1 0 Median 61 8360 1 1 AD 19.15 25.8570 0 0 COD 31.19 31.1980 0 190 0 0 Mean 74 99
100 0 0 SD 30.58 41.29110 1 0 COV 41.59 41.59120 0 0130 0 0 Wtd. Mean 68 91140 0 1 GeoMean 70 94150 0 0 PRD 1.09 1.09
3 160 0 0 95% Confidence 34.61 46.72
Central Tendencies
Month Mean Median SalesOct-19 85 85 2Nov-19 51 51 1
MA SA NH PRP CLS ST CLS CO CD ACCOUNT NO. TOTAL RMV SALE PRICE SALE DATE # RATIO02 95 000 112 932 33 434382 132150 122000 10/6/2019 2 10802 95 000 113 931 33 433249 229470 373788 10/16/2019 3 6102 95 000 114 942 33 432485 78870 155000 11/8/2019 4 51
Frequency
Included Sales
Number Of Sales:
0
20
40
60
80
100
120
140
160
Jan-
19
Feb-
19
Mar
-19
Apr-
19
May
-19
Jun-
19
Jul-1
9
Aug-
19
Sep-
19
Oct
-19
Nov
-19
Dec
-19
Mean Median Linear (Mean) Linear (Median)
0
0.5
1
1.5
2
2.5
3
3.5
4
1 2 3 4 5 6 7 8 9 10 11
Before After
310
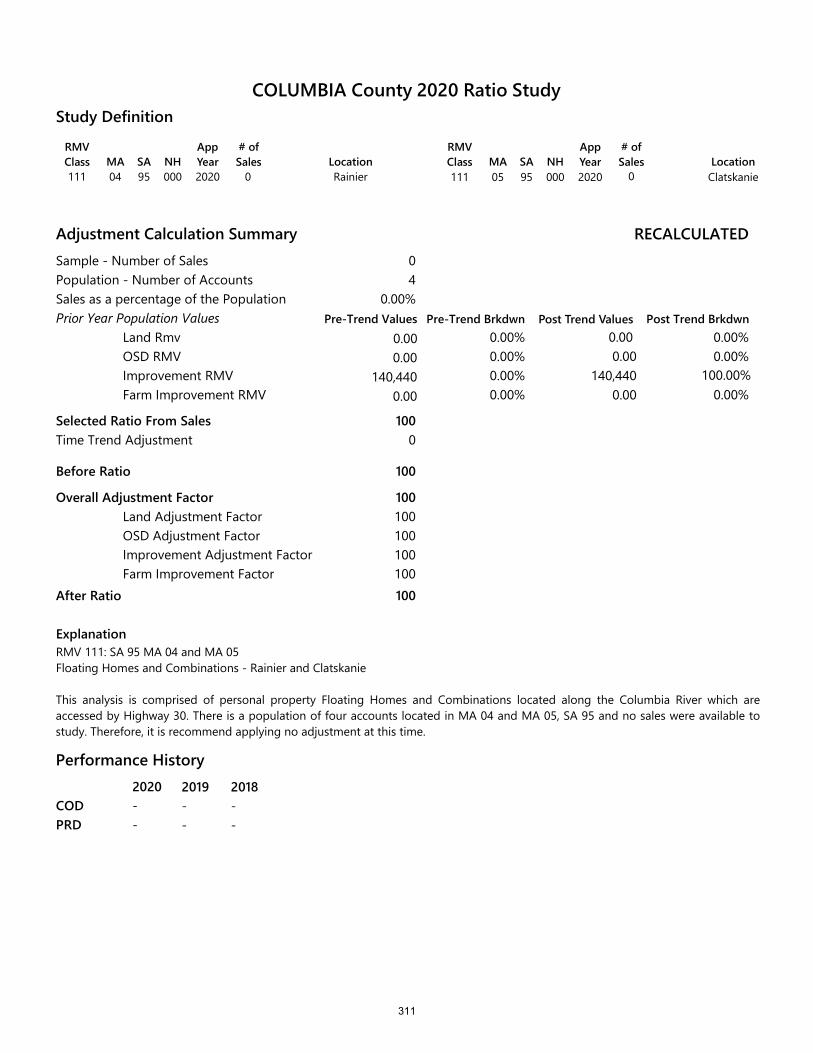
RMV Class MA SA NH
App Year
# of Sales Location
111 04 95 000 2020 Rainier
RMV Class MA SA NH
App Year
# of Sales Location
111 05 95 000 2020 Clatskanie
Study Definition
Adjustment Calculation SummarySample - Number of SalesPopulation - Number of AccountsSales as a percentage of the PopulationPrior Year Population Values
Land RmvOSD RMVImprovement RMVFarm Improvement RMV
Selected Ratio From Sales
Before Ratio
Overall Adjustment FactorLand Adjustment FactorOSD Adjustment FactorImprovement Adjustment FactorFarm Improvement Factor
After Ratio
ExplanationRMV 111: SA 95 MA 04 and MA 05 Floating Homes and Combinations - Rainier and Clatskanie
RECALCULATED
Pre-Trend Brkdwn Post Trend Values Post Trend Brkdwn
04
0.00%
0.00% 0.00%0.00% 0.00%0.00%0.00% 0.00%
100
100
100100100100100100
Time Trend Adjustment 0
This analysis is comprised of personal property Floating Homes and Combinations located along the Columbia River which are accessed by Highway 30. There is a population of four accounts located in MA 04 and MA 05, SA 95 and no sales were available to study. Therefore, it is recommend applying no adjustment at this time.
Performance History2020--
CODPRD
COLUMBIA County 2020 Ratio Study
0 0
100.00%
0.000.00
140,440 0.00
0.000.00
140,440 0.00
2019--
2018--
Pre-Trend Values
311

0
1Sales(Ratio) Sales(After Ratio)
Frequency Median
AD
CODMeanSDCOVWtd MeanGeoMeanPRD95% ConfidenceNumber Of Sales 0
0
1Mean Median Mean Trend Median Trend
Central Tendencies Month Mean Median Sales
Sales(Ratio)
Sales(After Ratio)
COLUMBIA County 2020 Ratio Study
312
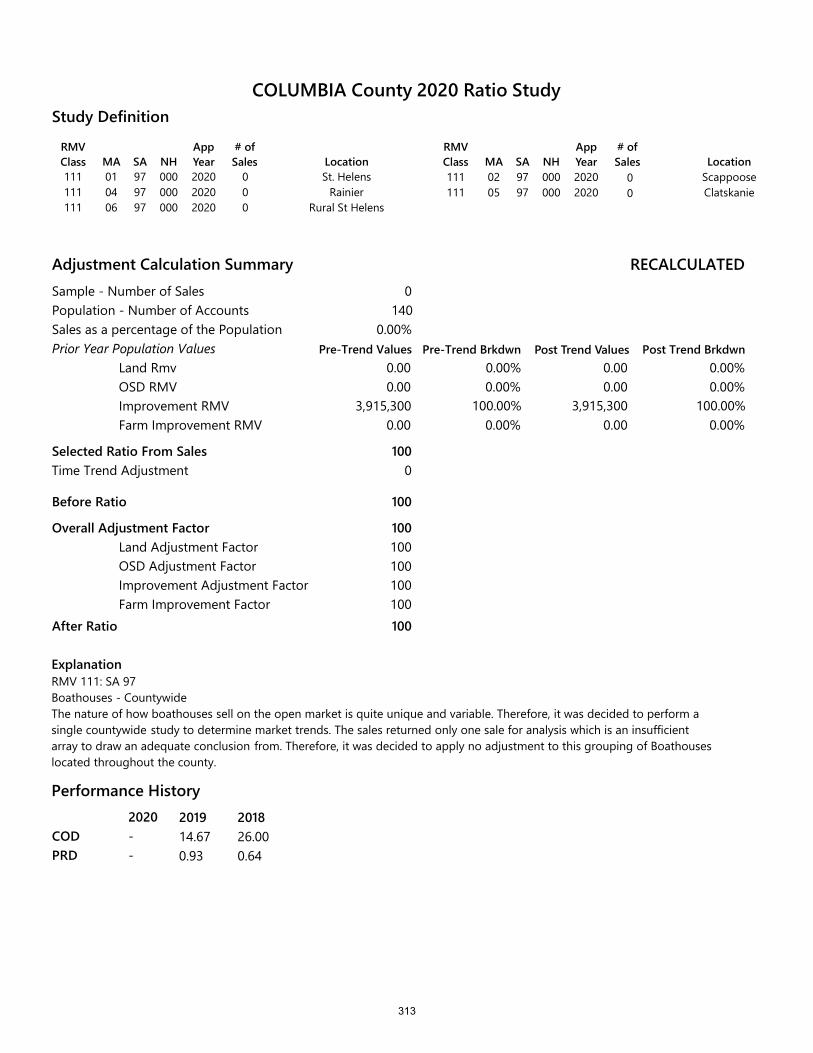
RMV Class MA SA NH
App Year
# of Sales Location
111 01 97 000 2020 St. Helens111 04 97 000 2020 Rainier111 06 97 000 2020 Rural St Helens
RMV Class MA SA NH
App Year
# of Sales Location
111 02 97 000 2020 Scappoose111 05 97 000 2020 Clatskanie
Study Definition
Adjustment Calculation SummarySample - Number of SalesPopulation - Number of AccountsSales as a percentage of the PopulationPrior Year Population Values
Land RmvOSD RMVImprovement RMVFarm Improvement RMV
Selected Ratio From Sales
Before Ratio
Overall Adjustment FactorLand Adjustment FactorOSD Adjustment FactorImprovement Adjustment FactorFarm Improvement Factor
After Ratio
RECALCULATED
Pre-Trend Brkdwn Post Trend Values Post Trend Brkdwn
0140
0.00%
0.00% 0.00%0.00%
100.00%0.00%
100
100
100100100100100100
Time Trend Adjustment 0
ExplanationRMV 111: SA 97 Boathouses - CountywideThe nature of how boathouses sell on the open market is quite unique and variable. Therefore, it was decided to perform a single countywide study to determine market trends. The sales returned only one sale for analysis which is an insufficient array to draw an adequate conclusion from. Therefore, it was decided to apply no adjustment to this grouping of Boathouses located throughout the county.
Performance History2020--
CODPRD
COLUMBIA County 2020 Ratio Study
000
00
0.000.00
3,915,3000.00
0.000.00
3,915,3000.00
0.00%100.00%
0.00%
201914.670.93
201826.000.64
Pre-Trend Values
313

0
1Sales(Ratio) Sales(After Ratio)
Frequency Median
AD
CODMeanSDCOVWtd MeanGeoMeanPRD95% ConfidenceNumber Of Sales 0
0
1Mean Median Mean Trend Median Trend
Central Tendencies Month Mean Median Sales
Sales(Ratio)
Sales(After Ratio)
COLUMBIA County 2020 Ratio Study
314
RMV CLASS 2XX
COMMERCIAL PROPERTY
315
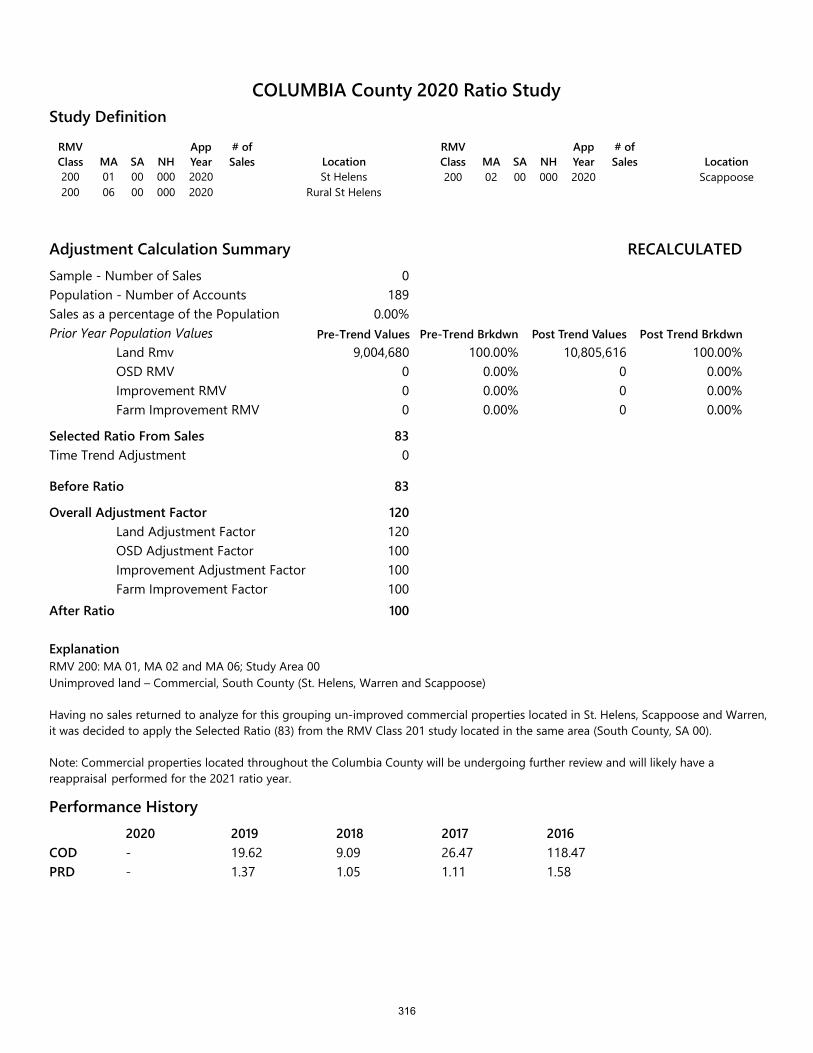
RMV Class MA SA NH
App Year
# of Sales Location
200 01 00 000 2020 St Helens200 06 00 000 2020 Rural St Helens
RMV Class MA SA NH
App Year
# of Sales Location
200 02 00 000 2020 Scappoose
Study Definition
Adjustment Calculation SummarySample - Number of SalesPopulation - Number of AccountsSales as a percentage of the PopulationPrior Year Population Values
Land RmvOSD RMVImprovement RMVFarm Improvement RMV
Selected Ratio From Sales
Before Ratio
Overall Adjustment FactorLand Adjustment FactorOSD Adjustment FactorImprovement Adjustment FactorFarm Improvement Factor
After Ratio
RECALCULATED
Pre-Trend Brkdwn Post Trend Values Post Trend Brkdwn
0189
0.00%
9,004,680 100.00% 10,805,616 100.00%000
0.00% 0 0.00%0.00% 0 0.00%0.00% 0 0.00%
83
83
120120100100100100
Time Trend Adjustment 0
ExplanationRMV 200: MA 01, MA 02 and MA 06; Study Area 00Unimproved land – Commercial, South County (St. Helens, Warren and Scappoose)
Having no sales returned to analyze for this grouping un-improved commercial properties located in St. Helens, Scappoose and Warren, it was decided to apply the Selected Ratio (83) from the RMV Class 201 study located in the same area (South County, SA 00).
Note: Commercial properties located throughout the Columbia County will be undergoing further review and will likely have a reappraisal performed for the 2021 ratio year.
Performance History2020 2019 2018 2017 2016- 19.62 9.09 26.47 118.47- 1.37 1.05 1.11 1.58
CODPRD
COLUMBIA County 2020 Ratio Study
Pre-Trend Values
316

0
1Sales(Ratio) Sales(After Ratio)
Frequency Median
AD
CODMeanSDCOVWtd MeanGeoMeanPRD95% ConfidenceNumber Of Sales 0
0
1Mean Median Mean Trend Median Trend
Central Tendencies Month Mean Median Sales
Sales(Ratio)
Sales(After Ratio)
COLUMBIA County 2020 Ratio Study
317
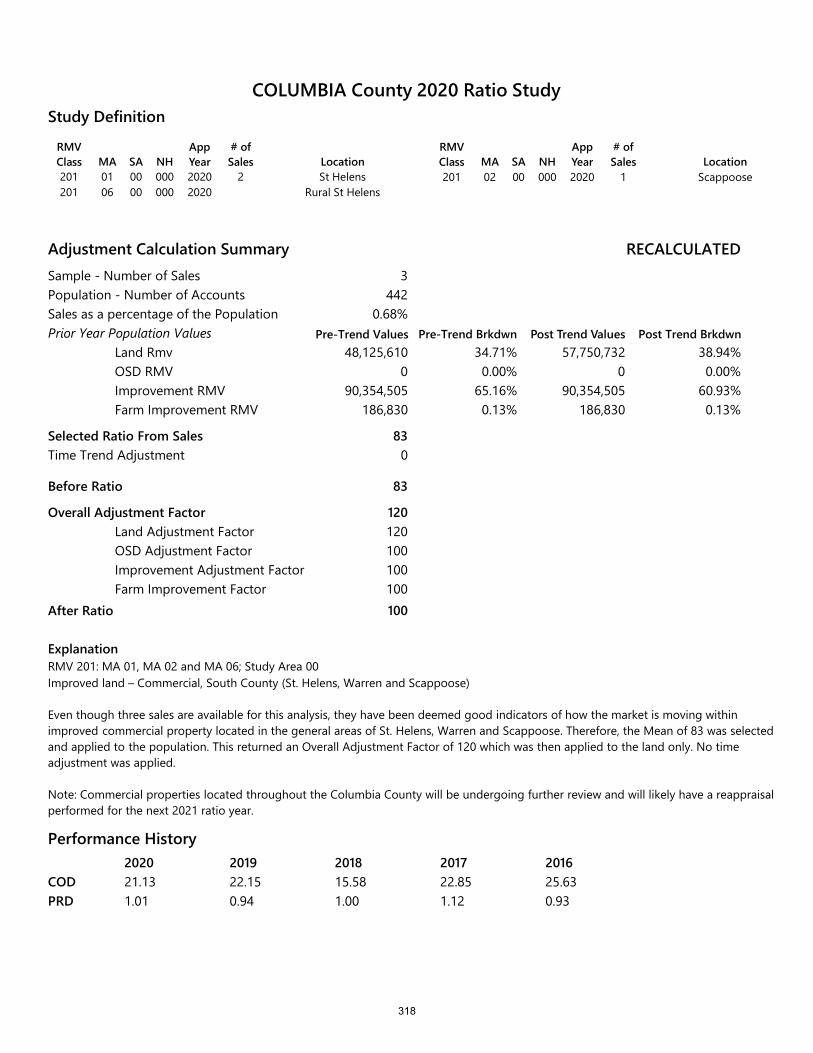
RMV Class MA SA NH
App Year
# of Sales Location
201 01 00 000 2020 2 St Helens201 06 00 000 2020 Rural St Helens
RMV Class MA SA NH
App Year
# of Sales Location
201 02 00 000 2020 1 Scappoose
Study Definition
Adjustment Calculation SummarySample - Number of SalesPopulation - Number of AccountsSales as a percentage of the PopulationPrior Year Population Values
Land RmvOSD RMVImprovement RMVFarm Improvement RMV
Selected Ratio From Sales
Before Ratio
Overall Adjustment FactorLand Adjustment FactorOSD Adjustment FactorImprovement Adjustment FactorFarm Improvement Factor
After Ratio
RECALCULATED
Pre-Trend Brkdwn Post Trend Values Post Trend Brkdwn
3442
0.68%
48,125,610 34.71% 57,750,732 38.94%0
90,354,505186,830
0.00% 0 0.00%65.16% 90,354,505 60.93%0.13% 186,830 0.13%
83
83
120120100100100100
Time Trend Adjustment 0
ExplanationRMV 201: MA 01, MA 02 and MA 06; Study Area 00 Improved land – Commercial, South County (St. Helens, Warren and Scappoose)
Even though three sales are available for this analysis, they have been deemed good indicators of how the market is moving within improved commercial property located in the general areas of St. Helens, Warren and Scappoose. Therefore, the Mean of 83 was selected and applied to the population. This returned an Overall Adjustment Factor of 120 which was then applied to the land only. No time adjustment was applied.
Note: Commercial properties located throughout the Columbia County will be undergoing further review and will likely have a reappraisal performed for the next 2021 ratio year.
Performance History2020 2019 2018 2017 201621.13 22.15 15.58 22.85 25.631.01 0.94 1.00 1.12 0.93
CODPRD
COLUMBIA County 2020 Ratio Study
Pre-Trend Values
318
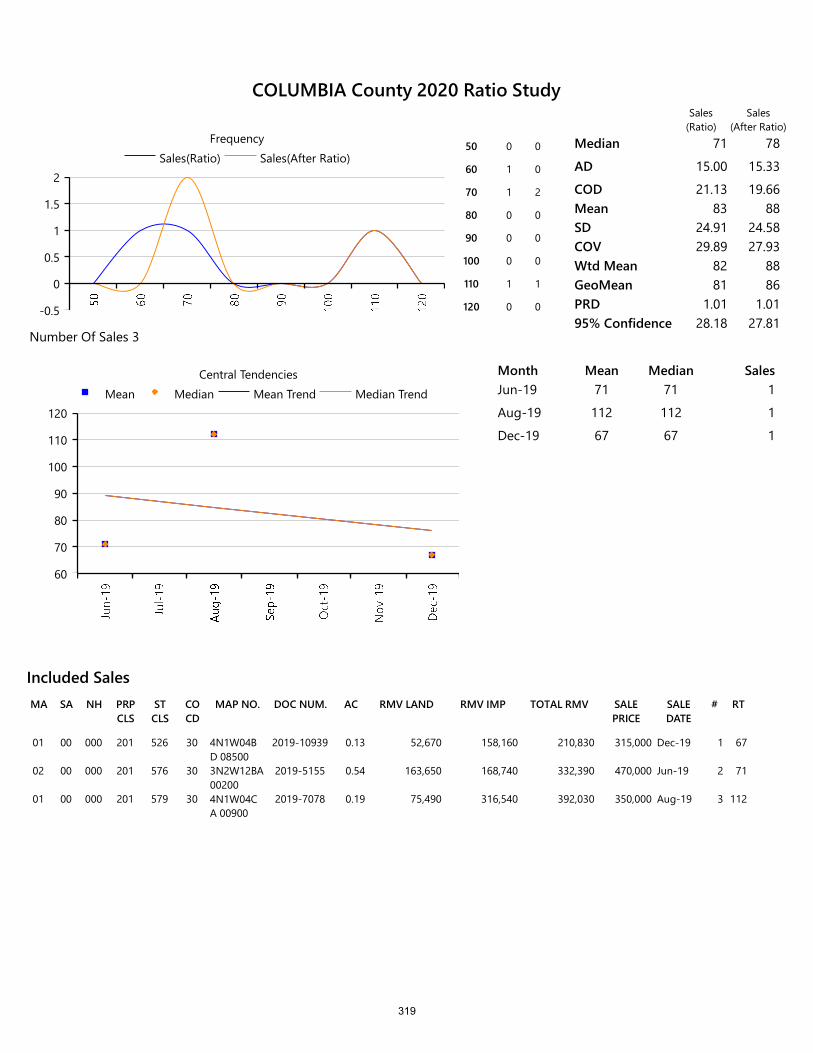
RMV LANDSA NH PRP CLS
ST CLS
CO CD
MAP NO. DOC NUM.MA AC RMV IMP TOTAL RMV SALE PRICE
SALE DATE
# RT
Included Sales
01 00 000 201 526 30 4N1W04BD 08500
2019-10939 0.13 52,670 158,160 210,830 315,000 Dec-19 1 67
02 00 000 201 576 30 3N2W12BA 00200
2019-5155 0.54 163,650 168,740 332,390 470,000 Jun-19 2 71
01 00 000 201 579 30 4N1W04CA 00900
2019-7078 0.19 75,490 316,540 392,030 350,000 Aug-19 3 112
-0.5
0
0.5
1
1.5
2Sales(Ratio) Sales(After Ratio)
Frequency50 0 0
60 1 0
70 1 2
80 0 0
90 0 0
100 0 0
110 1 1
120 0 0
Median 71 78
AD 15.00 15.33
COD 21.13 19.66Mean 83 88SD 24.91 24.58COV 29.89 27.93Wtd Mean 82 88GeoMean 81 86PRD 1.01 1.0195% Confidence 28.18 27.81
Number Of Sales 3
60
70
80
90
100
110
120Mean Median Mean Trend Median Trend
Central Tendencies Month Mean Median SalesJun-19 71 71 1
Aug-19 112 112 1
Dec-19 67 67 1
Sales(Ratio)
Sales(After Ratio)
COLUMBIA County 2020 Ratio Study
319
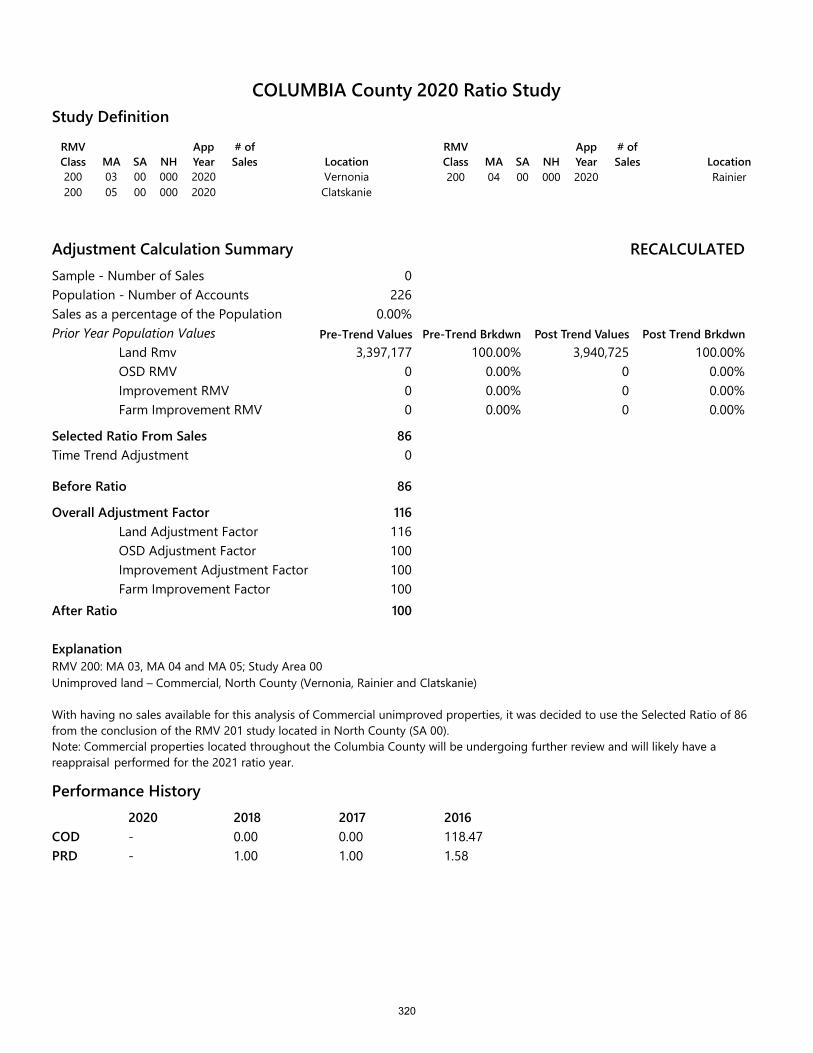
RMV Class MA SA NH
App Year
# of Sales Location
200 03 00 000 2020 Vernonia200 05 00 000 2020 Clatskanie
RMV Class MA SA NH
App Year
# of Sales Location
200 04 00 000 2020 Rainier
Study Definition
Adjustment Calculation SummarySample - Number of SalesPopulation - Number of AccountsSales as a percentage of the PopulationPrior Year Population Values
Land RmvOSD RMVImprovement RMVFarm Improvement RMV
Selected Ratio From Sales
Before Ratio
Overall Adjustment FactorLand Adjustment FactorOSD Adjustment FactorImprovement Adjustment FactorFarm Improvement Factor
After Ratio
RECALCULATED
Pre-Trend Brkdwn Post Trend Values Post Trend Brkdwn
0226
0.00%
3,397,177 100.00% 3,940,725 100.00%000
0.00% 0 0.00%0.00% 0 0.00%0.00% 0 0.00%
86
86
116116100100100100
Time Trend Adjustment 0
ExplanationRMV 200: MA 03, MA 04 and MA 05; Study Area 00Unimproved land – Commercial, North County (Vernonia, Rainier and Clatskanie)
With having no sales available for this analysis of Commercial unimproved properties, it was decided to use the Selected Ratio of 86 from the conclusion of the RMV 201 study located in North County (SA 00).Note: Commercial properties located throughout the Columbia County will be undergoing further review and will likely have a reappraisal performed for the 2021 ratio year.
Performance History2020 2018 2017 2016- 0.00 0.00 118.47- 1.00 1.00 1.58
CODPRD
COLUMBIA County 2020 Ratio Study
Pre-Trend Values
320

0
1Sales(Ratio) Sales(After Ratio)
Frequency Median
AD
CODMeanSDCOVWtd MeanGeoMeanPRD95% ConfidenceNumber Of Sales 0
0
1Mean Median Mean Trend Median Trend
Central Tendencies Month Mean Median Sales
Sales(Ratio)
Sales(After Ratio)
COLUMBIA County 2020 Ratio Study
321

RMV Class MA SA NH
App Year
# of Sales Location
201 03 00 000 2020 1 Vernonia201 05 00 000 2020 1 Clatskanie
RMV Class MA SA NH
App Year
# of Sales Location
201 04 00 000 2020 1 Rainier
Study Definition
Adjustment Calculation SummarySample - Number of SalesPopulation - Number of AccountsSales as a percentage of the PopulationPrior Year Population Values
Land RmvOSD RMVImprovement RMVFarm Improvement RMV
Selected Ratio From Sales
Before Ratio
Overall Adjustment FactorLand Adjustment FactorOSD Adjustment FactorImprovement Adjustment FactorFarm Improvement Factor
After Ratio
RECALCULATED
Pre-Trend Brkdwn Post Trend Values Post Trend Brkdwn
3345
0.87%
14,396,430 28.67% 16,699,859 31.79%118,950
35,605,552100,307
0.24% 118,950 0.23%70.90% 35,605,552 67.79%0.20% 100,307 0.19%
86
86
116116100100100100
Time Trend Adjustment 0
ExplanationRMV 201: MA 03, MA 04 and MA 05; Study Area 00 Improved land – Commercial, North County (Vernonia, Rainier and Clatskanie)
The sales array returned 3 good and appropriate sales for this analysis of improved commercial accounts located in North County SA 00. The Mean was selected and applied accordingly. The result is an adjustment of 116. This was applied to the land only with noadjustment for time.
Note: Commercial properties located throughout the Columbia County will be undergoing further review and will likely have a reappraisal performed for the 2021 ratio year.
Performance History2020 2019 2018 2017 201636.32 16.55 26.27 25.29 25.631.09 1.27 0.92 1.07 0.93
CODPRD
COLUMBIA County 2020 Ratio Study
Pre-Trend Values
322
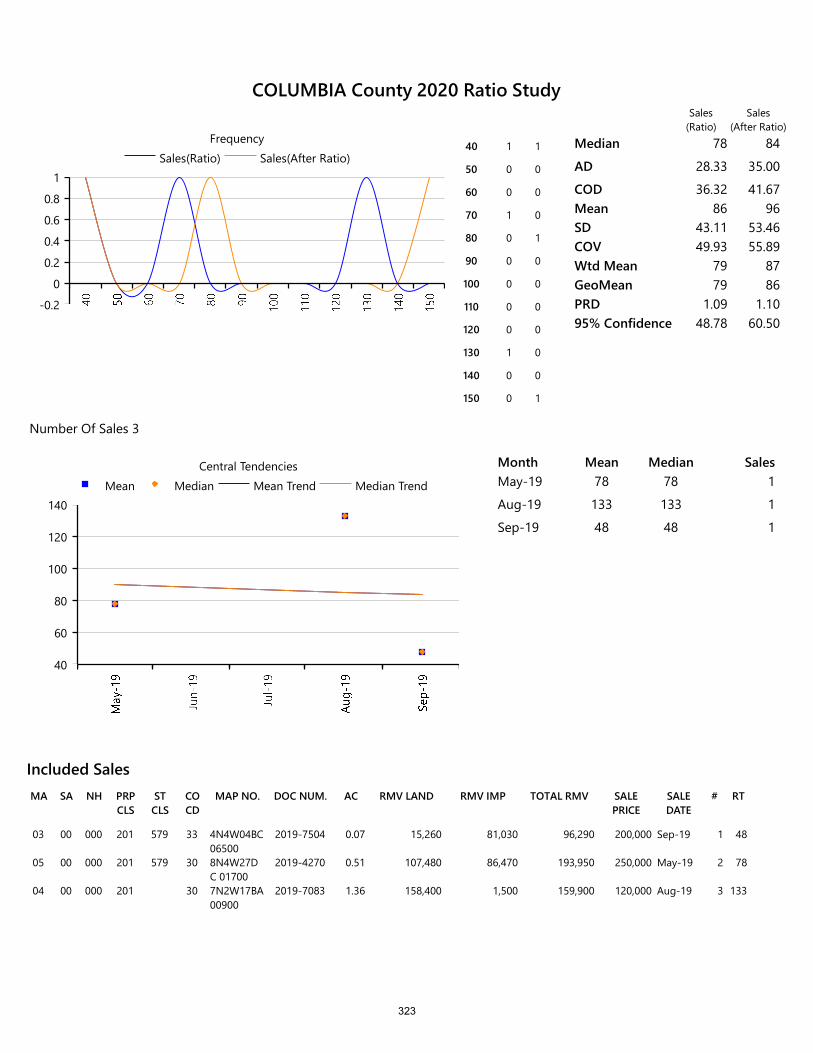
RMV LANDSA NH PRP CLS
ST CLS
CO CD
MAP NO. DOC NUM.MA AC RMV IMP TOTAL RMV SALE PRICE
SALE DATE
# RT
Included Sales
03 00 000 201 579 33 4N4W04BC 06500
2019-7504 0.07 15,260 81,030 96,290 200,000 Sep-19 1 48
05 00 000 201 579 30 8N4W27DC 01700
2019-4270 0.51 107,480 86,470 193,950 250,000 May-19 2 78
04 00 000 201 30 7N2W17BA 00900
2019-7083 1.36 158,400 1,500 159,900 120,000 Aug-19 3 133
-0.2
0
0.2
0.4
0.6
0.8
1Sales(Ratio) Sales(After Ratio)
Frequency40 1 1
50 0 0
60 0 0
70 1 0
80 0 1
90 0 0
100 0 0
110 0 0
120 0 0
130 1 0
140 0 0
150 0 1
Median 78 84
AD 28.33 35.00
COD 36.32 41.67Mean 86 96SD 43.11 53.46COV 49.93 55.89Wtd Mean 79 87GeoMean 79 86PRD 1.09 1.1095% Confidence 48.78 60.50
Number Of Sales 3
40
60
80
100
120
140Mean Median Mean Trend Median Trend
Central Tendencies Month Mean Median SalesMay-19 78 78 1
Aug-19 133 133 1
Sep-19 48 48 1
Sales(Ratio)
Sales(After Ratio)
COLUMBIA County 2020 Ratio Study
323
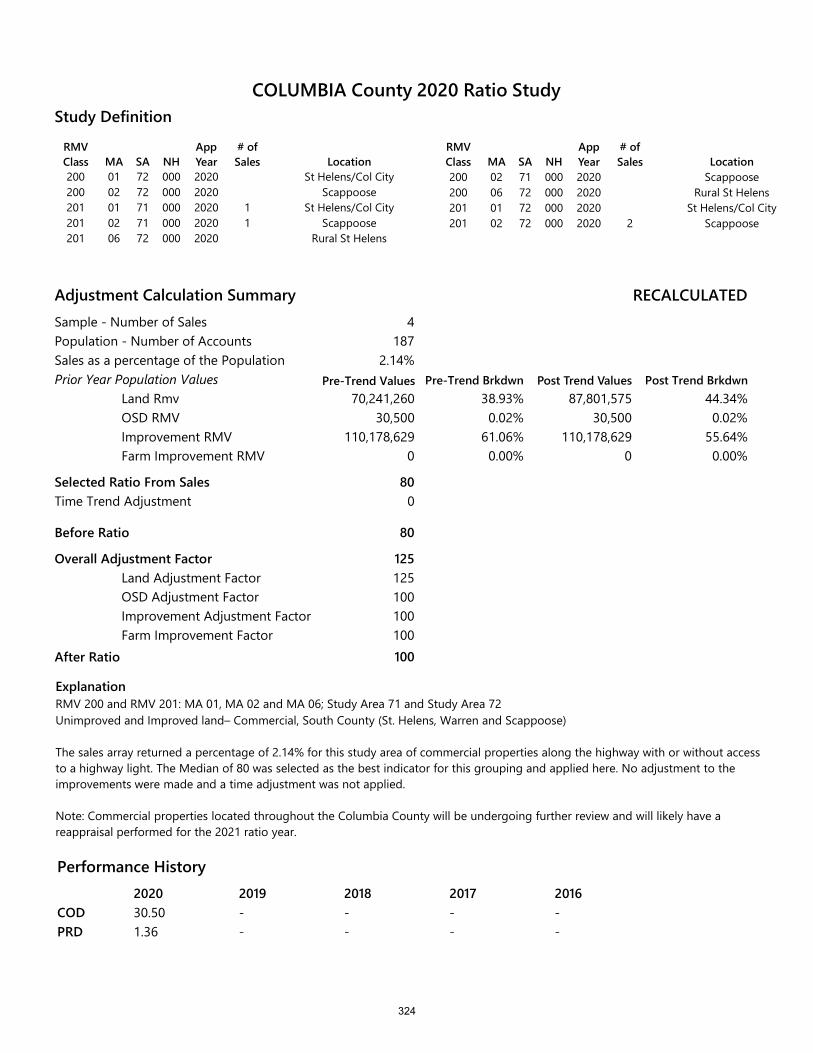
RMV Class MA SA NH
App Year
# of Sales Location
200 01 72 000 2020 St Helens/Col City200 02 72 000 2020 Scappoose201 01 71 000 2020 1 St Helens/Col City201 02 71 000 2020 1 Scappoose201 06 72 000 2020 Rural St Helens
RMV Class MA SA NH
App Year
# of Sales Location
200 02 71 000 2020 Scappoose200 06 72 000 2020 Rural St Helens201 01 72 000 2020 St Helens/Col City201 02 72 000 2020 2 Scappoose
Study Definition
Adjustment Calculation SummarySample - Number of SalesPopulation - Number of AccountsSales as a percentage of the PopulationPrior Year Population Values
Land RmvOSD RMVImprovement RMVFarm Improvement RMV
Selected Ratio From Sales
Before Ratio
Overall Adjustment FactorLand Adjustment FactorOSD Adjustment FactorImprovement Adjustment FactorFarm Improvement Factor
After Ratio
RECALCULATED
Pre-Trend Brkdwn Post Trend Values Post Trend Brkdwn
4187
2.14%
70,241,260 38.93% 87,801,575 44.34%30,500
110,178,6290
0.02% 30,500 0.02%61.06% 110,178,629 55.64%0.00% 0 0.00%
80
80
125125100100100100
Time Trend Adjustment 0
COLUMBIA County 2020 Ratio Study
ExplanationRMV 200 and RMV 201: MA 01, MA 02 and MA 06; Study Area 71 and Study Area 72Unimproved and Improved land– Commercial, South County (St. Helens, Warren and Scappoose)
The sales array returned a percentage of 2.14% for this study area of commercial properties along the highway with or without access to a highway light. The Median of 80 was selected as the best indicator for this grouping and applied here. No adjustment to the improvements were made and a time adjustment was not applied.
Note: Commercial properties located throughout the Columbia County will be undergoing further review and will likely have a reappraisal performed for the 2021 ratio year.
Performance History2020 2019 2018 2017 201630.50 - - - -1.36 - - - -
CODPRD
Pre-Trend Values
324
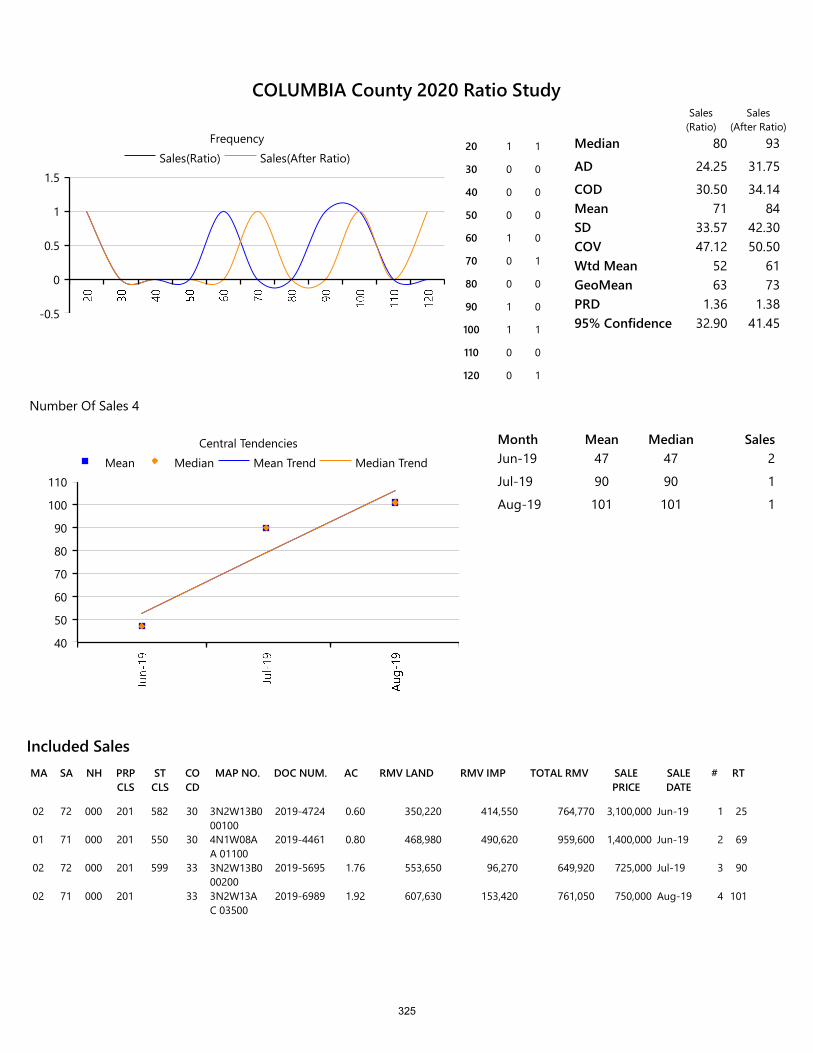
RMV LANDSA NH PRP CLS
ST CLS
CO CD
MAP NO. DOC NUM.MA AC RMV IMP TOTAL RMV SALE PRICE
SALE DATE
# RT
Included Sales
02 72 000 201 582 30 3N2W13B0 00100
2019-4724 0.60 350,220 414,550 764,770 3,100,000 Jun-19 1 25
01 71 000 201 550 30 4N1W08AA 01100
2019-4461 0.80 468,980 490,620 959,600 1,400,000 Jun-19 2 69
02 72 000 201 599 33 3N2W13B0 00200
2019-5695 1.76 553,650 96,270 649,920 725,000 Jul-19 3 90
02 71 000 201 33 3N2W13AC 03500
2019-6989 1.92 607,630 153,420 761,050 750,000 Aug-19 4 101
-0.5
0
0.5
1
1.5Sales(Ratio) Sales(After Ratio)
Frequency20 1 1
30 0 0
40 0 0
50 0 0
60 1 0
70 0 1
80 0 0
90 1 0
100 1 1
110 0 0
120 0 1
Median 80 93
AD 24.25 31.75
COD 30.50 34.14Mean 71 84SD 33.57 42.30COV 47.12 50.50Wtd Mean 52 61GeoMean 63 73PRD 1.36 1.3895% Confidence 32.90 41.45
Number Of Sales 4
40
50
60
70
80
90
100
110Mean Median Mean Trend Median Trend
Central Tendencies Month Mean Median SalesJun-19 47 47 2
Jul-19 90 90 1
Aug-19 101 101 1
Sales(Ratio)
Sales(After Ratio)
COLUMBIA County 2020 Ratio Study
325
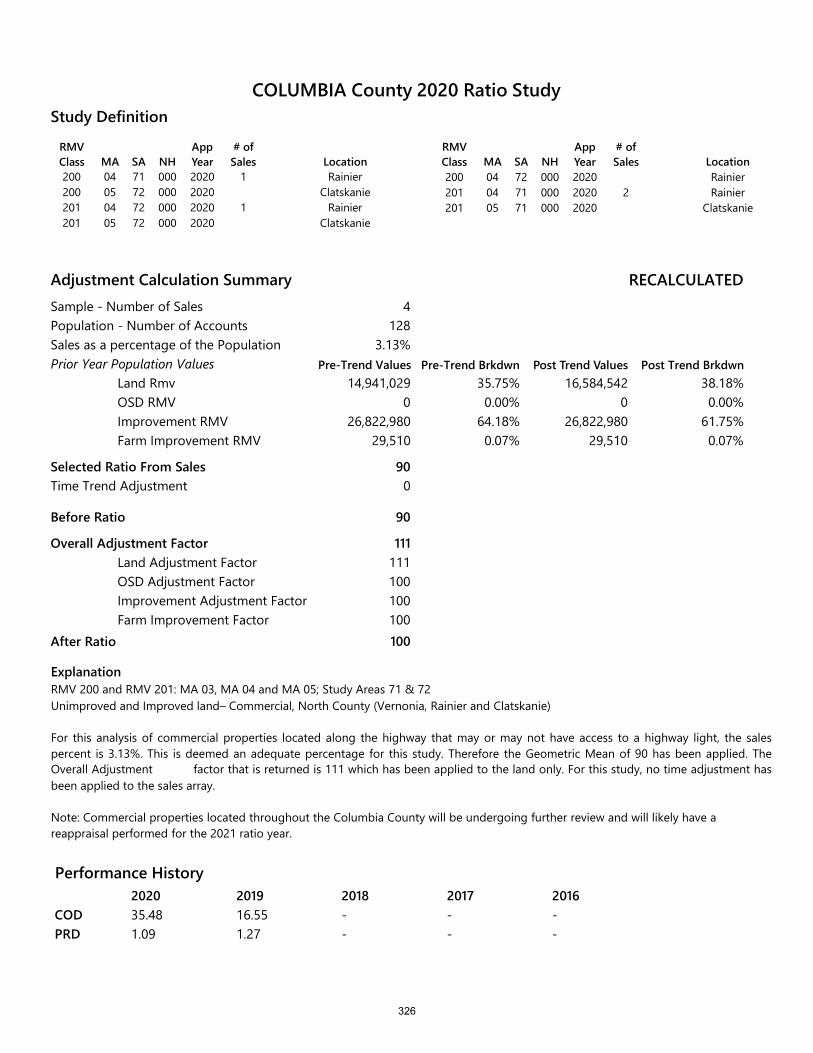
RMV Class MA SA NH
App Year
# of Sales Location
200 04 71 000 2020 1 Rainier200 05 72 000 2020 Clatskanie201 04 72 000 2020 1 Rainier201 05 72 000 2020 Clatskanie
RMV Class MA SA NH
App Year
# of Sales Location
200 04 72 000 2020 Rainier201 04 71 000 2020 2 Rainier201 05 71 000 2020 Clatskanie
Study Definition
Adjustment Calculation SummarySample - Number of SalesPopulation - Number of AccountsSales as a percentage of the PopulationPrior Year Population Values
Land RmvOSD RMVImprovement RMVFarm Improvement RMV
Selected Ratio From Sales
Before Ratio
Overall Adjustment FactorLand Adjustment FactorOSD Adjustment FactorImprovement Adjustment FactorFarm Improvement Factor
After Ratio
RECALCULATED
Pre-Trend Brkdwn Post Trend Values Post Trend Brkdwn
4128
3.13%
14,941,029 35.75% 16,584,542 38.18%0
26,822,98029,510
0.00% 0 0.00%64.18% 26,822,980 61.75%0.07% 29,510 0.07%
90
90
111111100100100100
Time Trend Adjustment 0
COLUMBIA County 2020 Ratio Study
ExplanationRMV 200 and RMV 201: MA 03, MA 04 and MA 05; Study Areas 71 & 72Unimproved and Improved land– Commercial, North County (Vernonia, Rainier and Clatskanie)
For this analysis of commercial properties located along the highway that may or may not have access to a highway light, the sales percent is 3.13%. This is deemed an adequate percentage for this study. Therefore the Geometric Mean of 90 has been applied. The Overall Adjustment factor that is returned is 111 which has been applied to the land only. For this study, no time adjustment has been applied to the sales array.
Note: Commercial properties located throughout the Columbia County will be undergoing further review and will likely have a reappraisal performed for the 2021 ratio year.
Performance History2020 2019 2018 2017 201635.48 16.55 - - -1.09 1.27 - - -
CODPRD
Pre-Trend Values
326
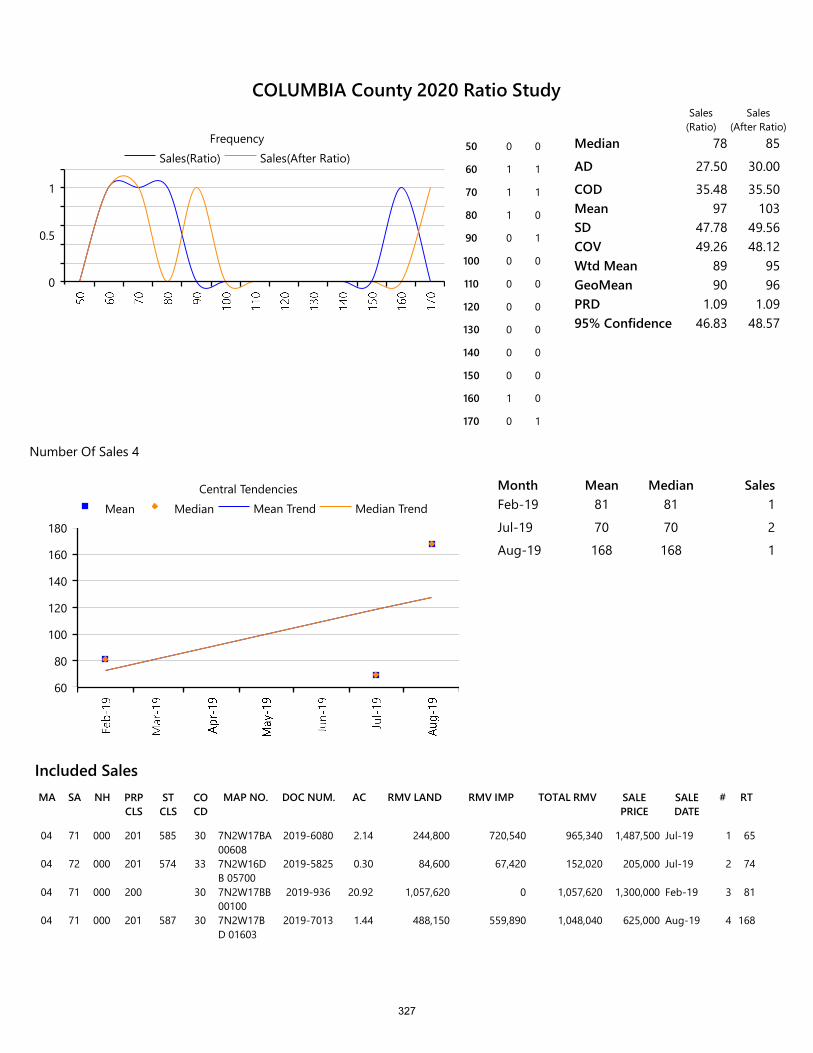
0
0.5
1
Sales(Ratio) Sales(After Ratio)Frequency
50 0 0
60 1 1
70 1 1
80 1 0
90 0 1
100 0 0
110 0 0
120 0 0
130 0 0
140 0 0
150 0 0
160 1 0
170 0 1
Median 78 85
AD 27.50 30.00
COD 35.48 35.50Mean 97 103SD 47.78 49.56COV 49.26 48.12Wtd Mean 89 95GeoMean 90 96PRD 1.09 1.0995% Confidence 46.83 48.57
Number Of Sales 4
60
80
100
120
140
160
180Mean Median Mean Trend Median Trend
Central Tendencies Month Mean Median SalesFeb-19 81 81 1
Jul-19 70 70 2
Aug-19 168 168 1
Sales(Ratio)
Sales(After Ratio)
COLUMBIA County 2020 Ratio Study
RMV LANDSA NH PRP CLS
ST CLS
CO CD
MAP NO. DOC NUM.MA AC RMV IMP TOTAL RMV SALE PRICE
SALE DATE
# RT
Included Sales
04 71 000 201 585 30 7N2W17BA 00608
2019-6080 2.14 244,800 720,540 965,340 1,487,500 Jul-19 1 65
04 72 000 201 574 33 7N2W16DB 05700
2019-5825 0.30 84,600 67,420 152,020 205,000 Jul-19 2 74
04 71 000 200 30 7N2W17BB 00100
2019-936 20.92 1,057,620 0 1,057,620 1,300,000 Feb-19 3 81
04 71 000 201 587 30 7N2W17BD 01603
2019-7013 1.44 488,150 559,890 1,048,040 625,000 Aug-19 4 168
327
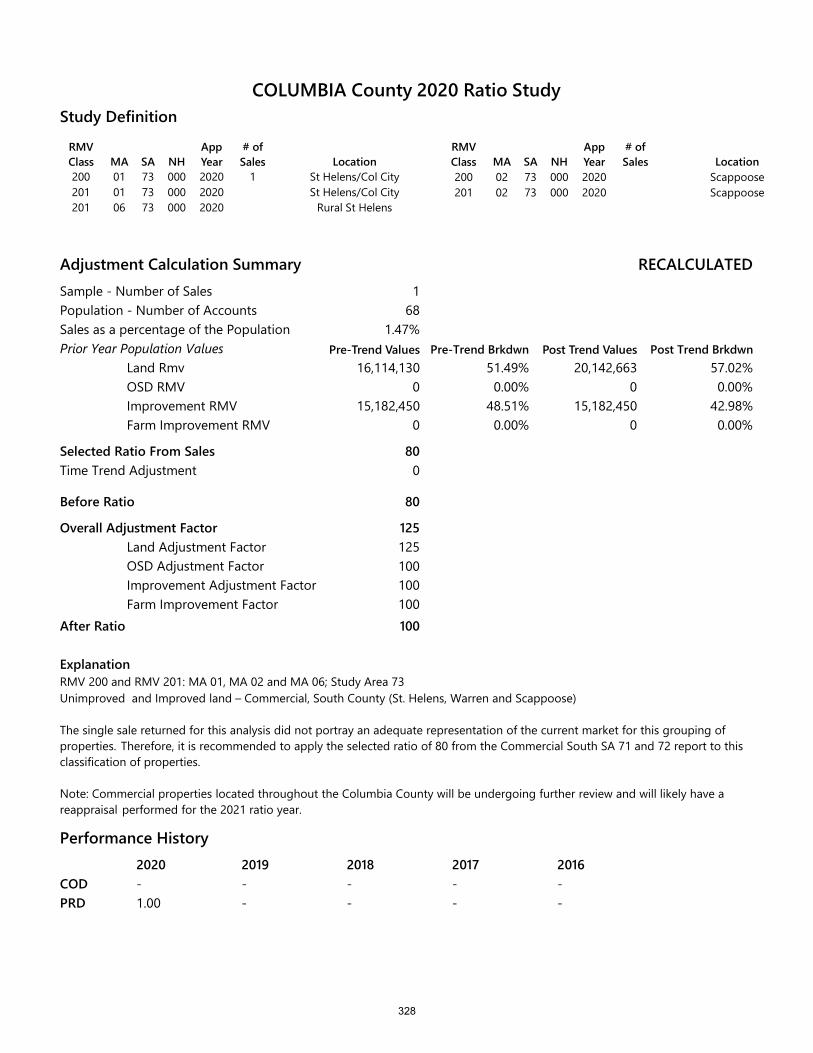
RMV Class MA SA NH
App Year
# of Sales Location
200 01 73 000 2020 1 St Helens/Col City201 01 73 000 2020 St Helens/Col City201 06 73 000 2020 Rural St Helens
RMV Class MA SA NH
App Year
# of Sales Location
200 02 73 000 2020 Scappoose201 02 73 000 2020 Scappoose
Study Definition
Adjustment Calculation SummarySample - Number of SalesPopulation - Number of AccountsSales as a percentage of the PopulationPrior Year Population Values
Land RmvOSD RMVImprovement RMVFarm Improvement RMV
Selected Ratio From Sales
Before Ratio
Overall Adjustment FactorLand Adjustment FactorOSD Adjustment FactorImprovement Adjustment FactorFarm Improvement Factor
After Ratio
RECALCULATED
Pre-Trend Brkdwn Post Trend Values Post Trend Brkdwn
168
1.47%
16,114,130 51.49% 20,142,663 57.02%0
15,182,4500
0.00% 0 0.00%48.51% 15,182,450 42.98%0.00% 0 0.00%
80
80
125125100100100100
Time Trend Adjustment 0
Pre-Trend Values
ExplanationRMV 200 and RMV 201: MA 01, MA 02 and MA 06; Study Area 73Unimproved and Improved land – Commercial, South County (St. Helens, Warren and Scappoose)
The single sale returned for this analysis did not portray an adequate representation of the current market for this grouping of properties. Therefore, it is recommended to apply the selected ratio of 80 from the Commercial South SA 71 and 72 report to this classification of properties.
Note: Commercial properties located throughout the Columbia County will be undergoing further review and will likely have a reappraisal performed for the 2021 ratio year.
Performance History2020 2019 2018 2017 2016- - - - -1.00 - - - -
CODPRD
COLUMBIA County 2020 Ratio Study
328
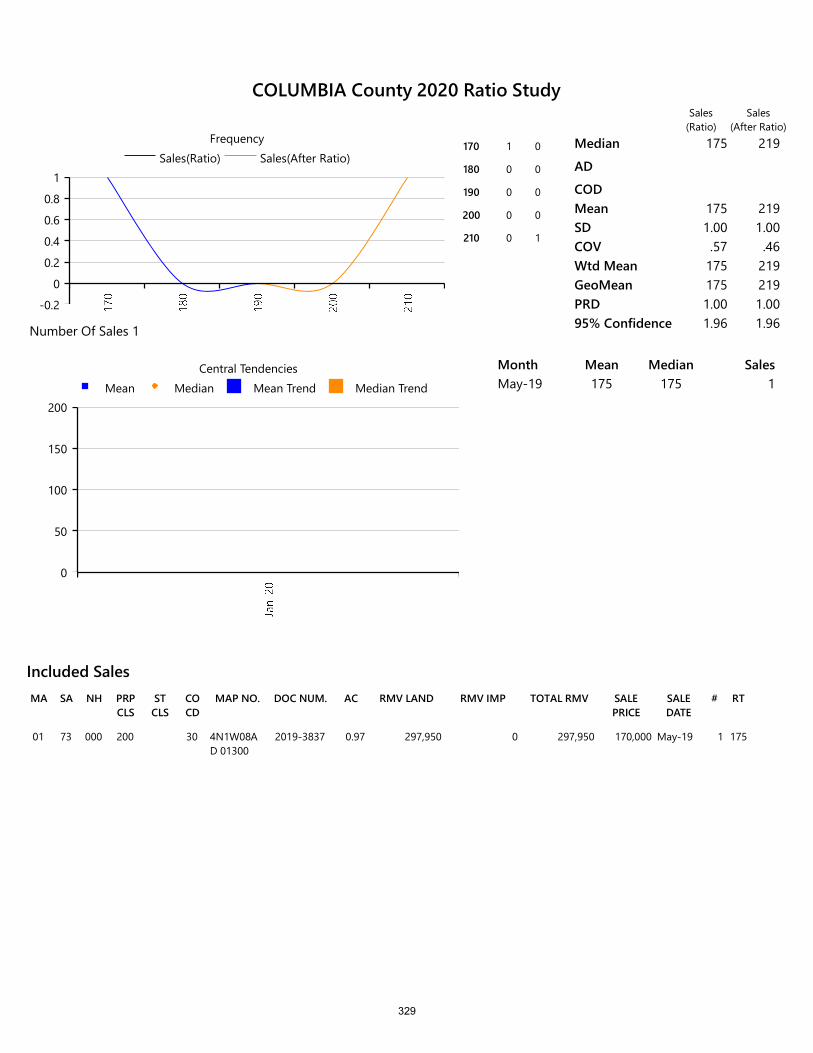
RMV LANDSA NH PRP CLS
ST CLS
CO CD
MAP NO. DOC NUM.MA AC RMV IMP TOTAL RMV SALE PRICE
SALE DATE
# RT
Included Sales
01 73 000 200 30 4N1W08AD 01300
2019-3837 0.97 297,950 0 297,950 170,000 May-19 1 175
-0.2
0
0.2
0.4
0.6
0.8
1Sales(Ratio) Sales(After Ratio)
Frequency170 1 0
180 0 0
190 0 0
200 0 0
210 0 1
Median 175 219
AD
CODMean 175 219SD 1.00 1.00COV .57 .46Wtd Mean 175 219GeoMean 175 219PRD 1.00 1.0095% Confidence 1.96 1.96Number Of Sales 1
0
50
100
150
200Mean Median Mean Trend Median Trend
Central Tendencies Month Mean Median SalesMay-19 175 175 1
Sales(Ratio)
Sales(After Ratio)
COLUMBIA County 2020 Ratio Study
329
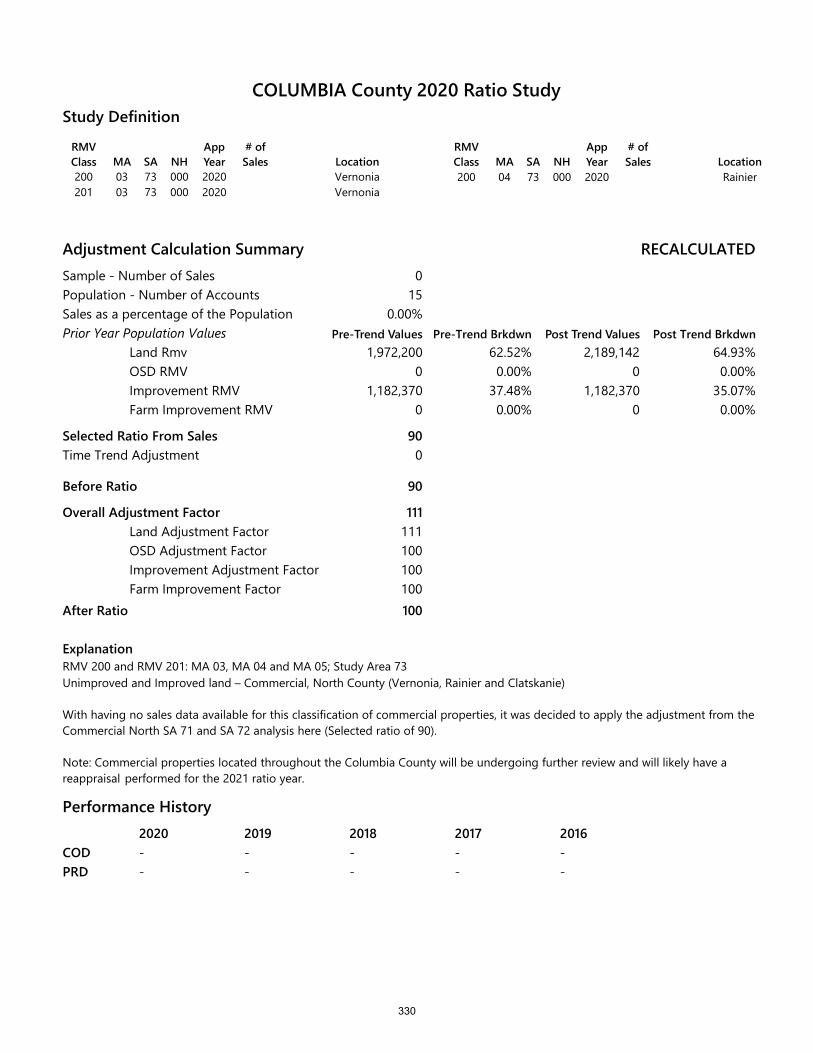
RMV Class MA SA NH
App Year
# of Sales Location
200 03 73 000 2020 Vernonia201 03 73 000 2020 Vernonia
RMV Class MA SA NH
App Year
# of Sales Location
200 04 73 000 2020 Rainier
Study Definition
Adjustment Calculation SummarySample - Number of SalesPopulation - Number of AccountsSales as a percentage of the PopulationPrior Year Population Values
Land RmvOSD RMVImprovement RMVFarm Improvement RMV
Selected Ratio From Sales
Before Ratio
Overall Adjustment FactorLand Adjustment FactorOSD Adjustment FactorImprovement Adjustment FactorFarm Improvement Factor
After Ratio
RECALCULATED
Pre-Trend Brkdwn Post Trend Values Post Trend Brkdwn
015
0.00%
1,972,200 62.52% 2,189,142 64.93%0
1,182,3700
0.00% 0 0.00%37.48% 1,182,370 35.07%0.00% 0 0.00%
90
90
111111100100100100
Time Trend Adjustment 0
Pre-Trend Values
ExplanationRMV 200 and RMV 201: MA 03, MA 04 and MA 05; Study Area 73 Unimproved and Improved land – Commercial, North County (Vernonia, Rainier and Clatskanie)
With having no sales data available for this classification of commercial properties, it was decided to apply the adjustment from the Commercial North SA 71 and SA 72 analysis here (Selected ratio of 90).
Note: Commercial properties located throughout the Columbia County will be undergoing further review and will likely have a reappraisal performed for the 2021 ratio year.
Performance History2020 2019 2018 2017 2016- - - - -- - - - -
CODPRD
COLUMBIA County 2020 Ratio Study
330

0
1Sales(Ratio) Sales(After Ratio)
Frequency Median
AD
CODMeanSDCOVWtd MeanGeoMeanPRD95% ConfidenceNumber Of Sales 0
0
1Mean Median Mean Trend Median Trend
Central Tendencies Month Mean Median Sales
Sales(Ratio)
Sales(After Ratio)
COLUMBIA County 2020 Ratio Study
331
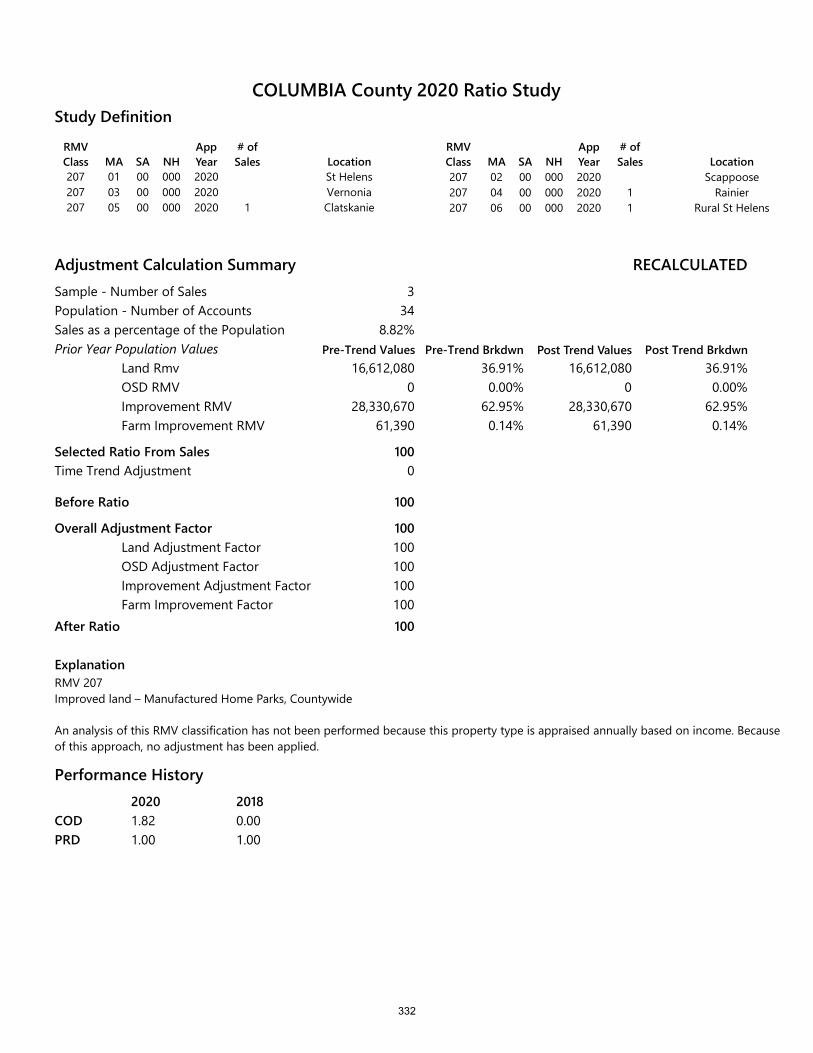
RMV Class MA SA NH
App Year
# of Sales Location
207 01 00 000 2020 St Helens207 03 00 000 2020 Vernonia207 05 00 000 2020 1 Clatskanie
RMV Class MA SA NH
App Year
# of Sales Location
207 02 00 000 2020 Scappoose207 04 00 000 2020 1 Rainier207 06 00 000 2020 1 Rural St Helens
Study Definition
Adjustment Calculation SummarySample - Number of SalesPopulation - Number of AccountsSales as a percentage of the PopulationPrior Year Population Values
Land RmvOSD RMVImprovement RMVFarm Improvement RMV
Selected Ratio From Sales
Before Ratio
Overall Adjustment FactorLand Adjustment FactorOSD Adjustment FactorImprovement Adjustment FactorFarm Improvement Factor
After Ratio
ExplanationRMV 207Improved land – Manufactured Home Parks, Countywide
RECALCULATED
Pre-Trend Brkdwn Post Trend Values Post Trend Brkdwn
334
8.82%
16,612,080 36.91% 16,612,080 36.91%0
28,330,67061,390
0.00% 0 0.00%62.95% 28,330,670 62.95%0.14% 61,390 0.14%
100
100
100100100100100100
Time Trend Adjustment 0
An analysis of this RMV classification has not been performed because this property type is appraised annually based on income. Because of this approach, no adjustment has been applied.
Performance History2020 20181.82 0.001.00 1.00
CODPRD
COLUMBIA County 2020 Ratio Study
Pre-Trend Values
332
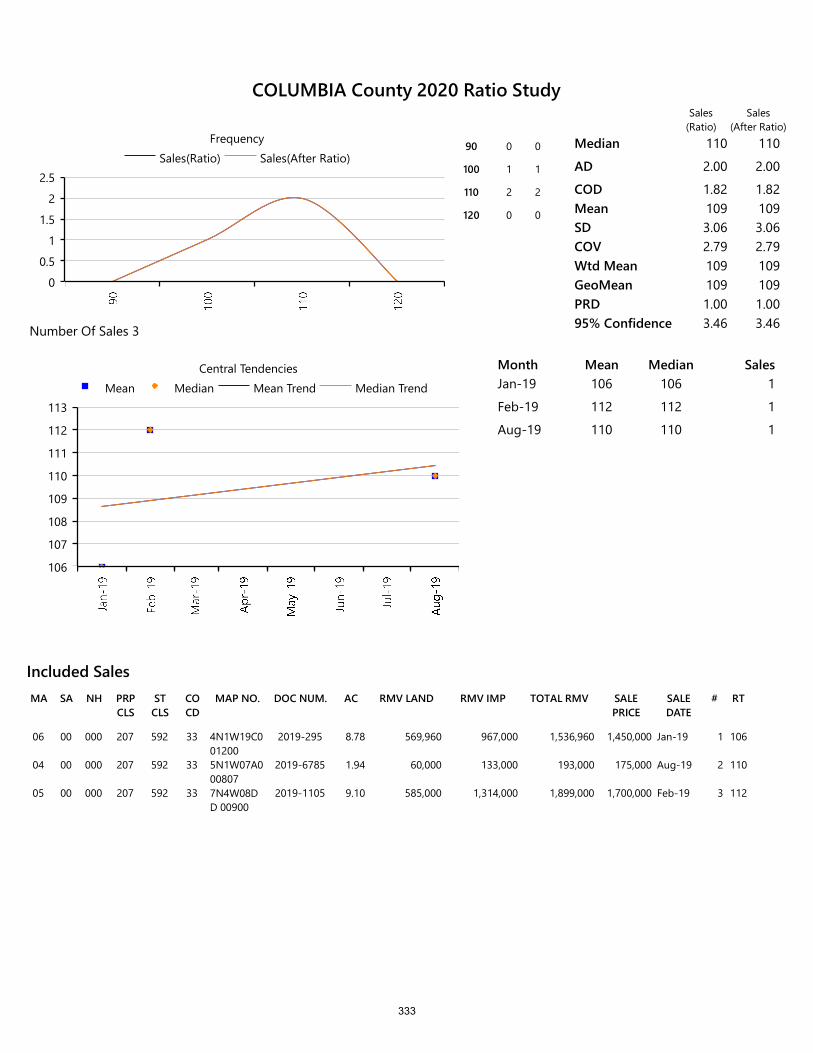
RMV LANDSA NH PRP CLS
ST CLS
CO CD
MAP NO. DOC NUM.MA AC RMV IMP TOTAL RMV SALE PRICE
SALE DATE
# RT
Included Sales
06 00 000 207 592 33 4N1W19C0 01200
2019-295 8.78 569,960 967,000 1,536,960 1,450,000 Jan-19 1 106
04 00 000 207 592 33 5N1W07A0 00807
2019-6785 1.94 60,000 133,000 193,000 175,000 Aug-19 2 110
05 00 000 207 592 33 7N4W08DD 00900
2019-1105 9.10 585,000 1,314,000 1,899,000 1,700,000 Feb-19 3 112
0
0.5
1
1.5
2
2.5Sales(Ratio) Sales(After Ratio)
Frequency90 0 0
100 1 1
110 2 2
120 0 0
Median 110 110
AD 2.00 2.00
COD 1.82 1.82Mean 109 109SD 3.06 3.06COV 2.79 2.79Wtd Mean 109 109GeoMean 109 109PRD 1.00 1.0095% Confidence 3.46 3.46Number Of Sales 3
106
107
108
109
110
111
112
113Mean Median Mean Trend Median Trend
Central Tendencies Month Mean Median SalesJan-19 106 106 1
Feb-19 112 112 1
Aug-19 110 110 1
Sales(Ratio)
Sales(After Ratio)
COLUMBIA County 2020 Ratio Study
333

RMV CLASS 3XX
INDUSTRIAL PROPERTY
334

RMV Class MA SA NH
App Year
# of Sales Location
008 01 00 000 2020 St Helens008 02 00 000 2020 Scappoose008 04 00 000 2020 Rainier008 06 90 000 2020 Rural St Helens
RMV Class MA SA NH
App Year
# of Sales Location
008 01 90 000 2020 St Helens/Col City008 02 90 000 2020 Scappoose008 05 00 000 2020 Clatskanie
Study Definition
Adjustment Calculation SummarySample - Number of SalesPopulation - Number of AccountsSales as a percentage of the PopulationPrior Year Population Values
Land RmvOSD RMVImprovement RMVFarm Improvement RMV
Selected Ratio From Sales
Before Ratio
Overall Adjustment FactorLand Adjustment FactorOSD Adjustment FactorImprovement Adjustment FactorFarm Improvement Factor
After Ratio
RECALCULATED
Pre-Trend Brkdwn Post Trend Values Post Trend Brkdwn
042
0.00%
0 0.00% 0 0.00%0
249,545,6600
0.00% 0 0.00%100.00% 249,545,660 100.00%
0.00% 0 0.00%
100
100
100100100100100100
Time Trend Adjustment 0
ExplanationRMV 008: MA 01 SA 00; MA 02 SA 00; MA 04 SA 00; MA 05 SA 00; MA 06 SA 00Machinery and Equipment – Industrial, Countywide
This grouping will not have an adjustment applied as they are machinery and equipment accounts that are valued through an State IPR and County RPR reporting process.
Performance History2020--
CODPRD
COLUMBIA County 2020 Ratio Study
Pre-Trend Values
335

0
1Sales(Ratio) Sales(After Ratio)
Frequency Median
AD
CODMeanSDCOVWtd MeanGeoMeanPRD95% ConfidenceNumber Of Sales 0
0
1Mean Median Mean Trend Median Trend
Central Tendencies Month Mean Median Sales
Sales(Ratio)
Sales(After Ratio)
COLUMBIA County 2020 Ratio Study
336
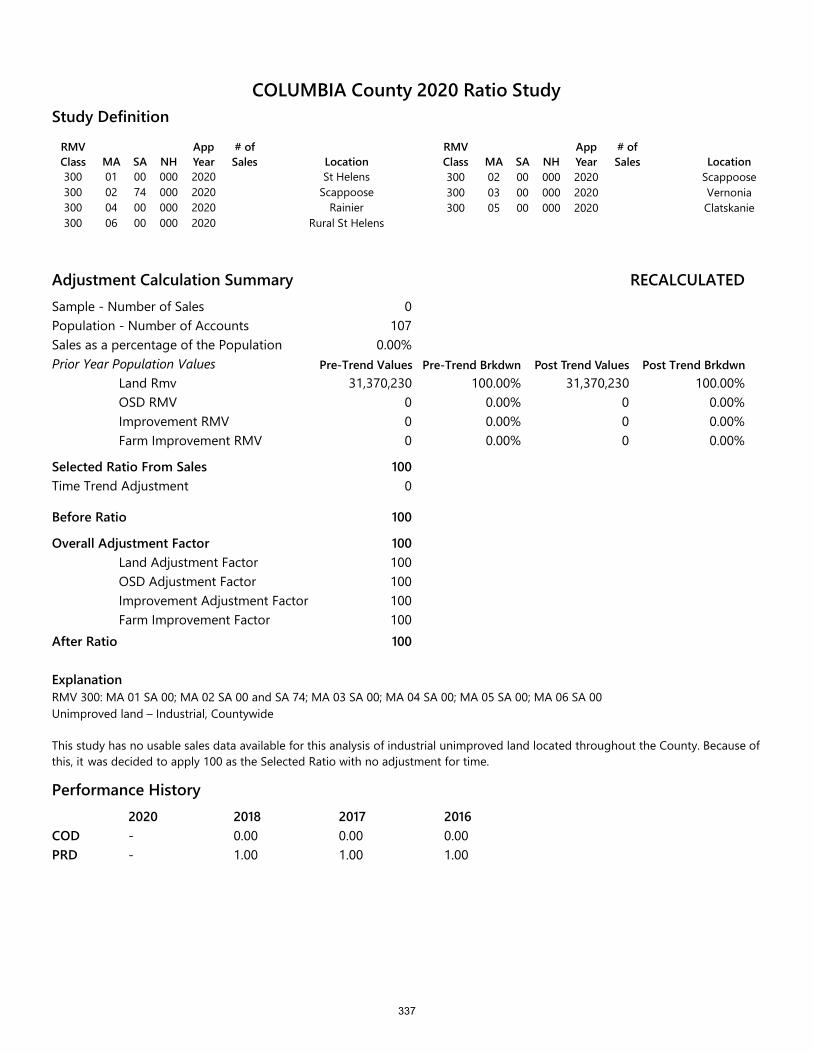
RMV Class MA SA NH
App Year
# of Sales Location
300 01 00 000 2020 St Helens300 02 74 000 2020 Scappoose300 04 00 000 2020 Rainier300 06 00 000 2020 Rural St Helens
RMV Class MA SA NH
App Year
# of Sales Location
300 02 00 000 2020 Scappoose300 03 00 000 2020 Vernonia300 05 00 000 2020 Clatskanie
Study Definition
Adjustment Calculation SummarySample - Number of SalesPopulation - Number of AccountsSales as a percentage of the PopulationPrior Year Population Values
Land RmvOSD RMVImprovement RMVFarm Improvement RMV
Selected Ratio From Sales
Before Ratio
Overall Adjustment FactorLand Adjustment FactorOSD Adjustment FactorImprovement Adjustment FactorFarm Improvement Factor
After Ratio
RECALCULATED
Pre-Trend Brkdwn Post Trend Values Post Trend Brkdwn
0107
0.00%
31,370,230 100.00% 31,370,230 100.00%000
0.00% 0 0.00%0.00% 0 0.00%0.00% 0 0.00%
100
100
100100100100100100
Time Trend Adjustment 0
ExplanationRMV 300: MA 01 SA 00; MA 02 SA 00 and SA 74; MA 03 SA 00; MA 04 SA 00; MA 05 SA 00; MA 06 SA 00Unimproved land – Industrial, Countywide
This study has no usable sales data available for this analysis of industrial unimproved land located throughout the County. Because of this, it was decided to apply 100 as the Selected Ratio with no adjustment for time.
Performance History2020 2018 2017 2016- 0.00 0.00 0.00- 1.00 1.00 1.00
CODPRD
COLUMBIA County 2020 Ratio Study
Pre-Trend Values
337

0
1Sales(Ratio) Sales(After Ratio)
Frequency Median
AD
CODMeanSDCOVWtd MeanGeoMeanPRD95% ConfidenceNumber Of Sales 0
0
1Mean Median Mean Trend Median Trend
Central Tendencies Month Mean Median Sales
Sales(Ratio)
Sales(After Ratio)
COLUMBIA County 2020 Ratio Study
338
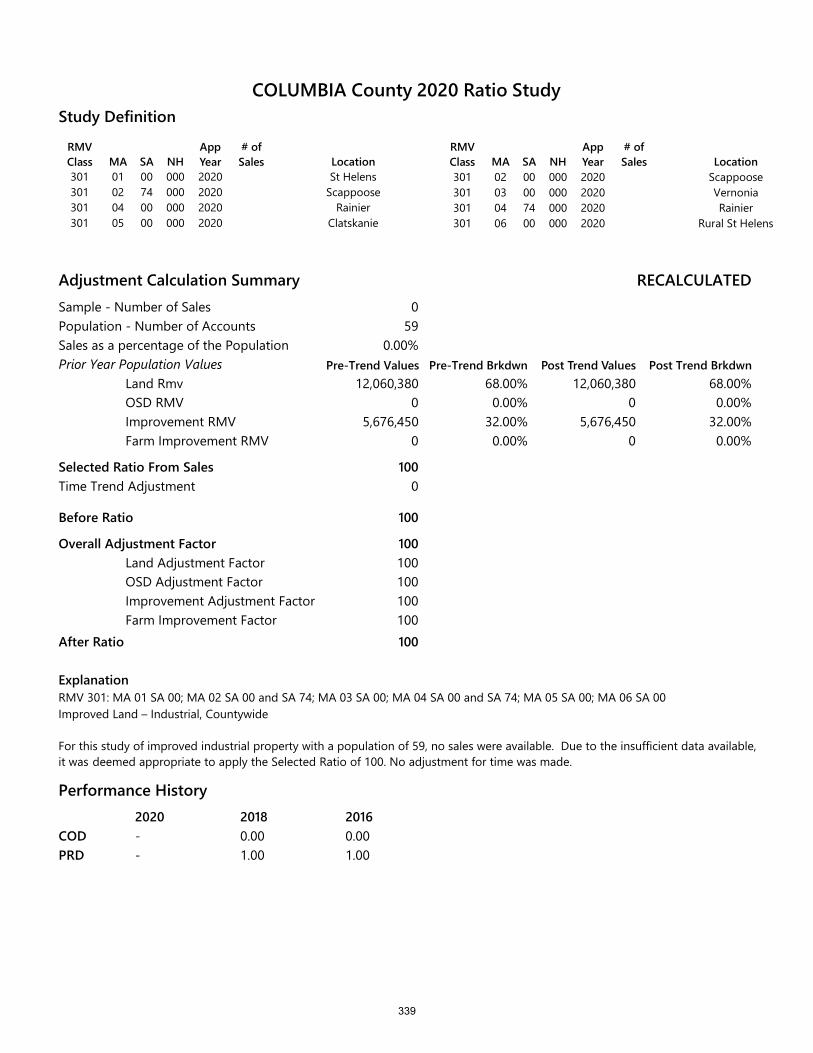
RMV Class MA SA NH
App Year
# of Sales Location
301 01 00 000 2020 St Helens301 02 74 000 2020 Scappoose301 04 00 000 2020 Rainier301 05 00 000 2020 Clatskanie
RMV Class MA SA NH
App Year
# of Sales Location
301 02 00 000 2020 Scappoose301 03 00 000 2020 Vernonia301 04 74 000 2020 Rainier301 06 00 000 2020 Rural St Helens
Study Definition
Adjustment Calculation SummarySample - Number of SalesPopulation - Number of AccountsSales as a percentage of the PopulationPrior Year Population Values
Land RmvOSD RMVImprovement RMVFarm Improvement RMV
Selected Ratio From Sales
Before Ratio
Overall Adjustment FactorLand Adjustment FactorOSD Adjustment FactorImprovement Adjustment FactorFarm Improvement Factor
After Ratio
RECALCULATED
Pre-Trend Brkdwn Post Trend Values Post Trend Brkdwn
059
0.00%
12,060,380 68.00% 12,060,380 68.00%0
5,676,4500
0.00% 0 0.00%32.00% 5,676,450 32.00%0.00% 0 0.00%
100
100
100100100100100100
Time Trend Adjustment 0
ExplanationRMV 301: MA 01 SA 00; MA 02 SA 00 and SA 74; MA 03 SA 00; MA 04 SA 00 and SA 74; MA 05 SA 00; MA 06 SA 00Improved Land – Industrial, Countywide
For this study of improved industrial property with a population of 59, no sales were available. Due to the insufficient data available, it was deemed appropriate to apply the Selected Ratio of 100. No adjustment for time was made.
Performance History2020 2018 2016- 0.00 0.00- 1.00 1.00
CODPRD
COLUMBIA County 2020 Ratio Study
Pre-Trend Values
339

0
1Sales(Ratio) Sales(After Ratio)
Frequency Median
AD
CODMeanSDCOVWtd MeanGeoMeanPRD95% ConfidenceNumber Of Sales 0
0
1Mean Median Mean Trend Median Trend
Central Tendencies Month Mean Median Sales
Sales(Ratio)
Sales(After Ratio)
COLUMBIA County 2020 Ratio Study
340
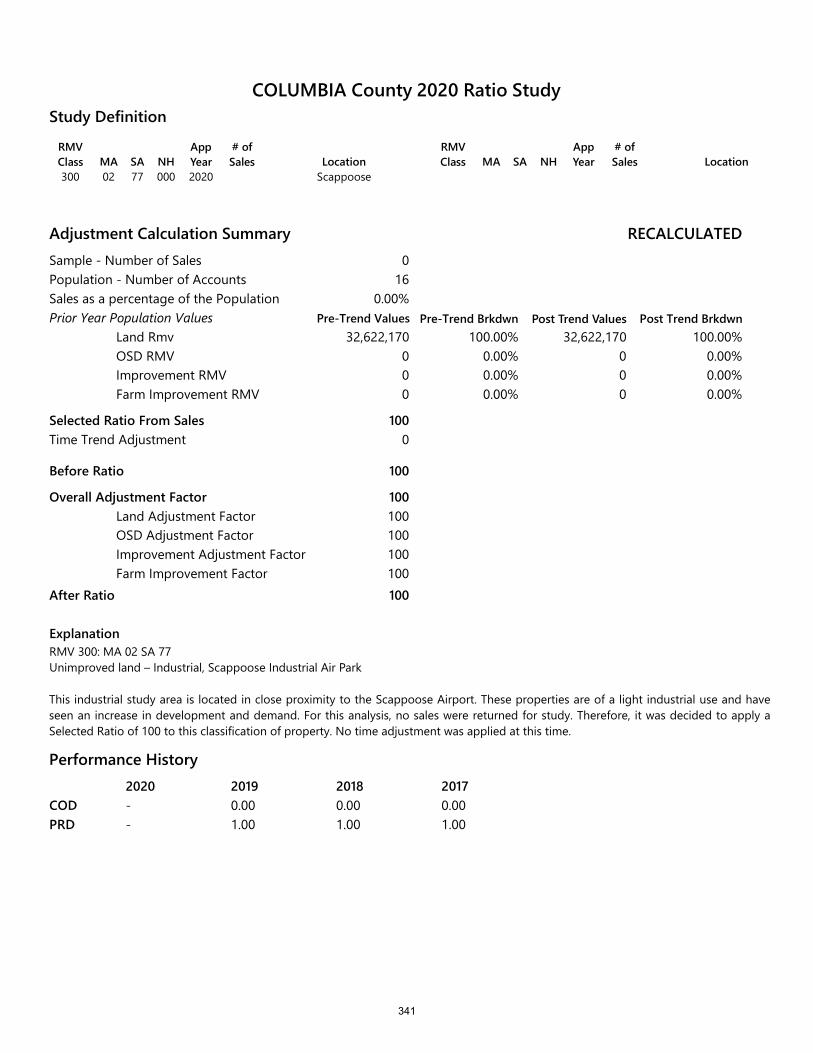
RMV Class MA SA NH
App Year
# of Sales Location
300 02 77 000 2020 Scappoose
RMV Class MA SA NH
App Year
# of Sales Location
Study Definition
Adjustment Calculation SummarySample - Number of SalesPopulation - Number of AccountsSales as a percentage of the PopulationPrior Year Population Values
Land RmvOSD RMVImprovement RMVFarm Improvement RMV
Selected Ratio From Sales
Before Ratio
Overall Adjustment FactorLand Adjustment FactorOSD Adjustment FactorImprovement Adjustment FactorFarm Improvement Factor
After Ratio
ExplanationRMV 300: MA 02 SA 77Unimproved land – Industrial, Scappoose Industrial Air Park
RECALCULATED
Pre-Trend Brkdwn Post Trend Values Post Trend Brkdwn
016
0.00%
32,622,170 100.00% 32,622,170 100.00%000
0.00% 0 0.00%0.00% 0 0.00%0.00% 0 0.00%
100
100
100100100100100100
Time Trend Adjustment 0
This industrial study area is located in close proximity to the Scappoose Airport. These properties are of a light industrial use and have seen an increase in development and demand. For this analysis, no sales were returned for study. Therefore, it was decided to apply a Selected Ratio of 100 to this classification of property. No time adjustment was applied at this time.
Performance History2020 2019 2018 2017- 0.00 0.00 0.00- 1.00 1.00 1.00
CODPRD
COLUMBIA County 2020 Ratio Study
Pre-Trend Values
341

0
1Sales(Ratio) Sales(After Ratio)
Frequency Median
AD
CODMeanSDCOVWtd MeanGeoMeanPRD95% ConfidenceNumber Of Sales 0
0
1Mean Median Mean Trend Median Trend
Central Tendencies Month Mean Median Sales
Sales(Ratio)
Sales(After Ratio)
COLUMBIA County 2020 Ratio Study
342
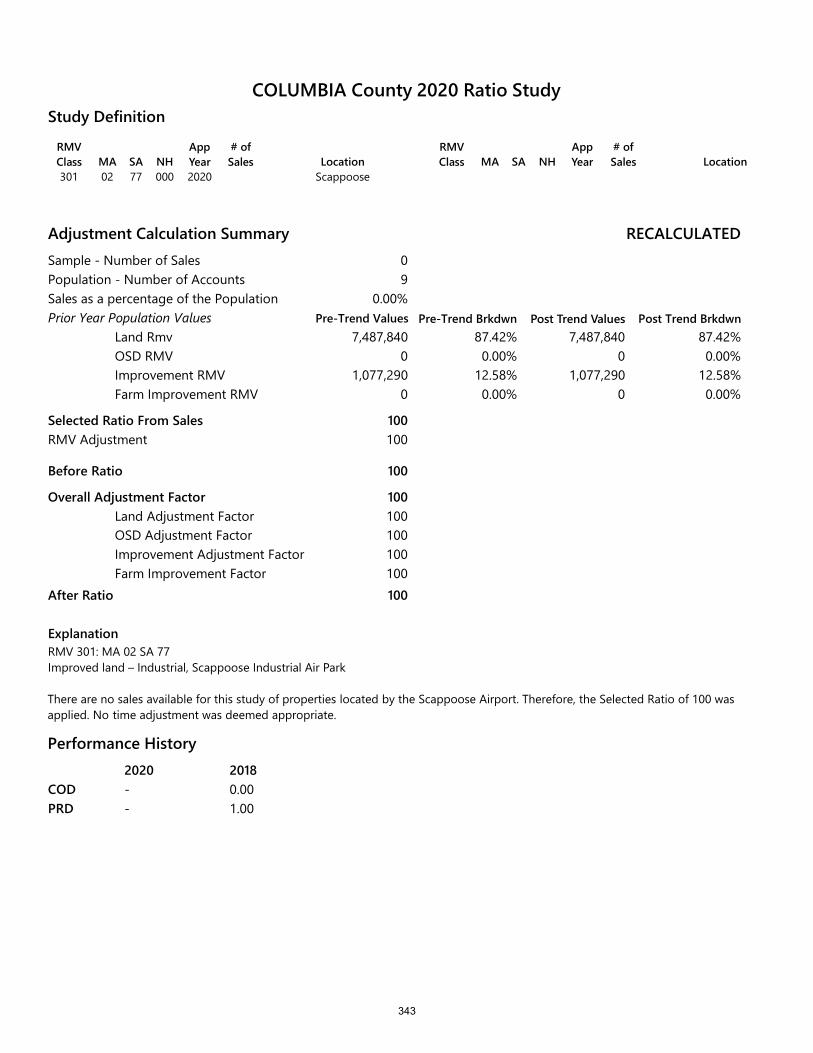
RMV Class MA SA NH
App Year
# of Sales Location
301 02 77 000 2020 Scappoose
RMV Class MA SA NH
App Year
# of Sales Location
Study Definition
Adjustment Calculation SummarySample - Number of SalesPopulation - Number of AccountsSales as a percentage of the PopulationPrior Year Population Values
Land RmvOSD RMVImprovement RMVFarm Improvement RMV
Selected Ratio From SalesRMV Adjustment
Before Ratio
Overall Adjustment FactorLand Adjustment FactorOSD Adjustment FactorImprovement Adjustment FactorFarm Improvement Factor
After Ratio
ExplanationRMV 301: MA 02 SA 77Improved land – Industrial, Scappoose Industrial Air Park
RECALCULATED
Pre-Trend Brkdwn Post Trend Values Post Trend Brkdwn
09
0.00%
7,487,840 87.42% 7,487,840 87.42%0
1,077,2900
0.00% 0 0.00%12.58% 1,077,290 12.58%0.00% 0 0.00%
100100
100
100100100100100100
There are no sales available for this study of properties located by the Scappoose Airport. Therefore, the Selected Ratio of 100 was applied. No time adjustment was deemed appropriate.
Performance History2020 2018- 0.00- 1.00
CODPRD
COLUMBIA County 2020 Ratio Study
Pre-Trend Values
343

0
1Sales(Ratio) Sales(After Ratio)
Frequency Median
AD
CODMeanSDCOVWtd MeanGeoMeanPRD95% ConfidenceNumber Of Sales 0
0
1Mean Median Mean Trend Median Trend
Central Tendencies Month Mean Median Sales
Sales(Ratio)
Sales(After Ratio)
COLUMBIA County 2020 Ratio Study
344

RMV Class MA SA NH
App Year
# of Sales Location
303 01 00 000 2020 St Helens303 02 77 000 2020 Scappoose303 05 00 000 2020 Clatskanie
RMV Class MA SA NH
App Year
# of Sales Location
303 02 00 000 2020 Scappoose303 04 00 000 2020 Rainier
Study Definition
Adjustment Calculation SummarySample - Number of SalesPopulation - Number of AccountsSales as a percentage of the PopulationPrior Year Population Values
Land RmvOSD RMVImprovement RMVFarm Improvement RMV
Selected Ratio From Sales
Before Ratio
Overall Adjustment FactorLand Adjustment FactorOSD Adjustment FactorImprovement Adjustment FactorFarm Improvement Factor
After Ratio
ExplanationRMV 303: MA 01 SA 00; MA 02 SA 00 and SA 77; MA 04 SA 00; MA 05 SA 00Industrial, Countywide
Since this classification of properties is processed via an IPR at the State level, no adjustment is warranted.
RECALCULATED
Pre-Trend Brkdwn Post Trend Values Post Trend Brkdwn
045
0.00%
23,984,260 19.58% 23,984,260 19.58%0
98,490,8103,940
0.00% 0 0.00%80.41% 98,490,810 80.41%0.00% 3,940 0.00%
100
100
100100100100100100
Time Trend Adjustment 0
Performance History2020--
CODPRD
COLUMBIA County 2020 Ratio Study
Pre-Trend Values
345

0
1Sales(Ratio) Sales(After Ratio)
Frequency Median
AD
CODMeanSDCOVWtd MeanGeoMeanPRD95% ConfidenceNumber Of Sales 0
0
1Mean Median Mean Trend Median Trend
Central Tendencies Month Mean Median Sales
Sales(Ratio)
Sales(After Ratio)
COLUMBIA County 2020 Ratio Study
346
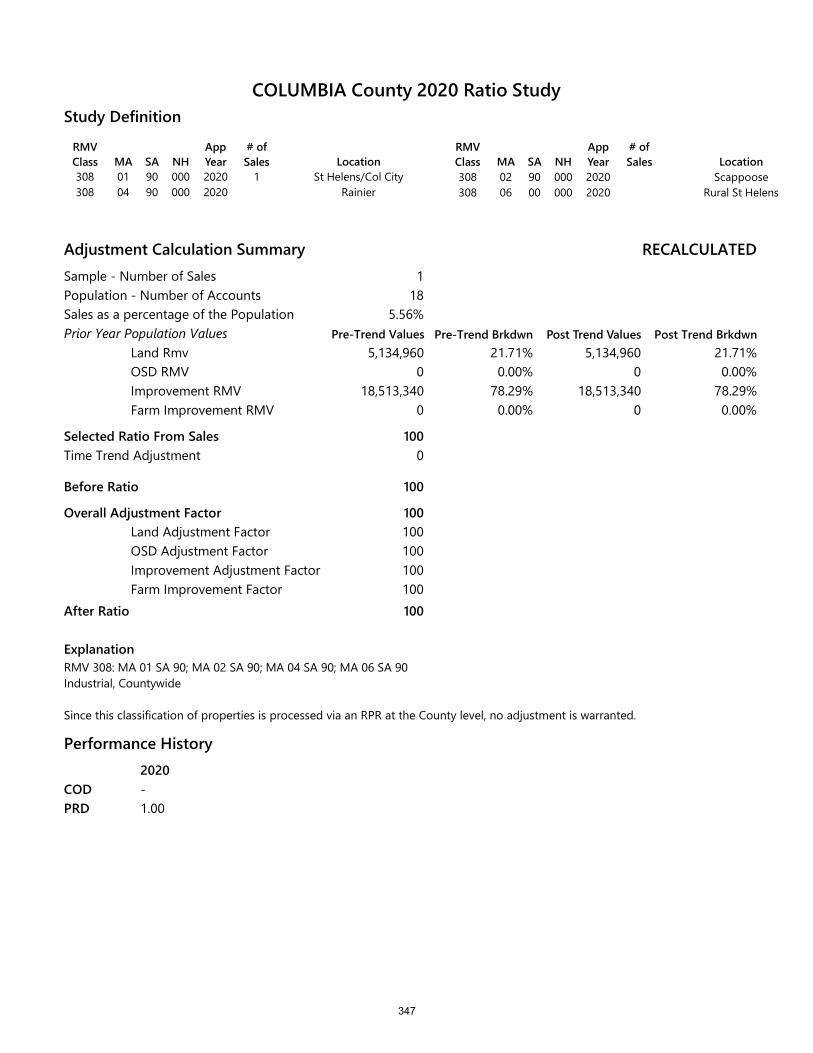
RMV Class MA SA NH
App Year
# of Sales Location
308 01 90 000 2020 1 St Helens/Col City308 04 90 000 2020 Rainier
RMV Class MA SA NH
App Year
# of Sales Location
308 02 90 000 2020 Scappoose308 06 00 000 2020 Rural St Helens
Study Definition
Adjustment Calculation SummarySample - Number of SalesPopulation - Number of AccountsSales as a percentage of the PopulationPrior Year Population Values
Land RmvOSD RMVImprovement RMVFarm Improvement RMV
Selected Ratio From Sales
Before Ratio
Overall Adjustment FactorLand Adjustment FactorOSD Adjustment FactorImprovement Adjustment FactorFarm Improvement Factor
After Ratio
ExplanationRMV 308: MA 01 SA 90; MA 02 SA 90; MA 04 SA 90; MA 06 SA 90Industrial, Countywide
Since this classification of properties is processed via an RPR at the County level, no adjustment is warranted.
RECALCULATED
Pre-Trend Brkdwn Post Trend Values Post Trend Brkdwn
118
5.56%
5,134,960 21.71% 5,134,960 21.71%0
18,513,3400
0.00% 0 0.00%78.29% 18,513,340 78.29%0.00% 0 0.00%
100
100
100100100100100100
Time Trend Adjustment 0
Performance History2020-1.00
CODPRD
COLUMBIA County 2020 Ratio Study
Pre-Trend Values
347

RMV LANDSA NH PRP CLS
ST CLS
CO CD
MAP NO. DOC NUM.MA AC RMV IMP TOTAL RMV SALE PRICE
SALE DATE
# RT
Included Sales
01 90 000 308 600 30 4N1W09B0 00100
2019-5093 25.16 1,467,030 2,961,690 4,428,720 3,500,000 Jun-19 1 127
0
0.2
0.4
0.6
0.8
1Sales(Ratio) Sales(After Ratio)
Frequency120 1 1 Median 127 127
AD
CODMean 127 127SD 1.00 1.00COV .79 .79Wtd Mean 127 127GeoMean 127 127PRD 1.00 1.0095% Confidence 1.96 1.96Number Of Sales 1
0
50
100
150Mean Median Mean Trend Median Trend
Central Tendencies Month Mean Median SalesJun-19 127 127 1
Sales(Ratio)
Sales(After Ratio)
COLUMBIA County 2020 Ratio Study
348
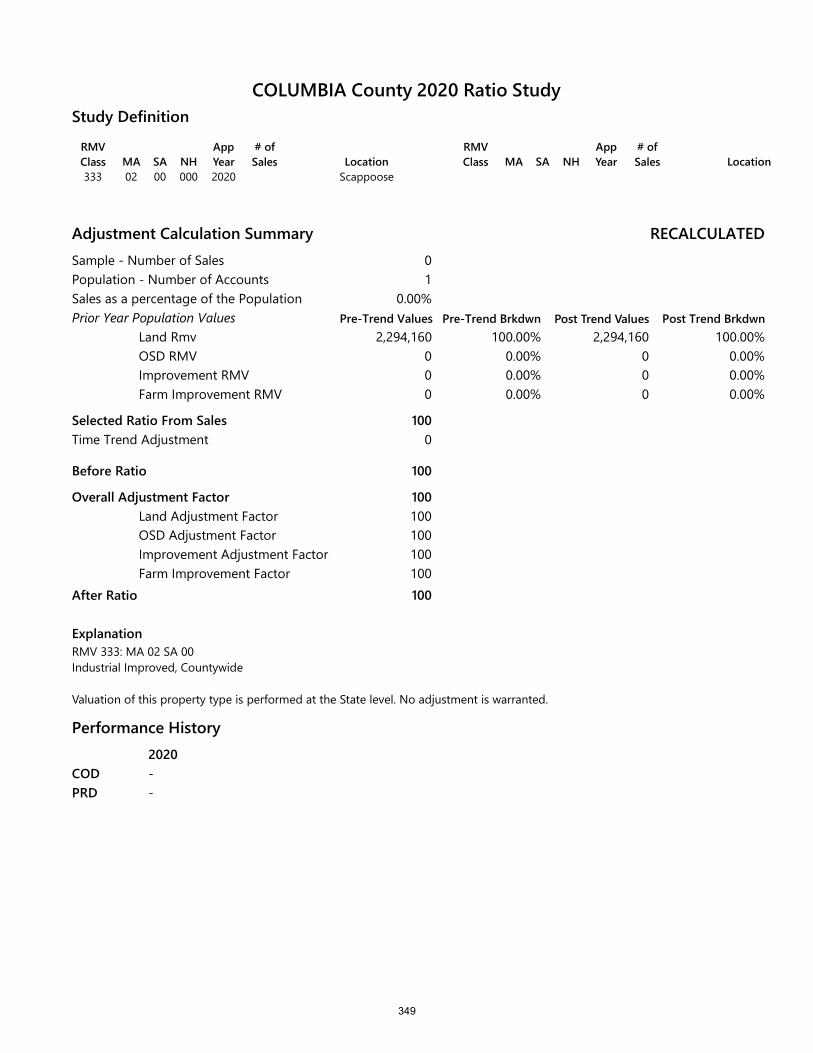
RMV Class MA SA NH
App Year
# of Sales Location
333 02 00 000 2020 Scappoose
RMV Class MA SA NH
App Year
# of Sales Location
Study Definition
Adjustment Calculation SummarySample - Number of SalesPopulation - Number of AccountsSales as a percentage of the PopulationPrior Year Population Values
Land RmvOSD RMVImprovement RMVFarm Improvement RMV
Selected Ratio From Sales
Before Ratio
Overall Adjustment FactorLand Adjustment FactorOSD Adjustment FactorImprovement Adjustment FactorFarm Improvement Factor
After Ratio
ExplanationRMV 333: MA 02 SA 00Industrial Improved, Countywide
Valuation of this property type is performed at the State level. No adjustment is warranted.
RECALCULATED
Pre-Trend Brkdwn Post Trend Values Post Trend Brkdwn
01
0.00%
2,294,160 100.00% 2,294,160 100.00%000
0.00% 0 0.00%0.00% 0 0.00%0.00% 0 0.00%
100
100
100100100100100100
Time Trend Adjustment 0
Performance History2020--
CODPRD
COLUMBIA County 2020 Ratio Study
Pre-Trend Values
349

0
1Sales(Ratio) Sales(After Ratio)
Frequency Median
AD
CODMeanSDCOVWtd MeanGeoMeanPRD95% ConfidenceNumber Of Sales 0
0
1Mean Median Mean Trend Median Trend
Central Tendencies Month Mean Median Sales
Sales(Ratio)
Sales(After Ratio)
COLUMBIA County 2020 Ratio Study
350
RMV CLASS 600
HIGHEST AND BEST USE FORESTLAND (SA 06)
351
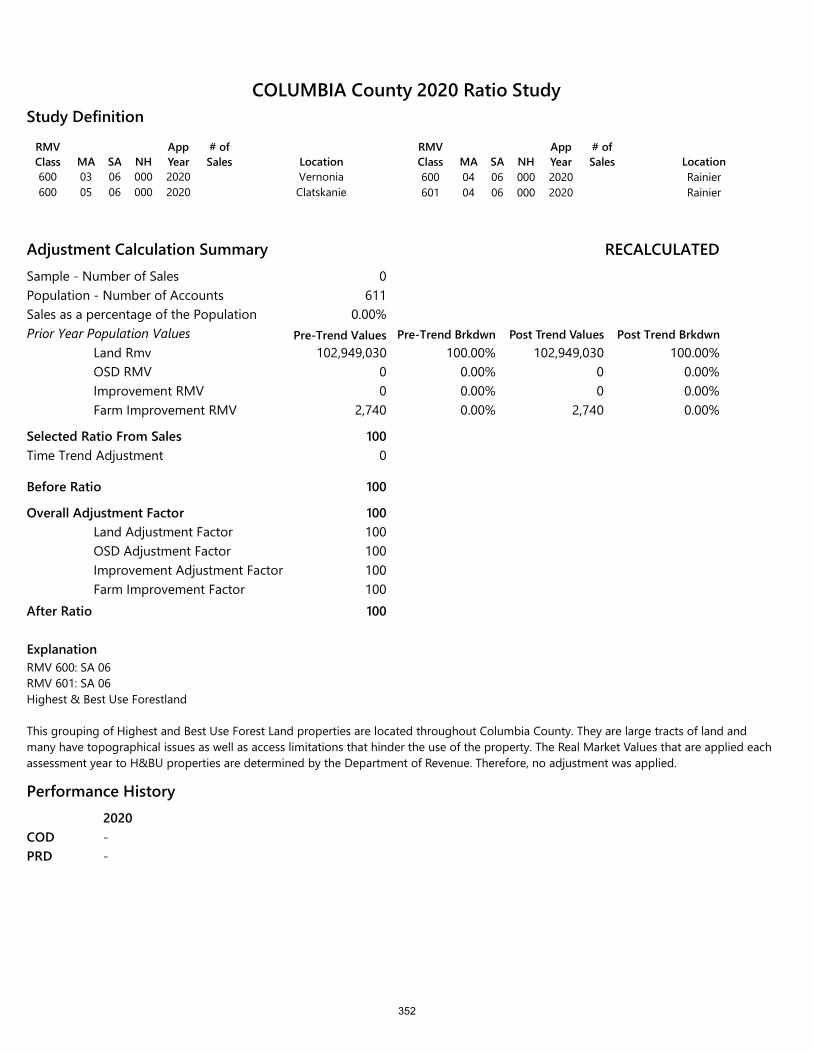
RMV Class MA SA NH
App Year
# of Sales Location
600 03 06 000 2020 Vernonia600 05 06 000 2020 Clatskanie
RMV Class MA SA NH
App Year
# of Sales Location
600 04 06 000 2020 Rainier601 04 06 000 2020 Rainier
Study Definition
Adjustment Calculation SummarySample - Number of SalesPopulation - Number of AccountsSales as a percentage of the PopulationPrior Year Population Values
Land RmvOSD RMVImprovement RMVFarm Improvement RMV
Selected Ratio From Sales
Before Ratio
Overall Adjustment FactorLand Adjustment FactorOSD Adjustment FactorImprovement Adjustment FactorFarm Improvement Factor
After Ratio
ExplanationRMV 600: SA 06 RMV 601: SA 06Highest & Best Use Forestland
This grouping of Highest and Best Use Forest Land properties are located throughout Columbia County. They are large tracts of land and many have topographical issues as well as access limitations that hinder the use of the property. The Real Market Values that are applied each assessment year to H&BU properties are determined by the Department of Revenue. Therefore, no adjustment was applied.
RECALCULATED
Pre-Trend Brkdwn Post Trend Values Post Trend Brkdwn
0611
0.00%
102,949,030 100.00% 102,949,030 100.00%00
2,740
0.00% 0 0.00%0.00% 0 0.00%0.00% 2,740 0.00%
100
100
100100100100100100
Time Trend Adjustment 0
Performance History2020--
CODPRD
COLUMBIA County 2020 Ratio Study
Pre-Trend Values
352

0
1Sales(Ratio) Sales(After Ratio)
Frequency Median
AD
CODMeanSDCOVWtd MeanGeoMeanPRD95% ConfidenceNumber Of Sales 0
0
1Mean Median Mean Trend Median Trend
Central Tendencies Month Mean Median Sales
Sales(Ratio)
Sales(After Ratio)
COLUMBIA County 2020 Ratio Study
353

RMV CLASS 701
MULTI FAMILY (Five or more units)
354

RMV Class MA SA NH
App Year
# of Sales Location
701 01 00 000 2020 4 St Helens701 02 00 000 2020 Scappoose701 04 00 000 2020 1 Rainier701 06 00 000 2020 Rural St Helens
RMV Class MA SA NH
App Year
# of Sales Location
701 01 72 000 2020 St Helens/Col City701 03 00 000 2020 Vernonia701 05 00 000 2020 Clatskanie
Study Definition
Adjustment Calculation SummarySample - Number of SalesPopulation - Number of AccountsSales as a percentage of the PopulationPrior Year Population Values
Land RmvOSD RMVImprovement RMVFarm Improvement RMV
Selected Ratio From Sales
Before Ratio
Overall Adjustment FactorLand Adjustment FactorOSD Adjustment FactorImprovement Adjustment FactorFarm Improvement Factor
After Ratio
RECALCULATED
Pre-Trend Brkdwn Post Trend Values Post Trend Brkdwn
587
5.75%
13,425,800 20.79% 23,092,376 31.10%13,900
51,143,2400
0.02% 13,900 0.02%79.19% 51,143,240 68.88%0.00% 0 0.00%
58
58
172172100100100100
Time Trend Adjustment 0
Pre-Trend Values
ExplanationRMV 701 Improved land – H & B Use Multi-Family (Apartments), Countywide
There are 5 sales available for this analysis out of a population of 87 accounts resulting in 5.75% of the population. It is recommended to use the Selected Ratio of 58 without adjustment for time and to apply it here. Once applied, the Overall Adjustment Factor is 172. This factor will be applied to the land only.
Performance History2020 2019 2017 201616.55 0.00 5.00 0.001.17 1.00 1.05 1.00
CODPRD
COLUMBIA County 2020 Ratio Study
355
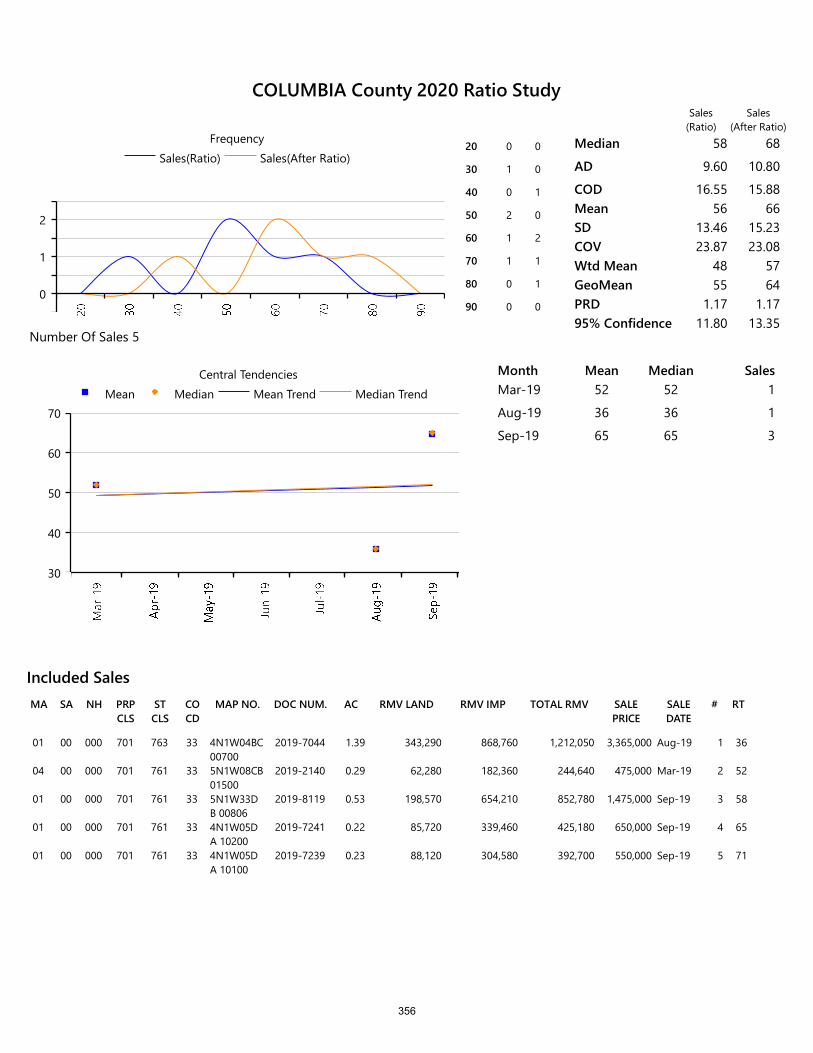
RMV LANDSA NH PRP CLS
ST CLS
CO CD
MAP NO. DOC NUM.MA AC RMV IMP TOTAL RMV SALE PRICE
SALE DATE
# RT
Included Sales
01 00 000 701 763 33 4N1W04BC 00700
2019-7044 1.39 343,290 868,760 1,212,050 3,365,000 Aug-19 1 36
04 00 000 701 761 33 5N1W08CB 01500
2019-2140 0.29 62,280 182,360 244,640 475,000 Mar-19 2 52
01 00 000 701 761 33 5N1W33DB 00806
2019-8119 0.53 198,570 654,210 852,780 1,475,000 Sep-19 3 58
01 00 000 701 761 33 4N1W05DA 10200
2019-7241 0.22 85,720 339,460 425,180 650,000 Sep-19 4 65
01 00 000 701 761 33 4N1W05DA 10100
2019-7239 0.23 88,120 304,580 392,700 550,000 Sep-19 5 71
0
1
2
Sales(Ratio) Sales(After Ratio)Frequency
20 0 0
30 1 0
40 0 1
50 2 0
60 1 2
70 1 1
80 0 1
90 0 0
Median 58 68
AD 9.60 10.80
COD 16.55 15.88Mean 56 66SD 13.46 15.23COV 23.87 23.08Wtd Mean 48 57GeoMean 55 64PRD 1.17 1.1795% Confidence 11.80 13.35
Number Of Sales 5
30
40
50
60
70Mean Median Mean Trend Median Trend
Central Tendencies Month Mean Median SalesMar-19 52 52 1
Aug-19 36 36 1
Sep-19 65 65 3
Sales(Ratio)
Sales(After Ratio)
COLUMBIA County 2020 Ratio Study
356
RMV CLASS 8XX
RECREATIONAL LAND
357
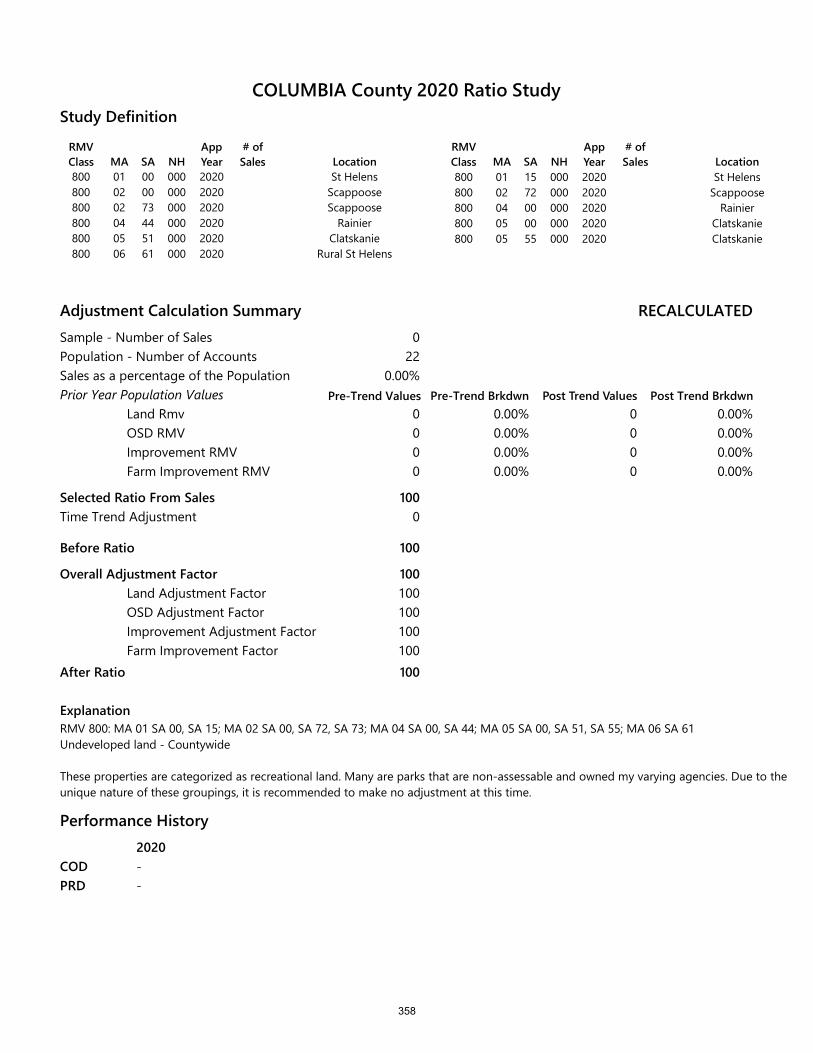
RMV Class MA SA NH
App Year
# of Sales Location
800 01 00 000 2020 St Helens800 02 00 000 2020 Scappoose800 02 73 000 2020 Scappoose800 04 44 000 2020 Rainier800 05 51 000 2020 Clatskanie800 06 61 000 2020 Rural St Helens
RMV Class MA SA NH
App Year
# of Sales Location
800 01 15 000 2020 St Helens800 02 72 000 2020 Scappoose800 04 00 000 2020 Rainier800 05 00 000 2020 Clatskanie800 05 55 000 2020 Clatskanie
Study Definition
Adjustment Calculation SummarySample - Number of SalesPopulation - Number of AccountsSales as a percentage of the PopulationPrior Year Population Values
Land RmvOSD RMVImprovement RMVFarm Improvement RMV
Selected Ratio From Sales
Before Ratio
Overall Adjustment FactorLand Adjustment FactorOSD Adjustment FactorImprovement Adjustment FactorFarm Improvement Factor
After Ratio
ExplanationRMV 800: MA 01 SA 00, SA 15; MA 02 SA 00, SA 72, SA 73; MA 04 SA 00, SA 44; MA 05 SA 00, SA 51, SA 55; MA 06 SA 61Undeveloped land - Countywide
These properties are categorized as recreational land. Many are parks that are non-assessable and owned my varying agencies. Due to the unique nature of these groupings, it is recommended to make no adjustment at this time.
RECALCULATED
Pre-Trend Brkdwn Post Trend Values Post Trend Brkdwn
022
0.00%
0 0.00% 0 0.00%000
0.00% 0 0.00%0.00% 0 0.00%0.00% 0 0.00%
100
100
100100100100100100
Time Trend Adjustment 0
Performance History2020--
CODPRD
COLUMBIA County 2020 Ratio Study
Pre-Trend Values
358

0
1Sales(Ratio) Sales(After Ratio)
Frequency Median
AD
CODMeanSDCOVWtd MeanGeoMeanPRD95% ConfidenceNumber Of Sales 0
0
1Mean Median Mean Trend Median Trend
Central Tendencies Month Mean Median Sales
Sales(Ratio)
Sales(After Ratio)
COLUMBIA County 2020 Ratio Study
359
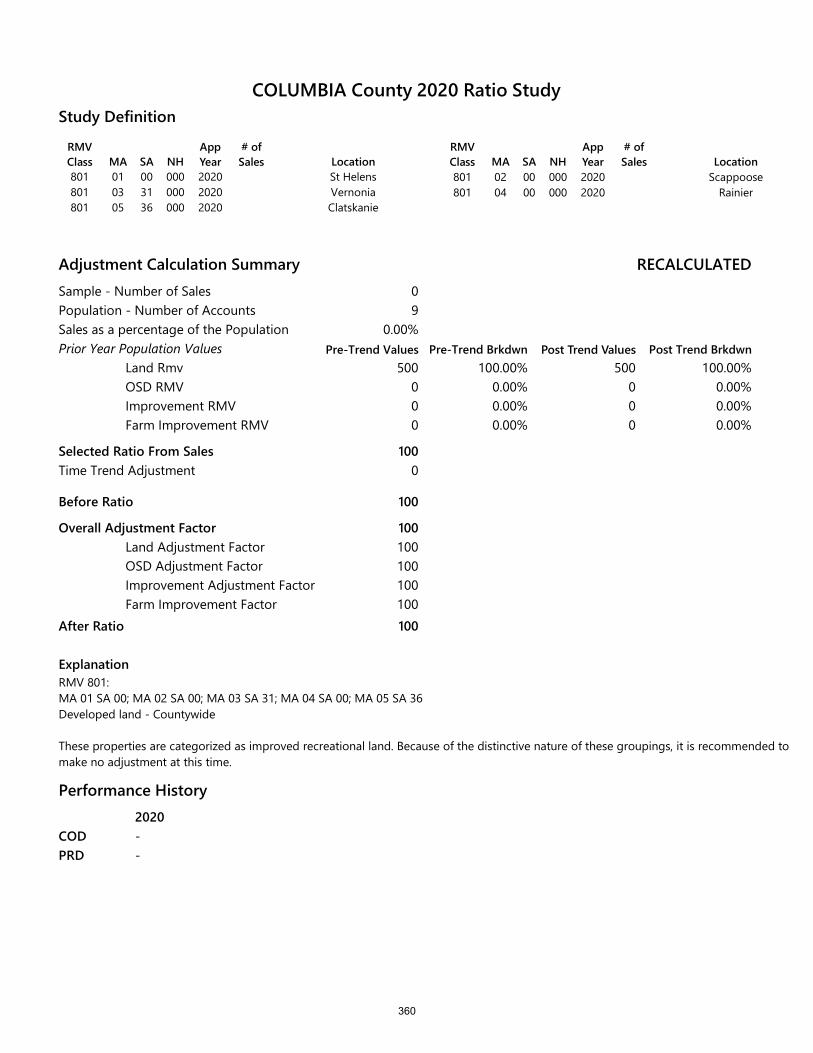
RMV Class MA SA NH
App Year
# of Sales Location
801 01 00 000 2020 St Helens801 03 31 000 2020 Vernonia801 05 36 000 2020 Clatskanie
RMV Class MA SA NH
App Year
# of Sales Location
801 02 00 000 2020 Scappoose801 04 00 000 2020 Rainier
Study Definition
Adjustment Calculation SummarySample - Number of SalesPopulation - Number of AccountsSales as a percentage of the PopulationPrior Year Population Values
Land RmvOSD RMVImprovement RMVFarm Improvement RMV
Selected Ratio From Sales
Before Ratio
Overall Adjustment FactorLand Adjustment FactorOSD Adjustment FactorImprovement Adjustment FactorFarm Improvement Factor
After Ratio
ExplanationRMV 801: MA 01 SA 00; MA 02 SA 00; MA 03 SA 31; MA 04 SA 00; MA 05 SA 36Developed land - Countywide
These properties are categorized as improved recreational land. Because of the distinctive nature of these groupings, it is recommended to make no adjustment at this time.
RECALCULATED
Pre-Trend Brkdwn Post Trend Values Post Trend Brkdwn
09
0.00%
500 100.00% 500 100.00%000
0.00% 0 0.00%0.00% 0 0.00%0.00% 0 0.00%
100
100
100100100100100100
Time Trend Adjustment 0
Performance History2020--
CODPRD
COLUMBIA County 2020 Ratio Study
Pre-Trend Values
360

0
1Sales(Ratio) Sales(After Ratio)
Frequency Median
AD
CODMeanSDCOVWtd MeanGeoMeanPRD95% ConfidenceNumber Of Sales 0
0
1Mean Median Mean Trend Median Trend
Central Tendencies Month Mean Median Sales
Sales(Ratio)
Sales(After Ratio)
COLUMBIA County 2020 Ratio Study
361
ODD LOTS
RMV CLASS 010 RMV CLASS 020 RMV CLASS 030 RMV CLASS 040
362
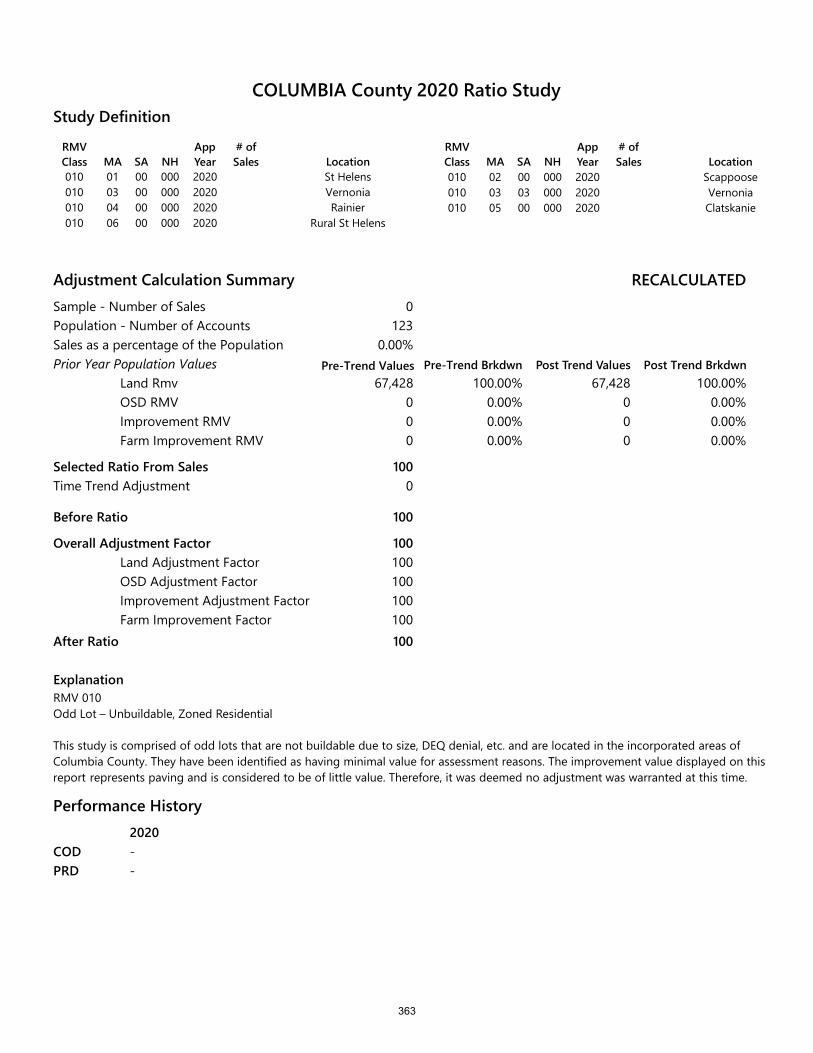
RMV Class MA SA NH
App Year
# of Sales Location
010 01 00 000 2020 St Helens010 03 00 000 2020 Vernonia010 04 00 000 2020 Rainier010 06 00 000 2020 Rural St Helens
RMV Class MA SA NH
App Year
# of Sales Location
010 02 00 000 2020 Scappoose010 03 03 000 2020 Vernonia010 05 00 000 2020 Clatskanie
Study Definition
Adjustment Calculation SummarySample - Number of SalesPopulation - Number of AccountsSales as a percentage of the PopulationPrior Year Population Values
Land RmvOSD RMVImprovement RMVFarm Improvement RMV
Selected Ratio From Sales
Before Ratio
Overall Adjustment FactorLand Adjustment FactorOSD Adjustment FactorImprovement Adjustment FactorFarm Improvement Factor
After Ratio
ExplanationRMV 010Odd Lot – Unbuildable, Zoned Residential
RECALCULATED
Pre-Trend Brkdwn Post Trend Values Post Trend Brkdwn
0123
0.00%
67,428 100.00% 67,428 100.00%000
0.00% 0 0.00%0.00% 0 0.00%0.00% 0 0.00%
100
100
100100100100100100
Time Trend Adjustment 0
This study is comprised of odd lots that are not buildable due to size, DEQ denial, etc. and are located in the incorporated areas of Columbia County. They have been identified as having minimal value for assessment reasons. The improvement value displayed on this report represents paving and is considered to be of little value. Therefore, it was deemed no adjustment was warranted at this time.
Performance History2020--
CODPRD
COLUMBIA County 2020 Ratio Study
Pre-Trend Values
363

0
1Sales(Ratio) Sales(After Ratio)
Frequency Median
AD
CODMeanSDCOVWtd MeanGeoMeanPRD95% ConfidenceNumber Of Sales 0
0
1Mean Median Mean Trend Median Trend
Central Tendencies Month Mean Median Sales
Sales(Ratio)
Sales(After Ratio)
COLUMBIA County 2020 Ratio Study
364

RMV Class MA SA NH
App Year
# of Sales Location
020 01 00 000 2020 St Helens020 03 00 000 2020 Vernonia020 05 00 000 2020 Clatskanie
RMV Class MA SA NH
App Year
# of Sales Location
020 02 00 000 2020 Scappoose020 04 00 000 2020 Rainier
Study Definition
Adjustment Calculation SummarySample - Number of SalesPopulation - Number of AccountsSales as a percentage of the PopulationPrior Year Population Values
Land RmvOSD RMVImprovement RMVFarm Improvement RMV
Selected Ratio From Sales
Before Ratio
Overall Adjustment FactorLand Adjustment FactorOSD Adjustment FactorImprovement Adjustment FactorFarm Improvement Factor
After Ratio
ExplanationRMV 020Odd Lot – Unbuildable, Zoned Commercial
RECALCULATED
Pre-Trend Brkdwn Post Trend Values Post Trend Brkdwn
013
0.00%
6,000 100.00% 6,000 100.00%000
0.00% 0 0.00%0.00% 0 0.00%0.00% 0 0.00%
100
100
100100100100100100
Time Trend Adjustment 0
These properties are zoned commercial and are located throughout Columbia County. Because of their size, shape and/or location they are considered as odd lots and have been given minimal value. It is recommended that no adjustment be made to these properties for the current year.
Performance History2020--
CODPRD
COLUMBIA County 2020 Ratio Study
Pre-Trend Values
365

0
1Sales(Ratio) Sales(After Ratio)
Frequency Median
AD
CODMeanSDCOVWtd MeanGeoMeanPRD95% ConfidenceNumber Of Sales 0
0
1Mean Median Mean Trend Median Trend
Central Tendencies Month Mean Median Sales
Sales(Ratio)
Sales(After Ratio)
COLUMBIA County 2020 Ratio Study
366
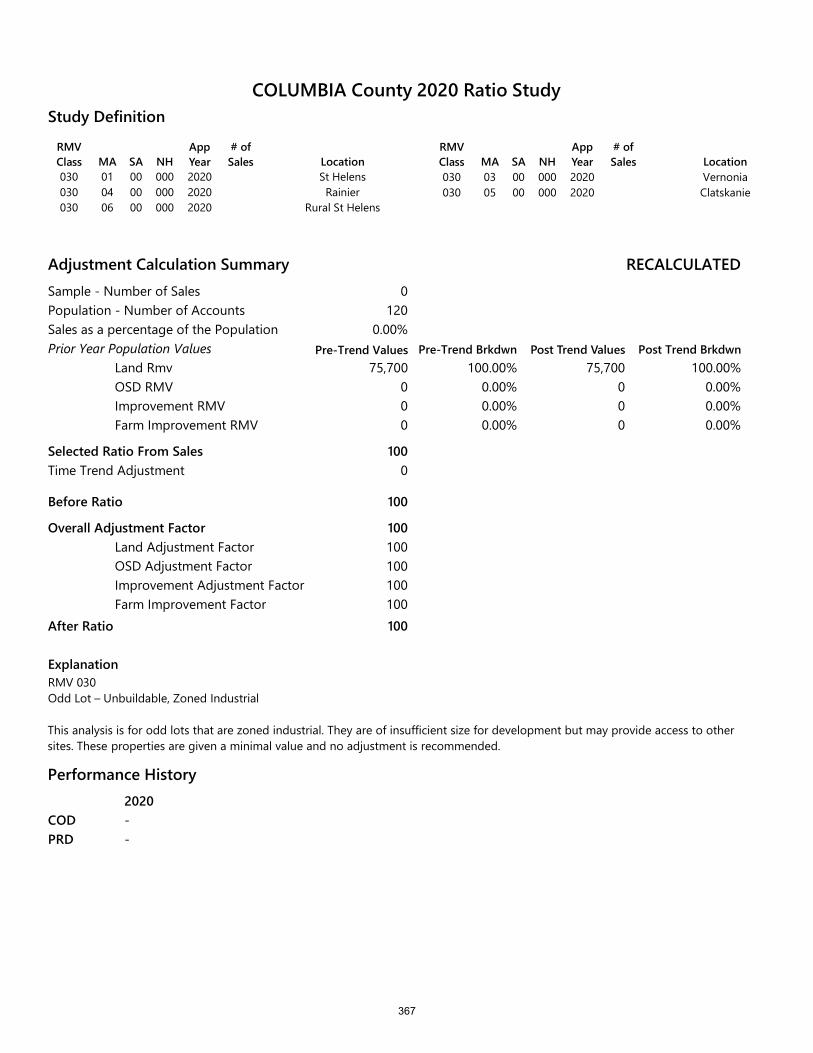
RMV Class MA SA NH
App Year
# of Sales Location
030 01 00 000 2020 St Helens030 04 00 000 2020 Rainier030 06 00 000 2020 Rural St Helens
RMV Class MA SA NH
App Year
# of Sales Location
030 03 00 000 2020 Vernonia030 05 00 000 2020 Clatskanie
Study Definition
Adjustment Calculation SummarySample - Number of SalesPopulation - Number of AccountsSales as a percentage of the PopulationPrior Year Population Values
Land RmvOSD RMVImprovement RMVFarm Improvement RMV
Selected Ratio From Sales
Before Ratio
Overall Adjustment FactorLand Adjustment FactorOSD Adjustment FactorImprovement Adjustment FactorFarm Improvement Factor
After Ratio
ExplanationRMV 030Odd Lot – Unbuildable, Zoned Industrial
RECALCULATED
Pre-Trend Brkdwn Post Trend Values Post Trend Brkdwn
0120
0.00%
75,700 100.00% 75,700 100.00%000
0.00% 0 0.00%0.00% 0 0.00%0.00% 0 0.00%
100
100
100100100100100100
Time Trend Adjustment 0
This analysis is for odd lots that are zoned industrial. They are of insufficient size for development but may provide access to other sites. These properties are given a minimal value and no adjustment is recommended.
Performance History2020--
CODPRD
COLUMBIA County 2020 Ratio Study
Pre-Trend Values
367

0
1Sales(Ratio) Sales(After Ratio)
Frequency Median
AD
CODMeanSDCOVWtd MeanGeoMeanPRD95% ConfidenceNumber Of Sales 0
0
1Mean Median Mean Trend Median Trend
Central Tendencies Month Mean Median Sales
Sales(Ratio)
Sales(After Ratio)
COLUMBIA County 2020 Ratio Study
368
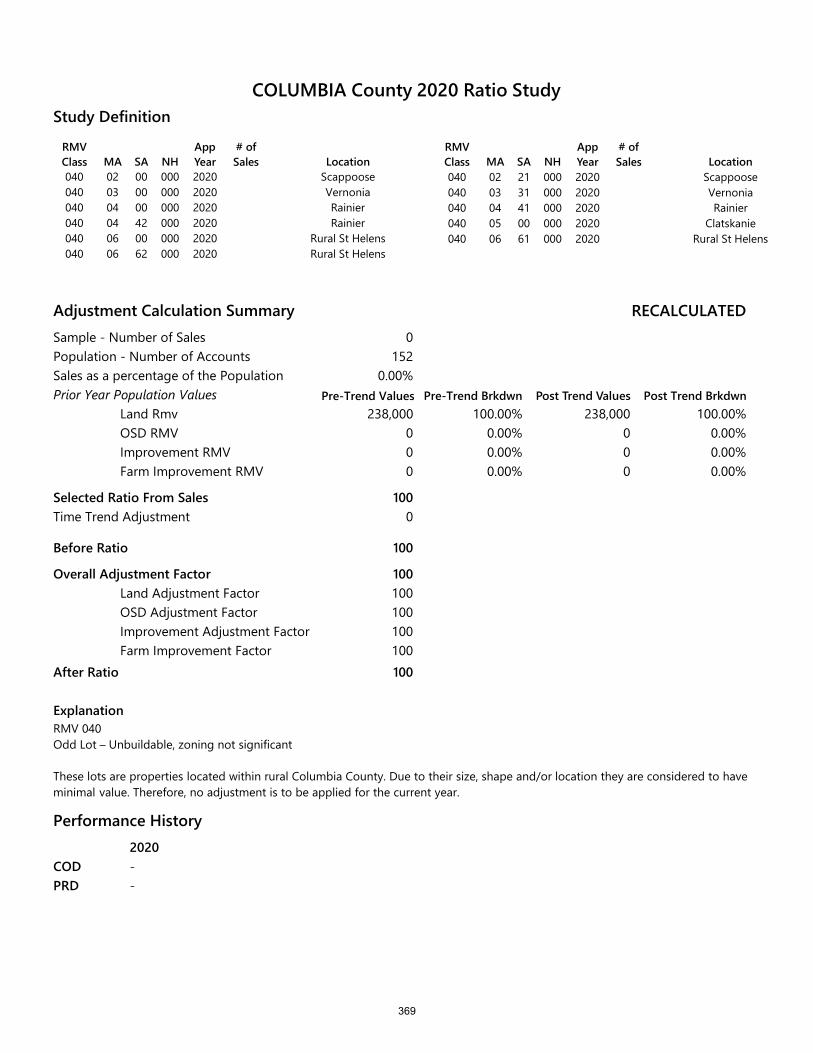
RMV Class MA SA NH
App Year
# of Sales Location
040 02 00 000 2020 Scappoose040 03 00 000 2020 Vernonia040 04 00 000 2020 Rainier040 04 42 000 2020 Rainier040 06 00 000 2020 Rural St Helens040 06 62 000 2020 Rural St Helens
RMV Class MA SA NH
App Year
# of Sales Location
040 02 21 000 2020 Scappoose040 03 31 000 2020 Vernonia040 04 41 000 2020 Rainier040 05 00 000 2020 Clatskanie040 06 61 000 2020 Rural St Helens
Study Definition
Adjustment Calculation SummarySample - Number of SalesPopulation - Number of AccountsSales as a percentage of the PopulationPrior Year Population Values
Land RmvOSD RMVImprovement RMVFarm Improvement RMV
Selected Ratio From Sales
Before Ratio
Overall Adjustment FactorLand Adjustment FactorOSD Adjustment FactorImprovement Adjustment FactorFarm Improvement Factor
After Ratio
ExplanationRMV 040Odd Lot – Unbuildable, zoning not significant
RECALCULATED
Pre-Trend Brkdwn Post Trend Values Post Trend Brkdwn
0152
0.00%
238,000 100.00% 238,000 100.00%000
0.00% 0 0.00%0.00% 0 0.00%0.00% 0 0.00%
100
100
100100100100100100
Time Trend Adjustment 0
These lots are properties located within rural Columbia County. Due to their size, shape and/or location they are considered to have minimal value. Therefore, no adjustment is to be applied for the current year.
Performance History2020--
CODPRD
COLUMBIA County 2020 Ratio Study
Pre-Trend Values
369

0
1Sales(Ratio) Sales(After Ratio)
Frequency Median
AD
CODMeanSDCOVWtd MeanGeoMeanPRD95% ConfidenceNumber Of Sales 0
0
1Mean Median Mean Trend Median Trend
Central Tendencies Month Mean Median Sales
Sales(Ratio)
Sales(After Ratio)
COLUMBIA County 2020 Ratio Study
370
ISLANDS
STUDY AREA 60
371
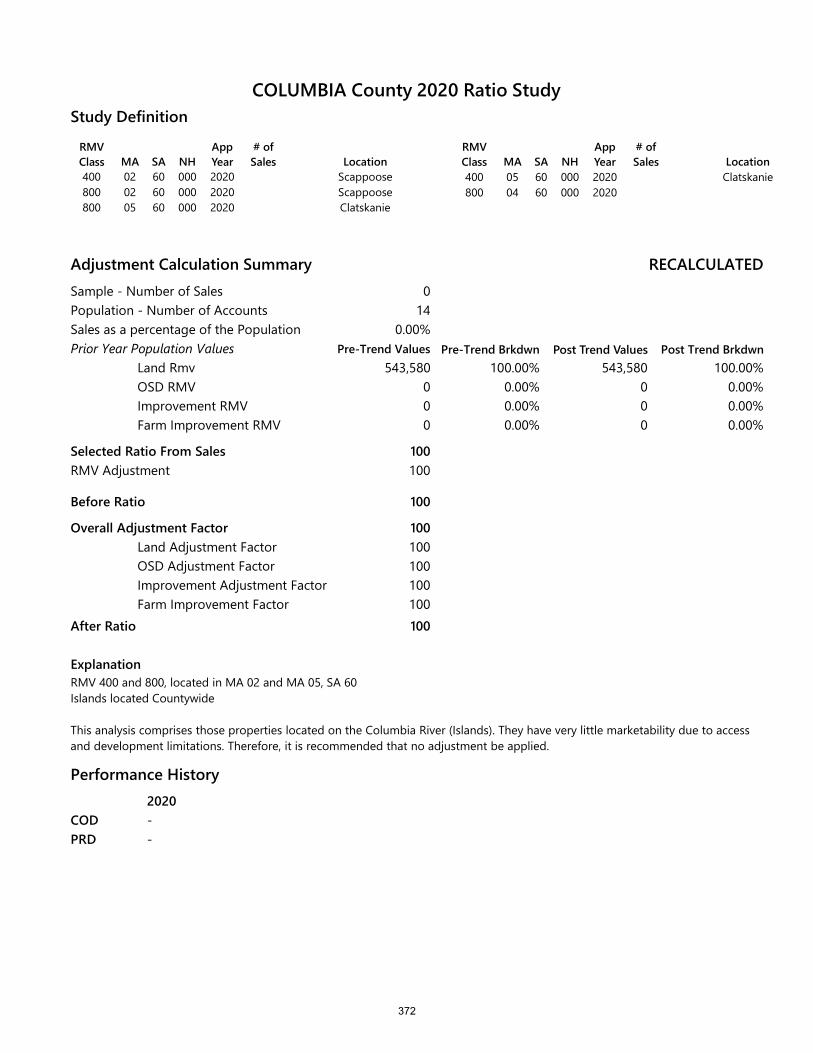
RMV Class MA SA NH
App Year
# of Sales Location
400 02 60 000 2020 Scappoose800 02 60 000 2020 Scappoose800 05 60 000 2020 Clatskanie
RMV Class MA SA NH
App Year
# of Sales Location
400 05 60 000 2020 Clatskanie800 04 60 000 2020
Study Definition
Adjustment Calculation SummarySample - Number of SalesPopulation - Number of AccountsSales as a percentage of the PopulationPrior Year Population Values
Land RmvOSD RMVImprovement RMVFarm Improvement RMV
Selected Ratio From SalesRMV Adjustment
Before Ratio
Overall Adjustment FactorLand Adjustment FactorOSD Adjustment FactorImprovement Adjustment FactorFarm Improvement Factor
After Ratio
ExplanationRMV 400 and 800, located in MA 02 and MA 05, SA 60Islands located Countywide
RECALCULATED
Pre-Trend Brkdwn Post Trend Values Post Trend Brkdwn
014
0.00%
543,580 100.00% 543,580 100.00%000
0.00% 0 0.00%0.00% 0 0.00%0.00% 0 0.00%
100100
100
100100100100100100
This analysis comprises those properties located on the Columbia River (Islands). They have very little marketability due to access and development limitations. Therefore, it is recommended that no adjustment be applied.
Performance History2020--
CODPRD
COLUMBIA County 2020 Ratio Study
Pre-Trend Values
372

0
1Sales(Ratio) Sales(After Ratio)
Frequency Median
AD
CODMeanSDCOVWtd MeanGeoMeanPRD95% ConfidenceNumber Of Sales 0
0
1Mean Median Mean Trend Median Trend
Central Tendencies Month Mean Median Sales
Sales(Ratio)
Sales(After Ratio)
COLUMBIA County 2020 Ratio Study
373
AREAS OF CONCERN
COEFFICIENT OF DISPERSION AND
PRICE RELATED DIFFERENTIAL
374
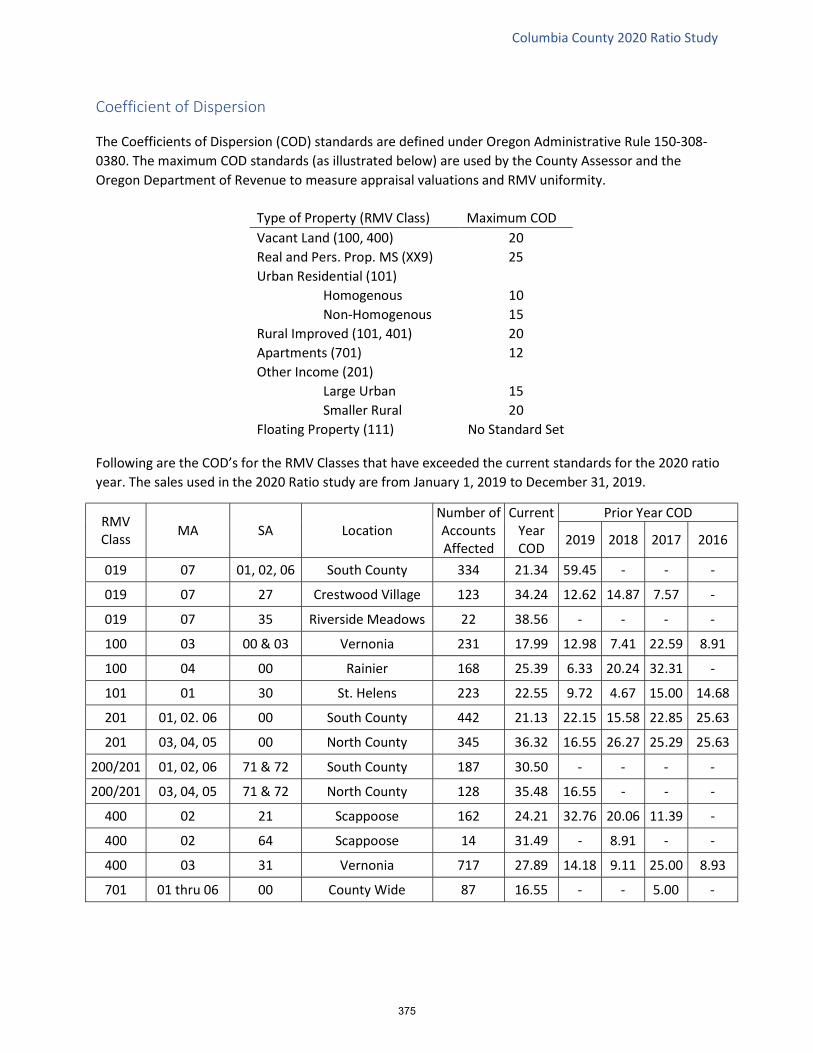
Columbia County 2020 Ratio Study
Coefficient of Dispersion
The Coefficients of Dispersion (COD) standards are defined under Oregon Administrative Rule 150-308-0380. The maximum COD standards (as illustrated below) are used by the County Assessor and the Oregon Department of Revenue to measure appraisal valuations and RMV uniformity.
Following are the COD’s for the RMV Classes that have exceeded the current standards for the 2020 ratio year. The sales used in the 2020 Ratio study are from January 1, 2019 to December 31, 2019.
RMV Class MA SA Location
Number of Accounts Affected
Current Year COD
Prior Year COD
2019 2018 2017 2016
019 07 01, 02, 06 South County 334 21.34 59.45 - - -
019 07 27 Crestwood Village 123 34.24 12.62 14.87 7.57 -
019 07 35 Riverside Meadows 22 38.56 - - - -
100 03 00 & 03 Vernonia 231 17.99 12.98 7.41 22.59 8.91
100 04 00 Rainier 168 25.39 6.33 20.24 32.31 -
101 01 30 St. Helens 223 22.55 9.72 4.67 15.00 14.68
201 01, 02. 06 00 South County 442 21.13 22.15 15.58 22.85 25.63
201 03, 04, 05 00 North County 345 36.32 16.55 26.27 25.29 25.63
200/201 01, 02, 06 71 & 72 South County 187 30.50 - - - -
200/201 03, 04, 05 71 & 72 North County 128 35.48 16.55 - - -
400 02 21 Scappoose 162 24.21 32.76 20.06 11.39 -
400 02 64 Scappoose 14 31.49 - 8.91 - -
400 03 31 Vernonia 717 27.89 14.18 9.11 25.00 8.93
701 01 thru 06 00 County Wide 87 16.55 - - 5.00 -
Type of Property (RMV Class) Maximum COD Vacant Land (100, 400) 20 Real and Pers. Prop. MS (XX9) 25 Urban Residential (101)
Homogenous 10 Non-Homogenous 15
Rural Improved (101, 401) 20 Apartments (701) 12 Other Income (201)
Large Urban 15 Smaller Rural 20
Floating Property (111) No Standard Set
375
Columbia County 2020 Ratio Study
Explanation for properties out of the COD range:
MA 01, SA 30, RMV Class 101 – This classification of properties are those that are designated as “Duplex, Tri-plex and Four-plex”. There were too few sales to use in the ratio study however, this grouping of properties has been impacted by the supply and demand of the current market due to the limited availability of single family residences located in St. Helens. It is expected the market will level out this next year resulting in an improved COD level.
MA 02, SA 21 and SA 64, RMV Class 400 - This area is comprised of vacant land located in rural Scappoose. There were not enough sales provided for both of these studies to determine reliable ratios. As the population moves further in to the rural areas of the County, we anticipate the COD indicators will fall back into range as the market continues to grow.
MA 03, SA 00 and SA 03, RMV Class 100 – Un-improved property located in the General area and FEMA Floodway in City of Vernonia. The COD indicator is slightly over the current COD standard. Sales have increased greatly in this area over the past year due to the influence from Hillsboro and Forest Grove. As growth continues, we will continue to monitor this area.
MA 03, SA 31, RMV Class 400 – the sales for this area represent 0.70% of the population which is insufficient for the ratio study analysis. As the market continues to be influenced by the Hillsboro and Portland areas, properties in the city have dwindled in availability. It is expected that the market in the rural areas of Vernonia will increase. Therefore, we will continue to monitor this area and anticipate an appropriate COD range in the coming year.
MA 04, SA 00, RMV Class 100 – there were only two arm’s length transactions available in this area which were deemed insufficient in quantity to apply to the ratio analysis. This area continues to see growth as the areas located in South County become more populated resulting in fewer properties available to purchase. It is anticipated that more sales will occur in this area next year and that the COD indicator will be back in standard range.
RMV Class 019 located in MA 07 SA 01, 02, 06 (South County), SA 27 (Crestwood Village), and SA 35 (Riverside Meadows) - this RMV Class is designated as personal property manufactured structures. The intent for the next appraisal year is to perform an analysis of these areas: review classing benchmarks, local cost modifiers and to analyze the current depreciation schedules. It is believed this will bring the Real Market Value of these properties in line with the current market and reduce the current COD indicators.
RMV Class 200 and RMV Class 201, County Wide – For the 2020/2021 appraisal year, all Commercial properties will be reviewed and re-appraised. Current study areas will be analyzed, land tables adjusted, and benchmarks reviewed. As Columbia County continues to be influenced by the Portland market, we anticipate an increase in demand for this property type.
RMV Class 701, County Wide – This classification of properties has seen an increase of sales (5 this ratio year) and it is anticipated the demand may continue to rise as the influence of the Portland market increases. For the next appraisal year, an analysis will be performed and sales will be reviewed in order to develop a new land schedule.
376
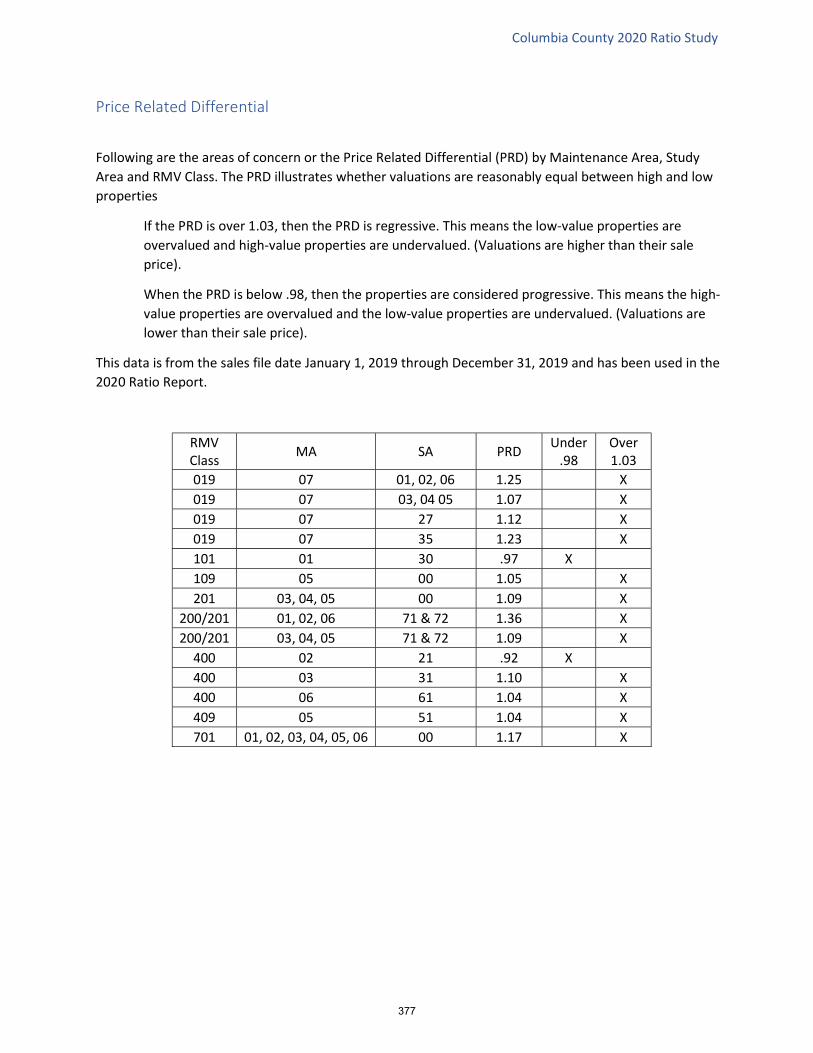
Columbia County 2020 Ratio Study
Price Related Differential
Following are the areas of concern or the Price Related Differential (PRD) by Maintenance Area, Study Area and RMV Class. The PRD illustrates whether valuations are reasonably equal between high and low properties
If the PRD is over 1.03, then the PRD is regressive. This means the low-value properties are overvalued and high-value properties are undervalued. (Valuations are higher than their sale price).
When the PRD is below .98, then the properties are considered progressive. This means the high-value properties are overvalued and the low-value properties are undervalued. (Valuations are lower than their sale price).
This data is from the sales file date January 1, 2019 through December 31, 2019 and has been used in the 2020 Ratio Report.
RMV Class MA SA PRD Under
.98 Over 1.03
019 07 01, 02, 06 1.25 X 019 07 03, 04 05 1.07 X 019 07 27 1.12 X 019 07 35 1.23 X 101 01 30 .97 X 109 05 00 1.05 X 201 03, 04, 05 00 1.09 X
200/201 01, 02, 06 71 & 72 1.36 X 200/201 03, 04, 05 71 & 72 1.09 X
400 02 21 .92 X 400 03 31 1.10 X 400 06 61 1.04 X 409 05 51 1.04 X 701 01, 02, 03, 04, 05, 06 00 1.17 X
377
APPENDIX A RECALCULATION
AND REAPPRAISAL SETUPS
378
2020 Annual Recalculation and Reappraisal Setup
Due to limited resources, a complete recalculation and reappraisal setup was not conducted for the 2020-21 tax year.
Minor changes were made to the depreciation tables to reflect one additional year of depreciation. Otherwise, the factors published in the 2019 Annual Recalculation and Reappraisal Setup were used for the 2020 tax year. A ratio study will be conducted to trend the resulting recalculated values to January 1, 2020.
A new setup study is planned for the 2021-22 tax year.
Sue Martin Columbia County Assessor

2019 Annual Recalculation and Reappraisal Setup Studies for All Residential Properties
in Columbia County for Property Tax Assessment
Published by the Columbia County Assessor
January 2, 2019

Table of Contents INTRODUCTION ............................................................................................................................................ 1
Summary of the Mass Appraisal of Property............................................................................................ 1
Sales Reviews and Coding ......................................................................................................................... 1
Pre-appraisal and Recalculation Setup ..................................................................................................... 2
Base Appraisal Date .............................................................................................................................. 2
Time Study ............................................................................................................................................ 2
Land Values ........................................................................................................................................... 2
Local Cost Modifier (LCM)..................................................................................................................... 2
Depreciation Study................................................................................................................................ 3
Adjustment Study ................................................................................................................................. 3
Reappraisal vs. Recalculation.................................................................................................................... 3
Physical Reappraisal.............................................................................................................................. 3
Recalculation......................................................................................................................................... 4
New Construction ................................................................................................................................. 4
Ratio Study................................................................................................................................................ 4
2019 Time Study Analysis and Conclusions .................................................................................................. 5
Time Trend Study for all Maintenance Areas (MA) .................................................................................. 6
2019 Land Analysis and Conclusions............................................................................................................. 9
Maintenance Area (MA) 1, City of Saint Helens Land Setup ..................................................................10
MA 1 City of Saint Helens Recalculation Land Schedules for 2019.....................................................12
Maintenance Area (MA) 2, City of Scappoose Land Setup .....................................................................13
MA 2 City of Scappoose Recalculation Land Schedules for 2019 .......................................................14
Maintenance Area (MA) 2, Rural Scappoose Land Setup .......................................................................15
MA 2 Rural Scappoose Recalculation Land Schedules for 2019 .........................................................16
Maintenance Area (MA) 3, City of Vernonia Land Setup........................................................................18
MA 3 City of Vernonia Reappraisal Land Schedules for 2019.............................................................19
Maintenance Area (MA) 3, Rural Vernonia Land Setup..........................................................................20
MA 3 Rural Vernonia Reappraisal Land Schedules for 2019...............................................................21
Maintenance Area (MA) 4, City of Rainier Land Setup ...........................................................................22
MA 4 City of Rainier Recalculation Land Schedules for 2019 .............................................................23
Maintenance Area (MA) 4, Rural Rainier Land Setup .............................................................................24
MA 4 Rural Rainier Recalculation Land Schedules for 2019 ...............................................................25
[i]
MA 4 Rural Rainier Recalculation Land Schedules for 2019 (continued) ...........................................26
Maintenance Area (MA) 5, City of Clatskanie Land Setup......................................................................27
MA 5 City of Clatskanie Recalculation Land Schedules for 2019 ........................................................28
Maintenance Area (MA) 5, Rural Clatskanie Land Setup........................................................................29
MA 5 Rural Clatskanie Recalculation Land Schedules for 2019 ..........................................................30
Maintenance Area (MA) 6, City of Columbia City Land Setup ................................................................31
MA 6 City of Columbia City Recalculation Land Schedules for 2019 ..................................................32
Maintenance Area (MA) 6, Rural Saint Helens Land Setup ....................................................................33
MA 6 Rural Saint Helens Recalculation Land Schedules for 2019.......................................................34
2019 On-Site Development (OSD) Analysis and Conclusions ....................................................................35
Maintenance Area 1, City of Saint Helens On-Site Development (OSD) Study ......................................36
Maintenance Area 2, City of Scappoose On-Site Development (OSD) Study .........................................37
Maintenance Area 2, Rural Scappoose On-Site Development (OSD) Study...........................................38
Maintenance Area 3, City of Vernonia On-Site Development (OSD) Study............................................40
Maintenance Area 3, Rural Vernonia On-Site Development (OSD) Study..............................................41
Maintenance Area 4, City of Rainier On-Site Development (OSD) Study ...............................................43
Maintenance Area 4, Rural Rainier On-Site Development (OSD) Study.................................................44
Maintenance Area 4, City of Prescott On-Site Development (OSD) Study.............................................46
Maintenance Area 5, City of Clatskanie On-Site Development (OSD) Study..........................................48
Maintenance Area 5, Rural Clatskanie On-Site Development (OSD) Study............................................49
Maintenance Area 5, Fishhawk Lake On-Site Development (OSD) Study ..............................................51
Maintenance Area 6, City of Columbia City On-Site Development (OSD) Study....................................52
2019 Local Cost Modifiers (LCM) Analysis and Conclusions ......................................................................55
Countywide Local Cost Modifier (LCM) Study for Conventional Dwellings............................................56
Countywide Local Cost Modifier (LCM) Study Manufactured Dwellings................................................57
Countywide Local Cost Modifier (LCM) Study for Floating Property......................................................58
Countywide Local Cost Modifier (LCM) for Farm Buildings ....................................................................59
2019 Depreciation Schedules Analysis and Conclusions ............................................................................61
Countywide Depreciation Study for Conventional Single Family Dwellings...........................................62
Countywide Conventional Single Family Dwelling Depreciation Schedule for 2019..........................63
Countywide Effective Year Built Based on Condition For Conventional Single Family Dwellings and Multi Family Dwellings for 2019 .........................................................................................................64
Countywide Depreciation Study for Multi-Family Dwellings..................................................................65
[ii]
Countywide Effective Year Built Based on Condition For Conventional Single Family Dwellings and Multi Family Dwellings for 2019 .........................................................................................................67
Countywide Effective Year Built Based on Condition For Real and Personal Property Manufactured
Countywide Effective Year Built Based on Condition For Real and Personal Property Manufactured
Countywide Depreciation Study for Real Property Manufactured Dwellings ........................................68
Dwellings for 2019 ..............................................................................................................................70
Countywide Depreciation Study for Personal Property Manufactured Dwellings .................................71
Countywide Personal Property Manufactured Dwelling Depreciation Schedule for 2019 ................72
Dwellings for 2019 ..............................................................................................................................72
Countywide Depreciation Study for Floating Property...........................................................................73
Countywide Floating Property Depreciation Schedule for 2019 ........................................................74
Countywide Effective Year Built Based on Condition for Floating Property for 2019 ........................75
Countywide Depreciation Study for Farm Buildings...............................................................................76
Countywide Farm Building Depreciation Schedule for 2019..............................................................77
2019 Land Adjustments Analysis and Conclusions .....................................................................................79
MA 01 and MA 06 (City) Adjustment Study for Premium Location........................................................80
MA 02 City Adjustment for Premium Location.......................................................................................81
MA 3 SA 03 Adjustment Study for Non-Elevated Homes in the Floodplain ...........................................83
Countywide Adjustment Study for Topography .....................................................................................84
Maintenance Area 4 and 5 Adjustment Study for Views........................................................................85
Maintenance Area 1, 2 and 6 Adjustment Study for Views....................................................................86
Maintenance Area 4 Adjustment Study for City of Rainier Slide Area ...................................................87
MA 04 SA 47 Adjustment Study for Riverfront Properties .....................................................................88
2019 Adjustment Study for Over-Improved Properties..........................................................................89
Other Adjustments Where a Study was Not Completed for 2019 .........................................................90
Creek Adjustment ...............................................................................................................................90
Busy Street Adjustment ......................................................................................................................90
Transmission Lines - Countywide........................................................................................................90
2 Parcels/Taxlot, 3 Parcels/Taxlot - Countywide ................................................................................90
Partition Costs - Countywide ..............................................................................................................90
Appeal Adjustments............................................................................................................................90
[iii]

INTRODUCTION
As part of our effort to provide as much information to the public as possible who are interested in how a mass appraisal system works and the steps taken to study the current market and apply our conclusions to all residential properties annually, we are publishing our setup analysis on our website. This document includes our methods, analysis, and conclusions. The raw data used for this setup is not included in this publication, however, it is available in our office.
In order to ensure statewide uniformity in administering Oregon’s Property Tax Laws, the Oregon Department of Revenue (DOR) exercises its supervisory authority over the property tax system under Oregon Revised Statute (ORS) 306.115. In addition to its statewide supervisory authority, under ORS 306.120, DOR must develop and provide manuals and instruction to all county assessors to ensure uniform methods of assessments. The publication developed by DOR and used as a guide for our setup is the “Appraisal Methods” manual. This manual, along with the “Cost Factors for Residential Buildings” and “Cost Factors for Farm Buildings”, can be found on and downloaded from the DOR’s website at http://www.oregon.gov/DOR/forms/.
Summary of the Mass Appraisal of Property
Mass Appraisal is an accepted method of appraisal and is not simply a cost approach to value.
A successful mass appraisal of residential properties in a selected area is dependent on an in-depth analysis of recent sales to determine land values, local cost modifiers to apply to our cost factors, and to develop local market-based depreciation schedules based on age and condition of structures. Set-up includes establishing benchmark properties to be used in determining class quality and condition of properties being reappraised so each appraiser can be consistent. Whenever a new residential cost factor book is published by the Department of Revenue, a local class quality benchmark study is completed to increase uniformity among appraisers when determining the class quality of a dwelling. Several homes of varying ages, design and quality are selected throughout the county and compared to the class quality descriptions given in the cost factor book. A class quality benchmark notebook is developed and used during the reappraisal process in addition to the cost factor book.
Sales Reviews and Coding
All real property deeds recorded in the county clerk’s office and personal property sales brought to our attention through various sources are reviewed on an ongoing basis to determine whether or not the sale meets the definition of ‘Real Market Value’. Real Market Value is defined under ORS 308.205(1):
Real market value of all property, real and personal, means the amount in cash that could reasonably be expected to be paid by an informed buyer to an informed seller, each acting without compulsion in an arm’s-length transaction occurring as of the assessment date for the tax year.
[1]

Each sale is coded based on the conditions of the sale, such as sale between relatives, foreclosures, confirmed market sale, etc. On sales considered to be market sales (meet the definition of real market value), the property is reviewed to determine if it is adequately described in our records. If the property is in better or worse condition, or inventory items are missing or overstated, our records are corrected to reflect the property as it sold. Only those sales that meet the definition of real market value are used in our setup studies.
Pre-appraisal and Recalculation Setup
Base Appraisal Date
Before a setup can be started, a base appraisal date must be selected. All sales data must be adjusted to this date. Generally, sales that occurred during the previous 12 months are used for the setup studies. However, when there are insufficient sales for a study, sales for the last 2 or more years may be included.
Time Study
A time study must be completed to determine if the market has been steady or if a time adjustment must be applied to all sales used in the study to adjust the sales prices to the base appraisal date.
Land Values
Vacant land sales in each Maintenance Area (MA) and Study Area (SA) are analyzed and graphed according to size and time adjusted sale price. This data is used to determine the typical value per acre (or square foot) of land for different size parcels and is converted to a land table used to calculate the land value of a property. Typical on-site development costs are gathered by obtaining cost data from general contractors and utility companies to determine the amount of on-site development (OSD) to add to the land value on improved properties. When there are not enough vacant land sales in a specific area to develop a land schedule, the improved sales for that area are set aside to use after the LCM and Depreciation Studies have been completed in order to ‘extract’ the land value from the sales price.
Local Cost Modifier (LCM)
In order to adjust the “Cost Factor Book for Residential Buildings” provided by the Department of Revenue to reflect local area costs, sales of new homes are analyzed. With the land study complete, the calculated land value and OSD are subtracted from the time adjusted sales price to determine the residual value attributed to the new home. Using the cost factor book, a replacement cost is calculated for the new home and accessory improvements. The residual value is then divided by the replacement cost new to determine the local cost modifier to be applied to the cost factor book for all improvements. If there are limited sales of properties with new homes, an analysis of homes that were built by a contractor hired by the land owner is included. The total contractor price is divided by the replacement cost new to determine a local cost modifier. In the absence of any sales data, local contractors are contacted to try to
[2]
determine an appropriate local cost modifier. This is generally the method used for general purpose and farm buildings. A separate LCM is calculated for conventional dwellings, manufactured dwellings, floating property and farm buildings.
Depreciation Study
Sales of improved properties are analyzed based on age and condition. Only verified market sales are used. The calculated land value and OSD are subtracted from the time adjusted sales price of each property to determine the residual value attributable to the dwelling and accessory improvements. A replacement cost new with the local modifier applied is calculated for the dwelling and any accessory improvements. The residual value is then divided by the adjusted replacement cost new to determine the depreciation for that age and condition. Once all the sales have been analyzed, the data is graphed based on age and condition to develop a depreciation schedule that is based on effective age. A separate schedule is created to restrict effective year to be selected based on physical age and noted condition (poor, fair, average, good, excellent). This ensures consistency among appraisers when selecting an effective age that is different than the physical age of a structure. A separate depreciation study is conducted for conventional single family dwellings, multi-family dwellings, manufactured dwellings sited on real property (same ownership and considered real property), manufactured dwellings sited in a park or other leased site (these are considered personal property), and floating property. A straight line depreciation schedule is used for general purpose and farm buildings, since it is not possible to extract enough data to base their depreciation on sales.
Adjustment Study
During the previous studies, sales of properties identified as having potential adjustments due to topography, views, or other unique features are set aside to determine the value of various factors that may influence value. After all studies have been completed, including the extraction method for determining land values in areas with insufficient vacant land sales, these sales are analyzed based on the type of adjustment and the area they are located in, however, if there is insufficient data, nearby areas may be combined in the study. By comparing the total sales price of the sold property with the total calculated cost of land, OSD and depreciated dwelling, the difference gives an indication of the value of the adjustment.
Reappraisal vs. Recalculation
Physical Reappraisal
With resources becoming more limited, very few interior inspections are completed during a reappraisal. The appraiser will determine class quality and condition of the structures from the exterior, attempt to contact owner to verify inventory at the door, and note any necessary adjustments for topography, views or any other factor that would likely have an effect on the value. The last appraisal diagram and inventory are reviewed to determine if there have been any changes to the property. The value of the property is calculated electronically using the
[3]
factors developed in the setup study.
Recalculation
Recalculation is an electronic revaluation of properties based on factors developed during the setup study and the existing inventory in our system. These properties are not visited to determine if any changes have taken place, however, the recalculation is a more reliable method of maintaining accurate real market values rather than relying solely on a ratio study to determine overall market trends.
New Construction
New construction throughout the county is physically inspected and appraised using the setup factors for the area.
Ratio Study
A ratio study is an analysis of sales in all study areas to determine the percentage of market increase or decrease in each study area since the base appraisal date selected in our setup. The study separates properties by type, such as commercial, industrial or residential, by location or study area, and by improved or vacant. All sales are time adjusted to the assessment date of January 1 before comparing to our current value. Once complete, the resulting trends are electronically applied to all properties prior to certifying the assessment roll.
[4]
2019 Time Study Analysis and Conclusions
[5]

Time Trend Study for all Maintenance Areas (MA)
Analysis
Before any setup studies can be conducted, a time trend for each Maintenance Area must be completed to adjust sales to the selected base appraisal date. The selected base appraisal date for the 2019 reappraisal and recalculation of residential properties countywide is January 1, 2018. A separate time study was completed for City Residential Property and Rural Residential Property in each Maintenance Area.
All sales of residential properties that occurred between January 1, 2017 and December 31, 2017 that reflected real market value were extracted from our sales files. The sales were separated based on Maintenance Area and property type (city or rural). The total sales price of all properties for each area was compared to our January 1, 2017 base RMV of the same properties, which gives an estimated market trend for the entire 2017 year. The trend is divided by 12 in order to give a per month percentage to apply to each sales price, based on the month in which the sale occurred, and used in our setup studies to reflect a sales price as of January 1, 2018.
Some studies required additional data before we were able to establish a reliable conclusion for the study. For this purpose, another time trend study was completed on properties that sold between January 1, 2018 and June 30, 2018, and separated based on Maintenance Area and property type (city or rural). The total sales price of all properties for each area was compared to our January 1, 2018 certified values (January 1, 2017 base RMV times the market trend from the 2018 Ratio Study) which gives an estimated market trend for the first half of 2018. The trend was divided by 6 in order to give a per month percentage to apply to each sales price, based on the month in which the sale occurred, and used in our setup studies to reflect a sales price as of January 1, 2018.
Conclusions
Based on the supporting data collected, there is sufficient sales data to estimate the market trends to be used to time trend sales to the base appraisal date of January 1, 2018 for city residential property and rural residential property in each maintenance area.
[6]

Time Trend Factors to be Applied to Sales Used for the 2019 Residential Setup Studies
Time Trend Rate for 2017 Sales to Reflect Base Appraisal Date of January 1, 2018
CITY AREA NO. OF SALES
ANNUAL TREND
PER MONTH TREND
Saint Helens MA 1 210 0.1474 0.0123 Scappoose MA 2 110 0.1792 0.0149 Vernonia MA 3 42 0.1155 0.0096 Rainier MA 4 20 0.0084 0.0007 Clatskanie MA 5 23 0.0207 0.0017 Columbia City MA 6 30 0.1569 0.0131
RURAL AREA NO. OF SALES
ANNUAL TREND
PER MONTH TREND
Rural Scappoose MA 2 42 0.0979 0.0082 Rural Vernonia MA 3 35 -0.1392 -0.0116 Rural Rainier MA 4 30 0.0359 0.0030 Rural Clatskanie MA 5 34 0.1093 0.0091 Rural Saint Helens MA 6 77 0.0832 0.0069
Time Trend Rate for 2018 Sales to Reflect Base Appraisal Date of January 1, 2018
CITY AREA NO. OF SALES
ANNUAL TREND
PER MONTH TREND
Saint Helens MA 1 109 0.0949 0.0158 Scappoose MA 2 49 0.0560 0.0093 Vernonia MA 3 21 0.0379 0.0063 Rainier MA 4 15 0.0446 0.0074 Clatskanie MA 5 19 0.0141 0.0024 Columbia City MA 6 13 0.0053 0.0009
RURAL AREA NO. OF SALES
ANNUAL TREND
PER MONTH TREND
Rural Scappoose MA 2 11 -0.0714 -0.0119 Rural Vernonia MA 3 12 0.0154 0.0026 Rural Rainier MA 4 25 -0.0419 -0.0070 Rural Clatskanie MA 5 23 0.0123 0.0021 Rural Saint Helens MA 6 38 -0.0069 -0.0012
[7]

Notes
[8]
2019 Land Analysis and Conclusions
[9]
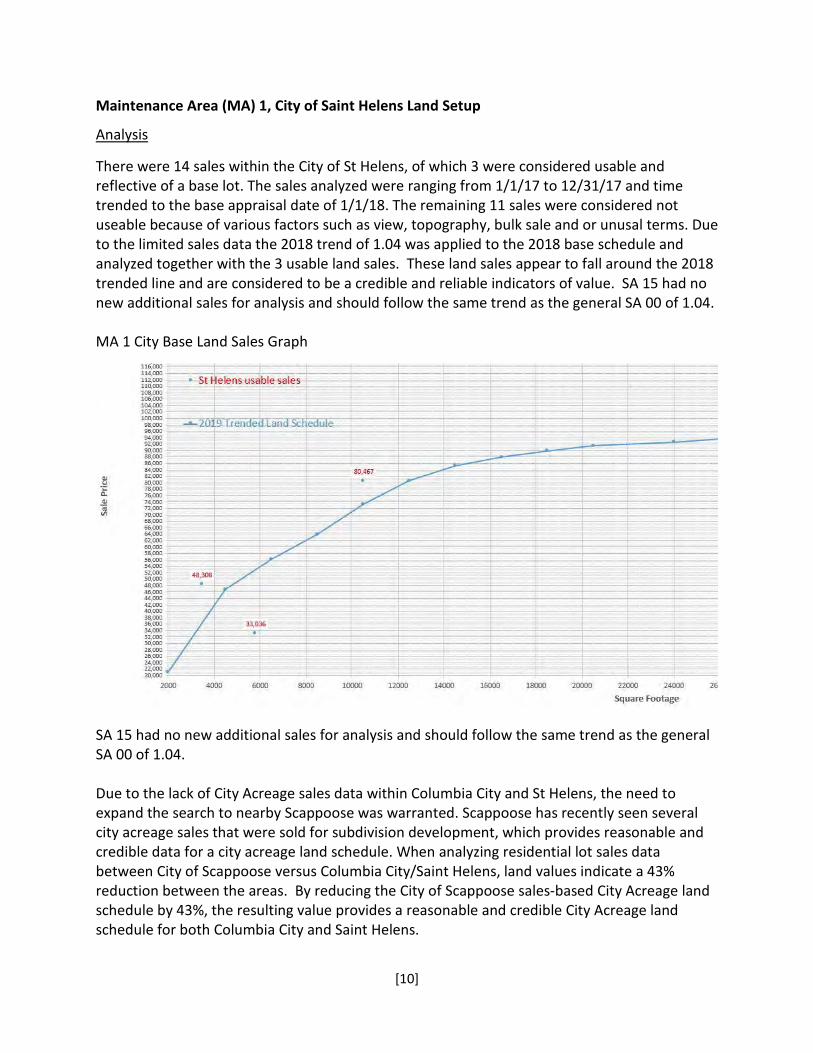
Maintenance Area (MA) 1, City of Saint Helens Land Setup
Analysis
There were 14 sales within the City of St Helens, of which 3 were considered usable and reflective of a base lot. The sales analyzed were ranging from 1/1/17 to 12/31/17 and time trended to the base appraisal date of 1/1/18. The remaining 11 sales were considered not useable because of various factors such as view, topography, bulk sale and or unusal terms. Due to the limited sales data the 2018 trend of 1.04 was applied to the 2018 base schedule and analyzed together with the 3 usable land sales. These land sales appear to fall around the 2018 trended line and are considered to be a credible and reliable indicators of value. SA 15 had no new additional sales for analysis and should follow the same trend as the general SA 00 of 1.04.
MA 1 City Base Land Sales Graph
SA 15 had no new additional sales for analysis and should follow the same trend as the general SA 00 of 1.04.
Due to the lack of City Acreage sales data within Columbia City and St Helens, the need to expand the search to nearby Scappoose was warranted. Scappoose has recently seen several city acreage sales that were sold for subdivision development, which provides reasonable and credible data for a city acreage land schedule. When analyzing residential lot sales data between City of Scappoose versus Columbia City/Saint Helens, land values indicate a 43% reduction between the areas. By reducing the City of Scappoose sales-based City Acreage land schedule by 43%, the resulting value provides a reasonable and credible City Acreage land schedule for both Columbia City and Saint Helens.
[10]
Conclusions
Based on limited sales data it is recommended to keep the 2018 base land schedue for SA 00, 15, 30 & 43 and land use code 001, 002 and 004, but to apply the 2018 trend of 1.04 for 2019.
Based on supporting data, the city acreage land schedules for Saint Helens and Columbia City will reflect a value that is 43% less than the City of Scappoose city acreage land schedule for 2019.
[11]
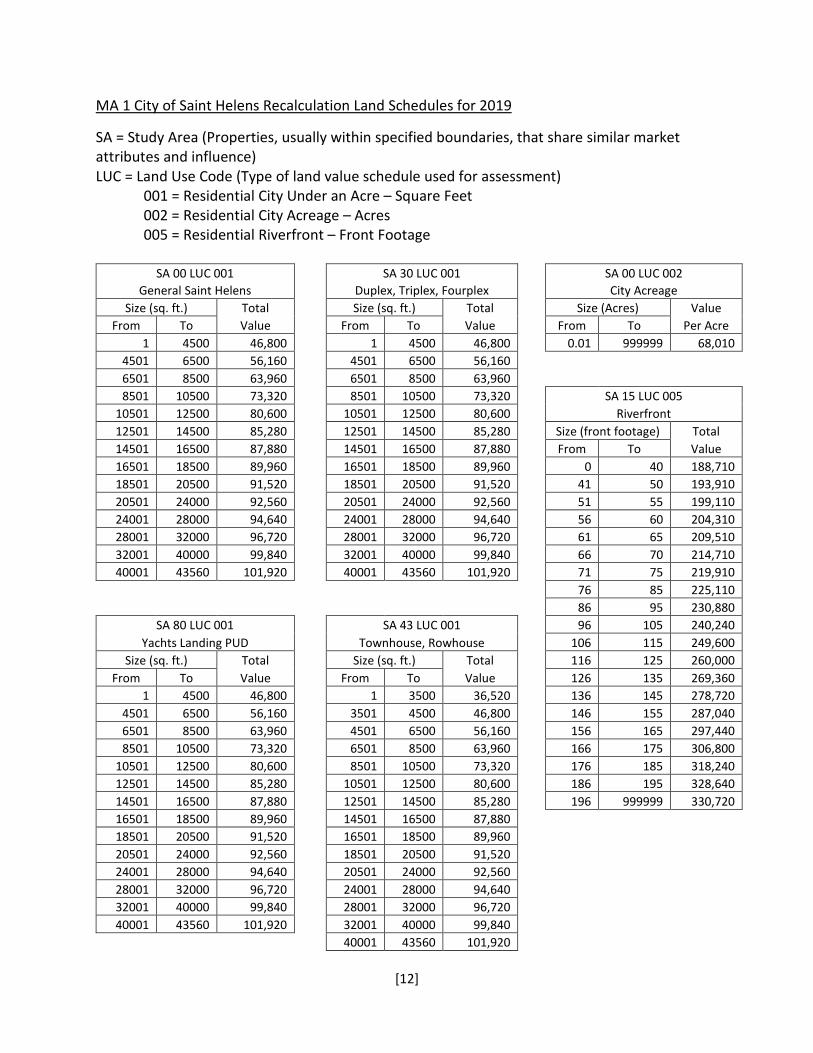
MA 1 City of Saint Helens Recalculation Land Schedules for 2019
SA = Study Area (Properties, usually within specified boundaries, that share similar market attributes and influence) LUC = Land Use Code (Type of land value schedule used for assessment)
001 = Residential City Under an Acre – Square Feet 002 = Residential City Acreage – Acres 005 = Residential Riverfront – Front Footage
SA 00 LUC 001 General Saint Helens
Size (sq. ft.) Total Value From To
1 4500 46,800 4501 6500 56,160 6501 8500 63,960 8501 10500 73,320
10501 12500 80,600 12501 14500 85,280 14501 16500 87,880 16501 18500 89,960 18501 20500 91,520 20501 24000 92,560 24001 28000 94,640 28001 32000 96,720 32001 40000 99,840 40001 43560 101,920
SA 30 LUC 001 Duplex, Triplex, Fourplex Size (sq. ft.) Total
Value From To 1 4500 46,800
4501 6500 56,160 6501 8500 63,960 8501 10500 73,320
10501 12500 80,600 12501 14500 85,280 14501 16500 87,880 16501 18500 89,960 18501 20500 91,520 20501 24000 92,560 24001 28000 94,640 28001 32000 96,720 32001 40000 99,840 40001 43560 101,920
SA 00 LUC 002 City Acreage
Size (Acres) Value Per Acre From To
0.01 999999 68,010
SA 15 LUC 005 Riverfront
Size (front footage) Total Value From To
0 40 188,710 41 50 193,910 51 55 199,110 56 60 204,310 61 65 209,510 66 70 214,710 71 75 219,910 76 85 225,110 86 95 230,880 96 105 240,240
106 115 249,600 116 125 260,000 126 135 269,360 136 145 278,720 146 155 287,040 156 165 297,440 166 175 306,800 176 185 318,240 186 195 328,640 196 999999 330,720
SA 80 LUC 001 Yachts Landing PUD
Size (sq. ft.) Total Value From To
1 4500 46,800 4501 6500 56,160 6501 8500 63,960 8501 10500 73,320
10501 12500 80,600 12501 14500 85,280 14501 16500 87,880 16501 18500 89,960 18501 20500 91,520 20501 24000 92,560 24001 28000 94,640 28001 32000 96,720 32001 40000 99,840 40001 43560 101,920
SA 43 LUC 001 Townhouse, Rowhouse
Size (sq. ft.) Total Value From To
1 3500 36,520 3501 4500 46,800 4501 6500 56,160 6501 8500 63,960 8501 10500 73,320
10501 12500 80,600 12501 14500 85,280 14501 16500 87,880 16501 18500 89,960 18501 20500 91,520 20501 24000 92,560 24001 28000 94,640 28001 32000 96,720 32001 40000 99,840 40001 43560 101,920
[12]
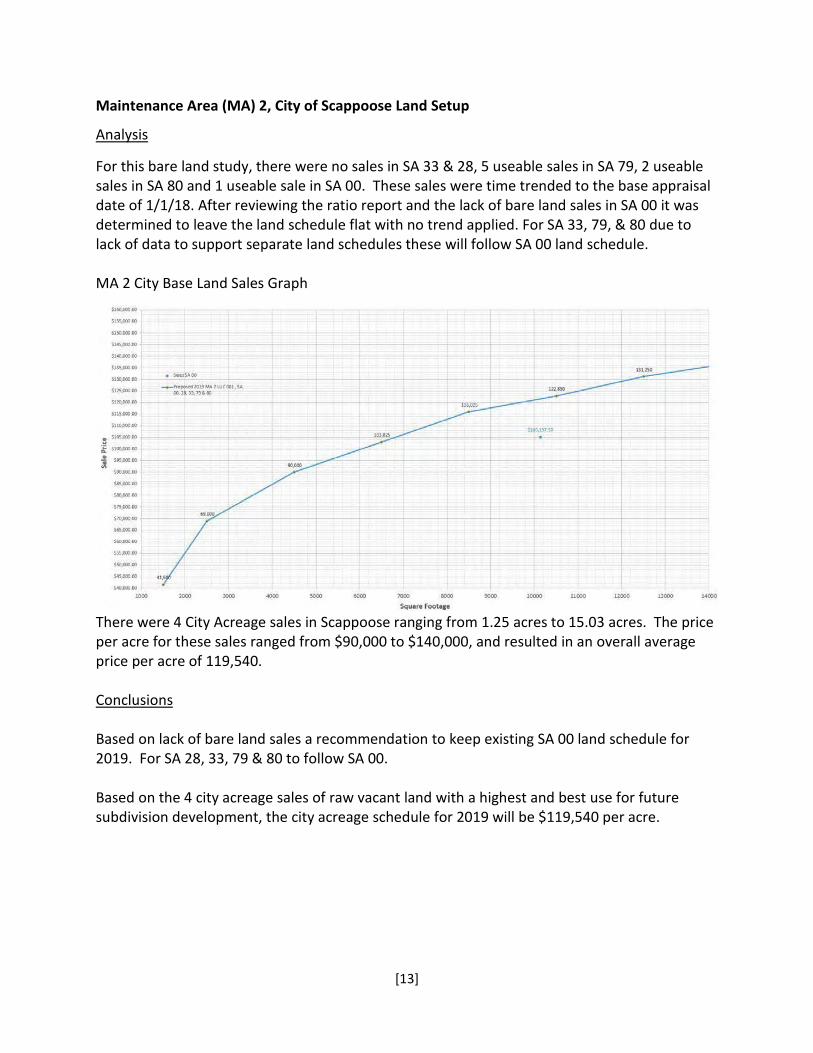
Maintenance Area (MA) 2, City of Scappoose Land Setup
Analysis
For this bare land study, there were no sales in SA 33 & 28, 5 useable sales in SA 79, 2 useable sales in SA 80 and 1 useable sale in SA 00. These sales were time trended to the base appraisal date of 1/1/18. After reviewing the ratio report and the lack of bare land sales in SA 00 it was determined to leave the land schedule flat with no trend applied. For SA 33, 79, & 80 due to lack of data to support separate land schedules these will follow SA 00 land schedule.
MA 2 City Base Land Sales Graph
There were 4 City Acreage sales in Scappoose ranging from 1.25 acres to 15.03 acres. The price per acre for these sales ranged from $90,000 to $140,000, and resulted in an overall average price per acre of 119,540.
Conclusions
Based on lack of bare land sales a recommendation to keep existing SA 00 land schedule for 2019. For SA 28, 33, 79 & 80 to follow SA 00.
Based on the 4 city acreage sales of raw vacant land with a highest and best use for future subdivision development, the city acreage schedule for 2019 will be $119,540 per acre.
[13]
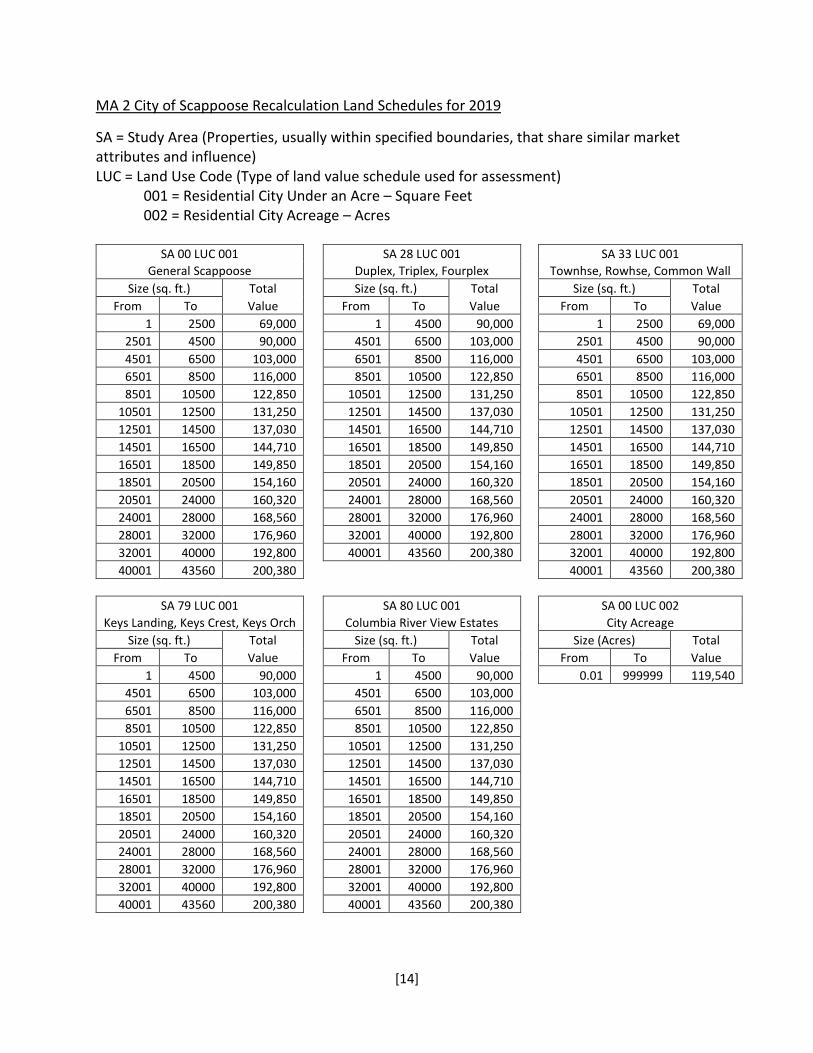
MA 2 City of Scappoose Recalculation Land Schedules for 2019
SA = Study Area (Properties, usually within specified boundaries, that share similar market attributes and influence) LUC = Land Use Code (Type of land value schedule used for assessment)
001 = Residential City Under an Acre – Square Feet 002 = Residential City Acreage – Acres
SA 00 LUC 001 General Scappoose
Size (sq. ft.) Total Value From To
1 2500 69,000 2501 4500 90,000 4501 6500 103,000 6501 8500 116,000 8501 10500 122,850
10501 12500 131,250 12501 14500 137,030 14501 16500 144,710 16501 18500 149,850 18501 20500 154,160 20501 24000 160,320 24001 28000 168,560 28001 32000 176,960 32001 40000 192,800 40001 43560 200,380
SA 28 LUC 001 Duplex, Triplex, Fourplex Size (sq. ft.) Total
Value From To 1 4500 90,000
4501 6500 103,000 6501 8500 116,000 8501 10500 122,850
10501 12500 131,250 12501 14500 137,030 14501 16500 144,710 16501 18500 149,850 18501 20500 154,160 20501 24000 160,320 24001 28000 168,560 28001 32000 176,960 32001 40000 192,800 40001 43560 200,380
SA 33 LUC 001 Townhse, Rowhse, Common Wall
Size (sq. ft.) Total Value From To
1 2500 69,000 2501 4500 90,000 4501 6500 103,000 6501 8500 116,000 8501 10500 122,850
10501 12500 131,250 12501 14500 137,030 14501 16500 144,710 16501 18500 149,850 18501 20500 154,160 20501 24000 160,320 24001 28000 168,560 28001 32000 176,960 32001 40000 192,800 40001 43560 200,380
SA 79 LUC 001 Keys Landing, Keys Crest, Keys Orch
Size (sq. ft.) Total Value From To
1 4500 90,000 4501 6500 103,000 6501 8500 116,000 8501 10500 122,850
10501 12500 131,250 12501 14500 137,030 14501 16500 144,710 16501 18500 149,850 18501 20500 154,160 20501 24000 160,320 24001 28000 168,560 28001 32000 176,960 32001 40000 192,800 40001 43560 200,380
SA 80 LUC 001 Columbia River View Estates
Size (sq. ft.) Total Value From To
1 4500 90,000 4501 6500 103,000 6501 8500 116,000 8501 10500 122,850
10501 12500 131,250 12501 14500 137,030 14501 16500 144,710 16501 18500 149,850 18501 20500 154,160 20501 24000 160,320 24001 28000 168,560 28001 32000 176,960 32001 40000 192,800 40001 43560 200,380
SA 00 LUC 002 City Acreage
Size (Acres) Total Value From To
0.01 999999 119,540
[14]
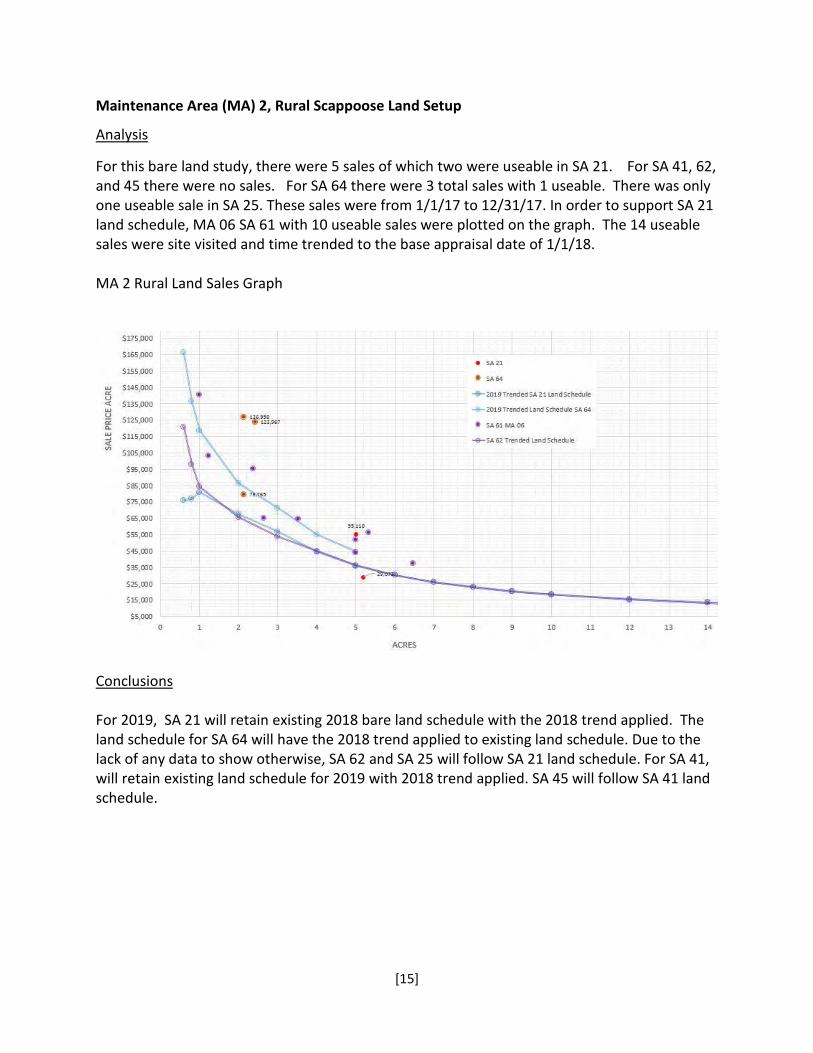
Maintenance Area (MA) 2, Rural Scappoose Land Setup
Analysis
For this bare land study, there were 5 sales of which two were useable in SA 21. For SA 41, 62, and 45 there were no sales. For SA 64 there were 3 total sales with 1 useable. There was only one useable sale in SA 25. These sales were from 1/1/17 to 12/31/17. In order to support SA 21 land schedule, MA 06 SA 61 with 10 useable sales were plotted on the graph. The 14 useable sales were site visited and time trended to the base appraisal date of 1/1/18.
MA 2 Rural Land Sales Graph
Conclusions
For 2019, SA 21 will retain existing 2018 bare land schedule with the 2018 trend applied. The land schedule for SA 64 will have the 2018 trend applied to existing land schedule. Due to the lack of any data to show otherwise, SA 62 and SA 25 will follow SA 21 land schedule. For SA 41, will retain existing land schedule for 2019 with 2018 trend applied. SA 45 will follow SA 41 land schedule.
[15]
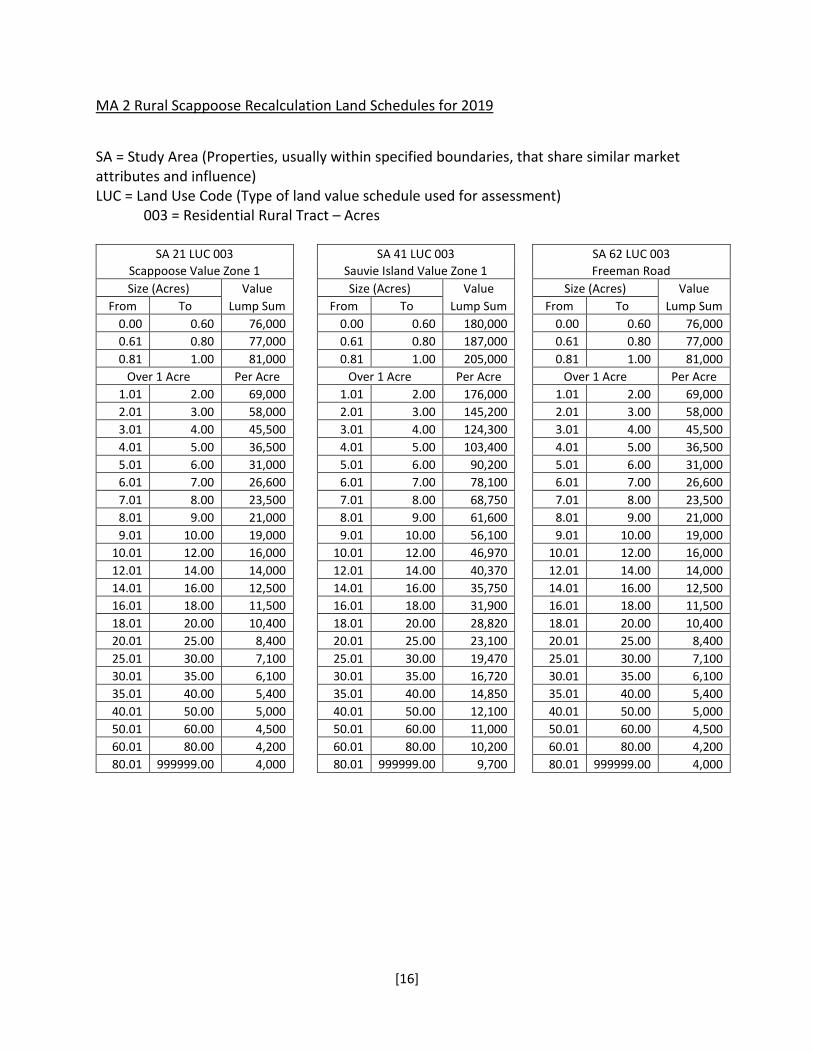
MA 2 Rural Scappoose Recalculation Land Schedules for 2019
SA = Study Area (Properties, usually within specified boundaries, that share similar market attributes and influence) LUC = Land Use Code (Type of land value schedule used for assessment)
003 = Residential Rural Tract – Acres
SA 21 LUC 003 Scappoose Value Zone 1 Size (Acres) Value
Lump Sum From To 0.00 0.60 76,000 0.61 0.80 77,000 0.81 1.00 81,000
Over 1 Acre Per Acre 1.01 2.00 69,000 2.01 3.00 58,000 3.01 4.00 45,500 4.01 5.00 36,500 5.01 6.00 31,000 6.01 7.00 26,600 7.01 8.00 23,500 8.01 9.00 21,000 9.01 10.00 19,000
10.01 12.00 16,000 12.01 14.00 14,000 14.01 16.00 12,500 16.01 18.00 11,500 18.01 20.00 10,400 20.01 25.00 8,400 25.01 30.00 7,100 30.01 35.00 6,100 35.01 40.00 5,400 40.01 50.00 5,000 50.01 60.00 4,500 60.01 80.00 4,200 80.01 999999.00 4,000
SA 41 LUC 003 Sauvie Island Value Zone 1 Size (Acres) Value
Lump Sum From To 0.00 0.60 180,000 0.61 0.80 187,000 0.81 1.00 205,000
Over 1 Acre Per Acre 1.01 2.00 176,000 2.01 3.00 145,200 3.01 4.00 124,300 4.01 5.00 103,400 5.01 6.00 90,200 6.01 7.00 78,100 7.01 8.00 68,750 8.01 9.00 61,600 9.01 10.00 56,100
10.01 12.00 46,970 12.01 14.00 40,370 14.01 16.00 35,750 16.01 18.00 31,900 18.01 20.00 28,820 20.01 25.00 23,100 25.01 30.00 19,470 30.01 35.00 16,720 35.01 40.00 14,850 40.01 50.00 12,100 50.01 60.00 11,000 60.01 80.00 10,200 80.01 999999.00 9,700
SA 62 LUC 003 Freeman Road
Size (Acres) Value Lump Sum From To
0.00 0.60 76,000 0.61 0.80 77,000 0.81 1.00 81,000
Over 1 Acre Per Acre 1.01 2.00 69,000 2.01 3.00 58,000 3.01 4.00 45,500 4.01 5.00 36,500 5.01 6.00 31,000 6.01 7.00 26,600 7.01 8.00 23,500 8.01 9.00 21,000 9.01 10.00 19,000
10.01 12.00 16,000 12.01 14.00 14,000 14.01 16.00 12,500 16.01 18.00 11,500 18.01 20.00 10,400 20.01 25.00 8,400 25.01 30.00 7,100 30.01 35.00 6,100 35.01 40.00 5,400 40.01 50.00 5,000 50.01 60.00 4,500 60.01 80.00 4,200 80.01 999999.00 4,000
[16]

MA 2 Rural Scappoose Recalculation Land Schedules for 2019 (continued)
SA 25 LUC 003 Scappoose Dikeland
Size (Acres) Value Lump Sum From To
0.00 0.60 76,000 0.61 0.80 77,000 0.81 1.00 81,000
Over 1 Acre Per Acre 1.01 2.00 69,000 2.01 3.00 58,000 3.01 4.00 45,500 4.01 5.00 36,500 5.01 6.00 31,000 6.01 7.00 26,600 7.01 8.00 23,500 8.01 9.00 21,000 9.01 10.00 19,000
10.01 12.00 16,000 12.01 14.00 14,000 14.01 16.00 12,500 16.01 18.00 11,500 18.01 20.00 10,400 20.01 25.00 8,400 25.01 30.00 7,100 30.01 35.00 6,100 35.01 40.00 5,400 40.01 50.00 5,000 50.01 60.00 4,500 60.01 80.00 4,200 80.01 999999.00 4,000
SA 45 LUC 003 Sauvie Island Dikeland
Size (Acres) Value Lump Sum From To
0.00 0.60 180,000 0.61 0.80 187,000 0.81 1.00 205,000
Over 1 Acre Per Acre 1.01 2.00 176,000 2.01 3.00 145,200 3.01 4.00 124,300 4.01 5.00 103,400 5.01 6.00 90,200 6.01 7.00 78,100 7.01 8.00 68,750 8.01 9.00 61,600 9.01 10.00 56,100
10.01 12.00 46,970 12.01 14.00 40,370 14.01 16.00 35,750 16.01 18.00 31,900 18.01 20.00 28,820 20.01 25.00 23,100 25.01 30.00 19,470 30.01 35.00 16,720 35.01 40.00 14,850 40.01 50.00 12,100 50.01 60.00 11,000 60.01 80.00 10,200 80.01 999999.00 9,700
SA 64 LUC 003 Columbia Acres/Hillcrest Size (Acres) Value
Lump Sum From To 0.00 0.60 99750 0.61 0.80 109250 0.81 1.00 118750
Over 1 Acre Per Acre 1.01 2.00 86,450 2.01 3.00 71,250 3.01 4.00 55,100 4.01 5.00 44,650
SA 64 LUC 003 Columbia Acres/Hillcrest (Unbuildable)
Size (Lots) Value Lump Sum From To
Per Platted Lot 500
[17]
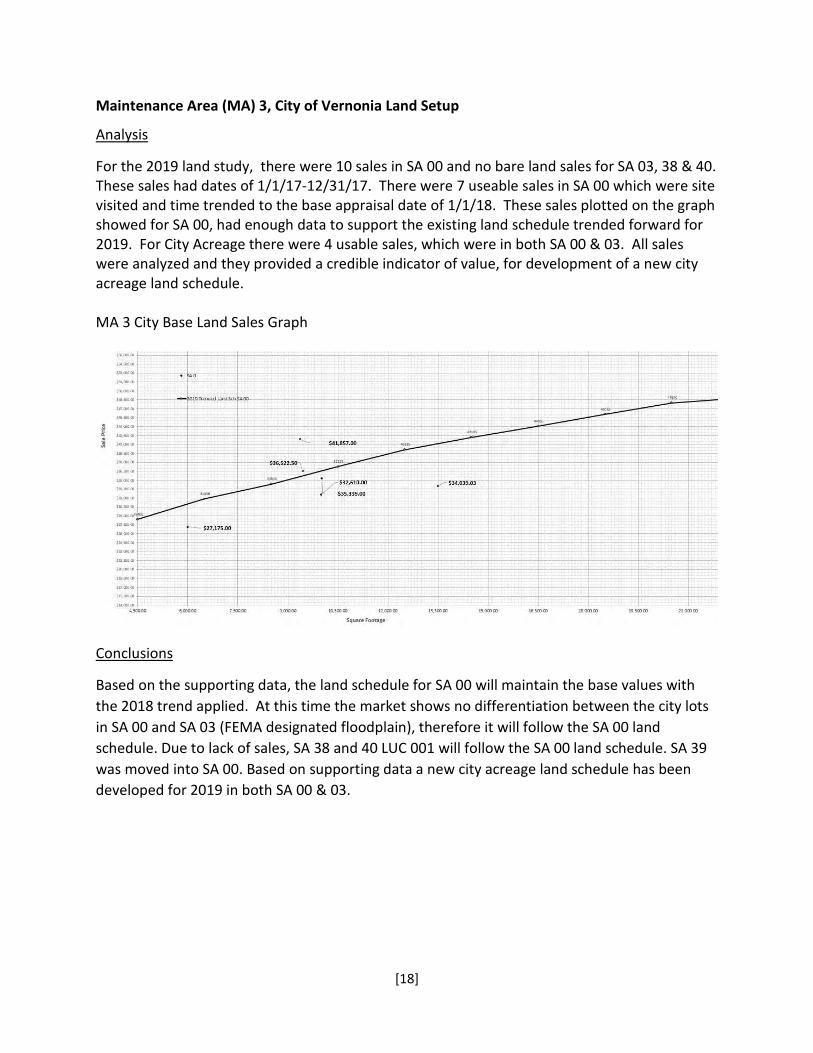
Maintenance Area (MA) 3, City of Vernonia Land Setup
Analysis
For the 2019 land study, there were 10 sales in SA 00 and no bare land sales for SA 03, 38 & 40. These sales had dates of 1/1/17-12/31/17. There were 7 useable sales in SA 00 which were site visited and time trended to the base appraisal date of 1/1/18. These sales plotted on the graph showed for SA 00, had enough data to support the existing land schedule trended forward for 2019. For City Acreage there were 4 usable sales, which were in both SA 00 & 03. All sales were analyzed and they provided a credible indicator of value, for development of a new city acreage land schedule.
MA 3 City Base Land Sales Graph
Conclusions
Based on the supporting data, the land schedule for SA 00 will maintain the base values with the 2018 trend applied. At this time the market shows no differentiation between the city lots in SA 00 and SA 03 (FEMA designated floodplain), therefore it will follow the SA 00 land schedule. Due to lack of sales, SA 38 and 40 LUC 001 will follow the SA 00 land schedule. SA 39 was moved into SA 00. Based on supporting data a new city acreage land schedule has been developed for 2019 in both SA 00 & 03.
[18]
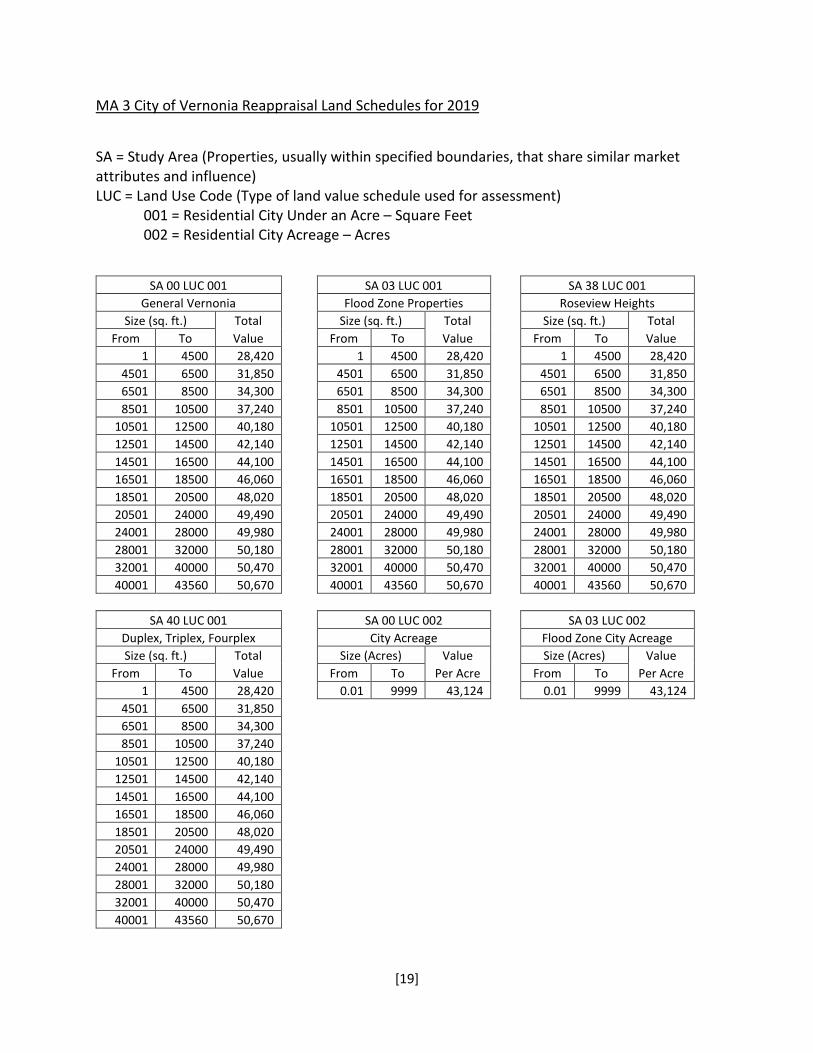
MA 3 City of Vernonia Reappraisal Land Schedules for 2019
SA = Study Area (Properties, usually within specified boundaries, that share similar market attributes and influence) LUC = Land Use Code (Type of land value schedule used for assessment)
001 = Residential City Under an Acre – Square Feet 002 = Residential City Acreage – Acres
SA 00 LUC 001 General Vernonia
Size (sq. ft.) Total Value From To
1 4500 28,420 4501 6500 31,850 6501 8500 34,300 8501 10500 37,240
10501 12500 40,180 12501 14500 42,140 14501 16500 44,100 16501 18500 46,060 18501 20500 48,020 20501 24000 49,490 24001 28000 49,980 28001 32000 50,180 32001 40000 50,470 40001 43560 50,670
SA 03 LUC 001 Flood Zone Properties
Size (sq. ft.) Total Value From To
1 4500 28,420 4501 6500 31,850 6501 8500 34,300 8501 10500 37,240
10501 12500 40,180 12501 14500 42,140 14501 16500 44,100 16501 18500 46,060 18501 20500 48,020 20501 24000 49,490 24001 28000 49,980 28001 32000 50,180 32001 40000 50,470 40001 43560 50,670
SA 38 LUC 001 Roseview Heights
Size (sq. ft.) Total Value From To
1 4500 28,420 4501 6500 31,850 6501 8500 34,300 8501 10500 37,240
10501 12500 40,180 12501 14500 42,140 14501 16500 44,100 16501 18500 46,060 18501 20500 48,020 20501 24000 49,490 24001 28000 49,980 28001 32000 50,180 32001 40000 50,470 40001 43560 50,670
SA 40 LUC 001 Duplex, Triplex, Fourplex Size (sq. ft.) Total
Value From To 1 4500 28,420
4501 6500 31,850 6501 8500 34,300 8501 10500 37,240
10501 12500 40,180 12501 14500 42,140 14501 16500 44,100 16501 18500 46,060 18501 20500 48,020 20501 24000 49,490 24001 28000 49,980 28001 32000 50,180 32001 40000 50,470 40001 43560 50,670
SA 00 LUC 002 City Acreage
Size (Acres) Value Per Acre From To
0.01 9999 43,124
SA 03 LUC 002 Flood Zone City Acreage Size (Acres) Value
Per Acre From To 0.01 9999 43,124
[19]
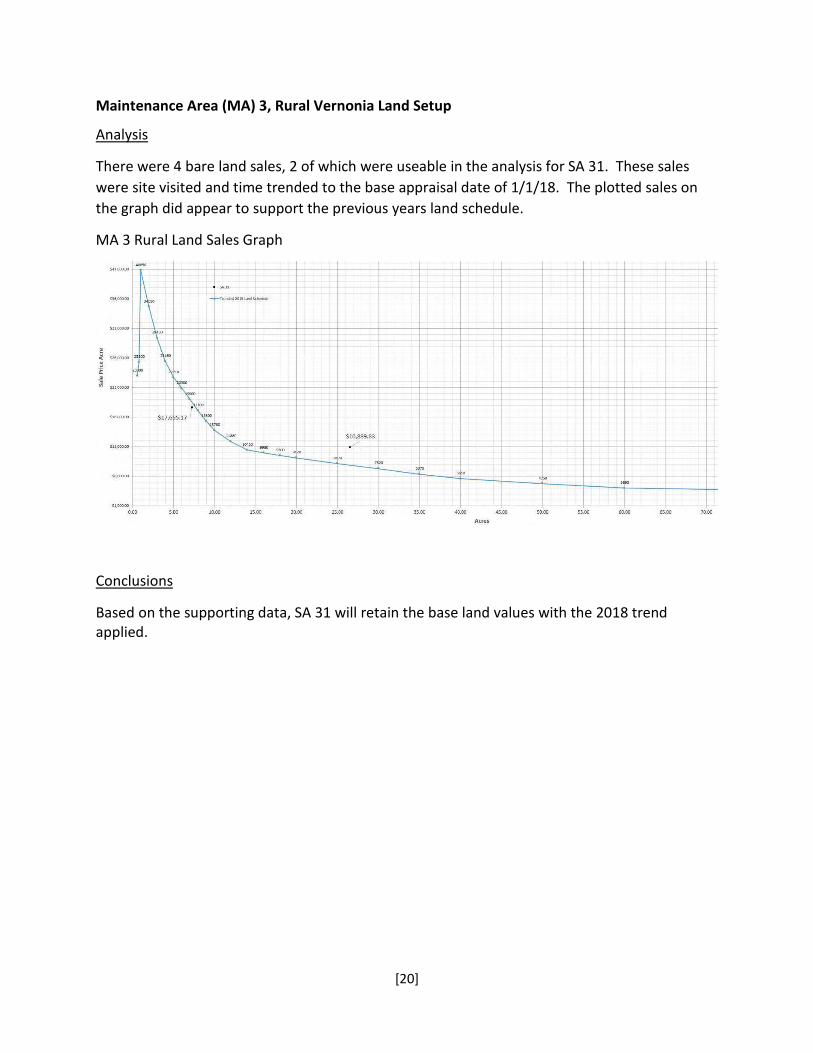
Maintenance Area (MA) 3, Rural Vernonia Land Setup
Analysis
There were 4 bare land sales, 2 of which were useable in the analysis for SA 31. These sales were site visited and time trended to the base appraisal date of 1/1/18. The plotted sales on the graph did appear to support the previous years land schedule.
MA 3 Rural Land Sales Graph
Conclusions
Based on the supporting data, SA 31 will retain the base land values with the 2018 trend applied.
[20]
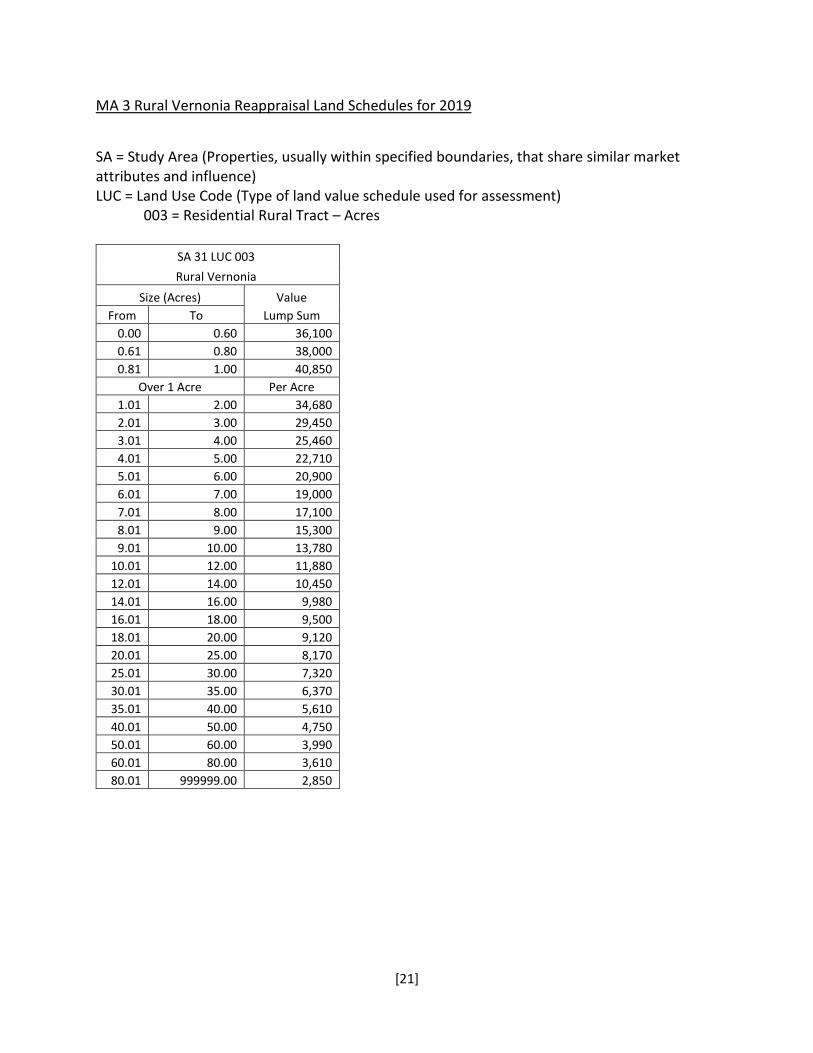
MA 3 Rural Vernonia Reappraisal Land Schedules for 2019
SA = Study Area (Properties, usually within specified boundaries, that share similar market attributes and influence) LUC = Land Use Code (Type of land value schedule used for assessment)
003 = Residential Rural Tract – Acres
SA 31 LUC 003 Rural Vernonia
Size (Acres) Value Lump Sum From To
0.00 0.60 36,100 0.61 0.80 38,000 0.81 1.00 40,850
Over 1 Acre Per Acre 1.01 2.00 34,680 2.01 3.00 29,450 3.01 4.00 25,460 4.01 5.00 22,710 5.01 6.00 20,900 6.01 7.00 19,000 7.01 8.00 17,100 8.01 9.00 15,300 9.01 10.00 13,780
10.01 12.00 11,880 12.01 14.00 10,450 14.01 16.00 9,980 16.01 18.00 9,500 18.01 20.00 9,120 20.01 25.00 8,170 25.01 30.00 7,320 30.01 35.00 6,370 35.01 40.00 5,610 40.01 50.00 4,750 50.01 60.00 3,990 60.01 80.00 3,610 80.01 999999.00 2,850
[21]
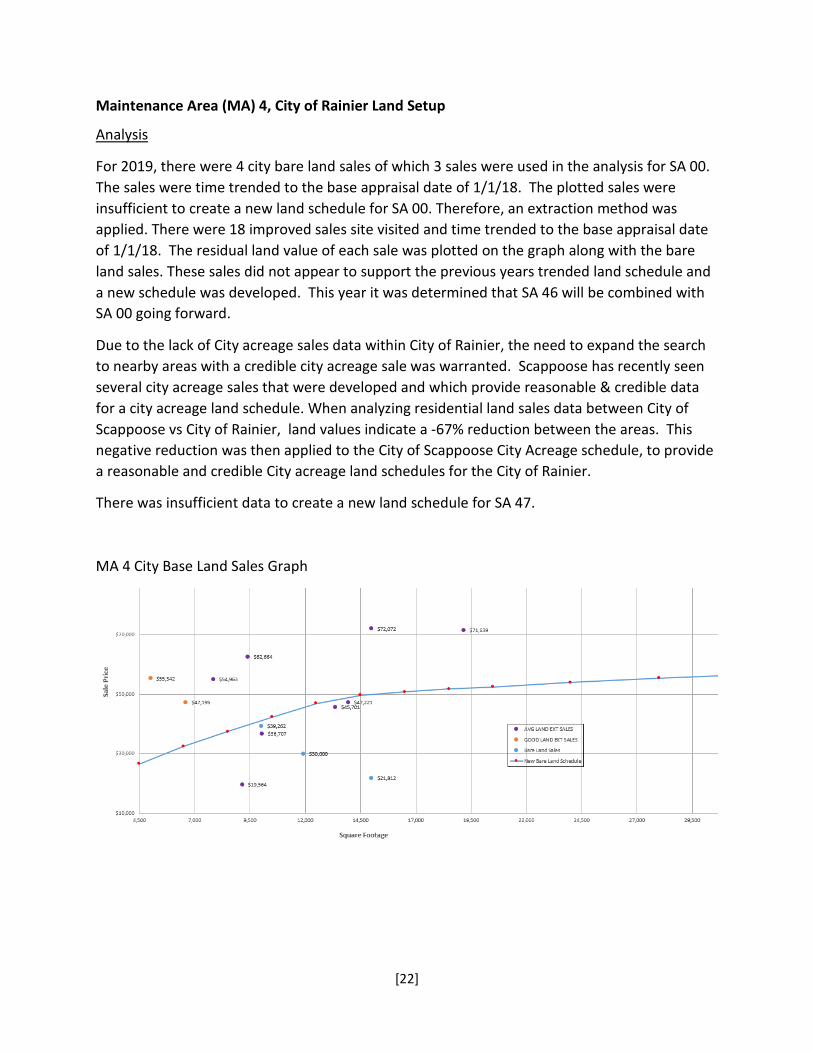
Maintenance Area (MA) 4, City of Rainier Land Setup
Analysis
For 2019, there were 4 city bare land sales of which 3 sales were used in the analysis for SA 00. The sales were time trended to the base appraisal date of 1/1/18. The plotted sales were insufficient to create a new land schedule for SA 00. Therefore, an extraction method was applied. There were 18 improved sales site visited and time trended to the base appraisal date of 1/1/18. The residual land value of each sale was plotted on the graph along with the bare land sales. These sales did not appear to support the previous years trended land schedule and a new schedule was developed. This year it was determined that SA 46 will be combined with SA 00 going forward.
Due to the lack of City acreage sales data within City of Rainier, the need to expand the search to nearby areas with a credible city acreage sale was warranted. Scappoose has recently seen several city acreage sales that were developed and which provide reasonable & credible data for a city acreage land schedule. When analyzing residential land sales data between City of Scappoose vs City of Rainier, land values indicate a -67% reduction between the areas. This negative reduction was then applied to the City of Scappoose City Acreage schedule, to provide a reasonable and credible City acreage land schedules for the City of Rainier.
There was insufficient data to create a new land schedule for SA 47.
MA 4 City Base Land Sales Graph
[22]

Conclusions
Based on the supporting data, a new land schedule for 2019 MA 04 SA 00 was developed. For SA 46, this was combined with SA 00. Due to the lack of data within SA 47, the prior year schedule should be used applying the 2018 ratio trend of 1.03. The City of Scappoose city acreage schedule of $119,540 reduced by -67% for a rate per acre of $39,450 will be used for the City acreage in the City of Rainier.
MA 4 City of Rainier Recalculation Land Schedules for 2019
SA = Study Area (Properties, usually within specified boundaries, that share similar market attributes and influence) LUC = Land Use Code (Type of land value schedule used for assessment)
001 = Residential City Under an Acre – Square Feet 002 = Residential City Acreage – Acres
SA 00 LUC 001 General Rainier
Size (sq. ft.) Total Value From To
1 4500 45,000 4501 6500 54,000 6501 8500 61,500 8501 10500 70,500
10501 12500 77,500 12501 14500 82,000 14501 16500 84,500 16501 18500 86,500 18501 20500 88,000 20501 24000 89,000 24001 28000 91,000 28001 32000 93,000 32001 40000 96,000 40001 43560 98,000
SA 40 LUC 001 Duplex, Triplex, Fourplex Size (sq. ft.) Total
Value From To 1 4500 45,000
4501 6500 54,000 6501 8500 61,500 8501 10500 70,500
10501 12500 77,500 12501 14500 82,000 14501 16500 84,500 16501 18500 86,500 18501 20500 88,000 20501 24000 89,000 24001 28000 91,000 28001 32000 93,000 32001 40000 96,000 40001 43560 98,000
SA 47 LUC 001 Rainier Riverfront Estates Size (sq. ft.) Total
Value From To 1 4500 17,500
4501 6500 92,700
SA 00 LUC 002 City Acreage
Size (Acres) Value Per Acre From To
0.01 999999 39,450
[23]
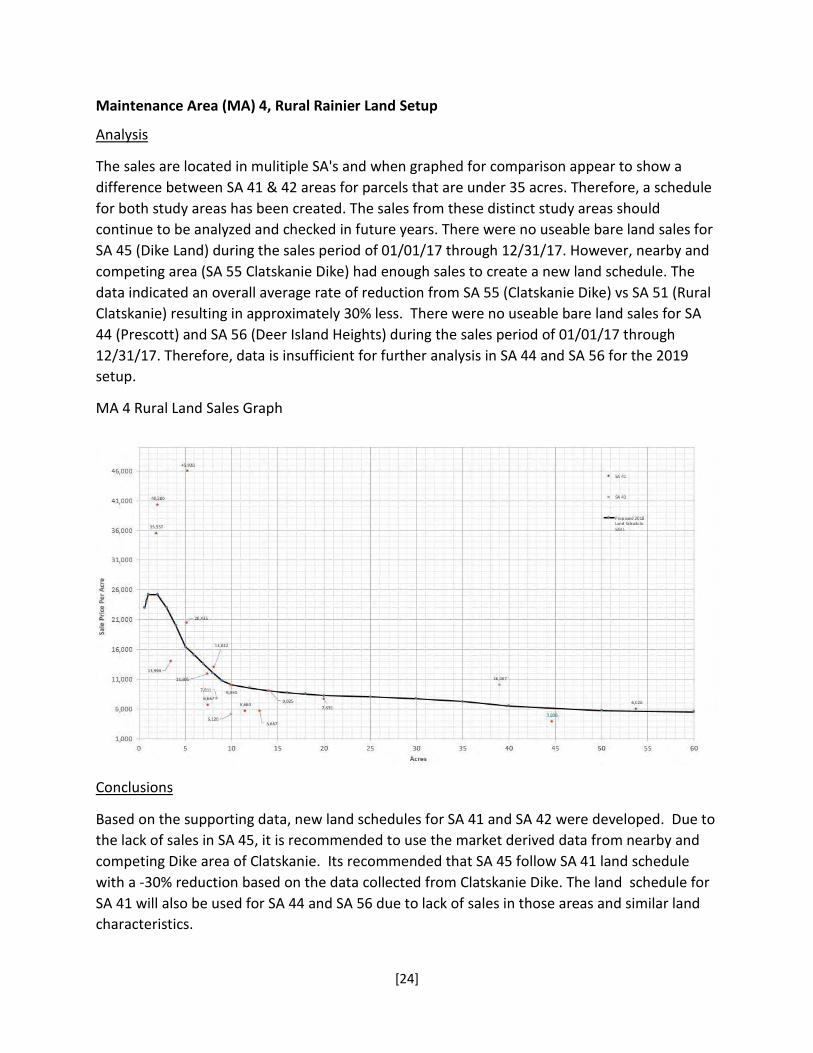
Maintenance Area (MA) 4, Rural Rainier Land Setup
Analysis
The sales are located in mulitiple SA's and when graphed for comparison appear to show a difference between SA 41 & 42 areas for parcels that are under 35 acres. Therefore, a schedule for both study areas has been created. The sales from these distinct study areas should continue to be analyzed and checked in future years. There were no useable bare land sales for SA 45 (Dike Land) during the sales period of 01/01/17 through 12/31/17. However, nearby and competing area (SA 55 Clatskanie Dike) had enough sales to create a new land schedule. The data indicated an overall average rate of reduction from SA 55 (Clatskanie Dike) vs SA 51 (Rural Clatskanie) resulting in approximately 30% less. There were no useable bare land sales for SA 44 (Prescott) and SA 56 (Deer Island Heights) during the sales period of 01/01/17 through 12/31/17. Therefore, data is insufficient for further analysis in SA 44 and SA 56 for the 2019 setup.
MA 4 Rural Land Sales Graph
Conclusions
Based on the supporting data, new land schedules for SA 41 and SA 42 were developed. Due to the lack of sales in SA 45, it is recommended to use the market derived data from nearby and competing Dike area of Clatskanie. Its recommended that SA 45 follow SA 41 land schedule with a -30% reduction based on the data collected from Clatskanie Dike. The land schedule for SA 41 will also be used for SA 44 and SA 56 due to lack of sales in those areas and similar land characteristics.
[24]

MA 4 Rural Rainier Recalculation Land Schedules for 2019
SA = Study Area (Properties, usually within specified boundaries, that share similar market attributes and influence) LUC = Land Use Code (Type of land value schedule used for assessment)
003 = Residential Rural Tract – Acres
SA 41 LUC 003 Rainier Value Zone 1
Size (Acres) Value Lump Sum From To
0.00 0.60 50,000 0.61 0.80 52,500 0.81 1.00 55,000
Over 1 Acre Per Acre 1.01 2.00 47,000 2.01 3.00 37,000 3.01 4.00 29,500 4.01 5.00 24,000 5.01 6.00 20,500 6.01 7.00 18,000 7.01 8.00 16,000 8.01 9.00 14,250 9.01 10.00 13,500
10.01 12.00 12,000 12.01 14.00 11,000 14.01 16.00 9,700 16.01 18.00 9,000 18.01 20.00 8,500 20.01 25.00 7,000 25.01 30.00 6,000 30.01 35.00 5,150 35.01 40.00 4,750 40.01 50.00 4,100 50.01 60.00 4,100 60.01 80.00 4,100 80.01 999999.00 4,100
SA 42 LUC 003 Rainier Value Zone 2
Size (Acres) Value Lump Sum From To
0.00 0.60 42,500 0.61 0.80 44,630 0.81 1.00 46,750
Over 1 Acre Per Acre 1.01 2.00 39,950 2.01 3.00 31,450 3.01 4.00 25,080 4.01 5.00 20,400 5.01 6.00 17,430 6.01 7.00 15,300 7.01 8.00 13,600 8.01 9.00 12,110 9.01 10.00 11,480
10.01 12.00 10,200 12.01 14.00 9,350 14.01 16.00 8,250 16.01 18.00 7,650 18.01 20.00 7,230 20.01 25.00 6,300 25.01 30.00 5,700 30.01 35.00 5,150 35.01 40.00 4,750 40.01 50.00 4,100 50.01 60.00 4,100 60.01 80.00 4,100 80.01 999999.00 4,100
SA 45 LUC 003 Rainier Dikeland
Size (Acres) Value Lump Sum From To
0.00 0.60 35,000 0.61 0.80 36,750 0.81 1.00 38,500
Over 1 Acre Per Acre 1.01 2.00 32,900 2.01 3.00 25,900 3.01 4.00 20,650 4.01 5.00 16,800 5.01 6.00 14,350 6.01 7.00 12,600 7.01 8.00 11,200 8.01 9.00 9,975 9.01 10.00 9,450
10.01 12.00 8,400 12.01 14.00 7,700 14.01 16.00 6,790 16.01 18.00 6,300 18.01 20.00 5,950 20.01 25.00 4,900 25.01 30.00 4,200 30.01 35.00 3,605 35.01 40.00 3,325 40.01 50.00 2,870 50.01 60.00 2,870 60.01 80.00 2,870 80.01 999999.00 2,870
[25]
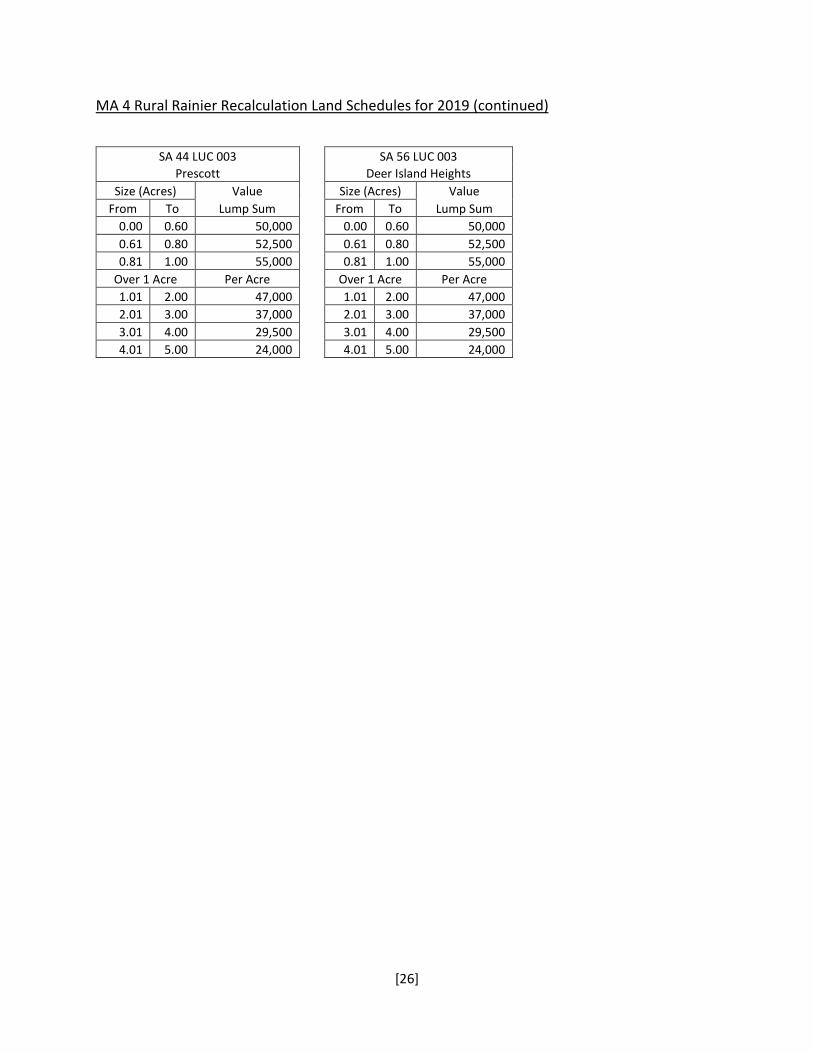
MA 4 Rural Rainier Recalculation Land Schedules for 2019 (continued)
SA 44 LUC 003 Prescott
Size (Acres) Value Lump Sum From To
0.00 0.60 50,000 0.61 0.80 52,500 0.81 1.00 55,000
Over 1 Acre Per Acre 1.01 2.00 47,000 2.01 3.00 37,000 3.01 4.00 29,500 4.01 5.00 24,000
SA 56 LUC 003 Deer Island Heights
Size (Acres) Value Lump Sum From To
0.00 0.60 50,000 0.61 0.80 52,500 0.81 1.00 55,000
Over 1 Acre Per Acre 1.01 2.00 47,000 2.01 3.00 37,000 3.01 4.00 29,500 4.01 5.00 24,000
[26]
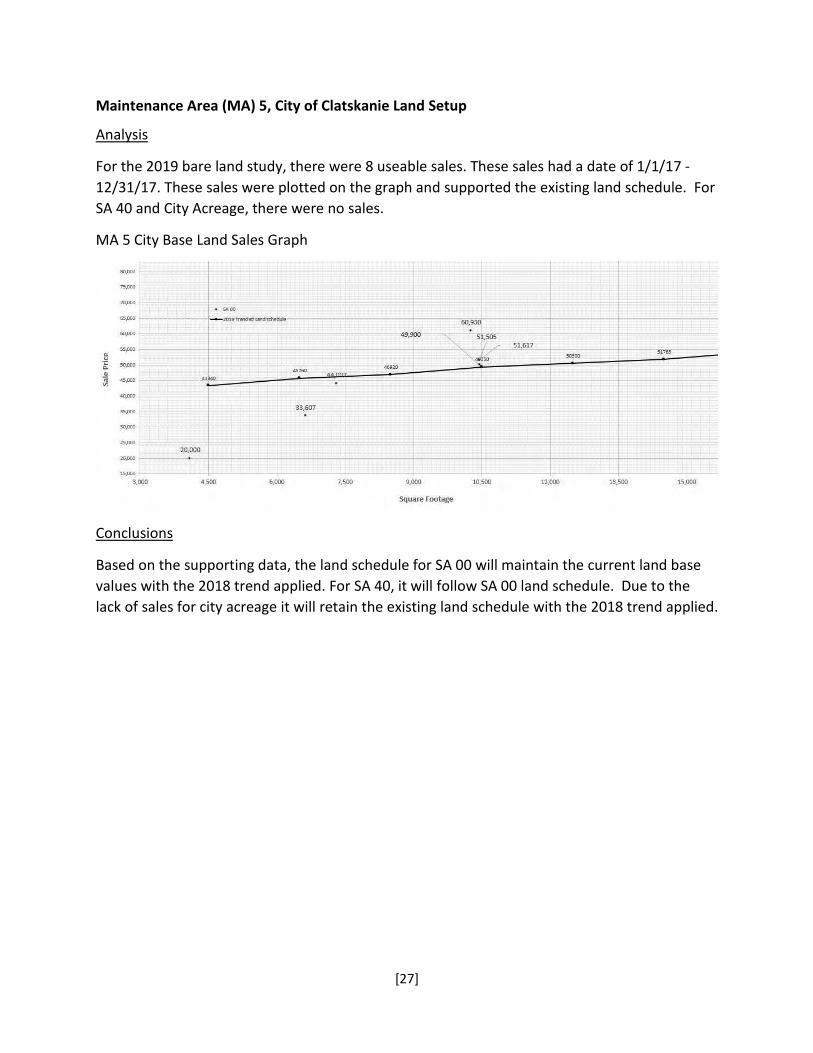
Maintenance Area (MA) 5, City of Clatskanie Land Setup
Analysis
For the 2019 bare land study, there were 8 useable sales. These sales had a date of 1/1/17 -12/31/17. These sales were plotted on the graph and supported the existing land schedule. For SA 40 and City Acreage, there were no sales.
MA 5 City Base Land Sales Graph
Conclusions
Based on the supporting data, the land schedule for SA 00 will maintain the current land base values with the 2018 trend applied. For SA 40, it will follow SA 00 land schedule. Due to the lack of sales for city acreage it will retain the existing land schedule with the 2018 trend applied.
[27]
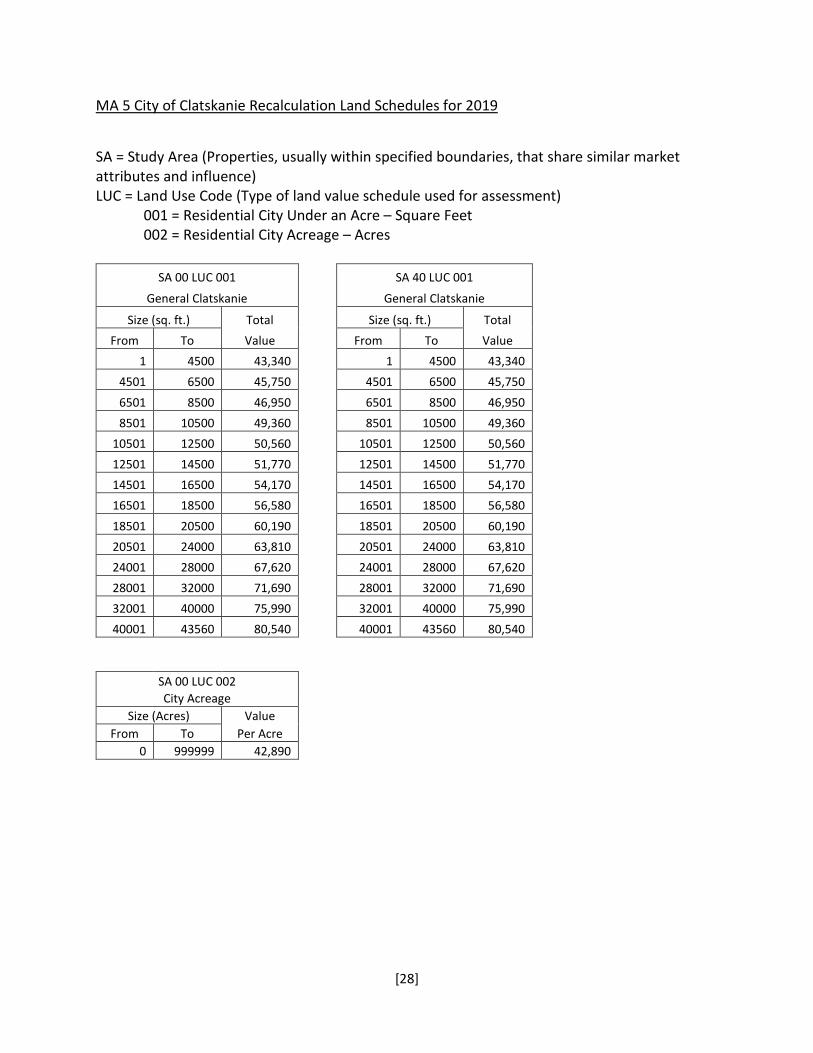
MA 5 City of Clatskanie Recalculation Land Schedules for 2019
SA = Study Area (Properties, usually within specified boundaries, that share similar market attributes and influence) LUC = Land Use Code (Type of land value schedule used for assessment)
001 = Residential City Under an Acre – Square Feet 002 = Residential City Acreage – Acres
SA 00 LUC 001
General Clatskanie
Size (sq. ft.) Total Value From To
1 4500 43,340 4501 6500 45,750 6501 8500 46,950 8501 10500 49,360
10501 12500 50,560 12501 14500 51,770 14501 16500 54,170 16501 18500 56,580 18501 20500 60,190 20501 24000 63,810 24001 28000 67,620 28001 32000 71,690 32001 40000 75,990 40001 43560 80,540
SA 40 LUC 001
General Clatskanie
Size (sq. ft.) Total Value From To
1 4500 43,340 4501 6500 45,750 6501 8500 46,950 8501 10500 49,360
10501 12500 50,560 12501 14500 51,770 14501 16500 54,170 16501 18500 56,580 18501 20500 60,190 20501 24000 63,810 24001 28000 67,620 28001 32000 71,690 32001 40000 75,990 40001 43560 80,540
SA 00 LUC 002 City Acreage
Size (Acres) Value Per Acre From To
0 999999 42,890
[28]

Maintenance Area (MA) 5, Rural Clatskanie Land Setup
Analysis
In SA 51, there were 11 rural bare land sales of which 6 sales were used in the analysis for SA 51. The sales were time trended to the base appraisal date of 1/1/18. The 2018 land schedule was trended and plotted. The plotted sales on the graph appear to support the previous years trended land schedule.
In SA 55, there were two sales used to analyze if SA 55 warranted a different land schedule than SA 51. The plotted sales did support a new land schedule for SA 55. Therefore, a new land schedule was created for 2019 setup for this study area.
In SA 36, Fishhawk Lake, the extraction method was used. Sales from both Columbia County and Clatsop County were used. 10 sales, and of those 5 sales showed a base land value range between 19,000 and 24,000. The other 5 were determined to be outliers. The average of these sales were compared to 2 base lot sales that took place in August of 2018. Those lots were sold for 25,000 each. The decision was made to use a base lot value of 22,500 for 2019.
MA 5 Rural Land Sales Graph
Conclusions
For 2019 in SA 51, the useable sales plotted on the graph did support the current land schedule with the 2018 ratio applied. There were three sales used to analyze if SA 55 warranted a different land schedule than SA 51. The plotted sales did support a new land schedule for SA 55. Based on the supporting sales data in SA 37, the new base lot land value in Fishhawk Lake Estates is $22,500.
[29]
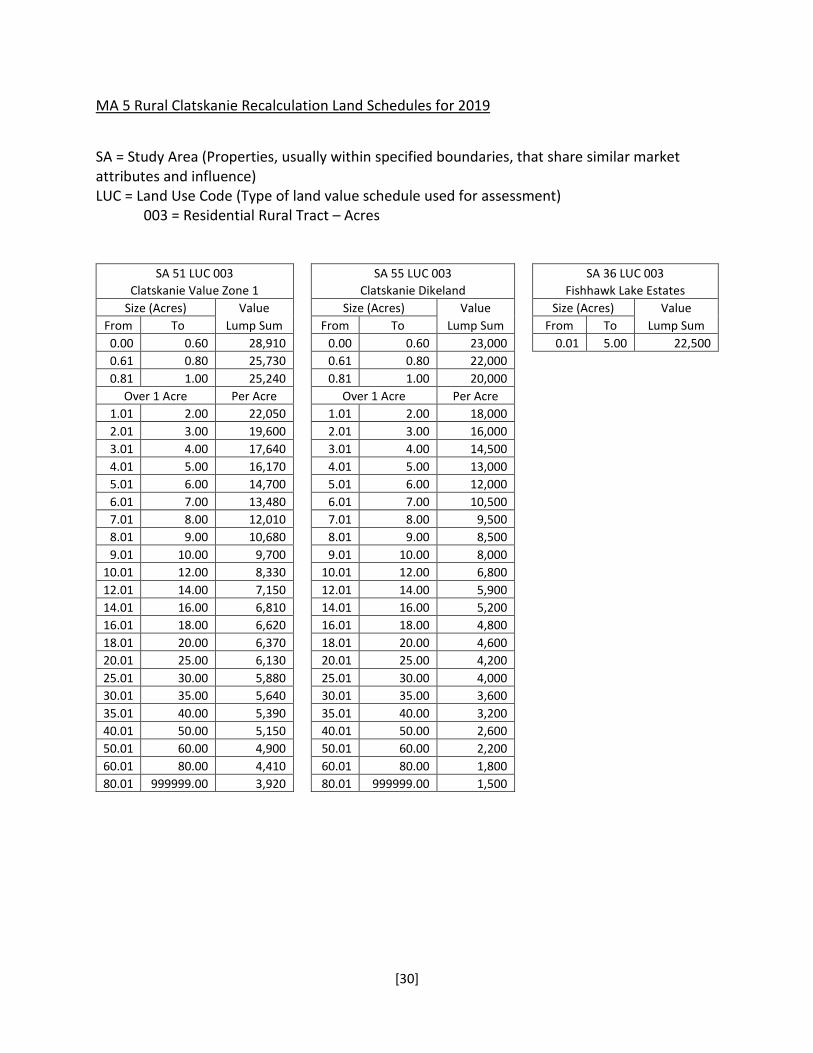
MA 5 Rural Clatskanie Recalculation Land Schedules for 2019
SA = Study Area (Properties, usually within specified boundaries, that share similar market attributes and influence) LUC = Land Use Code (Type of land value schedule used for assessment)
003 = Residential Rural Tract – Acres
SA 51 LUC 003 Clatskanie Value Zone 1
Size (Acres) Value Lump Sum From To
0.00 0.60 28,910 0.61 0.80 25,730 0.81 1.00 25,240
Over 1 Acre Per Acre 1.01 2.00 22,050 2.01 3.00 19,600 3.01 4.00 17,640 4.01 5.00 16,170 5.01 6.00 14,700 6.01 7.00 13,480 7.01 8.00 12,010 8.01 9.00 10,680 9.01 10.00 9,700
10.01 12.00 8,330 12.01 14.00 7,150 14.01 16.00 6,810 16.01 18.00 6,620 18.01 20.00 6,370 20.01 25.00 6,130 25.01 30.00 5,880 30.01 35.00 5,640 35.01 40.00 5,390 40.01 50.00 5,150 50.01 60.00 4,900 60.01 80.00 4,410 80.01 999999.00 3,920
SA 55 LUC 003 Clatskanie Dikeland
Size (Acres) Value Lump Sum From To
0.00 0.60 23,000 0.61 0.80 22,000 0.81 1.00 20,000
Over 1 Acre Per Acre 1.01 2.00 18,000 2.01 3.00 16,000 3.01 4.00 14,500 4.01 5.00 13,000 5.01 6.00 12,000 6.01 7.00 10,500 7.01 8.00 9,500 8.01 9.00 8,500 9.01 10.00 8,000
10.01 12.00 6,800 12.01 14.00 5,900 14.01 16.00 5,200 16.01 18.00 4,800 18.01 20.00 4,600 20.01 25.00 4,200 25.01 30.00 4,000 30.01 35.00 3,600 35.01 40.00 3,200 40.01 50.00 2,600 50.01 60.00 2,200 60.01 80.00 1,800 80.01 999999.00 1,500
SA 36 LUC 003 Fishhawk Lake Estates
Size (Acres) Value Lump Sum From To
0.01 5.00 22,500
[30]
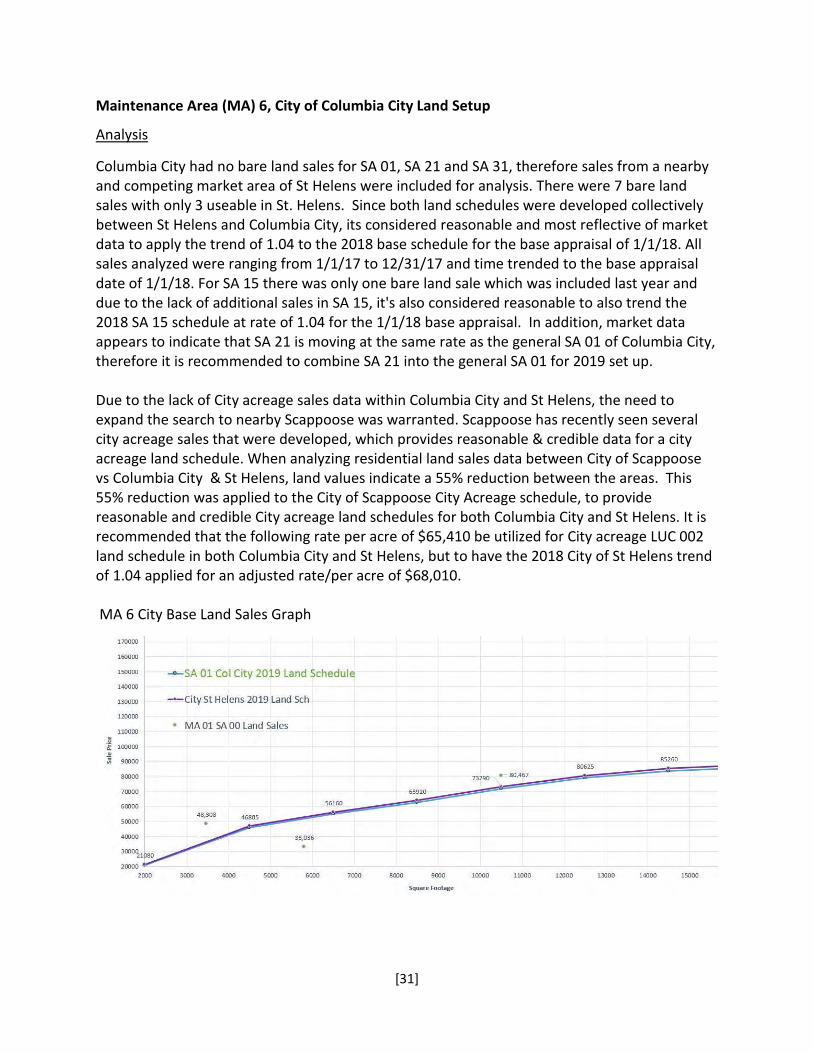
Maintenance Area (MA) 6, City of Columbia City Land Setup
Analysis
Columbia City had no bare land sales for SA 01, SA 21 and SA 31, therefore sales from a nearby and competing market area of St Helens were included for analysis. There were 7 bare land sales with only 3 useable in St. Helens. Since both land schedules were developed collectively between St Helens and Columbia City, its considered reasonable and most reflective of market data to apply the trend of 1.04 to the 2018 base schedule for the base appraisal of 1/1/18. All sales analyzed were ranging from 1/1/17 to 12/31/17 and time trended to the base appraisal date of 1/1/18. For SA 15 there was only one bare land sale which was included last year and due to the lack of additional sales in SA 15, it's also considered reasonable to also trend the 2018 SA 15 schedule at rate of 1.04 for the 1/1/18 base appraisal. In addition, market data appears to indicate that SA 21 is moving at the same rate as the general SA 01 of Columbia City, therefore it is recommended to combine SA 21 into the general SA 01 for 2019 set up.
Due to the lack of City acreage sales data within Columbia City and St Helens, the need to expand the search to nearby Scappoose was warranted. Scappoose has recently seen several city acreage sales that were developed, which provides reasonable & credible data for a city acreage land schedule. When analyzing residential land sales data between City of Scappoose vs Columbia City & St Helens, land values indicate a 55% reduction between the areas. This 55% reduction was applied to the City of Scappoose City Acreage schedule, to provide reasonable and credible City acreage land schedules for both Columbia City and St Helens. It is recommended that the following rate per acre of $65,410 be utilized for City acreage LUC 002 land schedule in both Columbia City and St Helens, but to have the 2018 City of St Helens trend of 1.04 applied for an adjusted rate/per acre of $68,010.
MA 6 City Base Land Sales Graph
[31]
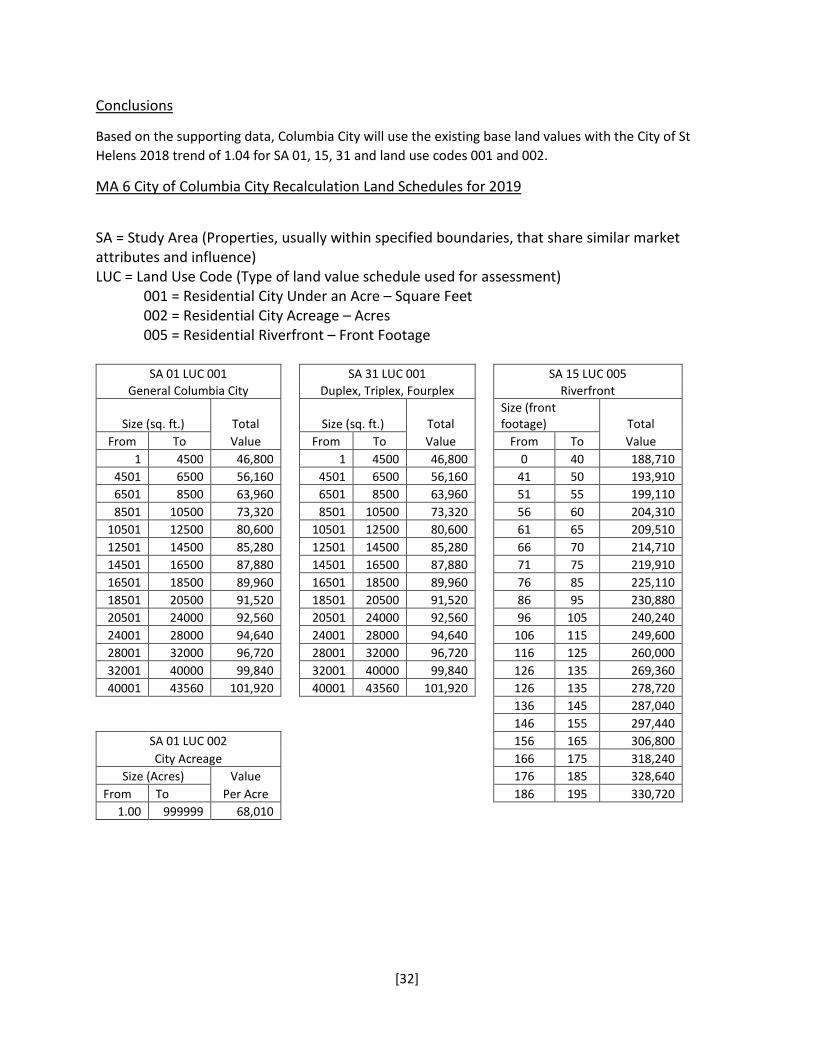
Conclusions
Based on the supporting data, Columbia City will use the existing base land values with the City of St Helens 2018 trend of 1.04 for SA 01, 15, 31 and land use codes 001 and 002.
MA 6 City of Columbia City Recalculation Land Schedules for 2019
SA = Study Area (Properties, usually within specified boundaries, that share similar market attributes and influence) LUC = Land Use Code (Type of land value schedule used for assessment)
001 = Residential City Under an Acre – Square Feet 002 = Residential City Acreage – Acres 005 = Residential Riverfront – Front Footage
SA 01 LUC 001 General Columbia City
Size (sq. ft.) Total Value From To
1 4500 46,800 4501 6500 56,160 6501 8500 63,960 8501 10500 73,320
10501 12500 80,600 12501 14500 85,280 14501 16500 87,880 16501 18500 89,960 18501 20500 91,520 20501 24000 92,560 24001 28000 94,640 28001 32000 96,720 32001 40000 99,840 40001 43560 101,920
SA 01 LUC 002 City Acreage
Size (Acres) Value Per Acre From To
1.00 999999 68,010
SA 31 LUC 001 Duplex, Triplex, Fourplex
Size (sq. ft.) Total Value From To
1 4500 46,800 4501 6500 56,160 6501 8500 63,960 8501 10500 73,320
10501 12500 80,600 12501 14500 85,280 14501 16500 87,880 16501 18500 89,960 18501 20500 91,520 20501 24000 92,560 24001 28000 94,640 28001 32000 96,720 32001 40000 99,840 40001 43560 101,920
SA 15 LUC 005 Riverfront
Size (front footage) Total
Value From To 0 40 188,710
41 50 193,910 51 55 199,110 56 60 204,310 61 65 209,510 66 70 214,710 71 75 219,910 76 85 225,110 86 95 230,880 96 105 240,240
106 115 249,600 116 125 260,000 126 135 269,360 126 135 278,720 136 145 287,040 146 155 297,440 156 165 306,800 166 175 318,240 176 185 328,640 186 195 330,720
[32]
Maintenance Area (MA) 6, Rural Saint Helens Land Setup
Analysis
For this bare land study, there were a total of 18 sales analyzed. Of those sales, 10 were considered usable in SA 61. For SA 62 there was 1 usable sale and 1 unusable. Also included were 7 land sales from nearby and competing market areas of Rural Scappoose ( SA's 21). For SA 65 there were no sales. All sales analyzed were ranging from 1/1/17 to 12/31/17 and time trended to the base appraisal date of 1/1/18.
MA 6 Rural Land Sales Graph
Conclusions
The sales data was analyzed together and separately to identify indicated patterns based on location, size, or other influencing factors. The sales data for SA 61 & SA 62 support the existing bare land schedule with the 2018 trend applied. SA 65 had no useable sales for analysis therefore will follow SA 61 land schedule with 2018 trend applied.
[33]
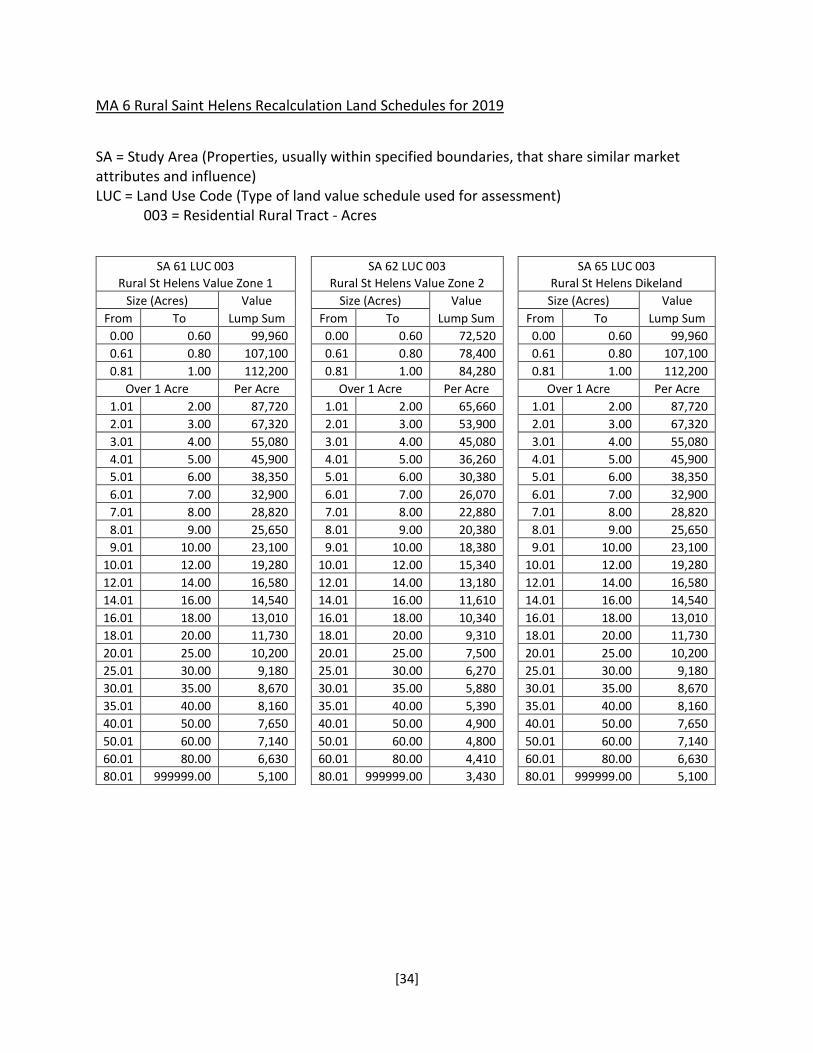
MA 6 Rural Saint Helens Recalculation Land Schedules for 2019
SA = Study Area (Properties, usually within specified boundaries, that share similar market attributes and influence) LUC = Land Use Code (Type of land value schedule used for assessment)
003 = Residential Rural Tract - Acres
SA 61 LUC 003 Rural St Helens Value Zone 1
Size (Acres) Value Lump Sum From To
0.00 0.60 99,960 0.61 0.80 107,100 0.81 1.00 112,200
Over 1 Acre Per Acre 1.01 2.00 87,720 2.01 3.00 67,320 3.01 4.00 55,080 4.01 5.00 45,900 5.01 6.00 38,350 6.01 7.00 32,900 7.01 8.00 28,820 8.01 9.00 25,650 9.01 10.00 23,100
10.01 12.00 19,280 12.01 14.00 16,580 14.01 16.00 14,540 16.01 18.00 13,010 18.01 20.00 11,730 20.01 25.00 10,200 25.01 30.00 9,180 30.01 35.00 8,670 35.01 40.00 8,160 40.01 50.00 7,650 50.01 60.00 7,140 60.01 80.00 6,630 80.01 999999.00 5,100
SA 62 LUC 003 Rural St Helens Value Zone 2
Size (Acres) Value Lump Sum From To
0.00 0.60 72,520 0.61 0.80 78,400 0.81 1.00 84,280
Over 1 Acre Per Acre 1.01 2.00 65,660 2.01 3.00 53,900 3.01 4.00 45,080 4.01 5.00 36,260 5.01 6.00 30,380 6.01 7.00 26,070 7.01 8.00 22,880 8.01 9.00 20,380 9.01 10.00 18,380
10.01 12.00 15,340 12.01 14.00 13,180 14.01 16.00 11,610 16.01 18.00 10,340 18.01 20.00 9,310 20.01 25.00 7,500 25.01 30.00 6,270 30.01 35.00 5,880 35.01 40.00 5,390 40.01 50.00 4,900 50.01 60.00 4,800 60.01 80.00 4,410 80.01 999999.00 3,430
SA 65 LUC 003 Rural St Helens Dikeland
Size (Acres) Value Lump Sum From To
0.00 0.60 99,960 0.61 0.80 107,100 0.81 1.00 112,200
Over 1 Acre Per Acre 1.01 2.00 87,720 2.01 3.00 67,320 3.01 4.00 55,080 4.01 5.00 45,900 5.01 6.00 38,350 6.01 7.00 32,900 7.01 8.00 28,820 8.01 9.00 25,650 9.01 10.00 23,100
10.01 12.00 19,280 12.01 14.00 16,580 14.01 16.00 14,540 16.01 18.00 13,010 18.01 20.00 11,730 20.01 25.00 10,200 25.01 30.00 9,180 30.01 35.00 8,670 35.01 40.00 8,160 40.01 50.00 7,650 50.01 60.00 7,140 60.01 80.00 6,630 80.01 999999.00 5,100
[34]
2019 On-Site Development (OSD) Analysis and
Conclusions
[35]

Maintenance Area 1, City of Saint Helens On-Site Development (OSD) Study
Analysis
The cost figures below are estimates associated with the development of a residential structure within the City of St Helens. The categories listed below are market related costs and supplemental development charges (SDC) required by the owner, or developer, for site development of a new structure.
• Excavation costs include; clearing, driveway, excavation, backfill, grading, & utility trenching. The site development cost is based on an overall typical site of 5-10k square foot lot.
• Power costs are provided by the local governing utility company Columbia River PUD. These cost estimates are based on CRPUD's flat rate fee schedule.
• All the necessary SDC fees associated with; water, sewer, parks, streets, and storms are only charged at initial development of a site.
• Multifamily properties, if available, have the choice to have each unit metered independently for water and sewer for billing purposes. It should be noted that contractors indicated no real increase in excavation costs for the typical up to 4 unit multifamily. These cost figures have been acquired and refreshed annually to keep up with market related development costs of residential.
Description SFD Duplex Triplex Fourplex Excavation $11,000 $11,000 $11,000 $11,000 Power (Columbia River PUD) $1,740 $1,880 $2,030 $2,190 Water SDC + connection $4,086 $8,172 $12,258 $16,344 Sanitary services SDC + connection $4,252 $8,504 $12,756 $17,008 Parks SDC $2,944 $2,904 $4,357 $5,809 Streets SDC $2,370 $4,233 $6,350 $8,466 Storm SDC $821 $821 $1,231 $1,642 School Construction Excise Tax (CET) $2,340 $2,600 $3,640 $4,680
TOTAL $29,553 $40,114 $53,622 $67,139
Conclusions
The collected cost data is deemed to be credible and reliable indicators of on site development costs for residential dwellings. For 2019, the new OSD costs are listed below.
2019 City of Saint Helens OSD Single Family Dwelling $29,600 Multi-Family – Duplex $40,100 Multi-Family – Triplex $53,600 Multi-Family – Fourplex $67,100
[36]
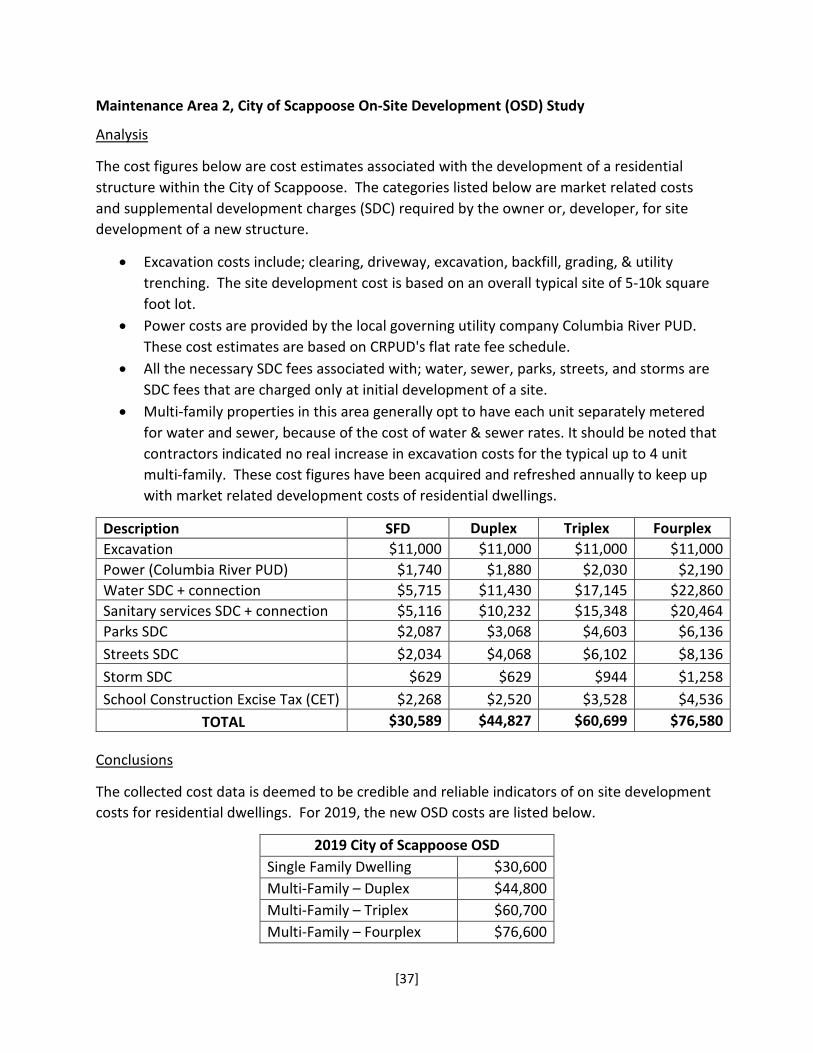
Maintenance Area 2, City of Scappoose On-Site Development (OSD) Study
Analysis
The cost figures below are cost estimates associated with the development of a residential structure within the City of Scappoose. The categories listed below are market related costs and supplemental development charges (SDC) required by the owner or, developer, for site development of a new structure.
• Excavation costs include; clearing, driveway, excavation, backfill, grading, & utility trenching. The site development cost is based on an overall typical site of 5-10k square foot lot.
• Power costs are provided by the local governing utility company Columbia River PUD. These cost estimates are based on CRPUD's flat rate fee schedule.
• All the necessary SDC fees associated with; water, sewer, parks, streets, and storms are SDC fees that are charged only at initial development of a site.
• Multi-family properties in this area generally opt to have each unit separately metered for water and sewer, because of the cost of water & sewer rates. It should be noted that contractors indicated no real increase in excavation costs for the typical up to 4 unit multi-family. These cost figures have been acquired and refreshed annually to keep up with market related development costs of residential dwellings.
Description SFD Duplex Triplex Fourplex Excavation $11,000 $11,000 $11,000 $11,000 Power (Columbia River PUD) $1,740 $1,880 $2,030 $2,190 Water SDC + connection $5,715 $11,430 $17,145 $22,860 Sanitary services SDC + connection $5,116 $10,232 $15,348 $20,464 Parks SDC $2,087 $3,068 $4,603 $6,136 Streets SDC $2,034 $4,068 $6,102 $8,136 Storm SDC $629 $629 $944 $1,258 School Construction Excise Tax (CET) $2,268 $2,520 $3,528 $4,536
TOTAL $30,589 $44,827 $60,699 $76,580
Conclusions
The collected cost data is deemed to be credible and reliable indicators of on site development costs for residential dwellings. For 2019, the new OSD costs are listed below.
2019 City of Scappoose OSD Single Family Dwelling $30,600 Multi-Family – Duplex $44,800 Multi-Family – Triplex $60,700 Multi-Family – Fourplex $76,600
[37]
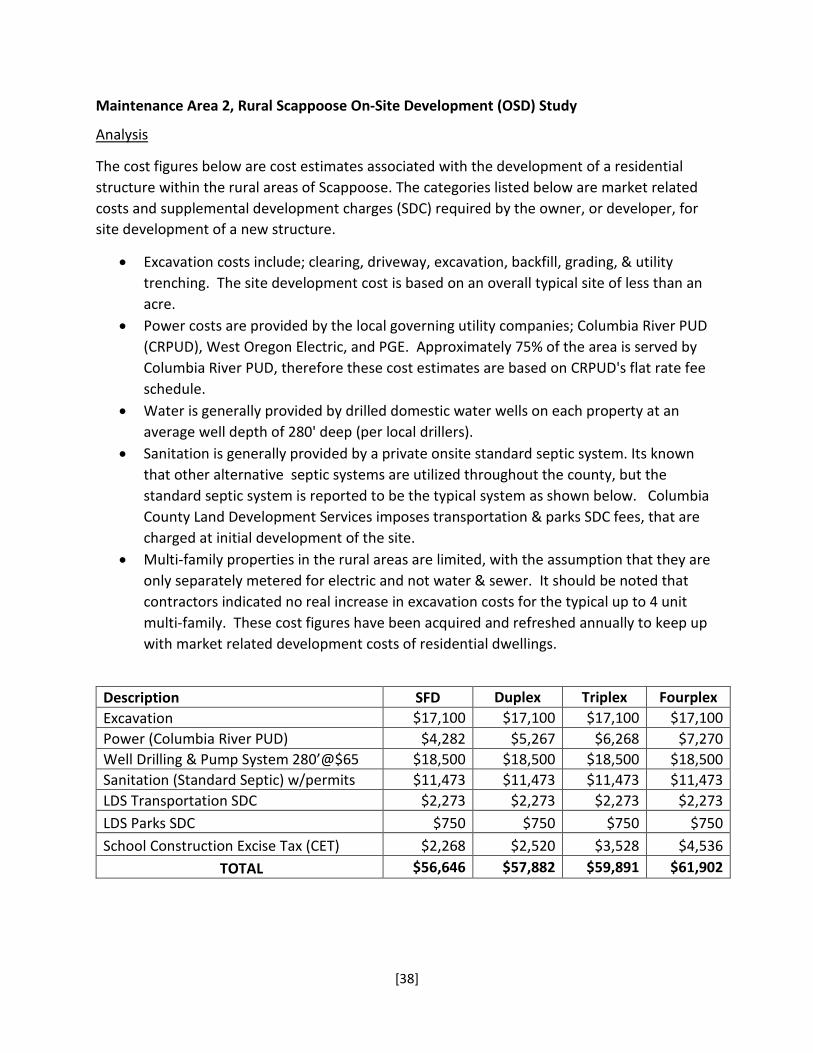
Maintenance Area 2, Rural Scappoose On-Site Development (OSD) Study
Analysis
The cost figures below are cost estimates associated with the development of a residential structure within the rural areas of Scappoose. The categories listed below are market related costs and supplemental development charges (SDC) required by the owner, or developer, for site development of a new structure.
• Excavation costs include; clearing, driveway, excavation, backfill, grading, & utility trenching. The site development cost is based on an overall typical site of less than an acre.
• Power costs are provided by the local governing utility companies; Columbia River PUD (CRPUD), West Oregon Electric, and PGE. Approximately 75% of the area is served by Columbia River PUD, therefore these cost estimates are based on CRPUD's flat rate fee schedule.
• Water is generally provided by drilled domestic water wells on each property at an average well depth of 280' deep (per local drillers).
• Sanitation is generally provided by a private onsite standard septic system. Its known that other alternative septic systems are utilized throughout the county, but the standard septic system is reported to be the typical system as shown below. Columbia County Land Development Services imposes transportation & parks SDC fees, that are charged at initial development of the site.
• Multi-family properties in the rural areas are limited, with the assumption that they are only separately metered for electric and not water & sewer. It should be noted that contractors indicated no real increase in excavation costs for the typical up to 4 unit multi-family. These cost figures have been acquired and refreshed annually to keep up with market related development costs of residential dwellings.
Description SFD Duplex Triplex Fourplex Excavation $17,100 $17,100 $17,100 $17,100 Power (Columbia River PUD) $4,282 $5,267 $6,268 $7,270 Well Drilling & Pump System 280’@$65 $18,500 $18,500 $18,500 $18,500 Sanitation (Standard Septic) w/permits $11,473 $11,473 $11,473 $11,473 LDS Transportation SDC $2,273 $2,273 $2,273 $2,273 LDS Parks SDC $750 $750 $750 $750 School Construction Excise Tax (CET) $2,268 $2,520 $3,528 $4,536
TOTAL $56,646 $57,882 $59,891 $61,902
[38]

Conclusions
The collected cost data is deemed to be credible and reliable indicators of on site development costs for residential dwellings. For 2019, the new OSD costs are listed below.
2019 Rural Scappoose OSD Single Family Dwelling $56,600 Multi-Family – Duplex $57,900 Multi-Family – Triplex $59,900 Multi-Family – Fourplex $61,900
[39]
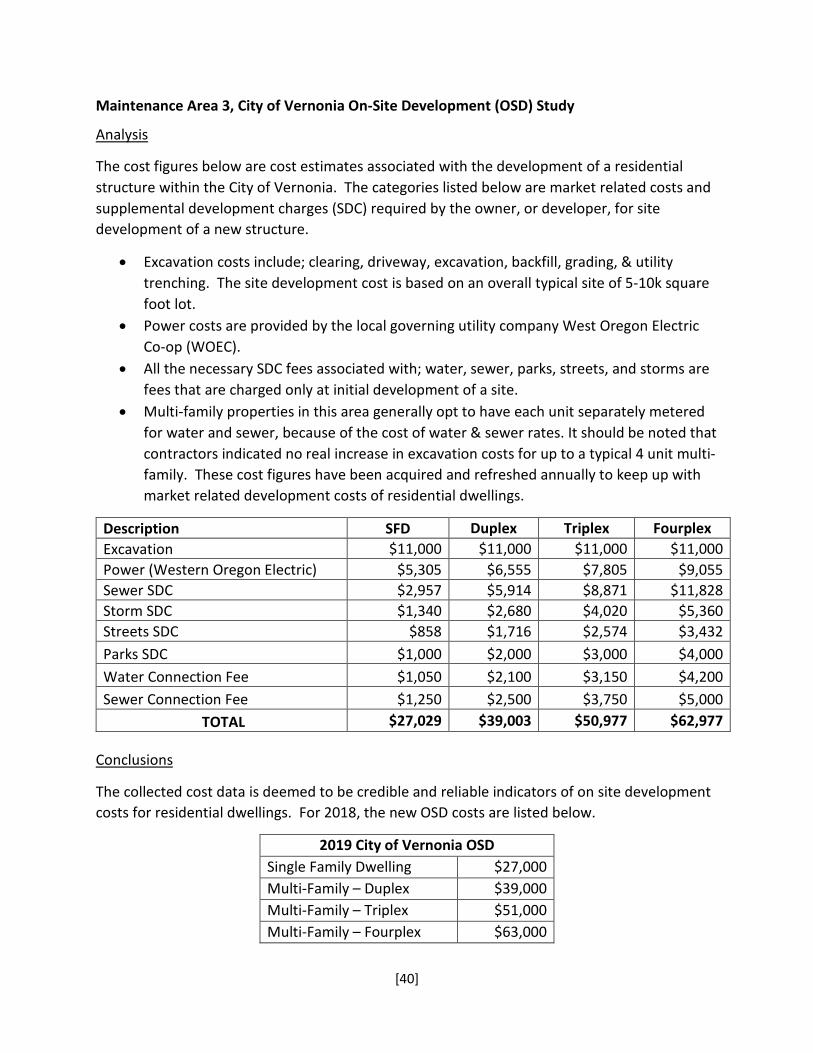
Maintenance Area 3, City of Vernonia On-Site Development (OSD) Study
Analysis
The cost figures below are cost estimates associated with the development of a residential structure within the City of Vernonia. The categories listed below are market related costs and supplemental development charges (SDC) required by the owner, or developer, for site development of a new structure.
• Excavation costs include; clearing, driveway, excavation, backfill, grading, & utility trenching. The site development cost is based on an overall typical site of 5-10k square foot lot.
• Power costs are provided by the local governing utility company West Oregon Electric Co-op (WOEC).
• All the necessary SDC fees associated with; water, sewer, parks, streets, and storms are fees that are charged only at initial development of a site.
• Multi-family properties in this area generally opt to have each unit separately metered for water and sewer, because of the cost of water & sewer rates. It should be noted that contractors indicated no real increase in excavation costs for up to a typical 4 unit multi-family. These cost figures have been acquired and refreshed annually to keep up with market related development costs of residential dwellings.
Description SFD Duplex Triplex Fourplex Excavation $11,000 $11,000 $11,000 $11,000 Power (Western Oregon Electric) $5,305 $6,555 $7,805 $9,055 Sewer SDC $2,957 $5,914 $8,871 $11,828 Storm SDC $1,340 $2,680 $4,020 $5,360 Streets SDC $858 $1,716 $2,574 $3,432 Parks SDC $1,000 $2,000 $3,000 $4,000 Water Connection Fee $1,050 $2,100 $3,150 $4,200 Sewer Connection Fee $1,250 $2,500 $3,750 $5,000
TOTAL $27,029 $39,003 $50,977 $62,977
Conclusions
The collected cost data is deemed to be credible and reliable indicators of on site development costs for residential dwellings. For 2018, the new OSD costs are listed below.
2019 City of Vernonia OSD Single Family Dwelling $27,000 Multi-Family – Duplex $39,000 Multi-Family – Triplex $51,000 Multi-Family – Fourplex $63,000
[40]
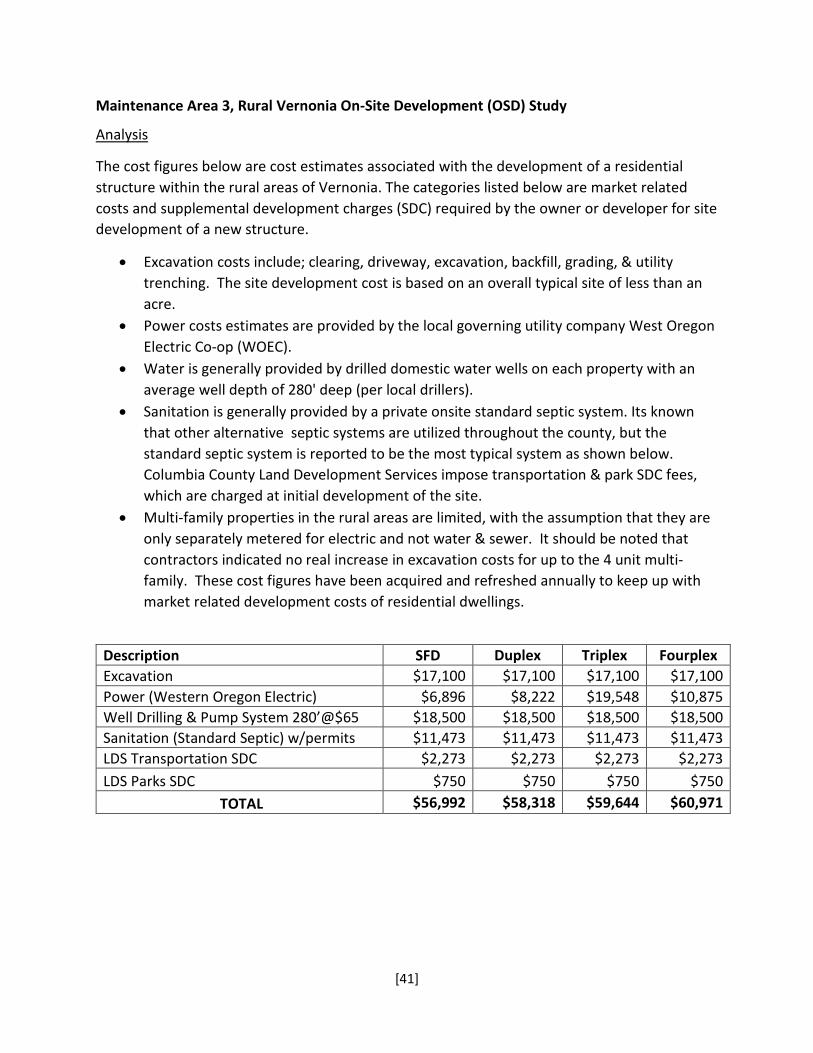
Maintenance Area 3, Rural Vernonia On-Site Development (OSD) Study
Analysis
The cost figures below are cost estimates associated with the development of a residential structure within the rural areas of Vernonia. The categories listed below are market related costs and supplemental development charges (SDC) required by the owner or developer for site development of a new structure.
• Excavation costs include; clearing, driveway, excavation, backfill, grading, & utility trenching. The site development cost is based on an overall typical site of less than an acre.
• Power costs estimates are provided by the local governing utility company West Oregon Electric Co-op (WOEC).
• Water is generally provided by drilled domestic water wells on each property with an average well depth of 280' deep (per local drillers).
• Sanitation is generally provided by a private onsite standard septic system. Its known that other alternative septic systems are utilized throughout the county, but the standard septic system is reported to be the most typical system as shown below. Columbia County Land Development Services impose transportation & park SDC fees, which are charged at initial development of the site.
• Multi-family properties in the rural areas are limited, with the assumption that they are only separately metered for electric and not water & sewer. It should be noted that contractors indicated no real increase in excavation costs for up to the 4 unit multi-family. These cost figures have been acquired and refreshed annually to keep up with market related development costs of residential dwellings.
Description SFD Duplex Triplex Fourplex Excavation $17,100 $17,100 $17,100 $17,100 Power (Western Oregon Electric) $6,896 $8,222 $19,548 $10,875 Well Drilling & Pump System 280’@$65 $18,500 $18,500 $18,500 $18,500 Sanitation (Standard Septic) w/permits $11,473 $11,473 $11,473 $11,473 LDS Transportation SDC $2,273 $2,273 $2,273 $2,273 LDS Parks SDC $750 $750 $750 $750
TOTAL $56,992 $58,318 $59,644 $60,971
[41]
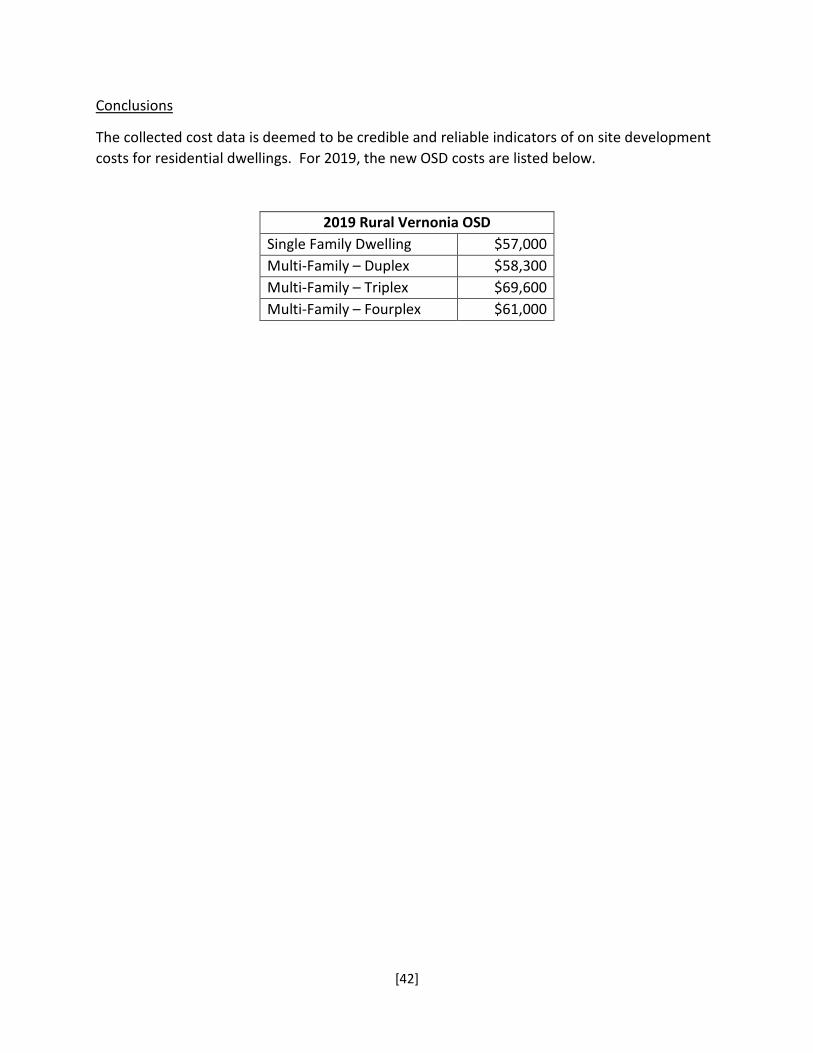
Conclusions
The collected cost data is deemed to be credible and reliable indicators of on site development costs for residential dwellings. For 2019, the new OSD costs are listed below.
2019 Rural Vernonia OSD Single Family Dwelling $57,000 Multi-Family – Duplex $58,300 Multi-Family – Triplex $69,600 Multi-Family – Fourplex $61,000
[42]
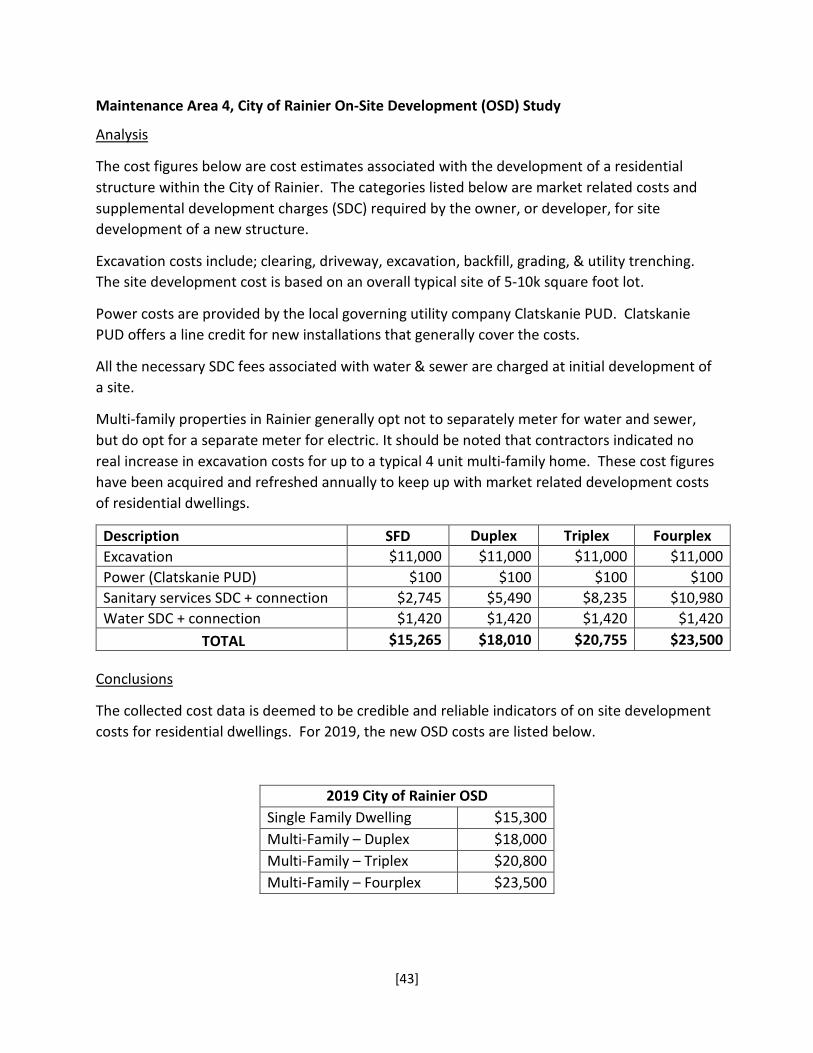
Maintenance Area 4, City of Rainier On-Site Development (OSD) Study
Analysis
The cost figures below are cost estimates associated with the development of a residential structure within the City of Rainier. The categories listed below are market related costs and supplemental development charges (SDC) required by the owner, or developer, for site development of a new structure.
Excavation costs include; clearing, driveway, excavation, backfill, grading, & utility trenching. The site development cost is based on an overall typical site of 5-10k square foot lot.
Power costs are provided by the local governing utility company Clatskanie PUD. Clatskanie PUD offers a line credit for new installations that generally cover the costs.
All the necessary SDC fees associated with water & sewer are charged at initial development of a site.
Multi-family properties in Rainier generally opt not to separately meter for water and sewer, but do opt for a separate meter for electric. It should be noted that contractors indicated no real increase in excavation costs for up to a typical 4 unit multi-family home. These cost figures have been acquired and refreshed annually to keep up with market related development costs of residential dwellings.
Description SFD Duplex Triplex Fourplex Excavation $11,000 $11,000 $11,000 $11,000 Power (Clatskanie PUD) $100 $100 $100 $100 Sanitary services SDC + connection $2,745 $5,490 $8,235 $10,980 Water SDC + connection $1,420 $1,420 $1,420 $1,420
TOTAL $15,265 $18,010 $20,755 $23,500
Conclusions
The collected cost data is deemed to be credible and reliable indicators of on site development costs for residential dwellings. For 2019, the new OSD costs are listed below.
2019 City of Rainier OSD Single Family Dwelling $15,300 Multi-Family – Duplex $18,000 Multi-Family – Triplex $20,800 Multi-Family – Fourplex $23,500
[43]
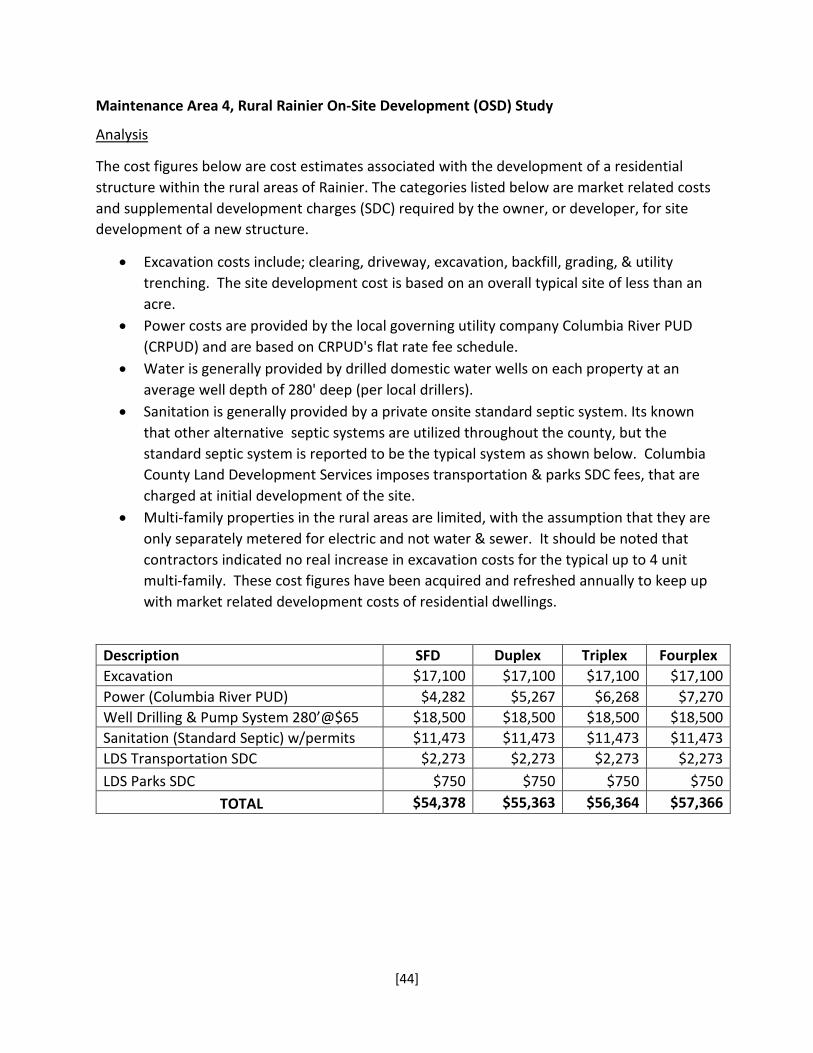
Maintenance Area 4, Rural Rainier On-Site Development (OSD) Study
Analysis
The cost figures below are cost estimates associated with the development of a residential structure within the rural areas of Rainier. The categories listed below are market related costs and supplemental development charges (SDC) required by the owner, or developer, for site development of a new structure.
• Excavation costs include; clearing, driveway, excavation, backfill, grading, & utility trenching. The site development cost is based on an overall typical site of less than an acre.
• Power costs are provided by the local governing utility company Columbia River PUD (CRPUD) and are based on CRPUD's flat rate fee schedule.
• Water is generally provided by drilled domestic water wells on each property at an average well depth of 280' deep (per local drillers).
• Sanitation is generally provided by a private onsite standard septic system. Its known that other alternative septic systems are utilized throughout the county, but the standard septic system is reported to be the typical system as shown below. Columbia County Land Development Services imposes transportation & parks SDC fees, that are charged at initial development of the site.
• Multi-family properties in the rural areas are limited, with the assumption that they are only separately metered for electric and not water & sewer. It should be noted that contractors indicated no real increase in excavation costs for the typical up to 4 unit multi-family. These cost figures have been acquired and refreshed annually to keep up with market related development costs of residential dwellings.
Description SFD Duplex Triplex Fourplex Excavation $17,100 $17,100 $17,100 $17,100 Power (Columbia River PUD) $4,282 $5,267 $6,268 $7,270 Well Drilling & Pump System 280’@$65 $18,500 $18,500 $18,500 $18,500 Sanitation (Standard Septic) w/permits $11,473 $11,473 $11,473 $11,473 LDS Transportation SDC $2,273 $2,273 $2,273 $2,273 LDS Parks SDC $750 $750 $750 $750
TOTAL $54,378 $55,363 $56,364 $57,366
[44]

Conclusions
The collected cost data is deemed to be credible and reliable indicators of on site development costs for residential dwellings. For 2019, the new OSD costs are listed below.
2019 Rural Rainier OSD Single Family Dwelling $54,400 Multi-Family – Duplex $55,400 Multi-Family – Triplex $56,400 Multi-Family – Fourplex $57,400
[45]
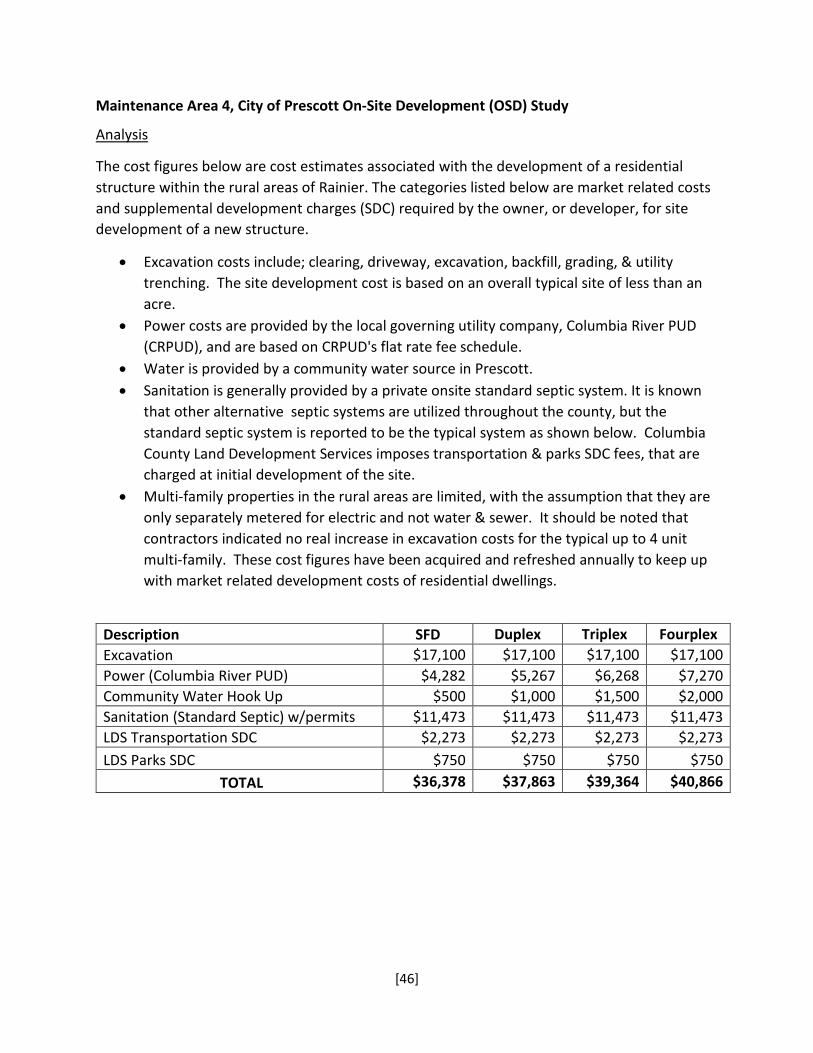
Maintenance Area 4, City of Prescott On-Site Development (OSD) Study
Analysis
The cost figures below are cost estimates associated with the development of a residential structure within the rural areas of Rainier. The categories listed below are market related costs and supplemental development charges (SDC) required by the owner, or developer, for site development of a new structure.
• Excavation costs include; clearing, driveway, excavation, backfill, grading, & utility trenching. The site development cost is based on an overall typical site of less than an acre.
• Power costs are provided by the local governing utility company, Columbia River PUD (CRPUD), and are based on CRPUD's flat rate fee schedule.
• Water is provided by a community water source in Prescott. • Sanitation is generally provided by a private onsite standard septic system. It is known
that other alternative septic systems are utilized throughout the county, but the standard septic system is reported to be the typical system as shown below. Columbia County Land Development Services imposes transportation & parks SDC fees, that are charged at initial development of the site.
• Multi-family properties in the rural areas are limited, with the assumption that they are only separately metered for electric and not water & sewer. It should be noted that contractors indicated no real increase in excavation costs for the typical up to 4 unit multi-family. These cost figures have been acquired and refreshed annually to keep up with market related development costs of residential dwellings.
Description SFD Duplex Triplex Fourplex Excavation $17,100 $17,100 $17,100 $17,100 Power (Columbia River PUD) $4,282 $5,267 $6,268 $7,270 Community Water Hook Up $500 $1,000 $1,500 $2,000 Sanitation (Standard Septic) w/permits $11,473 $11,473 $11,473 $11,473 LDS Transportation SDC $2,273 $2,273 $2,273 $2,273 LDS Parks SDC $750 $750 $750 $750
TOTAL $36,378 $37,863 $39,364 $40,866
[46]

Conclusions
The collected cost data is deemed to be credible and reliable indicators of on site development costs for residential dwellings. For 2019, the new OSD costs are listed below.
2019 City of Prescott OSD Single Family Dwelling $36,040 Multi-Family – Duplex $38,090 Multi-Family – Triplex $39,040 Multi-Family – Fourplex $41,090
[47]

Maintenance Area 5, City of Clatskanie On-Site Development (OSD) Study
Analysis
The cost figures below are cost estimates associated with the development of a residential structure within the City of Clatskanie. The categories listed below are market related costs and supplemental development charges (SDC) required by the owner, or developer, for site development of a new structure.
• Excavation costs include; clearing, driveway, excavation, backfill, grading, & utility trenching. The site development cost is based on an overall typical site of 5-10k square foot lot.
• Power costs are provided by the local governing utility company Clatskanie PUD. Clatskanie PUD offers a line credit for new installations that generally cover the costs.
• All the necessary SDC fees associated with water & sewer are charged at initial development of a site.
• Multi-family properties in this area generally opt not to separately meter for water and sewer, but do separately meter for electric. It should be noted that contractors indicated no real increase in excavation costs for up to a typical 4 unit multi-family. These cost figures have been acquired and refreshed annually to keep up with market related development costs of residential dwellings.
•
Description SFD Duplex Triplex Fourplex Excavation $11,000 $11,000 $11,000 $11,000 Power (Clatskanie) $100 $100 $100 $100 Sanitary services SDC + connection $1,500 $2,250 $3,000 $3,750 Water SDC + connection $1,250 $1,900 $2,550 $3,200
TOTAL $13,850 $15,250 $16,650 $18,050
Conclusions
The collected cost data is deemed to be credible and reliable indicators of on site development costs for residential dwellings. For 2019, the new OSD costs are listed below.
2019 City of Clatskanie OSD Single Family Dwelling $13,900 Multi-Family – Duplex $15,300 Multi-Family – Triplex $16,700 Multi-Family – Fourplex $18,100
[48]
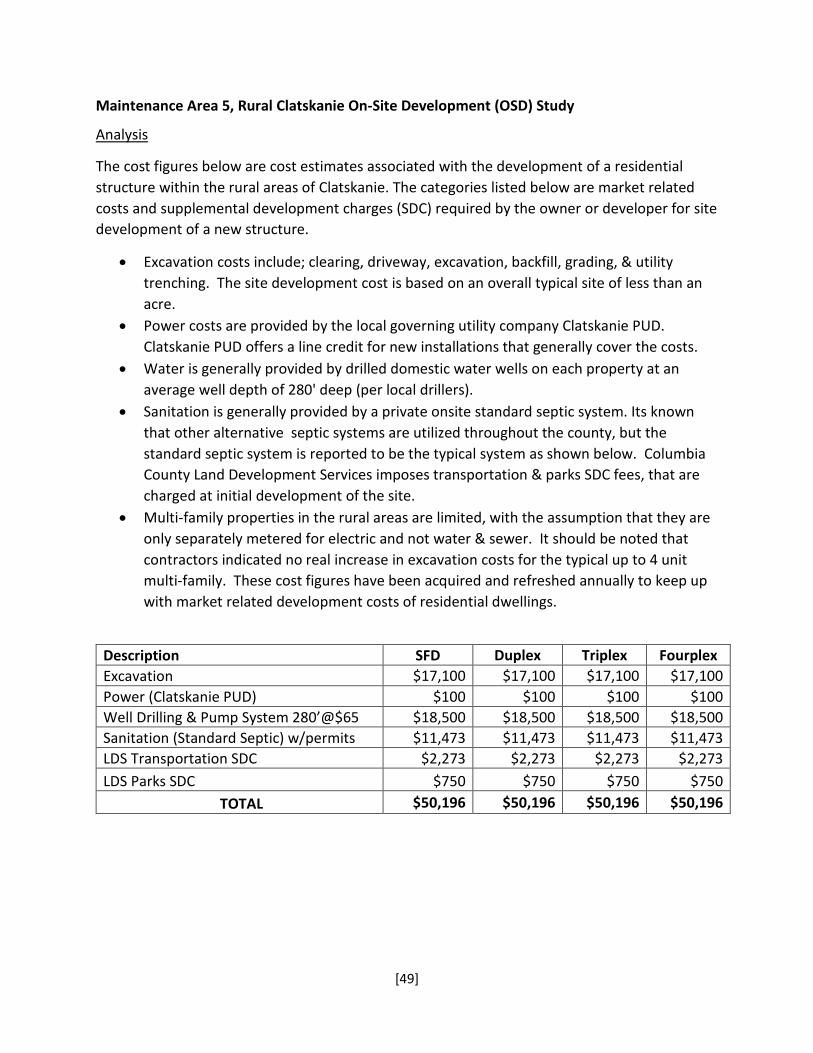
Maintenance Area 5, Rural Clatskanie On-Site Development (OSD) Study
Analysis
The cost figures below are cost estimates associated with the development of a residential structure within the rural areas of Clatskanie. The categories listed below are market related costs and supplemental development charges (SDC) required by the owner or developer for site development of a new structure.
• Excavation costs include; clearing, driveway, excavation, backfill, grading, & utility trenching. The site development cost is based on an overall typical site of less than an acre.
• Power costs are provided by the local governing utility company Clatskanie PUD. Clatskanie PUD offers a line credit for new installations that generally cover the costs.
• Water is generally provided by drilled domestic water wells on each property at an average well depth of 280' deep (per local drillers).
• Sanitation is generally provided by a private onsite standard septic system. Its known that other alternative septic systems are utilized throughout the county, but the standard septic system is reported to be the typical system as shown below. Columbia County Land Development Services imposes transportation & parks SDC fees, that are charged at initial development of the site.
• Multi-family properties in the rural areas are limited, with the assumption that they are only separately metered for electric and not water & sewer. It should be noted that contractors indicated no real increase in excavation costs for the typical up to 4 unit multi-family. These cost figures have been acquired and refreshed annually to keep up with market related development costs of residential dwellings.
Description SFD Duplex Triplex Fourplex Excavation $17,100 $17,100 $17,100 $17,100 Power (Clatskanie PUD) $100 $100 $100 $100 Well Drilling & Pump System 280’@$65 $18,500 $18,500 $18,500 $18,500 Sanitation (Standard Septic) w/permits $11,473 $11,473 $11,473 $11,473 LDS Transportation SDC $2,273 $2,273 $2,273 $2,273 LDS Parks SDC $750 $750 $750 $750
TOTAL $50,196 $50,196 $50,196 $50,196
[49]

Conclusions
The collected cost data is deemed to be credible and reliable indicators of on site development costs for residential dwellings. For 2019, the new OSD costs are listed below.
2019 Rural Clatskanie OSD Single Family Dwelling $50,200 Multi-Family – Duplex $50,200 Multi-Family – Triplex $50,200 Multi-Family – Fourplex $50,200
[50]
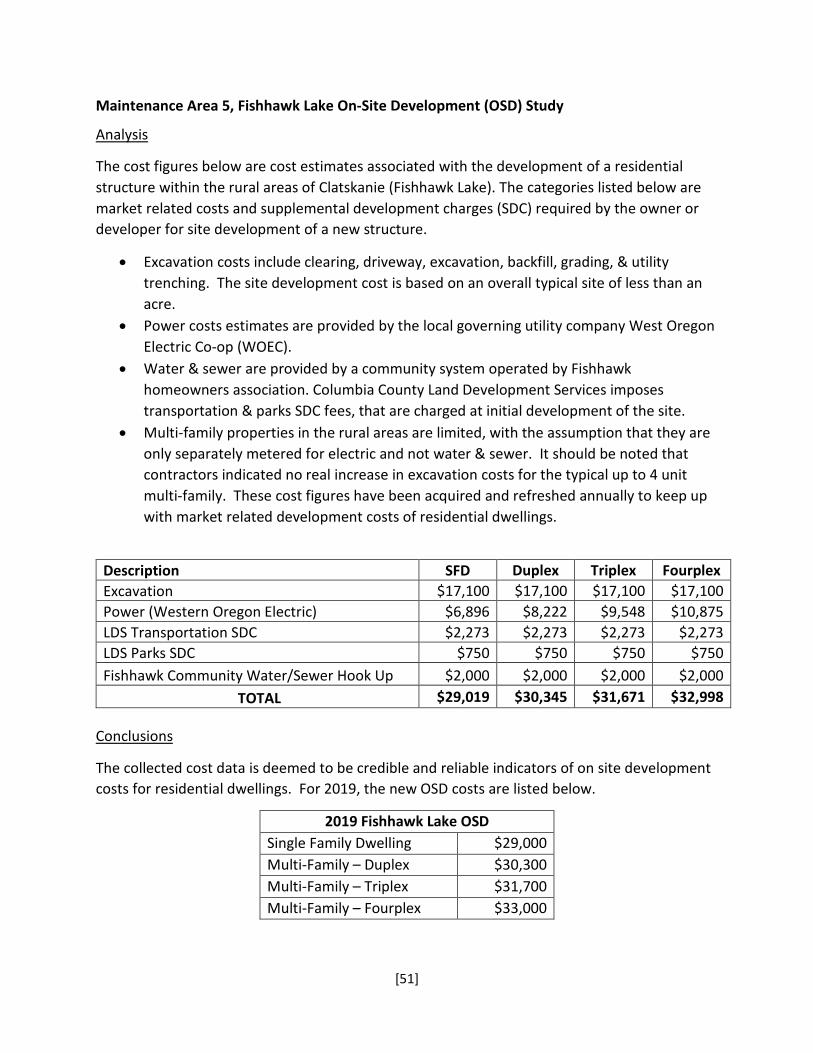
Maintenance Area 5, Fishhawk Lake On-Site Development (OSD) Study
Analysis
The cost figures below are cost estimates associated with the development of a residential structure within the rural areas of Clatskanie (Fishhawk Lake). The categories listed below are market related costs and supplemental development charges (SDC) required by the owner or developer for site development of a new structure.
• Excavation costs include clearing, driveway, excavation, backfill, grading, & utility trenching. The site development cost is based on an overall typical site of less than an acre.
• Power costs estimates are provided by the local governing utility company West Oregon Electric Co-op (WOEC).
• Water & sewer are provided by a community system operated by Fishhawk homeowners association. Columbia County Land Development Services imposes transportation & parks SDC fees, that are charged at initial development of the site.
• Multi-family properties in the rural areas are limited, with the assumption that they are only separately metered for electric and not water & sewer. It should be noted that contractors indicated no real increase in excavation costs for the typical up to 4 unit multi-family. These cost figures have been acquired and refreshed annually to keep up with market related development costs of residential dwellings.
Description SFD Duplex Triplex Fourplex Excavation $17,100 $17,100 $17,100 $17,100 Power (Western Oregon Electric) $6,896 $8,222 $9,548 $10,875 LDS Transportation SDC $2,273 $2,273 $2,273 $2,273 LDS Parks SDC $750 $750 $750 $750 Fishhawk Community Water/Sewer Hook Up $2,000 $2,000 $2,000 $2,000
TOTAL $29,019 $30,345 $31,671 $32,998
Conclusions
The collected cost data is deemed to be credible and reliable indicators of on site development costs for residential dwellings. For 2019, the new OSD costs are listed below.
2019 Fishhawk Lake OSD Single Family Dwelling $29,000 Multi-Family – Duplex $30,300 Multi-Family – Triplex $31,700 Multi-Family – Fourplex $33,000
[51]

Maintenance Area 6, City of Columbia City On-Site Development (OSD) Study
Analysis
The cost figures below are cost estimates associated with the development of a residential structure within the City of Columbia City. The categories listed below are market related costs and supplemental development charges (SDC) required by the owner, or developer, for site development of a new structure.
• Excavation costs include; clearing, driveway, excavation, backfill, grading, & utility trenching. The site development cost is based on an overall typical site of 5-10k square foot lot.
• Power costs are provided by the local governing utility company, Columbia River PUD (CRPUD), these cost estimates are based on CRPUD's flat rate fee schedule.
• All the necessary SDC fees associated with; water, sewer, parks, streets, and storms are SDC fees that are charged only at initial development of a site.
• Multi-family properties in this area generally opt to have each unit separately metered for water and sewer, because of the cost of water & sewer rates. It should be noted that contractors indicated no real increase in excavation costs for the typical up to 4 unit multi-family. These cost figures have been acquired and refreshed annually to keep up with market related development costs of residential.
Description SFD Duplex Triplex Fourplex Excavation $11,000 $11,000 $11,000 $11,000 Power (Columbia River PUD) $1,740 $1,880 $2,030 $2,190 Water SDC + connection $5,477 $10,954 $16,431 $21,908 Sanitary services SDC + connection $5,840 $11,680 $17,520 $23,360 Parks SDC $2,019 $4,038 $6,057 $8,076 Storm Drainage SDC $389 $464 $696 $928 Transportation SDC $4,575 $5,604 $8,406 $11,208 School Construction Excise Tax (CET) $2,340 $2,600 $3,640 $4,680
TOTAL $33,380 $48,220 $65,780 $83,350
Conclusions
The collected cost data is deemed to be credible and reliable indicators of on site development costs for residential dwellings. For 2019, the new OSD costs are listed below.
2019 City of Columbia City OSD Single Family Dwelling $33,400 Multi-Family – Duplex $48,200 Multi-Family – Triplex $65,800 Multi-Family – Fourplex $83,400
[52]
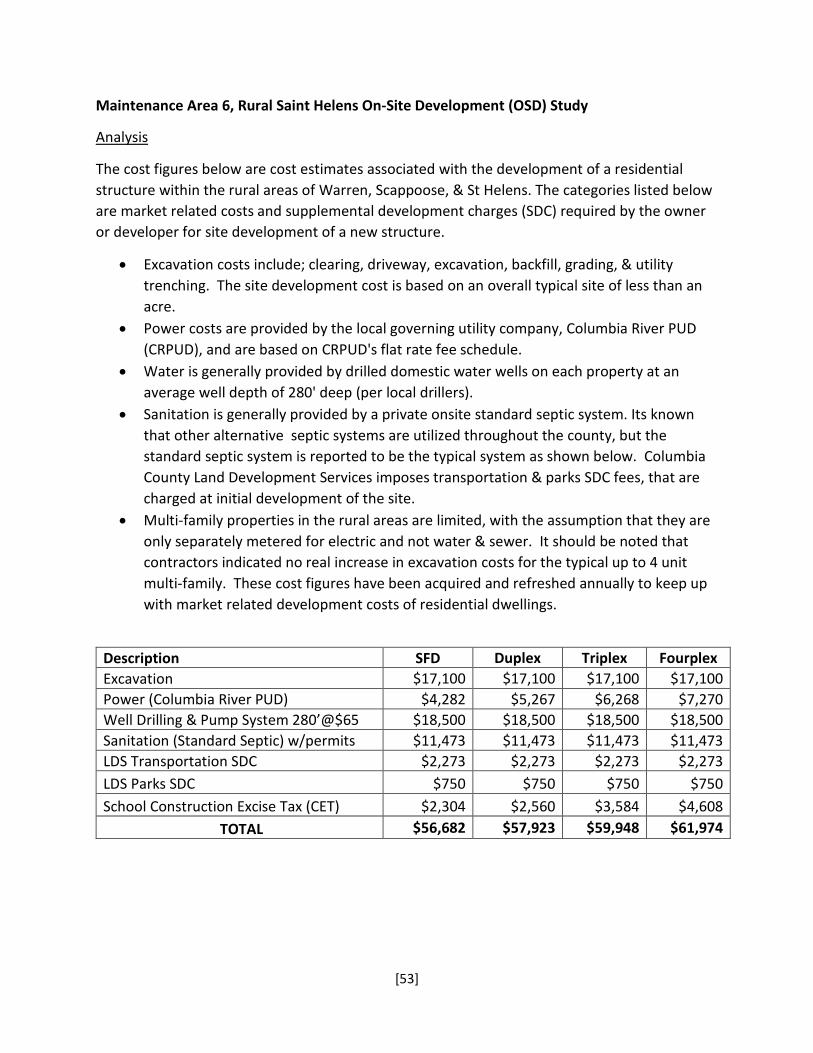
Maintenance Area 6, Rural Saint Helens On-Site Development (OSD) Study
Analysis
The cost figures below are cost estimates associated with the development of a residential structure within the rural areas of Warren, Scappoose, & St Helens. The categories listed below are market related costs and supplemental development charges (SDC) required by the owner or developer for site development of a new structure.
• Excavation costs include; clearing, driveway, excavation, backfill, grading, & utility trenching. The site development cost is based on an overall typical site of less than an acre.
• Power costs are provided by the local governing utility company, Columbia River PUD (CRPUD), and are based on CRPUD's flat rate fee schedule.
• Water is generally provided by drilled domestic water wells on each property at an average well depth of 280' deep (per local drillers).
• Sanitation is generally provided by a private onsite standard septic system. Its known that other alternative septic systems are utilized throughout the county, but the standard septic system is reported to be the typical system as shown below. Columbia County Land Development Services imposes transportation & parks SDC fees, that are charged at initial development of the site.
• Multi-family properties in the rural areas are limited, with the assumption that they are only separately metered for electric and not water & sewer. It should be noted that contractors indicated no real increase in excavation costs for the typical up to 4 unit multi-family. These cost figures have been acquired and refreshed annually to keep up with market related development costs of residential dwellings.
Description SFD Duplex Triplex Fourplex Excavation $17,100 $17,100 $17,100 $17,100 Power (Columbia River PUD) $4,282 $5,267 $6,268 $7,270 Well Drilling & Pump System 280’@$65 $18,500 $18,500 $18,500 $18,500 Sanitation (Standard Septic) w/permits $11,473 $11,473 $11,473 $11,473 LDS Transportation SDC $2,273 $2,273 $2,273 $2,273 LDS Parks SDC $750 $750 $750 $750 School Construction Excise Tax (CET) $2,304 $2,560 $3,584 $4,608
TOTAL $56,682 $57,923 $59,948 $61,974
[53]

Conclusions
The collected cost data is deemed to be credible and reliable indicators of on site development costs for residential dwellings. For 2019, the new OSD costs are listed below.
2019 Rural Saint Helens OSD Single Family Dwelling $56,700 Multi-Family – Duplex $57,900 Multi-Family – Triplex $59,900 Multi-Family – Fourplex $62,000
[54]
2019 Local Cost Modifiers (LCM) Analysis and
Conclusions
[55]
Countywide Local Cost Modifier (LCM) Study for Conventional Dwellings
This study establishes a modifier to be applied to construction costs found in the 2005 Cost Factors for Residential Buildings, to adjust the factors for conventional dwellings to the base appraisal date of 1/1/18.
Analysis
This analysis for the 2019 LCM set up year was based on sales of homes built in 2017. The initial raw data included 99 properties to review for use in the study. After an initial review of these properties, many were removed from this study for the following reasons:
• Sales of properties that included carriage houses, farm buildings, or additional structures.
• Sales of properties that had notable value influences due to topography, views, etc. • Sales of properties in areas that there were not enough vacant land sales to establish a
land schedule. • Sales of properties where it was difficult to accurately determine the quality of
construction as compared to our cost factor book and class benchmarks. • Cost of new homes where the owners were the general contractor.
Of the remaining 46 sales, 25 were properties where the new home and land were marketed and sold together, and 21 were homes where the owner had previously purchased the land and hired a general contractor to build. Sales that included land were time trended to the base appraisal date of January 1, 2018. All sites were field inspected by appraisers to verify class and gather data on the cost to build, if appropriate.
For the 25 homes that sold with the land, the land and OSD are calculated using the new factors from our land and OSD studies, and then subtracted from the time trended sale price of the property to extract the value of the dwelling. This residual value is then compared to a replacement cost new (RCN) calculated from the 2005 Residential Cost Factor Book. The ratio between the residual value and the RCN is an indicated Local Cost Modifier (LCM). The average LCM using this method was 1.29. For the 21 homes that were the contractor’s total cost to build on the buyer’s land, the ratio between the contractor’s cost and the RCN is an indicated LCM. The average LCM using this method was 1.29.
Conclusions
The overall LCM mean calculated at 1.29; the sales extraction and the cost method both indicated an LCM of 1.29.
The 2019 Conventional Dwelling LCM to be applied to the 2005 Residential Cost Factor Book is 1.29.
[56]

Countywide Local Cost Modifier (LCM) Study Manufactured Dwellings
This study establishes a modifier to be applied to construction costs found in the 2004 Cost Factors for Manufactured Structures, to adjust the factors for manufactured dwellings to the base appraisal date of 1/1/18.
Analysis
This analysis for the 2019 MS LCM set up year was based on sales of manufactured homes built in 2017 that were sited in Columbia County. These homes were placed throughout the county and site visited to verify classing and confirm building cost data for analyzation. There were a total of 12 usable properties for analysis based on constructions costs. No sales were available for extraction analysis at this time. The indicated LCM’s for the 12 homes ranged from 1.07 to 1.84, with a mean of 1.45.
Conclusions
The overall mean of 1.45 is consistent with the prior year LCM of 1.47.
The 2019 Manufactured Dwelling LCM to be applied to the 2004 Cost Factors for Manufactured Structures is 1.45.
[57]
Countywide Local Cost Modifier (LCM) Study for Floating Property
The Oregon Department of Revenue does not provide a separate cost factor book to be used on floating property, however, the primary difference between conventional dwellings and floating homes is the foundation structure, so the same factor book is used. The costs to build a floating home are much higher than to build a home on land, so the calculated LCM is expected to reflect those higher costs. This study establishes a modifier to be applied to construction costs found in the 2005 Cost Factors for Residential Buildings to adjust the factors for floating property to the base appraisal date of 1/1/18.
Analysis
This analysis for the floating property LCM uses sales of new floating homes from 2016 and 2017. Due to a lack of sales in Columbia County, the majority of sales used were from Multnomah County. The sales were all time adjusted to the base appraisal date of January 1, 2018. There were 9 sales that occurred in Multnomah County and 2 sales that occurred in Columbia County. An appropriate quality class was determined for each of the floating homes. All 11 of the sales have been included in the analysis and the time adjusted sales price was compared with the calculated cost from the 2005 Cost Factors for Residential Buildings. The Multnomah County sales indicated an average LCM of 2.73 and the Columbia County sales indicated an average LCM of 2.89. With all 11 sales combined the overall average LCM was 2.76. The weighted LCM mean between the 2 Columbia County sales and 9 Multnomah County Sales was also 2.76.
Conclusions
Based on the data available, it was determined that the mean is the most reliable indicator for the floating property LCM at 2.76.
The 2019 Floating Property LCM to be applied to the 2005 Cost Factors for Residential Buildings is 2.76.
[58]
Countywide Local Cost Modifier (LCM) for Farm Buildings
This study establishes a modifier to be applied to construction costs found in the 2009 Cost Factors for Farm Buildings, to adjust the factors for farm buildings to the base appraisal date of 1/1/18. The majority of farm buildings in Columbia County are general purpose pole frame type buildings.
Analysis
A sales extraction method for determining a Farm Building LCM was not done, properties are not generally sold with a new pole building. The best method of determining a local cost modifier for these types of buildings is by collecting data on the actual market cost to build. This analysis for the 2019 Farm LCM set up year was based on reported cost of Farm buildings that were built by contractors in Columbia County. These farm buildings were scattered throughout the county and site visited to verify classing and confirm building cost data for analyzation. There were a total of 10 usable properties for analysis based on owner reported constructions costs. The majority of the cost data above is reflective of class 4, 5 and 6 general purpose buildings. Other type of farm buildings were considered, but specialty type buildings were considered difficult to accurately gather costs for comparison.
Conclusions
The data consists of construction costs associated with building farm buildings in Columbia County. The LCM ranged from 1.34 to 1.85 with a mean of 1.58. This data appears to show an increase of approximately 10% from the prior year. It's recommended that the mean LCM of 1.58 be used for the 2019 setup.
The 2019 Farm Building LCM to be applied to the 2009 Cost Factors for Farm Buildings is 1.58.
[59]

Notes
[60]

2019 Depreciation Schedules Analysis and Conclusions
[61]
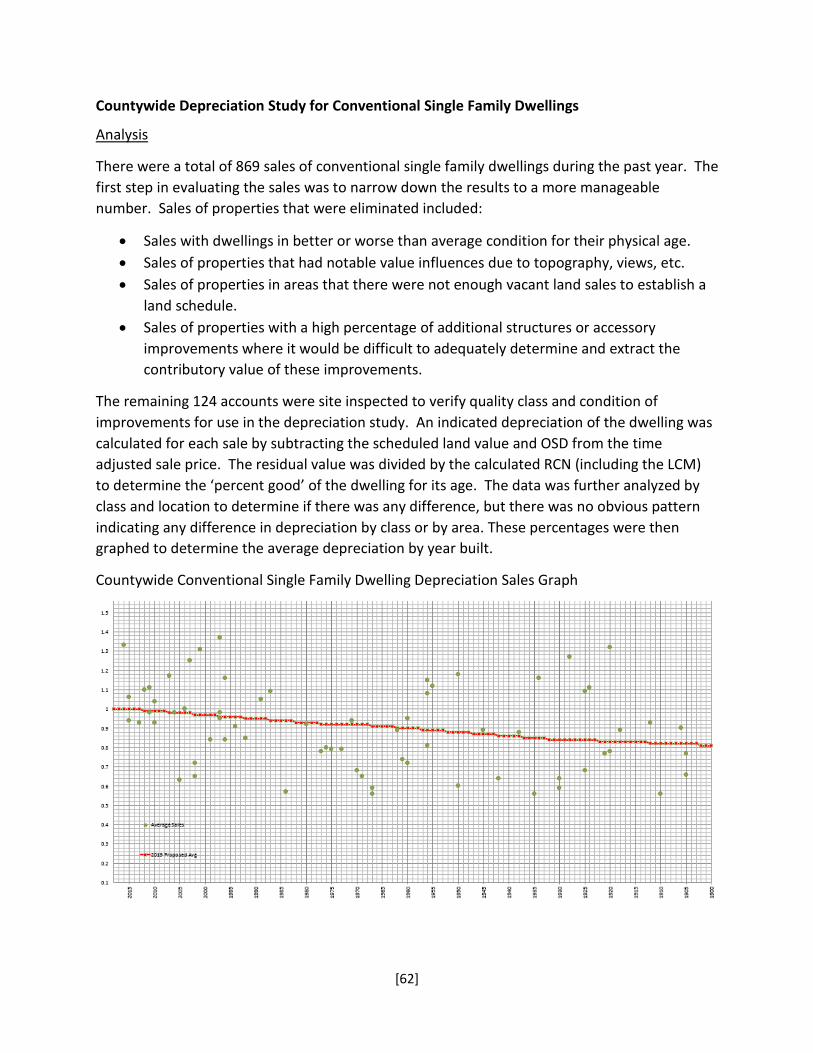
Countywide Depreciation Study for Conventional Single Family Dwellings
Analysis
There were a total of 869 sales of conventional single family dwellings during the past year. The first step in evaluating the sales was to narrow down the results to a more manageable number. Sales of properties that were eliminated included:
• Sales with dwellings in better or worse than average condition for their physical age. • Sales of properties that had notable value influences due to topography, views, etc. • Sales of properties in areas that there were not enough vacant land sales to establish a
land schedule. • Sales of properties with a high percentage of additional structures or accessory
improvements where it would be difficult to adequately determine and extract the contributory value of these improvements.
The remaining 124 accounts were site inspected to verify quality class and condition of improvements for use in the depreciation study. An indicated depreciation of the dwelling was calculated for each sale by subtracting the scheduled land value and OSD from the time adjusted sale price. The residual value was divided by the calculated RCN (including the LCM) to determine the ‘percent good’ of the dwelling for its age. The data was further analyzed by class and location to determine if there was any difference, but there was no obvious pattern indicating any difference in depreciation by class or by area. These percentages were then graphed to determine the average depreciation by year built.
Countywide Conventional Single Family Dwelling Depreciation Sales Graph
[62]
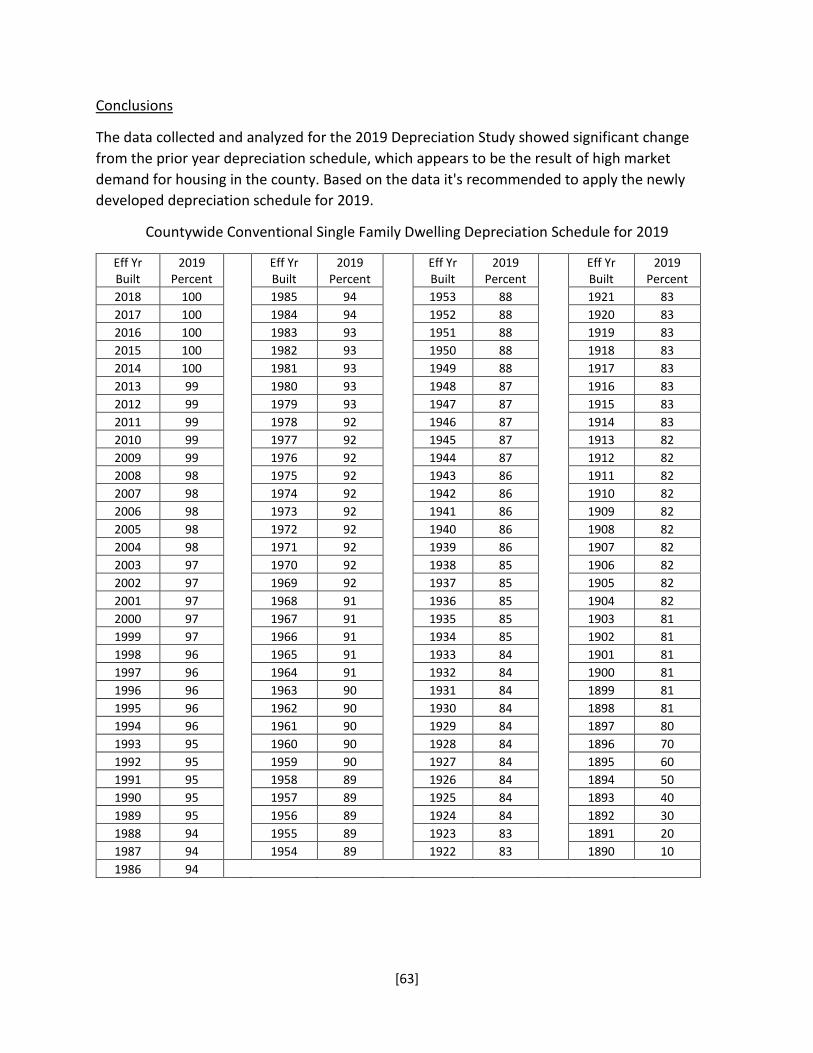
Conclusions
The data collected and analyzed for the 2019 Depreciation Study showed significant change from the prior year depreciation schedule, which appears to be the result of high market demand for housing in the county. Based on the data it's recommended to apply the newly developed depreciation schedule for 2019.
Countywide Conventional Single Family Dwelling Depreciation Schedule for 2019
Eff Yr Built
2019 Percent
Eff Yr Built
2019 Percent
Eff Yr Built
2019 Percent
Eff Yr Built
2019 Percent
2018 100 1985 94 1953 88 1921 83 2017 100 1984 94 1952 88 1920 83 2016 100 1983 93 1951 88 1919 83 2015 100 1982 93 1950 88 1918 83 2014 100 1981 93 1949 88 1917 83 2013 99 1980 93 1948 87 1916 83 2012 99 1979 93 1947 87 1915 83 2011 99 1978 92 1946 87 1914 83 2010 99 1977 92 1945 87 1913 82 2009 99 1976 92 1944 87 1912 82 2008 98 1975 92 1943 86 1911 82 2007 98 1974 92 1942 86 1910 82 2006 98 1973 92 1941 86 1909 82 2005 98 1972 92 1940 86 1908 82 2004 98 1971 92 1939 86 1907 82 2003 97 1970 92 1938 85 1906 82 2002 97 1969 92 1937 85 1905 82 2001 97 1968 91 1936 85 1904 82 2000 97 1967 91 1935 85 1903 81 1999 97 1966 91 1934 85 1902 81 1998 96 1965 91 1933 84 1901 81 1997 96 1964 91 1932 84 1900 81 1996 96 1963 90 1931 84 1899 81 1995 96 1962 90 1930 84 1898 81 1994 96 1961 90 1929 84 1897 80 1993 95 1960 90 1928 84 1896 70 1992 95 1959 90 1927 84 1895 60 1991 95 1958 89 1926 84 1894 50 1990 95 1957 89 1925 84 1893 40 1989 95 1956 89 1924 84 1892 30 1988 94 1955 89 1923 83 1891 20 1987 94 1954 89 1922 83 1890 10 1986 94
[63]
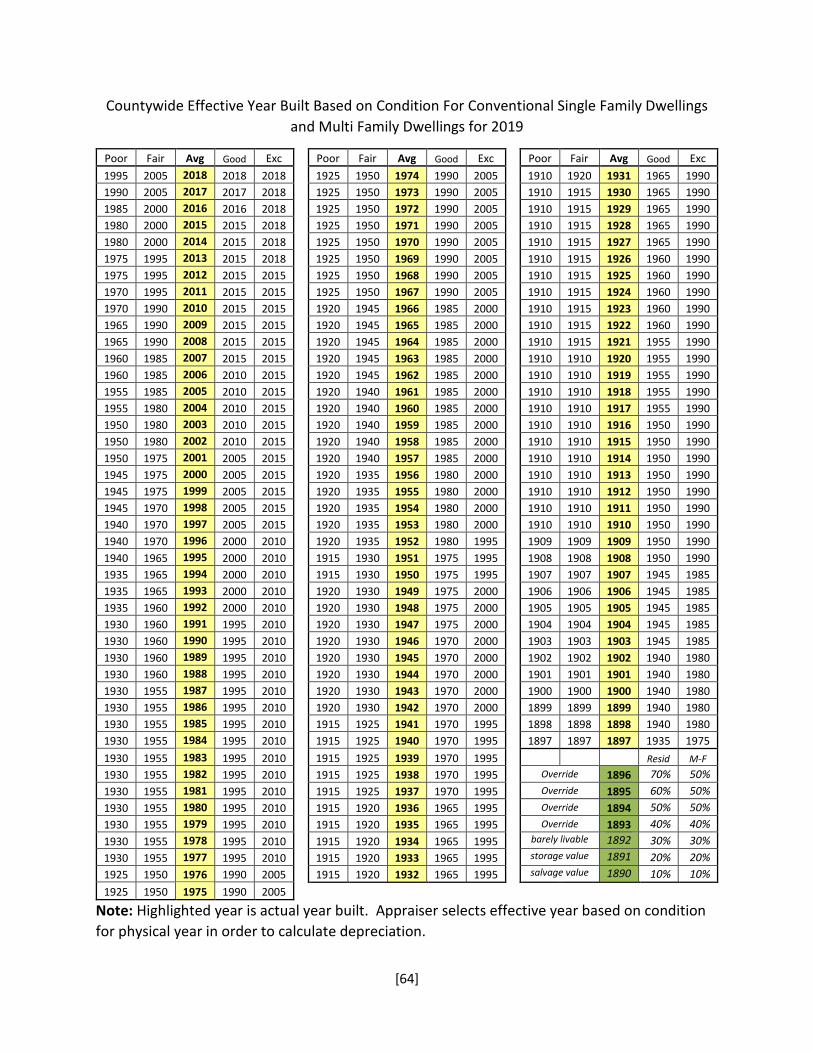
Countywide Effective Year Built Based on Condition For Conventional Single Family Dwellings and Multi Family Dwellings for 2019
Poor Fair Avg Good Exc 1995 2005 2018 2018 2018 1990 2005 2017 2017 2018 1985 2000 2016 2016 2018 1980 2000 2015 2015 2018 1980 2000 2014 2015 2018 1975 1995 2013 2015 2018 1975 1995 2012 2015 2015 1970 1995 2011 2015 2015 1970 1990 2010 2015 2015 1965 1990 2009 2015 2015 1965 1990 2008 2015 2015 1960 1985 2007 2015 2015 1960 1985 2006 2010 2015 1955 1985 2005 2010 2015 1955 1980 2004 2010 2015 1950 1980 2003 2010 2015 1950 1980 2002 2010 2015 1950 1975 2001 2005 2015 1945 1975 2000 2005 2015 1945 1975 1999 2005 2015 1945 1970 1998 2005 2015 1940 1970 1997 2005 2015 1940 1970 1996 2000 2010 1940 1965 1995 2000 2010 1935 1965 1994 2000 2010 1935 1965 1993 2000 2010 1935 1960 1992 2000 2010 1930 1960 1991 1995 2010 1930 1960 1990 1995 2010 1930 1960 1989 1995 2010 1930 1960 1988 1995 2010 1930 1955 1987 1995 2010 1930 1955 1986 1995 2010 1930 1955 1985 1995 2010 1930 1955 1984 1995 2010 1930 1955 1983 1995 2010 1930 1955 1982 1995 2010 1930 1955 1981 1995 2010 1930 1955 1980 1995 2010 1930 1955 1979 1995 2010 1930 1955 1978 1995 2010 1930 1955 1977 1995 2010 1925 1950 1976 1990 2005 1925 1950 1975 1990 2005
Poor Fair Avg Good Exc 1925 1950 1974 1990 2005 1925 1950 1973 1990 2005 1925 1950 1972 1990 2005 1925 1950 1971 1990 2005 1925 1950 1970 1990 2005 1925 1950 1969 1990 2005 1925 1950 1968 1990 2005 1925 1950 1967 1990 2005 1920 1945 1966 1985 2000 1920 1945 1965 1985 2000 1920 1945 1964 1985 2000 1920 1945 1963 1985 2000 1920 1945 1962 1985 2000 1920 1940 1961 1985 2000 1920 1940 1960 1985 2000 1920 1940 1959 1985 2000 1920 1940 1958 1985 2000 1920 1940 1957 1985 2000 1920 1935 1956 1980 2000 1920 1935 1955 1980 2000 1920 1935 1954 1980 2000 1920 1935 1953 1980 2000 1920 1935 1952 1980 1995 1915 1930 1951 1975 1995 1915 1930 1950 1975 1995 1920 1930 1949 1975 2000 1920 1930 1948 1975 2000 1920 1930 1947 1975 2000 1920 1930 1946 1970 2000 1920 1930 1945 1970 2000 1920 1930 1944 1970 2000 1920 1930 1943 1970 2000 1920 1930 1942 1970 2000 1915 1925 1941 1970 1995 1915 1925 1940 1970 1995 1915 1925 1939 1970 1995 1915 1925 1938 1970 1995 1915 1925 1937 1970 1995 1915 1920 1936 1965 1995 1915 1920 1935 1965 1995 1915 1920 1934 1965 1995 1915 1920 1933 1965 1995 1915 1920 1932 1965 1995
Poor Fair Avg Good Exc 1910 1920 1931 1965 1990 1910 1915 1930 1965 1990 1910 1915 1929 1965 1990 1910 1915 1928 1965 1990 1910 1915 1927 1965 1990 1910 1915 1926 1960 1990 1910 1915 1925 1960 1990 1910 1915 1924 1960 1990 1910 1915 1923 1960 1990 1910 1915 1922 1960 1990 1910 1915 1921 1955 1990 1910 1910 1920 1955 1990 1910 1910 1919 1955 1990 1910 1910 1918 1955 1990 1910 1910 1917 1955 1990 1910 1910 1916 1950 1990 1910 1910 1915 1950 1990 1910 1910 1914 1950 1990 1910 1910 1913 1950 1990 1910 1910 1912 1950 1990 1910 1910 1911 1950 1990 1910 1910 1910 1950 1990 1909 1909 1909 1950 1990 1908 1908 1908 1950 1990 1907 1907 1907 1945 1985 1906 1906 1906 1945 1985 1905 1905 1905 1945 1985 1904 1904 1904 1945 1985 1903 1903 1903 1945 1985 1902 1902 1902 1940 1980 1901 1901 1901 1940 1980 1900 1900 1900 1940 1980 1899 1899 1899 1940 1980 1898 1898 1898 1940 1980 1897 1897 1897 1935 1975
Resid M-F Override 1896 70% 50% Override 1895 60% 50% Override 1894 50% 50% Override 1893 40% 40%
barely livable 1892 30% 30% storage value 1891 20% 20% salvage value 1890 10% 10%
Note: Highlighted year is actual year built. Appraiser selects effective year based on condition for physical year in order to calculate depreciation.
[64]
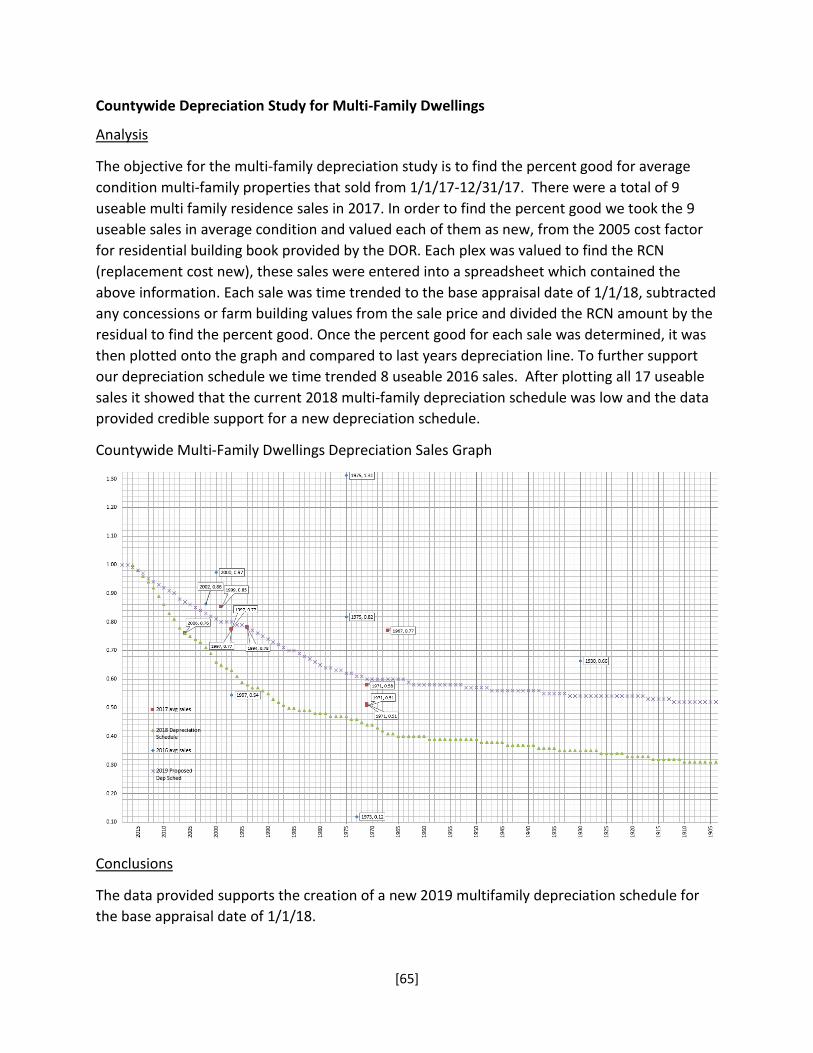
Countywide Depreciation Study for Multi-Family Dwellings
Analysis
The objective for the multi-family depreciation study is to find the percent good for average condition multi-family properties that sold from 1/1/17-12/31/17. There were a total of 9 useable multi family residence sales in 2017. In order to find the percent good we took the 9 useable sales in average condition and valued each of them as new, from the 2005 cost factor for residential building book provided by the DOR. Each plex was valued to find the RCN (replacement cost new), these sales were entered into a spreadsheet which contained the above information. Each sale was time trended to the base appraisal date of 1/1/18, subtracted any concessions or farm building values from the sale price and divided the RCN amount by the residual to find the percent good. Once the percent good for each sale was determined, it was then plotted onto the graph and compared to last years depreciation line. To further support our depreciation schedule we time trended 8 useable 2016 sales. After plotting all 17 useable sales it showed that the current 2018 multi-family depreciation schedule was low and the data provided credible support for a new depreciation schedule.
Countywide Multi-Family Dwellings Depreciation Sales Graph
Conclusions
The data provided supports the creation of a new 2019 multifamily depreciation schedule for the base appraisal date of 1/1/18.
[65]
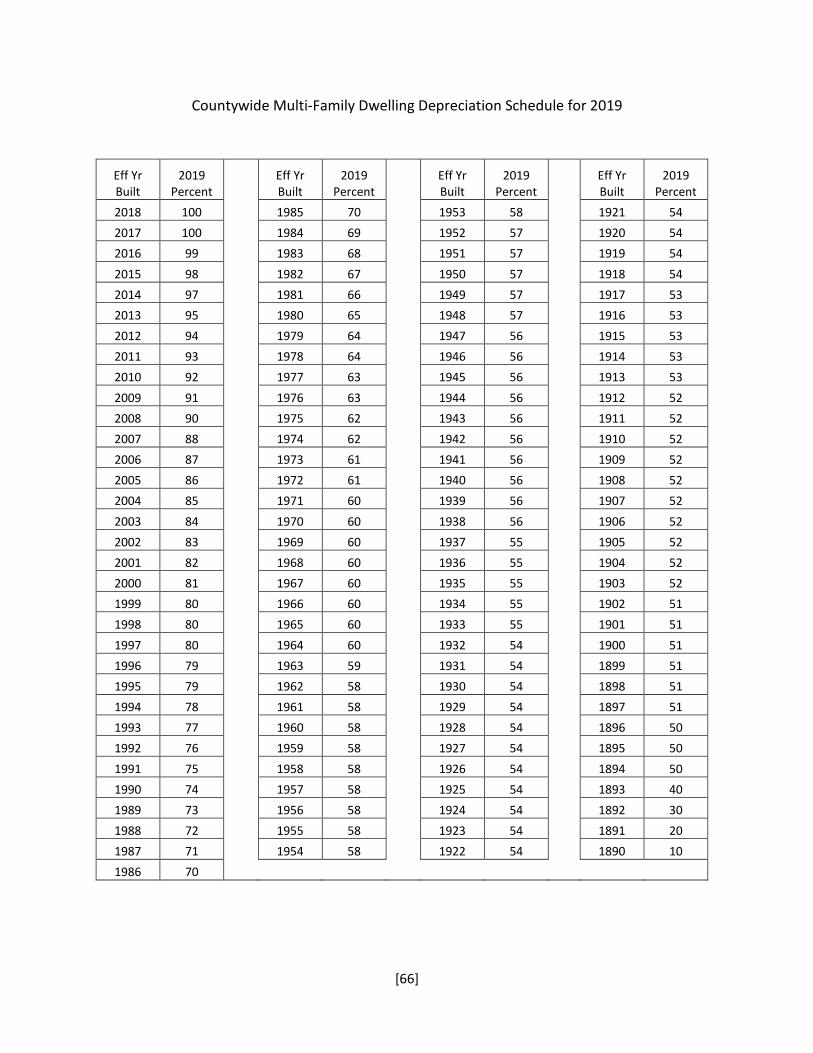
Countywide Multi-Family Dwelling Depreciation Schedule for 2019
Eff Yr Built
2019 Percent
Eff Yr Built
2019 Percent
Eff Yr Built
2019 Percent
Eff Yr Built
2019 Percent
2018 100 1985 70 1953 58 1921 54 2017 100 1984 69 1952 57 1920 54 2016 99 1983 68 1951 57 1919 54 2015 98 1982 67 1950 57 1918 54 2014 97 1981 66 1949 57 1917 53 2013 95 1980 65 1948 57 1916 53 2012 94 1979 64 1947 56 1915 53 2011 93 1978 64 1946 56 1914 53 2010 92 1977 63 1945 56 1913 53 2009 91 1976 63 1944 56 1912 52 2008 90 1975 62 1943 56 1911 52 2007 88 1974 62 1942 56 1910 52 2006 87 1973 61 1941 56 1909 52 2005 86 1972 61 1940 56 1908 52 2004 85 1971 60 1939 56 1907 52 2003 84 1970 60 1938 56 1906 52 2002 83 1969 60 1937 55 1905 52 2001 82 1968 60 1936 55 1904 52 2000 81 1967 60 1935 55 1903 52 1999 80 1966 60 1934 55 1902 51 1998 80 1965 60 1933 55 1901 51 1997 80 1964 60 1932 54 1900 51 1996 79 1963 59 1931 54 1899 51 1995 79 1962 58 1930 54 1898 51 1994 78 1961 58 1929 54 1897 51 1993 77 1960 58 1928 54 1896 50 1992 76 1959 58 1927 54 1895 50 1991 75 1958 58 1926 54 1894 50 1990 74 1957 58 1925 54 1893 40 1989 73 1956 58 1924 54 1892 30 1988 72 1955 58 1923 54 1891 20 1987 71 1954 58 1922 54 1890 10 1986 70
[66]

Countywide Effective Year Built Based on Condition For Conventional Single Family Dwellings and Multi Family Dwellings for 2019
Poor Fair Avg Good Exc 1995 2005 2018 2018 2018 1990 2005 2017 2017 2018 1985 2000 2016 2016 2018 1980 2000 2015 2015 2018 1980 2000 2014 2015 2018 1975 1995 2013 2015 2018 1975 1995 2012 2015 2015 1970 1995 2011 2015 2015 1970 1990 2010 2015 2015 1965 1990 2009 2015 2015 1965 1990 2008 2015 2015 1960 1985 2007 2015 2015 1960 1985 2006 2010 2015 1955 1985 2005 2010 2015 1955 1980 2004 2010 2015 1950 1980 2003 2010 2015 1950 1980 2002 2010 2015 1950 1975 2001 2005 2015 1945 1975 2000 2005 2015 1945 1975 1999 2005 2015 1945 1970 1998 2005 2015 1940 1970 1997 2005 2015 1940 1970 1996 2000 2010 1940 1965 1995 2000 2010 1935 1965 1994 2000 2010 1935 1965 1993 2000 2010 1935 1960 1992 2000 2010 1930 1960 1991 1995 2010 1930 1960 1990 1995 2010 1930 1960 1989 1995 2010 1930 1960 1988 1995 2010 1930 1955 1987 1995 2010 1930 1955 1986 1995 2010 1930 1955 1985 1995 2010 1930 1955 1984 1995 2010 1930 1955 1983 1995 2010 1930 1955 1982 1995 2010 1930 1955 1981 1995 2010 1930 1955 1980 1995 2010 1930 1955 1979 1995 2010 1930 1955 1978 1995 2010 1930 1955 1977 1995 2010 1925 1950 1976 1990 2005 1925 1950 1975 1990 2005
Poor Fair Avg Good Exc 1925 1950 1974 1990 2005 1925 1950 1973 1990 2005 1925 1950 1972 1990 2005 1925 1950 1971 1990 2005 1925 1950 1970 1990 2005 1925 1950 1969 1990 2005 1925 1950 1968 1990 2005 1925 1950 1967 1990 2005 1920 1945 1966 1985 2000 1920 1945 1965 1985 2000 1920 1945 1964 1985 2000 1920 1945 1963 1985 2000 1920 1945 1962 1985 2000 1920 1940 1961 1985 2000 1920 1940 1960 1985 2000 1920 1940 1959 1985 2000 1920 1940 1958 1985 2000 1920 1940 1957 1985 2000 1920 1935 1956 1980 2000 1920 1935 1955 1980 2000 1920 1935 1954 1980 2000 1920 1935 1953 1980 2000 1920 1935 1952 1980 1995 1915 1930 1951 1975 1995 1915 1930 1950 1975 1995 1920 1930 1949 1975 2000 1920 1930 1948 1975 2000 1920 1930 1947 1975 2000 1920 1930 1946 1970 2000 1920 1930 1945 1970 2000 1920 1930 1944 1970 2000 1920 1930 1943 1970 2000 1920 1930 1942 1970 2000 1915 1925 1941 1970 1995 1915 1925 1940 1970 1995 1915 1925 1939 1970 1995 1915 1925 1938 1970 1995 1915 1925 1937 1970 1995 1915 1920 1936 1965 1995 1915 1920 1935 1965 1995 1915 1920 1934 1965 1995 1915 1920 1933 1965 1995 1915 1920 1932 1965 1995
Poor Fair Avg Good Exc 1910 1920 1931 1965 1990 1910 1915 1930 1965 1990 1910 1915 1929 1965 1990 1910 1915 1928 1965 1990 1910 1915 1927 1965 1990 1910 1915 1926 1960 1990 1910 1915 1925 1960 1990 1910 1915 1924 1960 1990 1910 1915 1923 1960 1990 1910 1915 1922 1960 1990 1910 1915 1921 1955 1990 1910 1910 1920 1955 1990 1910 1910 1919 1955 1990 1910 1910 1918 1955 1990 1910 1910 1917 1955 1990 1910 1910 1916 1950 1990 1910 1910 1915 1950 1990 1910 1910 1914 1950 1990 1910 1910 1913 1950 1990 1910 1910 1912 1950 1990 1910 1910 1911 1950 1990 1910 1910 1910 1950 1990 1909 1909 1909 1950 1990 1908 1908 1908 1950 1990 1907 1907 1907 1945 1985 1906 1906 1906 1945 1985 1905 1905 1905 1945 1985 1904 1904 1904 1945 1985 1903 1903 1903 1945 1985 1902 1902 1902 1940 1980 1901 1901 1901 1940 1980 1900 1900 1900 1940 1980 1899 1899 1899 1940 1980 1898 1898 1898 1940 1980 1897 1897 1897 1935 1975
Resid M-F Override 1896 70% 50% Override 1895 60% 50% Override 1894 50% 50% Override 1893 40% 40%
barely livable 1892 30% 30% storage value 1891 20% 20% salvage value 1890 10% 10%
Note: Highlighted year is actual year built. Appraiser selects effective year based on condition for physical year in order to calculate depreciation.
[67]
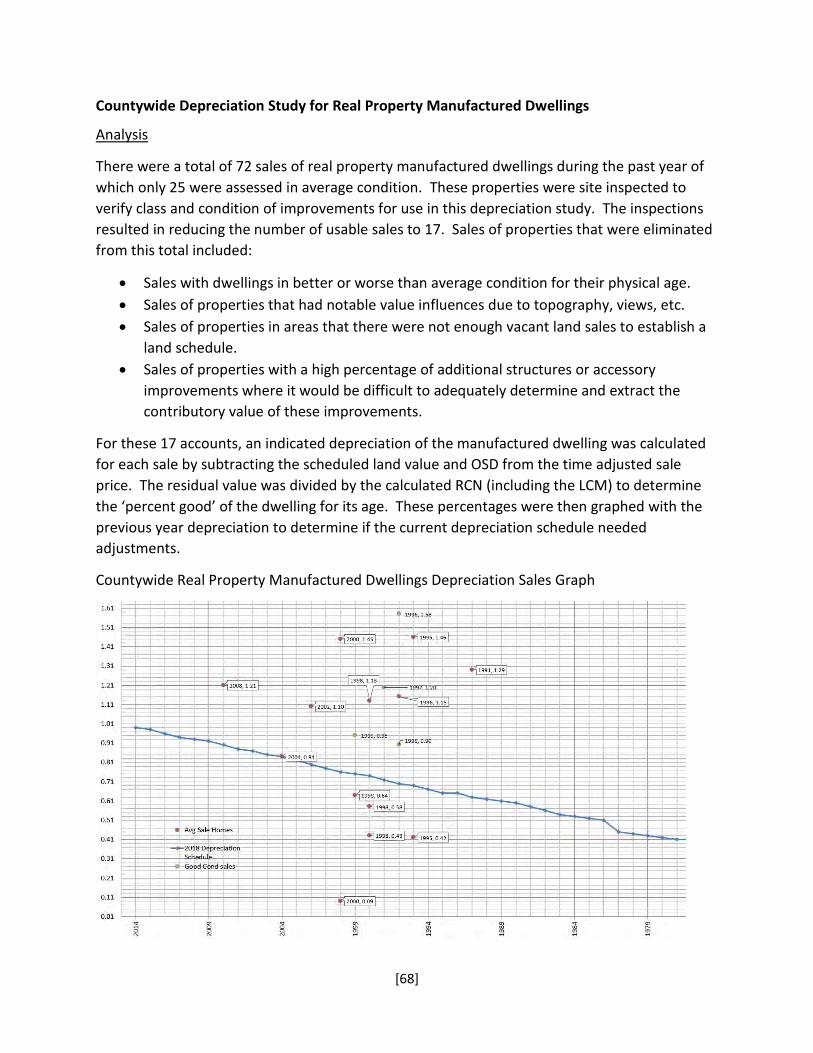
Countywide Depreciation Study for Real Property Manufactured Dwellings
Analysis
There were a total of 72 sales of real property manufactured dwellings during the past year of which only 25 were assessed in average condition. These properties were site inspected to verify class and condition of improvements for use in this depreciation study. The inspections resulted in reducing the number of usable sales to 17. Sales of properties that were eliminated from this total included:
• Sales with dwellings in better or worse than average condition for their physical age. • Sales of properties that had notable value influences due to topography, views, etc. • Sales of properties in areas that there were not enough vacant land sales to establish a
land schedule. • Sales of properties with a high percentage of additional structures or accessory
improvements where it would be difficult to adequately determine and extract the contributory value of these improvements.
For these 17 accounts, an indicated depreciation of the manufactured dwelling was calculated for each sale by subtracting the scheduled land value and OSD from the time adjusted sale price. The residual value was divided by the calculated RCN (including the LCM) to determine the ‘percent good’ of the dwelling for its age. These percentages were then graphed with the previous year depreciation to determine if the current depreciation schedule needed adjustments.
Countywide Real Property Manufactured Dwellings Depreciation Sales Graph
[68]
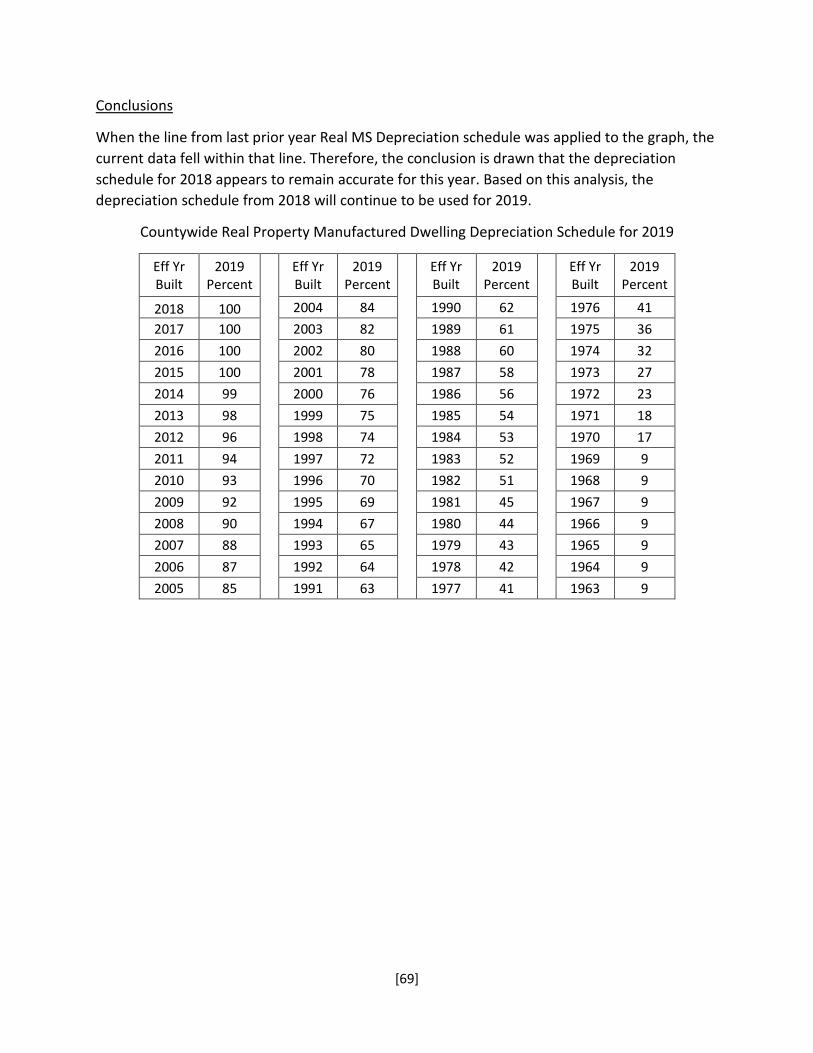
Conclusions
When the line from last prior year Real MS Depreciation schedule was applied to the graph, the current data fell within that line. Therefore, the conclusion is drawn that the depreciation schedule for 2018 appears to remain accurate for this year. Based on this analysis, the depreciation schedule from 2018 will continue to be used for 2019.
Countywide Real Property Manufactured Dwelling Depreciation Schedule for 2019
Eff Yr Built
2019 Percent
Eff Yr Built
2019 Percent
Eff Yr Built
2019 Percent
Eff Yr Built
2019 Percent
2018 100 2004 84 1990 62 1976 41 2017 100 2003 82 1989 61 1975 36 2016 100 2002 80 1988 60 1974 32 2015 100 2001 78 1987 58 1973 27 2014 99 2000 76 1986 56 1972 23 2013 98 1999 75 1985 54 1971 18 2012 96 1998 74 1984 53 1970 17 2011 94 1997 72 1983 52 1969 9 2010 93 1996 70 1982 51 1968 9 2009 92 1995 69 1981 45 1967 9 2008 90 1994 67 1980 44 1966 9 2007 88 1993 65 1979 43 1965 9 2006 87 1992 64 1978 42 1964 9 2005 85 1991 63 1977 41 1963 9
[69]
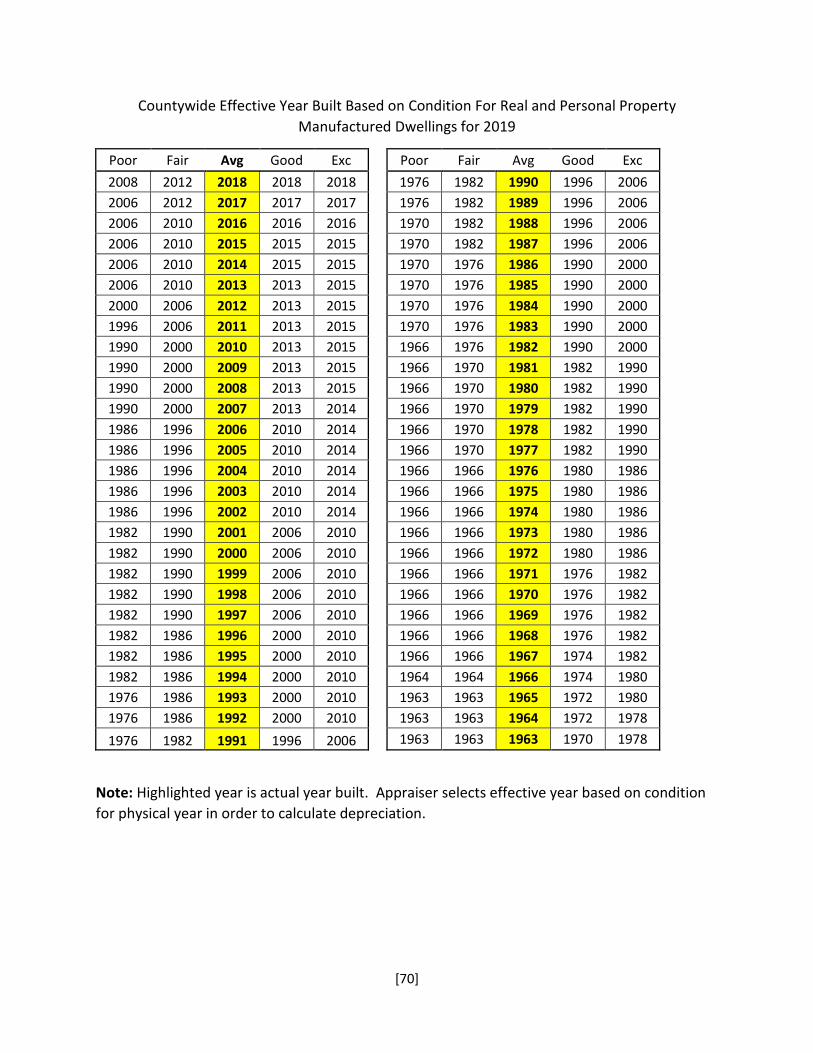
Countywide Effective Year Built Based on Condition For Real and Personal Property Manufactured Dwellings for 2019
Poor Fair Avg Good Exc 2008 2012 2018 2018 2018 2006 2012 2017 2017 2017 2006 2010 2016 2016 2016 2006 2010 2015 2015 2015 2006 2010 2014 2015 2015 2006 2010 2013 2013 2015 2000 2006 2012 2013 2015 1996 2006 2011 2013 2015 1990 2000 2010 2013 2015 1990 2000 2009 2013 2015 1990 2000 2008 2013 2015 1990 2000 2007 2013 2014 1986 1996 2006 2010 2014 1986 1996 2005 2010 2014 1986 1996 2004 2010 2014 1986 1996 2003 2010 2014 1986 1996 2002 2010 2014 1982 1990 2001 2006 2010 1982 1990 2000 2006 2010 1982 1990 1999 2006 2010 1982 1990 1998 2006 2010 1982 1990 1997 2006 2010 1982 1986 1996 2000 2010 1982 1986 1995 2000 2010 1982 1986 1994 2000 2010 1976 1986 1993 2000 2010 1976 1986 1992 2000 2010 1976 1982 1991 1996 2006
Poor Fair Avg Good Exc 1976 1982 1990 1996 2006 1976 1982 1989 1996 2006 1970 1982 1988 1996 2006 1970 1982 1987 1996 2006 1970 1976 1986 1990 2000 1970 1976 1985 1990 2000 1970 1976 1984 1990 2000 1970 1976 1983 1990 2000 1966 1976 1982 1990 2000 1966 1970 1981 1982 1990 1966 1970 1980 1982 1990 1966 1970 1979 1982 1990 1966 1970 1978 1982 1990 1966 1970 1977 1982 1990 1966 1966 1976 1980 1986 1966 1966 1975 1980 1986 1966 1966 1974 1980 1986 1966 1966 1973 1980 1986 1966 1966 1972 1980 1986 1966 1966 1971 1976 1982 1966 1966 1970 1976 1982 1966 1966 1969 1976 1982 1966 1966 1968 1976 1982 1966 1966 1967 1974 1982 1964 1964 1966 1974 1980 1963 1963 1965 1972 1980 1963 1963 1964 1972 1978 1963 1963 1963 1970 1978
Note: Highlighted year is actual year built. Appraiser selects effective year based on condition for physical year in order to calculate depreciation.
[70]
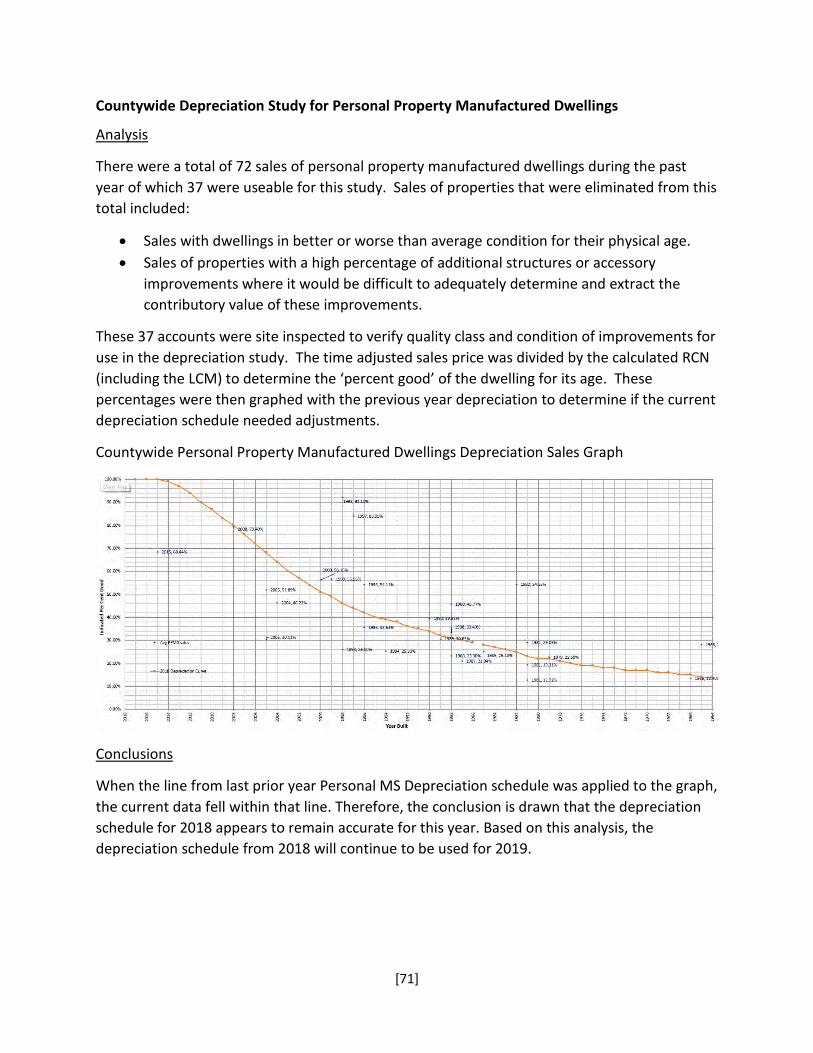
Countywide Depreciation Study for Personal Property Manufactured Dwellings
Analysis
There were a total of 72 sales of personal property manufactured dwellings during the past year of which 37 were useable for this study. Sales of properties that were eliminated from this total included:
• Sales with dwellings in better or worse than average condition for their physical age. • Sales of properties with a high percentage of additional structures or accessory
improvements where it would be difficult to adequately determine and extract the contributory value of these improvements.
These 37 accounts were site inspected to verify quality class and condition of improvements for use in the depreciation study. The time adjusted sales price was divided by the calculated RCN (including the LCM) to determine the ‘percent good’ of the dwelling for its age. These percentages were then graphed with the previous year depreciation to determine if the current depreciation schedule needed adjustments.
Countywide Personal Property Manufactured Dwellings Depreciation Sales Graph
Conclusions
When the line from last prior year Personal MS Depreciation schedule was applied to the graph, the current data fell within that line. Therefore, the conclusion is drawn that the depreciation schedule for 2018 appears to remain accurate for this year. Based on this analysis, the depreciation schedule from 2018 will continue to be used for 2019.
[71]
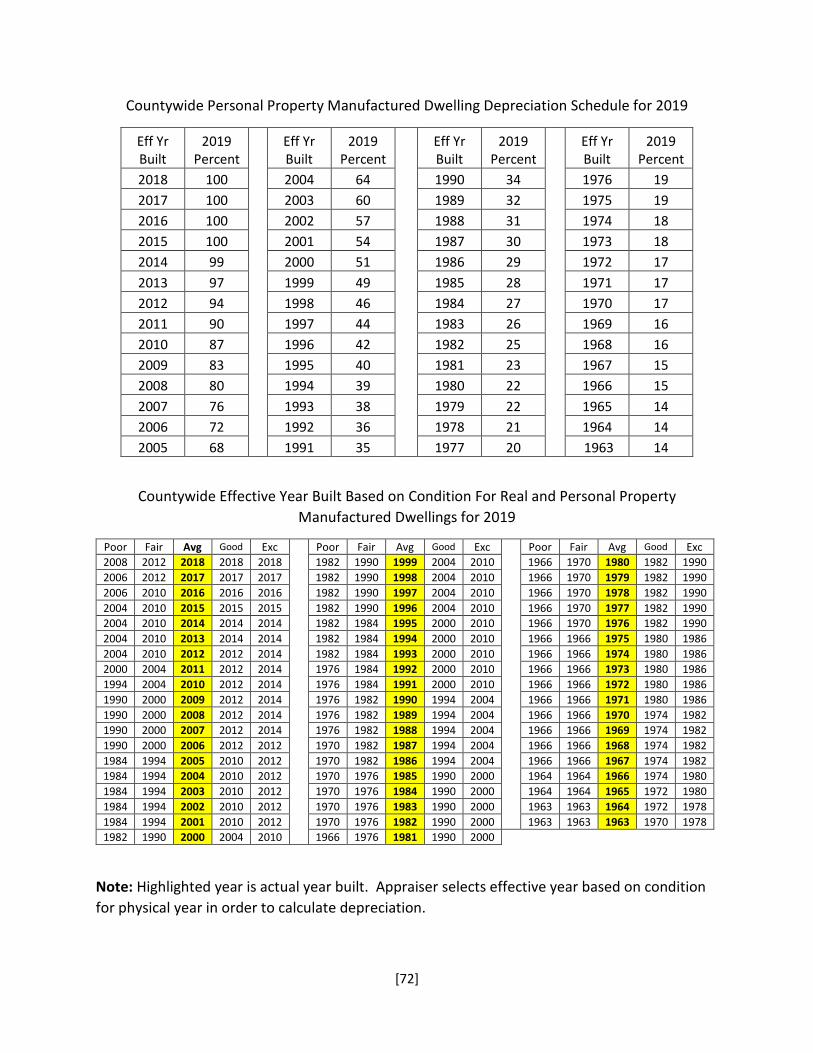
Countywide Personal Property Manufactured Dwelling Depreciation Schedule for 2019
Eff Yr Built
2019 Percent
Eff Yr Built
2019 Percent
Eff Yr Built
2019 Percent
Eff Yr Built
2019 Percent
2018 100 2004 64 1990 34 1976 19 2017 100 2003 60 1989 32 1975 19 2016 100 2002 57 1988 31 1974 18 2015 100 2001 54 1987 30 1973 18 2014 99 2000 51 1986 29 1972 17 2013 97 1999 49 1985 28 1971 17 2012 94 1998 46 1984 27 1970 17 2011 90 1997 44 1983 26 1969 16 2010 87 1996 42 1982 25 1968 16 2009 83 1995 40 1981 23 1967 15 2008 80 1994 39 1980 22 1966 15 2007 76 1993 38 1979 22 1965 14 2006 72 1992 36 1978 21 1964 14 2005 68 1991 35 1977 20 1963 14
Countywide Effective Year Built Based on Condition For Real and Personal Property Manufactured Dwellings for 2019
Poor Fair Avg Good Exc Poor Fair Avg Good Exc Poor Fair Avg Good Exc 2008 2012 2018 2018 2018 1982 1990 1999 2004 2010 1966 1970 1980 1982 1990 2006 2012 2017 2017 2017 1982 1990 1998 2004 2010 1966 1970 1979 1982 1990 2006 2010 2016 2016 2016 1982 1990 1997 2004 2010 1966 1970 1978 1982 1990 2004 2010 2015 2015 2015 1982 1990 1996 2004 2010 1966 1970 1977 1982 1990 2004 2010 2014 2014 2014 1982 1984 1995 2000 2010 1966 1970 1976 1982 1990 2004 2010 2013 2014 2014 1982 1984 1994 2000 2010 1966 1966 1975 1980 1986 2004 2010 2012 2012 2014 1982 1984 1993 2000 2010 1966 1966 1974 1980 1986 2000 2004 2011 2012 2014 1976 1984 1992 2000 2010 1966 1966 1973 1980 1986 1994 2004 2010 2012 2014 1976 1984 1991 2000 2010 1966 1966 1972 1980 1986 1990 2000 2009 2012 2014 1976 1982 1990 1994 2004 1966 1966 1971 1980 1986 1990 2000 2008 2012 2014 1976 1982 1989 1994 2004 1966 1966 1970 1974 1982 1990 2000 2007 2012 2014 1976 1982 1988 1994 2004 1966 1966 1969 1974 1982 1990 2000 2006 2012 2012 1970 1982 1987 1994 2004 1966 1966 1968 1974 1982 1984 1994 2005 2010 2012 1970 1982 1986 1994 2004 1966 1966 1967 1974 1982 1984 1994 2004 2010 2012 1970 1976 1985 1990 2000 1964 1964 1966 1974 1980 1984 1994 2003 2010 2012 1970 1976 1984 1990 2000 1964 1964 1965 1972 1980 1984 1994 2002 2010 2012 1970 1976 1983 1990 2000 1963 1963 1964 1972 1978 1984 1994 2001 2010 2012 1970 1976 1982 1990 2000 1963 1963 1963 1970 1978 1982 1990 2000 2004 2010 1966 1976 1981 1990 2000
Note: Highlighted year is actual year built. Appraiser selects effective year based on condition for physical year in order to calculate depreciation.
[72]

Countywide Depreciation Study for Floating Property
Analysis
There were only 12 useable sales of floating property that occurred during 2017, most of which were in average condition. Due to the limited sales, 12 additional floating properties that sold during 2015 and 2016 were included. All sales were time trended to the base appraisal date of 1/1/2018.
Each property was inspected to verify quality class and condition. Properties in better than average condition were not removed from the study, but rather included on the graph due to the limited number of sales available. The time adjusted sales price of each property was divided by the calculated RCN (including the LCM) to determine the ‘percent good’ of the dwelling for its age. These percentages were then graphed to identify a potential depreciation curve.
Countywide Floating Property Depreciation Sales Graph
Conclusions
Floating property has a much higher LCM than conventional dwellings, indicating a much higher cost of construction. However, they appear to depreciate much faster than conventional dwellings. Based on the supporting data, a new depreciation schedule for floating property has been developed.
[73]
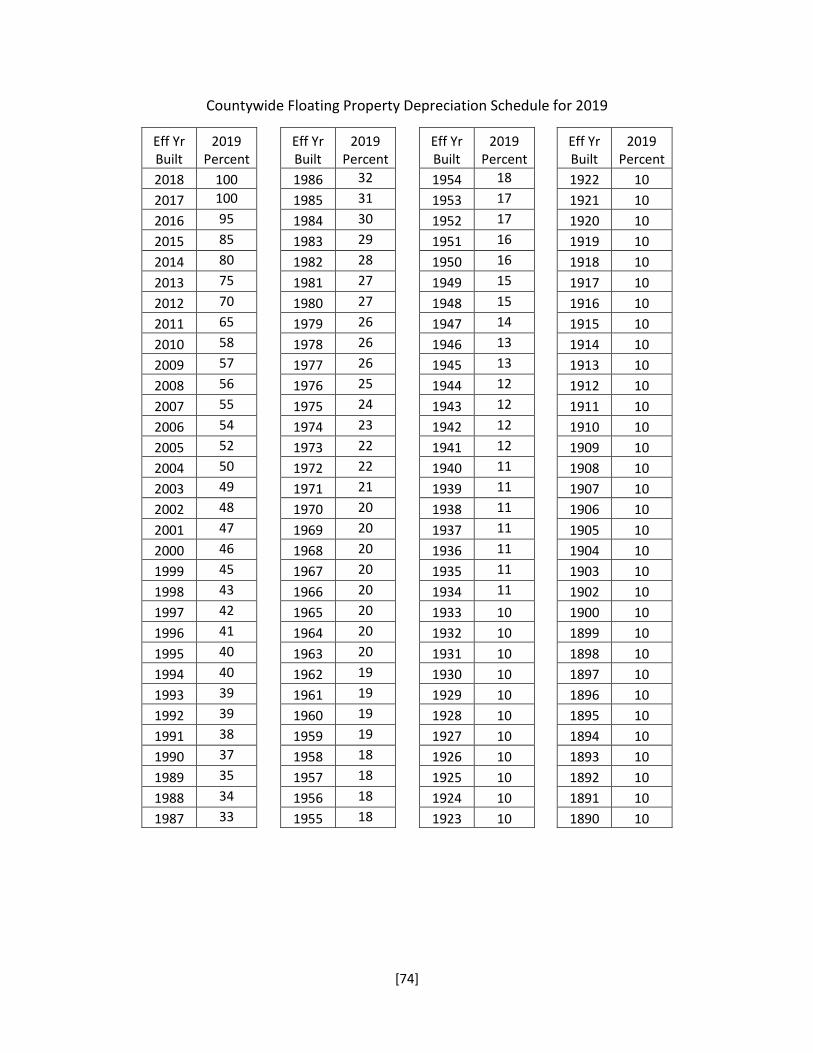
Countywide Floating Property Depreciation Schedule for 2019
Eff Yr 2019 Built Percent 2018 100 2017 100 2016 95 2015 85 2014 80 2013 75 2012 70 2011 65 2010 58 2009 57 2008 56 2007 55 2006 54 2005 52 2004 50 2003 49 2002 48 2001 47 2000 46 1999 45 1998 43 1997 42 1996 41 1995 40 1994 40 1993 39 1992 39 1991 38 1990 37 1989 35 1988 34 1987 33
Eff Yr 2019 Built Percent 1986 32 1985 31 1984 30 1983 29 1982 28 1981 27 1980 27 1979 26 1978 26 1977 26 1976 25 1975 24 1974 23 1973 22 1972 22 1971 21 1970 20 1969 20 1968 20 1967 20 1966 20 1965 20 1964 20 1963 20 1962 19 1961 19 1960 19 1959 19 1958 18 1957 18 1956 18 1955 18
Eff Yr 2019 Built Percent 1954 18 1953 17 1952 17 1951 16 1950 16 1949 15 1948 15 1947 14 1946 13 1945 13 1944 12 1943 12 1942 12 1941 12 1940 11 1939 11 1938 11 1937 11 1936 11 1935 11 1934 11 1933 10 1932 10 1931 10 1930 10 1929 10 1928 10 1927 10 1926 10 1925 10 1924 10 1923 10
Eff Yr 2019 Built Percent 1922 10 1921 10 1920 10 1919 10 1918 10 1917 10 1916 10 1915 10 1914 10 1913 10 1912 10 1911 10 1910 10 1909 10 1908 10 1907 10 1906 10 1905 10 1904 10 1903 10 1902 10 1900 10 1899 10 1898 10 1897 10 1896 10 1895 10 1894 10 1893 10 1892 10 1891 10 1890 10
[74]

Countywide Effective Year Built Based on Condition for Floating Property for 2019
Poor Fair Avg Good Exc 2017 2017 2018 2018 2018 2016 2016 2017 2017 2017 2014 2015 2016 2017 2017 2012 2014 2015 2017 2017 2010 2013 2014 2017 2017 2004 2011 2013 2017 2017 1998 2009 2012 2016 2017 1997 2007 2011 2016 2017 1997 2005 2010 2016 2017 1996 2004 2009 2016 2016 1996 2003 2008 2015 2016 1995 2002 2007 2015 2016 1994 2002 2006 2015 2016 1992 2001 2005 2015 2016 1990 2001 2004 2014 2016 1989 2000 2003 2014 2016 1988 2000 2002 2014 2016 1987 1999 2001 2014 2016 1987 1998 2000 2013 2016 1986 1996 1999 2013 2015 1985 1994 1998 2013 2015 1985 1992 1997 2013 2015 1984 1991 1996 2013 2015 1983 1990 1995 2012 2015 1983 1989 1994 2012 2015 1982 1988 1993 2012 2015 1980 1987 1992 2012 2015 1978 1986 1991 2012 2015 1977 1986 1990 2011 2015 1976 1985 1989 2011 2014 1974 1985 1988 2010 2014 1972 1984 1987 2010 2014 1970 1984 1986 2009 2014 1968 1983 1985 2009 2014 1966 1982 1984 2008 2014 1964 1980 1983 2006 2014 1962 1978 1982 2004 2013 1960 1976 1981 2003 2013 1958 1975 1980 2002 2013 1956 1974 1979 2001 2013
Poor Fair Avg Good Exc 1954 1973 1978 2000 2013 1952 1972 1977 1999 2013 1950 1971 1976 1998 2013 1948 1970 1975 1997 2013 1946 1968 1974 1996 2013 1944 1965 1973 1995 2012 1942 1961 1972 1994 2012 1942 1957 1971 1993 2012 1942 1952 1970 1992 2012 1942 1950 1969 1991 2012 1941 1948 1968 1990 2012 1941 1947 1967 1989 2012 1941 1946 1966 1988 2012 1940 1945 1965 1987 2012 1940 1944 1964 1986 2012 1940 1944 1963 1985 2011 1940 1943 1962 1984 2011 1940 1943 1961 1983 2011 1940 1942 1960 1982 2011 1940 1942 1959 1981 2011 1940 1942 1958 1980 2011 1940 1941 1957 1980 2011 1940 1941 1956 1978 2011 1940 1940 1955 1978 2011 1940 1940 1954 1976 2011 1940 1940 1953 1976 2011 1940 1940 1952 1976 2011 1940 1940 1951 1976 2011 1940 1940 1950 1975 2011 1940 1940 1949 1975 2010 1940 1940 1948 1975 2010 1940 1940 1947 1974 2010 1940 1940 1946 1974 2010 1940 1940 1945 1973 2010 1940 1940 1944 1973 2010 1940 1940 1943 1973 2010 1940 1940 1942 1972 2010 1940 1940 1941 1972 2010 1940 1940 1940 1971 2010 1939 1939 1939 1971 2010
Poor Fair Avg Good Exc 1938 1938 1938 1971 2010 1937 1937 1937 1971 2010 1936 1936 1936 1971 2010 1935 1935 1935 1970 2010 1934 1934 1934 1970 2010 1933 1933 1933 1970 2010 1932 1932 1932 1970 2010 1931 1931 1931 1970 2010 1930 1930 1930 1970 2010 1929 1929 1929 1970 2010 1928 1928 1928 1970 2010 1927 1927 1927 1970 2010 1926 1926 1926 1970 2010 1925 1925 1925 1970 2010 1924 1924 1924 1970 2010 1923 1923 1923 1970 2010 1922 1922 1922 1970 2010 1921 1921 1921 1970 2010 1920 1920 1920 1970 2010 1919 1919 1919 1970 2010 1918 1918 1918 1970 2010 1917 1917 1917 1970 2010 1916 1916 1916 1970 2010 1915 1915 1915 1970 2010 1914 1914 1914 1970 2010 1913 1913 1913 1970 2010 1912 1912 1912 1970 2010 1911 1911 1911 1970 2010 1910 1910 1910 1970 2010 1909 1909 1909 1970 2010 1908 1908 1908 1970 2010 1907 1907 1907 1970 2010 1906 1906 1906 1970 2010 1905 1905 1905 1970 2010 1904 1904 1904 1970 2010 1903 1903 1903 1970 2010 1902 1902 1902 1970 2010 1901 1901 1901 1970 2010 1900 1900 1900 1970 2010
Note: Highlighted year is actual year built. Appraiser selects effective year based on condition for physical year in order to calculate depreciation.
[75]
Countywide Depreciation Study for Farm Buildings
Analysis
It is not feasible to use an extraction method to determine a market-based depreciation schedule for farm buildings. In most cases, these structures represent a minimal portion of the overall real market value of a property.
Conclusions
Farm buildings are depreciated using a straight-line depreciation method. The appraiser uses judgment in determining the effective age of the structure.
[76]

Countywide Farm Building Depreciation Schedule for 2019
Eff Yr Built
2019 Percent
Eff Yr Built
2019 Percent
Eff Yr Built
2019 Percent
Eff Yr Built
2019 Percent
2018 100 1986 68 1954 36 1922 10 2017 99 1985 67 1953 35 1921 10 2016 98 1984 66 1952 34 1920 10 2015 97 1983 65 1951 33 1919 10 2014 96 1982 64 1950 32 1918 10 2013 95 1981 63 1949 31 1917 10 2012 94 1980 62 1948 30 1916 10 2011 93 1979 61 1947 29 1915 10 2010 92 1978 60 1946 28 1914 10 2009 91 1977 59 1945 27 1913 10 2008 90 1976 58 1944 26 1912 10 2007 89 1975 57 1943 25 1911 10 2006 88 1974 56 1942 24 1910 10 2005 87 1973 55 1941 23 1909 10 2004 86 1972 54 1940 22 1908 10 2003 85 1971 53 1939 21 1907 10 2002 84 1970 52 1938 20 1906 10 2001 83 1969 51 1937 19 1905 10 2000 82 1968 50 1936 18 1904 10 1999 81 1967 49 1935 17 1903 10 1998 80 1966 48 1934 16 1902 10 1997 79 1965 47 1933 15 1901 10 1996 78 1964 46 1932 14 1900 10 1995 77 1963 45 1931 13 1898 10 1994 76 1962 44 1930 12 1897 10 1993 75 1961 43 1929 11 1896 10 1992 74 1960 42 1928 10 1895 10 1991 73 1959 41 1927 10 1894 10 1990 72 1958 40 1926 10 1893 10 1989 71 1957 39 1925 10 1892 10 1988 70 1956 38 1924 10 1891 10 1987 69 1955 37 1923 10
[77]

Notes
[78]
2019 Land Adjustments Analysis and Conclusions
[79]
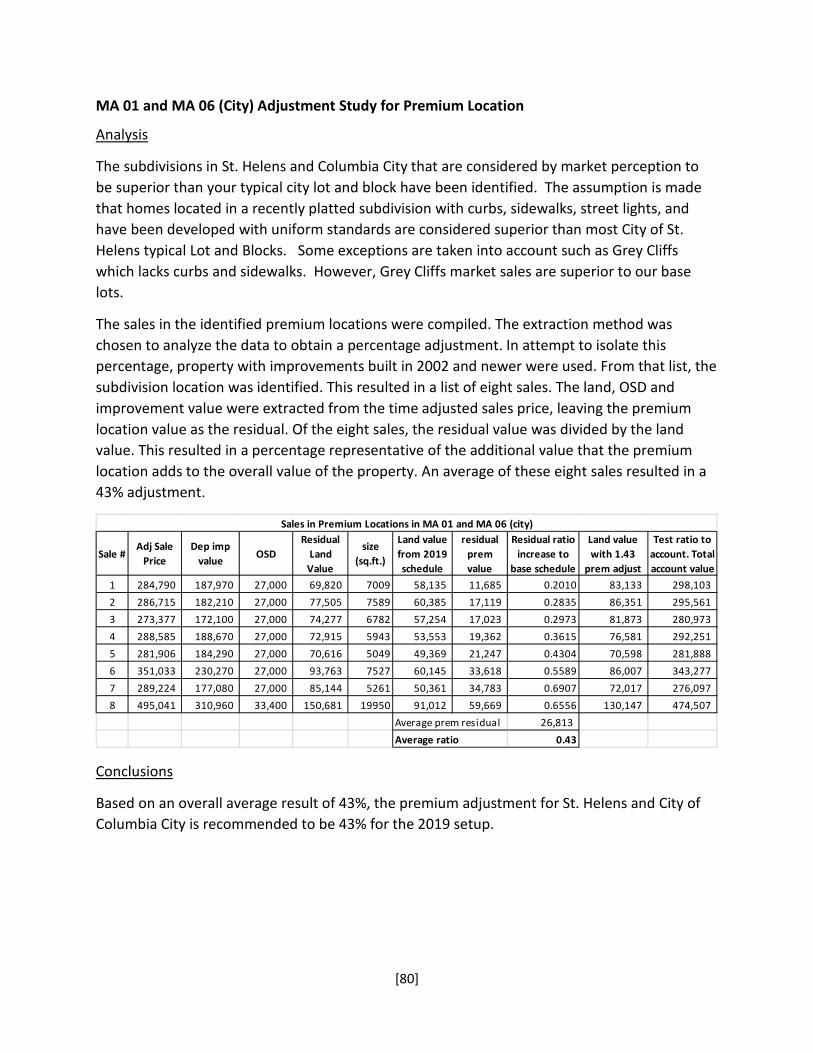
MA 01 and MA 06 (City) Adjustment Study for Premium Location
Analysis
The subdivisions in St. Helens and Columbia City that are considered by market perception to be superior than your typical city lot and block have been identified. The assumption is made that homes located in a recently platted subdivision with curbs, sidewalks, street lights, and have been developed with uniform standards are considered superior than most City of St. Helens typical Lot and Blocks. Some exceptions are taken into account such as Grey Cliffs which lacks curbs and sidewalks. However, Grey Cliffs market sales are superior to our base lots.
The sales in the identified premium locations were compiled. The extraction method was chosen to analyze the data to obtain a percentage adjustment. In attempt to isolate this percentage, property with improvements built in 2002 and newer were used. From that list, the subdivision location was identified. This resulted in a list of eight sales. The land, OSD and improvement value were extracted from the time adjusted sales price, leaving the premium location value as the residual. Of the eight sales, the residual value was divided by the land value. This resulted in a percentage representative of the additional value that the premium location adds to the overall value of the property. An average of these eight sales resulted in a 43% adjustment.
Sales in Premium Locations in MA 01 and MA 06 (city)
Sale # Adj Sale
Price Dep imp
value OSD Residual
Land Value
size (sq.ft.)
Land value from 2019 schedule
residual prem value
Residual ratio increase to
base schedule
Land value with 1.43
prem adjust
Test ratio to account. Total account value
1 284,790 187,970 27,000 69,820 7009 58,135 11,685 0.2010 83,133 298,103 2 286,715 182,210 27,000 77,505 7589 60,385 17,119 0.2835 86,351 295,561 3 273,377 172,100 27,000 74,277 6782 57,254 17,023 0.2973 81,873 280,973 4 288,585 188,670 27,000 72,915 5943 53,553 19,362 0.3615 76,581 292,251 5 281,906 184,290 27,000 70,616 5049 49,369 21,247 0.4304 70,598 281,888 6 351,033 230,270 27,000 93,763 7527 60,145 33,618 0.5589 86,007 343,277 7 289,224 177,080 27,000 85,144 5261 50,361 34,783 0.6907 72,017 276,097 8 495,041 310,960 33,400 150,681 19950 91,012 59,669 0.6556 130,147 474,507
Average prem residual 26,813 Average ratio 0.43
Conclusions
Based on an overall average result of 43%, the premium adjustment for St. Helens and City of Columbia City is recommended to be 43% for the 2019 setup.
[80]
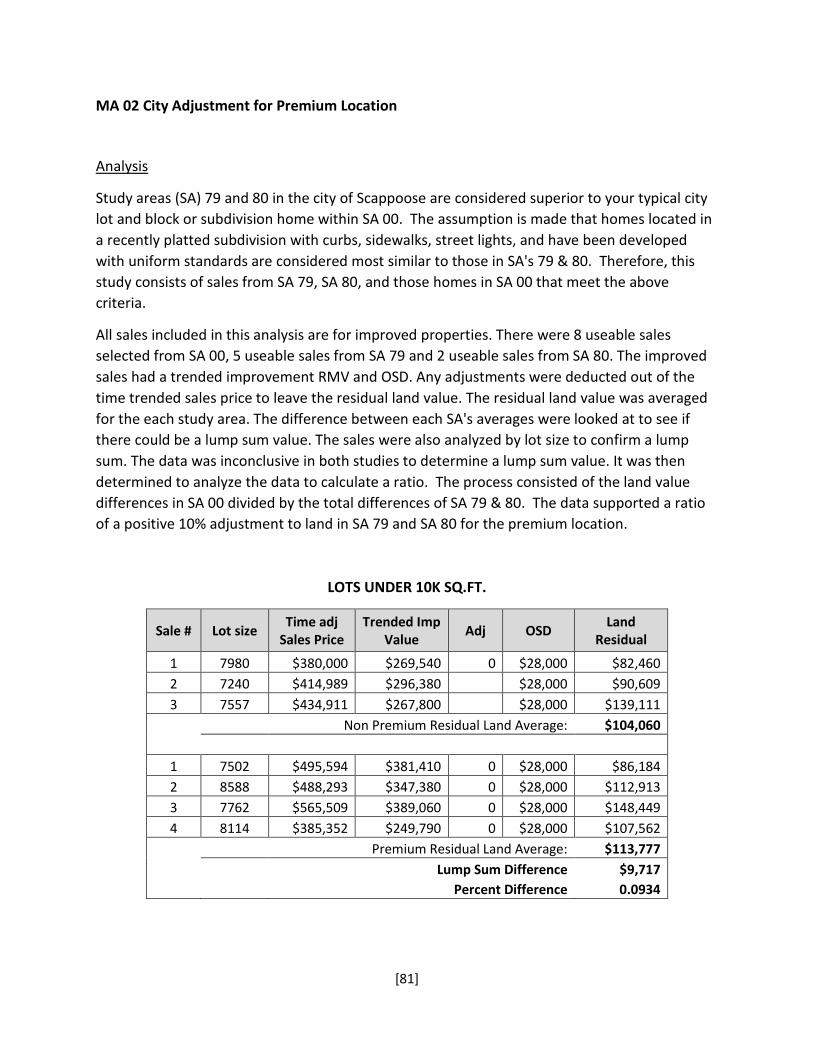
MA 02 City Adjustment for Premium Location
Analysis
Study areas (SA) 79 and 80 in the city of Scappoose are considered superior to your typical city lot and block or subdivision home within SA 00. The assumption is made that homes located in a recently platted subdivision with curbs, sidewalks, street lights, and have been developed with uniform standards are considered most similar to those in SA's 79 & 80. Therefore, this study consists of sales from SA 79, SA 80, and those homes in SA 00 that meet the above criteria.
All sales included in this analysis are for improved properties. There were 8 useable sales selected from SA 00, 5 useable sales from SA 79 and 2 useable sales from SA 80. The improved sales had a trended improvement RMV and OSD. Any adjustments were deducted out of the time trended sales price to leave the residual land value. The residual land value was averaged for the each study area. The difference between each SA's averages were looked at to see if there could be a lump sum value. The sales were also analyzed by lot size to confirm a lump sum. The data was inconclusive in both studies to determine a lump sum value. It was then determined to analyze the data to calculate a ratio. The process consisted of the land value differences in SA 00 divided by the total differences of SA 79 & 80. The data supported a ratio of a positive 10% adjustment to land in SA 79 and SA 80 for the premium location.
LOTS UNDER 10K SQ.FT.
Sale # Lot size Time adj Sales Price
Trended Imp Value Adj OSD Land
Residual
1 7980 $380,000 $269,540 0 $28,000 $82,460 2 7240 $414,989 $296,380 $28,000 $90,609 3 7557 $434,911 $267,800 $28,000 $139,111
Non Premium Residual Land Average: $104,060
1 7502 $495,594 $381,410 0 $28,000 $86,184 2 8588 $488,293 $347,380 0 $28,000 $112,913 3 7762 $565,509 $389,060 0 $28,000 $148,449 4 8114 $385,352 $249,790 0 $28,000 $107,562
Premium Residual Land Average: Lump Sum Difference
Percent Difference
$113,777 $9,717 0.0934
[81]
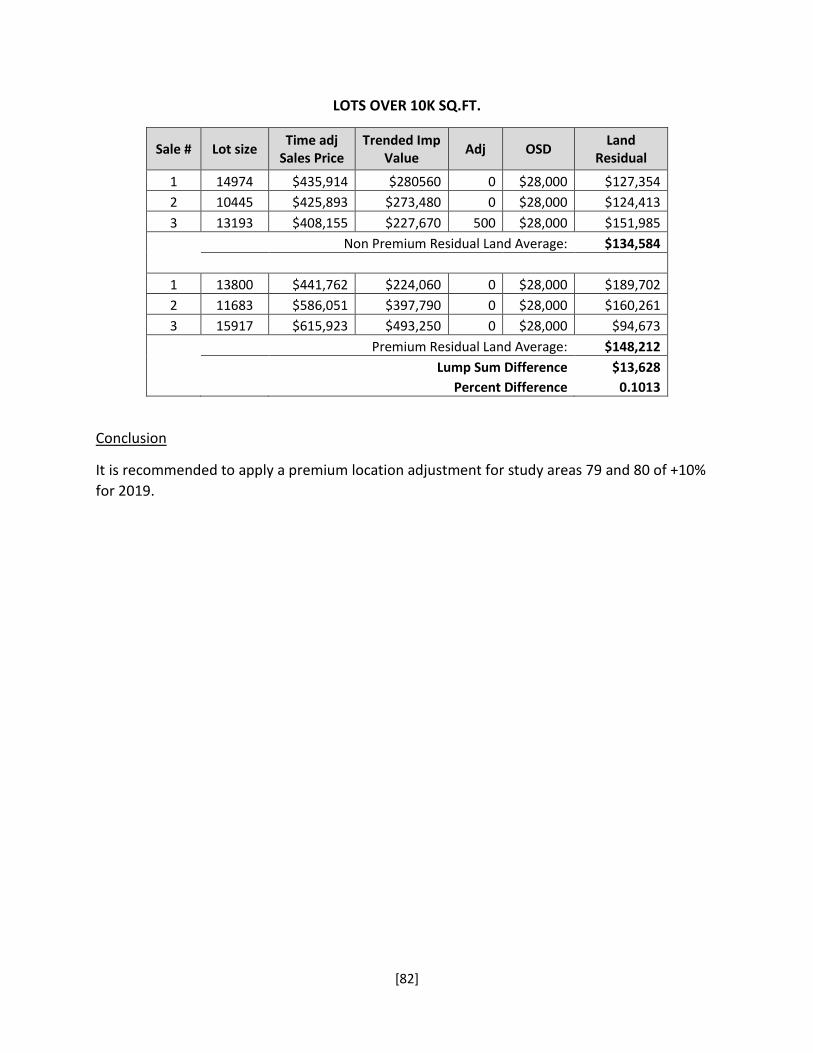
LOTS OVER 10K SQ.FT.
Sale # Lot size Time adj Sales Price
Trended Imp Value Adj OSD Land
Residual
1 14974 $435,914 $280560 0 $28,000 $127,354 2 10445 $425,893 $273,480 0 $28,000 $124,413 3 13193 $408,155 $227,670 500 $28,000 $151,985
Non Premium Residual Land Average: $134,584
1 13800 $441,762 $224,060 0 $28,000 $189,702 2 11683 $586,051 $397,790 0 $28,000 $160,261 3 15917 $615,923 $493,250 0 $28,000 $94,673
Premium Residual Land Average: $148,212 Lump Sum Difference $13,628
Percent Difference 0.1013
Conclusion
It is recommended to apply a premium location adjustment for study areas 79 and 80 of +10% for 2019.
[82]
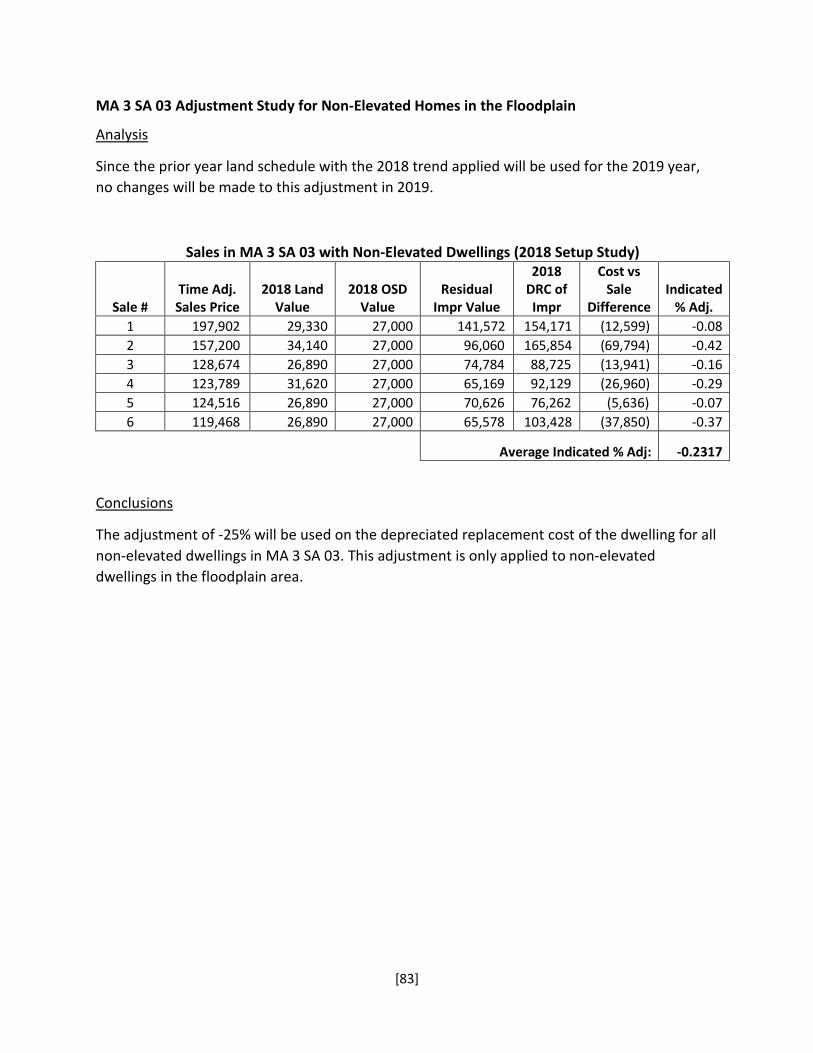
MA 3 SA 03 Adjustment Study for Non-Elevated Homes in the Floodplain
Analysis
Since the prior year land schedule with the 2018 trend applied will be used for the 2019 year, no changes will be made to this adjustment in 2019.
Sales in MA 3 SA 03 with Non-Elevated Dwellings (2018 Setup Study)
Sale # Time Adj. Sales Price
2018 Land Value
2018 OSD Value
Residual Impr Value
2018 DRC of Impr
Cost vs Sale
Difference Indicated
% Adj. 1 197,902 29,330 27,000 141,572 154,171 (12,599) -0.08 2 157,200 34,140 27,000 96,060 165,854 (69,794) -0.42 3 128,674 26,890 27,000 74,784 88,725 (13,941) -0.16 4 123,789 31,620 27,000 65,169 92,129 (26,960) -0.29 5 124,516 26,890 27,000 70,626 76,262 (5,636) -0.07 6 119,468 26,890 27,000 65,578 103,428 (37,850) -0.37
Average Indicated % Adj: -0.2317
Conclusions
The adjustment of -25% will be used on the depreciated replacement cost of the dwelling for all non-elevated dwellings in MA 3 SA 03. This adjustment is only applied to non-elevated dwellings in the floodplain area.
[83]
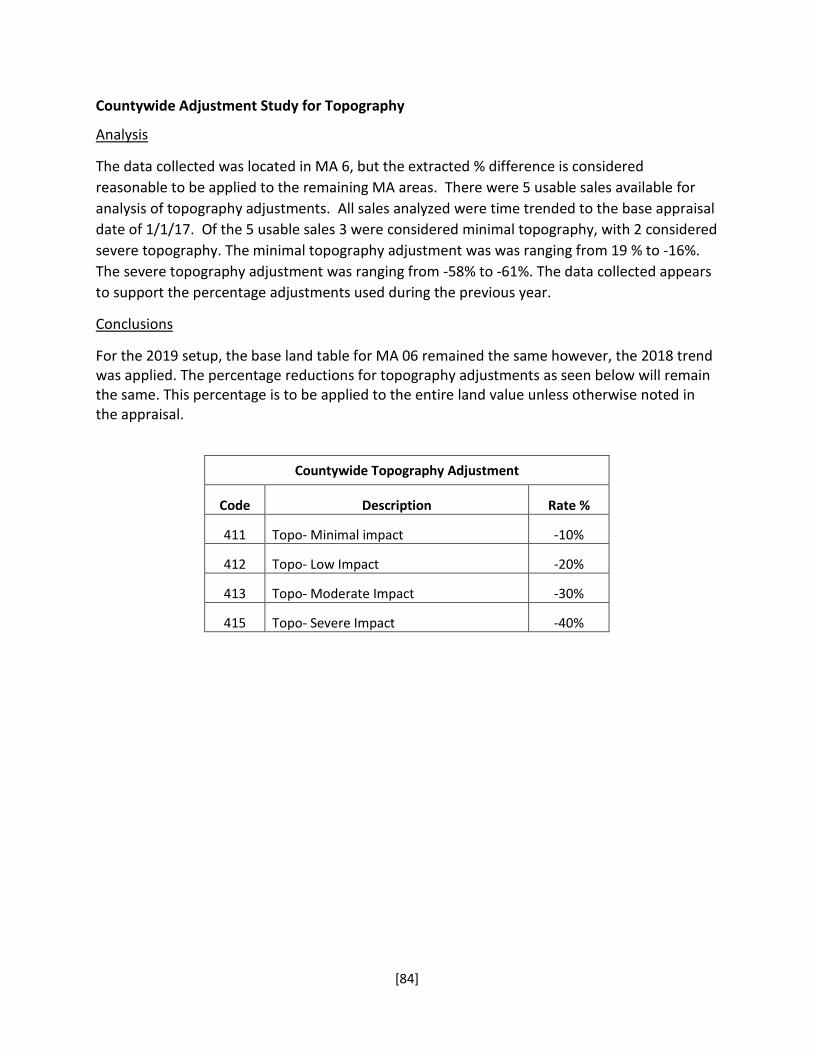
Countywide Adjustment Study for Topography
Analysis
The data collected was located in MA 6, but the extracted % difference is considered reasonable to be applied to the remaining MA areas. There were 5 usable sales available for analysis of topography adjustments. All sales analyzed were time trended to the base appraisal date of 1/1/17. Of the 5 usable sales 3 were considered minimal topography, with 2 considered severe topography. The minimal topography adjustment was was ranging from 19 % to -16%. The severe topography adjustment was ranging from -58% to -61%. The data collected appears to support the percentage adjustments used during the previous year.
Conclusions
For the 2019 setup, the base land table for MA 06 remained the same however, the 2018 trend was applied. The percentage reductions for topography adjustments as seen below will remain the same. This percentage is to be applied to the entire land value unless otherwise noted in the appraisal.
Countywide Topography Adjustment
Code Description Rate %
411 Topo- Minimal impact -10%
412 Topo- Low Impact -20%
413 Topo- Moderate Impact -30%
415 Topo- Severe Impact -40%
[84]
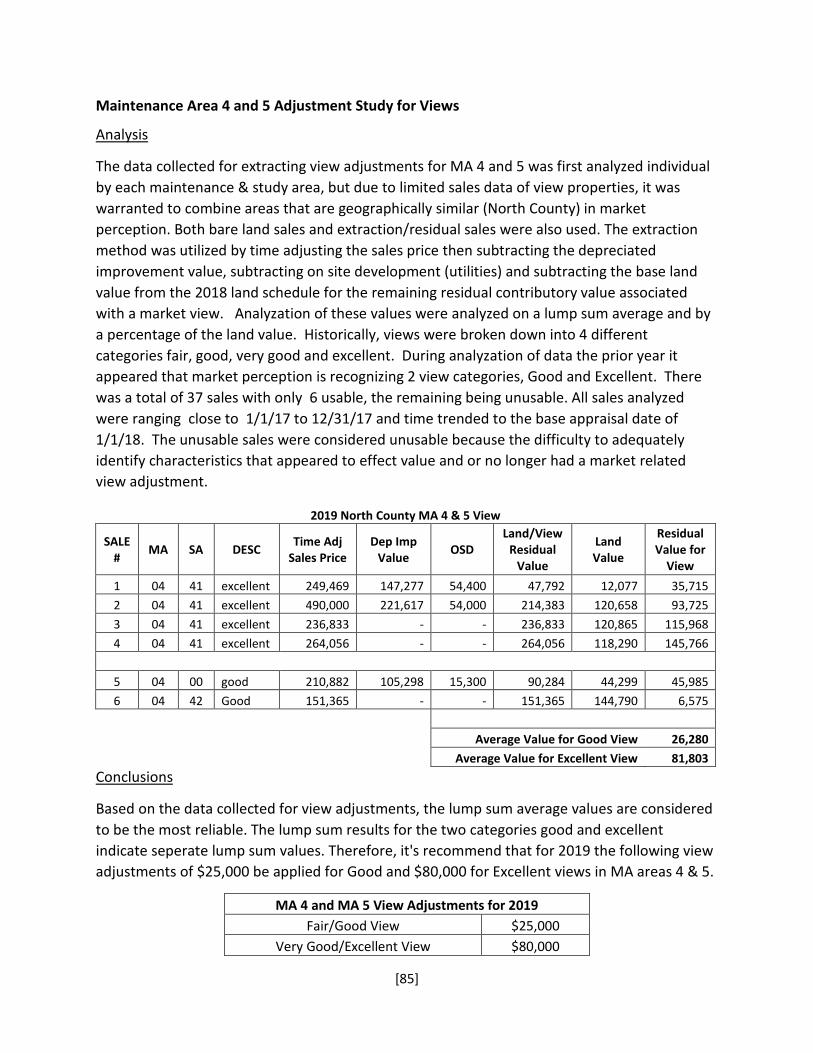
Maintenance Area 4 and 5 Adjustment Study for Views
Analysis
The data collected for extracting view adjustments for MA 4 and 5 was first analyzed individual by each maintenance & study area, but due to limited sales data of view properties, it was warranted to combine areas that are geographically similar (North County) in market perception. Both bare land sales and extraction/residual sales were also used. The extraction method was utilized by time adjusting the sales price then subtracting the depreciated improvement value, subtracting on site development (utilities) and subtracting the base land value from the 2018 land schedule for the remaining residual contributory value associated with a market view. Analyzation of these values were analyzed on a lump sum average and by a percentage of the land value. Historically, views were broken down into 4 different categories fair, good, very good and excellent. During analyzation of data the prior year it appeared that market perception is recognizing 2 view categories, Good and Excellent. There was a total of 37 sales with only 6 usable, the remaining being unusable. All sales analyzed were ranging close to 1/1/17 to 12/31/17 and time trended to the base appraisal date of 1/1/18. The unusable sales were considered unusable because the difficulty to adequately identify characteristics that appeared to effect value and or no longer had a market related view adjustment.
2019 North County MA 4 & 5 View
SALE # MA SA DESC Time Adj
Sales Price Dep Imp
Value OSD Land/View
Residual Value
Land Value
Residual Value for
View 1 04 41 excellent 249,469 147,277 54,400 47,792 12,077 35,715 2 04 41 excellent 490,000 221,617 54,000 214,383 120,658 93,725 3 04 41 excellent 236,833 - - 236,833 120,865 115,968 4 04 41 excellent 264,056 - - 264,056 118,290 145,766
5 04 00 good 210,882 105,298 15,300 90,284 44,299 45,985 6 04 42 Good 151,365 - - 151,365 144,790 6,575
Average Value for Good View 26,280 Average Value for Excellent View 81,803
Conclusions
Based on the data collected for view adjustments, the lump sum average values are considered to be the most reliable. The lump sum results for the two categories good and excellent indicate seperate lump sum values. Therefore, it's recommend that for 2019 the following view adjustments of $25,000 be applied for Good and $80,000 for Excellent views in MA areas 4 & 5.
MA 4 and MA 5 View Adjustments for 2019 Fair/Good View $25,000
Very Good/Excellent View $80,000
[85]
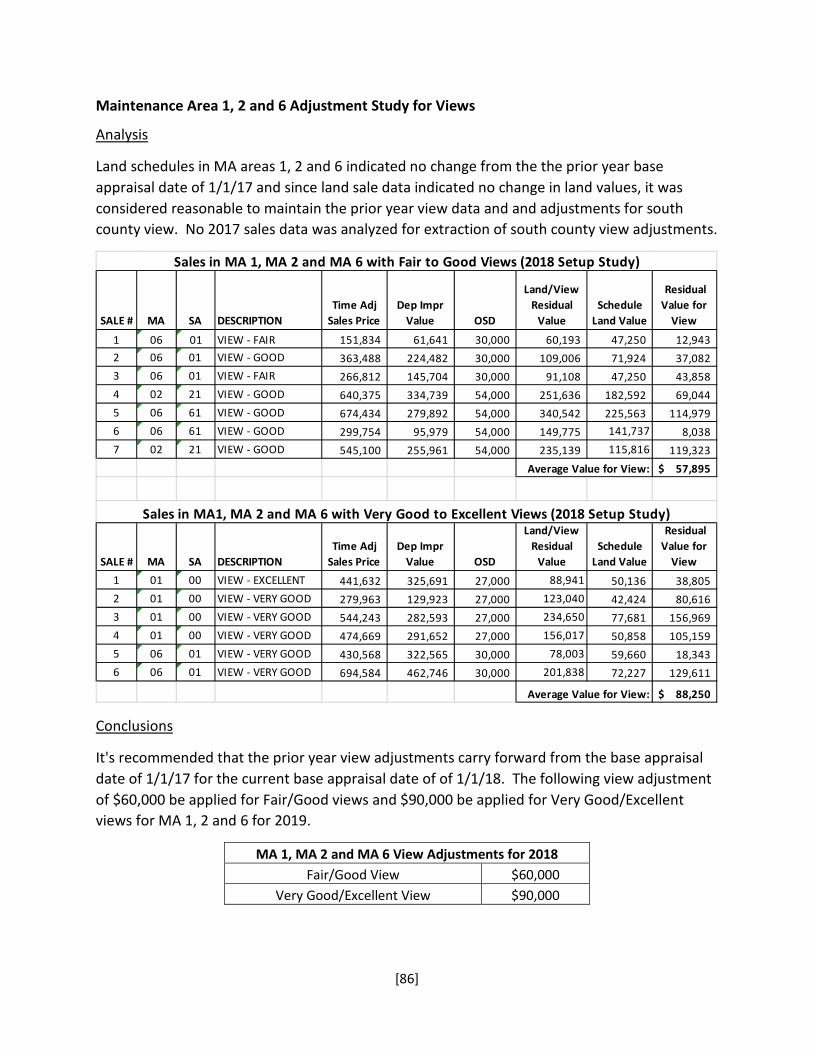
Maintenance Area 1, 2 and 6 Adjustment Study for Views
Analysis
Land schedules in MA areas 1, 2 and 6 indicated no change from the the prior year base appraisal date of 1/1/17 and since land sale data indicated no change in land values, it was considered reasonable to maintain the prior year view data and and adjustments for south county view. No 2017 sales data was analyzed for extraction of south county view adjustments.
Sales in MA 1, MA 2 and MA 6 with Fair to Good Views (2018 Setup Study)
SALE # MA SA DESCRIPTION Time Adj
Sales Price Dep Impr
Value OSD
Land/View Residual
Value Schedule
Land Value
Residual Value for
View
1 06 01 VIEW - FAIR 151,834 61,641 30,000 60,193 47,250 12,943 2 06 01 VIEW - GOOD 363,488 224,482 30,000 109,006 71,924 37,082 3 06 01 VIEW - FAIR 266,812 145,704 30,000 91,108 47,250 43,858 4 02 21 VIEW - GOOD 640,375 334,739 54,000 251,636 182,592 69,044 5 06 61 VIEW - GOOD 674,434 279,892 54,000 340,542 225,563 114,979 6 06 61 VIEW - GOOD 299,754 95,979 54,000 149,775 141,737 8,038 7 02 21 VIEW - GOOD 545,100 255,961 54,000 235,139 115,816 119,323
Average Value for View: 57,895 $
Sales in MA1, MA 2 and MA 6 with Very Good to Excellent Views (2018 Setup Study)
SALE # MA SA DESCRIPTION Time Adj
Sales Price Dep Impr
Value OSD
Land/View Residual
Value Schedule
Land Value
Residual Value for
View 1 01 00 VIEW - EXCELLENT 441,632 325,691 27,000 88,941 50,136 38,805 2 01 00 VIEW - VERY GOOD 279,963 129,923 27,000 123,040 42,424 80,616 3 01 00 VIEW - VERY GOOD 544,243 282,593 27,000 234,650 77,681 156,969 4 01 00 VIEW - VERY GOOD 474,669 291,652 27,000 156,017 50,858 105,159 5 06 01 VIEW - VERY GOOD 430,568 322,565 30,000 78,003 59,660 18,343 6 06 01 VIEW - VERY GOOD 694,584 462,746 30,000 201,838 72,227 129,611
Average Value for View: 88,250 $
Conclusions
It's recommended that the prior year view adjustments carry forward from the base appraisal date of 1/1/17 for the current base appraisal date of of 1/1/18. The following view adjustment of $60,000 be applied for Fair/Good views and $90,000 be applied for Very Good/Excellent views for MA 1, 2 and 6 for 2019.
MA 1, MA 2 and MA 6 View Adjustments for 2018 Fair/Good View $60,000
Very Good/Excellent View $90,000
[86]

Maintenance Area 4 Adjustment Study for City of Rainier Slide Area
Analysis
The slide area in Rainier is an area east of Fox Creek and South of Columbia River Highway. In addition, any piece of land within the city limits that has a slope of 20% or more west of Fox Creek. The City of Rainier is currently working on an overlay map of the slide area.
For undeveloped lots in the slide area, there is approximately $500 worth of planners time and application fee to review the required ‘Geological Technical Report’ prior to building.
Several Geological Engineers were contacted to determine the cost of having a Geological Technical Study and Report done for a property within the slide area of Rainier. The average cost is $8,525.
Conclusions
Following are the slide area adjustments that should be applied to all vacant properties in the slide area and to all older improved properties that appear to have problems due to being located within the slide area of Rainier.
MA 4 City of Rainier Slide Area Adjustments for 2019
Rainier Slide – City Fees $500 Rainier Slide – Engineering Fees $8,525
[87]
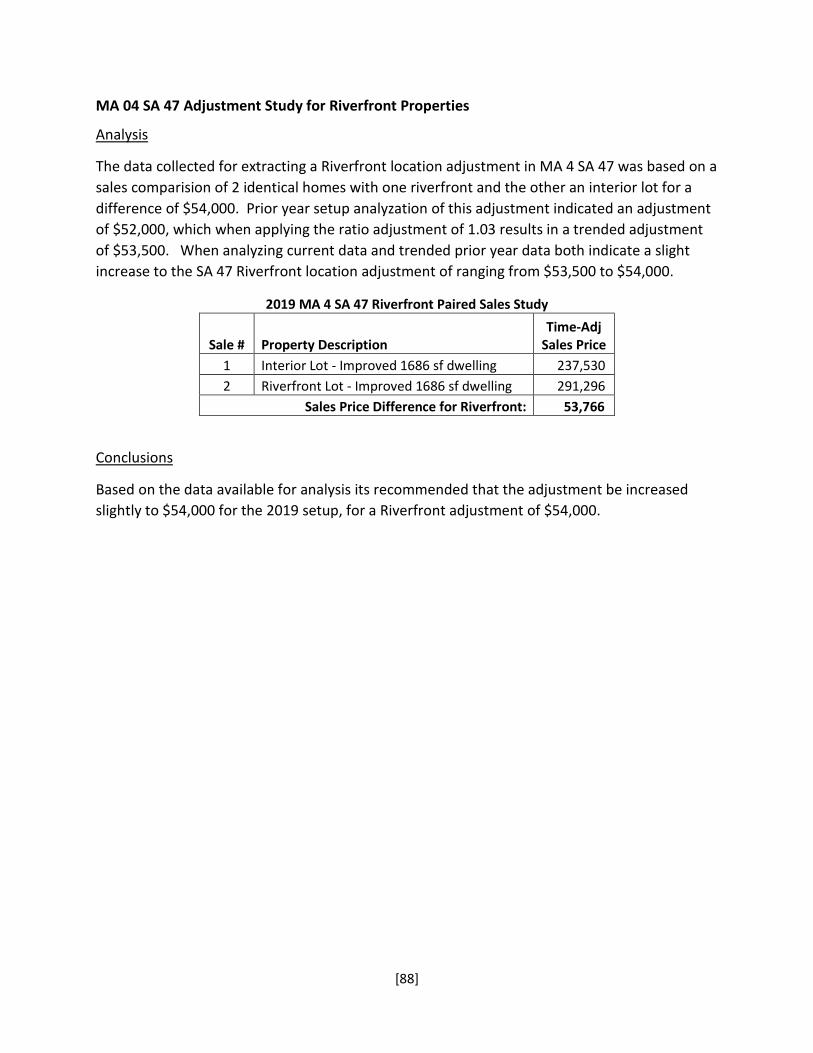
MA 04 SA 47 Adjustment Study for Riverfront Properties
Analysis
The data collected for extracting a Riverfront location adjustment in MA 4 SA 47 was based on a sales comparision of 2 identical homes with one riverfront and the other an interior lot for a difference of $54,000. Prior year setup analyzation of this adjustment indicated an adjustment of $52,000, which when applying the ratio adjustment of 1.03 results in a trended adjustment of $53,500. When analyzing current data and trended prior year data both indicate a slight increase to the SA 47 Riverfront location adjustment of ranging from $53,500 to $54,000.
2019 MA 4 SA 47 Riverfront Paired Sales Study
Sale # Property Description Time-Adj
Sales Price 1 Interior Lot - Improved 1686 sf dwelling 237,530 2 Riverfront Lot - Improved 1686 sf dwelling 291,296
Sales Price Difference for Riverfront: 53,766
Conclusions
Based on the data available for analysis its recommended that the adjustment be increased slightly to $54,000 for the 2019 setup, for a Riverfront adjustment of $54,000.
[88]
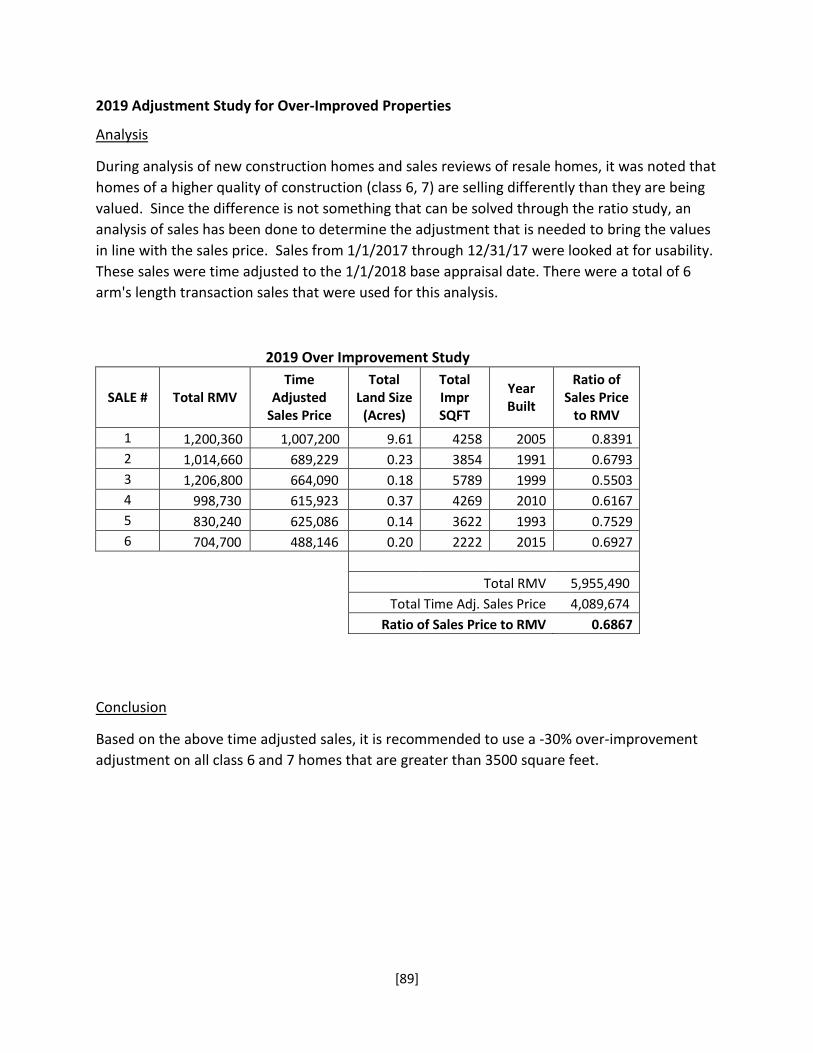
2019 Adjustment Study for Over-Improved Properties
Analysis
During analysis of new construction homes and sales reviews of resale homes, it was noted that homes of a higher quality of construction (class 6, 7) are selling differently than they are being valued. Since the difference is not something that can be solved through the ratio study, an analysis of sales has been done to determine the adjustment that is needed to bring the values in line with the sales price. Sales from 1/1/2017 through 12/31/17 were looked at for usability. These sales were time adjusted to the 1/1/2018 base appraisal date. There were a total of 6 arm's length transaction sales that were used for this analysis.
2019 Over Improvement Study
SALE # Total RMV Time
Adjusted Sales Price
Total Land Size
(Acres)
Total Impr SQFT
Year Built
Ratio of Sales Price
to RMV 1 1,200,360 1,007,200 9.61 4258 2005 0.8391 2 1,014,660 689,229 0.23 3854 1991 0.6793 3 1,206,800 664,090 0.18 5789 1999 0.5503 4 998,730 615,923 0.37 4269 2010 0.6167 5 830,240 625,086 0.14 3622 1993 0.7529 6 704,700 488,146 0.20 2222 2015 0.6927
Total RMV 5,955,490 Total Time Adj. Sales Price 4,089,674
Ratio of Sales Price to RMV 0.6867
Conclusion
Based on the above time adjusted sales, it is recommended to use a -30% over-improvement adjustment on all class 6 and 7 homes that are greater than 3500 square feet.
[89]

Other Adjustments Where a Study was Not Completed for 2019
Creek Adjustment
There is no measurable data at to support a percentage or fixed amount adjustment for this area identifiers at this time in the following areas.
MA 01 SA 00 MA 04 SA 00 MA 04 SA 44 MA 06 SA 01 MA 01 SA 30 MA 04 SA 40 MA 04 SA 45 MA 06 SA 21 MA 01 SA 31 MA 04 SA 41 MA 04 SA 47 MA 06 SA 31 MA 01 SA 43 MA 04 SA 42 MA 04 SA 56 MA 06 SA 44
Busy Street Adjustment
There is no measurable data at to support a percentage or fixed amount adjustment for this area identifiers at this time in the following areas.
MA 01 SA 00 MA 04 SA 00 MA 04 SA 44 MA 06 SA 01 MA 01 SA 30 MA 04 SA 40 MA 04 SA 45 MA 06 SA 21 MA 01 SA 31 MA 04 SA 41 MA 04 SA 47 MA 06 SA 31 MA 01 SA 43 MA 04 SA 42 MA 04 SA 56 MA 06 SA 44
Transmission Lines - Countywide
A 50% adjustment is made to the value of the portion of land that lays directly under a major transmission line easement. This adjustment is not based on market sales, but rather is made to recognize the limited use and negative market perception of land that lies beneath major transmission lines.
2 Parcels/Taxlot, 3 Parcels/Taxlot - Countywide
These adjustments are used on non-platted properties where the highest and best use of the property based on location, zoning and access is to divide the property through the partition plat process and sell each parcel individually.
2 Parcels/Taxlot adds 50% of the land value 3 Parcels/Taxlot adds 90% of the land value
Partition Costs - Countywide
This adjustment is added to all properties that have either a 2 or 3 Parcels per Taxlot adjustment. It reduces the total land value by the typical partitioning costs.
2019 Partition Costs adjustment is -$10,870.
Appeal Adjustments
This adjustment is used on properties where the value has been reduced by the Board of Property Tax Appeals or by the Oregon Tax Court (either Magistrate or Regular Division), to maintain the same percentage of reduction over the 5 year adjudication period while continuing to recalculate the values using current setup factors.
[90]

Notes
[91]

Published By Columbia County Assessor
230 Strand Street Saint Helens, OR 97051
503-397-2240www.co.columbia.or.us


