Embed Size (px)
Citation preview

This article appeared in a journal published by Elsevier. The attachedcopy is furnished to the author for internal non-commercial researchand education use, including for instruction at the authors institution
and sharing with colleagues.
Other uses, including reproduction and distribution, or selling orlicensing copies, or posting to personal, institutional or third party
websites are prohibited.
In most cases authors are permitted to post their version of thearticle (e.g. in Word or Tex form) to their personal website orinstitutional repository. Authors requiring further information
regarding Elsevier’s archiving and manuscript policies areencouraged to visit:
http://www.elsevier.com/copyright
Author's personal copy
Colonization of PAH-contaminated dredged sediment by earthworms
H. Eijsackers a,c,*, J. Bruggeman b, J. Harmsen c, Th. de Kort a, A. Schakel a
a Institute for Ecological Science, Faculty of Earth and Life Science, Vrije Universiteit, De Boelelaan 1085, 1081 HV Amsterdam, Netherlandsb Department of Theoretical Biology, Faculty of Earth and Life Science, Vrije Universiteit, De Boelelaan 1085, 1081 HV Amsterdam, Netherlandsc Alterra, Environmental Sciences Group, Wageningen University and Research Centre, pob 47, 6700 AA Wageningen, Netherlands
1. Introduction
Jones et al. (1994) have defined the term ‘ecosystem engineers’as: ‘‘organisms that directly or indirectly modulate the availabilityof resources other than themselves to other species, by causingphysical state changes in biotic materials. In doing so, they modify,maintain and/or create habitats’’. This was exemplified by the wayearthworms create a better growth substrate for certain plantspecies and micro-organisms. Lavelle et al. (1997) elaborated onthis in a broader context for earthworms in general. Eijsackers(1996) did this for their possible impact on soil pollution, andsuggested that earthworms could play an important role in theimprovement of soil substrates with a reduced quality due tochemical compounds. Earthworms can mobilize heavy metals (Maet al., 2002), but it was not possible to confirm this mobilizationunder semi-field and field conditions (Zorn et al., 2005a, b).
Eijsackers et al. (2001) showed that earthworms improvedegradation of PAHs, by improving physical conditions for aerobicbreakdown, by stimulating microbial processes through mixing
micro-organisms with contaminated soil or by increasing theavailability by decreasing the size of soil aggregates (Harmsen, 2004).
Substrates that benefit from such positive effects of ecosystemengineers are contaminated soils, like large scale industrializedareas (brownfields) or deposits of dredged contaminated sedi-ments. These substrates normally are devoid of earthworms orhave only very low populations due to toxic actions of thecontaminants present. They first have to be colonized by earth-worms, before these could start their engineering work. So thequestion is first: is colonization hampered by soil contaminants,and second: do established earthworms improve breakdown of soilcontaminants either directly or indirectly.
Colonization studies have been carried out in virgin agriculturalsoils (Stockdill, 1982; Springett, 1972; Hoogerkamp et al., 1983),fly ash deposits (Satchell and Stone, 1977; Eijsackers et al., 1983),and sediment deposits (Vandecasteele et al., 2004). But these wereall looking in retrospect at the outcome of colonization for longerperiods of several decades. The studies by Satchell and Stone(1977) and Vandecasteele et al. (2004), moreover, concentrated onthe relation with heavy metal loads of the sediments.
We were interested in the early colonization of depositedsediments, starting immediately after deposition and in therelation between colonization and soil conditions and relatedconditions for organic contaminants. In a previous study (Eijsack-
Applied Soil Ecology 43 (2009) 216–225
A R T I C L E I N F O
Article history:
Received 22 May 2009
Received in revised form 5 August 2009
Accepted 6 August 2009
Keywords:
Colonization
Succession
Eco-engineering
Earthworms
PAHs
Deposited sediment
A B S T R A C T
In freshly deposited dredged sediment contaminated with PAHs, we followed the colonization of
earthworm species by monthly monitoring over two years. Already five months after deposition the first
species, Lumbricus castaneus, appeared, although only temporarily. The first permanent colonizing
species was L. rubellus, soon followed by Aporrectodea caliginosa and L. castaneus, and a few months later
Eiseniella tetraeda. At the end of the two-year observation period some first few specimen of
Allolobophora rosea were present. These earthworm species colonized the deposited sediment
apparently in succession. The colonization of each individual species did not show a gradual influx
from the bordering dikes at both sides of the deposit, but a fast colonization over the whole width,
presumably by surface dispersal, although at low and variable numbers, followed by a gradual increase
of population numbers. Modeling the dispersal showed that diffusion was the primary driving factor.
Also juvenile earthworms were observed locally in high numbers, so reproduction did occur. Total
earthworm numbers in the deposit reached a maximum of 80% of the numbers in the bordering dikes
consisting of loamy and clayey soils. Numbers were highest in periods with warm and rainy weather. The
appearance of earthworms improved the soil development, stimulated a faster desiccation and aeration
of the sediment and may have contributed to the increased degradation of PAHs, especially three- and
four-ring PAHs.
� 2009 Elsevier B.V. All rights reserved.
* Corresponding author at: PO Box 9101, 6700 HB Wageningen, Netherlands.
Tel.: +31 317 481563.
E-mail address: [email protected] (H. Eijsackers).
Contents lists available at ScienceDirect
Applied Soil Ecology
journa l homepage: www.e lsev ier .com/ locate /apsoi l
0929-1393/$ – see front matter � 2009 Elsevier B.V. All rights reserved.
doi:10.1016/j.apsoil.2009.08.003

Author's personal copy
ers et al., 2001) it was shown experimentally that earthwormscould improve sediment quality, especially the aeration ofdeposited sediment, so that aerobic degradation of PAHs wasstimulated. Therefore we wanted to investigate the colonization ofsediment by earthworms: (1) under specified conditions in thefield, (2) directly from the moment the sediment was deposited, (3)with an intensive sampling scheme covering the first two years ofcolonization and (4) in combination with observations on thephysical sediment conditions and the fate of the contaminantspresent. To this end we set up an experimental sediment deposit inwhich we studied:
- the colonization by earthworms from the bordering dikes(quantitatively), both in the field and by modeling;
- the colonization by other surface-active soil faunal species(quantitatively);
- the colonization or establishment of plants on the deposit as thisprovides cover and organic material for soil animals (semi-quantitatively);
- the development of the sediment with respect to drainage,desiccation, surface crackling, and penetration of oxygen(aeration) to deeper sediment layers (qualitative field observa-tions);
- the fate of the contaminants, more specific PAHs (quantitatively);- a possible relation with environmental conditions (soil tem-
perature and soil moisture content).
2. Material and methods
2.1. Experimental field deposit and earthworm sampling
The study was carried out at the Oostwaardhoeve VOF,Ecotechnic Research Centre, at Wieringerwerf in the northwesternpart of The Netherlands (528500N and 48550E). This research farmdeals i.e., with research on sediment treatment by landfarming, incombination with bio energy farming.
For the experiment, a special deposit was constructed ofapproximately 75 m � 13 m � 1.50 m (length �width � depth)surrounded by dikes of the natural loamy soil directly availableat the spot. On May 8th 2001 the deposit was filled, by pumping,with sediment from inland waters at Schagen (province, NorthHolland), selected because of high PAH and low heavy metals andorganochlorines loads. This sediment was dredged in the end ofNovember 2000, transported to the farm with trucks andtemporarily stored in another deposit at the farm. During dredgingand subsequent pumping large items were discarded from thesediment, although the deposit still contained bigger inert items(parts of bricks etc.). The deposit was filled for about two third of itslength, at one end the deposit was left empty so that excess watercould drain off.
For sampling the deposited area was divided in 13 sections,each 3 m wide; the two end-sections of approximately 5.5 m eachat both sides of the row were excluded because they could becomecolonized from three directions (both dikes plus the lateral dike) orhad a different drainage. Soil animals were sampled monthly fortwo years. Due to severe frost or excessive rain, samplingsometimes had to be postponed for some days. At each samplingdate three sections were randomly chosen, and samples weretaken within the deposit at 2 m intervals, starting at 50 cm fromthe dikes, and from the third sampling date onwards also the twobordering dikes (per section seven samples in total).
Earthworms were sampled by digging out 25 cm � 25 cm� 20 cm of soil and hand sorting at the spot. Also all other soilanimals (macrofauna) found in these samples were collected. Thesearched soil (including earthworm cocoons) was redeposited atthe sampling site afterwards, so as to minimize the depleting
impact of sampling. Earthworms were brought to the laboratoryfor identification to species level according to Sims and Gerard(1999). During the first few months a qualitative description of thevegetation was carried out, but plant growth or organic matterproduction was not measured systematically. During the secondyear of colonization (from January to October 2003) also soiltemperature and precipitation were registered to correlate (andpossibly adjust) earthworm development in the deposit forpossible weather impacts.
2.2. Measuring soil physical and chemical characteristics
Observations on the development of the soil profile (downward‘progression’ of the aerobic soil layer) were done visually duringdigging for sampling earthworms, and by coring in October 2001,December 2001, February 2002 and August 2002. Visually adistinction was made between the aerated upper soil layer, thebrown/black transient zone, and the lower zone of black stillanaerobic sediment.
Throughout the whole observation period measurements ofsoil characteristics were carried out on moisture content, organicmatter content, pH (H2O). Samples were analyzed for the presenceof heavy metals, PAHs and organochlorines only at the beginning.At later samplings only total and available PAH concentrationswere measured together with moisture content (wet to dryweight), and organic matter content (as loss on ignition at 550 8C).Metal and organochlorine concentrations were determined byAlcontrol (Hoogvliet, The Netherlands) under certified qualityassurance conditions (RVA), according to their own protocolsusing respectively GC/MS and ICP/AES. PAH concentration wasdetermined for individual PAHs (naphthalene, anthracene,phenanthrene, fluoranthene, benz(a)anthracene, chrysene, ben-zo(k)fluoranthene, benzo(a)pyrene, benzo(ghi)perylene andindeno(1,2,3-cd)pyrene) and for the sum of these 10 PAHs. ThePAHs were measured after extraction with acetone and petroleumether, clean up on aluminum oxide using HPLC and fluorescencedetection (according to the Dutch standard method NEN 5771;NEN, 1999). The detection limit of this method is approximately0.01 mg kg�1 dry weight, which is far below the measuredconcentrations in this investigation. Applying this method onsamples of the International Sediment Exchange for Tests onOrganic Contaminants (SETOC) of Wageningen University, 96% ofall individual measurements had a Z-score <2. Available PAHswere measured using a solid phase technique described byCornelissen et al. (1998). In the applied procedure, sediment (1 g),water (50 ml), HgCl2 (1.25 g) to stop the activity of degradingorganisms and 1.5 g Tenax beads were brought together in aseparation funnel. Tenax TA (177–250 mm), a porous polymerbased on 2,6-diphenyl-p-phenylene oxide was obtained fromVarian. Before use the Tenax beads were rinsed with hexane,acetone and water. The funnel was continuously shaken at roomtemperature (approximately 20 8C). After 20 h of shaking, theTenax beads were separated from the slurry and the adsorbed PAHwere extracted again with hexane and measured by HPLCaccording to the method described in NEN 5771. This amountwas considered to be the fraction available for degradation. PAHremaining in the residue after removal of the Tenax beds weremeasured according the method for sediment. The available PAHare expressed as fraction (amount in Tenax/(amount in Tenax + -amount in residue).
Because of physical and financial constraints only one depositcould be constructed and sampled. For data comparison it isassumed that the various sections of the deposit provide randomsamples of the total deposit, and that other factors (like weatherconditions or drainage) have a similar impact on all sections.Within each section earthworm numbers in the deposit can be
H. Eijsackers et al. / Applied Soil Ecology 43 (2009) 216–225 217

Author's personal copy
compared with the source populations in the bordering dikes atboth sides. As it was not possible to distinguish the impact of bothsource dikes from each other we compared the mean numbers ofthe five sub-samples in the deposit with the mean numbers foundin the samples from the dikes; all in triplicate. Because of thelimited duplication and the inherent differences between samplingplots at different distances form the source dikes, it was notrealistic to calculate statistical variabilities within or between thesections.
3. Results
3.1. Soil development
The sediment as analyzed directly after dredging and deposi-tion at the Oostwaardhoeve in November 2000 contained 7.6%organic matter, 13% clay (<2 mm), 20% fine silt (2–16 mm) and 67%silt + sand (>16 mm), and had a pH-H2O of 7.1. Metal, PAH andorganochlorine concentrations in the sediment are summarized inTable 1.
According to Dutch policy, on the basis of theP
10PAH level of23.8 mg kg�1 dry weight, the sediment has to be classified asmedium contaminated. For none of the other pollutants, con-centrations exceeded the Intervention Value defined by the Dutchgovernment (VROM, 2000).
Three months after pumping the sediment into the deposit (July2001), the sediment had settled, with a cracked surface (includingbig cracks of over 1 cm wide) and a dried upper layer ofapproximately 10 cm thick. Below 10 cm there was a compact
moist anaerobic soil layer. There were no visible signs of layeredsedimentation, but the surface was irregular with heightdifferences up to 10 cm and dry and moist spots.
In September 2001, five months after deposition, the totalthickness of the sediment layer had diminished from 1.0 to 0.9 m,and the transition zone between aerobic and anaerobic soil waslowered to 30–40 cm below the soil surface.
The dry matter content of the soil was only registeredextensively and in relation to the analyses of PAH concentrations.Compared to the original sediment the dry matter contentincreased in time as an effect of settling and ripening. Themoisture content observed in the upper layer did approach fieldcapacity. When we sampled one section of the sediment in threelayers (2.5–7.5; 7.5–12.5 and 12.5–17.5 cm below surface level) inDecember 2001, the mean moisture content increased with depth,for the three layers respectively mean 58.2%, min 53.4%–max64.5%; mean 60.9%, 42.5–71.5%; mean 68.1%, 49.3–83.1%), but thetotal pattern was highly heterogeneous. The dry matter content ofthe lower layer (moist, anaerobic, not ripened) stayed at a higherlevel (approximately 40%), without clear trend in time. Neither wasthere a clear trend visible in the measured organic matter contents,which ranged between 7% and 8%.
3.2. PAH concentrations
The concentrations of phenanthrene (three-ring), fluoranthene(four-ring), benzo(a)pyrene (five-ring) and indenopyrene (six-ring) are plotted against time in Fig. 1. Concentrations of the twothree- and four-rings PAHs showed a fast decline in the first few
Table 1Pollutant concentrations in the sediment used for this study as sampled in November 2000. All concentrations in mg kg�1 dry sediment for PAH, mineral oil and heavy metals
and mg kg�1 dry sediment for organochlorines.
PAH Heavy metals Organochlorines
Naphthalene 0.1 Cadmium 1.1P
Chlorobenzenes 16.0
Anthracene 1.0 Mercury 0.6 Hexachlorobenzene 16.0
Phenanthrene 2.0 Copper 49.0P
Drins 25.0
Fluoranthene 7.9 Nickel 13.0P
HCHs <70.0
Benz(a)anthracene 2.8 Zinc 290P
Pesticides 90.0
Chrysene 2.4 Chromium 24.0P
7PCBs 105
Benzo(k)fluoranthene 1.3 Arsenic 1.0 Mineral oil 1200
Benzo(a)pyrene 3.2
Benzo(ghi)perylene 1.6
Indenopyrene 1.6P10PAH 23.8
Fig. 1. Decrease in the course of time (months) of the concentrations of phenanthrene (three-ring PAH), fluoranthene (four-ring), benzo(a)pyrene (five-ring) and
indenopyrene (six-ring) in the experimental dredged sediment deposit.
H. Eijsackers et al. / Applied Soil Ecology 43 (2009) 216–225218

Author's personal copy
months, while the two five- and six-rings PAHs showed onlylimited decrease. Six months after deposition (October 2001), theconcentrations of phenanthrene and fluoranthene (three- andfour-ring) in the surface layer (0–10 cm) were much lower than inthe layer directly below (10–20 cm). For benzo(a)pyrene andindenopyrene the differences in concentration between 0–10 and10–20 cm were much smaller or negligible.
Table 2 lists the mean concentrations of the various PAHs in theupper and lower layer and the ratio between these two. Next tothis, it is of interest to look at the decrease of the three-ring versusthe four-ring PAHs. For most of the PAHs the ratio of concentra-tions in the upper and lower layer was approximately the same(1.4–1.8), but for anthracene and phenanthrene this ratio wasmuch greater. This may indicate that degradation of these twoPAHs did occur, but caution is needed as the range in data is fairly
large. The concentrations of PAHs in the dikes around the depositwere at background level (<1 mg kg�1 dry weight)
The available PAH fraction, measured with Tenax extraction, inthe lower part of the sediment in direct contact with the waterphase, varied from around 30% for the three + four-ring PAHs to 6%for six-ring PAH. Available PAH fractions in the aerobic upper layerwere all lower (range 5–10%).
3.3. Vegetation development
The vegetation development was ‘luxuriant’ from the begin-ning. Three months after pumping the sediment into the deposit(July 2001), the surface was covered with Persicaria maculosa (70%coverage, about 1 m high), Phragmites australis, Capsella bursa-
pastoris, Chenopodium album, Epilobium hirsutum and Schoenopletus
triquetes. The latter species indicates for saline influences. At laterstages the vegetation developed to approximately 1.25 m high,became denser and covered the total surface of the deposit,although between the bushes there were still bare soil spotsavailable to sample soil animals.
This development resulted in a layer of fresh dead plantmaterial at the end of the first sampling year (autumn and winter2001), gradually degrading and forming a litter and raw humuslayer.
3.4. Earthworms
3.4.1. Total numbers and reproduction ratio
Data on total earthworm numbers are plotted in Fig. 2. Fromthe very first sampling, five months after pumping the sedimentinto the deposit, earthworms were found in the depositedsediment, albeit only very few, scattered individuals. From thethird sampling onwards also the two bordering dikes weresampled. The numbers of earthworms in the clayey dike (righthand side in Fig. 2) were much higher than in the sandy loam dike(left hand side in Fig. 2). The pattern of population development
Table 2Mean PAH concentrations and percentage available PAHs in the sediment of the
deposit in September 2002, 16 months after depositing. A distinction is made
between the upper (0–10 cm; aerobic) and lower (10–20 cm; anaerobic) sediment
layer, and expressed as the ratio of lower divided by upper. Available concentrations
were measured with the Tenax-method (see Harmsen, 2004).
Total mg kg�1dry weight Percentage
available
Upper Lower l/u Upper Lower
Anthracene 0.33 0.94 2.86 6.8 26.2
Phenanthrene 0.54 1.26 2.36 9.7 17.1
Fluoranthene 3.08 4.47 1.45 10.6 37.4
Benz(a)anthracene 1.38 1.96 1.42 7.2 22.8
Chrysene 1.68 2.71 1.61 7.4 19.5
Benzo(k)fluoranthene 1.35 2.03 1.50 7.0 16.6
Benzo(a)pyrene 1.61 2.74 1.70 5.6 13.0
Benzo(ghi)perylene 1.35 2.12 1.57 6.5 6.8
Indenopyrene 1.30 2.08 1.60 3.5 6.3PPAHa 12.0 19.5 1.62 7.2 19.1
a Pyrene is not included because of difficulties in analysis, hence,P
PAH includes
only nine PAHs here.
Fig. 2. Total earthworm numbers per sample (0.0625 m2) in an experimental dredged sediment deposit in the course of time (months). For each sampling date (day–month–
year) the mean numbers are given for three sampling series, and going from one source dike (most left hand bar) to the other source dike (most right hand bar). Distances
between sample sites were 2 m.
H. Eijsackers et al. / Applied Soil Ecology 43 (2009) 216–225 219

Author's personal copy
in the deposit with time can be deduced from Fig. 2. If theincrease would be due to dispersal (influx) from the populationsin the dikes into the deposit, the distribution pattern from onedike to the other should have a U-shape with a gradual decreasegoing from the dike into the deposit and lowest numbers in themiddle. For the total numbers this was not the case. Moreover,the figure shows clearly that there was a seasonal fluctuation ofthe earthworm numbers in the dikes. This fluctuation is plottedin Fig. 3 together with the seasonal fluctuations in the deposititself. Until mid 2002, earthworm numbers in the deposit stayedlow with some slight seasonal fluctuation, only after that(lag)period numbers started increasing consistently. The fluctua-tion in earthworm numbers was related to both soil temperatureand precipitation, with highest numbers especially found whenhigh temperatures and high precipitation occurred in the sameperiod (Fig. 3).
Next to adult worms also sub-adult and juvenile worms weresampled. The ratio between adult worms and sub-adult + juve-nile worms, as indicated in Fig. 4, was much lower in the depositthan in the dikes for the period July 2001–August 2002. In theautumn of 2002 and the winter of 2002/2003 there was animpressive reproduction in the dikes, and to a lesser extent inthe deposit. From spring 2003 onwards the ratio fluctuated, with
the ratio in the deposit being both higher and lower than in thedikes.
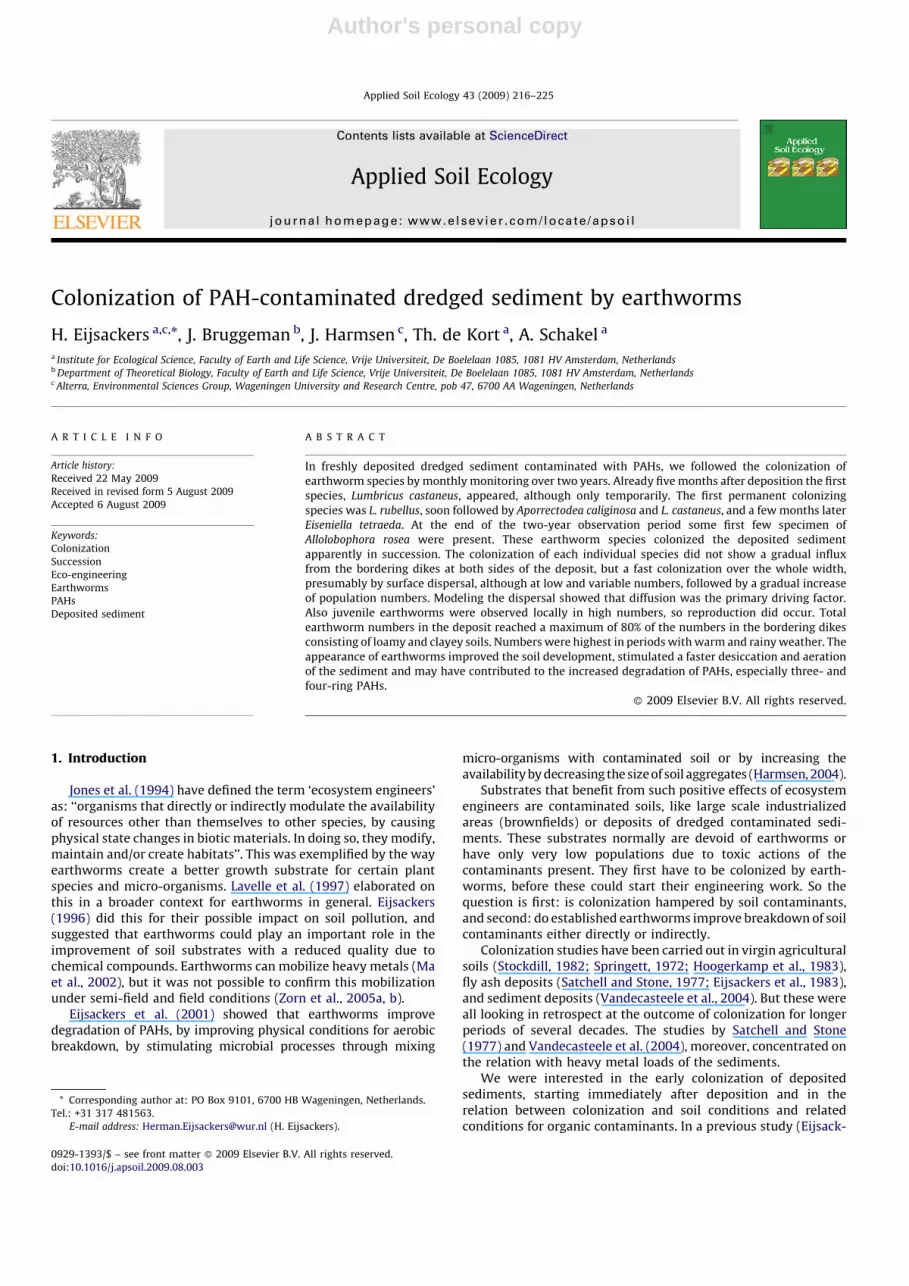
3.4.2. Numbers per species
The pattern of earthworm abundances in the deposit becomesmore diversified when looking at the numbers of the various species(Fig. 5). L. rubellus and L. castaneus were the first colonizers, foundfrom the first sampling in October 2001 onwards. The distributionpattern over the deposit of the epigeic L. rubellus (=active in thesurface litter layer) was irregular, and no seasonal pattern could beobserved. Only few individuals of L. castaneus were found and thisspecies disappeared at later sampling dates. The next species thatestablishedwas Aporrectodeacaliginosa.Herethedistributionpatternwas different, not only because there were high numbers in the dikes,but also due to low numbers in the middle parts of the deposit,causing a more or less a U-shaped distribution that lasted until April/May 2002. A few weeks later L. castaneus settled again. Thedistribution pattern was slightly irregular (and non-U-shaped).Eiseniella tetraeda appeared next, for the first time in November 2002.As last settler Allolobophora chlorotica was observed from February2003 onwards. Further there was a sparse observation of A. rosea inthis lastperiod (singlespecimeninAprilandJuly 2003),and therewasan observation of the relatively rare species Dendrobaena pygmea.
Fig. 3. Mean total numbers of earthworms per sample (0.0625 m2) in an experimental dredged sediment deposit in the course of time (months) in relation to the temperature
in 8C and rainfall in mm.
Fig. 4. Mean adult (hatched) and juvenile (non-hatched) numbers (total numbers � s.e.) of earthworms per sample (0.0625 m2) in an experimental dredged sediment deposit in
the course of time (months).
H. Eijsackers et al. / Applied Soil Ecology 43 (2009) 216–225220
Author's personal copy
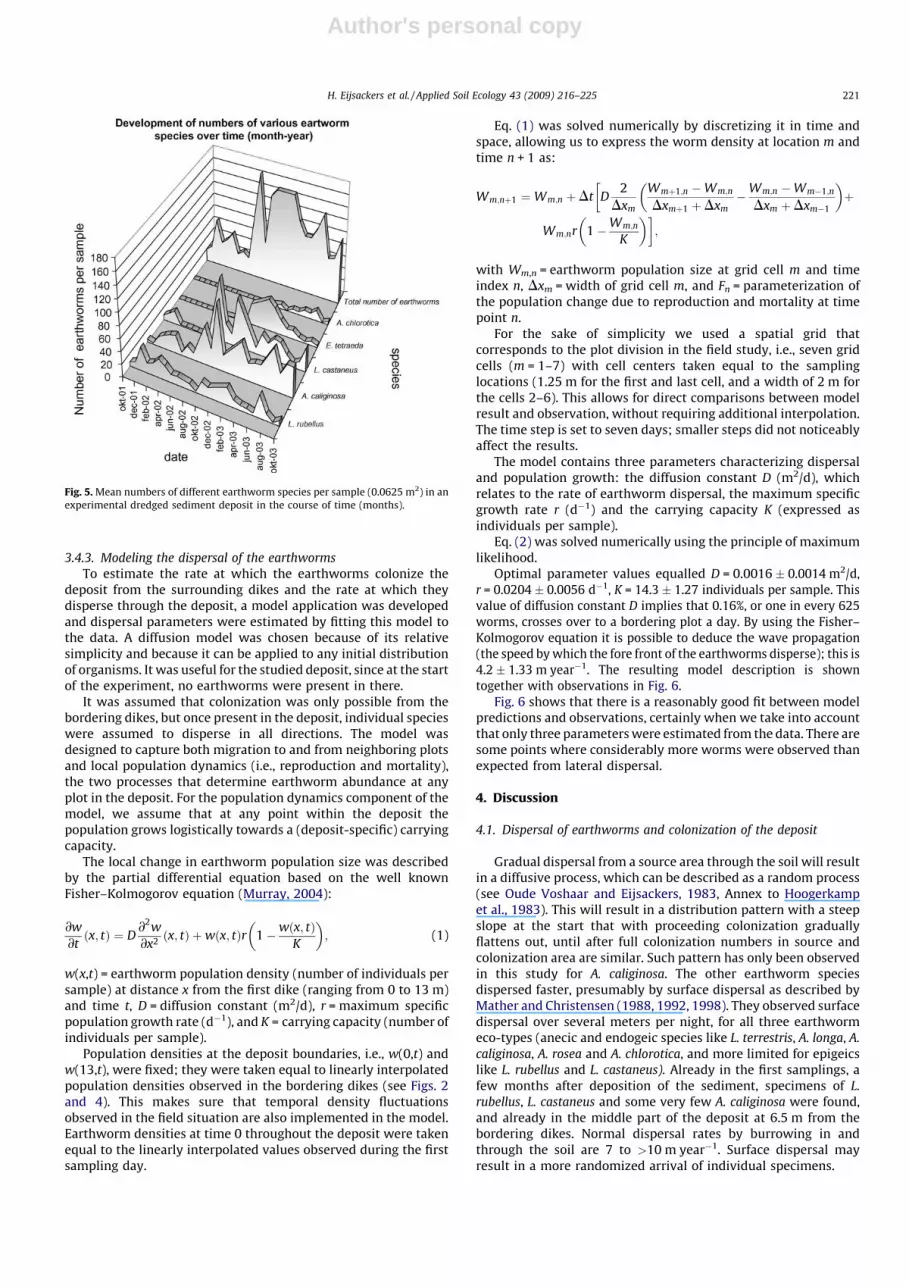
3.4.3. Modeling the dispersal of the earthworms
To estimate the rate at which the earthworms colonize thedeposit from the surrounding dikes and the rate at which theydisperse through the deposit, a model application was developedand dispersal parameters were estimated by fitting this model tothe data. A diffusion model was chosen because of its relativesimplicity and because it can be applied to any initial distributionof organisms. It was useful for the studied deposit, since at the startof the experiment, no earthworms were present in there.
It was assumed that colonization was only possible from thebordering dikes, but once present in the deposit, individual specieswere assumed to disperse in all directions. The model wasdesigned to capture both migration to and from neighboring plotsand local population dynamics (i.e., reproduction and mortality),the two processes that determine earthworm abundance at anyplot in the deposit. For the population dynamics component of themodel, we assume that at any point within the deposit thepopulation grows logistically towards a (deposit-specific) carryingcapacity.
The local change in earthworm population size was describedby the partial differential equation based on the well knownFisher–Kolmogorov equation (Murray, 2004):
@w
@tðx; tÞ ¼ D
@2w
@x2ðx; tÞ þwðx; tÞr 1�wðx; tÞ
K
� �; (1)
w(x,t) = earthworm population density (number of individuals persample) at distance x from the first dike (ranging from 0 to 13 m)and time t, D = diffusion constant (m2/d), r = maximum specificpopulation growth rate (d�1), and K = carrying capacity (number ofindividuals per sample).
Population densities at the deposit boundaries, i.e., w(0,t) andw(13,t), were fixed; they were taken equal to linearly interpolatedpopulation densities observed in the bordering dikes (see Figs. 2and 4). This makes sure that temporal density fluctuationsobserved in the field situation are also implemented in the model.Earthworm densities at time 0 throughout the deposit were takenequal to the linearly interpolated values observed during the firstsampling day.
Eq. (1) was solved numerically by discretizing it in time andspace, allowing us to express the worm density at location m andtime n + 1 as:
Wm;nþ1 ¼Wm;n þDt
�D
2
Dxm
Wmþ1;n �Wm;n
Dxmþ1 þDxm�Wm;n �Wm�1;n
Dxm þDxm�1
� �þ
Wm;nr 1�Wm;n
K
� ��;
with Wm,n = earthworm population size at grid cell m and timeindex n, Dxm = width of grid cell m, and Fn = parameterization ofthe population change due to reproduction and mortality at timepoint n.
For the sake of simplicity we used a spatial grid thatcorresponds to the plot division in the field study, i.e., seven gridcells (m = 1–7) with cell centers taken equal to the samplinglocations (1.25 m for the first and last cell, and a width of 2 m forthe cells 2–6). This allows for direct comparisons between modelresult and observation, without requiring additional interpolation.The time step is set to seven days; smaller steps did not noticeablyaffect the results.
The model contains three parameters characterizing dispersaland population growth: the diffusion constant D (m2/d), whichrelates to the rate of earthworm dispersal, the maximum specificgrowth rate r (d�1) and the carrying capacity K (expressed asindividuals per sample).
Eq. (2) was solved numerically using the principle of maximumlikelihood.
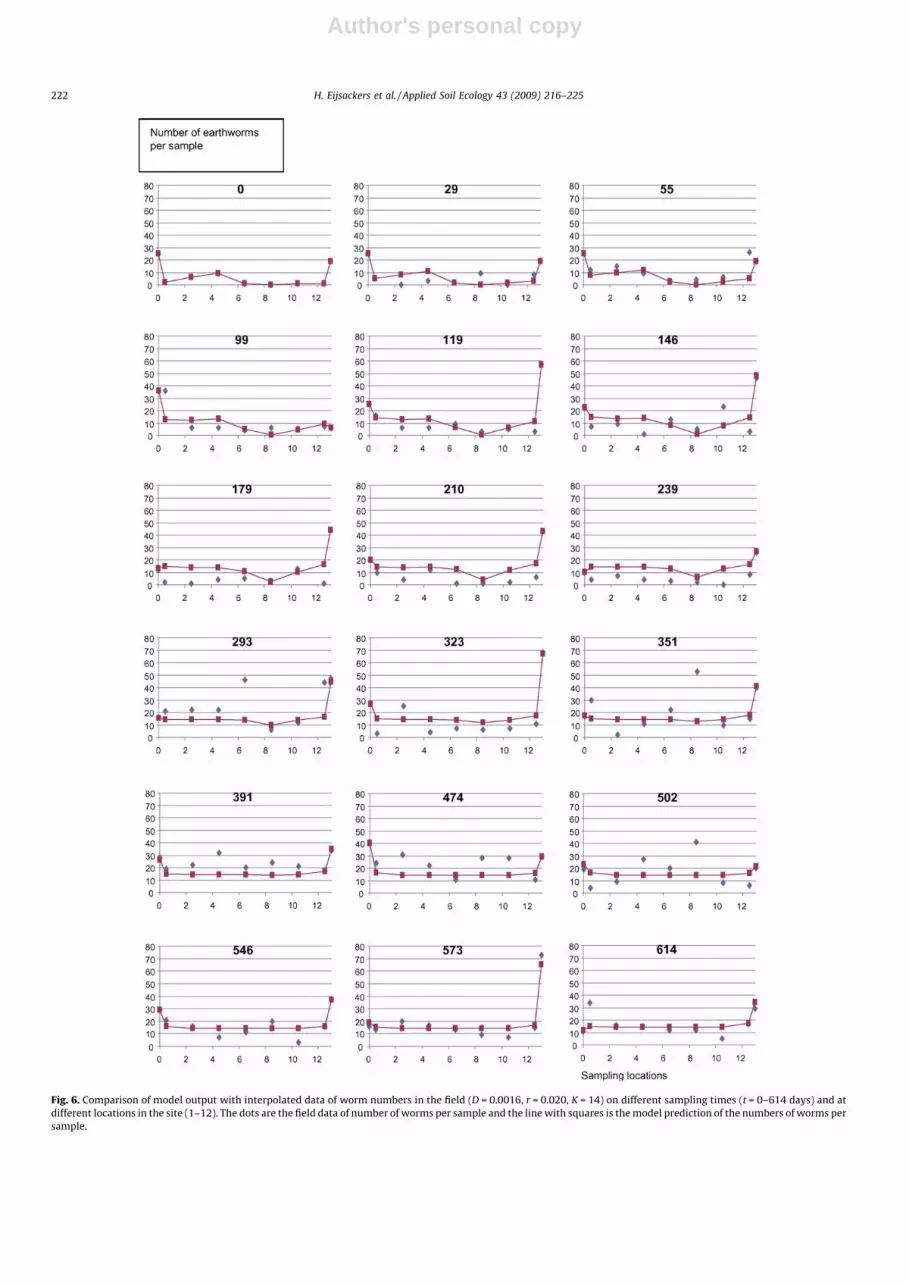
Optimal parameter values equalled D = 0.0016 � 0.0014 m2/d,r = 0.0204 � 0.0056 d�1, K = 14.3 � 1.27 individuals per sample. Thisvalue of diffusion constant D implies that 0.16%, or one in every 625worms, crosses over to a bordering plot a day. By using the Fisher–Kolmogorov equation it is possible to deduce the wave propagation(the speed by which the fore front of the earthworms disperse); this is4.2 � 1.33 m year�1. The resulting model description is showntogether with observations in Fig. 6.
Fig. 6 shows that there is a reasonably good fit between modelpredictions and observations, certainly when we take into accountthat only three parameters were estimated from the data. There aresome points where considerably more worms were observed thanexpected from lateral dispersal.
4. Discussion
4.1. Dispersal of earthworms and colonization of the deposit
Gradual dispersal from a source area through the soil will resultin a diffusive process, which can be described as a random process(see Oude Voshaar and Eijsackers, 1983, Annex to Hoogerkampet al., 1983). This will result in a distribution pattern with a steepslope at the start that with proceeding colonization graduallyflattens out, until after full colonization numbers in source andcolonization area are similar. Such pattern has only been observedin this study for A. caliginosa. The other earthworm speciesdispersed faster, presumably by surface dispersal as described byMather and Christensen (1988, 1992, 1998). They observed surfacedispersal over several meters per night, for all three earthwormeco-types (anecic and endogeic species like L. terrestris, A. longa, A.
caliginosa, A. rosea and A. chlorotica, and more limited for epigeicslike L. rubellus and L. castaneus). Already in the first samplings, afew months after deposition of the sediment, specimens of L.
rubellus, L. castaneus and some very few A. caliginosa were found,and already in the middle part of the deposit at 6.5 m from thebordering dikes. Normal dispersal rates by burrowing in andthrough the soil are 7 to >10 m year�1. Surface dispersal mayresult in a more randomized arrival of individual specimens.
Fig. 5. Mean numbers of different earthworm species per sample (0.0625 m2) in an
experimental dredged sediment deposit in the course of time (months).
H. Eijsackers et al. / Applied Soil Ecology 43 (2009) 216–225 221
Author's personal copy
Fig. 6. Comparison of model output with interpolated data of worm numbers in the field (D = 0.0016, r = 0.020, K = 14) on different sampling times (t = 0–614 days) and at
different locations in the site (1–12). The dots are the field data of number of worms per sample and the line with squares is the model prediction of the numbers of worms per
sample.
H. Eijsackers et al. / Applied Soil Ecology 43 (2009) 216–225222

Author's personal copy
These specimens established and reproduced as shown fromnumbers of cocoons and juveniles and sub-adults, althoughwithin the deposit with a retardation of about a year comparedto the bordering dikes. Establishment and population develop-ment were stimulated by favorable weather conditions (hightemperatures in combination with precipitation resulting inhigh soil moisture content). During field visits we did notobserve indications of stagnant rainwater that may haveresulted in anaerobic soil conditions. The luxuriant vegetationdevelopment illustrated the nutrient richness of the sedimentwhich is not surprising given the usual high nutrient value (bothN and P) of these inland water sediments (Van Puijenbroek andKampf, 1998).
Nevertheless the earthworm numbers never reached thepopulation levels in the surrounding dikes. The highest numberswe observed were just over 80% of those in the dikes. In general themaximum numbers in the dikes at favorable periods reached 40specimens per sample (with extreme numbers of over 60),corresponding with 640 worms per m2 (and over 960 per m2),which are high numbers for grasslands (Curry, 1994), in our caseincluding adult, sub-adult and juvenile worms. Also the highestnumbers within the sediment deposit (80% of the dikes, hence 512respectively 768 worms per m2) are well within this normal range(Edwards, 1983). The chemical quality of the deposit (concentra-tions of pollutants) at the beginning of the sampling five monthsafter deposition did not prevent earthworms from entering thedeposit. The general rate of diffusion was, however, somewhatlow compared to other studies in non-polluted virginal, clayeysoils.
4.2. Modeling dispersal
When we modeled these results on dispersal we found a muchlower dispersal rate of the worm front, a population growth ratethat is comparable to normal conditions and a carrying capacitythat is clearly lower than of the surrounding dikes.
For an initially empty area that is invaded from a singleboundary (here: reference dikes), the estimated diffusion constantimplies a rate of propagation of the population front of 2
ffiffiffiffiffiffirDp
¼4:2 m year�1 (Murray, 2004). This is at the low end of a range ofdispersal front rates of 9–14.5 m year�1 reported in other Dutchstudies on virginal clayey soils that did not contain earthwormsbefore (Hoogerkamp et al., 1983; Stein et al., 1992 and Eijsackers,unpublished data.). Modeling the results assuming a Poissoninstead of a normal distribution (not reported above), resulted in afront dispersal rate of 8.5 m year�1 instead of 4.2 m year�1, this ismore in agreement with rates observed in unpolluted virgin soils.Additionally, the estimated maximum specific population growthrate approximates the value of 0.014 d�1 reported by Klok (2007).The local higher earthworm numbers compared to the modeloutput can be explained by reproduction hotspots from earth-worms that arrived earlier over the surface.
The field situation differs from the model assumptions, as notall plots are equally suitable for worms, and different species ofworms have different habitat preferences and colonization rates asshown above. Moreover, seasonal influences and soil type are notincorporated in the model. The correspondence with estimatedparameters and reported values suggests that the present modelaptly captures the behaviour of the earthworm population duringcolonization of the deposit. From these results it seems thatespecially carrying capacity is negatively affected by the composi-tion of the sediment, while the front dispersal rate and populationgrowth rate are less affected. However, the colonization period wasonly two years, while Hoogerkamp et al. (1983) observed in well-drained clayey soil that build-up to a stabilized population leveltook 7–8 years.
4.3. Sequential appearance of earthworm species
We observed a clear sequence (succession) in appearance ofdifferent earthworm species on a short term of various months tosome years, which to our knowledge never has been reportedbefore. L. rubellus, L. castaneus and A. caliginosa were the firstarrivers with some few months in between, E. tetraeda and A.
chlorotica came as second shift (10 respectively 13 months later),while the anecic earthworm species are still to come; although A.
rosea was already observed incidentally. L. rubellus, L. castaneus
and A. caliginosa are well known as first colonizers from theliterature (see for instance Pizl, 1992, 1999), although it isremarkable that the first two species, which are known as typicalcolonizers of more acid sandy soils, also appeared first here. Theincidental presence of L. castaneus could be due to small pockets oforganic matter in the freshly deposited sediment. After thesepockets had been consumed, the species disappeared to returnonly after new organic matter (from the newly grown vegetation)had become available. The endogeic A. caliginosa burrows throughthe soil, and may take more time to enter the deposit subsoil fromthe dikes. A. chlorotica is mentioned as colonizer too, butespecially in more clayey and moist substrates, E. tetraeda isespecially observed in moist conditions at later stages, and isreported from wetter locations. October 2002 effectively had avery high precipitation level (Fig. 4). As the bottom part of thesediment was still wet, it is reasonable to assume that the top layercould quickly become saturated after heavy rain. A. rosea is arepresentative of the deeper burrowing anecic species appearingwhen a well-developed aerobic deeper topsoil is available,apparently at the end of the two-year experimental period.Another typical representative of the anecic group – L. terrestris –has not been observed yet.
Vandecasteele et al. (2004, 2005) did an inventory of sedimentdeposits between 6 and 70 years old. They found mainly L. rubellus
and L. castaneus as first colonizers and dominating in these deposits.Especially in moister deposits with willows, E. tetraeda was found.They related total earthworm biomass to grain size and time sincedisposal, soil pollution status was of lesser importance. Ma and vanden Ham (personnel communication) inventoried Rotterdam harborsediment deposits approximately 15 years after deposition. Singleindividuals of L. castaneus and D. rubida had dispersed farthest, at110 and 85 m from the source dike, E. tetraeda was found some 60 mfrom the dike, but the majority of the worms was within the first 30–40 m from the dike and consisted only of L. rubellus. Front dispersalrates were low: mean rates <4 m year�1 over a 15 years period,although limited drainage capacity and saturated soil conditionsmay have hampered dispersal.
4.4. Chemical and physical quality of the sediment, and impact of
earthworm activities
With respect to the chemical quality of the sediment in thedeposit, the levels of the different available organic compoundsand heavy metals did not cause serious intoxication. For copperwhich is very toxic for earthworms, the concentrations in thesediment were much lower than the approximate value for fieldeffects of 100 mg kg�1 (established by Ma (2005). Also for otherheavy metals present the threshold value was not surpassed.Harmsen (2004) measured the ecotoxicity of landfarmed sedi-ments with bioassays with L. rubellus. Negative impacts on weightincrease and reproduction were observed in sediment sampledbetween four and nine years after deposition, with total PAH-contents of 30–50 mg kg�1 dry weight, but also with considerableamounts of mineral oil and salt.
Earthworm activity improves soil quality by providing a bettersoil texture and structure by formation of stable aggregates
H. Eijsackers et al. / Applied Soil Ecology 43 (2009) 216–225 223

Author's personal copy
(Marashi and Scullion, 2003; Van Delft et al., 1999) and formationof desiccation cracks in recently inundated farmlands (Kazanciet al., 2001).
At Oostwaardhoeve surface drainage was possible from thestart of the experiment, and dry matter content increased in timeas an effect of settling and ripening. The moisture content observedin the upper layer did approach field capacity. The dry mattercontent of the lower layer (moist, anaerobic, and not ripened)stayed at approximately 40%. There was no clear trend in themeasured organic matter contents, which ranged betweenapproximately 7% and 8%. The sediment layer had shrunken from1.0 to 0.9 m and the aerobic/anaerobic transition zone was found at30–40 cm below the soil surface, this took one year longer at theKreekraksluizen landfarm (Harmsen, 2004).
In the deposit, concentrations of the lighter PAHs (phenan-threne and fluoranthene) disappeared quickly from the sediment,directly after depositions and some few months before anyearthworm had appeared. This reduction could be largely ascribedto sediment drainage and evaporation resulting in an aerobic toplayer, and the development of a vegetation cover. The first plantgrowth started shortly after deposition, covered the total surfaceafter five months) and rooted the upper sediment layer. This mayhave contributed to further aeration of that layer, while rootturnover may stimulate biodegradation of PAHs according to Leighet al. (2002).
In laboratory and field experiments, Eijsackers et al. (2001)observed that introduced earthworms increased degradation ofPAHs, either by improving aeration of the sediments or bystimulating microbial activities. Earthworms do not have thecapability to degrade PAHs by themselves (Stroomberg et al.,2004). Haimi et al. (1992) observed in the laboratory no influenceof earthworms (L. rubellus and A. caliginosa) on chlorophenol(2,3,4,6 TeCP, PeCP and metabolites) concentration in soil. Thefunction of earthworms in degradation of PAHs will be indirect.After dredging, the supply of oxygen is the most limiting conditionfor degradation. Earthworms have a positive effect on the changeof anaerobic sediment into well structured aerobic soil, therebystimulating the aerobic degradation of PAHs. We speculate thatthe role of the earthworms in the degradation of PAHs will be moreprominent in the next phase of slower degradation (Harmsen,2004). Next to optimizing soil structure and aeration, earthwormshave a major impact on the size of soil aggregates. Breaking of soilaggregates will increase the availability of PAHs for degradationby micro-organisms. Already after two years of observation thequality of the sediment was greatly improved. Such fastimprovement of the chemical sediment quality combined withthe fact that no adverse impacts on earthworms were observed,allows for a lower environmental risk assessment classification ofthe sediment and creates possibilities for reuse of the obtainedsoil.
Acknowledgements
P. Goedbloed, Director of the Oostwaardhoeve, and his staff aregratefully acknowledged for their help and support during theproject.
During fieldwork we received much help of various PhD-students at our department. C.A.M. van Gestel and N.M. vanStraalen made valuable comments on the manuscript.
References
Cornelissen, G., Rigterink, H., Ferdinandy, M.M.A., Van Noort, P.C.M., 1998.Rapidly desorbing fractions of PAHs in contaminated sediments as a predictorof the extent of bioremediation. Environmental Science and Technology 32,966–970.
Curry, J.P., 1994. Grassland Invertebrates. Chapman and Hall, London.
Edwards, C.A., 1983. Earthworm ecology in cultivated soils. In: Satchell, J.E. (Ed.),Earthworm Ecology. From Darwin to Vermiculture. Chapman and Hall, London,pp. 123–137.
Eijsackers, H., Lourijsen, N., Mentink, J., 1983. Effects of fly ash on soil fauna. In:Lebrun, Ph., Andre, H.M., de Medts, A., Gregoire-Wibo, C., Wauthy, G. (Eds.),New Trends in Soil Biology. Louvain-la-Neuve, Dieu-Brichart, Belgium, pp. 680–681.
Eijsackers, H., 1996. Natuurbeheer voor en door Milieubeheer. Oratie Vrije Uni-versiteit, Amsterdam, ISBN 90-5383-540-721, 21 pp.
Eijsackers, H., Gestel, C.A.M., Van De Jonge, S., Muijs, B., Slijkerman, D., 2001.Polycyclic aromatic hydrocarbon-polluted dredged peat sediments and earth-worms: a mutual interference. Ecotoxicology 10, 35–50.
Haimi, J., Salminen, J., Huhta, V., Knuutinen, V., Palm, H., 1992. Bioaccumulation oforganochlorine compounds in earthworms. Soil Biology & Biochemistry 24,1699–1703.
Harmsen, J., 2004. Landfarming of polycyclic aromatic hydrocarbons and mineral oilcontaminated sediments. PhD-thesis, Wageningen University, Alterra Scientificcontributions 14, Wageningen, 344 pp.
Hoogerkamp, M., Rogaar, H., Eijsackers, H.J.P., 1983. Effect of earthworms ongrassland on recently reclaimed polder soils in the Netherlands. In: Satchell,J.E. (Ed.), Earthworm Ecology. From Darwin to Vermiculture. Chapman and Hall,London, pp. 85–106.
Jones, C.G., Lawton, J.H., Sachak, M., 1994. Organisms as ecosystem engineers. Oikos69, 373–386.
Kazanci, N., Emre, O., Alcicek, M.C., 2001. Animal burrowing and associated for-mation of large desiccation cracks as factors of rapid restoration of soil cover inflooded farmlands. Environmental Geology 40, 964–967.
Klok, C., 2007. Effects of earthworm density on growth, development, and repro-duction in Lumbricus rubellus (Hoffm.) and possible consequences for theintrinsic rate of population increase. Soil Biology & Biochemistry 39, 2401–2407.
Lavelle, P., Bignell, D., Lepage, M., Wolters, V., Roger, P., Ineson, P., Heal, O.W.,Dhillion, S., 1997. Soil function in a changing world: the role of invertebrateecosystem engineers. European Journal of Soil Biology 33, 159–193.
Leigh, M.B., Fletcher, J.S., Fu, X., Schmitz, F.J., 2002. Root turnover: an importantsource of microbial substrates in rhizosphere remediation of recalcitrant con-taminants. Environmental Science and Technology 36 1779-1583.
Ma, Y., Dickinson, N.M., Wong, M.H., 2002. Toxicity of Pb and Zn mine tailings to theearthworm Pheretima spec. and the effects of burrowing on metal availability.Biology and Fertility of Soils 36, 79–86.
Ma, W.C., 2005. Critical body residues (CBRs) for ecotoxicological soil qualityassessment: copper in earthworms. Soil Biology and Biochemistry 37, 561–568.
Mather, J.G., Christensen, O., 1988. Surface migration of earthworms in agriculturalland. Pedobiologia 32, 399–405.
Mather, J.G., Christensen, O., 1992. Surface migration of earthworms in grassland.Pedobiologia 36, 51–57.
Mather, J.G., Christensen, O., 1998. Earthworm surface migrations in the field:influence of pesticides using benomyl as test chemical. In: Sheppard, S.,Bembridge, J., Holmstrup, M., Posthuma, L. (Eds.), Advances in EarthwormEcotoxicology. Setac-Press, Boca Raton, US, pp. 327–340.
Marashi, A.R-A., Scullion, J., 2003. Earthworm casts or stable aggregates in physi-cally degraded soils. Biology and Fertility of Soils 37, 375–380.
Murray, J., 2004. Biological Waves: Single-Species Models. Mathematical Biology.Springer, New York, US, pp. 437–483.
NEN, 1999. NEN 5771, Soil-Sediment. Determination of the content of polycyclicaromatic hydrocarbons by high pressure liquid chromatography. NetherlandsNormalisation Institute (NEN), Delft (in Dutch).
Oude Voshaar, J.H., Eijsackers, H.J.P., 1983. Estimation of the earthworm populationdensity in Biddinghuizen. Addendum to Hoogerkamp et al. (1983) 104–105.
Pizl, V., 1992. Succession of earthworm populations in abandoned fields. SoilBiology & Biochemistry 24, 1623–1628.
Pizl, V., 1999. Earthworm succession in abandoned fields—a comparison of deduc-tive and sequential approaches to study. Pedobiologia 43, 705–712.
Satchell, J.E., Stone, D.E., 1977. Colonization of pulverised fuel ash sites byearthworms. Publicazione del Centro Pirenacio de Biologica Experimentalis9, 59–74.
Sims, R.W., Gerard, G.M., 1999. Earthworms. Notes for the identification of Britishspecies. Field Studies Council, Shrewsbury, 169 pp.
Springett, J.A., 1972. Distribution of Lumbricid earthworms in New Zealand. SoilBiology & Biochemistry 24, 1377–1381.
Stein, A., Bekker, R.M., Blom, J.H.C., Rogaar, H., 1992. Spatial variability of earthwormpopulations in a permanent polder grassland. Biology and Fertility of Soils 14,260–266.
Stockdill, S.M.J., 1982. Effects of introduced earthworms on the productivity of NewZealand pastures. Pedobiologia 24, 29–35.
Stroomberg, G.J., Zappey, H., Steen, R.J.C.A., Van Gestel, C.A.M., Ariese, F., Velthorst,N.H., Van Straalen, N.M., 2004. PAH biotransformation in terrestrial inverte-brates—a new phase II metabolite in isopods and springtails. ComparativeBiochemistry and Physiology Part C 138, 129–137.
Vandecasteele, B., Samyn, J., Quataert, P., Muys, B., Tack, F.M.G., 2004. Earthwormbiomass as additional information for risk assessment of heavy metal biomag-nification: a case study for dredged sediment-derived soils and polluted flood-plain soils. Environmental Pollution 129, 363–375.
Vandecasteele, B., Vos, B., De Muys, B., Tack, F.M.G., 2005. Rates of forest floordecomposition and soil forming processes as indicators of forest ecosystem
H. Eijsackers et al. / Applied Soil Ecology 43 (2009) 216–225224

Author's personal copy
functioning on a polluted dredged sediment landfill. Soil Biology & Biochem-istry 37, 761–769.
Van Delft, S.P.J., Marinissen, J.C.Y., Didden, W.A.M., 1999. Humus profile degradationas influenced by decreasing earthworm activity. Pedobiologia 43, 561–657.
Van Puijenbroek, P.J.T.M., Kampf, R., 1998. GIS analysis of the effect of diffuse PAHsemissions on the sediment quality in the Hollands Noorderkwartier in theNetherlands using the WABOGIS model. National Institute of Public Health andthe Environment (RIVM), report 715651 011, Bilthoven, The Netherlands (inDutch).
VROM, 2000. Circulaire streefwaarden en interventiewaarden bodemsanering.Ministerie van Volkshuisvesting, Ruimtelijke Ordening en Milieubeheer, Direc-toraat-Generaal Milieubeheer, Den Haag.
Zorn, M.I., Van Gestel, C.A.M., Eijsackers, H., 2005a. The effect of Lumbricus rubellusand Lumbricus terrestris on zinc distribution and availability in artificial soilcolumns. Biology and Fertility of Soils 41, 212–215.
Zorn, M.I., Van Gestel, C.A.M., Eijsackers, H., 2005b. The effect of two endogeicearthworm species on zinc distribution and availability in artificial soil col-umns. Soil Biology & Biochemistry 37, 917–925.
H. Eijsackers et al. / Applied Soil Ecology 43 (2009) 216–225 225


