Embed Size (px)
Citation preview
Malaysian Journal of Analytical Sciences, Vol 25 No 3 (2021): 432 - 445
432
CO2-EFFERVESCENT TABLET-ASSISTED DISPERSIVE LIQUID-LIQUID
MICROEXTRACTION WITH CENTRAL COMPOSITE DESIGN FOR PRE-
CONCENTRATION OF ACETAMINOPHEN DRUG: METHOD
DEVELOPMENT, VALIDATION AND GREEN ASSESSMENT PROFILE
(Tablet Berbuak-CO2 Berbantukan Sebaran Pengekstrakan Mikro Cecair-Cecair dengan Reka
Bentuk Komposit Berpusat untuk Kepekatan Awalan Dadah Acetaminophen: Pembangunan
Kaedah, Validasi dan Profil Penilaian Hijau)
Priya Murugan, Sarveishwhary Rajendran, Saw Hong Loh, Marinah Mohd Ariffin,
Wan Mohd Afiq Wan Mohd Khalik*
Faculty of Science and Marine Environment,
Universiti Malaysia Terengganu, 21030 Kuala Nerus, Malaysia
*Corresponding author: [email protected]
Received: 15 April 2021; Accepted: 2 June 2021; Published: 27 June 2021
Abstract
This study discovered the extraction procedure of acetaminophen from water samples using the effervescent tablet-assisted
dispersive liquid-liquid microextraction (DLLME) method. The effervescent tablet that is composed of sodium dihydrogen
phosphate (proton donor) and sodium carbonate (CO2 source) was formulated using the wet granulation technique. In this study,
high performance liquid chromatography coupled with ultraviolet visible detection (HPLC-UV) was used for qualitative and
quantitative analysis of the targeted analyte. The chromatographic separation was conducted in less than 6 min (Rt 5.10 min)
using a non-polar C18 column and an isocratic elution (methanol: water of 40: 60 (v/v)) at a controlled flowrate of 1 mL min-1.
Optimum wavelength was set at 264 nm. Main variables that influenced the extraction efficiency namely the amount of extraction
solvent (X1), the number of tablets consumed (X2) and the effect of extraction temperature (X3) were tested during optimization
work. Operation setting for extraction procedure was optimized using a 23 full factorial central composite design, CCD
(STATISTICA Version 10). The values of optimum extraction condition were set as 215 µL of extraction solvent, 5 pieces of
tablets and 47 °C extraction temperature. Under optimal condition, a good linearity with determination coefficient R2 = 0.995
was obtained. Extraction recoveries at spiked concentrations (500 ng mL-1 and 100 ng mL-1) were recorded ranging from 83% to
94.1%. The detection and quantification limits of the proposed method were calculated at 8.62 ng mL-1 and 28 ng mL-1,
respectively. In terms of the precision method, the relative standard deviation was recorded ˂ 5%. Real analysis samples were
performed, which fortified with commercial drugs dissolved in 80 mL of deionized water. The concentration levels were
determined at 5.60 mg L-1 (sample A) and 5.47 mg L-1 (sample B) respectively.
Keywords: analgesic drug, CO2-effervescence, central composite design, liquid phase microextraction
Murugan et al: CO2-EFFERVESCENT TABLET-ASSISTED DISPERSIVE LIQUID-LIQUID
MICROEXTRACTION WITH CENTRAL COMPOSITE DESIGN FOR PRE-
CONCENTRATION OF ACETAMINOPHEN DRUG: METHOD DEVELOPMENT,
VALIDATION AND GREEN ASSESSMENT PROFILE
433
Abstrak
Kajian ini meneroka prosedur pengekstrakan bagi acetaminophen dari sampel air mengunakan kaedah tablet berbuak berbantukan
sebaran pengekstrakan mikro cecair-cecair (DLLME). Tablet berbuak terdiri dari sodium dihidrogen fosfat (penderma proton)
dan sodium karbonat (sumber CO2) di formulasi mengunakan teknik penggranulan basah. Dalam kajian ini, kromatografi cecair
berprestasi tinggi gabungan pengesan ultralembayung nampak (HPLC-UV) telah digunapakai bagi analisis kuantitatif dan
kualitatif terhadap analit sasaran. Pemisahan kromatografi berlaku dalam masa kurang 6 min (Rt 5.10 min) mengunakan turus tak
berkutub C18 dan elusi isokratik (metanol: air 40:60 (v/v)) pada kawalan aliran 1 mL min-1. Panjang gelombang optimum
ditetapkan pada 264 nm. Pemboleh ubah utama yang mempengaruhi keberkesanan pengekstrakan seperti jumlah pelarut
pengekstrak (X1), bilangan tablet yang digunakan (X2) dan kesan perubahan suhu (X3) diuji semasa kerja pengoptimuman.
Tetapan operasi bagi prosedur pengekstrakan bagi pengoptimuman mengunakan reka bentuk komposit berpusat, CCD
(STATISTICA versi 10). Nilai yang diperolehi bagi keadaan optimum ialah pelarut pengekstrakan 215 µL, 5 biji tablet dan
tetapan suhu 47 °C. Kelinearan yang baik dengan pekali regresi R2 = 0.995 telah diperolehi pada keadaan optimum. Perolehan
semula pengekstrakan pada kepekatan yang dipaku (500 ng mL-1 dan 100 ng mL-1) telah merekodkan nilai julat 83%-94.1%. Had
pengesanan dan pengkuantitian bagi kaedah yang dibangunkan dihitung masing-masing pada 8.62 ng mL-1 dan 28 ng mL-1. Bagi
aspek kejituan kaedah, sisihan piawai relatif telah direkodkan < 5%. Analisis sampel sebenar telah dijalakan dengan penambahan
dadah komersial yang dilarut dalam 80 mL air ternyah ion. Kepekatan telah ditentukan masing-masing pada 5.60 mg L-1 (sampel
A) dan 5.47 mg L-1 (sampel B).
Kata kunci: dadah analgesik, CO2-berbuak, reka bentuk komposit berpusat, pengekstrakan mikro fasa cecair
Introduction
Effervescent reaction is one of the disperser-solvent-free
techniques in DLLME. This novel work was first
introduced by Lasarte-Aragones et al. [1] for the
extraction of herbicides in water. Once the tablet is
mixed with an aqueous solution, a simple reaction
between the proton donor and carbon source (i.e. sodium
carbonate) induces the formation of gas microbubbles
(CO2). The effervescence occurs from the bottom to top
of the container and the extractant solvent is uniformly
distributed [2]. This method accelerates the dispersion
of the extraction solvent without additional energy.
Large contact surface area between the target analyte
and the extractant promotes mass transfer, which can
vastly improve extraction efficiency [3]. Indeed, it
reduces the partition coefficients of the hydrophobic
analytes into the extraction solvent [4]. Other
advantages include rapid, effective, reproducible,
eliminating multi-stage operation, and low cost [2-6].
The effervescent tablets are easy to formulate because
the proton donor, and carbon source are all solid
substances that can be simply mixed and compressed
using a tablet machine. The extraction solvent functions
as a binder when it solidifies at low temperature.
Microextraction method uses effervescence reaction
generated by a tablet for preconcentration of drugs
include antibiotics [7, 8], nonsteroidal anti-
inflammatories [9], steroid hormones [10], and
stimulants [11]. Selection of extraction solvents varies
from supramolecular to switchable hydrophilicity
solvents. Supramolecular solvent is relatively cheap,
low freezing points, and less volatile which has recently
been used in microextraction especially for the
effervescence method [12]. Meanwhile, switchable
hydrophilicity solvents offer tunable properties like
miscible liquid or biphasic mixture with water and easily
ionized by adjustment the pH values [13, 14]. The
extraction solvent can be efficiently dispersed into the
aqueous sample owing to the use of effervescent tablets,
which improves the effective mass transfer of target
analytes, and reflects through high enrichment factors
[15]. The extraction process needs a shorter time to
complete and the utilization of extractant is always
minimal.
Acetaminophen (N-acetyl-p-aminophenol; C8H9NO2) is
a mild analgesic that is effectively used to treat
headaches, minor aches or pains [16]. This drug is
considered as a first-line therapy due to its relatively low
Malaysian Journal of Analytical Sciences, Vol 25 No 3 (2021): 432 - 445
434
adverse side effects, efficacy and low price [17]. It has
been reported that human urine excretes 58-68% of
acetaminophen, a considerable low concentration of
residue but frequently detected in the municipal
wastewater systems, ranging between ng L−1 to µg L−1
[18, 19]. Development of the microextraction method
for the preconcentration of acetaminophen drugs from
waters includes solid phase (i.e., fiber coating, in-tube,
molecularly imprinted polymer) or liquid phase (i.e.,
hollow fiber, dispersive) [20-24]. In the present work,
dispersive liquid-liquid microextraction with the
acceleration of dispersion mode by effervescent tablets
was aimed for the extraction of acetaminophen
(analgesic drug) in the water samples. To construct the
experimental work, a full factorial central composite
design was applied to optimize the microextraction
procedure. Method validation and green profile
assessment were also carried out.
Materials and Methods
Reagents and materials
Acetaminophen standard was purchased from Sigma-
Aldrich (St. Louis, USA) with purity of 98%. HPLC-
grade acetonitrile and methanol were purchased from
Merck (Darmstadt, Germany). Analytical-grade sodium
bicarbonate, sodium hydrogen phosphate, glycerin, 1-
dodecanol were acquired from Merck. Due to its high
enrichment factors and low price, 1-dodecanol was
chosen as the extractant. Stock standard solution was
initially prepared in methanol with a concentration of 5
µg mL−1 and stored in the dark at 4 °C. The working
standard solutions of the acetaminophen drug were
prepared by appropriate dilution of the stock standard
solution with methanol. The purified deionized water
was obtained from a Millipore Milli-Q reference water
purification system that has a resistivity of 18.2 MΩ.cm
at 25 °C (Bedford, MA, USA). An analytical balance
210G/D.1MG HC-A Smith Model HC-A 210 was used
for weighing. A stainless-steel tablet machine (Henan,
China) was used to prepare the flat face radius edge
effervescent tablets.
Instrumental and analytical conditions
HPLC–UV analysis was performed using a Shimadzu
HPLC system (Kyoto, Japan) equipped with an
autosampler (SIL-20A HT), vacuum degasser (DGU-
20A 5R), system controller (LC-20AT), quaternary
pump (LC-10ATVP), oven (CTO-10AS VP), and series
multiple wavelength UV detector (SPD-20A). An
Apollo C18 column (250 mm x 4.6 mm, 5 µm Hichrom
Limited) was used for the separation. The mobile phase
was a mixture of methanol-water (40:60 v/v) at a flow
rate of 1 mL min−1, and the column temperature was held
at 30 °C. The UV detection wavelength was set at 264
nm. The injection volume was set at 10 μL per analysis.
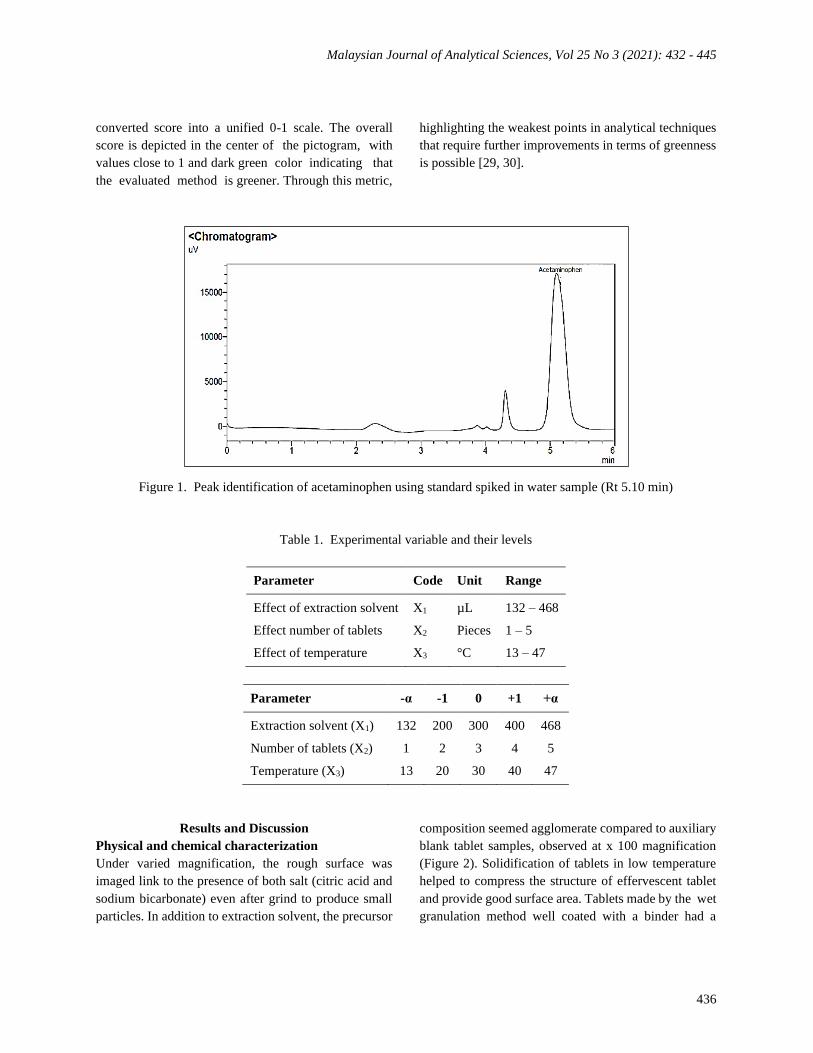
Peak identification was observed in less than 6 min
(Figure 1). Shimadzu Class VP version 6.41 SP1
software was used to control the HPLC–UV system and
to perform the data analysis.
Preparation of the effervescent tablet
In this study, the effervescent tablets were produced
using the wet granulation method. Sodium bicarbonate
and sodium hydrogen phosphate salt (effervescence
precursors), glycerin (binder) and 1-dodecanol
(extraction solvent) were formulated in a tablet form.
The effervescent precursors were dried in an oven at 60
°C overnight before mixing the materials. Sodium
bicarbonate (1.0 g) and sodium hydrogen phosphate (1.0
g) salt were weighed into a glass mortar, and sufficiently
ground to achieve homogeneous mixing. Then, a few
drops of glycerin and a desired volume of 1-dodecanol
(X1) were added into the mixture. The homogenous
mixture was transferred into a tablet mold with the
dimension of 2.5 cm × 3.7 cm and subsequently
compressed for 60 s to produce an effervescent tablet
using a tablet press hammer. The effervescent tablets
(dimension 2.5 cm (width) × 3.7 cm (height)) were
stored in a 30 mL plastic bottle with a screw cap at 4°C
to maintain the tablets’ shape.
Physical and chemical analysis
The morphology of effervescent tablet was observed
using a Jeol JSM-6360LV (Tokyo, Japan) scanning
electron microscope (SEM). The scanning electron
microscope operated at an accelerating voltage of 10 kV
with a probe current of ≈ 1 pA - 1 µA having a resolution
of 3.0 nm. Prior to examination, the effervescent tablet
was prepared by mounting approximately 0.1 to 1.0 g of
powder onto a 10 mm × 10 mm SEM specimen
aluminum stub via double-sided adhesive tape to permit
a quick mounting of samples on a stub. The effervescent
Murugan et al: CO2-EFFERVESCENT TABLET-ASSISTED DISPERSIVE LIQUID-LIQUID
MICROEXTRACTION WITH CENTRAL COMPOSITE DESIGN FOR PRE-
CONCENTRATION OF ACETAMINOPHEN DRUG: METHOD DEVELOPMENT,
VALIDATION AND GREEN ASSESSMENT PROFILE
435
tablet was made electrically conductive by coating it
with a thin layer of gold about 30 µm thickness using an
auto fine coater (Jeol JFC-1600, Japan). The samples
were coated for 60 s at a beam current of 30 mA.
Attenuated total reflectance Fourier transform infrared
(ATR-FTIR) Shimadzu IRTracer-100, (Kyoto, Japan)
spectra equipped with a temperature controlled
DLATGS detector were applied to study the occurrence
of different functional groups in effervescent tablets.
The spectra were recorded in transmittance mode at 40
scans and a resolution of 4 cm-1 over the wavenumber
region ranging between 4000 cm-1 to 400 cm-1.
Microextraction procedure
Eighty mL of water sample was transferred in a 150 mL
glass volumetric flask prior spiked with 1 mL of
working standard solution. Then, the flask was placed in
a water bath and the water temperature was adjusted to
the desired setting (X3) as listed in Table 1. Once the
temperature was achieved, the effervescent tablet was
released into water samples and the ETA-DLLME was
implemented. Number of the effervescent tablet (X2)
used was subject to design matrix. The effervescent
tablets disintegrated in the aqueous solution when
microbubbles started to form due to the releasing of CO2
gas. The reaction was considered complete once no
microbubbles were released from the tablet. Next, the
top organic phase containing analyte was collected using
a 1 mL syringe and placed into a 3 mL microcentrifuge
tube. The extracted solution was centrifuged for 1 min
at 3000 rpm. Then, the organic phase, 1-dodecanol was
mixed with 1 mL of HPLC grade methanol prior injected
into a HPLC-UV system.
Central composite design
Three variables, namely volume of extraction solvent
(X1), number of effervescent tablets (X2), and extraction
temperature (X3), were subjected to optimization in this
study (Table 1). A 23 full factorial design of CCD was
generated with STATISTICA version 10 (TIBCO
software, Germany). For optimization of extraction
conditions, peak area was used in the data processing.
Profiling the desirability of responses involved
specifying DF for each dependent variable, by assigning
predicted values a scale ranging from 0.0 to 1.0 [25].
Three-dimensional graphs were used to evaluate the
interactive effect of two variables on the response.
Method validation
The analytical figure of merits is investigated in terms
of linearity, detection limit, recovery, and repeatability.
A calibration curve was obtained by a series of 6
standard solutions ranging from 0.01 to 0.50 µg mL-1
spiked into water samples. Detection and quantification
limits were calculated using the linear regression
method. The lowest concentration spiked was 0.01 µg
mL-1, and triplicate analysis was performed. The
precision was evaluated through the repeatability (intra-
day) and (inter-day) assay of the method with water
samples spiked with acetaminophen. Both assays were
calculated as %RSD with respect to the measurements
made in triplicate (n=3). Extraction recovery was
calculated by the following mathematical expression in
equation 1:
ER = EF x Vorg
Vaq x 100% (1)
where VOrg, and Vaq are the volume of acetaminophen in
organic and aqueous phases, respectively. EF is
calculated value from ratio between concentration of
acetaminophen in organic phase and in aqueous phase,
respectively.
Green assessment profile
The green profile of the proposed method was tested
subject to analytical eco-scale and AGREE tools.
Analytical eco-scale is a semi-quantitative tool, in which
the calculation is based on maximum score of 100.
Penalty points were subtracted from a base 100 for non-
green aspects, which were linked to four parameters,
namely amount of reagent used, hazardousness, energy
consumption, and waste production. Eco-scale score
was classified as ideal (100), excellent (> 75),
acceptable (50-75) and inadequate (< 50), respectively
[26-28]. AGREE: Analytical Greenness Calculator v.
0.5 beta (Universidade de Vigo, Gdańsk University
of Technology) downloaded from
https://mostwiedzy.pl/ en/wojciech-wojnowski,174235-
1/AGREE. The evaluation metrics were extracted from
the 12 principles of green analytical chemistry and
Malaysian Journal of Analytical Sciences, Vol 25 No 3 (2021): 432 - 445
436
converted score into a unified 0-1 scale. The overall
score is depicted in the center of the pictogram, with
values close to 1 and dark green color indicating that
the evaluated method is greener. Through this metric,
highlighting the weakest points in analytical techniques
that require further improvements in terms of greenness
is possible [29, 30].
Figure 1. Peak identification of acetaminophen using standard spiked in water sample (Rt 5.10 min)
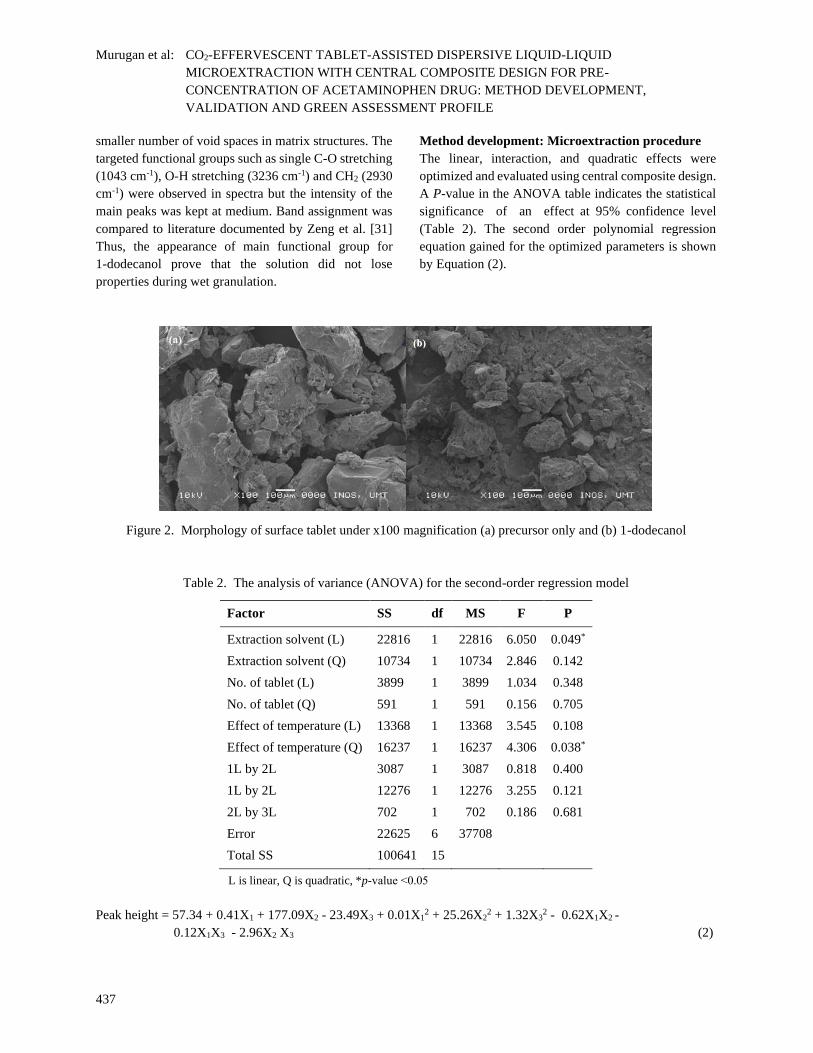
Table 1. Experimental variable and their levels
Parameter Code Unit Range
Effect of extraction solvent X1 µL 132 – 468
Effect number of tablets X2 Pieces 1 – 5
Effect of temperature X3 °C 13 – 47
Parameter -α -1 0 +1 +α
Extraction solvent (X1) 132 200 300 400 468
Number of tablets (X2) 1 2 3 4 5
Temperature (X3) 13 20 30 40 47
Results and Discussion
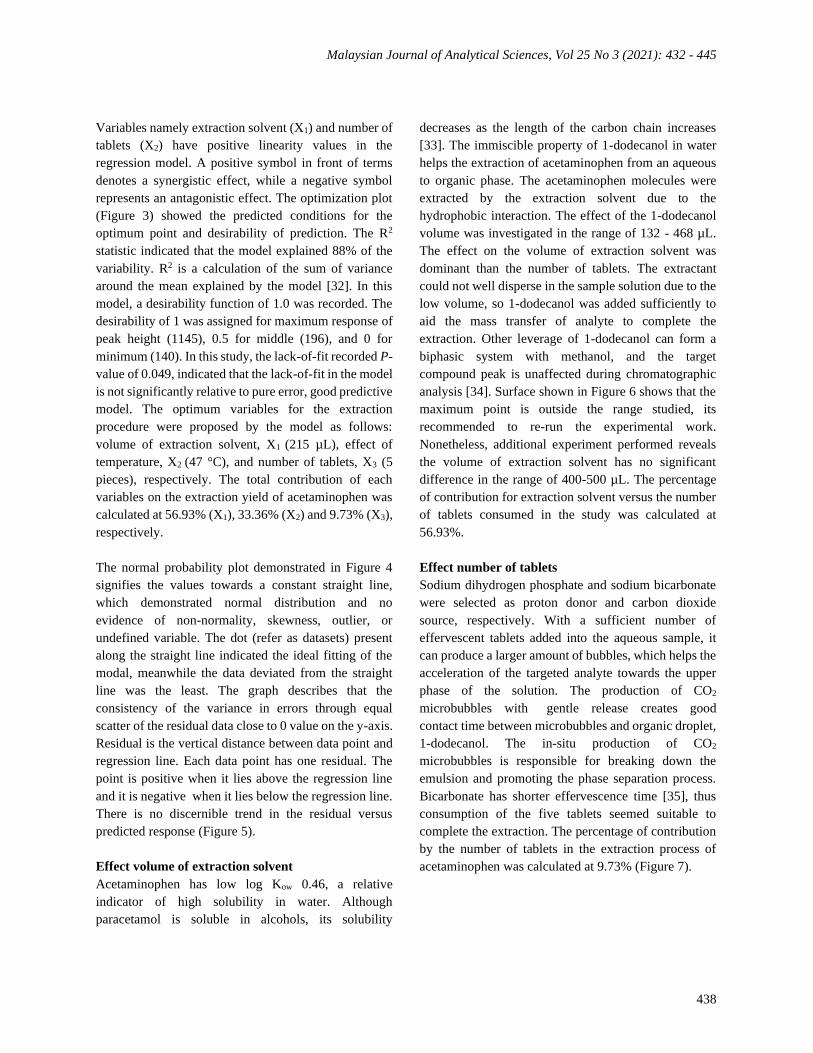
Physical and chemical characterization
Under varied magnification, the rough surface was
imaged link to the presence of both salt (citric acid and
sodium bicarbonate) even after grind to produce small
particles. In addition to extraction solvent, the precursor
composition seemed agglomerate compared to auxiliary
blank tablet samples, observed at x 100 magnification
(Figure 2). Solidification of tablets in low temperature
helped to compress the structure of effervescent tablet
and provide good surface area. Tablets made by the wet
granulation method well coated with a binder had a
Murugan et al: CO2-EFFERVESCENT TABLET-ASSISTED DISPERSIVE LIQUID-LIQUID
MICROEXTRACTION WITH CENTRAL COMPOSITE DESIGN FOR PRE-
CONCENTRATION OF ACETAMINOPHEN DRUG: METHOD DEVELOPMENT,
VALIDATION AND GREEN ASSESSMENT PROFILE
437
smaller number of void spaces in matrix structures. The
targeted functional groups such as single C-O stretching
(1043 cm-1), O-H stretching (3236 cm-1) and CH2 (2930
cm-1) were observed in spectra but the intensity of the
main peaks was kept at medium. Band assignment was
compared to literature documented by Zeng et al. [31]
Thus, the appearance of main functional group for
1-dodecanol prove that the solution did not lose
properties during wet granulation.
Method development: Microextraction procedure
The linear, interaction, and quadratic effects were
optimized and evaluated using central composite design.
A P-value in the ANOVA table indicates the statistical
significance of an effect at 95% confidence level
(Table 2). The second order polynomial regression
equation gained for the optimized parameters is shown
by Equation (2).
Figure 2. Morphology of surface tablet under x100 magnification (a) precursor only and (b) 1-dodecanol
Table 2. The analysis of variance (ANOVA) for the second-order regression model
Factor SS df MS F P
Extraction solvent (L) 22816 1 22816 6.050 0.049*
Extraction solvent (Q) 10734 1 10734 2.846 0.142
No. of tablet (L) 3899 1 3899 1.034 0.348
No. of tablet (Q) 591 1 591 0.156 0.705
Effect of temperature (L) 13368 1 13368 3.545 0.108
Effect of temperature (Q) 16237 1 16237 4.306 0.038*
1L by 2L 3087 1 3087 0.818 0.400
1L by 2L 12276 1 12276 3.255 0.121
2L by 3L 702 1 702 0.186 0.681
Error 22625 6 37708
Total SS 100641 15
L is linear, Q is quadratic, *p-value ˂0.05
Peak height = 57.34 + 0.41X1 + 177.09X2 - 23.49X3 + 0.01X12 + 25.26X2
2 + 1.32X32 - 0.62X1X2 -
0.12X1X3 - 2.96X2 X3 (2)
Malaysian Journal of Analytical Sciences, Vol 25 No 3 (2021): 432 - 445
438
Variables namely extraction solvent (X1) and number of
tablets (X2) have positive linearity values in the
regression model. A positive symbol in front of terms
denotes a synergistic effect, while a negative symbol
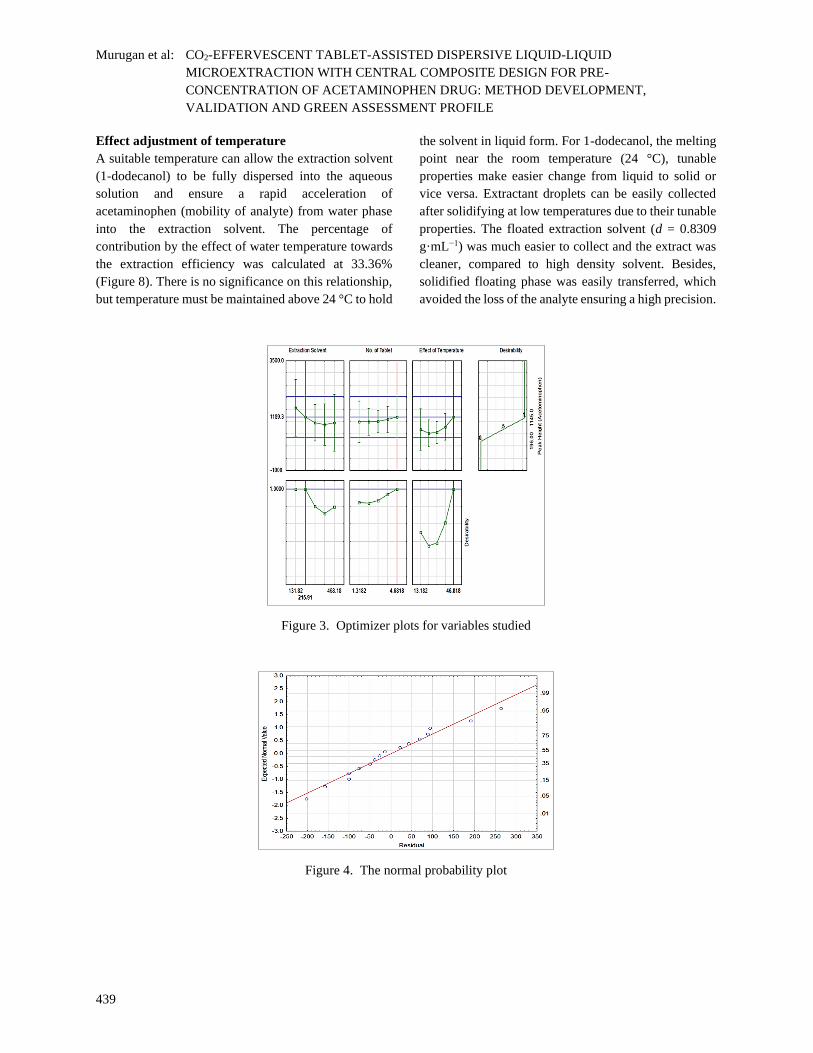
represents an antagonistic effect. The optimization plot
(Figure 3) showed the predicted conditions for the
optimum point and desirability of prediction. The R2
statistic indicated that the model explained 88% of the
variability. R2 is a calculation of the sum of variance
around the mean explained by the model [32]. In this
model, a desirability function of 1.0 was recorded. The
desirability of 1 was assigned for maximum response of
peak height (1145), 0.5 for middle (196), and 0 for
minimum (140). In this study, the lack-of-fit recorded P-
value of 0.049, indicated that the lack-of-fit in the model
is not significantly relative to pure error, good predictive
model. The optimum variables for the extraction
procedure were proposed by the model as follows:
volume of extraction solvent, X1 (215 µL), effect of
temperature, X2 (47 °C), and number of tablets, X3 (5
pieces), respectively. The total contribution of each
variables on the extraction yield of acetaminophen was
calculated at 56.93% (X1), 33.36% (X2) and 9.73% (X3),
respectively.
The normal probability plot demonstrated in Figure 4
signifies the values towards a constant straight line,
which demonstrated normal distribution and no
evidence of non-normality, skewness, outlier, or
undefined variable. The dot (refer as datasets) present
along the straight line indicated the ideal fitting of the
modal, meanwhile the data deviated from the straight
line was the least. The graph describes that the
consistency of the variance in errors through equal
scatter of the residual data close to 0 value on the y-axis.
Residual is the vertical distance between data point and
regression line. Each data point has one residual. The
point is positive when it lies above the regression line
and it is negative when it lies below the regression line.
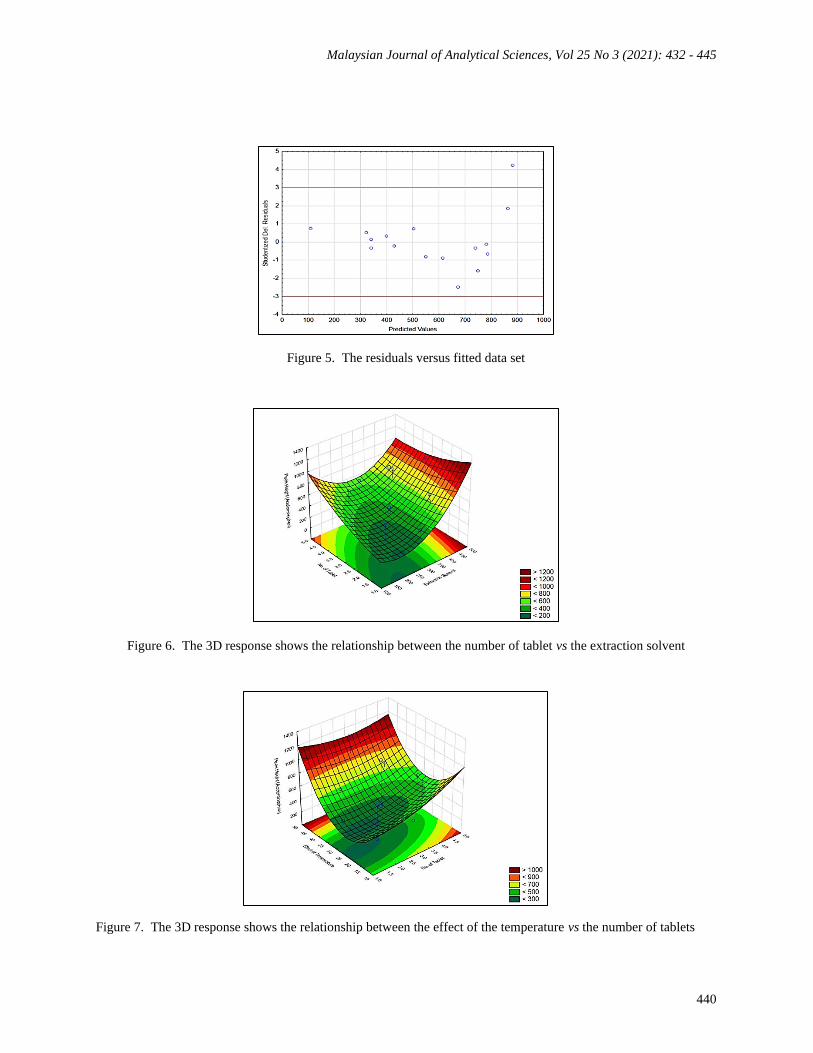
There is no discernible trend in the residual versus
predicted response (Figure 5).
Effect volume of extraction solvent
Acetaminophen has low log Kow 0.46, a relative
indicator of high solubility in water. Although
paracetamol is soluble in alcohols, its solubility
decreases as the length of the carbon chain increases
[33]. The immiscible property of 1-dodecanol in water
helps the extraction of acetaminophen from an aqueous
to organic phase. The acetaminophen molecules were
extracted by the extraction solvent due to the
hydrophobic interaction. The effect of the 1-dodecanol
volume was investigated in the range of 132 - 468 µL.
The effect on the volume of extraction solvent was
dominant than the number of tablets. The extractant
could not well disperse in the sample solution due to the
low volume, so 1-dodecanol was added sufficiently to
aid the mass transfer of analyte to complete the
extraction. Other leverage of 1-dodecanol can form a
biphasic system with methanol, and the target
compound peak is unaffected during chromatographic
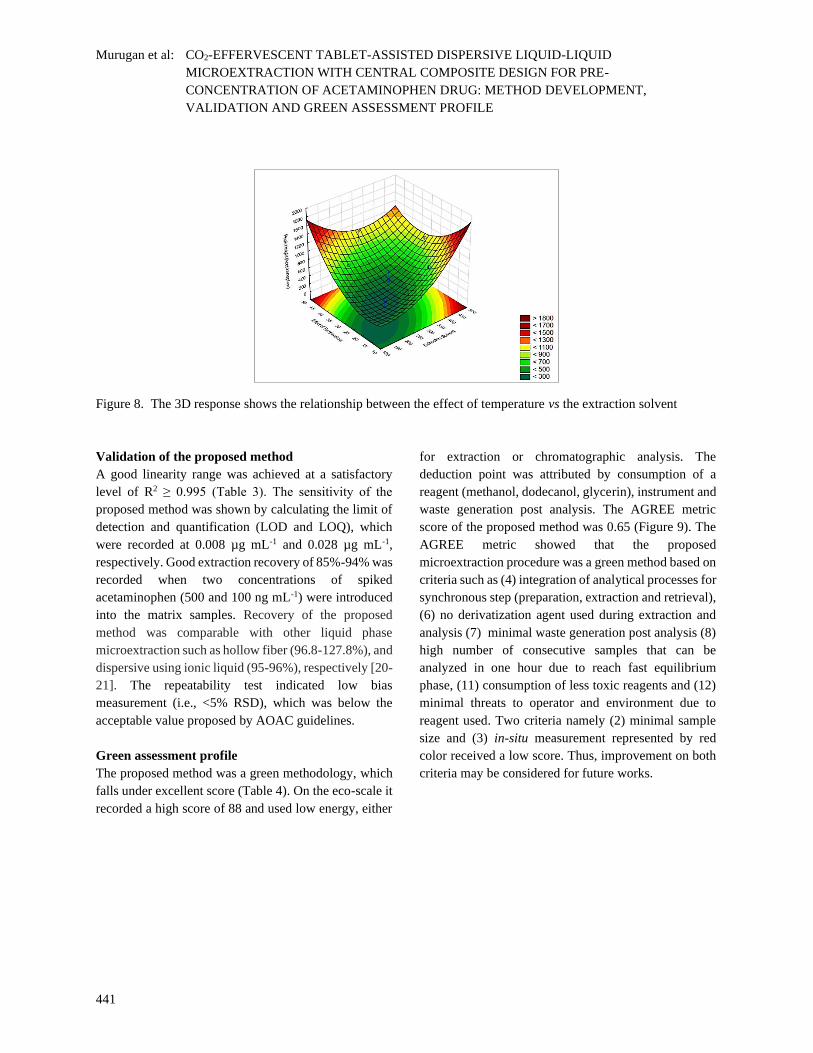
analysis [34]. Surface shown in Figure 6 shows that the
maximum point is outside the range studied, its
recommended to re-run the experimental work.
Nonetheless, additional experiment performed reveals
the volume of extraction solvent has no significant
difference in the range of 400-500 µL. The percentage
of contribution for extraction solvent versus the number
of tablets consumed in the study was calculated at
56.93%.
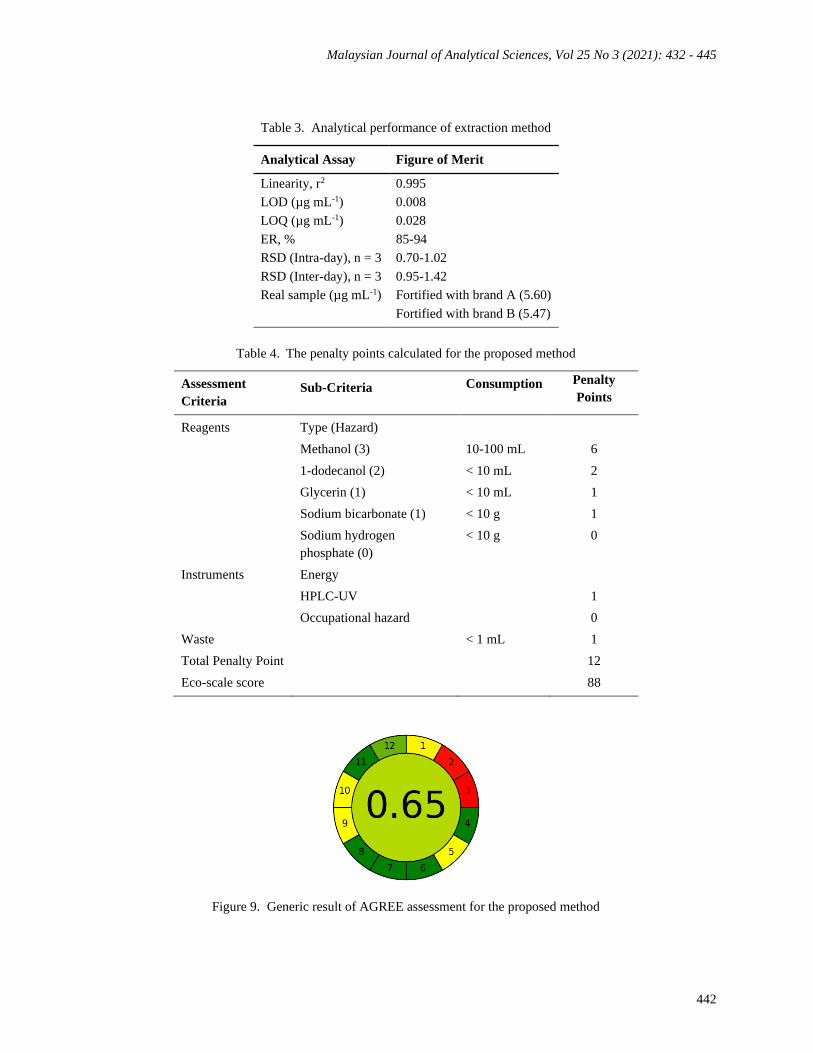
Effect number of tablets
Sodium dihydrogen phosphate and sodium bicarbonate
were selected as proton donor and carbon dioxide
source, respectively. With a sufficient number of
effervescent tablets added into the aqueous sample, it
can produce a larger amount of bubbles, which helps the
acceleration of the targeted analyte towards the upper
phase of the solution. The production of CO2
microbubbles with gentle release creates good
contact time between microbubbles and organic droplet,
1-dodecanol. The in-situ production of CO2
microbubbles is responsible for breaking down the
emulsion and promoting the phase separation process.
Bicarbonate has shorter effervescence time [35], thus
consumption of the five tablets seemed suitable to
complete the extraction. The percentage of contribution
by the number of tablets in the extraction process of
acetaminophen was calculated at 9.73% (Figure 7).
Murugan et al: CO2-EFFERVESCENT TABLET-ASSISTED DISPERSIVE LIQUID-LIQUID
MICROEXTRACTION WITH CENTRAL COMPOSITE DESIGN FOR PRE-
CONCENTRATION OF ACETAMINOPHEN DRUG: METHOD DEVELOPMENT,
VALIDATION AND GREEN ASSESSMENT PROFILE
439
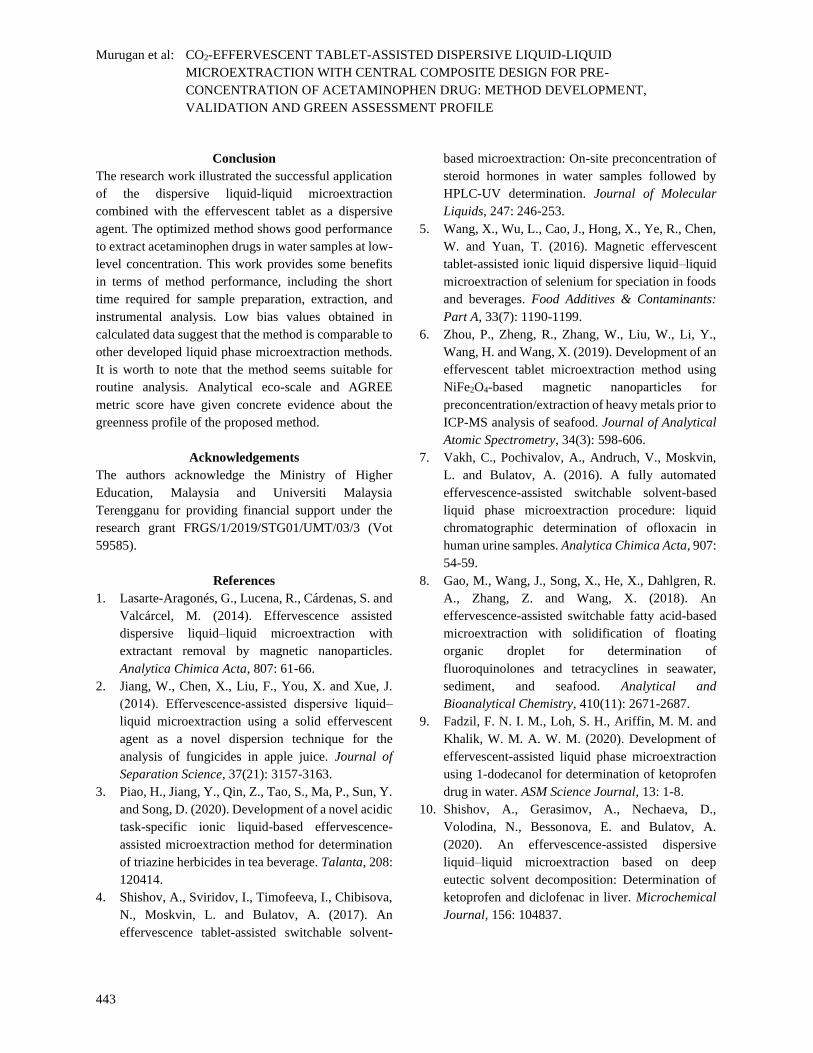
Effect adjustment of temperature
A suitable temperature can allow the extraction solvent
(1-dodecanol) to be fully dispersed into the aqueous
solution and ensure a rapid acceleration of
acetaminophen (mobility of analyte) from water phase
into the extraction solvent. The percentage of
contribution by the effect of water temperature towards
the extraction efficiency was calculated at 33.36%
(Figure 8). There is no significance on this relationship,
but temperature must be maintained above 24 °C to hold
the solvent in liquid form. For 1-dodecanol, the melting
point near the room temperature (24 °C), tunable
properties make easier change from liquid to solid or
vice versa. Extractant droplets can be easily collected
after solidifying at low temperatures due to their tunable
properties. The floated extraction solvent (d = 0.8309
g·mL−1) was much easier to collect and the extract was
cleaner, compared to high density solvent. Besides,
solidified floating phase was easily transferred, which
avoided the loss of the analyte ensuring a high precision.
Figure 3. Optimizer plots for variables studied
Figure 4. The normal probability plot
Malaysian Journal of Analytical Sciences, Vol 25 No 3 (2021): 432 - 445
440
Figure 5. The residuals versus fitted data set
Figure 6. The 3D response shows the relationship between the number of tablet vs the extraction solvent
Figure 7. The 3D response shows the relationship between the effect of the temperature vs the number of tablets
Murugan et al: CO2-EFFERVESCENT TABLET-ASSISTED DISPERSIVE LIQUID-LIQUID
MICROEXTRACTION WITH CENTRAL COMPOSITE DESIGN FOR PRE-
CONCENTRATION OF ACETAMINOPHEN DRUG: METHOD DEVELOPMENT,
VALIDATION AND GREEN ASSESSMENT PROFILE
441
Figure 8. The 3D response shows the relationship between the effect of temperature vs the extraction solvent
Validation of the proposed method
A good linearity range was achieved at a satisfactory
level of R2 ≥ 0.995 (Table 3). The sensitivity of the
proposed method was shown by calculating the limit of
detection and quantification (LOD and LOQ), which
were recorded at 0.008 µg mL-1 and 0.028 µg mL-1,
respectively. Good extraction recovery of 85%-94% was
recorded when two concentrations of spiked
acetaminophen (500 and 100 ng mL-1) were introduced
into the matrix samples. Recovery of the proposed
method was comparable with other liquid phase
microextraction such as hollow fiber (96.8-127.8%), and
dispersive using ionic liquid (95-96%), respectively [20-
21]. The repeatability test indicated low bias
measurement (i.e., <5% RSD), which was below the
acceptable value proposed by AOAC guidelines.
Green assessment profile
The proposed method was a green methodology, which
falls under excellent score (Table 4). On the eco-scale it
recorded a high score of 88 and used low energy, either
for extraction or chromatographic analysis. The
deduction point was attributed by consumption of a
reagent (methanol, dodecanol, glycerin), instrument and
waste generation post analysis. The AGREE metric
score of the proposed method was 0.65 (Figure 9). The
AGREE metric showed that the proposed
microextraction procedure was a green method based on
criteria such as (4) integration of analytical processes for
synchronous step (preparation, extraction and retrieval),
(6) no derivatization agent used during extraction and
analysis (7) minimal waste generation post analysis (8)
high number of consecutive samples that can be
analyzed in one hour due to reach fast equilibrium
phase, (11) consumption of less toxic reagents and (12)
minimal threats to operator and environment due to
reagent used. Two criteria namely (2) minimal sample
size and (3) in-situ measurement represented by red
color received a low score. Thus, improvement on both
criteria may be considered for future works.
Malaysian Journal of Analytical Sciences, Vol 25 No 3 (2021): 432 - 445
442
Table 3. Analytical performance of extraction method
Analytical Assay Figure of Merit
Linearity, r2 0.995
LOD (µg mL-1) 0.008
LOQ (µg mL-1) 0.028
ER, % 85-94
RSD (Intra-day), n = 3 0.70-1.02
RSD (Inter-day), n = 3 0.95-1.42
Real sample (µg mL-1) Fortified with brand A (5.60)
Fortified with brand B (5.47)
Table 4. The penalty points calculated for the proposed method
Assessment
Criteria Sub-Criteria Consumption Penalty
Points
Reagents Type (Hazard)
Methanol (3) 10-100 mL 6
1-dodecanol (2) < 10 mL 2
Glycerin (1) < 10 mL 1
Sodium bicarbonate (1) < 10 g 1
Sodium hydrogen
phosphate (0)
< 10 g 0
Instruments Energy
HPLC-UV 1
Occupational hazard 0
Waste < 1 mL 1
Total Penalty Point 12
Eco-scale score 88
Figure 9. Generic result of AGREE assessment for the proposed method
Murugan et al: CO2-EFFERVESCENT TABLET-ASSISTED DISPERSIVE LIQUID-LIQUID
MICROEXTRACTION WITH CENTRAL COMPOSITE DESIGN FOR PRE-
CONCENTRATION OF ACETAMINOPHEN DRUG: METHOD DEVELOPMENT,
VALIDATION AND GREEN ASSESSMENT PROFILE
443
Conclusion
The research work illustrated the successful application
of the dispersive liquid-liquid microextraction
combined with the effervescent tablet as a dispersive
agent. The optimized method shows good performance
to extract acetaminophen drugs in water samples at low-
level concentration. This work provides some benefits
in terms of method performance, including the short
time required for sample preparation, extraction, and
instrumental analysis. Low bias values obtained in
calculated data suggest that the method is comparable to
other developed liquid phase microextraction methods.
It is worth to note that the method seems suitable for
routine analysis. Analytical eco-scale and AGREE
metric score have given concrete evidence about the
greenness profile of the proposed method.
Acknowledgements
The authors acknowledge the Ministry of Higher
Education, Malaysia and Universiti Malaysia
Terengganu for providing financial support under the
research grant FRGS/1/2019/STG01/UMT/03/3 (Vot
59585).
References
1. Lasarte-Aragonés, G., Lucena, R., Cárdenas, S. and
Valcárcel, M. (2014). Effervescence assisted
dispersive liquid–liquid microextraction with
extractant removal by magnetic nanoparticles.
Analytica Chimica Acta, 807: 61-66.
2. Jiang, W., Chen, X., Liu, F., You, X. and Xue, J.
(2014). Effervescence‐assisted dispersive liquid–
liquid microextraction using a solid effervescent
agent as a novel dispersion technique for the
analysis of fungicides in apple juice. Journal of
Separation Science, 37(21): 3157-3163.
3. Piao, H., Jiang, Y., Qin, Z., Tao, S., Ma, P., Sun, Y.
and Song, D. (2020). Development of a novel acidic
task-specific ionic liquid-based effervescence-
assisted microextraction method for determination
of triazine herbicides in tea beverage. Talanta, 208:
120414.
4. Shishov, A., Sviridov, I., Timofeeva, I., Chibisova,
N., Moskvin, L. and Bulatov, A. (2017). An
effervescence tablet-assisted switchable solvent-
based microextraction: On-site preconcentration of
steroid hormones in water samples followed by
HPLC-UV determination. Journal of Molecular
Liquids, 247: 246-253.
5. Wang, X., Wu, L., Cao, J., Hong, X., Ye, R., Chen,
W. and Yuan, T. (2016). Magnetic effervescent
tablet-assisted ionic liquid dispersive liquid–liquid
microextraction of selenium for speciation in foods
and beverages. Food Additives & Contaminants:
Part A, 33(7): 1190-1199.
6. Zhou, P., Zheng, R., Zhang, W., Liu, W., Li, Y.,
Wang, H. and Wang, X. (2019). Development of an
effervescent tablet microextraction method using
NiFe2O4-based magnetic nanoparticles for
preconcentration/extraction of heavy metals prior to
ICP-MS analysis of seafood. Journal of Analytical
Atomic Spectrometry, 34(3): 598-606.
7. Vakh, C., Pochivalov, A., Andruch, V., Moskvin,
L. and Bulatov, A. (2016). A fully automated
effervescence-assisted switchable solvent-based
liquid phase microextraction procedure: liquid
chromatographic determination of ofloxacin in
human urine samples. Analytica Chimica Acta, 907:
54-59.
8. Gao, M., Wang, J., Song, X., He, X., Dahlgren, R.
A., Zhang, Z. and Wang, X. (2018). An
effervescence-assisted switchable fatty acid-based
microextraction with solidification of floating
organic droplet for determination of
fluoroquinolones and tetracyclines in seawater,
sediment, and seafood. Analytical and
Bioanalytical Chemistry, 410(11): 2671-2687.
9. Fadzil, F. N. I. M., Loh, S. H., Ariffin, M. M. and
Khalik, W. M. A. W. M. (2020). Development of
effervescent-assisted liquid phase microextraction
using 1-dodecanol for determination of ketoprofen
drug in water. ASM Science Journal, 13: 1-8.
10. Shishov, A., Gerasimov, A., Nechaeva, D.,
Volodina, N., Bessonova, E. and Bulatov, A.
(2020). An effervescence-assisted dispersive
liquid–liquid microextraction based on deep
eutectic solvent decomposition: Determination of
ketoprofen and diclofenac in liver. Microchemical
Journal, 156: 104837.
Malaysian Journal of Analytical Sciences, Vol 25 No 3 (2021): 432 - 445
444
11. Tazulazhar, N., Loh, S. H., Ariffin, M. M. and
Khalik, W. M. A. W. M. (2021). Optimization of
effervescent tablet-assisted dispersive liquid-liquid
microextraction with central composite design for
preconcentration of stimulant drug. Sains
Malaysiana, 50(1): 109-121.
12. Liu, X., Shen, Z., Wang, P., Liu, C., Zhou, Z. and
Liu, D. (2014). Effervescence assisted on-site liquid
phase microextraction for the determination of five
triazine herbicides in water. Journal of
Chromatography A, 1371: 58-64.
13. Moghadam, A. G., Rajabi, M., Hemmati, M. and
Asghari, A. (2017). Development of effervescence-
assisted liquid phase microextraction based on fatty
acid for determination of silver and cobalt ions
using micro-sampling flame atomic absorption
spectrometry. Journal of Molecular Liquids, 242:
1176-1183.
14. Jing, X., Cheng, X., Zhao, W., Wang, H. and Wang,
X. (2020). Magnetic effervescence tablet-assisted
switchable hydrophilicity solvent-based liquid
phase microextraction of triazine herbicides in
water samples. Journal of Molecular Liquids, 306:
112934.
15. Medinskaia, K., Vakh, C., Aseeva, D., Andruch, V.,
Moskvin, L. and Bulatov, A. (2016). A fully
automated effervescence assisted dispersive liquid–
liquid microextraction based on a stepwise injection
system. Determination of antipyrine in saliva
samples. Analytica Chimica Acta, 902: 129-134.
16. Villaroel, E., Silva-Agredo, J., Petrier, C., Taborda,
G. and Torres-Palma, R. A. (2014). Ultrasonic
degradation of acetaminophen in water: effect of
sonochemical parameters and water matrix.
Ultrasonics Sonochemistry, 21(5): 1763-1769.
17. Montaseri, H. and Forbes, P. B. (2018). Analytical
techniques for the determination of acetaminophen:
A review. TrAC Trends in Analytical Chemistry,
108: 122-134.
18. Lima, D. R., Hosseini-Bandegharaei, A., Thue, P.
S., Lima, E. C., de Albuquerque, Y. R., dos Reis, G.
S., and Tran, H. N. (2019). Efficient acetaminophen
removal from water and hospital effluents treatment
by activated carbons derived from Brazil nutshells.
Colloids and Surfaces A: Physicochemical and
Engineering Aspects, 583: 123966.
19. Mashayekh-Salehi, A., Moussavi, G. and
Yaghmaeian, K. (2017). Preparation,
characterization and catalytic activity of a novel
mesoporous nanocrystalline MgO nanoparticle for
ozonation of acetaminophen as an emerging water
contaminant. Chemical Engineering Journal, 310:
157-169.
20. Salvatierra-stamp, V., Muñiz-Valencia, R., Jurado,
J. M. and Ceballos-Magaña, S. G. (2018). Hollow
fiber liquid phase microextraction combined with
liquid chromatography-tandem mass spectrometry
for the analysis of emerging contaminants in water
samples. Microchemical Journal, 140: 87-95.
21. Yao, C., Li, T., Twu, P., Pitner, W. R. and
Anderson, J. L. (2011). Selective extraction of
emerging contaminants from water samples by
dispersive liquid–liquid microextraction using
functionalized ionic liquids. Journal of
Chromatography A, 1218(12): 1556-1566.
22. Yu, H., Merib, J. and Anderson, J. L. (2016). Faster
dispersive liquid-liquid microextraction methods
using magnetic ionic liquids as solvents. Journal of
Chromatography A, 1463: 11-19.
23. Moeder, M., Schrader, S., Winkler, M. and Popp, P.
(2000). Solid-phase microextraction–gas
chromatography–mass spectrometry of biologically
active substances in water samples. Journal of
Chromatography A, 873(1): 95-106.
24. Moliner-Martínez, Y., Prima-Garcia, H., Ribera,
A., Coronado, E. and Campíns-Falcó, P. (2012).
Magnetic in-tube solid phase microextraction.
Analytical Chemistry, 84(16): 7233-7240.
25. Asati, A., Satyanarayana, G. N. V. and Patel, D. K.
(2017). Comparison of two microextraction
methods based on solidification of floating organic
droplet for the determination of multiclass analytes
in river water samples by liquid chromatography
tandem mass spectrometry using central composite
design. Journal of Chromatography A, 1513: 157-
171.
26. Gałuszka, A., Migaszewski, Z. M., Konieczka, P.
and Namieśnik, J. (2012). Analytical eco-scale for
assessing the greenness of analytical procedures.
TrAC Trends in Analytical Chemistry, 37: 61-72.
Murugan et al: CO2-EFFERVESCENT TABLET-ASSISTED DISPERSIVE LIQUID-LIQUID
MICROEXTRACTION WITH CENTRAL COMPOSITE DESIGN FOR PRE-
CONCENTRATION OF ACETAMINOPHEN DRUG: METHOD DEVELOPMENT,
VALIDATION AND GREEN ASSESSMENT PROFILE
445
27. Mohamed, H. M. and Lamie, N. T. (2016).
Analytical eco-scale for assessing the greenness of
a developed RP-HPLC method used for
simultaneous analysis of combined
antihypertensive medications. Journal of AOAC
International, 99(5): 1260-1265.
28. Tobiszewski, M., Marć, M., Gałuszka, A. and
Namieśnik, J. (2015). Green chemistry metrics with
special reference to green analytical chemistry.
Molecules, 20(6): 10928-10946.
29. Pena-Pereira, F., Wojnowski, W. and Tobiszewski,
M. (2020). AGREE—Analytical GREEnness
Metric Approach and Software. Analytical
Chemistry, 92(14): 10076-10082.
30. Gamal, M., Naguib, I. A., Panda, D. S. and
Abdallah, F. F. (2021). Comparative study of four
greenness assessment tools for selection of greenest
analytical method for assay of hyoscine N-butyl
bromide. Analytical Methods, 13(3): 369-380.
31. Zeng, H., Qiao, K., Li, X., Yang, M., Zhang, S., Lu,
R. and Zhou, W. (2017). Dispersive liquid–liquid
microextraction based on the solidification of deep
eutectic solvent for the determination of
benzoylureas in environmental water samples.
Journal of Separation Science, 40(23): 4563-4570.
32. Khodadoust, S. and Ghaedi, M. (2013).
Optimization of dispersive liquid–liquid
microextraction with central composite design for
preconcentration of chlordiazepoxide drug and its
determination by HPLC‐UV. Journal of Separation
Science, 36(11): 1734-1742.
33. Granberg, R. A. and Rasmuson, Å. C. (1999).
Solubility of paracetamol in pure solvents. Journal
of Chemical & Engineering Data, 44(6): 1391-
1395.
34. Ojeda, C. B. and Rojas, F. S. (2011). Separation and
preconcentration by dispersive liquid–liquid
microextraction procedure: recent applications.
Chromatographia, 74(9-10): 651.
35. Jafarinejad, M., Ezoddin, M., Lamei, N., Abdi, K.,
Babhadi‐Ashar, N., Pirooznia, N. and Akhgari, M.
(2020). Effervescent tablet‐assisted demulsified
dispersive liquid–liquid microextraction based on
solidification of floating organic droplet for
determination of methadone in water and biological
samples prior to GC‐flame ionization and GC‐MS.
Journal of Separation Science, 43(16): 3266-3274.


