Embed Size (px)
Citation preview
UN
CO
RR
ECTE
D P
RO
OF
160
A program of ongoing testing for the assessment ofany athlete is essential to optimize training programdesign, reduce injury or illness risk, increase careerlongevity, and maximize sports performance. Theadage “you can’t manage what you can’t measure”applies equally to athletes as it does to business. Asecond important function of testing is to providefeedback to the athlete, which increases motiva-tion as well as the athlete’s understanding of theirresponses and adaptations to different trainingmanipulations.
Optimizing training program design and the window of adaptation
Almost all sports require a range of physical per-formance qualities. These include components ofstrength, power, speed, agility, endurance, cardio-vascular fitness, flexibility, and body composition.While there are other qualities such as skill and psychologic state, our discussion in this chapter isconfined to these physical capacities.
For any given sport, and in some case particularpositions in team sports, the athlete will have anenhanced chance of success if their body composi-tion, neuromuscular and cardiorespiratory systemsare specifically tuned for the tasks required. It iswhen the underlying “machinery” is correctly builtand tuned that the skill, strategy, and psychologic
abilities of the athlete can be best brought to bearand the greatest chance of success realized.
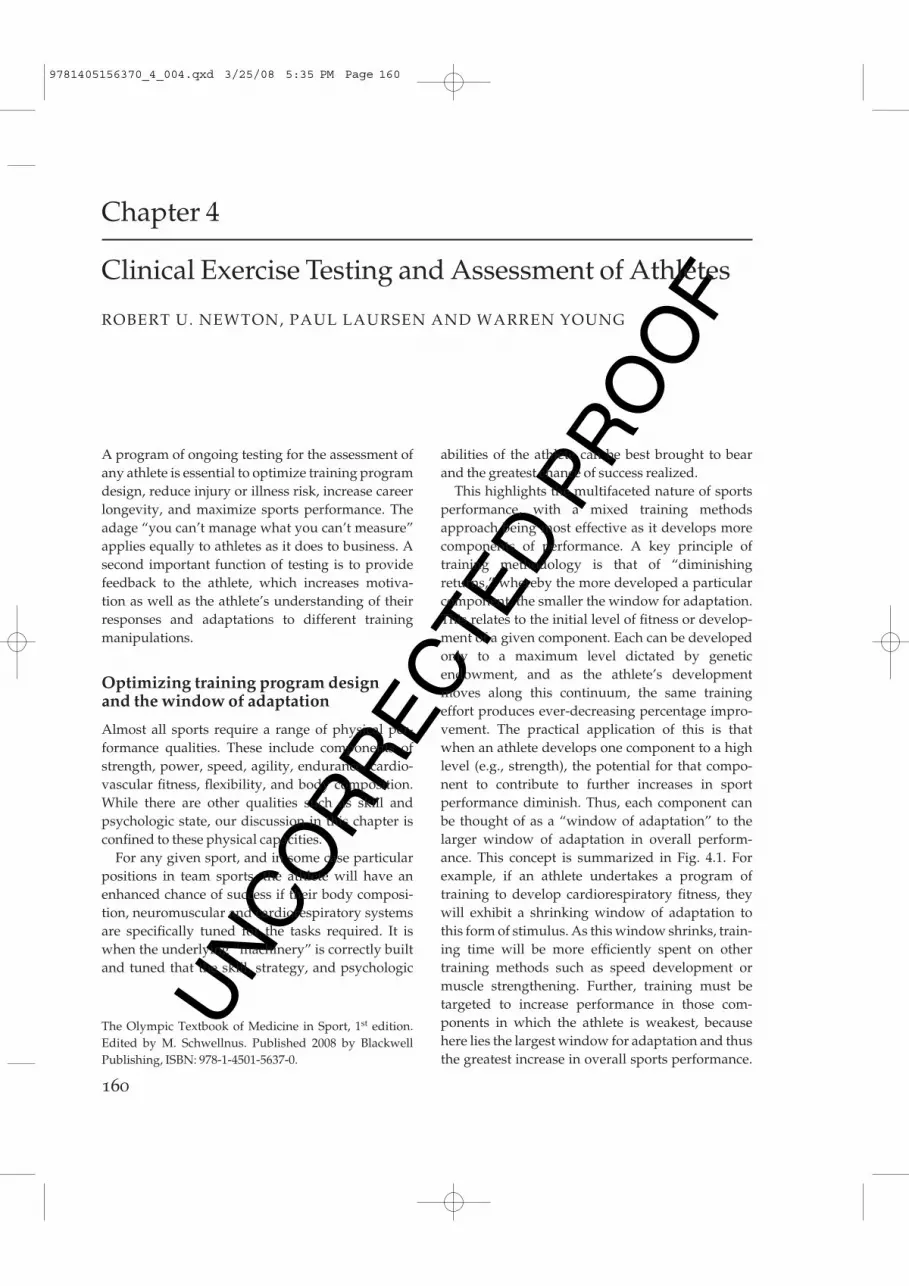
This highlights the multifaceted nature of sportsperformance, with a mixed training methodsapproach being most effective as it develops morecomponents of performance. A key principle oftraining methodology is that of “diminishingreturns,” whereby the more developed a particularcomponent, the smaller the window for adaptation.This relates to the initial level of fitness or develop-ment of a given component. Each can be developedonly to a maximum level dictated by genetic endowment, and as the athlete’s developmentmoves along this continuum, the same trainingeffort produces ever-decreasing percentage impro-vement. The practical application of this is thatwhen an athlete develops one component to a highlevel (e.g., strength), the potential for that compo-nent to contribute to further increases in sport performance diminish. Thus, each component canbe thought of as a “window of adaptation” to thelarger window of adaptation in overall perform-ance. This concept is summarized in Fig. 4.1. Forexample, if an athlete undertakes a program oftraining to develop cardiorespiratory fitness, theywill exhibit a shrinking window of adaptation tothis form of stimulus. As this window shrinks, train-ing time will be more efficiently spent on othertraining methods such as speed development ormuscle strengthening. Further, training must be targeted to increase performance in those com-ponents in which the athlete is weakest, because here lies the largest window for adaptation and thusthe greatest increase in overall sports performance.
Chapter 4
Clinical Exercise Testing and Assessment of Athletes
ROBERT U. NEWTON, PAUL LAURSEN AND WARREN YOUNG
The Olympic Textbook of Medicine in Sport, 1st edition.Edited by M. Schwellnus. Published 2008 by BlackwellPublishing, ISBN: 978-1-4501-5637-0.
9781405156370_4_004.qxd 3/25/08 5:35 PM Page 160
UN
CO
RR
ECTE
D P
RO
OF
clinical exercise testing 161
The athlete will be limited in potential by the weakest link.
General principles of testing athletes
Principles of measurement are described in manyreference tests (Thomas & Nelson 1990) and theinterested reader is advised to make themselvesfamiliar with the key issues prior to developing andimplementing a program of athlete assessment.Here we summarize the key aspects.
Validity
To have any meaning the test must: (i) actually measure what it is purported to measure; and (ii) bereliable (see p. 000). An example is the use of bio-impedence to measure body fat mass in the athlete.The technique, described later, actually estimatestotal body water based on electrical impedance tocurrent flow and then makes inferences about fatcontent. While a useful technique in some instances,
changes in hydration state for example can impactmarkedly on the result and yet actual fat content hasnot changed.
Reliability
For any test result to be meaningful there must be sufficient reliability so that differences betweenathletes and changes in a given athlete can be effect-ively detected above the noise of the measure-ment. How much a given value changes withrepeated measurements because of variation inequipment or methods or effects of environment istermed the reliability. The measure is usually ex-pressed as a coefficient of variation or expressed asintra class correlation (ICC) coefficients. An in-depthdiscussion of the statistics of reliability and methods for determination is beyond the scope of this chapter and the interested reader is referred to the excellent resources provided by Hopkins(http://www.sportsci.org/resource/stats/).
Specificity
Tests should be selected based on their ability to assess key performance components accurately.It is pointless to assess aerobic capacity in sprintrunners because the physiologic capacity beingmeasured has no relevance to performance in thetarget event. Time is valuable to the athlete andcoach, and testing can be seen as an imposition if it isnot efficient and directly assessing the key aspectsthat require monitoring and feedback.
Scheduling
Testing must be performed when the athlete is“fresh” and their performance capacity is maxim-ized. Generally, this requires 48 h abstinence fromhigh-intensity training or any competition. This isnot always feasible but is desirable to get the bestpossible scores. In some instances it is the goal oftesting to assess levels of fatigue, overtraining, andinjury so this principle does not apply. For example,athletes are now routinely tested in the days follow-ing a competitive event to assess recovery stra-tegies and readiness to compete in the subsequent
Explosivepower
Maximalstrength
Aerobiccapacity
Repeatsprintability
Agility
Sprintaccelerationand speed
Window of athlete performancedevelopment
Fig. 4.1 Schematic diagram representing the componentscontributing to athlete physical performance for aparticular sport (e.g., football). Each component cancontribute to the overall window for performanceadaptation. The greater the development of a singlecomponent, the smaller that component’s window ofadaptation and thus potential to develop overall sportingperformance. Thus, it may be more efficient to design thetraining program to target those components with thegreatest windows of adaptation (i.e., the components in which the athlete is weak).
!
9781405156370_4_004.qxd 3/25/08 5:35 PM Page 161
UN
CO
RR
ECTE
D P
RO
OF
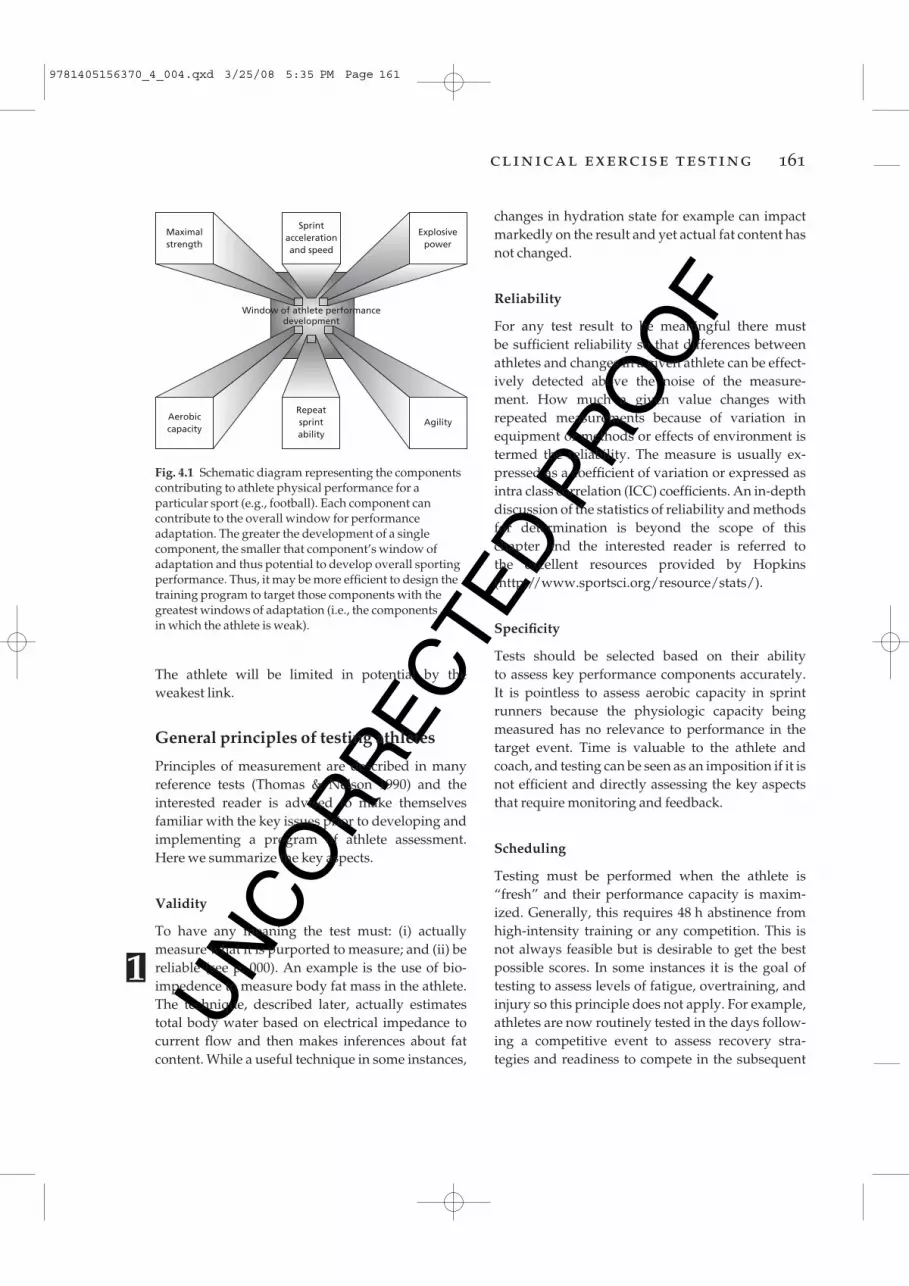
manipulation of training variables can be coordin-ated to progress the athlete toward performancegoals. The test–retest cycle (Fig. 4.2), with frequentadjustments to the training program, is a key featureof the performance diagnosis and prescription process. Various aspects of this process are nowaddressed.
Determination of key performance characteristics
The first step towards achieving the desired per-formance goal is to determine the key performancecharacteristics of the target activity. For example, ifthe task is to maximize take-off velocity in the highjump, then those strength and power qualities thatinfluence take-off velocity need to be determined.This can be achieved through several processes suchas biomechanical evaluation, analysis of high-levelathletes, and pre–post testing. The best approachmay be to combine all three to gain the greatestunderstanding of the target performance.1 Biomechanical evaluation leads to an under-standing of the forces exerted by the jump leg, min-imum knee angle, and contact times that areobserved during the high jump. Speed, range ofmotion, and contraction type of the other body seg-ments should also be determined. 2 Analysis of high-level athletes in the sport canprovide information on strength and power qual-ities. It can be assumed, although with caution, that if an athlete is performing well in the sport then the athlete possesses the necessary levels of thesequalities.
competition. Planning of the test schedule must be given careful consideration as test order and rest periods can have large effect on results. Forexample, a maximum strength test can be per-formed before an endurance test on the same daybut not in the opposite order. Any tests that arefatiguing with persistent effects must be scheduledtowards the end of the testing session. In many casesthe program will have to be be split over severaldays to avoid prior tests impacting later ones.
Performance qualities
Certain measures represent specific or independ-ent qualities of neuromuscular performance andthese qualities can be assessed and trained inde-pendently. Performance diagnosis is the process ofdetermining an athlete’s level of development ineach of these distinct qualities. By targeting specificperformance qualities with prescribed training,greater efficiency of training effort can be achievedresulting in enhanced athlete performance. Formost sports and athletic events, there are strength,speed-strength, and strength endurance dimensions.Because elite athletes tend to be genetically pre-disposed to their sport and train to enhance theirabilities, specificity of these qualities is inherent to a particular sport or athletic event. In other words,each sport or event requires a certain level of theseperformance qualities to underpin a competitiveadvantage.
Performance diagnosis and prescription
The implementation of performance diagnosis andprescription should flow according to a logicalsequence (Fig. 4.2). The initial step requires a deter-mination of the important qualities in the targetactivity (i.e., a performance needs analysis). A testbattery is then established to assess these qualities inan efficient, valid, and reliable manner. A trainingprogram is developed based on the performancediagnosis, which will improve performance in thetarget sport. The final aspect is perhaps the mostimportant as isolated testing has little utility. It is only with frequent, ongoing assessment that acomplete profile of the athlete is compiled and
162 chapter 4
Coach, athlete,scientist –
education &information
Frequentassessment
Performance needs analysis
Initial testing
Training program design
Implementation of program
Fig. 4.2 Test–retest cycle for performance diagnosis.
9781405156370_4_004.qxd 3/25/08 5:35 PM Page 162
UN
CO
RR
ECTE
D P
RO
OF
clinical exercise testing 163
3 A third method is to test athletes before and after phases involving certain training emphases. If they respond with large improvements in the targeted strength and power quality, then it couldbe that they are deficient in that quality and that thismay require further attention. Certainly, if a com-ponent is improving rapidly it may be prudent tomaintain the emphasis until some plateau occurs.However, there are caveats to this approach. First, it is wasteful to continue to seek improvement if the quality is not of significance to the task, or theathlete has an adequate level such that other qual-ities may be more limiting. Second, it may be betterfor the sake of training variety to take note of thelarge response and return to that quality at a laterphase of training.
Assessment of strength and power
An athlete’s strength and power profile has manycomponents and the most effective training shouldinvolve a “mixed methods” approach (Newton &Kraemer 1994). The degree of adaptation and thusincrease in power and strength that can be realizedfrom training is determined to a large extent by how well the particular strength/power quality isalready developed in the individual. However,there are biologic limits to how much the body canadapt. Thus, the adaptive capacity can be thought ofas being a continuum from novice to elite athlete.For novices, the window of adaptation is quite largeand starting a training program targeting that quality will elicit large and rapid increases in per-formance (Newton & Kraemer 1994). However, asthe athletes improve and move towards their geneticpotential the “window” shrinks and further gainsbecome harder to achieve. Several aspects need tobe considered here. First, a beginner will increase in strength and power with even the most basicresistance training program. They will then plateauand gains will become harder to produce. At thispoint more innovative programming is required.Second, after several years of resistance training the athlete will adapt very quickly and with limitedperformance gains to a given resistance trainingprogram and so variation in programming becomesmuch more important.
Equipment for measuring power performancequalities
force plate
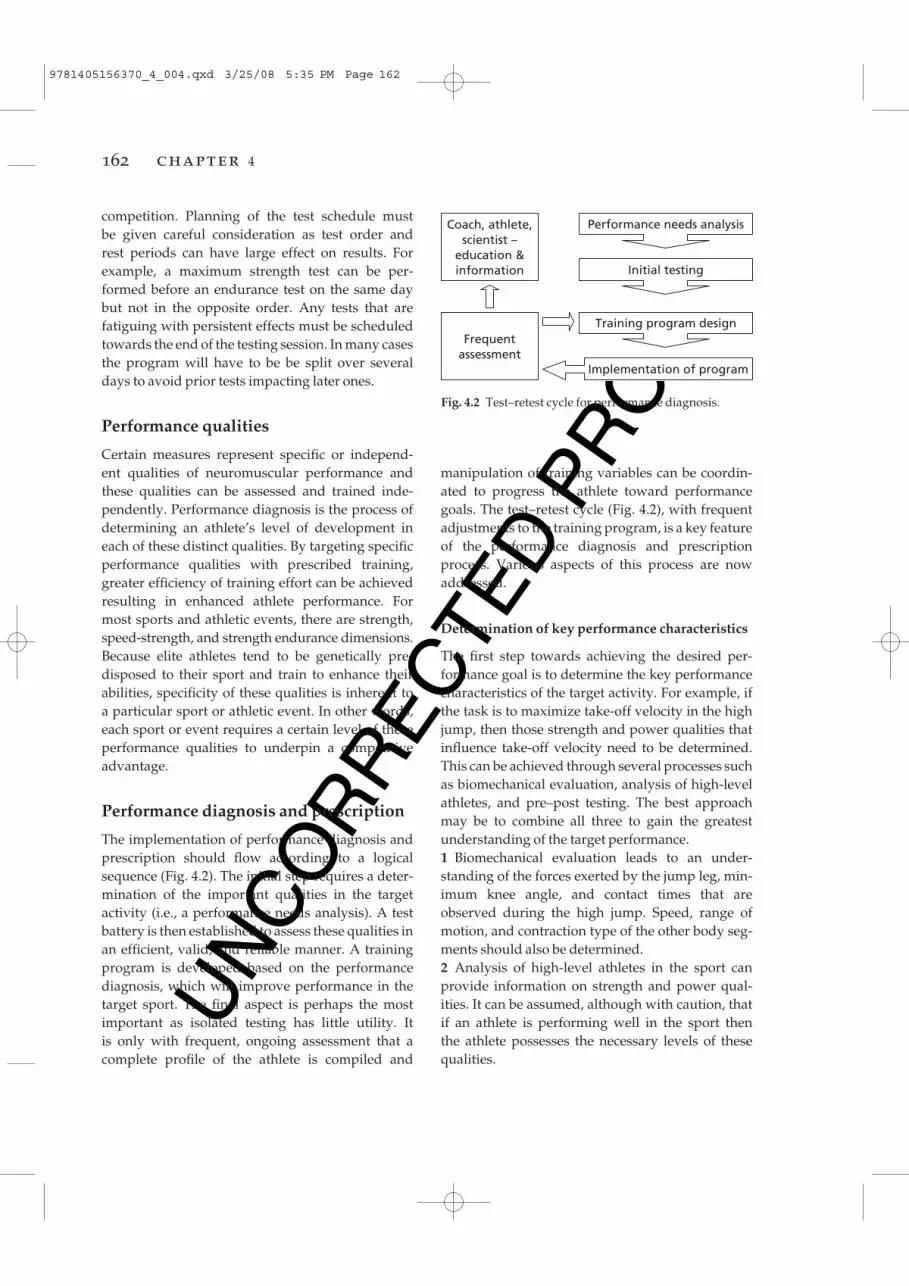
One of the most versatile items for assessing power performance is the force plate (Fig. 4.3). This is a platform containing force transducerswhich directly measures the force produced by theathlete. Force only needs to be measured in onedirection for most tests and so a uniaxial plate willsuffice. Triaxial force plates are more versatile asvertical and horizontal components of force outputcan be measured but they are also much moreexpensive.
By pushing against a force plate during the legpress or squat, force–time data can be obtained.Alternatively, if the equipment is fixed so that nomovement can occur, isometric measures of peakforce and rate of force development can also begathered. During dynamic movements, measures of dynamic strength such as the highest force produced can be measured.
Fig. 4.3 Force platform for measurement of strength andpower qualities.
9781405156370_4_004.qxd 3/25/08 5:35 PM Page 163
UN
CO
RR
ECTE
D P
RO
OF
linear displacement transducer
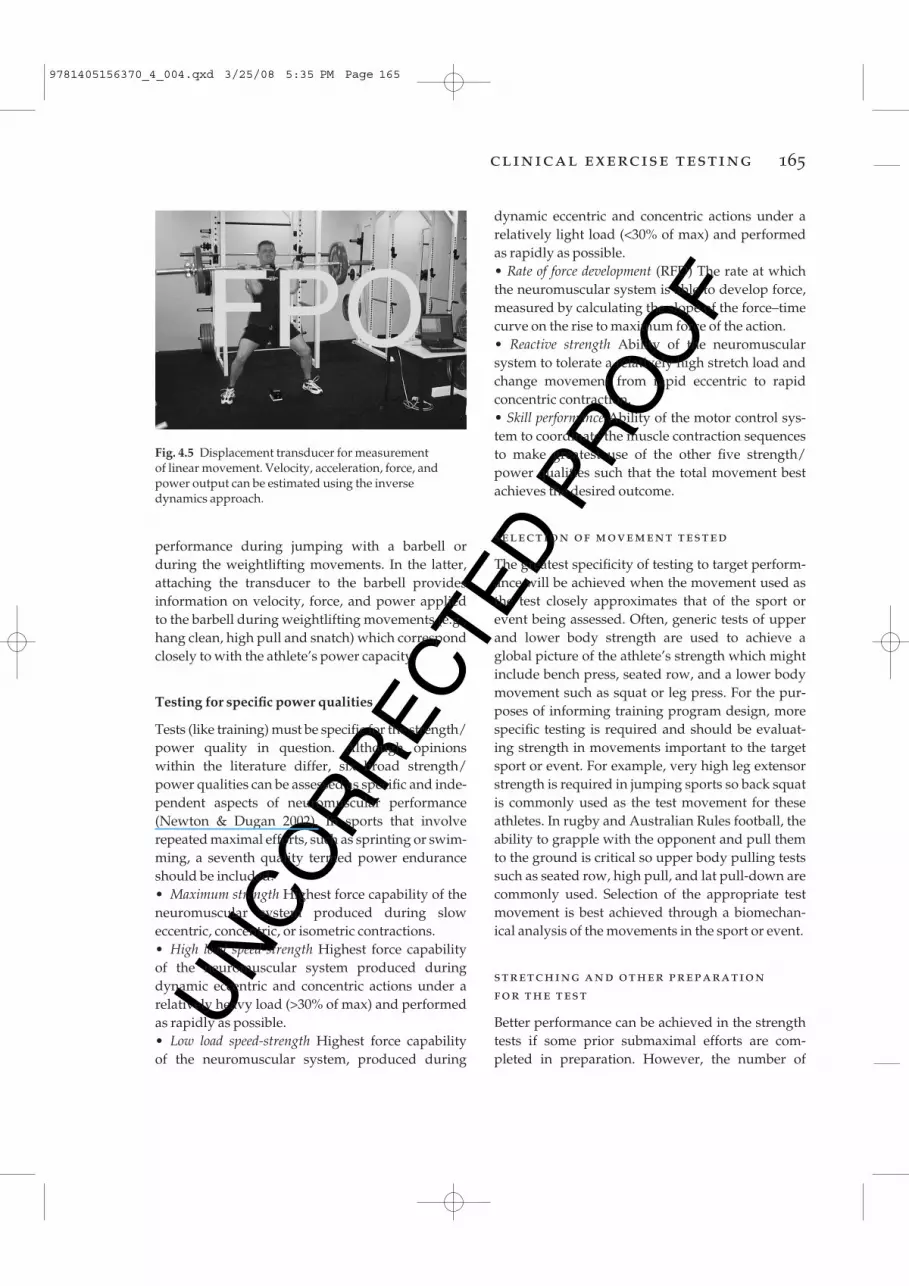
Transducer systems (Fig. 4.5) can provide veryaccurate displacement–time data at sampling rates of 500 Hz or more. These data can be used toderive velocity–time, acceleration–time, force–time(if mass is known), and power–time data sets. Thetransducers have an extendable cable which can be attached to an athlete or implement such as a barbell. As the object moves, the displacement ismeasured and recorded with a computer system.Such systems are particularly useful for measuring
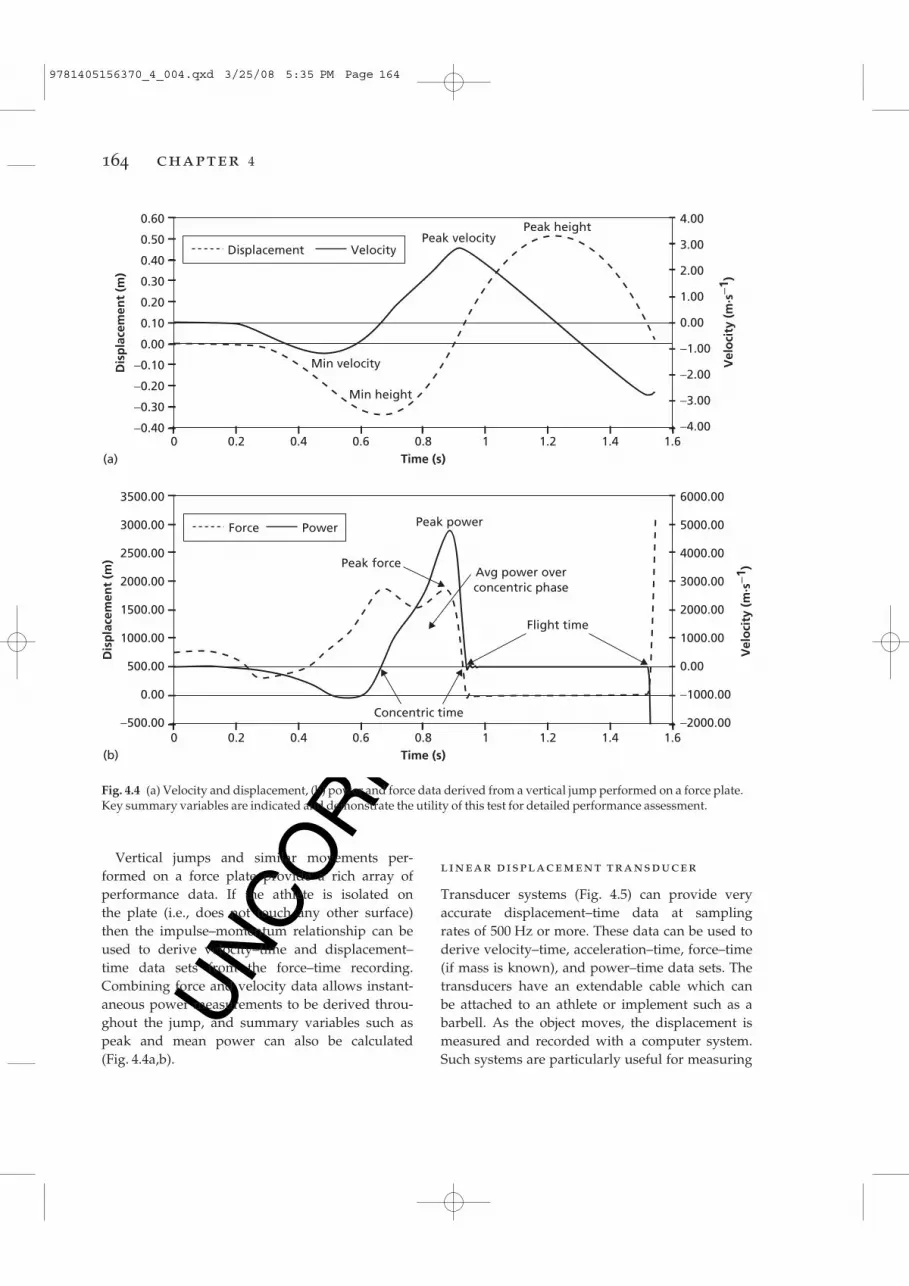
Vertical jumps and similar movements per-formed on a force plate provide a rich array of performance data. If the athlete is isolated on the plate (i.e., does not touch any other surface) then the impulse–momentum relationship can beused to derive velocity–time and displacement–time data sets from the force–time recording.Combining force and velocity data allows instant-aneous power measurements to be derived throu-ghout the jump, and summary variables such aspeak and mean power can also be calculated (Fig. 4.4a,b).
164 chapter 4
(a)
Dis
pla
cem
ent
(m)
Vel
oci
ty (
m·s
−1)
3500.00
3000.00
2500.00
2000.00
1500.00
1000.00
500.00
0.00
−500.00
6000.00
5000.00
4000.00
3000.00
2000.00
1000.00
0.00
−1000.00
−2000.00
Peak power
Peak forceAvg power overconcentric phase
Flight time
Concentric time
0(b)
1.61.41.210.8Time (s)
0.60.40.2
Force Power
Dis
pla
cem
ent
(m)
Vel
oci
ty (
m·s
−1)
0.60
0.50
0.40
0.30
0.20
0.10
0.00
−0.10
−0.20
−0.30
−0.40
4.00
3.00
2.00
1.00
0.00
−1.00
−2.00
−3.00
−4.00
Min velocity
0 1.61.41.210.8Time (s)
0.60.40.2
Displacement Velocity
Min height
Peak velocityPeak height
Fig. 4.4 (a) Velocity and displacement, (b) power and force data derived from a vertical jump performed on a force plate.Key summary variables are indicated and demonstrate the utility of this test for detailed performance assessment.
9781405156370_4_004.qxd 3/25/08 5:35 PM Page 164
UN
CO
RR
ECTE
D P
RO
OF
clinical exercise testing 165
performance during jumping with a barbell or during the weightlifting movements. In the latter,attaching the transducer to the barbell providesinformation on velocity, force, and power applied to the barbell during weightlifting movements (e.g.,hang clean, high pull and snatch) which correspondclosely to with the athlete’s power capacity.
Testing for specific power qualities
Tests (like training) must be specific for the strength/power quality in question. Although opinionswithin the literature differ, six broad strength/power qualities can be assessed as specific and inde-pendent aspects of neuromuscular performance(Newton & Dugan 2002). In sports that involve repeated maximal efforts, such as sprinting or swim-ming, a seventh quality termed power enduranceshould be included.• Maximum strength Highest force capability of theneuromuscular system produced during sloweccentric, concentric, or isometric contractions.• High load speed-strength Highest force capabilityof the neuromuscular system produced duringdynamic eccentric and concentric actions under arelatively heavy load (>30% of max) and performedas rapidly as possible.• Low load speed-strength Highest force capability of the neuromuscular system, produced during
dynamic eccentric and concentric actions under arelatively light load (<30% of max) and performedas rapidly as possible.• Rate of force development (RFD) The rate at whichthe neuromuscular system is able to develop force,measured by calculating the slope of the force–timecurve on the rise to maximum force of the action.• Reactive strength Ability of the neuromuscular system to tolerate a relatively high stretch load andchange movement from rapid eccentric to rapidconcentric contraction.• Skill performance Ability of the motor control sys-tem to coordinate the muscle contraction sequencesto make greatest use of the other five strength/power qualities such that the total movement bestachieves the desired outcome.
selection of movement tested
The greatest specificity of testing to target perform-ance will be achieved when the movement used asthe test closely approximates that of the sport orevent being assessed. Often, generic tests of upperand lower body strength are used to achieve aglobal picture of the athlete’s strength which mightinclude bench press, seated row, and a lower bodymovement such as squat or leg press. For the pur-poses of informing training program design, morespecific testing is required and should be evaluat-ing strength in movements important to the targetsport or event. For example, very high leg extensorstrength is required in jumping sports so back squatis commonly used as the test movement for theseathletes. In rugby and Australian Rules football, theability to grapple with the opponent and pull themto the ground is critical so upper body pulling testssuch as seated row, high pull, and lat pull-down arecommonly used. Selection of the appropriate testmovement is best achieved through a biomechan-ical analysis of the movements in the sport or event.
stretching and other preparation for the test
Better performance can be achieved in the strengthtests if some prior submaximal efforts are com-pleted in preparation. However, the number of
FPOFig. 4.5 Displacement transducer for measurement of linear movement. Velocity, acceleration, force, andpower output can be estimated using the inversedynamics approach.
9781405156370_4_004.qxd 3/25/08 5:35 PM Page 165
UN
CO
RR
ECTE
D P
RO
OF
moving mass against gravity. Also, experiencedathletes should have a long training history with the use of free weights and so are very familiar with movements such as bench press, back squat,and hang clean. A disadvantage of free weights isthe considerable component of skill that is required,and so to improve test control, possibly reduceinjury risk, and limit familiarization required, various forms of resistance machines may be used.The designs of such machines are myriad and manyinvolve cams or levers to alter the resistance forceprofile. This makes comparison between researchstudies and athletes groups tested on differentequipment difficult whereas free weight testing canbe more easily standardized. For example, benchpress strength measured with standard Olympicbarbell and bench is very repeatable in any weighttraining facility anywhere in the world.
rationale for 1 RM or repetitionmaximum testing
For isoinertial testing, the maximum weight that canbe lifted is determined ideally within 3–5 attempts.The two methods are to determine the maximumweight that can be lifted either once, termed the onerepetition maximum (1 RM) or, alternatively, lighterweights can be used for a 3–10 RM test. The 1 RMtest is a more direct measure of maximal strength as the athlete either has sufficient strength capabilityto lift the weight or they do not. The principlebehind multiple repetition testing is to fatigue theneuromuscular system by prior repetitions to adegree such that the last repetition they can completeis a maximal effort. Multiple repetition testing is preferred by some coaches and scientists becausethey believe that there is lower risk of injury becausea lighter weight is being lifted, although this has notbeen confirmed or refuted by research. An equallypersuasive argument can be made that 1 RM testinginvolves only a single effort whereas multiple repetition testing involves repeated events for possible injury and thus increases risk. Prefatiguingthe athlete in an attempt to elicit a maximal effortmay compromise technique resulting in injury andalso increases likelihood of muscle damage throughthe repeated eccentric actions when lowering the
trials must not produce any amount of fatigue that could reduce strength effort. Generally, 3–5 max-imal efforts are sufficient. Rest between trials is alsoimportant as sufficient recovery requires 3–5 min to avoid fatigue influencing the effort. A final noteon preparation is to avoid static stretching becausethis can reduce force and power output of the muscle (Marek et al. 2005).
Maximum strength
Maximum strength can be determined using severalmethods, each with advantages and disadvantages.The principal modes are isoinertial, isokinetic, andisometric. With all strength testing the force–velocity and length–tension relationships for musclemust be considered, as well as the effect of muscleangle of pull and mechanical advantage influenceson the amount of force that can be generated.Briefly, the faster the velocity of muscle shorteningthe less force can be generated. As the athlete movesthrough the range of motion for a particular move-ment, the amount of torque that can be generatedabout the joints and just overall force output pro-duced will change. For example, much less force can be generated from a deep squat position com-pared to a half squat where the knee angle is 90°. These effects must be considered in the followingdiscussion because they have large influence on thestrength measure recorded.
isoinertial strength testing
Isoinertial refers to constant mass of the resistance.This is perhaps the most simple, inexpensive, andaccessible form of strength testing. It involves theuse of the gravitational force acting on a mass suchas a barbell, dumbbell, or weight resistance machineand the athlete must overcome this force and movethe mass through the range of motion. Commonexamples are the bench press, squat, and deadliftexercises; however, some of the weightlifting move-ments and derivatives such as hang clean, high pull,and push press are increasingly being used.
Free weight testing as described above has hightransference to the sporting environment becausealmost all sports involve manipulating a freely
166 chapter 4
9781405156370_4_004.qxd 3/25/08 5:35 PM Page 166
UN
CO
RR
ECTE
D P
RO
OF
clinical exercise testing 167
weight. Finally, a 6 RM weight for the bench press is approximately 80% of the 1 RM weight, whichwhen lifted six times represents a much higher totalwork done. Also, because the 6 RM load can be acce-lerated faster, the peak forces applied to the mus-culoskeletal system are not appreciably different.
one repetition maximum test protocol
A typical protocol for 1 RM testing (McBride et al.1999) is outlined in Table 4.1. Experienced athletescan be asked to estimate their 1 RM and this weightused as a starting point. If the athlete does not knowtheir approximate 1 RM it must be estimated by thepersonnel performing the test based on the athlete’sbody weight, age, gender, and lifting experience.This can then be adjusted up or down depending ontheir performance in the warm-up sets. It should benoted that for 1 RM testing, as any performance test,familiarization can have considerable impact andconsideration should be given to employing at leasttwo sessions for accurate determination of 1 RM.
multiple repetition test protocol
There are two approaches to multiple repetitionisoinertial strength testing. The first involves selec-tion of a definitive repetition maximum, say 6 RM,and then executing a protocol to determine the max-imum weight the athlete can lift six times. The pro-tocol is similar to 1 RM testing with a submaximalwarm-up set of 10 repetitions completed first, thenan estimated 10 RM load lifted for six repetitionswith 1.25–10 kg added until the 6 RM load isobtained. As for the 1 RM protocol, the true 6 RMload should be determined in 3–5 attempts. Theother approach is to accurately determine between a6 RM and 10 RM load and then apply a regression
equation to estimate 1 RM strength based on weightlifted and number of repetitions completed. Thissecond method is appealing because an estimate of1 RM strength is obtained; however, there are lim-itations in that the regression equations decrease in accuracy of prediction with increasing differencebetween characteristics of the athlete being testedand the population sample from which the equationwas derived. An extensive discussion of protocolsand the accuracy of these methods is provided byLeSuer et al. (1997).
The range of motion for isoinertial testing must be closely controlled because of the effect on loadlifted. For example, the lower the depth in squattesting the less weight the athlete will be able to lift.
isometric strength testing
Isometric strength testing involves the athlete per-forming maximal contractions against an immov-able resistance. As no movement occurs this testingis termed static or isometric. Isometric testing isappealing because the measures are not confoundedby issues of movement velocity and changing jointangle already discussed. However, there is alsostrong argument that isometric testing lacksspecificity to the dynamic movements predominantin sports. In fact, research has found isometric measures to be quite poor at predicting dynamicperformance (Murphy & Wilson 1996b). Some sportsand events involve isometric muscle contractionsand such testing may be quite applicable in thisinstance. One of the advantages of isometric testingis that measures of rate of force development can beobtained which have been suggested (Häkkinen et al. 1985) to accurately represent the athlete’s ability to rapidly and forcefully contact their muscles, an important aspect of power productionto be discussed shortly.
Isometric strength testing can be performed forsingle (e.g., elbow flexion, knee extension) or multi-joint techniques (e.g., squat, bench, mid-thigh pull).Force measuring equipment is required such as a transducer, amplifier, and computer to collect,store, and analyze the force produced. The protocolconsists of a warm-up of submaximal efforts fol-lowed by a series of maximal efforts. These are
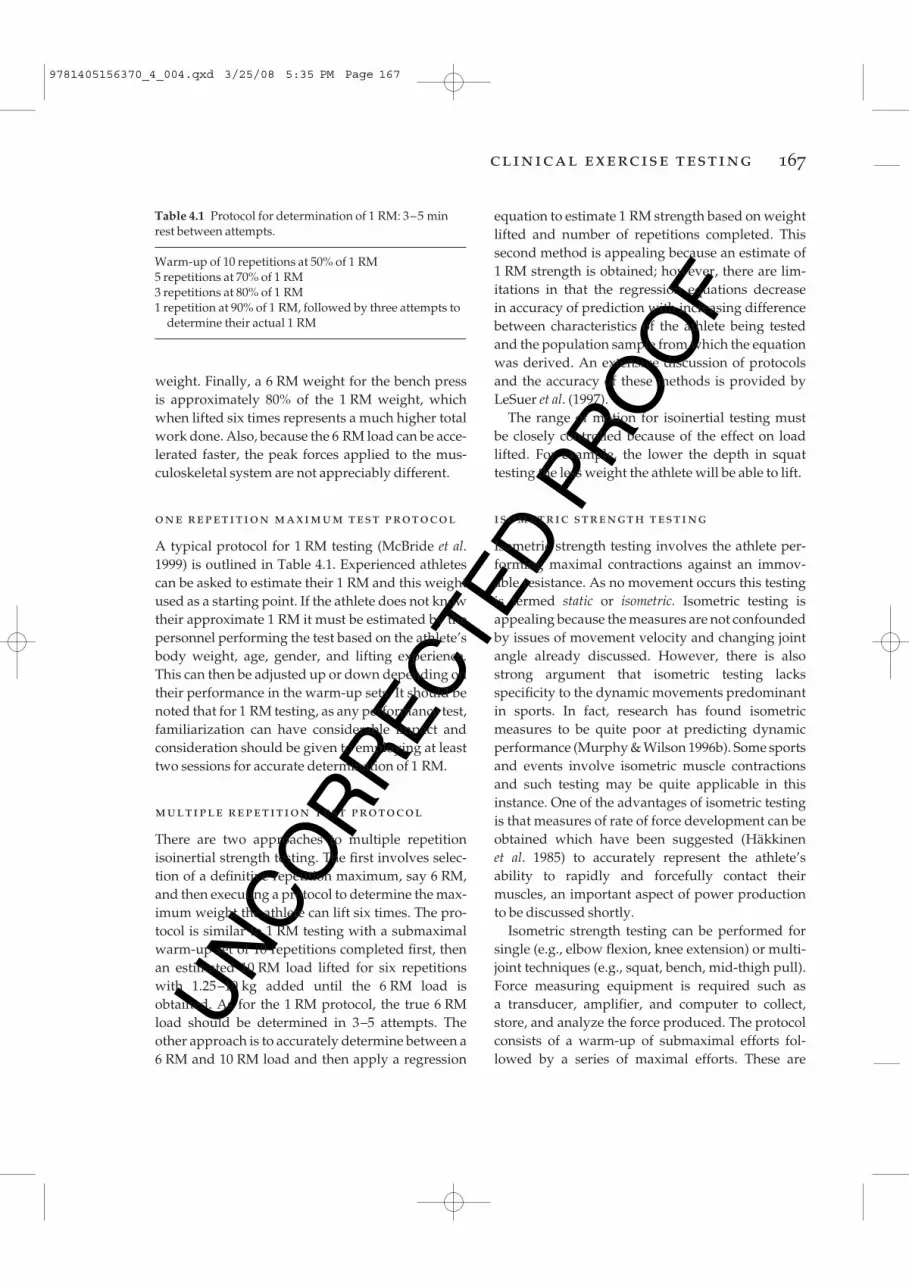
Table 4.1 Protocol for determination of 1 RM: 3–5 minrest between attempts.
Warm-up of 10 repetitions at 50% of 1 RM5 repetitions at 70% of 1 RM3 repetitions at 80% of 1 RM1 repetition at 90% of 1 RM, followed by three attempts to
determine their actual 1 RM
9781405156370_4_004.qxd 3/25/08 5:35 PM Page 167
UN
CO
RR
ECTE
D P
RO
OF
coordinated movement of several joints and musclegroups. To address this possible deficiency, manu-facturers such as Biodex™ have developed attach-ments that provide linear as well as rotary isokineticresistance, thus enabling multi-joint movementssuch as leg press to be tested.
Perhaps the greatest application of isokinetic testing has been with assessing hamstrings andquadriceps torque production about the knee.Consequently, much research has been directedtoward assessing the ratio between these two muscle groups as well as left to right asymmetries in an effort to understand mechanisms, screen andrehabilitate injuries, such as hamstring strain andACL injury of the knee.
By adjusting the resistance (accommodating) continuously to the torque capacity of the mus-culoskeletal system, a profile throughout the range of movement can be obtained. This is a useful feature of the isokinetic mode as weak portions ofthe range can be identified as well as shifts in theposition at which the peak in torque occurs. Suchinformation has been used to quantify the optimalangle and some researchers have related shifts in this optimal angle to injury events, such as hamstring strains (Brockett et al. 2004).
Two issues that clinicians should be aware ofwhen performing isokinetic testing is the torqueovershoot phenomenon and gravity correction. Atthe beginning of each repetition there will be aperiod when the limb is accelerated from zero to thepreset velocity of the dynamometer. This results inan impact when the limb attains this velocity and a spike and subsequent damped oscillation occursin the torque signal. The faster the set speed of the dynamometer for the trial the later into themovement this impact occurs and the larger thespike. Manufacturers have tried to address thisproblem with electronic and digital filters, as well asramping the dynamometer speed but, regardless,measurements in the early phase of a movement areproblematic. Gravity correction is used to account for the fact that when testing, gravity will assist(increase) torque measured during downwarddirection movements and impede (decrease) torquemeasured during upward direction movements.This is easily accounted for by contemporary
continued until no further improvement in maximalforce output can be achieved. The instruction to the athlete should be to “push (or pull) against theresistance as hard and fast as possible” for 3–5 s.The force will rise quickly to a peak within this timeperiod and the athlete can then relax once the peakis attained.
isokinetic strength testing
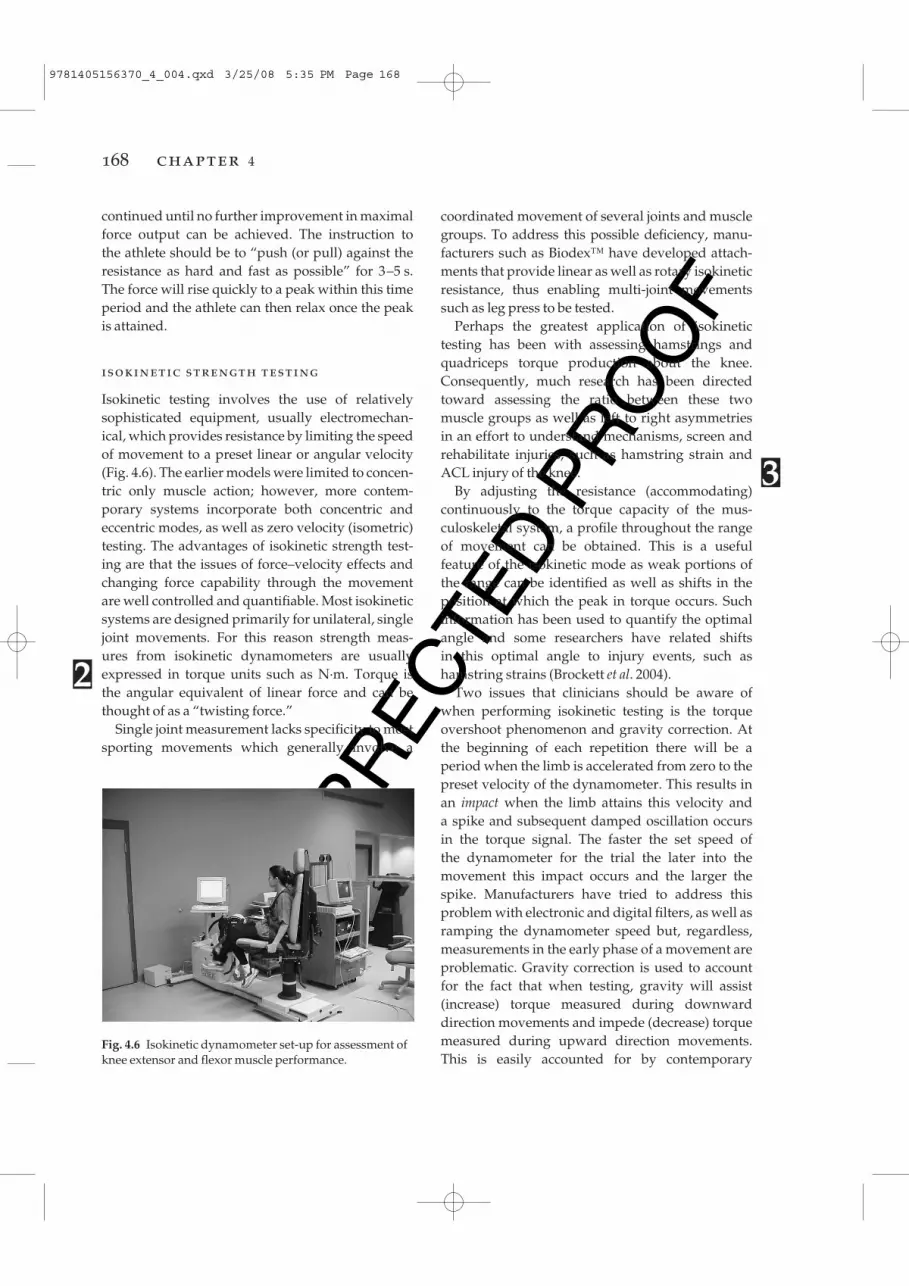
Isokinetic testing involves the use of relativelysophisticated equipment, usually electromechan-ical, which provides resistance by limiting the speedof movement to a preset linear or angular velocity(Fig. 4.6). The earlier models were limited to concen-tric only muscle action; however, more contem-porary systems incorporate both concentric andeccentric modes, as well as zero velocity (isometric)testing. The advantages of isokinetic strength test-ing are that the issues of force–velocity effects andchanging force capability through the movementare well controlled and quantifiable. Most isokineticsystems are designed primarily for unilateral, singlejoint movements. For this reason strength meas-ures from isokinetic dynamometers are usuallyexpressed in torque units such as N·m. Torque is the angular equivalent of linear force and can bethought of as a “twisting force.”
Single joint measurement lacks specificity to mostsporting movements which generally involve a
168 chapter 4
Fig. 4.6 Isokinetic dynamometer set-up for assessment ofknee extensor and flexor muscle performance.
@
#
9781405156370_4_004.qxd 3/25/08 5:35 PM Page 168
UN
CO
RR
ECTE
D P
RO
OF
clinical exercise testing 169
systems by performing a weighing procedure forthe limb and dynamometer arm prior to strengthmeasurement and the torque measurement is thencorrected throughout the range of movement.
Ballistic testing
The majority of sports involve striking, kicking,throwing, or projecting the body into free space. The kinetic and kinematic profile of isoinertial, isometric, and isokinetic testing methods are verydifferent to the accelerative, high power output char-acteristic of sport movements (Newton et al., 1994). As a result, measurement of force, velocity, andpower during ballistic movements such as counter-movement jump (CMJ), jump squat (CMJ with addi-tional load to body weight), squat jump (concentriconly jump with body weight or load), bench throws,bench pulls, and various weightlifting movementsis becoming increasingly used for athlete testing.
The CMJ is a basic test of vertical jump capacity.The athlete dips down and then immediately jumps upward, attempting to maximize the heightjumped. With the use of a force plate and positiontransducer, ground reaction force and displacementcan be recorded (McBride et al., 1999). From thesedata, a number of variables that characterize theperformance can be calculated. Jump height is anobvious measure, but the power output during thejump, peak force produced, and time to attain thatforce can also be calculated.
Sophisticated systems are available to measureforce output and displacement as explained earlierin this chapter. From these systems, data such asheight (displacement), velocity, force, and poweroutput can be calculated. The loads used depend onthe athlete and the task, but a spectrum is useful sothat an impression of the athlete’s performanceunder heavy and light loads can be ascertained (i.e.,high or low load speed-strength). One scheme is touse loads of 30, 55, and 80% 1 RM (McBride et al.,2001), while another method seeks to determine theoptimal load for power production (Baker et al.,2001a,b; Wilson et al. 1993).
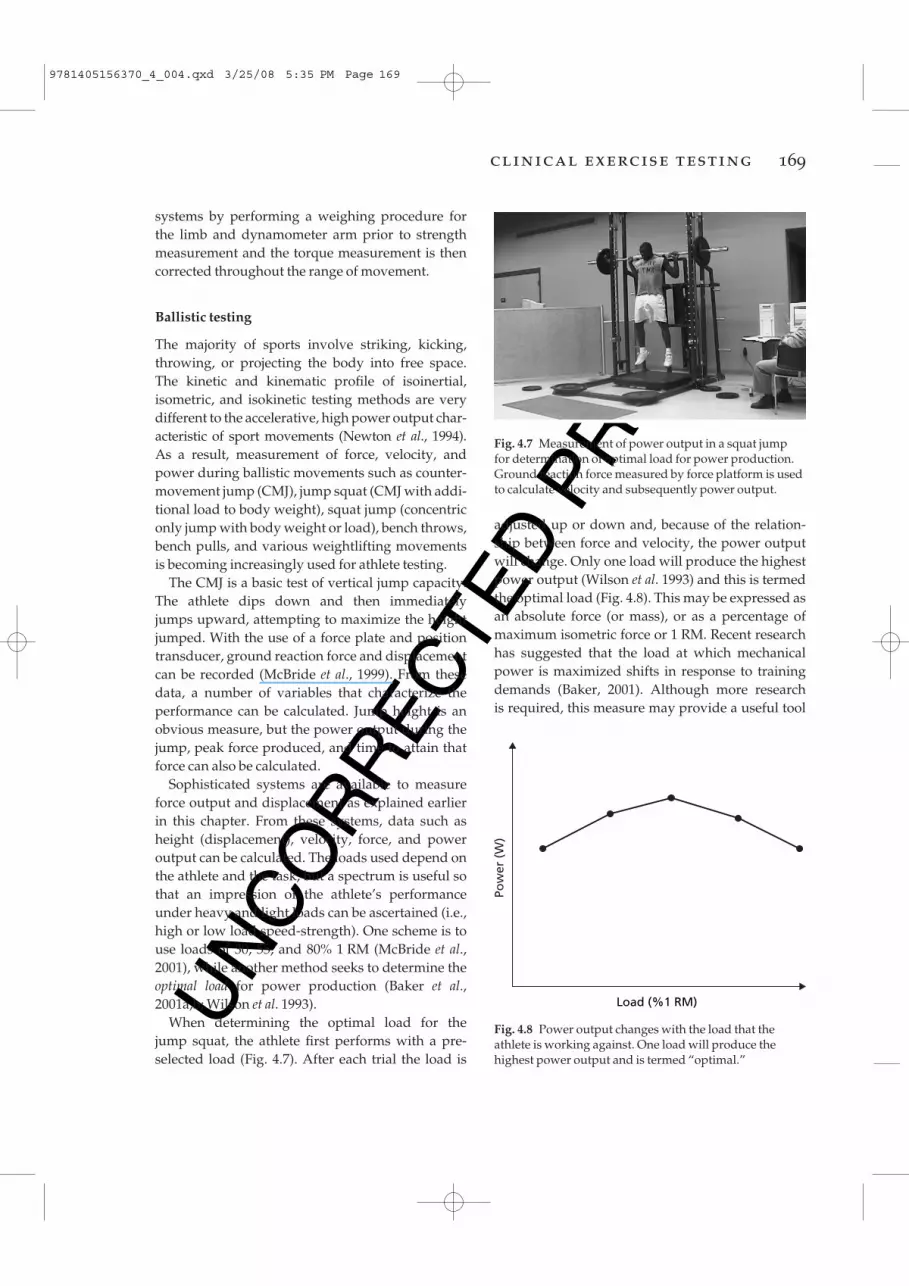
When determining the optimal load for the jump squat, the athlete first performs with a pre-selected load (Fig. 4.7). After each trial the load is
adjusted up or down and, because of the relation-ship between force and velocity, the power outputwill change. Only one load will produce the highestpower output (Wilson et al. 1993) and this is termedthe optimal load (Fig. 4.8). This may be expressed asan absolute force (or mass), or as a percentage ofmaximum isometric force or 1 RM. Recent researchhas suggested that the load at which mechanicalpower is maximized shifts in response to trainingdemands (Baker, 2001). Although more research is required, this measure may provide a useful tool
Fig. 4.7 Measurement of power output in a squat jump for determination of optimal load for power production.Ground reaction force measured by force platform is usedto calculate velocity and subsequently power output.
Pow
er (
W)
Load (%1 RM)
Fig. 4.8 Power output changes with the load that theathlete is working against. One load will produce thehighest power output and is termed “optimal.”
9781405156370_4_004.qxd 3/25/08 5:35 PM Page 169

UN
CO
RR
ECTE
D P
RO
OF
isometric tests) allow the calculation of several measures of the ability to rapidly develop force(Zatsiorsky 1995), such as maximum RFD or theimpulse (F × t) over the initial 100 ms.
Reactive strength
The most common test for assessing an athlete’sreactive strength is the depth jump. The athletedrops down from a box, lands, and then jumpsupward for maximum height (Fig. 4.9). A contactmat system or force plate can be used to record thecharacteristics of the performance. Young et al.(1995) has shown that the instructions given to theathlete affect the results, and that they shouldattempt maximum jump height while minimizingground contact time. Trials completed at increasingdrop heights provide insight into how the athleteresponds to increasing stretch loads. A common
for monitoring the effects of changing emphasis in program periodization as well as for detecting overtraining, illness, and staleness. For example,Baker (2001) has found that the optimal loadincreases during phases that emphasize strengthand decreases during speed training.
Rate of force development
There are several options to choose from when testing RFD. One common protocol uses isometricsquats, but this incorporates many of the sameadvantages and disadvantages as testing maximalstrength with isometrics (Murphy & Wilson 1996b).RFD can also be determined during both con-centric and eccentric phases of dynamic tests, which may have greater relevance to task performance(Murphy & Wilson 1996a, 1997; Wilson et al. 1995);however, this has not been well researched to date.
Two dynamic tests that are often utilized are theconcentric-only jump, often referred to as the squatjump (SJ), and the concentric-only jump squat. Forthe SJ, the athlete squats down to a self-selecteddepth and holds that position for 3–4 s, thenattempts to jump for maximum height without apreparatory movement. This can be difficult to perform and may require several trials to obtainaccurate data. The test is performed with bodyweight only as the load.
Concentric-only jump squats are SJ but per-formed with some additional load above bodyweight. For this variation, mechanical stops arepositioned in the squat rack or Smith machine at the appropriate angle for the bottom position of thejump, and this becomes the starting position for thejump. Ground reaction force and bar displacementcan be recorded, as well as such derived variables as jump height, power output, and peak force developed. The highest force produced during aconcentric-only movement has been termed max-imal dynamic strength (MDS; Young 1995) – astrength/power quality with good predictive anddiscriminatory capability between athletes of dif-ferent levels. Heavier external loads will result ingreater MDS values, and greater test specificity will be obtained if the selected load is similar to thetarget task. Dynamic concentric-only tests (as with
170 chapter 4
Fig. 4.9 Depth jump performed for the determination ofreactive strength index.
9781405156370_4_004.qxd 3/25/08 5:35 PM Page 170
UN
CO
RR
ECTE
D P
RO
OF
clinical exercise testing 171
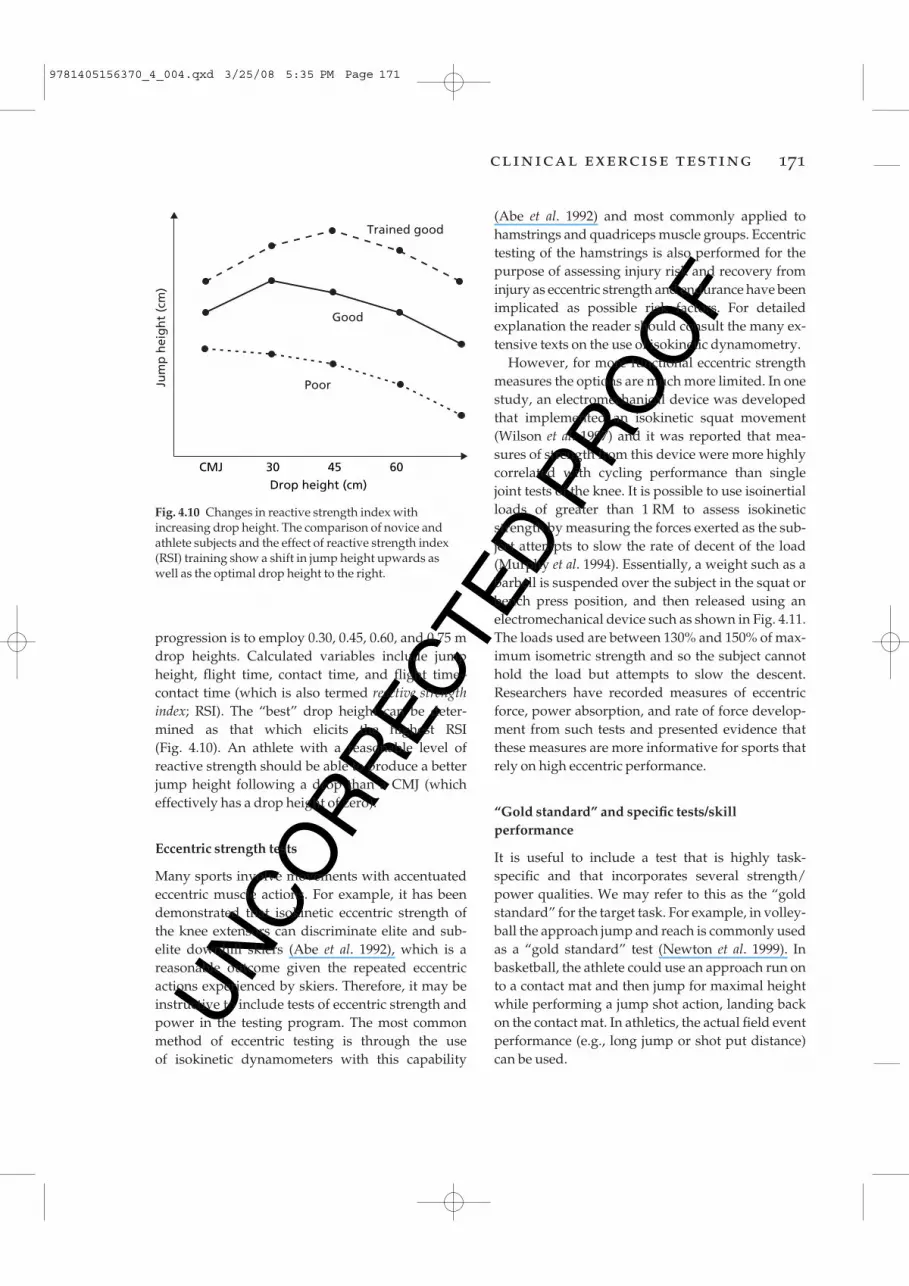
progression is to employ 0.30, 0.45, 0.60, and 0.75 mdrop heights. Calculated variables include jumpheight, flight time, contact time, and flight time–contact time (which is also termed reactive strengthindex; RSI). The “best” drop height can be deter-mined as that which elicits the highest RSI (Fig. 4.10). An athlete with a reasonable level of reactive strength should be able to produce a betterjump height following a drop than a CMJ (whicheffectively has a drop height of zero).
Eccentric strength tests
Many sports involve movements with accentuatedeccentric muscle actions. For example, it has beendemonstrated that isokinetic eccentric strength ofthe knee extensors can discriminate elite and sub-elite downhill skiers (Abe et al. 1992), which is a reasonable outcome given the repeated eccentricactions experienced by skiers. Therefore, it may beinstructive to include tests of eccentric strength andpower in the testing program. The most commonmethod of eccentric testing is through the use of isokinetic dynamometers with this capability
(Abe et al. 1992) and most commonly applied tohamstrings and quadriceps muscle groups. Eccentrictesting of the hamstrings is also performed for thepurpose of assessing injury risk and recovery frominjury as eccentric strength and endurance have beenimplicated as possible risk factors. For detailedexplanation the reader should consult the many ex-tensive texts on the use of isokinetic dynamometry.
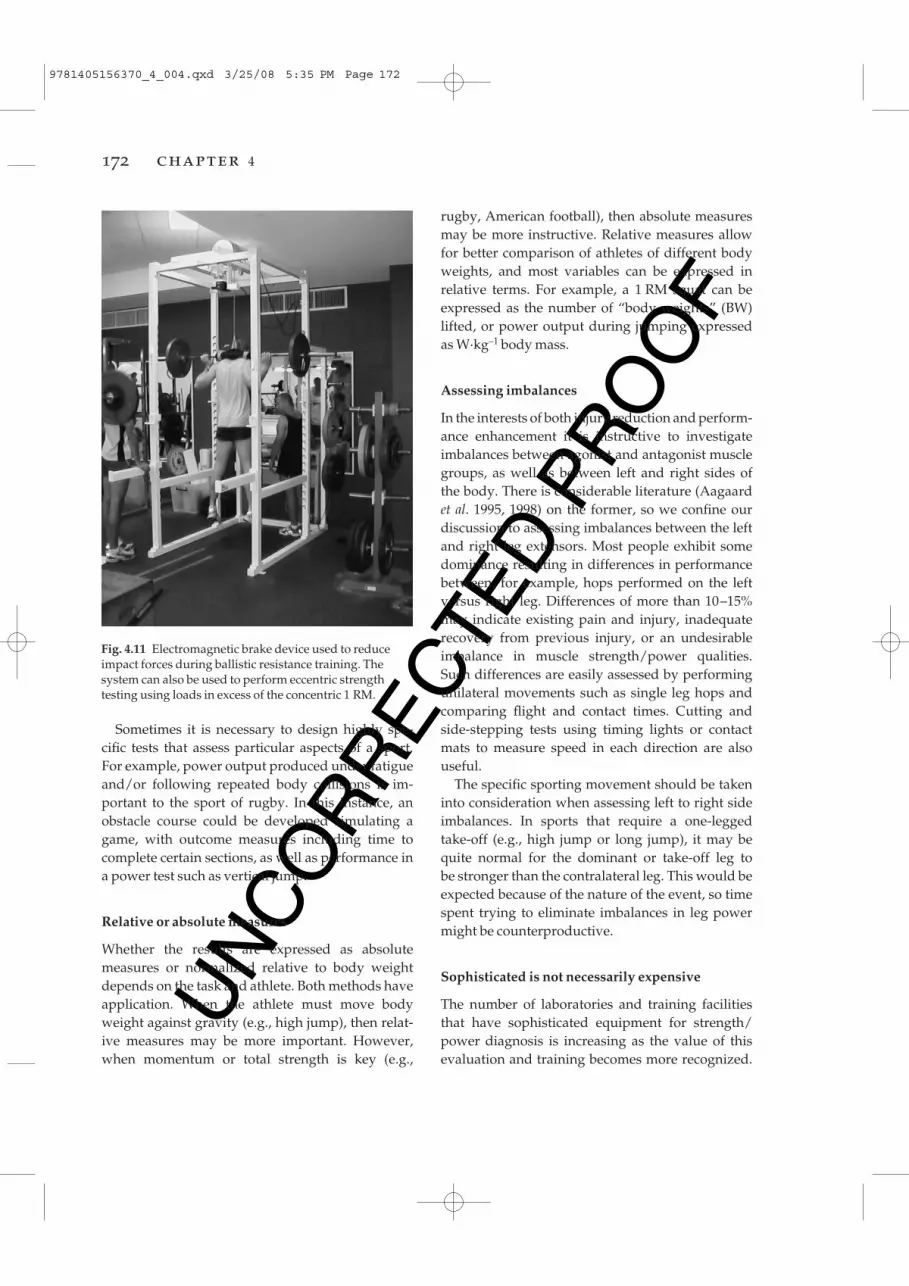
However, for more functional eccentric strengthmeasures the options are much more limited. In onestudy, an electromechanical device was developedthat implemented an isokinetic squat movement(Wilson et al. 1997) and it was reported that mea-sures of strength from this device were more highlycorrelated with cycling performance than singlejoint tests of the knee. It is possible to use isoinertialloads of greater than 1 RM to assess isokineticstrength by measuring the forces exerted as the sub-ject attempts to slow the rate of decent of the load(Murphy et al. 1994). Essentially, a weight such as abarbell is suspended over the subject in the squat orbench press position, and then released using anelectromechanical device such as shown in Fig. 4.11.The loads used are between 130% and 150% of max-imum isometric strength and so the subject cannothold the load but attempts to slow the descent.Researchers have recorded measures of eccentricforce, power absorption, and rate of force develop-ment from such tests and presented evidence thatthese measures are more informative for sports thatrely on high eccentric performance.
“Gold standard” and specific tests/skillperformance
It is useful to include a test that is highly task-specific and that incorporates several strength/power qualities. We may refer to this as the “goldstandard” for the target task. For example, in volley-ball the approach jump and reach is commonly usedas a “gold standard” test (Newton et al. 1999). In basketball, the athlete could use an approach run onto a contact mat and then jump for maximal heightwhile performing a jump shot action, landing backon the contact mat. In athletics, the actual field eventperformance (e.g., long jump or shot put distance)can be used.
Jum
p h
eig
ht
(cm
)
CMJ 30 45 60Drop height (cm)
Trained good
Good
Poor
Fig. 4.10 Changes in reactive strength index withincreasing drop height. The comparison of novice andathlete subjects and the effect of reactive strength index(RSI) training show a shift in jump height upwards as well as the optimal drop height to the right.
9781405156370_4_004.qxd 3/25/08 5:35 PM Page 171
UN
CO
RR
ECTE
D P
RO
OF
rugby, American football), then absolute measuresmay be more instructive. Relative measures allowfor better comparison of athletes of different bodyweights, and most variables can be expressed in relative terms. For example, a 1 RM squat can beexpressed as the number of “body weights” (BW)lifted, or power output during jumping expressedas W·kg–1 body mass.
Assessing imbalances
In the interests of both injury reduction and perform-ance enhancement it is instructive to investigateimbalances between agonist and antagonist musclegroups, as well as between left and right sides of the body. There is considerable literature (Aagaardet al. 1995, 1998) on the former, so we confine ourdiscussion to assessing imbalances between the leftand right leg extensors. Most people exhibit some dominance resulting in differences in performancebetween, for example, hops performed on the leftversus right leg. Differences of more than 10–15%may indicate existing pain and injury, inadequaterecovery from previous injury, or an undesirableimbalance in muscle strength/power qualities.Such differences are easily assessed by performingunilateral movements such as single leg hops andcomparing flight and contact times. Cutting andside-stepping tests using timing lights or contactmats to measure speed in each direction are alsouseful.
The specific sporting movement should be takeninto consideration when assessing left to right sideimbalances. In sports that require a one-legged take-off (e.g., high jump or long jump), it may bequite normal for the dominant or take-off leg to be stronger than the contralateral leg. This would beexpected because of the nature of the event, so timespent trying to eliminate imbalances in leg powermight be counterproductive.
Sophisticated is not necessarily expensive
The number of laboratories and training facilitiesthat have sophisticated equipment for strength/power diagnosis is increasing as the value of thisevaluation and training becomes more recognized.
Sometimes it is necessary to design highly spe-cific tests that assess particular aspects of a sport.For example, power output produced under fatigueand/or following repeated body collisions is im-portant to the sport of rugby. In this instance, anobstacle course could be developed simulating agame, with outcome measures including time tocomplete certain sections, as well as performance ina power test such as vertical jump.
Relative or absolute measures
Whether the results are expressed as absolute measures or normalized relative to body weightdepends on the task and athlete. Both methods haveapplication. When the athlete must move bodyweight against gravity (e.g., high jump), then relat-ive measures may be more important. However,when momentum or total strength is key (e.g.,
172 chapter 4
Fig. 4.11 Electromagnetic brake device used to reduceimpact forces during ballistic resistance training. Thesystem can also be used to perform eccentric strengthtesting using loads in excess of the concentric 1 RM.
9781405156370_4_004.qxd 3/25/08 5:35 PM Page 172
UN
CO
RR
ECTE
D P
RO
OF
clinical exercise testing 173
However, one can implement valid and reliablestrength/power diagnoses with a minimum ofequipment and expense. All of the jump tests can beperformed with either jump and reach equipmentor a contact mat system, and while not providingthe same detailed measures of force and power, theyprovide adequate information required for basicperformance diagnosis. Other tests such as thestanding broad jump or medicine ball throw canprovide good information and only require a mea-suring tape.
Speed and agility
Speed and agility are physical qualities required forsuccessful performance in many sports played on afield or court. In science, speed is defined as distancedivided by time, and can refer to the movement ofpart of the body (e.g., the foot in kicking a ball or thewhole body such as in running). For the purposes of this section, speed refers to total body runningspeed. Agility is more difficult to define and this creates difficulties when examining the assessmentof this complex quality; however, this is discussedin detail later in the chapter.
Speed
While running speed is normally expressed in m·s–1
or km·h–1, it is customary to measure and reportsprint times at known distances from the com-mencement of the sprint. Running speed can beclassified into three categories:1 Acceleration speed This refers to the speed duringrelatively short sprints (e.g., 5–20 m), when it isknown that running velocity rapidly increases(Bruggemann & Glad 1990).2 Maximum speed This refers to the peak runningspeed reached by an individual, and typicallyoccurs after 30–60 m of sprinting from a stationarystart.3 Speed-endurance This refers to the ability to sustainrelatively high running speeds (e.g., 90% of max-imum speed). In sport, this quality may be requiredduring long sprints, such as the 200 and 400 mevents, or in team sports where sprints may be short(less than 30 m) but are repeated with partial
recoveries. This has been termed “repeat sprint ability.”
Research has demonstrated that these speed qualities are quite specific (Delecluse et al. 1995).Therefore, an athlete who has a high level of onespeed quality may be relatively poor at the others,and is likely explained by each quality beinginfluenced by somewhat different physiologic mech-anisms. For example, acceleration speed involvesrelatively more forward lean, shorter steps, longerground contact times, and greater quadriceps muscleactivity than maximum speed sprinting, where hip extensors become relatively more important(Frick et al. 1995; Kyrolainen et al. 1999; Young et al. 2001).
An important implication of the specificity of the speed qualities is that each can be assessed bydifferent tests, and the tester must decide whichparticular qualities are most important for the sportof interest. A needs analysis should be conducted toassist the tester ascribe an importance to each qual-ity and improve the interpretation of test results.
methods of testing speed qualities
Running speed can be assessed directly from laseror radar recordings using the Doppler principle. Forexample, when a radar beam is directed at the backof a runner, the change in frequency between theemitted and reflected signal can be used to measurespeed. An advantage of such a system is that itrecords instantaneous velocity and is therefore useful for measuring peak or maximum speed. Adisadvantage is that it can only be used for runningin a straight line on an individual athlete.
Another method employed for direct measure-ment of velocity is the use of a device attached to a light wire attached to the athlete’s waist (Volkov & Lapin 1979; Witters et al. 1985). With increasingrunning displacement, the wire is extended whichrotates a wheel and this allows displacement andtime to be recorded. This kind of device has similaradvantages to the radar or laser techniques but a signi-ficant disadvantage is that it is obtrusive and cannotbe used for testing in competition conditions.
Technologic advances have made global position-ing systems (GPS) commercially available, which
9781405156370_4_004.qxd 3/25/08 5:35 PM Page 173

UN
CO
RR
ECTE
D P
RO
OF
This type of system should have a measurement resolution of at least 0.01 s.
Some interest has been generated about whetherone beam is adequate for accurate timing of runningbecause of the possibility of time being triggered bya limb rather than the trunk of the body. Because thearms and legs move forward and backward relativeto the trunk, limb movement is not a reflection ofwhole body speed. One solution to this potentialproblem is the use of multiple beam systems whichare programmed to record a time event only whenall beams are triggered simultaneously, therebyattempting to capture trunk rather than arm move-ment. Another solution is the use of real-time computer processing of the light gate pulses withalgorithms to predict the time at which the trunkpasses through the beam.
An example of a speed test using a timing lightgate system would be to use gates at 10 m intervalsup to 60 m. Acceleration speed could be representedby time to 10 or 20 m and maximum speed could beestimated by the smallest time elapsed between con-secutive gates, expected to be 40–50 m or 50–60 m.Because this procedure requires multiple gates, amore pragmatic approach may be to use four gatesplaced at the start line, 20 m, 50 m, and the finishline (60 m). The 20 m time is used as a measure ofacceleration and the flying 10 m time (50–60 m) isused to represent average speed. It should beacknowledged that the latter time indicates an aver-age rather than the true peak or maximum runningvelocity of the individual.
While the above approach to testing is an attemptto separate acceleration and maximum speed qual-ities, an alternative approach is to simply measuretimes to distances considered to be critical to a particular sport. For example, the time to sprint to18 m may be useful for softball because this is thedistance between bases. Similarly, a sprint to 10 mrather than 20 m may be more relevant for accelera-tion speed in tennis.
To assess speed-endurance, times over relativelylong sprints (e.g., 300 m) could be used, or to simu-late the demands of team sports requiring intermit-tent sprints, a test involving repeated short sprintswould be appropriate. Repeat sprint ability (RSA)can be thought of as a form of speed-endurance and
are able to accurately track the position of the running athlete over time. Although measurementof velocity is accurate, GPS systems with relat-ively low sampling frequencies (e.g., 1–10 Hz) canintroduce significant errors when there is a rapidchange in velocity. The latest systems, however,incorporate accelerometers that interpolate accel-eration between successive GPS measurements(e.g., www.gpsports.com).
The most common way to assess speed qualities is with time taken to reach known distances or time elapsed between relatively short intervals (e.g.,10 m). Traditionally, stopwatches have been used,but can be expected to result in errors associatedwith factors such as the variation in the reactiontime of the operator. Stopwatches have generallybeen replaced with electronic timing devices such as “light gates” consisting of an infrared beam thatis transmitted and received by a unit mounted ontripods (Fig. 4.12). As the athlete’s trunk passesthrough the beam, the time is recorded and stored.
174 chapter 4
Fig. 4.12 Infrared timing gate systems providemillisecond accuracy in measurement of speed andagility.
9781405156370_4_004.qxd 3/25/08 5:36 PM Page 174
UN
CO
RR
ECTE
D P
RO
OF
clinical exercise testing 175
the energy for such activity is derived from a com-bination of aerobic and anaerobic sources (Glaister2005). Variables such as the typical length or dura-tion of the sprint, sprint intensity, rest intervalbetween sprints, work to rest ratios, and total num-ber of sprints in a game will influence the precisephysiologic demands on the athlete (Spencer et al.2005). Therefore, it is unlikely that one test can suitall needs for assessing RSA in team sports. Further,selection of an appropriate test should be based on a careful evaluation of time–motion data of the sport of interest. An example of a test of RSA is sixrepetitions of 40 m maximum effort sprints, leavingevery 30 s (Dawson et al. 1998; Fitzsimons et al. 1993).With this protocol, the total time to complete thesprints and the percentage decrement score acrossthe six sprints can be used to monitor trainingeffects (Dawson et al. 1998).
standardization of speed testingprocedures
Whatever test protocol is selected, there are manyvariables that must be either controlled or standard-ized to maximize the reliability and sensitivity of the test.
Environmental conditions
While temperature and humidity cannot always beeasily controlled, the influence of wind can have aprofound effect on speed and, if possible, should beeliminated by performing the test indoors. A prac-tical consideration of indoor facilities is whether the space is large enough to include a sprint of therequired distance, including enough distance forslowing down safely at the end of the sprint. It isimportant to have enough extra space (at least 20 m)to decelerate while encouraging the athlete to maintain maximum velocity until the finish line isreached.
Floor surface
Assuming an indoor facility can be used, the floorsurface can influence the friction between the shoesand surface and therefore the likelihood of slippage.
The floor should be clean and free of dust. Thefootwear used by the athlete must be appropriatefor the floor surface and, if possible, the same type ofshoes should be worn on repeated tests.
Warm-up
An optimum warm-up is required to maximize testperformance and reduce the risk of injury, whichmay be considered higher than for other physicaltests. It is beyond the scope of this section to elab-orate on warm-up procedures, but two approachescan been used. The first is to administer a standardwarm-up for all athletes to ensure consistency. Theproblem with this approach is that a single protocolwill not be optimum for every individual because of variation in fitness levels. Another preferredapproach is to allow each athlete to use their ownindividualized warm-up as although this will vary,it is more likely to yield an optimum performance,which is a major goal of speed testing. The warm-upshould contain some submaximum run-throughsand conclude with some practice of the starting procedure about to be used.
Number of trials
While it is common in research to allow subjects toperform a predetermined number of trials, becausethe objective is to identify the true best performanceof the athlete, the number of trials should not berestricted. If the warm-up is adequate and the testskill has been learned, one or two trials should beenough, but further trials may be needed if test performance is continually improving in successivetrials. For relatively short sprint tests, such as 10–20 m, five or six trials could be completed with minimal fatigue effects, but for longer sprints, suchas 200 m or longer, a lower number of trials would be necessary, to avoid the influence of fatigue onperformance.
Starting procedure
The first consideration is whether reaction timeshould be included in the test. With track and fieldsprinters, reacting to the stimulus of the starter’s
9781405156370_4_004.qxd 3/25/08 5:36 PM Page 175
UN
CO
RR
ECTE
D P
RO
OF
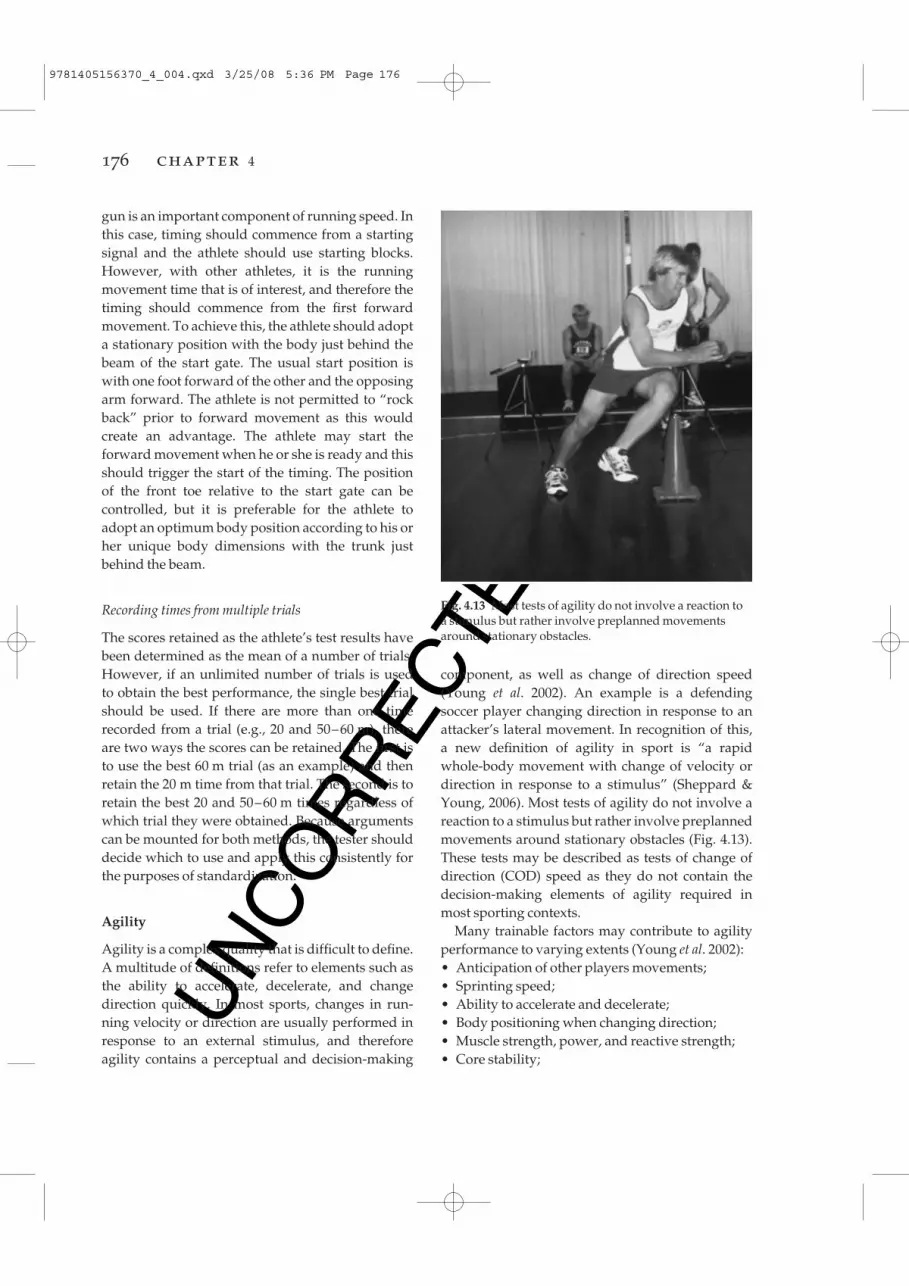
component, as well as change of direction speed(Young et al. 2002). An example is a defending soccer player changing direction in response to anattacker’s lateral movement. In recognition of this, a new definition of agility in sport is “a rapid whole-body movement with change of velocity ordirection in response to a stimulus” (Sheppard &Young, 2006). Most tests of agility do not involve areaction to a stimulus but rather involve preplannedmovements around stationary obstacles (Fig. 4.13).These tests may be described as tests of change ofdirection (COD) speed as they do not contain thedecision-making elements of agility required inmost sporting contexts.
Many trainable factors may contribute to agilityperformance to varying extents (Young et al. 2002):• Anticipation of other players movements;• Sprinting speed;• Ability to accelerate and decelerate;• Body positioning when changing direction;• Muscle strength, power, and reactive strength;• Core stability;
gun is an important component of running speed. Inthis case, timing should commence from a startingsignal and the athlete should use starting blocks.However, with other athletes, it is the runningmovement time that is of interest, and therefore thetiming should commence from the first forwardmovement. To achieve this, the athlete should adopta stationary position with the body just behind thebeam of the start gate. The usual start position iswith one foot forward of the other and the opposingarm forward. The athlete is not permitted to “rockback” prior to forward movement as this would create an advantage. The athlete may start the forward movement when he or she is ready and thisshould trigger the start of the timing. The position of the front toe relative to the start gate can be controlled, but it is preferable for the athlete toadopt an optimum body position according to his orher unique body dimensions with the trunk justbehind the beam.
Recording times from multiple trials
The scores retained as the athlete’s test results havebeen determined as the mean of a number of trials.However, if an unlimited number of trials is used to obtain the best performance, the single best trialshould be used. If there are more than one timerecorded from a trial (e.g., 20 and 50–60 m), thereare two ways the scores can be retained. The first isto use the best 60 m trial (as an example) and thenretain the 20 m time from that trial. The second is toretain the best 20 and 50–60 m times regardless ofwhich trial they were obtained. Because argumentscan be mounted for both methods, the tester shoulddecide which to use and apply this consistently forthe purposes of standardization.
Agility
Agility is a complex quality that is difficult to define.A multitude of definitions refer to elements such asthe ability to accelerate, decelerate, and changedirection quickly. In most sports, changes in run-ning velocity or direction are usually performed inresponse to an external stimulus, and thereforeagility contains a perceptual and decision-making
176 chapter 4
Fig. 4.13 Most tests of agility do not involve a reaction to a stimulus but rather involve preplanned movementsaround stationary obstacles.
9781405156370_4_004.qxd 3/25/08 5:36 PM Page 176
UN
CO
RR
ECTE
D P
RO
OF
clinical exercise testing 177
• Balance; and• Reaction time.
Because movement patterns in different sportsvary, agility can be considered to be a sport-specificquality. Therefore, a test that may be valid for soccermay not be valid for basketball. Unfortunately,there are no universally accepted tests of agility, andnew tests are rapidly emerging.
Evolution of agility testing
generic tests
These include movement patterns that may be con-sidered “typical” in many sports. For example, the“505” test involves a 10 m lead-in run followed by a5 m sprint to a turning line, then a 5 m sprint back.This 5 m up and 5 m back involves a single changeof direction and is performed with left leg and rightleg trials separately to enable comparison. Althoughthis test has been validated for cricket (Draper &Lancaster 1985), it has been widely used to assess“general” agility for several sports (Ellis et al. 2000).
sport-specific movement patterns
Because of the specificity of movement patterns,attempts have been made to analyze the move-ments of various sports so that these patterns can beincorporated into an agility test. For example, some sports (e.g., basketball, volleyball, and tennis)involve sideways “shuffling” and backwards running, and therefore tests have been devised containing these patterns (e.g., SEMO, “T” test;Buckeridge et al. 2000; Semenick 1994).
tests involving a reaction to a generic stimulus
It has been acknowledged that rapid changes ofvelocity and direction are often produced inresponse to an opposition player’s movements. Inan attempt to include reaction time in agility assess-ment, tests have been devised that require an athleteto change direction when they see a light, sound, or computer-generated directional stimulus (e.g.,arrow) appear to indicate the direction of movement
(Besier et al. 2001; Hertel et al. 1999). Although this type of test clearly involves reaction time, thestimulus used to initiate the change of direction isgeneral rather than sport-specific.
Better athletes tend to produce more accurate and faster responses as a result of a superior abilityto detect anticipatory information (Abernethy et al.1998). Therefore, a soccer defender may detect theangle of the hips as a cue to anticipate the change ofdirection of an attacking player. Research suggeststhat the stimulus must be sport-specific for skilledathletes to use their perceptual skill to advantage(Abernethy et al. 1993), and therefore the value of using stimuli such as lights or auditory cues isquestionable.
tests involving reaction to a sport-specific stimulus
Recently, attempts have been made to assess agilityin netball using a videotaped projected image of anattacking player passing the ball (Farrow et al. 2005).The athletes were required to step to the left or rightand sprint through a timing gate once they detectedthe direction of the “opposition player’s” pass. Aunique feature of this test was the use of a videocamera to determine the “decision time,” definedfrom ball release to the instant the tested playerplanted the foot to change direction. The total agilitymovement time was found to be shorter for highlyskilled players than a group of less skilled players.Of importance was the finding that the highlyskilled group achieved a negative decision time,whereas the less skilled group had a positive and significantly longer mean decision time. Thisindicated that the better players anticipated themovement of the netball pass and responded bycommencing the change of direction earlier. Recentresearch on rugby players (Jackson et al. 2006) hasdemonstrated that highly skilled players were better than novices in detecting a deceptive move-ment (“dummy” side-step) in a change of directionsituation.
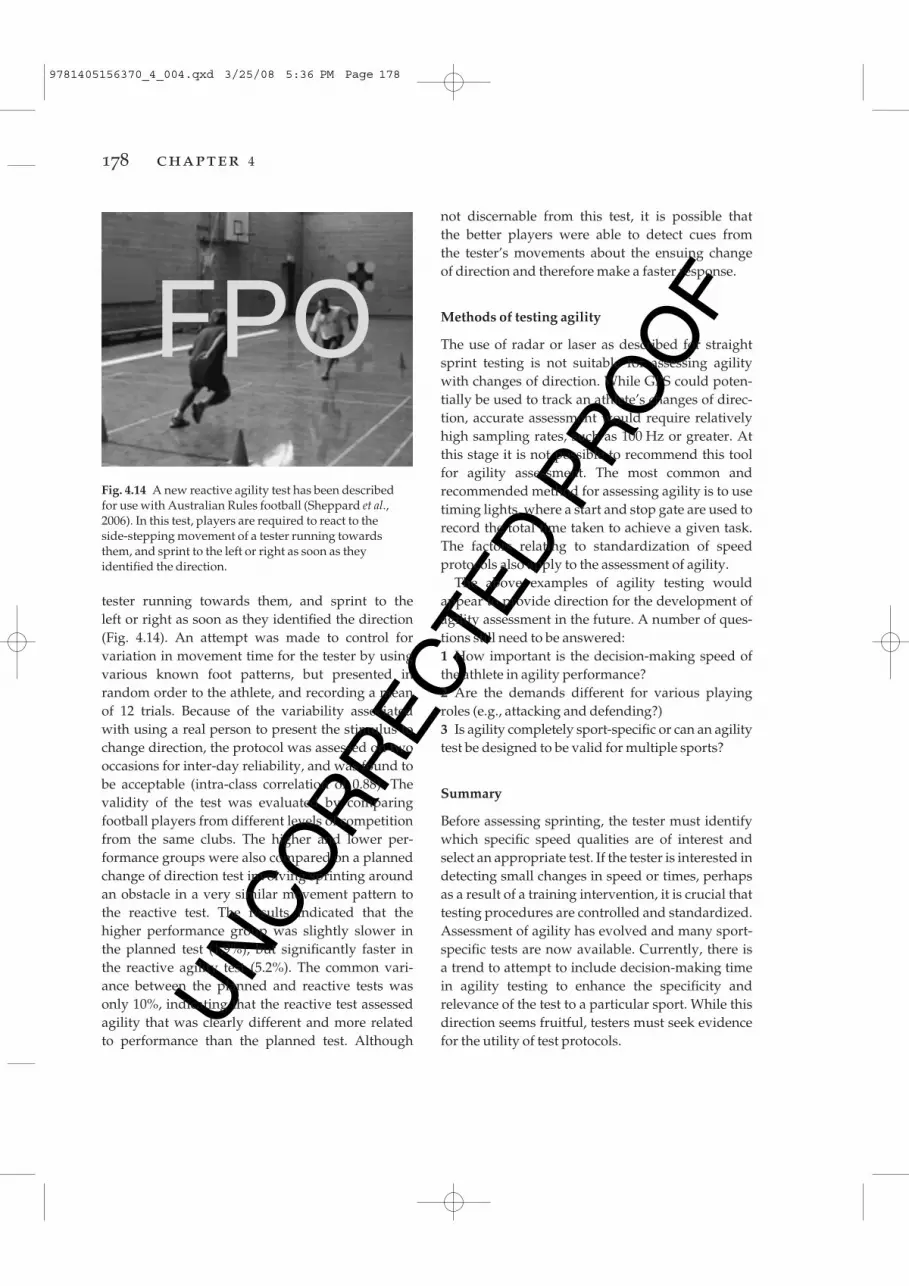
Another new reactive agility test has beendescribed for use with Australian Rules football(Sheppard et al. 2006). In this test, players wererequired to react to the side-stepping movement of a
9781405156370_4_004.qxd 3/25/08 5:36 PM Page 177
UN
CO
RR
ECTE
D P
RO
OF
not discernable from this test, it is possible that the better players were able to detect cues from the tester’s movements about the ensuing change of direction and therefore make a faster response.
Methods of testing agility
The use of radar or laser as described for straightsprint testing is not suitable for assessing agilitywith changes of direction. While GPS could poten-tially be used to track an athlete’s changes of direc-tion, accurate assessment would require relativelyhigh sampling rates, such as 100 Hz or greater. Atthis stage it is not possible to recommend this toolfor agility assessment. The most common and recommended method for assessing agility is to usetiming lights, where a start and stop gate are used torecord the total time taken to achieve a given task.The factors relating to standardization of speed protocols also apply to the assessment of agility.
The above examples of agility testing wouldappear to provide direction for the development ofagility assessment in the future. A number of ques-tions still need to be answered:1 How important is the decision-making speed ofthe athlete in agility performance?2 Are the demands different for various playingroles (e.g., attacking and defending?)3 Is agility completely sport-specific or can an agilitytest be designed to be valid for multiple sports?
Summary
Before assessing sprinting, the tester must identifywhich specific speed qualities are of interest andselect an appropriate test. If the tester is interested indetecting small changes in speed or times, perhapsas a result of a training intervention, it is crucial thattesting procedures are controlled and standardized.Assessment of agility has evolved and many sport-specific tests are now available. Currently, there is a trend to attempt to include decision-making timein agility testing to enhance the specificity and relevance of the test to a particular sport. While thisdirection seems fruitful, testers must seek evidencefor the utility of test protocols.
tester running towards them, and sprint to the left or right as soon as they identified the direction(Fig. 4.14). An attempt was made to control for variation in movement time for the tester by usingvarious known foot patterns, but presented in random order to the athlete, and recording a meanof 12 trials. Because of the variability associatedwith using a real person to present the stimulus tochange direction, the protocol was assessed on twooccasions for inter-day reliability, and was found tobe acceptable (intra-class correlation of 0.88). Thevalidity of the test was evaluated by comparingfootball players from different levels of competitionfrom the same clubs. The higher and lower per-formance groups were also compared on a plannedchange of direction test involving sprinting aroundan obstacle in a very similar movement pattern tothe reactive test. The results indicated that thehigher performance group was slightly slower inthe planned test (1.9%), but significantly faster in the reactive agility test (5.2%). The common vari-ance between the planned and reactive tests wasonly 10%, indicating that the reactive test assessedagility that was clearly different and more related to performance than the planned test. Although
178 chapter 4
Fig. 4.14 A new reactive agility test has been described for use with Australian Rules football (Sheppard et al.,2006). In this test, players are required to react to the side-stepping movement of a tester running towardsthem, and sprint to the left or right as soon as theyidentified the direction.
FPO
9781405156370_4_004.qxd 3/25/08 5:36 PM Page 178

UN
CO
RR
ECTE
D P
RO
OF
clinical exercise testing 179
Testing for endurance activities
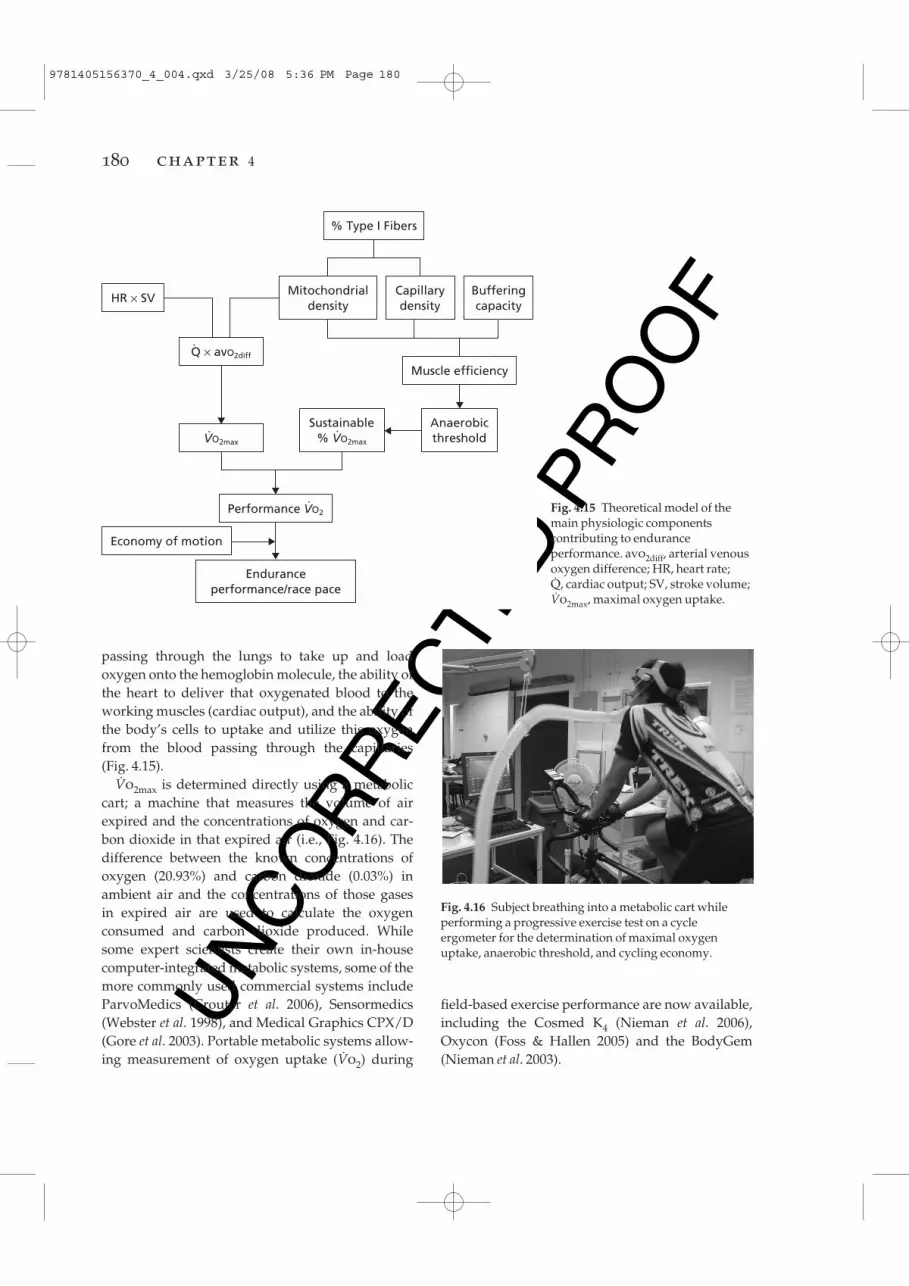
The testing of endurance ability is a common practice in the clinical setting, throughout sportingacademies, institutes, and universities. It is usefulfor identifying gifted athletes, for providing coacheswith knowledge of an athlete’s current perform-ance potential, for determining the effectiveness of a training program or ergogenic aid, and for allow-ing scientists to understand relationships betweentesting variables and endurance performance.Before identifying the various methods of endur-ance testing, the main physiologic factors that make up endurance performance must be understood.Successful endurance performance (i.e., an activityrequiring muscle contractions repeated over dura-tions of greater than 1 min) appears to be related tothree main physiologic components:1 The maximal oxygen uptake, or maximal rate ofoxygen consumption (also known as Vo2max);2 The anaerobic threshold, or the exercise intensitythat can be completed without the development ofhigh lactic acid levels; and3 The economy of motion, or the efficient con-version of usable energy into mechanical power(Coyle 1995).While indices of these three measurements can usually be obtained through the administration of a progressive exercise test (Vo2max test), not all pro-gressive exercise test protocols will provide an accurate assessment of all three variables. Thus, amore in-depth description of each of these physio-logic factors that relate to endurance performance,and a rundown on the various types of progressiveexercise test protocols best suited towards accu-rately measuring each of these distinct variables willbe discussed.
While the Vo2max, anaerobic threshold and eco-nomy of motion all contribute to and predictendurance performance ability, there is no bettermeasurement of one’s endurance performance abil-ity than assessment of performance during an actualendurance performance trial. Endurance perform-ance tests commonly used in assessing endurancecapacity include time-to-exhaustion tests (i.e., howlong can the athlete exercise for at a given exercise
intensity) and time trials (i.e., how fast can the athlete complete a prescribed distance). However,each of these tests has distinctly different character-istics in terms of the reliability, validity, specificity,and practicality, and the practitioner must makecareful consideration as to which type of test is mostsuited to examine the endurance ability pertinent totheir situation. Thus, the second half of this sectiondiscusses considerations for choosing the mostappropriate endurance performance test protocol.
Components of endurance performance
As outlined above, the three main physiologic components that well predict an athlete’s actualendurance performance (i.e., performance timeachieved over a set distance) include one’s maximaloxygen uptake (Vo2max), anaerobic threshold, andeconomy of motion (Fig. 4.15; Coyle 1999). Whileeach of these variables contribute in some degree to the overall endurance performance, the Vo2maxappears to be a better discriminator of enduranceperformance within heterogeneous populations(Butts et al. 1991), while the anaerobic or lactatethreshold and one’s economy of motion tends tobetter predict the endurance performance ability in more homogeneous populations of enduranceathletes (Farrell et al. 1979; Grant et al. 1997; Laursen & Rhodes 2001; Rhodes & McKenzie 1984).Conveniently, all of these variables can be measuredusing a progressive exercise test protocol, albeit certain progressive exercise test protocols are bettersuited to measure one variable than others.
maximal oxygen uptake
Maximal oxygen uptake (Vo2max), also referred to as aerobic capacity, is a well-known physiologic factor commonly found to be related not only to endurance performance ability throughout adiverse range of athletes (Butts et al. 1991), but also to one’s aerobic fitness, functional capacity, andgeneral health (Kohrt et al. 1987). As the termimplies, Vo2max reflects the maximal ability of thebody to uptake and process oxygen. Broken down,Vo2max is a product of the capacity of the blood
9781405156370_4_004.qxd 3/25/08 5:36 PM Page 179
UN
CO
RR
ECTE
D P
RO
OF
field-based exercise performance are now available,including the Cosmed K4 (Nieman et al. 2006),Oxycon (Foss & Hallen 2005) and the BodyGem(Nieman et al. 2003).
passing through the lungs to take up and load oxygen onto the hemoglobin molecule, the ability ofthe heart to deliver that oxygenated blood to theworking muscles (cardiac output), and the ability ofthe body’s cells to uptake and utilize this oxygenfrom the blood passing through the capillaries (Fig. 4.15).
Vo2max is determined directly using a metaboliccart; a machine that measures the volume of airexpired and the concentrations of oxygen and car-bon dioxide in that expired air (i.e., Fig. 4.16). Thedifference between the known concentrations ofoxygen (20.93%) and carbon dioxide (0.03%) inambient air and the concentrations of those gases in expired air are used to calculate the oxygen consumed and carbon dioxide produced. Whilesome expert scientists create their own in-housecomputer-integrated metabolic systems, some of themore commonly used commercial systems includeParvoMedics (Crouter et al. 2006), Sensormedics(Webster et al. 1998), and Medical Graphics CPX/D(Gore et al. 2003). Portable metabolic systems allow-ing measurement of oxygen uptake (Vo2) during
180 chapter 4
HR × SV
Q × avO2diff
VO2max
% Type I Fibers
Mitochondrialdensity
Capillarydensity
Bufferingcapacity
·
·
Performance VO2·
Economy of motion
Enduranceperformance/race pace
Sustainable% VO2max
·Anaerobicthreshold
Muscle efficiency
Fig. 4.15 Theoretical model of themain physiologic componentscontributing to enduranceperformance. avo2diff, arterial venousoxygen difference; HR, heart rate; q, cardiac output; SV, stroke volume;Vo2max, maximal oxygen uptake.
Fig. 4.16 Subject breathing into a metabolic cart whileperforming a progressive exercise test on a cycleergometer for the determination of maximal oxygenuptake, anaerobic threshold, and cycling economy.
9781405156370_4_004.qxd 3/25/08 5:36 PM Page 180

UN
CO
RR
ECTE
D P
RO
OF
clinical exercise testing 181
At exercise intensities below the anaerobic thresh-old, progressive increases in exercise intensity tendto be matched by equivalent increases in Vo2. At exercise intensities above the anaerobic thresh-old, further energy requirements (i.e., adenosinetriphophate [ATP] levels) can no longer be met withequivalent increases in oxidative phosphorylation,and the energy for these high exercise intensities mustbe supplemented through anaerobic glycolysis,which temporarily stores electrons and H+ ions onthe pyruvate molecule to form lactate. Thus, Vo2tends to plateau, peak, or even decrease during thelatter stages of a progressive exercise test. Thus,when a plateau is not evident, the term is no longerreferred to as Vo2max, but instead as a Vo2peak, andthe highest measurement of Vo2 that occurs duringthe exercise test is then used. A Vo2 plateau appearsless frequently in children, possibly because of theunaccustomed high physical and psychologic costsassociated with reaching such high exercise intens-ities (Rowland & Cunningham 1992). The peak inVo2 may therefore be caused by early termination ofthe exercise in this case. Some authors have been ofthe opinion that a Vo2max can only truly be obtainedduring exercise that can stress a very large musclemass, during exercise modes such as running orcross-country skiing, and that even aerobic capacityvalues for cycling should be classified as a Vo2peak(Brooks et al. 1996). Generally, however, “Vo2max” isan accepted term to use when assessing Vo2max witha cycle ergometer, especially in trained cyclists.Regardless, when a plateau in Vo2 does not occurduring a progressive exercise test, secondary crite-ria are often used to justify that the capacity of theaerobic system has been reached:1 A maximum heart rate (HRmax) of within ± 10beats of the age predicted HRmax (i.e., 220 – age);2 A respiratory exchange ratio (RER; Vco2/Vo2)value greater than 1.10;3 A blood lactate value of greater than 8 mmol·L–1;and;4 Volitional fatigue.
When the absolute values of Vo2max (L·min–1) arecompared amongst a normal distribution of indi-viduals there will be large variations in Vo2maxbecause of body size, muscle mass, age, genetic factors, and body composition, and the ability of
this value to consistently predict endurance capa-city is not always strong (Laursen & Rhodes 2001).However, when Vo2max is expressed as a measurerelative to an individual’s body mass, this tends to improve the relationship between Vo2max andendurance capacity. This relative measure isexpressed in mL·kg–1·min–1 by multiplying theVo2max in L·min–1 by 1000 and then dividing by thebody mass in kilograms.
The level of Vo2max obtained is also highly reliantupon the mode of exercise testing used, with thehighest values generally reported during cross-country skiing and treadmill running activities(Droghetti et al. 1985; Kohrt et al. 1987; Schneider et al. 1990). Thus, the higher Vo2max values generallyfound with these exercise modes likely relate to thelarge muscle mass recruited during these activitiescompared with smaller levels of muscle recruit-ment in activities such as swimming. Nevertheless,the principle of specificity applies when testing for aerobic capacity. That is, the Vo2max of a runnershould be measured using a running treadmill, theVo2max of a cyclist should be measured using a cycleergometer, the Vo2max of a rower should be mea-sured on a rowing ergometer, and so on. Indeed,well-trained cyclists measured on a cycle ergometerwill regularly record a level of Vo2max greater thanthat obtained while treadmill running (Kohrt et al.1987), and well-trained triathletes can have equi-valent measures of Vo2max measured using both exercise modes (Laursen et al. 2005b).
While obtainment of one’s Vo2max through directassessment might be ideal, it is often not practicalbecause of the requirements of expensive special-ized equipment and the time required to completesuch testing. Thus, many non-invasive tests havebeen developed to predict Vo2max. The Astrand–Rhyming test is a non-invasive submaximal pre-dictor of Vo2max and conveniently uses the linearrelationship between the parallel increases in heartrate with exercise intensity to conveniently predictVo2max (Macsween 2001). In this test, subjects cycle,performing progressive increases in exercise inten-sity until they achieve an age-based submaximaltarget heart rate; the workload achieved at thedesired target heart rate predicts the Vo2max througha derived formula (Siconolfi et al. 1985). Other
9781405156370_4_004.qxd 3/25/08 5:36 PM Page 181
UN
CO
RR
ECTE
D P
RO
OF
attained during a progressive exercise test, and thereferred term will be specific to the exercise modeperformed (e.g., peak power output for cycleergometry, maximal aerobic speed for treadmillrunning). This related variable also does well to predict the endurance performance ability of well-trained endurance athletes (Hawley & Noakes 1992;Noakes et al. 1990), but as the level of peak power orspeed attained will occur in the latter stages of a progressive exercise test, a partial contribution tothis variable will come from anaerobic sources andpossibly the anaerobic threshold (Fig. 4.15).
There are a multitude of commercially availabletreadmills that are applicable for clinical exercisetesting. When purchasing a treadmill, however, thereliability and drift of the treadmill speed should beexamined, as well as the peak treadmill velocity ifthe testing of highly trained runners is sought (i.e.,>25 km·h–1). There are also a number of commer-cially available cycle ergometers. The mechanicallybraked Monark 824E cycle ergometer is probablythe most commonly used cycle ergometer foundwithin the teaching and clinical setting, and pro-vides a reliable assessment of power output duringcycling (Franklin et al. 2005). When assessing theperformance of well-trained cyclists, however, theMonark falls somewhat short in terms of its externalvalidity, and adjustable cycle ergometers specific tocyclists include the Lode (Paton & Hopkins 2001),SRM (Smith et al. 2001) and Velotron cycle ergo-meters (McDaniel et al. 2005), as well as theKingcycle ergometer which utilizes the cyclist’sown bicycle (Paton & Hopkins 2001).
anaerobic threshold
Although scientists have in the past debated theexistence of an anaerobic threshold (Brooks 1985;Davis 1985), it is generally accepted to be the highestexercise intensity where blood lactate production isequal to the rate of its disappearance (Koike et al.1990), and is therefore considered to be a high exer-cise intensity that can be maintained for a prolongedperiod of time (Svedahl & MacIntosh 2003). At high work rates above the anaerobic threshold, thecapillary partial pressure of oxygen needed for the muscle cell’s oxygen requirements is not met by the cardiovascular oxygen supply (Svedahl &
commonly used predictive tests of Vo2max includethe Coopers 12-min run test (Grant et al. 1995), the1.5-mile run (Jackson et al. 1981), the multistage 20-m shuttle run (i.e., beep test; St Clair Gibson et al.1998) and the Bangsbo Yo-Yo test (Krustrup et al.2003). However, it should be noted that all of thesetests require a maximal effort.
For the Coopers 12-min run test and the 1.5-milerun, participants simply run either as far as they canin 12 min or as fast as they can for 1.5 miles, respect-ively, and equations are used to predict Vo2maxbased on their result. The multistage fitness test (the“beep test”) consists of multiple levels of runningspeed over a 20-m distance. The speed needed torun the 20 m distance is dictated by numerous aud-ible “beeps” and subjects need to complete the 20 mdistance before the audible “beep” occurs, turn 180°and run the next 20 m in the opposite direction andcomplete the distance again. The test begins veryeasy, but slowly progresses until the subject isunable to keep pace with the speed of the repeat-ing beeps. This test, originally developed by theAustralian Institute of Sport, is highly correlated to direct measures of aerobic capacity, and is com-monly used to assess aerobic fitness by sportingteams throughout the world. The Bangsbo Yo-Yointermittent endurance test consists of 5–18 s inter-vals of 20 m running interspersed by regular shortrest periods (5 s). The test evaluates an individual’sability to repeatedly perform intervals over a prolonged period of time. The test is particularlyuseful for an athlete who performs interval sports(e.g., tennis, team handball, basketball, and soccer)and the test usually lasts 5–20 min. For both themultistage fitness test and the Yo-Yo test, equationsare used to predict Vo2max, and the longer the athletelasts, the higher will be the predicted Vo2max.
In summary, the Vo2max, or aerobic capacity, represents the maximal capacity of the cardiovascu-lar system to uptake and deliver oxygenated bloodto working musculature, and Vo2max is an importantpredictor of endurance performance ability and cardiovascular fitness level.
peak aerobic power
Another factor that is related to the Vo2max is thehighest running speed or peak power output that is
182 chapter 4
9781405156370_4_004.qxd 3/25/08 5:36 PM Page 182
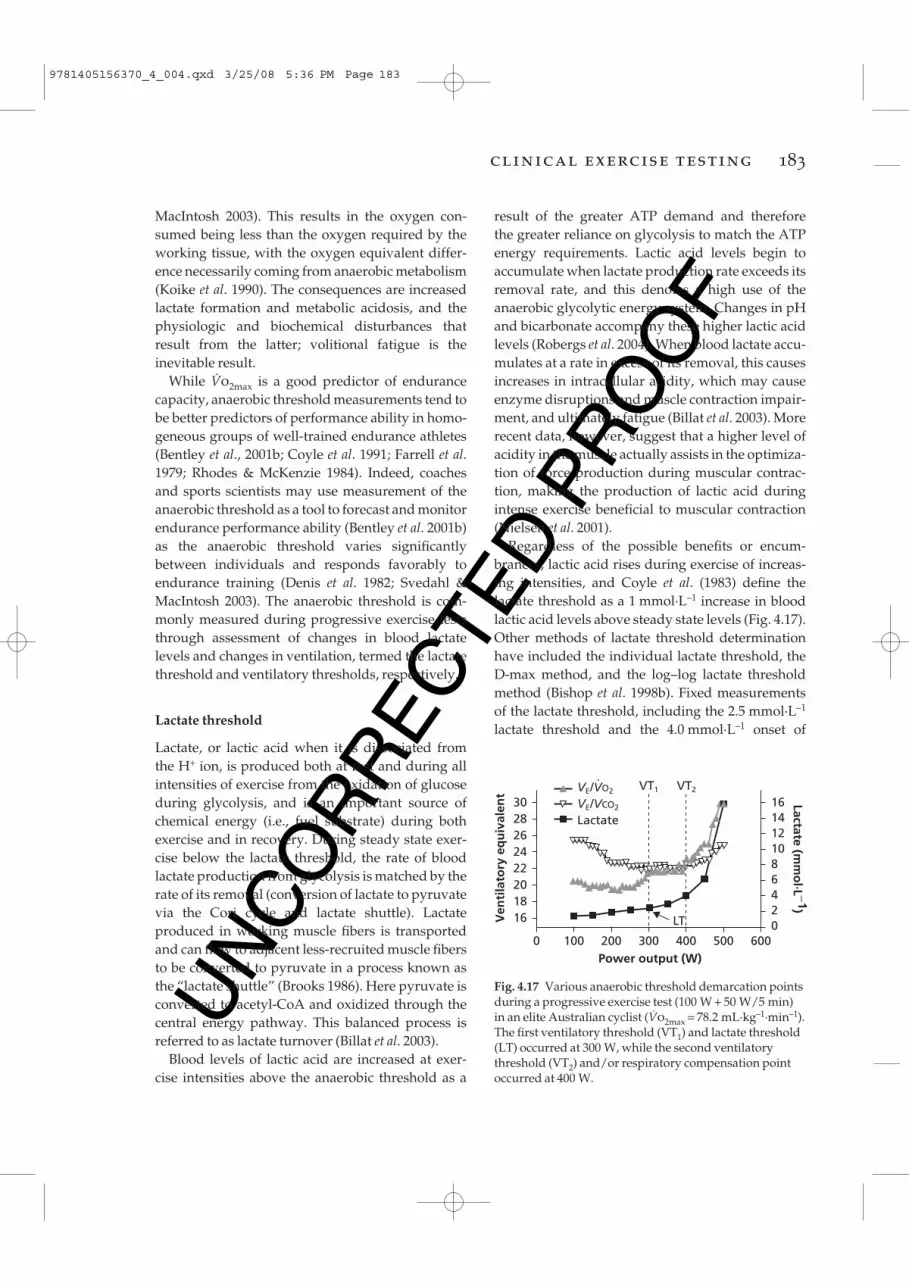
UN
CO
RR
ECTE
D P
RO
OF
clinical exercise testing 183
MacIntosh 2003). This results in the oxygen con-sumed being less than the oxygen required by theworking tissue, with the oxygen equivalent differ-ence necessarily coming from anaerobic metabolism(Koike et al. 1990). The consequences are increasedlactate formation and metabolic acidosis, and thephysiologic and biochemical disturbances thatresult from the latter; volitional fatigue is theinevitable result.
While Vo2max is a good predictor of endurancecapacity, anaerobic threshold measurements tend tobe better predictors of performance ability in homo-geneous groups of well-trained endurance athletes(Bentley et al., 2001b; Coyle et al. 1991; Farrell et al.1979; Rhodes & McKenzie 1984). Indeed, coachesand sports scientists may use measurement of theanaerobic threshold as a tool to forecast and monitorendurance performance ability (Bentley et al. 2001b)as the anaerobic threshold varies significantlybetween individuals and responds favorably toendurance training (Denis et al. 1982; Svedahl &MacIntosh 2003). The anaerobic threshold is com-monly measured during progressive exercise teststhrough assessment of changes in blood lactate levels and changes in ventilation, termed the lactatethreshold and ventilatory thresholds, respectively.
Lactate threshold
Lactate, or lactic acid when it is dissociated from the H+ ion, is produced both at rest and during allintensities of exercise from the oxidation of glucoseduring glycolysis, and is an important source ofchemical energy (i.e., fuel substrate) during bothexercise and in recovery. During steady state exer-cise below the lactate threshold, the rate of bloodlactate production from glycolysis is matched by therate of its removal (conversion of lactate to pyruvatevia the Cori cycle and lactate shuttle). Lactate produced in working muscle fibers is transportedand can flow to adjacent less-recruited muscle fibersto be converted to pyruvate in a process known asthe “lactate shuttle” (Brooks 1986). Here pyruvate isconverted to acetyl-CoA and oxidized through thecentral energy pathway. This balanced process isreferred to as lactate turnover (Billat et al. 2003).
Blood levels of lactic acid are increased at exer-cise intensities above the anaerobic threshold as a
result of the greater ATP demand and therefore the greater reliance on glycolysis to match the ATPenergy requirements. Lactic acid levels begin toaccumulate when lactate production rate exceeds itsremoval rate, and this denotes a high use of theanaerobic glycolytic energy system. Changes in pHand bicarbonate accompany these higher lactic acidlevels (Robergs et al. 2004). When blood lactate accu-mulates at a rate in excess of its removal, this causesincreases in intracellular acidity, which may causeenzyme disruptions and muscle contraction impair-ment, and ultimately fatigue (Billat et al. 2003). Morerecent data, however, suggest that a higher level ofacidity in the muscle actually assists in the optimiza-tion of force production during muscular contrac-tion, making the production of lactic acid duringintense exercise beneficial to muscular contraction(Nielsen et al. 2001).
Regardless of the possible benefits or encum-brances, lactic acid rises during exercise of increas-ing intensities, and Coyle et al. (1983) define thelactate threshold as a 1 mmol·L–1 increase in bloodlactic acid levels above steady state levels (Fig. 4.17).Other methods of lactate threshold determinationhave included the individual lactate threshold, theD-max method, and the log–log lactate thresholdmethod (Bishop et al. 1998b). Fixed measurements of the lactate threshold, including the 2.5 mmol·L–1
lactate threshold and the 4.0 mmol·L–1 onset of
Ven
tila
tory
eq
uiv
alen
t Lactate (mm
ol·L −1)
30 28 26 24 22 20 18 16
16 14 12 10 8 6 4 2 0
0 600Power output (W)200 300 400 500100
LT
VT1 VT2VE/VO2
VE/VCO2
Lactate
·
Fig. 4.17 Various anaerobic threshold demarcation pointsduring a progressive exercise test (100 W + 50 W/5 min)in an elite Australian cyclist (Vo2max = 78.2 mL·kg–1·min–1).The first ventilatory threshold (VT1) and lactate threshold(LT) occurred at 300 W, while the second ventilatorythreshold (VT2) and/or respiratory compensation pointoccurred at 400 W.
9781405156370_4_004.qxd 3/25/08 5:36 PM Page 183
UN
CO
RR
ECTE
D P
RO
OF
As a result of the commonality of these demarcationpoints, the ventilatory threshold is often used as atool to predict the lactate threshold (Laursen et al.2005c), particularly in children, as it is seen as beingfar less invasive. Interestingly, there are generallytwo distinct points during a progressive exercisetest where ventilation increases disproportionatelyto that of oxygen uptake. These two points are generally referred to as the first and second ventil-atory thresholds (Lucia et al. 2000) and examples of these are shown in Fig. 4.17.
first ventilatory threshold (VT1 )
The first ventilatory breakpoint is the point during aprogressive exercise test where a noticeable increasein the ventilatory equivalent for oxygen uptake(VE/Vo2) occurs (Lucia et al. 2000). Here the volumeof air breathed in and out increases at a dispropor-tionate rate to the level of oxygen that is consumed.This point is sometimes referred to as the “aerobicthreshold,” and is thought to be the exercise intens-ity where H+ ions released from lactate are beingadequately buffered by the bicarbonate ion to formthe weak acid carbonic acid (H2CO3), which disso-ciates into water and carbon dioxide. Increases in carbon dioxide levels and H+ ion levels trigger anincrease rate of breathing through their influence on the central and peripheral chemoreceptors. Thisincreased rate of minute ventilation removes theexcess carbon dioxide levels and as a result, pH lev-els are controlled. While the increase in VE initiallyfalls in line with that of carbon dioxide production(Vco2), the increase in Vo is disproportionate to thatof Vo2. Thus, the ventilatory equivalent for carbondioxide (VE/Vo2) does not change at this point (Fig. 4.17; Lucia et al. 2000).
second ventilatory threshold (VT2 )
The second ventilatory threshold (VT2) is associatedwith very high exercise intensities, where blood lactate accumulates significantly more than it can becleared (Fig. 4.17). The VT2 is depicted by anothersignificant increase in the VE/Vo2, but with a concomitant increase in the VE/Vo2 (Lucia et al.2000). Here these very high levels of blood lactic
blood accumulation (OBLA), have been used in thepast as absolute measures of the lactate threshold(Svedahl & MacIntosh 2003). While these fixed mea-surements of the lactate threshold have been shownto predict performance ability in earlier studies, it isnow established that the lactate threshold occurs at an individualized rate (Myburgh et al. 2001).Therefore, a fixed lactate threshold measurement isno longer recommended.
An individual’s lactate threshold will be specificto the exercise intensity (power output or runningspeed) where the imbalance between the muscle cell’s lactate formation and clearance occurs. Themeasurement of one’s lactate threshold then pro-vides a means of highlighting an athlete’s aerobicability, and may provide a benchmark for exercisetraining intensity prescription when incorporatedwith the associated heart rate, running speed, orpower output response. It is important to note that just like the Vo2max measurement, the lactatethreshold is also specific to the mode of exercisebecause of the neuromuscular blueprint utilized.Recruitment of less trained muscle fibers duringunfamiliar exercise modes will alter the lactatethreshold. Thus, the lactate threshold needs to bedetermined using the mode of exercise specific tothat athlete’s mode of familiarity.
In the clinical setting, lactate levels are com-monly measured using benchtop or portable lactate analyzers. A common benchtop analyzer is the YSILactate Analyzer (Bishop et al. 1992), while the“gold standard” for lactate analysis is thought bymany to be the Radiometer (Cobbaert et al. 1999).Some of the more common handheld, portable, lactate analyzers are the Accusport (Fell et al. 1998),Lactate Pro (van Someren et al. 2005), and i-STAT(Dascombe et al. 2006).
Ventilatory threshold
The ventilatory threshold is considered to be thepoint during a progressive exercise test where theminute ventilation (VE) rate increases disproportion-ately to that of the oxygen uptake (Vo2), and thistends to occur (but not always) at a similar point intime to that of the exponential rise in blood lactate(i.e., the lactate threshold; Brooks 1985; Davis 1985).
184 chapter 4
9781405156370_4_004.qxd 3/25/08 5:36 PM Page 184
UN
CO
RR
ECTE
D P
RO
OF
clinical exercise testing 185
acid trigger an exponential increase in the VE to levels much greater than required for oxygen uptakeor carbon dioxide removal. While the VT1 is com-monly referred to as the “aerobic threshold,” the VT2is sometimes referred to as the “anaerobic threshold”or “respiratory compensation point.”
The observation of these two distinct ventilatorythresholds (i.e., VT1 and VT2) then begs the followingtwo questions. First, how are these points practic-ally related to an athlete’s endurance performance?Second, could an athlete use this information ineither their training program, or as a pacing toolduring an endurance or ultra-endurance event? Fewstudies to date have examined this. However, arecent study showed in Ironman triathletes that the heart rate associated with VT1 was related to the heart rate performed at during the running and cycling phases of a 226-km Ironman triathlon(Laursen et al. 2005a). Moreover, triathletes whoperformed above their VT1 during the cycle phase ofthe event had slower marathon run performancesthan those who performed the cycle phase belowtheir VT1, suggestive to the fact that the heart rate at VT1 may be a good pacing tool for Ironman triathletes to use to pace their overall triathlon per-formance. It is possible therefore that the VT1, oraerobic threshold, may predict an exercise intensitythat is maintainable for prolonged endurance andultra-endurance durations. Conversely, the VT2 hasbeen shown to be related to endurance perform-ances requiring a very high exercise intensity fordurations of around 60 min, such as a 40 km cyclingtime trial (Laursen et al. 2003a).
Economy of motion
The successful endurance athlete is able to maintaina continual high work rate without critically affect-ing the endogenous energy supplies of their work-ing muscles. Thus, efficient use of accessible energyis an important contributor to the performance ability of the endurance athlete. Economy of motionrefers to the relationship between the mechanicalwork achieved (i.e., running speed or power output)and the total energy expended (i.e., oxygen uptake).For example, running economy is taken by measur-ing the oxygen uptake at a given submaximal
running speed (i.e., 14 km·h–1). Imagine two run-ners, identical in build and stature. The first of thoserunners is able to run at 14 km·h–1 at an oxygenuptake of 2.5 L·min–1, while the second runner runs14 km·h–1 at 2.7 L·min–1. The first runner is moreeconomical in using a range of physiologic systems(e.g., stretch–shortening cycle, lower respirationrate) to move at the set speed of 14 km·h–1. The firstrunner will also produce less heat than the secondrunner, as heat is produced relative to the metabolicrate. Thus, it is likely that the first runner will have the capacity to run for longer than the secondrunner through a sparing of energy reserves (i.e.,muscle glycogen), and by a reduction in the amountof heat that is produced from the decreased meta-bolic rate. Minimizing or eliminating unwanted or counterproductive muscular movements, as well as training adaptations that serve to enhancethe stretch–shortening cycle, have the potential toincrease one’s economy of motion and improveendurance performance (Paavolainen et al. 1999).
Similar to the anaerobic threshold measurement,economy of motion has been shown to segregate the performance ability of homogeneous groups of well-trained athletes with comparable levels ofVo2max (Lucia et al. 2002, Weston et al. 2000). Forexample, Weston et al. (2000) investigated the Vo2maxand economy of motion in African and Caucasianlong-distance runners, and while Vo2max was 13%higher in the Caucasian group, running economy at16.1 km·h–1 was 5% superior in the faster runningAfrican group.
In summary, theVo2max, peak power output,anaerobic threshold, and economy of motion are the main factors that influence overall enduranceperformance (Fig. 4.15). While Vo2max does well topredict performance throughout the general popu-lation, peak power output, the anaerobic thre-shold and the economy of motion may be better discriminators of performance ability in homo-geneous groups of well-trained endurance athletes.The extent to which each of these factors has a role in the overall performance outcome depends on the duration and intensity of the endurance per-formance in question, with a high Vo2max being more important for shorter duration high-intensityevents, and the peak power output, anaerobic
9781405156370_4_004.qxd 3/25/08 5:36 PM Page 185

UN
CO
RR
ECTE
D P
RO
OF
ramp running protocol used for well-trained run-ners might begin at 8 km·h–1, and increases in speedoccur by 1 km·h–1 every minute until 18 km·h–1.Thereafter, further increases in exercise intensitywould be achieved through increases in treadmillincline or grade (i.e., an increase of 1% grade everyminute thereafter until volitional fatigue (Laursen et al. 2005b). A typical “fast ramp” cycling protocolfor well-trained cyclists might have subjects com-mencing exercise at 100 W for the first minute, withpower output increases of 30 W every minute untilvolitional fatigue (Laursen et al. 2002a). However,these fast ramp protocols are not appropriate tomeasure either economy of motion or the anaerobicthreshold, as steady state for each exercise level isnot likely to be reached before the next increase in exercise intensity occurs (Bentley et al. 2001a).Nevertheless, the “fast ramp” protocol is appropri-ate for measuring Vo2max and maximum heart rate,and because of its relatively short time requirement,may be a useful tool for coaches and sports scientiststo monitor changes in Vo2max.
Slow ramp protocols
A progressive exercise test is classified as a “slowramp” protocol when the protocol is designed withprolonged stage durations of 3–8 min. Slow rampprotocols are typically used to assess indices of theanaerobic threshold, peak-sustained power, and in some instances running economy (Noakes et al.1990; Weston et al. 2000). Peak-sustained power output has a strong correlation with endurance performance ability, particularly in well-trainedathletes (Hawley & Noakes 1992; Noakes et al. 1990).The time to fatigue for a slow ramp progressiveexercise test will normally be 20–45 min, with 5-minincrements generally used as the step duration (Fig. 4.17). These tests may not be suitable for in-experienced or untrained subjects, especially whenassessingVo2max, as fatigue may ensue prior toreaching a level that would challenge cardiovascu-lar capacity. However, in better-trained subjects,slow ramp protocols have been shown to provideequivalent levels of Vo2max to those of fast ramp protocols (Bentley et al. 2001a; Bishop et al. 1998a).Therefore, if time permits, the use of a slow rampprotocol would seem to be more valuable to the
threshold, and economy of motion having a higherweighting for longer duration endurance events.Conveniently, all of these factors can be measuredusing a progressive exercise test.
Progressive exercise tests
A progressive or graded exercise test, sometimessimply referred to as a Vo2max test (Fig. 4.16), is acommon clinical endurance test that can be used toestimate all of the abovementioned variables thatwell predict endurance performance ability. However,not every type of graded exercise test will measureeach of these variables accurately. Thus, it is importantfor the practitioner to understand how the manipu-lation of the progressive exercise test protocol caninfluence the results. Differences in test protocolsinclude aspects such as the stage duration and therate of increase in exercise intensity (i.e., power orrunning speed) from one stage to the next. Mani-pulation of these variables categorizes a progressiveexercise test as either a fast or slow ramp proto-col (Bentley et al. 2001a; Bishop et al. 1998a). The suitability of these different types of progressiveexercise tests for measuring the main physiologicpredictors of performance success will be explained.
testing protocols
Fast ramp protocols
A progressive exercise test can be classified as having a “fast ramp” protocol when the test is created so that voluntary termination of the exercisefrom fatigue occurs at 8–15 min (Brooks et al. 2000).The reason for the broad range in duration isbecause if fatigue during a progressive exercise testoccurs in less than 8 min, the protocol might havecreated too great an exercise intensity too soon, andcardiac output might not have been fully chal-lenged. Conversely, for fatigue occurring in a timegreater than 15 min, untrained subjects might not beable to push themselves to exercise for such longperiods and again cardiovascular capacity mightnot be fully taxed.
The fast ramp protocol does well to measureVo2max and maximum heart rate (HRmax) in thebroad population (Bishop et al. 1998a). A typical fast
186 chapter 4
9781405156370_4_004.qxd 3/25/08 5:36 PM Page 186
UN
CO
RR
ECTE
D P
RO
OF
clinical exercise testing 187
endurance coach as it provides more useful measures of endurance performance, including theanaerobic threshold and economy of motion, withoutsacrificing the measurement of Vo2max (Bentley et al.2001a; Bishop et al. 1998a).
Slow ramp protocols implementing 5–6 min progressive stages are typically used for measuringeconomy to ensure steady state levels of oxygenconsumption are attained (Morgan & Daniels 1994).This protocol tends to be more applicable in well-trained athletes, as the longer time frame (20–45 min)fatigues untrained athletes before economy ofmotion can be properly assessed (Morgan & Daniels1994). Although not entirely clear as to the exactmechanisms responsible for improving economy ofmotion, training volume, training intensity, trainingtype (i.e., plyometrics), years of endurance trainingand genetics all appear to have a role (Franch et al.1998; Paavolainen et al. 1999; Sjodin & Svedenhag1985).
Considerations for endurance performancetesting
ergometer specificity
A cardinal rule of endurance performance testing is that the ergometer used for the test must be spe-cific to the population being studied. For example,there is no point in measuring the Vo2max of a cyclistusing a running treadmill, as the recruitment pat-terns used in cycling are different to those used inrunning, and the resultant Vo2max score will besignificantly lower than that obtained on a cycleergometer.
Thus, a population of cyclists should be measuredusing a cycle ergometer in the laboratory orremotely using field power measuring devices, run-ners must be examined on a running treadmill or on the track, rowers using rowing ergometers.Generally speaking, the more specific the test can beto the actual movements that are performed by theathlete during training and competition the better.
familiarization trials
Familiarity in a performance task is an import-ant variable related closely to variation which is
naturally inherent within repeated endurance per-formance trials. Thus, a familiarization trial of someform should be considered as a requirement for conducting a clinically valid endurance test. Thefamiliarization trial ensures that subjects are com-fortable with the equipment and procedures, andthis can significantly reduce the within-subject vari-ations that occur from the “learned effect” (Laursenet al. 2003a). For example, Laursen et al. (2003a) performed a study where cyclists had to performthree indoor 40 km cycle time trials on their ownbicycle mounted to a stationary wind-trainer. Thecoefficient of variation (measure of variability)between the first and second trial, and the first andthird trial was 3%. However, when the coefficient ofvariation was examined between the second andthird trials, the variation was markedly reduced to only 1%. Clearly then, a familiarization trial is avital component of endurance testing research as itsignificantly reduces the variance between tests.
standardized warm-up
A standardized warm-up is also an importantaspect of an endurance performance test. Thewarm-up should be specific to the exercise taskbeing performed and will allow for an increase inblood flow into the working muscles that will berecruited for the performance test. The warm-up literally increases the temperature of the musclesand increases the muscles’ ability to produce forcethrough an increase in enzyme activity and sub-sequent increase in energy production, known asthe Q-10 effect. A good warm-up for well-trainedcyclists could include 3 min of cycling at 25% ofpeak power output, followed by 5 min of cycling at60% of peak power output, followed by 2 min ofcycling at 80% of peak power output.
tests of endurance performance
Central to the administration of a meaningful physiologic performance test is the concept of repro-ducibility or reliability as discussed in the introduc-tion. Reproducibility implies how well a physicalperformance test is able to give the same result time and time again, which implies a high level of accuracy and precision of the measurement
9781405156370_4_004.qxd 3/25/08 5:36 PM Page 187
UN
CO
RR
ECTE
D P
RO
OF
to perform “to exhaustion.” However, this type oftest differs from time-to-exhaustion tests in that the exercise intensity is incremental under set timeblocks, and the work load is not kept constant. Thisincremental nature of the progressive exercise testsmay assist the subject to allow pacing to occur oncea familiarization test has occurred, or if the exercisestages and durations are presented to the subject. In time-to-exhaustion tests, time is typically blindedto the subject. The reliability of progressive tests has been reported to be less than 5% in untrainedrunners (Kyle et al. 1989), with strong reliabilitycoefficients also reported in triathletes performingprogressive exercise tests in the modes of running(0.97), cycling (0.93), and swimming (0.97) (Kohrt et al. 1987). Thus, progressive exercise tests, whichmay be considered by some as open-loop tests,appear to be reliable.
time-to-exhaustion tests
Time-to-exhaustion tests have been used as animportant tool to assess performance changes fol-lowing a training intervention. During time-to-exhaustion tests, subjects are required to perform at a predetermined exercise intensity that remainsconstant throughout each trial, until that pace canno longer be maintained and the time-to-exhaustionis recorded (Davis et al. 1992; Laursen et al. 2002b).The longer an athlete performs, the greater their end-urance potential is deemed to be. The submaximalspeed or power output is generally established as a percentage of an athlete’s Vo2max or thresholdmarker (Davis et al. 1992; Laursen et al. 2002b).During time-to-exhaustion tests, athletes areblinded to feedback on time or distance completed.Billat et al. (1994) conducted time-to-exhaustiontests in eight sub-elite runners at the running speedassociated with Vo2max and found no significant differences between the trials repeated within 1 weekof each other. Despite this, however, substantial differences existed in the individual subject mea-surements, and the coefficient of variation was calculated to be high at 25%.
Time-to-exhaustion tests performed at supra-maximal exercise intensity (exercise intensity inexcess of Vo2max power output or running speed)
(Hopkins 2000; Hopkins et al. 2001). If a test pos-sesses a high level of reproducibility, it increases the chance of detecting differences in physiologicparameters amongst individuals, or a real change inperformance potential, should one exist, followingadministration of either a training intervention orergogenic aid.
Current debate exists as to the methodology that should be used to design an endurance per-formance test. Many endurance performance tests are designed so that the athlete is asked to either“perform for as long as possible at a given exerciseintensity,” or to “perform a given distance in as fasta time as possible.” At first glance these two tasksmay seem comparable as both types of tests willchallenge one’s endurance capacity. Indeed, bothtypes of tests are used extensively within the realmof scientific endurance testing, both in the academicresearch setting and in national sporting academiesand institutes. However, issues surrounding thepracticality and reliability of these two types of testsare significant.
Open-loop testing
An exercise performance test that is performed at a constant running speed or power output can betermed an “open-loop” test. This test is deemed“open-looped” because the time to complete the testis determined by the individual; time is thereforeunknown, or open-ended. Traditionally, subjectsare requested to perform this type of test at set submaximal exercise intensities until they can nolonger maintain the required running speed orpower output (Jeukendrup et al. 1996). These typesof tests are better known in the exercise science literature as “time-to-exhaustion” tests and can berun at virtually any set exercise intensity. Whiletime-to-exhaustion tests will be the main focus ofthe open-loop testing, a progressive exercise testcould also be considered to be a type of open-looptest.
progressive exercise tests
The progressive exercise test may be considered to be an open-loop test because the subject is asked
188 chapter 4
9781405156370_4_004.qxd 3/25/08 5:36 PM Page 188
UN
CO
RR
ECTE
D P
RO
OF
clinical exercise testing 189
also appear to elicit relatively low absolute levels of repeatability. Graham and McLellan (1989)showed that treadmill running tests to exhaustionperformed at 120% of the Vo2max running speed produced a relatively high variation (coefficient ofvariation [CV] = 10%; r = 0.89), while Laursen et al. (2003c) also found that the cycling time-to-exhaustion performed at 150% of the cycling poweroutput associated with Vo2max was not highly reliable(CV = 11%) in well-trained cyclists and triathletes.
Closed-loop testing
A “closed-loop” exercise test can be defined as anendurance performance test with a known endpoint(i.e., a known amount of work to complete, distanceto travel, or time to perform for). Traditionally, subjects are asked to complete the given distance or work as fast as possible, or to complete as muchwork or distance as they can in a given time period.These types of tests are more commonly referred toas “time-trials.”
Closed-loop tests of known distances, work, ortime allow the subjects to adjust their exercise intens-ity according to their perception of fatigue. In thesetests, the subject is aware that they have a specificendpoint. In a time-trial of a known distance (mostcommon) the only feedback provided is distancecompleted or remaining. In these tests, subjects arerequired to complete every trial in the fastest timepossible. The closed-loop protocol shows high absolute levels of reliability, or low coefficient ofvariation scores (~1%). For example, Palmer et al.(1996) showed that the reproducibility of a 20- and40-km cycling time-trial on a Kingcycle ergometerwas highly reproducible (CV = 1.1 and 1.0%, respect-ively), and similar levels of reliability have beenshown by others (Balmer et al. 2000; Laursen et al.2003a).
Comparison of open- versus closed-loop tests
In a meta-analysis examining the reliability of cycle performance tests, Hopkins et al. (2001) haveshown that the test variation of open-loop time-to-exhaustion tests is generally much greater thanclosed-loop tests which use defined limits (i.e., a
known distance). This increased variance for open-loop tests shows the importance placed on “know-ing the expected outcome” and the importance ofbeing able to adjust pace in accordance with afferentsensory feedback signals. While some studies haveresearched each type of test (open- vs. closed-looptest) separately in the same subjects (Laursen et al.2003a–c), there are no known studies that havedirectly compared the two.
Two recent studies using the same subjects exam-ined the reproducibility of both a closed-loop 40-kmcycle time trial (Laursen et al. 2003a) and an open-loop time-to-exhaustion test at the power outputassociated with Vo2max (Laursen et al. 2003b). Bothtests were repeated following familiarization tests,at the same time of day, and about 1 week apart. Thevariation of performance times between the two trials (expressed as the CV) was markedly lower forthe time trial (1 ± 1%; Laursen et al. 2003a) comparedwith the time-to-exhaustion test (6 ± 6%; Laursen et al. 2003b). Thus, “knowing the task at hand” (i.e.,test distance) appeared to be responsible for lower-ing the variation in performance times comparedwith the open-ended time-to-exhaustion test. In thelatter mentioned study, the last of the two time-to-exhaustion tests was found to be significantlylonger than the first (Laursen et al. 2003b). Theauthors attributed this finding to the psychologicaffect associated with performing “the last test.”Physiologic variables in this study were not differ-ent between trials, and the performance differencecould only be attributed to psychologic factors; the knowledge of the trial being “the last task”somehow influencing performance time (Gleser &Vogel 1971; Hickey et al. 1992; Laursen et al. 2003b).However, there was no difference found for thesesame subjects in their 40 km time-trial performances(Laursen et al. 2003a).
While all this evidence suggests that closed-looptime-trial tests have a reduced variability comparedwith those of open-loop time-to-exhaustion tests, nostudy has directly compared the variation betweenopen- and closed-loop exercise trials of equivalentworkloads in the same subjects. In addition, there is some evidence to suggest that prolonged sub-maximal exercise tests have an improved repro-ducibility when compared with shorter high-intensity
9781405156370_4_004.qxd 3/25/08 5:36 PM Page 189
UN
CO
RR
ECTE
D P
RO
OF
performance following a training intervention isalso relatively small (usually <5%). Conversely, atime-to-exhaustion test that may have a relativelyhigh variability (35%), may also elicit a very largechange following a training intervention (i.e.,>20%). Thus, selection of an open-loop time-to-exhaustion test may be appropriate when thegoal of the sports scientist is to determine theinfluence that a particular exercise intervention may have on endurance performance. Research isrequired to confirm or refute these assumptions.
Summary
To summarize, endurance performance can be broken down into three key physiologic variables:the Vo2max, anaerobic threshold, and economy ofmotion. Different methods of testing these measureshave been used in the past but it would appear prudent that certain protocols be used in accordancewith the specific physiologic variable being soughtby the clinician. Slow ramp tests or tests with longerincremental progressions (approximately 5 min)enable subjects to attain steady state and are bestused to measure running economy and markers ofthe anaerobic threshold. As a result of the longerincrements, the total duration of the test can be morethan 25 min. Progressive exercise tests with shorterstages create shorter duration tests (8–15 min), andthese fast ramp tests provide a good means ofassessing Vo2max and maximum heart rate and areappropriate for use in untrained subjects.
Matching the testing protocol to that of the athlete’s sport, including a familiarization test and a warm-up, were identified as key aspects for theselection of any endurance test and will allow forimproved validity, reliability, and therefore greatercredibility and acceptance to the findings and con-clusions drawn from the results. Laboratory testingis a vital component for establishing and measuringthe effectiveness of a training intervention. Althoughboth open- and closed-loop protocols are commonlyused throughout the exercise science literature,closed-loop time-trial tests are thought to have agreater reliability and are more like the enduranceevents commonly performed by endurance athletes.However, some believe that time-to-exhaustion
exercise trials (Hickey et al. 1992; Palmer et al. 1996;Stepto et al. 1998). For example, in a series of studiesby Laursen et al. (2003a–c) using trained cyclists, therepeatability of prolonged exercise tests (i.e., 40 kmtime trials; CV = 1%) was improved compared with higher exercise intensities associated with thetime-to-exhaustion tests at Vo2max (CV = 6%), and at 150% of Vo2max (CV = 11%). Again, no studieshave directly examined the influence of exercise testduration or intensity on the variability betweenopen- and closed-loop exercise tests, and thisresearch is required before clear conclusions on thematter can be made.
Another consideration for sport scientists, whendeciding whether to use an open-loop or a closed-loop endurance performance test, comes back to theprinciple of specificity. That is, is use of an open-loop test a realistic representation of actual athleticperformance, as there are very few instances wherean endurance athlete must work to exhaustion at setexercise intensity? Thus, time-to-exhaustion testsmay be viewed as having less external validity, andhave even been labeled as survival tests for athleteswho must overcome feelings of boredom and a lackof motivation, rather than an accurate assessment oftheir endurance performance ability. Terminationof the exercise during a time-to-exhaustion test willbe dependent upon individual feelings of fatigue,and this will most likely explain the observations of higher levels of variability in these tests (Hopkinset al. 2001). Conversely, the closed-loop time-trialprotocol has a lower coefficient of variation and istherefore more reproducible, and may be moreapplicable for the measuring of athletic perform-ance. With this type of test, however, athletes pacethemselves and the workload is not even, which cancreate problems when comparison of physiologicvariables throughout the trial is desired.
While the external validity favors selection of the closed-loop test, it has been argued that the signal-to-noise ratio may be greater in the time-to-exhaustion tests than in time-trials. By “noise,” thisrefers to the variability of the measurement (i.e., CV),while by “signal” this refers to the improvementthat can be witnessed by the measurement. To illus-trate, while the variance in a closed-loop time-trial is generally less than 1%, the change in time-trial
190 chapter 4
9781405156370_4_004.qxd 3/25/08 5:36 PM Page 190
UN
CO
RR
ECTE
D P
RO
OF
clinical exercise testing 191
tests have a greater signal: noise ratio and there-fore may be a more appropriate test to use when the goal of the researcher is to examine the effective-ness of an intervention on the change in enduranceperformance.
The future of endurance tests will see improvedmeasures of reliability and validity, and the goal of sports scientists and clinicians will be to designmore practical tests based on performances in realcompetitions so as to reduce the disparity betweenlaboratory results and field performance results.
Body composition
An understanding of the significance of body composition is important for the exercise clinicianbecause of the influence that body composition canhave on both exercise performance and generalhealth. For athletes, a reduction in body fat levelsmeans a reduction in the mass that has to be acceler-ated and thus the force required to change direction,speed, project into the air during jumping, or perform work uphill against gravity. Quite simply,an athlete with more body fat will carry with him orher added non-functional weight that will requiremore energy to move and produce more heat fromthe increased metabolic rate. Moreover, additionalfat stores provide an added layer of insulation thatwill shield the body against the dissipation of heatfrom the central core to the environment. For thegeneral public living in the western world, obesitylevels have reached epidemic levels and reducingbody fat usually represents a major goal in any exercise training program. High body fat content,and in particular abdominal fat, greatly increasesrisk of a range of chronic diseases including car-diovascular disease, type II diabetes, hypertension,and some cancers. In light of its obvious import-ance to the exercise clinician, a general understanding of the science behind body composition and itsassessment is a final consideration of this chapter.
Composition of the body
Determination of the body’s make-up or composi-tion can be a fairly complex task because of the number of different ways that it can be broken up.
For example, we can separate the composition ofour bodies into:1 Atoms (61% O2, 23% C, 10% H, 2.6% N, 1.4% Ca,2% other);2 Major molecules (carbohydrates, lipids, proteins,mineral compounds, water);3 Different types of cells and body fluids (fat cells,muscle cells, body fluids);4 Various tissues (adipose tissue, skeletal muscle,bone, blood); or5 At a whole body level (using skinfolds, girths,and underwater weighing).Although the first four methods are considered to bemore direct, and have all been completed in priorresearch, they require expensive analytical equip-ment or cadaver dissection. However, dual energyX-ray absorptiometry (DEXA) is becoming acceptedas the “gold standard” for body composition assess-ment. This technology is still quite expensive($100,000–200,000) so more practical alternatives toestimate body composition at the whole body levelusing indirect methods of assessment are also dis-cussed. Some of the more commonly used indirectassessments include underwater weighing (densito-metry), bioelectrical impedence, skinfold thickness,girths, and weight : stature ratios. These indirectanthropometric assessments are attractive becausethey can easily be conducted in the laboratory or the field.
Dual energy X-ray absorptiometry
Dual energy X-ray absorptiometry involves verylow level X-ray radiation to image the body and,based on differential transmission by muscle, fat,and bone tissues, the system is able to separate andprovide accurate measures of the quantity of each in grams (Fig. 4.18). This is achieved by simul-taneously emitting beams of two different energylevels that are absorbed at different rates by dif-ferent tissues. DEXA has been used predominantlyfor determination of bone mineral density but is also finding excellent application for measuring fatand muscle tissue mass (Daly et al. 2005).
A further advantage of DEXA is that not onlywhole body measures can be derived, but also segments including trunk, upper and lower limbs.
9781405156370_4_004.qxd 3/25/08 5:36 PM Page 191
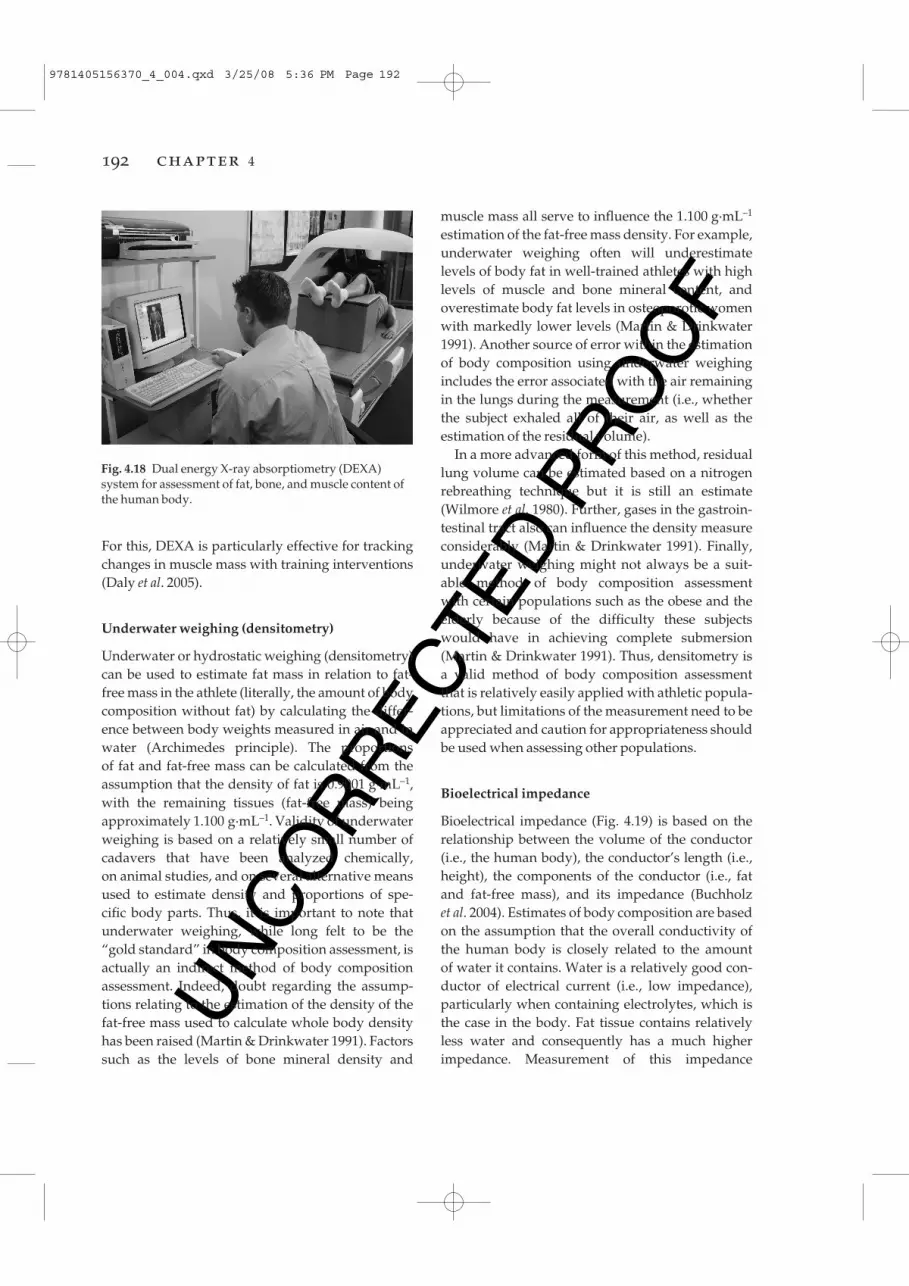
UN
CO
RR
ECTE
D P
RO
OF
muscle mass all serve to influence the 1.100 g·mL–1
estimation of the fat-free mass density. For example,underwater weighing often will underestimate levels of body fat in well-trained athletes with highlevels of muscle and bone mineral content, andoverestimate body fat levels in osteoporotic womenwith markedly lower levels (Martin & Drinkwater1991). Another source of error within the estimationof body composition using underwater weighingincludes the error associated with the air remainingin the lungs during the measurement (i.e., whetherthe subject exhaled all of their air, as well as the estimation of the residual volume).
In a more advanced form of this method, residuallung volume can be estimated based on a nitrogenrebreathing technique but it is still an estimate(Wilmore et al. 1980). Further, gases in the gastroin-testinal tract also can influence the density measureconsiderably (Martin & Drinkwater 1991). Finally,underwater weighing might not always be a suit-able method of body composition assessment with certain populations such as the obese and theelderly because of the difficulty these subjectswould have in achieving complete submersion(Martin & Drinkwater 1991). Thus, densitometry isa valid method of body composition assessmentthat is relatively easily applied with athletic popula-tions, but limitations of the measurement need to beappreciated and caution for appropriateness shouldbe used when assessing other populations.
Bioelectrical impedance
Bioelectrical impedance (Fig. 4.19) is based on therelationship between the volume of the conductor(i.e., the human body), the conductor’s length (i.e.,height), the components of the conductor (i.e., fatand fat-free mass), and its impedance (Buchholz et al. 2004). Estimates of body composition are basedon the assumption that the overall conductivity ofthe human body is closely related to the amount of water it contains. Water is a relatively good con-ductor of electrical current (i.e., low impedance),particularly when containing electrolytes, which isthe case in the body. Fat tissue contains relativelyless water and consequently has a much higherimpedance. Measurement of this impedance
For this, DEXA is particularly effective for trackingchanges in muscle mass with training interventions(Daly et al. 2005).
Underwater weighing (densitometry)
Underwater or hydrostatic weighing (densitometry)can be used to estimate fat mass in relation to fat-free mass in the athlete (literally, the amount of bodycomposition without fat) by calculating the differ-ence between body weights measured in air and inwater (Archimedes principle). The proportions of fat and fat-free mass can be calculated from theassumption that the density of fat is 0.9001 g·mL–1,with the remaining tissues (fat-free mass) beingapproximately 1.100 g·mL–1. Validity of underwaterweighing is based on a relatively small number ofcadavers that have been analyzed chemically, on animal studies, and on several alternative meansused to estimate density and proportions of spe-cific body parts. Thus, it is important to note thatunderwater weighing, while long felt to be the“gold standard” in body composition assessment, isactually an indirect method of body compositionassessment. Indeed, doubt regarding the assump-tions relating to the estimation of the density of thefat-free mass used to calculate whole body densityhas been raised (Martin & Drinkwater 1991). Factorssuch as the levels of bone mineral density and
192 chapter 4
Fig. 4.18 Dual energy X-ray absorptiometry (DEXA)system for assessment of fat, bone, and muscle content ofthe human body.
9781405156370_4_004.qxd 3/25/08 5:36 PM Page 192

UN
CO
RR
ECTE
D P
RO
OF
clinical exercise testing 193
involves placing electrodes to the surface of thelower arms and legs, passing a very low voltageelectrical current and measuring the ease of trans-mission through the body: the impedance. This iscombined with anthropometric measures of height,weight, and possibly circumferences to estimate fatand lean body mass. In some machines, the subjectstands on a scale with bare feet and the impedance ismeasured from one foot to the other with weightbeing recorded simultaneously.
Anthropometric techniques
skinfolds
Largely because of the convenience with whichskinfold callipers (Fig. 4.20) can be transported andthe comparative ease in measuring subcutaneousfat, skinfold data are now commonly used to estim-ate total body fat (Clark et al. 2002). However, theapparent simplicity in reliable skinfold measures isdeceptive. Care in calibration of the callipers, loca-tion of sites, and overall consistency in measure-ment is essential. Indeed, there are a number ofpossible factors that may reduce the accuracy of askinfold measurement. The hydration level of thesubject or the level of blood flow to the skin causedby showering or sauna can alter skinfold thick-ness through changes in skin turgidity (Martin &
Drinkwater 1991). As differences in site location will reduce the accuracy of the assessment, the measurement site must be carefully described andaccurately located for each measurement made. Thetype of instrument is also important, where a constant pressure must be applied no matter whatthe thickness of the skinfold. Standard skinfold cal-lipers are designed to exert a pressure of 10 g·mm–2,and commonly used skinfold callipers that do thisinclude Harpenden and Lange.
Skinfold measurement procedures, sites, andbody composition prediction equations have beenoutlined elsewhere (Norton et al. 2000). Briefly,when taking the measurement, it should be taken onthe right side of the body, with the skinfold beingpulled well clear of the underlying muscle using the flat pads of the index finger and thumb. If thereis doubt about whether muscle is included, have the subject contract the muscle allowing the sub-cutaneous fat to be exposed. Callipers should beapplied 1 cm from the fingers and placed at a depthof approximately the mid-fingernail. The readingshould be taken 2 s after the full pressure of the callipers is applied. Two to three readings should betaken at every site, with the average being taken iftwo readings are made (first two readings <4 mmdifference), and the median used if three readingsare made (third reading taken if difference betweenfirst and second reading >4 mm).
Fig. 4.19 Bioimpedence measurement for the estimationof body composition.
Fig. 4.20 Skinfold calipers are used to measure thethickness of subcutaneous fat and expressed as absolutevalues, a summed total, or entered into regressionformulae for estimation of body composition.
9781405156370_4_004.qxd 3/25/08 5:36 PM Page 193
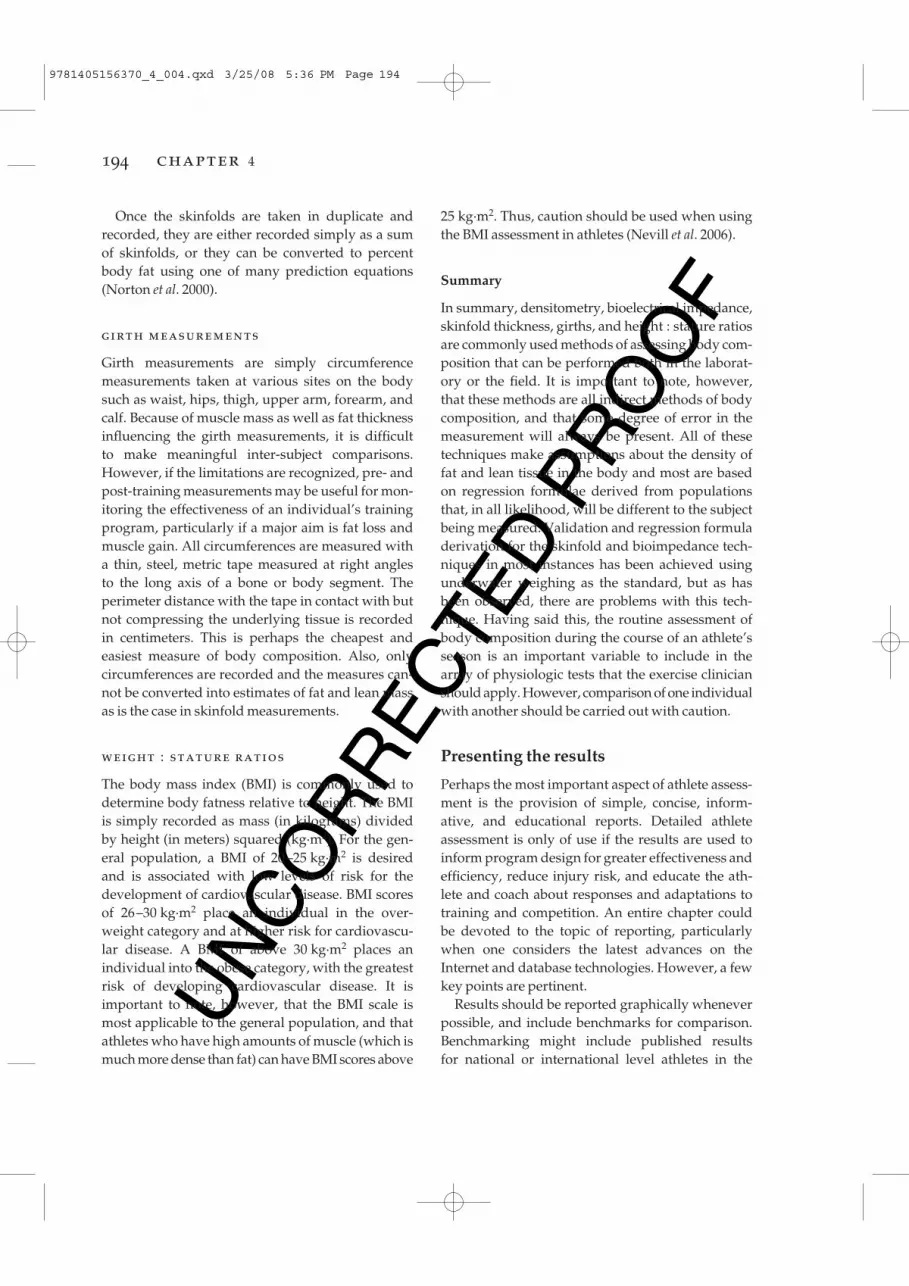
UN
CO
RR
ECTE
D P
RO
OF
25 kg·m2. Thus, caution should be used when usingthe BMI assessment in athletes (Nevill et al. 2006).
Summary
In summary, densitometry, bioelectrical impedance,skinfold thickness, girths, and height : stature ratiosare commonly used methods of assessing body com-position that can be performed both in the laborat-ory or the field. It is important to note, however, that these methods are all indirect methods of bodycomposition, and that some degree of error in themeasurement will always be present. All of thesetechniques make assumptions about the density offat and lean tissue in the body and most are based on regression formulae derived from populationsthat, in all likelihood, will be different to the subject being measured. Validation and regression formuladerivation for the skinfold and bioimpedance tech-niques in most instances has been achieved usingunderwater weighing as the standard, but as hasbeen observed, there are problems with this tech-nique. Having said this, the routine assessment ofbody composition during the course of an athlete’sseason is an important variable to include in thearray of physiologic tests that the exercise clinicianshould apply. However, comparison of one individualwith another should be carried out with caution.
Presenting the results
Perhaps the most important aspect of athlete assess-ment is the provision of simple, concise, inform-ative, and educational reports. Detailed athleteassessment is only of use if the results are used toinform program design for greater effectiveness andefficiency, reduce injury risk, and educate the ath-lete and coach about responses and adaptations totraining and competition. An entire chapter couldbe devoted to the topic of reporting, particularlywhen one considers the latest advances on theInternet and database technologies. However, a fewkey points are pertinent.
Results should be reported graphically wheneverpossible, and include benchmarks for comparison.Benchmarking might include published results for national or international level athletes in the
Once the skinfolds are taken in duplicate andrecorded, they are either recorded simply as a sumof skinfolds, or they can be converted to percentbody fat using one of many prediction equations(Norton et al. 2000).
girth measurements
Girth measurements are simply circumference measurements taken at various sites on the bodysuch as waist, hips, thigh, upper arm, forearm, andcalf. Because of muscle mass as well as fat thicknessinfluencing the girth measurements, it is difficult to make meaningful inter-subject comparisons.However, if the limitations are recognized, pre- andpost-training measurements may be useful for mon-itoring the effectiveness of an individual’s trainingprogram, particularly if a major aim is fat loss andmuscle gain. All circumferences are measured witha thin, steel, metric tape measured at right angles to the long axis of a bone or body segment. Theperimeter distance with the tape in contact with butnot compressing the underlying tissue is recordedin centimeters. This is perhaps the cheapest and easiest measure of body composition. Also, only circumferences are recorded and the measures can-not be converted into estimates of fat and lean massas is the case in skinfold measurements.
weight : stature ratios
The body mass index (BMI) is commonly used todetermine body fatness relative to height. The BMIis simply recorded as mass (in kilograms) dividedby height (in meters) squared (kg·m2). For the gen-eral population, a BMI of 20–25 kg·m2 is desired and is associated with low levels of risk for thedevelopment of cardiovascular disease. BMI scoresof 26–30 kg·m2 place an individual in the over-weight category and at higher risk for cardiovascu-lar disease. A BMI of above 30 kg·m2 places anindividual into the obese category, with the greatestrisk of developing cardiovascular disease. It isimportant to note, however, that the BMI scale ismost applicable to the general population, and thatathletes who have high amounts of muscle (which ismuch more dense than fat) can have BMI scores above
194 chapter 4
9781405156370_4_004.qxd 3/25/08 5:36 PM Page 194
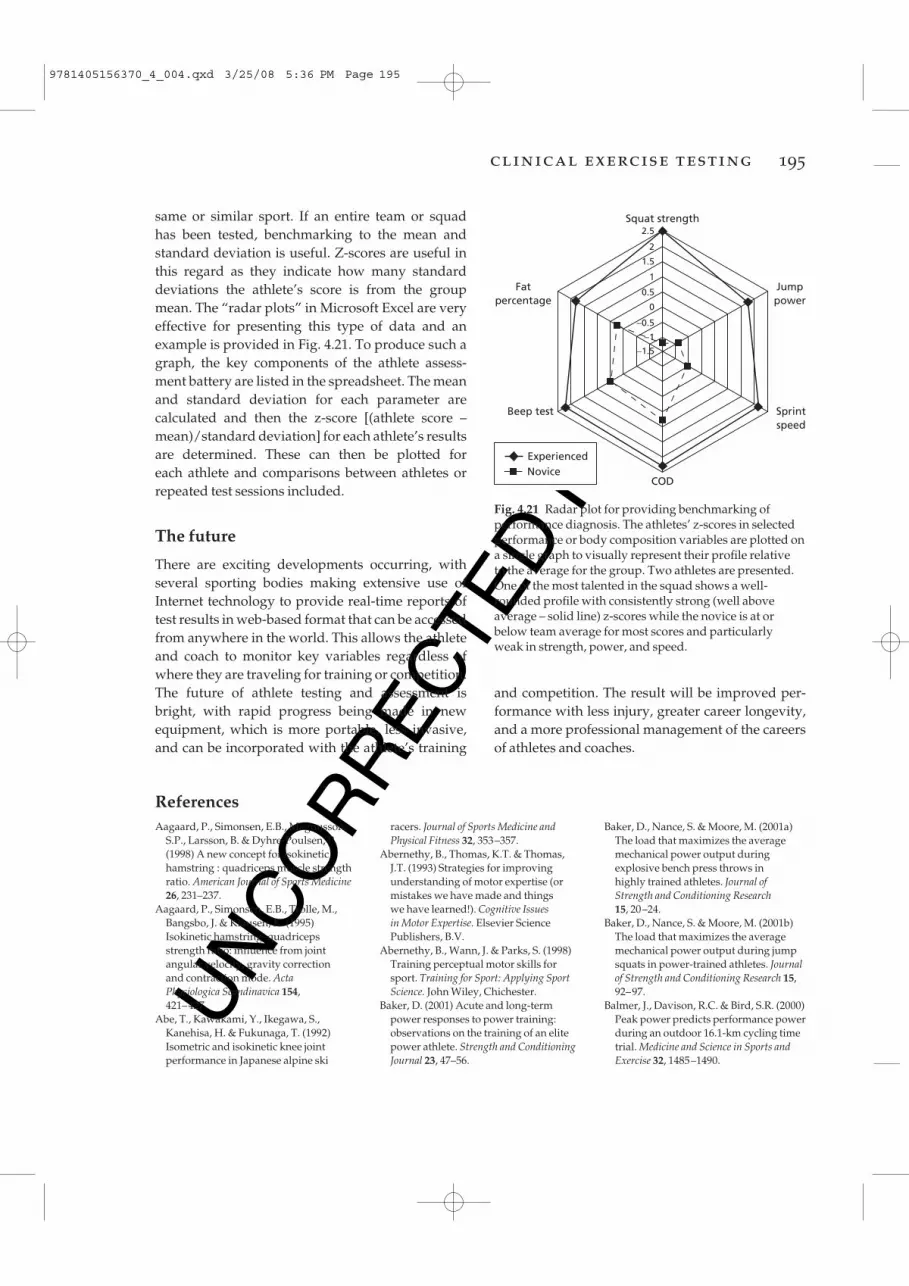
UN
CO
RR
ECTE
D P
RO
OF
clinical exercise testing 195
same or similar sport. If an entire team or squad has been tested, benchmarking to the mean andstandard deviation is useful. Z-scores are useful inthis regard as they indicate how many standarddeviations the athlete’s score is from the groupmean. The “radar plots” in Microsoft Excel are veryeffective for presenting this type of data and anexample is provided in Fig. 4.21. To produce such agraph, the key components of the athlete assess-ment battery are listed in the spreadsheet. The meanand standard deviation for each parameter are calculated and then the z-score [(athlete score –mean)/standard deviation] for each athlete’s resultsare determined. These can then be plotted for each athlete and comparisons between athletes orrepeated test sessions included.
The future
There are exciting developments occurring, withseveral sporting bodies making extensive use ofInternet technology to provide real-time reports oftest results in web-based format that can be accessedfrom anywhere in the world. This allows the athleteand coach to monitor key variables regardless ofwhere they are traveling for training or competition.The future of athlete testing and assessment isbright, with rapid progress being made in newequipment, which is more portable, less invasive,and can be incorporated with the athlete’s training
ReferencesAagaard, P., Simonsen, E.B., Magnusson,
S.P., Larsson, B. & Dyhre-Poulsen, P.(1998) A new concept for isokinetichamstring : quadriceps muscle strengthratio. American Journal of Sports Medicine26, 231–237.
Aagaard, P., Simonsen, E.B., Trolle, M.,Bangsbo, J. & Klausen, K. (1995)Isokinetic hamstring–quadricepsstrength ratio: influence from jointangular velocity, gravity correction and contraction mode. Acta Physiologica Scandinavica 154, 421–427.
Abe, T., Kawakami, Y., Ikegawa, S.,Kanehisa, H. & Fukunaga, T. (1992)Isometric and isokinetic knee jointperformance in Japanese alpine ski
racers. Journal of Sports Medicine andPhysical Fitness 32, 353–357.
Abernethy, B., Thomas, K.T. & Thomas,J.T. (1993) Strategies for improvingunderstanding of motor expertise (ormistakes we have made and things we have learned!). Cognitive Issues in Motor Expertise. Elsevier SciencePublishers, B.V.
Abernethy, B., Wann, J. & Parks, S. (1998)Training perceptual motor skills forsport. Training for Sport: Applying SportScience. John Wiley, Chichester.
Baker, D. (2001) Acute and long-termpower responses to power training:observations on the training of an elitepower athlete. Strength and ConditioningJournal 23, 47–56.
Baker, D., Nance, S. & Moore, M. (2001a)The load that maximizes the averagemechanical power output duringexplosive bench press throws in highly trained athletes. Journal of Strength and Conditioning Research15, 20–24.
Baker, D., Nance, S. & Moore, M. (2001b)The load that maximizes the averagemechanical power output during jumpsquats in power-trained athletes. Journalof Strength and Conditioning Research 15,92–97.
Balmer, J., Davison, R.C. & Bird, S.R. (2000)Peak power predicts performance powerduring an outdoor 16.1-km cycling timetrial. Medicine and Science in Sports andExercise 32, 1485–1490.
Fatpercentage
Jumppower
Sprintspeed
Beep test
Squat strength
COD
Experienced
2.5
2
1.5
1
0.5
0
−0.5
−1
−1.5
Novice
Fig. 4.21 Radar plot for providing benchmarking ofperformance diagnosis. The athletes’ z-scores in selectedperformance or body composition variables are plotted ona single graph to visually represent their profile relative to the average for the group. Two athletes are presented.One of the most talented in the squad shows a well-rounded profile with consistently strong (well aboveaverage – solid line) z-scores while the novice is at orbelow team average for most scores and particularly weak in strength, power, and speed.
and competition. The result will be improved per-formance with less injury, greater career longevity,and a more professional management of the careersof athletes and coaches.
9781405156370_4_004.qxd 3/25/08 5:36 PM Page 195

UN
CO
RR
ECTE
D P
RO
OF
Bioenergetics and its Applications.Mayfield Publishing, CA.
Brooks, G.A., Fahey, T.D., White, T.P. &Baldwin, K.M. (2000) Exercise Physiology:Human Bioenergetics and its Applications.McGraw Hill, Sydney.
Bruggemann, G. & Glad, B. (1990) Timeanalysis of the sprint events. In: ScientificResearch Project at the Games of the XXIVthOlympiad. Seoul, International AthleticFoundation, Monaco (Bruggemann, G. &Glad, B., eds.)
Buchholz, A.C., Bartok, C. & Schoeller,D.A. (2004) The validity of bioelectricalimpedance models in clinicalpopulations. Nutrition in Clinical Practice19, 433–446.
Buckeridge, A., Farrow, D., Gastin, P.,McGrath, M., Morrow, P., Quinn, A. et al. (2000) Protocols for thephysiological assessment of high-performance tennis players. PhysiologicalTests for Elite Athletes. Australian SportsCommission, Canberra.
Butts, N.K., Henry, B.A. & McLean, D.(1991) Correlations between Vo2max andperformance times of recreationaltriathletes. Journal of Sports Medicine andPhysical Fitness 31, 339–344.
Clark, R.R., Oppliger, R.A. & Sullivan, J.C.(2002) Cross-validation of the NCAAmethod to predict body fat for minimumweight in collegiate wrestlers. ClinicalJournal of Sport Medicine 12, 285–290.
Cobbaert, C., Morales, C., Van Fessem, M.& Kemperman, H. (1999) Precision,accuracy and linearity of radiometerEML 105 whole blood metabolitebiosensors. Annals of ClinicalBiochemistry 36, 730–738.
Coyle, E.F. (1995) Integration of thephysiological factors determiningendurance performance ability. Exerciseand Sport Sciences Reviews 23, 25–63.
Coyle, E.F. (1999) Physiologicaldeterminants of endurance exerciseperformance. Journal of Science andMedicine in Sport 2, 181–189.
Coyle, E.F., Feltner, M.E., Kautz, S.A.,Hamilton, M.T., Montain, S.J., Baylor,A.M., et al. (1991) Physiological andbiomechanical factors associated withelite endurance cycling performance.Medicine and Science in Sports and Exercise23, 93–107.
Coyle, E.F., Martin, W.H., Ehsani, A.A.,Hagberg, J.M., Bloomfield, S.A.,Sinacore, D.R., et al. (1983) Blood lactatethreshold in some well-trained ischemicheart disease patients. Journal of AppliedPhysiology 54, 18–23.
Crouter, S.E., Antczak, A., Hudak, J.R.,Dellavalle, D.M. & Haas, J. D. (2006)
Bentley, D.J., McNaughton, L.R. &Batterham, A.M. (2001a) Prolongedstage duration during incremental cycleexercise: effects on the lactate thresholdand onset of blood lactate accumulation.European Journal of Applied Physiology 85,351–357.
Bentley, D.J., McNaughton, L.R.,Thompson, D., Vleck, V.E. & Batterham,A.M. (2001b) Peak power output, thelactate threshold, and time trialperformance in cyclists. Medicine andScience in Sports and Exercise 33,2077–2081.
Besier, T.T.F., Lloyd, D.D.G., Cochrane,J.J.L. & Ackland, T.T.R. (2001) Externalloading of the knee joint during runningand cutting maneuvers. Medicine andScience in Sports and Exercise 33, 1168.
Billat, V., Bernard, O., Pinoteau, J., Petit, B.& Koralsztein, J.P. (1994) Time toexhaustion at Vo2max and lactate steadystate velocity in sub elite long-distancerunners. Archives Internationales dePhysiologie, de Biochimie et de Biophysique102, 215–219.
Billat, V., Sirvent, P., Py, G., Koralsztein,J.P. & Mercier, J. (2003) The concept ofmaximal lactate steady state: a bridgebetween biochemistry, physiology and sport science. Sports Medicine 33,407–426.
Bishop, D., Jenkins, D.G. & Mackinnon,L.T. (1998a) The effect of stage durationon the calculation of peak Vo2 duringcycle ergometry. Journal of Science andMedicine in Sport, 1, 171–178.
Bishop, D., Jenkins, D.G. & Mackinnon,L.T. (1998b) The relationship betweenplasma lactate parameters, Wpeak and 1-h cycling performance in women.Medicine and Science in Sports and Exercise30, 1270–1275.
Bishop, P.A., Smith, J.F., Kime, J.C., Mayo,J.M. & Tin, Y.H. (1992) Comparison of amanual and an automated enzymatictechnique for determining blood lactateconcentrations. International Journal ofSports Medicine 13, 36–39.
Brockett, C.L., Morgan, D.L. & Proske, U.(2004) Predicting hamstring strain injuryin elite athletes. Medicine and Science inSports and Exercise 36, 379–387.
Brooks, G.A. (1985) Anaerobic threshold:review of the concept and directions forfuture research. Medicine and Science inSports and Exercise 17, 22–34.
Brooks, G.A. (1986) The lactate shuttleduring exercise and recovery. Medicineand Science in Sports and Exercise 18,360–368.
Brooks, G.A., Fahey, T.D. & White, T.P.(1996) Exercise Physiology. Human
196 chapter 4
Accuracy and reliability of theParvoMedics TrueOne 2400 andMedGraphics VO2000 metabolicsystems. European Journal of AppliedPhysiology 98, 139–151.
Daly, R.M., Dunstan, D.W., Owen, N.,Jolley, D., Shaw, J.E. & Zimmet, P.Z.(2005) Does high-intensity resistancetraining maintain bone mass duringmoderate weight loss in olderoverweight adults with type 2 diabetes?Osteoporosis International 16, 1703–1712.
Dascombe, B.J., Reaburn, P.R., Sirotic, A.C.& Coutts, A.J. (2007) The reliability of thei-STAT clinical portable analyser. Journalof Science and Medicine in Sport 10,135–140
Davis, J.A. (1985) Anaerobic threshold:review of the concept and directions forfuture research. Medicine and Science inSports and Exercise 17, 6–21.
Davis, J.M., Bailey, S.P., Woods, J.A.,Galiano, F.J., Hamilton, M.T. & Bartoli,W.P. (1992) Effects of carbohydratefeedings on plasma free tryptophan andbranched-chain amino acids duringprolonged cycling. European Journal ofApplied Physiology and OccupationalPhysiology 65, 513–519.
Dawson, B., Fitzsimons, M., Green, S.,Goodman, C., Carey, M. & Cole, K.(1998) Changes in performance, musclemetabolites, enzymes and fibre typesafter short sprint training. EuropeanJournal of Applied Physiology andOccupational Physiology 78, 163–169.
Delecluse, C., Van Coppenolle, H.,Williams, E. & Goris, M. (1995) Influenceof high resistance and high velocitytraining on sprint performance. Medicineand Science in Sports and Exercise 27,1203–1209.
Denis, C., Fouquet, R., Poty, P., Geyssant,A. & Lacour, J.R. (1982) Effect of 40weeks of endurance training on theanaerobic threshold. International Journalof Sports Medicine 3, 208–214.
Draper, J.A. & Lancaster, M.G. (1985) The 505 test: a test for agility in thehorizontal plane. Australian Journal ofScience and Medicine in Sport 15–18.
Droghetti, P., Borsetto, C., Casoni, I.,Cellini, M., Ferrari, M., Paolini, A.R., et al. (1985) Noninvasive determinationof the anaerobic threshold in canoeing,cross-country skiing, cycling, roller, and ice-skating, rowing, and walking.European Journal of Applied Physiology andOccupational Physiology 53, 299–303.
Ellis, L., Gastin, P., Lawrence, S., Savage,B., Buckeridge, A., Stapff, A., et al. (2000) Protocols for the physiologicalassessment of team sport players.
9781405156370_4_004.qxd 3/25/08 5:36 PM Page 196

UN
CO
RR
ECTE
D P
RO
OF
clinical exercise testing 197
Australian Journal of Science and Medicinein Sport 21, 11–14.
Grant, S., Corbett, K., Amjad, A.M.,Wilson, J. & Aitchison, T. (1995) Acomparison of methods of predictingmaximum oxygen uptake. British Journalof Sports Medicine 29, 147–152.
Grant, S., Craig, I., Wilson, J. & Aitchison,T. (1997) The relationship between 3 kmrunning performance and selectedphysiological variables. Journal of SportsScience 15, 403–410.
Häkkinen, K., Alen, M. & Komi, P.V. (1985)Changes in isometric force- andrelaxation-time, electromyographic andmuscle fibre characteristics of humanskeletal muscle during strength trainingand detraining. Acta PhysiologicaScandinavica 125, 573–585.
Hawley, J.A. & Noakes, T.D. (1992) Peakpower output predicts maximal oxygenuptake and performance in trainedcyclists. European Journal of AppliedPhysiology 65, 79–83.
Hertel, J., Denegar, C.C.R., Johnson, P.P.D.,Hale, S.S.A. & Buckley, W.W.E. (1999)Reliability of the Cybex Reactor in theassessment of an agility task. Journal ofSport Rehabilitation 8, 24–31.
Hickey, M.S., Costill, D.L., McConell, G.K.,Widrick, J.J. & Tanaka, H. (1992) Day to day variation in time trial cyclingperformance. International Journal ofSports Medicine 13, 467–470.
Hopkins, W.G. (2000) Measures ofreliability in sports medicine andscience. Sports Medicine 30, 1–15.
Hopkins, W.G., Schabort, E.J. & Hawley,J.A. (2001) Reliability of power inphysical performance tests. SportsMedicine 31, 211–234.
Jackson, A., Dishman, R.K., La Croix, S.,Patton, R. & Weinberg, R. (1981) Theheart rate, perceived exertion, and paceof the 1.5 mile run. Medicine and Sciencein Sports and Exercise 13, 224–228.
Jackson, R., Warren, S. & Abernethy, B.(2006) Anticipation skill andsusceptibility to deceptive movement.Acta Psychologica 123, 355–371.
Jeukendrup, A., Saris, W.H., Brouns, F. &Kester, A.D. (1996) A new validatedendurance performance test. Medicineand Science in Sports and Exercise 28,266–270.
Kohrt, W.M., Morgan, D.W., Bates, B. & Skinner, J.S. (1987) Physiologicalresponses of triathletes to maximalswimming, cycling, and running.Medicine and Science in Sports and Exercise19, 51–55.
Koike, A., Wasserman, K., Beaver, W.L.,Weiler-Ravell, D., MCcKenzie, D.K. &
Physiological Tests for Elite Athletes.Australian Sports Commission,Canberra.
Farrell, P.A., Wilmore, J.H., Coyle, E.F.,Billing, J.E. & Costill, D.L. (1979) Plasmalactate accumulation and distancerunning performance. Medicine andScience in Sports 11, 338–444.
Farrow, D., Young, W. & Bruce, L. (2005)The development of a test of reactiveagility for netball: a new methodology.Journal of Science and Medicine in Sport 8,52–60.
Fell, J.W., Rayfield, J.M., Gulbin, J.P. &Gaffney, P.T. (1998) Evaluation of the Accusport Lactate Analyser.International Journal of Sports Medicine 19,199–204.
Fitzsimons, M., Dawson, B., Ward, D. &Wilkinson, A. (1993) Cycling andrunning tests of repeated sprint ability.Australian Journal of Science and Medicinein Sport 25, 82–87.
Foss, O. & Hallen, J. (2005) Validity andstability of a computerized metabolicsystem with mixing chamber.International Journal of Sports Medicine 26,569–575.
Franch, J., Madsen, K., Djurhuus, M.S. &Pedersen, P.K. (1998) Improved runningeconomy following intensified trainingcorrelates with reduced ventilatorydemands. Medicine and Science in Sportsand Exercise 30, 1250–1256.
Franklin, K.L., Gordon, R.S., Baker, J.S. & Davies, B. (2005) Mechanics of a rope-braked cycle ergometer flywheeland its use for physiologicalmeasurement. Research in Sports Medicine 13, 331–344.
Frick, U., Schmidtbleicher, D. & Stutz, R.(1995) Muscle activation duringacceleration-phase in sprint runningwith special reference to startingposture. Xvth Congress of the InternationalSociety of Biomechanics, Jyvaskyla.
Glaister, M. (2005) Multiple sprint workphysiological responses, mechanisms of fatigue and the influence of aerobicfitness. Sports Medicine 35, 757–777.
Gleser, M.A. & Vogel, J.A. (1971)Endurance exercise: effect of work-restschedules and repeated testing. Journal of Applied Physiology 31, 735–739.
Gore, C.J., Clark, R.J., Shipp, N.J., Van derPloeg, G.E. & Withers, R.T. (2003)CPX/D underestimates Vo2 in athletescompared with an automated Douglasbag system. Medicine and Science in Sportsand Exercise 35, 1341–1347.
Graham, K.S. & McLellan, T.M. (1989)Variability of time to exhaustion andoxygen deficit in supramaximal exercise.
Zanconato, S. (1990) Evidencesupporting the existence of an exerciseanaerobic threshold. Advances inExperimental Medicine and Biology277, 835–846.
Krustrup, P., Mohr, M., Amstrup, T.,Rysgaard, T., Johansen, J., Steensberg,A., Pedersen, P.K. & Bangsbo, J. (2003)The yo-yo intermittent recovery test:physiological response, reliability, andvalidity. Medicine and Science in Sportsand Exercise 35, 697–705.
Kyle, S.B., Smoak, B.L., Douglass, L.W. & Deuster, P.A. (1989) Variability ofresponses across training levels tomaximal treadmill exercise. Journal of Applied Physiology 67, 160–165.
Kyrolainen, H., Komi, P.P.V. & Belli,A.P.V. (1999) Changes in muscle activitypatterns and kinetics with increasingrunning speed. Journal of Strength andConditioning Research 13, 400.
Laursen, P.B., Blanchard, M.A. & Jenkins,D.G. (2002a) Acute high-intensityinterval training improves Tvent andpeak power output in highly trainedmales. Canadian Journal of AppliedPhysiology 27, 336–348.
Laursen, P.B., Knez, W.L., Shing, C.M.,Langill, R.H., Rhodes, E.C. & Jenkins,D.G. (2005a) Relationship betweenlaboratory measured variables and heart rate during an ultra-endurancetriathlon. Journal of Sports Sciences23, 1111–1120.
Laursen, P.B. & Rhodes, E.C. (2001) Factors affecting performance in anultraendurance triathlon. Sports Medicine31, 195–209.
Laursen, P.B., Rhodes, E.C., Langill, R.H.,McKenzie, D.C. & Taunton, J.E. (2002b)Relationship of exercise test variables tocycling performance in an Ironmantriathlon. European Journal of AppliedPhysiology, 87, 433–440.
Laursen, P.B., Rhodes, E.C., Langill, R.H.,Taunton, J.E. & McKenzie, D.C. (2005b)Exercise-induced arterial hypoxemia isnot different during cycling and runningin triathletes. Scandinavian Journal ofMedicine and Science in Sports 15,113–117.
Laursen, P.B., Shing, C.M. & Jenkins, D.G.(2003a) Reproducibility of a laboratory-based 40-km cycle time-trial on astationary wind-trainer in highly trainedcyclists. International Journal of SportsMedicine 24, 481–485.
Laursen, P.B., Shing, C.M. & Jenkins, D.G.(2003b) Reproducibility of the cyclingtime to exhaustion at Vo2peak in highlytrained cyclists. Canadian Journal ofApplied Physiology 28, 605–615.
9781405156370_4_004.qxd 3/25/08 5:36 PM Page 197

UN
CO
RR
ECTE
D P
RO
OF
Morgan, D.W. & Daniels, J.T. (1994)Relationship between Vo2max and theaerobic demand of running in elitedistance runners. International Journal ofSports Medicine 15, 426–429. [Publishederratum appears in International Journalof Sports Medicine 15, 527.]
Murphy, A.J. & Wilson, G.J. (1996a) Theassessment of human dynamic muscularfunction: a comparison of isoinertial andisokinetic tests. Journal of Sports Medicineand Physical Fitness 36, 169–177.
Murphy, A.J. & Wilson, G.J. (1996b) Poorcorrelations between isometric tests anddynamic performance: relationship tomuscle activation. European Journal ofApplied Physiology and OccupationalPhysiology 73, 353–357.
Murphy, A.J. & Wilson, G.J. (1997) Theability of tests of muscular function toreflect training-induced changes inperformance. Journal of Sports Sciences15, 191–200.
Murphy, A.J., Wilson, G.J. & Pryor, J.F.(1994) Use of the iso-inertial force mass relationship in the prediction of dynamic human performance.European Journal of Applied Physiologyand Occupational Physiology 69, 250–257.
Myburgh, K.H., Viljoen, A. & Tereblanche,S. (2001) Plasma lactate concentrationsfor self-selected maximal effort lasting 1 h. Medicine and Science in Sports andExercise 33, 152–156.
Nevill, A.M., Stewart, A.D., Olds, T. &Holder, R. (2006) Relationship betweenadiposity and body size revealslimitations of BMI. American Journal ofPhysical Anthropology 129, 151–156.
Newton, R.U. & Dugan, E. (2002)Application of strength diagnosis.Strength and Conditioning Journal 24,50–59.
Newton, R.U., Humphries, B., Murphy, A.,Wilson, G.J. & Kraemer., W.J. (1994)Biomechanics and neural activationduring fast bench press movements:implications for power training. NationalStrength and Conditioning AssociationConference. New Orleans.
Newton, R. U. & Kraemer, W. J. (1994)Developing explosive muscular power:implications for a mixed methodstraining strategy. Strength andConditioning Journal 16, 20–31.
Newton, R.U., Kraemer, W.J. & Hakkinen,K. (1999) Effects of ballistic training onpreseason preparation of elite volleyballplayers. Medicine and Science in Sportsand Exercise 31, 323–330.
Nielsen, O.B., De Paoli, F. & Overgaard, K.(2001) Protective effects of lactic acid on
Laursen, P.B., Shing, C.M., Peake, J.M.,Coombes, J.S. & Jenkins, D.G. (2005c)Influence of high-intensity intervaltraining on adaptations in well-trainedcyclists. Journal of Strength andConditioning Research 19, 527–533.
Laursen, P.B., Shing, C.M., Tennant, S.C.,Prentice, C.M. & Jenkins, D.G. (2003c) Acomparison of the cycling performanceof cyclists and triathletes. Journal ofSports Sciences 21, 411–418.
LeSuer, D.A., McCormick, J.H., Mayhew,J.L., Wasserstein, R.L. & Arnold, M.D.(1997) The accuracy of predictionequations for estimating 1-RMperformance in the bench press, squat,and deadlift. Journal of Strength andConditioning Research 11, 211–213.
Lucia, A., Hoyos, J., Perez, M. & Chicharro,J.L. (2000) Heart rate and performanceparameters in elite cyclists: alongitudinal study. Medicine and Sciencein Sports and Exercise 32, 1777–1782.
Lucia, A., Hoyos, J., Perez, M., Santalla, A.& Chicharro, J.L. (2002) Inverserelationship between Vo2max andeconomy/efficiency in world-classcyclists. Medicine and Science in Sports and Exercise 34, 2079–2084.
Macsween, A. (2001) The reliability andvalidity of the Astrand nomogram andlinear extrapolation for deriving Vo2maxfrom submaximal exercise data. Journalof Sports Medicine and Physical Fitness 41,312–317.
Marek, S.M., Cramer, J.T., Fincher, A.L.,Massey, L.L., Dangelmaier, S.M.,Purkayastha, S., et al. (2005) Acute effects of static and proprioceptiveneuromuscular facilitation stretching onand muscle strength power output.Journal of Athletic Training 40, 94–103.
Martin, A.D. & Drinkwater, D.T. (1991)Variability in the measures of body fat.Assumptions or technique? SportsMedicine 11, 277–288.
McBride, J.M., Triplett-McBride, N.T.,Davie, A. & Newton, R.U. (2001) Theeffect of heavy versus light load jumpsquats on the development of strength,power and speed. Journal of Strength andConditioning Research 16, 75–82.
McBride, J.M., Triplett-McBride, T., Davie,A. & Newton, R.U. (1999) A comparisonof strength and power characteristicsbetween power lifters, Olympic lifters,and sprinters. Journal of Strength andConditioning Research 13, 58–66.
McDaniel, J., Subudhi, A. & Martin, J.C.(2005) Torso stabilization reduces themetabolic cost of producing cyclingpower. Canadian Journal of AppliedPhysiology 30, 433–441.
198 chapter 4
force production in rat skeletal muscle.Journal of Physiology 536, 161–166.
Nieman, D.C., Austin, M.D., Benezra, L.,Pearce, S., McInnis, T., Unick, J. & Gross, S.J. (2006) Validation of Cosmed’sFitMate in measuring oxygenconsumption and estimating restingmetabolic rate. Research in SportsMedicine 14, 89–96.
Nieman, D.C., Trone, G.A. & Austin, M.D.(2003) A new handheld device formeasuring resting metabolic rate andoxygen consumption. Journal of theAmerican Diet Association 103, 588–592.
Noakes, T.D., Myburgh, K.H. & Schall, R.(1990) Peak treadmill running velocityduring the Vo2max test predicts runningperformance. Journal of Sports Sciences8, 35–45.
Norton, K., Marfell-Jones, M.,Whittingham, N., Kerr, D., Carter, L.,Saddington, K., et al. (2000)Anthropometric assessment protocols.In: Physiological Tests for Elite Athletes(Gore, C., ed.) Human Kinetics,Champaign, IL.
Paavolainen, L., Hakkinen, K.,Hamalainen, I., Nummela, A. & Rusko,H. (1999) Explosive-strength trainingimproves 5-km running time byimproving running economy andmuscle power. Journal of AppliedPhysiology 86, 1527–1533.
Palmer, G.S., Dennis, S.C., Noakes, T.D. &Hawley, J.A. (1996) Assessment of thereproducibility of performance testingon an air-braked cycle ergometer.International Journal of Sports Medicine17, 293–298.
Paton, C.D. & Hopkins, W.G. (2001) Testsof cycling performance. Sports Medicine31, 489–496.
Rhodes, E.C. & McKenzie, D.C. (1984)Predicting Marathon time fromanaerobic threshold measurements. The Physician and Sportsmedicine12, 95–99.
Robergs, R.A., Ghiasvand, F. & Parker, D.(2004) Biochemistry of exercise-inducedmetabolic acidosis. American Journal ofPhysiology. Regulatory, Integretative andComparative Physiology 287, R502–516.
Rowland, T.W. & Cunningham, L.N.(1992) Oxygen uptake plateau duringmaximal treadmill exercise in children.Chest 101, 485–489.
Schneider, D.A., Lacroix, K.A., Atkinson,G.R., Troped, P.J. & Pollack, J. (1990)Ventilatory threshold and maximaloxygen uptake during cycling andrunning in triathletes. Medicine andScience in Sports and Exercise 22, 257–264.
9781405156370_4_004.qxd 3/25/08 5:36 PM Page 198

UN
CO
RR
ECTE
D P
RO
OF
clinical exercise testing 199
Stepto, N.K., Hawley, J.A., Dennis, S.C. &Hopkins, W.G. (1998) Effects of differentinterval-training programs on cyclingtime-trial performance. Medicine andScience in Sports and Exercise 31, 736–741.
Svedahl, K. & MacIntosh, B.R. (2003)Anaerobic threshold: the concept andmethods of measurement. CanadianJournal of Applied Physiology 28, 299–323.
Thomas, J.R. & Nelson, J.K. (1990) ResearchMethods in Physical Activity. HumanKinetics, Champaign, IL.
Van Someren, K.A., Howatson, G., Nunan, D., Thatcher, R. & Shave, R.(2005) Comparison of the Lactate Pro and Analox GM7 blood lactateanalysers. International Journal of Sports Medicine 26, 657–661.
Volkov, N.N.I. & Lapin, V.V.I. (1979)Analysis of the velocity curve in sprintrunning. Medicine and Science in Sportsand Exercise 11, 332–337.
Webster, P.A., King, S.E. & Torres, A. Jr.(1998) An in vitro validation of acommercially available metabolic cartusing pediatric ventilator volumes.Pediatric Pulmonology 26, 405–411.
Weston, A.R., Ziphelele, M. & Myburgh,K.H. (2000) Running economy of Africanand Caucasian distance runners.Medicine and Science in Sports and Exercise32, 1130–1134.
Wilmore, J.H., Vodak, P.A., Parr, R.B.,Girandola, R.N. & Billing, J.E. (1980)Further simplification of a method fordetermination of residual lung volume.Medicine and Science in Sports and Exercise12, 216–218.
Wilson, G.J., Lyttle, A.D., Ostrowski, K.J. &Murphy, A.J. (1995) Assessing dynamicperformance: a comparison of rate offorce development tests. Journal of
Semenick, D. (1994) Testing protocols andprocedures. Essentials of Strength andConditioning. Human Kinetics,Champaign, IL.
Sheppard, J. & Young, W. (2006) Agilityliterature review: classifications, trainingand testing. Journal of Sports Sciences 24,919–923.
Sheppard, J., Young, W., Doyle, T.,Sheppard, T. & Newton, R. (2006) Anevaluation of a new test of reactiveagility, and its relationship to sprintspeed and change of direction speed.Journal of Science and Medicine in Sport 9, 342–349.
Siconolfi, S.F., Garber, C.E., Lasater, T.M. & Carleton, R.A. (1985) A simple, validstep test for estimating maximal oxygenuptake in epidemiologic studies.American Journal of Epidemiology 121,382–390.
Sjodin, B. & Svedenhag, J. (1985) Appliedphysiology of marathon running. SportsMedicine 2, 83–99.
Smith, M.F., Davison, R.C., Balmer, J. &Bird, S.R. (2001) Reliability of meanpower recorded during indoor andoutdoor self-paced 40 km cycling time-trials. International Journal of Sports Medicine 22, 270–274.
Spencer, M., Bishop, D., Dawson, B. &Goodman, C. (2005) Physiological andmetabolic responses of repeated-sprintactivities specific to field-based teamsports. Sports Medicine 35, 1025–1044.
St Clair Gibson, A., Broomhead, S.,Lambert, M.I. & Hawley, J.A. (1998)Prediction of maximal oxygen uptakefrom a 20-m shuttle run as measureddirectly in runners and squash players. Journal of Sports Sciences 16,331–335.
Strength and Conditioning Research 9,176–181.
Wilson, G.J., Newton, R.U., Murphy, A.J. & Humphries, B.J. (1993) The optimaltraining load for the development ofdynamic athletic performance. Medicineand Science in Sports and Exercise 25,1279–1286.
Wilson, G.J., Walshe, A.D. & Fisher, M.R.(1997) The development of an isokineticsquat device: reliability and relationshipto functional performance. EuropeanJournal of Applied Physiology andOccupational Physiology 75, 455–461.
Witters, J., Heremans, G., Bohets, W.,Stijnen, V. & Van Coppenolle, H. (1985)The design and testing of a wirevelocimeter. Journal of Sports Sciences 3,197–206.
Young, W., James, R. & Montgomery, I.(2002) Is muscle power related torunning speed with changes indirection? Journal of Sports Medicine and Physical Fitness 42.
Young, W.B. (1995) Laboratory strengthassessment of athletes. New Studies inAthletics 10, 89–96.
Young, W.B., Macdonald, C. & Flowers,M.A. (2001) Validity of double- andsingle-leg vertical jumps as tests of legextensor muscle function. Journal ofStrength and Conditioning Research 15,6–11.
Young, W.B., Pryor, J.F. & Wilson, G.J.(1995) Effect of instructions oncharacteristics of countermovement and drop jump performance. Journal ofStrength and Conditioning Research 9,232–236.
Zatsiorsky, V.M. (1995) Science and Practiceof Strength Training. Human Kinetics,Champaign, IL.
9781405156370_4_004.qxd 3/25/08 5:36 PM Page 199

UN
CO
RR
ECTE
D P
RO
OF
Author Query Form
Book title: Olympic Textbook of Medicine in Sport
Chapter title: Clinical Exercise Testing and Assessment of Athletes
Query Query RemarksRefs.
1 Au: Complete page X-ref
2 Au: Newton metre with raised dot correct here?
3 Au: Define ACL at first mention
9781405156370_4_004.qxd 3/25/08 5:36 PM Page 200


