Embed Size (px)
Citation preview

ARTICLESPUBLISHED ONLINE: 4 MAY 2015 | DOI: 10.1038/NCLIMATE2625
Projections of climate conditions that increasecoral disease susceptibility and pathogenabundance and virulenceJe�rey Maynard1,2*, Ruben van Hooidonk3,4, C. Mark Eakin5, Marjetta Puotinen6, Melissa Garren7,GarethWilliams8, Scott F. Heron5,9, Joleah Lamb1, ErnestoWeil10, BetteWillis11 and C. Drew Harvell1
Rising sea temperatures are likely to increase the frequency of disease outbreaks a�ecting reef-building corals throughimpacts on coral hosts and pathogens. We present and compare climate model projections of temperature conditions thatwill increase coral susceptibility to disease, pathogen abundance and pathogen virulence. Both moderate (RCP 4.5) and fossilfuel aggressive (RCP 8.5) emissions scenarios are examined. We also compare projections for the onset of disease-conduciveconditions and severe annual coral bleaching, and produce a disease risk summary that combines climate stress with stresscaused by local human activities. There is great spatial variation in the projections, both among and within the major oceanbasins, in conditions favouring disease development. Our results indicate that disease is as likely to cause coral mortality asbleaching in the coming decades. These projections identify priority locations to reduce stress caused by local human activitiesand test management interventions to reduce disease impacts.
The 2014 boreal summer was the warmest on record1,breaking air temperature records in hundreds of cities andcausing unprecedented highs in sea surface temperatures
in the North Pacific2. Concurrently, a catastrophic outbreak ofstarfish wasting disease decimated US West Coast populationsof ∼20 starfish species3 and outbreaks of eelgrass wastingdisease resulted in declines in habitat area as high as 90% inparts of California and Washington (Wyllie-Echeverria, personalobservation). Pathogens causing these wasting disease outbreakshave been in the environment for at least decades4, although thecausative virus for sea-star wasting is newly described3. Theserecent examples serve as reminders that disease outbreaks canrapidly and extensively devastate populations of keystone speciesand key habitat builders. Both events also caught the scientificand management communities by surprise, underscoring theimportance of developing forecasts and long-term projections ofconditions that increase outbreak likelihood.
Forecasts of conditions conducive to disease onset have beenmost extensively developed for the agricultural crop sector5,6because of the economic value of optimizing the timing of pesticideapplication. Studies presenting longer-term, climate-model-basedprojections of conditions that promote disease onset for other plantsand animals are far more rare. So far, climate models driven byIntergovernmental Panel on Climate Change (IPCC) emissionsscenarios have been used only to develop projections of conditions
related to the causative agents and vectors of human diseases7,such as malaria8–10 and Chikungunya virus11. Overall, the scienceof developing forecasts and projections for wildlife diseases is in itsinfancy and warrants much greater research focus7, especially in themarine environment, where disease outbreaks have been increasingin frequency and severity over recent decades12.
Climate-related diseases have already severely impacted theprimary framework builders of coral reef habitats12–15. Of the rangeof bacterial, fungal and protozoan diseases known to affect stonycorals16, many have explicit links to temperature, including blackband disease17, yellow band disease18,19 and white syndromes13,20,21.Here, we apply the climate models used in the IPCC 5th AssessmentReport (see Supplementary Table 1 for list) to project threetemperature conditions that increase the susceptibility of coral hoststo disease or increase pathogen abundance or virulence.
We posit that temperature conditions that increase host sus-ceptibility, pathogen abundance and pathogen virulence will sub-stantially increase the likelihood of disease outbreaks once the setthreshold frequencies and stress levels are surpassed. The outputfrom the climate model ensemble for each of these three conditionsis a projected year by which the target frequency or stress level isreached. All projections are presented for RCP 8.5, the emissionsscenario that best characterizes current conditions and emissiontrends, and for RCP 4.5, which represents a pathway to stabilizationat 4.5Wm−2 (∼650 ppmCO2 equivalent) after 2100 (ref. 22). Along
1Department of Ecology and Evolutionary Biology, Cornell University, Ithaca, New York 14850, USA. 2CRIOBE—USR 3278, CNRS—EPHE—UPVD,Laboratoire d’Excellence “CORAIL”, 58 Av. Paul Alduy - 66860 Perpignan cedex, France. 3NOAA Atlantic Oceanographic and Meteorological Laboratory,4301 Rickenbacker Causeway, Miami, Florida 33149, USA. 4Cooperative Institute for Marine and Atmospheric Studies, Rosenstiel School of Marine andAtmospheric Science, University of Miami, 4600 Rickenbacker Causeway, Miami, Florida 33149, USA. 5NOAA Coral Reef Watch, NESDIS Center forSatellite Applications and Research, 5830 University Research Ct., E/RA3, College Park, Maryland 20740, USA. 6Australian Institute of Marine Science,35 Stirling Hwy, Crawley 6009, Western Australia, Australia. 7Department of Civil and Environmental Engineering, Massachusetts Institute of Technology,15 Vassar St., Cambridge, Massachusetts 02139, USA. 8Center for Marine Biodiversity and Conservation, Scripps Institution of Oceanography, La Jolla,California 92037, USA. 9Marine Geophysical Laboratory, Physics Department, College of Science, Technology and Engineering, James Cook University,Townsville, Queensland 4811, Australia. 10Department of Marine Sciences, University of Puerto Rico, Mayaguez Puerto Rico 00680, USA. 11AustralianResearch Council (ARC) Centre of Excellence for Coral Reef Studies, and College of Marine and Environmental Sciences, James Cook University, Townsville,Queensland 4811, Australia. *e-mail: [email protected]
NATURE CLIMATE CHANGE | ADVANCE ONLINE PUBLICATION | www.nature.com/natureclimatechange 1
© 2015 Macmillan Publishers Limited. All rights reserved
ARTICLES NATURE CLIMATE CHANGE DOI: 10.1038/NCLIMATE2625
with the individual projections, we present maps of the earliest andlatest projected year one of these three conditions favourable todisease development is projected to occur.We also present: compar-isons between the projected timing of these conditions and annualsevere coral bleaching, a map of a composite metric of stress causedby local human activities that can also increase host susceptibility,and a map of disease risk under RCP 8.5 that combines globalclimate and local anthropogenic stress.
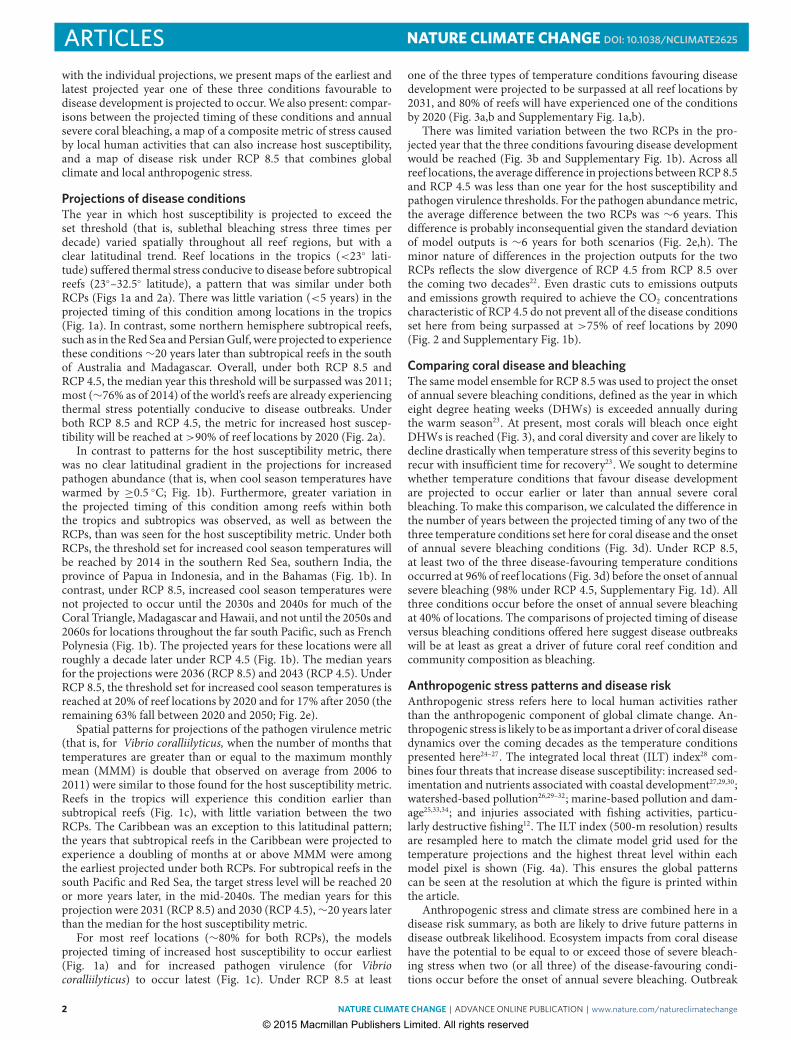
Projections of disease conditionsThe year in which host susceptibility is projected to exceed theset threshold (that is, sublethal bleaching stress three times perdecade) varied spatially throughout all reef regions, but with aclear latitudinal trend. Reef locations in the tropics (<23◦ lati-tude) suffered thermal stress conducive to disease before subtropicalreefs (23◦–32.5◦ latitude), a pattern that was similar under bothRCPs (Figs 1a and 2a). There was little variation (<5 years) in theprojected timing of this condition among locations in the tropics(Fig. 1a). In contrast, some northern hemisphere subtropical reefs,such as in theRed Sea andPersianGulf, were projected to experiencethese conditions ∼20 years later than subtropical reefs in the southof Australia and Madagascar. Overall, under both RCP 8.5 andRCP 4.5, the median year this threshold will be surpassed was 2011;most (∼76% as of 2014) of the world’s reefs are already experiencingthermal stress potentially conducive to disease outbreaks. Underboth RCP 8.5 and RCP 4.5, the metric for increased host suscep-tibility will be reached at >90% of reef locations by 2020 (Fig. 2a).
In contrast to patterns for the host susceptibility metric, therewas no clear latitudinal gradient in the projections for increasedpathogen abundance (that is, when cool season temperatures havewarmed by ≥0.5 ◦C; Fig. 1b). Furthermore, greater variation inthe projected timing of this condition among reefs within boththe tropics and subtropics was observed, as well as between theRCPs, than was seen for the host susceptibility metric. Under bothRCPs, the threshold set for increased cool season temperatures willbe reached by 2014 in the southern Red Sea, southern India, theprovince of Papua in Indonesia, and in the Bahamas (Fig. 1b). Incontrast, under RCP 8.5, increased cool season temperatures werenot projected to occur until the 2030s and 2040s for much of theCoral Triangle, Madagascar andHawaii, and not until the 2050s and2060s for locations throughout the far south Pacific, such as FrenchPolynesia (Fig. 1b). The projected years for these locations were allroughly a decade later under RCP 4.5 (Fig. 1b). The median yearsfor the projections were 2036 (RCP 8.5) and 2043 (RCP 4.5). UnderRCP 8.5, the threshold set for increased cool season temperatures isreached at 20% of reef locations by 2020 and for 17% after 2050 (theremaining 63% fall between 2020 and 2050; Fig. 2e).
Spatial patterns for projections of the pathogen virulence metric(that is, for Vibrio coralliilyticus, when the number of months thattemperatures are greater than or equal to the maximum monthlymean (MMM) is double that observed on average from 2006 to2011) were similar to those found for the host susceptibility metric.Reefs in the tropics will experience this condition earlier thansubtropical reefs (Fig. 1c), with little variation between the twoRCPs. The Caribbean was an exception to this latitudinal pattern;the years that subtropical reefs in the Caribbean were projected toexperience a doubling of months at or above MMM were amongthe earliest projected under both RCPs. For subtropical reefs in thesouth Pacific and Red Sea, the target stress level will be reached 20or more years later, in the mid-2040s. The median years for thisprojection were 2031 (RCP 8.5) and 2030 (RCP 4.5),∼20 years laterthan the median for the host susceptibility metric.
For most reef locations (∼80% for both RCPs), the modelsprojected timing of increased host susceptibility to occur earliest(Fig. 1a) and for increased pathogen virulence (for Vibriocoralliilyticus) to occur latest (Fig. 1c). Under RCP 8.5 at least
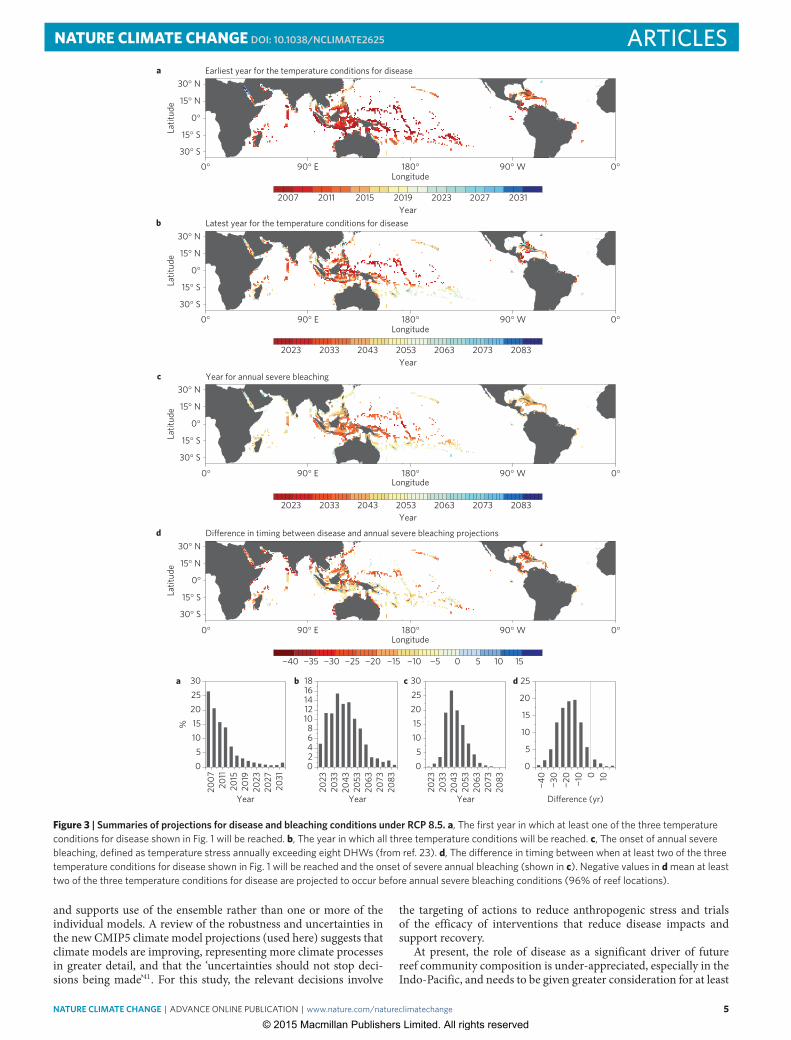
one of the three types of temperature conditions favouring diseasedevelopment were projected to be surpassed at all reef locations by2031, and 80% of reefs will have experienced one of the conditionsby 2020 (Fig. 3a,b and Supplementary Fig. 1a,b).
There was limited variation between the two RCPs in the pro-jected year that the three conditions favouring disease developmentwould be reached (Fig. 3b and Supplementary Fig. 1b). Across allreef locations, the average difference in projections betweenRCP 8.5and RCP 4.5 was less than one year for the host susceptibility andpathogen virulence thresholds. For the pathogen abundancemetric,the average difference between the two RCPs was ∼6 years. Thisdifference is probably inconsequential given the standard deviationof model outputs is ∼6 years for both scenarios (Fig. 2e,h). Theminor nature of differences in the projection outputs for the twoRCPs reflects the slow divergence of RCP 4.5 from RCP 8.5 overthe coming two decades22. Even drastic cuts to emissions outputsand emissions growth required to achieve the CO2 concentrationscharacteristic of RCP 4.5 do not prevent all of the disease conditionsset here from being surpassed at >75% of reef locations by 2090(Fig. 2 and Supplementary Fig. 1b).
Comparing coral disease and bleachingThe samemodel ensemble for RCP 8.5 was used to project the onsetof annual severe bleaching conditions, defined as the year in whicheight degree heating weeks (DHWs) is exceeded annually duringthe warm season23. At present, most corals will bleach once eightDHWs is reached (Fig. 3), and coral diversity and cover are likely todecline drastically when temperature stress of this severity begins torecur with insufficient time for recovery23. We sought to determinewhether temperature conditions that favour disease developmentare projected to occur earlier or later than annual severe coralbleaching. To make this comparison, we calculated the difference inthe number of years between the projected timing of any two of thethree temperature conditions set here for coral disease and the onsetof annual severe bleaching conditions (Fig. 3d). Under RCP 8.5,at least two of the three disease-favouring temperature conditionsoccurred at 96% of reef locations (Fig. 3d) before the onset of annualsevere bleaching (98% under RCP 4.5, Supplementary Fig. 1d). Allthree conditions occur before the onset of annual severe bleachingat 40% of locations. The comparisons of projected timing of diseaseversus bleaching conditions offered here suggest disease outbreakswill be at least as great a driver of future coral reef condition andcommunity composition as bleaching.
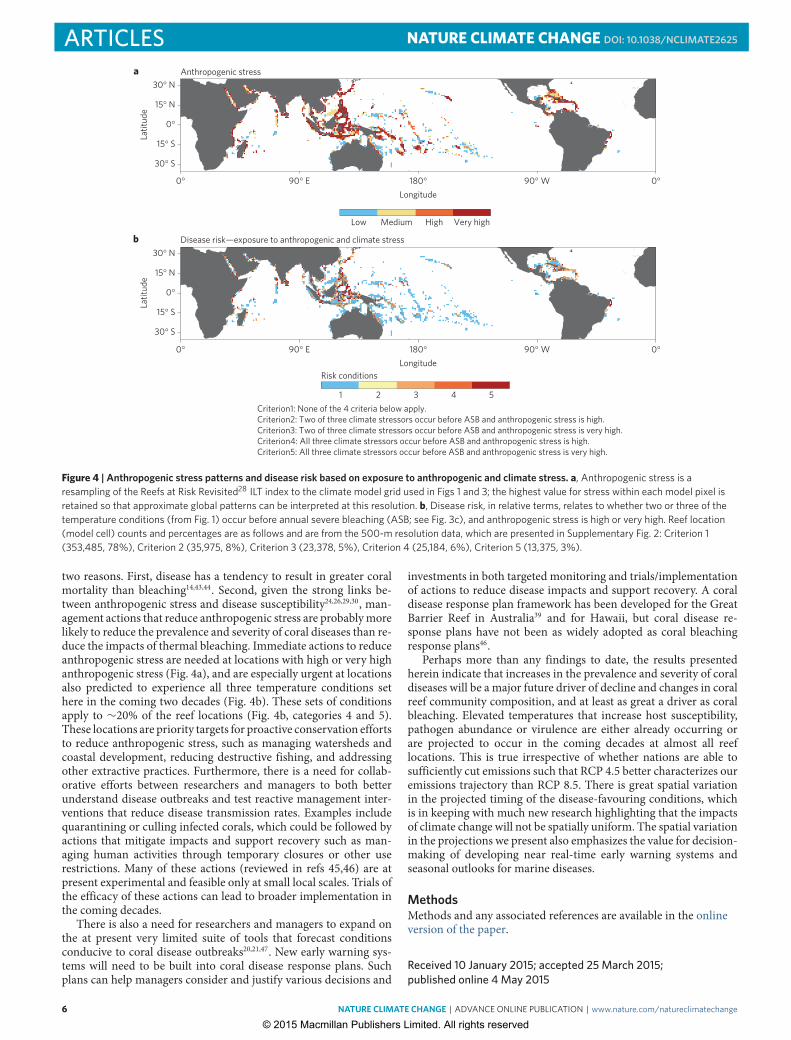
Anthropogenic stress patterns and disease riskAnthropogenic stress refers here to local human activities ratherthan the anthropogenic component of global climate change. An-thropogenic stress is likely to be as important a driver of coral diseasedynamics over the coming decades as the temperature conditionspresented here24–27. The integrated local threat (ILT) index28 com-bines four threats that increase disease susceptibility: increased sed-imentation and nutrients associated with coastal development27,29,30;watershed-based pollution26,29–32; marine-based pollution and dam-age25,33,34; and injuries associated with fishing activities, particu-larly destructive fishing12. The ILT index (500-m resolution) resultsare resampled here to match the climate model grid used for thetemperature projections and the highest threat level within eachmodel pixel is shown (Fig. 4a). This ensures the global patternscan be seen at the resolution at which the figure is printed withinthe article.
Anthropogenic stress and climate stress are combined here in adisease risk summary, as both are likely to drive future patterns indisease outbreak likelihood. Ecosystem impacts from coral diseasehave the potential to be equal to or exceed those of severe bleach-ing stress when two (or all three) of the disease-favouring condi-tions occur before the onset of annual severe bleaching. Outbreak
2 NATURE CLIMATE CHANGE | ADVANCE ONLINE PUBLICATION | www.nature.com/natureclimatechange
© 2015 Macmillan Publishers Limited. All rights reserved

NATURE CLIMATE CHANGE DOI: 10.1038/NCLIMATE2625 ARTICLES
30° S
30° N
15° S
15° N
0°
a
b
c
0°180°Longitude
Latit
ude
90° E 90° W
30° S
30° N
15° S
15° N
0°
30° S
30° N
15° S
15° N
0°
30° S
30° N
15° S
15° N
0°
30° S
30° N
15° S
15° N
0°
30° S
30° N
15° S
15° N
0°
0°
0°180°Longitude
90° E 90° W0°
0°180°Longitude
Year
Year
Year
90° E 90° W0°
2022 2026 2030 2034 2038 2042 20442024 2028 2032 2036 2040
2010 2020 2030 2040 2050 2060 20702015 2025 2035 2045 2055 2065
2006 2010 2014 2018 2022 2026 2030
Pathogen abundance
Pathogen virulence
RCP 4.5
RCP 8.5
RCP 4.5
RCP 8.5
RCP 4.5
RCP 8.5
Host susceptibility
Latit
ude
Latit
ude
Latit
ude
Latit
ude
Latit
ude
Figure 1 | Projections of temperature conditions that increase host susceptibility, pathogen abundance and pathogen virulence under RCPs 8.5 and 4.5.a, Host susceptibility with the threshold being the first year in which thermal stress first exceeds four DHWs three times per decade. b, Pathogenabundance with the threshold being the first year in which the three cool season months exceed 0.5 ◦C above the minimum monthly mean (1982–2008).c, Pathogen virulence with the threshold being the first year in which the number of months of temperatures greater than or equal to the maximum monthlymean (1982–2008) is twice that observed on average from 2006 to 2011. See Supplementary Table 1 for a list of climate models.
likelihood is also higher when anthropogenic stress is either highor very high. This logic was applied to produce five criteria forrelative outbreak likelihood over the coming 20–30 years, which wedescribe as ‘disease risk’ (Fig. 4b). Locations with greater relativerisk (Criteria 2–5 in Fig. 4b; 22% of locations) were southernFlorida, the southern and eastern Caribbean, Brazil, the province
of Papua in Indonesia, Philippines, Japan, India, northernMaldives,the Persian Gulf and the Red Sea (Fig. 4b). For the combined diseaserisk metric, relative risk was considered lower for locations whereanthropogenic stress was low or medium, a condition found for78% (see Fig. 4 caption) of reef locations. Some of these locationsincluded Hawaii, the central and south Pacific, Australia, Thailand
NATURE CLIMATE CHANGE | ADVANCE ONLINE PUBLICATION | www.nature.com/natureclimatechange 3
© 2015 Macmillan Publishers Limited. All rights reserved

ARTICLES NATURE CLIMATE CHANGE DOI: 10.1038/NCLIMATE2625
Perc
enta
ge o
f ree
f cel
lsPe
rcen
tage
of r
eef c
ells
100
80
60
40
20
0
100
80
60
40
20
0
Perc
enta
ge o
f ree
f cel
lsPe
rcen
tage
of r
eef c
ells
100
80
60
40
20
0
100
80
60
40
20
0
Num
ber o
f ree
fs
0
40
30
20
% % %
10
0
a
d
g h
b
e
c
f
i
200
400
600
100
300
500
Num
ber o
f ree
fs
700800
0.00
12.5
10.0
15.0
7.50
5.00
2.50
0
240280
200
Num
ber o
f ree
fs
40
Perc
enta
ge o
f ree
f cel
lsPe
rcen
tage
of r
eef c
ells
100
80
60
40
20
0
100
80
60
40
20
0
80120160
0
30
20
10
0
500
600
100
200
300
400
Year2020 2040 2060 2080 2100 2020 2040 2060 2080 2100 2020 2040 2060 2080 2100
Year Year
Year2020 2040 2060 2080 2100 2020 2040 2060 2080 2100 2020 2040 2060 2080 2100
Year Year
Year2020 2040 2060 2080 2100 2020 2040 2060 2080 2100 2020 2040 2060 2080 2100
Year Year
RCP 4.5RCP 8.5
RCP 8.5RCP 4.5
Host susceptibility Pathogen abundance Pathogen virulence
Figure 2 | Histograms and model means and spreads for the projections of temperature conditions under RCPs 8.5 and 4.5. a–c, For the histograms, binsare five-year intervals and n= 1,748 reef locations. d–i, For model means and spreads, means are shown as the bold line and spreads are the mean±1 s.d.(grey shade). These data correspond to the model projections shown as maps in Fig. 1. See Supplementary Table 1 for a list of climate models.
and Madagascar (Fig. 4b). The disease risk summary can be seen atthe resolution of the anthropogenic stress data (500m) in a high-resolution image presented in the Supplementary Information (seeSupplementary Fig. 2). The high-resolution image complementsFig. 4, enabling viewers to zoom into reef locations to interpretdisease risk in relation to the actual rather than resampled anthro-pogenic stress data. The disease risk summary reflects that anthro-pogenic stress is high or very high only at 22%of locations.However,at almost all reef locations (>95%), two of the three temperatureconditions conducive to disease development occurred before theonset of annual severe bleaching. The risk of coral diseases due toclimate change (ignoring anthropogenic stress) is high at nearly allreef locations.
Future applications and conclusionsThese are the first climate-model-based projections of conditionsthat influence the likelihood of marine disease outbreaks. Someimportant complexities are necessarily excluded here so that global-scale conservative projections could be produced. The four mainexamples are: variation among and within coral communities andspecies in host susceptibility due to variation in genetics relatedto immunity, the expression of immunity genes, and exposure toenvironmental disturbances and anthropogenic stress; the potentialfor coral evolution of resistance, whichwill be highly variable amongand even potentially variable within species; the relationships be-tween temperature conditions and the virulence of other pathogensthat cause diseases in stony corals, which are not as well knownor understood as Vibrio coralliilyticus and white syndromes; andextreme stochastic events such as extreme climatic events or theevolution of new ‘super’ pathogens, which could invalidate some
of the presented conclusions. Other possible conditions that canincrease disease susceptibility and pathogen abundance and viru-lence that are not included here are: sediment runoff and loweredsalinity following monsoonal rain events, and coral injuries fromcyclones35,36 or predation by coral-feeding gastropods37, crown-of-thorns starfish38 and reef fish39,40. Future scenarios that includeocean acidification projections would also be valuable for under-standing conditions that increase coral disease susceptibility andpathogen virulence. Members of the research community can usethe data presented here to refine or produce higher-resolution pro-jections for areas for which spatially explicit data on some or all ofthe information described above becomes available.
The standard caveats and assumptions related to the use ofclimate models also apply41,42, and two are especially pertinent.First, model resolution is coarse and a 1◦ × 1◦ cell can containmany individual coral reefs, a fact related to the computational-intensiveness of climate modelling and to modelling uncertainties(see below). Although spatial variation within single model cellsis not resolved here, there is considerable variation within reefregions in the projected timing of all three temperature conditionsfor disease and in anthropogenic stress. Therefore, even at thisresolution, the results can be used to target applied research andmanagement actions. Second, all climate models have uncertaintiesand vary greatly in their capacity to project trends in key drivers ofclimate in the tropics, such as the El Niño Southern Oscillation andits global teleconnections.We include the standard deviation aroundthe ensemble average (the ‘model spread’) for each temperaturecondition (Fig. 2d–i). The spread in the model results is small(standard deviation of 2–6.5 years), which increases confidencein the major conclusions presented based on the ensemble results
4 NATURE CLIMATE CHANGE | ADVANCE ONLINE PUBLICATION | www.nature.com/natureclimatechange
© 2015 Macmillan Publishers Limited. All rights reserved
NATURE CLIMATE CHANGE DOI: 10.1038/NCLIMATE2625 ARTICLES
2023 2033 2043 2053 2063 2073 2083
30° S
30° N
15° S
15° N
0°
30° S
30° N
15° S
15° N
0°
30° S
30° N
15° S
15° N
0°
30° S
30° N
15° S
15° N
0°
Earliest year for the temperature conditions for disease
0° 0°180°90° E 90° W
Difference in timing between disease and annual severe bleaching projections
Latest year for the temperature conditions for disease
Year for annual severe bleaching
0
25
10
15
20
5
Difference (yr)
−40
−30
−20
−10 0 10
−40 −30 −20 −10 −5−25−35 −15 0 105 15
2023 2033 2043 2053 2063 2073 2083
2007
a
b
c
d
a c db
2011 2015 2019Year
Year
Year
2023 2027 2031
%
0
15
25
105
20
30
Year
2007
2011
2015
2019
2023
2027
2031
0
18
10121416
2468
Year
2023
2033
2043
2053
2063
2073
2083
0
30
1015
2025
5
Year
2023
2033
2043
2053
2063
2073
2083
Longitude
0° 0°180°90° E 90° WLongitude
0° 0°180°90° E 90° WLongitude
0° 0°180°90° E 90° WLongitude
Latit
ude
Latit
ude
Latit
ude
Latit
ude
Figure 3 | Summaries of projections for disease and bleaching conditions under RCP 8.5. a, The first year in which at least one of the three temperatureconditions for disease shown in Fig. 1 will be reached. b, The year in which all three temperature conditions will be reached. c, The onset of annual severebleaching, defined as temperature stress annually exceeding eight DHWs (from ref. 23). d, The di�erence in timing between when at least two of the threetemperature conditions for disease shown in Fig. 1 will be reached and the onset of severe annual bleaching (shown in c). Negative values in d mean at leasttwo of the three temperature conditions for disease are projected to occur before annual severe bleaching conditions (96% of reef locations).
and supports use of the ensemble rather than one or more of theindividual models. A review of the robustness and uncertainties inthe new CMIP5 climate model projections (used here) suggests thatclimate models are improving, representing more climate processesin greater detail, and that the ‘uncertainties should not stop deci-sions being made’41. For this study, the relevant decisions involve
the targeting of actions to reduce anthropogenic stress and trialsof the efficacy of interventions that reduce disease impacts andsupport recovery.
At present, the role of disease as a significant driver of futurereef community composition is under-appreciated, especially in theIndo-Pacific, and needs to be given greater consideration for at least
NATURE CLIMATE CHANGE | ADVANCE ONLINE PUBLICATION | www.nature.com/natureclimatechange 5
© 2015 Macmillan Publishers Limited. All rights reserved
ARTICLES NATURE CLIMATE CHANGE DOI: 10.1038/NCLIMATE2625
30° S
30° N
15° S
15° N
0°
30° S
30° N
15° S
15° N
0°
Anthropogenic stress
Disease risk—exposure to anthropogenic and climate stress
Criterion1: None of the 4 criteria below apply.Criterion2: Two of three climate stressors occur before ASB and anthropogenic stress is high.Criterion3: Two of three climate stressors occur before ASB and anthropogenic stress is very high.Criterion4: All three climate stressors occur before ASB and anthropogenic stress is high.Criterion5: All three climate stressors occur before ASB and anthropogenic stress is very high.
Low
a
b
Medium High Very high
0° 0°180°Longitude
Latit
ude
Latit
ude
90° E 90° W
0° 0°180°Longitude
90° E 90° W
1 2 3 4 5
Risk conditions
Figure 4 | Anthropogenic stress patterns and disease risk based on exposure to anthropogenic and climate stress. a, Anthropogenic stress is aresampling of the Reefs at Risk Revisited28 ILT index to the climate model grid used in Figs 1 and 3; the highest value for stress within each model pixel isretained so that approximate global patterns can be interpreted at this resolution. b, Disease risk, in relative terms, relates to whether two or three of thetemperature conditions (from Fig. 1) occur before annual severe bleaching (ASB; see Fig. 3c), and anthropogenic stress is high or very high. Reef location(model cell) counts and percentages are as follows and are from the 500-m resolution data, which are presented in Supplementary Fig. 2: Criterion 1(353,485, 78%), Criterion 2 (35,975, 8%), Criterion 3 (23,378, 5%), Criterion 4 (25,184, 6%), Criterion 5 (13,375, 3%).
two reasons. First, disease has a tendency to result in greater coralmortality than bleaching14,43,44. Second, given the strong links be-tween anthropogenic stress and disease susceptibility24,26,29,30, man-agement actions that reduce anthropogenic stress are probablymorelikely to reduce the prevalence and severity of coral diseases than re-duce the impacts of thermal bleaching. Immediate actions to reduceanthropogenic stress are needed at locations with high or very highanthropogenic stress (Fig. 4a), and are especially urgent at locationsalso predicted to experience all three temperature conditions sethere in the coming two decades (Fig. 4b). These sets of conditionsapply to ∼20% of the reef locations (Fig. 4b, categories 4 and 5).These locations are priority targets for proactive conservation effortsto reduce anthropogenic stress, such as managing watersheds andcoastal development, reducing destructive fishing, and addressingother extractive practices. Furthermore, there is a need for collab-orative efforts between researchers and managers to both betterunderstand disease outbreaks and test reactive management inter-ventions that reduce disease transmission rates. Examples includequarantining or culling infected corals, which could be followed byactions that mitigate impacts and support recovery such as man-aging human activities through temporary closures or other userestrictions. Many of these actions (reviewed in refs 45,46) are atpresent experimental and feasible only at small local scales. Trials ofthe efficacy of these actions can lead to broader implementation inthe coming decades.
There is also a need for researchers and managers to expand onthe at present very limited suite of tools that forecast conditionsconducive to coral disease outbreaks20,21,47. New early warning sys-tems will need to be built into coral disease response plans. Suchplans can help managers consider and justify various decisions and
investments in both targeted monitoring and trials/implementationof actions to reduce disease impacts and support recovery. A coraldisease response plan framework has been developed for the GreatBarrier Reef in Australia39 and for Hawaii, but coral disease re-sponse plans have not been as widely adopted as coral bleachingresponse plans46.
Perhaps more than any findings to date, the results presentedherein indicate that increases in the prevalence and severity of coraldiseases will be a major future driver of decline and changes in coralreef community composition, and at least as great a driver as coralbleaching. Elevated temperatures that increase host susceptibility,pathogen abundance or virulence are either already occurring orare projected to occur in the coming decades at almost all reeflocations. This is true irrespective of whether nations are able tosufficiently cut emissions such that RCP 4.5 better characterizes ouremissions trajectory than RCP 8.5. There is great spatial variationin the projected timing of the disease-favouring conditions, whichis in keeping with much new research highlighting that the impactsof climate change will not be spatially uniform. The spatial variationin the projections we present also emphasizes the value for decision-making of developing near real-time early warning systems andseasonal outlooks for marine diseases.
MethodsMethods and any associated references are available in the onlineversion of the paper.
Received 10 January 2015; accepted 25 March 2015;published online 4 May 2015
6 NATURE CLIMATE CHANGE | ADVANCE ONLINE PUBLICATION | www.nature.com/natureclimatechange
© 2015 Macmillan Publishers Limited. All rights reserved
NATURE CLIMATE CHANGE DOI: 10.1038/NCLIMATE2625 ARTICLESReferences1. National Climatic Data Center State of the Climate (US National
Oceanic and Atmospheric Administration, 2014);http://www.ncdc.noaa.gov/sotc/global/2014/8
2. Slezak, M. Oceans get into hot water. New Sci. 224, 8–9 (2014).3. Hewson, I. et al. Densovirus associated with sea-star wasting disease and mass
mortality. Proc. Natl Acad. Sci. USA 111, 17278–17283 (2014).4. Groner, M. L. et al.Host demography influences the prevalence and severity of
eelgrass wasting disease. Dis. Aquat. Org. 108, 165–175 (2014).5. Savary, S., Nelson, A., Sparks, A. H. &Willocquet, L. International agricultural
research tackling the effects of global and climate changes on plant diseases inthe developing world. Plant Dis. 95, 1204–1216 (2011).
6. Garrett, K. A., Dendy, S. P. & Frank, E. E. Climate change effects on plantdisease: Genomes to ecosystems. Annu. Rev. Phytopathol. 44, 489–509 (2006).
7. Altizer, S., Ostfeld, R. S., Johnson, P. T. J., Kutz, S. & Harvell, C. D. Climatechange and infectious diseases: From evidence to a predictive framework.Science 341, 514–519 (2013).
8. Rogers, D. J. & Randolph, S. E. The global spread of malaria in a future, warmerworld. Science 289, 1763–1766 (2000).
9. van Lieshout, M., Kovats, R. S., Livermore, M. T. J. & Martens, P. Climatechange and malaria: Analysis of the SRES climate and socio-economicscenarios. Glob. Environ. Change 14, 87–99 (2004).
10. Béguin, A. et al. The opposing effects of climate change and socio-economicdevelopment on the global distribution of malaria. Glob. Environ. Change 21,1209–1214 (2011).
11. Ruiz-Moreno, D., Vargas, I. S., Olson, K. E. & Harrington, L. C. Modelingdynamic introduction of Chikungunya virus in the United States. PLoS Negl.Trop. Dis. 6, e1918 (2012).
12. Burge, C. A. et al. Climate change influences on marine infectious diseases:Implications for management and society. Annu. Rev. Mar. Sci. 6,249–277 (2014).
13. Bruno, J. F., Selig, E. R., Casey, K. S., Page, C. A. &Willis, B. L. Thermal stressand coral cover as drivers of coral disease outbreaks. PLoS Biol. 5, e124 (2007).
14. Miller, J. et al. Coral disease following massive bleaching in 2005 causes 60%decline in coral cover on reefs in the US Virgin Islands. Coral Reefs 28,925–937 (2009).
15. Harvell, D., Altizer, S., Cattadori, I. M., Harrington, L. & Weil, E. Climatechange and wildlife diseases: When does the host matter the most? Ecology 90,912–920 (2009).
16. Harvell, D., Jordán-Dahlgren, E. & Merkel, S. Coral disease, environmentaldrivers, and the balance between coral and microbial associates. Oceanography20, 172–195 (2007).
17. Sato, Y., Bourne, D. G. &Willis, B. L. Dynamics of seasonal outbreaks of blackband disease in an assemblage ofMontipora species at Pelorus Island (GreatBarrier Reef, Australia). Proc. Biol. Sci. 276, 2795–2803 (2009).
18. Riegl, B. Effects of the 1996 and 1998 positive sea-surface temperatureanomalies on corals, coral diseases and fish in the Arabian Gulf (Dubai, UAE).Mar. Biol. 140, 29–40 (2002).
19. Cervino, J. M. et al. Relationship of Vibrio species infection and elevatedtemperatures to yellow blotch/band disease in Caribbean corals. Appl. Environ.Microbiol. 70, 6855–6864 (2004).
20. Heron, S. F. et al. Summer hot snaps and winter conditions: Modelling whitesyndrome outbreaks on Great Barrier Reef Corals. PLoS ONE 5, e12210 (2010).
21. Maynard, J. A. et al. Predicting outbreaks of a climate-driven coral disease inthe Great Barrier Reef. Coral Reefs 30, 485–495 (2010).
22. van Vuuren, D. P. et al. The representative concentration pathways: Anoverview. Climatic Change 109, 5–31 (2011).
23. van Hooidonk, R. J., Maynard, J. A., Manzello, D. & Planes, S. Oppositelatitudinal gradients in projected ocean acidification and bleaching impacts oncoral reefs. Glob. Change Biol. 20, 103–112 (2014).
24. Aeby, G. S. et al. Patterns of Coral Disease across the Hawaiian Archipelago:Relating disease to environment. PLoS ONE 6, e20370 (2011).
25. Lamb, J. B. & Willis, B. L. Using coral disease prevalence to assess the effects ofconcentrating tourism activities on offshore reefs in a tropical marine park.Conserv. Biol. 25, 1044–1052 (2011).
26. Vega Thurber, R. L. et al. Chronic nutrient enrichment increases prevalence andseverity of coral disease and bleaching. Glob. Change Biol. 20, 544–554 (2013).
27. Pollock, F. J. et al. Sediment and turbidity associated with offshore dredgingincrease coral disease prevalence on nearby reefs. PLoS ONE 9, e102498 (2014).
28. Burke, L. M., Reytar, K., Spalding, M. & Perry, A. Reefs at Risk Revisited(World Resources Institute, 2011).
29. Kline, D. I., Kuntz, N. M. & Breitbart, M. Role of elevated organic carbon levelsand microbial activity in coral mortality.Mar. Ecol. 314, 119–125 (2006).
30. Bruno, J. F., Petes, L. E., Drew Harvell, C. & Hettinger, A. Nutrient enrichmentcan increase the severity of coral diseases. Ecol. Lett. 6, 1056–1061 (2003).
31. Haapkylä, J. et al. Seasonal rainfall and Runoff promote coral disease on aninshore reef. PLoS ONE 6, e16893 (2011).
32. Sutherland, K. P., Shaban, S., Joyner, J. L., Porter, J. W. & Lipp, E. K. Humanpathogen shown to cause disease in the threatened Eklhorn Coral Acroporapalmata. PLoS ONE 6, e23468 (2011).
33. Lamb, J. B., True, J. D., Piromvaragorn, S. & Willis, B. L. Scuba diving damageand intensity of tourist activities increases coral disease prevalence. Biol.Conserv. 178, 88–96 (2014).
34. Hawkins, J. P. et al. Effects of recreational scuba diving on Caribbean coral andfish communities. Conserv. Biol. 13, 888–897 (1999).
35. Miller, M. W. &Williams, D. E. Coral disease outbreak at Navassa, a remoteCaribbean island. Coral Reefs 26, 97–101 (2007).
36. Bruckner, A. W. & Bruckner, R. J. Outbreak of coral disease in Puerto Rico.Coral Reefs 16, 260 (1997).
37. Nicolet, K., Hoogenboom, M., Gardiner, N., Pratchett, M. &Willis, B. Thecorallivorous invertebrate Drupella aids in transmission of brown band diseaseon the Great Barrier Reef. Coral Reefs 32, 585–595 (2013).
38. Katz, S. M., Pollock, F. J., Bourne, D. G. &Willis, B. L. Crown-of-thorns starfishpredation and physical injuries promote brown band disease on corals. CoralReefs 33, 705–716 (2014).
39. Aeby, G. S. & Santavy, D. L. Factors affecting susceptibility of the coralMontastraea faveolata to black-band disease.Mar. Ecol. Prog. Ser. 318,103–110 (2006).
40. Casey, J. M., Ainsworth, T. D., Choat, J. H. & Connolly, S. R. Farming behaviourof reef fishes increases the prevalence of coral disease associated microbes andblack band disease. Proc. R. Soc. B 281, 20141032 (2014).
41. Knutti, R. & Sedláček, J. Robustness and uncertainties in the new CMIP5climate model projections. Nature Clim. Change 3, 369–373 (2012).
42. van Hooidonk, R. & Huber, M. Effects of modeled tropical sea surfacetemperature variability on coral reef bleaching predictions. Coral Reefs 31,121–131 (2012).
43. Cróquer, A. & Weil, E. Changes in Caribbean coral disease prevalence after the2005 bleaching event. Dis. Aquat. Org. 87, 33–43 (2009).
44. Aeby, G. S., Ross, M., Williams, G. J., Lewis, T. D. &Work, T. M. Diseasedynamics ofMontipora white syndrome within Kaneohe Bay, Oahu, Hawaii:Distribution, seasonality, virulence, and transmissibility. Dis. Aquat. Org. 91,1–8 (2010).
45. Beeden, R., Maynard, J. A., Marshall, P. A., Heron, S. F. & Willis, B. L. Aframework for responding to coral disease outbreaks that facilitates adaptivemanagement. Environ. Manag. 49, 1–13 (2012).
46. Maynard, J. A. et al. A strategic framework for responding to coral bleachingevents in a changing climate. Environ. Manag. 44, 1–11 (2009).
47. Williams, G. J., Aeby, G. S., Cowie, R. O. & Davy, S. K. Predictive modelingof coral disease distribution within a reef system. PLoS ONE 5,e9264 (2010).
AcknowledgementsThis study was primarily funded by a grant from the National Oceanic and AtmosphericAdministration (NOAA) Climate Program Office prepared by S.F.H. and awarded toC.D.H. and C.M.E. (NA13OAR4310127). Support was also provided by a NationalScience Foundation Research Coordination Network grant to C.D.H., in-kind supportfrom NOAA Atlantic and Oceanographic Meteorological Laboratory, as well as grantsfrom the NOAA Coral Reef Conservation Program, the US National Fish and WildlifeFoundation, the Pacific Islands Climate Change Cooperative, the European ResearchCommission, and The Nature Conservancy. Use of data from ref. 28 benefited fromdiscussions with L. Burke and K. Reytar. Figures were collaboratively developed withD. Tracey. The contents in this manuscript are solely the opinions of the authors and donot constitute a statement of policy, decision or position on behalf of the NOAA or theUS Government.
Author contributionsJ.M., C.D.H., C.M.E., S.F.H., R.v.H., B.W., M.G., J.L. and G.W. designed the study. R.v.H.compiled and analysed the climate model data in collaboration with J.M. M.P. conductedthe spatial analysis required to build the maps on which Figs 3 and 4 and SupplementaryFigs 1 and 2 are based, in collaboration with J.M. J.M., C.D.H., C.M.E. and B.W. wrote themanuscript with assistance from all other authors.
Additional informationSupplementary information is available in the online version of the paper and includes atable listing the climate models used, a review of experimental studies that examined theeffects of temperature on Vibrio coralliilyticus, a panel figure for RCP 4.5 that matchesFig. 3 here, and a 500-m resolution disease risk summary figure that complements Fig. 4here. Reprints and permissions information is available online atwww.nature.com/reprints. Correspondence and requests for materials should beaddressed to J.M.
Competing financial interestsThe authors declare no competing financial interests.
NATURE CLIMATE CHANGE | ADVANCE ONLINE PUBLICATION | www.nature.com/natureclimatechange 7
© 2015 Macmillan Publishers Limited. All rights reserved
ARTICLES NATURE CLIMATE CHANGE DOI: 10.1038/NCLIMATE2625
MethodsClimate model data.Monthly sea surface temperature (SST) data were retrievedfor each available GCM from the World Climate Research Programme’s CMIP5data set (from http://cmip-pcmdi.llnl.gov/cmip5/data_portal.html) for RCP 8.5(n=33) and RCP 4.5 (n=35, see Supplementary Table 1 for list of models).Methods for matching the start of each model with the observed climatology used(1982–2005), correcting model means, replacing annual cycles, and interpolationroutines are all as per ref. 48. Projections produced are based on model runs thatare then averaged, rather than on ensemble means23,48, ensuring variance amongmodels is examined and presented for each projection output (Fig. 2d–i).
Temperature conditions. Three temperature conditions are examined thatincrease the susceptibility of coral hosts to disease or increase pathogen abundanceor virulence.
For all of the projected conditions, results are shown for reef locations only(also as per ref. 48) rasterized to match the climate model grid (n=1,748 pixels or‘reef locations’). Histograms and plots of the spread in results (average±1 s.d.)from the climate models are presented for each temperature condition, withpercentages based on the total number of reef locations.
Host susceptibility. Field studies from all reef regions have shown that coraldiseases often follow sublethal bleaching, presumably when energy and resourcesrequired for the maintenance of disease resistance are reduced14,16,49–51. For sensitivespecies globally, thermal stress represented by four degree heating weeks (DHWs)is a conservative threshold for predicting the presence of sublethal bleaching,because the global optimum predictor of bleaching is slightly higher at roughly sixDHWs (ref. 52). Here, our ‘host susceptibility’ metric identifies when a decadestarts in which thermal stress is projected to exceed four DHWs at least three times.This frequency was selected because the return period is so short (∼3 years) thatcorals will probably struggle to recover between bleaching events, thus remainingin a weakened and therefore susceptible state.
Pathogen abundance. Research on diseases affecting agricultural cropsindicates that survival rates of both causative agents and disease vectors increaseduring anomalously warm winters (called ‘overwintering’6). Although manylong-term studies of coral diseases detect higher levels of disease prevalence whentemperatures peak12, a common group of coral diseases, white plague and whitesyndromes, have been found in higher abundances during warm summers thatfollow mild winters (neither excessively cool or warm20). This is probably due to acombination of overwintering and increased host susceptibility because warmerwinters provide less of a reprieve for corals between warm seasons. Here, the‘pathogen abundance’ metric indicates the first year in which the means of thethree months centred on the coolest month are ≥0.5 ◦C above the minimummonthly mean (coolest month) calculated from a 1982–2008 climatology. Thisroughly equates to the thermal stress associated with mild winters in ref. 20 of2–6.5 DHWs, which are calculated from a higher baseline than is used here andwhich resulted in an increased abundance of white syndromes in Australia duringthe following summers.
Pathogen virulence. The model coral pathogen used here, Vibrio coralliilyticus,is the causative agent of a number of virulent white syndromes on Indo-Pacificcorals, causing progressive tissue loss and, ultimately, whole colony mortality. We
reviewed experimental studies and related the temperatures at which the virulenceand host-seeking motility behaviours (that is, chemotaxis and chemokinesis) of thispathogen are augmented to the maximummonthly mean (MMM, warmest month)at each sampling location (see Supplementary Table 2). For each of three strains ofV. coralliilyticus, the pathogen becomes virulent within 2.5 ◦C of the MMMcalculated for the period 1982–2008 at the respective sampling location, so weconservatively set the threshold as MMM (1982–2008). Here, the metric ‘pathogenvirulence’ identifies when the number of months in which temperatures exceedthe MMM becomes twice that observed, on average, during 2006–2011.This represents the timing of anticipated increases in virulence and in theprojected number of months corals are exposed to thevirulent pathogen.
Maps and histograms (standardized to the total number of reef locations) arepresented for: the earliest year by which at least one disease condition will be met,the year by which all three disease conditions will be met, the year from whichannual severe bleaching stress is projected, and the difference between the year bywhich at least two of the three disease conditions are met and the onset of annualsevere bleaching (eight DHWs).
A map is also presented of anthropogenic stress using the integrated localthreat (ILT) index developed for Reefs at Risk Revisited28, as is described in thepaper. We resample these data to our climate model grid by taking the highestlevel of stress within each model pixel to produce a visual summary interpretableat article resolution. The disease risk summary presented for RCP 8.5 grades riskbased on five criteria: (Criterion 1) none of the following criteria apply;(Criterion 2) two of three climate stressors occur before the onset of annualsevere bleaching and anthropogenic stress is high; (Criterion 3) as for Criterion 2but anthropogenic stress is very high; (Criterion 4) all three climate stressors occurbefore the onset of annual severe bleaching and anthropogenic stress is high;(Criterion 5) as for Criterion 4 but anthropogenic stress is very high. A 500-mresolution image of the disease risk summary is provided in the SupplementaryMethods, enabling readers to zoom into reefs of interest to see which reefs meetthe criteria set. The percentage values cited in the paper for reef pixels that meeteach of the five criteria are derived at 500-m resolution rather than from theresampled data.
References48. van Hooidonk, R., Maynard, J. A. & Planes, S. Temporary refugia for coral reefs
in a warming world. Nature Clim. Change 3, 1–4 (2013).49. Miller, J., Waara, R., Muller, E. & Rogers, C. Coral bleaching and disease
combine to cause extensive mortality on reefs in US Virgin Islands. Coral Reefs25, 418 (2006).
50. Brandt, M. & McManus, J. Disease incidence is related to bleaching extent inreef-building corals. Ecology 90, 2859–2867 (2009).
51. Muller, E. M., Rogers, C. S., Spitzack, A. S. & VanWoesik, R. Bleachingincreases likelihood of disease on Acropora palmata (Lamarck) in HawksnestBay, St John, US Virgin Islands. Coral Reefs 27, 191–195 (2008).
52. van Hooidonk, R. & Huber, M. Quantifying the quality of coral bleachingpredictions. Coral Reefs 28, 579–587 (2009).
NATURE CLIMATE CHANGE | www.nature.com/natureclimatechange
© 2015 Macmillan Publishers Limited. All rights reserved


