Embed Size (px)
Citation preview

City-Wide Mobile Air Quality Measurement System
Vasco Carvalho Instituto Superior Técnico
Av. Rovisco Pais, 1 1049-001, Lisbon, Portugal
José Gabriel Lopes Instituto Superior de Engenharia de Lisboa
Rua Conselheiro Emídio Navarro, 1 1959-007, Lisbon, Portugal
Helena G. Ramos and F. Corrêa Alegria
Instituto de Telecomunicações Instituto Superior Técnico
Av. Rovisco Pais, 1 1049-001, Lisbon, Portugal
Abstract— In this paper we present an air quality measurement system that can be used to generate a map of the air quality in a city. The system is made of stations that can be attached to buses and taxis and gather data about air quality along the day as they travel in the city. Each station has sensors to measure the concentration of different gases, a position sensor (GPS) and a GSM/GPRS communication module to transmit the data to a central server. Each station is self-sufficient in terms of energy through the use of a battery and solar panels. The data server can be accessed through the internet using a browser and presents the results in real time overlapped onto a Google map of the city indicating, with different colors, the concentration of each measured gas (CO, NO2, O3, SO2, and CO2).
I. INTRODUCTION One big concern for people living in crowded cities around
the world is the quality of the air they breathe. Poor air quality is mainly due to combustion engine vehicles although other sources can contribute to it like factories, airplanes and waste incinerators. Air pollution causes deaths and respiratory diseases [1], [2].
Many cities, nowadays, have air quality measurement stations that monitor the air quality in different points around the city along the day and make the information accessible to the general public in the internet [3]-[6]. This information is, however, limited to the location where the monitoring stations are installed. In this paper we present a system which is made of mobile stations which measure the air quality in real time. Each station, besides measuring the concentration of different pollutants, is able to associate it with a time and position given by a GPS unit and to send it in real time to a computer using existing mobile phone networks. It is solar powered which makes it completely mobile and able to work continuously for large periods of time.
Several mobile stations can be installed on the top of buses or taxis that roam the city. Using the information gathered, it is possible to build a map of the pollution around the city in real time. Another advantage is the capability of easily
monitoring the air quality in a given place where there is no fixed air quality monitoring station.
Those that contribute in a systematic way to the increase the gases concentration, such as public transport or trucking companies, should be the first to monitor their emissions and to take corrective actions. The construction of gardens in polluted zones, the change of traffic routes or a more serious management of the architectural and industrial park of a city can considered to minimize the pollution problem. However, it is only possible to take concrete actions with accurate data obtained during different hours, days and seasons. For that, it’s necessary to have an extensive monitoring system, capable of covering large zones and not only a small location, where data obtained cannot be generalized. A mobile station to measure air quality, easily integrated on a public transport fleet, can be a first step to achieve these goals.
In this paper a mobile station to measure air quality is described and the results obtained in the city of Lisbon, Portugal, with the implemented prototype are presented.
II. AIR QUALITY In a general way, it is possible to describe the atmosphere
as a very thin gaseous film, where all the meteorological phenomena that regulate the human life occur. Filled with a great diversity of molecules (Table I), the atmosphere performs, at the same time, a role of protection and regulation.
Air pollution can have various definitions. According to [1], “air pollution means the presence, within the external atmospheres, of one or more contaminants, or its combination in quantities or with a temporal duration that can become harmful to human life, vegetable, animal or goods. The air contaminants include smokes, steams, paper hashes, dusts, soot, carbonic smokes, gases, fogs, radioactive material or toxic chemical products.”
Certain atmospheric pollutants react with each other creating others pollutants called secondary pollutants. The
This work was financed by Instituto Superior Técnico and Instituto deTelecomunicações whose support the authors gratefully acknowledge.
978-1-4244-5335-1/09/$26.00 ©2009 IEEE 546 IEEE SENSORS 2009 Conference

dissociation, trough the sun’s effect, of volatiles organic compounds, carbon monoxide and nitrogen oxide, produced by automobile’s motors, lead to the formation of ozone, essentially during the summer, when temperature reaches higher levels.
TABLE I. AVERAGE COMPOSITION OF PURE AIR.
Element Symbol Proportion Nitrogen N2 78.084 % Oxygen O2 20.946 % Argon Ar 0.934 %
Carbon dioxide CO2 340 ppm Neon Ne 18.18 ppm
Helium He 5.24 ppm Methane CH4 1.5 ppm Krypton Kr 1.14 ppm
Hydrogen H 0.50 ppm Oxide Nitrous N2O 0.40 ppm
Xenon Xe 0.09 ppm
Air pollution has dramatic consequences for human health, leading to respiratory problems and even death [6] and for the environment like the greenhouse effect, acid rains and ozone layer reduction [7].
The European Community has dedicated special attention to the problem of the most representative pollutant’s concentration, such as the case of Carbon Monoxide (CO), Nitrogen Dioxide (NO2), Sulphur Dioxide (SO2), Ozone (O3) and particles of 10 µm or less (PM10) and special Regulations have been produced.
Although the Carbonic Dioxide (CO2) isn’t considered a pollutant, its concentration has also to be quantified, due to importance of this gas to the planet’s ecosystems.
The system presented here is capable of measuring the following gases in the atmosphere:
• Carbon Dioxide (CO2) – Carbon Dioxide is a gas essential to life in the planet, because it is one of the most important elements evolving photosynthesis process, which converts solar into chemical energy. The concentration of CO2 has increased due mainly to massive fossil fuels burning. This increase makes plants grow rapidly. The rapid growth of undesirable plants leads to the increase use of chemicals to eliminate them.
• Carbon Monoxide (CO) – Carbon Monoxide is a colorless and odorless gas. It is mainly due to automobile traffic, industrial activity and volcanic eruptions. This gas affects cardiovascular and nervous systems and, in large concentrations, inhibits the blood’s capacity of exchange oxygen with vital organs. In extreme cases, may provoke death by poisoning.
• Sulphur Dioxide (SO2) – Sulphur Dioxide is a colorless gas, detectable by the distinct odor and taste. Like CO2, it is mainly due to fossil fuels burning and to industrial processes. In high concentrations may cause respiratory problems, especially in sensitive groups, like asthmatics. It contributes to acid rains.
• Nitrogen Dioxide (NO2) – Nitrogen Dioxide is a brownish gas, easily detectable for its odor, very corrosive and highly oxidant. It is produced as the result of fossil fuels burning. Usually NO thrown to the atmosphere is converted in NO2 by chemical processes. In high concentrations, NO2 may lead to respiratory problems. Like SO2, it contributes to acid rains.
• Ozone (O3) – Ozone is a colorless and highly oxidant gas present at low levels of the higher layers of the atmosphere (troposphere). It is the result of a chemical reaction evolving organic pollutants, nitrogen oxides and solar radiation. Usually, it is denominated as a secondary pollutant. Ozone is responsible for the so-called photochemical smog and is often pointed out as the main cause responsible for agricultural losses. There are vegetal species particularly sensitive to its effects. In humans it can irritate the respiratory tract and cause breathing difficulties.
The prototype station build is capable of measuring these five gases and can be upgraded to include the measurement of more gases and small airborne particles concentrations.
In Portugal the Government has defined some guide values and limits of concentration of pollutants in the atmosphere [10]. According to these information and [11], it was possible to build a table (Table II) which qualifies the air quality, given the concentration of these pollutants. There is no universal air quality index. Other organizations and countries have defined their own indexes (see [7] for the case of the United States of America).
III. MOBILE STATION HARDWARE
A. Station’s Main Structure In order to build a mobile, autonomous and automatic
device, capable of measuring the concentrations of different gases that contribute to pollution, several modules had to be designed and integrated into a single system (Fig. 1). Those modules are:
• Control module; • GPS module for station location; • GSM/SPRS module for data transmission; • Battery and photovoltaic cells for autonomous operation; • Sensors for each gas to be monitored; • Sensors for temperature and movement; • Temporary data storage.
TABLE II. LEVELS OF CONCENTRATIONS OF EACH POLLUTANT INDEX AND A QUALITATIVE MEASURE OF AIR QUALITY [10].
Class CO [μg/m3]
[PPM] NO2 [μg/m3]
[PPM] O3 [μg/m3]
[PPM] SO2 [μg/m3]
[PPM] Min Max Min Max Min Max Min Max
Bad 10000 [8.7290] ----- 400
[0.213] ----- 240 [0.1223] ----- 500
[0.1908] -----
Weak 8500 [7.4197]
9999 [8.7281]
230 [0.122]
399 [0.212]
180 [0.0917]
239 [0.1218]
350 [0.1336]
499 [0.1906]
Average 7000 [6.1103]
8499 [7.4188]
140 [0.074]
229 [0.122]
120 [0.0611]
179 [0.0912]
210 [0.0802]
349 [0.1332]
Good 5000 [4.3645]
6999 [6.1094]
100 [0.053]
139 [0.074]
60 [0.0306]
119 [0.0606]
140 [0.0534]
209 [0.0798]
Very Good 0 4999
[4.3636] 0 99 [0.053] 0 59
[0.0301] 0 139 [0.0531]
547

Figure 1. Block diagram with the system components.
The information obtained from the sensors is sent to a server’s database with Internet connection. The mobile station transmits to this server through a GSM/GPRS module and uploads the data. The database can be accessed with a browser program on an internet page which presents some generic information about the station status, displays the concentration ranges of the gases and allows the system administrator to perform some database maintenance services. Anyone can access the database and see graphically all the information of the measured values and their tracking for a given day. These information is color coded based on the gases concentration allowing an easy evaluation of the air quality. For each location, the specific concentration of each gas, time and date at which the data was acquired and the local temperature recorded at that moment are displayed.
B. Control Unit A 16-bit microcontroller from Microchip, model
dsPIC30F4013, is the heart of the mobile station. It has 49 KB of flash memory, 30 digital input/output ports, 13 analog input ports with 12-bit resolution and interface circuitry for peripheral connection (UART, SPI and I2C).
C. Temperature measurement It is important to know the temperature at each location in
order to correct the values given by sensors which are highly temperature dependent. The temperature sensor also reads the temperature inside the box, in order to control it with the help of a fan used to extract the hot air from inside the station. The sensor used was model MCP9701A from Microchip. It has an accuracy of 0.5 ºC in the range from 0 to 50 ºC. The analog output’s sensitivity is 19.53 mV/ºC.
D. Pollution Measurement Sensors Each gas concentration is measured with a different sensor
from Alphasense. They were chosen due their low power consumption which is an important factor in a solar powered system. From the available models the chosen ones were generally bigger to reduce the system cost although the use of smaller ones would allow a reduction in the total size of the mobile air quality measurement station. In Table III the characteristics of each gas sensor used are summarized.
TABLE III. CHARACTERISTICS OF THE GAS SENSORS FROM ALPHASENSE.
CO2 CO NO2 SO2 O3
Model CO2-A1 CO-BF NO2-B1 SO2-BF CL2-B1
Range 100 ppm to 90 %
0 to 100 ppm
0 to 20 ppm
0 to 20 ppm
0 to 20 ppm
Response Time
2 - 4 min 30 s 60 s 30 s 60 s
Resolution 0.3 ppm 0.02 ppm 0.1 ppm 0.02 ppm
Sensitivity 10 mV/ decade change
80 to 120 nA/ppm
@400 ppm
-600 to -1100
nA/ppm @
10 ppm
300 to 440
nA/ppm
-700 to -1100
nA/ppm (10 ppm)
The signal conditioning used for the carbon dioxide sensor (CO2) is an instrumentation amplifier powered by ±5 V (Fig. 2). The sensor voltage output ranges from 0 to 15 mV. The amplifier gain used was 100 leading to an amplified voltage between 0 and 1.5 V.
5V
V-
V+ +
-Vout
-5V
SensorCO2
AI
Figure 2. Signal conditioning of CO2 sensor.
The other sensors are amperimetric ones. Alphasense provides a signal conditioning board for these sensors (Fig. 3). These boards are powered with 9 V and the gas concentration information is given by the current they consume. This current, which can be adjusted, ranges from 4 mA (null concentration) to 20 mA (maximum concentration).
To convert this current to a voltage a 50 Ω sampling resistor (0.01 % accuracy) and an instrumentation amplifier with a 4.95 gain (Fig. 4) were used. The output voltage (vout) ranges from 0.99 V to 4.95 V.
Figure 3. Photograph of an Alphasense signal conditioning module for one of their carbon monoxide sensors.
548

Figure 4. Signal conditioning for the amperimetric sensors.
E. Data Transmission System – GSM/GPRS Module The automation of data acquisition and of data
transmission represents an essential feature of the mobile station. With it, the station doesn’t require any user intervention to acquire, store and transmit data since it automatically sends the data to the server where it can be easily read.
The system uses a low cost GSM/GPRS module from Siemens, model TC65, with integrated TCP/IP stack, which turned the system development to an easy task. It was connected to the microcontroller using a RS232 protocol.
F. Positioning System – GPS Module The mobile station moves around permanently and
acquires data in different locations, so it needs a GPS receiver to track its geographical location. The receiver gives a position relative to the Earth, referenced to the Equator, the Greenwich meridian and sea level. It is given by three parameters: latitude, longitude and altitude.
The receiver module used, made by Garmin (model 15H), was chosen due to its low cost, small size (36×46×9 mm) and low power consumption (390 mW). It has a fast acquisition rate, namely 2 s for reacquisition, 15 s for warm start and 45 s for a cold start. The position accuracy is 15 m which is not the best in the market but which was considered adequate for this application.
G. Additional Memory – EEPROM Due to the amount of data the station needs to store, even
in power failure situations, the system was fitted with a non-volatile memory EEPROM with 1 Mb capacity and an SPI interface. It is powered with 5 V and consumes less than 7 mA.
H. Movement Sensor The system is equipped with a movement sensor, which
detects small mechanical vibrations and converts it to electric impulses. The station turns itself off when it senses it is stopped for more than a defined amount of time, in order to save energy. When the sensor detects movement the station comes back from sleep mode.
I. Power Source The station is equipped with a photovoltaic system
constituted by two panels, a solar charge controller and a battery (Fig. 5) in order to guarantee its own energy generation and to be completely autonomous.
Figure 5. Diagram of photovoltaic system used showing the battery (1),
charge controller (2) and solar panels (3).
The solar panels convert energy from the sun into electric energy. These devices are composed by photovoltaic cells. Each photovoltaic cell produces a small amount of power and a solar panel aggregates several cells in order to get to produce more power (in series to increase current or in parallel to increase voltage).
Two monocrystalline solar panels, each with 16 cells and occupying a 180×226 mm area (0.04 m2) were used. Considering their 15.5% efficiency and the worst case average monthly solar radiation in Lisbon, Portugal, which is 63.6 W/m2 in December, as depicted in Fig. 6 [12], the average generated power is 390 mW. If we consider the annual solar radiation average of 185 W/m2, we have an annual average 1.14 W power supply. It is estimated that the station works only about 15 hours a day. The rest of the time it is in standby mode. The power consumed in the normal mode is 1044.75 mW and the power consumed in standby is 174 mW. The GPRS module consumes 2076 mW and works for about 8 minutes in each hour. Using these values the average power consumed by the station is 729 mW. Using just two solar panels is not enough for the station to have enough power in the months of November, December and January in Lisbon, Portugal. It will be necessary to fit the station with two additional solar panels.
77
111,9
177,2
217,2
262,9
300,2 307
273,9
209,6
135,5
87,863,6
0
100
200
300
400
Jan Fev Mar Abr Mai Jun Jul Aug Set Oct Nov Dec
Sola
r Rad
iati
on W
/m2
Figure 6. Average monthly solar radiance in Lisbon, Portugal [12].
549
The mobile station has a battery that converts chemical energy into electric energy, thus giving it the needed power any time of the day. This battery used was a 12 V sealed lead-acid with 2 Ah capacity. This type of battery was chosen because it is the most appropriate for applications where there is a constant charging and discharging of the battery.
The solar charge controller used was from STECA, model Solsum 5.0. It has overload protection, discharge protection and temperature compensation.
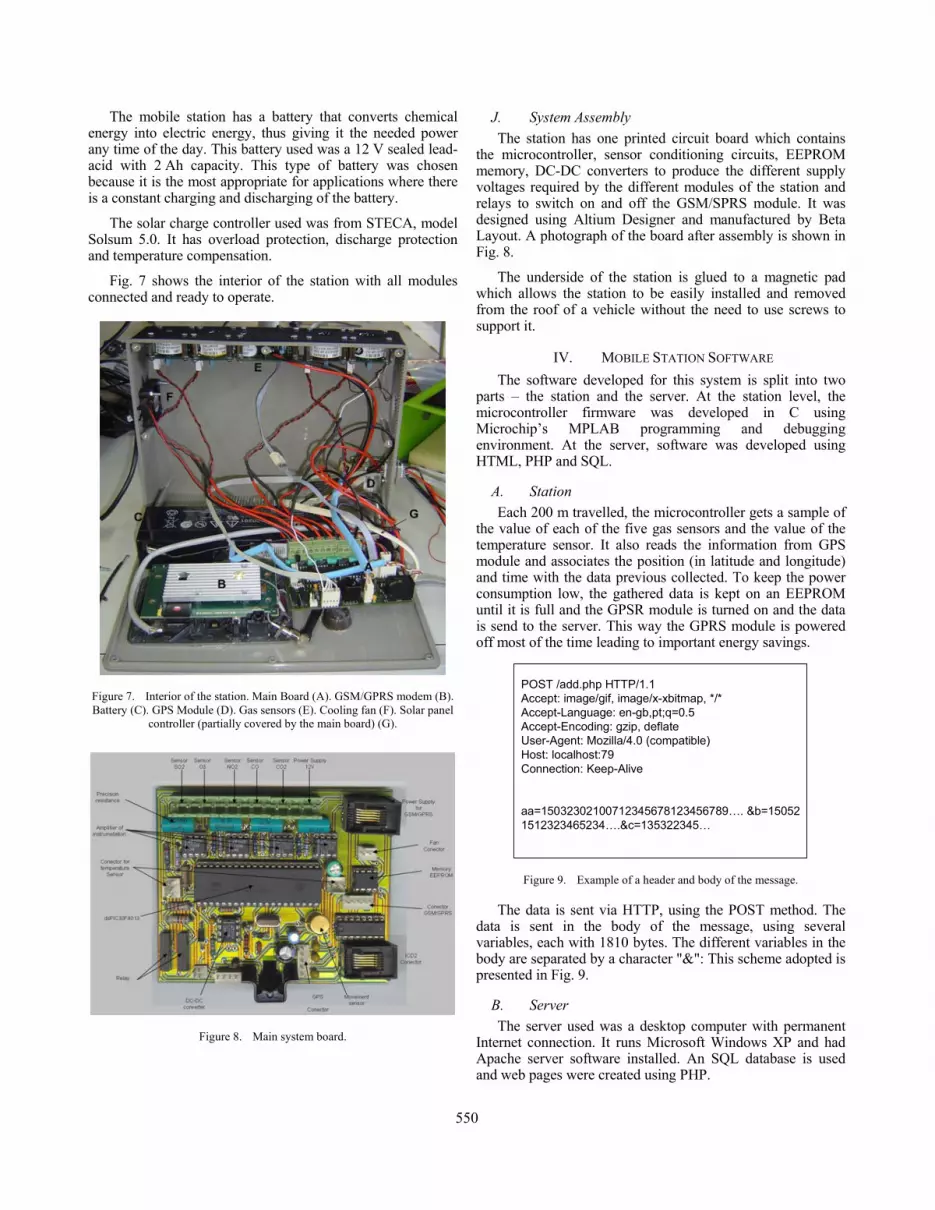
Fig. 7 shows the interior of the station with all modules connected and ready to operate.
Figure 7. Interior of the station. Main Board (A). GSM/GPRS modem (B). Battery (C). GPS Module (D). Gas sensors (E). Cooling fan (F). Solar panel
controller (partially covered by the main board) (G).
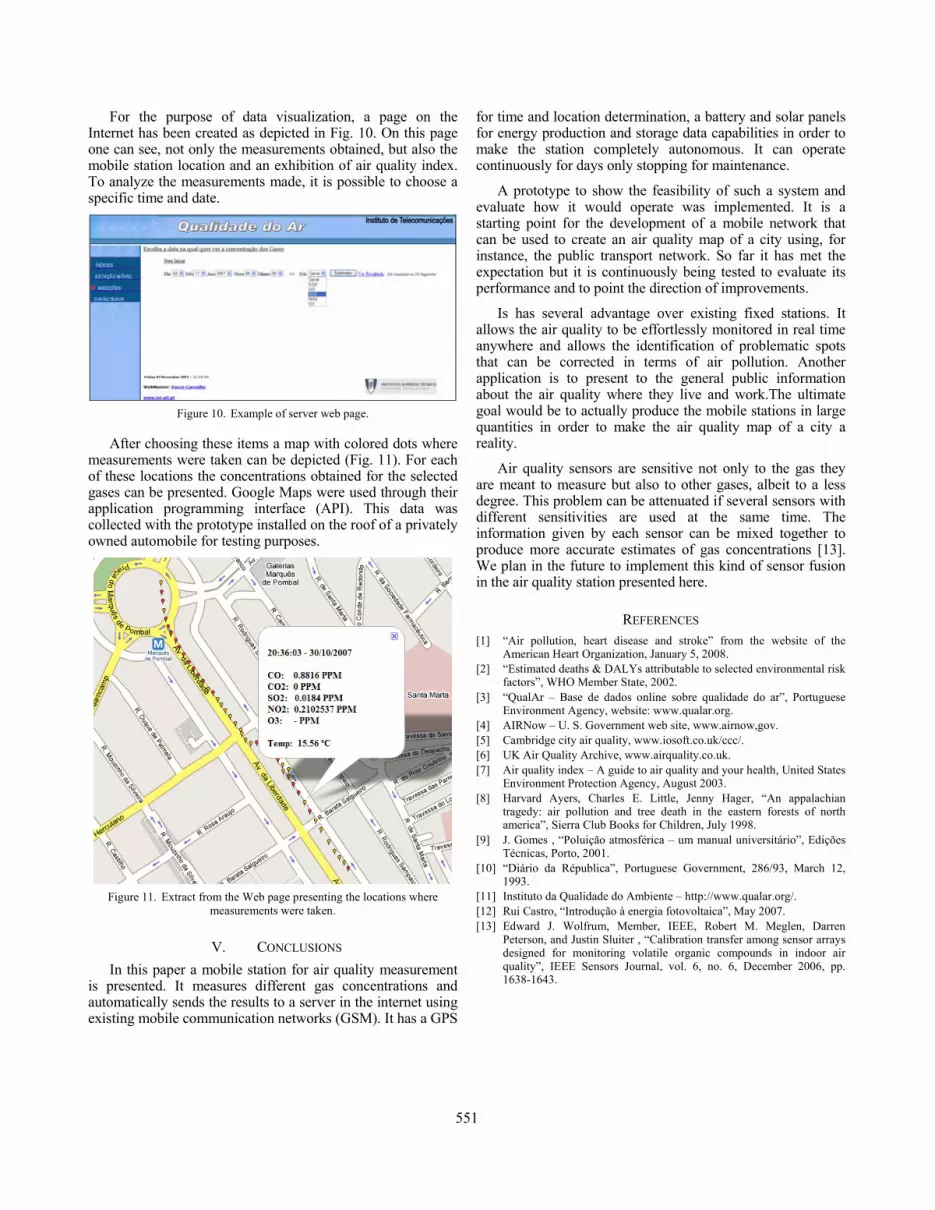
Figure 8. Main system board.
J. System Assembly The station has one printed circuit board which contains
the microcontroller, sensor conditioning circuits, EEPROM memory, DC-DC converters to produce the different supply voltages required by the different modules of the station and relays to switch on and off the GSM/SPRS module. It was designed using Altium Designer and manufactured by Beta Layout. A photograph of the board after assembly is shown in Fig. 8.
The underside of the station is glued to a magnetic pad which allows the station to be easily installed and removed from the roof of a vehicle without the need to use screws to support it.
IV. MOBILE STATION SOFTWARE The software developed for this system is split into two
parts – the station and the server. At the station level, the microcontroller firmware was developed in C using Microchip’s MPLAB programming and debugging environment. At the server, software was developed using HTML, PHP and SQL.
A. Station Each 200 m travelled, the microcontroller gets a sample of
the value of each of the five gas sensors and the value of the temperature sensor. It also reads the information from GPS module and associates the position (in latitude and longitude) and time with the data previous collected. To keep the power consumption low, the gathered data is kept on an EEPROM until it is full and the GPSR module is turned on and the data is send to the server. This way the GPRS module is powered off most of the time leading to important energy savings.
POST /add.php HTTP/1.1Accept: image/gif, image/x-xbitmap, */*Accept-Language: en-gb,pt;q=0.5Accept-Encoding: gzip, deflateUser-Agent: Mozilla/4.0 (compatible)Host: localhost:79Connection: Keep-Alive
aa=15032302100712345678123456789…. &b=150521512323465234….&c=135322345…
Figure 9. Example of a header and body of the message.
The data is sent via HTTP, using the POST method. The data is sent in the body of the message, using several variables, each with 1810 bytes. The different variables in the body are separated by a character "&": This scheme adopted is presented in Fig. 9.
B. Server The server used was a desktop computer with permanent
Internet connection. It runs Microsoft Windows XP and had Apache server software installed. An SQL database is used and web pages were created using PHP.
550
For the purpose of data visualization, a page on the Internet has been created as depicted in Fig. 10. On this page one can see, not only the measurements obtained, but also the mobile station location and an exhibition of air quality index. To analyze the measurements made, it is possible to choose a specific time and date.
Figure 10. Example of server web page.
After choosing these items a map with colored dots where measurements were taken can be depicted (Fig. 11). For each of these locations the concentrations obtained for the selected gases can be presented. Google Maps were used through their application programming interface (API). This data was collected with the prototype installed on the roof of a privately owned automobile for testing purposes.
Figure 11. Extract from the Web page presenting the locations where
measurements were taken.
V. CONCLUSIONS In this paper a mobile station for air quality measurement
is presented. It measures different gas concentrations and automatically sends the results to a server in the internet using existing mobile communication networks (GSM). It has a GPS
for time and location determination, a battery and solar panels for energy production and storage data capabilities in order to make the station completely autonomous. It can operate continuously for days only stopping for maintenance.
A prototype to show the feasibility of such a system and evaluate how it would operate was implemented. It is a starting point for the development of a mobile network that can be used to create an air quality map of a city using, for instance, the public transport network. So far it has met the expectation but it is continuously being tested to evaluate its performance and to point the direction of improvements.
Is has several advantage over existing fixed stations. It allows the air quality to be effortlessly monitored in real time anywhere and allows the identification of problematic spots that can be corrected in terms of air pollution. Another application is to present to the general public information about the air quality where they live and work.The ultimate goal would be to actually produce the mobile stations in large quantities in order to make the air quality map of a city a reality.
Air quality sensors are sensitive not only to the gas they are meant to measure but also to other gases, albeit to a less degree. This problem can be attenuated if several sensors with different sensitivities are used at the same time. The information given by each sensor can be mixed together to produce more accurate estimates of gas concentrations [13]. We plan in the future to implement this kind of sensor fusion in the air quality station presented here.
REFERENCES [1] “Air pollution, heart disease and stroke” from the website of the
American Heart Organization, January 5, 2008. [2] “Estimated deaths & DALYs attributable to selected environmental risk
factors”, WHO Member State, 2002. [3] “QualAr – Base de dados online sobre qualidade do ar”, Portuguese
Environment Agency, website: www.qualar.org. [4] AIRNow – U. S. Government web site, www.airnow,gov. [5] Cambridge city air quality, www.iosoft.co.uk/ccc/. [6] UK Air Quality Archive, www.airquality.co.uk. [7] Air quality index – A guide to air quality and your health, United States
Environment Protection Agency, August 2003. [8] Harvard Ayers, Charles E. Little, Jenny Hager, “An appalachian
tragedy: air pollution and tree death in the eastern forests of north america”, Sierra Club Books for Children, July 1998.
[9] J. Gomes , “Poluição atmosférica – um manual universitário”, Edições Técnicas, Porto, 2001.
[10] “Diário da Républica”, Portuguese Government, 286/93, March 12, 1993.
[11] Instituto da Qualidade do Ambiente – http://www.qualar.org/. [12] Rui Castro, “Introdução à energia fotovoltaica”, May 2007. [13] Edward J. Wolfrum, Member, IEEE, Robert M. Meglen, Darren
Peterson, and Justin Sluiter , “Calibration transfer among sensor arrays designed for monitoring volatile organic compounds in indoor air quality”, IEEE Sensors Journal, vol. 6, no. 6, December 2006, pp. 1638-1643.
551


