Embed Size (px)
Citation preview
CITY OF SPRINGFIELD
BUDGET COMMITTEE MEETING Tuesday, April 14, 2015, 5:30 p.m.
Library Meeting Room, Springfield City Hall
225 Fifth Street
Springfield, Oregon
AGENDA
A.) COMMITTEE OPENING REMARKS 10 minutes
1. Welcome from the Chair Chair Chris Stole
2. Roll Call Staff
3. Election of Chairperson Chair Chris Stole
4. Election of Vice Chairperson Chair Chris Stole
B.) STAFF OPENING REMARKS Gino Grimaldi 30 minutes
1. Welcome from the City Manager
2. Delivery of Budget Message
C.) INTRODUCTION OF BUDGET Bob Duey 30 minutes
1. Budget Committee Bylaws
2. Budget Process
3. Budget Overview
BREAK 15 minutes
D.) NEW BUSINESS Department presentations
1. Library Rob Everett 20 minutes
2. Fire & Life Safety Chief Groves 40 minutes
3. Information Technology Brandt Melick 20 minutes
E.) BUSINESS FROM THE AUDIENCE 10 minutes
F.) ANNOUNCE NEXT BUDGET COMMITTEE MEETING Chair
1. Tuesday, April 21, 2015 – 5:30 PM, Springfield City Hall – Library Meeting Room
Note:
The Budget Committee for the Springfield Urban Renewal Agency (SEDA) will convene at 5:30 PM at the
same location. The legal advertisement for this meeting will be published separately. Dinner will be
provided and the City of Springfield Budget Committee will convene at the conclusion of the SEDA
meeting.
G.) ADJOURN
Citizens’ comments are normally scheduled under the agenda item “Business from the Audience” and are limited
to three (3) minutes each. All subsequent meetings will have time scheduled for citizen input and anyone wishing
to make a longer presentation should contact the City Manager’s Office at 726-3700, so that the presentation can
be included separately on the agenda.
ATTACHMENTS
1) FY2015-2016 Budget Message
2) April 14, 2015 Agenda Memo
3) City of Springfield Total Operating Expenditures– Total All Funds
4) Operating Expenditures by Department’s – Total All Funds
April 14th 5) Library Budget Summary Memo 6) Library Presentation 7) Fire & Life Safety Budget Summary Memo 8) Fire & Life Safety Presentation 9) Information Technology Summary Memo 10) Information Technology Presentation
April 21st
11) City Manager’s Office Budget Summary Memo 12) City Manager’s Office Presentation 13) Human Resources Budget Summary Memo 14) Human Resources Presentation 15) Police Budget Summary Memo 16) Police Presentation
April 27th
17) Finance Budget Summary Memo 18) Finance Presentation 19) Legal/Judicial Services Budget Summary Memo 20) Legal/Judicial Services Presentation 21) Development & Public Works Budget Summary Memo 22) Development & Public Works Presentation 23) Capital Budget Presentation
FY16 Proposed
24) City of Springfield Proposed Budget Fiscal Year 2015/2016
Attachment 1 FY16 Budget Message Page 1 of 6
Attachment 1 FY16 Budget Message Page 2 of 6
Attachment 1 FY16 Budget Message Page 3 of 6
Attachment 1 FY16 Budget Message Page 4 of 6
Attachment 1 FY16 Budget Message Page 5 of 6
Attachment 1 FY16 Budget Message Page 6 of 6
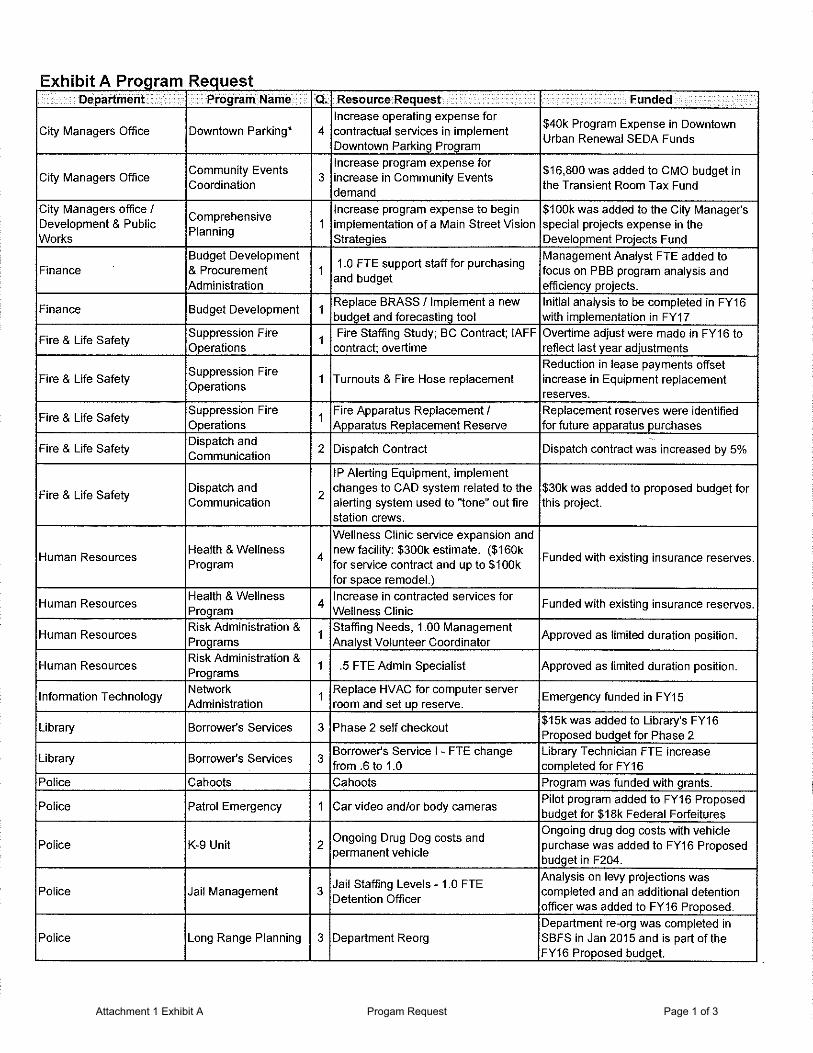
Attachment 1 Exhibit A Progam Request Page 1 of 3
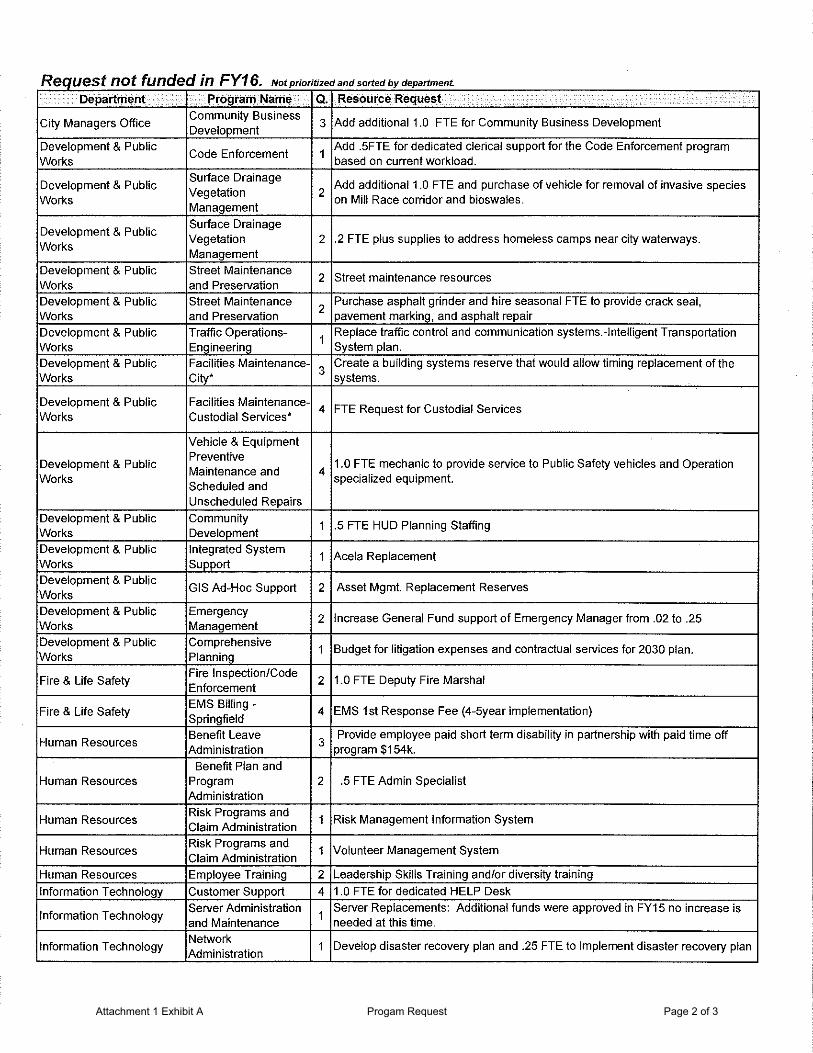
Attachment 1 Exhibit A Progam Request Page 2 of 3
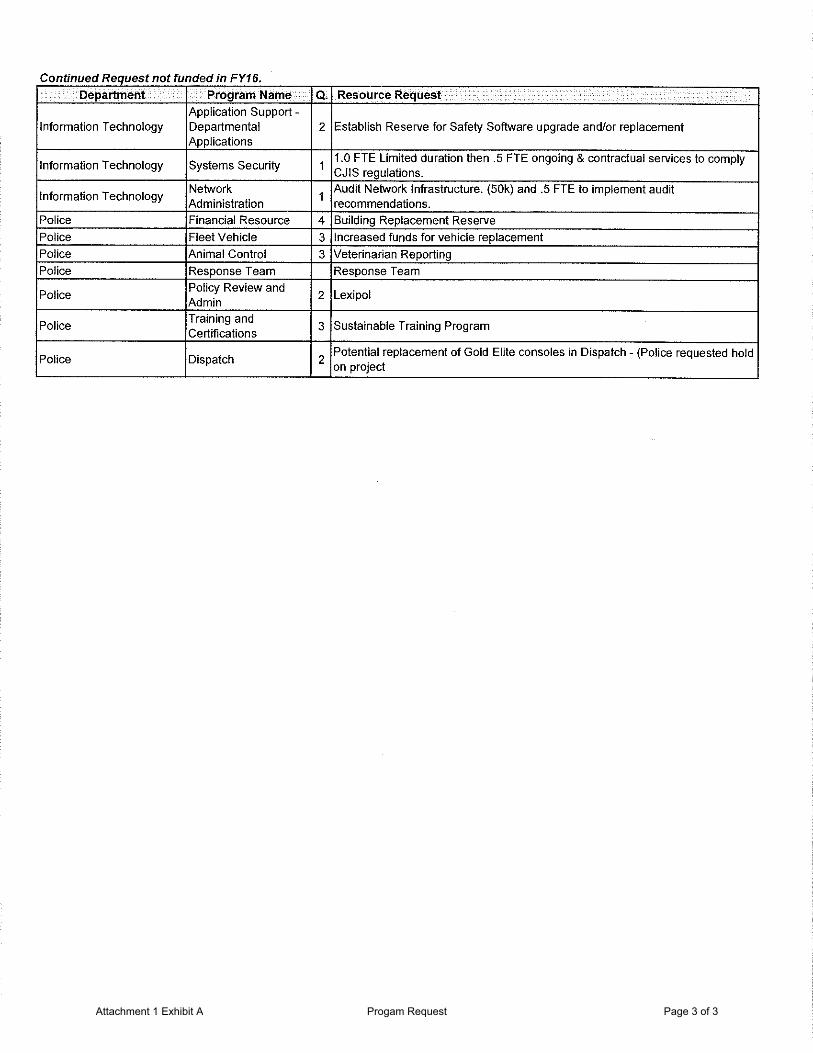
Attachment 1 Exhibit A Progam Request Page 3 of 3
FINANCE DEPARTMENT MEMO City of Springfield, Oregon
To: Members of the Springfield Budget Committee
From: Bob Duey, Finance Director
Date: March 23, 2015
Subject: First Budget Meeting Scheduled April 14, 2015
I would like to thank each of you in advance for volunteering your time to help review the Proposed Budget for the City. The first meeting is scheduled for Tuesday April 14, @ 5:30 p.m. in the Library Meeting Room of Springfield City hall. Dinner will be served and ready for you at 5:00 pm. Committee Roster and Officers In the front of your FY16 Proposed Budget document (Attachment 24) there is a listing of the members of this year’s committee. Returning for community members are Chris Stole (Ward 1), Terry Buck (Ward 2), Gabriele Guidero (Ward 4), Diana Alldredge (Ward 5) and Paul Selby (Ward 6). Our new member recently appointed to the Committee by the Council is Nathan Mischel (Ward 3). The current officers for the Committee are Chris Stole, Chairman, and Diana Alldredge, Vice Chair. One of the first official actions at your April 14th meeting will be to elect officers for 2015. For Springfield the chair position has historically been held by a community member but that is practice and not a rule and the positions can be held by any of the 12 members. The Budget Committee has been willing in past years to appoint the Mayor as a non-voting ex-officio member of the Committee as state statutes does not include the mayor of a city as an official appointed to the Budget Committee. You are also being asked again to serve on the Budget Committee for the Springfield Economic Development Agency (SEDA). As a separate agency, SEDA is required to follow Oregon budget law in the manner similar to your role on the city’s Budget Committee for the City’s two urban renewal districts. The SEDA Board is comprised of the six City Councilors, the City’s Mayor, and one County Commissioner. To ensure equal representation between elected officials and appointed members, the SEDA Budget Committee is comprised of those 8 individuals plus the six community members from the City’s Budget Committee plus 2 additional members. Volunteering
With the recent implementation of the new Volunteer Coordinator program in HR, the City has begun tracking volunteer hours. All volunteers are now covered by an excess medical policy or Workers Compensation Insurance while performing their duties. In accordance with City policies and procedures all time donated to the City of Springfield is documented and recognized annually. At the beginning of each meeting a sign in form will be sent around to assist us with this effort. Bylaws
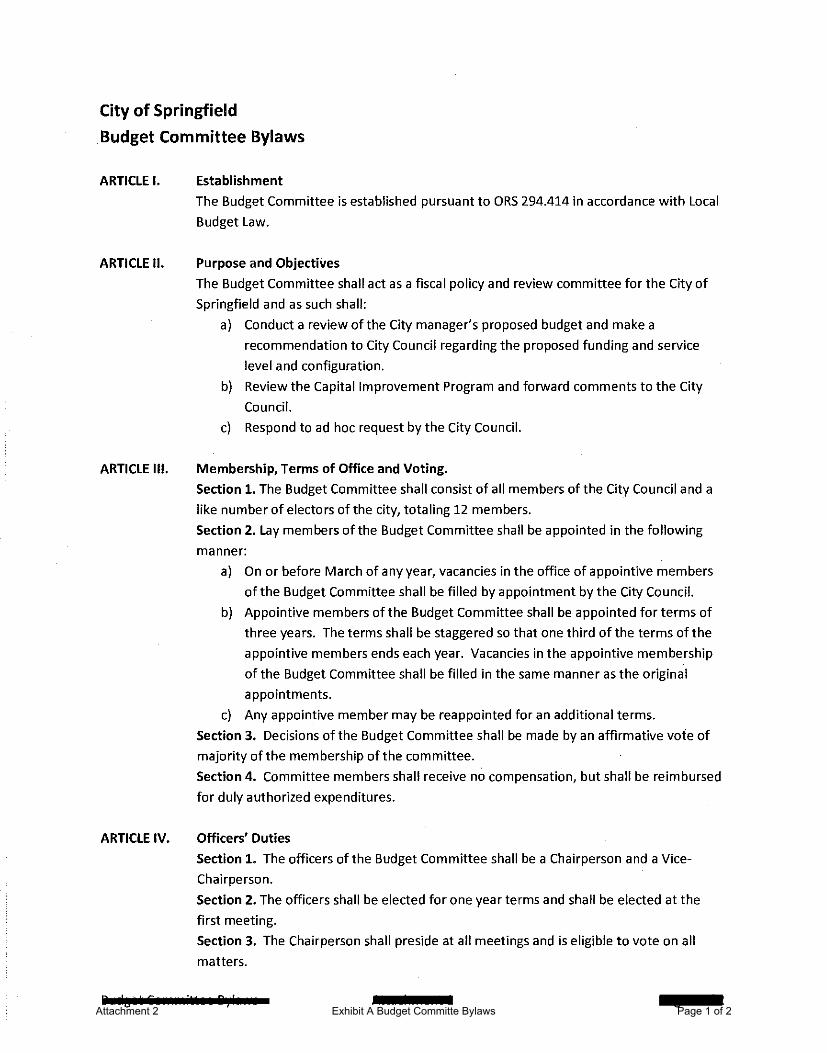
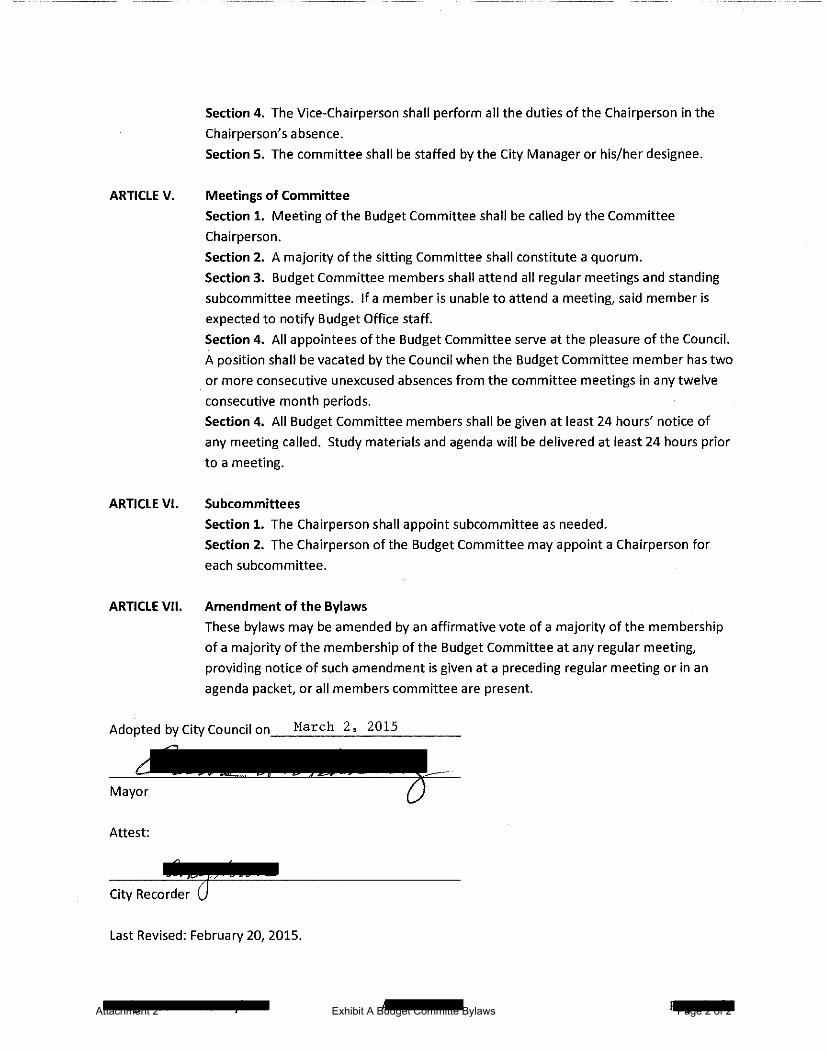
By request of Council and reviewed at a regular session bylaws for the Budget Committee were approved on March 2, 2015, Exhibit A. Bylaws set forth the structure of the committee in the organization. They state what rights the members have within the organization and what limits of power are put on boards and officers. The bylaws address the attendance policy that matches the language in the Council Operating Policies and Procedures document and are in accordance with Local Budget Law ORS294.414. Agenda Packet The agenda included in this packet for the first meeting on April 14th also includes tentative agendas for the next two Tuesdays. Staff has scheduled the presentations and deliberations for this year’s process to occur over three
Attachment 2 April 14th Agenda Memo Page 1 of 6
evenings. If the Committee does need more time to review department’s budgets or have more questions answered we have included on the calendar a fourth meeting for Tuesday May 05th. Fiscal Health
Priority Based Budgeting (PBB) is a process and a set of tools that has helped the City change the way we talk about making financial decisions and how we achieve the results that our community is looking for. The new process has allowed staff to focus on program results as opposed to budgeted line items. Staff has prioritized what programs and services are most important to our residents, identified programs we should focus on and recognized programs we continue to do will. Finance and department staff have been facilitating the use of PBB in the decision making process. As a result of the City’s use of PBB, several departments have identified, recommended and successfully reorganized their operations to shift resources from lower priorities to higher priority programs. This has improved customer services and increased efficiencies which has built trust and credibility to all stakeholders involved in the budget process.
To be successful in this effort the City must also engage in long range financial planning. Be able to properly analyze the long range impact of immediate decisions. Plan for the volatility that can occur with certain revenue sources, project and plan for knowable asset management and provide for a level of financial stability which will provide for an appropriate level of services during economic bust and boom times. The first of several steps that management is taking to move towards accomplishing this goal is to review and update existing fiscal policies. These policies have been adopted by the Council or administratively followed by staff. We will be assessing the policies current impact on the City’s fiscal health to determining where we are currently are, along a continuum and where we would like to be at some time in the future.
Because of the way municipal governments are organized financially with numerous types of accounting funds and many different types of legally dedicated revenues an effective approach to working on this project is to address different parts of the City’s budget at different times. The following is a breakout of the funds types for the City: Special Debt Internal Capital General Revenue Enterprise Service Service Projects General* Street* Sewer Bancroft Insurance Sewer Spec Rev Regional WW Bond Sinking Equip Replace. Drainage Room Tax Ambulance* MWMC Debt SDC Admin Street CDBG Drainage Regional WW (2) Building* Booth-Kelly SDC Drainage (2) Jail Ops Reg Fiber SDC Sanitary (2) Fire Levy SDC Transportation (2) Police Levy SDC Regional (2) Glenwood URD Devl’p Projects Downtown URD Devl’p Assessment The initial phases of the fiscal health analysis project is going to concentrate on operating funds and specifically the General Fund, the Street Fund (special revenue type), the Building Fund (special revenue type) and the Ambulance Fund (enterprise type). These accounting funds best represent the types of possible fiscal policies that could be applied universally across the remainder of the City and provide the template for additional analysis. Four Select Operating Funds Beginning Cash and Operating Balances The City’s total Proposed Budget for FY15 is $340,611,422 while the Operating Budget share of the total is $99,886,651 (Proposed Budget FY16Attachment 24 Pages 11-19). The Operating Budget includes the necessary resources for each of the 9 departments within the City and is appropriated across 29 different accounting funds in recognition of the various revenues received that are accounted for separately. Included in the total operating budget is over $13.5M that is the City of Eugene’s cost of operating the regional sanitary sewer treatment plant that is appropriated within the City of Springfield’s budget because of the role Springfield has as the administrator of the Metro Wastewater Management Commission.
Attachment 2 April 14th Agenda Memo Page 2 of 6
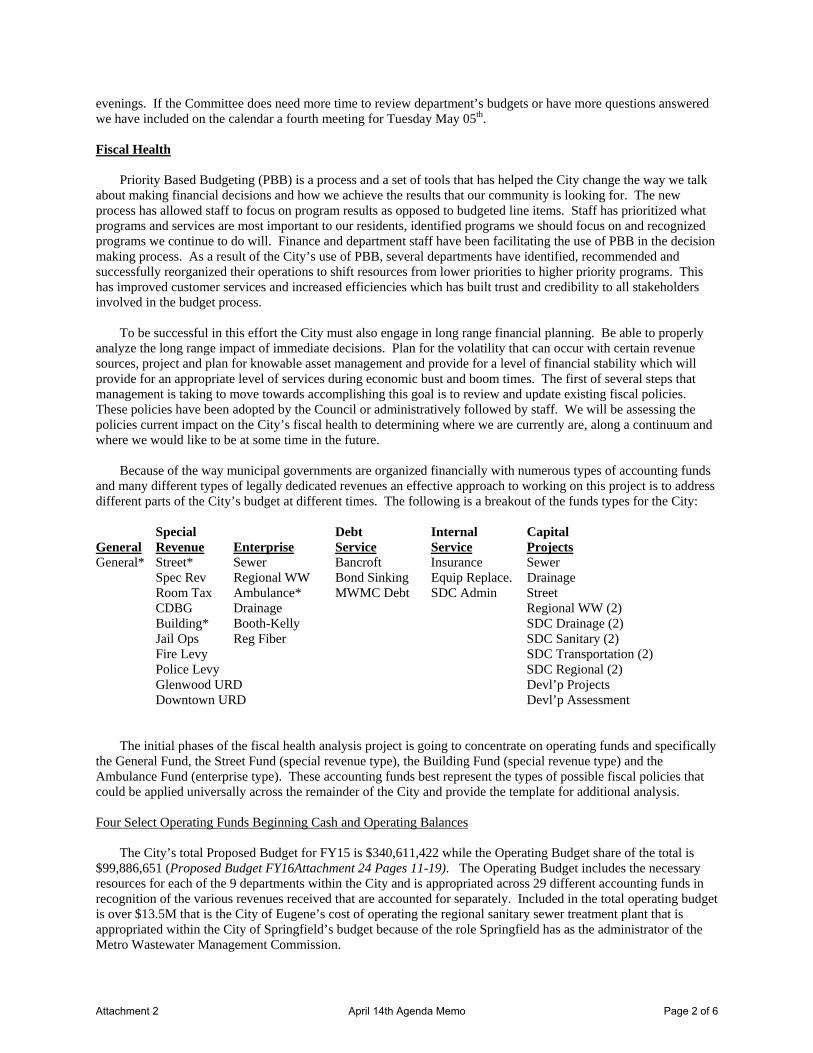
The General Fund is by far the single largest fund used by the City for accounting purposes and contains the largest percentage of every department’s operating budget except for the department of Development & Public Works (DPW). The largest percentage of the DPW operating budget is located in the Street, Sanitary Sewer and Storm Water funds. The table below shows the current cash flow projections for the City’s General Fund: GENERAL FUND
Actual Actual Actual Est Actuals Proposed Projected Projected
FY12 FY13 FY14 FY15 FY16 FY17 FY1832,148,512 32,622,492 32,917,157 34,709,014 35,404,046 35,993,261 36,788,002
30,866,349 31,107,938 31,775,305 33,390,117 34,607,945 35,616,503 36,600,989
XFR to Street Fd 357,673 367,715 377,220 397,866 397,566 397,866 397,866XRF to Jail Fd 450,000 401,393 373,685 450,000 450,000 450,000 450,000Xfr to Other Fds 38,499 2,947 100,000 0 0Debt Service 232,375 229,168 230,715 226,896 227,709 223,030 223,108
1,078,547 1,001,222 981,620 1,074,762 1,175,275 1,070,896 1,070,974
31,944,896 32,109,160 32,756,925 34,464,879 35,783,220 36,687,399 37,671,963
203,616 513,332 160,232 244,135 -379,174 -694,138 -883,961
7,551,136 7,754,752 8,268,084 8,428,315 8,672,450 8,293,276 7,599,1387,754,752 8,268,084 8,428,315 8,672,450 8,293,276 7,599,138 6,715,177
Revenue Over Expenses
Beginning CashEnding Cash
TOTAL EXPENSES
Operations Revenue
Operating ExpensesFiscal Transactions
Type of Fund: ................... General Description: ...................... Primary operating fund for the City, required by Oregon budget law Primary Revenue: ............. Property taxes are 56% of total fund and Intergovernmental 20% Revenue Stability:............. Most revenues are reliable from one year to the next with the exception being planning
fees resulting from the recession. A majority of fees trend low for growth potential. Fund History: .................... As primary operating fund and heavily supporting subsidized services, this fund has
historically kept itself in balance by finding efficiencies, reductions and deference of scheduled maintenance. Primarily relying on property taxes sets the revenue growth trend for the fund. To supplement fund activities the City has passed two special tax levies for police and fire services that are now accounted for separately.
Fund Outlook: ................... Tenuous stable, this fund has a basic structurally in-balance between its annual revenue and expenditures however not so large it can’t be solved but may require immediate resolutions. Current 3 year projections show a continual in-balance growing to $2M annually.
Financial Trends: .............. Property values are beginning to rise however may be capped somewhat as the 3% restriction from Measure 51. Some moderate growth in commercial property. Positive trends in building and construction market are being seen but have yet to show up on tax rolls. Personal service cost account for almost 80% of the fund expenditures which are generally trending at a rate greater than revenue growth
Operating Reserves: .......... Operating reserve for contingency and cash flow balances have remained positive during the recession and shown small growth.
Capital Reserves: .............. Currently minimal Reserve Requirements: ................... Cash flow, contingency, capital, long term stability and additional software & hardware
replacements, equipment replacement, building preservation and replacement. SEE ATTACHMENT 2 EXHIBIT B FOR GENERAL FUND BALANCE HISTORY
Attachment 2 April 14th Agenda Memo Page 3 of 6
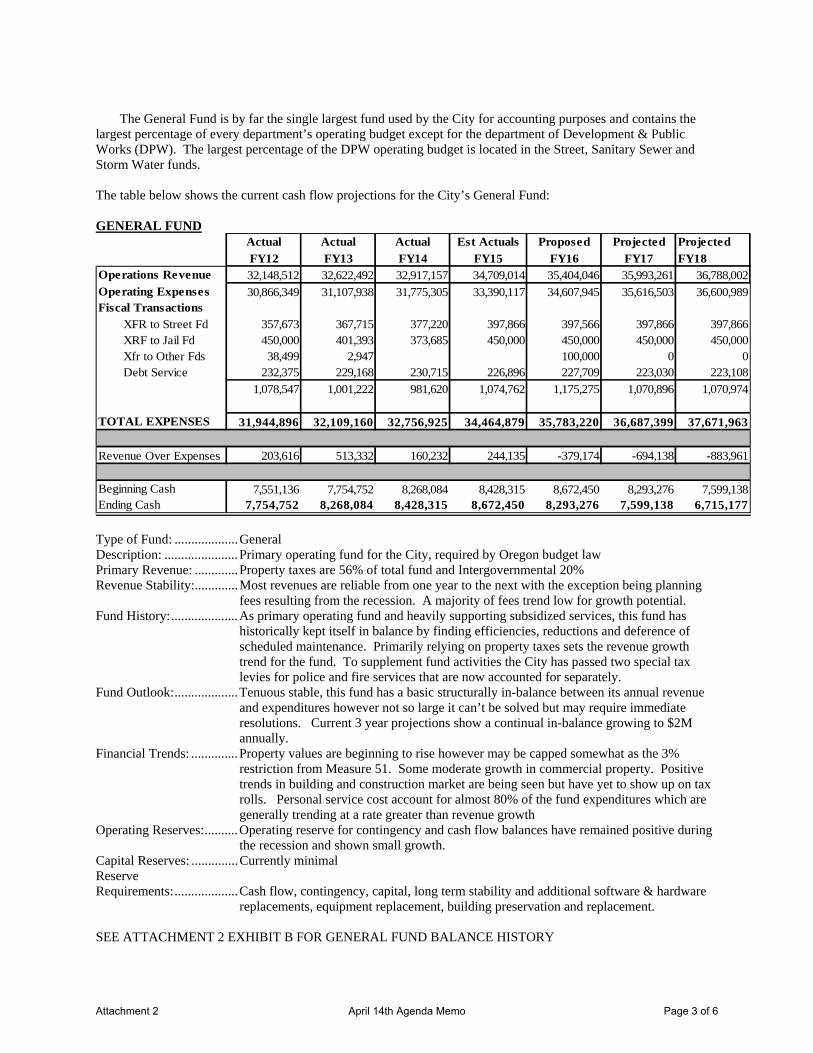
AMBULANCE FUND
FY14 FY15 FY16
Actual Estimated Proposed
Revenue 6,007,217$ 5,721,100$ 5,921,500$
Less Expenses (5,340,476) (5,659,061) (5,951,849)
Net 666,741 62,039 (30,349)
Plus Beginning Cash 328,104 994,845 1,056,884
Ending Cash Balance 994,845$ 1,056,884$ 1,026,535$ Type of Fund: ................... Enterprise Description: ...................... Ambulance services within the larger Fire & Life Safety Department Primary Revenue: ............. Ambulance transport fees with reliance on federal reimbursements for Medicare and
Medicate, supplemented with FireMed and Ambulance billing services revenue. Revenue Stability:............. Council sets local rates while federal government determines reimbursement rate. No
control over reimbursement rates. Fund History: .................... Strong financial performance late 90’s and early 00’s but change in federal
reimbursement program has restricted local control. Fund required use of $2M in reserves during relatively short period. Focused management has benefited fund by expanding revenue base and controlling growth increase of expenses.
Fund Outlook: ................... Tenuous stable, last 3 to 4 years has improved outlook and allowed time to consider longer term strategy. Any solution for under reimbursements by federal government is unlikely. Operating and Capital reserves underfunded.
Financial Trends: .............. Revenue growth since FY07 has been slow until last couple years. Strong in FY14 and FY15 from rate changes, activity level and collection efforts. Expenditures from FY07 thru FY13 showed only moderate growth. Recent growth in FY14 and projected through FY16 shows increasing at higher percentage.
Operating Reserves: .......... Completely eliminated as recently as FY11. Since that time reserves have been building every year and back to approximately $1M.
Capital Reserves: .............. During period of decline in operating reserves the capital reserves were maintained within a consistent dollar range. Long term health indicated that reserves should be growing as major apparatus becomes more expensive and technology needs increase.
Reserve Requirements: ................... Cash flow, contingency, capital, long term stability SEE ATTACHMENT 2 EXHIBIT C FOR AMBULANCE FUND BALANCE HISTORY
Attachment 2 April 14th Agenda Memo Page 4 of 6
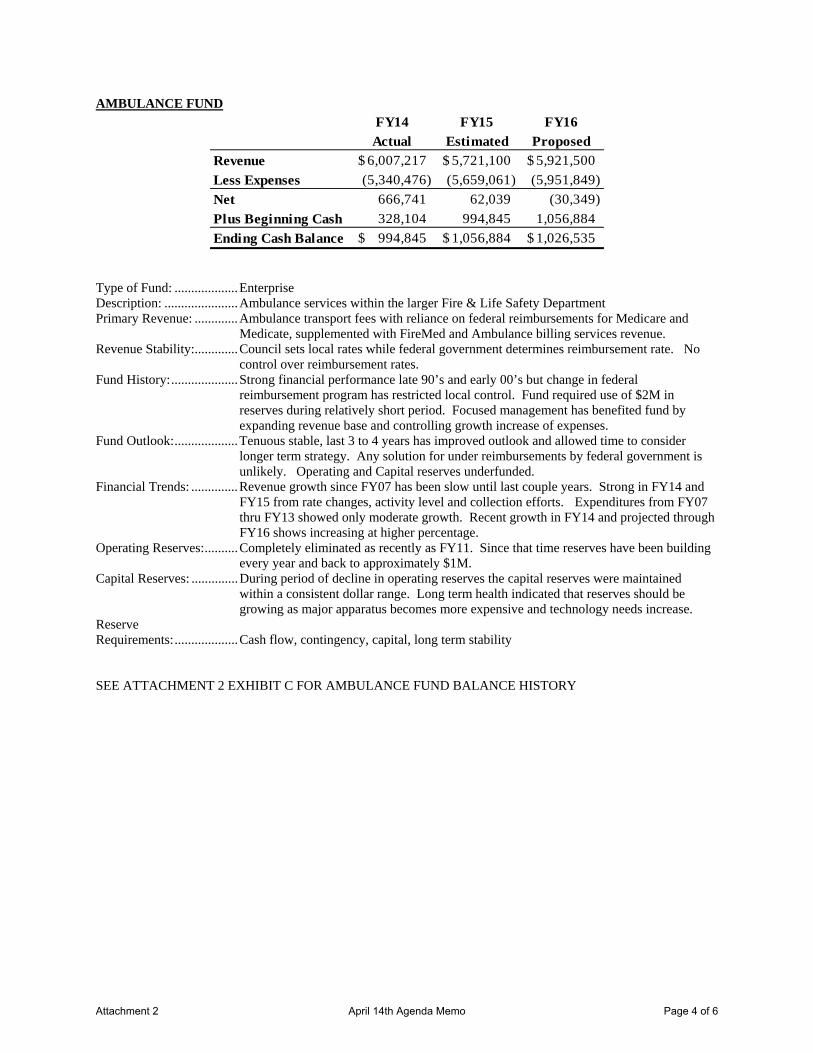
BUILDING CODE FUND
FY14 FY15 FY16
Actual Estimated Proposed
Revenue 727,427$ 965,254$ 901,180$
Less Expenses (792,465) (853,773) (939,953)
Net (65,038) (111,481) (38,773)
Plus Beginning Cash 150,068 85,030 196,511
Ending Cash Balance 85,030$ 196,511$ 157,738$
Type of Fund: ................... Special Revenue Description: ...................... Building Division within the Development and Public Works Department Primary Revenue: ............. Fees received from building permits and inspection fees. Revenue Stability:............. Council sets local rates but regulated by State of Oregon. State requires that fees are
reviewed by them prior to changes and monitored for comparison with actual cost of service. Also fees charged competitively compared with other jurisdictions.
Fund History: .................... Fund was created in FY05 from the General Fund to better account for the activities of this regulated service. Performance and reserves were strong through FY08 until recession. Revenue consistently dropped every year and eventually by 80%. Staffing was reduced but need to keep minimal qualified staffing for issuing permits and inspections required use of reserves.
Fund Outlook: ................... Unstable. Staff reductions have been severe. Revenues are still at the low point since the recession started. Recent activity is starting to show uptick but not enough yet to outpace expenditure growth. When building activity does show increase there may be a need to consider staffing levels to match activity level with qualified staff.
Financial Trends: .............. The recession hit the housing market particularly hard. Fees and charges are only revenue for this service and are set primarily to match expenditures. As revenue dropped (by 80%) immediately expenditures reductions were difficult to match (60%). During this time $2M in reserves were used. Expenditures are larger than current revenues every year with minimal reserves remaining. There are indications in the market that building activity is seeing an increase but without additional reserves to rely on this fund is not in a position to get too far out ahead of the activity with expenditure increases. Minimal revenue increases being shown for FY16.
Operating Reserves: .......... Even for cash flow purposes, minimal reserves remaining and showing decline projected for YY16.
Capital Reserves: .............. None established. Minimal requirement except for technology. Reserve Requirements: ................... Cash flow, contingency, capital, long term stability SEE ATTACHMENT 2 EXHIBIT D FOR BUILDING FUND BALANCE HISTORY
Attachment 2 April 14th Agenda Memo Page 5 of 6
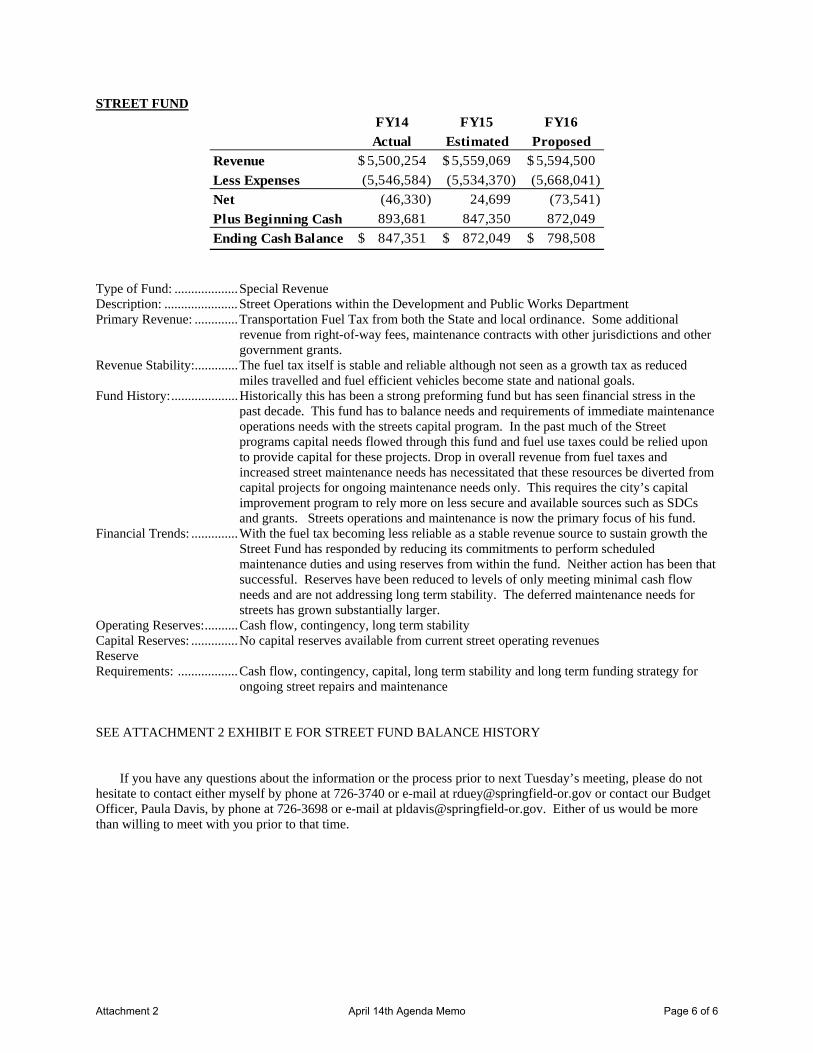
STREET FUND
FY14 FY15 FY16
Actual Estimated Proposed
Revenue 5,500,254$ 5,559,069$ 5,594,500$
Less Expenses (5,546,584) (5,534,370) (5,668,041)
Net (46,330) 24,699 (73,541)
Plus Beginning Cash 893,681 847,350 872,049
Ending Cash Balance 847,351$ 872,049$ 798,508$ Type of Fund: ................... Special Revenue Description: ...................... Street Operations within the Development and Public Works Department Primary Revenue: ............. Transportation Fuel Tax from both the State and local ordinance. Some additional
revenue from right-of-way fees, maintenance contracts with other jurisdictions and other government grants.
Revenue Stability:............. The fuel tax itself is stable and reliable although not seen as a growth tax as reduced miles travelled and fuel efficient vehicles become state and national goals.
Fund History: .................... Historically this has been a strong preforming fund but has seen financial stress in the past decade. This fund has to balance needs and requirements of immediate maintenance operations needs with the streets capital program. In the past much of the Street programs capital needs flowed through this fund and fuel use taxes could be relied upon to provide capital for these projects. Drop in overall revenue from fuel taxes and increased street maintenance needs has necessitated that these resources be diverted from capital projects for ongoing maintenance needs only. This requires the city’s capital improvement program to rely more on less secure and available sources such as SDCs and grants. Streets operations and maintenance is now the primary focus of his fund.
Financial Trends: .............. With the fuel tax becoming less reliable as a stable revenue source to sustain growth the Street Fund has responded by reducing its commitments to perform scheduled maintenance duties and using reserves from within the fund. Neither action has been that successful. Reserves have been reduced to levels of only meeting minimal cash flow needs and are not addressing long term stability. The deferred maintenance needs for streets has grown substantially larger.
Operating Reserves: .......... Cash flow, contingency, long term stability Capital Reserves: .............. No capital reserves available from current street operating revenues Reserve Requirements: .................. Cash flow, contingency, capital, long term stability and long term funding strategy for
ongoing street repairs and maintenance SEE ATTACHMENT 2 EXHIBIT E FOR STREET FUND BALANCE HISTORY If you have any questions about the information or the process prior to next Tuesday’s meeting, please do not hesitate to contact either myself by phone at 726-3740 or e-mail at [email protected] or contact our Budget Officer, Paula Davis, by phone at 726-3698 or e-mail at [email protected]. Either of us would be more than willing to meet with you prior to that time.
Attachment 2 April 14th Agenda Memo Page 6 of 6
Attachment 2 Exhibit A Budget Committe Bylaws Page 1 of 2
Attachment 2 Exhibit A Budget Committe Bylaws Page 2 of 2
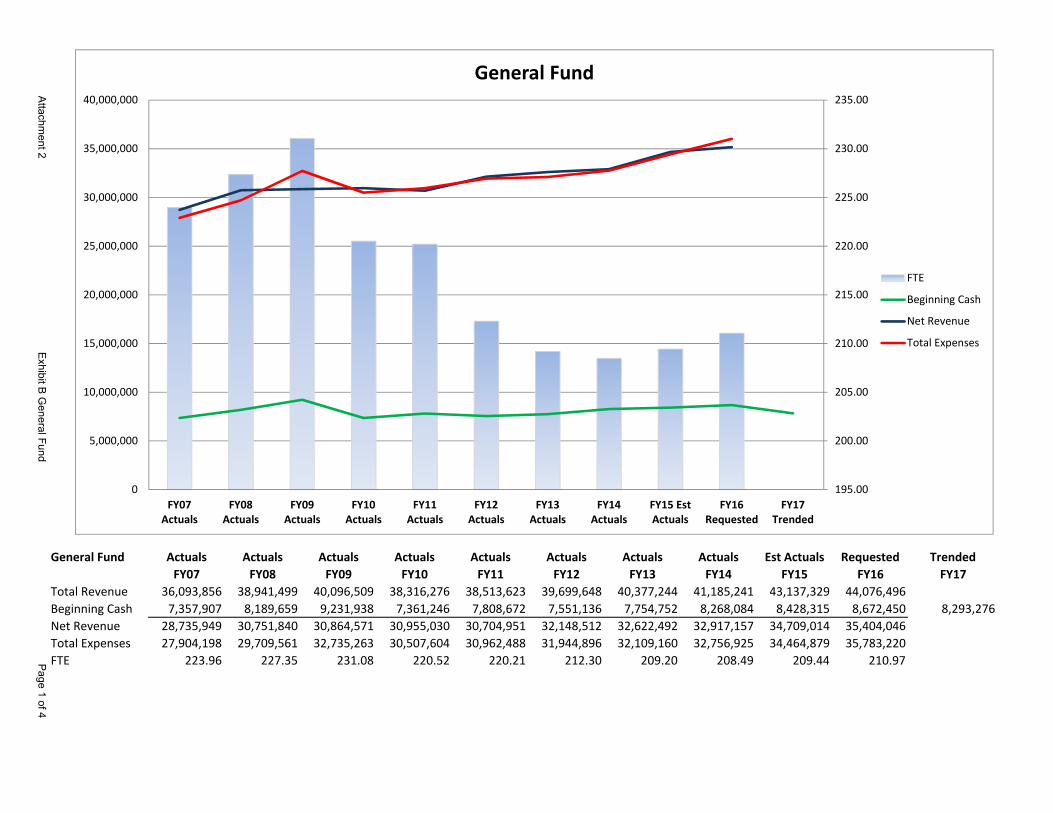
General Fund Actuals Actuals Actuals Actuals Actuals Actuals Actuals Actuals Est Actuals Requested TrendedFY07 FY08 FY09 FY10 FY11 FY12 FY13 FY14 FY15 FY16 FY17
Total Revenue 36,093,856 38,941,499 40,096,509 38,316,276 38,513,623 39,699,648 40,377,244 41,185,241 43,137,329 44,076,496Beginning Cash 7,357,907 8,189,659 9,231,938 7,361,246 7,808,672 7,551,136 7,754,752 8,268,084 8,428,315 8,672,450 8,293,276Net Revenue 28,735,949 30,751,840 30,864,571 30,955,030 30,704,951 32,148,512 32,622,492 32,917,157 34,709,014 35,404,046Total Expenses 27,904,198 29,709,561 32,735,263 30,507,604 30,962,488 31,944,896 32,109,160 32,756,925 34,464,879 35,783,220FTE 223.96 227.35 231.08 220.52 220.21 212.30 209.20 208.49 209.44 210.97
195.00
200.00
205.00
210.00
215.00
220.00
225.00
230.00
235.00
0
5,000,000
10,000,000
15,000,000
20,000,000
25,000,000
30,000,000
35,000,000
40,000,000
FY07Actuals
FY08Actuals
FY09Actuals
FY10Actuals
FY11Actuals
FY12Actuals
FY13Actuals
FY14Actuals
FY15 EstActuals
FY16Requested
FY17Trended
General Fund
FTE
Beginning Cash
Net Revenue
Total Expenses
Attachm
ent 2E
xhibit B G
eneral FundP
age 1 of 4
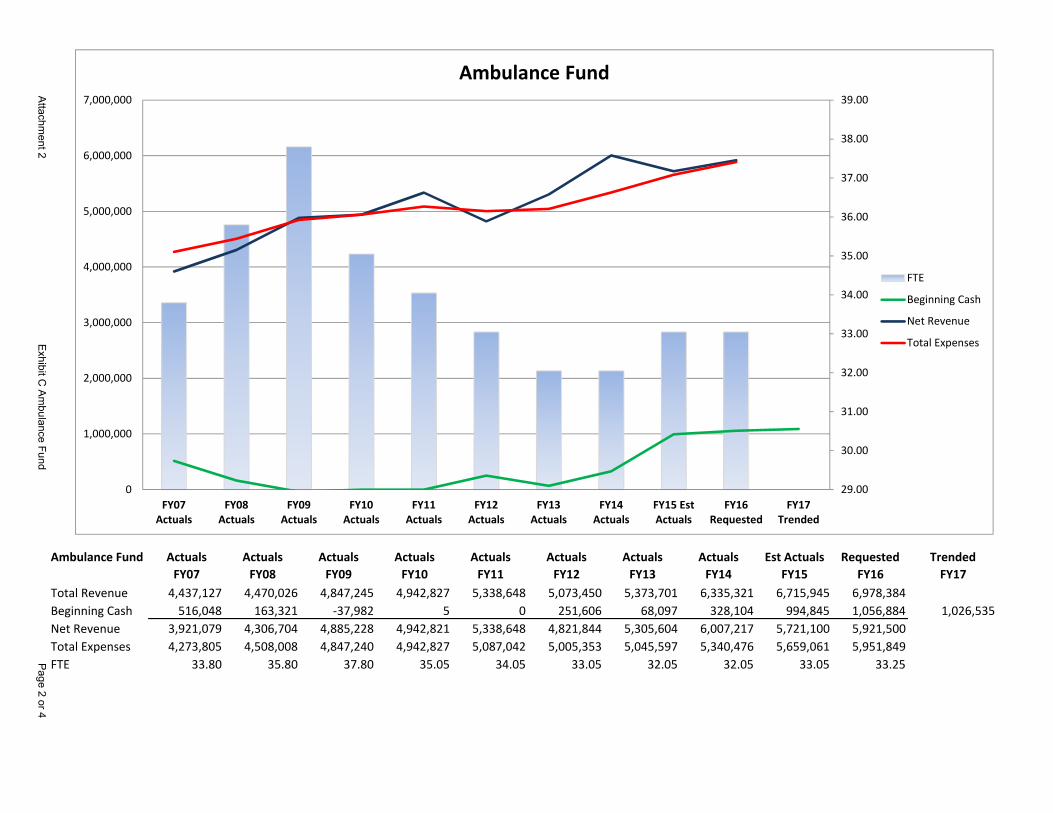
Ambulance Fund Actuals Actuals Actuals Actuals Actuals Actuals Actuals Actuals Est Actuals Requested TrendedFY07 FY08 FY09 FY10 FY11 FY12 FY13 FY14 FY15 FY16 FY17
Total Revenue 4,437,127 4,470,026 4,847,245 4,942,827 5,338,648 5,073,450 5,373,701 6,335,321 6,715,945 6,978,384Beginning Cash 516,048 163,321 ‐37,982 5 0 251,606 68,097 328,104 994,845 1,056,884 1,026,535Net Revenue 3,921,079 4,306,704 4,885,228 4,942,821 5,338,648 4,821,844 5,305,604 6,007,217 5,721,100 5,921,500Total Expenses 4,273,805 4,508,008 4,847,240 4,942,827 5,087,042 5,005,353 5,045,597 5,340,476 5,659,061 5,951,849FTE 33.80 35.80 37.80 35.05 34.05 33.05 32.05 32.05 33.05 33.25
29.00
30.00
31.00
32.00
33.00
34.00
35.00
36.00
37.00
38.00
39.00
0
1,000,000
2,000,000
3,000,000
4,000,000
5,000,000
6,000,000
7,000,000
FY07Actuals
FY08Actuals
FY09Actuals
FY10Actuals
FY11Actuals
FY12Actuals
FY13Actuals
FY14Actuals
FY15 EstActuals
FY16Requested
FY17Trended
Ambulance Fund
FTE
Beginning Cash
Net Revenue
Total Expenses
Attachm
ent 2E
xhibit C A
mbulance Fund
Page 2 or 4
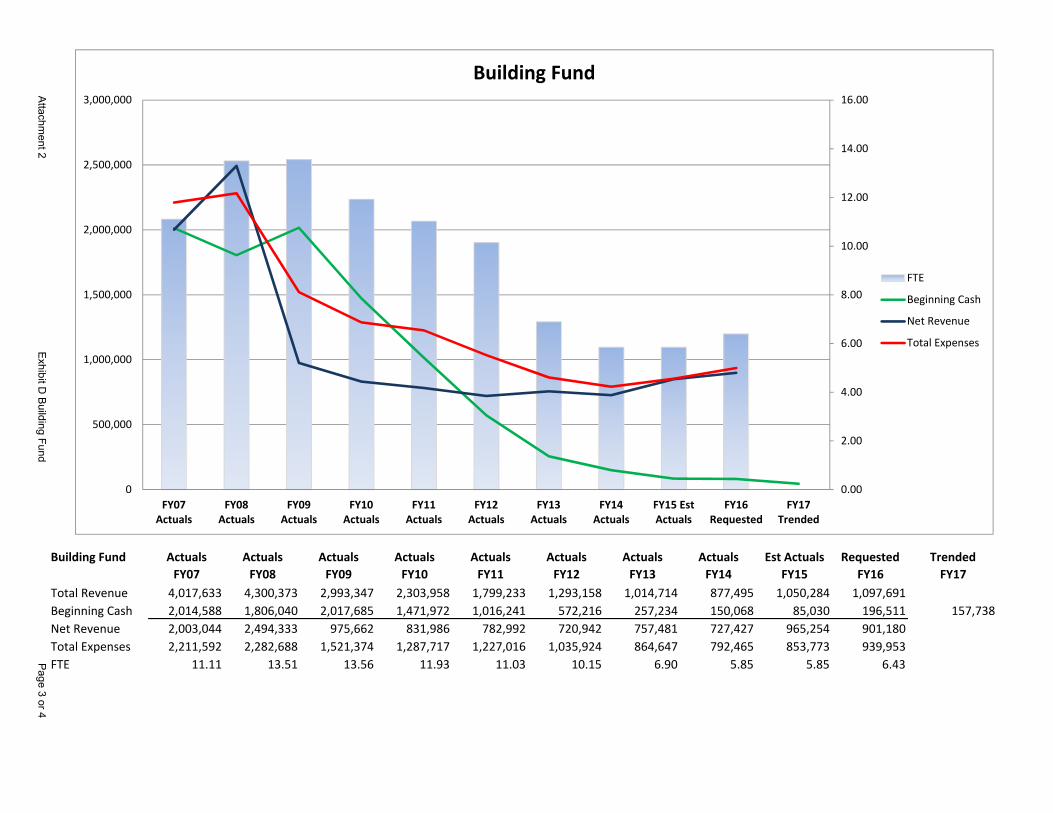
Building Fund Actuals Actuals Actuals Actuals Actuals Actuals Actuals Actuals Est Actuals Requested TrendedFY07 FY08 FY09 FY10 FY11 FY12 FY13 FY14 FY15 FY16 FY17
Total Revenue 4,017,633 4,300,373 2,993,347 2,303,958 1,799,233 1,293,158 1,014,714 877,495 1,050,284 1,097,691Beginning Cash 2,014,588 1,806,040 2,017,685 1,471,972 1,016,241 572,216 257,234 150,068 85,030 196,511 157,738Net Revenue 2,003,044 2,494,333 975,662 831,986 782,992 720,942 757,481 727,427 965,254 901,180Total Expenses 2,211,592 2,282,688 1,521,374 1,287,717 1,227,016 1,035,924 864,647 792,465 853,773 939,953FTE 11.11 13.51 13.56 11.93 11.03 10.15 6.90 5.85 5.85 6.43
0.00
2.00
4.00
6.00
8.00
10.00
12.00
14.00
16.00
0
500,000
1,000,000
1,500,000
2,000,000
2,500,000
3,000,000
FY07Actuals
FY08Actuals
FY09Actuals
FY10Actuals
FY11Actuals
FY12Actuals
FY13Actuals
FY14Actuals
FY15 EstActuals
FY16Requested
FY17Trended
Building Fund
FTE
Beginning Cash
Net Revenue
Total Expenses
Attachm
ent 2E
xhibit D B
uilding FundP
age 3 or 4
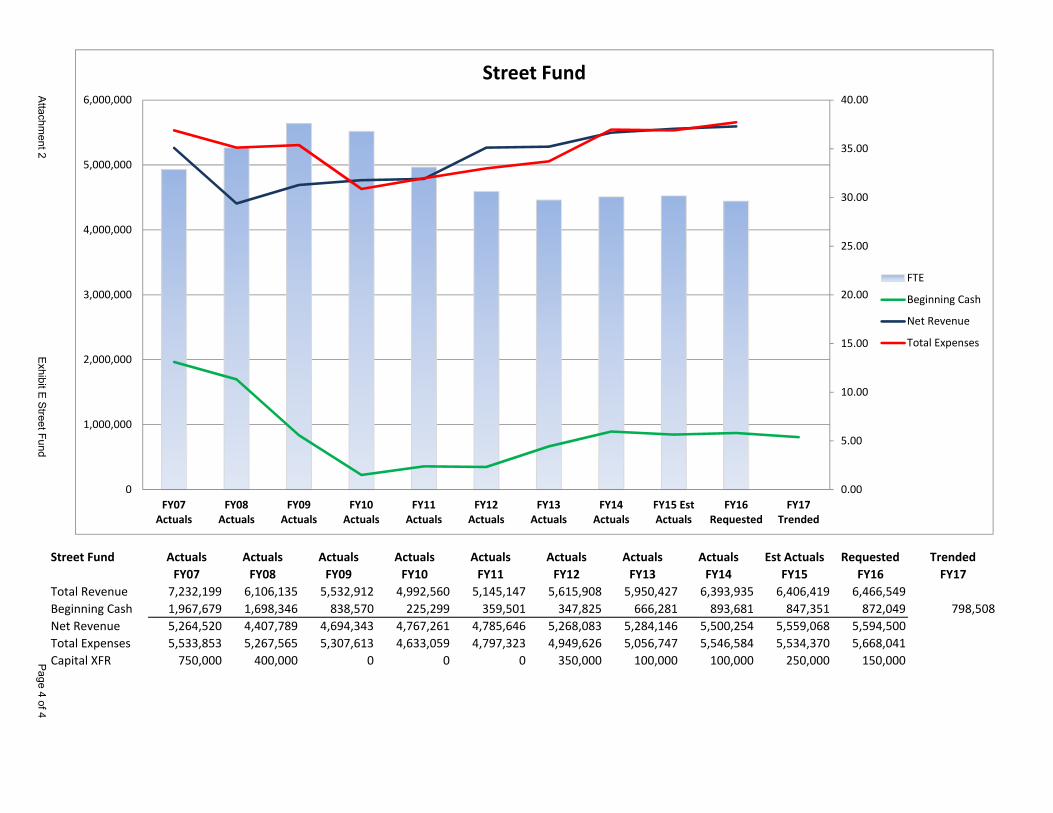
Street Fund Actuals Actuals Actuals Actuals Actuals Actuals Actuals Actuals Est Actuals Requested TrendedFY07 FY08 FY09 FY10 FY11 FY12 FY13 FY14 FY15 FY16 FY17
Total Revenue 7,232,199 6,106,135 5,532,912 4,992,560 5,145,147 5,615,908 5,950,427 6,393,935 6,406,419 6,466,549Beginning Cash 1,967,679 1,698,346 838,570 225,299 359,501 347,825 666,281 893,681 847,351 872,049 798,508Net Revenue 5,264,520 4,407,789 4,694,343 4,767,261 4,785,646 5,268,083 5,284,146 5,500,254 5,559,068 5,594,500Total Expenses 5,533,853 5,267,565 5,307,613 4,633,059 4,797,323 4,949,626 5,056,747 5,546,584 5,534,370 5,668,041Capital XFR 750,000 400,000 0 0 0 350,000 100,000 100,000 250,000 150,000
0.00
5.00
10.00
15.00
20.00
25.00
30.00
35.00
40.00
0
1,000,000
2,000,000
3,000,000
4,000,000
5,000,000
6,000,000
FY07Actuals
FY08Actuals
FY09Actuals
FY10Actuals
FY11Actuals
FY12Actuals
FY13Actuals
FY14Actuals
FY15 EstActuals
FY16Requested
FY17Trended
Street Fund
FTE
Beginning Cash
Net Revenue
Total Expenses
Attachm
ent 2E
xhibit E S
treet FundP
age 4 of 4
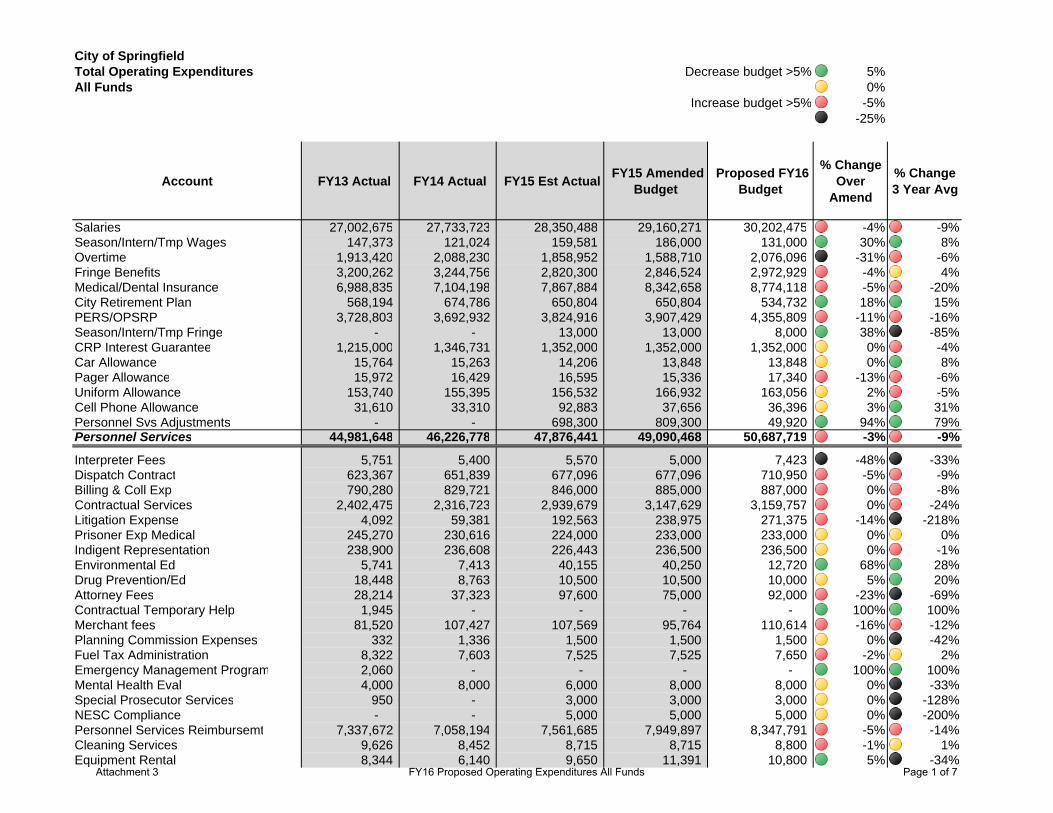
City of SpringfieldTotal Operating Expenditures Decrease budget >5% 5%All Funds 0%
Increase budget >5% -5%-25%
Account FY13 Actual FY14 Actual FY15 Est Actual FY15 Amended Budget
Proposed FY16 Budget
% Change Over
Amend
% Change 3 Year Avg
Salaries 27,002,675 27,733,723 28,350,488 29,160,271 30,202,475 -4% -9%Season/Intern/Tmp Wages 147,373 121,024 159,581 186,000 131,000 30% 8%Overtime 1,913,420 2,088,230 1,858,952 1,588,710 2,076,096 -31% -6%Fringe Benefits 3,200,262 3,244,756 2,820,300 2,846,524 2,972,929 -4% 4%Medical/Dental Insurance 6,988,835 7,104,198 7,867,884 8,342,658 8,774,118 -5% -20%City Retirement Plan 568,194 674,786 650,804 650,804 534,732 18% 15%PERS/OPSRP 3,728,803 3,692,932 3,824,916 3,907,429 4,355,809 -11% -16%Season/Intern/Tmp Fringe - - 13,000 13,000 8,000 38% -85%CRP Interest Guarantee 1,215,000 1,346,731 1,352,000 1,352,000 1,352,000 0% -4%Car Allowance 15,764 15,263 14,206 13,848 13,848 0% 8%Pager Allowance 15,972 16,429 16,595 15,336 17,340 -13% -6%Uniform Allowance 153,740 155,395 156,532 166,932 163,056 2% -5%Cell Phone Allowance 31,610 33,310 92,883 37,656 36,396 3% 31%Personnel Svs Adjustments - - 698,300 809,300 49,920 94% 79%Personnel Services 44,981,648 46,226,778 47,876,441 49,090,468 50,687,719 -3% -9%
Interpreter Fees 5,751 5,400 5,570 5,000 7,423 -48% -33%Dispatch Contract 623,367 651,839 677,096 677,096 710,950 -5% -9%Billing & Coll Exp 790,280 829,721 846,000 885,000 887,000 0% -8%Contractual Services 2,402,475 2,316,723 2,939,679 3,147,629 3,159,757 0% -24%Litigation Expense 4,092 59,381 192,563 238,975 271,375 -14% -218%Prisoner Exp Medical 245,270 230,616 224,000 233,000 233,000 0% 0%Indigent Representation 238,900 236,608 226,443 236,500 236,500 0% -1%Environmental Ed 5,741 7,413 40,155 40,250 12,720 68% 28%Drug Prevention/Ed 18,448 8,763 10,500 10,500 10,000 5% 20%Attorney Fees 28,214 37,323 97,600 75,000 92,000 -23% -69%Contractual Temporary Help 1,945 - - - - 100% 100%Merchant fees 81,520 107,427 107,569 95,764 110,614 -16% -12%Planning Commission Expenses 332 1,336 1,500 1,500 1,500 0% -42%Fuel Tax Administration 8,322 7,603 7,525 7,525 7,650 -2% 2%Emergency Management Program 2,060 - - - - 100% 100%Mental Health Eval 4,000 8,000 6,000 8,000 8,000 0% -33%Special Prosecutor Services 950 - 3,000 3,000 3,000 0% -128%NESC Compliance - - 5,000 5,000 5,000 0% -200%Personnel Services Reimbursemt 7,337,672 7,058,194 7,561,685 7,949,897 8,347,791 -5% -14%Cleaning Services 9,626 8,452 8,715 8,715 8,800 -1% 1%Equipment Rental 8,344 6,140 9,650 11,391 10,800 5% -34%
Attachment 3 FY16 Proposed Operating Expenditures All Funds Page 1 of 7
Account FY13 Actual FY14 Actual FY15 Est Actual FY15 Amended Budget
Proposed FY16 Budget
% Change Over
Amend
% Change 3 Year Avg
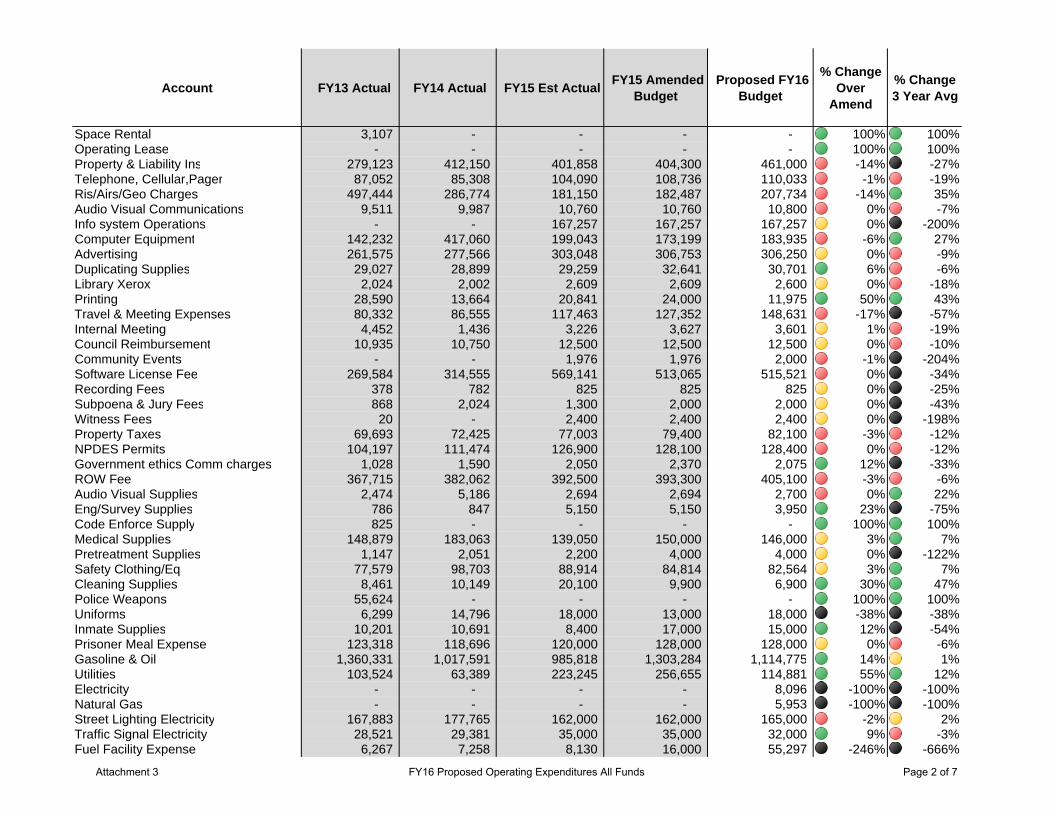
Space Rental 3,107 - - - - 100% 100%Operating Lease - - - - - 100% 100%Property & Liability Ins 279,123 412,150 401,858 404,300 461,000 -14% -27%Telephone, Cellular,Pager 87,052 85,308 104,090 108,736 110,033 -1% -19%Ris/Airs/Geo Charges 497,444 286,774 181,150 182,487 207,734 -14% 35%Audio Visual Communications 9,511 9,987 10,760 10,760 10,800 0% -7%Info system Operations - - 167,257 167,257 167,257 0% -200%Computer Equipment 142,232 417,060 199,043 173,199 183,935 -6% 27%Advertising 261,575 277,566 303,048 306,753 306,250 0% -9%Duplicating Supplies 29,027 28,899 29,259 32,641 30,701 6% -6%Library Xerox 2,024 2,002 2,609 2,609 2,600 0% -18%Printing 28,590 13,664 20,841 24,000 11,975 50% 43%Travel & Meeting Expenses 80,332 86,555 117,463 127,352 148,631 -17% -57%Internal Meeting 4,452 1,436 3,226 3,627 3,601 1% -19%Council Reimbursement 10,935 10,750 12,500 12,500 12,500 0% -10%Community Events - - 1,976 1,976 2,000 -1% -204%Software License Fee 269,584 314,555 569,141 513,065 515,521 0% -34%Recording Fees 378 782 825 825 825 0% -25%Subpoena & Jury Fees 868 2,024 1,300 2,000 2,000 0% -43%Witness Fees 20 - 2,400 2,400 2,400 0% -198%Property Taxes 69,693 72,425 77,003 79,400 82,100 -3% -12%NPDES Permits 104,197 111,474 126,900 128,100 128,400 0% -12%Government ethics Comm charges 1,028 1,590 2,050 2,370 2,075 12% -33%ROW Fee 367,715 382,062 392,500 393,300 405,100 -3% -6%Audio Visual Supplies 2,474 5,186 2,694 2,694 2,700 0% 22%Eng/Survey Supplies 786 847 5,150 5,150 3,950 23% -75%Code Enforce Supply 825 - - - - 100% 100%Medical Supplies 148,879 183,063 139,050 150,000 146,000 3% 7%Pretreatment Supplies 1,147 2,051 2,200 4,000 4,000 0% -122%Safety Clothing/Eq 77,579 98,703 88,914 84,814 82,564 3% 7%Cleaning Supplies 8,461 10,149 20,100 9,900 6,900 30% 47%Police Weapons 55,624 - - - - 100% 100%Uniforms 6,299 14,796 18,000 13,000 18,000 -38% -38%Inmate Supplies 10,201 10,691 8,400 17,000 15,000 12% -54%Prisoner Meal Expense 123,318 118,696 120,000 128,000 128,000 0% -6%Gasoline & Oil 1,360,331 1,017,591 985,818 1,303,284 1,114,775 14% 1%Utilities 103,524 63,389 223,245 256,655 114,881 55% 12%Electricity - - - - 8,096 -100% -100%Natural Gas - - - - 5,953 -100% -100%Street Lighting Electricity 167,883 177,765 162,000 162,000 165,000 -2% 2%Traffic Signal Electricity 28,521 29,381 35,000 35,000 32,000 9% -3%Fuel Facility Expense 6,267 7,258 8,130 16,000 55,297 -246% -666%
Attachment 3 FY16 Proposed Operating Expenditures All Funds Page 2 of 7
Account FY13 Actual FY14 Actual FY15 Est Actual FY15 Amended Budget
Proposed FY16 Budget
% Change Over
Amend
% Change 3 Year Avg
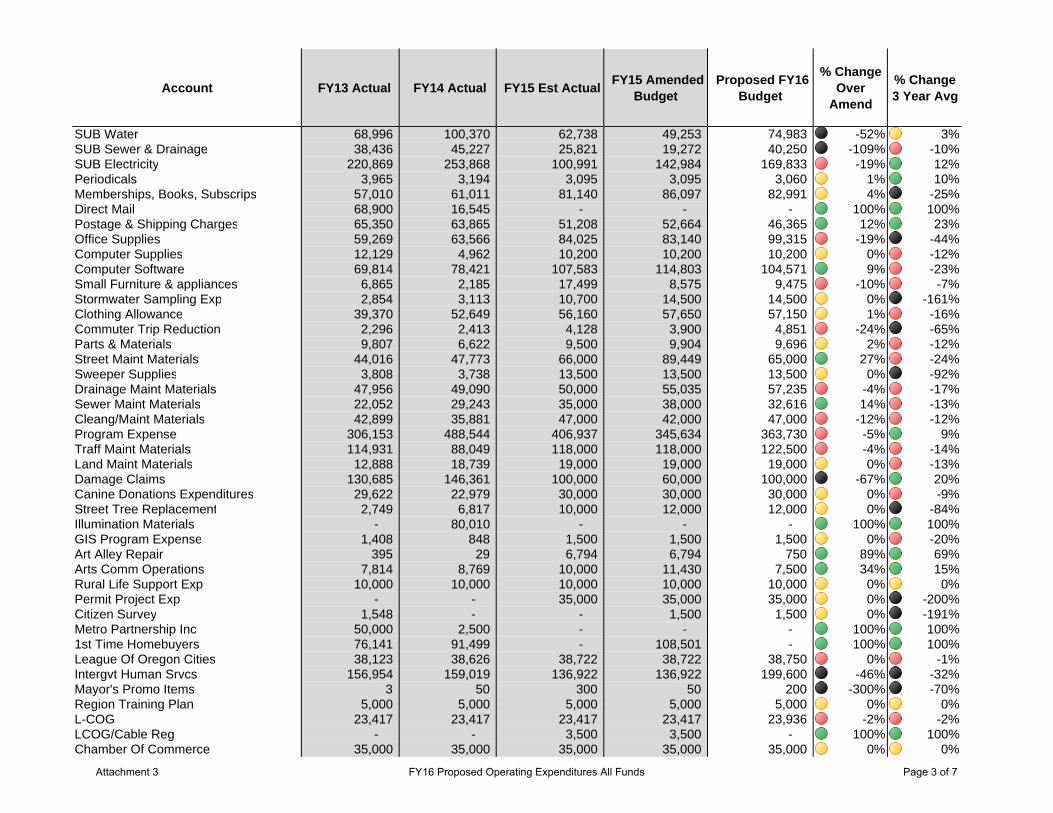
SUB Water 68,996 100,370 62,738 49,253 74,983 -52% 3%SUB Sewer & Drainage 38,436 45,227 25,821 19,272 40,250 -109% -10%SUB Electricity 220,869 253,868 100,991 142,984 169,833 -19% 12%Periodicals 3,965 3,194 3,095 3,095 3,060 1% 10%Memberships, Books, Subscrips 57,010 61,011 81,140 86,097 82,991 4% -25%Direct Mail 68,900 16,545 - - - 100% 100%Postage & Shipping Charges 65,350 63,865 51,208 52,664 46,365 12% 23%Office Supplies 59,269 63,566 84,025 83,140 99,315 -19% -44%Computer Supplies 12,129 4,962 10,200 10,200 10,200 0% -12%Computer Software 69,814 78,421 107,583 114,803 104,571 9% -23%Small Furniture & appliances 6,865 2,185 17,499 8,575 9,475 -10% -7%Stormwater Sampling Exp 2,854 3,113 10,700 14,500 14,500 0% -161%Clothing Allowance 39,370 52,649 56,160 57,650 57,150 1% -16%Commuter Trip Reduction 2,296 2,413 4,128 3,900 4,851 -24% -65%Parts & Materials 9,807 6,622 9,500 9,904 9,696 2% -12%Street Maint Materials 44,016 47,773 66,000 89,449 65,000 27% -24%Sweeper Supplies 3,808 3,738 13,500 13,500 13,500 0% -92%Drainage Maint Materials 47,956 49,090 50,000 55,035 57,235 -4% -17%Sewer Maint Materials 22,052 29,243 35,000 38,000 32,616 14% -13%Cleang/Maint Materials 42,899 35,881 47,000 42,000 47,000 -12% -12%Program Expense 306,153 488,544 406,937 345,634 363,730 -5% 9%Traff Maint Materials 114,931 88,049 118,000 118,000 122,500 -4% -14%Land Maint Materials 12,888 18,739 19,000 19,000 19,000 0% -13%Damage Claims 130,685 146,361 100,000 60,000 100,000 -67% 20%Canine Donations Expenditures 29,622 22,979 30,000 30,000 30,000 0% -9%Street Tree Replacement 2,749 6,817 10,000 12,000 12,000 0% -84%Illumination Materials - 80,010 - - - 100% 100%GIS Program Expense 1,408 848 1,500 1,500 1,500 0% -20%Art Alley Repair 395 29 6,794 6,794 750 89% 69%Arts Comm Operations 7,814 8,769 10,000 11,430 7,500 34% 15%Rural Life Support Exp 10,000 10,000 10,000 10,000 10,000 0% 0%Permit Project Exp - - 35,000 35,000 35,000 0% -200%Citizen Survey 1,548 - - 1,500 1,500 0% -191%Metro Partnership Inc 50,000 2,500 - - - 100% 100%1st Time Homebuyers 76,141 91,499 - 108,501 - 100% 100%League Of Oregon Cities 38,123 38,626 38,722 38,722 38,750 0% -1%Intergvt Human Srvcs 156,954 159,019 136,922 136,922 199,600 -46% -32%Mayor's Promo Items 3 50 300 50 200 -300% -70%Region Training Plan 5,000 5,000 5,000 5,000 5,000 0% 0%L-COG 23,417 23,417 23,417 23,417 23,936 -2% -2%LCOG/Cable Reg - - 3,500 3,500 - 100% 100%Chamber Of Commerce 35,000 35,000 35,000 35,000 35,000 0% 0%
Attachment 3 FY16 Proposed Operating Expenditures All Funds Page 3 of 7
Account FY13 Actual FY14 Actual FY15 Est Actual FY15 Amended Budget
Proposed FY16 Budget
% Change Over
Amend
% Change 3 Year Avg
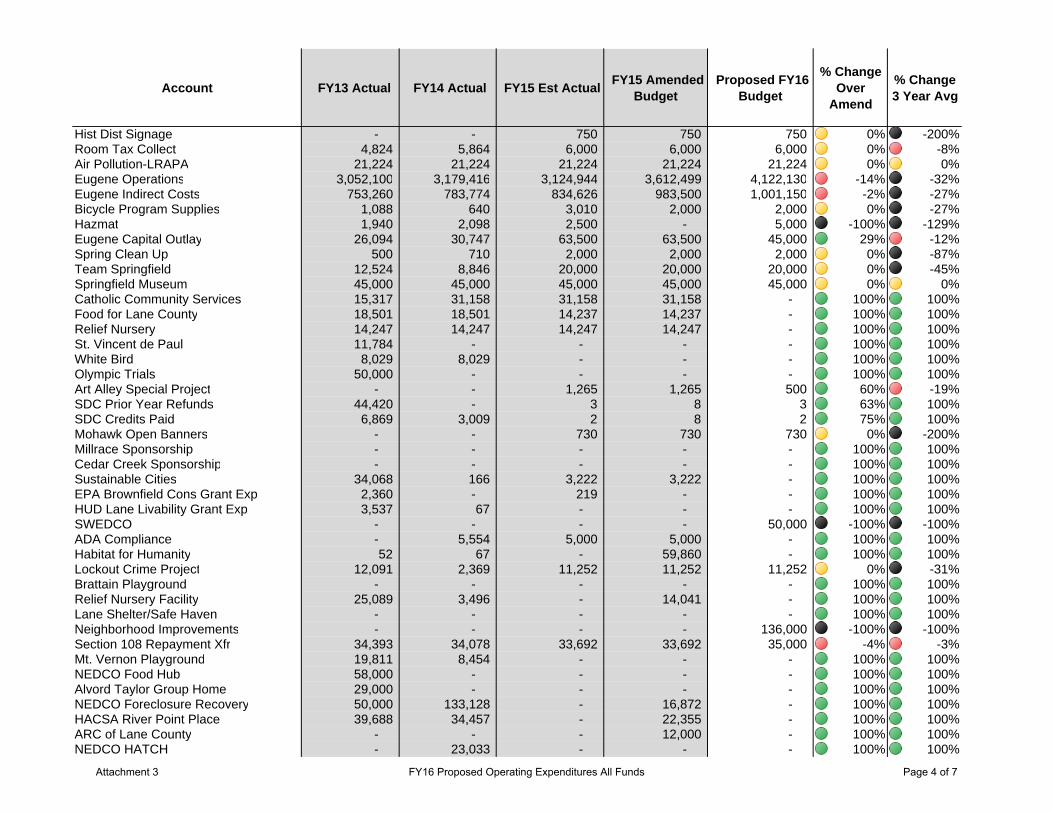
Hist Dist Signage - - 750 750 750 0% -200%Room Tax Collect 4,824 5,864 6,000 6,000 6,000 0% -8%Air Pollution-LRAPA 21,224 21,224 21,224 21,224 21,224 0% 0%Eugene Operations 3,052,100 3,179,416 3,124,944 3,612,499 4,122,130 -14% -32%Eugene Indirect Costs 753,260 783,774 834,626 983,500 1,001,150 -2% -27%Bicycle Program Supplies 1,088 640 3,010 2,000 2,000 0% -27%Hazmat 1,940 2,098 2,500 - 5,000 -100% -129%Eugene Capital Outlay 26,094 30,747 63,500 63,500 45,000 29% -12%Spring Clean Up 500 710 2,000 2,000 2,000 0% -87%Team Springfield 12,524 8,846 20,000 20,000 20,000 0% -45%Springfield Museum 45,000 45,000 45,000 45,000 45,000 0% 0%Catholic Community Services 15,317 31,158 31,158 31,158 - 100% 100%Food for Lane County 18,501 18,501 14,237 14,237 - 100% 100%Relief Nursery 14,247 14,247 14,247 14,247 - 100% 100%St. Vincent de Paul 11,784 - - - - 100% 100%White Bird 8,029 8,029 - - - 100% 100%Olympic Trials 50,000 - - - - 100% 100%Art Alley Special Project - - 1,265 1,265 500 60% -19%SDC Prior Year Refunds 44,420 - 3 8 3 63% 100%SDC Credits Paid 6,869 3,009 2 8 2 75% 100%Mohawk Open Banners - - 730 730 730 0% -200%Millrace Sponsorship - - - - - 100% 100%Cedar Creek Sponsorship - - - - - 100% 100%Sustainable Cities 34,068 166 3,222 3,222 - 100% 100%EPA Brownfield Cons Grant Exp 2,360 - 219 - - 100% 100%HUD Lane Livability Grant Exp 3,537 67 - - - 100% 100%SWEDCO - - - - 50,000 -100% -100%ADA Compliance - 5,554 5,000 5,000 - 100% 100%Habitat for Humanity 52 67 - 59,860 - 100% 100%Lockout Crime Project 12,091 2,369 11,252 11,252 11,252 0% -31%Brattain Playground - - - - - 100% 100%Relief Nursery Facility 25,089 3,496 - 14,041 - 100% 100%Lane Shelter/Safe Haven - - - - - 100% 100%Neighborhood Improvements - - - - 136,000 -100% -100%Section 108 Repayment Xfr 34,393 34,078 33,692 33,692 35,000 -4% -3%Mt. Vernon Playground 19,811 8,454 - - - 100% 100%NEDCO Food Hub 58,000 - - - - 100% 100%Alvord Taylor Group Home 29,000 - - - - 100% 100%NEDCO Foreclosure Recovery 50,000 133,128 - 16,872 - 100% 100%HACSA River Point Place 39,688 34,457 - 22,355 - 100% 100%ARC of Lane County - - - 12,000 - 100% 100%NEDCO HATCH - 23,033 - - - 100% 100%
Attachment 3 FY16 Proposed Operating Expenditures All Funds Page 4 of 7
Account FY13 Actual FY14 Actual FY15 Est Actual FY15 Amended Budget
Proposed FY16 Budget
% Change Over
Amend
% Change 3 Year Avg
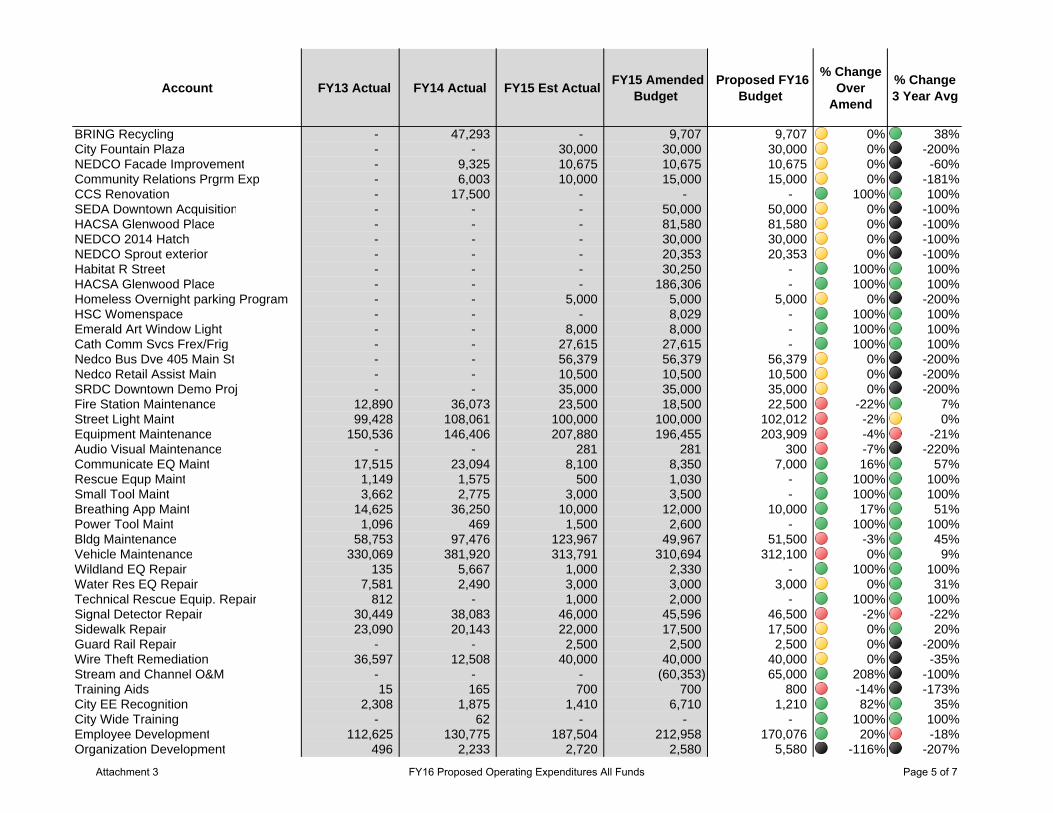
BRING Recycling - 47,293 - 9,707 9,707 0% 38%City Fountain Plaza - - 30,000 30,000 30,000 0% -200%NEDCO Facade Improvement - 9,325 10,675 10,675 10,675 0% -60%Community Relations Prgrm Exp - 6,003 10,000 15,000 15,000 0% -181%CCS Renovation - 17,500 - - - 100% 100%SEDA Downtown Acquisition - - - 50,000 50,000 0% -100%HACSA Glenwood Place - - - 81,580 81,580 0% -100%NEDCO 2014 Hatch - - - 30,000 30,000 0% -100%NEDCO Sprout exterior - - - 20,353 20,353 0% -100%Habitat R Street - - - 30,250 - 100% 100%HACSA Glenwood Place - - - 186,306 - 100% 100%Homeless Overnight parking Program - - 5,000 5,000 5,000 0% -200%HSC Womenspace - - - 8,029 - 100% 100%Emerald Art Window Light - - 8,000 8,000 - 100% 100%Cath Comm Svcs Frex/Frig - - 27,615 27,615 - 100% 100%Nedco Bus Dve 405 Main St - - 56,379 56,379 56,379 0% -200%Nedco Retail Assist Main - - 10,500 10,500 10,500 0% -200%SRDC Downtown Demo Proj - - 35,000 35,000 35,000 0% -200%Fire Station Maintenance 12,890 36,073 23,500 18,500 22,500 -22% 7%Street Light Maint 99,428 108,061 100,000 100,000 102,012 -2% 0%Equipment Maintenance 150,536 146,406 207,880 196,455 203,909 -4% -21%Audio Visual Maintenance - - 281 281 300 -7% -220%Communicate EQ Maint 17,515 23,094 8,100 8,350 7,000 16% 57%Rescue Equp Maint 1,149 1,575 500 1,030 - 100% 100%Small Tool Maint 3,662 2,775 3,000 3,500 - 100% 100%Breathing App Maint 14,625 36,250 10,000 12,000 10,000 17% 51%Power Tool Maint 1,096 469 1,500 2,600 - 100% 100%Bldg Maintenance 58,753 97,476 123,967 49,967 51,500 -3% 45%Vehicle Maintenance 330,069 381,920 313,791 310,694 312,100 0% 9%Wildland EQ Repair 135 5,667 1,000 2,330 - 100% 100%Water Res EQ Repair 7,581 2,490 3,000 3,000 3,000 0% 31%Technical Rescue Equip. Repair 812 - 1,000 2,000 - 100% 100%Signal Detector Repair 30,449 38,083 46,000 45,596 46,500 -2% -22%Sidewalk Repair 23,090 20,143 22,000 17,500 17,500 0% 20%Guard Rail Repair - - 2,500 2,500 2,500 0% -200%Wire Theft Remediation 36,597 12,508 40,000 40,000 40,000 0% -35%Stream and Channel O&M - - - (60,353) 65,000 208% -100%Training Aids 15 165 700 700 800 -14% -173%City EE Recognition 2,308 1,875 1,410 6,710 1,210 82% 35%City Wide Training - 62 - - - 100% 100%Employee Development 112,625 130,775 187,504 212,958 170,076 20% -18%Organization Development 496 2,233 2,720 2,580 5,580 -116% -207%
Attachment 3 FY16 Proposed Operating Expenditures All Funds Page 5 of 7
Account FY13 Actual FY14 Actual FY15 Est Actual FY15 Amended Budget
Proposed FY16 Budget
% Change Over
Amend
% Change 3 Year Avg
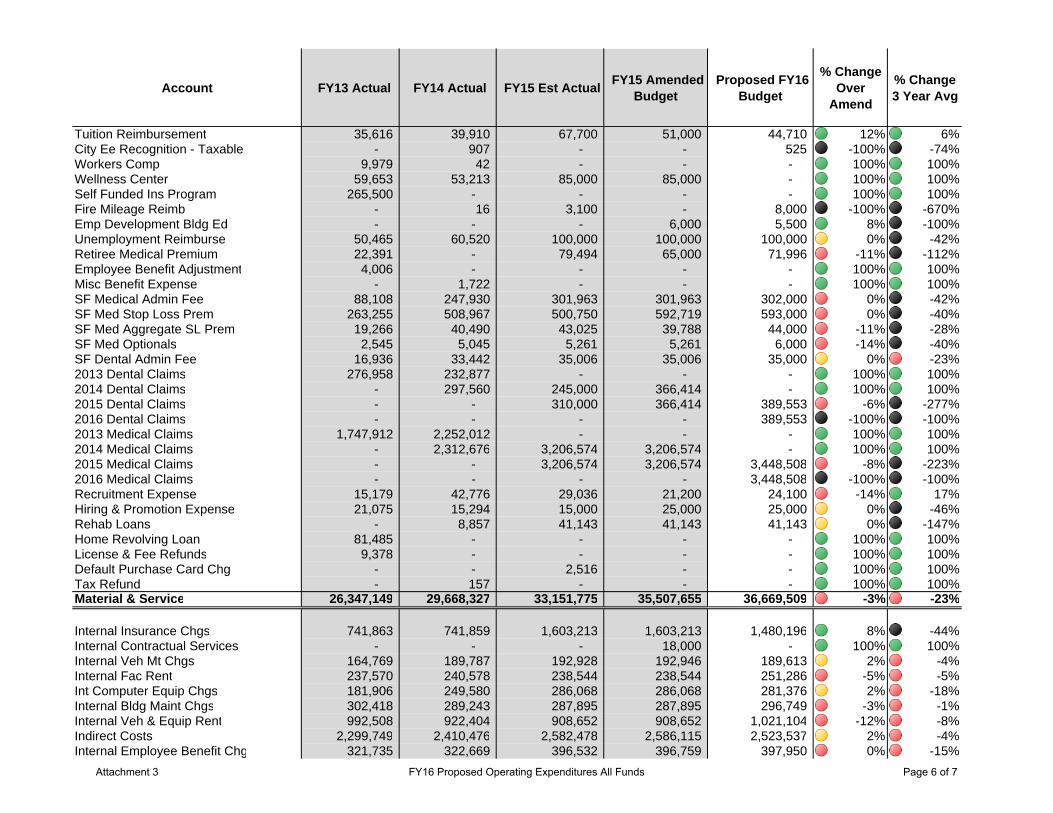
Tuition Reimbursement 35,616 39,910 67,700 51,000 44,710 12% 6%City Ee Recognition - Taxable - 907 - - 525 -100% -74%Workers Comp 9,979 42 - - - 100% 100%Wellness Center 59,653 53,213 85,000 85,000 - 100% 100%Self Funded Ins Program 265,500 - - - - 100% 100%Fire Mileage Reimb - 16 3,100 - 8,000 -100% -670%Emp Development Bldg Ed - - - 6,000 5,500 8% -100%Unemployment Reimburse 50,465 60,520 100,000 100,000 100,000 0% -42%Retiree Medical Premium 22,391 - 79,494 65,000 71,996 -11% -112%Employee Benefit Adjustment 4,006 - - - - 100% 100%Misc Benefit Expense - 1,722 - - - 100% 100%SF Medical Admin Fee 88,108 247,930 301,963 301,963 302,000 0% -42%SF Med Stop Loss Prem 263,255 508,967 500,750 592,719 593,000 0% -40%SF Med Aggregate SL Prem 19,266 40,490 43,025 39,788 44,000 -11% -28%SF Med Optionals 2,545 5,045 5,261 5,261 6,000 -14% -40%SF Dental Admin Fee 16,936 33,442 35,006 35,006 35,000 0% -23%2013 Dental Claims 276,958 232,877 - - - 100% 100%2014 Dental Claims - 297,560 245,000 366,414 - 100% 100%2015 Dental Claims - - 310,000 366,414 389,553 -6% -277%2016 Dental Claims - - - - 389,553 -100% -100%2013 Medical Claims 1,747,912 2,252,012 - - - 100% 100%2014 Medical Claims - 2,312,676 3,206,574 3,206,574 - 100% 100%2015 Medical Claims - - 3,206,574 3,206,574 3,448,508 -8% -223%2016 Medical Claims - - - - 3,448,508 -100% -100%Recruitment Expense 15,179 42,776 29,036 21,200 24,100 -14% 17%Hiring & Promotion Expense 21,075 15,294 15,000 25,000 25,000 0% -46%Rehab Loans - 8,857 41,143 41,143 41,143 0% -147%Home Revolving Loan 81,485 - - - - 100% 100%License & Fee Refunds 9,378 - - - - 100% 100%Default Purchase Card Chg - - 2,516 - - 100% 100%Tax Refund - 157 - - - 100% 100%Material & Service 26,347,149 29,668,327 33,151,775 35,507,655 36,669,509 -3% -23%
Internal Insurance Chgs 741,863 741,859 1,603,213 1,603,213 1,480,196 8% -44%Internal Contractual Services - - - 18,000 - 100% 100%Internal Veh Mt Chgs 164,769 189,787 192,928 192,946 189,613 2% -4%Internal Fac Rent 237,570 240,578 238,544 238,544 251,286 -5% -5%Int Computer Equip Chgs 181,906 249,580 286,068 286,068 281,376 2% -18%Internal Bldg Maint Chgs 302,418 289,243 287,895 287,895 296,749 -3% -1%Internal Veh & Equip Rent 992,508 922,404 908,652 908,652 1,021,104 -12% -8%Indirect Costs 2,299,749 2,410,476 2,582,478 2,586,115 2,523,537 2% -4%Internal Employee Benefit Chg 321,735 322,669 396,532 396,759 397,950 0% -15%
Attachment 3 FY16 Proposed Operating Expenditures All Funds Page 6 of 7
Account FY13 Actual FY14 Actual FY15 Est Actual FY15 Amended Budget
Proposed FY16 Budget
% Change Over
Amend
% Change 3 Year Avg
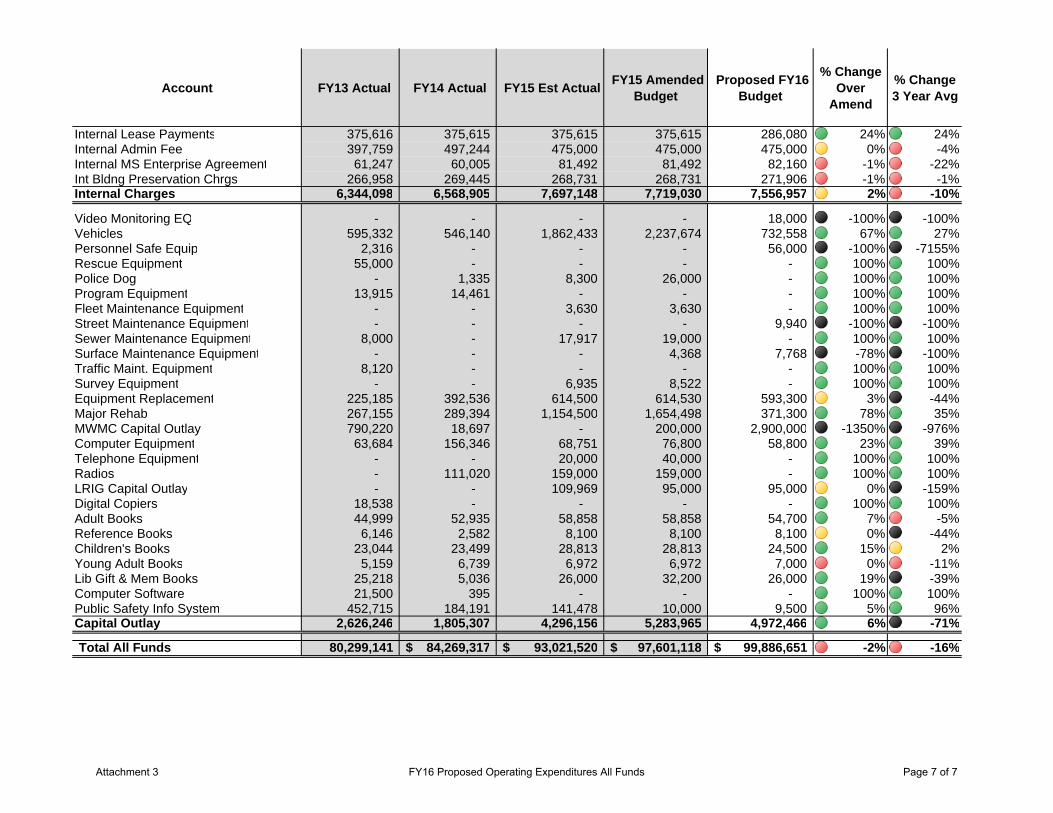
Internal Lease Payments 375,616 375,615 375,615 375,615 286,080 24% 24%Internal Admin Fee 397,759 497,244 475,000 475,000 475,000 0% -4%Internal MS Enterprise Agreement 61,247 60,005 81,492 81,492 82,160 -1% -22%Int Bldng Preservation Chrgs 266,958 269,445 268,731 268,731 271,906 -1% -1%Internal Charges 6,344,098 6,568,905 7,697,148 7,719,030 7,556,957 2% -10%
Video Monitoring EQ - - - - 18,000 -100% -100%Vehicles 595,332 546,140 1,862,433 2,237,674 732,558 67% 27%Personnel Safe Equip 2,316 - - - 56,000 -100% -7155%Rescue Equipment 55,000 - - - - 100% 100%Police Dog - 1,335 8,300 26,000 - 100% 100%Program Equipment 13,915 14,461 - - - 100% 100%Fleet Maintenance Equipment - - 3,630 3,630 - 100% 100%Street Maintenance Equipment - - - - 9,940 -100% -100%Sewer Maintenance Equipment 8,000 - 17,917 19,000 - 100% 100%Surface Maintenance Equipment - - - 4,368 7,768 -78% -100%Traffic Maint. Equipment 8,120 - - - - 100% 100%Survey Equipment - - 6,935 8,522 - 100% 100%Equipment Replacement 225,185 392,536 614,500 614,530 593,300 3% -44%Major Rehab 267,155 289,394 1,154,500 1,654,498 371,300 78% 35%MWMC Capital Outlay 790,220 18,697 - 200,000 2,900,000 -1350% -976%Computer Equipment 63,684 156,346 68,751 76,800 58,800 23% 39%Telephone Equipment - - 20,000 40,000 - 100% 100%Radios - 111,020 159,000 159,000 - 100% 100%LRIG Capital Outlay - - 109,969 95,000 95,000 0% -159%Digital Copiers 18,538 - - - - 100% 100%Adult Books 44,999 52,935 58,858 58,858 54,700 7% -5%Reference Books 6,146 2,582 8,100 8,100 8,100 0% -44%Children's Books 23,044 23,499 28,813 28,813 24,500 15% 2%Young Adult Books 5,159 6,739 6,972 6,972 7,000 0% -11%Lib Gift & Mem Books 25,218 5,036 26,000 32,200 26,000 19% -39%Computer Software 21,500 395 - - - 100% 100%Public Safety Info System 452,715 184,191 141,478 10,000 9,500 5% 96%Capital Outlay 2,626,246 1,805,307 4,296,156 5,283,965 4,972,466 6% -71%
Total All Funds 80,299,141 84,269,317$ 93,021,520$ 97,601,118$ 99,886,651$ -2% -16%
Attachment 3 FY16 Proposed Operating Expenditures All Funds Page 7 of 7
City of SpringfieldTotal Operating Expenditures Decrease budget >5% 5%
All Funds 0%
Increase budget >5% -5%
-25%
City Manager's Office
Account FY13 Actual FY14 Actual FY15 Est Actual FY15 Amended Budget
Proposed FY16
Budget
% Change Over Amend
% Change 3 Year Avg
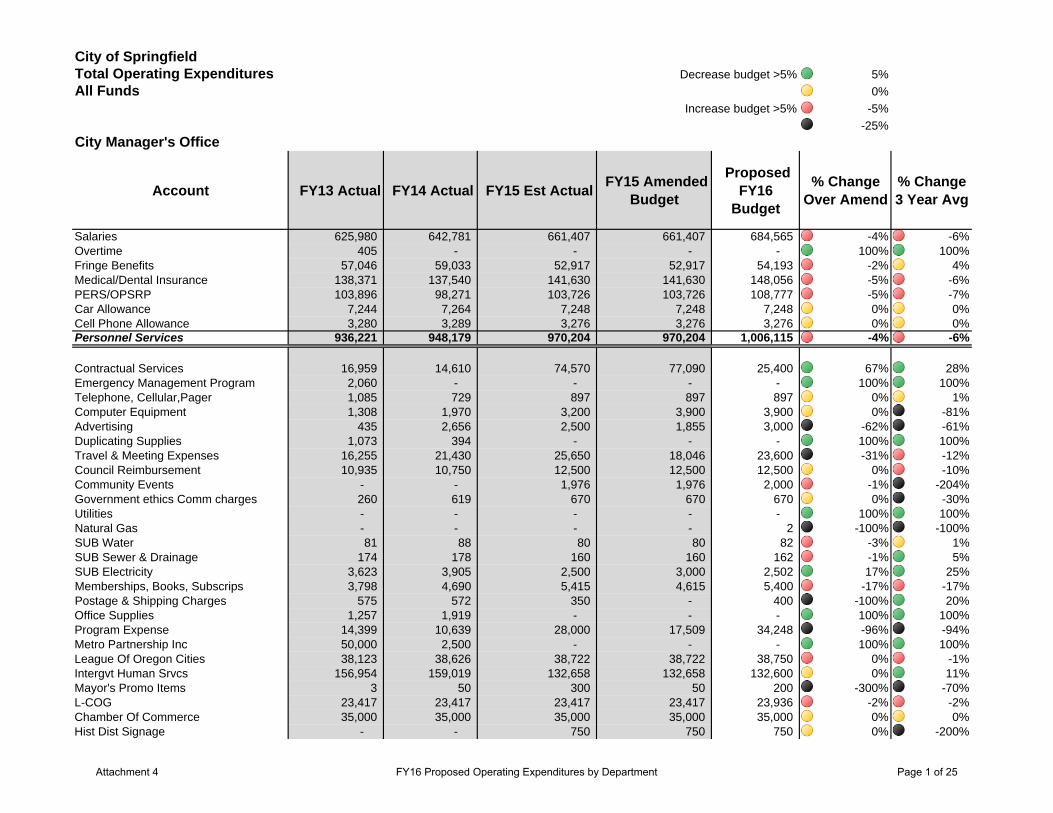
Salaries 625,980 642,781 661,407 661,407 684,565 -4% -6%Overtime 405 - - - - 100% 100%Fringe Benefits 57,046 59,033 52,917 52,917 54,193 -2% 4%Medical/Dental Insurance 138,371 137,540 141,630 141,630 148,056 -5% -6%PERS/OPSRP 103,896 98,271 103,726 103,726 108,777 -5% -7%Car Allowance 7,244 7,264 7,248 7,248 7,248 0% 0%Cell Phone Allowance 3,280 3,289 3,276 3,276 3,276 0% 0%Personnel Services 936,221 948,179 970,204 970,204 1,006,115 -4% -6%
Contractual Services 16,959 14,610 74,570 77,090 25,400 67% 28%Emergency Management Program 2,060 - - - - 100% 100%Telephone, Cellular,Pager 1,085 729 897 897 897 0% 1%Computer Equipment 1,308 1,970 3,200 3,900 3,900 0% -81%Advertising 435 2,656 2,500 1,855 3,000 -62% -61%Duplicating Supplies 1,073 394 - - - 100% 100%Travel & Meeting Expenses 16,255 21,430 25,650 18,046 23,600 -31% -12%Council Reimbursement 10,935 10,750 12,500 12,500 12,500 0% -10%Community Events - - 1,976 1,976 2,000 -1% -204%Government ethics Comm charges 260 619 670 670 670 0% -30%Utilities - - - - - 100% 100%Natural Gas - - - - 2 -100% -100%SUB Water 81 88 80 80 82 -3% 1%SUB Sewer & Drainage 174 178 160 160 162 -1% 5%SUB Electricity 3,623 3,905 2,500 3,000 2,502 17% 25%Memberships, Books, Subscrips 3,798 4,690 5,415 4,615 5,400 -17% -17%Postage & Shipping Charges 575 572 350 - 400 -100% 20%Office Supplies 1,257 1,919 - - - 100% 100%Program Expense 14,399 10,639 28,000 17,509 34,248 -96% -94%Metro Partnership Inc 50,000 2,500 - - - 100% 100%League Of Oregon Cities 38,123 38,626 38,722 38,722 38,750 0% -1%Intergvt Human Srvcs 156,954 159,019 132,658 132,658 132,600 0% 11%Mayor's Promo Items 3 50 300 50 200 -300% -70%L-COG 23,417 23,417 23,417 23,417 23,936 -2% -2%Chamber Of Commerce 35,000 35,000 35,000 35,000 35,000 0% 0%Hist Dist Signage - - 750 750 750 0% -200%
Attachment 4 FY16 Proposed Operating Expenditures by Department Page 1 of 25
City Manager's Office
Account FY13 Actual FY14 Actual FY15 Est Actual FY15 Amended Budget
Proposed FY16
Budget
% Change Over Amend
% Change 3 Year Avg
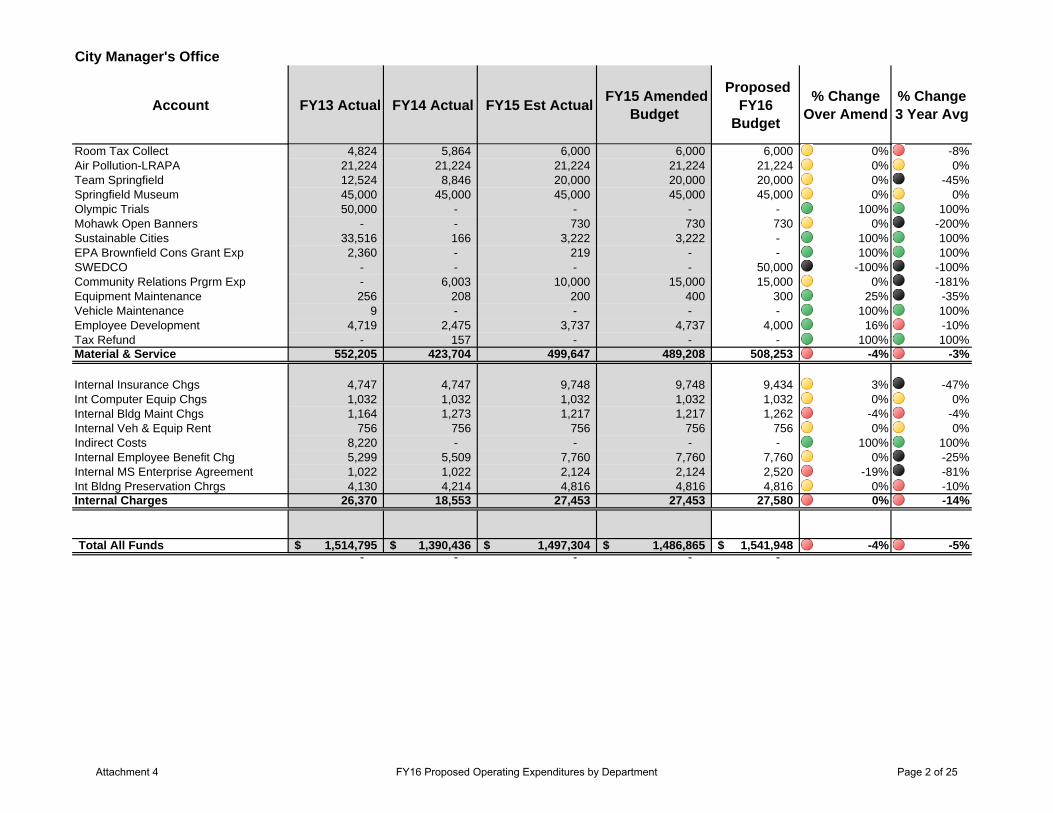
Room Tax Collect 4,824 5,864 6,000 6,000 6,000 0% -8%Air Pollution-LRAPA 21,224 21,224 21,224 21,224 21,224 0% 0%Team Springfield 12,524 8,846 20,000 20,000 20,000 0% -45%Springfield Museum 45,000 45,000 45,000 45,000 45,000 0% 0%Olympic Trials 50,000 - - - - 100% 100%Mohawk Open Banners - - 730 730 730 0% -200%Sustainable Cities 33,516 166 3,222 3,222 - 100% 100%EPA Brownfield Cons Grant Exp 2,360 - 219 - - 100% 100%SWEDCO - - - - 50,000 -100% -100%Community Relations Prgrm Exp - 6,003 10,000 15,000 15,000 0% -181%Equipment Maintenance 256 208 200 400 300 25% -35%Vehicle Maintenance 9 - - - - 100% 100%Employee Development 4,719 2,475 3,737 4,737 4,000 16% -10%Tax Refund - 157 - - - 100% 100%Material & Service 552,205 423,704 499,647 489,208 508,253 -4% -3%
Internal Insurance Chgs 4,747 4,747 9,748 9,748 9,434 3% -47%Int Computer Equip Chgs 1,032 1,032 1,032 1,032 1,032 0% 0%Internal Bldg Maint Chgs 1,164 1,273 1,217 1,217 1,262 -4% -4%Internal Veh & Equip Rent 756 756 756 756 756 0% 0%Indirect Costs 8,220 - - - - 100% 100%Internal Employee Benefit Chg 5,299 5,509 7,760 7,760 7,760 0% -25%Internal MS Enterprise Agreement 1,022 1,022 2,124 2,124 2,520 -19% -81%Int Bldng Preservation Chrgs 4,130 4,214 4,816 4,816 4,816 0% -10%Internal Charges 26,370 18,553 27,453 27,453 27,580 0% -14%
Total All Funds 1,514,795$ 1,390,436$ 1,497,304$ 1,486,865$ 1,541,948$ -4% -5%- - - - -
Attachment 4 FY16 Proposed Operating Expenditures by Department Page 2 of 25
City of SpringfieldTotal Operating Expenditures Decrease budget >5% 5%
All Funds 0%
Increase budget >5% -5%
-25%
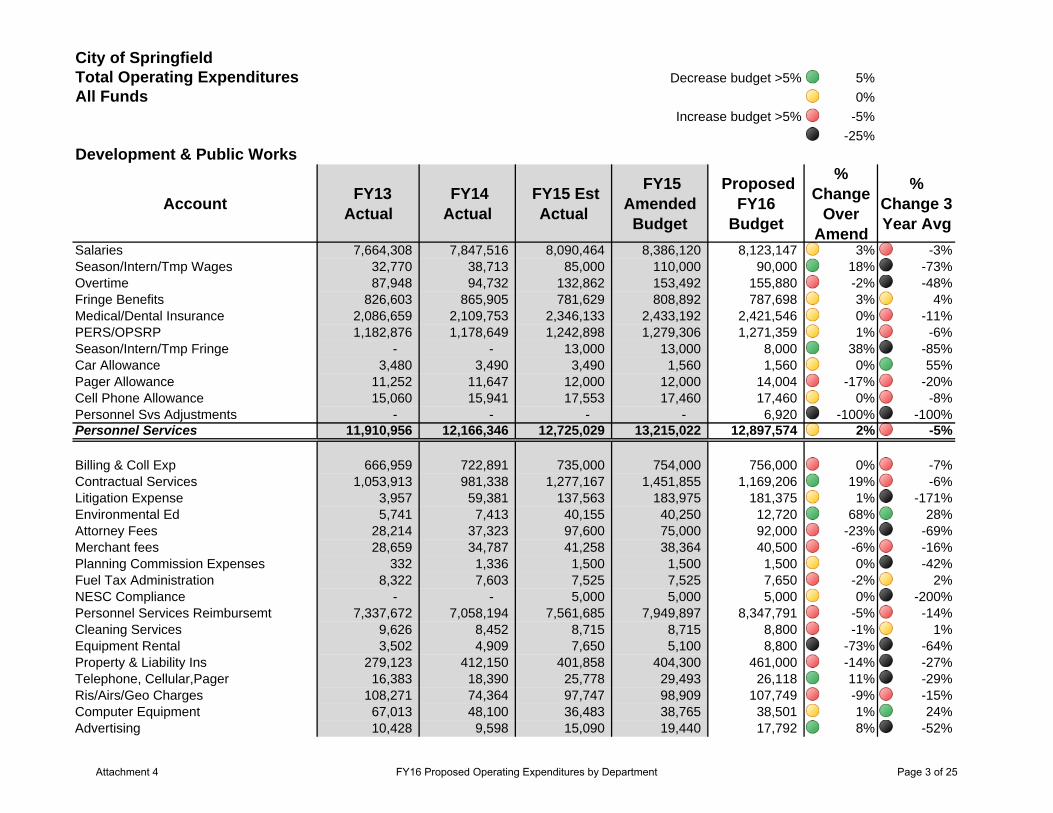
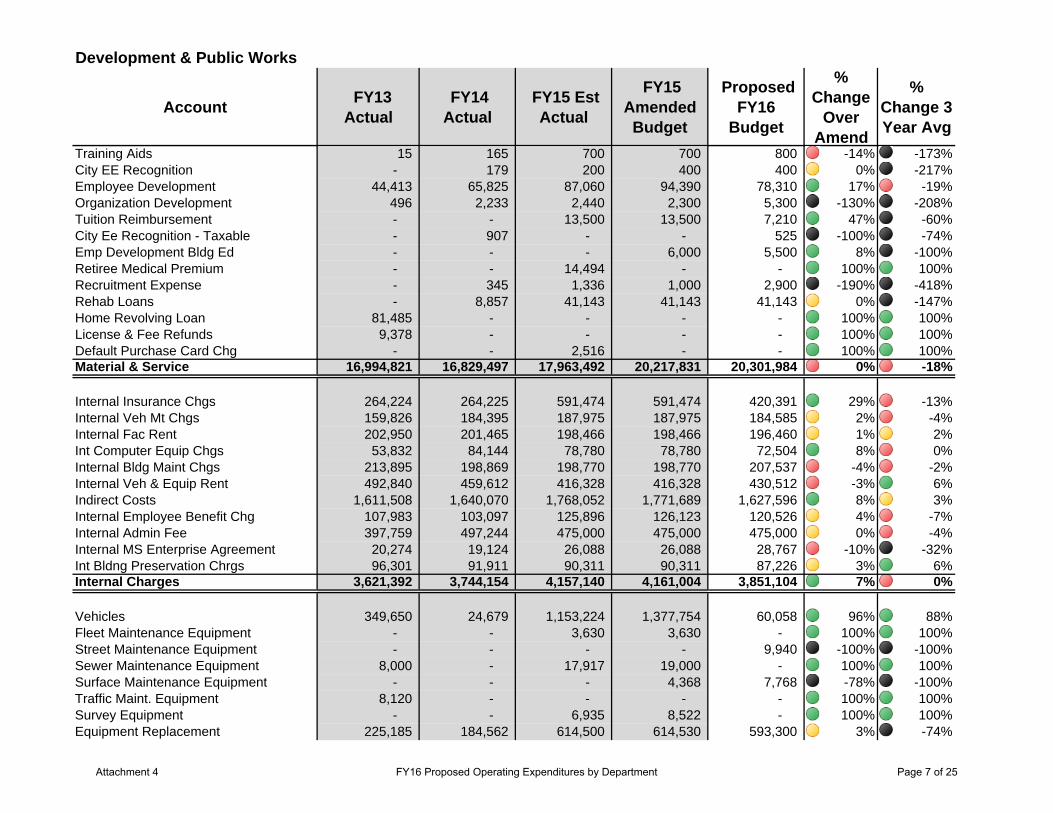
Development & Public Works
Account FY13 Actual
FY14 Actual
FY15 Est Actual
FY15 Amended Budget
Proposed FY16
Budget
% Change
Over Amend
% Change 3 Year Avg
Salaries 7,664,308 7,847,516 8,090,464 8,386,120 8,123,147 3% -3%Season/Intern/Tmp Wages 32,770 38,713 85,000 110,000 90,000 18% -73%Overtime 87,948 94,732 132,862 153,492 155,880 -2% -48%Fringe Benefits 826,603 865,905 781,629 808,892 787,698 3% 4%Medical/Dental Insurance 2,086,659 2,109,753 2,346,133 2,433,192 2,421,546 0% -11%PERS/OPSRP 1,182,876 1,178,649 1,242,898 1,279,306 1,271,359 1% -6%Season/Intern/Tmp Fringe - - 13,000 13,000 8,000 38% -85%Car Allowance 3,480 3,490 3,490 1,560 1,560 0% 55%Pager Allowance 11,252 11,647 12,000 12,000 14,004 -17% -20%Cell Phone Allowance 15,060 15,941 17,553 17,460 17,460 0% -8%Personnel Svs Adjustments - - - - 6,920 -100% -100%Personnel Services 11,910,956 12,166,346 12,725,029 13,215,022 12,897,574 2% -5%
Billing & Coll Exp 666,959 722,891 735,000 754,000 756,000 0% -7%Contractual Services 1,053,913 981,338 1,277,167 1,451,855 1,169,206 19% -6%Litigation Expense 3,957 59,381 137,563 183,975 181,375 1% -171%Environmental Ed 5,741 7,413 40,155 40,250 12,720 68% 28%Attorney Fees 28,214 37,323 97,600 75,000 92,000 -23% -69%Merchant fees 28,659 34,787 41,258 38,364 40,500 -6% -16%Planning Commission Expenses 332 1,336 1,500 1,500 1,500 0% -42%Fuel Tax Administration 8,322 7,603 7,525 7,525 7,650 -2% 2%NESC Compliance - - 5,000 5,000 5,000 0% -200%Personnel Services Reimbursemt 7,337,672 7,058,194 7,561,685 7,949,897 8,347,791 -5% -14%Cleaning Services 9,626 8,452 8,715 8,715 8,800 -1% 1%Equipment Rental 3,502 4,909 7,650 5,100 8,800 -73% -64%Property & Liability Ins 279,123 412,150 401,858 404,300 461,000 -14% -27%Telephone, Cellular,Pager 16,383 18,390 25,778 29,493 26,118 11% -29%Ris/Airs/Geo Charges 108,271 74,364 97,747 98,909 107,749 -9% -15%Computer Equipment 67,013 48,100 36,483 38,765 38,501 1% 24%Advertising 10,428 9,598 15,090 19,440 17,792 8% -52%
Attachment 4 FY16 Proposed Operating Expenditures by Department Page 3 of 25
Development & Public Works
Account FY13 Actual
FY14 Actual
FY15 Est Actual
FY15 Amended Budget
Proposed FY16
Budget
% Change
Over Amend
% Change 3 Year Avg
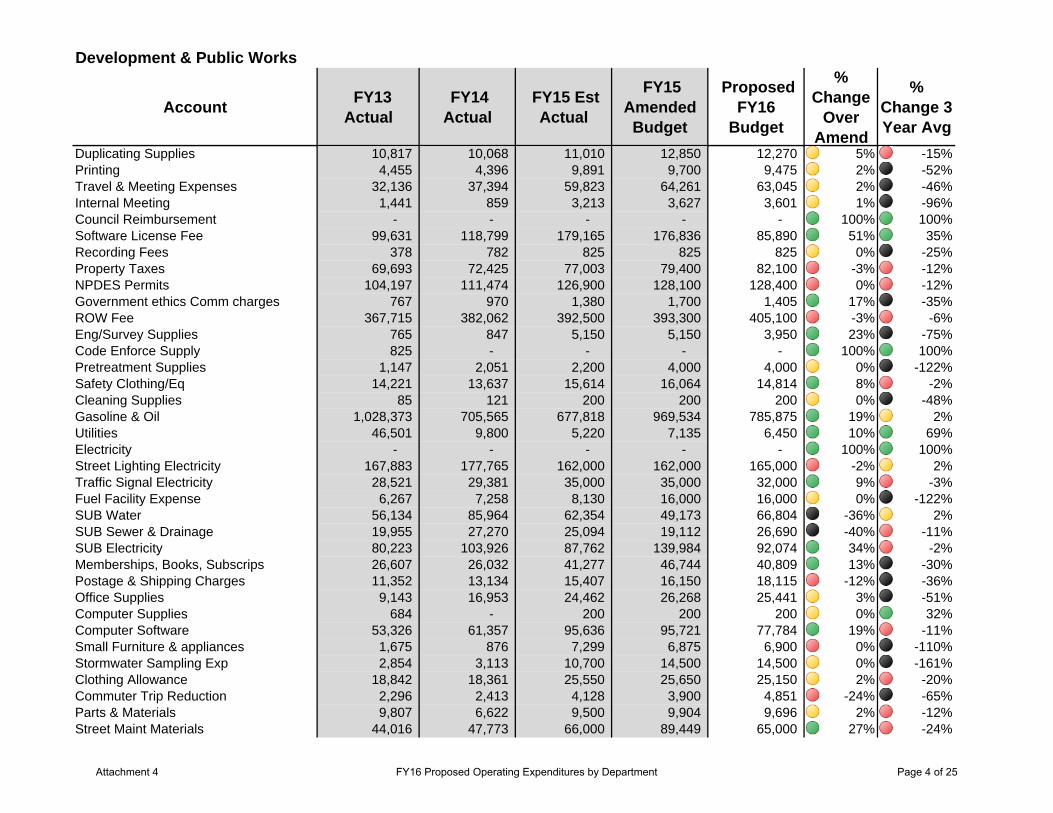
Duplicating Supplies 10,817 10,068 11,010 12,850 12,270 5% -15%Printing 4,455 4,396 9,891 9,700 9,475 2% -52%Travel & Meeting Expenses 32,136 37,394 59,823 64,261 63,045 2% -46%Internal Meeting 1,441 859 3,213 3,627 3,601 1% -96%Council Reimbursement - - - - - 100% 100%Software License Fee 99,631 118,799 179,165 176,836 85,890 51% 35%Recording Fees 378 782 825 825 825 0% -25%Property Taxes 69,693 72,425 77,003 79,400 82,100 -3% -12%NPDES Permits 104,197 111,474 126,900 128,100 128,400 0% -12%Government ethics Comm charges 767 970 1,380 1,700 1,405 17% -35%ROW Fee 367,715 382,062 392,500 393,300 405,100 -3% -6%Eng/Survey Supplies 765 847 5,150 5,150 3,950 23% -75%Code Enforce Supply 825 - - - - 100% 100%Pretreatment Supplies 1,147 2,051 2,200 4,000 4,000 0% -122%Safety Clothing/Eq 14,221 13,637 15,614 16,064 14,814 8% -2%Cleaning Supplies 85 121 200 200 200 0% -48%Gasoline & Oil 1,028,373 705,565 677,818 969,534 785,875 19% 2%Utilities 46,501 9,800 5,220 7,135 6,450 10% 69%Electricity - - - - - 100% 100%Street Lighting Electricity 167,883 177,765 162,000 162,000 165,000 -2% 2%Traffic Signal Electricity 28,521 29,381 35,000 35,000 32,000 9% -3%Fuel Facility Expense 6,267 7,258 8,130 16,000 16,000 0% -122%SUB Water 56,134 85,964 62,354 49,173 66,804 -36% 2%SUB Sewer & Drainage 19,955 27,270 25,094 19,112 26,690 -40% -11%SUB Electricity 80,223 103,926 87,762 139,984 92,074 34% -2%Memberships, Books, Subscrips 26,607 26,032 41,277 46,744 40,809 13% -30%Postage & Shipping Charges 11,352 13,134 15,407 16,150 18,115 -12% -36%Office Supplies 9,143 16,953 24,462 26,268 25,441 3% -51%Computer Supplies 684 - 200 200 200 0% 32%Computer Software 53,326 61,357 95,636 95,721 77,784 19% -11%Small Furniture & appliances 1,675 876 7,299 6,875 6,900 0% -110%Stormwater Sampling Exp 2,854 3,113 10,700 14,500 14,500 0% -161%Clothing Allowance 18,842 18,361 25,550 25,650 25,150 2% -20%Commuter Trip Reduction 2,296 2,413 4,128 3,900 4,851 -24% -65%Parts & Materials 9,807 6,622 9,500 9,904 9,696 2% -12%Street Maint Materials 44,016 47,773 66,000 89,449 65,000 27% -24%
Attachment 4 FY16 Proposed Operating Expenditures by Department Page 4 of 25
Development & Public Works
Account FY13 Actual
FY14 Actual
FY15 Est Actual
FY15 Amended Budget
Proposed FY16
Budget
% Change
Over Amend
% Change 3 Year Avg
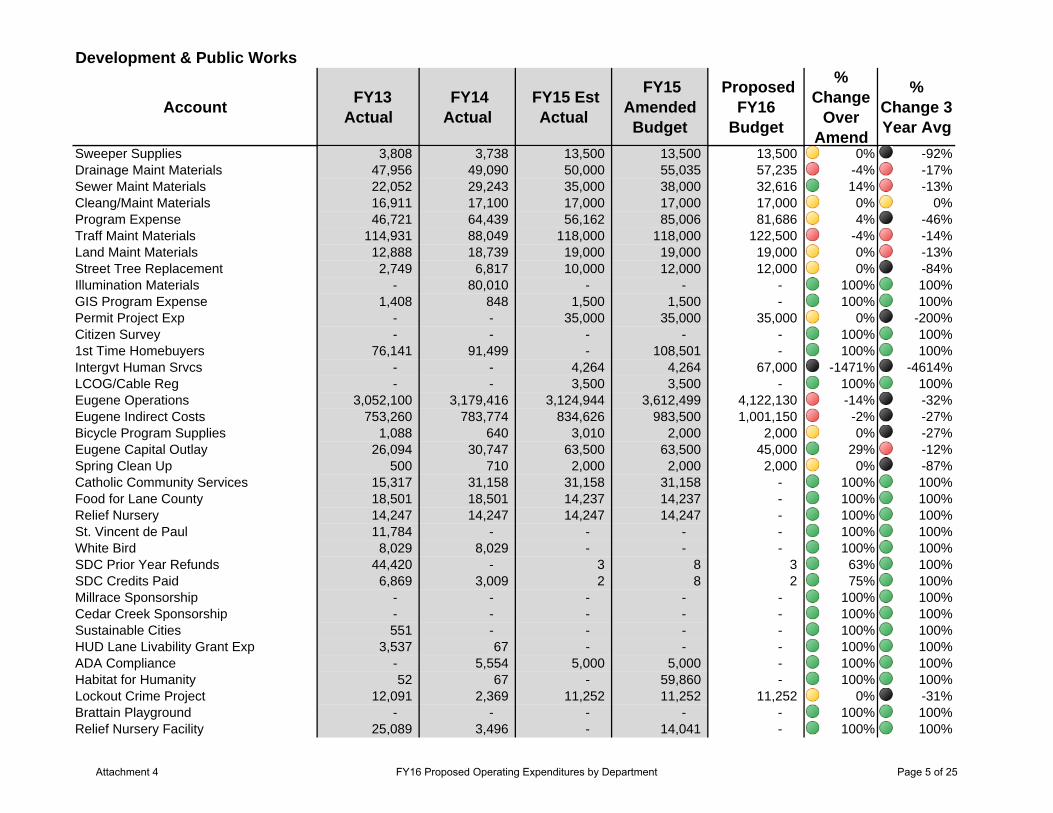
Sweeper Supplies 3,808 3,738 13,500 13,500 13,500 0% -92%Drainage Maint Materials 47,956 49,090 50,000 55,035 57,235 -4% -17%Sewer Maint Materials 22,052 29,243 35,000 38,000 32,616 14% -13%Cleang/Maint Materials 16,911 17,100 17,000 17,000 17,000 0% 0%Program Expense 46,721 64,439 56,162 85,006 81,686 4% -46%Traff Maint Materials 114,931 88,049 118,000 118,000 122,500 -4% -14%Land Maint Materials 12,888 18,739 19,000 19,000 19,000 0% -13%Street Tree Replacement 2,749 6,817 10,000 12,000 12,000 0% -84%Illumination Materials - 80,010 - - - 100% 100%GIS Program Expense 1,408 848 1,500 1,500 - 100% 100%Permit Project Exp - - 35,000 35,000 35,000 0% -200%Citizen Survey - - - - - 100% 100%1st Time Homebuyers 76,141 91,499 - 108,501 - 100% 100%Intergvt Human Srvcs - - 4,264 4,264 67,000 -1471% -4614%LCOG/Cable Reg - - 3,500 3,500 - 100% 100%Eugene Operations 3,052,100 3,179,416 3,124,944 3,612,499 4,122,130 -14% -32%Eugene Indirect Costs 753,260 783,774 834,626 983,500 1,001,150 -2% -27%Bicycle Program Supplies 1,088 640 3,010 2,000 2,000 0% -27%Eugene Capital Outlay 26,094 30,747 63,500 63,500 45,000 29% -12%Spring Clean Up 500 710 2,000 2,000 2,000 0% -87%Catholic Community Services 15,317 31,158 31,158 31,158 - 100% 100%Food for Lane County 18,501 18,501 14,237 14,237 - 100% 100%Relief Nursery 14,247 14,247 14,247 14,247 - 100% 100%St. Vincent de Paul 11,784 - - - - 100% 100%White Bird 8,029 8,029 - - - 100% 100%SDC Prior Year Refunds 44,420 - 3 8 3 63% 100%SDC Credits Paid 6,869 3,009 2 8 2 75% 100%Millrace Sponsorship - - - - - 100% 100%Cedar Creek Sponsorship - - - - - 100% 100%Sustainable Cities 551 - - - - 100% 100%HUD Lane Livability Grant Exp 3,537 67 - - - 100% 100%ADA Compliance - 5,554 5,000 5,000 - 100% 100%Habitat for Humanity 52 67 - 59,860 - 100% 100%Lockout Crime Project 12,091 2,369 11,252 11,252 11,252 0% -31%Brattain Playground - - - - - 100% 100%Relief Nursery Facility 25,089 3,496 - 14,041 - 100% 100%
Attachment 4 FY16 Proposed Operating Expenditures by Department Page 5 of 25
Development & Public Works
Account FY13 Actual
FY14 Actual
FY15 Est Actual
FY15 Amended Budget
Proposed FY16
Budget
% Change
Over Amend
% Change 3 Year Avg
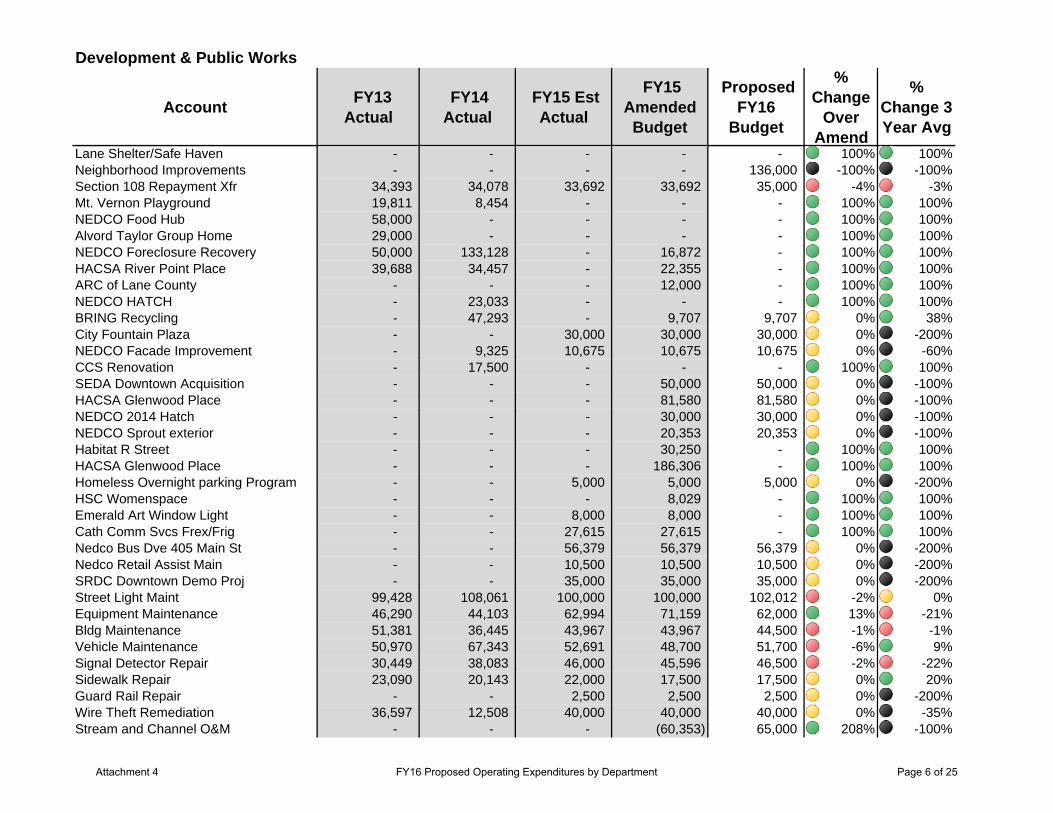
Lane Shelter/Safe Haven - - - - - 100% 100%Neighborhood Improvements - - - - 136,000 -100% -100%Section 108 Repayment Xfr 34,393 34,078 33,692 33,692 35,000 -4% -3%Mt. Vernon Playground 19,811 8,454 - - - 100% 100%NEDCO Food Hub 58,000 - - - - 100% 100%Alvord Taylor Group Home 29,000 - - - - 100% 100%NEDCO Foreclosure Recovery 50,000 133,128 - 16,872 - 100% 100%HACSA River Point Place 39,688 34,457 - 22,355 - 100% 100%ARC of Lane County - - - 12,000 - 100% 100%NEDCO HATCH - 23,033 - - - 100% 100%BRING Recycling - 47,293 - 9,707 9,707 0% 38%City Fountain Plaza - - 30,000 30,000 30,000 0% -200%NEDCO Facade Improvement - 9,325 10,675 10,675 10,675 0% -60%CCS Renovation - 17,500 - - - 100% 100%SEDA Downtown Acquisition - - - 50,000 50,000 0% -100%HACSA Glenwood Place - - - 81,580 81,580 0% -100%NEDCO 2014 Hatch - - - 30,000 30,000 0% -100%NEDCO Sprout exterior - - - 20,353 20,353 0% -100%Habitat R Street - - - 30,250 - 100% 100%HACSA Glenwood Place - - - 186,306 - 100% 100%Homeless Overnight parking Program - - 5,000 5,000 5,000 0% -200%HSC Womenspace - - - 8,029 - 100% 100%Emerald Art Window Light - - 8,000 8,000 - 100% 100%Cath Comm Svcs Frex/Frig - - 27,615 27,615 - 100% 100%Nedco Bus Dve 405 Main St - - 56,379 56,379 56,379 0% -200%Nedco Retail Assist Main - - 10,500 10,500 10,500 0% -200%SRDC Downtown Demo Proj - - 35,000 35,000 35,000 0% -200%Street Light Maint 99,428 108,061 100,000 100,000 102,012 -2% 0%Equipment Maintenance 46,290 44,103 62,994 71,159 62,000 13% -21%Bldg Maintenance 51,381 36,445 43,967 43,967 44,500 -1% -1%Vehicle Maintenance 50,970 67,343 52,691 48,700 51,700 -6% 9%Signal Detector Repair 30,449 38,083 46,000 45,596 46,500 -2% -22%Sidewalk Repair 23,090 20,143 22,000 17,500 17,500 0% 20%Guard Rail Repair - - 2,500 2,500 2,500 0% -200%Wire Theft Remediation 36,597 12,508 40,000 40,000 40,000 0% -35%Stream and Channel O&M - - - (60,353) 65,000 208% -100%
Attachment 4 FY16 Proposed Operating Expenditures by Department Page 6 of 25
Development & Public Works
Account FY13 Actual
FY14 Actual
FY15 Est Actual
FY15 Amended Budget
Proposed FY16
Budget
% Change
Over Amend
% Change 3 Year Avg
Training Aids 15 165 700 700 800 -14% -173%City EE Recognition - 179 200 400 400 0% -217%Employee Development 44,413 65,825 87,060 94,390 78,310 17% -19%Organization Development 496 2,233 2,440 2,300 5,300 -130% -208%Tuition Reimbursement - - 13,500 13,500 7,210 47% -60%City Ee Recognition - Taxable - 907 - - 525 -100% -74%Emp Development Bldg Ed - - - 6,000 5,500 8% -100%Retiree Medical Premium - - 14,494 - - 100% 100%Recruitment Expense - 345 1,336 1,000 2,900 -190% -418%Rehab Loans - 8,857 41,143 41,143 41,143 0% -147%Home Revolving Loan 81,485 - - - - 100% 100%License & Fee Refunds 9,378 - - - - 100% 100%Default Purchase Card Chg - - 2,516 - - 100% 100%Material & Service 16,994,821 16,829,497 17,963,492 20,217,831 20,301,984 0% -18%
Internal Insurance Chgs 264,224 264,225 591,474 591,474 420,391 29% -13%Internal Veh Mt Chgs 159,826 184,395 187,975 187,975 184,585 2% -4%Internal Fac Rent 202,950 201,465 198,466 198,466 196,460 1% 2%Int Computer Equip Chgs 53,832 84,144 78,780 78,780 72,504 8% 0%Internal Bldg Maint Chgs 213,895 198,869 198,770 198,770 207,537 -4% -2%Internal Veh & Equip Rent 492,840 459,612 416,328 416,328 430,512 -3% 6%Indirect Costs 1,611,508 1,640,070 1,768,052 1,771,689 1,627,596 8% 3%Internal Employee Benefit Chg 107,983 103,097 125,896 126,123 120,526 4% -7%Internal Admin Fee 397,759 497,244 475,000 475,000 475,000 0% -4%Internal MS Enterprise Agreement 20,274 19,124 26,088 26,088 28,767 -10% -32%Int Bldng Preservation Chrgs 96,301 91,911 90,311 90,311 87,226 3% 6%Internal Charges 3,621,392 3,744,154 4,157,140 4,161,004 3,851,104 7% 0%
Vehicles 349,650 24,679 1,153,224 1,377,754 60,058 96% 88%Fleet Maintenance Equipment - - 3,630 3,630 - 100% 100%Street Maintenance Equipment - - - - 9,940 -100% -100%Sewer Maintenance Equipment 8,000 - 17,917 19,000 - 100% 100%Surface Maintenance Equipment - - - 4,368 7,768 -78% -100%Traffic Maint. Equipment 8,120 - - - - 100% 100%Survey Equipment - - 6,935 8,522 - 100% 100%Equipment Replacement 225,185 184,562 614,500 614,530 593,300 3% -74%
Attachment 4 FY16 Proposed Operating Expenditures by Department Page 7 of 25
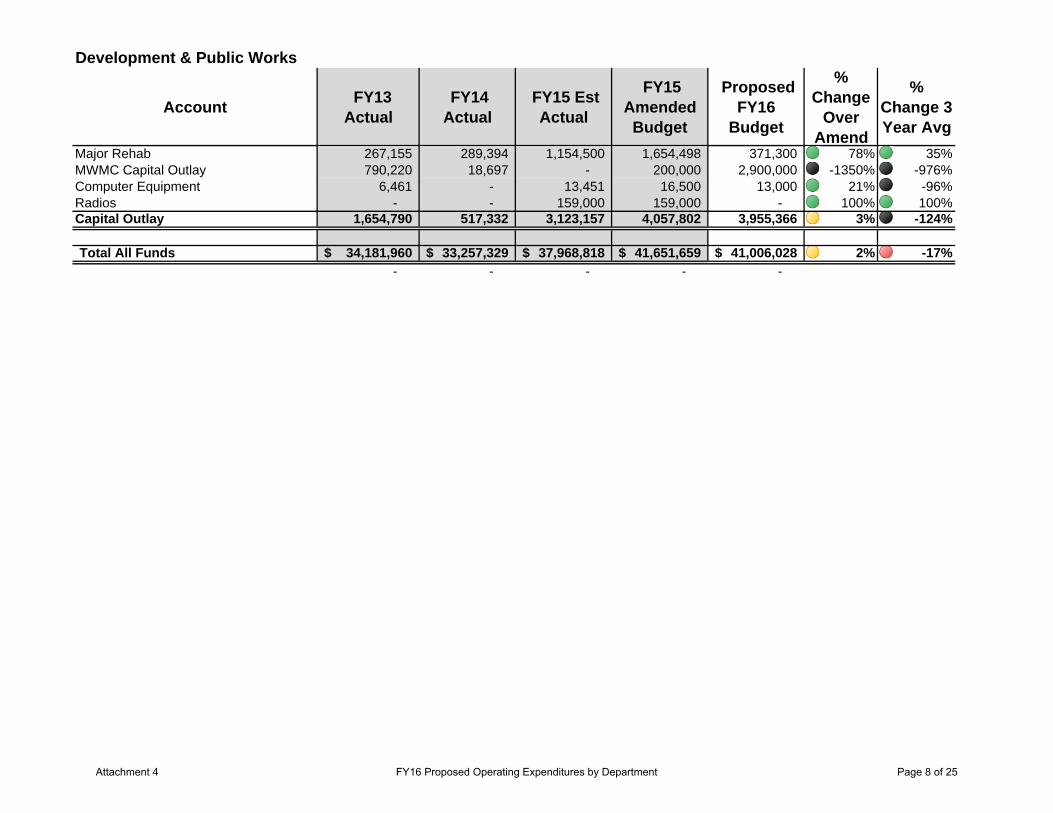
Development & Public Works
Account FY13 Actual
FY14 Actual
FY15 Est Actual
FY15 Amended Budget
Proposed FY16
Budget
% Change
Over Amend
% Change 3 Year Avg
Major Rehab 267,155 289,394 1,154,500 1,654,498 371,300 78% 35%MWMC Capital Outlay 790,220 18,697 - 200,000 2,900,000 -1350% -976%Computer Equipment 6,461 - 13,451 16,500 13,000 21% -96%Radios - - 159,000 159,000 - 100% 100%Capital Outlay 1,654,790 517,332 3,123,157 4,057,802 3,955,366 3% -124%
Total All Funds 34,181,960$ 33,257,329$ 37,968,818$ 41,651,659$ 41,006,028$ 2% -17%- - - - -
Attachment 4 FY16 Proposed Operating Expenditures by Department Page 8 of 25
City of SpringfieldTotal Operating Expenditures Decrease budget >5% 5%
All Funds 0%
Increase budget >5% -5%
-25%
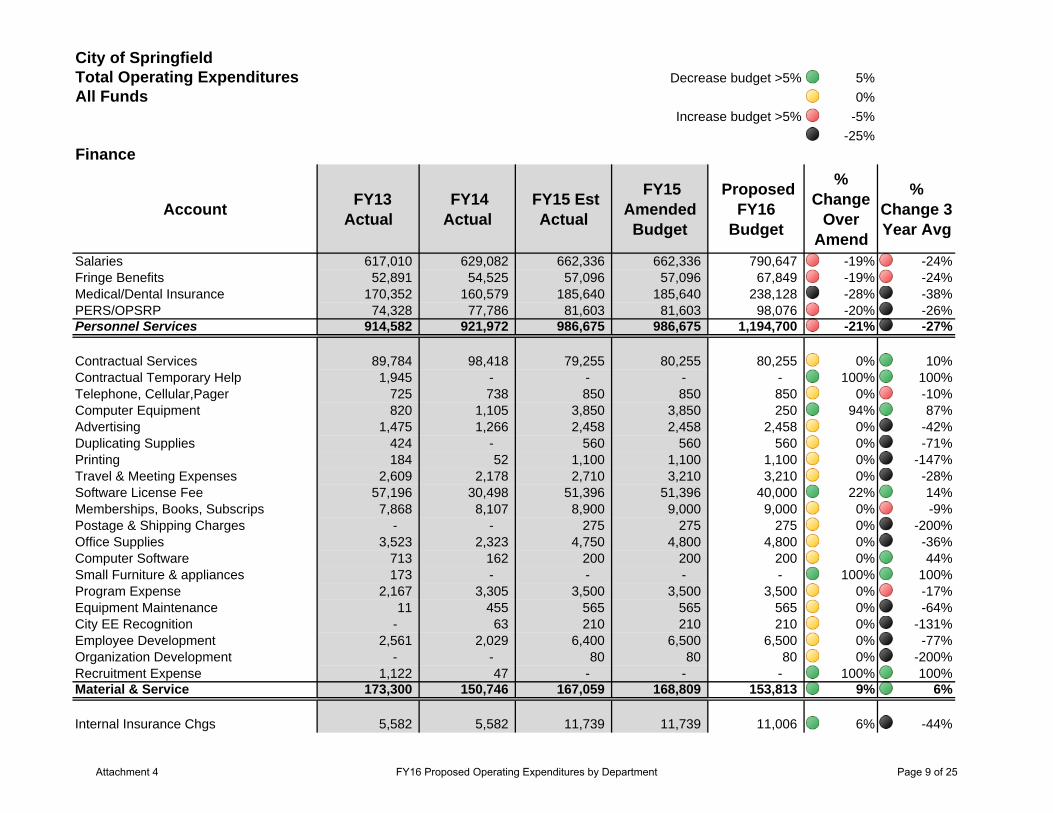
Finance
Account FY13 Actual
FY14 Actual
FY15 Est Actual
FY15 Amended Budget
Proposed FY16
Budget
% Change
Over Amend
% Change 3 Year Avg
Salaries 617,010 629,082 662,336 662,336 790,647 -19% -24%Fringe Benefits 52,891 54,525 57,096 57,096 67,849 -19% -24%Medical/Dental Insurance 170,352 160,579 185,640 185,640 238,128 -28% -38%PERS/OPSRP 74,328 77,786 81,603 81,603 98,076 -20% -26%Personnel Services 914,582 921,972 986,675 986,675 1,194,700 -21% -27%
Contractual Services 89,784 98,418 79,255 80,255 80,255 0% 10%Contractual Temporary Help 1,945 - - - - 100% 100%Telephone, Cellular,Pager 725 738 850 850 850 0% -10%Computer Equipment 820 1,105 3,850 3,850 250 94% 87%Advertising 1,475 1,266 2,458 2,458 2,458 0% -42%Duplicating Supplies 424 - 560 560 560 0% -71%Printing 184 52 1,100 1,100 1,100 0% -147%Travel & Meeting Expenses 2,609 2,178 2,710 3,210 3,210 0% -28%Software License Fee 57,196 30,498 51,396 51,396 40,000 22% 14%Memberships, Books, Subscrips 7,868 8,107 8,900 9,000 9,000 0% -9%Postage & Shipping Charges - - 275 275 275 0% -200%Office Supplies 3,523 2,323 4,750 4,800 4,800 0% -36%Computer Software 713 162 200 200 200 0% 44%Small Furniture & appliances 173 - - - - 100% 100%Program Expense 2,167 3,305 3,500 3,500 3,500 0% -17%Equipment Maintenance 11 455 565 565 565 0% -64%City EE Recognition - 63 210 210 210 0% -131%Employee Development 2,561 2,029 6,400 6,500 6,500 0% -77%Organization Development - - 80 80 80 0% -200%Recruitment Expense 1,122 47 - - - 100% 100%Material & Service 173,300 150,746 167,059 168,809 153,813 9% 6%
Internal Insurance Chgs 5,582 5,582 11,739 11,739 11,006 6% -44%
Attachment 4 FY16 Proposed Operating Expenditures by Department Page 9 of 25
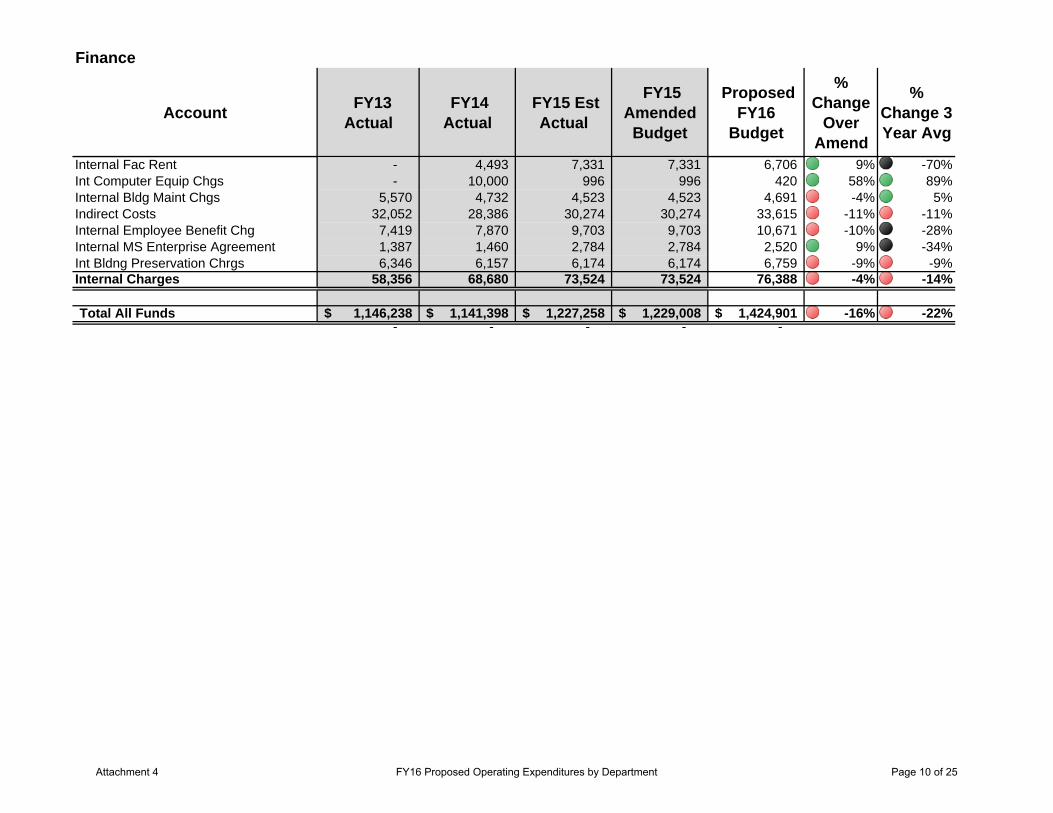
Finance
Account FY13 Actual
FY14 Actual
FY15 Est Actual
FY15 Amended Budget
Proposed FY16
Budget
% Change
Over Amend
% Change 3 Year Avg
Internal Fac Rent - 4,493 7,331 7,331 6,706 9% -70%Int Computer Equip Chgs - 10,000 996 996 420 58% 89%Internal Bldg Maint Chgs 5,570 4,732 4,523 4,523 4,691 -4% 5%Indirect Costs 32,052 28,386 30,274 30,274 33,615 -11% -11%Internal Employee Benefit Chg 7,419 7,870 9,703 9,703 10,671 -10% -28%Internal MS Enterprise Agreement 1,387 1,460 2,784 2,784 2,520 9% -34%Int Bldng Preservation Chrgs 6,346 6,157 6,174 6,174 6,759 -9% -9%Internal Charges 58,356 68,680 73,524 73,524 76,388 -4% -14%
Total All Funds 1,146,238$ 1,141,398$ 1,227,258$ 1,229,008$ 1,424,901$ -16% -22%- - - - -
Attachment 4 FY16 Proposed Operating Expenditures by Department Page 10 of 25
City of SpringfieldTotal Operating Expenditures Decrease budget >5% 5%
All Funds 0%
Increase budget >5% -5%
-25%
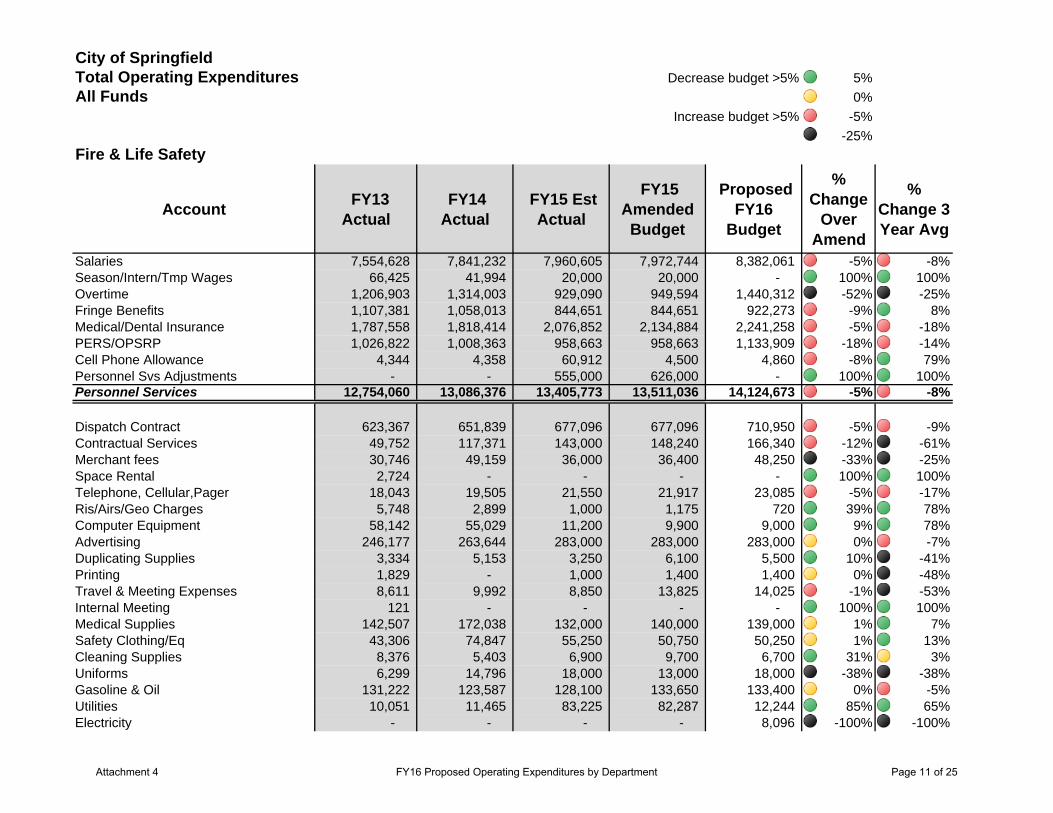
Fire & Life Safety
Account FY13 Actual
FY14 Actual
FY15 Est Actual
FY15 Amended Budget
Proposed FY16
Budget
% Change
Over Amend
% Change 3 Year Avg
Salaries 7,554,628 7,841,232 7,960,605 7,972,744 8,382,061 -5% -8%Season/Intern/Tmp Wages 66,425 41,994 20,000 20,000 - 100% 100%Overtime 1,206,903 1,314,003 929,090 949,594 1,440,312 -52% -25%Fringe Benefits 1,107,381 1,058,013 844,651 844,651 922,273 -9% 8%Medical/Dental Insurance 1,787,558 1,818,414 2,076,852 2,134,884 2,241,258 -5% -18%PERS/OPSRP 1,026,822 1,008,363 958,663 958,663 1,133,909 -18% -14%Cell Phone Allowance 4,344 4,358 60,912 4,500 4,860 -8% 79%Personnel Svs Adjustments - - 555,000 626,000 - 100% 100%Personnel Services 12,754,060 13,086,376 13,405,773 13,511,036 14,124,673 -5% -8%
Dispatch Contract 623,367 651,839 677,096 677,096 710,950 -5% -9%Contractual Services 49,752 117,371 143,000 148,240 166,340 -12% -61%Merchant fees 30,746 49,159 36,000 36,400 48,250 -33% -25%Space Rental 2,724 - - - - 100% 100%Telephone, Cellular,Pager 18,043 19,505 21,550 21,917 23,085 -5% -17%Ris/Airs/Geo Charges 5,748 2,899 1,000 1,175 720 39% 78%Computer Equipment 58,142 55,029 11,200 9,900 9,000 9% 78%Advertising 246,177 263,644 283,000 283,000 283,000 0% -7%Duplicating Supplies 3,334 5,153 3,250 6,100 5,500 10% -41%Printing 1,829 - 1,000 1,400 1,400 0% -48%Travel & Meeting Expenses 8,611 9,992 8,850 13,825 14,025 -1% -53%Internal Meeting 121 - - - - 100% 100%Medical Supplies 142,507 172,038 132,000 140,000 139,000 1% 7%Safety Clothing/Eq 43,306 74,847 55,250 50,750 50,250 1% 13%Cleaning Supplies 8,376 5,403 6,900 9,700 6,700 31% 3%Uniforms 6,299 14,796 18,000 13,000 18,000 -38% -38%Gasoline & Oil 131,222 123,587 128,100 133,650 133,400 0% -5%Utilities 10,051 11,465 83,225 82,287 12,244 85% 65%Electricity - - - - 8,096 -100% -100%
Attachment 4 FY16 Proposed Operating Expenditures by Department Page 11 of 25
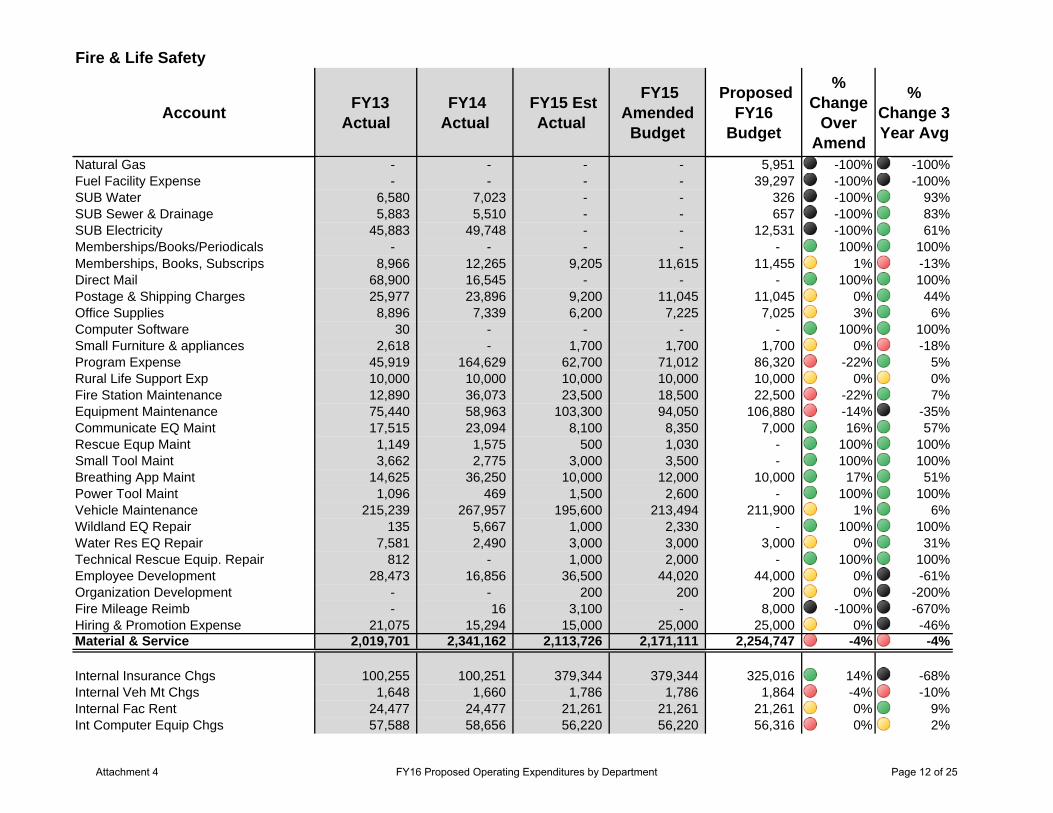
Fire & Life Safety
Account FY13 Actual
FY14 Actual
FY15 Est Actual
FY15 Amended Budget
Proposed FY16
Budget
% Change
Over Amend
% Change 3 Year Avg
Natural Gas - - - - 5,951 -100% -100%Fuel Facility Expense - - - - 39,297 -100% -100%SUB Water 6,580 7,023 - - 326 -100% 93%SUB Sewer & Drainage 5,883 5,510 - - 657 -100% 83%SUB Electricity 45,883 49,748 - - 12,531 -100% 61%Memberships/Books/Periodicals - - - - - 100% 100%Memberships, Books, Subscrips 8,966 12,265 9,205 11,615 11,455 1% -13%Direct Mail 68,900 16,545 - - - 100% 100%Postage & Shipping Charges 25,977 23,896 9,200 11,045 11,045 0% 44%Office Supplies 8,896 7,339 6,200 7,225 7,025 3% 6%Computer Software 30 - - - - 100% 100%Small Furniture & appliances 2,618 - 1,700 1,700 1,700 0% -18%Program Expense 45,919 164,629 62,700 71,012 86,320 -22% 5%Rural Life Support Exp 10,000 10,000 10,000 10,000 10,000 0% 0%Fire Station Maintenance 12,890 36,073 23,500 18,500 22,500 -22% 7%Equipment Maintenance 75,440 58,963 103,300 94,050 106,880 -14% -35%Communicate EQ Maint 17,515 23,094 8,100 8,350 7,000 16% 57%Rescue Equp Maint 1,149 1,575 500 1,030 - 100% 100%Small Tool Maint 3,662 2,775 3,000 3,500 - 100% 100%Breathing App Maint 14,625 36,250 10,000 12,000 10,000 17% 51%Power Tool Maint 1,096 469 1,500 2,600 - 100% 100%Vehicle Maintenance 215,239 267,957 195,600 213,494 211,900 1% 6%Wildland EQ Repair 135 5,667 1,000 2,330 - 100% 100%Water Res EQ Repair 7,581 2,490 3,000 3,000 3,000 0% 31%Technical Rescue Equip. Repair 812 - 1,000 2,000 - 100% 100%Employee Development 28,473 16,856 36,500 44,020 44,000 0% -61%Organization Development - - 200 200 200 0% -200%Fire Mileage Reimb - 16 3,100 - 8,000 -100% -670%Hiring & Promotion Expense 21,075 15,294 15,000 25,000 25,000 0% -46%Material & Service 2,019,701 2,341,162 2,113,726 2,171,111 2,254,747 -4% -4%
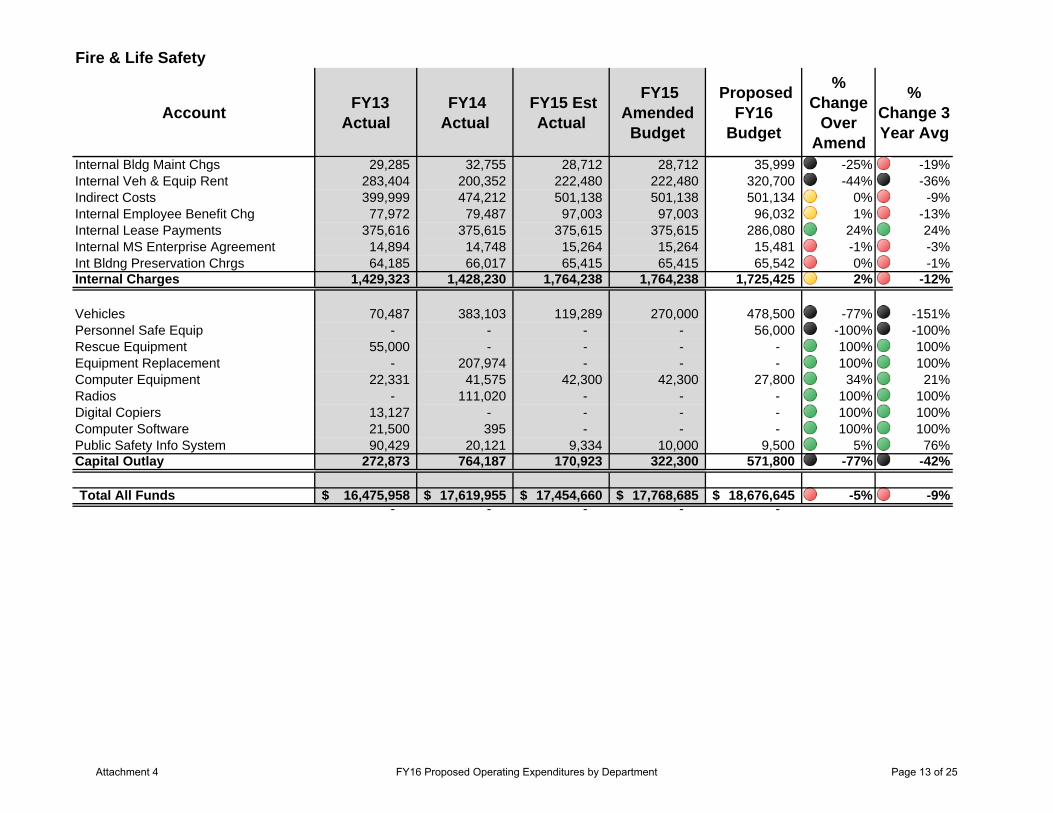
Internal Insurance Chgs 100,255 100,251 379,344 379,344 325,016 14% -68%Internal Veh Mt Chgs 1,648 1,660 1,786 1,786 1,864 -4% -10%Internal Fac Rent 24,477 24,477 21,261 21,261 21,261 0% 9%Int Computer Equip Chgs 57,588 58,656 56,220 56,220 56,316 0% 2%
Attachment 4 FY16 Proposed Operating Expenditures by Department Page 12 of 25
Fire & Life Safety
Account FY13 Actual
FY14 Actual
FY15 Est Actual
FY15 Amended Budget
Proposed FY16
Budget
% Change
Over Amend
% Change 3 Year Avg
Internal Bldg Maint Chgs 29,285 32,755 28,712 28,712 35,999 -25% -19%Internal Veh & Equip Rent 283,404 200,352 222,480 222,480 320,700 -44% -36%Indirect Costs 399,999 474,212 501,138 501,138 501,134 0% -9%Internal Employee Benefit Chg 77,972 79,487 97,003 97,003 96,032 1% -13%Internal Lease Payments 375,616 375,615 375,615 375,615 286,080 24% 24%Internal MS Enterprise Agreement 14,894 14,748 15,264 15,264 15,481 -1% -3%Int Bldng Preservation Chrgs 64,185 66,017 65,415 65,415 65,542 0% -1%Internal Charges 1,429,323 1,428,230 1,764,238 1,764,238 1,725,425 2% -12%
Vehicles 70,487 383,103 119,289 270,000 478,500 -77% -151%Personnel Safe Equip - - - - 56,000 -100% -100%Rescue Equipment 55,000 - - - - 100% 100%Equipment Replacement - 207,974 - - - 100% 100%Computer Equipment 22,331 41,575 42,300 42,300 27,800 34% 21%Radios - 111,020 - - - 100% 100%Digital Copiers 13,127 - - - - 100% 100%Computer Software 21,500 395 - - - 100% 100%Public Safety Info System 90,429 20,121 9,334 10,000 9,500 5% 76%Capital Outlay 272,873 764,187 170,923 322,300 571,800 -77% -42%
Total All Funds 16,475,958$ 17,619,955$ 17,454,660$ 17,768,685$ 18,676,645$ -5% -9%- - - - -
Attachment 4 FY16 Proposed Operating Expenditures by Department Page 13 of 25
City of SpringfieldTotal Operating Expenditures Decrease budget >5% 5%
All Funds 0%
Increase budget >5% -5%
-25%
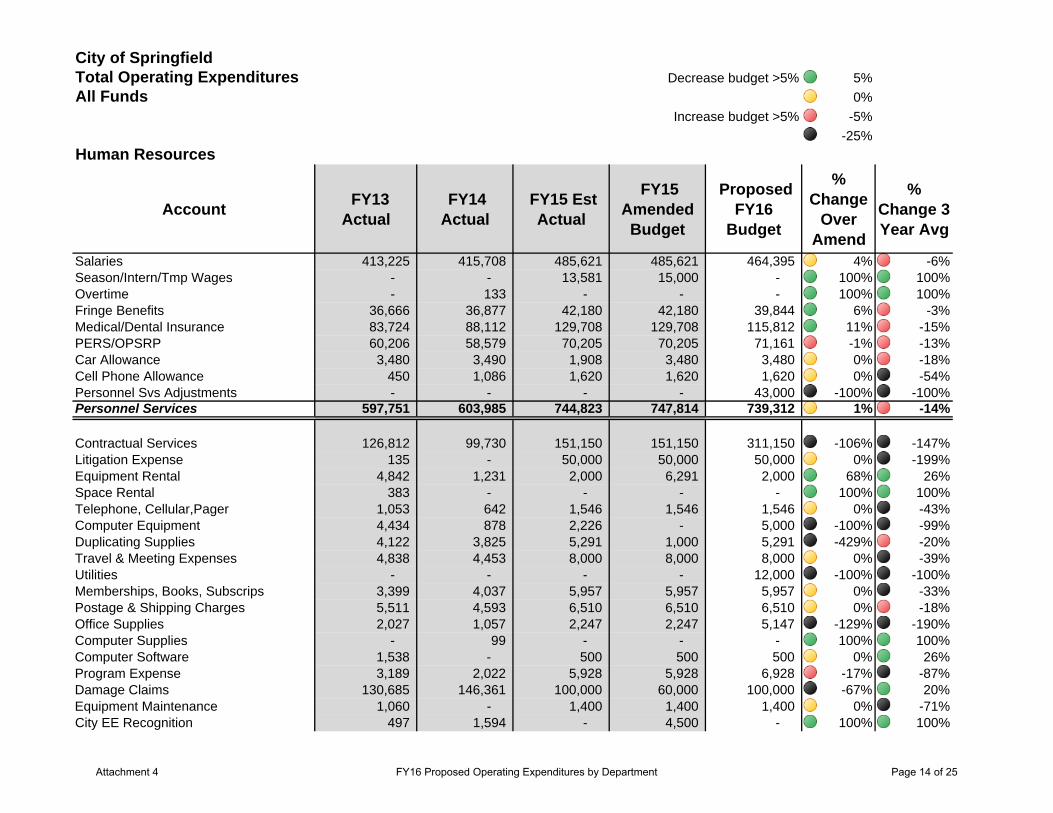
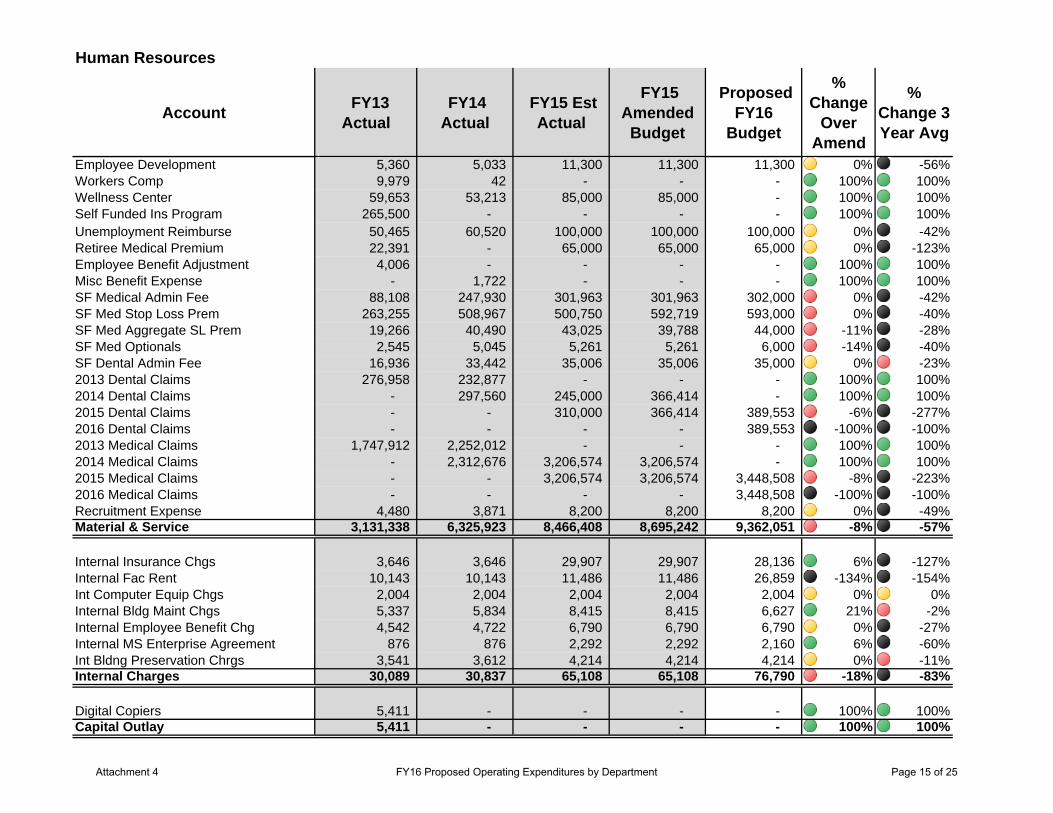
Human Resources
Account FY13 Actual
FY14 Actual
FY15 Est Actual
FY15 Amended Budget
Proposed FY16
Budget
% Change
Over Amend
% Change 3 Year Avg
Salaries 413,225 415,708 485,621 485,621 464,395 4% -6%Season/Intern/Tmp Wages - - 13,581 15,000 - 100% 100%Overtime - 133 - - - 100% 100%Fringe Benefits 36,666 36,877 42,180 42,180 39,844 6% -3%Medical/Dental Insurance 83,724 88,112 129,708 129,708 115,812 11% -15%PERS/OPSRP 60,206 58,579 70,205 70,205 71,161 -1% -13%Car Allowance 3,480 3,490 1,908 3,480 3,480 0% -18%Cell Phone Allowance 450 1,086 1,620 1,620 1,620 0% -54%Personnel Svs Adjustments - - - - 43,000 -100% -100%Personnel Services 597,751 603,985 744,823 747,814 739,312 1% -14%
Contractual Services 126,812 99,730 151,150 151,150 311,150 -106% -147%Litigation Expense 135 - 50,000 50,000 50,000 0% -199%Equipment Rental 4,842 1,231 2,000 6,291 2,000 68% 26%Space Rental 383 - - - - 100% 100%Telephone, Cellular,Pager 1,053 642 1,546 1,546 1,546 0% -43%Computer Equipment 4,434 878 2,226 - 5,000 -100% -99%Duplicating Supplies 4,122 3,825 5,291 1,000 5,291 -429% -20%Travel & Meeting Expenses 4,838 4,453 8,000 8,000 8,000 0% -39%Utilities - - - - 12,000 -100% -100%Memberships, Books, Subscrips 3,399 4,037 5,957 5,957 5,957 0% -33%Postage & Shipping Charges 5,511 4,593 6,510 6,510 6,510 0% -18%Office Supplies 2,027 1,057 2,247 2,247 5,147 -129% -190%Computer Supplies - 99 - - - 100% 100%Computer Software 1,538 - 500 500 500 0% 26%Program Expense 3,189 2,022 5,928 5,928 6,928 -17% -87%Damage Claims 130,685 146,361 100,000 60,000 100,000 -67% 20%Equipment Maintenance 1,060 - 1,400 1,400 1,400 0% -71%City EE Recognition 497 1,594 - 4,500 - 100% 100%
Attachment 4 FY16 Proposed Operating Expenditures by Department Page 14 of 25
Human Resources
Account FY13 Actual
FY14 Actual
FY15 Est Actual
FY15 Amended Budget
Proposed FY16
Budget
% Change
Over Amend
% Change 3 Year Avg
Employee Development 5,360 5,033 11,300 11,300 11,300 0% -56%Workers Comp 9,979 42 - - - 100% 100%Wellness Center 59,653 53,213 85,000 85,000 - 100% 100%Self Funded Ins Program 265,500 - - - - 100% 100%Unemployment Reimburse 50,465 60,520 100,000 100,000 100,000 0% -42%Retiree Medical Premium 22,391 - 65,000 65,000 65,000 0% -123%Employee Benefit Adjustment 4,006 - - - - 100% 100%Misc Benefit Expense - 1,722 - - - 100% 100%SF Medical Admin Fee 88,108 247,930 301,963 301,963 302,000 0% -42%SF Med Stop Loss Prem 263,255 508,967 500,750 592,719 593,000 0% -40%SF Med Aggregate SL Prem 19,266 40,490 43,025 39,788 44,000 -11% -28%SF Med Optionals 2,545 5,045 5,261 5,261 6,000 -14% -40%SF Dental Admin Fee 16,936 33,442 35,006 35,006 35,000 0% -23%2013 Dental Claims 276,958 232,877 - - - 100% 100%2014 Dental Claims - 297,560 245,000 366,414 - 100% 100%2015 Dental Claims - - 310,000 366,414 389,553 -6% -277%2016 Dental Claims - - - - 389,553 -100% -100%2013 Medical Claims 1,747,912 2,252,012 - - - 100% 100%2014 Medical Claims - 2,312,676 3,206,574 3,206,574 - 100% 100%2015 Medical Claims - - 3,206,574 3,206,574 3,448,508 -8% -223%2016 Medical Claims - - - - 3,448,508 -100% -100%Recruitment Expense 4,480 3,871 8,200 8,200 8,200 0% -49%Material & Service 3,131,338 6,325,923 8,466,408 8,695,242 9,362,051 -8% -57%
Internal Insurance Chgs 3,646 3,646 29,907 29,907 28,136 6% -127%Internal Fac Rent 10,143 10,143 11,486 11,486 26,859 -134% -154%Int Computer Equip Chgs 2,004 2,004 2,004 2,004 2,004 0% 0%Internal Bldg Maint Chgs 5,337 5,834 8,415 8,415 6,627 21% -2%Internal Employee Benefit Chg 4,542 4,722 6,790 6,790 6,790 0% -27%Internal MS Enterprise Agreement 876 876 2,292 2,292 2,160 6% -60%Int Bldng Preservation Chrgs 3,541 3,612 4,214 4,214 4,214 0% -11%Internal Charges 30,089 30,837 65,108 65,108 76,790 -18% -83%
Digital Copiers 5,411 - - - - 100% 100%Capital Outlay 5,411 - - - - 100% 100%
Attachment 4 FY16 Proposed Operating Expenditures by Department Page 15 of 25
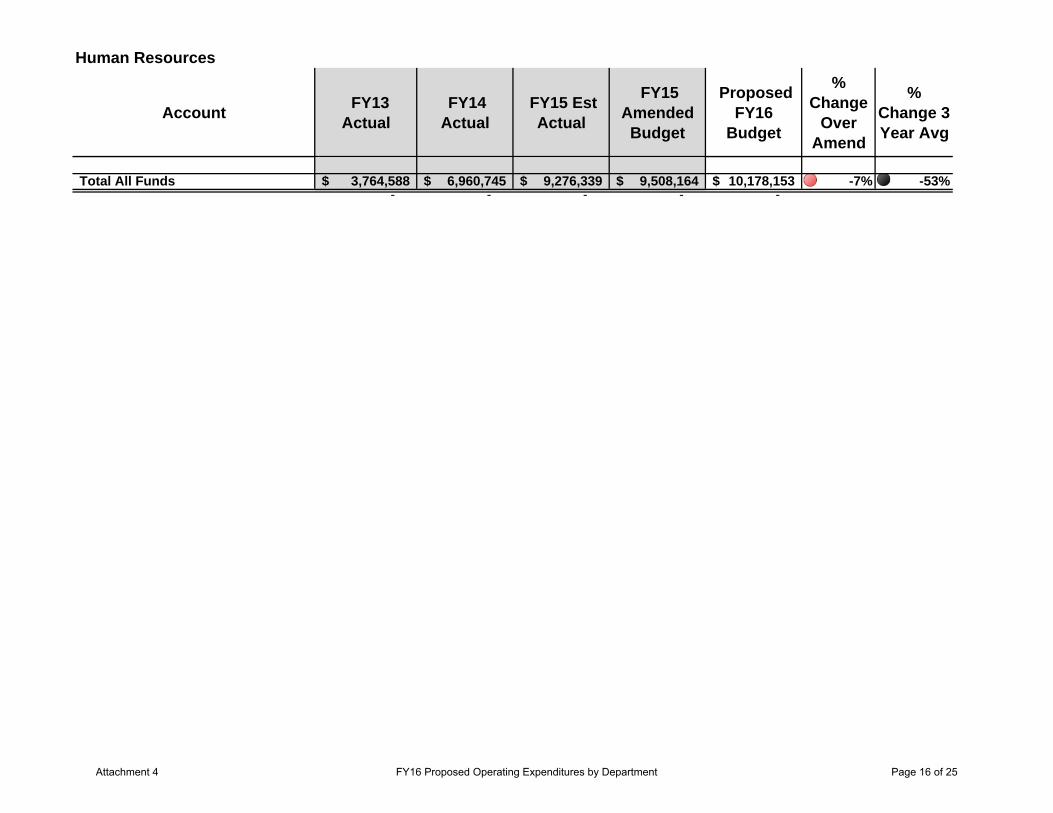
Human Resources
Account FY13 Actual
FY14 Actual
FY15 Est Actual
FY15 Amended Budget
Proposed FY16
Budget
% Change
Over Amend
% Change 3 Year Avg
Total All Funds 3,764,588$ 6,960,745$ 9,276,339$ 9,508,164$ 10,178,153$ -7% -53%- - - - -
Attachment 4 FY16 Proposed Operating Expenditures by Department Page 16 of 25
City of SpringfieldTotal Operating Expenditures Decrease budget >5% 5%
All Funds 0%
Increase budget >5% -5%
-25%
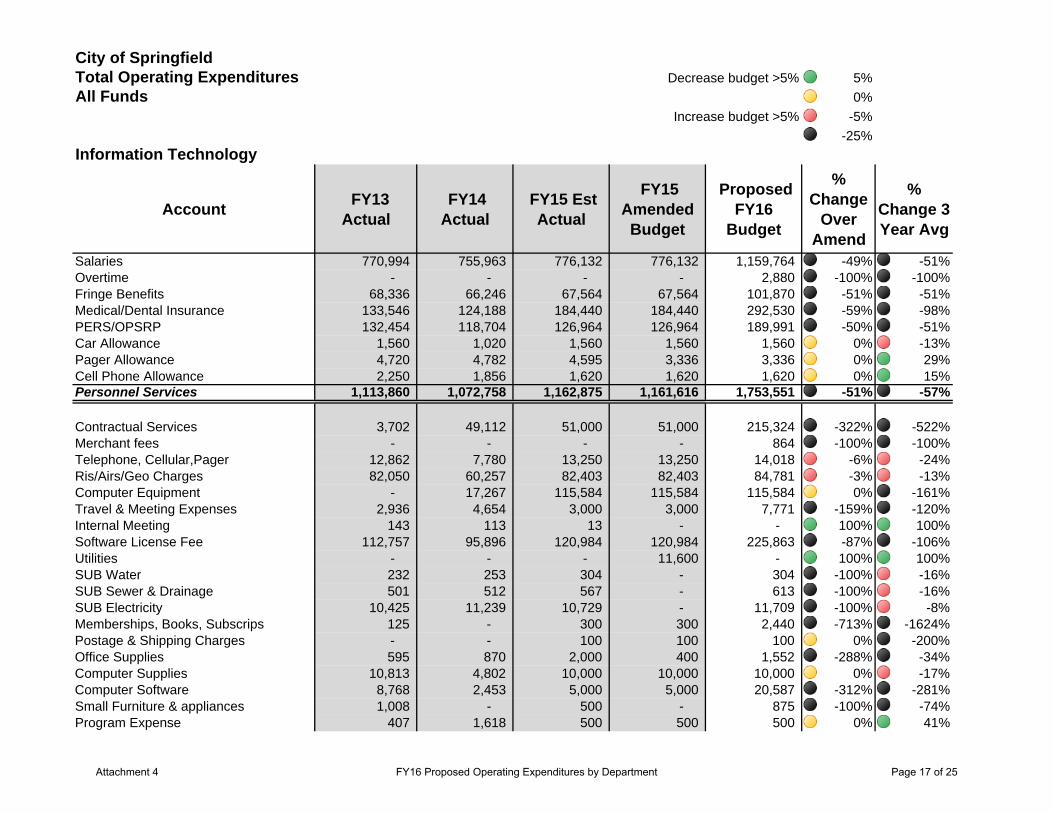
Information Technology
Account FY13 Actual
FY14 Actual
FY15 Est Actual
FY15 Amended Budget
Proposed FY16
Budget
% Change
Over Amend
% Change 3 Year Avg
Salaries 770,994 755,963 776,132 776,132 1,159,764 -49% -51%Overtime - - - - 2,880 -100% -100%Fringe Benefits 68,336 66,246 67,564 67,564 101,870 -51% -51%Medical/Dental Insurance 133,546 124,188 184,440 184,440 292,530 -59% -98%PERS/OPSRP 132,454 118,704 126,964 126,964 189,991 -50% -51%Car Allowance 1,560 1,020 1,560 1,560 1,560 0% -13%Pager Allowance 4,720 4,782 4,595 3,336 3,336 0% 29%Cell Phone Allowance 2,250 1,856 1,620 1,620 1,620 0% 15%Personnel Services 1,113,860 1,072,758 1,162,875 1,161,616 1,753,551 -51% -57%
Contractual Services 3,702 49,112 51,000 51,000 215,324 -322% -522%Merchant fees - - - - 864 -100% -100%Telephone, Cellular,Pager 12,862 7,780 13,250 13,250 14,018 -6% -24%Ris/Airs/Geo Charges 82,050 60,257 82,403 82,403 84,781 -3% -13%Computer Equipment - 17,267 115,584 115,584 115,584 0% -161%Travel & Meeting Expenses 2,936 4,654 3,000 3,000 7,771 -159% -120%Internal Meeting 143 113 13 - - 100% 100%Software License Fee 112,757 95,896 120,984 120,984 225,863 -87% -106%Utilities - - - 11,600 - 100% 100%SUB Water 232 253 304 - 304 -100% -16%SUB Sewer & Drainage 501 512 567 - 613 -100% -16%SUB Electricity 10,425 11,239 10,729 - 11,709 -100% -8%Memberships, Books, Subscrips 125 - 300 300 2,440 -713% -1624%Postage & Shipping Charges - - 100 100 100 0% -200%Office Supplies 595 870 2,000 400 1,552 -288% -34%Computer Supplies 10,813 4,802 10,000 10,000 10,000 0% -17%Computer Software 8,768 2,453 5,000 5,000 20,587 -312% -281%Small Furniture & appliances 1,008 - 500 - 875 -100% -74%Program Expense 407 1,618 500 500 500 0% 41%
Attachment 4 FY16 Proposed Operating Expenditures by Department Page 17 of 25
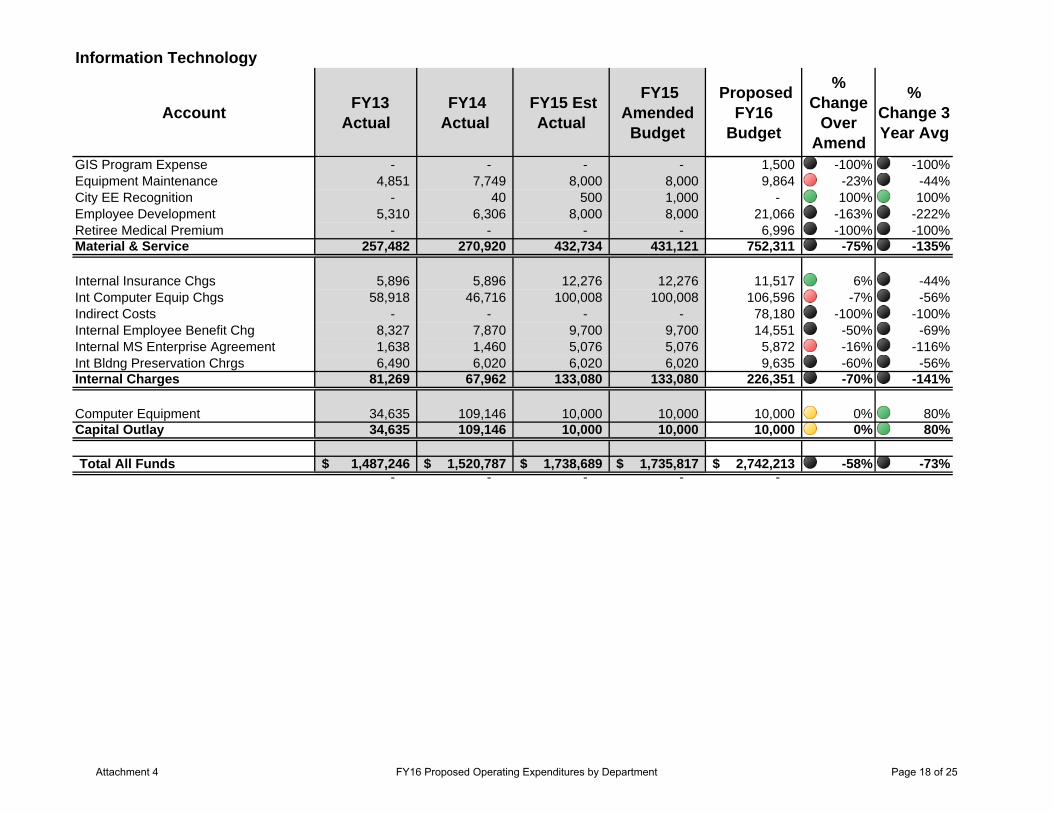
Information Technology
Account FY13 Actual
FY14 Actual
FY15 Est Actual
FY15 Amended Budget
Proposed FY16
Budget
% Change
Over Amend
% Change 3 Year Avg
GIS Program Expense - - - - 1,500 -100% -100%Equipment Maintenance 4,851 7,749 8,000 8,000 9,864 -23% -44%City EE Recognition - 40 500 1,000 - 100% 100%Employee Development 5,310 6,306 8,000 8,000 21,066 -163% -222%Retiree Medical Premium - - - - 6,996 -100% -100%Material & Service 257,482 270,920 432,734 431,121 752,311 -75% -135%
Internal Insurance Chgs 5,896 5,896 12,276 12,276 11,517 6% -44%Int Computer Equip Chgs 58,918 46,716 100,008 100,008 106,596 -7% -56%Indirect Costs - - - - 78,180 -100% -100%Internal Employee Benefit Chg 8,327 7,870 9,700 9,700 14,551 -50% -69%Internal MS Enterprise Agreement 1,638 1,460 5,076 5,076 5,872 -16% -116%Int Bldng Preservation Chrgs 6,490 6,020 6,020 6,020 9,635 -60% -56%Internal Charges 81,269 67,962 133,080 133,080 226,351 -70% -141%
Computer Equipment 34,635 109,146 10,000 10,000 10,000 0% 80%Capital Outlay 34,635 109,146 10,000 10,000 10,000 0% 80%
Total All Funds 1,487,246$ 1,520,787$ 1,738,689$ 1,735,817$ 2,742,213$ -58% -73%- - - - -
Attachment 4 FY16 Proposed Operating Expenditures by Department Page 18 of 25
City of SpringfieldTotal Operating Expenditures Decrease budget >5% 5%
All Funds 0%
Increase budget >5% -5%
-25%
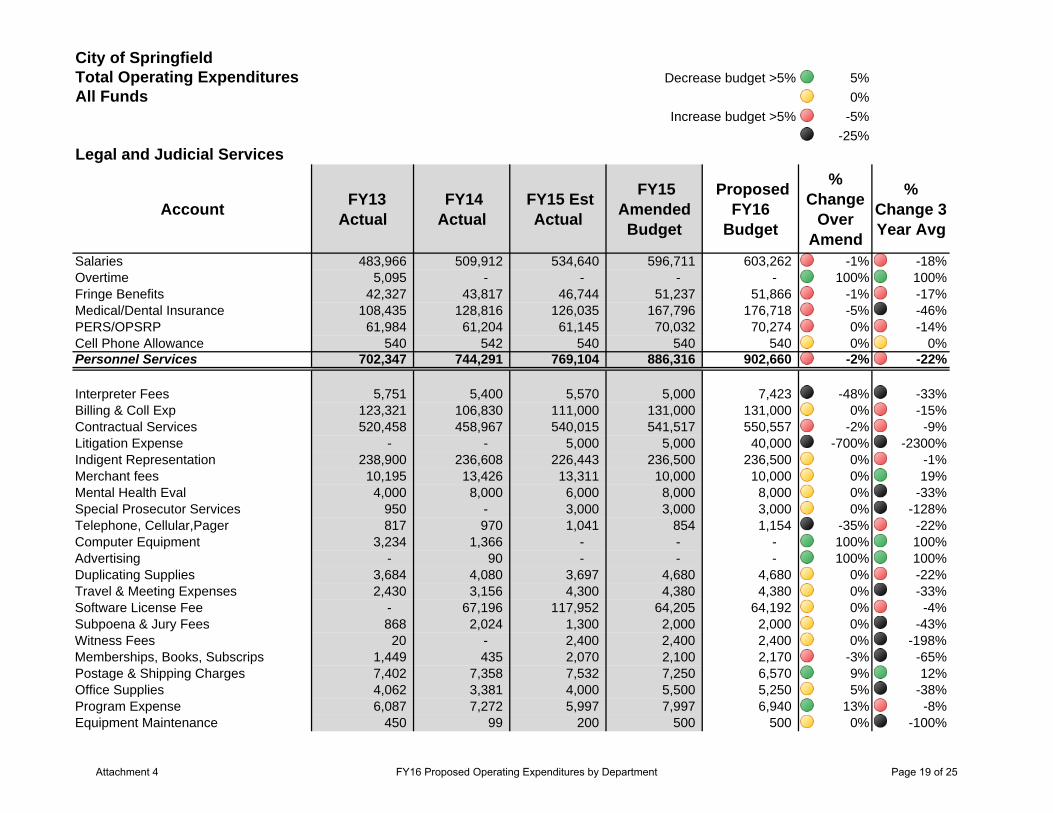
Legal and Judicial Services
Account FY13 Actual
FY14 Actual
FY15 Est Actual
FY15 Amended Budget
Proposed FY16
Budget
% Change
Over Amend
% Change 3 Year Avg
Salaries 483,966 509,912 534,640 596,711 603,262 -1% -18%Overtime 5,095 - - - - 100% 100%Fringe Benefits 42,327 43,817 46,744 51,237 51,866 -1% -17%Medical/Dental Insurance 108,435 128,816 126,035 167,796 176,718 -5% -46%PERS/OPSRP 61,984 61,204 61,145 70,032 70,274 0% -14%Cell Phone Allowance 540 542 540 540 540 0% 0%Personnel Services 702,347 744,291 769,104 886,316 902,660 -2% -22%
Interpreter Fees 5,751 5,400 5,570 5,000 7,423 -48% -33%Billing & Coll Exp 123,321 106,830 111,000 131,000 131,000 0% -15%Contractual Services 520,458 458,967 540,015 541,517 550,557 -2% -9%Litigation Expense - - 5,000 5,000 40,000 -700% -2300%Indigent Representation 238,900 236,608 226,443 236,500 236,500 0% -1%Merchant fees 10,195 13,426 13,311 10,000 10,000 0% 19%Mental Health Eval 4,000 8,000 6,000 8,000 8,000 0% -33%Special Prosecutor Services 950 - 3,000 3,000 3,000 0% -128%Telephone, Cellular,Pager 817 970 1,041 854 1,154 -35% -22%Computer Equipment 3,234 1,366 - - - 100% 100%Advertising - 90 - - - 100% 100%Duplicating Supplies 3,684 4,080 3,697 4,680 4,680 0% -22%Travel & Meeting Expenses 2,430 3,156 4,300 4,380 4,380 0% -33%Software License Fee - 67,196 117,952 64,205 64,192 0% -4%Subpoena & Jury Fees 868 2,024 1,300 2,000 2,000 0% -43%Witness Fees 20 - 2,400 2,400 2,400 0% -198%Memberships, Books, Subscrips 1,449 435 2,070 2,100 2,170 -3% -65%Postage & Shipping Charges 7,402 7,358 7,532 7,250 6,570 9% 12%Office Supplies 4,062 3,381 4,000 5,500 5,250 5% -38%Program Expense 6,087 7,272 5,997 7,997 6,940 13% -8%Equipment Maintenance 450 99 200 500 500 0% -100%
Attachment 4 FY16 Proposed Operating Expenditures by Department Page 19 of 25
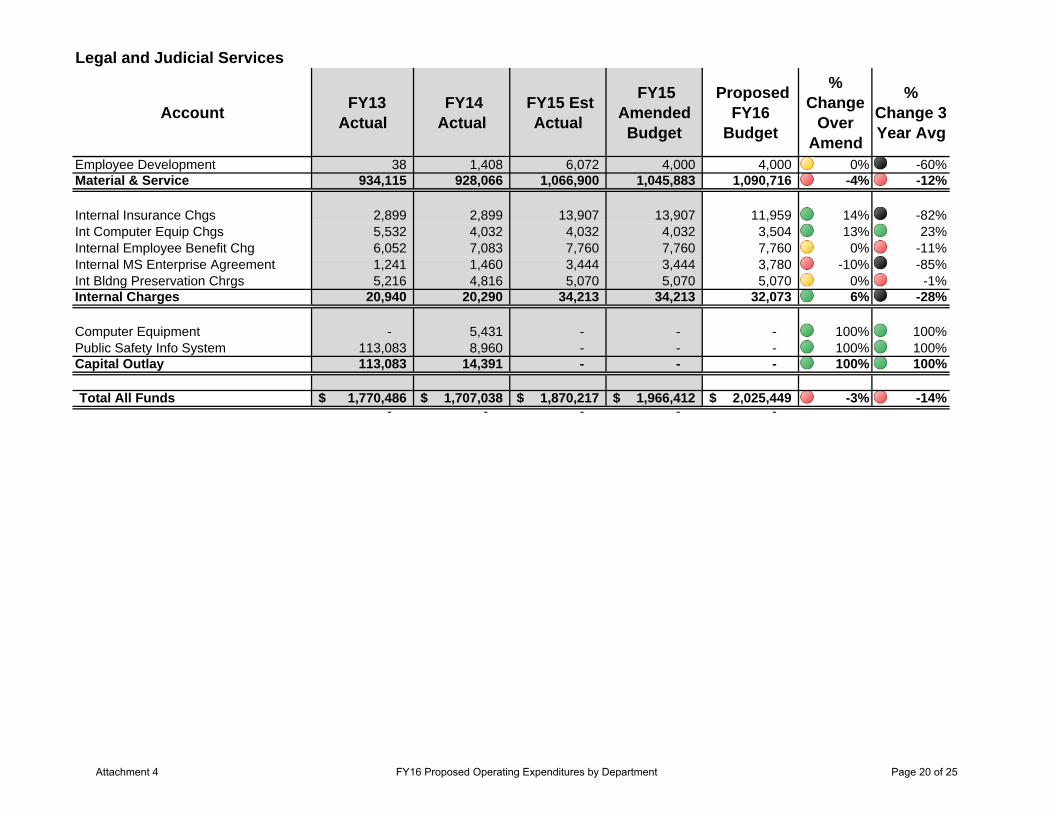
Legal and Judicial Services
Account FY13 Actual
FY14 Actual
FY15 Est Actual
FY15 Amended Budget
Proposed FY16
Budget
% Change
Over Amend
% Change 3 Year Avg
Employee Development 38 1,408 6,072 4,000 4,000 0% -60%Material & Service 934,115 928,066 1,066,900 1,045,883 1,090,716 -4% -12%
Internal Insurance Chgs 2,899 2,899 13,907 13,907 11,959 14% -82%Int Computer Equip Chgs 5,532 4,032 4,032 4,032 3,504 13% 23%Internal Employee Benefit Chg 6,052 7,083 7,760 7,760 7,760 0% -11%Internal MS Enterprise Agreement 1,241 1,460 3,444 3,444 3,780 -10% -85%Int Bldng Preservation Chrgs 5,216 4,816 5,070 5,070 5,070 0% -1%Internal Charges 20,940 20,290 34,213 34,213 32,073 6% -28%
Computer Equipment - 5,431 - - - 100% 100%Public Safety Info System 113,083 8,960 - - - 100% 100%Capital Outlay 113,083 14,391 - - - 100% 100%
Total All Funds 1,770,486$ 1,707,038$ 1,870,217$ 1,966,412$ 2,025,449$ -3% -14%- - - - -
Attachment 4 FY16 Proposed Operating Expenditures by Department Page 20 of 25
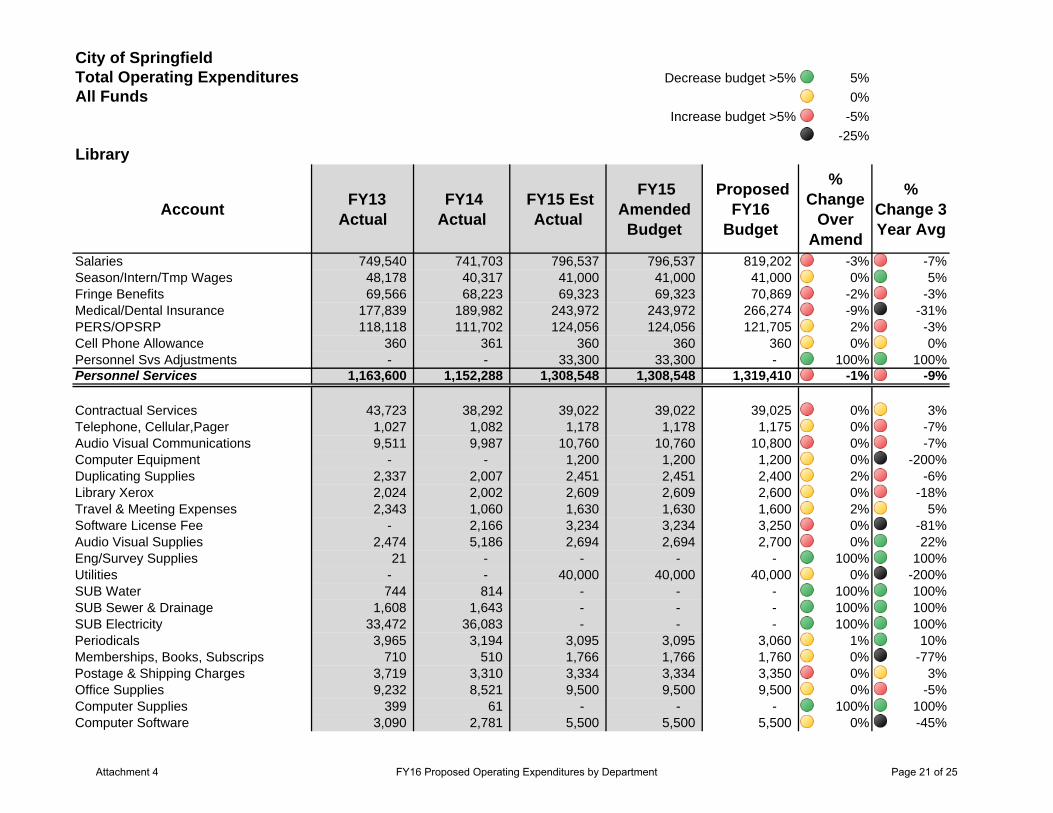
City of SpringfieldTotal Operating Expenditures Decrease budget >5% 5%
All Funds 0%
Increase budget >5% -5%
-25%
Library
Account FY13 Actual
FY14 Actual
FY15 Est Actual
FY15 Amended Budget
Proposed FY16
Budget
% Change
Over Amend
% Change 3 Year Avg
Salaries 749,540 741,703 796,537 796,537 819,202 -3% -7%Season/Intern/Tmp Wages 48,178 40,317 41,000 41,000 41,000 0% 5%Fringe Benefits 69,566 68,223 69,323 69,323 70,869 -2% -3%Medical/Dental Insurance 177,839 189,982 243,972 243,972 266,274 -9% -31%PERS/OPSRP 118,118 111,702 124,056 124,056 121,705 2% -3%Cell Phone Allowance 360 361 360 360 360 0% 0%Personnel Svs Adjustments - - 33,300 33,300 - 100% 100%Personnel Services 1,163,600 1,152,288 1,308,548 1,308,548 1,319,410 -1% -9%
Contractual Services 43,723 38,292 39,022 39,022 39,025 0% 3%Telephone, Cellular,Pager 1,027 1,082 1,178 1,178 1,175 0% -7%Audio Visual Communications 9,511 9,987 10,760 10,760 10,800 0% -7%Computer Equipment - - 1,200 1,200 1,200 0% -200%Duplicating Supplies 2,337 2,007 2,451 2,451 2,400 2% -6%Library Xerox 2,024 2,002 2,609 2,609 2,600 0% -18%Travel & Meeting Expenses 2,343 1,060 1,630 1,630 1,600 2% 5%Software License Fee - 2,166 3,234 3,234 3,250 0% -81%Audio Visual Supplies 2,474 5,186 2,694 2,694 2,700 0% 22%Eng/Survey Supplies 21 - - - - 100% 100%Utilities - - 40,000 40,000 40,000 0% -200%SUB Water 744 814 - - - 100% 100%SUB Sewer & Drainage 1,608 1,643 - - - 100% 100%SUB Electricity 33,472 36,083 - - - 100% 100%Periodicals 3,965 3,194 3,095 3,095 3,060 1% 10%Memberships, Books, Subscrips 710 510 1,766 1,766 1,760 0% -77%Postage & Shipping Charges 3,719 3,310 3,334 3,334 3,350 0% 3%Office Supplies 9,232 8,521 9,500 9,500 9,500 0% -5%Computer Supplies 399 61 - - - 100% 100%Computer Software 3,090 2,781 5,500 5,500 5,500 0% -45%
Attachment 4 FY16 Proposed Operating Expenditures by Department Page 21 of 25
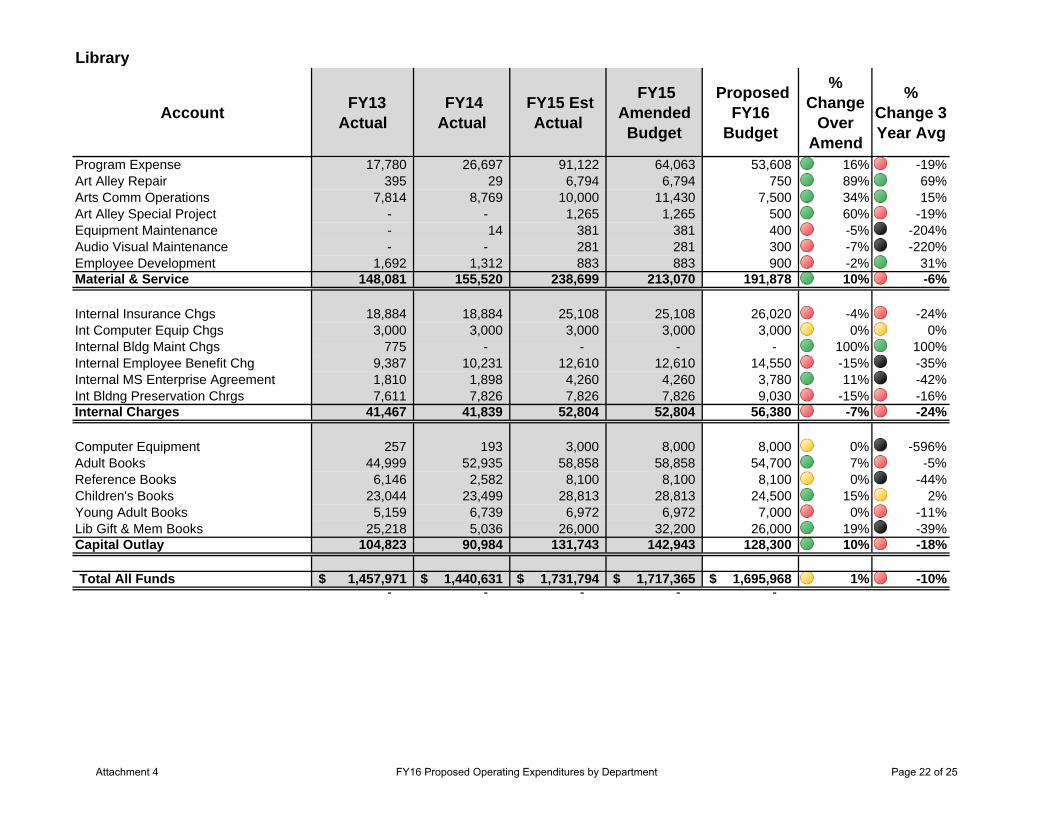
Library
Account FY13 Actual
FY14 Actual
FY15 Est Actual
FY15 Amended Budget
Proposed FY16
Budget
% Change
Over Amend
% Change 3 Year Avg
Program Expense 17,780 26,697 91,122 64,063 53,608 16% -19%Art Alley Repair 395 29 6,794 6,794 750 89% 69%Arts Comm Operations 7,814 8,769 10,000 11,430 7,500 34% 15%Art Alley Special Project - - 1,265 1,265 500 60% -19%Equipment Maintenance - 14 381 381 400 -5% -204%Audio Visual Maintenance - - 281 281 300 -7% -220%Employee Development 1,692 1,312 883 883 900 -2% 31%Material & Service 148,081 155,520 238,699 213,070 191,878 10% -6%
Internal Insurance Chgs 18,884 18,884 25,108 25,108 26,020 -4% -24%Int Computer Equip Chgs 3,000 3,000 3,000 3,000 3,000 0% 0%Internal Bldg Maint Chgs 775 - - - - 100% 100%Internal Employee Benefit Chg 9,387 10,231 12,610 12,610 14,550 -15% -35%Internal MS Enterprise Agreement 1,810 1,898 4,260 4,260 3,780 11% -42%Int Bldng Preservation Chrgs 7,611 7,826 7,826 7,826 9,030 -15% -16%Internal Charges 41,467 41,839 52,804 52,804 56,380 -7% -24%
Computer Equipment 257 193 3,000 8,000 8,000 0% -596%Adult Books 44,999 52,935 58,858 58,858 54,700 7% -5%Reference Books 6,146 2,582 8,100 8,100 8,100 0% -44%Children's Books 23,044 23,499 28,813 28,813 24,500 15% 2%Young Adult Books 5,159 6,739 6,972 6,972 7,000 0% -11%Lib Gift & Mem Books 25,218 5,036 26,000 32,200 26,000 19% -39%Capital Outlay 104,823 90,984 131,743 142,943 128,300 10% -18%
Total All Funds 1,457,971$ 1,440,631$ 1,731,794$ 1,717,365$ 1,695,968$ 1% -10%- - - - -
Attachment 4 FY16 Proposed Operating Expenditures by Department Page 22 of 25
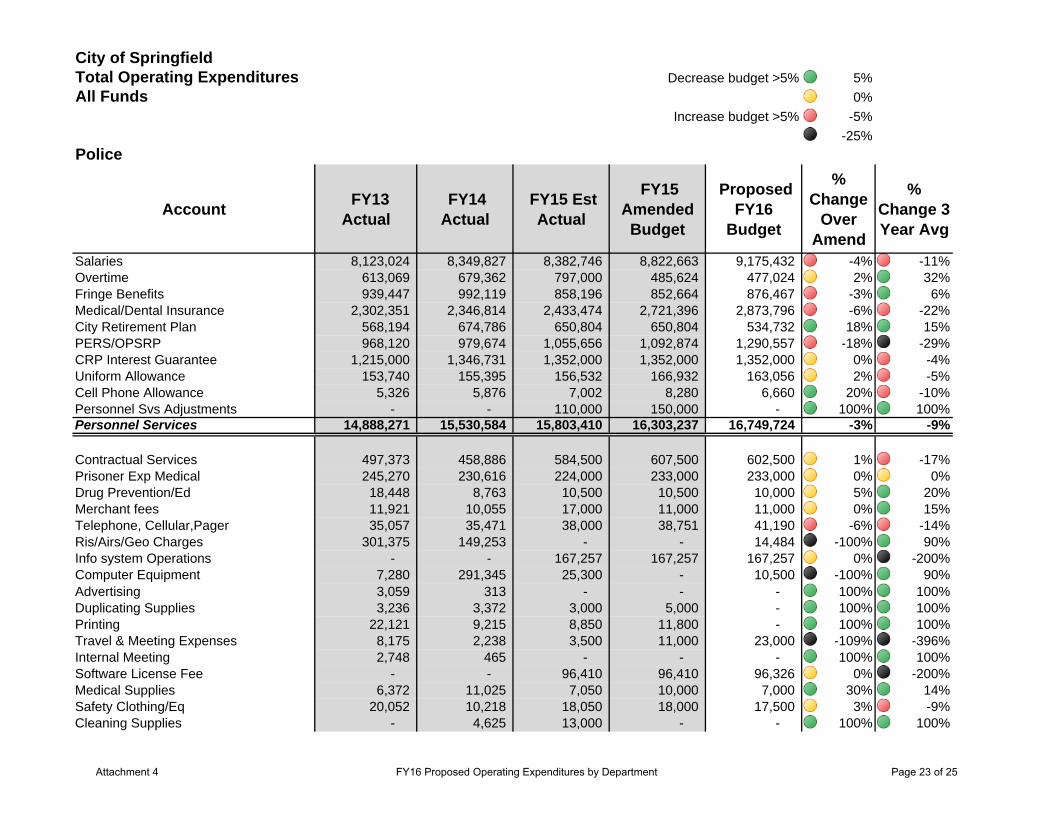
City of SpringfieldTotal Operating Expenditures Decrease budget >5% 5%
All Funds 0%
Increase budget >5% -5%
-25%
Police
Account FY13 Actual
FY14 Actual
FY15 Est Actual
FY15 Amended Budget
Proposed FY16
Budget
% Change
Over Amend
% Change 3 Year Avg
Salaries 8,123,024 8,349,827 8,382,746 8,822,663 9,175,432 -4% -11%Overtime 613,069 679,362 797,000 485,624 477,024 2% 32%Fringe Benefits 939,447 992,119 858,196 852,664 876,467 -3% 6%Medical/Dental Insurance 2,302,351 2,346,814 2,433,474 2,721,396 2,873,796 -6% -22%City Retirement Plan 568,194 674,786 650,804 650,804 534,732 18% 15%PERS/OPSRP 968,120 979,674 1,055,656 1,092,874 1,290,557 -18% -29%CRP Interest Guarantee 1,215,000 1,346,731 1,352,000 1,352,000 1,352,000 0% -4%Uniform Allowance 153,740 155,395 156,532 166,932 163,056 2% -5%Cell Phone Allowance 5,326 5,876 7,002 8,280 6,660 20% -10%Personnel Svs Adjustments - - 110,000 150,000 - 100% 100%Personnel Services 14,888,271 15,530,584 15,803,410 16,303,237 16,749,724 -3% -9%
Contractual Services 497,373 458,886 584,500 607,500 602,500 1% -17%Prisoner Exp Medical 245,270 230,616 224,000 233,000 233,000 0% 0%Drug Prevention/Ed 18,448 8,763 10,500 10,500 10,000 5% 20%Merchant fees 11,921 10,055 17,000 11,000 11,000 0% 15%Telephone, Cellular,Pager 35,057 35,471 38,000 38,751 41,190 -6% -14%Ris/Airs/Geo Charges 301,375 149,253 - - 14,484 -100% 90%Info system Operations - - 167,257 167,257 167,257 0% -200%Computer Equipment 7,280 291,345 25,300 - 10,500 -100% 90%Advertising 3,059 313 - - - 100% 100%Duplicating Supplies 3,236 3,372 3,000 5,000 - 100% 100%Printing 22,121 9,215 8,850 11,800 - 100% 100%Travel & Meeting Expenses 8,175 2,238 3,500 11,000 23,000 -109% -396%Internal Meeting 2,748 465 - - - 100% 100%Software License Fee - - 96,410 96,410 96,326 0% -200%Medical Supplies 6,372 11,025 7,050 10,000 7,000 30% 14%Safety Clothing/Eq 20,052 10,218 18,050 18,000 17,500 3% -9%Cleaning Supplies - 4,625 13,000 - - 100% 100%
Attachment 4 FY16 Proposed Operating Expenditures by Department Page 23 of 25
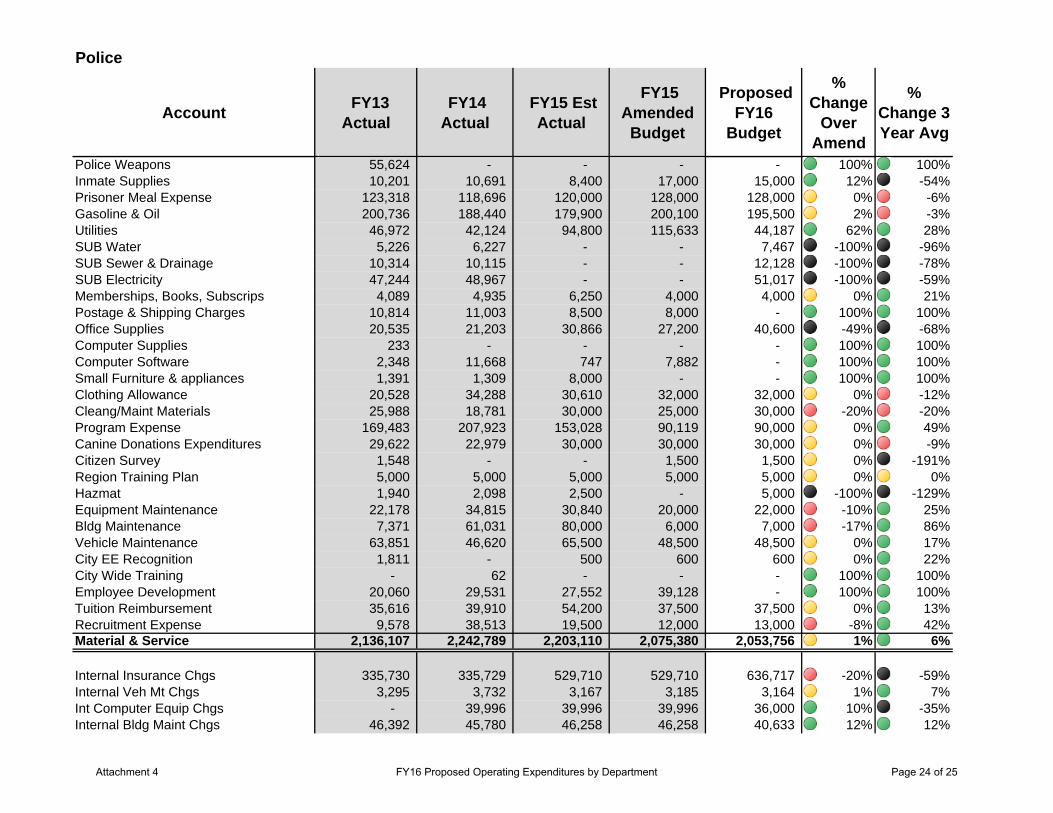
Police
Account FY13 Actual
FY14 Actual
FY15 Est Actual
FY15 Amended Budget
Proposed FY16
Budget
% Change
Over Amend
% Change 3 Year Avg
Police Weapons 55,624 - - - - 100% 100%Inmate Supplies 10,201 10,691 8,400 17,000 15,000 12% -54%Prisoner Meal Expense 123,318 118,696 120,000 128,000 128,000 0% -6%Gasoline & Oil 200,736 188,440 179,900 200,100 195,500 2% -3%Utilities 46,972 42,124 94,800 115,633 44,187 62% 28%SUB Water 5,226 6,227 - - 7,467 -100% -96%SUB Sewer & Drainage 10,314 10,115 - - 12,128 -100% -78%SUB Electricity 47,244 48,967 - - 51,017 -100% -59%Memberships, Books, Subscrips 4,089 4,935 6,250 4,000 4,000 0% 21%Postage & Shipping Charges 10,814 11,003 8,500 8,000 - 100% 100%Office Supplies 20,535 21,203 30,866 27,200 40,600 -49% -68%Computer Supplies 233 - - - - 100% 100%Computer Software 2,348 11,668 747 7,882 - 100% 100%Small Furniture & appliances 1,391 1,309 8,000 - - 100% 100%Clothing Allowance 20,528 34,288 30,610 32,000 32,000 0% -12%Cleang/Maint Materials 25,988 18,781 30,000 25,000 30,000 -20% -20%Program Expense 169,483 207,923 153,028 90,119 90,000 0% 49%Canine Donations Expenditures 29,622 22,979 30,000 30,000 30,000 0% -9%Citizen Survey 1,548 - - 1,500 1,500 0% -191%Region Training Plan 5,000 5,000 5,000 5,000 5,000 0% 0%Hazmat 1,940 2,098 2,500 - 5,000 -100% -129%Equipment Maintenance 22,178 34,815 30,840 20,000 22,000 -10% 25%Bldg Maintenance 7,371 61,031 80,000 6,000 7,000 -17% 86%Vehicle Maintenance 63,851 46,620 65,500 48,500 48,500 0% 17%City EE Recognition 1,811 - 500 600 600 0% 22%City Wide Training - 62 - - - 100% 100%Employee Development 20,060 29,531 27,552 39,128 - 100% 100%Tuition Reimbursement 35,616 39,910 54,200 37,500 37,500 0% 13%Recruitment Expense 9,578 38,513 19,500 12,000 13,000 -8% 42%Material & Service 2,136,107 2,242,789 2,203,110 2,075,380 2,053,756 1% 6%
Internal Insurance Chgs 335,730 335,729 529,710 529,710 636,717 -20% -59%Internal Veh Mt Chgs 3,295 3,732 3,167 3,185 3,164 1% 7%Int Computer Equip Chgs - 39,996 39,996 39,996 36,000 10% -35%Internal Bldg Maint Chgs 46,392 45,780 46,258 46,258 40,633 12% 12%
Attachment 4 FY16 Proposed Operating Expenditures by Department Page 24 of 25
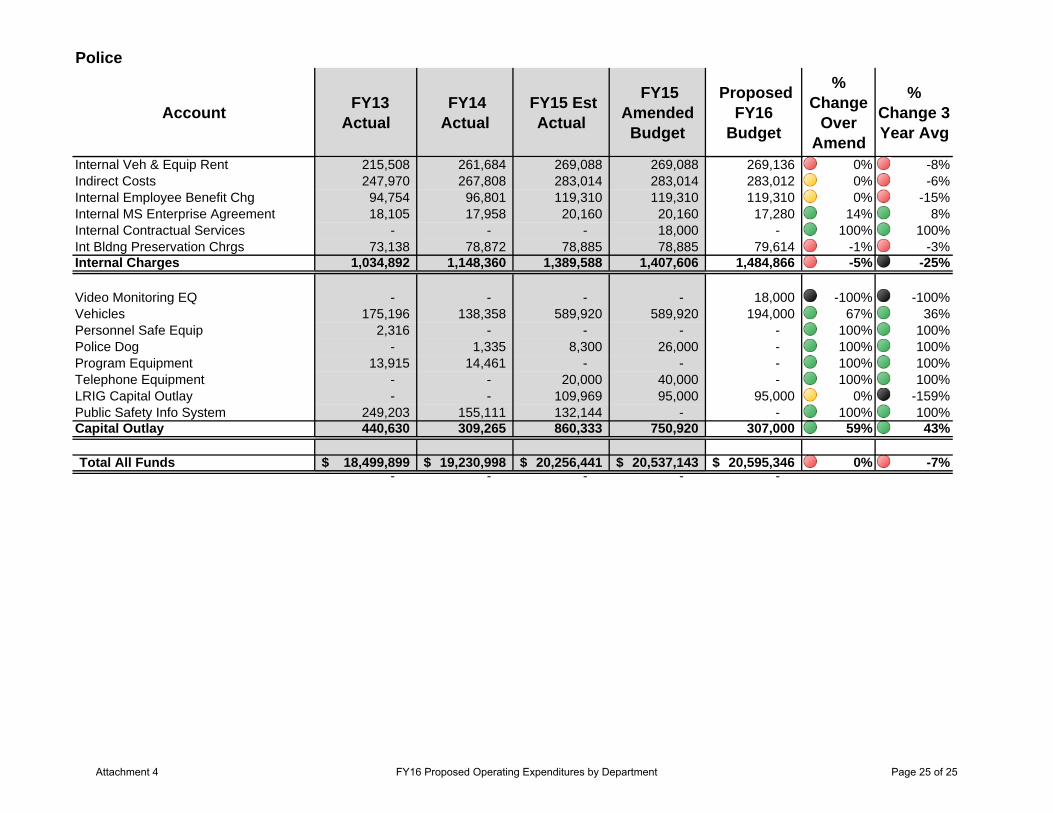
Police
Account FY13 Actual
FY14 Actual
FY15 Est Actual
FY15 Amended Budget
Proposed FY16
Budget
% Change
Over Amend
% Change 3 Year Avg
Internal Veh & Equip Rent 215,508 261,684 269,088 269,088 269,136 0% -8%Indirect Costs 247,970 267,808 283,014 283,014 283,012 0% -6%Internal Employee Benefit Chg 94,754 96,801 119,310 119,310 119,310 0% -15%Internal MS Enterprise Agreement 18,105 17,958 20,160 20,160 17,280 14% 8%Internal Contractual Services - - - 18,000 - 100% 100%Int Bldng Preservation Chrgs 73,138 78,872 78,885 78,885 79,614 -1% -3%Internal Charges 1,034,892 1,148,360 1,389,588 1,407,606 1,484,866 -5% -25%
Video Monitoring EQ - - - - 18,000 -100% -100%Vehicles 175,196 138,358 589,920 589,920 194,000 67% 36%Personnel Safe Equip 2,316 - - - - 100% 100%Police Dog - 1,335 8,300 26,000 - 100% 100%Program Equipment 13,915 14,461 - - - 100% 100%Telephone Equipment - - 20,000 40,000 - 100% 100%LRIG Capital Outlay - - 109,969 95,000 95,000 0% -159%Public Safety Info System 249,203 155,111 132,144 - - 100% 100%Capital Outlay 440,630 309,265 860,333 750,920 307,000 59% 43%
Total All Funds 18,499,899$ 19,230,998$ 20,256,441$ 20,537,143$ 20,595,346$ 0% -7%- - - - -
Attachment 4 FY16 Proposed Operating Expenditures by Department Page 25 of 25
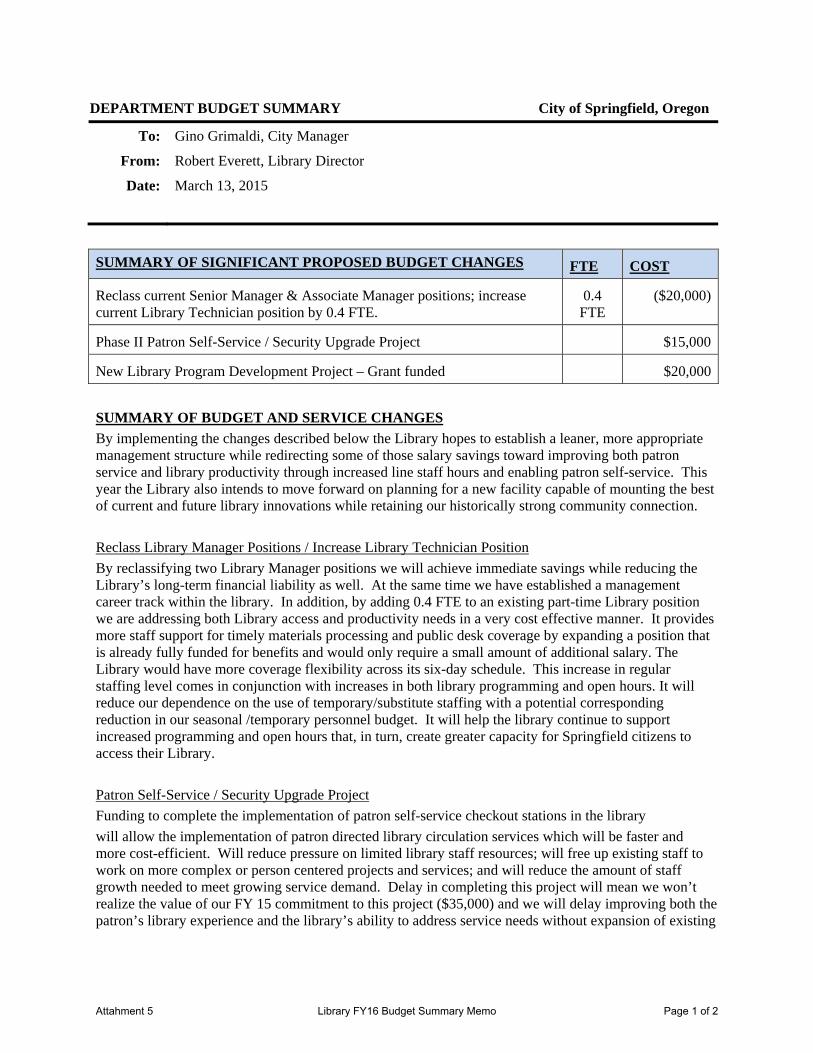
DEPARTMENT BUDGET SUMMARY City of Springfield, Oregon
To: Gino Grimaldi, City Manager
From: Robert Everett, Library Director
Date: March 13, 2015
SUMMARY OF SIGNIFICANT PROPOSED BUDGET CHANGES FTE COST
Reclass current Senior Manager & Associate Manager positions; increase current Library Technician position by 0.4 FTE.
0.4 FTE
($20,000)
Phase II Patron Self-Service / Security Upgrade Project $15,000
New Library Program Development Project – Grant funded $20,000
SUMMARY OF BUDGET AND SERVICE CHANGES
By implementing the changes described below the Library hopes to establish a leaner, more appropriate management structure while redirecting some of those salary savings toward improving both patron service and library productivity through increased line staff hours and enabling patron self-service. This year the Library also intends to move forward on planning for a new facility capable of mounting the best of current and future library innovations while retaining our historically strong community connection.
Reclass Library Manager Positions / Increase Library Technician Position
By reclassifying two Library Manager positions we will achieve immediate savings while reducing the Library’s long-term financial liability as well. At the same time we have established a management career track within the library. In addition, by adding 0.4 FTE to an existing part-time Library position we are addressing both Library access and productivity needs in a very cost effective manner. It provides more staff support for timely materials processing and public desk coverage by expanding a position that is already fully funded for benefits and would only require a small amount of additional salary. The Library would have more coverage flexibility across its six-day schedule. This increase in regular staffing level comes in conjunction with increases in both library programming and open hours. It will reduce our dependence on the use of temporary/substitute staffing with a potential corresponding reduction in our seasonal /temporary personnel budget. It will help the library continue to support increased programming and open hours that, in turn, create greater capacity for Springfield citizens to access their Library.
Patron Self-Service / Security Upgrade Project
Funding to complete the implementation of patron self-service checkout stations in the library
will allow the implementation of patron directed library circulation services which will be faster and more cost-efficient. Will reduce pressure on limited library staff resources; will free up existing staff to work on more complex or person centered projects and services; and will reduce the amount of staff growth needed to meet growing service demand. Delay in completing this project will mean we won’t realize the value of our FY 15 commitment to this project ($35,000) and we will delay improving both the patron’s library experience and the library’s ability to address service needs without expansion of existing
Attahment 5 Library FY16 Budget Summary Memo Page 1 of 2
staff. The Library will continue to allocate its scarce staff resource to mechanical and repetitive tasks at the expense of services that require person-to-person interactions and/or professional expertise.
The City allocates $15,000 to the project in addition to a $10,000 grant from the Library Foundation that would provide $25,000 for the completion of the self-check stations and security system. This is a one-time expenditure. This two-year project was originally priced at $85,000. The first year of the project was funded at $35,000 with the second year funding requested being $50,000. We have subsequently opted to use a less expensive technology which will reduce the overall cost of the project by $25,000. We have also obtained a $10,000 grant from the Library Foundation further reducing the City’s liability in completing this project. This project improves PBB Library program – Borrower Services.
New Library Program Development
Finally we will be utilizing dedicated grant funds to develop a building program for a new library facility. This is an initial step in gathering both community input and professional guidance on the type and scope of a new library building and the services it would house that current and future Springfield residents want and need.
FUTURE NEEDS
The Library needs to update both its range of services and the facilities capable of delivering them in order to respond to the changing nature and growing importance of literacy and information in today’s knowledge-based economy. Three important steps can be taken to help secure a successful literacy/information future for Springfield:
1. Increase access to existing services by increasing the hours of operation of the current library. An additional 2 hours added to the current Library schedule would provide consistent open hours, across our six-day schedule, and would have a modest funding impact of approximately $18,200.
2. Institute a robust, interactive, virtual library service, via the library’s website creating 24/7 information access for Springfield citizens and managed by an information professional who could liaison with Springfield schools. $46,700
3. Design and build a new library that serves as the hub of not only community literacy and information but as the hub of community creativity as well. A facility designed and dedicated to enlightening and inspiring generations of Springfield citizens. $25,000,000
CONCLUSION
Each year the Library takes a similar approach to evaluating its budget and services. First we make sure we are maximizing the level of service we can provide within our current budget allocation. This year’s example would be the reclassifying and reorganizing of the Library management team which produced significant salary savings now and in the future. It also provided funds to increase line staff hours by 0.4 FTE thereby directing our limited resources to the service point not the board room. Next we look for ways to invest in the near term to improve services within our current funding capacity. An example of this is the patron self-service / security project funded by one-time city funding and a $10,000 grant from the Library Foundation. Finally we are always striving to secure a better future for the Library and by utilizing another source of grant funding we are able to move forward on planning for a new library facility designed to meet the immediate and future information needs of Springfield citizens.
Attahment 5 Library FY16 Budget Summary Memo Page 2 of 2
Library FY 2016
Literacy • CultureCommunity
Attachment 6 Library FY16 Presentation
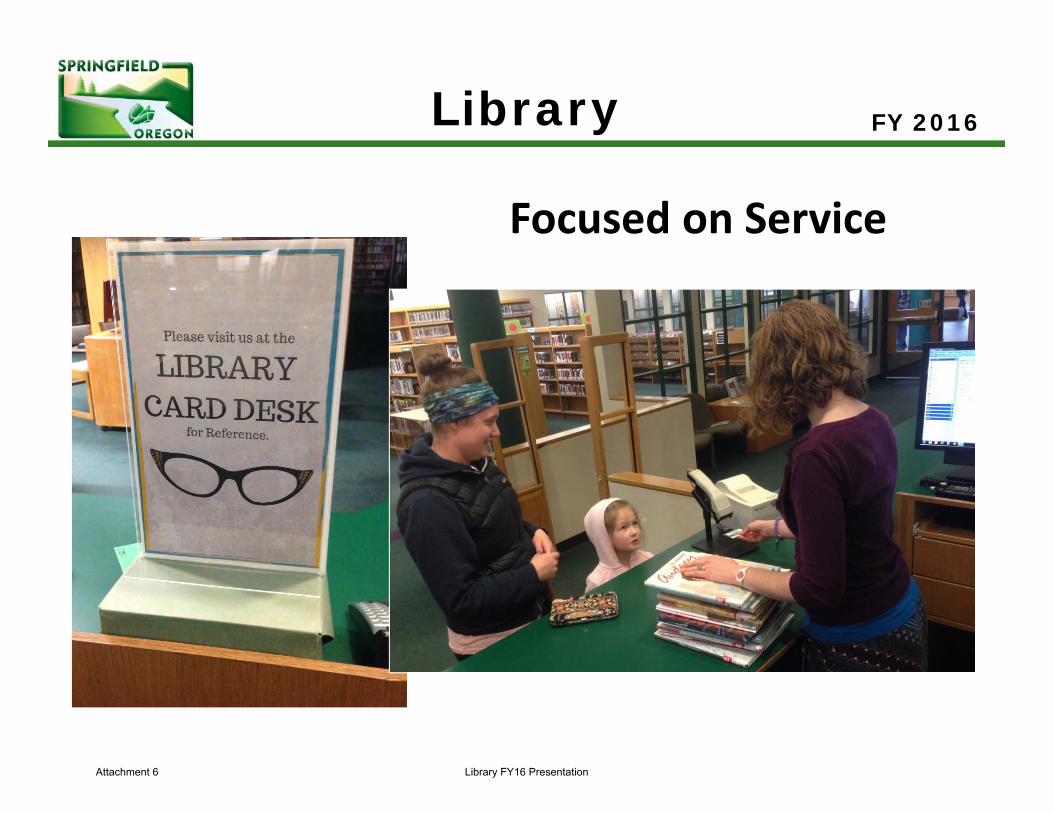
Library FY 2016
Focused on Service
Attachment 6 Library FY16 Presentation
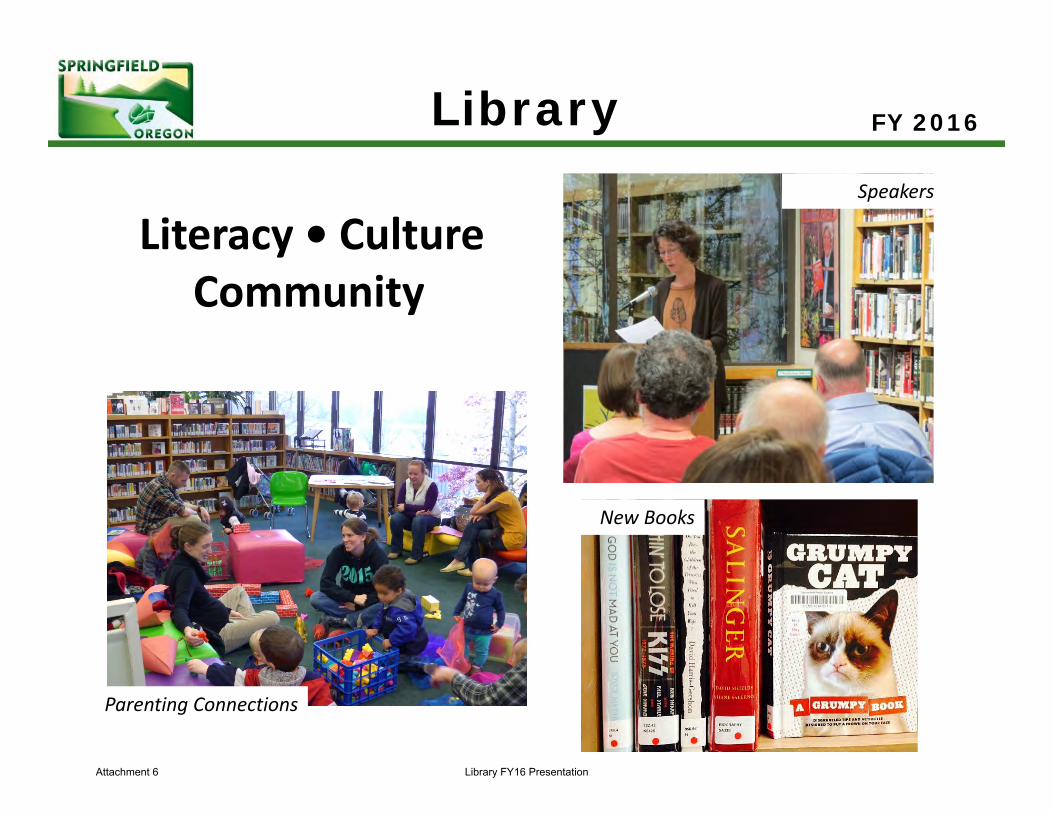
Library FY 2016
Literacy • CultureCommunity
Speakers
New Books
Parenting Connections
Attachment 6 Library FY16 Presentation
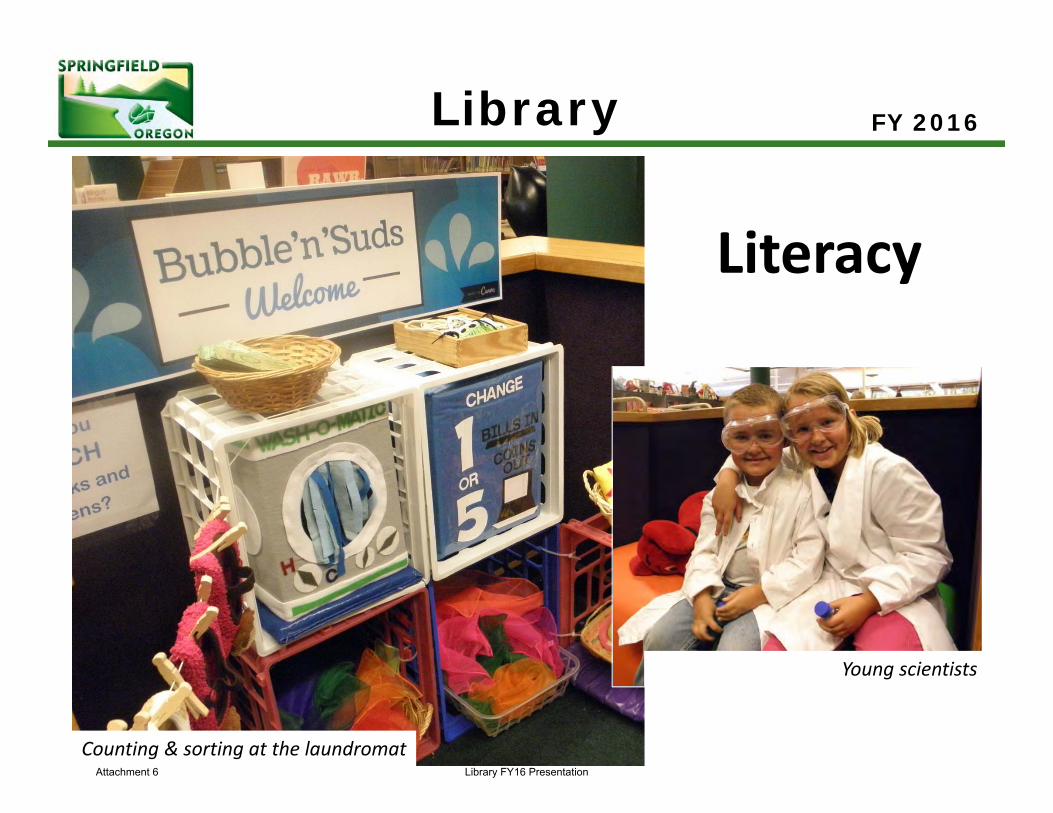
Library FY 2016
Literacy
Counting & sorting at the laundromat
Young scientists
Attachment 6 Library FY16 Presentation
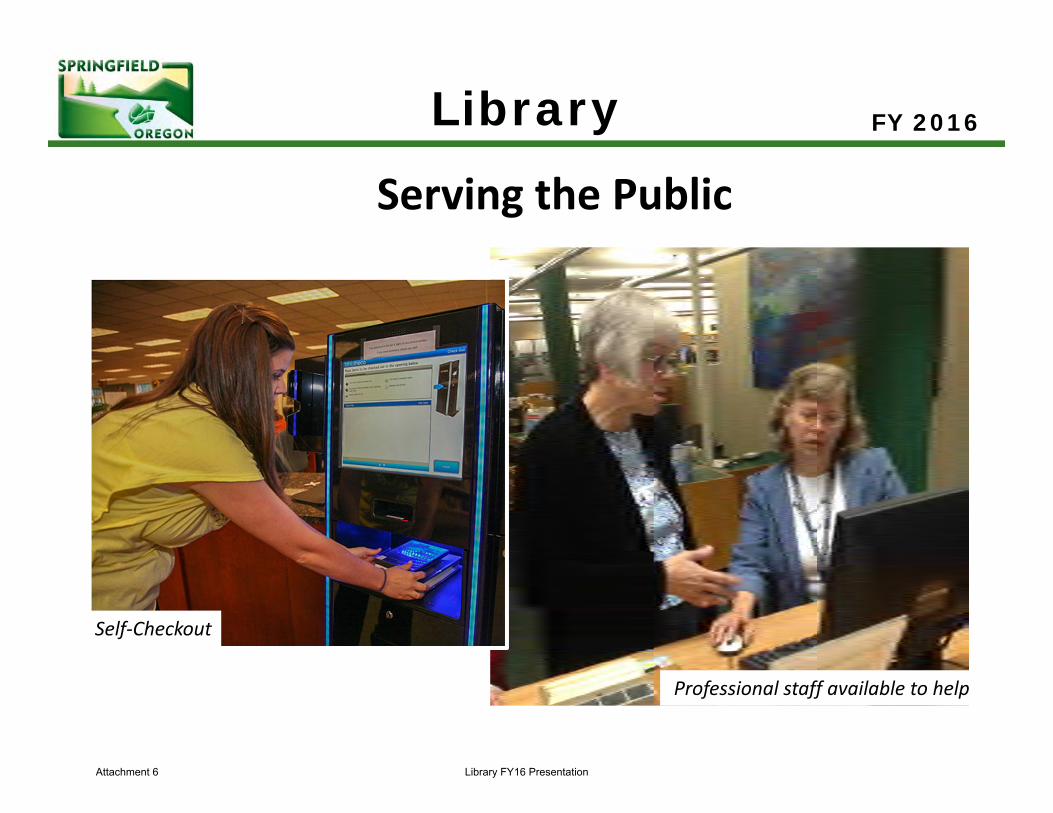
Library FY 2016
Serving the Public
Self‐Checkout
Professional staff available to help
Attachment 6 Library FY16 Presentation
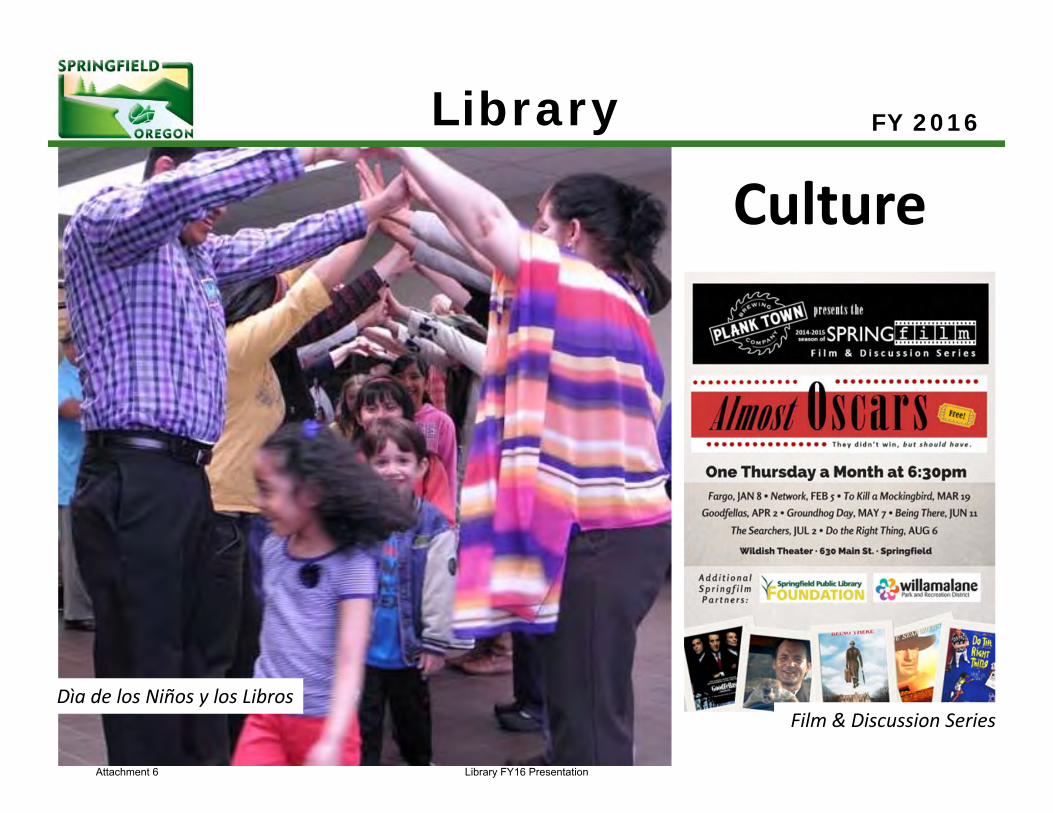
Library FY 2016
Culture
Dìa de los Niños y los LibrosFilm & Discussion Series
Attachment 6 Library FY16 Presentation
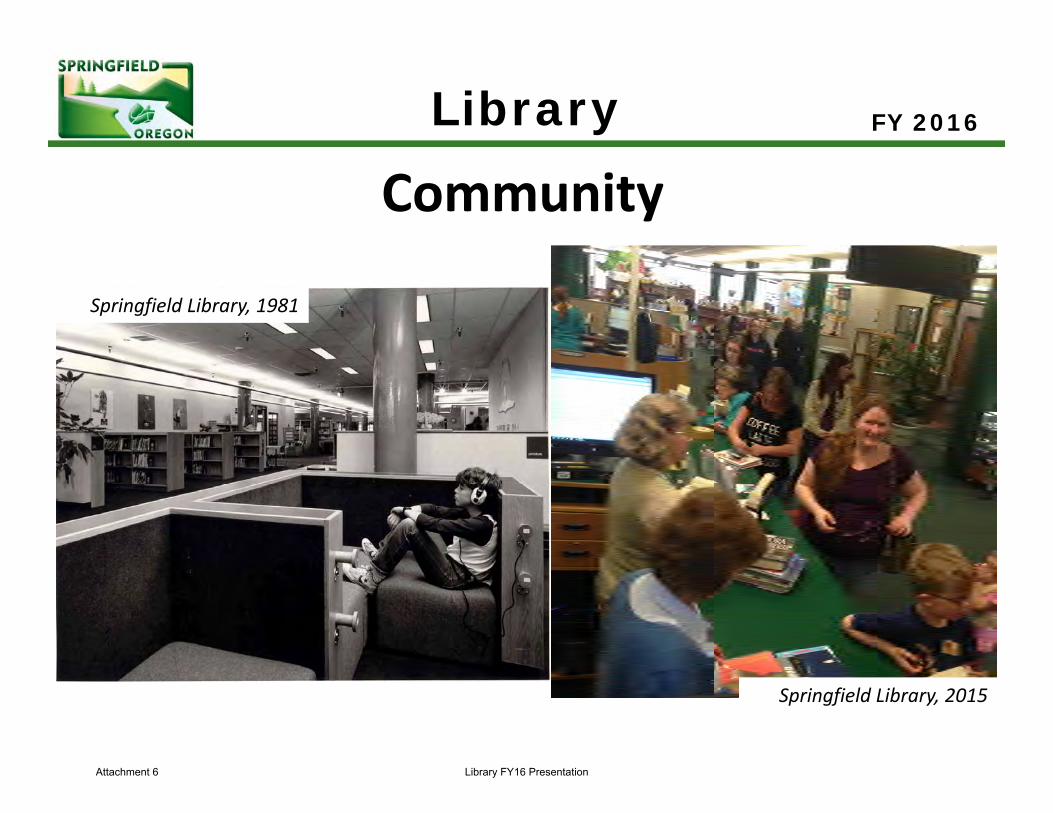
Library FY 2016
Community
Springfield Library, 1981
Springfield Library, 2015
Attachment 6 Library FY16 Presentation
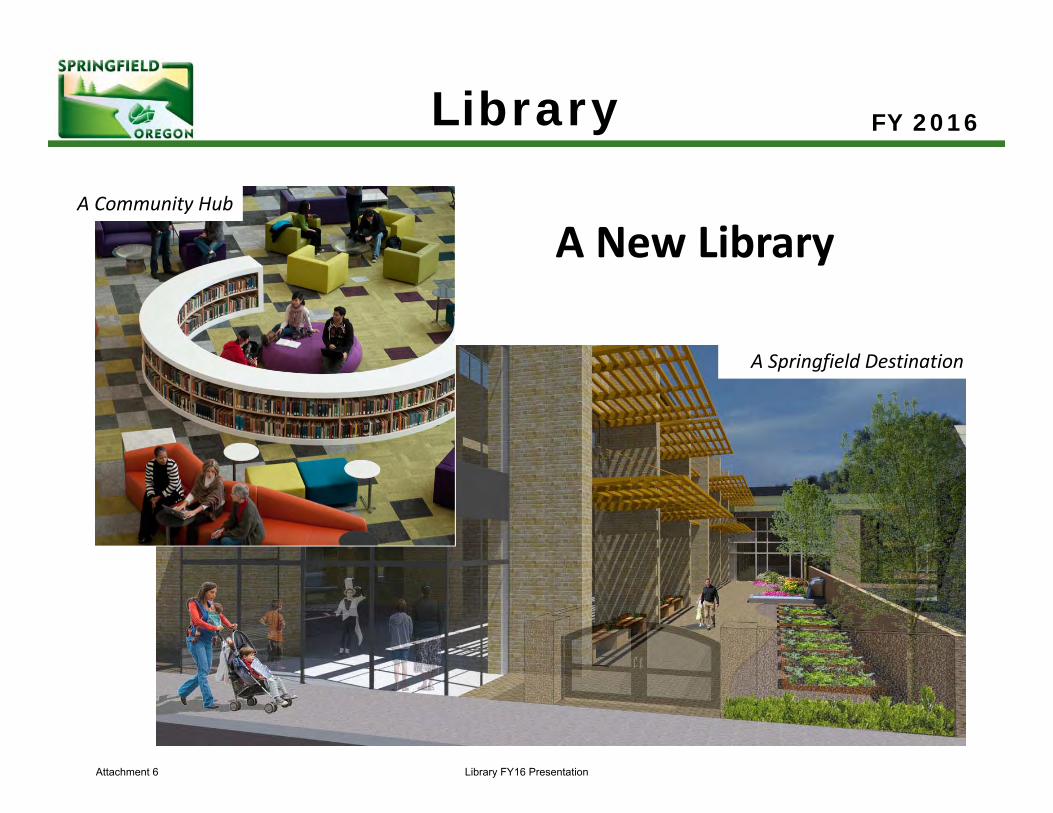
Library FY 2016
A New Library
A Springfield Destination
A Community Hub
Attachment 6 Library FY16 Presentation
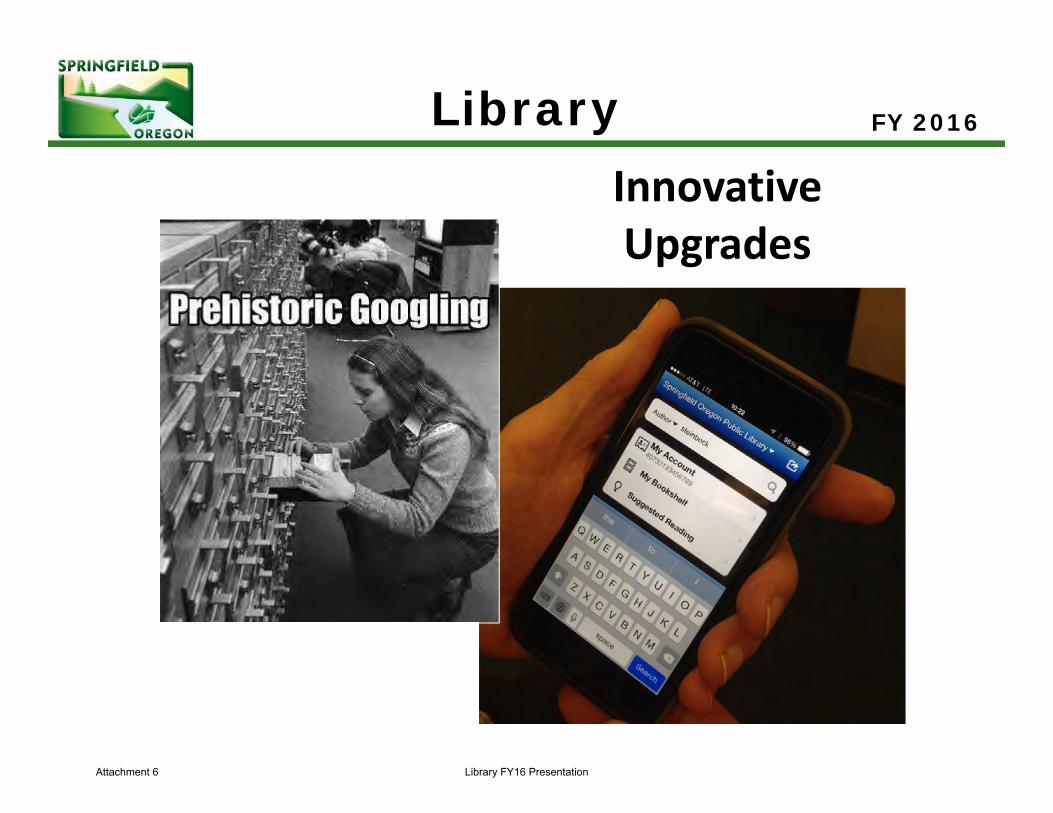
Library FY 2016
Innovative Upgrades
Attachment 6 Library FY16 Presentation
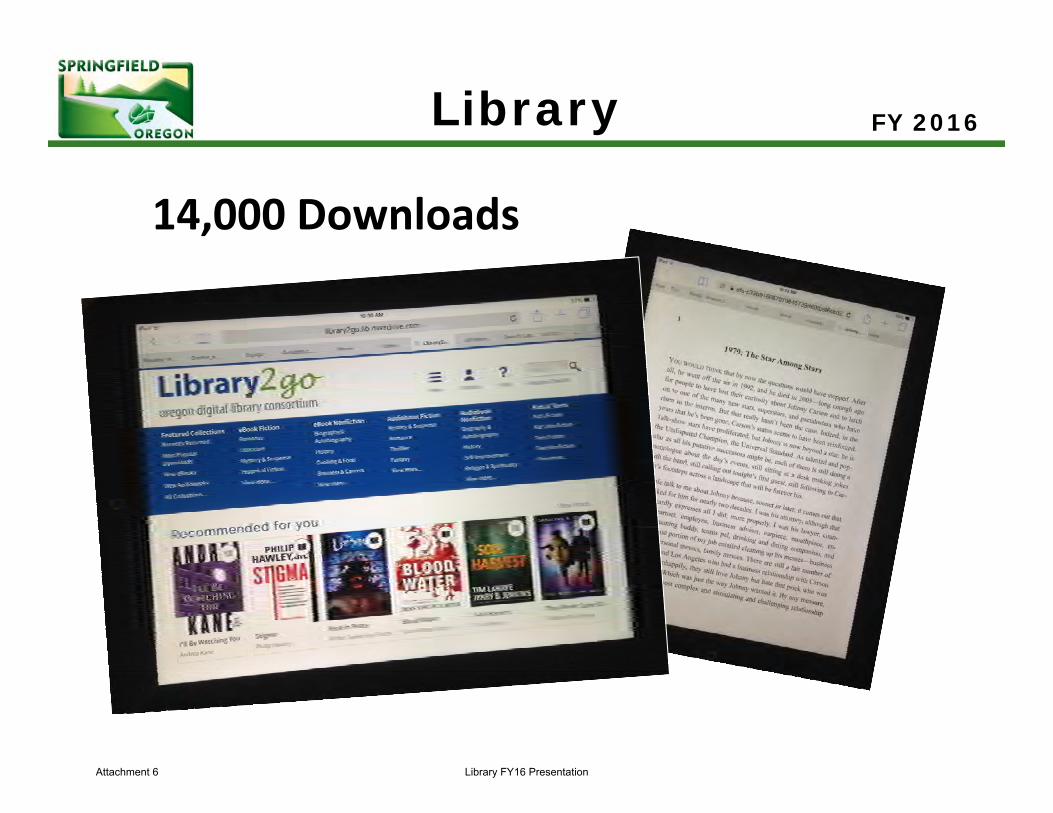
Library FY 2016
14,000 Downloads
Attachment 6 Library FY16 Presentation
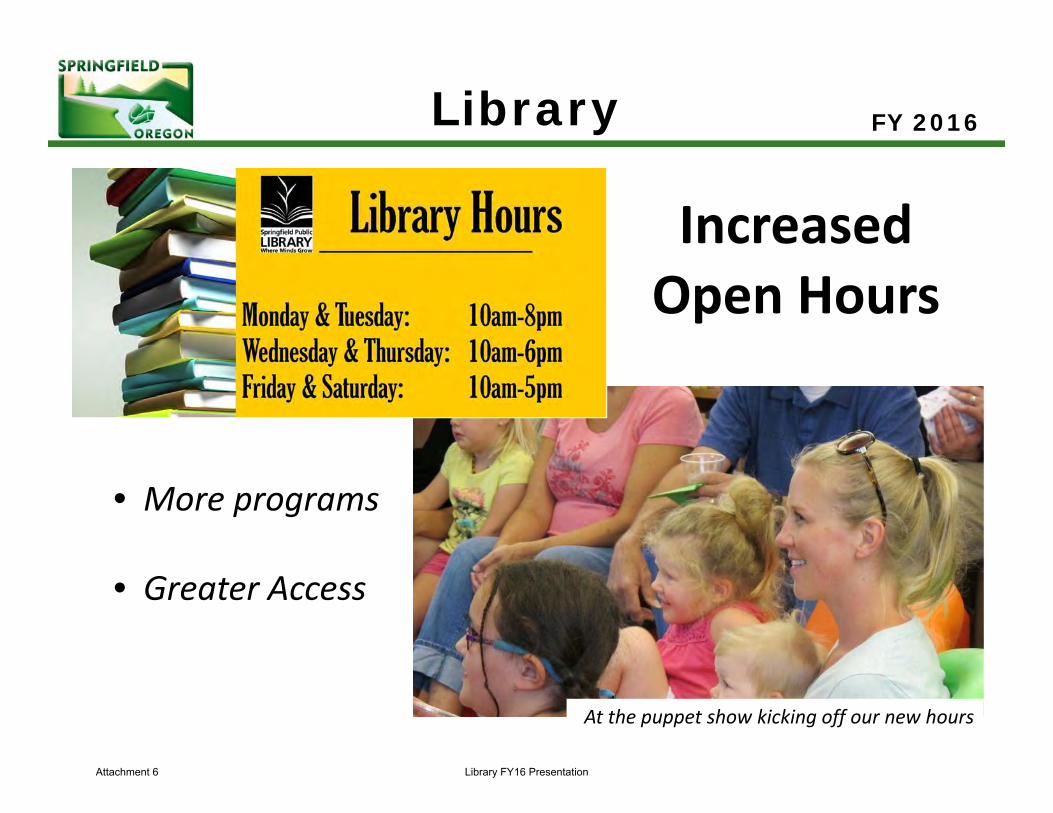
Library FY 2016
At the puppet show kicking off our new hours
IncreasedOpen Hours
• More programs
• Greater Access
Attachment 6 Library FY16 Presentation
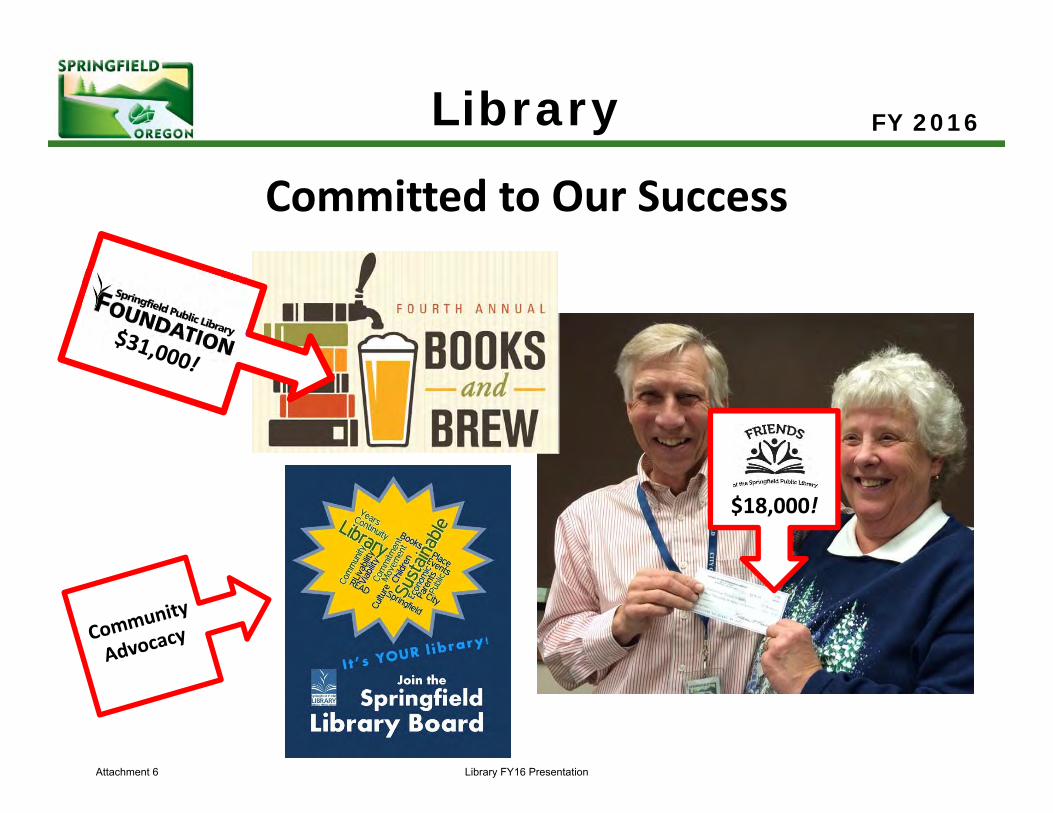
Library FY 2016
$18,000!
Committed to Our Success
Attachment 6 Library FY16 Presentation
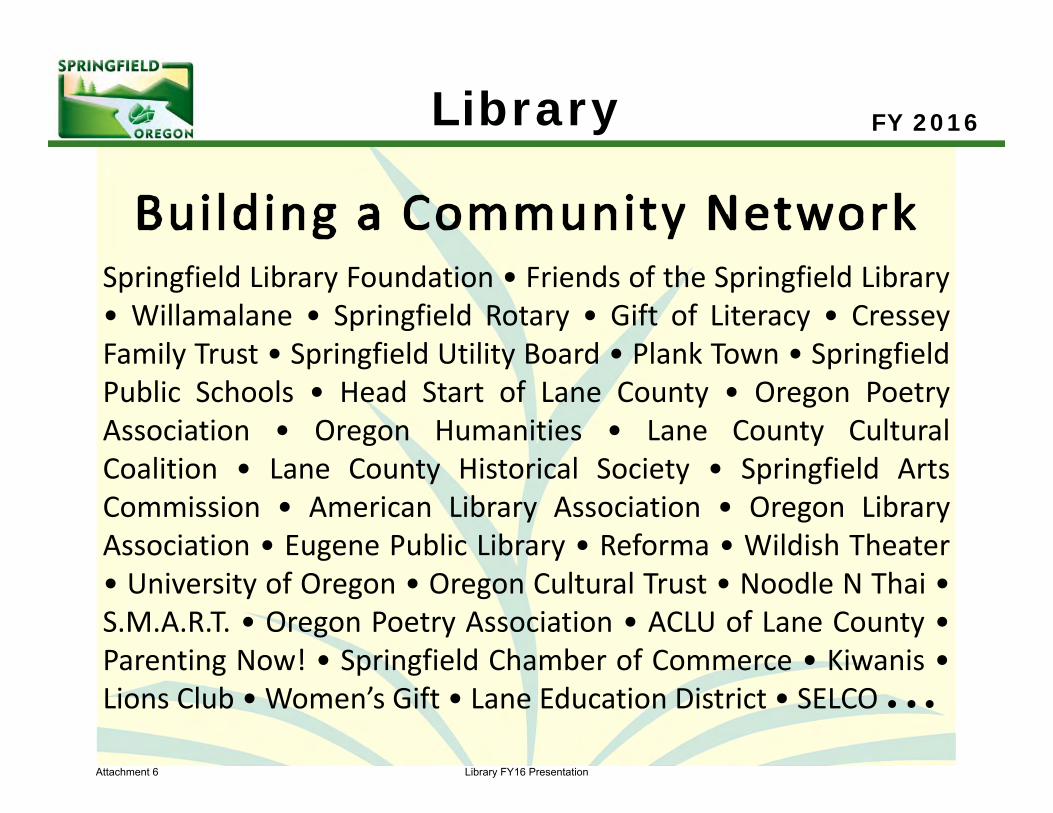
Library FY 2016
Springfield Library Foundation • Friends of the Springfield Library• Willamalane • Springfield Rotary • Gift of Literacy • CresseyFamily Trust • Springfield Utility Board • Plank Town • SpringfieldPublic Schools • Head Start of Lane County • Oregon PoetryAssociation • Oregon Humanities • Lane County CulturalCoalition • Lane County Historical Society • Springfield ArtsCommission • American Library Association • Oregon LibraryAssociation • Eugene Public Library • Reforma • Wildish Theater• University of Oregon • Oregon Cultural Trust • Noodle N Thai •S.M.A.R.T. • Oregon Poetry Association • ACLU of Lane County •Parenting Now! • Springfield Chamber of Commerce • Kiwanis •Lions Club • Women’s Gift • Lane Education District • SELCO
Attachment 6 Library FY16 Presentation
Library FY 2016
Attachment 6 Library FY16 Presentation
Library FY 2016
Attachment 6 Library FY16 Presentation
DEPARTMENT BUDGET SUMMARY City of Springfield, Oregon
To: Gino Grimaldi, City Manager
From: Randall B. Groves
Date: 3/17/2015
SUMMARY OF SIGNIFICANT PROPOSED BUDGET CHANGES FTE COST
Reduction of Administrative Staff (General Fund) 1.0 ($87,000)
Re-allocation of 25% Administrative Services Bureau Mgr to Ambulance Fund
0.25 $37,000
SUMMARY OF BUDGET AND SERVICE CHANGES
No service level changes are planned for FY16. Fire’s focus will be on continuing to gain efficiencies in the merged environment, with no major budget impacts. The system has already achieved, and exceeded, what was intended when the merger process began.
IAFF Merger Successful
In FY15, the Fire line personnel merged into one labor group and began working as a fully-integrated unit. Personnel may be assigned to any station throughout the system, as needed, and share a vacation calendar and promotional process. This allows more growth opportunities for employees, more flexibility in assignments, and will expand the knowledge base of the department. Additionally, as calls for service rise (we have seen an 11.8% call volume increase in the last six months alone), the merged environment allows Fire to always have emergency resources available to respond. Fire has maintained a timely response while decreasing the need for off-duty call backs. When one city’s fire apparatus or ambulance is out of service for repair and/or maintenance, reserve apparatus from either city can be utilized to maintain the response fleet.
Fire Staffing Analysis Completed
In FY14, Fire committed to doing a staffing analysis in FY15 that would objectively evaluate the current line staffing costs. The analysis outlined the current staffing model including: shift structure, minimum staffing requirements, authorized full time equivalents (FTE), and approved number of relief personnel. Staffing numbers, average availability, and backfill needs were the elements used to develop a cost analysis of hiring additional FTE or using overtime to cover vacant assignments. The cost analysis provided support for the current level of staffing by showing there is not a significant difference in the cost of adding FTE versus paying overtime. Final staffing decisions need to include a consideration of non-financial considerations. The analysis highlighted some of these considerations as well. Further, to answer concerns regarding total overtime costs associated with maintaining minimum fire suppression activities, the analysis provided a summary overview of shift versus non-shift overtime. Finally, based on the review, the analysis team developed the following recommendations: 1) Maintain current staffing levels at least for one year. This gives the department time to analyze average time off and overtime trends as a merged department; 2) Review and update the analysis annually; 3) Continue to stabilize the common database (ELOG) capturing hiring and overtime data to ensure consistency in trend analysis; 4) Develop common time accounting system to ensure consistency in trend analysis (earn codes, project codes); 5) Include analysis as part of discussions affecting any future changes to staffing levels.
Attachment 7 Fire & Life Safety FY16 Budget Summary Memo Page 1 of 4
In FY16, Fire will continue work on stabilizing the database and developing common time accounting codes to allow consistent data analysis.
Cardio Cerebral Resuscitation (CCR)
Cardio Cerebral Resuscitation (CCR) as a model is a radical departure from traditional cardiopulmonary resuscitation (CPR) as based on the 2000 American Heart Association guidelines. It calls for chest compressions to be rapidly performed with very minimal interruption in order to keep oxygenated blood flowing to the brain. This model is based on the principle that survival is improved when blood flow from the heart to the brain is maximized. We have had several successful resuscitations ultimately leading to full patient recovery. Since the merger date (08/04/14) Eugene Springfield Fire has responded to 202 CCR calls in the metro area including 83 calls in Springfield. In FY16, continued use of this model could impact many lives in the metro area.
Ambulance Equipped with Power Loading Devices
In FY15, Eugene Springfield Fire received a $420,000 Assistance to Firefighters federal grant, to equip all of the ambulances with lifting devices called power loaders. These devices attach to the stretcher (power gurney) and lift the stretcher and patient into the ambulance for transport. These new devices secure the stretcher in the ambulance and are dynamically crash-tested. Consistent use of the power loaders is expected to improve firefighter safety and wellness through reduced back stress injuries.
Fire continually seeks alternative funding sources for safety, extrication and communications equipment, training props, software and other projects where funding is available.
Fire Local Option Levy Preparing for Renewal Effort in November 2015
The current Fire Local Option Levy will expire in June 2016. This funding source is critical to maintaining our emergency response force and providing adequate coverage for all Springfield area EMS/fire/rescue emergencies. The Levy funds 20% of our staffed fire suppression and EMS first response resources. Discussion will begin soon regarding placing the Levy on the ballot for voters in November 2015.
Ambulance Fund has Another Good Year
The Ambulance Fund is enjoying another successful year in FY15. Revenues are expected to finish above the adopted budget, with expenses within budget. This should ensure that additional reserves are maintained going into FY16. In FY15, Ambulance Account Services gained further efficiencies by outsourcing invoicing, mailing of patient statements, and electronic claims submissions to a third party. Additionally, a patient exchange web portal now in use allows patients to pay their bills online, offering customers convenience while saving staff time.
Due to some of the recent gains in efficiencies, an additional ambulance billing client was added to the enterprise in early 2015. This new client will bring in new revenues in FY16, potentially as much as $70,000-$75,000, without the need to add additional staff.
In FY16, Account Services will begin using technology now available to auto-verify patent insurance information and addresses. This new functionality in the Zoll RescueNet billing system will save staff time, reduce mailing costs/returned mail, and provide updated addressing and insurance information automatically for all patients billed. Fire will begin testing this new function on a month-to-month basis to make sure the benefits outweigh the costs as much as expected. This is potentially a huge time saver that could allow Fire to continue expanding the client base and increase revenues.
Attachment 7 Fire & Life Safety FY16 Budget Summary Memo Page 2 of 4
Metro West Joins Eugene-Springfield Fire Department Team
As part of our tiered-response system, Eugene-Springfield Fire has contracted out certain non-emergency transports to a private ambulance provider the past several years. In January 2015, through an RFP process, Metro West Ambulance (MWA) joined the Eugene-Springfield Fire response team as our new non-emergency transport partner. MWA will provide prescheduled and inter-facility non-emergency transport services throughout the metro area. MWA is a privately-held Oregon company with a long history in the non-emergency transport arena. Fire will continue to focus the available resources on emergency responses, leaving non-emergency transports to a real expert in the field. This partnership will allow Fire to stretch the available resources, as call volumes continue to increase each year.
Investing in Technology to Improve Processes and Services
In FY15, Fire implemented an improved way to alert firefighter’s of incoming calls. Known collectively as ‘heart saver tones’, the new tones provide a gentler notification to firefighters, reducing stress and providing for a healthier environment. The new tones start out softy and gradually increase in level instead of blasting at full volume from the start.
In FY16 additional improvements in technology will get firefighters to the emergency scene faster than ever. A new enhancement to the Computer Aided Dispatch (CAD) system will reduce emergency response times by using technology to ‘tone’ all required units at the same time. IP Alerting (Internet Protocol) will produce simultaneous rather than sequential alerting for our metro fire stations. Fire station alerting is accomplished through a radio signal transmitted by the dispatch center to the fire stations where speakers are activated allowing a voice transmission from the fire dispatcher. Currently, Central Lane 9-1-1 must alert our fire stations sequentially to provide emergency response notification. This adds 20 seconds to the average emergency medical call, 30 seconds to a small incident multi-company response, and up to 40 seconds for a large incident multi-company response. Once in place, the system should consistently improve response times for all units.
Staff Reduction and Reallocation
Fire will reduce General Fund expenditures for FY16, including a reduction of 1.0 FTE. This approximately $124,000 reduction was accomplished through elimination of an administrative support position and re-allocation of 0.25 FTE of the Administrative Services Bureau Manager.
FUTURE NEEDS
As you can see from the Summary of Budget and Service Changes section; the use of technology has allowed the Fire department to increase efficiencies and continue to provide excellent service to the public. However there is also a need for additional staff resources. In all, over the past five years, through both the merger and budget reduction process, the Department has reduced its size by about 10%.
Fire Marshal and Administrative Staffing
The Fire Marshal’s Office (FMO) will continue to operate with two Deputy Fire Marshals, vs. four positions considered ‘full’ staffing. A Deputy Fire Marshal position was eliminated in FY14 to meet budget targets. A second position was unfunded in FY15 and will remain unfunded in FY16.This will limit the Fire Marshal’s Office capabilities, and Springfield Deputy Fire Marshal’s will be focused only on those high-priority tasks required by law. Additionally, the FMO has no support staff since the position was eliminated in budget reductions several years ago.
Fire Administration has absorbed 6.0 FTE reductions in the past 5 years, to meet General Fund budget targets. The addition of another 1.0 FTE in FY16 will severely stretch the limited resources now available. Customer service (internal and external) and administrative processes will be negatively affected.
Attachment 7 Fire & Life Safety FY16 Budget Summary Memo Page 3 of 4
Equipment and Apparatus Replacement Funding
Ongoing funding for equipment and apparatus replacement remains an issue. For FY16 equipment replacement funds will be utilized to purchase necessary fire hose and turnout gear. This is an ongoing expense of approximately $50,000 per year that cannot be funded beyond FY16 using current replacement funds.
Apparatus replacements in recent years have been done on 5-year lease agreements. As more apparatus are purchased in lease agreements, overlapping leases will cause dips/spikes in General Fund needs for the department. A planned engine replacement in FY16 has been delayed until FY17 due to funding issues.
CONCLUSION
Fire is presenting what is essentially a flat budget, with some General Fund reductions and use of equipment reserves, one time, to fund FY16 safety equipment needs. The IAFF contract expires June 2015 and may impact FY16 budget requirements.
Attachment 7 Fire & Life Safety FY16 Budget Summary Memo Page 4 of 4
FY 2014
Preserving Life, Property, and the Environment
Fire & Life Safety FY 2016
Attachment 8 Fire & Life Safety FY16 Presentation Page 1 of 16
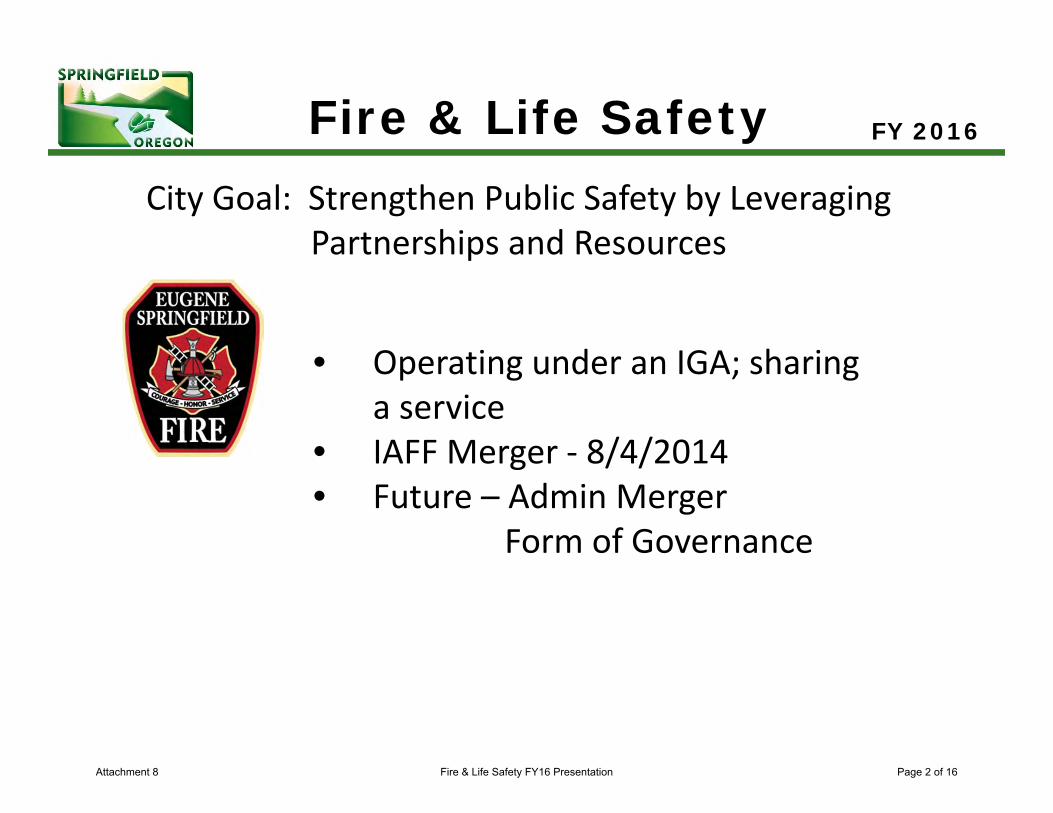
Fire & Life Safety FY 2016
City Goal: Strengthen Public Safety by Leveraging Partnerships and Resources
• Operating under an IGA; sharing a service
• IAFF Merger ‐ 8/4/2014• Future – Admin Merger
Form of Governance
Attachment 8 Fire & Life Safety FY16 Presentation Page 2 of 16
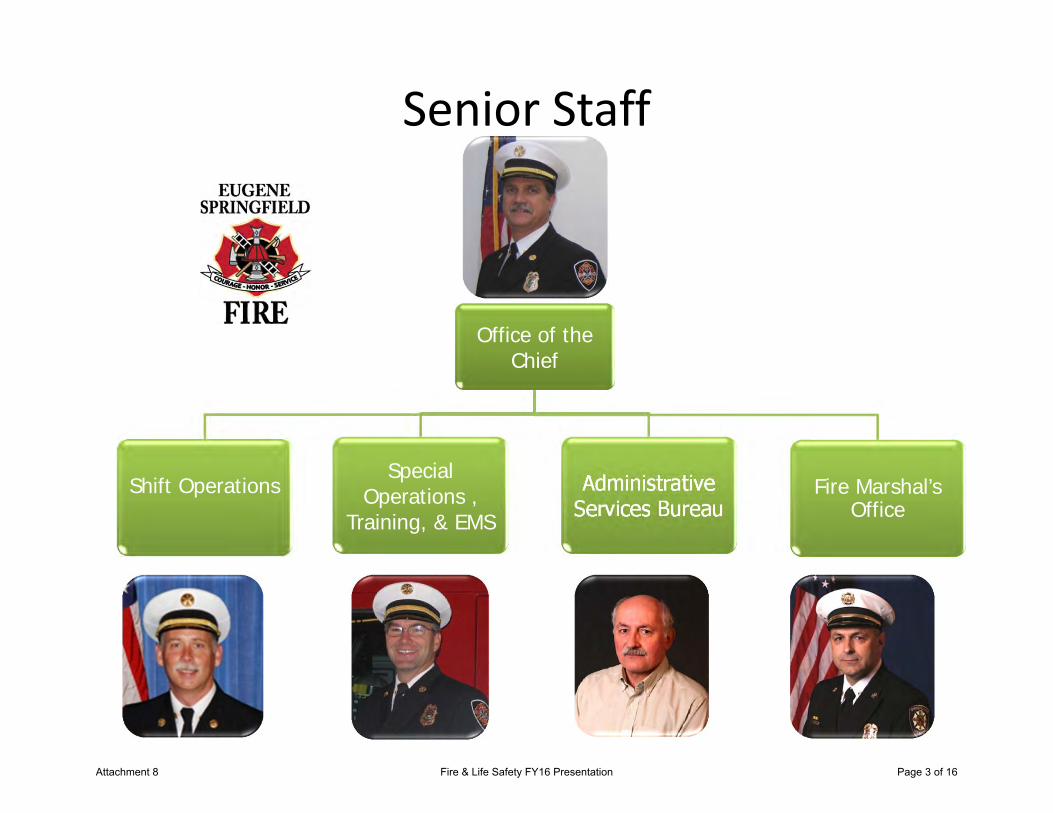
Senior Staff
Office of the Chief
Shift OperationsSpecial
Operations ,Training, & EMS
AdministrativeServices Bureau
Fire Marshal’sOffice
Attachment 8 Fire & Life Safety FY16 Presentation Page 3 of 16
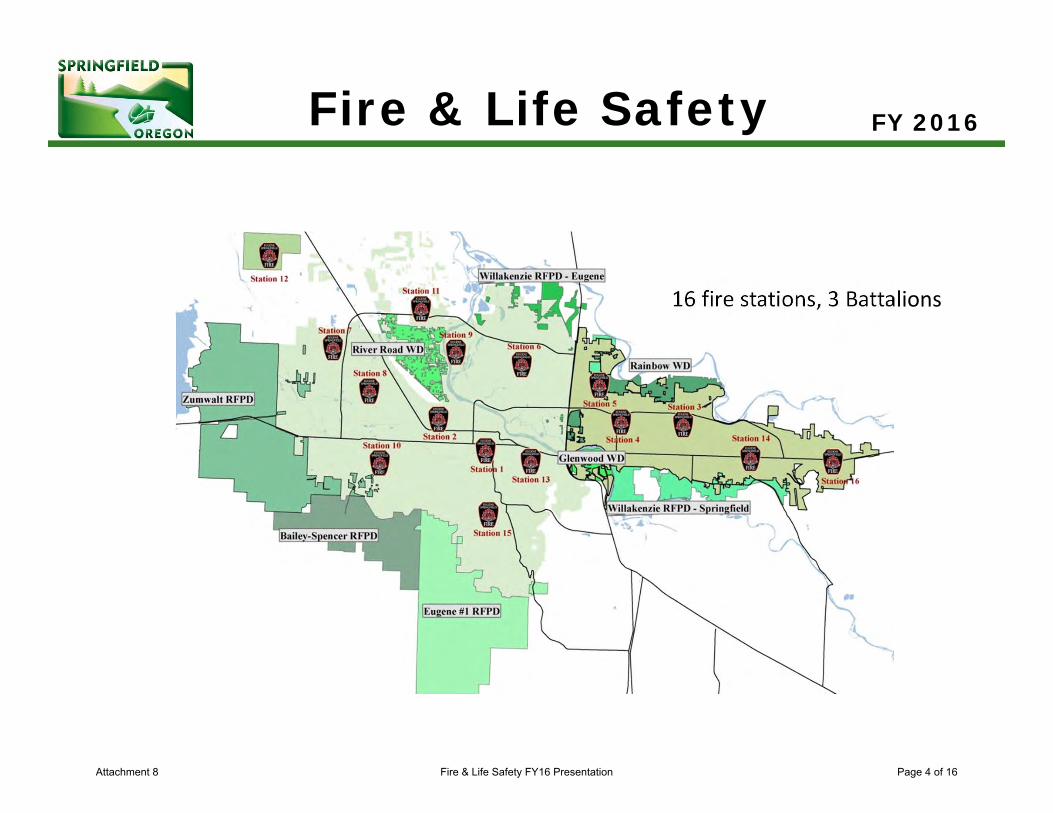
16 fire stations, 3 Battalions
Fire & Life Safety FY 2016
Attachment 8 Fire & Life Safety FY16 Presentation Page 4 of 16
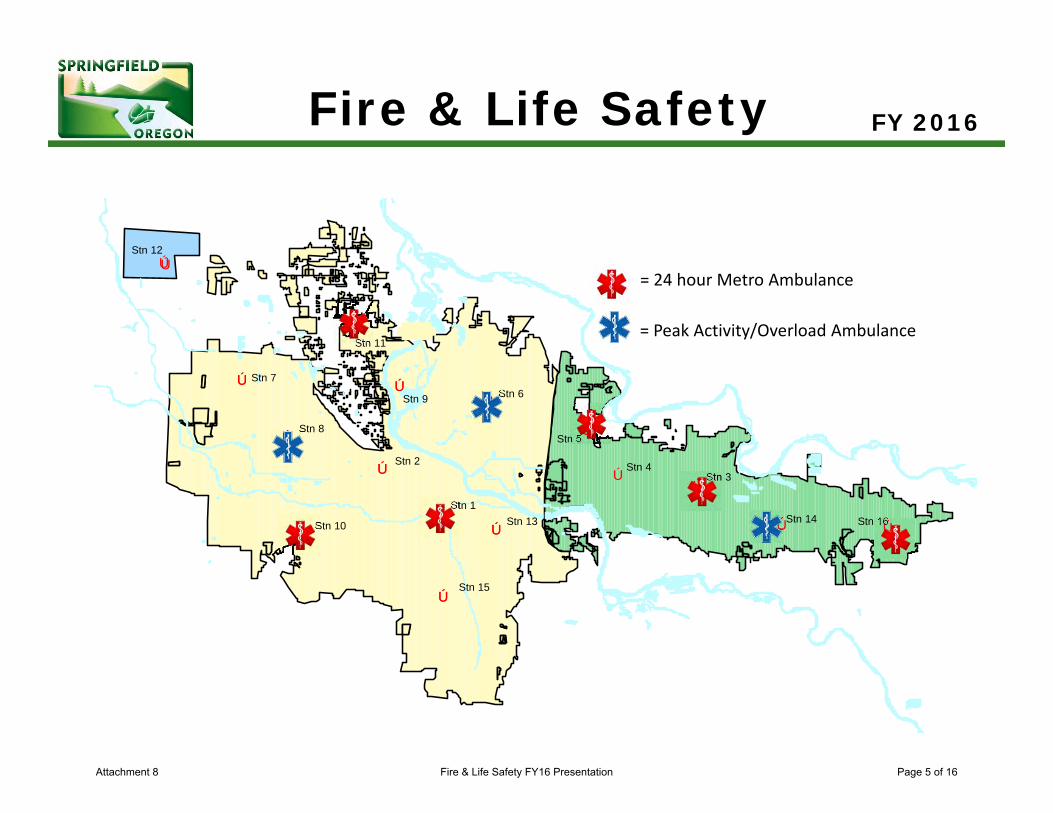
Fire & Life SafetyFY 2014
= 24 hour Metro Ambulance
= Peak Activity/Overload Ambulance
Ú
ÚÚ
Ú
ÚÚ
Ú
Ú
Ú
Ú
Ú
Ú
Ú
Ú Ú
Ú
Ú
Ú
Ú
Ú
ÚÚ
Ú
Ú ÚÚ
Ú
Stn 12
Stn 7
Stn 8
Stn 2
Stn 11
Stn 9 Stn 6
Stn 1
Stn 13
Stn 15
Stn 10
Stn 5
Stn 4Stn 3
Stn 14 Stn 16
Fire & Life Safety FY 2016
Attachment 8 Fire & Life Safety FY16 Presentation Page 5 of 16
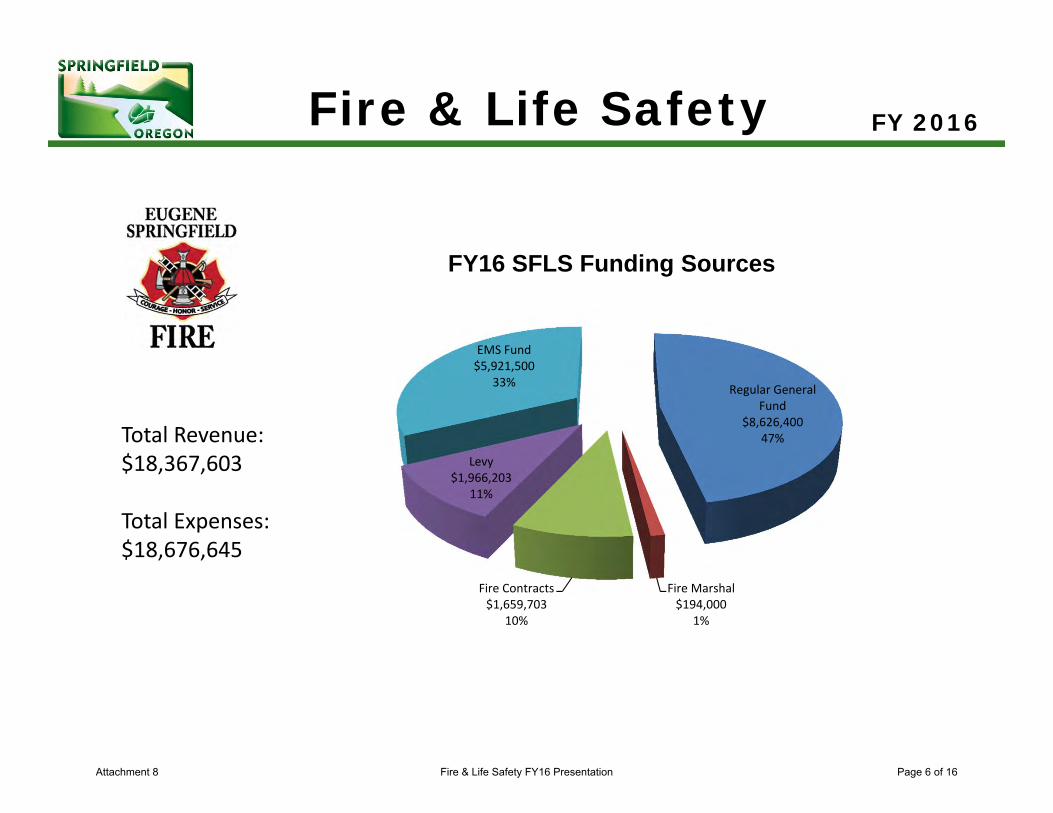
Total Revenue:$18,367,603
Total Expenses:$18,676,645
Fire & Life Safety FY 2016
Regular General Fund
$8,626,40047%
Fire Marshal$194,000
1%
Fire Contracts$1,659,703
10%
Levy$1,966,203
11%
EMS Fund$5,921,500
33%
FY16 SFLS Funding Sources
Attachment 8 Fire & Life Safety FY16 Presentation Page 6 of 16
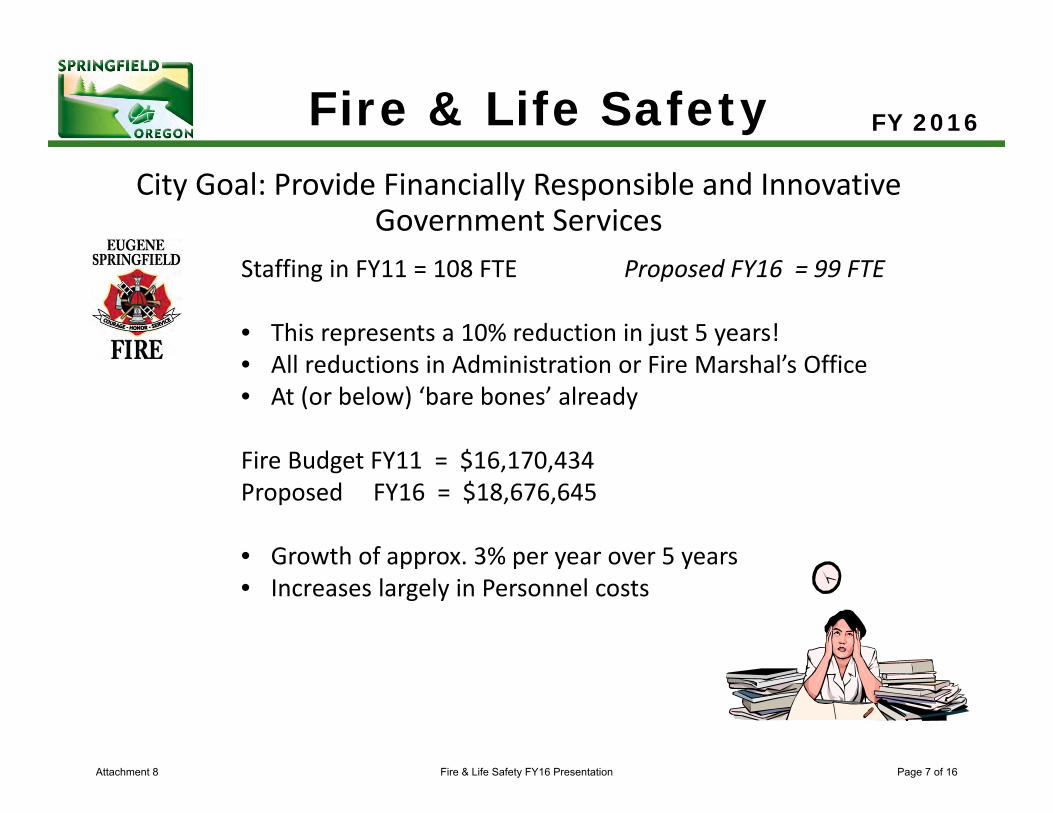
Fire & Life Safety FY 2016
Staffing in FY11 = 108 FTE Proposed FY16 = 99 FTE
• This represents a 10% reduction in just 5 years!• All reductions in Administration or Fire Marshal’s Office• At (or below) ‘bare bones’ already
Fire Budget FY11 = $16,170,434Proposed FY16 = $18,676,645
• Growth of approx. 3% per year over 5 years• Increases largely in Personnel costs
City Goal: Provide Financially Responsible and Innovative Government Services
Attachment 8 Fire & Life Safety FY16 Presentation Page 7 of 16
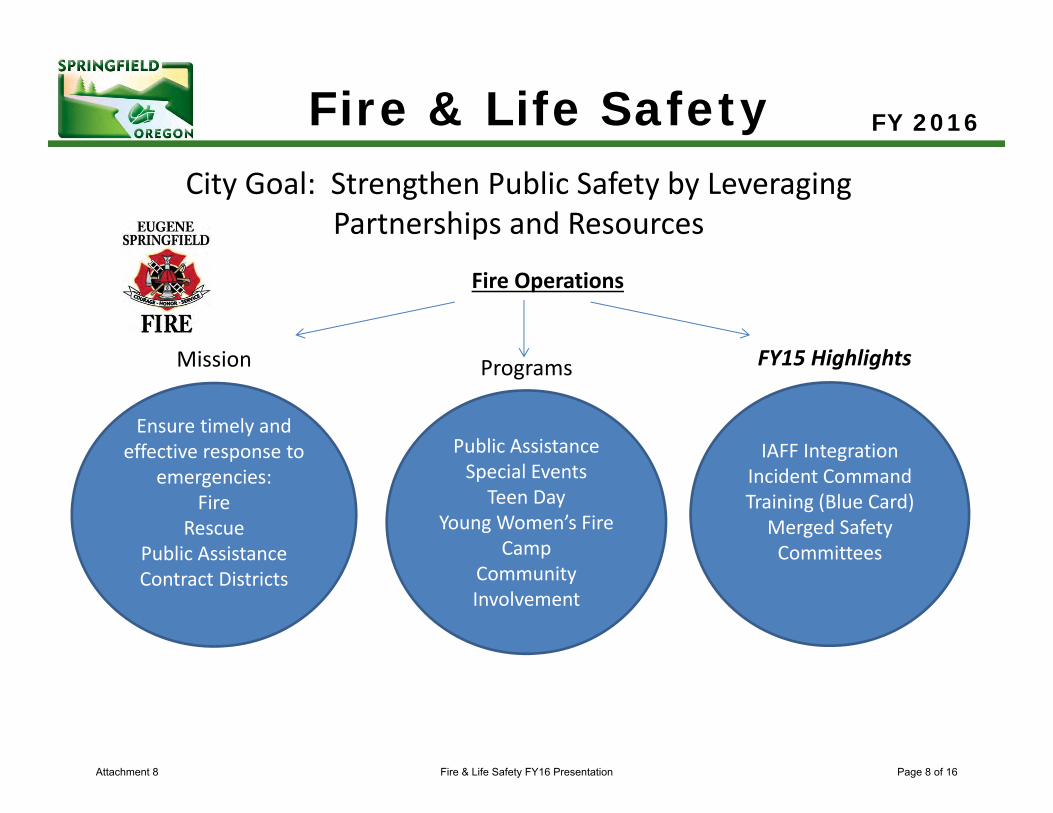
FY 2016
City Goal: Strengthen Public Safety by Leveraging Partnerships and Resources
Ensure timely and effective response to
emergencies:Fire
RescuePublic AssistanceContract Districts
IAFF IntegrationIncident Command Training (Blue Card)
Merged Safety Committees
Public AssistanceSpecial Events
Teen DayYoung Women’s Fire
CampCommunity Involvement
Fire Operations
Mission Programs FY15 Highlights
Fire & Life Safety
Attachment 8 Fire & Life Safety FY16 Presentation Page 8 of 16
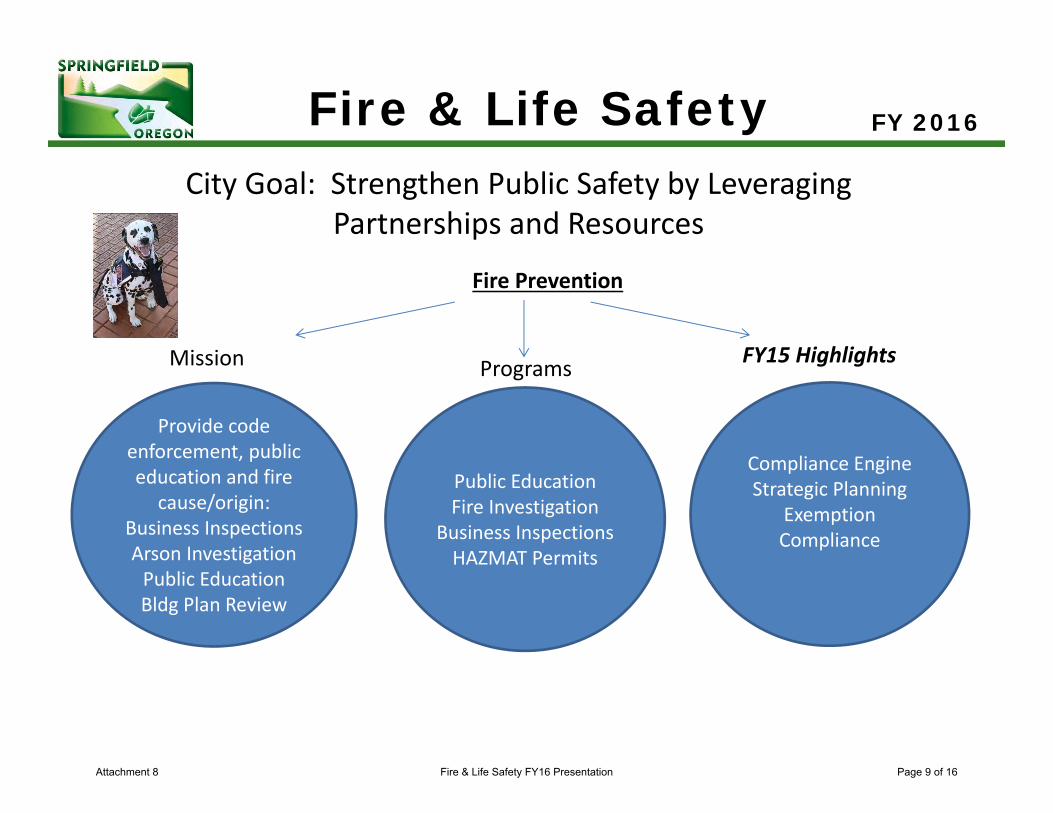
FY 2016
City Goal: Strengthen Public Safety by Leveraging Partnerships and Resources
Provide code enforcement, public education and fire
cause/origin:Business InspectionsArson InvestigationPublic EducationBldg Plan Review
Compliance EngineStrategic Planning
Exemption Compliance
Public EducationFire Investigation
Business InspectionsHAZMAT Permits
Fire Prevention
Mission Programs FY15 Highlights
Fire & Life Safety
Attachment 8 Fire & Life Safety FY16 Presentation Page 9 of 16
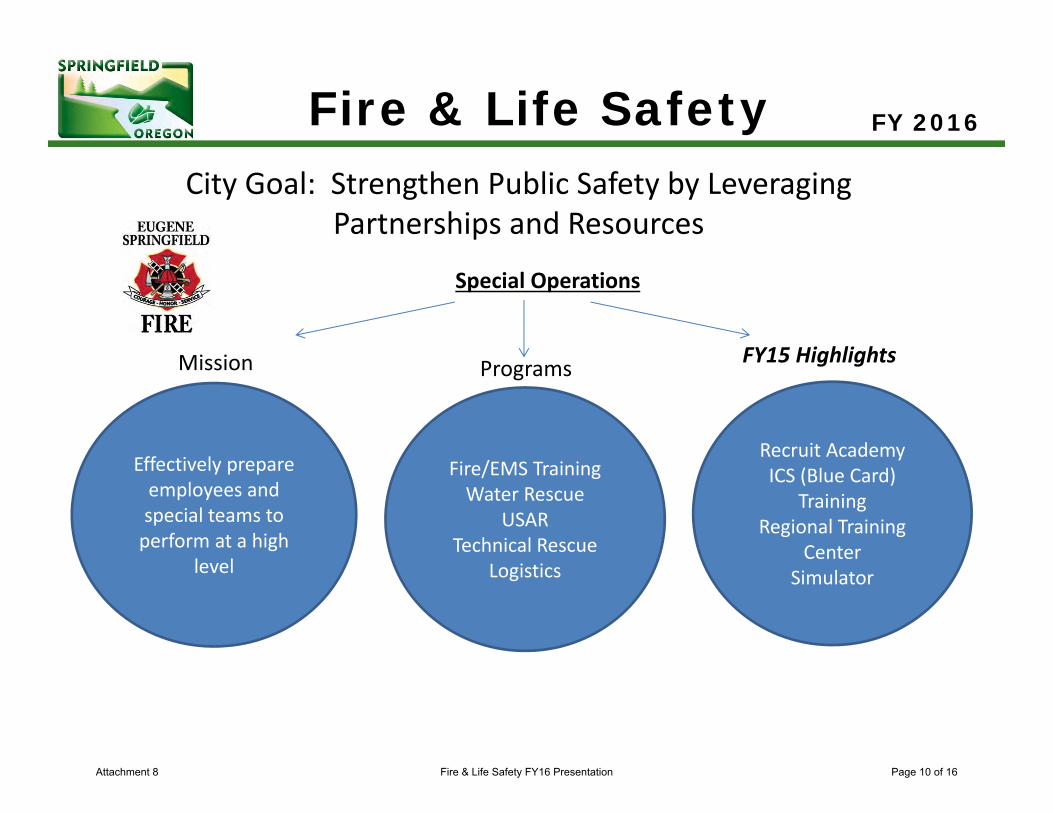
FY 2016
City Goal: Strengthen Public Safety by Leveraging Partnerships and Resources
Effectively prepare employees and special teams to perform at a high
level
Recruit AcademyICS (Blue Card)
TrainingRegional Training
CenterSimulator
Fire/EMS TrainingWater Rescue
USARTechnical Rescue
Logistics
Special Operations
Mission Programs FY15 Highlights
Fire & Life Safety
Attachment 8 Fire & Life Safety FY16 Presentation Page 10 of 16
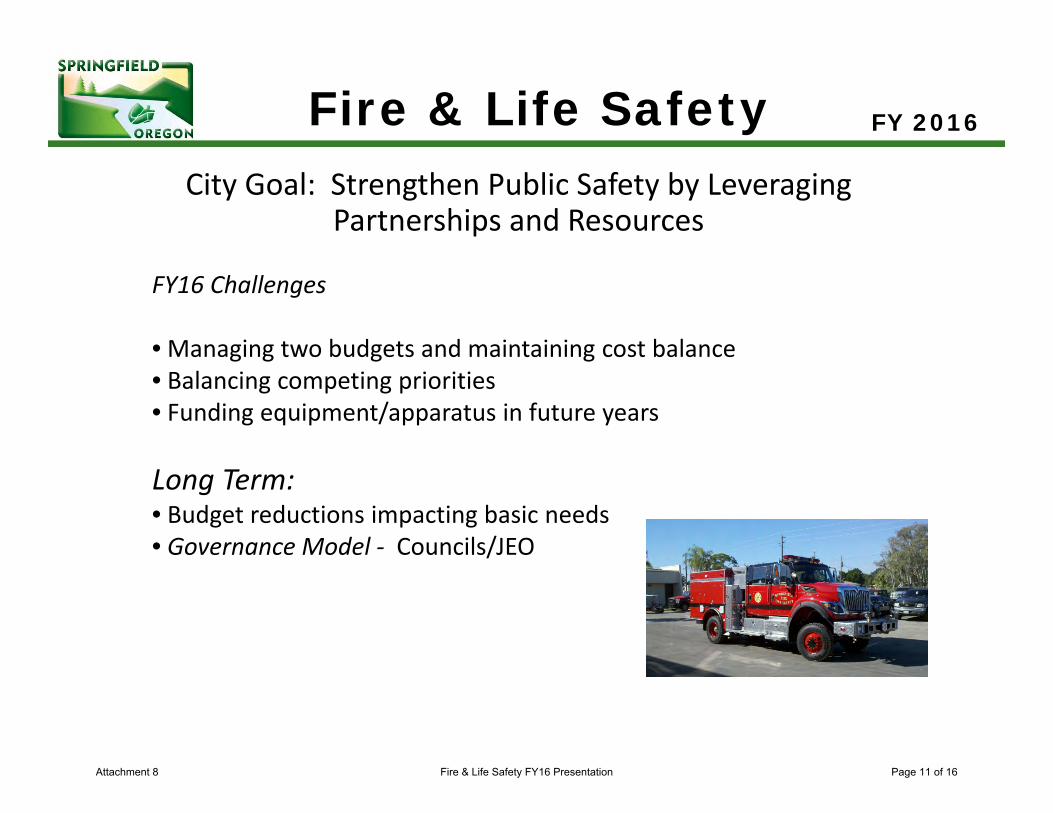
Fire & Life Safety
FY16 Challenges
• Managing two budgets and maintaining cost balance• Balancing competing priorities• Funding equipment/apparatus in future years
Long Term:• Budget reductions impacting basic needs • Governance Model ‐ Councils/JEO
Fire & Life Safety FY 2016
City Goal: Strengthen Public Safety by Leveraging Partnerships and Resources
Attachment 8 Fire & Life Safety FY16 Presentation Page 11 of 16
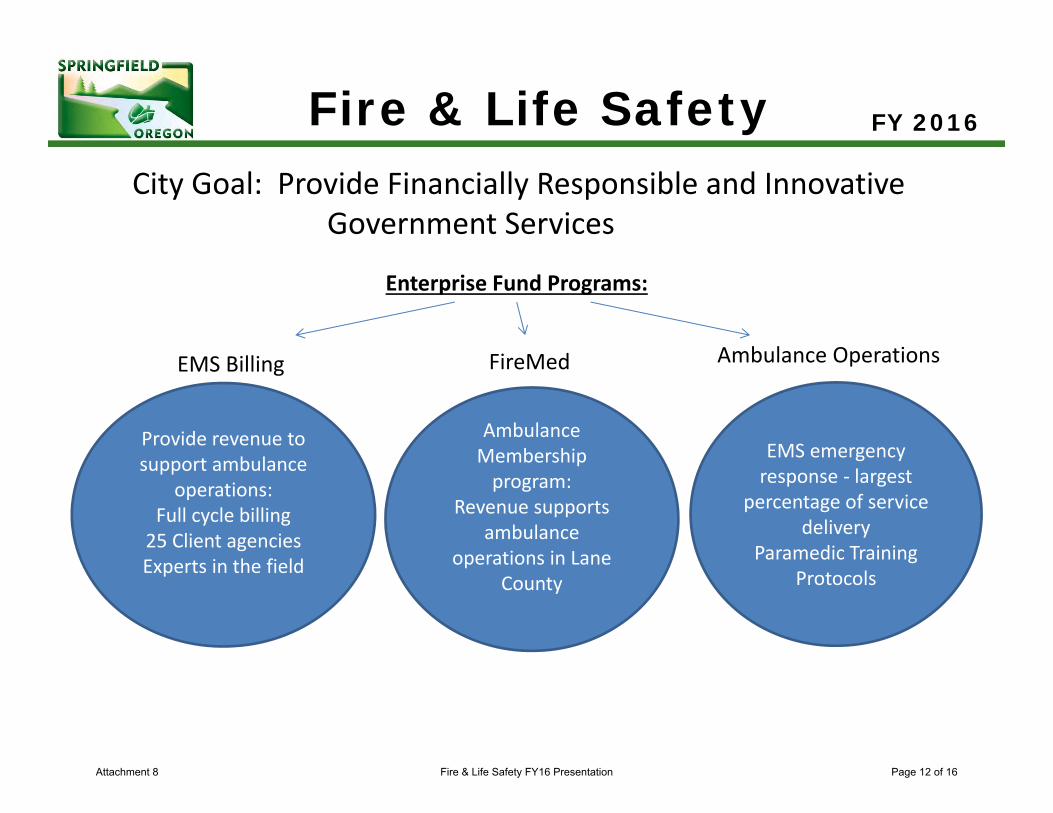
FY 2016
City Goal: Provide Financially Responsible and Innovative Government Services
Provide revenue to support ambulance
operations:Full cycle billing25 Client agenciesExperts in the field
EMS emergency response ‐ largest
percentage of service delivery
Paramedic Training Protocols
Ambulance Membership program:
Revenue supports ambulance
operations in Lane County
Enterprise Fund Programs:
EMS Billing FireMed Ambulance Operations
Fire & Life Safety
Attachment 8 Fire & Life Safety FY16 Presentation Page 12 of 16
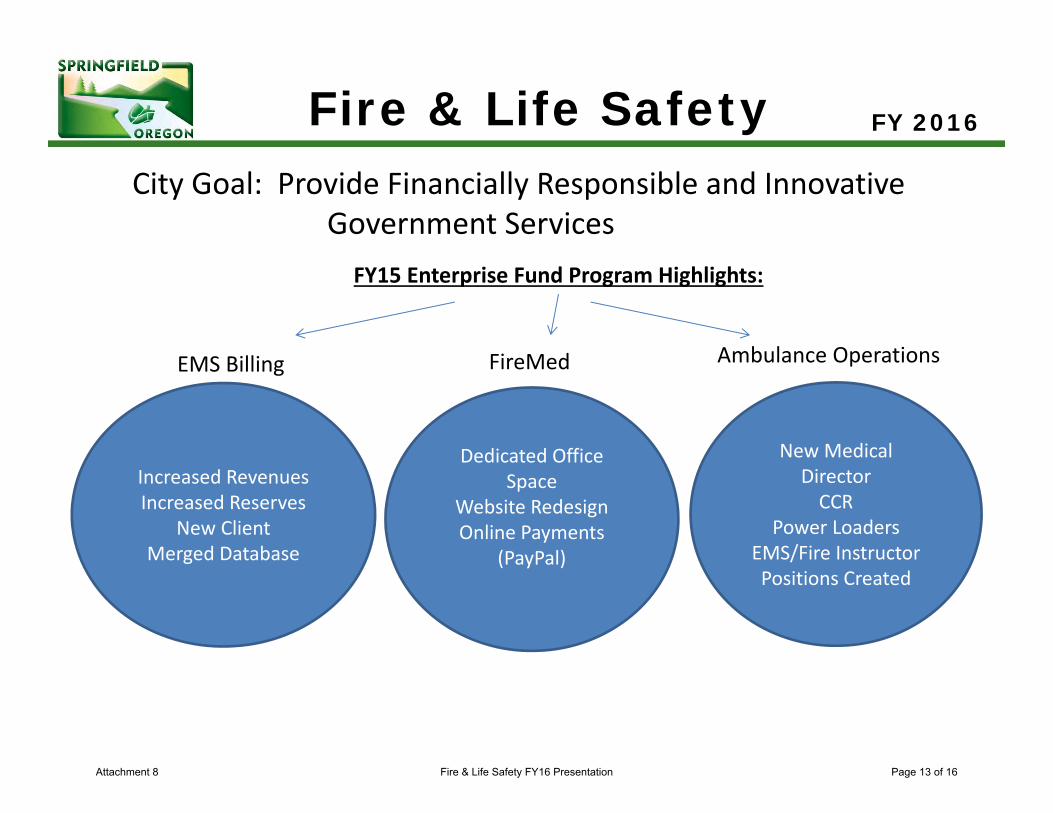
FY 2016
City Goal: Provide Financially Responsible and Innovative Government Services
Increased RevenuesIncreased Reserves
New Client Merged Database
New Medical DirectorCCR
Power LoadersEMS/Fire Instructor Positions Created
Dedicated Office Space
Website RedesignOnline Payments
(PayPal)
FY15 Enterprise Fund Program Highlights:
EMS Billing FireMed Ambulance Operations
Fire & Life Safety
Attachment 8 Fire & Life Safety FY16 Presentation Page 13 of 16
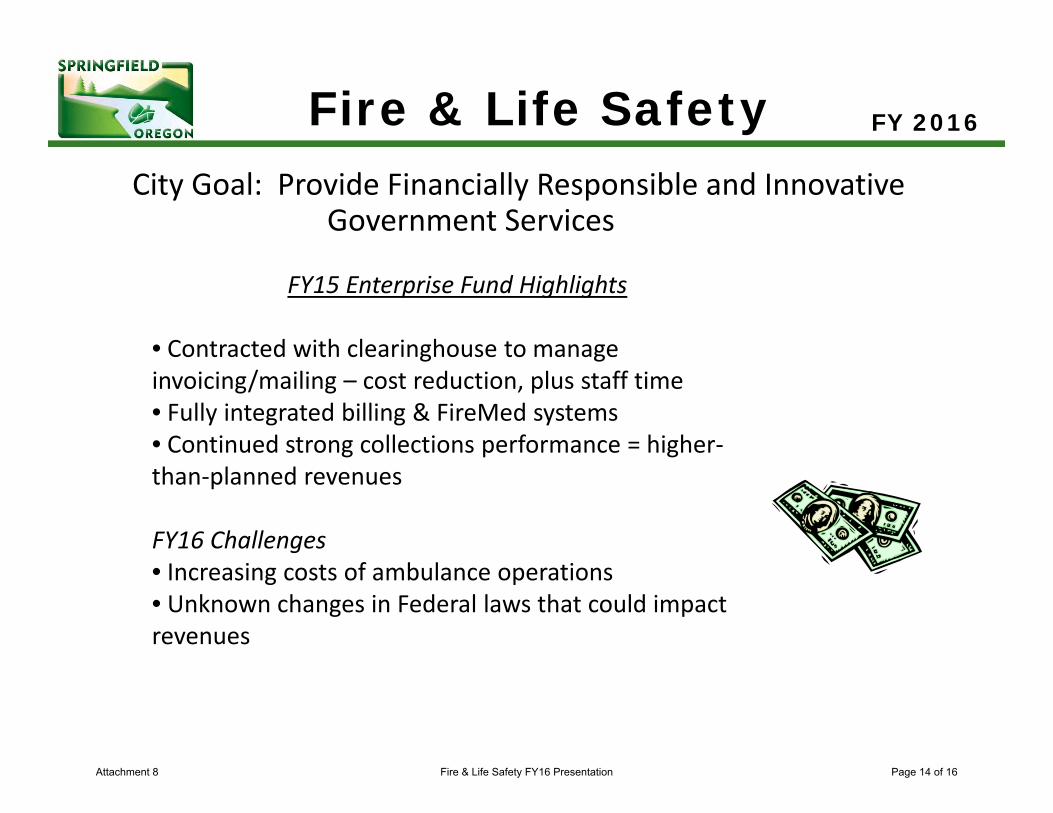
Fire & Life Safety
FY15 Enterprise Fund Highlights
• Contracted with clearinghouse to manage invoicing/mailing – cost reduction, plus staff time• Fully integrated billing & FireMed systems • Continued strong collections performance = higher‐than‐planned revenues
FY16 Challenges• Increasing costs of ambulance operations• Unknown changes in Federal laws that could impact revenues
Fire & Life Safety FY 2016
City Goal: Provide Financially Responsible and Innovative Government Services
Attachment 8 Fire & Life Safety FY16 Presentation Page 14 of 16
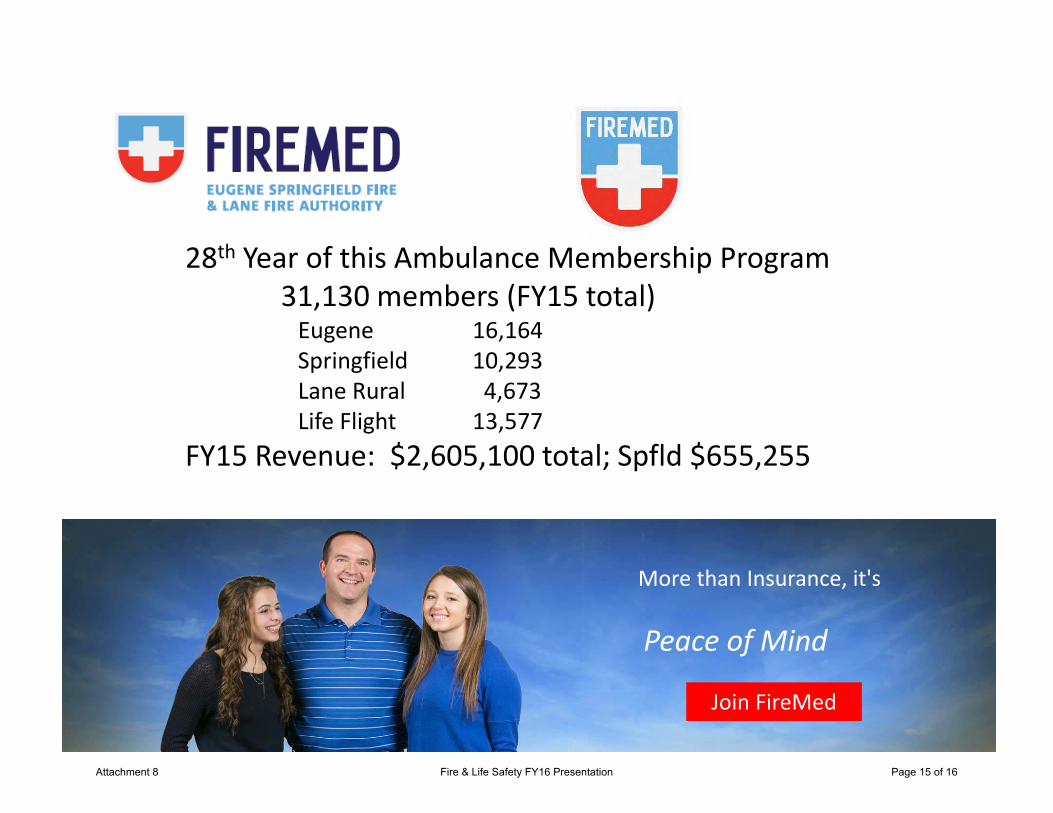
28th Year of this Ambulance Membership Program31,130 members (FY15 total)Eugene 16,164Springfield 10,293Lane Rural 4,673Life Flight 13,577
FY15 Revenue: $2,605,100 total; Spfld $655,255
More than Insurance, it's
Peace of Mind
Join FireMed
Attachment 8 Fire & Life Safety FY16 Presentation Page 15 of 16

Fire & Life Safety FY 2016
QUESTIONS?
Cody the Fire Dog says: Anyone can learn CPR and everyone should. You are most likely to perform CPR on someone you know, four out of five cardiac arrests happen at home. Woof!
Attachment 8 Fire & Life Safety FY16 Presentation Page 16 of 16
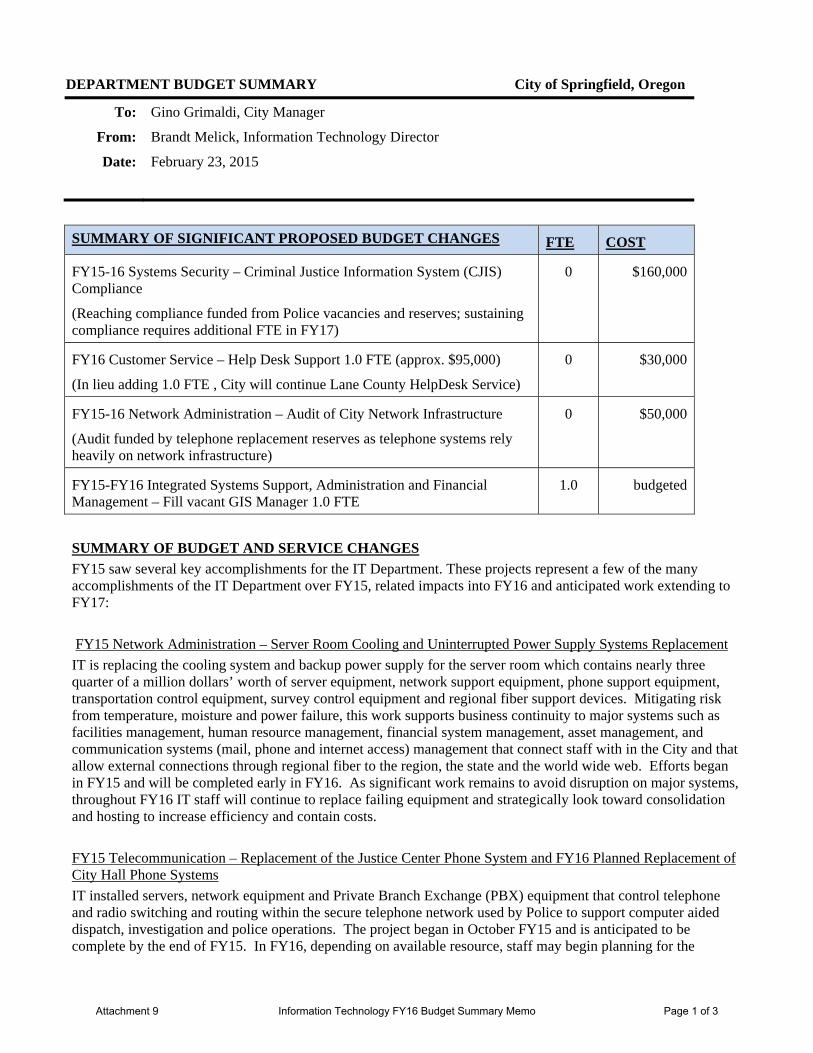
DEPARTMENT BUDGET SUMMARY City of Springfield, Oregon
To: Gino Grimaldi, City Manager
From: Brandt Melick, Information Technology Director
Date: February 23, 2015
SUMMARY OF SIGNIFICANT PROPOSED BUDGET CHANGES FTE COST
FY15-16 Systems Security – Criminal Justice Information System (CJIS) Compliance
(Reaching compliance funded from Police vacancies and reserves; sustaining compliance requires additional FTE in FY17)
0 $160,000
FY16 Customer Service – Help Desk Support 1.0 FTE (approx. $95,000)
(In lieu adding 1.0 FTE , City will continue Lane County HelpDesk Service)
0 $30,000
FY15-16 Network Administration – Audit of City Network Infrastructure
(Audit funded by telephone replacement reserves as telephone systems rely heavily on network infrastructure)
0 $50,000
FY15-FY16 Integrated Systems Support, Administration and Financial Management – Fill vacant GIS Manager 1.0 FTE
1.0 budgeted
SUMMARY OF BUDGET AND SERVICE CHANGES
FY15 saw several key accomplishments for the IT Department. These projects represent a few of the many accomplishments of the IT Department over FY15, related impacts into FY16 and anticipated work extending to FY17:
FY15 Network Administration – Server Room Cooling and Uninterrupted Power Supply Systems Replacement
IT is replacing the cooling system and backup power supply for the server room which contains nearly three quarter of a million dollars’ worth of server equipment, network support equipment, phone support equipment, transportation control equipment, survey control equipment and regional fiber support devices. Mitigating risk from temperature, moisture and power failure, this work supports business continuity to major systems such as facilities management, human resource management, financial system management, asset management, and communication systems (mail, phone and internet access) management that connect staff with in the City and that allow external connections through regional fiber to the region, the state and the world wide web. Efforts began in FY15 and will be completed early in FY16. As significant work remains to avoid disruption on major systems, throughout FY16 IT staff will continue to replace failing equipment and strategically look toward consolidation and hosting to increase efficiency and contain costs.
FY15 Telecommunication – Replacement of the Justice Center Phone System and FY16 Planned Replacement of City Hall Phone Systems
IT installed servers, network equipment and Private Branch Exchange (PBX) equipment that control telephone and radio switching and routing within the secure telephone network used by Police to support computer aided dispatch, investigation and police operations. The project began in October FY15 and is anticipated to be complete by the end of FY15. In FY16, depending on available resource, staff may begin planning for the
Attachment 9 Information Technology FY16 Budget Summary Memo Page 1 of 3
replacement of phone systems in City Hall and the conversion to newer phone technologies such as voice over internet protocol (VOIP).
FY15-16 Systems Security – Criminal Justice Information System
Facing an anticipated audit by the Federal Bureau of Investigation and the Oregon State Police in the summer of 2015, IT reviewed recent regional audit reports, initiated a preparatory internal audit, sought legal review and followed legal advice to develop and (now) implement a work plan to meet published requirements for the protection of Criminal Justice Information System (CJIS) information. The resulting scope of work exceeded current city network resource (people and budget) and went before Executive Team for prioritization. Receiving top priority and authorization to proceed, IT procured hardware, software and personal services and initiated a limited duration not-to-exceed project to complete the work plan. Work began FY15. The project will lapse the anticipated audit this summer and extend for a total duration of approximately twelve months. The project is anticipated to be complete toward the end of FY16.
FY15-16 Administration and Financial Management – Regional Partnerships and Agreements
IT worked closely with the Police Department, the Finance Department and the City Attorney’s Office to complete intergovernmental agreements with regional Public Safety partners and clarify costs sharing arrangements for implementation, interim service support and on-going future hosting services. Efforts spanned approximately six months and resulted in an equitable cost sharing solution that reflects Springfield’s more conservative approach to funding large IT projects. Moving forward in FY16, the City has concise agreements in place that clearly cap on-going charges, articulate decision making process and account for full cost of ownership (software, hardware, personal services and reserves).
FY16 Administration and Financial Management – GIS-IT Integration
Beginning July 1, 2015, GIS will be moving from the Development and Public Works Department and will be a program within IT. This change neither increases nor decreases FTE within City; it simply reallocates an information services program from the Development and Public Works Department to the IT Department. Long term advantages to this departmental move includes the ability to better coordinate information services to customers, better coordinate activities with regional partners, advance location based technologies (e.g., locating critical infrastructure like servers, communications facilities, emergency operations facilities, etc.), advance mobile and remote access technologies, advance asset management, and advance information security in critical areas such as emergency response, human resource and purchasing. Since both programs (IT and GIS) face increasing demands for service with limited resources, shorter term benefits of merging the groups does not solve resource shortages. The merge simply increases efficiency and meets current service delivery levels with existing funds.
FY15-16 Integrated Systems Support, Administration and Financial Management –Asset Information System Integration Project – Phase Three
Phase Three of the Asset Management (Transportation Integration) will be funded with savings from earlier phases and will be the most complex of all asset management system projects to date. To accomplish this work, in late FY15 and into FY16 the department will be filling the vacant GIS Manager position. In addition to work on Phase Three, the position will coordinate service delivery to the Development and Public Works Department (DPW) and service other DPW needs such as those to address and formalize processes surrounding data security, contribute to reducing the asset workload facing the network audit, and support on-going needs to support facilities master planning, downtown planning and citywide 2030 planning initiatives.
FY16 Administration and Financial Management – New Program and Product Delivery
Most notably, the newly merged IT Department will be implementing a new strategic plan and consolidated work plan. In addition to the items listed above, the work plan includes development of new policies and operating procedures to streamline work and increase system security; upgrades to major systems such as electronic
Attachment 9 Information Technology FY16 Budget Summary Memo Page 2 of 3
recruiting, data security and risk management in human resource systems, contracting and budget planning in financial systems; journal entry and work flow automation in electronic document management systems; and automated lighting control and transportation system integration in asset management systems.
Planned for the FY16 proposed budget are anticipated major equipment replacements and systems upgrades and implementations. These are only some of the anticipated projects in addition to ongoing support services provided to the organization.
FUTURE NEEDS
With proliferation of use and reliance on IT services and ever increasing regulations on the protection of information contained in city systems, workload strain will continue to be significant on existing staff. Accordingly all approved FTE are planned to be filled early in FY16, helping the merged IT Department to continue forward with project schedules. The FY16 proposed budget has 15.0 FTE with additional FTE and contractual services costs anticipated in the FY17 department budget.
Customer Support and Systems Security -Help Desk Support
This request is for an additional 1.0 FTE, General Fund, for dedicated Help Desk resource staffing to allow senior staff time to address critical network infrastructure issues and address on-going system security issues related to justice system information, purchase card information and other forms of protected information and systems. These programs have cost savings for the city by providing timely customer support, which allows the city staff continuity in workflow without interruptions from technical issues, mitigate risk associated with not adequately protecting sensitive information, allows for the protection, management, and optimization of city resources by providing technical customer support to city staff, influences a high quality and productive workforce by maintaining the optimal technical work environment, and strongly influences the city ability to provide responsive, courteous, and innovative services to the citizens.
Administration and Financial Management and Integrated Systems Support – Systems Software Reserves
Similar to existing reserves for computer servers, this request is to increase funding $100k, General Fund, to create dedicated reserves to replace large integrated software systems at the end of their useful life. These systems (such as facilities management systems, financial systems, and public safety systems) support city programs with costly systems software that experience lost productivity at end of useful life when systems start to fail. These services will be delayed and productivity levels decreased until budget has been identified, dedicated and approved. The maintenance costs for aging systems will continue to increase as more effort is put into old systems to prolong their lifecycle. Implementation of this reserve would include an inventory, prioritization and synchronization of replacement schedules in support of priority programs.
CONCLUSION
Department efforts focus on business continuity, security, fiscal responsibility and transparency. It is the ultimate goal of the department to most effectively, responsibly, and innovatively implement the priorities of the Mayor and Council, thus continuing to deliver high quality services and projects to the organization and community.
The proposed budget meets the guidelines set forth by the Finance Department.
Attachment 9 Information Technology FY16 Budget Summary Memo Page 3 of 3
Information TechnologiesFY 2016
Focusing on business continuity, security, fiscal responsibility and transparency
“We live in a society exquisitely dependent on science and technology, in which hardly anyone knows anything about science and technology.”
‐Carl Sagan
Attachment 10 Information Technology FY16 Presentation Page 1 of 13
Information Technologies (IT)FY 2016
Attachment 10 Information Technology FY16 Presentation Page 2 of 13
Information TechnologiesFY 2016
Agenda
• What is IT . . .(what is IT today)?• IT Programs and Key Accomplishments• Future Needs• Future Opportunities
Attachment 10 Information Technology FY16 Presentation Page 3 of 13
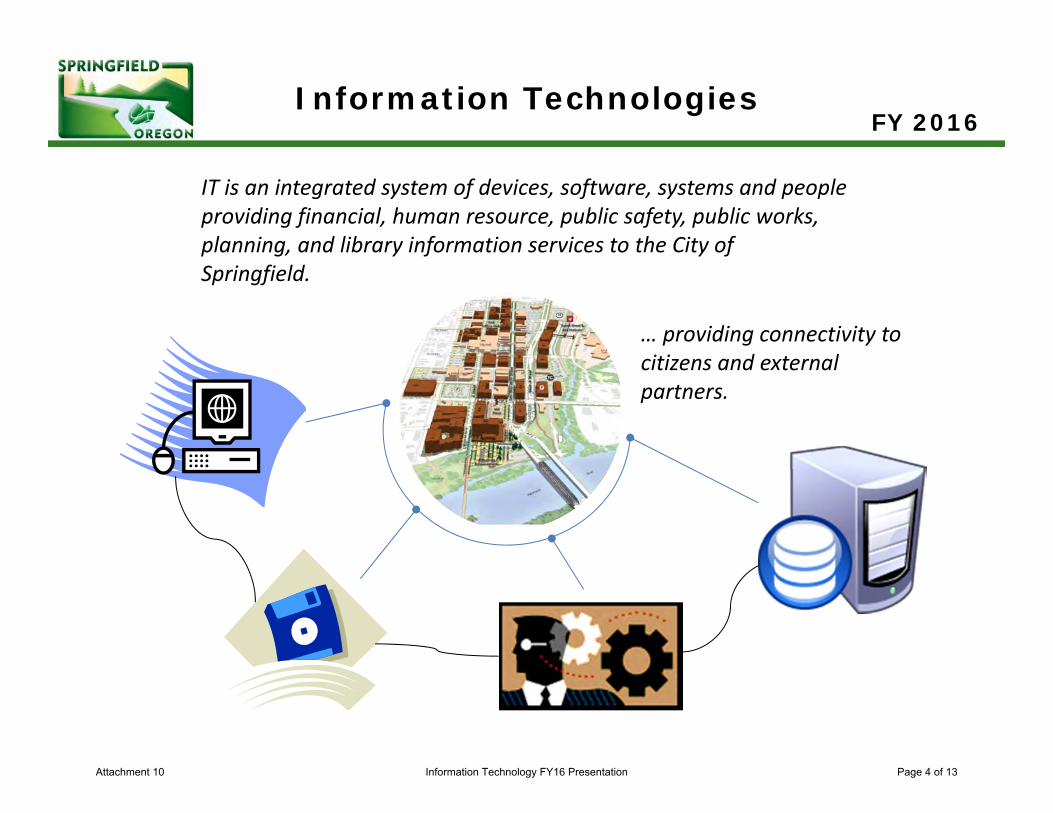
Information TechnologiesFY 2016
IT is an integrated system of devices, software, systems and people providing financial, human resource, public safety, public works, planning, and library information services to the City of Springfield.
… providing connectivity to citizens and external partners.
Attachment 10 Information Technology FY16 Presentation Page 4 of 13
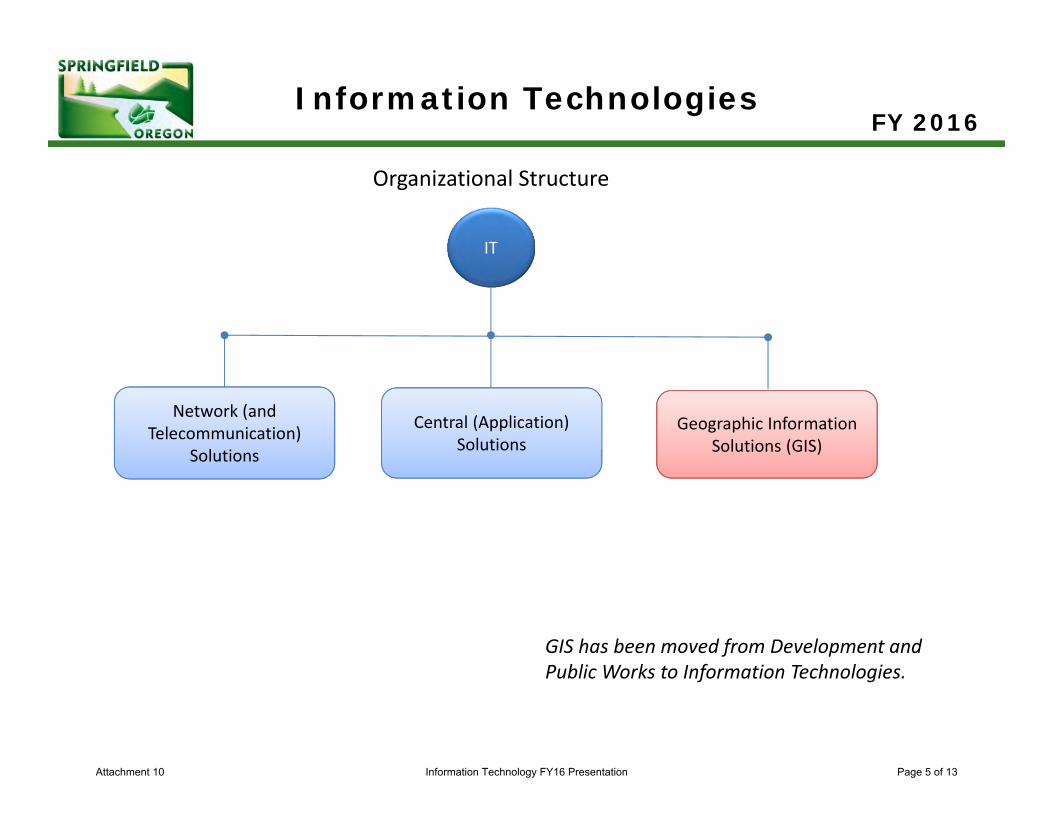
Information TechnologiesFY 2016
IT
Network (and Telecommunication)
Solutions
GIS has been moved from Development and Public Works to Information Technologies.
Organizational Structure
Central (Application) Solutions
Geographic Information Solutions (GIS)
Attachment 10 Information Technology FY16 Presentation Page 5 of 13
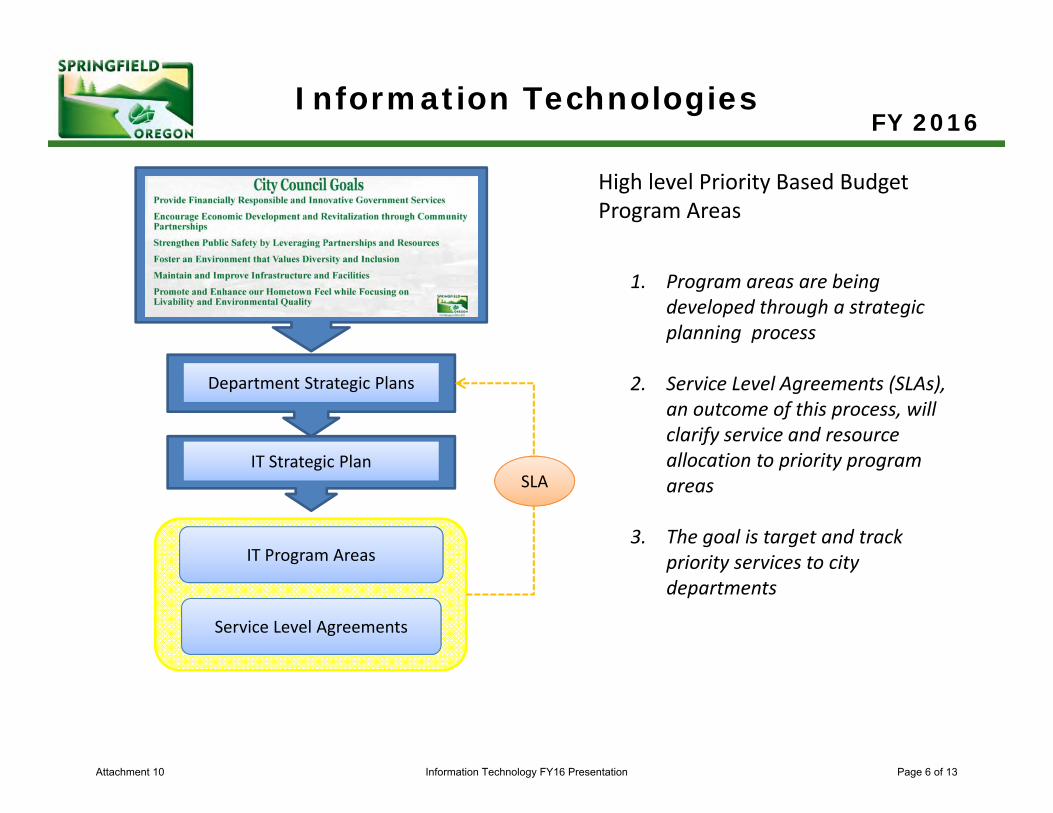
Information TechnologiesFY 2016
1. Program areas are being developed through a strategic planning process
2. Service Level Agreements (SLAs), an outcome of this process, will clarify service and resource allocation to priority program areas
3. The goal is target and track priority services to city departments
High level Priority Based Budget Program Areas
Department Strategic Plans
IT Strategic Plan
IT Program Areas
Service Level Agreements
SLA
Attachment 10 Information Technology FY16 Presentation Page 6 of 13
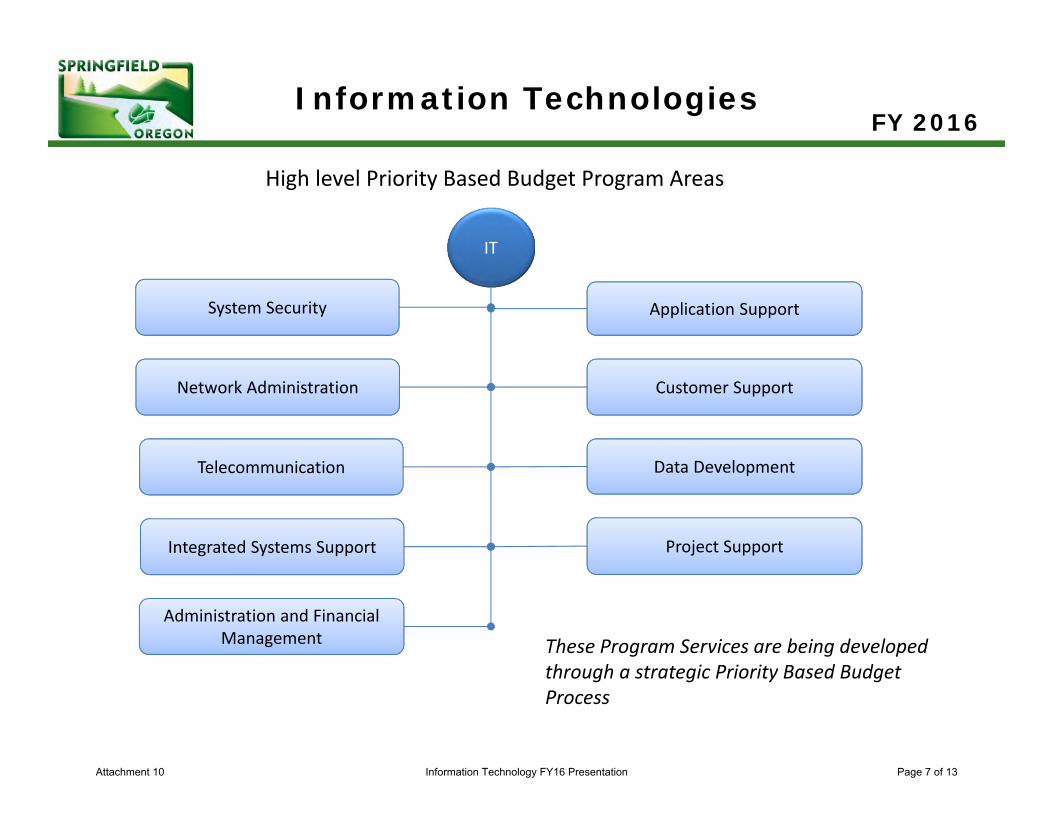
Information TechnologiesFY 2016
IT
System Security
These Program Services are being developed through a strategic Priority Based Budget Process
High level Priority Based Budget Program Areas
Network Administration
Application Support
Telecommunication
Integrated Systems Support
Customer Support
Project Support
Data Development
Administration and Financial Management
Attachment 10 Information Technology FY16 Presentation Page 7 of 13
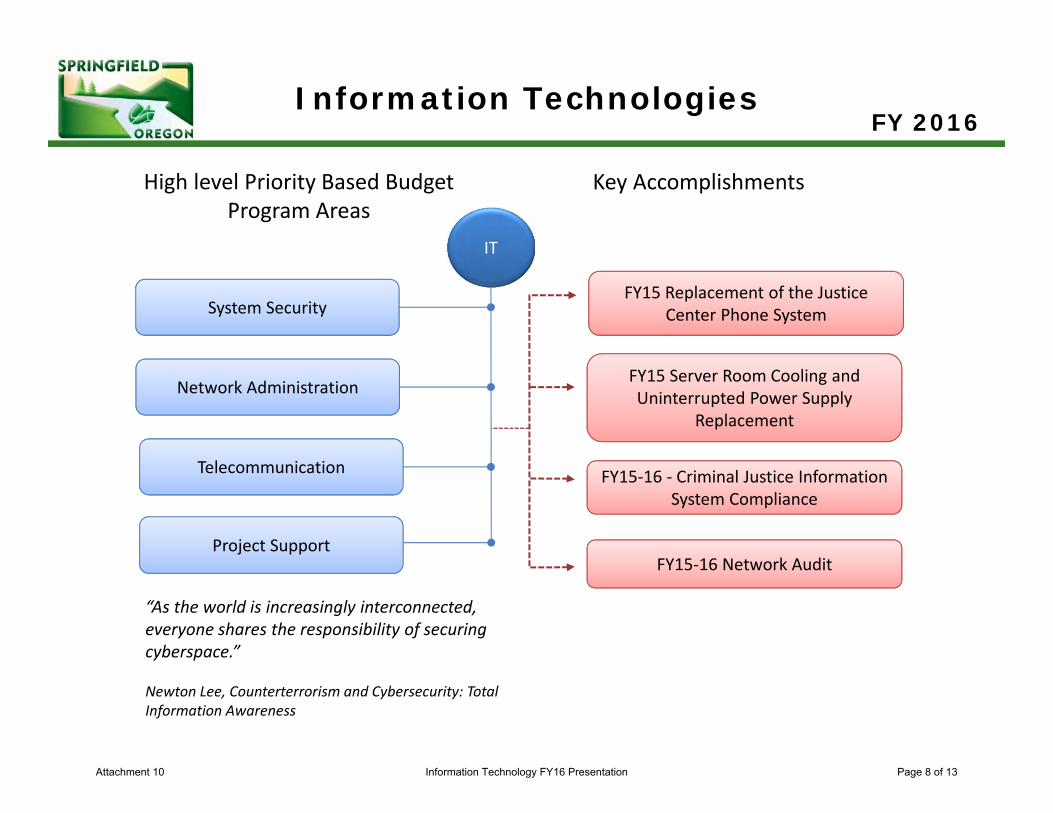
Information TechnologiesFY 2016
IT
System Security
“As the world is increasingly interconnected, everyone shares the responsibility of securing cyberspace.”
Newton Lee, Counterterrorism and Cybersecurity: Total Information Awareness
Key Accomplishments
Network Administration
FY15‐16 ‐ Criminal Justice Information System Compliance
Telecommunication
FY15 Server Room Cooling and Uninterrupted Power Supply
Replacement
Project Support
FY15 Replacement of the Justice Center Phone System
High level Priority Based Budget Program Areas
FY15‐16 Network Audit
Attachment 10 Information Technology FY16 Presentation Page 8 of 13
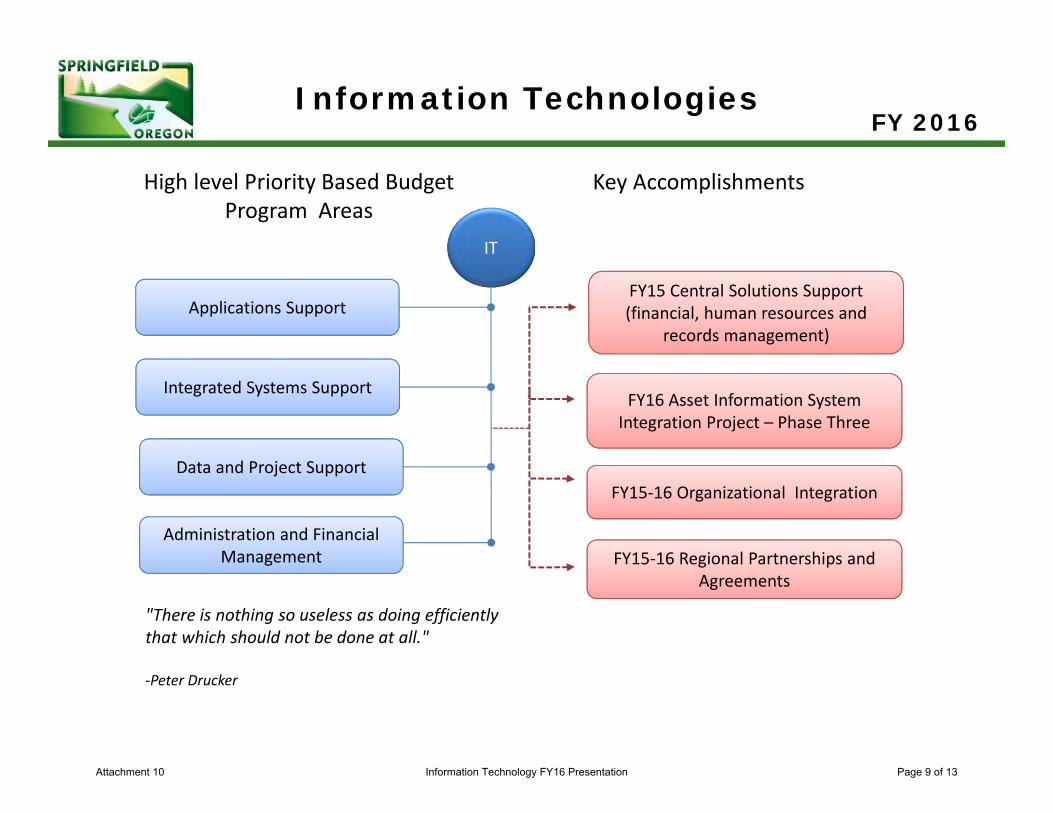
Information TechnologiesFY 2016
IT
Applications Support
"There is nothing so useless as doing efficiently that which should not be done at all."
‐Peter Drucker
Key Accomplishments
Integrated Systems Support
FY15‐16 Organizational IntegrationData and Project Support
FY16 Asset Information System Integration Project – Phase Three
Administration and Financial Management
FY15 Central Solutions Support (financial, human resources and
records management)
High level Priority Based Budget Program Areas
FY15‐16 Regional Partnerships and Agreements
Attachment 10 Information Technology FY16 Presentation Page 9 of 13
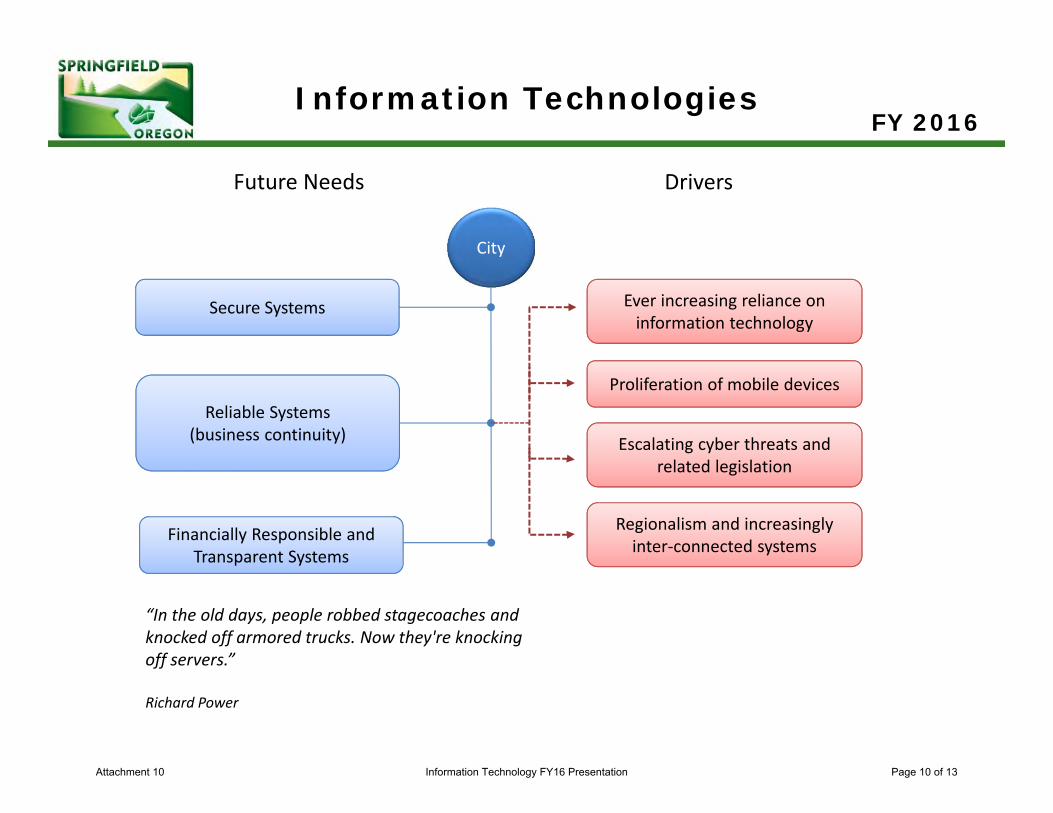
Information TechnologiesFY 2016
City
Secure Systems
Drivers
Reliable Systems(business continuity)
Proliferation of mobile devices
Escalating cyber threats and related legislation
Financially Responsible and Transparent Systems
Ever increasing reliance on information technology
Future Needs
“In the old days, people robbed stagecoaches and knocked off armored trucks. Now they're knocking off servers.”
Richard Power
Regionalism and increasingly inter‐connected systems
Attachment 10 Information Technology FY16 Presentation Page 10 of 13
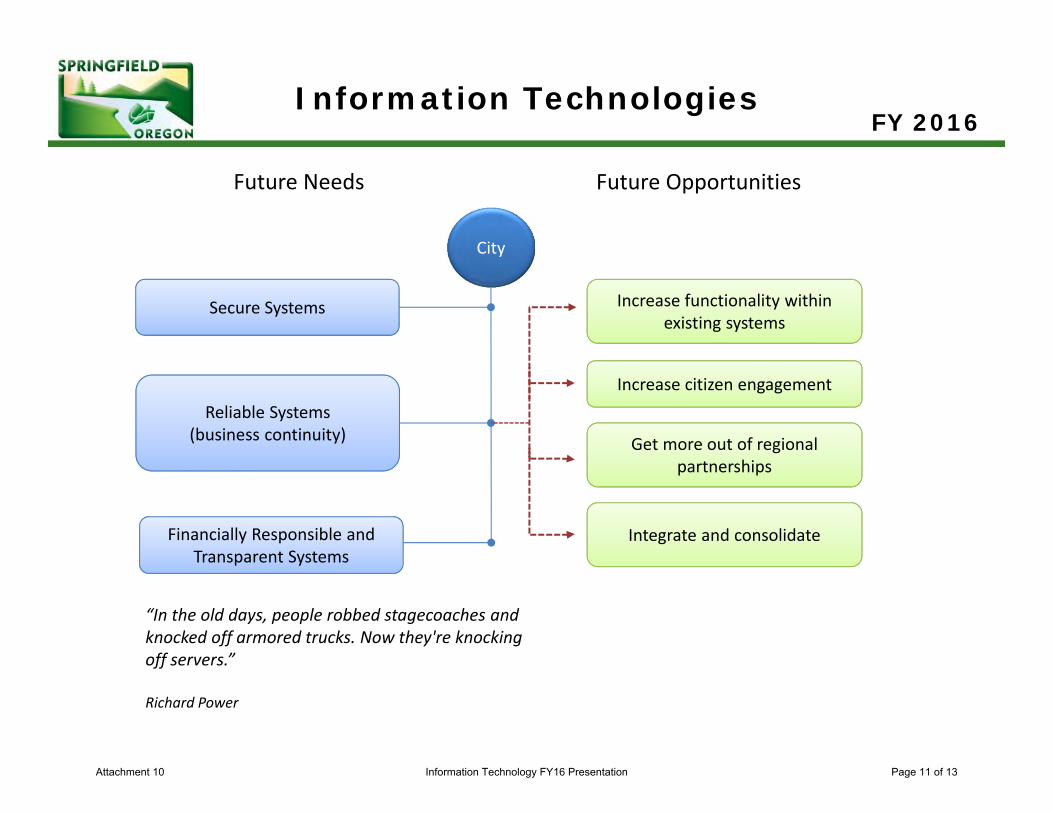
Information TechnologiesFY 2016
City
Secure Systems
Future Opportunities
Reliable Systems(business continuity)
Increase citizen engagement
Get more out of regional partnerships
Financially Responsible and Transparent Systems
Increase functionality within existing systems
Future Needs
“In the old days, people robbed stagecoaches and knocked off armored trucks. Now they're knocking off servers.”
Richard Power
Integrate and consolidate
Attachment 10 Information Technology FY16 Presentation Page 11 of 13
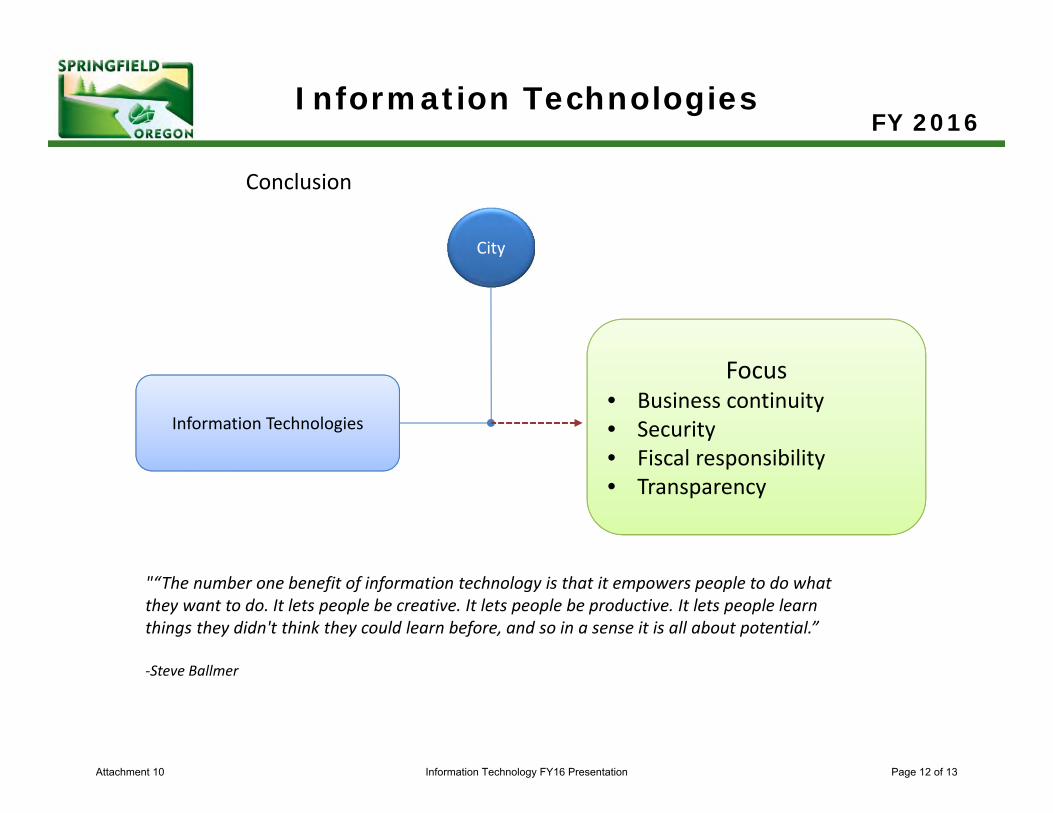
Information TechnologiesFY 2016
City
Information Technologies
Focus• Business continuity • Security • Fiscal responsibility• Transparency
Conclusion
"“The number one benefit of information technology is that it empowers people to do what they want to do. It lets people be creative. It lets people be productive. It lets people learn things they didn't think they could learn before, and so in a sense it is all about potential.”
‐Steve Ballmer
Attachment 10 Information Technology FY16 Presentation Page 12 of 13
Information TechnologiesFY 2016
Questions for us?
Attachment 10 Information Technology FY16 Presentation Page 13 of 13
DEPARTMENT BUDGET SUMMARY City of Springfield, Oregon
To: Gino Grimaldi, City Manager
From: Courtney Griesel, Community & Economic Development Analyst
Date: March 23, 2015
SUMMARY OF SIGNIFICANT PROPOSED BUDGET CHANGES FTE COST
South Willamette Economic Development Corporation Support Contract 0.0 $50,000
SUMMARY OF BUDGET AND SERVICE CHANGES The economy continues to show signs of recovery from the past years of economic downturn. Area businesses are leading the recovery by investing in Springfield facilities and employees, positively impacting the value of individual properties and the area unemployement rates. While staff is optimistic about continued recovery, we are still understanding that it will continue to occur at a slow and gradual rate, demanding us to be strategic and efficient in our budgeting and service delivery. It must also be noted that business changes have occurred which were both unexpected and unrelated to the economy’s downturn or recovery, but will impact city-wide property tax revenues recieved.
While there are no key projects or budget changes proposed which generate a request for additional FTE, it should be noted that 1FTE is anticipated to retire during FY16, generating opportunity for minor adjustments in reporting structure and general fund and urban renewal budget expenditures on staffing. These adjustments are anticipated to lessen impacts to the General Fund while increasing capacity in the Economic Development Program. The current proposed FTE for FY16 remains at 7.5 without a proposed increase in FTE or associated costs.
This year’s City Managers Office budget does not propose any significant program budget increases. The budget continues to fund programs at a level aimed to effectively provide key services and monitor costs and efficiency of service delivery.
South Willamette Economic Development Corporation (SWEDCO) Contract SWEDCO is a newly formed (January 2015) regional organization focused on regional business recruitment, retention, and expansion. Formed in January, 2015, SWEDCO is supported by the City of Springfield, the City of Eugene, Lane County, Eugene Chamber of Commerce, Springfield Area Chamber of Commerce, Lane Workforce Partnership, and multiple other business support organization. The City of Springfield’s support to SWEDCO in the amount of $50,000 for FY16 is the beginning of a commitment for annual support.
FUTURE NEEDS The City Manager’s Office Economic Development Program manages both Urban Renewal Areas (Glenwood and Downtown) as well as revenues received from local Transient Room Taxes. While revenues seen from these programs has been gradually increasing over the past year, the increase is anticipated to continue at a conservative pace, requiring continued caution in the allocation of these funds to City and community projects. Additionally, the loss of a key industrial property located within the Downtown Urban Reneal Area will create a significant decrease in the annual increment funds generated within the district. Through committed leadership by the Mayor and efforts of staff, the loss will only be temporary while the property redevelops and utilizes enterprise zone incentives. This decrease in available funds is anticipated to, at minimum, limit the ability of the Downtown Urban Renewal District to implement multiple, or large, projects for FY16.
Transient Room Tax funds, those dollars received from each overnight hotel stay in Springfield, are also increasing as the economy recovers. These funds are vital to the City’s ability to fund community projects and events which positively impact the tourism industry and the number of travelers visiting Springfield, projects like the Simpson’s Mural installation and community unveiling and celebration event in FY15 which drew visitors to Springfield from around the world and has continued to draw visitors to the area since. In FY16, the City
Attachment 11 City Manager's Office FY16 Budget Summary Memo Page 1 of 2
Manager’s Office Communications Program is excited for the next installation of artwork, a mural to honor Springfield resident Ken Kesey.
Beginning in FY13, the Communications Program also began accepting sponsorships for City organized events and projects. These revenues are aimed directly at funding the specific costs of a specific community project or event. Staff continues to identify and secure increasing numbers of partnerships for the funding of important community events and as a result, the FY16 budget includes an increased event program budget which utilizes no City tax funds but, rather, benefits from full repayment by event/project private sponsorships.
CONCLUSION It is the ultimate goal of the department to most effectively, responsibly, and innovatively implement the priorities of the Mayor and Council, thus continuing to deliver high quality services and projects to both the organization and community.
The proposed budget meets the guidelines set forth by the Finance Department.
Attachment 11 City Manager's Office FY16 Budget Summary Memo Page 2 of 2
City Manager’s Office FY 2016
AGENDA
• Mayor and City Council
• Community Partnerships
• Intergovernmental Partnerships
• Economic Development
• Community Relations and Events
• Coming Up in FY16
Attachment 12 City Manager's Office FY16 Presentation Page 1 of 9
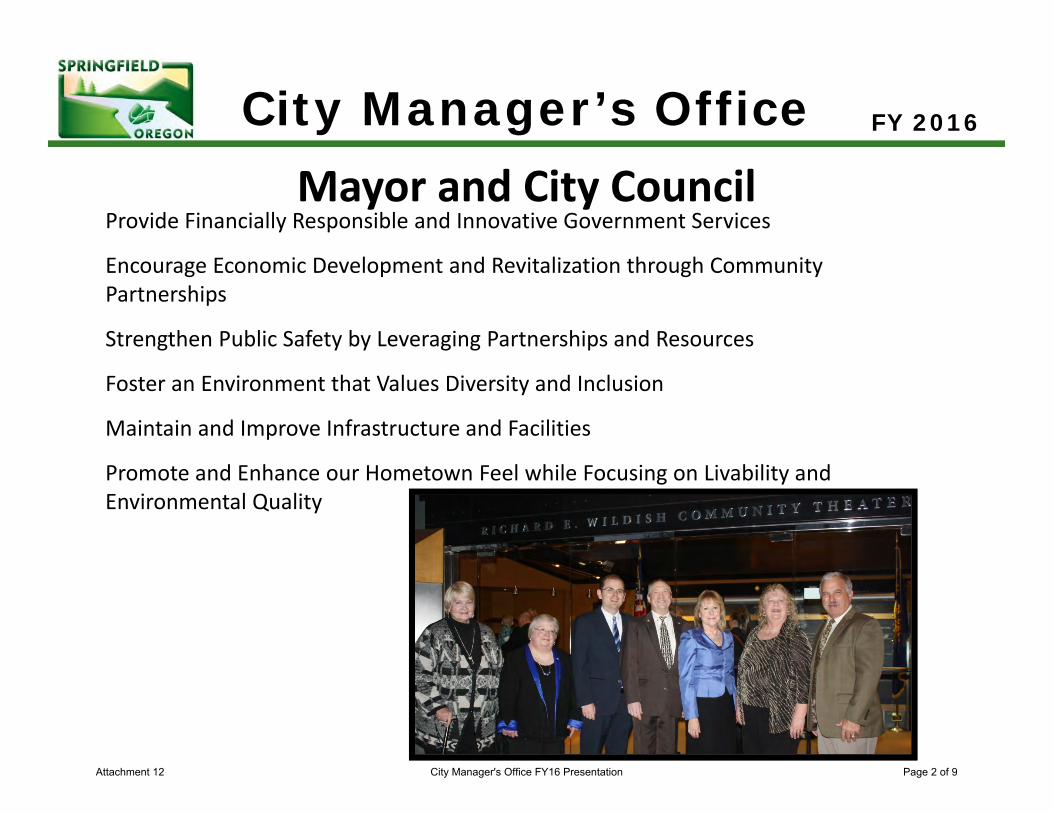
City Manager’s OfficeMayor and City Council
Provide Financially Responsible and Innovative Government Services
Encourage Economic Development and Revitalization through Community Partnerships
Strengthen Public Safety by Leveraging Partnerships and Resources
Foster an Environment that Values Diversity and Inclusion
Maintain and Improve Infrastructure and Facilities
Promote and Enhance our Hometown Feel while Focusing on Livability and Environmental Quality
FY 2016
Attachment 12 City Manager's Office FY16 Presentation Page 2 of 9
City Manager’s Office FY 2016
Attachment 12 City Manager's Office FY16 Presentation Page 3 of 9
City Manager’s OfficeChanges to Intergovernmental Funding Partnerships for Services in FY16
South Willamette Economic Development Corporation (SWEDCO)‐ Regional Business Recruitment ‐ Regional Business Retention & Expansion‐ Partnership through Inter‐Governmental Agreement‐ Proposed funding: $25,000 General Fund
FY 2016
Attachment 12 City Manager's Office FY16 Presentation Page 4 of 9
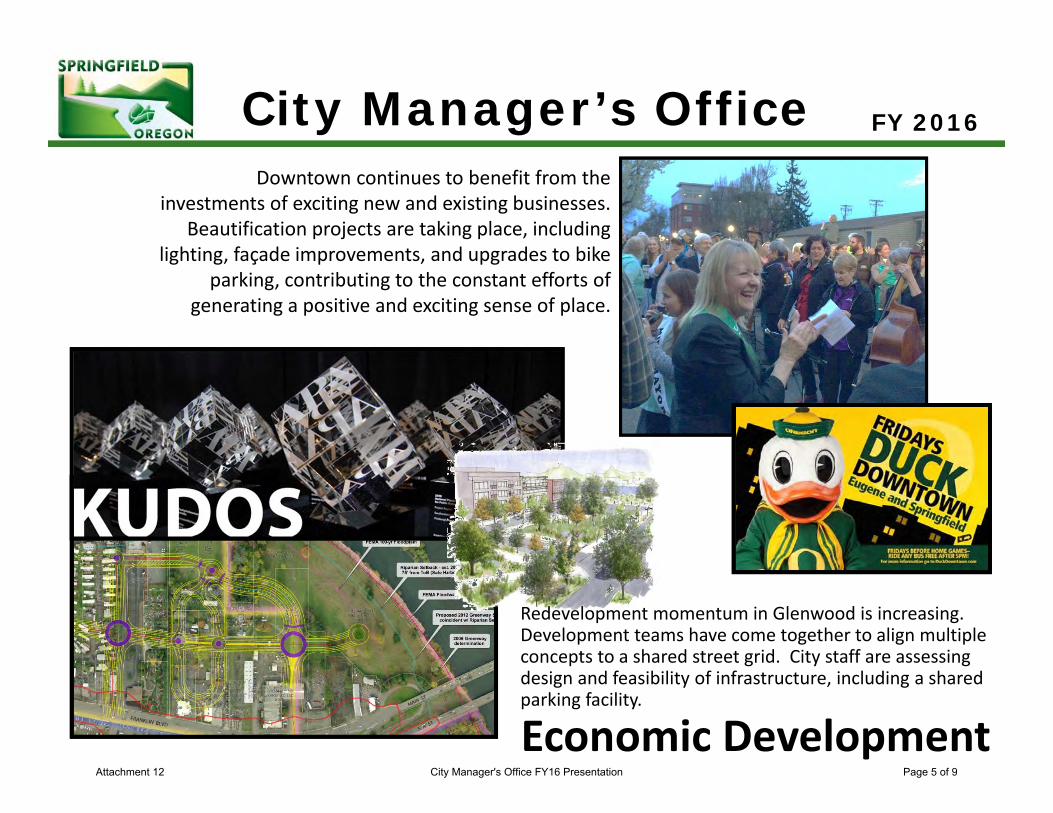
City Manager’s Office
Economic Development
Redevelopment momentum in Glenwood is increasing. Development teams have come together to align multiple concepts to a shared street grid. City staff are assessing design and feasibility of infrastructure, including a shared parking facility.
Downtown continues to benefit from the investments of exciting new and existing businesses.
Beautification projects are taking place, including lighting, façade improvements, and upgrades to bike
parking, contributing to the constant efforts of generating a positive and exciting sense of place.
FY 2016
Attachment 12 City Manager's Office FY16 Presentation Page 5 of 9
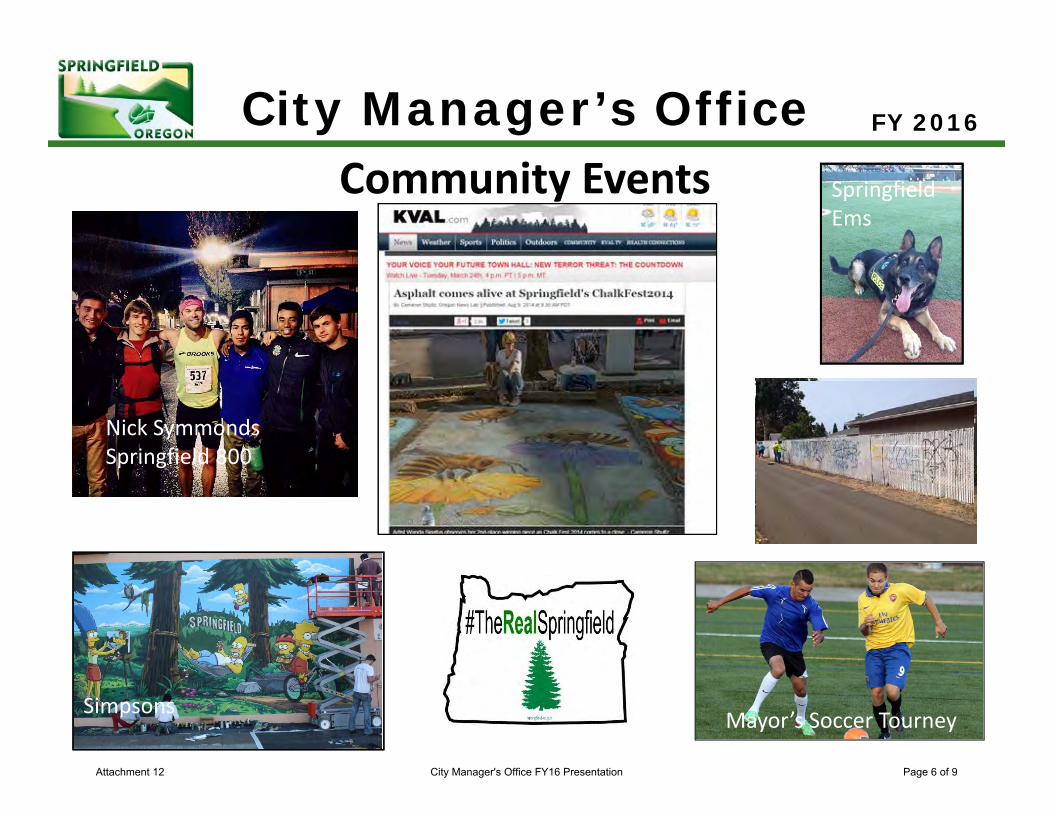
City Manager’s OfficeCommunity Events
Media
FY 2016
Simpsons
MediaNick SymmondsSpringfield 800
Springfield Ems
Mayor’s Soccer Tourney
Attachment 12 City Manager's Office FY16 Presentation Page 6 of 9
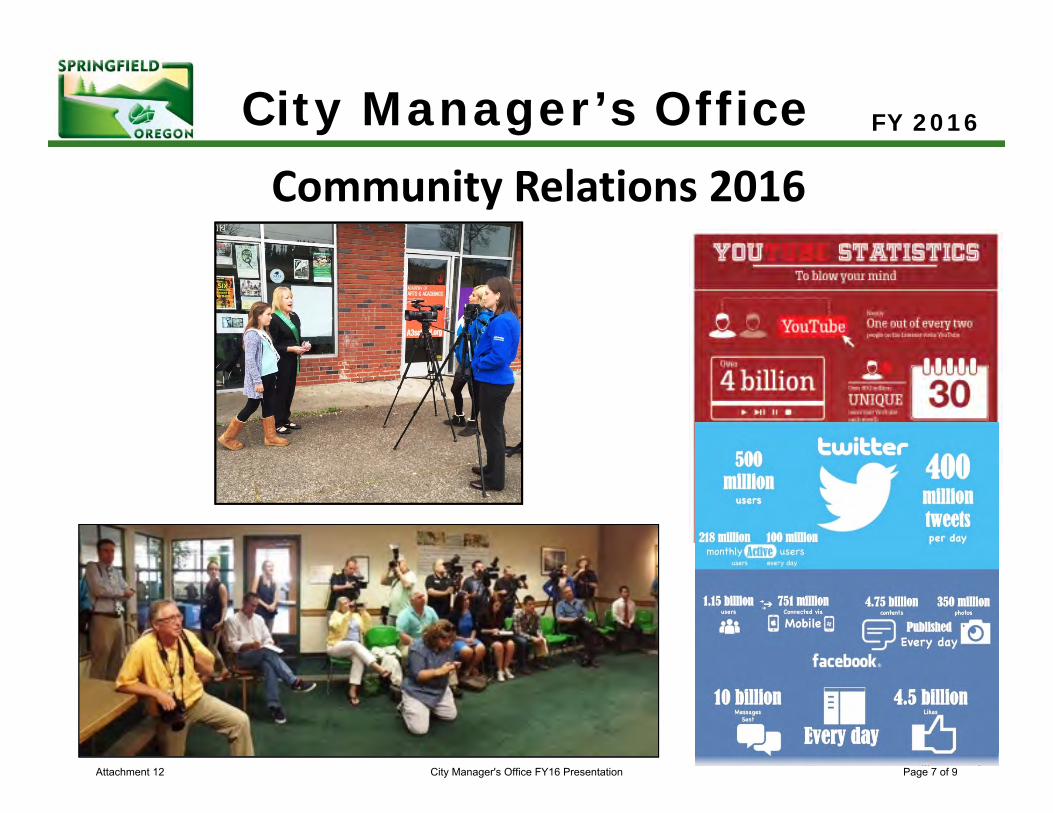
City Manager’s OfficeCommunity Relations 2016
Media
FY 2016
Nick SymmondsSpringfield 800
Attachment 12 City Manager's Office FY16 Presentation Page 7 of 9
City Manager’s Office
Mayor’s Invitational Soccer Tournament
FY 2016
Attachment 12 City Manager's Office FY16 Presentation Page 8 of 9
City Manager’s Office
Questions?
FY 2016
Attachment 12 City Manager's Office FY16 Presentation Page 9 of 9
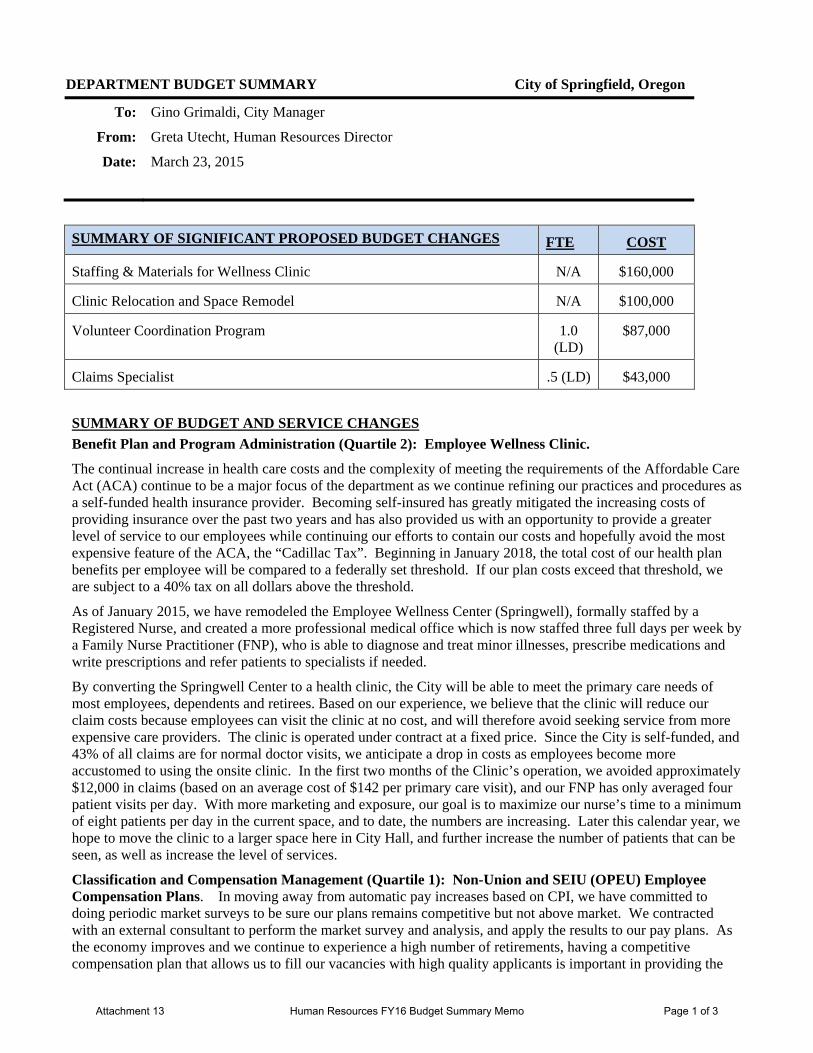
DEPARTMENT BUDGET SUMMARY City of Springfield, Oregon
To: Gino Grimaldi, City Manager
From: Greta Utecht, Human Resources Director
Date: March 23, 2015
SUMMARY OF SIGNIFICANT PROPOSED BUDGET CHANGES FTE COST
Staffing & Materials for Wellness Clinic N/A $160,000
Clinic Relocation and Space Remodel N/A $100,000
Volunteer Coordination Program 1.0 (LD)
$87,000
Claims Specialist .5 (LD) $43,000
SUMMARY OF BUDGET AND SERVICE CHANGES
Benefit Plan and Program Administration (Quartile 2): Employee Wellness Clinic.
The continual increase in health care costs and the complexity of meeting the requirements of the Affordable Care Act (ACA) continue to be a major focus of the department as we continue refining our practices and procedures as a self-funded health insurance provider. Becoming self-insured has greatly mitigated the increasing costs of providing insurance over the past two years and has also provided us with an opportunity to provide a greater level of service to our employees while continuing our efforts to contain our costs and hopefully avoid the most expensive feature of the ACA, the “Cadillac Tax”. Beginning in January 2018, the total cost of our health plan benefits per employee will be compared to a federally set threshold. If our plan costs exceed that threshold, we are subject to a 40% tax on all dollars above the threshold.
As of January 2015, we have remodeled the Employee Wellness Center (Springwell), formally staffed by a Registered Nurse, and created a more professional medical office which is now staffed three full days per week by a Family Nurse Practitioner (FNP), who is able to diagnose and treat minor illnesses, prescribe medications and write prescriptions and refer patients to specialists if needed.
By converting the Springwell Center to a health clinic, the City will be able to meet the primary care needs of most employees, dependents and retirees. Based on our experience, we believe that the clinic will reduce our claim costs because employees can visit the clinic at no cost, and will therefore avoid seeking service from more expensive care providers. The clinic is operated under contract at a fixed price. Since the City is self-funded, and 43% of all claims are for normal doctor visits, we anticipate a drop in costs as employees become more accustomed to using the onsite clinic. In the first two months of the Clinic’s operation, we avoided approximately $12,000 in claims (based on an average cost of $142 per primary care visit), and our FNP has only averaged four patient visits per day. With more marketing and exposure, our goal is to maximize our nurse’s time to a minimum of eight patients per day in the current space, and to date, the numbers are increasing. Later this calendar year, we hope to move the clinic to a larger space here in City Hall, and further increase the number of patients that can be seen, as well as increase the level of services.
Classification and Compensation Management (Quartile 1): Non-Union and SEIU (OPEU) Employee Compensation Plans. In moving away from automatic pay increases based on CPI, we have committed to doing periodic market surveys to be sure our plans remains competitive but not above market. We contracted with an external consultant to perform the market survey and analysis, and apply the results to our pay plans. As the economy improves and we continue to experience a high number of retirements, having a competitive compensation plan that allows us to fill our vacancies with high quality applicants is important in providing the
Attachment 13 Human Resources FY16 Budget Summary Memo Page 1 of 3
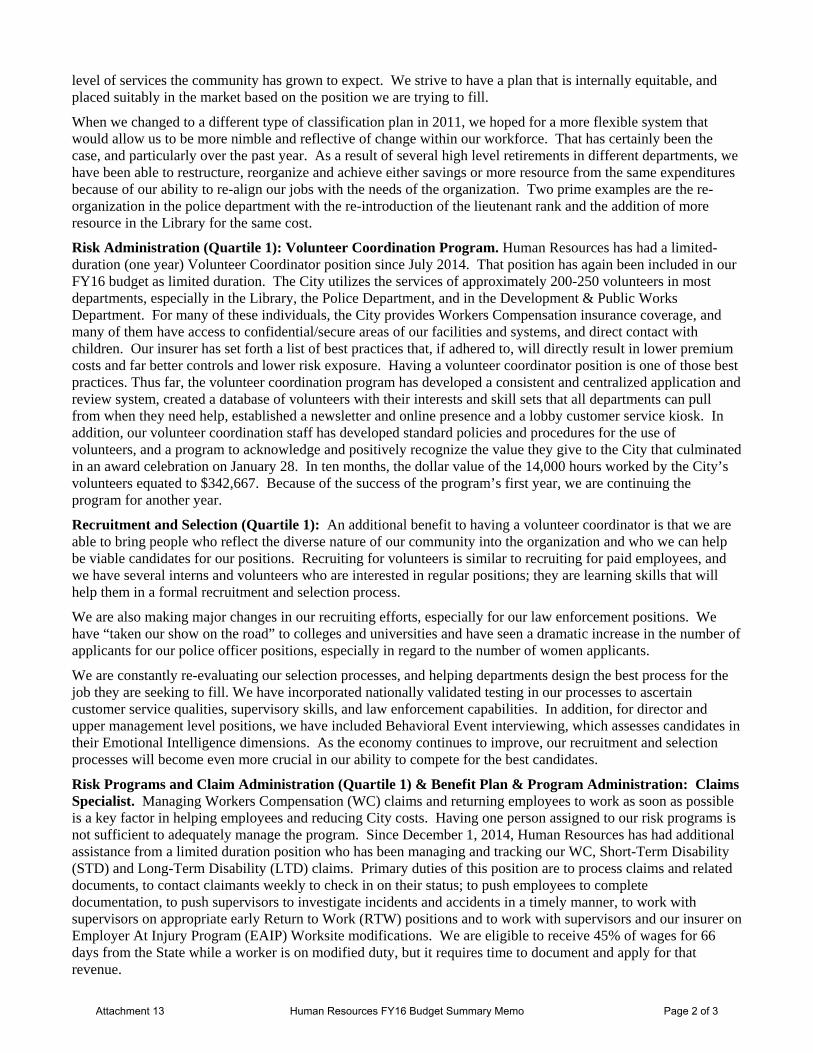
level of services the community has grown to expect. We strive to have a plan that is internally equitable, and placed suitably in the market based on the position we are trying to fill.
When we changed to a different type of classification plan in 2011, we hoped for a more flexible system that would allow us to be more nimble and reflective of change within our workforce. That has certainly been the case, and particularly over the past year. As a result of several high level retirements in different departments, we have been able to restructure, reorganize and achieve either savings or more resource from the same expenditures because of our ability to re-align our jobs with the needs of the organization. Two prime examples are the re-organization in the police department with the re-introduction of the lieutenant rank and the addition of more resource in the Library for the same cost.
Risk Administration (Quartile 1): Volunteer Coordination Program. Human Resources has had a limited-duration (one year) Volunteer Coordinator position since July 2014. That position has again been included in our FY16 budget as limited duration. The City utilizes the services of approximately 200-250 volunteers in most departments, especially in the Library, the Police Department, and in the Development & Public Works Department. For many of these individuals, the City provides Workers Compensation insurance coverage, and many of them have access to confidential/secure areas of our facilities and systems, and direct contact with children. Our insurer has set forth a list of best practices that, if adhered to, will directly result in lower premium costs and far better controls and lower risk exposure. Having a volunteer coordinator position is one of those best practices. Thus far, the volunteer coordination program has developed a consistent and centralized application and review system, created a database of volunteers with their interests and skill sets that all departments can pull from when they need help, established a newsletter and online presence and a lobby customer service kiosk. In addition, our volunteer coordination staff has developed standard policies and procedures for the use of volunteers, and a program to acknowledge and positively recognize the value they give to the City that culminated in an award celebration on January 28. In ten months, the dollar value of the 14,000 hours worked by the City’s volunteers equated to $342,667. Because of the success of the program’s first year, we are continuing the program for another year.
Recruitment and Selection (Quartile 1): An additional benefit to having a volunteer coordinator is that we are able to bring people who reflect the diverse nature of our community into the organization and who we can help be viable candidates for our positions. Recruiting for volunteers is similar to recruiting for paid employees, and we have several interns and volunteers who are interested in regular positions; they are learning skills that will help them in a formal recruitment and selection process.
We are also making major changes in our recruiting efforts, especially for our law enforcement positions. We have “taken our show on the road” to colleges and universities and have seen a dramatic increase in the number of applicants for our police officer positions, especially in regard to the number of women applicants.
We are constantly re-evaluating our selection processes, and helping departments design the best process for the job they are seeking to fill. We have incorporated nationally validated testing in our processes to ascertain customer service qualities, supervisory skills, and law enforcement capabilities. In addition, for director and upper management level positions, we have included Behavioral Event interviewing, which assesses candidates in their Emotional Intelligence dimensions. As the economy continues to improve, our recruitment and selection processes will become even more crucial in our ability to compete for the best candidates.
Risk Programs and Claim Administration (Quartile 1) & Benefit Plan & Program Administration: Claims Specialist. Managing Workers Compensation (WC) claims and returning employees to work as soon as possible is a key factor in helping employees and reducing City costs. Having one person assigned to our risk programs is not sufficient to adequately manage the program. Since December 1, 2014, Human Resources has had additional assistance from a limited duration position who has been managing and tracking our WC, Short-Term Disability (STD) and Long-Term Disability (LTD) claims. Primary duties of this position are to process claims and related documents, to contact claimants weekly to check in on their status; to push employees to complete documentation, to push supervisors to investigate incidents and accidents in a timely manner, to work with supervisors on appropriate early Return to Work (RTW) positions and to work with supervisors and our insurer on Employer At Injury Program (EAIP) Worksite modifications. We are eligible to receive 45% of wages for 66 days from the State while a worker is on modified duty, but it requires time to document and apply for that revenue.
Attachment 13 Human Resources FY16 Budget Summary Memo Page 2 of 3
Between 12/1/2014 and 2/28/2015 this effort has resulted in an additional $22,000 of revenue from the State as wage subsidy, and $20,000 in reimbursement for worksite modification purchases. Ergonomic furniture, heart healthy fire sirens, better lighting, and public reception counter safety features are examples of ways the EAIP funds can be used.
STD and LTD claims tracking can result in less duplication of effort if benefit is delivered at time of injury. Calculating differential between insurance benefit and employee’s accrued time usage is complicated and after the fact, which results in manual adjustments and increased resource needs.
In order to have a longer period of time to assess whether the revenue experienced thus far is sustainable, we are continuing the claims administration program through December 2015 on a limited duration basis and will then reassess.
Employee and Labor Relations (Quartile 1): Contract negotiations, grievance management and supervisor coaching continue to be a large workload in Human Resources and Finance. This past year saw the birth of a new bargaining group when changes in State statute allowed the Fire Battalion Chiefs to organize. As a result, a new contract was bargained between the Battalion Chiefs (now part of the larger IAFF 851 unit) and the Cities of Springfield and Eugene. Shared governance of the Fire Department continues to pose challenges and opportunities as we discover more differences between each City, and work to find common solutions to problems and issues.
We are now in the beginning stages of bargaining the larger IAFF contract, which expires June 30, 2015. In addition we are also at the bargaining table with our AFSCME unit.
FUTURE NEEDS
Personnel costs (compensation and benefits) continue to be the major cost driver in our and other public sector organizations. Maintaining an attractive compensation and benefit package is fundamental to our ability to continue to provide excellent services to the community, while protecting the assets of the City means constantly analyzing and searching for the best way to achieve that goal without jeopardizing the City’s financial stability. In addition to base salary, we will continue to review other compensation ingredients to determine if we are above, at, or below what is appropriate to pay. We are reviewing our vacation and sick leave benefits, both for active and for retiring employees. For example, in partnership with Finance staff, we have embarked upon an analysis of whether it would be to the City’s and our employees’ advantage to move from a separate vacation and sick leave benefit, to a combined benefit, often referred to as “paid time out.” We have also reviewed implementing a post-retirement VEBA plan account that would allow for retirement payouts to be placed into a tax free account for health related expenditures. Employees would avoid federal and state taxes and the City will avoid payroll taxes.
Greater investment in employee training is also high on our priority list, especially with regard to cultural competency, improved communication, and supervisory training, all of which have been reduced during the past four years.
Investment in more analytical resources, whether in Human Resources or Finance is an investment in our future, as is more support and investment in technology. There are technological tools available such as a Risk Management system, a Volunteer Management system, and a Recruitment system that would provide far more sophisticated analysis and support than what we now have, plus allowing for staff resources to be more effectively deployed.
The Springwell Employee Clinic is a perfect example of finding the right balance between employee support and financial savings. With the onset of the Affordable Care Act, and the probability of the Cadillac Tax in 2018, we believe that the Clinic may actually save us direct health care costs in the long term, while providing an incredible benefit to our employees.
CONCLUSION
A fundamental value of the Human Resources department is to maximize employee effectiveness and satisfaction. Protecting our financial and human resources, preventing needless costs that can result from inadequate risk management or misadministration of pay plans and benefits, and continuing to evaluate our programs for cost containment is how we see our role in providing the best service to the community.
Attachment 13 Human Resources FY16 Budget Summary Memo Page 3 of 3

Human Resources FY 2016
Hghlights, Challenges & Opportunitiesbenefits
Attachment 14 Human Resources FY16 Presentation Page 1 of 20
Human Resources FY 2016
Highlights Challenges
Opportunities
Attachment 14 Human Resources FY16 Presentation Page 2 of 20
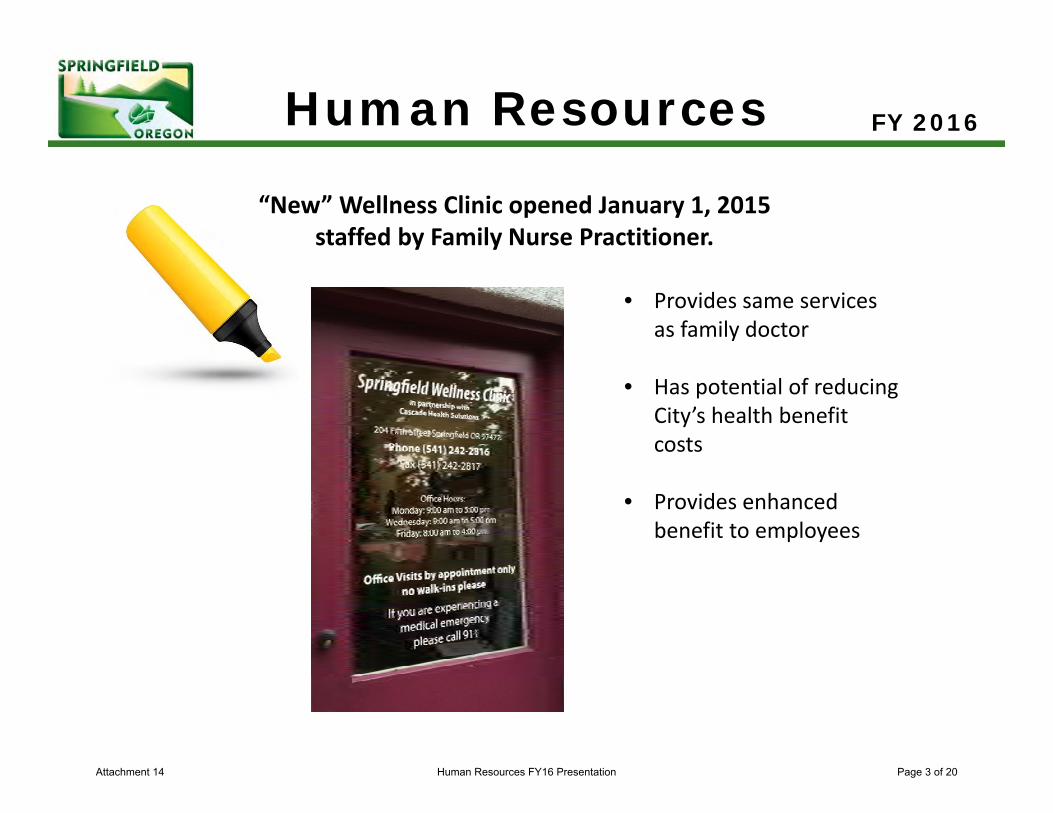
Human Resources FY 2016
• Provides same services as family doctor
• Has potential of reducing City’s health benefit costs
• Provides enhanced benefit to employees
“New” Wellness Clinic opened January 1, 2015 staffed by Family Nurse Practitioner.
Attachment 14 Human Resources FY16 Presentation Page 3 of 20
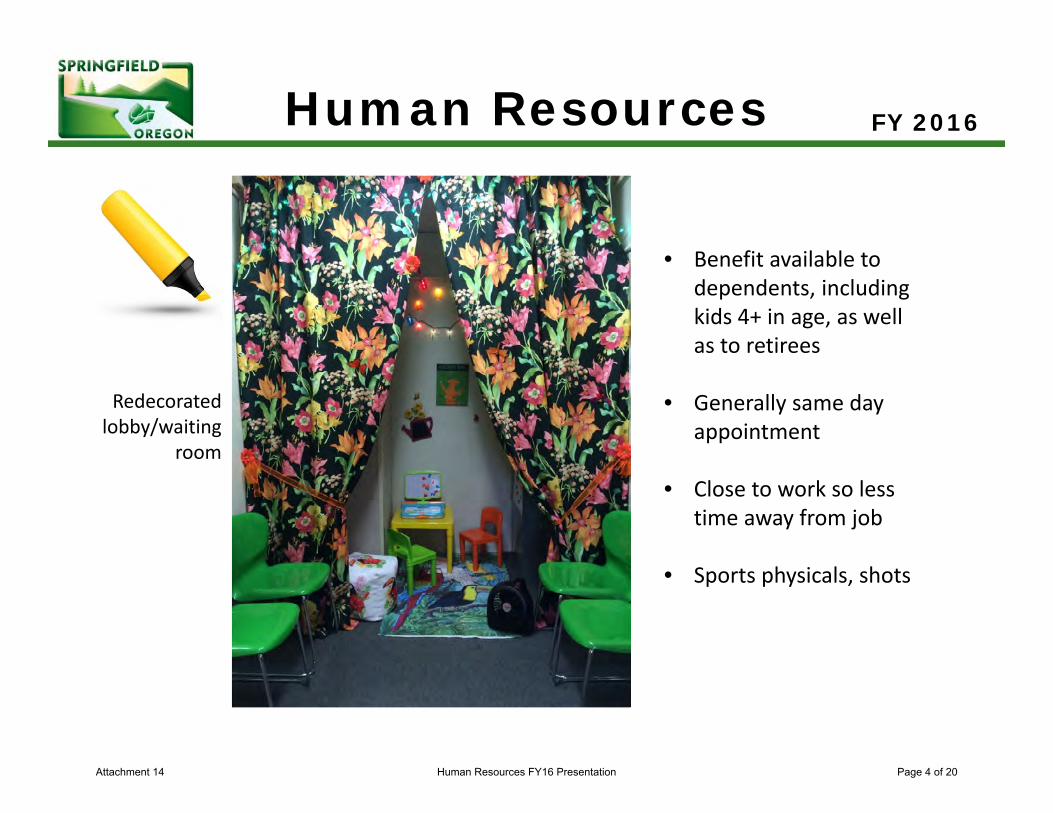
Human Resources FY 2016
• Benefit available to dependents, including kids 4+ in age, as well as to retirees
• Generally same day appointment
• Close to work so less time away from job
• Sports physicals, shots
Redecorated lobby/waiting
room
Attachment 14 Human Resources FY16 Presentation Page 4 of 20
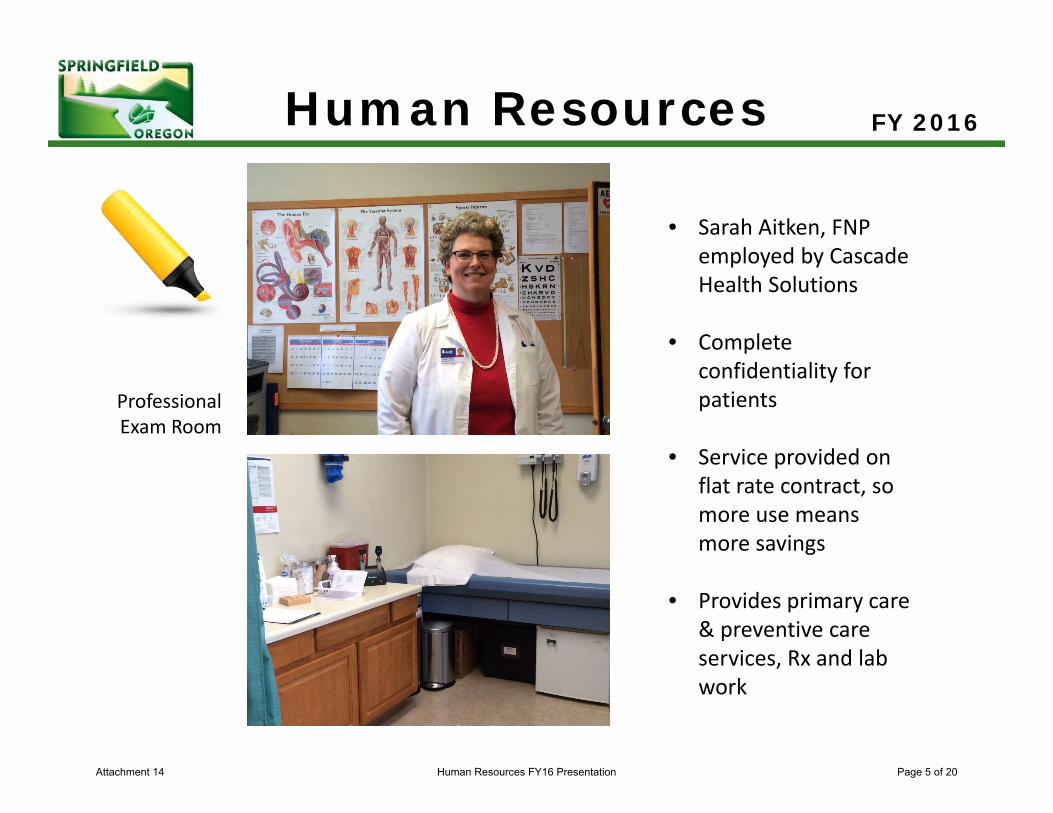
Human Resources FY 2016
• Sarah Aitken, FNP employed by Cascade Health Solutions
• Complete confidentiality for patients
• Service provided on flat rate contract, so more use means more savings
• Provides primary care & preventive care services, Rx and lab work
Professional Exam Room
Attachment 14 Human Resources FY16 Presentation Page 5 of 20
Human Resources FY 2016
Wellness Clinic Challenges:Need larger space in order to perform more procedures:• Lab• Accessible rest rooms• Additional exam room with sink• Office space• Waiting/reception space• Sound‐proofing
Attachment 14 Human Resources FY16 Presentation Page 6 of 20
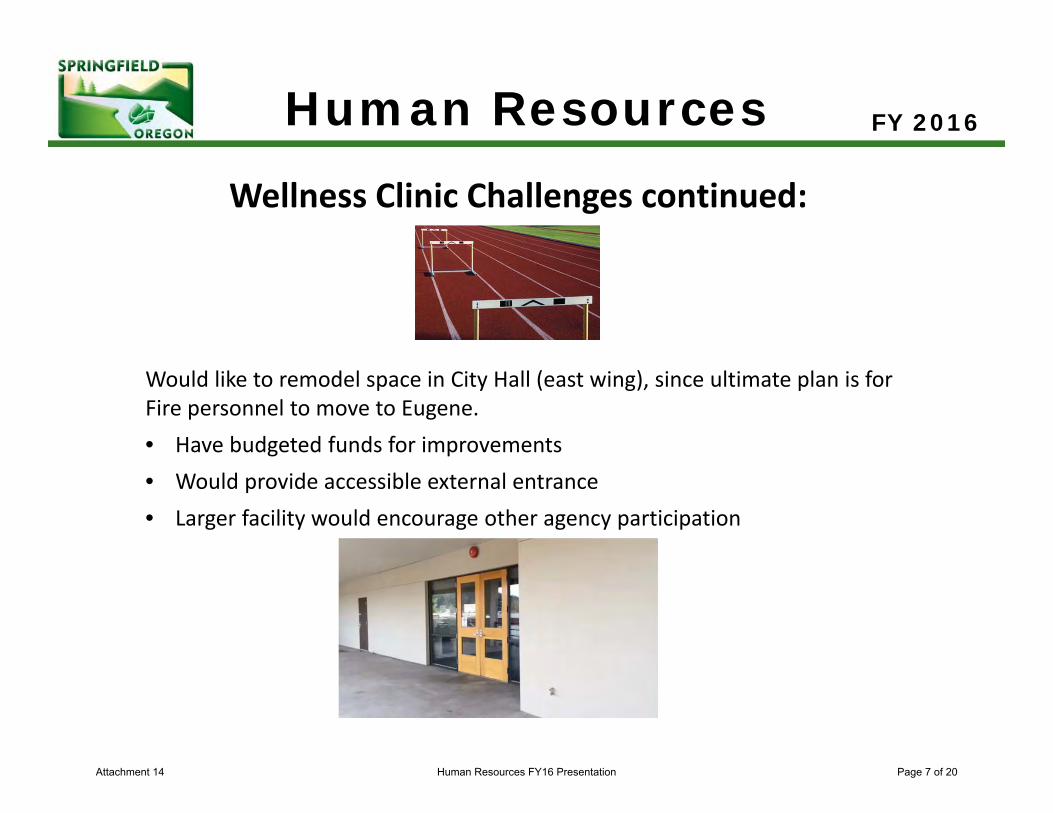
Human Resources FY 2016
Wellness Clinic Challenges continued:
Would like to remodel space in City Hall (east wing), since ultimate plan is for Fire personnel to move to Eugene. • Have budgeted funds for improvements• Would provide accessible external entrance• Larger facility would encourage other agency participation
Attachment 14 Human Resources FY16 Presentation Page 7 of 20
Human Resources FY 2016
Wellness Clinic Opportunities:
• Keep overall health costs down and mitigate Cadillac tax in 2018
• Reduce time employees need to be away from work to see family doctor therefore increasing productivity
• Encourage employees to seek treatment at onset rather than waiting until Urgent Care situation
• Identify chronic conditions early and treat with less extensive methods
• Provides an attractive recruitment tool; we are currently the only public sector agency except 4J Schools with such a positive benefit
Attachment 14 Human Resources FY16 Presentation Page 8 of 20
Human Resources FY 2016
• City benefits from 200‐250 volunteers annually
• We provide WC insurance coverage for many; our insurer provides City with financial incentive if we have strong oversight of volunteers
• Until FY2015 we had no coordinated oversight for volunteers.
Volunteer Coordinator Program
Attachment 14 Human Resources FY16 Presentation Page 9 of 20
Human Resources FY 2016
We couldn’t do it without our volunteers!
Attachment 14 Human Resources FY16 Presentation Page 10 of 20
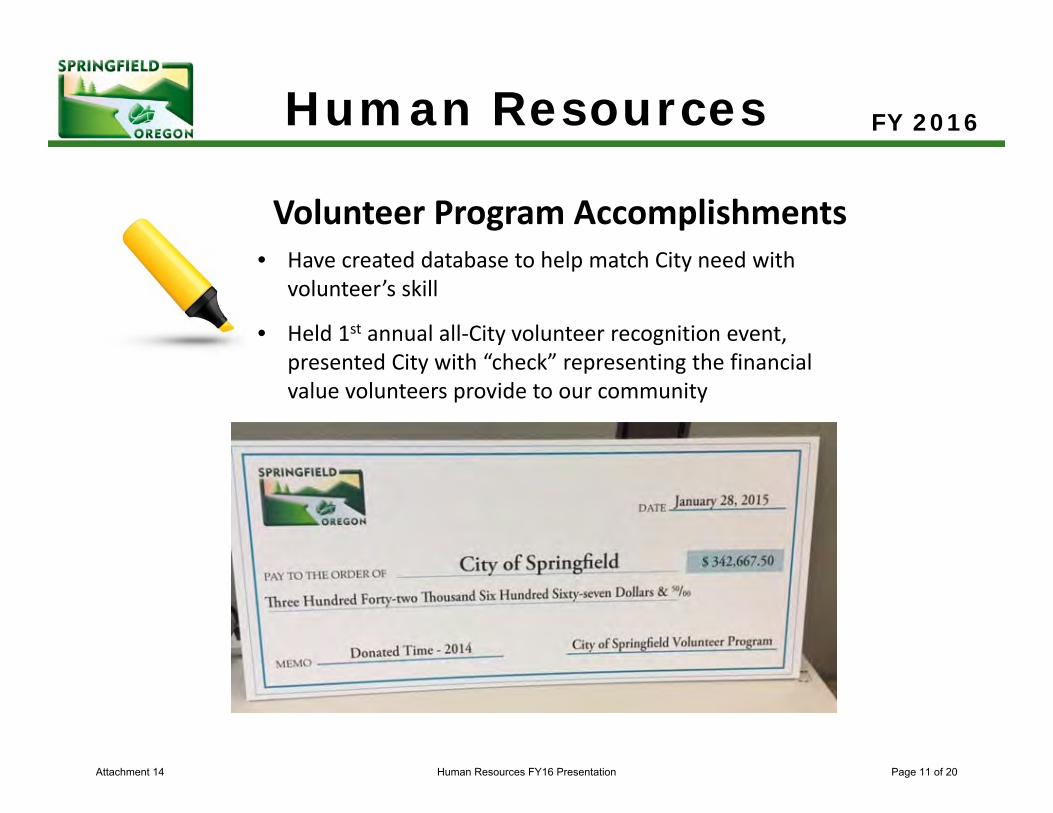
Human Resources FY 2016
• Have created database to help match City need with volunteer’s skill
• Held 1st annual all‐City volunteer recognition event, presented City with “check” representing the financial value volunteers provide to our community
Volunteer Program Accomplishments
Attachment 14 Human Resources FY16 Presentation Page 11 of 20
Human Resources FY 2016
• Have website presence and newsletter to recruit new volunteers
• Are placing volunteers in departments throughout City to help perform duties that support ongoing operations:, such as book shelving in Library, filing in DPW, data entry in HR, fleet maintenance in the PD, etc.
• Developed policies and practices for use of volunteers and interns to ensure our compliance with State labor laws
• Recognizing hours that volunteers put in with President’s Volunteer Service Award Program
Volunteer Program Accomplishments
Attachment 14 Human Resources FY16 Presentation Page 12 of 20
Human Resources FY 2016
Volunteer Program Challenges
• Currently staffed by one limited duration (LD) FTE and supported by volunteers; need ongoing permanent position to ensure that gains made in FY15 continue
• Need better software system to enroll, review, engage, recognize and match volunteers with appropriate assignments
• Need to continue culture of appreciation and recognition of how much volunteers bring. Change employees’ perception of “just a volunteer” to “one of us; service motivated unpaid employee”
Attachment 14 Human Resources FY16 Presentation Page 13 of 20
Human Resources FY 2016
Volunteer Program Opportunities
• Integrates community with City organization & allows citizen to learn and support our operations
• Provides unofficial recruitment opportunities: volunteers see what it takes to work at the City of Springfield, and we have chance to test and observe skills in informal venue
• Provides highly motivated workforce we couldn’t otherwise afford
• Demonstrates our organization’s and community’s “can do, will do” values
Attachment 14 Human Resources FY16 Presentation Page 14 of 20
Human Resources FY 2016
Risk & Benefits: Claims Management
• Employing .5 FTE LD to actively manage Workers’ Compensation and Disability claims
• In initial three months, were able to recoup $22,000 in wage subsidy and $20,000 in work site modification reimbursement
• Have ability to help employees return to work more quickly after injury and prevent injuries in future
• Changing employee demographics require more flexible work sites and equipment
Attachment 14 Human Resources FY16 Presentation Page 15 of 20
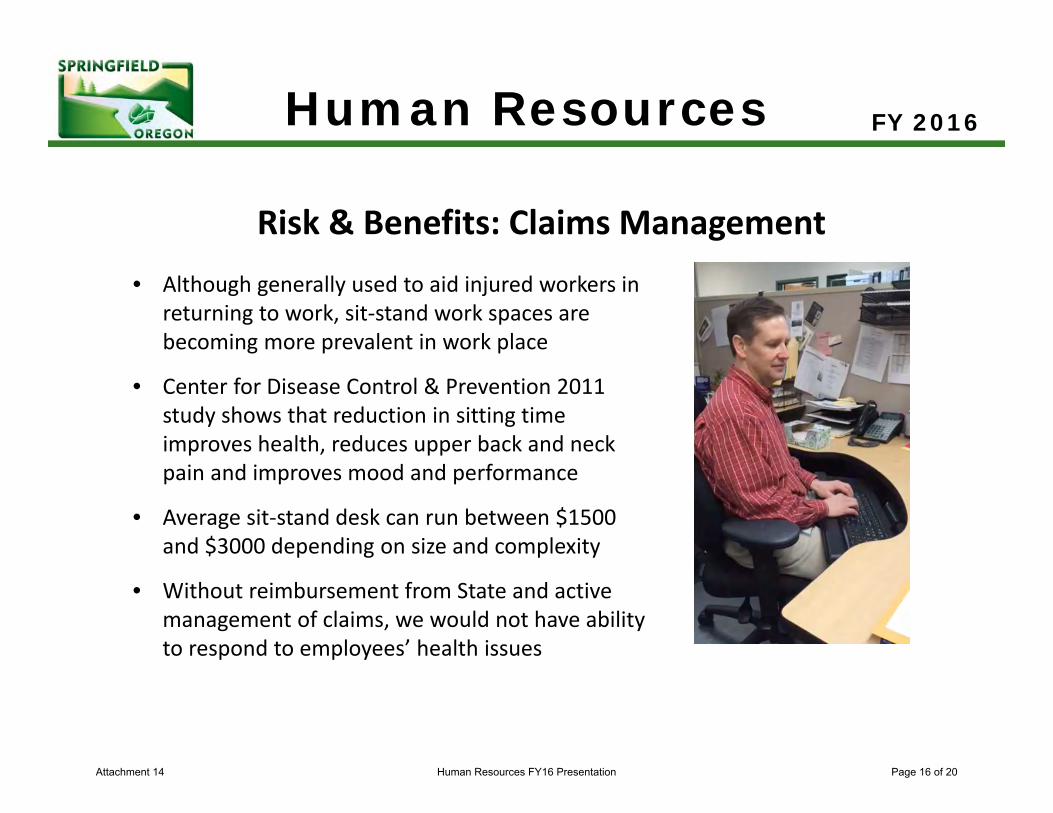
Human Resources FY 2016
Risk & Benefits: Claims Management • Although generally used to aid injured workers in
returning to work, sit‐stand work spaces are becoming more prevalent in work place
• Center for Disease Control & Prevention 2011 study shows that reduction in sitting time improves health, reduces upper back and neck pain and improves mood and performance
• Average sit‐stand desk can run between $1500 and $3000 depending on size and complexity
• Without reimbursement from State and active management of claims, we would not have ability to respond to employees’ health issues
Attachment 14 Human Resources FY16 Presentation Page 16 of 20
Human Resources FY 2016
Challenges Now and in the Future
• Personnel costs major expense for public sector; total compensation package review is key in finding balance and solutions
• We need to be vigilant in searching for ways to mitigate costs while not deteriorating our ability to be employer of choice
• Economic recovery in private sector putting pressure on our ability to attract and retain top caliber employees
• Responding to changes resulting from Affordable Care Act will continue to impact all aspects of HR’s work
Attachment 14 Human Resources FY16 Presentation Page 17 of 20
Human Resources FY 2016
Challenges Now and in the Future
• Potential unfunded legislative mandates regarding employment matters and collective bargaining
• Demographics indicate huge loss in institutional knowledge: 56% of supervisors and managers able to retire in next 3 years
• Need to provide more leadership and risk avoidance training
• Need to continue to find ways to diversify our workforce
Attachment 14 Human Resources FY16 Presentation Page 18 of 20
Human Resources FY 2016
Opportunities for HR
• Have a trust relationship with our employees
• Able to be more nimble in making changes than larger organizations
• Have good relationships with our unions
• Have been able to recruit very talented employees city‐wide
• Stars aligned re Clinic, Self‐funding and ACA
Attachment 14 Human Resources FY16 Presentation Page 19 of 20

Human Resources FY 2016
Our future’s so bright…
We gotta wear shades!
Attachment 14 Human Resources FY16 Presentation Page 20 of 20
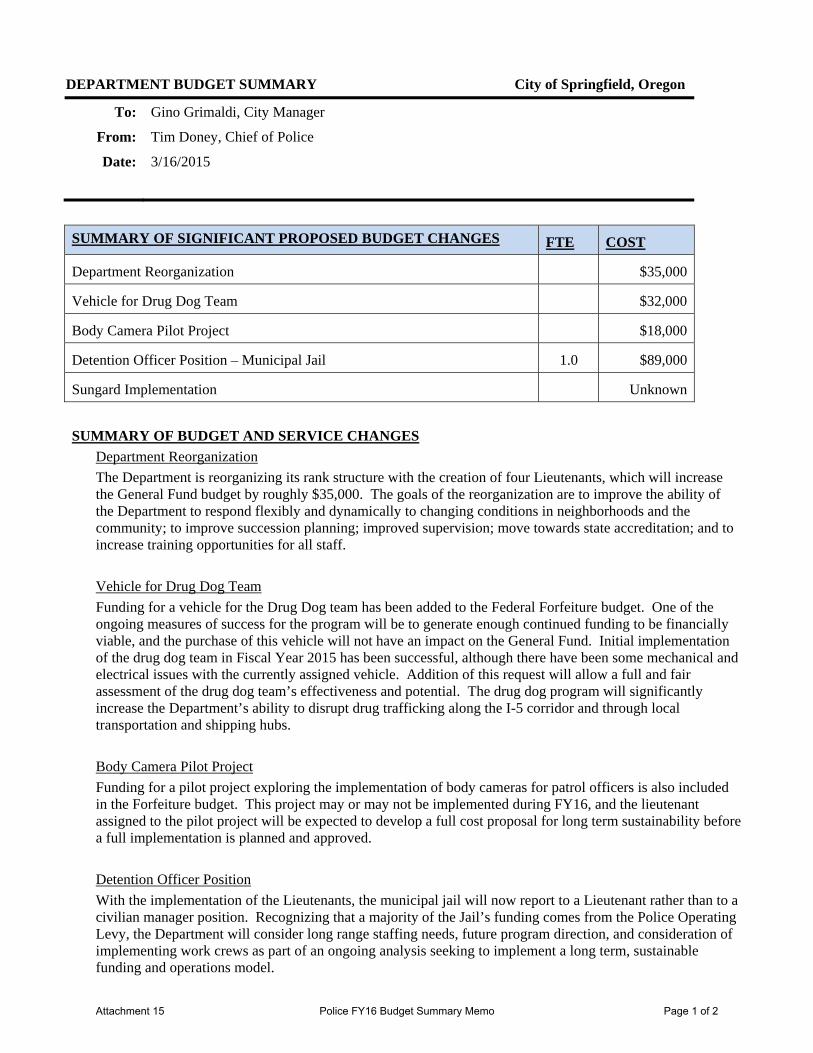
DEPARTMENT BUDGET SUMMARY City of Springfield, Oregon
To: Gino Grimaldi, City Manager
From: Tim Doney, Chief of Police
Date: 3/16/2015
SUMMARY OF SIGNIFICANT PROPOSED BUDGET CHANGES FTE COST
Department Reorganization $35,000
Vehicle for Drug Dog Team $32,000
Body Camera Pilot Project $18,000
Detention Officer Position – Municipal Jail 1.0 $89,000
Sungard Implementation Unknown
SUMMARY OF BUDGET AND SERVICE CHANGES
Department Reorganization
The Department is reorganizing its rank structure with the creation of four Lieutenants, which will increase the General Fund budget by roughly $35,000. The goals of the reorganization are to improve the ability of the Department to respond flexibly and dynamically to changing conditions in neighborhoods and the community; to improve succession planning; improved supervision; move towards state accreditation; and to increase training opportunities for all staff.
Vehicle for Drug Dog Team
Funding for a vehicle for the Drug Dog team has been added to the Federal Forfeiture budget. One of the ongoing measures of success for the program will be to generate enough continued funding to be financially viable, and the purchase of this vehicle will not have an impact on the General Fund. Initial implementation of the drug dog team in Fiscal Year 2015 has been successful, although there have been some mechanical and electrical issues with the currently assigned vehicle. Addition of this request will allow a full and fair assessment of the drug dog team’s effectiveness and potential. The drug dog program will significantly increase the Department’s ability to disrupt drug trafficking along the I-5 corridor and through local transportation and shipping hubs.
Body Camera Pilot Project
Funding for a pilot project exploring the implementation of body cameras for patrol officers is also included in the Forfeiture budget. This project may or may not be implemented during FY16, and the lieutenant assigned to the pilot project will be expected to develop a full cost proposal for long term sustainability before a full implementation is planned and approved.
Detention Officer Position
With the implementation of the Lieutenants, the municipal jail will now report to a Lieutenant rather than to a civilian manager position. Recognizing that a majority of the Jail’s funding comes from the Police Operating Levy, the Department will consider long range staffing needs, future program direction, and consideration of implementing work crews as part of an ongoing analysis seeking to implement a long term, sustainable funding and operations model.
Attachment 15 Police FY16 Budget Summary Memo Page 1 of 2
For FY16, one additional Detention Officer position has been added to the Jail budget, position #1539, at an estimated cost of $89,000. Adding this position will decrease the number of forced overtime shifts worked by Detention staff.
Sungard Project Implementation
In November of 2013, the Department implemented new dispatching and record keeping databases that support a majority of the law enforcement work carried out by the Department. We are continuing to work with the vendor, Sungard, and with our regional partners to implement additional components of the system: such as field-based reporting, electronic ticketing, and to integrate our data with the systems used by Municipal Courts. The Department will continue to work on efficiencies available within the system, with an eye towards improving productivity and lowering the costs of conducting business. Negotiations for contractual support of the system with the City of Eugene are ongoing, and the outcome of those negotiations will impact future operating costs for the Department.
FUTURE NEEDS
CJIS Compliance Project
Additional funding during FY16 for the CJIS compliance project is part of the IT Department’s budget request, but the work directly impacts the Police Department. Costs for the portion of the work scheduled during FY15 is being funded by the Police Department budget, and the PD strongly supports the request from IT to include funding for FY16 to complete the work.
Regional Radio System Maintenance and Upgrades
The Police Dispatch Center relies upon three Motorola Gold Elite consoles for radio dispatching. This equipment, originally purchased and installed in 1996, has reached the end of its useful life and needs to be replaced. The Department will coordinate with regional partners to secure the best pricing from Motorola for this critical investment.
Departmental Training and Policy Development
The Police Department believes that public support, departmental accountability and integrity are essential to maintaining a positive relationship with the community, and to limiting the City’s exposure to civil liability. To that end, the Department will seek to provide training opportunities to its members in areas of professional expertise, leadership, and community interaction. In support of that training, the Department will explore adopting Lexipol as a policy platform. Lexipol is a set of standardized policies developed for each state that follows best practices and maintains policies current with case law and societal trends. Oregon Accreditation may also be considered in the future.
CONCLUSION
The Department has submitted a budged which complies with the direction received from the Finance Department. This budget continues to be extremely frugal and will likely rely upon staffing vacancies to meet financial targets. The Department believes that it will be able to meet the goals and objectives of the City Council within the available resources.
Attachment 15 Police FY16 Budget Summary Memo Page 2 of 2
Police Department FY 2016
Committed to ExcellenceAttachment 16 Police FY16 Presentation Page 1 of 23
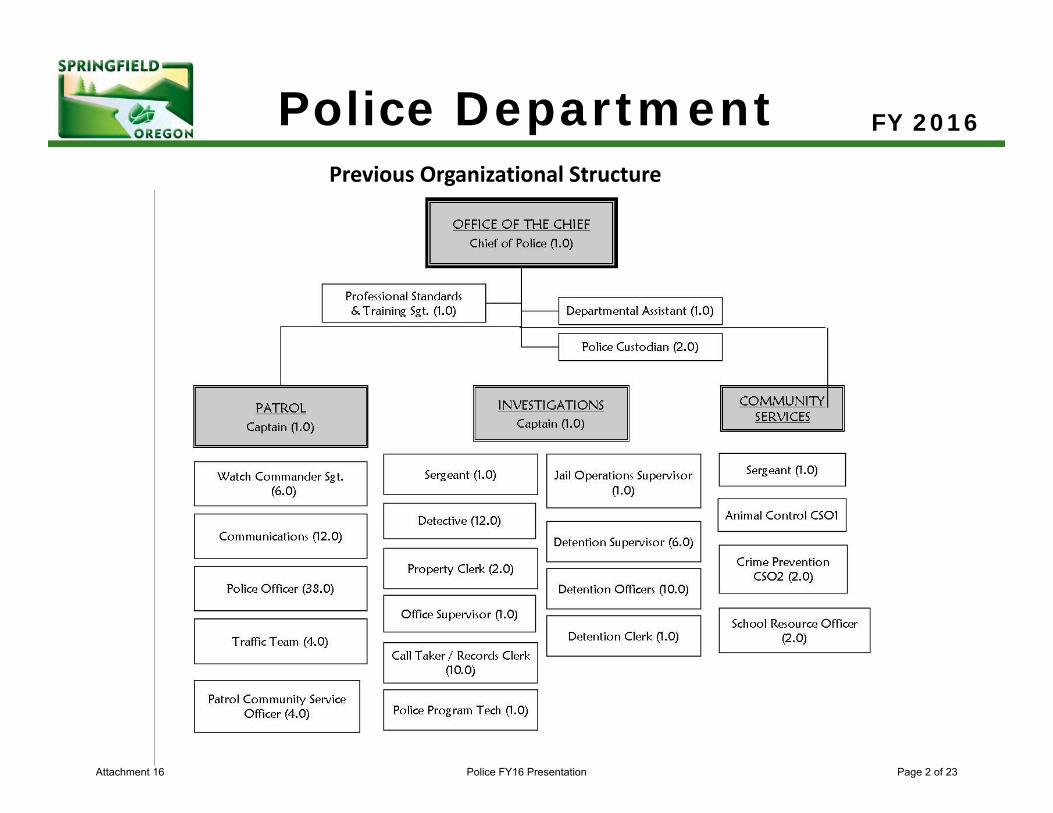
Police Department FY 2016
Previous Organizational Structure
Attachment 16 Police FY16 Presentation Page 2 of 23
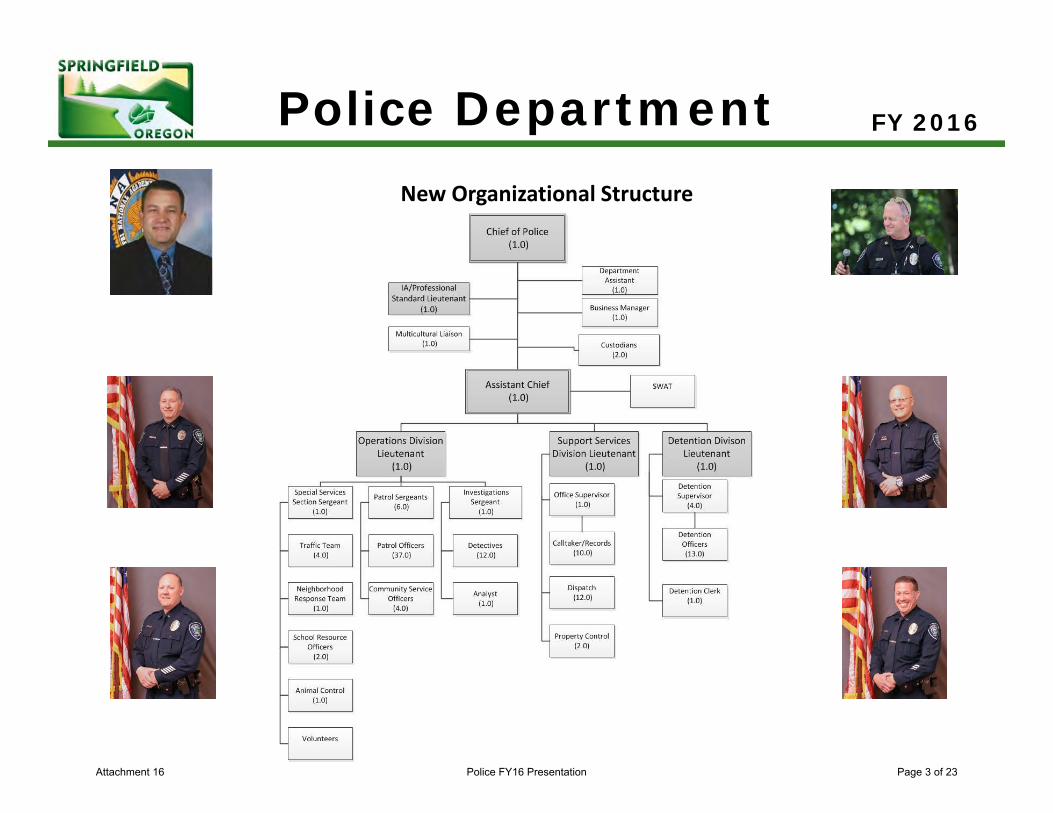
Police Department FY 2016
New Organizational Structure
Attachment 16 Police FY16 Presentation Page 3 of 23
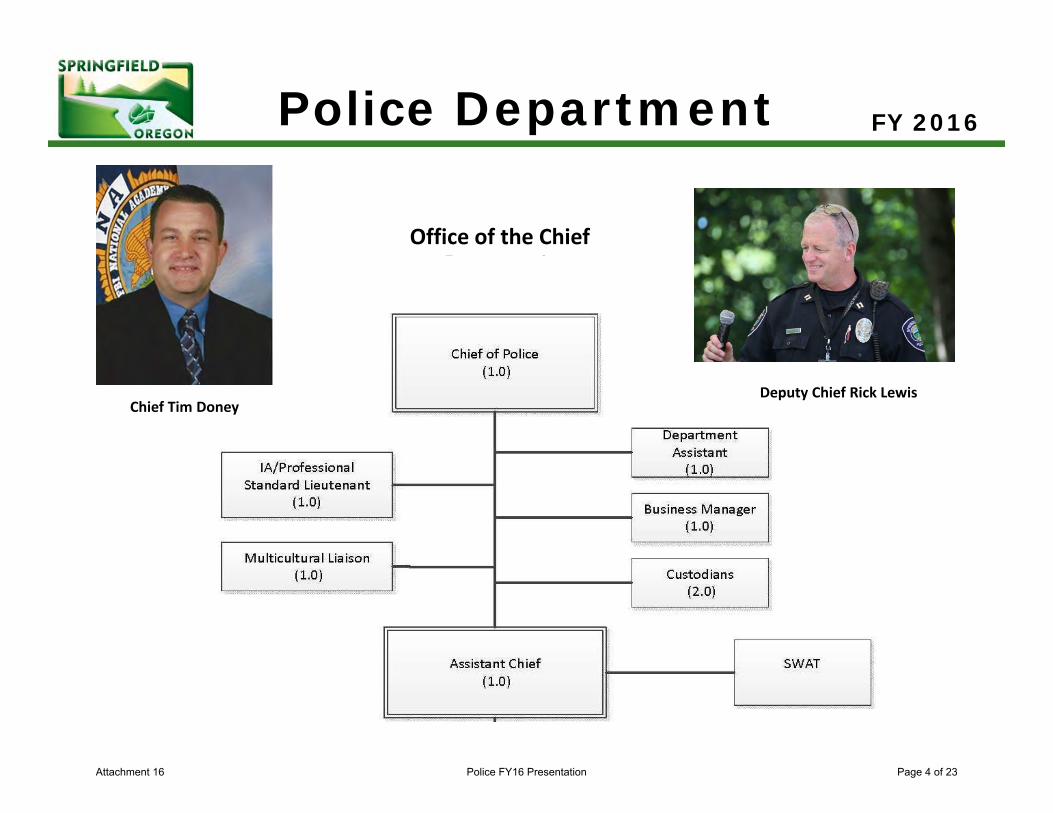
Police Department FY 2016
Office of the Chief
Chief Tim DoneyDeputy Chief Rick Lewis
Attachment 16 Police FY16 Presentation Page 4 of 23
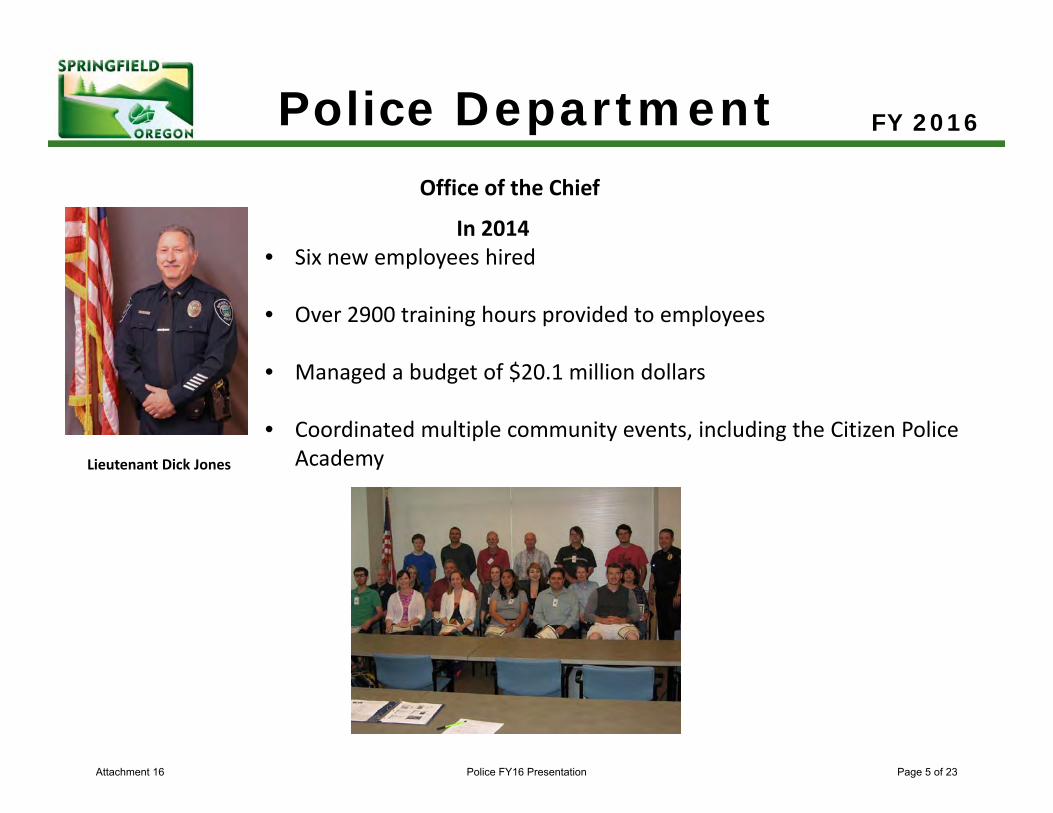
Police Department FY 2016
In 2014• Six new employees hired
• Over 2900 training hours provided to employees
• Managed a budget of $20.1 million dollars
• Coordinated multiple community events, including the Citizen Police Academy
Office of the Chief
Lieutenant Dick Jones
Attachment 16 Police FY16 Presentation Page 5 of 23
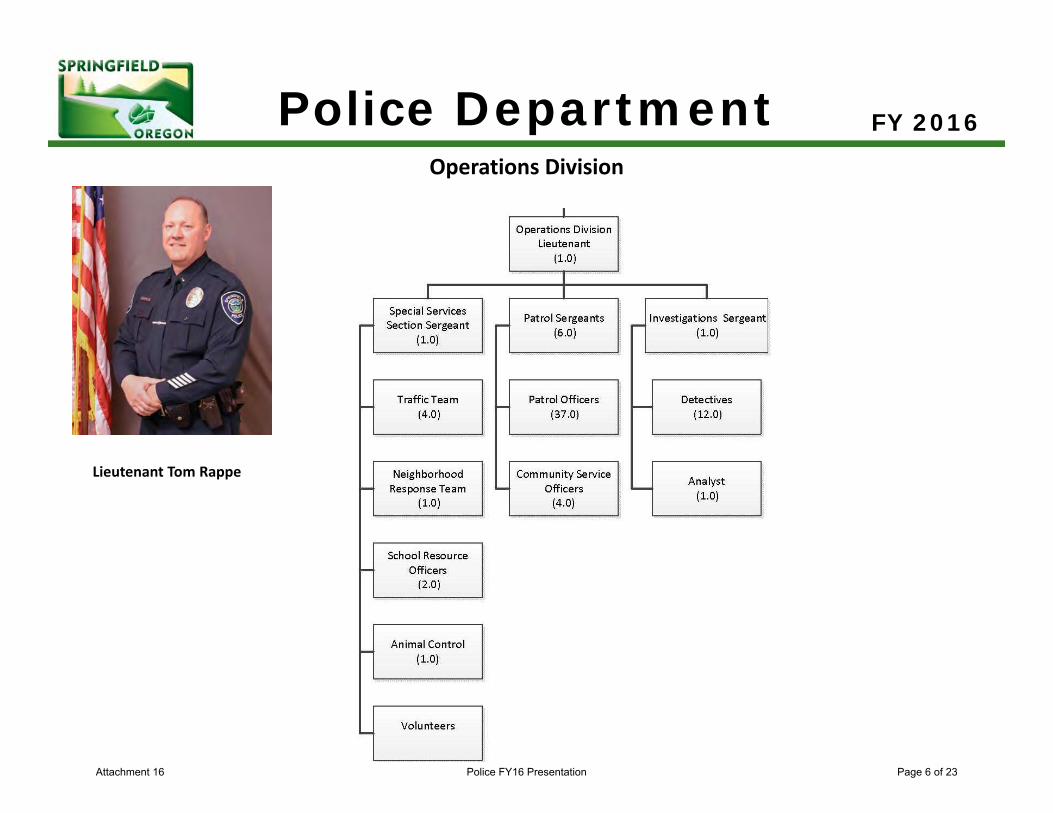
Police Department FY 2016
Operations Division
Lieutenant Tom Rappe
Attachment 16 Police FY16 Presentation Page 6 of 23
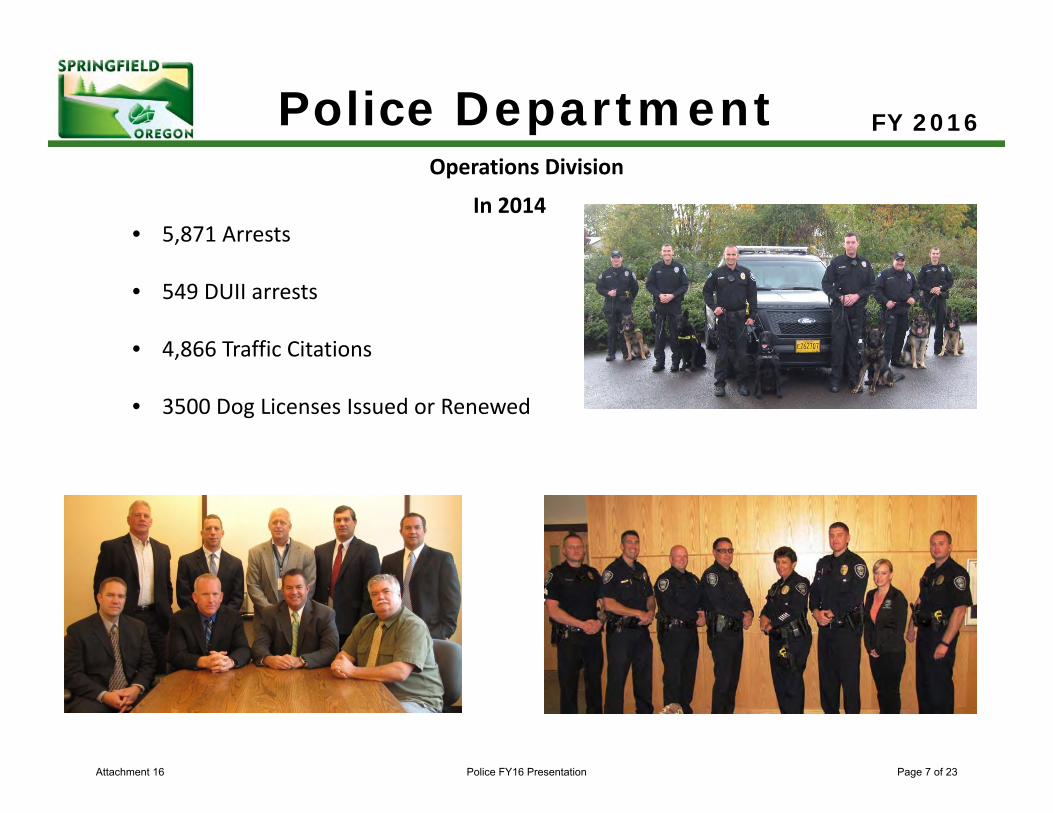
Police Department FY 2016
In 2014• 5,871 Arrests
• 549 DUII arrests
• 4,866 Traffic Citations
• 3500 Dog Licenses Issued or Renewed
Operations Division
Attachment 16 Police FY16 Presentation Page 7 of 23
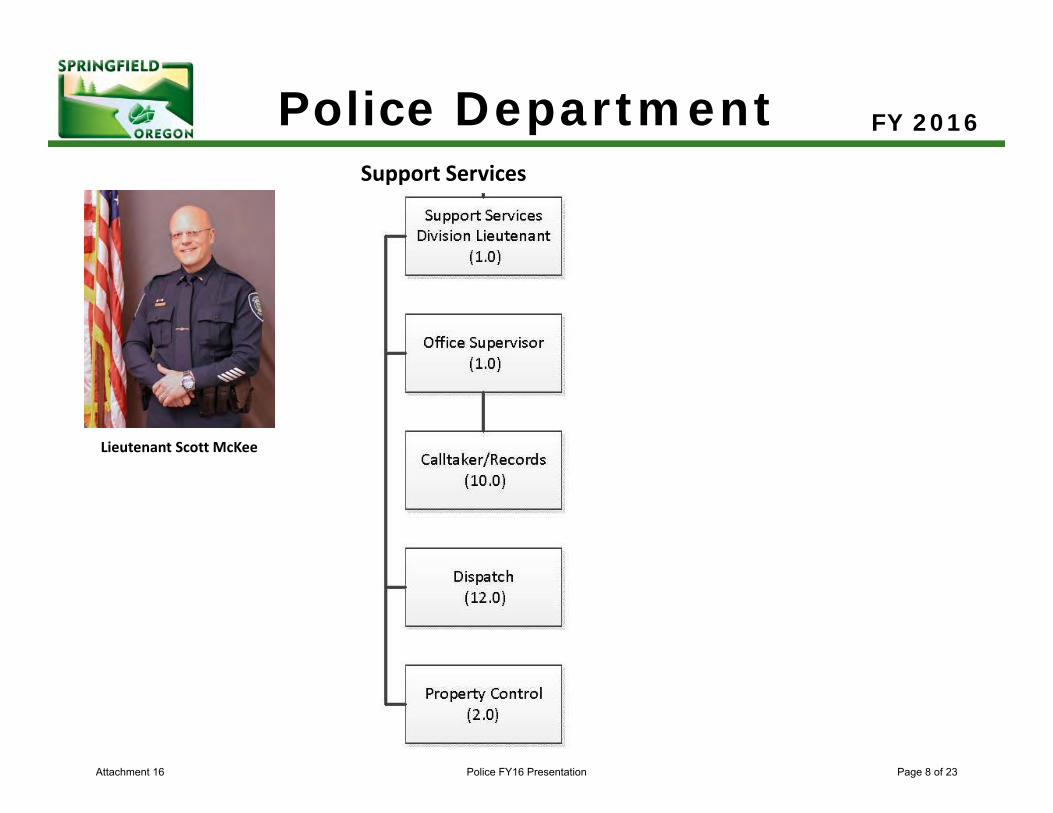
Police Department FY 2016
Support Services
Lieutenant Scott McKee
Attachment 16 Police FY16 Presentation Page 8 of 23
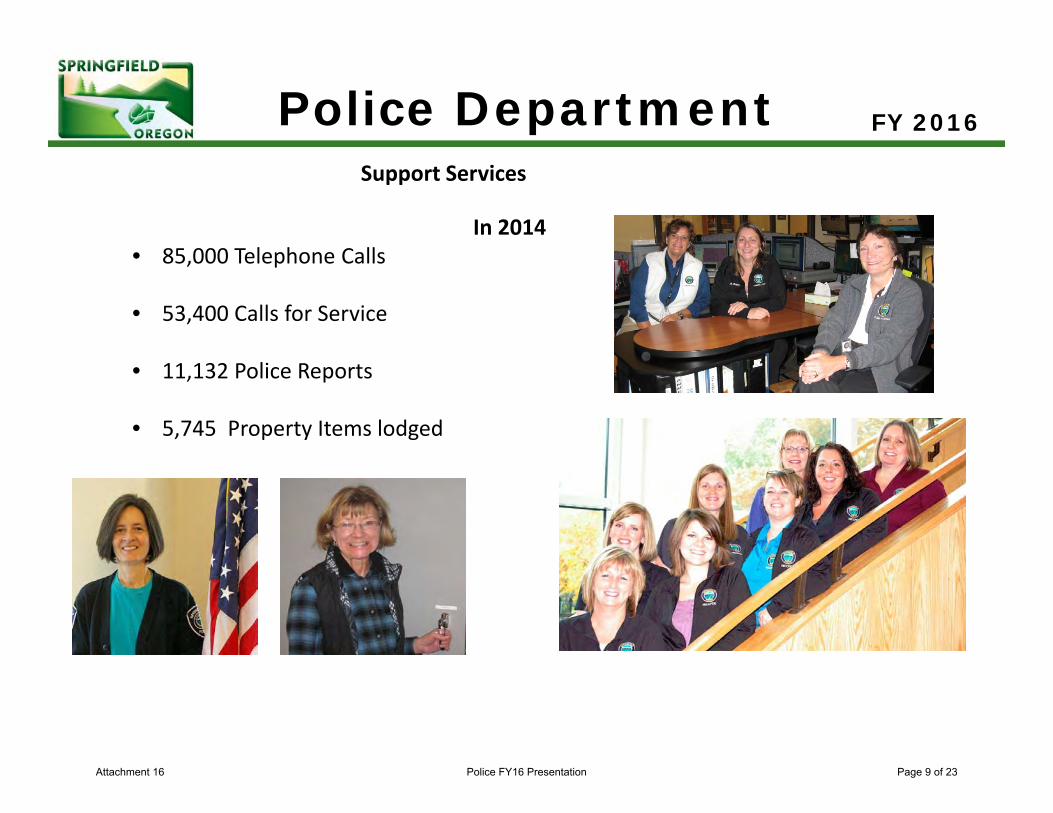
Police Department FY 2016
In 2014• 85,000 Telephone Calls
• 53,400 Calls for Service
• 11,132 Police Reports
• 5,745 Property Items lodged
Support Services
Attachment 16 Police FY16 Presentation Page 9 of 23
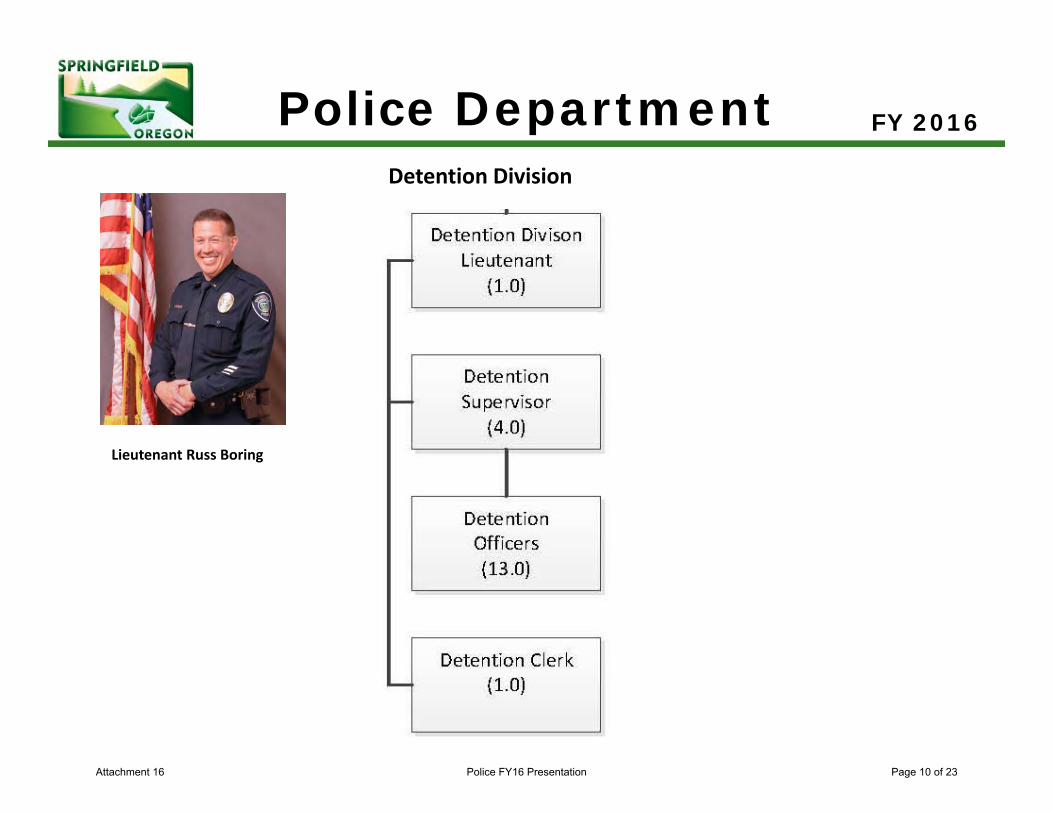
Police Department FY 2016
Detention Division
Lieutenant Russ Boring
Attachment 16 Police FY16 Presentation Page 10 of 23
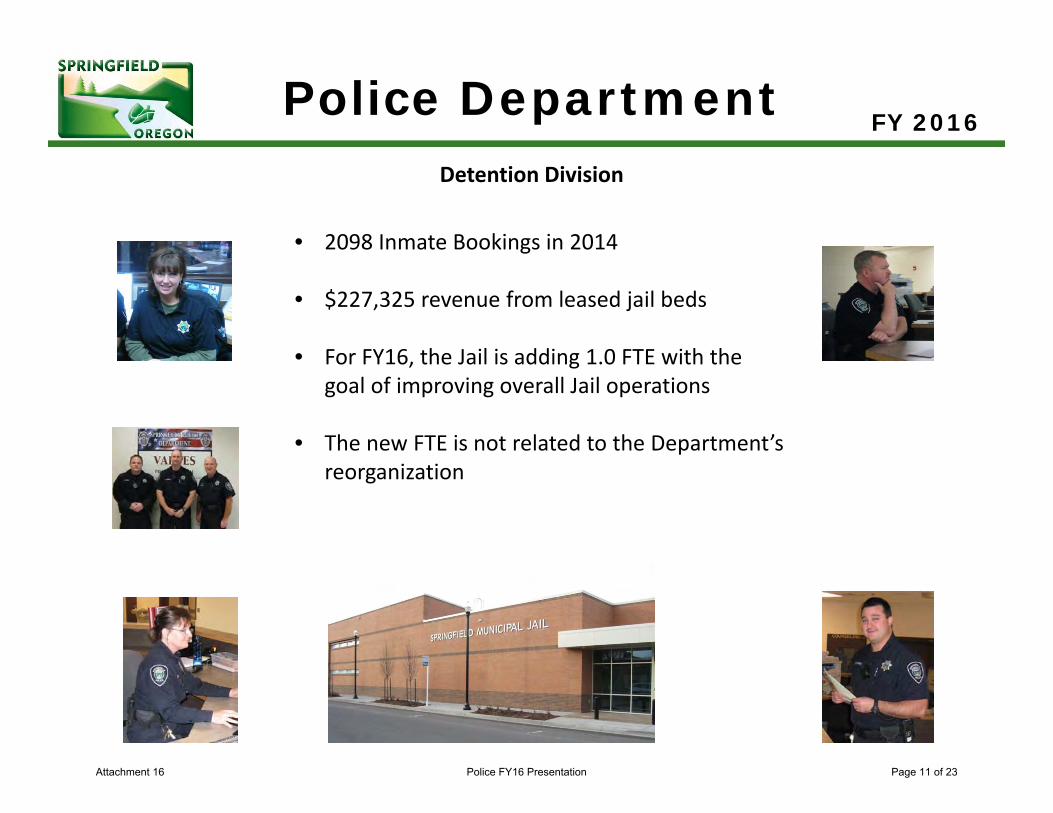
FY 2016
• 2098 Inmate Bookings in 2014
• $227,325 revenue from leased jail beds
• For FY16, the Jail is adding 1.0 FTE with the goal of improving overall Jail operations
• The new FTE is not related to the Department’s reorganization
Police DepartmentDetention Division
Attachment 16 Police FY16 Presentation Page 11 of 23
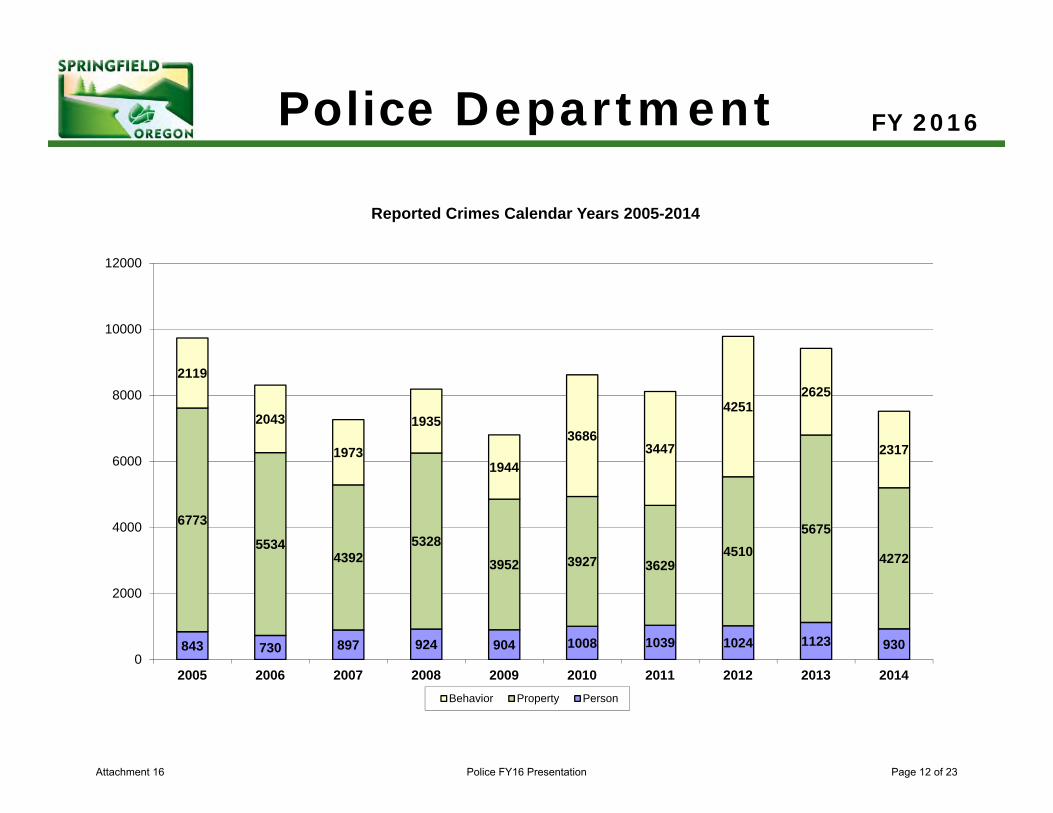
Police Department FY 2016
843 730 897 924 904 1008 1039 1024 1123 930
6773
55344392
5328
3952 3927 36294510
5675
4272
2119
2043
1973
1935
1944
36863447
42512625
2317
0
2000
4000
6000
8000
10000
12000
2005 2006 2007 2008 2009 2010 2011 2012 2013 2014
Reported Crimes Calendar Years 2005-2014
Behavior Property Person
Attachment 16 Police FY16 Presentation Page 12 of 23
Police Department FY 2016
We are Involved in Our Community
2014 Citizen Police Academy Graduates
Attachment 16 Police FY16 Presentation Page 13 of 23
Police Department FY 2016
Attachment 16 Police FY16 Presentation Page 14 of 23
Police Department FY 2016
Attachment 16 Police FY16 Presentation Page 15 of 23
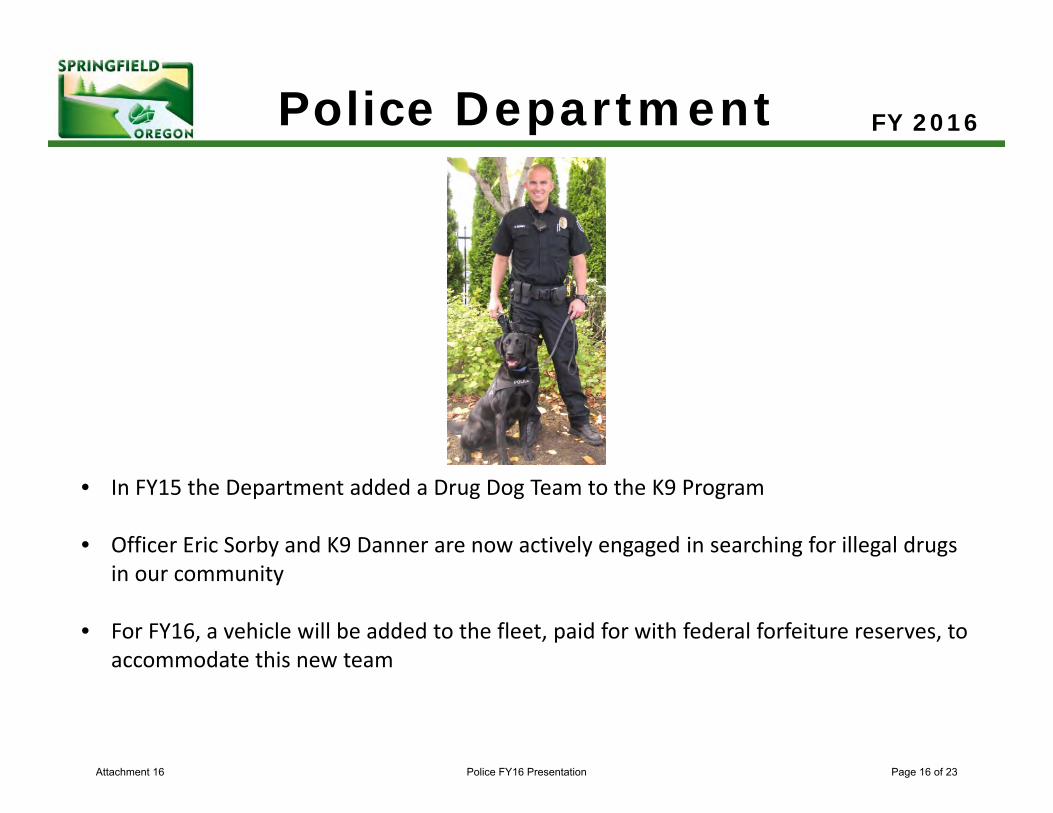
Police Department FY 2016
• In FY15 the Department added a Drug Dog Team to the K9 Program
• Officer Eric Sorby and K9 Danner are now actively engaged in searching for illegal drugs in our community
• For FY16, a vehicle will be added to the fleet, paid for with federal forfeiture reserves, to accommodate this new team
Attachment 16 Police FY16 Presentation Page 16 of 23
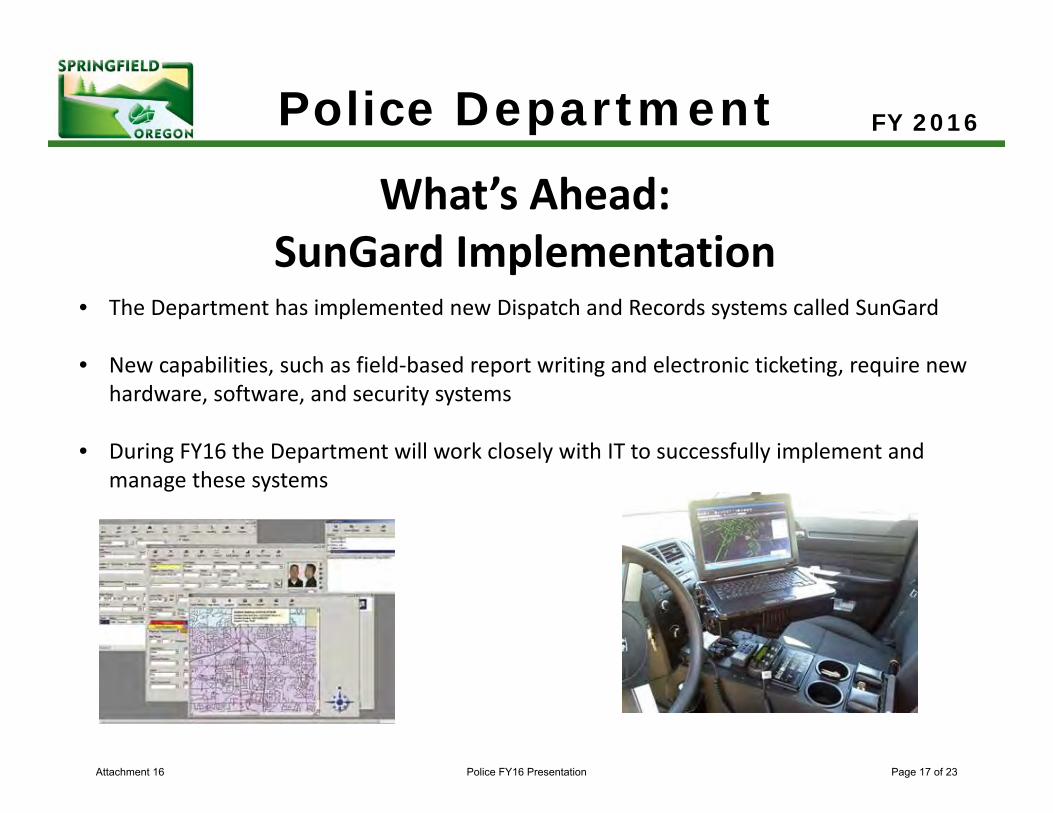
Police Department FY 2016
What’s Ahead: SunGard Implementation
• The Department has implemented new Dispatch and Records systems called SunGard
• New capabilities, such as field‐based report writing and electronic ticketing, require new hardware, software, and security systems
• During FY16 the Department will work closely with IT to successfully implement and manage these systems
Attachment 16 Police FY16 Presentation Page 17 of 23
Police Department FY 2016
What’s Ahead: Body Cameras
• Body Cameras are currently an important topic in law enforcement
• During FY16 the Department has designated funding for a pilot project to study what successful implementation will look like
• Upfront costs may not be significant, but policy implications, data storage needs and long term funding will be important issues to understand as we move forward
Attachment 16 Police FY16 Presentation Page 18 of 23
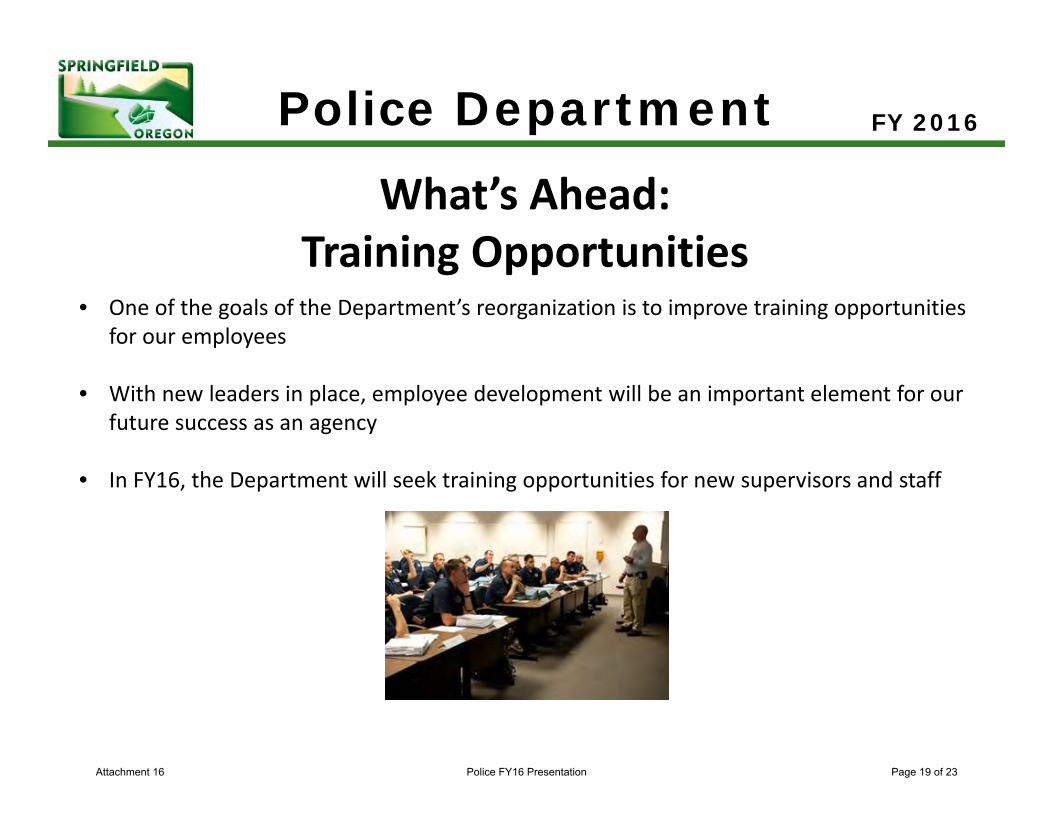
Police Department FY 2016
What’s Ahead: Training Opportunities
• One of the goals of the Department’s reorganization is to improve training opportunities for our employees
• With new leaders in place, employee development will be an important element for our future success as an agency
• In FY16, the Department will seek training opportunities for new supervisors and staff
Attachment 16 Police FY16 Presentation Page 19 of 23
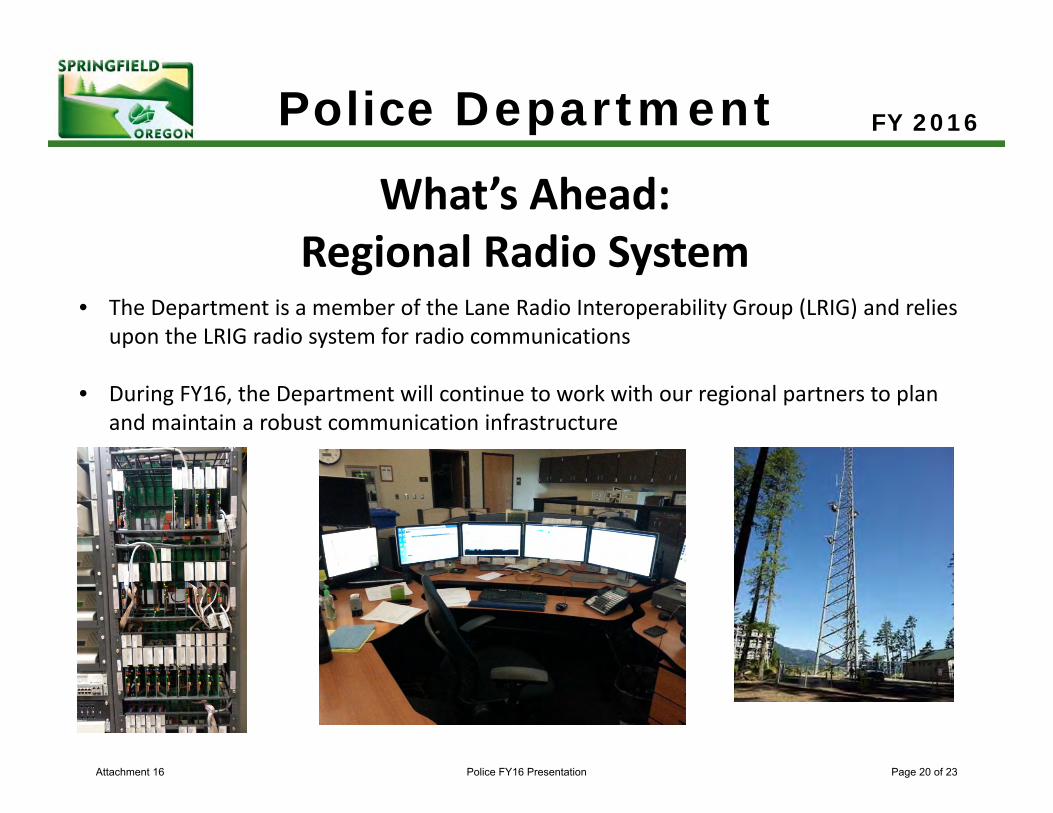
Police Department FY 2016
What’s Ahead: Regional Radio System
• The Department is a member of the Lane Radio Interoperability Group (LRIG) and relies upon the LRIG radio system for radio communications
• During FY16, the Department will continue to work with our regional partners to plan and maintain a robust communication infrastructure
Attachment 16 Police FY16 Presentation Page 20 of 23
Police Department FY 2016
What’s Ahead: Policy Development and State Accreditation
• The Department is considering joining many other agencies around the State and the Country in adopting a standardized, tested policy manual for Police Departments
• During FY16, the Department will begin the work of standardizing policies, and moving toward State Accreditation
Attachment 16 Police FY16 Presentation Page 21 of 23
Police Department FY 2016
• Recruiting successful new employees continues to be a challenge in the law enforcement environment as high quality candidates are recruited by multiple agencies
• 35% of the Department’s interns in the last year have been hired to work for the Police Department
• During FY16, the Department will continue to strive to recruit and retain a workforce that is representative of the values and diversity of the Springfield community.
What’s Ahead: Recruitment and Retention
Attachment 16 Police FY16 Presentation Page 22 of 23
Police Department FY 2016
Committed to Excellence
Questions?
Attachment 16 Police FY16 Presentation Page 23 of 23
DEPARTMENT BUDGET SUMMARY City of Springfield, Oregon
To: Gino Grimaldi, City Manager
From: Bob Duey, Finance Director
Date: March 23, 2015
SUMMARY OF SIGNIFICANT PROPOSED BUDGET CHANGES FTE COST
Centralized AP Accounting Tech
(Occurred July 2014 as an in-house recruitment for the paperless accounts payable project, no net FTE gain for the City.)
1.0 $69,060
Priority Based Budget Management Analyst 1.0 $84,978
Admin Specialist – scanning support .20 $9,072
Phase 1 Budget Software System Replacement $0
SUMMARY OF BUDGET AND SERVICE CHANGES
The Finance Department is going to be project driven this next year ranging from the use of additional technology to improve processes to the next step in the process of utilizing priority based budgeting to address financial planning. The projects are:
Centralizing Accounts Payable Processing
The Finance Department implemented a centralized paperless AP process in FY15. This was a significant project that was a year in planning and involved or impacted many people across every department. Most departments were easily integrated into a centralized process and the majority of stakeholders have benefitted from either reduced workloads and/or improved access to financial information. With the timing of the implementation coincided with a PeopleSoft Financials upgrade and a Laserfiche upgrade shortly thereafter, the new process was rolled out in phases with continued enhancements through the present date based on planned functionality as well as stakeholder feedback and suggestions. While meeting our expectations in the first year in both reduced workloads and better information access, we continue to see more opportunities to streamline processes and potentially centralize additional AP activities still retained in outside departments without any additional FTE added in the Finance Department. The additional FTE for Finance Department to accomplish the project was provided by the Development and Public Works Department by electing to not re-hire for a vacant administrative support position as a result of the work load savings from this project.
Priority Based Budgeting Year Three
The Department has been facilitating the second year of the priority based budgeting (PBB) process by working to bring the available data into the decision making process. Supplemental budget requests that were presented to Council during this year were required to incorporate PBB scoring into the explanation of need and request for service changes for FY16 were also required to use PBB to assist in the justifications. Numerous meetings have been held with departments during the course of the year looking for efficiency opportunities and re-organizational strategies to better utilize resources. A connecting program to PBB has been studying revenue and expenditure past and future trending activities to help determine the overall fiscal health of the organization. For FY16 all of the fore mentioned efforts will continue but the year will begin by providing the opportunity for departments to review their current description of programs, services and costings methodologies to see if the initial data still fits the needs of the program. For this program to be successful it is important to ensure that all
Attachment 17 Finance FY16 Budget Summary Memo Page 1 of 3
departments city-wide have access to analytical support skills to complete the necessary program analysis for aligning services with Council and Community priorities. In response to this an additional FTE has been added to the Finance Department’s budget to increase the ability for it to provide staff support in this area. PBB is multi-year learning tool that will require occasional review and updating to keep relevant. It is believed that Year 3 will be a good year timing wise to go back and review the initial set-up.
Journal Entry Work Flow
The accounting staff currently are required to write, post, file and store journal entries manually. The step of filing and the constant need by finance and staff city-wide to retrieve this data is very time consuming. A current project is scheduled to automate the file and retrieval process by committing these steps to the City’s Laserfiche product. Once completed the finance staff, will be able to store and all city staff long with the City’ s auditors will be able to complete the search for this financial information from the computer without need to physically search for the journal entry packets in centralized file cabinets.
PeopleSoft Contract Work Flow
Much like was done for the City’s time entry system, Springfield again has the opportunity to take advantage of a Lane County effort to add value to the PeopleSoft product. A fully developed process for helping put the development of a contract for services into a on-line work flow process that can be utilized by multiple people and departments involved in its development is available from Lane County for a estimated nominal cost of $5,000. The use of this product would be significant time saver through efficiencies for both the department initiating the contract and for Finance in the contract review phase. Finance plans to pursue this effort but will be able to absorb this cost into its existing budget due to other savings.
Budget Software Replacement
Viewed as a multi-year project (1 to 3 years), Finance considers the replacement of the current BRASS budgeting system has a high priority. This system was implemented prior to Y2K and is well past its expected life. The vendor has moved onto newer versions and platforms and no longer supports this particular product. The system is clunky in its capabilities and does not support the more up to date budget practices wanting to be utilized at the City. Replacement software would allow the Finance department to continue to provide support in the decision making process; provide timely and accurate short-term and long range analysis. It will also allow the department to meet regulatory and policy compliance beyond December 2019. The replacement of BRASS/SBFS could allow more transparency to the departments with easier accessibility within the system and the ability to perform scenario planning. A significant budget savings is being realized as the Department has dropped on-going software support for the current product. It is planned that the research to provide the specification s for a new vendor product will be completed during FY16 with the actual selection of a specific vendor to occur in late FY16 or early FY17.
Consolidated Account Receivables
Much like the previous accounts payable process, the city has decentralized its accounts receivables programs to the individual departments. Reviewing this type of program across the entire city from a efficiency of service perspective indicates that there could be gains made by developing standards that are consistent across all departments and possibly a reduction in overall staff effort by developing a single point of contact for most billings and receipting. The Finance Department will be studying this topic shortly and looking for ways to enhance this particular service. Billing and collecting programs that are most likely not to be included in this particular review are those that have HIPPA or CJIS confidentiality issues such as ambulance billing and court services.
Attachment 17 Finance FY16 Budget Summary Memo Page 2 of 3
FUTURE NEEDS
From the types of projects identified in the Significant Issues discussion it becomes obvious that the use of technology is what allows Finance to improve or increase the services it is able to provide to others departments, city vendors and outside reporting entities.
For the last decade the only staff position budget that has been added to the department is the recent accounts payable technician which was added when a full FTE of work of added because of the centralization process. Next year the proposed budget includes a position that will be vital to the implementation of the priority based budgeting program. Also during this past decade the volume of work and increased expectations have grown faster than what the technology improvements are able to address. This has resulted in professional staff in different areas not having adequate support services available to match the department’s work plan expectations. The following additional position has been talked about in the budget conversation for next year but has not been included in the budget as proposed.
PBB Program: Procurement Administration and Support Activities
Description: Procure goods and services at the best value for the City using the most efficient and effective methods possible while abiding by state and local rules and regulations while maintain good stewardship of public funds. Draft Municipal Code, Administrative Guidelines, legislative review, contract administration, provide business and legal sufficiency review, and grant compliance.
Request: Funding for 1.00 FTE. Specific job classification has yet to be determined but would align within a Clerk 3, Accounting Tech or entry level Management Analyst with an estimated cost of $65k to $80k. The FTE would be responsible for advanced paraprofessional procurement duties. Currently the Program Manager in procurement is responsible for all day to day transactions within the program. This limits her availability to perform high level analysis work or expand the program beyond its current scope. This request would allow the Finance department to manage and optimize its financial and human resources.
CONCLUSION
Status quo for budget requirements with several key projects planned.
Attachment 17 Finance FY16 Budget Summary Memo Page 3 of 3
FinanceFY 2016
Mission Statement:
Provides professional oversight and consultation to City programs and services regarding financial, accounting and budgetary practices. The Department’s focus is
to ensure compliance with all relevant financial and budgetary regulations.
Attachment 18 Finance FY16 Presentation Page 1 of 7
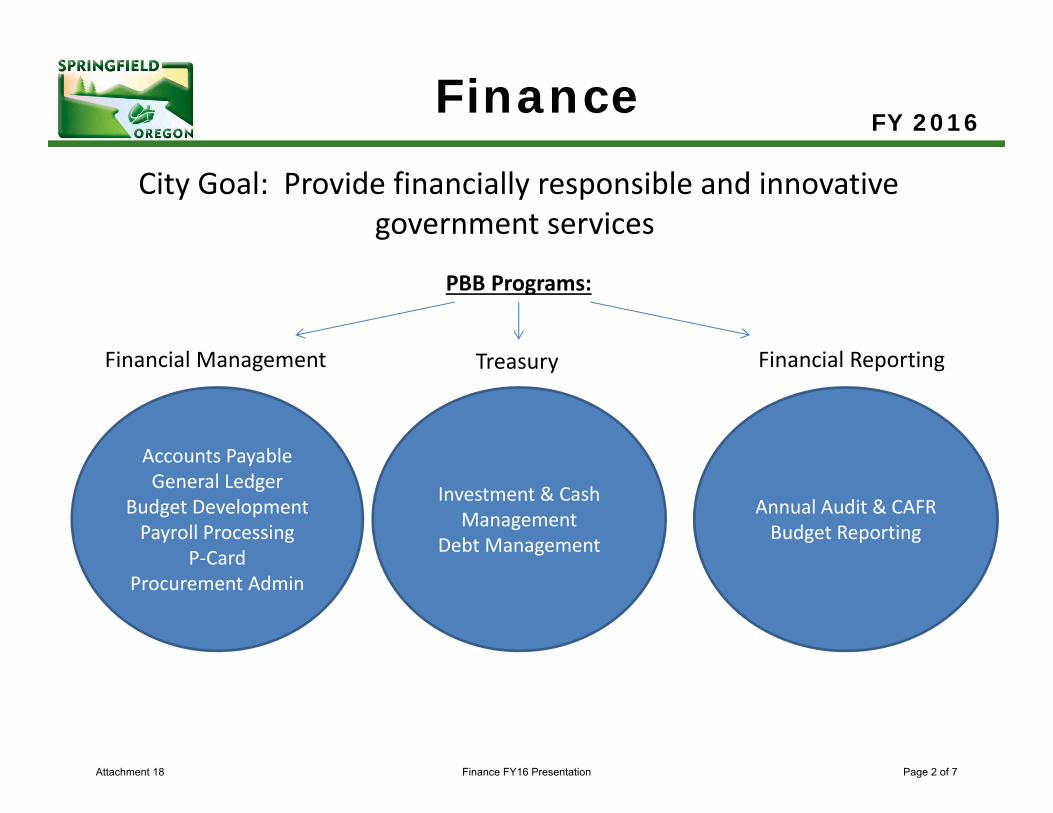
FinanceFY 2016
City Goal: Provide financially responsible and innovative government services
Annual Audit & CAFRBudget Reporting
Accounts PayableGeneral Ledger
Budget DevelopmentPayroll Processing
P‐CardProcurement Admin
Investment & Cash Management
Debt Management
PBB Programs:
Financial ReportingTreasuryFinancial Management
Attachment 18 Finance FY16 Presentation Page 2 of 7
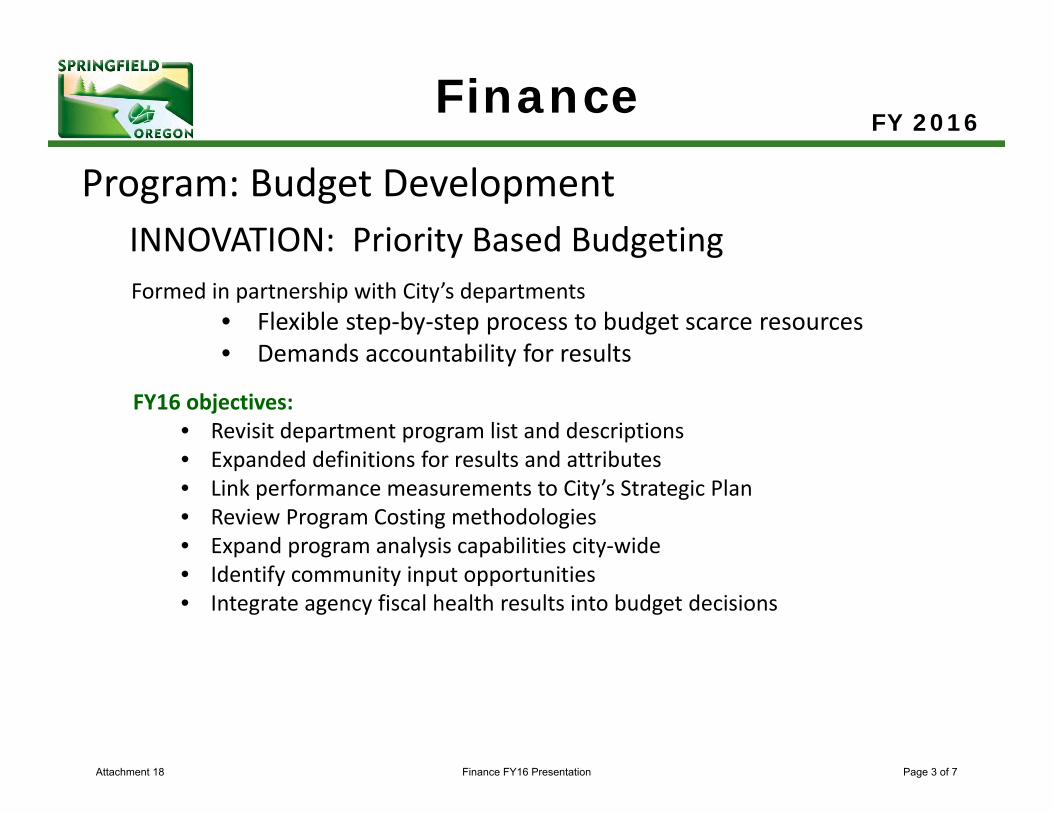
FinanceFY 2016
Formed in partnership with City’s departments• Flexible step‐by‐step process to budget scarce resources• Demands accountability for results
FY16 objectives: • Revisit department program list and descriptions• Expanded definitions for results and attributes• Link performance measurements to City’s Strategic Plan• Review Program Costing methodologies• Expand program analysis capabilities city‐wide• Identify community input opportunities• Integrate agency fiscal health results into budget decisions
Program: Budget DevelopmentINNOVATION: Priority Based Budgeting
Attachment 18 Finance FY16 Presentation Page 3 of 7
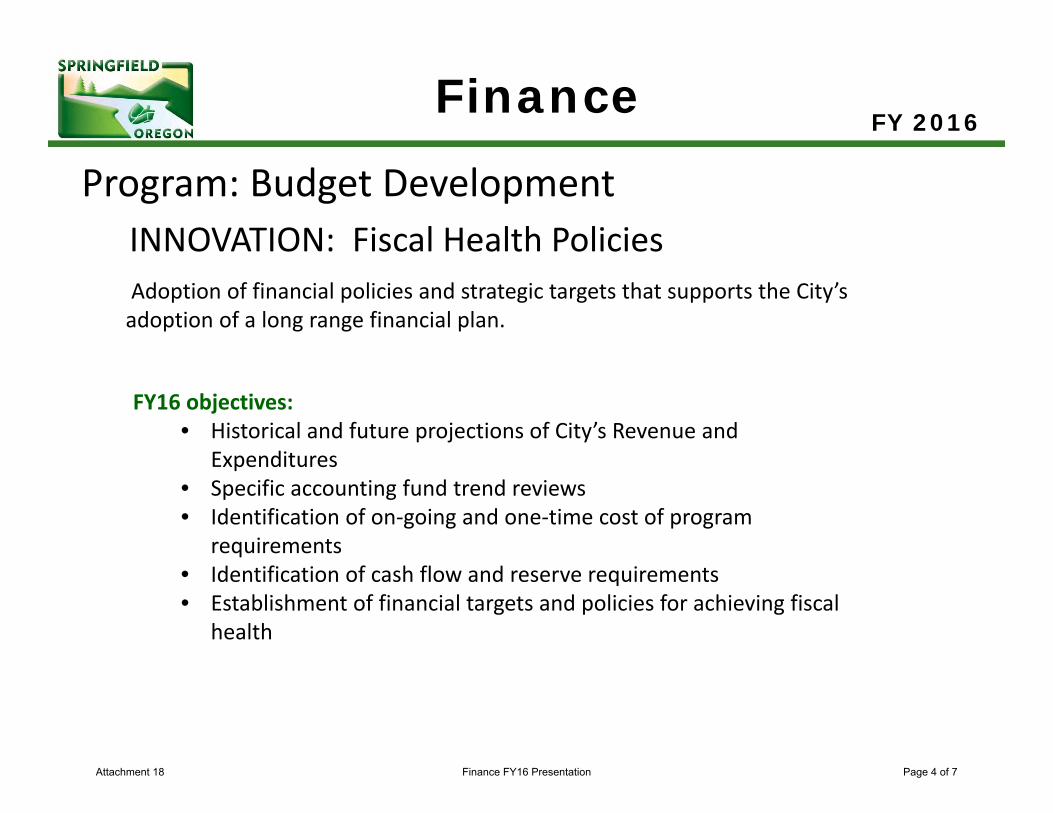
FinanceFY 2016
Adoption of financial policies and strategic targets that supports the City’s adoption of a long range financial plan.
FY16 objectives: • Historical and future projections of City’s Revenue and
Expenditures• Specific accounting fund trend reviews• Identification of on‐going and one‐time cost of program
requirements• Identification of cash flow and reserve requirements• Establishment of financial targets and policies for achieving fiscal
health
Program: Budget DevelopmentINNOVATION: Fiscal Health Policies
Attachment 18 Finance FY16 Presentation Page 4 of 7
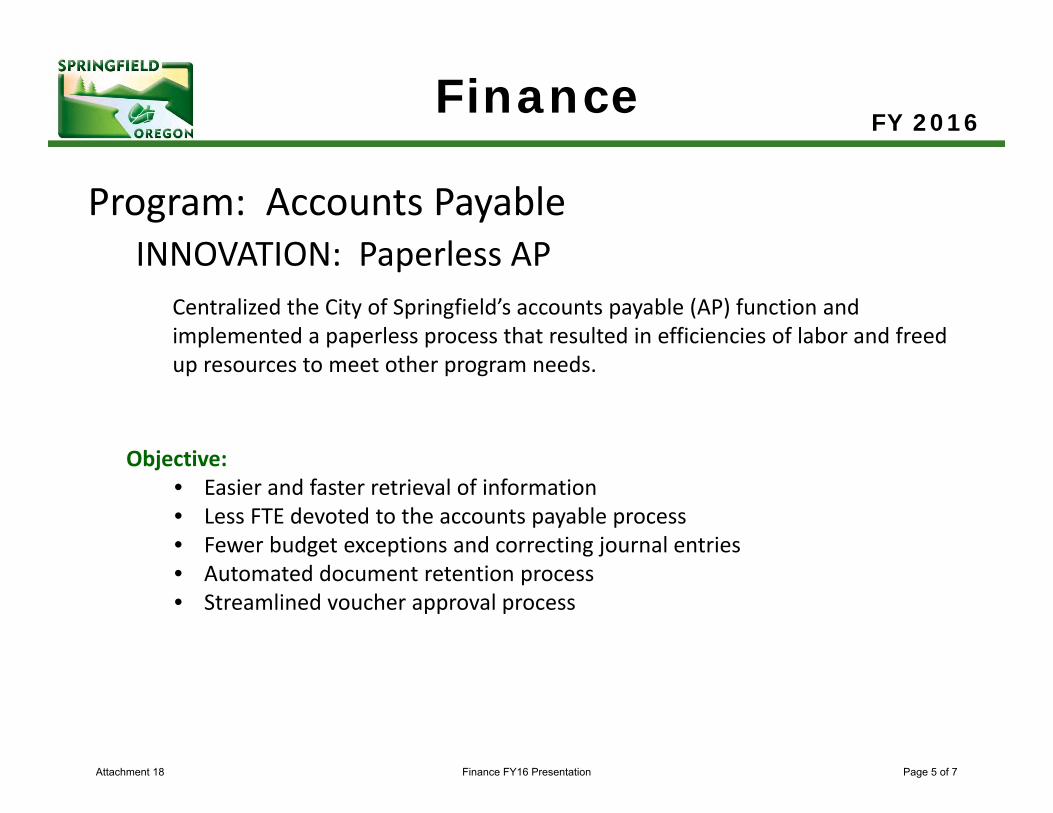
FinanceFY 2016
Program: Accounts PayableINNOVATION: Paperless AP
Centralized the City of Springfield’s accounts payable (AP) function and implemented a paperless process that resulted in efficiencies of labor and freed up resources to meet other program needs.
Objective: • Easier and faster retrieval of information• Less FTE devoted to the accounts payable process• Fewer budget exceptions and correcting journal entries• Automated document retention process• Streamlined voucher approval process
Attachment 18 Finance FY16 Presentation Page 5 of 7
FinanceFY 2016
Implement a fully integrated software product that supports a program driven priority based budgeting process that promotes both a regular budget reporting cycle as well as modeling for long‐term fiscal stability.
FY16 objectives: • Research current software vendors on the market for innovative
solutions• Develop the specific requirements of the City for budget
development software needs and requirements• Fully develop a request for proposal for soliciting bids from
vendors• Develop an action plan that allows full implementation of new
product for the FY18 budget process
Program: Budget DevelopmentINNOVATION: Budget Module Software Replacement
Attachment 18 Finance FY16 Presentation Page 6 of 7
FinanceFY 2016
FY16 objectives: • Continued improvements to Paperless AP• Journal entry work flow• PeopleSoft contract work flow• Laserfiche data storage and retrieval• Consolidated accounts receivables
Program: Financial Management & Financial Reporting
INNOVATION: Process Improvement through Technology Solutions
Attachment 18 Finance FY16 Presentation Page 7 of 7
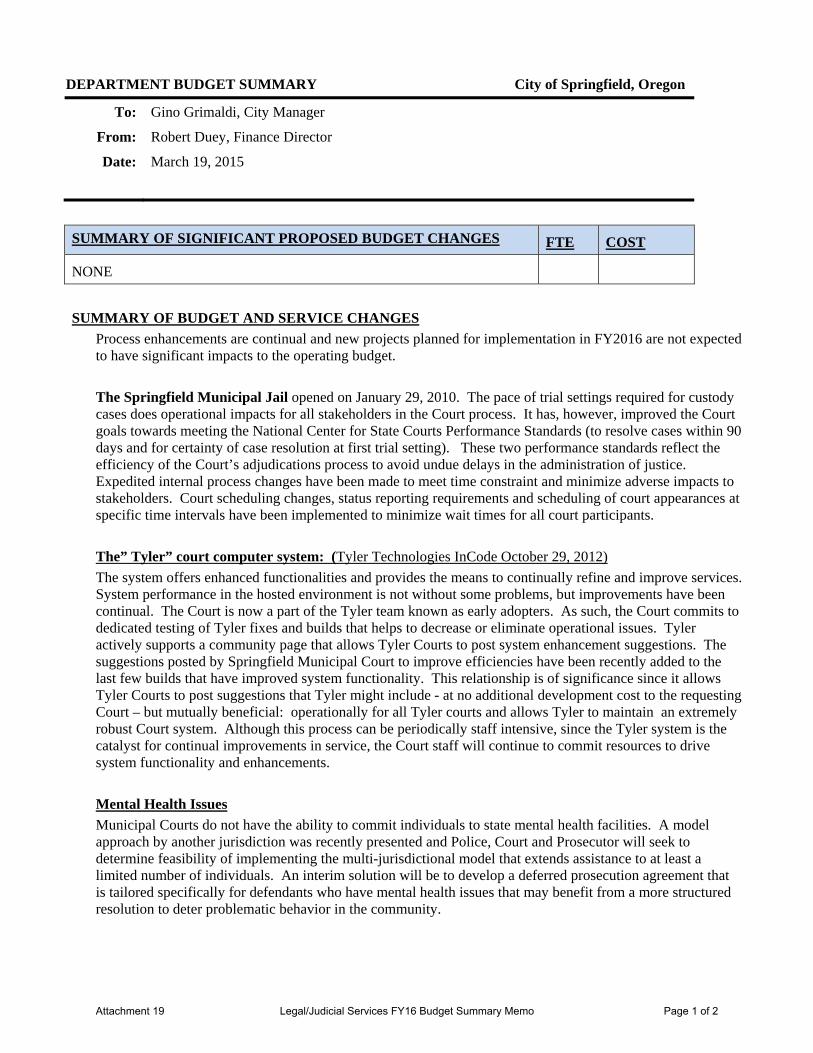
DEPARTMENT BUDGET SUMMARY City of Springfield, Oregon
To: Gino Grimaldi, City Manager
From: Robert Duey, Finance Director
Date: March 19, 2015
SUMMARY OF SIGNIFICANT PROPOSED BUDGET CHANGES FTE COST
NONE
SUMMARY OF BUDGET AND SERVICE CHANGES
Process enhancements are continual and new projects planned for implementation in FY2016 are not expected to have significant impacts to the operating budget.
The Springfield Municipal Jail opened on January 29, 2010. The pace of trial settings required for custody cases does operational impacts for all stakeholders in the Court process. It has, however, improved the Court goals towards meeting the National Center for State Courts Performance Standards (to resolve cases within 90 days and for certainty of case resolution at first trial setting). These two performance standards reflect the efficiency of the Court’s adjudications process to avoid undue delays in the administration of justice. Expedited internal process changes have been made to meet time constraint and minimize adverse impacts to stakeholders. Court scheduling changes, status reporting requirements and scheduling of court appearances at specific time intervals have been implemented to minimize wait times for all court participants.
The” Tyler” court computer system: (Tyler Technologies InCode October 29, 2012)
The system offers enhanced functionalities and provides the means to continually refine and improve services. System performance in the hosted environment is not without some problems, but improvements have been continual. The Court is now a part of the Tyler team known as early adopters. As such, the Court commits to dedicated testing of Tyler fixes and builds that helps to decrease or eliminate operational issues. Tyler actively supports a community page that allows Tyler Courts to post system enhancement suggestions. The suggestions posted by Springfield Municipal Court to improve efficiencies have been recently added to the last few builds that have improved system functionality. This relationship is of significance since it allows Tyler Courts to post suggestions that Tyler might include - at no additional development cost to the requesting Court – but mutually beneficial: operationally for all Tyler courts and allows Tyler to maintain an extremely robust Court system. Although this process can be periodically staff intensive, since the Tyler system is the catalyst for continual improvements in service, the Court staff will continue to commit resources to drive system functionality and enhancements.
Mental Health Issues
Municipal Courts do not have the ability to commit individuals to state mental health facilities. A model approach by another jurisdiction was recently presented and Police, Court and Prosecutor will seek to determine feasibility of implementing the multi-jurisdictional model that extends assistance to at least a limited number of individuals. An interim solution will be to develop a deferred prosecution agreement that is tailored specifically for defendants who have mental health issues that may benefit from a more structured resolution to deter problematic behavior in the community.
Attachment 19 Legal/Judicial Services FY16 Budget Summary Memo Page 1 of 2
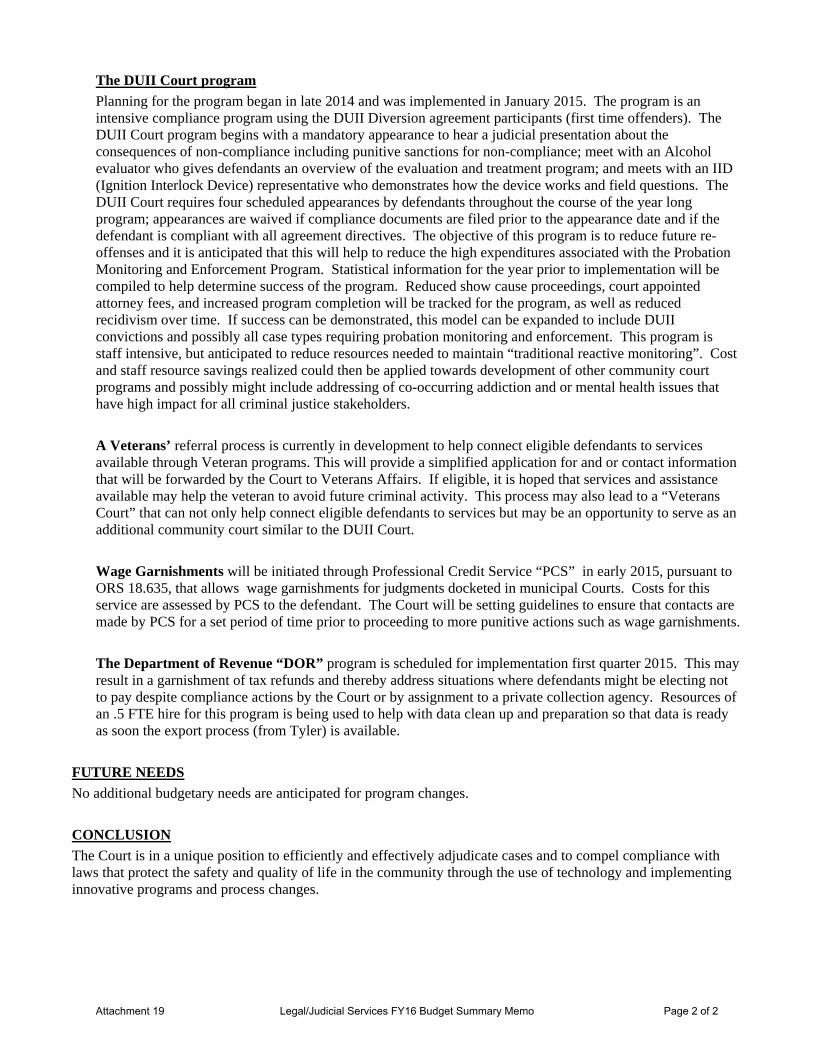
The DUII Court program
Planning for the program began in late 2014 and was implemented in January 2015. The program is an intensive compliance program using the DUII Diversion agreement participants (first time offenders). The DUII Court program begins with a mandatory appearance to hear a judicial presentation about the consequences of non-compliance including punitive sanctions for non-compliance; meet with an Alcohol evaluator who gives defendants an overview of the evaluation and treatment program; and meets with an IID (Ignition Interlock Device) representative who demonstrates how the device works and field questions. The DUII Court requires four scheduled appearances by defendants throughout the course of the year long program; appearances are waived if compliance documents are filed prior to the appearance date and if the defendant is compliant with all agreement directives. The objective of this program is to reduce future re-offenses and it is anticipated that this will help to reduce the high expenditures associated with the Probation Monitoring and Enforcement Program. Statistical information for the year prior to implementation will be compiled to help determine success of the program. Reduced show cause proceedings, court appointed attorney fees, and increased program completion will be tracked for the program, as well as reduced recidivism over time. If success can be demonstrated, this model can be expanded to include DUII convictions and possibly all case types requiring probation monitoring and enforcement. This program is staff intensive, but anticipated to reduce resources needed to maintain “traditional reactive monitoring”. Cost and staff resource savings realized could then be applied towards development of other community court programs and possibly might include addressing of co-occurring addiction and or mental health issues that have high impact for all criminal justice stakeholders.
A Veterans’ referral process is currently in development to help connect eligible defendants to services available through Veteran programs. This will provide a simplified application for and or contact information that will be forwarded by the Court to Veterans Affairs. If eligible, it is hoped that services and assistance available may help the veteran to avoid future criminal activity. This process may also lead to a “Veterans Court” that can not only help connect eligible defendants to services but may be an opportunity to serve as an additional community court similar to the DUII Court.
Wage Garnishments will be initiated through Professional Credit Service “PCS” in early 2015, pursuant to ORS 18.635, that allows wage garnishments for judgments docketed in municipal Courts. Costs for this service are assessed by PCS to the defendant. The Court will be setting guidelines to ensure that contacts are made by PCS for a set period of time prior to proceeding to more punitive actions such as wage garnishments.
The Department of Revenue “DOR” program is scheduled for implementation first quarter 2015. This may result in a garnishment of tax refunds and thereby address situations where defendants might be electing not to pay despite compliance actions by the Court or by assignment to a private collection agency. Resources of an .5 FTE hire for this program is being used to help with data clean up and preparation so that data is ready as soon the export process (from Tyler) is available.
FUTURE NEEDS
No additional budgetary needs are anticipated for program changes.
CONCLUSION
The Court is in a unique position to efficiently and effectively adjudicate cases and to compel compliance with laws that protect the safety and quality of life in the community through the use of technology and implementing innovative programs and process changes.
Attachment 19 Legal/Judicial Services FY16 Budget Summary Memo Page 2 of 2
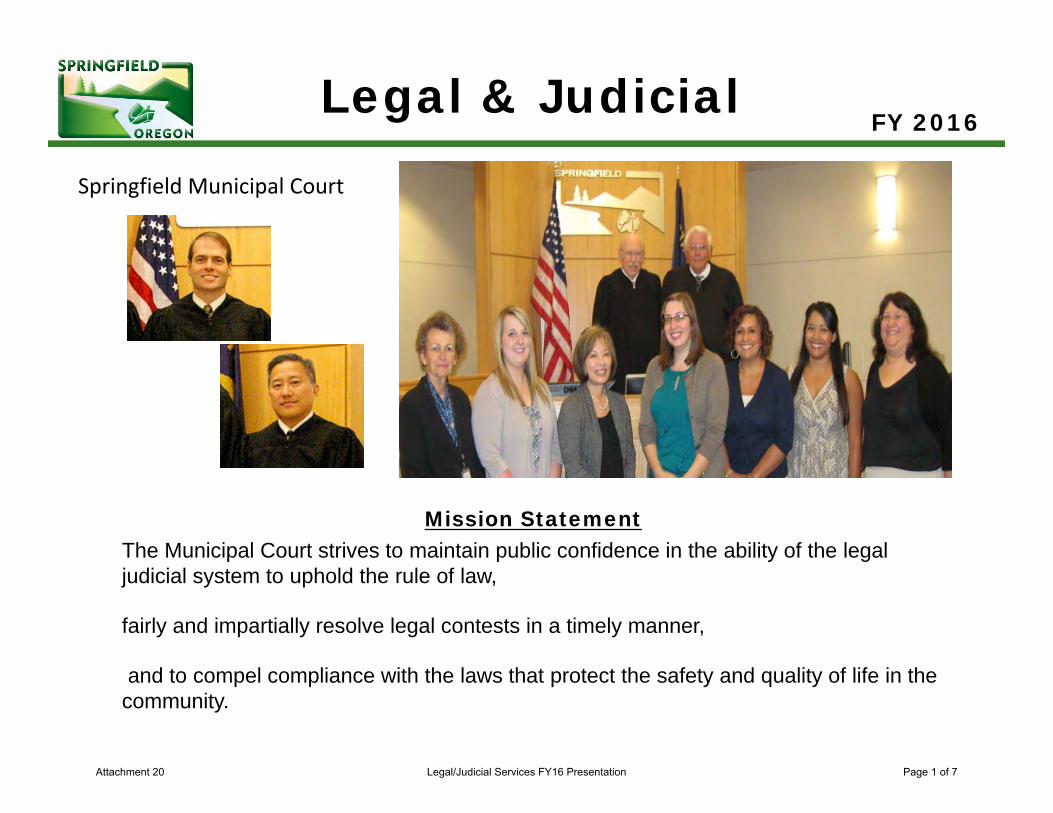
Mission StatementThe Municipal Court strives to maintain public confidence in the ability of the legal judicial system to uphold the rule of law,
fairly and impartially resolve legal contests in a timely manner,
and to compel compliance with the laws that protect the safety and quality of life in the community.
Legal & JudicialFY 2016
Springfield Municipal Court
Attachment 20 Legal/Judicial Services FY16 Presentation Page 1 of 7
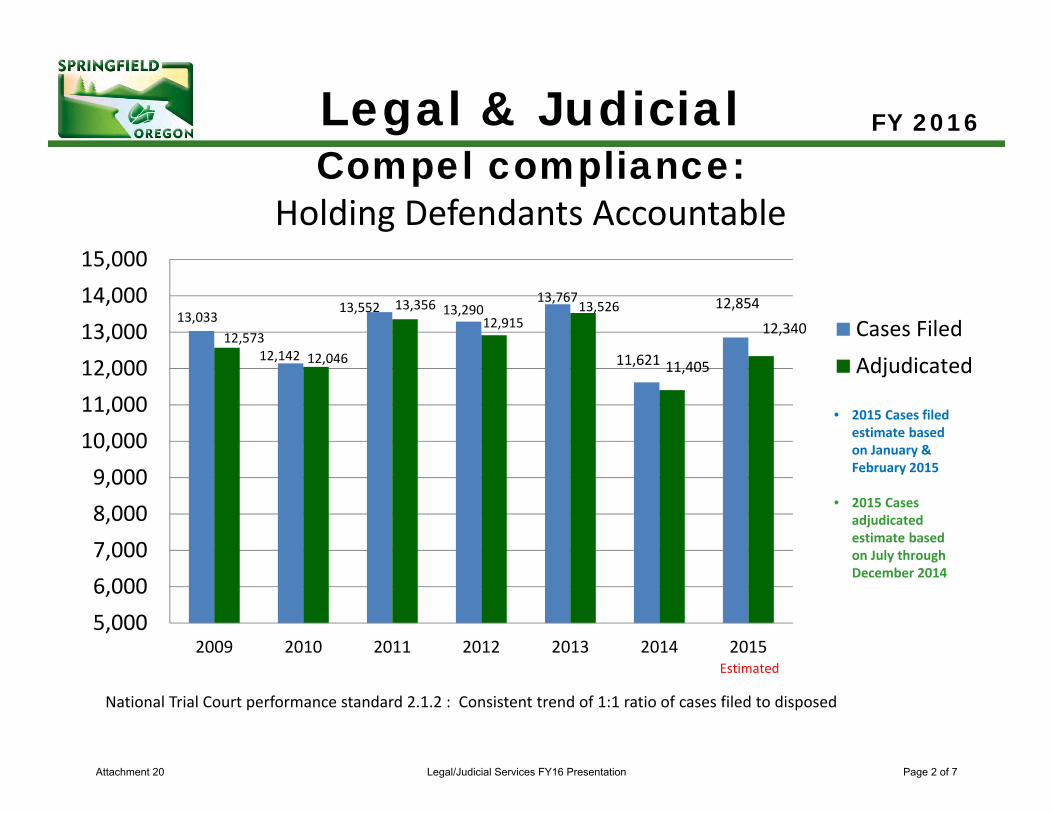
FY 2015 Compel compliance: Holding Defendants Accountable
5,0006,0007,0008,0009,000
10,00011,00012,00013,00014,00015,000
2009 2010 2011 2012 2013 2014 2015
Cases FiledAdjudicated
13,03312,573
12,142 12,046
13,552 13,35612,915
13,29013,767
13,526
• 2015 Cases filed estimate based on January & February 2015
• 2015 Cases adjudicated estimate based on July through December 2014
Estimated
Legal & Judicial FY 2016
11,621 11,405
National Trial Court performance standard 2.1.2 : Consistent trend of 1:1 ratio of cases filed to disposed
12,854
12,340
Attachment 20 Legal/Judicial Services FY16 Presentation Page 2 of 7
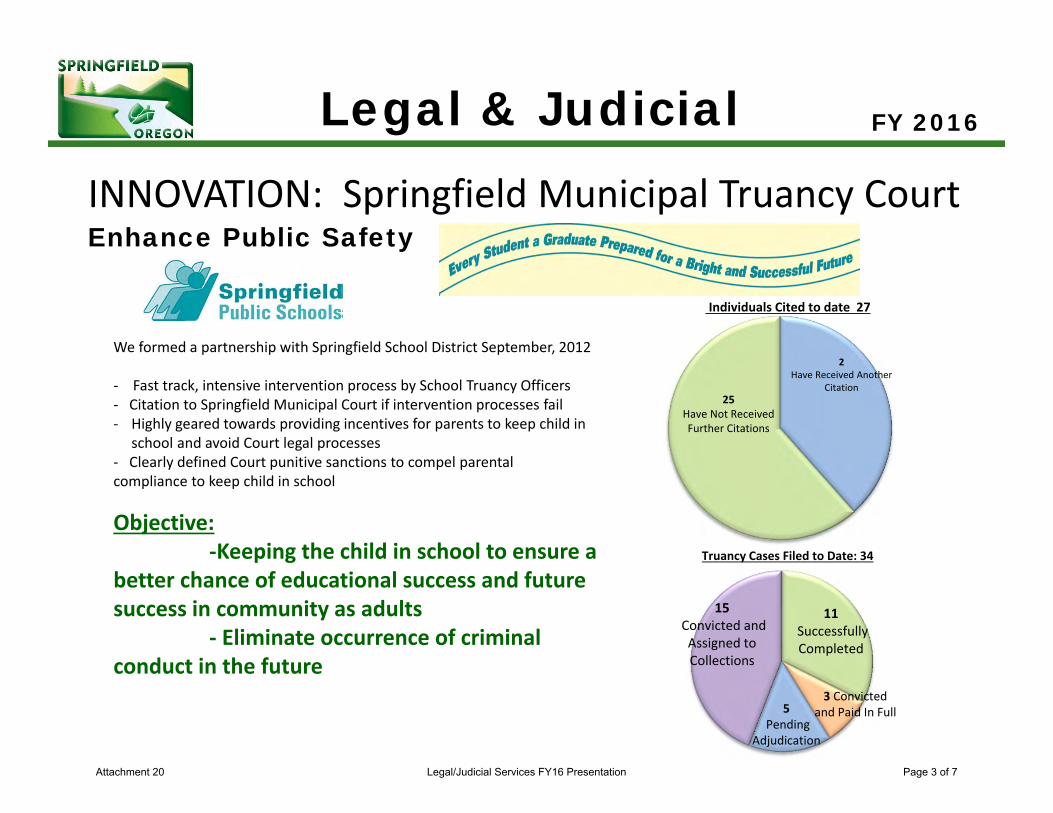
INNOVATION: Springfield Municipal Truancy CourtEnhance Public Safety
We formed a partnership with Springfield School District September, 2012
‐ Fast track, intensive intervention process by School Truancy Officers‐ Citation to Springfield Municipal Court if intervention processes fail‐ Highly geared towards providing incentives for parents to keep child in
school and avoid Court legal processes‐ Clearly defined Court punitive sanctions to compel parental compliance to keep child in school
Objective: ‐Keeping the child in school to ensure a
better chance of educational success and future success in community as adults
‐ Eliminate occurrence of criminal conduct in the future
Legal & Judicial FY 2016
Truancy Cases Filed to Date: 34
11Successfully Completed
15Convicted and Assigned to Collections
5 Pending
Adjudication
3 Convicted and Paid In Full
Individuals Cited to date 27
2 Have Received Another
Citation25
Have Not Received Further Citations
Attachment 20 Legal/Judicial Services FY16 Presentation Page 3 of 7
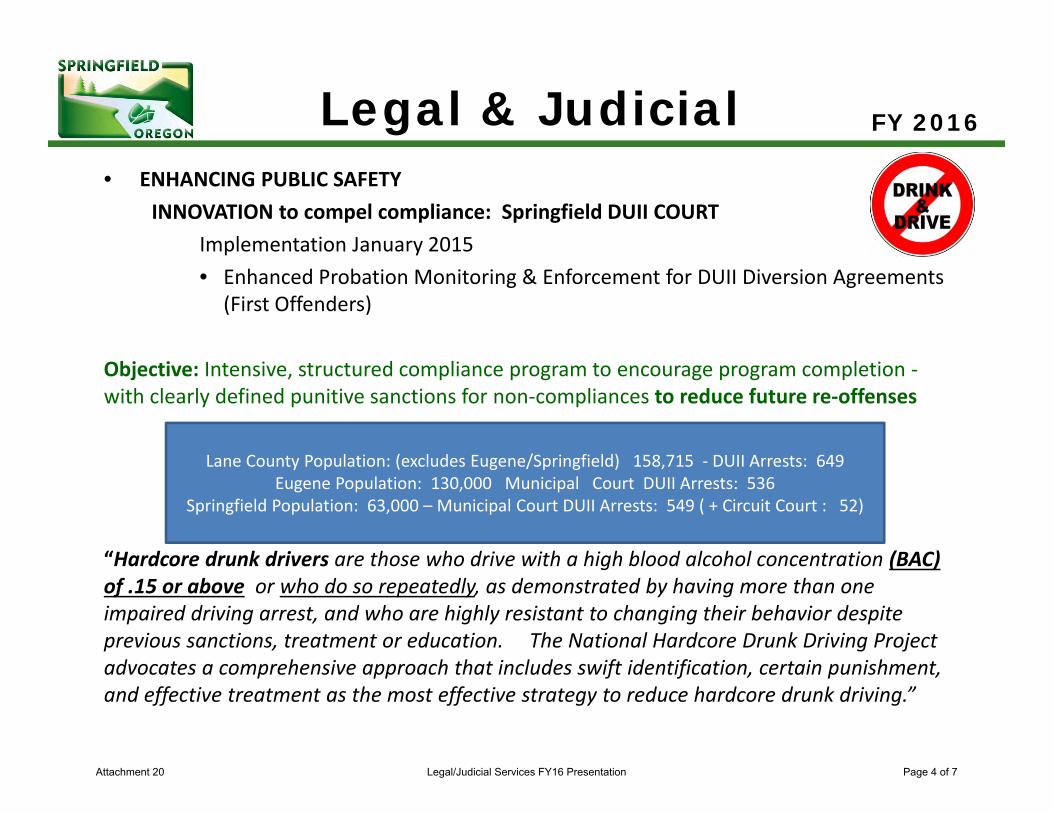
• ENHANCING PUBLIC SAFETYINNOVATION to compel compliance: Springfield DUII COURT
Implementation January 2015• Enhanced Probation Monitoring & Enforcement for DUII Diversion Agreements
(First Offenders)
Objective: Intensive, structured compliance program to encourage program completion ‐with clearly defined punitive sanctions for non‐compliances to reduce future re‐offenses
“Hardcore drunk drivers are those who drive with a high blood alcohol concentration (BAC) of .15 or above or who do so repeatedly, as demonstrated by having more than one impaired driving arrest, and who are highly resistant to changing their behavior despite previous sanctions, treatment or education. The National Hardcore Drunk Driving Project advocates a comprehensive approach that includes swift identification, certain punishment, and effective treatment as the most effective strategy to reduce hardcore drunk driving.”
Legal & Judicial FY 2016
Lane County Population: (excludes Eugene/Springfield) 158,715 ‐ DUII Arrests: 649 Eugene Population: 130,000 Municipal Court DUII Arrests: 536
Springfield Population: 63,000 – Municipal Court DUII Arrests: 549 ( + Circuit Court : 52)
Attachment 20 Legal/Judicial Services FY16 Presentation Page 4 of 7
Legal & Judicial FY 2016
* Automated Collection Processes‐ The ability to import and export cases and payments to and from Professional Credit Service “PCS”
( 2015 authorization to garnish wages through PCS)
*Call notifications “Robo‐calls”‐ An automated call will go out to individuals notifying them of pending further court action… potential to avoid costs for Court and individuals.
* New online records search website with configurable security controls.
INNOVATION: Using technology to provide better services
*Fingerprint signature for Judges on electronic warrants (spring/summer 2015)
* “Automated, on‐demand” document creation from system information
* Electronic signature for defendants
Attachment 20 Legal/Judicial Services FY16 Presentation Page 5 of 7
Legal & Judicial FY 2016
• Enhanced Automated Processes:‐ Citation Import Process
• Bulk import of traffic violations from Police– Shortens time between the citation being issued and citation being available at the
court level for payments and court appearances. – Time that used to be used entering each citation manually is now available for other
court processes.
‐ Warrant Export Process• Bulk export of all warrants activated and recalled by the court
‐ Shortens time between the Court issuing/recalling a warrant and Police entering it in SunGard
‐ Faster warrant service results in faster case adjudication ‐ Electronic Warrant documents are pending implementation in Spring 2015
Attachment 20 Legal/Judicial Services FY16 Presentation Page 6 of 7
: Opportunities
Pending implementation 2015– *Feasibility of Diversion options for individuals with mental health issues.
– * Veterans Assistance Program‐ Provide referrals for eligible individuals to connect with Veterans Assistance programs
– * Community First: Vehicle Compliance Program ‐to improve vehicle safety
Legal & Judicial FY 2016
“Be the change you want to see in the World.”
‐Mahatma Gandhi
Attachment 20 Legal/Judicial Services FY16 Presentation Page 7 of 7
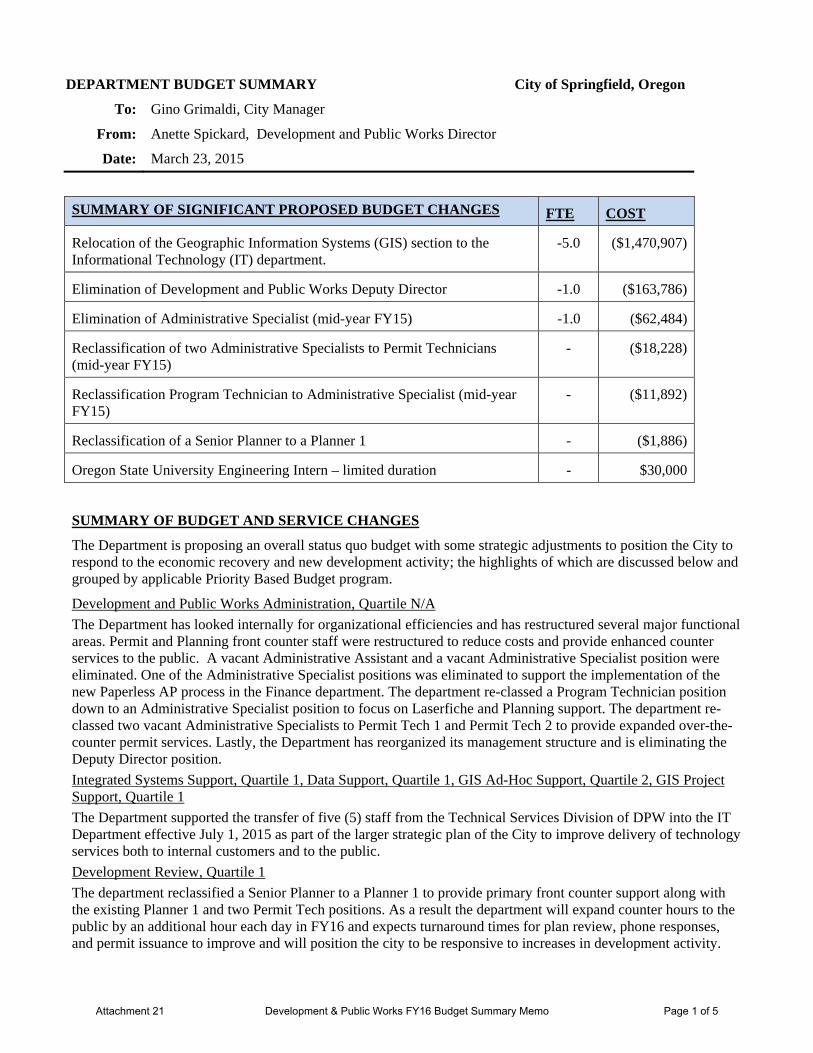
DEPARTMENT BUDGET SUMMARY City of Springfield, Oregon
To: Gino Grimaldi, City Manager
From: Anette Spickard, Development and Public Works Director
Date: March 23, 2015
SUMMARY OF SIGNIFICANT PROPOSED BUDGET CHANGES FTE COST
Relocation of the Geographic Information Systems (GIS) section to the Informational Technology (IT) department.
-5.0 ($1,470,907)
Elimination of Development and Public Works Deputy Director -1.0 ($163,786)
Elimination of Administrative Specialist (mid-year FY15) -1.0 ($62,484)
Reclassification of two Administrative Specialists to Permit Technicians (mid-year FY15)
- ($18,228)
Reclassification Program Technician to Administrative Specialist (mid-year FY15)
- ($11,892)
Reclassification of a Senior Planner to a Planner 1 - ($1,886)
Oregon State University Engineering Intern – limited duration - $30,000
SUMMARY OF BUDGET AND SERVICE CHANGES
The Department is proposing an overall status quo budget with some strategic adjustments to position the City to respond to the economic recovery and new development activity; the highlights of which are discussed below and grouped by applicable Priority Based Budget program.
Development and Public Works Administration, Quartile N/A
The Department has looked internally for organizational efficiencies and has restructured several major functional areas. Permit and Planning front counter staff were restructured to reduce costs and provide enhanced counter services to the public. A vacant Administrative Assistant and a vacant Administrative Specialist position were eliminated. One of the Administrative Specialist positions was eliminated to support the implementation of the new Paperless AP process in the Finance department. The department re-classed a Program Technician position down to an Administrative Specialist position to focus on Laserfiche and Planning support. The department re-classed two vacant Administrative Specialists to Permit Tech 1 and Permit Tech 2 to provide expanded over-the-counter permit services. Lastly, the Department has reorganized its management structure and is eliminating the Deputy Director position.
Integrated Systems Support, Quartile 1, Data Support, Quartile 1, GIS Ad-Hoc Support, Quartile 2, GIS Project Support, Quartile 1
The Department supported the transfer of five (5) staff from the Technical Services Division of DPW into the IT Department effective July 1, 2015 as part of the larger strategic plan of the City to improve delivery of technology services both to internal customers and to the public.
Development Review, Quartile 1
The department reclassified a Senior Planner to a Planner 1 to provide primary front counter support along with the existing Planner 1 and two Permit Tech positions. As a result the department will expand counter hours to the public by an additional hour each day in FY16 and expects turnaround times for plan review, phone responses, and permit issuance to improve and will position the city to be responsive to increases in development activity.
Attachment 21 Development & Public Works FY16 Budget Summary Memo Page 1 of 5
Comprehensive Land Use Planning, Quartile 1
The Comprehensive Land Use Planning program has two major Council initiatives underway, the Main Street Vision Plan and the 2030 Plan that require contractual services and special legal counsel assistance. For FY16 the legal fees associated with the 2030 Plan will be absorbed through the City Attorney’s budget, estimated at $50k. Contractual services funding for the 2030 Plan will continue to be developed over the next fiscal year. Main Street Vision Plan implementation activities will be funded through the City Manager’s Opportunity Fund. Traffic and pedestrian safety improvements are the first strategies prioritized by Council as part of the Main Street Vision Plan implementation efforts.
Capital Projects-Stormwater, Quartile 1, Capital Projects-Street, Quartile 1, Capital Projects-Wastewater, Quartile 1, Development Review, Quartile 1
DPW continues to focus its efforts on maintaining the public infrastructure of the city as well as supporting new development and delivering major capital projects that provide a community benefit and generate new jobs. We are working with developers and our local government partners on major economic development initiatives such as new mixed use developments in Glenwood; the Glenwood Riverfront Path; the Millrace Stormwater Park; siting and reconstruction of the new Swanson Mill; development of new commercial and industrial parks; new subdivisions and housing starts in the residential market; and creating new process efficiency measures such as the newly proposed Minimum Development and Ministerial Review Standards created by the Developer Advisory Committee (DAC).
The Department has partnered with the Oregon State University engineering program and is hosting an engineering intern. This intern is working with the local wastewater system staff and Metropolitan Wastewater Management Commission (MWMC) staff to analyze collection system flows to help design performance metrics and identify sewer rehabilitation projects under the Capacity Management Operations and Maintenance (CMOM) plan being developed by the City.
Traffic Engineering-Operations, Quartile 1
The Department consolidated the Traffic Engineering, Maintenance and Operations functions under the Traffic Engineer. The previous Traffic Maintenance supervisor has been re-assigned to Subsurface Maintenance thereby removing 1.0 FTE from the Street Fund to help relieve budgetary pressure in that fund. Traffic safety initiatives continue to be a high priority for this program.
Street Maintenance and Preservation, Quartile 2
The Oregon Department of Transportation (ODOT) signed over jurisdiction of the Franklin Blvd in this current fiscal year. The City received a onetime payment of $3.2M for this transfer and is planning to use the funding for the Franklin Blvd redesign. The City has been fortunate recently to receive discretionary state and federal funds for key projects such as Gateway Street surface preservation, $1,525,000 (STP-U); Main Street Pedestrian Crossings construction, $750,000 (ODOT R2 Bike/Ped); Virginia/Daisy Bike Boulevard implementation, $698,400 (ODOT Statewide Bike/Ped); and Franklin Boulevard Phase 1 reconstruction, $6,000,000 (STIP). Staff continues to work with regional, state and federal partners to secure investments in Springfield’s multi-modal transportation system.
Surface Drainage Maintenance, Quartile 2
The PBB Surface Drainage Maintenance program maintains surface stormwater quality by performing culvert cleaning, culvert repair/construction, canal reshaping, ditch/canal cleaning, flood control, drainage grading, high velocity culvert cleaning, inspections, shoulder repair, water quality features maintenance. In the past the program’s expenditure of $65K for Millrace maintenance was budgeted in the stormwater capital fund. In FY16 it will be budgeted into the stormwater operating fund as it is an ongoing maintenance expense. This increases the operating line item beyond the 0% directive for this fund, but needs to be viewed holistically in terms of the 0% Materials & Services directive. This is not new budget but only a movement of budget from capital to operating for the same dollar amount as FY15.
Attachment 21 Development & Public Works FY16 Budget Summary Memo Page 2 of 5
Facilities Maintenance-City, Quartile 3
The City Hall Seismic study project was initiated in FY15 and will be completed by July 2015. The preliminary report indicates the building has several major deficiencies and areas of concern. The final report will be shared when received with the City Executive Team for discussion and planning to address the issues.
FUTURE NEEDS
As part of the budget preparation process the department actively participated in the Priority Based Budgeting initiative which gave the department a fresh look at the services delivered and how they relate to the Council’s goals for the city. This effort helped the department set priorities for work to be accomplished in this year’s budget proposal. The department will continue to fine tune these Priority Based Budget programs.
The department has multiple future expenditure items that are noteworthy and not budgeted for at this time.
Street Maintenance and Preservation, Quartile 2, Bicycle Facilities, Quartile 2, Landscape Tree Maintenance, Quartile 3, Landscape Maintenance, Quartile 2, Street Sweeping, Quartile 2, Street Sidewalk Maintenance and Preservation, Quartile 2, Street Lighting, Quartile 2, Traffic Operation-Engineering, Quartile 1, Street Engineering, Quartile 1, Capital Projects-Streets, Quartile 1
The City has identified a $4.5M annual revenue shortfall to perform adequate levels of maintenance and preservation on the City’s Street System. The City has also identified a backlog of $27M for street surface improvements. The City Council has a goal that our Street Condition Index (surface condition) will show 85% at Fair or Better condition. At this time more than half of our streets are in the Fair to Poor condition category.
A breakdown of estimated annual program service improvement funding needs is as follows ($4.5 Million):
$2,500,000 annual capital spending for street preservation through overlay or rehabilitation (arterials, collectors, locals)
$500,000 annual street crack and slurry seal (locals) $750,000 annual program funding for service enhancements for landscape, traffic and street operations $500,000 annual program funding to address City R.O.W. ADA compliance (sidewalks, ped crossing) $250,000 annual program funding to replace/upgrade City street lighting systems
If the County’s vehicle registration fee is passed by voters in May 2015 the City will be able to reinstate the residential slurry seal program along with other priority street preservation work on arterials and collectors. Project list includes, in order of priority, 42nd Street, Marcola Road, Virginia/Daisy, South 5th Street, Thurston Road, South 2nd Street, 48th Street and 52nd Street, Olympic Street, 18th Street, Mohawk Boulevard, and 18th Street (next segment continuation).
If the City were to restart a street preservation program, the first step would be to purchase a compact track machine up-fitted with an asphalt grinder attachment ($100,000) to expedite needed asphalt repairs; hire seasonal staff ($50,000 [2,600 hours]) to perform crack seal, pavement marking, and general asphalt repair activities as part of street preservation and maintenance work. This equipment will improve the operational efficiency of removing damage areas of asphalt surface so crews can achieve high quality repairs. Another benefit is that staff can accomplish the work much quicker which is important toward minimizing traffic disruption and improved construction zone safety. The additional seasonal staff will perform crack seal, pavement marking, and general asphalt repair activities as part of street preservation and maintenance work.
Traffic Engineering Operations, Quartile 1
The City has an identified need to replace outdated traffic control and communication systems in conformity with the Intelligent Transportation Systems (ITS) Metropolitan Area Plan. The key actions to implement this:
Replace obsolete traffic signal controllers and cabinets with current standard controllers and cabinets; ~50 City owned or maintained controllers and cabinets, ODOT controllers and cabinets are not included.
Upgrade the central control system to current standard and compatibility with controllers. Repair or replace legacy copper wire signal communication lines and equipment. Expand digital radio signal communications deployment or establish fiber optic paths to unserved
locations or in lieu of legacy copper lines.
Attachment 21 Development & Public Works FY16 Budget Summary Memo Page 3 of 5
This program is mandated by FHWA/USDOT requirements related to use of federal transportation funds such as STP-U, and other programs, Oregon law and administrative rules adopted by OTC concerning application of the Manual on Uniform Traffic Control Devices (MUTCD), and ITS rules requiring new traffic controls to conform to National Transportation Communications for ITS Protocol standards. The estimated cost of the project is $250k annually for five (5) years.
Affordable Housing, Quartile 2, Community Development, Quartile 1, Social Services, Quartile 3
The CDBG, HOME and Social Service programs have experienced regulatory changes in FY15. The combination of increasing regulatory burden and reductions in funding allocations at the federal level has created a challenging environment in which to manage an effective program using only CDBG/HOME dollars to pay for program staff. The Department is continuing to develop strategies that will allow the City to more effectively provide these services within known resource constraints and prioritize spending on those activities that are of the highest priority to the community and the CDAC. Staff are refocusing efforts and reducing program spending in the FY16 budget through the reallocation of Code Enforcement out of the Community Development fund. Staff continues the negotiation of a new HOME program model with the City of Eugene. In order to fully staff the program to HUD recommended staff levels, the department needs an additional .50FTE.
Integrated Systems Support, Quartile 1
The Accela software for managing building permit, development review and code enforcement has neared its end of useful life. The City has several choices for replacement software but no funds identified yet for the purchase. It is estimated that $500k will be needed to purchase a new system and do the data conversion. This system is core to the City’s work with private development and essential to economic development. The most significant service level improvements from a system upgrade will result from better quality data and the reduction in time to process a unit of work, which also means customers will spend less time waiting at the front counter. For example: It takes 20 to 25 minutes to process an over-the-counter transaction with Accela. It is estimated that time can be reduced 50% to 75% with new software.
The City has invested in Asset Management software which is integral to the Public Infrastructure management activities of the City. It is prudent for the City to begin planning and saving for a future upgrade or replacement of that system. The request to begin saving is to insure manageable, reliable funding for the upgrade or replacement of the Asset Management System at the end of its useful life and to avoid the large one time budgetary expense that is typically incurred when information technology systems are replaced.
Code Enforcement, Quartile 1, Building Safety Programs, Quartile 2, Land Drainage & Alteration Permit (LDAP), Quartile 2
As part of positioning the City for a rebound in private construction activity, the Department recommends the addition of 1.0 FTE administrative support staff to support Code Enforcement, LDAP and the Building Safety program to reduce service backlog and improve the timeliness of service provided to the community. The additional staffing will result in a number of service improvements, including effective ability to achieve enforcement in the urban transition area and building safety code enforcement everywhere in Springfield’s jurisdiction.
Surface Drainage Vegetation Management, Quartile 2
Expansion of City stormwater infrastructure has increased the inventory of bioswales needing annual maintenance work. A key outcome of Springfield’s existing stormwater management plan is to ensure that stormwater management is focused on creating safe, clean, and attractive community amenities from Springfield’s many open waterways. The program prevents and/or avoids risk to the property of the citizens by reducing the amount of vegetation in waterways, thus allowing for the efficient flow of stormwater. This program has a strong influence on the environmental quality, natural resource stewardship and community livability of the city. Not maintaining vegetation properly results in loss of drainage system functionality and jeopardizes our ability to meet Clean Water Act requirements of reducing pollutants to the maximum extent practicable. The City would benefit from a dedicated seasonal work crew with 1.0 FTE coordinator to oversee the seasonal work crew plus equipment that would focus on City stormwater facilities and the removal of invasive species on the Mill Race corridor and bioswales.
Attachment 21 Development & Public Works FY16 Budget Summary Memo Page 4 of 5
Licensing and Fees, Quartile 4
On the horizon is the updated Lane County Solid Waste Management Plan which will trigger the need for a related Municipal Action Plan. As a result of the County’s intent to adopt a new Solid Waste Management Plan in 2016, the city will be asked by Lane County to pursue the creation of a Municipal Action plan, which will cost an estimated $25k in FY17. The County’s plan will provide the vehicle for the future of the Glenwood Transfer Station and the City has an interest in those decisions as part of Glenwood’s redevelopment. The plan could also impact the City’s waste hauler, Sanipac, and potentially our citizen’s garbage rates. Therefore, the city should remain engaged in this process and be ready respond in the future with its own plan.
Facilities Maintenance-City, Quartile 4
Maintenance of City facilities continues to be a challenge due to several factors including; an ever aging infrastructure, acquisition of additional (typically older) facilities; and limited funding. The City has several large facilities projects on the horizon that will require strategic decision making about funding such as a City Hall HVAC system and duct replacement project (approximately $1M), and the City Hall Seismic retrofit project (approximately $2-$3M); and other major system upgrades such as roofing, plumbing, mechanical and electrical at a number of buildings. Strategies range from saving funds over time as a “pay as you go” strategy to using bonds as a debt financing strategy. Looking holistically at the City’s needs for buildings and facilities now and in the future will be an important factor in determining the best approach to financing these needs.
Facilities Maintenance-Custodial Services, Quartile 4
Custodial services provided to City Hall remains at minimal levels, including such items as restroom cleaning/sanitation, vacuuming, garbage/recycle, dusting and window cleaning. A recent City Hall staff survey indicated that 72% of employees were satisfied or very satisfied with the current level of service, 15% of respondents were dissatisfied or very dissatisfied with overall facility cleanliness, and the remaining 13% are either satisfied or dissatisfied. One specific category revealed a 21% dissatisfaction rating with the cleanliness of entries, counters, floors and trash cans. If an additional custodian position was created frequency of service delivery would substantially improve and would address cleanliness concerns.
Vehicle & Equipment Maintenance and Repair, Quartile 4
Repair and maintenance of city vehicles and large specialized heavy equipment is provided by two mechanics at the Operations Division location. The program is unable to maintain optimal service levels with only 2.0 FTE; during vacations and sickness only one mechanic is available to service the needs of the City’s fleet, including any emergency repairs that occur. The addition of one mechanic would improve timeliness of service and minimize downtime of operations. Currently, when the program is reduced to 1.0 FTE due to sickness or vacation, the service needs are slowed to half for required turnaround time on vehicle and equipment repairs. The program also lacks a dedicated FTE for Public Safety or Infrastructure system vehicles and equipment.
CONCLUSION
The Department’s proposed budget for FY16 will allow DPW to continue to be responsive to Council initiatives and customer service requests from the public even though we face many challenges in the coming year. We will continue to maintain the city’s infrastructure assets and will actively participate in partnerships with our other government and non-profit partners to bring positive community benefits to the residents and visitors of Springfield. We will continue to look for creative solutions to our challenges and look forward to serving Springfield.
Attachment 21 Development & Public Works FY16 Budget Summary Memo Page 5 of 5
Development and Public Works Department FY 2016
Building a safe and livable community through proper public infrastructure and
support for private development
“You can design and create, and build the most wonderful place in the world. But it takes people to make the dream a reality.”
‐Walt Disney
Attachment 22 Development & Public Works FY16 Presentation Page 1 of 23
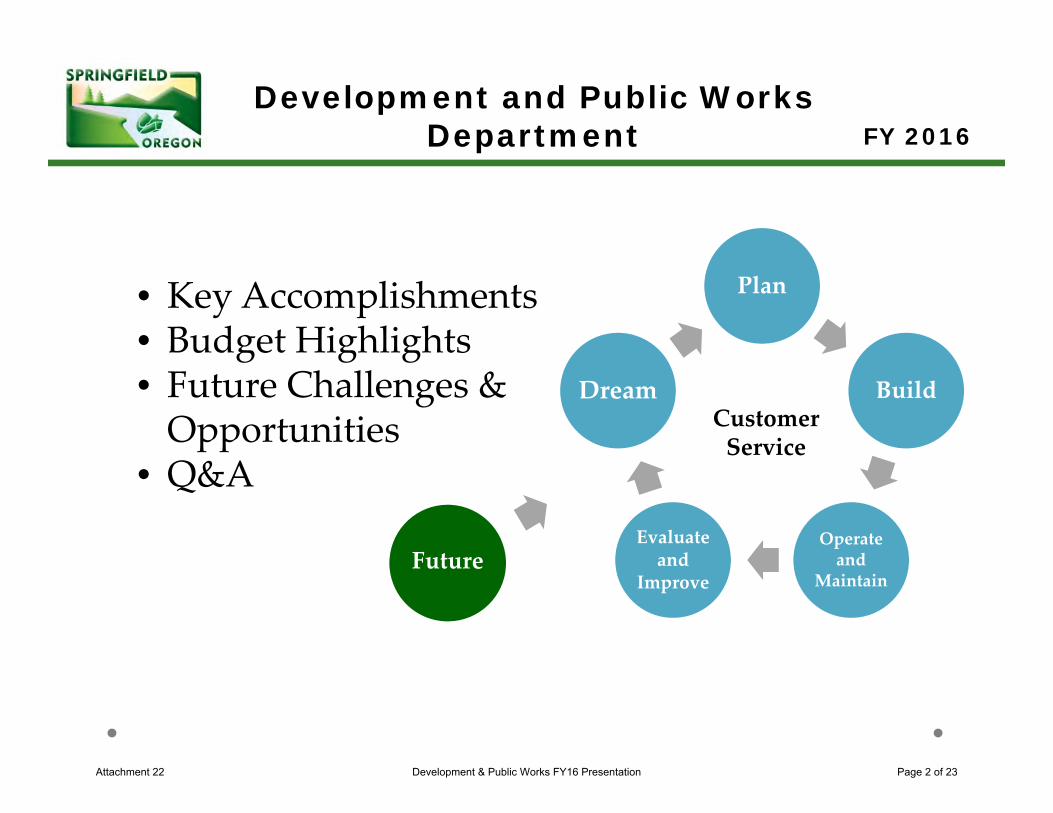
Development and Public Works Department FY 2016
• Key Accomplishments• Budget Highlights• Future Challenges & Opportunities
• Q&A
Plan
Build
Operate and
Maintain
Evaluate and
Improve
DreamCustomer Service
Future
Attachment 22 Development & Public Works FY16 Presentation Page 2 of 23
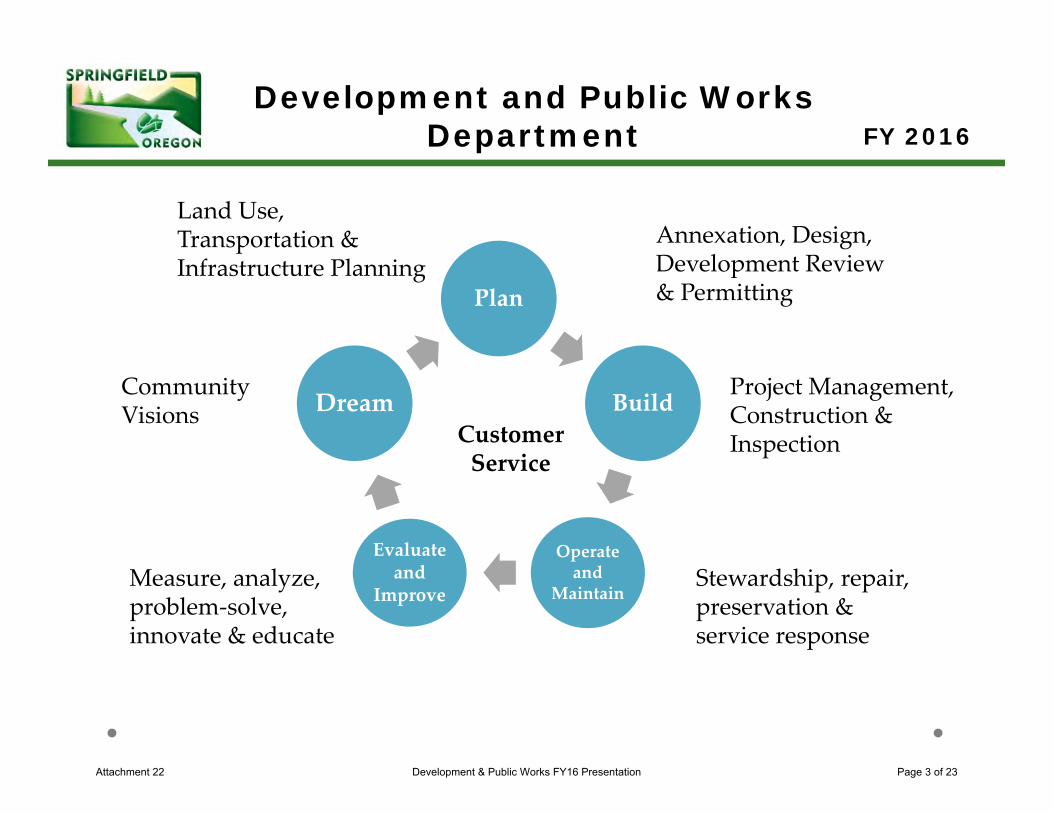
Development and Public Works Department FY 2016
Plan
Build
Operate and
Maintain
Evaluate and
Improve
Dream
Land Use, Transportation & Infrastructure Planning
Annexation, Design, Development Review & Permitting
Project Management, Construction & Inspection
Stewardship, repair, preservation & service response
Community Visions
Measure, analyze, problem‐solve, innovate & educate
Customer Service
Attachment 22 Development & Public Works FY16 Presentation Page 3 of 23
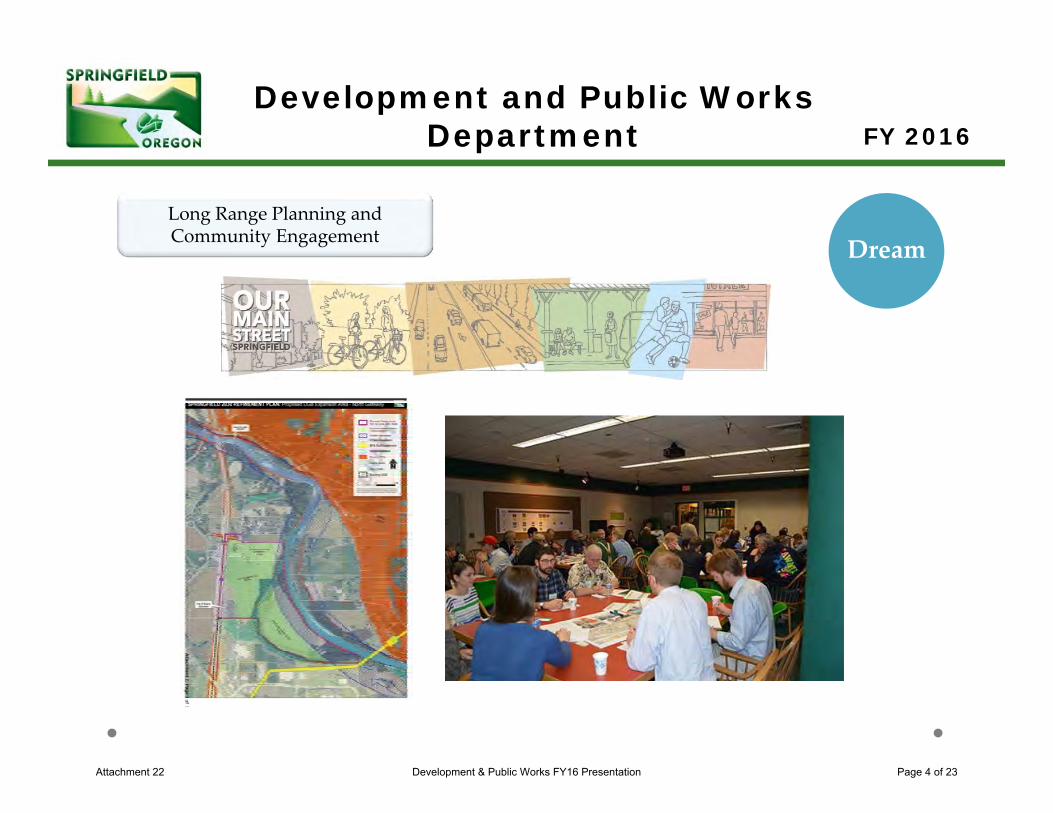
Development and Public Works Department FY 2016
DreamLong Range Planning and Community Engagement
Attachment 22 Development & Public Works FY16 Presentation Page 4 of 23
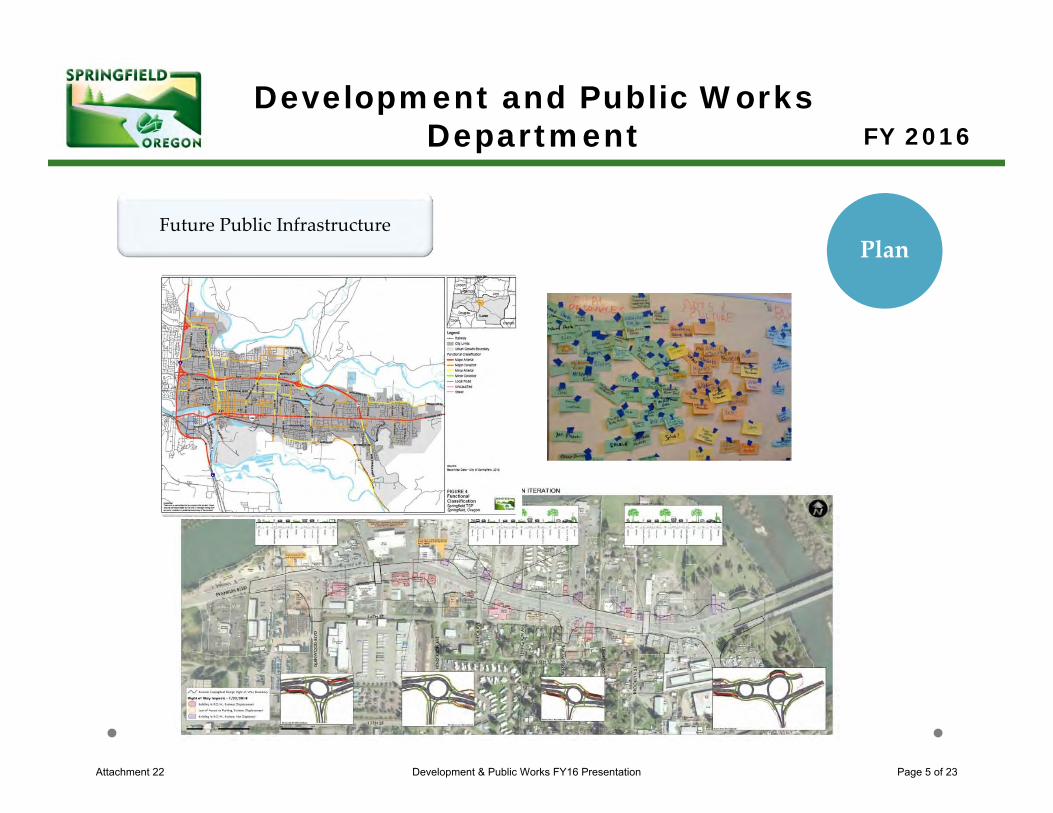
Development and Public Works Department FY 2016
PlanFuture Public Infrastructure
Attachment 22 Development & Public Works FY16 Presentation Page 5 of 23
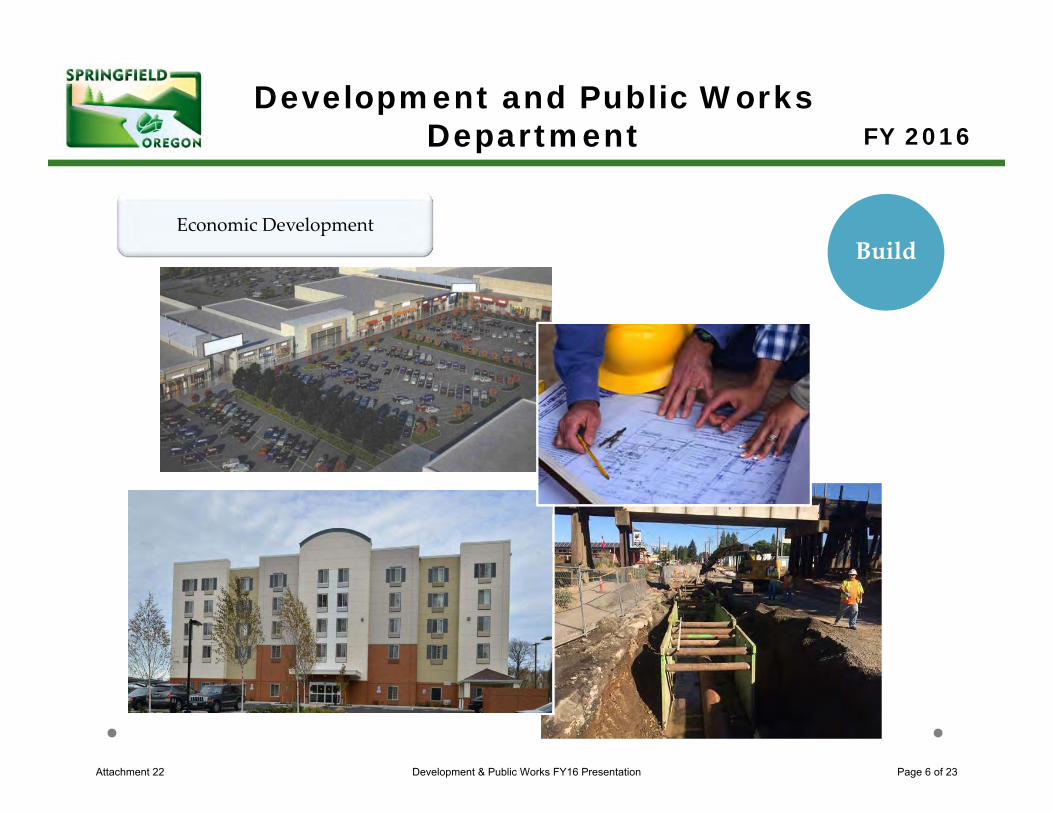
Development and Public Works Department FY 2016
BuildEconomic Development
Attachment 22 Development & Public Works FY16 Presentation Page 6 of 23
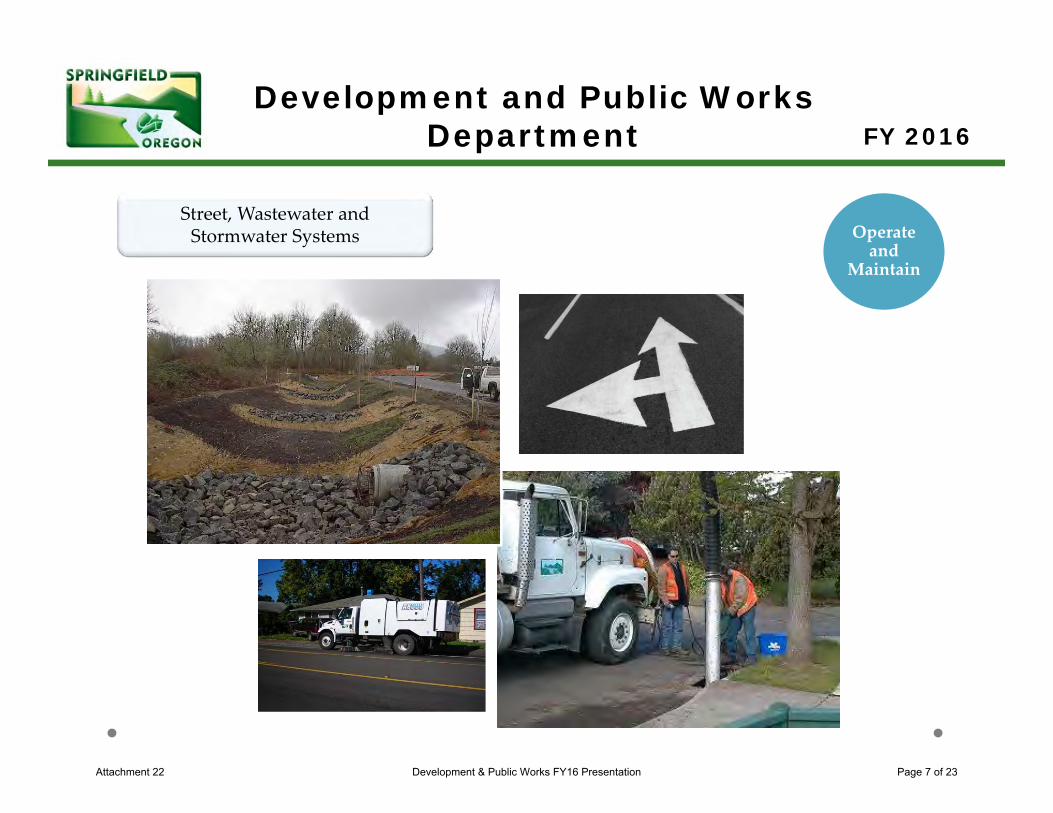
Development and Public Works Department FY 2016
Operate and
Maintain
Street, Wastewater and Stormwater Systems
Attachment 22 Development & Public Works FY16 Presentation Page 7 of 23
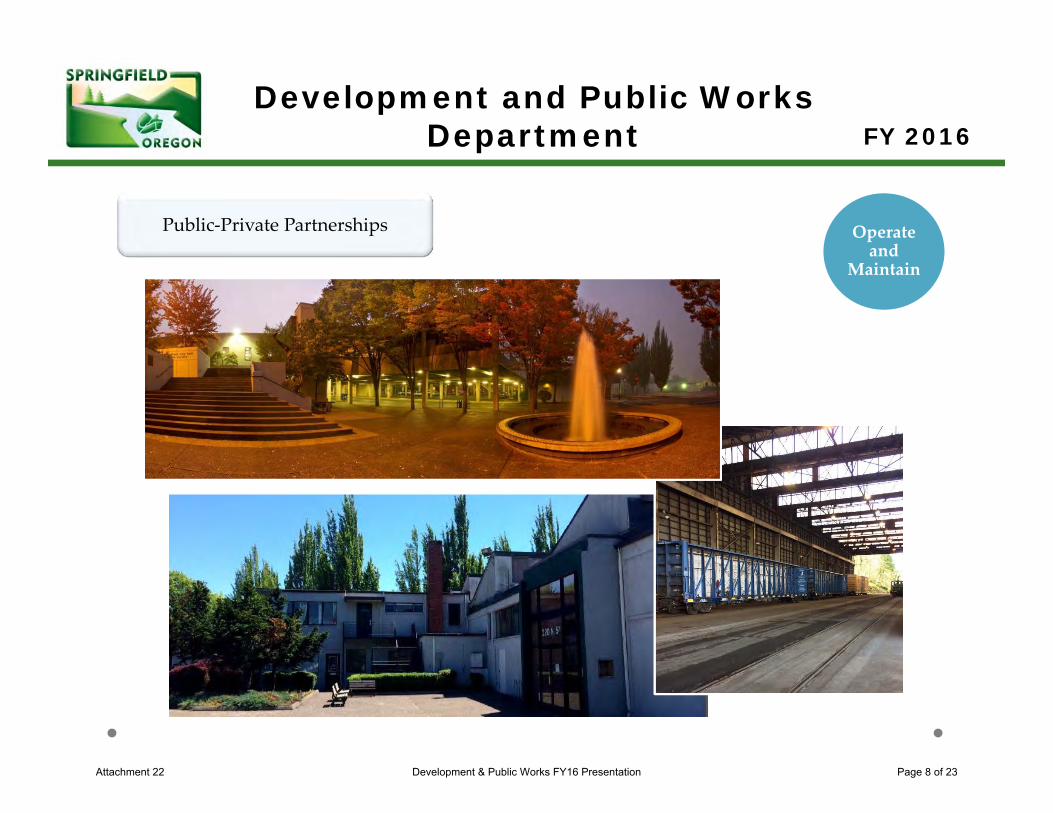
Development and Public Works Department FY 2016
Operate and
Maintain
Public‐Private Partnerships
Attachment 22 Development & Public Works FY16 Presentation Page 8 of 23
Development and Public Works Department FY 2016
Preservation and Residential Slurry Seal Operate
and Maintain
Attachment 22 Development & Public Works FY16 Presentation Page 9 of 23
Development and Public Works Department FY 2016
GIS Consolidation with IT Department Evaluate
and Improve
Attachment 22 Development & Public Works FY16 Presentation Page 10 of 23
Development and Public Works Department FY 2016
Front Counter staffing restructureTo increase hours of operation Evaluate
and Improve
Attachment 22 Development & Public Works FY16 Presentation Page 11 of 23
Development and Public Works Department FY 2016
Traffic Engineering and Operations Restructure Evaluate
and Improve
Attachment 22 Development & Public Works FY16 Presentation Page 12 of 23
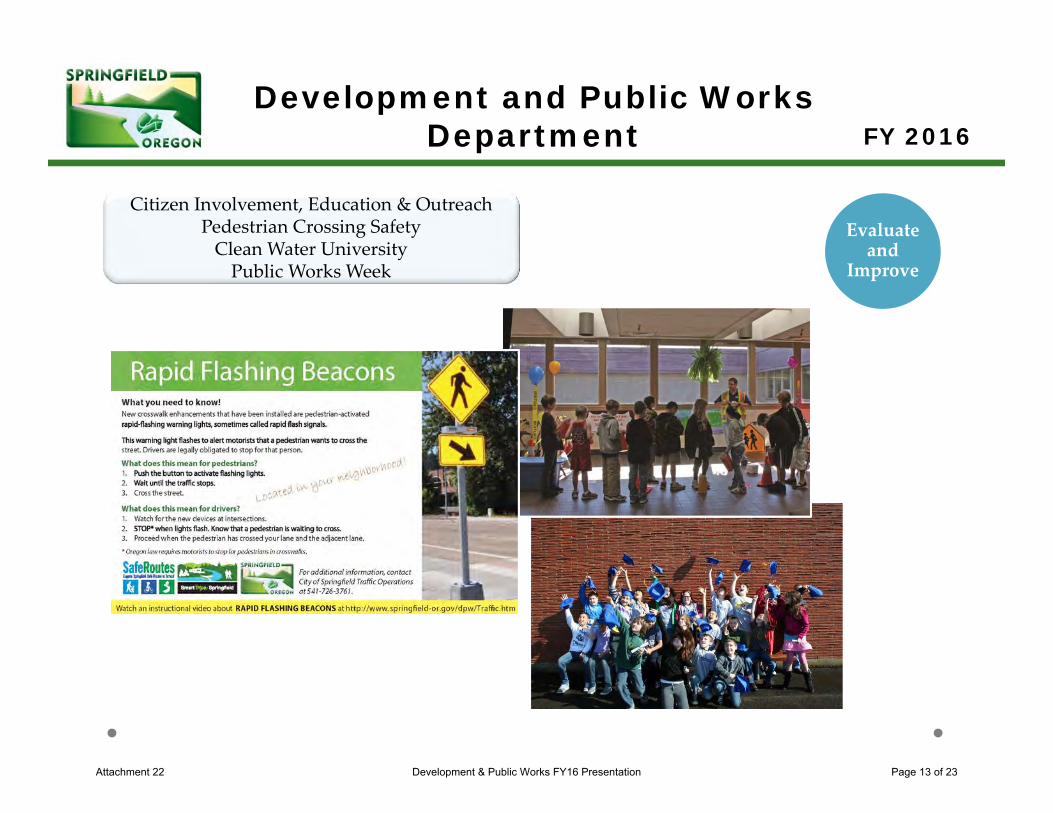
Development and Public Works Department FY 2016
Citizen Involvement, Education & OutreachPedestrian Crossing SafetyClean Water UniversityPublic Works Week
Evaluate and
Improve
Attachment 22 Development & Public Works FY16 Presentation Page 13 of 23
Development and Public Works Department FY 2016
Caring for the communityGoing the extra mile Evaluate
and Improve
Attachment 22 Development & Public Works FY16 Presentation Page 14 of 23
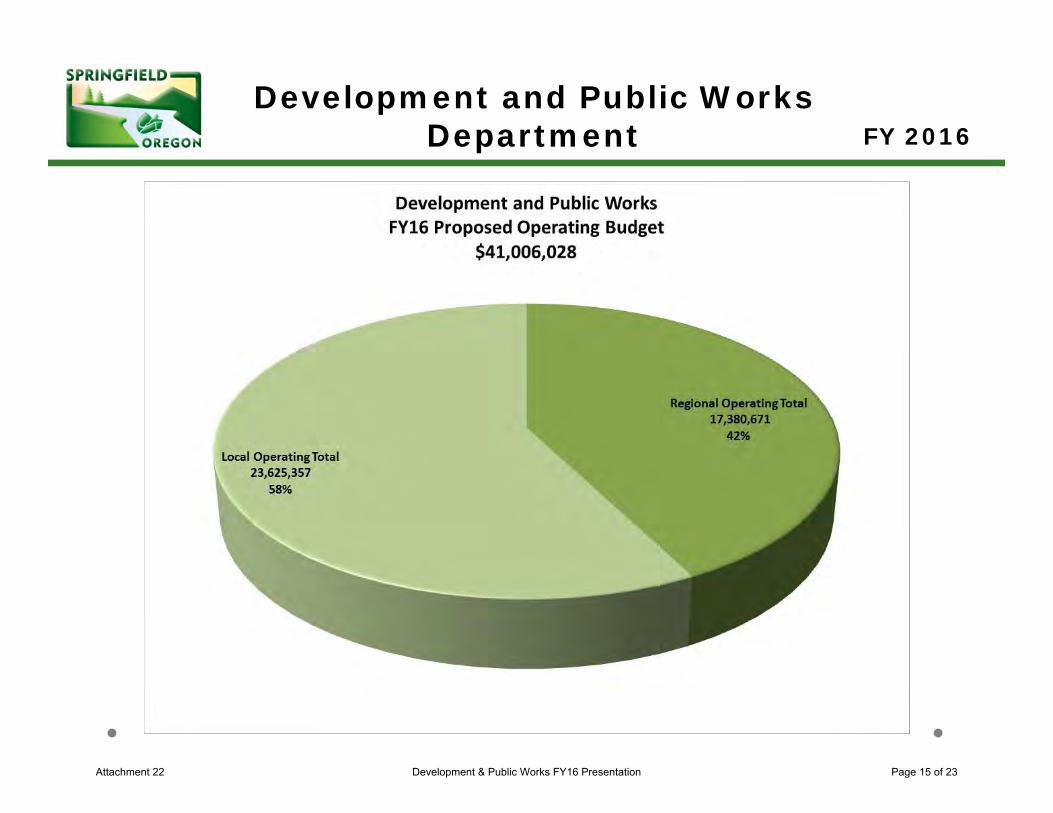
Development and Public Works Department FY 2016
Attachment 22 Development & Public Works FY16 Presentation Page 15 of 23
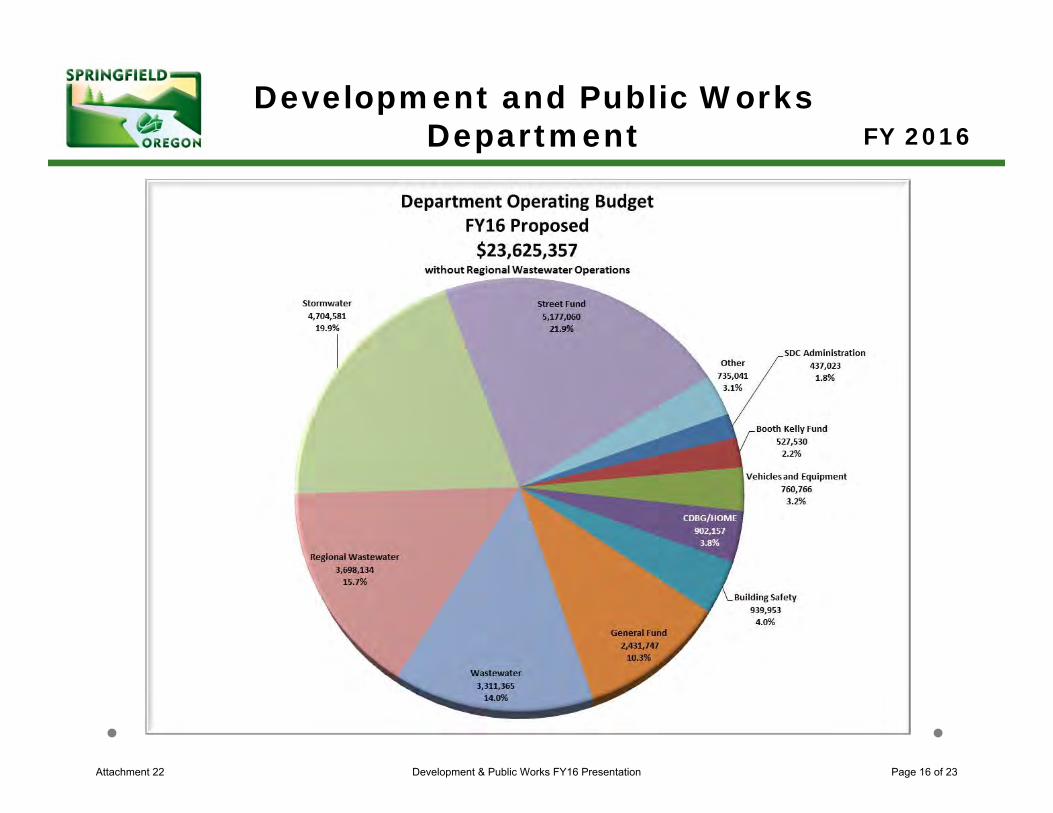
Development and Public Works Department FY 2016
Attachment 22 Development & Public Works FY16 Presentation Page 16 of 23
Development and Public Works Department FY 2016
Sanitary Sewer SystemCapacity, Maintenance, Operations &
Management (CMOM) Future
Attachment 22 Development & Public Works FY16 Presentation Page 17 of 23
Development and Public Works Department FY 2016
Traffic Signal upgrades andStreet Preservation
Future
Attachment 22 Development & Public Works FY16 Presentation Page 18 of 23
Development and Public Works Department FY 2016
Social Services and affordable housing development
Future
Attachment 22 Development & Public Works FY16 Presentation Page 19 of 23
Development and Public Works Department FY 2016
Technology ReplacementFuture
Attachment 22 Development & Public Works FY16 Presentation Page 20 of 23
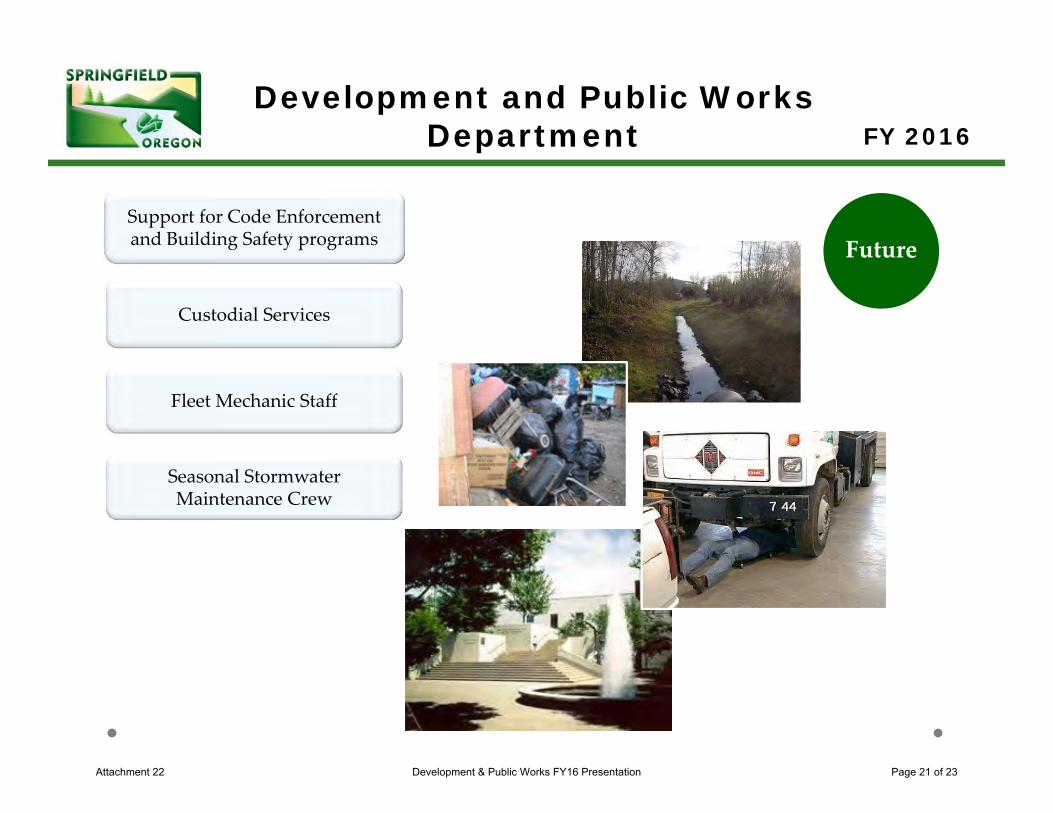
Development and Public Works Department FY 2016
Support for Code Enforcement and Building Safety programs
Custodial Services
Fleet Mechanic Staff
Seasonal Stormwater Maintenance Crew
Future
Attachment 22 Development & Public Works FY16 Presentation Page 21 of 23
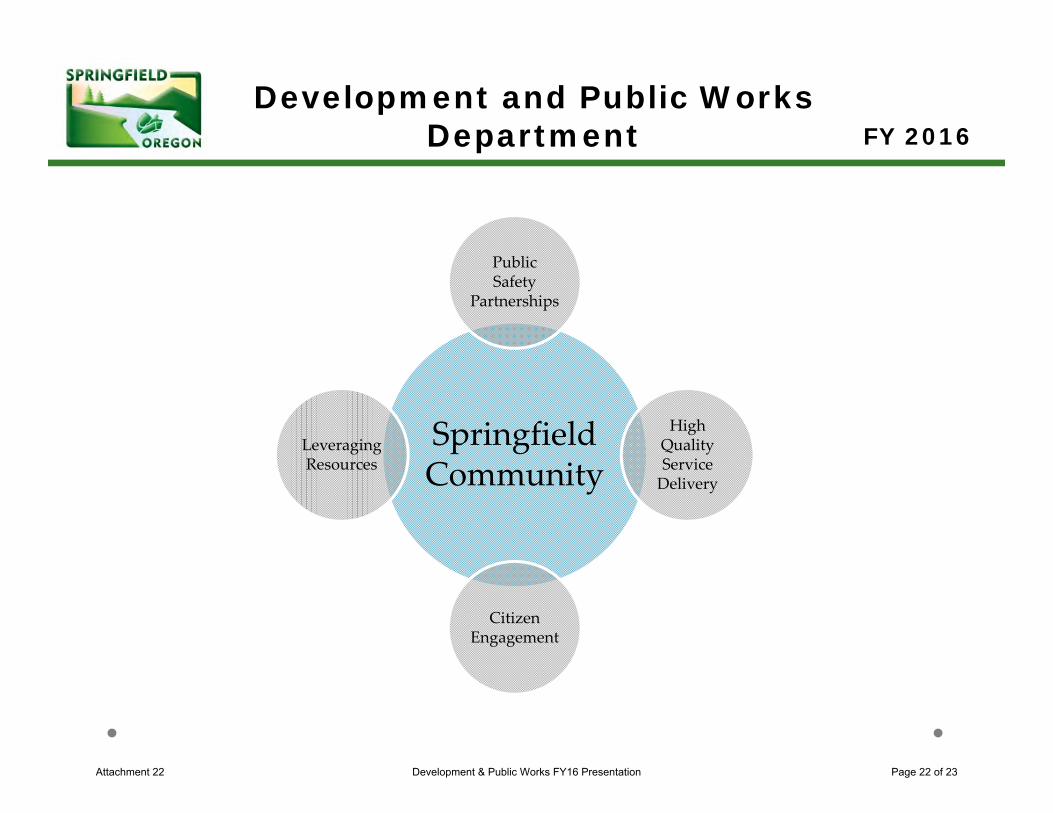
Development and Public Works Department FY 2016
Springfield Community
Public Safety
Partnerships
High Quality Service Delivery
Citizen Engagement
Leveraging Resources
Attachment 22 Development & Public Works FY16 Presentation Page 22 of 23
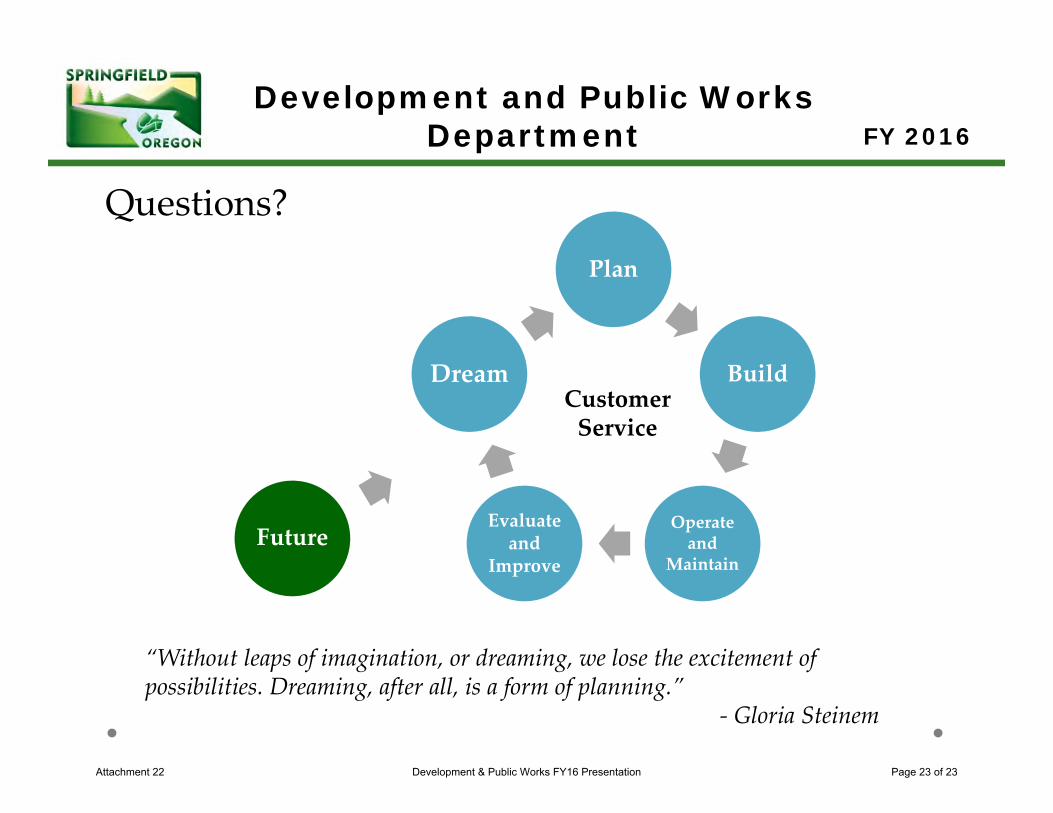
Development and Public Works Department FY 2016
Questions?
“Without leaps of imagination, or dreaming, we lose the excitement of possibilities. Dreaming, after all, is a form of planning.”
‐ Gloria Steinem
Plan
Build
Operate and
Maintain
Evaluate and
Improve
DreamCustomer Service
Future
Attachment 22 Development & Public Works FY16 Presentation Page 23 of 23
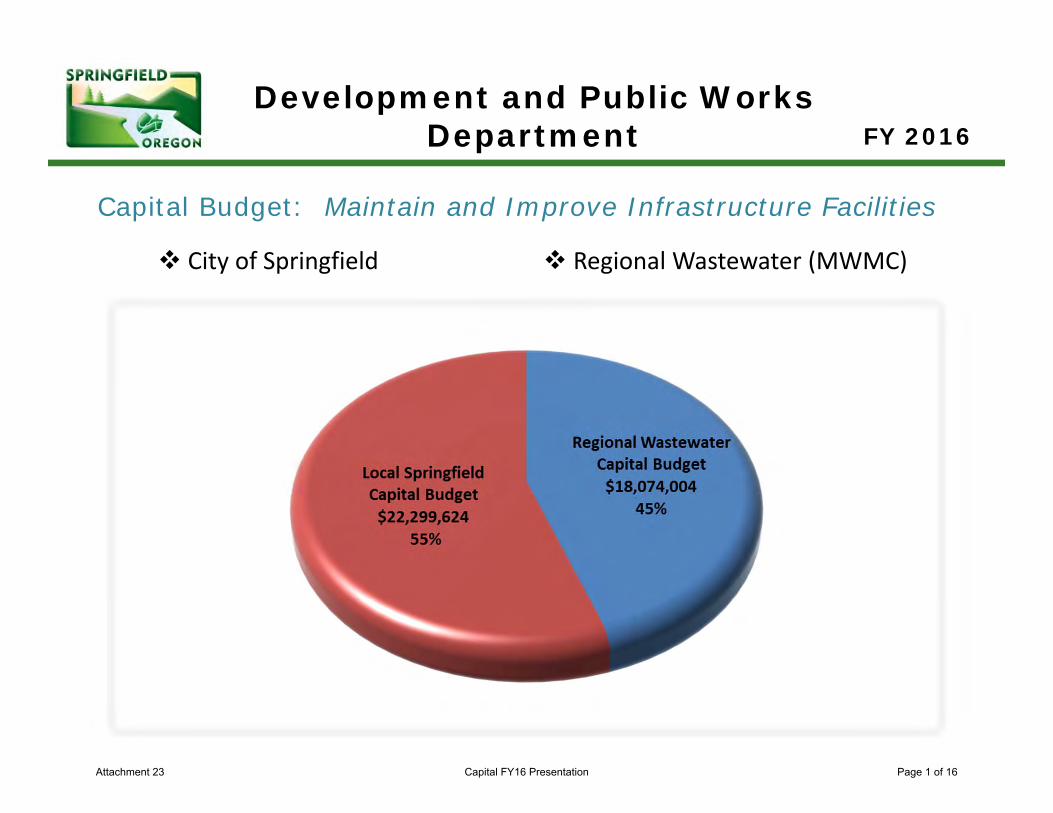
Development and Public Works Department FY 2016
Capital Budget: Maintain and Improve Infrastructure Facilities
City of Springfield Regional Wastewater (MWMC)
Attachment 23 Capital FY16 Presentation Page 1 of 16
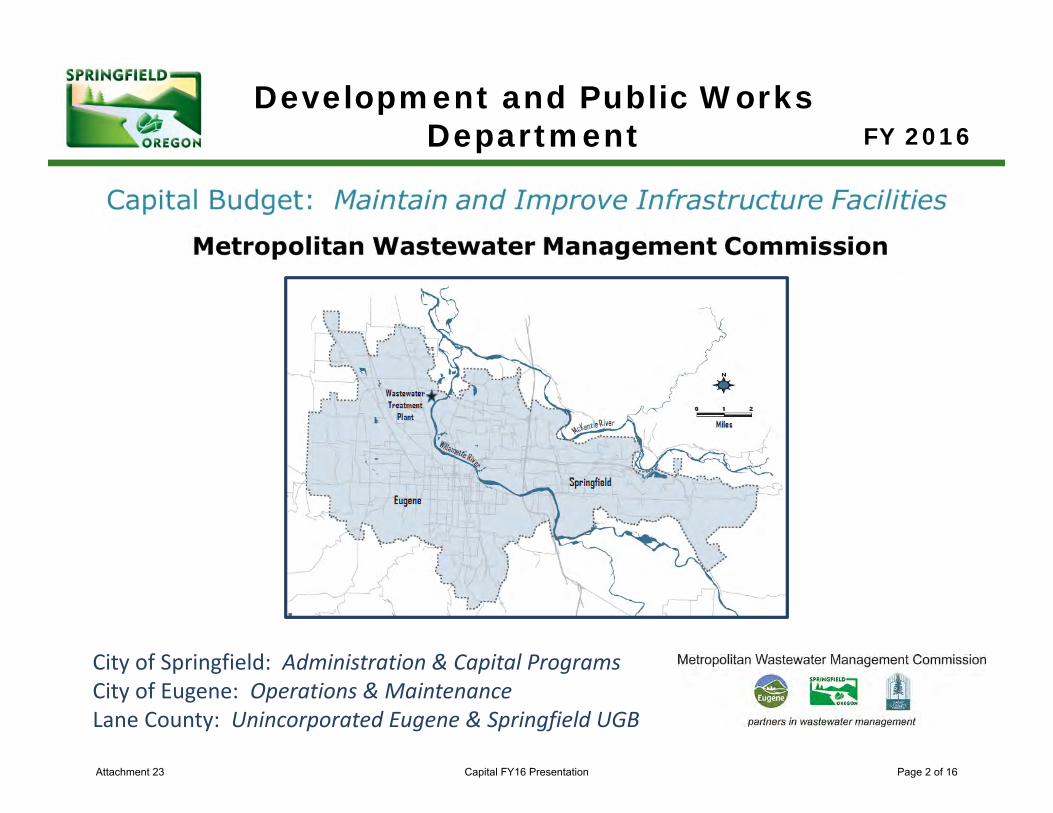
Development and Public Works Department FY 2016
City of Springfield: Administration & Capital ProgramsCity of Eugene: Operations & MaintenanceLane County: Unincorporated Eugene & Springfield UGB
Attachment 23 Capital FY16 Presentation Page 2 of 16
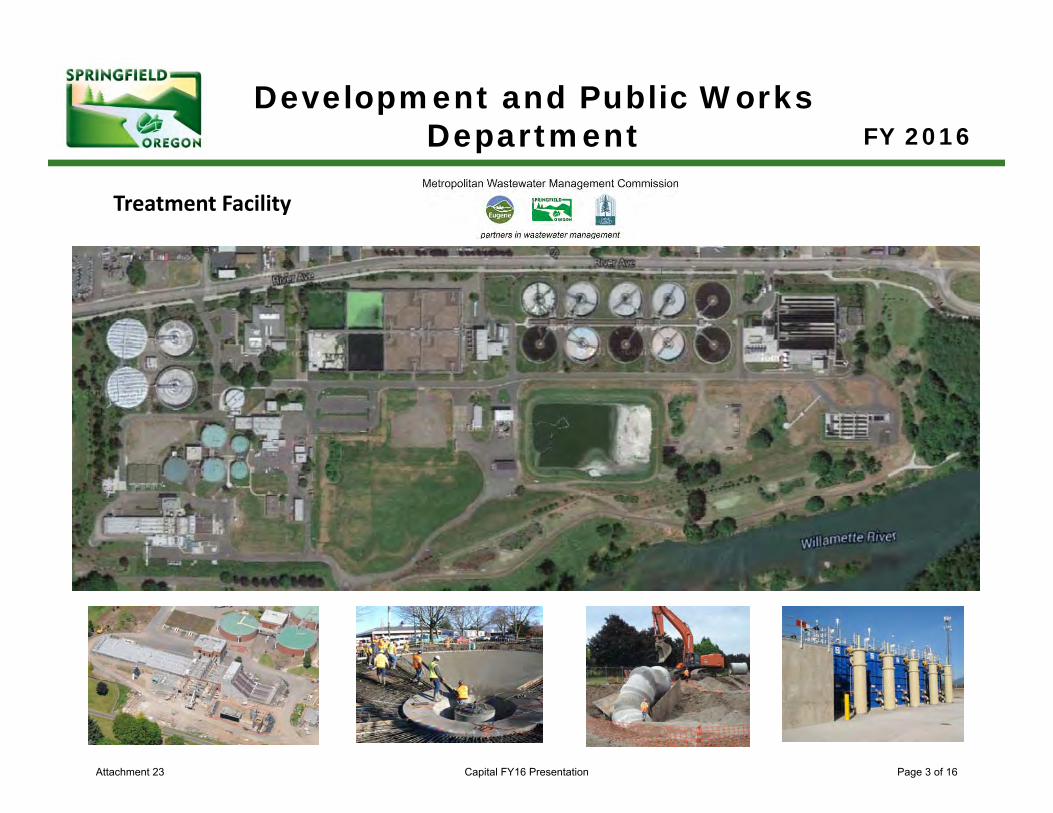
Development and Public Works Department FY 2016
Treatment Facility
Attachment 23 Capital FY16 Presentation Page 3 of 16
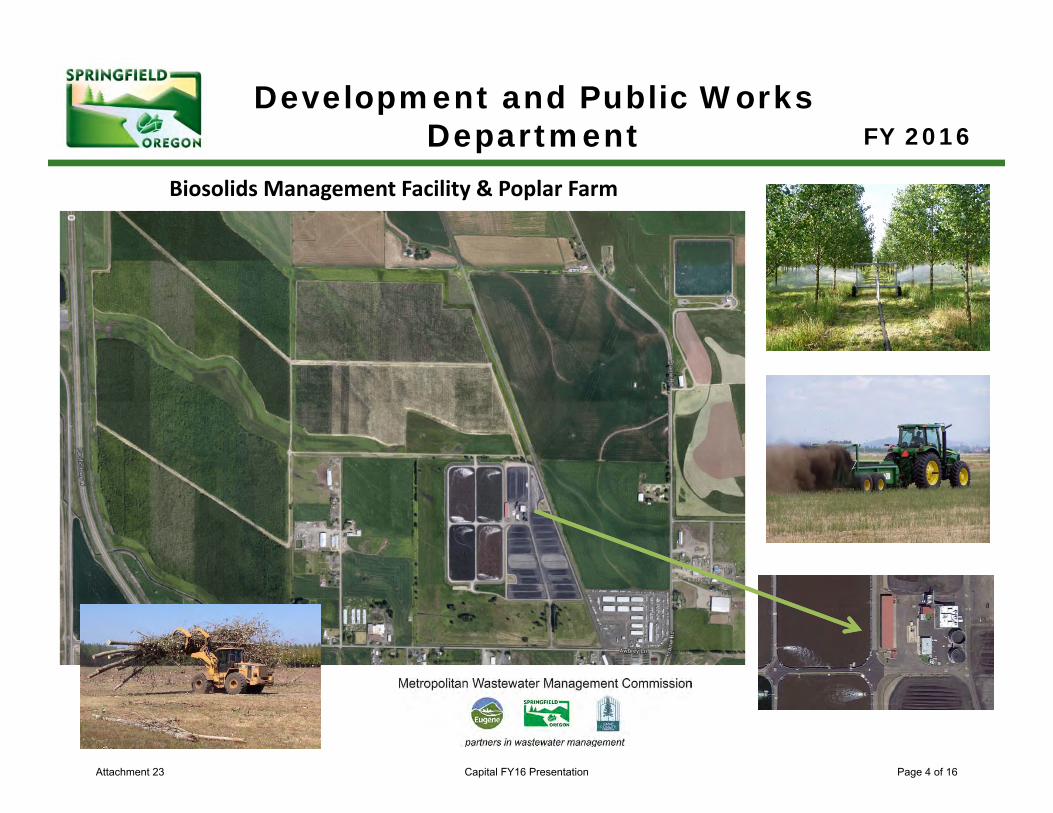
Development and Public Works Department FY 2016
Biosolids Management Facility & Poplar Farm
Attachment 23 Capital FY16 Presentation Page 4 of 16
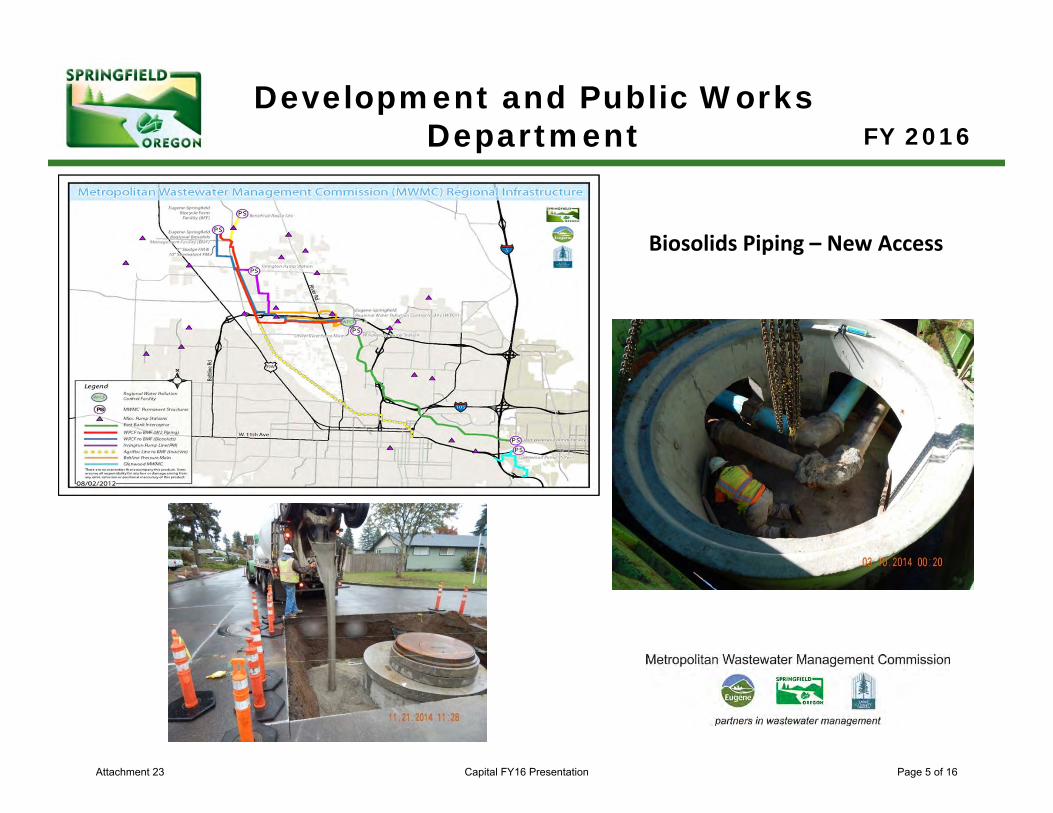
Development and Public Works Department FY 2016
Biosolids Piping – New Access
Attachment 23 Capital FY16 Presentation Page 5 of 16
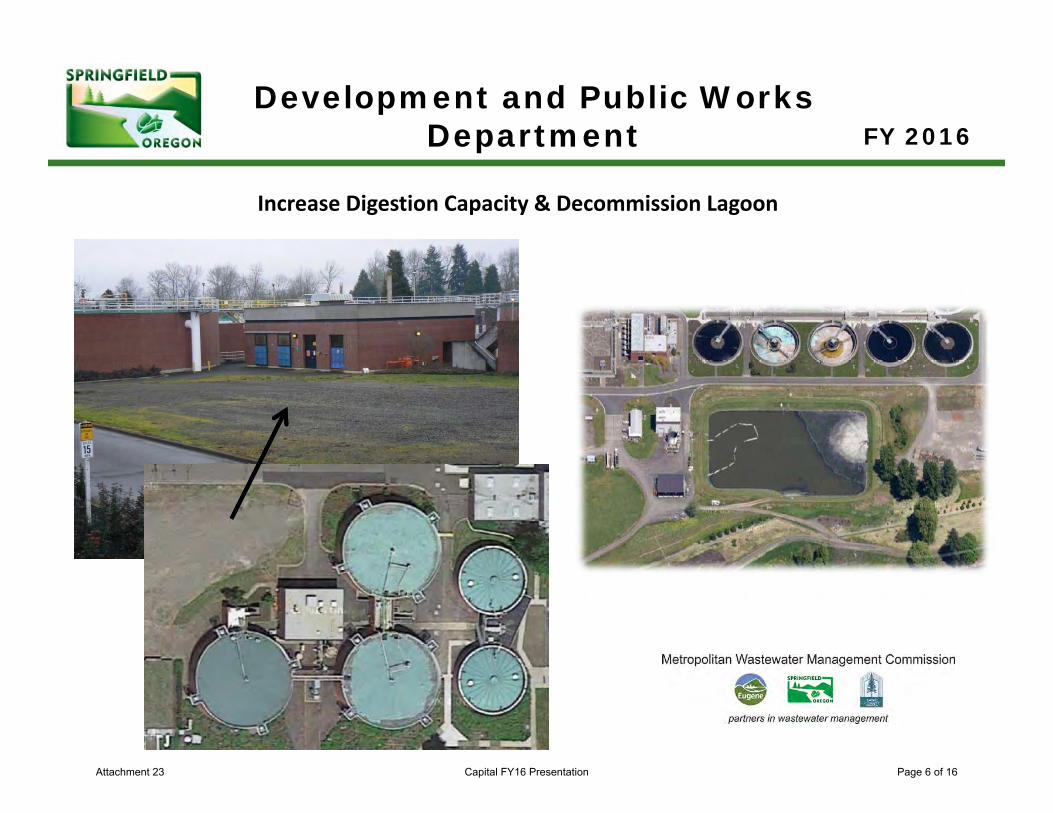
Development and Public Works Department FY 2016
Increase Digestion Capacity & Decommission Lagoon
Attachment 23 Capital FY16 Presentation Page 6 of 16
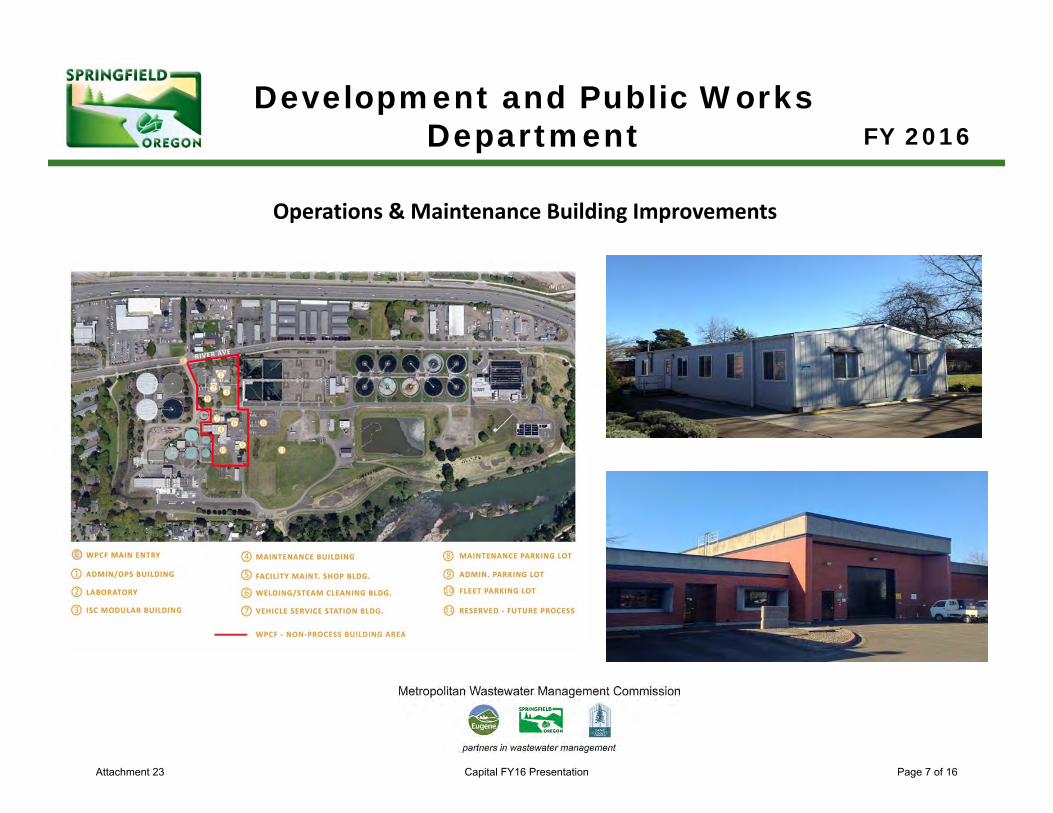
Development and Public Works Department FY 2016
Operations & Maintenance Building Improvements
Attachment 23 Capital FY16 Presentation Page 7 of 16
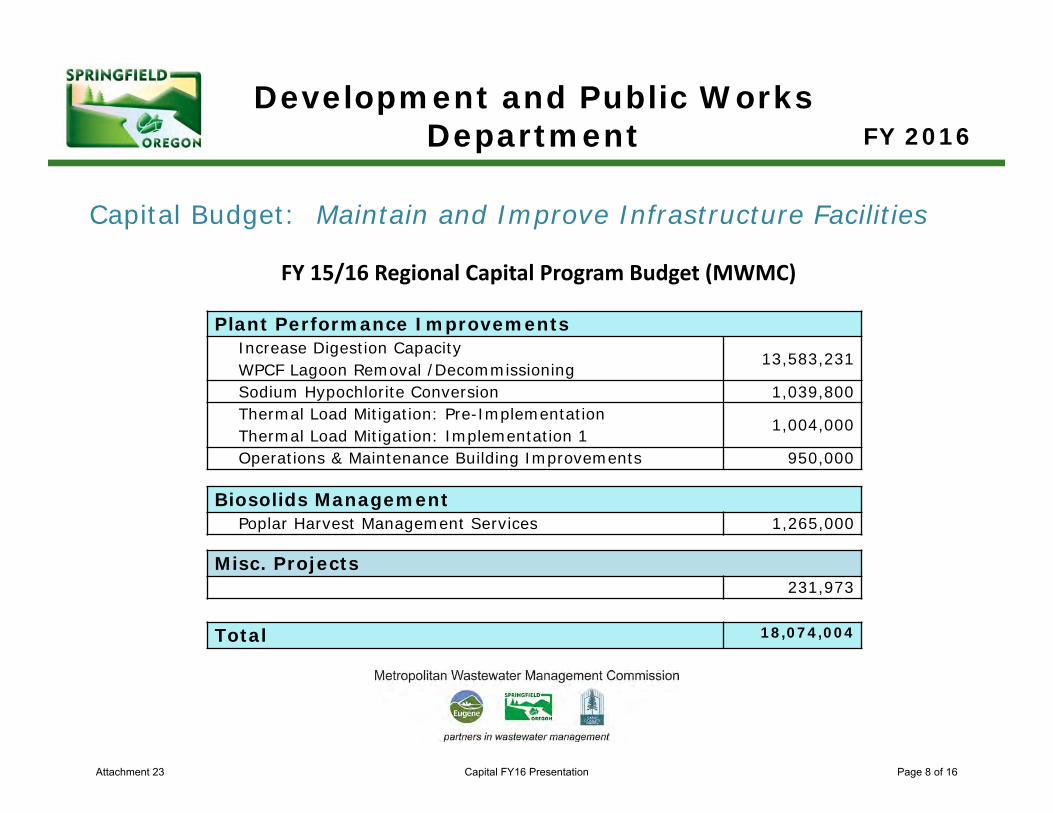
Development and Public Works Department FY 2016
FY 15/16 Regional Capital Program Budget (MWMC)
Plant Performance ImprovementsIncrease Digestion CapacityWPCF Lagoon Removal /Decommissioning
13,583,231
Sodium Hypochlorite Conversion 1,039,800Thermal Load Mitigation: Pre-ImplementationThermal Load Mitigation: Implementation 1
1,004,000
Operations & Maintenance Building Improvements 950,000
Biosolids ManagementPoplar Harvest Management Services 1,265,000
Misc. Projects231,973
Total 18,074,004
Capital Budget: Maintain and Improve Infrastructure Facilities
Attachment 23 Capital FY16 Presentation Page 8 of 16
Development and Public Works Department FY 2016
Capital Budget: Maintain and Improve Infrastructure Facilities
Agenda:• Overview• Highlights• Looking Ahead
City of SpringfieldCapital Budget
Attachment 23 Capital FY16 Presentation Page 9 of 16
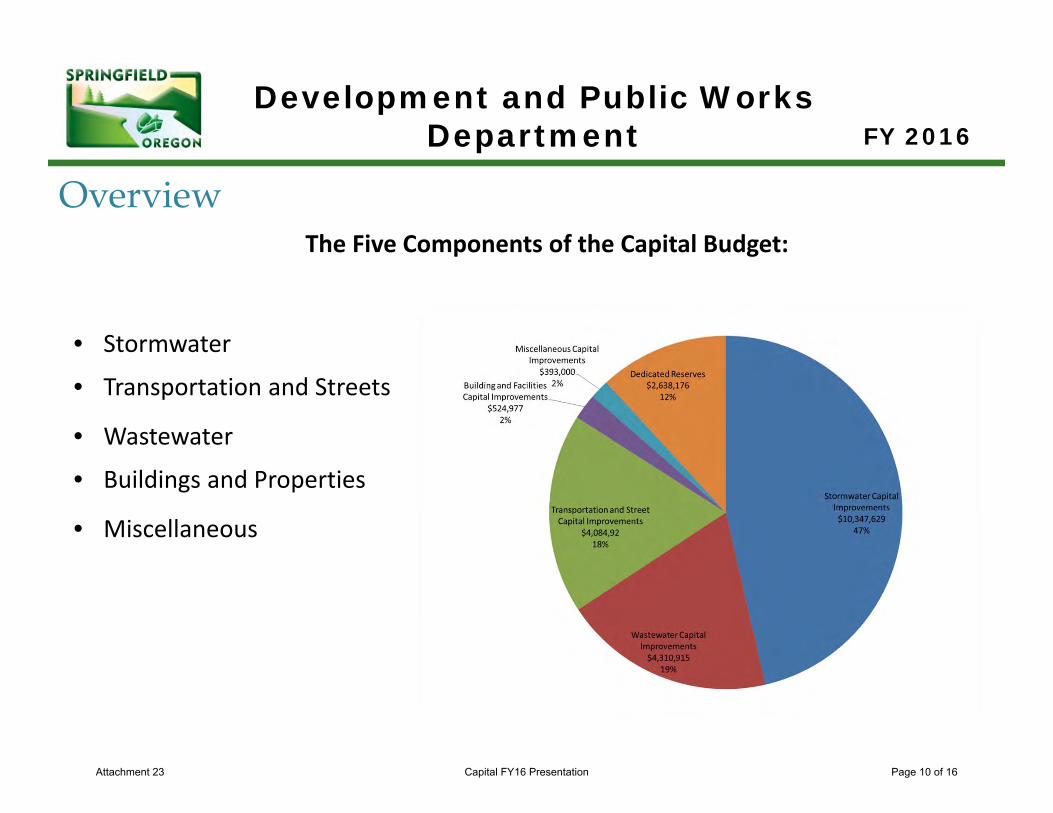
Development and Public Works Department FY 2016
Overview
• Stormwater
• Transportation and Streets
• Wastewater
• Buildings and Properties
• Miscellaneous
The Five Components of the Capital Budget:
Attachment 23 Capital FY16 Presentation Page 10 of 16
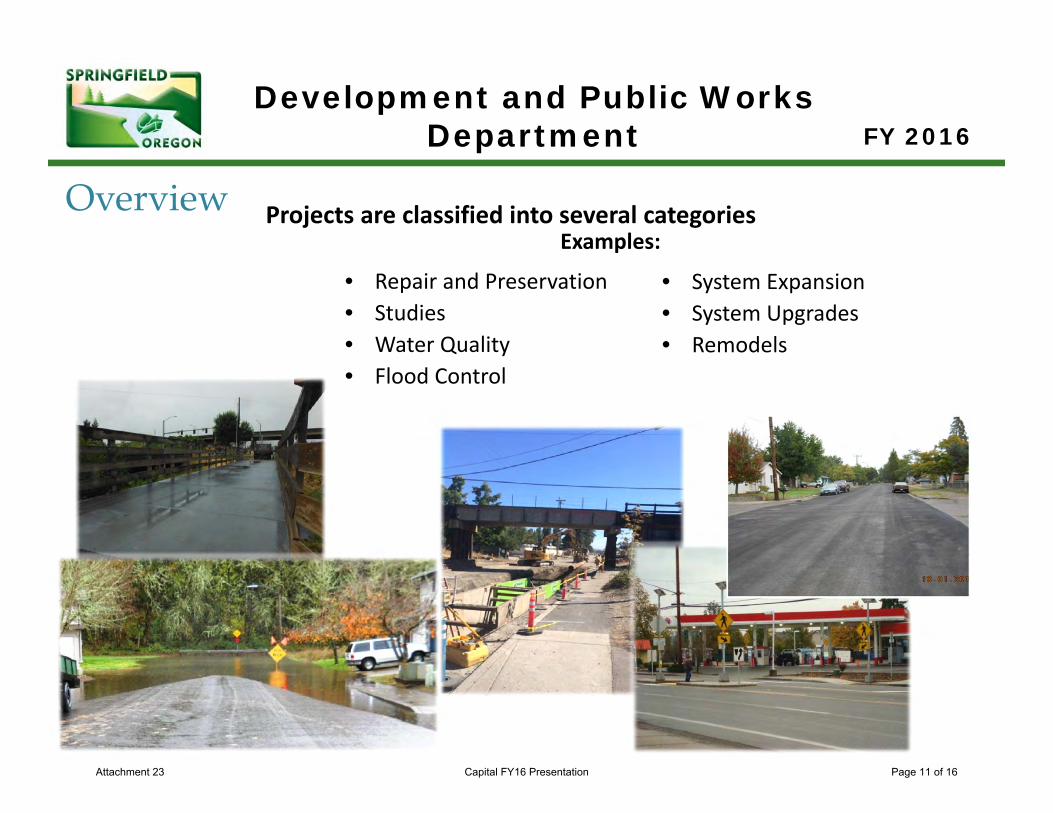
Development and Public Works Department FY 2016
Projects are classified into several categoriesOverviewExamples:
• System Expansion• System Upgrades• Remodels
• Repair and Preservation• Studies• Water Quality• Flood Control
Attachment 23 Capital FY16 Presentation Page 11 of 16
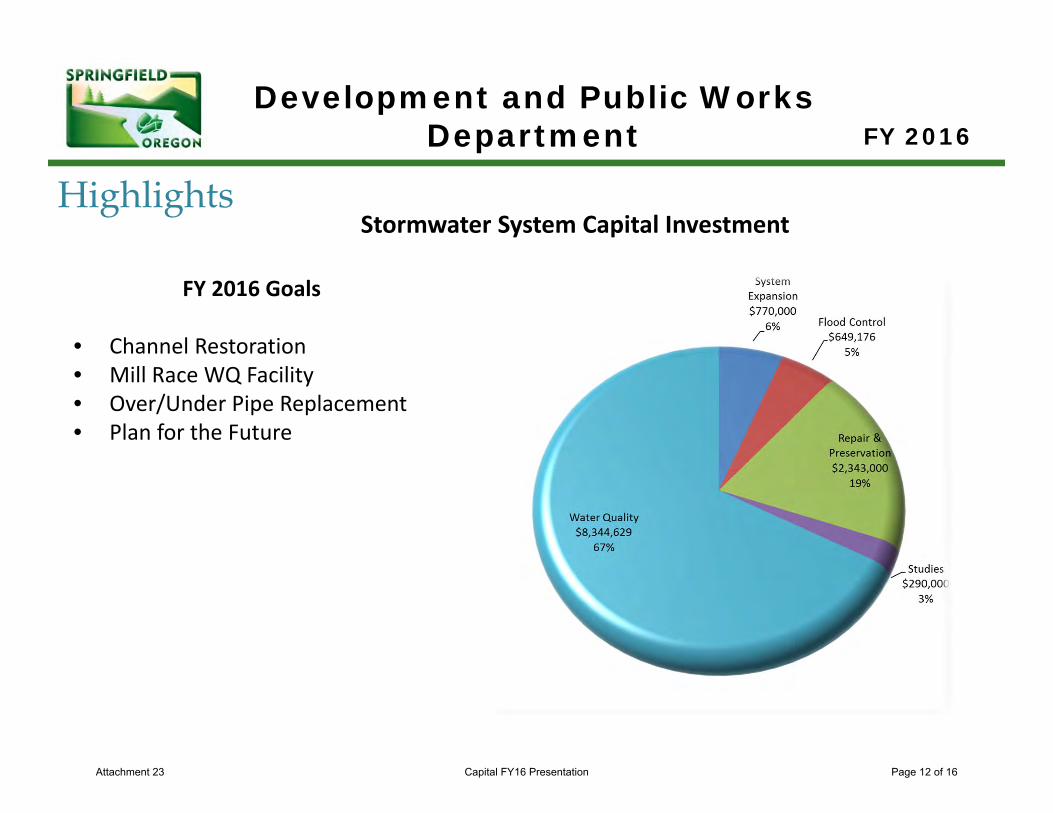
Development and Public Works Department FY 2016
Highlights
FY 2016 Goals
• Channel Restoration• Mill Race WQ Facility• Over/Under Pipe Replacement• Plan for the Future
Stormwater System Capital Investment
Attachment 23 Capital FY16 Presentation Page 12 of 16
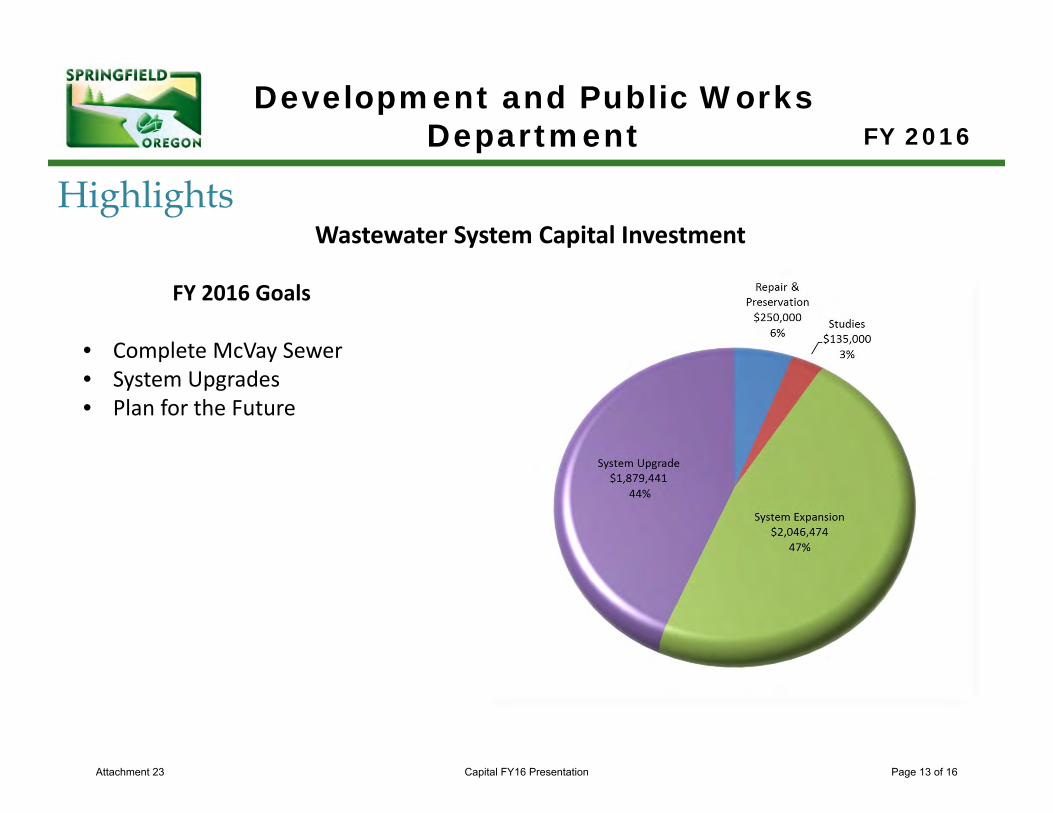
Development and Public Works Department FY 2016
FY 2016 Goals
• Complete McVay Sewer• System Upgrades• Plan for the Future
HighlightsWastewater System Capital Investment
Attachment 23 Capital FY16 Presentation Page 13 of 16
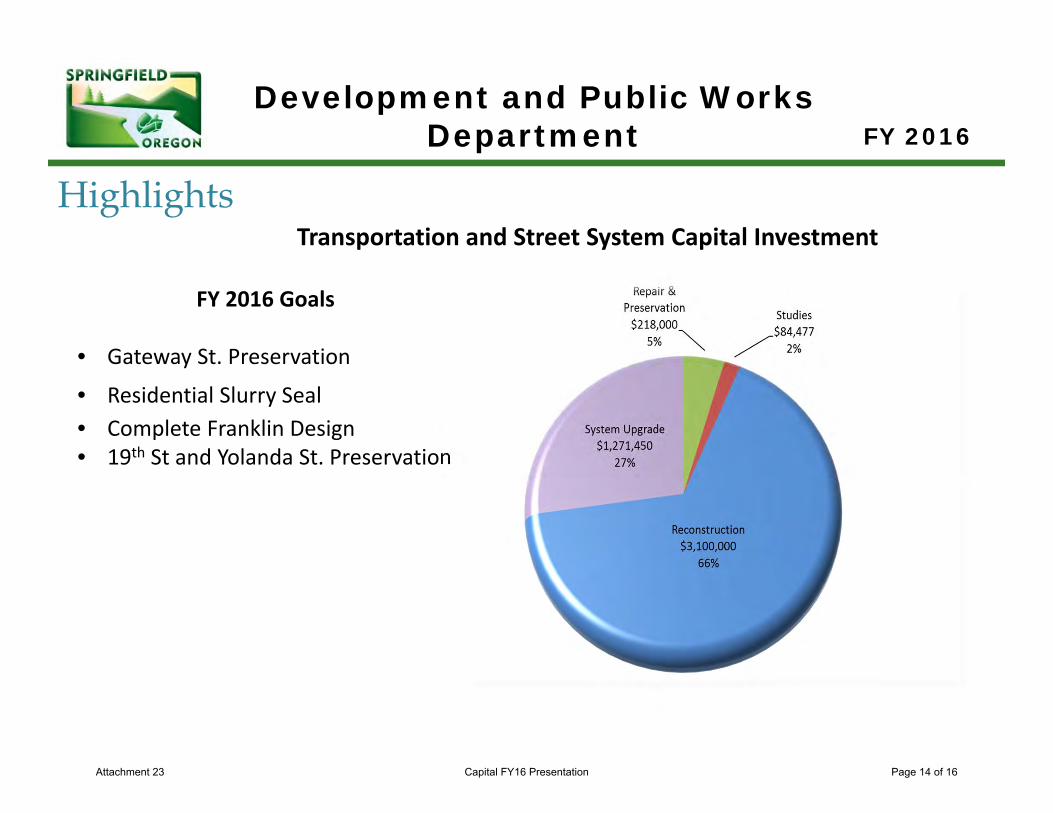
Development and Public Works Department FY 2016
FY 2016 Goals
• Gateway St. Preservation
• Residential Slurry Seal• Complete Franklin Design• 19th St and Yolanda St. Preservation
HighlightsTransportation and Street System Capital Investment
Attachment 23 Capital FY16 Presentation Page 14 of 16
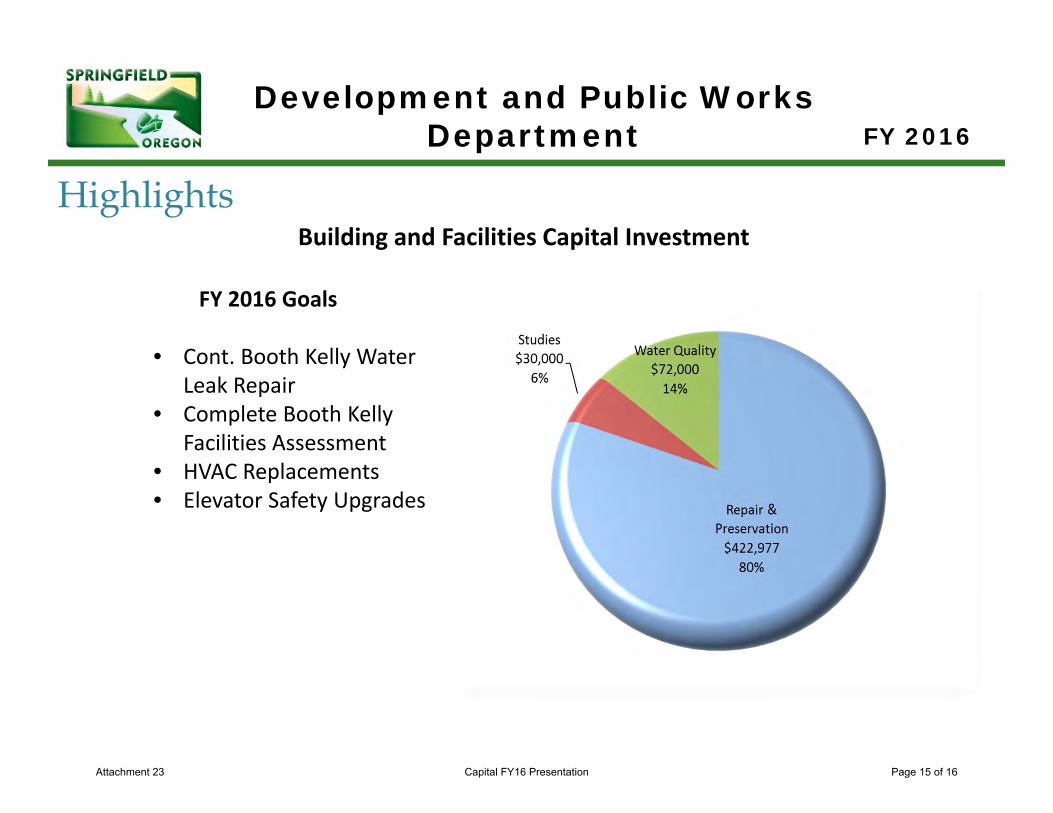
Development and Public Works Department FY 2016
FY 2016 Goals
• Cont. Booth Kelly Water Leak Repair
• Complete Booth Kelly Facilities Assessment
• HVAC Replacements• Elevator Safety Upgrades
HighlightsBuilding and Facilities Capital Investment
Attachment 23 Capital FY16 Presentation Page 15 of 16
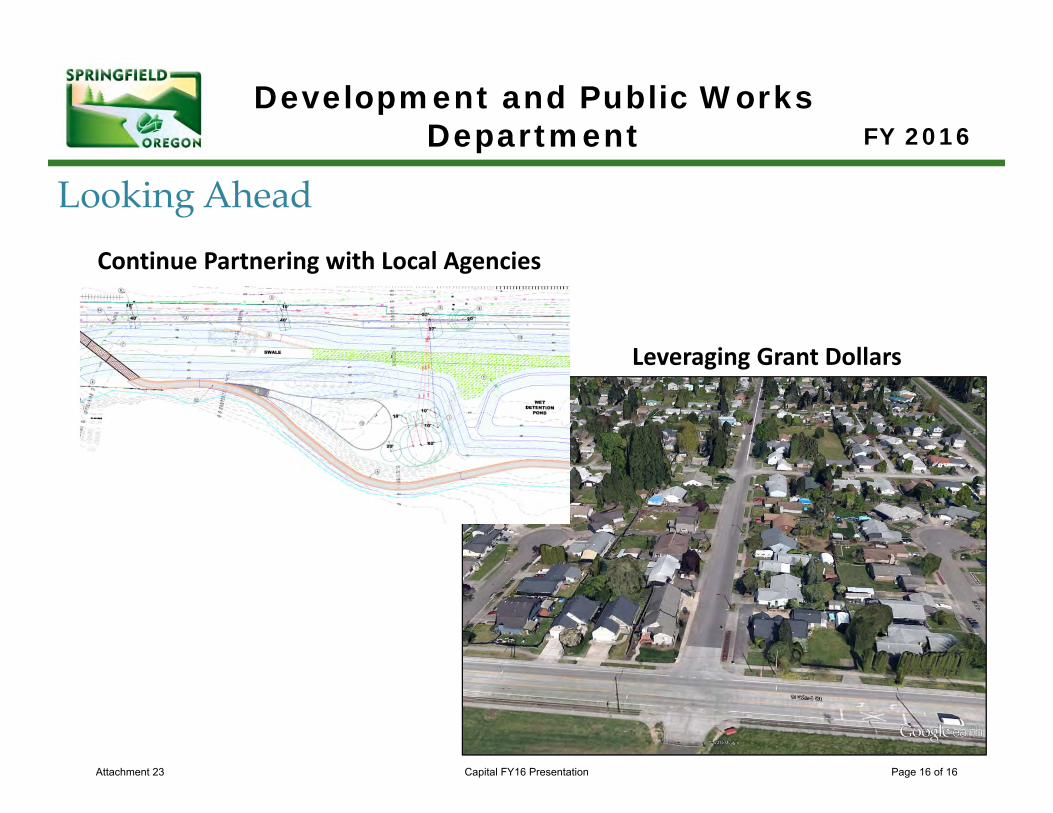
Development and Public Works Department FY 2016
Looking AheadContinue Partnering with Local Agencies
Leveraging Grant Dollars
Attachment 23 Capital FY16 Presentation Page 16 of 16
Council Members: Ward Public Members:
Sean Van Gordon 1 Chris StoleHillary Wylie 2 Terry BuckSheri Moore 3 Nathan Mischel
Dave Ralston 4 Gabrielle GuideroMarilee Woodrow 5 Diana Alldredge
Joe Pishioneri 6 Paul Selby
Gino Grimaldi Jeff ToweryCity Manager Assistant City Manager
Bob Duey -Rob Everett -
Anette Spickard -Brandt Melick -
Niel Laudati - Community Relations ManagerRandy Groves -
Timothy Doney - Chief of PoliceGreta Utecht - Human Resources Director
ADA StatementThe City of Springfield operates without regard to race, color, national origin, religion, sex, sexual orientation, gender identity, marital status, age, or disability in accordance with the Civil Rights Act of 1964, the Civil Rights Restoration Act of 1987, Executive Order 12898 on Environmental Justice and related statutes and regulations, including Title VI of the Civil Rights Act and Title II of the Americans with Disabilities Act. For accommodations, translations, or additional information, contact the ADA Coordinator at 541-726-3724 or [email protected], City TTY users dial Oregon Relay Services at 711.
City Executive Team
CITY OF SPRINGFIELDAdopted Budget – FY16
Christine L. LundbergMayor
Members of the Budget Committee
Finance DirectorLibrary Director
Information Technology Director
Fire Chief
Development & Public Works Director
Attachment 24 FY16 Proposed
Budget Review Team: Gino Grimaldi, City ManagerJeff Towery, Asst. City ManagerBob Duey, Finance DirectorPaula Davis, Budget Officer
Kathy Cunningham, Legal & Judicial ServicesMike Harman, Police DepartmentBrandt Melick, Information Technology DepartmentRhonda Rice, Development & Public Works DepartmentJana Sorenson, Fire and Life Safety DepartmentCourtney Griesel, City Manager's OfficeDee Dee Thomas, HR Specialist
Meg Allocco, AccountantNathan Bell, Accounting ManagerAndrew Bemiller, Accounting TechDavid Held, Administrative AssistantJayne McMahan, Procurement AnalystSally McKay, AccountantAlison Rich, Payroll Specialist
Budget SystemSupport: Kerrie Miller, Programmer Analyst
Finance Department Staff:
Preparation of the Budget Document:
Acknowledgments
Additional appreciation goes to support staff, who have assisted the department budget coordinators.
Department Budget Coordinators:
Special thanks go to the following individuals for their assistance with the compilation of the FY15 Adopted Budget Document.
Paula Davis, Budget Officer
Attachment 24 FY16 Proposed
Passion * Integrity *
Results
Passion for our community
We are dedicated to providing exceptional service. We listen carefully and respond to the needs and expectations of our customers and our community. Each of us plays an important role in serving the community and making our city a great place to live and work. We encourage creativity and innovation as we constantly seek to improve our services and to enhance the quality of life in our community. At Springfield, each individual makes a difference.
Integrity in our work
We are professional and honest in our working relationships. We strive for equity and fairness in our decision making and in our treatment of one another. We honor our commitments. We hold ourselves accountable to the highest ethical and performance standards.
Results through collaboration
As City of Springfield employees we are committed to working together with citizens, elected officials and each other. We get the job done. We value our culture of participation, building strong partnerships across our organization and within our community. We respect individual differences, recognizing they are part of our strength as a team. We share ideas to inspire and learn from one another.
Our Organizational Values Statement
Attachment 24 FY16 Proposed

Attachment 24 FY16 Proposed
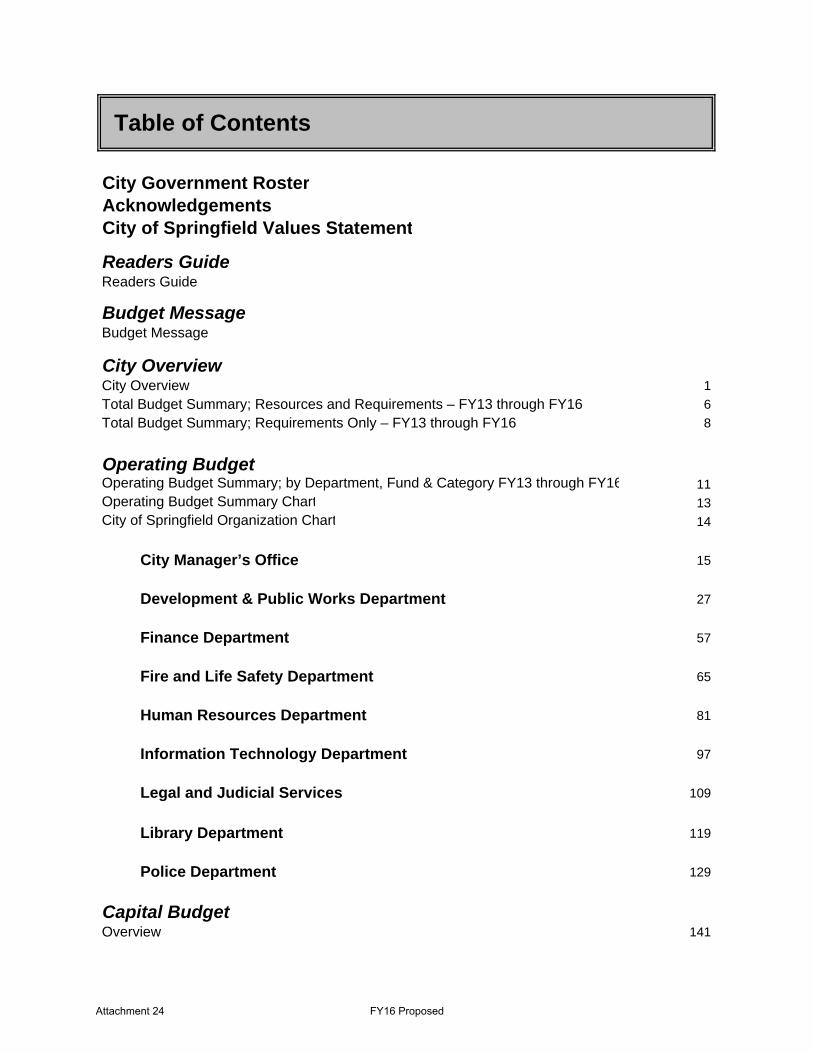
City Government RosterAcknowledgementsCity of Springfield Values Statement
Readers GuideReaders Guide
Budget MessageBudget Message
City OverviewCity Overview 1
Total Budget Summary; Resources and Requirements – FY13 through FY16 6
Total Budget Summary; Requirements Only – FY13 through FY16 8
Operating BudgetOperating Budget Summary; by Department, Fund & Category FY13 through FY16 11Operating Budget Summary Chart 13City of Springfield Organization Chart 14
City Manager’s Office 15
Development & Public Works Department 27
Finance Department 57
Fire and Life Safety Department 65
Human Resources Department 81
Information Technology Department 97
Legal and Judicial Services 109
Library Department 119
Police Department 129
Capital BudgetOverview 141
Table of Contents
Attachment 24 FY16 Proposed
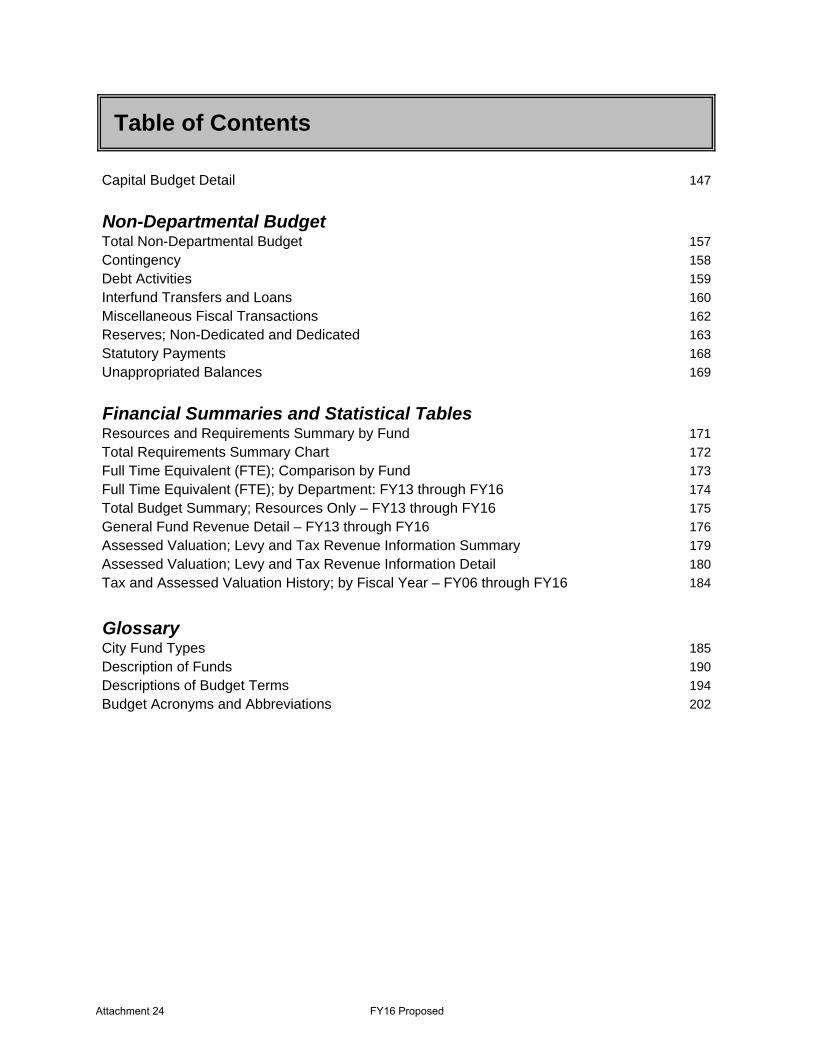
Table of Contents
Capital Budget Detail 147
Non-Departmental BudgetTotal Non-Departmental Budget 157
Contingency 158
Debt Activities 159
Interfund Transfers and Loans 160
Miscellaneous Fiscal Transactions 162
Reserves; Non-Dedicated and Dedicated 163
Statutory Payments 168
Unappropriated Balances 169
Financial Summaries and Statistical TablesResources and Requirements Summary by Fund 171
Total Requirements Summary Chart 172
Full Time Equivalent (FTE); Comparison by Fund 173
Full Time Equivalent (FTE); by Department: FY13 through FY16 174
Total Budget Summary; Resources Only – FY13 through FY16 175
General Fund Revenue Detail – FY13 through FY16 176
Assessed Valuation; Levy and Tax Revenue Information Summary 179
Assessed Valuation; Levy and Tax Revenue Information Detail 180
Tax and Assessed Valuation History; by Fiscal Year – FY06 through FY16 184
GlossaryCity Fund Types 185
Description of Funds 190
Descriptions of Budget Terms 194
Budget Acronyms and Abbreviations 202
Attachment 24 FY16 Proposed
READERS GUIDE
The Budget Document The budget document represents the entire City budget. The City of Springfield budget is arranged in separate sections to provide an easier understanding of the budget document. They are:
Budget Message City Overview Operating Budget Capital Budget Non-Departmental Budget Financial Summaries and Statistical Tables Glossary
The Budget Message is a letter to the Mayor and City Council of Springfield, from the Springfield City Manager. The budget message from the City Manager outlines the overall direction and key goals used in developing the budget. The message highlights major service changes, organization changes or budgetary changes that are part of the adopted budget. The City Overview provides the reader with a view of how the City is organized, information on how to contact the City and a list of scheduled meetings for the Budget Committee. This is also a description of the City’s Budget Process and Annual Budget Process and Timeline. The Operating Budget by Department presents the City’s operating budget (personnel services, materials and services, and capital outlay) from the department view. There are eight City departments and one service area: City Manager’s Office; Development & Public Works; Finance; Fire and Life Safety; Human Resources; Information Technology; Legal and Judicial (a service area); Library, and Police. Each of the nine Departmental areas includes a description of the Department, its mission, community outcomes, organization chart, financial summary, and information about the personnel services of the Department. The Department view answers such questions as “How is the department organized to provide services to Springfield citizens? What budget authority is established for each major category of expenditures? What is the total budget for the Department and where is the funding coming from?” The Operating Budget of $99,886,651 makes up 29.33% of the total City budget. The Capital Budget section provides a summary page of the total City capital budget and detail descriptions of the projects and project categories are included. The Capital Budget of $34,839,266 makes up 10.23% of the total City budget. This section
Attachment 24 FY16 Proposed
represents the recommended budget for projects previously published and approved by Council in the Capital Improvement Program (CIP) document. The CIP is prepared annually, beginning in early October. The process begins with an outreach effort to gain public input, and input from private utilities and other public agencies and ends with City council adoption in February. The Non-Departmental Budget section provides information for all budget categories that are neither department operating nor capital costs. The Non-Departmental Budget of $205,885,505 makes up 60.45% of the total City Budget. This section provides detail to those expenditures not under the direct authority of a department and/or the activities of the program are not specifically identifiable by department. Such detail as the City Fund Reserves, debt servicing costs, and inter-fund transfers of all funds are summarized in this section. The Financial Summaries and Statistical Tables section provides additional reference information. The City’s property taxes and operating budget analysis are included as well. The Glossary includes a description of each City Fund, as well as a list of Budget Acronyms and Abbreviations used in the document and common for municipalities.
Attachment 24 FY16 Proposed
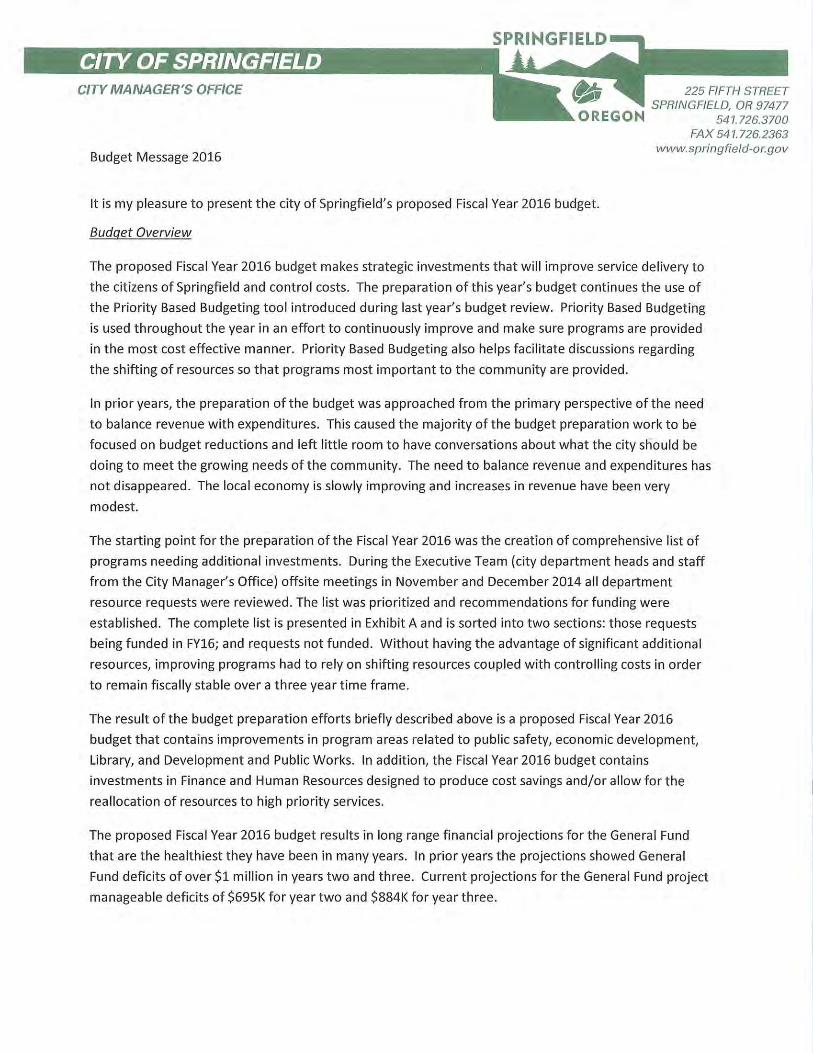
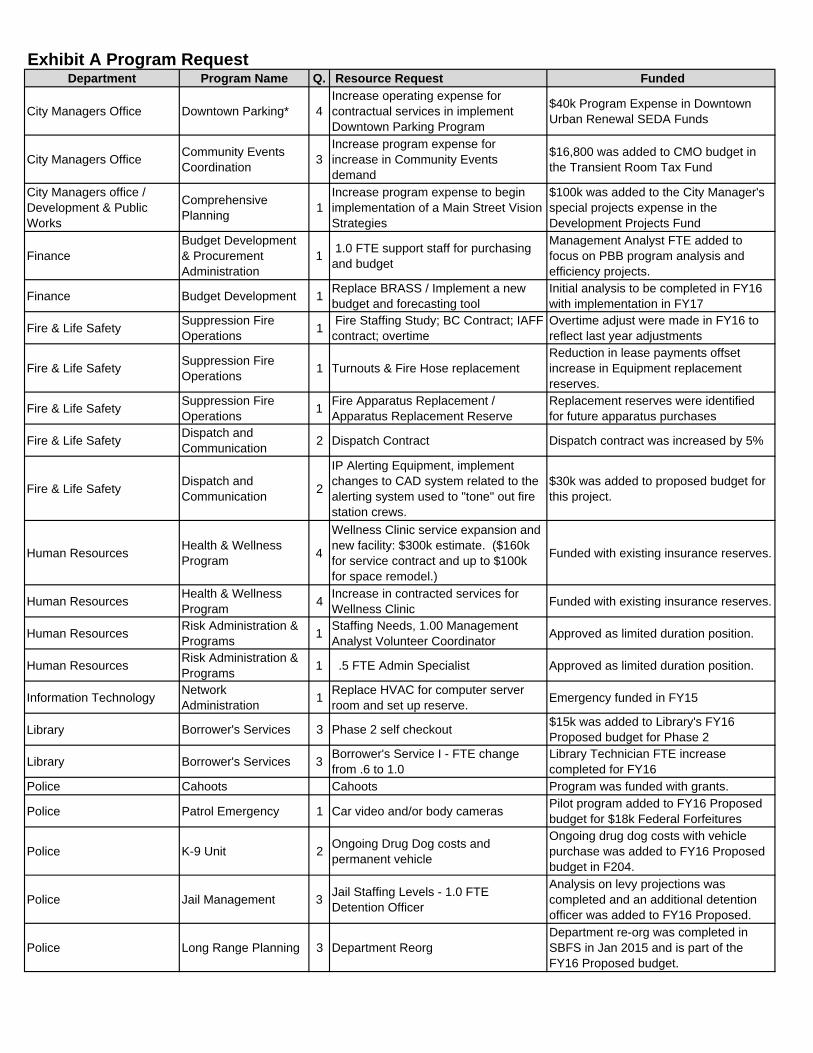
Exhibit A Program RequestDepartment Program Name Q. Resource Request Funded
City Managers Office Downtown Parking* 4Increase operating expense for contractual services in implement Downtown Parking Program
$40k Program Expense in Downtown Urban Renewal SEDA Funds
City Managers OfficeCommunity Events Coordination
3Increase program expense for increase in Community Events demand
$16,800 was added to CMO budget in the Transient Room Tax Fund
City Managers office / Development & Public Works
Comprehensive Planning
1Increase program expense to begin implementation of a Main Street Vision Strategies
$100k was added to the City Manager's special projects expense in the Development Projects Fund
FinanceBudget Development & Procurement Administration
1 1.0 FTE support staff for purchasing and budget
Management Analyst FTE added to focus on PBB program analysis and efficiency projects.
Finance Budget Development 1Replace BRASS / Implement a new budget and forecasting tool
Initial analysis to be completed in FY16 with implementation in FY17
Fire & Life SafetySuppression Fire Operations
1 Fire Staffing Study; BC Contract; IAFF contract; overtime
Overtime adjust were made in FY16 to reflect last year adjustments
Fire & Life SafetySuppression Fire Operations
1 Turnouts & Fire Hose replacementReduction in lease payments offset increase in Equipment replacement reserves.
Fire & Life SafetySuppression Fire Operations
1Fire Apparatus Replacement / Apparatus Replacement Reserve
Replacement reserves were identified for future apparatus purchases
Fire & Life SafetyDispatch and Communication
2 Dispatch Contract Dispatch contract was increased by 5%
Fire & Life SafetyDispatch and Communication
2
IP Alerting Equipment, implement changes to CAD system related to the alerting system used to "tone" out fire station crews.
$30k was added to proposed budget for this project.
Human ResourcesHealth & Wellness Program
4
Wellness Clinic service expansion and new facility: $300k estimate. ($160k for service contract and up to $100k for space remodel.)
Funded with existing insurance reserves.
Human ResourcesHealth & Wellness Program
4Increase in contracted services for Wellness Clinic
Funded with existing insurance reserves.
Human ResourcesRisk Administration & Programs
1Staffing Needs, 1.00 Management Analyst Volunteer Coordinator
Approved as limited duration position.
Human ResourcesRisk Administration & Programs
1 .5 FTE Admin Specialist Approved as limited duration position.
Information TechnologyNetwork Administration
1Replace HVAC for computer server room and set up reserve.
Emergency funded in FY15
Library Borrower's Services 3 Phase 2 self checkout$15k was added to Library's FY16 Proposed budget for Phase 2
Library Borrower's Services 3Borrower's Service I - FTE change from .6 to 1.0
Library Technician FTE increase completed for FY16
Police Cahoots Cahoots Program was funded with grants.
Police Patrol Emergency 1 Car video and/or body camerasPilot program added to FY16 Proposed budget for $18k Federal Forfeitures
Police K-9 Unit 2Ongoing Drug Dog costs and permanent vehicle
Ongoing drug dog costs with vehicle purchase was added to FY16 Proposed budget in F204.
Police Jail Management 3Jail Staffing Levels - 1.0 FTE Detention Officer
Analysis on levy projections was completed and an additional detention officer was added to FY16 Proposed.
Police Long Range Planning 3 Department ReorgDepartment re-org was completed in SBFS in Jan 2015 and is part of the FY16 Proposed budget.
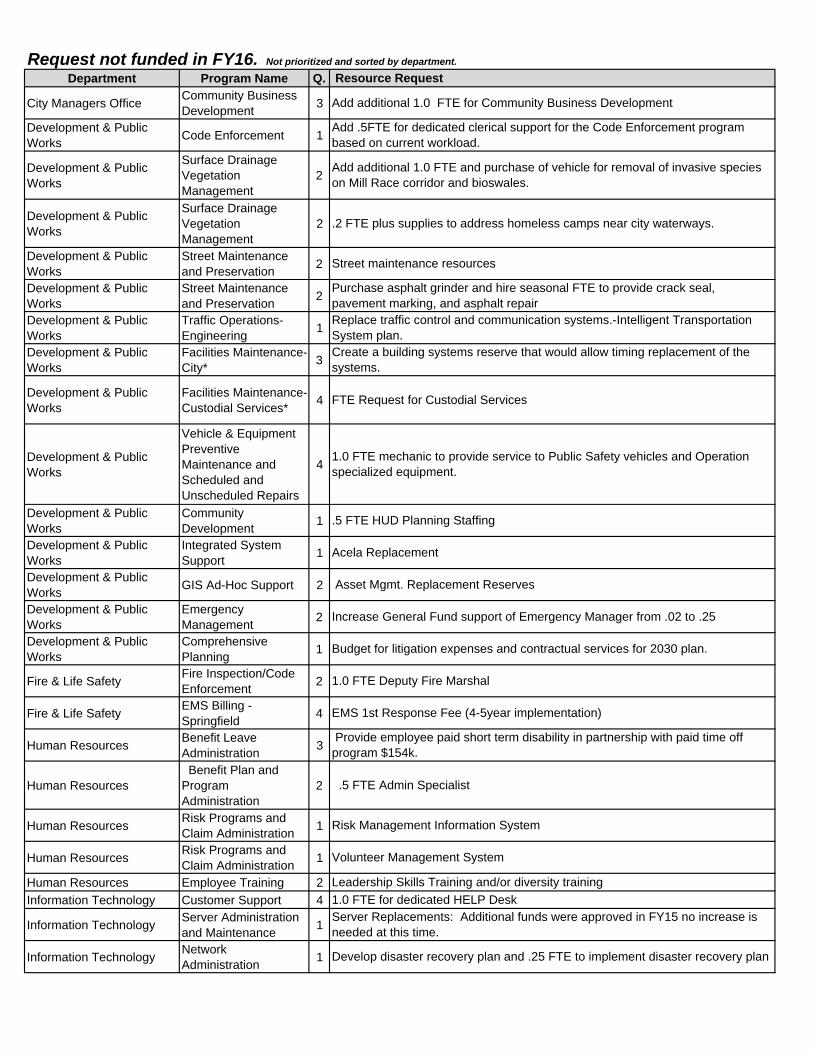
Request not funded in FY16. Not prioritized and sorted by department.
Department Program Name Q.
City Managers OfficeCommunity Business Development
3
Development & Public Works
Code Enforcement 1
Development & Public Works
Surface Drainage Vegetation Management
2
Development & Public Works
Surface Drainage Vegetation Management
2
Development & Public Works
Street Maintenance and Preservation
2
Development & Public Works
Street Maintenance and Preservation
2
Development & Public Works
Traffic Operations-Engineering
1
Development & Public Works
Facilities Maintenance-City*
3
Development & Public Works
Facilities Maintenance-Custodial Services*
4
Development & Public Works
Vehicle & Equipment Preventive Maintenance and Scheduled and Unscheduled Repairs
4
Development & Public Works
Community Development
1
Development & Public Works
Integrated System Support
1
Development & Public Works
GIS Ad-Hoc Support 2
Development & Public Works
Emergency Management
2
Development & Public Works
Comprehensive Planning
1
Fire & Life SafetyFire Inspection/Code Enforcement
2
Fire & Life SafetyEMS Billing - Springfield
4
Human ResourcesBenefit Leave Administration
3
Human Resources Benefit Plan and Program Administration
2
Human ResourcesRisk Programs and Claim Administration
1
Human ResourcesRisk Programs and Claim Administration
1
Human Resources Employee Training 2
Information Technology Customer Support 4
Information TechnologyServer Administration and Maintenance
1
Information TechnologyNetwork Administration
1
.5 FTE HUD Planning Staffing
Resource Request
Add additional 1.0 FTE for Community Business Development
Add .5FTE for dedicated clerical support for the Code Enforcement program based on current workload.
Add additional 1.0 FTE and purchase of vehicle for removal of invasive species on Mill Race corridor and bioswales.
.2 FTE plus supplies to address homeless camps near city waterways.
Street maintenance resources
Purchase asphalt grinder and hire seasonal FTE to provide crack seal, pavement marking, and asphalt repairReplace traffic control and communication systems.-Intelligent Transportation System plan.Create a building systems reserve that would allow timing replacement of the systems.
FTE Request for Custodial Services
1.0 FTE mechanic to provide service to Public Safety vehicles and Operation specialized equipment.
1.0 FTE for dedicated HELP Desk
Acela Replacement
Asset Mgmt. Replacement Reserves
Increase General Fund support of Emergency Manager from .02 to .25
Budget for litigation expenses and contractual services for 2030 plan.
1.0 FTE Deputy Fire Marshal
EMS 1st Response Fee (4-5year implementation)
Provide employee paid short term disability in partnership with paid time off program $154k.
.5 FTE Admin Specialist
Risk Management Information System
Volunteer Management System
Leadership Skills Training and/or diversity training
Server Replacements: Additional funds were approved in FY15 no increase is needed at this time.
Develop disaster recovery plan and .25 FTE to implement disaster recovery plan
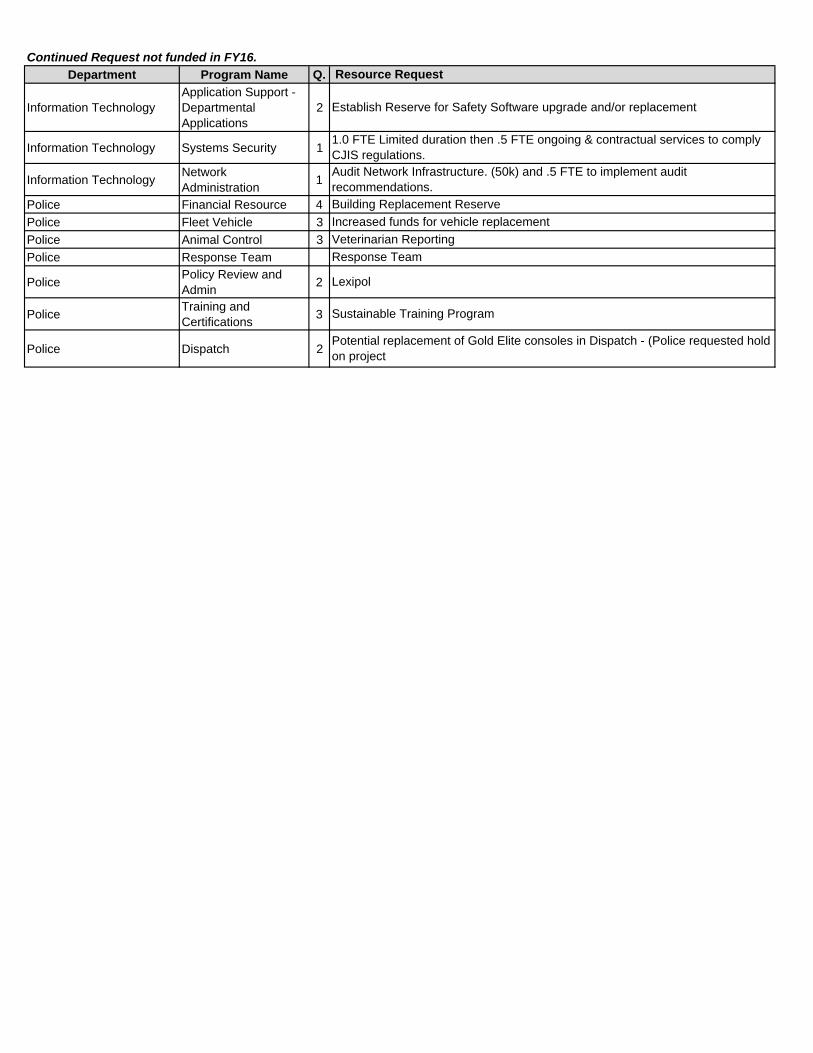
Continued Request not funded in FY16.Department Program Name Q.
Information TechnologyApplication Support - Departmental Applications
2
Information Technology Systems Security 1
Information TechnologyNetwork Administration
1
Police Financial Resource 4
Police Fleet Vehicle 3
Police Animal Control 3
Police Response Team
PolicePolicy Review and Admin
2
PoliceTraining and Certifications
3
Police Dispatch 2Potential replacement of Gold Elite consoles in Dispatch - (Police requested hold on project
Establish Reserve for Safety Software upgrade and/or replacement
1.0 FTE Limited duration then .5 FTE ongoing & contractual services to comply CJIS regulations.Audit Network Infrastructure. (50k) and .5 FTE to implement audit recommendations.Building Replacement Reserve
Resource Request
Increased funds for vehicle replacement
Veterinarian Reporting
Response Team
Lexipol
Sustainable Training Program

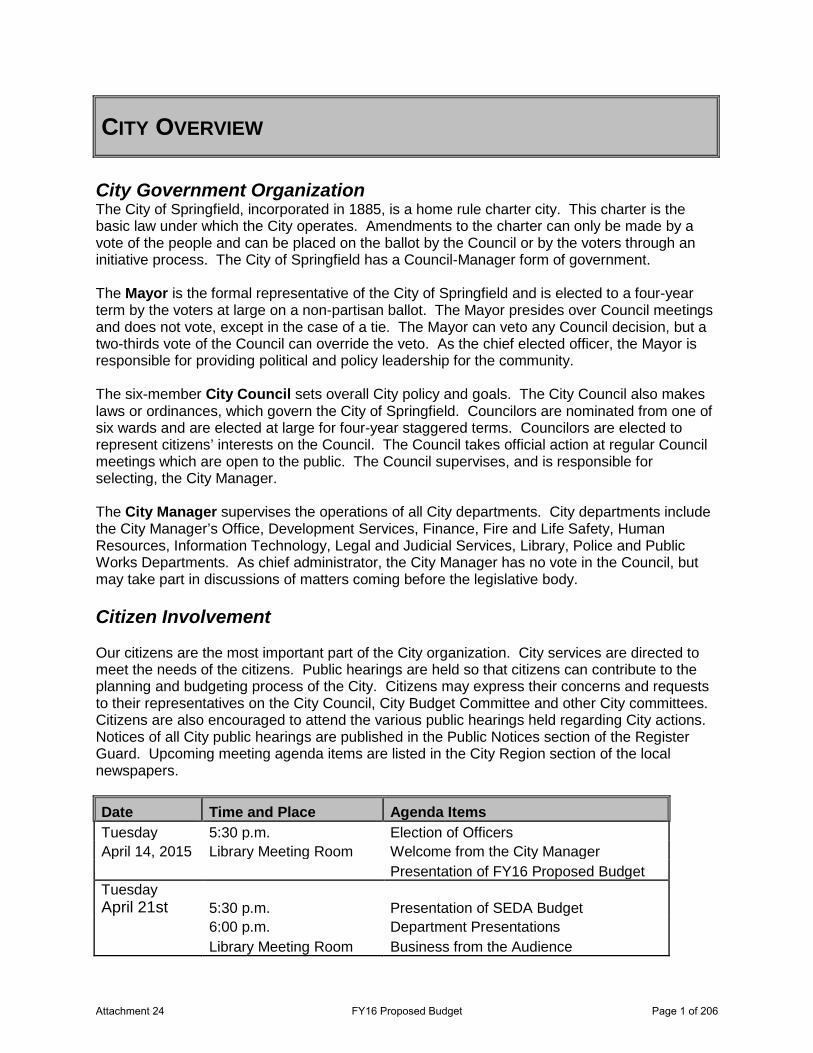
CITY OVERVIEW
City Government Organization The City of Springfield, incorporated in 1885, is a home rule charter city. This charter is the basic law under which the City operates. Amendments to the charter can only be made by a vote of the people and can be placed on the ballot by the Council or by the voters through an initiative process. The City of Springfield has a Council-Manager form of government. The Mayor is the formal representative of the City of Springfield and is elected to a four-year term by the voters at large on a non-partisan ballot. The Mayor presides over Council meetings and does not vote, except in the case of a tie. The Mayor can veto any Council decision, but a two-thirds vote of the Council can override the veto. As the chief elected officer, the Mayor is responsible for providing political and policy leadership for the community. The six-member City Council sets overall City policy and goals. The City Council also makes laws or ordinances, which govern the City of Springfield. Councilors are nominated from one of six wards and are elected at large for four-year staggered terms. Councilors are elected to represent citizens’ interests on the Council. The Council takes official action at regular Council meetings which are open to the public. The Council supervises, and is responsible for selecting, the City Manager. The City Manager supervises the operations of all City departments. City departments include the City Manager’s Office, Development Services, Finance, Fire and Life Safety, Human Resources, Information Technology, Legal and Judicial Services, Library, Police and Public Works Departments. As chief administrator, the City Manager has no vote in the Council, but may take part in discussions of matters coming before the legislative body. Citizen Involvement Our citizens are the most important part of the City organization. City services are directed to meet the needs of the citizens. Public hearings are held so that citizens can contribute to the planning and budgeting process of the City. Citizens may express their concerns and requests to their representatives on the City Council, City Budget Committee and other City committees. Citizens are also encouraged to attend the various public hearings held regarding City actions. Notices of all City public hearings are published in the Public Notices section of the Register Guard. Upcoming meeting agenda items are listed in the City Region section of the local newspapers.
Date Time and Place Agenda Items Tuesday 5:30 p.m. Election of Officers April 14, 2015 Library Meeting Room Welcome from the City Manager Presentation of FY16 Proposed Budget Tuesday April 21st 5:30 p.m. Presentation of SEDA Budget
6:00 p.m. Department Presentations
Library Meeting Room Business from the Audience
Attachment 24 FY16 Proposed Budget Page 1 of 206
Continued Date Time and Place Agenda Items
Tuesday 5:30 p.m. Business from the Audience April 28tj Library Meeting Room Departmental Presentation
Conclusion
City Services Under the direction of the City Manager, eight departments and one service area provide services to the citizens of Springfield: City Manager’s Office, Development & Public Works, Finance, Fire and Life Safety, Human Resources, Information Technology, Legal and Judicial Services, Library, and Police Departments. The City Manager’s Office is responsible for directing and coordinating the work plans of all City Departments in conformance with the goals and objectives established by the Mayor and City Council. The Development & Public Works Department provides urban planning services to the community, mandates building permitting and inspection, responds to property nuisance complaints, manages City-owned real estate; designs, constructs, operates, and maintains public improvements, facilities and equipment owned by the City and the public. The Finance Department provides financial management services to all City Departments, the City Council, Budget Committee, the Metropolitan Wastewater Management Commission, the Regional Fiber Consortium and the Springfield Economic Development Agency. The Fire and Life Safety Department acts as first responder in medical and fire-related emergencies, reviews buildings and construction plans to ensure fire safety and provides FireMed and ambulance billing services for many different agencies. The Human Resources Department serves other City Departments by providing technical advice, service, leadership and training for issues related to the City’s work force. The Information Technology Department is responsible for the purchasing, repair and maintenance of the City’s telecommunications and computer networks and systems. The Legal and Judicial Service Area is responsible for functions provided by the City Attorney, the City Prosecutor and the Municipal Court. The Library Department provides a wide range of informational, educational, cultural and recreational materials to more than 18,070 patrons in our community. The Police Department responds to the emergency and law enforcement needs of the community through response to calls for service, police patrols, traffic law enforcement and investigation of crimes.
Attachment 24 FY16 Proposed Budget Page 2 of 206
Please refer to the Operating Budget section of this document for more detailed information about the departments and service area listed above. City Services Purpose of an Annual Budget – The budget represents the financial plan of the City. It is a policy tool for the Mayor and City Council to express the targets and priorities for the next fiscal year and an implementation tool that translates the targets into action plans which are reflected in each program’s goals, objectives and performance measures. The budget serves other functions as well. It is a financial tool which enables the City to allocate its resources. As a public document, it is a tool for elected officials and administrators to communicate decisions to the citizens and staff. As a decision-making document, staff uses the budget both as an accounting tool to ensure financial integrity and a management auditing tool to measure performance. Budget Process Overview – Oregon’s local budget law, as set forth in Chapter 294 of the Oregon Revised Statutes, requires local governments to prepare and adopt an annual budget. The law establishes standard procedures for preparing, presenting, and administering the budget. The law requires citizen involvement in the preparation of the budget and public disclosure of the budget before final adoption. Preparation – The City of Springfield operates on a fiscal year calendar (July 1 to June 30 of the following year). Preparation of the City budget usually begins in January by projecting annual resources and requirements for the coming fiscal year. Resources include revenues received in the current fiscal year, such as property tax receipts, user fees, grants and inter-governmental revenues, as well as reserves and working capital carried forward from the previous fiscal year. Requirements include wages, materials and services and other known costs. This comparison of resources and requirements establishes the context in which the Budget Committee provides policy direction for the preparation of the budget. Before City staff begins preparing the budget for the upcoming fiscal year, the Budget Committee or City Council are asked to establish general guidelines that will govern the preparation process. After the guidelines are established, staff prepares a proposed budget which the City manager presents to the Budget Committee, usually in April. The Budget Committee, consisting of the City Council and an equal number of citizens, reviews and revises the budget during a series of meetings in April and May. After the Budget Committee approves the budget, it is forwarded to the City Council for final adoption, usually in late June. A summary of the budget is published in the local newspaper prior to a City Council public hearing. The City Council has final authority to adopt or change the budget. If a change occurs during the review and adoption of the budget (after the public notice of the budget) that increases the property tax levy or increases expenditures in any fund by more than 10%, the budget must be referred back to the Budget Committee.
Attachment 24 FY16 Proposed Budget Page 3 of 206
City of Springfield Annual Budget Process and Timeline
A summary of the City’s annual budget process timeline is as follows: January - March
The citizen members of the City of Springfield Budget Committee are appointed by Council.
Springfield City Council adopts goals for the next fiscal year.
The City Council adopts the Five Year Capital Improvement Program. The City Council reviews the Community Development Block Grant projects for
budget preparation. The Budget Committee or City Council provides guidance to City Manager. The City Manager prepares the recommended FY16 Proposed Budget for
consideration by the Budget Committee.
April – May The City Manager’s budget message and the Proposed Budget are presented to the
Budget Committee. The Budget Committee meets and deliberates on the Proposed Budget.
The Budget Committee recommends its FY16 Approved Budget to the City Council.
June
The City Council holds hearings and adopts the FY16 Annual Budget. July
The FY16 Adopted Budget is implemented and Tax Levy certified.
Adjusting the Adopted Budget The budget may be amended during the fiscal year. Amending a budget means that the original resolution adopted by Council will be changed based on updated information and/or unanticipated revenues or expenditures occurring after the adoption. Changes to the original resolution that alter legal spending levels must be approved by the City Council before any action can occur. Changes to the resolution are processed through supplemental budget action. A supplemental budget must be prepared and adopted before any expenditures are made in excess of a department’s legal budget appropriation. Notices of all budget hearings are published in the Springfield Times using guidelines in the Oregon Budget Law manual.
Attachment 24 FY16 Proposed Budget Page 4 of 206
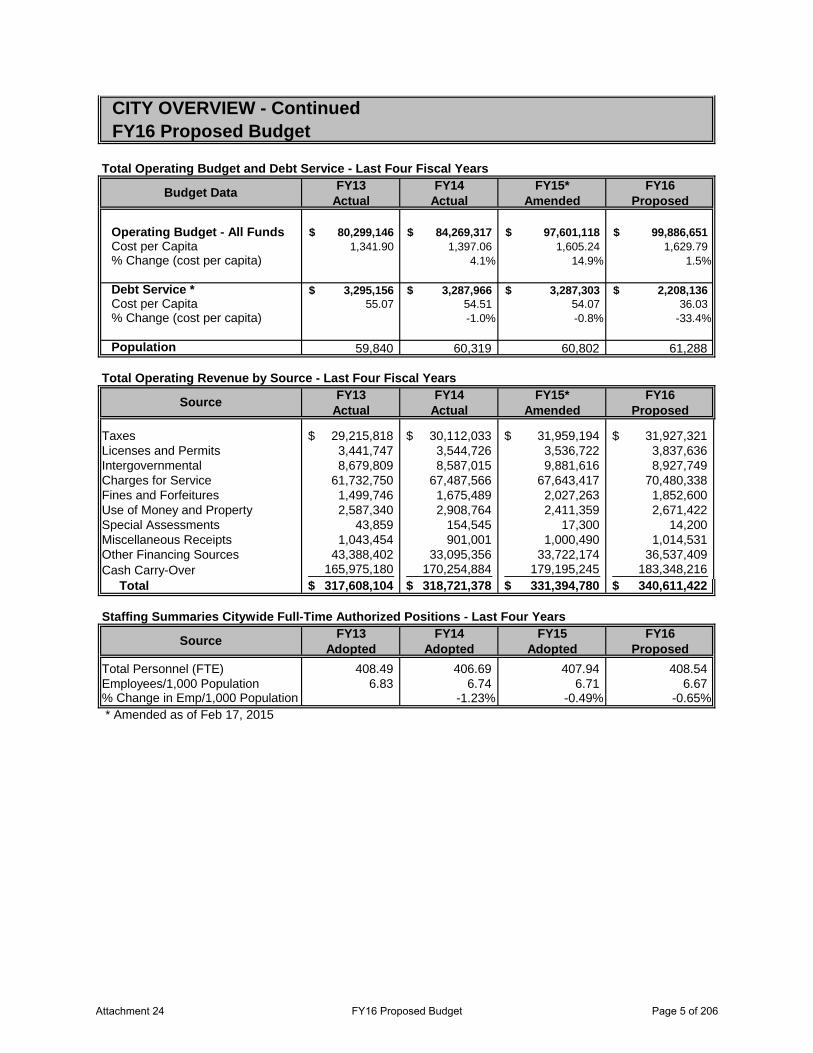
Total Operating Budget and Debt Service - Last Four Fiscal YearsFY13 FY14 FY15* FY16
Actual Actual Amended Proposed
80,299,146$ 84,269,317$ 97,601,118$ 99,886,651$ 1,341.90 1,397.06 1,605.24 1,629.79
4.1% 14.9% 1.5%
3,295,156$ 3,287,966$ 3,287,303$ 2,208,136$ 55.07 54.51 54.07 36.03
-1.0% -0.8% -33.4%
59,840 60,319 60,802 61,288
Total Operating Revenue by Source - Last Four Fiscal YearsFY13 FY14 FY15* FY16
Actual Actual Amended Proposed
29,215,818$ 30,112,033$ 31,959,194$ 31,927,321$ 3,441,747 3,544,726 3,536,722 3,837,636 8,679,809 8,587,015 9,881,616 8,927,749
61,732,750 67,487,566 67,643,417 70,480,338 1,499,746 1,675,489 2,027,263 1,852,600 2,587,340 2,908,764 2,411,359 2,671,422
43,859 154,545 17,300 14,200 1,043,454 901,001 1,000,490 1,014,531
43,388,402 33,095,356 33,722,174 36,537,409 165,975,180 170,254,884 179,195,245 183,348,216 317,608,104$ 318,721,378$ 331,394,780$ 340,611,422$
Staffing Summaries Citywide Full-Time Authorized Positions - Last Four YearsFY13 FY14 FY15 FY16
Adopted Adopted Adopted Proposed408.49 406.69 407.94 408.54
6.83 6.74 6.71 6.67 -1.23% -0.49% -0.65%
* Amended as of Feb 17, 2015
Total Personnel (FTE)Employees/1,000 Population% Change in Emp/1,000 Population
Special AssessmentsMiscellaneous ReceiptsOther Financing SourcesCash Carry-Over Total
Source
Use of Money and Property
Debt Service *Cost per Capita% Change (cost per capita)
Population
Source
TaxesLicenses and PermitsIntergovernmentalCharges for ServiceFines and Forfeitures
% Change (cost per capita)
CITY OVERVIEW - ContinuedFY16 Proposed Budget
Budget Data
Operating Budget - All FundsCost per Capita
Attachment 24 FY16 Proposed Budget Page 5 of 206
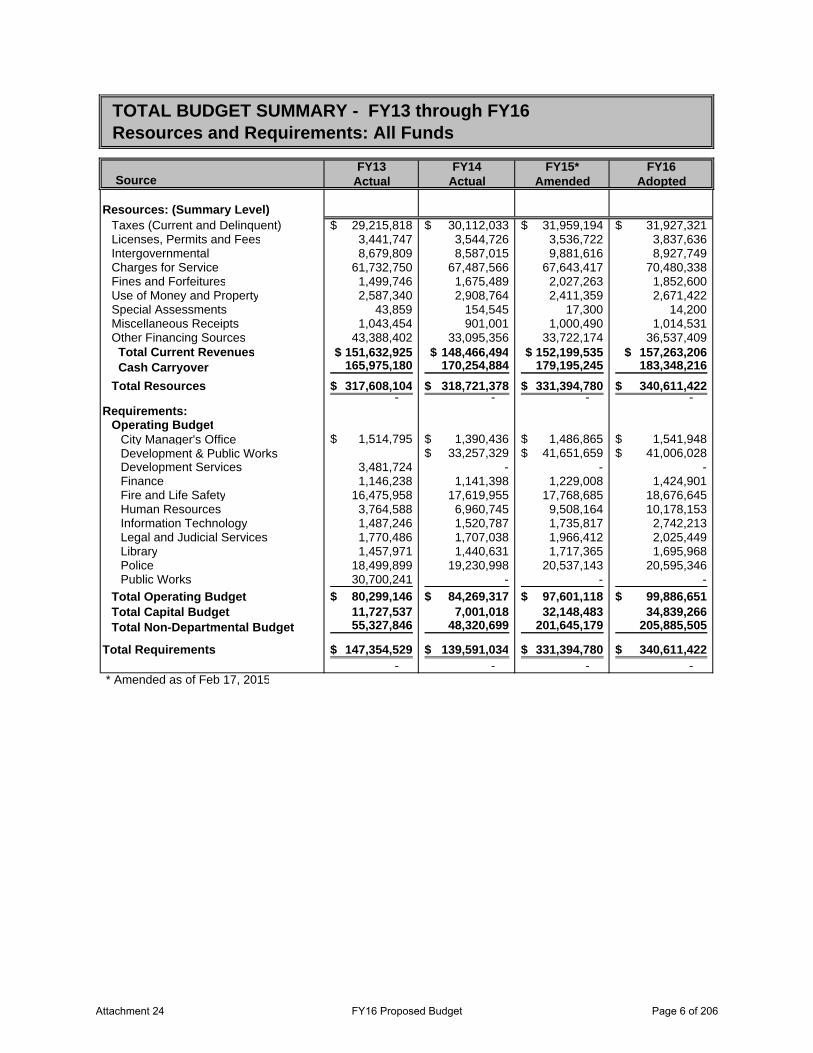
FY13 FY14 FY15* FY16Source Actual Actual Amended Adopted
Resources: (Summary Level)Taxes (Current and Delinquent) 29,215,818$ 30,112,033$ 31,959,194$ 31,927,321$ Licenses, Permits and Fees 3,441,747 3,544,726 3,536,722 3,837,636 Intergovernmental 8,679,809 8,587,015 9,881,616 8,927,749 Charges for Service 61,732,750 67,487,566 67,643,417 70,480,338 Fines and Forfeitures 1,499,746 1,675,489 2,027,263 1,852,600 Use of Money and Property 2,587,340 2,908,764 2,411,359 2,671,422 Special Assessments 43,859 154,545 17,300 14,200 Miscellaneous Receipts 1,043,454 901,001 1,000,490 1,014,531 Other Financing Sources 43,388,402 33,095,356 33,722,174 36,537,409 Total Current Revenues 151,632,925$ 148,466,494$ 152,199,535$ 157,263,206$ Cash Carryover 165,975,180 170,254,884 179,195,245 183,348,216 Total Resources 317,608,104$ 318,721,378$ 331,394,780$ 340,611,422$
- - - - Requirements:
Operating BudgetCity Manager's Office 1,514,795$ 1,390,436$ 1,486,865$ 1,541,948$ Development & Public Works 33,257,329$ 41,651,659$ 41,006,028$ Development Services 3,481,724 - - - Finance 1,146,238 1,141,398 1,229,008 1,424,901 Fire and Life Safety 16,475,958 17,619,955 17,768,685 18,676,645 Human Resources 3,764,588 6,960,745 9,508,164 10,178,153 Information Technology 1,487,246 1,520,787 1,735,817 2,742,213 Legal and Judicial Services 1,770,486 1,707,038 1,966,412 2,025,449 Library 1,457,971 1,440,631 1,717,365 1,695,968 Police 18,499,899 19,230,998 20,537,143 20,595,346 Public Works 30,700,241 - - -
Total Operating Budget 80,299,146$ 84,269,317$ 97,601,118$ 99,886,651$ Total Capital Budget 11,727,537 7,001,018 32,148,483 34,839,266 Total Non-Departmental Budget 55,327,846 48,320,699 201,645,179 205,885,505
Total Requirements 147,354,529$ 139,591,034$ 331,394,780$ 340,611,422$ - - - -
* Amended as of Feb 17, 2015
TOTAL BUDGET SUMMARY - FY13 through FY16Resources and Requirements: All Funds
Attachment 24 FY16 Proposed Budget Page 6 of 206
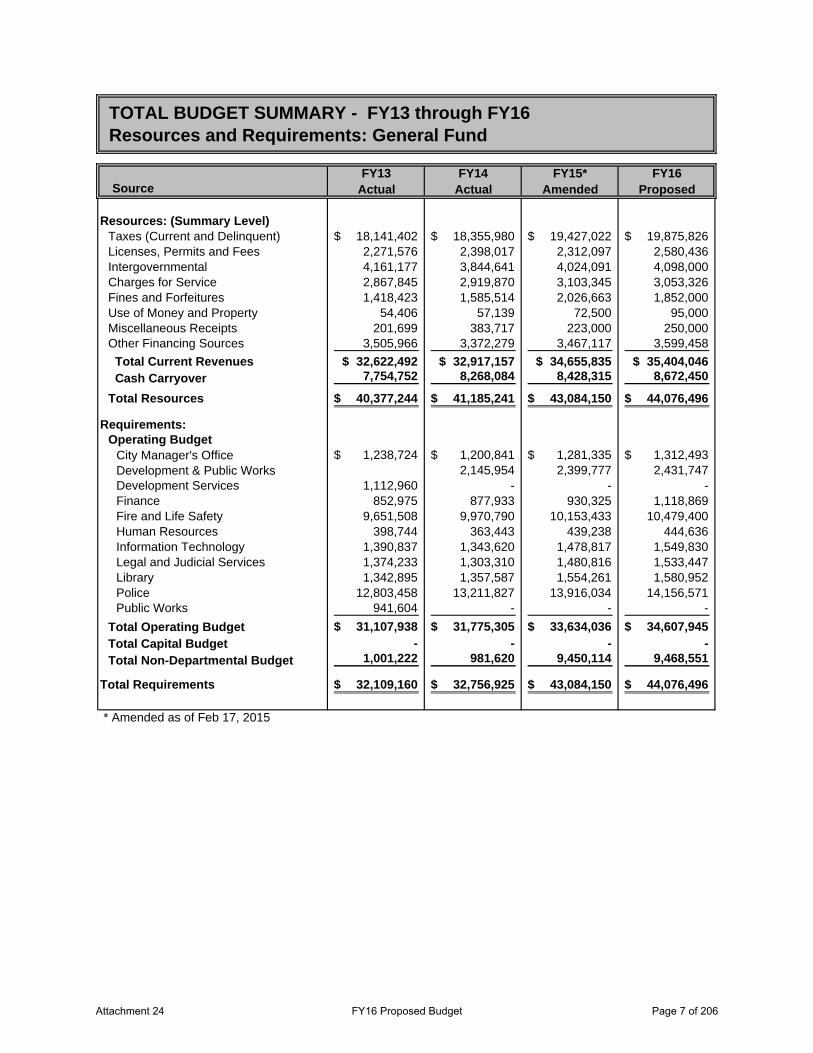
FY13 FY14 FY15* FY16Source Actual Actual Amended Proposed
Resources: (Summary Level)Taxes (Current and Delinquent) 18,141,402$ 18,355,980$ 19,427,022$ 19,875,826$ Licenses, Permits and Fees 2,271,576 2,398,017 2,312,097 2,580,436 Intergovernmental 4,161,177 3,844,641 4,024,091 4,098,000 Charges for Service 2,867,845 2,919,870 3,103,345 3,053,326 Fines and Forfeitures 1,418,423 1,585,514 2,026,663 1,852,000 Use of Money and Property 54,406 57,139 72,500 95,000 Miscellaneous Receipts 201,699 383,717 223,000 250,000 Other Financing Sources 3,505,966 3,372,279 3,467,117 3,599,458
Total Current Revenues 32,622,492$ 32,917,157$ 34,655,835$ 35,404,046$ Cash Carryover 7,754,752 8,268,084 8,428,315 8,672,450
Total Resources 40,377,244$ 41,185,241$ 43,084,150$ 44,076,496$
Requirements:Operating Budget
City Manager's Office 1,238,724$ 1,200,841$ 1,281,335$ 1,312,493$ Development & Public Works 2,145,954 2,399,777 2,431,747 Development Services 1,112,960 - - - Finance 852,975 877,933 930,325 1,118,869 Fire and Life Safety 9,651,508 9,970,790 10,153,433 10,479,400 Human Resources 398,744 363,443 439,238 444,636 Information Technology 1,390,837 1,343,620 1,478,817 1,549,830 Legal and Judicial Services 1,374,233 1,303,310 1,480,816 1,533,447 Library 1,342,895 1,357,587 1,554,261 1,580,952 Police 12,803,458 13,211,827 13,916,034 14,156,571 Public Works 941,604 - - -
Total Operating Budget 31,107,938$ 31,775,305$ 33,634,036$ 34,607,945$ Total Capital Budget - - - - Total Non-Departmental Budget 1,001,222 981,620 9,450,114 9,468,551
Total Requirements 32,109,160$ 32,756,925$ 43,084,150$ 44,076,496$
* Amended as of Feb 17, 2015
TOTAL BUDGET SUMMARY - FY13 through FY16Resources and Requirements: General Fund
Attachment 24 FY16 Proposed Budget Page 7 of 206
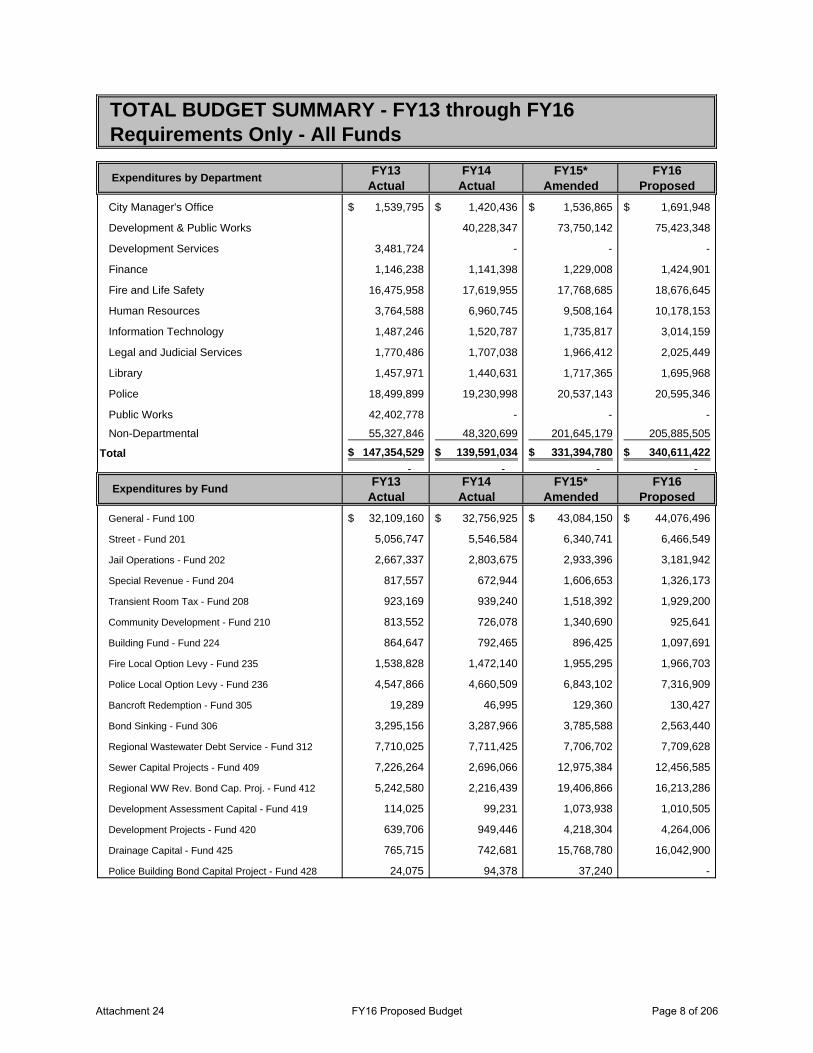
FY13 FY14 FY15* FY16Actual Actual Amended Proposed
City Manager's Office 1,539,795$ 1,420,436$ 1,536,865$ 1,691,948$
Development & Public Works 40,228,347 73,750,142 75,423,348
Development Services 3,481,724 - - -
Finance 1,146,238 1,141,398 1,229,008 1,424,901
Fire and Life Safety 16,475,958 17,619,955 17,768,685 18,676,645
Human Resources 3,764,588 6,960,745 9,508,164 10,178,153
Information Technology 1,487,246 1,520,787 1,735,817 3,014,159
Legal and Judicial Services 1,770,486 1,707,038 1,966,412 2,025,449
Library 1,457,971 1,440,631 1,717,365 1,695,968
Police 18,499,899 19,230,998 20,537,143 20,595,346
Public Works 42,402,778 - - -
Non-Departmental 55,327,846 48,320,699 201,645,179 205,885,505
Total 147,354,529$ 139,591,034$ 331,394,780$ 340,611,422$ - - - -
FY13 FY14 FY15* FY16Actual Actual Amended Proposed
General - Fund 100 32,109,160$ 32,756,925$ 43,084,150$ 44,076,496$
Street - Fund 201 5,056,747 5,546,584 6,340,741 6,466,549
Jail Operations - Fund 202 2,667,337 2,803,675 2,933,396 3,181,942
Special Revenue - Fund 204 817,557 672,944 1,606,653 1,326,173
Transient Room Tax - Fund 208 923,169 939,240 1,518,392 1,929,200
Community Development - Fund 210 813,552 726,078 1,340,690 925,641
Building Fund - Fund 224 864,647 792,465 896,425 1,097,691
Fire Local Option Levy - Fund 235 1,538,828 1,472,140 1,955,295 1,966,703
Police Local Option Levy - Fund 236 4,547,866 4,660,509 6,843,102 7,316,909
Bancroft Redemption - Fund 305 19,289 46,995 129,360 130,427
Bond Sinking - Fund 306 3,295,156 3,287,966 3,785,588 2,563,440
Regional Wastewater Debt Service - Fund 312 7,710,025 7,711,425 7,706,702 7,709,628
Sewer Capital Projects - Fund 409 7,226,264 2,696,066 12,975,384 12,456,585
Regional WW Rev. Bond Cap. Proj. - Fund 412 5,242,580 2,216,439 19,406,866 16,213,286
Development Assessment Capital - Fund 419 114,025 99,231 1,073,938 1,010,505
Development Projects - Fund 420 639,706 949,446 4,218,304 4,264,006
Drainage Capital - Fund 425 765,715 742,681 15,768,780 16,042,900
Police Building Bond Capital Project - Fund 428 24,075 94,378 37,240 -
TOTAL BUDGET SUMMARY - FY13 through FY16Requirements Only - All Funds
Expenditures by Department
Expenditures by Fund
Attachment 24 FY16 Proposed Budget Page 8 of 206
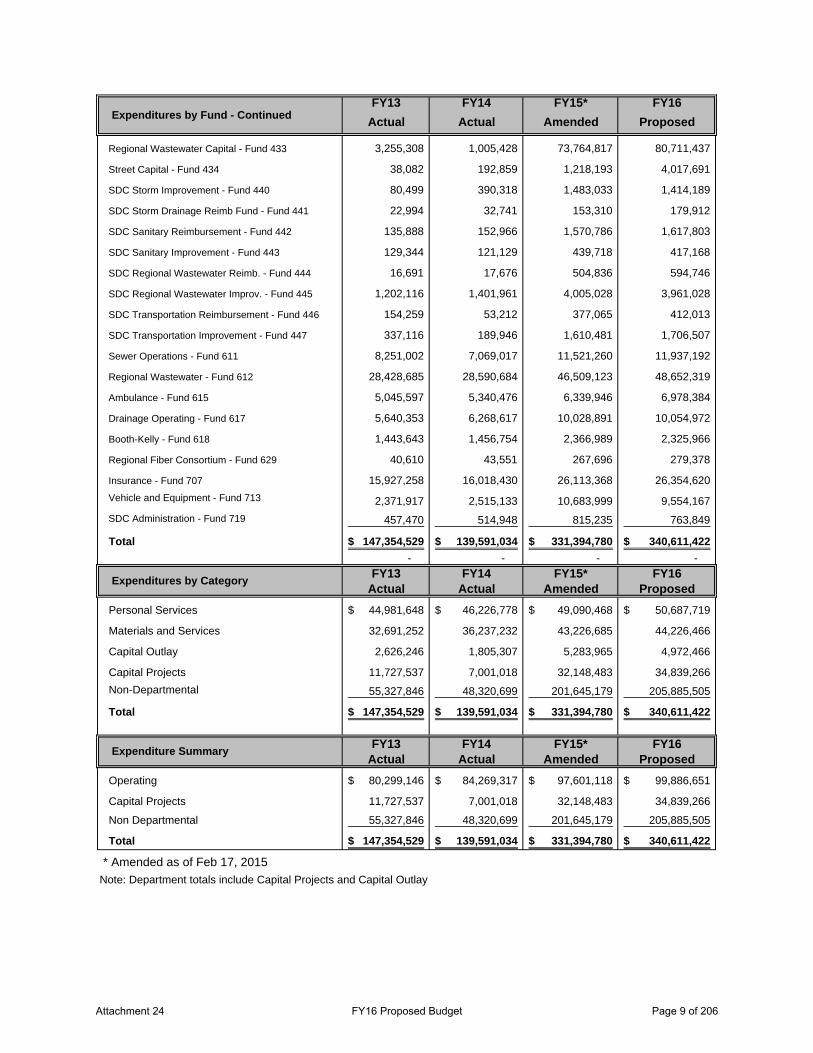
FY13 FY14 FY15* FY16Actual Actual Amended Proposed
Regional Wastewater Capital - Fund 433 3,255,308 1,005,428 73,764,817 80,711,437
Street Capital - Fund 434 38,082 192,859 1,218,193 4,017,691
SDC Storm Improvement - Fund 440 80,499 390,318 1,483,033 1,414,189
SDC Storm Drainage Reimb Fund - Fund 441 22,994 32,741 153,310 179,912
SDC Sanitary Reimbursement - Fund 442 135,888 152,966 1,570,786 1,617,803
SDC Sanitary Improvement - Fund 443 129,344 121,129 439,718 417,168
SDC Regional Wastewater Reimb. - Fund 444 16,691 17,676 504,836 594,746
SDC Regional Wastewater Improv. - Fund 445 1,202,116 1,401,961 4,005,028 3,961,028
SDC Transportation Reimbursement - Fund 446 154,259 53,212 377,065 412,013
SDC Transportation Improvement - Fund 447 337,116 189,946 1,610,481 1,706,507
Sewer Operations - Fund 611 8,251,002 7,069,017 11,521,260 11,937,192
Regional Wastewater - Fund 612 28,428,685 28,590,684 46,509,123 48,652,319
Ambulance - Fund 615 5,045,597 5,340,476 6,339,946 6,978,384
Drainage Operating - Fund 617 5,640,353 6,268,617 10,028,891 10,054,972
Booth-Kelly - Fund 618 1,443,643 1,456,754 2,366,989 2,325,966
Regional Fiber Consortium - Fund 629 40,610 43,551 267,696 279,378
Insurance - Fund 707 15,927,258 16,018,430 26,113,368 26,354,620
Vehicle and Equipment - Fund 713 2,371,917 2,515,133 10,683,999 9,554,167
SDC Administration - Fund 719 457,470 514,948 815,235 763,849
Total 147,354,529$ 139,591,034$ 331,394,780$ 340,611,422$ - - - -
FY13 FY14 FY15* FY16Actual Actual Amended Proposed
Personal Services 44,981,648$ 46,226,778$ 49,090,468$ 50,687,719$
Materials and Services 32,691,252 36,237,232 43,226,685 44,226,466
Capital Outlay 2,626,246 1,805,307 5,283,965 4,972,466
Capital Projects 11,727,537 7,001,018 32,148,483 34,839,266
Non-Departmental 55,327,846 48,320,699 201,645,179 205,885,505
Total 147,354,529$ 139,591,034$ 331,394,780$ 340,611,422$
FY13 FY14 FY15* FY16Actual Actual Amended Proposed
Operating 80,299,146$ 84,269,317$ 97,601,118$ 99,886,651$
Capital Projects 11,727,537 7,001,018 32,148,483 34,839,266
Non Departmental 55,327,846 48,320,699 201,645,179 205,885,505
Total 147,354,529$ 139,591,034$ 331,394,780$ 340,611,422$
* Amended as of Feb 17, 2015
Note: Department totals include Capital Projects and Capital Outlay
Expenditure Summary
Expenditures by Category
Expenditures by Fund - Continued
Attachment 24 FY16 Proposed Budget Page 9 of 206

Attachment 24 FY16 Proposed Budget Page 10 of 206
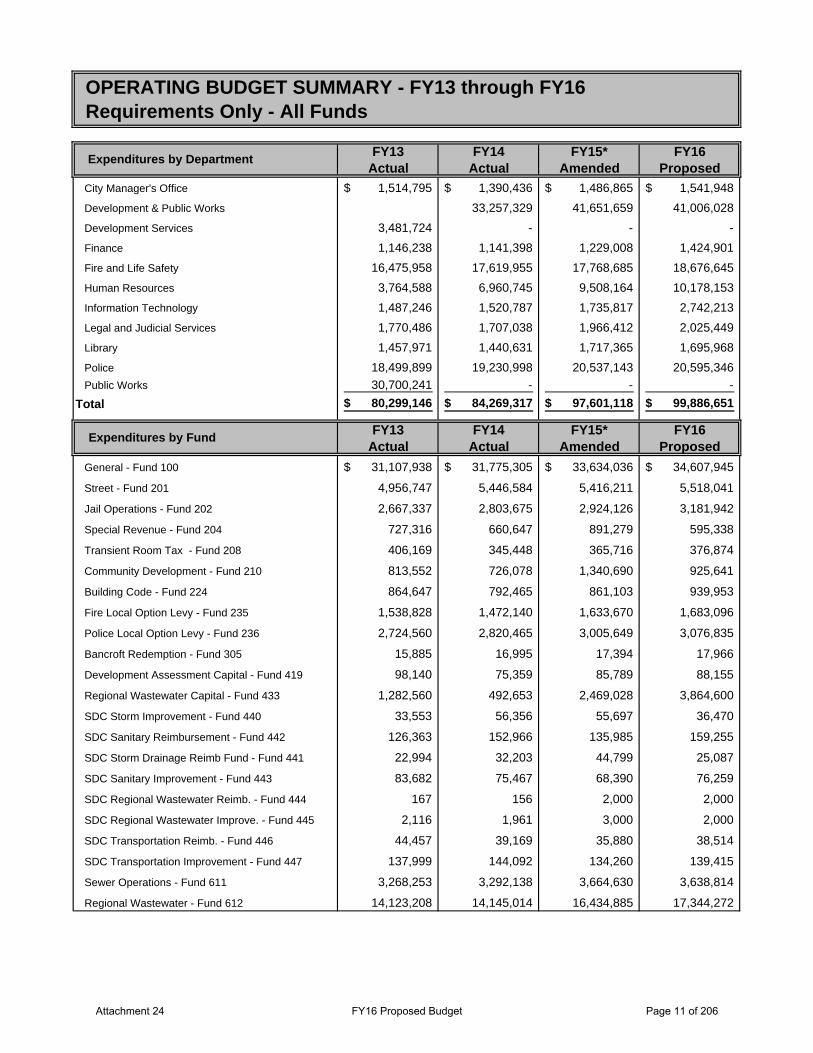
FY13 FY14 FY15* FY16Actual Actual Amended Proposed
City Manager's Office 1,514,795$ 1,390,436$ 1,486,865$ 1,541,948$
Development & Public Works 33,257,329 41,651,659 41,006,028
Development Services 3,481,724 - - -
Finance 1,146,238 1,141,398 1,229,008 1,424,901
Fire and Life Safety 16,475,958 17,619,955 17,768,685 18,676,645
Human Resources 3,764,588 6,960,745 9,508,164 10,178,153
Information Technology 1,487,246 1,520,787 1,735,817 2,742,213
Legal and Judicial Services 1,770,486 1,707,038 1,966,412 2,025,449
Library 1,457,971 1,440,631 1,717,365 1,695,968
Police 18,499,899 19,230,998 20,537,143 20,595,346
Public Works 30,700,241 - - -
Total 80,299,146$ 84,269,317$ 97,601,118$ 99,886,651$
FY13 FY14 FY15* FY16Actual Actual Amended Proposed
General - Fund 100 31,107,938$ 31,775,305$ 33,634,036$ 34,607,945$
Street - Fund 201 4,956,747 5,446,584 5,416,211 5,518,041
Jail Operations - Fund 202 2,667,337 2,803,675 2,924,126 3,181,942
Special Revenue - Fund 204 727,316 660,647 891,279 595,338
Transient Room Tax - Fund 208 406,169 345,448 365,716 376,874
Community Development - Fund 210 813,552 726,078 1,340,690 925,641
Building Code - Fund 224 864,647 792,465 861,103 939,953
Fire Local Option Levy - Fund 235 1,538,828 1,472,140 1,633,670 1,683,096
Police Local Option Levy - Fund 236 2,724,560 2,820,465 3,005,649 3,076,835
Bancroft Redemption - Fund 305 15,885 16,995 17,394 17,966
Development Assessment Capital - Fund 419 98,140 75,359 85,789 88,155
Regional Wastewater Capital - Fund 433 1,282,560 492,653 2,469,028 3,864,600
SDC Storm Improvement - Fund 440 33,553 56,356 55,697 36,470
SDC Sanitary Reimbursement - Fund 442 126,363 152,966 135,985 159,255
SDC Storm Drainage Reimb Fund - Fund 441 22,994 32,203 44,799 25,087
SDC Sanitary Improvement - Fund 443 83,682 75,467 68,390 76,259
SDC Regional Wastewater Reimb. - Fund 444 167 156 2,000 2,000
SDC Regional Wastewater Improve. - Fund 445 2,116 1,961 3,000 2,000
SDC Transportation Reimb. - Fund 446 44,457 39,169 35,880 38,514
SDC Transportation Improvement - Fund 447 137,999 144,092 134,260 139,415
Sewer Operations - Fund 611 3,268,253 3,292,138 3,664,630 3,638,814
Regional Wastewater - Fund 612 14,123,208 14,145,014 16,434,885 17,344,272
OPERATING BUDGET SUMMARY - FY13 through FY16Requirements Only - All Funds
Expenditures by Department
Expenditures by Fund
Attachment 24 FY16 Proposed Budget Page 11 of 206
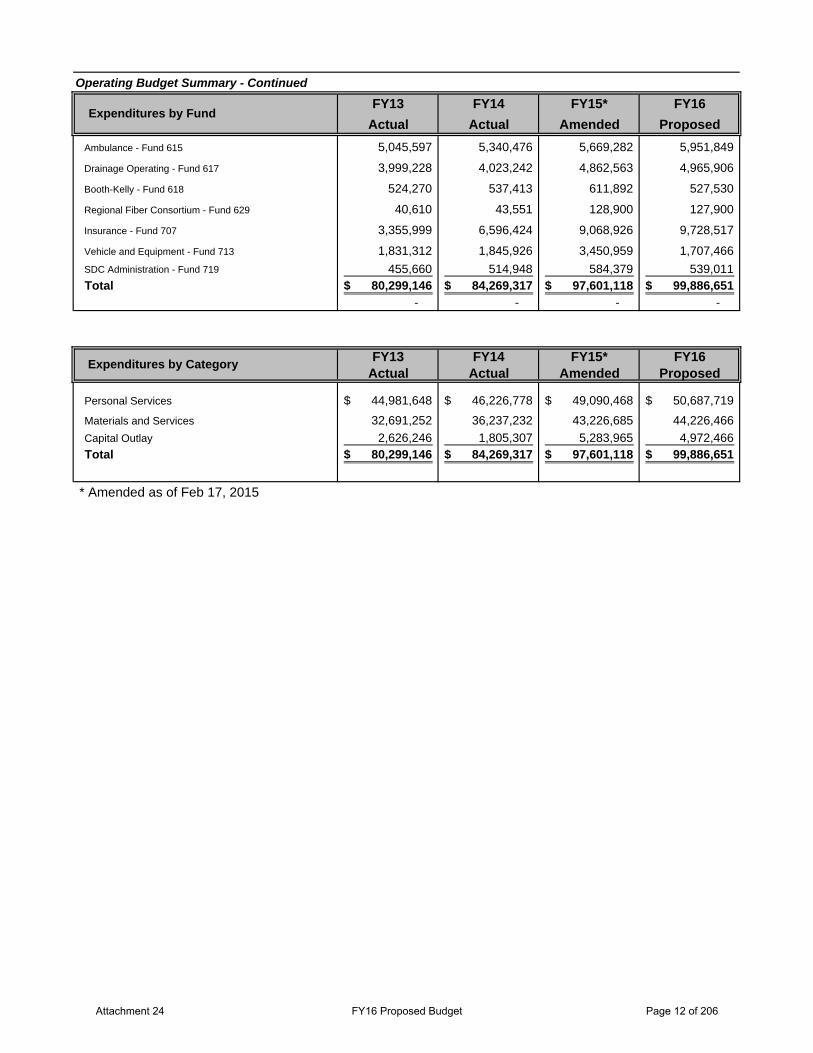
Operating Budget Summary - Continued
FY13 FY14 FY15* FY16Actual Actual Amended Proposed
Ambulance - Fund 615 5,045,597 5,340,476 5,669,282 5,951,849
Drainage Operating - Fund 617 3,999,228 4,023,242 4,862,563 4,965,906
Booth-Kelly - Fund 618 524,270 537,413 611,892 527,530
Regional Fiber Consortium - Fund 629 40,610 43,551 128,900 127,900
Insurance - Fund 707 3,355,999 6,596,424 9,068,926 9,728,517
Vehicle and Equipment - Fund 713 1,831,312 1,845,926 3,450,959 1,707,466
SDC Administration - Fund 719 455,660 514,948 584,379 539,011 Total 80,299,146$ 84,269,317$ 97,601,118$ 99,886,651$
- - - -
FY13 FY14 FY15* FY16Actual Actual Amended Proposed
Personal Services 44,981,648$ 46,226,778$ 49,090,468$ 50,687,719$
Materials and Services 32,691,252 36,237,232 43,226,685 44,226,466
Capital Outlay 2,626,246 1,805,307 5,283,965 4,972,466 Total 80,299,146$ 84,269,317$ 97,601,118$ 99,886,651$
* Amended as of Feb 17, 2015
Expenditures by Category
Expenditures by Fund
Attachment 24 FY16 Proposed Budget Page 12 of 206
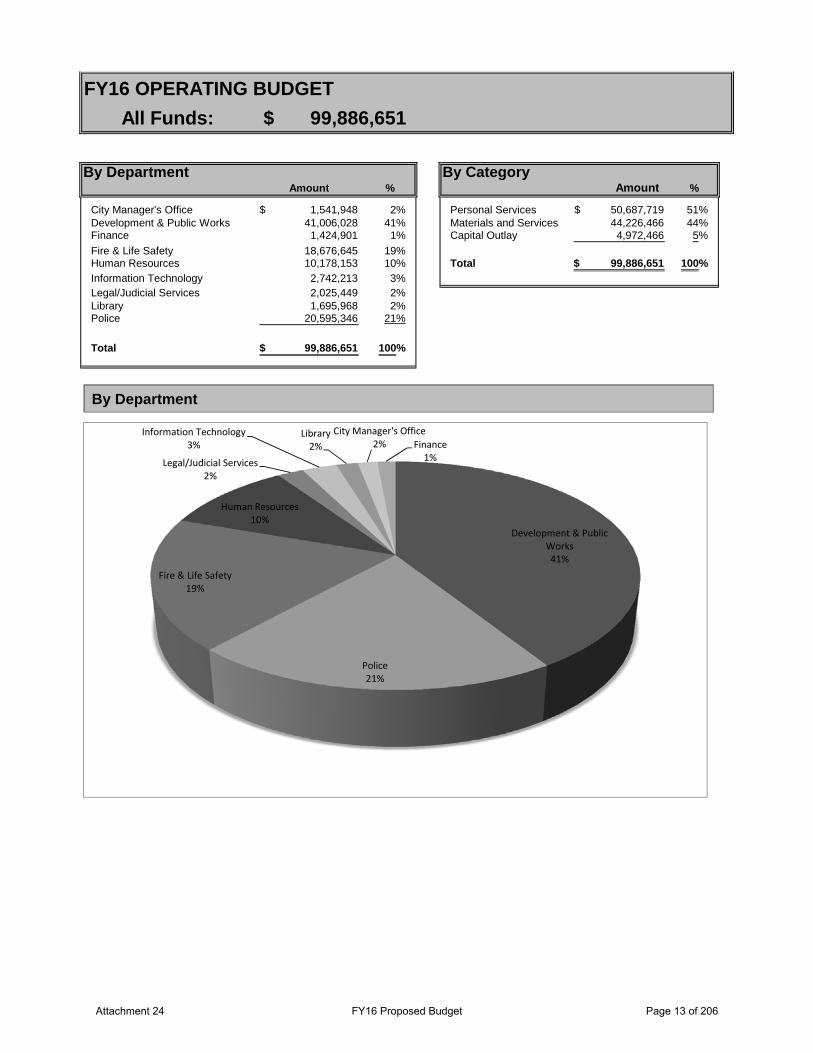
All Funds:
Amount % Amount %
City Manager's Office 1,541,948$ 2% Personal Services 50,687,719$ 51%Development & Public Works 41,006,028 41% Materials and Services 44,226,466 44%Finance 1,424,901 1% Capital Outlay 4,972,466 5%
Fire & Life Safety 18,676,645 19%Human Resources 10,178,153 10% Total 99,886,651$ 100%Information Technology 2,742,213 3%Legal/Judicial Services 2,025,449 2%Library 1,695,968 2%Police 20,595,346 21%
Total 99,886,651$ 100%
99,886,651$
By Department By Category
FY16 OPERATING BUDGET
By Department
Development & Public Works41%
Police21%
Fire & Life Safety19%
Human Resources10%
Legal/Judicial Services2%
Information Technology3%
Library2%
City Manager's Office2% Finance
1%
Attachment 24 FY16 Proposed Budget Page 13 of 206
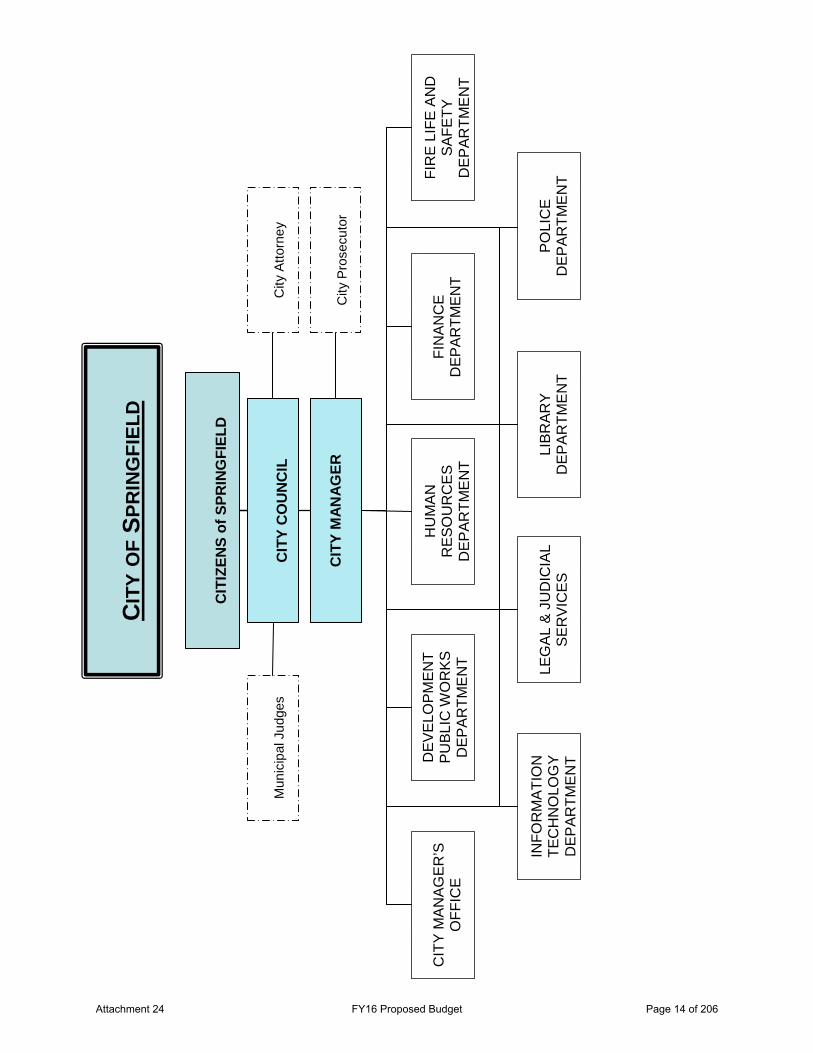
CIT
Y O
F SP
RIN
GFI
ELD
CIT
Y C
OU
NC
IL
CIT
Y M
ANAG
ER
LEG
AL
& J
UD
ICIA
L S
ER
VIC
ES
CIT
IZEN
S of
SPR
ING
FIEL
D
CIT
Y M
AN
AG
ER
’S
OF
FIC
E
FIN
AN
CE
D
EP
AR
TM
EN
T
HU
MA
N
RE
SO
UR
CE
S
DE
PA
RT
ME
NT
DE
VE
LOP
ME
NT
P
UB
LIC
WO
RK
S
DE
PA
RT
ME
NT
INF
OR
MA
TIO
N
TE
CH
NO
LOG
Y
DE
PA
RT
ME
NT
FIR
E L
IFE
AN
D
SA
FE
TY
D
EP
AR
TM
EN
T
PO
LIC
E
DE
PA
RT
ME
NT
LI
BR
AR
Y
DE
PA
RT
ME
NT
City
Att
orne
y
City
Pro
secu
tor
Mun
icip
al J
udg
es
Attachment 24 FY16 Proposed Budget Page 14 of 206
City Manager's Office
Departmental Programs
• Administration • Economic Development • Communications • Mayor and Council
Department Description The City Manager’s Office directs and coordinates the work plans of all City departments in conformance with the goals and objectives established by the Mayor and City Council. The City Manager is the chief administrative officer for the City and is responsible for informing and advising the City Council regarding services the City provides to the community and ensures that appropriate administrative processes are in place to facilitate effective and efficient provision of City services. The City Manager oversees the administration of all City departments and functions and appoints the department directors. Staff in the City Manager’s Office support the Mayor and City Council and are responsible for city recorder functions, city elections, management of boards, commissions and committees as well as media relations, public information, responding to citizen concerns, intergovernmental relations, website maintenance, administration of the City budget, , and managing the city’s community and economic development program, including staffing of the Springfield Economic Development Agency.
Mission The City Manager’s Office mission is to ensure a common vision exists throughout the City’s service delivery systems and the citizens of Springfield are encouraged to participate in City government. Supporting multi-jurisdictional partnerships and maintaining excellent working relationships with other governments is a focus of the City Manager’s Office. The City Manager’s Office creates and facilitates systems, processes and policies necessary to provide quality and consistent services to our community. The City Manager’s Office ensures the city’s Community and Economic Development Program offers businesses, community organizations and citizens the appropriate support for economic development and growth, and promotes awareness and understanding of city services, policies, projects and issues through communication with the citizens, employees, news media, special interest groups, community groups, neighborhoods and businesses. The City Manager’s Office also staffs and implements the Springfield Economic Development Agency to develop and redevelop both the Glenwood and Downtown areas through their respective Urban Renewal plans.
Attachment 24 FY16 Proposed Budget Page 15 of 206
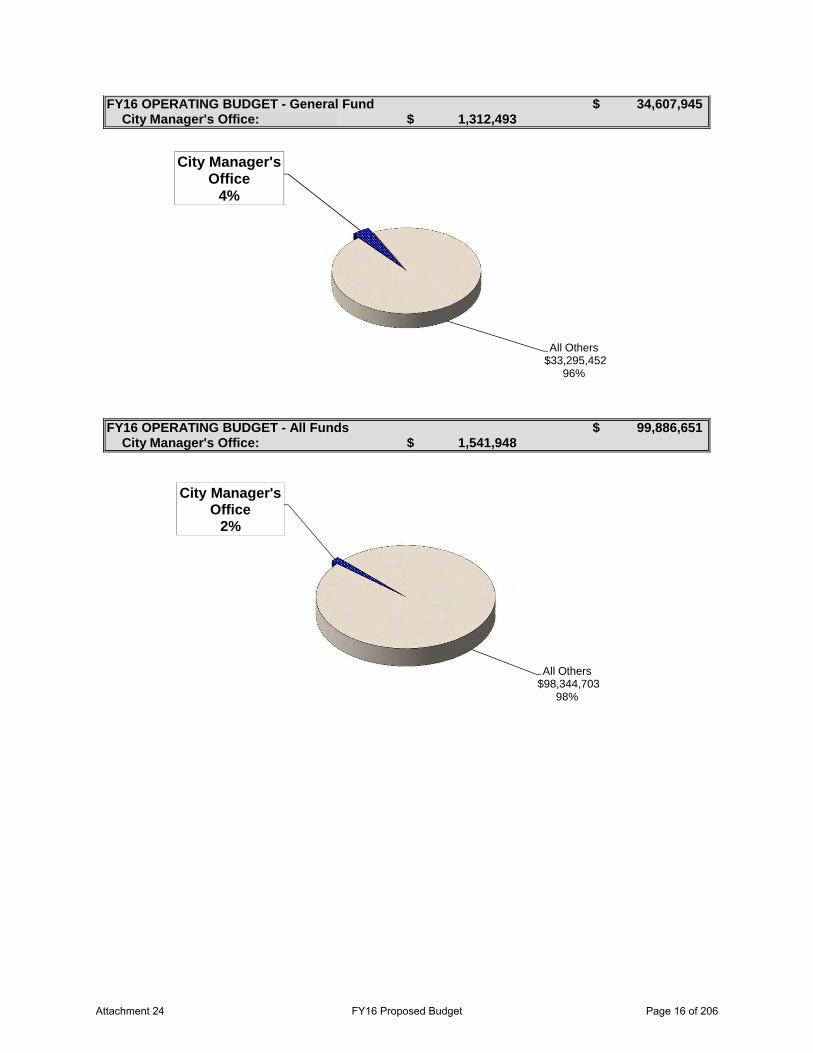
City Manager's Office:
City Manager's Office:
FY16 OPERATING BUDGET - General Fund 34,607,945$
FY16 OPERATING BUDGET - All Funds 99,886,651$
1,312,493$
1,541,948$
City Manager's Office
4%
All Others$33,295,452
96%
City Manager's Office
2%
All Others$98,344,703
98%
Attachment 24 FY16 Proposed Budget Page 16 of 206
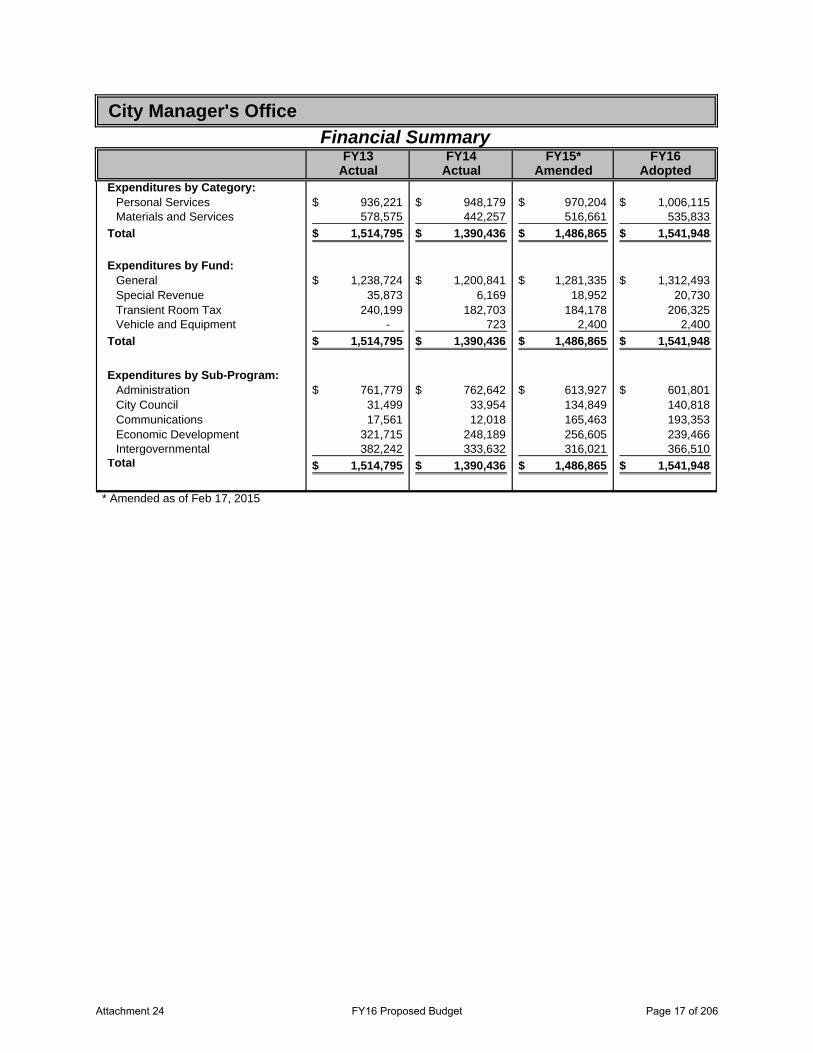
FY13 FY14 FY15* FY16Actual Actual Amended Adopted
Expenditures by Category:Personal Services 936,221$ 948,179$ 970,204$ 1,006,115$ Materials and Services 578,575 442,257 516,661 535,833
Total 1,514,795$ 1,390,436$ 1,486,865$ 1,541,948$
Expenditures by Fund:General 1,238,724$ 1,200,841$ 1,281,335$ 1,312,493$ Special Revenue 35,873 6,169 18,952 20,730 Transient Room Tax 240,199 182,703 184,178 206,325 Vehicle and Equipment - 723 2,400 2,400
Total 1,514,795$ 1,390,436$ 1,486,865$ 1,541,948$
Expenditures by Sub-Program:Administration 761,779$ 762,642$ 613,927$ 601,801$ City Council 31,499 33,954 134,849 140,818 Communications 17,561 12,018 165,463 193,353 Economic Development 321,715 248,189 256,605 239,466 Intergovernmental 382,242 333,632 316,021 366,510
Total 1,514,795$ 1,390,436$ 1,486,865$ 1,541,948$
City Manager's OfficeFinancial Summary
* Amended as of Feb 17, 2015
Attachment 24 FY16 Proposed Budget Page 17 of 206
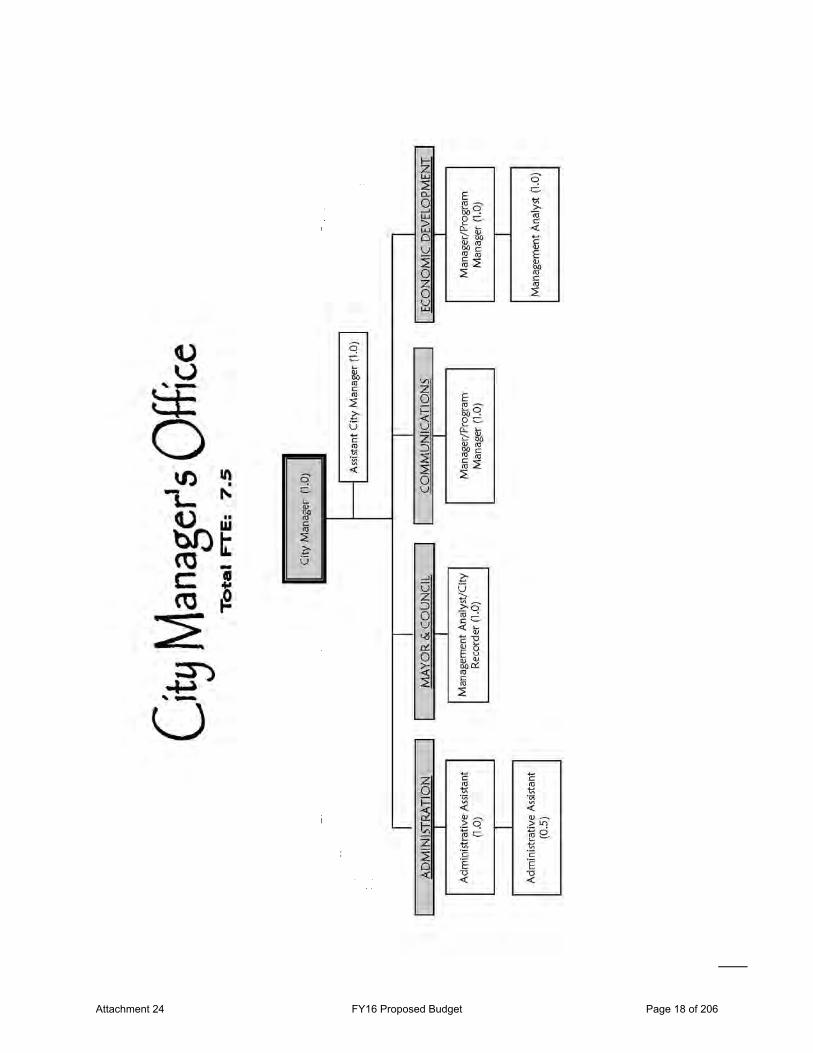
Attachment 24 FY16 Proposed Budget Page 18 of 206
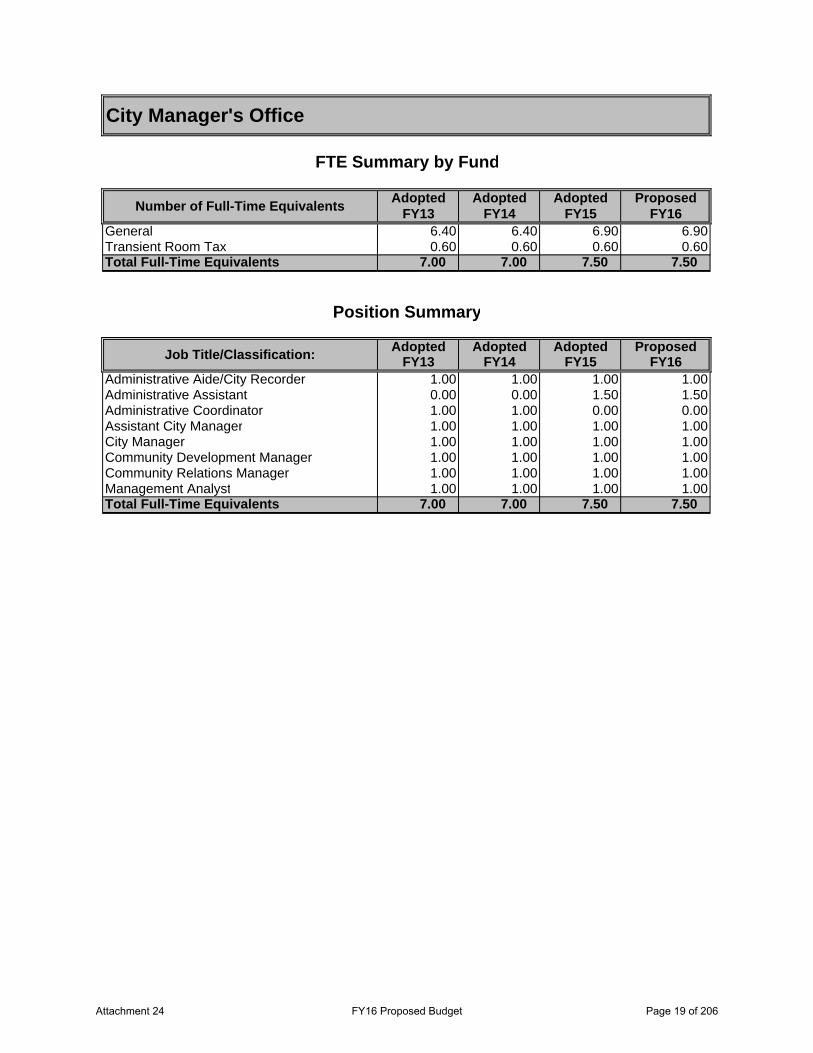
Adopted Adopted Adopted ProposedFY13 FY14 FY15 FY16
General 6.40 6.40 6.90 6.90Transient Room Tax 0.60 0.60 0.60 0.60Total Full-Time Equivalents 7.00 7.00 7.50 7.50
Adopted Adopted Adopted ProposedFY13 FY14 FY15 FY16
Administrative Aide/City Recorder 1.00 1.00 1.00 1.00Administrative Assistant 0.00 0.00 1.50 1.50Administrative Coordinator 1.00 1.00 0.00 0.00Assistant City Manager 1.00 1.00 1.00 1.00City Manager 1.00 1.00 1.00 1.00Community Development Manager 1.00 1.00 1.00 1.00Community Relations Manager 1.00 1.00 1.00 1.00Management Analyst 1.00 1.00 1.00 1.00Total Full-Time Equivalents 7.00 7.00 7.50 7.50
City Manager's Office
Position Summary
Number of Full-Time Equivalents
Job Title/Classification:
FTE Summary by Fund
Attachment 24 FY16 Proposed Budget Page 19 of 206

Attachment 24 FY16 Proposed Budget Page 20 of 206
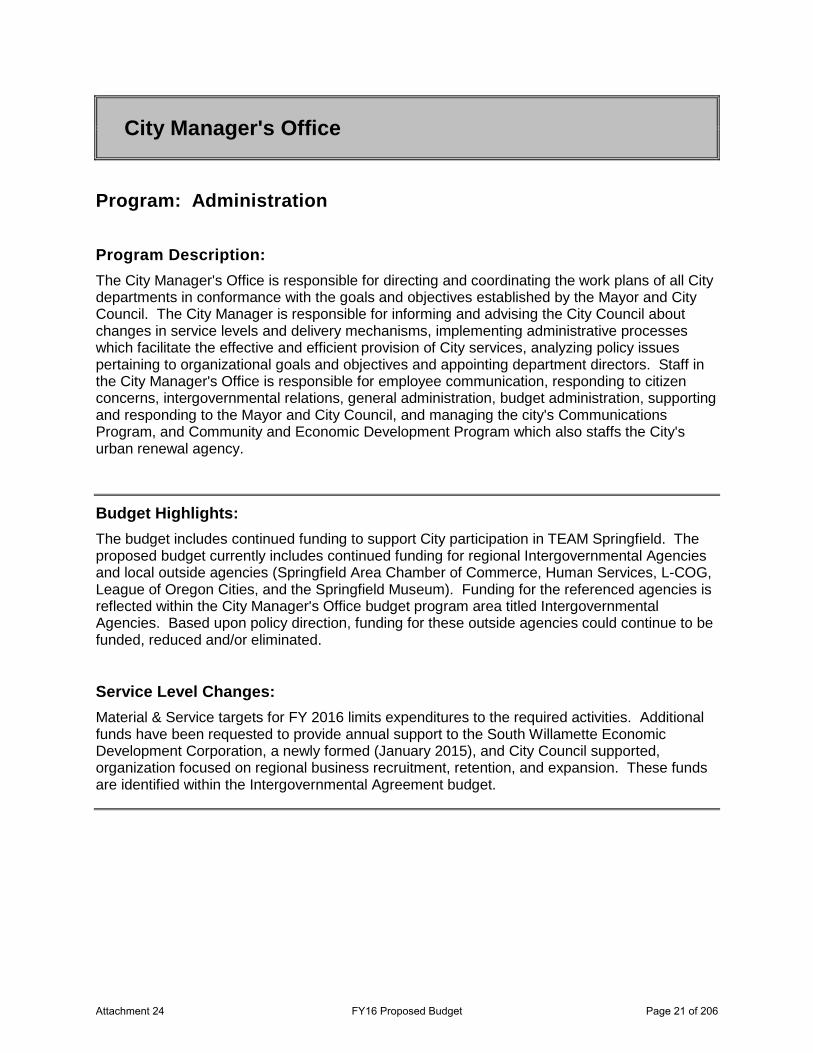
City Manager's Office
Program: Administration Program Description: The City Manager's Office is responsible for directing and coordinating the work plans of all City departments in conformance with the goals and objectives established by the Mayor and City Council. The City Manager is responsible for informing and advising the City Council about changes in service levels and delivery mechanisms, implementing administrative processes which facilitate the effective and efficient provision of City services, analyzing policy issues pertaining to organizational goals and objectives and appointing department directors. Staff in the City Manager's Office is responsible for employee communication, responding to citizen concerns, intergovernmental relations, general administration, budget administration, supporting and responding to the Mayor and City Council, and managing the city's Communications Program, and Community and Economic Development Program which also staffs the City's urban renewal agency.
Budget Highlights: The budget includes continued funding to support City participation in TEAM Springfield. The proposed budget currently includes continued funding for regional Intergovernmental Agencies and local outside agencies (Springfield Area Chamber of Commerce, Human Services, L-COG, League of Oregon Cities, and the Springfield Museum). Funding for the referenced agencies is reflected within the City Manager's Office budget program area titled Intergovernmental Agencies. Based upon policy direction, funding for these outside agencies could continue to be funded, reduced and/or eliminated.
Service Level Changes: Material & Service targets for FY 2016 limits expenditures to the required activities. Additional funds have been requested to provide annual support to the South Willamette Economic Development Corporation, a newly formed (January 2015), and City Council supported, organization focused on regional business recruitment, retention, and expansion. These funds are identified within the Intergovernmental Agreement budget.
Attachment 24 FY16 Proposed Budget Page 21 of 206
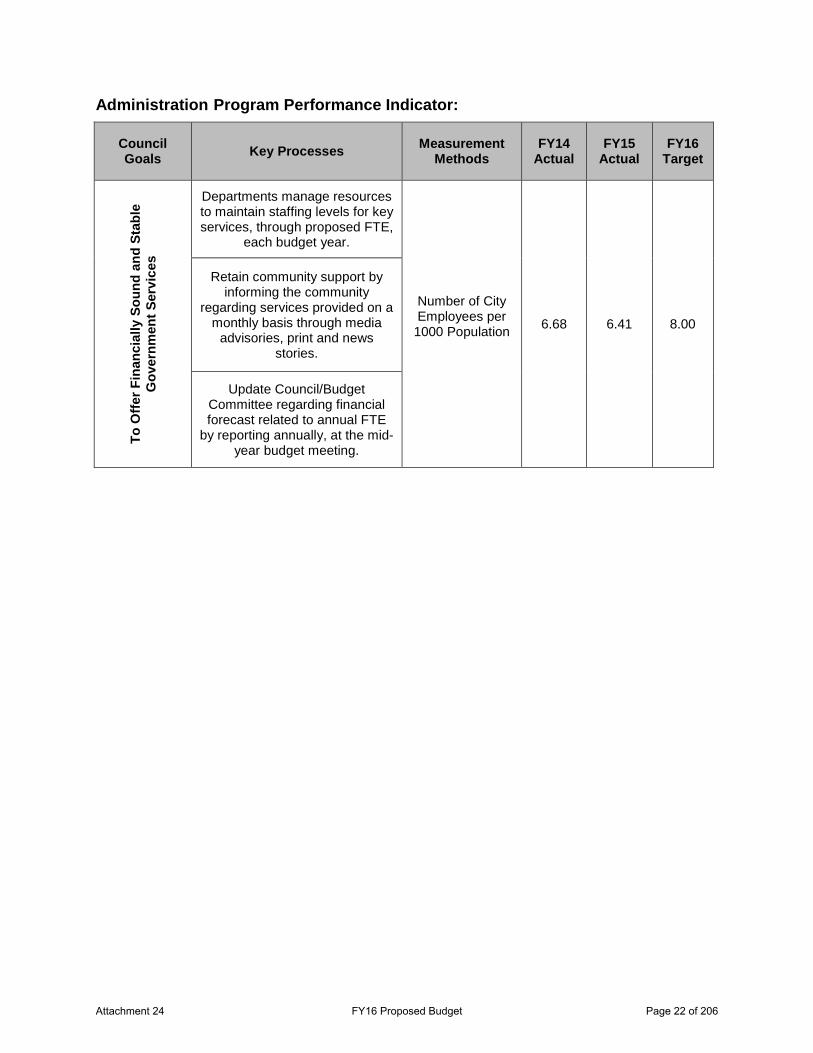
Administration Program Performance Indicator:
Council Goals Key Processes Measurement
Methods FY14
Actual FY15
Actual FY16
Target
To O
ffer F
inan
cial
ly S
ound
and
Sta
ble
Gov
ernm
ent S
ervi
ces
Departments manage resources to maintain staffing levels for key services, through proposed FTE,
each budget year.
Number of City Employees per 1000 Population
6.68 6.41 8.00
Retain community support by informing the community
regarding services provided on a monthly basis through media
advisories, print and news stories.
Update Council/Budget Committee regarding financial forecast related to annual FTE
by reporting annually, at the mid-year budget meeting.
Attachment 24 FY16 Proposed Budget Page 22 of 206
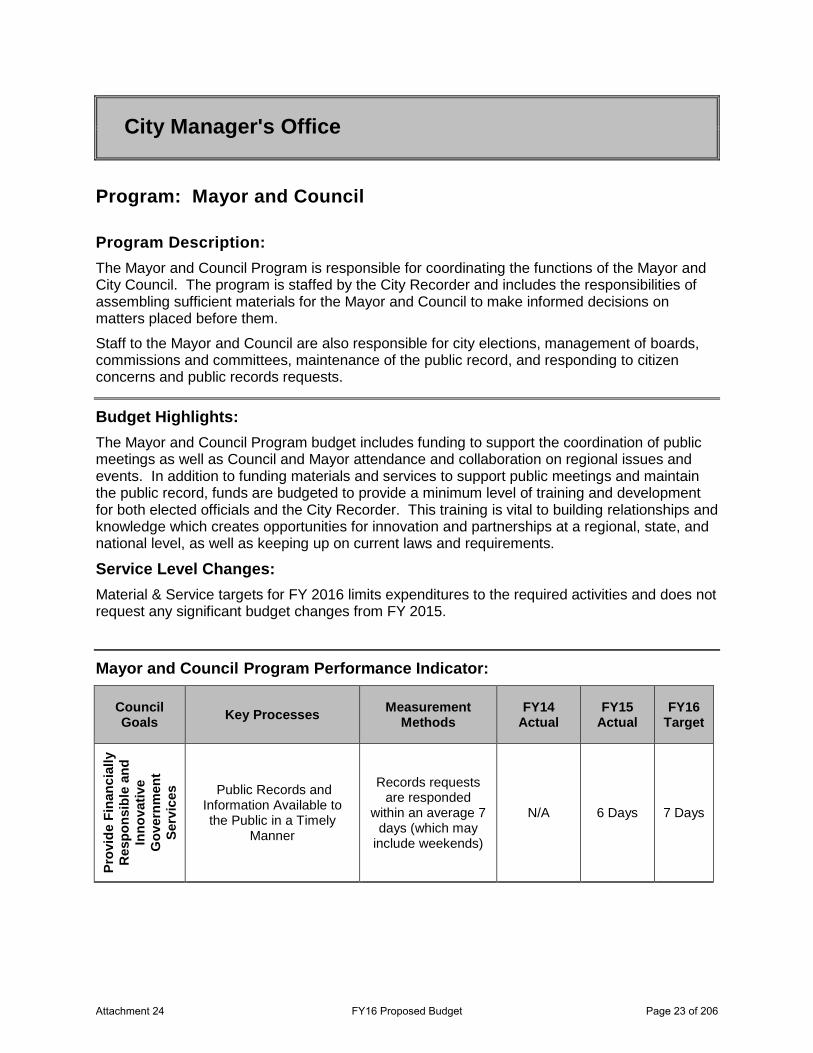
City Manager's Office
Program: Mayor and Council Program Description: The Mayor and Council Program is responsible for coordinating the functions of the Mayor and City Council. The program is staffed by the City Recorder and includes the responsibilities of assembling sufficient materials for the Mayor and Council to make informed decisions on matters placed before them.
Staff to the Mayor and Council are also responsible for city elections, management of boards, commissions and committees, maintenance of the public record, and responding to citizen concerns and public records requests.
Budget Highlights: The Mayor and Council Program budget includes funding to support the coordination of public meetings as well as Council and Mayor attendance and collaboration on regional issues and events. In addition to funding materials and services to support public meetings and maintain the public record, funds are budgeted to provide a minimum level of training and development for both elected officials and the City Recorder. This training is vital to building relationships and knowledge which creates opportunities for innovation and partnerships at a regional, state, and national level, as well as keeping up on current laws and requirements.
Service Level Changes: Material & Service targets for FY 2016 limits expenditures to the required activities and does not request any significant budget changes from FY 2015.
Mayor and Council Program Performance Indicator:
Council Goals Key Processes Measurement
Methods FY14
Actual FY15
Actual FY16
Target
Prov
ide
Fina
ncia
lly
Res
pons
ible
and
In
nova
tive
Gov
ernm
ent
Serv
ices
Public Records and Information Available to the Public in a Timely
Manner
Records requests are responded
within an average 7 days (which may
include weekends)
N/A 6 Days 7 Days
Attachment 24 FY16 Proposed Budget Page 23 of 206
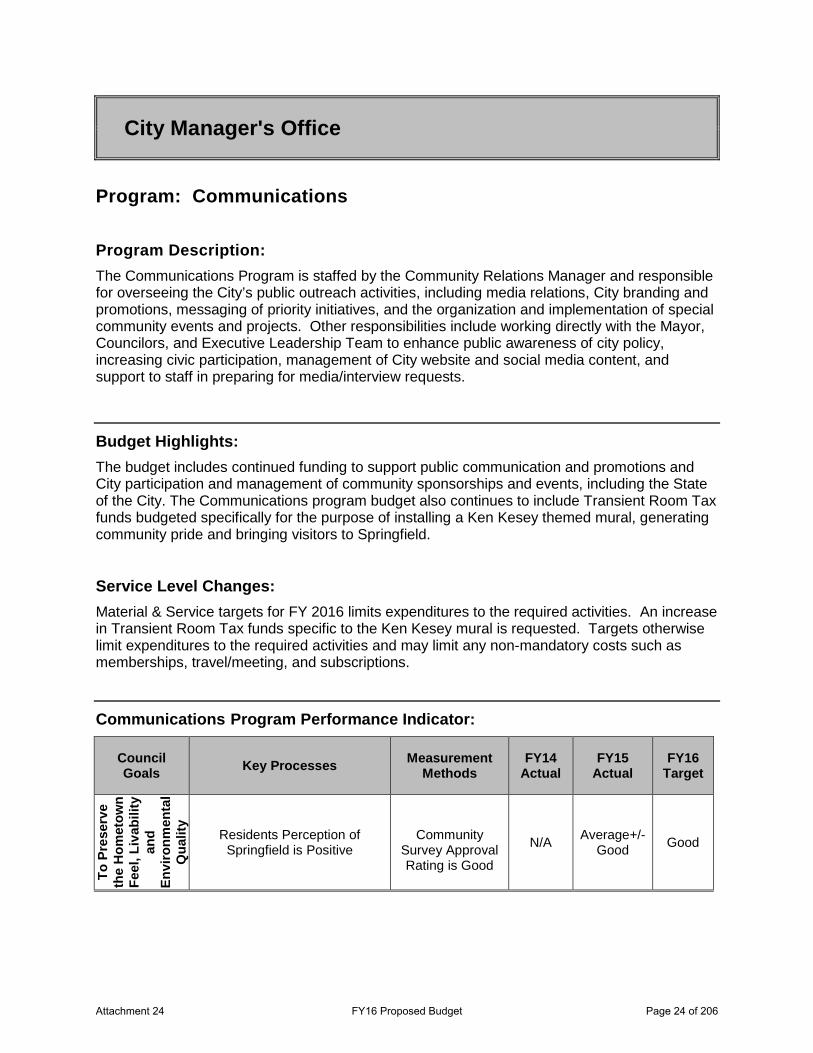
City Manager's Office
Program: Communications Program Description: The Communications Program is staffed by the Community Relations Manager and responsible for overseeing the City’s public outreach activities, including media relations, City branding and promotions, messaging of priority initiatives, and the organization and implementation of special community events and projects. Other responsibilities include working directly with the Mayor, Councilors, and Executive Leadership Team to enhance public awareness of city policy, increasing civic participation, management of City website and social media content, and support to staff in preparing for media/interview requests.
Budget Highlights: The budget includes continued funding to support public communication and promotions and City participation and management of community sponsorships and events, including the State of the City. The Communications program budget also continues to include Transient Room Tax funds budgeted specifically for the purpose of installing a Ken Kesey themed mural, generating community pride and bringing visitors to Springfield.
Service Level Changes: Material & Service targets for FY 2016 limits expenditures to the required activities. An increase in Transient Room Tax funds specific to the Ken Kesey mural is requested. Targets otherwise limit expenditures to the required activities and may limit any non-mandatory costs such as memberships, travel/meeting, and subscriptions.
Communications Program Performance Indicator:
Council Goals Key Processes Measurement
Methods FY14
Actual FY15
Actual FY16
Target
To P
rese
rve
the
Hom
etow
n Fe
el, L
ivab
ility
an
d En
viro
nmen
tal
Qua
lity
Residents Perception of Springfield is Positive
Community
Survey Approval Rating is Good
N/A Average+/-
Good Good
Attachment 24 FY16 Proposed Budget Page 24 of 206
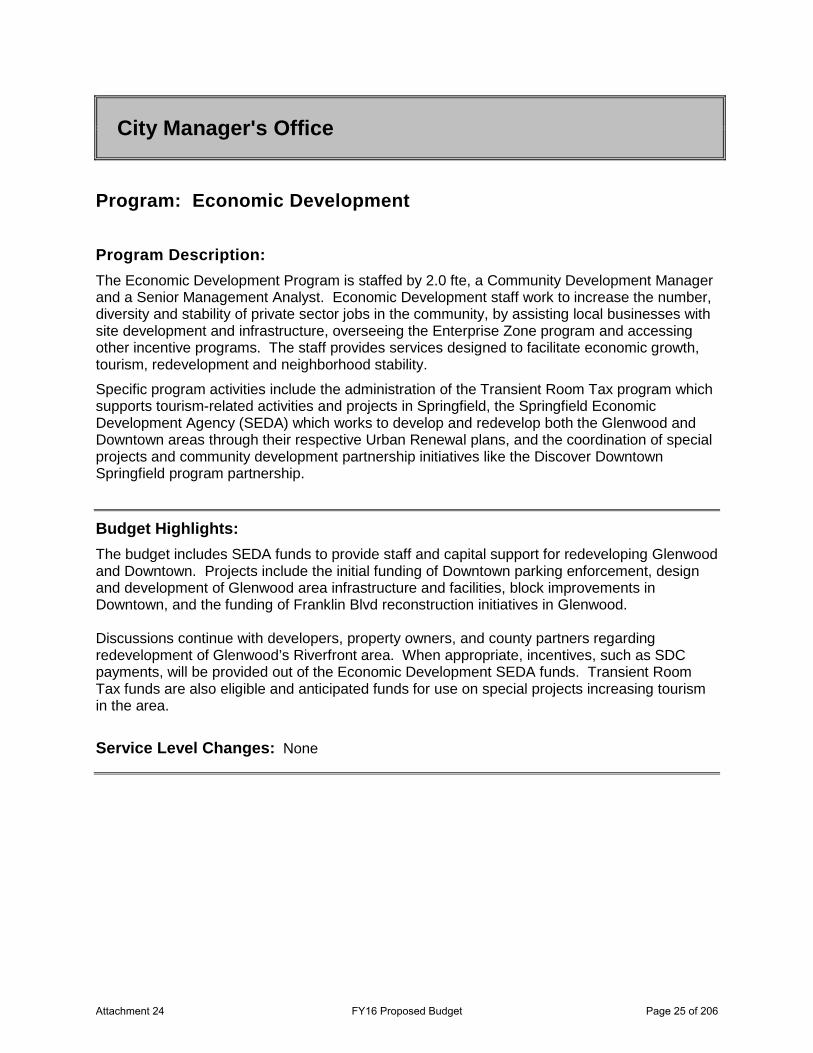
City Manager's Office
Program: Economic Development Program Description: The Economic Development Program is staffed by 2.0 fte, a Community Development Manager and a Senior Management Analyst. Economic Development staff work to increase the number, diversity and stability of private sector jobs in the community, by assisting local businesses with site development and infrastructure, overseeing the Enterprise Zone program and accessing other incentive programs. The staff provides services designed to facilitate economic growth, tourism, redevelopment and neighborhood stability.
Specific program activities include the administration of the Transient Room Tax program which supports tourism-related activities and projects in Springfield, the Springfield Economic Development Agency (SEDA) which works to develop and redevelop both the Glenwood and Downtown areas through their respective Urban Renewal plans, and the coordination of special projects and community development partnership initiatives like the Discover Downtown Springfield program partnership.
Budget Highlights: The budget includes SEDA funds to provide staff and capital support for redeveloping Glenwood and Downtown. Projects include the initial funding of Downtown parking enforcement, design and development of Glenwood area infrastructure and facilities, block improvements in Downtown, and the funding of Franklin Blvd reconstruction initiatives in Glenwood. Discussions continue with developers, property owners, and county partners regarding redevelopment of Glenwood’s Riverfront area. When appropriate, incentives, such as SDC payments, will be provided out of the Economic Development SEDA funds. Transient Room Tax funds are also eligible and anticipated funds for use on special projects increasing tourism in the area.
Service Level Changes: None
Attachment 24 FY16 Proposed Budget Page 25 of 206
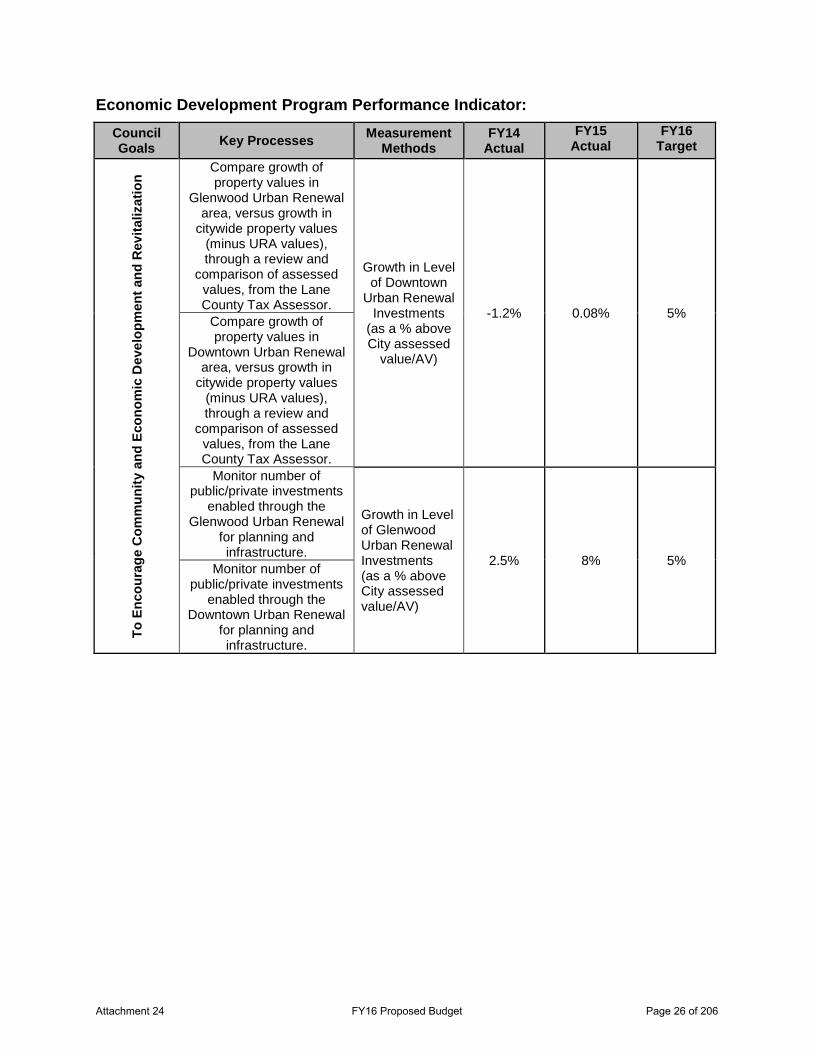
Economic Development Program Performance Indicator: Council Goals Key Processes Measurement
Methods FY14
Actual FY15
Actual FY16
Target To
Enc
oura
ge C
omm
unity
and
Eco
nom
ic D
evel
opm
ent a
nd R
evita
lizat
ion
Compare growth of property values in
Glenwood Urban Renewal area, versus growth in
citywide property values (minus URA values), through a review and
comparison of assessed values, from the Lane County Tax Assessor.
Growth in Level of Downtown
Urban Renewal Investments
(as a % above City assessed
value/AV)
-1.2% 0.08% 5% Compare growth of property values in
Downtown Urban Renewal area, versus growth in
citywide property values (minus URA values), through a review and
comparison of assessed values, from the Lane County Tax Assessor.
Monitor number of public/private investments
enabled through the Glenwood Urban Renewal
for planning and infrastructure.
Growth in Level of Glenwood Urban Renewal Investments (as a % above City assessed value/AV)
2.5% 8% 5% Monitor number of
public/private investments enabled through the
Downtown Urban Renewal for planning and infrastructure.
Attachment 24 FY16 Proposed Budget Page 26 of 206
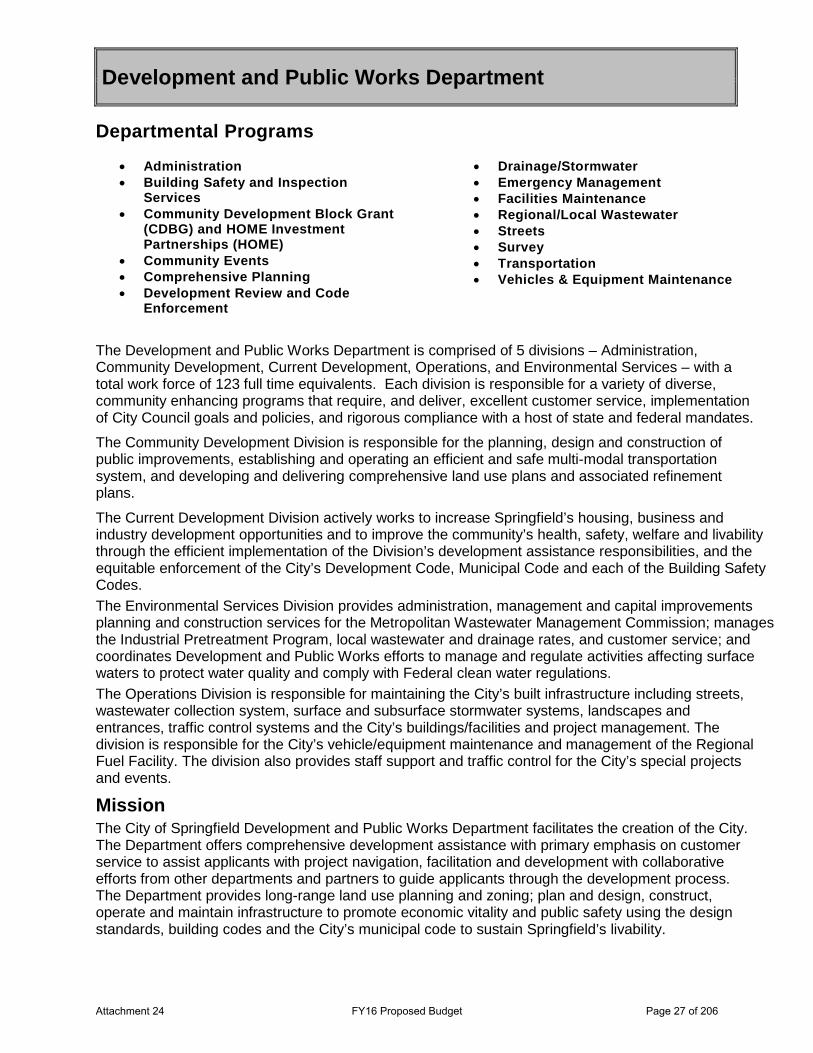
Development and Public Works Department Departmental Programs
• Administration • Building Safety and Inspection
Services • Community Development Block Grant
(CDBG) and HOME Investment Partnerships (HOME)
• Community Events • Comprehensive Planning • Development Review and Code
Enforcement
• Drainage/Stormwater • Emergency Management • Facilities Maintenance • Regional/Local Wastewater • Streets • Survey • Transportation • Vehicles & Equipment Maintenance
The Development and Public Works Department is comprised of 5 divisions – Administration, Community Development, Current Development, Operations, and Environmental Services – with a total work force of 123 full time equivalents. Each division is responsible for a variety of diverse, community enhancing programs that require, and deliver, excellent customer service, implementation of City Council goals and policies, and rigorous compliance with a host of state and federal mandates.
The Community Development Division is responsible for the planning, design and construction of public improvements, establishing and operating an efficient and safe multi-modal transportation system, and developing and delivering comprehensive land use plans and associated refinement plans.
The Current Development Division actively works to increase Springfield’s housing, business and industry development opportunities and to improve the community’s health, safety, welfare and livability through the efficient implementation of the Division’s development assistance responsibilities, and the equitable enforcement of the City’s Development Code, Municipal Code and each of the Building Safety Codes.
The Environmental Services Division provides administration, management and capital improvements planning and construction services for the Metropolitan Wastewater Management Commission; manages the Industrial Pretreatment Program, local wastewater and drainage rates, and customer service; and coordinates Development and Public Works efforts to manage and regulate activities affecting surface waters to protect water quality and comply with Federal clean water regulations.
The Operations Division is responsible for maintaining the City’s built infrastructure including streets, wastewater collection system, surface and subsurface stormwater systems, landscapes and entrances, traffic control systems and the City’s buildings/facilities and project management. The division is responsible for the City’s vehicle/equipment maintenance and management of the Regional Fuel Facility. The division also provides staff support and traffic control for the City’s special projects and events.
Mission The City of Springfield Development and Public Works Department facilitates the creation of the City. The Department offers comprehensive development assistance with primary emphasis on customer service to assist applicants with project navigation, facilitation and development with collaborative efforts from other departments and partners to guide applicants through the development process. The Department provides long-range land use planning and zoning; plan and design, construct, operate and maintain infrastructure to promote economic vitality and public safety using the design standards, building codes and the City’s municipal code to sustain Springfield’s livability.
Attachment 24 FY16 Proposed Budget Page 27 of 206
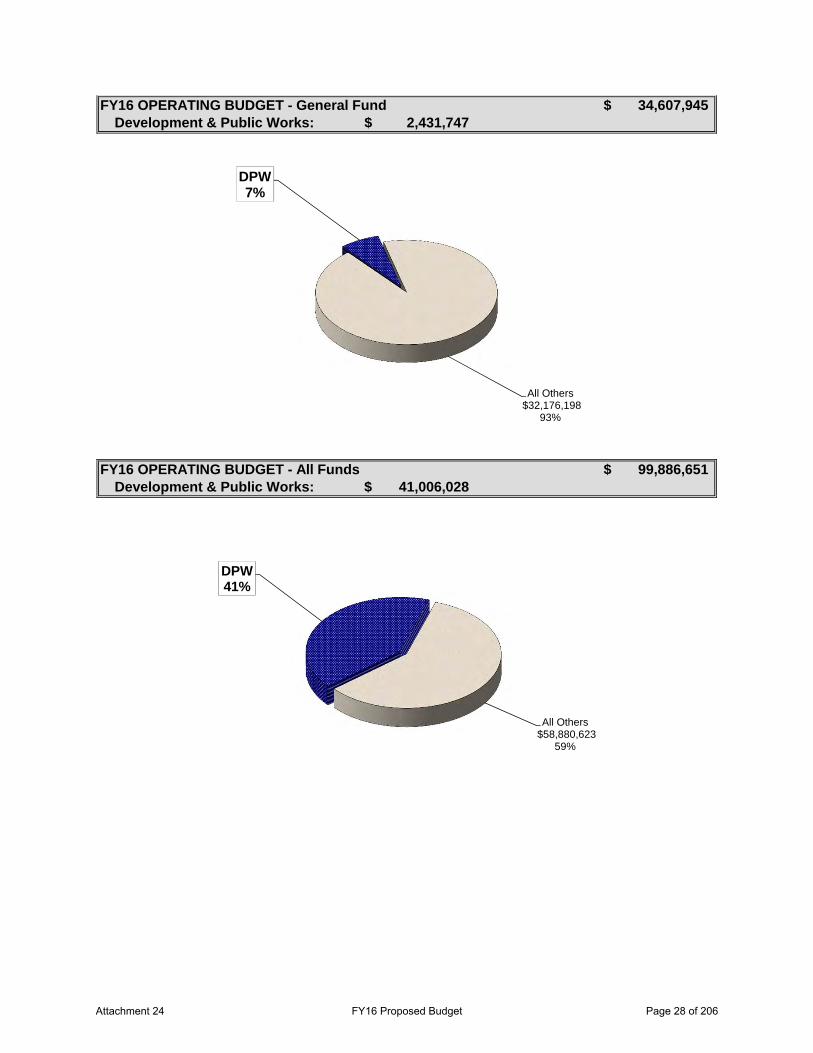
Development & Public Works:
Development & Public Works:
FY16 OPERATING BUDGET - General Fund 34,607,945$
FY16 OPERATING BUDGET - All Funds 99,886,651$
2,431,747$
41,006,028$
DPW7%
All Others$32,176,198
93%
DPW41%
All Others$58,880,623
59%
Attachment 24 FY16 Proposed Budget Page 28 of 206
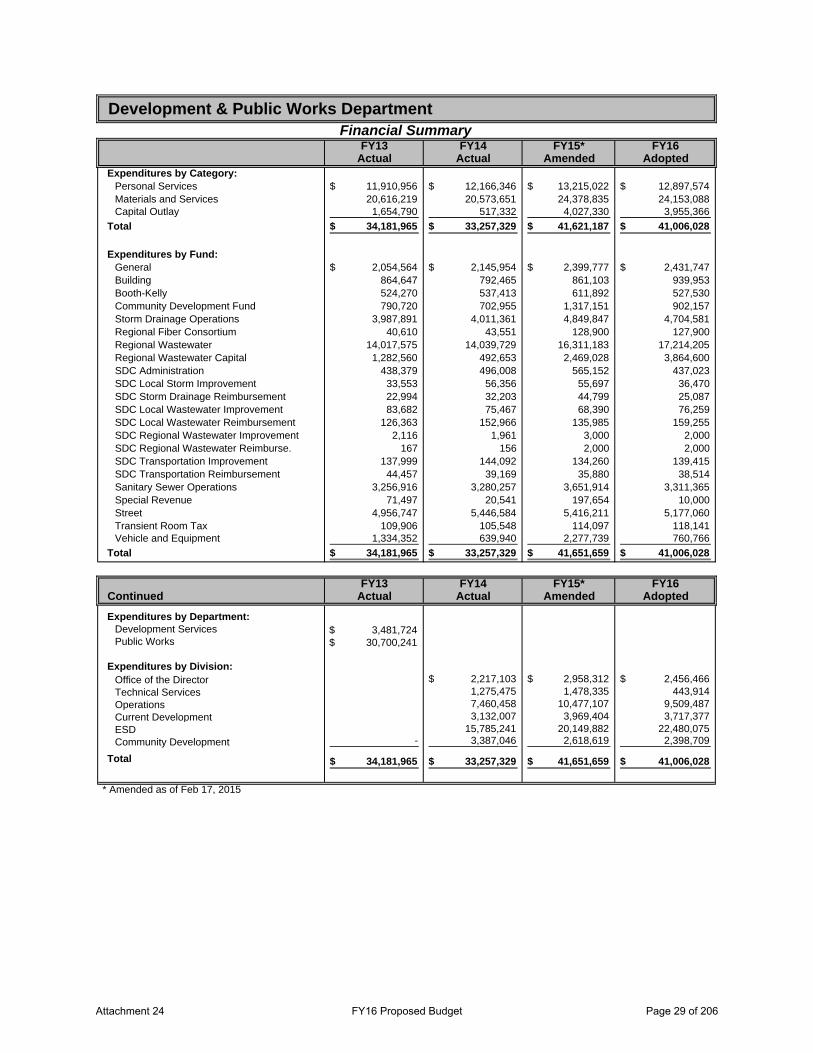
FY13 FY14 FY15* FY16Actual Actual Amended Adopted
Expenditures by Category:Personal Services 11,910,956$ 12,166,346$ 13,215,022$ 12,897,574$ Materials and Services 20,616,219 20,573,651 24,378,835 24,153,088 Capital Outlay 1,654,790 517,332 4,027,330 3,955,366
Total 34,181,965$ 33,257,329$ 41,621,187$ 41,006,028$
Expenditures by Fund:General 2,054,564$ 2,145,954$ 2,399,777$ 2,431,747$ Building 864,647 792,465 861,103 939,953 Booth-Kelly 524,270 537,413 611,892 527,530 Community Development Fund 790,720 702,955 1,317,151 902,157 Storm Drainage Operations 3,987,891 4,011,361 4,849,847 4,704,581 Regional Fiber Consortium 40,610 43,551 128,900 127,900 Regional Wastewater 14,017,575 14,039,729 16,311,183 17,214,205 Regional Wastewater Capital 1,282,560 492,653 2,469,028 3,864,600 SDC Administration 438,379 496,008 565,152 437,023 SDC Local Storm Improvement 33,553 56,356 55,697 36,470 SDC Storm Drainage Reimbursement 22,994 32,203 44,799 25,087 SDC Local Wastewater Improvement 83,682 75,467 68,390 76,259 SDC Local Wastewater Reimbursement 126,363 152,966 135,985 159,255 SDC Regional Wastewater Improvement 2,116 1,961 3,000 2,000 SDC Regional Wastewater Reimburse. 167 156 2,000 2,000 SDC Transportation Improvement 137,999 144,092 134,260 139,415 SDC Transportation Reimbursement 44,457 39,169 35,880 38,514 Sanitary Sewer Operations 3,256,916 3,280,257 3,651,914 3,311,365 Special Revenue 71,497 20,541 197,654 10,000 Street 4,956,747 5,446,584 5,416,211 5,177,060 Transient Room Tax 109,906 105,548 114,097 118,141 Vehicle and Equipment 1,334,352 639,940 2,277,739 760,766
Total 34,181,965$ 33,257,329$ 41,651,659$ 41,006,028$
FY13 FY14 FY15* FY16Continued Actual Actual Amended Adopted
Expenditures by Department:Development Services $ 3,481,724 Public Works $ 30,700,241
Expenditures by Division:Office of the Director 2,217,103$ 2,958,312$ 2,456,466$ Technical Services 1,275,475 1,478,335 443,914 Operations 7,460,458 10,477,107 9,509,487 Current Development 3,132,007 3,969,404 3,717,377 ESD 15,785,241 20,149,882 22,480,075 Community Development - 3,387,046 2,618,619 2,398,709
Total 34,181,965$ 33,257,329$ 41,651,659$ 41,006,028$
Development & Public Works DepartmentFinancial Summary
* Amended as of Feb 17, 2015
Attachment 24 FY16 Proposed Budget Page 29 of 206
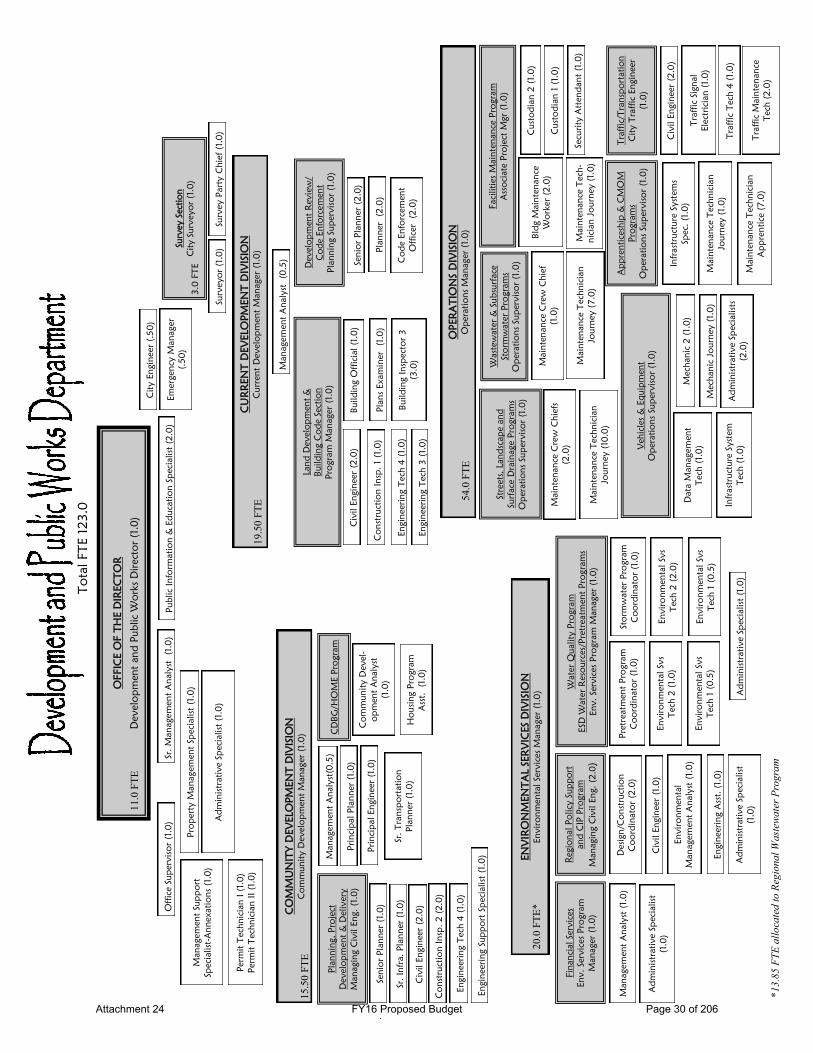
OFFIC
E O
F T
HE D
IR
EC
TO
R
Develo
pm
ent and Public W
orks D
irecto
r (1.0)
Pro
perty M
anagem
ent Sp
ecia
list (1.0
)
Offic
e Supervis
or (1.0
)
Wastew
ater &
Subsurface
Sto
rm
water Pro
gram
s
Operatio
ns Supervis
or (1.0
)
OPER
ATIO
NS D
IV
ISIO
N
Operatio
ns M
anager (1.0
)
Facilitie
s M
ain
tenance Pro
gram
Asso
cia
te Pro
ject M
gr (1.0
)
EN
VIR
ON
MEN
TA
L SER
VIC
ES D
IV
ISIO
N
Envir
onm
ental Servic
es M
anager (1.0
)
Adm
inis
trativ
e Sp
ecia
list
(1.0
)
Envir
onm
ental
Managem
ent A
naly
st (1.0
)
Water Q
uality Pro
gram
ESD
W
ater R
eso
urces/Pretreatm
ent Pro
gram
s
Env. Servic
es Pro
gram
M
anager (1.0
)
Envir
onm
ental Svs
Tech 2 (1.0
)
Pretreatm
ent Pro
gram
Co
ordin
ato
r (1.0
)
Sto
rm
water Pro
gram
Co
ordin
ato
r (1.0
)
Envir
onm
ental Svs
Tech 1 (0
.5)
Adm
inis
trativ
e Sp
ecia
list (1.0
)
Regio
nal Po
licy Suppo
rt
and C
IP Pro
gram
Managin
g C
ivil Eng. (2.0)
Engin
eerin
g A
sst. (1.0
)
Adm
inis
trativ
e Sp
ecia
list
(1.0
)
Desig
n/C
onstructio
n
Co
ordin
ato
r (2.0
)
CO
MM
UN
ITY
D
EV
ELO
PM
EN
T D
IV
ISIO
N
Co
mm
unity D
evelo
pm
ent M
anager (1.0
)
Prin
cip
al Engin
eer (1.0
)
Engin
eerin
g Sup
po
rt Sp
ecia
list (1.0
)
Surveyo
r (1.0
)
Survey Party C
hie
f (1.0
)
Survey Sectio
n
City Surveyo
r (1.0
)
Pla
nnin
g, Pro
ject
Develo
pm
ent &
D
elivery
Managin
g C
ivil Eng. (1.0
)
Engin
eerin
g T
ech 4 (1.0
)
Co
nstructio
n Insp. 2 (2.0
)
Civ
il Engin
eer (2.0
)
City Engin
eer (.50
)
Custo
dia
n 2 (1.0
)
Custo
dia
n 1 (1.0
)
Bld
g M
ain
tenance
Wo
rker (2.0
)
Mechanic
2 (1.0
)
Mechanic
Jo
urney (1.0
)
Adm
inis
trativ
e Sp
ecia
lists
(2.0
)
Main
tenance T
echnic
ian
Jo
urney (7.0
)
Traffic
M
ain
tenance
Tech (2.0
)
Traffic
Sig
nal
Ele
ctric
ian (1.0
)
Data M
anagem
ent
Tech (1.0
)
Main
tenance C
rew
C
hie
f
(1.0
)
Civ
il Engin
eer (1.0
)
Infrastructure System
s
Spec. (1.0
)
Sr. M
anagem
ent A
naly
st (1.0
)
15.5
0 F
TE
20.0
FT
E*
54.0
FT
E
11.0
FT
E
Managem
ent A
naly
st (1.0
)
Security A
ttendant (1.0
)
Land D
evelo
pm
ent &
Buildin
g C
ode Sectio
n
Pro
gram
M
anager (1.0
)
Civ
il Engin
eer (2.0
)
Co
nstructio
n Insp. 1 (1.0
)
Engin
eerin
g T
ech 4 (1.0
)
Engin
eerin
g T
ech 3 (1.0
)
Public Info
rm
atio
n &
Educatio
n Specia
list (2.0
)
Adm
inis
trativ
e Sp
ecia
list (1.0
)
Managem
ent Suppo
rt
Specia
list-A
nnexatio
ns (1.0
)
Perm
it T
echnic
ian I (1.0
)
Perm
it T
echnic
ian II (1.0
)
CU
RR
EN
T D
EV
ELO
PM
EN
T D
IV
ISIO
N
Current D
evelo
pm
ent M
anager (1.0
)
Managem
ent A
naly
st(0
.5)
Sr. Infra. Pla
nner (1.0
)
Prin
cip
al Pla
nner (1.0
)
Develo
pm
ent R
eview
/
Co
de Enfo
rcem
ent
Pla
nnin
g Sup
ervis
or (1.0
)
19.5
0 F
TE
Managem
ent A
naly
st (0
.5)
Buildin
g O
ffic
ial (1.0
)
Pla
ns Exam
iner (1.0
)
Buildin
g Inspecto
r 3
(3.0
)
Co
de Enfo
rcem
ent
Offic
er (2.0
)
Senio
r Pla
nner (2.0
)
Pla
nner (2.0
)
Envir
onm
ental Svs
Tech 2 (2.0
)
Envir
onm
ental Svs
Tech 1 (0
.5)
Infrastructure System
Tech (1.0
)
Senio
r Pla
nner (1.0
)
Em
ergency M
anager
(.50
)
To
tal FT
E 123.0
Civ
il Engin
eer (2.0
)
Traffic
T
ech 4 (1.0
)
Traffic
/T
ranspo
rtatio
n
City T
raffic
Engin
eer
(1.0
)
Co
mm
unity D
evel-
opm
ent A
nalyst
(1.0
)
Ho
usin
g Pro
gram
Asst. (1.0
)
CD
BG
/H
OM
E Pro
gram
Fin
ancia
l Servic
es
Env. Servic
es Pro
gram
Manager (1.0
)
Sr. T
ranspo
rtatio
n
Pla
nner (1.0
)
3.0
FT
E
Vehic
les &
Equip
ment
Operatio
ns Supervis
or (1.0
)
Apprentic
eship
&
C
MO
M
Pro
gram
s
Operatio
ns Supervis
or (1.0
)
Main
tenance T
echnic
ian
Apprentic
e (7.0
)
Streets, Landscape and
Surface D
rain
age Pro
gram
s
Operatio
ns Supervis
or (1.0
)
Main
tenance C
rew
C
hie
fs
(2.0
)
Main
tenance T
echnic
ian
Jo
urney (10.0
)
*13
.85
FT
E a
llo
cate
d t
o R
egio
nal
Wast
ewate
r P
rog
ram
Main
tenance T
echnic
ian
Jo
urney (1.0
)
Main
tenance T
ech-
nic
ian Jo
urney (1.0
)
Attachment 24 FY16 Proposed Budget Page 30 of 206
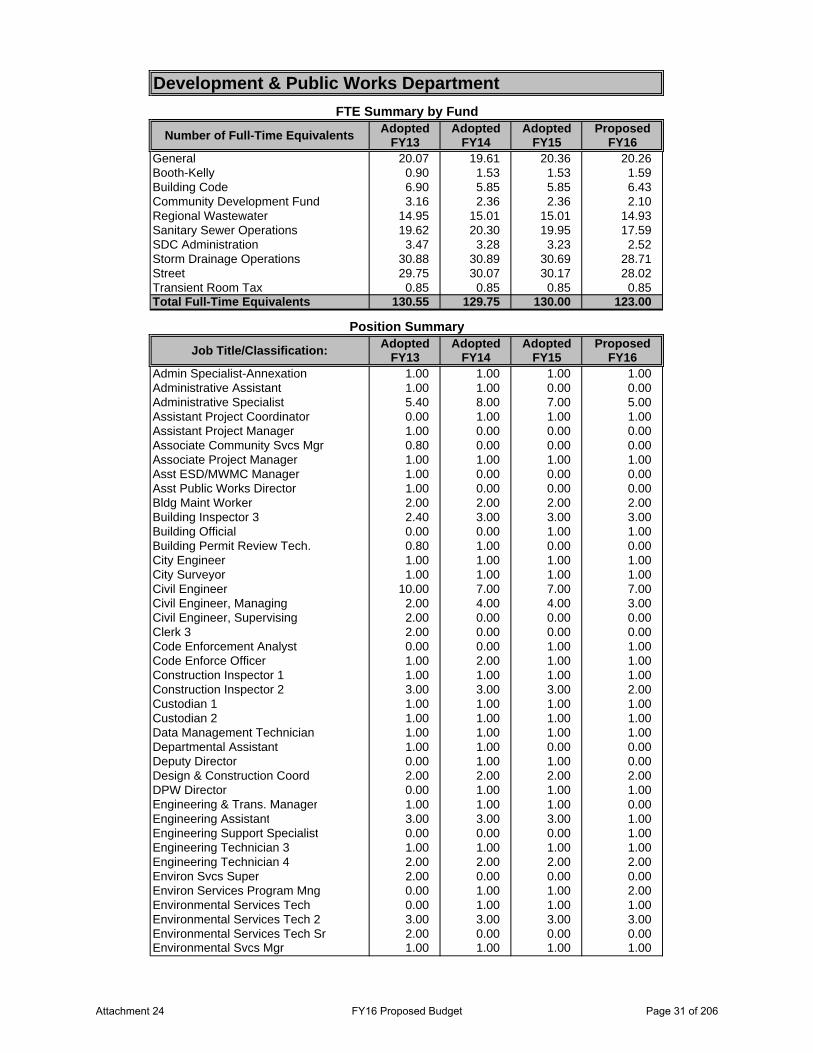
Adopted Adopted Adopted ProposedFY13 FY14 FY15 FY16
General 20.07 19.61 20.36 20.26Booth-Kelly 0.90 1.53 1.53 1.59Building Code 6.90 5.85 5.85 6.43Community Development Fund 3.16 2.36 2.36 2.10Regional Wastewater 14.95 15.01 15.01 14.93Sanitary Sewer Operations 19.62 20.30 19.95 17.59SDC Administration 3.47 3.28 3.23 2.52Storm Drainage Operations 30.88 30.89 30.69 28.71Street 29.75 30.07 30.17 28.02Transient Room Tax 0.85 0.85 0.85 0.85Total Full-Time Equivalents 130.55 129.75 130.00 123.00
Adopted Adopted Adopted ProposedFY13 FY14 FY15 FY16
Admin Specialist-Annexation 1.00 1.00 1.00 1.00Administrative Assistant 1.00 1.00 0.00 0.00Administrative Specialist 5.40 8.00 7.00 5.00Assistant Project Coordinator 0.00 1.00 1.00 1.00Assistant Project Manager 1.00 0.00 0.00 0.00Associate Community Svcs Mgr 0.80 0.00 0.00 0.00Associate Project Manager 1.00 1.00 1.00 1.00Asst ESD/MWMC Manager 1.00 0.00 0.00 0.00Asst Public Works Director 1.00 0.00 0.00 0.00Bldg Maint Worker 2.00 2.00 2.00 2.00Building Inspector 3 2.40 3.00 3.00 3.00Building Official 0.00 0.00 1.00 1.00Building Permit Review Tech. 0.80 1.00 0.00 0.00City Engineer 1.00 1.00 1.00 1.00City Surveyor 1.00 1.00 1.00 1.00Civil Engineer 10.00 7.00 7.00 7.00Civil Engineer, Managing 2.00 4.00 4.00 3.00Civil Engineer, Supervising 2.00 0.00 0.00 0.00Clerk 3 2.00 0.00 0.00 0.00Code Enforcement Analyst 0.00 0.00 1.00 1.00Code Enforce Officer 1.00 2.00 1.00 1.00Construction Inspector 1 1.00 1.00 1.00 1.00Construction Inspector 2 3.00 3.00 3.00 2.00Custodian 1 1.00 1.00 1.00 1.00Custodian 2 1.00 1.00 1.00 1.00Data Management Technician 1.00 1.00 1.00 1.00Departmental Assistant 1.00 1.00 0.00 0.00Deputy Director 0.00 1.00 1.00 0.00Design & Construction Coord 2.00 2.00 2.00 2.00DPW Director 0.00 1.00 1.00 1.00Engineering & Trans. Manager 1.00 1.00 1.00 0.00Engineering Assistant 3.00 3.00 3.00 1.00Engineering Support Specialist 0.00 0.00 0.00 1.00Engineering Technician 3 1.00 1.00 1.00 1.00Engineering Technician 4 2.00 2.00 2.00 2.00Environ Svcs Super 2.00 0.00 0.00 0.00Environ Services Program Mng 0.00 1.00 1.00 2.00Environmental Services Tech 0.00 1.00 1.00 1.00Environmental Services Tech 2 3.00 3.00 3.00 3.00Environmental Services Tech Sr 2.00 0.00 0.00 0.00Environmental Svcs Mgr 1.00 1.00 1.00 1.00
Development & Public Works DepartmentFTE Summary by Fund
Number of Full-Time Equivalents
Position Summary
Job Title/Classification:
Attachment 24 FY16 Proposed Budget Page 31 of 206
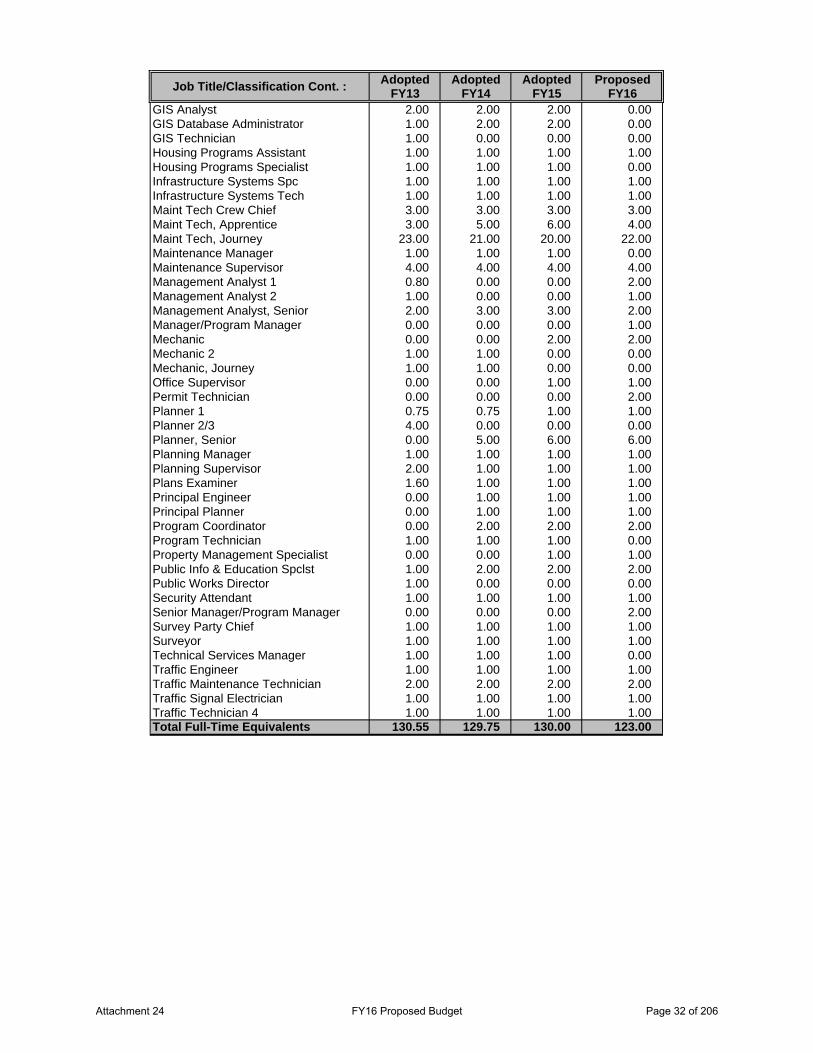
Adopted Adopted Adopted ProposedFY13 FY14 FY15 FY16
GIS Analyst 2.00 2.00 2.00 0.00GIS Database Administrator 1.00 2.00 2.00 0.00GIS Technician 1.00 0.00 0.00 0.00Housing Programs Assistant 1.00 1.00 1.00 1.00Housing Programs Specialist 1.00 1.00 1.00 0.00Infrastructure Systems Spc 1.00 1.00 1.00 1.00Infrastructure Systems Tech 1.00 1.00 1.00 1.00Maint Tech Crew Chief 3.00 3.00 3.00 3.00Maint Tech, Apprentice 3.00 5.00 6.00 4.00Maint Tech, Journey 23.00 21.00 20.00 22.00Maintenance Manager 1.00 1.00 1.00 0.00Maintenance Supervisor 4.00 4.00 4.00 4.00Management Analyst 1 0.80 0.00 0.00 2.00Management Analyst 2 1.00 0.00 0.00 1.00Management Analyst, Senior 2.00 3.00 3.00 2.00Manager/Program Manager 0.00 0.00 0.00 1.00Mechanic 0.00 0.00 2.00 2.00Mechanic 2 1.00 1.00 0.00 0.00Mechanic, Journey 1.00 1.00 0.00 0.00Office Supervisor 0.00 0.00 1.00 1.00Permit Technician 0.00 0.00 0.00 2.00Planner 1 0.75 0.75 1.00 1.00Planner 2/3 4.00 0.00 0.00 0.00Planner, Senior 0.00 5.00 6.00 6.00Planning Manager 1.00 1.00 1.00 1.00Planning Supervisor 2.00 1.00 1.00 1.00Plans Examiner 1.60 1.00 1.00 1.00Principal Engineer 0.00 1.00 1.00 1.00Principal Planner 0.00 1.00 1.00 1.00Program Coordinator 0.00 2.00 2.00 2.00Program Technician 1.00 1.00 1.00 0.00Property Management Specialist 0.00 0.00 1.00 1.00Public Info & Education Spclst 1.00 2.00 2.00 2.00Public Works Director 1.00 0.00 0.00 0.00Security Attendant 1.00 1.00 1.00 1.00Senior Manager/Program Manager 0.00 0.00 0.00 2.00Survey Party Chief 1.00 1.00 1.00 1.00Surveyor 1.00 1.00 1.00 1.00Technical Services Manager 1.00 1.00 1.00 0.00Traffic Engineer 1.00 1.00 1.00 1.00Traffic Maintenance Technician 2.00 2.00 2.00 2.00Traffic Signal Electrician 1.00 1.00 1.00 1.00Traffic Technician 4 1.00 1.00 1.00 1.00Total Full-Time Equivalents 130.55 129.75 130.00 123.00
Job Title/Classification Cont. :
Attachment 24 FY16 Proposed Budget Page 32 of 206
Development and Public Works Department
Program: Administration Program Descriptions: The Office of the Director provides overall leadership direction and management of the Development and Public Works (DPW) department by administering and coordinating intra- and interdepartmental activities, City Engineer services, financial management, long term strategic initiatives, public outreach and media relations, coordinating a variety of program and services delivery with Team Springfield as well as with our regional partners Eugene and Lane County; and policy support for the City Council.
DPW’s Financial Management program supports the City by forecasting and monitoring key revenue sources that impact the General Fund; assisting with budget compliance; and preparing semi-annual updates of the City’s fee schedule. The Licensing and Fees program manages utility license agreements for utility and telecommunication businesses that operate within the city limits; franchise agreements for long-term uses of public rights-of-way; acquisition of public rights of way; and the Business License registration program. The Real Property Management program provides leasing services for city-owned property.
The DPW Administration program supports the coordination of broader activities with City-wide impact such as Front Counter customer services; the City’s legislative agenda at the state and federal levels; new and updated policy initiatives of the Council; and administers the City’s Management Agreement with the Springfield Museum Board. The Office of the Director also provides public information, education and outreach through a variety of media to inform the public and development community about current projects, city services, and new opportunities provided by and through Council directed initiatives.
Budget Highlights: The Office of the Director’s budget has decreased 10.5 percent or $288,000 largely due to the elimination of the Deputy Director position, an administrative support position and a decrease in internal insurance charges. Specifically the Property and Auto components of the internal insurance charges have decreased due to a decline in claims. There is a slight rise in software licensing expenditures due to the annual increase for the Accela (building permits) software and Business Licensing hosting and maintenance. .
Service Level Changes: This fiscal year there is a decrease of 1.34 FTE as a result of reductions in administrative support staff and the elimination of the Deputy Director position. The Office of the Director’s Priority Based Budget programs included adjustments to job duties of existing staff in order to minimize program level service impacts caused by these reductions.
Attachment 24 FY16 Proposed Budget Page 33 of 206
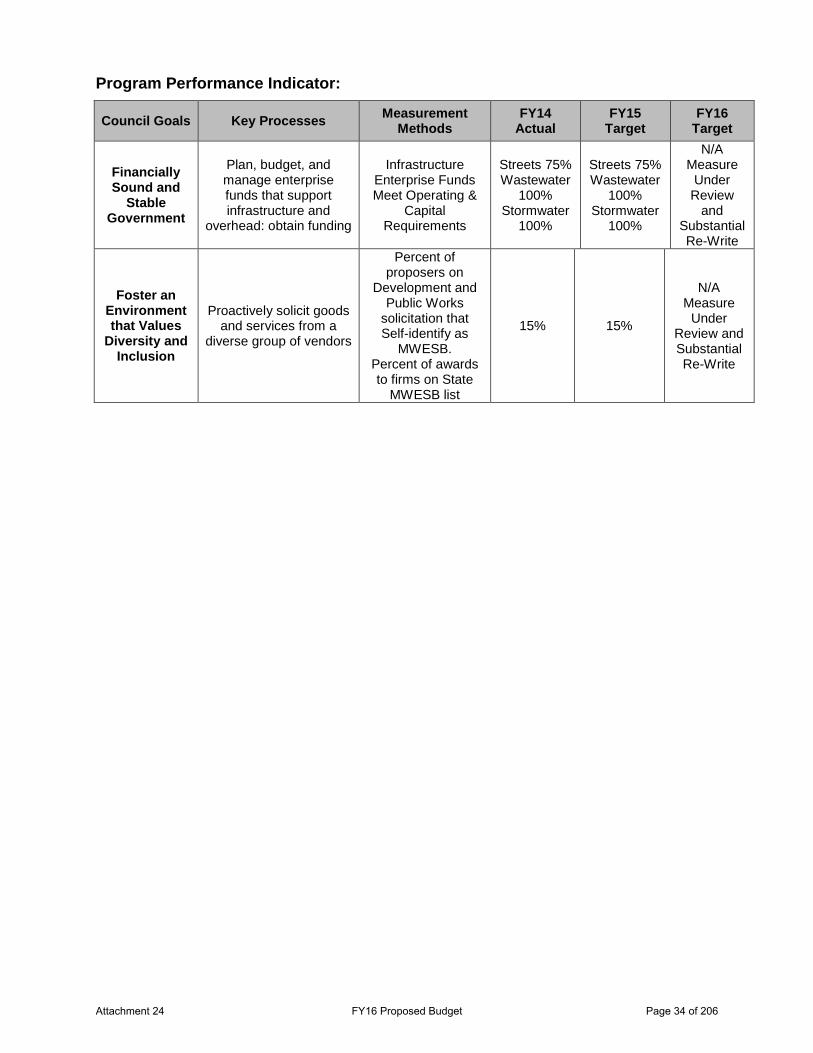
Program Performance Indicator:
Council Goals Key Processes Measurement Methods
FY14 Actual
FY15 Target
FY16 Target
Financially Sound and
Stable Government
Plan, budget, and manage enterprise funds that support infrastructure and
overhead: obtain funding
Infrastructure Enterprise Funds Meet Operating &
Capital Requirements
Streets 75% Wastewater
100% Stormwater
100%
Streets 75% Wastewater
100% Stormwater
100%
N/A Measure
Under Review
and Substantial Re-Write
Foster an Environment that Values
Diversity and Inclusion
Proactively solicit goods and services from a
diverse group of vendors
Percent of proposers on
Development and Public Works
solicitation that Self-identify as
MWESB. Percent of awards to firms on State
MWESB list
15% 15%
N/A Measure
Under Review and Substantial Re-Write
Attachment 24 FY16 Proposed Budget Page 34 of 206
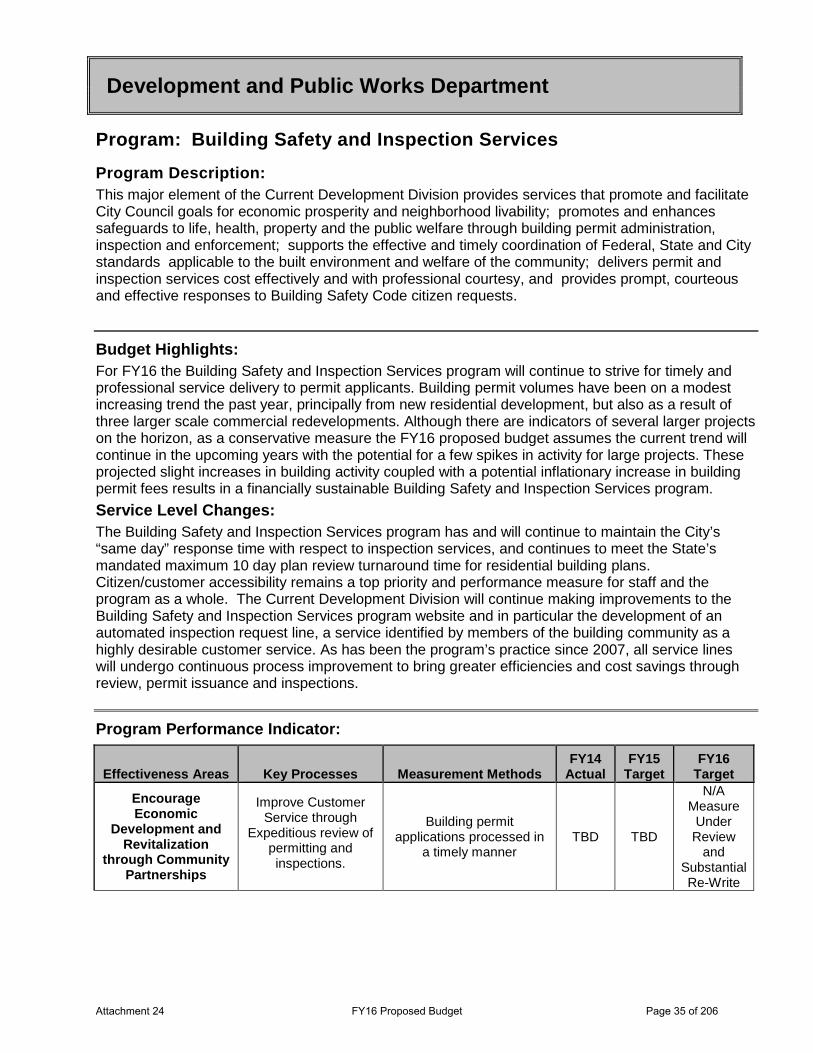
Program: Building Safety and Inspection Services Program Description: This major element of the Current Development Division provides services that promote and facilitate City Council goals for economic prosperity and neighborhood livability; promotes and enhances safeguards to life, health, property and the public welfare through building permit administration, inspection and enforcement; supports the effective and timely coordination of Federal, State and City standards applicable to the built environment and welfare of the community; delivers permit and inspection services cost effectively and with professional courtesy, and provides prompt, courteous and effective responses to Building Safety Code citizen requests.
Budget Highlights: For FY16 the Building Safety and Inspection Services program will continue to strive for timely and professional service delivery to permit applicants. Building permit volumes have been on a modest increasing trend the past year, principally from new residential development, but also as a result of three larger scale commercial redevelopments. Although there are indicators of several larger projects on the horizon, as a conservative measure the FY16 proposed budget assumes the current trend will continue in the upcoming years with the potential for a few spikes in activity for large projects. These projected slight increases in building activity coupled with a potential inflationary increase in building permit fees results in a financially sustainable Building Safety and Inspection Services program.
Service Level Changes: The Building Safety and Inspection Services program has and will continue to maintain the City’s “same day” response time with respect to inspection services, and continues to meet the State’s mandated maximum 10 day plan review turnaround time for residential building plans. Citizen/customer accessibility remains a top priority and performance measure for staff and the program as a whole. The Current Development Division will continue making improvements to the Building Safety and Inspection Services program website and in particular the development of an automated inspection request line, a service identified by members of the building community as a highly desirable customer service. As has been the program’s practice since 2007, all service lines will undergo continuous process improvement to bring greater efficiencies and cost savings through review, permit issuance and inspections.
Program Performance Indicator:
Effectiveness Areas Key Processes Measurement Methods FY14
Actual FY15
Target FY16
Target
Encourage Economic
Development and Revitalization
through Community Partnerships
Improve Customer Service through
Expeditious review of permitting and inspections.
Building permit applications processed in
a timely manner TBD TBD
N/A Measure
Under Review
and Substantial Re-Write
Development and Public Works Department
Attachment 24 FY16 Proposed Budget Page 35 of 206
Development and Public Works Department
Program: Community Development Block Grant (CDBG) and HOME Investment Partnerships (HOME) Programs Program Description: This program, which resides in the Community Development Division, administers the CDBG and HOME funded programs and projects for the benefit of the Springfield community, in compliance with federal regulations. Staff prepare and implement plans to address community needs for affordable housing, removal of slum and blight conditions, job creation, public safety, and contributing to the delivery of social services through agency and non-profit providers. The program assists low-income Springfield residents with housing rehabilitation loans, grants, neighborhood improvements, social services, access to housing, and provides financial assistance to non-profit and for-profit housing developers that create affordable housing for low-income Springfield residents. The program provides assistance to low and moderate-income homebuyers purchasing homes in Springfield, and provides assistance to downtown and Glenwood redevelopment efforts.
Budget Highlights: Program levels are driven by the level of federal funding available from the U.S. Department of Housing and Urban Development. In FY16 Springfield and Eugene will change the way the HOME program is delivered in the metro area, with Eugene taking on all program administration. This will reduce the amount of federal funding available for city staff time costs and require that certain functions that had been funded in part by CDBG/HOME be budgeted in other funds. Staff estimates that the City will receive an allocation of approximately $466,694 in CDBG funds in FY16, compared to $451,142 in CDBG in FY15. For the HOME program there are no anticipated funds for FY16, compared with $299,575 in HOME funding in FY15.
The programs will assist approximately 14,000 low-income persons with social services in part by providing approximately $67,000 to the Intergovernmental Human Services Commission (HSC). The HSC redistributes the funds to four service agencies; Food for Lane County, the Relief Nursery, White Bird Medical and Catholic Community Services. Funds will also be used to provide down payment assistance for low-income homebuyers, and emergency repair assistance to low-income homeowners. Project development assistance to affordable housing and community based non-profit organizations will now be provided on a metro-wide basis as the “last dollar” of funding necessary to complete a project.
Due to the shift in the HOME program, specific CDBG funding allocations to non-profit partners will not be available until summer 2015.
Service Level Changes: As overall funding decreases in FY16, the City has moved certain staff costs that do not directly administer the federal programs out of the Program. In spite of this program-specific allocation, it is anticipated that the 2017 Program budget will need general fund support to continue to operate.
Attachment 24 FY16 Proposed Budget Page 36 of 206
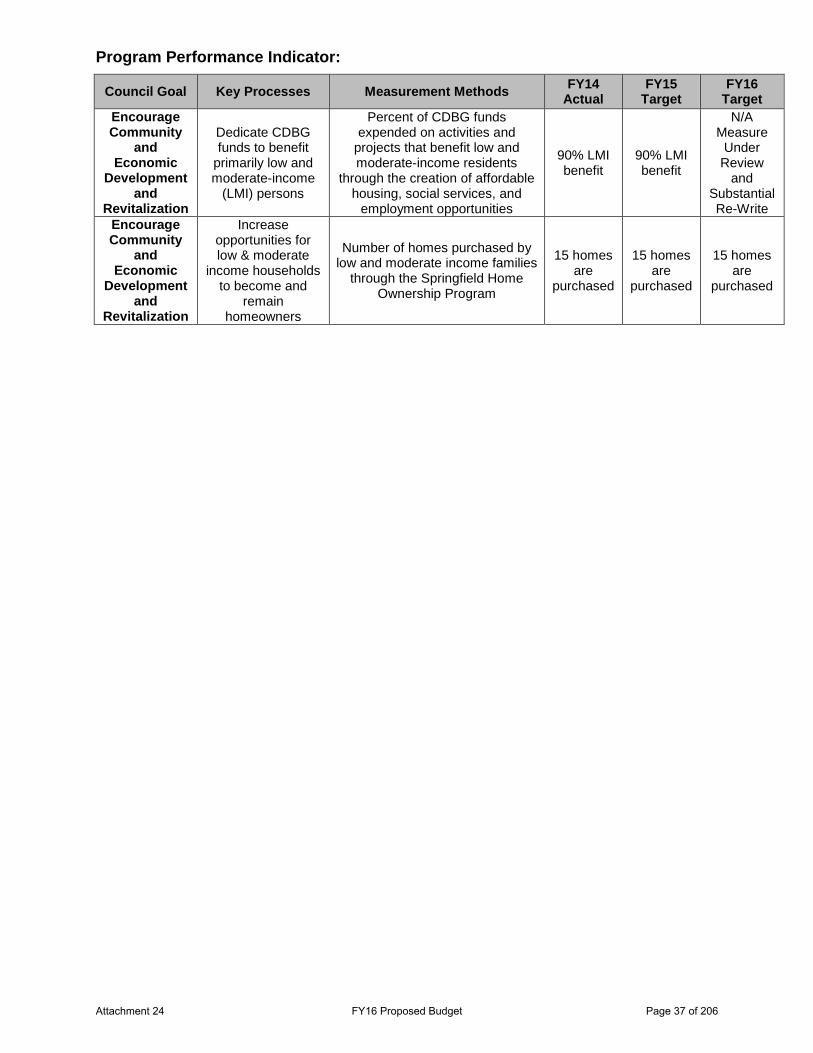
Program Performance Indicator:
Council Goal Key Processes Measurement Methods FY14 Actual
FY15 Target
FY16 Target
Encourage Community
and Economic
Development and
Revitalization
Dedicate CDBG funds to benefit
primarily low and moderate-income
(LMI) persons
Percent of CDBG funds expended on activities and
projects that benefit low and moderate-income residents
through the creation of affordable housing, social services, and
employment opportunities
90% LMI benefit
90% LMI benefit
N/A Measure
Under Review
and Substantial Re-Write
Encourage Community
and Economic
Development and
Revitalization
Increase opportunities for low & moderate
income households to become and
remain homeowners
Number of homes purchased by low and moderate income families
through the Springfield Home Ownership Program
15 homes are
purchased
15 homes are
purchased
15 homes are
purchased
Attachment 24 FY16 Proposed Budget Page 37 of 206
Development and Public Works Department
Program: Community Events
Program Description: The Community Events program supports community-wide projects funded from the Transient Room Tax and appropriate expenditures from the Street Operating Fund and Drainage Operating Fund. The program provides assistance to the Veteran's Day Parade, Holiday Parade, Spring Clean-Up, hanging of holiday decorations, community festivals and special projects. Examples of support services include street sweeping, street light decorations, hanging of street banners, volunteer and event coordination, and logistics support such as barricades and traffic control.
Budget Highlights: The Community Events program is projected to remain status quo in FY16. Program activities will mirror past fiscal years.
Service Level Changes: There are no anticipated service level changes for the upcoming fiscal year.
Program Performance Indicator:
Effectiveness Areas Key Processes Measurement Methods
FY14 Actual
FY15 Target
FY16 Target
Promote and Enhance Our
Hometown Feel while Focusing
on Livability and Environmental
Quality
Reduce solid waste, pollutants and poor
environmental conditions in the
community
Citizens Value Spring Clean-Up and Are Recycling More
383 Cars averaging 0.22 tons (439 lbs.)
each
420 Cars averaging 0.23 tons (469 lbs.)
each
456 Cars averaging 0.21 tons (463 lbs.)
each
Attachment 24 FY16 Proposed Budget Page 38 of 206
Development and Public Works Department
Program: Comprehensive Planning
Program Description: The Comprehensive Planning Program, administered by the Community Development Division, is tasked with the preparation, update and technical assistance in the implementation of the Metro Plan, Springfield 2030 Comprehensive Plan, neighborhood level refinement plans, special projects, and federal and state mandates; coordinates regional and metropolitan-wide comprehensive planning with Eugene, Lane County and other governments and service providers; prepares reports and option scenarios as directed by Council; and assists other divisions and departments in evaluating and implementing state and federal laws applicable to buildable lands, housing, natural resources and hazards, TransPlan, and the Public Facilities and Services Plan.
Budget Highlights: The Comprehensive Planning Program will continue to make progress toward completing the Springfield 2030 Comprehensive Plan while working with Metro planning partners to revise the Metro Plan in response to the presence of separate municipal UGBs, and acknowledge the emergence of greater jurisdictional planning autonomy as a direct result of these separate UGBs.
In FY15 staff continued to work on the Springfield 2030 Plan Urbanization Element. In FY16 decision packages will be forwarded to the elected officials for adoption of both the Economic and Urbanization Elements of the Plan. These Council decisions are highly significant to Springfield’s future growth and vitality, as they will identify and locate a sufficient employment lands base to accommodate economic and community development for the planning period 2010-2030. In addition, work will continue on a parcel-specific Springfield 2030 Comprehensive Plan Diagram that will assign specific land use designations for all lands within Springfield’s Urban Growth Boundary. A parcel-specific inventory greatly improves the real-time status of each of these inventories; eliminates confusion about future development or redevelopment actions intended for these lands; improves the accuracy of inventory reporting; and provides decision-makers with concise analysis in the deliberation or review of land use proposals that add to or reduce any of these inventories.
In FY16, the City will decide how to begin to implement the Main Street Corridor Vision Plan that was funded by the Oregon Department of Transportation. The Comprehensive Planning program will continue to provide coordination for Downtown Revitalization, potentially undertaking an update to the Downtown Refinement Plan, and completing amendments to the Springfield Development Code to implement new development standards downtown. The Downtown Citizen Advisory Committee will be reconvened to participate in the plan update and code amendments that support Downtown redevelopment. Staff will continue to provide liaison support for the Neighborhood Economic Development Corporation (NEDCO) initiated Main Street Program committees.
Service Level Changes: In FY15 Comprehensive Planning was budgeted at 2.0 FTE, although the majority of 1.0 FTE was assigned to support review of current development activities after significant cuts in that program. In The FY16 budget will remain at 2.0 FTE, but it is intended that all of this resource will be dedicated to comprehensive planning as the Development Review program staff levels have stabilized. Comprehensive planning project timelines will continue to be adjusted as funding and council priorities are set.
Attachment 24 FY16 Proposed Budget Page 39 of 206
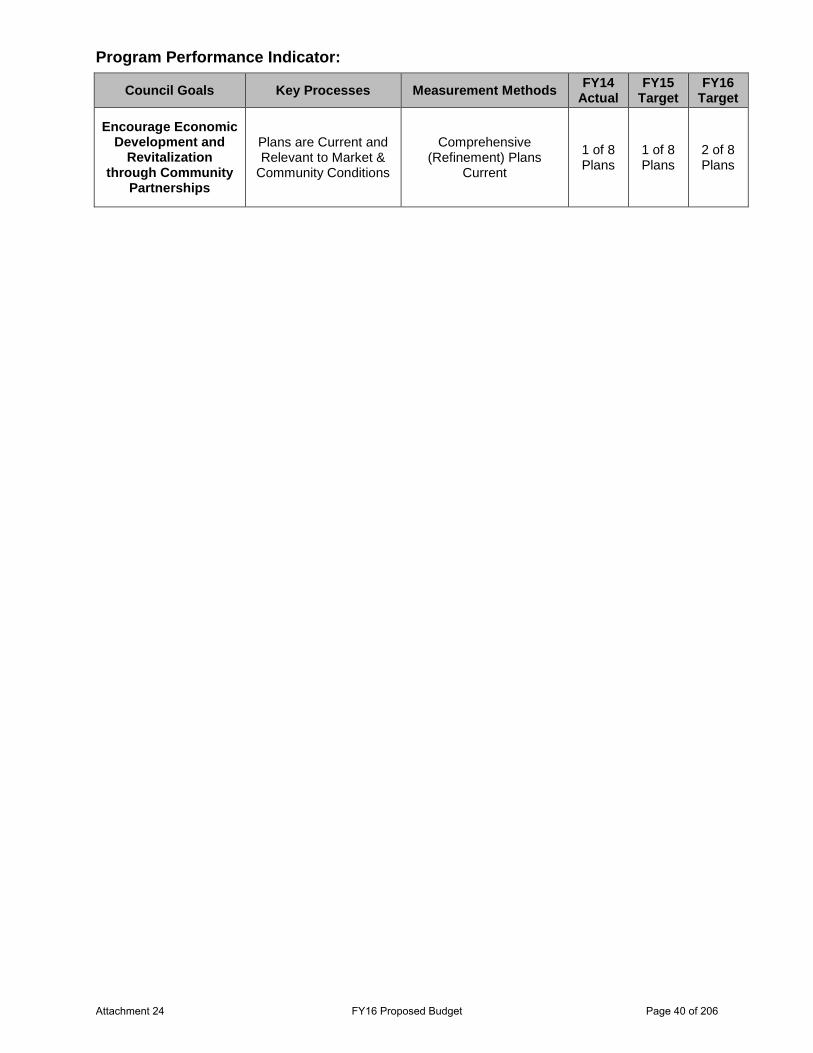
Program Performance Indicator:
Council Goals Key Processes Measurement Methods FY14 Actual
FY15 Target
FY16 Target
Encourage Economic Development and
Revitalization through Community
Partnerships
Plans are Current and Relevant to Market &
Community Conditions
Comprehensive (Refinement) Plans
Current
1 of 8 Plans
1 of 8 Plans
2 of 8 Plans
Attachment 24 FY16 Proposed Budget Page 40 of 206
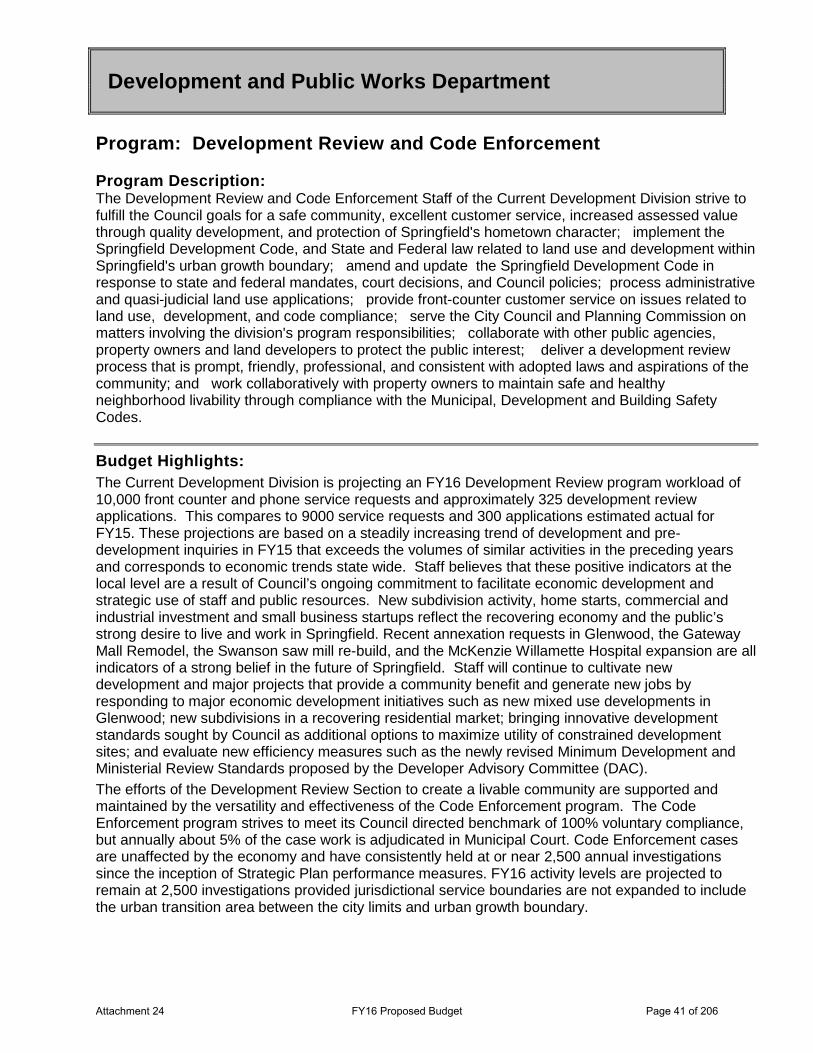
Development and Public Works Department
Program: Development Review and Code Enforcement Program Description: The Development Review and Code Enforcement Staff of the Current Development Division strive to fulfill the Council goals for a safe community, excellent customer service, increased assessed value through quality development, and protection of Springfield's hometown character; implement the Springfield Development Code, and State and Federal law related to land use and development within Springfield's urban growth boundary; amend and update the Springfield Development Code in response to state and federal mandates, court decisions, and Council policies; process administrative and quasi-judicial land use applications; provide front-counter customer service on issues related to land use, development, and code compliance; serve the City Council and Planning Commission on matters involving the division's program responsibilities; collaborate with other public agencies, property owners and land developers to protect the public interest; deliver a development review process that is prompt, friendly, professional, and consistent with adopted laws and aspirations of the community; and work collaboratively with property owners to maintain safe and healthy neighborhood livability through compliance with the Municipal, Development and Building Safety Codes.
Budget Highlights: The Current Development Division is projecting an FY16 Development Review program workload of 10,000 front counter and phone service requests and approximately 325 development review applications. This compares to 9000 service requests and 300 applications estimated actual for FY15. These projections are based on a steadily increasing trend of development and pre-development inquiries in FY15 that exceeds the volumes of similar activities in the preceding years and corresponds to economic trends state wide. Staff believes that these positive indicators at the local level are a result of Council’s ongoing commitment to facilitate economic development and strategic use of staff and public resources. New subdivision activity, home starts, commercial and industrial investment and small business startups reflect the recovering economy and the public’s strong desire to live and work in Springfield. Recent annexation requests in Glenwood, the Gateway Mall Remodel, the Swanson saw mill re-build, and the McKenzie Willamette Hospital expansion are all indicators of a strong belief in the future of Springfield. Staff will continue to cultivate new development and major projects that provide a community benefit and generate new jobs by responding to major economic development initiatives such as new mixed use developments in Glenwood; new subdivisions in a recovering residential market; bringing innovative development standards sought by Council as additional options to maximize utility of constrained development sites; and evaluate new efficiency measures such as the newly revised Minimum Development and Ministerial Review Standards proposed by the Developer Advisory Committee (DAC).
The efforts of the Development Review Section to create a livable community are supported and maintained by the versatility and effectiveness of the Code Enforcement program. The Code Enforcement program strives to meet its Council directed benchmark of 100% voluntary compliance, but annually about 5% of the case work is adjudicated in Municipal Court. Code Enforcement cases are unaffected by the economy and have consistently held at or near 2,500 annual investigations since the inception of Strategic Plan performance measures. FY16 activity levels are projected to remain at 2,500 investigations provided jurisdictional service boundaries are not expanded to include the urban transition area between the city limits and urban growth boundary.
Attachment 24 FY16 Proposed Budget Page 41 of 206
Service Level Changes: FY16 FTE for the Current Development Division are the same as the FY15 Adopted Budget. The FY16 staff levels are sufficient to staff the economic turnaround indicators of FY15 and should sustain the performance benchmarks established in the Strategic Plan, and endorsed by the City Council as the city standard, for all but the most unexpected circumstances of development application volume. In the event that actual development activity or other demands for program services exceed budgeted projections, some minor but temporary adjustments to staff assignments elsewhere within the Department may be necessary to effectively accommodate this temporary change in circumstances.
Code enforcement staffing will remain at 2.0 FTE for FY16; however, limited administrative assistance for the program highlights the need for better document management technology to ensure staff time is effectively used for investigation and follow up to citizen requests/inquiries.
Land Drainage Alteration (LDAP) and Encroachment Permit staffing for FY16 will remain at FY15 levels and staff will continue to maintain existing review time targets for Encroachment Permits of five (5) business days (2 days for Utility Companies) and 10 business days for LDAP reviews.
Program Performance Indicator:
Council Goals Key Processes Measurement Methods FY14 Actual
FY15 Target
FY16 Target
Promote and Enhance Our
Hometown Feel while Focusing
on Livability and
Environmental Quality
Continuously advance customer service
satisfaction
Citizen request/Inquiries are given timely attention
90% 90% 75%
Recognize and prioritize time value of private
investment
Development Applications processed in a timely manner
87% 80% 90%
Promote Community values through collaborative public
engagement
Development Code and Municipal Code standards
enforced without the Necessity of a Warning Citation or Municipal Court Action
100% 100% 100%
Attachment 24 FY16 Proposed Budget Page 42 of 206
Development and Public Works Department
Program: Drainage/Stormwater
Program Description: The Drainage/Stormwater program consists of subprograms that maintain, enhance and improve surface and subsurface drainage, implement State and Federal water quality standards and regulations for urban runoff, and provide management of stream and waterway restoration projects, such as maintaining riparian environments and operational flows. Drainage management and planning activities optimize the stormwater drainage system capacity, minimize the occurrences and extent of local flooding, and protect the functions of open waterways. Drainage management services also provide public information and education, and program administration functions such as providing customer service, setting rates and charges, and maintaining financial plans. Drainage maintenance activities provide for leaf and debris removal, vegetation control, management of the Mill Race, and functional maintenance of water quality facilities and bioswales. Drainage engineering activities include design and construction of new and existing drainage facilities to City standards, and oversight for private construction of public facilities.
Budget Highlights: In FY16, the drainage program operating budget continues to require careful management as pressure to minimize rate increases coupled with meeting debt service obligations and the need to support investments in capital assets forces constraint on the operating programs.
The City’s Capital program to implement the Stormwater Facilities Master Plan will be a major focus of the program’s FY16 activities. The sale of $10 million in revenue bonds in early FY11 has permitted the program to focus attention on immediately needed projects. The Mill Race Ecosystem Restoration project has been completed and the City has accepted the project from the United States Corp of Engineers necessitating the need to begin annual maintenance and operation activities of the newly completed 2.5 mile channel. The positive bidding environment resulting from the recession has permitted the City to fund capital activities in FY16 in the face of weak Systems Development Charge revenues. Projects in FY16 will include design of the Over-Under Channel Pipe Replacement, design and construction of the Mill Race Stormwater Park, analysis of the City-owned flood control levee along 42nd Street for compliance with federal standards, and design and implementation of high priority channel restoration projects. In addition to capital design and construction activities, it is anticipated an analysis and update of high priority basins to the Stormwater Facilities Plans will be initiated.
In FY16 the City will continue to implement its Stormwater Management Plan (SWMP) to meet requirements of the City’s National Pollutant Discharge Elimination System (NPDES) Stormwater Permit and Total Maximum Daily Load (TMDL) Implementation Plan. The storm drainage program will continue to benefit from the ongoing intergovernmental agreement and partnership with Lane County, which provides payment for stormwater permit activities in the urbanizable area outside City limits. City staff have been in conversations with DEQ regarding issues and concerns with the City’s draft renewal Phase II NPDES permit. As a result, DEQ has agreed to revise their permitting approach from an individual permit basis to a general permit template for all Oregon Phase II communities. The City continues its participation as part of a regional task force with Oregon DEQ, other Phase II communities, and affected parties to develop recommendations for an integrated permit template applicable to all Phase II communities. This new approach will likely rely on individual SWMP’s tailored to each specific discharger. Given these developments, permit renewal is not anticipated until late FY16 or early FY17. Additional staff time associated with the City’s role as a partner to the
Attachment 24 FY16 Proposed Budget Page 43 of 206
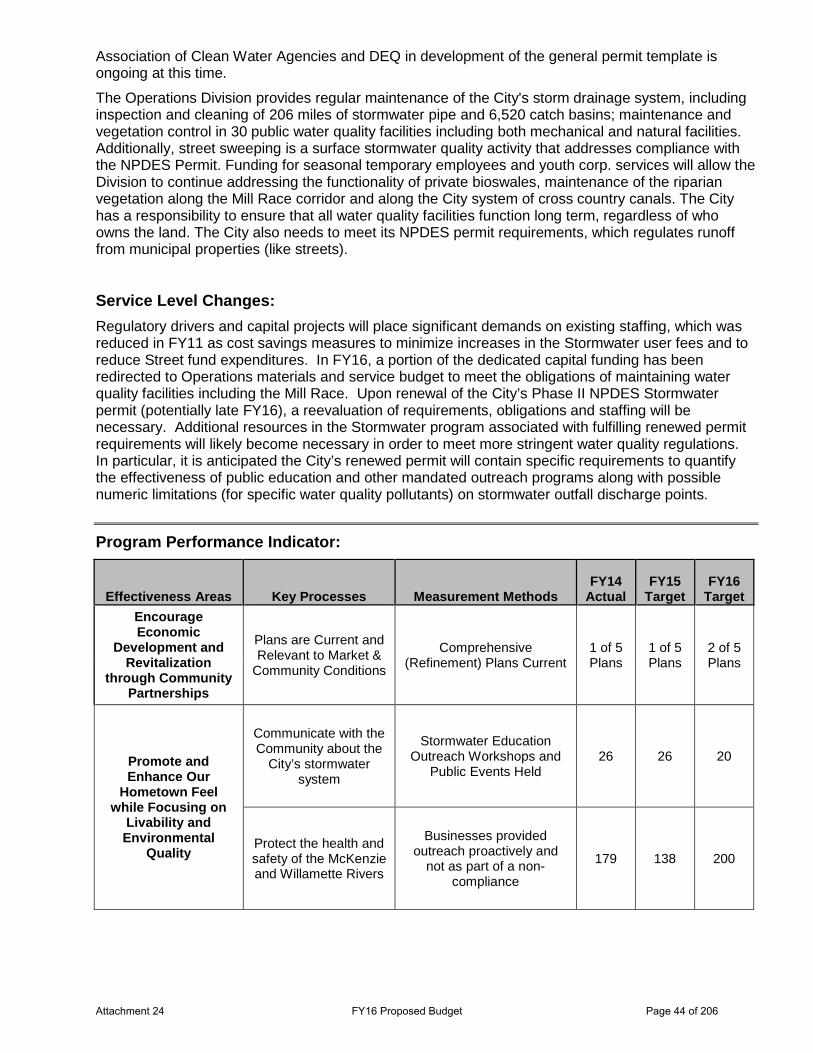
Association of Clean Water Agencies and DEQ in development of the general permit template is ongoing at this time.
The Operations Division provides regular maintenance of the City's storm drainage system, including inspection and cleaning of 206 miles of stormwater pipe and 6,520 catch basins; maintenance and vegetation control in 30 public water quality facilities including both mechanical and natural facilities. Additionally, street sweeping is a surface stormwater quality activity that addresses compliance with the NPDES Permit. Funding for seasonal temporary employees and youth corp. services will allow the Division to continue addressing the functionality of private bioswales, maintenance of the riparian vegetation along the Mill Race corridor and along the City system of cross country canals. The City has a responsibility to ensure that all water quality facilities function long term, regardless of who owns the land. The City also needs to meet its NPDES permit requirements, which regulates runoff from municipal properties (like streets).
Service Level Changes: Regulatory drivers and capital projects will place significant demands on existing staffing, which was reduced in FY11 as cost savings measures to minimize increases in the Stormwater user fees and to reduce Street fund expenditures. In FY16, a portion of the dedicated capital funding has been redirected to Operations materials and service budget to meet the obligations of maintaining water quality facilities including the Mill Race. Upon renewal of the City’s Phase II NPDES Stormwater permit (potentially late FY16), a reevaluation of requirements, obligations and staffing will be necessary. Additional resources in the Stormwater program associated with fulfilling renewed permit requirements will likely become necessary in order to meet more stringent water quality regulations. In particular, it is anticipated the City’s renewed permit will contain specific requirements to quantify the effectiveness of public education and other mandated outreach programs along with possible numeric limitations (for specific water quality pollutants) on stormwater outfall discharge points.
Program Performance Indicator:
Effectiveness Areas Key Processes Measurement Methods FY14
Actual FY15
Target FY16
Target Encourage Economic
Development and Revitalization
through Community Partnerships
Plans are Current and Relevant to Market &
Community Conditions
Comprehensive (Refinement) Plans Current
1 of 5 Plans
1 of 5 Plans
2 of 5 Plans
Promote and Enhance Our
Hometown Feel while Focusing on
Livability and Environmental
Quality
Communicate with the Community about the
City’s stormwater system
Stormwater Education Outreach Workshops and
Public Events Held 26 26 20
Protect the health and safety of the McKenzie and Willamette Rivers
Businesses provided outreach proactively and
not as part of a non-compliance
179 138 200
Attachment 24 FY16 Proposed Budget Page 44 of 206
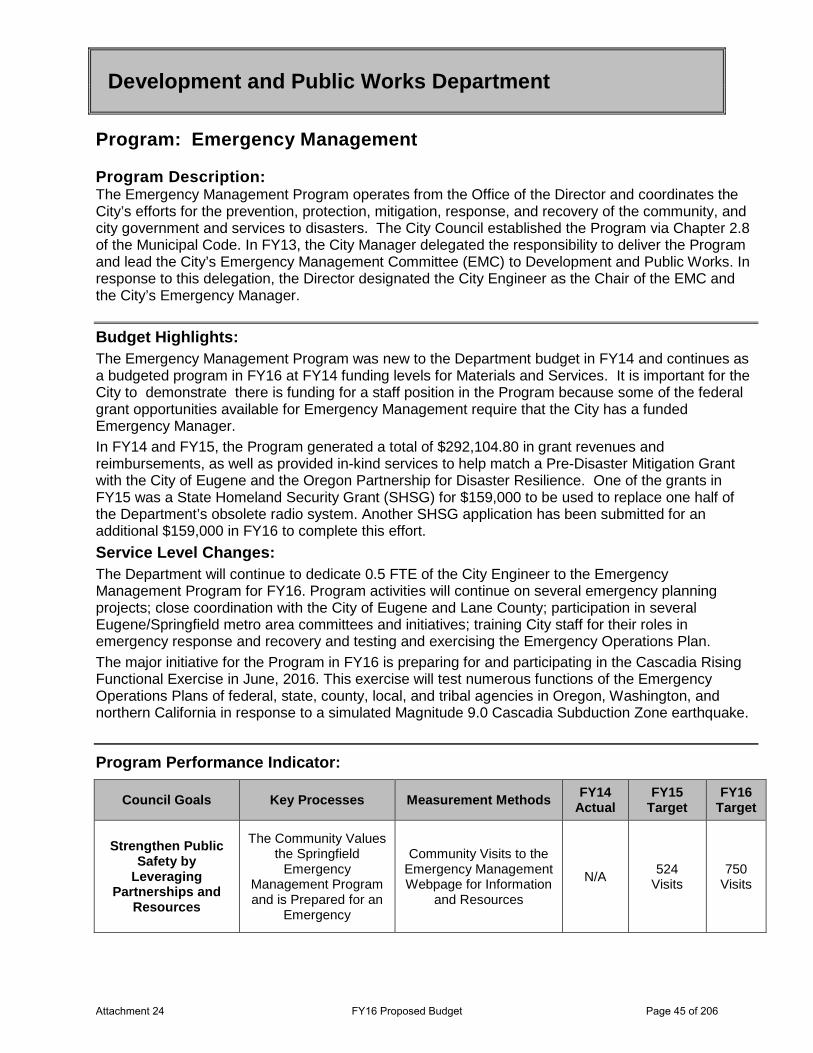
Development and Public Works Department
Program: Emergency Management Program Description: The Emergency Management Program operates from the Office of the Director and coordinates the City’s efforts for the prevention, protection, mitigation, response, and recovery of the community, and city government and services to disasters. The City Council established the Program via Chapter 2.8 of the Municipal Code. In FY13, the City Manager delegated the responsibility to deliver the Program and lead the City’s Emergency Management Committee (EMC) to Development and Public Works. In response to this delegation, the Director designated the City Engineer as the Chair of the EMC and the City’s Emergency Manager.
Budget Highlights: The Emergency Management Program was new to the Department budget in FY14 and continues as a budgeted program in FY16 at FY14 funding levels for Materials and Services. It is important for the City to demonstrate there is funding for a staff position in the Program because some of the federal grant opportunities available for Emergency Management require that the City has a funded Emergency Manager.
In FY14 and FY15, the Program generated a total of $292,104.80 in grant revenues and reimbursements, as well as provided in-kind services to help match a Pre-Disaster Mitigation Grant with the City of Eugene and the Oregon Partnership for Disaster Resilience. One of the grants in FY15 was a State Homeland Security Grant (SHSG) for $159,000 to be used to replace one half of the Department’s obsolete radio system. Another SHSG application has been submitted for an additional $159,000 in FY16 to complete this effort.
Service Level Changes: The Department will continue to dedicate 0.5 FTE of the City Engineer to the Emergency Management Program for FY16. Program activities will continue on several emergency planning projects; close coordination with the City of Eugene and Lane County; participation in several Eugene/Springfield metro area committees and initiatives; training City staff for their roles in emergency response and recovery and testing and exercising the Emergency Operations Plan.
The major initiative for the Program in FY16 is preparing for and participating in the Cascadia Rising Functional Exercise in June, 2016. This exercise will test numerous functions of the Emergency Operations Plans of federal, state, county, local, and tribal agencies in Oregon, Washington, and northern California in response to a simulated Magnitude 9.0 Cascadia Subduction Zone earthquake.
Program Performance Indicator:
Council Goals Key Processes Measurement Methods FY14 Actual
FY15 Target
FY16 Target
Strengthen Public Safety by
Leveraging Partnerships and
Resources
The Community Values the Springfield
Emergency Management Program and is Prepared for an
Emergency
Community Visits to the Emergency Management Webpage for Information
and Resources
N/A 524
Visits 750
Visits
Attachment 24 FY16 Proposed Budget Page 45 of 206
Development and Public Works Department
Programs: Facilities Maintenance Program Description: This program of the Operations Division includes Building Maintenance and Building Preservation. The Building Preservation program sets the action plan for rehabilitation and replacement of City buildings and facilities. This includes capital projects planning and construction to sustain structural, mechanical and electrical infrastructure systems. The Building Maintenance program supports activities that include general maintenance of HVAC, roofs, fire suppression/sprinklers, elevators, office construction and remodel, painting, contract management, grounds keeping, asphalt and concrete surface maintenance, and building security at City Hall and Museum. This program also includes custodial services for City Hall, Carter Building, and Museum and it may provide backup custodial services to the Operations complex.
Budget Highlights: In FY08 the Facilities Maintenance programs budgeted $300K per year to provide annual funding for In FY08 the Facilities Maintenance programs budgeted $300K per year to provide annual funding for priority building preservation projects identified in the 5-Year Building and Facilities Work Plan. The City Council and Budget Committee also approved an additional $500K to begin addressing the building projects backlog referenced in the 2007 Building Condition Report prepared by DLR Group Consulting. Unfortunately, since the 2009 recession the City has reduced the appropriation for the Building Maintenance and Building Preservation Programs. Although the program funding has decreased out of the necessity of budget balancing, staff continues to be effective in prioritizing the City’s existing building maintenance and preservation needs. However this is not sustainable due to a growing backlog of preservation needs.
Furthering the program service challenge since 2008, the City has added the Justice Center- Municipal Jail, Carter Building, Springfield Depot, 138 Main Street, and Tom’s Tapper in Glenwood to the inventory of facilities maintained while funding has remained relatively unchanged. In addition to the new buildings brought into the purview of this program, the City commissioned a seismic study of City Hall in concert with the broader subject of earthquakes and the emergency management plan. The results of the seismic study will be factored into the priority list of building preservation projects for FY16.
The Building Preservation program proposed FY16 budget is $270,000 and predominately generated through an internal charge to all City funds, a 0% increase over FY15. This funding is traditionally dedicated to priority capital preservation and rehabilitation projects. Also, approximately $80,000 of the $270,000 is dedicated to fund a 1.0 FTE Building Maintenance Worker, leaving $190,000 available for actual preservation/capital projects. Projects proposed for completion in FY16 include planning for seismic upgrades, HVAC replacements, elevator safety upgrades, and plumbing repair and upgrade projects across all buildings owned by the City.
The Building Maintenance program proposed FY16 budget is funded 83% by an internal charge from all City non-General Fund departments,10% from the Booth-Kelly Fund and the remaining 7% from the General Fund. FY16 proposed has an increase of 3.3% or $26,755 over FY15 Adopted. This increase is proposed to be evenly distributed among each of these revenue sources.
Service Level Changes: The Facilities Maintenance Program FY16 budget anticipates no significant program service changes.
Attachment 24 FY16 Proposed Budget Page 46 of 206
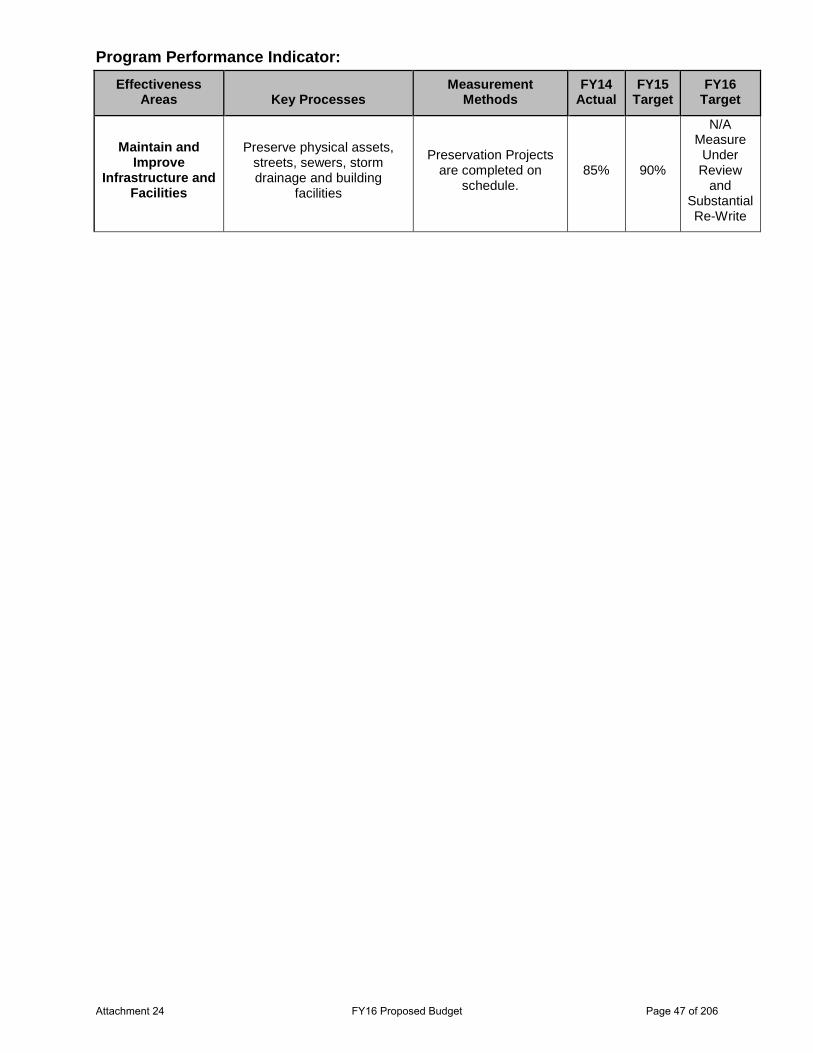
Program Performance Indicator: Effectiveness
Areas Key Processes Measurement
Methods FY14
Actual FY15
Target FY16
Target
Maintain and Improve
Infrastructure and Facilities
Preserve physical assets, streets, sewers, storm drainage and building
facilities
Preservation Projects are completed on
schedule. 85% 90%
N/A Measure
Under Review
and Substantial Re-Write
Attachment 24 FY16 Proposed Budget Page 47 of 206
Development and Public Works Department
Program: Regional/Local Wastewater
Program Description: The Regional/Local Wastewater program consists of sub-programs that design, construct, maintain, operate, and administer the local and regional wastewater (sanitary sewer) systems. Sewer operations activities preserve the local wastewater collection and conveyance system capacity, minimize infiltration and inflow into the system, and ensure minimal disruptions in service. Sewer engineering services design and construct new and expanded publicly developed wastewater facilities and oversee development of privately constructed public wastewater facilities to City's standards. Local wastewater services also provide administrative functions, such as customer service, and setting rates and charges, maintaining financial plans, and building and tracking budgets. Industrial Pretreatment activities manage industrial wastewater discharges to the system and implement pollution management programs necessary to comply with State and Federal regulations.
Regional Wastewater Program administration supports the Metropolitan Wastewater Management Commission (MWMC) in carrying out its purpose to protect public health and safety and the environment by providing high quality wastewater management services to the Eugene-Springfield metropolitan area. The Regional Wastewater program provides: 1) interagency coordination in support of the regional partners; 2) financial management activities including budgeting, rate setting, and financial planning; 3) planning, design, and construction of new capital assets; and, 4) regulatory and permit programs to meet State and Federal wastewater quality requirements. The regional wastewater operations and maintenance activities, staffed by the City of Eugene Wastewater Division, ensure the safe and efficient operation of the regional wastewater operations conveyance and treatment facilities to meet the intended outcomes of the MWMC Regional Wastewater Program.
Budget Highlights: Regional Wastewater The Regional Wastewater Program incorporates the entire regional water pollution control facilities budget. In FY16, the Regional Wastewater Program activities will continue to emphasize obligations for funding and constructing MWMC facility upgrades as identified in the 2004 Facilities Plan, and the 2014 Partial Facilities Plan Update. Fortunately, due to the successful project management and a favorable bidding climate, a projected borrowing of $20 million, originally anticipated for FY11, will continue to be deferred.
Wet Weather Flow Management Regional Wastewater Program (RWP) staff are working with Eugene and Springfield to coordinate wet weather flow management efforts as well as other collection system management issues. With regional support and guidance, both partner agencies have agreed to implement local Capacity, Management, Operations, and Maintenance (CMOM) programs. The regional CMOM program approach replaces the need to update the 2001 Wet Weather Flow Management Plan, as the program will address the ongoing need to reduce inflow and infiltration in both the public and private sewer systems. Working with the Regional Wastewater Policy Team, RWP staff has developed regional CMOM framework and guidance documents. The framework and guidance documents were written as guidelines to protect the regional Water Pollution Control Facility against flows in excess of its design peak flow capacity. Working with RWP staff, both Eugene and Springfield have performed gap analyses to inform them on how best to develop their respective local CMOM implementation plans. Now both partner agencies are engaged in the development of these local implementation plans. Once implemented, these programs will meet the general requirements as outlined in Environmental Protection Agency’s Guide for Evaluating Capacity, Management, Operation and Maintenance for sanitary sewer collection systems and address any specific requirements of the
Attachment 24 FY16 Proposed Budget Page 48 of 206
Department of Environmental Quality including those associated with wet weather flow management. The local CMOM programs, now under development, will ultimately serve both communities as adaptive collection system management plans and will provide tools for making business decisions required to manage the conveyance system in the most cost effective manner and maintain up-to-date asset inventory, condition assessment, and risk analysis information to assist in capital improvement planning. The City’s CMOM program gap-analysis identified work activities that need to be implemented or improved to more effectively manage our assets. This analysis was completed in FY15 and will be used by staff and a consultant to develop the plan.
Temperature Standard Regulatory uncertainty remains high for determining how the regional Water Pollution Control Facility (WPCF) will meet the Willamette Basin Total Maximum Daily Load for temperature due to recent legal action challenging Oregon’s temperature standard. A case filed in the United States District Court by Northwest Environmental Advocates against the United States Environmental Protection Agency has dramatically affected the legal landscape in Oregon with respect to the Willamette Total Maximum Daily Load for temperature. In the spring of 2013, a Federal Court issued an Order, vacating and remanding to the Environmental Protection Agency its previous approvals of a portion of the temperature standard. As a result the status of the temperature Total Maximum Daily Load is now uncertain. It is unclear at this time what the discharge standards for temperature will be for the WPCF, however, it is likely the future standard will be more restrictive than the current limits listed in the administratively extended permit. The uncertainty surrounding the temperature Total Maximum Daily Load litigation is challenging the MWMC capital planning process and implementation schedule of the recycle water plan as the temperature standard remains in flux. However, the Oregon Department of Environmental Quality has indicated they may be ready to renew the MWMC’s National Pollutant Discharge Elimination (NPDES) Permit, which would include new thermal load limits, as early as 2017. Accordingly, RWP staff is pursuing a phased and multi-pronged planning approach to best position the MWMC to cost-effectively meet future thermal load obligations.
Local Wastewater In the local wastewater subprograms, FY16 activities will focus on implementation of the remaining rehabilitation and system upgrade work identified in the Wastewater Master Plan. Major wastewater projects in the FY16 Capital Budget include: evaluation and design of necessary upgrades to the Hayden Lo and River Glen Pump stations to avoid future sanitary sewer overflows; and completing construction of the Franklin Boulevard trunk sewer extension. The completion of this project will allow the annexation and development of more than 150 acres of land recently re-designated in the Glenwood Refinement Plan for mixed use employment and mixed use commercial, adding considerable value to the City’s tax base and hundreds of new family wage jobs. Constructions of the first two phases of the Jasper Trunk Sewer Extension have been completed and work to obtain easements for phase three continues. Construction of phase three is deferred until service is needed by future development in the Jasper Natron area. As a result, the city will continue to defer further revenue bond sales. In addition to the capital construction activities, it is anticipated that an update to the Wastewater Master Plan will be initiated mid-year.
In FY16, Operations will develop a flow monitoring program as an important part of the collection system rehabilitation program, including closed circuit television inspection, smoke testing, and manhole inspections. There will be continued maintenance of 240 miles of wastewater lines, including pipeline repairs, high velocity cleaning, TV inspection, manhole repair and root control.
Service Level Changes: No significant service level changes are projected. Regional capital project activity for FY16 and the near term, is appropriately matched to the current staff level, and no further staffing reductions, beyond those implemented in FY11, are anticipated.
Attachment 24 FY16 Proposed Budget Page 49 of 206
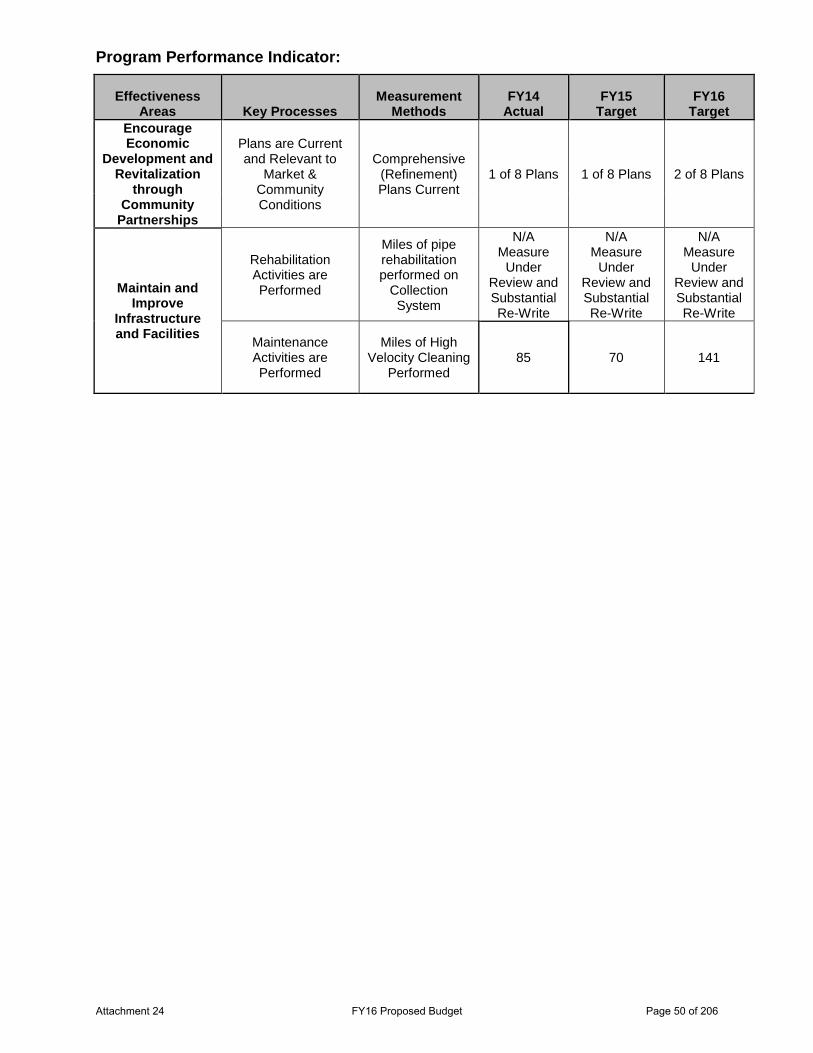
Program Performance Indicator:
Effectiveness Areas Key Processes
Measurement Methods
FY14 Actual
FY15 Target
FY16 Target
Encourage Economic
Development and Revitalization
through Community
Partnerships
Plans are Current and Relevant to
Market & Community Conditions
Comprehensive (Refinement) Plans Current
1 of 8 Plans 1 of 8 Plans 2 of 8 Plans
Maintain and Improve
Infrastructure and Facilities
Rehabilitation Activities are Performed
Miles of pipe rehabilitation performed on
Collection System
N/A Measure
Under Review and Substantial Re-Write
N/A Measure
Under Review and Substantial Re-Write
N/A Measure
Under Review and Substantial Re-Write
Maintenance Activities are Performed
Miles of High Velocity Cleaning
Performed 85 70 141
Attachment 24 FY16 Proposed Budget Page 50 of 206
Development and Public Works Department
Program: Streets
Program Description: The Streets program consists of sub-programs that clean, maintain, design and construct City streets and associated assets in the City rights-of-way. Street maintenance and repair activities preserve the structural integrity of improved streets, minimize hazards to motorists and pedestrians, and respond to requests for service in a timely manner. Street engineering services design and construct new and existing street facilities and oversee the private construction of public street improvements in compliance with City standards. Street cleaning improves the appearance of the city and prevents debris and pollutants from entering the stormwater system. Street landscaping services provide maintenance activities to maintain the public trees and urban landscape in public rights-of-way.
Budget Highlights: Springfield relies primarily on State and Local Fuel Taxes which currently generate approximately $4.2 million annually as the primary source of funding for street system operations and capital preservation spending. Street system programs include traffic maintenance, transportation engineering, street landscape, and general street maintenance. Capital activities include Capital Improvement Program planning, project engineering, design, construction, and financing.
The City of Springfield shares the same struggle that the Oregon Department of Transportation (ODOT) and numerous Oregon counties and cities face regarding adequate funding for transportation system needs. The City Council and staff continue to look for appropriate and sufficient revenues to support desired levels of transportation system operations, maintenance and preservation. Staff estimates a $4.5 million annual unfunded need to effectively support the City’s transportation system operations and preservation objectives, in addition to an approximate $27 million backlog of more comprehensive street rehabilitation projects.
Staff continues to prioritize the day to day operational needs to maintain a safe and reliable City street system. Traffic engineering and operations continues to effectively manage City and State traffic signals and striping within the City limits through Intergovernmental Agreements/Contracts with ODOT and Lane County. City street maintenance resources are directed first toward maintaining arterials and collectors streets, whereas residential street maintenance is relegated to street sweeping and more reactive activities such as filling potholes, emergency repairs, etc.
In FY15 one-time savings from other programs were used to pay for two residential crack and slurry seal projects.
Service Level Changes: Service levels will remain essentially unchanged in FY16. Virtually all locally-funded preservation activities have been suspended and maintenance activity remains reduced. The continued deferral of the fuel tax-supported portion of street preservation activities such as street sealing and overlaying, results in a growing backlog of streets that will require full or partial reconstruction to return the street to a fair or better condition. The FY16 budget continues partial funding for sidewalk repair, street grading, and collector crack sealing. While there are some signs that the economy is finally beginning to rebound, the need for services will be compounded once economic activity resumes. The City continues to pursue Federal and State funding for preservation and rehabilitation of arterials and collectors.
Attachment 24 FY16 Proposed Budget Page 51 of 206
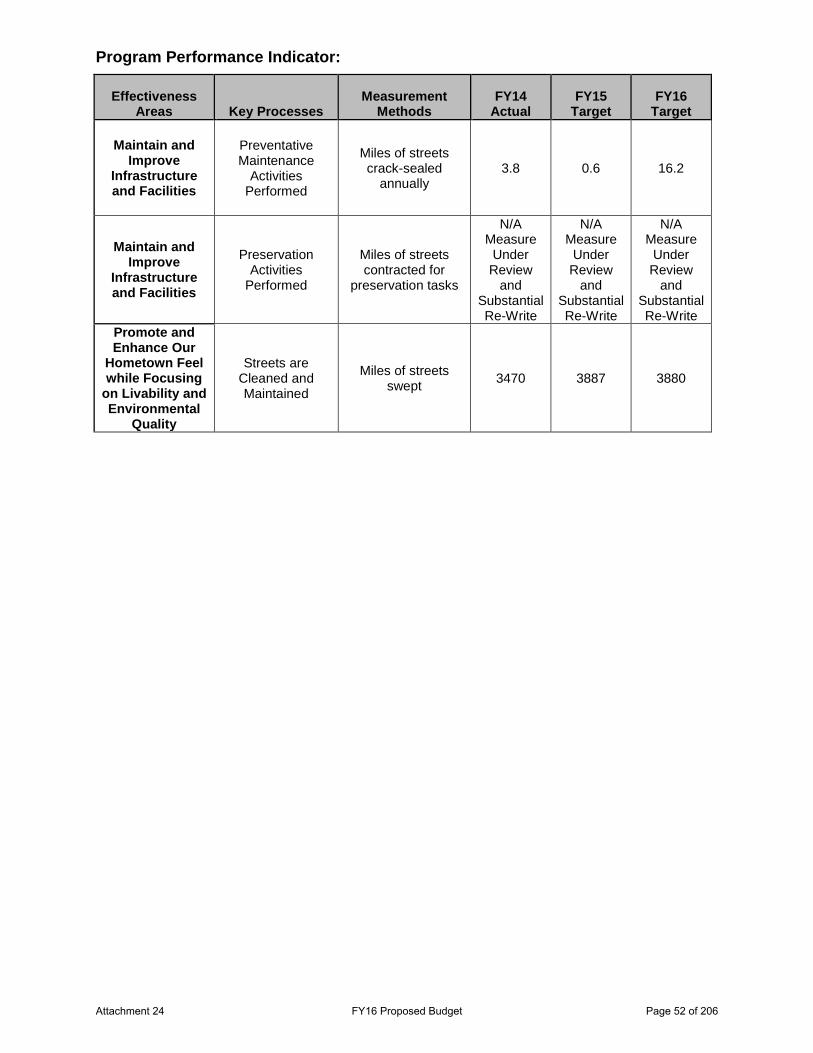
Program Performance Indicator:
Effectiveness Areas Key Processes
Measurement Methods
FY14 Actual
FY15 Target
FY16 Target
Maintain and Improve
Infrastructure and Facilities
Preventative Maintenance
Activities Performed
Miles of streets crack-sealed
annually 3.8 0.6 16.2
Maintain and Improve
Infrastructure and Facilities
Preservation Activities
Performed
Miles of streets contracted for
preservation tasks
N/A Measure
Under Review
and Substantial Re-Write
N/A Measure
Under Review
and Substantial Re-Write
N/A Measure
Under Review
and Substantial Re-Write
Promote and Enhance Our
Hometown Feel while Focusing
on Livability and Environmental
Quality
Streets are Cleaned and Maintained
Miles of streets swept
3470 3887 3880
Attachment 24 FY16 Proposed Budget Page 52 of 206
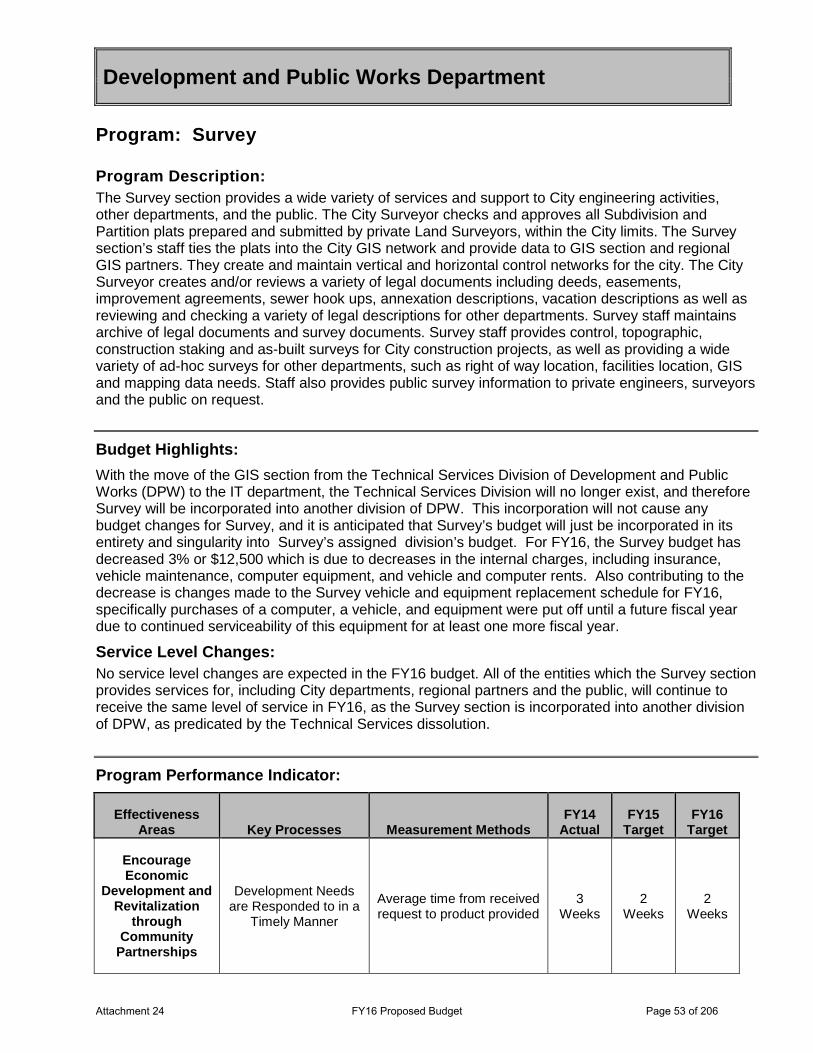
Development and Public Works Department
Program: Survey
Program Description: The Survey section provides a wide variety of services and support to City engineering activities, other departments, and the public. The City Surveyor checks and approves all Subdivision and Partition plats prepared and submitted by private Land Surveyors, within the City limits. The Survey section’s staff ties the plats into the City GIS network and provide data to GIS section and regional GIS partners. They create and maintain vertical and horizontal control networks for the city. The City Surveyor creates and/or reviews a variety of legal documents including deeds, easements, improvement agreements, sewer hook ups, annexation descriptions, vacation descriptions as well as reviewing and checking a variety of legal descriptions for other departments. Survey staff maintains archive of legal documents and survey documents. Survey staff provides control, topographic, construction staking and as-built surveys for City construction projects, as well as providing a wide variety of ad-hoc surveys for other departments, such as right of way location, facilities location, GIS and mapping data needs. Staff also provides public survey information to private engineers, surveyors and the public on request.
Budget Highlights: With the move of the GIS section from the Technical Services Division of Development and Public Works (DPW) to the IT department, the Technical Services Division will no longer exist, and therefore Survey will be incorporated into another division of DPW. This incorporation will not cause any budget changes for Survey, and it is anticipated that Survey’s budget will just be incorporated in its entirety and singularity into Survey’s assigned division’s budget. For FY16, the Survey budget has decreased 3% or $12,500 which is due to decreases in the internal charges, including insurance, vehicle maintenance, computer equipment, and vehicle and computer rents. Also contributing to the decrease is changes made to the Survey vehicle and equipment replacement schedule for FY16, specifically purchases of a computer, a vehicle, and equipment were put off until a future fiscal year due to continued serviceability of this equipment for at least one more fiscal year.
Service Level Changes: No service level changes are expected in the FY16 budget. All of the entities which the Survey section provides services for, including City departments, regional partners and the public, will continue to receive the same level of service in FY16, as the Survey section is incorporated into another division of DPW, as predicated by the Technical Services dissolution.
Program Performance Indicator:
Effectiveness Areas Key Processes Measurement Methods
FY14 Actual
FY15 Target
FY16 Target
Encourage Economic
Development and Revitalization
through Community
Partnerships
Development Needs are Responded to in a
Timely Manner
Average time from received request to product provided
3 Weeks
2 Weeks
2 Weeks
Attachment 24 FY16 Proposed Budget Page 53 of 206
Development and Public Works Department
Program: Transportation
Program Description: The Transportation program is one of the most diverse, multi-faceted programs in the City. It is the only program in DPW that specifically budgets two divisions (Community Development and Operations) for administration and implementation of several of its numerous subprograms. This program plans and supports the construction and operation of all modes of transportation using the infrastructure that is owned by the public and operated by the City, as well as the many interactions with the regional transportation network of State freeways and highways, County roads, public transit, and multi-use paths. Bicycle and pedestrian facilities support a safe, interconnected and convenient system for bicyclists and pedestrians to provide trip making choices to citizens and visitors and improve community livability. Transportation planning and engineering activities develop the capacity, safety, and efficiency of the City's transportation system as the City grows and system demand needs change. This program has traditionally been very effective at securing federal and state resources to support both staff time and larger capital investments. This program also operates and maintains traffic control devices and street lights to maximize transportation safety and efficiency. Traffic control maintenance and construction activities provide traffic control devices such as traffic signals, pedestrian signals, signs, pavement markings and striping that are visible, informative, and effective in promoting traffic safety among all modes of transportation to comply with State and National standards.
Budget Highlights: This Street Fund supported program faces the same challenges as previously described for the Streets program; stagnate revenue streams leading to challenges in meeting program targets. To maintain program continuity, State and Federal Transportation funds will continue to be sought to help fund City staff time devoted to regional transportation planning and to underwrite project and program-specific costs. Federal and State funds will be used to the fullest extent possible, instead of state and local gas taxes and other Street Fund revenue sources, so that those funds can be used for the street system operations, maintenance and preservation.
Focus will remain on a wide variety of important transportation projects and programs in FY16. These projects and programs advance the integrated network of transportation systems of the City and its State and Regional partners. Fundamental responsibilities to respond to citizen issues in a timely and effective manner and participate in development review activities will continue to be a program focus.
The Operations Division provides routine preventative and emergency maintenance on the City’s transportation system. This includes maintenance of 38 City-owned traffic signals, and 34 signals by contract. Thirty (30) of these traffic signals are State of Oregon owned, two are Lane Transit District owned and two are privately-owned. Additionally the program oversees approximately 8,000 signs and funds about 145 lane miles of striping and pavement markings. Traffic control services are provided for numerous regional and community events including University of Oregon football games, Eugene Marathon, Veteran’s and Holiday Parades and numerous charity runs.
The program objectives include the following strategic and long range projects, all of which are urgent matters:
1) Develop external financing, design and install phase one of systemic overhaul of the street light system with new street light fixtures to replace existing fixtures at end of useful life and to improve energy efficiency.
2) Locate and replace failing underground wire that feeds street lights. Replace wire stolen by scrap metal thieves.
Attachment 24 FY16 Proposed Budget Page 54 of 206
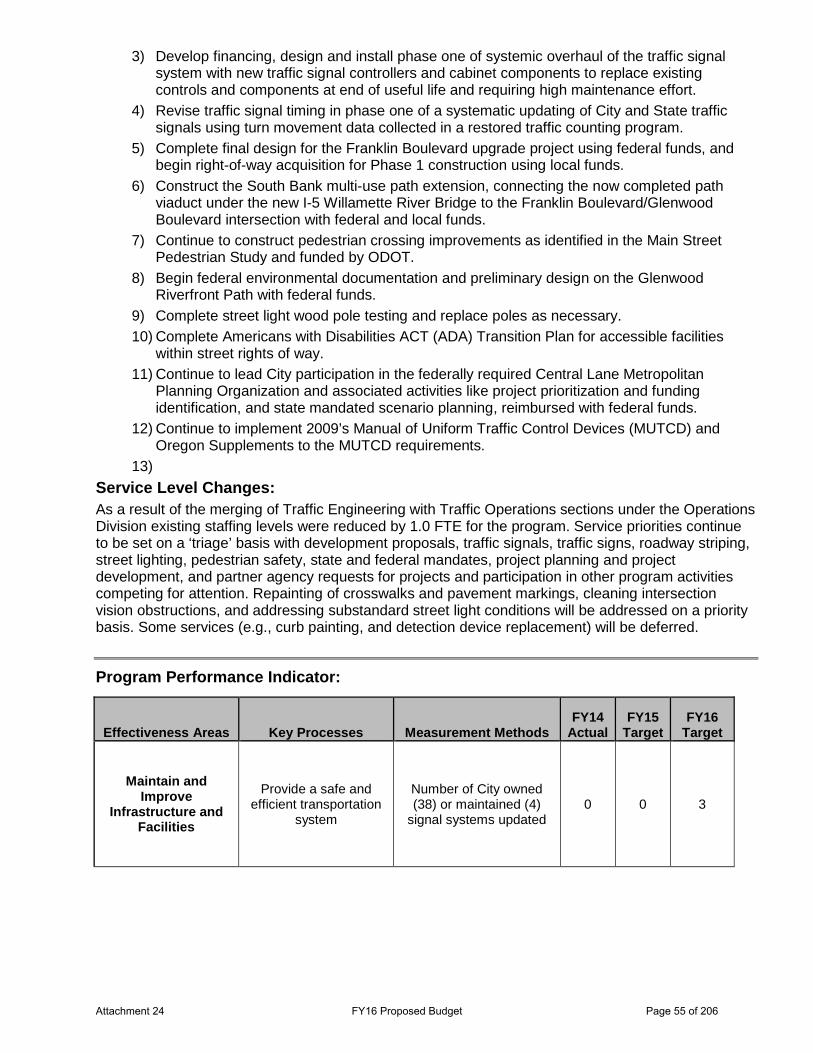
3) Develop financing, design and install phase one of systemic overhaul of the traffic signal system with new traffic signal controllers and cabinet components to replace existing controls and components at end of useful life and requiring high maintenance effort.
4) Revise traffic signal timing in phase one of a systematic updating of City and State traffic signals using turn movement data collected in a restored traffic counting program.
5) Complete final design for the Franklin Boulevard upgrade project using federal funds, and begin right-of-way acquisition for Phase 1 construction using local funds.
6) Construct the South Bank multi-use path extension, connecting the now completed path viaduct under the new I-5 Willamette River Bridge to the Franklin Boulevard/Glenwood Boulevard intersection with federal and local funds.
7) Continue to construct pedestrian crossing improvements as identified in the Main Street Pedestrian Study and funded by ODOT.
8) Begin federal environmental documentation and preliminary design on the Glenwood Riverfront Path with federal funds.
9) Complete street light wood pole testing and replace poles as necessary.
10) Complete Americans with Disabilities ACT (ADA) Transition Plan for accessible facilities within street rights of way.
11) Continue to lead City participation in the federally required Central Lane Metropolitan Planning Organization and associated activities like project prioritization and funding identification, and state mandated scenario planning, reimbursed with federal funds.
12) Continue to implement 2009’s Manual of Uniform Traffic Control Devices (MUTCD) and Oregon Supplements to the MUTCD requirements.
13)
Service Level Changes: As a result of the merging of Traffic Engineering with Traffic Operations sections under the Operations Division existing staffing levels were reduced by 1.0 FTE for the program. Service priorities continue to be set on a ‘triage’ basis with development proposals, traffic signals, traffic signs, roadway striping, street lighting, pedestrian safety, state and federal mandates, project planning and project development, and partner agency requests for projects and participation in other program activities competing for attention. Repainting of crosswalks and pavement markings, cleaning intersection vision obstructions, and addressing substandard street light conditions will be addressed on a priority basis. Some services (e.g., curb painting, and detection device replacement) will be deferred.
Program Performance Indicator:
Effectiveness Areas Key Processes Measurement Methods FY14
Actual FY15
Target FY16
Target
Maintain and Improve
Infrastructure and Facilities
Provide a safe and efficient transportation
system
Number of City owned (38) or maintained (4)
signal systems updated 0 0 3
Attachment 24 FY16 Proposed Budget Page 55 of 206
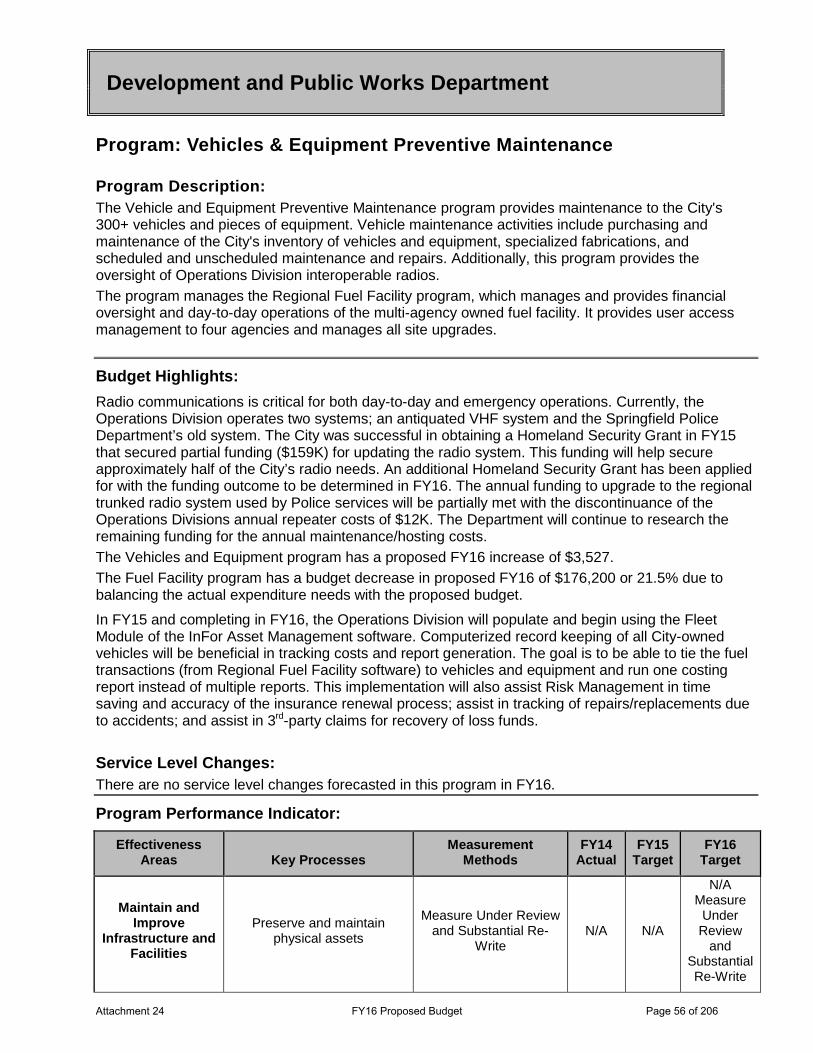
Program: Vehicles & Equipment Preventive Maintenance
Program Description: The Vehicle and Equipment Preventive Maintenance program provides maintenance to the City's 300+ vehicles and pieces of equipment. Vehicle maintenance activities include purchasing and maintenance of the City's inventory of vehicles and equipment, specialized fabrications, and scheduled and unscheduled maintenance and repairs. Additionally, this program provides the oversight of Operations Division interoperable radios.
The program manages the Regional Fuel Facility program, which manages and provides financial oversight and day-to-day operations of the multi-agency owned fuel facility. It provides user access management to four agencies and manages all site upgrades.
Budget Highlights: Radio communications is critical for both day-to-day and emergency operations. Currently, the Operations Division operates two systems; an antiquated VHF system and the Springfield Police Department’s old system. The City was successful in obtaining a Homeland Security Grant in FY15 that secured partial funding ($159K) for updating the radio system. This funding will help secure approximately half of the City’s radio needs. An additional Homeland Security Grant has been applied for with the funding outcome to be determined in FY16. The annual funding to upgrade to the regional trunked radio system used by Police services will be partially met with the discontinuance of the Operations Divisions annual repeater costs of $12K. The Department will continue to research the remaining funding for the annual maintenance/hosting costs.
The Vehicles and Equipment program has a proposed FY16 increase of $3,527.
The Fuel Facility program has a budget decrease in proposed FY16 of $176,200 or 21.5% due to balancing the actual expenditure needs with the proposed budget.
In FY15 and completing in FY16, the Operations Division will populate and begin using the Fleet Module of the InFor Asset Management software. Computerized record keeping of all City-owned vehicles will be beneficial in tracking costs and report generation. The goal is to be able to tie the fuel transactions (from Regional Fuel Facility software) to vehicles and equipment and run one costing report instead of multiple reports. This implementation will also assist Risk Management in time saving and accuracy of the insurance renewal process; assist in tracking of repairs/replacements due to accidents; and assist in 3rd-party claims for recovery of loss funds.
Service Level Changes: There are no service level changes forecasted in this program in FY16.
Program Performance Indicator:
Effectiveness Areas Key Processes
Measurement Methods
FY14 Actual
FY15 Target
FY16 Target
Maintain and Improve
Infrastructure and Facilities
Preserve and maintain physical assets
Measure Under Review and Substantial Re-
Write N/A N/A
N/A Measure
Under Review
and Substantial Re-Write
Development and Public Works Department
Attachment 24 FY16 Proposed Budget Page 56 of 206
Finance Department
Departmental Programs
• Financial Management
Department Description The Finance Department provides financial management services to City departments, the City Council and Budget Committee. The Department oversees the preparation and monitoring of the City’s annual budget, cash management and investments, and prepares the City’s Long Range Financial Forecast. The Department also provides services to Metropolitan Wastewater Management Commission, the Regional Fiber Consortium, and the Springfield Economic Development Agency (SEDA).
Mission The Finance Department provides professional oversight and consultation to City programs and services regarding financial, accounting and budgetary practices. The Department’s focus is to ensure compliance with all relevant financial and budgetary regulations, including Oregon Budget Law and State statutes governing financial information.
Attachment 24 FY16 Proposed Budget Page 57 of 206
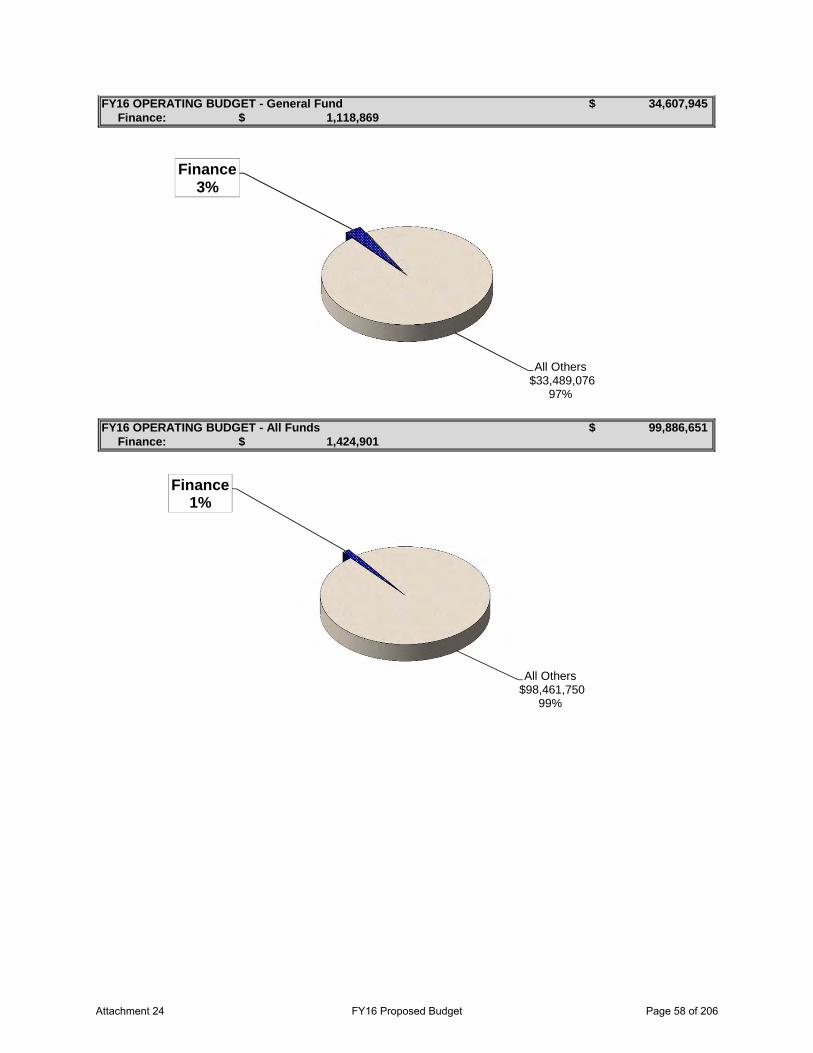
Finance:
Finance:
FY16 OPERATING BUDGET - General Fund 34,607,945$
FY16 OPERATING BUDGET - All Funds 99,886,651$
1,118,869$
1,424,901$
Finance3%
All Others$33,489,076
97%
Finance1%
All Others$98,461,750
99%
Attachment 24 FY16 Proposed Budget Page 58 of 206
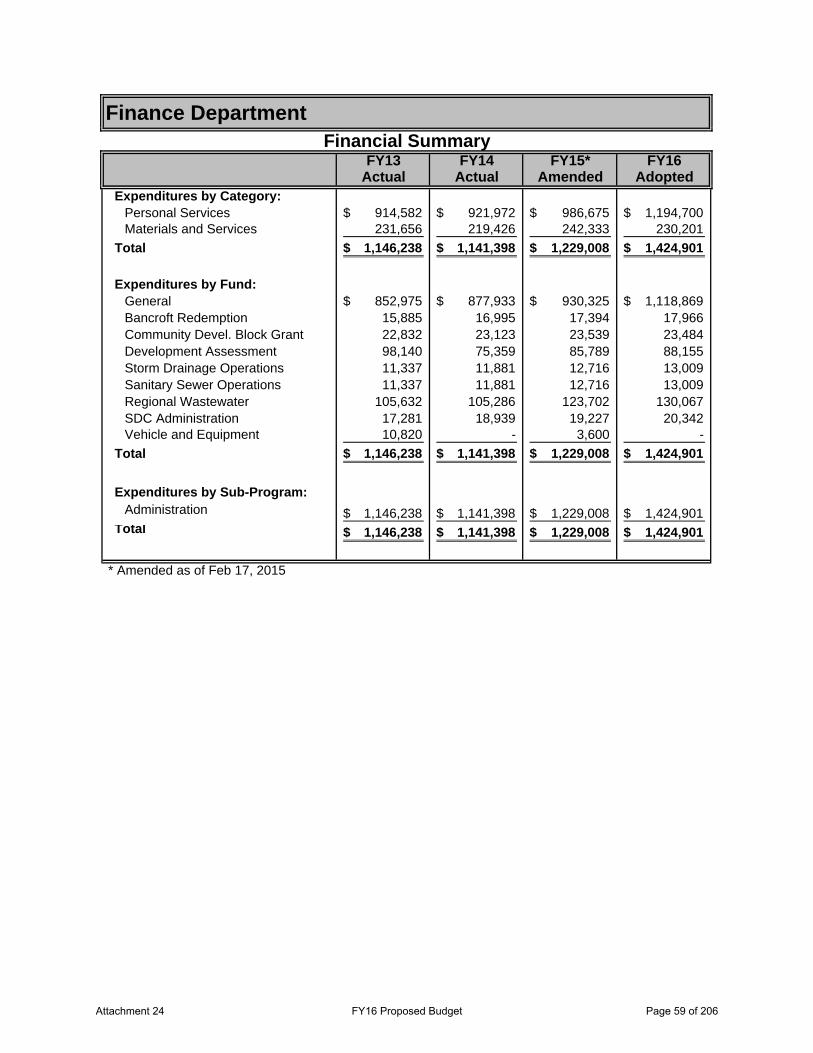
FY13 FY14 FY15* FY16Actual Actual Amended Adopted
Expenditures by Category:Personal Services 914,582$ 921,972$ 986,675$ 1,194,700$ Materials and Services 231,656 219,426 242,333 230,201
Total 1,146,238$ 1,141,398$ 1,229,008$ 1,424,901$
Expenditures by Fund:General 852,975$ 877,933$ 930,325$ 1,118,869$ Bancroft Redemption 15,885 16,995 17,394 17,966 Community Devel. Block Grant 22,832 23,123 23,539 23,484 Development Assessment 98,140 75,359 85,789 88,155 Storm Drainage Operations 11,337 11,881 12,716 13,009 Sanitary Sewer Operations 11,337 11,881 12,716 13,009 Regional Wastewater 105,632 105,286 123,702 130,067 SDC Administration 17,281 18,939 19,227 20,342 Vehicle and Equipment 10,820 - 3,600 -
Total 1,146,238$ 1,141,398$ 1,229,008$ 1,424,901$
Expenditures by Sub-Program:Administration 1,146,238$ 1,141,398$ 1,229,008$ 1,424,901$
Total 1,146,238$ 1,141,398$ 1,229,008$ 1,424,901$
Finance DepartmentFinancial Summary
* Amended as of Feb 17, 2015
Attachment 24 FY16 Proposed Budget Page 59 of 206
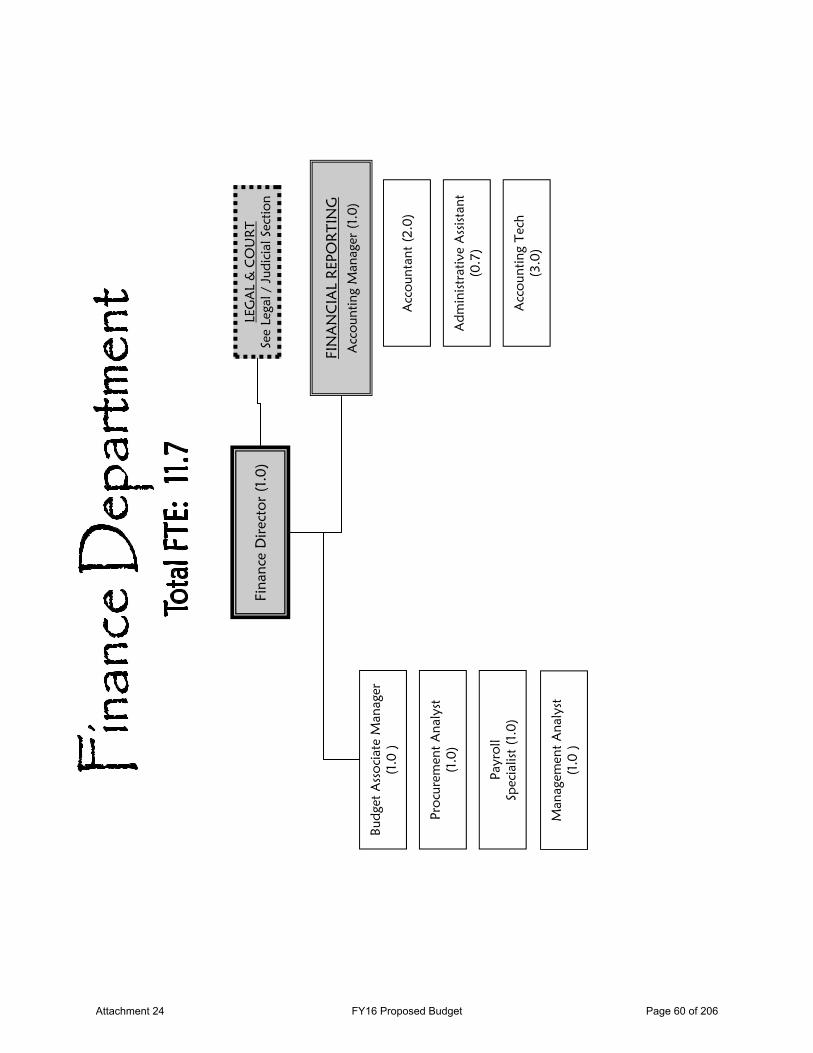
Fina
nce
Dir
ecto
r (1
.0)
FIN
AN
CIA
L R
EPO
RTI
NG
A
ccou
ntin
g M
anag
er (
1.0)
LEG
AL
& C
OU
RT
See
Lega
l / J
udic
ial S
ectio
n
Proc
urem
ent
Ana
lyst
(1
.0)
Acc
oun
ting
Tech
(3
.0)
Adm
inist
rativ
e A
ssist
ant
(0.7
)
Acc
ount
ant
(2.0
)
Budg
et A
sso
ciat
e M
anag
er
(1.0
)
Payr
oll
Spec
ialis
t (1
.0)
Man
agem
ent
Ana
lyst
(1
.0 )
Attachment 24 FY16 Proposed Budget Page 60 of 206
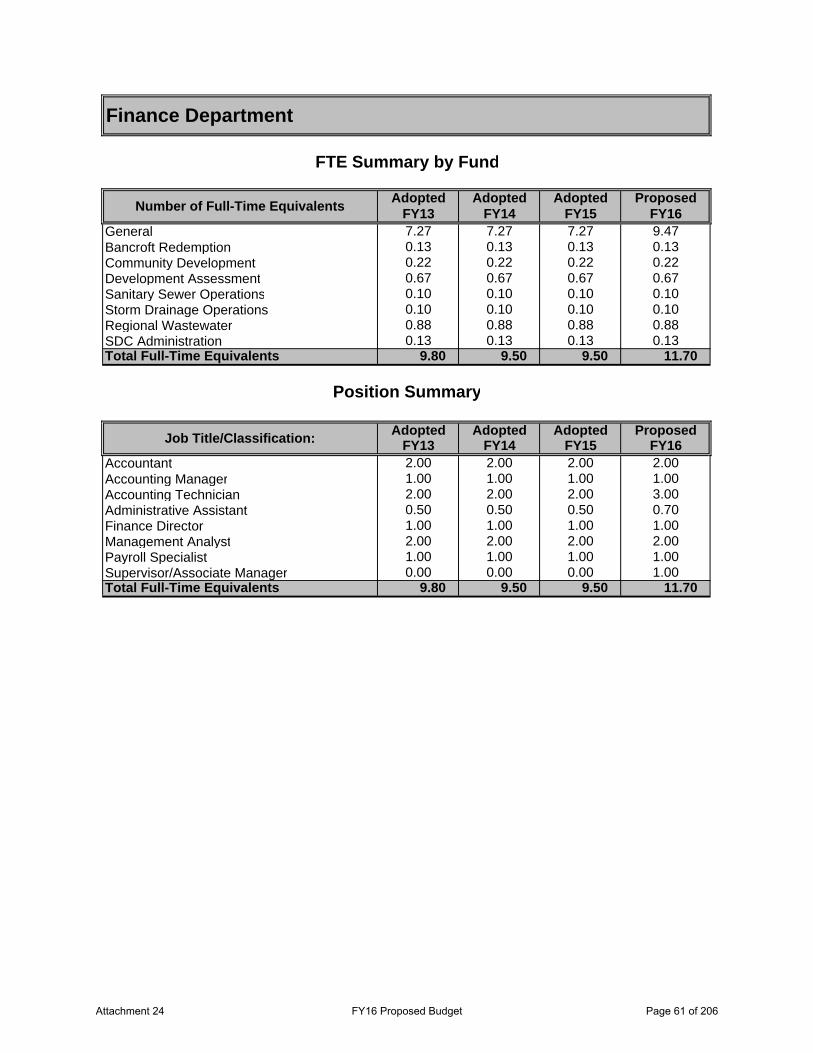
Adopted Adopted Adopted ProposedFY13 FY14 FY15 FY16
General 7.27 7.27 7.27 9.47Bancroft Redemption 0.13 0.13 0.13 0.13Community Development 0.22 0.22 0.22 0.22Development Assessment 0.67 0.67 0.67 0.67Sanitary Sewer Operations 0.10 0.10 0.10 0.10Storm Drainage Operations 0.10 0.10 0.10 0.10Regional Wastewater 0.88 0.88 0.88 0.88SDC Administration 0.13 0.13 0.13 0.13Total Full-Time Equivalents 9.80 9.50 9.50 11.70
Adopted Adopted Adopted ProposedFY13 FY14 FY15 FY16
Accountant 2.00 2.00 2.00 2.00Accounting Manager 1.00 1.00 1.00 1.00Accounting Technician 2.00 2.00 2.00 3.00Administrative Assistant 0.50 0.50 0.50 0.70Finance Director 1.00 1.00 1.00 1.00Management Analyst 2.00 2.00 2.00 2.00Payroll Specialist 1.00 1.00 1.00 1.00Supervisor/Associate Manager 0.00 0.00 0.00 1.00Total Full-Time Equivalents 9.80 9.50 9.50 11.70
Finance Department
FTE Summary by Fund
Number of Full-Time Equivalents
Position Summary
Job Title/Classification:
Attachment 24 FY16 Proposed Budget Page 61 of 206

Attachment 24 FY16 Proposed Budget Page 62 of 206
Finance Department
Program: Financial Management The Finance Department is principally an internal service provider of financial management services to all Departments, the City Council, Budget Committee, Metropolitan Wastewater Commission, Regional Fiber Consortium and the Springfield Economic Development Agency. Externally, the Department has various reporting requirements to City residents, Federal and State grantors and bondholders of the City's municipal debt. Financial services include preparation of the City's annual budget and long-range financial projections, revenue collection, cash and investment management, debt administration, financial reporting, audit management, purchasing and accounts payable, contract development, payroll, assessment administration and billing, and collection of accounts receivable.
Budget Highlights: The Finance Department will be project driven in FY2015-2016, with projects ranging from the use of additional technology to improve processes to the next step of Priority Based Budgeting. During FY15, the department implemented a centralized paperless accounts payable process. While meeting our expectation in the first year with reduced workloads and better information access, we continue to see more opportunities to streamline the process. Early in FY16, we will review Priority Based Budgeting and provide the opportunity for departments to review their current description of programs, services, and costing methodologies. Additional FTE has been added to the Finance Department to ensure that all departments city-wide have access to analytical support skills to complete the necessary PBB program analysis for aligning services with Council and Community priorities. In addition to these projects, the Finance Department will look at ways to consolidate Accounts Receivable, improve journal entry work flow, and implement contract work flow with the use of technology as well as replace the BRASS/SBFS budgeting software.
Service Level Changes: The department has several significant projects scheduled for next year that will have an impact on services provided next year and beyond. With the consolidation of Accounts Receivable, we anticipate a reduction of workloads and better access to information internal and externally. With the addition of a management analyst, the department will be assisting other departments with analytical support to bring the PBB process into the City’s decisions. The department will also be implementing a contract development work flow module within our financial system that can be utilized city-wide for the drafting and reviewing of contracts. Lastly, The City’s budget software is nearing the end of its useful life, and during FY16, the department will focus on system replacement needs with the implementation beginning early FY17.
Attachment 24 FY16 Proposed Budget Page 63 of 206
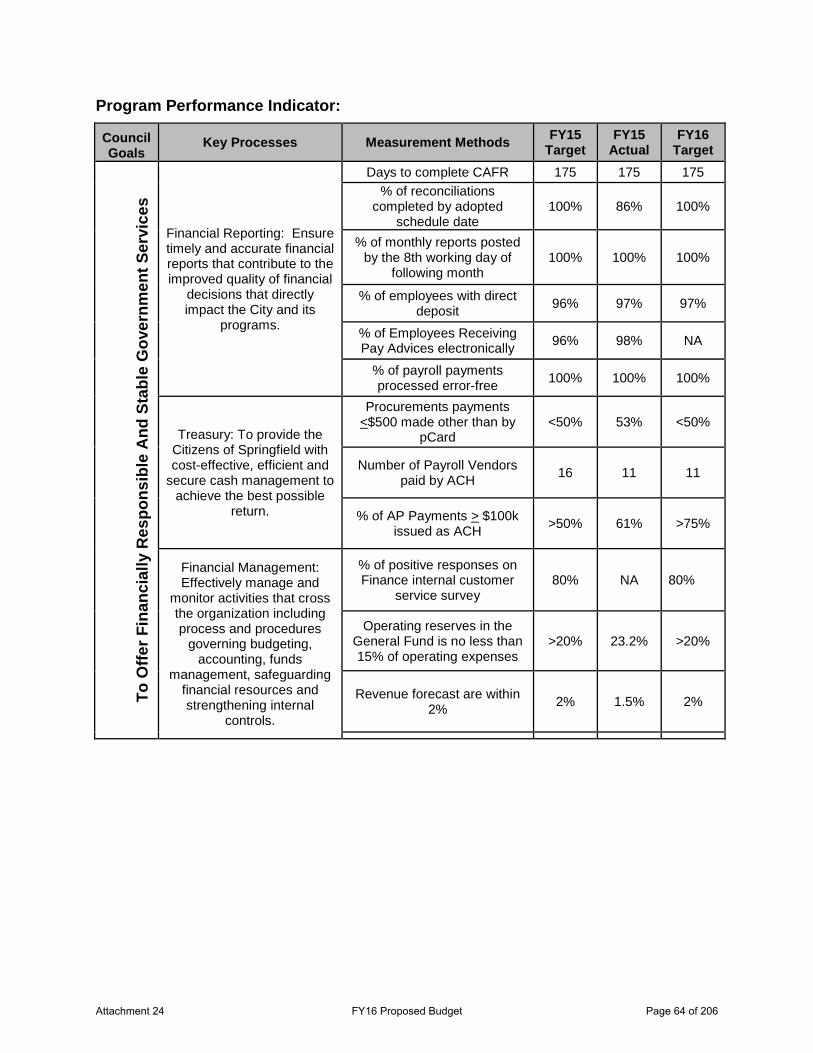
Program Performance Indicator:
Council Goals
Key Processes Measurement Methods FY15 Target
FY15 Actual
FY16 Target
To O
ffer F
inan
cial
ly R
espo
nsib
le A
nd S
tabl
e G
over
nmen
t Ser
vice
s
Financial Reporting: Ensure timely and accurate financial reports that contribute to the improved quality of financial
decisions that directly impact the City and its
programs.
Days to complete CAFR 175 175 175
% of reconciliations completed by adopted
schedule date 100% 86% 100%
% of monthly reports posted by the 8th working day of
following month 100% 100% 100%
% of employees with direct deposit
96% 97% 97%
% of Employees Receiving Pay Advices electronically
96% 98% NA
% of payroll payments processed error-free
100% 100% 100%
Treasury: To provide the Citizens of Springfield with cost-effective, efficient and
secure cash management to achieve the best possible
return.
Procurements payments <$500 made other than by
pCard <50% 53% <50%
Number of Payroll Vendors paid by ACH
16 11 11
% of AP Payments > $100k issued as ACH
>50% 61% >75%
Financial Management: Effectively manage and
monitor activities that cross the organization including process and procedures
governing budgeting, accounting, funds
management, safeguarding financial resources and strengthening internal
controls.
% of positive responses on Finance internal customer
service survey 80% NA 80%
Operating reserves in the General Fund is no less than 15% of operating expenses
>20% 23.2% >20%
Revenue forecast are within 2%
2% 1.5% 2%
Attachment 24 FY16 Proposed Budget Page 64 of 206
Fire and Life Safety Department
Departmental Programs
• Office-of-the-Chief • Administrative Services Bureau • Emergency Medical Services • Fire Marshal’s Office • Fire Operations • Fire and Life Safety Training
Department Description The Fire Department provides services that prevent the loss of life and property, and protect the environment. Administrative responsibilities include planning, supporting and controlling a diversified service delivery system for the City, the urban growth boundary, and East Lane Ambulance Service areas. Services include establishing modifying and providing fire protection and prevention services, firefighting, basic and advanced life support and ambulance transportation, illness and injury prevention, special rescue, hazardous materials control, fire safety education, code enforcement and fire cause investigation. The City also provides fire, rescue and EMS first response to three contract districts in the Springfield area – Glenwood Fire Protection District, Rainbow Fire Protection District, and a portion of Willakenzie Fire Protection District as well as ambulance service to a much larger region totaling 1,514 square miles.
Additionally, the department performs ambulance billing services for twenty-four (24) jurisdictions throughout the State, and administers the FireMed membership program for Eugene Fire & EMS, Lane Rural Fire/Rescue, and Springfield Fire & Life Safety.
Mission To serve our communities by protecting life and preserving property and the environment through prevention, education, rescue, fire suppression and emergency medical services.
Attachment 24 FY16 Proposed Budget Page 65 of 206
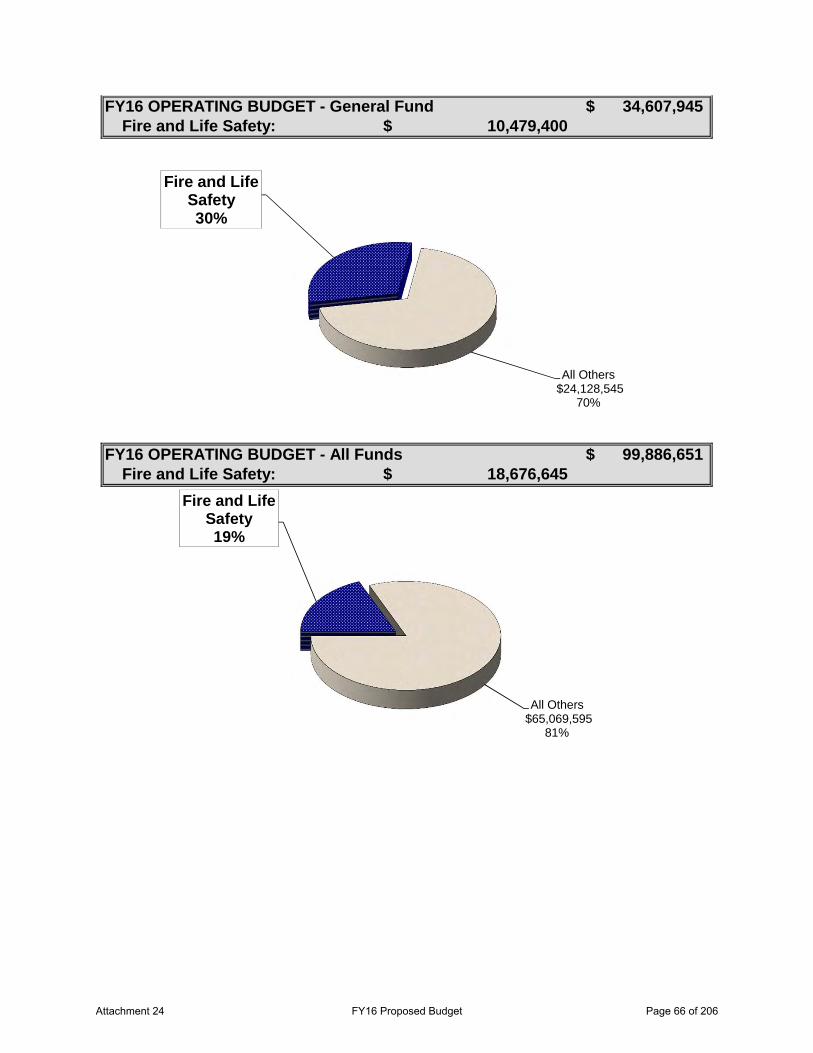
Fire and Life Safety:
Fire and Life Safety:
FY16 OPERATING BUDGET - General Fund
18,676,645$
34,607,945$
FY16 OPERATING BUDGET - All Funds 99,886,651$
10,479,400$
Fire and Life Safety30%
All Others$24,128,545
70%
Fire and Life Safety 19%
All Others$65,069,595
81%
Attachment 24 FY16 Proposed Budget Page 66 of 206
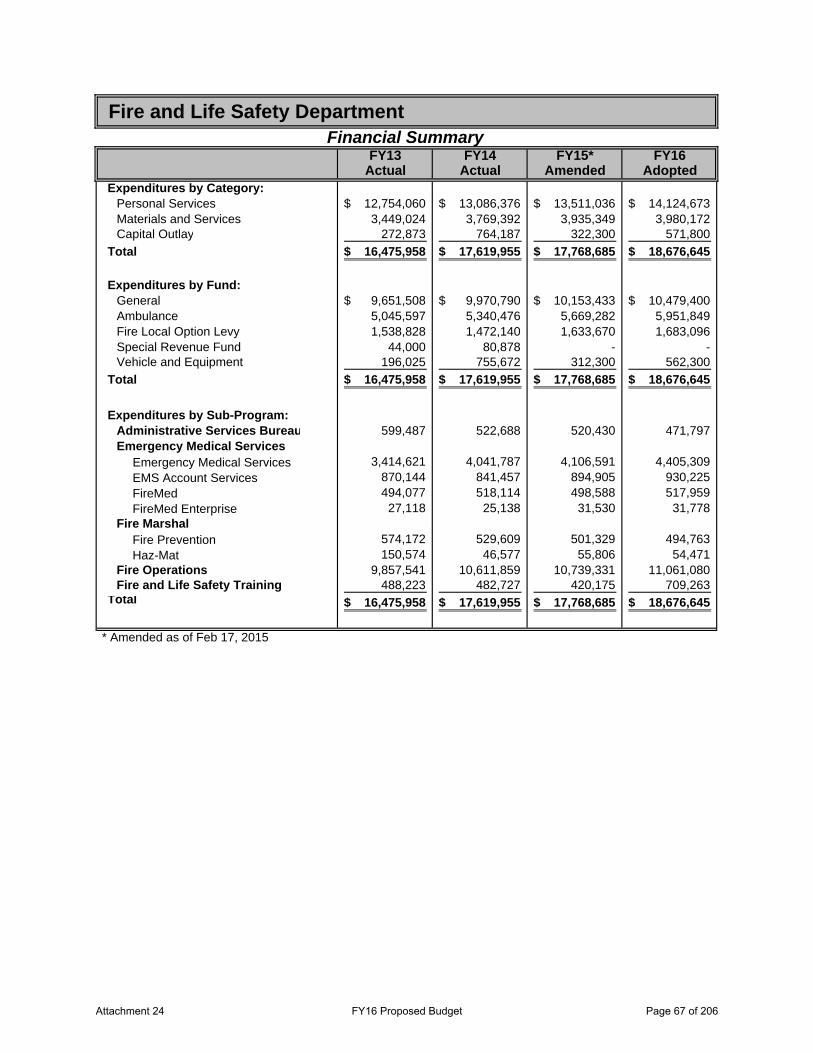
FY13 FY14 FY15* FY16Actual Actual Amended Adopted
Expenditures by Category:Personal Services 12,754,060$ 13,086,376$ 13,511,036$ 14,124,673$ Materials and Services 3,449,024 3,769,392 3,935,349 3,980,172 Capital Outlay 272,873 764,187 322,300 571,800
Total 16,475,958$ 17,619,955$ 17,768,685$ 18,676,645$
Expenditures by Fund:General 9,651,508$ 9,970,790$ 10,153,433$ 10,479,400$ Ambulance 5,045,597 5,340,476 5,669,282 5,951,849 Fire Local Option Levy 1,538,828 1,472,140 1,633,670 1,683,096 Special Revenue Fund 44,000 80,878 - - Vehicle and Equipment 196,025 755,672 312,300 562,300
Total 16,475,958$ 17,619,955$ 17,768,685$ 18,676,645$
Expenditures by Sub-Program:Administrative Services Bureau 599,487 522,688 520,430 471,797 Emergency Medical Services
Emergency Medical Services 3,414,621 4,041,787 4,106,591 4,405,309 EMS Account Services 870,144 841,457 894,905 930,225 FireMed 494,077 518,114 498,588 517,959 FireMed Enterprise 27,118 25,138 31,530 31,778
Fire Marshal Fire Prevention 574,172 529,609 501,329 494,763 Haz-Mat 150,574 46,577 55,806 54,471
Fire Operations 9,857,541 10,611,859 10,739,331 11,061,080 Fire and Life Safety Training 488,223 482,727 420,175 709,263
Total 16,475,958$ 17,619,955$ 17,768,685$ 18,676,645$
Fire and Life Safety DepartmentFinancial Summary
* Amended as of Feb 17, 2015
Attachment 24 FY16 Proposed Budget Page 67 of 206
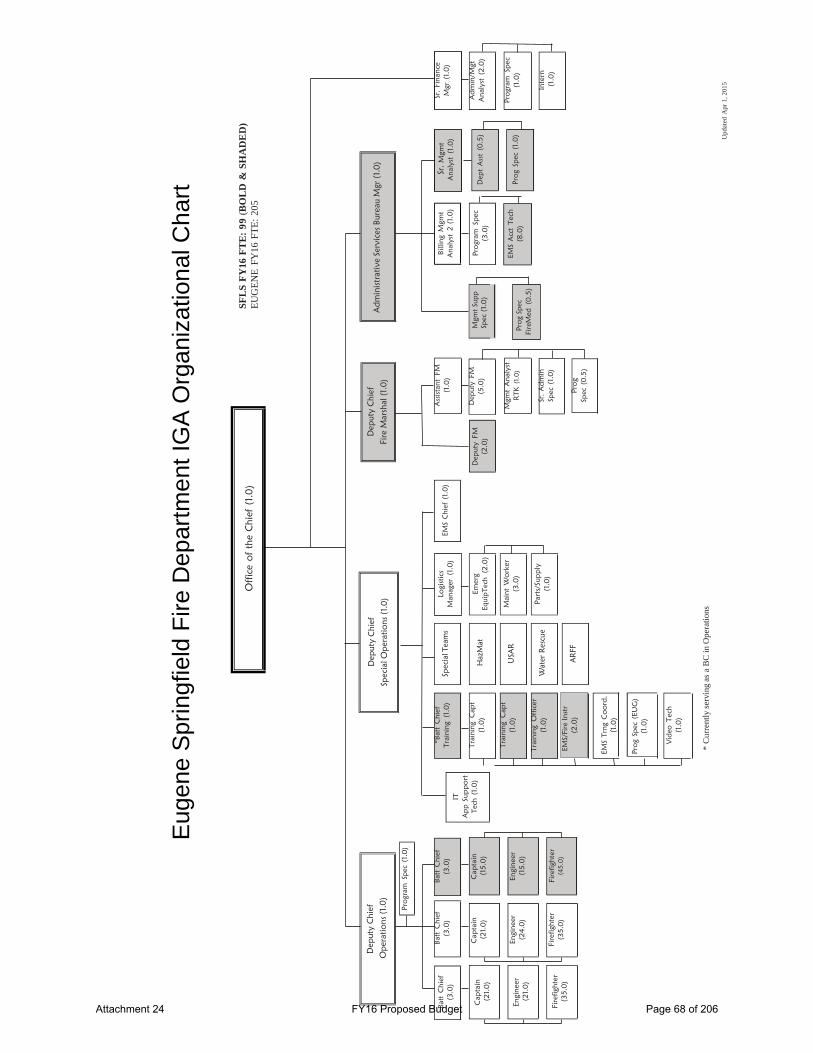
Eug
ene
Spr
ingf
ield
Fire
Dep
artm
ent
IG
A O
rgan
izat
ion
al C
har
t
O
ffic
e of
the
Chi
ef (
1.0
) S
FL
S F
Y16
FT
E:
99
(B
OL
D &
SH
AD
ED
) E
UG
EN
E F
Y16
FT
E:
205
D
eput
y C
hief
O
pera
tions
(1.0
) D
eput
y C
hief
Sp
ecia
l Ope
ratio
ns (
1.0)
Dep
uty
Chi
ef
Fire
Mar
shal
(1.
0)
Adm
inis
trat
ive
Serv
ices
Bur
eau
Mgr
(1.
0)
Pr
ogr
am S
pec
(1.0
) Ba
tt C
hief
(3
.0)
Cap
tain
(2
1.0)
En
gine
er
(21.
0)
Fire
fight
er
(35.
0)
Batt
Chi
ef
(3.0
)
Cap
tain
(2
1.0)
Engi
neer
(2
4.0)
Fire
fight
er
(35.
0)
Batt
Chi
ef
(3.0
)
Cap
tain
(1
5.0)
Engi
neer
(1
5.0)
Fire
fight
er
(45.
0)
IT
A
pp S
uppo
rt
Tech
(1.
0)
*Bat
t C
hief
Tr
aini
ng (
1.0)
Trai
ning
Cap
t (1
.0)
Trai
ning
Cap
t (1
.0)
Trai
ning
Off
icer
(1
.0)
EMS/
Fire
Ins
tr
(2.0
)
EM
S Tr
ng C
oo
rd.
(1.0
)
Spec
ial T
eam
s
Haz
Mat
USA
R
Wat
er R
escu
e
AR
FF
Logi
stic
s M
anag
er (
1.0)
Em
erg
Equi
pTec
h (2
.0)
Mai
nt W
ork
er
(3.0
)
Part
s/Su
pply
(1
.0)
EMS
Chi
ef (
1.0)
Dep
uty
FM
(2.0
)
Ass
istan
t FM
(1
.0)
Dep
uty
FM
(5.0
)
Mgm
t A
naly
st
RTK
(1.
0)
Sr.
Adm
in
Spec
(1.
0)
Pr
og
Spec
(0.5
)
Mgm
t Su
pp
Spec
(1.
0)
Pro
g Sp
ec
Fire
Med
(0.5
)
Billi
ng M
gmt
Ana
lyst
2 (
1.0)
Pro
gram
Spe
c (3
.0)
EMS
Acc
t Tec
h (8
.0)
Sr. M
gmt
Ana
lyst
(1.
0)
Dep
t A
sst
(0.5
)
Pro
g Sp
ec (
1.0)
Sr.
Fina
nce
Mgr
(1.
0)
Adm
in/M
gt
Ana
lyst
(2.
0)
Pro
gram
Spe
c (1
.0)
In
tern
(1
.0)
Pr
og
Spec
(EU
G)
(1.0
)
V
ideo
Tec
h (1
.0)
*
Cur
rent
ly s
ervi
ng a
s a
BC
in O
pera
tion
s
Upd
ated
Apr
1, 2
015
Attachment 24 FY16 Proposed Budget Page 68 of 206
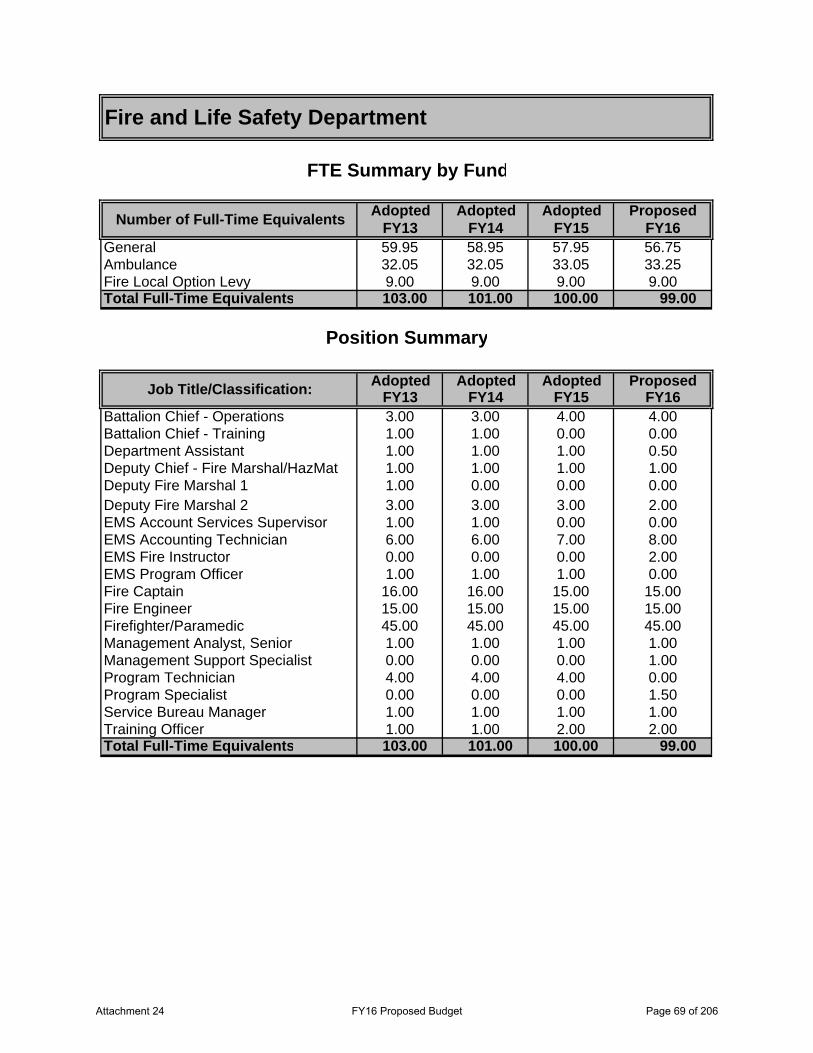
Adopted Adopted Adopted ProposedFY13 FY14 FY15 FY16
General 59.95 58.95 57.95 56.75Ambulance 32.05 32.05 33.05 33.25Fire Local Option Levy 9.00 9.00 9.00 9.00Total Full-Time Equivalents 103.00 101.00 100.00 99.00
Adopted Adopted Adopted ProposedFY13 FY14 FY15 FY16
Battalion Chief - Operations 3.00 3.00 4.00 4.00Battalion Chief - Training 1.00 1.00 0.00 0.00Department Assistant 1.00 1.00 1.00 0.50Deputy Chief - Fire Marshal/HazMat 1.00 1.00 1.00 1.00Deputy Fire Marshal 1 1.00 0.00 0.00 0.00Deputy Fire Marshal 2 3.00 3.00 3.00 2.00EMS Account Services Supervisor 1.00 1.00 0.00 0.00EMS Accounting Technician 6.00 6.00 7.00 8.00EMS Fire Instructor 0.00 0.00 0.00 2.00EMS Program Officer 1.00 1.00 1.00 0.00Fire Captain 16.00 16.00 15.00 15.00Fire Engineer 15.00 15.00 15.00 15.00Firefighter/Paramedic 45.00 45.00 45.00 45.00Management Analyst, Senior 1.00 1.00 1.00 1.00Management Support Specialist 0.00 0.00 0.00 1.00Program Technician 4.00 4.00 4.00 0.00Program Specialist 0.00 0.00 0.00 1.50Service Bureau Manager 1.00 1.00 1.00 1.00Training Officer 1.00 1.00 2.00 2.00Total Full-Time Equivalents 103.00 101.00 100.00 99.00
Fire and Life Safety Department
FTE Summary by Fund
Number of Full-Time Equivalents
Position Summary
Job Title/Classification:
Attachment 24 FY16 Proposed Budget Page 69 of 206

Attachment 24 FY16 Proposed Budget Page 70 of 206
Fire and Life Safety Department
Program: Office of the Chief Program Description: The Office of the Chief ensures that City Council goals and targets are met, represents the Department in community, interagency, and media relations and provides management direction and support of the entire Department in order to maintain a high level of community fire, rescue, emergency medical and life safety services delivery.
Budget Highlights: Continue to explore and implement opportunities for efficiencies and standardization. Work with staff and elected officials to find long term solutions for sustainability of the ambulance transport system.
Service Level Changes: The consolidated Office of the Chief will continue in FY16, with primary focus on consolidation/merger initiatives in all divisions of the department as well as maintenance of existing, or enhanced, service levels already established.
Program Performance Indicator: Council Goals Key Processes
Measurement Methods
FY15 Target
FY15 Actual
FY16 Target
Fina
ncia
lly S
ound
and
St
able
Gov
ernm
ent
Serv
ices
Provide Information to City Staff:
Content
Annual Reviews Current
100% 100% 100%
Attachment 24 FY16 Proposed Budget Page 71 of 206
Fire and Life Safety Department
Program: Administrative Services Bureau Program Description: The Administrative Services Bureau (ASB) supervises and manages the revenue-generating programs: Ambulance Account Services and FireMed. In addition, the ASB is responsible for budget development, grant management, accounts payable, payroll, contract coordination, and fiscal monitoring. It provides support services for the Office of the Chief, Operations Division, Training, Ambulance Transport, Fire Marshal's Office, FireMed and Ambulance Account Services.
Budget Highlights: The FireMed Ambulance Membership Program in FY15 saw flat revenues for FY15, but a decrease in actual number of memberships of -1.92%. FireMed is transitioning to a year-around membership enrollment period rather than pro-rating member fees under a July 1st to June 30th membership year. This will allow members to join for a full year of membership at any time throughout the year. FireMed’s marketing team has increased the use of social media and the FireMed website, and is focused on achieving the best results for the dollars available. The re-branding of FireMed continues, and the 2016 campaign should be an exciting one. Membership marketing will continue to face obstacles with limited funds, but memberships are expected to grow marginally in FY16.
Ambulance Account Services continues their ambulance account enterprise, with billing services for 24 government entities besides Springfield. Account Services staff provide a level of expertise found in few other local government agencies. Account Services has implemented several process improvements to maximize revenues and gain efficiencies in processing in an attempt to offset Medicare reimbursement limitations. FY15 collection percentages held constant, while overall revenue gained slightly, allowing an increase in Ambulance Fund reserves for the fiscal year.
Service Level Changes: All ambulance billing functions are in their second year under one roof, with one supervisor. The ambulance billing databases of Eugene and Springfield have been fully integrated. Outsourcing of certain tasks has improved efficiency and reduced costs. In FY16, the consolidated work unit will use Continuous Process Improvement (CPI), Benchmarking, and Best Practices to gain further efficiencies and increase revenues.
Attachment 24 FY16 Proposed Budget Page 72 of 206
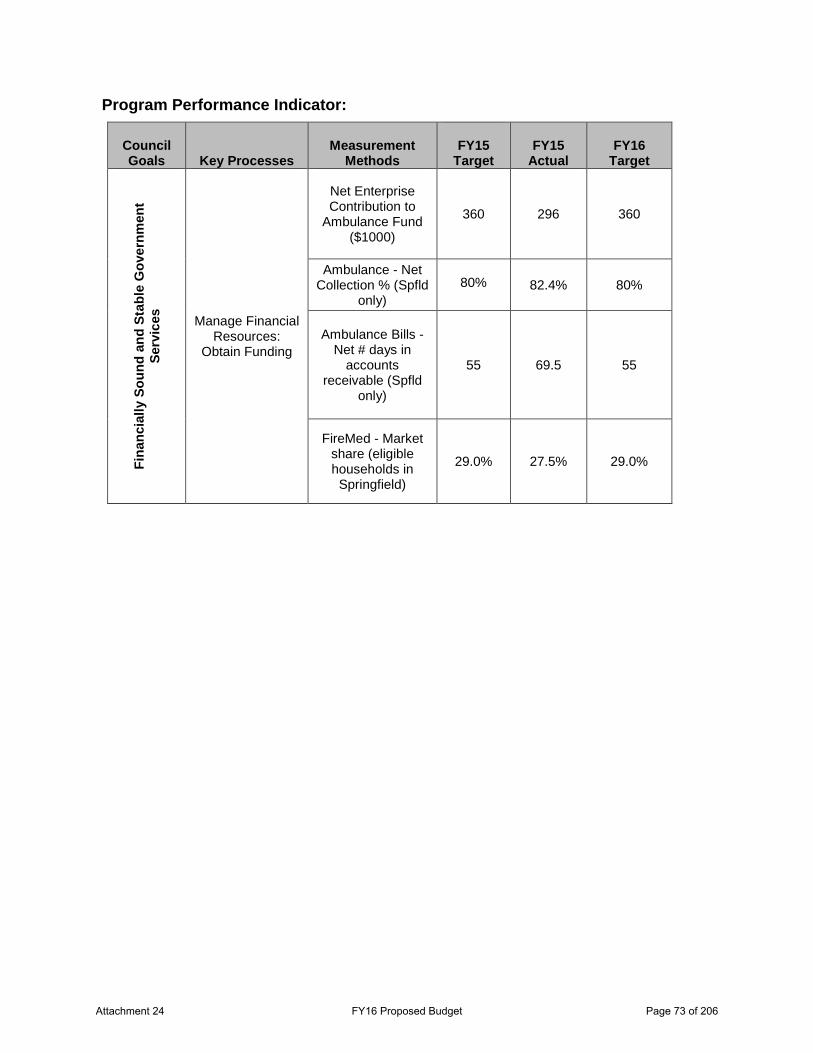
Program Performance Indicator:
Council Goals Key Processes
Measurement Methods
FY15
Target FY15
Actual FY16
Target Fi
nanc
ially
Sou
nd a
nd S
tabl
e G
over
nmen
t Se
rvic
es
Manage Financial Resources:
Obtain Funding
Net Enterprise Contribution to
Ambulance Fund ($1000)
360
296 360
Ambulance - Net Collection % (Spfld
only)
80% 82.4% 80%
Ambulance Bills - Net # days in
accounts receivable (Spfld
only)
55 69.5 55
FireMed - Market share (eligible households in Springfield)
29.0% 27.5% 29.0%
Attachment 24 FY16 Proposed Budget Page 73 of 206
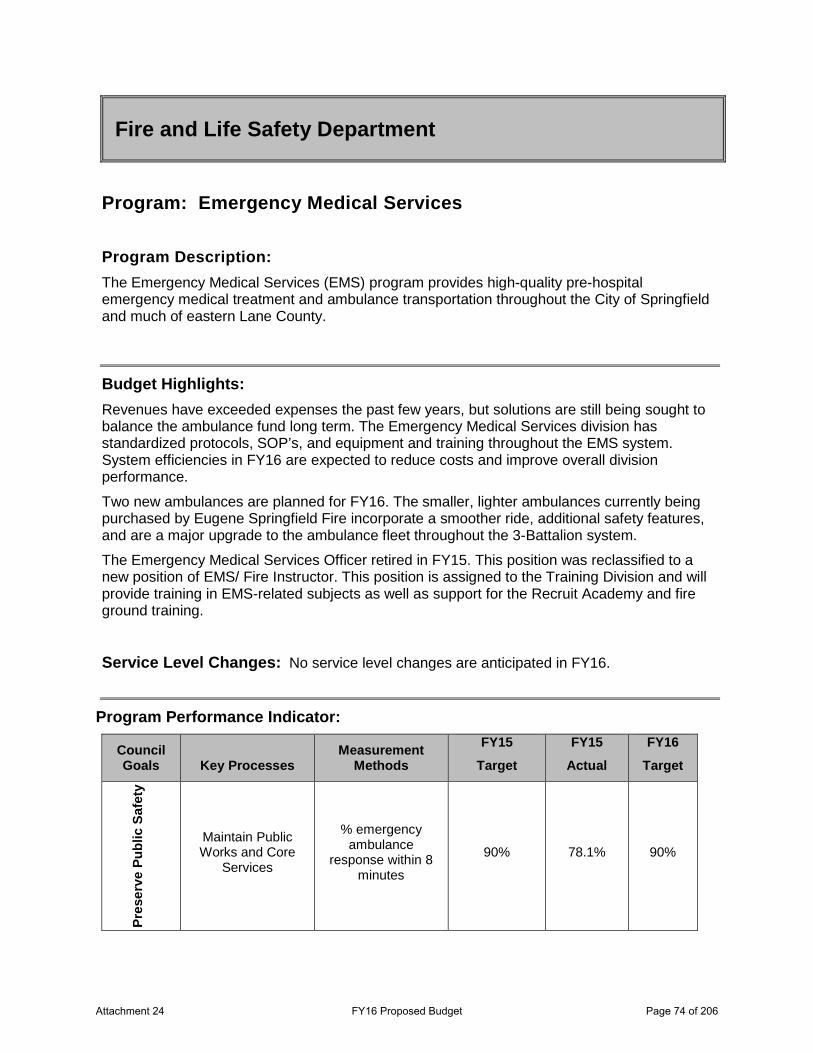
Fire and Life Safety Department
Program: Emergency Medical Services Program Description: The Emergency Medical Services (EMS) program provides high-quality pre-hospital emergency medical treatment and ambulance transportation throughout the City of Springfield and much of eastern Lane County.
Budget Highlights: Revenues have exceeded expenses the past few years, but solutions are still being sought to balance the ambulance fund long term. The Emergency Medical Services division has standardized protocols, SOP’s, and equipment and training throughout the EMS system. System efficiencies in FY16 are expected to reduce costs and improve overall division performance.
Two new ambulances are planned for FY16. The smaller, lighter ambulances currently being purchased by Eugene Springfield Fire incorporate a smoother ride, additional safety features, and are a major upgrade to the ambulance fleet throughout the 3-Battalion system.
The Emergency Medical Services Officer retired in FY15. This position was reclassified to a new position of EMS/ Fire Instructor. This position is assigned to the Training Division and will provide training in EMS-related subjects as well as support for the Recruit Academy and fire ground training.
Service Level Changes: No service level changes are anticipated in FY16.
Program Performance Indicator:
Council Goals Key Processes
Measurement Methods
FY15
Target
FY15
Actual
FY16
Target
Pres
erve
Pub
lic S
afet
y
Maintain Public Works and Core
Services
% emergency ambulance
response within 8 minutes
90% 78.1% 90%
Attachment 24 FY16 Proposed Budget Page 74 of 206
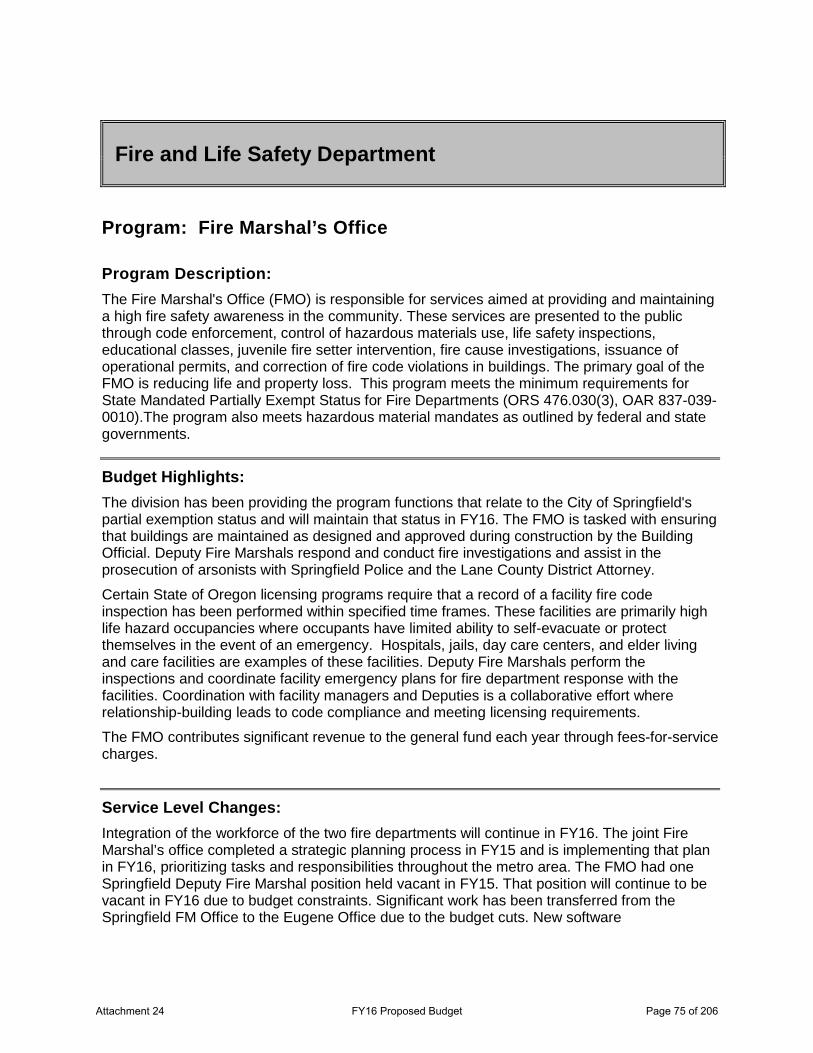
Fire and Life Safety Department
Program: Fire Marshal’s Office Program Description: The Fire Marshal's Office (FMO) is responsible for services aimed at providing and maintaining a high fire safety awareness in the community. These services are presented to the public through code enforcement, control of hazardous materials use, life safety inspections, educational classes, juvenile fire setter intervention, fire cause investigations, issuance of operational permits, and correction of fire code violations in buildings. The primary goal of the FMO is reducing life and property loss. This program meets the minimum requirements for State Mandated Partially Exempt Status for Fire Departments (ORS 476.030(3), OAR 837-039-0010).The program also meets hazardous material mandates as outlined by federal and state governments.
Budget Highlights: The division has been providing the program functions that relate to the City of Springfield's partial exemption status and will maintain that status in FY16. The FMO is tasked with ensuring that buildings are maintained as designed and approved during construction by the Building Official. Deputy Fire Marshals respond and conduct fire investigations and assist in the prosecution of arsonists with Springfield Police and the Lane County District Attorney.
Certain State of Oregon licensing programs require that a record of a facility fire code inspection has been performed within specified time frames. These facilities are primarily high life hazard occupancies where occupants have limited ability to self-evacuate or protect themselves in the event of an emergency. Hospitals, jails, day care centers, and elder living and care facilities are examples of these facilities. Deputy Fire Marshals perform the inspections and coordinate facility emergency plans for fire department response with the facilities. Coordination with facility managers and Deputies is a collaborative effort where relationship-building leads to code compliance and meeting licensing requirements.
The FMO contributes significant revenue to the general fund each year through fees-for-service charges.
Service Level Changes: Integration of the workforce of the two fire departments will continue in FY16. The joint Fire Marshal’s office completed a strategic planning process in FY15 and is implementing that plan in FY16, prioritizing tasks and responsibilities throughout the metro area. The FMO had one Springfield Deputy Fire Marshal position held vacant in FY15. That position will continue to be vacant in FY16 due to budget constraints. Significant work has been transferred from the Springfield FM Office to the Eugene Office due to the budget cuts. New software
Attachment 24 FY16 Proposed Budget Page 75 of 206
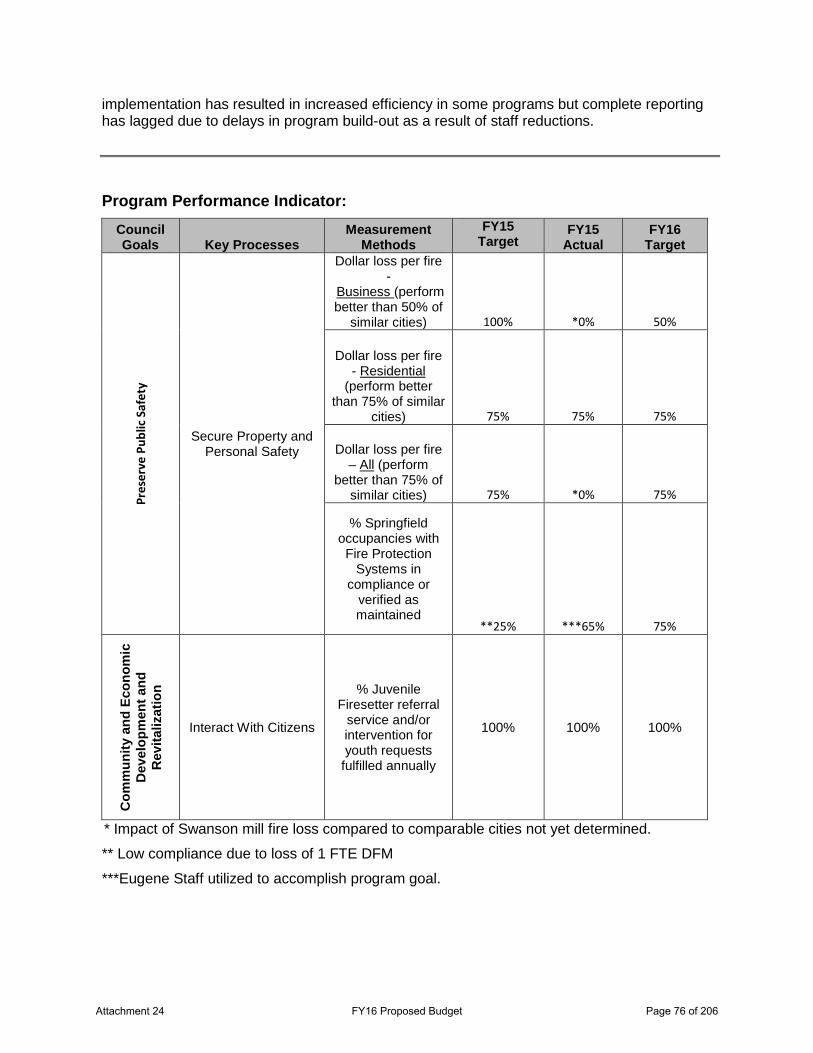
implementation has resulted in increased efficiency in some programs but complete reporting has lagged due to delays in program build-out as a result of staff reductions.
Program Performance Indicator:
Council Goals Key Processes
Measurement Methods
FY15 Target
FY15 Actual
FY16 Target
Pres
erve
Pub
lic S
afet
y
Secure Property and Personal Safety
Dollar loss per fire -
Business (perform better than 50% of
similar cities) 100% *0% 50%
Dollar loss per fire - Residential
(perform better than 75% of similar
cities) 75% 75% 75%
Dollar loss per fire – All (perform
better than 75% of similar cities) 75% *0% 75%
% Springfield occupancies with Fire Protection
Systems in compliance or
verified as maintained
**25% ***65% 75%
Com
mun
ity a
nd E
cono
mic
D
evel
opm
ent a
nd
Rev
italiz
atio
n
Interact With Citizens
% Juvenile Firesetter referral
service and/or intervention for youth requests
fulfilled annually
100% 100% 100%
* Impact of Swanson mill fire loss compared to comparable cities not yet determined.
** Low compliance due to loss of 1 FTE DFM
***Eugene Staff utilized to accomplish program goal.
Attachment 24 FY16 Proposed Budget Page 76 of 206
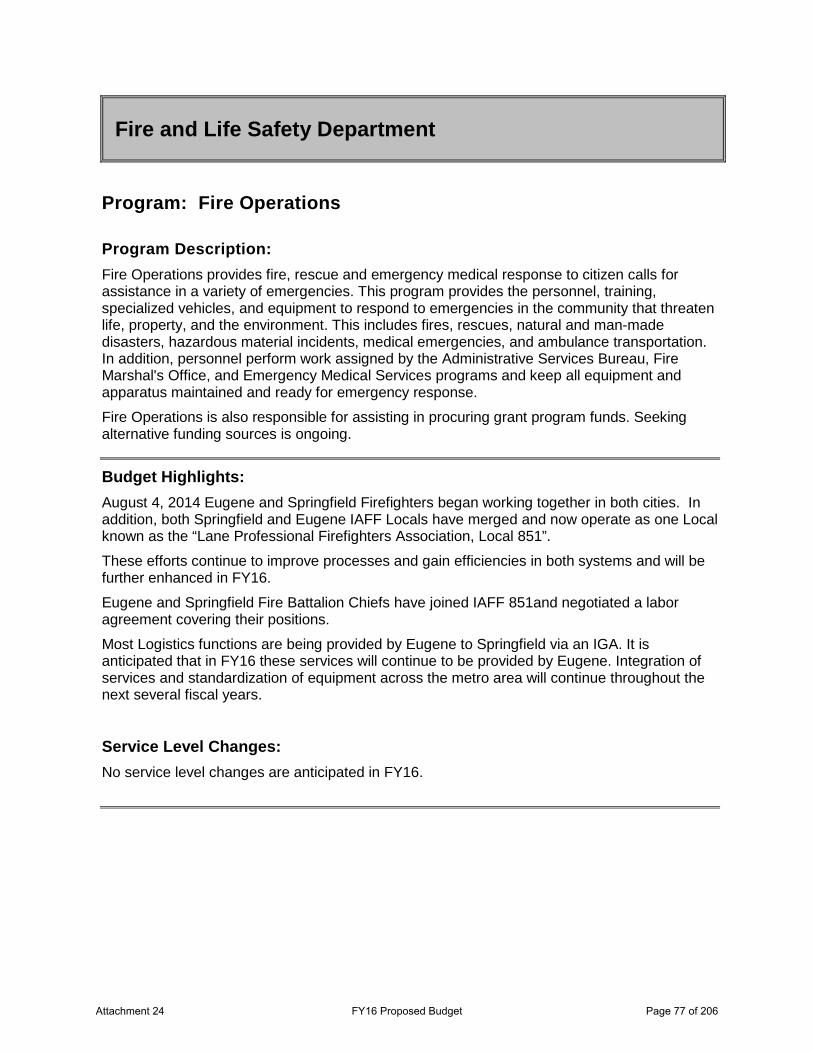
Fire and Life Safety Department
Program: Fire Operations Program Description: Fire Operations provides fire, rescue and emergency medical response to citizen calls for assistance in a variety of emergencies. This program provides the personnel, training, specialized vehicles, and equipment to respond to emergencies in the community that threaten life, property, and the environment. This includes fires, rescues, natural and man-made disasters, hazardous material incidents, medical emergencies, and ambulance transportation. In addition, personnel perform work assigned by the Administrative Services Bureau, Fire Marshal's Office, and Emergency Medical Services programs and keep all equipment and apparatus maintained and ready for emergency response.
Fire Operations is also responsible for assisting in procuring grant program funds. Seeking alternative funding sources is ongoing.
Budget Highlights: August 4, 2014 Eugene and Springfield Firefighters began working together in both cities. In addition, both Springfield and Eugene IAFF Locals have merged and now operate as one Local known as the “Lane Professional Firefighters Association, Local 851”.
These efforts continue to improve processes and gain efficiencies in both systems and will be further enhanced in FY16.
Eugene and Springfield Fire Battalion Chiefs have joined IAFF 851and negotiated a labor agreement covering their positions.
Most Logistics functions are being provided by Eugene to Springfield via an IGA. It is anticipated that in FY16 these services will continue to be provided by Eugene. Integration of services and standardization of equipment across the metro area will continue throughout the next several fiscal years.
Service Level Changes: No service level changes are anticipated in FY16.
Attachment 24 FY16 Proposed Budget Page 77 of 206
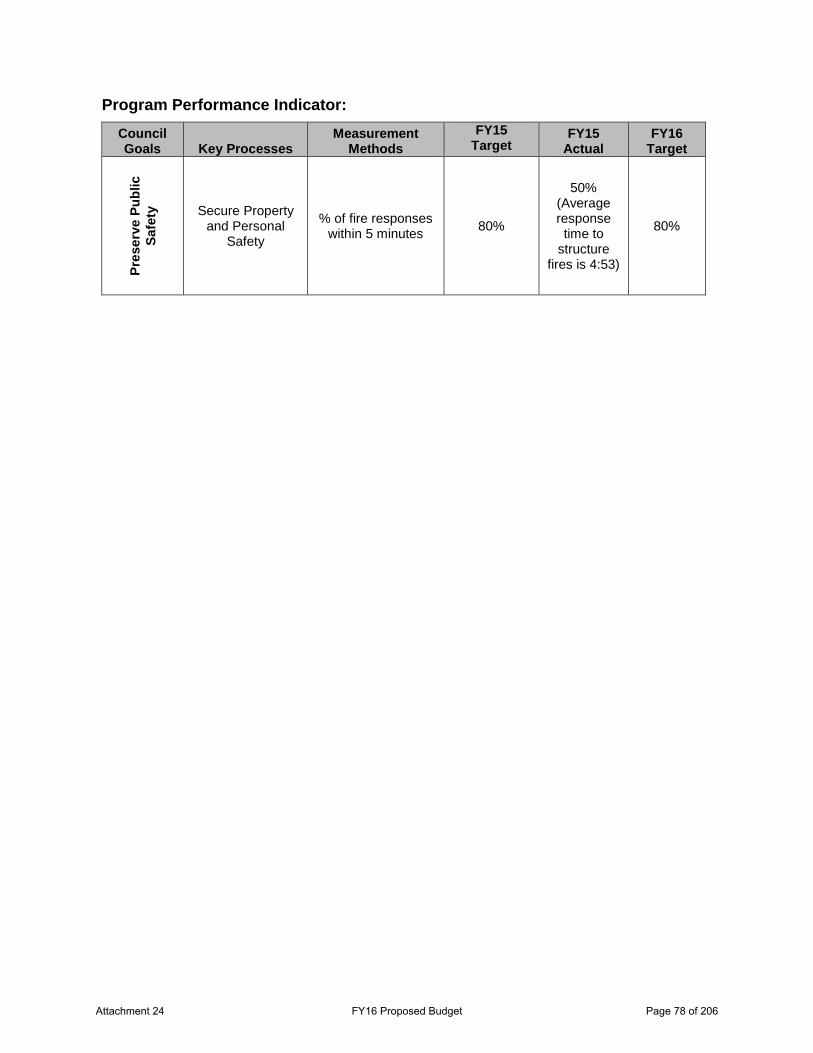
Program Performance Indicator: Council Goals Key Processes
Measurement Methods
FY15 Target
FY15 Actual
FY16 Target
Pres
erve
Pub
lic
Safe
ty
Secure Property and Personal
Safety
% of fire responses within 5 minutes
80%
50% (Average response time to
structure fires is 4:53)
80%
Attachment 24 FY16 Proposed Budget Page 78 of 206
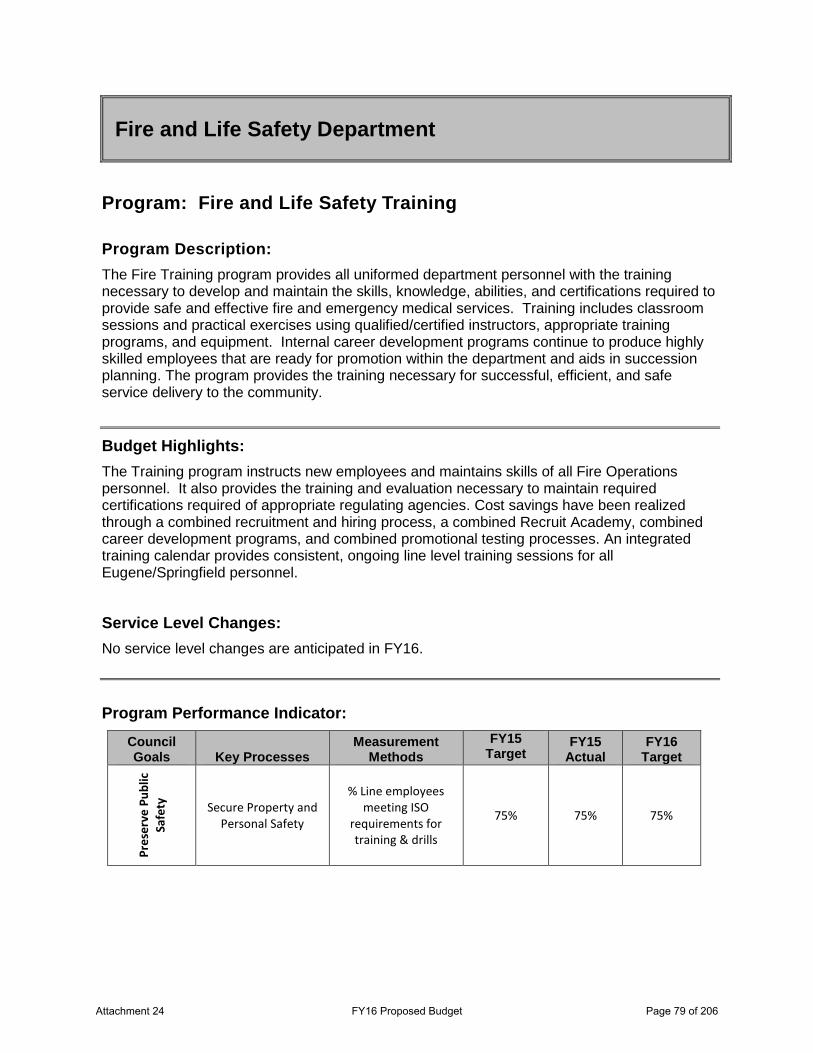
Fire and Life Safety Department
Program: Fire and Life Safety Training Program Description: The Fire Training program provides all uniformed department personnel with the training necessary to develop and maintain the skills, knowledge, abilities, and certifications required to provide safe and effective fire and emergency medical services. Training includes classroom sessions and practical exercises using qualified/certified instructors, appropriate training programs, and equipment. Internal career development programs continue to produce highly skilled employees that are ready for promotion within the department and aids in succession planning. The program provides the training necessary for successful, efficient, and safe service delivery to the community.
Budget Highlights: The Training program instructs new employees and maintains skills of all Fire Operations personnel. It also provides the training and evaluation necessary to maintain required certifications required of appropriate regulating agencies. Cost savings have been realized through a combined recruitment and hiring process, a combined Recruit Academy, combined career development programs, and combined promotional testing processes. An integrated training calendar provides consistent, ongoing line level training sessions for all Eugene/Springfield personnel.
Service Level Changes: No service level changes are anticipated in FY16.
Program Performance Indicator: Council Goals Key Processes
Measurement Methods
FY15 Target
FY15 Actual
FY16 Target
Pres
erve
Pub
lic
Safe
ty
Secure Property and Personal Safety
% Line employees meeting ISO
requirements for training & drills
75% 75% 75%
Attachment 24 FY16 Proposed Budget Page 79 of 206

Attachment 24 FY16 Proposed Budget Page 80 of 206
Human Resources Department
Departmental Programs
• Recruitment, Selection, & Retention • Employee & Labor Relations • City Wide Training • Risk Management • Benefits
Department Description The Human Resources Department serves as a support system to and strategic partner with other City departments by providing all major employment, risk, and benefit services for the City. These services are delivered through five major program areas: Employee Recruitment, Selection & Retention, Employee & Labor Relations, City-Wide Training, Risk Management, and Employee Benefits.
Human Resources administers a job classification system that is relevant, flexible and fair, oversees the City’s compensation practices to ensure compliance with State and Federal compensation regulations, and develops competitive compensation strategies that will enable the City to attract and retain talented employees. In addition, Human Resources strives to work collaboratively with the City's collective bargaining units in administering the labor contracts, resolving disputes, and handling grievances. Human Resources builds positive relationships with employees through implementation of equitable employment policies, performance management practices, employee recognition programs, and the City’s training program. This training program includes new employee orientation, supervisory development, and other mandatory and discretionary training.
The City’s Employee Benefits program includes: health, life, and disability insurance, employee leave administration, retirement, and employee wellness. The key component in our wellness program is our Springwell Employee Clinic, staffed by a Family Nurse Practitioner. The Department is also responsible for City-wide Risk Management, including loss prevention planning, workplace health and safety, litigation coordination, workers compensation, volunteer coordination and insurance and liability claim administration.
Human Resources staff must stay abreast of new federal, state and local laws and regulations impacting each of our five program areas.
Mission The mission of the Human Resources Department is to serve the organization by providing professional organizational development & technical counsel, strategic guidance, service, leadership, and training for issues related to the City’s work force to our partner departments.
Attachment 24 FY16 Proposed Budget Page 81 of 206
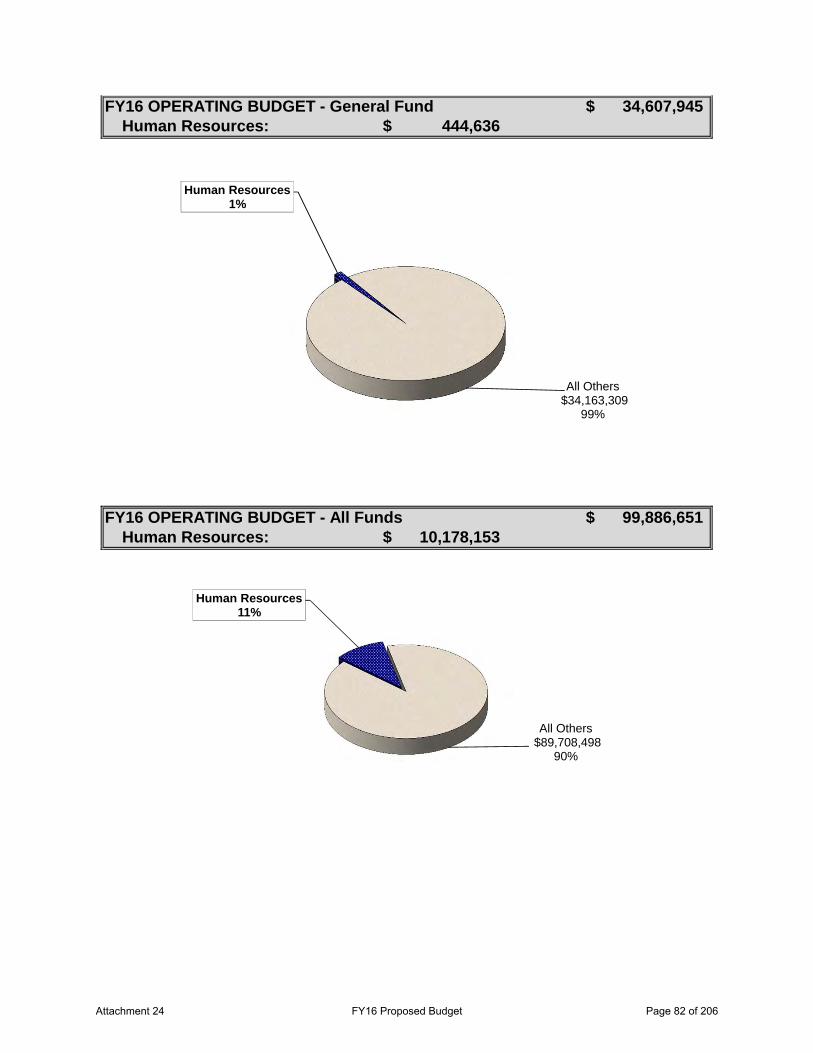
Human Resources:
Human Resources:
FY16 OPERATING BUDGET - General Fund 34,607,945$
FY16 OPERATING BUDGET - All Funds 99,886,651$
444,636$
10,178,153$
Human Resources1%
All Others$34,163,309
99%
Human Resources11%
All Others$89,708,498
90%
Attachment 24 FY16 Proposed Budget Page 82 of 206
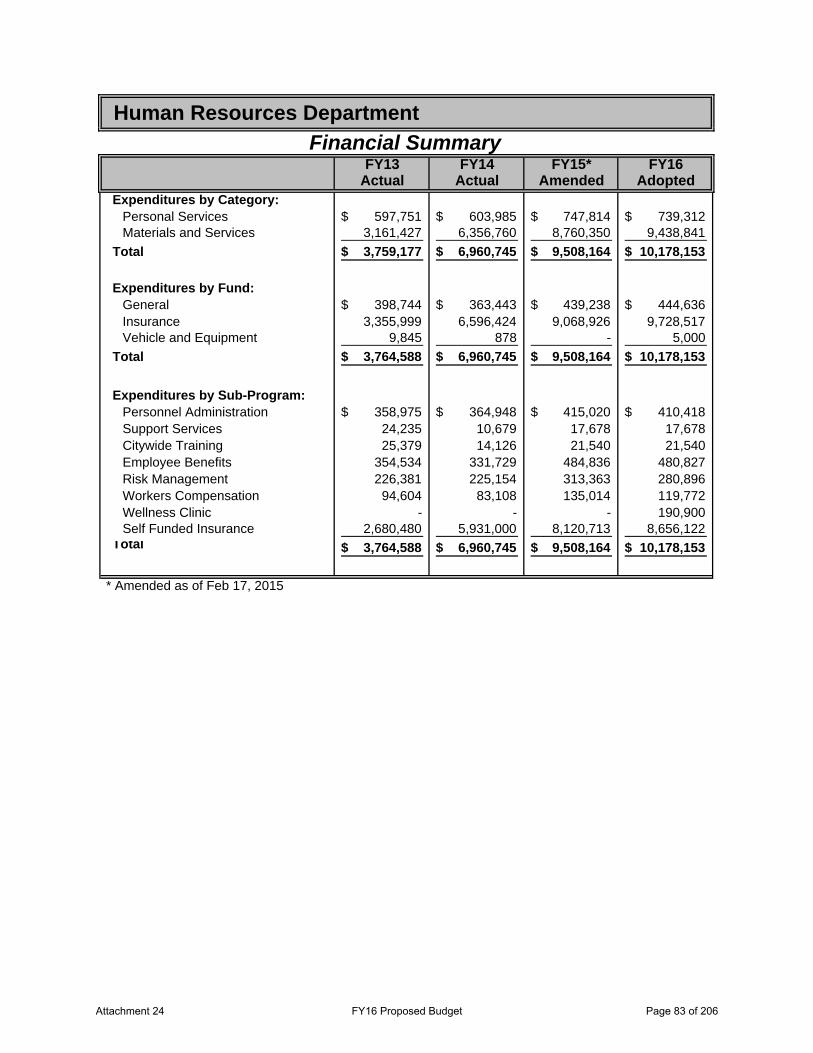
FY13 FY14 FY15* FY16Actual Actual Amended Adopted
Expenditures by Category:Personal Services 597,751$ 603,985$ 747,814$ 739,312$ Materials and Services 3,161,427 6,356,760 8,760,350 9,438,841
Total 3,759,177$ 6,960,745$ 9,508,164$ 10,178,153$
Expenditures by Fund:General 398,744$ 363,443$ 439,238$ 444,636$ Insurance 3,355,999 6,596,424 9,068,926 9,728,517 Vehicle and Equipment 9,845 878 - 5,000
Total 3,764,588$ 6,960,745$ 9,508,164$ 10,178,153$
Expenditures by Sub-Program:Personnel Administration 358,975$ 364,948$ 415,020$ 410,418$ Support Services 24,235 10,679 17,678 17,678 Citywide Training 25,379 14,126 21,540 21,540 Employee Benefits 354,534 331,729 484,836 480,827 Risk Management 226,381 225,154 313,363 280,896 Workers Compensation 94,604 83,108 135,014 119,772 Wellness Clinic - - - 190,900 Self Funded Insurance 2,680,480 5,931,000 8,120,713 8,656,122
Total 3,764,588$ 6,960,745$ 9,508,164$ 10,178,153$
Human Resources DepartmentFinancial Summary
* Amended as of Feb 17, 2015
Attachment 24 FY16 Proposed Budget Page 83 of 206
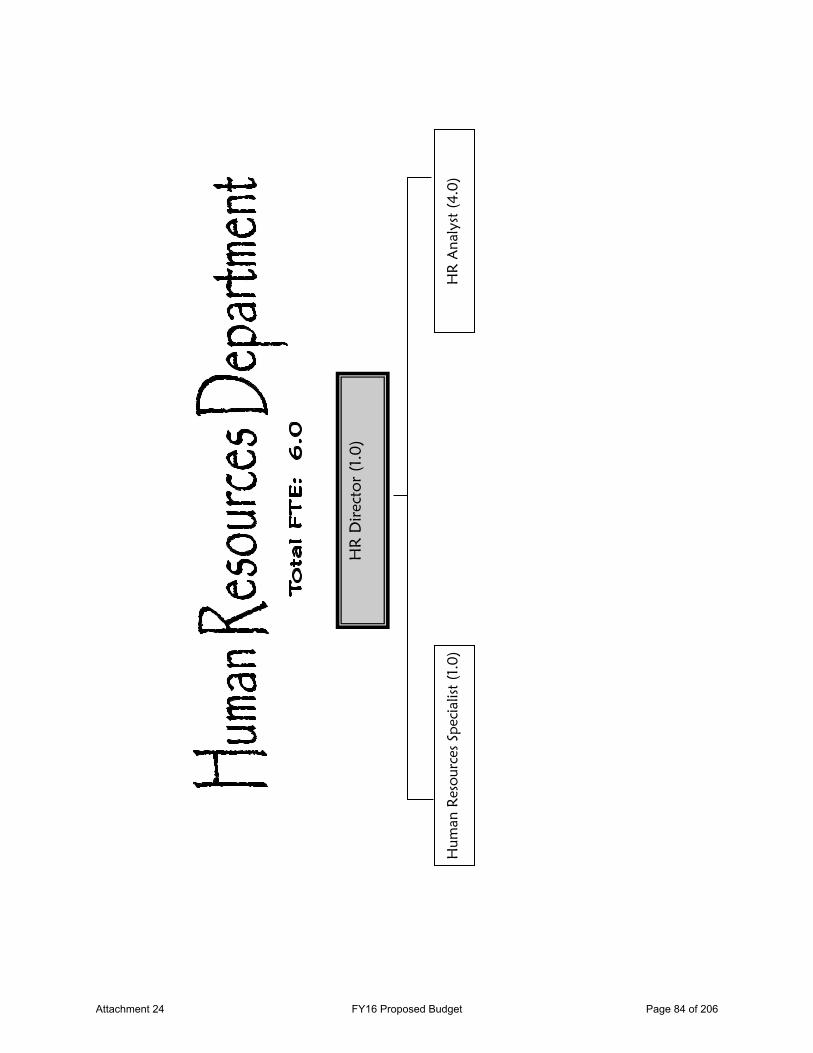
HR
Dir
ecto
r (1
.0)
HR
Ana
lyst
(4.
0)
Hum
an R
esou
rces
Spe
cial
ist (
1.0)
Attachment 24 FY16 Proposed Budget Page 84 of 206
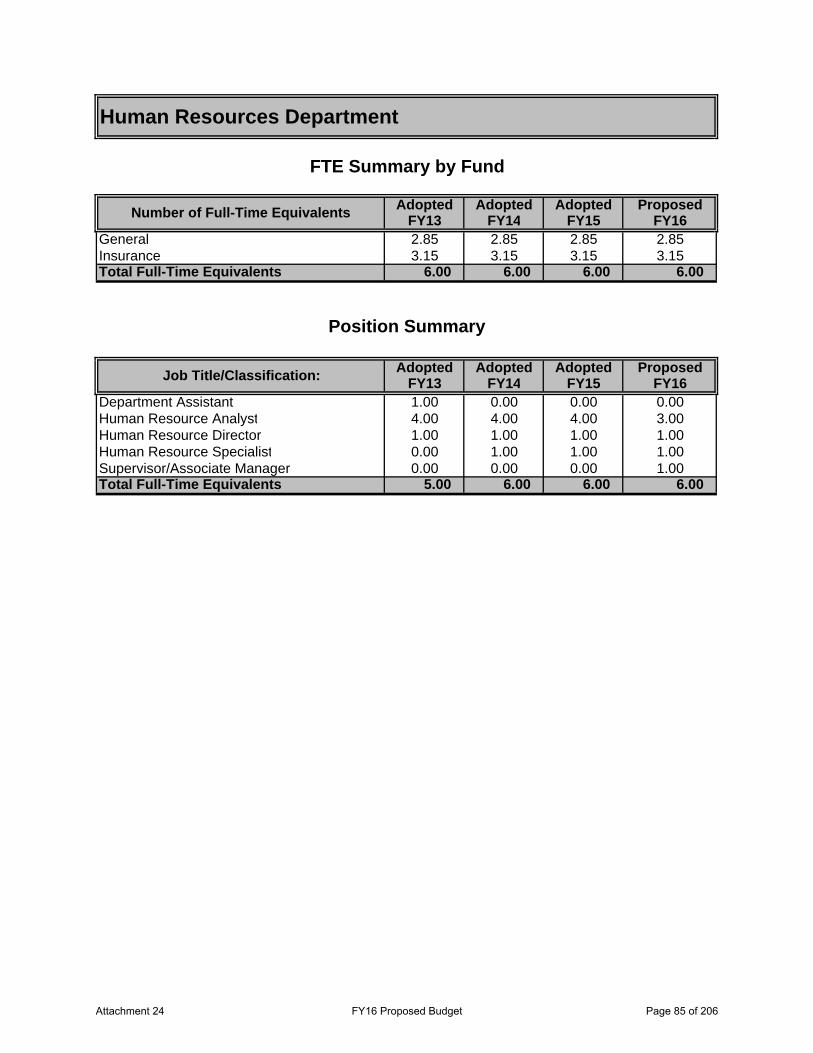
Adopted Adopted Adopted ProposedFY13 FY14 FY15 FY16
General 2.85 2.85 2.85 2.85Insurance 3.15 3.15 3.15 3.15Total Full-Time Equivalents 6.00 6.00 6.00 6.00
Adopted Adopted Adopted ProposedFY13 FY14 FY15 FY16
Department Assistant 1.00 0.00 0.00 0.00Human Resource Analyst 4.00 4.00 4.00 3.00Human Resource Director 1.00 1.00 1.00 1.00Human Resource Specialist 0.00 1.00 1.00 1.00Supervisor/Associate Manager 0.00 0.00 0.00 1.00Total Full-Time Equivalents 5.00 6.00 6.00 6.00
Human Resources Department
FTE Summary by Fund
Number of Full-Time Equivalents
Position Summary
Job Title/Classification:
Attachment 24 FY16 Proposed Budget Page 85 of 206

Attachment 24 FY16 Proposed Budget Page 86 of 206
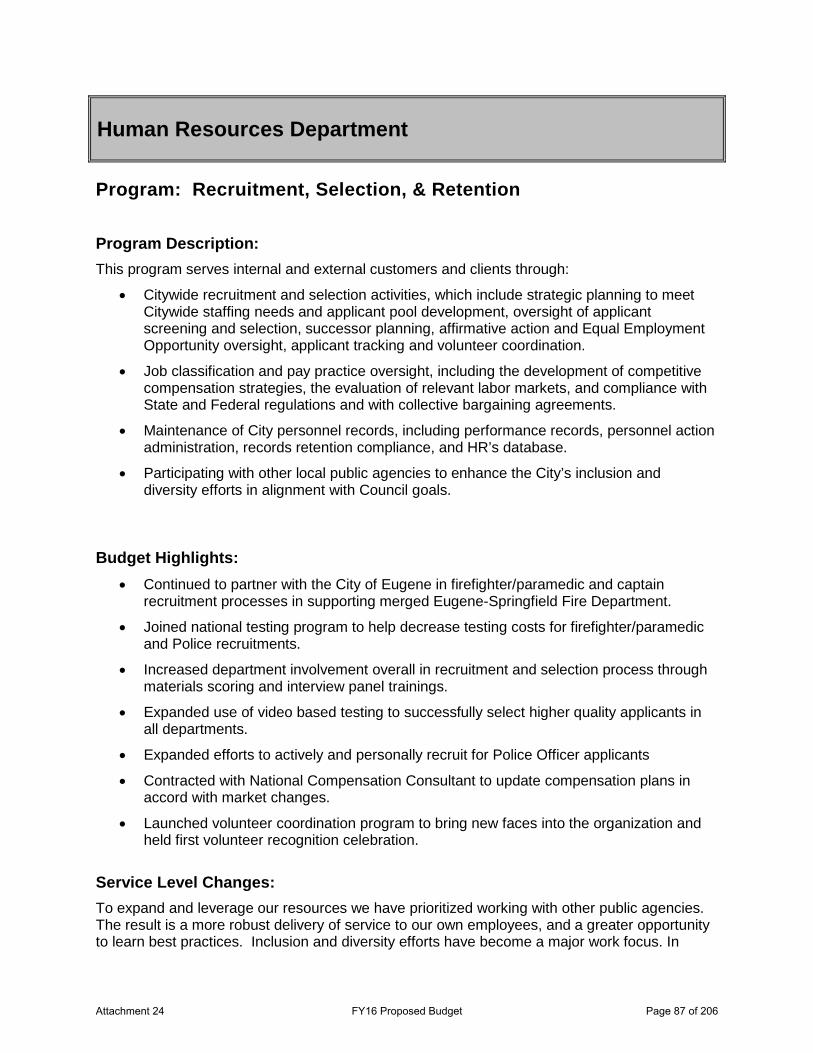
Human Resources Department
Program: Recruitment, Selection, & Retention Program Description: This program serves internal and external customers and clients through:
• Citywide recruitment and selection activities, which include strategic planning to meet Citywide staffing needs and applicant pool development, oversight of applicant screening and selection, successor planning, affirmative action and Equal Employment Opportunity oversight, applicant tracking and volunteer coordination.
• Job classification and pay practice oversight, including the development of competitive compensation strategies, the evaluation of relevant labor markets, and compliance with State and Federal regulations and with collective bargaining agreements.
• Maintenance of City personnel records, including performance records, personnel action administration, records retention compliance, and HR’s database.
• Participating with other local public agencies to enhance the City’s inclusion and diversity efforts in alignment with Council goals.
Budget Highlights: • Continued to partner with the City of Eugene in firefighter/paramedic and captain
recruitment processes in supporting merged Eugene-Springfield Fire Department.
• Joined national testing program to help decrease testing costs for firefighter/paramedic and Police recruitments.
• Increased department involvement overall in recruitment and selection process through materials scoring and interview panel trainings.
• Expanded use of video based testing to successfully select higher quality applicants in all departments.
• Expanded efforts to actively and personally recruit for Police Officer applicants
• Contracted with National Compensation Consultant to update compensation plans in accord with market changes.
• Launched volunteer coordination program to bring new faces into the organization and held first volunteer recognition celebration.
Service Level Changes: To expand and leverage our resources we have prioritized working with other public agencies. The result is a more robust delivery of service to our own employees, and a greater opportunity to learn best practices. Inclusion and diversity efforts have become a major work focus. In
Attachment 24 FY16 Proposed Budget Page 87 of 206
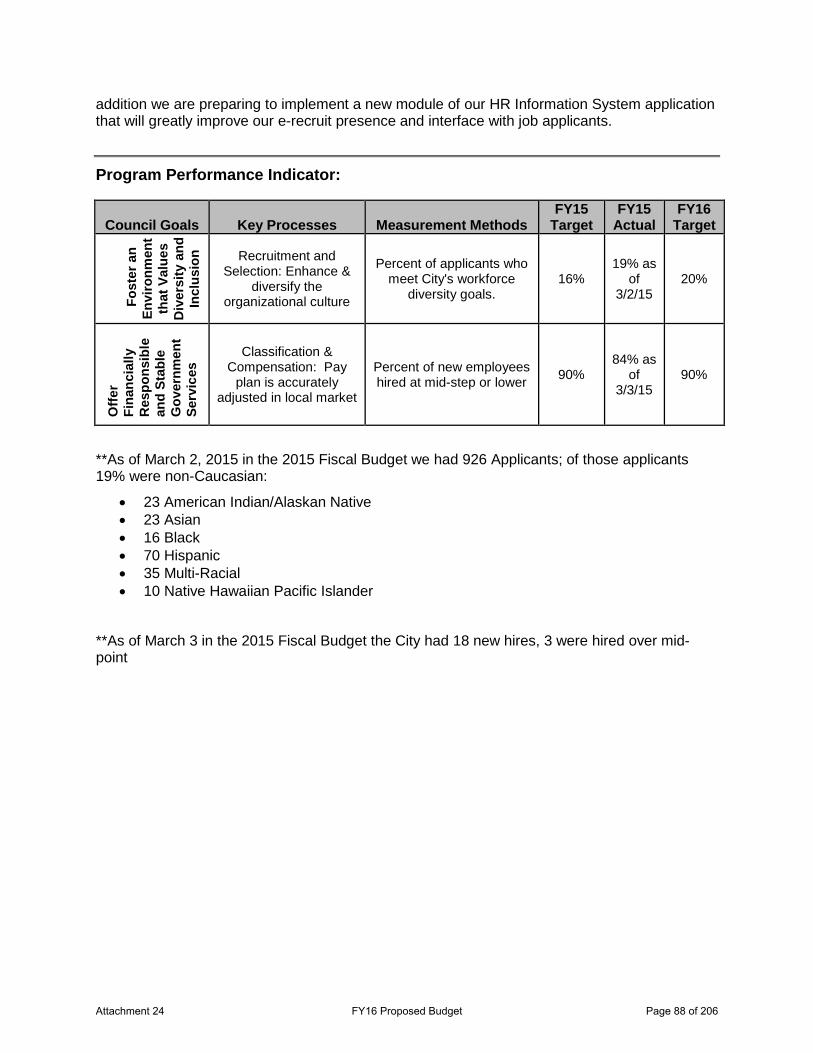
addition we are preparing to implement a new module of our HR Information System application that will greatly improve our e-recruit presence and interface with job applicants.
Program Performance Indicator:
Council Goals Key Processes Measurement Methods FY15
Target FY15
Actual FY16
Target
Fos
ter a
n En
viro
nmen
t th
at V
alue
s D
iver
sity
and
In
clus
ion
Recruitment and Selection: Enhance &
diversify the organizational culture
Percent of applicants who meet City's workforce
diversity goals. 16%
19% as of
3/2/15 20%
Offe
r Fi
nanc
ially
R
espo
nsib
le
and
Stab
le
Gov
ernm
ent
Serv
ices
Classification & Compensation: Pay
plan is accurately adjusted in local market
Percent of new employees hired at mid-step or lower
90% 84% as
of 3/3/15
90%
**As of March 2, 2015 in the 2015 Fiscal Budget we had 926 Applicants; of those applicants 19% were non-Caucasian:
• 23 American Indian/Alaskan Native • 23 Asian • 16 Black • 70 Hispanic • 35 Multi-Racial • 10 Native Hawaiian Pacific Islander
**As of March 3 in the 2015 Fiscal Budget the City had 18 new hires, 3 were hired over mid-point
Attachment 24 FY16 Proposed Budget Page 88 of 206
Human Resources Department
Program: Employee & Labor Relations Program Description: This program supports supervisors and employees alike in understanding and navigating the many regulations, rules, and contract provisions that govern the employment relationship between the City and its employees. This is achieved by developing, implementing, and administering the City’s policies and procedures in collaboration with our employees, and in negotiating and administering the contracts the City has with its four collective bargaining units. Essential functions of this program are:
• Providing guidance, consultation, advice, and training to supervisors and employees in dealing with workplace issues (including union grievances).
• Encouraging fair and positive performance management practices.
• Investigating discrimination and harassment complaints.
• Investigating allegations of employment rule violation.
• Negotiating and resolving workplace disputes.
• Assisting in responding to Equal Employment Opportunity Commission investigations and employee litigation.
• Negotiating collective bargaining agreements with four different unions.
Budget Highlights: • Taking the lead on reorganizing, updating, and rewriting all City-wide policies and
procedures to reduce City’s risk exposure and decrease liability insurance premium costs.
• Bargained a new separate contract covering the recently organized battalion chief positions with the International Association of Firefighters (IAFF 851).
• Hosted a regional training in conjunction with the Oregon Employers Labor Association to strategize how management might respond to a legislative effort to allow supervisors to unionize..
Service Level Changes: Have taken a leadership role in the Oregon Public Employers Labor Relations Association in order to be more informed about State collective bargaining issues, and to have more input in how unions impact public service. Working with other public agencies has become a priority in expanding and leveraging our resources. The result is a more robust delivery of service to our own employees, and a greater opportunity to learn best practices. In addition, Human Resource staff is now holding regular office hours at the Justice Center in order to be more familiar with
Attachment 24 FY16 Proposed Budget Page 89 of 206
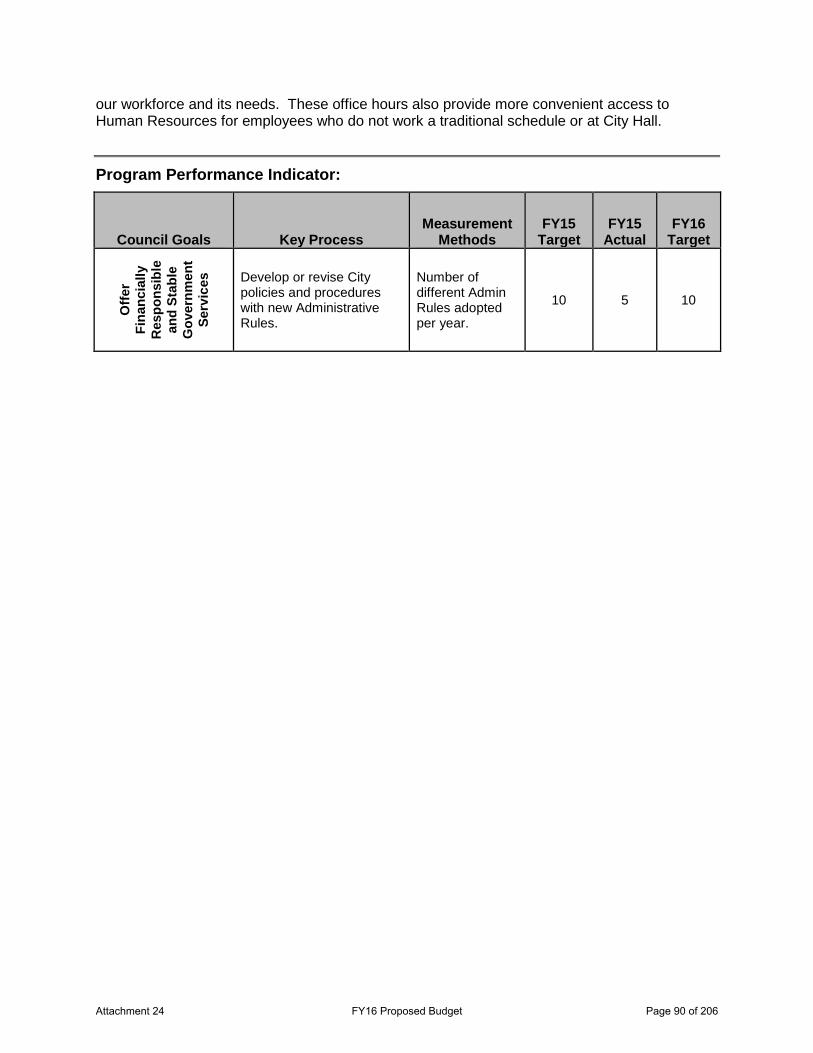
our workforce and its needs. These office hours also provide more convenient access to Human Resources for employees who do not work a traditional schedule or at City Hall.
Program Performance Indicator:
Council Goals Key Process Measurement
Methods FY15
Target FY15
Actual FY16
Target
Offe
r Fi
nanc
ially
R
espo
nsib
le
and
Stab
le
Gov
ernm
ent
Serv
ices
Develop or revise City policies and procedures with new Administrative Rules.
Number of different Admin Rules adopted per year.
10 5 10
Attachment 24 FY16 Proposed Budget Page 90 of 206
Human Resources Department
Program: City-Wide Training Program Description: Coordinating the delivery of City-provided training and communicating opportunities for outside training are key functions of this program. Required City trainings include:
• New employee orientation;
• Employee development planning and counseling;
• Mandatory legal and regulatory obligations, such as anti-harassment and discrimination training; and
• Diversity and inclusion training.
Human Resources also provide other training opportunities that address current trends and topics and support our employees’ development.
Budget Highlights: We made progress in implementing online training. Much of the training required of employees is fairly standardized and lends itself well to computer based training. By allowing employees to complete training on their schedule and at their own desks, this frees up staff training time for more complex and tailored trainings.
We have begun using a system provided by City County Insurance Services (CIS) for all volunteers and many new hires. We hope to continue rolling out the system to remaining staff. A sampling of the 400+ trainings include:
• Sexual Harassment and Discrimination in the Government Workplace
• Workplace Ethics
• Interviewing & Hiring Practices
• Safety Committee Responsibilities
• Bloodborne Pathogen Awareness
• Workplace Violence
• Computer Skills (MS Word, Excel, etc.)
• Etc.
Attachment 24 FY16 Proposed Budget Page 91 of 206
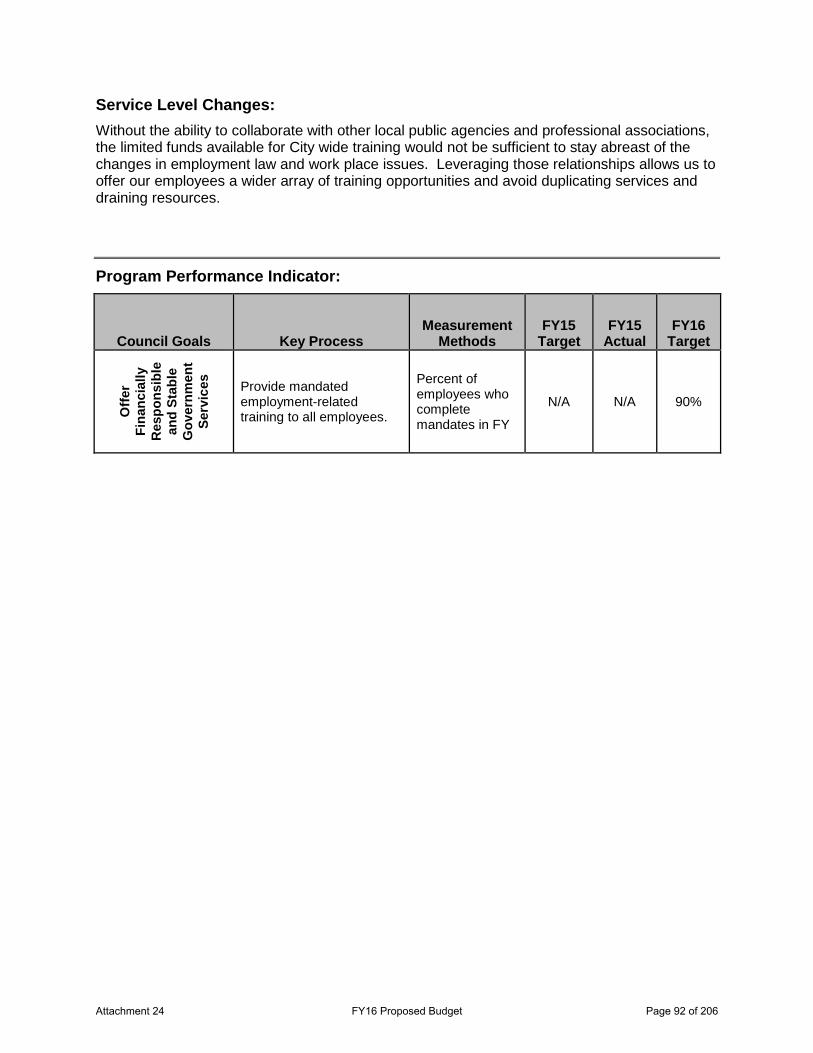
Service Level Changes: Without the ability to collaborate with other local public agencies and professional associations, the limited funds available for City wide training would not be sufficient to stay abreast of the changes in employment law and work place issues. Leveraging those relationships allows us to offer our employees a wider array of training opportunities and avoid duplicating services and draining resources.
Program Performance Indicator:
Council Goals Key Process Measurement
Methods FY15
Target FY15
Actual FY16
Target
Offe
r Fi
nanc
ially
R
espo
nsib
le
and
Stab
le
Gov
ernm
ent
Serv
ices
Provide mandated employment-related training to all employees.
Percent of employees who complete mandates in FY
N/A N/A 90%
Attachment 24 FY16 Proposed Budget Page 92 of 206
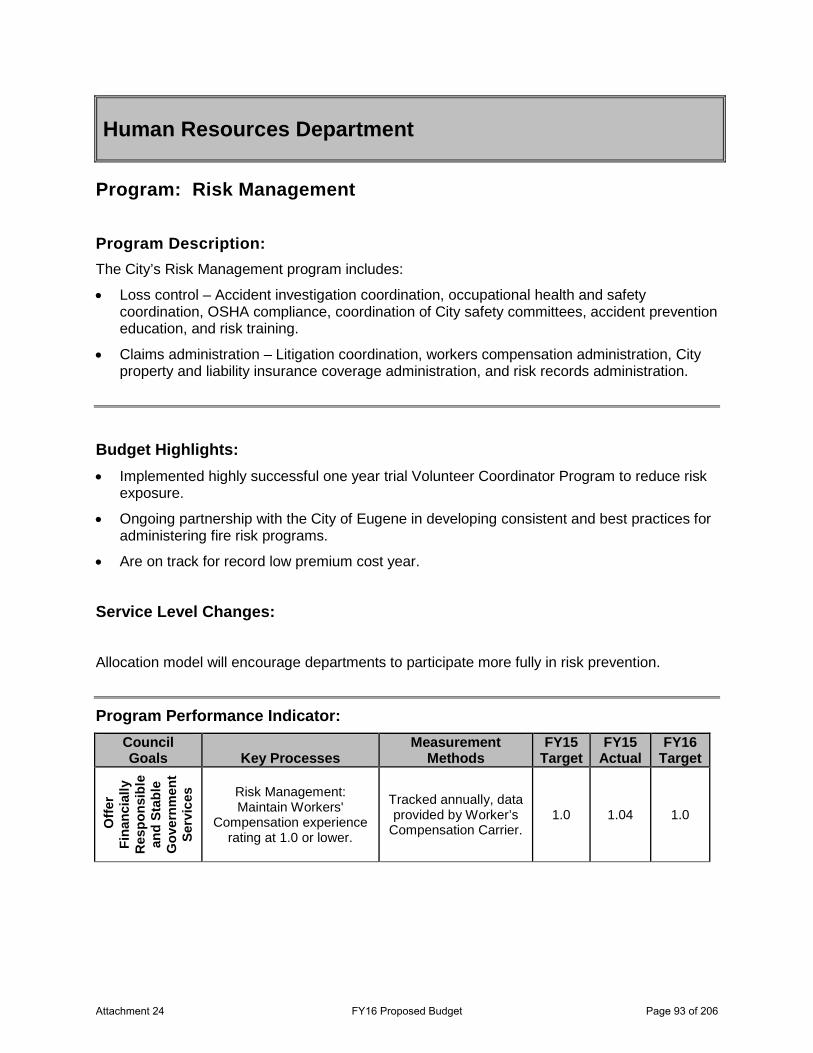
Human Resources Department
Program: Risk Management Program Description: The City’s Risk Management program includes:
• Loss control – Accident investigation coordination, occupational health and safety coordination, OSHA compliance, coordination of City safety committees, accident prevention education, and risk training.
• Claims administration – Litigation coordination, workers compensation administration, City property and liability insurance coverage administration, and risk records administration.
Budget Highlights: • Implemented highly successful one year trial Volunteer Coordinator Program to reduce risk
exposure.
• Ongoing partnership with the City of Eugene in developing consistent and best practices for administering fire risk programs.
• Are on track for record low premium cost year.
Service Level Changes:
Allocation model will encourage departments to participate more fully in risk prevention.
Program Performance Indicator: Council Goals Key Processes
Measurement Methods
FY15 Target
FY15 Actual
FY16 Target
Offe
r Fi
nanc
ially
R
espo
nsib
le
and
Stab
le
Gov
ernm
ent
Serv
ices
Risk Management: Maintain Workers'
Compensation experience rating at 1.0 or lower.
Tracked annually, data provided by Worker’s
Compensation Carrier. 1.0 1.04 1.0
Attachment 24 FY16 Proposed Budget Page 93 of 206
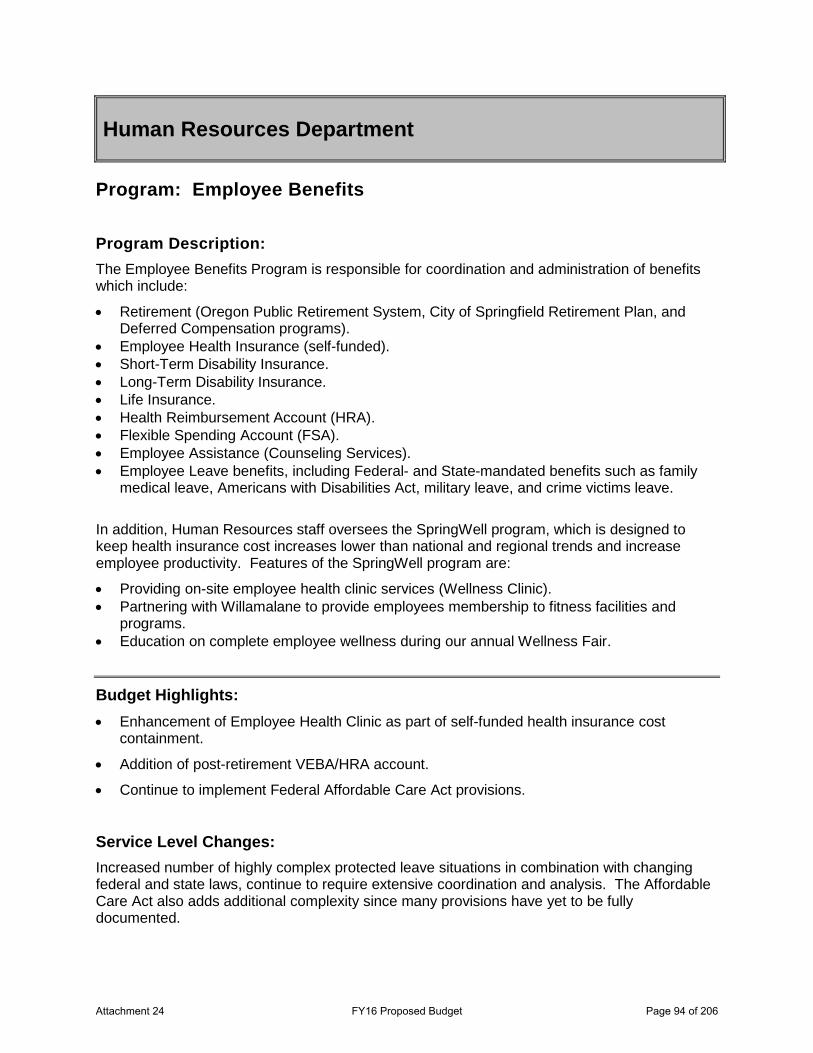
Human Resources Department
Program: Employee Benefits Program Description: The Employee Benefits Program is responsible for coordination and administration of benefits which include:
• Retirement (Oregon Public Retirement System, City of Springfield Retirement Plan, and Deferred Compensation programs).
• Employee Health Insurance (self-funded). • Short-Term Disability Insurance. • Long-Term Disability Insurance. • Life Insurance. • Health Reimbursement Account (HRA). • Flexible Spending Account (FSA). • Employee Assistance (Counseling Services). • Employee Leave benefits, including Federal- and State-mandated benefits such as family
medical leave, Americans with Disabilities Act, military leave, and crime victims leave.
In addition, Human Resources staff oversees the SpringWell program, which is designed to keep health insurance cost increases lower than national and regional trends and increase employee productivity. Features of the SpringWell program are:
• Providing on-site employee health clinic services (Wellness Clinic). • Partnering with Willamalane to provide employees membership to fitness facilities and
programs. • Education on complete employee wellness during our annual Wellness Fair.
Budget Highlights: • Enhancement of Employee Health Clinic as part of self-funded health insurance cost
containment.
• Addition of post-retirement VEBA/HRA account.
• Continue to implement Federal Affordable Care Act provisions.
Service Level Changes: Increased number of highly complex protected leave situations in combination with changing federal and state laws, continue to require extensive coordination and analysis. The Affordable Care Act also adds additional complexity since many provisions have yet to be fully documented.
Attachment 24 FY16 Proposed Budget Page 94 of 206
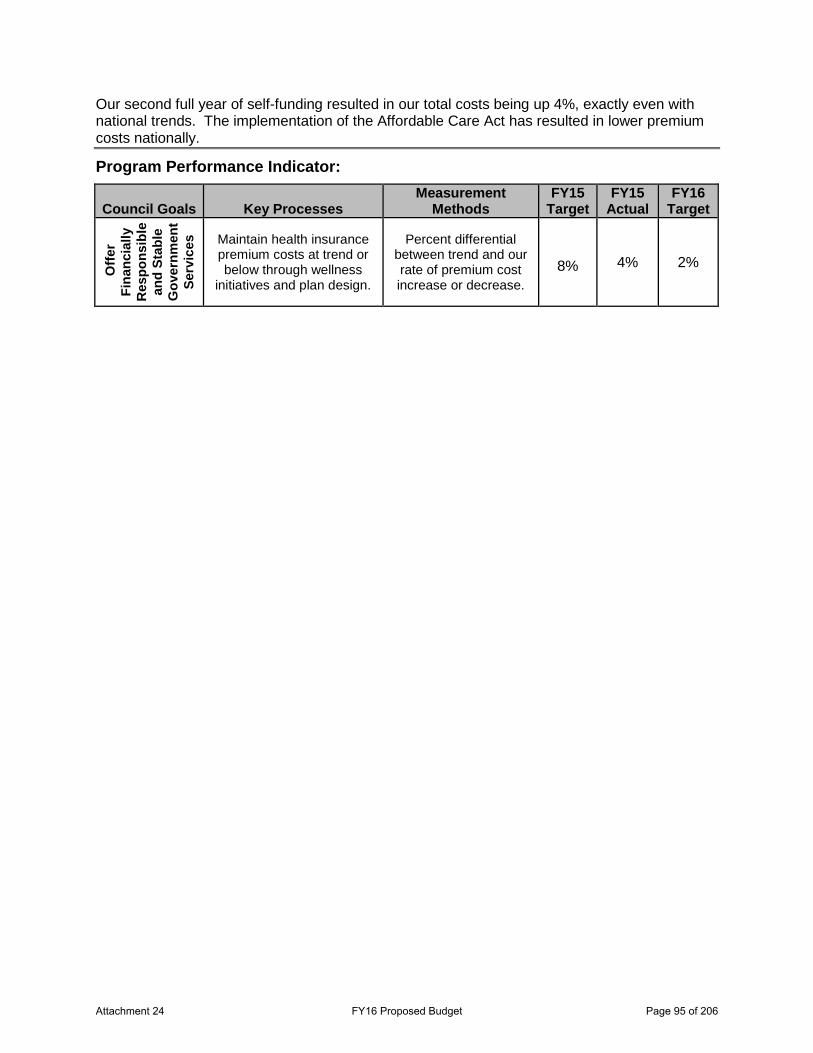
Our second full year of self-funding resulted in our total costs being up 4%, exactly even with national trends. The implementation of the Affordable Care Act has resulted in lower premium costs nationally.
Program Performance Indicator:
Council Goals Key Processes Measurement
Methods FY15
Target FY15
Actual FY16
Target
Offe
r Fi
nanc
ially
R
espo
nsib
le
and
Stab
le
Gov
ernm
ent
Serv
ices
Maintain health insurance premium costs at trend or below through wellness
initiatives and plan design.
Percent differential between trend and our rate of premium cost increase or decrease.
8% 4% 2%
Attachment 24 FY16 Proposed Budget Page 95 of 206

Attachment 24 FY16 Proposed Budget Page 96 of 206
Information Technology Department
Departmental Programs
Information Technology (IT) Geographic Information Systems (GIS)
Department Description The Information Technology (IT) Department helps other City Departments develop innovative and efficient IT solutions through a series of services that includes implementing and integrating computer systems, coordinating and providing training, negotiating and managing information technology-related contracts, performing application development, and technology assistance and support.
Current Program IT Program – Traditionally the IT Department included loosely defined programs, the network solutions team and the central service (or application) solutions team. Combined these teams represented the IT Program that creates the technology environment that enables City employees to quickly access vital information using the most efficient and cost effective system hardware and software. The program is also responsible for providing effective voice communications utilizing a combination of Public Branch Exchange (PBX) and Voice over IP (VoIP) technologies.
GIS Program - Beginning in FY16, the IT Department will include the GIS Program. The GIS Program focuses on locating, documenting and managing data concerning facilities, structures (both public and private), planning activity, code enforcement activities, and geographic features of the City. The program provides spatial data collection, management, mapping, and integration using traditional advanced geospatial technology. Although all City departments and several intergovernmental organizations receive data and support for their ongoing operations and business decisions from the GIS Program, the Development and Public Works Department (DPW) is the direct recipient of GIS services. Furthermore, since the GIS Program receives a majority of funding directly from utilities funds (Street, Stormwater and Wastewater), GIS Program services need to directly related back to utilities services. Other departments are indirect recipients of these services.
Planned Program Changes - Moving forward, the combined IT and GIS programs will operate under a new organizational structure, new strategic plan, new set of Priority Based Budgeting (PBB) programs and new service level agreements with city departments. Strategic Planning is underway and on-track for completion 4th Quarter FY15. Department programs, PBB programs and service areas will be defined, implemented and tested throughout FY16.
Mission The Information Technology Department assists City Departments in responding to the needs of the citizens by enabling City employees to quickly access vital information and make data-driven decisions. We are dedicated to providing quality service through teamwork, partnerships, and developing team and individual strengths. Refinements to the “Mission” of the IT Department will occur during the Strategic Planning process.
Attachment 24 FY16 Proposed Budget Page 97 of 206
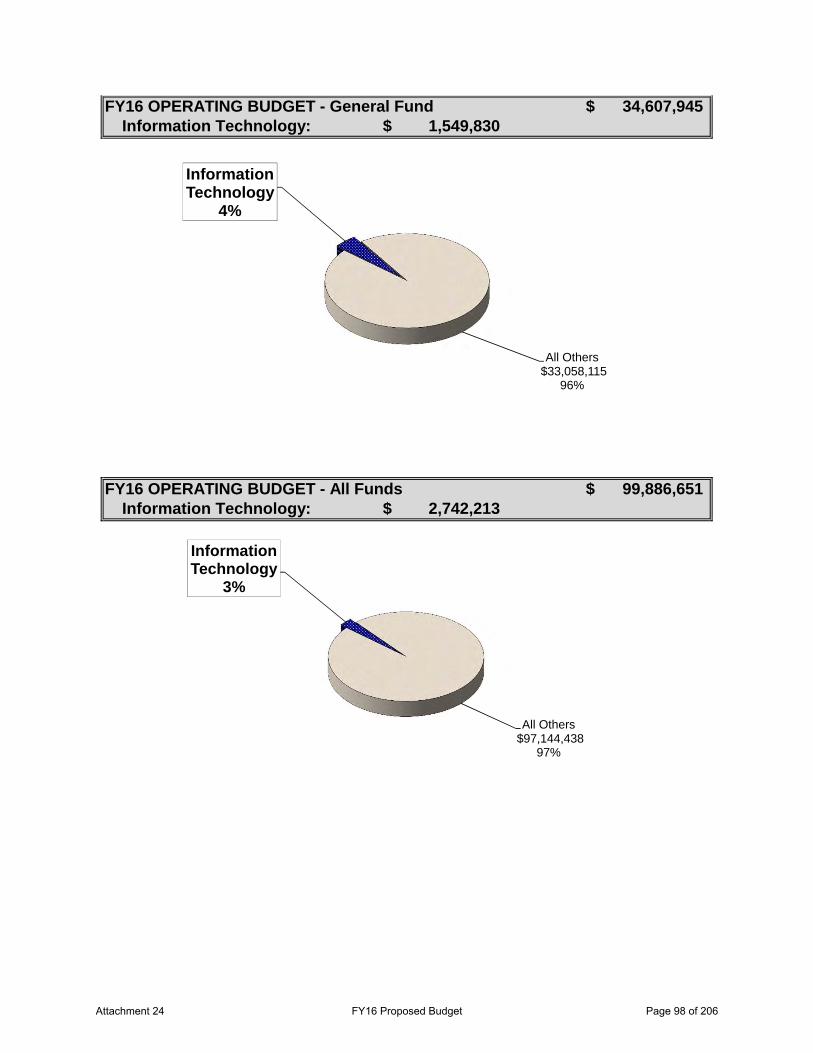
Information Technology:
Information Technology:
FY16 OPERATING BUDGET - General Fund 34,607,945$
FY16 OPERATING BUDGET - All Funds 99,886,651$
1,549,830$
2,742,213$
Information Technology
4%
All Others$33,058,115
96%
Information Technology
3%
All Others$97,144,438
97%
Attachment 24 FY16 Proposed Budget Page 98 of 206
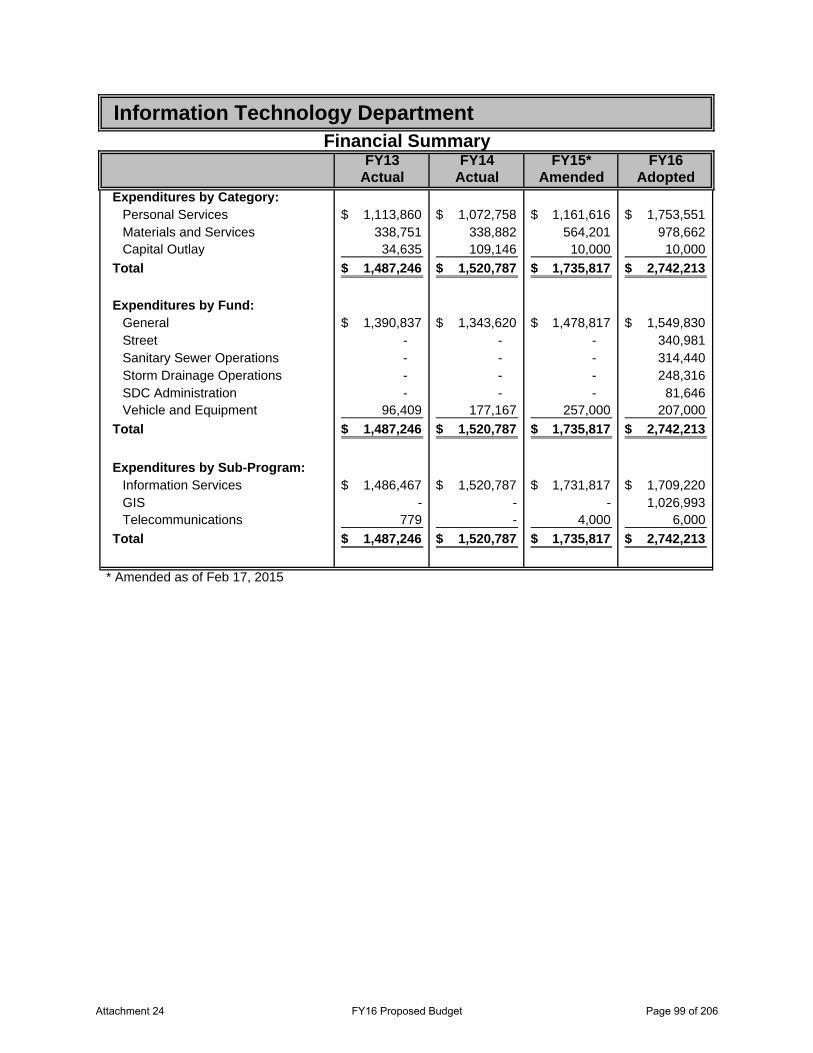
FY13 FY14 FY15* FY16Actual Actual Amended Adopted
Expenditures by Category:Personal Services 1,113,860$ 1,072,758$ 1,161,616$ 1,753,551$ Materials and Services 338,751 338,882 564,201 978,662 Capital Outlay 34,635 109,146 10,000 10,000
Total 1,487,246$ 1,520,787$ 1,735,817$ 2,742,213$
Expenditures by Fund:General 1,390,837$ 1,343,620$ 1,478,817$ 1,549,830$ Street - - - 340,981 Sanitary Sewer Operations - - - 314,440 Storm Drainage Operations - - - 248,316 SDC Administration - - - 81,646 Vehicle and Equipment 96,409 177,167 257,000 207,000
Total 1,487,246$ 1,520,787$ 1,735,817$ 2,742,213$
Expenditures by Sub-Program:Information Services 1,486,467$ 1,520,787$ 1,731,817$ 1,709,220$ GIS - - - 1,026,993 Telecommunications 779 - 4,000 6,000
Total 1,487,246$ 1,520,787$ 1,735,817$ 2,742,213$
Information Technology DepartmentFinancial Summary
* Amended as of Feb 17, 2015
Attachment 24 FY16 Proposed Budget Page 99 of 206
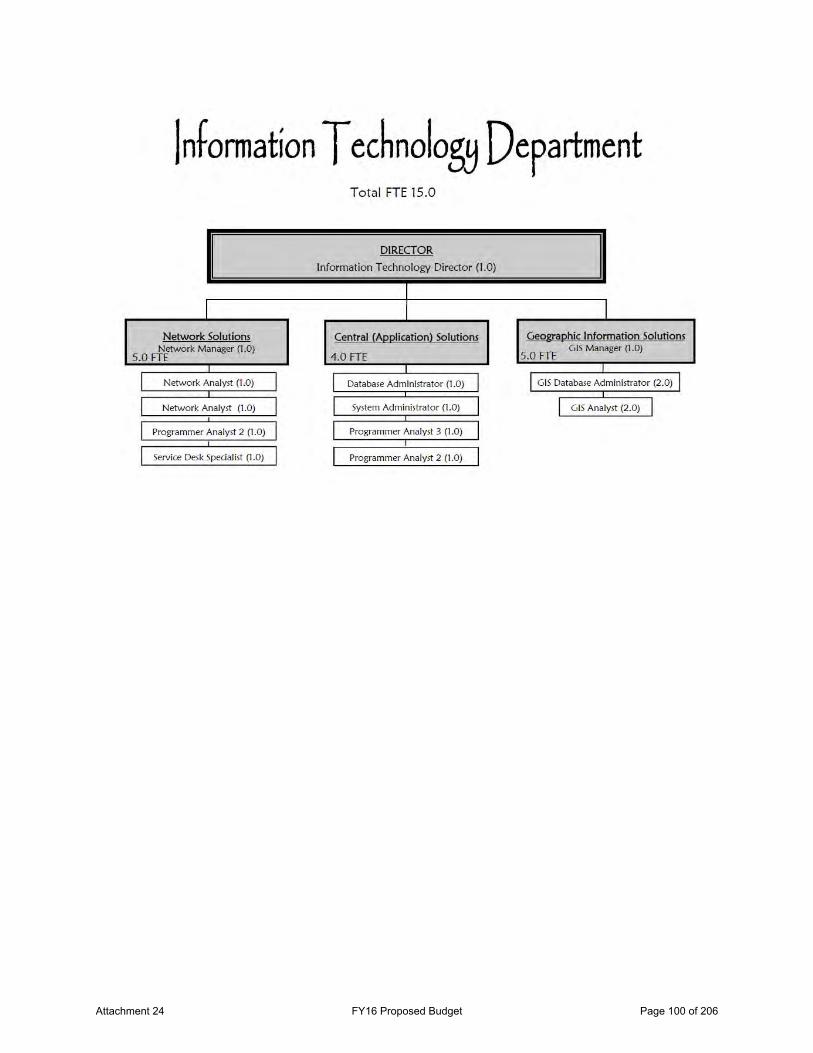
Attachment 24 FY16 Proposed Budget Page 100 of 206
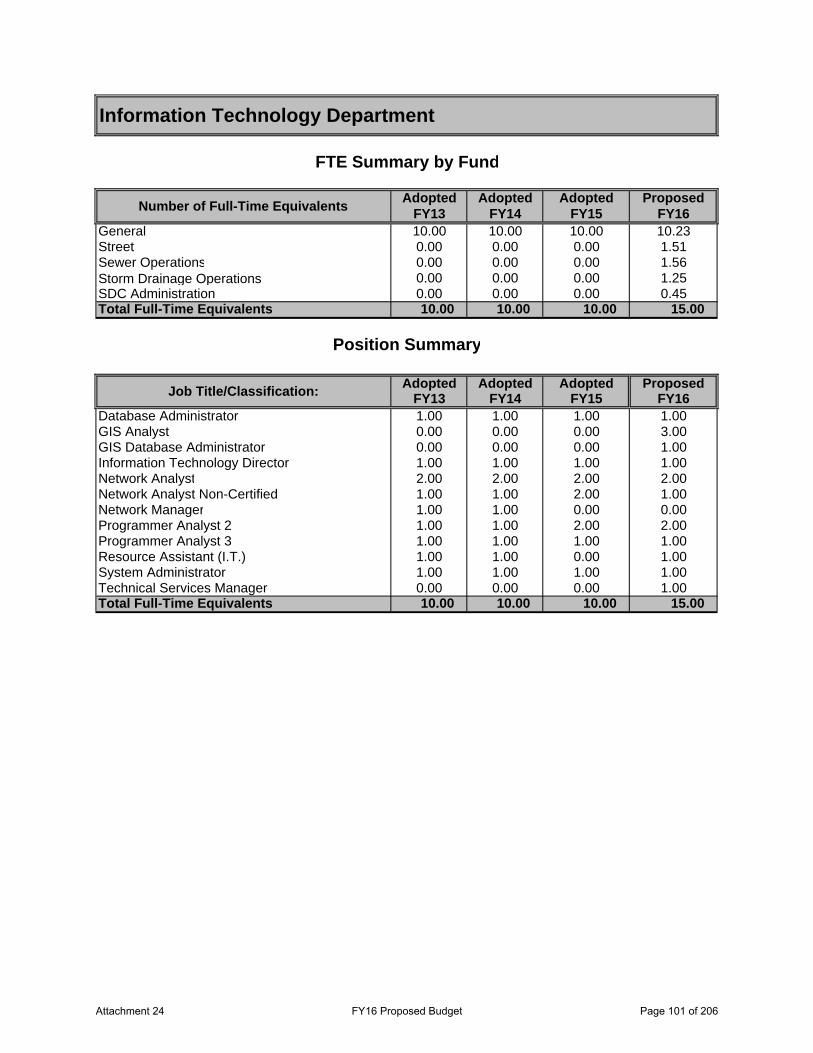
Adopted Adopted Adopted ProposedFY13 FY14 FY15 FY16
General 10.00 10.00 10.00 10.23Street 0.00 0.00 0.00 1.51Sewer Operations 0.00 0.00 0.00 1.56Storm Drainage Operations 0.00 0.00 0.00 1.25SDC Administration 0.00 0.00 0.00 0.45Total Full-Time Equivalents 10.00 10.00 10.00 15.00
Adopted Adopted Adopted ProposedFY13 FY14 FY15 FY16
Database Administrator 1.00 1.00 1.00 1.00GIS Analyst 0.00 0.00 0.00 3.00GIS Database Administrator 0.00 0.00 0.00 1.00Information Technology Director 1.00 1.00 1.00 1.00Network Analyst 2.00 2.00 2.00 2.00Network Analyst Non-Certified 1.00 1.00 2.00 1.00Network Manager 1.00 1.00 0.00 0.00Programmer Analyst 2 1.00 1.00 2.00 2.00Programmer Analyst 3 1.00 1.00 1.00 1.00Resource Assistant (I.T.) 1.00 1.00 0.00 1.00System Administrator 1.00 1.00 1.00 1.00Technical Services Manager 0.00 0.00 0.00 1.00Total Full-Time Equivalents 10.00 10.00 10.00 15.00
Information Technology Department
FTE Summary by Fund
Number of Full-Time Equivalents
Position Summary
Job Title/Classification:
Attachment 24 FY16 Proposed Budget Page 101 of 206

Attachment 24 FY16 Proposed Budget Page 102 of 206
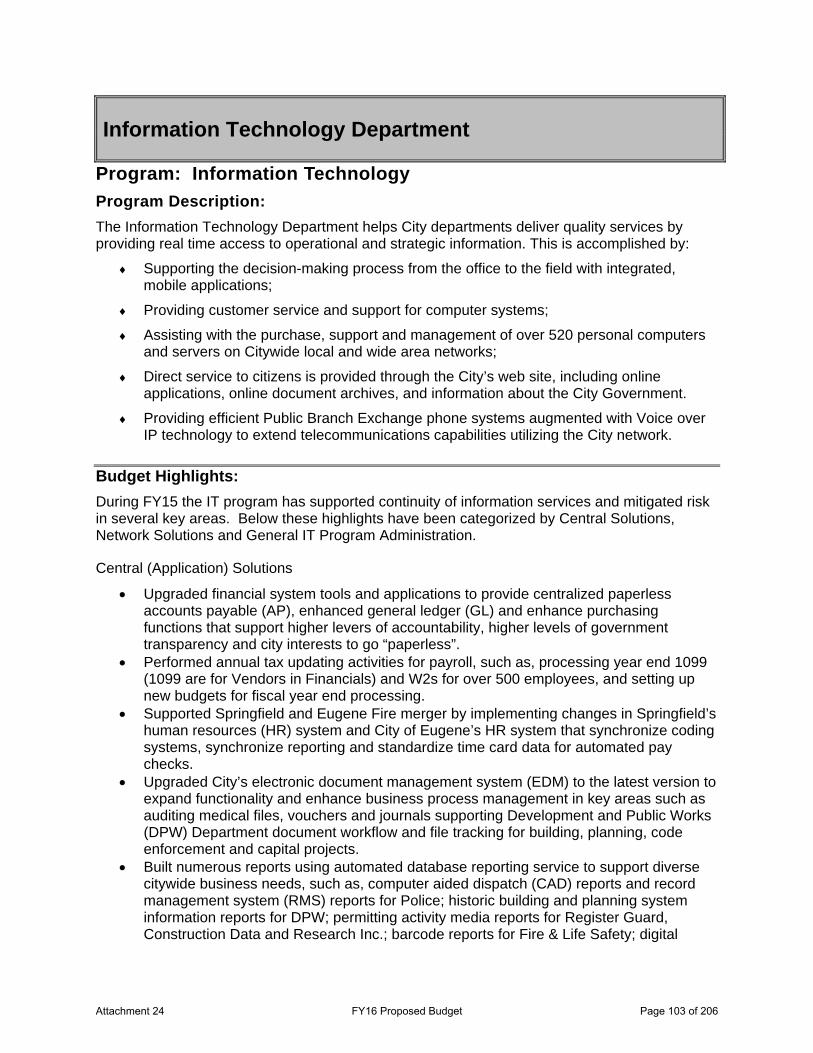
Information Technology Department
Program: Information Technology Program Description: The Information Technology Department helps City departments deliver quality services by providing real time access to operational and strategic information. This is accomplished by:
Supporting the decision-making process from the office to the field with integrated, mobile applications;
Providing customer service and support for computer systems;
Assisting with the purchase, support and management of over 520 personal computers and servers on Citywide local and wide area networks;
Direct service to citizens is provided through the City’s web site, including online applications, online document archives, and information about the City Government.
Providing efficient Public Branch Exchange phone systems augmented with Voice over IP technology to extend telecommunications capabilities utilizing the City network.
Budget Highlights: During FY15 the IT program has supported continuity of information services and mitigated risk in several key areas. Below these highlights have been categorized by Central Solutions, Network Solutions and General IT Program Administration.
Central (Application) Solutions
Upgraded financial system tools and applications to provide centralized paperless accounts payable (AP), enhanced general ledger (GL) and enhance purchasing functions that support higher levers of accountability, higher levels of government transparency and city interests to go “paperless”.
Performed annual tax updating activities for payroll, such as, processing year end 1099 (1099 are for Vendors in Financials) and W2s for over 500 employees, and setting up new budgets for fiscal year end processing.
Supported Springfield and Eugene Fire merger by implementing changes in Springfield’s human resources (HR) system and City of Eugene’s HR system that synchronize coding systems, synchronize reporting and standardize time card data for automated pay checks.
Upgraded City’s electronic document management system (EDM) to the latest version to expand functionality and enhance business process management in key areas such as auditing medical files, vouchers and journals supporting Development and Public Works (DPW) Department document workflow and file tracking for building, planning, code enforcement and capital projects.
Built numerous reports using automated database reporting service to support diverse citywide business needs, such as, computer aided dispatch (CAD) reports and record management system (RMS) reports for Police; historic building and planning system information reports for DPW; permitting activity media reports for Register Guard, Construction Data and Research Inc.; barcode reports for Fire & Life Safety; digital
Attachment 24 FY16 Proposed Budget Page 103 of 206
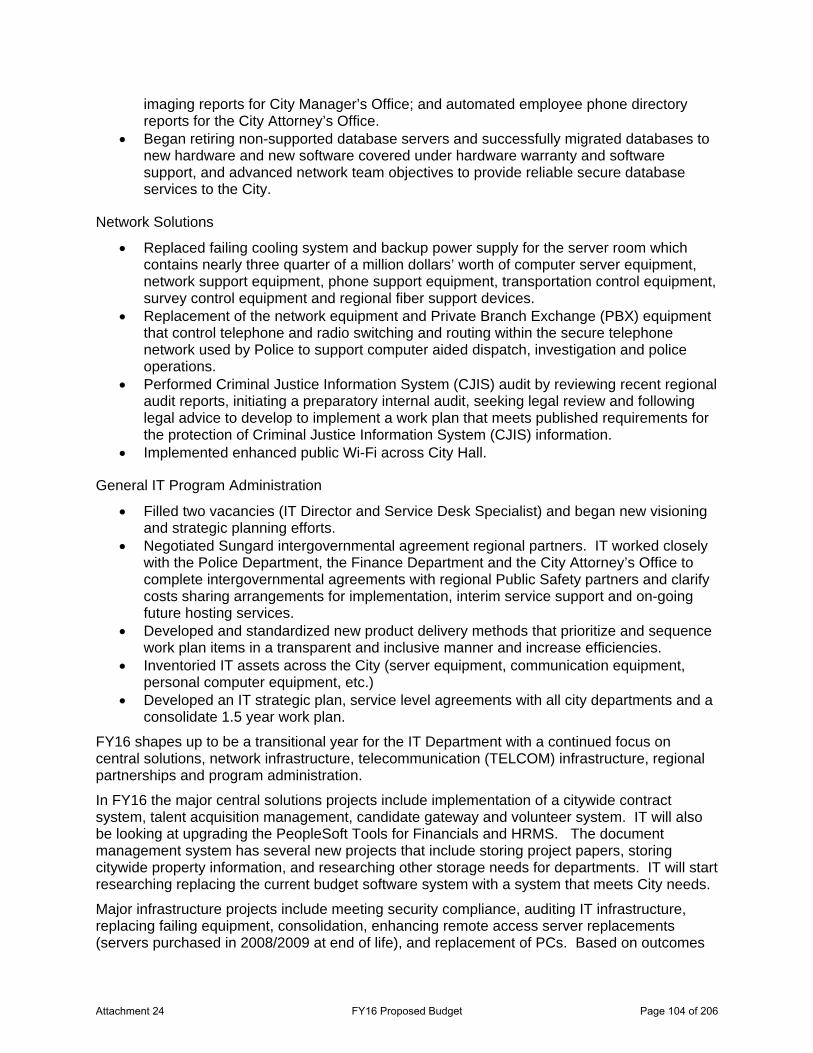
imaging reports for City Manager’s Office; and automated employee phone directory reports for the City Attorney’s Office.
Began retiring non-supported database servers and successfully migrated databases to new hardware and new software covered under hardware warranty and software support, and advanced network team objectives to provide reliable secure database services to the City.
Network Solutions
Replaced failing cooling system and backup power supply for the server room which contains nearly three quarter of a million dollars’ worth of computer server equipment, network support equipment, phone support equipment, transportation control equipment, survey control equipment and regional fiber support devices.
Replacement of the network equipment and Private Branch Exchange (PBX) equipment that control telephone and radio switching and routing within the secure telephone network used by Police to support computer aided dispatch, investigation and police operations.
Performed Criminal Justice Information System (CJIS) audit by reviewing recent regional audit reports, initiating a preparatory internal audit, seeking legal review and following legal advice to develop to implement a work plan that meets published requirements for the protection of Criminal Justice Information System (CJIS) information.
Implemented enhanced public Wi-Fi across City Hall.
General IT Program Administration
Filled two vacancies (IT Director and Service Desk Specialist) and began new visioning and strategic planning efforts.
Negotiated Sungard intergovernmental agreement regional partners. IT worked closely with the Police Department, the Finance Department and the City Attorney’s Office to complete intergovernmental agreements with regional Public Safety partners and clarify costs sharing arrangements for implementation, interim service support and on-going future hosting services.
Developed and standardized new product delivery methods that prioritize and sequence work plan items in a transparent and inclusive manner and increase efficiencies.
Inventoried IT assets across the City (server equipment, communication equipment, personal computer equipment, etc.)
Developed an IT strategic plan, service level agreements with all city departments and a consolidate 1.5 year work plan.
FY16 shapes up to be a transitional year for the IT Department with a continued focus on central solutions, network infrastructure, telecommunication (TELCOM) infrastructure, regional partnerships and program administration.
In FY16 the major central solutions projects include implementation of a citywide contract system, talent acquisition management, candidate gateway and volunteer system. IT will also be looking at upgrading the PeopleSoft Tools for Financials and HRMS. The document management system has several new projects that include storing project papers, storing citywide property information, and researching other storage needs for departments. IT will start researching replacing the current budget software system with a system that meets City needs.
Major infrastructure projects include meeting security compliance, auditing IT infrastructure, replacing failing equipment, consolidation, enhancing remote access server replacements (servers purchased in 2008/2009 at end of life), and replacement of PCs. Based on outcomes
Attachment 24 FY16 Proposed Budget Page 104 of 206
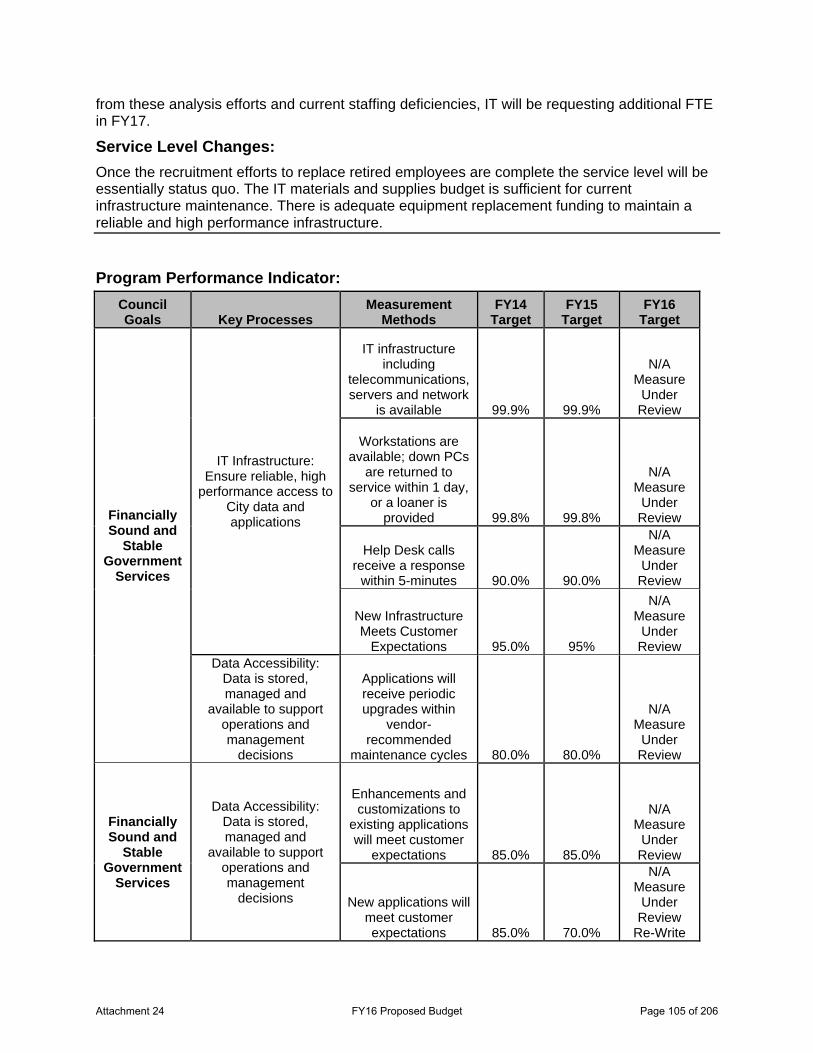
from these analysis efforts and current staffing deficiencies, IT will be requesting additional FTE in FY17.
Service Level Changes: Once the recruitment efforts to replace retired employees are complete the service level will be essentially status quo. The IT materials and supplies budget is sufficient for current infrastructure maintenance. There is adequate equipment replacement funding to maintain a reliable and high performance infrastructure.
Program Performance Indicator:
Council Goals Key Processes
Measurement Methods
FY14 Target
FY15 Target
FY16 Target
Financially Sound and
Stable Government
Services
IT Infrastructure: Ensure reliable, high
performance access to City data and applications
IT infrastructure including
telecommunications, servers and network
is available 99.9% 99.9%
N/A Measure
Under Review
Workstations are available; down PCs
are returned to service within 1 day,
or a loaner is provided 99.8% 99.8%
N/A Measure
Under Review
Help Desk calls receive a response
within 5-minutes 90.0% 90.0%
N/A Measure
Under Review
New Infrastructure Meets Customer
Expectations 95.0% 95%
N/A Measure
Under Review
Data Accessibility: Data is stored, managed and
available to support operations and management
decisions
Applications will receive periodic upgrades within
vendor-recommended
maintenance cycles 80.0% 80.0%
N/A Measure
Under Review
Financially Sound and
Stable Government
Services
Data Accessibility: Data is stored, managed and
available to support operations and management
decisions
Enhancements and customizations to
existing applications will meet customer
expectations 85.0% 85.0%
N/A Measure
Under Review
New applications will meet customer expectations 85.0% 70.0%
N/A Measure
Under Review
Re-Write
Attachment 24 FY16 Proposed Budget Page 105 of 206
Information Technology Department
Program: Geographic Information Systems
Program Description: The program focuses on locating, documenting and managing data concerning facilities, structures (both public and private), planning activity, code enforcement activities, and geographic features of the City. The Division provides spatial data collection, management, mapping, and integration using traditional advanced geospatial technology. All City departments and several intergovernmental organizations receive data and support for their ongoing operations and business decisions. The range of information and support includes decision material for asset management, land use, planning and building activities, current information to support both Police and Fire and Life Safety Services operations, and support for economic development activities.
Budget Highlights: Over the last several years the GIS program has reduced risks of data loss associated with the City's larger geospatial and infrastructure management systems by completing initial phases of hardware and software upgrades to move facilities and infrastructure systems information into a uniform and accessible database on July 10, 2013, permitting the uniform management of all City assets. Cost savings achieved during this project funded continued work on data migration and business process redesign. This final phase includes incorporating the transportation infrastructure facilities into the asset inventory and implementing new business process to take advantage of new capabilities in the asset management systems. Additionally the program has supported FEMA flood map revision review, topographic map updates, citywide urban growth planning, preliminary data analysis and cleanup for stormwater and wastewater master planning efforts and ad-hoc requests for mapping and surveying services.
Overall program expenditures are proposed to increase by 8% in FY16 due to the increase in Personal Services costs. Across all funds, FY16 Materials and Services expenditures will decrease approximately $4,582 when compared to amended FY15. Program resources will remain dedicated to supporting the Infor asset management system, Accela building permit system and data delivery services for projects of high importance to the City such as transportation, stormwater and wastewater master planning efforts, the Glenwood Refinement Plan, downtown redevelopment, and the 2030 Comprehensive Plan.
Service Level Changes: No significant service level changes are planned in the FY16 budget. Program funding from the General Fund remains at approximately 4% of program budget, while service requests to support Accela and provide City-wide data for General Fund services are expected to increase. The program assists other programs in the Information Technology Department where resources are limited.
Attachment 24 FY16 Proposed Budget Page 106 of 206

Program Performance Indicator:
Effectiveness Areas Key Processes
Measurement Methods
FY14 Targets
FY15 Target
FY16 Target
Encourage Economic
Development and Revitalization
through Community
Partnerships
Plan and design for community growth
Infrastructure Needed for Growth is Identified
& Planned (Streets, Wastewater, and
Drainage systems)
95% 95%
N/A Measure
Under Review
Attachment 24 FY16 Proposed Budget Page 107 of 206

Attachment 24 FY16 Proposed Budget Page 108 of 206
Legal and Judicial Services Department
Departmental Programs
City Attorney City Prosecutor Municipal Court
Department Description The City Attorney, City Prosecutor and the Municipal Court comprise the service area identified as Legal and Judicial Services. The City Council oversees City Attorney services via a contract with an outside legal firm. The program reports directly to the City Council and is responsible for attending all City Council and Planning Commission meetings and for supplying the City Council and staff with legal opinions regarding existing or proposed City operations and activities. All ordinances, resolutions, contracts and activities having legal implications are reviewed and approved by the City Attorney to assure compliance with intent, Charter, State and Federal laws as well as the possibility of liability exposure or litigation.
The City Manager’s Office oversees the City Prosecutor services via a contract. The City Prosecutor represents the City in Municipal Court and Appellate Courts. Prosecution services are provided for all misdemeanor criminal and traffic crimes and for any violation cases in which the defendant has retained counsel. The City Prosecutor represents the City in trials by court or by jury.
The Municipal Judges report to the City Council. The operations of the Municipal Court report to the Finance Director. The Municipal Court provides judicial services for the administration of justice, case and jury management, the appointment of attorneys for indigent defense, probation monitoring, providing interpreters, and the enforcement and collection of bail, fines, and fees. The Municipal court has jurisdiction over misdemeanor criminal, traffic crimes and violations cited by the Springfield Police Department, Nuisance Code Enforcement, Animal Control and Parking Control, and Springfield School District Truancy Officers.
Mission The City Attorney’s Office strives to provide practical legal advice, effectively interpret laws, reviews and drafts City ordinances, resolutions and contracts and works to minimize the City’s exposure to liability and legal expenses.
The City Prosecutor’s Office strives to maintain public confidence in the ability of the legal judicial system to pursue prosecution of criminal conduct, to resolve legal contests in a timely manner, and to compel compliance with the laws that protect the safety and quality of life in the community.
Municipal Court strives to maintain public confidence in the ability of the legal judicial system to uphold the rule of law, fairly and impartially resolve legal contests in a timely manner, and to compel compliance with the laws that protect the safety and quality of life in the community.
Attachment 24 FY16 Proposed Budget Page 109 of 206
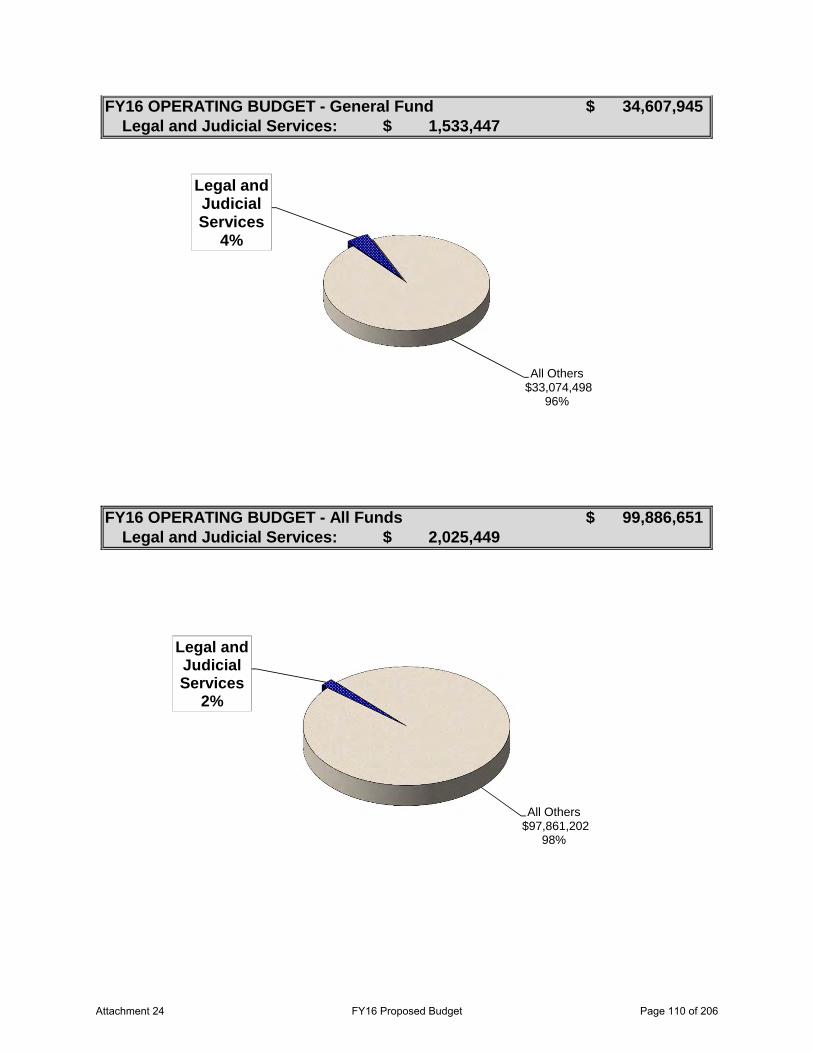
Legal and Judicial Services:
Legal and Judicial Services: 2,025,449$
FY16 OPERATING BUDGET - General Fund 34,607,945$
FY16 OPERATING BUDGET - All Funds 99,886,651$
1,533,447$
Legal and Judicial Services
4%
All Others$33,074,498
96%
Legal and Judicial Services
2%
All Others$97,861,202
98%
Attachment 24 FY16 Proposed Budget Page 110 of 206
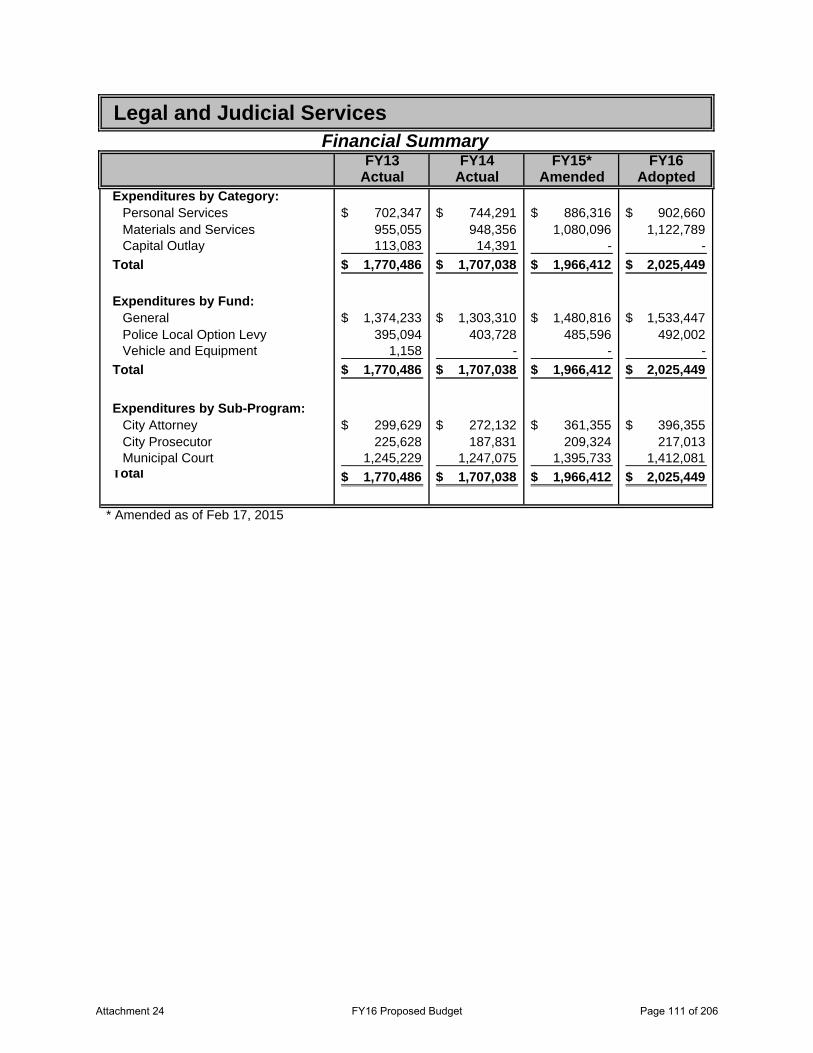
FY13 FY14 FY15* FY16Actual Actual Amended Adopted
Expenditures by Category:Personal Services 702,347$ 744,291$ 886,316$ 902,660$ Materials and Services 955,055 948,356 1,080,096 1,122,789 Capital Outlay 113,083 14,391 - -
Total 1,770,486$ 1,707,038$ 1,966,412$ 2,025,449$
Expenditures by Fund:General 1,374,233$ 1,303,310$ 1,480,816$ 1,533,447$ Police Local Option Levy 395,094 403,728 485,596 492,002 Vehicle and Equipment 1,158 - - -
Total 1,770,486$ 1,707,038$ 1,966,412$ 2,025,449$
Expenditures by Sub-Program:City Attorney 299,629$ 272,132$ 361,355$ 396,355$ City Prosecutor 225,628 187,831 209,324 217,013 Municipal Court 1,245,229 1,247,075 1,395,733 1,412,081
Total 1,770,486$ 1,707,038$ 1,966,412$ 2,025,449$
Legal and Judicial ServicesFinancial Summary
* Amended as of Feb 17, 2015
Attachment 24 FY16 Proposed Budget Page 111 of 206
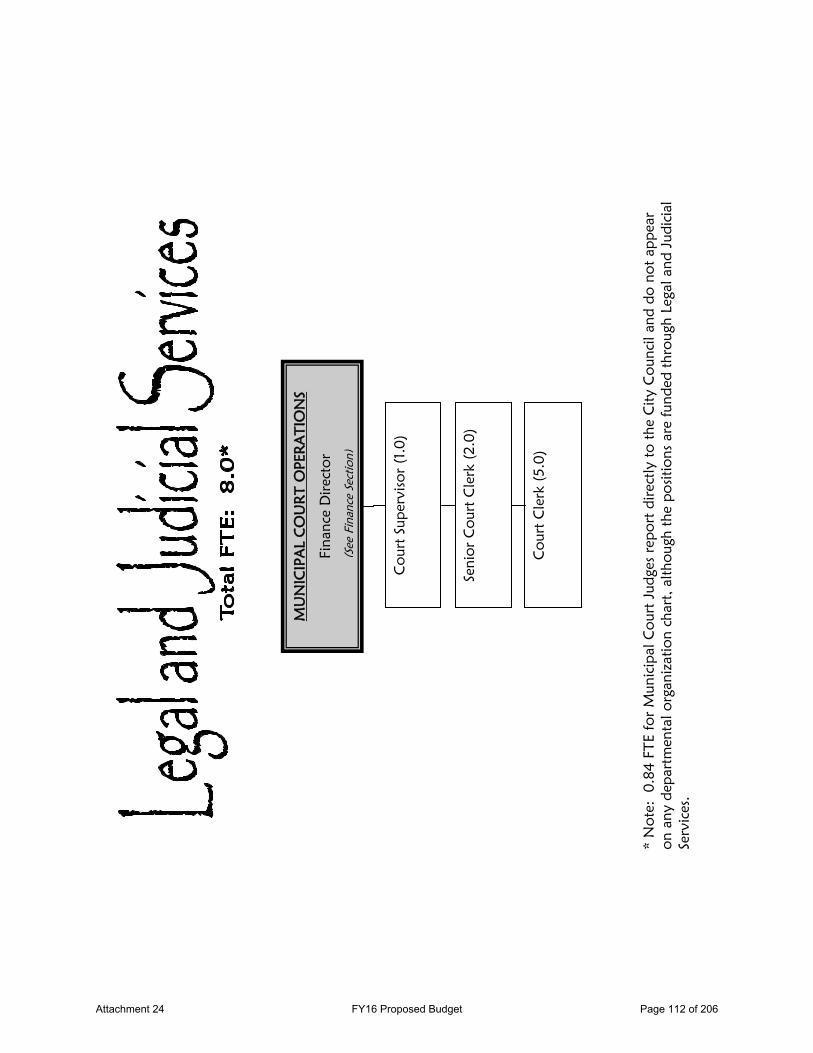
MU
NIC
IPA
L C
OU
RT
OPE
RA
TIO
NS
Fina
nce
Dir
ecto
r
(See
Fin
ance
Sec
tion)
Cou
rt S
uper
viso
r (1
.0)
Seni
or C
ourt
Cle
rk (
2.0)
Cou
rt C
lerk
(5.
0)
* N
ote:
0.8
4 FT
E fo
r M
unic
ipal
Cou
rt J
udge
s re
port
dir
ectly
to
the
City
Cou
ncil
and
do n
ot a
ppea
r on
any
dep
artm
enta
l org
aniz
atio
n ch
art,
alth
ough
the
pos
ition
s ar
e fu
nded
thr
ough
Leg
al a
nd J
udic
ial
Serv
ices
.
Attachment 24 FY16 Proposed Budget Page 112 of 206
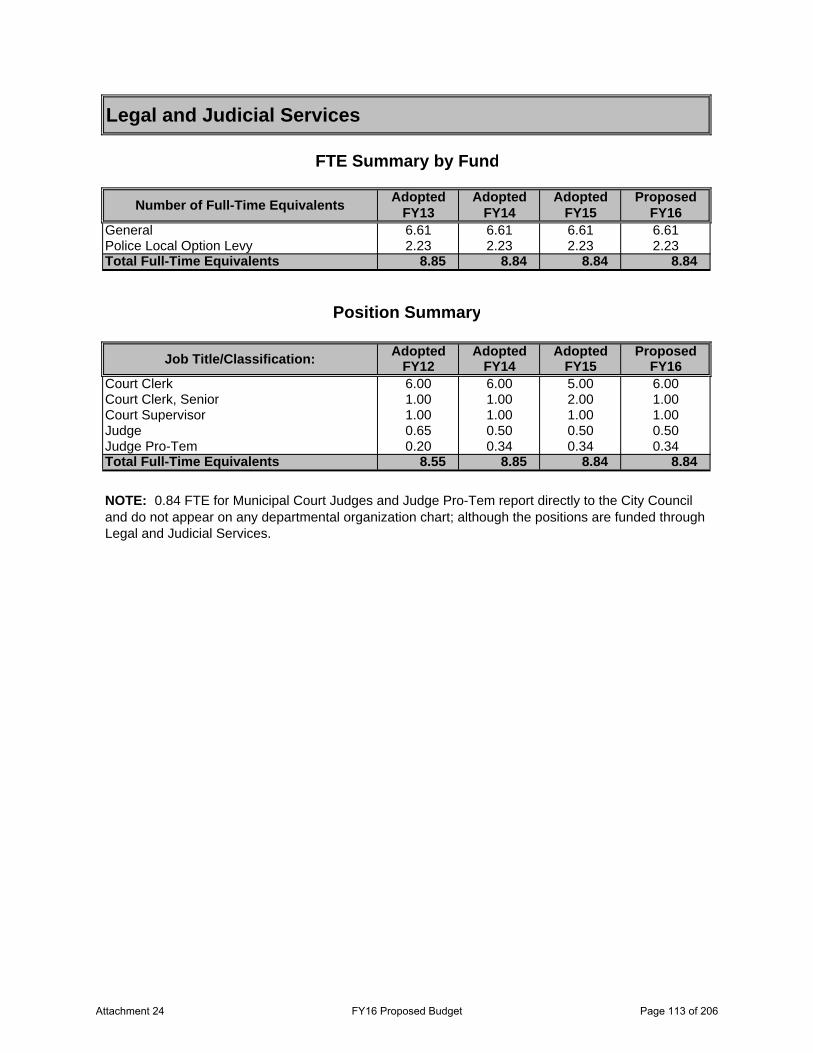
Adopted Adopted Adopted ProposedFY13 FY14 FY15 FY16
General 6.61 6.61 6.61 6.61Police Local Option Levy 2.23 2.23 2.23 2.23Total Full-Time Equivalents 8.85 8.84 8.84 8.84
Adopted Adopted Adopted ProposedFY12 FY14 FY15 FY16
Court Clerk 6.00 6.00 5.00 6.00Court Clerk, Senior 1.00 1.00 2.00 1.00Court Supervisor 1.00 1.00 1.00 1.00Judge 0.65 0.50 0.50 0.50Judge Pro-Tem 0.20 0.34 0.34 0.34Total Full-Time Equivalents 8.55 8.85 8.84 8.84
NOTE: 0.84 FTE for Municipal Court Judges and Judge Pro-Tem report directly to the City Council and do not appear on any departmental organization chart; although the positions are funded through Legal and Judicial Services.
Legal and Judicial Services
FTE Summary by Fund
Number of Full-Time Equivalents
Position Summary
Job Title/Classification:
Attachment 24 FY16 Proposed Budget Page 113 of 206

Attachment 24 FY16 Proposed Budget Page 114 of 206
Legal and Judicial Services Department
Program: City Attorney Program Description: The City Council contracts with the firm of Leahy, Van Vactor, Cox and Melendy, LLP, for legal services. The City Attorney's Office is responsible for attending all City Council and Planning Commission meetings and for supplying the City Council and staff with legal opinions regarding existing or proposed City operations and activities. All ordinances, resolutions, contracts and activities having legal implications are reviewed and approved to assure compliance with intent, charter, state and federal laws, as well as the possibility of liability exposure or litigation.
Budget Highlights: Provide general counsel to City Council, Planning Commission and staff regarding planning and development proposals, economic development initiatives, contract development and review, code enforcement, Justice Center, Glenwood Development, Gateway Area, Human Resources, BOLI Issues, Environmental Services, Municipal Court, risk consultation, OLCC issues, public records, public meetings, ethics, and general counsel to Council and staff. An additional service was added in FY15 for labor negotiations that was outside the retainer services but will not be continued in FY16.
Service Level Changes: FY16 service level changes include the reduction in the City Attorney’s involvement in labor negotiations and a possible increase in litigation support for land use planning. Actual billing hours based on tracking for FY14 they were 2,092. The retainer hours for FY15 are estimated to be close to the budgeted hours of 2,124. Our proposed hours for FY16 are still scheduled to remain the same. The hourly rate charged by the firm will remain at $166.36
Attachment 24 FY16 Proposed Budget Page 115 of 206
Legal and Judicial Services Department
Program: City Prosecutor Program Description: The City contracts for Prosecution Services with the firm of Leahy, Van Vactor, Cox and Melendy, LLP/ The City Prosecutor represents the City in Municipal Court and Appellate courts. Prosecution services are provided for all misdemeanor criminal and traffic crimes and for any violation cases in which the defendant has retained counsel. Services provided include screening of reports filed, negotiations for settlement of cases and for representation of the City in trials by court or by jury. The City Prosecutor also recommends revisions to the Municipal Code to conform with case law and state statutes, provides legal advice and training for the Police Department and maintains the criminal law library.
Budget Highlights: The opening of the municipal jail has created an additional demand on the City Prosecutor’s Office, particularly in the areas of completing discovery and preparation for trial. For this reason an increase in the City Prosecutor’s budget has been included in the public safety levy since the opening of the facility in 2010. There are no significant changes to the City Prosecutor’s budget for FY16..
Service Level Changes: None at this time. The City Prosecutor’s Office has significant involvement in all of the changes that occur in Court, conversations concerning the expansion of the DUII Court to include convictions and the use of a mental health response team requires the ideas and cooperation of the City Prosecutor. Caseloads and any change in trial patterns will be watched closely.
Attachment 24 FY16 Proposed Budget Page 116 of 206
Legal and Judicial Services Department
Program: Municipal Court Program Description: The Municipal Court has jurisdiction over misdemeanor criminal, traffic crimes and violations cited by the Springfield Police Department, Nuisance Code Enforcement, and Parking Control and Springfield School District Truancy officers. The Court provides judicial services for the administration of justice, case and jury management, appointments of attorneys for indigent defense and interpreters, probation monitoring and enforcement and collection of bail, fines, and fees. The Court strives to maintain public confidence in the ability of the legal judicial system to uphold the rule of law, resolve legal contests in a fair and timely manner and to compel compliance with the laws that protect the safety and quality of life in the community.
Budget Highlights: Since adoption of State statutes in November of 1997, case filings at the Municipal rather than state level has ensured prosecution of misdemeanor crimes committed in the City of Springfield.
The opening of the Springfield Municipal Jail on January 29, 2010, increased the ability of the court to hold offenders accountable and to increase the ability of the Court to compel compliance with sentencing orders, including payment of monetary penalties.
Caseload filings are currently estimated at 13,552 for FY15, with a total of $2,156,000 estimated in total fines and fees imposed. Total collection for fiscal year is currently estimated at $2,311,000 (includes fines and fee revenue to the city, and state fees).
The Court implemented new computer software on October 29, 2012. The system allows the Court to move closer to a “near paperless” operation. The system offers enhanced customer services through on-line case adjudication options for violations and on-line web payments. Tyler automated Phone notifications will be implemented as a new collections tool (without incurring the costs associated with formal collection actions). Assignment of cases to the Collection Agency as well as automated receipting of payments to Court cases has been automated. Continued improvements and enhancements are being made to the system.
The new system does not provide real time information integration to other local criminal justice agency systems. E-citations import pending in early 2015 will reinstate data propagation to Tyler eliminating the need for duplicate data entry by Court staff. The Police and Jail systems were implemented in late 2013 and the scope of changes implemented and/or to be implemented will continue to impact Court operations until alternative interface processes are implemented.
Service Level Changes: No service level change for FY16
Attachment 24 FY16 Proposed Budget Page 117 of 206
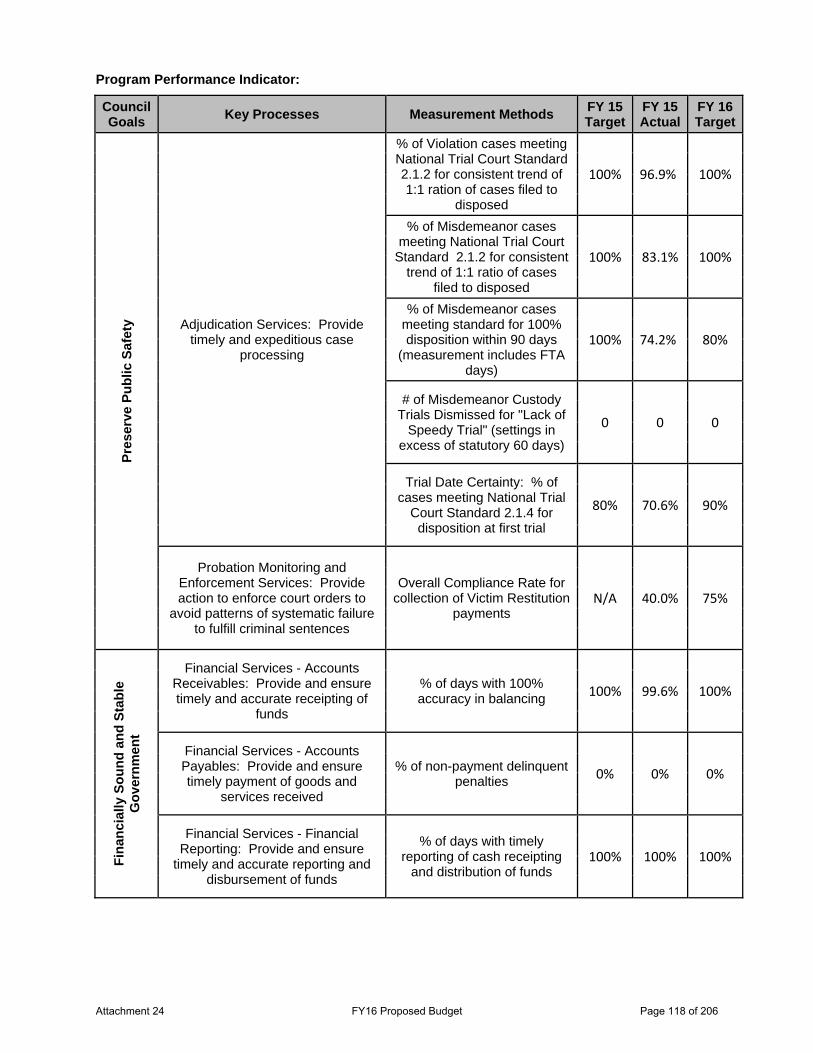
Program Performance Indicator:
Council Goals Key Processes Measurement Methods FY 15
Target FY 15 Actual
FY 16 Target
Pres
erve
Pub
lic S
afet
y Adjudication Services: Provide timely and expeditious case
processing
% of Violation cases meeting National Trial Court Standard 2.1.2 for consistent trend of 1:1 ration of cases filed to
disposed
100% 96.9% 100%
% of Misdemeanor cases meeting National Trial Court
Standard 2.1.2 for consistent trend of 1:1 ratio of cases
filed to disposed
100% 83.1% 100%
% of Misdemeanor cases meeting standard for 100% disposition within 90 days
(measurement includes FTA days)
100% 74.2% 80%
# of Misdemeanor Custody Trials Dismissed for "Lack of
Speedy Trial" (settings in excess of statutory 60 days)
0 0 0
Trial Date Certainty: % of cases meeting National Trial
Court Standard 2.1.4 for disposition at first trial
80% 70.6% 90%
Probation Monitoring and Enforcement Services: Provide action to enforce court orders to
avoid patterns of systematic failure to fulfill criminal sentences
Overall Compliance Rate for collection of Victim Restitution
payments N/A 40.0% 75%
Fina
ncia
lly S
ound
and
Sta
ble
Gov
ernm
ent
Financial Services - Accounts Receivables: Provide and ensure timely and accurate receipting of
funds
% of days with 100% accuracy in balancing 100% 99.6% 100%
Financial Services - Accounts Payables: Provide and ensure timely payment of goods and
services received
% of non-payment delinquent penalties 0% 0% 0%
Financial Services - Financial Reporting: Provide and ensure
timely and accurate reporting and disbursement of funds
% of days with timely reporting of cash receipting
and distribution of funds 100% 100% 100%
Attachment 24 FY16 Proposed Budget Page 118 of 206
Library Department
Departmental Programs
Adult/Reference Services Community Services Support Services Youth Services
Department Description The Springfield Library is an essential community resource providing citizens of all ages, backgrounds, and economic statuses access to information, education, early literacy training, and a wide range of family friendly programs. The Library also provides high-speed internet access as well as the ability to download digital audio books and e-books from home. In addition to our early literacy efforts focused on ensuring that every Springfield child enters school “ready to read” the Library has also added support of Springfield School District’s “Science, Technology, and Math (STEM) curriculum as another area of emphasis. We continue to engage our entire community by offering award-winning Spanish/English bi-lingual programming and programming focused on diversity, such as our monthly storytelling series, “Year of Stories”. Our Teen Advisory Board has been active at the library, both participating in their programs and assisting library staff with programs for other age groups. This year continues to see a marked increase in program attendance for all age groups. The Library continues to excel at enlisting the support of community members through its active volunteer program and its citizen fund-raising groups. We continue to partner with other area libraries in expanding access to materials for all of our patrons through our shared, online, catalog and inter-library loan program. From emergent literacy for infants to job retraining for adults the Library strives to support all members of its community in achieving their educational and economic aspirations.
Mission The Library Department places a strong and continuing focus on the importance of excellent customer service for our citizens’ and their information and recreational needs. The Library continues to emphasize the importance of providing diverse materials and instructional and cultural programming for our patrons.
Attachment 24 FY16 Proposed Budget Page 119 of 206
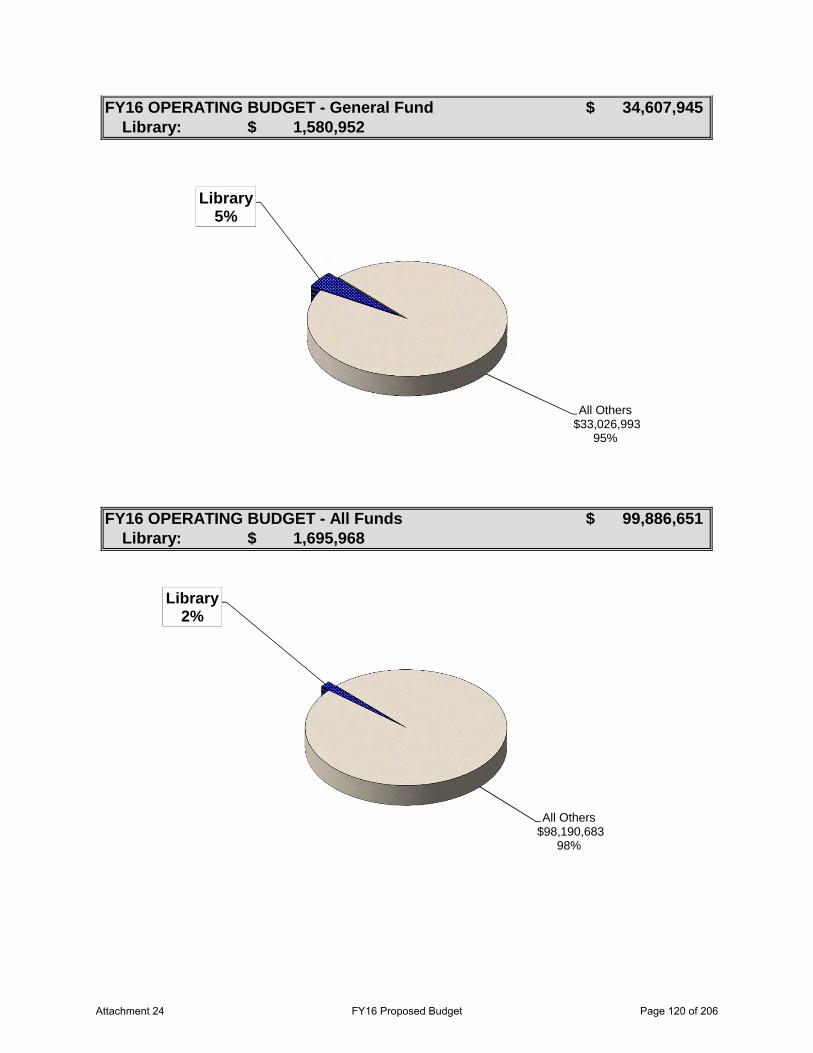
Library:
Library:
FY16 OPERATING BUDGET - General Fund 34,607,945$
FY16 OPERATING BUDGET - All Funds 99,886,651$
1,580,952$
1,695,968$
Library5%
All Others$33,026,993
95%
Library2%
All Others$98,190,683
98%
Attachment 24 FY16 Proposed Budget Page 120 of 206
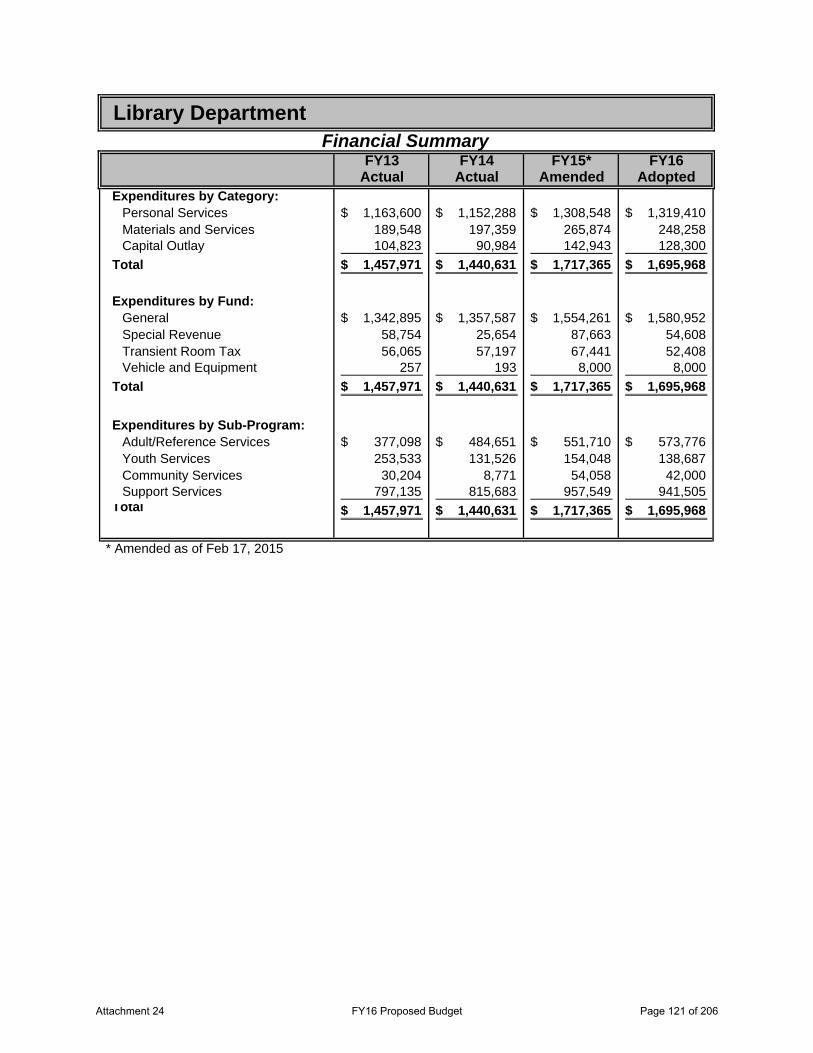
FY13 FY14 FY15* FY16Actual Actual Amended Adopted
Expenditures by Category:Personal Services 1,163,600$ 1,152,288$ 1,308,548$ 1,319,410$ Materials and Services 189,548 197,359 265,874 248,258 Capital Outlay 104,823 90,984 142,943 128,300
Total 1,457,971$ 1,440,631$ 1,717,365$ 1,695,968$
Expenditures by Fund:General 1,342,895$ 1,357,587$ 1,554,261$ 1,580,952$ Special Revenue 58,754 25,654 87,663 54,608 Transient Room Tax 56,065 57,197 67,441 52,408 Vehicle and Equipment 257 193 8,000 8,000
Total 1,457,971$ 1,440,631$ 1,717,365$ 1,695,968$
Expenditures by Sub-Program:Adult/Reference Services 377,098$ 484,651$ 551,710$ 573,776$ Youth Services 253,533 131,526 154,048 138,687 Community Services 30,204 8,771 54,058 42,000 Support Services 797,135 815,683 957,549 941,505
Total 1,457,971$ 1,440,631$ 1,717,365$ 1,695,968$
Library DepartmentFinancial Summary
* Amended as of Feb 17, 2015
Attachment 24 FY16 Proposed Budget Page 121 of 206
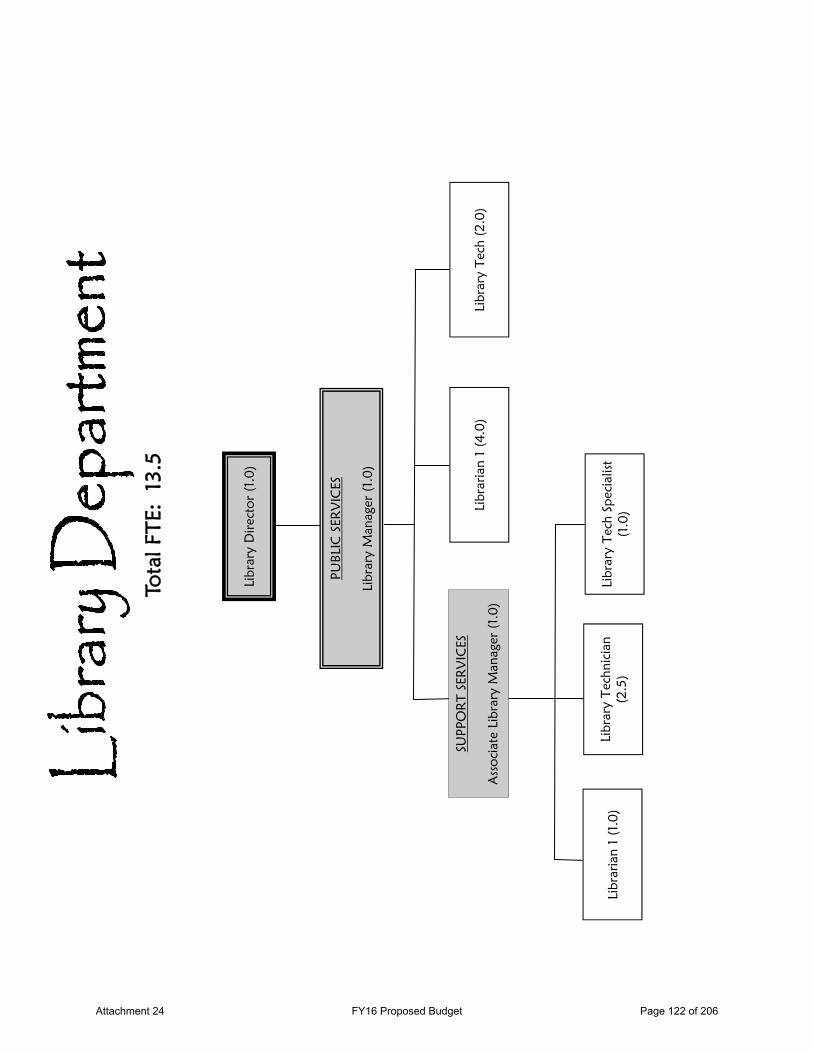
SUPP
OR
T SE
RV
ICES
Ass
ocia
te L
ibra
ry M
anag
er (
1.0)
PUBL
IC S
ERV
ICES
Libr
ary
Man
ager
(1.
0)
Tota
l FTE
: 1
3.5
Libr
ary
Dir
ecto
r (1
.0)
Libr
aria
n 1
(4.0
) Li
brar
y Te
ch (
2.0)
Libr
aria
n 1
(1.0
) Li
brar
y Te
chni
cian
(2
.5)
Libr
ary
Tech
Spe
cial
ist
(1.0
)
Attachment 24 FY16 Proposed Budget Page 122 of 206
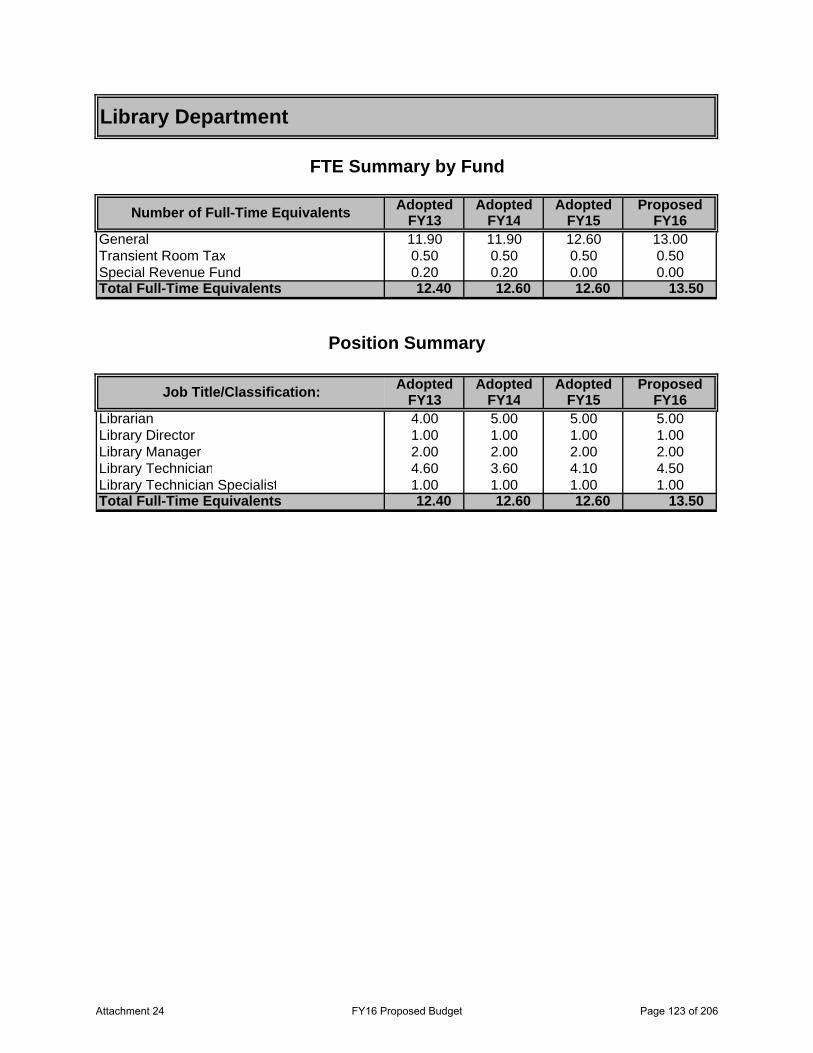
Adopted Adopted Adopted ProposedFY13 FY14 FY15 FY16
General 11.90 11.90 12.60 13.00Transient Room Tax 0.50 0.50 0.50 0.50Special Revenue Fund 0.20 0.20 0.00 0.00Total Full-Time Equivalents 12.40 12.60 12.60 13.50
Adopted Adopted Adopted ProposedFY13 FY14 FY15 FY16
Librarian 4.00 5.00 5.00 5.00Library Director 1.00 1.00 1.00 1.00Library Manager 2.00 2.00 2.00 2.00Library Technician 4.60 3.60 4.10 4.50Library Technician Specialist 1.00 1.00 1.00 1.00Total Full-Time Equivalents 12.40 12.60 12.60 13.50
Position Summary
Job Title/Classification:
Library Department
FTE Summary by Fund
Number of Full-Time Equivalents
Attachment 24 FY16 Proposed Budget Page 123 of 206

Attachment 24 FY16 Proposed Budget Page 124 of 206
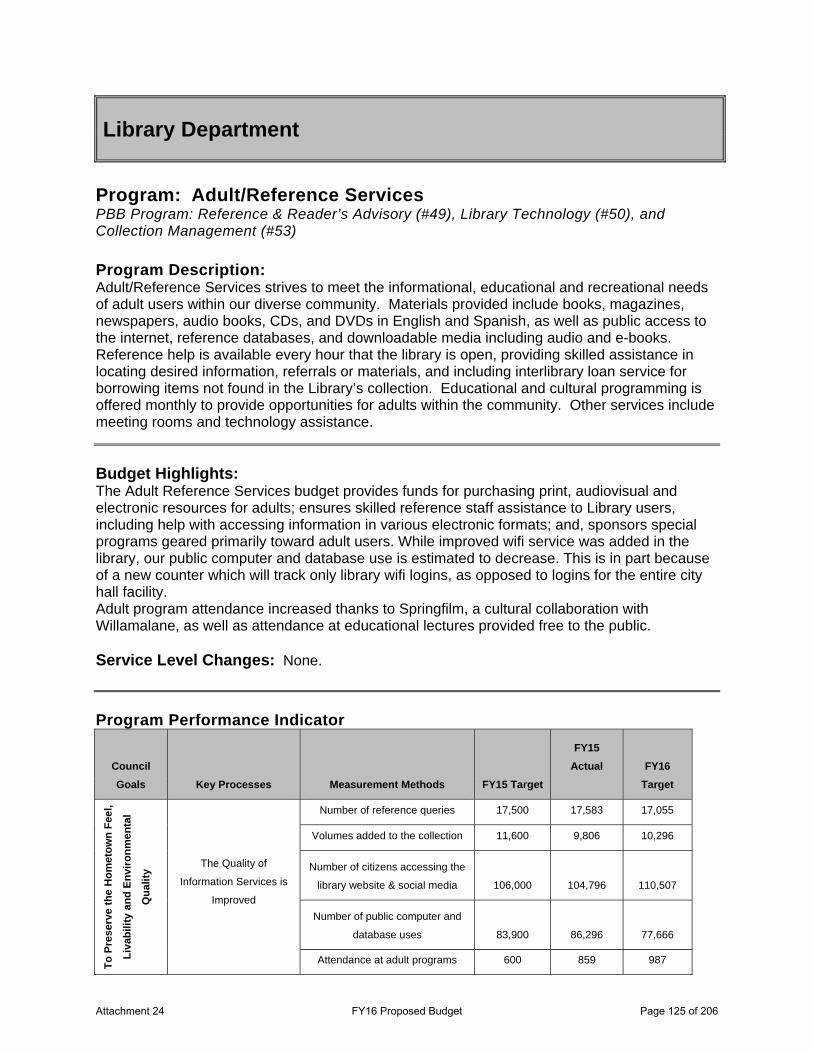
Library Department
Program: Adult/Reference Services PBB Program: Reference & Reader’s Advisory (#49), Library Technology (#50), and Collection Management (#53) Program Description: Adult/Reference Services strives to meet the informational, educational and recreational needs of adult users within our diverse community. Materials provided include books, magazines, newspapers, audio books, CDs, and DVDs in English and Spanish, as well as public access to the internet, reference databases, and downloadable media including audio and e-books. Reference help is available every hour that the library is open, providing skilled assistance in locating desired information, referrals or materials, and including interlibrary loan service for borrowing items not found in the Library’s collection. Educational and cultural programming is offered monthly to provide opportunities for adults within the community. Other services include meeting rooms and technology assistance.
Budget Highlights: The Adult Reference Services budget provides funds for purchasing print, audiovisual and electronic resources for adults; ensures skilled reference staff assistance to Library users, including help with accessing information in various electronic formats; and, sponsors special programs geared primarily toward adult users. While improved wifi service was added in the library, our public computer and database use is estimated to decrease. This is in part because of a new counter which will track only library wifi logins, as opposed to logins for the entire city hall facility. Adult program attendance increased thanks to Springfilm, a cultural collaboration with Willamalane, as well as attendance at educational lectures provided free to the public. Service Level Changes: None.
Program Performance Indicator
Council Goals Key Processes Measurement Methods FY15 Target
FY15 Actual
FY16
Target
To P
rese
rve
the
Hom
etow
n Fe
el,
Liva
bilit
y an
d En
viro
nmen
tal
Qua
lity The Quality of
Information Services is
Improved
Number of reference queries 17,500 17,583 17,055
Volumes added to the collection 11,600 9,806 10,296
Number of citizens accessing the
library website & social media 106,000 104,796 110,507
Number of public computer and
database uses 83,900 86,296 77,666
Attendance at adult programs 600 859 987
Attachment 24 FY16 Proposed Budget Page 125 of 206
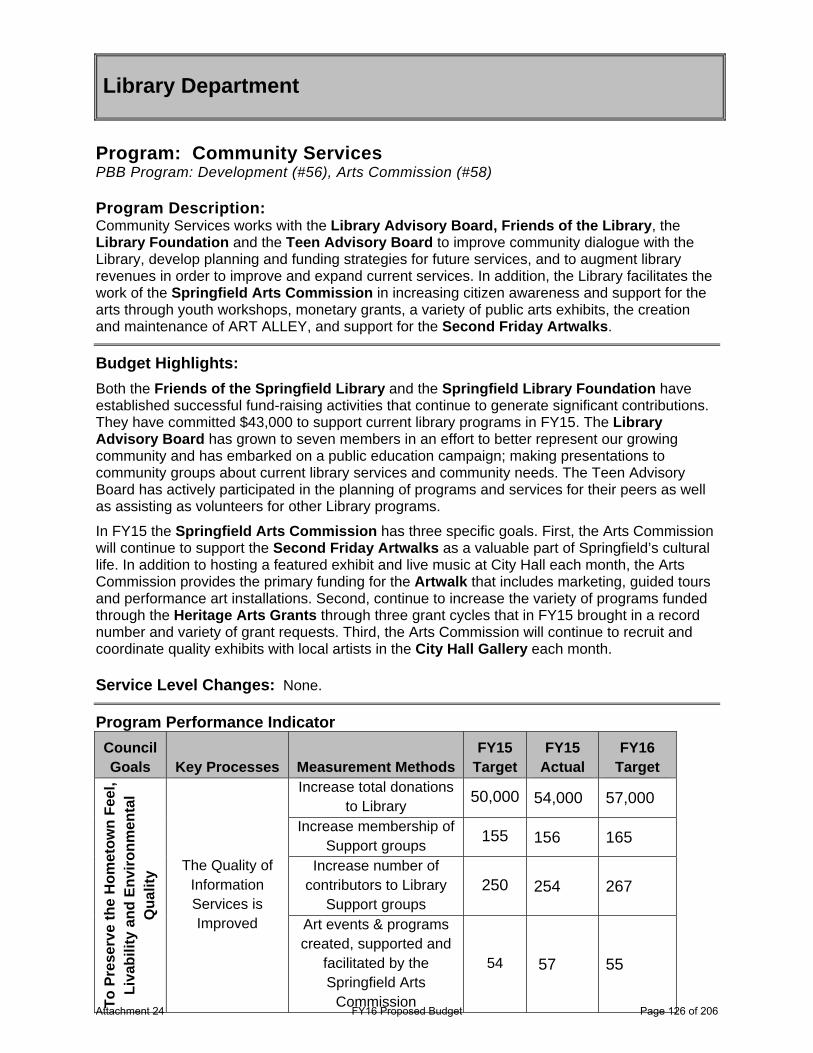
Library Department
Program: Community Services PBB Program: Development (#56), Arts Commission (#58) Program Description: Community Services works with the Library Advisory Board, Friends of the Library, the Library Foundation and the Teen Advisory Board to improve community dialogue with the Library, develop planning and funding strategies for future services, and to augment library revenues in order to improve and expand current services. In addition, the Library facilitates the work of the Springfield Arts Commission in increasing citizen awareness and support for the arts through youth workshops, monetary grants, a variety of public arts exhibits, the creation and maintenance of ART ALLEY, and support for the Second Friday Artwalks.
Budget Highlights: Both the Friends of the Springfield Library and the Springfield Library Foundation have established successful fund-raising activities that continue to generate significant contributions. They have committed $43,000 to support current library programs in FY15. The Library Advisory Board has grown to seven members in an effort to better represent our growing community and has embarked on a public education campaign; making presentations to community groups about current library services and community needs. The Teen Advisory Board has actively participated in the planning of programs and services for their peers as well as assisting as volunteers for other Library programs.
In FY15 the Springfield Arts Commission has three specific goals. First, the Arts Commission will continue to support the Second Friday Artwalks as a valuable part of Springfield’s cultural life. In addition to hosting a featured exhibit and live music at City Hall each month, the Arts Commission provides the primary funding for the Artwalk that includes marketing, guided tours and performance art installations. Second, continue to increase the variety of programs funded through the Heritage Arts Grants through three grant cycles that in FY15 brought in a record number and variety of grant requests. Third, the Arts Commission will continue to recruit and coordinate quality exhibits with local artists in the City Hall Gallery each month. Service Level Changes: None.
Program Performance Indicator Council Goals Key Processes Measurement Methods
FY15 Target
FY15 Actual
FY16 Target
To P
rese
rve
the
Hom
etow
n Fe
el,
Liva
bilit
y an
d En
viro
nmen
tal
Qua
lity The Quality of
Information Services is Improved
Increase total donations to Library
50,000 54,000 57,000
Increase membership of Support groups
155 156 165
Increase number of contributors to Library
Support groups 250 254 267
Art events & programs created, supported and
facilitated by the Springfield Arts
Commission
54 57 55
Attachment 24 FY16 Proposed Budget Page 126 of 206
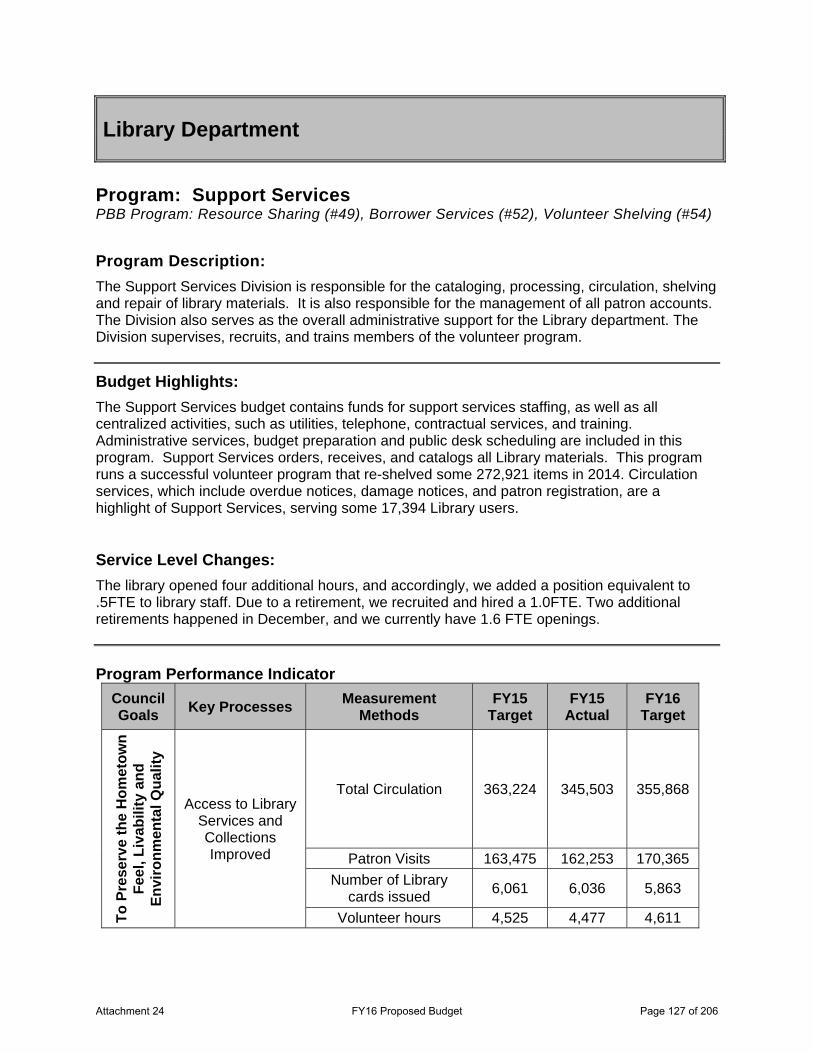
Library Department
Program: Support Services PBB Program: Resource Sharing (#49), Borrower Services (#52), Volunteer Shelving (#54) Program Description: The Support Services Division is responsible for the cataloging, processing, circulation, shelving and repair of library materials. It is also responsible for the management of all patron accounts. The Division also serves as the overall administrative support for the Library department. The Division supervises, recruits, and trains members of the volunteer program.
Budget Highlights: The Support Services budget contains funds for support services staffing, as well as all centralized activities, such as utilities, telephone, contractual services, and training. Administrative services, budget preparation and public desk scheduling are included in this program. Support Services orders, receives, and catalogs all Library materials. This program runs a successful volunteer program that re-shelved some 272,921 items in 2014. Circulation services, which include overdue notices, damage notices, and patron registration, are a highlight of Support Services, serving some 17,394 Library users.
Service Level Changes: The library opened four additional hours, and accordingly, we added a position equivalent to .5FTE to library staff. Due to a retirement, we recruited and hired a 1.0FTE. Two additional retirements happened in December, and we currently have 1.6 FTE openings.
Program Performance Indicator
Council Goals Key Processes Measurement
Methods FY15
Target FY15
Actual FY16
Target
To P
rese
rve
the
Hom
etow
n Fe
el, L
ivab
ility
and
En
viro
nmen
tal Q
ualit
y
Access to Library Services and Collections Improved
Total Circulation 363,224 345,503 355,868
Patron Visits 163,475 162,253 170,365
Number of Library cards issued
6,061 6,036 5,863
Volunteer hours 4,525 4,477 4,611
Attachment 24 FY16 Proposed Budget Page 127 of 206
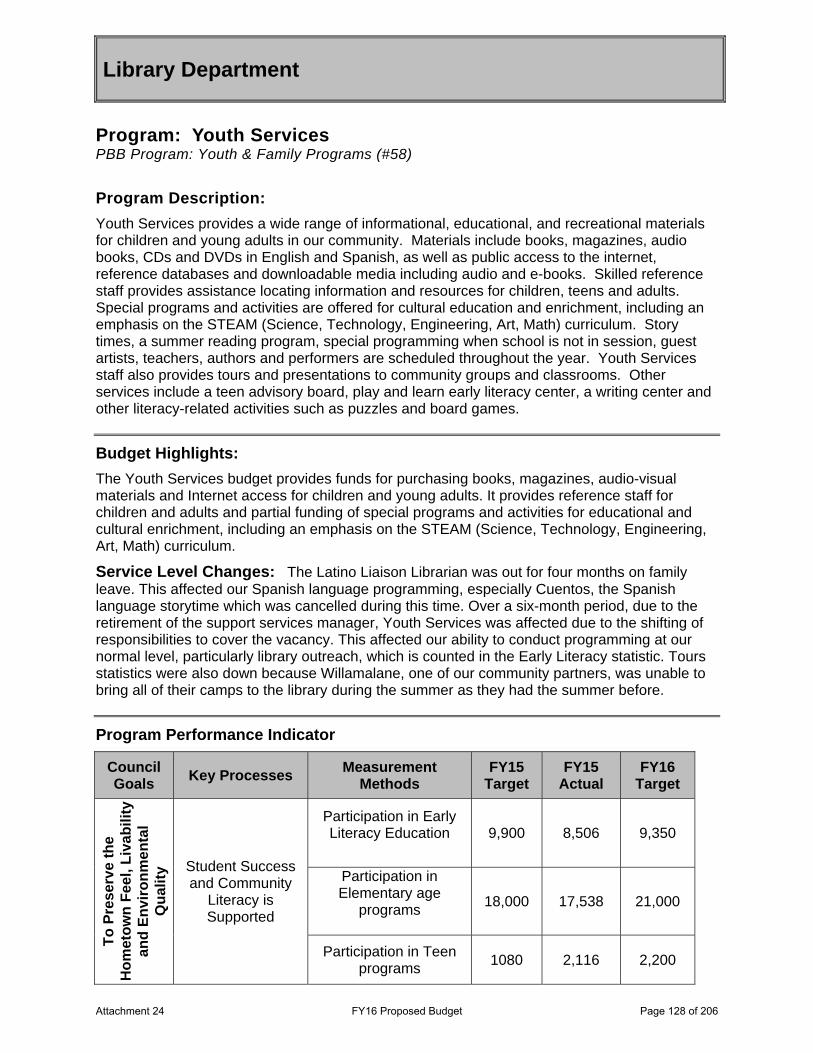
Library Department
Program: Youth Services PBB Program: Youth & Family Programs (#58) Program Description: Youth Services provides a wide range of informational, educational, and recreational materials for children and young adults in our community. Materials include books, magazines, audio books, CDs and DVDs in English and Spanish, as well as public access to the internet, reference databases and downloadable media including audio and e-books. Skilled reference staff provides assistance locating information and resources for children, teens and adults. Special programs and activities are offered for cultural education and enrichment, including an emphasis on the STEAM (Science, Technology, Engineering, Art, Math) curriculum. Story times, a summer reading program, special programming when school is not in session, guest artists, teachers, authors and performers are scheduled throughout the year. Youth Services staff also provides tours and presentations to community groups and classrooms. Other services include a teen advisory board, play and learn early literacy center, a writing center and other literacy-related activities such as puzzles and board games.
Budget Highlights: The Youth Services budget provides funds for purchasing books, magazines, audio-visual materials and Internet access for children and young adults. It provides reference staff for children and adults and partial funding of special programs and activities for educational and cultural enrichment, including an emphasis on the STEAM (Science, Technology, Engineering, Art, Math) curriculum.
Service Level Changes: The Latino Liaison Librarian was out for four months on family leave. This affected our Spanish language programming, especially Cuentos, the Spanish language storytime which was cancelled during this time. Over a six-month period, due to the retirement of the support services manager, Youth Services was affected due to the shifting of responsibilities to cover the vacancy. This affected our ability to conduct programming at our normal level, particularly library outreach, which is counted in the Early Literacy statistic. Tours statistics were also down because Willamalane, one of our community partners, was unable to bring all of their camps to the library during the summer as they had the summer before.
Program Performance Indicator
Council Goals Key Processes Measurement
Methods FY15
Target FY15
Actual FY16
Target
To P
rese
rve
the
Hom
etow
n Fe
el, L
ivab
ility
an
d En
viro
nmen
tal
Qua
lity Student Success
and Community Literacy is Supported
Participation in Early Literacy Education
9,900 8,506 9,350
Participation in Elementary age
programs
18,000 17,538 21,000
Participation in Teen programs
1080 2,116 2,200
Attachment 24 FY16 Proposed Budget Page 128 of 206
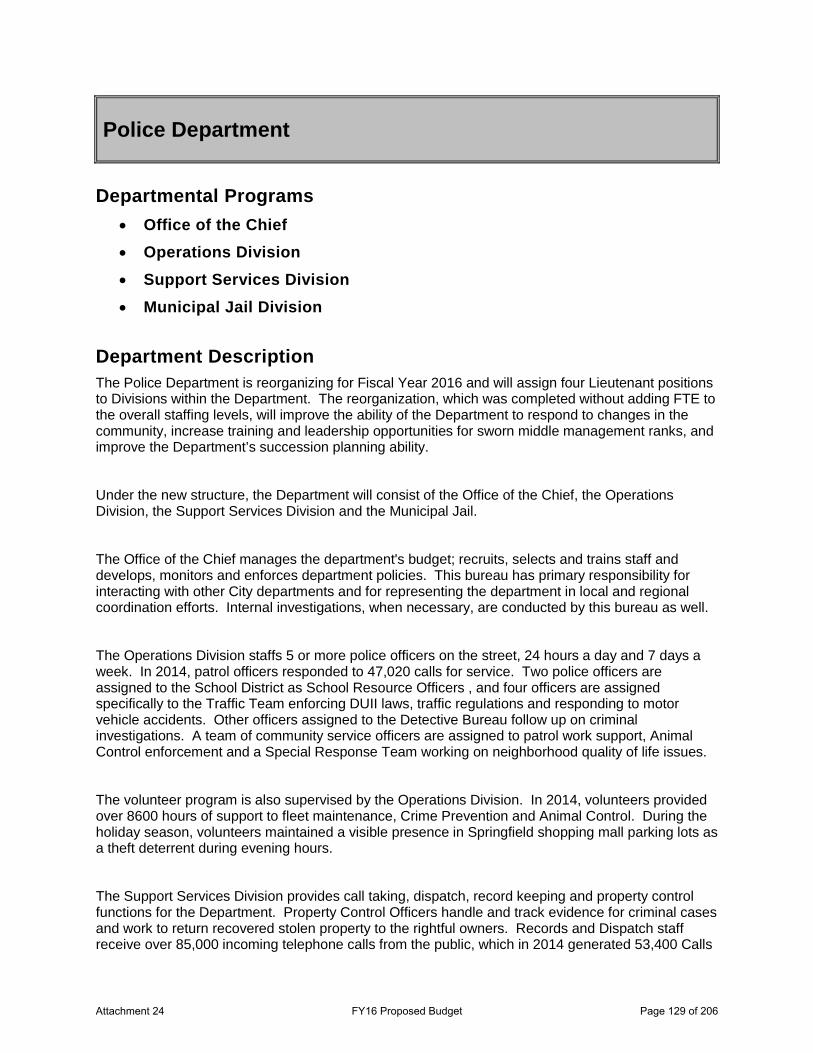
Police Department
Departmental Programs
• Office of the Chief • Operations Division • Support Services Division • Municipal Jail Division
Department Description The Police Department is reorganizing for Fiscal Year 2016 and will assign four Lieutenant positions to Divisions within the Department. The reorganization, which was completed without adding FTE to the overall staffing levels, will improve the ability of the Department to respond to changes in the community, increase training and leadership opportunities for sworn middle management ranks, and improve the Department’s succession planning ability.
Under the new structure, the Department will consist of the Office of the Chief, the Operations Division, the Support Services Division and the Municipal Jail.
The Office of the Chief manages the department's budget; recruits, selects and trains staff and develops, monitors and enforces department policies. This bureau has primary responsibility for interacting with other City departments and for representing the department in local and regional coordination efforts. Internal investigations, when necessary, are conducted by this bureau as well.
The Operations Division staffs 5 or more police officers on the street, 24 hours a day and 7 days a week. In 2014, patrol officers responded to 47,020 calls for service. Two police officers are assigned to the School District as School Resource Officers , and four officers are assigned specifically to the Traffic Team enforcing DUII laws, traffic regulations and responding to motor vehicle accidents. Other officers assigned to the Detective Bureau follow up on criminal investigations. A team of community service officers are assigned to patrol work support, Animal Control enforcement and a Special Response Team working on neighborhood quality of life issues.
The volunteer program is also supervised by the Operations Division. In 2014, volunteers provided over 8600 hours of support to fleet maintenance, Crime Prevention and Animal Control. During the holiday season, volunteers maintained a visible presence in Springfield shopping mall parking lots as a theft deterrent during evening hours.
The Support Services Division provides call taking, dispatch, record keeping and property control functions for the Department. Property Control Officers handle and track evidence for criminal cases and work to return recovered stolen property to the rightful owners. Records and Dispatch staff receive over 85,000 incoming telephone calls from the public, which in 2014 generated 53,400 Calls
Attachment 24 FY16 Proposed Budget Page 129 of 206
for Service. Over 6000 of those calls were handled over the phone, which would otherwise have required Police Officers to respond.
The Detention Division operates the Springfield Municipal Jail, and continues to provide detention space for municipal offenders in Springfield and provides Municipal Court Security and Prisoner Transports. In 2014, the Jail leased an average of 8 beds per day to other agencies, generating over $225,000 in revenue, and booked in 2098 inmates. For Fiscal Year 2016, the Department will add one additional Detention Officer to the jail staff, in order to reduce the number of forced overtime shifts worked by staff.
The Department works closely with other agencies to coordinate services and provide the highest quality, lowest cost service to the citizens of Springfield.
Mission The Springfield Police Department strives to respond to the emergency and law enforcement needs of the community through response to calls for service in accordance with established priorities, visible police patrols, enforcement of traffic laws, investigation of crime and coordination with community service agencies, programs and activities.
Attachment 24 FY16 Proposed Budget Page 130 of 206
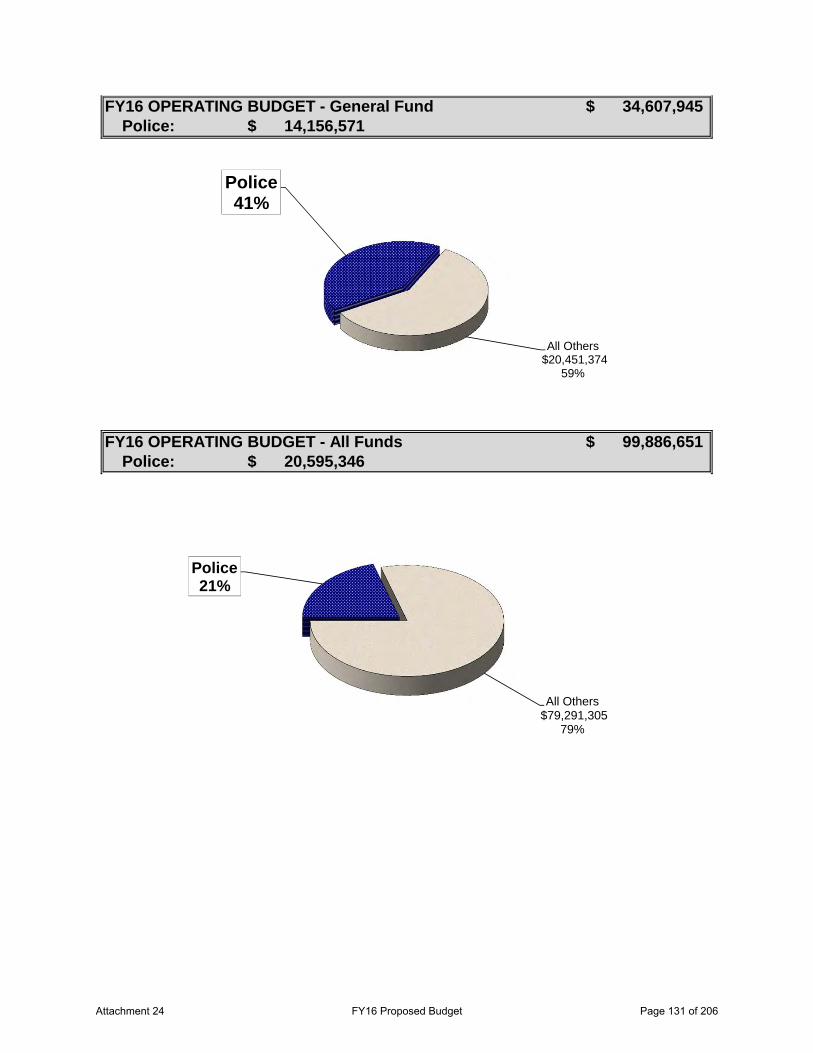
Police:
Police:
FY16 OPERATING BUDGET - General Fund 34,607,945$
FY16 OPERATING BUDGET - All Funds 99,886,651$
14,156,571$
20,595,346$
Police41%
All Others$20,451,374
59%
Police 21%
All Others$79,291,305
79%
Attachment 24 FY16 Proposed Budget Page 131 of 206
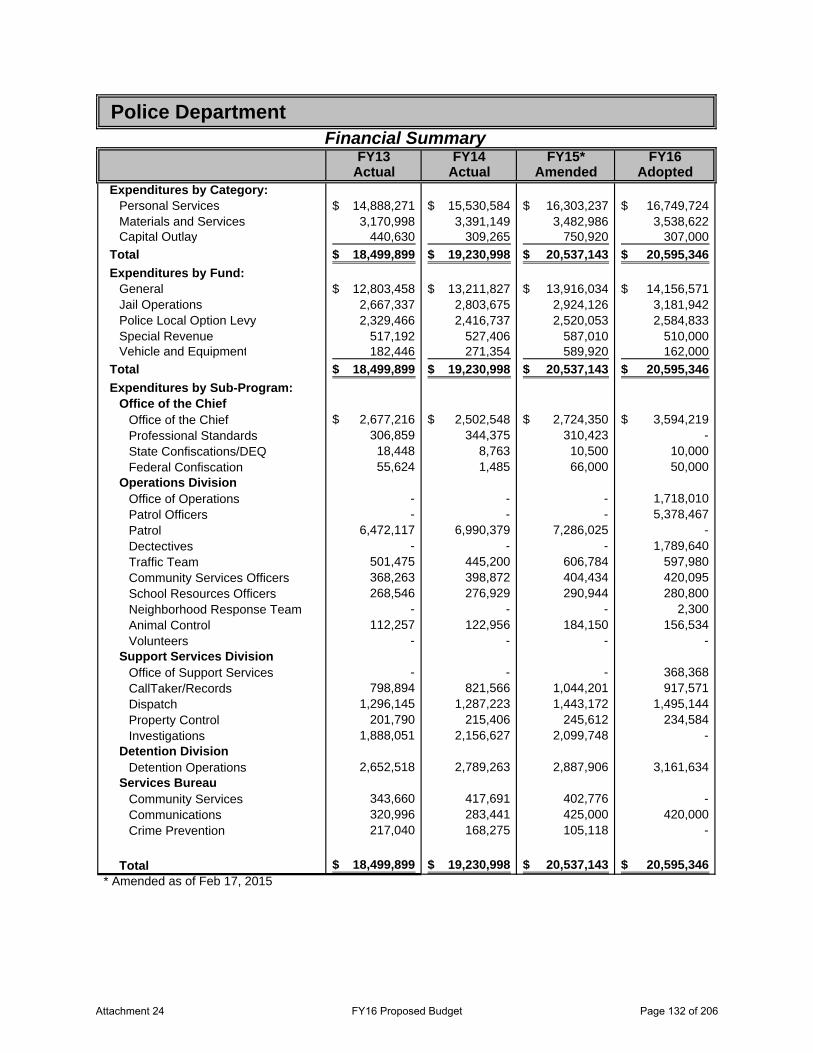
FY13 FY14 FY15* FY16Actual Actual Amended Adopted
Expenditures by Category:Personal Services 14,888,271$ 15,530,584$ 16,303,237$ 16,749,724$ Materials and Services 3,170,998 3,391,149 3,482,986 3,538,622 Capital Outlay 440,630 309,265 750,920 307,000
Total 18,499,899$ 19,230,998$ 20,537,143$ 20,595,346$ Expenditures by Fund:
General 12,803,458$ 13,211,827$ 13,916,034$ 14,156,571$ Jail Operations 2,667,337 2,803,675 2,924,126 3,181,942 Police Local Option Levy 2,329,466 2,416,737 2,520,053 2,584,833 Special Revenue 517,192 527,406 587,010 510,000 Vehicle and Equipment 182,446 271,354 589,920 162,000
Total 18,499,899$ 19,230,998$ 20,537,143$ 20,595,346$ Expenditures by Sub-Program:
Office of the ChiefOffice of the Chief 2,677,216$ 2,502,548$ 2,724,350$ 3,594,219$ Professional Standards 306,859 344,375 310,423 - State Confiscations/DEQ 18,448 8,763 10,500 10,000 Federal Confiscation 55,624 1,485 66,000 50,000
Operations DivisionOffice of Operations - - - 1,718,010 Patrol Officers - - - 5,378,467 Patrol 6,472,117 6,990,379 7,286,025 - Dectectives - - - 1,789,640 Traffic Team 501,475 445,200 606,784 597,980 Community Services Officers 368,263 398,872 404,434 420,095 School Resources Officers 268,546 276,929 290,944 280,800 Neighborhood Response Team - - - 2,300 Animal Control 112,257 122,956 184,150 156,534 Volunteers - - - -
Support Services DivisionOffice of Support Services - - - 368,368 CallTaker/Records 798,894 821,566 1,044,201 917,571 Dispatch 1,296,145 1,287,223 1,443,172 1,495,144 Property Control 201,790 215,406 245,612 234,584 Investigations 1,888,051 2,156,627 2,099,748 -
Detention DivisionDetention Operations 2,652,518 2,789,263 2,887,906 3,161,634
Services BureauCommunity Services 343,660 417,691 402,776 - Communications 320,996 283,441 425,000 420,000 Crime Prevention 217,040 168,275 105,118 -
Total 18,499,899$ 19,230,998$ 20,537,143$ 20,595,346$
Police DepartmentFinancial Summary
* Amended as of Feb 17, 2015
Attachment 24 FY16 Proposed Budget Page 132 of 206
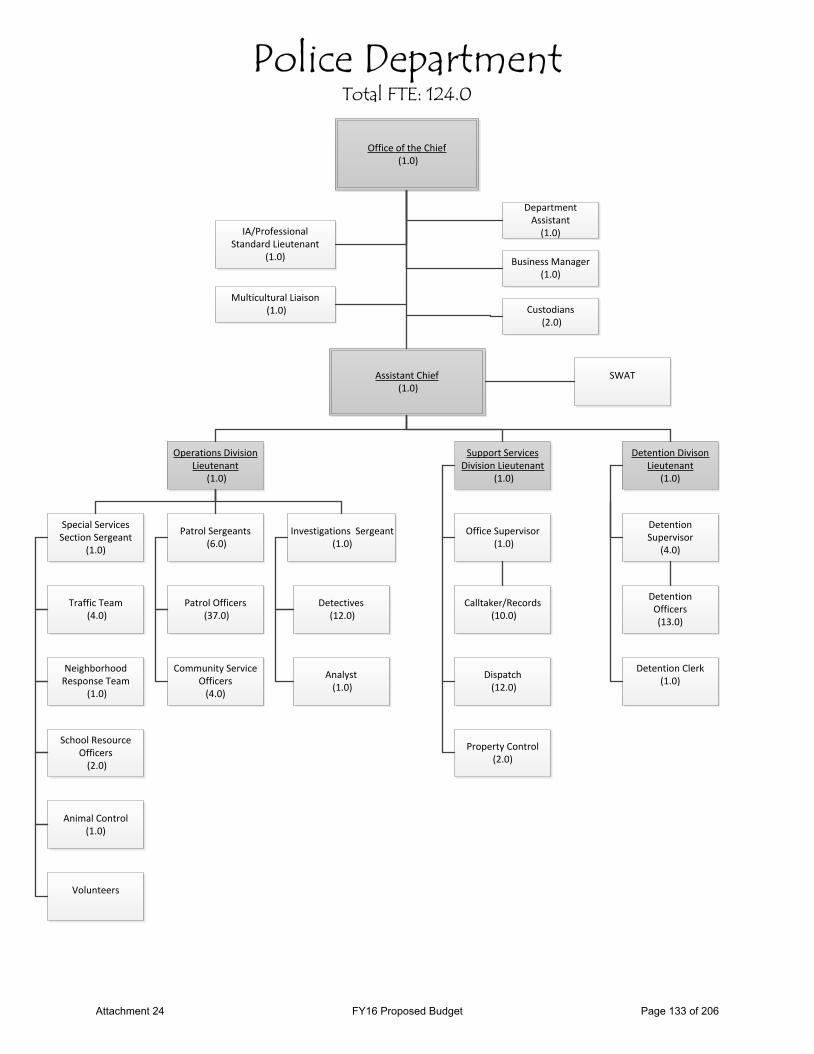
Office of the Chief (1.0)
Assistant Chief (1.0)
Department Assistant
(1.0)
IA/Professional
Standard Lieutenant(1.0)
Business Manager
(1.0)
Multicultural Liaison (1.0) Custodians
(2.0)
Support Services Division Lieutenant
(1.0)
Operations Division Lieutenant
(1.0)
Detention DivisonLieutenant
(1.0)
Patrol Officers (37.0)
Community Service Officers
(4.0)
Office Supervisor (1.0)
Calltaker/Records (10.0)
Dispatch (12.0)
Detention Supervisor
(4.0)
Detention Clerk(1.0)
DetentionOfficers (13.0)
SWAT
Patrol Sergeants (6.0)
Police DepartmentTotal FTE: 124.0
Investigations Sergeant (1.0)
Special Services Section Sergeant
(1.0)
Traffic Team (4.0)
Neighborhood Response Team
(1.0)
Detectives (12.0)
Analyst (1.0)
School Resource Officers
(2.0)
Animal Control(1.0)
Property Control(2.0)
Volunteers
Attachment 24 FY16 Proposed Budget Page 133 of 206
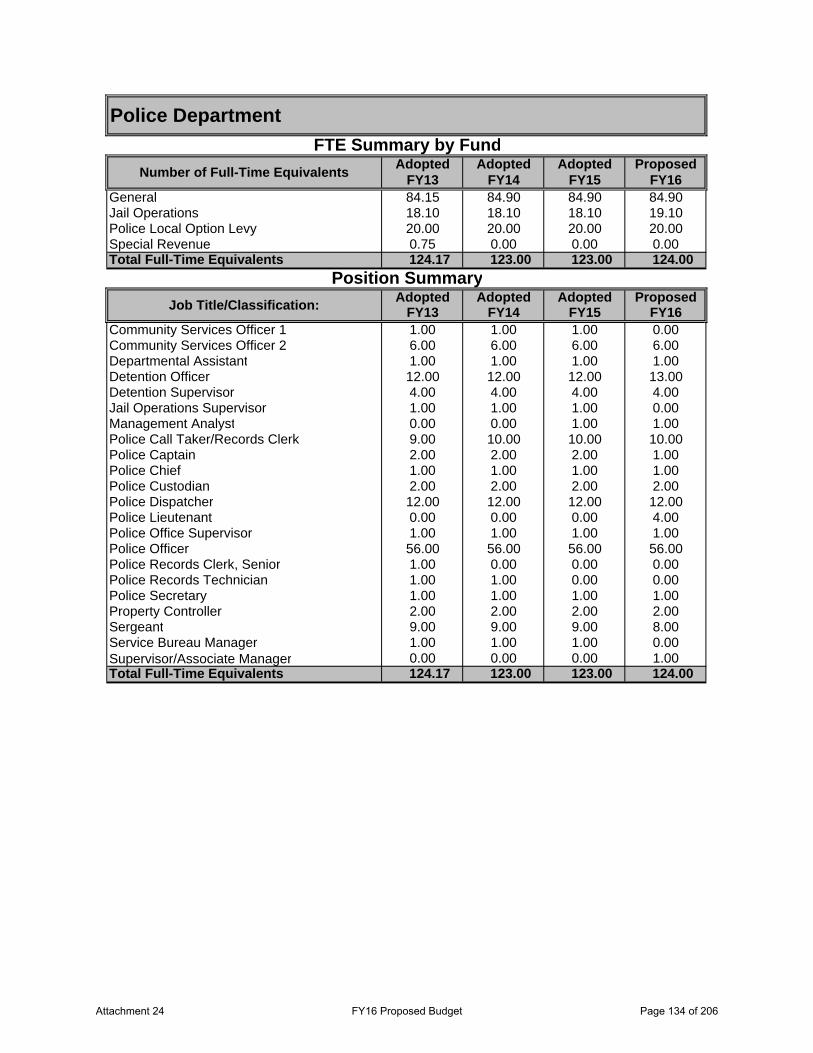
Adopted Adopted Adopted ProposedFY13 FY14 FY15 FY16
General 84.15 84.90 84.90 84.90Jail Operations 18.10 18.10 18.10 19.10Police Local Option Levy 20.00 20.00 20.00 20.00Special Revenue 0.75 0.00 0.00 0.00Total Full-Time Equivalents 124.17 123.00 123.00 124.00
Adopted Adopted Adopted ProposedFY13 FY14 FY15 FY16
Community Services Officer 1 1.00 1.00 1.00 0.00Community Services Officer 2 6.00 6.00 6.00 6.00Departmental Assistant 1.00 1.00 1.00 1.00Detention Officer 12.00 12.00 12.00 13.00Detention Supervisor 4.00 4.00 4.00 4.00Jail Operations Supervisor 1.00 1.00 1.00 0.00Management Analyst 0.00 0.00 1.00 1.00Police Call Taker/Records Clerk 9.00 10.00 10.00 10.00Police Captain 2.00 2.00 2.00 1.00Police Chief 1.00 1.00 1.00 1.00Police Custodian 2.00 2.00 2.00 2.00Police Dispatcher 12.00 12.00 12.00 12.00Police Lieutenant 0.00 0.00 0.00 4.00Police Office Supervisor 1.00 1.00 1.00 1.00Police Officer 56.00 56.00 56.00 56.00Police Records Clerk, Senior 1.00 0.00 0.00 0.00Police Records Technician 1.00 1.00 0.00 0.00Police Secretary 1.00 1.00 1.00 1.00Property Controller 2.00 2.00 2.00 2.00Sergeant 9.00 9.00 9.00 8.00Service Bureau Manager 1.00 1.00 1.00 0.00Supervisor/Associate Manager 0.00 0.00 0.00 1.00Total Full-Time Equivalents 124.17 123.00 123.00 124.00
Police DepartmentFTE Summary by Fund
Number of Full-Time Equivalents
Position SummaryJob Title/Classification:
Attachment 24 FY16 Proposed Budget Page 134 of 206
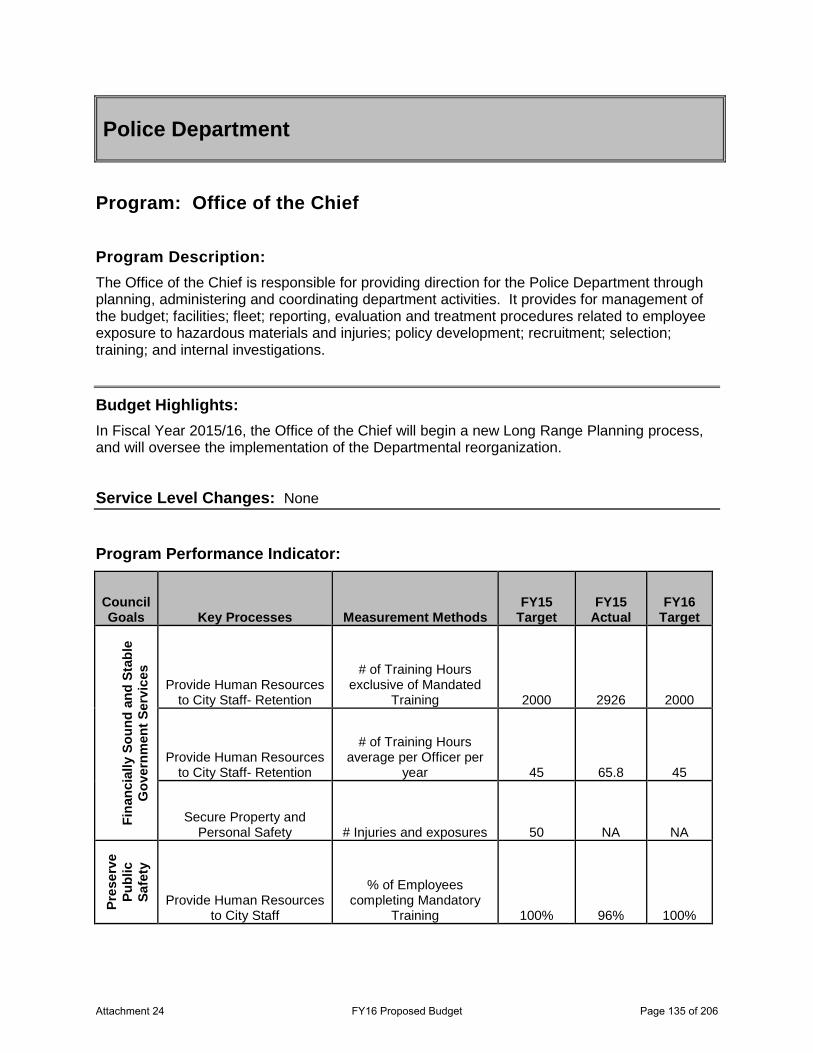
Police Department
Program: Office of the Chief Program Description: The Office of the Chief is responsible for providing direction for the Police Department through planning, administering and coordinating department activities. It provides for management of the budget; facilities; fleet; reporting, evaluation and treatment procedures related to employee exposure to hazardous materials and injuries; policy development; recruitment; selection; training; and internal investigations.
Budget Highlights: In Fiscal Year 2015/16, the Office of the Chief will begin a new Long Range Planning process, and will oversee the implementation of the Departmental reorganization.
Service Level Changes: None
Program Performance Indicator:
Council Goals Key Processes Measurement Methods
FY15 Target
FY15 Actual
FY16 Target
Fina
ncia
lly S
ound
and
Sta
ble
Gov
ernm
ent S
ervi
ces
Provide Human Resources to City Staff- Retention
# of Training Hours exclusive of Mandated
Training 2000 2926 2000
Provide Human Resources to City Staff- Retention
# of Training Hours average per Officer per
year 45 65.8 45
Secure Property and Personal Safety # Injuries and exposures 50 NA NA
Pres
erve
Pu
blic
Sa
fety
Provide Human Resources to City Staff
% of Employees completing Mandatory
Training 100% 96% 100%
Attachment 24 FY16 Proposed Budget Page 135 of 206
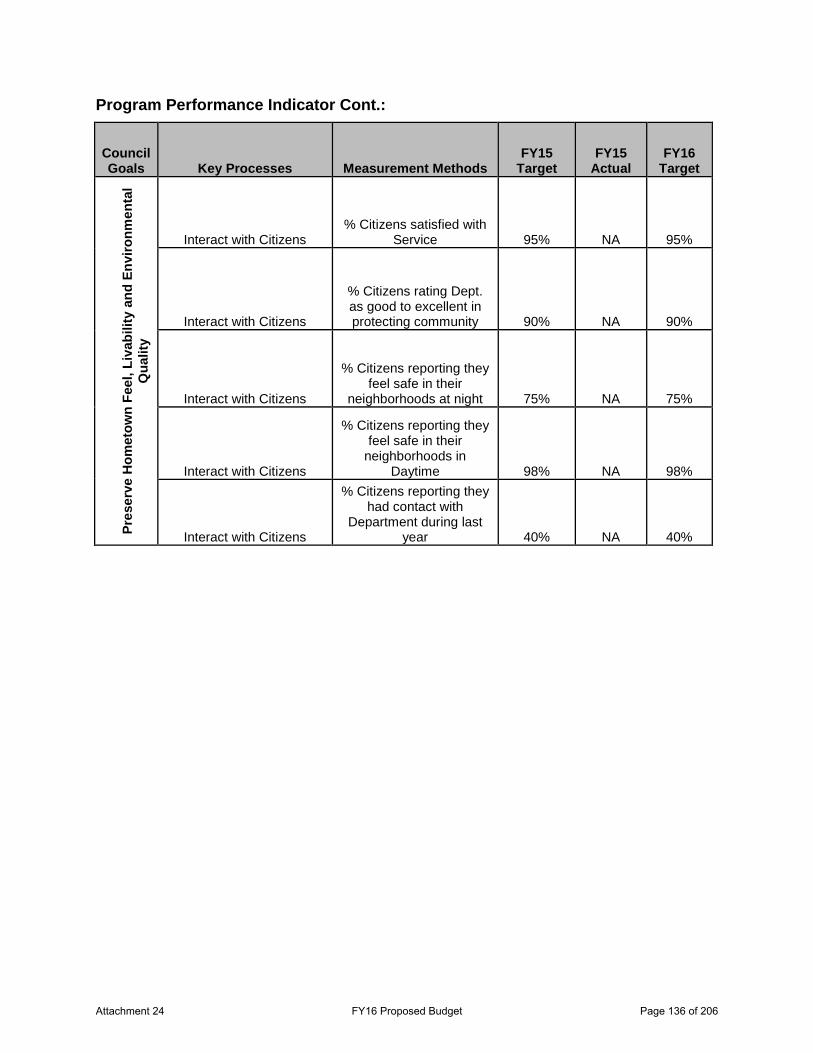
Program Performance Indicator Cont.:
Council Goals Key Processes Measurement Methods
FY15 Target
FY15 Actual
FY16 Target
Pres
erve
Hom
etow
n Fe
el, L
ivab
ility
and
Env
ironm
enta
l Q
ualit
y
Interact with Citizens % Citizens satisfied with
Service 95% NA 95%
Interact with Citizens
% Citizens rating Dept. as good to excellent in protecting community 90% NA 90%
Interact with Citizens
% Citizens reporting they feel safe in their
neighborhoods at night 75% NA 75%
Interact with Citizens
% Citizens reporting they feel safe in their
neighborhoods in Daytime 98% NA 98%
Interact with Citizens
% Citizens reporting they had contact with
Department during last year 40% NA 40%
Attachment 24 FY16 Proposed Budget Page 136 of 206
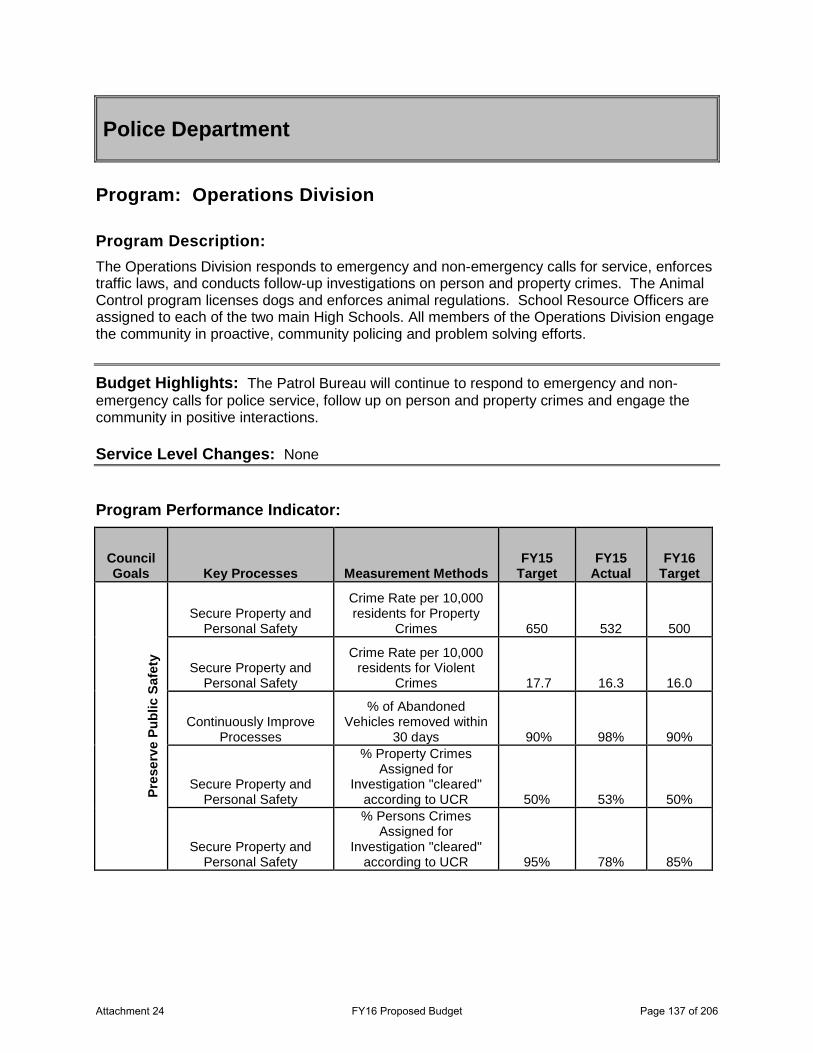
Police Department
Program: Operations Division Program Description: The Operations Division responds to emergency and non-emergency calls for service, enforces traffic laws, and conducts follow-up investigations on person and property crimes. The Animal Control program licenses dogs and enforces animal regulations. School Resource Officers are assigned to each of the two main High Schools. All members of the Operations Division engage the community in proactive, community policing and problem solving efforts.
Budget Highlights: The Patrol Bureau will continue to respond to emergency and non-emergency calls for police service, follow up on person and property crimes and engage the community in positive interactions.
Service Level Changes: None
Program Performance Indicator:
Council Goals Key Processes Measurement Methods
FY15 Target
FY15 Actual
FY16 Target
Pres
erve
Pub
lic S
afet
y
Secure Property and Personal Safety
Crime Rate per 10,000 residents for Property
Crimes 650 532 500
Secure Property and Personal Safety
Crime Rate per 10,000 residents for Violent
Crimes 17.7 16.3 16.0
Continuously Improve Processes
% of Abandoned Vehicles removed within
30 days 90% 98% 90%
Secure Property and Personal Safety
% Property Crimes Assigned for
Investigation "cleared" according to UCR 50% 53% 50%
Secure Property and Personal Safety
% Persons Crimes Assigned for
Investigation "cleared" according to UCR 95% 78% 85%
Attachment 24 FY16 Proposed Budget Page 137 of 206
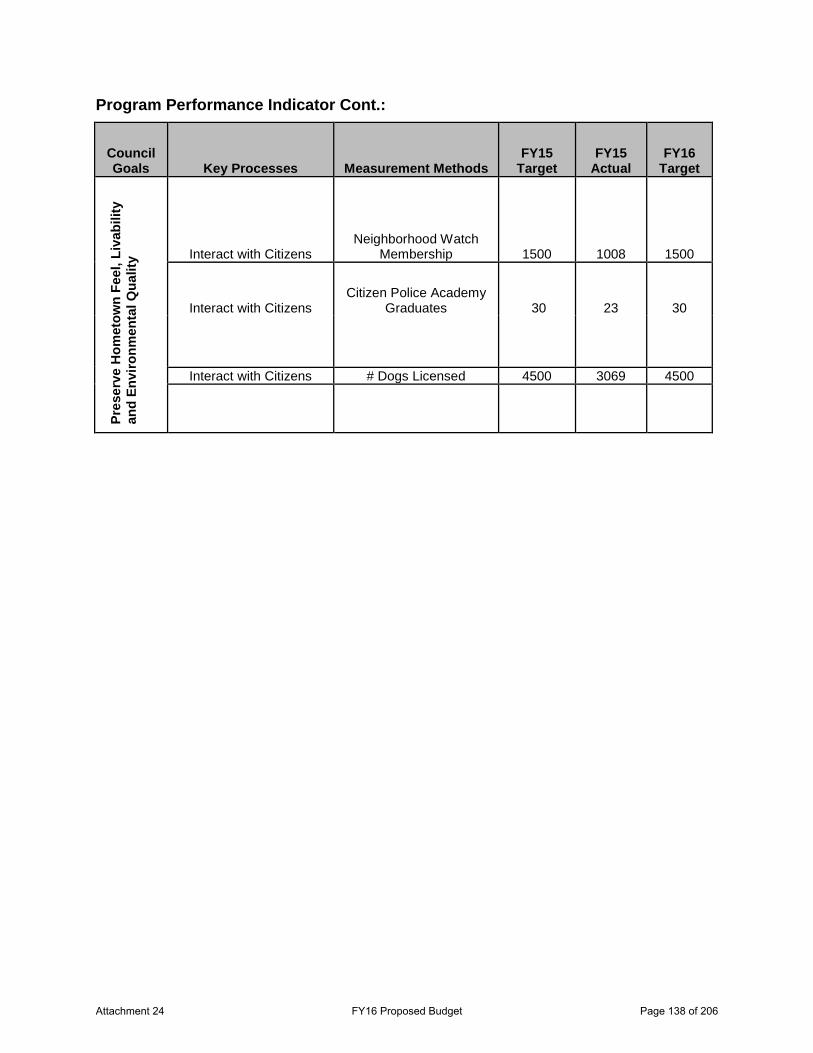
Program Performance Indicator Cont.:
Council Goals Key Processes Measurement Methods
FY15 Target
FY15 Actual
FY16 Target
Pres
erve
Hom
etow
n Fe
el, L
ivab
ility
an
d En
viro
nmen
tal Q
ualit
y
Interact with Citizens Neighborhood Watch
Membership 1500 1008 1500
Interact with Citizens Citizen Police Academy
Graduates 30 23 30
Interact with Citizens # Dogs Licensed 4500 3069 4500
Attachment 24 FY16 Proposed Budget Page 138 of 206
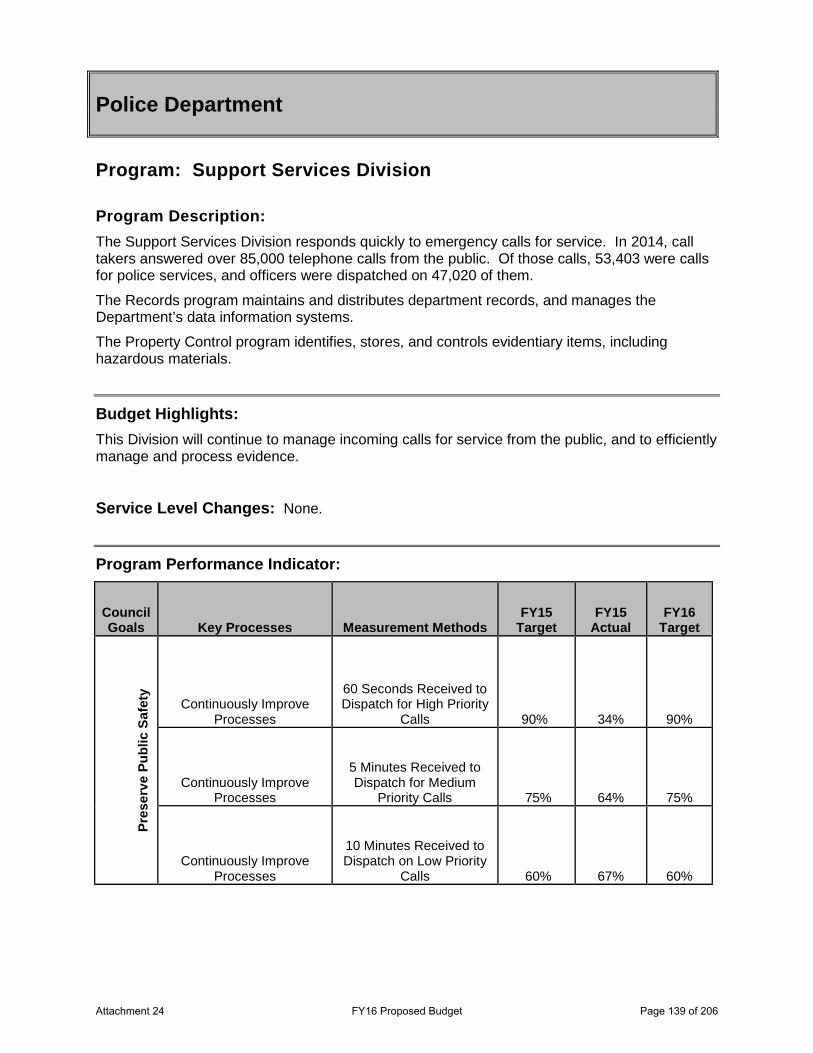
Program: Support Services Division Program Description: The Support Services Division responds quickly to emergency calls for service. In 2014, call takers answered over 85,000 telephone calls from the public. Of those calls, 53,403 were calls for police services, and officers were dispatched on 47,020 of them.
The Records program maintains and distributes department records, and manages the Department’s data information systems.
The Property Control program identifies, stores, and controls evidentiary items, including hazardous materials.
Budget Highlights: This Division will continue to manage incoming calls for service from the public, and to efficiently manage and process evidence.
Service Level Changes: None.
Program Performance Indicator:
Council Goals Key Processes Measurement Methods
FY15 Target
FY15 Actual
FY16 Target
Pres
erve
Pub
lic S
afet
y
Continuously Improve Processes
60 Seconds Received to Dispatch for High Priority
Calls 90% 34% 90%
Continuously Improve Processes
5 Minutes Received to Dispatch for Medium
Priority Calls 75% 64% 75%
Continuously Improve Processes
10 Minutes Received to Dispatch on Low Priority
Calls 60% 67% 60%
Police Department
Attachment 24 FY16 Proposed Budget Page 139 of 206
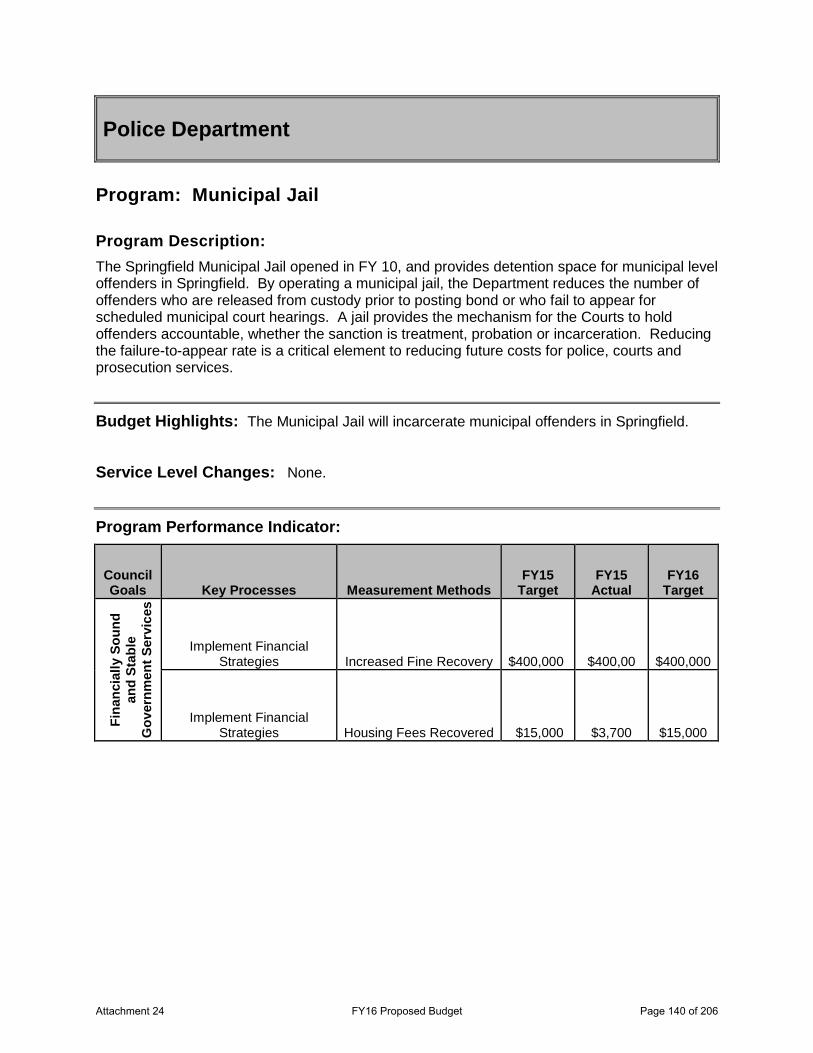
Police Department
Program: Municipal Jail Program Description: The Springfield Municipal Jail opened in FY 10, and provides detention space for municipal level offenders in Springfield. By operating a municipal jail, the Department reduces the number of offenders who are released from custody prior to posting bond or who fail to appear for scheduled municipal court hearings. A jail provides the mechanism for the Courts to hold offenders accountable, whether the sanction is treatment, probation or incarceration. Reducing the failure-to-appear rate is a critical element to reducing future costs for police, courts and prosecution services.
Budget Highlights: The Municipal Jail will incarcerate municipal offenders in Springfield.
Service Level Changes: None.
Program Performance Indicator:
Council Goals Key Processes Measurement Methods
FY15 Target
FY15 Actual
FY16 Target
Fina
ncia
lly S
ound
an
d St
able
G
over
nmen
t Ser
vice
s
Implement Financial Strategies Increased Fine Recovery $400,000 $400,00 $400,000
Implement Financial Strategies Housing Fees Recovered $15,000 $3,700 $15,000
Attachment 24 FY16 Proposed Budget Page 140 of 206
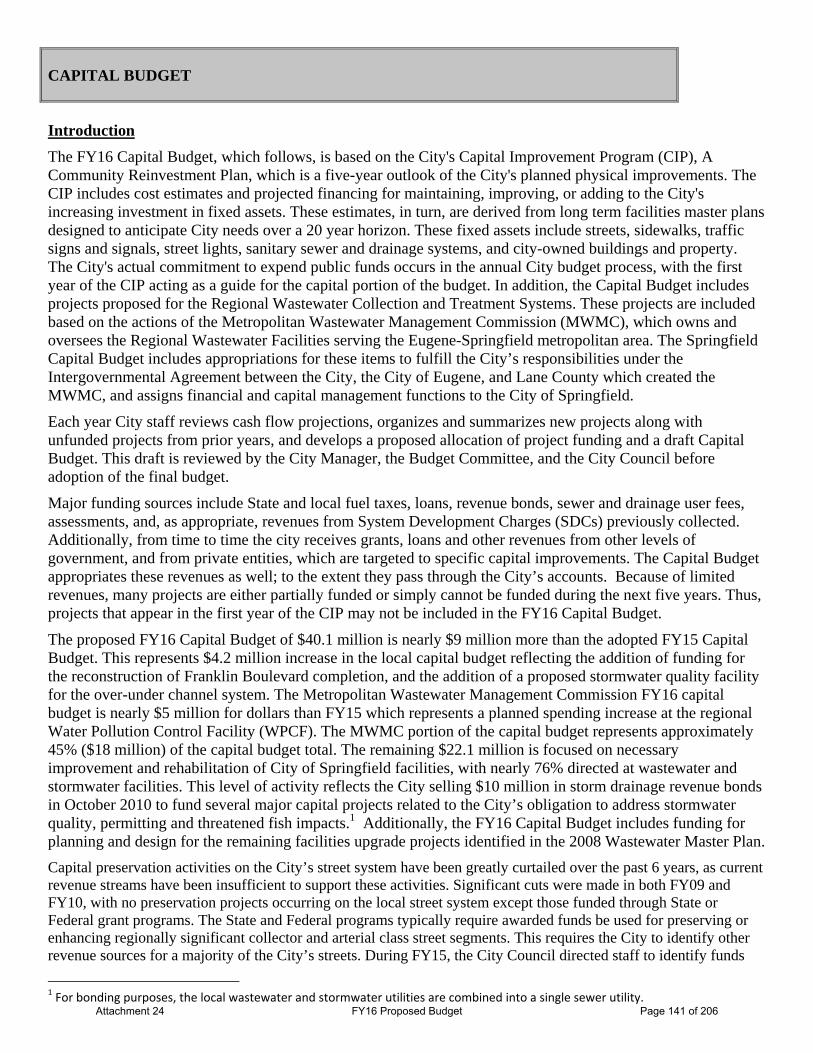
CAPITAL BUDGET
Introduction
The FY16 Capital Budget, which follows, is based on the City's Capital Improvement Program (CIP), A Community Reinvestment Plan, which is a five-year outlook of the City's planned physical improvements. The CIP includes cost estimates and projected financing for maintaining, improving, or adding to the City's increasing investment in fixed assets. These estimates, in turn, are derived from long term facilities master plans designed to anticipate City needs over a 20 year horizon. These fixed assets include streets, sidewalks, traffic signs and signals, street lights, sanitary sewer and drainage systems, and city-owned buildings and property. The City's actual commitment to expend public funds occurs in the annual City budget process, with the first year of the CIP acting as a guide for the capital portion of the budget. In addition, the Capital Budget includes projects proposed for the Regional Wastewater Collection and Treatment Systems. These projects are included based on the actions of the Metropolitan Wastewater Management Commission (MWMC), which owns and oversees the Regional Wastewater Facilities serving the Eugene-Springfield metropolitan area. The Springfield Capital Budget includes appropriations for these items to fulfill the City’s responsibilities under the Intergovernmental Agreement between the City, the City of Eugene, and Lane County which created the MWMC, and assigns financial and capital management functions to the City of Springfield.
Each year City staff reviews cash flow projections, organizes and summarizes new projects along with unfunded projects from prior years, and develops a proposed allocation of project funding and a draft Capital Budget. This draft is reviewed by the City Manager, the Budget Committee, and the City Council before adoption of the final budget.
Major funding sources include State and local fuel taxes, loans, revenue bonds, sewer and drainage user fees, assessments, and, as appropriate, revenues from System Development Charges (SDCs) previously collected. Additionally, from time to time the city receives grants, loans and other revenues from other levels of government, and from private entities, which are targeted to specific capital improvements. The Capital Budget appropriates these revenues as well; to the extent they pass through the City’s accounts. Because of limited revenues, many projects are either partially funded or simply cannot be funded during the next five years. Thus, projects that appear in the first year of the CIP may not be included in the FY16 Capital Budget.
The proposed FY16 Capital Budget of $40.1 million is nearly $9 million more than the adopted FY15 Capital Budget. This represents $4.2 million increase in the local capital budget reflecting the addition of funding for the reconstruction of Franklin Boulevard completion, and the addition of a proposed stormwater quality facility for the over-under channel system. The Metropolitan Wastewater Management Commission FY16 capital budget is nearly $5 million for dollars than FY15 which represents a planned spending increase at the regional Water Pollution Control Facility (WPCF). The MWMC portion of the capital budget represents approximately 45% ($18 million) of the capital budget total. The remaining $22.1 million is focused on necessary improvement and rehabilitation of City of Springfield facilities, with nearly 76% directed at wastewater and stormwater facilities. This level of activity reflects the City selling $10 million in storm drainage revenue bonds in October 2010 to fund several major capital projects related to the City’s obligation to address stormwater quality, permitting and threatened fish impacts.1 Additionally, the FY16 Capital Budget includes funding for planning and design for the remaining facilities upgrade projects identified in the 2008 Wastewater Master Plan.
Capital preservation activities on the City’s street system have been greatly curtailed over the past 6 years, as current revenue streams have been insufficient to support these activities. Significant cuts were made in both FY09 and FY10, with no preservation projects occurring on the local street system except those funded through State or Federal grant programs. The State and Federal programs typically require awarded funds be used for preserving or enhancing regionally significant collector and arterial class street segments. This requires the City to identify other revenue sources for a majority of the City’s streets. During FY15, the City Council directed staff to identify funds
1 For bonding purposes, the local wastewater and stormwater utilities are combined into a single sewer utility.
Attachment 24 FY16 Proposed Budget Page 141 of 206
for a slurry seal project on local class residential streets. Utilizing Street Fund Reserves, A project was completed for just over $128,000 effectively slurry sealing approximately 3.4 lane miles of local class residential streets, or 1.5% of the local class residential system inventory.
Looking forward, funding for street preservation projects in FY16 and beyond is still inadequate, and the prolonged lack of dedicated preservation funding has led to a severe overall decline of street conditions directly correlating to the need for higher cost reconstruction preservation methods. The FY16 budget carries with it the recommendation of utilizing local resources to maximize receipt of federal dollars street projects. This includes borrowing matching funds to move the Franklin Boulevard Reconstruction forward, as well as dedicating a majority of limited street capital funds to the Southbank Path Extension, Gateway Street Overlay, and the Virginia/Daisy Bicycle Boulevard. Additionally, there has been and continues to be an absence of regular street preservation activities in the capital budget resulting in a sharp decline in the condition of the local street system. As reported to the Council in June 2014, the City faces an annual $4.5 million unfunded street preservation need. Voter passage of Lane County’s proposed Vehicle Registration Fee would provide approximately $1 million toward closing the City’s funding gap.
Other preservation or rehabilitation activities currently underfunded in the Capital Budget are for City owned buildings. The City continues to face several critical building/facilities operations, maintenance and preservation issues. The DLR Buildings Condition Report (DLR) identified $600K deferred/backlog facilities repair needs and $300K ongoing annual maintenance/preservation needs. In FY09, the City implemented an Internal Building Preservation Charge with intent to program $300k annually for ongoing preservation and $200k to start addressing the backlog projects. Since inception, the Internal Building Preservation Charge has generated just over $260k per year through FY14 dedicated to projects, with just under $269k anticipated in FY15 and $270k anticipated in FY16. The first priority of staff charged with this capital program was to develop the City Buildings/Facilities Work Plan inclusive of all City Fire Stations, City Hall, Springfield Justice Center, Development and Public Works operations facilities, Springfield Depot, Carter Building. This 5-year work plan is reviewed and updated annually, and used as the basis for project budgeting each fiscal year. For example, the 2016-2020 Capital Improvement Program includes a project to replace the City Hall HVAC System at a projected cost of $1.65 million. The last major update or replacement to the system was nearly 20 years ago and the current units are nearing the end of the serviceable life.
SDC reserves remain very low forcing many large system expansion projects identified in the adopted master plans to be projected further out in the CIP than originally planned. Recovery of the SDC funds has been slow, but the positive trend that started in FY14 has continued into FY15 and is anticipated to build in FY16. By continuing to postpone projects SDC reserves can be built back up and permit the construction of these system and expansion projects supporting community growth and development.
Attachment 24 FY16 Proposed Budget Page 142 of 206
Major Projects
Among the major capital projects included in the Capital Budget are the following: CMOM Planning and Implementation – The City continues to make the repair, rehabilitation, or replacement
of older wastewater pipes throughout the City to reduce leakage of ground water into the system as a high priority in the Capital Improvement Program. In 2010, The City completed rehabilitation of the basins identified in the Wet Weather Flow Management Plan (WWFMP) adopted in 2001 by the City and the Metropolitan Wastewater Management Commission (MWMC). Rather than update the WWFMP, the City, in conjunction with MWMC, is moving to a Capacity, Management, Operations, and Maintenance (CMOM) program to remain in compliance with both State and Federal regulations. This program will be utilized to identify future preservation needs, as may an update to the Local Wastewater Management Plan.
Gateway Street Overlay – The City has received approximately $1.5 million in Surface Transportation
Program funding for pavement preservation work on Gateway Street. Gateway Street is an extremely busy minor arterial providing critical commercial access and serving over 22,000 vehicles a day. The current Surface Condition Index (SCI) is 38.6, which equates to a rating of poor. The receipt of this federal funding is timely and critical to preserving Gateway Street, as further deterioration of the pavement structure would most likely result in a full depth reconstruction that would be extremely costly, and have major impact to the commercial and retail community. The anticipated project includes 0.97 miles of pavement preservation as well as ADA and signal upgrades.
Franklin Boulevard Sanitary Sewer System Expansion – The expansion of the Franklin Boulevard Trunk
Sewer extends the Glenwood wastewater system from the end of the existing trunk line in Franklin Boulevard south to the Urban Growth Boundary. The City Council has made the redevelopment of Glenwood and the reconstruction of Franklin Boulevard a priority to promote development and community growth. The City has recently applied for funding to begin construction of the roadway project, elevating the priority for the sewer extension project. Funding to begin the planning and design phase was programmed and budgeted in FY13. Construction began in FY14 and will continue into FY15 ensuring the sewer extension project is completed ahead of any street construction work. Funding for the project is secured through wastewater user fee collections.
Franklin Boulevard Reconstruction –The NEPA process is complete, with the project receiving a Categorical
Exclusion (CE). The Franklin concept endorsed by Council in 2008 envisions sections of improved arterial and sections of a multi-way boulevard treatment that includes access lanes and parking adjacent to the arterial. Project elements include roundabout intersections, median control, relocated EmX station platforms, space preserved for future dedicated EmX guideways, and provision of high quality bicycle and pedestrian facilities. The City has received $6 million through the Statewide Transportation Improvement Program (2015-2018 STIP), and will match that with a $3.5 to $5 million Oregon Transportation Infrastructure Bank loan to complete a Phase 1 improvement from the Franklin/McVey intersection to a logical terminus to the west. Consultant design and right of acquisition contracts have recently been approved, with construction anticipated in 2016.
Over-Under Channel Pipe Replacement – The Over-Under Channel is part of the City’s stormwater system
serving mid-Springfield from 5th to 28th Streets and from Main Street to Highway 126. The name of the Channel comes from the configuration of the system where stormwater is collected and conveyed in both an open channel and in a large pipe located under and adjacent to the channel. A portion of the piped system, from the east side of Silke Field to the outfall of the system into the Q Street Channel at Moffitt School, is a corrugated metal arch pipe (CMP) installed in the late 1950’s and early 1960’s. Staff has found that this CMP has reached the end of its useful life and is showing signs of corrosion and minor failures. In FY11, the City Council approved funding to design a replacement pipe system and identify the amount of additional funds needed for construction. Investigation and hydraulic study work has been completed, with design and citizen outreach efforts currently underway.
Attachment 24 FY16 Proposed Budget Page 143 of 206
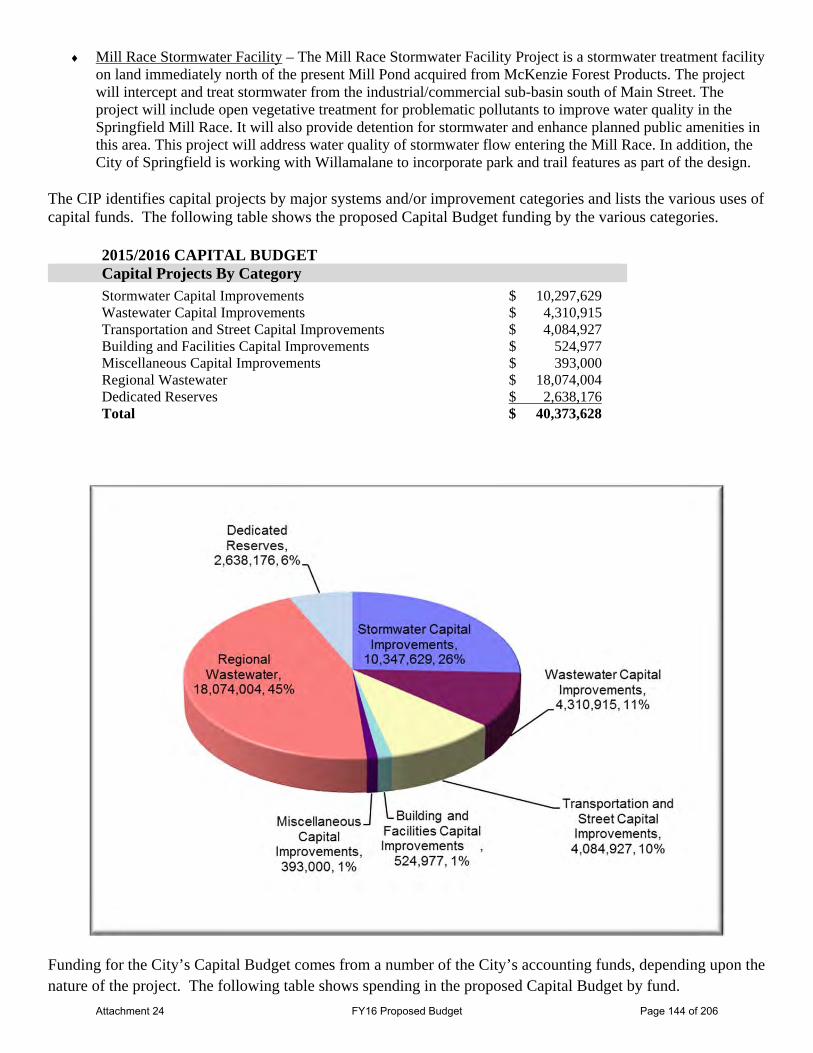
Mill Race Stormwater Facility – The Mill Race Stormwater Facility Project is a stormwater treatment facility on land immediately north of the present Mill Pond acquired from McKenzie Forest Products. The project will intercept and treat stormwater from the industrial/commercial sub-basin south of Main Street. The project will include open vegetative treatment for problematic pollutants to improve water quality in the Springfield Mill Race. It will also provide detention for stormwater and enhance planned public amenities in this area. This project will address water quality of stormwater flow entering the Mill Race. In addition, the City of Springfield is working with Willamalane to incorporate park and trail features as part of the design.
The CIP identifies capital projects by major systems and/or improvement categories and lists the various uses of capital funds. The following table shows the proposed Capital Budget funding by the various categories.
2015/2016 CAPITAL BUDGET Capital Projects By Category Stormwater Capital Improvements $ 10,297,629 Wastewater Capital Improvements $ 4,310,915 Transportation and Street Capital Improvements $ 4,084,927 Building and Facilities Capital Improvements $ 524,977 Miscellaneous Capital Improvements $ 393,000 Regional Wastewater $ 18,074,004 Dedicated Reserves $ 2,638,176 Total $ 40,373,628
Funding for the City’s Capital Budget comes from a number of the City’s accounting funds, depending upon the nature of the project. The following table shows spending in the proposed Capital Budget by fund.
Attachment 24 FY16 Proposed Budget Page 144 of 206
Capital Projects by Fund
Type Amount Local Wastewater Capital Fund $ 3,437,915 Development Projects Fund $ 320,977 Drainage Capital Fund $ 9,461,329 Drainage Capital Fund Dedicated Reserve $ 1,900,000 Regional Wastewater Capital Bond Fund $ 12,213,286 Regional Wastewater Capital Fund $ 5,860,718 Street Capital Fund $ 415,940 SDC Local Storm Improvement Fund $ 888,650 SDC Local Storm Improvement Dedicated Reserve $ 149,176 SDC Local Storm Reimbursement Fund $ 169,650 SDC Local Wastewater Improvement Fund $ 180,000 SDC Local Wastewater Reimbursement Fund $ 901,000 SDC Regional Wastewater Improvement Fund $ 0 SDC Regional Wastewater Reimbursement Fund $ 0 SDC Transportation Reimbursement Fund $ 0 SDC Transportation Improvement Fund $ 553,987 SDC Transportation Improvement Dedicated Reserve $ 589,000 Booth Kelly $ 232,000 SEDA Glenwood Capital $ 3,100,000 Total $ 40,373,628
Three of the funds listed above have no capital expenditures budgeted for FY16. These are the SDC Regional Wastewater Reimbursement Fund, SDC Regional Wastewater Improvement Fund, and the SDC Transportation Reimbursement Fund. MWMC opted in FY10 to limit expenditures in the two Regional SDC funds to debt service payments and to continue the capital program using the Regional Wastewater Capital Bond Fund and the Regional Wastewater Capital Fund. Therefore, no expenditures are shown in the Capital Budget for the two SDC funds and they are shown here for reporting purposes only.
Also shown above in italics are the designated dedicated reserves within five of the funds: Drainage Capital Fund Dedicated Reserve, Street Capital Fund Dedicated Reserve, SDC Local Storm Improvement Dedicated Reserve, and the SDC Transportation Improvement Dedicated Reserve. These four dedicated reserves contain funds that have been set aside for specific projects but that are not expected to be needed for those projects in FY16.
Operating Impact of the Capital Budget
The City's financial management policies require that the City’s operating budget reflect the effect of projects in the Capital Budget.
Many capital projects that are classified as preservation projects are intended to limit increases in operating and maintenance expenditures by preserving and extending the useful life of the City's infrastructure. Long-term financial plans prepared for the City's operating funds consider the impact of these improvements on efficiency when forecasting growth in operating expenditures for the next several years. Other capital improvement projects that involve development of new facilities or new and expanded infrastructure may result in additional operating costs or savings in future years.
Attachment 24 FY16 Proposed Budget Page 145 of 206
For example, while new fire station construction will result in additional staffing and operations costs, repaving a street, or bringing it to full City standards typically results in a reduced need for maintenance. These costs or savings are not included in the capital budget estimates, but rather are incorporated into the operating budget beginning in the year that the facility is anticipated to become operational. An important element of the CIP process is the consideration of any future increases in operating costs that may result from capital activity so that estimates of those costs can be incorporated in the appropriate long-term financial plans for the affected funds.
In a governmental setting, these operating impacts often occur in funds other than those in which the capital expenditure is recorded. As projects move from the CIP into the Capital Budget they are reviewed to evaluate the impact on the appropriate operating fund budget.
Analysis of the FY16 Capital Budget indicates that a large number of projects do not have a measurable operating impact. In many cases these projects are planning activities, which do not result in additional infrastructure or equipment. For example, projects that do not have any impact on the City’s operational budget include expenditures to participate in a regional waterways study, to plan Franklin Boulevard improvements, and to complete base map updating. The Capital Budget includes approximately $2 million in the category of projects that appear to have no significant operational impact.
A second category of capital projects that are not estimated to have operating impacts are those where the capital expenditure is designed to replace or upgrade existing systems. In many cases, there may be operating efficiencies or future cost avoidance that results from the improvements, but these impacts are not presently quantifiable and are believed to be marginal. Examples in this project category include preservation projects for streets, drainage and sanitary sewers where the only operating impact is potential avoidance of future costs that might occur if repairs or replacement do not occur on a timely basis. Approximately $5.5 million is budgeted for such projects. Projects such as the $600,000 budgeted for upgrading the wastewater main in 19th Street may have little or no operational impact, but instead prevent the need to make significant capital investments that might otherwise be required to increase the handling capacity of the sanitary system.
A third category of projects not presently estimated to have an impact on the operating budget includes those where the scope of the project is not sufficiently defined to develop an estimate. An example of this category of projects where definition is inadequate to determine operational impact is the $164,000 budgeted for City participation in private projects. These expenditures will be used to support a variety of capital improvements such as streets and sewers that are constructed by private developers. The City’s participation pays for portions of those capital expenditures which are principally for the benefit of the general public, not the particular development. While there will be an operating impact to the City after these projects are completed by developers and the infrastructure is donated to the City, the maintenance impact of the City participation portion of project costs is not calculated.
In dollar terms, the cost of capital projects expected to result in increased operating expenditures, excluding MWMC projects and dedicated reserves, totals over $5.5 million. The increased operating costs resulting from these capital improvements are estimated to be about $75,000 annually. The majority of this cost is for projects that will result in the need to increase staffing in future years as the infrastructure asset base grows. However, it is typical that not all projects are constructed in the same year they are funded. Therefore, the project and operating values are typically less than stated above.
Attachment 24 FY16 Proposed Budget Page 146 of 206
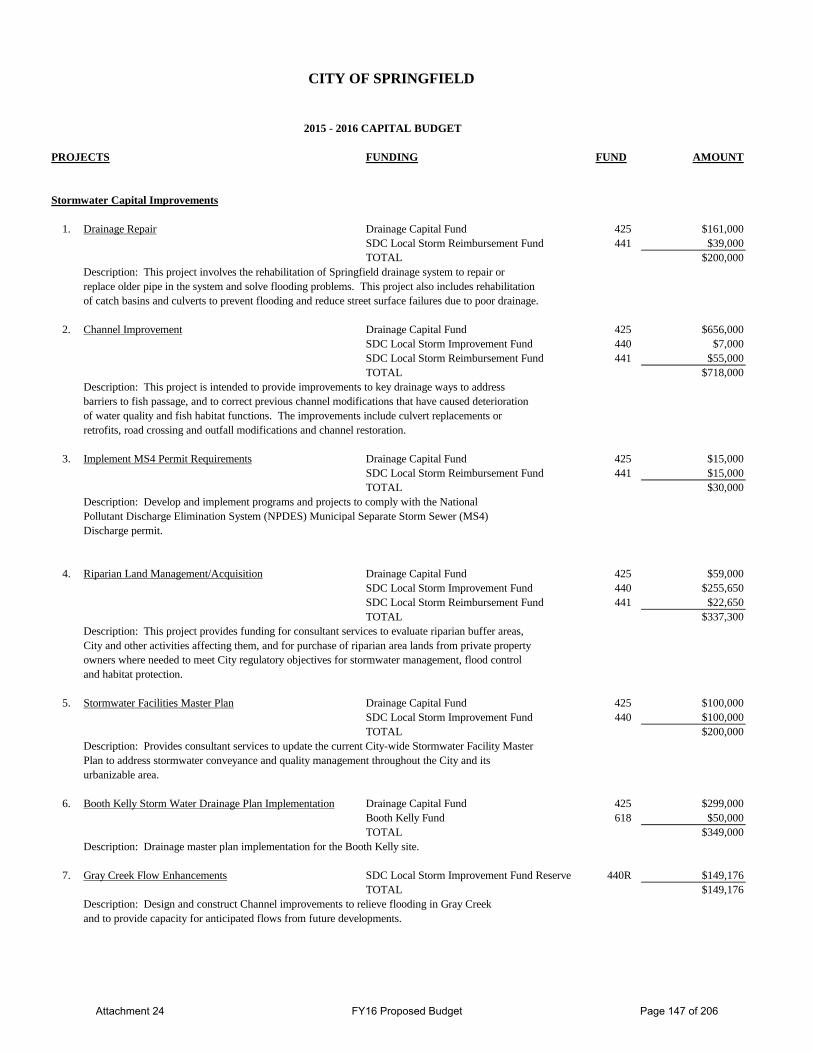
CITY OF SPRINGFIELD
2015 - 2016 CAPITAL BUDGET
PROJECTS FUNDING FUND AMOUNT
Stormwater Capital Improvements
1. Drainage Repair Drainage Capital Fund 425 $161,000SDC Local Storm Reimbursement Fund 441 $39,000TOTAL $200,000
Description: This project involves the rehabilitation of Springfield drainage system to repair or replace older pipe in the system and solve flooding problems. This project also includes rehabilitation of catch basins and culverts to prevent flooding and reduce street surface failures due to poor drainage.
2. Channel Improvement Drainage Capital Fund 425 $656,000SDC Local Storm Improvement Fund 440 $7,000SDC Local Storm Reimbursement Fund 441 $55,000TOTAL $718,000
Description: This project is intended to provide improvements to key drainage ways to address barriers to fish passage, and to correct previous channel modifications that have caused deterioration of water quality and fish habitat functions. The improvements include culvert replacements orretrofits, road crossing and outfall modifications and channel restoration.
3. Implement MS4 Permit Requirements Drainage Capital Fund 425 $15,000SDC Local Storm Reimbursement Fund 441 $15,000TOTAL $30,000
Description: Develop and implement programs and projects to comply with the National Pollutant Discharge Elimination System (NPDES) Municipal Separate Storm Sewer (MS4) Discharge permit.
4. Riparian Land Management/Acquisition Drainage Capital Fund 425 $59,000SDC Local Storm Improvement Fund 440 $255,650SDC Local Storm Reimbursement Fund 441 $22,650TOTAL $337,300
Description: This project provides funding for consultant services to evaluate riparian buffer areas,City and other activities affecting them, and for purchase of riparian area lands from private propertyowners where needed to meet City regulatory objectives for stormwater management, flood control and habitat protection.
5. Stormwater Facilities Master Plan Drainage Capital Fund 425 $100,000SDC Local Storm Improvement Fund 440 $100,000TOTAL $200,000
Description: Provides consultant services to update the current City-wide Stormwater Facility Master Plan to address stormwater conveyance and quality management throughout the City and itsurbanizable area.
6. Booth Kelly Storm Water Drainage Plan Implementation Drainage Capital Fund 425 $299,000Booth Kelly Fund 618 $50,000TOTAL $349,000
Description: Drainage master plan implementation for the Booth Kelly site.
7. Gray Creek Flow Enhancements SDC Local Storm Improvement Fund Reserve 440R $149,176TOTAL $149,176
Description: Design and construct Channel improvements to relieve flooding in Gray Creekand to provide capacity for anticipated flows from future developments.
Attachment 24 FY16 Proposed Budget Page 147 of 206
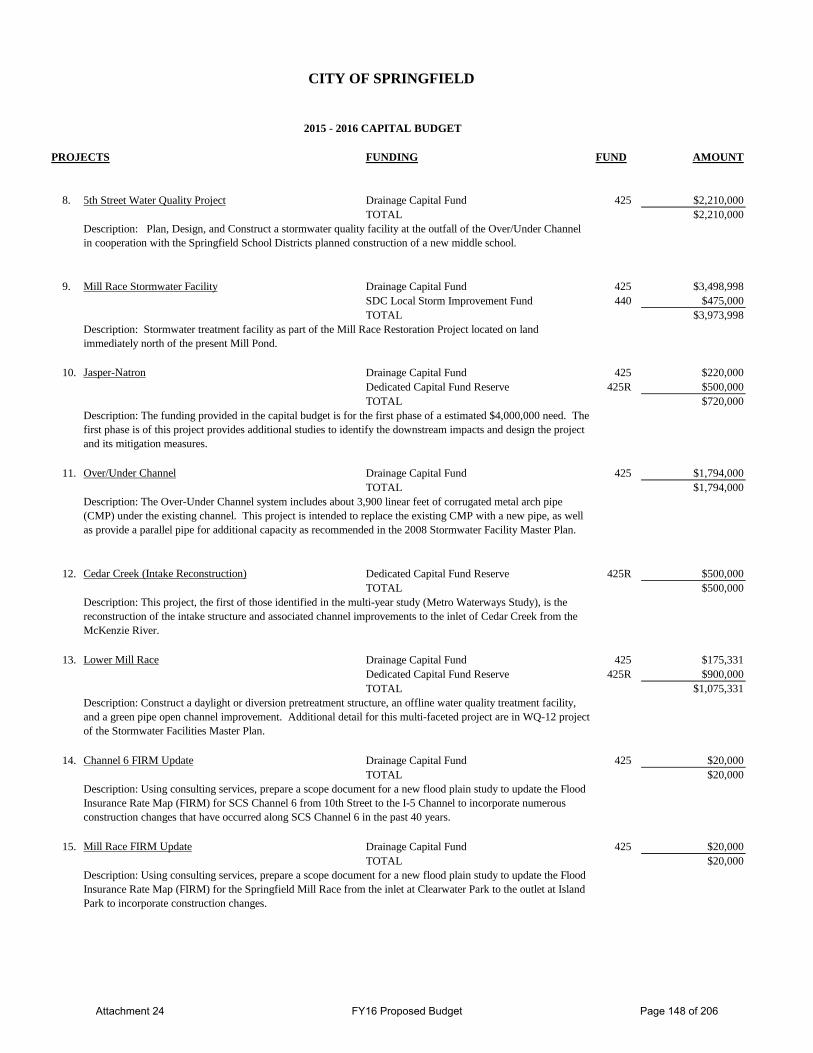
CITY OF SPRINGFIELD
2015 - 2016 CAPITAL BUDGET
PROJECTS FUNDING FUND AMOUNT
8. 5th Street Water Quality Project Drainage Capital Fund 425 $2,210,000TOTAL $2,210,000
9. Mill Race Stormwater Facility Drainage Capital Fund 425 $3,498,998SDC Local Storm Improvement Fund 440 $475,000TOTAL $3,973,998
10. Jasper-Natron Drainage Capital Fund 425 $220,000Dedicated Capital Fund Reserve 425R $500,000TOTAL $720,000
11. Over/Under Channel Drainage Capital Fund 425 $1,794,000TOTAL $1,794,000
12. Cedar Creek (Intake Reconstruction) Dedicated Capital Fund Reserve 425R $500,000TOTAL $500,000
13. Lower Mill Race Drainage Capital Fund 425 $175,331Dedicated Capital Fund Reserve 425R $900,000TOTAL $1,075,331
14. Channel 6 FIRM Update Drainage Capital Fund 425 $20,000TOTAL $20,000
15. Mill Race FIRM Update Drainage Capital Fund 425 $20,000TOTAL $20,000
Description: Stormwater treatment facility as part of the Mill Race Restoration Project located on land immediately north of the present Mill Pond.
Description: The funding provided in the capital budget is for the first phase of a estimated $4,000,000 need. The first phase is of this project provides additional studies to identify the downstream impacts and design the project and its mitigation measures.
Description: The Over-Under Channel system includes about 3,900 linear feet of corrugated metal arch pipe (CMP) under the existing channel. This project is intended to replace the existing CMP with a new pipe, as well as provide a parallel pipe for additional capacity as recommended in the 2008 Stormwater Facility Master Plan.
Description: This project, the first of those identified in the multi-year study (Metro Waterways Study), is the reconstruction of the intake structure and associated channel improvements to the inlet of Cedar Creek from the McKenzie River.
Description: Construct a daylight or diversion pretreatment structure, an offline water quality treatment facility, and a green pipe open channel improvement. Additional detail for this multi-faceted project are in WQ-12 project of the Stormwater Facilities Master Plan.
Description: Plan, Design, and Construct a stormwater quality facility at the outfall of the Over/Under Channel in cooperation with the Springfield School Districts planned construction of a new middle school.
Description: Using consulting services, prepare a scope document for a new flood plain study to update the Flood Insurance Rate Map (FIRM) for SCS Channel 6 from 10th Street to the I-5 Channel to incorporate numerous construction changes that have occurred along SCS Channel 6 in the past 40 years.
Description: Using consulting services, prepare a scope document for a new flood plain study to update the Flood Insurance Rate Map (FIRM) for the Springfield Mill Race from the inlet at Clearwater Park to the outlet at Island Park to incorporate construction changes.
Attachment 24 FY16 Proposed Budget Page 148 of 206
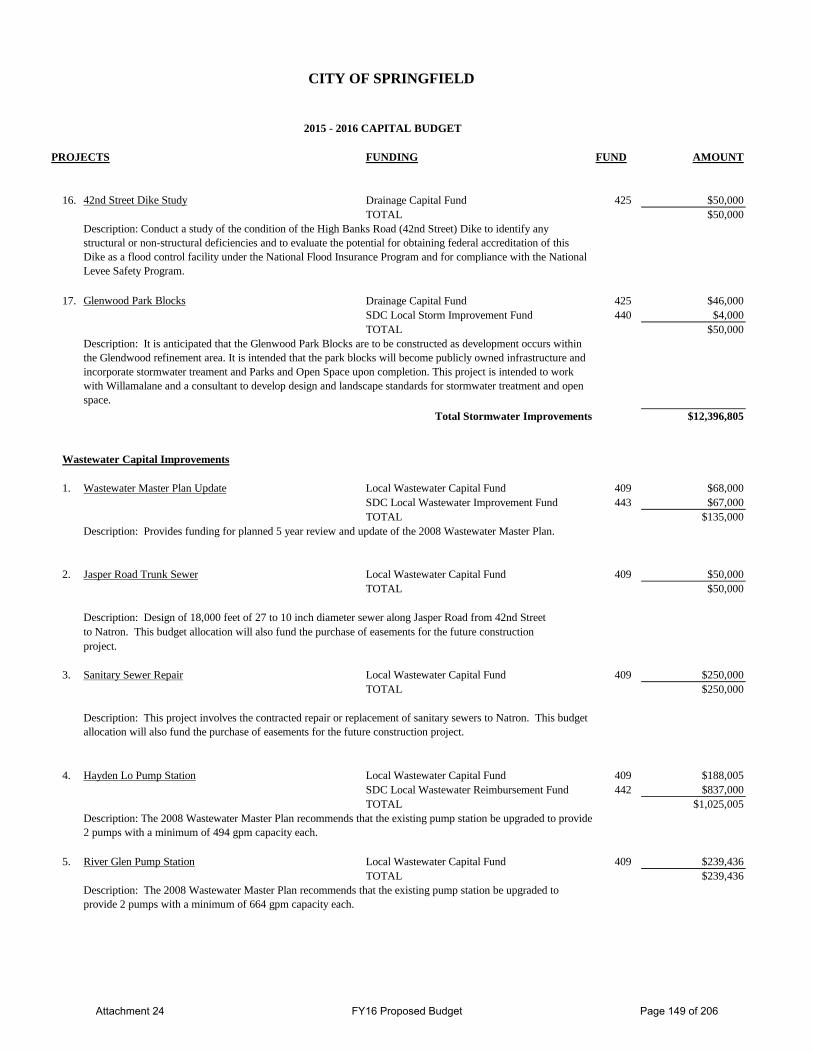
CITY OF SPRINGFIELD
2015 - 2016 CAPITAL BUDGET
PROJECTS FUNDING FUND AMOUNT
16. 42nd Street Dike Study Drainage Capital Fund 425 $50,000TOTAL $50,000
17. Glenwood Park Blocks Drainage Capital Fund 425 $46,000SDC Local Storm Improvement Fund 440 $4,000TOTAL $50,000
Total Stormwater Improvements $12,396,805
Wastewater Capital Improvements
1. Wastewater Master Plan Update Local Wastewater Capital Fund 409 $68,000SDC Local Wastewater Improvement Fund 443 $67,000TOTAL $135,000
Description: Provides funding for planned 5 year review and update of the 2008 Wastewater Master Plan.
2. Jasper Road Trunk Sewer Local Wastewater Capital Fund 409 $50,000TOTAL $50,000
Description: Design of 18,000 feet of 27 to 10 inch diameter sewer along Jasper Road from 42nd Streetto Natron. This budget allocation will also fund the purchase of easements for the future constructionproject.
3. Sanitary Sewer Repair Local Wastewater Capital Fund 409 $250,000TOTAL $250,000
4. Hayden Lo Pump Station Local Wastewater Capital Fund 409 $188,005SDC Local Wastewater Reimbursement Fund 442 $837,000TOTAL $1,025,005
5. River Glen Pump Station Local Wastewater Capital Fund 409 $239,436TOTAL $239,436
Description: This project involves the contracted repair or replacement of sanitary sewers to Natron. This budget allocation will also fund the purchase of easements for the future construction project.
Description: It is anticipated that the Glenwood Park Blocks are to be constructed as development occurs within the Glendwood refinement area. It is intended that the park blocks will become publicly owned infrastructure and incorporate stormwater treament and Parks and Open Space upon completion. This project is intended to work with Willamalane and a consultant to develop design and landscape standards for stormwater treatment and open space.
Description: The 2008 Wastewater Master Plan recommends that the existing pump station be upgraded to provide 2 pumps with a minimum of 664 gpm capacity each.
Description: Conduct a study of the condition of the High Banks Road (42nd Street) Dike to identify any structural or non-structural deficiencies and to evaluate the potential for obtaining federal accreditation of this Dike as a flood control facility under the National Flood Insurance Program and for compliance with the National Levee Safety Program.
Description: The 2008 Wastewater Master Plan recommends that the existing pump station be upgraded to provide 2 pumps with a minimum of 494 gpm capacity each.
Attachment 24 FY16 Proposed Budget Page 149 of 206
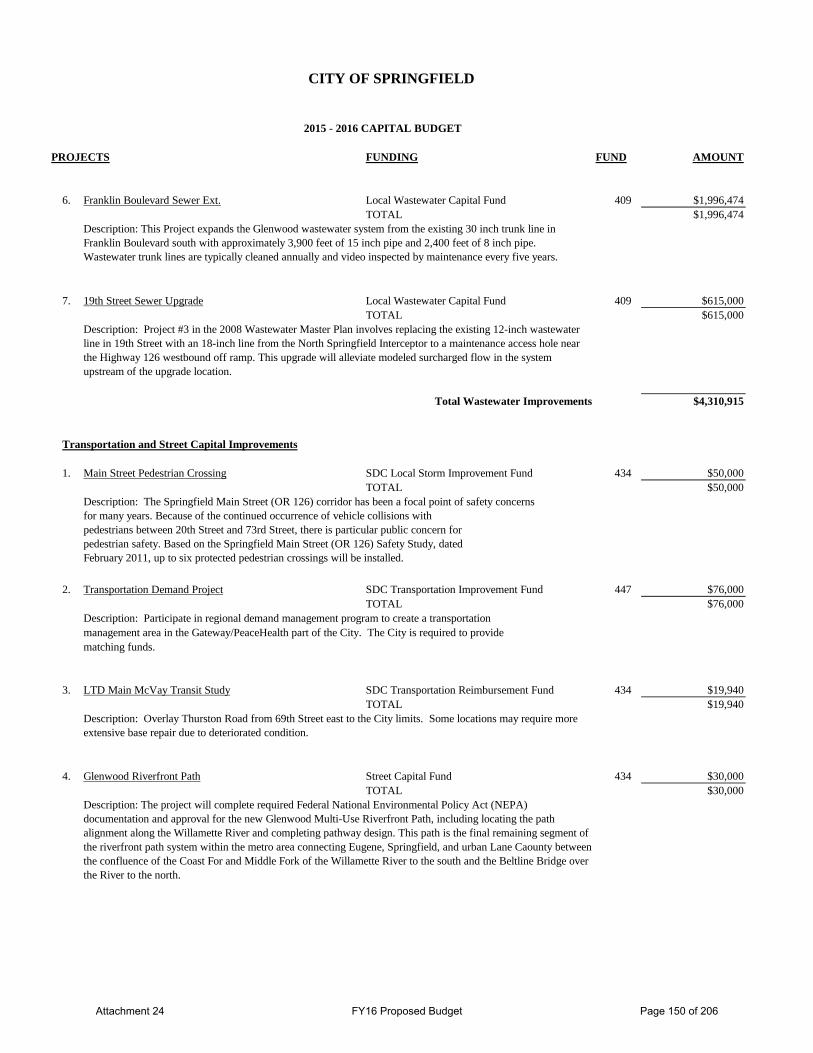
CITY OF SPRINGFIELD
2015 - 2016 CAPITAL BUDGET
PROJECTS FUNDING FUND AMOUNT
6. Franklin Boulevard Sewer Ext. Local Wastewater Capital Fund 409 $1,996,474TOTAL $1,996,474
7. 19th Street Sewer Upgrade Local Wastewater Capital Fund 409 $615,000TOTAL $615,000
Total Wastewater Improvements $4,310,915
Transportation and Street Capital Improvements
1. Main Street Pedestrian Crossing SDC Local Storm Improvement Fund 434 $50,000TOTAL $50,000
2. Transportation Demand Project SDC Transportation Improvement Fund 447 $76,000TOTAL $76,000
Description: Participate in regional demand management program to create a transportation management area in the Gateway/PeaceHealth part of the City. The City is required to providematching funds.
3. LTD Main McVay Transit Study SDC Transportation Reimbursement Fund 434 $19,940TOTAL $19,940
4. Glenwood Riverfront Path Street Capital Fund 434 $30,000TOTAL $30,000
Description: This Project expands the Glenwood wastewater system from the existing 30 inch trunk line in Franklin Boulevard south with approximately 3,900 feet of 15 inch pipe and 2,400 feet of 8 inch pipe. Wastewater trunk lines are typically cleaned annually and video inspected by maintenance every five years.
Description: The Springfield Main Street (OR 126) corridor has been a focal point of safety concernsfor many years. Because of the continued occurrence of vehicle collisions withpedestrians between 20th Street and 73rd Street, there is particular public concern forpedestrian safety. Based on the Springfield Main Street (OR 126) Safety Study, datedFebruary 2011, up to six protected pedestrian crossings will be installed.
Description: Overlay Thurston Road from 69th Street east to the City limits. Some locations may require more extensive base repair due to deteriorated condition.
Description: The project will complete required Federal National Environmental Policy Act (NEPA) documentation and approval for the new Glenwood Multi-Use Riverfront Path, including locating the path alignment along the Willamette River and completing pathway design. This path is the final remaining segment of the riverfront path system within the metro area connecting Eugene, Springfield, and urban Lane Caounty between the confluence of the Coast For and Middle Fork of the Willamette River to the south and the Beltline Bridge over the River to the north.
Description: Project #3 in the 2008 Wastewater Master Plan involves replacing the existing 12-inch wastewater line in 19th Street with an 18-inch line from the North Springfield Interceptor to a maintenance access hole near the Highway 126 westbound off ramp. This upgrade will alleviate modeled surcharged flow in the system upstream of the upgrade location.
Attachment 24 FY16 Proposed Budget Page 150 of 206
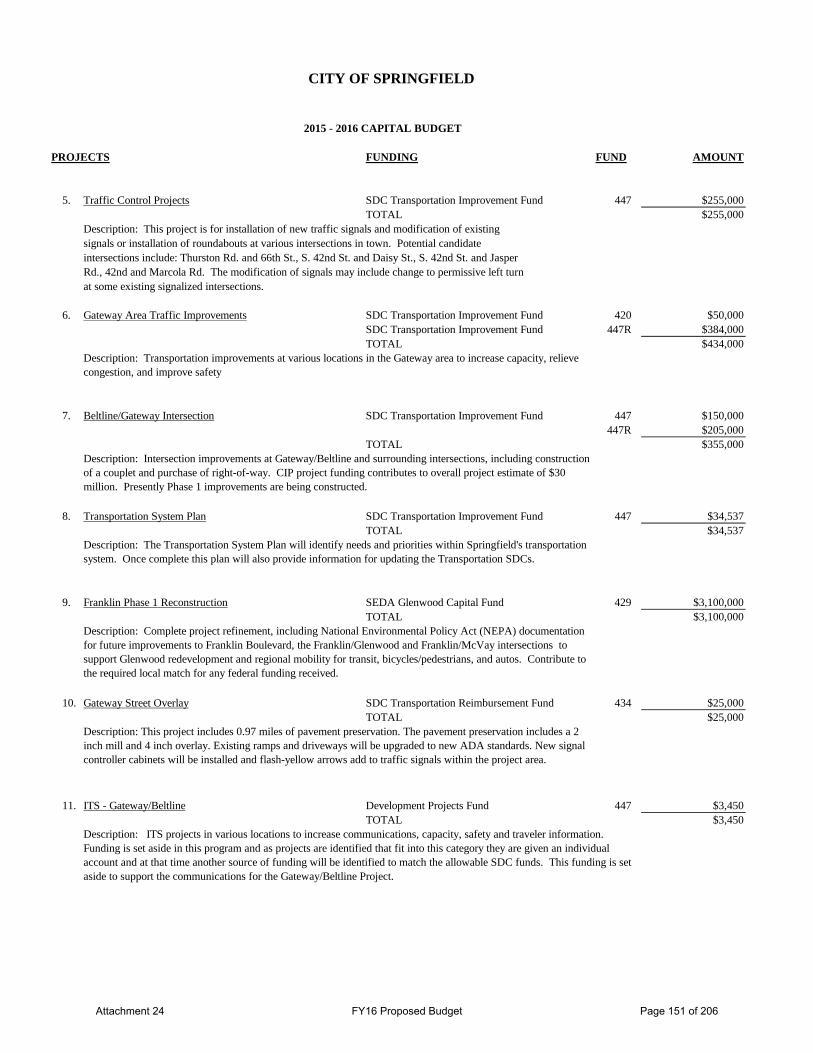
CITY OF SPRINGFIELD
2015 - 2016 CAPITAL BUDGET
PROJECTS FUNDING FUND AMOUNT
5. Traffic Control Projects SDC Transportation Improvement Fund 447 $255,000TOTAL $255,000
Description: This project is for installation of new traffic signals and modification of existing signals or installation of roundabouts at various intersections in town. Potential candidate intersections include: Thurston Rd. and 66th St., S. 42nd St. and Daisy St., S. 42nd St. and JasperRd., 42nd and Marcola Rd. The modification of signals may include change to permissive left turn at some existing signalized intersections.
6. Gateway Area Traffic Improvements SDC Transportation Improvement Fund 420 $50,000SDC Transportation Improvement Fund 447R $384,000TOTAL $434,000
7. Beltline/Gateway Intersection SDC Transportation Improvement Fund 447 $150,000447R $205,000
TOTAL $355,000
8. Transportation System Plan SDC Transportation Improvement Fund 447 $34,537TOTAL $34,537
9. Franklin Phase 1 Reconstruction SEDA Glenwood Capital Fund 429 $3,100,000TOTAL $3,100,000
10. Gateway Street Overlay SDC Transportation Reimbursement Fund 434 $25,000TOTAL $25,000
11. ITS - Gateway/Beltline Development Projects Fund 447 $3,450TOTAL $3,450
Description: ITS projects in various locations to increase communications, capacity, safety and traveler information. Funding is set aside in this program and as projects are identified that fit into this category they are given an individual account and at that time another source of funding will be identified to match the allowable SDC funds. This funding is set aside to support the communications for the Gateway/Beltline Project.
Description: Complete project refinement, including National Environmental Policy Act (NEPA) documentation for future improvements to Franklin Boulevard, the Franklin/Glenwood and Franklin/McVay intersections to support Glenwood redevelopment and regional mobility for transit, bicycles/pedestrians, and autos. Contribute to the required local match for any federal funding received.
Description: This project includes 0.97 miles of pavement preservation. The pavement preservation includes a 2 inch mill and 4 inch overlay. Existing ramps and driveways will be upgraded to new ADA standards. New signal controller cabinets will be installed and flash-yellow arrows add to traffic signals within the project area.
Description: The Transportation System Plan will identify needs and priorities within Springfield's transportation system. Once complete this plan will also provide information for updating the Transportation SDCs.
Description: Intersection improvements at Gateway/Beltline and surrounding intersections, including construction of a couplet and purchase of right-of-way. CIP project funding contributes to overall project estimate of $30 million. Presently Phase 1 improvements are being constructed.
Description: Transportation improvements at various locations in the Gateway area to increase capacity, relieve congestion, and improve safety
Attachment 24 FY16 Proposed Budget Page 151 of 206
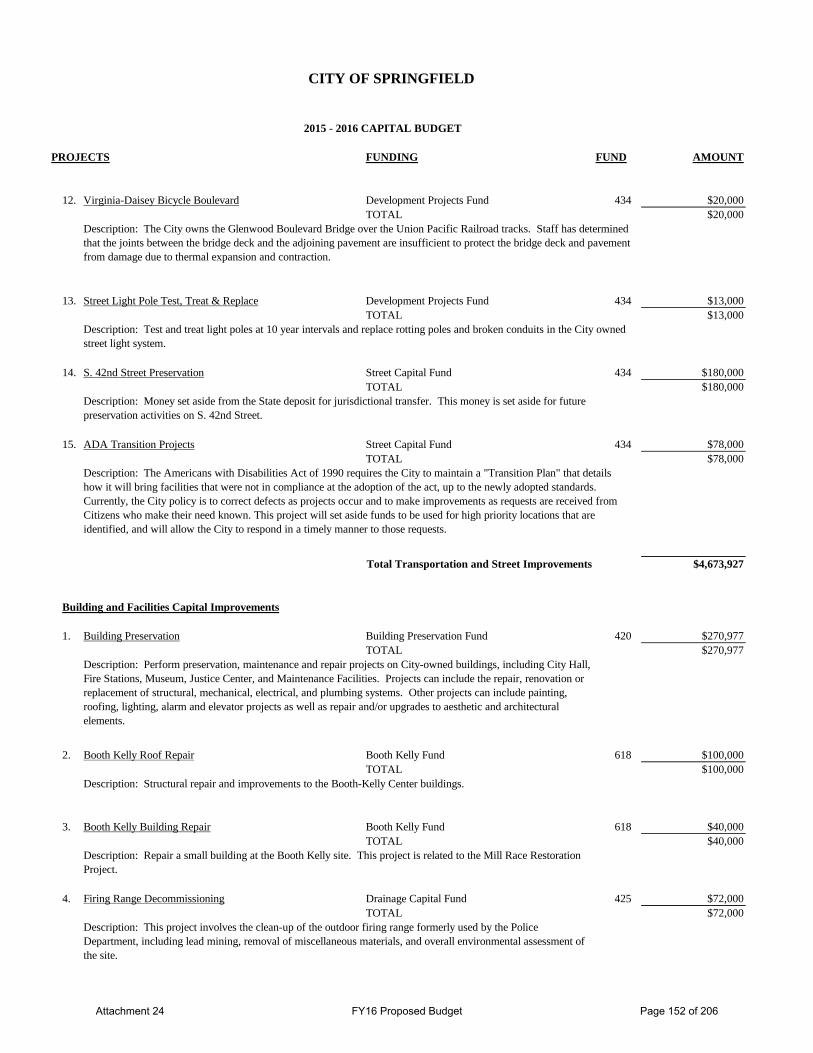
CITY OF SPRINGFIELD
2015 - 2016 CAPITAL BUDGET
PROJECTS FUNDING FUND AMOUNT
12. Virginia-Daisey Bicycle Boulevard Development Projects Fund 434 $20,000TOTAL $20,000
13. Street Light Pole Test, Treat & Replace Development Projects Fund 434 $13,000TOTAL $13,000
14. S. 42nd Street Preservation Street Capital Fund 434 $180,000TOTAL $180,000
15. ADA Transition Projects Street Capital Fund 434 $78,000TOTAL $78,000
Total Transportation and Street Improvements $4,673,927
Building and Facilities Capital Improvements
1. Building Preservation Building Preservation Fund 420 $270,977TOTAL $270,977
2. Booth Kelly Roof Repair Booth Kelly Fund 618 $100,000TOTAL $100,000
Description: Structural repair and improvements to the Booth-Kelly Center buildings.
3. Booth Kelly Building Repair Booth Kelly Fund 618 $40,000TOTAL $40,000
4. Firing Range Decommissioning Drainage Capital Fund 425 $72,000TOTAL $72,000
Description: This project involves the clean-up of the outdoor firing range formerly used by the Police Department, including lead mining, removal of miscellaneous materials, and overall environmental assessment of the site.
Description: Perform preservation, maintenance and repair projects on City-owned buildings, including City Hall, Fire Stations, Museum, Justice Center, and Maintenance Facilities. Projects can include the repair, renovation or replacement of structural, mechanical, electrical, and plumbing systems. Other projects can include painting, roofing, lighting, alarm and elevator projects as well as repair and/or upgrades to aesthetic and architectural elements.
Description: Repair a small building at the Booth Kelly site. This project is related to the Mill Race Restoration Project.
Description: Test and treat light poles at 10 year intervals and replace rotting poles and broken conduits in the City owned street light system.
Description: The City owns the Glenwood Boulevard Bridge over the Union Pacific Railroad tracks. Staff has determined that the joints between the bridge deck and the adjoining pavement are insufficient to protect the bridge deck and pavement from damage due to thermal expansion and contraction.
Description: Money set aside from the State deposit for jurisdictional transfer. This money is set aside for future preservation activities on S. 42nd Street.
Description: The Americans with Disabilities Act of 1990 requires the City to maintain a "Transition Plan" that details how it will bring facilities that were not in compliance at the adoption of the act, up to the newly adopted standards. Currently, the City policy is to correct defects as projects occur and to make improvements as requests are received from Citizens who make their need known. This project will set aside funds to be used for high priority locations that are identified, and will allow the City to respond in a timely manner to those requests.
Attachment 24 FY16 Proposed Budget Page 152 of 206
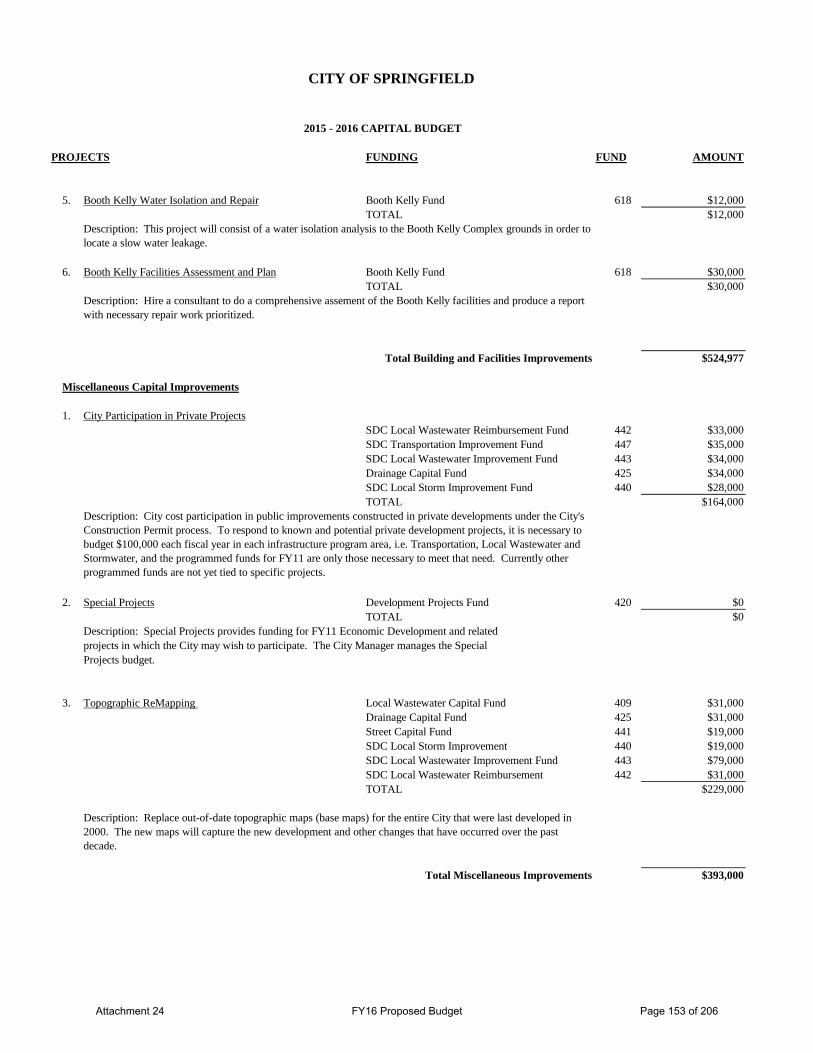
CITY OF SPRINGFIELD
2015 - 2016 CAPITAL BUDGET
PROJECTS FUNDING FUND AMOUNT
5. Booth Kelly Water Isolation and Repair Booth Kelly Fund 618 $12,000TOTAL $12,000
6. Booth Kelly Facilities Assessment and Plan Booth Kelly Fund 618 $30,000TOTAL $30,000
Total Building and Facilities Improvements $524,977
Miscellaneous Capital Improvements
1. City Participation in Private ProjectsSDC Local Wastewater Reimbursement Fund 442 $33,000SDC Transportation Improvement Fund 447 $35,000SDC Local Wastewater Improvement Fund 443 $34,000Drainage Capital Fund 425 $34,000SDC Local Storm Improvement Fund 440 $28,000TOTAL $164,000
2. Special Projects Development Projects Fund 420 $0TOTAL $0
Description: Special Projects provides funding for FY11 Economic Development and relatedprojects in which the City may wish to participate. The City Manager manages the Special Projects budget.
3. Topographic ReMapping Local Wastewater Capital Fund 409 $31,000Drainage Capital Fund 425 $31,000Street Capital Fund 441 $19,000SDC Local Storm Improvement 440 $19,000SDC Local Wastewater Improvement Fund 443 $79,000SDC Local Wastewater Reimbursement 442 $31,000TOTAL $229,000
Total Miscellaneous Improvements $393,000
Description: Replace out-of-date topographic maps (base maps) for the entire City that were last developed in 2000. The new maps will capture the new development and other changes that have occurred over the past decade.
Description: City cost participation in public improvements constructed in private developments under the City's Construction Permit process. To respond to known and potential private development projects, it is necessary to budget $100,000 each fiscal year in each infrastructure program area, i.e. Transportation, Local Wastewater and Stormwater, and the programmed funds for FY11 are only those necessary to meet that need. Currently other programmed funds are not yet tied to specific projects.
Description: This project will consist of a water isolation analysis to the Booth Kelly Complex grounds in order to locate a slow water leakage.
Description: Hire a consultant to do a comprehensive assement of the Booth Kelly facilities and produce a report with necessary repair work prioritized.
Attachment 24 FY16 Proposed Budget Page 153 of 206
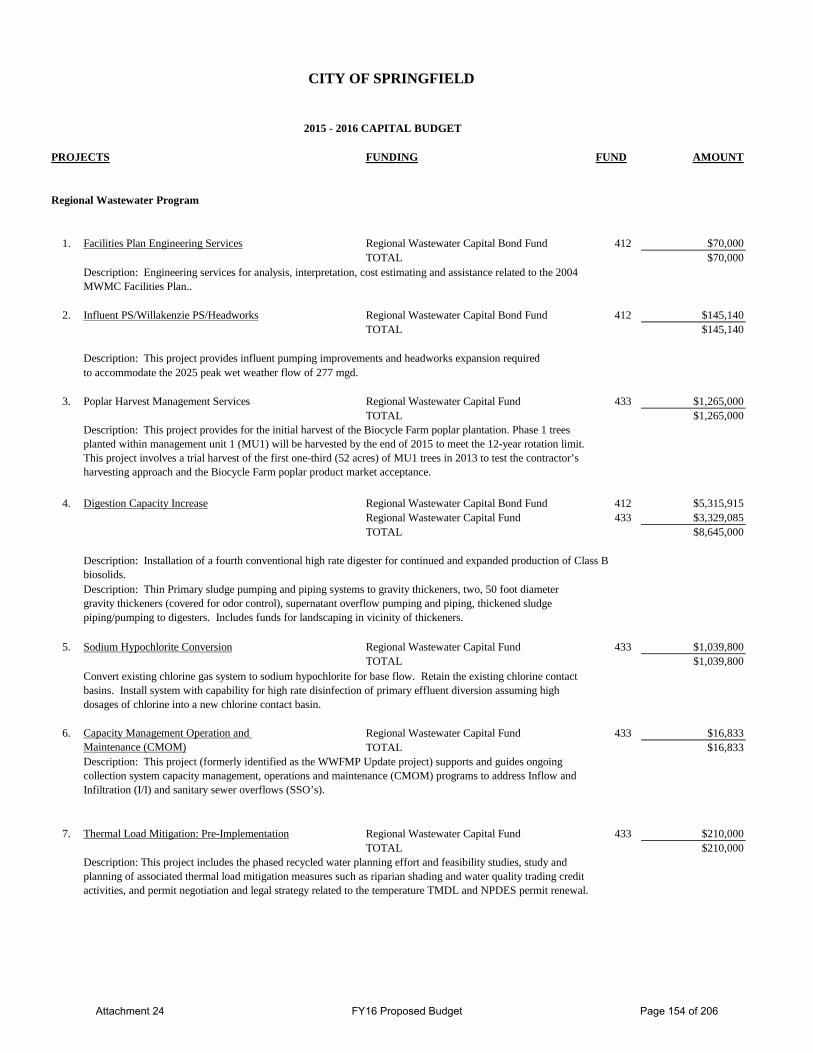
CITY OF SPRINGFIELD
2015 - 2016 CAPITAL BUDGET
PROJECTS FUNDING FUND AMOUNT
Regional Wastewater Program
1. Facilities Plan Engineering Services Regional Wastewater Capital Bond Fund 412 $70,000TOTAL $70,000
2. Influent PS/Willakenzie PS/Headworks Regional Wastewater Capital Bond Fund 412 $145,140TOTAL $145,140
Description: This project provides influent pumping improvements and headworks expansion requiredto accommodate the 2025 peak wet weather flow of 277 mgd.
3. Poplar Harvest Management Services Regional Wastewater Capital Fund 433 $1,265,000TOTAL $1,265,000
4. Digestion Capacity Increase Regional Wastewater Capital Bond Fund 412 $5,315,915Regional Wastewater Capital Fund 433 $3,329,085TOTAL $8,645,000
5. Sodium Hypochlorite Conversion Regional Wastewater Capital Fund 433 $1,039,800TOTAL $1,039,800
6. Regional Wastewater Capital Fund 433 $16,833TOTAL $16,833
7. Thermal Load Mitigation: Pre-Implementation Regional Wastewater Capital Fund 433 $210,000TOTAL $210,000
Capacity Management Operation and Maintenance (CMOM)
Description: This project includes the phased recycled water planning effort and feasibility studies, study and planning of associated thermal load mitigation measures such as riparian shading and water quality trading credit activities, and permit negotiation and legal strategy related to the temperature TMDL and NPDES permit renewal.
Convert existing chlorine gas system to sodium hypochlorite for base flow. Retain the existing chlorine contact basins. Install system with capability for high rate disinfection of primary effluent diversion assuming high dosages of chlorine into a new chlorine contact basin.
Description: Thin Primary sludge pumping and piping systems to gravity thickeners, two, 50 foot diameter gravity thickeners (covered for odor control), supernatant overflow pumping and piping, thickened sludge piping/pumping to digesters. Includes funds for landscaping in vicinity of thickeners.
Description: Installation of a fourth conventional high rate digester for continued and expanded production of Class B biosolids.
Description: Engineering services for analysis, interpretation, cost estimating and assistance related to the 2004 MWMC Facilities Plan..
Description: This project provides for the initial harvest of the Biocycle Farm poplar plantation. Phase 1 trees planted within management unit 1 (MU1) will be harvested by the end of 2015 to meet the 12-year rotation limit. This project involves a trial harvest of the first one-third (52 acres) of MU1 trees in 2013 to test the contractor’s harvesting approach and the Biocycle Farm poplar product market acceptance.
Description: This project (formerly identified as the WWFMP Update project) supports and guides ongoing collection system capacity management, operations and maintenance (CMOM) programs to address Inflow and Infiltration (I/I) and sanitary sewer overflows (SSO’s).
Attachment 24 FY16 Proposed Budget Page 154 of 206
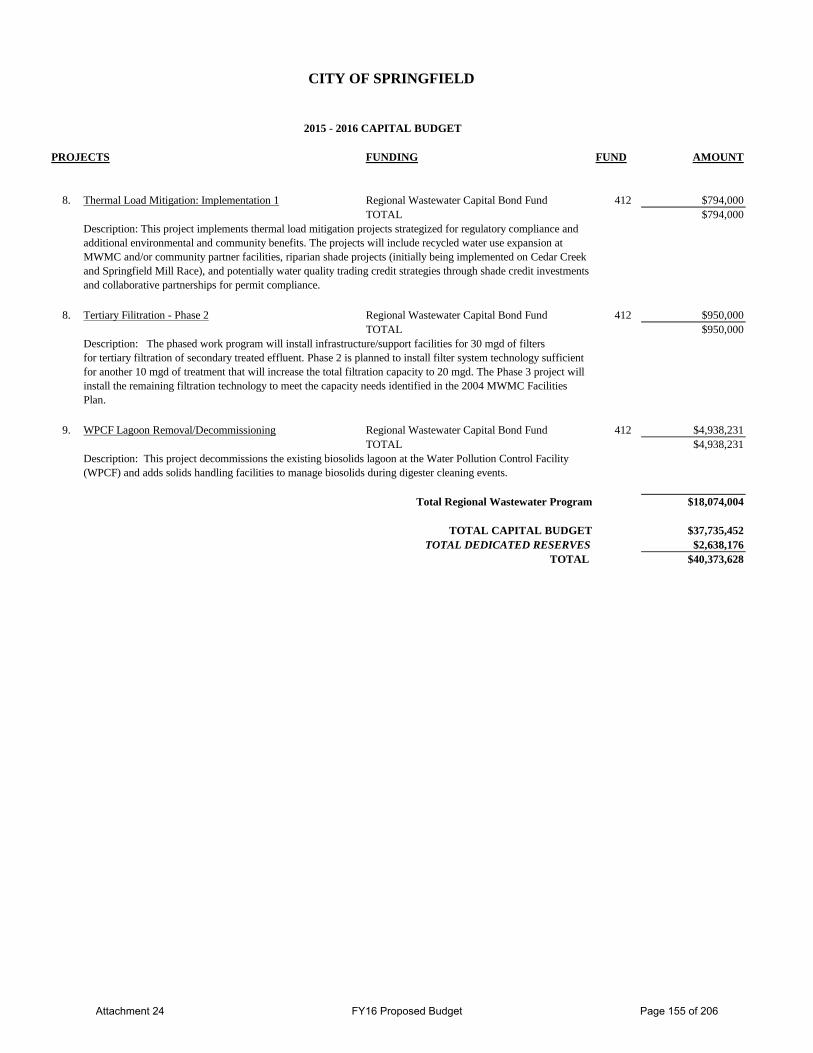
CITY OF SPRINGFIELD
2015 - 2016 CAPITAL BUDGET
PROJECTS FUNDING FUND AMOUNT
8. Thermal Load Mitigation: Implementation 1 Regional Wastewater Capital Bond Fund 412 $794,000TOTAL $794,000
8. Tertiary Filitration - Phase 2 Regional Wastewater Capital Bond Fund 412 $950,000TOTAL $950,000
9. WPCF Lagoon Removal/Decommissioning Regional Wastewater Capital Bond Fund 412 $4,938,231TOTAL $4,938,231
Total Regional Wastewater Program $18,074,004
$37,735,452$2,638,176
$40,373,628
Description: The phased work program will install infrastructure/support facilities for 30 mgd of filtersfor tertiary filtration of secondary treated effluent. Phase 2 is planned to install filter system technology sufficient for another 10 mgd of treatment that will increase the total filtration capacity to 20 mgd. The Phase 3 project will install the remaining filtration technology to meet the capacity needs identified in the 2004 MWMC Facilities Plan.
Description: This project decommissions the existing biosolids lagoon at the Water Pollution Control Facility (WPCF) and adds solids handling facilities to manage biosolids during digester cleaning events.
Description: This project implements thermal load mitigation projects strategized for regulatory compliance and additional environmental and community benefits. The projects will include recycled water use expansion at MWMC and/or community partner facilities, riparian shade projects (initially being implemented on Cedar Creek and Springfield Mill Race), and potentially water quality trading credit strategies through shade credit investments and collaborative partnerships for permit compliance.
TOTAL
TOTAL CAPITAL BUDGET TOTAL DEDICATED RESERVES
Attachment 24 FY16 Proposed Budget Page 155 of 206

Attachment 24 FY16 Proposed Budget Page 156 of 206
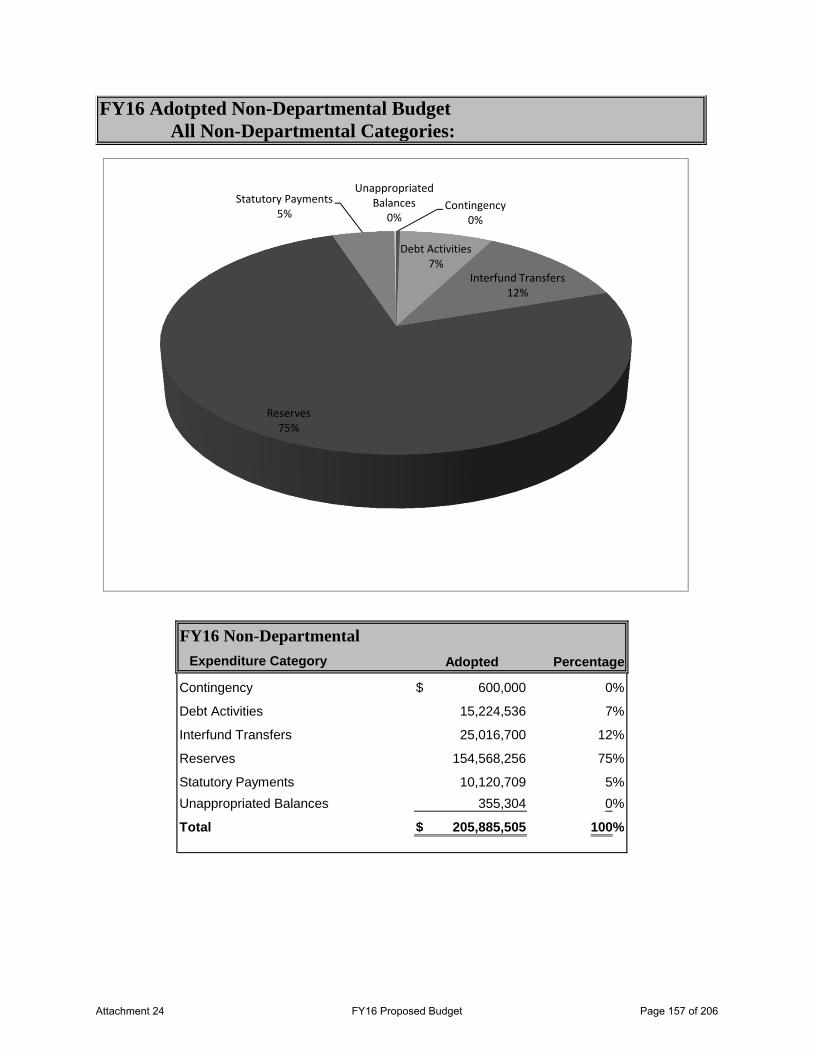
Expenditure Category Adopted Percentage
Contingency 600,000$ 0%
Debt Activities 15,224,536 7%
Interfund Transfers 25,016,700 12%
Reserves 154,568,256 75%
Statutory Payments 10,120,709 5%
Unappropriated Balances 355,304 0%
Total 205,885,505$ 100%
FY16 Adotpted Non-Departmental BudgetAll Non-Departmental Categories:
FY16 Non-Departmental
Contingency0%
Debt Activities7%
Interfund Transfers12%
Reserves75%
Statutory Payments5%
Unappropriated Balances
0%
Attachment 24 FY16 Proposed Budget Page 157 of 206
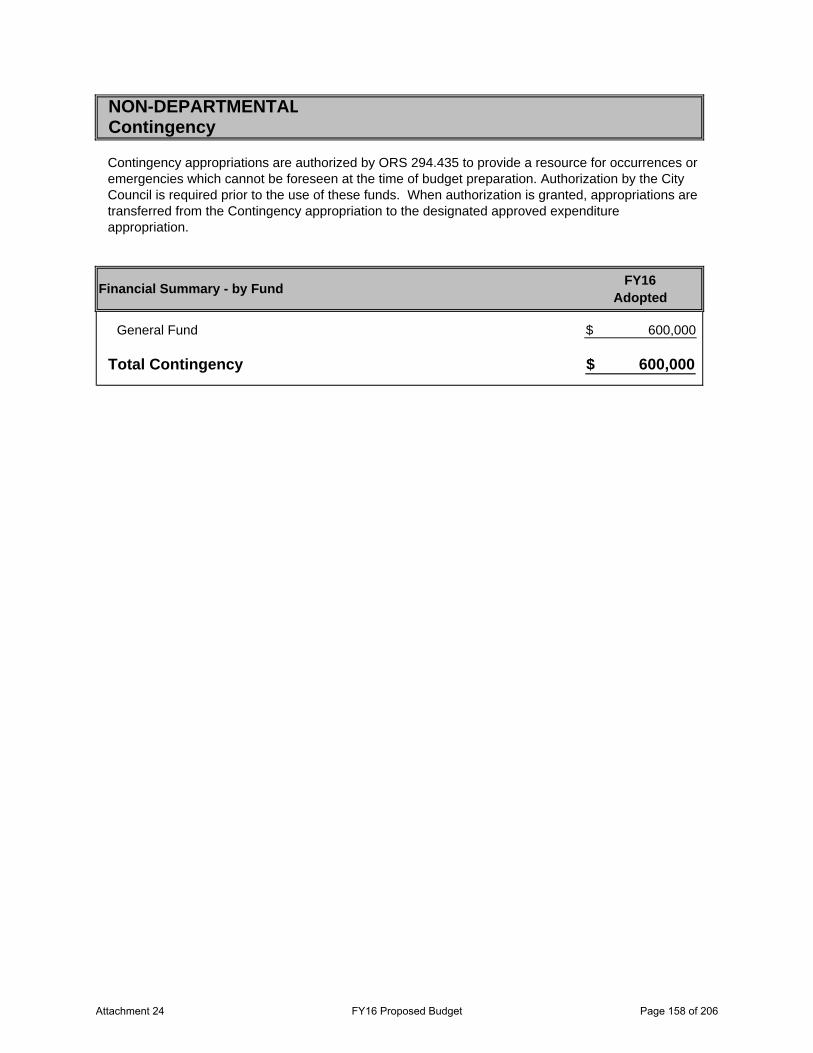
NON-DEPARTMENTALContingency
FY16Adopted
General Fund 600,000$
Total Contingency 600,000$
Contingency appropriations are authorized by ORS 294.435 to provide a resource for occurrences or emergencies which cannot be foreseen at the time of budget preparation. Authorization by the City Council is required prior to the use of these funds. When authorization is granted, appropriations are transferred from the Contingency appropriation to the designated approved expenditure appropriation.
Financial Summary - by Fund
Attachment 24 FY16 Proposed Budget Page 158 of 206
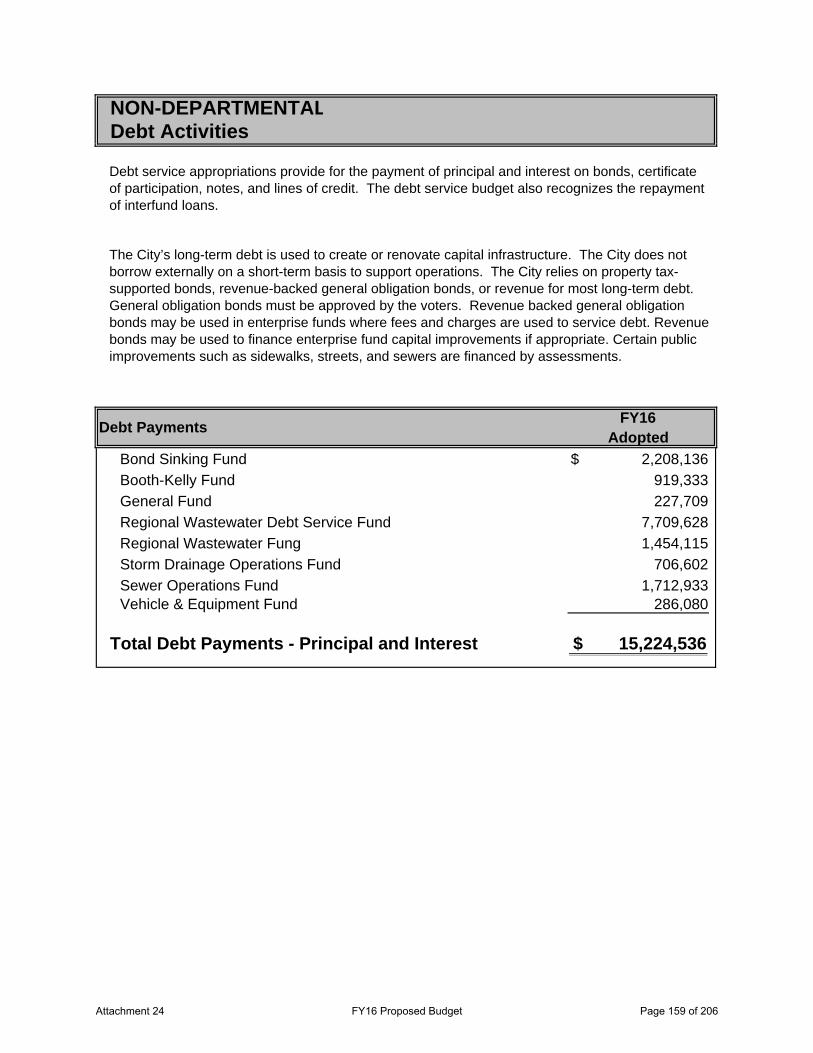
FY16Adopted
Bond Sinking Fund 2,208,136$
Booth-Kelly Fund 919,333
General Fund 227,709
Regional Wastewater Debt Service Fund 7,709,628
Regional Wastewater Fung 1,454,115
Storm Drainage Operations Fund 706,602
Sewer Operations Fund 1,712,933 Vehicle & Equipment Fund 286,080
Total Debt Payments - Principal and Interest 15,224,536$
The City’s long-term debt is used to create or renovate capital infrastructure. The City does not borrow externally on a short-term basis to support operations. The City relies on property tax-supported bonds, revenue-backed general obligation bonds, or revenue for most long-term debt. General obligation bonds must be approved by the voters. Revenue backed general obligation bonds may be used in enterprise funds where fees and charges are used to service debt. Revenue bonds may be used to finance enterprise fund capital improvements if appropriate. Certain public improvements such as sidewalks, streets, and sewers are financed by assessments.
NON-DEPARTMENTALDebt Activities
Debt service appropriations provide for the payment of principal and interest on bonds, certificate of participation, notes, and lines of credit. The debt service budget also recognizes the repayment of interfund loans.
Debt Payments
Attachment 24 FY16 Proposed Budget Page 159 of 206
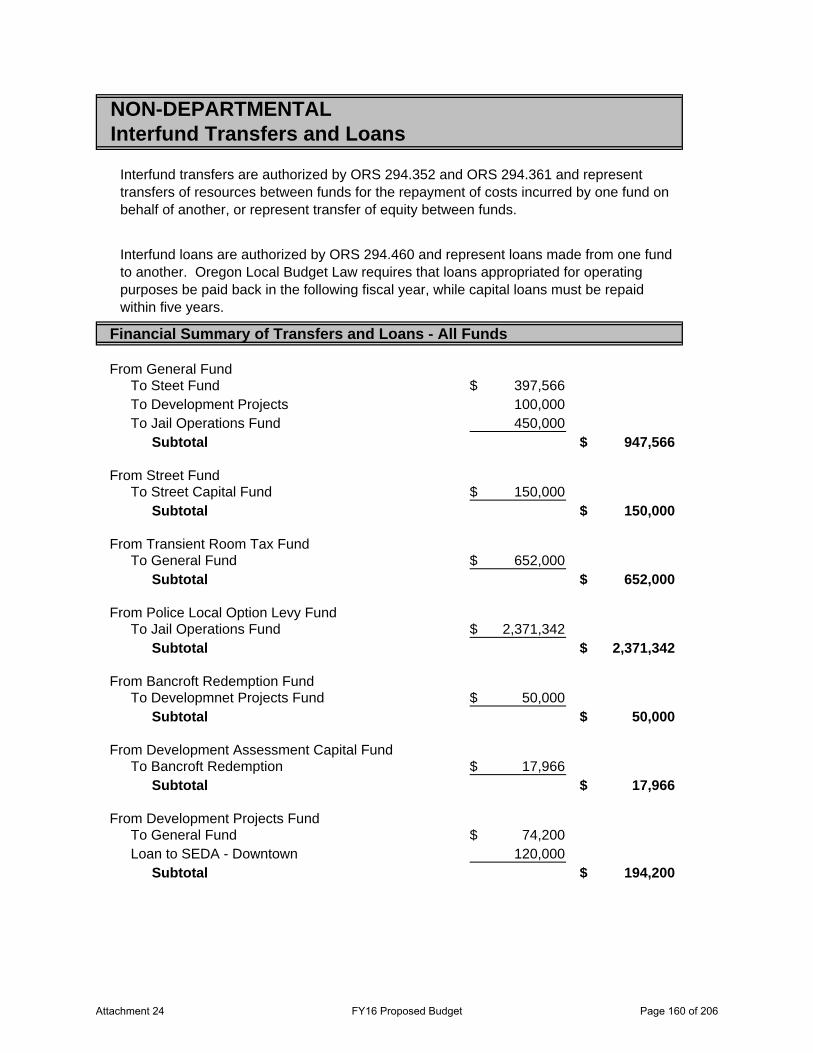
Financial Summary of Transfers and Loans - All Funds
From General FundTo Steet Fund 397,566$ To Development Projects 100,000 To Jail Operations Fund 450,000
Subtotal 947,566$
From Street FundTo Street Capital Fund 150,000$
Subtotal 150,000$
From Transient Room Tax FundTo General Fund 652,000$
Subtotal 652,000$
From Police Local Option Levy FundTo Jail Operations Fund 2,371,342$
Subtotal 2,371,342$
From Bancroft Redemption FundTo Developmnet Projects Fund 50,000$
Subtotal 50,000$
From Development Assessment Capital FundTo Bancroft Redemption 17,966$
Subtotal 17,966$
From Development Projects FundTo General Fund 74,200$ Loan to SEDA - Downtown 120,000
Subtotal 194,200$
Interfund transfers are authorized by ORS 294.352 and ORS 294.361 and represent transfers of resources between funds for the repayment of costs incurred by one fund on behalf of another, or represent transfer of equity between funds.
NON-DEPARTMENTALInterfund Transfers and Loans
Interfund loans are authorized by ORS 294.460 and represent loans made from one fund to another. Oregon Local Budget Law requires that loans appropriated for operating purposes be paid back in the following fiscal year, while capital loans must be repaid within five years.
Attachment 24 FY16 Proposed Budget Page 160 of 206
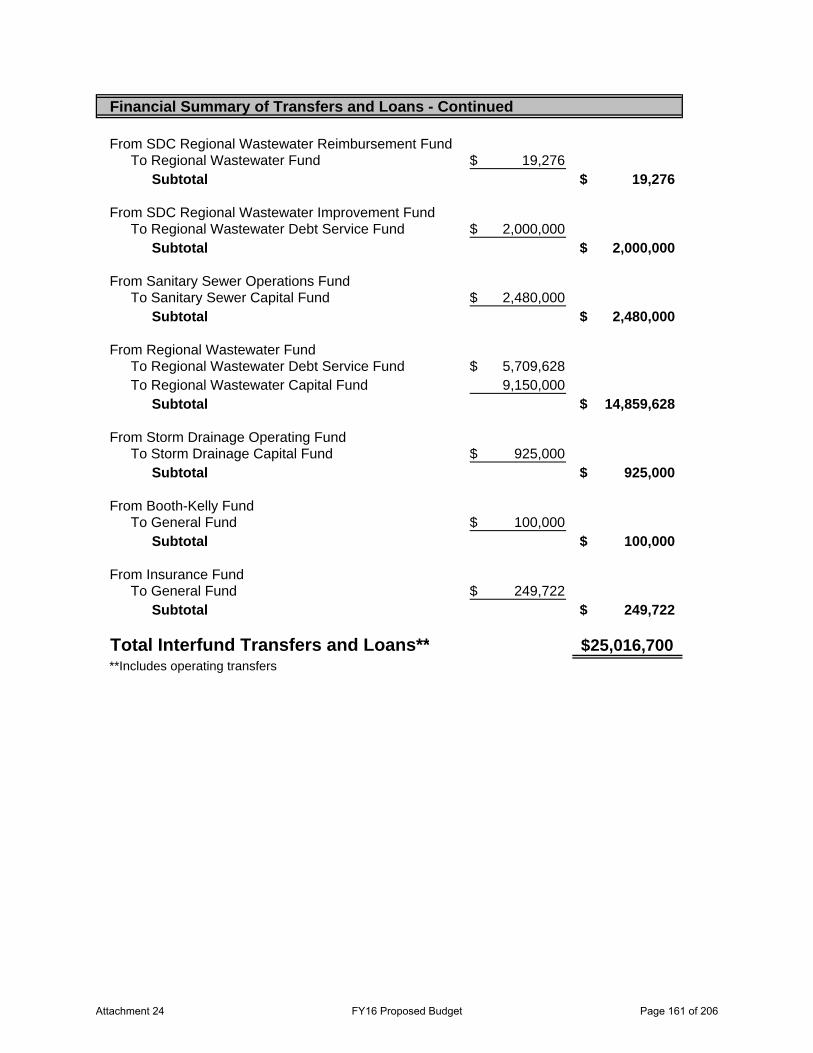
Financial Summary of Transfers and Loans - Continued
From SDC Regional Wastewater Reimbursement FundTo Regional Wastewater Fund 19,276$
Subtotal 19,276$
From SDC Regional Wastewater Improvement FundTo Regional Wastewater Debt Service Fund 2,000,000$
Subtotal 2,000,000$
From Sanitary Sewer Operations FundTo Sanitary Sewer Capital Fund 2,480,000$
Subtotal 2,480,000$
From Regional Wastewater FundTo Regional Wastewater Debt Service Fund 5,709,628$ To Regional Wastewater Capital Fund 9,150,000
Subtotal 14,859,628$
From Storm Drainage Operating FundTo Storm Drainage Capital Fund 925,000$
Subtotal 925,000$
From Booth-Kelly FundTo General Fund 100,000$
Subtotal 100,000$
From Insurance FundTo General Fund 249,722$
Subtotal 249,722$
Total Interfund Transfers and Loans** 25,016,700$ **Includes operating transfers
Attachment 24 FY16 Proposed Budget Page 161 of 206
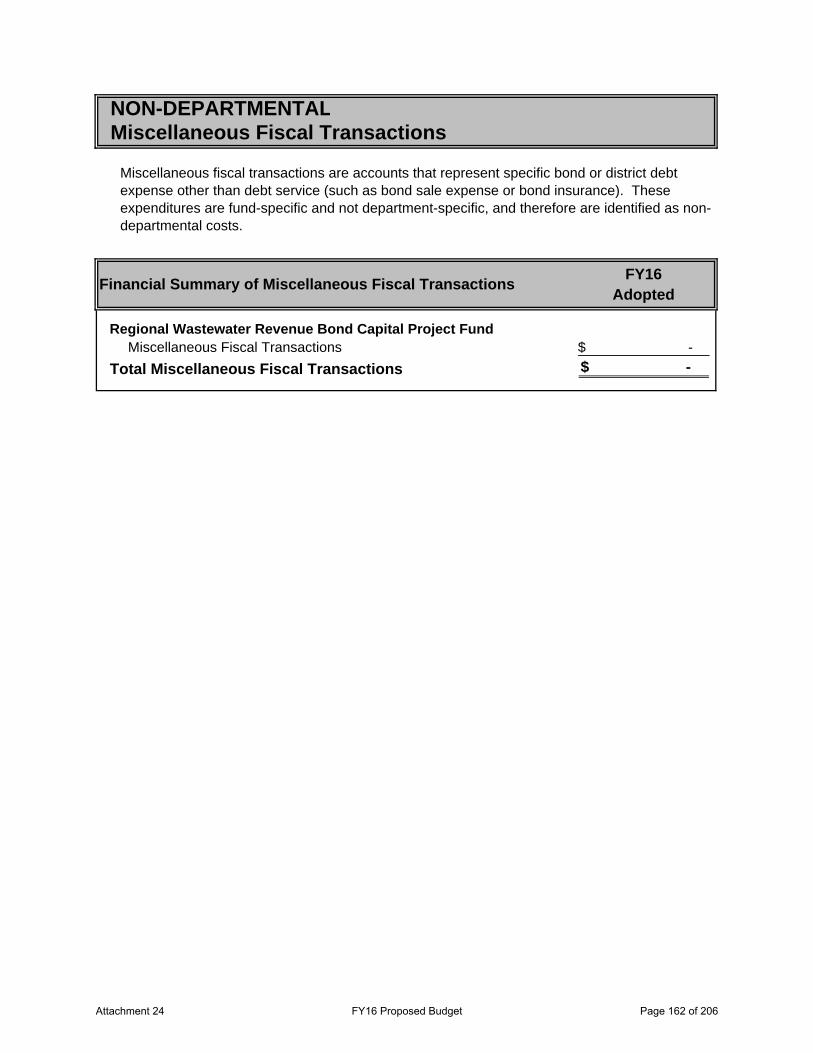
NON-DEPARTMENTALMiscellaneous Fiscal Transactions
FY16Adopted
Regional Wastewater Revenue Bond Capital Project Fund Miscellaneous Fiscal Transactions -$
Total Miscellaneous Fiscal Transactions -$
Miscellaneous fiscal transactions are accounts that represent specific bond or district debt expense other than debt service (such as bond sale expense or bond insurance). These expenditures are fund-specific and not department-specific, and therefore are identified as non-departmental costs.
Financial Summary of Miscellaneous Fiscal Transactions
Attachment 24 FY16 Proposed Budget Page 162 of 206
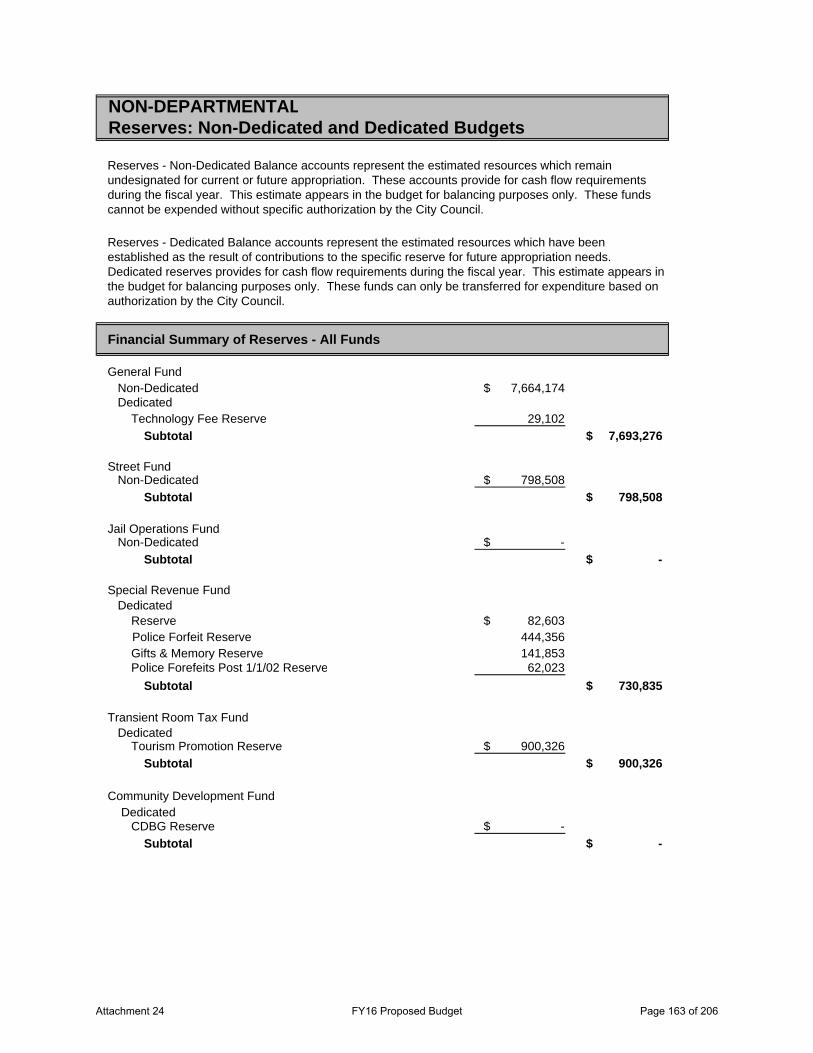
Financial Summary of Reserves - All Funds
General Fund Non-Dedicated 7,664,174$ Dedicated Technology Fee Reserve 29,102
Subtotal 7,693,276$
Street Fund Non-Dedicated 798,508$
Subtotal 798,508$
Jail Operations Fund Non-Dedicated -$
Subtotal -$
Special Revenue Fund Dedicated Reserve 82,603$
Police Forfeit Reserve 444,356 Gifts & Memory Reserve 141,853 Police Forefeits Post 1/1/02 Reserve 62,023
Subtotal 730,835$
Transient Room Tax Fund Dedicated Tourism Promotion Reserve 900,326$
Subtotal 900,326$
Community Development Fund Dedicated CDBG Reserve -$
Subtotal -$
NON-DEPARTMENTALReserves: Non-Dedicated and Dedicated Budgets
Reserves - Non-Dedicated Balance accounts represent the estimated resources which remain undesignated for current or future appropriation. These accounts provide for cash flow requirements during the fiscal year. This estimate appears in the budget for balancing purposes only. These funds cannot be expended without specific authorization by the City Council.
Reserves - Dedicated Balance accounts represent the estimated resources which have been established as the result of contributions to the specific reserve for future appropriation needs. Dedicated reserves provides for cash flow requirements during the fiscal year. This estimate appears in the budget for balancing purposes only. These funds can only be transferred for expenditure based on authorization by the City Council.
Attachment 24 FY16 Proposed Budget Page 163 of 206
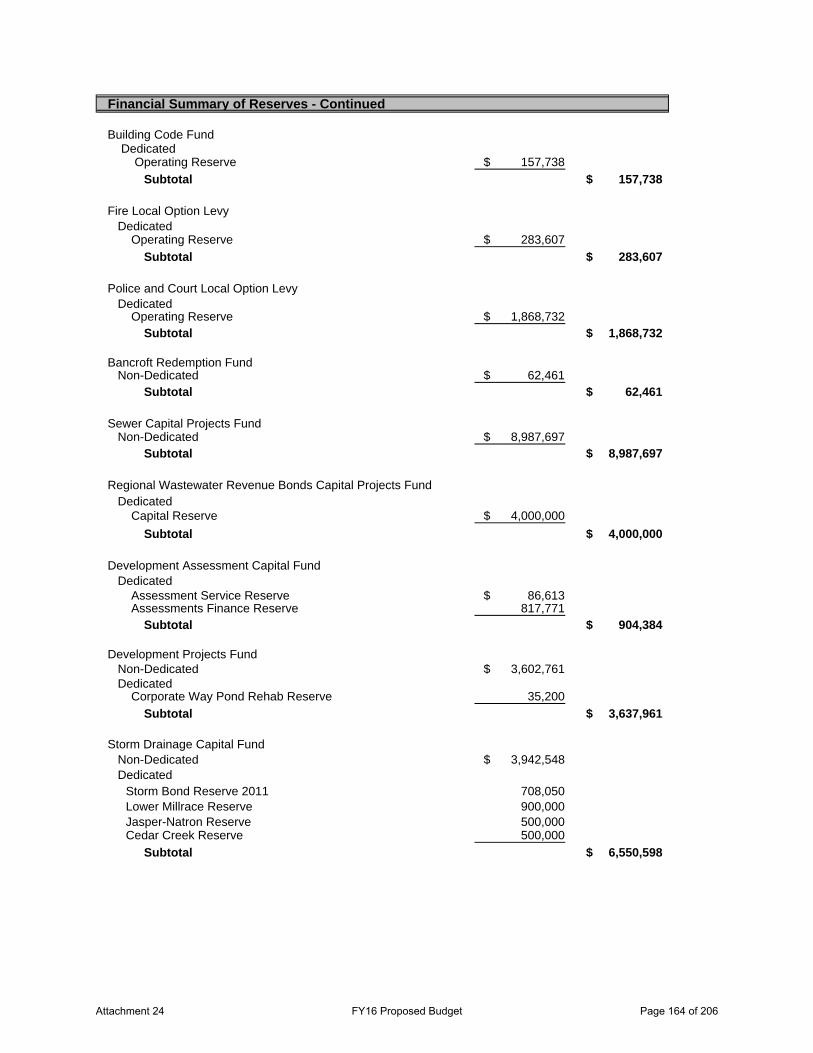
Financial Summary of Reserves - Continued
Building Code Fund Dedicated Operating Reserve 157,738$
Subtotal 157,738$
Fire Local Option Levy Dedicated Operating Reserve 283,607$
Subtotal 283,607$
Police and Court Local Option Levy Dedicated Operating Reserve 1,868,732$
Subtotal 1,868,732$
Bancroft Redemption Fund Non-Dedicated 62,461$
Subtotal 62,461$
Sewer Capital Projects Fund Non-Dedicated 8,987,697$
Subtotal 8,987,697$
Regional Wastewater Revenue Bonds Capital Projects Fund Dedicated Capital Reserve 4,000,000$
Subtotal 4,000,000$
Development Assessment Capital Fund Dedicated Assessment Service Reserve 86,613$ Assessments Finance Reserve 817,771
Subtotal 904,384$
Development Projects Fund Non-Dedicated 3,602,761$ Dedicated Corporate Way Pond Rehab Reserve 35,200
Subtotal 3,637,961$
Storm Drainage Capital Fund Non-Dedicated 3,942,548$ Dedicated
Storm Bond Reserve 2011 708,050 Lower Millrace Reserve 900,000 Jasper-Natron Reserve 500,000 Cedar Creek Reserve 500,000
Subtotal 6,550,598$
Attachment 24 FY16 Proposed Budget Page 164 of 206
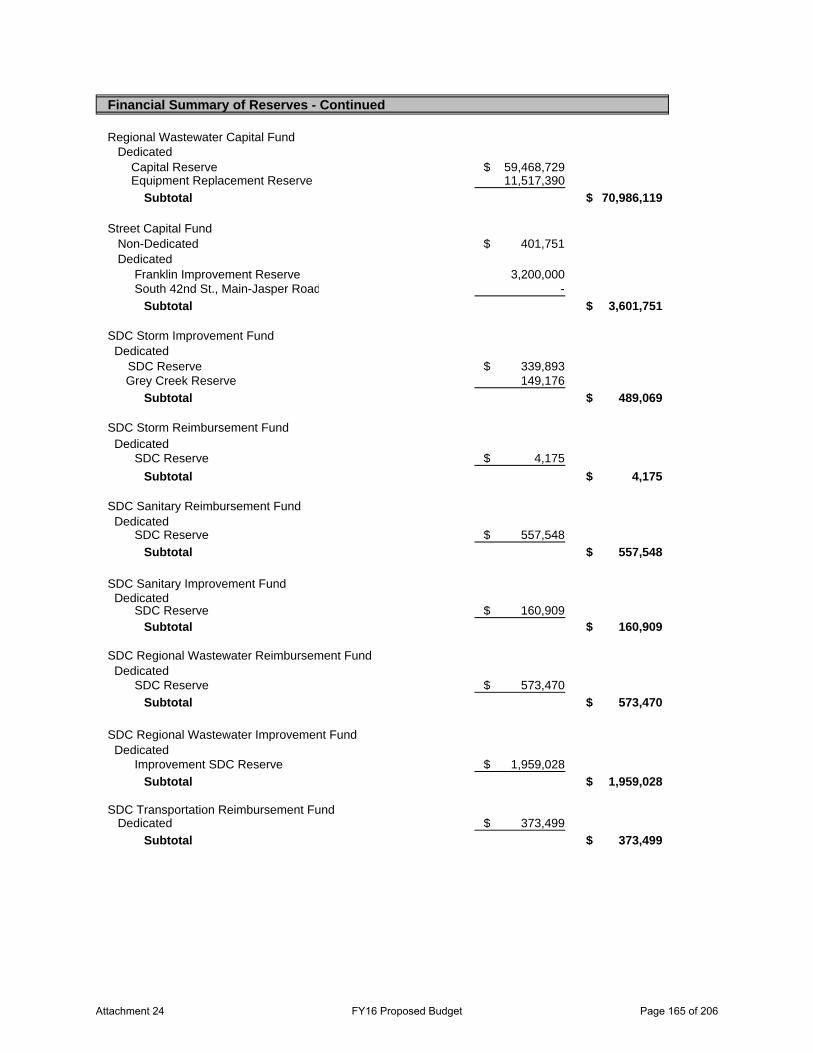
Financial Summary of Reserves - Continued
Regional Wastewater Capital Fund Dedicated Capital Reserve 59,468,729$ Equipment Replacement Reserve 11,517,390
Subtotal 70,986,119$
Street Capital Fund Non-Dedicated 401,751$ Dedicated Franklin Improvement Reserve 3,200,000 South 42nd St., Main-Jasper Road -
Subtotal 3,601,751$
SDC Storm Improvement Fund Dedicated SDC Reserve 339,893$
Grey Creek Reserve 149,176
Subtotal 489,069$
SDC Storm Reimbursement Fund Dedicated SDC Reserve 4,175$
Subtotal 4,175$
SDC Sanitary Reimbursement Fund Dedicated SDC Reserve 557,548$
Subtotal 557,548$
SDC Sanitary Improvement Fund Dedicated SDC Reserve 160,909$
Subtotal 160,909$
SDC Regional Wastewater Reimbursement Fund Dedicated SDC Reserve 573,470$
Subtotal 573,470$
SDC Regional Wastewater Improvement Fund Dedicated Improvement SDC Reserve 1,959,028$
Subtotal 1,959,028$
SDC Transportation Reimbursement Fund Dedicated 373,499$
Subtotal 373,499$
Attachment 24 FY16 Proposed Budget Page 165 of 206
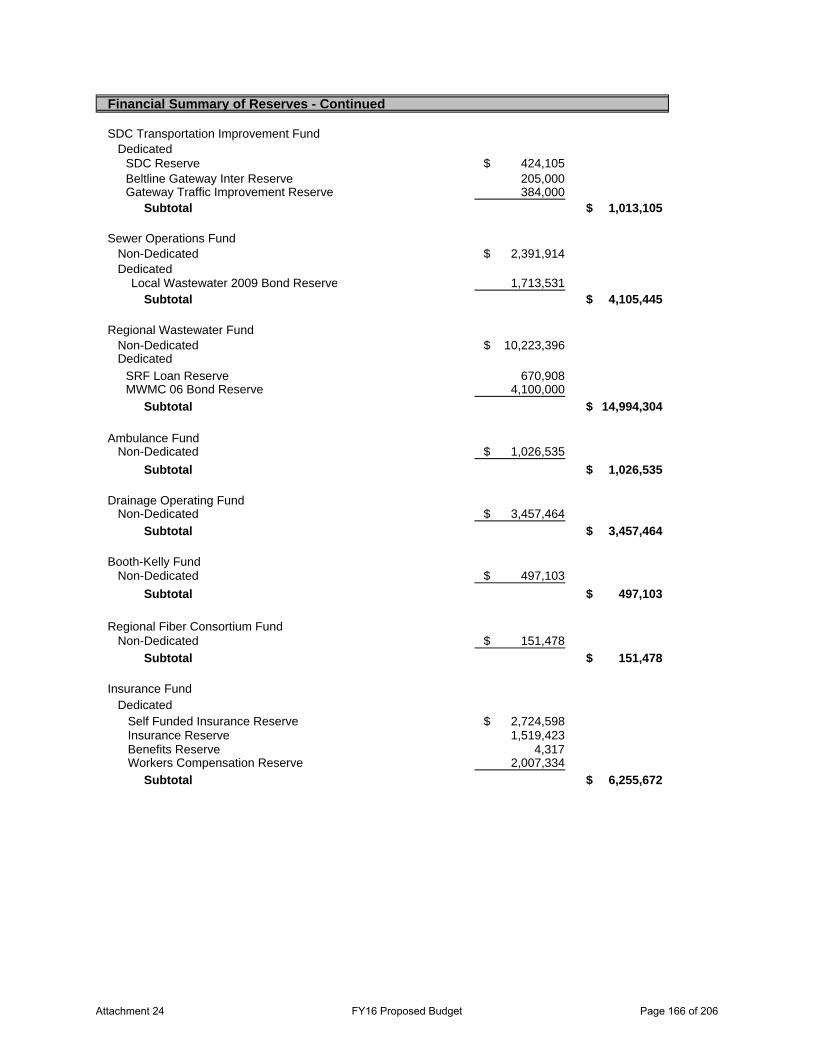
Financial Summary of Reserves - Continued
SDC Transportation Improvement Fund Dedicated
SDC Reserve 424,105$ Beltline Gateway Inter Reserve 205,000 Gateway Traffic Improvement Reserve 384,000
Subtotal 1,013,105$
Sewer Operations Fund Non-Dedicated 2,391,914$ Dedicated Local Wastewater 2009 Bond Reserve 1,713,531
Subtotal 4,105,445$
Regional Wastewater Fund Non-Dedicated 10,223,396$ Dedicated
SRF Loan Reserve 670,908 MWMC 06 Bond Reserve 4,100,000
Subtotal 14,994,304$
Ambulance Fund Non-Dedicated 1,026,535$
Subtotal 1,026,535$
Drainage Operating Fund Non-Dedicated 3,457,464$
Subtotal 3,457,464$
Booth-Kelly Fund Non-Dedicated 497,103$
Subtotal 497,103$
Regional Fiber Consortium Fund Non-Dedicated 151,478$
Subtotal 151,478$
Insurance Fund Dedicated Self Funded Insurance Reserve 2,724,598$ Insurance Reserve 1,519,423 Benefits Reserve 4,317 Workers Compensation Reserve 2,007,334
Subtotal 6,255,672$
Attachment 24 FY16 Proposed Budget Page 166 of 206
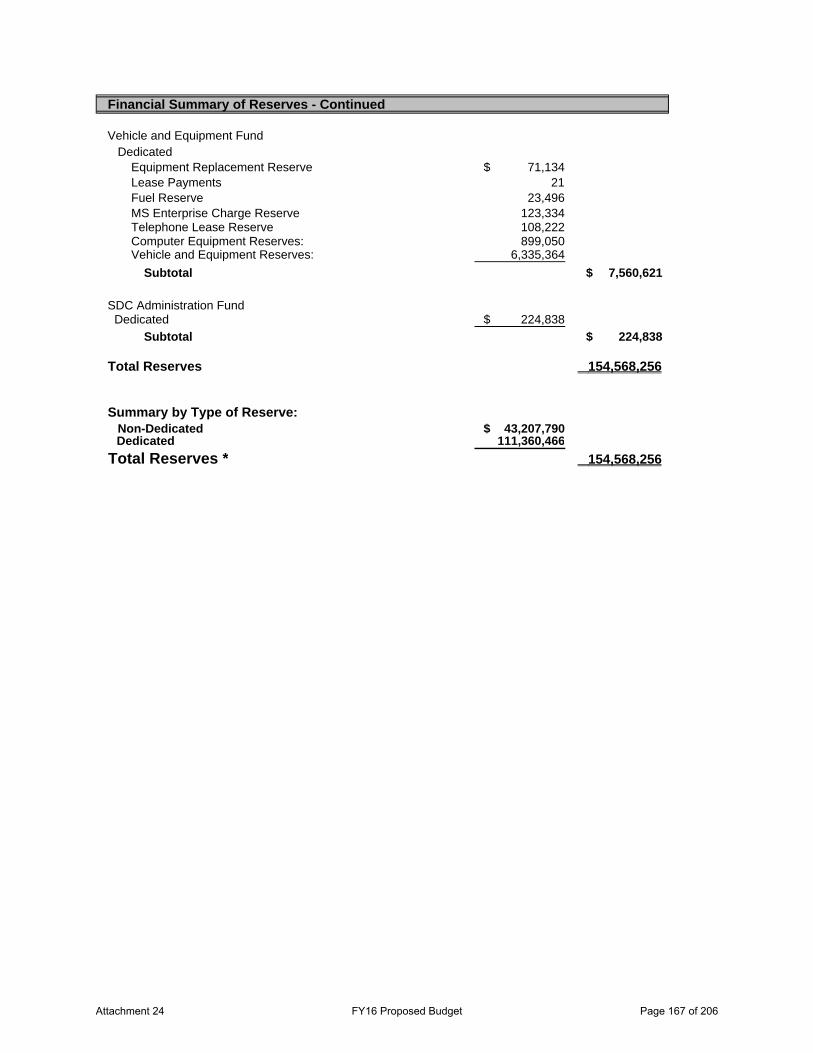
Financial Summary of Reserves - Continued
Vehicle and Equipment Fund Dedicated Equipment Replacement Reserve 71,134$ Lease Payments 21 Fuel Reserve 23,496 MS Enterprise Charge Reserve 123,334 Telephone Lease Reserve 108,222 Computer Equipment Reserves: 899,050 Vehicle and Equipment Reserves: 6,335,364
Subtotal 7,560,621$
SDC Administration Fund Dedicated 224,838$
Subtotal 224,838$
Total Reserves 154,568,256
Summary by Type of Reserve: Non-Dedicated 43,207,790$
Dedicated 111,360,466 Total Reserves * 154,568,256
Attachment 24 FY16 Proposed Budget Page 167 of 206
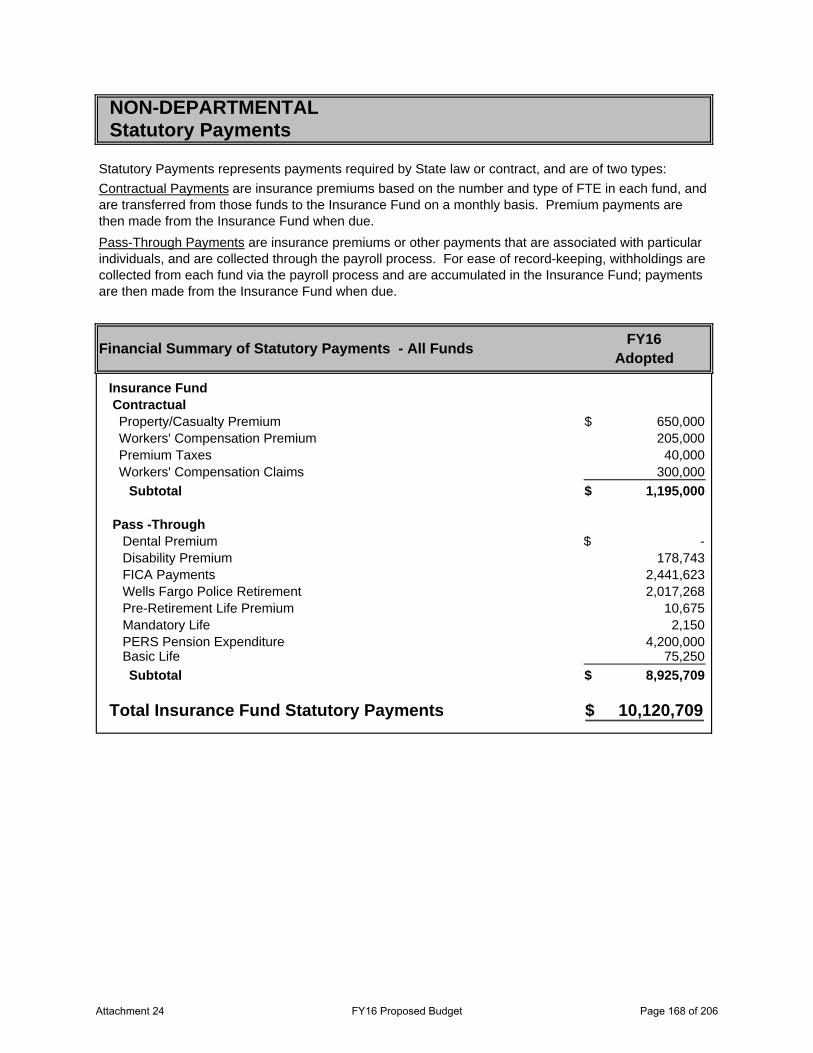
Statutory Payments represents payments required by State law or contract, and are of two types:
FY16Adopted
Insurance Fund Contractual
Property/Casualty Premium 650,000$ Workers' Compensation Premium 205,000 Premium Taxes 40,000 Workers' Compensation Claims 300,000
Subtotal 1,195,000$
Pass -Through Dental Premium -$ Disability Premium 178,743 FICA Payments 2,441,623 Wells Fargo Police Retirement 2,017,268 Pre-Retirement Life Premium 10,675 Mandatory Life 2,150 PERS Pension Expenditure 4,200,000 Basic Life 75,250
Subtotal 8,925,709$
Total Insurance Fund Statutory Payments 10,120,709$
NON-DEPARTMENTALStatutory Payments
Contractual Payments are insurance premiums based on the number and type of FTE in each fund, and are transferred from those funds to the Insurance Fund on a monthly basis. Premium payments are then made from the Insurance Fund when due.
Financial Summary of Statutory Payments - All Funds
Pass-Through Payments are insurance premiums or other payments that are associated with particular individuals, and are collected through the payroll process. For ease of record-keeping, withholdings are collected from each fund via the payroll process and are accumulated in the Insurance Fund; payments are then made from the Insurance Fund when due.
Attachment 24 FY16 Proposed Budget Page 168 of 206
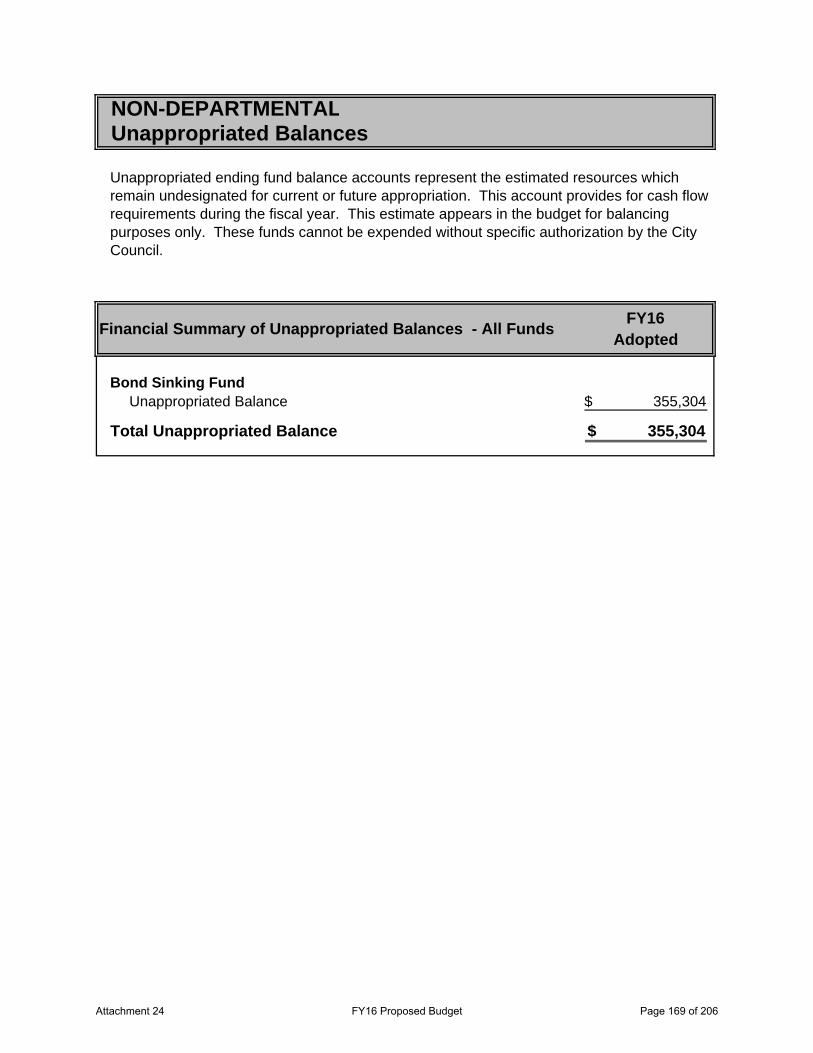
NON-DEPARTMENTALUnappropriated Balances
FY16Adopted
Bond Sinking Fund Unappropriated Balance 355,304$
Total Unappropriated Balance 355,304$
Unappropriated ending fund balance accounts represent the estimated resources which remain undesignated for current or future appropriation. This account provides for cash flow requirements during the fiscal year. This estimate appears in the budget for balancing purposes only. These funds cannot be expended without specific authorization by the City Council.
Financial Summary of Unappropriated Balances - All Funds
Attachment 24 FY16 Proposed Budget Page 169 of 206

Attachment 24 FY16 Proposed Budget Page 170 of 206
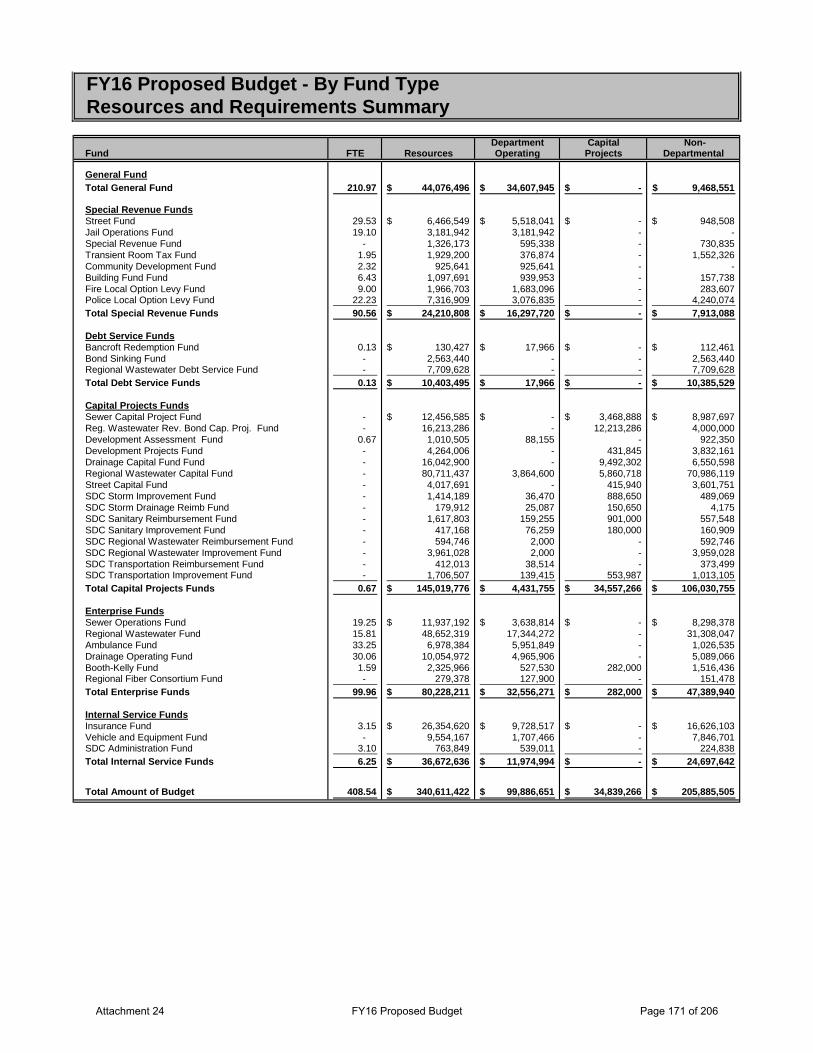
FY16 Proposed Budget - By Fund TypeResources and Requirements Summary
Department Capital Non-Fund FTE Resources Operating Projects Departmental
General FundTotal General Fund 210.97 44,076,496$ 34,607,945$ -$ 9,468,551$
Special Revenue FundsStreet Fund 29.53 6,466,549$ 5,518,041$ -$ 948,508$ Jail Operations Fund 19.10 3,181,942 3,181,942 - - Special Revenue Fund - 1,326,173 595,338 - 730,835 Transient Room Tax Fund 1.95 1,929,200 376,874 - 1,552,326 Community Development Fund 2.32 925,641 925,641 - - Building Fund Fund 6.43 1,097,691 939,953 - 157,738 Fire Local Option Levy Fund 9.00 1,966,703 1,683,096 - 283,607 Police Local Option Levy Fund 22.23 7,316,909 3,076,835 - 4,240,074 Total Special Revenue Funds 90.56 24,210,808$ 16,297,720$ -$ 7,913,088$
Debt Service FundsBancroft Redemption Fund 0.13 130,427$ 17,966$ -$ 112,461$ Bond Sinking Fund - 2,563,440 - - 2,563,440 Regional Wastewater Debt Service Fund - 7,709,628 - - 7,709,628 Total Debt Service Funds 0.13 10,403,495$ 17,966$ -$ 10,385,529$
Capital Projects FundsSewer Capital Project Fund - 12,456,585$ -$ 3,468,888$ 8,987,697$ Reg. Wastewater Rev. Bond Cap. Proj. Fund - 16,213,286 - 12,213,286 4,000,000 Development Assessment Fund 0.67 1,010,505 88,155 - 922,350 Development Projects Fund - 4,264,006 - 431,845 3,832,161 Drainage Capital Fund Fund - 16,042,900 - 9,492,302 6,550,598 Regional Wastewater Capital Fund - 80,711,437 3,864,600 5,860,718 70,986,119 Street Capital Fund - 4,017,691 - 415,940 3,601,751 SDC Storm Improvement Fund - 1,414,189 36,470 888,650 489,069 SDC Storm Drainage Reimb Fund - 179,912 25,087 150,650 4,175 SDC Sanitary Reimbursement Fund - 1,617,803 159,255 901,000 557,548 SDC Sanitary Improvement Fund - 417,168 76,259 180,000 160,909 SDC Regional Wastewater Reimbursement Fund - 594,746 2,000 - 592,746 SDC Regional Wastewater Improvement Fund - 3,961,028 2,000 - 3,959,028 SDC Transportation Reimbursement Fund - 412,013 38,514 - 373,499 SDC Transportation Improvement Fund - 1,706,507 139,415 553,987 1,013,105 Total Capital Projects Funds 0.67 145,019,776$ 4,431,755$ 34,557,266$ 106,030,755$
Enterprise FundsSewer Operations Fund 19.25 11,937,192$ 3,638,814$ -$ 8,298,378$ Regional Wastewater Fund 15.81 48,652,319 17,344,272 - 31,308,047 Ambulance Fund 33.25 6,978,384 5,951,849 - 1,026,535 Drainage Operating Fund 30.06 10,054,972 4,965,906 - 5,089,066 Booth-Kelly Fund 1.59 2,325,966 527,530 282,000 1,516,436 Regional Fiber Consortium Fund - 279,378 127,900 - 151,478 Total Enterprise Funds 99.96 80,228,211$ 32,556,271$ 282,000$ 47,389,940$
Internal Service FundsInsurance Fund 3.15 26,354,620$ 9,728,517$ -$ 16,626,103$ Vehicle and Equipment Fund - 9,554,167 1,707,466 - 7,846,701 SDC Administration Fund 3.10 763,849 539,011 - 224,838 Total Internal Service Funds 6.25 36,672,636$ 11,974,994$ -$ 24,697,642$
Total Amount of Budget 408.54 340,611,422$ 99,886,651$ 34,839,266$ 205,885,505$
Attachment 24 FY16 Proposed Budget Page 171 of 206
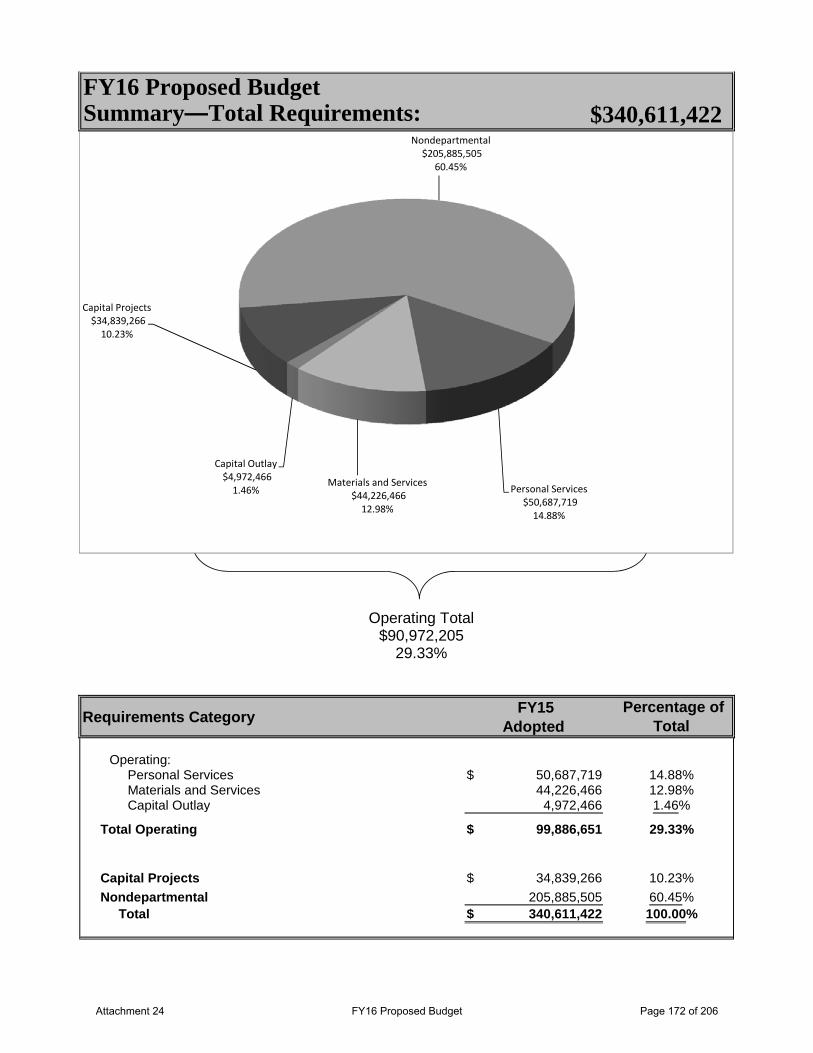
Summary—Total Requirements:
Requirements Category FY15Adopted
Percentage of Total
Operating:Personal Services 50,687,719$ 14.88%Materials and Services 44,226,466 12.98%Capital Outlay 4,972,466 1.46%
Total Operating 99,886,651$ 29.33%
Capital Projects 34,839,266$ 10.23%
Nondepartmental 205,885,505 60.45%Total 340,611,422$ 100.00%
$340,611,422FY16 Proposed Budget
Operating Total$90,972,205
29.33%
Personal Services$50,687,719 14.88%
Materials and Services$44,226,466 12.98%
Capital Outlay$4,972,466 1.46%
Capital Projects$34,839,266 10.23%
Nondepartmental$205,885,505
60.45%
Attachment 24 FY16 Proposed Budget Page 172 of 206
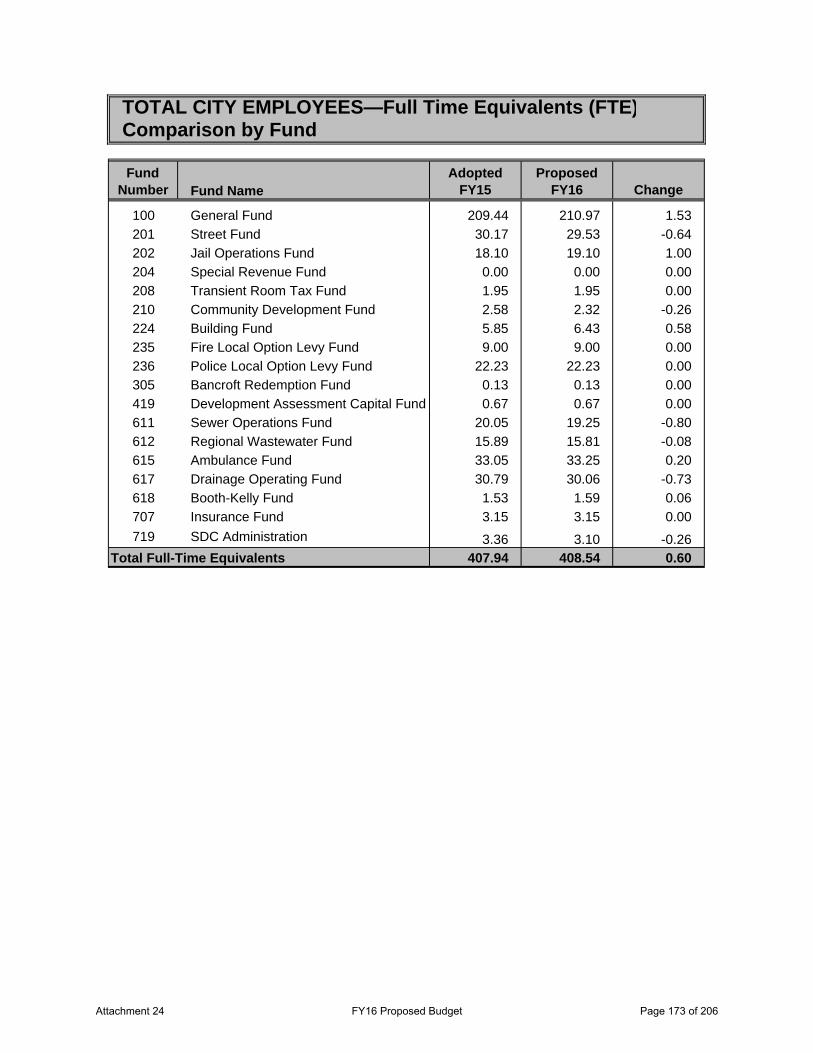
TOTAL CITY EMPLOYEES—Full Time Equivalents (FTE)Comparison by Fund
FundNumber Fund Name
AdoptedFY15
ProposedFY16 Change
100 General Fund 209.44 210.97 1.53
201 Street Fund 30.17 29.53 -0.64
202 Jail Operations Fund 18.10 19.10 1.00
204 Special Revenue Fund 0.00 0.00 0.00
208 Transient Room Tax Fund 1.95 1.95 0.00
210 Community Development Fund 2.58 2.32 -0.26
224 Building Fund 5.85 6.43 0.58
235 Fire Local Option Levy Fund 9.00 9.00 0.00
236 Police Local Option Levy Fund 22.23 22.23 0.00
305 Bancroft Redemption Fund 0.13 0.13 0.00
419 Development Assessment Capital Fund 0.67 0.67 0.00
611 Sewer Operations Fund 20.05 19.25 -0.80
612 Regional Wastewater Fund 15.89 15.81 -0.08
615 Ambulance Fund 33.05 33.25 0.20
617 Drainage Operating Fund 30.79 30.06 -0.73
618 Booth-Kelly Fund 1.53 1.59 0.06
707 Insurance Fund 3.15 3.15 0.00
719 SDC Administration 3.36 3.10 -0.26Total Full-Time Equivalents 407.94 408.54 0.60
Attachment 24 FY16 Proposed Budget Page 173 of 206
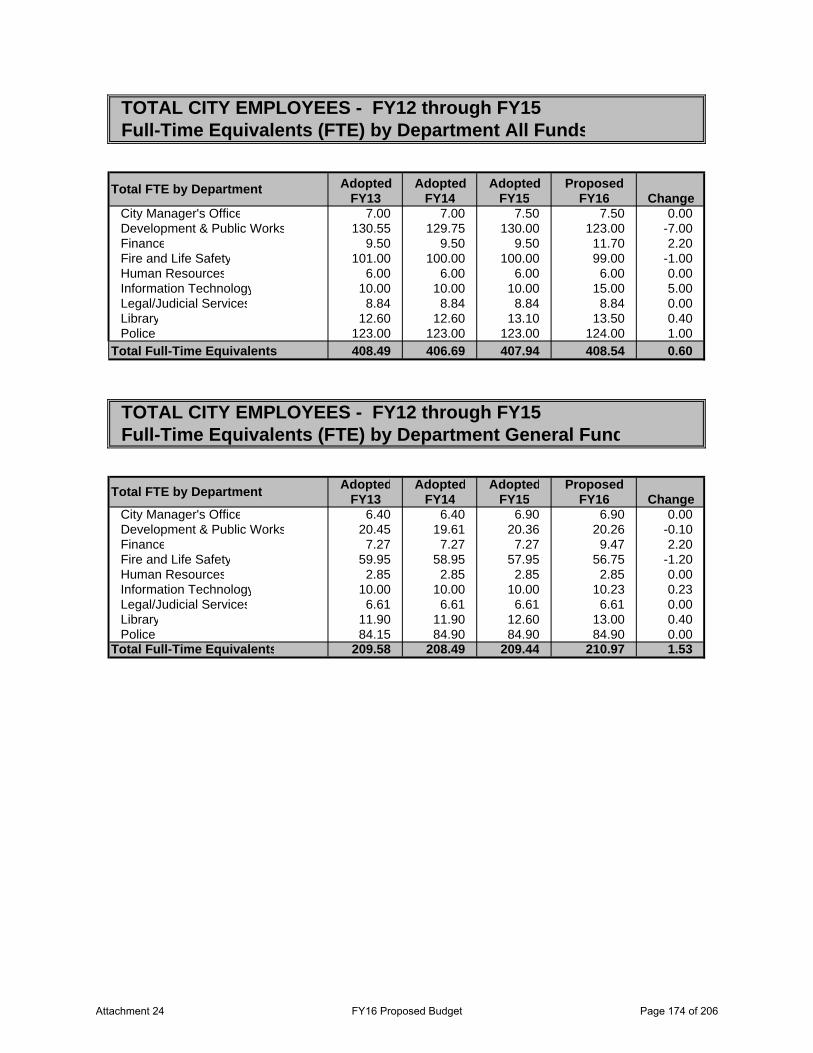
TOTAL CITY EMPLOYEES - FY12 through FY15Full-Time Equivalents (FTE) by Department All Funds
Adopted Adopted Adopted ProposedFY13 FY14 FY15 FY16
City Manager's Office 7.00 7.00 7.50 7.50 0.00Development & Public Works 130.55 129.75 130.00 123.00 -7.00Finance 9.50 9.50 9.50 11.70 2.20Fire and Life Safety 101.00 100.00 100.00 99.00 -1.00Human Resources 6.00 6.00 6.00 6.00 0.00Information Technology 10.00 10.00 10.00 15.00 5.00Legal/Judicial Services 8.84 8.84 8.84 8.84 0.00Library 12.60 12.60 13.10 13.50 0.40Police 123.00 123.00 123.00 124.00 1.00
Total Full-Time Equivalents 408.49 406.69 407.94 408.54 0.60
TOTAL CITY EMPLOYEES - FY12 through FY15Full-Time Equivalents (FTE) by Department General Fund
Adopted Adopted Adopted ProposedFY13 FY14 FY15 FY16
City Manager's Office 6.40 6.40 6.90 6.90 0.00Development & Public Works 20.45 19.61 20.36 20.26 -0.10Finance 7.27 7.27 7.27 9.47 2.20Fire and Life Safety 59.95 58.95 57.95 56.75 -1.20Human Resources 2.85 2.85 2.85 2.85 0.00Information Technology 10.00 10.00 10.00 10.23 0.23Legal/Judicial Services 6.61 6.61 6.61 6.61 0.00Library 11.90 11.90 12.60 13.00 0.40Police 84.15 84.90 84.90 84.90 0.00
Total Full-Time Equivalents 209.58 208.49 209.44 210.97 1.53
Total FTE by DepartmentChange
Total FTE by Department Change
Attachment 24 FY16 Proposed Budget Page 174 of 206
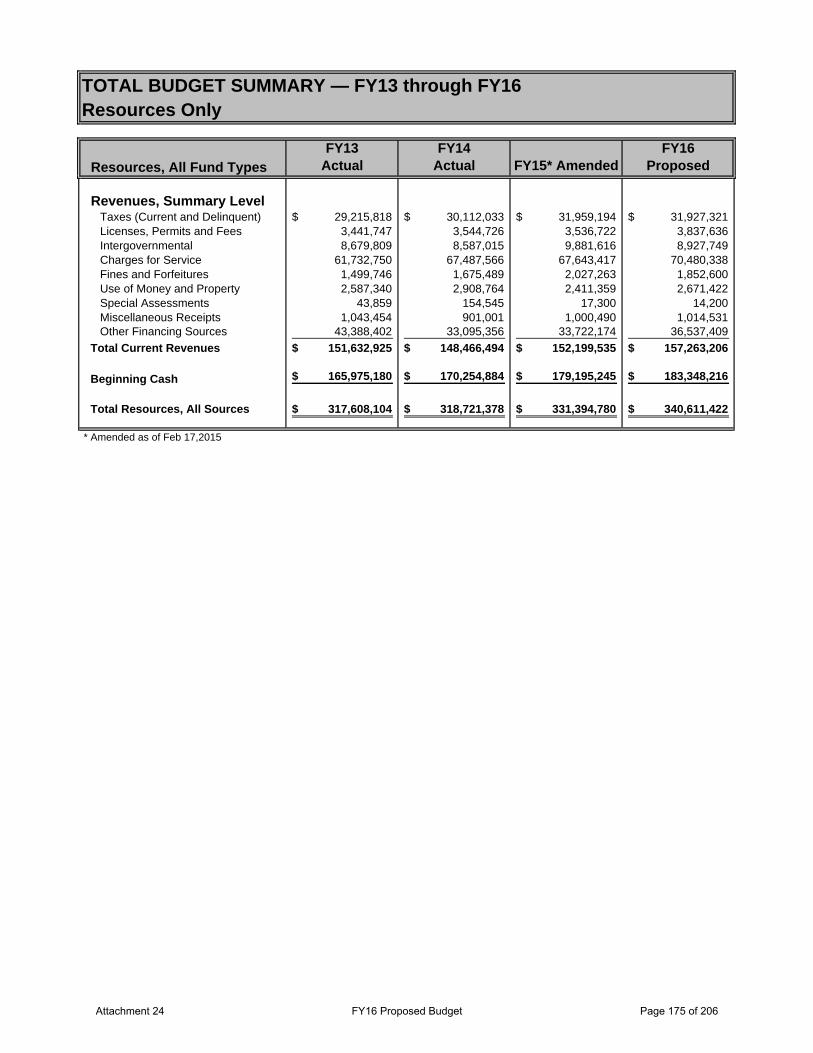
Resources, All Fund TypesFY13
ActualFY14
Actual FY15* AmendedFY16
Proposed
Revenues, Summary LevelTaxes (Current and Delinquent) 29,215,818$ 30,112,033$ 31,959,194$ 31,927,321$ Licenses, Permits and Fees 3,441,747 3,544,726 3,536,722 3,837,636 Intergovernmental 8,679,809 8,587,015 9,881,616 8,927,749 Charges for Service 61,732,750 67,487,566 67,643,417 70,480,338 Fines and Forfeitures 1,499,746 1,675,489 2,027,263 1,852,600 Use of Money and Property 2,587,340 2,908,764 2,411,359 2,671,422 Special Assessments 43,859 154,545 17,300 14,200 Miscellaneous Receipts 1,043,454 901,001 1,000,490 1,014,531 Other Financing Sources 43,388,402 33,095,356 33,722,174 36,537,409
Total Current Revenues 151,632,925$ 148,466,494$ 152,199,535$ 157,263,206$
Beginning Cash 165,975,180$ 170,254,884$ 179,195,245$ 183,348,216$
Total Resources, All Sources 317,608,104$ 318,721,378$ 331,394,780$ 340,611,422$
* Amended as of Feb 17,2015
TOTAL BUDGET SUMMARY — FY13 through FY16Resources Only
Attachment 24 FY16 Proposed Budget Page 175 of 206
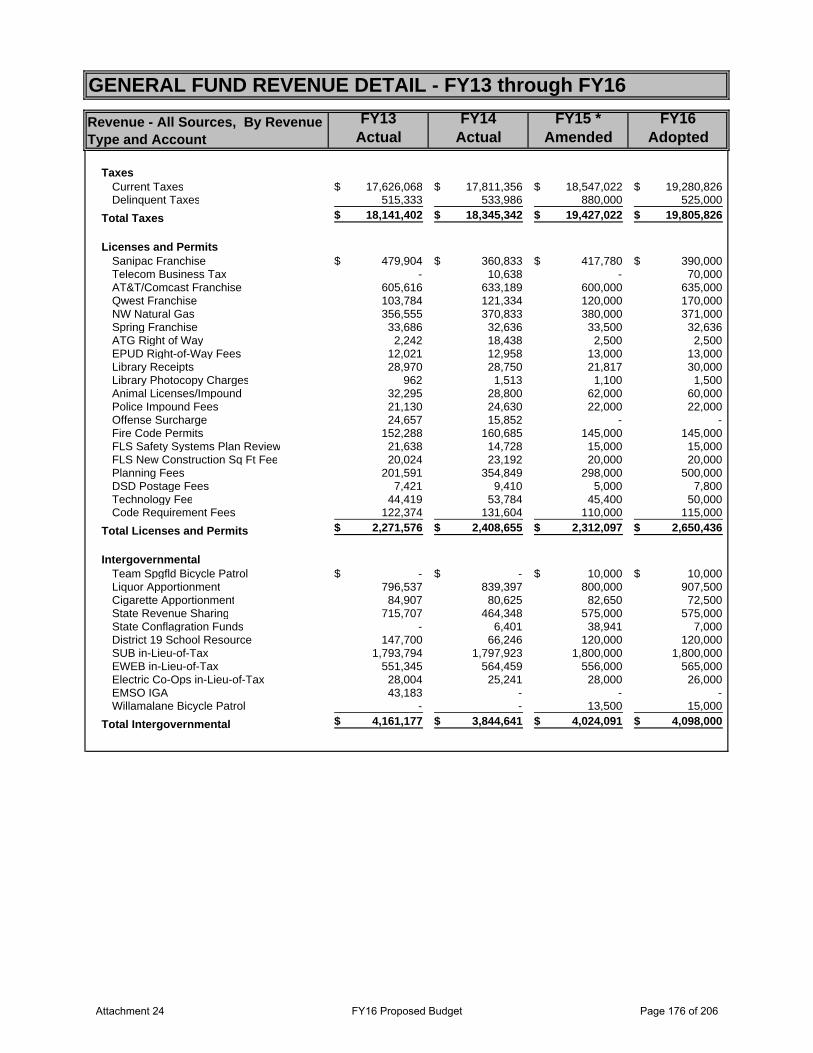
Revenue - All Sources, By Revenue Type and Account
FY13Actual
FY14Actual
FY15 * Amended
FY16Adopted
TaxesCurrent Taxes 17,626,068$ 17,811,356$ 18,547,022$ 19,280,826$ Delinquent Taxes 515,333 533,986 880,000 525,000
Total Taxes 18,141,402$ 18,345,342$ 19,427,022$ 19,805,826$
Licenses and Permits Sanipac Franchise 479,904$ 360,833$ 417,780$ 390,000$ Telecom Business Tax - 10,638 - 70,000 AT&T/Comcast Franchise 605,616 633,189 600,000 635,000 Qwest Franchise 103,784 121,334 120,000 170,000 NW Natural Gas 356,555 370,833 380,000 371,000 Spring Franchise 33,686 32,636 33,500 32,636 ATG Right of Way 2,242 18,438 2,500 2,500 EPUD Right-of-Way Fees 12,021 12,958 13,000 13,000 Library Receipts 28,970 28,750 21,817 30,000 Library Photocopy Charges 962 1,513 1,100 1,500 Animal Licenses/Impound 32,295 28,800 62,000 60,000 Police Impound Fees 21,130 24,630 22,000 22,000 Offense Surcharge 24,657 15,852 - - Fire Code Permits 152,288 160,685 145,000 145,000 FLS Safety Systems Plan Review 21,638 14,728 15,000 15,000 FLS New Construction Sq Ft Fee 20,024 23,192 20,000 20,000 Planning Fees 201,591 354,849 298,000 500,000 DSD Postage Fees 7,421 9,410 5,000 7,800 Technology Fee 44,419 53,784 45,400 50,000 Code Requirement Fees 122,374 131,604 110,000 115,000
Total Licenses and Permits 2,271,576$ 2,408,655$ 2,312,097$ 2,650,436$
Intergovernmental Team Spgfld Bicycle Patrol -$ -$ 10,000$ 10,000$ Liquor Apportionment 796,537 839,397 800,000 907,500 Cigarette Apportionment 84,907 80,625 82,650 72,500 State Revenue Sharing 715,707 464,348 575,000 575,000 State Conflagration Funds - 6,401 38,941 7,000 District 19 School Resource 147,700 66,246 120,000 120,000 SUB in-Lieu-of-Tax 1,793,794 1,797,923 1,800,000 1,800,000 EWEB in-Lieu-of-Tax 551,345 564,459 556,000 565,000 Electric Co-Ops in-Lieu-of-Tax 28,004 25,241 28,000 26,000 EMSO IGA 43,183 - - - Willamalane Bicycle Patrol - - 13,500 15,000
Total Intergovernmental 4,161,177$ 3,844,641$ 4,024,091$ 4,098,000$
GENERAL FUND REVENUE DETAIL - FY13 through FY16
Attachment 24 FY16 Proposed Budget Page 176 of 206
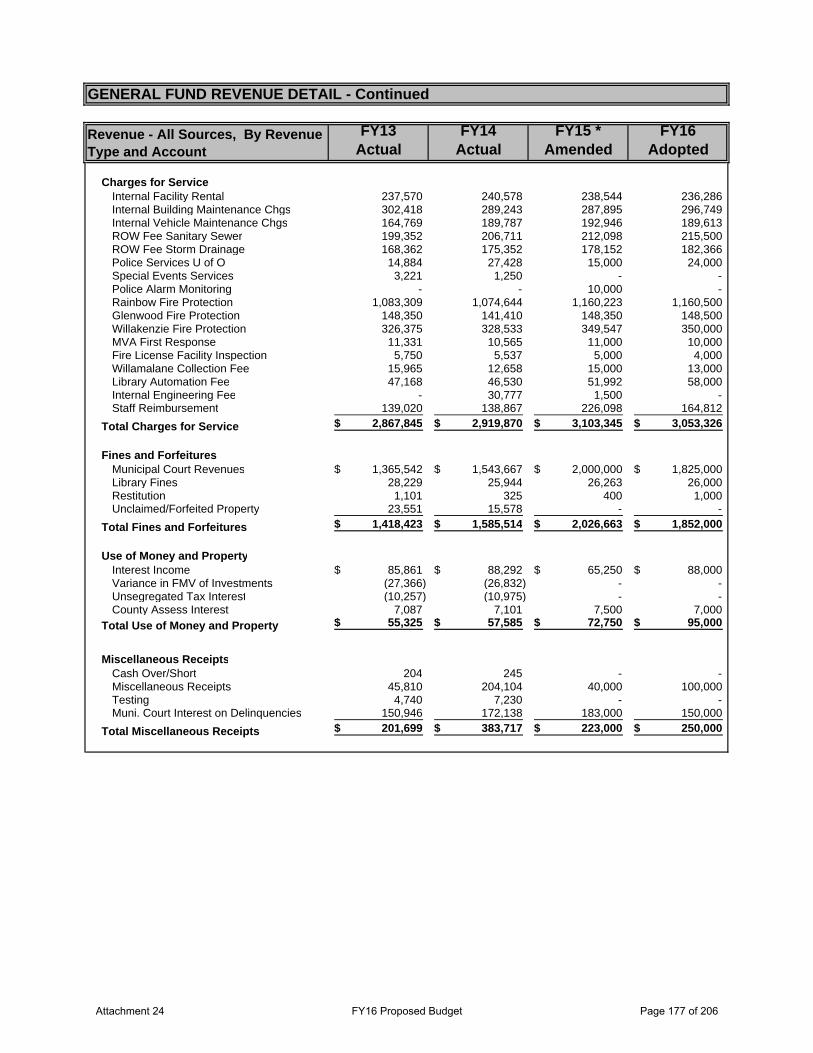
Revenue - All Sources, By Revenue Type and Account
FY13Actual
FY14Actual
FY15 * Amended
FY16Adopted
Charges for ServiceInternal Facility Rental 237,570 240,578 238,544 236,286 Internal Building Maintenance Chgs 302,418 289,243 287,895 296,749 Internal Vehicle Maintenance Chgs 164,769 189,787 192,946 189,613 ROW Fee Sanitary Sewer 199,352 206,711 212,098 215,500 ROW Fee Storm Drainage 168,362 175,352 178,152 182,366 Police Services U of O 14,884 27,428 15,000 24,000 Special Events Services 3,221 1,250 - - Police Alarm Monitoring - - 10,000 - Rainbow Fire Protection 1,083,309 1,074,644 1,160,223 1,160,500 Glenwood Fire Protection 148,350 141,410 148,350 148,500 Willakenzie Fire Protection 326,375 328,533 349,547 350,000 MVA First Response 11,331 10,565 11,000 10,000 Fire License Facility Inspection 5,750 5,537 5,000 4,000 Willamalane Collection Fee 15,965 12,658 15,000 13,000 Library Automation Fee 47,168 46,530 51,992 58,000 Internal Engineering Fee - 30,777 1,500 - Staff Reimbursement 139,020 138,867 226,098 164,812
Total Charges for Service 2,867,845$ 2,919,870$ 3,103,345$ 3,053,326$
Fines and ForfeituresMunicipal Court Revenues 1,365,542$ 1,543,667$ 2,000,000$ 1,825,000$ Library Fines 28,229 25,944 26,263 26,000 Restitution 1,101 325 400 1,000 Unclaimed/Forfeited Property 23,551 15,578 - -
Total Fines and Forfeitures 1,418,423$ 1,585,514$ 2,026,663$ 1,852,000$
Use of Money and PropertyInterest Income 85,861$ 88,292$ 65,250$ 88,000$ Variance in FMV of Investments (27,366) (26,832) - - Unsegregated Tax Interest (10,257) (10,975) - - County Assess Interest 7,087 7,101 7,500 7,000
Total Use of Money and Property 55,325$ 57,585$ 72,750$ 95,000$
Miscellaneous ReceiptsCash Over/Short 204 245 - - Miscellaneous Receipts 45,810 204,104 40,000 100,000 Testing 4,740 7,230 - - Muni. Court Interest on Delinquencies 150,946 172,138 183,000 150,000
Total Miscellaneous Receipts 201,699$ 383,717$ 223,000$ 250,000$
GENERAL FUND REVENUE DETAIL - Continued
Attachment 24 FY16 Proposed Budget Page 177 of 206
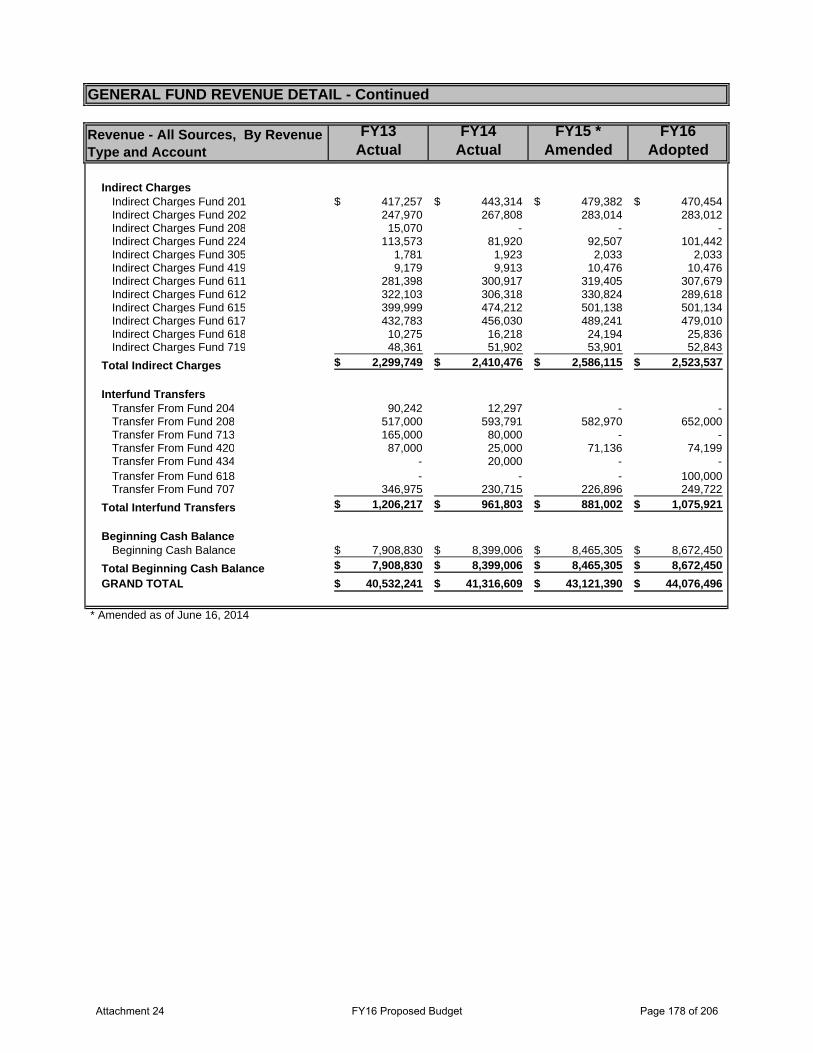
Revenue - All Sources, By Revenue Type and Account
FY13Actual
FY14Actual
FY15 * Amended
FY16Adopted
Indirect Charges Indirect Charges Fund 201 417,257$ 443,314$ 479,382$ 470,454$ Indirect Charges Fund 202 247,970 267,808 283,014 283,012 Indirect Charges Fund 208 15,070 - - - Indirect Charges Fund 224 113,573 81,920 92,507 101,442 Indirect Charges Fund 305 1,781 1,923 2,033 2,033 Indirect Charges Fund 419 9,179 9,913 10,476 10,476 Indirect Charges Fund 611 281,398 300,917 319,405 307,679 Indirect Charges Fund 612 322,103 306,318 330,824 289,618 Indirect Charges Fund 615 399,999 474,212 501,138 501,134 Indirect Charges Fund 617 432,783 456,030 489,241 479,010 Indirect Charges Fund 618 10,275 16,218 24,194 25,836 Indirect Charges Fund 719 48,361 51,902 53,901 52,843
Total Indirect Charges 2,299,749$ 2,410,476$ 2,586,115$ 2,523,537$
Interfund Transfers Transfer From Fund 204 90,242 12,297 - - Transfer From Fund 208 517,000 593,791 582,970 652,000 Transfer From Fund 713 165,000 80,000 - - Transfer From Fund 420 87,000 25,000 71,136 74,199 Transfer From Fund 434 - 20,000 - - Transfer From Fund 618 - - - 100,000 Transfer From Fund 707 346,975 230,715 226,896 249,722
Total Interfund Transfers 1,206,217$ 961,803$ 881,002$ 1,075,921$
Beginning Cash Balance Beginning Cash Balance 7,908,830$ 8,399,006$ 8,465,305$ 8,672,450$
Total Beginning Cash Balance 7,908,830$ 8,399,006$ 8,465,305$ 8,672,450$ GRAND TOTAL 40,532,241$ 41,316,609$ 43,121,390$ 44,076,496$
* Amended as of June 16, 2014
GENERAL FUND REVENUE DETAIL - Continued
Attachment 24 FY16 Proposed Budget Page 178 of 206
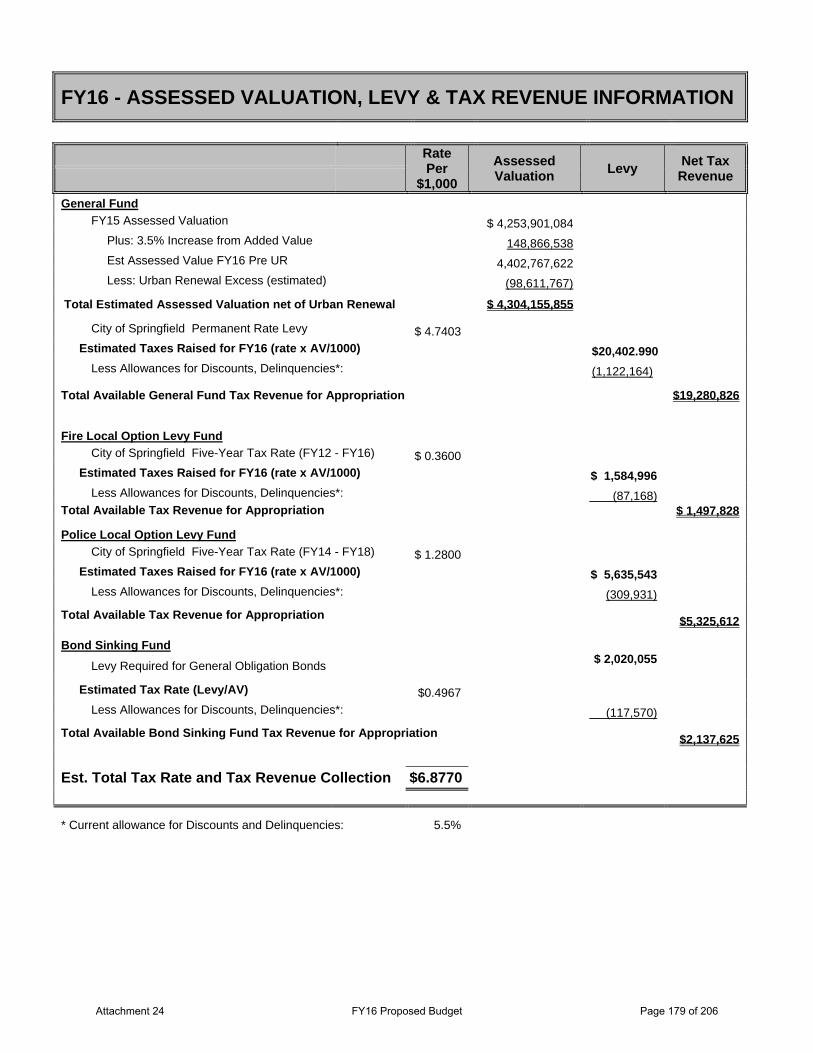
FY16 - ASSESSED VALUATION, LEVY & TAX REVENUE INFORMATION
Rate Per
$1,000 Assessed Valuation Levy Net Tax
Revenue
General Fund FY15 Assessed Valuation $ 4,253,901,084
Plus: 3.5% Increase from Added Value 148,866,538
Est Assessed Value FY16 Pre UR 4,402,767,622
Less: Urban Renewal Excess (estimated) (98,611,767)
Total Estimated Assessed Valuation net of Urban Renewal $ 4,304,155,855
City of Springfield Permanent Rate Levy $ 4.7403
Estimated Taxes Raised for FY16 (rate x AV/1000) $20,402.990Less Allowances for Discounts, Delinquencies*: (1,122,164)
Total Available General Fund Tax Revenue for Appropriation $19,280,826
Fire Local Option Levy Fund
City of Springfield Five-Year Tax Rate (FY12 - FY16) $ 0.3600
Estimated Taxes Raised for FY16 (rate x AV/1000) $ 1,584,996 Less Allowances for Discounts, Delinquencies*: (87,168)
Total Available Tax Revenue for Appropriation $ 1,497,828
Police Local Option Levy Fund City of Springfield Five-Year Tax Rate (FY14 - FY18) $ 1.2800
Estimated Taxes Raised for FY16 (rate x AV/1000) $ 5,635,543 Less Allowances for Discounts, Delinquencies*: (309,931)
Total Available Tax Revenue for Appropriation $5,325,612
Bond Sinking Fund
Levy Required for General Obligation Bonds $ 2,020,055
Estimated Tax Rate (Levy/AV) $0.4967
Less Allowances for Discounts, Delinquencies*: (117,570)
Total Available Bond Sinking Fund Tax Revenue for Appropriation $2,137,625
Est. Total Tax Rate and Tax Revenue Collection $6.8770
* Current allowance for Discounts and Delinquencies: 5.5%
Attachment 24 FY16 Proposed Budget Page 179 of 206
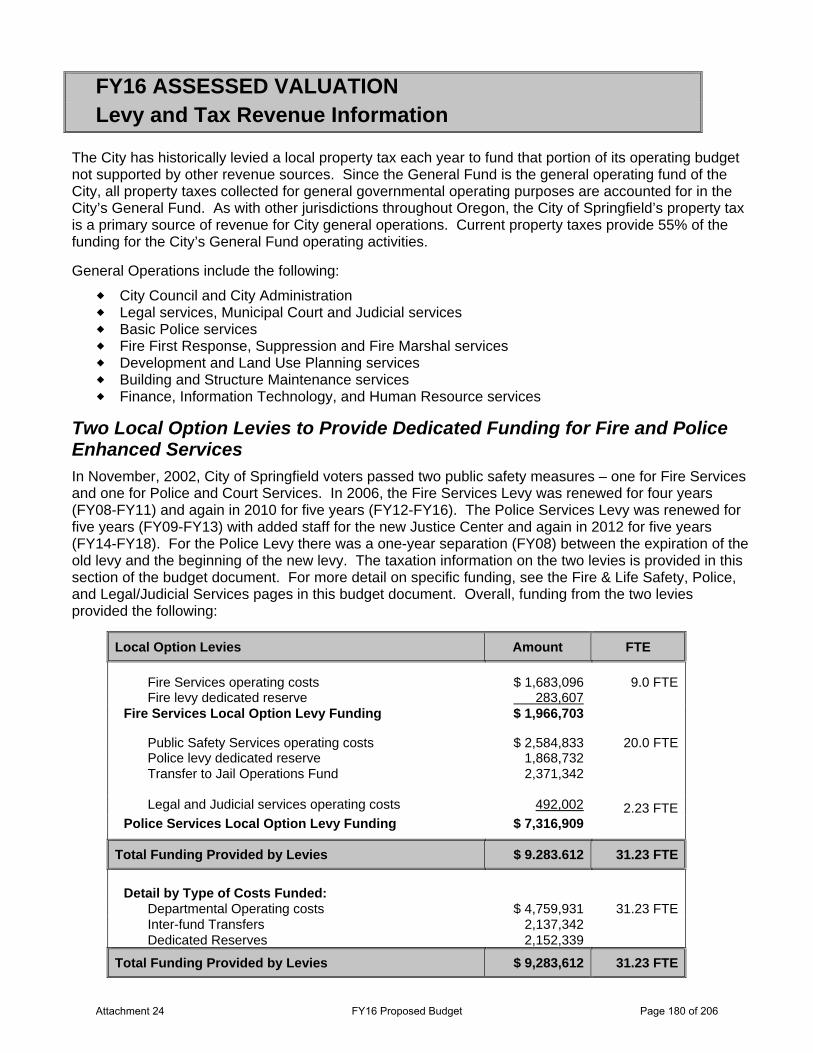
FY16 ASSESSED VALUATION Levy and Tax Revenue Information
The City has historically levied a local property tax each year to fund that portion of its operating budget not supported by other revenue sources. Since the General Fund is the general operating fund of the City, all property taxes collected for general governmental operating purposes are accounted for in the City’s General Fund. As with other jurisdictions throughout Oregon, the City of Springfield’s property tax is a primary source of revenue for City general operations. Current property taxes provide 55% of the funding for the City’s General Fund operating activities.
General Operations include the following:
City Council and City Administration Legal services, Municipal Court and Judicial services Basic Police services Fire First Response, Suppression and Fire Marshal services Development and Land Use Planning services Building and Structure Maintenance services Finance, Information Technology, and Human Resource services
Two Local Option Levies to Provide Dedicated Funding for Fire and Police Enhanced Services In November, 2002, City of Springfield voters passed two public safety measures – one for Fire Services and one for Police and Court Services. In 2006, the Fire Services Levy was renewed for four years (FY08-FY11) and again in 2010 for five years (FY12-FY16). The Police Services Levy was renewed for five years (FY09-FY13) with added staff for the new Justice Center and again in 2012 for five years (FY14-FY18). For the Police Levy there was a one-year separation (FY08) between the expiration of the old levy and the beginning of the new levy. The taxation information on the two levies is provided in this section of the budget document. For more detail on specific funding, see the Fire & Life Safety, Police, and Legal/Judicial Services pages in this budget document. Overall, funding from the two levies provided the following:
Local Option Levies Amount FTE
Fire Services operating costs $ 1,683,096 9.0 FTEFire levy dedicated reserve 283,607
Fire Services Local Option Levy Funding $ 1,966,703
Public Safety Services operating costs $ 2,584,833 20.0 FTEPolice levy dedicated reserve 1,868,732 Transfer to Jail Operations Fund
2,371,342
Legal and Judicial services operating costs 492,002 2.23 FTEPolice Services Local Option Levy Funding $ 7,316,909
Total Funding Provided by Levies $ 9.283.612 31.23 FTE
Detail by Type of Costs Funded: Departmental Operating costs $ 4,759,931 31.23 FTEInter-fund Transfers 2,137,342 Dedicated Reserves 2,152,339
Total Funding Provided by Levies $ 9,283,612 31.23 FTE
Attachment 24 FY16 Proposed Budget Page 180 of 206
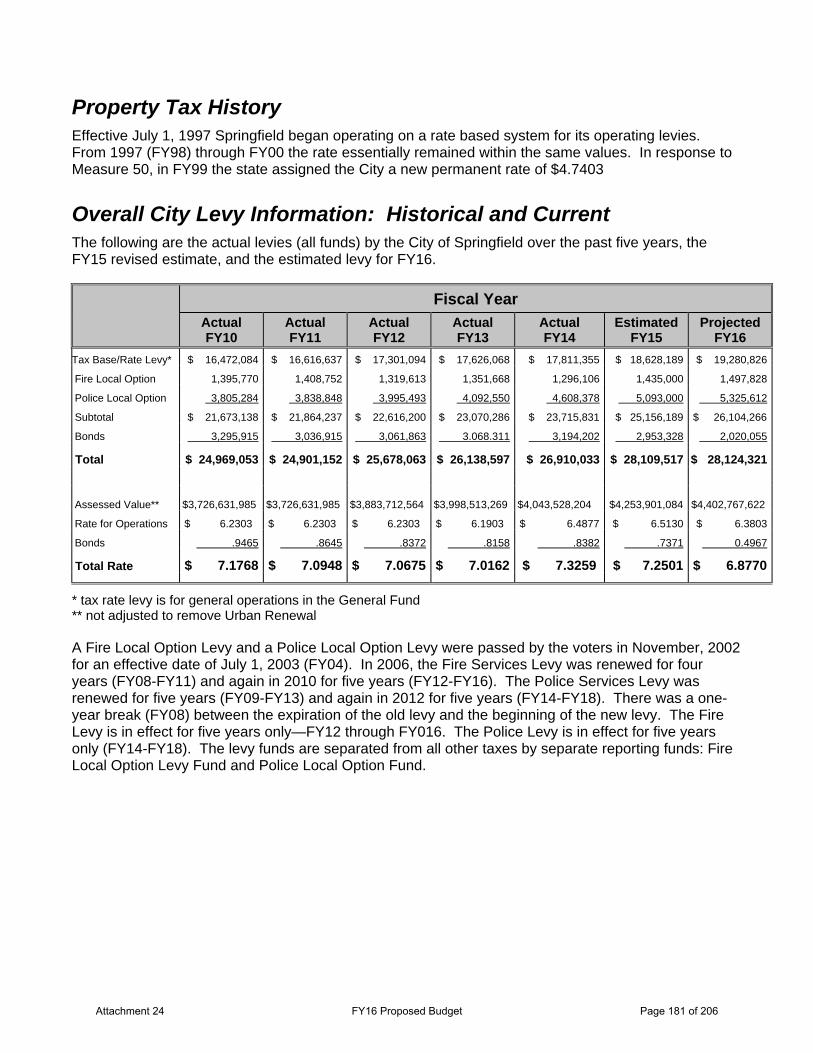
Property Tax History Effective July 1, 1997 Springfield began operating on a rate based system for its operating levies. From 1997 (FY98) through FY00 the rate essentially remained within the same values. In response to Measure 50, in FY99 the state assigned the City a new permanent rate of $4.7403
Overall City Levy Information: Historical and Current The following are the actual levies (all funds) by the City of Springfield over the past five years, the FY15 revised estimate, and the estimated levy for FY16.
Fiscal Year Actual FY10
Actual FY11
Actual FY12
Actual FY13
Actual FY14
EstimatedFY15
Projected FY16
Tax Base/Rate Levy* $ 16,472,084 $ 16,616,637 $ 17,301,094 $ 17,626,068 $ 17,811,355 $ 18,628,189 $ 19,280,826
Fire Local Option 1,395,770 1,408,752 1,319,613 1,351,668 1,296,106 1,435,000 1,497,828
Police Local Option 3,805,284 3,838,848 3,995,493 4,092,550 4,608,378 5,093,000 5,325,612
Subtotal $ 21,673,138 $ 21,864,237 $ 22,616,200 $ 23,070,286 $ 23,715,831 $ 25,156,189 $ 26,104,266
Bonds 3,295,915 3,036,915 3,061,863 3.068.311 3,194,202 2,953,328 2,020,055
Total $ 24,969,053 $ 24,901,152 $ 25,678,063 $ 26,138,597 $ 26,910,033 $ 28,109,517 $ 28,124,321
Assessed Value** $3,726,631,985 $3,726,631,985 $3,883,712,564 $3,998,513,269 $4,043,528,204 $4,253,901,084 $4,402,767,622
Rate for Operations $ 6.2303 $ 6.2303 $ 6.2303 $ 6.1903 $ 6.4877 $ 6.5130 $ 6.3803
Bonds .9465 .8645 .8372 .8158 .8382 .7371 0.4967
Total Rate $ 7.1768 $ 7.0948 $ 7.0675 $ 7.0162 $ 7.3259 $ 7.2501 $ 6.8770
* tax rate levy is for general operations in the General Fund ** not adjusted to remove Urban Renewal
A Fire Local Option Levy and a Police Local Option Levy were passed by the voters in November, 2002 for an effective date of July 1, 2003 (FY04). In 2006, the Fire Services Levy was renewed for four years (FY08-FY11) and again in 2010 for five years (FY12-FY16). The Police Services Levy was renewed for five years (FY09-FY13) and again in 2012 for five years (FY14-FY18). There was a one-year break (FY08) between the expiration of the old levy and the beginning of the new levy. The Fire Levy is in effect for five years only—FY12 through FY016. The Police Levy is in effect for five years only (FY14-FY18). The levy funds are separated from all other taxes by separate reporting funds: Fire Local Option Levy Fund and Police Local Option Fund.
Attachment 24 FY16 Proposed Budget Page 181 of 206
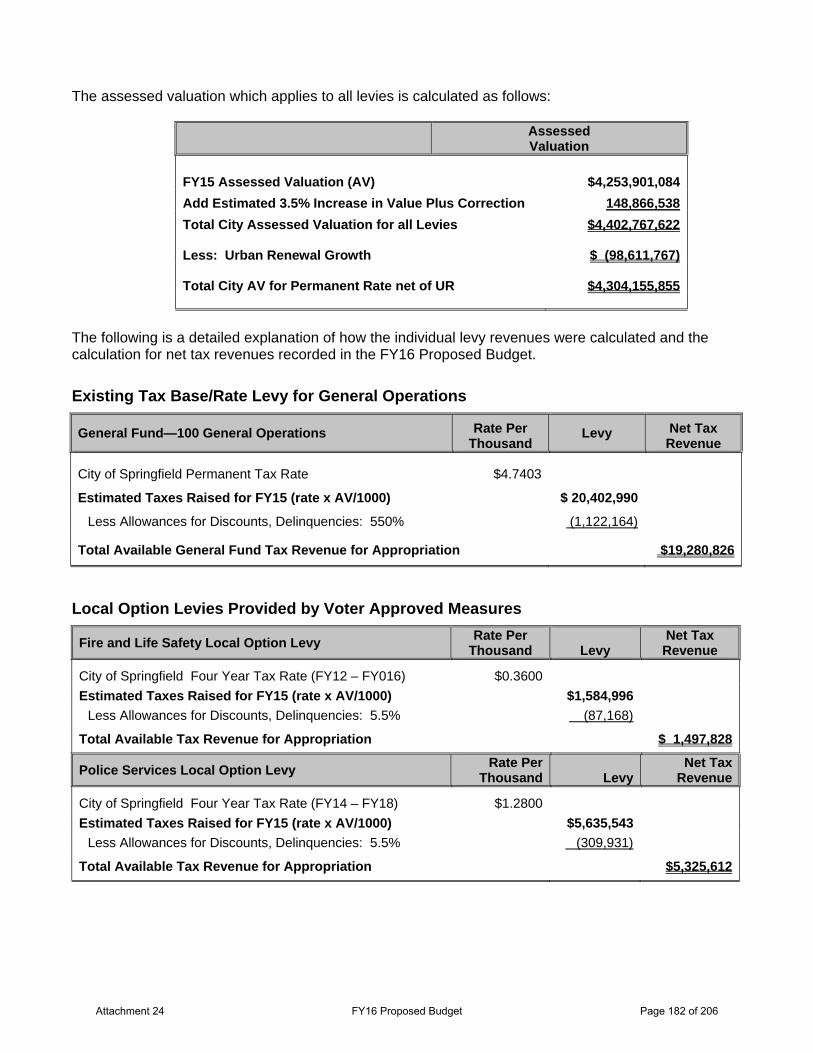
The assessed valuation which applies to all levies is calculated as follows:
Assessed Valuation
FY15 Assessed Valuation (AV) $4,253,901,084Add Estimated 3.5% Increase in Value Plus Correction 148,866,538Total City Assessed Valuation for all Levies $4,402,767,622 Less: Urban Renewal Growth $ (98,611,767) Total City AV for Permanent Rate net of UR $4,304,155,855
The following is a detailed explanation of how the individual levy revenues were calculated and the calculation for net tax revenues recorded in the FY16 Proposed Budget.
Existing Tax Base/Rate Levy for General Operations
General Fund—100 General Operations Rate Per Thousand
Levy Net Tax Revenue
City of Springfield Permanent Tax Rate $4.7403
Estimated Taxes Raised for FY15 (rate x AV/1000) $ 20,402,990
Less Allowances for Discounts, Delinquencies: 550% (1,122,164)
Total Available General Fund Tax Revenue for Appropriation $19,280,826
Local Option Levies Provided by Voter Approved Measures
Fire and Life Safety Local Option Levy Rate Per
Thousand
Levy Net Tax Revenue
City of Springfield Four Year Tax Rate (FY12 – FY016) $0.3600
Estimated Taxes Raised for FY15 (rate x AV/1000) $1,584,996 Less Allowances for Discounts, Delinquencies: 5.5% (87,168)
Total Available Tax Revenue for Appropriation $ 1,497,828
Police Services Local Option Levy Rate Per
Thousand
Levy Net Tax
Revenue
City of Springfield Four Year Tax Rate (FY14 – FY18) $1.2800
Estimated Taxes Raised for FY15 (rate x AV/1000) $5,635,543 Less Allowances for Discounts, Delinquencies: 5.5% (309,931)
Total Available Tax Revenue for Appropriation $5,325,612
Attachment 24 FY16 Proposed Budget Page 182 of 206
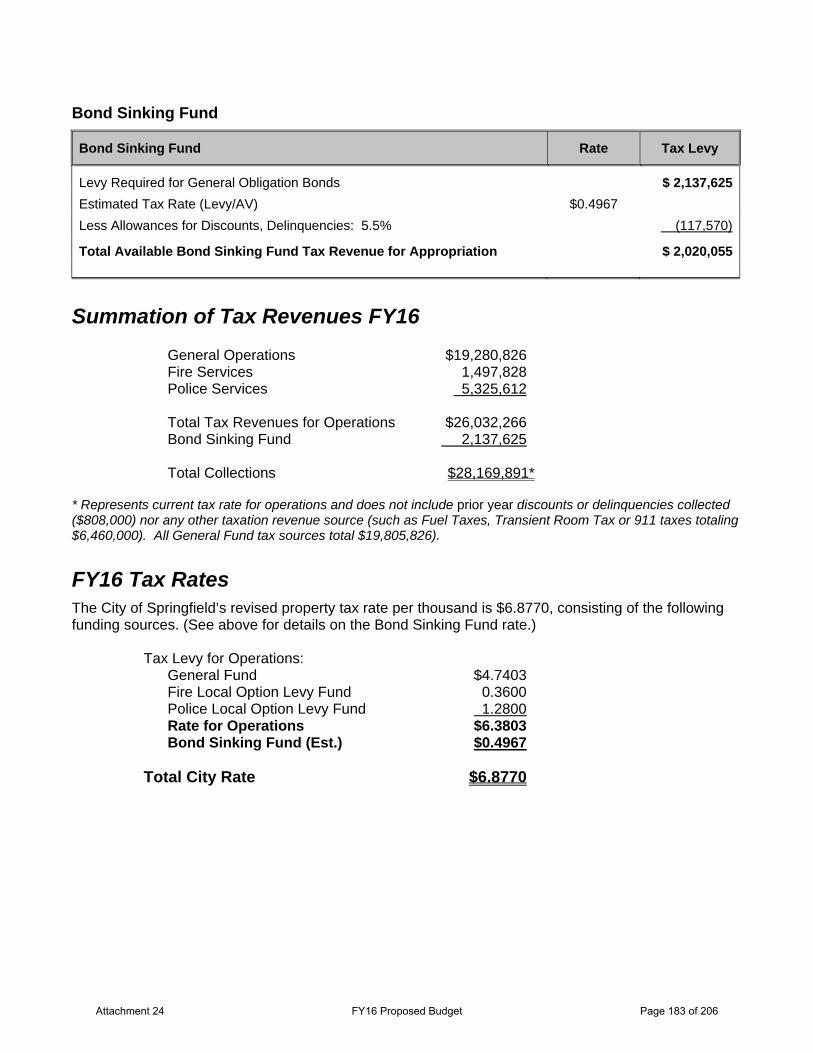
Bond Sinking Fund
Bond Sinking Fund Rate Tax Levy
Levy Required for General Obligation Bonds $ 2,137,625 Estimated Tax Rate (Levy/AV) $0.4967
Less Allowances for Discounts, Delinquencies: 5.5% (117,570)
Total Available Bond Sinking Fund Tax Revenue for Appropriation $ 2,020,055
Summation of Tax Revenues FY16
General Operations $19,280,826 Fire Services 1,497,828 Police Services 5,325,612 Total Tax Revenues for Operations $26,032,266 Bond Sinking Fund 2,137,625 Total Collections $28,169,891*
* Represents current tax rate for operations and does not include prior year discounts or delinquencies collected ($808,000) nor any other taxation revenue source (such as Fuel Taxes, Transient Room Tax or 911 taxes totaling $6,460,000). All General Fund tax sources total $19,805,826).
FY16 Tax Rates The City of Springfield’s revised property tax rate per thousand is $6.8770, consisting of the following funding sources. (See above for details on the Bond Sinking Fund rate.)
Tax Levy for Operations: General Fund $4.7403 Fire Local Option Levy Fund 0.3600 Police Local Option Levy Fund 1.2800 Rate for Operations $6.3803 Bond Sinking Fund (Est.) $0.4967
Total City Rate $6.8770
Attachment 24 FY16 Proposed Budget Page 183 of 206
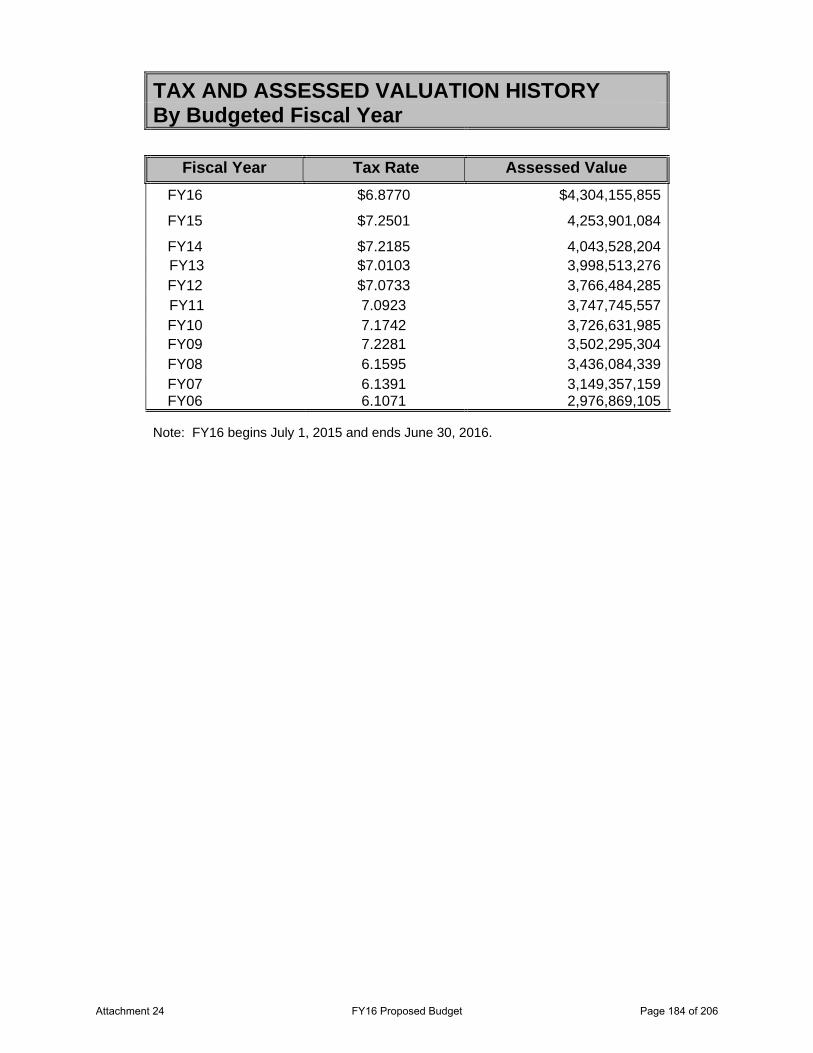
TAX AND ASSESSED VALUATION HISTORY By Budgeted Fiscal Year
Fiscal Year Tax Rate Assessed Value FY16 $6.8770 $4,304,155,855
FY15 $7.2501 4,253,901,084
FY14 $7.2185 4,043,528,204 FY13 $7.0103 3,998,513,276
FY12 $7.0733 3,766,484,285 FY11 7.0923 3,747,745,557
FY10 7.1742 3,726,631,985FY09 7.2281 3,502,295,304 FY08 6.1595 3,436,084,339 FY07 6.1391 3,149,357,159 FY06 6.1071 2,976,869,105
Note: FY16 begins July 1, 2015 and ends June 30, 2016.
Attachment 24 FY16 Proposed Budget Page 184 of 206
City Fund Types
The City of Springfield groups funds into two broad fund categories:
Governmental Funds
Proprietary Funds
Funds are further categorized into six generic fund types:
General Fund Special Revenue Funds Debt Service Funds Capital Project Funds Enterprise Funds and Internal Service Funds
Governmental Fund Category Governmental Funds are those through which most governmental functions of the City are financed and include the
General Fund Special Revenue Funds Debt Service Funds and Capital Project Funds
The financial measurement focus for governmental funds is on the determination of the change in spendable financial resources, rather than upon determination of net income.
General Fund The General Fund serves as the primary reporting vehicle for current government operations. The General Fund, by definition, accounts for all current financial resources not required by law or administrative action to be accounted for in another fund.
General Fund Accounts for the general operations of the City including Library, Police, Fire, Public Works, Municipal Court, Planning, and the General Administrative business support activities.
Special Revenue Funds Special revenue funds account for the proceeds of specific revenue sources (other than major capital projects) that are legally restricted to expenditure for specific purposes.
Building Code Fund Accounts for the cost of building permit and inspection services, through the dedicated revenues generated in providing these services. As a result of Senate Bill 587, revenues from building permit fees are required to be used only for the administration and enforcement of the State Building Code.
Attachment 24 FY16 Proposed Budget Page 185 of 206
Community Development Block Grant Fund (CDBG) Required by federal law to account for receipt and expenditure of Community Development Block Grant funds.
Fire Local Option Levy Fund Accounts for the receipt of the local option levy passed in November, 2002 and effective for FY04 through FY07 to provide funding for enhanced fire services as well as houses the expenditures made for the increased services.
Jail Operations Fund Established in FY08, the fund accounts for revenues and expenditures associated with the operations of the Springfield Jail.
Police Local Option Levy Fund Accounts for the receipt of the local option levy passed in November, 2002 and effective for FY04 through FY07 to provide funding for enhanced police services as well as houses the expenditures made for the increased services.
Riverbend Development Fund Established in FY03, this fund accounts for the revenues received and expenditures made on behalf of the long term project identified as the Riverbend Development Project.
Special Revenue Fund Accounts for receipt of transient room taxes dedicated to the University of Oregon Hayward Field renovation, receipt of telephone tax dedicated to the 911 program and grant activities.
Street Fund Required by state law for receipt and expenditure of state shared gas tax. One percent of gas tax is required to be spent on bicycle facilities.
Transient Room Tax Fund Accounts for the receipt of transient room taxes, hotel and motel, and for expenditures that will enhance tourism.
Debt Service Funds Debt service funds account for the accumulation of resources for, and the payment of, general long–term debt principal and interest.
Bancroft Redemption Fund Accounts for assessment bond debt service payments; supported by property owners’ principal and interest payments assessed in the past.
Bond Sinking Fund Accounts for payments on City debt including general obligation bonds supported by property taxes. Regional Wastewater Debt Service Fund Established in FY08, this fund accounts for revenue bond payments supported by regional wastewater (MWMC) revenues.
Attachment 24 FY16 Proposed Budget Page 186 of 206
Capital Project Funds Capital project funds account for financial resources to be used for the acquisition or construction of major capital facilities (other than those financed by proprietary funds)
Development Assessment Fund Accounts for the cost of local public improvements (supported by assessments to benefiting properties) to construct streets, storm sewers, sidewalks, street lighting, sewers and other public improvement projects.
Development Projects Fund Accounts for the cost to construct streets, facilities and other public improvements; supported by system development charges, grants, contracts, and capital reserves. Projects funded by assessments are excluded from this fund and are accounted for in separate funds.
Drainage Capital Project Fund Accounts for storm sewer (drainage) capital improvement costs supported by drainage system connection fees and by storm sewer user fees through transfers from the Drainage Operating Fund.
G. O. Bond Capital Projects Fund Accounts for the cost of capital projects and improvements financed by general obligation (G.O.) bonds.
Police Building Bond Capital Project Fund To account for costs to construct a new municipal building to house the Police Department, Municipal Court, City Prosecutor and a city jail. Financing will be provided by issuance of debt.
Regional Wastewater Revenue Bond Capital Projects Fund Established in FY08, this fund accounts for regional wastewater (MWMC) capital projects funded by MWMC revenue bond receipts.
Regional Wastewater Capital Fund Accounts for regional sewer capital improvement costs supported by sewer user fees, through transfers from the Regional Wastewater Operation Fund, and proceeds of debt issuance. SDC Local Storm Improvement Fund Established in July, 2005 (FY06), this fund accounts for capacity-increasing public storm drainage improvements supported by system development charges. Financing is provided by charges paid by developers for new construction, as allowed by law.
SDC Local Wastewater Improvement Fund Established in July, 2005 (FY06), this fund accounts for local capacity-increasing public sanitary sewer improvements supported by system development charges. Financing is provided by charges paid by developers for new construction, as allowed by law.
Attachment 24 FY16 Proposed Budget Page 187 of 206
SDC Local Wastewater Reimbursement Fund Established in July, 2005 (FY06), this fund accounts for public sanitary sewer improvements supported by reimbursement system development charges. Financing is provided by charges paid by developers for new construction, as allowed by law.
SDC Regional Wastewater Improvement Fund Established in July, 2005 (FY06), this fund accounts for regional (MWMC) capacity-increasing public sanitary sewer improvements supported by system development charges. Financing is provided by charges paid by developers for new construction, as allowed by law.
SDC Regional Wastewater Reimbursement Fund Established in July, 2005 (FY06), this fund accounts for regional (MWMC) public sanitary sewer improvements supported by reimbursement system development charges. Financing is provided by charges paid by developers for new construction, as allowed by law.
SDC Transportation Improvement Fund Established in July, 2005 (FY06), this fund accounts for local capacity-increasing public transportation improvements supported by system development charges. Financing is provided by charges paid by developers for new construction, as allowed by law.
SDC Transportation Reimbursement Fund Established in July, 2005 (FY06), this fund accounts for public transportation improvements supported by reimbursement system development charges. Financing is provided by charges paid by developers for new construction, as allowed by law.
Sewer Capital Projects Fund Accounts for sewer capital improvement costs supported by sewer connection fees and by sewer user fees through transfers from the Sewer Operating Fund.
Street Capital Fund Established as of July, 2002 (FY03), this fund accounts for transportation capital improvement costs. Costs are supported by transfers from the Street Operating Fund.
Proprietary Fund Category Proprietary Funds are used to account for the City’s ongoing activities which are similar to those often found in the private sector and include
Enterprise Funds and Internal Service Funds
The focus of financial measurement for proprietary funds is on the determination of net income, financial position and changes in financial position.
Attachment 24 FY16 Proposed Budget Page 188 of 206

Enterprise Funds Enterprise funds account for operations that are financed and operated in a manner similar to private business enterprises – where the intent of the governing body is that the costs of providing goods or services to the general public on a continuing basis be financed or recovered primarily through user changes. An enterprise program is managed much like a business in that it is self-supporting in nature.
Ambulance Fund (formerly Emergency Medical Service Fund) Accounts for the cost of emergency medical services, ambulance and medic supported by user fees and subscription memberships in the FireMed Program.
Booth-Kelly Fund Accounts for the cost of the improvements and operating expenses of the Booth-Kelly Center; program supported through grants and revenue generated by the leasing of commercial space to local industry.
Drainage Operating Fund Accounts for operations and maintenance costs of the local public storm drainage system supported by local storm drainage fees.
Regional Fiber Consortium Fund Accounts for the financial affairs of the Regional Fiber Consortium. The Regional Fiber Consortium is an intergovernmental entity which manages the operation costs of the Fiber Consortium; supported by membership dues and franchise fees.
Regional Wastewater Fund Accounts for the financial affairs of the Metropolitan Wastewater Management Commission (MWMC). The MWMC is an intergovernmental entity which manages the construction, operations and maintenance costs of the regional sewer system; supported by grants and regional sewer user fees.
Sewer Operations Fund Accounts for operations and maintenance costs of local sanitary and storm sewer systems supported by local sewer user fees.
Internal Service Funds Internal service funds account for the financing of goods and services provided by one department to another department on a cost-reimbursement basis.
Insurance Fund An internal service fund that accounts for risk management, property/casualty insurance premium, damage claim and employee benefit costs; supported by service charges to departmental operating budgets.
Vehicle and Equipment Fund A sinking fund for the future replacement of vehicles and major equipment; supported by charges to departmental operating budgets.
SDC Administration Fund Established in July, 2005 (FY06), this fund accounts for activities supporting setting methodologies for, calculation, planning and accounting for System Development Charges. Financing is provided by administrative fees charged on SDCs and administrative fees charged to SDC Capital Projects funds.
Attachment 24 FY16 Proposed Budget Page 189 of 206
DESCRIPTION OF FUNDS
A fund is a separate budgeting and accounting entity with balancing appropriations and estimated revenues. All of the City's funds are briefly described below:
Ambulance Fund (615): Accounts for the cost of emergency medical services, ambulance and medic supported by user fees and subscription memberships in the FireMed Program.
Bancroft Redemption Fund (305): Accounts for assessment bond debt service payments; supported by property owners’ principal and interest payments assessed in the past.
Bond Sinking Fund (306): Accounts for payments on City debt including general obligation bonds supported by property taxes.
Booth-Kelly Fund (618): Accounts for the cost of the improvements and operating expenses of the Booth-Kelly Center; program supported through grants and revenue generated by the leasing of commercial space to local industry.
Building Code Fund (224): Accounts for the cost of building permit and inspection services, through the dedicated revenues generated in providing these services. As a result of Senate Bill 587, revenues from building permit fees are required to be used only for the administration and enforcement of the State Building Code.
Community Development Block Grant Fund (CDBG) (210): Required by federal law to account for receipt and expenditure of Community Development Block Grant funds.
Development Assessment Fund (419): Accounts for the cost of local public improvements (supported by assessments to benefiting properties) to construct streets, storm sewers, sidewalks, street lighting, sewers and other public improvement projects.
Development Projects Fund (420): The fund is used to account for costs of constructing and improving city-owned buildings and for infrastructure projects with shared funding. Financing is provided by pre-1991 system development charges, grants, contracts, intergovernmental revenues and other non-recurring revenues.
Drainage Capital Projects Fund (425): Accounts for storm sewer (drainage) capital improvement costs supported by stormsewer connection fees and by storm sewer user fees through transfers from the Drainage Operating Fund.
Attachment 24 FY16 Proposed Budget Page 190 of 206
Drainage Operating Fund (617): Accounts for operations and maintenance costs of local stormsewer (drainage) systems supported by stormsewer user fees.
Fire and Life Safety Local Option Levy Fund (235): Accounts for the receipt of the local option levy passed in November, 2002 and effective for FY04 through FY07 to provide funding for enhanced fire services as well as houses the expenditures made for the increased services.
General Fund (100): Accounts for the general operations of the City including Library, Police, Fire, Public Works, Municipal Court, Planning, Building and General Administrative business support activities.
G.O. Bond Capital Projects Fund (427): Accounts for the cost of capital projects and improvements financed by general obligation (G.O.) bonds. A $12.7 million general obligation bond measure was passed by the voters on November 7, 1995.
Insurance Fund (707): An internal service fund that accounts for risk management, property/casualty insurance premium, damage claim and employee benefit costs; supported by service charges to departmental operating budgets.
Jail Operations Fund (202): Established in FY08, this fund accounts for revenues and expenditures associated with the operations of the Springfield Jail.
Police Building Bond Capital Project Fund (428): The fund is used to account for costs of constructing a Justice Center. Financing consists of bond proceeds.
Police Local Option Levy Fund (236): Accounts for the receipt of the local option levy passed in November, 2002 and effective for FY04 through FY07 to provide funding for enhanced police services as well as houses the expenditures made for the increased services.
Regional Fiber Consortium Fund (629): Accounts for the financial affairs of the Regional Fiber Consortium. The Regional Fiber Consortium is an intergovernmental entity which manages the operation costs of the Fiber Consortium; supported by membership dues and franchise fees.
Regional Wastewater Fund (612): Accounts for the financial affairs of the Metropolitan Wastewater Management Commission (MWMC). The MWMC is an intergovernmental entity which manages the construction, operations and maintenance costs of the regional sanitary sewer system; supported by grants and regional sanitary sewer user fees.
Attachment 24 FY16 Proposed Budget Page 191 of 206
Regional Wastewater Capital Fund (433): Accounts for regional sanitary sewer capital improvement costs supported by sewer user fees, other user fees, reimbursement system development charges (SDCs) and County Service District contributions through transfers from the Regional Wastewater Operation Fund.
Regional Wastewater Debt Service Fund (312): Established in FY08, the fund accounts for revenue bond payments supported by regional wastewater (MWMC) revenues.
Regional Wastewater Revenue Bond Capital Projects Fund (412):
Established in FY08, this fund accounts for regional wastewater (MWMC) capital projects funded by MWMC revenue bond receipts.
SDC Administration Fund (719): An internal service fund that accounts for activities supporting setting methodologies for, calculating, planning, and accounting for System Development Charges. Financing is provided by administrative fees charged on SDCs and administrative fees charged to SDC Capital Projects funds.
SDC Local Storm Improvement Fund (440): Established in July, 2005 (FY06), this fund accounts for capacity-increasing public storm drainage improvements supported by system development charges. Financing is provided by charges paid by developers for new construction, as allowed by law.
SDC Storm Drainage Reimbursement Fund (441): Established in July, 2009 (FY10), this fund accounts for public storm drainage improvements supported by reimbursement system development charges. Financing is provided by charges paid by developers for new construction, as allowed by law.
SDC Local Wastewater Reimbursement Fund (442): Established in July, 2005 (FY06), this fund accounts for public sanitary sewer improvements supported by reimbursement system development charges. Financing is provided by charges paid by developers for new construction, as allowed by law.
SDC Local Wastewater Improvement Fund (443): Established in July, 2005 (FY06), this fund accounts for local capacity-increasing public sanitary sewer improvements supported by system development charges. Financing is provided by charges paid by developers for new construction, as allowed by law.
SDC Regional Wastewater Reimbursement Fund (444): Established in July, 2005 (FY06), this fund accounts for regional (MWMC) public sanitary sewer improvements supported by reimbursement system development charges. Financing is provided by charges paid by developers for new construction, as allowed by law.
SDC Regional Wastewater Improvement Fund (445): Established in July, 2005 (FY06), this fund accounts for regional (MWMC) capacity-increasing public sanitary sewer improvements supported by system development charges. Financing is provided by charges paid by developers for new construction, as allowed by law.
Attachment 24 FY16 Proposed Budget Page 192 of 206
SDC Transportation Reimbursement Fund (446): Established in July, 2005 (FY06), this fund accounts for public transportation improvements supported by reimbursement system development charges. Financing is provided by charges paid by developers for new construction, as allowed by law.
SDC Transportation Improvement Fund (447): Established in July, 2005 (FY06), this fund accounts for local capacity-increasing public transportation improvements supported by system development charges. Financing is provided by charges paid by developers for new construction, as allowed by law.
Sewer Capital Projects Fund (409): Accounts for sanitary sewer capital improvement costs supported by sanitary sewer connection fees and by sanitary sewer user fees through transfers from the Sewer Operations Fund.
Sewer Operations Fund (611): Accounts for operations and maintenance costs of local sanitary sewer systems supported by local sewer user fees.
Special Revenue Fund (204): Accounts for receipt of transient room taxes dedicated to the University of Oregon Hayward Field renovation, receipt of telephone tax dedicated to the 911 program and Development Services Department's grants.
Street Fund (201): Required by state law for receipt and expenditure of state shared gas tax. One percent of gas tax is required to be spent on bicycle facilities. Street Capital Fund (434): Accounts for transportation capital improvement costs. Costs are supported by transfers from the Street Operating Fund.
Transient Room Tax Fund (208): Accounts for the receipt of transient room taxes, hotel and motel, and for expenditures that will enhance tourism.
Vehicle and Equipment Fund (713): A sinking fund for the future replacement of vehicles and major equipment; supported by charges to departmental operating budgets.
Attachment 24 FY16 Proposed Budget Page 193 of 206
DESCRIPTIONS OF BUDGET TERMS
Ad Valorem Tax A tax based on the assessed value of a property. Adopted Budget Financial plan which forms the basis and limits for appropriations and is adopted by the City
Council. Appropriation Legal authorization granted by the City Council for spending a specific amount of money for
a specific purpose during a specific period of time. Assessed Valuation (AV) The value set on taxable property as a basis for levying property taxes. Assessment Any fee, charge or assessment that does not exceed the actual cost incurred by a unit of
government for design, construction, and financing of local improvements such as street paving, sidewalks, and sewers.
Assets Resources having a monetary value and that are owned or held by an entity. Beginning Cash Balance Includes unexpended resources from the previous years. A portion of these resources will
appear in the Reserve balances of City funds. Reserves are dedicated and non- dedicated. The non dedicated reserves portion is the amount available to fund City operations. For the General Fund and in some of the Special Revenue funds, reserves must fund operations until the first receipt of taxes, which may be as late as six months into the fiscal year.
Bond or Bond Issue A certificate of debt guaranteeing payment of the original investment plus interest on specific
dates. Budget Committee Fiscal planning board of the City consisting of City Council members plus an equal number
of lay members appointed by the Council. Budget Document A written report showing a government’s comprehensive financial plan for a specified period,
usually one year, which includes both the capital and operating budgets. Budget Message Written explanation of the budget and the City's financial priorities for the next fiscal year;
prepared by the City Manager
Attachment 24 FY16 Proposed Budget Page 194 of 206
Budget Officer Person appointed by the City Council to assemble the budget; for the City of Springfield the
City Manager serves in this role. Budget Review Team Team consisting of the City Manager, Assistant City Manager, Finance Director and the
Budget Manager. Capital Budget The City's budget for projects, major repairs, and improvements or additions to the City's
fixed assets (streets, sidewalks, traffic signals, sewers, drainage and buildings.) Capital Improvement A term defined in ORS 310.410(10) to include land, structures, facilities, machinery,
equipment, or furnishings having a useful life longer than one year. Capital Improvement Program (CIP) A major budgeting and planning tool through which needed capital projects are identified,
evaluated, priced and discussed with the general public and the Budget Committee. Capital Outlay City policy requires the use of capital outlay for capital items with a cost of $5,000 or more.
It also allows, but does not require, the use of capital outlay for capital items which cost less than $5,000.
Capital Projects Major repairs, improvements or additions to the City's fixed assets, including rental property.
(Streets, sidewalks, traffic signals, sewers, drainage and buildings, etc.) Cash Basis A basis of accounting under which transactions are recognized only when cash changes
hands. Cash Carryover Cash that is remaining after subtracting prior year’s actual expenditures from prior year’s
total resources. Cash carryover is classified as revenue. Referred to as Beginning Cash Balance.
Charges for Service Includes a wide variety of fees charged for services provided to the public and other
agencies. Comprehensive Annual Financial Report (CAFR) The annual audited results of the City’s financial position and activity. Contingency A special appropriation set aside for unforeseen and unplanned expenses. Contingencies
may not be spent without approval by resolution of the City Council.
Attachment 24 FY16 Proposed Budget Page 195 of 206
Debt Service The payment of general long-term debt, consisting of principal and interest. Electors A qualified voter who has the right to vote for the adoption of any measure.
Encumbrance A contractual commitment for which the payment is contingent upon the future delivery of
specified goods or services. Encumbrance Cash Balance A cash carryover which is used as a resource to provide funds for prior year items which are
re-budgeted in the new fiscal year. Ending Working Capital Funds which allow the City to meet current cash flow requirements, shortfalls in revenue, or
unexpected demands until tax revenue are available. Enterprise Funds Funds that are usually self-supporting and are operated and financed in a manner that is
similar to private business enterprises. Enterprise funds are usually financed through some type of user charges.
Executive Team The team consisting of the department executive directors, the Assistant City Manager and
the City Manager. Fines and Forfeitures Revenue Includes fines charged for traffic citations, library fines and fines for City Code violations. Fiscal Year Twelve month period from July 1 to June 30 of the following year. Fixed Assets Assets with a long-term character such as land, buildings, streets and major equipment. Full time Equivalent (FTE) A full-time position is one that is 40 hours per week for the entire fiscal year and is
designated as 1.0 FTE. Fund A budgetary and accounting entity with balancing revenues and appropriations. Fund Balance The difference between a fund’s resources and its requirements. In budget years, the
resources must equal requirements. In actual years, the difference between resources and requirements is the fund balance’s Ending Working Capital.
Attachment 24 FY16 Proposed Budget Page 196 of 206
Generally Accepted Accounting Procedures (GAAP) Standards established by the American Institute of Certified Public Accountants for the
conduct and reporting of financial audits. General Government Tax Rate A category of tax rate defined by State of Oregon Ballot Measure 5. It includes revenues
raised to fund general government operations, such as cities, counties and special districts. The total rate of tax for all entities on this category is limited to $10 per $1,000 of real market value.
General Obligation Bonds Form of debt that is backed by the taxing power of the City of Springfield. General
obligation bonds are issued to provide the capital needed to build structures and improvements that will be used by the entire community.
Governing Body City Council, board of trustees, board of directors, or other governing board of a local
government. HOME A grant supported program with the purpose of developing viable urban communities by
providing decent, safe and affordable housing for persons of low income. Impact Fees Fees charged to developers to cover, in whole or in part, the anticipated cost of
improvements that will be necessary as a result of the development (e.g., parks or sidewalks). See also System Development Charges.
Infrastructure Public domain fixed assets such as roads, bridges, streets and sidewalks and similar assets
that are immovable and of value only to the government unit. Indirect Charges Administrative costs that are incurred in the General Fund to support the operations of other
funds. These charges are shown as a reimbursement revenue to the General Fund and an expense in all other funds.
Interfund Transfers Appropriation category used in the City's budget resolution which includes amounts
distributed from one fund to pay for services provided by another fund. Transfers from the other funds appear as non departmental expenditures called “Interfund Transfers”.
Intergovernmental Revenue Includes grants from federal, state and local governments as well as state cigarette and
liquor taxes. Issue Papers Summary of departments requests for funding of services that are in addition to those
services that have historically been funded through the base budget.
Attachment 24 FY16 Proposed Budget Page 197 of 206
Levy Gross amount of property taxes imposed on taxable property. The net amount received by
a government will be less than the gross levy as a result of delinquent or uncollectable payments or early payment discounts. Budgets are developed on the basis of the projected amount of property taxes receivable.
Licenses and Permits Revenue Includes revenues collected per City ordinance and state law including the collection of fees
and franchises. Line Item Budget The traditional form of budget, where proposed appropriations are based on individual
objects of expense within a department or division. Long Range Financial Projections A multi-year financial projection of revenues and expenditures for the General Fund that is
an integral part of the City of Springfield’s strategic planning and budget process. These projections enable the Council, Budget Committee and the City staff to evaluate the impact of service level changes, as well as to anticipate the effects of revenue and expenditure trends.
Limited Tax General Obligation Bond A bond that is secured by the pledge of a government’s taxing authority that is limited as to
the rate or amount. Local Budget Law Oregon Revised Statutes (ORS) dictates local budgeting practices. ORS Chapter 294
contains Local Budget Law provisions. Local Option Levy Under Measure 50, local governments and special districts were given the ability to ask
voters for temporary authority to increase taxes through approval of a local option levy. The maximum length of time for a local option levy is 10 years, depending on the purpose of the levy. A local option levy must be approved by a majority of voters at a general election occurring in an even-numbered year, or at any election with at least a 50 % voter turnout.
Materials and Services An object classification which includes contractual and other services, consumable materials
and supplies, and other operating costs. Measure 5 On November 6, 1990, voters of Oregon passed Measure 5, a property tax limitation. Under
M5, the combined property tax rate was split into a portion for schools and one for general governments (cities, counties, special districts). The combined rate limit for schools is $5 per $1,000 of real market value and the rate for general governments is $10 per $1,000 of real market value. These rates are not comparable to the tax rates under Measure 50 because those tax rates are applied to a lower assessed value. See Assessed Valuation.
Attachment 24 FY16 Proposed Budget Page 198 of 206
Measure 50 On May 20, 1997, the voters of Oregon passed Measure 50, which fundamentally changed
the Oregon property tax system. Under M50, each jurisdiction was assigned a permanent tax rate limit. In addition the assessed value of each property was reduced in Fiscal Year 1998 and future increases in assessed value were capped. See Assessed Valuation and Permanent Tax Rate.
Millage An increment of taxation measured in units of one-tenth of one cent or 0.001 of one dollar.
Millage is the rate used in calculating taxes based upon the value of property, expressed in mills per dollar of assessed value.
Miscellaneous Receipts Includes the total revenue from assessments. Miscellaneous Revenue Includes a variety of miscellaneous revenues received by the City, the most significant being
Special Assessments. In the budget document, miscellaneous revenues are more detailed in the “Combined Statement of Revenues, Expenditures and Changes in Fund Balance Statement”. (See Financial Summaries and Statistics section of this document.)
Modified Accrual Basis of accounting in which expenditures, other than accrued interest on general long-term
debt, are recorded at the time liabilities are incurred and revenues are recorded when received, except for material and/or available revenues that should be accrued to reflect taxes levied or revenue earned.
Non-Department Budget The part of the budget summarizing expenditures or reductions to reserve accounts that are
not associated with, nor under the authority of, a department budget, including interfund transfers, reserves, contingency, unappropriated fund balance , debt service payments, miscellaneous fiscal transactions, and statutory payments. See Non Department Expenditure.
Non-Department Expenditure Non department identified expenditures of a fund that are not associated with, nor under the
authority of, a department budget, including debt service, interfund transfers, contingency, reserves, balance available and unappropriated fund balance.
Non-Operating Budget Part of the budget composed of the Insurance Fund and fiscal transactions (interfund
transfers, reserves, contingency, unappropriated fund balance, insurance premiums and debt service payments.)
Objective The course of action to obtain a stated goal.
Attachment 24 FY16 Proposed Budget Page 199 of 206
Operating Budget The day to day departmental and program operating costs of the City. Includes
expenditures for personal services, materials and services and capital outlay only. Overlapping Tax Rate The tax rate paid to several governments, such as a city, county and school district. Permanent Tax Rate Under Measure 50, each school district, local government and special district was assigned
a permanent tax rate limit in FY98. This permanent tax rate applies to property taxes for operations. The City of Springfield’s permanent tax rate is $4.7403 per $1,000 of assessed value.
Personal Services Object classification for costs of employees, including salary, overtime, taxes and benefits. Property Tax A tax assessed equally against the assessed value of all taxable property within a
government’s boundaries. The first receipt of property taxes usually occurs in November or December of each year.
Proposed Budget A financial and operating program prepared by the City Manager and submitted to the public
and the Budget Committee for review. Real Market Value The real market value of a property was defined under Measure 50 to be the amount of cash
that could reasonably be expected to be paid by an informed buyer to an informed seller, each acting without compulsion in an arm’s length transaction occurring as of the assessment date for the tax year.
Reserves An accumulation of funds for a specific future purpose. Reserves may only be spent by
resolution of the City Council. Resolution A special or temporary order of a legislative body requiring City Council action. Revenue Funds received by the City from either tax or non-tax sources. Special Assessment Charges imposed against property in a particular locality because that property receives a
special benefit by virtue of some public improvement, separate and apart from the general benefit accruing to the public at large. Special assessments must be apportioned according to the value of the benefit received, rather than the cost of improvement and may not exceed the value of such benefit.
Attachment 24 FY16 Proposed Budget Page 200 of 206
Special Assessment Bond A bond issue payable from the payments on special assessments imposed against
properties that have been specially benefited by the construction of public improvements, such as sidewalks or sewer systems.
Supplemental Budget Appropriations established to meet needs not anticipated at the time the budget was
originally adopted. A supplemental budget may not increase the tax levy. System Development Charge (SDC) Designed to finance the construction, extension, or enlargement of a park, street, storm
sewer or sewerage or disposal system. SDC’s are imposed by a governmental unit as a condition to issuance of any occupancy permit or imposed by a governmental unit at such other time as, by ordinance, it may determine.
Tax Compulsory charges levied by a government for the purpose of raising revenue. Taxes are
used to pay for services or improvements provided for the general public benefit. Tax Levy The total amount of property taxes needed to pay for General Fund operations and for
principal and interest on bonds. Tax Rate The amount of tax stated in terms of a unit of the tax base, for example $6.00 per $1,000 of
assessed value of taxable property. Tax Revenue Includes property taxes, local fuel taxes, 911 taxes, and hotel and motel room taxes. Tax Roll The official list showing the amount of taxes levied against each property. The Lane County
Department of Assessment and Taxation compiles and maintains the tax roll for the City of Springfield.
Unappropriated Balance An amount set aside as cash working capital for the next year's budget. Funds designated
as unappropriated may not be spent within the current year. Use of Money and Property Revenue Includes a variety of revenues including interest on the City’s investments and assessments. User Fees Charges or fees established to recover part or all of the costs incurred in the provision of
services by a government; based on the philosophy that the recipient of the benefit should pay for the services. Also called charges for service.
Attachment 24 FY16 Proposed Budget Page 201 of 206
BUDGET ACRONYMS AND ABBREVIATIONS
ACWA Association of Clean Water Agencies
ADA Americans with Disabilities Act
ADMIN Administration
AIRS Area Information Records System
A/R Accounts Receivable
AV Assessed Value
BAN Bond Anticipation Note
BLM Bureau of Land Management
BPA Bonneville Power Administration
CAFR
Comprehensive Annual Financial Report
CDAC Community Development Advisory Committee
CDBG Community Development Block Grant
CDC Community Development Corporation
CIP Capital Improvement Program
CMO City Manager's Office
CPI Consumer Price Index
DARE Drug Abuse Resistance Education
DLCD Department of Land Conservation and Development
DP Data Processing
DPW Development & Public Works Department
DUII Driving Under the Influence of Intoxicants
ED Economic Development
EEO Equal Employment Opportunity
Attachment 24 FY16 Proposed Budget Page 202 of 206
EMS Emergency Medical Services
EMT Emergency Medical Technician
EPA Environmental Protection Agency
EWEB Eugene Water and Electric Board
FIREMED Ambulance Membership Program
FLS Fire and Life Safety
FMLA Family and Medical Leave Act
FRS Federal Revenue Sharing
FTE Full-Time Equivalent Employee
FY Fiscal Year
GAAP
Generally Accepted Accounting Principals
GFOA Government Finance Officers Association
GRAC Glenwood Redevelopment Advisory Committee
HAZ-MAT Hazardous Materials
HOME Home Investment Partnership Program
HR Human Resources Department
HUD Housing and Urban Development
ICMA International City Managers Association
I/I Inflow and Infiltration
IT Information Technology Department
JR / YA Junior / Young Adult
LAN Local Area Network
LCC Lane Community College
LCDC Land Conservation and Development Commission
Attachment 24 FY16 Proposed Budget Page 203 of 206
LCJ Lane County Jail
LCOG Lane Council of Governments
LOC League of Oregon Cities
LRAPA Lane Regional Air Pollution AuthorityM5
Measure 5 – Tax Limitation Measure
M50
Measure 50 – Tax Limitation Measure
MGMT Management
M&S Materials and Services
MWMC Metropolitan Wastewater Management Commission
NLC National League of Cities
OCLC On-line Computer Library Center
ODOT Oregon Department of Transportation
O&M Operations and Maintenance
ORS Oregon Revised Statutes
OSPWF Oregon Special Public Works Fund
OTIA Oregon Transportation Improvement Act
PS Personal Services
P / T Part-time position
SCUSA Springfield Comprehensive Urbanization Study and Annexation
SDC System Development Charges
SEDA Springfield Economic Development Agency
SHOP
Springfield Home Ownership Program
SHPO State Historic Preservation Office
SOPP Standard Operating Procedure Policy
Attachment 24 FY16 Proposed Budget Page 204 of 206
SRF State Revolving Fund
SUB Springfield Utility Board
TCV True Cash Value
TDD Telecommunications Device for the Deaf
UB or UEFB Unappropriated Balance / Unappropriated Ending Fund Balance
Attachment 24 FY16 Proposed Budget Page 205 of 206

Attachment 24 FY16 Proposed Budget Page 206 of 206


