Embed Size (px)
Citation preview
brainsciences
Article
Citation Classics in Consumer Neuroscience, Neuromarketingand Neuroaesthetics: Identification and Conceptual Analysis
Pablo Sánchez-Núñez 1,2,3,* , Manuel J. Cobo 4 , Gustavo Vaccaro 2,3,5 , José Ignacio Peláez 2,3,5 andEnrique Herrera-Viedma 6
�����������������
Citation: Sánchez-Núñez, P.;
Cobo, M.J.; Vaccaro, G.; Peláez, J.I.;
Herrera-Viedma, E. Citation Classics
in Consumer Neuroscience,
Neuromarketing and Neuroaesthetics:
Identification and Conceptual
Analysis. Brain Sci. 2021, 11, 548.
https://doi.org/10.3390/brainsci
11050548
Academic Editors: Tomás Ortiz and
Luigi De Gennaro
Received: 12 February 2021
Accepted: 23 April 2021
Published: 27 April 2021
Publisher’s Note: MDPI stays neutral
with regard to jurisdictional claims in
published maps and institutional affil-
iations.
Copyright: © 2021 by the authors.
Licensee MDPI, Basel, Switzerland.
This article is an open access article
distributed under the terms and
conditions of the Creative Commons
Attribution (CC BY) license (https://
creativecommons.org/licenses/by/
4.0/).
1 Joint-PhD Programme in Communication, Department of Audiovisual Communication and Advertising,Faculty of Communication Sciences, Universidad de Málaga, 29071 Málaga, Spain
2 Center for Applied Social Research (CISA), Universidad de Málaga, 29071 Málaga, Spain;[email protected] (G.V.); [email protected] (J.I.P.)
3 Instituto de Investigación Biomédica de Málaga (IBIMA), 29010 Málaga, Spain4 Department of Computer Science and Engineering, School of Engineering, Universidad de Cádiz,
11202 Cádiz, Spain; [email protected] Department of Languages and Computer Science, Higher Technical School of Computer Engineering,
Universidad de Málaga, 29071 Málaga, Spain6 Andalusian Research Institute on Data Science and Computational Intelligence, Department of Computer
Science and AI, University of Granada, 18071 Granada, Spain; [email protected]* Correspondence: [email protected]
Abstract: Neuromarketing, consumer neuroscience and neuroaesthetics are a broad research area ofneuroscience with an extensive background in scientific publications. Thus, the present study aims toidentify the highly cited papers (HCPs) in this research field, to deliver a summary of the academicwork produced during the last decade in this area, and to show patterns, features, and trends thatdefine the past, present, and future of this specific area of knowledge. The HCPs show a perspectiveof those documents that, historically, have attracted great interest from a research community and thatcould be considered as the basis of the research field. In this study, we retrieved 907 documents andanalyzed, through H-Classics methodology, 50 HCPs identified in the Web of Science (WoS) duringthe period 2010–2019. The H-Classic approach offers an objective method to identify core knowledgein neuroscience disciplines such as neuromarketing, consumer neuroscience, and neuroaesthetics. Toaccomplish this study, we used Bibliometrix R Package and SciMAT software. This analysis providesresults that give us a useful insight into the development of this field of research, revealing thosescientific actors who have made the greatest contribution to its development: authors, institutions,sources, countries as well as documents and references.
Keywords: Bibliometrix; consumer behaviour; consumer psychology; consumer neuroscience;H-index; highly cited papers (HCPs); scientometrics; science mapping analysis; SciMAT
1. Introduction
Consumer neuroscience, neuromarketing, and neuroaesthetics are three subfields ofneuroscience, and play a key role in the design’s products, experiences, or services sincethey are concerned with how our brain perceives, process and reacts to the various stimulipresented in our environment [1–4].
Consumer neuroscience is the discipline that investigates the neural correlates ofconsumer decisions with a clear focus on progress in basic scientific understanding of thebrain [5], whereas neuromarketing is the discipline that tries to use the methodologies andinsights from consumer neuroscience in applied research and business applications [6], andneuroaesthetics, which the main goal is to characterize the neurobiological foundationsand evolutionary history of the cognitive and affective processes involved in aestheticexperiences and artistic and creative activities as well as to recognize which are the subjec-tive ratings and universal standard and patterns of beauty [7,8], by using all the power of
Brain Sci. 2021, 11, 548. https://doi.org/10.3390/brainsci11050548 https://www.mdpi.com/journal/brainsci
Brain Sci. 2021, 11, 548 2 of 23
functional magnetic resonances (fMRI), electroencephalography (EEG), pupillometry oreye-tracking techniques, among others to analyze what happens in our brain during thecontemplation of beauty and ugliness [9].
Previous research has demonstrated how consumer neuroscience, neuromarketingand neuroaesthetics are fundamental when it comes to determining new commercialviewpoints, analyzing the consumer in a non-intrusive way without asking questions ormarket research, refining the user experience, reinforcing the brand image, or craftinga marketing message that attracts quality leads and improves conversion rates, amongothers [10,11]. Furthermore, from the entrepreneur’s point of view, consumer neuroscience,neuromarketing and neuroaesthetics improve risk reduction, since experiences, products,and services are designed and developed according to the tastes of individuals. Theobjectives of these neuroscientific techniques are, precisely, to know how the nervoussystem translates the high number of stimuli to people exposed in different contexts, aswell as to understand the consumer’s attitudes and motivations so that helps to anticipateand select the advertising and marketing strategy that causes the greatest emotional impacton individuals [12–14]. Some of the recent studies in these subfields of neuroscience havenot been without controversy regarding the relationship between consumer neuroscience,neuromarketing and neuroaesthetics. More specifically, in the field of neuroaesthetics,some different currents or detractors advocate a separation between empirical aestheticsand neuroaesthetics or demand a formal definition of what is one and what is the other [15].However, their view is not necessarily widely shared by the research community, and that,though there may be good arguments to merge consumer neuroscience, neuromarketingand neuroaesthetics, the fields currently are separated.
Within this context, synthesizing the results of recent and relevant research becomes acritical duty to advance in a specific research line. Through H-Classics methodology [16],we can summarize the scientific production in a knowledge domain like consumer neuro-science, neuromarketing and neuroaesthetics. The H-Classics methodology [16] is basedon the study of “citation classic”, also called “literacy classic” or “classic article” [17].The H-Classics is an extension of the H-Index metric that is often used to quantify anindividual’s research output [18]. Some authors have established a criteria threshold inthe number of articles designated, limiting the list to the 50 [19] or 100 [20] most citedones, or restricting the selection to those articles that have been cited at least 400 times [21].Nevertheless, Martinez et al. [22] proposed that the selection of classic articles should bebased on two parameters:
- The computing of the H-Index [18]. Burrell points out that the H-Index identifies themost productive core of an author’s output in terms of the most cited papers [23].
- The computing of the H-Core, also called Hirsch Core. For this core, consisting of thefirst h papers, Rousseau [24] introduced the term H-core, which can be considered asa group of high-performance publications concerning the scientist’s career [23,25].
The study of classic articles is crucial because they attract the interest of the scientificcommunity and are therefore considered the “gold bars of science” [26,27] and permitsanalysis of the past, present, and future of a specific area of knowledge. The advantages ofH-Classics are that, through a structured process, we can review the research work with thehighest impact in a systematic, transparent, and reproducible way [16,28–30]. H-Classicsmethod comprises the collection in a single process of the number of papers available ineach field and their impact. It is also simple to compute and sensitive to alterations amongareas in the impact of papers [16]. Due to such virtues, several studies focused on highlycited papers (HCPs) and citation classics have been published in different disciplines.Highly cited papers are papers that perform in the top 1% based on the number of citationsreceived when compared to other papers published in the same field in the same year.Some outstanding examples are H-Classics studies in rheumatology [30], biology [31],intelligent transportation systems [32], social work [33], implant dentistry, periodontics,and oral surgery [29], aggregation operators in group decision making [34], or fuzzydecision making [28], and the rest.
Brain Sci. 2021, 11, 548 3 of 23
To the best of our knowledge, there is no study covering the recent research aboutconsumer neuroscience, neuromarketing and neuroaesthetics. The HCP of the consumerneuroscience, neuromarketing and neuroaesthetics research field has not been analyzedand explored yet from a Citation Classics scientometric perspective.
According to the aim stated above, some aspects can be analyzed by identifying theset of HCP: (I) the HCP distribution during the period studied; (II) the most productivejournals, authors, institutions and countries; and, (III) the main topics covered by thepapers detected.
Due to this high social importance, the present study aims at identifying the HighlyCited Papers (HCP) in consumer neuroscience, neuromarketing and neuroaesthetics dis-ciplines, to deliver a summary of the academic work during the last decade in this areaand to show tendencies, practices, methods, and findings that could be the basis for futureadvances in the discipline.
This study aims to answer the following research questions:
â RQ1. What are the leaders and knowledge hubs (most relevant authors, affiliations,countries, and sources) in consumer neuroscience, neuromarketing and neuroaesthetics?
â RQ2. What are the disruptive documents and sources (most relevant cited papers,references, and sources) in consumer neuroscience, neuromarketing and neuroaesthetics?
â RQ3. What is the conceptual structure (motor themes, and emerging or decliningthemes) in scientific publications about consumer neuroscience, neuromarketingand neuroaesthetics?
To do so, the paper is set out as follows: Section 2, defines the materials, methods, andthe approach used in the analysis, Section 3 presents the results of our analysis, and, finally,Section 4 concludes with the discussion, conclusion, and upcoming investigation approaches.
2. Materials and Methods2.1. Bibliographic Database and Data Acquisition
The H-Classics analysis was realized based on academic publications related to con-sumer neuroscience, neuromarketing, and neuroaesthetics. The source of information wasthe Web of Science (WoS) database.
The WoS database (Clarivate Analytics, Philadelphia, PA, USA), was founded byEugene Garfield, one of the precursors of informetrics. The WoS is a collection of databasesof bibliographic references and citations from periodicals that collect information from1900 to the present. The choice of the WoS as the data source was made based on two maincharacteristics of the database: it provides numerous analysis tools for processing the dataand it offers highly accurate and reliable research information [30,33].
In this research, we gathered 907 scientific documents ranging from 2010 to 2019.907 results were checked for applicability in the present work. Authors considered
the period 2010–2019 the one that covers the most recent academic production in thisresearch area by, establishing the last decade as a timespan, to analyze the most recent andinnovative innovations and discoveries in consumer neuroscience, neuromarketing andneuroaesthetics. The specific search equation was formulated according to the search logicof the WoS database. The terms selected for the search equation were keywords related toconsumer behaviour and neuroscience (neuromarketing, neuroaesthetics, and consumerneuroscience). Choosing all document types and scientific work written in any language.Table 1 illustrates the query design. The retrieved WoS dataset and the citation report areavailable at the Zenodo repository [35].
Brain Sci. 2021, 11, 548 4 of 23
Table 1. Querying from Clarivate Analytics WoS.
Indexes Timespan Search Results Search Date
Web of ScienceCore Collection:
SCI-EXPANDED, SSCI, A&HCI, CPCI-S,CPCI-SSH, BKCI-S, BKCI-SSH, ESCI,
CCR-EXPANDED, IC.
2010–2019
TS = (“Neuromarketing” OR “ConsumerNeuroscience” OR (“Neuroscience” AND
(“Marketing” OR “Advert*”)) OR(“Neuroaesthetics” OR “Neuroesthetics”))
907 22 October 2020
2.2. H-Classics Methodology
According to Martinez et al. [16], there are four key phases to follow for carrying outthe identification procedure of HCPs of a research area applying the H-Classics concept:
(1) Bibliographic database and source of information selection to retrieve the studysample. Some commonly used examples are the PubMed database, Google Scholardatabase, Scopus database, or WoS database. For the reasons explained above, thedatabase chosen in this study is the WoS.
(2) Delimit the WoS research area. Due to the interdisciplinary nature of the study subject,this discipline focuses on many sub-areas/categories in WoS (such as COMMUNI-CATION, HEALTH SCIENCES, MARKETING, BUSINESS, MANAGEMENT, NEU-ROSCIENCE, NEUROIMAGING, SOCIAL SCIENCES, etc.). Due to this, the subjectcategory has not been delimited in WoS, as it could produce a skewed and incompleteresult. To properly delimit the research area, in this study we have elaborated thequery that is presented in Table 1.
(3) Computing the H-Index. The computation of the H-Index of the document retrievalis completed by establishing a ranking of the papers according to their citations in theresearch area. The WoS database provides us with filtering tools (Citation Report) toeasily compute the H-Index of the study topic.
(4) Computing the H-Core. The H-Core and consequently the HCPs in this field ofresearch were retrieved through the automatic function provided by Web of Science,called “Create Citation Report”. The tool provides the H-Index of the HCPs, knownas H-Core.
Following the example:If we have retrieved N articles and their respective citations subject to scientific
category of A, we could also calculate the H-Index of category A as we calculate theH-index of a researcher [16] i.e.,
A paper P of scientific category A is considered an H-Classic of A if and only if P is insideof the H-core of A.
In such a way,
H-Classics of a research area A could be defined as the H-core of A that is composed of theH highly cited papers with more than H citations received.
2.3. Citation Report and Record Count
Table 2 shows the Citation Report and the Record Count resulting from the WoSquerying. The total publications gathered (907), combined a sum of 9931 times cited andproduced an average of 10.95 citations per paper. The H-Index is the same as 50, whichmeans that 50 studies have received at least 50 citations. Consequently, the H-Classicsselection (50 H-Index documents) is the study sample of this work.
2.4. Scientometric and Science Mapping Analysis Tools
To perform the H-Classics Analysis, we have used the following scientometric andscience mapping analysis tools:
• Bibliometrix version 3.0.2, designed by Aria and Cuccurullo [36], is an open-sourcetool, developed in R. It is designed for informetrics research including all the main
Brain Sci. 2021, 11, 548 5 of 23
bibliometric methods of analysis (co-citation, coupling, and scientific collaborationanalysis). The package allows importing bibliographic data from the main scientificdatabases such as Scopus, WoS, PubMed, or Cochrane, among others. Bibliometrix hasbeen frequently used by researchers in various fields of knowledge such as educationaltechnology research [37], Big Data and Social Media [19], or infectious diseases [20],along with others. We used Bibliometrix to perform the annual production of H-Classics, the percentage of citations of papers as well as to detect the most relevantauthors, documents, affiliations, and countries.
• SciMAT version 1.1.04, developed by Cobo, López-Herrera, and Herrera-Viedma [21,22],is an open-source science mapping software tool that incorporates methods, algorithms,and measures for all the steps in science mapping workflow, from preprocessing to thevisualization of the results. SciMAT has been recently used by several researchers infields of knowledge such as library and information science [38], scientometrics andCOVID-19 (or coronavirus or SARS-CoV-2) research [39] or artificial intelligence andmachine learning [40]. We used SciMAT to study the incoming and outgoing keywords,the conceptual structure of science and key themes over time as well as the identificationof developing or decreasing topics.
Table 2. Citation Report and Record Count.
Citation Report Record Count
Results found 907Sum of the Times Cited 9931
Average Citations per Item 10.95H-Index 50
3. Results3.1. Main Information about the Collection
Table 3 presents the summarized main results of the H-Classics analysis. The tabledisplays key information about the bibliographic data retrieved and several sub-tables,such as annual scientific production, top manuscripts per number of citations, most produc-tive authors, most productive countries, total citation per country, most relevant sources(journals), and most relevant keywords.
Additionally, various diverse co-authorship indices are exposed. In specific, theAuthors per Article index is calculated as the ratio between the total number of authorsand the total number of articles. The Co-Authors per Articles index is measured as theaverage number of co-authors per article. In this circumstance, the index reflects theauthor’s appearances while for the “authors per article” an author, even if he publishedmore than one article, is counted only on one occasion (Authors per Article index ≤ Co-authors per Article index). The CI or Collaboration Index (Total Authors of Multi-AuthoredArticles/Total Multi-Authored Articles) is a Co-authors per Article index calculated onlyusing the multi-authored article set [41].
3.2. Distribution of Publications by Year and Record Count
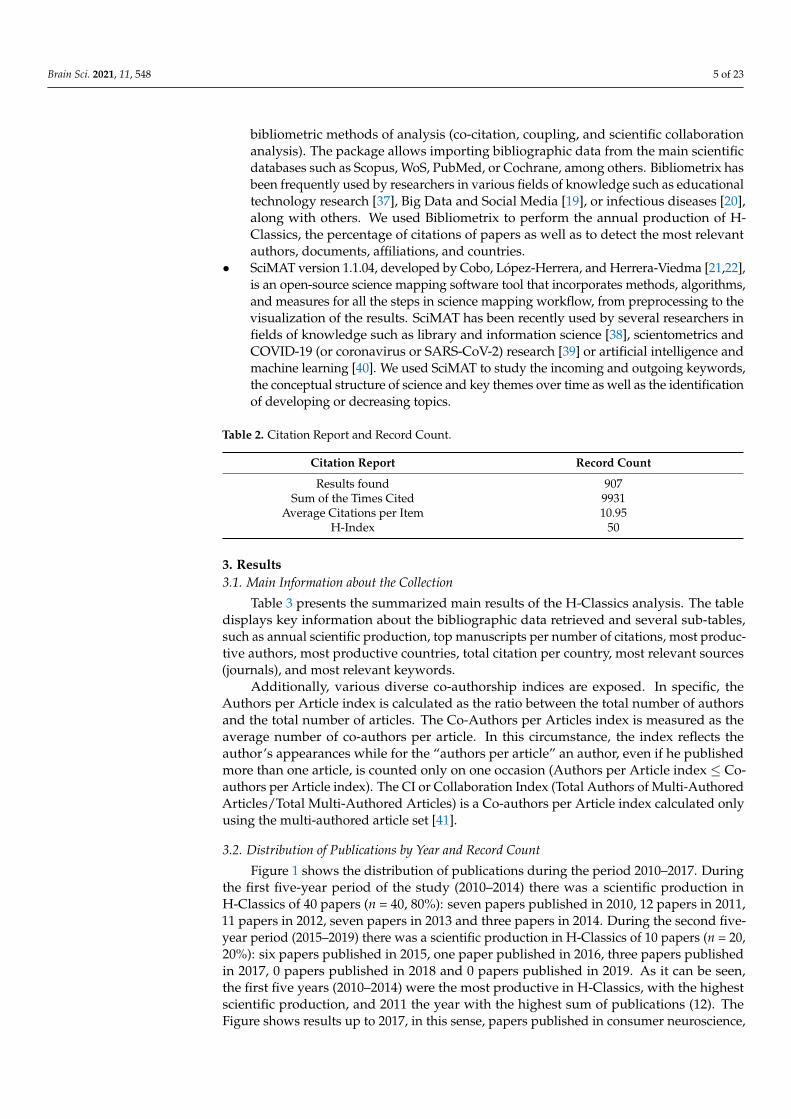
Figure 1 shows the distribution of publications during the period 2010–2017. Duringthe first five-year period of the study (2010–2014) there was a scientific production inH-Classics of 40 papers (n = 40, 80%): seven papers published in 2010, 12 papers in 2011,11 papers in 2012, seven papers in 2013 and three papers in 2014. During the second five-year period (2015–2019) there was a scientific production in H-Classics of 10 papers (n = 20,20%): six papers published in 2015, one paper published in 2016, three papers publishedin 2017, 0 papers published in 2018 and 0 papers published in 2019. As it can be seen,the first five years (2010–2014) were the most productive in H-Classics, with the highestscientific production, and 2011 the year with the highest sum of publications (12). TheFigure shows results up to 2017, in this sense, papers published in consumer neuroscience,
Brain Sci. 2021, 11, 548 6 of 23
neuromarketing and neuroaesthetics during 2018 and 2019 have not reached the highlycited category (HCPs) by other authors, for this reason, they are not represented.
Table 3. Main information about data.
Description HCPs Results
Main Information about Data
Timespan: There are no HCPs gathered during the last two years of the study period (2018–2019), however, the studyperiod is 2010–2019. 2010:2017
Sources (Journals, Books, etc.) 36Documents 50
Average Years from Publication (average years to an article to be cited) 7.52Average Citations Per Documents 99.9
Average Citations Per Year Per Doc 12.53References (Total number of documents cited in the HCPs collection) 3727
Document Types
Article published in a Journal 39Article published as a Proceedings Paper 2
A review published in a Journal 8A review published as a Book Chapter 1
Document Contents
Keywords Plus (Id): extracted from the titles of the cited references by Thomson Reuters. 282Author’s Keywords (De): provided by the original Authors. 179
Authors
Number of authors 210The number of author appearances (while for the “authors per article” an author, even if he has published more than one
article, is counted only once). 243
Authors of Single-Authored Documents 8Authors of Multi-Authored Documents 202
Authors Collaboration
Single-Authored Documents 8Documents Per Author 0.238Authors Per Document 4.2
Co-Authors Per Documents 4.86Collaboration Index (CI): is calculated as Total Authors of Multi-Authored Articles/Total Multi-Authored Articles. 4.81
Brain Sci. 2021, 11, x FOR PEER REVIEW 7 of 25
Figure 1. Distribution of publications by year and record count.
3.3. Average Citations per Year Table 4 show the Average Citations per Year. The results show that 2010, with 7 H-
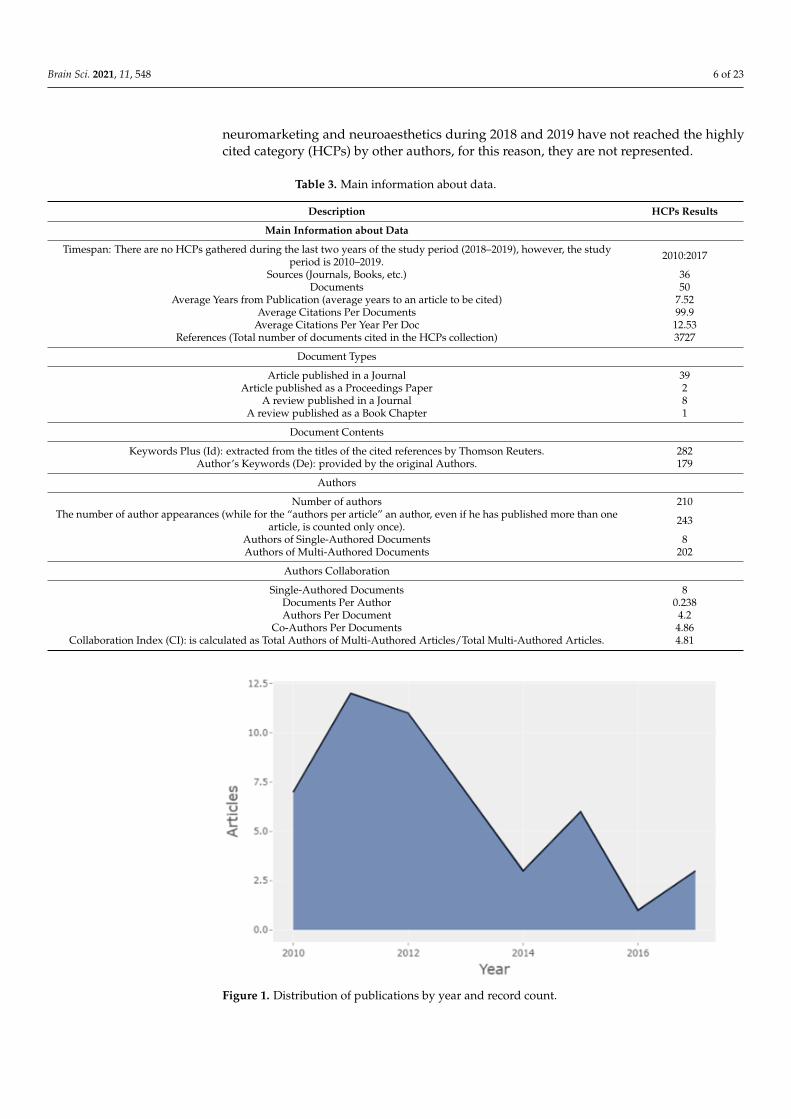
Classics papers, was the year with the highest average percentage of citations per paper (115.14), considering that had 10 years of citation ahead of it (which is the length of the study period). However, the most satisfactory year in terms of total citations per year (TCpY) was 2017, with the highest peak (represented in Figure 2), and with 3 H-Classics papers published and an average of 38.11 total citations per year (TCpY) and only 3 citable years (CY) (the remainder of the study period until 2019).
Table 4. Average Citations per Year.
Year Number of Articles Total Citations per Article (TCpA) Total Citations per Year (TCpY) Citable Years (CY) 2010 7 115.1428571 11.51428571 10 2011 12 97.25 10.80555556 9 2012 11 110.0909091 13.76136364 8 2013 7 82.57142857 11.79591837 7 2014 3 87.33333333 14.55555556 6 2015 6 94.83333333 18.96666667 5 2016 1 59 14.75 4 2017 3 114.3333333 38.11111111 3
Figure 1. Distribution of publications by year and record count.
Brain Sci. 2021, 11, 548 7 of 23
3.3. Average Citations per Year
Table 4 show the Average Citations per Year. The results show that 2010, with7 H-Classics papers, was the year with the highest average percentage of citations perpaper (115.14), considering that had 10 years of citation ahead of it (which is the length ofthe study period). However, the most satisfactory year in terms of total citations per year(TCpY) was 2017, with the highest peak (represented in Figure 2), and with 3 H-Classicspapers published and an average of 38.11 total citations per year (TCpY) and only 3 citableyears (CY) (the remainder of the study period until 2019).
Table 4. Average Citations per Year.
Year Number of Articles Total Citations per Article (TCpA) Total Citations per Year (TCpY) Citable Years (CY)
2010 7 115.1428571 11.51428571 102011 12 97.25 10.80555556 92012 11 110.0909091 13.76136364 82013 7 82.57142857 11.79591837 72014 3 87.33333333 14.55555556 62015 6 94.83333333 18.96666667 52016 1 59 14.75 42017 3 114.3333333 38.11111111 3
Brain Sci. 2021, 11, x FOR PEER REVIEW 8 of 25
Figure 2. Total Citations per Year (TCpY).
3.4. Most Local Cited Sources (from Reference Lists), Most Relevant Sources, Source Local Impact, and Source Dynamics
A source is a journal/book/conference proceeding series/etc. which published one or more documents included in our bibliographic collection. In our collection, we have a total of 36 different sources.
Table 5 shows Most Local Cited Sources (from Reference Lists). Local citations meas-ure how many times a document included in this collection have been cited by the docu-ments also included in the collection. A cited source is a journal/book/conference proceed-ing series/etc. included in at least one of the reference lists (bibliography) of the document set. In our collection, we have 1428 cited sources included in the 50 document bibliog-raphies. In this case, NEUROIMAGE stands out in 1st position with 182 articles, in 2nd position JOURNAL OF NEUROSCIENCE with 117 articles, in 3rd position we found NEURON with 111 articles, in 4th position we found JOURNAL OF CONSUMER RE-SEARCH with 99 articles and in 5th position we found SCIENCE with 87 referenced arti-cles.
Table 5. Top 10 Most Local Cited Sources (from Reference Lists).
Rank Sources Articles 1. Neuroimage 182 2. Journal of Neuroscience 117 3. Neuron 111 4. Journal of Consumer Research 99 5. Science 87 6. PNAS 82 7. Trends in Cognitive Sciences 79 8. Nature Neuroscience 67 9. Nature Reviews Neuroscience 64 10. Journal of Consumer Psychology 55
Table 6 shows the most relevant sources, as well as the source local impact, the initial year of publication of the manuscripts in the sources, the total number of citations (TC), the number of publications (NP), the number of articles, and various indexes and metrics of scientific productivity such as the H-Index [18], the G-Index [42] and the M-Index [43]. G-Index is a variant of the H-Index that, in its calculation, gives credit for the most highly
Figure 2. Total Citations per Year (TCpY).
3.4. Most Local Cited Sources (from Reference Lists), Most Relevant Sources, Source Local Impact,and Source Dynamics
A source is a journal/book/conference proceeding series/etc. which published one ormore documents included in our bibliographic collection. In our collection, we have a totalof 36 different sources.
Table 5 shows Most Local Cited Sources (from Reference Lists). Local citations measurehow many times a document included in this collection have been cited by the documentsalso included in the collection. A cited source is a journal/book/conference proceedingseries/etc. included in at least one of the reference lists (bibliography) of the document set.In our collection, we have 1428 cited sources included in the 50 document bibliographies.In this case, NEUROIMAGE stands out in 1st position with 182 articles, in 2nd positionJOURNAL OF NEUROSCIENCE with 117 articles, in 3rd position we found NEURONwith 111 articles, in 4th position we found JOURNAL OF CONSUMER RESEARCH with99 articles and in 5th position we found SCIENCE with 87 referenced articles.
Brain Sci. 2021, 11, 548 8 of 23
Table 5. Top 10 Most Local Cited Sources (from Reference Lists).
Rank Sources Articles
1. Neuroimage 1822. Journal of Neuroscience 1173. Neuron 1114. Journal of Consumer Research 995. Science 876. PNAS 827. Trends in Cognitive Sciences 798. Nature Neuroscience 679. Nature Reviews Neuroscience 6410. Journal of Consumer Psychology 55
Table 6 shows the most relevant sources, as well as the source local impact, the initialyear of publication of the manuscripts in the sources, the total number of citations (TC),the number of publications (NP), the number of articles, and various indexes and metricsof scientific productivity such as the H-Index [18], the G-Index [42] and the M-Index [43].G-Index is a variant of the H-Index that, in its calculation, gives credit for the most highlycited papers in a data set and the G-Index is always the same as or higher than the H-Indexand M-Index is another variant of the H-Index that displays H-Index per year since firstpublication [44].
Table 6. Top 10 Most Relevant Sources and Source Local Impact.
Rank Source Articles H_Index G_Index M_Index Total Citations(TC)
Number ofPublications (NP)
Publication YearStart
1. Journal of Consumer Psychology 6 6 6 0.545454545 739 6 20102. Frontiers in Human Neuroscience 4 4 4 0.4 304 4 20113. Journal of Marketing Research 4 4 4 0.666666667 389 4 20154. Neuroimage 2 2 2 0.2 238 2 20115. Psychology & Marketing 2 2 2 0.2 259 2 20116. Trends in Cognitive Sciences 2 2 2 0.285714286 227 2 20147. Acta Psychologica 1 1 1 0.111111111 128 1 20128. Annual Review of Psychology, Vol 63 1 1 1 0.111111111 54 1 20129. Archives of General Psychiatry 1 1 1 0.111111111 113 1 201210. Biosocieties 1 1 1 0.25 58 1 2017
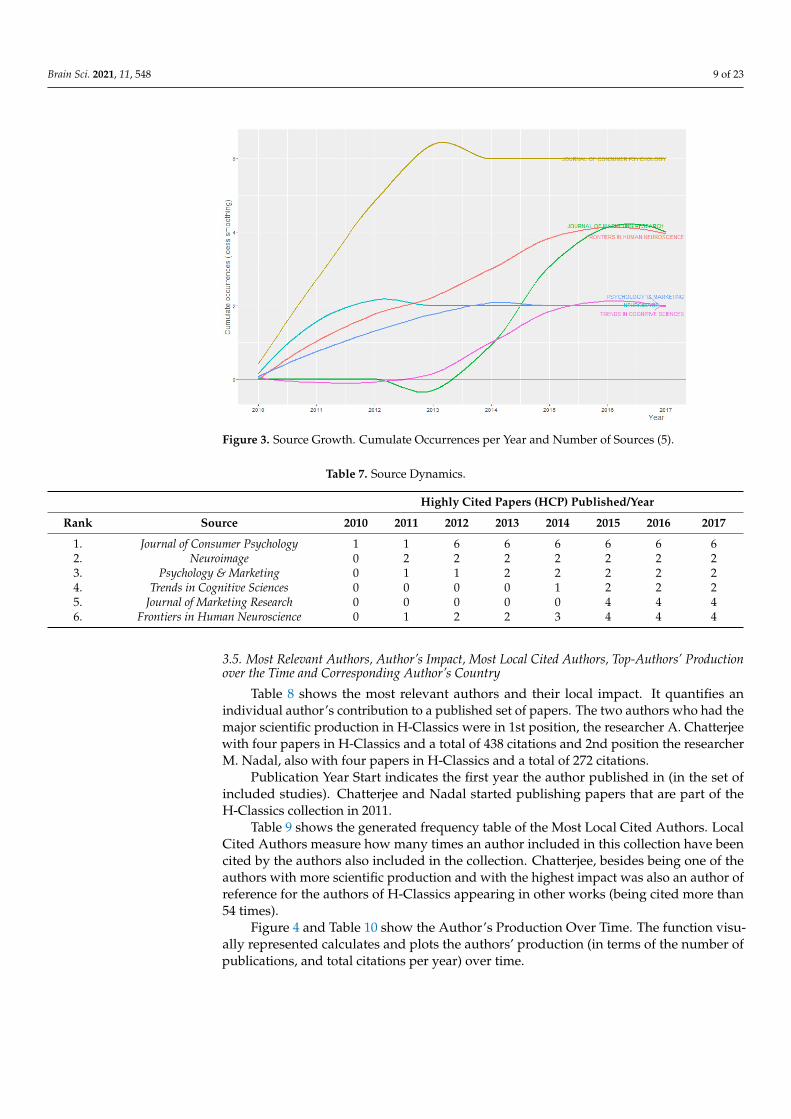
The most relevant source was in 1st place Journal of Consumer Psychology (with sixpublished articles, a total of 739 citations and starting to publish articles from this selectionin the year 2010), followed in 2nd position FRONTIERS IN HUMAN NEUROSCIENCE(with four articles, a total of 304 citations and starting to publish articles from this selectionin the year 2011), in 3rd position JOURNAL OF MARKETING RESEARCH (with fourpublished articles, a total of 389 citations and beginning to publish articles from thisselection in the year 2015), in 4th place NEUROIMAGE (two articles, a total of 238 citationsand beginning to publish articles from this selection in the year 2011) and in 5th placePSYCHOLOGY & MARKETING (with two published articles, a total of 259 citations andbeginning to publish articles from this selection in the year 2011).
The distribution frequency of articles (Figure 3) indicates the sources dealing with theissue and related topics and it calculates yearly published documents of the top sources(Table 7). Between 2011 and 2014, it was substantial growth in the number of publicationson the subject. The graph shows the result of the Loess regression. As variables, it includesthe number and the publication time of the source under study. This method allowed thefunction to assume a limitless distribution, that is, it permits the function to adopt valuesbelow zero if the data is near to zero. It contributed to a better graphic result and highlightsthe break in the history of the publications [45].
Brain Sci. 2021, 11, 548 9 of 23Brain Sci. 2021, 11, x FOR PEER REVIEW 10 of 25
Figure 3. Source Growth. Cumulate Occurrences per Year and Number of Sources (5).
Table 7. Source Dynamics.
Highly Cited Papers (HCP) Published/Year Rank Source 2010 2011 2012 2013 2014 2015 2016 2017
1. Journal of Consumer Psychology 1 1 6 6 6 6 6 6 2. Neuroimage 0 2 2 2 2 2 2 2 3. Psychology & Marketing 0 1 1 2 2 2 2 2 4. Trends in Cognitive Sciences 0 0 0 0 1 2 2 2 5. Journal of Marketing Research 0 0 0 0 0 4 4 4 6. Frontiers in Human Neuroscience 0 1 2 2 3 4 4 4
3.5. Most Relevant Authors, Author’s Impact, Most Local Cited Authors, Top-Authors’ Production over the Time and Corresponding Author’s Country
Table 8 shows the most relevant authors and their local impact. It quantifies an indi-vidual author’s contribution to a published set of papers. The two authors who had the major scientific production in H-Classics were in 1st position, the researcher A. Chatterjee with four papers in H-Classics and a total of 438 citations and 2nd position the researcher M. Nadal, also with four papers in H-Classics and a total of 272 citations.
Publication Year Start indicates the first year the author published in (in the set of included studies). Chatterjee and Nadal started publishing papers that are part of the H-Classics collection in 2011.
Table 8. Top 10 Most Relevant Authors and Author Local Impact.
Rank Author Articles H_Index G_Index M_Index Total Citations
(TC) Number of Publi-
cations (NP) Publication Year Start
1. Chatterjee, A 4 4 4 0.4 438 4 2011 2. Nadal, M 4 4 4 0.4 272 4 2011 3. Dimoka, A 3 3 3 0.273 289 3 2010 4. Leder, H 3 3 3 0.375 216 3 2013 5. Vartanian, O 3 3 3 0.375 283 3 2013 6. Venkatraman, V 3 3 3 0.333 289 3 2012 7. Astolfi, L 2 2 2 0.2 141 2 2011 8. Babiloni, F 2 2 2 0.2 141 2 2011 9. Berns, G.S. 2 2 2 0.182 442 2 2010 10. Bez, F 2 2 2 0.2 141 2 2011
Figure 3. Source Growth. Cumulate Occurrences per Year and Number of Sources (5).
Table 7. Source Dynamics.
Highly Cited Papers (HCP) Published/Year
Rank Source 2010 2011 2012 2013 2014 2015 2016 2017
1. Journal of Consumer Psychology 1 1 6 6 6 6 6 62. Neuroimage 0 2 2 2 2 2 2 23. Psychology & Marketing 0 1 1 2 2 2 2 24. Trends in Cognitive Sciences 0 0 0 0 1 2 2 25. Journal of Marketing Research 0 0 0 0 0 4 4 46. Frontiers in Human Neuroscience 0 1 2 2 3 4 4 4
3.5. Most Relevant Authors, Author’s Impact, Most Local Cited Authors, Top-Authors’ Productionover the Time and Corresponding Author’s Country
Table 8 shows the most relevant authors and their local impact. It quantifies anindividual author’s contribution to a published set of papers. The two authors who had themajor scientific production in H-Classics were in 1st position, the researcher A. Chatterjeewith four papers in H-Classics and a total of 438 citations and 2nd position the researcherM. Nadal, also with four papers in H-Classics and a total of 272 citations.
Publication Year Start indicates the first year the author published in (in the set ofincluded studies). Chatterjee and Nadal started publishing papers that are part of theH-Classics collection in 2011.
Table 9 shows the generated frequency table of the Most Local Cited Authors. LocalCited Authors measure how many times an author included in this collection have beencited by the authors also included in the collection. Chatterjee, besides being one of theauthors with more scientific production and with the highest impact was also an author ofreference for the authors of H-Classics appearing in other works (being cited more than54 times).
Figure 4 and Table 10 show the Author’s Production Over Time. The function visu-ally represented calculates and plots the authors’ production (in terms of the number ofpublications, and total citations per year) over time.
Brain Sci. 2021, 11, 548 10 of 23
Table 8. Top 10 Most Relevant Authors and Author Local Impact.
Rank Author Articles H_Index G_Index M_Index Total Citations (TC) Number of Publications (NP) Publication Year Start
1. Chatterjee, A 4 4 4 0.4 438 4 20112. Nadal, M 4 4 4 0.4 272 4 20113. Dimoka, A 3 3 3 0.273 289 3 20104. Leder, H 3 3 3 0.375 216 3 20135. Vartanian, O 3 3 3 0.375 283 3 20136. Venkatraman, V 3 3 3 0.333 289 3 20127. Astolfi, L 2 2 2 0.2 141 2 20118. Babiloni, F 2 2 2 0.2 141 2 20119. Berns, G.S. 2 2 2 0.182 442 2 201010. Bez, F 2 2 2 0.2 141 2 2011
Table 9. Top 10 Most Local Cited Authors.
Rank Authors Citations
1 Chatterjee, A 542 Jacobsen, T 363 Knutson, B 304 Plassmann, H 305 Leder, H 246 Vartanian, O 237 Berridge, K.C. 228 Mcclure, S.M 229 Koelsch, S 2110 Poldrack, R.A. 20
Brain Sci. 2021, 11, x FOR PEER REVIEW 11 of 25
Table 9 shows the generated frequency table of the Most Local Cited Authors. Local Cited Authors measure how many times an author included in this collection have been cited by the authors also included in the collection. Chatterjee, besides being one of the authors with more scientific production and with the highest impact was also an author of reference for the authors of H-Classics appearing in other works (being cited more than 54 times).
Table 9. Top 10 Most Local Cited Authors.
Rank Authors Citations 1 Chatterjee, A 54 2 Jacobsen, T 36 3 Knutson, B 30 4 Plassmann, H 30 5 Leder, H 24 6 Vartanian, O 23 7 Berridge, K.C. 22 8 Mcclure, S.M 22 9 Koelsch, S 21 10 Poldrack, R.A. 20
Figure 4 and Table 10 show the Author’s Production Over Time. The function visu-ally represented calculates and plots the authors’ production (in terms of the number of publications, and total citations per year) over time.
Total citations represent the number of times each manuscript has been cited and Total citations per year represent the yearly average number of times each manuscript has been cited.
The three authors who had a longer and more consistent trajectory in H-Classics were: Chatterjee (2011–2016), Nadal (2011–2016), and Dimoka (2010–2105). Chatterjee was the author, who besides having one of the longest and most consistent trajectories in H-Classics during the period studied, had H-Classics publications almost every year of those five years (four publications). Venkatraman was the author, who, despite having one of the shortest trajectories in H-Classics during the studied period, presented several works in 2015 that make him the author with the highest TC/TCpY (two H-Classics publications freq., 229 citations and total citations per year of 38.167).
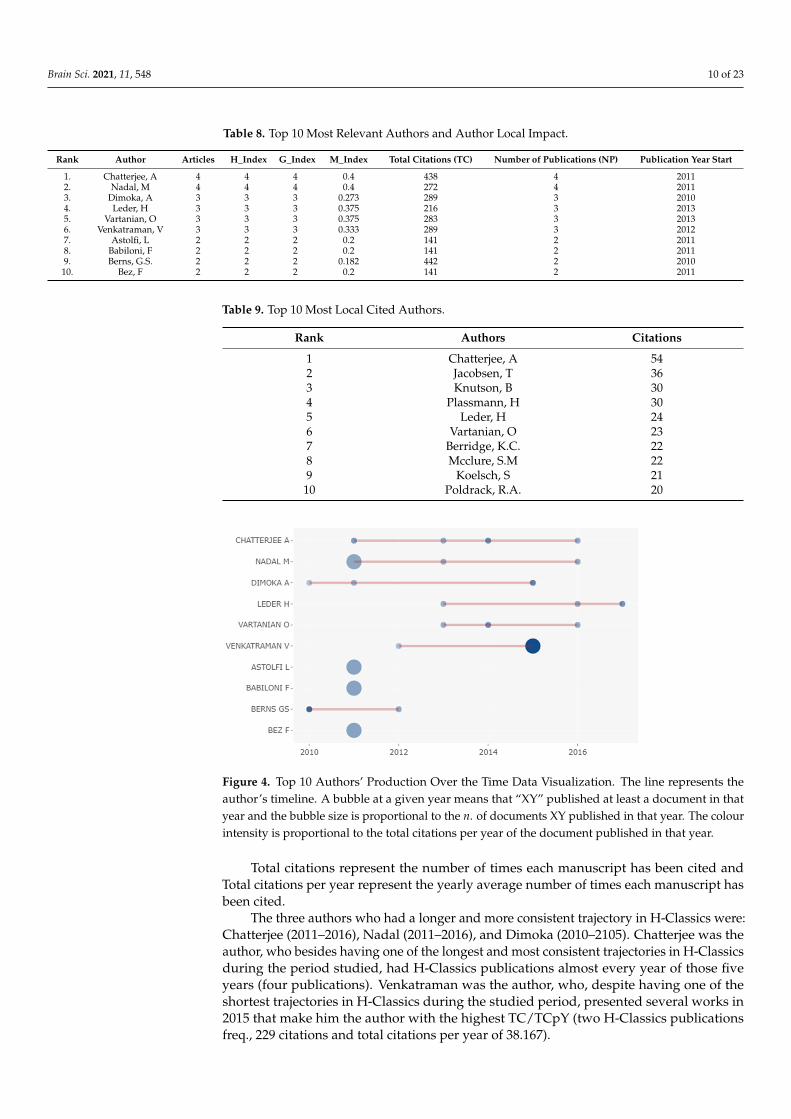
Figure 4. Top 10 Authors’ Production Over the Time Data Visualization. The line represents the author’s timeline. A bubble at a given year means that “XY” published at least a document in that year and the bubble size is proportional to the n. of documents XY published in that year. The colour intensity is proportional to the total citations per year of the document published in that year.
Figure 4. Top 10 Authors’ Production Over the Time Data Visualization. The line represents theauthor’s timeline. A bubble at a given year means that “XY” published at least a document in thatyear and the bubble size is proportional to the n. of documents XY published in that year. The colourintensity is proportional to the total citations per year of the document published in that year.
Total citations represent the number of times each manuscript has been cited andTotal citations per year represent the yearly average number of times each manuscript hasbeen cited.
The three authors who had a longer and more consistent trajectory in H-Classics were:Chatterjee (2011–2016), Nadal (2011–2016), and Dimoka (2010–2105). Chatterjee was theauthor, who besides having one of the longest and most consistent trajectories in H-Classicsduring the period studied, had H-Classics publications almost every year of those fiveyears (four publications). Venkatraman was the author, who, despite having one of theshortest trajectories in H-Classics during the studied period, presented several works in2015 that make him the author with the highest TC/TCpY (two H-Classics publicationsfreq., 229 citations and total citations per year of 38.167).
Brain Sci. 2021, 11, 548 11 of 23
Table 10. Top 10 Authors’ Production Over the Time.
Author Year Frequency Total Citations (TC) Total Citations per Year (TCpY)
Astolfi, L 2011 2 141 14.1Babiloni, F 2011 2 141 14.1Berns, G.S. 2010 1 332 30.182Berns, G.S. 2012 1 110 12.222
Bez, F 2011 2 141 14.1Chatterjee, A 2011 1 155 15.5Chatterjee, A 2013 1 86 10.75Chatterjee, A 2014 1 138 19.714Chatterjee, A 2016 1 59 11.8Dimoka, A 2010 1 57 5.182Dimoka, A 2011 1 102 10.2Dimoka, A 2015 1 130 21.667Leder, H 2013 1 86 10.75Leder, H 2016 1 59 11.8Leder, H 2017 1 71 17.75Nadal, M 2011 2 127 12.7Nadal, M 2013 1 86 10.75Nadal, M 2016 1 59 11.8
Vartanian, O 2013 1 86 10.75Vartanian, O 2014 1 138 19.714Vartanian, O 2016 1 59 11.8
Venkatraman, V 2012 1 60 6.667Venkatraman, V 2015 2 229 38.167
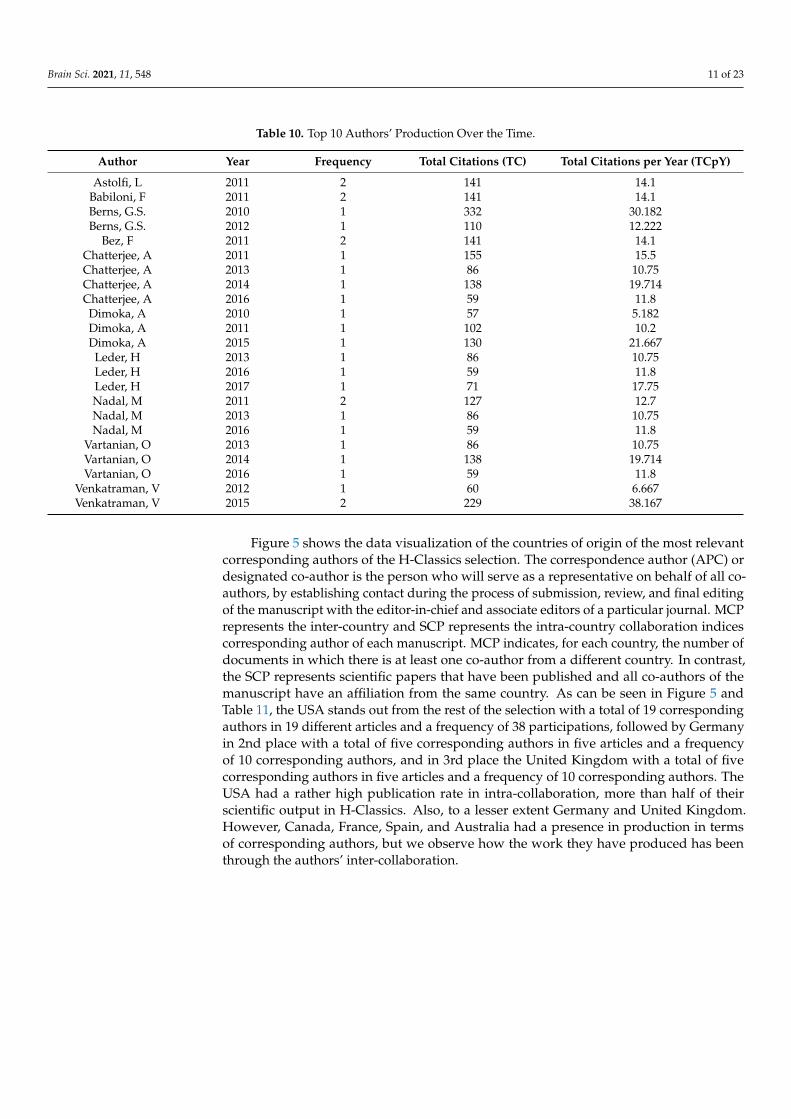
Figure 5 shows the data visualization of the countries of origin of the most relevantcorresponding authors of the H-Classics selection. The correspondence author (APC) ordesignated co-author is the person who will serve as a representative on behalf of all co-authors, by establishing contact during the process of submission, review, and final editingof the manuscript with the editor-in-chief and associate editors of a particular journal. MCPrepresents the inter-country and SCP represents the intra-country collaboration indicescorresponding author of each manuscript. MCP indicates, for each country, the number ofdocuments in which there is at least one co-author from a different country. In contrast,the SCP represents scientific papers that have been published and all co-authors of themanuscript have an affiliation from the same country. As can be seen in Figure 5 andTable 11, the USA stands out from the rest of the selection with a total of 19 correspondingauthors in 19 different articles and a frequency of 38 participations, followed by Germanyin 2nd place with a total of five corresponding authors in five articles and a frequencyof 10 corresponding authors, and in 3rd place the United Kingdom with a total of fivecorresponding authors in five articles and a frequency of 10 corresponding authors. TheUSA had a rather high publication rate in intra-collaboration, more than half of theirscientific output in H-Classics. Also, to a lesser extent Germany and United Kingdom.However, Canada, France, Spain, and Australia had a presence in production in termsof corresponding authors, but we observe how the work they have produced has beenthrough the authors’ inter-collaboration.
Brain Sci. 2021, 11, 548 12 of 23Brain Sci. 2021, 11, x FOR PEER REVIEW 13 of 25
Figure 5. Top 10 Corresponding Author’s Country Data Visualization. Collaboration indices: The intra-country (SCP) and inter-country (MCP).
Table 11. Top 10 Corresponding Author’s Country.
Rank Country Articles Frequency Single-Country Publications
(SCP) Multiple-Country Publications
(MCP) 1 USA 19 38 14 5 2 Germany 5 10 3 2 3 United Kingdom 5 10 2 3 4 Canada 4 8 0 4 5 Austria 3 6 1 2 6 Italy 3 6 1 2 7 France 2 4 0 2 8 The Netherlands 2 4 1 1 9 Spain 2 4 0 2
10 Australia 1 2 0 1
3.6. Most Relevant Affiliations (Organizations) Table 12 shows the most relevant affiliations, the frequency distribution of affiliations
of all co-authors for each paper. Two international reputation and excellence rankings of worldwide universities were used to compare the results: ARWU World University Rank-ings 2019 [46] and QS World University Rankings 2019 [47].
Temple University was the American university with the largest volume of articles (12), followed by the American universities University of Pennsylvania (2nd position and 10 articles), Duke University (3rd position and eight articles), Emory University (6th po-sition and five articles), The University oF California, Los Angeles (7th position and five articles) and Columbia University (9th position and four articles). The rest of the institu-tions were European organizations belonging to Germany (Freie Universität Berlin in 4th position and eight articles), Denmark (Copenhagen Business School in 5th position and five articles), the UK (the University of Oxford in 8th position and five articles) and the Netherlands (Erasmus Universiteit Rotterdam in 10th position and 4 articles).
All the research centres and organizations selected in the table had a presence in at least one of the two prestigious international university rankings (QS/ARWU) and all of them occupied relevant positions within the university reputation rankings.
Figure 5. Top 10 Corresponding Author’s Country Data Visualization. Collaboration indices: Theintra-country (SCP) and inter-country (MCP).
Table 11. Top 10 Corresponding Author’s Country.
Rank Country Articles Frequency Single-Country Publications (SCP) Multiple-Country Publications (MCP)
1 USA 19 38 14 52 Germany 5 10 3 23 United Kingdom 5 10 2 34 Canada 4 8 0 45 Austria 3 6 1 26 Italy 3 6 1 27 France 2 4 0 28 The Netherlands 2 4 1 19 Spain 2 4 0 2
10 Australia 1 2 0 1
3.6. Most Relevant Affiliations (Organizations)
Table 12 shows the most relevant affiliations, the frequency distribution of affiliationsof all co-authors for each paper. Two international reputation and excellence rankingsof worldwide universities were used to compare the results: ARWU World UniversityRankings 2019 [46] and QS World University Rankings 2019 [47].
Temple University was the American university with the largest volume of articles(12), followed by the American universities University of Pennsylvania (2nd positionand 10 articles), Duke University (3rd position and eight articles), Emory University (6thposition and five articles), The University oF California, Los Angeles (7th position andfive articles) and Columbia University (9th position and four articles). The rest of theinstitutions were European organizations belonging to Germany (Freie Universität Berlinin 4th position and eight articles), Denmark (Copenhagen Business School in 5th positionand five articles), the UK (the University of Oxford in 8th position and five articles) and theNetherlands (Erasmus Universiteit Rotterdam in 10th position and 4 articles).
All the research centres and organizations selected in the table had a presence in atleast one of the two prestigious international university rankings (QS/ARWU) and all ofthem occupied relevant positions within the university reputation rankings.
3.7. Country Scientific Production and Most Cited Countries
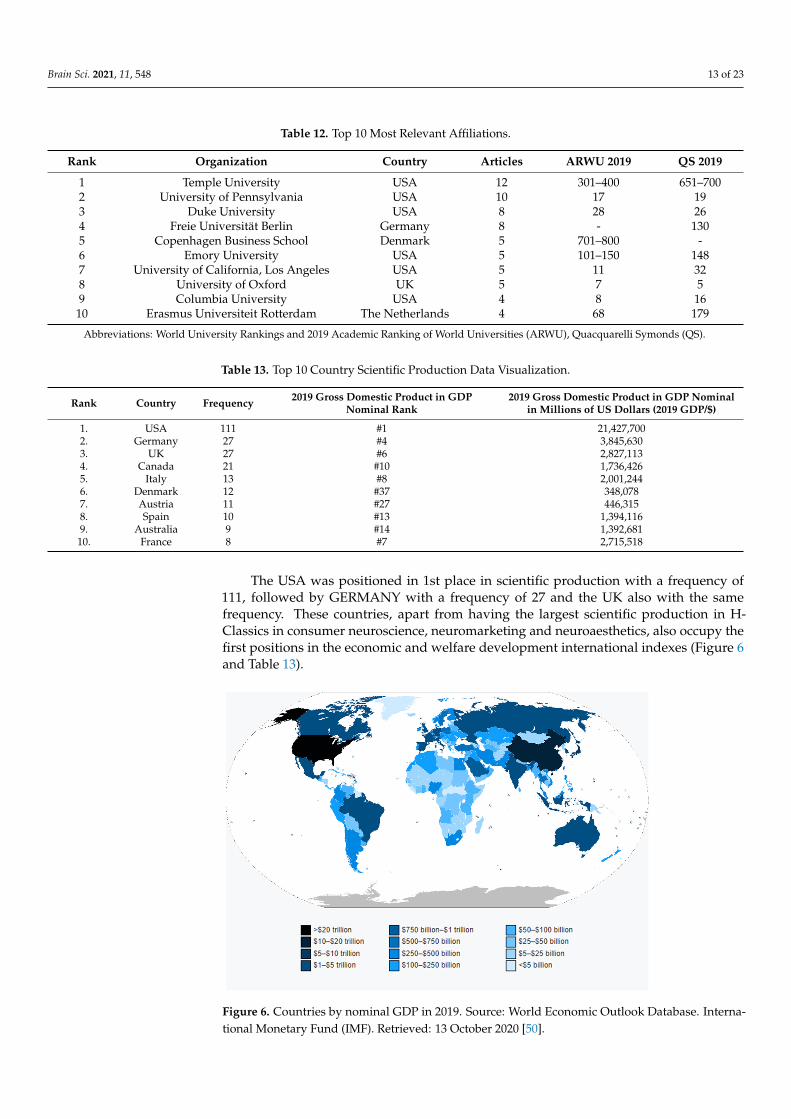
Table 13 shows the affiliation countries’ frequency distribution. To understand theresearch productivity of a nation, the resulting frequency of scientific production by countrywas compared with the international monetary indicator Gross Domestic Product (GDP)2019 World Bank [48]. The Gross Domestic Product (GDP) measures the monetary value ofa country’s production of final goods and services during a year. GDP is commonly usedas a measure of the degree of the well-being of a country’s population [49].
Brain Sci. 2021, 11, 548 13 of 23
Table 12. Top 10 Most Relevant Affiliations.
Rank Organization Country Articles ARWU 2019 QS 2019
1 Temple University USA 12 301–400 651–7002 University of Pennsylvania USA 10 17 193 Duke University USA 8 28 264 Freie Universität Berlin Germany 8 - 1305 Copenhagen Business School Denmark 5 701–800 -6 Emory University USA 5 101–150 1487 University of California, Los Angeles USA 5 11 328 University of Oxford UK 5 7 59 Columbia University USA 4 8 16
10 Erasmus Universiteit Rotterdam The Netherlands 4 68 179
Abbreviations: World University Rankings and 2019 Academic Ranking of World Universities (ARWU), Quacquarelli Symonds (QS).
Table 13. Top 10 Country Scientific Production Data Visualization.
Rank Country Frequency 2019 Gross Domestic Product in GDPNominal Rank
2019 Gross Domestic Product in GDP Nominalin Millions of US Dollars (2019 GDP/$)
1. USA 111 #1 21,427,7002. Germany 27 #4 3,845,6303. UK 27 #6 2,827,1134. Canada 21 #10 1,736,4265. Italy 13 #8 2,001,2446. Denmark 12 #37 348,0787. Austria 11 #27 446,3158. Spain 10 #13 1,394,1169. Australia 9 #14 1,392,681
10. France 8 #7 2,715,518
The USA was positioned in 1st place in scientific production with a frequency of111, followed by GERMANY with a frequency of 27 and the UK also with the samefrequency. These countries, apart from having the largest scientific production in H-Classics in consumer neuroscience, neuromarketing and neuroaesthetics, also occupy thefirst positions in the economic and welfare development international indexes (Figure 6and Table 13).
Brain Sci. 2021, 11, x FOR PEER REVIEW 15 of 25
Figure 6. Countries by nominal GDP in 2019. Source: World Economic Outlook Database. Interna-tional Monetary Fund (IMF). Retrieved: 13 October 2020 [50].
Table 14 shows the countries that have received the highest total citations among the 50 H-Classics documents published and classified. Among the 50 selected papers, many of the selected authors chose articles to reference their scientific works having their origin of scientific production in the USA (2265 citations), followed by Germany (446 citations), Canada (406), United Kingdom (391 citations) and France (250 citations).
Table 14. Top 10 Most Cited Countries.
Rank Country Total Citations (TC) Average Article Citations (AAC) 1 USA 2265 119.2 2 Germany 446 89.2 3 Canada 406 101.5 4 United Kingdom 391 78.2 5 France 250 125 6 Italy 220 73.3 7 Brazil 214 214 8 Austria 180 60 9 Australia 161 161 10 The Netherlands 151 75.5
3.8. Sources, Countries and Keywords: Three-Fields Plot Figure 7 shows relationships among Top Sources (left field), Top Countries (middle
field), and Top Keywords (right field) and several items (1–10) summarized by a Sankey Plot. Sankey’s diagrams show the flows and their quantities in proportion to each other. The width of the arrows or lines is used to show their magnitudes, so the larger the arrow, the greater the amount of flow. The flow arrows or lines can be combined or divided through their paths at each stage of a process. The colour can be used to divide the dia-gram into different categories or to show the transition from one state of the process to another [51].
The USA was the country that published the H-Classics selection in the most relevant sources (Expert Systems with Applications, Nature Reviews Neuroscience, Journal of Cognitive Neuroscience, Journal of Marketing Research, Journal of Consumer Psychol-ogy, Psychology & Marketing, Frontiers in Human Neuroscience, Trends in Cognitive
Figure 6. Countries by nominal GDP in 2019. Source: World Economic Outlook Database. Interna-tional Monetary Fund (IMF). Retrieved: 13 October 2020 [50].
Brain Sci. 2021, 11, 548 14 of 23
Table 14 shows the countries that have received the highest total citations among the50 H-Classics documents published and classified. Among the 50 selected papers, many ofthe selected authors chose articles to reference their scientific works having their originof scientific production in the USA (2265 citations), followed by Germany (446 citations),Canada (406), United Kingdom (391 citations) and France (250 citations).
Table 14. Top 10 Most Cited Countries.
Rank Country Total Citations (TC) Average Article Citations (AAC)
1 USA 2265 119.22 Germany 446 89.23 Canada 406 101.54 United Kingdom 391 78.25 France 250 1256 Italy 220 73.37 Brazil 214 2148 Austria 180 609 Australia 161 16110 The Netherlands 151 75.5
3.8. Sources, Countries and Keywords: Three-Fields Plot
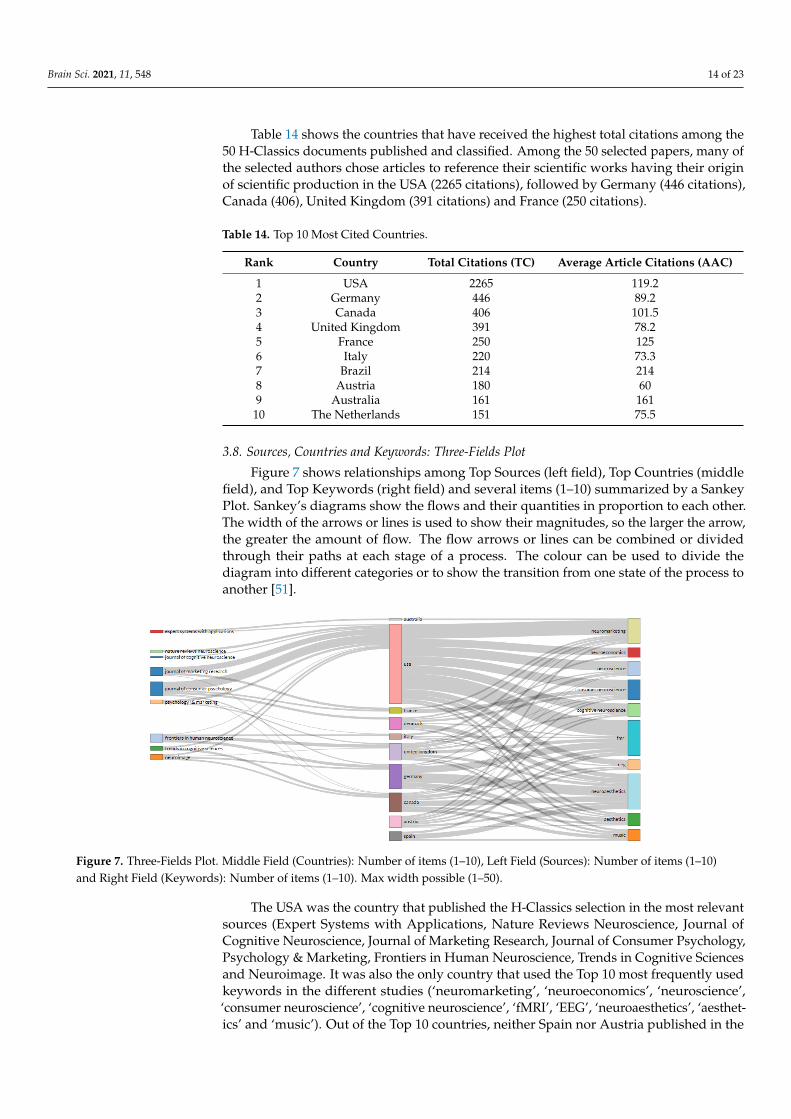
Figure 7 shows relationships among Top Sources (left field), Top Countries (middlefield), and Top Keywords (right field) and several items (1–10) summarized by a SankeyPlot. Sankey’s diagrams show the flows and their quantities in proportion to each other.The width of the arrows or lines is used to show their magnitudes, so the larger the arrow,the greater the amount of flow. The flow arrows or lines can be combined or dividedthrough their paths at each stage of a process. The colour can be used to divide thediagram into different categories or to show the transition from one state of the process toanother [51].
Brain Sci. 2021, 11, x FOR PEER REVIEW 16 of 25
Sciences and Neuroimage. It was also the only country that used the Top 10 most fre-quently used keywords in the different studies (‘neuromarketing’, ‘neuroeconomics’, ‘neuroscience’, ‘consumer neuroscience’, ‘cognitive neuroscience’, ‘fMRI’, ‘EEG’, ‘neu-roaesthetics’, ‘aesthetics’ and ‘music’). Out of the Top 10 countries, neither Spain nor Aus-tria published in the Top main journals on the studied subject. The two keywords used in most of the countries were ‘fMRI’ and ‘neuroaesthetics’.
Figure 7. Three-Fields Plot. Middle Field (Countries): Number of items (1–10), Left Field (Sources): Number of items (1–10) and Right Field (Keywords): Number of items (1–10). Max width possible (1–50).
3.9. Most Global Cited Documents and Most Local Cited References Table 15 shows the list of the most relevant manuscripts sorted by citations from the
H-Classics selection (50 documents). Global Citations (TC) means the Total Citations that an article, included in the selected collection, has received from documents indexed on a bibliographic database (WoS, Scopus, etc.). So, TC counts citations received by a selected article “all over the world”. The most frequently cited work was ‘Neuromarketing: the hope and hype of neuroimaging in business’ [52], a research study about the application of neu-roimaging methods to product marketing with 332 citations and a total citation per year of 30.18.
Table 15. Top 10 Most Global Cited Document.
Rank Paper DOI Reference Total Citations (TC)
Total Citations per Year (TCpY)
1 Ariely D, 2010, Nat Rev Neu-
rosci 10.1038/nrn2795 [52] 332 30.18
2 Lopes At, 2017, Pattern Re-
cognit 10.1016/j.patcog.2016.07.026 [53] 214 53.50
3 Schmitt B, 2012, J Consum
Psychol 10.1016/j.jcps.2011.09.005 [54] 170 18.89
4 Reimann M, 2010, J Consum
Psychol 10.1016/j.jcps.2010.06.009 [55] 165 15.00
5 Khushaba RN, 2013, Expert
Syst Appl 10.1016/j.eswa.2012.12.095 [5] 161 20.12
6 Brown S, 2011, Neuroimage 10.1016/j.neuroimage.2011.06.012 [56] 161 16.10
7 Chatterjee A, 2011, J Cogn
Neurosci 10.1162/jocn.2010.21457 [57] 155 15.50
8 Plassmann H, 2012, J Consum
Psychol 10.1016/j.jcps.2011.11.010 [58] 151 16.78
9 Spence C, 2011, Psychol Mark 10.1002/mar.20392 [59] 140 14.00 10 Morin C, 2011, Society 10.1007/s12115-010-9408-1 [1] 139 13.90
Figure 7. Three-Fields Plot. Middle Field (Countries): Number of items (1–10), Left Field (Sources): Number of items (1–10)and Right Field (Keywords): Number of items (1–10). Max width possible (1–50).
The USA was the country that published the H-Classics selection in the most relevantsources (Expert Systems with Applications, Nature Reviews Neuroscience, Journal ofCognitive Neuroscience, Journal of Marketing Research, Journal of Consumer Psychology,Psychology & Marketing, Frontiers in Human Neuroscience, Trends in Cognitive Sciencesand Neuroimage. It was also the only country that used the Top 10 most frequently usedkeywords in the different studies (‘neuromarketing’, ‘neuroeconomics’, ‘neuroscience’,‘consumer neuroscience’, ‘cognitive neuroscience’, ‘fMRI’, ‘EEG’, ‘neuroaesthetics’, ‘aesthet-ics’ and ‘music’). Out of the Top 10 countries, neither Spain nor Austria published in the
Brain Sci. 2021, 11, 548 15 of 23
Top main journals on the studied subject. The two keywords used in most of the countrieswere ‘fMRI’ and ‘neuroaesthetics’.
3.9. Most Global Cited Documents and Most Local Cited References
Table 15 shows the list of the most relevant manuscripts sorted by citations from theH-Classics selection (50 documents). Global Citations (TC) means the Total Citations thatan article, included in the selected collection, has received from documents indexed on abibliographic database (WoS, Scopus, etc.). So, TC counts citations received by a selectedarticle “all over the world”. The most frequently cited work was ‘Neuromarketing: thehope and hype of neuroimaging in business’ [52], a research study about the application ofneuroimaging methods to product marketing with 332 citations and a total citation peryear of 30.18.
Table 15. Top 10 Most Global Cited Document.
Rank Paper DOI Reference Total Citations (TC) Total Citationsper Year (TCpY)
1 Ariely D, 2010, Nat Rev Neurosci 10.1038/nrn2795 [52] 332 30.182 Lopes At, 2017, Pattern Recognit 10.1016/j.patcog.2016.07.026 [53] 214 53.503 Schmitt B, 2012, J Consum Psychol 10.1016/j.jcps.2011.09.005 [54] 170 18.894 Reimann M, 2010, J Consum Psychol 10.1016/j.jcps.2010.06.009 [55] 165 15.005 Khushaba RN, 2013, Expert Syst Appl 10.1016/j.eswa.2012.12.095 [5] 161 20.126 Brown S, 2011, Neuroimage 10.1016/j.neuroimage.2011.06.012 [56] 161 16.107 Chatterjee A, 2011, J Cogn Neurosci 10.1162/jocn.2010.21457 [57] 155 15.508 Plassmann H, 2012, J Consum Psychol 10.1016/j.jcps.2011.11.010 [58] 151 16.789 Spence C, 2011, Psychol Mark 10.1002/mar.20392 [59] 140 14.0010 Morin C, 2011, Society 10.1007/s12115-010-9408-1 [1] 139 13.90
Table 16 shows the generated frequency table of the Most Cited References. It refersto the scientific document included in at least one of the reference lists (bibliography) ofthe document set. In our collection, we have more than 3700 references included in the50 document bibliographies.
Table 16. Top 10 Most Local Cited References (Rank/Cited References/Reference/Citations).
Rank Cited References Reference Citations
1 McClure SM, 2004, Neuron, V44, P379, DOI 10.1016/J.Neuron.2004.09.019 [60] 172 Knutson B, 2007, Neuron, V53, P147, DOI 10.1016/J.Neuron.2006.11.010 [61] 153 Kawabata H, 2004, J Neurophysiol, V91, P1699, DOI 10.1152/Jn.00696.2003 [62] 134 Poldrack RA, 2006, Trends Cogn Sci, V10, P59, DOI 10.1016/J.Tics.2005.12.004 [63] 135 Jacobsen T, 2006, Neuroimage, V29, P276, DOI10.1016/J.Neuroimage.2005.07.010 [64] 126 Leder H, 2004, Brit J Psychol, V95, P489, DOI 10.1348/0007126042369811 [65] 127 Vartanian O, 2004, Neuroreport, V15, P893, DOI 10.1097/00001756-200404090-00032 [66] 128 Ariely D, 2010, Nat Rev Neurosci, V11, P284, DOI 10.1038/Nrn2795 [52] 119 Blood Aj, 2001, P Natl Acad Sci USA, V98, P11818, DOI 10.1073/Pnas.191355898 [67] 11
10 Aharon I, 2001, Neuron, V32, P537, DOI 10.1016/S0896-6273(01)00491-3 [68] 10
The most frequently cited local reference was the scientific work ‘Neural correlates ofbehavioural preference for culturally familiar drinks’ [60]. a research study where the authorsdelivered Coke and Pepsi to human subjects and examined them in behavioural taste testsand passive experiments carried out during functional magnetic resonance imaging (fMRI).The scientific work was cited 17 times in our H-Classics collection.
3.10. Conceptual Structure (2010–2019): Period View and Strategic Diagram (Network andPerformance Measures Based on Words Analysis)
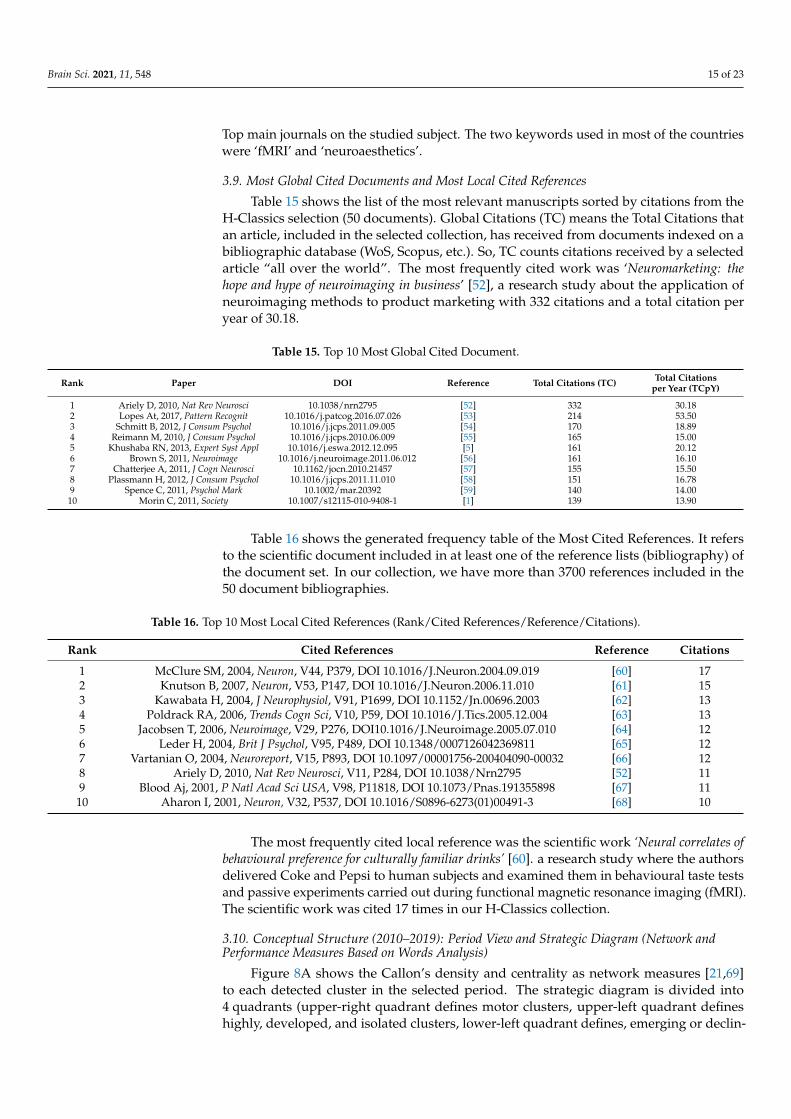
Figure 8A shows the Callon’s density and centrality as network measures [21,69]to each detected cluster in the selected period. The strategic diagram is divided into4 quadrants (upper-right quadrant defines motor clusters, upper-left quadrant defineshighly, developed, and isolated clusters, lower-left quadrant defines, emerging or declin-
Brain Sci. 2021, 11, 548 16 of 23
ing clusters and lower-right quadrant defines basic and transversal clusters). Callon’scentrality measures the degree of interaction of a network with other networks, and itcan be understood as the external cohesion of the network and Callon’s density measuresthe internal strength of the network, and it can be understood as the internal cohesionof the network. Figure 8B represents the strategic diagram during the period 2010–2019.Figure 8C shows the Quadrant distribution/Themes/Documents count. Figure 8D showsART cluster, (E) PREFRONTAL CORTEX cluster, (F) NEUROMARKETING cluster, and(G) EEG cluster. Were analyzed the two quadrants (upper-right and lower-left) that weconsidered essential and most interesting for the development of the research area:
Brain Sci. 2021, 11, x FOR PEER REVIEW 18 of 25
processes while participants undertook a choice task designed to elicit preferences for a product using EEG and eye-tracking.
Figure 8. (A) Callon’s density and centrality measures. (B) SciMAT Strategic Diagram (2010–2019).(C) Quadrants/Themes/CoreDocuments-Documents Count. (D) ART cluster, (E) PREFRONTALCORTEX cluster, (F) NEUROMARKETING cluster, and (G) EEG cluster.
Brain Sci. 2021, 11, 548 17 of 23
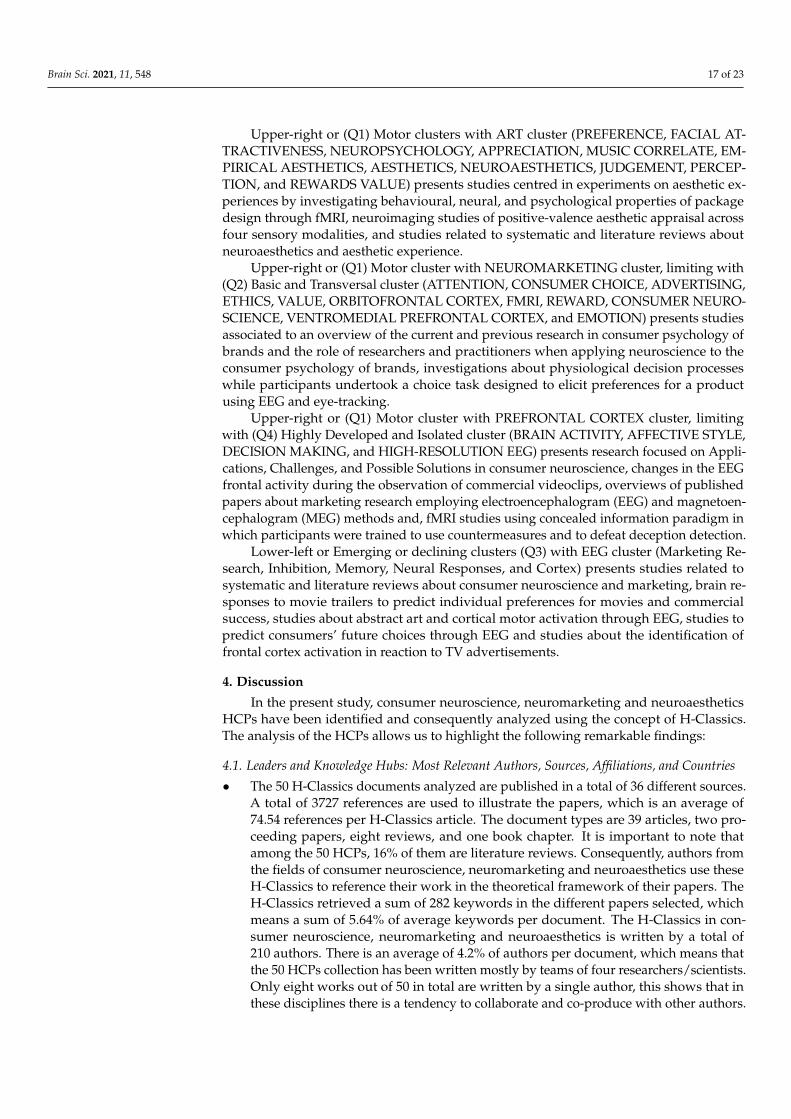
Upper-right or (Q1) Motor clusters with ART cluster (PREFERENCE, FACIAL AT-TRACTIVENESS, NEUROPSYCHOLOGY, APPRECIATION, MUSIC CORRELATE, EM-PIRICAL AESTHETICS, AESTHETICS, NEUROAESTHETICS, JUDGEMENT, PERCEP-TION, and REWARDS VALUE) presents studies centred in experiments on aesthetic ex-periences by investigating behavioural, neural, and psychological properties of packagedesign through fMRI, neuroimaging studies of positive-valence aesthetic appraisal acrossfour sensory modalities, and studies related to systematic and literature reviews aboutneuroaesthetics and aesthetic experience.
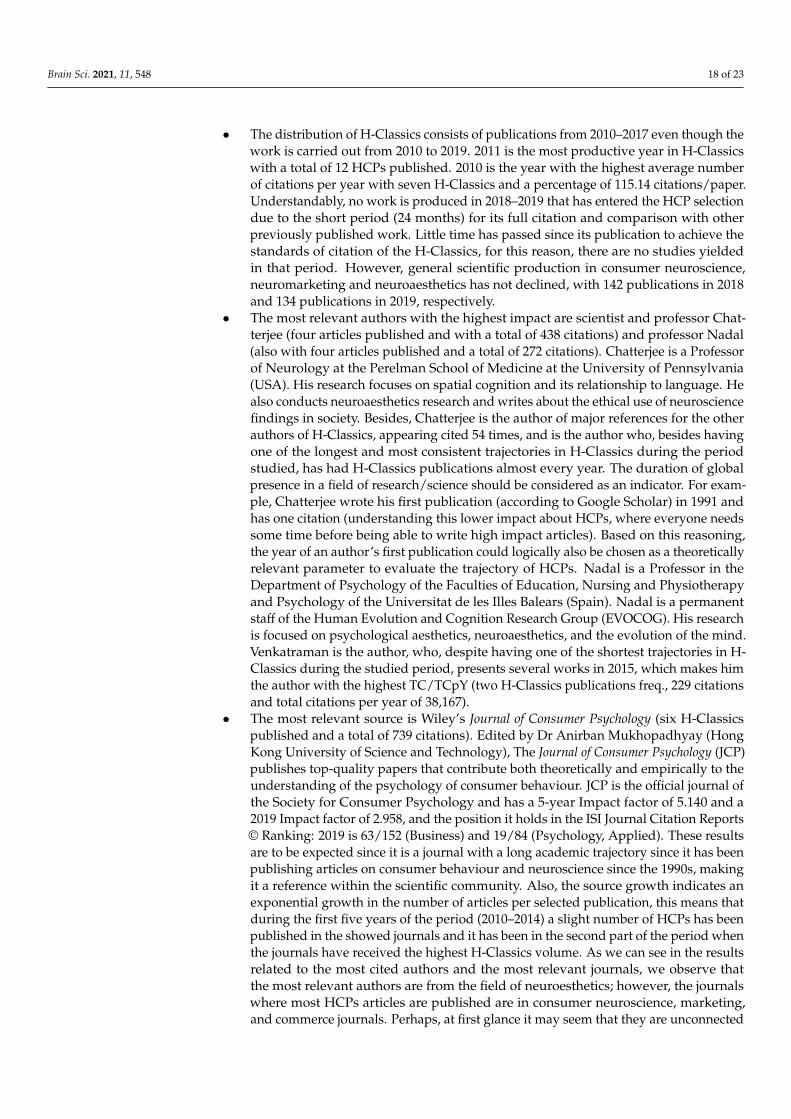
Upper-right or (Q1) Motor cluster with NEUROMARKETING cluster, limiting with(Q2) Basic and Transversal cluster (ATTENTION, CONSUMER CHOICE, ADVERTISING,ETHICS, VALUE, ORBITOFRONTAL CORTEX, FMRI, REWARD, CONSUMER NEURO-SCIENCE, VENTROMEDIAL PREFRONTAL CORTEX, and EMOTION) presents studiesassociated to an overview of the current and previous research in consumer psychology ofbrands and the role of researchers and practitioners when applying neuroscience to theconsumer psychology of brands, investigations about physiological decision processeswhile participants undertook a choice task designed to elicit preferences for a productusing EEG and eye-tracking.
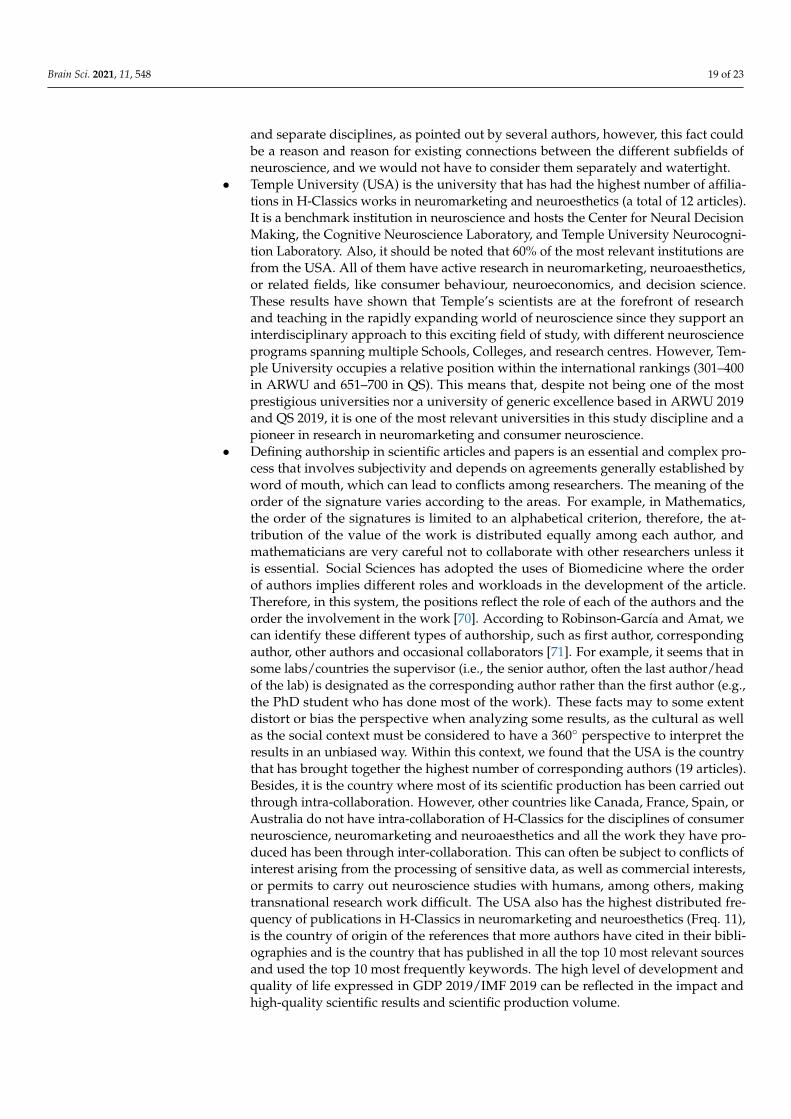
Upper-right or (Q1) Motor cluster with PREFRONTAL CORTEX cluster, limitingwith (Q4) Highly Developed and Isolated cluster (BRAIN ACTIVITY, AFFECTIVE STYLE,DECISION MAKING, and HIGH-RESOLUTION EEG) presents research focused on Appli-cations, Challenges, and Possible Solutions in consumer neuroscience, changes in the EEGfrontal activity during the observation of commercial videoclips, overviews of publishedpapers about marketing research employing electroencephalogram (EEG) and magnetoen-cephalogram (MEG) methods and, fMRI studies using concealed information paradigm inwhich participants were trained to use countermeasures and to defeat deception detection.
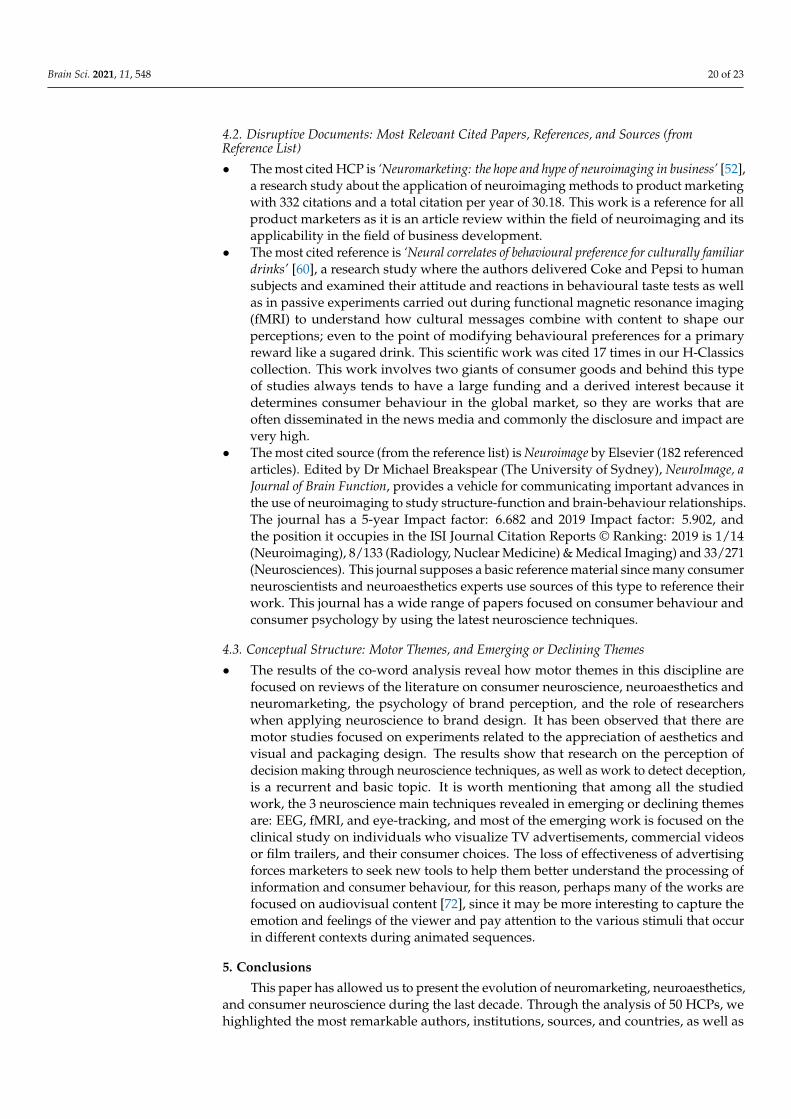
Lower-left or Emerging or declining clusters (Q3) with EEG cluster (Marketing Re-search, Inhibition, Memory, Neural Responses, and Cortex) presents studies related tosystematic and literature reviews about consumer neuroscience and marketing, brain re-sponses to movie trailers to predict individual preferences for movies and commercialsuccess, studies about abstract art and cortical motor activation through EEG, studies topredict consumers’ future choices through EEG and studies about the identification offrontal cortex activation in reaction to TV advertisements.
4. Discussion
In the present study, consumer neuroscience, neuromarketing and neuroaestheticsHCPs have been identified and consequently analyzed using the concept of H-Classics.The analysis of the HCPs allows us to highlight the following remarkable findings:
4.1. Leaders and Knowledge Hubs: Most Relevant Authors, Sources, Affiliations, and Countries
• The 50 H-Classics documents analyzed are published in a total of 36 different sources.A total of 3727 references are used to illustrate the papers, which is an average of74.54 references per H-Classics article. The document types are 39 articles, two pro-ceeding papers, eight reviews, and one book chapter. It is important to note thatamong the 50 HCPs, 16% of them are literature reviews. Consequently, authors fromthe fields of consumer neuroscience, neuromarketing and neuroaesthetics use theseH-Classics to reference their work in the theoretical framework of their papers. TheH-Classics retrieved a sum of 282 keywords in the different papers selected, whichmeans a sum of 5.64% of average keywords per document. The H-Classics in con-sumer neuroscience, neuromarketing and neuroaesthetics is written by a total of210 authors. There is an average of 4.2% of authors per document, which means thatthe 50 HCPs collection has been written mostly by teams of four researchers/scientists.Only eight works out of 50 in total are written by a single author, this shows that inthese disciplines there is a tendency to collaborate and co-produce with other authors.
Brain Sci. 2021, 11, 548 18 of 23
• The distribution of H-Classics consists of publications from 2010–2017 even though thework is carried out from 2010 to 2019. 2011 is the most productive year in H-Classicswith a total of 12 HCPs published. 2010 is the year with the highest average numberof citations per year with seven H-Classics and a percentage of 115.14 citations/paper.Understandably, no work is produced in 2018–2019 that has entered the HCP selectiondue to the short period (24 months) for its full citation and comparison with otherpreviously published work. Little time has passed since its publication to achieve thestandards of citation of the H-Classics, for this reason, there are no studies yieldedin that period. However, general scientific production in consumer neuroscience,neuromarketing and neuroaesthetics has not declined, with 142 publications in 2018and 134 publications in 2019, respectively.
• The most relevant authors with the highest impact are scientist and professor Chat-terjee (four articles published and with a total of 438 citations) and professor Nadal(also with four articles published and a total of 272 citations). Chatterjee is a Professorof Neurology at the Perelman School of Medicine at the University of Pennsylvania(USA). His research focuses on spatial cognition and its relationship to language. Healso conducts neuroaesthetics research and writes about the ethical use of neurosciencefindings in society. Besides, Chatterjee is the author of major references for the otherauthors of H-Classics, appearing cited 54 times, and is the author who, besides havingone of the longest and most consistent trajectories in H-Classics during the periodstudied, has had H-Classics publications almost every year. The duration of globalpresence in a field of research/science should be considered as an indicator. For exam-ple, Chatterjee wrote his first publication (according to Google Scholar) in 1991 andhas one citation (understanding this lower impact about HCPs, where everyone needssome time before being able to write high impact articles). Based on this reasoning,the year of an author’s first publication could logically also be chosen as a theoreticallyrelevant parameter to evaluate the trajectory of HCPs. Nadal is a Professor in theDepartment of Psychology of the Faculties of Education, Nursing and Physiotherapyand Psychology of the Universitat de les Illes Balears (Spain). Nadal is a permanentstaff of the Human Evolution and Cognition Research Group (EVOCOG). His researchis focused on psychological aesthetics, neuroaesthetics, and the evolution of the mind.Venkatraman is the author, who, despite having one of the shortest trajectories in H-Classics during the studied period, presents several works in 2015, which makes himthe author with the highest TC/TCpY (two H-Classics publications freq., 229 citationsand total citations per year of 38,167).
• The most relevant source is Wiley’s Journal of Consumer Psychology (six H-Classicspublished and a total of 739 citations). Edited by Dr Anirban Mukhopadhyay (HongKong University of Science and Technology), The Journal of Consumer Psychology (JCP)publishes top-quality papers that contribute both theoretically and empirically to theunderstanding of the psychology of consumer behaviour. JCP is the official journal ofthe Society for Consumer Psychology and has a 5-year Impact factor of 5.140 and a2019 Impact factor of 2.958, and the position it holds in the ISI Journal Citation Reports© Ranking: 2019 is 63/152 (Business) and 19/84 (Psychology, Applied). These resultsare to be expected since it is a journal with a long academic trajectory since it has beenpublishing articles on consumer behaviour and neuroscience since the 1990s, makingit a reference within the scientific community. Also, the source growth indicates anexponential growth in the number of articles per selected publication, this means thatduring the first five years of the period (2010–2014) a slight number of HCPs has beenpublished in the showed journals and it has been in the second part of the period whenthe journals have received the highest H-Classics volume. As we can see in the resultsrelated to the most cited authors and the most relevant journals, we observe thatthe most relevant authors are from the field of neuroesthetics; however, the journalswhere most HCPs articles are published are in consumer neuroscience, marketing,and commerce journals. Perhaps, at first glance it may seem that they are unconnected
Brain Sci. 2021, 11, 548 19 of 23
and separate disciplines, as pointed out by several authors, however, this fact couldbe a reason and reason for existing connections between the different subfields ofneuroscience, and we would not have to consider them separately and watertight.
• Temple University (USA) is the university that has had the highest number of affilia-tions in H-Classics works in neuromarketing and neuroesthetics (a total of 12 articles).It is a benchmark institution in neuroscience and hosts the Center for Neural DecisionMaking, the Cognitive Neuroscience Laboratory, and Temple University Neurocogni-tion Laboratory. Also, it should be noted that 60% of the most relevant institutions arefrom the USA. All of them have active research in neuromarketing, neuroaesthetics,or related fields, like consumer behaviour, neuroeconomics, and decision science.These results have shown that Temple’s scientists are at the forefront of researchand teaching in the rapidly expanding world of neuroscience since they support aninterdisciplinary approach to this exciting field of study, with different neuroscienceprograms spanning multiple Schools, Colleges, and research centres. However, Tem-ple University occupies a relative position within the international rankings (301–400in ARWU and 651–700 in QS). This means that, despite not being one of the mostprestigious universities nor a university of generic excellence based in ARWU 2019and QS 2019, it is one of the most relevant universities in this study discipline and apioneer in research in neuromarketing and consumer neuroscience.
• Defining authorship in scientific articles and papers is an essential and complex pro-cess that involves subjectivity and depends on agreements generally established byword of mouth, which can lead to conflicts among researchers. The meaning of theorder of the signature varies according to the areas. For example, in Mathematics,the order of the signatures is limited to an alphabetical criterion, therefore, the at-tribution of the value of the work is distributed equally among each author, andmathematicians are very careful not to collaborate with other researchers unless itis essential. Social Sciences has adopted the uses of Biomedicine where the orderof authors implies different roles and workloads in the development of the article.Therefore, in this system, the positions reflect the role of each of the authors and theorder the involvement in the work [70]. According to Robinson-García and Amat, wecan identify these different types of authorship, such as first author, correspondingauthor, other authors and occasional collaborators [71]. For example, it seems that insome labs/countries the supervisor (i.e., the senior author, often the last author/headof the lab) is designated as the corresponding author rather than the first author (e.g.,the PhD student who has done most of the work). These facts may to some extentdistort or bias the perspective when analyzing some results, as the cultural as wellas the social context must be considered to have a 360◦ perspective to interpret theresults in an unbiased way. Within this context, we found that the USA is the countrythat has brought together the highest number of corresponding authors (19 articles).Besides, it is the country where most of its scientific production has been carried outthrough intra-collaboration. However, other countries like Canada, France, Spain, orAustralia do not have intra-collaboration of H-Classics for the disciplines of consumerneuroscience, neuromarketing and neuroaesthetics and all the work they have pro-duced has been through inter-collaboration. This can often be subject to conflicts ofinterest arising from the processing of sensitive data, as well as commercial interests,or permits to carry out neuroscience studies with humans, among others, makingtransnational research work difficult. The USA also has the highest distributed fre-quency of publications in H-Classics in neuromarketing and neuroesthetics (Freq. 11),is the country of origin of the references that more authors have cited in their bibli-ographies and is the country that has published in all the top 10 most relevant sourcesand used the top 10 most frequently keywords. The high level of development andquality of life expressed in GDP 2019/IMF 2019 can be reflected in the impact andhigh-quality scientific results and scientific production volume.
Brain Sci. 2021, 11, 548 20 of 23
4.2. Disruptive Documents: Most Relevant Cited Papers, References, and Sources (fromReference List)
• The most cited HCP is ‘Neuromarketing: the hope and hype of neuroimaging in business’ [52],a research study about the application of neuroimaging methods to product marketingwith 332 citations and a total citation per year of 30.18. This work is a reference for allproduct marketers as it is an article review within the field of neuroimaging and itsapplicability in the field of business development.
• The most cited reference is ‘Neural correlates of behavioural preference for culturally familiardrinks’ [60], a research study where the authors delivered Coke and Pepsi to humansubjects and examined their attitude and reactions in behavioural taste tests as wellas in passive experiments carried out during functional magnetic resonance imaging(fMRI) to understand how cultural messages combine with content to shape ourperceptions; even to the point of modifying behavioural preferences for a primaryreward like a sugared drink. This scientific work was cited 17 times in our H-Classicscollection. This work involves two giants of consumer goods and behind this typeof studies always tends to have a large funding and a derived interest because itdetermines consumer behaviour in the global market, so they are works that areoften disseminated in the news media and commonly the disclosure and impact arevery high.
• The most cited source (from the reference list) is Neuroimage by Elsevier (182 referencedarticles). Edited by Dr Michael Breakspear (The University of Sydney), NeuroImage, aJournal of Brain Function, provides a vehicle for communicating important advances inthe use of neuroimaging to study structure-function and brain-behaviour relationships.The journal has a 5-year Impact factor: 6.682 and 2019 Impact factor: 5.902, andthe position it occupies in the ISI Journal Citation Reports © Ranking: 2019 is 1/14(Neuroimaging), 8/133 (Radiology, Nuclear Medicine) & Medical Imaging) and 33/271(Neurosciences). This journal supposes a basic reference material since many consumerneuroscientists and neuroaesthetics experts use sources of this type to reference theirwork. This journal has a wide range of papers focused on consumer behaviour andconsumer psychology by using the latest neuroscience techniques.
4.3. Conceptual Structure: Motor Themes, and Emerging or Declining Themes
• The results of the co-word analysis reveal how motor themes in this discipline arefocused on reviews of the literature on consumer neuroscience, neuroaesthetics andneuromarketing, the psychology of brand perception, and the role of researcherswhen applying neuroscience to brand design. It has been observed that there aremotor studies focused on experiments related to the appreciation of aesthetics andvisual and packaging design. The results show that research on the perception ofdecision making through neuroscience techniques, as well as work to detect deception,is a recurrent and basic topic. It is worth mentioning that among all the studiedwork, the 3 neuroscience main techniques revealed in emerging or declining themesare: EEG, fMRI, and eye-tracking, and most of the emerging work is focused on theclinical study on individuals who visualize TV advertisements, commercial videosor film trailers, and their consumer choices. The loss of effectiveness of advertisingforces marketers to seek new tools to help them better understand the processing ofinformation and consumer behaviour, for this reason, perhaps many of the works arefocused on audiovisual content [72], since it may be more interesting to capture theemotion and feelings of the viewer and pay attention to the various stimuli that occurin different contexts during animated sequences.
5. Conclusions
This paper has allowed us to present the evolution of neuromarketing, neuroaesthetics,and consumer neuroscience during the last decade. Through the analysis of 50 HCPs, wehighlighted the most remarkable authors, institutions, sources, and countries, as well as
Brain Sci. 2021, 11, 548 21 of 23
the most relevant documents, references, and driving forces or emerging or decliningissues. The applicability and practicality of the present study should be remarked since itis a sample of information that is relevant to help understand and identify the academicnetwork, composition, and structure of the past and present in the field of neuromarketing,and neuroaesthetics. This work acts as a frame of reference or a common indicator forpeople interested in the field of neuroesthetics, consumer neuroscience and neuromarketingwhen it comes to know with whom to research with, where to research, where to publish,which groups to collaborate with or what trends to research on, among others. This workenables new future research lines such as studying the impact of neuromarketing, andneuroaesthetics research development through other bibliometric indicators, measuringnational and international scientific collaboration as well as future work centred within thecurrent scientific production through the analysis of altmetrics [73] to evaluate the impactof the research work in the digital media ecosystems.
Author Contributions: Conceptualization, P.S.-N.; methodology, P.S.-N. and M.J.C.; software, P.S.-N.and M.J.C.; validation, P.S.-N.; formal analysis, P.S.-N.; investigation, P.S.-N.; resources, M.J.C. andE.H.-V.; data curation, P.S.-N.; writing—original draft preparation, P.S.-N.; writing—review andediting, P.S.-N. and G.V.; visualization, P.S.-N.; supervision, M.J.C., G.V., E.H.-V. and J.I.P.; projectadministration, J.I.P.; funding acquisition, J.I.P. All authors have read and agreed to the publishedversion of the manuscript.
Funding: This work was supported by the Programa Operativo FEDER Andalucía 2014–2020 underGrant UMA 18-FEDERJA-148.
Institutional Review Board Statement: Not applicable.
Informed Consent Statement: Not applicable.
Data Availability Statement: The data presented in this study are openly available in the Zenodorepository at https://doi.org/10.5281/zenodo.4684621 (accessed on 13 April 2021).
Conflicts of Interest: The authors declare no conflict of interest. The funders had no role in the designof the study; in the collection, analyses, or interpretation of data; in the writing of the manuscript, orin the decision to publish the results.
References1. Morin, C. Neuromarketing: The New Science of Consumer Behavior. Society 2011, 48, 131–135. [CrossRef]2. Croft, J. The Challenges of Interdisciplinary Epistemology in Neuroaesthetics. Mind Brain Educ. 2011, 5, 5–11. [CrossRef]3. Sánchez-Fernández, J.; Casado-Aranda, L.-A.; Bastidas-Manzano, A.-B. Consumer Neuroscience Techniques in Advertising
Research: A Bibliometric Citation Analysis. Sustainability 2021, 13, 1589. [CrossRef]4. Mañas-Viniegra, L.; Núñez-Gómez, P.; Tur-Viñes, V. Neuromarketing as a strategic tool for predicting how Instagramers have an
influence on the personal identity of adolescents and young people in Spain. Heliyon 2020, 6, e03578. [CrossRef]5. Khushaba, R.N.; Wise, C.; Kodagoda, S.; Louviere, J.; Kahn, B.E.; Townsend, C. Consumer neuroscience: Assessing the brain
response to marketing stimuli using electroencephalogram (EEG) and eye tracking. Expert Syst. Appl. 2013, 40, 3803–3812.[CrossRef]
6. Hsu, L.; Chen, Y.-J. Neuromarketing, Subliminal Advertising, and Hotel Selection: An EEG Study. Australas. Mark. J. 2020,28, 200–208. [CrossRef]
7. Iigaya, K.; O’Doherty, J.P.; Starr, G.G. Progress and Promise in Neuroaesthetics. Neuron 2020, 108, 594–596. [CrossRef]8. Conway, B.R.; Rehding, A. Neuroaesthetics and the Trouble with Beauty. PLoS Biol. 2013, 11, e1001504. [CrossRef] [PubMed]9. Sanchez-Nunez, P.; Cobo, M.J.; Las Heras-Pedrosa, C.D.; Pelaez, J.I.; Herrera-Viedma, E.; de las Heras-Pedrosa, C.; Pelaez, J.I.;
Herrera-Viedma, E. Opinion Mining, Sentiment Analysis and Emotion Understanding in Advertising: A Bibliometric Analysis.IEEE Access 2020, 8, 134563–134576. [CrossRef]
10. Lee, N.; Broderick, A.J.; Chamberlain, L. What is ‘neuromarketing’? A discussion and agenda for future research.Int. J. Psychophysiol. 2007, 63, 199–204. [CrossRef] [PubMed]
11. Pearce, M.T.; Zaidel, D.W.; Vartanian, O.; Skov, M.; Leder, H.; Chatterjee, A.; Nadal, M. Neuroaesthetics: The CognitiveNeuroscience of Aesthetic Experience. Perspect. Psychol. Sci. 2016, 11, 265–279. [CrossRef] [PubMed]
12. Fortunato, V.C.R.; Giraldi, J.D.M.E.; De Oliveira, J.H.C. A Review of Studies on Neuromarketing: Practical Results, Techniques,Contributions and Limitations. J. Manag. Res. 2014, 6, 201. [CrossRef]
13. Ferrer, G.G. A Neuroaesthetic Approach to the Search of Beauty From the Consumer’s Perspective. In Encyclopedia of InformationScience and Technology, 4th ed.; IGI Global: Hershey, PA, USA, 2018; pp. 5767–5774.
Brain Sci. 2021, 11, 548 22 of 23
14. Wang, Y.J.; Cruthirds, K.W.; Axinn, C.N.; Guo, C. In search of aesthetics in consumer marketing: An examination of aestheticstimuli from the philosophy of art and the psychology of art. Acad. Mark. Stud. J. 2013, 17, 37–56.
15. Skov, M.; Nadal, M. A Farewell to Art: Aesthetics as a Topic in Psychology and Neuroscience. Perspect. Psychol. Sci. 2020,15, 630–642. [CrossRef] [PubMed]
16. Martínez, M.A.; Herrera, M.; López-Gijón, J.; Herrera-Viedma, E. H-Classics: Characterizing the concept of citation classicsthrough H-index. Scientometrics 2014, 98, 1971–1983. [CrossRef]
17. Garfield, E. Introducing Citation Classics: The Human Side of Scientific Reports. Essays Inf. Sci. 1977, 3, 1–2.18. Hirsch, J.E. An index to quantify an individual’s scientific research output. Proc. Natl. Acad. Sci. USA 2005, 102, 16569–16572.
[CrossRef]19. Esfahani, H.; Tavasoli, K.; Jabbarzadeh, A. Big data and social media: A scientometrics analysis. Int. J. Data Netw. Sci. 2019,
145–164. [CrossRef]20. VanderWaal, K.; Deen, J. Global trends in infectious diseases of swine. Proc. Natl. Acad. Sci. USA 2018, 115, 11495–11500.
[CrossRef]21. Cobo, M.J.J.; López-Herrera, A.G.G.; Herrera-Viedma, E.; Herrera, F. SciMAT: A new science mapping analysis software tool.
J. Am. Soc. Inf. Sci. Technol. 2012, 63, 1609–1630. [CrossRef]22. Cobo, M.J.; López-Herrera, A.G.; Herrera-Viedma, E.; Herrera, F. An approach for detecting, quantifying, and visualizing the
evolution of a research field: A practical application to the Fuzzy Sets Theory field. J. Informetr. 2011, 5, 146–166. [CrossRef]23. Burrell, Q.L. On the h-index, the size of the Hirsch core and Jin’s A-index. J. Informetr. 2007, 1, 170–177. [CrossRef]24. Rousseau, R. New Developments Related to the Hirsch Index. Ind. Sci. Technol. Belg. 2006. Available online: http://eprints.rclis.
org/7616/1/Hirsch_new_developments.pdf (accessed on 27 April 2021).25. Rousseau, R. Robert Fairthorne and the empirical power laws. J. Doc. 2005, 61, 194–202. [CrossRef]26. Smith, D. Ten citation classics from the New Zealand medical journal. N. Z. Med. J. 2007, 120, 2871–2875.27. Stack, S. Citation classics in suicide and life threatening behavior: A research note. Suicide Life Threat. Behav. 2012, 42, 628–639.
[CrossRef]28. Cobo, M.J.; Martínez, M.A.; Gutiérrez-Salcedo, M.; Herrera, M.; Herrera-Viedma, E. Identifying Citation Classics in Fuzzy
Decision Making Field Using the Concept of H-Classics. Procedia Comput. Sci. 2014, 31, 567–576. [CrossRef]29. De la Flor-Martínez, M.; Galindo-Moreno, P.; Sánchez-Fernández, E.; Piattelli, A.; Cobo, M.J.; Herrera-Viedma, E. H-classic: A new
method to identify classic articles in Implant Dentistry, Periodontics, and Oral Surgery. Clin. Oral Implant Res. 2016, 27, 1317–1330.[CrossRef]
30. Perez-Cabezas, V.; Ruiz-Molinero, C.; Carmona-Barrientos, I.; Herrera-Viedma, E.; Cobo, M.J.; Moral-Munoz, J.A. Highly citedpapers in rheumatology: Identification and conceptual analysis. Scientometrics 2018, 116, 555–568. [CrossRef]
31. Di Zeo-Sánchez, D.E.; Sánchez-Núñez, P.; Stephens, C.; Lucena, M.I. Characterizing Highly Cited Papers in Mass Cytometrythrough H-Classics. Biology 2021, 10, 104. [CrossRef]
32. Moral-Munoz, J.A.; Cobo, M.J.; Chiclana, F.; Collop, A.; Herrera-Viedma, E. Analyzing Highly Cited Papers in IntelligentTransportation Systems. IEEE Trans. Intell. Transp. Syst. 2016, 17, 993–1001. [CrossRef]
33. Martínez, M.A.; Herrera, M.; Contreras, E.; Ruíz, A.; Herrera-Viedma, E. Characterizing highly cited papers in Social Workthrough H-Classics. Scientometrics 2015, 102, 1713–1729. [CrossRef]
34. Cabrerizo, F.J.; Martínez, M.A.; Cobo, M.J.; Lázaro-Rodríguez, P.; López-Gijón, J.; Herrera-Viedma, E. Aggregation operators ingroup decision making: Identifying citation classics via H-classics. Procedia Comput. Sci. 2017, 122, 902–909. [CrossRef]
35. Sánchez-Núñez, P.; Cobo, M.J.; Vaccaro, G.; Peláez, J.I.; Herrera-Viedma, E. Citation Classics in Consumer Neuroscience,Neuromarketing and Neuroaesthetics: Identification and Conceptual Analysis (Citation Report and WoS Dataset). Zenodo 2021.[CrossRef]
36. Aria, M.; Cuccurullo, C. bibliometrix: An R-tool for comprehensive science mapping analysis. J. Informetr. 2017, 11, 959–975.[CrossRef]
37. Bond, M.; Zawacki-Richter, O.; Nichols, M. Revisiting five decades of educational technology research: A content and authorshipanalysis of the British Journal of Educational Technology. Br. J. Educ. Technol. 2019, 50, 12–63. [CrossRef]
38. Cascón-Katchadourian, J.; Moral-Munoz, J.A.; Liao, H.; Cobo, M.J. Análisis bibliométrico de la Revista Española de Docu-mentación Científica desde su inclusión en la Web of Science (2008–2018). Rev. Española Doc. Científica 2020, 43, 267. [CrossRef]
39. Herrera-Viedma, E.; López-Robles, J.-R.; Guallar, J.; Cobo, M.-J. Global trends in coronavirus research at the time of Covid-19: Ageneral bibliometric approach and content analysis using SciMAT. El Prof. la Inf. 2020, 29. [CrossRef]
40. Rincon-Patino, J.; Ramirez-Gonzalez, G.; Corrales, J.C. Exploring machine learning: A bibliometric general approach usingSciMAT. F1000Research 2018, 7, 1210. [CrossRef]
41. Koseoglu, M.A. Mapping the institutional collaboration network of strategic management research: 1980–2014. Scientometrics2016, 109, 203–226. [CrossRef]
42. Egghe, L. Theory and practise of the g-index. Scientometrics 2006, 69, 131–152. [CrossRef]43. Bornmann, L.; Mutz, R.; Daniel, H.-D. Are there better indices for evaluation purposes than the h index? A comparison of nine
different variants of theh index using data from biomedicine. J. Am. Soc. Inf. Sci. Technol. 2008, 59, 830–837. [CrossRef]44. Alonso, S.; Cabrerizo, F.J.; Herrera-Viedma, E.; Herrera, F. h-Index: A review focused in its variants, computation and standard-
ization for different scientific fields. J. Informetr. 2009, 3, 273–289. [CrossRef]
Brain Sci. 2021, 11, 548 23 of 23
45. Jacoby, W.G. Loess: A nonparametric, graphical tool for depicting relationships between variables. Elect. Stud. 2020, 19, 577–613.[CrossRef]
46. Consulting, S. ARWU Academic Ranking of World Universities. 2019. Available online: http://www.shanghairanking.com/arwu2019.html (accessed on 4 December 2020).
47. Symonds, Q. Quacquarelli Symonds QS World University Rankings. 2019. Available online: https://www.topuniversities.com/university-rankings/world-university-rankings/2019 (accessed on 4 December 2020).
48. Bank, T.W. The World Bank Annual Report 2020. Available online: https://www.worldbank.org/en/about/annual-report(accessed on 4 December 2020).
49. Callen, T. Gross Domestic Product: An Economy’s All; International Monetary Fund: Washington, DC, USA, 2012.50. IMF International Monetary Fund (IMF). World Economic Outlook Database. Available online: https://www.imf.org/en/
Publications/WEO/weo-database/2020/October/ (accessed on 4 December 2020).51. Schmidt, M. The Sankey Diagram in Energy and Material Flow Management. J. Ind. Ecol. 2008, 12, 82–94. [CrossRef]52. Ariely, D.; Berns, G.S. Neuromarketing: The hope and hype of neuroimaging in business. Nat. Rev. Neurosci. 2010, 11, 284–292.
[CrossRef]53. Lopes, A.T.; de Aguiar, E.; De Souza, A.F.; Oliveira-Santos, T. Facial expression recognition with Convolutional Neural Networks:
Coping with few data and the training sample order. Pattern Recognit. 2017, 61, 610–628. [CrossRef]54. Schmitt, B. The consumer psychology of brands. J. Consum. Psychol. 2012, 22, 7–17. [CrossRef]55. Reimann, M.; Zaichkowsky, J.; Neuhaus, C.; Bender, T.; Weber, B. Aesthetic package design: A behavioral, neural, and psychologi-
cal investigation. J. Consum. Psychol. 2010, 20, 431–441. [CrossRef]56. Brown, S.; Gao, X.; Tisdelle, L.; Eickhoff, S.B.; Liotti, M. Naturalizing aesthetics: Brain areas for aesthetic appraisal across sensory
modalities. Neuroimage 2011, 58, 250–258. [CrossRef]57. Chatterjee, A. Neuroaesthetics: A Coming of Age Story. J. Cogn. Neurosci. 2011, 23, 53–62. [CrossRef]58. Plassmann, H.; Ramsøy, T.Z.; Milosavljevic, M. Branding the brain: A critical review and outlook. J. Consum. Psychol. 2012,
22, 18–36. [CrossRef]59. Spence, C.; Gallace, A. Multisensory design: Reaching out to touch the consumer. Psychol. Mark. 2011, 28, 267–308. [CrossRef]60. McClure, S.M.; Li, J.; Tomlin, D.; Cypert, K.S.; Montague, L.M.; Montague, P.R. Neural Correlates of Behavioral Preference for
Culturally Familiar Drinks. Neuron 2004, 44, 379–387. [CrossRef] [PubMed]61. Knutson, B.; Rick, S.; Wimmer, G.E.; Prelec, D.; Loewenstein, G. Neural Predictors of Purchases. Neuron 2007, 53, 147–156.
[CrossRef] [PubMed]62. Kawabata, H.; Zeki, S. Neural Correlates of Beauty. J. Neurophysiol. 2004, 91, 1699–1705. [CrossRef]63. Poldrack, R.A. Can cognitive processes be inferred from neuroimaging data? Trends Cogn. Sci. 2006, 10, 59–63. [CrossRef]
[PubMed]64. Jacobsen, T.; Schubotz, R.I.; Höfel, L.; Cramon, D.Y.V. Brain correlates of aesthetic judgment of beauty. Neuroimage 2006,
29, 276–285. [CrossRef] [PubMed]65. Leder, H.; Belke, B.; Oeberst, A.; Augustin, D. A model of aesthetic appreciation and aesthetic judgments. Br. J. Psychol. 2004,
95, 489–508. [CrossRef]66. Vartanian, O.; Goel, V. Neuroanatomical correlates of aesthetic preference for paintings. Neuroreport 2004, 15, 893–897. [CrossRef]
[PubMed]67. Blood, A.J.; Zatorre, R.J. Intensely pleasurable responses to music correlate with activity in brain regions implicated in reward
and emotion. Proc. Natl. Acad. Sci. USA 2001, 98, 11818–11823. [CrossRef] [PubMed]68. Aharon, I.; Etcoff, N.; Ariely, D.; Chabris, C.F.; O’Connor, E.; Breiter, H.C. Beautiful Faces Have Variable Reward Value. Neuron
2001, 32, 537–551. [CrossRef]69. Callon, M.; Courtial, J.P.; Laville, F. Co-word analysis as a tool for describing the network of interactions between basic and
technological research: The case of polymer chemsitry. Scientometrics 1991, 22, 155–205. [CrossRef]70. Erlen, J.A.; Siminoff, L.A.; Sereika, S.M.; Sutton, L.B. Multiple authorship: Issues and recommendations. J. Prof. Nurs. 1997,
13, 262–270. [CrossRef]71. Robinson-Garcia, N.; Amat, C.B. ¿Tiene sentido limitar la coautoría científica? No existe inflación de autores en Ciencias Sociales
y Educación en España. Rev. Española Doc. Científica 2018, 41, 201. [CrossRef]72. Baraybar-Fernández, A.; Baños-González, M.; Barquero-Pérez, Ó.; Goya-Esteban, R.; Morena-Gómez, A. Evaluación de las
respuestas emocionales a la publicidad televisiva desde el Neuromarketing. Comun. Rev. Científica Iberoam. Comun. Y Educ. 2017,25, 19–28. [CrossRef]
73. Torres-Salinas, D.; Cabezas-Clavijo, A.; Jimenez-Contreras, E. Altmetrics: New indicators for scientific communication in Web 2.0.Comunicar 2015, 2013, 1–9. [CrossRef]


