Embed Size (px)
Citation preview

arX
iv:a
stro
-ph/
9807
075v
2 2
Sep
199
8
submitted to The Astrophysical Journal Letters on June 25, 1998
Circumnuclear Keplerian Disks in Galaxies1
F. Bertola2, M. Cappellari2, J.G. Funes, S.J.2,
E.M. Corsini2, A. Pizzella3 & J.C. Vega Beltran4
ABSTRACT
In this paper we demonstrate the possibility of inferring the presence of Keplerian
gaseous disks using optical ground-based telescopes properly equipped.
We have modeled the peculiar bidimensional shape of the emission lines in a sample
of five S0-Sa galaxies as due to the motion of a gaseous disk rotating in the combined
potential of a central point-like mass and of an extended stellar disk. The value of
the central mass concentration estimated for four galaxies of the sample (NGC 2179,
NGC 4343, NGC 4435 and NGC 4459) is ∼ 109 M⊙. For the remaining galaxy
NGC 5064 an upper limit of 5 × 10⁷ M⊙ is estimated.
Subject headings: black hole physics — galaxies: kinematics and dynamics — galaxies:
nuclei — galaxies: structure
1Based on observations carried out at ESO, La Silla, (Chile) (ESO N. 58, A-0564), and at the Mt. Graham
International Observatory (Arizona) with the VATT: the Alice P. Lennon Telescope and the Thomas J. Bannan
Astrophysics Facility.
2Dipartimento di Astronomia, Universita di Padova, Vicolo dell’Osservatorio 5, I-35122 Padova, Italy
3European Southern Observatory, Alonso de Cordova 3107, Casilla 19001, Santiago 10, Chile
4Telescopio Nazionale Galileo, Osservatorio Astronomico di Padova, Vicolo dell’Osservatorio 5, I-35122 Padova,
Italy
– 2 –
1. Introduction
There is an increasing evidence of conspicuous mass concentrations in the center of galaxies,
lending support to the idea that their central engine is constituted by a black hole (see Kormendy
& Richstone 1995, Ho 1998 for recent reviews). This evidence comes both from stellar and gaseous
dynamics. In this latter case the mass concentration is deduced by the observation of an increase
towards the center of the rotation velocity of the gaseous disk, according to the Kepler’s third
law. Seven circumnuclear Keplerian disks (hereafter CNKD) have been up to now observed: four
have been discovered in elliptical galaxies using the high resolution capability of the Hubble Space
Telescope (HST) (Ferrarese et al. 1996, Macchetto et al. 1997, Bower et al. 1998, van der Marel &
van den Bosch 1998), while three were detected in spirals with Very Long Baseline Interferometry
(VLBI) and Very Long Baseline Array (VLBA) observations of maser sources (Miyoshi et al.
1995, Greenhill & Gwinn 1997, Greenhill, Moran & Herrnstein 1997).
In a program aimed to study with high spatial and spectral resolution the structure of the
emission lines in the nuclear regions of early-type disk galaxies, we have obtained with the 3.6-m
telescope at La Silla major axis spectra of the Sa galaxies NGC 2179 and NGC 5064. In the first
case it is possible to recognize, applying our modeling technique, the kinematical behavior typical
of a CNKD while the second represents a limiting case for its detection with our instrumental
setup. In addition we apply our modeling to three early-type disk galaxies (NGC 4343, NGC 4435
and NGC 4459) observed by Rubin, Kenney & Young (1997), showing that also in these cases the
shape of the emission lines is consistent with the presence of CNKDs. In this way we demonstrate
the feasibility of detecting CNKDs with optical ground-based telescopes. The general data on the
galaxies studied are given in Table 1.
2. Observations and data reduction
The spectroscopic observations of NGC 2179 and NGC 5064 were carried out at the
3.6-m ESO Telescope in La Silla on February 3-4, 1997. The telescope was equipped with the
Cassegrain Echelle Spectrograph mounting the Long Camera in long-slit configuration without
the crossdisperser. The 31.6 lines mm−1 grating was used in combination with a 1.′′3×2.′4 slit.
The spectral order #86 (λc = 6617 A) corresponding to the redshifted Hα region was isolated
by means of the narrow-band 6630/51 A filter. It yielded a wavelength coverage of about 78 A
between 6593 A and 6670 A with a reciprocal dispersion of 3.17 A mm−1. The adopted detector
was the No. 37 1024×1024 TK1024AB CCD with a 24×24 µm2 pixel size. No on-chip binning
was applied and each pixel corresponds to 0.076 A×0.′′33.
We took for NGC 2179 and NGC 5064 six and four separate major-axis spectra (P.A. =
170◦ and P.A. = 38◦ respectively) centered on the nucleus for a total exposure time of 360 and
240 minutes respectively. The galaxies were centered on the slit using the guiding camera at the
beginning of each exposure. Comparison thorium-argon lamp exposures were obtained before
– 3 –
and after each object integration. The value of the seeing FWHM during the observing nights
was between 0.′′8 and 1.′′2 as measured by the La Silla Differential Image Motion Monitor. Using
standard MIDAS routines the spectra were bias subtracted, flat-field corrected, cleaned for cosmic
rays and wavelength calibrated. Cosmic rays were identified by comparing the counts in each
pixel with the local mean and standard deviation, and then corrected by substituting a suitable
value. The instrumental resolution was derived by measuring the FWHM of ∼ 30 single emission
lines distributed all over the spectral range of a calibrated comparison spectrum. It corresponds
to a FWHM = 0.233 ± 0.017 A (i.e. ∼ 11 km s−1 at Hα). The single spectra of the same object
were aligned and coadded using their stellar-continuum centers as reference. In each spectrum the
center of the galaxy was defined by the center of a Gaussian fit to the radial profile of the stellar
continuum. The contribution of the sky was determined from the edges of the resulting frame and
then subtracted. To study the Hα emission line, we subtracted the underlying stellar continuum
which was determined by averaging a 2.5 A wide region with high S/N adjacent to the Hα line.
A constant stellar continuum provides a good match to the underlying distribution within this
narrow wavelength range. For the purpose of this paper the subtraction of a continuum with the
proper Hα absorption is not crucial since the same bidimensional shape is observed also in the
[N II] λ6583 line. We did not model this line bacause it falls at the edge of the sensitivity curve.
In addition to the spectroscopic material narrow-band Hα imaging of NGC 2179 was
performed on March 9-11, 1997 at the 1.8-m Vatican Advanced Technology Telescope. A back
illuminated 2048×2048 Loral CCD with 15 × 15 µm2 pixels was used as detector at the aplanatic
Gregorian focus, f/9. It yielded a field of view of 6.′4 × 6.′4 with an image scale of 0.′′4 pixel−1
after a 2 × 2 on-line pixel binning. We obtained 3 × 10 minutes emission-band images and 3 × 2
minutes Cousins R−band images. The emission-band images were taken with an interference filter
(λc = 6630 A; ∆λFWHM = 70 A) isolating the spectral region characterized by the redshifted Hα
and [N II] λλ6548, 6583 emission lines. The data reduction was routine. Gaussian fit to field stars
in the two final processed images yielded point spread function FWHM of 1.′′0. The continuum-free
image of NGC 2179 showing the galaxy Hα+[N II] emission was obtained by subtracting the
R-band image, suitably scaled, from the emission-band image.
3. Results
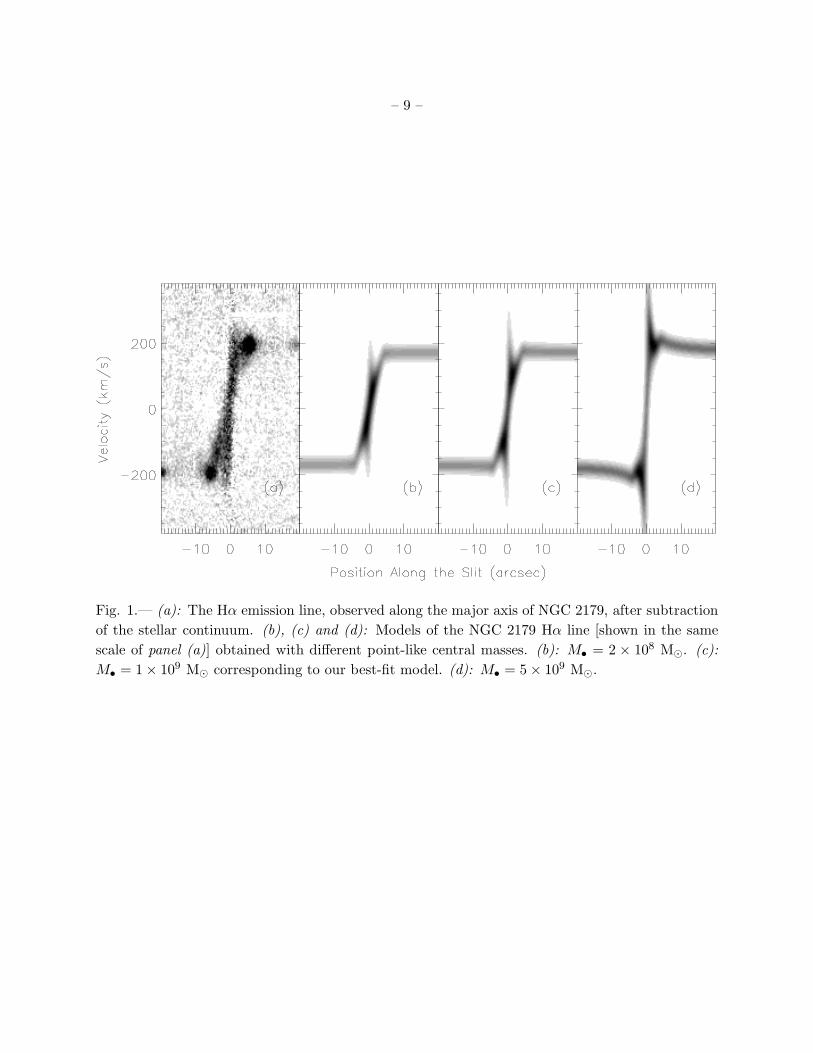
The complex bidimensional structure (in the velocity-position map) of the Hα emission line
in NGC 2179 is shown in Fig. 1a. In the central region (r∼< 2′′) the line is highly tilted and
extends up to ±250 km s−1. The intensity distribution along the line shows two symmetric peaks
and a central minimum at r = 0, v = 0. The shape of the emission is such that at r = ±3′′ we
observe ∆v = 200 km s−1. Proceeding further away from the center, ∆v increases up to an almost
constant value of 400 km s−1.
In the following we demonstrate that the peculiar shape and intensity distribution of these
emission lines is not produced by two kinematically distinct components as the appearance could
– 4 –
suggest, but they are due to a unique velocity field traced by a thin gaseous disk rotating in the
combined potential of a central point-like mass (v → ∞ as r → 0) embedded in an extended stellar
disk and to the deterioration caused by the instrumental resolution and seeing. The presence of
a gaseous disk in the principal plane of NGC 2179 is supported by our Hα image, which shows a
smooth central structure characterized by the same ellipticity (ǫ ≃ 0.2) and major-axis position
angle (P.A. ≃ 170◦) as those of the stellar content observed in the R−band. The bright knots
present in the observed spectrum are due to spiral arms which are also visible in our Hα image.
We assume that the gas resides in an infinitesimally thin disk whose mean motion is
characterized by circular orbits in the plane of the galaxy. At each position (x, y) on the sky the
line-of-sight velocity profile is a Gaussian φ with mean V (x, y) = Vc(R) x sin i/R and dispersion
σ(R), where R2 = x2 + (y/ cos i)2 is the radius in the disk and i (Table 1) the inclination of the
galaxy. The dispersion is given by σ2(R) = σ2gas(R) + σ2
instr, where σgas(R) is the intrinsic velocity
dispersion of the gas and σinstr is the instrumental dispersion (assuming a Gaussian instrumental
broadening function). The gas dispersion is assumed to be isotropic and has been parametrized
through σgas(R) = σ0 + σ1 exp(−R/Rt), where Rt is the scale length of the turbulence.
The circular velocity Vc(R) is produced by the combined potential of a point-like mass M•
and of the disk-like stellar component. The contribution to the velocity due to the point-like
mass is given by V•(R) =√
GM•/R. The contribution V⋆(R) due to the stars potential has been
directly measured on the emission lines of each spectrum at distances where both the seeing
effect and the point-like mass attraction are negligible, and it has been linearly interpolated for
smaller R by imposing that V⋆(0) = 0. The linearity of this interpolation is not crucial for the
model since in the inner regions the potential is dominated by the contribution of the central
point-like mass concentration. The resulting intrinsic velocity profile of the disk is then computed
as V 2c (R) = V 2
• (R) + V 2⋆ (R).
The bidimensional model of the emission lines is given by
Φ(v, S) =
∫ S+∆s2
S−∆s2
ds
∫ B+ h2
B−h2
db
∫∫ +∞
−∞
ds′db′φ[v − V (s′, b′)]I(s′, b′)P (s′ − s, b′ − b) (1)
where (S,B) are the coordinate along the slit and perpendicularly to it respectively, while h is
the slit width and ∆s is the pixel size of the detector. I(s′, b′) is the intrinsic surface brightness
distribution of the disk and has been parametrized as I(R) = I0 + I1 exp(−R/RI), where I0, I1
and RI are free parameters. P (s′ − s, b′ − b) is the PSF which has been modeled as a Gaussian,
owing to the lack of a specific PSF image obtained at the time of the observations. Note that the
parameterizations for I(R) and σgas(R) have been chosen because they are able to adequately
reproduce our data, but they have no further physical significance.
The line profile Φ(v, S), rebinned on a grid with steps ∆v (reciprocal dispersion) and ∆s, can
be directly compared to the star-light-subtracted bidimensional spectrum obtained on the CCD.
Using the above model and the distance given in Table 1 we have obtained for NGC 2179 the
simulation of the Hα emission line shown in Fig. 1c, which is remarkable for its similarity with the

– 5 –
observed one (Fig. 1a). The bright knots in the spectrum due to the spiral arms have not been
reproduced in our model. The point-like mass of the best-fit model is 1 × 10⁹ M⊙. It should be
clear that our model shows only the consistency of the observations with the presence of a central
point-like mass (black hole). However a central stellar density cusp could also fit the data. In
order to estimate the errors in the central mass determination we have modeled the shape of the
line for different central point-like masses. In Fig. 1b and Fig. 1d we show two extreme cases
where the central mass is smaller and larger respectively by a factor 5 than the mass of the best
fit. On the basis of visual comparison with the observations of a series of models we estimate that
our error could not be larger than a factor 3 (log M• = 9.0 ± 0.5 in solar units).
The bidimensional shape of the Hα emission line in the second galaxy we observed, NGC 5064,
is shown in Fig. 2a. Contrary to NGC 2179, it does not present any peculiar central structure.
The line gives rise to a standard rotation curve with the inner rigid-body rotation extended up
to r = ±4′′, and followed by a flat portion (∆v = 400 km s−1). By applying the same modeling
technique as we did for NGC 2179 we computed the shape of the emission lines as a function
of decreasing central mass until the complex structure described above tend to disappear. The
limiting case corresponds to a central point-like mass of 5 × 10⁷ M⊙ and is illustrated in Fig 2b.
Comparing this model with the observed Hα line in NGC 5064 we deduce that in this galaxy
either the central mass is lower than 5 × 10⁷ M⊙ or the unresolved Keplerian part of the gaseous
disk does not give a detectable contribution.
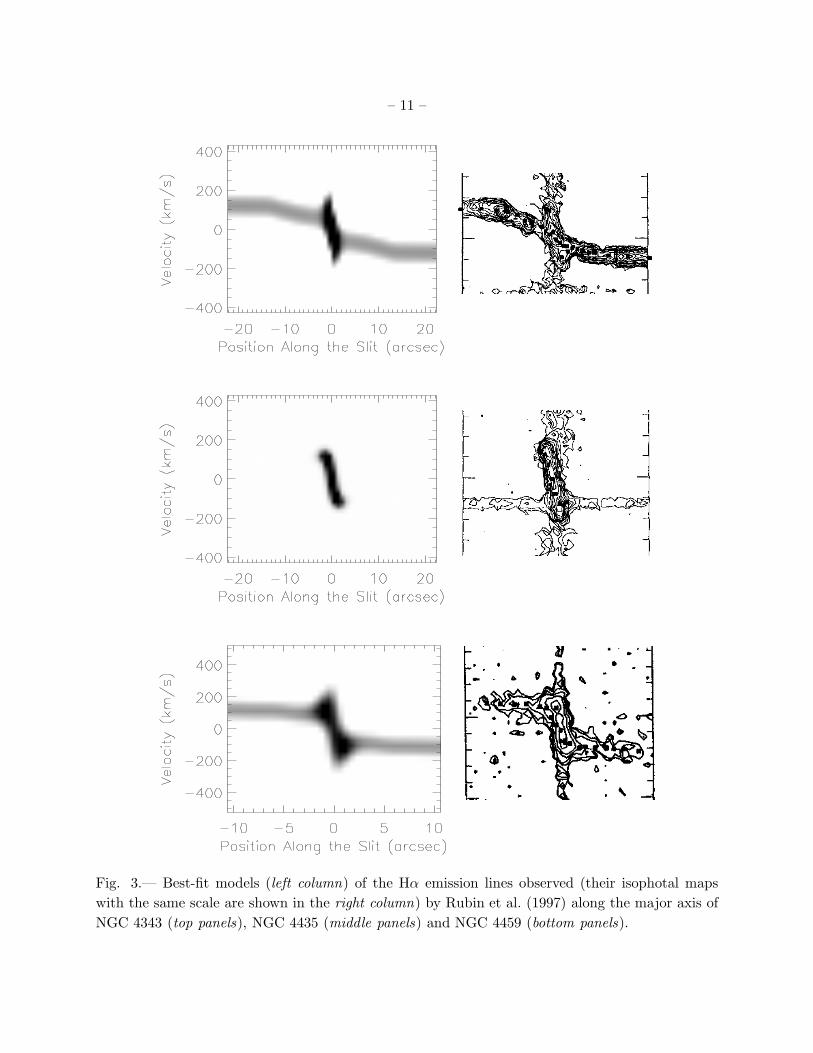
Emission lines with a bidimensional shape and an intensity distribution similar to those
observed in NGC 2179 have been observed also by Rubin et al. (1997). We have selected in their
sample the most representative ones, namely NGC 4343 (Sa), NGC 4435 (S0) and NGC 4459
(S0). We applied our modeling techniques to reproduce their isophotal maps, taking into account
their instrumental setup and seeing condition. The comparison between the observations and our
models is shown in Fig. 3, and it appears quite satisfactory. In all the three cases the central
tilted part of the emission is characterized by the absence of a central intensity peak, both in the
model and in the observed line. The absence of the flat region of the rotation curve produced
by the potential of the stellar disk in the case of NGC 4435 can be easily modeled by adopting
I0 ≃ 0. The values of the central masses are of the same order as that of NGC 2179 and are given
in Table 1. A comparison between a set of model lines obtained with different central masses and
the observations has been carried out for these galaxies, in the same way as we did for NGC 2179.
We estimate that the masses given in Table 1 for the Rubin et al. (1997) galaxies are affected by
uncertainties of the same order of magnitude as in NGC 2179.
4. Discussion
In the previous paragraphs we have shown that the peculiar bidimensional shape of the
emission lines in a sample of four galaxies is consistent with the effect produced by the combined
potential of a central point-like mass and of an extended component. In this way we were able to
– 6 –
point out the presence of central mass concentrations of the order of 109 M⊙ in a sample of disk
galaxies, observed with ground-based telescopes.
With the observations presented in this paper we demonstrate the possibility of detecting
central mass concentrations in galaxies with ground-based telescopes properly equipped using the
CNKDs as probes. The masses which can be detected in this way are larger than 5 × 10⁷ M⊙
at the distance of the Virgo cluster. Up to now the higher resolution offered by HST has not
contributed to the detection, using CNKDs, of central masses lower than this limit. In fact the
four galaxies so far studied with HST posses central masses of the same order of ours. A simulation
similar to the one used in this paper predicts that HST, equipped with the Space Telescope
Imaging Spectrograph will allow to detect central masses down to the level of 5 × 10⁶ M⊙. Note
that although VLBI spectroscopy of H2O masers delivers much higher angular resolution, this
technique is limited by the availability of suitably bright sources. We are inclined to think that
the detection of lower mass black holes will constitute one of the most proper use of HST, which
also allows to put more stringent constraint on the size of the region containing the central mass.
For the four galaxies of this paper with positive detection we can summarize our measurements
with a single median value of the ratio of the central mass to the luminosity of the bulge component
M•/LB , bulge ∼ 0.16. This value is one order of magnitude larger than the median value derived
by Ho (1998) from a sample of 20 objects but still within the scatter. If we assume for M• of
NGC 5064 the upper limit we derived, also this galaxy falls within the scatter of the relation
M• − LB , bulge (Ho 1998).
We thank Dave Burstein and Vera Rubin for helpful discussions. JCVB acknowledges the
support by a grant of the Telescopio Nazionale Galileo and Osservatorio Astronomico di Padova.
– 7 –
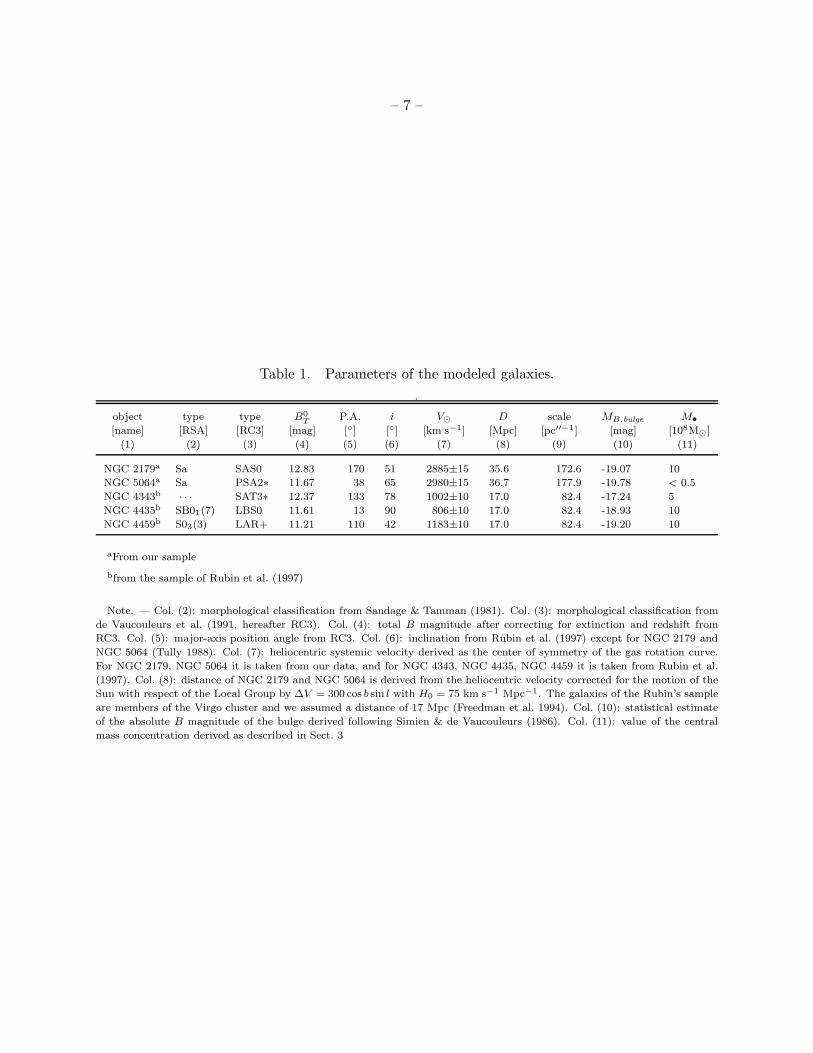
Table 1. Parameters of the modeled galaxies.
.
object type type B0
TP.A. i V⊙ D scale MB,bulge M•
[name] [RSA] [RC3] [mag] [◦] [◦] [km s−1] [Mpc] [pc′′−1] [mag] [108M⊙]
(1) (2) (3) (4) (5) (6) (7) (8) (9) (10) (11)
NGC 2179a Sa SAS0 12.83 170 51 2885±15 35.6 172.6 -19.07 10
NGC 5064a Sa PSA2∗ 11.67 38 65 2980±15 36.7 177.9 -19.78 < 0.5
NGC 4343b · · · SAT3∗ 12.37 133 78 1002±10 17.0 82.4 -17.24 5
NGC 4435b SB01(7) LBS0 11.61 13 90 806±10 17.0 82.4 -18.93 10
NGC 4459b S03(3) LAR+ 11.21 110 42 1183±10 17.0 82.4 -19.20 10
aFrom our sample
bfrom the sample of Rubin et al. (1997)
Note. — Col. (2): morphological classification from Sandage & Tamman (1981). Col. (3): morphological classification from
de Vaucouleurs et al. (1991, hereafter RC3). Col. (4): total B magnitude after correcting for extinction and redshift from
RC3. Col. (5): major-axis position angle from RC3. Col. (6): inclination from Rubin et al. (1997) except for NGC 2179 and
NGC 5064 (Tully 1988). Col. (7): heliocentric systemic velocity derived as the center of symmetry of the gas rotation curve.
For NGC 2179, NGC 5064 it is taken from our data, and for NGC 4343, NGC 4435, NGC 4459 it is taken from Rubin et al.
(1997). Col. (8): distance of NGC 2179 and NGC 5064 is derived from the heliocentric velocity corrected for the motion of the
Sun with respect of the Local Group by ∆V = 300 cos b sin l with H0 = 75 km s−1 Mpc−1. The galaxies of the Rubin’s sample
are members of the Virgo cluster and we assumed a distance of 17 Mpc (Freedman et al. 1994). Col. (10): statistical estimate
of the absolute B magnitude of the bulge derived following Simien & de Vaucouleurs (1986). Col. (11): value of the central
mass concentration derived as described in Sect. 3
– 8 –
REFERENCES
Bower, G.A., Green, R.F., Danks, A., Gull, T., Heap, S., Hutchings, J., Joseph, C., Kaiser, M.E.,
Kimble, R., Kraemer, S., Weistrop, D., Woodgate, B., Lindler, D., Hill, R.S., Malumuth,
E.M., Baum, S., Sarajedini, V., Heckman, T.M., Wilosn, A.S., & Richstone, D.O. 1998,
ApJ, 492, L111
de Vaucouleurs, G., de Vaucouleurs, A., Corwin, H.G., Jr., Buta, R.J., Paturel, G., & Fouque, R.
1991, Third Reference Catalogue of Bright Galaxies (New York: Springer-Verlag) (RC3)
Ferrarese, L., Ford, H.C., & Jaffe, W. 1996, ApJ, 470, 444
Freedman, W.L., Madore, B.F., Mould, J.R., Ferrarese, L., Hill, R., Kennicutt, R.C., Jr., Saha,
A., Stetson, P.B., Graham, J.A., Ford, H., Hoessel, J.G., Hucra, J., Hughes, S.M., &
Illingworth, G.D. 1994, Nature, 371, 757
Greenhill, L.J., & Gwinn, C. 1997, Ap&SS, 248, 261
Greenhill, L.J, Moran, J.M., & Herrnstein, J.R. 1997, ApJ, 481, L23
Ho, L.C. 1998, in Observational Evidence for Black Hole in the Universe, ed. S.K. Chakrabati
(Dodrecht: Kluver Academic Publishers), in press [astro-ph/9803307]
Kormendy, J., & Richstone, D. 1995, ARA&A, 33, 581
Macchetto, F., Marconi, A., Axon, D.J., Capetti, A., Sparks, W., & Crane, P. 1997, ApJ, 489, 579
Miyoshi, M., Moran, J., Herrnstein, J., Greennhill, L.J., Nakai, N., Diamond, P., & Inoue, M.
1995, Nature 373, 127
Rubin, V.C., Kenney, J.D.P., & Young, J.S. 1997, AJ, 113, 1250
Sandage, A., & Tammann, G.A. 1981, A Revised Shapley-Ames Catalog of Bright Galaxies
(Washington: Carnagie Institution)
Simien, F., & de Vaucouleurs, G. 1986, ApJ, 302, 564
Tully, R.B. 1988, Nearby Galaxies Catalog (Cambridge: Cambridge University Press)
van der Marel, R.P., & van den Bosch, F.C. 1998, AJ, submitted [astro-ph/9804194]
This preprint was prepared with the AAS LATEX macros v4.0.
– 9 –
Fig. 1.— (a): The Hα emission line, observed along the major axis of NGC 2179, after subtraction
of the stellar continuum. (b), (c) and (d): Models of the NGC 2179 Hα line [shown in the same
scale of panel (a)] obtained with different point-like central masses. (b): M• = 2 × 10⁸ M⊙. (c):
M• = 1 × 10⁹ M⊙ corresponding to our best-fit model. (d): M• = 5 × 10⁹ M⊙.

– 10 –
Fig. 2.— (a): The Hα emission line, observed along the major axis of NGC 5064, after subtraction
of the stellar continuum. (b): Model of the NGC 5064 Hα line obtained with the highest point-like
central mass which can be added without significantly disturbing the general shape of the line
(M• = 5 × 10⁷ M⊙).
– 11 –
Fig. 3.— Best-fit models (left column) of the Hα emission lines observed (their isophotal maps
with the same scale are shown in the right column) by Rubin et al. (1997) along the major axis of
NGC 4343 (top panels), NGC 4435 (middle panels) and NGC 4459 (bottom panels).