Embed Size (px)
Citation preview
ABSTRACT
Title of thesis: Chronic Ingestion of (3R,3’R,6’R)-Lutein and (3R,3’R)-Zeaxanthinin Female Rhesus Macaque Primates
Edra London, Master of Science, 2006
Thesis directed by: Professor Frederick Khachik
Adjunct Professor, Department of Chemistry and Biochemistry andthe Department of Nutrition and Food Science
Age-related macular degeneration (AMD) is the leading cause of blindness in
developed countries in individuals over the age of 65. High intake of the dietary carotenoids
lutein (L) and zeaxanthin (Z) is believed to reduce the risk of AMD. This study investigated
the effects of long-term supplementation of primates with high doses of L or Z, and their 1:1
combination, and whether high supplemental doses cause ocular toxicity.
Eighteen female rhesus macaques were divided into four groups: control (n=3), L-
treated (n=5, 9.34 mg/kg L and 0.66 mg/kg Z), Z-treated (n=5, 10 mg/kg Z), and L/Z-treated
(n=5, L and Z each at 0.5 mg/kg). At 6 month intervals beginning at baseline, plasma
samples were analyzed by HPLC for L, Z, and their metabolites. Carotenoid analysis of
tissues, ocular examinations, and toxicity assays were performed.
High-dose supplementation of primates with L or Z significantly increased plasma,
and ocular and other tissue concentrations of these carotenoids and their metabolites in most
cases. Supplementation with a 1:1 dose of L and Z increased plasma concentrations of these
carotenoids after 6 months, but baseline and month 12 levels in plasma and ocular tissues
were not significantly different. Supplementation of primates with L or Z at high doses does
not cause ocular or kidney toxicity.
CHRONIC INGESTION OF (3R,3’R,6’R)-LUTEIN AND (3R,3’R)-ZEAXANTHIN
IN FEMALE RHESUS MACAQUE PRIMATES
by
Edra London
Thesis submitted to the Faculty of the Graduate School of theUniversity of Maryland, College Park in partial fulfillment
of the requirements for the degree ofMaster of Science
2006
Advisory Committee:
Professor Frederick Khachik, Chair/AdvisorProfessor Mark A. KantorProfessor Liangli Yu

© Copyright by
Edra Charlotte London
2006
ii
ACKNOWLEDGEMENTS
I would like to thank my research advisor, Dr. Frederick Khachik, for his support and
guidance throughout my studies in the Master’s Program in Nutrition. His expertise in the
field of carotenoids and in conducting laboratory research as well as his advice on the
preparation of my data and this thesis was invaluable. I would also like to thank the other
members of my graduate advisory committee, Dr. Mark A. Kantor and Dr. Liangli Yu for
their valuable feedback regarding the organization of my data, clarification of the study
design, and for their other useful suggestions for improving this thesis. Dr. Bernadene
Magnuson, originally a member of my graduate committee, also provided much thoughtful
input during the initial stages of this project. Special acknowledgment is due to Dr. Fabiana
de Moura who provided much of the statistical analysis for this study, and who patiently
taught me about carotenoid extraction and HPLC analysis upon my joining Dr. Khachik’s
laboratory group.
This study was funded by the National Eye Institute of the National Institutes of
Health. Without their financial support, this project would not have been possible. Thanks
are also due to DSM Nutritional Products Ltd., Human Nutrition and Health Division, Basel,
Switzerland for providing the beadlets of lutein and zeaxanthin that were used in this study.
Additionally, I would like to thank my fellow graduate students in the Department
of Nutrition and Food Science for their ongoing support, and my lab mate An-Ni Chang for
her thoughtfulness and her technical expertise in the laboratory which she so generously
shared.

iii
TABLE OF CONTENTS
LIST OF TABLES . . . . . . . . . . . . . . . . . . . . . . . . . . . . . . . . . . . . . . . . . . . . . . . . . . . . . vii
LIST OF FIGURES . . . . . . . . . . . . . . . . . . . . . . . . . . . . . . . . . . . . . . . . . . . . . . . . . . . . . ix
INTRODUCTION . . . . . . . . . . . . . . . . . . . . . . . . . . . . . . . . . . . . . . . . . . . . . . . . . . . . . . . 1
LITERATURE REVIEW . . . . . . . . . . . . . . . . . . . . . . . . . . . . . . . . . . . . . . . . . . . . . . . . . . 9Distribution of Carotenoids in the Macular Pigment . . . . . . . . . . . . . . . . . . . . . . . 9Dietary Sources of Lutein and Zeaxanthin . . . . . . . . . . . . . . . . . . . . . . . . . . . . . 12Proposed Metabolic Pathways of Lutein and Zeaxanthin in Humans . . . . . . . . . 14Epidemiological Studies and Risk Factors Associated with AMD . . . . . . . . . . . 17Supplementation Studies with Lutein and Zeaxanthin . . . . . . . . . . . . . . . . . . . . 27
RESEARCH QUESTIONS . . . . . . . . . . . . . . . . . . . . . . . . . . . . . . . . . . . . . . . . . . . . . . . 35
METHODS AND PROCEDURES . . . . . . . . . . . . . . . . . . . . . . . . . . . . . . . . . . . . . . . . . 36I. Study Investigators . . . . . . . . . . . . . . . . . . . . . . . . . . . . . . . . . . . . . . . . . . . . . . 36II. Selection of Animal Model for Supplementation Studies with Lutein
and Zeaxanthin . . . . . . . . . . . . . . . . . . . . . . . . . . . . . . . . . . . . . . . . . . . . . 37Study Primates . . . . . . . . . . . . . . . . . . . . . . . . . . . . . . . . . . . . . . . 37Procedures to Assure Comfort and Appropriate Analgesia . . . . . 38Institutional Animal Care and Use Committee (IACUC)
Approval . . . . . . . . . . . . . . . . . . . . . . . . . . . . . . . . . . . . . . 38III. Selection of Lutein and Zeaxanthin Doses for the
Supplementation Studies . . . . . . . . . . . . . . . . . . . . . . . . . . . . . . . . . . . . . 38Source of Lutein and Zeaxanthin Supplements . . . . . . . . . . . . . . . . . . . . 39
IV. Study Design . . . . . . . . . . . . . . . . . . . . . . . . . . . . . . . . . . . . . . . . . . . . . . . . . 40The Control Group . . . . . . . . . . . . . . . . . . . . . . . . . . . . . . . . . . . . . . . . . . 41The Lutein Supplementation Study . . . . . . . . . . . . . . . . . . . . . . . . . . . . . 41The Zeaxanthin Supplementation Study . . . . . . . . . . . . . . . . . . . . . . . . . 42The Lutein/Zeaxanthin Supplementation Study . . . . . . . . . . . . . . . . . . . 42
V. Collection, Handling, and Shipping of the Primate Plasma and TissueSamples for Measurement of Biomarkers . . . . . . . . . . . . . . . . . . . . . . . . 43Collection of Plasma Samples for Carotenoid Analysis . . . . . . . . . . . . . 43Method of Euthanasia . . . . . . . . . . . . . . . . . . . . . . . . . . . . . . . . . . . . . . . 43Collection, Handling, and Shipping of Tissues and Organs . . . . . . . . . . 44Collection of Urine for Analysis of Urinary Creatinine
and Proteins . . . . . . . . . . . . . . . . . . . . . . . . . . . . . . . . . . . . . . . . . 44VI. Measurement of Biomarkers . . . . . . . . . . . . . . . . . . . . . . . . . . . . . . . . . . . . . 45
Biomarkers of Ocular Toxicity . . . . . . . . . . . . . . . . . . . . . . . . . . . . . . . . 45Ocular Toxicity . . . . . . . . . . . . . . . . . . . . . . . . . . . . . . . . . . . . . . . . . . . . 45
iv
Primate Plasma Analysis . . . . . . . . . . . . . . . . . . . . . . . . . . . . . . . . . . . . . 45Primate Tissue Analysis . . . . . . . . . . . . . . . . . . . . . . . . . . . . . . . . . . . . . . 46
VII. Standardized Monkey Diet . . . . . . . . . . . . . . . . . . . . . . . . . . . . . . . . . . . . . . 46VIII. Extraction and Analysis of Lutein and Zeaxanthin Beadlets . . . . . . . . . . . 47IX. Extraction of Carotenoids from Primate Plasma . . . . . . . . . . . . . . . . . . . . . . 48X. Extraction of Carotenoids from Primate Tissues . . . . . . . . . . . . . . . . . . . . . . 49XI. HPLC Analysis of Carotenoids . . . . . . . . . . . . . . . . . . . . . . . . . . . . . . . . . . . 50
Carotenoid Separation by HPLC Normal Phase Column . . . . . . . . . . . . 50Carotenoid Separation of Retina Tissue Extracts by
HPLC Chiral Column . . . . . . . . . . . . . . . . . . . . . . . . . . . . . . . . . . 51XII. Accuracy and Reproducibility of HPLC Results . . . . . . . . . . . . . . . . . . . . . 51XIII. Statistical Analysis . . . . . . . . . . . . . . . . . . . . . . . . . . . . . . . . . . . . . . . . . . . 52
RESULTS . . . . . . . . . . . . . . . . . . . . . . . . . . . . . . . . . . . . . . . . . . . . . . . . . . . . . . . . . . . . 53Lutein Supplementation Study: Daily Supplementation of Female Rhesus
Macaque Monkeys with Lutein (9.34 mg/kg L, 0.66 mg/kg Z)for 12 Months . . . . . . . . . . . . . . . . . . . . . . . . . . . . . . . . . . . . . . . . . . . . . . 53
Plasma Carotenoid Analysis of Primates in the LuteinSupplementation Study . . . . . . . . . . . . . . . . . . . . . . . . . . 53
Plasma Concentrations of Lutein and Zeaxanthin Metabolitesin Primates in the Lutein Supplementation Study . . . . . . 58
Carotenoid Concentrations in the Ocular Tissues of Primates inthe Lutein Supplementation Study . . . . . . . . . . . . . . . . . . 62
Carotenoid Concentrations in the Major Organs and Tissues ofPrimates in the Lutein Supplementation Study . . . . . . . . 66
Zeaxanthin Supplementation Study: Daily Supplementation of Female RhesusMacaque Monkeys with Zeaxanthin (10 mg/kg) for 12 Months . . . . . . . 69
Plasma Carotenoid Analysis of Primates in the ZeaxanthinSupplementation Study . . . . . . . . . . . . . . . . . . . . . . . . . . 69
Plasma Concentrations of Lutein and Zeaxanthin Metabolitesin Primates in the Zeaxanthin Supplementation Study . . 72
Concentrations of Carotenoids in the Ocular Tissues ofPrimates in the Zeaxanthin Supplementation Study . . . . 74
Carotenoid Concentrations in the Major Organs and Tissuesof Primates in the Zeaxanthin Supplementation Study . . 77
Lutein/Zeaxanthin (L/Z) Supplementation Study: Daily Supplementationof Female Rhesus Macaque Monkeys with a 1:1 Combinationof Lutein and Zeaxanthin (0.5 mg/kg of each) for 12 Months . . . . . . . . 80
Plasma Carotenoid Analysis of Primates in theLutein/Zeaxanthin Supplementation Study . . . . . . . . . . . 80
Plasma Concentrations of Lutein and ZeaxanthinMetabolites in Primates in the Lutein/ZeaxanthinSupplementation Study . . . . . . . . . . . . . . . . . . . . . . . . . . 84
v
Concentrations of Carotenoids in the Ocular Tissues ofPrimates in the Lutein/Zeaxanthin
Supplementation Study . . . . . . . . . . . . . . . . . . . . . . . . . . 85Carotenoid Concentrations in the Major Organs and Tissues
of Primates in the Lutein/ZeaxanthinSupplementation Study . . . . . . . . . . . . . . . . . . . . . . . . . . 88
Safety of High Supplemental Doses (~10mg/kg) of Lutein or Zeaxanthin . . . . . 89Fundus Photography and Histopathology . . . . . . . . . . . . . . . . . . . . . . . . . . . . . . 90Urinary Creatinine and Protein . . . . . . . . . . . . . . . . . . . . . . . . . . . . . . . . . . . . . . 90
DISCUSSION . . . . . . . . . . . . . . . . . . . . . . . . . . . . . . . . . . . . . . . . . . . . . . . . . . . . . . . . . 91Changes in the Plasma Concentrations of Lutein, Zeaxanthin, and
Their Metabolites in the Control, L-treated, Z-treated, andL/Z-treated Primates . . . . . . . . . . . . . . . . . . . . . . . . . . . . . . . . . . . . . . . . 93
Plasma Concentrations of Lutein and Zeaxanthin . . . . . . . . . . . . . . . . . . . . . . . . 93Plasma Concentration of Lutein and Zeaxanthin Metabolites . . . . . . . . . . . . . . 100Concentrations of Lutein, Zeaxanthin, and Their Metabolites in
the Ocular Tissues, Major Organs and Other Tissues of the Controland Supplemented Primates . . . . . . . . . . . . . . . . . . . . . . . . . . . . . . . . . . 103
Concentrations of Lutein, Zeaxanthin, and Their Metabolitesin Major Organs and Other Tissues . . . . . . . . . . . . . . . . 103
Concentrations of Lutein, Zeaxanthin, and Their Metabolitesin Major Organs and Other Tissues . . . . . . . . . . . . . . . . 112
Limitations and Strengths of the Study . . . . . . . . . . . . . . . . . . . . . . . . . . . . . . . 113
SUMMARY AND CONCLUSIONS . . . . . . . . . . . . . . . . . . . . . . . . . . . . . . . . . . . . . . . 116
APPENDICES . . . . . . . . . . . . . . . . . . . . . . . . . . . . . . . . . . . . . . . . . . . . . . . . . . . . . . . . 118Appendix A. Approval from Institutional Animal Care & Use Committee . . . 118Appendix B. Carotenoids in the Ocular Tissues of L-Treated Primates
at Months 12 and 18 . . . . . . . . . . . . . . . . . . . . . . . . . . . . . . . . . . . . . . . . 119Appendix C. Carotenoids in the Major Organs and Tissues of the
L-Treated Primates . . . . . . . . . . . . . . . . . . . . . . . . . . . . . . . . . . . . . . . . . 121Appendix D. Carotenoids in the Major Organs and Tissues of L-Treated
Primates at Month 18 . . . . . . . . . . . . . . . . . . . . . . . . . . . . . . . . . . . . . . . 124Appendix E. Carotenoids in the Ocular Tissues of Z-Treated Primates
at Months 12 and 18 . . . . . . . . . . . . . . . . . . . . . . . . . . . . . . . . . . . . . . . . 126Appendix F. Carotenoids in the Major Organs and Tissues of Z-Treated
Primates at Month 12 . . . . . . . . . . . . . . . . . . . . . . . . . . . . . . . . . . . . . . . 128Appendix G. Carotenoids in the Major Organs and Tissues of Z-Treated
Primates at Month 18 . . . . . . . . . . . . . . . . . . . . . . . . . . . . . . . . . . . . . . . 130Appendix H. Carotenoids in the Ocular Tissues of L/Z-Treated Primates
at Month 12 . . . . . . . . . . . . . . . . . . . . . . . . . . . . . . . . . . . . . . . . . . . . . . 132Appendix I. Carotenoids in the Major Organs and Tissues of
vi
L/Z-Treated Primates at Month 12 . . . . . . . . . . . . . . . . . . . . . . . . . . . . . 134
Appendix J. Age at Baseline and Body Weights at Baseline and Months 6,12, and 18 for Control, L-, Z-, and L/Z-Treated Primates . . . . . . . . . . . 137
Appendix K. Summary of the Mean Carotenoid Concentrations(Mean ± SEM) in the Ocular Tissues of L-Treated, Z-Treated,and L/Z-Treated Primates at Months 12 and 18 . . . . . . . . . . . . . . . . . . 138
REFERENCES . . . . . . . . . . . . . . . . . . . . . . . . . . . . . . . . . . . . . . . . . . . . . . . . . . . . . . . . 139
vii
LIST OF TABLES
Table 1. Plasma lutein concentrations (:mol/L, mean ± SEM) of the controlprimates and the L-treated primates (9.34 mg/kg L and 0.66 mg/kg Zfor 12 months) at baseline, months 6, 12, and 6 months post-supplementation (month 18) . . . . . . . . . . . . . . . . . . . . . . . . . . . . . . . . . . . . . . . 56
Table 2. Plasma zeaxanthin concentrations (:mol/L) in the control and the L-treatedprimates (9.34 mg/kg L and 0.66 mg/kg Z daily for 12 months) at baseline,months 6, 12, and 18 . . . . . . . . . . . . . . . . . . . . . . . . . . . . . . . . . . . . . . . . . . . . . . 58
Table 3. Plasma concentrations (:mol/L) of 3’-epilutein in the L-treated group(9.34 mg/kg L and 0.66 mg/kg Z daily for 12 months) and the control groupat baseline, months 6, 12, and at 6 months post-supplementation (month 18) . . 62
Table 4. Concentrations (:mol/L) of 3’-oxolutein in the control group and the L-treatedgroup (9.34 mg/kg L and 0.66 mg/kg Z daily for 12 months) at baseline,months 6, 12, and at 18 . . . . . . . . . . . . . . . . . . . . . . . . . . . . . . . . . . . . . . . . . . . . 63
Table 5. Concentrations (ng/tissue; mean ± SEM) of lutein, zeaxanthin,meso-zeaxanthin, and 3’-oxolutein in the ocular tissues of 2 L-treatedprimates (9.34 mg/kg L and 0.66 mg/kg Z daily for 12 months) atmonth 12, and 3 L-treated primates at month 18 in comparison withthe mean levels for the control primates . . . . . . . . . . . . . . . . . . . . . . . . . . . . . . . 65
Table 6. Concentrations (:g/g tissue) of lutein, zeaxanthin, 3’-oxolutein, andretinol in tissues of one control primate and 2 primates supplemented daily(9.34 mg/kg L and 0.66 mg/kg Z) for 12 months . . . . . . . . . . . . . . . . . . . . . . . . . 69
Table 7. Mean concentrations (:g/g tissue) of lutein, zeaxanthin, 3’-oxolutein,and retinol in tissues of 2 control primates and 3 primates supplementeddaily with lutein (9.34 mg/kg L and 0.66 mg/kg Z) month 18 (12 monthssupplementation plus 6 months treatment-free) . . . . . . . . . . . . . . . . . . . . . . . . . 70
Table 8. Concentrations (:mol/L) of zeaxanthin in the plasma of 5 primatessupplemented daily with zeaxanthin (10 mg/kg) for 12 months at baseline,6 and 12 months of supplementation, and at 6 months post-supplementation(month 18) . . . . . . . . . . . . . . . . . . . . . . . . . . . . . . . . . . . . . . . . . . . . . . . . . . . . . . 71
Table 9. Concentrations (:mol/L) of 3’-oxolutein in the plasma of primatessupplemented daily with zeaxanthin (10 mg/kg) for 12 months at baseline,months 6, 12, and 18 . . . . . . . . . . . . . . . . . . . . . . . . . . . . . . . . . . . . . . . . . . . . . . 75
Table 10. Mean concentrations (ng/tissue) of lutein, zeaxanthin, meso-zeaxanthin,and 3’-oxolutein in ocular tissues of the Z-treated primates at month 12(n=2) and at month 18 (n=3) compared to the mean levels ofthe control group (n=3) . . . . . . . . . . . . . . . . . . . . . . . . . . . . . . . . . . . . . . . . . . . . 77
Table 11. Mean concentrations (:g/g tissues) of lutein, zeaxanthin, 3’-oxolutein,and retinol in tissues of 2 Z-treated primates (10 mg/kg Z daily for 12 months)in comparison with those of the control primate (RQ4079) . . . . . . . . . . . . . . . . 80
viii
Table 12. Mean concentrations (:g/g tissue) of lutein, zeaxanthin, 3’-oxolutein,and retinol 6 months post-supplementation in the tissues of 3 Z-treatedprimates in comparison to those of the control primates . . . . . . . . . . . . . . . . . . . 81
Table 13. Concentrations (:mol/L) of lutein, zeaxanthin, 3’-epilutein, and3’-oxolutein in the plasma of 5 L/Z-treated primates (0.5mg/kg L and0.5mg/kg Z daily for 12 months) at baseline, 6 and 12 months . . . . . . . . . . . . . . 82
Table 14. Mean concentrations (ng/tissue) of lutein, zeaxanthin, meso-zeaxanthin,and 3’-oxolutein in ocular tissues of L/Z-treated primates compared tothose of the control primates . . . . . . . . . . . . . . . . . . . . . . . . . . . . . . . . . . . . . . . . 88
Table 15. Mean concentrations (:g/g tissue) of lutein, zeaxanthin, 3’-oxolutein,and retinol in the tissues of the L/Z-treated primates compared tocontrol primate RQ4079 . . . . . . . . . . . . . . . . . . . . . . . . . . . . . . . . . . . . . . . . . . . 91
Table 16. Mean concentrations of total lutein and total zeaxanthin in the plasmaof control, L-treated, Z-treated, and L/Z-treated primates atbaseline, months 6, 12, and 18 . . . . . . . . . . . . . . . . . . . . . . . . . . . . . . . . . . . . . . . 97

ix
LIST OF FIGURES
Figure 1. Chemical structures of lutein, zeaxanthin, and their metabolites . . . . . . . . . . 11Figure 2. Proposed metabolic pathways of dietary lutein and
zeaxanthin in humans . . . . . . . . . . . . . . . . . . . . . . . . . . . . . . . . . . . . . . . . . . . . . . 16Figure 3. Anatomy of retina and posterior eye . . . . . . . . . . . . . . . . . . . . . . . . . . . . . . . . 17Figure 4. Changes in the plasma concentrations of lutein (:mol/L) in the control and
the L-treated primates during the 12-month supplementation period and6 months post-supplementation . . . . . . . . . . . . . . . . . . . . . . . . . . . . . . . . . . . . . . 58
Figure 5. Changes in the mean (±SEM) plasma concentrations of lutein (mmol/L)for the L-treated group (9.34 mg/kg L and 0.66 mg/kg Z daily for 12 months)and the control group at baseline and months 6, 12, and 18` . . . . . . . . . . . . . . . 59
Figure 6. Changes in plasma concentrations of zeaxanthin (:mol/L) in theL-treated group (9.34 mg/kg L and 0.66 mg/kg Z daily for 12 months) andthe control group at baseline and months 6, 12, and 18 . . . . . . . . . . . . . . . . . . . 61
Figure 7. Changes in the mean plasma concentrations of zeaxanthin (:mol/L)in the L-treated primates (9.34 mg/kg L and 0.66 mg/kg Z daily for 12months) and the control primates at baseline, months 6, 12, and 18 . . . . . . . . . . 61
Figure 8. Lutein and zeaxanthin metabolites measured in the plasma ofthe study primates: (3R, 3’S, 6’R)-lutein (3’-epilutein) and3-hydroxy-$,,-caroten-3’-one (3’-oxolutein) . . . . . . . . . . . . . . . . . . . . . . . . . . . 63
Figure 9. Changes in the mean plasma concentrations of 3’-epilutein in the controland the L-treated primates at baseline and months 6, 12, and 18 . . . . . . . . . . . . 64
Figure 10. Changes in the mean plasma concentrations of 3’-oxolutein (:mol/L)in the L-treated primates (9.34 mg/kg L and 0.66 mg/kg Z daily for 12 months)and the control primates at baseline and months six, 12, and 18 . . . . . . . . . . . . 66
Figure 11. Mean concentrations of lutein, zeaxanthin, meso-zeaxanthin, and3’-oxolutein (ng/tissue) in the retinas and ciliary bodies of the L-treatedprimates (9.34 mg/kg L and 0.66 mg/kg Z daily for 12 months) at month 12(n=2) and month 18 (n=3) compared to the control primates (n= 3) . . . . . . . . . 69
Figure 12. Changes in the plasma concentrations (mmol/L) of zeaxanthin inthe Z-treated primates (10 mg zeaxanthin/kg daily for 12 months) atbaseline and months 6, 12, and 18 . . . . . . . . . . . . . . . . . . . . . . . . . . . . . . . . . . . . 74
Figure 13. Changes in the mean plasma zeaxanthin concentrations (mmol/L)of the Z-treated primates (10 mg/kg Z daily for 12 months) in comparisonwith the control primates at baseline and months 6, 12, and 18 . . . . . . . . . . . . . 75
Figure 14. Changes in the plasma concentrations of lutein in the Z-treatedprimates (10 mg zeaxanthin/kg daily for 12 months) at baseline andmonths 6, 12, and 18 . . . . . . . . . . . . . . . . . . . . . . . . . . . . . . . . . . . . . . . . . . . . . . 76
Figure 15. Changes in the mean plasma concentrations (:mol/L) of 3’-oxoluteinin the Z-treated primates at baseline, months 6, 12, and 18 . . . . . . . . . . . . . . . . 77
x
Figure 16. Mean concentrations (ng/tissue) of lutein, zeaxanthin, and their metabolitesin the retina and ciliary body of the Z-treated primates at months 12 (n = 2)and 18 (n = 3) in comparison to the control primates (n = 3) . . . . . . . . . . . . . . . 80
Figure 17. Changes in the plasma lutein concentrations (:mol/L) of the L/Z-treated primates (0.5mg/kg L and 0.5mg/kg Z daily for 12 months) at baseline,6, and 12 months . . . . . . . . . . . . . . . . . . . . . . . . . . . . . . . . . . . . . . . . . . . . . . . . . 85
Figure 18. Changes in the mean plasma concentrations of lutein inthe L/Z-treated primates (0.5mg/kg L and 0.5mg/kg Z daily for 12 months)and the control primates . . . . . . . . . . . . . . . . . . . . . . . . . . . . . . . . . . . . . . . . . . . . 86
Figure 19. Changes in the mean plasma concentrations of zeaxanthin (:mol/L)in the L/Z-treated primates at baseline and months 6 and 12 . . . . . . . . . . . . . . . 87
Figure 20. Changes in the mean plasma zeaxanthin concentrations (:mol/L) ofthe L/Z-treated primates in comparison to the control group at baseline and months 6 and 12 . . . . . . . . . . . . . . . . . . . . . . . . . . . . . . . . . . . . . . . . . . . . . . . . . . 87
Figure 21. Changes in the mean plasma concentrations of 3’-oxolutein inthe L/Z-treated primates in comparison to the control primates at baselineand months 6 and 12 . . . . . . . . . . . . . . . . . . . . . . . . . . . . . . . . . . . . . . . . . . . . . . 89
Figure 22. Mean concentrations of lutein, zeaxanthin, meso-zeaxanthin, and3’-oxolutein (ng/tissue) in the retinas and ciliary bodies ofthe L/Z-treated primates at month 12 (n=5) in comparison withthe control primates (n=3) . . . . . . . . . . . . . . . . . . . . . . . . . . . . . . . . . . . . . . . . . . 91
Figure 23. Changes in the mean plasma lutein concentrations (:mol/L) forthe control, L-treated, Z-treated, and L/Z-treated primates at baselineand months 6, 12, and 18 . . . . . . . . . . . . . . . . . . . . . . . . . . . . . . . . . . . . . . . . . . . 96
Figure 24. Changes in mean plasma zeaxanthin concentrations (:mol/L) in the control, L-treated, Z-treated, and L/Z-treated primates at baselineand months 6, 12, and 18 . . . . . . . . . . . . . . . . . . . . . . . . . . . . . . . . . . . . . . . . . . 100
Figure 25. Changes in the mean plasma concentrations of 3’-oxolutein (:mol/L)in the control, L-treated, Z-treated, and L/Z-treated primates at baseline, andat months 6, 12, and 18 . . . . . . . . . . . . . . . . . . . . . . . . . . . . . . . . . . . . . . . . . . . 103
Figure 26. Changes in the mean plasma concentrations of 3’-epilutein (:mol/L)in the L-treated, L/Z-treated, and control primates. . . . . . . . . . . . . . . . . . . . . . . 103
Figure 27. Mean plasma concentrations (:g/dL) and retina concentrations (ng/tissue)of lutein in the lutein-supplemented primates [L-treated (9.34 mg/kg),L/Z-treated (0.5 mg/kg)] at month 12 in comparison to the mean levels inthe control primates . . . . . . . . . . . . . . . . . . . . . . . . . . . . . . . . . . . . . . . . . . . . . . 108
Figure 28. Mean concentrations (ng/tissue) of lutein, zeaxanthin, meso-zeaxanthin,and 3’-oxolutein in the retinas of the control, L-treated (9.34 mg/kg L and0.66 mg/kg Z), Z-treated (10 mg/kg Z), and L/Z-treated (L and Z eachat 0.5 mg/kg) primates at month 12 . . . . . . . . . . . . . . . . . . . . . . . . . . . . . . . . . . 110
Figure 29. Mean concentration of zeaxanthin in plasma (:g/dL) and retina (ng/tissue)in the primates supplemented with zeaxanthin at month 12 in comparisonto those of the control primates. . . . . . . . . . . . . . . . . . . . . . . . . . . . . . . . . . . . . 113
1
INTRODUCTION
Age-Related Macular Degeneration (AMD) is the most common cause of blindness
and visual impairment in Americans age 60 or older [National Eye Institute (NEI), 2004].
NEI and the Eye Disease Prevalence Research Group estimate that 1.8 million Americans
currently suffer from AMD-related vision loss and that number will rise to a projected 2.9
million by the year 2020. The exact etiology of AMD is currently unknown.
AMD is characterized by the degeneration of the retina and the retinal pigment
epithelium (RPE) in the macular region that causes progressive vision loss. The macular
region is characterized as the small depression in the center of the retinal surface called the
fovea, and the presence of yellow pigments that accumulate there. This area is extremely
rich in cone photoreceptors that are responsible for enabling maximal visual acuity.
It was not until the publication of a case-controlled epidemiological study by Seddon
et al. in 1994 that increased attention was drawn to AMD. This study revealed that high
consumption of fruits and vegetables, specifically those rich in two dietary carotenoids,
lutein and zeaxanthin, reduced the risk of AMD (Seddon et al., 1994). High consumption
was defined as approximately 6 mg/day of combined dietary lutein and zeaxanthin, and this
level of intake was correlated with a 43% lower risk for AMD. Additionally, this status was
most readily achieved in subjects who frequently consumed dark green leafy vegetables such
as spinach or collard greens. Unfortunately, studies conducted nearly a decade later have
revealed that awareness among the general population is low in comparison to other eye
diseases (e.g., glaucoma, cataracts) and chronic diseases (e.g., coronary heart disease, high
blood pressure) (Rosenthal et al., 2003; Prahlad, 2002).
2
In 1984, Snodderly et al. first described the localization and distribution of the
yellow macular pigment within the Henle fiber layer of the fovea (Snodderly et al. 1984a &
1984b). Shortly thereafter, lutein and zeaxanthin, two dietary xanthophylls, were recognized
as the chemical compounds that comprise the macular pigment (Bone et al., 1985;
Handelman et al., 1988). Xanthophylls refer to the class of oxygenated carotenoids found
mostly in green plants. It has since been determined that the macula consists of 3 major
carotenoids (Bone et al., 1993; Khachik et al., 2002). The third major pigment present was
identified as (3R,3’S, meso)-zeaxanthin (referred to hereafter as meso-zeaxanthin). meso-
Zeaxanthin is a stereoisomer of zeaxanthin that is of non-dietary origin (Bone et al., 1993;
Khachik et al., 2002). These colored carotenoids in the macular region give the fovea its
characteristic yellow color (hence the name macula lutea). In addition to lutein, zeaxanthin,
and meso-zeaxanthin, a wide range of carotenoids have also been identified in human retinal
pigment epithelium (RPE/choroid), ciliary body, iris, lens, and in the uveal tract and other
tissues of the human eye (Khachik et al., 1997a; Bernstein et al., 2001; Khachik et al., 2002).
Unless otherwise specified in this proposal, lutein and zeaxanthin refer to dietary
(3R,3’R,6’R)-lutein and (3R,3’R)-zeaxanthin, respectively.
Lutein and zeaxanthin have been quantified in a wide range of fruits and vegetables
(Humphries et al., 2003; USDA, 2004). Humphries et al. have shown that the best dietary
sources of lutein and zeaxanthin are green leafy vegetables, yellow-orange fruits and
vegetables, and to a lesser extent, foods containing egg yolk such as wheat and pasta
products. It was observed that green vegetables tend to have higher ratios of lutein to
3
zeaxanthin, while the yellow-orange fruits and vegetables tends to have a lower lutein to
zeaxanthin ratio (Humphries et al., 2003).
Prior to 1992, many studies routinely analyzed carotenoids in human blood and the
HPLC techniques employed allowed for the separation and identification of only about seven
18carotenoids. In 1992, Khachik et al. used a combination of C reversed-phase and silica-
based nitrile-bonded high performance liquid chromatography (HPLC) columns to
effectively separate, identify, and quantify 25 carotenoids and 9 metabolites, and thus
provided a detailed method for analysis of human plasma (Khachik et al., 1992a & 1992b).
Later, the same researchers identified these carotenoids and their metabolites in human
breast milk (Khachik et al., 1997b). The carotenoid metabolites identified in human serum
and breast milk were not of dietary origin. In 1997, Khachik et al. reported that among 25
dietary carotenoids and 9 metabolites routinely found in human serum, lutein, zeaxanthin,
and their metabolites were also present in human and monkey retinas (Khachik et al. 1997a).
An extension of this work identified the complete spectrum of carotenoids in other ocular
tissues of the human eye (RPE/choroid, ciliary body, iris, lens) (Bernstein et al., 2001).
While lutein, zeaxanthin, and their metabolites were the major carotenoids found in human
ocular tissues, lycopene and a wide range of other dietary carotenoids were detected in high
concentrations in ciliary body and RPE/choroid.
Schalch reviewed a number of publications from the early 1990s and concluded that
the cumulative data from various observational studies provided circumstantial evidence for
the protective role of lutein and zeaxanthin in the retina against AMD (Schalch, 1992).
Thereafter, Snodderly suggested potential mechanisms for the protective role of these
4
carotenoids in the human ocular tissues (Snodderly, 1995). These investigators suggested
that lutein and zeaxanthin play a protective role in the macula in the prevention of AMD by
absorbing short-wavelength visible light and thus preventing photochemical damage to cones
and photoreceptors (Schalch, 1992; Snodderly et al., 1984a & 1984b).
Epidemiological and observational studies have revealed that low macular pigment
optical density (MPOD) is associated with an increased risk of AMD (EDCCS, 1993; Beatty,
2001). MPOD refers to the concentration of carotenoids found in the macular region of the
retina.
Since the early 1990s a main area of focus has been oxidative damage to
photoreceptors that results from exposure to blue light. Two mechanisms have been
proposed for the protective role of lutein and zeaxanthin; these are: (1) acting as optical
filters by absorbing damaging short wavelength (blue) light; and (2) the antioxidant function
by which these carotenoids quench oxygen free radicals and singlet oxygen that result from
the simultaneous presence of light and oxygen in the macula (Kirschfield, 1982; Handelman,
1988; Snodderly, 1995; Landrum et al., 1997a; Beatty, 1999; Schalch, 1999).
In 1997, for the first time, Khachik et al. provided preliminary evidence for the
photo-protective role of lutein and zeaxanthin in the retina by an antioxidant mechanism of
action (Khachik et al., 1997a). This was accomplished by isolation, identification, and
structural elucidation of lutein, zeaxanthin, and their oxidation products in the retinas of 11
human donor eyes and that of one monkey. While lutein, zeaxanthin, and a direct oxidation
product of lutein were found to be the major carotenoids in the macula, 11 minor
carotenoids were also identified. Based on these findings, Khachik et al. postulated a series
5
of oxidation-reduction reactions by which dietary lutein and zeaxanthin can be converted to
their oxidation products in order to protect the macula against bright light and prevent AMD
(Khachik et al., 1997a). As mentioned earlier, these investigators identified the metabolites
of lutein and zeaxanthin in all ocular tissues of the human eye in their subsequent follow-up
studies (Bernstein et al., 2001; Khachik et al., 2002). The proposed metabolic pathways of
lutein and zeaxanthin in the human ocular tissues will be discussed later in this thesis. The
epidemiological and supplementation studies presented are also described in detail later in
this thesis.
The age-related eye disease study (AREDS) was one of the first large-scale human
supplementation studies that investigated the protective role of carotenoids against AMD.
This multi-center clinical intervention trial that began in 1992 and involved 3,640 subjects
investigated the effects of supplementation with various combinations of antioxidant
vitamins (including b-carotene) and zinc on the development and progression of cataracts
and AMD (AREDS, 2000). Lutein and zeaxanthin, however, were not commercially
available at the outset of planning this study and were therefore not included in the
supplements. The results of this study showed a 25% decrease in the risk of AMD with the
daily supplementation of 500 mg vitamin C, 400 IU vitamin E, 15 mg b-carotene, and 80 mg
zinc (NEI, 2004).
The first human supplementation with lutein was conducted by Khachik et al. in
which three healthy Caucasian males (non-smokers) between the ages of 42–59 were given
oral supplements containing 10 mg/day of lutein dispersed in olive oil for 18 days (Khachik
et al., 1995). Plasma carotenoid profiles of the subjects were monitored by HPLC at specific
6
intervals. The blood levels of lutein in all 3 subjects increased by 4- to 5-fold after one week
of supplementation. In one subject lutein blood level increased from about 16 :g/dL (0.28
X 10 mol/L) to about 64 :g/dL (1.12 X 10 mol/L) resulting in the maximum absorption-6 -6
of this compound after one week of supplementation. The levels of the lutein oxidation
products (metabolites) during this study increased significantly, confirming that the in vivo
oxidation of lutein is indeed one of the key reactions in the metabolism of this carotenoid
in humans. No apparent toxicity or side effects as a result of lutein ingestion was observed
in the subjects.
In a similarly designed study by Khachik et al., one subject ingested 20 mg/day of
lutein dispersed in olive oil for 21 days and the plasma carotenoid profile of the subject was
monitored at various intervals up to 40 days (Khachik et al., 1997c). The blood levels of
lutein increased by 9-fold from 0.21 :mol/L to 1.89 :mol/L within 3 weeks of treatment. At
the end of the supplementation period, the levels of the lutein oxidative metabolites
increased by 2- to 3-fold. A complete eye examination conducted after 21 days of
supplementation revealed no unusual accumulation of lutein in the retina or ocular toxicity
in the subject of the study.
The first supplementation study with zeaxanthin was also conducted by Khachik et
al. in which 3 subjects ingested oral supplements containing 10 mg/day of zeaxanthin in
olive oil for 3 weeks and the carotenoid plasma levels of the subjects were monitored at
various intervals (Khachik et al., 1995). The blood levels of zeaxanthin in all three subjects
increased by 4-fold after one week of supplementation. In addition, the plasma
7
concentrations of the oxidation products of lutein and zeaxanthin (metabolites) increased
significantly.
In 1997, Landrum et al. conducted a study involving 2 subjects that were
supplemented with lutein esters equivalent to 30 mg of free lutein per day for 140 days
(Landrum et al., 1997b). In this study, serum lutein levels of the subjects increased by 10-
fold within 20 days and plateaued at 1761 nmol/L and remained at this level for the duration
of the study. After 40 days, these researchers observed an increase in MPOD at an average
rate of 1.13±0.12 milliabsorbance units/day.
A recent double-blind randomized clinical trial investigated the dose response of
elderly subjects with and without AMD to lutein at 3 supplemental doses (Moura et al.,
2004). Forty-five subjects aged 60 years or older were divided into 3 groups: (1) no diagnosis
of AMD, (2) middle stage of AMD, or (3) end stage of AMD, and were randomly assigned
to receive one of three oral doses of lutein containing 5% zeaxanthin for 6 months. Serum
lutein levels of all subjects increased, and subjects on doses of 2.5, 5, 10 mg/day of lutein
reached a serum plateau of 450, 490, and 810 nmol/L, respectively. This study revealed that
serum concentration of lutein was dose dependent and that the presence or absence of AMD
did not interfere with serum levels of lutein (Moura et al., 2004).
The Veterans LAST Study was a double-masked, placebo-controlled, randomized
trial of lutein and antioxidant supplementation that involved 90 subjects with atrophic AMD
and a mean age of about 75 (Richer et al., 2004). The purpose of this study was to
investigate the effect of lutein alone and lutein in combination with other carotenoids,
antioxidants, vitamins, and minerals on MPOD and central vision outcome measures in
atrophic AMD. Richer et al. showed that daily supplementation of human subjects with
8
lutein alone or in combination with other antioxidant vitamins for one year effectively
increased MPOD and improved glare recovery, near visual acuity and significantly improved
most measures of quality of vision.
Although lutein and zeaxanthin have been commercially available and widely used
in the United States as a nutritional supplement for nearly a decade, the safety and efficacy
of these carotenoids had not yet been established. Meanwhile, because of the implication of
lutein and zeaxanthin in the prevention and treatment of AMD and other ocular diseases,
multi-center clinical trials with these carotenoids are in the planning stage by the NEI. Prior
to the study discussed in this thesis, metabolic and toxicity studies with lutein and
zeaxanthin had not been explored. The study outlined in this thesis was undertaken to
investigate the safety and efficacy of chronic supplementation with high doses of lutein or
zeaxanthin. Additionally, supplementation with a 1:1 combination of lutein and zeaxanthin
had not been conducted so this study also sought to examine the efficacy of such a dose as
well as possible interaction between these carotenoids. Female rhesus macaques (Macaca
mulatta) were selected as an appropriate animal model due to the invasive nature of the
proposed studies and possible toxicity associated with the administration of lutein and
zeaxanthin at pharmaceutical doses. As described earlier, the distribution of lutein,
zeaxanthin, and their metabolites in the ocular tissues of primates has been shown to be
similar to that of humans which make this animal a suitable model for metabolic and
toxicity studies. Justification for the selection of the animal model will be described later
in the thesis.
9
LITERATURE REVIEW
Distribution of Carotenoids in the Macular Pigment
In 1945, George Wald first identified the yellow pigment in the human macula as
a carotenoid member of the xanthophyll family (Wald, 1945). Xanthophylls include
oxygenated carotenoids that are derived from green plants (e.g., lutein). Since then, the
relationship between dietary xanthophylls and the optical density of the yellow macular
pigment was established in a study in which primates were fed a xanthophyll-deficient
diet (Malinow et al., 1980). In this study, animals that were fed a xanthophyll-deficient
diet showed a reduction in the optical density of yellow macular pigment and more
frequently developed drusen- like bodies. Drusen, which are extracellular deposits that
accumulate between the retinal pigment epithelium (RPE) and Bruch’s membrane, have
been cited as possible precursors of AMD. Bruch’s membrane, together with the RPE
serves as the blood-retinal barrier and both are therefore critical in maintaining the
integrity of the retina (Mares-Perlman & Klein, 1999). The decrease in macular pigment
optical density observed by Malinow et al. was related to the absence of the major
xanthophyll component of greens, the carotenoid lutein. In 1985, the macular pigments
were first identified by Bone et al. as lutein [(3R,3'R,6'R)-βe-carotene-3,3'-diol] and
zeaxanthin [(3R,3'R)-β ,β-carotene-3,3'-diol] by HPLC analysis of retinal extracts (Bone
et al., 1985). In 1988, these pigments were detected not only in the human macula, but
throughout the entire retina (Handleman et al., 1988).
In 1993, the complete identification and stereochemistry of the human macular
pigment was accomplished and the composition was shown to consist of: lutein
10
[(3R,3'R,6'R)-βe-carotene-3,3'-diol)], zeaxanthin [(3R,3'R)-β ,β-cartotene-3,3'-diol)], and
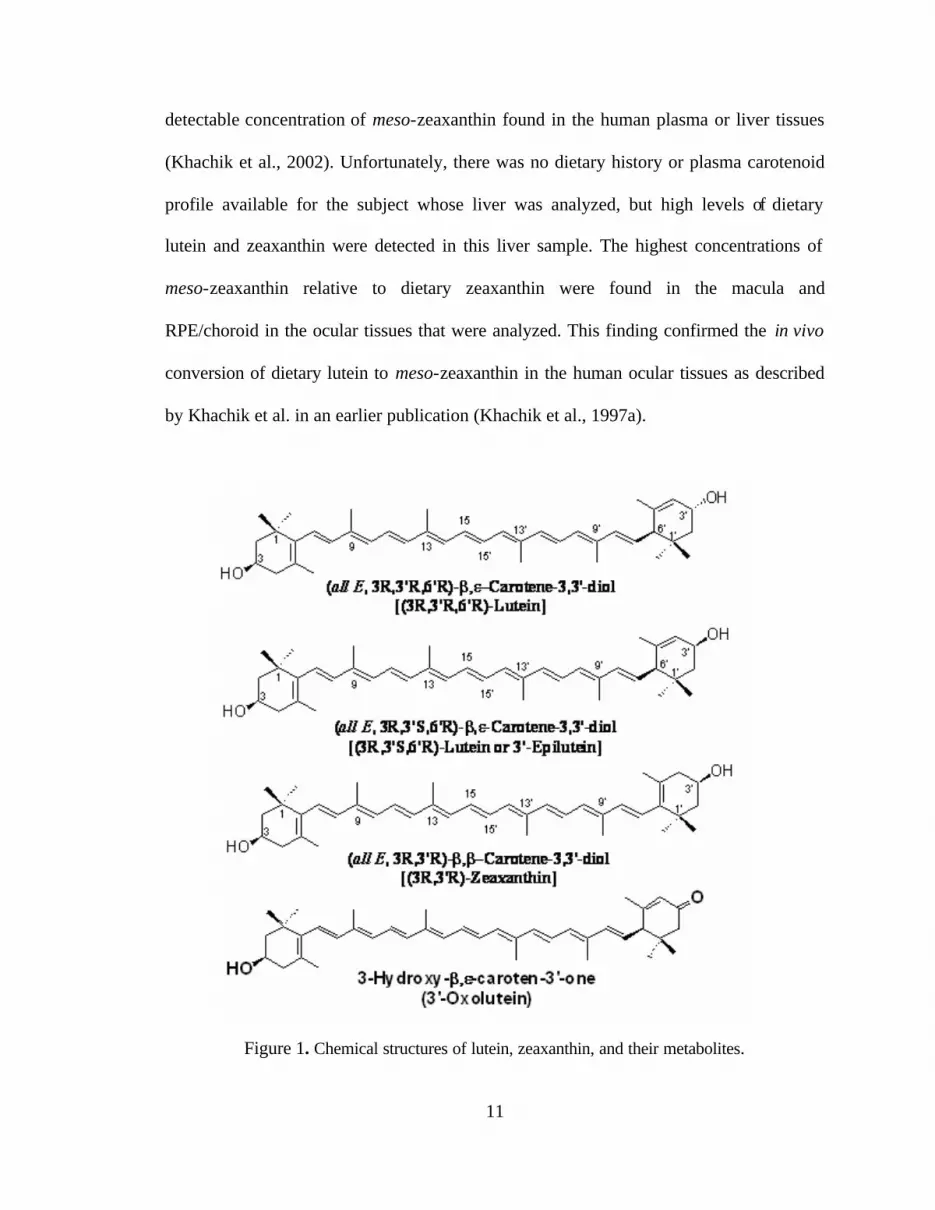
(3R,3’S, meso)-zeaxanthin [(3R,3'S)-β ,β-carotene-3,3'-diol] (Bone et al., 1993). The
structures of these carotenoids are shown in Figure 1. Unless specified in this thesis,
lutein, zeaxanthin, and meso-zeaxanthin refer to dietary lutein [(3R,3’R,6’R)-β ,ε-
carotene-3,3’-diol), dietary zeaxanthin [3R,3’R)-β ,β-carotene-3,3’-diol)], and (3R,3’S,
meso)-zeaxanthin [(3R,3'S)-β ,β-carotene-3,3'-diol].
Bone et al. also found that the ratio of lutein to zeaxanthin in donor retinas varied
from the center of the macula outward. In the periphery of the retina (8.7–12.2 mm), the
lutein to zeaxanthin ratio was found to be 2:1, and in the central region (0–.25 mm), the
ratio was 1:2.4 with zeaxanthin predominating (Bone et al., 1988 & 1992). Additionally,
the overall retinal carotenoid content was shown by these investigators to decrease
considerably with increased eccentricity from the fovea. Further evidence to support the
distribution of these carotenoids in the macula came from a study of postmortem human
eyes (van Kuijk et al., 1997). In this study, lutein was found to be the predominant
carotenoid associated with the rod photoreceptors, which are primarily located in the
periphery of the retina.
In human serum, the ratio of lutein to zeaxanthin is considerably higher than in
the retina, perhaps because of the comparable abundance of dietary lutein in most diets. A
compelling finding was that approximately half of the zeaxanthin in the macula was
dietary (3R,3'R)-zeaxanthin, and the remainder was meso-zeaxanthin, which is not of
dietary origin (Bone et al., 1993; Khachik et al., 2002). meso-Zeaxanthin was found to
account for less than 1% of the total zeaxanthin found in human blood. More recently, in
a study of the in vivo transformations of dietary lutein and zeaxanthin, there was no
11
detectable concentration of meso-zeaxanthin found in the human plasma or liver tissues
(Khachik et al., 2002). Unfortunately, there was no dietary history or plasma carotenoid
profile available for the subject whose liver was analyzed, but high levels of dietary
lutein and zeaxanthin were detected in this liver sample. The highest concentrations of
meso-zeaxanthin relative to dietary zeaxanthin were found in the macula and
RPE/choroid in the ocular tissues that were analyzed. This finding confirmed the in vivo
conversion of dietary lutein to meso-zeaxanthin in the human ocular tissues as described
by Khachik et al. in an earlier publication (Khachik et al., 1997a).
Figure 1. Chemical structures of lutein, zeaxanthin, and their metabolites.

12
Dietary Sources of Lutein and Zeaxanthin
Lutein and zeaxanthin are found in a variety of foods commonly consumed in
Western diets. The best sources of lutein and zeaxanthin are green leafy vegetables,
yellow-orange fruits and vegetables, and to a lesser extent, wheat and pasta products; the
best sources of β-carotene and lycopene are carrots and tomatoes, respectively (Mangels
et al., 1993). In 2003, a study was published that, for the first time quantified
(3R,3'R,6'R)- lutein, (3R,3'R)-zeaxanthin, and their (E/Z)-geometrical isomers in a variety
of fruits, vegetables, wheat, and pasta products (Humphries et al., 2003). Prior to this,
most data that quantified lutein and zeaxanthin in foods were presented as the combined
concentration of these carotenoids plus their geometrical isomers due to the difficulties
associated with separation of these carotenoids by high performance liquid
chromatography (HPLC). An extensive listing of the commonly consumed foods in the
United States and their combined lutein and zeaxanthin content is available at
<http://www.nal.usda.gov/fnic/foodcomp/Data/SR17/wtrank/sr17w338.pdf> (USDA,
2004).
The 2003 study by Humphries et al. revealed nearly identical qualitative HPLC
profiles among green leafy vegetables (with the exception of romaine lettuce), and among
these, the highest concentration of lutein and zeaxanthin was found in kale, parsley,
spinach, and collards.
Additionally, in all of the green fruits and vegetables analyzed, the ratio of lutein
to zeaxanthin varied from 12 to 63 (Humphries et al., 2003). Romaine lettuce was the
exception due to the presence of significant quantities of the rare dihydroxycarotenoid
lactucaxanthin. Other sources of lutein and zeaxanthin include green beans, lima beans,
13
broccoli, lettuce, and peas. Yellow-orange fruits and vegetables including butternut
squash, corn, oranges, and nectarines were identified as good sources of zeaxanthin. This
study found that the ratio of lutein to zeaxanthin was close to one in these foods; this is
with the exception of corn and nectarines which contained higher concentrations of
zeaxanthin than lutein. Of the wheat and pasta products analyzed, the levels of lutein and
zeaxanthin were lower than that of the yellow-orange and green fruits and vegetables.
The presence of these carotenoids in wheat and pasta products was attributed to the
presence of egg yolk, which contains moderate levels of dietary lutein and zeaxanthin.
This study enabled the identification of good sources of lutein and zeaxanthin.
Epidemiological studies have shown that a decreased risk of neovascular AMD is
associated with high plasma concentrations of carotenoids (lutein, zeaxanthin, β-carotene,
α-carotene, β-cryptoxanthin, α-cryptoxanthin, and lycopene) (EDCCS, 1992; Gale et al.,
2003). While serum carotenoid levels increase quickly with supplementation (Khachik et
al., 1995; Landrum et al., 1997a), it has been shown that the increase in MPOD as a result
of supplementation or dietary intake of these carotenoids is a much slower process
(Landrum et al., 1997b; Toyoda et al., 2002). Although the exact mechanism for uptake
of dietary lutein and zeaxanthin into the macula has not yet been elucidated, retinal
tubulin, a carotenoid binding protein has been suggested as a mediator for uptake of these
carotenoids in the fovea (Bernstein et al., 1997). More recently, a pi isoform of glutathione s-
transferase (GSTP1) has been identified as a xanthophyll-binding protein in the human
macula that displays a strong affinity for dietary zeaxanthin and meso-zeaxanthin and, and to
a lesser extent, lutein (Prakash et al., 2004).
14
Proposed Metabolic Pathways of Lutein and Zeaxanthin in Humans
It has been hypothesized that lutein and zeaxanthin in the human macula provide
protection against AMD by two mechanisms. First, lutein and zeaxanthin absorb short-
wavelength blue light between 400–475 nm, which peaks at 440 nm, and has the most
damaging effects on the retina. The main absorption maxima of lutein and zeaxanthin in
organic solvents are 448 nm and 454 nm, respectively (Britton, 1995). It has been
suggested that lutein and zeaxanthin in the macula act as optical filters by absorbing
damaging blue light, and as a consequence, reduce and/or prevent the amount of light-
induced oxidative damage. Secondly, carotenoids are potent antioxidants and can quench
reactive oxygen species in the macula and thereby prevent damage to the cones and
photoreceptors (Schalch et al., 1999; Beatty et al., 1999; Liebler et al., 1997). The retina
is highly susceptible to oxidative damage due to the high rate of metabolic activity and
the simultaneous presence of high levels of oxygen and light.
The initial hypothesis of this protective effect was based on the previously
observed concentrations of lutein and zeaxanthin in the macula, epidemiological data,
and animal studies (EDCCS, 1992; EDCCS, 1993; Seddon et al., 1994; Malinow et al.,
1980; Kirschfeld, 1982; Krinsky, 1989; Snodderly, 1995). A cumulative body of data was
reviewed in 1992 by Schalch, who concluded that the presence of lutein and zeaxanthin
in human and monkey retinas does indeed serve a specific purpose (Schalch, 1992). It
was noted that of the 10 dietary carotenoids found in human blood, lutein and zeaxanthin
are present in the macula due to their excellent ability to quench oxygen free radicals and
singlet oxygen, both of which are generated in this region due to the concurrent presence
of light and oxygen (Schalch, 1999). Additionally, Landrum et al. provided evidence for
15
the possible role of these carotenoids by showing the loss of these macular pigments
throughout the macula in AMD donor eyes in comparison with control eyes (Landrum et
al., 1997). It is now believed that the presence of these carotenoids in the macula may
retard some of the destructive processes that occur in the retina and RPE that may lead to
AMD. For a complete review of the evidence supporting the protective role of lutein and
zeaxanthin against AMD see the publications of by Snodderly, 1995; Schalch et al., 1999;
and Landrum & Bone, 2001.
The discovery of the metabolites and several oxidation products of lutein and
zeaxanthin that are not of dietary origin in the human retina led to a postulated metabolic
transformation by which dietary lutein and zeaxanthin in the retina may be converted to
their metabolites (Khachik et al., 1995; Bernstein et al., 2001; Khachik et al., 2002). The
presence of the oxidation products of lutein and zeaxanthin in the human retina provided
preliminary evidence for the protective role of these carotenoids as antioxidants (Khachik
et al., 1995; Khachik et al., 1997a; Landrum & Bone, 2001). According to the metabolic
transformations proposed by Khachik et al., (3'R,3'S, meso)-zeaxanthin, (3R,3'R,6'R)-
lutein, and (3R,3'R)-zeaxanthin may be interconverted by a series of oxidation-reduction
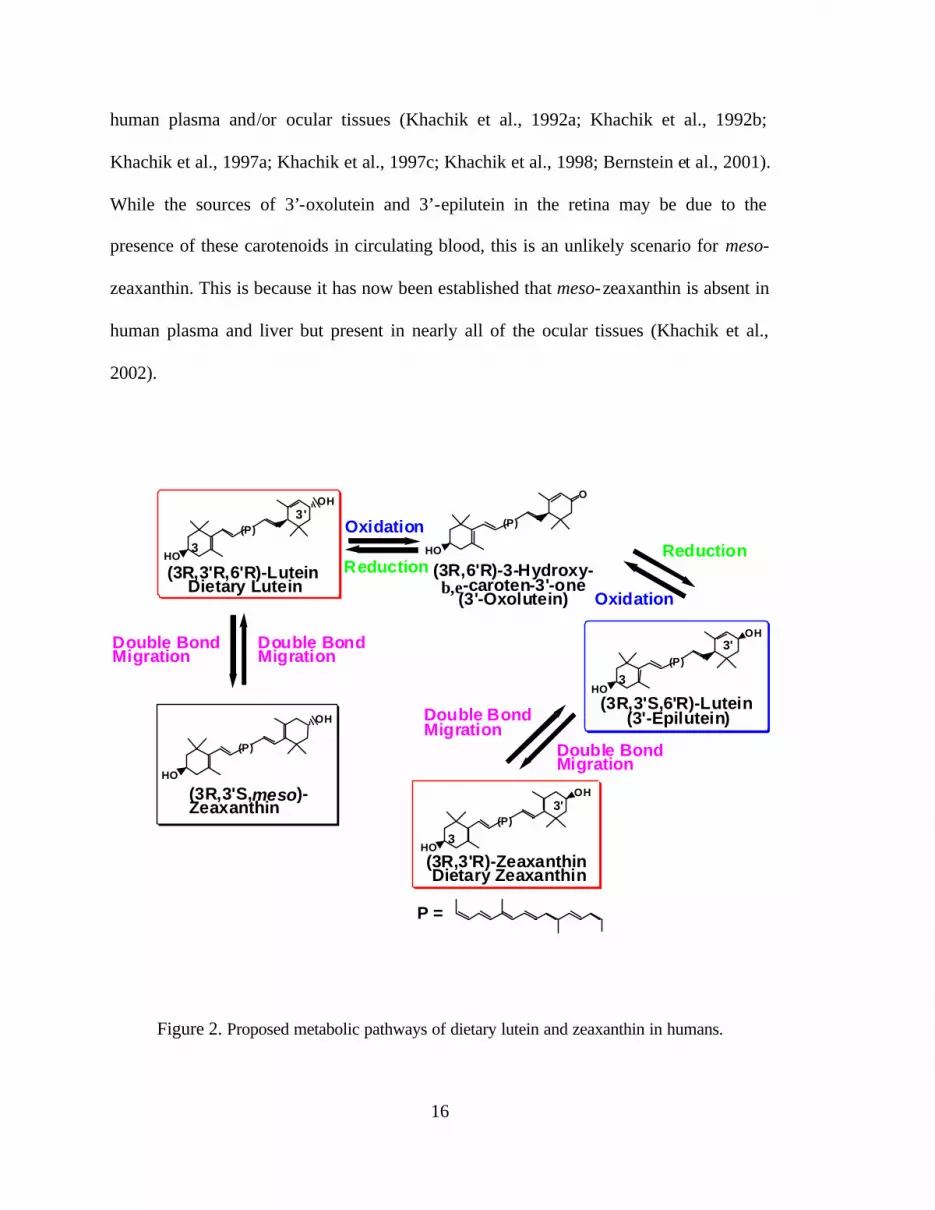
and double-bond isomerization reactions as shown in Figure 2. The 3 types of reactions
that may take place are: 1) the oxidation of the allylic hydroxyl group of the ,-end group
of lutein to give an α,β-unsaturated ketocarotenoid (e.g., 3’-oxolutein), 2) the reduction
of the resulting ketocarotenoid via epimerization at C-3' to form 3’-epilutein, and 3)
stereospecific double bond isomerization of the β-end group of dietary zeaxanthin to
form 3’-epilutein, and by a similar mechanism, the conversion of dietary lutein to
(3R,3’R, meso)-zeaxanthin. The carotenoids shown in Figure 2 have all been detected in
16
human plasma and/or ocular tissues (Khachik et al., 1992a; Khachik et al., 1992b;
Khachik et al., 1997a; Khachik et al., 1997c; Khachik et al., 1998; Bernstein et al., 2001).
While the sources of 3’-oxolutein and 3’-epilutein in the retina may be due to the
presence of these carotenoids in circulating blood, this is an unlikely scenario for meso-
zeaxanthin. This is because it has now been established that meso-zeaxanthin is absent in
human plasma and liver but present in nearly all of the ocular tissues (Khachik et al.,
2002).
D o u b l e B o n d M i g r a t i o n
O x i d a t i o n
R e d u c t i o n O x i d a t i o n
( 3 R , 3 ' R , 6 ' R ) - L u t e i n D i e t a r y L u t e i n
( 3 R , 6 ' R ) - 3 - H y d r o x y - β , ε - c a r o t e n - 3 ' - o n e
( 3 ' - O x o l u t e i n )
( 3 R , 3 ' S , 6 ' R ) - L u t e i n ( 3 ' - E p i l u t e i n )
( 3 R , 3 ' S , m e s o ) - Z e a x a n t h i n
( 3 R , 3 ' R ) - Z e a x a n t h i n D i e t a r y Z e a x a n t h i n
O H
H O
O H
H O
O H
H O
O
H O
O H
H O R e d u c t i o n
P =
D o u b l e B o n d M i g r a t i o n
3 '
3
3
3 '
3 '
3
D o u b l e B o n d M i g r a t i o n
D o u b l e B o n d M i g r a t i o n
( P )
( P ) ( P )
( P )
( P )
Figure 2. Proposed metabolic pathways of dietary lutein and zeaxanthin in humans.
17
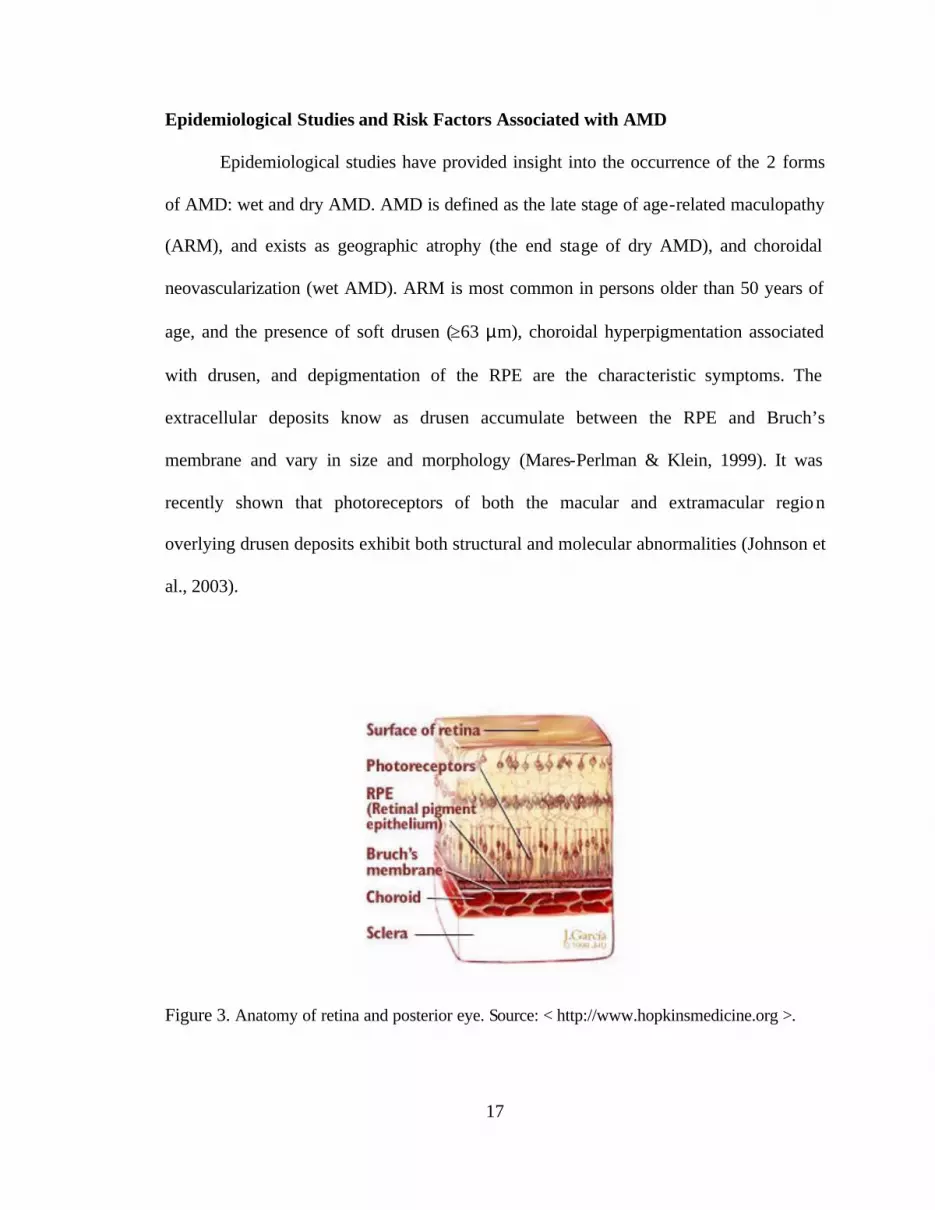
Epidemiological Studies and Risk Factors Associated with AMD
Epidemiological studies have provided insight into the occurrence of the 2 forms
of AMD: wet and dry AMD. AMD is defined as the late stage of age-related maculopathy
(ARM), and exists as geographic atrophy (the end stage of dry AMD), and choroidal
neovascularization (wet AMD). ARM is most common in persons older than 50 years of
age, and the presence of soft drusen (≥63 µm), choroidal hyperpigmentation associated
with drusen, and depigmentation of the RPE are the characteristic symptoms. The
extracellular deposits know as drusen accumulate between the RPE and Bruch’s
membrane and vary in size and morphology (Mares-Perlman & Klein, 1999). It was
recently shown that photoreceptors of both the macular and extramacular region
overlying drusen deposits exhibit both structural and molecular abnormalities (Johnson et
al., 2003).
Figure 3. Anatomy of retina and posterior eye. Source: < http://www.hopkinsmedicine.org >.
18
Prevalence studies of AMD have been conducted mainly in industrialized
countries. Three large population-based epidemiological studies have provided estimates
for the prevalence of geographic atrophy and neovascular AMD. They are: the Beaver
Dam Study in Wisconsin (Klein et al, 1992); the Rotterdam Study in The Netherlands
(Vingerling et al., 1995); and the Blue Mountains Eye Study in Australia (Mitchell et al.,
1995). The data from these studies revealed the following figures for the prevalence of
geographic atrophy: 0.44% (the Beaver Dam Study), 0.66% (the Rotterdam Study), and
0.45% (the Blue Mountains Eye Study). Meanwhile, the same studies reported that the
prevalence of neovascular AMD was: 0.88%, 0.72%, and 1.20%, respectively.
AMD is a multifactorial disorder. While the etiology of AMD is unknown, it has
been linked to the combination of numerous risk factors. One of the major risk factors for
AMD is age. The Framingham Eye Study showed that 28% of individuals between the
ages of 75 and 85 had AMD compared to 22% of individuals between the ages of 52 and
74 (Kahn et al., 1977). Additionally, the Beaver Dam Eye Study, which investigated the
10-year incidence of ARM showed a significant increase in the incidence of this disease
with age. This study revealed a 19.5% increase of retinal pigment abnormality in subjects
aged 75 or older at baseline from the outset of the study to its conclusion compared with
a 0.8% increase in individuals aged 43 to 54 at baseline (Klein et al., 2002).
Family history has also been shown to be an important risk factor associated with
late AMD and early ARM (Smith et al., 1998). Several studies with twins proposed
genetic influence as an AMD risk factor, although the relative importance of genetic
versus environmental factors was not defined (Meyers & Zachary, 1988; Klein et al.,
1994). In a study that compared monozygotic twins to dizygotic twins in order to exclude
19
the influence of shared family environment, results showed 45% heritability at the early
stage of ARM (Hammond et al., 2002).
More recently, variants of several genes have been identified as possible risk
factors for AMD. A single-nucleotide polymorphism (SNP) in the complement factor H
(CFH/HF1) gene has been associated with an increased risk of AMD (Klein et al., 2005;
Hageman et al., 2005). CFH plays a critical regulatory role in the complement system of
innate immunity which protects against infection and attacks diseased cells. It has been
hypothesized that inappropriate complement activation which causes an abnormal
inflammatory response may result in AMD by way of tissue damage and cell death. The
haplotype N1 within the CFH gene increases the risk for AMD significantly. In a whole-
genome case-control association study that used a subset of participants from the Age-
Related Eye Disease Study (AREDS) (96 case and 50 control subjects), being
heterozygous for this haplotype increased the risk for AMD by a factor of 4.6 and being
homozygous for this haplotype increased the risk for AMD by a factor of 7.4 (Klein et al,
2005).
In a study of 2 independent cohorts comprised of 900 AMD cases and 400
matched controls that analyzed genetic variations in HF1, multiple HF1 variants were
associated with elevated or reduced risk of AMD (Hageman et al., 2005). Strong
associations with AMD were found among 3 SNPs for this gene ; the strongest was the
A473A variant in exon 10 (rs2274700) (odds ratio = 3.42, 95% CI). Additionally, 2
common protective haplotypes were identified in 34% of controls and 18% of cases.
Results suggest that the HF1 protein associated with the at-risk HF1 haplotype(s) may
attenuate complement inhibitory function leading to excessive amounts of membrane
20
attack complex and consequent tissue damage. This evidence supports the hypothesis that
a specific and common haplotype of HF1, a complement regulator, predisposes
individuals to AMD (Hageman et al., 2005; Klein et al, 2005).
Also implicated as a risk factor for AMD are variants of the ABCA4 gene. In a
study that screened over 1,000 unrelated AMD patients, the 2 most frequent AMD-
associated variants in ABCR were investigated (Allikmets et al., 2000). The risk of AMD
was 3-fold higher for the variant D2177N and 5-fold higher for the variant G1961E.
The ApoE gene has also been implicated as a risk factor for AMD (Schmidt et al.,
2000; Malek et al., 2005). In a recent experimental study, a new animal model that was
developed, the apoE TR mouse, manifests a comprehensive range of human AMD-like
pathologies (Malek et al., 2005). The homozygous ApoE4 genotype when combined with
advanced age and high fat cholesterol-rich diets produced neovascularization (NV)
associated with advanced AMD among approximately 18% of the animals in this group
and was not observed in the age and diet matched group that expressed the other two
apoE alleles. Additionally, the proteins detected in the NV lesions of these mice were
consistent with those seen in human NV.
Being Caucasian appears to increase the risk of AMD. The white population has
been shown to have a higher prevalence of ARM (5.6%) when compared to that of the
black population (3.7%) (Klein et al.,1999). The Baltimore Eye Survey which involved a
total of 5,431 participants found that the prevalence of AMD among whites over 70 years
of age was 2.1%, while there were no cases of AMD detected among the 243 black
participants in this age group (Friedman et al., 1999).
21
Gender has also been shown to be a risk factor for AMD. The Beaver Dam Eye
Study found that the prevalence of exudative AMD was 6.7% for women and 2.6% for
men among the Caucasian population in the study (Klein et al., 1992). The gender
difference was also apparent among the African American population as women were
twice as likely to have AMD as men (Pieramici et al., 1994). An interesting point to note
is that MPOD has been shown to be lower in women; men were shown to have an
average of 38% or higher MPOD than women (Hammond et al., 1996). Low MPOD
causes increased exposure to damaging blue light which may explain the higher
prevalence of AMD seen in women.
Cigarette smoking is an important modifiable risk factor for AMD. Smoking has
been associated to a greater extent with neovascular AMD rather than with geographic
atrophy (Hyman et al., 1992). The Eye-Disease Case Control Study Group also found a
strong association between risk of neovascular AMD and current smokers (EDCCS,
1992). Additonally, the Blue Mountains Eye Study assessed the relationship between
baseline smoking and the 5-year incidence of late and early ARM in 3,654 subjects aged
49 years or older (Blue Mountains Eye Study, 2002). This study found that current
smokers had an increased risk in pigment abnormalities and of developed late ARM at a
significantly earlier age than former smokers and those who had never been smokers.
Additionally, the POLA Study found former smokers to remain at increased risk for
AMD (Delcourt et al., 1998).
While epidemiological studies have investigated the association between AMD
and cardiovascular disease and related risk factors such as high blood pressure and high
serum cholesterol, the relationship is still unclear. The Eye Case Control Study Group
22
(EDCCS, 1992), did not find a significant association between hypertension and
neovascular AMD, but did find a significant trend with higher systolic blood pressure.
Conversely, the AMD Risk Factors Study Group found a positive association between
neovascular AMD and diastolic blood pressure greater than 95 mm Hg (odds ratio [OR] =
4.4) (Hyman et al., 2000). Additionally, a direct association between elevated HDL
cholesterol levels and the incidence of AMD has been suggested but the reason is not
known (Hyman et al., 2000; Klein et al., 2003a). Several epidemiological studies did not
find any association between AMD and hypertension, stroke, angina, and acute
myocardial infarction (Smith et al., 1998; Klein et al., 2003b). Examined cumulatively,
the results of studies investigating these associations are inconclusive.
Chronic or abnormal inflammatory responses have emerged as possible indicators
of AMD risk. It has been noted that cardiovascular disease and AMD share common
antecedents and biomarkers of systemic inflammation such as elevated C-Reactive Protein
(CRP) levels (Snow et al., 1999). In a study of over 250 subjects with a mean age of 72
years, analysis of biomarkers of inflammation showed: 1) physical activity was inversely
related to CRP, interleukin-6 (IL-6), and tumor necrosis factor-a-R2 (TNF-a-R2); 2)
smoking was associated with all biomarkers but vascular cell adhesion molecule-1
(VCAM-1); and CVD; 3) systolic blood pressure were positively related to most markers;
and 4) body mass was positively associated with CRP, TNF-a-R2, and VCAM-1.
Statistical analysis from this study showed a 2-fold greater risk of progression of AMD
among the highest quartile of CRP, and odds ratio of 1.81 for the highest quartile of IL-6;
and both smoking and BMI were positively related high levels of CRP and IL-6 and to
AMD. The identification of the factor H gene (HF1) as an AMD risk gene provides
23
support for the role of inflammation in AMD (Bok et al., 2005; Klein et al., 2005). HF1
codes for a protein involved in the innate system, the body’s first line of defense against
infection. A broader haplotype of the regulator of complement activation (RCA) gene
located nearby on the same chromosome was recently found to be present in nearly half
of those with AMD compared to approximately 29 % of controls (Hageman et al., 2005).
It has been hypothesized that dysfunction of the complement system which leads to
chronic inflammation could contribute to chronic diseases and, in the case of AMD,
disruption of Bruch’s membrane and subsequent lesion formation (Hageman et al., 2005).
Prolonged inflammatory response, a condition seen in obesity and in other chronic
diseases, may provide a link between the aforementioned diseases and increased AMD
risk.
Obesity, high BMI, and waist-to-hip ratio have been cited as risk factors for AMD
(AREDS 2000). In a study of 680 men and women from two sites in the United States,
there was an inverse relationship between MPOD and BMI (p <0.0008) and MPOD and
body fat percentage (p < 0.01) (B.R. Hammond et al., 2002). These relationships were
observed only in the group of subjects with a BMI above 29 and fat percentage above
27%. However, dietary intake of lutein and zeaxanthin was also lower in these groups. In
the 5-year follow-up of the Beaver Dam Eye Study (n=3722), researchers found a
significant association between age-related maculopathy and both BMI and waist-to-hip
ratio among women, but found that waist-to-hip ratio was more strongly associated with
nearly every outcome (Klein et al., 2001). These researchers found little difference
between BMI and waist-to-hip ratio as indicators of age-related eye disease among men
24
(Klein et al., 2001). While there is a greater range of waist-to-hip ratios in women than
men, these results suggest the distribution of adiposity might be related to AMD risk.
There is some evidence to suggest that light iris color (i.e., blue, green irises) is
associated with increased risk of AMD, but this is controversial. Analysis of the cross-
sectional data from the Blue Mountain Study revealed a significant association between
blue iris color and an increased risk of early ARM (odds ratio=1.45) and late ARM (odds
ratio=1.69) (Mitchell et al., 1998). However, the Beaver Dam Eye Study showed that
individuals with brown eyes were more likely to develop soft indistinct drusen than those
with blue irises (Tomany et al., 2003). Additionally, the Eye Disease Case Control Study
group found no significant association between iris color and AMD (EDCCS, 1992).
Dietary factors have been cited as possible factors in the development of AMD.
Dietary fat is one potential risk factor for AMD, however results from studies have been
inconsistent. The Beaver Dam Eye Study reported that subjects in the highest quintile of
saturated fatty acid intake were at a significantly higher risk for early AMD than those in
the lowest quintile. (Mares-Perlman et al.,1995a). Alternatively, The Blue Mountains
Study did not find a significant association between AMD and saturated fat, but instead
found a relationship between intake of monounsaturated fat and a significant borderline
increase in the risk of early AMD (Smith et al., 2000). In yet another study,
polyunsaturated fat, such as linoleic acid, was associated with risk of AMD (Seddon et
al., 2001).
Antioxidants, alternatively, may prevent the progression of AMD. Carotenoids
have been cited as being among the most effective and abundant dietary antioxidants that
25
prevent oxidative damage by quenching singlet oxygen and other reactive oxygen species
in liposomes, lipoproteins, membranes, and cells (Krinsky, 1989).
Evidence for the protective role of carotenoids against AMD was collected in a
study conducted by the Eye Disease Case-Control Study Group, specifically for the
beneficial role of carotenoids in the prevention of neovascular (wet) AMD (EDCCS,
1993). The study subjects included 421 patients with neovascular AMD and 615 controls,
and the goal was to evaluate antioxidant status (including vitamins C and E, carotenoids,
and selenium) and the risk factors for wet AMD. The results of this study showed that the
subjects with medium and high serum carotenoid levels as compared to those with low
serum carotenoid concentrations were at significantly reduced risk of neovascular AMD.
However, a nested case-control study (Beaver Dam Eye Study), examined subjects with
retinal pigment abnormalities with the presence of drusen (n = 127), late AMD/geographic
atrophy (n = 9), or exudative AMD (n = 31), and an equal number of controls (n = 167),
and found no correlation between serum lutein and zeaxanthin concentrations and risk of
AMD. This study revealed that the subjects with serum lycopene levels in the lowest
quintile were twice as likely to develop AMD (Mares-Perlman et al., 1995b).
Another study, published in 1994 reported that diets high in fruits and vegetables,
specifically those rich in lutein and zeaxanthin, were correlated with a reduced risk of
AMD (Seddon et al., 1994). Seddon et al. examined 356 case subjects with advanced
stage of AMD and 520 control subjects who were within the same age range and from the
same geographic region, but had ocular diseases other than AMD. This study showed that
the subjects in the highest quintile of carotenoid intake had a 43% lower risk for AMD
compared with those in the lowest quintile. More specifically, frequent consumption of
26
spinach or collard greens, which contain high concentrations of lutein and zeaxanthin,
was associated with a substantially lower risk for AMD.
The epidemiological and observational studies that provided such promising
results in the early 1990s were the impetus for the large-scale clinical intervention trial
with β-carotene known as the Age-Related Eye Disease Study (AREDS, 2000; Sackett &
Schenning, 2002). AREDS began in 1992 and was concluded in 2001, and involved over
4,600 subjects at 11 eye disease centers across the United States. The intent of this study
was to examine whether long-term supplementation of patients at various stages of AMD
or cataract with β-carotene, vitamins C and E, and zinc, alone or in combination, could
prevent or slow the progression of these eye diseases. An important point to note is that
at the outset of planning AREDS, lutein and zeaxanthin were not yet commercially
available, but β-carotene was both commercially available and accepted as a safe dietary
supplement. Although β-carotene does not accumulate in the retina, it was selected for
this study based on its role in the human visual cycle as a precursor of retinol (vitamin
A). The subjects of this study were categorized into one of 4 groups: 1) no diagnosis of
AMD, 2) early stage of AMD, 3) intermediate AMD, and 4) advanced stage of AMD.
Nutritional supplements given to members of each group were randomized. Results of
this study showed that a daily dose of 500 mg vitamin C, 400 I.U. vitamin E, 15 mg β-
carotene, and 80 mg zinc oxide with 2 mg cupric oxide reduced the risk of developing
advanced AMD by about 25% in individuals at high risk for developing advanced AMD
(i.e., those with intermediate AMD or advanced AMD in one eye) (AREDS, 2000; Sacket
& Schenning, 2002).
27
Because lutein and zeaxanthin are concentrated in the human retina and it has
been suggested that they have possible protective roles against disease, blood levels of
these carotenoids were examined in 7059 participants of the Third National Health and
Nutrition Examination Survey aged 40 and over (Gruber et al., 2004). It was shown that
lower serum lutein and zeaxanthin were significantly associated with smoking, heavy
drinking, higher fat- free mass, being white, female, or not being physically active, having
lower dietary cholesterol, and the presence of inflammatory markers such as higher white
blood cell count, and high levels of C-reactive protein (p < 0.05). This study, in finding
associations between low serum concentrations of lutein and zeaxanthin and previously
identified risk factors for AMD further demonstrates the multi- factorial nature of this
disease. Unfortunately, the results provide no information about the relative contribution
of the individual risk factors to AMD risk.
Supplementation Studies with Lutein and Zeaxanthin
There have been few studies involving human supplementation of lutein and/or
zeaxanthin; these studies provide a foundation for current research. Results of the first
human studies of supplementation with lutein and zeaxanthin were published in 1995
(Khachik et al., 1995). In these studies, Khachik and 2 colleagues were the subjects of a
lutein supplementation study. All 3 subjects were healthy nonsmoking Caucasian males
between the ages of 42 and 59. Subjects were placed on a restricted diet that excluded
green and yellow-orange fruits and vegetables containing lutein, and they were
supplemented daily with 10 mg oral doses of lutein that were dispersed in olive oil.
Otherwise, subjects were on self-selecting diets and kept dietary records throughout the
28
study. Baseline levels of plasma carotenoids were determined 25 and 11 days prior to the
supplementation period (3 data points: days -25, -11, and baseline). Plasma carotenoid
profiles were monitored at baseline and on days 2, 4, 7, 18, 26, 33, 40, and 57, and
analyzed by HPLC. Lutein serum levels in all 3 subjects increased by 4- to 5-fold after
one week of supplementation and peaked in one subject after one week of supplementation.
Additionally, the levels of lutein oxidation products during this study increased
significantly, providing preliminary evidence for the in vivo oxidation of lutein as a result
of the metabolism of this carotenoid (Khachik et al., 1995).
A similar study was conducted by the same researchers in order to investigate the
effects of short-term zeaxanthin supplementation on serum carotenoid levels (Khachik et
al., 1995). The 3 subjects ingested 10 mg/day of zeaxanthin orally for 3 weeks. After one
week of supplementation, the plasma zeaxanthin concentrations increased by 4-fold in all
subjects, and plasma concentrations of lutein, 3'-epilutein, and the oxidation products
(ketocarotenoids) of these carotenoids increased significantly.
Another study conducted by the same researchers sought to examine the short-
term effects of a higher daily dose of lutein. In this study, one subject ingested a daily
dose of 20 mg of lutein for a period of 21 days (Khachik et al., 1997c). The supplements
were prepared in the same manner as previously described. Serum analysis was
performed at baseline and on days 2, 4, 7, 9, 11, 15, 18, 18, 21, 25, 31, and 39 that
measured the levels of 22 carotenoids, vitamin A, and vitamin E (α- and ?-tocopherol).
There was a 9-fold increase in lutein serum levels of subjects from 12 µg/dL at baseline
to 108 µg/dL after 3 weeks of supplementation. At the end of the supplementation period,
the levels of lutein oxidation products were shown to increase by 2- to 3-fold. Because of
29
the known accumulation of lutein in the retinas, a complete eye examination of the
subject was performed after 21 days of supplementation at the National Eye Institute. No
unusual accumulation of lutein in the retina or ocular toxicity was observed.
The Veterans Lutein Antioxidant Supplementation Trail (LAST) investigated the
effects of long-term lutein supplementation in patients with atrophic AMD (Richer et al.,
2004). This double-masked, placebo-controlled, randomized trial of lutein and
antioxidant supplementation involved 90 subjects with a mean age of about 75. Subjects
were randomly assigned to one of the following 3 treatments for 12 months: 1)
supplementation with 10 mg/day of lutein, 2) supplementation with 10 mg/day of lutein
plus a wide range of antioxidants, vitamins, and minerals including zinc (L/A), and 3)
administration of a placebo. Lutein in the supplements was in its non-esterified form to
approximate food-equivalent lutein intake from spinach. The results of this study
demonstrated that long-term supplementation (12 months) of lutein alone or in
combination with additional carotenoids, antioxidants, vitamins, and minerals
significantly improved MPOD, glare recovery, near visual acuity, and most measures of
quality of vision. Additionally, in the patients receiving L/A supplementation, there was
no observed progression of AMD retinopathy. However, while it was shown that
improved visual function resulted from lutein supplementation, the researchers of this
study identified the preliminary nature of the results due to limitations such as the small
number of subjects and the population studied, as well as a lack of statistical significance
among the 3 groups.
Another recent human supplementation study involving 45 subjects aged 60 or
older investigated the association of 3 daily doses of orally ingested lutein supplements

30
with the serum levels of this carotenoid among 3 groups: 1) those without AMD, 2) those
with middle stage AMD, and 3) those with end stage AMD (Moura et al., 2004; Chew et
al., 2003). The supplemental doses of lutein, which contained 5% zeaxanthin, were 2.5, 5,
and 10 mg/day. The data from this study showed a direct correlation between serum
lutein concentrations and the 3 dose levels for all subjects, revealing that serum lutein
concentration is dose-dependent. Serum concentrations of lutein increased in all subjects,
and after 3 weeks of supplementation all groups reached a plateau. Subjects on doses of
2.5, 5, and 10 mg/day of lutein reached a serum plateau of 450, 490, and 810 nmol/L,
respectively. Subjects given a dose of 10 mg/day showed a 3- to 4-fold increase in serum
lutein levels after 3 weeks, while the subjects receiving 2.5 and 5 mg/day lutein doses
showed almost a 2-fold increase. There was no significant difference between these 2
treatment groups (2.5 and 5 mg/day) until after week 25 of supplementation when
subjects receiving 2.5 mg/day of lutein showed a decrease in serum plasma levels. It was
shown that the presence or absence of AMD did not interfere with serum levels of lutein.
Additionally, all subjects showed an increase in serum levels of 3’-oxolutein and 3’-
epilutein (lutein and zeaxanthin metabolites), which supports the metabolic pathways
previously discussed in this proposal (see Figure 2) (Khachik et al., 1995; Khachik et al.,
1998; Khachik et al., 2002). Overall, the results from this study suggested that
supplementation with a dose of at least 5 mg/day of lutein would provide the serum lutein
level needed to lower the risk of AMD (Moura et al., 2004). This correlates with the
plasma lutein level reported by the Eye Disease Case-Control Study to be associated with
the lowest risk of AMD (670 nm/L) (EDCCS, 1993).
31
A series of recently published papers presented the results of a long-term study
involving 18 Rhesus monkeys that were raised from birth until 7–16 years of age on a
semipurified xanthophyll- free diet. Six of these primates were then fed pure lutein
supplements (L-treated) and 6 with fed pure zeaxanthin supplements (Z-treated) at a daily
dose of 2.2 mg/kg (3.9 µmol/kg) for 24–56 weeks; 6 were maintained on the xanthophyll-
free diet until death (Neuringer et al., 2004; Leung et al., 2004; Johnson et al., 2005;
Leung et al., 2005). These 3 groups were subdivided and assigned to diets containing
either low or adequate n-3 fatty acids to see whether n-3 fatty acid status affects uptake of
lutein or zeaxanthin into blood or tissues. Serum carotenoid levels and MPOD, which
were measured at baseline and various intervals, were compared to control monkeys fed a
stock diet (n=15) that provided a daily dose of ~150 µg (0.26 µmol)/kg of lutein and
~135 µg (0.26 µmol)/kg of zeaxanthin. Reversed-phase HPLC was used for qualitative
and quantitative analysis of serum, and two-wavelength monochromatic fundus
reflectometry and monochromatic fundus photographs were used to determine MPOD.
After primate sacrifice the central retinas were serially sectioned and the number of RPE
cells were counted and compared to the data from 15 animals fed the stock diet described
(Leung et al., 2004).
Results showed that prior to supplementation, primates on the semipurified diet
had no measurable serum lutein or zeaxanthin, while the stock diet- fed primates had a
mean concentration of 0.074 ± 0.009 µmol/L of lutein (trans form only) and 0.081 ±
0.007 µmol/L of combined cis and trans zeaxanthin (Neuringer et al., 2004). After 2
weeks of supplementation the L-treated and Z-treated animals’ serum xanthophylls levels
exceeded those of the stock diet- fed animals and reached levels approximately 10-fold for
32
lutein and 10- to 20-fold for zeaxanthin compared to those of the control group. The
researchers noted high inter- individual variability as the reason for the serum level
differences between the L-treated and Z-treated primates not reaching statistical
significance (p = 0.12) using repeated measures ANOVA. MPOD measured within the
central 1mm of the retina of the xanthophyll- free primates were zero or very low. In the
L-treated and Z-treated primates, MPODs increased during the first 24 to 32 weeks, but
showed no consistent increases thereafter. No significant differences were observed
between the L- and Z-treated animals. Both serum and ocular tissue data showed no
effect of n-3 fatty acid status. It was also found that MPOD was not significantly related
to total serum xanthophylls concentrations. While MPOD of the primates raised on a
xanthophylls-free diet increased significantly, levels were only about half that of the
primates fed stock diets.
Retina analysis revealed that foveal and parafoveal RPE cell densities increased
with age and that the xanthophyll- free monkeys had a dip in the cell density profile of the
RPE, unlike the control monkeys (Leung et al., 2004). After supplementation, n-3 fatty
acid status seemed to interact with the supplemental lutein or zeaxanthin causing
asymmetries in the RPE profile leading the researchers to conclude that adequate
xanthophylls and n-3 fatty acids are essential for developing and maintaining normal
distribution and/or maintenance of such a distribution.
A third paper published about this group of xanthophyll- free primates examined
the effects of the aforementioned lutein or zeaxanthin supplementation on serum, adipose
tissue, and retina concentrations of these carotenoids in the primates (Johnson et al.,
2005). Results showed that adipose tissue, as well as the serum and retinas of the
33
xanthophyll- free primates had no lutein or zeaxanthin, but that concentrations increased
significantly in both the L-treated and Z-treated groups after supplementation. Further,
lutein and non-dietary meso-zeaxanthin were detected in the retina of the L-treated
animals, but only all-trans zeaxanthin and no t meso-zeaxanthin was detected in the Z-
treated animals. The researchers concluded that lutein is a precursor of meso-zeaxanthin.
Another study of the xanthophyll- free primates examined the density of S-cone
and rod cells in the foveal region (Leung et al., 2005). Serial sections 2 µm thick from the
region containing the foveal depression were cut and outer segments of S-cones and
nuclei of rods were counted. Results showed no consistent effect of n-3 fatty acid status
or xanthophyll supplementation on the density profiles. There was, however, high inter-
individual variability. Data suggested that some of the animals were resistant to the
imposed nutritional manipulations while others may have been affected.
The study presented in this thesis followed a logical progression to the recent
supplementation studies discussed in this review by investigating chronic high-dose
supplementation with lutein or zeaxanthin in primates. While supplemental lutein at
doses as high as 10 mg/day resulted in no interaction with other carotenoids, retinol, and
α- and γ-tocopherols, and no adverse side effects, there were no data available for the
effects of long-term supplementation with pharmaceutical doses of this carotenoid.
Therefore, a study to begin investigating the effect of long-term supplementation with
pharmaceutical doses of lutein was needed. Pharmaceutical doses refer to doses
significantly higher than the average dietary intake levels. Also, there had been no studies
to investigate the effects of long-term supplementation with pharmaceutical doses of
zeaxanthin. This study also sought to investigate the effects of supplementation with a 1:1
34
combination of lutein and zeaxanthin on the plasma and tissue deposition of these
carotenoids and their metabolites, which had not previously been investigated. Prior to
the studies described in this thesis, the only supplementation study that has been
conducted with zeaxanthin was a short-term study involving three subjects supplemented
with a dose of 10 mg/day (Khachik et al., 1995).
Because of the invasive nature of the studies undertaken and the safety
considerations associated with potential toxicity at high supplemental doses of lutein and
zeaxanthin, the use of an appropriate animal model was necessary. Rhesus Macaque
primates were chosen for this study because of their similarities to humans; specifically,
because of their similar metabolism, and their accumulation of lutein, zeaxanthin, and
their metabolites in the serum and macula (Khachik et al., 1995). The challenging task
of achieving optimal MPOD in females was posed in this study since MPOD has been
shown to be lower in women than in men (Hammond et al., 1996). Thus, female Rhesus
Macaques were chosen rather than males. As discussed throughout this thesis, the
association between lutein and zeaxanthin and the prevention and treatment of AMD has
been implied. Yet, while multi-center clinical trials with these carotenoids are in the
planning stage by the NEI, metabolic and toxicity studies with lutein and zeaxanthin had
not been conducted prior to this study. For this reason, the experiments outlined in this
thesis were undertaken.
35
RESEARCH QUESTIONS
1) How does long-term chronic supplementation of primates with lutein (9.34 mg/kg
body weight and 0.66 mg/kg body weight), zeaxanthin (10 mg/kg body weight),
and a 1:1 combination of the two (lutein and zeaxanthin each at a dose of 0.5
mg/kg body weight) affect plasma concentrations and tissue deposition of these
carotenoids and their metabolites over time?
2) How is the concentration of lutein, zeaxanthin, and their metabolites in the ocular
tissues of primates affected by long-term chronic supplementation with lutein
and/or zeaxanthin?
3) Can long-term supplementation of primates with lutein, zeaxanthin, and their
combination provide insight into the metabolic pathways of these carotenoids?
4) Can long-term chronic supplementation of primates with pharmaceutical doses of
lutein and zeaxanthin result in ocular toxicity and/or side effects? Pharmaceutical
doses in this study refer to greater than 60-fold that of the highest amount
administered (0.16 mg/kg body weight) in a recent human supplementation study
(Moura et al., 2004; Chew et al., 2003)?
36
METHODS AND ANALYTICAL PROCEDURES
This study was conducted in collaboration with a number of investigators at
various institutes of the University of Maryland (Baltimore) and the Wilmer Eye Institute
(John Hopkins University, Baltimore) under the supervision of Dr. Frederick Khachik,
the principal investigator. The project collaborators and their respective contributions are
described herein.
I. Study Investigators
Dr. Steve Shipley (DVM) who is a veterinary pathologist at the Veterinary
Resources Division of the School of Medicine oversaw the care and carotenoid
supplementation of the primates. The primates were housed at the Medical Student
Teaching Facility (MSTF) building of the University of Maryland, Baltimore campus.
Additionally, Dr. Shipley was responsible for conducting standard necropsy of all major
organs from the sacrificed animals.
All ocular exams were performed by either Dr. Scott Steidl or Dr. Mary Johnson
at the University of Maryland, Baltimore School of Ophthalmology who are both board
certified ophthalmologists.
Dr. Gerard Lutty and Scott McLeod at the Wilmer Eye Institute at John’s Hopkins
Medical Center performed complete histopathology of the primate retinas following
euthanasia.
The toxicology evaluation was handled by Dr. Jodi Anne Flaws of the Program in
Toxicology at the University of Maryland, School of Medicine, Baltimore.
37
The qualitative and quantitative analysis of lutein, zeaxanthin, and their
metabolites as well as vitamin A in the plasma and major organs and tissues (including
ocular tissues) of primates were measured in the laboratory of Dr. Khachik (University of
Maryland, College Park).
II. Selection of Animal Model for Supplementation Studies with Lutein and Zeaxanthin
Due to the invasive nature of the study and the safety considerations associated
with administering pharmaceutical doses of lutein and zeaxanthin, these studies needed to
be conducted in an appropriate animal model. Primates were chosen because of their
similar metabolism, and their accumulation of lutein, zeaxanthin, and their metabolites in
the retina (Khachik et al., 1995). Therefore, female Rhesus Macaques (Macaca mulatta)
were selected for the chronic supplementation studies with lutein, zeaxanthin, and their
combination. This selection was based on the assumption that female Rhesus Macaques,
similar to humans, may accumulate a lower macular pigment optical density (MPOD)
than their male counterparts. In such a case, establishing a safe dose range at which lutein
and zeaxanthin supplementation can result in an optimal MPOD was the challenging task
undertaken in these studies.
Study Primates
Eighteen female Rhesus Macaque monkeys weighing between 2.6–3.2 kg were
selected and divided into 3 treatment groups designated as L-treated (L at 9.34 mg/kg/day
and Z at 0.66 mg/kg/day), Z-treated (Z at 10 mg/kg/day), L/Z-treated (L & Z each at 0.5
mg/kg/day), and a control group. Each treatment group consisted of 5 animals that was
38
supplemented daily according to their assigned treatment. The control group consisted of
3 primates that were not supplemented and served as the control group for all 3 studies.
Procedures to Assure Comfort and Appropriate Analgesia
The laboratory animal veterinarian (Dr. Steve Shipley) was responsible for the
selection of the most appropriate analgesic or anesthetic which best met the clinical and
humane requirements without compromising the scientific data. For analgesia,
buprenorphine was administered intramuscularly at a dose of 0.015 mg/kg body weight
of primate. The Rhesus Macaque monkeys were anesthetized with ketamine at an
intramuscular dose of 10 mg/kg body weight. The health of each animal was monitored
by performing complete blood chemistry at various intervals throughout the study (Dr.
Shipley).
Institutional Animal Care and Use Committee (IACUC) Approval
The proposed studies were approved by the IACUC of the University of
Maryland, Baltimore and the University of Maryland, College Park. (See attached letter,
Appendix A). Tissue distribution complied with the tenets of the Declaration of Helsinki.
III. Selection of Lutein and Zeaxanthin Doses for the Supplementation Studies
The oral daily doses chosen for the proposed studies, a lutein supplement of 9.34 mg/kg
body weight, and a zeaxanthin supplement of 10 mg/kg body weight was approximately 60-
fold that of the highest dose of lutein administered in the study conducted by Moura et al.
(Moura et al., 2004). These approximately 10 mg/kg of body weight doses of lutein or

39
zeaxanthin corresponded with approximately 149–303 times the average daily carotenoid
intake in the U.S diet (estimated at 2–4 mg/day) (Chug-Ahuja et al., 1993).
The L/Z-treated primates were supplemented daily with a combination of lutein
and zeaxanthinin at the dose of 0.5 mg/kg body weight for each of these carotenoids. The
lutein dose of 0.5 mg/kg body weight of primates was approximately 3-fold that of the
highest dose of lutein supplemented to humans by Moura et al., and the zeaxanthin dose
was approximately 10-fold that of the highest zeaxanthin received by subjects in the same
study (Moura et al., 2004).
It is relevant to note that the supplementation levels for the Lutein Supplementation
Study and Zeaxanthin Supplementation Study are 60-fold that of the highest dose of a
recent human supplementation, and thus allowed the examination of potential toxicity as
well as the bioavailability at a relatively high level of supplementation (Moura et al.,
2004; Chew et al., 2003).
Source of Lutein and Zeaxanthin Supplements
The supplemental doses of lutein and zeaxanthin were formulated by DSM
Nutritional Products (Basel, Switzerland) into 5% water-dispersible beadlets. The water-
dispersible beadlet formulation is the most bioavailable form of these carotenoids. All
supplements were stored in well-sealed aluminum bags within plastic bags at 5°C to
protect them from moisture, air, and light. The stability and the composition of the
beadlets were monitored by extraction and HPLC analysis throughout the study.
Supplements were given to the animals by adding each dose to a banana and
providing it to the animal as a treat.
40
IV. Study Design
The 3 supplementation studies were designated as the Lutein Supplementation
Study, the Zeaxanthin Supplementation Study, and the Lutein/Zeaxanthin Supplementation
Study. The Lutein Supplementation Study involved 5 female Rhesus Macaque monkeys
(L-treated primates) that were supplemented daily with a high dose of lutein for 12
months. The Zeaxanthin Supplementation Study involved the daily supplementation of 5
female Rhesus Macaque monkeys with a high dose of zeaxanthin for 12 months, and the
Lutein/Zeaxanthin Supplementation Study consisted of 5 female Rhesus Macaque
monkeys that were supplemented daily with a 1:1 combination of lutein and zeaxanthin,
each at the dose of 0.5 mg/kg for 12 months. The control group (n = 3) was not fed any
supplements.
Prior to this study, neither long-term high-dose supplementation with lutein or
zeaxanthin nor the effects of supplementation with a combination of lutein and zeaxanthin in
primates or humans had been investigated. The proposed study was designed to investigate
the safety and efficacy of high-dose supplementation with lutein or zeaxanthin, and the
effects of combined lutein and zeaxanthin supplementation on plasma and tissue carotenoid
levels as well as the combined protective effect of these carotenoids against AMD.
At baseline, months 6, 12, and 18 plasma samples were collected for the analysis of
carotenoids and their metabolites. Major organs and tissues (liver, lung, colon, breast, kidney,
spleen, ovary, cervix, adipose) including ocular tissues (retina, ciliary body, lens, iris) of the
sacrificed animals were analyzed for carotenoids and their metabolites. Additionally, the
primates’ weights were recorded at baseline and at months 6, 12, and 18.
41
Several other biomarkers were analyzed by other co-investigators of this study
including urinary creatinine and proteins, histopathology of retinas, and ocular exams that
included fundus examination and photography, as well as multifocal ERGs. The
abovementioned urinary analyses and ocular assessments were performed at baseline, months
6, 12, and 18. Complete histopathology of the retina and in vitro culture of primate
keratinocyte and retinal cells were completed at either month 12 or month 18 depending on
which time point the primate was sacrificed.
The Control Group
The control group consisted of 3 female Rhesus monkeys that were housed with
the Lutein Supplementation Study animals and served as the control group for the entire
study. These animals were fed a standardized monkey diet, which is described later in
this section, and was identical to that fed to the other study primates. The collection of
biomarkers for the control group followed the same timeline as that of the animals in the
Lutein Supplementation Study. One control primate was sacrificed at month 12 and the
remaining 2 were sacrificed at month 18.
The Lutein Supplementation Study
A total of 5 female Rhesus monkeys comprised the treatment group. The L-
treated primates of the Lutein Supplementation Study received daily lutein supplements
at the dose of 10 mg/kg for the duration of 12 months. The lutein in these supplements
contained approximately 6.6% zeaxanthin by weight so each 10 mg dose consisted of
42
approximately 9.34 mg of lutein and 0.66 mg of zeaxanthin. Therefore, the L-treated
primates actually received 9.34 mg/kg of lutein and 0.66 mg/kg of zeaxanthin daily.
Due to the high supplemental dose given to the primates in the L-treated group,
statistically significant differences in measurements of the various biomarkers at the
months 6 and 12 of supplementation were expected. At the end of the supplementation
period, 2 of the L-treated primates were sacrificed and the remaining 3 animals remained
under observation for 6 months to assess whether there was any toxicity associated with
these high supplemental doses. At month 18, the remaining L-treated primates were
sacrificed.
The Zeaxanthin Supplementation Study
A total of 5 female Rhesus Macaque monkeys were supplemented daily with
zeaxanthin at the dose of 10 mg/kg body weight for 12 months. At the end of the
supplementation period (month 12), 2 of the Z-treated primates were sacrificed and the
remaining 3 animals were kept under observation for 6 months. After 6 months of post-
supplementation observation (month 18), the remaining 3 Z-treated primates were
sacrificed.
The Lutein/Zeaxanthin Supplementation Study
A total of 5 female Rhesus Macaques monkeys were supplemented daily with a
1:1 mixture of lutein and zeaxanthin to provide a lutein dose of 0.5 mg/kg body weight
and a zeaxanthin dose of 0.5 mg/kg body weight for 12 months. All 5 of the L/Z-treated
primates were sacrificed after 12 months of supplementation.
43
V. Collection, Handling, and Shipping of the Primate Plasma and Tissue Samples for Measurement of Biomarkers
Collection of Plasma Samples for Carotenoid Analysis
Two fasting blood samples, 10 mL each, were drawn from each primate via
venipuncture at the specified intervals for these studies. The collected blood samples
were immediately placed on ice, protected from light, and centrifuged (1000 x g) for 20
minutes at 4°C within 1 hour after collection to separate the plasma. Approximately 4−5
ml of plasma was expected from each 10 ml blood sample drawn from each primate.
The plasma samples were dated and coded with the appropriate number for each
primate known only to the study coordinator in Baltimore (Dr. Shipley) and stored at -70°C
or lower. The samples for carotenoid analysis were transported to our laboratories on Dry
Ice for analysis. Upon arrival, the plasma samples were immediately stored at -70°C; the
samples were extracted and analyzed by HPLC as promptly as possible.
Method of Euthanasia
The Rhesus Macaque monkeys were euthanized at the end of the study. The
animals were first anesthetized with an intramuscular dose of ketamine of 10 mg/kg body
weight. The animals were then humanely euthanized with a 100 mg/kg dose of
pentobarbitol injected intravenously consistent with the 1993 Report of the American
Veterinary Medical Association panel on euthanasia. The procedures were performed and
monitored by Dr. Shipley and his colleagues.
44
Collection, Handling, and Shipping of Tissues and Organs
At sacrifice, all tissues and organs to be analyzed were removed, dated, and coded
with the appropriate number for each primate known only to the study coordinator at
Baltimore (Dr. Shipley) and stored at -70°C or lower until they were transported on Dry
Ice to our laboratories (UMD, College Park) for analysis.
One of the eyes from each primate was dissected under the supervision of Dr.
Steidl or Dr. Johnson and the various ocular tissues were stored at -70°C or lower. The
dissected eye tissues of one eye from each animal was labeled and coded with the
appropriate number for each primate known only to the study coordinator at Baltimore
(Dr. Shipley) and stored at -70°C or lower until they were shipped via Express Mail on
Dry Ice to our laboratories (UMD, College Park) for analysis.
The other intact eye from each primate was labeled and coded with an appropriate
number for each primate and stored at -70°C or lower until they were transported to Dr.
Gerard Lutty (Wilmer Eye Institute, JHU, Baltimore) for histhopathology.
Collection of Urine for Analysis of Urinary Creatinine and Proteins
Urine samples for creatinine and protein analyses were collected by placing the
animals in metabolic cages with free access to water for 24-hour urine collections. The
urine samples was collected in foil-wrapped containers containing sodium carbonate, 24-
hour urine volumes was measured and recorded prior to being frozen at –80°C.

45
VI. Measurement of Biomarkers
Biomarkers of Toxicity
Specific biomarkers associated with skin, liver and kidney function were probed
as these organs are actively involved in the metabolism and excretion of various organic
substances and tend to concentrate dietary carotenoids. The 3 toxicological evaluations
that were conducted by Dr. Flaws included: 1) culturing of skin epithelial cells and
consequent examination for any alterations in gene expression patterns; 2) urinary
creatinine excretion patterns and potential hepatoxic effects; and 3) identification of
chemical-specific urinary proteins using N-terminal sequence analysis which was
performed by Dr. Flaws of the University of Maryland, School of Medicine, Baltimore.
Ocular Toxicity
Possible retinopathy was monitored throughout the supplementation trials. Whenever
the monkeys’ eyes were dilated, a board certified ophthalmologist (Dr. Steidl or Dr.
Johnson) examined the retinas with indirect ophthalmoscopy. Any detected abnormalities
were recorded using Fundus photography. Histopathology of the retina was performed by
Dr. Gerard Lutty and Scott McLeod (Wilmer Eye Institute). Dr. Mary Johnson also
performed multifocal, scotopic, and photopic electroretinography. At various intervals
(baseline, months 6, 12 and 18) multifocal ERGs was taken from the monkeys to monitor
for any electrophysiological evidence of carotenoid- induced toxicity.
Primate Plasma Analysis
Plasma that was collected from each of the treatment and control primates at the
various intervals (baseline, months 6, 12, and 18) was sent to our laboratories for
46
qualitative and quantitative analysis (UMD, College Park). Normal phase HPLC-
UV/visible-photodiode array detection was employed for identification and quantification
of lutein, zeaxanthin and related geometrical isomers, as well as metabolites and retinol.
The procedures for plasma carotenoid extraction and HPLC analysis is described later in
this section.
Primate Tissue Analysis
The qualitative and quantitative distributions of carotenoids in major organs and
tissues [adipose, cervix, colon, kidney, liver, lung, breast, spleen, ovaries] as well as
ocular tissues (retina, iris, lens, ciliary body) of the necropsied primates were determined
in our laboratories (UMD, College Park) by extraction and HPLC analysis.
Normal phase HPLC-UV/visible photodiode array detection was employed for
identification and quantification of lutein, zeaxanthin and related geometrical isomers as
well as their metabolites and retinol. HPLC-UV/visible photodiode array detection on a
chiral column was employed for the identification and quantification of (3R,3’R)-
zeaxanthin and (3R,3’S; meso)-zeaxanthin in the retina tissues. These procedures are
described later in this thesis.
VII. Standardized Monkey Diet
The standardized monkey diet was purchased in bulk once every 6 weeks from
Harlan Tekland (Madison, WI). The feed chosen as the standard diet, Harlan Tekland-
8775, contained the highest concentrations of lutein and zeaxanthin available (total lutein
content: 5.49 µg/g feed; total zeaxanthin content: 1.47 µg/g feed). Prior to the beginning
47
of the supplementation period of these studies, a sample of this feed (Harlan Telkand-
8775) was extracted and analyzed by HPLC to determine the carotenoid levels of the diet.
All primates in the study were kept on the same standard monkey diet. The diet
came in the form of biscuits, each weighing approximately 12 grams. Each monkey ate
between 15 and 20 monkey biscuits per day equaling 180 to 240 grams of feed. This
amount of feed supplied the primates with between 0.99 and 1.32 mg of lutein, and 0.26
and 0.35 mg of zeaxanthin per day. The light cycle for all the animals was maintained at
12 hours of light and 12 hours of dark.
VIII. Extraction and Analysis of Lutein and Zeaxanthin Beadlets
A suspension of 300 mg of the beadlets of lutein or zeaxanthin and approximately
100 mg of protease Maxatase P 440,000 (DSM Nutritional Products, Basel, Switzerland)
in 10 mL of deionized water in a 100 mL volumetric flask was sonicated in an ultrasonic
water bath for 30 minutes. Ethanol (30 mL) and dichloromethane (40 mL) were added
and the mixture was sonicated for 10 minutes. The solution was brought up to a final
volume of 100 mL using dichloromethane, and after mixing, the solids were allowed to
settle. A 1 mL aliquot of the solution was transferred into a vial and evaporated to
dryness under nitrogen. The residue was dissolved in the HPLC eluent (a 3:1 mixture of
hexane:dichloromethane) and filtered through a 0.45 µm disposable polyvinylidene
fluoride filter assembly (Acrodisk; VWR Scientific products, Bridgeport, NJ) into a 25
mL volumetric flask and brought up to volume for HPLC analysis on a silica-based nitrile
bonded column according to our published procedures (Khachik et al., 1992; Khachik et
al., 1997a; ). For spectrophotometric analysis, a 1 mL aliquot of the solution of lutein or
48
zeaxanthin was similarly filtered into 25 mL volumetric flask and brought up to volume
using ethanol. The concentrations of lutein (λmax = 445 nm, E1% = 2550) and zeaxanthin
(λmax = 450 nm, E1% = 2540) in the extracts were measured in ethanol at their corresponding
absorption maximum and extinction coefficient (Britton, 1995).
IX. Extraction of Carotenoids from Primate Plasma
All primate plasma samples were shipped from the University of Maryland,
Baltimore to the laboratory of Dr. Khachik on dry ice. Upon receipt, primate plasma
samples were catalogued and stored in a freezer at -80°C. Primate plasma samples were
first thawed, and accurately measured using a disposable syringe (latex-free syringe, 5
mL, VWR Scientific Products) and then transferred into a 50 mL centrifuge tube (Blue
Max™, polypropylene conical tube). Each sample was treated with 5 mL ethanol to
precipitate the proteins. The plasma carotenoids were extracted by adding tetrahydrofuran
(THF) containing 0.1 % 2,6-di-tert-butyl-4-methylphenol (BHT); the amount of THF
added was equal to the plasma volume plus the volume of ethano l previously added. The
tube was then vortexed for 2 minutes, and then centrifuged at 2000 g for 5 minutes to
separate the protein solids from the supernatant liquid. The extract was removed with a
pipette and saved, and the solid was reextracted by adding 5 mL of THF (with 0.1%
BHT) to the protein residue and then repeating the vortexing and centrifuging processes
as outlined above. The combined extracts were evaporated to dryness using an evaporator
(RapidVap Vacuum, model 79000-02, LABCONCO Co., MO). The dried extract was
dissolved in dichloromethane, sonicated, centrifuged, and then filtered through a 0.45 µm
disposable polyvinyl fluoride filter (VWR, Scientific Products, NJ) into a 5mL graduated
49
micro-sample vial. The solvent was evaporated under nitrogen (Nitrogen Evaporator, N-
EVAP™ 112, Organomation Associates, Inc., MA) and 250 µL of the HPLC injection solvent
(hexane 75%, dichloromethane 25%, methanol 0.35%, N,N-diisopropylethylamine 0.10%)
was added to the dried extract. The vial was then sonicated and centrifuged. For normal
phase HPLC, 120 µL of the extract was transferred to a chromatography vial and 50 µL
was injected into the HPLC system. The remaining extract was stored at -80°C in the
event that the HPLC analysis needed to be repeated.
X. Extraction of Carotenoids from Primate Tissues
All primate tissue samples were shipped on dry ice to Dr. Khachik’s laboratory
(UMD, College Park). Upon receipt, primate tissue samples were stored in a freezer at -80°C.
Tissue samples were thawed to room temperature and blood was removed by washing
with water; the excess water was removed by blotting the tissue samples with paper
towels and applying gentle pressure with a mortar. Each tissue sample was cut into
smaller pieces to facilitate the extraction of carotenoids by increasing the surface area.
Samples were accurately weighed and then placed into a beaker and anhydrous sodium
sulfate (10% by weight of the tissue) and sufficient volume of tetrahydrofuran (THF)
containing 0.1 % BHT to completely cover the sample was then added. The samples were
sonicated for 1 hour in an ice bath (10−15°C) and the extract was then decanted into a
round bottom flask. The tissue was reextracted by adding more THF, crushing the sample
with a mortar, and then sonicating for 30 minutes. The extracts were combined and
filtered on a Buchner funnel. The solids were washed with THF and the filtrate was
transferred to the round bottom flask and combined with previously saved extracts. The
50
combined extract was then evaporated on a rotary evaporator at 40°C. The round bottom
flask was thoroughly rinsed with dichloromethane, sonicated to remove the residual
sample from the sides of the flask, and the extract was then filtered through a 0.45 µm
disposable polyvinyl fluoride filter (VWR, Scientific Products, NJ) and diluted to an
appropriate volume. The solvent was evaporated to dryness under nitrogen (Evaporator,
N-EVAP™ 112, Organomation Associaties, Inc., MA). An appropriate volume of HPLC
injection solvent was added to the residue and depending upon the carotenoid
concentration, the sample was diluted to a final volume of 0.3, 1.0, 3.0, or 5.0 mL. The
extract (120 µL) was transferred to a chromatography vial and 50 µL was injected into
the HPLC system. The remaining sample was stored at -80°C in the event that additional
HPLC analysis was required.
XI. HPLC Analysis of Carotenoids
Carotenoid Separation by HPLC Normal Phase Column
Plasma and tissue extracts were analyzed using a normal phase HPLC system
according to a published procedure (Khachik et al., 1997b). HPLC separations were
carried out on a silica-based nitrile bonded HPLC column (Spherisorb®; 250 mm length x
4.6 mm i.d.; 5 µm spherical particle; Waters Company, U.S.). The column was protected
with a nitrile-bonded guard cartridge (3 cm length x 4.6 mm i.d.; 5 µm spherical particle).
The mobile phase consisted of an isocratic mixture of hexanes (75%), dichloromethane
(25%), methanol (0.35%), and N,N-diisopropylethylamine (DIPEA, 0.1%). The column
flow rate was 0.8 ml/min. HPLC runs were simultaneously monitored at 325, 446, and
456 nm. Carotenoids were identified by comparison of their HPLC retention times and
51
UV-visible absorption spectra with those of authentic standards. Carotenoids were
quantified from calibration tables obtained from the HPLC response factors of standards
at five or six known concentrations using linear regression analysis.
For the retina tissues, zeaxanthin concentrations were initially determined using a
normal phase column, but because dietary zeaxanthin and nondietary meso-zeaxanthin
cannot be separated by this method, further HPLC analysis of the extracts on a chiral
column was necessary.
Carotenoid Separation of Retina Tissue Extracts by HPLC Chiral Column
Retina extracts were also analyzed on a chiral HPLC column according to a
previously published procedure (Khachik et al., 2003). HPLC separations were carried
out on a [amylose tris-(3,5-dimethylphenyl-carbamate) coated on 10 µm silica gel] chiral
HPLC column. This allowed for the simultaneous separation of (3R,3’R)-zeaxanthin,
(3R,3’S; meso)-zeaxanthin, (3S,3’S)-zeaxanthin, (3R,3’R,6’R)- lutein, and 3’-epilutein.
This analysis was not performed on the ciliary body, iris, or lens tissues because the
concentrations of zeaxanthin and meso-zeaxanthin were too low for chiral HPLC
analysis. Therefore, only the total concentration of (3R,3’S; meso)-zeaxanthin and dietary
(3R,3’R)-zeaxanthin were reported.
XII. Accuracy and Reproducibility of HPLC Results
The accuracy of extractions was monitored regularly by the extraction,
identification, and quantification of carotenoids in standardized Red Cross plasma. No
internal standard in the extraction and analysis of various samples was employed because
52
of the possibility that its HPLC peak could interfere with the presence of possible
unknown carotenoids.
The reproducibility of the normal phase HPLC analysis of carotenoids was
monitored regularly by HPLC analysis of a calibrated solution containing known
concentrations of (3R,3’R,6’R)- lutein, (3R,3’R)-zeaxanthin, and 3’-epilutein.
XIII. Statistical Analysis
Statistical analysis of the data obtained from plasma and ocular tissue carotenoid
analyses were performed by Analysis of Variance and Covariance (ANCOVA) with
repeated measurements using SAS version 8.2 (SAS Institute Inc., Cary, NC). The least
significant difference (LSD) protected test was used to determine which treatment
groups’ mean plasma and ocular tissue levels of lutein, zeaxanthin, and their metabolites
were significantly different from one another at baseline and months 6, 12, and 18.
Similarly, the interactions between the body weight or age of the animals and the plasma
lutein and zeaxanthin levels were also examined. A p value of less than 0.05 was
considered statistically significant.
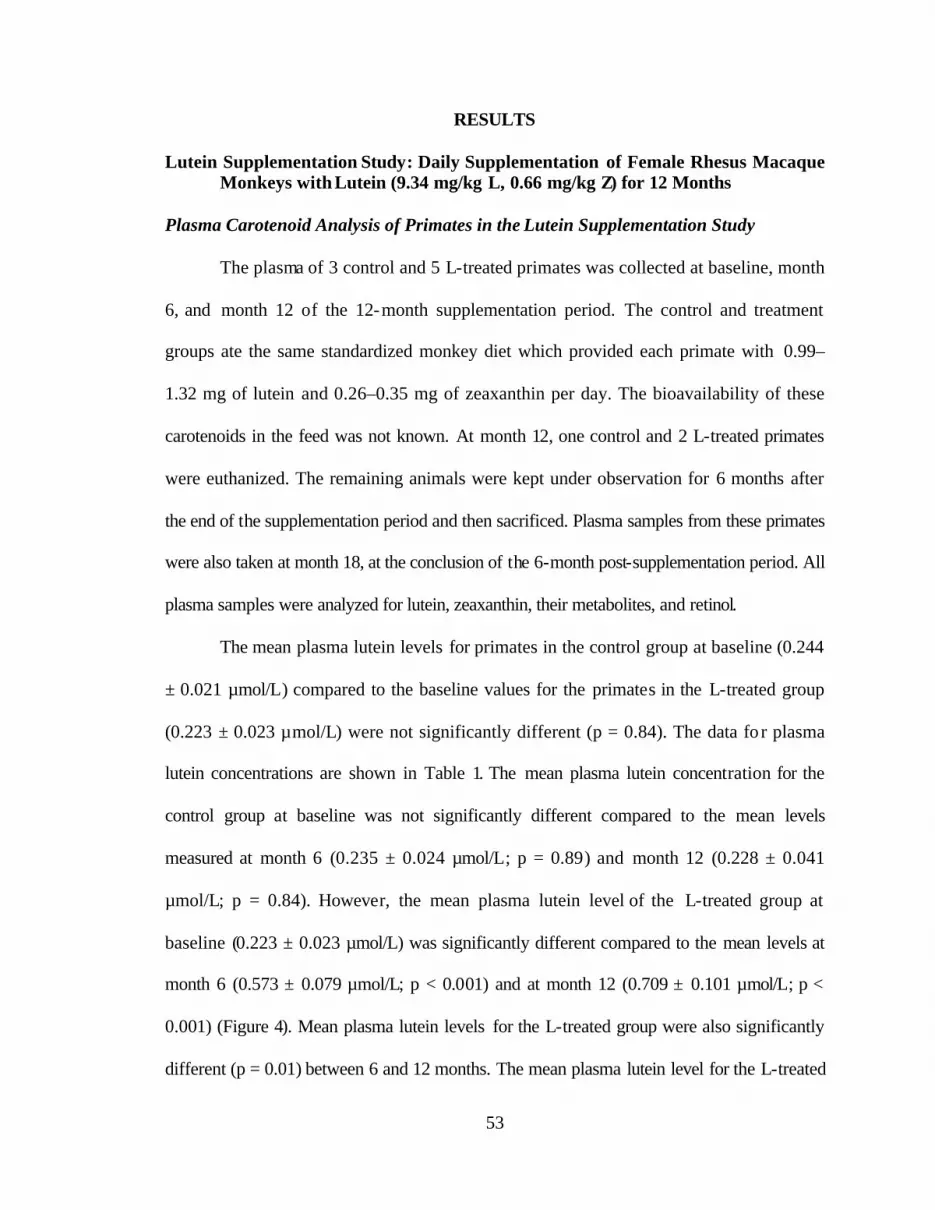
53
RESULTS
Lutein Supplementation Study: Daily Supplementation of Female Rhesus Macaque Monkeys with Lutein (9.34 mg/kg L, 0.66 mg/kg Z) for 12 Months
Plasma Carotenoid Analysis of Primates in the Lutein Supplementation Study
The plasma of 3 control and 5 L-treated primates was collected at baseline, month
6, and month 12 of the 12-month supplementation period. The control and treatment
groups ate the same standardized monkey diet which provided each primate with 0.99–
1.32 mg of lutein and 0.26–0.35 mg of zeaxanthin per day. The bioavailability of these
carotenoids in the feed was not known. At month 12, one control and 2 L-treated primates
were euthanized. The remaining animals were kept under observation for 6 months after
the end of the supplementation period and then sacrificed. Plasma samples from these primates
were also taken at month 18, at the conclusion of the 6-month post-supplementation period. All
plasma samples were analyzed for lutein, zeaxanthin, their metabolites, and retinol.
The mean plasma lutein levels for primates in the control group at baseline (0.244
± 0.021 µmol/L) compared to the baseline values for the primates in the L-treated group
(0.223 ± 0.023 µmol/L) were not significantly different (p = 0.84). The data fo r plasma
lutein concentrations are shown in Table 1. The mean plasma lutein concentration for the
control group at baseline was not significantly different compared to the mean levels
measured at month 6 (0.235 ± 0.024 µmol/L; p = 0.89) and month 12 (0.228 ± 0.041
µmol/L; p = 0.84). However, the mean plasma lutein level of the L-treated group at
baseline (0.223 ± 0.023 µmol/L) was significantly different compared to the mean levels at
month 6 (0.573 ± 0.079 µmol/L; p < 0.001) and at month 12 (0.709 ± 0.101 µmol/L; p <
0.001) (Figure 4). Mean plasma lutein levels for the L-treated group were also significantly
different (p = 0.01) between 6 and 12 months. The mean plasma lutein level for the L-treated
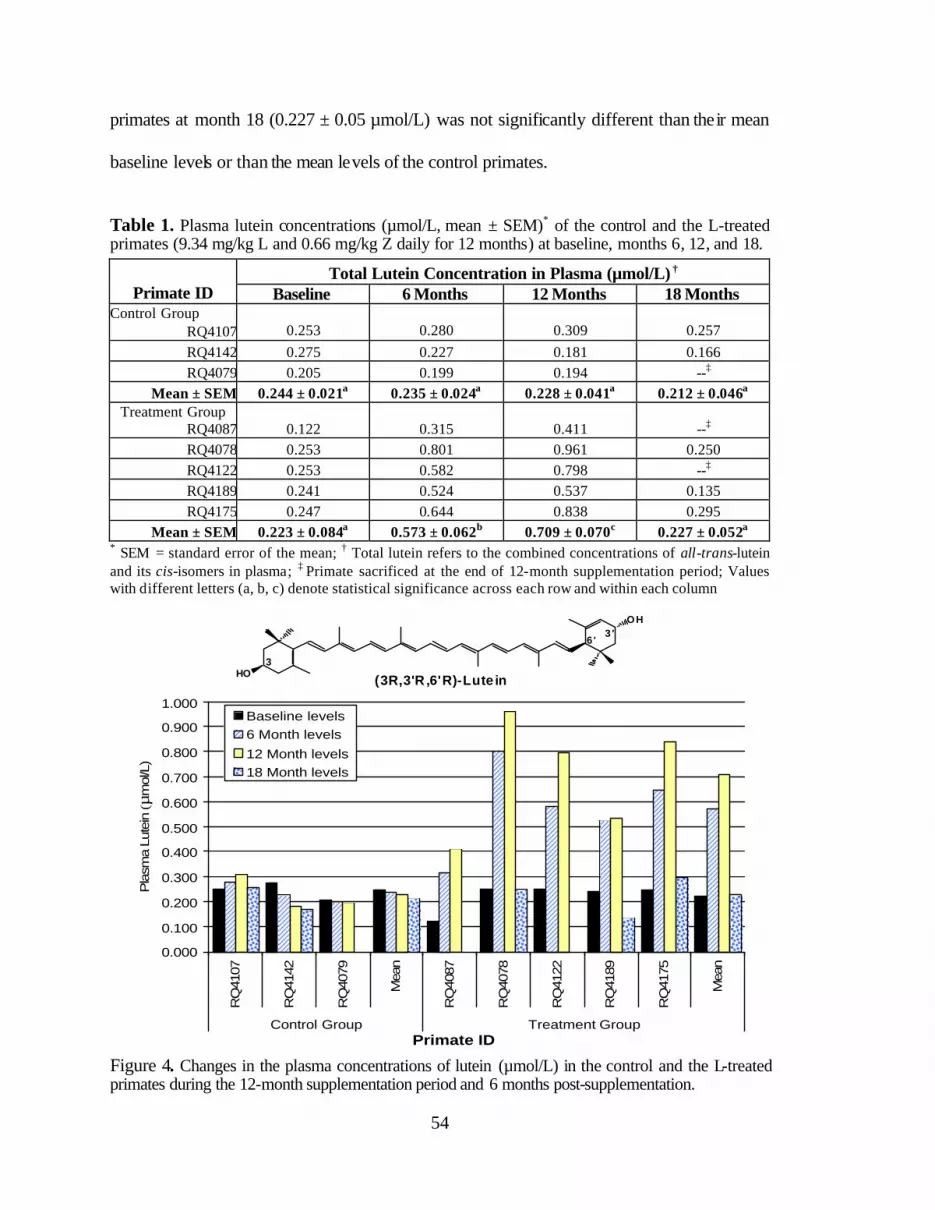
54
primates at month 18 (0.227 ± 0.05 µmol/L) was not significantly different than their mean
baseline levels or than the mean levels of the control primates.
Table 1. Plasma lutein concentrations (µmol/L, mean ± SEM)* of the control and the L-treated primates (9.34 mg/kg L and 0.66 mg/kg Z daily for 12 months) at baseline, months 6, 12, and 18.
Total Lutein Concentration in Plasma (µmol/L) † Primate ID Baseline 6 Months 12 Months 18 Months
Control Group RQ4107 0.253 0.280 0.309 0.257 RQ4142 0.275 0.227 0.181 0.166 RQ4079 0.205 0.199 0.194 --‡
Mean ± SEM 0.244 ± 0.021a 0.235 ± 0.024a 0.228 ± 0.041a 0.212 ± 0.046a Treatment Group
RQ4087 0.122 0.315 0.411 --‡ RQ4078 0.253 0.801 0.961 0.250 RQ4122 0.253 0.582 0.798 --‡ RQ4189 0.241 0.524 0.537 0.135 RQ4175 0.247 0.644 0.838 0.295
Mean ± SEM 0.223 ± 0.084a 0.573 ± 0.062b 0.709 ± 0.070c 0.227 ± 0.052a * SEM = standard error of the mean; † Total lutein refers to the combined concentrations of all-trans-lutein and its cis-isomers in plasma; ‡ Primate sacrificed at the end of 12-month supplementation period; Values with different letters (a, b, c) denote statistical significance across each row and within each column
OH
HO (3R,3'R ,6'R)-Lute in
3 '
3
6 '
0.000
0.100
0.200
0.300
0.400
0.500
0.600
0.700
0.800
0.900
1.000
RQ
4107
RQ
4142
RQ
4079
Mea
n
RQ
4087
RQ
4078
RQ
4122
RQ
4189
RQ
4175
Mea
n
Control Group Treatment GroupPrimate ID
Pla
sma
Lute
in (µm
ol/L
)
Baseline levels6 Month levels
12 Month levels18 Month levels
Figure 4. Changes in the plasma concentrations of lutein (µmol/L) in the control and the L-treated primates during the 12-month supplementation period and 6 months post-supplementation.
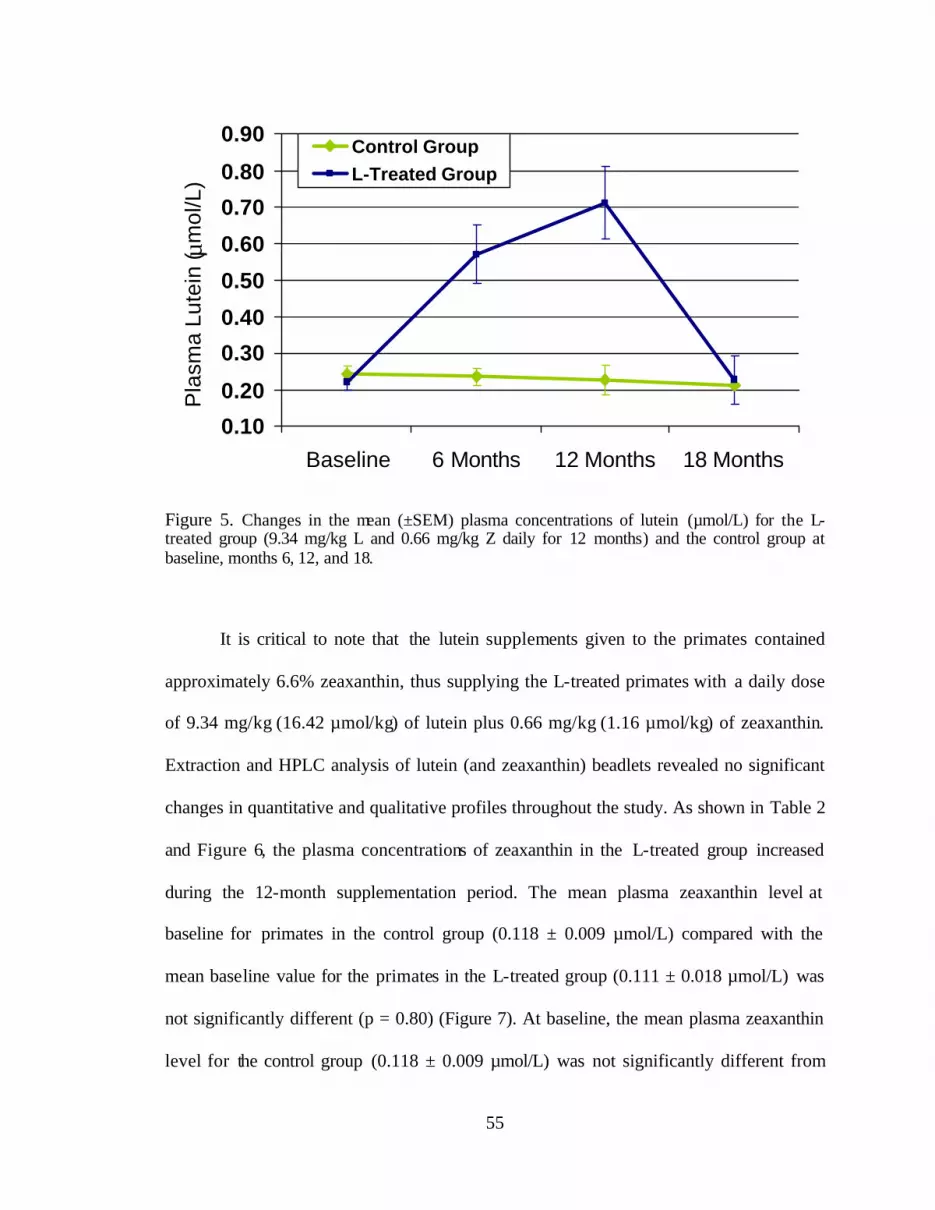
55
0.10
0.20
0.30
0.40
0.50
0.60
0.70
0.80
0.90
Baseline 6 Months 12 Months 18 Months
Pla
sma
Lute
in ( µ
mol
/L)
Control GroupL-Treated Group
Figure 5. Changes in the mean (±SEM) plasma concentrations of lutein (µmol/L) for the L-treated group (9.34 mg/kg L and 0.66 mg/kg Z daily for 12 months) and the control group at baseline, months 6, 12, and 18. It is critical to note that the lutein supplements given to the primates contained
approximately 6.6% zeaxanthin, thus supplying the L-treated primates with a daily dose
of 9.34 mg/kg (16.42 µmol/kg) of lutein plus 0.66 mg/kg (1.16 µmol/kg) of zeaxanthin.
Extraction and HPLC analysis of lutein (and zeaxanthin) beadlets revealed no significant
changes in quantitative and qualitative profiles throughout the study. As shown in Table 2
and Figure 6, the plasma concentrations of zeaxanthin in the L-treated group increased
during the 12-month supplementation period. The mean plasma zeaxanthin level at
baseline for primates in the control group (0.118 ± 0.009 µmol/L) compared with the
mean baseline value for the primates in the L-treated group (0.111 ± 0.018 µmol/L) was
not significantly different (p = 0.80) (Figure 7). At baseline, the mean plasma zeaxanthin
level for the control group (0.118 ± 0.009 µmol/L) was not significantly different from
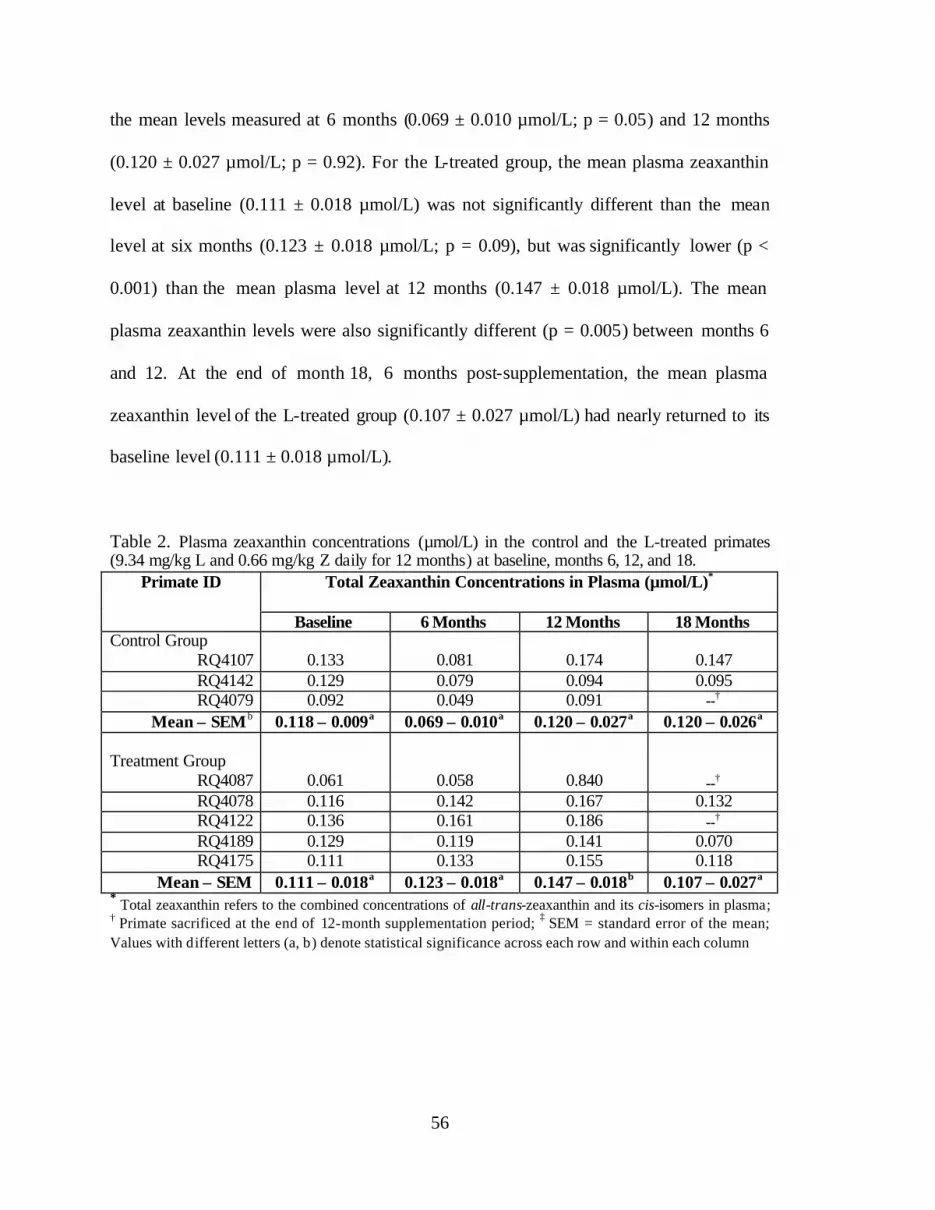
56
the mean levels measured at 6 months (0.069 ± 0.010 µmol/L; p = 0.05) and 12 months
(0.120 ± 0.027 µmol/L; p = 0.92). For the L-treated group, the mean plasma zeaxanthin
level at baseline (0.111 ± 0.018 µmol/L) was not significantly different than the mean
level at six months (0.123 ± 0.018 µmol/L; p = 0.09), but was significantly lower (p <
0.001) than the mean plasma level at 12 months (0.147 ± 0.018 µmol/L). The mean
plasma zeaxanthin levels were also significantly different (p = 0.005) between months 6
and 12. At the end of month 18, 6 months post-supplementation, the mean plasma
zeaxanthin level of the L-treated group (0.107 ± 0.027 µmol/L) had nearly returned to its
baseline level (0.111 ± 0.018 µmol/L).
Table 2. Plasma zeaxanthin concentrations (µmol/L) in the control and the L-treated primates (9.34 mg/kg L and 0.66 mg/kg Z daily for 12 months) at baseline, months 6, 12, and 18.
Total Zeaxanthin Concentrations in Plasma (µmol/L)*
Primate ID
Baseline 6 Months 12 Months 18 Months Control Group
RQ4107 0.133 0.081 0.174 0.147 RQ4142 0.129 0.079 0.094 0.095 RQ4079 0.092 0.049 0.091 --†
Mean ± SEMb 0.118 ± 0.009a 0.069 ± 0.010a 0.120 ± 0.027a 0.120 ± 0.026a Treatment Group
RQ4087
0.061
0.058
0.840
--† RQ4078 0.116 0.142 0.167 0.132 RQ4122 0.136 0.161 0.186 --† RQ4189 0.129 0.119 0.141 0.070 RQ4175 0.111 0.133 0.155 0.118
Mean ± SEM 0.111 ± 0.018a 0.123 ± 0.018a 0.147 ± 0.018b 0.107 ± 0.027a * Total zeaxanthin refers to the combined concentrations of all-trans-zeaxanthin and its cis-isomers in plasma; † Primate sacrificed at the end of 12-month supplementation period; ‡ SEM = standard error of the mean; Values with different letters (a, b) denote statistical significance across each row and within each column
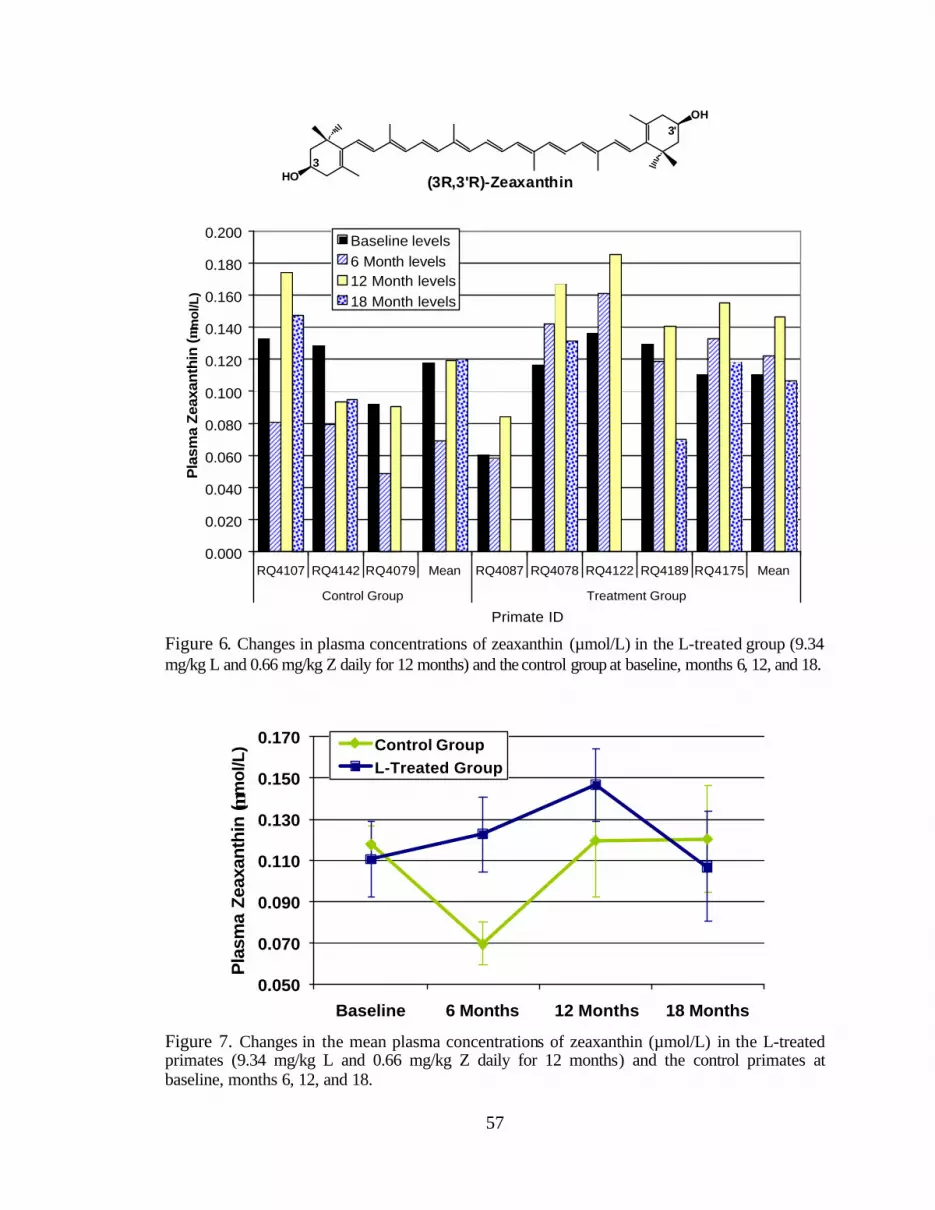
57
OH
HO (3R,3'R)-Zeaxanthin3
3'
0.000
0.020
0.040
0.060
0.080
0.100
0.120
0.140
0.160
0.180
0.200
RQ4107 RQ4142 RQ4079 Mean RQ4087 RQ4078 RQ4122 RQ4189 RQ4175 Mean
Control Group Treatment Group
Primate ID
Pla
sma
Zea
xan
thin
(µm
ol/L
)
Baseline levels6 Month levels12 Month levels18 Month levels
Figure 6. Changes in plasma concentrations of zeaxanthin (µmol/L) in the L-treated group (9.34 mg/kg L and 0.66 mg/kg Z daily for 12 months) and the control group at baseline, months 6, 12, and 18.
0.050
0.070
0.090
0.110
0.130
0.150
0.170
Baseline 6 Months 12 Months 18 Months
Pla
sma
Zeax
anth
in ( µ
mol
/L) Control Group
L-Treated Group
Figure 7. Changes in the mean plasma concentrations of zeaxanthin (µmol/L) in the L-treated primates (9.34 mg/kg L and 0.66 mg/kg Z daily for 12 months) and the control primates at baseline, months 6, 12, and 18.

58
Plasma Concentrations of Lutein and Zeaxanthin Metabolites in Primates in the Lutein Supplementation Study
Two of the lutein and zeaxanthin metabolites analyzed in the plasma of the L-
treated primates were (3R,3’S,6’R)-lutein (3’-epilutein) and 3-hydroxy-β,ε−caroten-3’-one
(3’-oxolutein). The structures of these metabolites are shown in Figure 8, and the proposed
pathway for their in vivo formation is depicted in Figure 2. Plasma concentrations of these
carotenoids were measured at baseline, months 6 and 12, and also at 6 months post-
supplementation (month 18) in the primates that were kept under observation after the
supplementation period (n = 3).
The data for 3’-epilutein plasma levels, presented in Table 3, show that the mean
plasma 3’-epilutein level for the control group at baseline (0.012 ± 0.0012 µmol/L) and
the mean baseline level for the L-treated group (0.013 ± 0.0028 µmol/L) were not
significantly different (p = 0.92). Additionally, the mean plasma 3’-epilutein level for the
control group at baseline compared to that at 6 months (0.0073 ± 0.0021 µmol/L) was not
significantly different (p = 0.13), nor was the mean baseline value significantly different
(p = 0.29) from the mean level for the control group at month 12 (0.0089 ± 0.0021
µmol/L). See Figure 9 for a comparison of the mean 3’-epilutein levels for the control and the
L-treated primates. While the mean plasma 3’-epilutein levels for the L-treated group were
not significantly different between baseline (0.0173 ± 0.0028 µmol/L) and month 6 (0.0182 ±
0.0042 µmol/L; p = 0.60), the mean 3’-epilutein level at month 12 (0.0423 ± 0.0113 µmol/L)
was significantly higher (p = 0.01) than the mean level at baseline. For the L-treated group,
the mean plasma concentrations of 3’-epilutein between months 6 and 12 were also
significantly different (p = 0.03). The mean plasma 3’-epilutein level for the L-treated group
at month 18 had returned to near the mean baseline level.
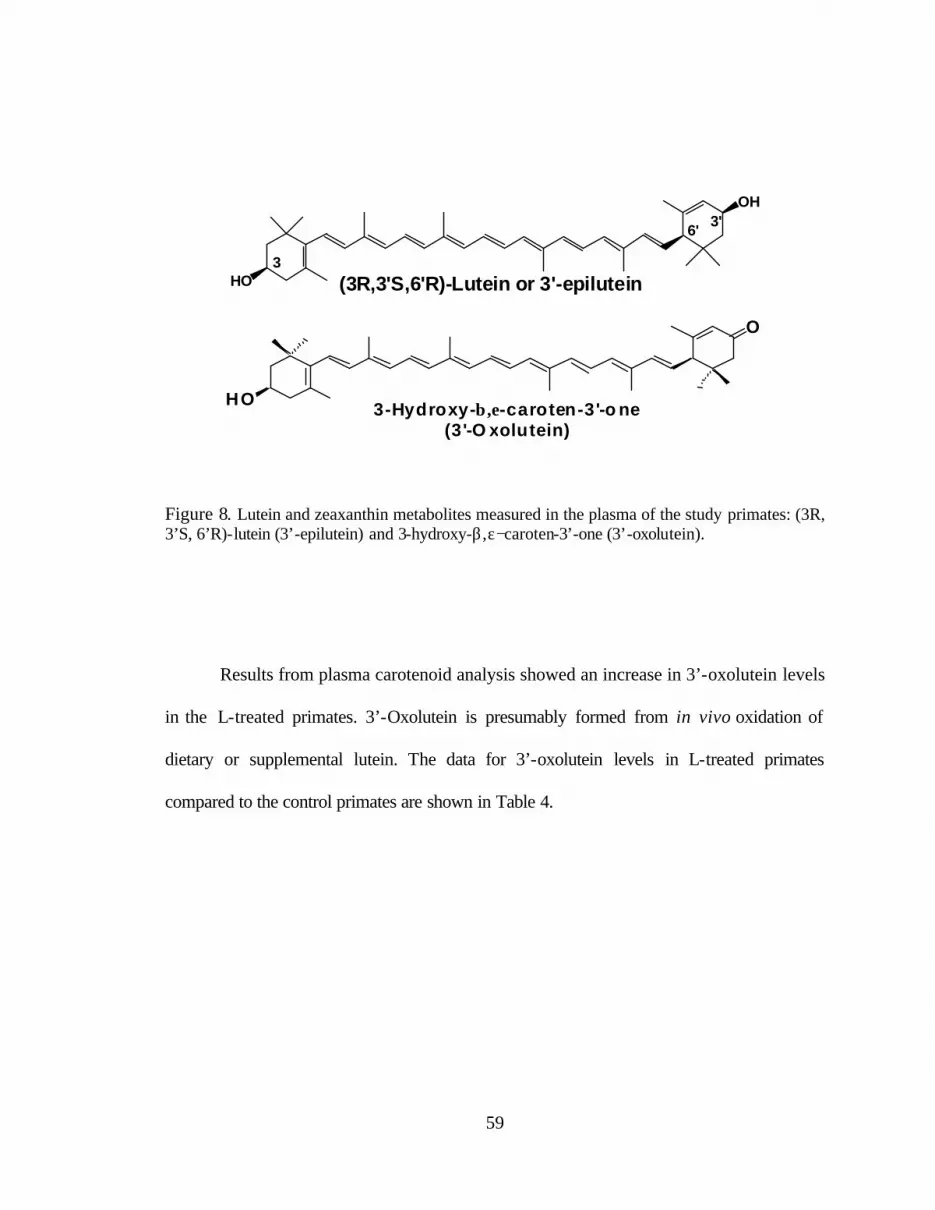
59
OH
HO (3R,3'S,6'R)-Lutein or 3'-epilutein3
6'3'
O
HO 3-Hydroxy-β,ε-caroten-3'-o ne(3'-O xolutein)
Figure 8. Lutein and zeaxanthin metabolites measured in the plasma of the study primates: (3R, 3’S, 6’R)-lutein (3’-epilutein) and 3-hydroxy-β,ε−caroten-3’-one (3’-oxolutein).
Results from plasma carotenoid analysis showed an increase in 3’-oxolutein levels
in the L-treated primates. 3’-Oxolutein is presumably formed from in vivo oxidation of
dietary or supplemental lutein. The data for 3’-oxolutein levels in L-treated primates
compared to the control primates are shown in Table 4.
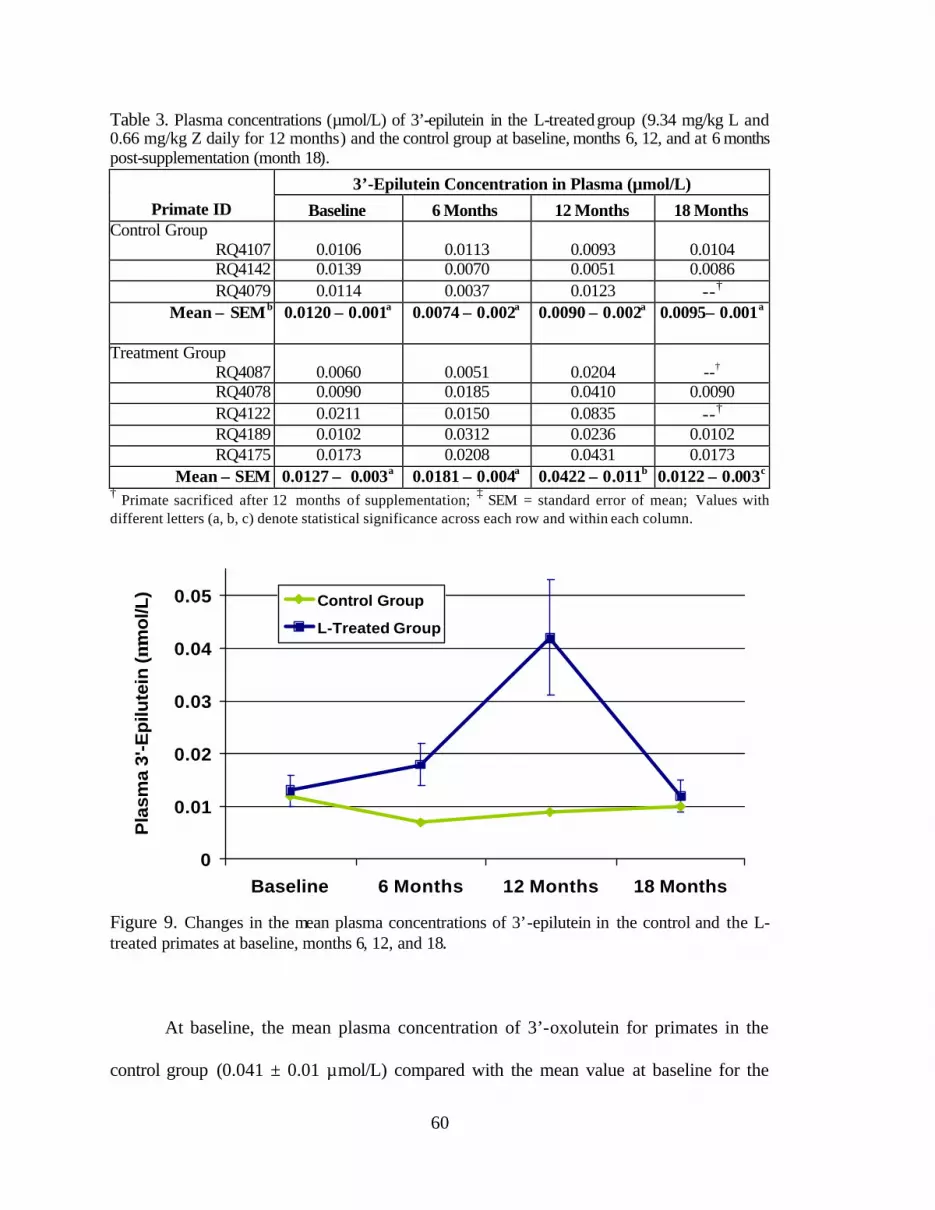
60
Table 3. Plasma concentrations (µmol/L) of 3’-epilutein in the L-treated group (9.34 mg/kg L and 0.66 mg/kg Z daily for 12 months) and the control group at baseline, months 6, 12, and at 6 months post-supplementation (month 18).
3’-Epilutein Concentration in Plasma (µmol/L) Primate ID Baseline 6 Months 12 Months 18 Months
Control Group RQ4107 0.0106 0.0113 0.0093 0.0104 RQ4142 0.0139 0.0070 0.0051 0.0086 RQ4079 0.0114 0.0037 0.0123 --† Mean ± SEMb 0.0120 ± 0.001a
0.0074 ± 0.002a
0.0090 ± 0.002a
0.0095± 0.001a
Treatment Group RQ4087 0.0060 0.0051 0.0204 --† RQ4078 0.0090 0.0185 0.0410 0.0090 RQ4122 0.0211 0.0150 0.0835 --† RQ4189 0.0102 0.0312 0.0236 0.0102 RQ4175 0.0173 0.0208 0.0431 0.0173 Mean ± SEM 0.0127 ± 0.003a 0.0181 ± 0.004a 0.0422 ± 0.011b 0.0122 ± 0.003c † Primate sacrificed after 12 months of supplementation; ‡ SEM = standard error of mean; Values with different letters (a, b, c) denote statistical significance across each row and within each column.
0
0.01
0.02
0.03
0.04
0.05
Baseline 6 Months 12 Months 18 Months
Pla
sma
3'-E
pilu
tein
(µm
ol/L
) Control Group
L-Treated Group
Figure 9. Changes in the mean plasma concentrations of 3’-epilutein in the control and the L-treated primates at baseline, months 6, 12, and 18.
At baseline, the mean plasma concentration of 3’-oxolutein for primates in the
control group (0.041 ± 0.01 µmol/L) compared with the mean value at baseline for the
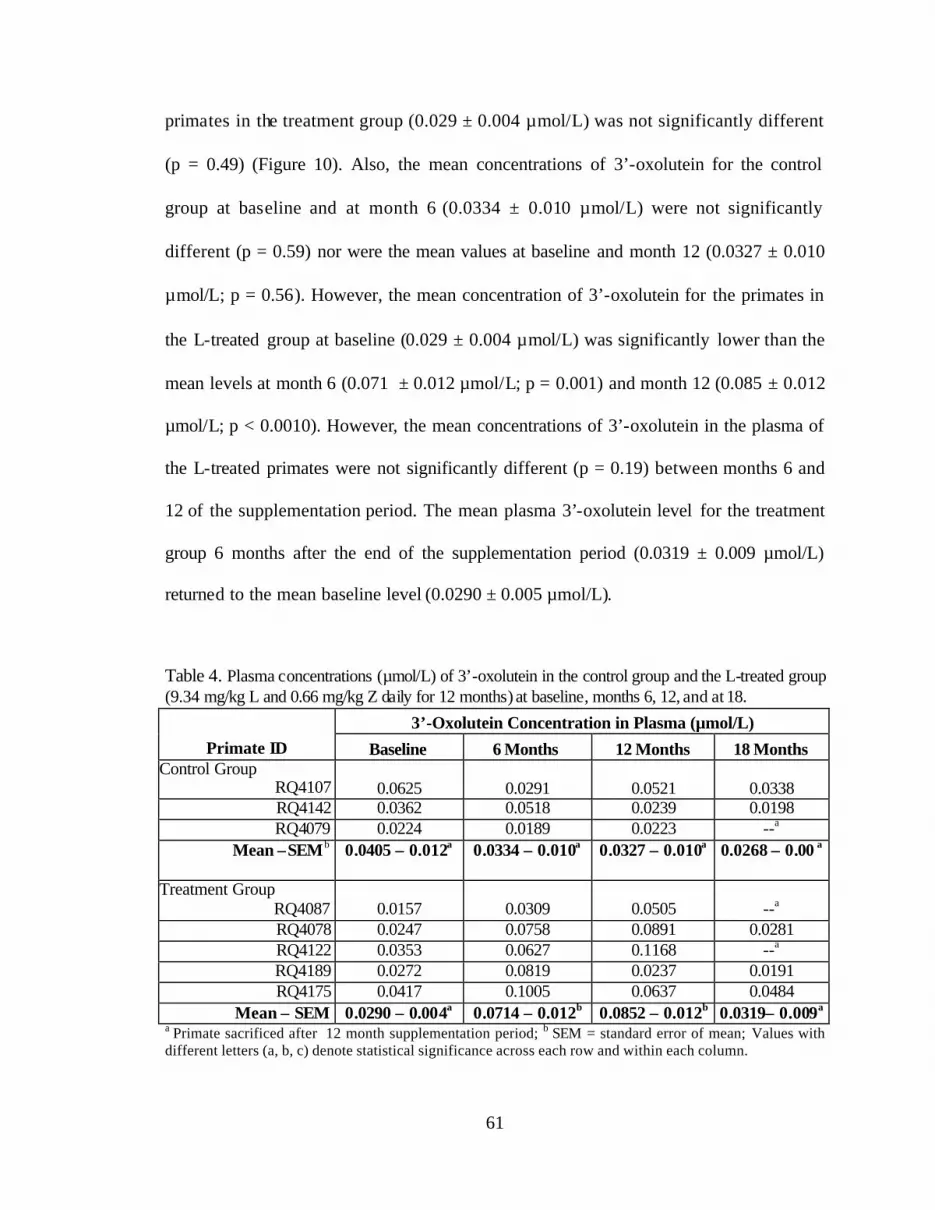
61
primates in the treatment group (0.029 ± 0.004 µmol/L) was not significantly different
(p = 0.49) (Figure 10). Also, the mean concentrations of 3’-oxolutein for the control
group at baseline and at month 6 (0.0334 ± 0.010 µmol/L) were not significantly
different (p = 0.59) nor were the mean values at baseline and month 12 (0.0327 ± 0.010
µmol/L; p = 0.56). However, the mean concentration of 3’-oxolutein for the primates in
the L-treated group at baseline (0.029 ± 0.004 µmol/L) was significantly lower than the
mean levels at month 6 (0.071 ± 0.012 µmol/L; p = 0.001) and month 12 (0.085 ± 0.012
µmol/L; p < 0.0010). However, the mean concentrations of 3’-oxolutein in the plasma of
the L-treated primates were not significantly different (p = 0.19) between months 6 and
12 of the supplementation period. The mean plasma 3’-oxolutein level for the treatment
group 6 months after the end of the supplementation period (0.0319 ± 0.009 µmol/L)
returned to the mean baseline level (0.0290 ± 0.005 µmol/L).
Table 4. Plasma concentrations (µmol/L) of 3’-oxolutein in the control group and the L-treated group (9.34 mg/kg L and 0.66 mg/kg Z daily for 12 months) at baseline, months 6, 12, and at 18.
3’-Oxolutein Concentration in Plasma (µmol/L) Primate ID Baseline 6 Months 12 Months 18 Months
Control Group RQ4107 0.0625 0.0291 0.0521 0.0338 RQ4142 0.0362 0.0518 0.0239 0.0198 RQ4079 0.0224 0.0189 0.0223 --a Mean ±SEMb 0.0405 ± 0.012a
0.0334 ± 0.010a
0.0327 ± 0.010a
0.0268 ± 0.00 a
Treatment Group RQ4087 0.0157 0.0309 0.0505 --a RQ4078 0.0247 0.0758 0.0891 0.0281 RQ4122 0.0353 0.0627 0.1168 --a RQ4189 0.0272 0.0819 0.0237 0.0191 RQ4175 0.0417 0.1005 0.0637 0.0484 Mean ± SEM 0.0290 ± 0.004a 0.0714 ± 0.012b 0.0852 ± 0.012b 0.0319± 0.009a
a Primate sacrificed after 12 month supplementation period; b SEM = standard error of mean; Values with different letters (a, b, c) denote statistical significance across each row and within each column.
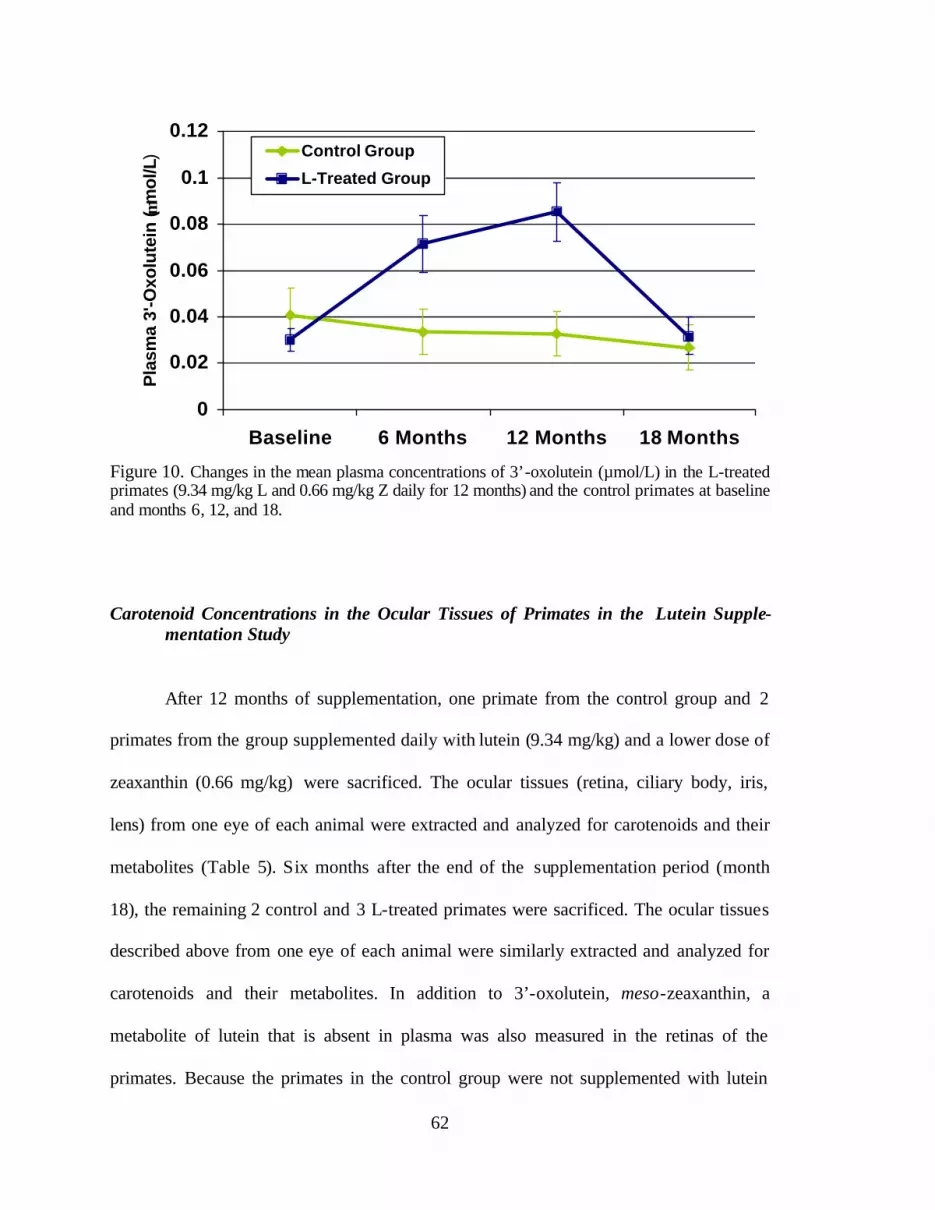
62
0
0.02
0.04
0.06
0.08
0.1
0.12
Baseline 6 Months 12 Months 18 Months
Pla
sma
3'-O
xolu
tein
( µm
ol/L
) Control Group
L-Treated Group
Figure 10. Changes in the mean plasma concentrations of 3’-oxolutein (µmol/L) in the L-treated primates (9.34 mg/kg L and 0.66 mg/kg Z daily for 12 months) and the control primates at baseline and months 6, 12, and 18. Carotenoid Concentrations in the Ocular Tissues of Primates in the Lutein Supple-
mentation Study
After 12 months of supplementation, one primate from the control group and 2
primates from the group supplemented daily with lutein (9.34 mg/kg) and a lower dose of
zeaxanthin (0.66 mg/kg) were sacrificed. The ocular tissues (retina, ciliary body, iris,
lens) from one eye of each animal were extracted and analyzed for carotenoids and their
metabolites (Table 5). Six months after the end of the supplementation period (month
18), the remaining 2 control and 3 L-treated primates were sacrificed. The ocular tissues
described above from one eye of each animal were similarly extracted and analyzed for
carotenoids and their metabolites. In addition to 3’-oxolutein, meso-zeaxanthin, a
metabolite of lutein that is absent in plasma was also measured in the retinas of the
primates. Because the primates in the control group were not supplemented with lutein
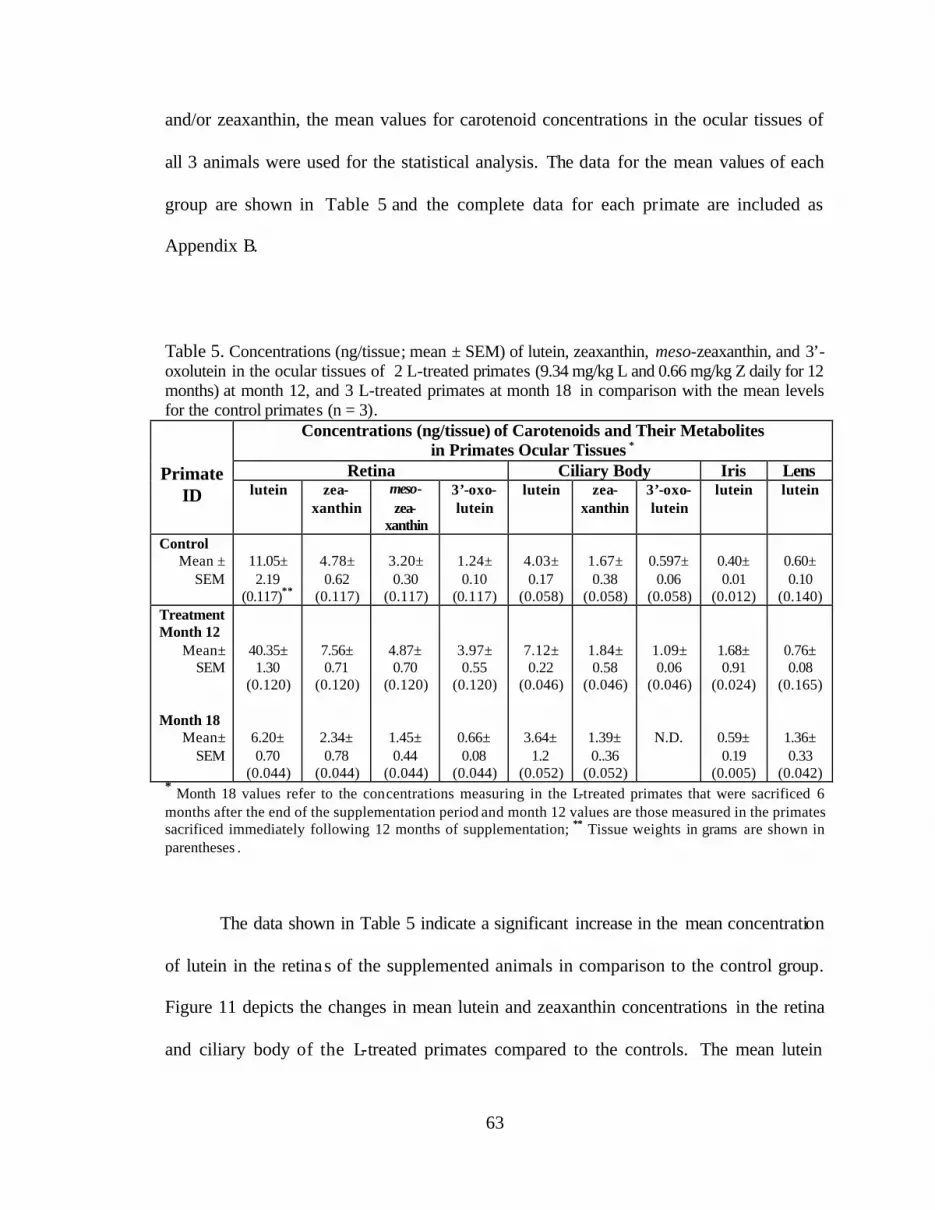
63
and/or zeaxanthin, the mean values for carotenoid concentrations in the ocular tissues of
all 3 animals were used for the statistical analysis. The data for the mean values of each
group are shown in Table 5 and the complete data for each primate are included as
Appendix B.
Table 5. Concentrations (ng/tissue; mean ± SEM) of lutein, zeaxanthin, meso-zeaxanthin, and 3’-oxolutein in the ocular tissues of 2 L-treated primates (9.34 mg/kg L and 0.66 mg/kg Z daily for 12 months) at month 12, and 3 L-treated primates at month 18 in comparison with the mean levels for the control primates (n = 3).
Concentrations (ng/tissue) of Carotenoids and Their Metabolites in Primates Ocular Tissues *
Retina Ciliary Body Iris Lens
Primate ID lutein zea-
xanthin meso-zea-
xanthin
3’-oxo-lutein
lutein zea-xanthin
3’-oxo-lutein
lutein lutein
Control Mean ±
SEM
11.05± 2.19
(0.117)**
4.78± 0.62
(0.117)
3.20± 0.30
(0.117)
1.24± 0.10
(0.117)
4.03± 0.17
(0.058)
1.67± 0.38
(0.058)
0.597±
0.06 (0.058)
0.40± 0.01
(0.012)
0.60± 0.10
(0.140) Treatment Month 12
Mean± SEM
Month 18
Mean± SEM
40.35± 1.30
(0.120)
6.20± 0.70
(0.044)
7.56± 0.71
(0.120)
2.34± 0.78
(0.044)
4.87± 0.70
(0.120)
1.45± 0.44
(0.044)
3.97± 0.55
(0.120)
0.66± 0.08
(0.044)
7.12± 0.22
(0.046)
3.64±
1.2 (0.052)
1.84± 0.58
(0.046)
1.39± 0..36
(0.052)
1.09± 0.06
(0.046)
N.D.
1.68± 0.91
(0.024)
0.59± 0.19
(0.005)
0.76± 0.08
(0.165)
1.36± 0.33
(0.042) * Month 18 values refer to the concentrations measuring in the L-treated primates that were sacrificed 6 months after the end of the supplementation period and month 12 values are those measured in the primates sacrificed immediately following 12 months of supplementation; ** Tissue weights in grams are shown in parentheses .
The data shown in Table 5 indicate a significant increase in the mean concentration
of lutein in the retinas of the supplemented animals in comparison to the control group.
Figure 11 depicts the changes in mean lutein and zeaxanthin concentrations in the retina
and ciliary body of the L-treated primates compared to the controls. The mean lutein
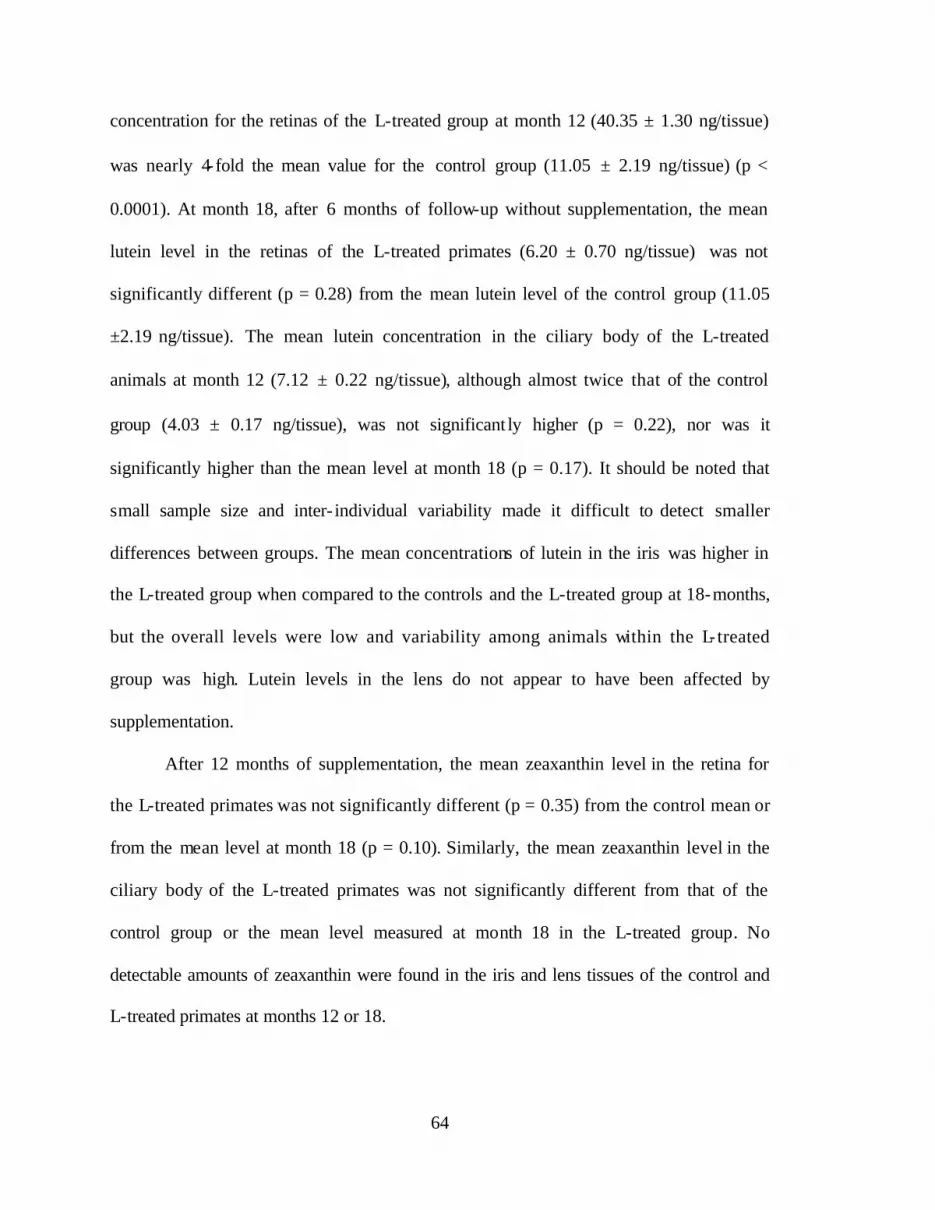
64
concentration for the retinas of the L-treated group at month 12 (40.35 ± 1.30 ng/tissue)
was nearly 4-fold the mean value for the control group (11.05 ± 2.19 ng/tissue) (p <
0.0001). At month 18, after 6 months of follow-up without supplementation, the mean
lutein level in the retinas of the L-treated primates (6.20 ± 0.70 ng/tissue) was not
significantly different (p = 0.28) from the mean lutein level of the control group (11.05
±2.19 ng/tissue). The mean lutein concentration in the ciliary body of the L-treated
animals at month 12 (7.12 ± 0.22 ng/tissue), although almost twice that of the control
group (4.03 ± 0.17 ng/tissue), was not significant ly higher (p = 0.22), nor was it
significantly higher than the mean level at month 18 (p = 0.17). It should be noted that
small sample size and inter- individual variability made it difficult to detect smaller
differences between groups. The mean concentrations of lutein in the iris was higher in
the L-treated group when compared to the controls and the L-treated group at 18-months,
but the overall levels were low and variability among animals within the L- treated
group was high. Lutein levels in the lens do not appear to have been affected by
supplementation.
After 12 months of supplementation, the mean zeaxanthin level in the retina for
the L-treated primates was not significantly different (p = 0.35) from the control mean or
from the mean level at month 18 (p = 0.10). Similarly, the mean zeaxanthin level in the
ciliary body of the L-treated primates was not significantly different from that of the
control group or the mean level measured at month 18 in the L-treated group. No
detectable amounts of zeaxanthin were found in the iris and lens tissues of the control and
L-treated primates at months 12 or 18.

65
The mean level of meso-zeaxanthin in the retina of the L-treated primates at
month 12 was not significantly different (p = 0.11) from the control group, but was
significantly higher (p = 0.004) than the mean level of the L-treated primates after 18
months.
0
5
10
15
20
25
30
35
40
lutein zeaxanthin meso-zeaxanthin
3'-oxolutein lutein zeaxanthin 3'-oxolutein
Retina Ciliary Body
ng/t
issu
e
Control GroupL-Treated Group (Month 12)L-Treated Group (Month 18)
Figure 11. Mean concentrations of lutein, zeaxanthin, meso-zeaxanthin, and 3’-oxolutein (ng/tissue) in the retina and ciliary body of the L-treated primates (9.34 mg/kg L and 0.66 mg/kg Z daily for 12 months) at month 12 (n=2) and month 18 (n=3) compared to the control primates (n= 3). (One control primate was sacrificed at month 12 and 2 were sacrificed at month 18.)
The mean level for the metabolite 3’-oxolutein in the L-treated primates at month
12 was significantly higher (p = 0.002) when compared to the control group, and was also
significantly higher (p < 0.001) than the mean level for the L-treated primates at month
18. This 18 month value, however, was not significantly different from the control mean.
66
Carotenoid Concentrations in the Major Organs and Tissues of Primates in the Lutein Supplementation Study
The major organs and tissues of one control primate (RQ4079) and 2 L-treated
primates (9.34 mg/kg L and 0.66 mg/kg Z daily for 12 months ) (RQ4087, RQ4122) were
sacrificed at the end of the 12-month supplementation period and were analyzed for
carotenoids, their metabolites, and retinol. The data for the control primate in comparison
to the mean values for the L-treated group are shown in Table 6. Complete data for each
primate are included as Appendix C. Lutein, zeaxanthin, and 3’-oxolutein were detected
in all tissues analyzed with the exception of the livers which did not contain any
detectable amounts of 3’-oxolutein. Although there was considerable inter- individual
variability among the primates in the L-treated group, the mean lutein levels in the primates
supplemented with lutein were significant ly higher than the mean levels measured in all
tissues of the control group. The highest concentrations of carotenoids and retinol were
found in the liver of the primates. Another point worth noting is that inconsistencies in
the adipose tissue samples analyzed resulted from the varied sources of adipose tissue.
Multiple adipose samples were provided for each of the primates that was sacrificed, but
the locations from which these adipose tissues were collected were not specified.
Two of the control primates and 3 of the L-treated primates were sacrificed at
month 18, following 6 months of observation. The liver, lung, colon, and breast tissues of
these primates were analyzed for carotenoids, their metabolites, and retinol. As shown in
Table 7, the mean lutein levels observed in the L-treated primates at month 18 were
considerably lower than the mean levels observed in the L-treated primates that were
sacrificed after 12 months of supplementation. Complete data for each of these primates
are tabulated in Appendix D. There was considerable inter- individual variability in the
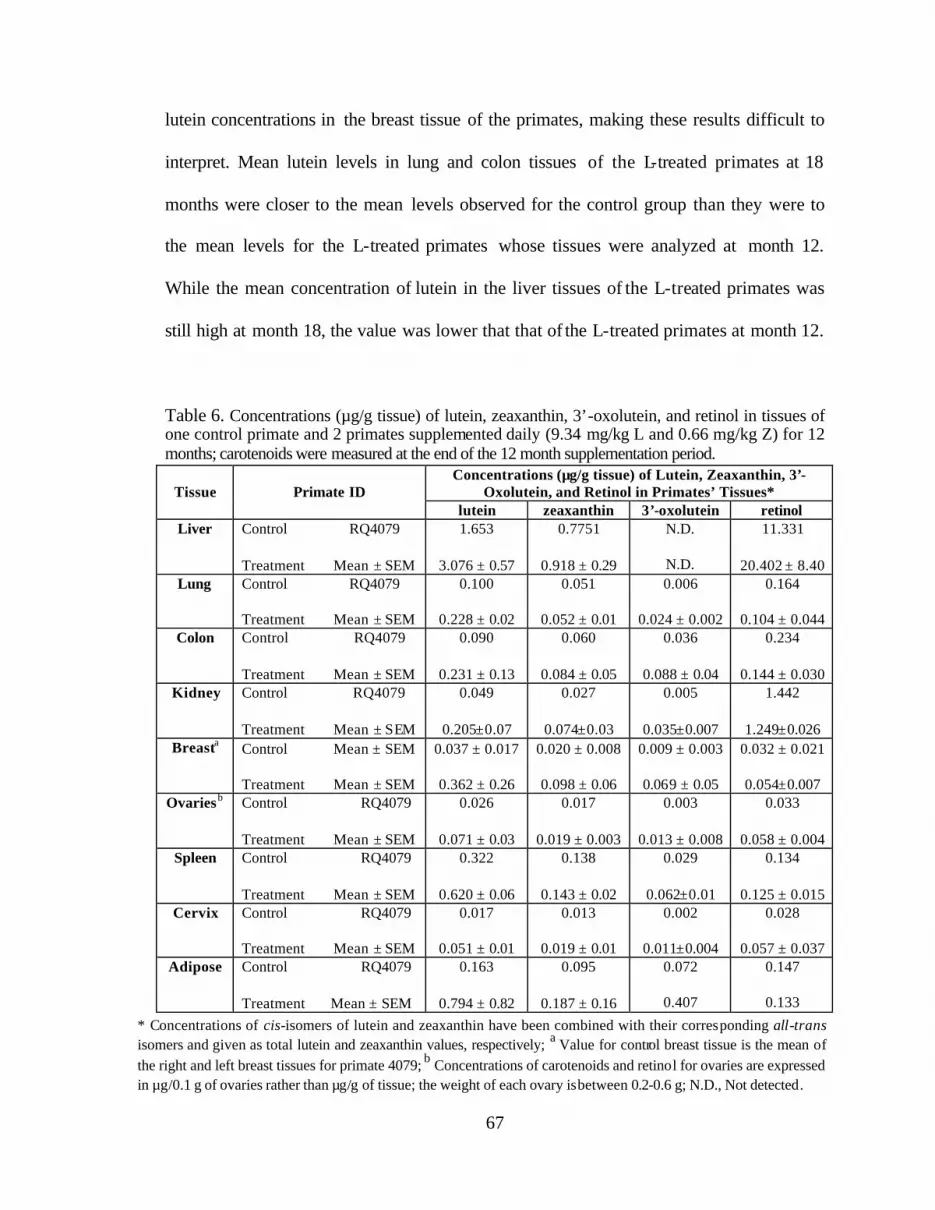
67
lutein concentrations in the breast tissue of the primates, making these results difficult to
interpret. Mean lutein levels in lung and colon tissues of the L-treated primates at 18
months were closer to the mean levels observed for the control group than they were to
the mean levels for the L-treated primates whose tissues were analyzed at month 12.
While the mean concentration of lutein in the liver tissues of the L-treated primates was
still high at month 18, the value was lower that that of the L-treated primates at month 12.
Table 6. Concentrations (µg/g tissue) of lutein, zeaxanthin, 3’-oxolutein, and retinol in tissues of one control primate and 2 primates supplemented daily (9.34 mg/kg L and 0.66 mg/kg Z) for 12 months; carotenoids were measured at the end of the 12 month supplementation period.
Concentrations (µg/g tissue) of Lutein, Zeaxanthin, 3’-Oxolutein, and Retinol in Primates’ Tissues*
Tissue
Primate ID
lutein zeaxanthin 3’-oxolutein retinol Liver
Control RQ4079 Treatment Mean ± SEM
1.653
3.076 ± 0.57
0.7751
0.918 ± 0.29
N.D.
N.D.
11.331
20.402 ± 8.40 Lung
Control RQ4079 Treatment Mean ± SEM
0.100
0.228 ± 0.02
0.051
0.052 ± 0.01
0.006
0.024 ± 0.002
0.164
0.104 ± 0.044 Colon
Control RQ4079 Treatment Mean ± SEM
0.090
0.231 ± 0.13
0.060
0.084 ± 0.05
0.036
0.088 ± 0.04
0.234
0.144 ± 0.030 Kidney
Control RQ4079 Treatment Mean ± SEM
0.049
0.205±0.07
0.027
0.074±0.03
0.005
0.035±0.007
1.442
1.249±0.026 Breasta
Control Mean ± SEM Treatment Mean ± SEM
0.037 ± 0.017
0.362 ± 0.26
0.020 ± 0.008
0.098 ± 0.06
0.009 ± 0.003
0.069 ± 0.05
0.032 ± 0.021 0.054±0.007
Ovariesb
Control RQ4079 Treatment Mean ± SEM
0.026
0.071 ± 0.03
0.017
0.019 ± 0.003
0.003
0.013 ± 0.008
0.033
0.058 ± 0.004 Spleen
Control RQ4079 Treatment Mean ± SEM
0.322
0.620 ± 0.06
0.138
0.143 ± 0.02
0.029
0.062±0.01
0.134
0.125 ± 0.015 Cervix
Control RQ4079 Treatment Mean ± SEM
0.017
0.051 ± 0.01
0.013
0.019 ± 0.01
0.002
0.011±0.004
0.028 0.057 ± 0.037
Adipose
Control RQ4079 Treatment Mean ± SEM
0.163
0.794 ± 0.82
0.095
0.187 ± 0.16
0.072
0.407
0.147
0.133
* Concentrations of cis-isomers of lutein and zeaxanthin have been combined with their corresponding all-trans isomers and given as total lutein and zeaxanthin values, respectively; a Value for control breast tissue is the mean of the right and left breast tissues for primate 4079; b Concentrations of carotenoids and retinol for ovaries are expressed in µg/0.1 g of ovaries rather than µg/g of tissue; the weight of each ovary is between 0.2-0.6 g; N.D., Not detected.
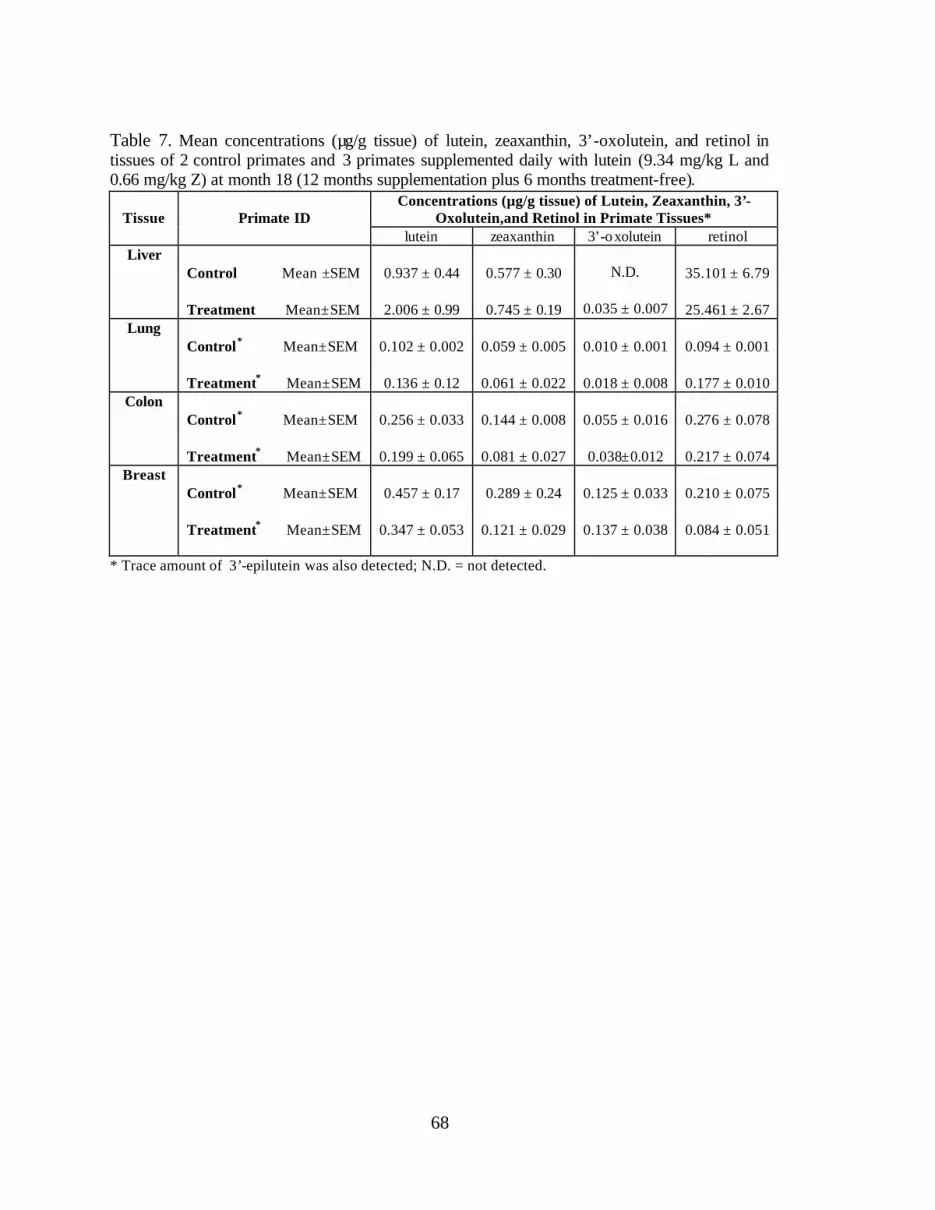
68
Table 7. Mean concentrations (µg/g tissue) of lutein, zeaxanthin, 3’-oxolutein, and retinol in tissues of 2 control primates and 3 primates supplemented daily with lutein (9.34 mg/kg L and 0.66 mg/kg Z) at month 18 (12 months supplementation plus 6 months treatment-free).
Concentrations (µg/g tissue) of Lutein, Zeaxanthin, 3’-Oxolutein,and Retinol in Primate Tissues*
Tissue
Primate ID
lutein zeaxanthin 3’-oxolutein retinol Liver
Control Mean ±SEM Treatment Mean±SEM
0.937 ± 0.44
2.006 ± 0.99
0.577 ± 0.30
0.745 ± 0.19
N.D.
0.035 ± 0.007
35.101 ± 6.79
25.461 ± 2.67
Lung
Control* Mean±SEM
Treatment* Mean±SEM
0.102 ± 0.002
0.136 ± 0.12
0.059 ± 0.005
0.061 ± 0.022
0.010 ± 0.001
0.018 ± 0.008
0.094 ± 0.001
0.177 ± 0.010
Colon
Control* Mean±SEM Treatment* Mean±SEM
0.256 ± 0.033
0.199 ± 0.065
0.144 ± 0.008
0.081 ± 0.027
0.055 ± 0.016
0.038±0.012
0.276 ± 0.078
0.217 ± 0.074
Breast
Control* Mean±SEM Treatment* Mean±SEM
0.457 ± 0.17
0.347 ± 0.053
0.289 ± 0.24
0.121 ± 0.029
0.125 ± 0.033
0.137 ± 0.038
0.210 ± 0.075
0.084 ± 0.051
* Trace amount of 3’-epilutein was also detected; N.D. = not detected.
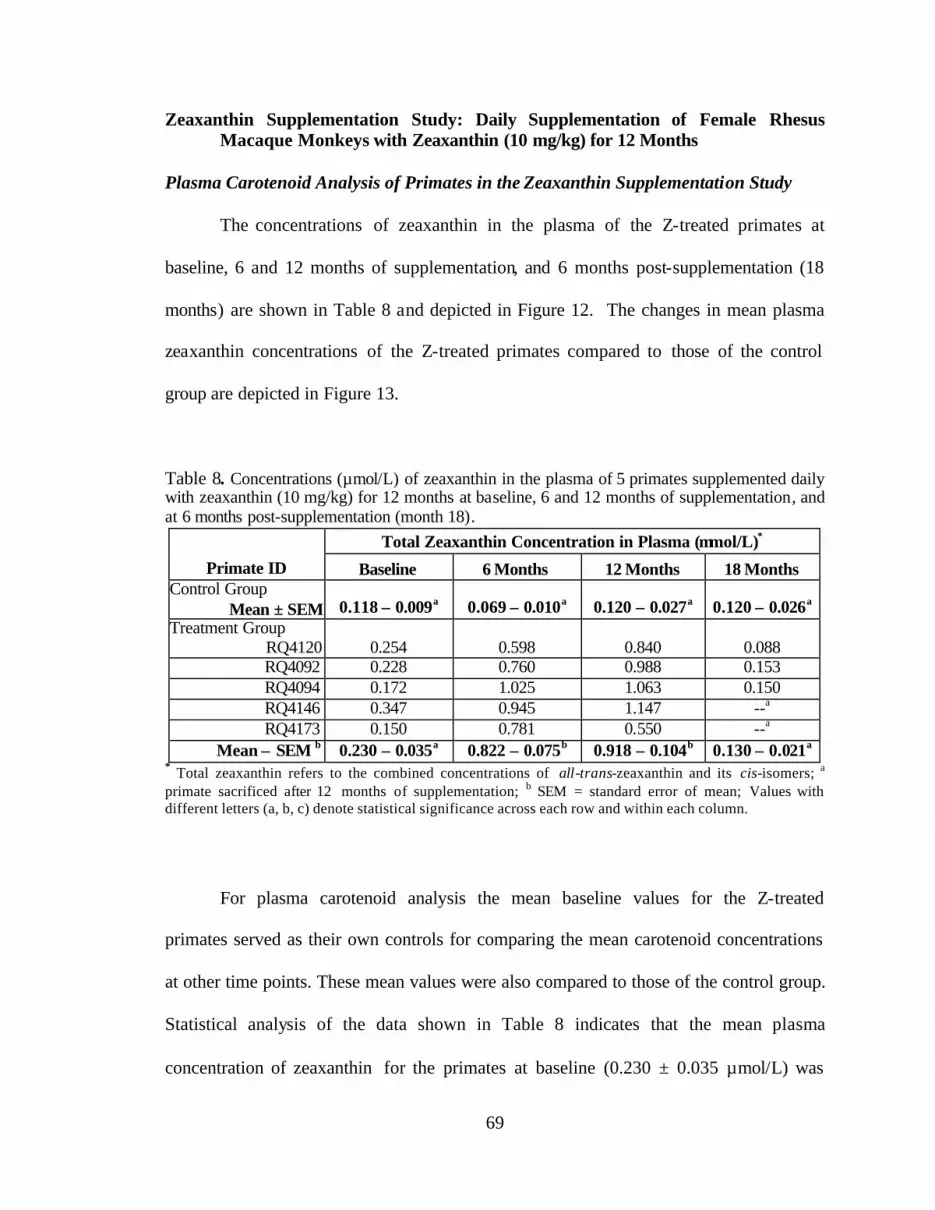
69
Zeaxanthin Supplementation Study: Daily Supplementation of Female Rhesus Macaque Monkeys with Zeaxanthin (10 mg/kg) for 12 Months
Plasma Carotenoid Analysis of Primates in the Zeaxanthin Supplementation Study
The concentrations of zeaxanthin in the plasma of the Z-treated primates at
baseline, 6 and 12 months of supplementation, and 6 months post-supplementation (18
months) are shown in Table 8 and depicted in Figure 12. The changes in mean plasma
zeaxanthin concentrations of the Z-treated primates compared to those of the control
group are depicted in Figure 13.
Table 8. Concentrations (µmol/L) of zeaxanthin in the plasma of 5 primates supplemented daily with zeaxanthin (10 mg/kg) for 12 months at baseline, 6 and 12 months of supplementation, and at 6 months post-supplementation (month 18).
Total Zeaxanthin Concentration in Plasma (µmol/L)*
Primate ID Baseline 6 Months 12 Months 18 Months Control Group
Mean ± SEM 0.118 ± 0.009a 0.069 ± 0.010a 0.120 ± 0.027a 0.120 ± 0.026a Treatment Group RQ4120 0.254 0.598 0.840 0.088 RQ4092 0.228 0.760 0.988 0.153 RQ4094 0.172 1.025 1.063 0.150 RQ4146 0.347 0.945 1.147 --a RQ4173 0.150 0.781 0.550 --a Mean ± SEM b 0.230 ± 0.035a 0.822 ± 0.075b 0.918 ± 0.104b 0.130 ± 0.021a
* Total zeaxanthin refers to the combined concentrations of all-trans-zeaxanthin and its cis-isomers; a
primate sacrificed after 12 months of supplementation; b SEM = standard error of mean; Values with different letters (a, b, c) denote statistical significance across each row and within each column.
For plasma carotenoid analysis the mean baseline values for the Z-treated
primates served as their own controls for comparing the mean carotenoid concentrations
at other time points. These mean values were also compared to those of the control group.
Statistical analysis of the data shown in Table 8 indicates that the mean plasma
concentration of zeaxanthin for the primates at baseline (0.230 ± 0.035 µmol/L) was
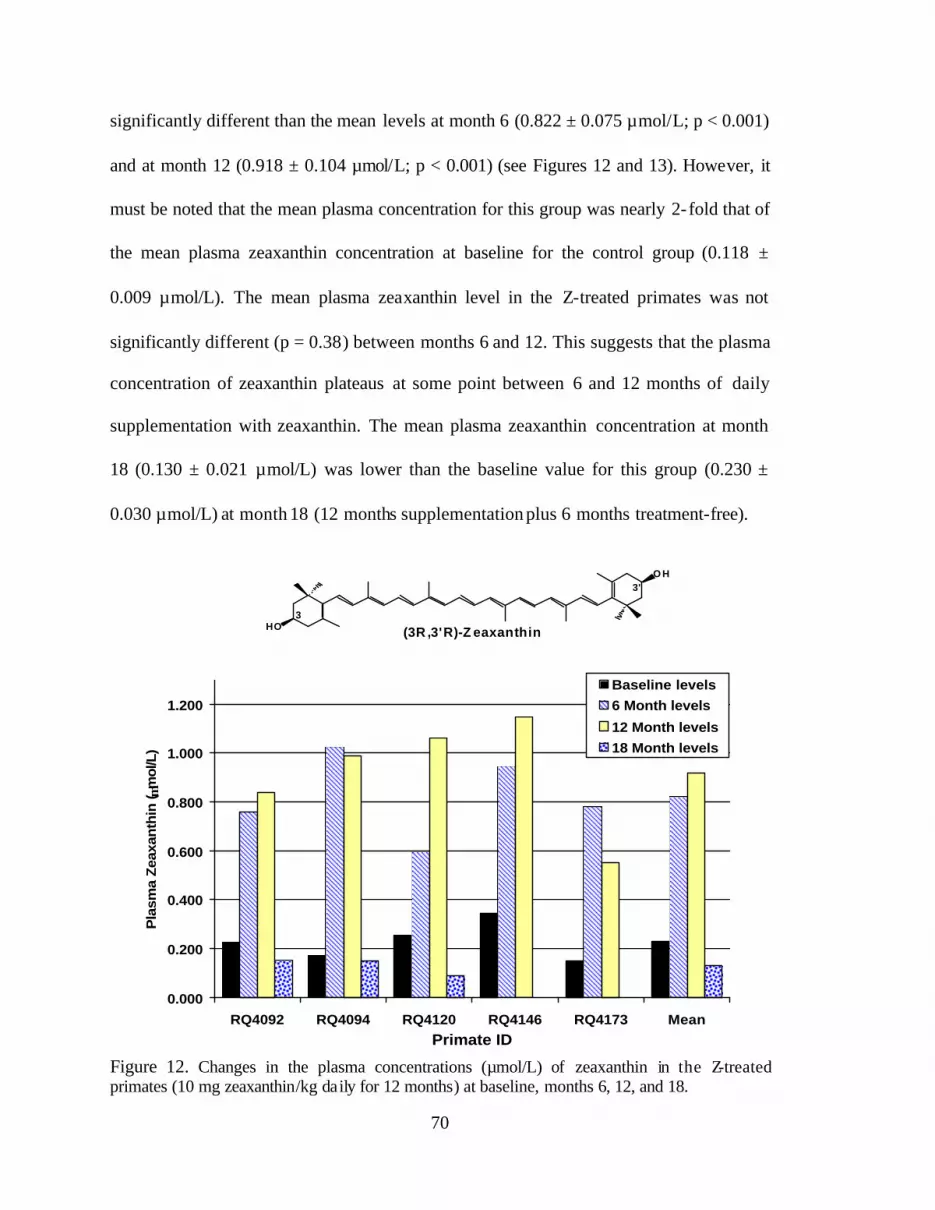
70
significantly different than the mean levels at month 6 (0.822 ± 0.075 µmol/L; p < 0.001)
and at month 12 (0.918 ± 0.104 µmol/L; p < 0.001) (see Figures 12 and 13). However, it
must be noted that the mean plasma concentration for this group was nearly 2-fold that of
the mean plasma zeaxanthin concentration at baseline for the control group (0.118 ±
0.009 µmol/L). The mean plasma zeaxanthin level in the Z-treated primates was not
significantly different (p = 0.38) between months 6 and 12. This suggests that the plasma
concentration of zeaxanthin plateaus at some point between 6 and 12 months of daily
supplementation with zeaxanthin. The mean plasma zeaxanthin concentration at month
18 (0.130 ± 0.021 µmol/L) was lower than the baseline value for this group (0.230 ±
0.030 µmol/L) at month 18 (12 months supplementation plus 6 months treatment-free).
O H
HO (3R ,3'R)-Z eaxanthin3
3'
0.000
0.200
0.400
0.600
0.800
1.000
1.200
RQ4092 RQ4094 RQ4120 RQ4146 RQ4173 Mean
Primate ID
Pla
sma
Zea
xan
thin
( µm
ol/L
)
Baseline levels
6 Month levels
12 Month levels
18 Month levels
Figure 12. Changes in the plasma concentrations (µmol/L) of zeaxanthin in the Z-treated primates (10 mg zeaxanthin/kg daily for 12 months) at baseline, months 6, 12, and 18.

71
0.00
0.20
0.40
0.60
0.80
1.00
1.20
Baseline 6 Months 12 Months 18 Months
Pla
sma
Zea
xan
thin
(µm
ol/L
) Control GroupZ-Treated Group
Figure 13. Changes in the mean plasma zeaxanthin concentrations (µmol/L) of the Z-treated primates (10 mg/kg Z daily for 12 months) in comparison with the control primates at baseline, months 6, 12 , and 18.
The mean plasma concentration of lutein of the Z-treated primates at baseline
(0.250 ± 0.06 µmol/L) was not significantly different (p = 0.81) in comparison with the
mean level at month 12 (0.316 ± 0.088 µmol/L) (Figure 14). And, while the mean lutein
level did increase between baseline and month 6 (0.416 ± 0.071 µmol/L), this increase
was not significant (p = 0.07), nor was the decrease observed in the mean plasma lutein
concentration between months 6 and 12 (p = 0.10). The mean plasma lutein level at
month 18 (0.316 ± 0.067 µmol/L) was not significantly different from the mean plasma
lutein level at baseline (0.303 ± 0.050 µmol/L) (Figure 14). It must be noted that the
zeaxanthin supplements did not contain any lutein.
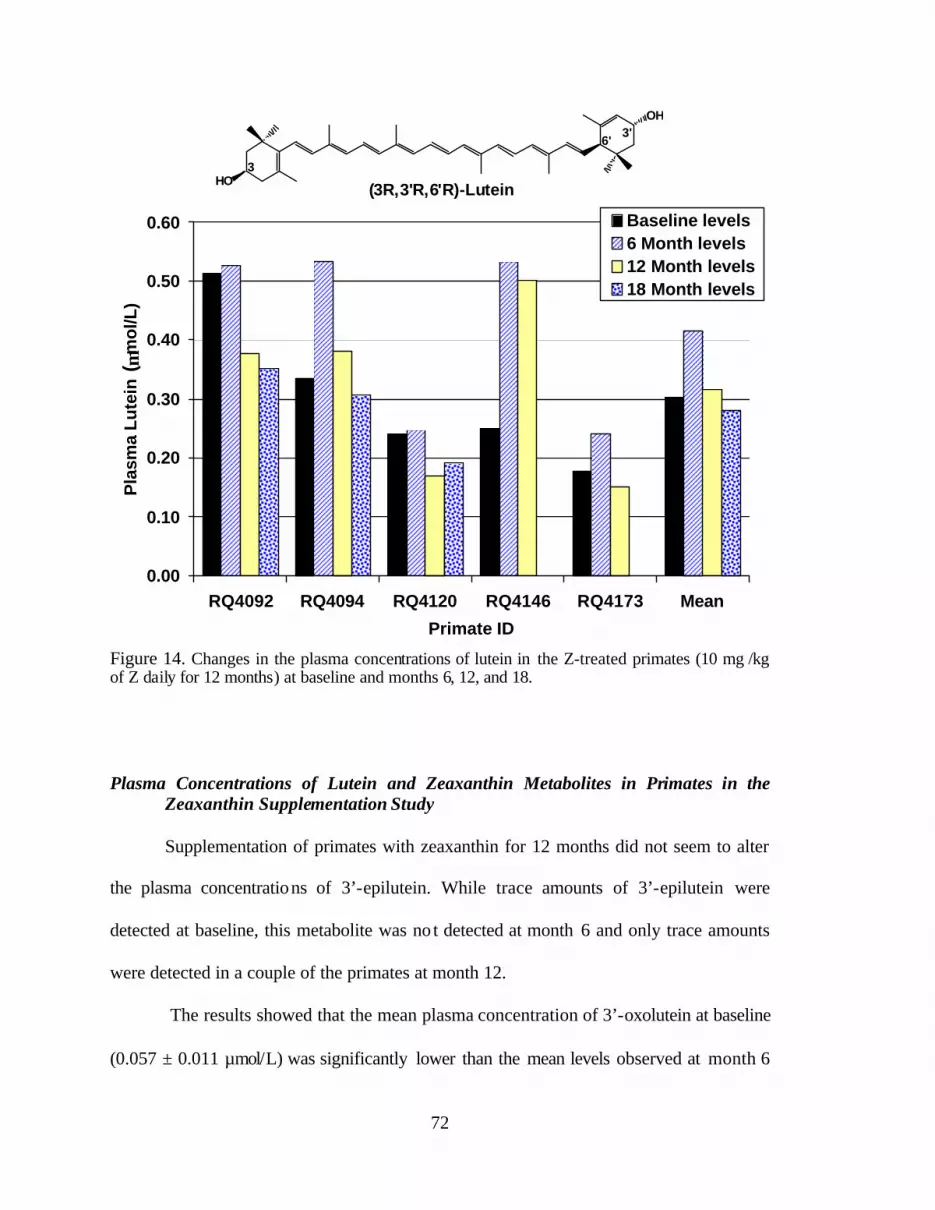
72
OH
HO(3R,3'R,6'R)-Lutein
3'
3
6'
0.00
0.10
0.20
0.30
0.40
0.50
0.60
RQ4092 RQ4094 RQ4120 RQ4146 RQ4173 Mean
Primate ID
Pla
sma
Lu
tein
( µm
ol/L
)
Baseline levels6 Month levels12 Month levels18 Month levels
Figure 14. Changes in the plasma concentrations of lutein in the Z-treated primates (10 mg /kg of Z daily for 12 months) at baseline and months 6, 12, and 18. Plasma Concentrations of Lutein and Zeaxanthin Metabolites in Primates in the
Zeaxanthin Supplementation Study
Supplementation of primates with zeaxanthin for 12 months did not seem to alter
the plasma concentrations of 3’-epilutein. While trace amounts of 3’-epilutein were
detected at baseline, this metabolite was no t detected at month 6 and only trace amounts
were detected in a couple of the primates at month 12.
The results showed that the mean plasma concentration of 3’-oxolutein at baseline
(0.057 ± 0.011 µmol/L) was significantly lower than the mean levels observed at month 6
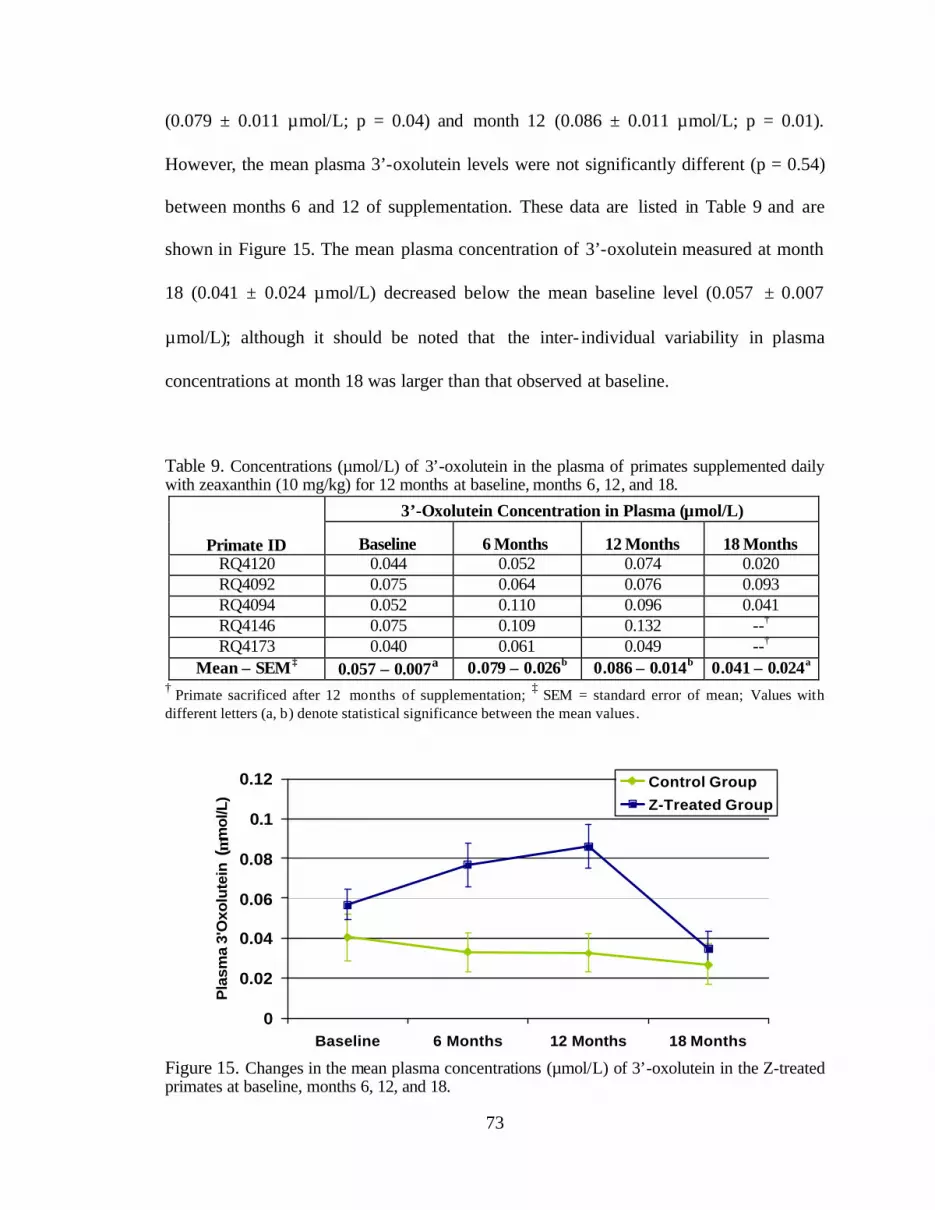
73
(0.079 ± 0.011 µmol/L; p = 0.04) and month 12 (0.086 ± 0.011 µmol/L; p = 0.01).
However, the mean plasma 3’-oxolutein levels were not significantly different (p = 0.54)
between months 6 and 12 of supplementation. These data are listed in Table 9 and are
shown in Figure 15. The mean plasma concentration of 3’-oxolutein measured at month
18 (0.041 ± 0.024 µmol/L) decreased below the mean baseline level (0.057 ± 0.007
µmol/L); although it should be noted that the inter- individual variability in plasma
concentrations at month 18 was larger than that observed at baseline.
Table 9. Concentrations (µmol/L) of 3’-oxolutein in the plasma of primates supplemented daily with zeaxanthin (10 mg/kg) for 12 months at baseline, months 6, 12, and 18.
3’-Oxolutein Concentration in Plasma (µmol/L)
Primate ID Baseline 6 Months 12 Months 18 Months RQ4120 0.044 0.052 0.074 0.020 RQ4092 0.075 0.064 0.076 0.093 RQ4094 0.052 0.110 0.096 0.041 RQ4146 0.075 0.109 0.132 --† RQ4173 0.040 0.061 0.049 --†
Mean ± SEM‡ 0.057 ± 0.007a 0.079 ± 0.026b 0.086 ± 0.014b 0.041 ± 0.024a
† Primate sacrificed after 12 months of supplementation; ‡ SEM = standard error of mean; Values with different letters (a, b) denote statistical significance between the mean values.
0
0.02
0.04
0.06
0.08
0.1
0.12
Baseline 6 Months 12 Months 18 Months
Pla
sma
3'O
xolu
tein
( µm
ol/L
)
Control Group
Z-Treated Group
Figure 15. Changes in the mean plasma concentrations (µmol/L) of 3’-oxolutein in the Z-treated primates at baseline, months 6, 12, and 18.
74
Concentrations of Carotenoids in the Ocular Tissues of Primates in the Zeaxanthin Supplementation Study
After 12 months of daily supplementation with zeaxanthin (10 mg/kg), 2 primates
were sacrificed and the ocular tissues (retina, ciliary body, iris, lens) from one eye of each
animal were extracted and analyzed for zeaxanthin, lutein, their metabolites, and retinol.
Six months post-supplementation, the remaining 3 primates were sacrificed, and in most
cases, the tissues from both the right and left eyes of each animal were analyzed. The
mean concentrations of carotenoids in the ocular tissues of the Z-treated group at month
12 and month 18 compared to the control group are shown in Table 11. Complete data for
carotenoid and metabolite concentrations of the ocular tissues of each of the Z-treated
primates are attached as Appendix E. The mean concentrations of lutein, zeaxanthin,
meso-zeaxanthin, and 3’-oxolutein in the ocular tissues of the Z-treated primates at month
12 were compared to the mean values for the 3 control primates (RQ4079, RQ4107, and
RQ4142).
The data depicted in Figure 16 clearly indicate increases in the mean
concentrations of zeaxanthin in the retina and ciliary body of the Z-treated primates at
month 12 in comparison to the mean levels of the control primates as well as the Z-
treated primates at month 18. The mean concentration of zeaxanthin in the retina of the
Z-treated primates at month 12 (20.43 ± 3.88 ng/tissue) was greater than 4-fold that of the
mean value of the control primates (4.78 ± 0.62 ng/tissue) (p < 0.001). The month 12
value for the Z-treated primates was also significantly higher (p < 0.001) than that of the
Z-treated primates at month 18 (6.85 ± 0.82 ng/tissue) which was not significantly
different (p = 0.89) from that of the control. It should be noted that the mean retina weight
for the control primates was 0.117 g and that the mean retina weight of the Z-treated
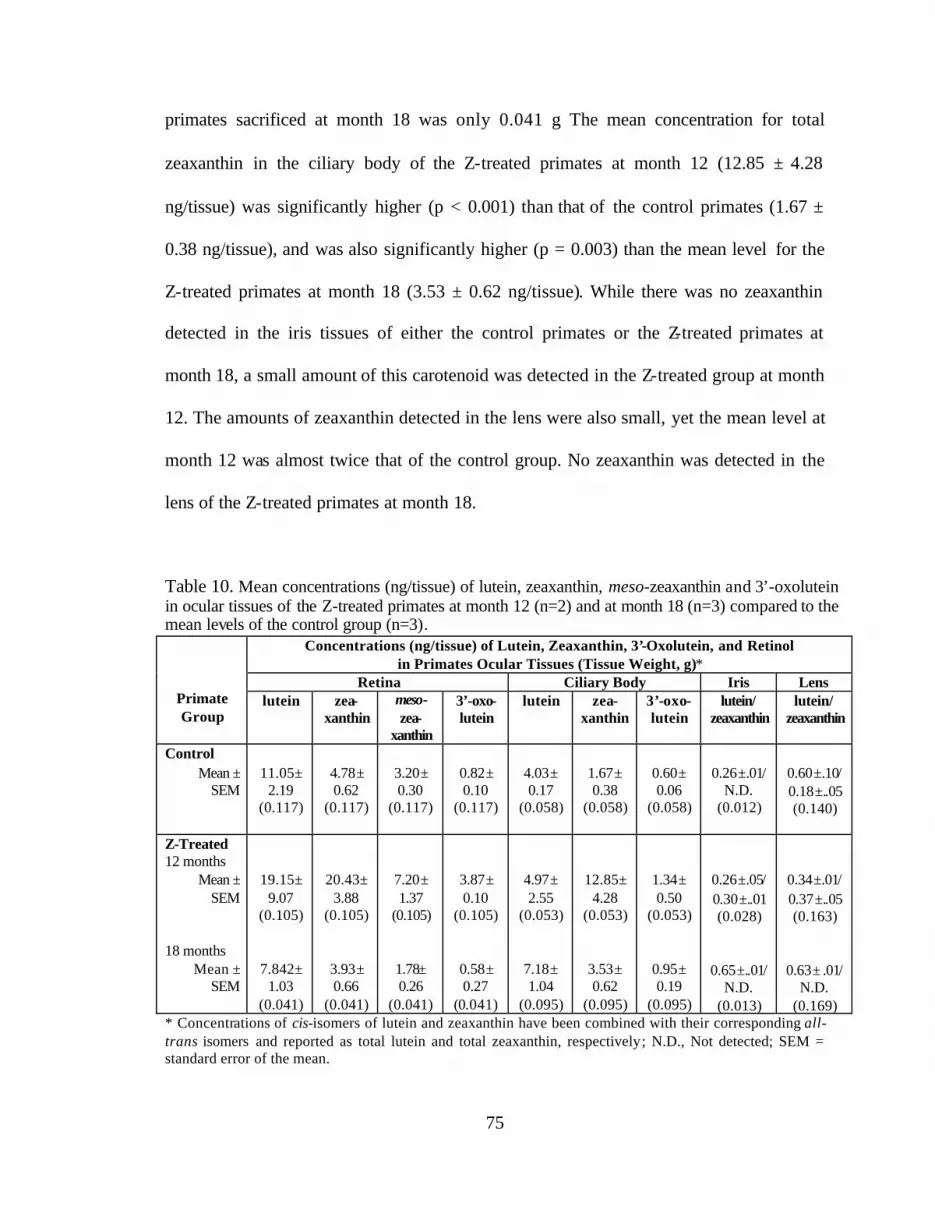
75
primates sacrificed at month 18 was only 0.041 g. The mean concentration for total
zeaxanthin in the ciliary body of the Z-treated primates at month 12 (12.85 ± 4.28
ng/tissue) was significantly higher (p < 0.001) than that of the control primates (1.67 ±
0.38 ng/tissue), and was also significantly higher (p = 0.003) than the mean level for the
Z-treated primates at month 18 (3.53 ± 0.62 ng/tissue). While there was no zeaxanthin
detected in the iris tissues of either the control primates or the Z-treated primates at
month 18, a small amount of this carotenoid was detected in the Z-treated group at month
12. The amounts of zeaxanthin detected in the lens were also small, yet the mean level at
month 12 was almost twice that of the control group. No zeaxanthin was detected in the
lens of the Z-treated primates at month 18.
Table 10. Mean concentrations (ng/tissue) of lutein, zeaxanthin, meso-zeaxanthin and 3’-oxolutein in ocular tissues of the Z-treated primates at month 12 (n=2) and at month 18 (n=3) compared to the mean levels of the control group (n=3).
Concentrations (ng/tissue) of Lutein, Zeaxanthin, 3’-Oxolutein, and Retinol in Primates Ocular Tissues (Tissue Weight, g)*
Retina Ciliary Body Iris Lens
Primate Group
lutein zea-xanthin
meso-zea-
xanthin
3’-oxo-lutein
lutein zea- xanthin
3’-oxo-lutein
lutein/ zeaxanthin
lutein/ zeaxanthin
Control Mean ±
SEM
11.05±
2.19 (0.117)
4.78± 0.62
(0.117)
3.20± 0.30
(0.117)
0.82± 0.10
(0.117)
4.03± 0.17
(0.058)
1.67± 0.38
(0.058)
0.60± 0.06
(0.058)
0.26±.01/
N.D. (0.012)
0.60±.10/ 0.18±..05 (0.140)
Z-Treated 12 months
Mean ± SEM
18 months
Mean ± SEM
19.15± 9.07
(0.105)
7.842±
1.03 (0.041)
20.43± 3.88
(0.105)
3.93± 0.66
(0.041)
7.20± 1.37
(0.105)
1.78± 0.26
(0.041)
3.87± 0.10
(0.105)
0.58± 0.27
(0.041)
4.97± 2.55
(0.053)
7.18± 1.04
(0.095)
12.85± 4.28
(0.053)
3.53± 0.62
(0.095)
1.34± 0.50
(0.053)
0.95± 0.19
(0.095)
0.26±.05/ 0.30±..01 (0.028)
0.65±..01/ N.D.
(0.013)
0.34±.01/ 0.37±..05 (0.163)
0.63± .01/ N.D.
(0.169) * Concentrations of cis-isomers of lutein and zeaxanthin have been combined with their corresponding all-trans isomers and reported as total lutein and total zeaxanthin, respectively; N.D., Not detected; SEM = standard error of the mean.
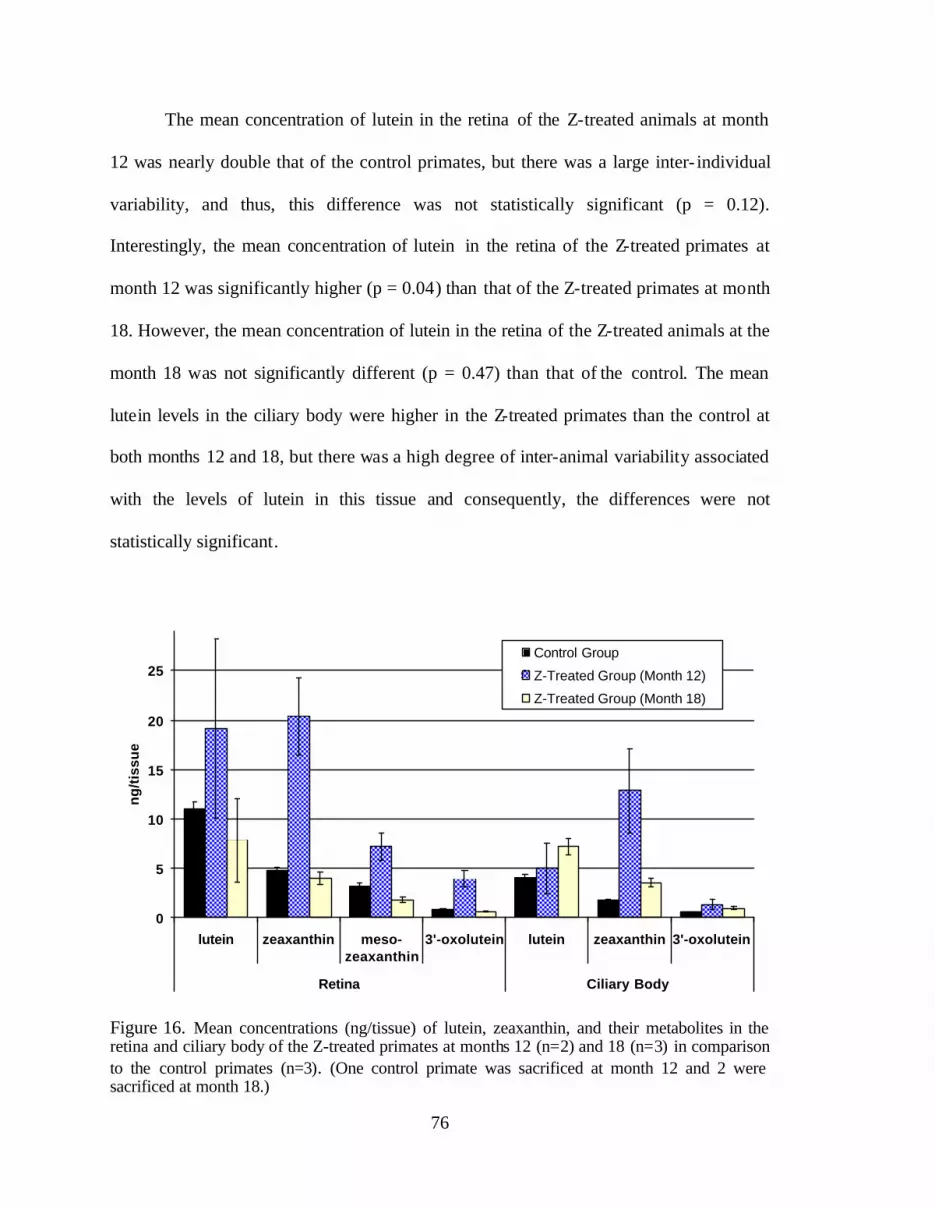
76
The mean concentration of lutein in the retina of the Z-treated animals at month
12 was nearly double that of the control primates, but there was a large inter- individual
variability, and thus, this difference was not statistically significant (p = 0.12).
Interestingly, the mean concentration of lutein in the retina of the Z-treated primates at
month 12 was significantly higher (p = 0.04) than that of the Z-treated primates at month
18. However, the mean concentration of lutein in the retina of the Z-treated animals at the
month 18 was not significantly different (p = 0.47) than that of the control. The mean
lutein levels in the ciliary body were higher in the Z-treated primates than the control at
both months 12 and 18, but there was a high degree of inter-animal variability associated
with the levels of lutein in this tissue and consequently, the differences were not
statistically significant.
0
5
10
15
20
25
lutein zeaxanthin meso-zeaxanthin
3'-oxolutein lutein zeaxanthin 3'-oxolutein
Retina Ciliary Body
ng
/tis
sue
Control Group
Z-Treated Group (Month 12)
Z-Treated Group (Month 18)
Figure 16. Mean concentrations (ng/tissue) of lutein, zeaxanthin, and their metabolites in the retina and ciliary body of the Z-treated primates at months 12 (n=2) and 18 (n=3) in comparison to the control primates (n=3). (One control primate was sacrificed at month 12 and 2 were sacrificed at month 18.)
77
The mean concentration of meso-zeaxanthin in the retinas of the Z-treated
primates at month 12 was significantly higher (p = 0.001) than that of the control
primates, and that of the Z-treated primates at month 18 (p < 0.001).
The mean concentration of 3’-oxolutein in the retina of the Z-treated primates at
month 12 was significantly higher than that of the control group (p = 0.002) and the Z-
treated primates at month 18 (p < 0.001). However, the mean level of 3’-oxolutein in the
Z-treated group at month 18 was not significantly different from the control mean (p = 0.52).
The mean concentration of 3’-oxolutein in the ciliary body of the Z-treated
primates had increased by month 12 of supplementation, and levels of this metabolite
then decreased during the post-supplementation period (Figure 16).
Carotenoid Concentrations in the Major Organs and Tissues of Primates in the
Zeaxanthin Supplementation Study
Other major organs and tissues of the sacrificed animals were also analyzed for
carotenoids, their metabolites, and retinol. The organs and tissues analyzed in the
primates sacrificed at month 12 were: liver, lung, colon, kidney, breast, ovaries, spleen,
cervix, and adipose. The mean concentrations of lutein, zeaxanthin, their metabolites, and
retinol for the 2 Z-treated primates sacrificed at month 12 were compared to that of the
control primate (RQ4079). These data are listed in Table 11 and the complete data for
each primate are attached as Appendix F. In all cases, the concentrations of zeaxanthin in the
tissues and organs of the Z-treated primates were significantly higher than the values
obtained for the control primate. As expected, the liver tissues accumulated the highest
concentrations of carotenoids and retinol.
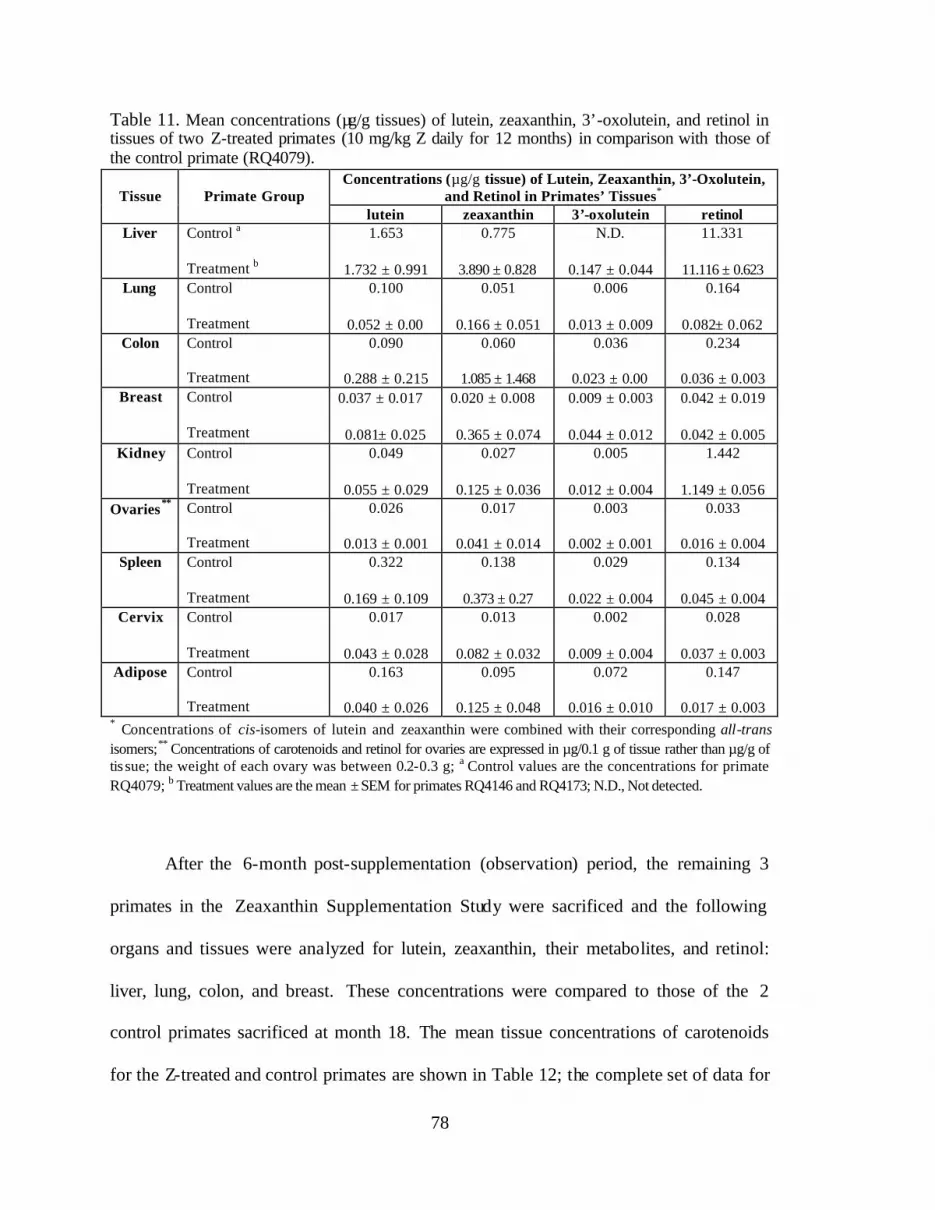
78
Table 11. Mean concentrations (µg/g tissues) of lutein, zeaxanthin, 3’-oxolutein, and retinol in tissues of two Z-treated primates (10 mg/kg Z daily for 12 months) in comparison with those of the control primate (RQ4079).
Concentrations (µg/g tissue) of Lutein, Zeaxanthin, 3’-Oxolutein, and Retinol in Primates’ Tissues*
Tissue
Primate Group
lutein zeaxanthin 3’-oxolutein retinol Liver
Control a Treatment b
1.653
1.732 ± 0.991
0.775
3.890 ± 0.828
N.D.
0.147 ± 0.044
11.331
11.116 ± 0.623 Lung
Control Treatment
0.100
0.052 ± 0.00
0.051
0.166 ± 0.051
0.006
0.013 ± 0.009
0.164
0.082± 0.062 Colon
Control Treatment
0.090
0.288 ± 0.215
0.060
1.085 ± 1.468
0.036
0.023 ± 0.00
0.234
0.036 ± 0.003 Breast
Control Treatment
0.037 ± 0.017
0.081± 0.025
0.020 ± 0.008
0.365 ± 0.074
0.009 ± 0.003
0.044 ± 0.012
0.042 ± 0.019
0.042 ± 0.005 Kidney
Control Treatment
0.049 0.055 ± 0.029
0.027
0.125 ± 0.036
0.005
0.012 ± 0.004
1.442
1.149 ± 0.056 Ovaries**
Control Treatment
0.026
0.013 ± 0.001
0.017
0.041 ± 0.014
0.003
0.002 ± 0.001
0.033
0.016 ± 0.004 Spleen
Control Treatment
0.322
0.169 ± 0.109
0.138
0.373 ± 0.27
0.029
0.022 ± 0.004
0.134
0.045 ± 0.004 Cervix
Control Treatment
0.017
0.043 ± 0.028
0.013
0.082 ± 0.032
0.002
0.009 ± 0.004
0.028
0.037 ± 0.003 Adipose
Control Treatment
0.163
0.040 ± 0.026
0.095
0.125 ± 0.048
0.072
0.016 ± 0.010
0.147
0.017 ± 0.003
* Concentrations of cis-isomers of lutein and zeaxanthin were combined with their corresponding all-trans isomers; ** Concentrations of carotenoids and retinol for ovaries are expressed in µg/0.1 g of tissue rather than µg/g of tis sue; the weight of each ovary was between 0.2-0.3 g; a Control values are the concentrations for primate RQ4079; b Treatment values are the mean ± SEM for primates RQ4146 and RQ4173; N.D., Not detected.
After the 6-month post-supplementation (observation) period, the remaining 3
primates in the Zeaxanthin Supplementation Study were sacrificed and the following
organs and tissues were analyzed for lutein, zeaxanthin, their metabolites, and retinol:
liver, lung, colon, and breast. These concentrations were compared to those of the 2
control primates sacrificed at month 18. The mean tissue concentrations of carotenoids
for the Z-treated and control primates are shown in Table 12; the complete set of data for
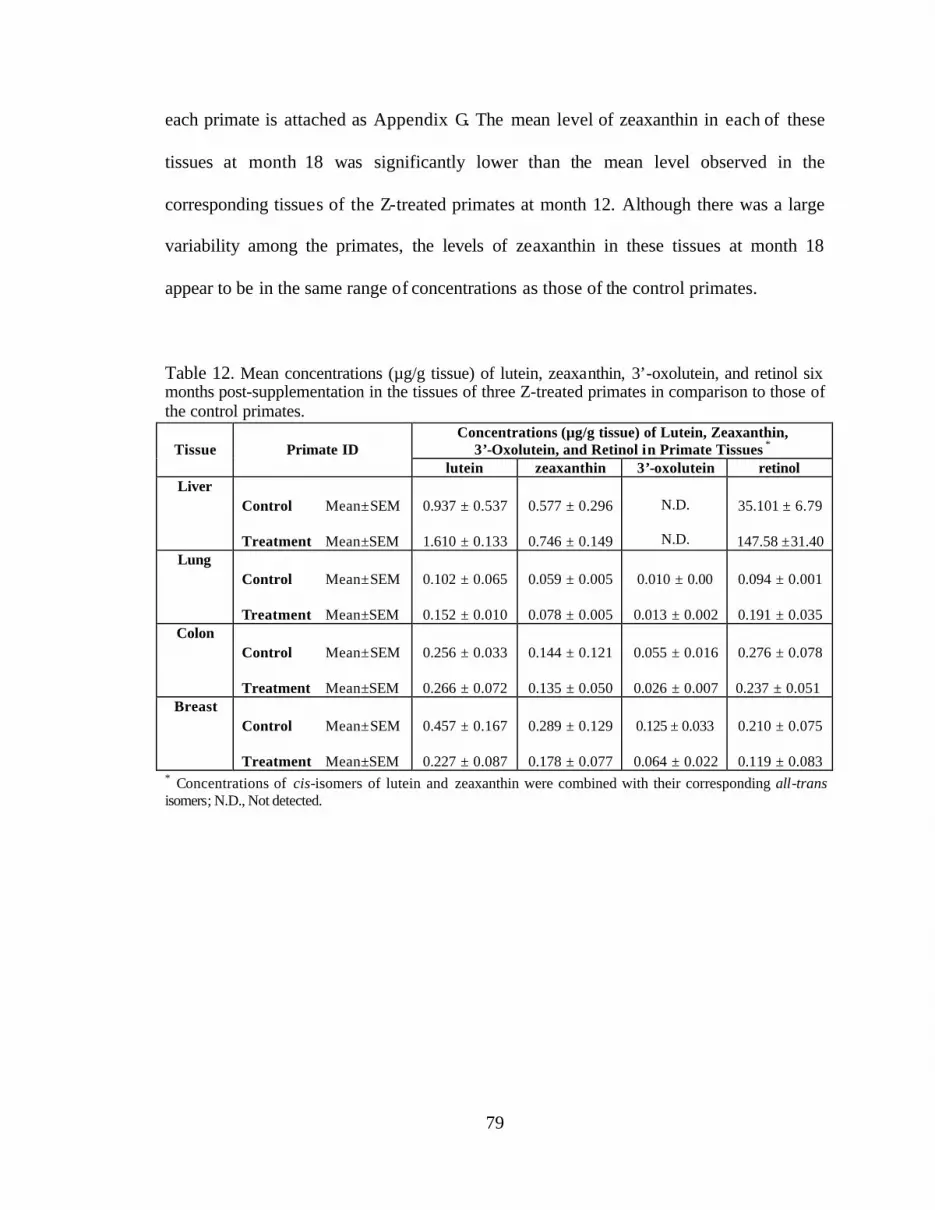
79
each primate is attached as Appendix G. The mean level of zeaxanthin in each of these
tissues at month 18 was significantly lower than the mean level observed in the
corresponding tissues of the Z-treated primates at month 12. Although there was a large
variability among the primates, the levels of zeaxanthin in these tissues at month 18
appear to be in the same range of concentrations as those of the control primates.
Table 12. Mean concentrations (µg/g tissue) of lutein, zeaxanthin, 3’-oxolutein, and retinol six months post-supplementation in the tissues of three Z-treated primates in comparison to those of the control primates.
Concentrations (µg/g tissue) of Lutein, Zeaxanthin, 3’-Oxolutein, and Retinol in Primate Tissues *
Tissue
Primate ID
lutein zeaxanthin 3’-oxolutein retinol Liver
Control Mean±SEM Treatment Mean±SEM
0.937 ± 0.537
1.610 ± 0.133
0.577 ± 0.296
0.746 ± 0.149
N.D.
N.D.
35.101 ± 6.79
147.58 ±31.40
Lung
Control Mean±SEM Treatment Mean±SEM
0.102 ± 0.065
0.152 ± 0.010
0.059 ± 0.005
0.078 ± 0.005
0.010 ± 0.00
0.013 ± 0.002
0.094 ± 0.001
0.191 ± 0.035
Colon
Control Mean±SEM Treatment Mean±SEM
0.256 ± 0.033
0.266 ± 0.072
0.144 ± 0.121
0.135 ± 0.050
0.055 ± 0.016
0.026 ± 0.007
0.276 ± 0.078
0.237 ± 0.051
Breast
Control Mean±SEM Treatment Mean±SEM
0.457 ± 0.167
0.227 ± 0.087
0.289 ± 0.129
0.178 ± 0.077
0.125 ± 0.033
0.064 ± 0.022
0.210 ± 0.075
0.119 ± 0.083
* Concentrations of cis-isomers of lutein and zeaxanthin were combined with their corresponding all-trans isomers; N.D., Not detected.
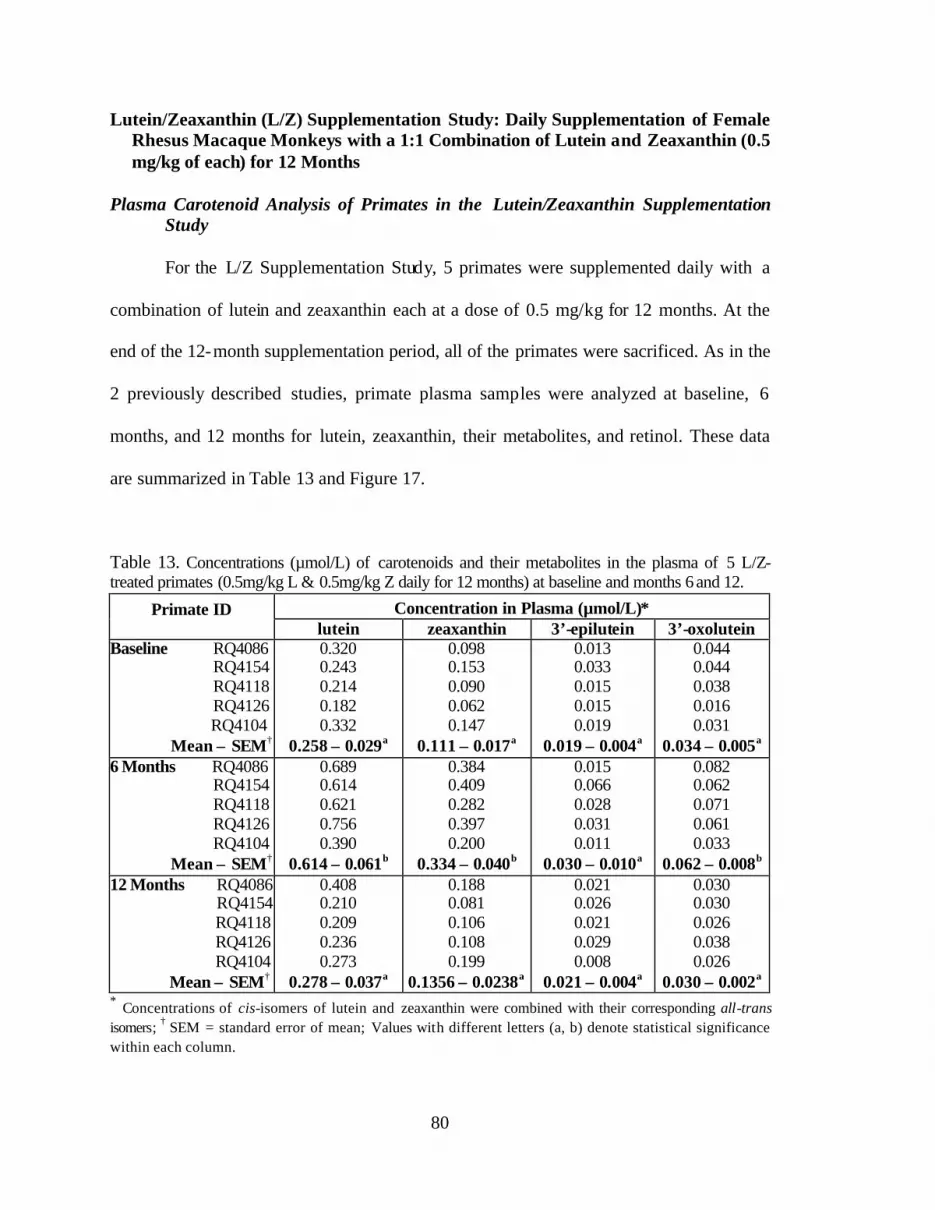
80
Lutein/Zeaxanthin (L/Z) Supplementation Study: Daily Supplementation of Female Rhesus Macaque Monkeys with a 1:1 Combination of Lutein and Zeaxanthin (0.5 mg/kg of each) for 12 Months
Plasma Carotenoid Analysis of Primates in the Lutein/Zeaxanthin Supplementation
Study For the L/Z Supplementation Study, 5 primates were supplemented daily with a
combination of lutein and zeaxanthin each at a dose of 0.5 mg/kg for 12 months. At the
end of the 12-month supplementation period, all of the primates were sacrificed. As in the
2 previously described studies, primate plasma samples were analyzed at baseline, 6
months, and 12 months for lutein, zeaxanthin, their metabolites, and retinol. These data
are summarized in Table 13 and Figure 17.
Table 13. Concentrations (µmol/L) of carotenoids and their metabolites in the plasma of 5 L/Z-treated primates (0.5mg/kg L & 0.5mg/kg Z daily for 12 months) at baseline and months 6 and 12.
Concentration in Plasma (µmol/L)* Primate ID lutein zeaxanthin 3’-epilutein 3’-oxolutein
Baseline RQ4086 RQ4154 RQ4118 RQ4126 RQ4104
Mean ± SEM†
0.320 0.243 0.214 0.182 0.332
0.258 ± 0.029a
0.098 0.153 0.090 0.062 0.147
0.111 ± 0.017a
0.013 0.033 0.015 0.015 0.019
0.019 ± 0.004a
0.044 0.044 0.038 0.016 0.031
0.034 ± 0.005a 6 Months RQ4086 RQ4154 RQ4118 RQ4126 RQ4104 Mean ± SEM†
0.689 0.614 0.621 0.756 0.390
0.614 ± 0.061b
0.384 0.409 0.282 0.397 0.200
0.334 ± 0.040b
0.015 0.066 0.028 0.031 0.011
0.030 ± 0.010a
0.082 0.062 0.071 0.061 0.033
0.062 ± 0.008b 12 Months RQ4086 RQ4154 RQ4118 RQ4126 RQ4104 Mean ± SEM†
0.408 0.210 0.209 0.236 0.273
0.278 ± 0.037a
0.188 0.081 0.106 0.108 0.199
0.1356 ± 0.0238a
0.021 0.026 0.021 0.029 0.008
0.021 ± 0.004a
0.030 0.030 0.026 0.038 0.026
0.030 ± 0.002a
* Concentrations of cis-isomers of lutein and zeaxanthin were combined with their corresponding all-trans isomers; † SEM = standard error of mean; Values with different letters (a, b) denote statistical significance within each column.
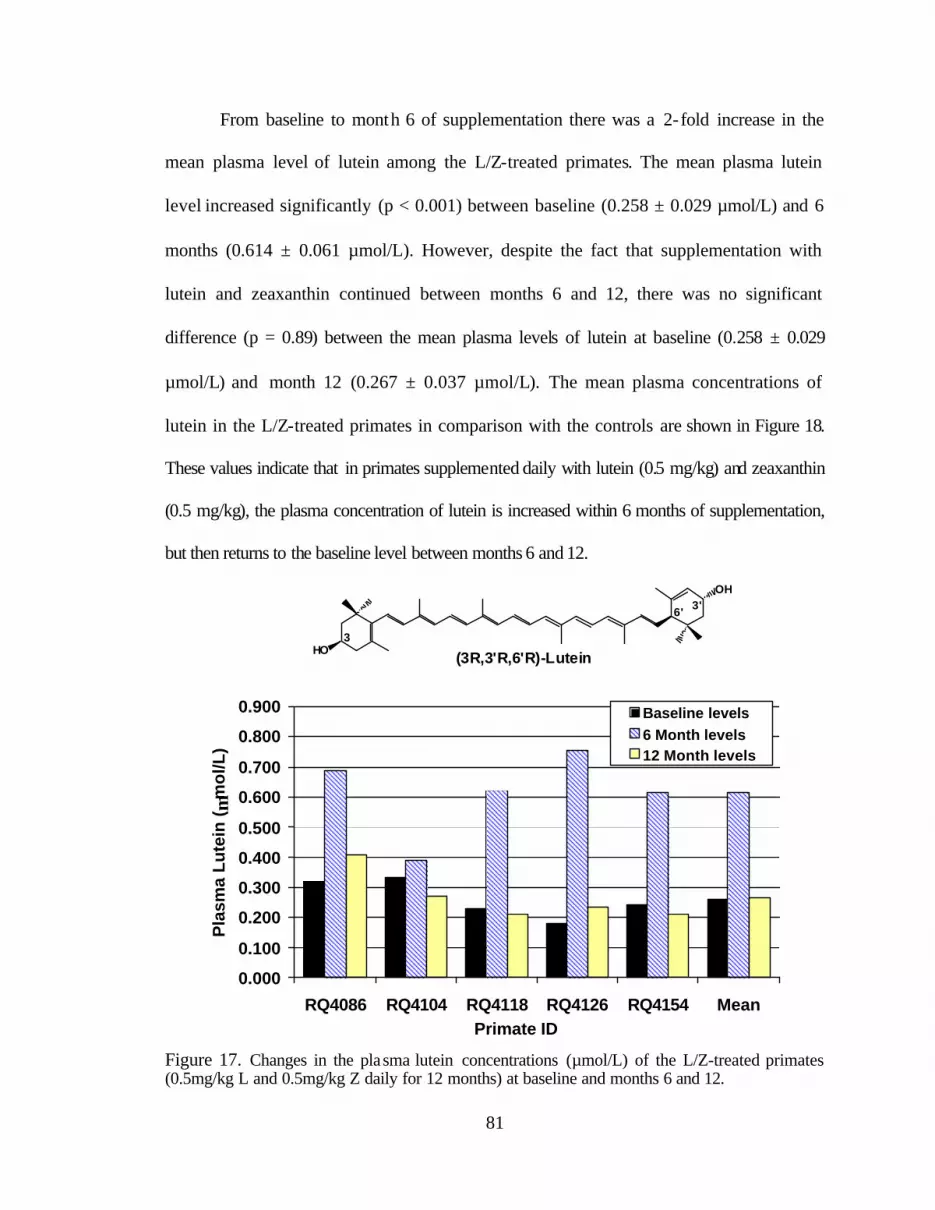
81
From baseline to month 6 of supplementation there was a 2-fold increase in the
mean plasma level of lutein among the L/Z-treated primates. The mean plasma lutein
level increased significantly (p < 0.001) between baseline (0.258 ± 0.029 µmol/L) and 6
months (0.614 ± 0.061 µmol/L). However, despite the fact that supplementation with
lutein and zeaxanthin continued between months 6 and 12, there was no significant
difference (p = 0.89) between the mean plasma levels of lutein at baseline (0.258 ± 0.029
µmol/L) and month 12 (0.267 ± 0.037 µmol/L). The mean plasma concentrations of
lutein in the L/Z-treated primates in comparison with the controls are shown in Figure 18.
These values indicate that in primates supplemented daily with lutein (0.5 mg/kg) and zeaxanthin
(0.5 mg/kg), the plasma concentration of lutein is increased within 6 months of supplementation,
but then returns to the baseline level between months 6 and 12.
OH
HO (3R,3'R,6'R)-Lutein
3'
3
6'
0.000
0.100
0.200
0.300
0.400
0.500
0.600
0.700
0.800
0.900
RQ4086 RQ4104 RQ4118 RQ4126 RQ4154 MeanPrimate ID
Pla
sma
Lu
tein
(µm
ol/L
)
Baseline levels6 Month levels12 Month levels
Figure 17. Changes in the plasma lutein concentrations (µmol/L) of the L/Z-treated primates (0.5mg/kg L and 0.5mg/kg Z daily for 12 months) at baseline and months 6 and 12.
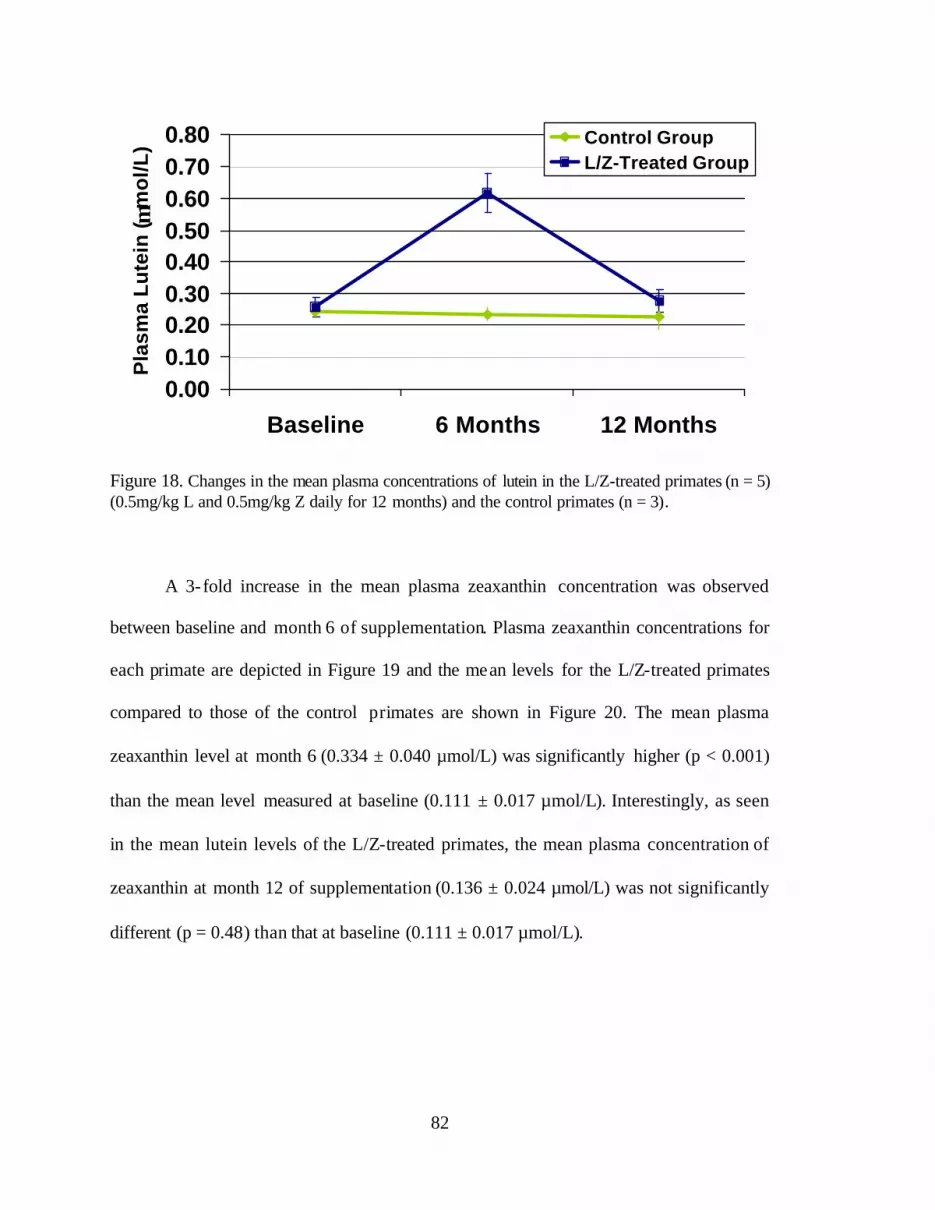
82
0.000.100.200.300.400.500.600.700.80
Baseline 6 Months 12 Months
Pla
sma
Lu
tein
( µm
ol/L
) Control GroupL/Z-Treated Group
Figure 18. Changes in the mean plasma concentrations of lutein in the L/Z-treated primates (n = 5) (0.5mg/kg L and 0.5mg/kg Z daily for 12 months) and the control primates (n = 3).
A 3-fold increase in the mean plasma zeaxanthin concentration was observed
between baseline and month 6 of supplementation. Plasma zeaxanthin concentrations for
each primate are depicted in Figure 19 and the mean levels for the L/Z-treated primates
compared to those of the control primates are shown in Figure 20. The mean plasma
zeaxanthin level at month 6 (0.334 ± 0.040 µmol/L) was significantly higher (p < 0.001)
than the mean level measured at baseline (0.111 ± 0.017 µmol/L). Interestingly, as seen
in the mean lutein levels of the L/Z-treated primates, the mean plasma concentration of
zeaxanthin at month 12 of supplementation (0.136 ± 0.024 µmol/L) was not significantly
different (p = 0.48) than that at baseline (0.111 ± 0.017 µmol/L).

83
OH
HO (3R,3'R)-Zeaxanthin3
3'
0.000
0.050
0.100
0.150
0.200
0.250
0.300
0.350
0.400
0.450
RQ4086 RQ4104 RQ4118 RQ4126 RQ4154 Mean
Primate ID
Pla
sma
Zea
xan
thin
(µm
ol/L
)
Baseline levels
6 Month levels
12 Month levels
Figure 19. Changes in the mean plasma concentrations of zeaxanthin (µmol/L) in the L/Z-treated primates at baseline and months 6 and 12.
0
0.05
0.1
0.15
0.2
0.25
0.3
0.35
0.4
Baseline 6 Months 12 Months
Pla
sma
Zea
xan
thin
(µm
ol/L
) Control Group
L/Z-Treated Group
Figure 20. Changes in the mean plasma zeaxanthin concentrations (µmol/L) of the L/Z-treated primates in comparison to the control group at baseline and months 6 and 12.
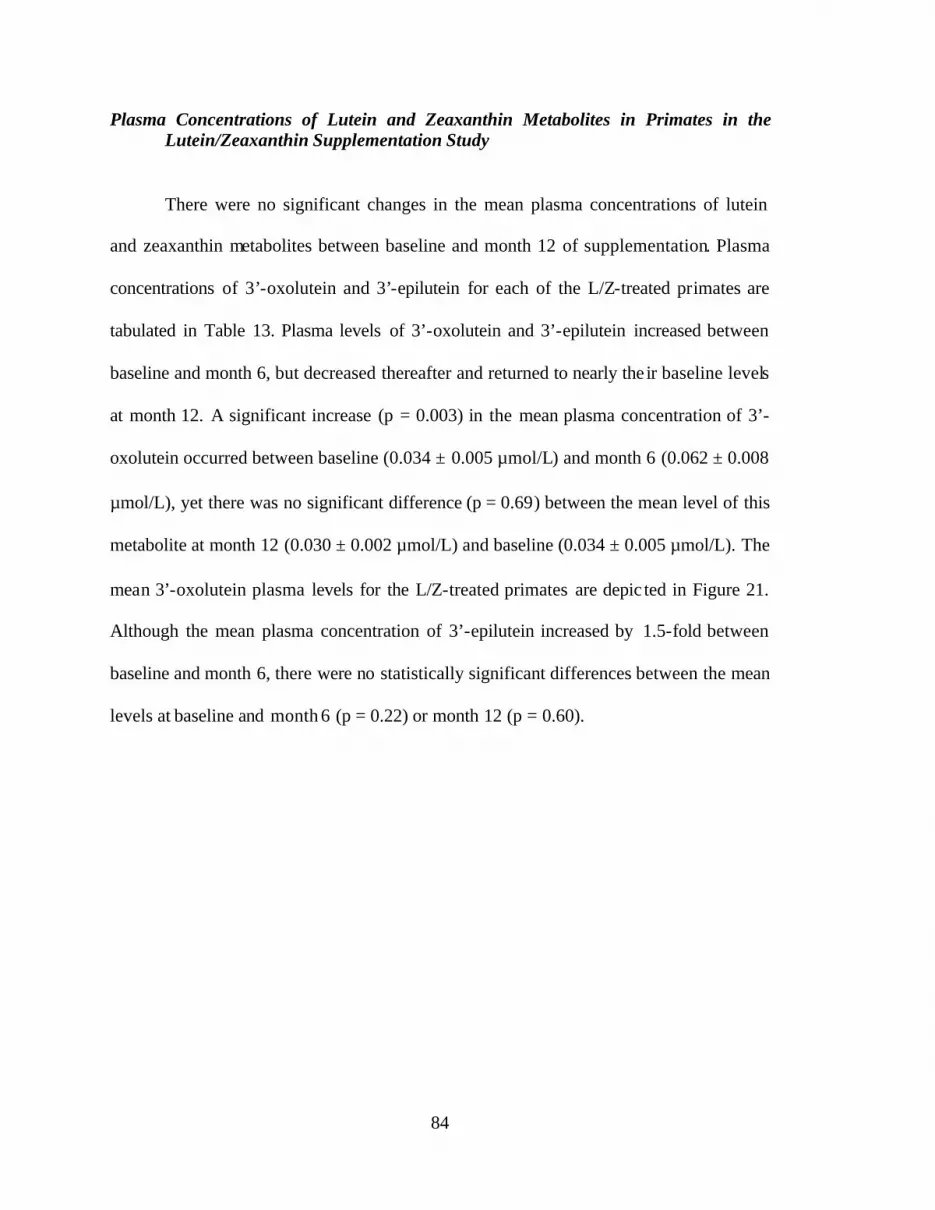
84
Plasma Concentrations of Lutein and Zeaxanthin Metabolites in Primates in the Lutein/Zeaxanthin Supplementation Study
There were no significant changes in the mean plasma concentrations of lutein
and zeaxanthin metabolites between baseline and month 12 of supplementation. Plasma
concentrations of 3’-oxolutein and 3’-epilutein for each of the L/Z-treated primates are
tabulated in Table 13. Plasma levels of 3’-oxolutein and 3’-epilutein increased between
baseline and month 6, but decreased thereafter and returned to nearly the ir baseline levels
at month 12. A significant increase (p = 0.003) in the mean plasma concentration of 3’-
oxolutein occurred between baseline (0.034 ± 0.005 µmol/L) and month 6 (0.062 ± 0.008
µmol/L), yet there was no significant difference (p = 0.69) between the mean level of this
metabolite at month 12 (0.030 ± 0.002 µmol/L) and baseline (0.034 ± 0.005 µmol/L). The
mean 3’-oxolutein plasma levels for the L/Z-treated primates are depic ted in Figure 21.
Although the mean plasma concentration of 3’-epilutein increased by 1.5-fold between
baseline and month 6, there were no statistically significant differences between the mean
levels at baseline and month 6 (p = 0.22) or month 12 (p = 0.60).
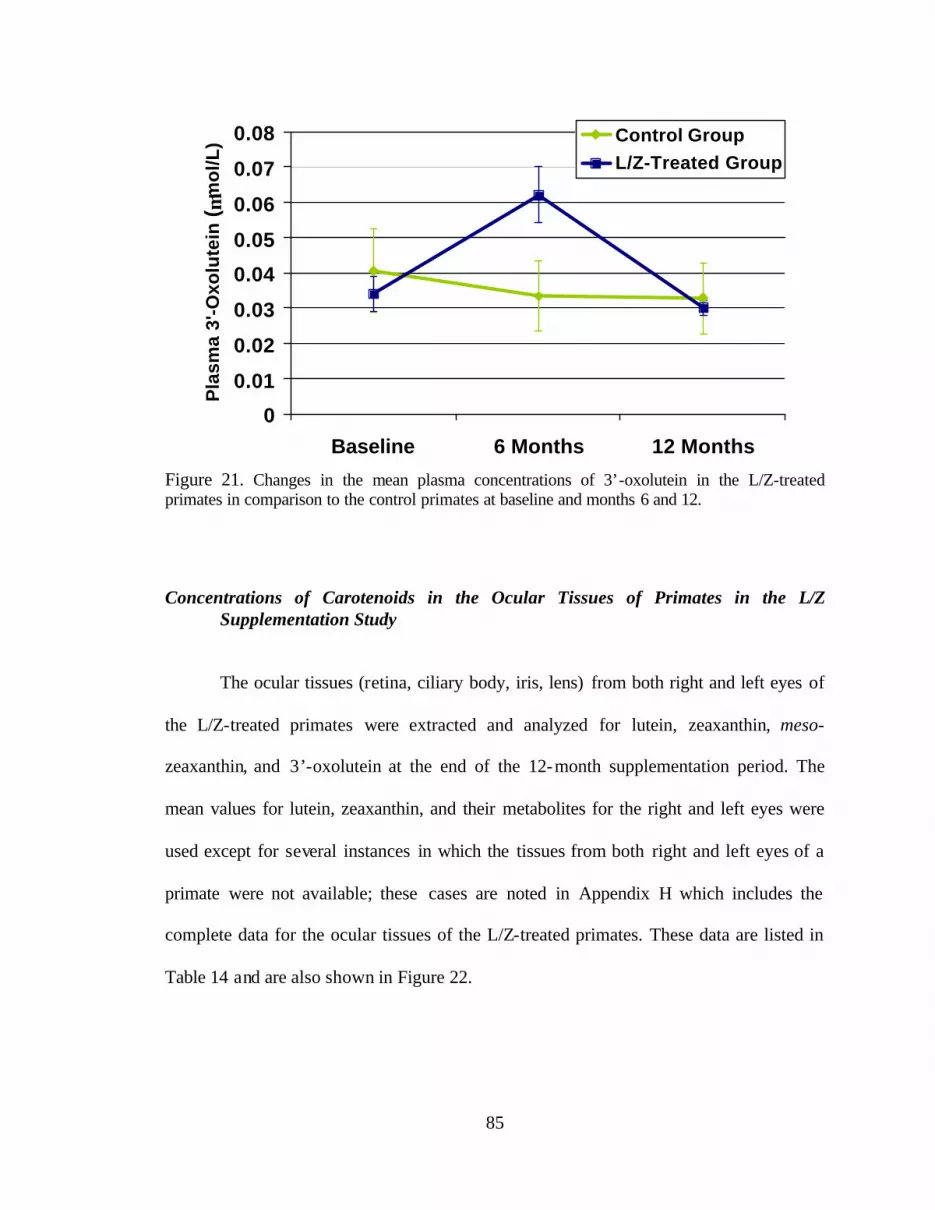
85
0
0.01
0.02
0.03
0.04
0.05
0.06
0.07
0.08
Baseline 6 Months 12 Months
Pla
sma
3'-O
xolu
tein
(µm
ol/L
) Control GroupL/Z-Treated Group
Figure 21. Changes in the mean plasma concentrations of 3’-oxolutein in the L/Z-treated primates in comparison to the control primates at baseline and months 6 and 12. Concentrations of Carotenoids in the Ocular Tissues of Primates in the L/Z
Supplementation Study
The ocular tissues (retina, ciliary body, iris, lens) from both right and left eyes of
the L/Z-treated primates were extracted and analyzed for lutein, zeaxanthin, meso-
zeaxanthin, and 3’-oxolutein at the end of the 12-month supplementation period. The
mean values for lutein, zeaxanthin, and their metabolites for the right and left eyes were
used except for several instances in which the tissues from both right and left eyes of a
primate were not available; these cases are noted in Appendix H which includes the
complete data for the ocular tissues of the L/Z-treated primates. These data are listed in
Table 14 and are also shown in Figure 22.
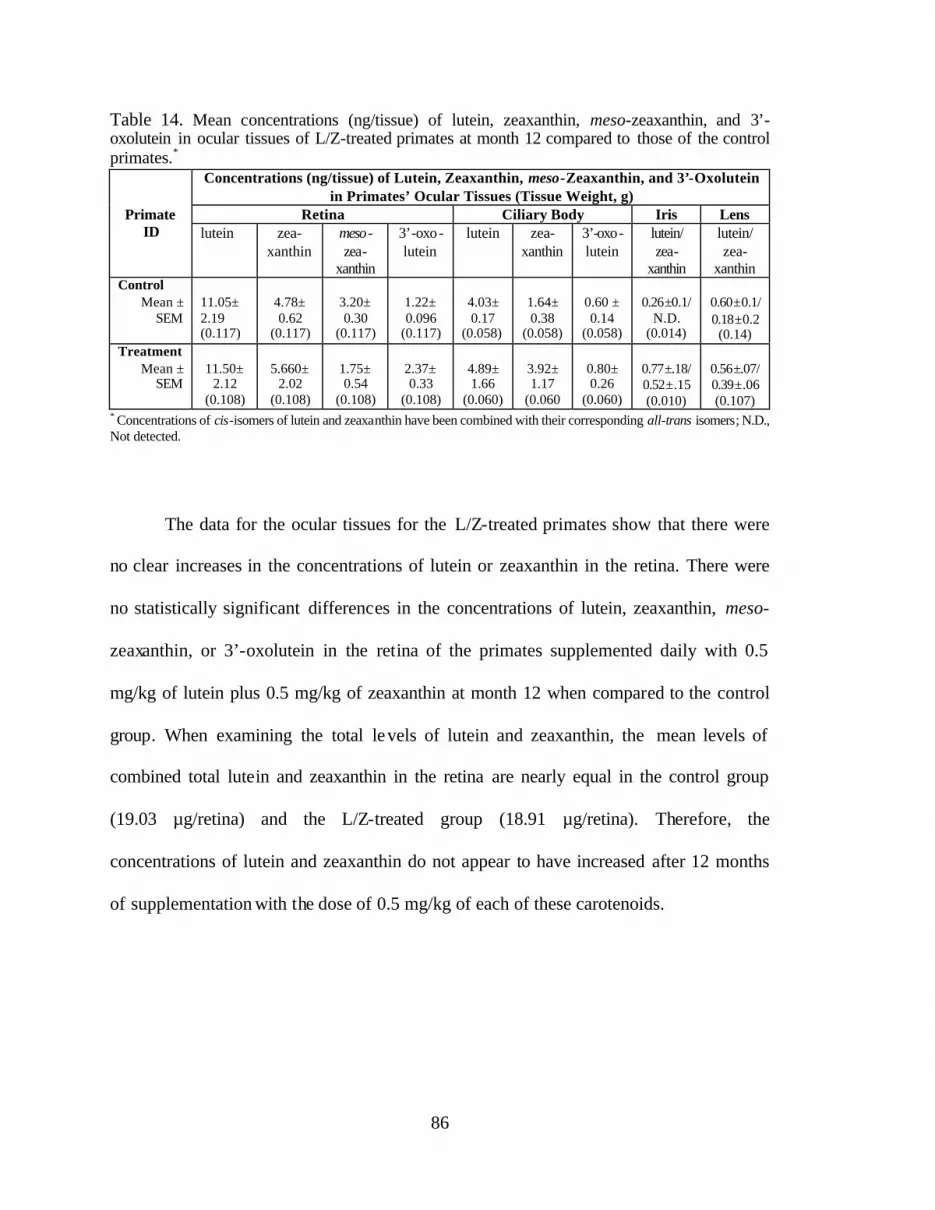
86
Table 14. Mean concentrations (ng/tissue) of lutein, zeaxanthin, meso-zeaxanthin, and 3’-oxolutein in ocular tissues of L/Z-treated primates at month 12 compared to those of the control primates.*
Concentrations (ng/tissue) of Lutein, Zeaxanthin, meso-Zeaxanthin, and 3’-Oxolutein in Primates’ Ocular Tissues (Tissue Weight, g)
Retina Ciliary Body Iris Lens
Primate
ID lutein zea-xanthin
meso-zea-
xanthin
3’-oxo- lutein
lutein zea-xanthin
3’-oxo- lutein
lutein/ zea-
xanthin
lutein/ zea-
xanthin Control
Mean ± SEM
11.05± 2.19 (0.117)
4.78± 0.62
(0.117)
3.20± 0.30
(0.117)
1.22± 0.096
(0.117)
4.03± 0.17
(0.058)
1.64± 0.38
(0.058)
0.60 ± 0.14
(0.058)
0.26±0.1/
N.D. (0.014)
0.60 ±0.1/ 0.18 ±0.2 (0.14)
Treatment Mean ±
SEM
11.50±
2.12 (0.108)
5.660±
2.02 (0.108)
1.75± 0.54
(0.108)
2.37± 0.33
(0.108)
4.89± 1.66
(0.060)
3.92± 1.17
(0.060
0.80± 0.26
(0.060)
0.77±.18/ 0.52±.15 (0.010)
0.56±.07/ 0.39±.06 (0.107)
* Concentrations of cis-isomers of lutein and zeaxanthin have been combined with their corresponding all-trans isomers; N.D., Not detected. The data for the ocular tissues for the L/Z-treated primates show that there were
no clear increases in the concentrations of lutein or zeaxanthin in the retina. There were
no statistically significant differences in the concentrations of lutein, zeaxanthin, meso-
zeaxanthin, or 3’-oxolutein in the retina of the primates supplemented daily with 0.5
mg/kg of lutein plus 0.5 mg/kg of zeaxanthin at month 12 when compared to the control
group. When examining the total levels of lutein and zeaxanthin, the mean levels of
combined total lutein and zeaxanthin in the retina are nearly equal in the control group
(19.03 µg/retina) and the L/Z-treated group (18.91 µg/retina). Therefore, the
concentrations of lutein and zeaxanthin do not appear to have increased after 12 months
of supplementation with the dose of 0.5 mg/kg of each of these carotenoids.
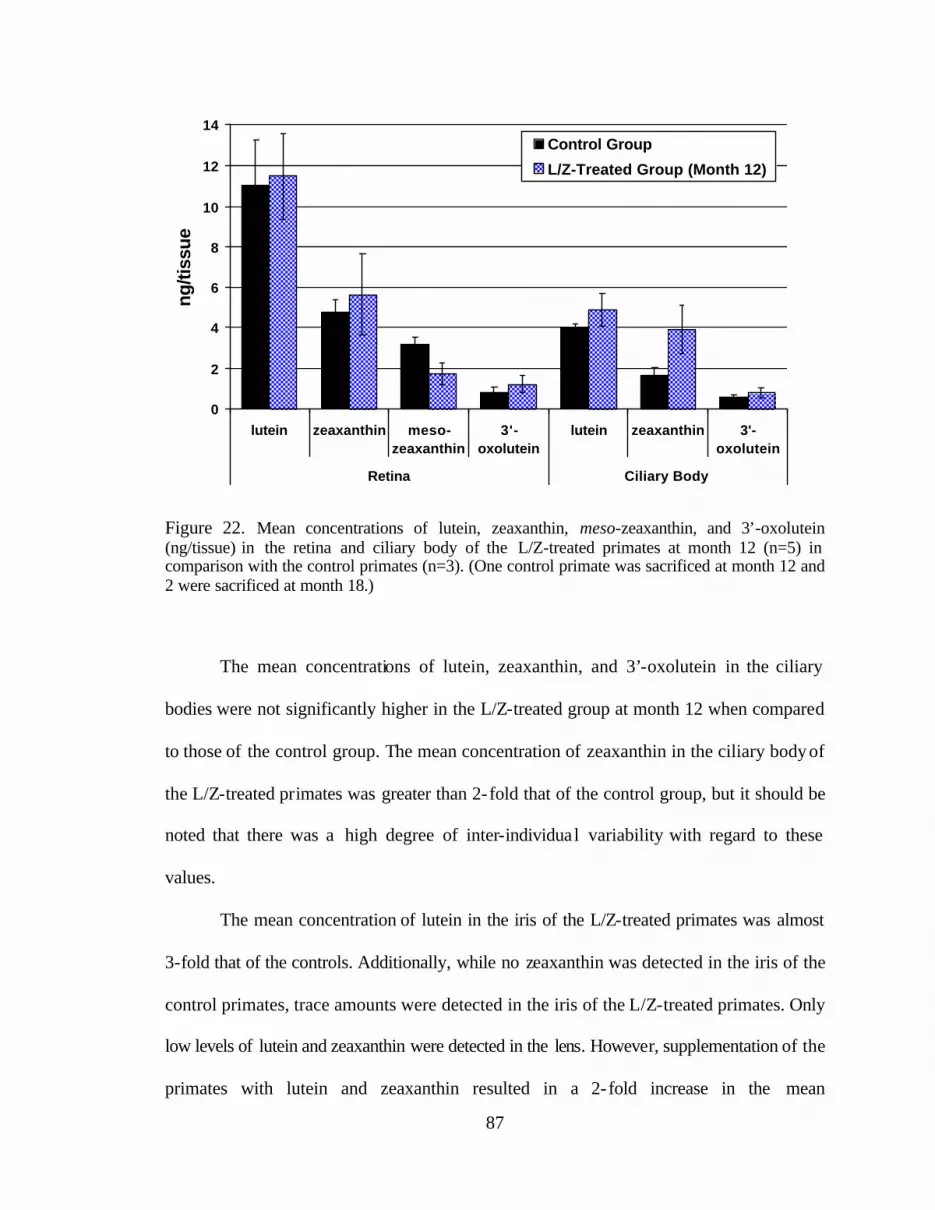
87
0
2
4
6
8
10
12
14
lutein zeaxanthin meso-zeaxanthin
3'-oxolutein
lutein zeaxanthin 3'-oxolutein
Retina Ciliary Body
ng/ti
ssue
Control Group
L/Z-Treated Group (Month 12)
Figure 22. Mean concentrations of lutein, zeaxanthin, meso-zeaxanthin, and 3’-oxolutein (ng/tissue) in the retina and ciliary body of the L/Z-treated primates at month 12 (n=5) in comparison with the control primates (n=3). (One control primate was sacrificed at month 12 and 2 were sacrificed at month 18.)
The mean concentrations of lutein, zeaxanthin, and 3’-oxolutein in the ciliary
bodies were not significantly higher in the L/Z-treated group at month 12 when compared
to those of the control group. The mean concentration of zeaxanthin in the ciliary body of
the L/Z-treated primates was greater than 2-fold that of the control group, but it should be
noted that there was a high degree of inter-individual variability with regard to these
values.
The mean concentration of lutein in the iris of the L/Z-treated primates was almost
3-fold that of the controls. Additionally, while no zeaxanthin was detected in the iris of the
control primates, trace amounts were detected in the iris of the L/Z-treated primates. Only
low levels of lutein and zeaxanthin were detected in the lens. However, supplementation of the
primates with lutein and zeaxanthin resulted in a 2-fold increase in the mean
88
concentration of zeaxanthin in the lens when compared to that of the control group.
Meanwhile, the mean level of lutein did not appear to be affected by supplementation.
Carotenoid Concentrations in the Major Organs and Tissues of Primates in the
Lutein/Zeaxanthin Supplementation Study
At the end of the 12-month supplementation period, the major organs and tissues
of the 5 L/Z-treated primates were extracted and analyzed for lutein, zeaxanthin, their
metabolites, and retinol. The mean concentrations of these carotenoids in this group were
compared to those measured in the control primate (RQ4079) (Table 15). Complete data
for organs and tissues of each L/Z-treated primate compared to the control primate are
presented in Appendix I.
In the colon, kidney, breast, ovary, cervix, and adipose tissues, the mean lutein
and zeaxanthin levels were considerably higher in the L/Z-treated primates than in the
control primate. For instance, the mean lutein and zeaxanthin concentrations in the colon
tissues of the L/Z-treated group were more than 6-fold higher than the concentrations
measured for the control animal. Interestingly, the mean levels of lutein and zeaxanthin
were higher in the liver tissue of the control primate in comparison to the mean levels
observed in the L/Z-treated group. The lutein concentration in the liver of the control
primate (1.65 µg/g) was more than 2-fold the mean concentration of the L/Z-treated
group (0.72 µg/g). Meanwhile, the zeaxanthin concentration in the liver was almost 2-
fold higher in the control primate in comparison to the mean level of the L/Z-treated
group.
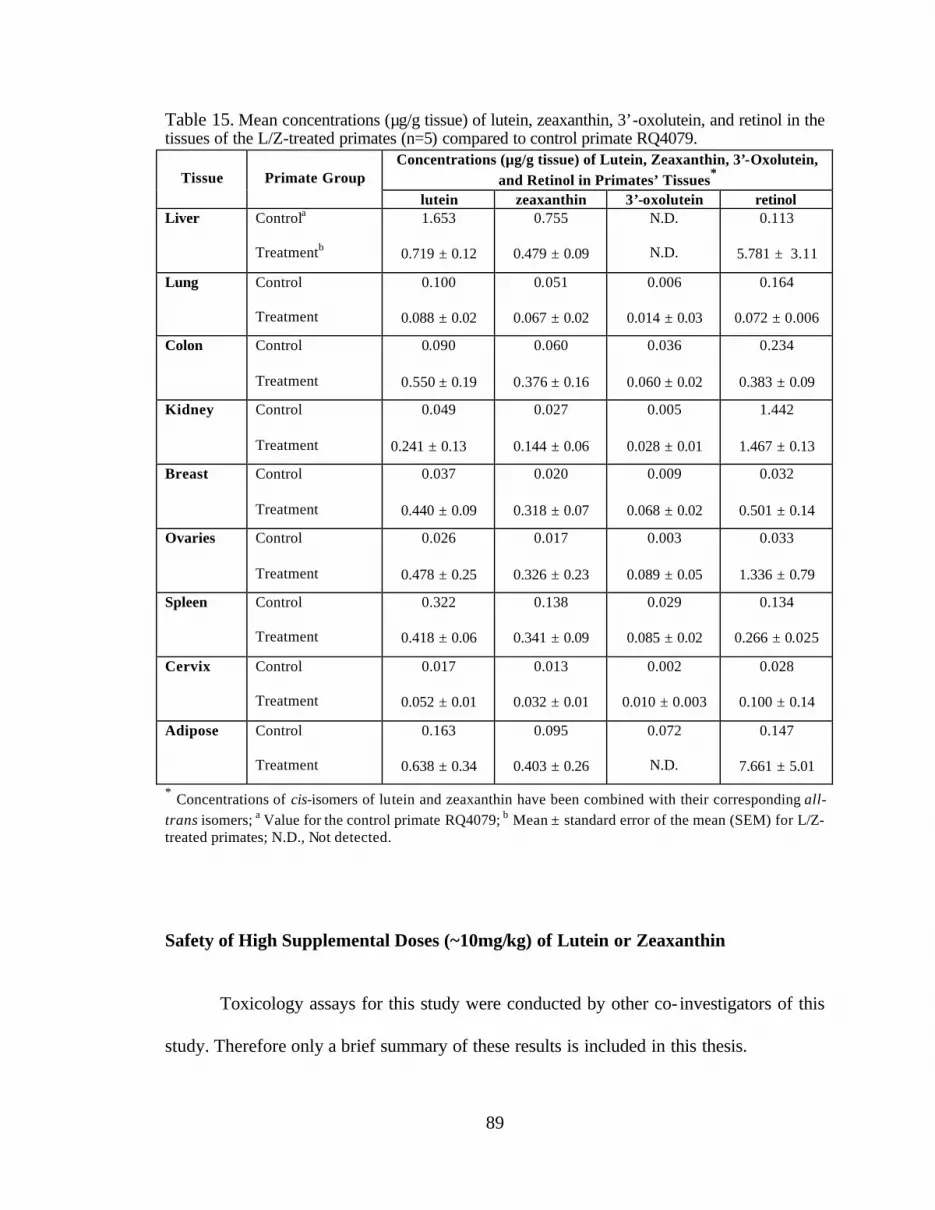
89
Table 15. Mean concentrations (µg/g tissue) of lutein, zeaxanthin, 3’-oxolutein, and retinol in the tissues of the L/Z-treated primates (n=5) compared to control primate RQ4079.
Concentrations (µg/g tissue) of Lutein, Zeaxanthin, 3’-Oxolutein, and Retinol in Primates’ Tissues*
Tissue
Primate Group
lutein zeaxanthin 3’-oxolutein retinol Liver
Controla Treatmentb
1.653
0.719 ± 0.12
0.755
0.479 ± 0.09
N.D.
N.D.
0.113
5.781 ± 3.11
Lung
Control Treatment
0.100
0.088 ± 0.02
0.051
0.067 ± 0.02
0.006
0.014 ± 0.03
0.164
0.072 ± 0.006
Colon
Control Treatment
0.090
0.550 ± 0.19
0.060
0.376 ± 0.16
0.036
0.060 ± 0.02
0.234
0.383 ± 0.09
Kidney
Control Treatment
0.049
0.241 ± 0.13
0.027
0.144 ± 0.06
0.005
0.028 ± 0.01
1.442
1.467 ± 0.13
Breast
Control Treatment
0.037
0.440 ± 0.09
0.020
0.318 ± 0.07
0.009
0.068 ± 0.02
0.032
0.501 ± 0.14
Ovaries
Control Treatment
0.026
0.478 ± 0.25
0.017
0.326 ± 0.23
0.003
0.089 ± 0.05
0.033
1.336 ± 0.79
Spleen
Control Treatment
0.322
0.418 ± 0.06
0.138
0.341 ± 0.09
0.029
0.085 ± 0.02
0.134
0.266 ± 0.025
Cervix
Control Treatment
0.017
0.052 ± 0.01
0.013
0.032 ± 0.01
0.002
0.010 ± 0.003
0.028
0.100 ± 0.14
Adipose
Control Treatment
0.163
0.638 ± 0.34
0.095
0.403 ± 0.26
0.072
N.D.
0.147
7.661 ± 5.01
* Concentrations of cis-isomers of lutein and zeaxanthin have been combined with their corresponding all-trans isomers; a Value for the control primate RQ4079; b Mean ± standard error of the mean (SEM) for L/Z-treated primates; N.D., Not detected. Safety of High Supplemental Doses (~10mg/kg) of Lutein or Zeaxanthin
Toxicology assays for this study were conducted by other co- investigators of this
study. Therefore only a brief summary of these results is included in this thesis.
90
Fundus Photography and Retina Histopathology
The results from fundus photography and histopathology of retina revealed no
abnormalities in any of the animals supplemented daily with a high dose of lutein or
zeaxanthin for 12 months. The retinal pigment epithelium (RPE) of all monkeys appeared
normal and showed a normal distribution of melanosomes and lipofuscin granules.
Bruch's membranes were normal and free of deposits. The choroids and their cellular
components were also normal. In addition, there are no signs of inflammation or
abnormal numbers of circulating leukocytes in retinal or choroidal blood vessels. The
refractile elements seen in gross examination were not evident in histologic sections.
Therefore supplementation with lutein or zeaxanthin at high doses would not be expected
to cause ocular toxicity.
Urinary Creatinine and Total Protein
The results of studies on total urinary protein excretion showed no statistically
significant alterations in protein excretion patterns based upon per milligram of creatinine
excreted. Overall, these data suggest that the various lutein and zeaxanthin treatments did
not produce any clinical renal damage to the monkeys. The statistically non-significant
increase in the urinary protein excretion per mg of creatinine that was observed in the
L/Z-treated group was undoubtedly a reflection of the lower urinary creatinine values
seen in this group in comparison to the other treatment groups. This is most likely the
result of a more dilute urine samples in some of these animals but general maintenance of
the protein/creatinine ratio.
91
DISCUSSION
The study described in this thesis was undertaken in order to determine the effects
of high-dose dietary supplementation with lutein and zeaxanthin, and their 1:1
combination on the deposition of these carotenoids and their metabolites in the plasma,
ocular tissues, and other organs and major tissues in female Rhesus Macaque primates.
To date, several lutein and zeaxanthin supplementation studies in various species of
primates have been conducted (Snodderly et al., 1990; Snodderly et al., 1997; Leung et
al., 2001; Neuringer et al., 2004). The results discussed in this thesis were part of a larger
study that involved ocular examinations including fundus photography and multifocal
electroretinograms (ERGs), retina histopathology, and the measurement of various
biomarkers associated with toxicity. Thus, this study aimed to explore the efficacy of
high-dose lutein and zeaxanthin supplementation as a potential treatment in the
prevention and/or attenuation of AMD and to investigate the safety of such treatments.
Prior to this study no data were available concerning the potential toxicity from high
(pharmaceutical) doses of lutein and zeaxanthin such as those selected for the L-treated
and the Z-treated primates. The dose of approximately 10 mg/kg/day that was chosen for
lutein and zeaxanthin was approximately 60 times the highest dose selected for a recent
clinical trial in older adults with and without AMD (Moura et al., 2004), and 5 times
higher than the dose selected for the primates in the study by Neuringer et al. (2004). This
amount is approximately 100 times the amount considered to be a high dietary intake
level of combined lutein and zeaxanthin relative to the average American diet (Seddon et
al., 1994).
92
Another aim of this study was to examine the effectiveness of supplementation
with equal amounts of lutein and zeaxanthin and to gain insight into the effects of 1:1
supplementation with these carotenoids and to identify whether there is an interaction.
Rhesus Macaque monkeys were selected as the animal model for this study
because of their low serum xanthophylls concentrations relative to other species studied
(Snodderly et al., 1990; Neuringer et al., 2004; Slifka et al., 1999; Crissey et al., 1999).
Additionally, women have been shown to have lower MPOD than men (Hammond et al.,
1996) and a higher risk of AMD (Kle in et al., 1992; Pieramici et al., 1994), so the
selection of female Rhesus monkeys posed the challenge of increasing plasma and ocular
concentrations of lutein and zeaxanthin through dietary supplementation. As this study
was nearing completion, another group of researchers reported on their studies in which
Rhesus monkeys raised to adulthood on a xanthophyll- free diet were fed lutein and
zeaxanthin as dietary supplements (Neuringer et al., 2004; Leung et al., 2004; Johnson et
al., 2005; Leung et al., 2005). The mean serum concentrations reported for the control
primates used in these studies was 74 ± 9 nmol/L for lutein and 81 ± 7 nmol/L for
zeaxanthin, whereas the baseline levels in our study were considerably higher. The mean
plasma lutein levels for the primates in our study were 240 ± 20 nmol/L for lutein and
120 ± 10 nmol/L for zeaxanthin. The diet selected for the primates in our study provided
approximately 0.99–1.32 mg (1.74–2.32 µmol) of lutein, and 0.26–0.35 mg (0.46–0.62
µmol) of zeaxanthin per day, and the diet chosen in the primate studies conducted by
Neuringer et al. provided nearly equal amounts of lutein (0.72–2.18 mg/day) and
zeaxanthin (0.72–1.82 mg/day). The differences between the two diets cannot provide a
reasonable explanation for the differences in serum or plasma concentrations of

93
carotenoids that were observed in the 2 studies. Both the mean age and mean body weight
of the xanthophyll- free primate studies were nearly 3 times the mean values for the
primates in our study which may have contributed to the disparities in serum/plasma
carotenoid levels. At the outset of our study the animal weights ranged from 2.9 to 4.4 kg,
and ages ranged from 1.9 to 3.9 years (Appendix J). The inter- individual variability with
respect to weight and age was not significant, but there was considerable variability
among the primates in their responses to the 3 treatments. The differences in baseline
plasma levels suggest that younger Rhesus Macaque monkeys may absorb and
metabolize lutein and zeaxanthin more efficiently than their older counterparts. However,
because of these differences as well as differences in supplemental doses and duration,
study design, and analytical procedures, the results of these studies are difficult to
compare to those of our study. Where applicable in this thesis discussion, further
comparisons of the results of these studies are made.
Changes in the Plasma Concentrations of Lutein, Zeaxanthin, and Their Metabolites in the Control, L-Treated, Z-Treated, and L/Z-Treated Primates
Plasma Concentrations of Lutein and Zeaxanthin
Mean plasma concentrations of both lutein and zeaxanthin in the L-treated group,
the Z-treated group, and the L/Z-treated group increased during the initial 6 months of
supplementation (Figure 23). It is important to note that the all-trans- and the cis- isomers
of lutein (9-cis, 9’-cis, 13-cis, 13’-cis, 15-cis) and zeaxanthin (9-cis, 13-cis, 15-cis) were
simultaneously separated by HPLC, but because the ratio of these isomers did not
significantly change during the supplementation period and follow-up, the reported
plasma concentrations of lutein and zeaxanthin are the combined totals for their
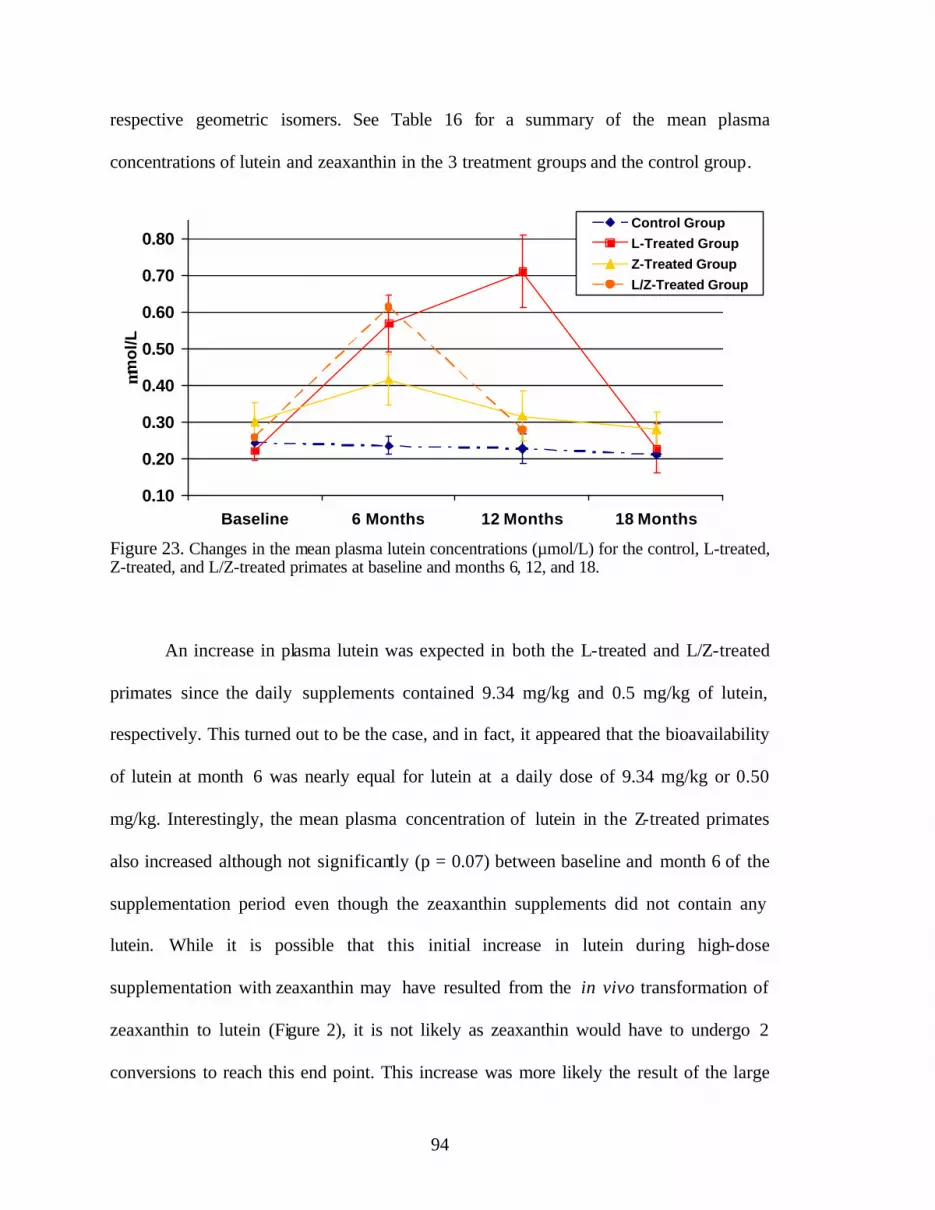
94
respective geometric isomers. See Table 16 for a summary of the mean plasma
concentrations of lutein and zeaxanthin in the 3 treatment groups and the control group.
0.10
0.20
0.30
0.40
0.50
0.60
0.70
0.80
Baseline 6 Months 12 Months 18 Months
µmo
l/L
Control Group
L-Treated Group
Z-Treated Group
L/Z-Treated Group
Figure 23. Changes in the mean plasma lutein concentrations (µmol/L) for the control, L-treated, Z-treated, and L/Z-treated primates at baseline and months 6, 12, and 18.
An increase in plasma lutein was expected in both the L-treated and L/Z-treated
primates since the daily supplements contained 9.34 mg/kg and 0.5 mg/kg of lutein,
respectively. This turned out to be the case, and in fact, it appeared that the bioavailability
of lutein at month 6 was nearly equal for lutein at a daily dose of 9.34 mg/kg or 0.50
mg/kg. Interestingly, the mean plasma concentration of lutein in the Z-treated primates
also increased although not significantly (p = 0.07) between baseline and month 6 of the
supplementation period even though the zeaxanthin supplements did not contain any
lutein. While it is possible that this initial increase in lutein during high-dose
supplementation with zeaxanthin may have resulted from the in vivo transformation of
zeaxanthin to lutein (Figure 2), it is not likely as zeaxanthin would have to undergo 2
conversions to reach this end point. This increase was more likely the result of the large
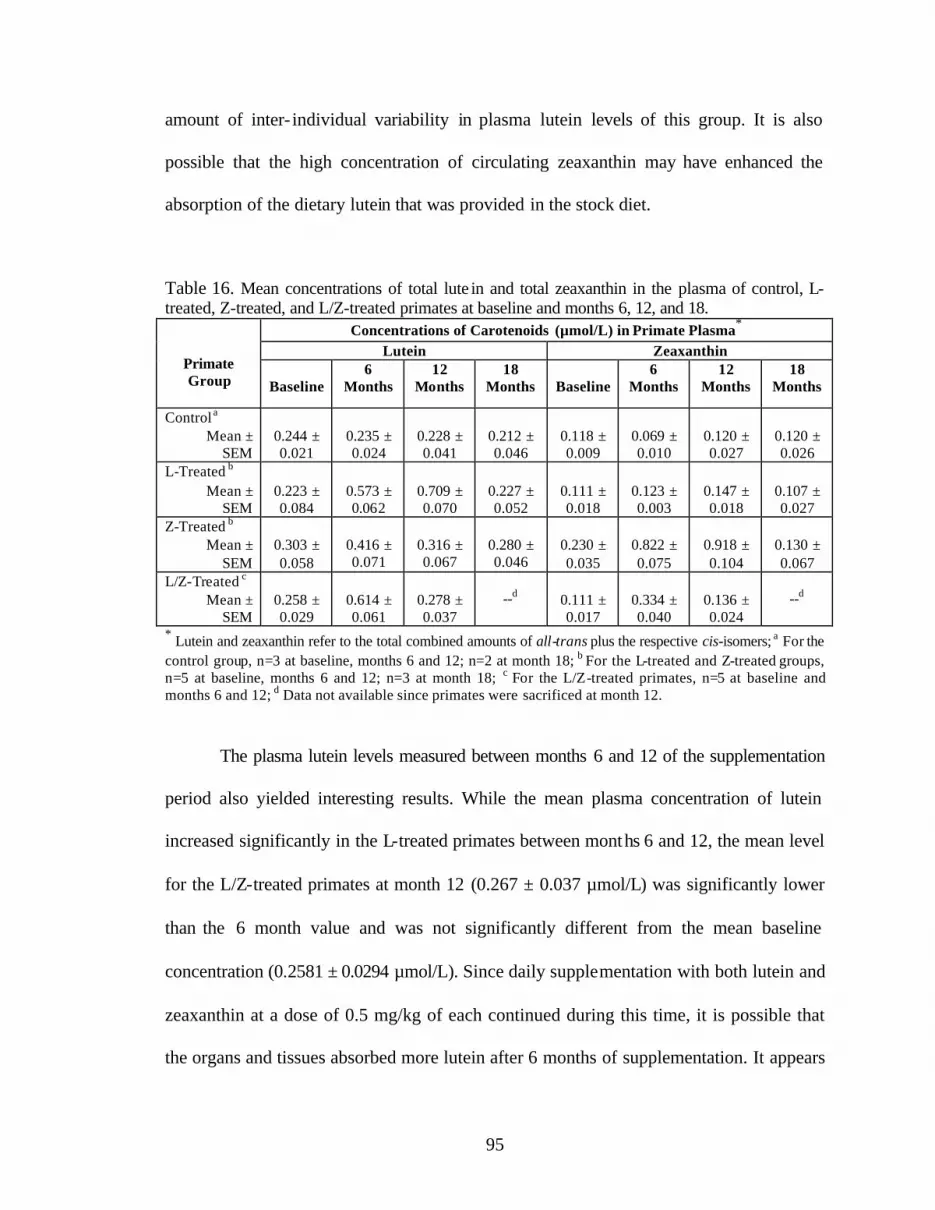
95
amount of inter- individual variability in plasma lutein levels of this group. It is also
possible that the high concentration of circulating zeaxanthin may have enhanced the
absorption of the dietary lutein that was provided in the stock diet.
Table 16. Mean concentrations of total lute in and total zeaxanthin in the plasma of control, L-treated, Z-treated, and L/Z-treated primates at baseline and months 6, 12, and 18.
Concentrations of Carotenoids (µmol/L) in Primate Plasma* Lutein Zeaxanthin
Primate Group
Baseline
6 Months
12 Months
18 Months
Baseline
6 Months
12 Months
18 Months
Control a Mean ±
SEM
0.244 ± 0.021
0.235 ± 0.024
0.228 ± 0.041
0.212 ± 0.046
0.118 ± 0.009
0.069 ± 0.010
0.120 ± 0.027
0.120 ± 0.026
L-Treated b Mean ±
SEM
0.223 ± 0.084
0.573 ± 0.062
0.709 ± 0.070
0.227 ± 0.052
0.111 ± 0.018
0.123 ± 0.003
0.147 ± 0.018
0.107 ± 0.027
Z-Treated b Mean ±
SEM
0.303 ± 0.058
0.416 ± 0.071
0.316 ± 0.067
0.280 ± 0.046
0.230 ± 0.035
0.822 ± 0.075
0.918 ± 0.104
0.130 ± 0.067
L/Z-Treated c Mean ±
SEM
0.258 ± 0.029
0.614 ± 0.061
0.278 ± 0.037
--d
0.111 ± 0.017
0.334 ± 0.040
0.136 ± 0.024
--d
* Lutein and zeaxanthin refer to the total combined amounts of all-trans plus the respective cis-isomers; a For the control group, n=3 at baseline, months 6 and 12; n=2 at month 18; b For the L-treated and Z-treated groups, n=5 at baseline, months 6 and 12; n=3 at month 18; c For the L/Z-treated primates, n=5 at baseline and months 6 and 12; d Data not available since primates were sacrificed at month 12.
The plasma lutein levels measured between months 6 and 12 of the supplementation
period also yielded interesting results. While the mean plasma concentration of lutein
increased significantly in the L-treated primates between months 6 and 12, the mean level
for the L/Z-treated primates at month 12 (0.267 ± 0.037 µmol/L) was significantly lower
than the 6 month value and was not significantly different from the mean baseline
concentration (0.2581 ± 0.0294 µmol/L). Since daily supplementation with both lutein and
zeaxanthin at a dose of 0.5 mg/kg of each continued during this time, it is possible that
the organs and tissues absorbed more lutein after 6 months of supplementation. It appears
96
that chronic supplementation with the combination of lutein (0.5 mg/kg) and zeaxanthin
(0.5 mg/kg) in primates does not result in persistent significant increases in plasma lutein
levels. These results could also suggest an interaction between lutein and zeaxanthin
when given at this dose that causes decreased absorption of lutein into the bloodstream
after an initial peak is reached.
By comparing the L-treated group and the L/Z-treated group we can explore the
possibility of an interaction caused by concurrent lutein and zeaxanthin supplementation.
The L-treated primates, in addition to receiving a high dose of lutein (9.34 mg/kg) also
received a lower daily dose of zeaxanthin (0.66 mg/kg) that was comparable to the dose
given to the L/Z-treated group (0.5mg/kg). Because the lutein absorption into the plasma
of the L-treated group did not appear to have been affected by the zeaxanthin
supplementation between 6 and 12 months, it does not seem likely that zeaxanthin
decreased the absorption of lutein into the bloodstream. Another interesting finding was
that while the L/Z-treated group was given equal amounts of lutein and zeaxanthin (0.5
mg/kg each) plasma lutein levels were approximately twice as high as the zeaxanthin
levels after 6 months of supplementation. While the higher mean plasma level of lutein at
baseline compared to that of zeaxanthin can be explained by differences in the
composition of the stock diet (L:Z ≅ 3.8), the 6 month levels cannot be as easily
explained. It appears that lutein was better absorbed than zeaxanthin after 6 months of
supplementation. This is a contrast to the higher mean levels of plasma zeaxanthin found
at both 6 and 12 months in the primates supplemented daily with 10 mg/kg of zeaxanthin
when compared to the levels of lutein in those supplemented daily with approximately
the same amount of lutein (L-treated group).
97
Between baseline and 6 months only the Z-treated and the L/Z-treated primates
had significant increases in their mean plasma zeaxanthin concentrations, even though the
L-treated group received a dose of zeaxanthin slightly higher than the dose given to the
L/Z-treated group. Table 16 and Figure 24 compare the mean zeaxanthin levels for the
control and treatment groups (L, Z, and L/Z) during the supplementation period and after
6 months without supplementation.
While the L-treated primates were supplemented daily with approximately 0.66
mg/kg of zeaxanthin and the L/Z-treated primates received 0.5 mg/kg of zeaxanthin, the
mean plasma concentration of zeaxanthin in the L/Z-treated group increased significantly
(p< 0.0001) between baseline and month 6, but that of the L-treated group did not.
Conversely, while the mean zeaxanthin level in the L-treated group was not significantly
higher at month 6 compared to baseline, it was significantly higher between baseline and
month 12 suggesting a gradual and consistent increase in plasma zeaxanthin concentration
during the 12 months of supplementation. In the L/Z-treated primates, plasma zeaxanthin
increased significantly (by 3-fold) between baseline and month 6, and then decreased to
nearly the baseline concentration at month 12. Interestingly, the mean plasma concentrations
of zeaxanthin at month 12 among the 2 groups were nearly the same. In the L/Z-treated
primates a similar trend was observed in the changes in mean plasma lutein levels during
12 months of supplementation in that the concentration increased significantly between
baseline and month 6 and declined thereafter to near the baseline level by month 12.
In comparing the mean plasma concentrations of lutein in the L-treated group
(9.34 mg/kg L) and the L/Z-treated group (0.5 mg/kg L) at month 6 (Figure 23), it
appears that supplementation with both a very high dose and a much lower dose of lutein
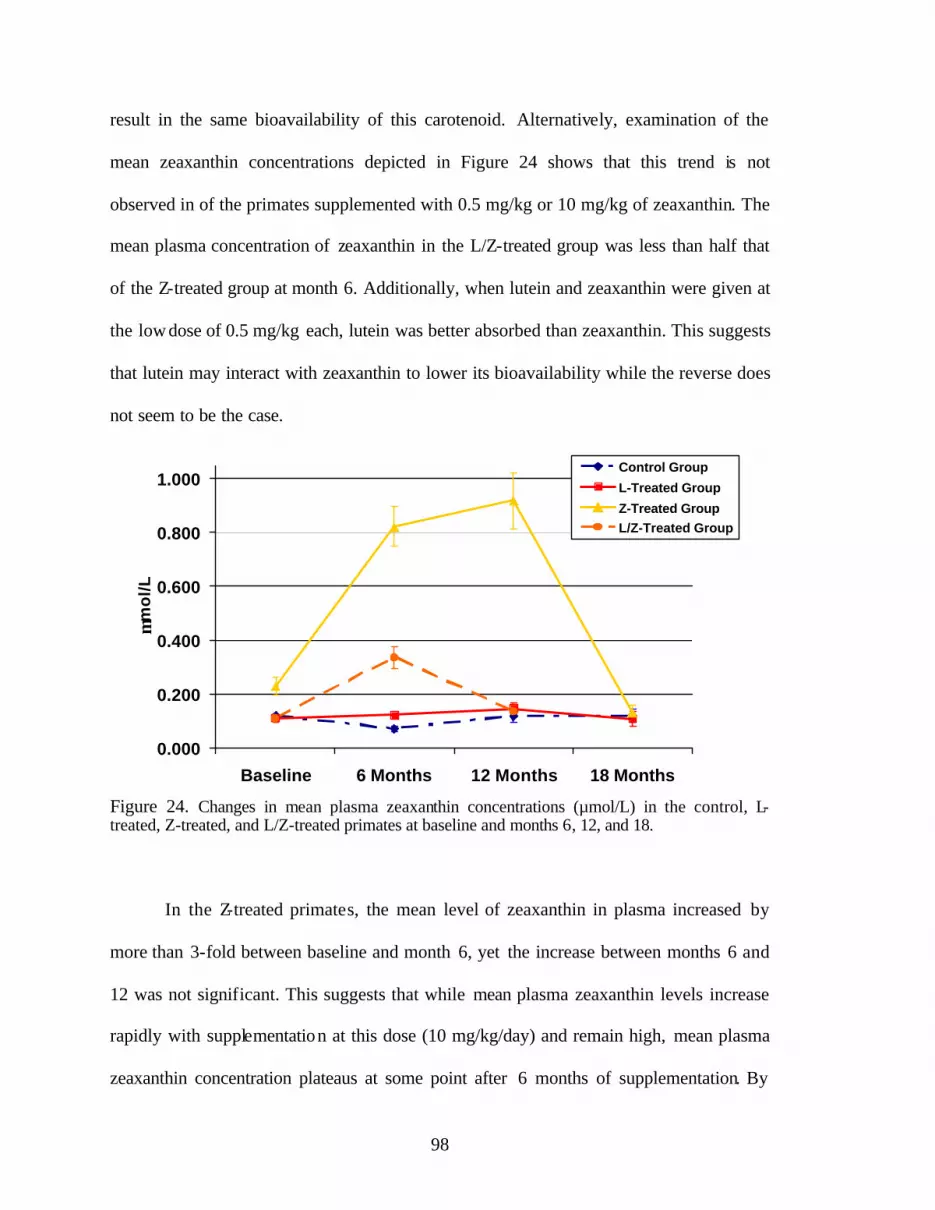
98
result in the same bioavailability of this carotenoid. Alternatively, examination of the
mean zeaxanthin concentrations depicted in Figure 24 shows that this trend is not
observed in of the primates supplemented with 0.5 mg/kg or 10 mg/kg of zeaxanthin. The
mean plasma concentration of zeaxanthin in the L/Z-treated group was less than half that
of the Z-treated group at month 6. Additionally, when lutein and zeaxanthin were given at
the low dose of 0.5 mg/kg each, lutein was better absorbed than zeaxanthin. This suggests
that lutein may interact with zeaxanthin to lower its bioavailability while the reverse does
not seem to be the case.
0.000
0.200
0.400
0.600
0.800
1.000
Baseline 6 Months 12 Months 18 Months
µm
ol/
L
Control Group
L-Treated Group
Z-Treated GroupL/Z-Treated Group
Figure 24. Changes in mean plasma zeaxanthin concentrations (µmol/L) in the control, L-treated, Z-treated, and L/Z-treated primates at baseline and months 6, 12, and 18.
In the Z-treated primates, the mean level of zeaxanthin in plasma increased by
more than 3-fold between baseline and month 6, yet the increase between months 6 and
12 was not significant. This suggests that while mean plasma zeaxanthin levels increase
rapidly with supplementation at this dose (10 mg/kg/day) and remain high, mean plasma
zeaxanthin concentration plateaus at some point after 6 months of supplementation. By
99
month 18, the plasma level of zeaxanthin decreased to below the baseline level. However,
the baseline concentration of zeaxanthin for this group was almost twice as high as the
levels of the L-treated, L/Z-treated, and control groups and at 18 months, the mean level
was nearly the same as those seen in the L-treated and Z-treated primates.
Comparing plasma concentrations of lutein or zeaxanthin in response to high-dose
supplementation (~10 mg/kg/day) with these carotenoids provides an insight into the
bioavailability of these carotenoids. Although the mean concentration for all of the
primates in the study (n=18) at baseline was 0.259 µmol/L for lutein and 0.145 µmol/L
for zeaxanthin, the mean concentration of lutein in the L-treated group (9.34 mg/kg of L)
at month 6 (0.573 ± 0.062 µmol/L) was lower than that of zeaxanthin in the Z-treated
group (10 mg/kg of Z) at month 6 (0.822 ± 0.075 µmol/L). Similarly, the mean level of
lutein at month 12 in the L-treated group (0.709 ± 0.070 µmol/L) was also lower than that
of zeaxanthin in the Z-treated group (0.918 ± 0.104 µmol/L). It is unlikely that the 0.66
mg/kg difference in supplemental dose could have caused this difference especially since
the stock diet provided more lutein than zeaxanthin and could therefore balance this
difference. These results suggest that zeaxanthin is more efficiently absorbed into the
circulating blood than lutein and/or that lutein may be better absorbed into the tissues and
organs than zeaxanthin, and is therefore sequestered by the tissues at a higher rate than
zeaxanthin. It is particularly interesting to note that in the L/Z-treated primates that were
fed equal doses of lutein and zeaxanthin (0.5 mg/kg of each), lutein appears to be more
effectively absorbed into the bloodstream after 6 months of supplementation than
zeaxanthin. This is clearly indicated by the mean concentration of lutein in plasma that
was nearly twice that of zeaxanthin at month 6 (Figure 24). The doses that were given in
100
the present study were considerably higher than a dose that would be more appropriate
for a clinical trial involving humans. Nonetheless, the possible interaction between
supplemental lutein and zeaxanthin at various doses warrants further investigation.
Plasma Concentrations of Lutein and Zeaxanthin Metabolites
Based on evidence from earlier studies, it has been hypothesized that 3’-oxolutein
is most likely formed via the allylic oxidation of dietary lutein (Khachik et al., 1995;
Khachik et al, 1997a; Khachik et al., 1997c; Khachik et al., 2002). As shown in the
proposed metabolic pathways in Figure 2, 3’-oxolutein can then be reduced to form 3’-
epilutein or revert to lutein. It has also been proposed that dietary zeaxanthin can undergo
stereospecific double-bond isomerization to form 3’-epilutein which can then be oxidized
to form 3’-oxolutein. Given this overall scheme, it is possible that 3’-oxolutein and 3’-
epilutein can be formed from lutein and/or zeaxanthin. It must be noted, however, that the
validity of these proposed metabolic transformations can only be confirmed by
supplementation studies with isotopically labeled lutein and zeaxanthin, which have not
been conducted to date.
The mean plasma concentrations of 3’-oxolutein and 3’-epilutein in the control,
L-treated, Z-treated, and L/Z-treated groups are compared in Figures 25 and 26,
respectively. In the L-treated primates, the mean 3’-oxolutein concentration increased
significantly between baseline and month 6, and continued to increase between months 6
and 12, although the latter change was not statistically significant. Meanwhile, the
opposite effect was observed in the mean plasma concentration of 3’-epilutein. The
increase in the mean level of 3’-epilutein in the L-treated group between baseline and
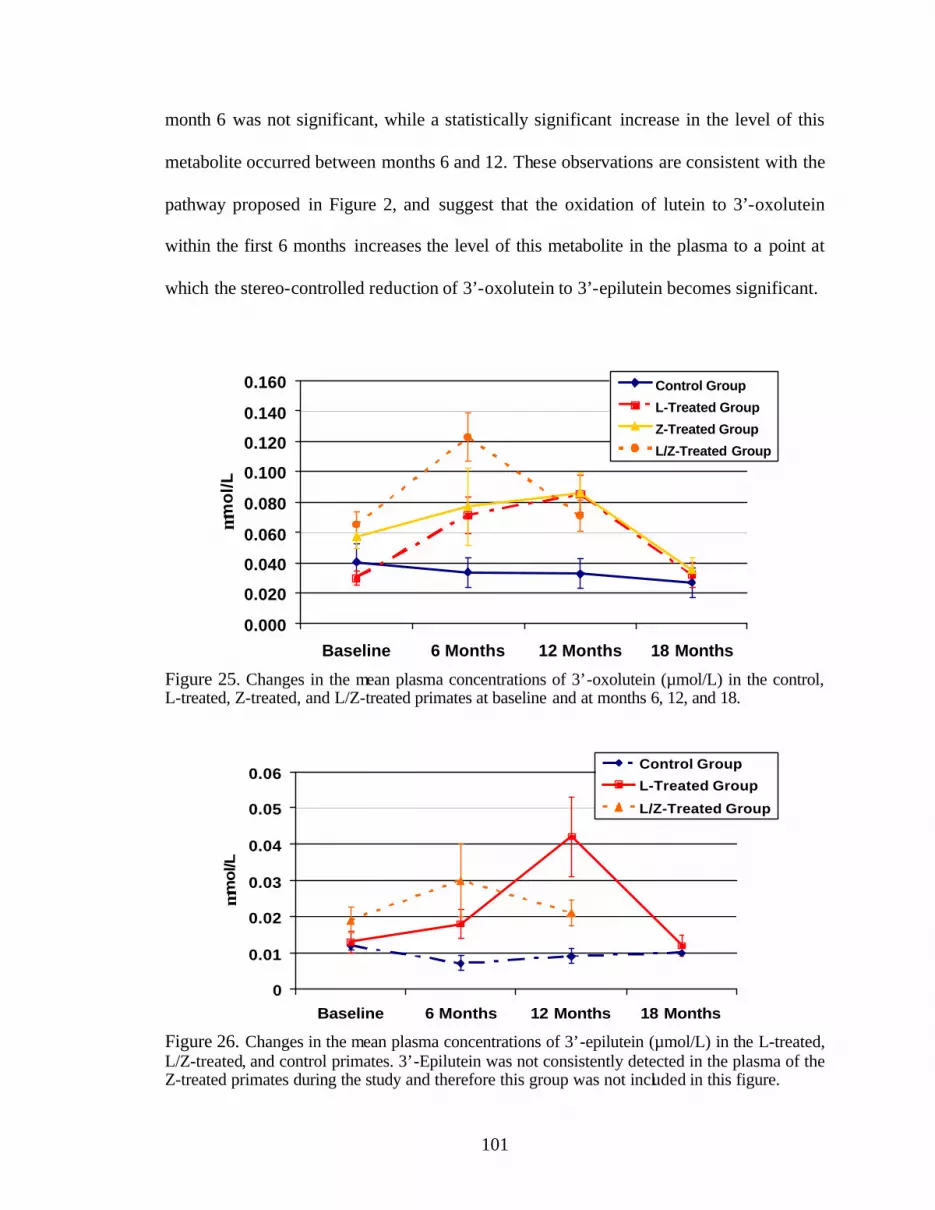
101
month 6 was not significant, while a statistically significant increase in the level of this
metabolite occurred between months 6 and 12. These observations are consistent with the
pathway proposed in Figure 2, and suggest that the oxidation of lutein to 3’-oxolutein
within the first 6 months increases the level of this metabolite in the plasma to a point at
which the stereo-controlled reduction of 3’-oxolutein to 3’-epilutein becomes significant.
0.000
0.020
0.040
0.060
0.080
0.100
0.120
0.140
0.160
Baseline 6 Months 12 Months 18 Months
µmo
l/L
Control Group
L-Treated Group
Z-Treated Group
L/Z-Treated Group
Figure 25. Changes in the mean plasma concentrations of 3’-oxolutein (µmol/L) in the control, L-treated, Z-treated, and L/Z-treated primates at baseline and at months 6, 12, and 18.
0
0.01
0.02
0.03
0.04
0.05
0.06
Baseline 6 Months 12 Months 18 Months
µm
ol/L
Control Group
L-Treated Group
L/Z-Treated Group
Figure 26. Changes in the mean plasma concentrations of 3’-epilutein (µmol/L) in the L-treated, L/Z-treated, and control primates. 3’-Epilutein was not consistently detected in the plasma of the Z-treated primates during the study and therefore this group was not included in this figure.
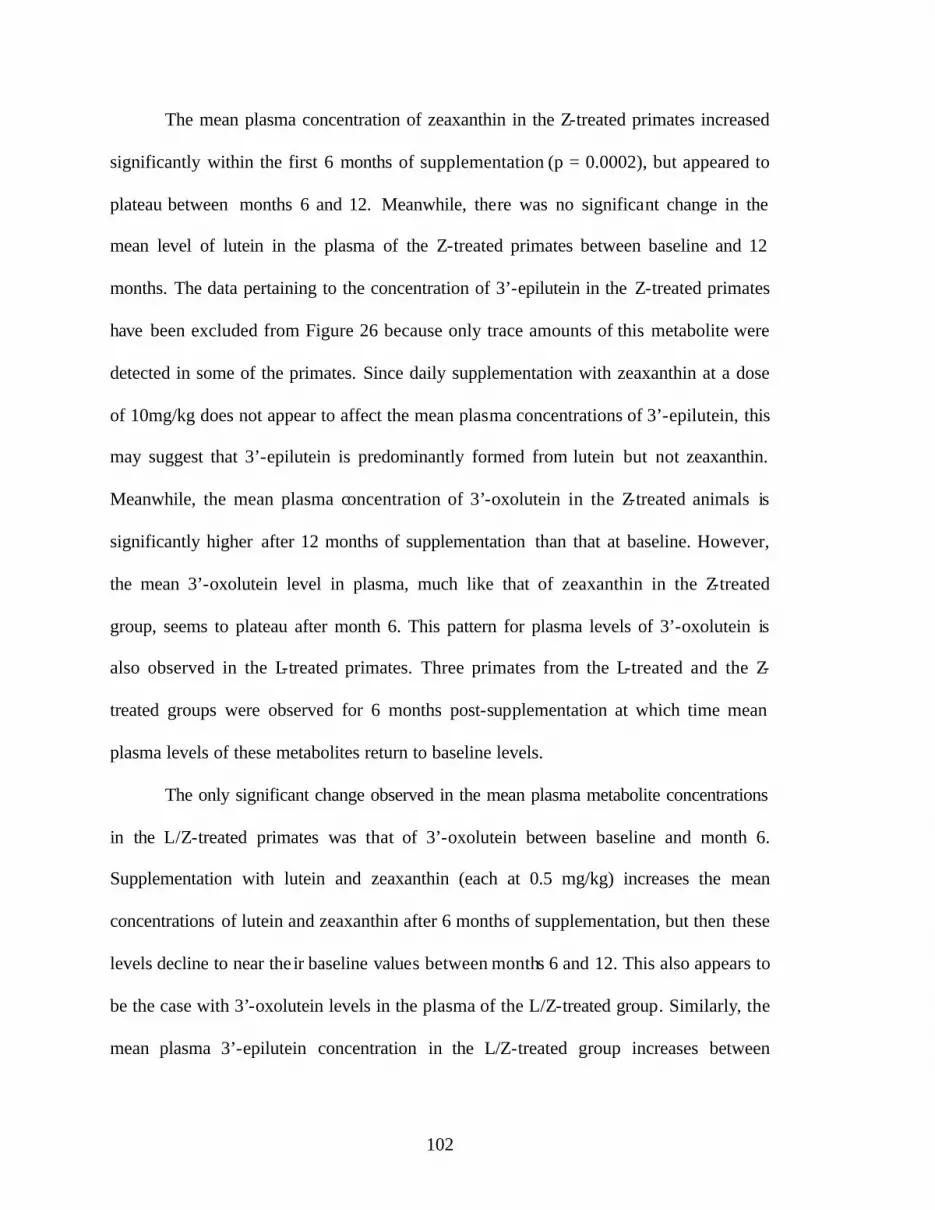
102
The mean plasma concentration of zeaxanthin in the Z-treated primates increased
significantly within the first 6 months of supplementation (p = 0.0002), but appeared to
plateau between months 6 and 12. Meanwhile, there was no significant change in the
mean level of lutein in the plasma of the Z-treated primates between baseline and 12
months. The data pertaining to the concentration of 3’-epilutein in the Z-treated primates
have been excluded from Figure 26 because only trace amounts of this metabolite were
detected in some of the primates. Since daily supplementation with zeaxanthin at a dose
of 10mg/kg does not appear to affect the mean plasma concentrations of 3’-epilutein, this
may suggest that 3’-epilutein is predominantly formed from lutein but not zeaxanthin.
Meanwhile, the mean plasma concentration of 3’-oxolutein in the Z-treated animals is
significantly higher after 12 months of supplementation than that at baseline. However,
the mean 3’-oxolutein level in plasma, much like that of zeaxanthin in the Z-treated
group, seems to plateau after month 6. This pattern for plasma levels of 3’-oxolutein is
also observed in the L-treated primates. Three primates from the L-treated and the Z-
treated groups were observed for 6 months post-supplementation at which time mean
plasma levels of these metabolites return to baseline levels.
The only significant change observed in the mean plasma metabolite concentrations
in the L/Z-treated primates was that of 3’-oxolutein between baseline and month 6.
Supplementation with lutein and zeaxanthin (each at 0.5 mg/kg) increases the mean
concentrations of lutein and zeaxanthin after 6 months of supplementation, but then these
levels decline to near the ir baseline values between months 6 and 12. This also appears to
be the case with 3’-oxolutein levels in the plasma of the L/Z-treated group. Similarly, the
mean plasma 3’-epilutein concentration in the L/Z-treated group increases between
103
baseline and month 6 and thereafter returns to its baseline value between months 6 and
12. The decrease in the mean concentrations of lutein, zeaxanthin, and their metabolites
between months 6 and 12 in the L/Z-treated primates (0.5 mg/kg each of lutein and
zeaxanthin) may suggest that during this period the supplemental carotenoids are better
absorbed into the organs and tissues. The high concentrations of lutein, zeaxanthin, and
3’-oxolutein in the major organs and tissues of the supplemented animals at month 12
support this conclusion.
Concentrations of Lutein, Zeaxanthin, and Their Metabolites in the Ocular Tissues,
Major Organs and Other Tissues of the Control and Supplemented Primates Concentrations of Lutein, Zeaxanthin, and Their Metabolites in Ocular Tissues
Lutein and zeaxanthin were identified as the major carotenoids in the ocular
tissues (retina, ciliary body, lens, iris) of the primates. The metabolites 3’-oxolutein and
meso-zeaxanthin were detected in the retina while the former was also detected in the
ciliary body. Due to the low concentration of carotenoids in the ciliary body, iris, and
lens, no attempt was made to measure meso-zeaxanthin in these tissues. It has been
proposed that 3’-oxolutein can be formed from lutein and/or zeaxanthin and that its
presence in the ocular tissues may be the result of its transport from circulating blood or
the in vivo enzymatic and light-induced metabolic transformation of lutein and/or
zeaxanthin in the eye (Khachik et al., 1997a; Bernstein et al., 2001; Khachik et al., 1995).
However, it has been demonstrated that meso-zeaxanthin, which is not of dietary origin is
present in the retina yet is absent from both human plasma and liver (Khachik et al.,
2002). Therefore, while the origin of 3’-oxolutein in the ocular tissues is unclear, meso-
104
zeaxanthin is most likely formed in the retina from lutein. Additional support for this
metabolic transformation comes from the supplementation studies of xanthophyll- free
primates by Johnson et al. (2005), who demonstrated that meso-zeaxanthin was absent in
the retinas of xanthophyll- free and zeaxanthin-fed primates, but was present in the
primates supplemented with lutein. These researchers showed that meso-zeaxanthin was
present only in the macula (innermost 4-mm area of retina) of the primates that were
supplemented with lutein (Johnson et al., 2005). One of the objectives of our study was to
identify and quantify 3’-oxolutein and meso-zeaxanthin in the retina of the Rhesus
monkeys that were supplemented with high doses of lutein and zeaxanthin. The central
and peripheral regions of the retina s were not examined separately, because the low
concentration of these metabolites in the various regions of the retina would not allow
their unequivocal identification by HPLC-UV/Visible photodiode array detection.
Consequently, the mean concentrations of carotenoids are expressed for the whole retina.
Similarly, because the concentrations of carotenoids in the ciliary body, iris, and lens
were very low, no attempt was made to quantify meso-zeaxanthin in these tissues.
After 12 months of supplementation, significant increases in the mean
concentrations of lutein were found in the retina and iris of the L-treated primates in
comparison to the control primates. The results depicted in Figure 27 clearly show the
significant increases in the mean concentrations of lutein in the retina and iris of the
primates that were supplemented daily with lutein (9.34 mg/kg L and 0.66 mg/kg Z) for
12 months in comparison with those of the control group. Six months after the end of
supplementation with lutein (month 18), the mean level of lutein in the retina of the L-
treated group was not significantly different than that of the control group (p = 0.28). The
105
mean concentrations of lutein in the ciliary body and lens after 12 months of daily
supplementation with 9.34 mg/kg of lutein and 0.66 mg/kg of zeaxanthin did not change
significantly compared to those of the control group although the mean level of lutein in
lens increased in the animals that were sacrificed after 18 months. While the mean
concentration of zeaxanthin in the retina of the L-treated primates at month 12 appeared
to be much higher than that of the control group and the L-treated group at month 18, the
differences were not statistically significant due to the large amount of inter- individual
variability. The mean concentration of zeaxanthin in the ciliary body at month 12 was
also higher than that of the control group, but this difference was not statistically
significant. This is despite the fact that the mean plasma concentration of zeaxanthin is
significantly increased after 12 months of supplementation with 0.66 mg/kg zeaxanthin in
comparison to the mean baseline level. It should be noted, however, that the high inter-
individual variability observed in the concentrations of this carotenoid was a limitation
for establishing the true statistical significance.
There were significant increases in the mean concentrations of the metabolites 3’-
oxolutein and meso-zeaxanthin in the retina of the L-treated (9.34 mg/kg L and 0.66
mg/kg Z) primates after 12 months of supplementation compared to that of their levels at
month 18 (6 months post-supplementation) (Appendix K). There was no significant
difference between the mean levels of meso-zeaxanthin in the primates supplemented
with 9.34 mg/kg of lutein at month 12 and tha t of the control group. It should be noted
that the mean concentration of meso-zeaxanthin in the control group was considerably
higher than those of either the L-treated or the Z-treated (10 mg/kg Z) groups at month
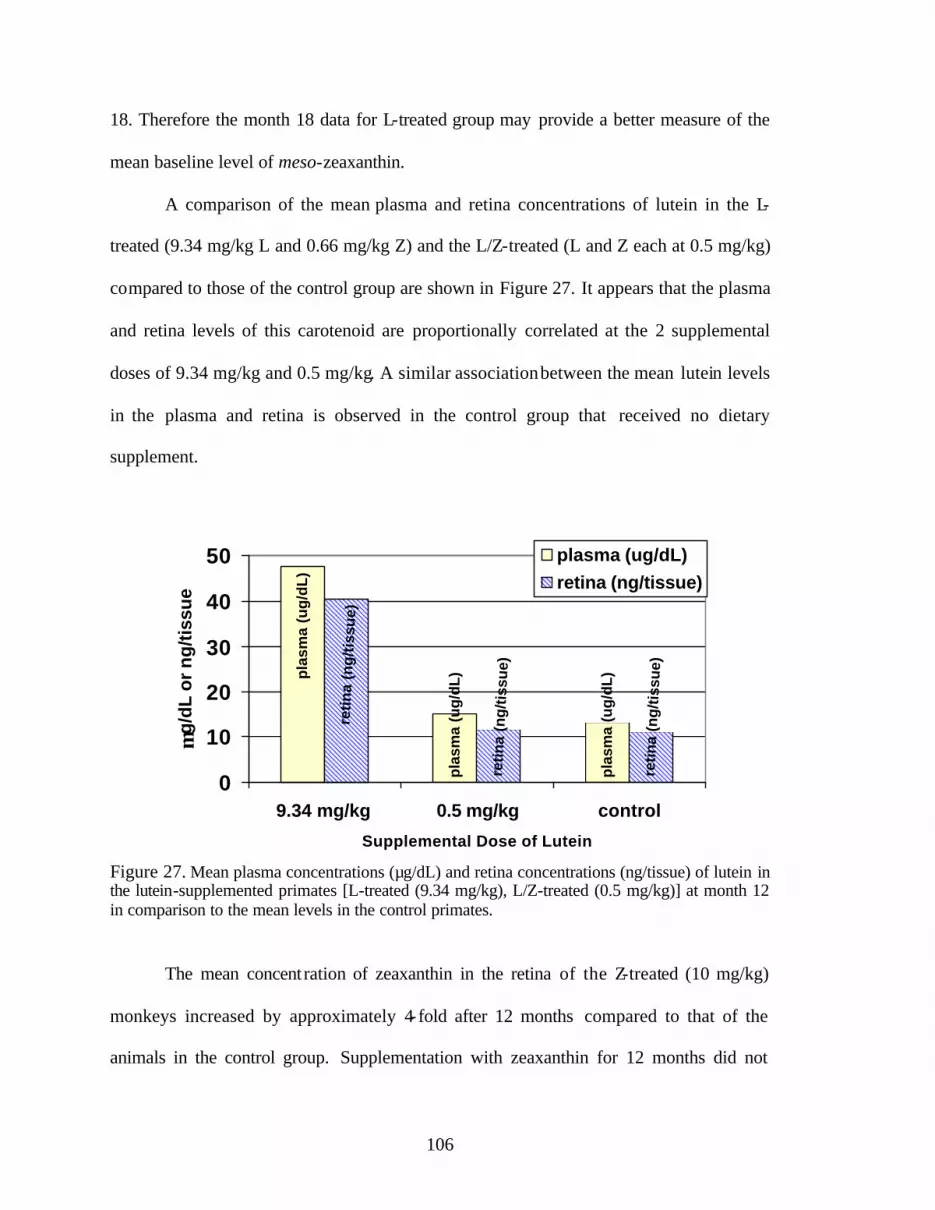
106
18. Therefore the month 18 data for L-treated group may provide a better measure of the
mean baseline level of meso-zeaxanthin.
A comparison of the mean plasma and retina concentrations of lutein in the L-
treated (9.34 mg/kg L and 0.66 mg/kg Z) and the L/Z-treated (L and Z each at 0.5 mg/kg)
compared to those of the control group are shown in Figure 27. It appears that the plasma
and retina levels of this carotenoid are proportionally correlated at the 2 supplemental
doses of 9.34 mg/kg and 0.5 mg/kg. A similar association between the mean lutein levels
in the plasma and retina is observed in the control group that received no dietary
supplement.
pla
sma
(ug
/dL
)
pla
sma
(ug
/dL
)
pla
sma
(ug
/dL
)
reti
na
(ng
/tis
sue)
retin
a (n
g/ti
ssu
e)
retin
a (n
g/ti
ssu
e)
0
10
20
30
40
50
9.34 mg/kg 0.5 mg/kg control
Supplemental Dose of Lutein
µg
/dL
or
ng
/tiss
ue
plasma (ug/dL)retina (ng/tissue)
Figure 27. Mean plasma concentrations (µg/dL) and retina concentrations (ng/tissue) of lutein in the lutein-supplemented primates [L-treated (9.34 mg/kg), L/Z-treated (0.5 mg/kg)] at month 12 in comparison to the mean levels in the control primates.
The mean concentration of zeaxanthin in the retina of the Z-treated (10 mg/kg)
monkeys increased by approximately 4-fold after 12 months compared to that of the
animals in the control group. Supplementation with zeaxanthin for 12 months did not
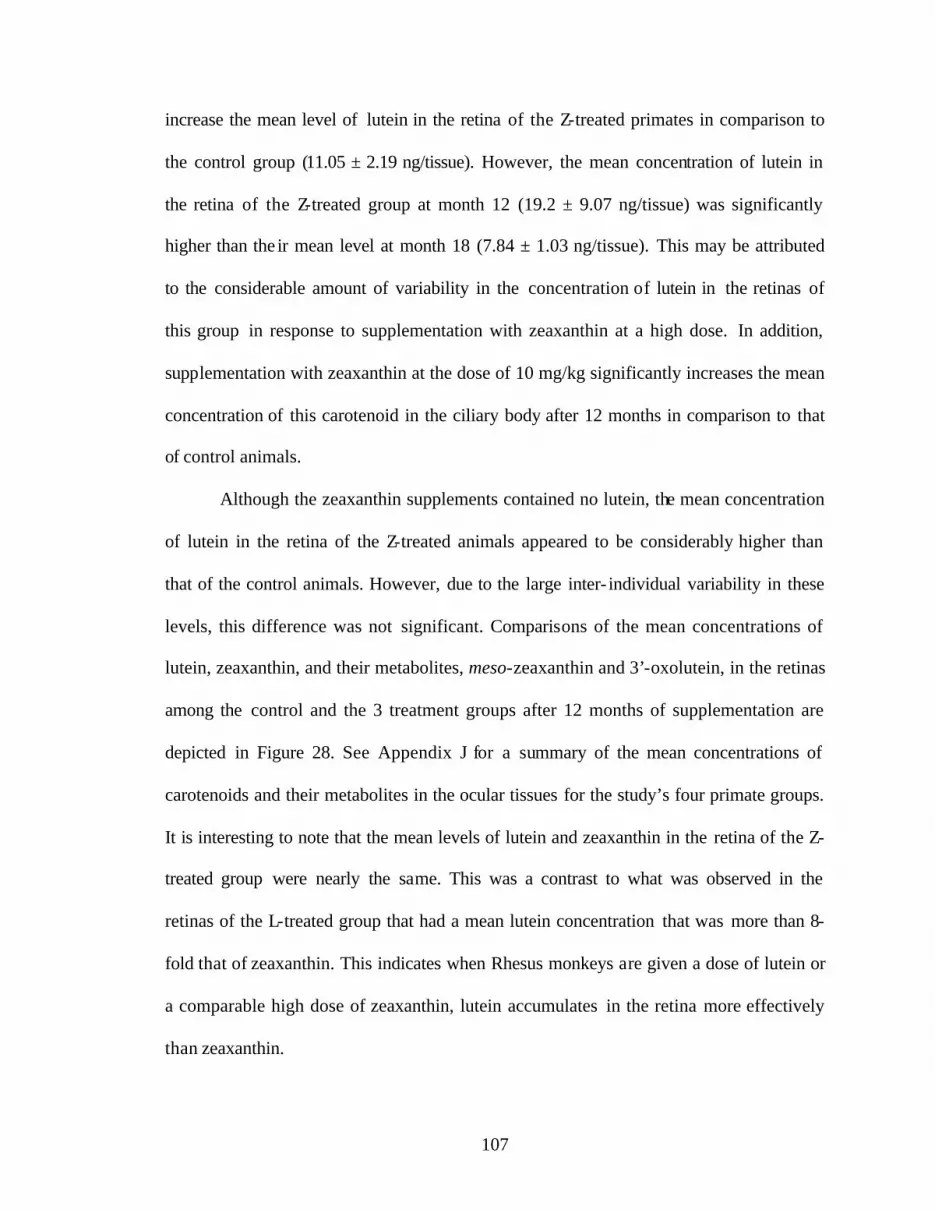
107
increase the mean level of lutein in the retina of the Z-treated primates in comparison to
the control group (11.05 ± 2.19 ng/tissue). However, the mean concentration of lutein in
the retina of the Z-treated group at month 12 (19.2 ± 9.07 ng/tissue) was significantly
higher than the ir mean level at month 18 (7.84 ± 1.03 ng/tissue). This may be attributed
to the considerable amount of variability in the concentration of lutein in the retinas of
this group in response to supplementation with zeaxanthin at a high dose. In addition,
supplementation with zeaxanthin at the dose of 10 mg/kg significantly increases the mean
concentration of this carotenoid in the ciliary body after 12 months in comparison to that
of control animals.
Although the zeaxanthin supplements contained no lutein, the mean concentration
of lutein in the retina of the Z-treated animals appeared to be considerably higher than
that of the control animals. However, due to the large inter- individual variability in these
levels, this difference was not significant. Comparisons of the mean concentrations of
lutein, zeaxanthin, and their metabolites, meso-zeaxanthin and 3’-oxolutein, in the retinas
among the control and the 3 treatment groups after 12 months of supplementation are
depicted in Figure 28. See Appendix J for a summary of the mean concentrations of
carotenoids and their metabolites in the ocular tissues for the study’s four primate groups.
It is interesting to note that the mean levels of lutein and zeaxanthin in the retina of the Z-
treated group were nearly the same. This was a contrast to what was observed in the
retinas of the L-treated group that had a mean lutein concentration that was more than 8-
fold that of zeaxanthin. This indicates when Rhesus monkeys are given a dose of lutein or
a comparable high dose of zeaxanthin, lutein accumulates in the retina more effectively
than zeaxanthin.
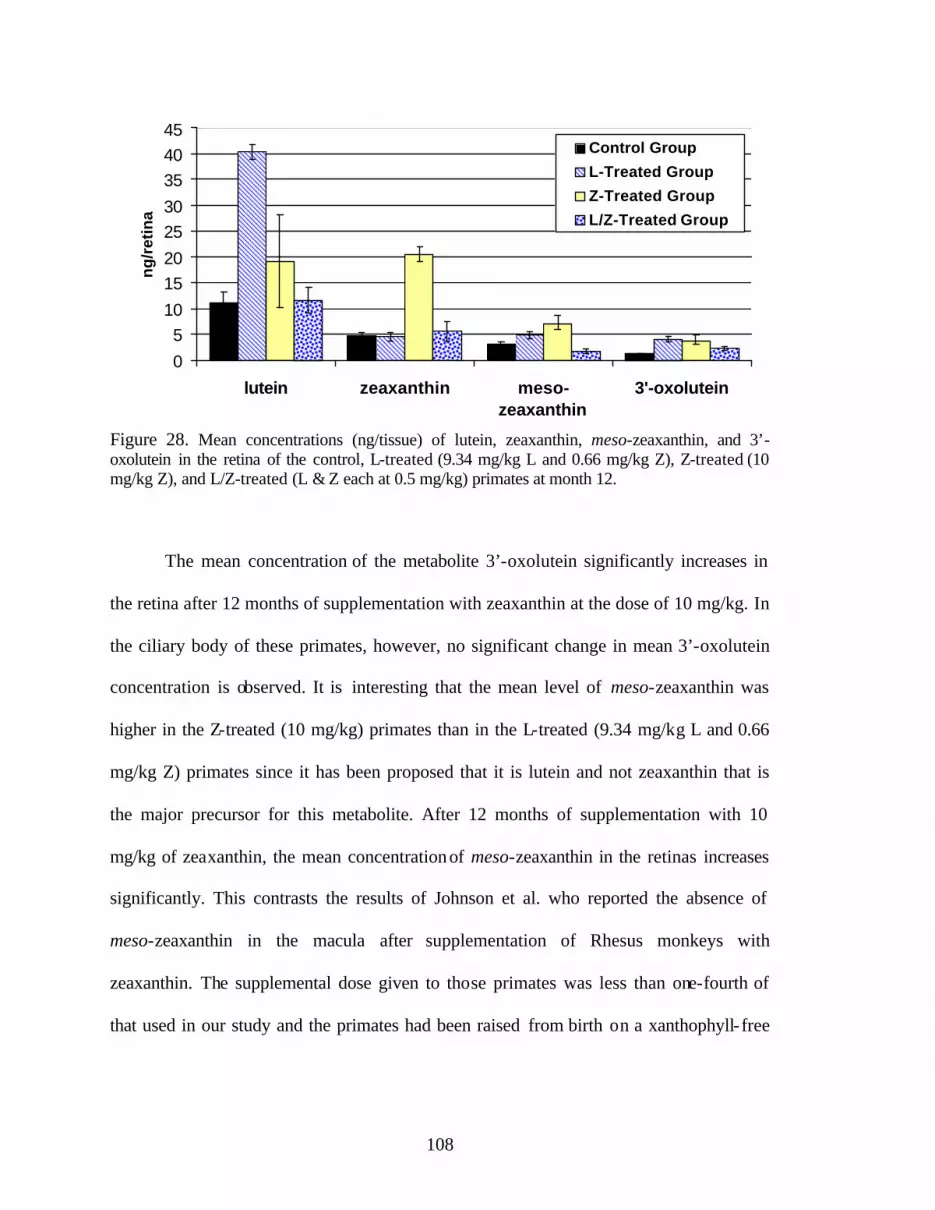
108
0
510
1520
2530
354045
lutein zeaxanthin meso-zeaxanthin
3'-oxolutein
ng
/ret
ina
Control Group
L-Treated Group
Z-Treated Group
L/Z-Treated Group
Figure 28. Mean concentrations (ng/tissue) of lutein, zeaxanthin, meso-zeaxanthin, and 3’-oxolutein in the retina of the control, L-treated (9.34 mg/kg L and 0.66 mg/kg Z), Z-treated (10 mg/kg Z), and L/Z-treated (L & Z each at 0.5 mg/kg) primates at month 12.
The mean concentration of the metabolite 3’-oxolutein significantly increases in
the retina after 12 months of supplementation with zeaxanthin at the dose of 10 mg/kg. In
the ciliary body of these primates, however, no significant change in mean 3’-oxolutein
concentration is observed. It is interesting that the mean level of meso-zeaxanthin was
higher in the Z-treated (10 mg/kg) primates than in the L-treated (9.34 mg/kg L and 0.66
mg/kg Z) primates since it has been proposed that it is lutein and not zeaxanthin that is
the major precursor for this metabolite. After 12 months of supplementation with 10
mg/kg of zeaxanthin, the mean concentration of meso-zeaxanthin in the retinas increases
significantly. This contrasts the results of Johnson et al. who reported the absence of
meso-zeaxanthin in the macula after supplementation of Rhesus monkeys with
zeaxanthin. The supplemental dose given to those primates was less than one-fourth of
that used in our study and the primates had been raised from birth on a xanthophyll- free
109
diet prior to supplementation. These differences make it increasingly difficult to compare
results of the two studies.
In our study, we found that the mean level of meso-zeaxanthin in the retina of the
L-treated primates is not significantly higher after 12 months when compared to the
control group. Because of the large inter- individual variability, however, the month 18
values may be a better measure of the baseline level of this metabolite than the control
value. Without metabolic studies that employ isotopically labeled lutein and zeaxanthin,
it is not possible to determine the origin of meso-zeaxanthin with certainty. One
possibility that cannot be ruled out is the formation of meso-zeaxanthin from 3’-oxolutein
since the mean concentration of the latter metabolite was increased significantly after 12
months of daily supplementation with zeaxanthin (10 mg/kg) compared to the control
primates. This metabolic conversion would require the stereospecific reduction of 3’-
oxolutein to 3’-epilutein followed by double-bond migration. Because no measurable
amount of 3’-epilutein was detected in the retina of the Z-treated primates, this
transformation would most likely take place in a single step reaction. Alternatively, if
meso-zeaxanthin is formed exclusively via double-bond isomerization of lutein, our
results indicate that the high concentration of zeaxanthin in the retina of these primates
may interact with lutein metabolism in this tissue. In both the iris and lens of the Z-
treated primates, the mean lutein concentration was roughly 2 times as high at month 18
than at month 12, while zeaxanthin was detected at month 12 but not at month 18. These
findings suggest the idea that zeaxanthin is cleared from both the iris and lens, while the
concentrations of lutein in these tissues are actually higher at month 18 than at month 12.
110
The mean concentrations of the lutein and zeaxanthin in the retinas of the L/Z -
treated group (L & Z each at 0.5 mg/kg) after 12 months of supplementation is not
significantly different from that of the animals in the control group. This may be because
the mean concentrations of these carotenoids in plasma of the monkeys peaked around
month 6 and declined to their baseline values after this point. It appears that this decrease
is not accompanied by an increase in the uptake of lutein and zeaxanthin by retina or
ciliary body in Rhesus Macaque monkeys. Therefore, it is likely that lutein and
zeaxanthin are incorporated into the retinas of the monkeys initially between baseline and
month 6 of supplementation, and subsequently, as the mean plasma levels of these
carotenoids decrease significantly between months 6 and 12, the retina levels follow the
same pattern. The mean concentrations of meso-zeaxanthin and 3′-oxolutein in the retina
of the L/Z treated animals after 12 months were not significantly different than those of
the control group. This is not surprising since the levels of these metabolites in the retina
of the monkeys appear to correlate with those of lutein and zeaxanthin. Figures 27 and 29
illustrate that plasma concentrations of lutein and zeaxanthin correlate directly with levels
of these carotenoids in the retina. After 12 months of supplementation with lutein and
zeaxanthin each at a dose of 0.5 mg/kg, only the concentrations of lutein and zeaxanthin
appear to increase in the iris of the primates.
The high daily dose of supplemental lutein (9.34 mg/kg) led to a considerably
higher mean concentration of this carotenoid (40.4 ± 1.41 ng/tissue) in the primate retinas
compared to the mean zeaxanthin level (20.4 ± 3.88 ng/tissue) that resulted from daily
supplementation with a comparable dose of zeaxanthin (10 mg/kg).
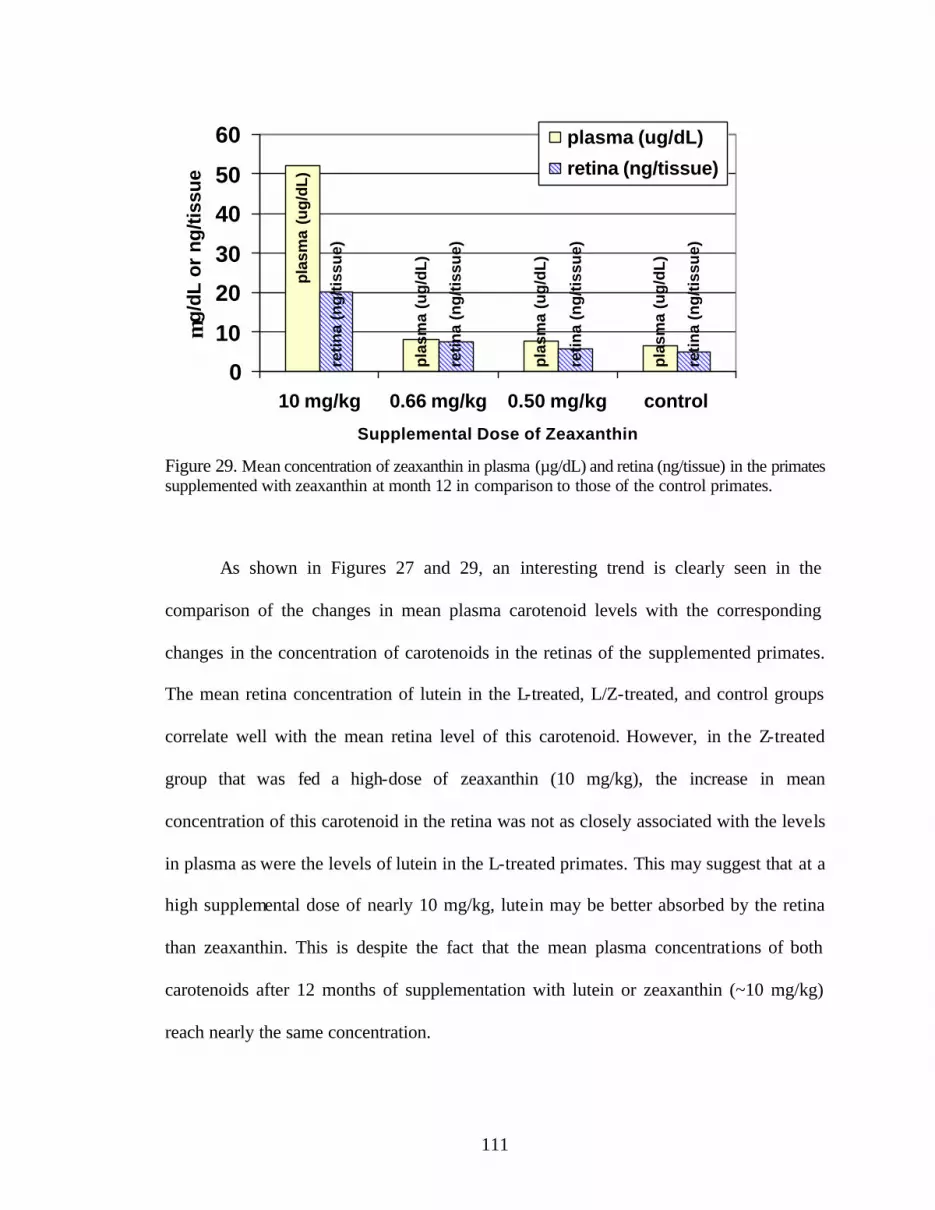
111
pla
sma
(ug
/dL
)
pla
sma
(ug
/dL
)
pla
sma
(ug
/dL
)
pla
sma
(ug
/dL
)
reti
na
(ng
/tis
sue)
reti
na
(ng
/tis
sue)
reti
na
(ng
/tis
sue)
reti
na
(ng
/tis
sue)
0
10
20
30
40
50
60
10 mg/kg 0.66 mg/kg 0.50 mg/kg control
Supplemental Dose of Zeaxanthin
µg/
dL o
r ng
/tiss
ue
plasma (ug/dL)
retina (ng/tissue)
Figure 29. Mean concentration of zeaxanthin in plasma (µg/dL) and retina (ng/tissue) in the primates supplemented with zeaxanthin at month 12 in comparison to those of the control primates.
As shown in Figures 27 and 29, an interesting trend is clearly seen in the
comparison of the changes in mean plasma carotenoid levels with the corresponding
changes in the concentration of carotenoids in the retinas of the supplemented primates.
The mean retina concentration of lutein in the L-treated, L/Z-treated, and control groups
correlate well with the mean retina level of this carotenoid. However, in the Z-treated
group that was fed a high-dose of zeaxanthin (10 mg/kg), the increase in mean
concentration of this carotenoid in the retina was not as closely associated with the levels
in plasma as were the levels of lutein in the L-treated primates. This may suggest that at a
high supplemental dose of nearly 10 mg/kg, lutein may be better absorbed by the retina
than zeaxanthin. This is despite the fact that the mean plasma concentrations of both
carotenoids after 12 months of supplementation with lutein or zeaxanthin (~10 mg/kg)
reach nearly the same concentration.
112
Concentrations of Lutein, Zeaxanthin and Their Metabolites in Major Organs and Other Tissues
Daily supplementation with a high dose of either lutein (9.34 mg/kg) or
zeaxanthin (10 mg/kg) significantly increased the concentrations of lutein and zeaxanthin
in most of the major organs and tissues of the primates after 12 months. For each group,
the highest mean concentrations of these carotenoids were found in the liver. However,
levels of lutein and zeaxanthin in the liver were considerably lower in the L/Z-treated
group when compared to the L- and the Z-treated groups. This suggests that when plasma
levels of lutein and/or zeaxanthin are chronically high the liver may act a storage
repository for these carotenoids. Interestingly, the mean levels of lutein and zeaxanthin in
the liver were significantly higher in the primates in the control group in comparison to
those of the L/Z-treated group.
The mean concentrations of lutein and zeaxanthin in the lung were also much
lower in the L/Z-treated group in comparison with those of the L-treated and the Z-
treated groups. Additionally, the mean concentration of zeaxanthin in the lung tissues of
the Z-treated group (1.65 µg/g) was nearly 7-fold that of lutein in the L-treated group
(0.23 ± 0.02 µg/g). Similarly, in the colon the mean level of lutein in the L-treated group
(0.23 ± 0.13 µg/g) was considerably lower than that of zeaxanthin in the Z-treated group
(1.34 ± 0.78 µg/g). This suggests that while both carotenoids are effectively accumulated
in the lung and colon tissue when administered at a high dose, zeaxanthin is absorbed
more efficiently than lutein. The bioavailability of lutein and zeaxanthin in the other
organs and tissues (liver, kidney, breast, ovary, spleen, cervix) appear to be about the
same irrespective of the supplemental dose of lutein and zeaxanthin.
113
Lutein and zeaxanthin are also absorbed effectively into the major organs and
tissues of the L/Z-treated monkeys (L & Z each at 0.5 mg/kg). The highest concentrations
of these carotenoids were found in the liver, colon, breast, ovary, and spleen. In fact, at
the dose of 0.5 mg/kg of lutein and zeaxanthin each, these carotenoids are equally as
bioavailable in most organs and tissues of the primates as they are at the substantially
higher dose of approximately 10 mg/kg of lutein or zeaxanthin fed separately (L-treated
& Z-treated groups).
Overall, the the liver accumulates the highest levels of lutein and zeaxanthin
among all 3 treatment groups as well as the control group. Both lutein and zeaxanthin are
absorbed well into the organs and tissues of the primates, but the uptake of zeaxanthin
into the lung and colon is considerably higher than that of lutein.
Limitations and Strengths of the Study
Small sample size was the major limitation of the study. Because there were only
3 control animals and 5 animals per treatment group it was difficult to detect small
differences. The issue of small sample size was compounded by the high inter- individual
variability that was observed in the concentrations of carotenoids in plasma and ocular
tissues of the primates in response to supplementation. Larger treatment groups would
have increased the statistical power of the tests (Analysis of Variance and Covariance,
Least Significant Difference) that were applied to the data. The fact that the start dates for
the three studies differed from one another by several months was another limitation.
Furthermore, the control group was housed with the animals from the Lutein
114
Supplementation Study and followed the same timeline as this group. It is not known
how this housing situation or the different start dates may have affected the results.
Another limitation lied in the variability in the weights of the retinas and other
ocular tissues that were analyzed. It is not known whether weight is directly correlated to
the total amount of carotenoids present in these tissues, and consequently, the extent to
which this variability affected the data cannot be predicted.
In retrospect, a couple of aspects of the study design could have been modified to
provide additional information. First, it would have been interesting to see the effects of
treatment with a combined high dose of zeaxanthin (e.g., 10 mg/kg) and a low dose of
lutein (e.g., 0.66 mg/kg); this would be opposite to the doses that were given to the L-
treated group. Such a study would have been useful in further exploring the metabolic
interaction between lutein and zeaxanthin in the plasma, retina, and various organs and
tissues. Also, the study design could have been considerably improved by collecting
additional blood samples between baseline, month 6, month 12 and month 18. This would
in turn provide valuable information regarding the absorption of carotenoids and their
metabolites into plasma and their rate of clearance from the circulating blood.
Additionally, by increasing the number of animals in each group, it would have been
possible to sacrifice several animals at month 6 and to correlate the concentrations of
carotenoids and their metabolites in the ocular tissues to their corresponding levels in
plasma. Unfortunately, the cost associated with procurement and long-term care of
primates in this NEI-sponsored study did not allow for the inclusion of additional
animals.
115
Conversely, this study has several noteworthy strengths. Rhesus Macaque
monkeys have been shown to be a good animal model in that this species has similar
carotenoid plasma and tissue deposition and metabolism to that of humans (Khachik et
al., 1995). Therefore, the results obtained from the studies presented here can be extended
to humans. Finally, the design of this study allowed us to measure the effects of long-
term supplementation beyond the initial spikes in plasma carotenoid levels that have been
shown to occur within a few weeks of supplementation (Khachik et al., 1995; Khachik et
al., 1997c; Landrum et al., 1997b; Richer et al., 2004). By supplementing the animals
with lutein and zeaxanthin at high doses for 12 months, we were able to determine the
absorption of these carotenoids and their metabolites into the plasma, ocular tissues, and
major organs and tissues, and establish their safety.
116
SUMMARY AND CONCLUSIONS
Daily supplementation of female Rhesus Macaque monkeys with lutein (9.34
mg/kg, 17.58 µmol/kg) for one year results in a 3.2-fold increase in the mean
concentrations of this carotenoid in plasma and a 6.5-fold increase in that of the retina.
Following treatment, these levels return to the baseline level after 6 months without
further supplementation. This supplemental dose of lutein also results in 3.4- and 6-fold
increases in the mean concentrations of meso-zeaxanthin and 3′-oxolutein in the retina of
the monkeys, respectively.
Daily supplementation of Rhesus Macaque monkeys with zeaxanthin at nearly the
same dose level (10 mg/kg) for one year increases the mean concentrations of zeaxanthin
in the plasma and retina by 3.6-fold and 4.6-fold, respectively. These levels return to
approximately the same levels measured at baseline by 6 months post-supplementation.
Supplementation with a high-dose of zeaxanthin also results in significant increases in the
mean levels of meso-zeaxanthin and 3’-oxolutein in the retina of the primates. These
results suggest that although meso-zeaxanthin is most likely formed in the retina of the
monkeys from dietary lutein, it may also be formed from 3’-oxolutein by the
stereospecific reduction to 3′-epilutein followed by double bond isomerizaton.
Daily supplementation of primates with a combination of lutein and zeaxanthin
(each at the dose of 0.5 mg/kg) for one year increases the mean plasma concentration of
these carotenoids within the first 6 months, but thereafter, the levels of these carotenoids
return to their baseline values. This is also reflected in the mean concentrations of lutein
117
and zeaxanthin in the retina of the L/Z-treated monkeys after 12 months that are not
significantly different from the levels found in the control group.
Chronic supplementation of Rhesus Macaque monkeys with lutein, zeaxanthin or
their 1:1 combination (0.5 mg/kg of each) increases the mean concentrations of these
carotenoids in most of the major organs and major tissues, yet zeaxanthin is more
efficiently absorbed than lutein in lung and colon when given at comparable doses. The
highest accumulation of these carotenoids occurs in the liver regardless of the
supplemental dose. The bioavailability of lutein and zeaxanthin in most of the major
organs and tissues is nearly equal for this group (L & Z each at 0.5 mg/kg) in comparison
with the groups that were supplemented with a high dose of these carotenoids. Retina
histopathology revealed no ocular toxicity and measurement of biomarkers associated
with kidney toxicity revealed no toxicity as well. This work was conducted by other co-
investigators of the study presented in this thesis. Thus, supplementation of female
Rhesus monkeys with lutein or zeaxanthin for one year at the dose of approximately 10
mg/kg (17.58 µmol/kg) does not cause ocular toxicity and has no effect on biomarkers
associated with kidney toxicity.
This study provides a foundation for future clinical trials with a combination of
lutein and zeaxanthin involving human subjects. For a 60 kg human, the chronic dose of
lutein and zeaxanthin given to the L- and Z-treated primates is equivalent to 600 mg/day
of lutein or zeaxanthin. Consequently, future long-term human supplementation studies
with lutein and zeaxanthin that plan to investigate the efficacy of these carotenoids in the
prevention of AMD at a much lower dose (e.g. 0.5 mg/kg or lower), should not present
any problems associated with toxicity.

APPENDIX A. APPROVAL FROM INSTITUTIONAL ANIMAL CARE & USE COMMITTEE

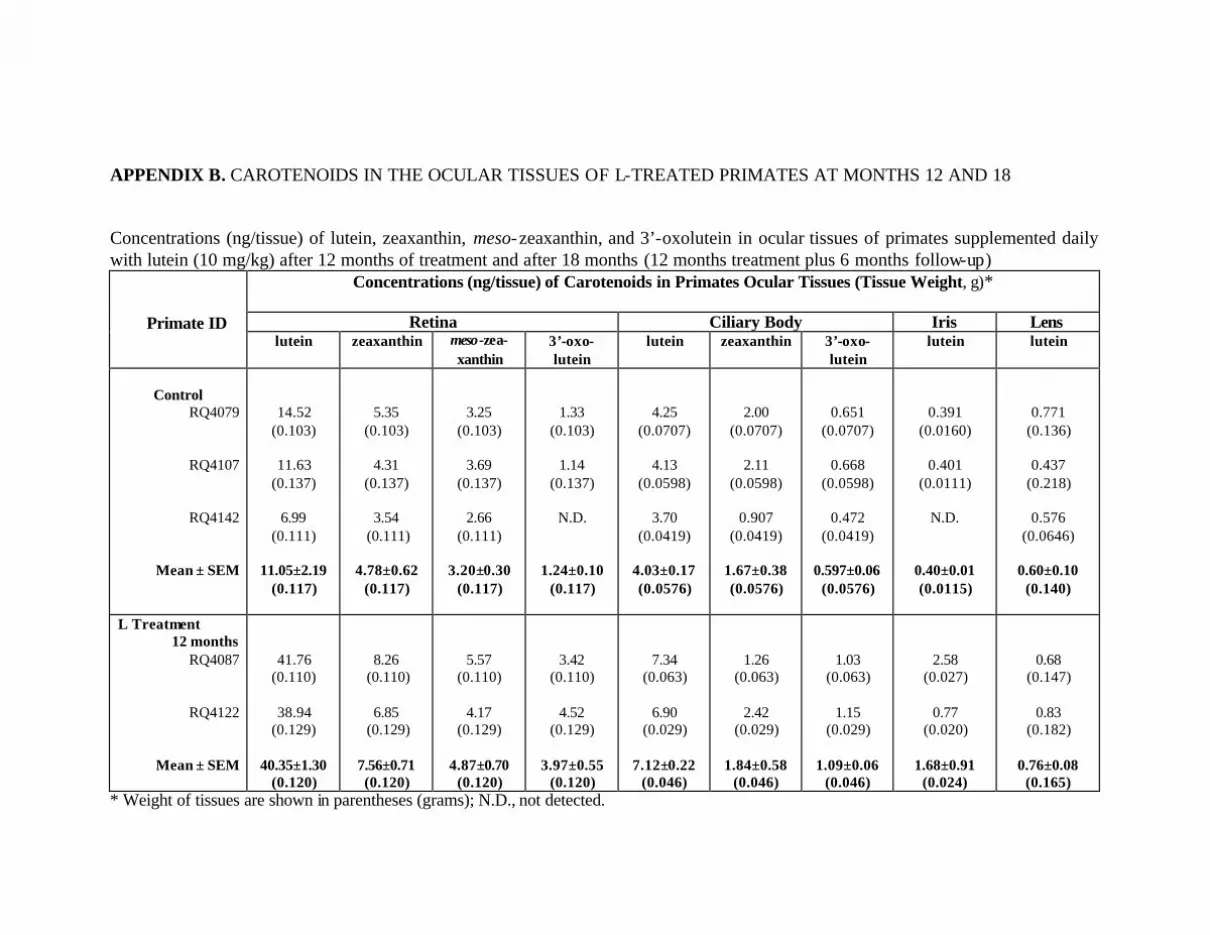
APPENDIX B. CAROTENOIDS IN THE OCULAR TISSUES OF L-TREATED PRIMATES AT MONTHS 12 AND 18
Concentrations (ng/tissue) of lutein, zeaxanthin, meso-zeaxanthin, and 3’-oxolutein in ocular tissues of primates supplemented daily with lutein (10 mg/kg) after 12 months of treatment and after 18 months (12 months treatment plus 6 months follow-up)
Concentrations (ng/tissue) of Carotenoids in Primates Ocular Tissues (Tissue Weight, g)*
Retina Ciliary Body Iris Lens
Primate ID lutein zeaxanthin meso-zea-
xanthin 3’-oxo-lutein
lutein zeaxanthin 3’-oxo-lutein
lutein lutein
Control
RQ4079
RQ4107
RQ4142
Mean ± SEM
14.52 (0.103)
11.63
(0.137)
6.99 (0.111)
11.05±2.19
(0.117)
5.35 (0.103)
4.31
(0.137)
3.54 (0.111)
4.78±0.62
(0.117)
3.25 (0.103)
3.69
(0.137)
2.66 (0.111)
3.20±0.30
(0.117)
1.33 (0.103)
1.14
(0.137)
N.D.
1.24±0.10 (0.117)
4.25 (0.0707)
4.13
(0.0598)
3.70 (0.0419)
4.03±0.17 (0.0576)
2.00 (0.0707)
2.11
(0.0598)
0.907 (0.0419)
1.67±0.38 (0.0576)
0.651 (0.0707)
0.668
(0.0598)
0.472 (0.0419)
0.597±0.06
(0.0576)
0.391 (0.0160)
0.401
(0.0111)
N.D.
0.40±0.01 (0.0115)
0.771 (0.136)
0.437
(0.218)
0.576 (0.0646)
0.60±0.10
(0.140)
L Treatment 12 months
RQ4087
RQ4122
Mean ± SEM
41.76 (0.110)
38.94
(0.129)
40.35±1.30 (0.120)
8.26 (0.110)
6.85
(0.129)
7.56±0.71 (0.120)
5.57 (0.110)
4.17
(0.129)
4.87±0.70 (0.120)
3.42 (0.110)
4.52
(0.129)
3.97±0.55 (0.120)
7.34 (0.063)
6.90
(0.029)
7.12±0.22 (0.046)
1.26 (0.063)
2.42
(0.029)
1.84±0.58 (0.046)
1.03 (0.063)
1.15
(0.029)
1.09±0.06 (0.046)
2.58 (0.027)
0.77
(0.020)
1.68±0.91 (0.024)
0.68 (0.147)
0.83
(0.182)
0.76±0.08 (0.165)
* Weight of tissues are shown in parentheses (grams); N.D., not detected.
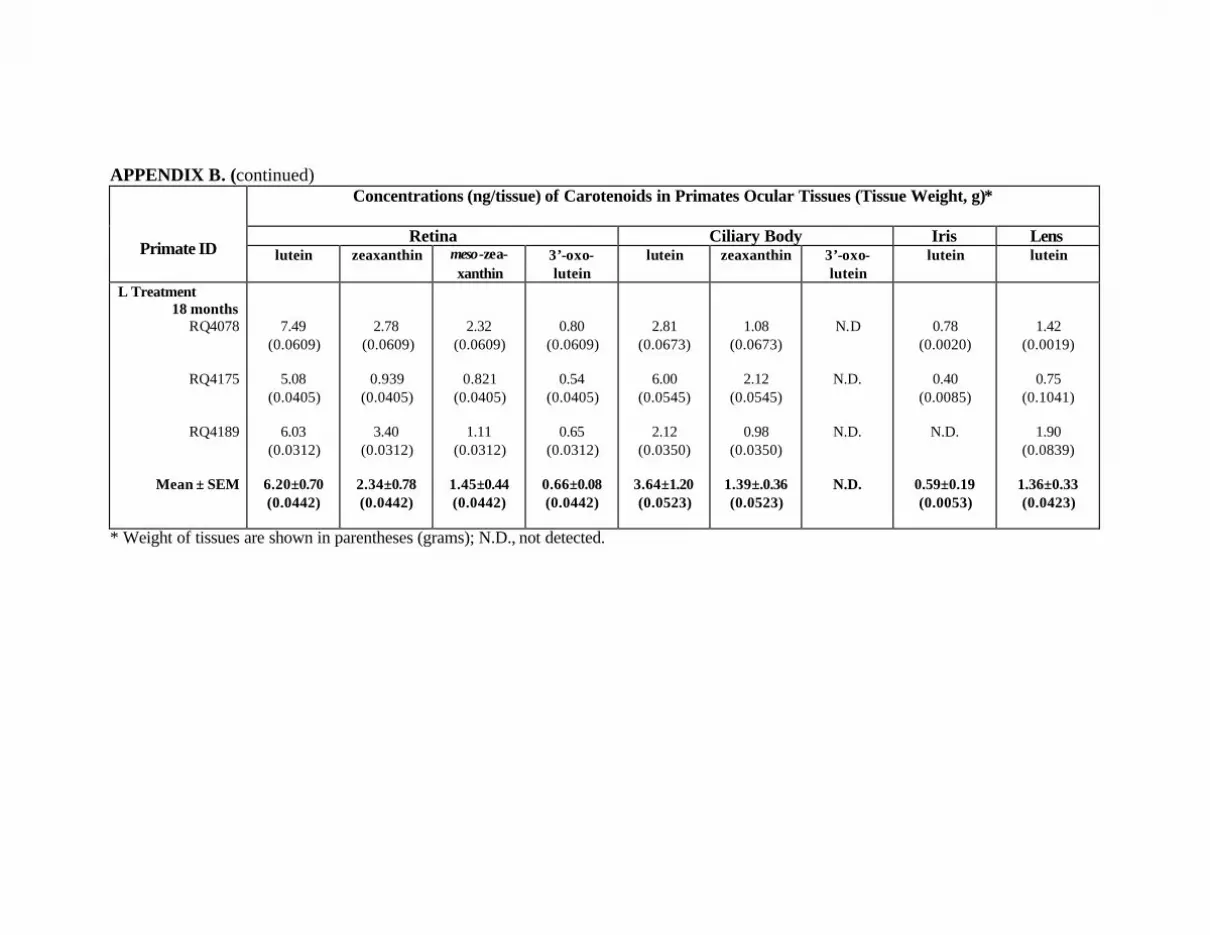
APPENDIX B. (continued) Concentrations (ng/tissue) of Carotenoids in Primates Ocular Tissues (Tissue Weight, g)*
Retina Ciliary Body Iris Lens
Primate ID lutein zeaxanthin meso-zea-xanthin
3’-oxo-lutein
lutein zeaxanthin 3’-oxo-lutein
lutein lutein
L Treatment 18 months
RQ4078
RQ4175
RQ4189
Mean ± SEM
7.49 (0.0609)
5.08
(0.0405)
6.03 (0.0312)
6.20±0.70 (0.0442)
2.78 (0.0609)
0.939
(0.0405)
3.40 (0.0312)
2.34±0.78 (0.0442)
2.32 (0.0609)
0.821
(0.0405)
1.11 (0.0312)
1.45±0.44 (0.0442)
0.80 (0.0609)
0.54
(0.0405)
0.65 (0.0312)
0.66±0.08 (0.0442)
2.81 (0.0673)
6.00
(0.0545)
2.12 (0.0350)
3.64±1.20 (0.0523)
1.08 (0.0673)
2.12
(0.0545)
0.98 (0.0350)
1.39±.0.36 (0.0523)
N.D
N.D.
N.D.
N.D.
0.78 (0.0020)
0.40
(0.0085)
N.D.
0.59±0.19 (0.0053)
1.42 (0.0019)
0.75
(0.1041)
1.90 (0.0839)
1.36±0.33 (0.0423)
* Weight of tissues are shown in parentheses (grams); N.D., not detected.
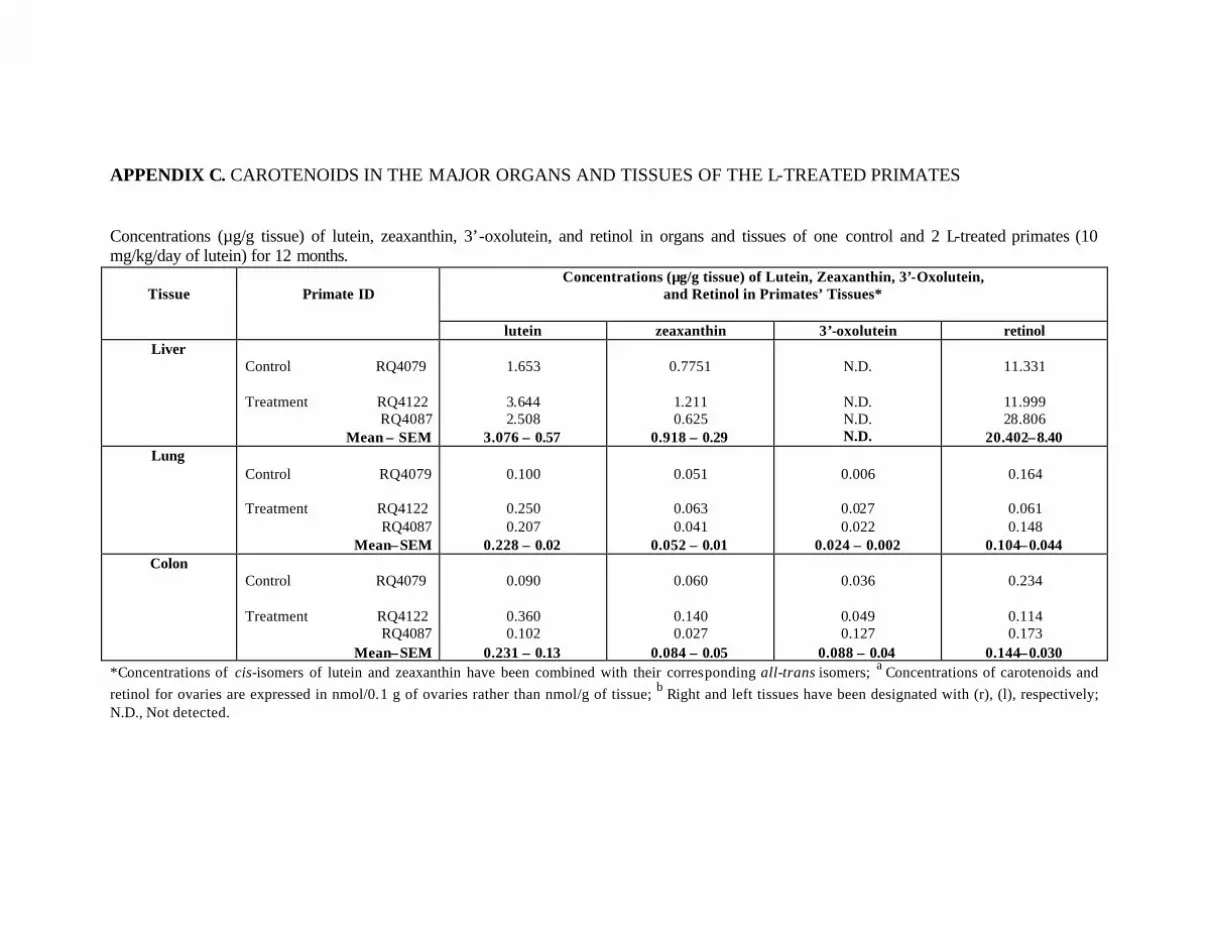
APPENDIX C. CAROTENOIDS IN THE MAJOR ORGANS AND TISSUES OF THE L-TREATED PRIMATES
Concentrations (µg/g tissue) of lutein, zeaxanthin, 3’-oxolutein, and retinol in organs and tissues of one control and 2 L-treated primates (10 mg/kg/day of lutein) for 12 months.
Concentrations (µg/g tissue) of Lutein, Zeaxanthin, 3’-Oxolutein, and Retinol in Primates’ Tissues*
Tissue
Primate ID
lutein zeaxanthin 3’-oxolutein retinol Liver
Control RQ4079 Treatment RQ4122
RQ4087 Mean ± SEM
1.653
3.644 2.508
3.076 ± 0.57
0.7751
1.211 0.625
0.918 ± 0.29
N.D.
N.D. N.D. N.D.
11.331
11.999 28.806
20.402±8.40 Lung
Control RQ4079 Treatment RQ4122
RQ4087 Mean±SEM
0.100
0.250 0.207
0.228 ± 0.02
0.051
0.063 0.041
0.052 ± 0.01
0.006
0.027 0.022
0.024 ± 0.002
0.164
0.061 0.148
0.104±0.044 Colon
Control RQ4079 Treatment RQ4122
RQ4087 Mean±SEM
0.090
0.360 0.102
0.231 ± 0.13
0.060
0.140 0.027
0.084 ± 0.05
0.036
0.049 0.127
0.088 ± 0.04
0.234
0.114 0.173
0.144±0.030 *Concentrations of cis-isomers of lutein and zeaxanthin have been combined with their corresponding all-trans isomers; a Concentrations of carotenoids and retinol for ovaries are expressed in nmol/0.1 g of ovaries rather than nmol/g of tissue; b Right and left tissues have been designated with (r), (l), respectively; N.D., Not detected.
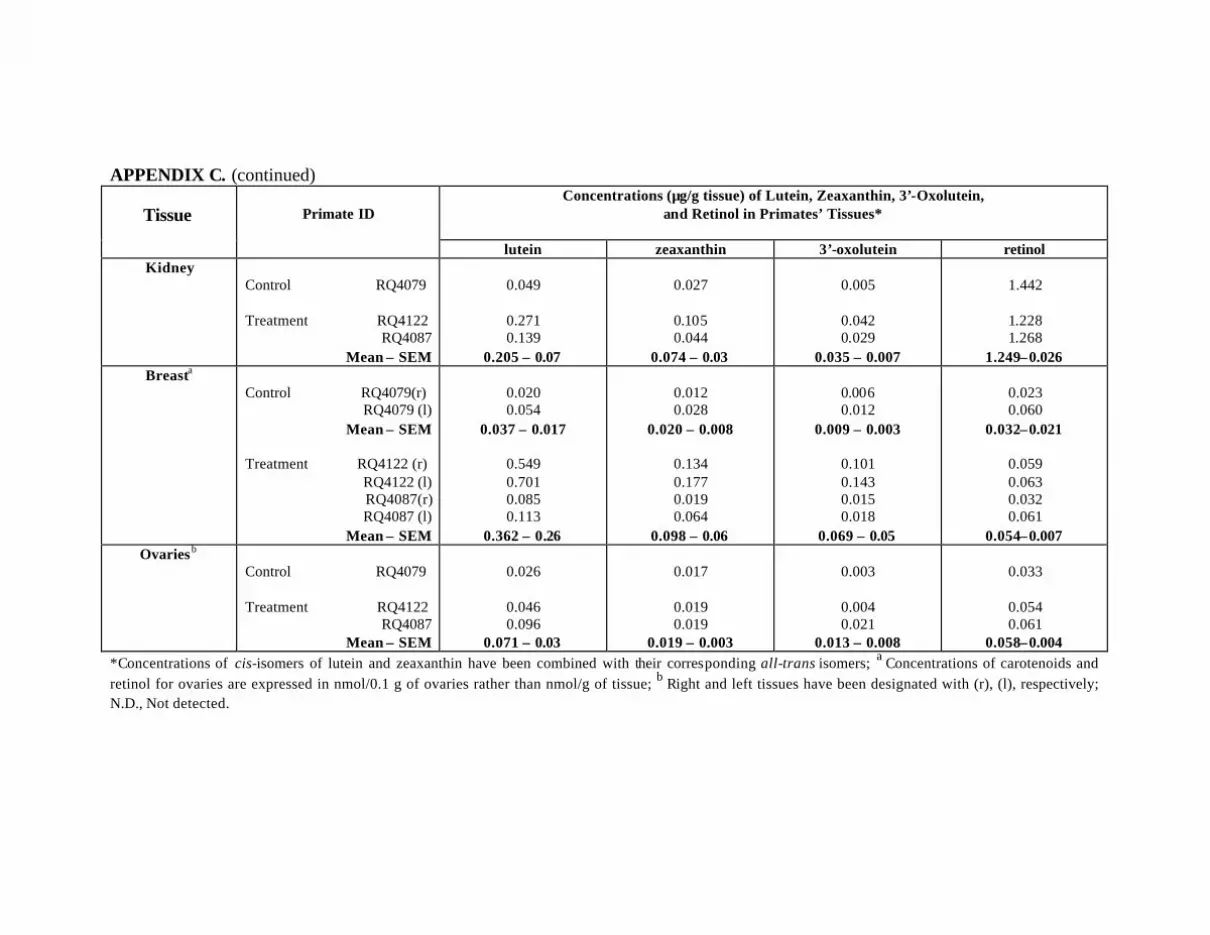
APPENDIX C. (continued) Concentrations (µg/g tissue) of Lutein, Zeaxanthin, 3’-Oxolutein,
and Retinol in Primates’ Tissues*
Tissue
Primate ID
lutein zeaxanthin 3’-oxolutein retinol Kidney
Control RQ4079 Treatment RQ4122
RQ4087 Mean ± SEM
0.049
0.271 0.139
0.205 ± 0.07
0.027
0.105 0.044
0.074 ± 0.03
0.005
0.042 0.029
0.035 ± 0.007
1.442
1.228 1.268
1.249±0.026 Breasta
Control RQ4079(r)
RQ4079 (l) Mean ± SEM
Treatment RQ4122 (r)
RQ4122 (l) RQ4087(r) RQ4087 (l)
Mean ± SEM
0.020 0.054
0.037 ± 0.017
0.549 0.701 0.085 0.113
0.362 ± 0.26
0.012 0.028
0.020 ± 0.008
0.134 0.177 0.019 0.064
0.098 ± 0.06
0.006 0.012
0.009 ± 0.003
0.101 0.143 0.015 0.018
0.069 ± 0.05
0.023 0.060
0.032±0.021
0.059 0.063 0.032 0.061
0.054±0.007 Ovariesb
Control RQ4079 Treatment RQ4122
RQ4087 Mean ± SEM
0.026
0.046 0.096
0.071 ± 0.03
0.017
0.019 0.019
0.019 ± 0.003
0.003
0.004 0.021
0.013 ± 0.008
0.033
0.054 0.061
0.058±0.004 *Concentrations of cis-isomers of lutein and zeaxanthin have been combined with their corresponding all-trans isomers; a Concentrations of carotenoids and retinol for ovaries are expressed in nmol/0.1 g of ovaries rather than nmol/g of tissue; b Right and left tissues have been designated with (r), (l), respectively; N.D., Not detected.
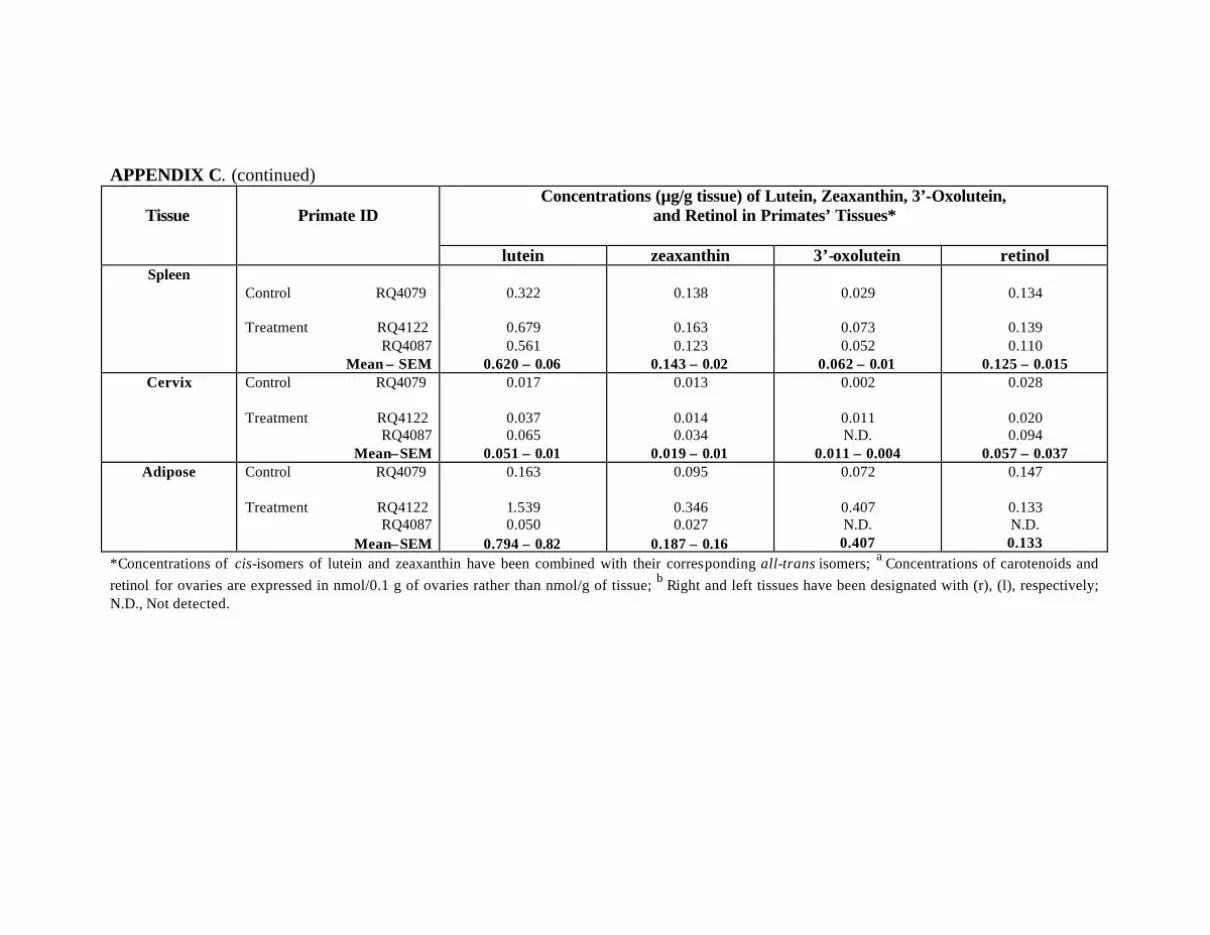
APPENDIX C. (continued) Concentrations (µg/g tissue) of Lutein, Zeaxanthin, 3’-Oxolutein,
and Retinol in Primates’ Tissues*
Tissue
Primate ID
lutein zeaxanthin 3’-oxolutein retinol Spleen
Control RQ4079 Treatment RQ4122
RQ4087 Mean ± SEM
0.322
0.679 0.561
0.620 ± 0.06
0.138
0.163 0.123
0.143 ± 0.02
0.029
0.073 0.052
0.062 ± 0.01
0.134
0.139 0.110
0.125 ± 0.015 Cervix
Control RQ4079 Treatment RQ4122
RQ4087 Mean±SEM
0.017
0.037 0.065
0.051 ± 0.01
0.013
0.014 0.034
0.019 ± 0.01
0.002
0.011 N.D.
0.011 ± 0.004
0.028
0.020 0.094
0.057 ± 0.037 Adipose
Control RQ4079 Treatment RQ4122
RQ4087 Mean±SEM
0.163
1.539 0.050
0.794 ± 0.82
0.095
0.346 0.027
0.187 ± 0.16
0.072
0.407 N.D. 0.407
0.147
0.133 N.D. 0.133
*Concentrations of cis-isomers of lutein and zeaxanthin have been combined with their corresponding all-trans isomers; a Concentrations of carotenoids and retinol for ovaries are expressed in nmol/0.1 g of ovaries rather than nmol/g of tissue; b Right and left tissues have been designated with (r), (l), respectively; N.D., Not detected.

APPENDIX D. CAROTENOIDS IN THE MAJOR ORGANS AND TISSUES OF L-TREATED PRIMATES AT MONTH 18
Concentrations (µg/g tissue) of lutein, zeaxanthin, 3’-oxolutein, and retinol in organs and tissues 6 months post-supplementation (month 18) of 2 control primates and 3 primates supplemented daily with lutein (10 mg/kg) for 12 months.
Concentrations (µg/g tissue) of Lutein, Zeaxanthin, 3’-Oxolutein, and Retinol in Primate Tissues*
Tissue
Primate ID
Lutein Zeaxanthin 3’-Oxolutein Retinol Liver
Control RQ4107
RQ4142
Mean ±SEM
Treatment RQ4078
RQ4175
RQ4189
Mean±SEM
1.374
0.499
0.937 ± 0.44
1.261
3.963
0.795
2.006 ± 0.99
0.873
0.282
0.577 ± 0.30
0.709
1.093
0.433
0.745 ± 0.19
N.D.
N.D.
N.D.
0.028
0.042
N.D.
0.035 ± 0.007
28.309
41.894
35.101 ± 6.79
25.781
20.680
29.925
25.461 ± 2.67
Lung**
Control RQ4107
RQ4142
Mean±SEM Treatment RQ4078
RQ4175
RQ4189
Mean±SEM
0.101
0.104
0.102 ± 0.002
0.084
0.244
0.080
0.136 ± 0.12
0.055
0.064
0.059 ± 0.005
0.040
0.106
0.039
0.061 ± 0.022
0.011
0.009
0.010 ± 0.001
0.009
0.034
0.011
0.018 ± 0.008
0.093
0.095
0.094 ± 0.001
0.181
0.193
0.159
0.177 ± 0.010 * Concentrations of cis-isomers of lutein and zeaxanthin have been combined with their corresponding all-trans isomers; ** Trace amounts of 3’-epilutein detected; N.D., Not detected.
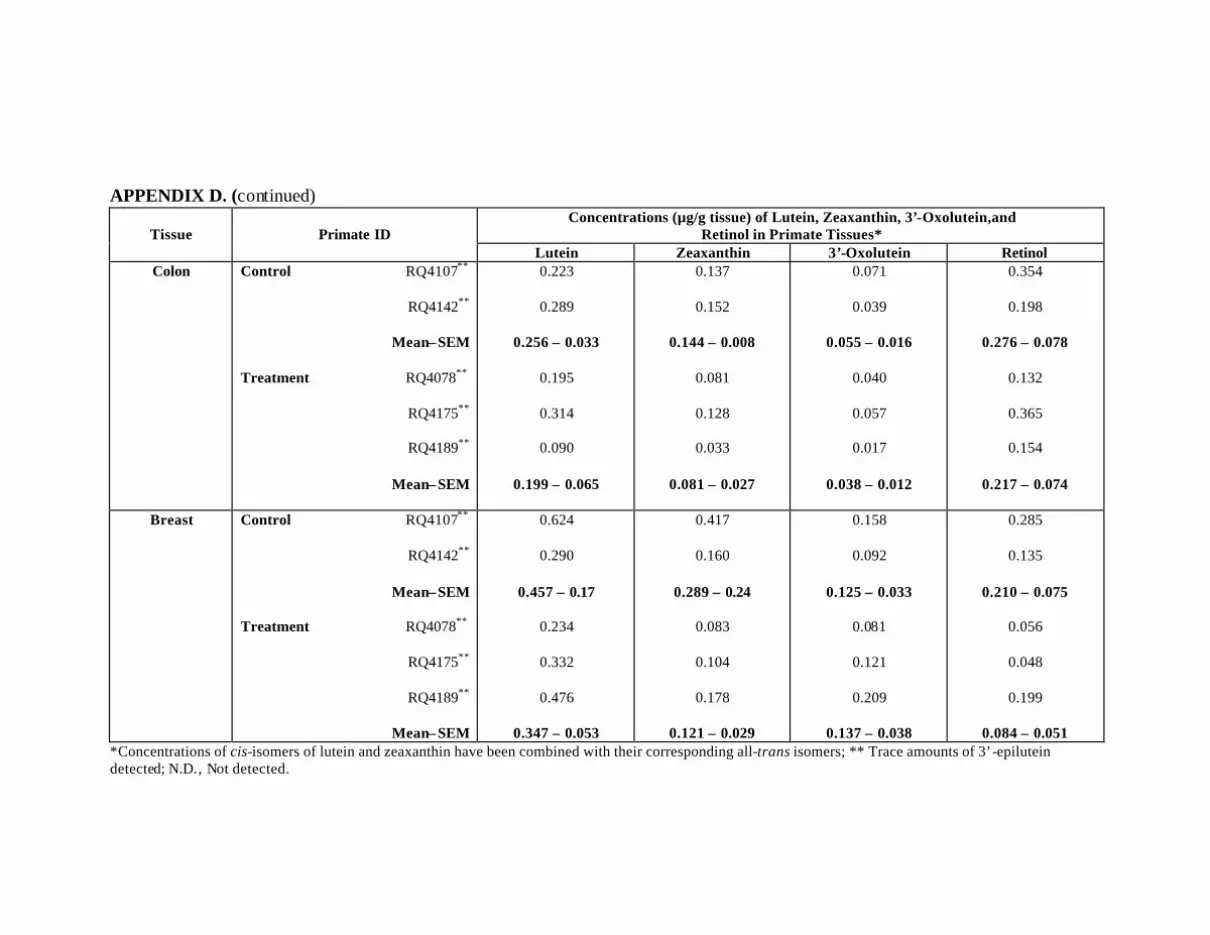
APPENDIX D. (continued)
Concentrations (µg/g tissue) of Lutein, Zeaxanthin, 3’-Oxolutein,and Retinol in Primate Tissues*
Tissue
Primate ID
Lutein Zeaxanthin 3’-Oxolutein Retinol Colon
Control RQ4107**
RQ4142**
Mean±SEM
Treatment RQ4078**
RQ4175**
RQ4189**
Mean±SEM
0.223
0.289
0.256 ± 0.033
0.195
0.314
0.090
0.199 ± 0.065
0.137
0.152
0.144 ± 0.008
0.081
0.128
0.033
0.081 ± 0.027
0.071
0.039
0.055 ± 0.016
0.040
0.057
0.017
0.038 ± 0.012
0.354
0.198
0.276 ± 0.078
0.132
0.365
0.154
0.217 ± 0.074
Breast
Control RQ4107**
RQ4142**
Mean±SEM
Treatment RQ4078**
RQ4175**
RQ4189**
Mean±SEM
0.624
0.290
0.457 ± 0.17
0.234
0.332
0.476
0.347 ± 0.053
0.417
0.160
0.289 ± 0.24
0.083
0.104
0.178
0.121 ± 0.029
0.158
0.092
0.125 ± 0.033
0.081
0.121
0.209
0.137 ± 0.038
0.285
0.135
0.210 ± 0.075
0.056
0.048
0.199
0.084 ± 0.051 *Concentrations of cis-isomers of lutein and zeaxanthin have been combined with their corresponding all-trans isomers; ** Trace amounts of 3’-epilutein detected; N.D., Not detected.
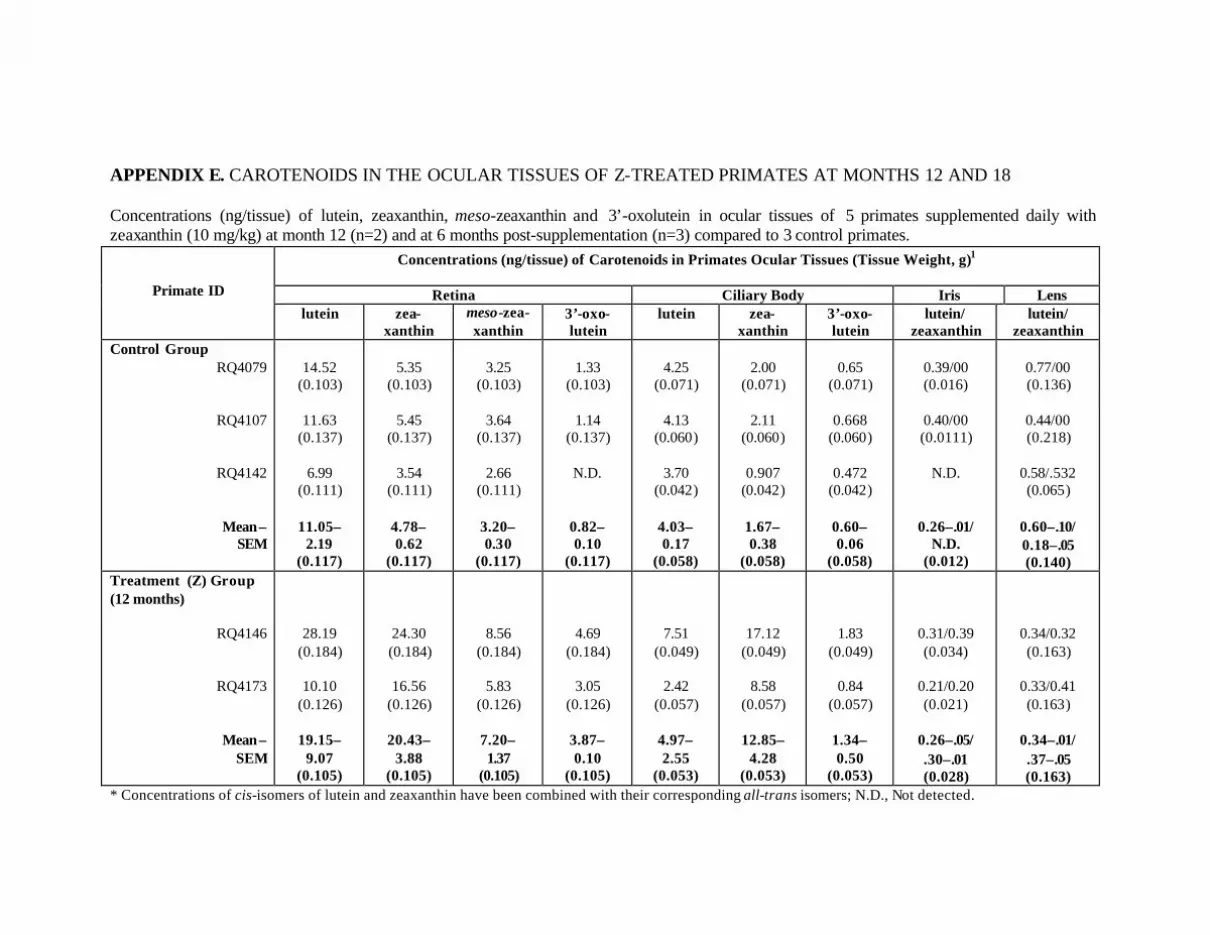
APPENDIX E. CAROTENOIDS IN THE OCULAR TISSUES OF Z-TREATED PRIMATES AT MONTHS 12 AND 18 Concentrations (ng/tissue) of lutein, zeaxanthin, meso-zeaxanthin and 3’-oxolutein in ocular tissues of 5 primates supplemented daily with zeaxanthin (10 mg/kg) at month 12 (n=2) and at 6 months post-supplementation (n=3) compared to 3 control primates.
Concentrations (ng/tissue) of Carotenoids in Primates Ocular Tissues (Tissue Weight, g)1
Retina Ciliary Body Iris Lens
Primate ID
lutein zea-xanthin
meso-zea- xanthin
3’-oxo-lutein
lutein zea-xanthin
3’-oxo-lutein
lutein/ zeaxanthin
lutein/ zeaxanthin
Control Group RQ4079
RQ4107
RQ4142
Mean ± SEM
14.52
(0.103)
11.63 (0.137)
6.99
(0.111)
11.05± 2.19
(0.117)
5.35
(0.103)
5.45 (0.137)
3.54
(0.111)
4.78± 0.62
(0.117)
3.25
(0.103)
3.64 (0.137)
2.66
(0.111)
3.20± 0.30
(0.117)
1.33
(0.103)
1.14 (0.137)
N.D.
0.82± 0.10
(0.117)
4.25
(0.071)
4.13 (0.060)
3.70
(0.042)
4.03± 0.17
(0.058)
2.00
(0.071)
2.11 (0.060)
0.907
(0.042)
1.67± 0.38
(0.058)
0.65
(0.071)
0.668 (0.060)
0.472
(0.042)
0.60± 0.06
(0.058)
0.39/00 (0.016)
0.40/00 (0.0111)
N.D.
0.26±.01/ N.D.
(0.012)
0.77/00 (0.136)
0.44/00 (0.218)
0.58/.532 (0.065)
0.60±.10/ 0.18±.05 (0.140)
Treatment (Z) Group (12 months)
RQ4146
RQ4173
Mean ± SEM
28.19 (0.184)
10.10
(0.126)
19.15± 9.07
(0.105)
24.30 (0.184)
16.56
(0.126)
20.43± 3.88
(0.105)
8.56 (0.184)
5.83
(0.126)
7.20± 1.37
(0.105)
4.69 (0.184)
3.05
(0.126)
3.87± 0.10
(0.105)
7.51 (0.049)
2.42
(0.057)
4.97± 2.55
(0.053)
17.12 (0.049)
8.58
(0.057)
12.85± 4.28
(0.053)
1.83 (0.049)
0.84
(0.057)
1.34± 0.50
(0.053)
0.31/0.39 (0.034)
0.21/0.20 (0.021)
0.26±.05/ .30±.01 (0.028)
0.34/0.32 (0.163)
0.33/0.41 (0.163)
0.34±.01/ .37±.05 (0.163)
* Concentrations of cis-isomers of lutein and zeaxanthin have been combined with their corresponding all-trans isomers; N.D., Not detected.
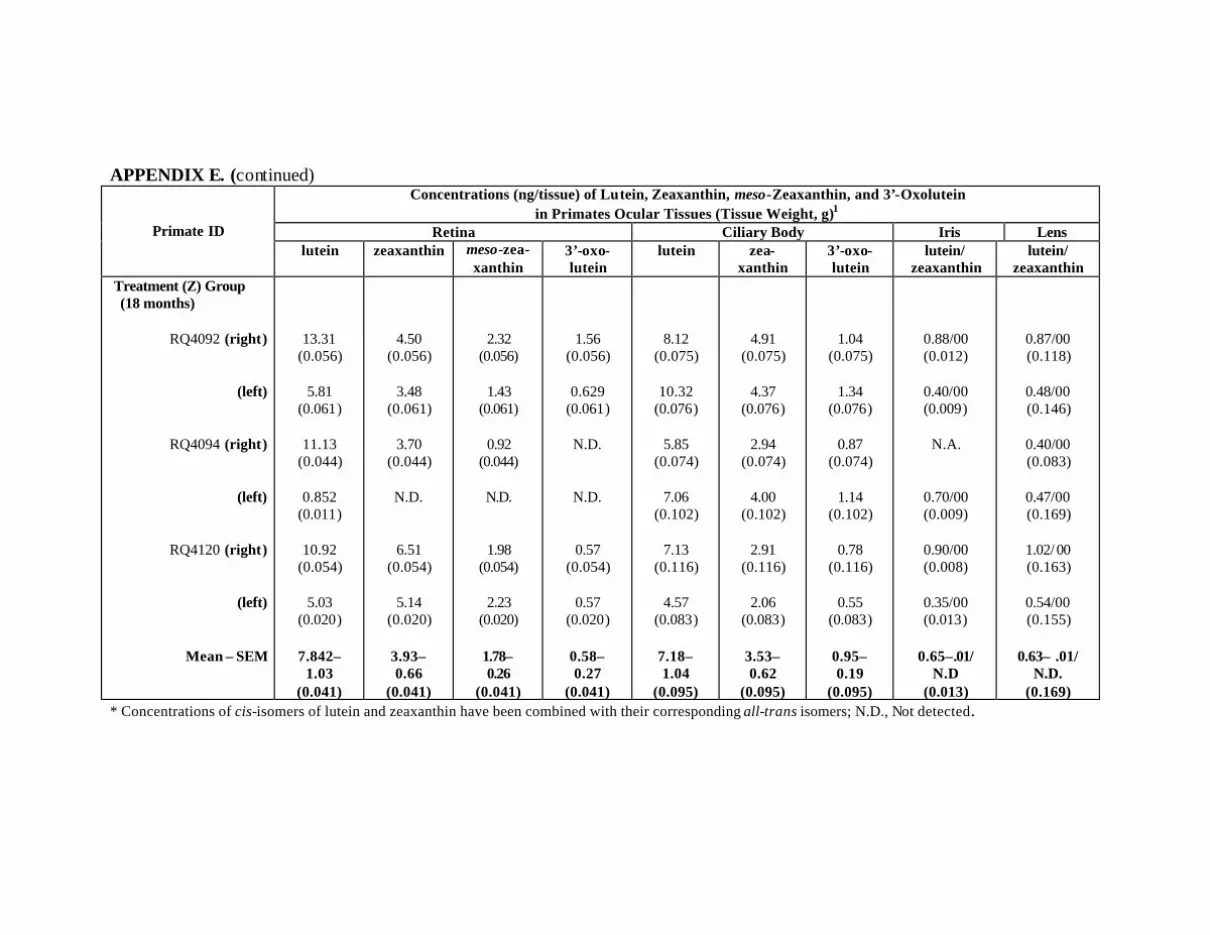
APPENDIX E. (continued) Concentrations (ng/tissue) of Lutein, Zeaxanthin, meso-Zeaxanthin, and 3’-Oxolutein
in Primates Ocular Tissues (Tissue Weight, g)1 Retina Ciliary Body Iris Lens
Primate ID lutein zeaxanthin meso-zea-
xanthin 3’-oxo-lutein
lutein zea-xanthin
3’-oxo-lutein
lutein/ zeaxanthin
lutein/ zeaxanthin
Treatment (Z) Group (18 months)
RQ4092 (right)
(left)
RQ4094 (right)
(left)
RQ4120 (right)
(left)
Mean ± SEM
13.31 (0.056)
5.81
(0.061)
11.13 (0.044)
0.852
(0.011)
10.92 (0.054)
5.03
(0.020)
7.842± 1.03
(0.041)
4.50 (0.056)
3.48
(0.061)
3.70 (0.044)
N.D.
6.51 (0.054)
5.14
(0.020)
3.93± 0.66
(0.041)
2.32
(0.056)
1.43 (0.061)
0.92
(0.044)
N.D.
1.98 (0.054)
2.23
(0.020)
1.78± 0.26
(0.041)
1.56 (0.056)
0.629
(0.061)
N.D.
N.D.
0.57 (0.054)
0.57
(0.020)
0.58± 0.27
(0.041)
8.12
(0.075)
10.32 (0.076)
5.85
(0.074)
7.06 (0.102)
7.13
(0.116)
4.57 (0.083)
7.18± 1.04
(0.095)
4.91 (0.075)
4.37
(0.076)
2.94 (0.074)
4.00
(0.102)
2.91 (0.116)
2.06
(0.083)
3.53± 0.62
(0.095)
1.04
(0.075)
1.34 (0.076)
0.87
(0.074)
1.14 (0.102)
0.78
(0.116)
0.55 (0.083)
0.95± 0.19
(0.095)
0.88/00 (0.012)
0.40/00 (0.009)
N.A.
0.70/00 (0.009)
0.90/00 (0.008)
0.35/00 (0.013)
0.65±.01/
N.D (0.013)
0.87/00 (0.118)
0.48/00 (0.146)
0.40/00 (0.083)
0.47/00 (0.169)
1.02/ 00 (0.163)
0.54/00 (0.155)
0.63± .01/
N.D. (0.169)
* Concentrations of cis-isomers of lutein and zeaxanthin have been combined with their corresponding all-trans isomers; N.D., Not detected.
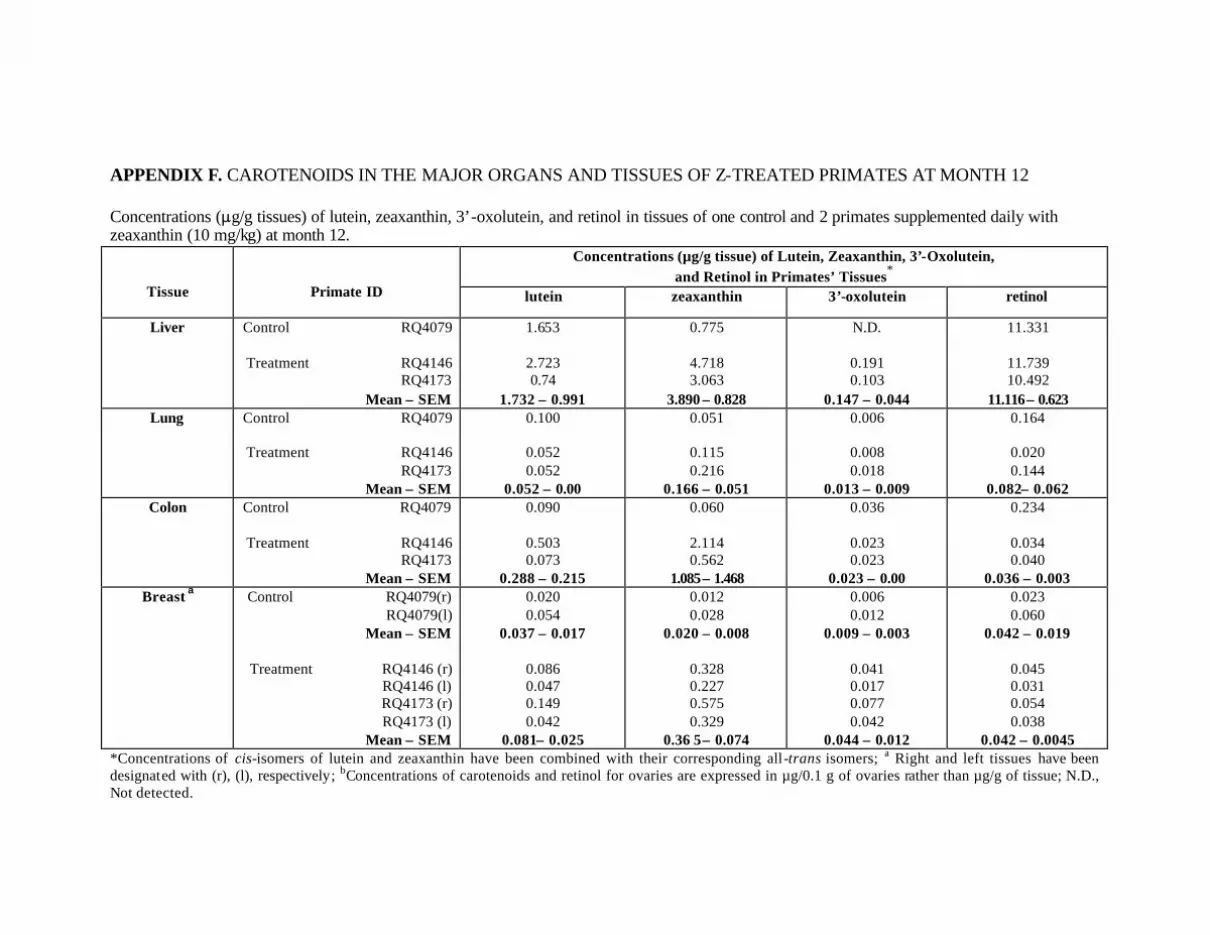
APPENDIX F. CAROTENOIDS IN THE MAJOR ORGANS AND TISSUES OF Z-TREATED PRIMATES AT MONTH 12 Concentrations (:g/g tissues) of lutein, zeaxanthin, 3’-oxolutein, and retinol in tissues of one control and 2 primates supplemented daily with zeaxanthin (10 mg/kg) at month 12.
Concentrations (µg/g tissue) of Lutein, Zeaxanthin, 3’-Oxolutein, and Retinol in Primates’ Tissues*
Tissue
Primate ID lutein zeaxanthin 3’-oxolutein retinol
Liver
Control RQ4079
Treatment RQ4146 RQ4173 Mean ± SEM
1.653
2.723 0.74
1.732 ± 0.991
0.775
4.718 3.063
3.890 ± 0.828
N.D.
0.191 0.103
0.147 ± 0.044
11.331
11.739 10.492
11.116 ± 0.623 Lung
Control RQ4079
Treatment RQ4146
RQ4173 Mean ± SEM
0.100
0.052 0.052
0.052 ± 0.00
0.051
0.115 0.216
0.166 ± 0.051
0.006
0.008 0.018
0.013 ± 0.009
0.164
0.020 0.144
0.082± 0.062 Colon
Control RQ4079
Treatment RQ4146
RQ4173 Mean ± SEM
0.090
0.503 0.073
0.288 ± 0.215
0.060
2.114 0.562
1.085 ± 1.468
0.036
0.023 0.023
0.023 ± 0.00
0.234
0.034 0.040
0.036 ± 0.003 Breast a
Control RQ4079(r)
RQ4079(l) Mean ± SEM
Treatment RQ4146 (r)
RQ4146 (l) RQ4173 (r)
RQ4173 (l) Mean ± SEM
0.020 0.054
0.037 ± 0.017
0.086 0.047 0.149 0.042
0.081± 0.025
0.012 0.028
0.020 ± 0.008
0.328 0.227 0.575 0.329
0.36 5± 0.074
0.006 0.012
0.009 ± 0.003
0.041 0.017 0.077 0.042
0.044 ± 0.012
0.023 0.060
0.042 ± 0.019
0.045 0.031 0.054 0.038
0.042 ± 0.0045 *Concentrations of cis-isomers of lutein and zeaxanthin have been combined with their corresponding all-trans isomers; a Right and left tissues have been designated with (r), (l), respectively; bConcentrations of carotenoids and retinol for ovaries are expressed in µg/0.1 g of ovaries rather than µg/g of tissue; N.D., Not detected.

APPENDIX F. (continued) Concentrations (µg/g tissue) of Lutein, Zeaxanthin, 3’-Oxolutein,
and Retinol in Primates’ Tissues*
Tissue
Primate ID lutein zeaxanthin 3’-oxolutein retinol
Kidney
Control RQ4079
Treatment RQ4146 RQ4173 Mean ± S EM
0.049
0.084 0.025
0.055 ± 0.029
0.027
0.161 0.089
0.125 ± 0.036
0.005
0.016 0.08
0.012 ± 0.004
1.442
1.093 1.204
1.149 ± 0.056
Ovariesb
Control RQ4079
Treatment RQ4146 RQ4173 Mean ± SEM
0.026
0.014 0.012
0.013 ± 0.001
0.017
0.028 0.054
0.041 ± 0.014
0.003
0.001 0.003
0.002 ± 0.001
0.033 0.013 0.020
0.016 ± 0.004
Spleen
Control RQ4079
Treatment RQ4146 RQ4173
Mean ± SEM
0.322
0.277 0.060
0.169 ± 0.109
0.138
0.723 0.227
0.475 ± 0.351
0.029
0.026 0.017
0.022 ± 0.004
0.134
0.041 0.049
0.045 ± 0.004 Cervix
Control RQ4079
Treatment RQ4146
RQ4173 Mean ± SEM
0.017
0.071 0.015
0.043 ± 0.028
0.013
0.114 0.050
0.082 ± 0.032
0.002
0.013 0.005
0.009 ± 0.004
0.028
0.034 0.039
0.037 ± 0.003 Adipose
Control RQ4079
Treatment RQ4146
RQ4173 Mean ± SEM
0.163
0.066 0.014
0.040 ± 0.026
0.095
0.174 0.077
0.125 ± 0.048
0.072
0.026 0.006
0.016 ± 0.010
0.147
0.020 0.014
0.017 ± 0.003 *Concentrations of cis-isomers of lutein and zeaxa nthin have been combined with their corresponding all-trans isomers; a Right and left tissues have been designated with (r), (l), respectively; bConcentrations of carotenoids and retinol for ovaries are expressed in µg/0.1 g of ovaries rather than µg/g of tissue; N.D. Not detected.
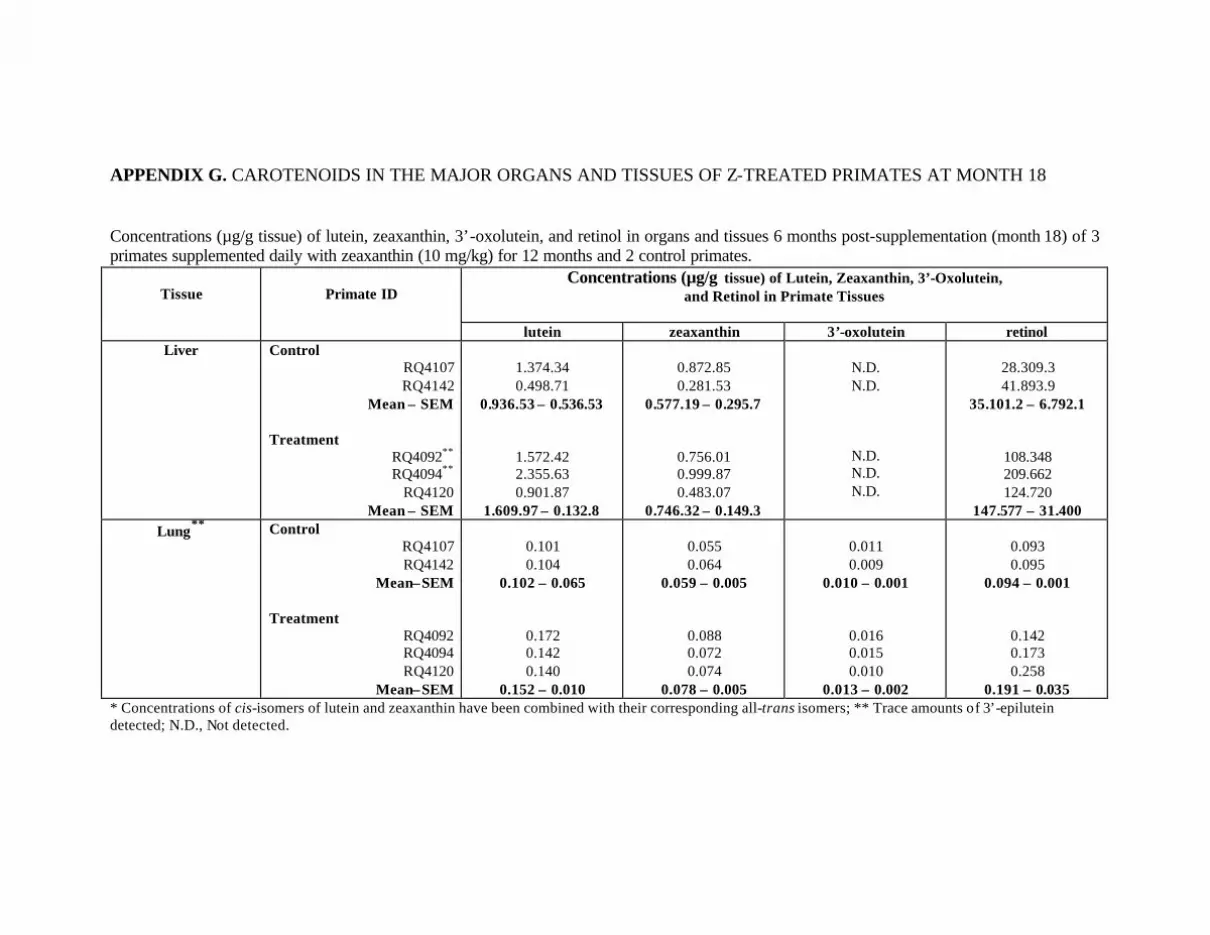
APPENDIX G. CAROTENOIDS IN THE MAJOR ORGANS AND TISSUES OF Z-TREATED PRIMATES AT MONTH 18 Concentrations (µg/g tissue) of lutein, zeaxanthin, 3’-oxolutein, and retinol in organs and tissues 6 months post-supplementation (month 18) of 3 primates supplemented daily with zeaxanthin (10 mg/kg) for 12 months and 2 control primates.
Concentrations (µg/g tissue) of Lutein, Zeaxanthin, 3’-Oxolutein, and Retinol in Primate Tissues
Tissue
Primate ID
lutein zeaxanthin 3’-oxolutein retinol Liver
Control
RQ4107 RQ4142
Mean ± SEM
Treatment RQ4092** RQ4094**
RQ4120 Mean ± SEM
1.374.34 0.498.71
0.936.53 ± 0.536.53
1.572.42 2.355.63 0.901.87
1.609.97 ± 0.132.8
0.872.85 0.281.53
0.577.19 ± 0.295.7
0.756.01 0.999.87 0.483.07
0.746.32 ± 0.149.3
N.D. N.D.
N.D. N.D. N.D.
28.309.3 41.893.9
35.101.2 ± 6.792.1
108.348 209.662 124.720
147.577 ± 31.400 Lung**
Control
RQ4107 RQ4142
Mean±SEM
Treatment RQ4092 RQ4094 RQ4120
Mean±SEM
0.101 0.104
0.102 ± 0.065
0.172 0.142 0.140
0.152 ± 0.010
0.055 0.064
0.059 ± 0.005
0.088 0.072 0.074
0.078 ± 0.005
0.011 0.009
0.010 ± 0.001
0.016 0.015 0.010
0.013 ± 0.002
0.093 0.095
0.094 ± 0.001
0.142 0.173 0.258
0.191 ± 0.035 * Concentrations of cis-isomers of lutein and zeaxanthin have been combined with their corresponding all-trans isomers; ** Trace amounts of 3’-epilutein detected; N.D., Not detected.
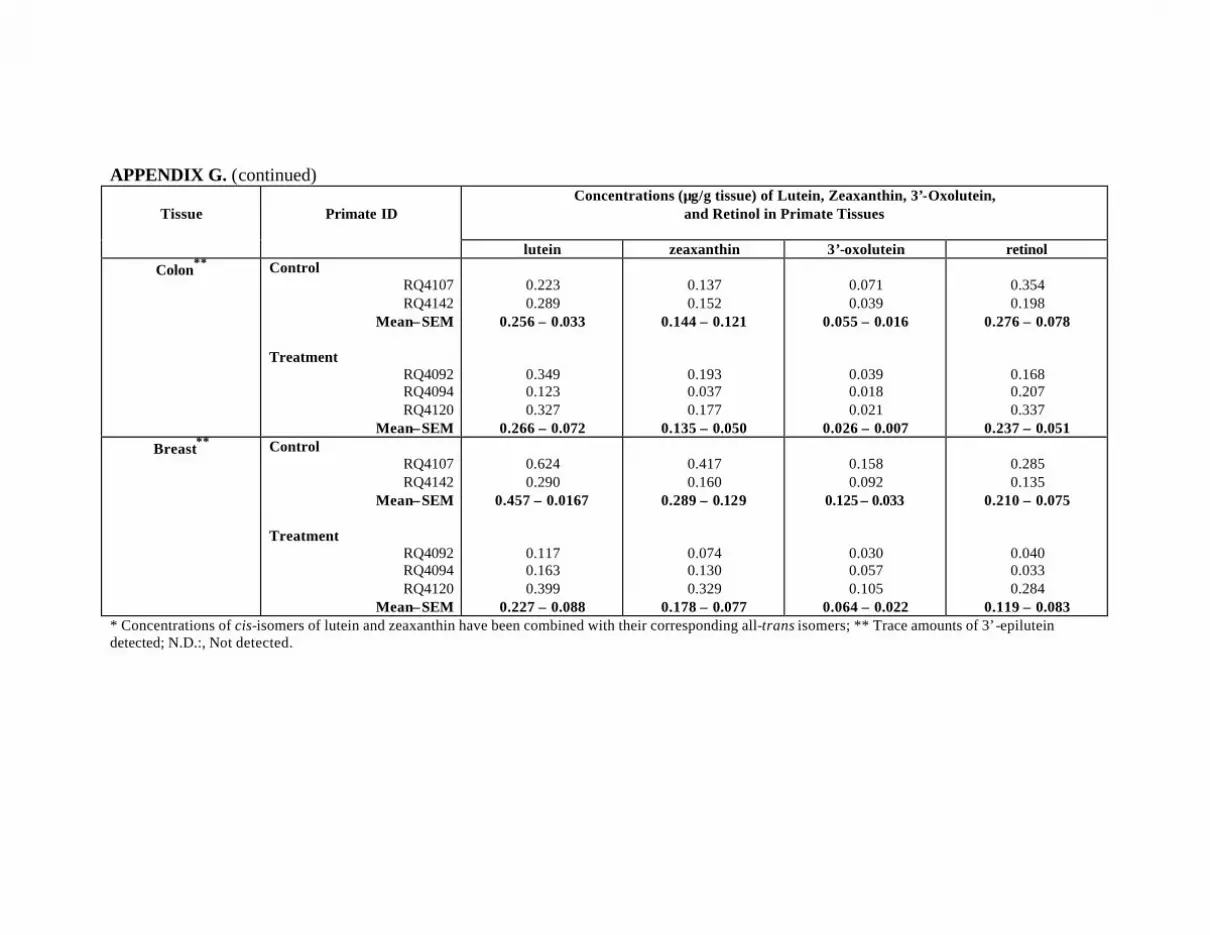
APPENDIX G. (continued) Concentrations (µg/g tissue) of Lutein, Zeaxanthin, 3’-Oxolutein,
and Retinol in Primate Tissues
Tissue
Primate ID
lutein zeaxanthin 3’-oxolutein retinol Colon**
Control
RQ4107 RQ4142
Mean±SEM
Treatment RQ4092 RQ4094 RQ4120
Mean±SEM
0.223 0.289
0.256 ± 0.033
0.349 0.123 0.327
0.266 ± 0.072
0.137 0.152
0.144 ± 0.121
0.193 0.037 0.177
0.135 ± 0.050
0.071 0.039
0.055 ± 0.016
0.039 0.018 0.021
0.026 ± 0.007
0.354 0.198
0.276 ± 0.078
0.168 0.207 0.337
0.237 ± 0.051 Breast**
Control
RQ4107 RQ4142
Mean±SEM
Treatment RQ4092 RQ4094 RQ4120
Mean±SEM
0.624 0.290
0.457 ± 0.0167
0.117 0.163 0.399
0.227 ± 0.088
0.417 0.160
0.289 ± 0.129
0.074 0.130 0.329
0.178 ± 0.077
0.158 0.092
0.125 ± 0.033
0.030 0.057 0.105
0.064 ± 0.022
0.285 0.135
0.210 ± 0.075
0.040 0.033 0.284
0.119 ± 0.083 * Concentrations of cis-isomers of lutein and zeaxanthin have been combined with their corresponding all-trans isomers; ** Trace amounts of 3’-epilutein detected; N.D.:, Not detected.
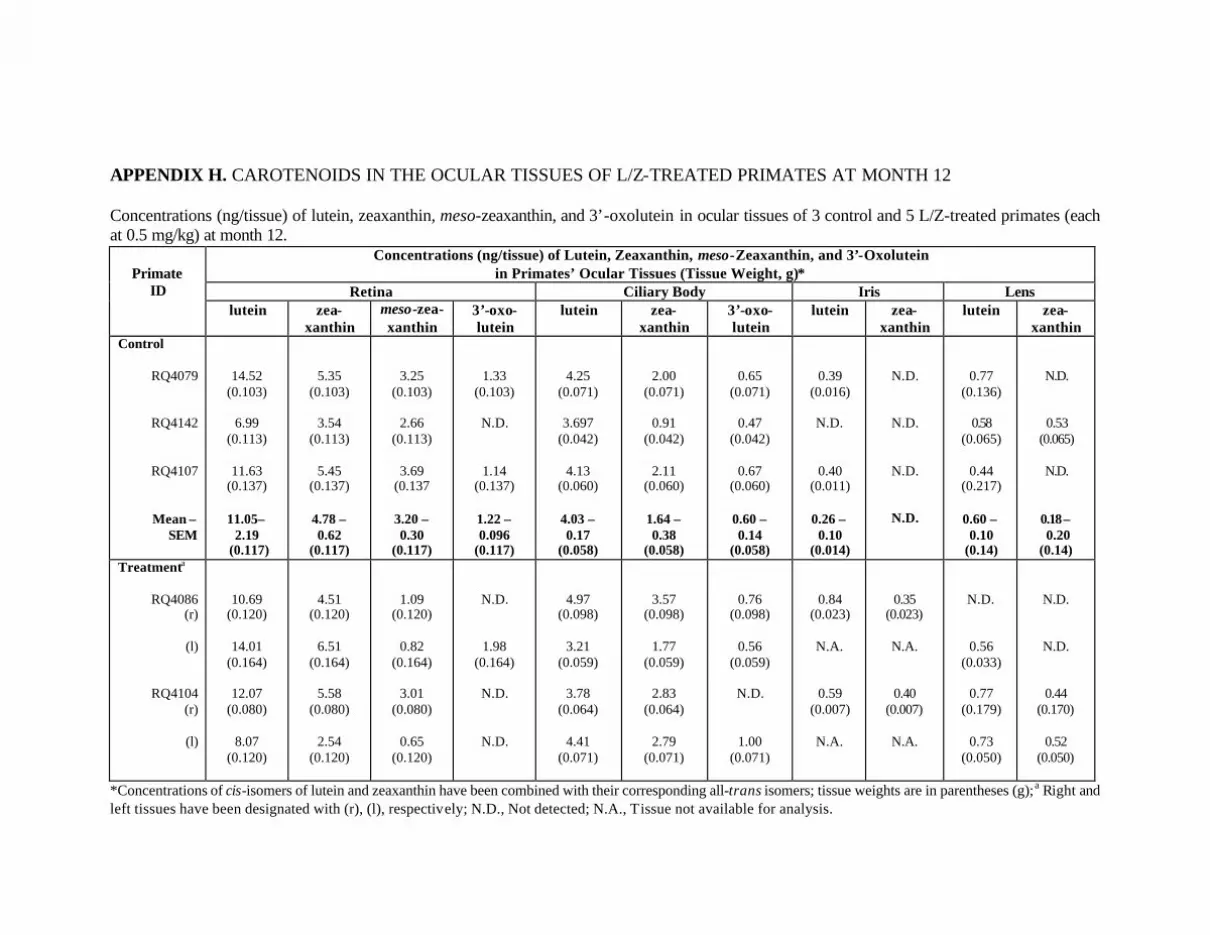
APPENDIX H. CAROTENOIDS IN THE OCULAR TISSUES OF L/Z-TREATED PRIMATES AT MONTH 12
Concentrations (ng/tissue) of lutein, zeaxanthin, meso-zeaxanthin, and 3’-oxolutein in ocular tissues of 3 control and 5 L/Z-treated primates (each at 0.5 mg/kg) at month 12.
Concentrations (ng/tissue) of Lutein, Zeaxanthin, meso-Zeaxanthin, and 3’-Oxolutein in Primates’ Ocular Tissues (Tissue Weight, g)*
Retina Ciliary Body Iris Lens
Primate
ID lutein zea-
xanthin meso-zea-xanthin
3’-oxo-lutein
lutein zea-xanthin
3’-oxo-lutein
lutein zea-xanthin
lutein zea-xanthin
Control
RQ4079
RQ4142
RQ4107
Mean ± SEM
14.52 (0.103)
6.99
(0.113)
11.63 (0.137)
11.05±
2.19 (0.117)
5.35 (0.103)
3.54
(0.113)
5.45 (0.137)
4.78 ± 0.62
(0.117)
3.25 (0.103)
2.66
(0.113)
3.69 (0.137
3.20 ± 0.30
(0.117)
1.33 (0.103)
N.D.
1.14 (0.137)
1.22 ± 0.096
(0.117)
4.25 (0.071)
3.697
(0.042)
4.13 (0.060)
4.03 ± 0.17
(0.058)
2.00 (0.071)
0.91
(0.042)
2.11 (0.060)
1.64 ± 0.38
(0.058)
0.65 (0.071)
0.47
(0.042)
0.67 (0.060)
0.60 ± 0.14
(0.058)
0.39 (0.016)
N.D.
0.40 (0.011)
0.26 ± 0.10
(0.014)
N.D.
N.D.
N.D.
N.D.
0.77 (0.136)
0.58
(0.065)
0.44 (0.217)
0.60 ± 0.10
(0.14)
N.D.
0.53 (0.065)
N.D.
0.18 ± 0.20 (0.14)
Treatmenta
RQ4086 (r)
(l)
RQ4104 (r)
(l)
10.69 (0.120)
14.01
(0.164)
12.07 (0.080)
8.07
(0.120)
4.51 (0.120)
6.51
(0.164)
5.58 (0.080)
2.54
(0.120)
1.09 (0.120)
0.82
(0.164)
3.01 (0.080)
0.65
(0.120)
N.D.
1.98 (0.164)
N.D.
N.D.
4.97 (0.098)
3.21
(0.059)
3.78 (0.064)
4.41
(0.071)
3.57 (0.098)
1.77
(0.059)
2.83 (0.064)
2.79
(0.071)
0.76 (0.098)
0.56
(0.059)
N.D.
1.00 (0.071)
0.84 (0.023)
N.A.
0.59 (0.007)
N.A.
0.35 (0.023)
N.A.
0.40 (0.007)
N.A.
N.D.
0.56 (0.033)
0.77
(0.179)
0.73 (0.050)
N.D.
N.D.
0.44 (0.170)
0.52
(0.050)
*Concentrations of cis-isomers of lutein and zeaxanthin have been combined with their corresponding all-trans isomers; tissue weights are in parentheses (g); a Right and left tissues have been designated with (r), (l), respectively; N.D., Not detected; N.A., Tissue not available for analysis.
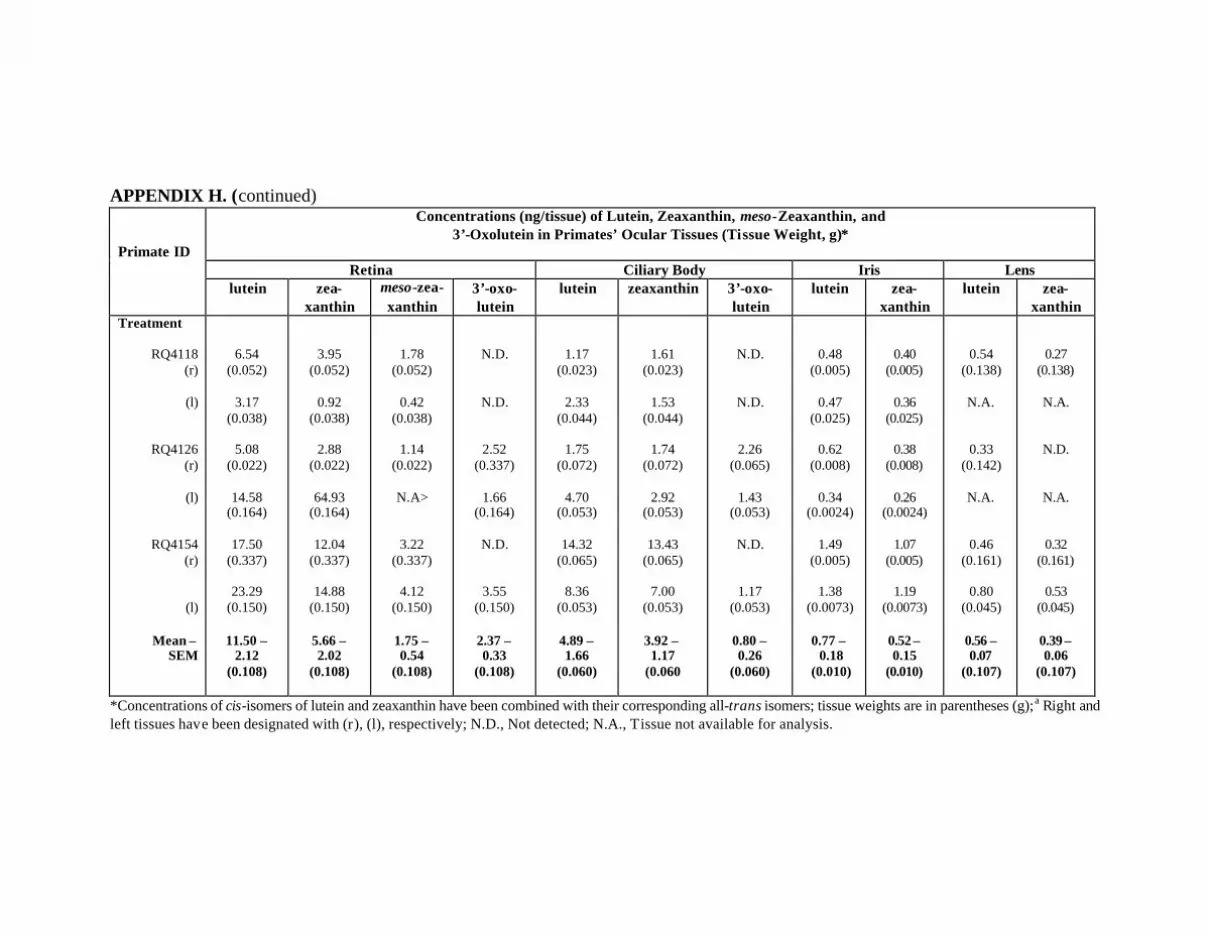
APPENDIX H. (continued)
Concentrations (ng/tissue) of Lutein, Zeaxanthin, meso-Zeaxanthin, and 3’-Oxolutein in Primates’ Ocular Tissues (Tissue Weight, g)*
Retina Ciliary Body Iris Lens
Primate ID
lutein zea-xanthin
meso-zea-xanthin
3’-oxo-lutein
lutein zeaxanthin 3’-oxo-lutein
lutein zea-xanthin
lutein zea-xanthin
Treatment
RQ4118 (r)
(l)
RQ4126 (r)
(l)
RQ4154 (r)
(l)
Mean ± SEM
6.54 (0.052)
3.17
(0.038)
5.08 (0.022)
14.58
(0.164)
17.50 (0.337)
23.29
(0.150)
11.50 ± 2.12
(0.108)
3.95 (0.052)
0.92
(0.038)
2.88 (0.022)
64.93
(0.164)
12.04 (0.337)
14.88
(0.150)
5.66 ± 2.02
(0.108)
1.78 (0.052)
0.42
(0.038)
1.14 (0.022)
N.A>
3.22 (0.337)
4.12
(0.150)
1.75 ± 0.54
(0.108)
N.D.
N.D.
2.52 (0.337)
1.66
(0.164)
N.D.
3.55 (0.150)
2.37 ± 0.33
(0.108)
1.17 (0.023)
2.33
(0.044)
1.75 (0.072)
4.70
(0.053)
14.32 (0.065)
8.36
(0.053)
4.89 ± 1.66
(0.060)
1.61 (0.023)
1.53
(0.044)
1.74 (0.072)
2.92
(0.053)
13.43 (0.065)
7.00
(0.053)
3.92 ± 1.17
(0.060
N.D.
N.D.
2.26 (0.065)
1.43
(0.053)
N.D.
1.17 (0.053)
0.80 ± 0.26
(0.060)
0.48 (0.005)
0.47
(0.025)
0.62 (0.008)
0.34
(0.0024)
1.49 (0.005)
1.38
(0.0073)
0.77 ± 0.18
(0.010)
0.40 (0.005)
0.36
(0.025)
0.38 (0.008)
0.26
(0.0024)
1.07 (0.005)
1.19
(0.0073)
0.52 ± 0.15
(0.010)
0.54 (0.138)
N.A.
0.33 (0.142)
N.A.
0.46 (0.161)
0.80
(0.045)
0.56 ± 0.07
(0.107)
0.27 (0.138)
N.A.
N.D.
N.A.
0.32 (0.161)
0.53
(0.045)
0.39 ± 0.06
(0.107)
*Concentrations of cis-isomers of lutein and zeaxanthin have been combined with their corresponding all-trans isomers; tissue weights are in parentheses (g); a Right and left tissues have been designated with (r), (l), respectively; N.D., Not detected; N.A., Tissue not available for analysis.
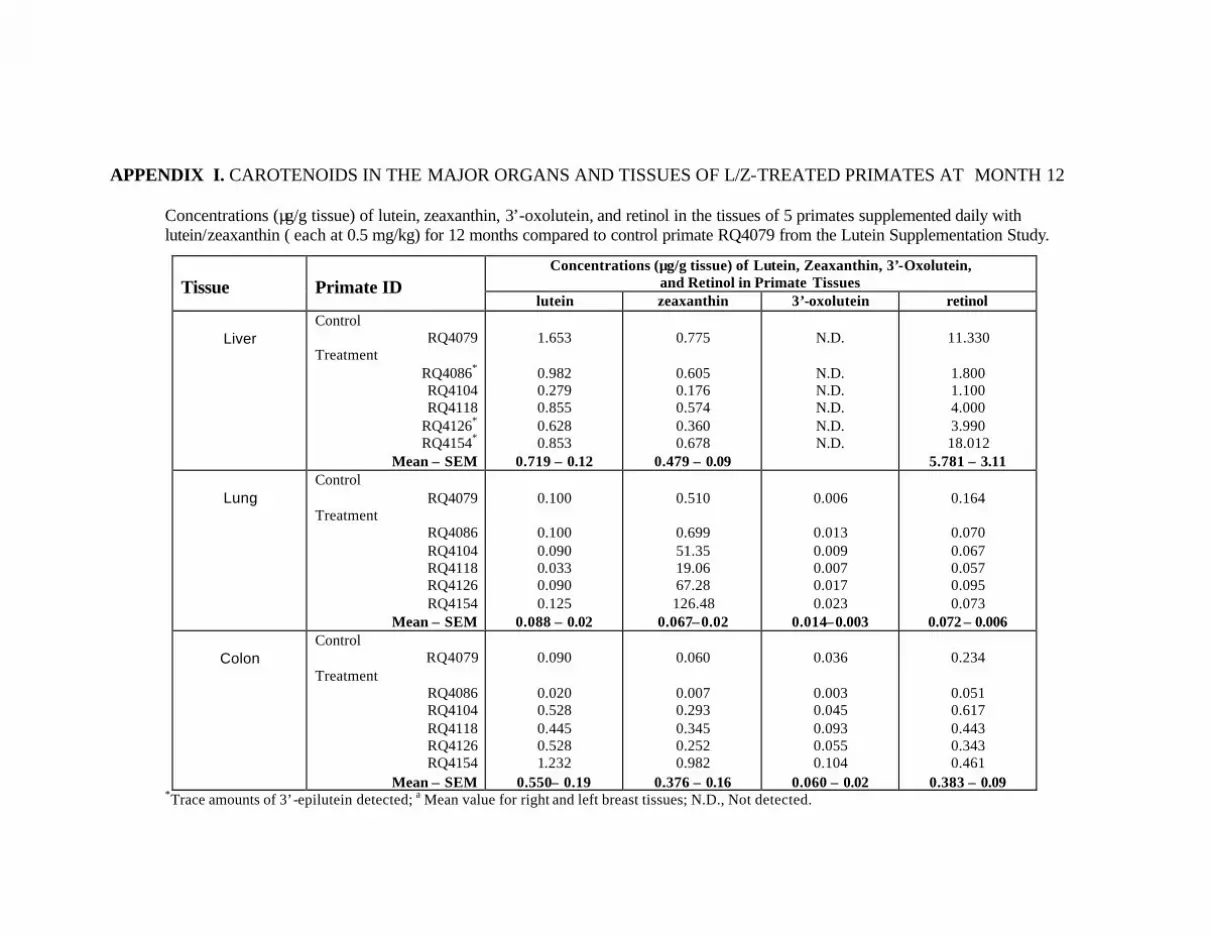
APPENDIX I. CAROTENOIDS IN THE MAJOR ORGANS AND TISSUES OF L/Z-TREATED PRIMATES AT MONTH 12
Concentrations (µg/g tissue) of lutein, zeaxanthin, 3’-oxolutein, and retinol in the tissues of 5 primates supplemented daily with lutein/zeaxanthin ( each at 0.5 mg/kg) for 12 months compared to control primate RQ4079 from the Lutein Supplementation Study.
Concentrations (µg/g tissue) of Lutein, Zeaxanthin, 3’-Oxolutein, and Retinol in Primate Tissues
Tissue
Primate ID
lutein zeaxanthin 3’-oxolutein retinol
Liver
Control RQ4079
Treatment RQ4086* RQ4104 RQ4118
RQ4126* RQ4154*
Mean ± SEM
1.653
0.982 0.279 0.855 0.628 0.853
0.719 ± 0.12
0.775
0.605 0.176 0.574 0.360 0.678
0.479 ± 0.09
N.D.
N.D. N.D. N.D. N.D. N.D.
11.330
1.800 1.100 4.000 3.990 18.012
5.781 ± 3.11
Lung
Control RQ4079
Treatment RQ4086 RQ4104 RQ4118 RQ4126 RQ4154
Mean ± SEM
0.100
0.100 0.090 0.033 0.090 0.125
0.088 ± 0.02
0.510
0.699 51.35 19.06 67.28 126.48
0.067±0.02
0.006
0.013 0.009 0.007 0.017 0.023
0.014±0.003
0.164
0.070 0.067 0.057 0.095 0.073
0.072 ± 0.006
Colon
Control RQ4079
Treatment RQ4086 RQ4104 RQ4118 RQ4126 RQ4154
Mean ± SEM
0.090
0.020 0.528 0.445 0.528 1.232
0.550± 0.19
0.060
0.007 0.293 0.345 0.252 0.982
0.376 ± 0.16
0.036
0.003 0.045 0.093 0.055 0.104
0.060 ± 0.02
0.234
0.051 0.617 0.443 0.343 0.461
0.383 ± 0.09 *Trace amounts of 3’-epilutein detected; a Mean value for right and left breast tissues; N.D., Not detected.
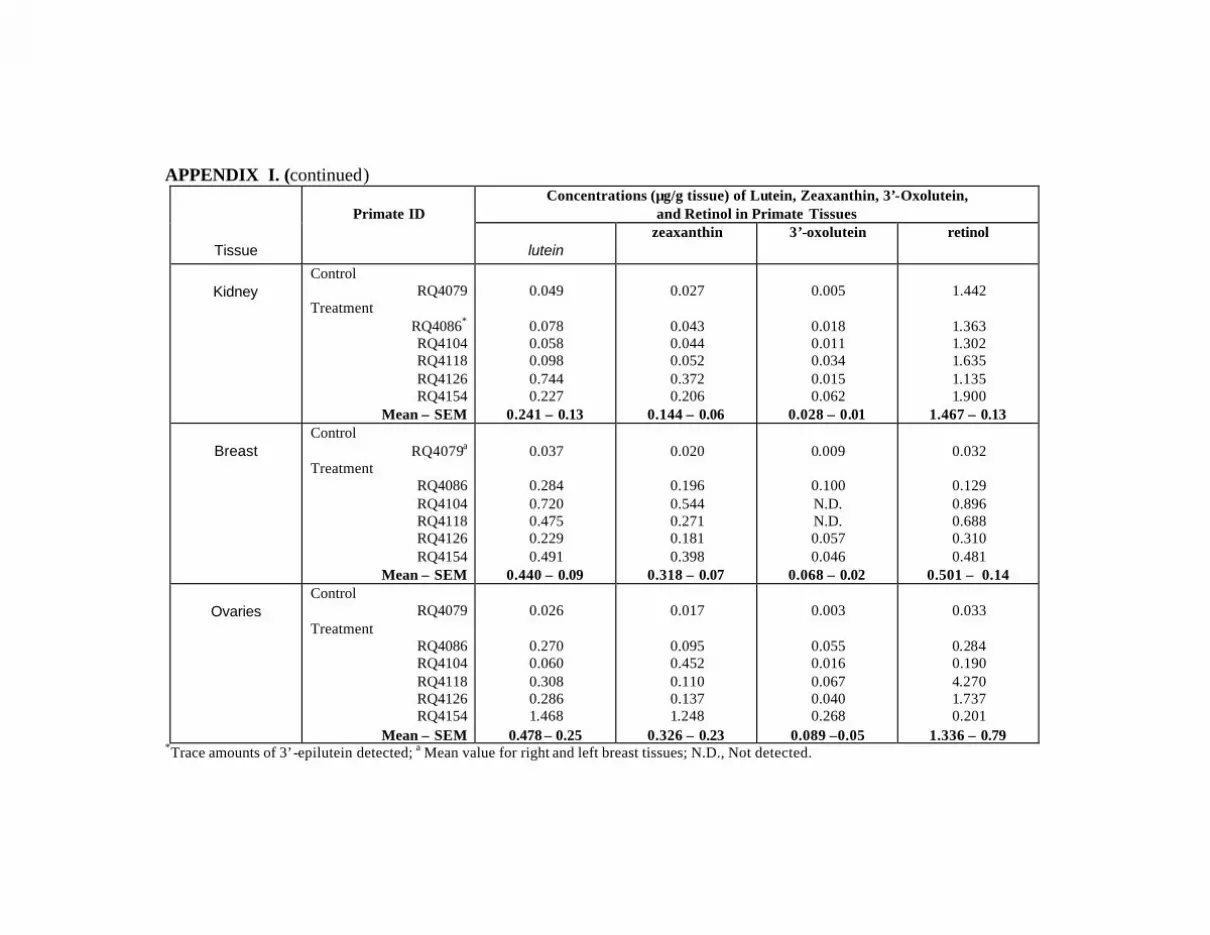
APPENDIX I. (continued) Concentrations (µg/g tissue) of Lutein, Zeaxanthin, 3’-Oxolutein,
and Retinol in Primate Tissues
Tissue
Primate ID
lutein zeaxanthin 3’-oxolutein retinol
Kidney
Control RQ4079
Treatment RQ4086* RQ4104 RQ4118 RQ4126 RQ4154
Mean ± SEM
0.049
0.078 0.058 0.098 0.744 0.227
0.241 ± 0.13
0.027
0.043 0.044 0.052 0.372 0.206
0.144 ± 0.06
0.005
0.018 0.011 0.034 0.015 0.062
0.028 ± 0.01
1.442
1.363 1.302 1.635 1.135 1.900
1.467 ± 0.13
Breast
Control RQ4079a
Treatment RQ4086 RQ4104 RQ4118 RQ4126 RQ4154
Mean ± SEM
0.037
0.284 0.720 0.475 0.229 0.491
0.440 ± 0.09
0.020
0.196 0.544 0.271 0.181 0.398
0.318 ± 0.07
0.009
0.100 N.D. N.D. 0.057 0.046
0.068 ± 0.02
0.032
0.129 0.896 0.688 0.310 0.481
0.501 ± 0.14
Ovaries
Control RQ4079
Treatment RQ4086 RQ4104 RQ4118 RQ4126 RQ4154
Mean ± SEM
0.026
0.270 0.060 0.308 0.286 1.468
0.478 ± 0.25
0.017
0.095 0.452 0.110 0.137 1.248
0.326 ± 0.23
0.003
0.055 0.016 0.067 0.040 0.268
0.089 ±0.05
0.033
0.284 0.190 4.270 1.737 0.201
1.336 ± 0.79 *Trace amounts of 3’-epilutein detected; a Mean value for right and left breast tissues; N.D., Not detected.
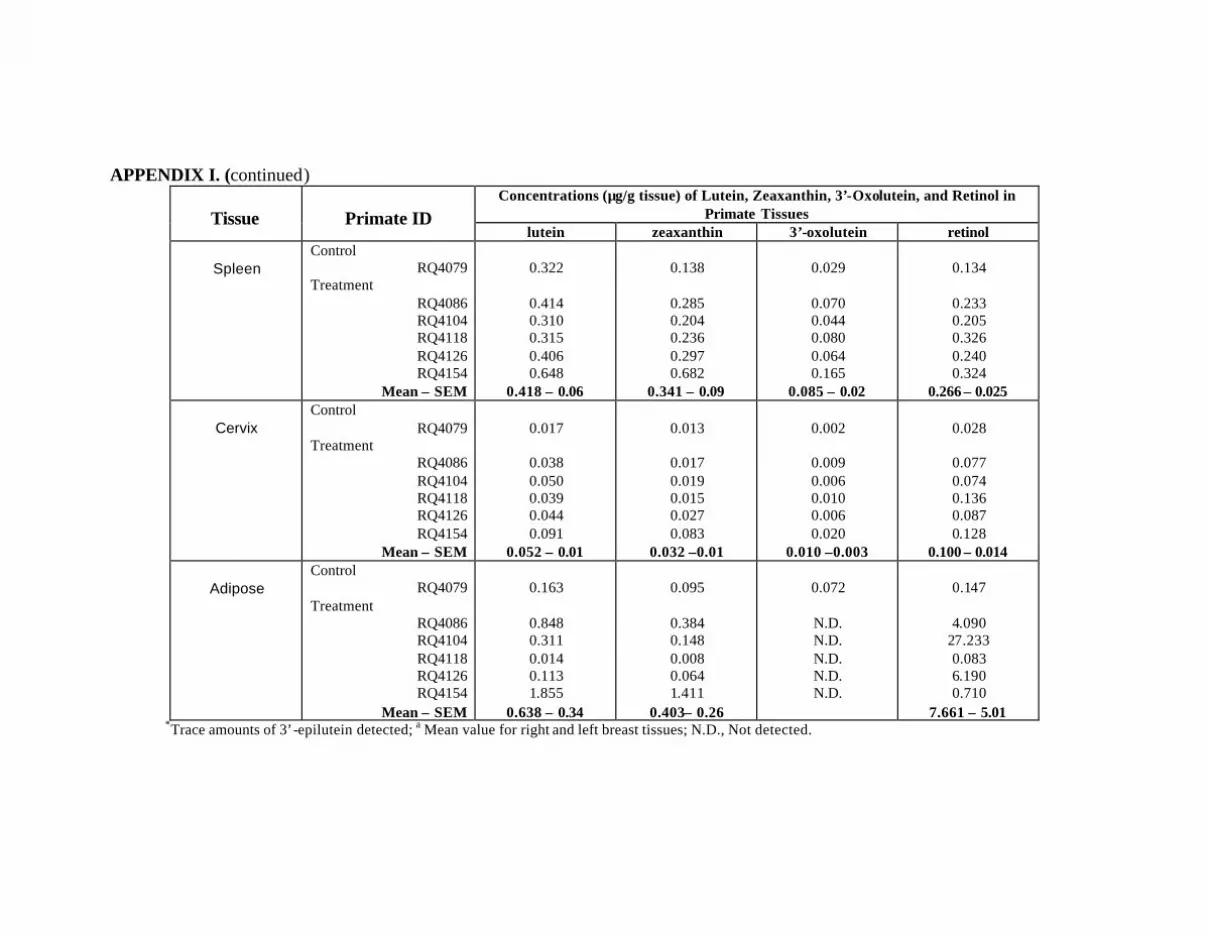
APPENDIX I. (continued) Concentrations (µg/g tissue) of Lutein, Zeaxanthin, 3’-Oxolutein, and Retinol in
Primate Tissues
Tissue
Primate ID lutein zeaxanthin 3’-oxolutein retinol
Spleen
Control RQ4079
Treatment RQ4086 RQ4104 RQ4118 RQ4126 RQ4154
Mean ± SEM
0.322
0.414 0.310 0.315 0.406 0.648
0.418 ± 0.06
0.138
0.285 0.204 0.236 0.297 0.682
0.341 ± 0.09
0.029
0.070 0.044 0.080 0.064 0.165
0.085 ± 0.02
0.134
0.233 0.205 0.326 0.240 0.324
0.266 ± 0.025
Cervix
Control RQ4079
Treatment RQ4086 RQ4104 RQ4118 RQ4126 RQ4154
Mean ± SEM
0.017
0.038 0.050 0.039 0.044 0.091
0.052 ± 0.01
0.013
0.017 0.019 0.015 0.027 0.083
0.032 ±0.01
0.002
0.009 0.006 0.010 0.006 0.020
0.010 ±0.003
0.028
0.077 0.074 0.136 0.087 0.128
0.100 ± 0.014
Adipose
Control RQ4079
Treatment RQ4086 RQ4104 RQ4118 RQ4126 RQ4154
Mean ± SEM
0.163
0.848 0.311 0.014 0.113 1.855
0.638 ± 0.34
0.095
0.384 0.148 0.008 0.064 1.411
0.403± 0.26
0.072
N.D. N.D. N.D. N.D. N.D.
0.147
4.090
27.233 0.083 6.190 0.710
7.661 ± 5.01 *Trace amounts of 3’-epilutein detected; a Mean value for right and left breast tissues; N.D., Not detected.
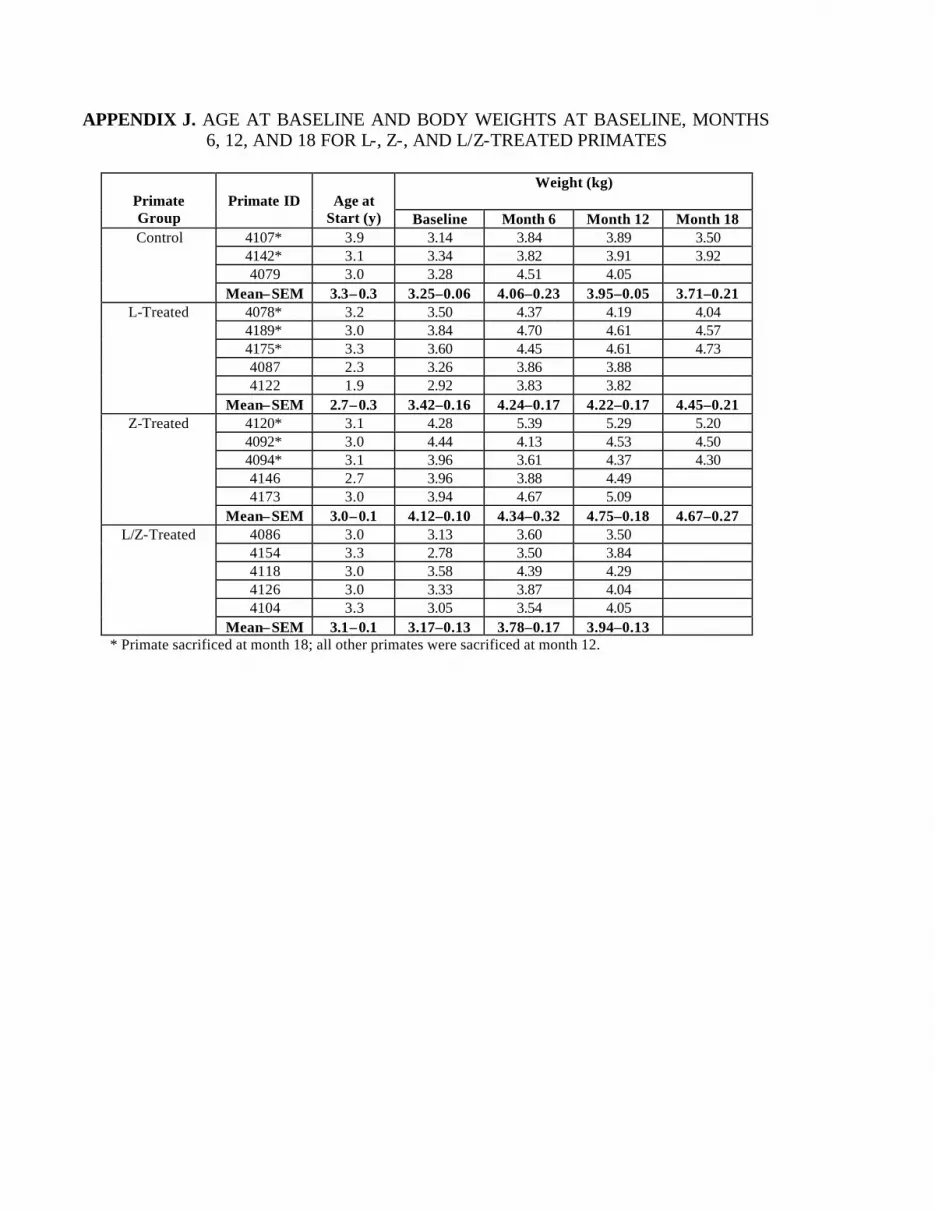
APPENDIX J. AGE AT BASELINE AND BODY WEIGHTS AT BASELINE, MONTHS 6, 12, AND 18 FOR L-, Z-, AND L/Z-TREATED PRIMATES
Weight (kg)
Primate Group
Primate ID
Age at
Start (y) Baseline Month 6 Month 12 Month 18 4107* 3.9 3.14 3.84 3.89 3.50 4142* 3.1 3.34 3.82 3.91 3.92 4079 3.0 3.28 4.51 4.05
Control
Mean±SEM 3.3±0.3 3.25±0.06 4.06±0.23 3.95±0.05 3.71±0.21 4078* 3.2 3.50 4.37 4.19 4.04 4189* 3.0 3.84 4.70 4.61 4.57 4175* 3.3 3.60 4.45 4.61 4.73 4087 2.3 3.26 3.86 3.88 4122 1.9 2.92 3.83 3.82
L-Treated
Mean±SEM 2.7±0.3 3.42±0.16 4.24±0.17 4.22±0.17 4.45±0.21 4120* 3.1 4.28 5.39 5.29 5.20 4092* 3.0 4.44 4.13 4.53 4.50 4094* 3.1 3.96 3.61 4.37 4.30 4146 2.7 3.96 3.88 4.49 4173 3.0 3.94 4.67 5.09
Z-Treated
Mean±SEM 3.0±0.1 4.12±0.10 4.34±0.32 4.75±0.18 4.67±0.27 4086 3.0 3.13 3.60 3.50 4154 3.3 2.78 3.50 3.84 4118 3.0 3.58 4.39 4.29 4126 3.0 3.33 3.87 4.04 4104 3.3 3.05 3.54 4.05
L/Z-Treated
Mean±SEM 3.1±0.1 3.17±0.13 3.78±0.17 3.94±0.13 * Primate sacrificed at month 18; all other primates were sacrificed at month 12.
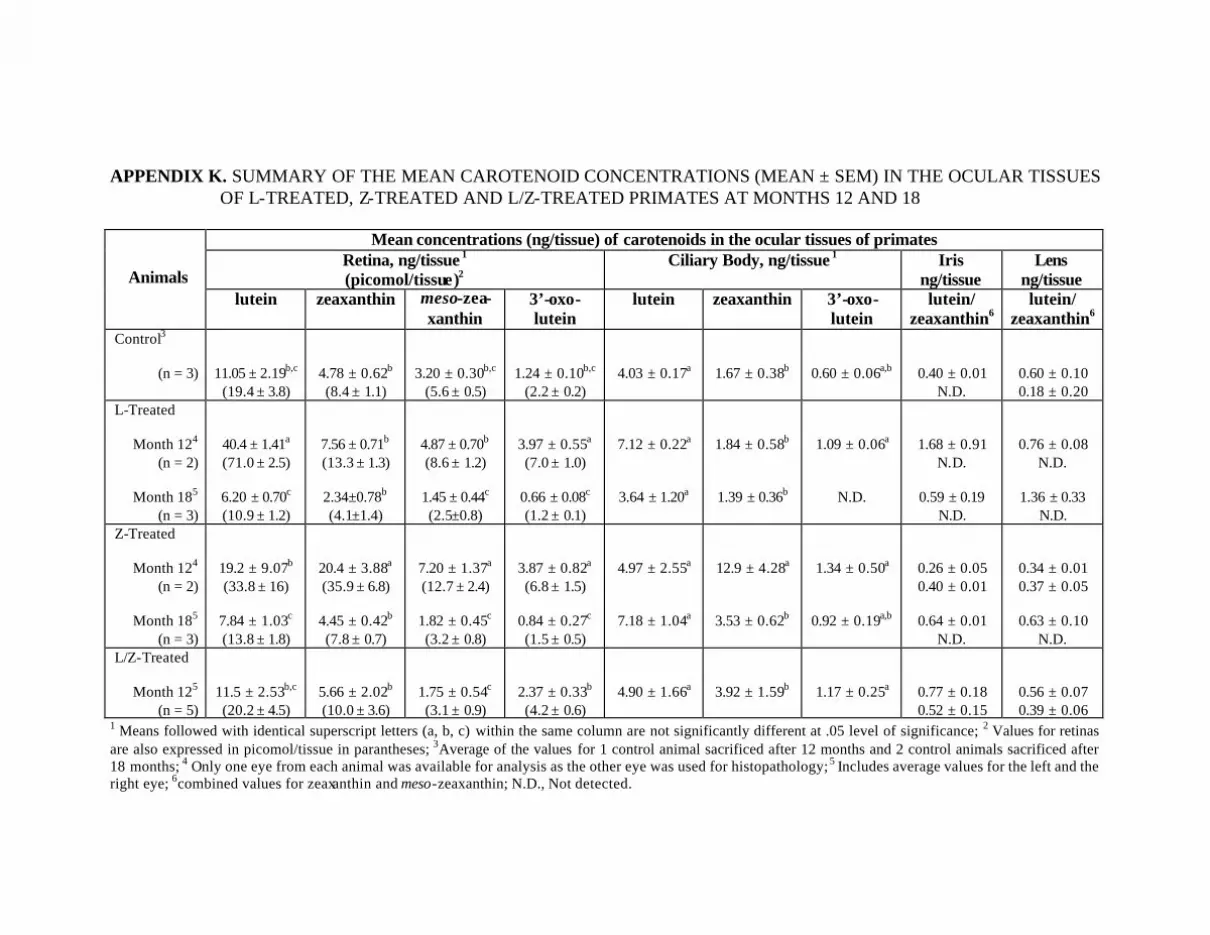
APPENDIX K. SUMMARY OF THE MEAN CAROTENOID CONCENTRATIONS (MEAN ± SEM) IN THE OCULAR TISSUES OF L-TREATED, Z-TREATED AND L/Z-TREATED PRIMATES AT MONTHS 12 AND 18
Mean concentrations (ng/tissue) of carotenoids in the ocular tissues of primates
Retina, ng/tissue 1 (picomol/tissue)2
Ciliary Body, ng/tissue 1 Iris ng/tissue
Lens ng/tissue
Animals lutein zeaxanthin meso-zea-
xanthin 3’-oxo-lutein
lutein zeaxanthin 3’-oxo-lutein
lutein/ zeaxanthin6
lutein/ zeaxanthin6
Control3
(n = 3)
11.05 ± 2.19b,c (19.4 ± 3.8)
4.78 ± 0.62b (8.4 ± 1.1)
3.20 ± 0.30b,c (5.6 ± 0.5)
1.24 ± 0.10b,c (2.2 ± 0.2)
4.03 ± 0.17a
1.67 ± 0.38b
0.60 ± 0.06a,b
0.40 ± 0.01 N.D.
0.60 ± 0.10 0.18 ± 0.20
L-Treated
Month 124 (n = 2)
Month 185
(n = 3)
40.4 ± 1.41a (71.0 ± 2.5)
6.20 ± 0.70c (10.9 ± 1.2)
7.56 ± 0.71b (13.3 ± 1.3)
2.34±0.78b (4.1±1.4)
4.87 ± 0.70b (8.6 ± 1.2)
1.45 ± 0.44c (2.5±0.8)
3.97 ± 0.55a (7.0 ± 1.0)
0.66 ± 0.08c (1.2 ± 0.1)
7.12 ± 0.22a
3.64 ± 1.20a
1.84 ± 0.58b
1.39 ± 0.36b
1.09 ± 0.06a
N.D.
1.68 ± 0.91 N.D.
0.59 ± 0.19
N.D.
0.76 ± 0.08 N.D.
1.36 ± 0.33
N.D. Z-Treated
Month 124 (n = 2)
Month 185
(n = 3)
19.2 ± 9.07b (33.8 ± 16)
7.84 ± 1.03c (13.8 ± 1.8)
20.4 ± 3.88a (35.9 ± 6.8)
4.45 ± 0.42b (7.8 ± 0.7)
7.20 ± 1.37a (12.7 ± 2.4)
1.82 ± 0.45c (3.2 ± 0.8)
3.87 ± 0.82a (6.8 ± 1.5)
0.84 ± 0.27c (1.5 ± 0.5)
4.97 ± 2.55a
7.18 ± 1.04a
12.9 ± 4.28a
3.53 ± 0.62b
1.34 ± 0.50a
0.92 ± 0.19a,b
0.26 ± 0.05 0.40 ± 0.01
0.64 ± 0.01
N.D.
0.34 ± 0.01 0.37 ± 0.05
0.63 ± 0.10
N.D. L/Z-Treated
Month 125 (n = 5)
11.5 ± 2.53b,c (20.2 ± 4.5)
5.66 ± 2.02b (10.0 ± 3.6)
1.75 ± 0.54c (3.1 ± 0.9)
2.37 ± 0.33b (4.2 ± 0.6)
4.90 ± 1.66a
3.92 ± 1.59b
1.17 ± 0.25a
0.77 ± 0.18 0.52 ± 0.15
0.56 ± 0.07 0.39 ± 0.06
1 Means followed with identical superscript letters (a, b, c) within the same column are not significantly different at .05 level of significance; 2 Values for retinas are also expressed in picomol/tissue in parantheses; 3Average of the values for 1 control animal sacrificed after 12 months and 2 control animals sacrificed after 18 months; 4 Only one eye from each animal was available for analysis as the other eye was used for histopathology; 5 Includes average values for the left and the right eye; 6combined values for zeaxanthin and meso-zeaxanthin; N.D., Not detected.
139
REFERENCES
AREDS. Risk factors associated with age-related macular degeneration: a case-control study in the Age-Related Eye Disease Study, report number 3. Ophthalmol. 2000; 107:2224−2232. Beatty S, Boulton M, Henson D, Koh H-H, Murray IJ. Macular pigment and age-related macular degeneration. Br J Ophthalmol. 1999; 83:867−877. Beatty S, Boulton M, Henson D, Koh H-H, Murray IJ. Macular pigment and risk for age-related macular degeneration in subjects from a Northern European population. Invest Ophthalmol Vis Sci. 2001; 42:439−446. Bernstein PS, Balashov NA, Tsong ED, Rando RR. Retinal tubulin binds macular carotenoids. Invest Ophthalmol Vis Sci. 1997; 38:167−175. Bernstein PS, Khachik F, Carvalho LS, Muir GJ, Zhao DY, Katz NB. Identification and quantification of carotenoids and their metabolites in the tissues of the human eye. Exp Eye Res. 2001; 72:215–223. The Blue Mountains Eye Study. Smoking and the 5-year incidence of age-related maculopathy. Arch Ophthalmol. 2002; 120:1357−1363. Bok D. Evidence for an inflammatory process in age-related macular degeneration gains new support. PNAS. 2005; 20:7053−7054. Bone RA, Landrum JT, Tarsis SL. Preliminary identification of the human macular pigment. Vision Res. 1985; 258: 1531–35. Bone RA, Landrum JT, Fernandez L, Tarsis SL. Analysis of the macular pigment by HPLC: retinal distribution and age study. Invest Ophthalmol Vis Sci. 1988; 29:843–849. Bone RA, Landrum JT. Distribution of macular pigment components, zeaxanthin and lutein, in human retina. In: Packer L, ed., Methods in Enzymology. San Diego: Academic Press, 1992, 213A:360–366. Bone RA, Landrum JT, Hime GW, Cains A, Zamor J. Stereochemistry of the human macular carotenoids. Invest Ophthalmol Vis Sci. 1993; 34:2033−2040. Britton, George. UV/Visible Spectroscopy. In: Britton et al., eds., Carotenoids, Vol. 1B: Spectroscopy. Basel: Birkhauser Verlag, 1995, 13−62. Chew EY, Ferris FL III, deMonasterio FM, Thompson DJ, Kim J, Csaky CG, Woods M, Khachik F, Bone R, Landrum J. Dose ranging study of lutein supplementation in persons
140
over age 60. Association for Research in Vision and Ophthalmology (ARVO): Fort Lauderdale, Florida, May 4−9, 2003. Chug-Ahuja JK, Holden JM, Forman MR, Mangels AR, Beecher GR, Lanza E. The development and application of a carotenoid database for fruits, vegetables, and selected multicomponent foods. J Am Diet Assoc. 1993; 93:318−323. Crissey SD, Barr JE, Slifka KA et al. Serum concentrations of lipids, vitamins A and E, vitamin D metabolites, and carotenoids in nine primate species at four zoos. Zoo Biol. 1999; 18:551−564. Delcourt C, Diaz J, Ponton-Sanchez A, Papoz L. Smoking and age-related macular degeneration: The POLA Study. Arch Ophthalmol. 1998; 116:1031−1035. The Eye-Disease Case Control Study Group. Risk factors for neovascular age-related macular degeneration. Arch Ophthalmol. 1992; 110:1701–1708. The Eye-Disease Case Control Study Group. Antioxidant status and neovascular age-related macular degeneration. Arch Ophthalmol. 1993; 111:104–109. Friedman DS, Katz J, Bressler NM, Rahmani B, Tielsch JM. Racial differences in the prevalence of age-related macular degeneration: the Baltimore Eye Survey. Ophthalmol. 1999; 106(6):1049−1055. Gale CR, Hall NF, Phillips DIW, Martyn CN. Lutein and zeaxanthin status and risk of age-related macular degeneration. Invest Ophthalmol Vis Sci. 2003; 44:2461−2465. Gruber M, Chappell R, Millen A, LaRowe T, Moeller SM, Iannoccone A, Kritchevsky SB, Mares J. Correlates of Serum Lutein + Zeaxanthin: Findings from the Third National Health and Nutrition Examination Survey. J Nutr. 2004; 134: 2387–2394. Hageman GS, Anderson DH, Johnson LV, Hancox LS, Taiber AJ, Hardisty LI, Hageman JL, Stockman HA, Borchardt JD, Gehrs KM, Smith RJH, Silvestri G, Russell SR, Klaver CCW, Barbazetto I, Chang S, Yannuzzi LA, Barile GR, Merriam JC, Smith RT, Olsh AK, Bergeron J, Zernant J, Merriam JE, Gold B, Dean M, Allikmets R. A common haplotype in the complement regulatory gene factor H (HF1/CFH) predisposes individuals to age-related macular degeneration. PNAS 2005; 20:7227–7232. Hammond BR, Curran-Celentano J, Judd S, Fuld K, Krinsky NI, Wooten BR, Snodderly DM. Sex differences in macular pigment optical density: relation to plasma carotenoid concentrations and dietary patterns. Vision Res. 1996; 36:2001−2012. Hammond BR, Ciulla TA, Snodderly DM. Macular Pigment Density is Reduced in Obese Subjects. Invest Ophthalmol Vis Sci. 2002; 43:47–50.
141
Hammond CJ, Webster AR, Snieder H, Bird AC, Gilbert CE, Spector TD. Genetic influence on early age-related maculopathy. Ophthalmol. 2002; 109:730−736. Handelman GJ, Dratz EA, Reay CC, van Kuijk FJGM. Carotenoids in the human macula and whole retina. Invest Ophthalmol Vis Sci. 1988; 29:850–855. Handelman GJ, Nightingale ZD, Lichtenstein AH, Schaefer EJ, Blumberg JB. Lutein and zeaxanthin concentrations in plasma after dietary supplementation with egg yolk. Am J Clin Nutr. 1999; 70:247−251. Humphries JM, Khachick F. Distribution of lutein, zeaxanthin, and related geometrical isomers in fruit, vegetables, wheat, and pasta products. J Agric Food Chem. 2003; 51:1322−1327. Hyman L, He Q, Grimson R. Risk factors for age-related maculopathy. Invest Ophthalmol Vis Sci. 1992; 33:801. Hyman L, Schachat AP, He Q, Leske C. Hypertension, cardiovascular disease and age-relaed macular degeneration. Arch Ophthalmol. 2000; 117:351−358. Johnson PT, Lewis GP, Talaga KC, Brown MN, Kappel PJ, Fisher SK, Anderson DH, Johnson L. Drusen-associated degeneration in the retina. Invest Ophthalmol Vis Sci. 2003; 44:4481−4488. Johnson EJ, Neuringer M, Russell RM, Schalch W, Snodderly DM. Nutritional manipulation of primate retinas, III: Effects of lutein or zeaxanthin supplementation on adipose tissue and retina of xanthophylls- free monkeys. Invest Ophthalmol Vis Sci. 2005; 46:692−702. Kahn HA, Leibowitz HM, Ganley JP, Kini MM, Colton T, Nicherson RS, Dawber TR. The Framingham Eye Study II. Association of ophthalmic pathology with single variables previously measured in the Framingham Heart Study. Am J Epidemiol. 1977; 106:33−41. Khachik F, Beecher GR, Goli MB, Lusby WR, Smith JC. Separation and identification of carotenoids and their oxidation products in extracts of human plasma. Anal Chem. 1992a; 64:2111–2112. Khachik F, Englert G, Daitch CE, Beecher GR, Lusby WR, Tonucci LH. Isolation and structural elucidation of the geometrical isomers of lutein and zeaxanthin in extracts from human plasma. J Chromatogr Biomed Appl. 1992b; 582:153-166. Khachik F, Beecher GR, Smith JC Jr. Lutein, lycopene, and their oxidative metabolites in chemoprevention of cancer. J Cellular Biochem. 1995; 22:236–246.
142
Khachik F, Bernstein PS, Garland DL. Identification of lutein and zeaxanthin oxidation products in human and monkey retinas. Invest Ophthalmol Vis Sci. 1997a; 38:1802–1811. Khachik F, Spangler CJ, Smith JC Jr., Canfield LM, Pfander H, Steck A. Identification , quantification, and relative concentration of carotenoids, their metabolites in human milk and serum. Anal Chem. 1997b; 69:1873–1881. Khachick F, Steck A, Pfander H. Bioavailability, metabolism, and possible mechanism of chemoprevention by lutein and lycopene in humans. In: H Ohigashi, T Osawa, J Terao, S Watanabe, T Yoshikawa, eds., Food Factors for Cancer Prevention. Tokyo: Springer-Verlag, 1997c:542–547. Khachik F, Askin FB, Lai K. Distribution, bioavailability, and metabolism of cartotenoids in humans. In: Bidlack WR, Omaye ST, Meskin MS, Jahner D, eds. Phytochemicals, a New Paradigm. Lancaster, PA: Technomic; 1998:77–96. Khachik F, de Moura FF, Zhao D, Aebischer C, Bernstein PS. Transformation of selected carotenoids in plasma, liver, and ocular tissues of humans and in nonprimate animal models. Invest Opthalmol Vis Sci. 2002; 43:3383−3392. Khachik F. An efficient conversion of (3R,3’R,6’R)- lutein to (3R,3’S,6’R)- lutein (3’-epilutein) and (3R,3’R)-zeaxanthin. J Nat Prod. 2003; 66:67–72. Kirschfield K. Carotenoid pigments: their possible role in protecting against photo-oxidation in eyes and photoreceptor cells. Proc Royal Soc London [Biol]. 1982; 216:71−85. Klein R, Klein BE, Linton KLP. Prevalence of age-related maculopathy: the Beaver Dam Eye Study. Ophthalmol. 1992; 99:933−943. Klein ML, Mauldin WM, Stoumbos VD. Heredity and age-related macular degeneration. Observations in monozygotic twins. Arch Ophthalmol. 1994; 112:932−937. Klein R, Clegg L, Cooper LS, Hubbard LD, Klein BEK, King WN, Folsom AR. Prevalence of age-related maculopathy in the atherosclerosis risk in communities study. Arch Ophthalmol. 1999; 117:1203−1210. Klein BEK, Klein R, Lee KE, Jensen SC. Measures of obesity and age-related eye diseases. Ophthalmic Epidemiol. 2001; 8:251–262. Klein R, Klein BEK, Tomany SC, Meuer SM, Huang G-H. The Beaver Dam Eye Study. Ten-year incidence and progression of age-related maculopathy. Ophthalmol. 2002; 109:1767−1779.
143
Klein R, Klein B, Tomany SC, Cruickshanks KJ. The association of cardiovascular disease with the long-term incidence of age-related maculopathy. The Beaver Dam Eye Study. Ophthalmology. 2003a; 110:636−643. Klein R, Klein BEK, Marino EK, Kuller LH, Furberg C, Burke GL, Hubbard LD. Early age-related maculopathy in the cardiovascular health study. Ophthalmol. 2003b; 110:25−33. Klein R.J, Zeiss C, Chew EY, Tsai J-Y, Sackler RS, Haynes C, Henning AK, SanGiovanni JP, Mane SM, Mayne ST, Bracken MB, Ferris FL, Ott J, Barnstable C, Hoh J. Complement Factor H Polymorphism in Age-Related Macular Degeneration. Science 2005; 308:385–389. Krinsky NI. Antioxidant functions of carotenoids. Free Radical Biology and Medicine. 1989; 7(6): 617−635. Landrum JT, Bone RA, Kilburn MD. The macular pigment: a possible role in protection from age-related macular degeneration. Adv Pharmacol. 1997a; 38:537−556. Landrum JT, Bone RA, Joa H, Kilburn MD, Moore LL, Sprague KE. A one year study of the macular pigment: the effect of 140 days of a lutein supplement. Exp Eye Res. 1997b; 65:57−62. Landrum JT, Bone RA. Mini review: lutein, zeaxanthin, and the macular pigment. Arch Biochem Biophys. 2001; 385:28−40. Leung IYF, Tso MOM, Li WWY, Lam TT. Absorption and tissue distribution of zeaxanthin and lutein in rhesus monkeys after taking Fructis lycii (Gou Qi Zi) extract. Invest Ophthalmol Vis Sci. 2001; 42:466–471. Leung IYF, Sandstorm MM, Zucker CL, Neuringer M, Snodderly DM. Nutritional manipulation of primate retinas, II: Effects of age, n-3 fatty acids, lutein, and zeaxanthin on retinal pigment epithelium. Invest Ophthalmol Vis Sci. 2004; 45(9):3244–3256. Leung IYF, Sandstorm MM, Zucker CL, Neuringer M, Snodderly DM. Nutritional manipulation of primate retinas, IV: Effects of age, n-3 fatty acids, lutein, and zeaxanthin on S-cones and rods in the foveal region. Exp. Eye Res. 2005; 81:513–529. Liebler DC, Stratton SP, Kaysen KL. Antioxidant actions of β-carotene in liposomal and microsomal membranes: Role of carotenoid-membrane incorporation and α-tocopherol. Arch Biochem Biophys. 1997; 338:244−250. Malek G, Johnson LV, Mace BE, Saloupis P, Schmechel DE, Rickman DW, Toth CA, Sullivan P.M., Bowes Rickman C. Apolipoprotein E allele-dependent pathogenesis: A model for age-related retinal degeneration. PNAS 2005; 102:11900–11905.
144
Malinow MR, Feeney-Burns L, Peterson LH, Klein ML, Neuringer M. Diet-related macular anomalies in monkeys. Invest. Opthalmol Vis Sci. 1980; 19:857–863. Mangels AR, Holden JM, Beecher GR, Former MR, Lanza E. Carotenoid content of fruits and vegetables: an evaluation of analytic data. J Am Diet Assoc. 1993; 93:284−296. Mares-Perlman JA, Brady WE, Klein R, VandenLangenbert GM, Klein BE, Palta M. Dietary fat and age-related maculopathy. Arch Ophthalmol. 1995a; 113:743−748. Mares-Perlman JA, Brady WE, Klein R, Klein BEK, Bowen P, Stacewicz-Sapuntzakis M, Palta M. Serum antioxidants and age-related macular degeneration in a population-based control study. Arch Ophthalmol. 1995b; 113:1518−1523. Mares-Perlmen JA, Klein R. Diet and age-related macular degeneration. Taylor A, ed., Nutritional and Environmental Influences on the Eye. Boca Raton, FL: CRC Press, 1999:215−250. Meyers SM, Zachary AA. Monozygotic twins with age-related macular degeneration. Arch Ophthalmol. 1988; 106:651−653. Mitchell P, Smith W, Wang JJ. Iris color, skin sun sensitivity, and age-related maculopathy−The Blue Mountains Eye Study. Ophthalmol. 1998; 105:1359−1363. Moura FF, Khachik F, Chew EY, Csaky K, Ferris FL, Sran PK, Dabas K. Dose ranging study of lutein supplementation in humans over 60 with and without age-related macular degeneration. Doctorate of Philosophy Dissertation of the Graduate School of the University of Maryland, College Park, Maryland, 2004. National Eye Insitute (NEI). Age-Related Eye Disease Study Results. National Eye Institute website, <http://www.nei.nih.gov/ amd/index.asp> (last visited Dec. 22, 2004). Neuringer M, Sandstorm MM, Johnson EJ, Snodderly DM. Nutritional manipulation of primate retinas, I: Effects of lutein or zeaxanthin supplements on serum and macular pigment in xanthophylls-free Rhesus monkeys. Invest Ophthalmol Vis Sci. 2004; 45:3234−3243. Pieramici DJ, Bressler NM, Bressler SB, Schachat AP. Choroidal neovascularization in black patients. Arch Ophthalmol. 1994; 112:1043−1046. Prahlad S. Extent of awareness of age-related macular degeneration among elderly Americans. Master of Science Thesis of the Graduate School of the University of Maryland, College Park, Maryland, 2002. Prakash B, Larson AJ, Frederick JM, Southwick K, Thulin CD, Bernstein PS. Identification and characterization of a pi isoform of glutathione s-transferase (GSTP1) in as a zeaxanthin-binding protein in the macula of the human eye. J Biol Chem. 2004; 47:49447–49454.
145
Richer OD, William Stiles, et al. Double-masked, placebo-contolled, randomized trial of lutein and antioxidant supplementation in the intervention of atrophic age-related macular degeneration: the Veterans LAST study (Lutein and Antioxidant Supplementation Trial). Optometry. 2004; 75:216–230. Rosenthal OD, Thompson B. Awareness of age-related macular degeneration in adults: the results of a large-scale international survey. Optometry. 2003; 74:16–23. Sackett CS, Schenning S. The age-related eye disease study: The results of the clinical trial. Insight. 2002; 27:5−7. Schalch W. Carotenoids in the retina—a review of their possible role in preventing or limiting damage caused by light and oxygen. In: Emerit, I., Chance, B., eds., Free Radicals and Aging. Basel, Switzerland: Birkhauser Verlag, 1992, 280–298. Schalch W, Dayhaw-Barker P, Barker FM II. The Carotenoids of the Human Retina. In: Taylor A, ed., Nutritional and Environmental Influences on the Eye. Boca Raton, FL: CRC Press, 1999:215−250. Schmidt S, Saunders AM, De La Paz MA, Postel EA, Heinis RM, Agarwal A, Scott WK, Gilbert JR, McDowell JG, Bazyk A, Gass JDM, Haines JL, Pericak-Vance MA. Association of the Apolipoprotein E gene with age-related macular degeneration: Possible effect modification by family history, age, and gender. Mol Vis. 2000; 6: 287–293. Seddon JM, Ajani UA, Sperduto RD, Hiller R, Blair N, Burton TC, Farber MD, Gragoudas ES, Haller J, Miller DT, Yannuzzi LA, Willett W. Dietary carotenoids, vitamin A, C, and E, and advanced age-related macular degeneration. J Am Med Assoc. 1994; 272:1413–1420. Seddon JM, Rosner B, Sperduto RD, Yannuzzi L, Haller JA, Blair NP, Willett W. Dietary fat and risk for advanced age-related macular degeneration. Arch Ophthalmol. 2001; 119:1191−1199. Slifka KA, Bowen P, Stacewicz-Sapuntzakis M, Crissey SD. A survey of serum and dietary carotenoids in captive wild animals. J.Nutr. 1999; 129:380–390. Smith W, Mitchell P. Family history and age-related maculopathy: the Blue Mountains Eye Study. Austr. & New Zealand J Ophthalmol. 1998; 26:203−206. Smith W, Mitchell P, Leeder SRL. Dietary fat and fish intake and age-related maculopathy. Arch Ophthalmol. 2000; 118:401−404. Snodderly DM, Russett MD, Land RI, Krinsky NI. Plasma carotenoids of monkeys (Macaca fascilularis and Saimiri sciureus) fed a nonpurified diet. J Nutr. 1990; 120: 1663–16671.
146
Snodderly DM, Brown PK, Delori FC, Auran JD. The macular pigment. I. Absorbance spectra, localization, and discrimination from other yellow pigments in primate retinas. Invest Ophthalmol Vis Sci. 1984a; 25:660−673. Snodderly DM, Auran JD, Delori FC. The macular pigment. II. Spatial distribution in primate retinas. Invest Ophthalmol Vis Sci. 1984b; 25:674−685. Snodderly DM, Handelman GJ, Adler A. Distribution of individual macular pigment carotenoids in central retina of macaque and squirrel monkeys. Invest Ophthalmo Vis Sci. 1991; 32:268-279. Snodderly DM. Evidence for the protection against age-related macular degeneration by carotenoids and antioxidant vitamins. Am J Clin Nutr. 1995; 62(suppl):1448S−1461S. Snodderly DM, Shen B, Land RI, Krinsky NI. Dietary manipulation of plasma carotenoid concentration of squirrel monkeys (Saimiri sciureus). J Nutr. 1997; 127:122–129. Snow K, Seddon J. Do age related macular degeneration and cardiovascular disease share common antecedents? Opthalmic Epidemiol. 1999; 6:124−143. Tomany SC, Klein R, Klein BEK. The relationship between iris color, hair color, and skin sun sensitivity and the 10-year incidence of age-related maculopathy. Ophthalmol. 2003; 110:1526−33. Toyoda Y, Thomson LR, Langner A, Craft NE, Garnett KM, Nichols CR, Cheng KM, Dorey CK. Effect of dietary zeaxanthin on tissue distribution of zeaxanthin and lutein in quail. Invest Ophthalmol Vis Sci. 2002; 43:1210−1221. USDA National Nutrient Database for Standard Reference, Release 17: Lutein + Zeaxanthin (µg) content of selected foods per common measure, sorted by nutrient content. Available at <http://www.nal.usda.gov/fnic/foodcomp/Data/SR17/wtrank/sr17w338.pdf> (last visited Dec. 22, 2004). Van Kuijk FJGM, Siems WG, Sommerburg O. Carotenoid localization in human eye tissues. Invest Ophthalmol Vis Sci. 1997; 38(suppl):S1030. Vingerling JR, Dielemans I, Hofman A. The prevalence of age-related maculopathy in the Rotterdam Study. Ophthalmol. 1995; 102:205−210. Wald G. Human vision and the spectrum. Science. 1945; 101:653–658.


![<R^R] ?ReY efc_d <¶eR\R eRS]Vd Z_ >A - Daily Pioneer](https://img.dokumen.tips/doc/110x75/631e3fbc85e2495e150fd41e/rr-rey-efcd-err-ersvd-z-a-daily-pioneer.jpg)


