Embed Size (px)
Citation preview
Accepted Manuscript
Characterization of planar flaws by synthetic focusing of sound
beam using linear arrays
Paritosh Nanekar, Anish Kumar, T. Jayakumar
PII: S2214-6571(15)00002-7
DOI: 10.1016/j.csndt.2015.01.001
Reference: CSNDT 17
To appear in: Case Studies in Nondestructive Testing and Evaluation
Please cite this article in press as: Nanekar P, et al. Characterization of planar flaws by
synthetic focusing of sound beam using linear arrays. Case Stud Nondestruct Test Eval (2015),
http://dx.doi.org/10.1016/j.csndt.2015.01.001
This is a PDF file of an unedited manuscript that has been accepted for publication. As a
service to our customers we are providing this early version of the manuscript. The manuscript
will undergo copyediting, typesetting, and review of the resulting proof before it is published
in its final form. Please note that during the production process errors may be discovered which
could affect the content, and all legal disclaimers that apply to the journal pertain.
*Corresponding author. Tel: +91 22 25594867
Email: [email protected] (Paritosh Nanekar).
Characterization of Planar Flaws by Synthetic Focusing of Sound Beam
Using Linear Arrays
Paritosh Nanekara,*
, Anish Kumarb
and T Jayakumarb
aBhabha Atomic Research Centre, Trombay, Mumbai-400085, Maharashtra, India
bIndira Gandhi Centre for Atomic Research, Kalpakkam- 603102, Tamil Nadu, India
Abstract
Characterization of planar flaws by non-destructive evaluation is crucial from the point of
view of structural integrity assessment. An approach involving SAFT processing of B-scan
image collected by electronic scanning using linear array has been used for detection and
characterization of planar flaws. The study was carried out on stainless steel plate with slots
inclined at various orientations and carbon steel plates having implanted weld planar flaws.
The results of these investigations are presented in this paper.
Keywords: Phased array; SAFT; Planar Flaws; Flaw characterization
1.0 Introduction
Planar flaws are considered harmful from the point of view of structural integrity of the
pressurized components because of the stress concentration associated with them.
Manufacturing processes such as forging, rolling, welding, etc. can introduce planar flaws in
the component. Service induced flaws such as fatigue cracks and stress corrosion cracks are
also planar flaws. A crucial parameter determining the acceptability of a planar flaw is its
depth (height or through-wall dimension) [1]. The amplitude based ultrasonic methods for
flaw depth estimation are prone to errors primarily because of the fact that the signal
amplitude from a flaw is dependent on many factors not related to flaw depth such as
2
orientation, roughness, transparency and coupling efficiency [2]. Advanced ultrasonic based
approaches reply on locating the flaw extremities and hence are less prone to sizing errors.
The time-of-flight diffraction technique uses a separate transmitter and receiver and rely on
the time-of-flight of the diffracted signals from the flaw tips for depth sizing [3-4]. Synthetic
Aperture Focusing Technique (SAFT) aims at locating the flaw tips and improving signal to
noise ratio by carrying out post-processing of ultrasonic B-scan and C-scan images collected
using a divergent sound beam [5-6]. During processing, the sound beams are time shifted or
back propagated to the scattering source and averaged out using wave propagation formulae.
The signal amplitude at the defect location is highly improved due to constructive
interference, while at other locations the destructive interference of sound beam lead to huge
drop in signal amplitude [7-8].
In the present study, an approach combining linear arrays and SAFT has been employed for
characterization of planar flaws. The approach involves SAFT processing of B-scan image
collected during electronic scanning using a linear array. The results of flaw characterization on
a stainless steel plate with simulated planar flaws and carbon steel plates with weld planar flaws
are discussed in this paper
2.0 Array Based Ultrasonic Methods for Characterization of Planar Flaws
Linear arrays are increasingly being used for flaw detection and characterization in
engineering components. Conventional phased array is based on the use of focal laws to steer
and focus the sound beam [9-10]. Linear arrays with digital signal processing has also been
reported for flaw characterization [11]. In Full Matrix Capture (FMC), the raw B-Scan data
is collected by using a single element as transmitter and all elements as receivers [12-13].
Once the data is acquired using FMC, the imaging of the target region is done using Total
Focusing Method (TFM). With TFM, the region of interest is discretized into grids and the
3
beam is focused at every point in the grid by summing up the signals from all the elements in
an array. FMC approach leads to high resolution imaging for enhanced detection and sizing
of flaws. However, the data size becomes large, especially while dealing with an array with
large number of elements.
An approach combining a linear array with SAFT, named as SFLA, has been used in this
study. This approach offers many advantages. Firstly, since smaller element size can easily be
realized in a linear array transducer, one can achieve a good amount of beam divergence,
which is crucial for SAFT processing. Secondly, the near field length is limited to a very
short distance (less than a millimeter), thus ensuring that SAFT processing is effective for the
full thickness of the sample. Thirdly, by using the electronic scanning approach of phased
array, not only physical movement of the transducer is avoided, but it also ensures that the
raw data is collected at much smaller increments corresponding to the element pitch.
Another significant advantage is the huge reduction in the equipment cost as compared to the
one required for conventional phased array. Since only one channel is used for data
collection, a single channel multiplexed system, with a provision to connect large number of
array elements can replace the costly and bulky conventional phased array instrument. Use of
single element for transmission, may restrict the penetration of sound, especially in materials
with high sound attenuation, which could be a limitation of this approach. Also, since the
reception is by a single element and not by all, the signal-to-noise ratio is expected to be
inferior to FMC.
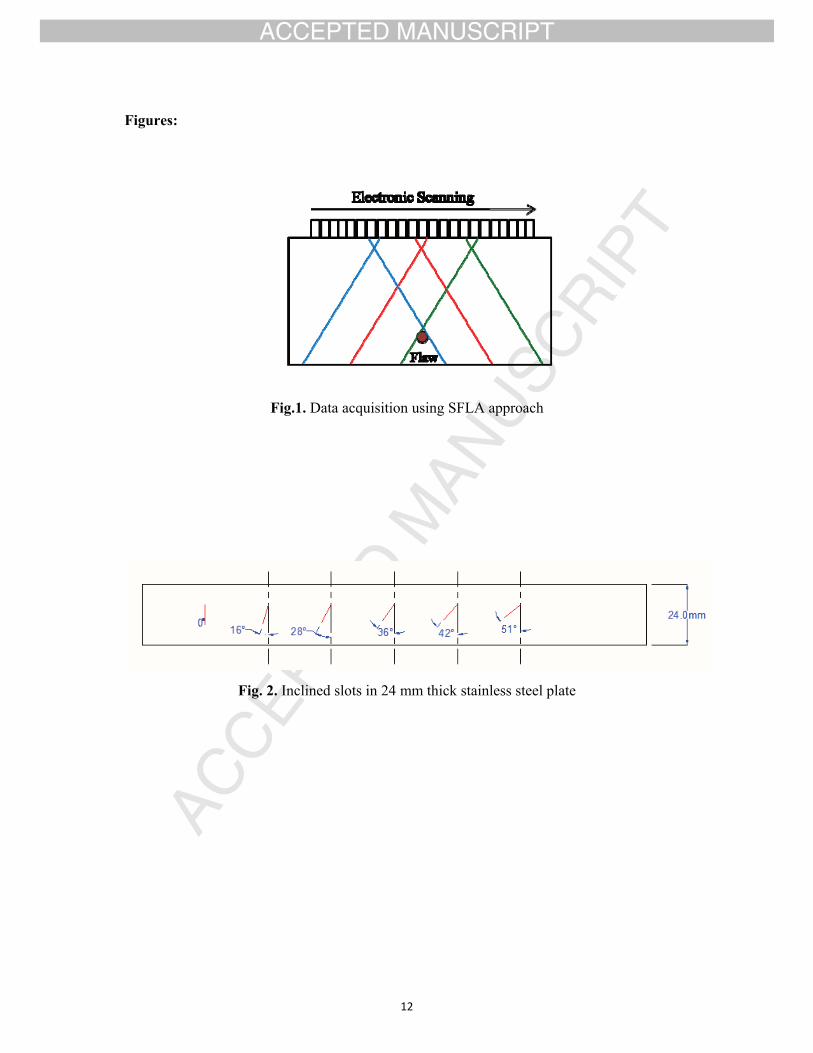
Fig. 1 schematically depicts the methodology followed for imaging of flaws using the SFLA
approach. A single element is used for transmission and reception. The raw B-scan image
collected during electronic scan by a divergent sound beam is processed by time based SAFT
algorithm.
4
3.0 Experimental Details
Six slots oriented at angles ranging from 0º to 51º, having 8.5 mm length, 2 mm width and 25
mm depth, were machined by electro-discharge machining in 24 mm thick stainless steel
plate from one of the faces, as shown in Fig. 2. These machine flaws represent fusion line
defects in the weld joints or cracks in forged and rolled products in carbon steel or low alloy
steel material. However, these inclined slots do not represent fusion-line defects in austenitic
stainless steel welds, as the influence of inhomogeneous and anisotropic microstructure needs
to be considered. Additionally, studies were carried out on carbon steel plates with embedded
weld flaws (Fig. 3) in the form of (a) Lack of fusion and (b) Root Crack. These are natural
flaws and have been intentionally produced during welding. The samples had surface finish
of better than 6 micron, which is stipulated in ASME Boiler and Pressure Vessel Code
Section [14].
The ultrasonic data was collected using M2M make Multi 2000 Phased Array system having
a configuration of 64 x 256. The data on the carbon steel weld samples was collected using a
10 MHz, 0.3 mm pitch, 128 elements linear array transducer. A 5 MHz, 0.6 mm pitch, 64
elements linear array was used for stainless steel plate. Specific software was developed in
LabVIEW®
for post-processing of the data using time-domain SAFT algorithm. To study the
effectiveness of SFLA approach for flaw characterization, the flaws were also imaged by
FMC + TFM approach using 64 parallel receivers.
4.0 Results and Discussions
4.1 Block 1: Stainless Steel plate with Inclined Slots
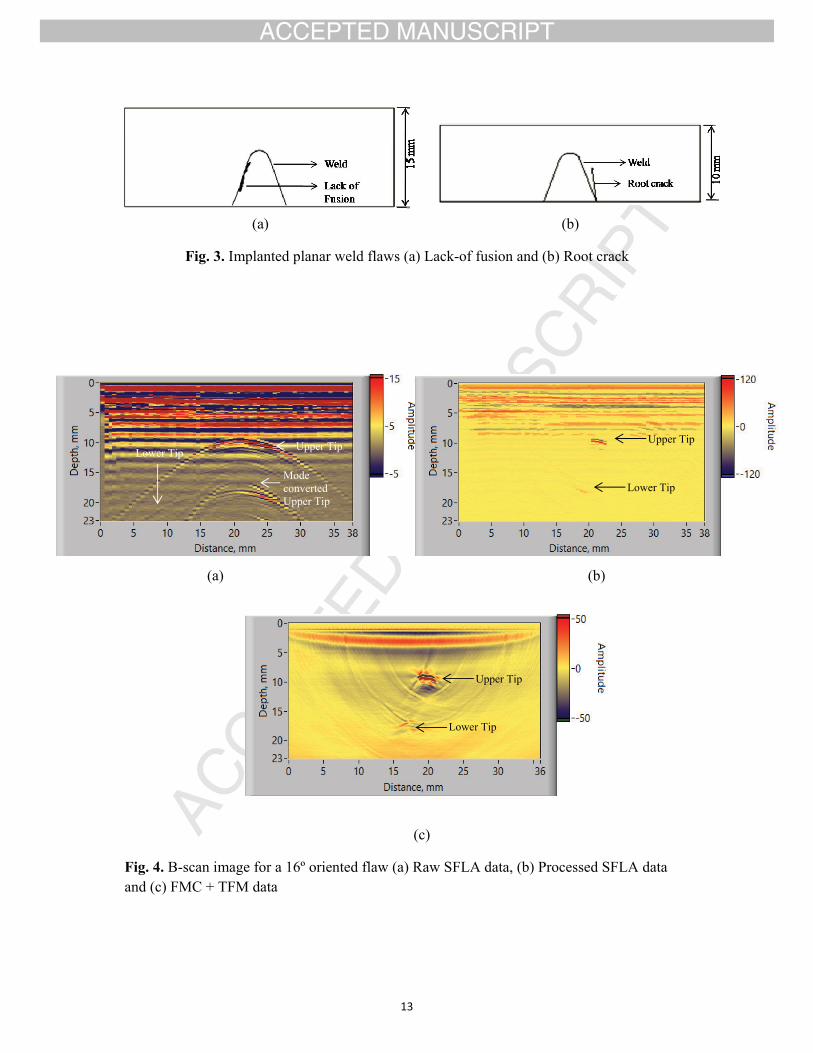
Fig. 4a shows the raw B-scan image for a 16º inclined slot in the stainless steel plate using
SFLA approach. From the image, one can see that the upper tip of the flaw shows a strong
signal over a wide range as it is seen by the sound beam emanating from all the elements.
5
Contrary to this, because of the flaw-tilt, the bottom tip signal is seen over a relatively narrow
range, as it is seen only by the elements which lie on one side of the flaw. The image also
shows a signal at approximately 1.5 times the time-of-flight of the signal corresponding to the
upper flaw tip. This signal is from the mode converted shear wave, which is generated when
the longitudinal wave is incident at the upper flaw tip. For the mode converted signal, the
sound beam travels in the longitudinal mode (L) during the onward path and as a shear wave
(S) during the return path. The velocity of shear wave is approximately half of that of the
longitudinal wave in a material. Hence, the time-of-flight of this signal (LS) is approximately
1.5 times the time-of-flight of the signal (LL) that travels as longitudinal wave, both during
onward and return path. The SAFT processed image is shown in Fig. 4b. During the SAFT
processing, the mode converted signal gets eliminated due to the averaging, leaving behind
only the LL signals from the upper and the lower tip of the flaws. From the SAFT processed
image, one can accurately locate the flaw extremities and evaluate the height of the flaw. One
can also find the orientation of the flaw with respect to the surface normal. Both these
parameters are vital for fitness-for-service assessment. The result obtained by FMC + TFM
approach for this flaw is shown in Fig. 4c.
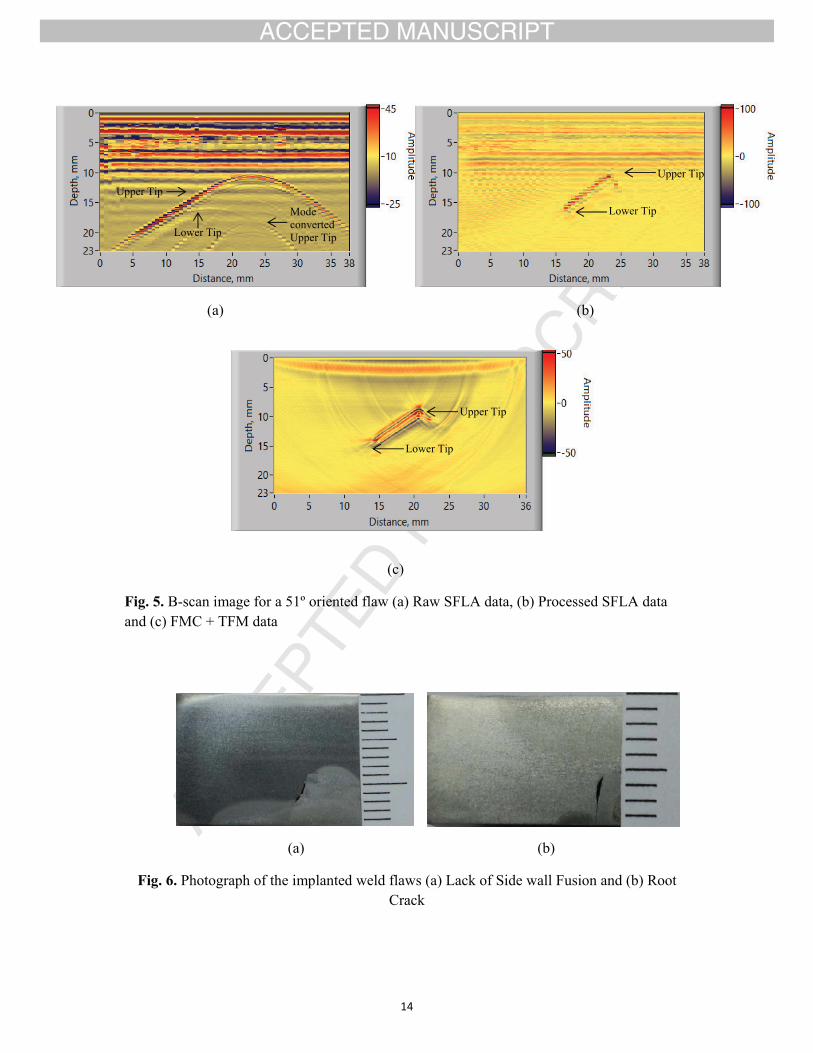
Fig. 5 shows the raw, SFLA and FMC+TFM B-scan images for a flaw oriented at 51º. The
processed images, in addition to the flaw tips, also show the flaw surface. When the divergent
sound beam is incident on the flaw, a part of the reflected sound beam goes back to the
receiving element since it is at near normal incidence to flaw surface. These signals are not
seen clearly in the raw data but appear prominently in the processed image. For flaw of lower
orientations (16º), the reflected signal from the flaw does not reach the receiving element due
to unfavorable angle of incidence as a result of which the flaw surface is not imaged and only
the extremities are seen.
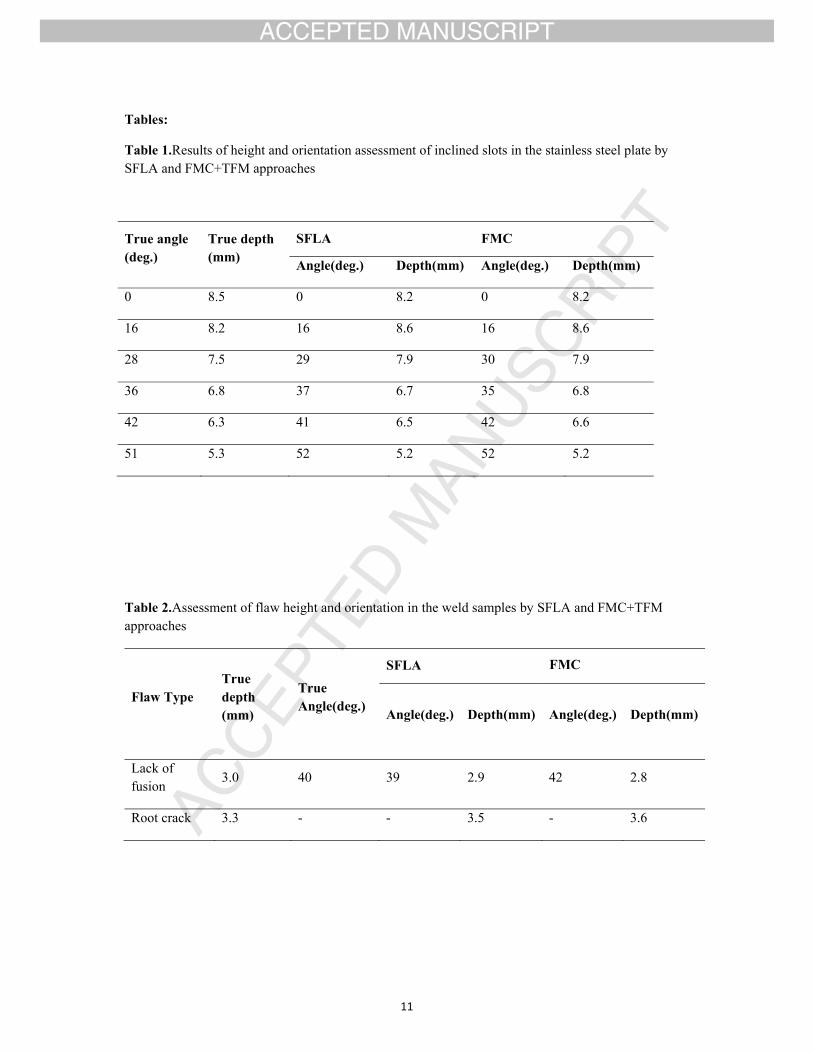
Table 1 shows the results of assessment of flaw height and flaw orientation by SFLA and
6
FMC + TFM approaches. The results obtained by SFLA approach are accurate and
comparable to the ones obtained by FMC+TFM approach.
4.2 Carbon Steel Plate with Embedded Weld Flaws
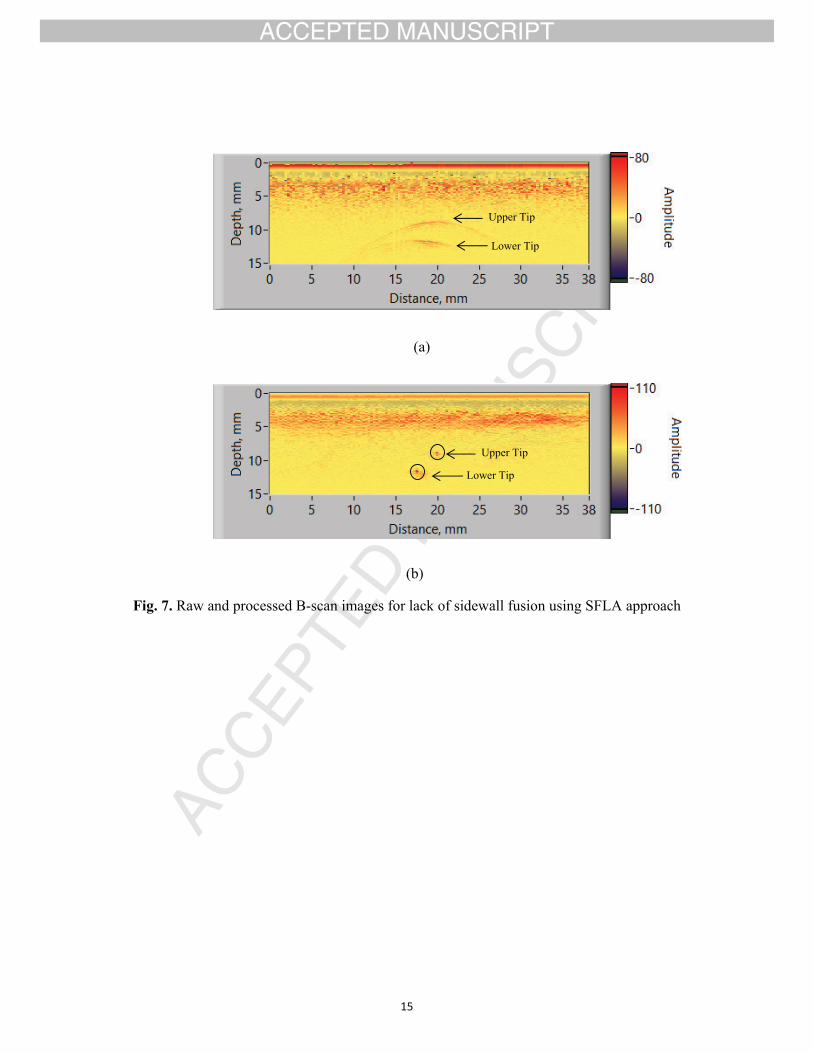
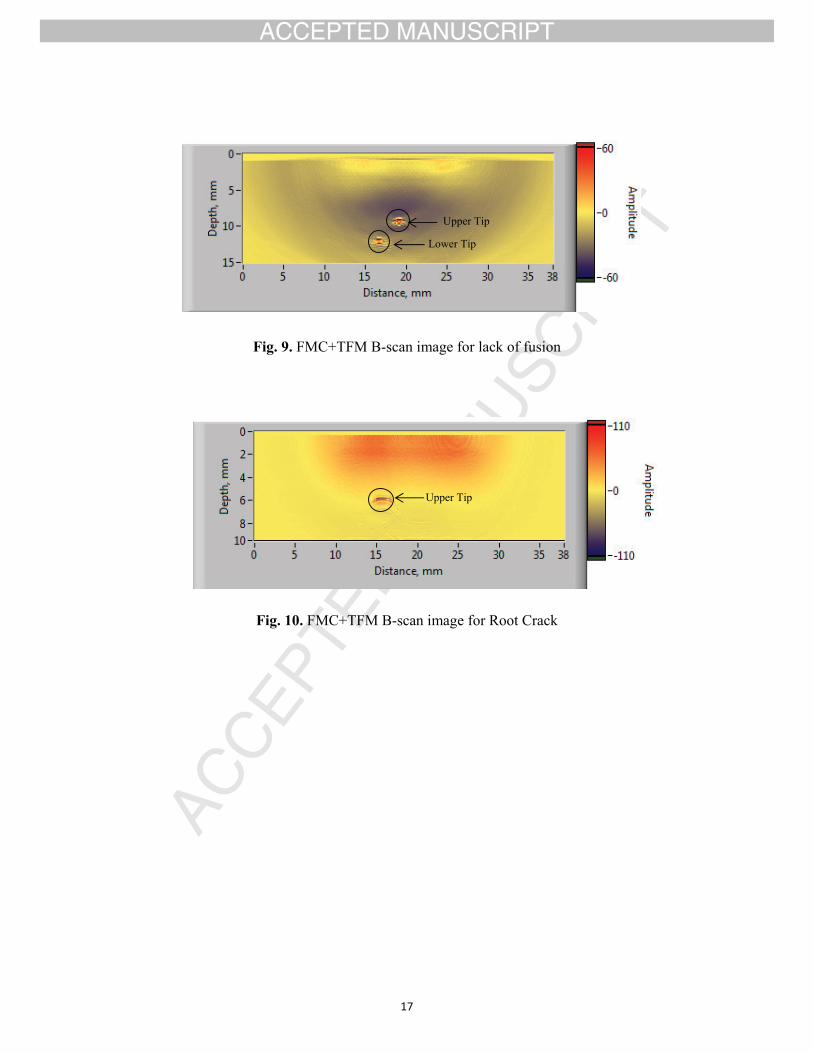
The weld flaws in the form of lack of side wall fusion and root crack were sized by SFLA
and FMC approach. The photographs for these flaws are shown in Fig. 6. The raw and
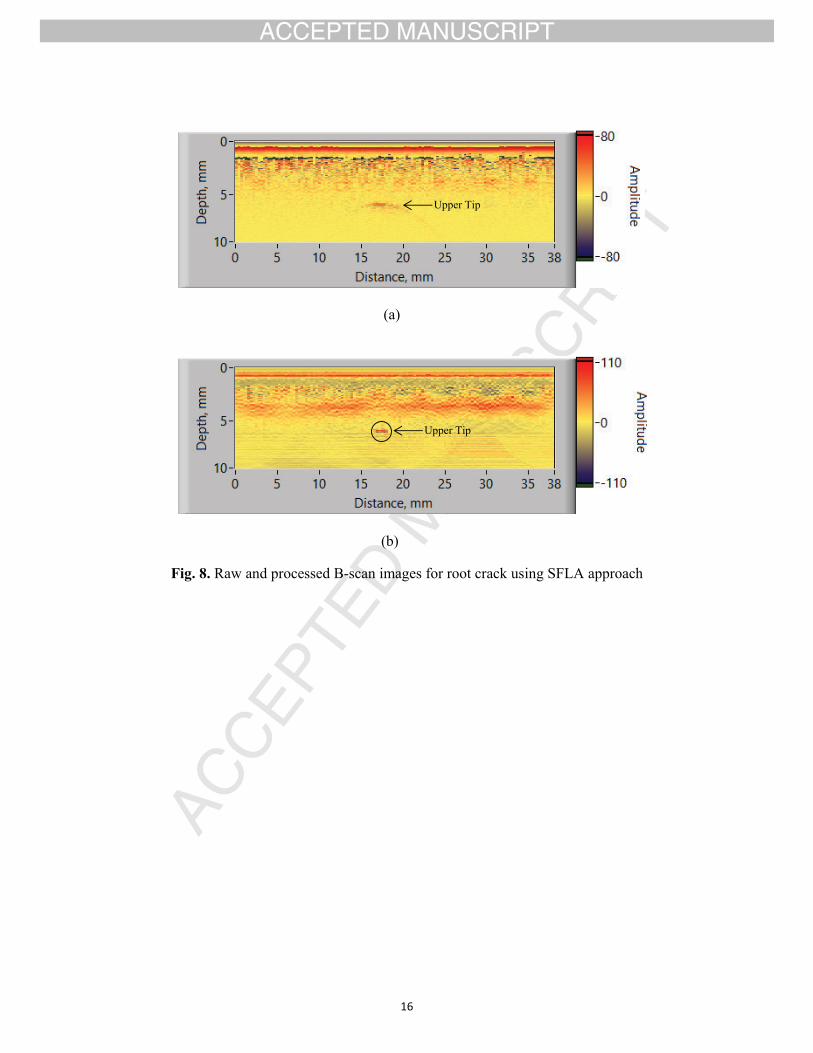
processed SFLA B-scan images for lack of sidewall fusion and root crack are shown in Figs.7
and 8, respectively. For the lack of sidewall fusion, the raw data clearly reveals two
hyperbolic indications, corresponding to the upper and the lower tips. These two signals are
reduced to two spots on SAFT processing. For the root crack, only the upper tip is visible,
since the flaw is open to the surface. In this case too, the well spread out signal from the
crack tip is reduced to a spot upon SAFT processing. The results of FMC+TFM for lack of
fusion and crack are shown in Figs. 9 and 10 respectively. The flaw tips are effectively
located with better signal to noise ratio as compared to SFLA approach.
The results of estimation of height and orientation of these flaws by SFLA and FMC+TFM
are summarized in Table 2. The above results indicate that SFLA is very effective for
characterization of weld flaws and hence can be used under factory conditions for inspection
of welds in various product forms. It also has a very good potential for characterization of
service induced cracks in vessels and pipelines. However, there is a need to carry out
extensive performance demonstration exercise to achieve the required level of confidence on
this approach.
5.0 Conclusions
Accurate characterization of planar flaws, in terms of orientation and depth, was carried out
using an approach combining a linear array and SAFT. The major advantages of this
approach are: (i) a single channel instrument with multiplexer is sufficient for data
7
acquisition, (ii) divergent sound beam because of small element size, and small pitch of an
array, results in effective SAFT processing and (iii) no computation of focal laws is required,
which is a must for conventional phased array. The approach involves SAFT processing of B-
scan data collected by divergent sound beam emanating from a single element of a linear
array. During this process, the signals from flaw extremities get enhanced and the un-wanted
mode converted signals are eliminated. Moreover, with this approach full-face mapping of
flaws, especially those which are oriented at higher angles, is possible. Results obtained using
SFLA approach on stainless steel plate with simulated planar flaws and carbon steel plates
with real weld planar flaws have shown good accuracy in assessment of flaw orientation and
flaw height, which are crucial parameters for fitness-for-service assessment.
Acknowledgments
The authors would like to acknowledge the help rendered by Ms. N. Jothilakshmi of AFD,
BARC in carrying out experiments during the course of this work.
8
References:
1. Compilation of NDE Effectiveness Data. European Commission, March 1999.
2. PP Nanekar, MD Mangsulikar and BK Shah, Development of NDE techniques for in-
service inspection of nuclear power plants,Journal of Non-destructive Testing &
Evaluation, 5 (2007) 21-28.
3. A.N. Sinclair, J. Fortin, B. Shakibi, F. Honarvar, M. Jastrzebski, MDC. Moles,
Enhancement of ultrasonic images for sizing of defects by time-of-Þight diffraction,
NDT&E Int. 43 (2010) 258-264.
4. FA Ravenscroft, K Newton, CB Scruby, Diffraction of ultrasound by cracks:
comparison of experiment with theory, Ultrasonics 29 (1991).
5. R.N. Thomson, Transverse and longitudinal resolution of the synthetic aperture
focusing technique’, Ultrasonics (1984) 9-15.
6. W. Muller, V. Schmitz and G. Schafer, Reconstruction By the Synthetic Aperture
Focussing Technique (SAFT), Nucl. Eng. Des.94 (1986) 393-404.
7. V. Schmitz, S. Chakhlov, W. Muller, Experiences with synthetic aperture focusing
technique in the field, Ultrasonics 38 (2000) 731–738.
8. K.J. Langenberg, M. Berger, Th. Kreutter, K. Mayer, V. Schmitz, Synthetic aperture
focusing technique signal processing, NDT&E Int. 19 (1986) 177–189.
9. W. Gebhardt, Improvement of Ultrasonic Testing by Phased Arrays, Nucl. Eng. Des.
76 (1983) 275-283.
10. K. Uchida, S. Nagaii, H. Kashiwaya, M. Arii, Availability Study of a Phased Array
Ultrasonic Technique. Nucl. Eng. Des. 81 (1984) 309-14.
11. N. Portzgen, D. Gisolf, and G. Blacquiere, Inverse Wave Field Extrapolation: A
Different NDI Approach to Imaging Defects, IEEE T. Ultrason. Ferr. 54 (2007) 118-
127.
9
12. C. Holmes, B.W. Drinkwater, P.D. Wilcox, Post-Processing of the Full Matrix of
Ultrasonic Transmit–Receive Array Data for Non-Destructive Evaluation, NDT&E
Int. 38 (2005) 701–711.
13. D I A. Lines, J. Wharrie and J. Hottenroth, Real-time full matrix capture + Total
focusing and other novel imaging options using general purpose PC-based array
instrumentation, Insight 54 (2012) 86-90.
14. ASME Boiler and Pressure Vessel Code, Section V, Non-destructive Methods of
Examination

10
Figure Captions:
Fig. 1. Data acquisition using SFLA approach
Fig. 2. Inclined slots in 24 mm thick stainless steel plate
Fig. 3. Implanted planar weld flaws (a) Lack-of fusion and (b) Root crack
Fig. 4. B-scan image for a 16º oriented flaw (a) Raw SFLA data, (b) Processed SFLA data
and (c) FMC + TFM data
Fig. 5. B-scan image for a 51º oriented flaw (a) Raw SFLA data, (b) Processed SFLA data
and (c) FMC + TFM data
Fig. 6. Photograph of the implanted weld flaws (a) Lack of Side wall Fusion and (b) Root
Crack
Fig. 7. Raw and processed B-scan images for Lack of Sidewall Fusion using SFLA approach
Fig. 8. Raw and processed B-scan images for Root Crack using SFLA approach
Fig. 9. FMC+TFM B-scan image for lack of fusion
Fig. 10. FMC+TFM B-scan image for Root Crack
11
Tables:
Table 1.Results of height and orientation assessment of inclined slots in the stainless steel plate by
SFLA and FMC+TFM approaches
True angle
(deg.)
True depth
(mm)
SFLA FMC
Angle(deg.) Depth(mm) Angle(deg.) Depth(mm)
0 8.5 0 8.2 0 8.2
16 8.2 16 8.6 16 8.6
28 7.5 29 7.9 30 7.9
36 6.8 37 6.7 35 6.8
42 6.3 41 6.5 42 6.6
51 5.3 52 5.2 52 5.2
Table 2.Assessment of flaw height and orientation in the weld samples by SFLA and FMC+TFM
approaches
Flaw Type
True
depth
(mm)
True
Angle(deg.)
SFLA FMC
Angle(deg.) Depth(mm) Angle(deg.) Depth(mm)
Lack of
fusion 3.0 40 39 2.9 42 2.8
Root crack 3.3 - - 3.5 - 3.6
12
Figures:
Fig.1. Data acquisition using SFLA approach
Fig. 2. Inclined slots in 24 mm thick stainless steel plate
13
(a) (b)
Fig. 3. Implanted planar weld flaws (a) Lack-of fusion and (b) Root crack
(a) (b)
(c)
Fig. 4. B-scan image for a 16º oriented flaw (a) Raw SFLA data, (b) Processed SFLA data
and (c) FMC + TFM data
Lower Tip Upper Tip
Mode
converted
Upper Tip
Lower Tip
Upper Tip
Upper Tip
Lower Tip
14
(a) (b)
(c)
Fig. 5. B-scan image for a 51º oriented flaw (a) Raw SFLA data, (b) Processed SFLA data
and (c) FMC + TFM data
(a) (b)
Fig. 6. Photograph of the implanted weld flaws (a) Lack of Side wall Fusion and (b) Root
Crack
Lower Tip
Upper Tip
Mode
converted
Upper Tip
Upper Tip
Lower Tip
Upper Tip
Lower Tip
15
(a)
(b)
Fig. 7. Raw and processed B-scan images for lack of sidewall fusion using SFLA approach
Lower Tip
Upper Tip
Lower Tip
Upper Tip
16
(a)
(b)
Fig. 8. Raw and processed B-scan images for root crack using SFLA approach
Upper Tip
Upper Tip
17
Fig. 9. FMC+TFM B-scan image for lack of fusion
Fig. 10. FMC+TFM B-scan image for Root Crack
Lower Tip
Upper Tip
Upper Tip


