Embed Size (px)
Citation preview

1
CHAPTER ONE
INTRODUCTION
1.1 Background of the Study
Animal Agriculture is the main stay of the rural economy (AFSP, 2013). Livestock
contribution is notable in the rural economy, and food security for the rural
development in Nepal. Dairy sub-sector, among livestock commodity, is one of the
key contributing sectors in Nepalese agricultural economy (Poudel, 2014). It shares
around one third of the Agricultural Gross Domestic Product (AGDP) and contributes
almost two third (63%) in the livestock GDP in Nepal. At household level, it
contributes to maintain food and nutritional security and generates rural employment
and ensures flow of money from urban to rural areas. In Nepal, more than 100,000
farm households are involved in dairy business and more than 1750 primary milk
producers’ cooperatives (MPCs) are engaged in delivering milk from rural to urban
areas in Nepal (Shrestha, 2013).
Cattle and buffaloes are the major dairy species for milk production in the country.
Naks, to some extent in the high mountain region, are also producing the milk. The
estimated population of cattle and buffaloes are 7.274 million and 5.241 million
respectively (MoAD, 2012). Despite larger cattle population, the buffalo contributes
around 71% of the annual milk production and only rest 26% by cattle (MoAD,
2012). This is mainly due to extremely low productivity of non-descript indigenous
cattle as compared to that of buffaloes (Shrestha, 2013). The population of yak and
chauries has been reported to be declining rapidly due to various inherent and
external constraints. Buffaloes are also being kept for meat purpose. The dairy sector
is gradually emerging as commercial/ semi commercial enterprise particularly in the
peri urban and rural area areas of the country (Poudel, 2013) and has a great future
prospect to develop as a high value commercial product in the rural and peri urban
area of Nepal (Shrestha, 2013).
Many issues and problems have been emerging with the existing milk marketing
system from in the rural farming. The policy makers and farmers have the key
challenge of how to address those issues of dairy value chain marketing and problems

2
so that milk marketing system, at least in the mid hills districts (Gorkha, Tanahun,
Chitwan and Kashki) can be improved. Some key questions/issues on dairy marketing
from the rural to urban area are as follow;
Over the ten years, the milk production has been increase but (1) milk quality has not
been improved (2) the milk marketing is still traditional and (3) cool chain is not
maintained to improve on the keeping quality of the milk. How can be the milk
quality and the marketing in the rural area can be improved by improving the
management in milk value chain to enhance on the rural farming economy through
the rural development activities related to the dairy farming?
What are the constraints appeared in milk value chain? i.e. (1) milk production:
buffalo breeds and farming systems (considering the inputs such as fodder
seed/saplings, feeds and vet drug through agro vets, banking facilities, insurance,
good agricultural practices (GAP) and healthy milking practices), (2) milk collection
and milk transport (informal and formal), (3) milk Chilling/bulking (collectors:
cooperatives, milk processing industries), (4) milk processing and transport (GMP:
Good Manufacturing Practices) and distribution i.e. traders , (5) milk consumers in
both village and cities and how dairy farming can be useful for rural development
particularly in the Gandaki river basin.
1.2 Statement of the Problem
The latest milk production data of Nepal shows that 1,388,730 mt of milk with cow
milk 400,950 mt (28.87 per cent) and buffalo milk 987,780 mt (71.13 per cent) has
been produced in 2007/084. Of this volume, only about 10 per cent of milk (138,873
mt) is estimated of being used by the formal sector dairies Milk production is the
regular activity in the rural area of the Nepal. This is the means to carry the money
from the urban to the rural area of Nepal. It creates self employment in the farm
family and employment to the milk sellers both in the rural and urban area.
Production of 100 liters milk in the rural area can creates one full time employment in
the country. Production of milk contributes (1) income (2) nutritious food particularly
for vulnerable groups of people such as children less than 2 years, pregnant women,
and the elderly and helps in the rural food security. Livestock production in these
areas supports an estimated 10% of population and covers 50-60% of the total area.

3
But the potential of this type of commodity has not been fully explored for the
improvement in the country in the line to rural development of the pastoralists.
The exact figure of the Gandaki river basin is yet to exploit, however roughly
estimated data says only around 20% enters to the chain. Hygienic milk production/
lack of stringent measure on quality control / lack of awareness, scattered production
and difficult geography- increased cost in collection and transportation, poor
infrastructure for milk collection, chilling and transport. Poor infrastructure and
information networking, Inadequate quality feeding resources for dairy animals,
Serious depletion of animal feeding base due to deterioration in the forest areas for
fuel wood and timber, and additional land for settlement and cultivation, Inadequate
government support services due to lack of resources as many of the district and sub-
district level (livestock service centres) face shortage of manpower as well as
necessary equipments and veterinary medicines, inadequate and inappropriate
breeding support services as there is shortage of improved breeding bulls as well as
artificial insemination services, weak farm advisory services and training as there
remains a big gap between the specialized and expanded farmers’ are the most
reoccurring problems in these sectors. Therefore the after mentioned project work has
been designed to overcome these different types of problems observed in milk value
chain existed, hence increasing the quality of milk and production as well. This
research is supposed to answer the queries like "What is the existing situation of dairy
production status and livestock production status in the country? ", Who are the the
partners involved in the milk value chain and their role to improve the milk
business?", What is the status of existing milk value chain and their operation?" and
What are the strength, weakness and potentials of steps in milk value chain?" etc.
1.3 Objectives of the Study
The main objective of this study is to assess the existing milk value chain in rural
dairy farming in the study area of Gandaki river basin in the milk production and
marketing.
4
The specific objectives
1. To analyze the existing situation of dairy production status and livestock
production status in the country and study area as well.
2. To identify the partners involved in the milk value chain and their role to
improve on the milk business.
3. To assess the existing milk value chain and their operation.
4. To identify the strength, weakness and potentials of steps in milk value chain.
1.4 Significance of the Study
Milk production is the main daily regular activity in the rural area of the Nepal. This
is the means to carry the money from the urban area to the rural area of Nepal. It
creates self employment in the farm family and employment to the milk sellers both in
the rural and urban area. Production of 100 liters milk in the rural area can creates one
full time employment in the country (Singh, 2010). Production of milk contributes (1)
income (2) nutritious food particularly for vulnerable groups of people such as
children less than 2 years, pregnant women, and the elderly and helps in the rural food
security. But the potential of this type of commodity has not been fully explored for
the improvement in the country in the line to rural development.
Despite of the importance of the milk chain in the contribution of rural economy, the
existing situation of the milk value chain in the line to rural development has not been
studied and the propose study can help to evaluate the situation mainly in the milk
shed area in the mid hills of Nepal. Therefore the proposed study is important to find
out the problem related to milk value chain to improve the livelihood of the rural
communities in the hills of Nepal.
1.5 Scope and Limitation of the Study
The rural area in the mid hills of Nepal is still under developed. The dairy farming is
one of the tools among several others in rural development through improving the
nutritional status and creating the jobs. But the limitations to block the opportunities
are still not well documented in the country and therefore there is potential scope of

5
this type of study. The limitation of this study is that the study is only for one season
and is short period of time.
1.6 Organization of the Study
The thesis has been divided into five chapters. The first chapter is introductory
whereas the second chapter includes the literature review where different related
literatures have been elaborated in nutshell. The third chapter is about research
methodology where descriptions on sampling, population, site selection and time
framework of the research process have been included.
The Fourth chapter includes the data presentation and analysis. This chapter includes
both the qualitative and quantitative form of data presentations. Both tables and
graphs have been used.
The data have been presented in the form of graphs. Household surveys, distance
from milk chilling centers, total number of livestock heads in the study area etc. have
been presented.
The last fifth chapter comprises of summary, conclusions and recommendations.

6
CHAPTER - TWO
LITERATURE REVIEW
The research entitled on Milk Value Chain analysis in the different areas of the
Gandaki river Basins is the pioneer study in such topic in the area. Some researchers
have been done regarding the value chain study on vegetables and meat etc. Therefore
such researches on value chain analysis on other countries were cited. Different
books, literatures, thesis, article, websites, papers etc were cited. The information on
different topics were gathered from CBS, Nepal, Annual booklet of DLSO's of
different districts and household surveys as well. Here's the description on literature
review under few headings and subheadings. The literature made has been tried to
comply with the objectives of the project as well.
2.1 Existing scenario on Dairy Sector Study of Nepal and the Study
Area
The latest milk production data of Nepal shows that 1,388,730 mt of milk with cow
milk 400,950 mt (28.87 per cent) and buffalo milk 987,780 mt (71.13 per cent) has
been produced in 2007/084. Of this volume, only about 10 per cent of milk (138,873
mt) is estimated of being used by the formal sector dairies. (APP, 2014)
2.1.1 Historical Background on Dairy Development
Organized dairy development activities in Nepal began in 1952 with the establishment
of a Yak cheese factory in Langtang of Rasuwa district under Food and Agriculture
Organization (FAO) assistance in 1953. In 1954, a Dairy Development Section was
established under the Department of Agriculture (DoA) and also a small-scale milk
processing plant was started in Tusal, a village of Kavre district. In 1955, a Dairy
Development Commission was formed. (Statistical Information on Nepalese
Agriculture MoAC, Kathmandu. (Statistical Information on Nepalese Agriculture
MoAC, Kathmandu).
The First Five Year Plan (1956-61) stressed on the need to develop a modern dairy
industry. Accordingly, in 1956, a Central Dairy Plant, with an average milk
processing capacity of 500 liters/hr was established in Lainchaur, with the financial
7
assistance from New Zealand and technical assistance from FAO. Around the same
time, a second mini milk processing plant was established at Kharipati, in Bhaktapur
district. The plant started processing of milk and marketing activities from 1958. In
the process, prior to 1960, two additional cheese factories were established under the
DoA in other two alpine districts of the country. In 1960, a Cheese Production and
Supply Scheme were also established. The Dairy Development Commission was
converted to the Dairy Development Board in 1962. So as to meet the growing
demand for milk in Kathmandu, the Board was converted to Dairy Development
Corporation (DDC) in 1969.
2.1.2 Dairy Cooperatives
History of dairy cooperatives dates back to the First Five Year Plan (1956-61) when
the dairy cooperatives were formed in Tusal Village of Kavre district. However, the
dairy cooperatives were became more effective only after December 1981, when
DDC initiated the milk producers oriented program by encouraging the farmers to
form their own Milk Producers’ Associations (MPAs) along the lines of cooperative
principles. The MPAs operated under the by-laws prepared by DDC. The MPAs had
no formal legal status and they operated as single purpose primary cooperatives with
milk trade and support to milk production as their main activities.
In order to enable the MPAs with the formal legal identity and to make them more
autonomous, DDC took initiation to convert these MPAs into Milk Producers’
Cooperative Society (MPCS) in February 1989. For this, it encouraged and facilitated
to register these MPAs in the Cooperative Office of Government of Nepal (GoN).
According to the available information, presently about 1,603 MPCSs are registered
in 53 districts of the country (Annex 1). The Cooperative Act, 1992 of the government
governs these MPCS.
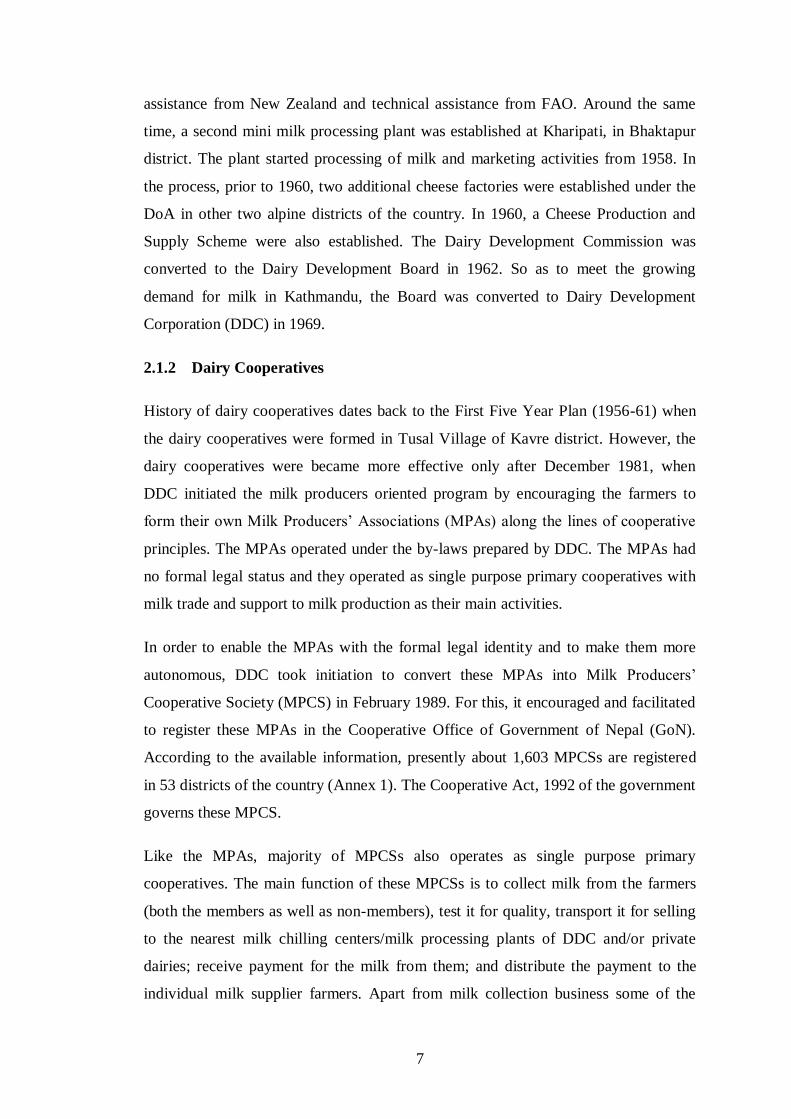
Like the MPAs, majority of MPCSs also operates as single purpose primary
cooperatives. The main function of these MPCSs is to collect milk from the farmers
(both the members as well as non-members), test it for quality, transport it for selling
to the nearest milk chilling centers/milk processing plants of DDC and/or private
dairies; receive payment for the milk from them; and distribute the payment to the
individual milk supplier farmers. Apart from milk collection business some of the

8
MPCSs have also started the operation of milk chilling vats; and milk processing for
producing various dairy products.
The dairy cooperatives in Nepal have adopted a three - tier system of which the
MPCSs are the first-tier primary level cooperatives. In the second tier, MPCSs in
different districts have formed district level District Milk Producers’ Cooperative
Unions (DMPCUs), which are registered under Cooperative Act as district level
bodies. Presently, there are 36 DMPCUs in different districts (mainly in terai and
mid-hills) and their main objectives are to deliver programs designed to support the
increased production and processing of milk and milk products and to contribute to
the financial and social upliftment of the rural milk producers.
In the third tier, the MPCSs and DMPCUs have formed Central Dairy Cooperative
Association Limited Nepal (CDCAN). CDCAN is registered as their central-level
cooperative organization. Established in 1993, CDCAN is a national level tertiary
organization of all the milk producers' cooperatives at primary and secondary levels.
CDCAN aims to bring increased economic benefits to milk producers and to
contribute to make the country self-reliant in clean and high-quality milk and related
products. It also implements policy advocacy activities at the central level to represent
the interest of member organizations. Currently, 36 DMPCUs and 1,329 MPCS are
affiliated to CDCAN.
2.1.3 Consumption and Supply of Milk and Milk Products
In earlier days when there were no organized dairies, demand for milk was fulfilled
by raising cows/buffaloes by the people themselves or through the direct supply from
the professional milk producers. These producers used to go house by house and
deliver the required quantity of milk to the households. Dahi (yoghurt) filled in clay
containers were produced by some traditional dahi makers and milk-based sweets
were prepared by traditional sweet makers (haluwain). But after the advent of DDC,
the scenario began to gradually change with the increasing supply of pasteurized milk
and modern dairy products such as cheese, butter, ice cream etc. Many new sweet
shops also started to emerge. Now, particularly in the urban areas, the situation has
completely changed because many dairies in the organized sector have come up with
9
varieties of dairy products. Besides, different dairy products are also imported to cater
the consumers’ demand.
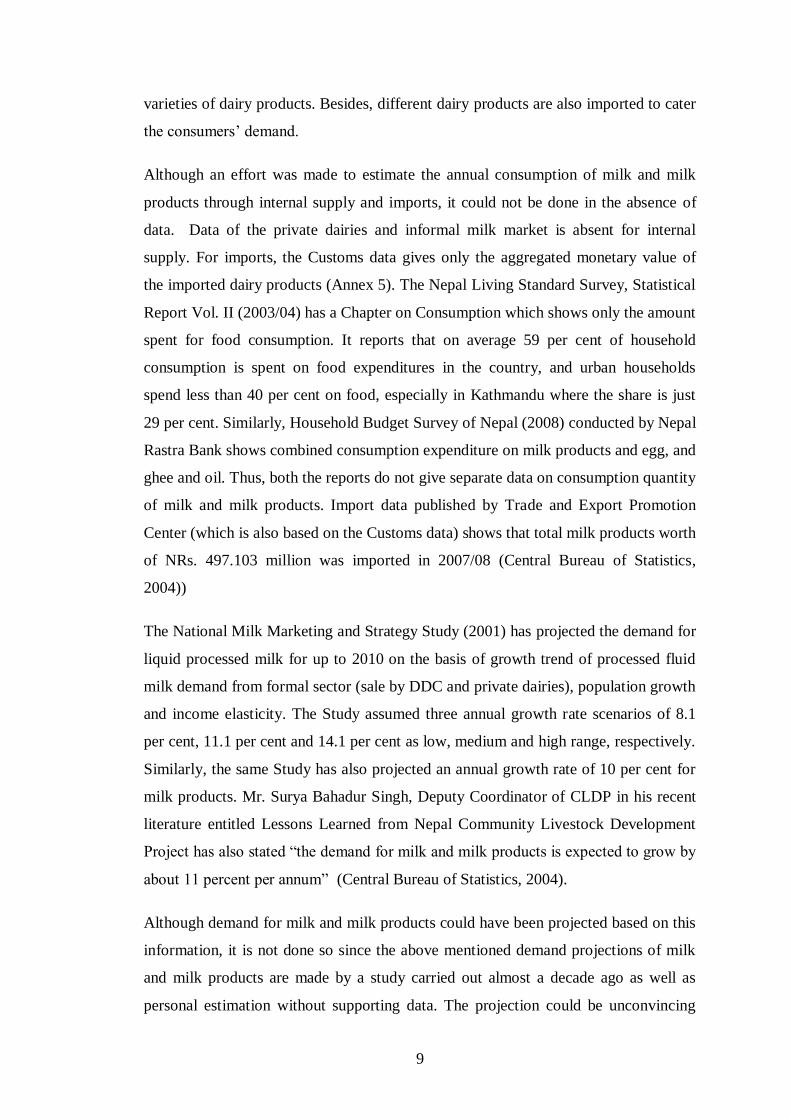
Although an effort was made to estimate the annual consumption of milk and milk
products through internal supply and imports, it could not be done in the absence of
data. Data of the private dairies and informal milk market is absent for internal
supply. For imports, the Customs data gives only the aggregated monetary value of
the imported dairy products (Annex 5). The Nepal Living Standard Survey, Statistical
Report Vol. II (2003/04) has a Chapter on Consumption which shows only the amount
spent for food consumption. It reports that on average 59 per cent of household
consumption is spent on food expenditures in the country, and urban households
spend less than 40 per cent on food, especially in Kathmandu where the share is just
29 per cent. Similarly, Household Budget Survey of Nepal (2008) conducted by Nepal
Rastra Bank shows combined consumption expenditure on milk products and egg, and
ghee and oil. Thus, both the reports do not give separate data on consumption quantity
of milk and milk products. Import data published by Trade and Export Promotion
Center (which is also based on the Customs data) shows that total milk products worth
of NRs. 497.103 million was imported in 2007/08 (Central Bureau of Statistics,
2004))
The National Milk Marketing and Strategy Study (2001) has projected the demand for
liquid processed milk for up to 2010 on the basis of growth trend of processed fluid
milk demand from formal sector (sale by DDC and private dairies), population growth
and income elasticity. The Study assumed three annual growth rate scenarios of 8.1
per cent, 11.1 per cent and 14.1 per cent as low, medium and high range, respectively.
Similarly, the same Study has also projected an annual growth rate of 10 per cent for
milk products. Mr. Surya Bahadur Singh, Deputy Coordinator of CLDP in his recent
literature entitled Lessons Learned from Nepal Community Livestock Development
Project has also stated “the demand for milk and milk products is expected to grow by
about 11 percent per annum” (Central Bureau of Statistics, 2004).
Although demand for milk and milk products could have been projected based on this
information, it is not done so since the above mentioned demand projections of milk
and milk products are made by a study carried out almost a decade ago as well as
personal estimation without supporting data. The projection could be unconvincing

10
and it would be inappropriate to base any future actions based on such projection. A
detail national study about milk and milk product marketing is felt essential to assess
the current consumption, demand for and supply of milk and milk products (Nepal
Agriculture Strategy study, Volume I Main Report and Recommendations and
Volume II Detail Sector Review and Analysis, Kathmandu).
2.1.4 Supply of Liquid Milk
Processed liquid milk is the prominent product of the dairy industry as almost 80 per
cent of milk collection in the formal sector is used to produce processed milk. It is
very difficult to know the supply of private dairies mainly because of the absence of
data collection and reporting system. As such, the estimate of private dairies’ supply
is based on the available literature as well as proportion of private dairies’ milk via
DDC milk sold by the milk selling booths in the major markets.
2.1.5 Consumption and Supply of Milk Products
Various brands of the locally produced as well as imported modern and traditional
milk products of varying categories are sold in the urban markets of Nepal.
Kathmandu valley is the main market of the milk products. The major milk products
available in the markets are imported Skim Milk Powder (SMP), Full Cream Milk or
Whole Milk Powder (WMP), infant milk formula, diary whitener, cheese, butter,
sweetened condensed milk, ice cream and ghee; and locally produced cheese, butter,
ghee, ice cream, paneer and yoghurt. Milk products from more than 20 countries from
Asia, Europe, Australia and North America compete in the Nepalese market. Different
varieties with various sizes and from ordinary to advanced packaging are available for
most of the products (Dairy: World Markets and Trade (December 2007) World
Bank, Doing Business, Kenya (2007) standard survey.
Milk products being available in the local urban markets indicate that there is ample
demand for the modern as well as traditional dairy products. The demand for dairy
products in the urban markets is expected to grow in the future mainly due to the
increasing population and rise in income. Additionally, exposures to outer world
mainly through the TV have particularly attracted the educated younger generation to
consume the modern dairy products. Moreover, their demand is also expected to rise
due to the increasing establishment of hotels and restaurants. Some years ago many
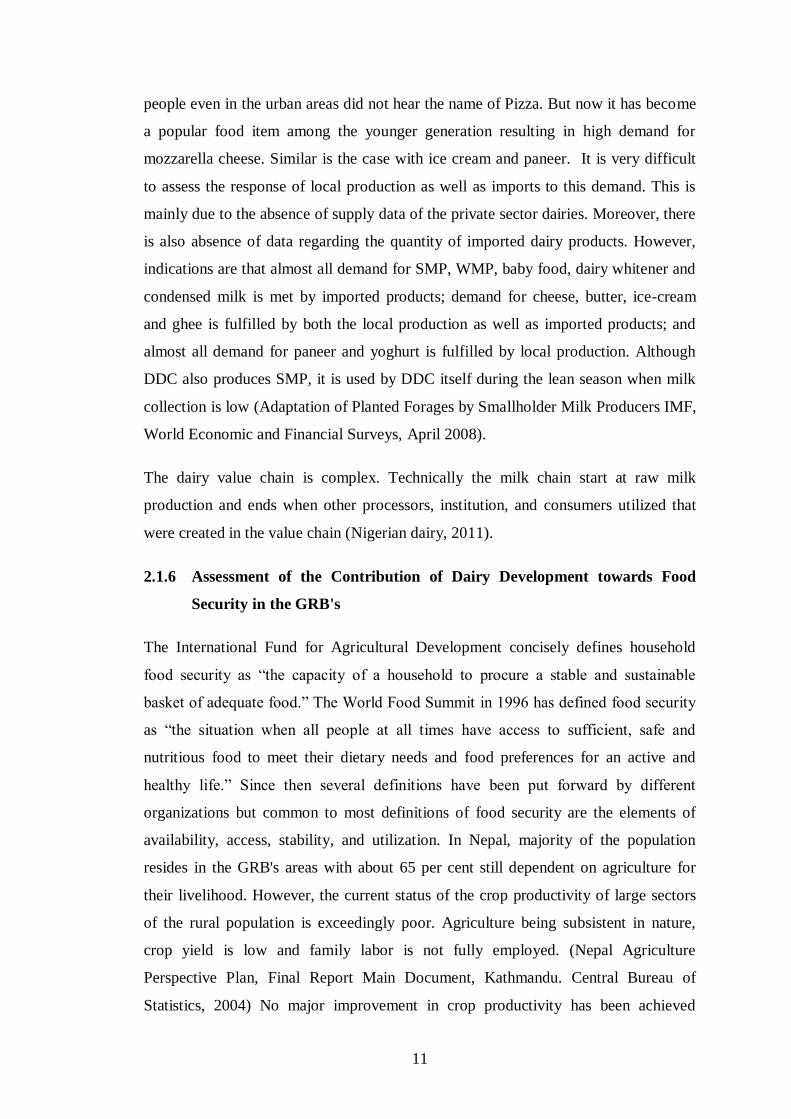
11
people even in the urban areas did not hear the name of Pizza. But now it has become
a popular food item among the younger generation resulting in high demand for
mozzarella cheese. Similar is the case with ice cream and paneer. It is very difficult
to assess the response of local production as well as imports to this demand. This is
mainly due to the absence of supply data of the private sector dairies. Moreover, there
is also absence of data regarding the quantity of imported dairy products. However,
indications are that almost all demand for SMP, WMP, baby food, dairy whitener and
condensed milk is met by imported products; demand for cheese, butter, ice-cream
and ghee is fulfilled by both the local production as well as imported products; and
almost all demand for paneer and yoghurt is fulfilled by local production. Although
DDC also produces SMP, it is used by DDC itself during the lean season when milk
collection is low (Adaptation of Planted Forages by Smallholder Milk Producers IMF,
World Economic and Financial Surveys, April 2008).
The dairy value chain is complex. Technically the milk chain start at raw milk
production and ends when other processors, institution, and consumers utilized that
were created in the value chain (Nigerian dairy, 2011).
2.1.6 Assessment of the Contribution of Dairy Development towards Food
Security in the GRB's
The International Fund for Agricultural Development concisely defines household
food security as “the capacity of a household to procure a stable and sustainable
basket of adequate food.” The World Food Summit in 1996 has defined food security
as “the situation when all people at all times have access to sufficient, safe and
nutritious food to meet their dietary needs and food preferences for an active and
healthy life.” Since then several definitions have been put forward by different
organizations but common to most definitions of food security are the elements of
availability, access, stability, and utilization. In Nepal, majority of the population
resides in the GRB's areas with about 65 per cent still dependent on agriculture for
their livelihood. However, the current status of the crop productivity of large sectors
of the rural population is exceedingly poor. Agriculture being subsistent in nature,
crop yield is low and family labor is not fully employed. (Nepal Agriculture
Perspective Plan, Final Report Main Document, Kathmandu. Central Bureau of
Statistics, 2004) No major improvement in crop productivity has been achieved

12
though it has been in priority in all-national budget due to constraints in
infrastructural support and capacities to make appropriate investment. In addition, the
distribution of land is such that the number of small and/or marginal farmers and
landless dominate the scene and the resources of this class of people are very meager
and much of the household is heavily indebted. At this backdrop, the dairy sector has
been playing a major role in order to ensure social justice amongst the GRB's farmers
by providing off farm opportunities for increased employment and income generation.
Dairy sector is directly contributing food security to the large number of population as
part of their milk production is consumed within the farm households in the form of
milk and milk products which encompass both elements of availability and access to
food. The dairy sector is also contributing to the stability of food security of GRB's
households because dairy animals form an integral part of crop- livestock integrated
form of agriculture systems, in which they provide a steady stream of food and
revenues for households, they can be used as collateral for credit, sold for emergency
cash needs arising due to an injury or illness of productive family members, they also
provide draught power, fertilizer and pest control, contributing to total farm
productivity and hence to food security. The final element of utilization is
materialized through production and consumption of milk-based foods which is a
common practice in the farm households (Household Budget Survey Nepal, 2009).
Apart from the above direct contribution to food security, the dairy sector has been
the major source of income generation contributing indirectly to food security in the
rural areas. According to the available information, in fiscal year 2008/09 there were
about 40,000 farmers of the GRB's areas directly involved in supplying milk to DDC
and they were paid about NRs. 1,296 million (around 57 percent of the total DDC
expenditure) for their milk. In this manner, the DDC has paid about NRs. 3.55 million
per day on average to the rural areas of the GRB's. Although the exact figures about
the farmers involved in supplying milk to the private sector dairies as well as the
amount paid by these dairies is not available, based on their share in milk collection, it
is estimated that about NRs. 3,00 million is paid to the farmers by them to the rural
milk producers in the same fiscal year. (TechnoServe, 2005).
Accordingly, the dairy development activities have been one of the major means to
regularly channeling a large amount of urban money to the rural areas of GRB's

13
significantly contributing to total farm productivity and hence to food security and
improve the living standards of the rural poor. (National Milk Marketing and Strategy
Study, 2008)
Three districts namely; Chitwan, Tanhu and Gorkha comes under Gandaki River
Basin (GRB) . These districts are representative of the terai, hill and high hills of
Nepal in terms of climate, household and communities (FFIL CR ALSCC: INPB
Nepal 2012). Study sites own the rural inhabitant. Study sites would represent
smallholder farmers all across geographic regions of Nepal and elsewhere (Joshi,
2012). Dairy plays important role in this region as a source of income to the farming
families for livelihood and food security in the rural area. Example: Buffaloes alone
contribute about 84% of the milk production in the GRB and 29% of the total milk in
the country. Buffalo is also the main source of meat in the region by providing 41,382
Mt (69%) of the meat and 25% of the total buffalo meat in the country. This signifies
the importance of buffaloes in the rural area of GRB. Improvement in cattle and
buffalo farming can play an important role in reducing rural poverty and food security
and hence important in rural development. The GRB region is rich in animal
resources as it owns ~20% of cattle population and ~30% of buffalo population of the
country (MoAD, 2012) which are the main source of milk to support rural
communities in the rural area of GRB. This situation justifies the development in milk
production is the tools of rural development in GRP and in other similar context of the
country.
Table 2.1: Ruminant population of Gandaki River Basin (MOAC 2010)
Species Gandaki River Basin
Cattle 1,445, 717
Buffalo 1,453,577
Goat 2,012,376
Sheep 174,383
Source: MOAC, 2010.
The National Adaptation Program of Action (NAPA, 2011) to climate change has
prioritized improvement of housing, nutrition (based on local feed and forage
resource) and disease and parasite management to reduce vulnerability to climate

14
change for food security (TWG, 2010). It is predictable that Nepal’s food security
situation would be adversely impacted further with climate change that impacts
negatively in rural development in GRB. Livestock has the potential to support the
adaptation effort of the poor in the rural area of Nepal. In general, livestock is more
resistant to climate change than crops because of its mobility and access to feed.
However, it is important to consider that the capacity of local communities in the rural
area to adapt to climate change to support livestock rearing will also depend on their
socio-economic and environmental conditions, and on the resources they have
available. Therefore it is important to timely consider climate change and
consequences focusing to the livestock in the context of rural development.
Demand for dairy products in Nepal has been growing over the last decade and has
doubled since 1995 and, after more than half a century of declining real prices for
dairy products, there are strong signs of a structural change in the dairy sector of
Nepal that could make it attractive for investment. This offers livelihood and rural
development opportunities for smallholder dairy producers in Nepal who are currently
supplying more than three-quarters of domestic consumption needs in the country
projected to be one of the fastest growing agriculture sector over the next decade.
There are many successful business models through which smallholder milk
producers in GRB's have gained sustainable access to markets. However, to date,
many of the insights on supporting inclusion of smallholder dairy producers are
neither sustainable nor scalable( Muruiki et.al ,2001) .The government objective in
fostering smallholder dairy development in Nepal is not only in consideration of
livelihood opportunities for small farmers but in recognition that investment in dairy
has important spin-offs for rural development and food security. It is estimated that
one additional job is created in milk value chain for each 10-15 litres of milk
marketed per day. On the consumption side, the nutritional benefits of increasing the
productivity of milk animals by just 20 percent could provide a daily glass of milk for
every Nepali child (Samartha 2013). Increasing production of 100 liter of milk and fit
in milk value chain can create 1 full time job to the rural youth (Singh, 2010) in the
study area. The exact Figure is not available, but it is estimated that less than 10% of
the total production of milk reaches the market. Steps in milk value chain are shown
in Figure 1(SAMARTHA. 2010).

15
Figure 2.1: Milk value chain the hills of Nepal
Source: Questionnaire Survey, 2071.
Milk production in the rural area of the GRB's is the main occupation since more than
century. Analysis done by NDDB during 2012 has indicated the strength of dairy in
rural development, its weakness, opportunity and threats. This study has indicated the
money flow from the urban area to rural area to support the food security and
consequently help in rural development of GRB's.
2.1.6.1 Well established milk transport and payment system
Particularly in market channel three there is a well established milk transport and
transaction system. This system is highly depend and built up on trust. The trust has
no any written agreement. Milk is put on truck in the case of, in bus in the case of -the
driver is responsible to take the milk safely and give to the agent /client/traders in as
per the mark on the container and the instruction on who should collect and when the
cars get back the traders/agents give instruction on who the payments are made in the
same way. It was learnt that in some occasions this system was harmed and the
consequences was affected the pastoralists but it has remained largely consistent and
is a driving force in transaction. Not-withstanding this, the system has to be
strengthened with the introduction modern systems like transaction through mobile
phone, safe money transfer and money transfer through small scale financial
institution (Alexander, D.Y., 2004).
Input
Supplies
Production Collection &
Storage
Processing &
distribution

16
2.1.6.2 Increased demand for milk and milk products in urban centers
It is apparent that as of other agricultural products the price for milk and milk
products in urban centers are increased if not doubled. Given the existing asphalt road
infrastructure the milk can easily transported to different urban centers like Pokhara,
Damauli, Narayangardh and other urban centers through private companies or through
organized pastoral communities after a value is added to increase its shelf life. In this
case it would be helpful to capture the untapped demand.
2.2 Identification of key intermediates in the dairy value system
As per objectives, some intermediates existed in the milk value chain existed in the
study areas were identified Descriptions on these are mentioned as the followings.
2.2.1 The Key Actors and their Functions
The key actors in the formal dairy value system include milk producer farmers,
MPCSs, MCCs, and milk processing plants/cheese factories. Firstly, there are rural
farmers and their function is to be engaged in milk production. The next are MPCSs
established in the rural areas. Farmers from the surrounding villages carry their milk
production to the nearest MPCS where their milk is received, measured, recorded and
samples are taken for quality check [mostly fat and solid-not-fat (SNF) test]. After
receiving milk from all farmers, it is then transported by available means (vehicles,
porters, carts, rickshaws, bi-cycles, horses) to the nearest MCC or cheese production
center (in case of cow milk cheese). Some of the MPCSs have their own chilling
system where they chill the milk, deliver it to the DDC and/or private MCCs or sell in
the local market (Amirsalehy, and Nili, H, Mohammadi, , 2012).
Next are the MCCs or cow cheese production centers where milk received from the
MPCSs is measured, recorded, and platform quality control tests are performed that
generally include organoleptic test, fat and SNF test, clot-on-boiling (COB) test etc.
Occasionally, adulteration test is also performed. Milk in the MCC is cooled by either
instant chilling system or in the bulk milk cooling vat. In the cheese production
centers, milk received from the MPCSs is directly processed to produce cheese, butter

17
and other dairy products such as paneer, and sweets. Milk from the MCCs is
transported to the milk processing plants in insulated bulk milk tankers (FAO, 2011).
Then there are milk processing plants. Here milk from the MCCs and MPCSs after
being received in the reception dock firstly undergoes quality control tests and quality
passed milk is then measured and cooled prior to keeping it in an insulated milk
storage tanks for further processing and producing pasteurized milk and milk
products. After processing, milk and milk products are kept in cold store for sales
(Kenya, May 2005).
2.2.2 Dairy Industry Task Force
The different tier of dairy industry task force includes middlemen, processors and
retailers. These are described accordingly:
2.2.2.1 Middlemen
The middlemen are informal and they could be milk traders or contractors or farmers
themselves. They are active in collecting raw milk from the farmers and transport it
particularly to the MCCs or processing plants of the private dairies. They are also
involved in collecting and transporting milk to the sweet shops, restaurants and tea
shops. The middlemen are mostly active in the surrounding rural areas of the major
urban centers because of easy transportation facility but not in the distant rural where
there is lack of transportation facility or transportation is difficult. The transaction by
middlemen is based on the price negotiation. The role of middlemen is thus limited to
milk collection and transportation to the milk MCCs/processing plants. (Feeding
Dairy Cattle, A manual for smallholder dairy farmers and extension workers in East
Africa (January 2007, ILRI).
2.2.2.2 Processors
The milk processors are the main actors to mobilize various channels of milk and milk
products marketing. They act as a bridge between the producers and consumers. They
create different channels for milk collection from the farmers in the rural areas and for
selling milk and milk products in the urban areas. In the rural areas, they form MPCS
or channelize middlemen/farmers for milk collection and transportation. In the urban
18
areas they manage milk booths to sell processed milk. They either set-up own sales
centers or create franchise shops to market milk products to the urban consumers.
Moreover, they also channelize the products to the retail shops through arranging
dealers. Due to increasing popularity of supermarkets/department stores, the
processors have also started to market their products through these sales outlets. Thus
the processors (Informal Traders Lock Horns with the Formal Milk Industry: The role
of research in pro-poor dairy policy shift in Kenya (May 2006) ILRI, mobilize both
the formal and informal sales outlet to channelize the milk and milk products to the
urban consumers.
Accordingly, milk processing plants are the focal and play the crucial role in relation
to different marketing channels for milk and milk products. They put a lot of efforts in
creating and managing these marketing channels. Due to fierce competition for milk
collection, the big milk processors have now started to adopt various measures to
attract farmers towards them. These include arrangement of credit facility for
purchasing dairy animals through financial institutions, veterinary health care and
breeding services; support for fodder production through seed distribution and
technical services; distribution of smaller milk chilling units with automatic milk
analyzing system; trainings and exposure visits to the farmers. Through providing
these services, the processors are making efforts to tie-up the farmers with them for
assured milk supply. (Transforming the Kenyan Dairy Feeds System to Improve
Farmer Productivity and Livelihoods (2007).
Similarly, in the sales and distribution front also the processors have been involved in
motivating the operators of sales outlets to increase the sale of their products. The
motivating measures include higher sales commissions on the products, and provision
of other hardware support such as refrigerators, freezers and counter coolers.
However, such measures are adopted only by the big processors mainly due to the
requirement of enough financial resources. But, unfortunately, the processors have
not been much serious in motivating the general consumers who are the ultimate
destination of their products. Except for occasional advertisements in the print media
and audio-visuals through radio and televisions by some, most of the processors are
indifferent towards implementing such customer- oriented programs as awareness

19
campaign, product promotion, product presentation (packaging, selling methods etc.)
to attract the customers.
The last actors are the milk selling booths/dairy shops and institutional buyers. The
milk booths sell only milk to the consumers/tea shops, and dairy shops mostly sell
milk products to the consumers. The milk selling booths operate for only 2-3 hours in
the morning but the dairy shops are open from morning to evening. There are some
such shops also which buy milk from the booths in the morning and put it in the
refrigerator and sell it later with extra charge. The institutional buyers include hotels,
supermarkets/departmental stores and fresh houses. Among these, hotels use milk and
milk products for their own purposes whereas supermarkets/departmental stores and
fresh houses sell milk products to the consumers.
Milk also passes through the informal channel. In this system, individual farmers or
the contractors are the main actors who directly deliver milk to the individual
households/tea shops/sweet shops etc.
2.3 Existing Channels within the Value System and Volumes Going
through These Channels
Dairy industry is said to be a process from “Grass to Glass” which passes through
different channels involving various actors. Figure 2 depicts the formal channel of
raw milk to the milk processing plants as well as informal trading of raw milk.
Seasonal variation in milk production and hence milk collection has been a regular
phenomenon in Nepal due to dominance of buffalo milk. The main reason is
attributed to seasonal breeding and calving pattern of this species. However,
availability of green forage is also responsible indirectly for animals to set their
breeding season physiologically (Action Aid Kenya, An analysis of the impact of
Import surges on Rural Poverty in Kenya: The Case of Dairy Sub- Sector (March
2007) E. A. Birachi, Determinants of Coordination and Supply Chain Performance:
The Case of Fresh Milk Supply Chains in Kenya (May 2005)
2.3.1 Volume of Milk Passing through the Channels
In the formal sector most of the milk passes through the MPCS @ MCC @ milk
processing plants channel. In this system, whatever volume of milk is received in the
20
MCC from the MPCSs is accounted regardless of the volume dispatched by the
MPCSs. The same practice prevails in case of milk directly received in the milk
processing plant from the MPCSs. As such, the volume passing from the MPCSs to
either MCC or milk processing plant remains the same. Since the MCCs are operated
by the concerned milk processing plants and their own vehicle is used for transporting
milk from the MCC to the processing plants, there is virtually no difference between
the milk dispatched by the MCC and received at the milk processing plant. Similarly,
a small volume directly passes from MPCSs to cow milk cheese factories and from
farmers to the Yak cheese factories.
It is very difficult to track the volume of milk passing through all these channels,
particularly in case of private dairies and cooperatives that are not supplying milk to
DDC (as all cooperatives are not the part of DDC system)5; and informal milk trading
mainly due to unavailability of data. Even if the private dairies are also a part of the
formal sector, they are very reluctant to share their data and information. As learned,
although some years back Livestock Market Promotion Directorate of DLS had
developed an information system with the consent of private dairies to share their
data; the system did not work even for a short period mainly because of the erratic and
inconsistent data received from the private dairies. As such, presently there are no
ways to find out the reliable data of the private sector. For that reason, only that
volume of milk received (milk collection) in the milk processing plants and cheese
factories of the DDC could be presented.
2.3.2 Cross Border Trade of Milk
In the recent past, during flush season (November-February) there used to be
oversupply of milk from the farmers mainly due to the seasonal variation particularly
in buffalo milk production. The milk processing plants could not accept all the milk
offered by the farmers and they were asked not to bring milk in the MCCs for once or
twice a week. The days during which farmers were asked to halt milk supply to the
MCCs was referred as “Milk Holidays.” The “Milk Holidays” started in 1991/92 but
the problem was resolved by exporting milk by DDC to HIMUL of West Bengal,
India for about one and half years in 1992/93. This was done with limited success
again in 1990/2000. The volume of this cross border trade was not available in DDC.
During 2000-2007, no any concrete measures were taken to ease the problem of “Milk
21
Holidays” except organizing seminars, discussions and conducting studies. But, in the
last fiscal year (2008/09) DDC again exported 1,223 mt of milk to Patna Dairy, Bihar.
Apart from this formal cross border trading of milk, there is also informal trading in
the border areas of Nepal and India by individual farmers/contractors. The actual
volume of this trade is difficult to ascertain because of the trade occurring at
individual level in the long border between these two countries. Feeding Dairy Cattle,
A manual for smallholder dairy farmers and extension workers in East Africa
(January 2007) ILRI.
This trading is mainly guided by the price factor i.e. milk flows to either cross border
where price is higher marketing. Even though some of the MPCS are also involved in
producing milk products and sell them in the local markets through their own
production points, this practice is very limited. This is so because of the financial as
well as technical constraints. The role of small farmers is thus to produce milk and
market it through either MPCS or middlemen or by themselves. (Dairy: World
Markets and Trade (December 2007) World Bank, Doing Business, Kenya (2007,
standard Survey).
2.3.3 Existing Milk and Milk Products Value Chain Analysis and their
Operation
2.3.3.1 Overview of the value chain
The value chain of the milk and milk products oinvolves six distinct value adding
activities from the production of the milk through reaching to the final consumer in
the market. These activities include input supply; production; gathering (bulking);
processing; transportation; and retail trading.
This part the actors involved in each of these segments of the chain and their
interrelationships with other players; the value they add to the product; and the
constraints and opportunities they face. In the course of analyzing this section enable
to identify the type of interventions required at each chain segment which in turn, if
addressed well will create smooth flow of the products and information along the
chain eventually increases the competitiveness of the overall chain.

22
2.3.3.2 Production
It is the basic segment for any value chain analysis and it is the pivotal point where
makes the value chain to develop and attain competitiveness. The improvement made
in this level of the chain could have a significant implication in enhancing
competitiveness in all other levels of the chain. It holds true particularly for
agricultural value chains in general and milk and milk products in particular
2.3.3.3 Producers (Pastoralists)
These are the basis of the milk and milk products value chain. They have two major
functions. One is livestock management so that production and productivity of
livestock increases or at least maintained at current levels. The farmers have long
term experience of properly managing livestock for getting better milk yield and
reproduction year in year out. A good indication to this is they keep 60-70% of the
herd as female animals.
2.3.3.4 Milk Transportation
The milk transportation task has two segments. The first involves transferring the
milk packed in 5, 10 and 20 liter jerry cans from the production areas to the roadside
bulking and collection centers. This is mainly done on women/men backs, bicycles,
motorcycles. The second segment is milk will be transported from collection centers
to the terminal market (traveling up to the distance of 30-150 kilometers. During milk
transportation in this segment the producers do not travel with their milk. They send
their milk by the drivers putting unique marks of string tied, color of the containers
etc on the jerry can which enables their corresponding client in local collection center
to easily identify the container. In this segment the activity is done by two transport
companies.

23
Table 3.2: Showing the Distance from shed to Milk Market and Collection
Centers
Distance from shed to milk Market and Collection centers
Sites Mean distance Travelled
Value
Maximum Distance
in Km
Minimum
distance in km
Chanuali 3.04 7 0.05
Gorkha 1.68 5 0.05
Tanahun 51.56 200 0.5
2.4 SWOT Analysis of Dairy Sector
2.4.1 Strength of Dairy Sector
The strength of dairy sector to develop the rural area are; strong dairy cooperatives
with their presence from the grass root level i.e. rural area to the central level and
have become a strong channel between the rural milk producers and the milk
processing industries keeping animal is a household practice and people are
passionate in animal keeping , increasing involvement of NGOs and private sector in
livestock development activities in rural area particularly in providing technical
support services and veterinary health care, employment (full or part) for millions of
HHs (formal and informal sector), stable and daily source of income, Cash flow from
urban to rural sector. Any improvement in milk value chain in the rural area definitely
helps in rural development. The review has proven that the rural dairy is the means to
pull the money from urban area and ultimately the tool for rural development.
(Muruiki et.al 2001).
2.4.2 Weakness of Dairy Sector
Despite of the strength, a dairy sector in Nepal has several weakness which can be
corrected for rural development. Large number of low productive cattle and buffaloes
(avg. annual production-469 liter/milking cow and 867/milking buffalo), Hygienic
milk production/ lack of stringent measure on quality control / lack of awareness,
scattered production and difficult geography- increased cost in collection and
transportation, poor infrastructure for milk collection, chilling and transport. Poor

24
infrastructure and information networking, Inadequate quality feeding resources for
dairy animals, Serious depletion of animal feeding base due to deterioration in the
forest areas for fuel wood and timber, and additional land for settlement and
cultivation, Inadequate government support services due to lack of resources as many
of the district and sub-district level (livestock service centres) face shortage of
manpower as well as necessary equipments and veterinary medicines, inadequate and
inappropriate breeding support services as there is shortage of improved breeding
bulls as well as artificial insemination services, weak farm advisory services and
training as there remains a big gap between the specialized and expanded farmers’
service needs and those delivered by DLS resulting in lack of knowledge among the
farmers regarding improved dairy farming and hence limiting their capacity to adopt
new technology for production enhancement, critical shortage of dairy animals as
dairy heifer rearing practice is not common due to small landholding and lack of cost
effective heifer rearing technology, high opportunity costs of land and labour
particularly around the main highways and towns where the dairy farming activities is
mostly carried out, shrinking farm labour is becoming a serious problem due to
migration of youth for off-farm jobs within or outside countries, inadequate financial
service is a serious problem particularly in the rural areas as the rural branches of the
financial institutions were closed down due to insurgency in the past resulting in
drastically curtailed investment in dairy animals, poverty and illiteracy among
livestock raisers is severely hampering effective communication and the ability of
livestock raisers to respond to new opportunities as lack of basic literacy among them
complicates the extension process by requiring more face to face communication,
limited market opportunities for a large proportion of the farming population caused
by distance from market, poor access or lack of marketing mechanism and market
information (Kate Sadler et.al 2009).
2.4.3 Opportunities in Dairy Sector
Livestock are widely distributed with even distribution of cattle and buffaloes
throughout the country, consumption of milk and dairy products is traditional but
there is increasing gap between demand for and supply of milk and milk products,
market opportunities of milk and milk products have increased particularly in the
densely populated urban areas, involvement of private sector in dairy business has
25
greatly increased with the establishment of new dairy industries and cheese factories,
growth of tourism is also likely to provide increasing demand for modern dairy
products, dairy cooperatives have strongly developed with their presence from the
grass root level to the central level and have become a strong channel between the
rural milk producers and the milk processing industries, increasing involvement of
NGOs and private sector in livestock development activities particularly in providing
technical support services and veterinary health care. Growth of tourism is also likely
to provide increasing demand for modern dairy products; donors’ support has created
a positive environment for dairy livestock and dairy business development. (Nigerian
Dairy Development Board, 2012)
2.4.4 Threats of Dairy Sector
Compulsion for coexistence of productive and unproductive (old, male, diseased)
cattle further depleting scarce feeding resources, poor competitiveness- upsurge in
import of milk and milk products, open and uncontrolled border with India, increasing
cost of inputs including labor, shortage of labor- young generation seeking jobs
overseas, reluctance of financial institutions on lending for agriculture, high
opportunity costs of land and labour particularly around the main highways and
townships where the dairy farming activities is mostly carried out, emerging diseases
of zoonotic and economic significance, rising awareness on carbon trade among
people has resulted in increasing closure of community forests (which are presently
the main source of fuel wood and fodder to the community in many part of the
country) for animal grazing and tree cutting which has pushed the poor further away
from livestock keeping because they have been depending on free forest feed to the
animals, higher cost of milk production due to rising cost of inputs and absence of
mechanism to regularly assess the farmers’ cost of milk production and relating it to
the pricing of milk, discouraged farmers due to frequent closures and strikes by
different political parties resulting in shifting from farming to other occupations.
These are some important prevalent threat that is bottle neck for the rural
development (Abolnik, 2014).
26
CHAPTER- THREE
RESEARCH METHODOLOGY
In the present study both descriptive and exploratory research design have been
applied to study the Milk value Chain in the three districts of the Gandaki River
Basin. This research has also been designed to discover both qualitative and
quantitative information about the samples.
3.1 Research Design
The study was connected in for dissident districts of Gandaki River Basin namely (1)
Gorkha at Palungtar (2) Tanahun Dulegaunda (3) Chitawan at Chanauli.
Total 90 farmers 30 farmers from each research sites were selected to collect the
information. The farmers were selected from Buffalo/Cattle Raising Groups of the
research sites. The farmers providing at least 10 liters or more milk to the
cooperatives were selected. A structured questionnaire was used to collect the
information (See Annex 1).
Figure 1. Map of Gandaki river basin and selected Research Sites (See Annex 2)
3.2 Rationale of the Selection of the Study Area
Districts of Gandaki River basin (GRB) have been experiencing in dairy business.
Cattle and buffalo farming are important as a source of milk production in this area.
These areas are occupying the central part of country, over about 40% of the country.
The existing asphalt road infrastructure the milk were easily transported to different
urban centers like Pokhara, Damauli, Narayanghard and other urban centers through
private companies or through organized pastoral communities after a value is added to
increase its shelf life.
3.3 Nature and Source of Data
The study is based on both qualitative and quantitative nature of data Quantitative
information is supported by qualitative information and vice versa. Data source were

27
of two types; viz. primary and secondary. Field survey was the basic source of the
primary data. Data were collected from field survey, personal interview, case study
and focus group discussion.
3.3.1 Primary Source of Data
Total 90 individual farmers, 30 farmers from each research site, were interviewed
using structural questioner. Information were collected from buffalo keeping
farmers, Milk collection center, milk chilling center, milk processing factories, milk
distributing booth consumers and agro vets in the research sites.
3.3.2 Secondary Source of Data
The data on dairy status of the country was collected from the Central Bureau of
Statistics, Babarmahal. This type of work will also help to take the precaution in
animal husbandry in the milk value chain evaluation. The milk production, collection,
transportation, processing and selling data were obtained from Government, milk
cooperatives, DDC, private dairy from research sites, in and around of GRB's.
3.4 Universe, Sample Size and the Sampling Procedure
The universe of the study was 500 sample .The sample size was 18 % of the total
universe balancing the same percentage from the existed milk cooperatives.
Table 3.1: Total Sample Size and Sampling
S.N Universe Sample size Sample percent
Damauli 175 30 17.14
Chitwan 200 30 15
Gorkha 125 30 24
Source: Household survey, 2071/72.
Samples were collected from total 90 household (HH) focusing to the buffalo and
cattle keepers. Total 30 HH, out of total cattle and buffalo from the Buffalo
cooperatives from each research sites, was randomly selected and used to collect the
information. Both secondary and primary data from the major milk producing sites
were collected covering the whole milk value chain from production to the market as
28
well as the policy, regulatory and institutional framework under which the sub-sector
is operating. The farmers providing at least 10 ltrs of milk production in the
cooperatives were selected. Simple random sampling and systematic random
sampling have been used as respondents. Actively working intermediates (key
informants) were also used. Household survey, interview, observation, focused group
discussion and interview with the key informants were adopted to collect data. For
this, structured questionnaire and guidelines were developed (See Annex 1).
3.5 Data Collection Techniques and Tools
To collect primary data, the structured questionnaire, semi or unstructured interview
and observation methods were used. Data was collected using PRA technique. There
were both open end and close end questions included. The questions included in the
questionnaire tried to attempt the findings listed in the objectives. Especially, the
existing pattern of livestock and milk production, Milk value chain, role of key
intermediates and the constraints and opportunities were tried to obtain as well. (For
further See Annex 1).
3.5.1 Household Survey
Samples were collected from total 90 household (HH) focusing to the buffalo and
cattle keepers. Total 30 HH, out of total cattle and buffalo from the Buffalo
cooperatives from each research sites, was randomly selected and used to collect the
information. (See questionnaire, Annex)
3.5.2 Key Informant Interview
Farmers were interviewed and considered as key informant for household survey.
Again, persons including officers of DLSO's of the concerned districts, chairman of
the Local cooperatives, vehicle drivers and local vendors as well etc. were
interviewed were to obtain the cross verification of the answers received from the
farmer's interview. (See questionnaire, Annex)

29
3.5.4 Data Presentation and Analysis
The data presentation is descriptive, analytical and interpretative. Microsoft XL, SPSS
were used to summarize the data and for statistical analysis. Minitab was also used
wherever applicable. Most of the data are descriptive.

30
CHAPTER - FOUR
DATA PRESENTATION AND ANALYSIS
This chapter as a whole has been subjected to data presentation and analysis. The
result obtained is objective oriented i.e it has more or less tried to answer the queries
set as the objectives. The different findings have been organized under the following
headings
4.1 Existing Situation of Dairy Milk Production Status in Gandaki
River Basin
Gandaki River Basin is repetitively exemplified as the most potential a country in
livestock resource. The resource forms an integral part in the agricultural system and
basis of livelihood for entire rural and semi-urban population in most part of the
country. The purpose of livestock production is diversified and includes the provision
of draft power, food supply, source of income, means of transportation, alternate
energy source. (Mugerewa et.al 2009). In these areas, beyond the economic advantage
as a source of income it matters social prestige and status in the community. With
regard to the national economy, Livestock production plays a significant role the
country’s national economy. It contributes about one-third of agriculture's share of
GDP, or nearly l5 percent of total GDP. There are approximately 1.5 million cattle,
1.5 million buffaloes, 0.1 million sheep, 2 million goats. The raising of livestock
always has been largely a subsistence activity. Cattle in Gandaki River Basin are
almost entirely of the zebu type and are sources of milk and meat. However, these
cattle do relatively well under the traditional production system. Meat and milk yields
are low and losses high, especially among calves and young stock. Contagious
diseases and parasitic infections are major causes of death, factors that are
exacerbated by malnutrition and starvation due to frequent drought. Recurring
drought is a factor for the loss of huge livestock resource that influences the animal
population, although it is difficult to determine the extent of losses. Practically all
animals are range-fed. During the rainy seasons, water and grass are generally
plentiful, but with the onset of the dry season, forage is generally insufficient to keep
animals nourished and able to resist disease.
31
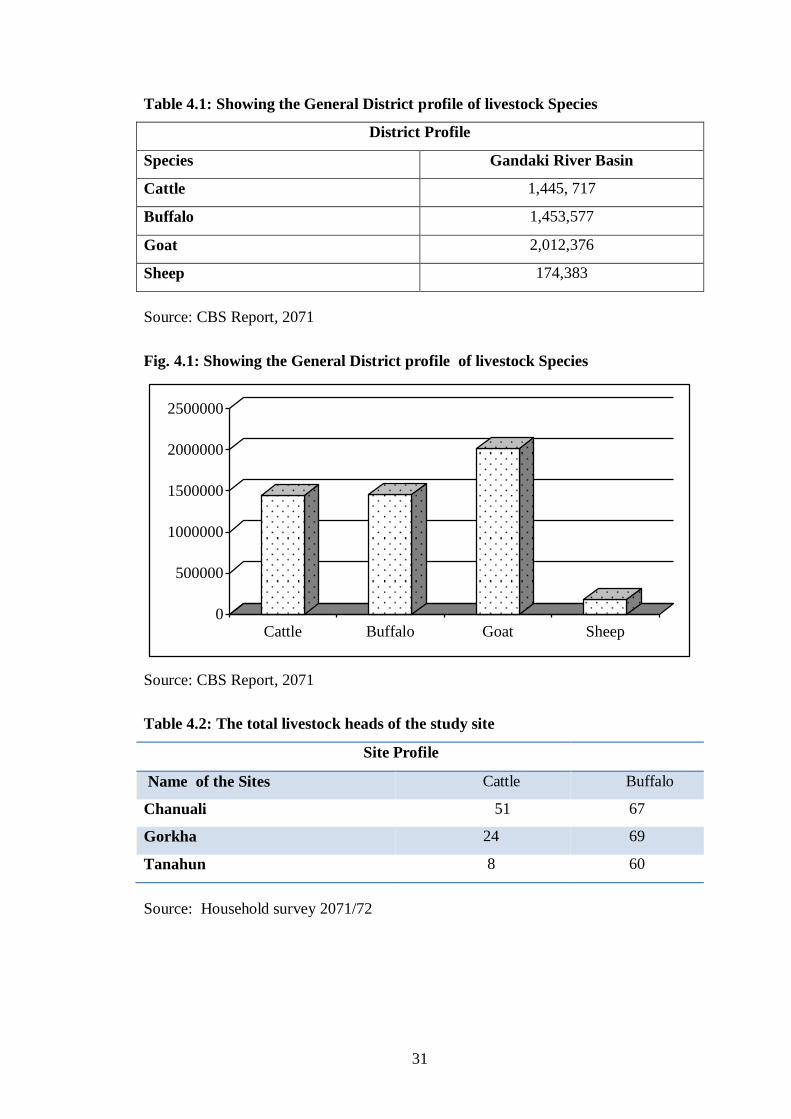
Table 4.1: Showing the General District profile of livestock Species
District Profile
Species Gandaki River Basin
Cattle 1,445, 717
Buffalo 1,453,577
Goat 2,012,376
Sheep 174,383
Source: CBS Report, 2071
Fig. 4.1: Showing the General District profile of livestock Species
0
500000
1000000
1500000
2000000
2500000
Cattle Buffalo Goat Sheep
Source: CBS Report, 2071
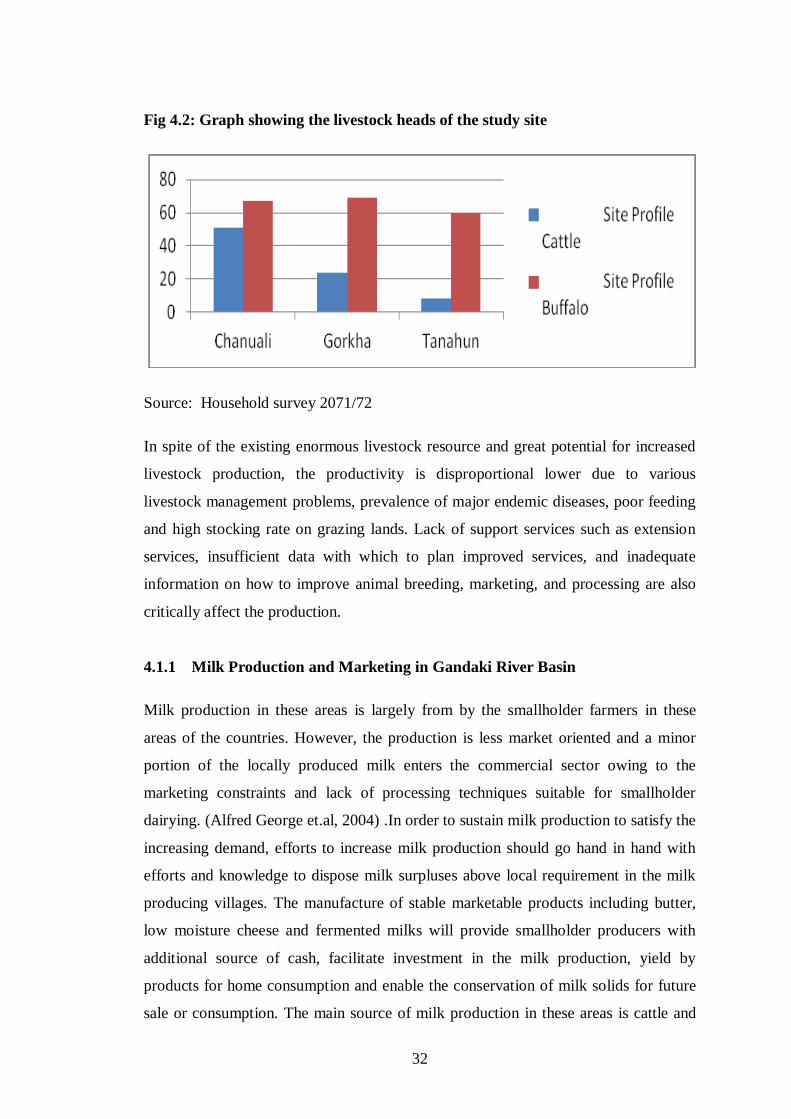
Table 4.2: The total livestock heads of the study site
Site Profile
Name of the Sites Cattle Buffalo
Chanuali 51 67
Gorkha 24 69
Tanahun 8 60
Source: Household survey 2071/72
32
Fig 4.2: Graph showing the livestock heads of the study site
Source: Household survey 2071/72
In spite of the existing enormous livestock resource and great potential for increased
livestock production, the productivity is disproportional lower due to various
livestock management problems, prevalence of major endemic diseases, poor feeding
and high stocking rate on grazing lands. Lack of support services such as extension
services, insufficient data with which to plan improved services, and inadequate
information on how to improve animal breeding, marketing, and processing are also
critically affect the production.
4.1.1 Milk Production and Marketing in Gandaki River Basin
Milk production in these areas is largely from by the smallholder farmers in these
areas of the countries. However, the production is less market oriented and a minor
portion of the locally produced milk enters the commercial sector owing to the
marketing constraints and lack of processing techniques suitable for smallholder
dairying. (Alfred George et.al, 2004) .In order to sustain milk production to satisfy the
increasing demand, efforts to increase milk production should go hand in hand with
efforts and knowledge to dispose milk surpluses above local requirement in the milk
producing villages. The manufacture of stable marketable products including butter,
low moisture cheese and fermented milks will provide smallholder producers with
additional source of cash, facilitate investment in the milk production, yield by
products for home consumption and enable the conservation of milk solids for future
sale or consumption. The main source of milk production in these areas is cattle and

33
buffalo. Based on the system of production, Milk production can be viewed at three
different sources. These include:
4.1.2 Major Milk and Milk Product Markets
There are three major milk and milk products markets were identified. These are
Dumre, Damauli and Narayanghad. On average a total of 6150 liter of milk enters to
this market per day from these markets. There is a permanent tractor/ tractor etc
which transports milk from. According to the focus group discussion with milk
freighters association and information obtained from the transporters, up to 1500 liters
of milk is supplied in dry season and up to 4600 liters of milk is during wet season
from the area. On the average 1050 liter is supplied on daily basis. Out of the total
milk supplied to the local gathering center 2592 liter (15%) is transported.
4.1.3 Pastoral Milk Production
Livestock production in pastoral areas system that supports an estimated 10% of
population covers 50-60% of the total area. However, because of the rainfall pattern
and related reasons shortage of feed availability milk production is low and highly
seasonally dependent. In this system indigenous stock grazing in pastures in extended
rangeland throughout the year and milked twice a day. No supplementary feeding is
provided.
4.1.4 The Small Holder Milk Production
The small holder farmers have high potential for dairy development. These areas are
occupying the central part of country, over about 40% of the country. In these areas
agricultural production system is predominantly substance smallholder mixed
farming, with crop and livestock husbandry. In this system feed for livestock consists
of forages, crop residues and stub grazing and hay native pastures. The majority of
milking cows in the smallholders milk production are indigenous breeds which have
low production performance with the average age at first calving is 53 months and
average calving intervals is 25 months. The average cow lactation yield is 524 litres
for 305 days, of which 238 litres is off-take for human use while 286 litres is suckled
by the calf. But also a very small number of crossbred animals are milked to provide
the family with fresh milk butter and cheese. Surpluses are sold, usually by women,
34
who use the regular cash income to buy household necessities or to save for festival
occasions (Mugerewa et. al, 2009). Both the pastoralist and smallholder farmers
produce 98% of the country milk production (MOA, 1985 E.C).
4.1.5 Urban and peri-urban milk production
This system developed based on the high market demand in and around major cities
and towns for milk and milk products. The main feeds sources are agro-industrial by
products (Oil Seed Cakes, Bran, etc) and purchased roughage.
Farmers use all or part of their land for home grown feeds. Generally, the primary
objective of the production system is to sale milk as a means of additional cash
income. The system basically characterized by small scale intensive husbandry with
cross breeds not more than 10 heads and managed under zero grazing.
4.1.6 Intensive Dairy Farming
The system is basically characterized by a more specialized dairy farming practices by
state and private commercial farms. Most of the intensive dairy farms are
concentrated in and around these areas are basically based on cross bred stock. The
urban, peri-urban and intensive dairy farmers are produce 2% of the total milk
production of the country. The system mostly run with cross bred animals more than
20 heads feed on improved pastures, hays and supplemental agro-industrial feeds.
Currently, most of the state dairy farms are decline in their management that has been
the major causes of inefficiencies in production. There is a downwards trend in milk
yields and herd performance. Both the herd size and total number of cows have been
on declining trend suggesting acute short fall of replacement herd and supply of
breeding stock to smallholder farmers.
4.1.6.1 Quantity of Milk Produced
The quantity of milk produced in the study area provides the basic outlines on Milk
consumption/ Day and Market Availability. To estimate the total milk production in
the pastoral area the following parameters were used: livestock population, female
and lactating animals’ proportion in the herd size, length of lactation period and milk
yield per day per animal. Moreover the following assumptions were also used to
35
identify the milk production size for each of the milk producing species. Milk: Out of
the total population in these areas, the mature female animals kept for milk production
are identified and it is found to be 38.42% and of these about 60% assumed is milk
producing animals annually (CSA, 2000/2001). Besides this proportion the
productivity of milk i.e. milk litre/ animal /day identified from the study and ranges
between 0.5 litters and 2.5 litters and an estimated average of 1.5 litters/cattle. The
lactation length also ranges between 120 to 305 days based on availability of feed and
water as well as length of dry seasons and an average of 270 days is considered.
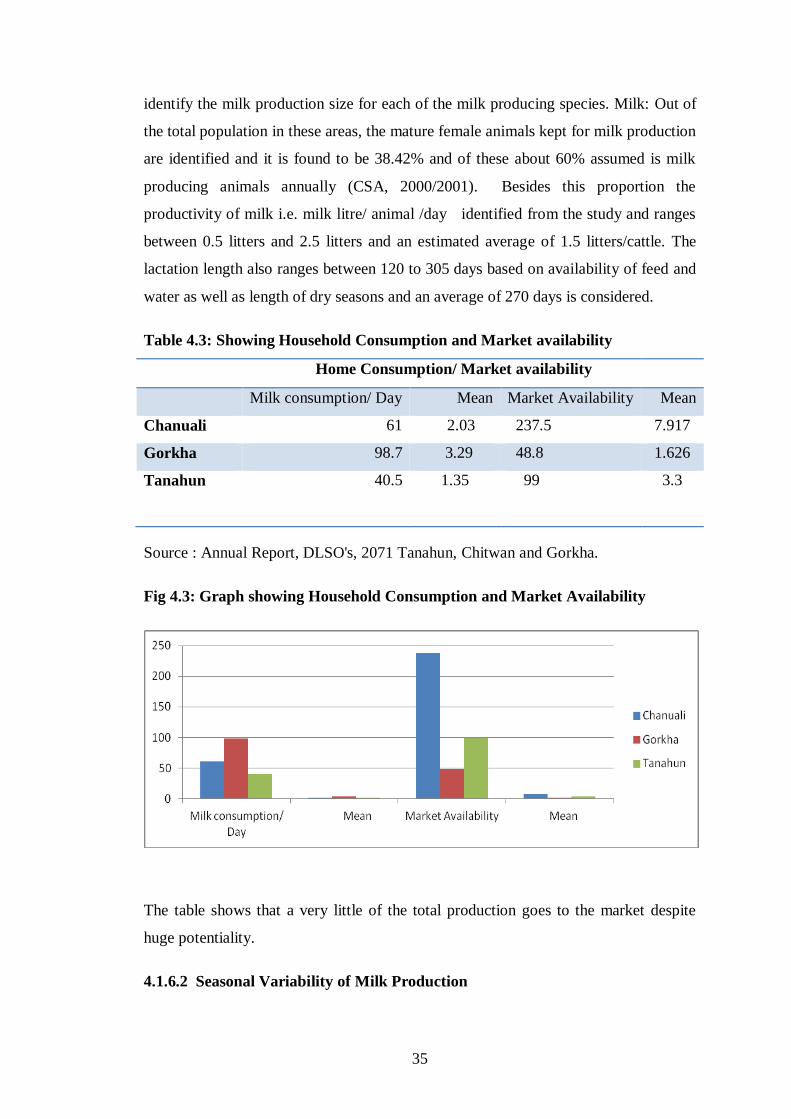
Table 4.3: Showing Household Consumption and Market availability
Home Consumption/ Market availability
Milk consumption/ Day Mean Market Availability Mean
Chanuali 61 2.03 237.5 7.917
Gorkha 98.7 3.29 48.8 1.626
Tanahun 40.5 1.35 99 3.3
Source : Annual Report, DLSO's, 2071 Tanahun, Chitwan and Gorkha.
Fig 4.3: Graph showing Household Consumption and Market Availability
The table shows that a very little of the total production goes to the market despite
huge potentiality.
4.1.6.2 Seasonal Variability of Milk Production

36
Milk production and productivity is affected by the seasons of the year. There is more
milk is produced with high productivity (litre/animal) (March, April and May) and
short rainy season called (September and October) and productivity is fluctuated over
season and years. Seasonal variability of milk production in these areas is basically
managed by amount and distribution of rainfall, and availability of forager and water.
Based on these events milk production is fluctuated in the four seasons of year and
from year to year container. Tying of the tail is important in the local setting because
cows carry a lot of dust or mud from the stable on their body. During milking, a lot of
this dust is dislodged by the constant waving of the tail to drive way flies. This
constitutes one of the most direct methods of milk contamination. The following
figure depicts the percentage of pastoralists using the stated practices.
4.16.3 Milk Products
The pastoralists and agro-pastoralists of these zones have been doing a traditional
milk processing practices at the household level and produces butter, skimmed milk,
yoghurt. They produce milk products like butter to cope the problem of short shelf
life of fresh milk. This is because the fresh milk will not stay fresh in some areas even
until they reach to the market hence they are forced to process it to butter to cope with
the risk of perishables. The study revealed that the more the farmers are far from the
market they tend to process the milk and produce butter. Moreover the higher the
wealth (livestock) the farmers have the higher will be the intensity and size of milk
processed and changed into different milk products. According to the FGD with the
farmers and women milk processing cooperatives, the proportion of the skimmed milk
production from the whole milk is ranged from 70% to 80 % with an average of 75%
where, yoghurt production is on average estimated to about 25% of the total processed
whole milk values. It was also learnt that that 1kg of butter was produced from 8-
12litters of whole milk (depending on the season- in wet season takes 12 litre and in
dry season 8 litres). Hence on the average 10 litters whole milk is considered to
produce 1 kg of butter. Above all it is apparent that the proportion of the butter
product per unit of whole milk varies based on the breed type, parity, milking
management and feed types.
4.1.7 Milk Marketing
37
In these areas, Milk and milk products are channeled to consumers through both
formal and informal marketing systems. Until 1991, the formal market of cold chain,
pasteurized milk was exclusively dominated by the DDC which supplied 12 percent
of the total fresh milk. Recently, however, private businesses have begun collecting,
processing, packing and distributing milk and other dairy products. Still, the
proportion of total production being marketed through the formal markets remains
small (Muriuki et. al 2001). Formal milk markets are particularly limited to peri-urban
areas. The informal market involves direct delivery of fresh milk by producers to
consumer in the immediate neighborhood and sale to collectors or traders nearby
towns. In the informal market, milk may pass from producers to consumers directly or
it may pass through two or more market agents. The informal system is characterized
by no licensing requirement to operate, low cost of operations, high producer price
compared to formal market and no regulation of operations. The informal (traditional)
market has remained dominant.
4.2 Partners Involved in Milk Value Chain
Following are the partners involved in milk value chain in different tiers. They have
been described accordingly.
4.2.1 Milk and Milk Products Production and Marketing
Milk is one of the most important livestock products. It is the main diet for
pastoralists. Milk production from milking animals (Cattle, Buffalo) is influenced by
their population and distribution, and the availability of natural pasture and water.
Besides, types of animal breeds, the composition of milking animals in herd and etc
are one of the most important factors influencing milk production in the pastoral
systems. The milk production also directly correlated with the environmental
situation. The better the environment/climate the better is the milk production and
vice versa. The milk producing animals (cattle, buffalo) in all studied pastoral areas
are indigenous and cross breeds. Cattle are well recognized in their dual purposes
production and hardiness .Moreover the study identified that during prolonged dry
season and drought hazard, milking cows move further away from pastoralists’ camp
to take advantage of grazing and water sources. The animals milking frequency per
day varies based on the type of livestock species and seasonal calendars of the year. In

38
wet season, where forage and water is relatively available, lactating cows are milked
twice a day during early in the morning before grazing time and evening after grazing.
Traditional cows those lost their calf due to death will not be milked even though they
are able to supply milk. On the other hand, during prolonged dry periods where feed
and water is highly scarce.

39
Figure 4.4: Flow of Processed Milk and Milk Products
Source: Questionnaire Survey, 2071
MILK PROCESSING PLANTS
PROCESSED MILK MILK PRODUCTS
MILK BOOTHS OWN SALES
CENTERS
HOTEL/
RESTURANTS
OWN SALES
CENTERS
FRANCHISE
SHOPS
DEPARTMENT
STORES/ SUPER
MARKETS
DISTRIBUTORS
HOUSEHOLD
CONSUMERS
RETAILERS HOUSE HOLDCONSUMERS

40
The above ascribed flow chart is easy and comprehensive. It describes about different
levels of intermediates of milk value chain and marketing. The Milk marketing in the
study area seeks the following key actors with the role of whose there is value
addition in the milk and its products.
4.2.2 General Features of the Open Markets
Milk and milk product marketing in these areas is done to fulfill their main basic
needs require for their livelihood. Food is the most important one. The pastoralists
supply fresh milk, butter, and yoghurt. Milk market is being open and competitive.
Table 4.4: Table showing the general cost of milk Byproducts
Cost of Milk Byproducts
Milk Byproducts Price/kg
Paneer 540
Dahi 80
Cheese 550
Butter 500
Source: Local dairy Price list of GRB's, 2071.
Though the prices of different products seemed accordingly, the price however
fluctuated due to various factors. The table illustrates that with the diversification in
products, the value of milk gets more added.
4.2.3 Adulteration
Milk and milk products are very susceptible to adulteration. In study area, milk and
milk product adulteration increases as the product is moved to market from areas
where closer to the pre-urban and urban centers. There is less adulteration at
production level. Water is used as substance for milk adulteration and butter of plant
fat is used for adulterating butter.

41
4.3 Milk Value Change and their Operation in GRB's
4.3.1 Number of Buyers and Sellers in the Market
Except in the terminal market, milk sellers are milk producers and are all women and
girls. In terminal market like Narayanghad the majority of the sellers are traders and
in terms of sex here also all are girls and women. Buyers are market participants
particularly pastoralists who directly on spot consume milk. Other buyers include tea
and coffee shop owners, restaurants and hotel owners. Few intermediaries in the
market: It is customary to see many intermediaries in many kinds of products
marketing such as livestock, horticulture, grains and etc. In contrast in milk and milk
product marketing there are insignificant numbers of intermediaries in study areas.
4.3.2 Price Uniformity across Location
One peculiarity we came across in milk and milk product marketing was price
uniformity especially for milk across the locations. One of key incentives for trading
is product price differential in space and time. The less number of intermediaries in
the market may attribute to constant price across locations.
4.3.3 Packaging /containers:
The supply milk to the market using local materials like Dumre and Damauli and
Narayanghad cans and retail at the market with a cup which has a volume of
300ml.While the Butter is supplied by Chitwan dairy milk in different tins and cups.
Generally the milk consumers prefer to buy milk from the local container.
4.4 SWOT Analysis
There are different levels of strength, weaknesses, opportunities and threats recognize
in the dairy sub-sector of GRB's. These are describes accordingly:
4.4.1 Strength of Dairy Sector
The strength of dairy sector to develop the rural area are; strong dairy cooperatives
with their presence from the grass root level i.e. rural area to the central level and
have become a strong channel between the rural milk producers and the milk
42
processing industries keeping animal is a household practice and people are
passionate in animal keeping , increasing involvement of NGOs and private sector in
livestock development activities in rural area particularly in providing technical
support services and veterinary health care, employment (full or part) for millions of
HHs (formal and informal sector), stable and daily source of income.
4.4.2 Weaknesses of Dairy Sector
The pragmatic weakness of the dairy sector were Hygienic milk production/ lack of
stringent measure on quality control / lack of awareness, scattered production and
difficult geography- increased cost in collection and transportation, poor infrastructure
for milk collection, chilling and transport etc.
4.4.3 Opportunities of Dairy Sector
The opportunities are wide as livestock are widely distributed with even distribution
of cattle and buffaloes throughout, consumption of milk and dairy products is
traditional but there is increasing gap between demand for and supply of milk and
milk products, market opportunities of milk and milk products have increased
particularly in the densely populated urban areas, involvement of private sector in
dairy business has greatly increased with the establishment of new dairy industries
and cheese factories, growth of tourism is also likely to provide increasing demand for
modern dairy products, dairy cooperatives have strongly developed with their
presence from the grass root level to the central level and have become a strong
channel between the rural milk producers and the milk processing industries
4.4.4 Threats of Dairy Sector
Compulsion for coexistence of productive and unproductive (old, male, diseased)
cattle further depleting scarce feeding resources, poor competitiveness- upsurge in
import of milk and milk products, open and uncontrolled border with India, increasing
cost of inputs including labor, shortage of labor- young generation seeking jobs
overseas, reluctance of financial institutions on lending for agriculture, high
opportunity costs of land and labour particularly around the main highways and
townships where the dairy farming activities is mostly carried out, emerging diseases
of zoonotic and economic significance, rising awareness on carbon trade among

43
people has resulted in increasing closure of community forests (which are presently
the main source of fuel wood and fodder to the community in many part of the
country) etc were some pragmatic threats of the milk producing areas in the Gandaki
river basins.
44
CHAPTER - FIVE
SUMMARY, CONCLUSION AND RECOMMENDATIONS
The chapter deals with the summary of the findings, conclusions and
recommendations. They are mentioned below.
5.1 Summary
Summary of the findings is the concise form of the findings of the research under
socio economic information of the respondents, milk value chain of the three districts
of the Gandaki River Basin and their SWOT's analysis.
There are approximately 1.5 million cattle, 1.5 million buffaloes, 0.1 million sheep, 2
million goats. The raising of livestock always has been largely a subsistence activity.
Cattle in Gandaki River Basin are almost entirely of the zebu type and are sources of
milk and meat.
There are three major milk and milk products markets identified. These are Dumre,
Damauli and Narayanghad . On average a total of 6150 liter of milk enters to these
markets per day from these markets. Information obtained from the transporters
revealed that, up to 1500 liters of milk is supplied in dry season and up to 4600 liters
of milk is during wet season from the area. On the average 1050 liter is supplied on
daily basis. Out of the total milk supplied to the local gathering center 2592 liter 15%
is transported. The average cow lactation yield is 524 litres for 305 days, of which
238 litres is off-take for human use while 286 litres is suckled by the calf.
This system developed based on the high market demand in and around major cities
and towns for milk and milk products. The main feeds sources are agro-industrial by
products (Oil Seed Cakes, Bran, etc) and purchased roughage. Farmers use all or part
of their land for home grown feeds. Generally, the primary objective of the production
system is to sale milk as a means of additional cash income. The system basically
characterized by small scale intensive husbandry with cross breeds not more than 10
heads and managed under zero grazing. The key actors in the formal dairy value
system include milk producer farmers, MPCSs, MCCs, and milk processing
plants/cheese factories. Firstly, there are rural farmers and their function is to be

45
engaged in milk production. The next are MPCSs established in the rural areas, Milk
and milk products were channeled to consumers through both formal and informal
marketing systems.
SWOT analysis revealed that the strength of dairy sector to develop the rural area are;
strong dairy cooperatives with their presence from the grass root level i.e. rural area
to the central level and have become a strong channel between the rural milk
producers and the milk processing industries, The pragmatic weakness of the dairy
sector were Hygienic milk production/ lack of stringent measure on quality control /
lack of awareness, scattered production and difficult geography- increased cost in
collection and transportation, poor infrastructure for milk collection, chilling and
transport etc. The study concludes that there are opportunities which the
competitiveness of milk subsector can be built up on untapped high milk production
potential.
5.2 Conclusions
Based on the figures and facts, the study has been concluded accordingly. Small scale
farmers viz. Pastoralist culture of keeping more female animals (60-70% of the herd)
in Gandaki River Basin areas. There is Good practice of forming informal milk
producer and marketing groups within villages. Out of the total milk supplied to the
local gathering center 2592 liter (15%) is transported Milk producer farmers, MPCSs,
MCCs, and milk processing plants/cheese factories are the key intermediates of milk
value chain. The price of milk gets added when its byproduct gets diversified. There is
big potential for milk sources in the districts of GRB's and should be exploited fully.
5.3 Recommendations
Different recommendations have been enlisted accordingly.

46
5.3.1 Infrastructure
The need for electricity for establishing cooling chains is a prerequisite;
accordingly it is a positive move in the area for rural electric power expansion
being developed.
Therefore, government rural electrification program need to be expanded in
some of the pastoral areas where there is high milk potential. (Aamir et al.,
2009).
Means of transportation and bandha and strikes should be politically
addressed.
Establishment of loan facilities is at most.
The policy of compulsory selling of milk to be implemented.
5.3.2 Productivity improvement
It is apparent that the productivity of milk in these areas is very low i.e. on
average 1.5 liter/ cow per day. The productivity varies with the types of the
seasons in the year. The productivity increases during wet season in March,
April and May and short rainy season in September and October).
The amount and distribution of rain fall affect the availability of feed and
water hence affect the productivity. Among others milking cow management
considering feed and feeding management ,animal diseases control (mastitis),
availability of AI etc are factors contributed to the low productivity of milk
(OIE,2008).
Promote the value chain approach as an economic tool to tackle the problems
of milk and milk products value chain
Present the intervention points identified and enrich by accepting more from
the stakeholders and show how the situation needs a holistic approach
5.3.3 Environment management
The cheapest source of feed for livestock is natural resources. As a result
pastoral communities depend on rangelands for grazing their animals. T
47
he economic significance is that about 100% of the total milk and milk
products marketed in come from indigenous livestock which, thrive on natural
pastures in the rangelands. There is also poor management of pastures in these
rangelands characterized by burning. This has a negative impact in that some
important pasture species like legumes may find it difficult to re-grow after
burning.
It was established that pastures in the rangeland cattle corridor areas studied
are of low quality.
5.3.4 Establish Gandaki River zone pastoralists’ milk and milk products
stakeholder forum (commodity oriented):
Promote the value chain approach as an economic tool to tackle the problems
of milk and milk products value chain
Present the intervention points identified and enrich by accepting more from
the stakeholders and show how the situation needs a holistic approach.
Establish permanent stakeholder forum with the private sector plays a leading
role and decide permanent meeting period to evaluate the work progress done
by different actors
Recruit business development service provider to the chain that facilitate t
communication among the stakeholders, who disseminate information to all of
the stakeholders and who facilitate the stakeholders’ meetings.
5.3.5 Support the Improvement of Milk Market and Marketing
Develop milk market development strategies for Gandaki River Basin pastoral
communities.
Show the profitability of the milk business in Gandaki River Basin to the big
private companies to invest on UHT/pasteurizing milk processing industry
and to establish chilling centers at different potential milk production sites o
Support pastoralists to organize them -selves into milk marketing groups and
cooperatives with a voice

48
Educating pastoralists on the need for milk marketing and meat consumption.
Deliberately step must be taken by government to instill the culture of milk
and meat consumption.
Promote the introduction of appropriate rural milk transporting facilities and
lobby for the improvement of village/feeder roads
49
References
Aamir, U.B., Naeem, K., Ahmed, Z., Obert, C.A., Franks, J., Krauss, S., Seiler, P.,
Webster, R.G. (2009). An analysis of the impact of Import surges on Rural
Poverty in Kenya.
Abolnik, C. A.( 2014). A study on Dairy Farmers in Nepal (Final Draft), Kathmandu:
NDDB and Danida Support Project.
Action Aid Kenya, (2005). An analysis of the impact of Import surges on Rural
Poverty in Kenya. Kenya: The Case of Dairy Sub- Sector.
ADS, ( 2011). ADS, Final Report, Prepared for Government of Nepal. Kathmandu:
MoAD.
Agri-Business Promotion and Statistics Division. (2007/08). Statistical Information
on Nepalese Agriculture MoAC. Kathmandu: Agriculture Project Services
Center and John Mellor Associates Inc (1995).
Alexander, D.Y. (2004), A review of dairy subsectors Available at:
http://www.esvv.unizh.ch/gent_abstracts/Alexander.html.* Accessed 30 Aug.
Amirsalehy, H., Nili, H., Mohammadi, A. (2012) Can dairy sector elliminate the
global poverty ? J.; 90(9): 341-5.
Annual Report and Livestock Market Promotion Technical Booklet. (1991). DLS,
Lalitpur. Ministry of Agriculture
ANZDEC, (2002). Final Specialist Report, Livestock. Report by ANZDEC Limited,
New Zealand.
APP. (2014). Nepal Agriculture Prospective Plan. Kathmandu: APRSC.
FAO. (2011). Approaches to controlling, preventing and eliminating micro-
organisms in milk in endemic countries. Rome: Animal Production and Health
Paper. No. 171.

50
His Majesty’s Government, Asian Development Bank, ANZDEC Limited,
Agriculture Project Services Center (1993): Livestock Master Plan Volume II:
The Plan and Volume III: The Livestock Sector, Kathmandu: Livestock
Market Promotion Directorate.
Information on DLS (http://www.dls.gov.np/). Food Act and Regulation
(http://www.dftqc.gov.np/) Data on Cooperatives and Cooperative Act
(http://www.deoc.gov.np/).
Kenya Dairy Board Strategy (2005). Land O’Lakes, Impact of Post Election Violence
on the Kenyan Dairy Industry. Kenya: ILRI.
MOAC. (2010). Statistical Information on Nepalese Agriculture. Ministry of
Agriculture and Co-operatives Singhdarbar, Kathmandu, Nepal.
www.http://moac.gov.np
MoAD. (2012). Krishi Diary, Kathmandu: MoAD 2014.
Nigerian Dairy Development Board. (2012). Analysis of selected food value chain.
Nigeria: Dairy Development Board.
Poudel,, L. ( 2014). Proceeding of LCC Workshop. Kathmandu: USAID
Practical Action Nepal. (2012). Dairy sub-sector : Analysis and Vission, Kathmandu:
In Report of SAMARTH.
Sherestha, B.S. (2013). Dairy Vision 2030. Prepared by NDDB for the Government
of Nepal. Kathmandu: NARC.
TWG. ( 2010). Assessing Vulnerability Provides Foundation For Identification And
Prioritization of Adaptation Measures to Climate Change. Thematic Working
Group on Agriculture and food Security (MOAC), National Adaptation
Program of Action (NAPA) to climate change, Kathmandu, Nepal.

51
Annex1
Questionnaire
Study on the Dairy value Chain in rural dairy farming System as a tools for
rural development for food security in the hills of Nepal
(Gorkha: Palungtar, Tanahun: Dulegaunda, and Chitwan: Chanauli, Kashki)
1. Household Characteristics and Milk Production
1. 1 Household Characteristics
Name of the respondent:
VDC :
Ward :
Village :
Age of the respondent :
Sex : (a) Male (b) Female
Education of respondent :
Ethnicity :
Occupation of the respondent : (a) Primary…… (b) Secondary ….
No. of family members of the respondents by age category
Age Male Female
Less than 16 years
16-60 years
Above 60 years
1.2 Educational status of the family members
Education category Male Female
Illiterate
Literate only
Primary level
Secondary level
SLC
College and university level

52
1.3 Major Occupation of the family members
Sex
Occupation
Agriculture
including livestock
Agriculture and
business
Agriculture
and service
Service/enterprise
only
Male
Female
1.4 Land use pattern and size of holdings
Land Type Own land
(Ropani)
Rented-
out(Ropoani)
Rented- in
(Ropani)
Total
Ropani
Khet (low land)
Bari (upland)
Marginal land
Pastureland /rangeland
Kharbari (bush land)
Total land (ropani)
2. Milk Value Chain
2. 1 Milk Production
2.1.1 Animal population and herd composition
What is the animal population and herd composition of your farm?
Animal
Species
Improved Local
Adult
Heifer
Adult Heifer
Milch Dry Milch Dry
Cattle
Buffalo
He Buffalo
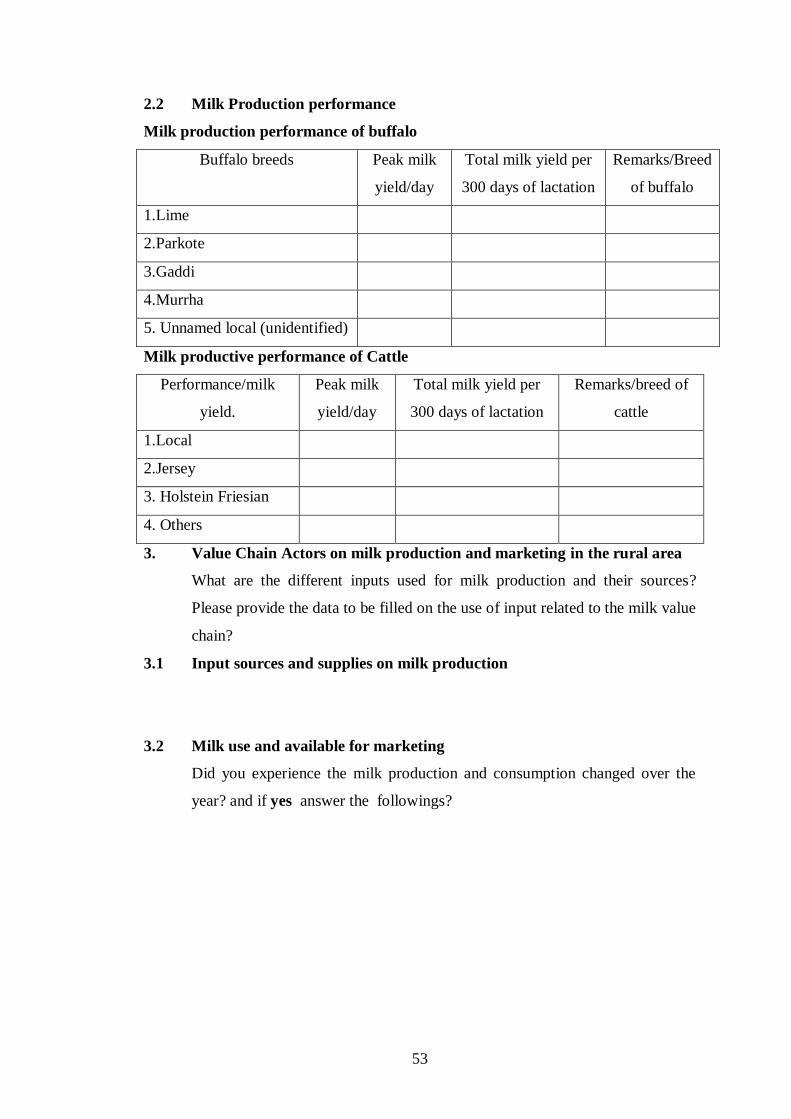
53
2.2 Milk Production performance
Milk production performance of buffalo
Buffalo breeds Peak milk
yield/day
Total milk yield per
300 days of lactation
Remarks/Breed
of buffalo
1.Lime
2.Parkote
3.Gaddi
4.Murrha
5. Unnamed local (unidentified)
Milk productive performance of Cattle
Performance/milk
yield.
Peak milk
yield/day
Total milk yield per
300 days of lactation
Remarks/breed of
cattle
1.Local
2.Jersey
3. Holstein Friesian
4. Others
3. Value Chain Actors on milk production and marketing in the rural area
What are the different inputs used for milk production and their sources?
Please provide the data to be filled on the use of input related to the milk value
chain?
3.1 Input sources and supplies on milk production
3.2 Milk use and available for marketing
Did you experience the milk production and consumption changed over the
year? and if yes answer the followings?

54
3.2.1 Milk Use (home)
Years
Total milk
production
(ter /day)
Home
consumption
(ml/d)
Available
milk to sale
Milk used for product
diversification
Quantity
used
Milk Products
(Ghee, paneer etc)
Now
5 yrs back
10 yrs. back
3.2.2 Milk marketing (collection and transportation)
Please provide the following information about the milk products and
marketing?
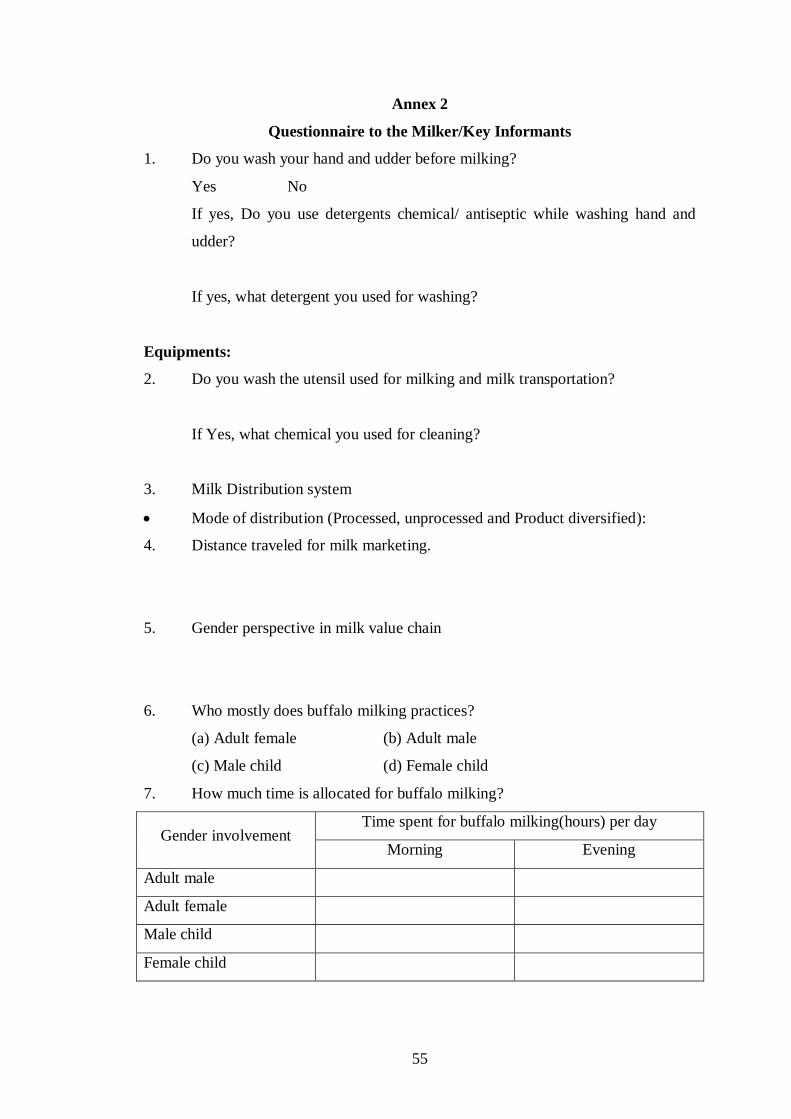
55
Annex 2
Questionnaire to the Milker/Key Informants
1. Do you wash your hand and udder before milking?
Yes No
If yes, Do you use detergents chemical/ antiseptic while washing hand and
udder?
If yes, what detergent you used for washing?
Equipments:
2. Do you wash the utensil used for milking and milk transportation?
If Yes, what chemical you used for cleaning?
3. Milk Distribution system
Mode of distribution (Processed, unprocessed and Product diversified):
4. Distance traveled for milk marketing.
5. Gender perspective in milk value chain
6. Who mostly does buffalo milking practices?
(a) Adult female (b) Adult male
(c) Male child (d) Female child
7. How much time is allocated for buffalo milking?
Gender involvement Time spent for buffalo milking(hours) per day
Morning Evening
Adult male
Adult female
Male child
Female child

56
8. Have you ever received training on hygienic milk production over the 5 years
period of time?
(a) Yes (b) No
9. Who has received the training?
(a) Adult male (b) Adult female (c) Male child (d) Female child
If yes, what was the duration of the training? -------------------
10. Was the training useful to you for clean milk production and marketing?
(a) Yes (b) No
11. If not, what is the best way to improve the quality of milk from cattle and
buffaloes?
(a)----------------------------------
(b)----------------------------------
(c)----------------------------------
Present and future
1. Do you think milk production and buffalo rearing is affected by change in
rainfall pattern and its magnitude?
a. Yes b. No
2. Do you think milk production and buffalo rearing is affected by temperature
fluctuation and its magnitude?
a. Yes b. No
3. Is there any possibility to tackle with changed consequences in buffalo
keeping due to changed in climatic parameters? In terms of practices to be
followed.
a. Yes, it is possible to tackle
b. No, it is hard to tackle
c. I have no idea on this issue
4. If yes, do you think differences in men’s and women’s roles in cattle and
buffaloes milking will be visible?
a. Yes
b. No
5. Constraints and threats faced by milk producer, sellers and distributers
5.1. Milk producers

57
5.2. Milk sellers
5.3. Milk distributers
6. Suggestions (to improve milk value change system)
1.
2.
3.
4.
5.
6.

58
Annex 3: Map of Gandaki River Basin


