Embed Size (px)
Citation preview
CHAPTER 5Planning
True/False
1. Scheduling is the systematic arrangement of tasks to accomplish an objective.
ANSWER: F
2. Though the plan becomes a benchmark against which actual progress can be compared, it does not allow for corrective action if deviations occur.
ANSWER: F
3. It is important that the people who are involved in performing the work are also involved in planning the work.
ANSWER: T
4. The first step in the planning process is to define the project criteria.
ANSWER: F
5. For a project, the objective is usually defined in terms of scope, intangibles, and cost.
ANSWER: F
6. Once the project objective has been defined, the next step is to determine what work elements or activities need to be performed to accomplish it.
ANSWER: T
7. The brainstorm approach is best suited for determining the list of activities needed to accomplish project objectives for large, complex projects.
ANSWER: F
8. The brainstorm approach breaks a project down into manageable pieces, or items, to help ensure that all of the work elements needed to complete the project work scope is identified.
ANSWER: F
9. The lowest-level item of any one branch of a WBS is called a work code.
ANSWER: F
10. The WBS usually indicates the organization or individual responsible for each work item.
ANSWER: T
11. The resource map is a method used to display, in tabular format, the individuals responsible for accomplishing the work items in the WBS.
ANSWER: F
12. Some responsibility matrices use an ‘X’ to show who is responsible for each work item.
ANSWER: T
13. An activity requires the expenditure of effort by people.
ANSWER: F
14. The GERT falls under the general category of network planning techniques.
ANSWER: T
15. The Gantt chart is sometimes called a bar chart.
ANSWER: T
16. In a Gantt chart, activities are listed on the left-hand side, and the person responsible for each task is listed at the bottom.
ANSWER: F
17. One of the major advantages to the traditional Gantt chart is that it graphically displays the interrelationships of activities.
ANSWER: F
18. Network techniques combine the planning and scheduling functions.
ANSWER: F
19. A network diagram is typically not drawn to a time scale.
ANSWER: T
20. In the AIB format, the activity description is written above the arrow.
ANSWER: F
21. An activity cannot start until all of the preceding activities that are linked to it by arrows have been finished.
ANSWER: T
22. In the AOA format, each activity is assigned a unique number.
ANSWER: F
23. Activities in a ladder are not allowed because it portrays a path of activities that perpetually repeats itself.
ANSWER: F
24. Loops allow the project to be completed in the shortest possible time while making the best use of available resources.
ANSWER: F
25. An information system (IS) is a computer-based system that accepts data as input, processes the data, and produces useful information for users.
ANSWER: T
26. During the systems design phase of the SDLC, the development team defines the scope of the system to be developed, interviews potential users, studies the existing system, and defines user requirements.
ANSWER: F
Multiple Choice

27. __________ is the systematic arrangement of tasks to accomplish an objective.a. Schedulingb. Planningc. Team buildingd. Controlling
ANSWER: B
28. By participating in the __________ of the work, individuals will become committed to accomplishing it.a. planningb. controllingc. discussiond. timing
ANSWER: A
29. In the planning process, the __________ is/are the end product(s) that the project team must deliver.a. environmentb. cyclec. objectived. work forms
ANSWER: C
30. For a project, the objective is usually defined in terms of scope, __________, and cost.a. planb. schedulec. controlsd. packages
ANSWER: B
31. The __________ breaks a project down into manageable pieces, or items, to help ensure that all of the work elements needed to complete the project work scope are identified.a. work package planb. work budget planc. work brainstorm techniqued. work breakdown structure
ANSWER: D
32. __________ is a hierarchical tree of end items that will be accomplished or produced by the project team during the project.a. Work package planb. Work budget planc. Work contingency pland. Work breakdown structure
ANSWER: D
33. A WBS subdivides the project into smaller pieces called __________.a. object codesb. task statementsc. work itemsd. work loads
ANSWER: C
34. The lowest-level item of any one branch is called a __________.a. object itemb. task statementc. work packaged. activity node
ANSWER: C
35. The __________ is a method used to display, in tabular format, the individuals responsible for accomplishing the work items in the WBS.a. responsibility matrixb. resource mapc. brainstorm techniqued. task structure
ANSWER: A
36. A(n) __________ is defined as a piece of work that consumes time.a. work itemb. activityc. elementd. work object
ANSWER: B
37. When all the detailed activities have been defined for each of the work packages, the

next step is to graphically portray them in a __________ that shows the appropriate sequence and interrelationships to accomplish the overall project work scope.a. bubble diagramb. Gantt chartc. network diagramd. responsibility chart
ANSWER: C
38. Unlike __________separate(s) the planning and scheduling functions.a. the Gantt chart, network techniquesb. the bar chart, the Gantt chartc. network techniques, the bar chartd. network techniques, the Gantt chart
ANSWER: A
39. A __________ is the result, or output, of the planning function and is not drawn to a time scale.a. Gantt chartb. responsibility matrixc. network diagramd. bar chart
ANSWER: C
40. With __________, the scheduling of activities occurs simultaneously with their planning.a. network diagramsb. responsibility matricesc. Gantt chartsd. graphical evaluation and review techniques
ANSWER: C
41. The Gantt chart combines the two functions of __________.a. planning and levelingb. scheduling and evaluatingc. planning and schedulingd. scheduling and controlling
ANSWER: C
42. One of the major drawbacks to the __________ is that it does not graphically
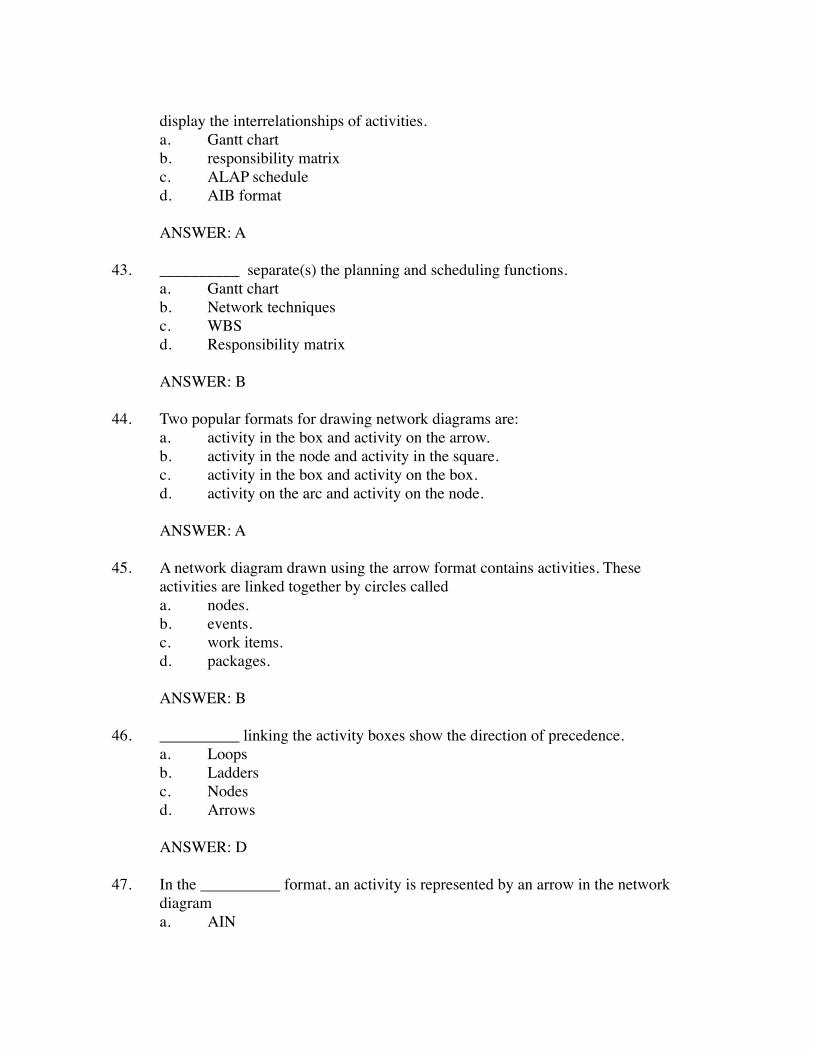
display the interrelationships of activities.a. Gantt chartb. responsibility matrixc. ALAP scheduled. AIB format
ANSWER: A
43. __________ separate(s) the planning and scheduling functions.a. Gantt chartb. Network techniquesc. WBSd. Responsibility matrix
ANSWER: B
44. Two popular formats for drawing network diagrams are:a. activity in the box and activity on the arrow.b. activity in the node and activity in the square.c. activity in the box and activity on the box.d. activity on the arc and activity on the node.
ANSWER: A
45. A network diagram drawn using the arrow format contains activities. These activities are linked together by circles calleda. nodes.b. events.c. work items.d. packages.
ANSWER: B
46. __________ linking the activity boxes show the direction of precedence.a. Loopsb. Laddersc. Nodesd. Arrows
ANSWER: D
47. In the __________ format, an activity is represented by an arrow in the network diagrama. AIN

b. ABCc. AOAd. AIB
ANSWER: C
48. In the __________ format, there is a special type of activity known as a dummy activity.a. AOAb. ABCc. AINd. AIB
ANSWER: A
49. A __________ consumes zero time, and is represented by a dashed arrow in the network diagram.a. discontinuous activityb. dummy activityc. predecessor eventd. successor event
ANSWER: B
50. __________ can sometimes be used for projects that have a set of activities that are repeated several times.a. Truncationb. Loopingc. Ladderingd. Transitions
ANSWER: C
51. A project management planning tool, or methodology, called the __________ is often used to help plan, execute, and control IS development projects.a. software plannerb. systems development life cyclec. software development learning curved. systems development life circle
ANSWER: B
52. During which phase of the SDLC is data gathered and analyzed, and problems and opportunities clearly defined?
a. Problem definitionb. System analysisc. System designd. System development
ANSWER: A
53. During which phase of the SDLC does the development team define the scope of the system to be developed, interview potential users, study the existing system, and define user requirements?a. Problem definitionb. System analysisc. System designd. System development
ANSWER: B
54. During which phase of the SDLC is hardware purchased, while software is purchased, customized, or developed?a. System analysisb. System designc. System developmentd. System implementation
ANSWER: C
Short Answer/Problems
55. What questions regarding each individual activity should be asked, while deciding the sequence in which activities should be drawn showing their logical preceding relationships to each other?
ANSWER:a. Which activities must be finished immediately before this activity can be
started?b. Which activities can be done concurrently with this activity?c. Which activities cannot be started until this activity is finished?
56. List the steps of the SDLC.
ANSWER:a. Problem definitionb. System analysis
c. System designd. System developmente. System testingf. System implementation
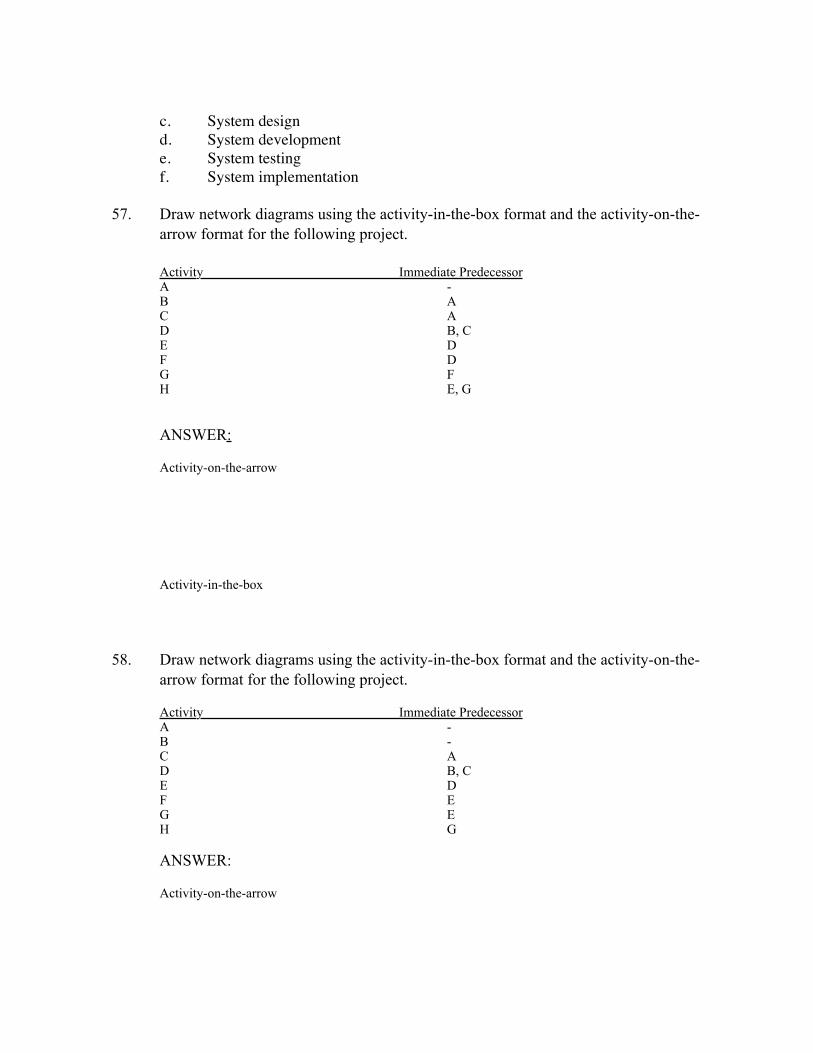
57. Draw network diagrams using the activity-in-the-box format and the activity-on-the-arrow format for the following project.
Activity Immediate PredecessorA -B AC AD B, CE DF DG FH E, G
ANSWER:
Activity-on-the-arrow
Activity-in-the-box
58. Draw network diagrams using the activity-in-the-box format and the activity-on-the-arrow format for the following project.
Activity Immediate PredecessorA -B -C AD B, CE DF EG EH G
ANSWER:
Activity-on-the-arrow
Activity-in-the-box
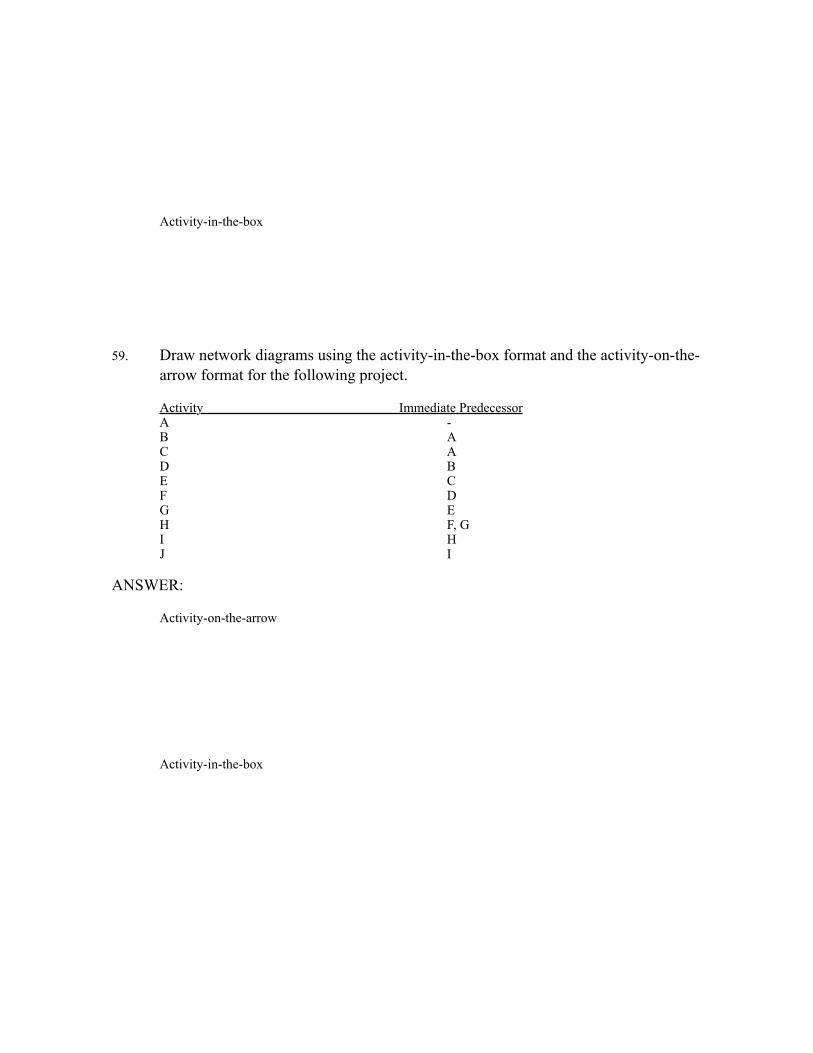
59. Draw network diagrams using the activity-in-the-box format and the activity-on-the-arrow format for the following project.
Activity Immediate PredecessorA -B AC AD BE CF DG EH F, GI HJ I
ANSWER:
Activity-on-the-arrow
Activity-in-the-box

CHAPTER 6Scheduling
True/False
1. When network planning techniques are used, the planning function depends on the scheduling function.
ANSWER: F
2. The duration estimate for each activity includes the total elapsed time and any associated waiting time.
ANSWER: T
3. Whenever possible, it is a good practice to have the person who will be responsible for performing a particular activity help make the duration estimate for that activity.
ANSWER: T
4. An activity’s duration estimate must be based on the quantity of resources expected to be used on the activity.
ANSWER: T
5. When calculating duration estimates for projects that have a high degree of uncertainty, two duration estimates are often suggested for each activity.
ANSWER: F
6. The ES and EF times are determined by working through the network diagram from the beginning of the project to the end of the project.
ANSWER: T
7. The latest finish time for a particular activity must be the same as or later than the latest of all the earliest finish times of all the activities leading directly into that particular activity.
ANSWER: F
8. Latest start time (LS) can be calculated by multiplying the duration estimate by the

latest finish time (LF).
ANSWER: F
9. If the critical lag is negative, it represents the amount of time that the activities on a particular path must be delayed in order to complete the project by its required completion time.
ANSWER: F
10. The longest path in the overall network diagram is called the extreme path.
ANSWER: F
11. The amount of time a particular activity can be postponed without delaying the earliest start time of its immediately succeeding activities is called the critical path.
ANSWER: F
12. Free slack is the relative difference between the amounts of total slack for activities entering into the same activity.
ANSWER: T
13. Since free slack is a relative difference between values of total slack, it is always a positive value.
ANSWER: T
14. A rule of thumb is that there should be only one chance in five of completing the activity in less than the optimistic time estimate.
ANSWER: F
15. In network planning, when three time estimates are used for each activity, it is assumed that the three estimates follow a normal probability distribution.
ANSWER: F
16. Network planning in which three time estimates are used for each activity can be considered a stochastic or probabilistic, technique.
ANSWER: T
Multiple Choice
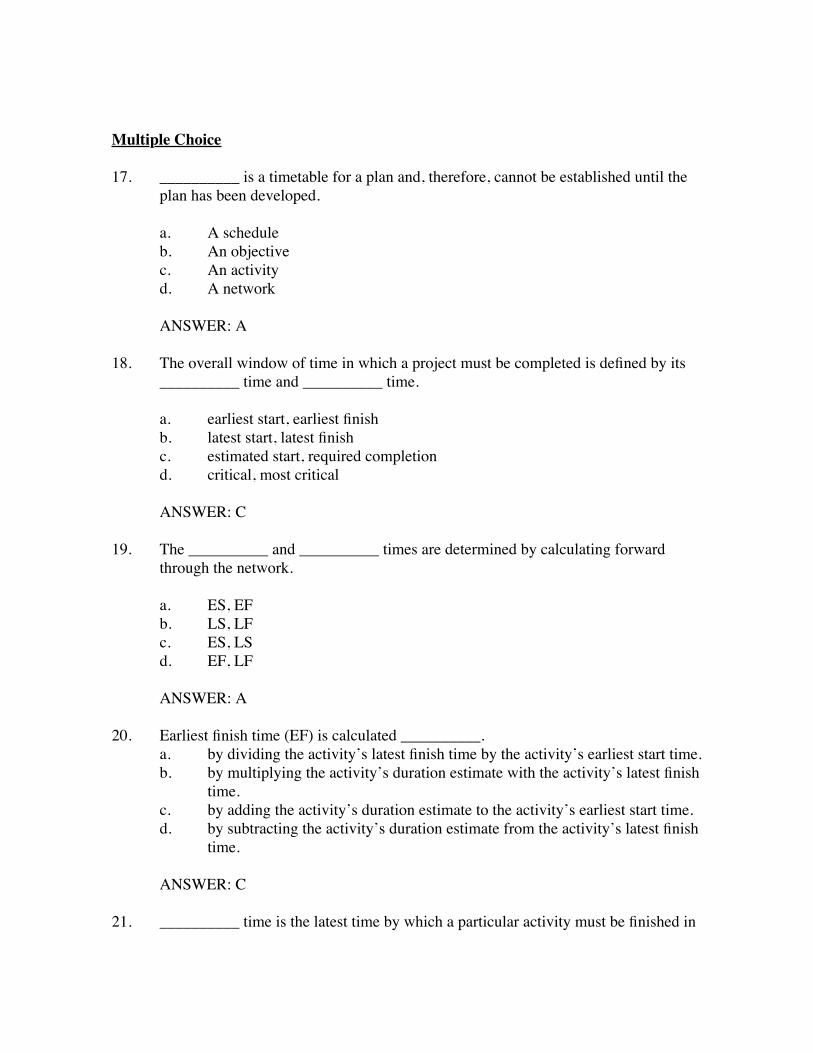
17. __________ is a timetable for a plan and, therefore, cannot be established until the plan has been developed.
a. A scheduleb. An objectivec. An activityd. A network
ANSWER: A
18. The overall window of time in which a project must be completed is defined by its __________ time and __________ time.
a. earliest start, earliest finishb. latest start, latest finishc. estimated start, required completiond. critical, most critical
ANSWER: C
19. The __________ and __________ times are determined by calculating forward through the network.
a. ES, EFb. LS, LFc. ES, LSd. EF, LF
ANSWER: A
20. Earliest finish time (EF) is calculated __________.a. by dividing the activity’s latest finish time by the activity’s earliest start time.b. by multiplying the activity’s duration estimate with the activity’s latest finish
time.c. by adding the activity’s duration estimate to the activity’s earliest start time.d. by subtracting the activity’s duration estimate from the activity’s latest finish
time.
ANSWER: C
21. __________ time is the latest time by which a particular activity must be finished in

order for the entire project to be completed by its required completion time.
a. Earliest startb. Earliest finishc. Latest startd. Latest finish
ANSWER: D
22. The ___________ and ___________ times are determined by working through the network diagram from the end of the project to the beginning of the project.
a. ES, EFb. LF, LSc. ES, LSd. EF, LF
ANSWER: B
23. If __________ is positive, it represents the maximum amount of time that the activities on a particular path can be delayed without jeopardizing completion of the project by its required completion time.a. total timeb. free timec. total slackd. cumulative slack
ANSWER: C
24. Total slack is calculated by __________.a. subtracting the activity’s duration estimate from the activity’s latest finish
timeb. adding the activity’s duration estimate to the activity’s earliest start timec. finding the relative difference between values of free slack for
activities entering into the same activity.d. subtracting the activity’s earliest finish (or start) time from its latest finish (or
start) time.
ANSWER: D
25. The longest path of activities from the beginning to the end of a project is called the_________ path.
a. value
b. noncriticalc. criticald. float
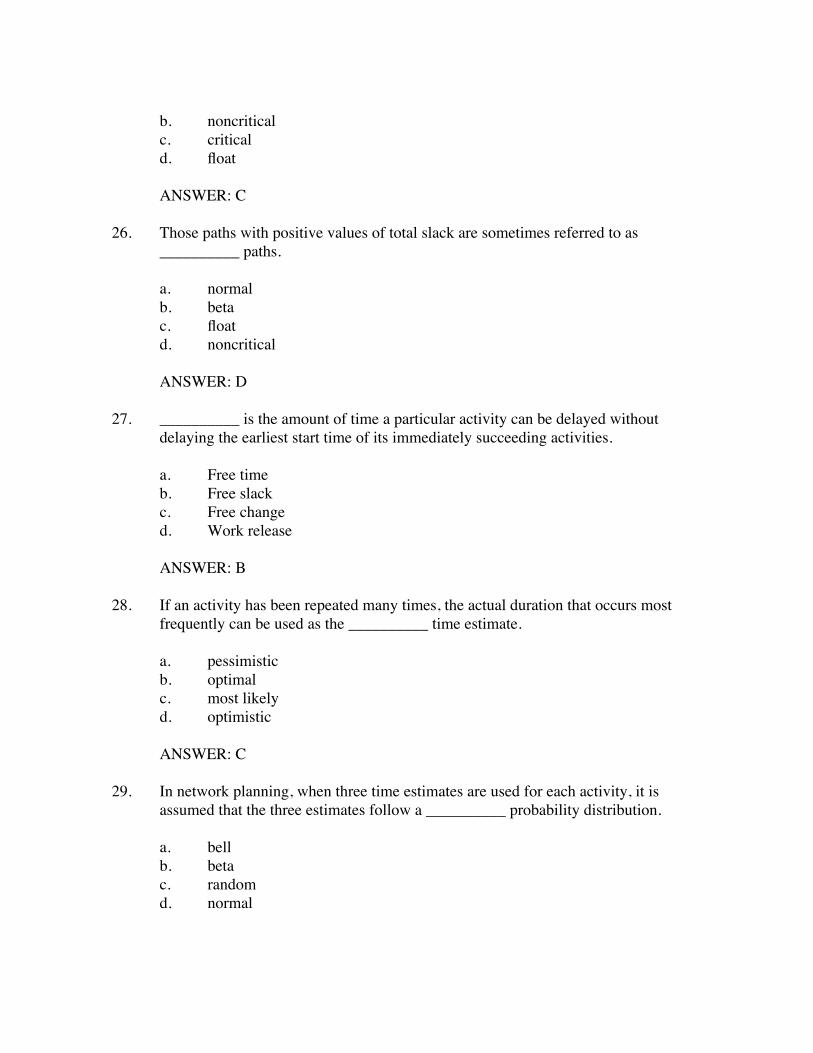
ANSWER: C
26. Those paths with positive values of total slack are sometimes referred to as __________ paths.
a. normalb. betac. floatd. noncritical
ANSWER: D
27. __________ is the amount of time a particular activity can be delayed without delaying the earliest start time of its immediately succeeding activities.
a. Free timeb. Free slackc. Free changed. Work release
ANSWER: B
28. If an activity has been repeated many times, the actual duration that occurs most frequently can be used as the __________ time estimate.
a. pessimisticb. optimalc. most likelyd. optimistic
ANSWER: C
29. In network planning, when three time estimates are used for each activity, it is assumed that the three estimates follow a __________ probability distribution.
a. bellb. betac. randomd. normal

ANSWER: B
30. Any technique that uses only one time estimate is considered to be a __________ technique.a. deterministicb. stochasticc. probabilisticd. random
ANSWER: A
Short Answer/Problems
31. List the duration estimates that should be used with projects for which there is a high degree of uncertainty about the activity.
ANSWER:Optimistic time estimate, pessimistic time estimate, and most likely time estimate
32. What is the equation for calculating an activity’s earliest finish time (EF)?
ANSWER:EF = ES + Duration Estimate
33. What is the equation for calculating an activity’s latest start time (LS)?
ANSWER:LS = LF – Duration Estimate
34. List at least 6 common problems that often push IS development projects beyond their required completion time.
ANSWER:a. Failure to identify all user requirementsb. Failure to identify user requirements properlyc. Continuing growth of project scoped. Underestimating learning curves for new software packagese. Incompatible hardwaref. Logical design flawsg. Poor selection of softwareh. Failure to select the best design strategyi. Data incompatibility issuesj. Failure to perform all phases of the SDLC
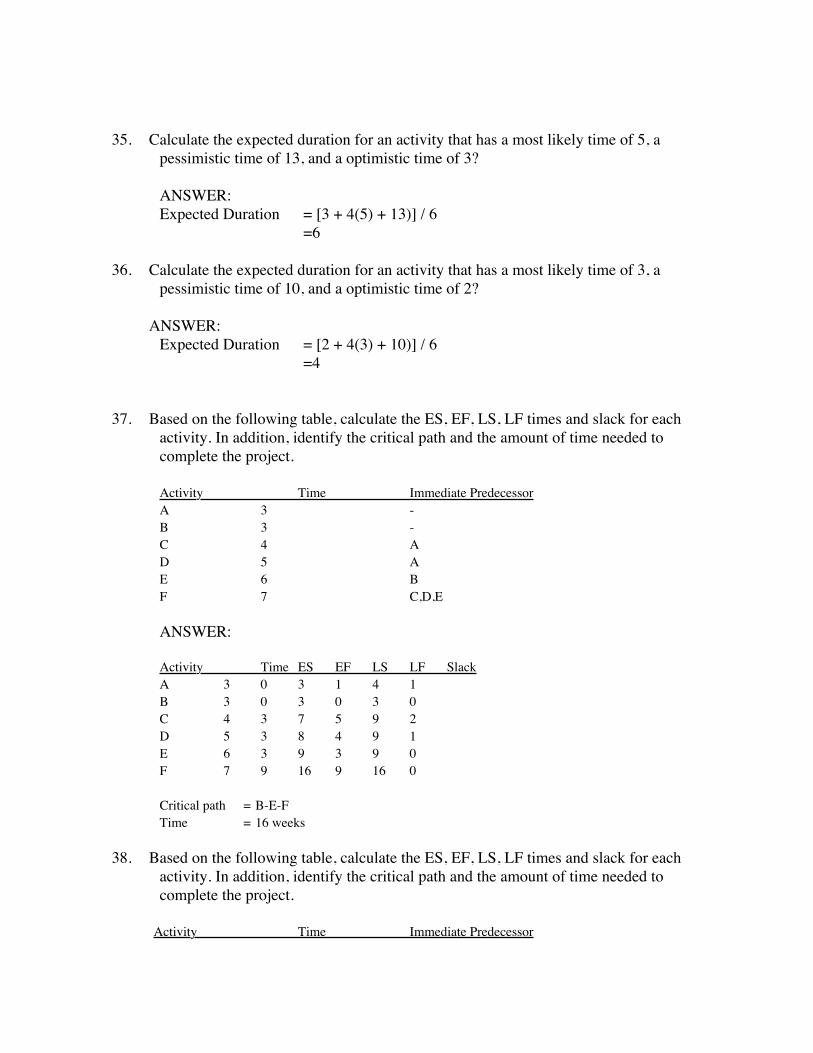
35. Calculate the expected duration for an activity that has a most likely time of 5, a pessimistic time of 13, and a optimistic time of 3?
ANSWER:Expected Duration = [3 + 4(5) + 13)] / 6
=6
36. Calculate the expected duration for an activity that has a most likely time of 3, a pessimistic time of 10, and a optimistic time of 2?
ANSWER:Expected Duration = [2 + 4(3) + 10)] / 6
=4
37. Based on the following table, calculate the ES, EF, LS, LF times and slack for each activity. In addition, identify the critical path and the amount of time needed to complete the project.
Activity Time Immediate PredecessorA 3 -B 3 -C 4 AD 5 AE 6 BF 7 C,D,E
ANSWER:
Activity Time ES EF LS LF SlackA 3 0 3 1 4 1B 3 0 3 0 3 0C 4 3 7 5 9 2D 5 3 8 4 9 1E 6 3 9 3 9 0F 7 9 16 9 16 0
Critical path = B-E-FTime = 16 weeks
38. Based on the following table, calculate the ES, EF, LS, LF times and slack for each activity. In addition, identify the critical path and the amount of time needed to complete the project.
Activity Time Immediate Predecessor
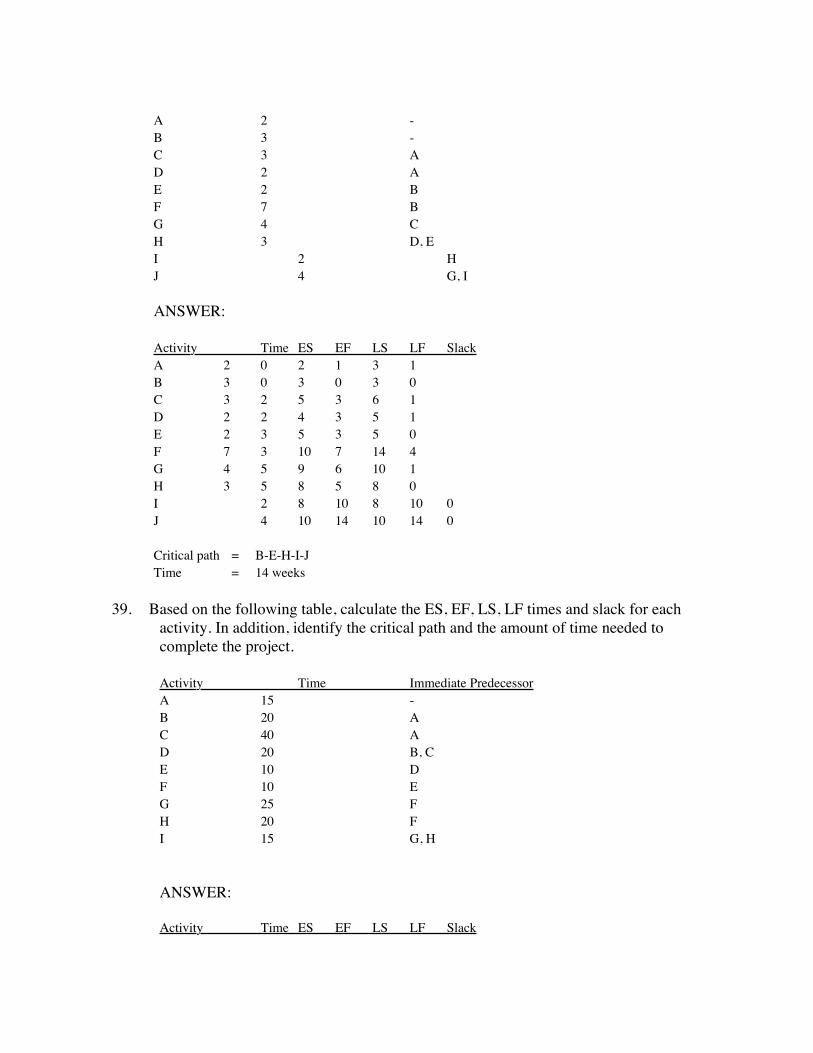
A 2 -B 3 -C 3 AD 2 AE 2 BF 7 BG 4 CH 3 D, EI 2 HJ 4 G, I
ANSWER:
Activity Time ES EF LS LF SlackA 2 0 2 1 3 1B 3 0 3 0 3 0C 3 2 5 3 6 1D 2 2 4 3 5 1E 2 3 5 3 5 0F 7 3 10 7 14 4G 4 5 9 6 10 1H 3 5 8 5 8 0I 2 8 10 8 10 0J 4 10 14 10 14 0
Critical path = B-E-H-I-JTime = 14 weeks
39. Based on the following table, calculate the ES, EF, LS, LF times and slack for each activity. In addition, identify the critical path and the amount of time needed to complete the project.
Activity Time Immediate PredecessorA 15 -B 20 AC 40 AD 20 B, CE 10 DF 10 EG 25 FH 20 F I 15 G, H
ANSWER:
Activity Time ES EF LS LF Slack
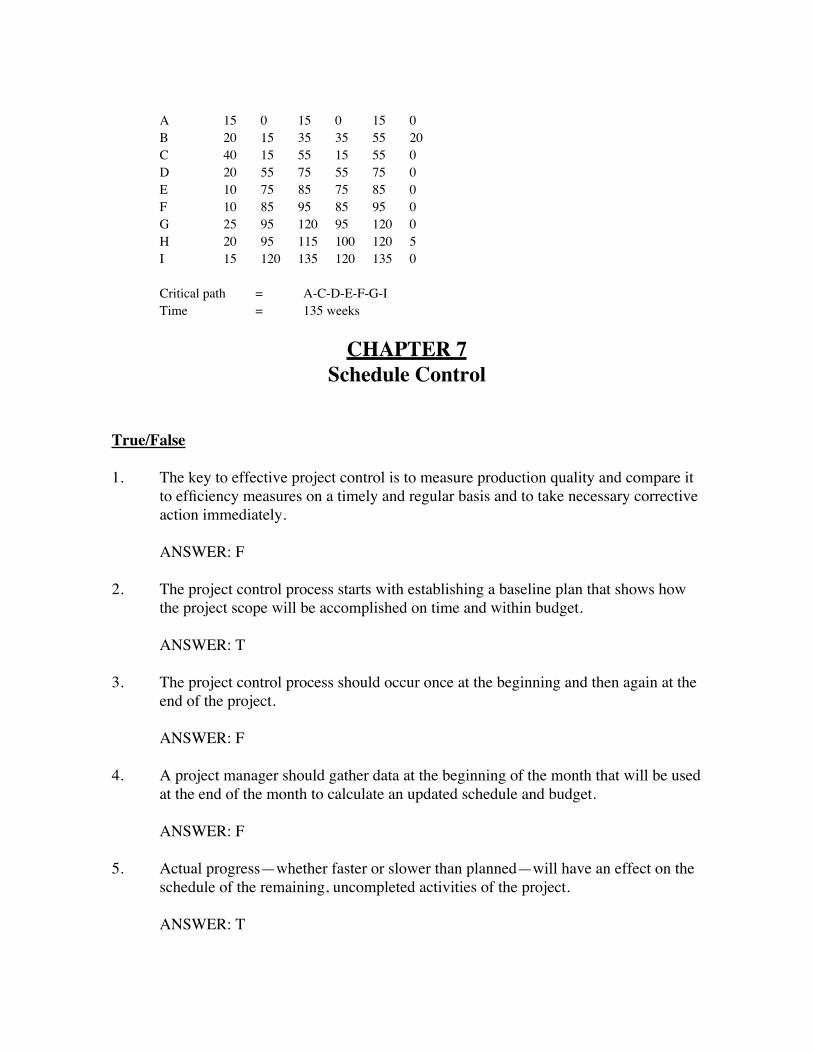
A 15 0 15 0 15 0B 20 15 35 35 55 20C 40 15 55 15 55 0D 20 55 75 55 75 0E 10 75 85 75 85 0F 10 85 95 85 95 0G 25 95 120 95 120 0H 20 95 115 100 120 5I 15 120 135 120 135 0
Critical path = A-C-D-E-F-G-ITime = 135 weeks
CHAPTER 7Schedule Control
True/False
1. The key to effective project control is to measure production quality and compare it to efficiency measures on a timely and regular basis and to take necessary corrective action immediately.
ANSWER: F
2. The project control process starts with establishing a baseline plan that shows how the project scope will be accomplished on time and within budget.
ANSWER: T
3. The project control process should occur once at the beginning and then again at the end of the project.
ANSWER: F
4. A project manager should gather data at the beginning of the month that will be used at the end of the month to calculate an updated schedule and budget.
ANSWER: F
5. Actual progress—whether faster or slower than planned—will have an effect on the schedule of the remaining, uncompleted activities of the project.
ANSWER: T
6. In general, the longer the reporting period, the better the chances of identifying problems early and taking effective corrective actions.
ANSWER: F
7. Establishing a sound baseline plan is sufficient project control.
ANSWER: F
8. The finish estimates (FE) of completed activities will determine the earliest start and earliest finish times for the remaining activities in the network diagram, as well as the total slack.
ANSWER: F
9. Activities that have been completed, can be indicated on the network diagram by shading or crosshatching the activity box.
ANSWER: T
10. When the customer requests a change, the contractor or project team should estimate the impact on the project budget and schedule and then obtain customer approval before proceeding.
ANSWER: T
11. Since the network plan (diagram) and schedule (tabulation) are separate, they are more complicated to update manually than a traditional Gantt chart.
ANSWER: F
12. After actual data or project changes are incorporated or after corrective actions are planned, it is no longer necessary to analyze the newly calculated schedule to determine whether it needs further attention.
ANSWER: F
13. When attempting to get a schedule back on track, the path with the most positive slack should be given top priority.
ANSWER: F
14. A change in the estimated duration of any activity on a path will cause a
corresponding change in the slack for that path.
ANSWER: T
15. In most cases, eliminating negative slack by reducing durations of activities will involve a trade-off in the form of an increase in production hours or an increase in scope.
ANSWER: F
16. Addressing schedule problems early will minimize the negative impact on cost and scope.
ANSWER: T
17. The time–quality trade-off methodology is used to incrementally reduce the project duration with the smallest associated increase in incremental cost.
ANSWER: F
18. Each activity has two pairs of duration and cost estimates: normal and flash.
ANSWER: F
19. The normal time is the estimated length of time required to perform the activity under normal conditions, according to the plan.
ANSWER: T
20. An activity cannot be completed in less than its crash time, no matter how many additional resources are applied.ANSWER: T
Multiple Choice
21. The __________ involves regularly gathering data on project performance, comparing actual performance to planned performance, and taking corrective actions if actual performance is behind planned performance.
a. rational unified processb. project control processc. network-based planning processd. work breakdown structure
ANSWER: B
22. The project control process starts with establishing a __________.
a. baseline planb. work order formc. schedule assignmentsd. time-cost tradeoff
ANSWER: A
23. A regular __________ should be established for comparing actual progress with planned progress.
a. work breakdown assignment chartb. time-cost tradeoff analysisc. printout evaluationd. reporting period
ANSWER: D
24. The __________ of completed activities will determine the earliest start and earliest finish times for the remaining activities in the network diagram, as well as the total slack.
a. actual finish timesb. finish estimatesc. actual efficiency ratiosd. actual resource shares
ANSWER: A
25. When changes are agreed upon, a new __________ should be established and used as the benchmark against which actual project performance will be compared.
a. time-cost diagramb. baseline planc. work expectations formd. management matrix
ANSWER: B
26. The amount of __________ should determine the priority with which concentrated

efforts are applied.
a. actual progressb. work breakdown structurec. time spentd. slack
ANSWER: D
27. In most cases, eliminating negative slack by reducing durations of activities will involve a trade-off in the form of an increase in __________ or a reduction in __________.
a. production hours, budgetb. costs, scopec. scope, costsd. scope, production hours
ANSWER: B
28. The __________ trade-off methodology is used to incrementally reduce the project duration with the smallest associated increase in incremental cost.
a. schedule-qualityb. cost-productionc. time-qualityd. time–cost
ANSWER: D
29. Each activity has two pairs of duration and cost estimates: __________ and __________.
a. normal and crashb. normal and flashc. actual and crashd. flash and level
ANSWER: A
30. The __________ time is the shortest estimated length of time in which the activity can be completed.
a. flash
b. levelc. crashd. normal
ANSWER: C
31. The __________ is the estimated cost to complete the activity in the crash time.
a. opportunity costb. path costc. crash costd. normal cost
ANSWER: C
32. The __________ is the estimated cost to complete the activity in the normal time.
a. normal costb. path costc. crash costd. opportunity cost
ANSWER: A
33. The objective of the __________ method is to determine the shortest project completion time based on crashing those activities that result in the smallest increase in total project cost.a. smoothingb. resource-limited schedulingc. resource levelingd. time–cost trade-off
ANSWER: D
Short Answer/Problems
34. During each reporting period what two kinds of data or information need to be collected?
ANSWER:a. Data on actual performance. This includes the actual time that activities were
started and/or finished and the actual costs expended and committed.b. Information on any changes to the project scope, schedule, and budget.

35. Describe the four steps to schedule control.
ANSWER: a. Analyzing the schedule to determine which areas may need corrective action.b. Deciding what specific corrective actions should be taken.c. Revising the plan to incorporate the chosen corrective actions.d. Recalculating the schedule to evaluate the effects of the planned corrective
actions.
36. When analyzing a path of activities that has negative slack, what two kinds of activities should you focus on?
ANSWER:a. Activities that are near term (that is, in progress or to be started in the immediate future).b. Activities that have long estimated durations.
37. Describe 4 approaches to reducing the estimated durations of activities.
ANSWER:a. Apply more resources to speed up an activity (this doesn’t always work).b. Assign a person with greater expertise or more experience to perform or help
with the activity.c. Reducing the scope or requirements for an activitya. Increasing productivity through improved methods or technology
38. Name at least 6 changes that are common during IS development projects.
ANSWER:a. Changes to the interfaceb. Changes to reportsc. Changes to on-line queriesd. Changes to database structurese. Changes to software processing routinesf. Changes to processing speedsg. Changes to storage capacitiesh. Changes to business processesi. Changes to software resulting from hardware upgrades or, conversely, hardware upgrades resulting from the availability of more powerful software
1. Based on the following table, calculate the ES, EF, LS, LF times and slack for each activity assuming a expected completion time of 16 weeks. Can the project still be

completed on time? If necessary, identify the activities you would concentrate on to get the project back on schedule.
Activity Estimated Time Actual Finish Time Immediate PredecessorA 3 4 -B 3 6 -C 4 AD 5 AE 6 BF 7 C,D,E
ANSWER:
Activity Time ES EF LS LF Slack Actual FinishA 4B 6C 4 4 8 5 9 1D 5 4 9 4 9 0E 6 6 12 3 9 -3F 7 12 19 9 16 -3
To get the project back on schedule, a combined total of 3 weeks must be cut from activities E and F.
40. Based on the following table, calculate the ES, EF, LS, LF times and slack for each activity assuming a expected completion time of 145 weeks. Can the project still be completed on time? If necessary, identify the activities you would concentrate on to get the project back on schedule.
Activity Time Actual Finish Time Immediate PredecessorA 15 15 -B 20 45 AC 40 65 AD 20 85 B, CE 10 DF 10 EG 25 FH 20 F I 15 G, H
ANSWER:
Activity Time ES EF LS LF Slack Actual FinishA 15B 45C 65D 85E 10 85 95 85 95 0F 10 95 105 95 105 0G 25 105 130 105 130 0H 20 105 125 110 130 5I 15 130 145 130 145 0
At this point the project can still be completed by 145 weeks. Attention should stay focused on E, F, G, and I.
CHAPTER 8Resource Considerations
True/False
1. Resources can include people, equipment, machines, tools, facilities, and space.
ANSWER: T
2. In many projects, the amount of resources available to perform the project activities is unlimited.
ANSWER: F
3. Resources can be an obstacle to completing the project within budget if it is determined that additional resources are needed to complete the project on time.
ANSWER: T
4. Activities in a network diagram are drawn in a parallel relationship because, from a technical standpoint, they can be performed in any sequence.
ANSWER: F
5. In addition to showing the technical constraints among activities, the network diagram can also exhibit resource constraints.
ANSWER: T
6. If resources are to be considered in planning, it’s necessary to indicate the amounts and types of resources needed to perform each activity.
ANSWER: T
7. Resource utilization charts based on each activity’s latest start time are said to be based on an as-early-as-possible schedule.
ANSWER: F
8. Resource monitoring, is a method for developing a schedule that attempts to minimize the fluctuations in requirements for resources.

ANSWER: F
9. Resource smoothing levels the resources so that they are applied as uniformly as possible without extending the project schedule beyond the required completion time.
ANSWER: T
10. Resource-limited scheduling attempts to establish a schedule in which resource use is made as level as possible without extending the project beyond the required completion time.
ANSWER: F
11. Resource-limited scheduling is a method for developing the longest schedule when the number or amount of available resources is variable.
ANSWER: F
12. Resource-limited scheduling will extend the project completion time if necessary in order to keep within the resource limits.
ANSWER: T
13. In resource-limited scheduling, when several activities need the same limited resource at the same time, activities with the least slack have last priority.
ANSWER: F
14. Most software packages allow you to create and maintain a list of resources that can be accessed by all of the tasks within a project.
ANSWER: T
15. Because the expenses for resources can be accrued at different times throughout a project, most software systems allow you to create charges for a resource at the beginning of its use, at fixed intervals, or at the end of the project.
ANSWER: T
Multiple Choice

16. At a minimum, network diagrams illustrate the _________ constraints among activities.a. referentialb. technicalc. checkd. entity
ANSWER: B
17. Activities in a network diagram are drawn in a __________ relationship because, from a technical standpoint, they must be performed in that sequence.
a. parallelb. vectorc. seriald. interlocking
ANSWER: C
18. Resource utilization charts based on each activity’s earliest start time are said to be based on an __________ schedule.
a. as-soon-as-possibleb. as-late-as-possiblec. as-neededd. as-flexible-as-possible
ANSWER: A
19. Resource utilization charts based on each activity’s latest start time are said to be based on an __________ schedule.
a. as-soon-as-possibleb. as-late-as-possiblec. as-neededd. as-flexible-as-possible
ANSWER: B
20. __________ is a trial-and-error method in which the start of noncritical activities are delayed beyond their earliest start times in order to maintain a uniform level of required resources.
a. Resource evaluation scheduling
b. Resource monitoringc. Resource smoothingd. Resource limited scheduling
ANSWER: C
21. Resource leveling attempts to establish a schedule in which resource use is made as level as possible without extending the project beyond the _________ time.a. anticipated finishb. anticipated responsec. required startd. required completion
ANSWER: D
22. __________ levels the resources so that they are applied as uniformly as possible without extending the project schedule beyond the required completion time.
a. Resource evaluation schedulingb. Resource monitoringc. Resource limited schedulingd. Resource smoothing
ANSWER: D
23. __________ is a method for developing the shortest schedule when the number or amount of available resources is fixed.
a. Resource evaluation schedulingb. Resource monitoringc. Resource limited schedulingd. Resource smoothing
ANSWER: C
24. __________ is an iterative method in which resources are allocated to activities based on the least slack.
a. Resource evaluation schedulingb. Resource monitoringc. Resource levelingd. Resource limited scheduling
ANSWER: D

25. In __________, when several activities need the same limited resource at the same time, the activities with the least slack have first priority.
a. resource limited schedulingb. resource monitoringc. resource levelingd. resource evaluation scheduling
ANSWER: A
Short Answer/Problems
26. Describe resource leveling.
ANSWER:Resource leveling, or smoothing, is a method for developing a schedule that attempts to minimize the fluctuations in requirements for resources. This method levels the resources so that they are applied as uniformly as possible without extending the project schedule beyond the required completion time.
27. Describe resource-limited scheduling.
ANSWER:Resource-limited scheduling is a method for developing the shortest schedule when the number or amount of available resources is fixed. This method is appropriate when the resources available for the project are limited and these resource limits cannot be exceeded. This method will extend the project completion time if necessary in order to keep within the resource limits.
28. Based on the table below, perform resource leveling. Assume that each task can be performed independently of the other tasks. What is the new completion date for the project?
Task Workers Needed Scheduled Days1 2 1, 2, 3, 4, 5, 6, 7, 82 1 7, 8, 9, 103 1 1, 2, 3, 44 1 1, 2, 3, 4, 5, 65 1 11, 12ANSWER:
Because we are performing resource leveling the completion date of the project will not change.

Steps: 1) move task 4 to days 5, 6, 7, 8, 9, 102) move task 2 to days 9, 10, 11, 12
29. Based on the table below, perform resource-limited scheduling. Assume that each task can be performed independently of the other tasks. Also, assume that only 2 workers are available at any given time. What is the new completion date for the project?
Task Workers Needed Scheduled Days1 2 1, 2, 3, 4, 5, 6, 7, 82 1 7, 8, 9, 103 1 1, 2, 3, 44 1 1, 2, 3, 4, 5, 65 1 11, 12
ANSWER:
Steps 1) move task 2 to days 9, 10, 11, 122) move task 3 to days 9, 10, 11, 123) move task 4 to days 13, 14, 15, 16, 17, 184) move task 5 to days 13, 14
The project will now take 18 days to complete.
30. Based on the table below, perform resource leveling. Assume that each task can be performed independently of the other tasks. What is the new completion date for the project?
Task Workers Needed Scheduled Days1 3 1, 2, 32 2 2,3,4,53 1 2, 3, 44 2 5, 6, 75 3 7, 8, 96 1 10
ANSWER:
Because we are performing resource leveling the completion date of the project will not change.
Steps: 1) move task 3 to days 1, 2, 3 2) move task 2 to days 4, 5, 6, 7
3) move task 4 to days 4, 5, 64) move task 6 to day 7
5) move task 5 to days 8, 9, 10Task Workers Needed Scheduled Days1 3 1, 2, 32 2 4, 5, 6, 73 1 1, 2, 34 2 4, 5, 65 3 8, 9, 106 1 7
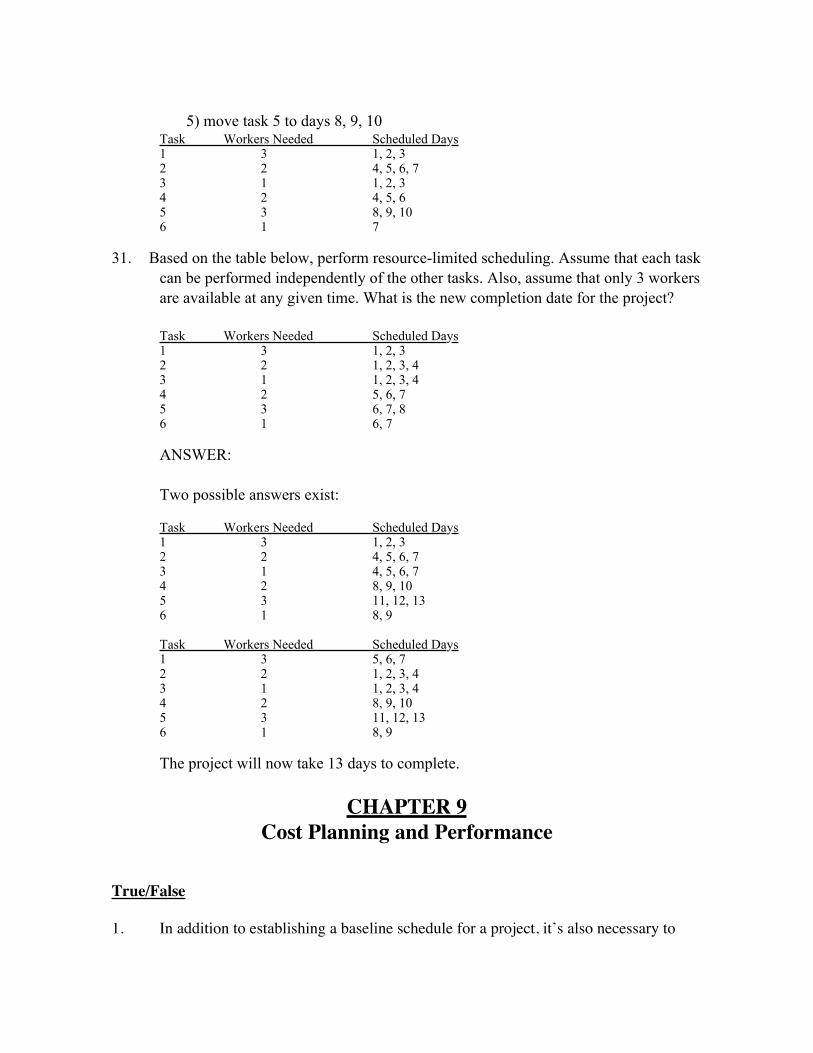
31. Based on the table below, perform resource-limited scheduling. Assume that each task can be performed independently of the other tasks. Also, assume that only 3 workers are available at any given time. What is the new completion date for the project?
Task Workers Needed Scheduled Days1 3 1, 2, 32 2 1, 2, 3, 43 1 1, 2, 3, 44 2 5, 6, 75 3 6, 7, 86 1 6, 7
ANSWER:
Two possible answers exist:
Task Workers Needed Scheduled Days1 3 1, 2, 32 2 4, 5, 6, 73 1 4, 5, 6, 74 2 8, 9, 105 3 11, 12, 136 1 8, 9
Task Workers Needed Scheduled Days1 3 5, 6, 72 2 1, 2, 3, 43 1 1, 2, 3, 44 2 8, 9, 105 3 11, 12, 136 1 8, 9
The project will now take 13 days to complete.
CHAPTER 9Cost Planning and Performance
True/False
1. In addition to establishing a baseline schedule for a project, it’s also necessary to

develop a baseline budget.
ANSWER: T
2. Cost planning starts when a proposal for the project has been accepted by the client.
ANSWER: F
3. Proposals seldom indicate a detailed breakdown of costs, and list only the total bottom-line cost for the proposed project.
ANSWER: F
4. If possible, it is good practice to have the person who will be responsible for the costs associated with the work make the cost estimates.
ANSWER: T
5. Allocating total project costs for the various elements to the appropriate work packages in the work breakdown structure will establish a total actual cost for each work package.
ANSWER: F
6. The top-down approach to establishing the TBC for each work package is based on an estimate of the costs for the detailed activities associated with each work package.
ANSWER: F
7. The TBC for each work package will be the multiplication of the costs of all the activities that make up that work package.
ANSWER: F
8. The total budgeted cost is the amount budgeted to accomplish the work that was scheduled to be performed up to a certain point in time.
ANSWER: F
9. With the CBC values, it’s possible to draw a cumulative budgeted cost curve to illustrate budgeted expenditures over the duration of the project.
ANSWER: T
10. Once the project starts, it’s necessary to keep track of actual cost and committed cost so that they can be compared to the CAC.
ANSWER: F
11. Large dollar amounts that are expended for materials or services that are used over a period of time longer than one cost reporting period are called conventional costs.
ANSWER: F
12. To permit a realistic comparison of actual cost to total budgeted cost, portions of the committed amount should not be assigned to actual cost while the work is being performed.
ANSWER: F
13. In some cases, the supplier or subcontractor may require progress payments, rather than waiting until all the work is finished before being paid.
ANSWER: T
14. The estimate of the percent complete data, usually obtained each period from the individual responsible for the work package, is objective in most cases.
ANSWER: F
15. There often seems to be an inclination to be overly pessimistic and make a low percent complete estimate too soon.
ANSWER: F
16. The cumulative earned value for each work package is calculated by multiplying each percent complete by the CAC for the work package.
ANSWER: F
17. The cost performance index is a measure of the cost efficiency with which the project is being performed.
ANSWER: T
18. Cost variance (CV) is the difference between the cumulative earned value of the work performed and the cumulative budgeted cost.
ANSWER: F
19. For analyzing cost performance, it is important that the data collected all be as current as possible and all be based on the same reporting period.
ANSWER: T
20. Project management software makes it fairly easy to handle the cost considerations of a project.
ANSWER: T
Multiple Choice
21. Allocating total project costs for the various elements to the appropriate work packages in the work breakdown structure will establish a __________ for each work package.
a. total allocated costb. total control costc. total quality costd. total budgeted cost
ANSWER: D
22. The __________ is the amount that is budgeted to accomplish the work that was scheduled to be performed up to a certain point in time.
a. total budgeted costb. cumulative budgeted costc. total cumulative feesd. contract cumulating amount
ANSWER: B
23. The ___________ for the entire project or each work package provides a baseline against which actual cost and work performance can be compared at any time during the project.
a. total budgeted costb. cumulative budgeted costc. total cumulative feesd. contract cumulating amount

ANSWER: B
24. Once the project starts, it is necessary to keep track of actual cost and committed cost so that they can be compared to the ___________.
a. total budgeted costb. cumulative budgeted costc. total cumulative feesd. contract cumulating amount
ANSWER: B
25. To keep track of __________ on a project, it’s necessary to set up a system to collect, on a regular and timely basis, data on funds actually expended.a. actual costb. budgeted costc. projected costd. estimated cost
ANSWER: A
26. In companies using a __________ organization structure, individuals may be assigned to several projects concurrently.a. divisionalb. matrix c. functionald. traditional
ANSWER: B
27. In many projects, when large dollar amounts are expended for materials or services that are used over a period longer than one cost reporting period, they can be referred to as __________ costs.
a. committedb. conventionalc. constrainedd. cumulative
ANSWER: A
28. ___________ is the value of the work actually performed, and is a key parameter
that must be determined throughout the project.
a. Anticipated valueb. Forecasted valuec. Earned valued. Interest
ANSWER: C
29. Determining the earned value involves collecting data on the percent complete for each work package and then converting this percentage to a dollar amount by multiplying the ___________ of the work package by the percent complete.a. total budgeted costb. cumulative budgeted costc. total cumulative feesd. contract cumulating amount
ANSWER: A
30. The cumulative earned value for each work package is calculated by multiplying each percent complete by the ___________ for the work package.
a. total budgeted costb. cumulative budgeted costc. total cumulative feesd. contract cumulating amount
ANSWER: A
31. The ___________ is a measure of the cost efficiency with which the project is being performed.
a. cumulative performance factorb. cost quality indexc. cost production indexd. cost performance index
ANSWER: D
32. ___________ is the difference between the cumulative earned value of the work performed and the cumulative actual cost.
a. Cost performance indexb. Cost variance

c. Budgeted costs d. Cost quality index
ANSWER: B
33. The cost performance analysis should include identifying those work packages that have a negative cost variance or a cost performance index of less than _____.
a. 0.0b. 1.0c. 5.0d. 100.0
ANSWER: B
34. The first method for determining __________ assumes that the work to be performed on the remaining portion of the project or work package will be done at the same rate of efficiency as the work performed so far.a. forecasted cost at completionb. cumulative actual costc. cumulative earned valued. cost performance index
ANSWER: A
35. The key to managing _________ is to ensure that cash comes in faster than it goes out.
a. scope extensionsb. budget & schedule chartsc. cash flowd. cash variances
ANSWER: C
Short Answer/Problems
36. What four cost-related measures are used to analyze project cost performance?
ANSWER:a. TBC (total budgeted cost)b. CBC (cumulative budgeted cost)c. CAC (cumulative actual cost)d. CEV (cumulative earned value)

37. List the elements of the cost section of a proposal, which may consist of tabulations of the contractor’s estimated costs.
ANSWER:a. Laborb. Materialsc. Subcontractors and consultantsd. Equipment and facilities rentale. Travelf. Contingencies
38. Describe the two steps of the project budgeting process.
ANSWER:First, the project cost estimate is allocated to the various work packages in the project work breakdown structure. Second, the budget for each work package is distributed over the duration of the work package so that it’s possible to determine how much of its budget should have been spent at any point in time.
39. Describe the three steps in cost control.
ANSWER:a. Analyzing cost performance to determine which work packages may require
corrective actionb. Deciding what specific corrective action should be takenc. Revising the project plan—including time and cost estimates—to incorporate
the planned corrective action
40. Describe four approaches to reducing the cost of activities.
ANSWER:a. Substitute less expensive materials that meet the required specifications.b. Assign a person with greater expertise or more experience to perform or
help with the activity to get it done more efficiently.c. Reducing the scope or requirements for an activity.a. Increasing productivity through improved methods or technology.
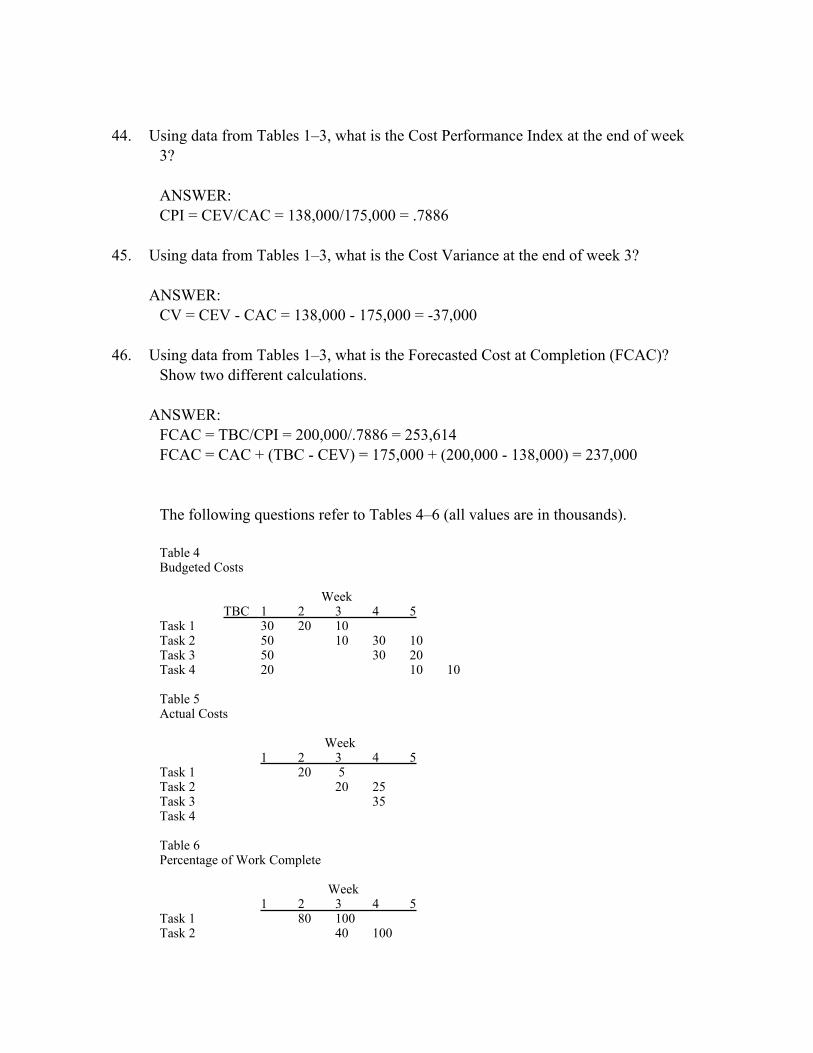
The following questions refer to Tables 1–3 (all values are in thousands):
Table 1Budgeted Costs
Week

TBC 1 2 3 4 5Task 1 50 25 15 10Task 2 80 25 40 15Task 3 40 20 20Task 4 30 15 15
Table 2Actual Costs
Week1 2 3 4 5
Task 1 30 20 10Task 2 25 45 20Task 3 25Task 4
Table 3Percentage of Work Complete
Week1 2 3 4 5
Task 1 50 80 100Task 2 25 40 90Task 3 40Task 4
41. Using data from Tables 1–3, what is the cumulative budgeted cost at the end of week 3?
ANSWER:$150,000
42. Using data from Tables 1–3, what is the cumulative actual cost at the end of week 3?ANSWER:$175,000
43. What is the cumulative earned value at the end of week 3?
ANSWER:Week
1 2 3 4 5Task 1 25 40 50Task 2 20 32 72Task 3 16Task 4
Total 45 72 138
$138,000
44. Using data from Tables 1–3, what is the Cost Performance Index at the end of week 3?
ANSWER:CPI = CEV/CAC = 138,000/175,000 = .7886
45. Using data from Tables 1–3, what is the Cost Variance at the end of week 3?
ANSWER:CV = CEV - CAC = 138,000 - 175,000 = -37,000
46. Using data from Tables 1–3, what is the Forecasted Cost at Completion (FCAC)? Show two different calculations.
ANSWER:FCAC = TBC/CPI = 200,000/.7886 = 253,614FCAC = CAC + (TBC - CEV) = 175,000 + (200,000 - 138,000) = 237,000
The following questions refer to Tables 4–6 (all values are in thousands).
Table 4Budgeted Costs
WeekTBC 1 2 3 4 5
Task 1 30 20 10 Task 2 50 10 30 10Task 3 50 30 20Task 4 20 10 10
Table 5Actual Costs
Week1 2 3 4 5
Task 1 20 5 Task 2 20 25Task 3 35Task 4
Table 6Percentage of Work Complete
Week1 2 3 4 5
Task 1 80 100 Task 2 40 100

Task 3 70Task 4
47. Using the data from Tables 4–6, what is the cumulative budgeted cost at the end of week 3?
ANSWER:$100,000
48. Using the data from Tables 4–6, what is the cumulative actual cost at the end of week 3?
ANSWER:$105,000
49. Using the data from Tables 4–6, what is the cumulative earned value at the end of week 3?
ANSWERWeek
1 2 3 4 5Task 1 24 30 30Task 2 20 50Task 3 35Task 4
Total 24 50 115
$115,000
50. Using the data from Tables 4–6 what is the Cost Performance Index at the end of week 3?
ANSWER:CPI = CEV/CAC = 115,000/105,000 = 1.0952
51. Using the data from Tables 4–6, what is the Cost Variance at the end of week 3?
ANSWER:CV = CEV - CAC = 115,000 - 105,000 = 10,000
52. Using the data from Tables 4–6, what is the Forecasted Cost at Completion (FCAC)? Show two different calculations.

ANSWER:FCAC = TBC/CPI = 150,000/1.0952 = 136,961FCAC = CAC + (TBC - CEV) = 105,000 + (150,000 - 115,000) = 140,000