Embed Size (px)
Citation preview
APPLIED ECONOMIC ANALYSIS
IN BRUNEI DARUSSALAM EVALUATION OF ECONOMIC GROWTH AND TRADE,
MICROECONOMIC EFFICIENCY AND ANALYSIS OF SOCIO -
ECONOMIC PROBLEMS
i.yySwiJjiii/jj
Universiti Brunei Darussalam
Kwabena A. Anaman and
Ismail Duraman
APPLIED ECONOMIC ANALYSIS IN BRUNEI DARUSSALAM:
EVALUATION OF ECONOMIC GROWTH AND
TRADE, MICROECONOMIC EFFICIENCY
AND ANALYSIS OF SOCIO-ECONOMIC PROBLEMS
EDITED BY
KWABENA A. ANAMAN
AND
ISMAIL DURAMAN
DEPARTMENT OF ECONOMICS
FACULTY OF BUSINESS, ECONOMICS AND POLICY STUDIES
UNIVERSITI BRUNEI DARUSSALAM
BANDAR SERI BEGAWAN
BRUNEI DARUSSALAM
III
First Published 2003 by
Universiti Brunei Darussalam
Jalan Tungku Link Bandar Seri
Begawan BE1410 Brunei
Darussalam
Copyright © 2003 authors
All rights reserved. No part of this publication may be reproduced, stored in a retrieval system,
or transmitted in any form or any means, electronic, mechanical, photocopying, recording or
otherwise, without the prior permission, in writing, from the publisher.
Cataloguing in Publication Data
Applied economic analysis in Brunei Darussalam : evaluation of economic growth and trade,
microeconomic efficiency and analysis of socio-economic problems / edited by Kwabena A.
Anaman and Ismail Duraman.
ix, 204 p. ; 25 cm.
ISBN: 99917-1-126-0
1. Brunei Darussalam - Economic conditions. 2. Brunei Darussalam - Social conditions.
I. Anaman, Kwabena A. II. Ismail bin Haji Duraman, Haji.
HC445.85 A66 2003
IV
NAMES OF CONTRIBUTORS
1. Dr. Awang Haji Ismail bin Awang Haji Duraman, Vice-Chancellor, Universiti
Brunei Darussalam (UBD).
Professional Literary Name: Ismail Duraman
2. Dr. Kwabena Asomanin Anaman, Senior Lecturer, Department of Economics,
UBD.
Professional Literary Name: Kwabena A. Anaman
3. Dr. John Onu Odihi, Senior Lecturer and Head, Department of Geography, UBD.
Professional Literary Name: John O. Odihi
4. Dr. Razali Mat Zin, Senior Lecturer, Department of Management Studies, UBD.
Professional Literary Name: Razali M. Zin
5. Dayang Hajah Salma binte Awang Haji Abdul Latiff, Senior Lecturer, Department
of Management Studies, UBD.
Professional Literary Name: Salma A. Latiff
6. Dayang Rosnah binte Awang Opai, Lecturer, Department of Economics, UBD.
Professional Literary Name: Rosnah Opai
7. Dayang Hartini binte Awang Haji Mohammed Yussof, Lecturer, Department of
Economics, UBD.
Professional Literary Name: Hartini Yussof
8. Dayang Kartini binte Awang Haji Kabri, Professional Officer, Government of
Brunei Darussalam, Bandar Seri Begawan.
Professional Literary Name: Kartini Kabri
9. Dayangku Hartinie binte Pengiran Mohammed Kassim, Trade and Corporate
Financing Executive Officer, PerbadananTabung Amanah Islam Brunei (Brunei
Islamic Trust Fund), Bandar Seri Begawan.
Professional Literary Name: Hartinie M. Kassim
10. Dayangku Sri Joedianna binte Pengiran Haji Mohammed, Graduate, UBD.
Professional Literary Name: Sri Joedianna Mohammed
11. Dayang Rina Hayane binte Awang Haji Sumardi, Graduate, UBD.
Professional Literary Name: Rina H. Sumardi
12. Dayangku Suzelawati Fazidah binte Pengiran Haji Sulaiman, Final Year Student,
Department of Economics, UBD.
Professional Literary Name: Suzelawati F. Sulaiman
13. Dayang Suhaila binte Awang Matzan, Final Year Student, Department of
Economics, UBD.
Professional Literary Name: Suhaila Matzan
V
CONTENTS
ITEM PAGE
CONTRIBUTORS IV
PREFACE VII
SECTION A MACROECONOMIC ANALYSIS: EVALUATION
OF ECONOMIC GROWTH AND TRADE
CHAPTER 1 Prospects and Challenges of Economic Growth and
Diversification in Brunei Darussalam
by Ismail Duraman
1
CHAPTER 2 Can the Construction Industry Pull the Rest of the
Economy out of a Recession? Evaluation of the
Causality Links Between the Construction Industry
and the Macroeconomy in Brunei Darussalam
by Kwabena A. Anaman
16
CHAPTER 3 Estimation of the Aggregate Demand of Labour in
Brunei Darussalam Using Dynamic Econometric
Models
by Kwabena A. Anaman
24
CHAPTER 4 Analysis of the Health and Environmental Quality
Adjusted Gross Domestic Product for Brunei
Darussalam
by Sri Joedianna Mohammed and Kwabena A.
Anaman
47
CHAPTER 5 Analysis of Trade Flows Between Brunei Darussalam
and Other Members of the Association of Southeast
Asian Nations
by Suhaila Matzan, Kwabena A. Anaman and Ismail
Duraman
67
SECTION B MICROECONOMIC ANALYSIS: ANALYSIS OF
THE EFFICIENCY OF VARIOUS INDUSTRIES
AND SERVICES
CHAPTER 6 Economic Analysis of the Adoption and Use of Internet
Services by Householders in Bandar Seri Begawan
by Kartini Kabri, Kwabena A. Anaman, Ismail
Duraman and Rosnah Opai
85
VI
CHAPTER 7 Analysis of Aggregate Production Function and
Technical Efficiency of the Agricultural Sector in
Brunei Darussalam
by Kwabena A. Anaman, Suzelawati F. Sulaiman, and
Hartini M. Yussof
104
CHAPTER 8 A Survey-Based Analysis of Factors Influencing the
Efficiency of the Construction Industry in Brunei
Darussalam
by Rina H. Sumardi
117
CHAPTER 9 The Prospects and Challenges of Islamic Business
Transactions in Brunei Darussalam
By Salma A. Latiff, Ismail Duraman and Razali M.
Zin
132
SECTION C ANALYSIS OF SOCIO-ECONOMIC PROBLEMS
CHAPTER 10 Analysis of Marital Choice of Women in an Urban
Community in Bandar Seri Begawan
by Kwabena A. Anaman and Hartinie M. Kassim
142
CHAPER 11 Analysis of the Causality Links Between Aggregate
Women Labour Force and the Divorce Rate in Brunei
Darussalam
by Sri Joedianna Mohammed and Kwabena A.
Anaman
164
CHAPTER 12 A Study of Some Specific Socio-economic Problems of
Low-income Immigrant Workers in Brunei
Darussalam
by John O. Odihi
183
Index
200
VII
PREFACE
Given the rapid changes in the economic and social fabric of Brunei Darussalam (Brunei) over
the last 40 years, there has been an increasing need for books and other published works on the
economic and social aspects of development in the country. Brunei is scarcely covered in the
international published economic literature including the databases of the key international
lending agencies such as the World Bank and the International Monetary Fund. This book
attempts to fill a small part of the big gap in knowledge about economic and social
development issues concerning Brunei. It is the culmination of efforts made by several
individuals at Universiti Brunei Darussalam (UBD) over the last five years in undertaking
various research projects in three main areas of economic science and related social sciences:
(a) macroeconomic analysis (b) microeconomic analysis and (c) analysis of socio-economic
problems. The book is divided into three sections in line with the three main themes of
economic and social science research undertaken by the authors. The first section consists of
five chapters that analyse macroeconomic issues involving economic growth, aggregate labour
demand and international trade. The second section deals with the analysis of microeconomic
efficiency of various industries and services namely agriculture, construction, internet services
and Islamic banking services. This section is made up of four chapters. The third section
consists of three chapters dealing with several socio-economic problems.
In Chapter 1, the author describes the underlying fundamentals of the economy of Brunei over
the period, 1971 to 2001, and outlines the prospects and challenges affecting economic growth
and diversification in the country. He offers several suggestions for diversifying the economy
and accelerating economic growth. The possibility of using the construction industry, the third
largest economic sector, as a vehicle for pulling the economy out of a recession is analysed in
Chapter 2. The author concludes that the construction industry is not likely to pull the economy
out of a recession. Rather it is the rest of the economy which is likely to pull the construction
industry along as it expands. It is generally considered that as an economy expands or grows,
more people are employed. The analysis of factors influencing the aggregate demand of labour
is undertaken in Chapter 3 using a relatively new econometric technique. Real wage reduction
is shown to have higher impact on total employment than output expansion. The recent Asian
financial crisis is shown to have had a negative lingering effect on employment in the country.
Employment in the private sector has been growing modestly while government sector
employment has been declining.
In Chapter 4, the authors estimate the social welfare of Brunei by applying the concept of
health and environmental quality adjusted gross domestic product. The use of gross domestic
product (GDP) as a measure of social welfare fails to take into account of the deterioration of
other aspects of social welfare such as health, the environment and social capital that is linked
to the growth of GDP. Based on the application of health and environmental quality adjusted
gross domestic product, the authors suggest that over the period of the study, 1996-2001, an
average of 12% of the country’s unadjusted GDP should be set aside as the real societal costs
for maintaining the quality of health of the population, preserving the natural environment and
social capital. Chapter 5, the last chapter of Section 1 of the book, is devoted to the analysis of
the factors influencing merchandise trade flows between Brunei and the nine other member
countries of the Association of Southeast Asian Nations (ASEAN). The authors build on recent
studies on international trade involving Brunei. They demonstrate that bilateral trade flows
between Brunei and ASEAN countries are driven mainly by the population of the ASEAN
countries, historical relationships of ASEAN countries with Brunei and cultural similarities
between the ASEAN member countries and Brunei.
VIII
The second section of the book starts with an analysis of the use of internet services by urban
householders in Bandar Seri Begawan (Chapter 6). The authors establish that the likelihood of
using internet services increases with longer experience using computers, younger age, higher
family incomes and the ability to read and write English. The intensity or level of use of
internet services is positively related to internet monthly charges, household income and the
level of education. In Chapter 7, the authors estimate the aggregate production function for the
agricultural sector in Brunei Darussalam. They show that labour inputs, machinery and
intermediate capital inputs significantly influence the output of the sector in the positive sense.
However there has been negative technological change in the agricultural sector. With the high
technical inefficiency of the sector, the authors recommend the use of more quality capital
inputs in the sector.
Technical inefficiency of a sector can also be ascertained by direct interviewing of managers of
firms to identify the constraints that they face. In Chapter 8, the author reports on a survey of
construction firms undertaken to identify the factors that adversely affect the efficiency of their
operations. The three most important problems identified are the delay in payments by the
government for completed work done by firms, the delay and late payments of work done for
clients other than the government and the difficulty in accessing loans from local banks. In the
concluding chapter of Section 2, Chapter 9, the authors discuss the various factors that
influence the implementation of business activities in Brunei according to Islamic doctrine.
They indicate the important challenges that need to be addressed to ensure that efforts directed
towards achieving maximum use of Islamic business transactions in Brunei are successful.
The third and final section of the book is made up of three chapters and they all deal with
emerging socio-economic problems in Brunei. In Chapter 10, the two authors analyse factors
influencing the choice of marriage partners by currently married women in a representative
urban Muslim community in Bandar Seri Begawan. Their analysis is extended to the
identification of attributes of potential husbands desired by single females. The results indicate
that husbands of currently married women come predominantly from similar educational
attainment groups and social classes. Single females indicate preferences for potential partners
from their own age groups though not necessarily from their own social class. With
marriageable women outnumbering marriageable men in Brunei, the authors suggest the
relaxation of laws to make it easier for Bruneian women to marry foreigners.
The linkage between the number of women working and the divorce rate is discussed in
Chapter 11. The authors show that rising women labour participation has not led to the
increasing divorce rate in Brunei. Rather it is the increasing divorce rate that is linked to
increasing women labour force participation. They suggest the implementation of policies to
assist married working women through provision of more childcare facilities and improved
welfare system for divorced women. The final chapter of the book, Chapter 12, is devoted to
the discussion of socio-economic problems faced by low-income immigrant workers in Brunei.
These people constitute the largest group of workers in the country. The author analyses the
socio-economic problems based on data gathered from a combination of survey and field
research including focus group studies. He suggests several policy interventions to reduce the
problems faced by low-income immigrant workers in Brunei.
We would like to take this opportunity to thank all the contributors for the efforts and time
spent in developing the papers from their research projects. UBD financed the research project
entitled “Evaluation of Economic Growth and Macroeconomic Environmental Quality in
Brunei Darussalam” which provided some of the key papers of this book. We thank Dr.
IX
Pengiran Hajah Rahmah binte Pengiran Haji Jadid, the Deputy Vice-Chancellor, UBD for her
assistance in providing resources for this project as the Chairperson of the UBD Research and
Consultancy Committee. Our thanks are also extended to Awang Haji Tarip bin Awang Haji
Yassin, Deputy Registrar, Research and Development, for facilitating the work of this research
project. Several chapters of the book were written while the senior editor of the book was on
research leave at the Graduate School of the Environment (GSE), Macquarie University,
Sydney, Australia in the years, 2002 and 2003 during UBD vacation periods. We thank
Macquarie University for the technical support and assistance provided during the research
leave. Special thanks are reserved for Professor Peter Nelson, Head of GSE, Professor Dodo
Jesuthason Thampapillai, Ms Gunnella Murphy and Ms Joy Monckton, all of GSE.
Kwabena A. Anaman
Ismail Duraman
August 2003
1
CHAPTER 1
PROSPECTS AND CHALLENGES OF ECONOMIC
GROWTH AND DIVERSIFICATION
IN BRUNEI DARUSSALAM
ISMAIL DURAMAN
Abstract
This paper briefly describes the underlying fundamentals of the economy of Brunei
Darussalam over the last 30 years and outlines the prospects and challenges affecting
economic growth and diversification in the country. A simple index of economic diversification
for Brunei, based on the concentration index used for measuring the concentration of firms in
industry, is used for the analysis. Economic diversification of Brunei is analysed based on the
economy being made up of 15 economic sectors. It is shown that the economy has become less
dependent on the oil and gas industry especially in the 1990s as compared with the 1970s and
1980s. However this reduction in the dependence on the oil and gas sector has coincided with
slow and negative growth rates of the economy as a whole. Suggestions for diversifying the
economy include the rapid development of the non-oil export sector and the expansion of the
services sector through tourism, financial services and the development of a modest
manufacturing base.
1. Introduction
The Sultanate of Brunei Darussalam (hereafter Brunei) is situated on the north-western tip of
the Borneo Island. It is one of the smallest countries in Southeast Asia with a land area of
5,765 square kilometres and a population of 332,800 in 2001 based on the 2001 Population
Census (Government of Brunei Darussalam, 2003). Brunei has a rich and long history. Since
its inception over six centuries ago, the country has been governed as a monarchy with Islam
and traditional Malay culture incorporated and extensively used in all aspects of government
and society. After a brief period of residency by the Government of the United Kingdom
starting in early part of the 20th Century, Brunei regained its full political independence in
February 1984. The Constitution of Brunei, promulgated in 1959, enshrined Brunei as a
Malay-Muslim-Monarchy. At independence in 1984, the country re-asserted its Malay cultural
and Islamic values as the fundamental components of government administration. The Malay-
Muslim-Monarchy concept became the guiding philosophy of the state. Thus the monarchy,
blended with a ministerial system, following Islamic teachings according to the Sunni
tradition, and adapting traditional Malay cultural traditions for use in the modern era,
constitutes the political system of Brunei. This political system has allowed for continuous
peace and prosperity over the last two decades in Brunei in a region of intermittent political
violence and instability. The political system has worked effectively not only in achieving
tranquillity but has also played a dominant role in shaping the economic development of the
country.
2
While the unique political system has provided the enabling environment for the pursuit of the
material and spiritual progress of the country, it has been the rapid development of the oil and
gas industry over the last 40 years which has provided the economic engine that has allowed
the country to reach a high-income status. Oil and gas products currently account for about
95% of the total actual exports (excluding re-exports) of the country. Including re-exports, oil
and gas exports constitute about 90% of all exports (both actual exports and re-exports) from
Brunei. In addition, the oil and gas industry has accounted for about 40% of the gross domestic
product (GDP) of Brunei over the last 10 years (Government of Brunei Darussalam, 2003).
With the eventual depletion of oil and gas reserves, reported in some circles to occur in about
20 to 40 years, (Bloomberg News, Borneo Bulletin, 3rd July 2003, page 10), the need to
diversify the economy has assumed a high level of importance. Brunei needs to have viable
economic substitutes in place as sources of national income before the inevitable depletion of
the oil and gas reserves.
Like many countries in East Asia, Brunei was affected by the 1997/98 Asian financial crisis
that started in Thailand and then spread throughout East Asia. Though the real GDP of Brunei
contracted by about 14% in 1998, the economic impact of the Asian financial crisis in Brunei
was not as serious compared to other Asian countries. A reason for the relatively small impact
was the relative absence of financial institutions and stock markets in Brunei. Nevertheless, the
Asian financial crisis contributed to the collapse of Amedeo Company, then the largest private
sector company in the country. The collapse of Amedeo affected many small and medium
scale enterprises in the country and led to increased unemployment for local people. The
collapse of this company also led to a severe recession in the local construction industry and
retrenchment of many foreign workers in that industry.
In 1999, the Government established a Task Force on Economic Affairs, involving members
of the public and private sectors, called the Brunei Darussalam Economic Council (BDEC), to
discuss ways of reviving the economy. Based on the report of this task force submitted in
2000, BDEC indicated that the structure of the economy of Brunei was unsustainable in the long-
term period unless economic growth and diversification were increased substantially. With the
release of the Eight Five-Year National Development Plan (2001-2005), the Government
recommitted itself to advance the objectives of economic growth and diversification with various
programmes and projects including those suggested by the BDEC (Government of Brunei
Darussalam, 2001). The successful implementation of these programmes and projects will
contribute to the advancement of economic diversification and growth of the country.
The literature on the economy of Brunei has been growing in recent times. Nevertheless
compared to most countries in the East Asian region, it can be said that there is some
considerable gap in the existing literature on the economy of Brunei. This paper provides some
insight into the history of the development of the oil-based economy of Brunei and recent
developments since the 1997/98 Asian financial crisis. A key objective of this paper is to
undertake a simple analysis of economic diversification of Brunei and offer some suggestions
for enhanced economic diversification in the country.
The rest of the paper is organised as follows: the next section, I provide a brief summary of the
history of the development of the oil and gas sector in Brunei. This is followed by more
detailed explanation of the current concerns about the sustainability of the economy of Brunei.
After this discussion, a brief literature review related to peculiar problems faced by Brunei in
terms of economic diversification is reported. Following that the methodology used to conduct
a simple diversification analysis of Brunei is described. The results of the analysis,
3
conclusions, policy implications, acknowledgments and references are reported in the last
section of the paper.
2. A Brief Historical Perspective of the Oil and Gas Sector as the Economic Power for
Development of the Country
Brunei has been blessed and endowed with oil and gas, two exhaustible resources, which have
contributed to its current high standard of living and prosperity of its people. Oil was first
discovered in 1929 and commercial production commenced several years later. However the
rapid development of the oil and gas industry started after the discovery of major offshore oil
reserves in the early 1960s. Before the discovery of oil in 1929, the economic development of
Brunei was largely linked to semi-subsistence agriculture. People who lived in the forests
established their living through the harvesting of jungle produce and some production from
settled farming such as rice cropping. Those who lived close to the sea and rivers depended
largely on fishing and small cottage industries. Domestic market trading between those who
lived on the land and those who lived in the water villages flourished with the peace and
stability created by the government. The mode of trading was basically via river using the
barter system. The concept of “pengalu”’ or wholesaler became popular at that time. The
pengalu would distribute their merchandise to their main customers who were usually
traditional women vendors commonly known as ‘pedian’. These pedian covered their heads
from the hot sun with big hats called ‘seraong bini’. These vendors would go from house to
house in different villages to sell their products.
The development of the oil and gas industry led to increased revenues for the state. These
revenues have been used to establish the infrastructure of a modern state. The women vendors
have been largely replaced by modern supermarkets and small retail outlets scattered
throughout the country. The revenues from the export of oil and gas products by Brunei were
modest throughout the 1960s. In 1974, the world market oil price tripled due to temporary oil
embargo related to political events surrounding the 1973 Arab-Israeli conflict. World oil prices
remained high throughout the 1970s and increased sharply again in the early 1980s. The two
world oil price shocks in the 1970s and 1980s brought large export revenues to Brunei even
though annual oil production was relatively constant. These revenues paved the way for rapid
modernisation and the establishment of a virtually complete welfare state in Brunei.
3. Current Concerns for the Economy of Brunei
Brunei’s current main economic engine is the oil and gas sector. As indicated earlier, the rapid
expansion of the oil and gas sector started in the early 1960s with the development of some
major offshore oil deposits. Brunei received large amounts of oil export revenues in the 1970s and
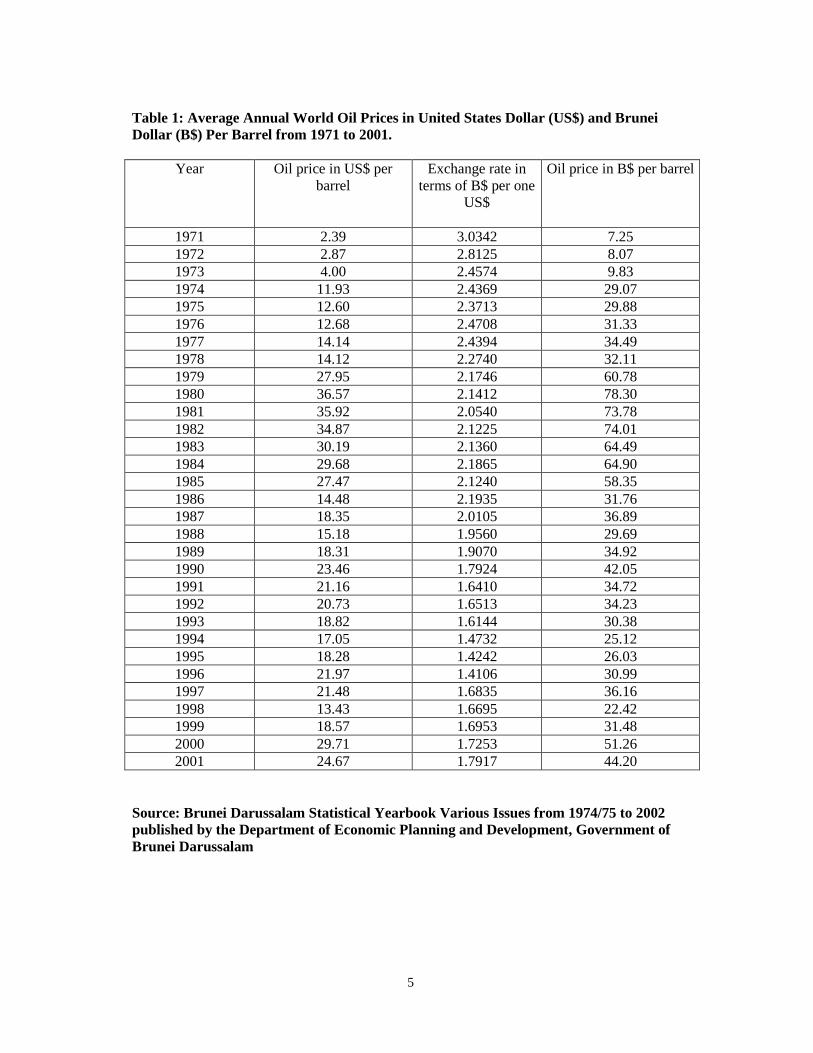
1980s due to the relatively high world oil market prices in those times. Table 1 is a summary of
world oil prices in both the United States and Brunei dollars. In 1980, with a record world oil
price of B$78 per barrel, Brunei was ranked as the country with the highest per capita GDP in that
year. In 2003, Brunei was ranked 31st among 175 countries based on the human development
index adopted by the United Nations Development Programme (UNDP, 2003). Despite the
enormous progress made by Brunei over the last 40 years, there are some concerns about the
sustainability of economic growth and development in the country due to a number of factors.
4
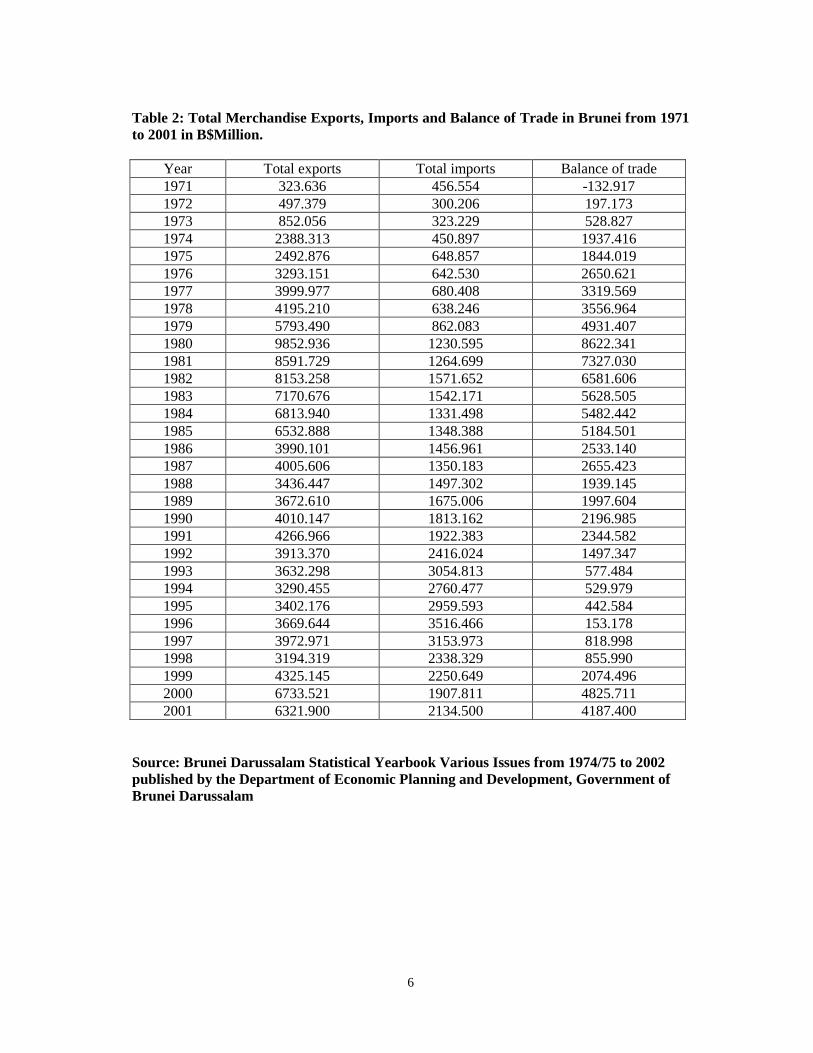
First, the balance of merchandise trade (total merchandise exports minus total merchandise
imports) has been declining due to the faster rate of increase of imports compared to the slow
growth of exports. Table 2 shows the level of merchandise imports and exports in Brunei over
the period, 1971 to 2001. Over the period, 1990 to 2000, merchandise imports accounted for
about 30% of GDP. While the balance of trade has improved modestly over the last few years, the
underlying trend is a general reduction of the positive trade balance. With slow growth of total
exports due to the low world oil prices and the high dependence of the economy on the oil and
gas sector, it is just a matter of time before the country experiences balance of trade deficits
unless a programme of economic diversification is vigorously pursued.
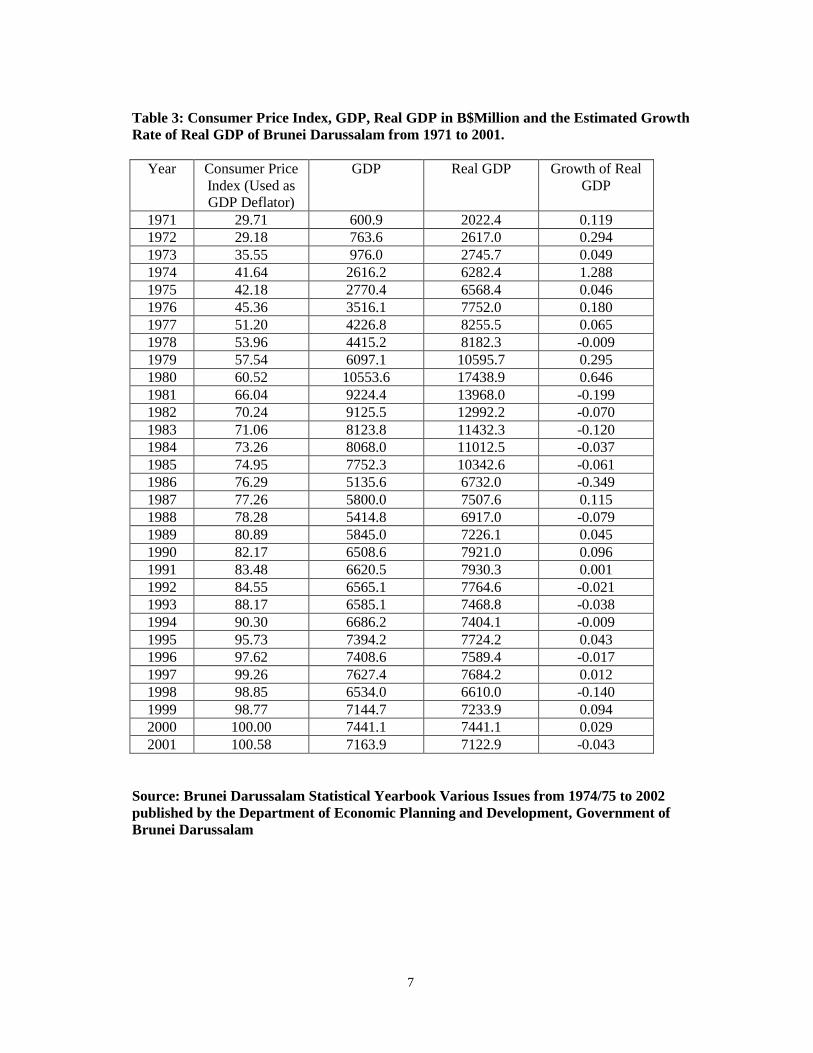
Second, while the country achieved modest to high economic growth rates as measured by the
growth of real GDP in the 1970s and 1980s, there have been negative growth rates throughout
the 1990s and early years of the 21st Century. The inability to achieve modest sustained
economic growth rates has led to increased local unemployment especially among the local
youth. Table 3 is a summary of the annual growth rates of the economy of Brunei measured as
the annual changes in the real GDP from 1971 to 2001. Real GDP is measured using the year
2000 as the base year. While large annual growth rates were experienced in the 1970s and
1980s, slow annual growth rates were the norm throughout the 1990s. In addition, during the
eleven-year period from 1991 to 2001, there were six years of negative economic growth rates
including the 14% reduction experienced in 1998, the year the recent Asian financial crisis hit
Brunei (refer to Table 3).
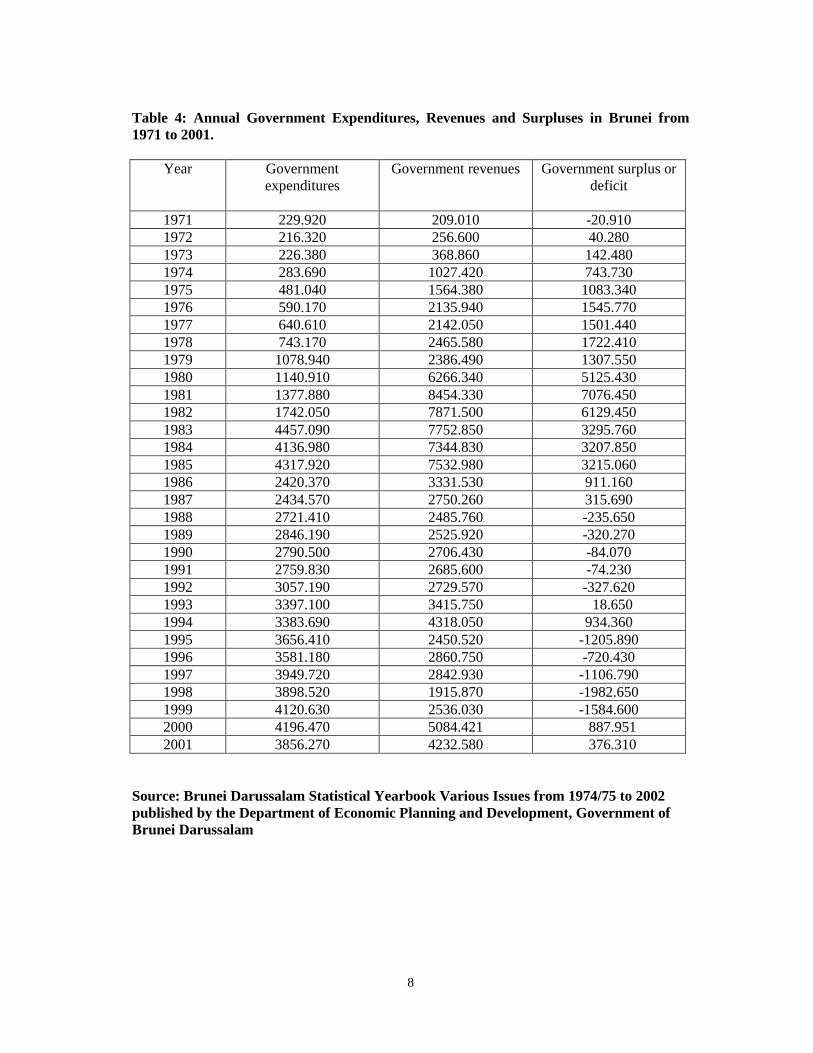
Third, a recent phenomenon that has occurred in Brunei is large government budget deficits, as
a result of government expenditures overwhelming government revenues raised from local
sources. These deficits have been financed by revenues from Brunei’s overseas investments
through the Brunei Investment Agency. Table 4 shows the annual government expenditures,
government revenues and surpluses over the period, 1971 to 2001. Budget deficits were
common throughout the 1990s. The increasing levels of deficits forced the government to
reduce the growth of the size of its workforce and also to cut expenditures in a number of areas
including public work programmes.
5
Table 1: Average Annual World Oil Prices in United States Dollar (US$) and Brunei
Dollar (B$) Per Barrel from 1971 to 2001.
Year Oil price in US$ per
barrel
Exchange rate in
terms of B$ per one
US$
Oil price in B$ per barrel
1971 2.39 3.0342 7.25
1972 2.87 2.8125 8.07
1973 4.00 2.4574 9.83
1974 11.93 2.4369 29.07
1975 12.60 2.3713 29.88
1976 12.68 2.4708 31.33
1977 14.14 2.4394 34.49
1978 14.12 2.2740 32.11
1979 27.95 2.1746 60.78
1980 36.57 2.1412 78.30
1981 35.92 2.0540 73.78
1982 34.87 2.1225 74.01
1983 30.19 2.1360 64.49
1984 29.68 2.1865 64.90
1985 27.47 2.1240 58.35
1986 14.48 2.1935 31.76
1987 18.35 2.0105 36.89
1988 15.18 1.9560 29.69
1989 18.31 1.9070 34.92
1990 23.46 1.7924 42.05
1991 21.16 1.6410 34.72
1992 20.73 1.6513 34.23
1993 18.82 1.6144 30.38
1994 17.05 1.4732 25.12
1995 18.28 1.4242 26.03
1996 21.97 1.4106 30.99
1997 21.48 1.6835 36.16
1998 13.43 1.6695 22.42
1999 18.57 1.6953 31.48
2000 29.71 1.7253 51.26
2001 24.67 1.7917 44.20
Source: Brunei Darussalam Statistical Yearbook Various Issues from 1974/75 to 2002
published by the Department of Economic Planning and Development, Government of
Brunei Darussalam
6
Table 2: Total Merchandise Exports, Imports and Balance of Trade in Brunei from 1971
to 2001 in B$Million.
Year Total exports Total imports Balance of trade
1971 323.636 456.554 -132.917
1972 497.379 300.206 197.173
1973 852.056 323.229 528.827
1974 2388.313 450.897 1937.416
1975 2492.876 648.857 1844.019
1976 3293.151 642.530 2650.621
1977 3999.977 680.408 3319.569
1978 4195.210 638.246 3556.964
1979 5793.490 862.083 4931.407
1980 9852.936 1230.595 8622.341
1981 8591.729 1264.699 7327.030
1982 8153.258 1571.652 6581.606
1983 7170.676 1542.171 5628.505
1984 6813.940 1331.498 5482.442
1985 6532.888 1348.388 5184.501
1986 3990.101 1456.961 2533.140
1987 4005.606 1350.183 2655.423
1988 3436.447 1497.302 1939.145
1989 3672.610 1675.006 1997.604
1990 4010.147 1813.162 2196.985
1991 4266.966 1922.383 2344.582
1992 3913.370 2416.024 1497.347
1993 3632.298 3054.813 577.484
1994 3290.455 2760.477 529.979
1995 3402.176 2959.593 442.584
1996 3669.644 3516.466 153.178
1997 3972.971 3153.973 818.998
1998 3194.319 2338.329 855.990
1999 4325.145 2250.649 2074.496
2000 6733.521 1907.811 4825.711
2001 6321.900 2134.500 4187.400
Source: Brunei Darussalam Statistical Yearbook Various Issues from 1974/75 to 2002
published by the Department of Economic Planning and Development, Government of
Brunei Darussalam
7
Table 3: Consumer Price Index, GDP, Real GDP in B$Million and the Estimated Growth
Rate of Real GDP of Brunei Darussalam from 1971 to 2001.
Year Consumer Price
Index (Used as
GDP Deflator)
GDP Real GDP Growth of Real
GDP
1971 29.71 600.9 2022.4 0.119
1972 29.18 763.6 2617.0 0.294
1973 35.55 976.0 2745.7 0.049
1974 41.64 2616.2 6282.4 1.288
1975 42.18 2770.4 6568.4 0.046
1976 45.36 3516.1 7752.0 0.180
1977 51.20 4226.8 8255.5 0.065
1978 53.96 4415.2 8182.3 -0.009
1979 57.54 6097.1 10595.7 0.295
1980 60.52 10553.6 17438.9 0.646
1981 66.04 9224.4 13968.0 -0.199
1982 70.24 9125.5 12992.2 -0.070
1983 71.06 8123.8 11432.3 -0.120
1984 73.26 8068.0 11012.5 -0.037
1985 74.95 7752.3 10342.6 -0.061
1986 76.29 5135.6 6732.0 -0.349
1987 77.26 5800.0 7507.6 0.115
1988 78.28 5414.8 6917.0 -0.079
1989 80.89 5845.0 7226.1 0.045
1990 82.17 6508.6 7921.0 0.096
1991 83.48 6620.5 7930.3 0.001
1992 84.55 6565.1 7764.6 -0.021
1993 88.17 6585.1 7468.8 -0.038
1994 90.30 6686.2 7404.1 -0.009
1995 95.73 7394.2 7724.2 0.043
1996 97.62 7408.6 7589.4 -0.017
1997 99.26 7627.4 7684.2 0.012
1998 98.85 6534.0 6610.0 -0.140
1999 98.77 7144.7 7233.9 0.094
2000 100.00 7441.1 7441.1 0.029
2001 100.58 7163.9 7122.9 -0.043
Source: Brunei Darussalam Statistical Yearbook Various Issues from 1974/75 to 2002
published by the Department of Economic Planning and Development, Government of
Brunei Darussalam
8
Table 4: Annual Government Expenditures, Revenues and Surpluses in Brunei from
1971 to 2001.
Year Government
expenditures
Government revenues Government surplus or
deficit
1971 229.920 209.010 -20.910
1972 216.320 256.600 40.280
1973 226.380 368.860 142.480
1974 283.690 1027.420 743.730
1975 481.040 1564.380 1083.340
1976 590.170 2135.940 1545.770
1977 640.610 2142.050 1501.440
1978 743.170 2465.580 1722.410
1979 1078.940 2386.490 1307.550
1980 1140.910 6266.340 5125.430
1981 1377.880 8454.330 7076.450
1982 1742.050 7871.500 6129.450
1983 4457.090 7752.850 3295.760
1984 4136.980 7344.830 3207.850
1985 4317.920 7532.980 3215.060
1986 2420.370 3331.530 911.160
1987 2434.570 2750.260 315.690
1988 2721.410 2485.760 -235.650
1989 2846.190 2525.920 -320.270
1990 2790.500 2706.430 -84.070
1991 2759.830 2685.600 -74.230
1992 3057.190 2729.570 -327.620
1993 3397.100 3415.750 18.650
1994 3383.690 4318.050 934.360
1995 3656.410 2450.520 -1205.890
1996 3581.180 2860.750 -720.430
1997 3949.720 2842.930 -1106.790
1998 3898.520 1915.870 -1982.650
1999 4120.630 2536.030 -1584.600
2000 4196.470 5084.421 887.951
2001 3856.270 4232.580 376.310
Source: Brunei Darussalam Statistical Yearbook Various Issues from 1974/75 to 2002
published by the Department of Economic Planning and Development, Government of
Brunei Darussalam
9
4. Brief Literature Review on Economic Diversification
Oxford Dictionary of Economics defines diversification as the spread of the activities of a
firm between different types of products or different markets. The concept of diversification
can be applied to the whole economy. In Brunei, the aim of the government has been to
diversify the economy away from the excessive dependence on the oil and gas industry. This
is to be achieved through the development of the non-oil economic sectors. Economic
diversification has become one of the major objectives of the country since the Second
National Development Plan from 1962-66 (Government of Brunei Darussalam, 2001). The
relatively slow pace of the development of Brunei’s economic diversification programmes
can be explained partly as a result of the problem known as “rentier state”. The concept of
economic rent refers to excess or extra returns from fixed factors. Thus a rentier state enjoys
large amounts of revenues from the extraction of fixed natural resources such as energy.
Such a state is often characterised as one that embarks on social and economic programmes
involving large expenditures without resorting to taxation. Due to the increased rents
available from the extraction of natural resources, such large expenditures do not lead to
drastic balance of payments or inflation problems. A rentier state is also associated with a
problem of economic development known as the “Dutch disease” that is usually associated
with stagnant growth of economic sectors other than the energy sector. The term was
originally used to analyse the negative effects of natural gas discoveries on the
manufacturing sector of the Netherlands in the 1960s and early 1970s by Corden and Neary
(1982). Corden and Neary argued that the expansion of activities in the energy sector
adversely affected the manufacturing sector partly by raising the marginal value product of
labour in the energy sector. This caused the movement of labour from the manufacturing and
non-tradeable sectors to the energy sector.
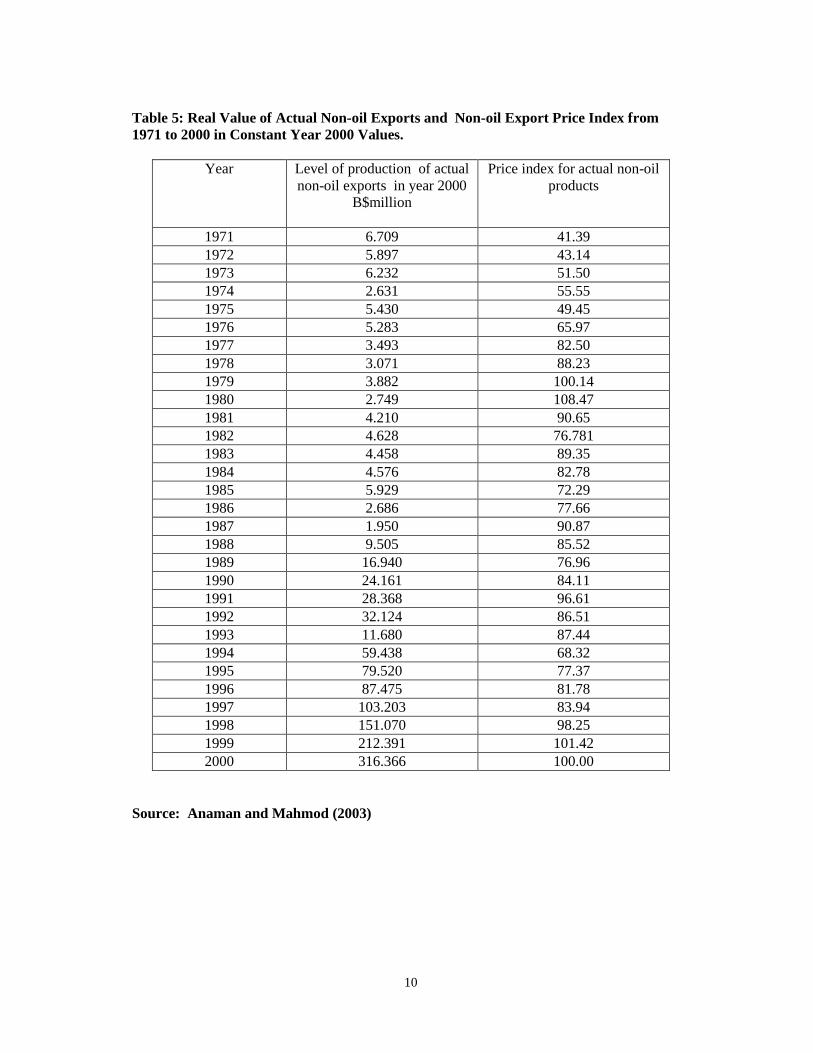
While some aspects of rentier state may be applicable to Brunei, it is important to note that
considerable progress has been made by Brunei throughout the 1990s to develop a modest
non-oil export manufacturing industrial base revolving around garment exports. This
development has been achieved through the mobilisation of resources and technology by the
government involving tax incentives to local and foreign investors (Anaman and Mahmod,
2003). Table 5 shows the level of non-oil exports actually produced in Brunei from 1971 to
2000 and the average price index of non-oil products over that period. It can be noticed that
from 1988 onwards, the non-oil export sector underwent a major transformation with the
establishment of several garment factories producing products for export especially to the
United States. The total value of actual non-oil exports in 2000 was B$316 million, about 5%
of total actual exports; this value has been increasing over the last few years (Government of
Brunei Darussalam, 2003). The rapid increase in the value of non-oil exports was also
related to the relative low cost of labour due to the availability of foreign workers in the
country and concerted efforts by the government to promote the foreign direct investment in
the country through the setting up of garment factories. Thus we have in Brunei a proven
case of successful economic diversification policy involving the development of export
manufacturing by the private sector as a result of enhanced government incentives.
10
Table 5: Real Value of Actual Non-oil Exports and Non-oil Export Price Index from
1971 to 2000 in Constant Year 2000 Values.
Year Level of production of actual
non-oil exports in year 2000
B$million
Price index for actual non-oil
products
1971 6.709 41.39
1972 5.897 43.14
1973 6.232 51.50
1974 2.631 55.55
1975 5.430 49.45
1976 5.283 65.97
1977 3.493 82.50
1978 3.071 88.23
1979 3.882 100.14
1980 2.749 108.47
1981 4.210 90.65
1982 4.628 76.781
1983 4.458 89.35
1984 4.576 82.78
1985 5.929 72.29
1986 2.686 77.66
1987 1.950 90.87
1988 9.505 85.52
1989 16.940 76.96
1990 24.161 84.11
1991 28.368 96.61
1992 32.124 86.51
1993 11.680 87.44
1994 59.438 68.32
1995 79.520 77.37
1996 87.475 81.78
1997 103.203 83.94
1998 151.070 98.25
1999 212.391 101.42
2000 316.366 100.00
Source: Anaman and Mahmod (2003)
11
5. Methodology for Analysis of Economic Diversification of Brunei
I develop a measure of economic diversification to gauge the extent of progress Brunei has
made towards diversifying its economic base. A common measure of industry concentration is
the Herfindahl-Hirschmann Index (Hirschman, 1945; Hall and Tideman, 1967). The
Herfindahl-Hirschmann Index is a relatively simple method of measuring industry
concentration. This index is derived by squaring the market share of each industry player and
then summing all the squares. Therefore for an industry consisting of only two firms
(oligopoly), the Herfindahl-Hirschmann Index will be 5,000, derived as the sum of the two
squares of 50%. The maximum value of the index is 10,000 for a pure monopoly (that is the
square of 100). In this paper the Herfindahl-Hirschmann index has been modified to derive an
economy diversification index (EDI) for Brunei. The EDI is derived by squaring the
proportion (percentage) of GDP contributed by each of the economic sectors and then
summing them up. In the case of only one economic sector, EDI will be 10,000 (the square of
100). For the case of an infinite number of identically small economic sectors, the EDI will be
close to zero. There are 15 economic sectors in Brunei based on the classification used by the
Department of Economic Planning and Development (DEPD). Duraman and Asafu-Adjaye
(1999) use 12 sectors for the development of an input-output table for Brunei. In this paper, I
follow the approach of DEPD because of the availability of their data on the 15 economic
sectors from 1971 to 2001. The EDI for Brunei is calculated for each year from 1971 to 2001.
6. Results of Diversification Analysis
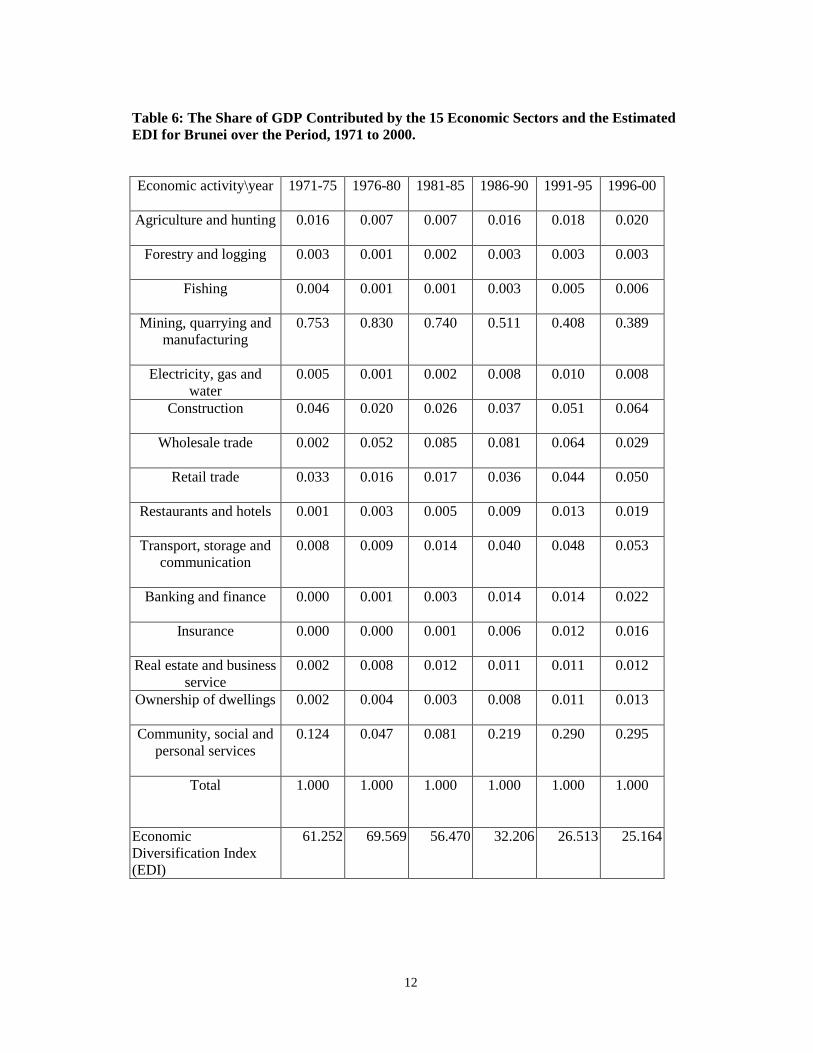
The share of GDP contributed by the 15 economic sectors and the estimated EDI for Brunei
from 1971 to 2000 for five-year periods are reported in Table 6. These results indicated that
the mining, quarrying and manufacturing sector, which is largely made up of the oil and gas
industry, has become less dominant in the economy. During the period, 1976 to 1980, when
world oil prices were very high, the mining, quarrying and manufacturing sector accounted for
about 83% of the total economic output as measured by GDP. However this share declined
steadily to about 39% in the 1996-2000 period. In 2001, the oil and gas industry accounted for
about 98.7% of the value added to gross domestic product of the mining, quarrying and
manufacturing sector (Government of Brunei Darussalam, 2003, pp. 135 and 140). The second
most important economic sector in Brunei is the community, social and personal services. In
2001, government services contributed about 86.4% of the value of this sector (Government of
Brunei Darussalam, 2003, pp. 135 and 140). The community, social and personal services
sector contributed on average 29.5% of the GDP of the country over the 1996 to 2000 period.
Thus the oil and gas industry and the government services sub-sector are the two largest
economic entities in Brunei. Any considerable diversification of the economy will therefore
entail the reduction of the dominance of these two sectors and the relative expansion of the
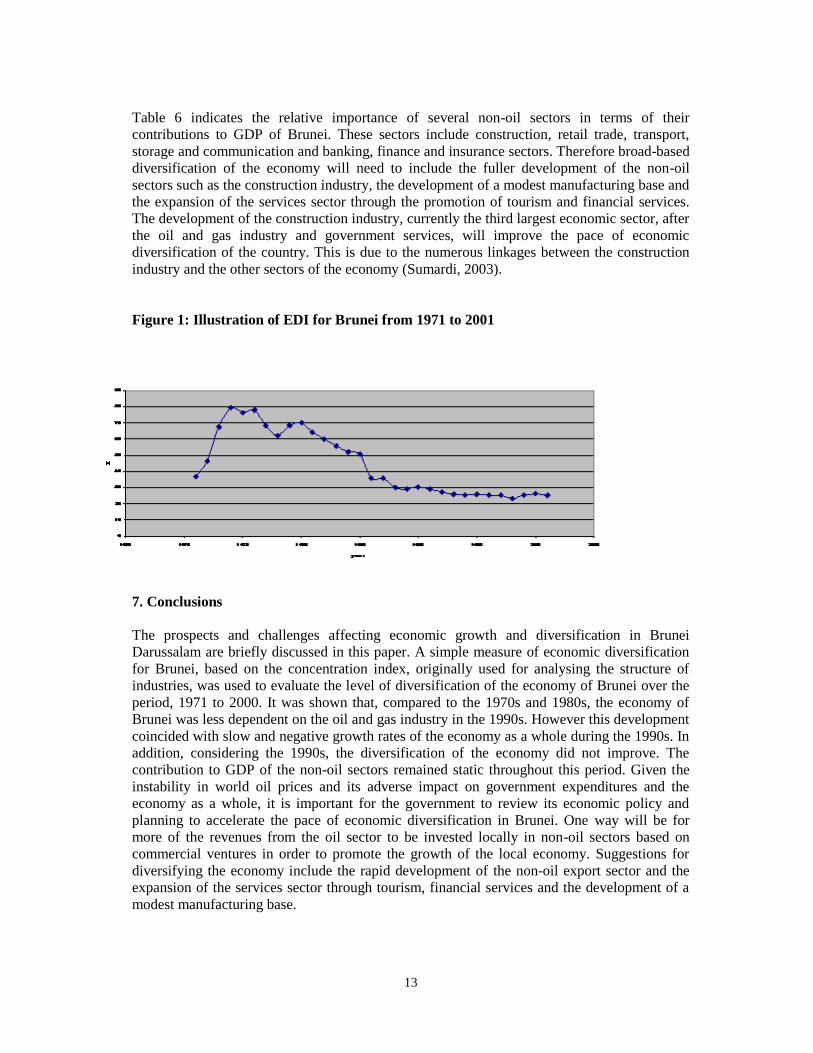
other sectors. The estimated economic diversification index (EDI) is shown in Table 6 based
on five-year intervals and illustrated in Figure 1 using annual data. Simple statistical analysis
of EDI clearly indicated that the degree of diversification of the economy of Brunei was low in
the 1970s and 1980s as measured by the relatively high EDI. This relatively high EDI was due
to the dominance of the oil and gas industry. During the period, 1991 to 2000, EDI declined
sharply and stabilised around the value of 25. The reduction of the dominant role of the oil and
gas industry was due to slow and negative growth rates of the economy mainly due to the
relatively low world oil prices.
12
Table 6: The Share of GDP Contributed by the 15 Economic Sectors and the Estimated
EDI for Brunei over the Period, 1971 to 2000.
Economic activity\year 1971-75 1976-80 1981-85 1986-90 1991-95 1996-00
Agriculture and hunting 0.016 0.007 0.007 0.016 0.018 0.020
Forestry and logging 0.003 0.001 0.002 0.003 0.003 0.003
Fishing 0.004 0.001 0.001 0.003 0.005 0.006
Mining, quarrying and
manufacturing
0.753 0.830 0.740 0.511 0.408 0.389
Electricity, gas and
water
0.005 0.001 0.002 0.008 0.010 0.008
Construction 0.046 0.020 0.026 0.037 0.051 0.064
Wholesale trade 0.002 0.052 0.085 0.081 0.064 0.029
Retail trade 0.033 0.016 0.017 0.036 0.044 0.050
Restaurants and hotels 0.001 0.003 0.005 0.009 0.013 0.019
Transport, storage and
communication
0.008 0.009 0.014 0.040 0.048 0.053
Banking and finance 0.000 0.001 0.003 0.014 0.014 0.022
Insurance 0.000 0.000 0.001 0.006 0.012 0.016
Real estate and business
service
0.002 0.008 0.012 0.011 0.011 0.012
Ownership of dwellings 0.002 0.004 0.003 0.008 0.011 0.013
Community, social and
personal services
0.124 0.047 0.081 0.219 0.290 0.295
Total 1.000 1.000 1.000 1.000 1.000 1.000
Economic
Diversification Index
(EDI)
61.252 69.569 56.470 32.206 26.513 25.164
13
Table 6 indicates the relative importance of several non-oil sectors in terms of their
contributions to GDP of Brunei. These sectors include construction, retail trade, transport,
storage and communication and banking, finance and insurance sectors. Therefore broad-based
diversification of the economy will need to include the fuller development of the non-oil
sectors such as the construction industry, the development of a modest manufacturing base and
the expansion of the services sector through the promotion of tourism and financial services.
The development of the construction industry, currently the third largest economic sector, after
the oil and gas industry and government services, will improve the pace of economic
diversification of the country. This is due to the numerous linkages between the construction
industry and the other sectors of the economy (Sumardi, 2003).
Figure 1: Illustration of EDI for Brunei from 1971 to 2001
7. Conclusions
The prospects and challenges affecting economic growth and diversification in Brunei
Darussalam are briefly discussed in this paper. A simple measure of economic diversification
for Brunei, based on the concentration index, originally used for analysing the structure of
industries, was used to evaluate the level of diversification of the economy of Brunei over the
period, 1971 to 2000. It was shown that, compared to the 1970s and 1980s, the economy of
Brunei was less dependent on the oil and gas industry in the 1990s. However this development
coincided with slow and negative growth rates of the economy as a whole during the 1990s. In
addition, considering the 1990s, the diversification of the economy did not improve. The
contribution to GDP of the non-oil sectors remained static throughout this period. Given the
instability in world oil prices and its adverse impact on government expenditures and the
economy as a whole, it is important for the government to review its economic policy and
planning to accelerate the pace of economic diversification in Brunei. One way will be for
more of the revenues from the oil sector to be invested locally in non-oil sectors based on
commercial ventures in order to promote the growth of the local economy. Suggestions for
diversifying the economy include the rapid development of the non-oil export sector and the
expansion of the services sector through tourism, financial services and the development of a
modest manufacturing base.
14
The prospects of rapid diversification of the economy of Brunei require sustained efforts by
the Government to promote local and foreign investment in the country. Brunei has
successfully proven that it can diversify its export trade. Non-oil exports from Brunei were
negligible until the early 1990s. For example, as shown by Anaman and Mahmod (2003),
actual non-oil exports were valued less than B$2 million in 1987. In 2001, Brunei exported
non-oil products valued at around B$350 million, almost 5% of the GDP for that year. The
rapid increase in non-oil exports over the last 15 years has been partly due to the concerted
efforts by the Government to encourage local and foreign investors to set up garment factories
with tax incentives and enabling political stable environment friendly for businesses. The
development of just a few industry clusters, other than the garment industry, can lead to
broader diversification of the economy which can lead to increased numbers of work
opportunities for local people.
The implementation of development policies that will accelerate the drive towards a broad-
based diversification of the economy requires clear intentions of policy makers (political
leaders), policy implementers (government bureaucrats) and policy shapers (academics,
business leaders and the public at large). All parties and players must be aware and understand
clearly their roles in order to advance the cause of building a sustainable economic future for
Brunei. The ultimate aim of economic development is for human beings to enjoy the benefits
from the implementation of programmes and projects with minimal damage to the
environment. The environment provides the habitat for many non-human animal species which
are essential for the material welfare of people. Therefore the diversification of the economy
cannot be achieved through reckless destruction of the environment and ecosystems to achieve
high economic growth rates over the short to medium term period. We must aim to create an
economy that creates jobs and improve the welfare of the citizens of the country without
irreparably damaging the natural environment. Sustainable economic growth and
diversification also require the maintenance of the spiritual health of our people through the
strong adherence of Islamic values which emphasise the mutual understanding and tolerance of
Muslims and non-Muslim people who live and work in Brunei.
In pursuit of sustainable economic growth and development of the country, the role of the
government should be clear and should facilitate the nourishment of the private sector as the
main engine of economic development. The government needs to remove unnecessary
impediments and obstacles that hinder the economic advancement of businesses and
individuals. The maintenance of a peaceful and tranquil society, based on the rule of law, is an
essential duty of the government necessary for any meaningful economic development to take
place. The time for Bruneians to take the economic problems of the country lightly has gone. It
is time for us to learn from the lessons of our home-grown economic crises of recent years and
those crises that have occurred in other parts of the world in order to avoid the mistakes of the
past. Brunei needs to take note of the rapid changes taking place around the region and world.
These changes need to be incorporated in our way of thinking and as variables in our models
for achieving sustainable economic growth and development.
Acknowledgments
I thank Dr. Kwabena A. Anaman and Awangku Haji Sariffudin bin Pengiran Haji Alli for their
assistance with the compilation of the data on Brunei for this paper.
15
References
Anaman, K.A. and T.H. Mahmod (2003). “Determinants of Supply of Non-Oil Exports in
Brunei Darussalam”, Asean Economic Bulletin, 20(2): 144-157.
Bloomberg News (2003). “Economic Lessons for Asia from Brunei”, Borneo Bulletin, 3rd July,
page 10.
Corden, W.M and J.P. Neary (1982). “Booming Sector and De-Industrialisation in a Small
Open Economy”, The Economic Journal, 92: 825-848.
Duraman, Ismail (1998). “Development in Brunei Darussalam: Problems and Prospects of
Economic Diversification”, Anang, 46-62.
Duraman, Ismail and John Asafu-Adjaye (1999). "An Economy-Wide Model of Brunei:
Theory, Data and Application", Tinjauan: Policy and Management Review, 3: 1-20.
Government of Brunei Darussalam (2001). Brunei Darussalam: Eighth National Development
Plan 2001-2005, Bandar Seri Begawan: Department of Economic Planning and Development,
228 pp.
Government of Brunei Darussalam (2003). Brunei Statistical Yearbook 2002, Bandar Seri
Begawan: Department of Economic Planning and Development.
Hall, M. and N. Tideman (1967). "Measures of Concentration", Journal of the American
Statistical Association, 62: 162-168.
Hirschman, A.O. (1945). National Power and the Structure of Foreign Trade, London.
United Nations Development Programme (UNDP) (2003). Human Development Report: Human
Development Index, New York: UNDP.
Sumardi, R.H. (2003). Analysis of the Productivity of the Construction Industry in Brunei
Darussalam, Bachelor of Arts (Economics) Degree, Department of Economics, Universiti Brunei
Darussalam, Bandar Seri Begawan, 140 pp. (unpublished).
16
CHAPTER 2
CAN THE CONSTRUCTION INDUSTRY PULL
THE REST OF THE ECONOMY OUT OF A
RECESSION? EVALUATION OF CAUSALITY
LINKS BETWEEN THE CONSTRUCTION
INDUSTRY AND THE MACROECONOMY IN
BRUNEI DARUSSALAM
KWABENA A. ANAMAN
Abstract
The relationship between the construction industry and the macroeconomy in Brunei
Darussalam was analysed based on a simple Granger causality test. The output of the
macroeconomy was measured by the real gross domestic product (GDP) while the value
added to real GDP was used to measure the output of the construction industry. It was
established that the macroeconomy Granger-caused or influenced the real value of the
construction industry in the positive sense. Increases in real GDP in the previous year would
lead to increased value of the output of the construction industry in the current year. It was
also determined that there was a feedback mechanism from the construction industry to the
wider economy. Higher level of construction industry activities in the previous year was
followed by a decline in real GDP.
1. Introduction
Brunei Darussalam (hereafter Brunei) is a small country of about 5,765 square kilometres at
the tip of the Borneo Island in Southeast Asia. The country is heavily dependent on oil and gas
exports with the oil and gas industry contributing about half of its GDP. Based on contribution to
GDP, the construction industry is the third largest sector of the economy after the oil and gas
and community, and social and personal services (mainly government services) industries.
The construction industry is recognized by the Government as a key engine to diversify the
economy away from its excessive dependence on the oil and gas industry (Government of
Brunei Darussalam, 2001).
According to Ofori (1990), the construction industry is a key contributor of the GDP of many
developing countries. The industry is also important in the economies of developed countries
such as the United States and Australia. In developed countries, it is often the construction
industry that leads the economy out of recession when governments or Central Banks use a
policy of lower interest rates to stimulate purchase of homes and factories. The issue of
whether the construction industry in developing countries leads the rest of the economy or
whether the wider economy pulls the construction industry along as it expands has been
17
discussed in the literature. Tse and Ganesan (1997) using Granger causality methodology
show for Hong Kong that the GDP tends to lead the construction flows and not vice versa .
However Lopes (1998) indicates that long term decreasing growth in GDP per capita for the
developing countries of Sub-Saharan Africa corresponded directly to relative decline of the
output of the construction industry and not vice versa.
There are several reasons for undertaking the study for Brunei. First, though Brunei is a
relatively small country, its very high per capita GDP over the last 30 years through oil and gas
exports, has allowed the country to become an important economic player in the Asian Pacific
Region as exemplified by its hosting of the Asian Pacific Economic Cooperation summit in
2000 and its permanent hosting of the ASEAN-European Community Management Centre.
Secondly, over the last 20 years, the country has undertaken some major first class
construction projects such as the lstana Nurul Iman, the largest single palace in the world and
the Empire Hotel, probably the largest hotel in Asia. There is some impact from such major
construction projects on the wider economy in Brunei and surrounding countries in the
Southeast Asia, for example, through imports of labour and raw materials. Finally, causality
relationships between construction industry and the macroeconomy for Brunei provides
additional information for comparative analysis between high income but weakly diversified
economies of small, oil-rich countries such as Brunei and similar countries in the Middle East,
and high income and highly diversified economies such as the United States. The rest of the
paper is organised as follows: The methodology is briefly discussed followed by the empirical
results, conclusions and the list of references.
2. Methodology
The Granger causality test was pioneered in economic literature by Granger (1969) and later
expanded by Granger (1988). The test is described by Gujarati (2003, pp. 696-702). Briefly
the Granger causality test is based on the fact that the future cannot be used to predict the past
since time does not run backwards. However past events can be used to predict current and
future events. Hence if past or lagged values of a variable (X) included in an equation can
statistically improve the prediction of the current values of another variable (Y), then X is
supposed to cause or influence Y in the Granger sense. This is unidirectional causality.
However if the lagged values of Y included in an alternative equation can statistically help to
improve the prediction of current values of X, then the causality is bilateral.
For Granger causality analysis, the variables must be expressed in stationary forms. Assume
that the variables (Y and X) are stationary and follows an autoregressive process (AR) as
follows in Equation 1:
q1 q2
Yt = A0 + ∑ Bi(1-L)Yt-i + ∑ Cj(1-L)Xt-j + Ut Equation 1
i=1 j=1
where L is the lag operator, Ut is a random error term and q1 and q2 are the orders of the AR
process. Xt is said to Granger-cause Yt if the lagged Xt terms are jointly statistically
significant based on the F test. The optimal lag length is determined with the model
specification that results in the minimum Schwarz Bayesian Information Criterion score.
18
3. Results
Figure 1 represents the movement of natural logarithm of the real GDP (LRGDP) and the
natural logarithm of the real value of the construction industry (LRVAGDP) based on data
from 1971 to 2001 available from Government of Brunei Darussalam (2002). The graphical
analysis appears to indicate that LRGDP and LRVAGDP series move together. The analysis
of unit roots of LRGDP and LRVAGDP was undertaken with Augmented Dickey Fuller
(ADF) test incorporating a trend variable, the augmented weighted symmetric test and the
Philip-Perron (PP) test using the Time Series Processor software (Hall and Cummins, 1999).
The three statistics taken together indicated that LRGDP and LRVAGDP were not stationary
at the levels. However they were stationary when they were differenced once (integrated of
the order 1). The Johansen trace test was used to undertake the cointegration analysis
(Johansen and Juseliu, 1990). The test confirmed that there was one valid cointegration
relationship between LRGDP and LRVAGDP (refer to the results in Table 1). Hence there
existed an error correction model representation among the two variables. The presence of a
valid cointegration relationship also suggested that there should be some Granger causation
between LRGDP and LRVAGDP in order for a long run relationship to exist between the two
variables.
The empirical analysis of Granger causality was conducted using the first differences of
LRGDP and LRVAGDP. This was because the first differences of these variables were
stationary. Table 2 summarises the results of the Granger causality test analysis between the
first differences of LRGDP and LRVAGDP. Based on the optimal lag length of two,
determined as the (optimal) lag length with the least Schwarz Bayesian Information Criterion
score, a statistically significant positive causal linkage from LRGDP to LRVAGDP was shown
(refer to the results of the second equation in Table 2). This statistical significance was shown
for lag (t-1). This meant that real GDP would Granger-cause the real value of the construction
industry in the positive sense. That is an increase in real GDP in the previous year would lead
to increased value of the construction industry in the current year. A statistical negative
causality link was shown from LRVAGDP to LRGDP. This was also for one lag, the previous
year (t-1). This particular result indicated that higher levels of construction industry activities
in the previous year would be followed by a decline in real GDP. This meant that completion
of major construction activities in the previous year preceded a slow down of the economy in
the current year.

19
Figure 1: Movement of the series LRGDP and LRVAGDP
0.000
2.000
4.000
6.000
8.000
10.000
12.000
1971
1973
1975
1977
1979
1981
1983
1985
1987
1989
1991
1993
1995
1997
1999
2001
Year
Mili
on
s o
f B
run
ei d
olla
r (L
OG
)
LRGDP
LRVAGDP
Table 1: Results of the Johansen Cointegration Trace Test for LRGDP and LRVAGDP*.
Likelihood Ratio Statistic
Asymptotic P Value Hypothesised Number of
Cointegration Vectors (r)
21.495 0.017** None
2.802 0.087** At least one
Notes
* cointegration between LRGDP and LRVAGDP was also confirmed by the Engle-
Granger tau test (Engle and Granger, 1987). The p value for rejecting the null hypothesis
of no cointegration was 0.025, substantially less than the critical p value of 0.10 used in this
study. The value of the test statistic was –4.030. The optimal number of lags was 8.
** denotes statistical significance at the 10% level.
20
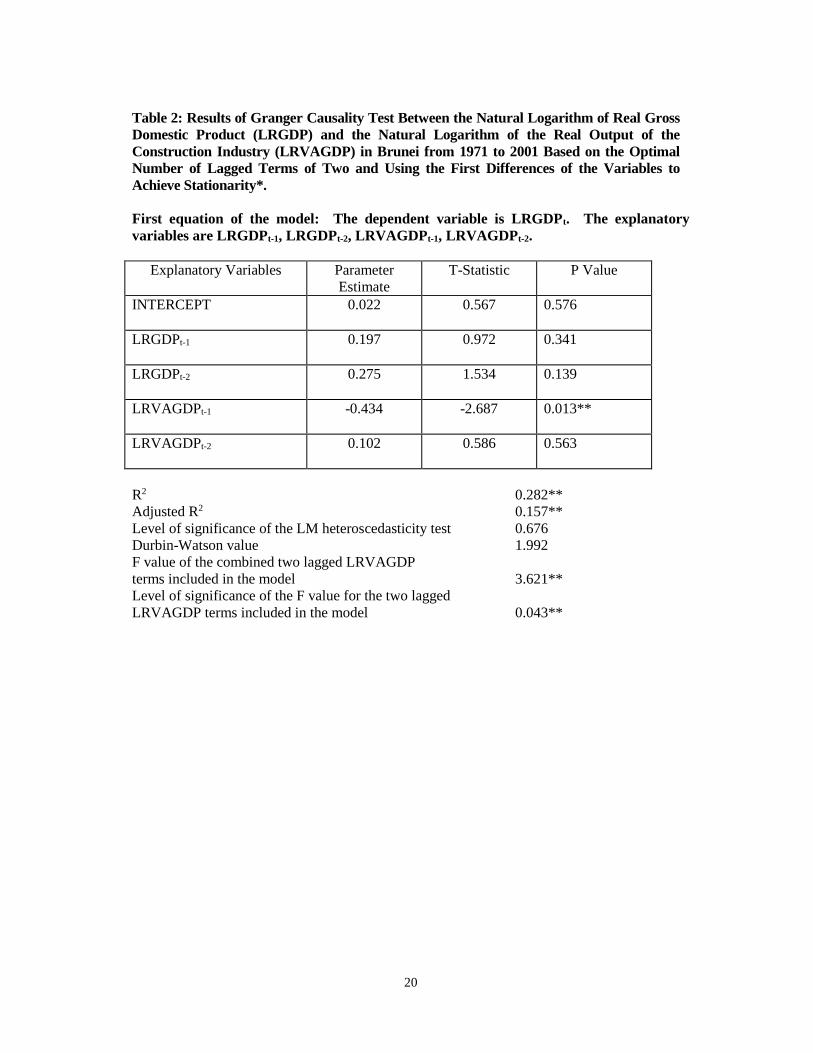
Table 2: Results of Granger Causality Test Between the Natural Logarithm of Real Gross
Domestic Product (LRGDP) and the Natural Logarithm of the Real Output of the
Construction Industry (LRVAGDP) in Brunei from 1971 to 2001 Based on the Optimal
Number of Lagged Terms of Two and Using the First Differences of the Variables to
Achieve Stationarity*.
First equation of the model: The dependent variable is LRGDPt. The explanatory
variables are LRGDPt-1, LRGDPt-2, LRVAGDPt-1, LRVAGDPt-2.
Explanatory Variables
Parameter
Estimate
T-Statistic P Value
INTERCEPT
0.022 0.567 0.576
LRGDPt-1 0.197 0.972 0.341
LRGDPt-2 0.275 1.534 0.139
LRVAGDPt-1 -0.434 -2.687 0.013**
LRVAGDPt-2 0.102 0.586 0.563
R2 0.282**
Adjusted R2 0.157**
Level of significance of the LM heteroscedasticity test 0.676
Durbin-Watson value 1.992
F value of the combined two lagged LRVAGDP
terms included in the model 3.621**
Level of significance of the F value for the two lagged
LRVAGDP terms included in the model 0.043**
21
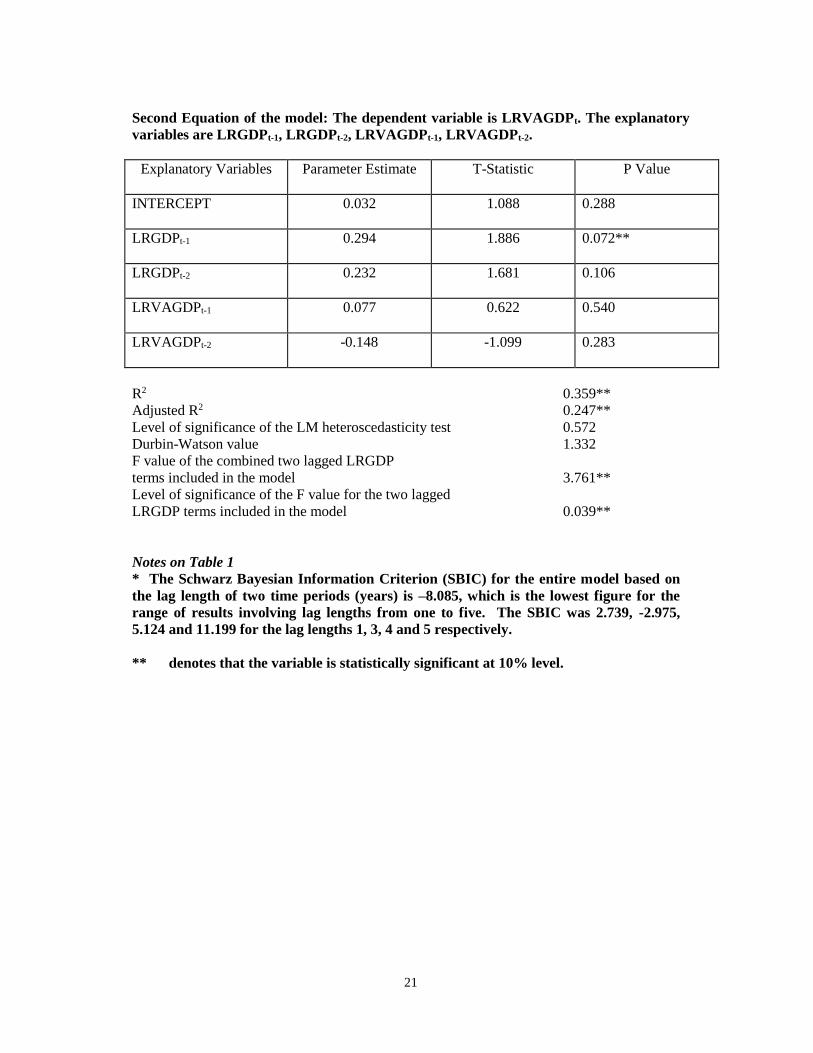
Second Equation of the model: The dependent variable is LRVAGDPt. The explanatory
variables are LRGDPt-1, LRGDPt-2, LRVAGDPt-1, LRVAGDPt-2.
Explanatory Variables Parameter Estimate T-Statistic P Value
INTERCEPT
0.032 1.088 0.288
LRGDPt-1
0.294 1.886 0.072**
LRGDPt-2
0.232 1.681 0.106
LRVAGDPt-1
0.077 0.622 0.540
LRVAGDPt-2
-0.148 -1.099 0.283
R2 0.359**
Adjusted R2 0.247**
Level of significance of the LM heteroscedasticity test 0.572
Durbin-Watson value 1.332
F value of the combined two lagged LRGDP
terms included in the model 3.761**
Level of significance of the F value for the two lagged
LRGDP terms included in the model 0.039**
Notes on Table 1
* The Schwarz Bayesian Information Criterion (SBIC) for the entire model based on
the lag length of two time periods (years) is –8.085, which is the lowest figure for the
range of results involving lag lengths from one to five. The SBIC was 2.739, -2.975,
5.124 and 11.199 for the lag lengths 1, 3, 4 and 5 respectively.
** denotes that the variable is statistically significant at 10% level.
22
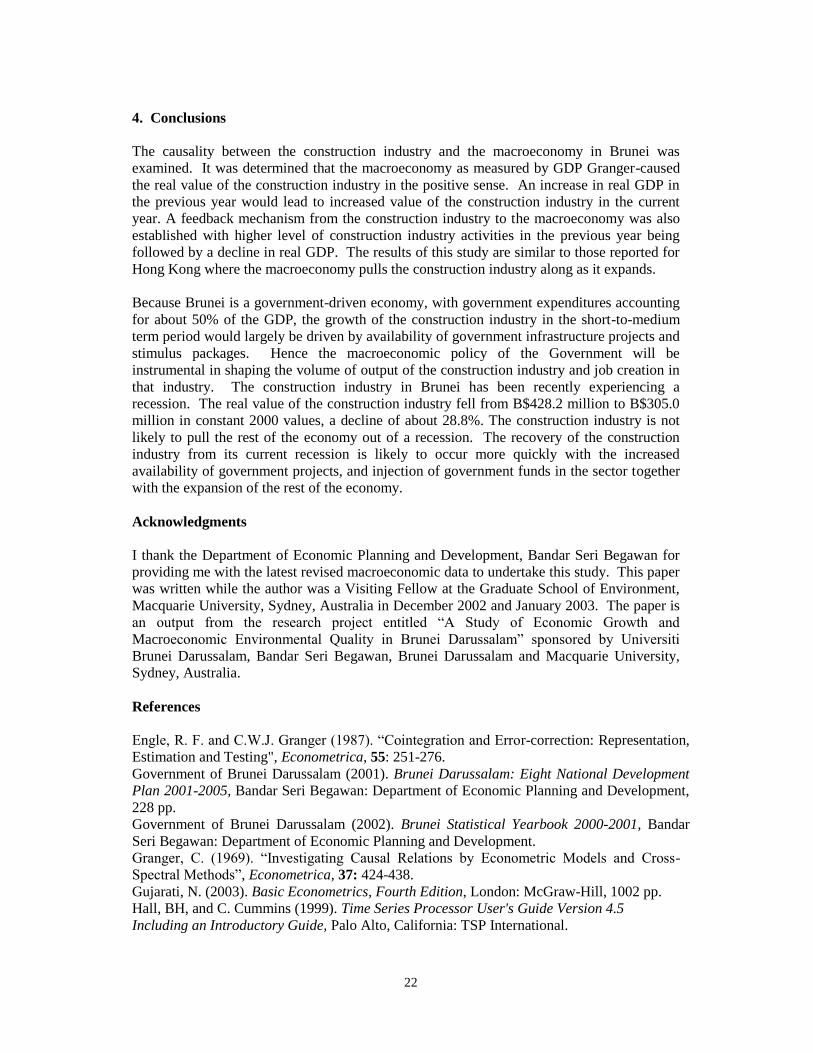
4. Conclusions
The causality between the construction industry and the macroeconomy in Brunei was
examined. It was determined that the macroeconomy as measured by GDP Granger-caused
the real value of the construction industry in the positive sense. An increase in real GDP in
the previous year would lead to increased value of the construction industry in the current
year. A feedback mechanism from the construction industry to the macroeconomy was also
established with higher level of construction industry activities in the previous year being
followed by a decline in real GDP. The results of this study are similar to those reported for
Hong Kong where the macroeconomy pulls the construction industry along as it expands.
Because Brunei is a government-driven economy, with government expenditures accounting
for about 50% of the GDP, the growth of the construction industry in the short-to-medium
term period would largely be driven by availability of government infrastructure projects and
stimulus packages. Hence the macroeconomic policy of the Government will be
instrumental in shaping the volume of output of the construction industry and job creation in
that industry. The construction industry in Brunei has been recently experiencing a
recession. The real value of the construction industry fell from B$428.2 million to B$305.0
million in constant 2000 values, a decline of about 28.8%. The construction industry is not
likely to pull the rest of the economy out of a recession. The recovery of the construction
industry from its current recession is likely to occur more quickly with the increased
availability of government projects, and injection of government funds in the sector together
with the expansion of the rest of the economy.
Acknowledgments
I thank the Department of Economic Planning and Development, Bandar Seri Begawan for
providing me with the latest revised macroeconomic data to undertake this study. This paper
was written while the author was a Visiting Fellow at the Graduate School of Environment,
Macquarie University, Sydney, Australia in December 2002 and January 2003. The paper is
an output from the research project entitled “A Study of Economic Growth and
Macroeconomic Environmental Quality in Brunei Darussalam” sponsored by Universiti
Brunei Darussalam, Bandar Seri Begawan, Brunei Darussalam and Macquarie University,
Sydney, Australia.
References
Engle, R. F. and C.W.J. Granger (1987). “Cointegration and Error-correction: Representation,
Estimation and Testing", Econometrica, 55: 251-276.
Government of Brunei Darussalam (2001). Brunei Darussalam: Eight National Development
Plan 2001-2005, Bandar Seri Begawan: Department of Economic Planning and Development,
228 pp.
Government of Brunei Darussalam (2002). Brunei Statistical Yearbook 2000-2001, Bandar
Seri Begawan: Department of Economic Planning and Development.
Granger, C. (1969). “Investigating Causal Relations by Econometric Models and Cross-
Spectral Methods”, Econometrica, 37: 424-438.
Gujarati, N. (2003). Basic Econometrics, Fourth Edition, London: McGraw-Hill, 1002 pp.
Hall, BH, and C. Cummins (1999). Time Series Processor User's Guide Version 4.5
Including an Introductory Guide, Palo Alto, California: TSP International.
23
Johansen, S, and J. Juseliu (1990). “Maximum Likelihood Estimation and Inference on
Cointegration - with Applications to the Demand for Money”, Oxford Bulletin of Economics and
Statistics, 52: 169-210.
Lopes, J. (1998). “The Construction Industry and Macroeconomy in Sub-Saharan Africa Post
1970”, Construction Management and Economics, 16: 637-649.
Ofori, G. (1990). The Construction Industry: Aspects of its Economics and Management, Kent
Ridge, Singapore: Singapore University Press, 236 pp.
Tse, R.Y.C and S. Ganesan (1997). “Causal Relationship Between Construction Flows and
GDP: Evidence from Hong Kong”, Construction Management and Economics, 15: 371-376.
24
CHAPTER 3
ANALYSIS OF THE AGGREGATE DEMAND OF
LABOUR IN BRUNEI DARUSSALAM USING
DYNAMIC ECONOMETRIC MODELS
KWABENA A. ANAMAN
Abstract
The aggregate demand of labour was estimated in this paper for both the private and
government sectors for Brunei Darussalam using two main dynamic econometric models: the
partial expectation and cointegration-based models. This estimation allowed the impact of
increases in wages on employment to be measured. The results showed that decreases in real
wages led to overall increase in employment. Increased employment also occurred with
expansion of the total economy output as expected. However real wage reduction had a higher
impact on total employment than output expansion. The recent Asian financial crisis was
shown to have had a negative lingering effect on employment in the country. Employment in
the private sector had been growing modestly while government sector employment had been
declining.
1. Introduction
Brunei Darussalam (hereafter Brunei) has achieved very high standards of living over the last
40 years primarily due to the income generated from oil and gas exports. This income has
allowed the government to establish a virtually complete welfare state with the availability of
free education and health services for its citizens. The government is also a major player in the
economy as a key employer. The government has stated its commitment to an increased role of
the private sector in order to achieve a broad-based diversification of the economy
(Government of Brunei Darussalam, 2001). In this regard, the private sector has been called
upon to expand its activities and employ more local workers as the government is no longer
able to absorb more local people in its workforce.
Table 1 shows the total number of people employed in both the government and private sectors
in Brunei from 1971 to 2001. Over the period, 1971 to 1990, which coincided with two major
international oil price-increase shocks, employment in the private sector, government sector
and the whole economy grew at a relatively fast pace of 6.6%, 10.2% and 7.9% respectively
based on constant compound annual growth rates. However during the period (1991 to 2001),
employment growth was reduced in line with the slower growth rates of the economy. The
annual growth rates of employment in the private sector, government sector and the whole
economy were 4.1%, 2.0% and 3.4% respectively. The government has recognized the
problems associated with slow employment growth rates and has committed itself to faster
employment growth and a broad-based diversification of the economy (Government of Brunei
Darussalam, 2001).
25
An important feature of the labour market in Brunei is the heavy reliance on foreign workers.
In 2001, the year with the most recent available data, the total number of foreign workers was
75461 compared to 64492 for local workers (refer to Table 1). Most of the foreign workers
were employed in the private sector especially in the construction, retail and hotel &
hospitality sectors. Given an estimated number of 7,000 unemployed people in the country in
2001 based on the number of new registrations at employment centres (Government of Brunei
Darussalam, 2003), then the total foreign workers outnumbered unemployed locals by a ratio
of 10:1in 2001.
Table 2 shows the proportions of government sector workforce and private sector workforce
attributed to local workers (Bruneian citizens and permanent residents). Since 1980, local
workers have constituted almost a constant proportion of the government sector workforce
(between 89% to 91%). Foreign workers in the government sector are largely made up of
Gurkhas foreign contract soldiers employed to protect oil fields and highly-skilled personnel
such as medical doctors and university teachers. In the private sector, the proportion of the
workforce attributed to local workers had been steadily declining from a high of 48.0% in
1974 to a low of 17.9% in 1997. With the advent of the recent Asian financial crisis in
1997/98, local citizens and permanent residents, as a proportion of the total private sector
workforce has increased from 17.9% in 1997 to 27.0% in 2001.
Since 1999, with the recovery of the economy from the severe effects of Asian financial crisis,
there have been increases in absolute numbers of both local and foreign workers in the private
sector. Another feature of the labour workforce in Brunei is the rapid increase in participation
by women. This rapid increase in women labour force participation is shown with figures in
Table 3. The proportion of women in the government sector workforce increased steadily from
22.4% in 1971 to 44.0% in 2001. Similarly for the private sector, women participation in the
workforce increased from about 10% in 1971 to almost 30% in 2000 and then dropped slightly
to about 29% in 2001 even though the absolute number of women working in the private
sector increased from 2000 to 2001 (refer to Table 3).
Table 4 shows the per capita real GDP, labour productivity and employment ratio for Brunei
from 1971 to 2001. Labour productivity is measured in two ways: (a) as real GDP divided by
the total civilian workforce (numbers reported in Table 1) and as GDP divided by oil prices
and divided by the total civilian workforce. Employment ratio is derived as the total number of
people employed divided by the total population. I follow the method used by Lim and Lee
(2002, pp. 270-271) that per capita real GDP is simply labour productivity multiplied by
employment ratio. Thus the growth rate of per capita real GDP is the sum of the growth rate of
labour productivity plus the growth of the employment ratio.
In 1971, per capita real GDP in Brunei was B$14843. It increased to B$30445 in 1991 and fell
to B$21400 in 2001. Brunei had the highest per capita real GDP in the world in 1980 of
B$94152 as a result of the very high world oil prices in that year. Similarly, in 1971, output
per worker was B$9001. Output per worker fluctuated throughout the next 20 years and by
1991 it stood at B$90033, almost identical to the figure in 1971. In 2001, output per worker
had shrunk by about 44% to B$50900. However over the period, 1971 to 2001, the
employment ratio had consistently increased from 0.165 in 1971 to 0.337 in 1991 and then to
0.420 in 2001 (refer to Table 4). When output per worker is measured based on world oil
prices index due to the oil-based nature of the economy (LABPROD2), the fluctuation of
output per worker is considerably reduced. Nevertheless, the decline of output of worker in
recent years is clear.
26
In terms of annual compound constant growth rates, over the period 1971 to 1990, per capita
real GDP, output per worker and employment ratio grew at annual rate of 1.7%, -2.6% and
4.4% respectively. Over this period, the modest growth in per capita real GDP was achieved
by increasing growth of the employment ratio which overwhelmed the negative labour
productivity growth. From the period, 1991 to 2001, per capita real GDP, output per worker
and employment ratio grew at annual rate of –3.3%, -4.8% and 1.6% respectively. During this
period, the severe decline in the growth of per capita real GDP was associated with larger
decline in the growth rate of worker productivity. Not surprisingly, the growth rate of the
employment ratio was relatively small for the 1991-2001 period compared to the 1971-1990
period. An interesting question, given the continuing decline in labour productivity and zero or
negative real GDP growth rates over the last ten years, is what factors have led to the
increasing total employment recorded? A likely culprit is the decline in real wage per worker.
Given the background discussion, the main objective of this study is to establish the main
factors influencing the level of aggregate demand of labour for the economy. A secondary
objective is to determine the aggregate demand of labour also for both private and government
sectors. The remainder of this paper is organised as follows: the next section deals with
definitions and summary of economic theories and models concerning internet. This is
followed by a discussion of the methods and procedures for the study and specification of
models using econometric analysis. The results are then reported followed by the conclusions
and recommendations and the cited references.
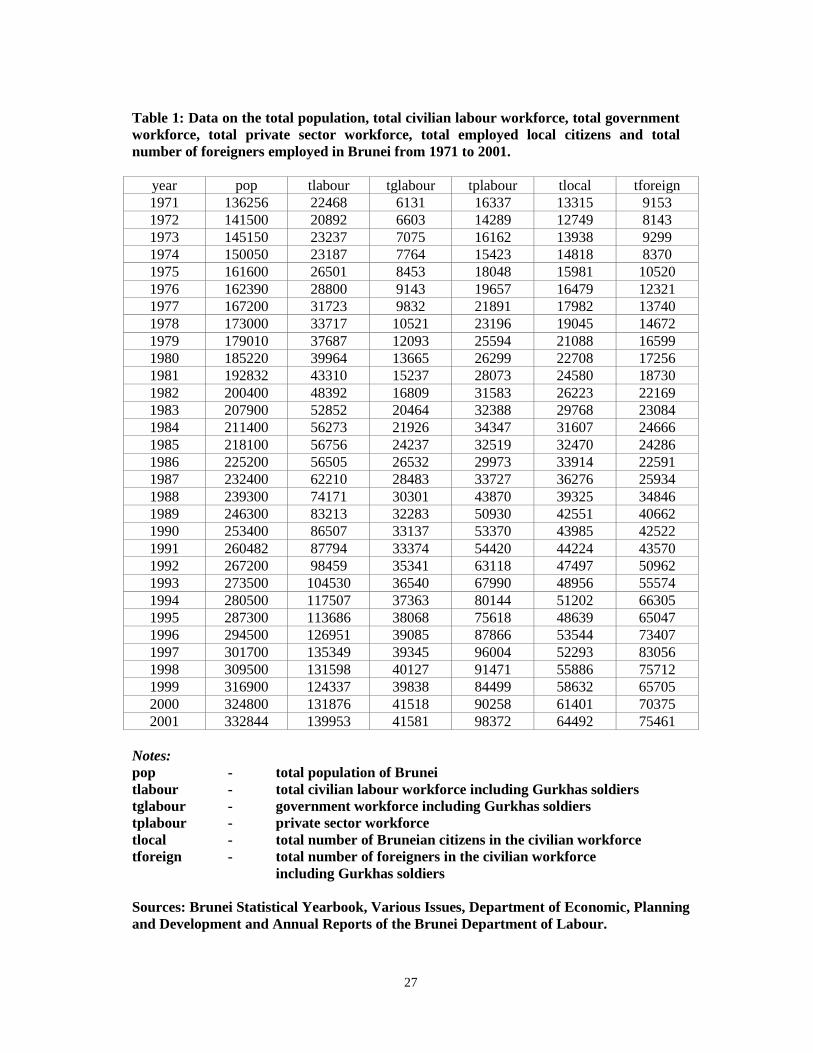
27
Table 1: Data on the total population, total civilian labour workforce, total government
workforce, total private sector workforce, total employed local citizens and total
number of foreigners employed in Brunei from 1971 to 2001.
year pop tlabour tglabour tplabour tlocal tforeign
1971 136256 22468 6131 16337 13315 9153
1972 141500 20892 6603 14289 12749 8143
1973 145150 23237 7075 16162 13938 9299
1974 150050 23187 7764 15423 14818 8370
1975 161600 26501 8453 18048 15981 10520
1976 162390 28800 9143 19657 16479 12321
1977 167200 31723 9832 21891 17982 13740
1978 173000 33717 10521 23196 19045 14672
1979 179010 37687 12093 25594 21088 16599
1980 185220 39964 13665 26299 22708 17256
1981 192832 43310 15237 28073 24580 18730
1982 200400 48392 16809 31583 26223 22169
1983 207900 52852 20464 32388 29768 23084
1984 211400 56273 21926 34347 31607 24666
1985 218100 56756 24237 32519 32470 24286
1986 225200 56505 26532 29973 33914 22591
1987 232400 62210 28483 33727 36276 25934
1988 239300 74171 30301 43870 39325 34846
1989 246300 83213 32283 50930 42551 40662
1990 253400 86507 33137 53370 43985 42522
1991 260482 87794 33374 54420 44224 43570
1992 267200 98459 35341 63118 47497 50962
1993 273500 104530 36540 67990 48956 55574
1994 280500 117507 37363 80144 51202 66305
1995 287300 113686 38068 75618 48639 65047
1996 294500 126951 39085 87866 53544 73407
1997 301700 135349 39345 96004 52293 83056
1998 309500 131598 40127 91471 55886 75712
1999 316900 124337 39838 84499 58632 65705
2000 324800 131876 41518 90258 61401 70375
2001 332844 139953 41581 98372 64492 75461
Notes:
pop - total population of Brunei
tlabour - total civilian labour workforce including Gurkhas soldiers
tglabour - government workforce including Gurkhas soldiers
tplabour - private sector workforce
tlocal - total number of Bruneian citizens in the civilian workforce
tforeign - total number of foreigners in the civilian workforce
including Gurkhas soldiers
Sources: Brunei Statistical Yearbook, Various Issues, Department of Economic, Planning
and Development and Annual Reports of the Brunei Department of Labour.
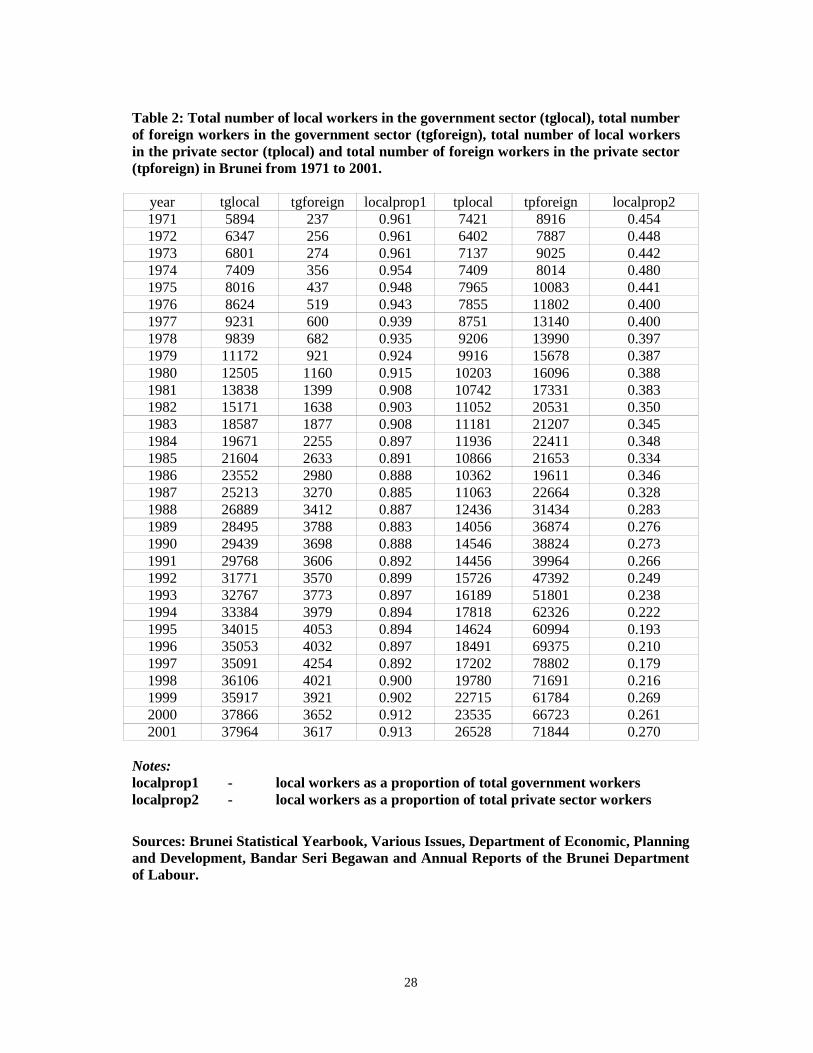
28
Table 2: Total number of local workers in the government sector (tglocal), total number
of foreign workers in the government sector (tgforeign), total number of local workers
in the private sector (tplocal) and total number of foreign workers in the private sector
(tpforeign) in Brunei from 1971 to 2001.
year tglocal tgforeign localprop1 tplocal tpforeign localprop2
1971 5894 237 0.961 7421 8916 0.454
1972 6347 256 0.961 6402 7887 0.448
1973 6801 274 0.961 7137 9025 0.442
1974 7409 356 0.954 7409 8014 0.480
1975 8016 437 0.948 7965 10083 0.441
1976 8624 519 0.943 7855 11802 0.400
1977 9231 600 0.939 8751 13140 0.400
1978 9839 682 0.935 9206 13990 0.397
1979 11172 921 0.924 9916 15678 0.387
1980 12505 1160 0.915 10203 16096 0.388
1981 13838 1399 0.908 10742 17331 0.383
1982 15171 1638 0.903 11052 20531 0.350
1983 18587 1877 0.908 11181 21207 0.345
1984 19671 2255 0.897 11936 22411 0.348
1985 21604 2633 0.891 10866 21653 0.334
1986 23552 2980 0.888 10362 19611 0.346
1987 25213 3270 0.885 11063 22664 0.328
1988 26889 3412 0.887 12436 31434 0.283
1989 28495 3788 0.883 14056 36874 0.276
1990 29439 3698 0.888 14546 38824 0.273
1991 29768 3606 0.892 14456 39964 0.266
1992 31771 3570 0.899 15726 47392 0.249
1993 32767 3773 0.897 16189 51801 0.238
1994 33384 3979 0.894 17818 62326 0.222
1995 34015 4053 0.894 14624 60994 0.193
1996 35053 4032 0.897 18491 69375 0.210
1997 35091 4254 0.892 17202 78802 0.179
1998 36106 4021 0.900 19780 71691 0.216
1999 35917 3921 0.902 22715 61784 0.269
2000 37866 3652 0.912 23535 66723 0.261
2001 37964 3617 0.913 26528 71844 0.270
Notes:
localprop1 - local workers as a proportion of total government workers
localprop2 - local workers as a proportion of total private sector workers
Sources: Brunei Statistical Yearbook, Various Issues, Department of Economic, Planning
and Development, Bandar Seri Begawan and Annual Reports of the Brunei Department
of Labour.
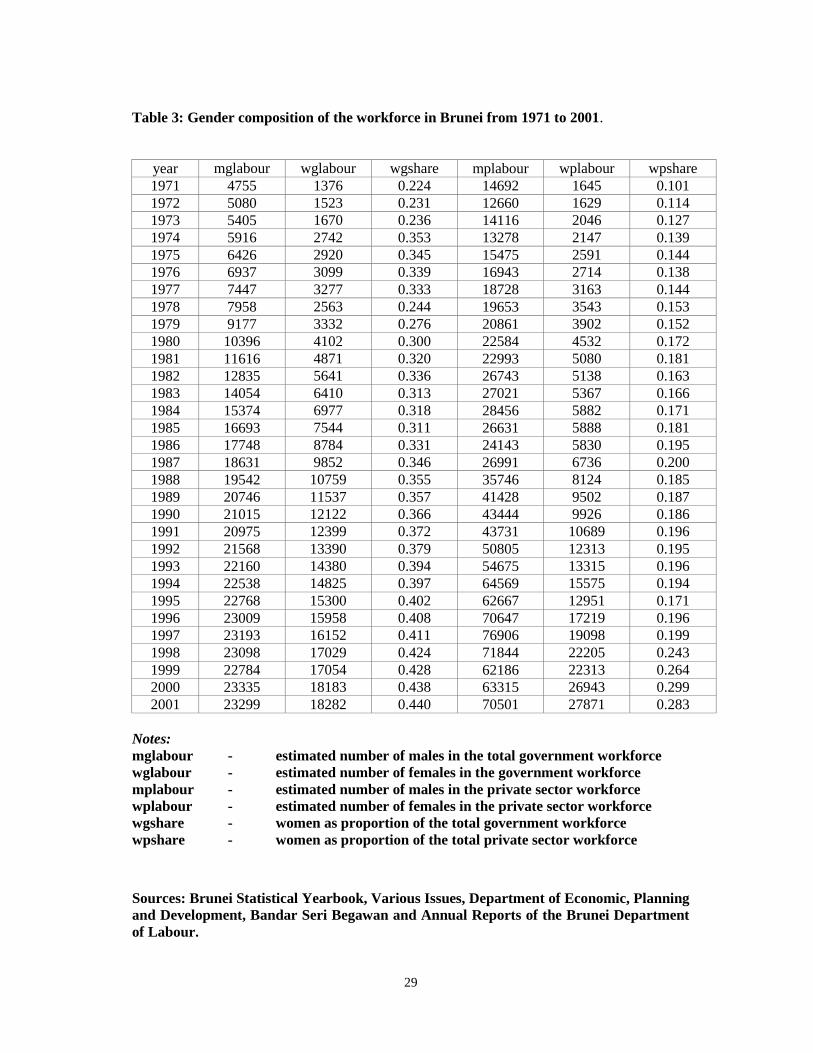
29
Table 3: Gender composition of the workforce in Brunei from 1971 to 2001.
year mglabour wglabour wgshare mplabour wplabour wpshare
1971 4755 1376 0.224 14692 1645 0.101
1972 5080 1523 0.231 12660 1629 0.114
1973 5405 1670 0.236 14116 2046 0.127
1974 5916 2742 0.353 13278 2147 0.139
1975 6426 2920 0.345 15475 2591 0.144
1976 6937 3099 0.339 16943 2714 0.138
1977 7447 3277 0.333 18728 3163 0.144
1978 7958 2563 0.244 19653 3543 0.153
1979 9177 3332 0.276 20861 3902 0.152
1980 10396 4102 0.300 22584 4532 0.172
1981 11616 4871 0.320 22993 5080 0.181
1982 12835 5641 0.336 26743 5138 0.163
1983 14054 6410 0.313 27021 5367 0.166
1984 15374 6977 0.318 28456 5882 0.171
1985 16693 7544 0.311 26631 5888 0.181
1986 17748 8784 0.331 24143 5830 0.195
1987 18631 9852 0.346 26991 6736 0.200
1988 19542 10759 0.355 35746 8124 0.185
1989 20746 11537 0.357 41428 9502 0.187
1990 21015 12122 0.366 43444 9926 0.186
1991 20975 12399 0.372 43731 10689 0.196
1992 21568 13390 0.379 50805 12313 0.195
1993 22160 14380 0.394 54675 13315 0.196
1994 22538 14825 0.397 64569 15575 0.194
1995 22768 15300 0.402 62667 12951 0.171
1996 23009 15958 0.408 70647 17219 0.196
1997 23193 16152 0.411 76906 19098 0.199
1998 23098 17029 0.424 71844 22205 0.243
1999 22784 17054 0.428 62186 22313 0.264
2000 23335 18183 0.438 63315 26943 0.299
2001 23299 18282 0.440 70501 27871 0.283
Notes:
mglabour - estimated number of males in the total government workforce
wglabour - estimated number of females in the government workforce
mplabour - estimated number of males in the private sector workforce
wplabour - estimated number of females in the private sector workforce
wgshare - women as proportion of the total government workforce
wpshare - women as proportion of the total private sector workforce
Sources: Brunei Statistical Yearbook, Various Issues, Department of Economic, Planning
and Development, Bandar Seri Begawan and Annual Reports of the Brunei Department
of Labour.
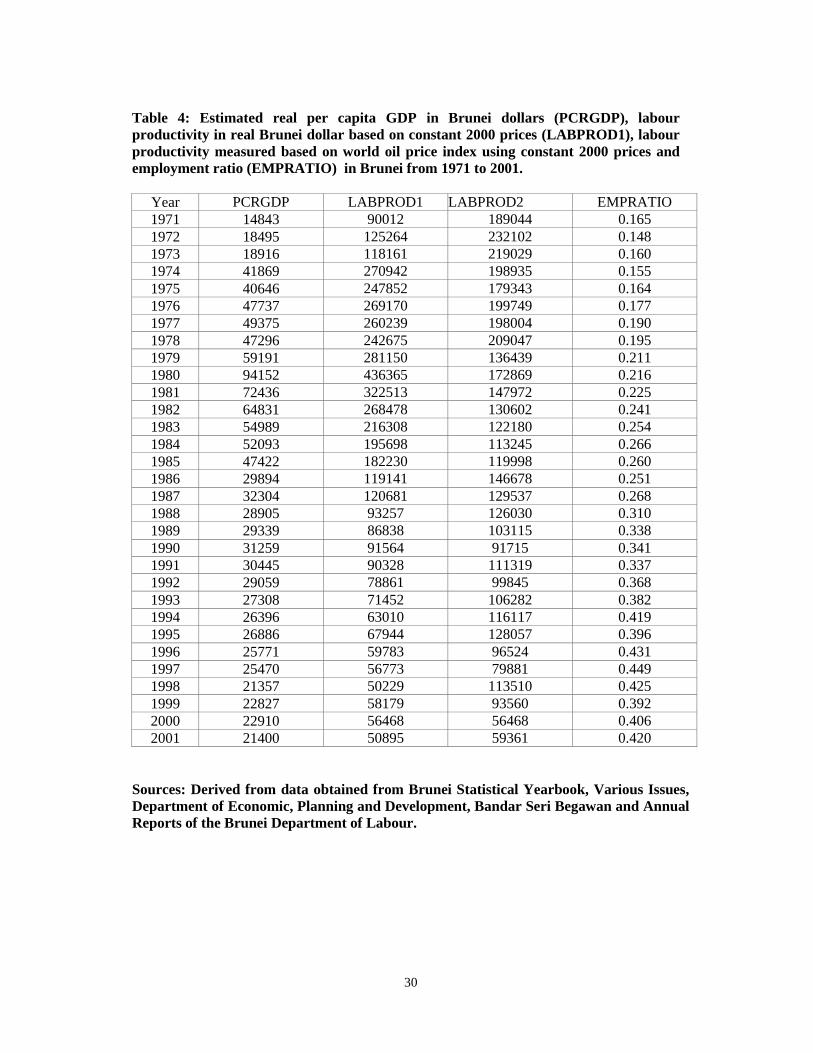
30
Table 4: Estimated real per capita GDP in Brunei dollars (PCRGDP), labour
productivity in real Brunei dollar based on constant 2000 prices (LABPROD1), labour
productivity measured based on world oil price index using constant 2000 prices and
employment ratio (EMPRATIO) in Brunei from 1971 to 2001.
Year PCRGDP LABPROD1 LABPROD2 EMPRATIO
1971 14843 90012 189044 0.165
1972 18495 125264 232102 0.148
1973 18916 118161 219029 0.160
1974 41869 270942 198935 0.155
1975 40646 247852 179343 0.164
1976 47737 269170 199749 0.177
1977 49375 260239 198004 0.190
1978 47296 242675 209047 0.195
1979 59191 281150 136439 0.211
1980 94152 436365 172869 0.216
1981 72436 322513 147972 0.225
1982 64831 268478 130602 0.241
1983 54989 216308 122180 0.254
1984 52093 195698 113245 0.266
1985 47422 182230 119998 0.260
1986 29894 119141 146678 0.251
1987 32304 120681 129537 0.268
1988 28905 93257 126030 0.310
1989 29339 86838 103115 0.338
1990 31259 91564 91715 0.341
1991 30445 90328 111319 0.337
1992 29059 78861 99845 0.368
1993 27308 71452 106282 0.382
1994 26396 63010 116117 0.419
1995 26886 67944 128057 0.396
1996 25771 59783 96524 0.431
1997 25470 56773 79881 0.449
1998 21357 50229 113510 0.425
1999 22827 58179 93560 0.392
2000 22910 56468 56468 0.406
2001 21400 50895 59361 0.420
Sources: Derived from data obtained from Brunei Statistical Yearbook, Various Issues,
Department of Economic, Planning and Development, Bandar Seri Begawan and Annual
Reports of the Brunei Department of Labour.
31
2. Literature Review
2.1. Introduction
The factors that influence the aggregate demand of labour have been the focus of many
macroeconomic studies. This is due to the need to understand the societal impacts of policies
dealing with wages, migration, income stabilisation and reduction of unemployment (Lewis
and MacDonald, 2002). In particular the impact of cross and transnational labour migration on
the aggregate demand of labour has assumed increasing importance given the speed of
globalisation over the last 50 years (Osberg et al., 1994). Other issues of importance include
female participation in the labour market and the growth of part-time employment.
The level of aggregate labour employed is directly related to the equilibrium price level and
real output of the economy achieved when the quantities of total output demanded and
supplied are equal (McConnell et al., 2003, pp. 562-563). The aggregate supply curve
incorporates both the traditional Keynesian and the classical views of the working of the
economy. Below the full-employment level of real output of the economy, a fall in the
aggregate demand of the economy leads to decline in sales. Due to the inflexible downward
nature of wages, there is increased unemployment as workers are laid off by firms in order to
control costs. When the economy is at the full-employment level of real output, the level of
real output cannot be increased at least in the short-term period. Hence any increase in
aggregate demand is translated into higher levels of inflation.
The full-employment level of real output is regarded as the natural level of real output and
national income. The natural rate of unemployment is achieved at the full-employment level of
real output (McConnell et al., 2003, p. 563). The relationship between the rate of inflation and
the level of unemployment is known as the Philips curve. In the long-run period, the Philips
curve is a straight line at the economy’s full-employment level of real output. In the short-term
period, the Philips curve is a non-linear relationship between the inflation rate and
unemployment (Debelle and Vickery, 1998).
Factors influencing aggregate demand of labour are ultimately linked with the level of
unemployment especially the natural rate of unemployment. Lilien (1982) in a seminal paper
shows that the unemployment rate at any point in time can be decomposed into two parts. The
first part is related to the impact of the level of aggregate demand on the unemployment rate
and the second part is linked to the effect of the changes in the composition of aggregate
demand on the level of unemployment.
Lilien’s formulation of the unemployment rate has been restated by several authors. The rate
of unemployment at a given point in time is made up of two components: a component related
to the level of aggregate demand and the natural rate of unemployment (Groenewold and
Hagger, 1998; Debelle and Lowe, 1999). Groenewold and Hagger indicate that the long-term
rise in unemployment rate since the 1970s in Australia is the result of the rise in the natural
rate of unemployment similar to the result reported earlier by Lilien for the United States.
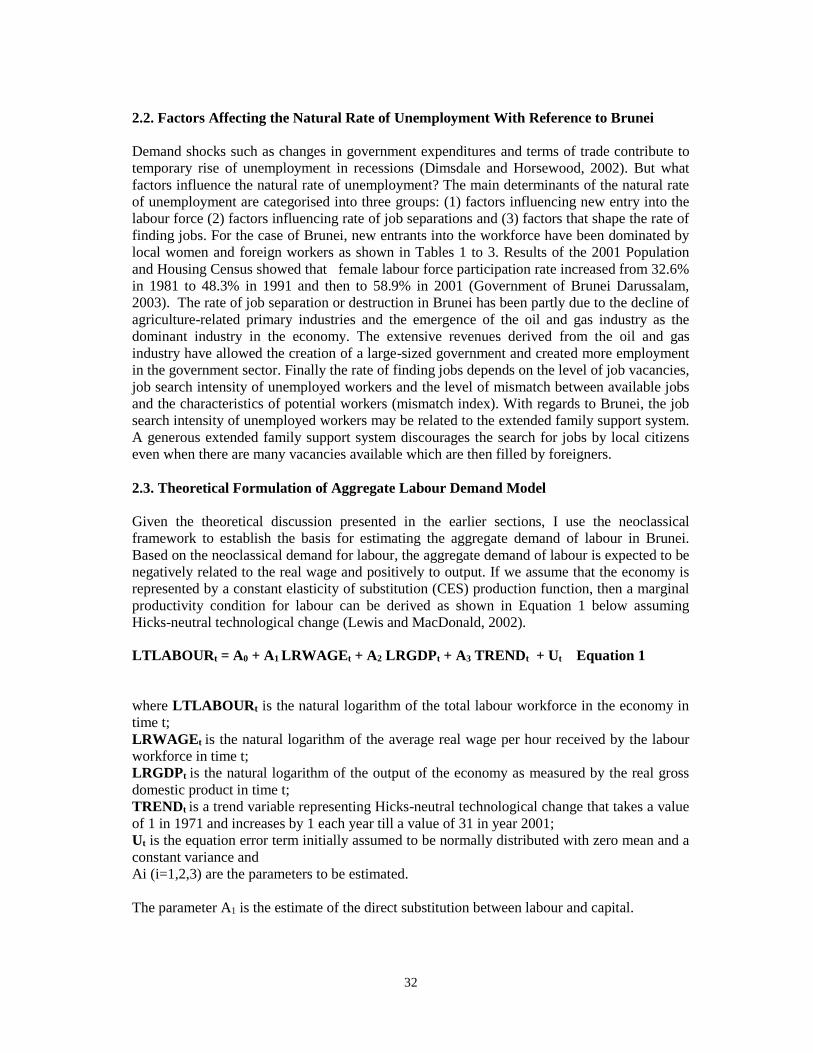
32
2.2. Factors Affecting the Natural Rate of Unemployment With Reference to Brunei
Demand shocks such as changes in government expenditures and terms of trade contribute to
temporary rise of unemployment in recessions (Dimsdale and Horsewood, 2002). But what
factors influence the natural rate of unemployment? The main determinants of the natural rate
of unemployment are categorised into three groups: (1) factors influencing new entry into the
labour force (2) factors influencing rate of job separations and (3) factors that shape the rate of
finding jobs. For the case of Brunei, new entrants into the workforce have been dominated by
local women and foreign workers as shown in Tables 1 to 3. Results of the 2001 Population
and Housing Census showed that female labour force participation rate increased from 32.6%
in 1981 to 48.3% in 1991 and then to 58.9% in 2001 (Government of Brunei Darussalam,
2003). The rate of job separation or destruction in Brunei has been partly due to the decline of
agriculture-related primary industries and the emergence of the oil and gas industry as the
dominant industry in the economy. The extensive revenues derived from the oil and gas
industry have allowed the creation of a large-sized government and created more employment
in the government sector. Finally the rate of finding jobs depends on the level of job vacancies,
job search intensity of unemployed workers and the level of mismatch between available jobs
and the characteristics of potential workers (mismatch index). With regards to Brunei, the job
search intensity of unemployed workers may be related to the extended family support system.
A generous extended family support system discourages the search for jobs by local citizens
even when there are many vacancies available which are then filled by foreigners.
2.3. Theoretical Formulation of Aggregate Labour Demand Model
Given the theoretical discussion presented in the earlier sections, I use the neoclassical
framework to establish the basis for estimating the aggregate demand of labour in Brunei.
Based on the neoclassical demand for labour, the aggregate demand of labour is expected to be
negatively related to the real wage and positively to output. If we assume that the economy is
represented by a constant elasticity of substitution (CES) production function, then a marginal
productivity condition for labour can be derived as shown in Equation 1 below assuming
Hicks-neutral technological change (Lewis and MacDonald, 2002).
LTLABOURt = A0 + A1 LRWAGEt + A2 LRGDPt + A3 TRENDt + Ut Equation 1
where LTLABOURt is the natural logarithm of the total labour workforce in the economy in
time t;
LRWAGEt is the natural logarithm of the average real wage per hour received by the labour
workforce in time t;
LRGDPt is the natural logarithm of the output of the economy as measured by the real gross
domestic product in time t;
TRENDt is a trend variable representing Hicks-neutral technological change that takes a value
of 1 in 1971 and increases by 1 each year till a value of 31 in year 2001;
Ut is the equation error term initially assumed to be normally distributed with zero mean and a
constant variance and
Ai (i=1,2,3) are the parameters to be estimated.
The parameter A1 is the estimate of the direct substitution between labour and capital.
33
3. Methodology
3.1. Description of Aggregate Labour Demand Models
This analysis concentrates on the derivation of aggregate demand of labour for private sector,
government sector and the total economy using the partial expectation and cointegration-based
methods. The estimation of the aggregate demand for the private sector for Brunei builds on
the earlier work undertaken by Lim and Tan (2002) by the introduction of dynamics through
the use of more advanced econometric techniques. The aggregate private sector labour demand
based on the partial expectation model is denoted as follows in Equation 2.
LTLABOURt = B0 + B1 LRPWAGEt + B2 LRGDPt + B3 TRENDt + B4 ASIANFCt + B5
PDUMMY + B6 LTLABOURt-1 + Ut Equation 2
where ASIANFC is a dummy variable for the lingering effect of the 1998 Asian financial
crisis on the economy of Brunei with a value of 1 denoting years from 1998 to 2001 and zero
for all other years;
LRPWAGEt is the natural logarithm of the average real wage per hour received by the labour
workforce in the private sector force in time t;
PDUMMY is a dummy variable for the years 1988 and 1989 when there was an unusually
high demand of labour for construction-related activities. This variable takes a value of 1 for
1988 and 1989 and zero for all other years and
LTLABOURt-1 is the lagged value of LTLABOURt
The other terms have been defined earlier in Equation 1.
The corresponding partial expectation model for the aggregate demand of government sector
labour is denoted in Equation 3.
LGLABOURt = C0 + C1 LGWAGEt + C2 LRGDPt + C3 TRENDt + C4 ASIANFCt + C5
INDEPt + C6 LGLABOURt-1 + Ut Equation 3
where LGLABOURt is the natural logarithm of the total labour workforce in the government
sector in time t;
LRGWAGEt is the natural logarithm of the average real wage per hour received by workers in
the government sector;
INDEPt is a dummy variable for the years 1982 and 1983 when there was an unusually high
level of intake of workers in the government sector in preparation for the transition to
independence from Britain in February 1984 This variable takes a value of 1 for 1982 and
1983 and zero for all other years and
LGLABOURt-1 is the lagged value of LGLABOURt
The other terms have been defined earlier in Equations 1 and 2.
The corresponding partial expectation model for the aggregate demand of labour for the whole
economy is denoted in Equation 4.
LTLABOURt = D0 + D1 LTWAGEt + D2 LRGDPt + D3 TRENDt + D4 ASIANFCt + D5
PDUMMY + D6 INDEPt + D7 LTLABOURt-1 + Ut Equation 4
where LRTWAGEt is the natural logarithm of the average real wage per hour received by
workers in the entire economy (both private and government sectors) and
LTLABOURt-1 is the lagged value of LTLABOURt
The other terms have been defined earlier in Equations 1, 2 and 3.
34
3.2. Cointegration Analysis
Since Engle and Granger (1987), it is now widely recognized that the estimated coefficients of
time-series data can be inconsistent if the variables are not stationary. However if the variables
are integrated of the order I(1) or any order, consistent long-run estimates of the model can be
derived if the variables are cointegrated. A recent cointegration technique, the autoregressive
distributed lag (ARDL) method developed by Pesaran et al. (2001) is used to establish
cointegration relationships among the variables using the Microfit 4.0 for Windows software
(Pesaran and Pesaran, 1997). The advantage of the ARDL method is that it can be applied to the
model whether the variables are stationary i.e. I(0) or integrated of the first order I(1). This
method also establishes a maximum of one long run cointegration relationship.
The ARDL model is a vector autoregressive (VAR) model. An unrestricted error correction
model can be derived from this VAR model. This is simply a re-parameterisation of the VAR
model (Pesaran et al., 2001, Lewis and MacDonald, 2002). The ARDL method involves two
steps. First, the existence of a long run relationship among the variables in the model is
established. The existence of such a long run relationship is determined by the bounds test
based on the use of a correctly specified and appropriate ARDL model and its associated
unrestricted error correction model (Pesaran et al., 2001).
Second, the determination of an appropriate and correctly specified ARDL model is based on
test criteria such as the Schwartz-Bayesian Criterion, Adjusted R2 and the Ramsey test for
correct model specification. The bounds test determines whether the coefficients of the lagged
terms of the unrestricted error correction model are jointly equal zero. This is the null
hypothesis. If the test statistic lies above the upper bound then the existence of a long run
relationship among the variables is proven.
3.3. Data and Data Sources
Time-series data on GDP, consumer price index, the numbers of workers in the government
sector were obtained from various issues of the Brunei Darussalam Statistical Yearbook from
1974/75 to the 2002. The consumer price index was used as the GDP deflator to derive real
GDP using year 2000 as the base year. Data on the annual number of workers in the private
sector were obtained from published and unpublished annual reports of the Department of
Labour from 1971 to 2002.
4. Results
4.1. Results of the Analysis of Demand of Labour in the Private Sector
The results of the analysis of demand of labour in the private sector using both the partial
expectation model and the Pesaran cointegration model are reported in Tables 5 and 6
respectively. The partial expectation model produced results consistent with economic theory.
There was absence of any of the seven common econometric problems based on the usual
diagnostic tests. These tests are autocorrelation, heteroscedasticity diagnosed by the LM
heteroscedasticity test , non-normality of the error term tested by the Jarque-Bera test, incorrect
specification of the model detected by the Ramsey reset test and the instability of the parameters
tested by the CUMSUM and CUMSUMSQ of the recursive residuals (refer to results in Table 5).
35
All the parameters were statistically significant. The parameter estimate for LPLABOURt-1 was
0.614 and it implied that the coefficient of adjustment was 0.386 (1-0.614). This suggested that
private sector firms were getting only about 38.6% of their desired level of annual change in
labour. The negative impact on the demand of labour in the private sector as a result of the
lingering effect of the Asian financial crisis is shown by the strong statistical significance of the
ASIANFC variable.
Table 6 shows the results for the long run coefficients derived from the ARDL cointegration
analysis of the aggregate labour demand of the private sector. The power of this model is similar
to that of the partial adjustment model. Both models had the same R2 and adjusted R2. The
coefficient estimate of –0.690 for LRPWAGE represented the elasticity of substitution of labour
for capital. This suggested a high level of substitution in the use of labour for capital in the
private sector possibly due to availability of relatively inexpensive foreign labour. Similar to
results obtained in Table 5, the Asian financial crisis had negative impact on labour
employment.
The results from the analysis of the parsimonious error correction model (ECM) of the long
run aggregate labour demand derived from the ARDL method are reported in Table 7. These
showed that the lagged error term of the cointegration equation, the first difference of
LRWAGE had significant negative effect on short run change in LTLABOUR. The first
difference of LRGDP had a positive effect on the short run change in LTLABOUR. The
value of the parameter of error correction term, Vt-1 was –0.386 (refer to Table 7). This
meant that about 0.386 of the discrepancy between the actual value of the dependent variable
and the long run value would be eliminated or corrected in each year. This result was exactly
the same figure as derived from the partial expectation model reported in the earlier section
(refer to Table 5). An error correction model offers an alternative test of causality or weak
exogeneity, which is not picked up, by the traditional Granger causality test as proposed by
Granger (1969). Since the coefficient of the error correction term was statistically
significant, this implied that the variables were cointegrated and the dependent variable was
endogenous. Granger causality ran from the independent variables to the dependent variable.
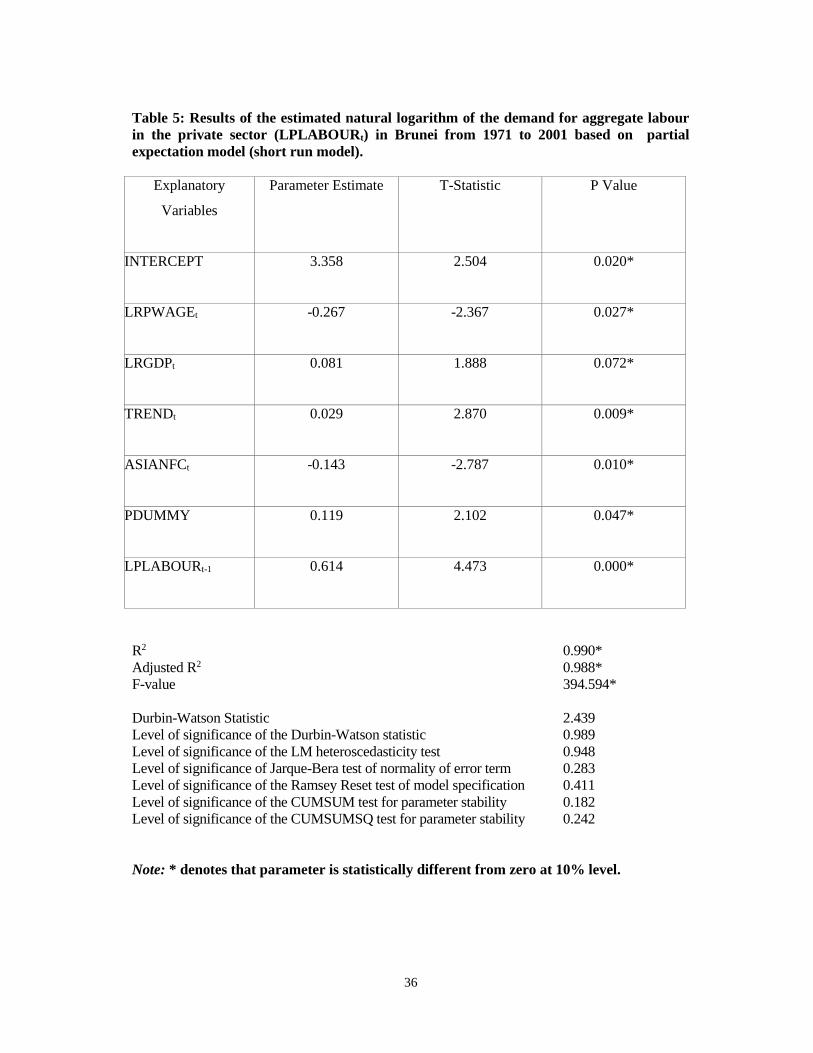
36
Table 5: Results of the estimated natural logarithm of the demand for aggregate labour
in the private sector (LPLABOURt) in Brunei from 1971 to 2001 based on partial
expectation model (short run model).
Explanatory
Variables
Parameter Estimate T-Statistic P Value
INTERCEPT
3.358 2.504 0.020*
LRPWAGEt
-0.267 -2.367 0.027*
LRGDPt
0.081 1.888 0.072*
TRENDt
0.029 2.870 0.009*
ASIANFCt
-0.143 -2.787 0.010*
PDUMMY 0.119 2.102 0.047*
LPLABOURt-1 0.614
4.473 0.000*
R2 0.990*
Adjusted R2 0.988*
F-value 394.594*
Durbin-Watson Statistic 2.439
Level of significance of the Durbin-Watson statistic 0.989
Level of significance of the LM heteroscedasticity test 0.948
Level of significance of Jarque-Bera test of normality of error term 0.283
Level of significance of the Ramsey Reset test of model specification 0.411
Level of significance of the CUMSUM test for parameter stability 0.182
Level of significance of the CUMSUMSQ test for parameter stability 0.242
Note: * denotes that parameter is statistically different from zero at 10% level.
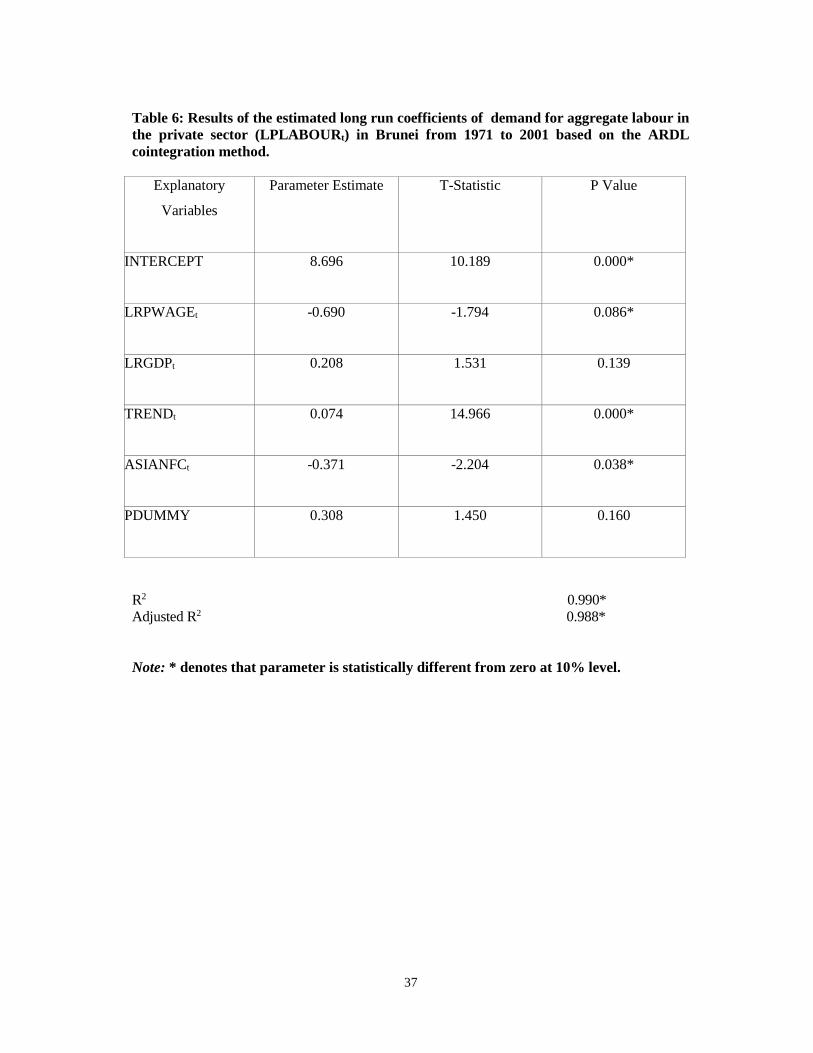
37
Table 6: Results of the estimated long run coefficients of demand for aggregate labour in
the private sector (LPLABOURt) in Brunei from 1971 to 2001 based on the ARDL
cointegration method.
Explanatory
Variables
Parameter Estimate T-Statistic P Value
INTERCEPT
8.696 10.189 0.000*
LRPWAGEt
-0.690 -1.794 0.086*
LRGDPt
0.208 1.531 0.139
TRENDt
0.074 14.966 0.000*
ASIANFCt
-0.371 -2.204 0.038*
PDUMMY 0.308 1.450 0.160
R2 0.990*
Adjusted R2 0.988*
Note: * denotes that parameter is statistically different from zero at 10% level.
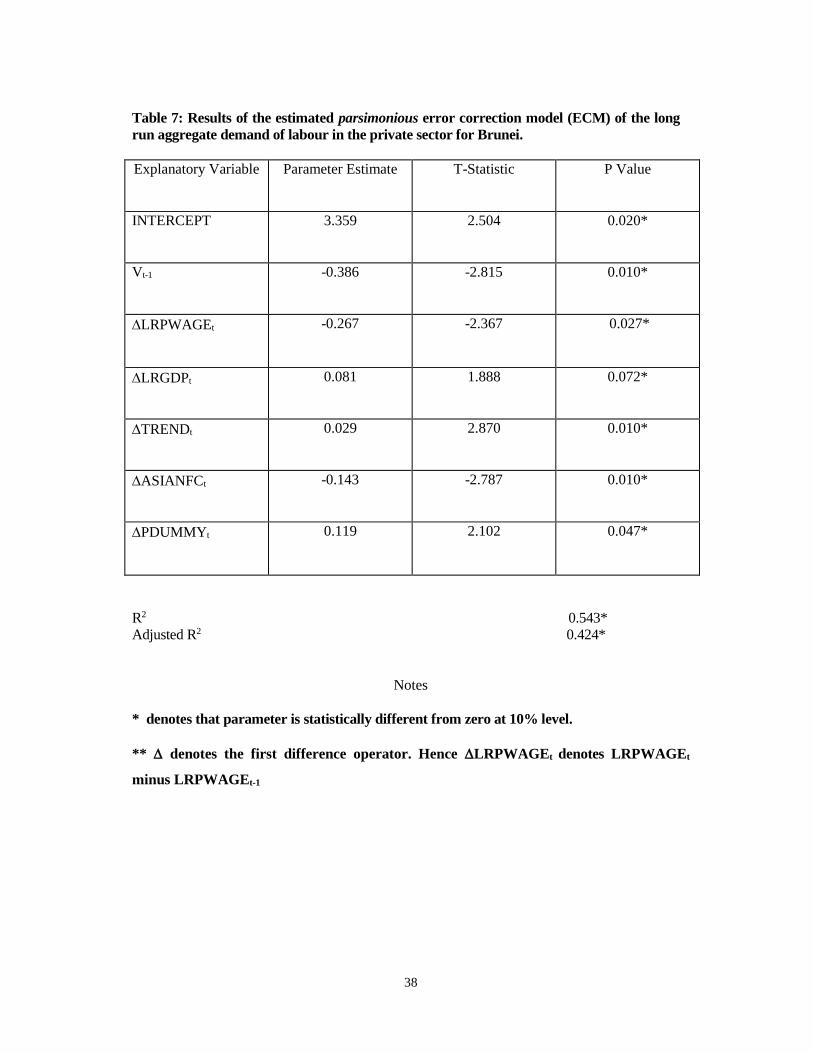
38
Table 7: Results of the estimated parsimonious error correction model (ECM) of the long
run aggregate demand of labour in the private sector for Brunei.
Explanatory Variable
Parameter Estimate T-Statistic P Value
INTERCEPT
3.359 2.504 0.020*
Vt-1 -0.386 -2.815 0.010*
LRPWAGEt
-0.267 -2.367 0.027*
LRGDPt 0.081 1.888 0.072*
TRENDt 0.029 2.870 0.010*
ASIANFCt -0.143 -2.787 0.010*
PDUMMYt
0.119 2.102 0.047*
R2 0.543*
Adjusted R2 0.424*
Notes
* denotes that parameter is statistically different from zero at 10% level.
** denotes the first difference operator. Hence LRPWAGEt denotes LRPWAGEt
minus LRPWAGEt-1
39
4.2. Results of the Analysis of the Demand of Labour in the Government Sector
The results of the analysis of the demand of labour in the government sector using the partial
expectation model are reported in Table 8. They showed that as expected employment in the
government sector expanded with increase in the output of the economy as measured by real
GDP. However there has been a general decline in employment in this sector measured by the
negative sign of the coefficient of TREND variable. The lack of statistical significance of the
average wage of the government sector (LRGWAGE) reflected that employment in the
government sector was not dictated by real average wage but by other factors such as the need to
increase government employment to prepare the government administration for political
independence (positive coefficient sign for INDEP variable). The results of estimated labour
demand in the government sector using the ARDL cointegration method revealed that there were
no statistically significant variables affecting labour employment in the government sector. This
model therefore appeared to be inappropriate.
4.3. Results of the Analysis of Aggregate Demand of Labour for the Entire Economy
Tables 10 and 11 show the results for the analysis of the aggregate demand of labour for the entire
economy based on the partial expectation and the ARDL cointegration models respectively. Both
models could be regarded as acceptable given the consistency of the parameter estimates with
economic theory. The results of the partial expectation model showed that the employment in the
economy had been growing at about 4.3% annually based on the estimate of the TREND
parameter. Nevertheless both real wage and real GDP were not shown to have had any significant
impact on total employment in the economy though the signs of the estimated coefficients were in
the correct direction. However the negative impact of the Asian financial crisis was confirmed by
this model The estimate of 0.441 on the LTLABOUR coefficient implied that the coefficient of
adjustment was about 0.56. This meant that employers were getting 56% of desired annual change
in employment.
Table 11 shows the results of the aggregate demand of labour based on the ARDL model. The
results from this model are quite appealing. All the independent variables were shown to have
statistically significant impact on the dependent variable. The expected impact on total economy
employment induced by the independent variables was in the correct direction as predicted by
economic theory or a priori reasoning. In particular, the coefficient estimate of LRTWAGE of –
0.107 implied a relatively low degree of substitution of labour for capital as compared to the
corresponding value of –0.690 for the private sector (refer to Table 6). This could be explained by
the difficulty in substituting capital for labour in the government sector since many tasks in
government had to be done by human beings, for example, school teachers. Hence economy-
wide substitution of capital for labour would appear to be relatively low.
A different result emerged with the private sector where the relatively inexpensive foreign labour
could be used to substitute for expensive capital. A result that emerged from Table 11 and which
was consistent throughout the analysis was the relatively low degree impact of real GDP on
employment creation either in the private or government sector or for the whole economy. This
result was confirmed by the derivation of the standandised estimates of the parameters. The
parsimonious ECM model for Table 11 revealed that there was not statistically significant ECM
term.
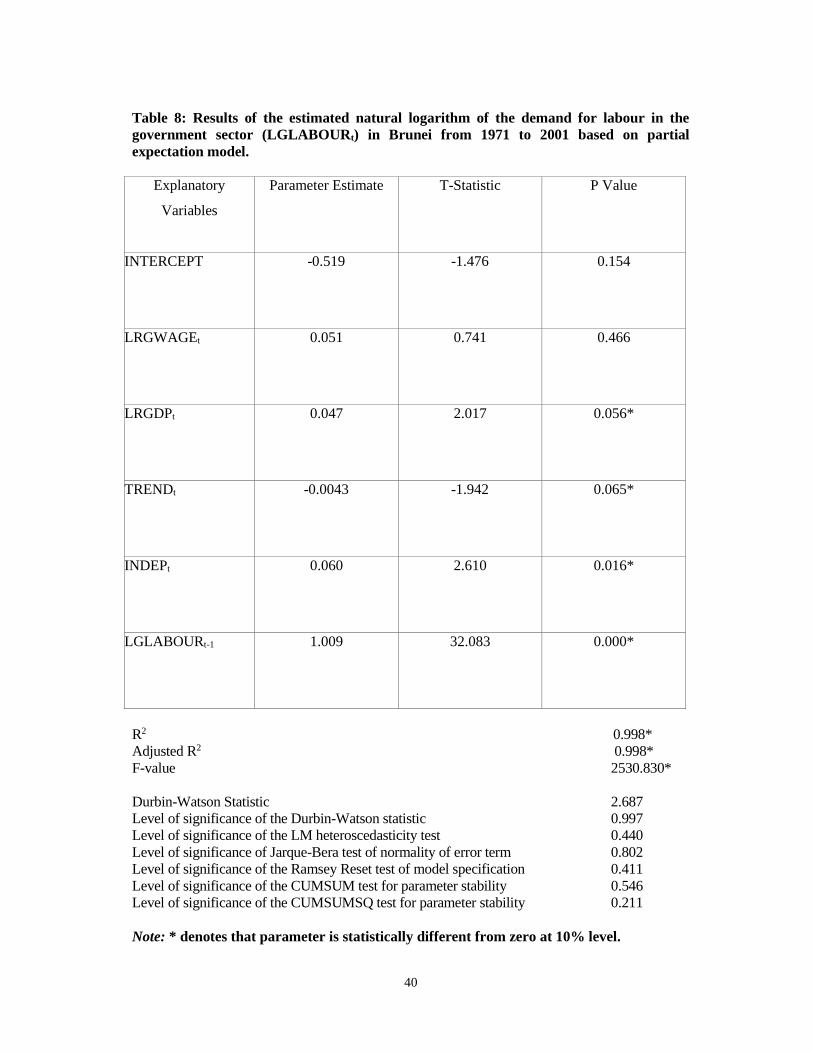
40
Table 8: Results of the estimated natural logarithm of the demand for labour in the
government sector (LGLABOURt) in Brunei from 1971 to 2001 based on partial
expectation model.
Explanatory
Variables
Parameter Estimate T-Statistic P Value
INTERCEPT
-0.519 -1.476 0.154
LRGWAGEt
0.051 0.741 0.466
LRGDPt
0.047 2.017 0.056*
TRENDt
-0.0043 -1.942 0.065*
INDEPt
0.060 2.610 0.016*
LGLABOURt-1
1.009
32.083 0.000*
R2 0.998*
Adjusted R2 0.998*
F-value 2530.830*
Durbin-Watson Statistic 2.687
Level of significance of the Durbin-Watson statistic 0.997
Level of significance of the LM heteroscedasticity test 0.440
Level of significance of Jarque-Bera test of normality of error term 0.802
Level of significance of the Ramsey Reset test of model specification 0.411
Level of significance of the CUMSUM test for parameter stability 0.546
Level of significance of the CUMSUMSQ test for parameter stability 0.211
Note: * denotes that parameter is statistically different from zero at 10% level.
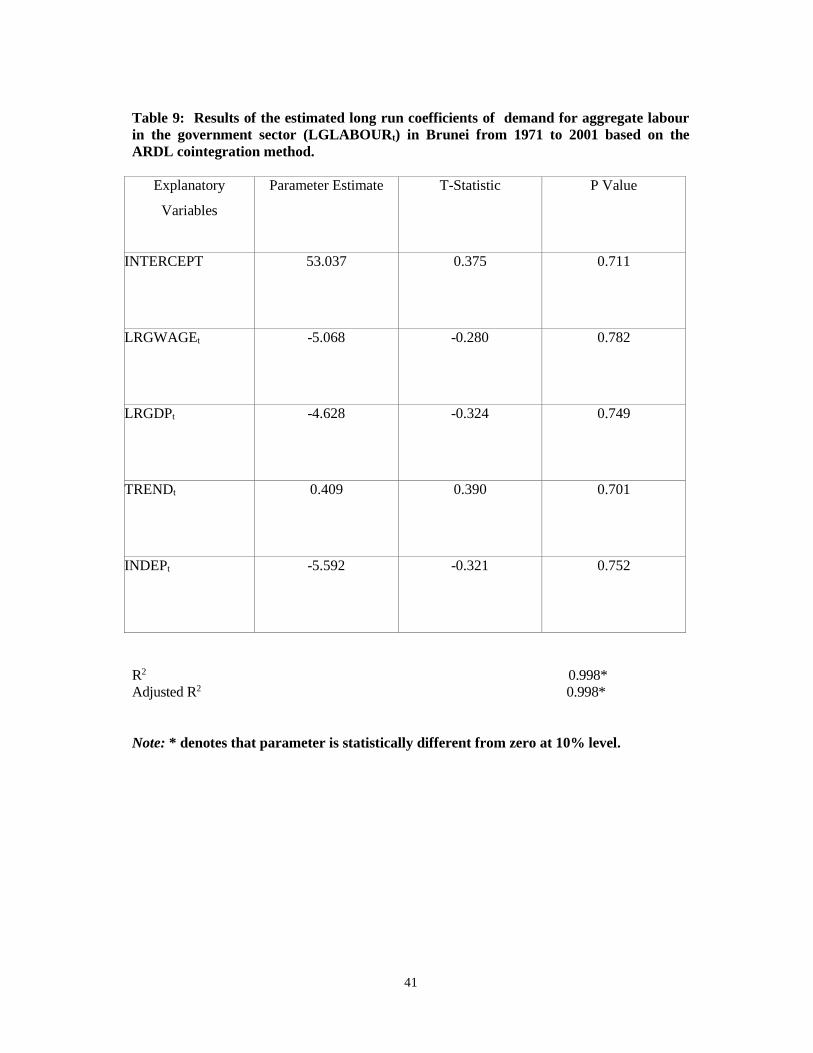
41
Table 9: Results of the estimated long run coefficients of demand for aggregate labour
in the government sector (LGLABOURt) in Brunei from 1971 to 2001 based on the
ARDL cointegration method.
Explanatory
Variables
Parameter Estimate T-Statistic P Value
INTERCEPT
53.037 0.375 0.711
LRGWAGEt
-5.068 -0.280 0.782
LRGDPt
-4.628 -0.324 0.749
TRENDt
0.409 0.390 0.701
INDEPt
-5.592 -0.321 0.752
R2 0.998*
Adjusted R2 0.998*
Note: * denotes that parameter is statistically different from zero at 10% level.
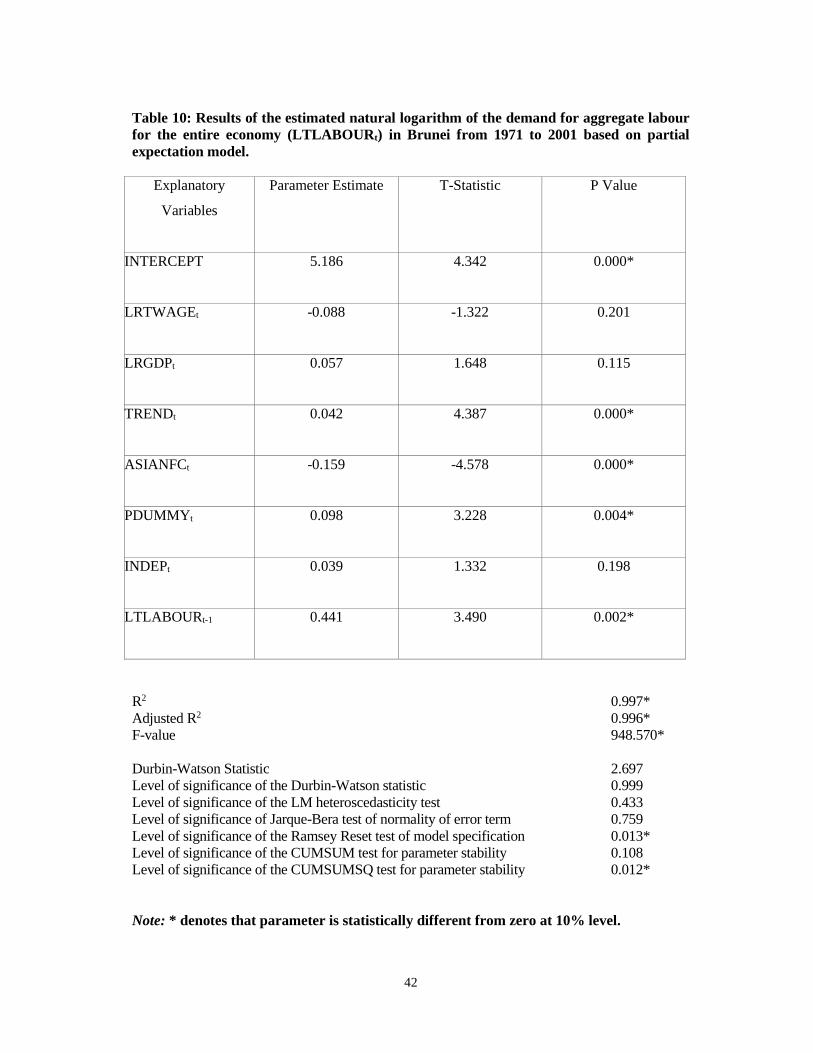
42
Table 10: Results of the estimated natural logarithm of the demand for aggregate labour
for the entire economy (LTLABOURt) in Brunei from 1971 to 2001 based on partial
expectation model.
Explanatory
Variables
Parameter Estimate T-Statistic P Value
INTERCEPT
5.186 4.342 0.000*
LRTWAGEt
-0.088 -1.322 0.201
LRGDPt
0.057 1.648 0.115
TRENDt
0.042 4.387 0.000*
ASIANFCt
-0.159 -4.578 0.000*
PDUMMYt 0.098 3.228 0.004*
INDEPt 0.039 1.332
0.198
LTLABOURt-1 0.441 3.490
0.002*
R2 0.997*
Adjusted R2 0.996*
F-value 948.570*
Durbin-Watson Statistic 2.697
Level of significance of the Durbin-Watson statistic 0.999
Level of significance of the LM heteroscedasticity test 0.433
Level of significance of Jarque-Bera test of normality of error term 0.759
Level of significance of the Ramsey Reset test of model specification 0.013*
Level of significance of the CUMSUM test for parameter stability 0.108
Level of significance of the CUMSUMSQ test for parameter stability 0.012*
Note: * denotes that parameter is statistically different from zero at 10% level.
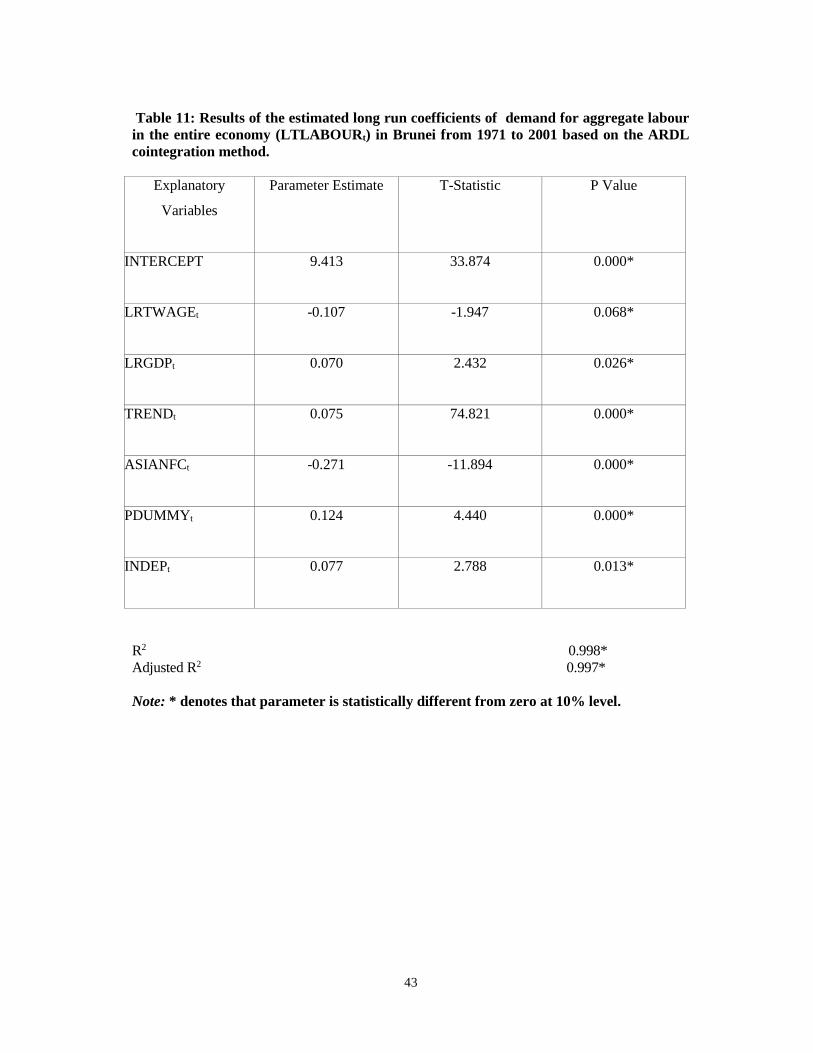
43
Table 11: Results of the estimated long run coefficients of demand for aggregate labour
in the entire economy (LTLABOURt) in Brunei from 1971 to 2001 based on the ARDL
cointegration method.
Explanatory
Variables
Parameter Estimate T-Statistic P Value
INTERCEPT
9.413 33.874 0.000*
LRTWAGEt
-0.107 -1.947 0.068*
LRGDPt
0.070 2.432 0.026*
TRENDt
0.075 74.821 0.000*
ASIANFCt
-0.271 -11.894 0.000*
PDUMMYt 0.124 4.440 0.000*
INDEPt 0.077 2.788
0.013*
R2 0.998*
Adjusted R2 0.997*
Note: * denotes that parameter is statistically different from zero at 10% level.
44
5. Conclusions
The aggregate demand of labour was estimated in this paper for both the private and
government sectors for Brunei Darussalam using two main dynamic econometric models: the
partial expectation and cointegration models. This estimation allowed the impact of increases
in wages on employment to be measured. The results showed that increases in wages led to
overall lower employment. Increased employment occurred with expansion of the total
economy output as expected. However real wage reduction had a higher impact on total
employment than output expansion. The recent Asian financial crisis was shown to have had
negative lingering effect on employment in the country. Employment in the private sector had
been growing modestly while government sector employment had been declining.
A policy implication derived from this study is that the private sector offers a chance for rapid
increase in total employment. However this cannot be achieved by unnecessary restrictions on
the recruitment of foreign labour. An interesting observation is that since 1999, with the
recovery of the economy from the severe effects of Asian financial crisis, there have been
increases in absolute numbers of both local and foreign workers in the private sector (refer to
Tables 1 and 2). In addition, over the period from 1971 to 2001, there had been annual
increases in the employment of both local and foreign workers in 25 out of 30 years. This
appears to suggest that increasing numbers of foreign workers may not necessarily displace
potential local workers but that more jobs are created for locals in the private sector when
more foreign workers are available to do certain jobs. This is true for the construction industry
which is dominated by local managers and owners but the bulk of unskilled workforce is made
up of foreigners. Without adequate unskilled workforce, construction firms find it difficult to
implement their operations.
Another policy implication relates to the increase in the natural rate of unemployment. The
natural rate of unemployment appeared to have increased with the increasing number of
locally unemployed. The reasons for this apparent increase have been discussed and include
rapid increase in the number of women entering the workforce, the generosity of the extended
family support system which reduces the search intensity of the locally unemployed and
mismatch of jobs with the acquired skills of local citizens entering the workforce. The natural
rate of unemployment may be reduced if the government institutes a child allowance scheme
whereby mothers are paid a certain monthly allowance if they stayed at home to take care of
their children. This can allow increased employment for males in the government sector where
women account for about 44% of the workforce.
Another suggestion will be for the government to encourage more foreign direct investment in
the country especially in the establishment of headquarters of international and regional offices
of international corporations. This approach can be undertaken through the government giving
land and other resources to entice such corporations to move their international offices to
Brunei. Establishment of such offices in Brunei will create hundreds of jobs for locally-trained
people from colleges and universities.
45
Acknowledgments
I thank Associate Professor Tan Siew Ee, Department of Economics, UBD and Dr. John
Asafu-Adjaye for their comments on an earlier draft of the paper. I also thank the
Department of Economic Planning and Development, Bandar Seri Begawan for providing
me with the latest revised macroeconomic data to undertake this study especially those
dealing with government labour costs. The paper is an output from the research project
entitled “A Study of Economic Growth and Macroeconomic Environmental Quality in
Brunei Darussalam” sponsored by Universiti Brunei Darussalam. This funding is gratefully
acknowledged.
References
Debelle, G and J. Vickery (1998). “Is the Phillips Curve a Curve? Some Evidence and
Implications for Australia”, The Economic Record, 74: 384-398.
Debelle, G and P. Lowe (1999). “The Natural Rate of Unemployment in Australia Since the
Seventies: A Comment”, The Economic Record, 75: 171-172.
Dimsdale, N.H. and N.J. Horsewood (2002). “The Causes of Unemployment in Interwar
Australia”, The Economic Record, 78: 388-405.
Engle, R. F. and C.W.J. Granger (1987). "Cointegration and Error-Correction: Representation,
Estimation and Testing", Econometrica, 55: 251-276.
Government of Brunei Darussalam (2001). Brunei Darussalam: Eighth National Development
Plan 2001-2005, Bandar Seri Begawan: Department of Economic Planning and Development,
228 pp.
Government of Brunei Darussalam (2003). Brunei Statistical Yearbook 2002, Bandar Seri
Begawan: Department of Economic Planning and Development.
Granger, C. (1969). Investigating causal relations by econometric models and cross-spectral
methods, Econometrica, 37, 424-438.
Greene, W.H. (2000). Econometric Analysis, Fourth Edition, London: Prentice Hall
International, 1004 pp.
Groenewold, N. and A.J. Hagger (1998). “The Natural Rate of Unemployment in Australia
Since the Seventies”, The Economic Record, 74: 24-35.
Gujarati, N. (2003). Basic Econometrics, Fourth Edition, London: McGraw-Hill, 1002 pp.
Hall, B.H. and C. Cummins (2001). Time Series Processor Version 4.5 Reference Manual,
Palo Alto, California: TSP International.
Jarque, C.M and A.K. Bera (1987). "A Test for Normality of Observations and Regression
Residuals", International Statistical Review, 55: 163-172.
Lewis, P.E.T and G. MacDonald (2002). “The Elasticity of Demand for Labour in Australia”,
The Economic Record, 78: 18-30.
Lilien, D.M. (1982). “Sectoral Shifts and Cyclical Unemployment”, Journal of Political
Economy, 90: 777-794.
Lim, L.T. and S.E. Tan (2002). “Private Sector Employment in Negara Brunei Darussalam:
Trends and Determinants”, In S.E. Tan and I. Duraman (editors), Readings on the Economy of
Brunei Darussalam Volume 2, Bandar Seri Begawan: Universiti Brunei Darussalam.
Lim, C-Y and C-Y Lee (2002). ”An Examination of Labor Productivity Growth and Structural
Changes in the Singapore Labor Force”, Asian Economic Journal, 16(3): 267-283.
McConnell, C.R., S.L. Brue and D.A. Macpherson (2003). Contemporary Labour Economics
Sixth Edition, Singapore: McGraw-Hill Irwin, 654 pp.
Osberg, L., D. Gordon and Z. Lin (1994). ”Inter-Regional and Inter-Industry Labour
Mobility”, Canadian Journal of Economics, 27(1): 58-80.

46
Pesaran, H.M and B. Pesaran, B (1997). Working with Microfit 4.0: Interactive Econometric
Analysis, London: Oxford University Press.
Pesaran, M.H., Y. Shin and R.J. Smith (2001). Bounds Testing Approaches to the Analysis of
Long-run Relationships, Working Paper No. 9907, Department of Applied Economics,
University of Cambridge, Cambridge.
Ramsey, J.B. (1969). “Tests for Specification Errors in Classical Linear Least Squares
Regression Analysis”, Journal of the Royal Statistical Society Series B, 31:350-371.
47
CHAPTER 4
ANALYSIS OF THE HEALTH AND
ENVIRONMENTAL QUALITY ADJUSTED GROSS
DOMESTIC PRODUCT
IN BRUNEI DARUSSALAM
SRI JOEDIANNA MOHAMMED AND KWABENA A. ANAMAN
Abstract
Gross domestic product (GDP), defined as the value of goods and services legally produced
within the political boundaries of a country, has been used as a yardstick for measuring the
social welfare of countries since the 1950s. The use of GDP as a measure of social welfare
fails to take into account of the deterioration of other aspects of social welfare such as health,
the environment and social capital that is linked to the growth of GDP. This criticism has led
to the development of newer measures of social welfare that incorporate GDP but adjust for
the aspects of environmental degradation, health deterioration and social capital reduction
that often accompany the growth of GDP. One such measure is the health and environmental
quality adjusted gross domestic product (HEQAGDP). The analysis of HEQAGDP was
undertaken for Brunei Darussalam for the period, 1996-2001. We showed that over this period
that an average of 12% of the country’s unadjusted real GDP should be set aside as the real
societal costs for maintaining the quality of health of the population, preserving the natural
environment and social capital. Our study showed that the real HEQAGDP of Brunei
increased slightly from 2000 to 2001 compared to the observed corresponding decline in real
GDP. We propose that the Brunei Government adopt RHEQAGDP as an additional measure
of societal welfare and that this index be estimated each year and published in the Brunei
Darussalam Statistical Yearbook as is currently done for real GDP.
1. Introduction and Problem Statement
1.1. Introduction to Brunei
Brunei Darussalam (hereafter Brunei), situated at the north-western tip of the Borneo Island is
a small country in Southeast Asia with a geographical area of 5,765 sq. km. and population of
340,800 in 2002 (Government of Brunei Darussalam, 2003). Over the last 40 years, Brunei has
achieved high per capita incomes. The country has the second highest per capita GDP in the
Southeast Asian region after Singapore. The United Nations Development Programme
(UNDP, 2003) classifies Brunei and Singapore as the only two high-income countries in
Southeast Asia. The rapid growth of Brunei as a high-income country over the last 40 years
has been due to the production and export of oil and gas, the country’s main export. In
particular as a result of the world oil price shocks of early 1970s and 1980s, Brunei earned
48
very large export revenues. Some of these revenues were used to develop infrastructure and
establish an extensive welfare system for the citizens of the country.
Realizing that reliance on the production of oil and gas cannot last forever, the country has
embarked on an economic diversification programme. This programme requires extensive
development of the non-oil sector, expansion of the private sector and a reduction in the role of
the public sector. Progress towards broad-based diversification of the economy has been
sluggish due to a number of factors including the small domestic market, relatively high wage
rates compared to those of neighbouring countries and preference of locals for public sector
employment. The commitment of the government towards expansion of the non-oil sector has
become greater due to the lingering negative effects on the country resulting from the 1997/98
Asian financial crisis. This is observed from the regular policy pronouncements and actions
with regards to the promotion of tourism, upgrading of information and communication
technology and the development of small and medium size enterprises.
1.2. Determination of GDP for Brunei
Brunei uses the ‘value added’ method in determining its gross domestic product (GDP). For
the purpose of estimating GDP, the economy of Brunei is divided into 15 economic sectors
(Government of Brunei Darussalam, 2003). The value added approach involves estimating the
value added to GDP as the difference between the total value of gross output and the value of
intermediate inputs for each of the 15 economic sectors. Table 1 shows the breakdown of the
contribution to GDP by different economic activities from 1996 to 2001 and the annual GDP
growth rates within the same period. The mining, quarrying and manufacturing sector, which
is largely dominated by the oil and gas industry, is the largest component of the economy of
Brunei. The share of this sector has actually declined from a high of 88% of GDP in 1974 to
just less than 40% in 2001 (Government of Brunei Darussalam, 2003). Nevertheless, oil and
gas products accounted for about 90% of Brunei’s total exports in 2002 (Government of
Brunei Darussalam, 2003).
The next most important economic sector is the community, social and personal services. This
sector is largely made up of government services and the sector contributed about one-third of
the GDP over the period, 1996 to 2001 (refer to Table 1). This reflected the large government
sector made possible by the increased revenues from oil and gas exports over the last 40 years.
The construction industry is the third largest economic sector but its relative contribution to
GDP had declined in recent years partly due to the lingering effects of the 1997/98 Asian
financial crisis. However the rapid development of the construction industry is likely to
accelerate the progress of economic diversification due to the numerous linkages between the
construction industry and the other sectors of the economy (Sumardi, 2003).
Table 2 shows the contribution of GDP of Brunei classified according to only three sectors: oil
sector, the non-oil private sector and the government sector. It shows that the oil sector
remains the largest single sector of the economy accounting for about 38% of GDP in 2001.
The government sector contributed about 26% to GDP in 1996 increasing slightly to 27% in
2001 indicating the relative high importance of government to the economy compared to other
countries in Southeast Asia.
49
1.3. The Need for a Health and Environmental Quality Adjusted Social Welfare Index as
an Alternative Measure of Social Welfare for Brunei
Analysis of economic wellbeing allows a government to gauge the population’s access to
material goods and services. However the use of GDP as a measure of the wellbeing of society
is limited due to the fact GDP measures both good material goods and services and also “bads”
such as pollution-related activities. The use of GDP does not take into account important
aspects of social welfare such as income distribution, environmental degradation, deterioration
of health quality, depletion of natural resources (McConnell and Brue, 2002). It also does not
value many useful non-market goods and services such as work of housewives. Impressive
economic growth as measured by increases in GDP may not necessarily mean improved
societal well being.
Excessive extraction of natural resources is often not associated with sustainable economic
development. The GDP accounting measure of social welfare may indicate the achievement of
high levels of current incomes when extraction of non-renewable resources is intensified.
Alternatively, slow growth in GDP may not always imply reduced social welfare if it is the
result of reduction of harmful activities such as pollution.
In the context of Brunei, high economic growth rates as measured by increases in GDP were
observed in the 1970s and 1980s mainly due to the increased value of oil and gas exports
resulting from the relatively high world oil prices. Throughout the 1990s and the early years of
the 21st Century, slow and declining growth of GDP and per capita GDP have occurred partly
due to the relative decline of world oil prices. Does the decline of GDP per capita in Brunei
over the last 14 years imply a real decline of social welfare? This question can be answered if
measures of social welfare other than GDP are used.
The priorities of the Brunei Government are to achieve broad-based diversification of the
economy with minimal damages to the health status of its people, environment and social
capital in line with Islamic ethics and values enshrined in the 1959 Constitution which
established Brunei as a Malay-Islamic Monarchy (Government of Brunei Darussalam, 2001).
It is therefore imperative that economists pay attention to the measurement of both economic
growth and any activities that lead to the reduction of social welfare such as reductions in the
quality of health, environment and social capital. This will allow citizens and policy makers to
be better informed about making decisions concerning economic planning and development
that enhance social welfare.
In the light of the above discussion, the main objective of this study was to estimate and
analyse the health and environmental quality adjusted gross domestic product (HEQAGDP)
for Brunei. The rest of the paper is organised as followed. The next section deals with the
literature review followed by the methodology. The results, conclusions and references follow.
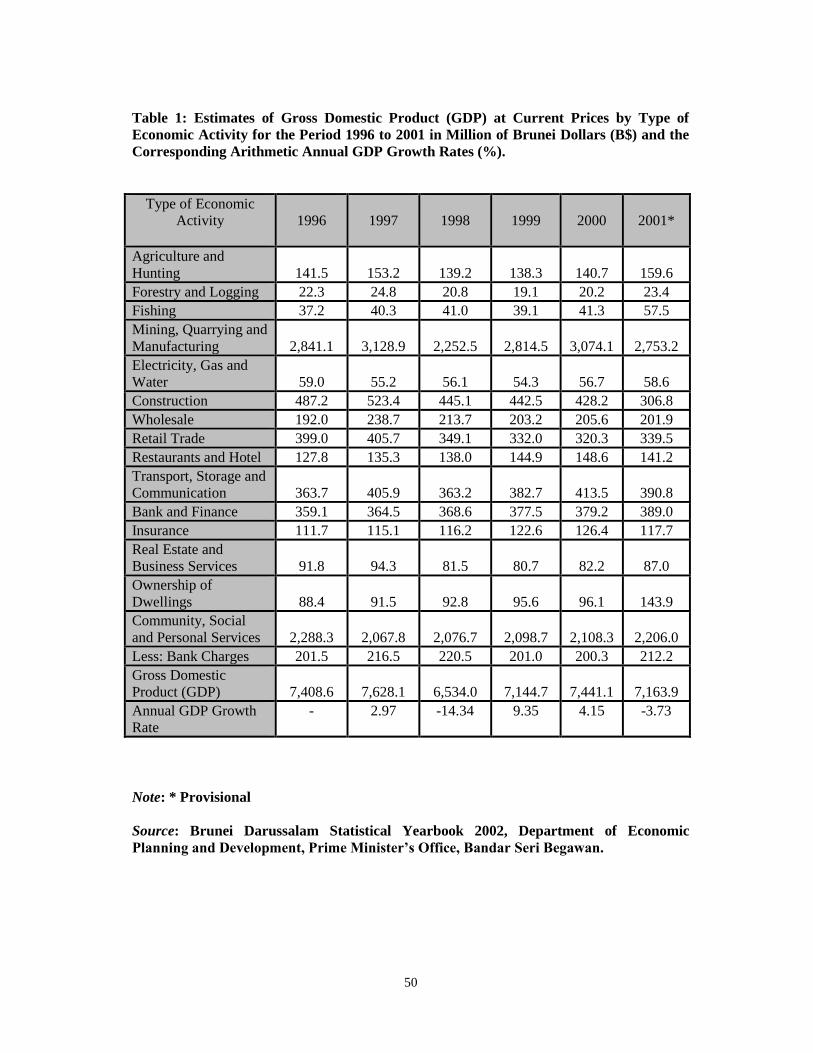
50
Table 1: Estimates of Gross Domestic Product (GDP) at Current Prices by Type of
Economic Activity for the Period 1996 to 2001 in Million of Brunei Dollars (B$) and the
Corresponding Arithmetic Annual GDP Growth Rates (%).
Type of Economic
Activity
1996
1997
1998
1999
2000
2001*
Agriculture and
Hunting
141.5
153.2
139.2
138.3
140.7
159.6
Forestry and Logging 22.3 24.8 20.8 19.1 20.2 23.4
Fishing 37.2 40.3 41.0 39.1 41.3 57.5
Mining, Quarrying and
Manufacturing
2,841.1
3,128.9
2,252.5
2,814.5
3,074.1
2,753.2
Electricity, Gas and
Water
59.0
55.2
56.1
54.3
56.7
58.6
Construction 487.2 523.4 445.1 442.5 428.2 306.8
Wholesale 192.0 238.7 213.7 203.2 205.6 201.9
Retail Trade 399.0 405.7 349.1 332.0 320.3 339.5
Restaurants and Hotel 127.8 135.3 138.0 144.9 148.6 141.2
Transport, Storage and
Communication
363.7
405.9
363.2
382.7
413.5
390.8
Bank and Finance 359.1 364.5 368.6 377.5 379.2 389.0
Insurance 111.7 115.1 116.2 122.6 126.4 117.7
Real Estate and
Business Services
91.8
94.3
81.5
80.7
82.2
87.0
Ownership of
Dwellings
88.4
91.5
92.8
95.6
96.1
143.9
Community, Social
and Personal Services
2,288.3
2,067.8
2,076.7
2,098.7
2,108.3
2,206.0
Less: Bank Charges 201.5 216.5 220.5 201.0 200.3 212.2
Gross Domestic
Product (GDP)
7,408.6
7,628.1
6,534.0
7,144.7
7,441.1
7,163.9
Annual GDP Growth
Rate
- 2.97 -14.34 9.35 4.15 -3.73
Note: * Provisional
Source: Brunei Darussalam Statistical Yearbook 2002, Department of Economic
Planning and Development, Prime Minister’s Office, Bandar Seri Begawan.
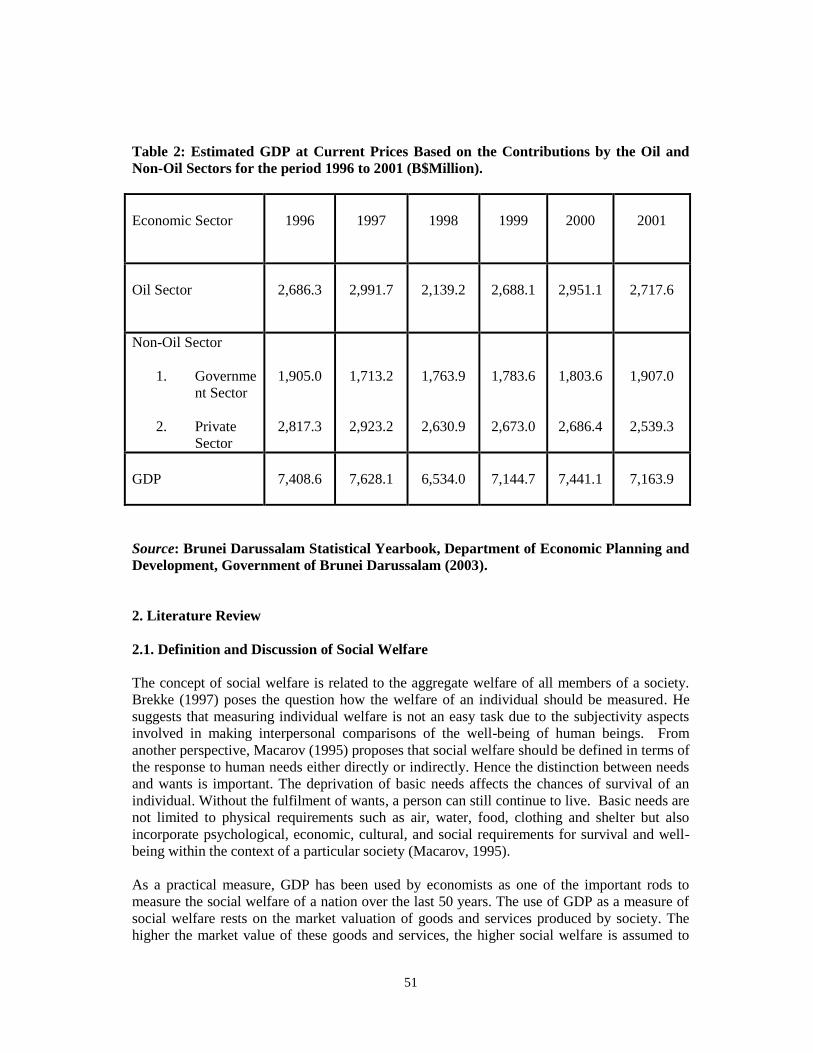
51
Table 2: Estimated GDP at Current Prices Based on the Contributions by the Oil and
Non-Oil Sectors for the period 1996 to 2001 (B$Million).
Economic Sector
1996
1997
1998
1999
2000
2001
Oil Sector
2,686.3
2,991.7
2,139.2
2,688.1
2,951.1
2,717.6
Non-Oil Sector
1. Governme
nt Sector
2. Private
Sector
1,905.0
2,817.3
1,713.2
2,923.2
1,763.9
2,630.9
1,783.6
2,673.0
1,803.6
2,686.4
1,907.0
2,539.3
GDP
7,408.6
7,628.1
6,534.0
7,144.7
7,441.1
7,163.9
Source: Brunei Darussalam Statistical Yearbook, Department of Economic Planning and
Development, Government of Brunei Darussalam (2003).
2. Literature Review
2.1. Definition and Discussion of Social Welfare
The concept of social welfare is related to the aggregate welfare of all members of a society.
Brekke (1997) poses the question how the welfare of an individual should be measured. He
suggests that measuring individual welfare is not an easy task due to the subjectivity aspects
involved in making interpersonal comparisons of the well-being of human beings. From
another perspective, Macarov (1995) proposes that social welfare should be defined in terms of
the response to human needs either directly or indirectly. Hence the distinction between needs
and wants is important. The deprivation of basic needs affects the chances of survival of an
individual. Without the fulfilment of wants, a person can still continue to live. Basic needs are
not limited to physical requirements such as air, water, food, clothing and shelter but also
incorporate psychological, economic, cultural, and social requirements for survival and well-
being within the context of a particular society (Macarov, 1995).
As a practical measure, GDP has been used by economists as one of the important rods to
measure the social welfare of a nation over the last 50 years. The use of GDP as a measure of
social welfare rests on the market valuation of goods and services produced by society. The
higher the market value of these goods and services, the higher social welfare is assumed to
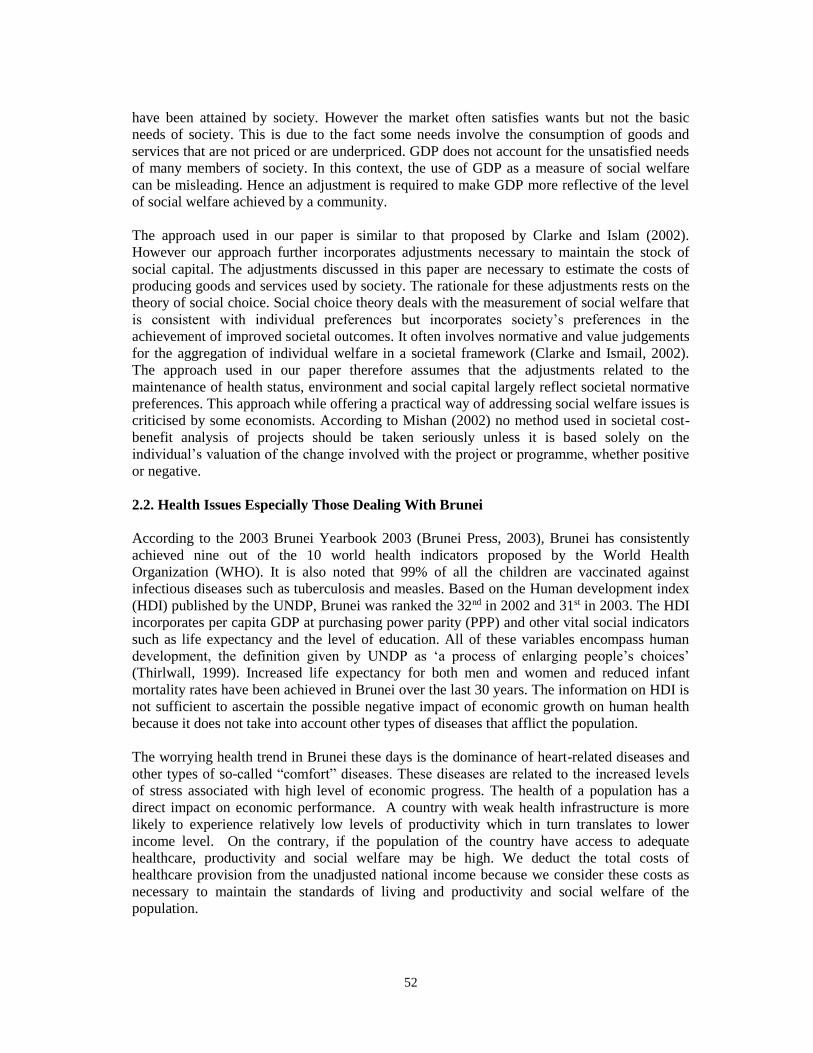
52
have been attained by society. However the market often satisfies wants but not the basic
needs of society. This is due to the fact some needs involve the consumption of goods and
services that are not priced or are underpriced. GDP does not account for the unsatisfied needs
of many members of society. In this context, the use of GDP as a measure of social welfare
can be misleading. Hence an adjustment is required to make GDP more reflective of the level
of social welfare achieved by a community.
The approach used in our paper is similar to that proposed by Clarke and Islam (2002).
However our approach further incorporates adjustments necessary to maintain the stock of
social capital. The adjustments discussed in this paper are necessary to estimate the costs of
producing goods and services used by society. The rationale for these adjustments rests on the
theory of social choice. Social choice theory deals with the measurement of social welfare that
is consistent with individual preferences but incorporates society’s preferences in the
achievement of improved societal outcomes. It often involves normative and value judgements
for the aggregation of individual welfare in a societal framework (Clarke and Ismail, 2002).
The approach used in our paper therefore assumes that the adjustments related to the
maintenance of health status, environment and social capital largely reflect societal normative
preferences. This approach while offering a practical way of addressing social welfare issues is
criticised by some economists. According to Mishan (2002) no method used in societal cost-
benefit analysis of projects should be taken seriously unless it is based solely on the
individual’s valuation of the change involved with the project or programme, whether positive
or negative.
2.2. Health Issues Especially Those Dealing With Brunei
According to the 2003 Brunei Yearbook 2003 (Brunei Press, 2003), Brunei has consistently
achieved nine out of the 10 world health indicators proposed by the World Health
Organization (WHO). It is also noted that 99% of all the children are vaccinated against
infectious diseases such as tuberculosis and measles. Based on the Human development index
(HDI) published by the UNDP, Brunei was ranked the 32nd in 2002 and 31st in 2003. The HDI
incorporates per capita GDP at purchasing power parity (PPP) and other vital social indicators
such as life expectancy and the level of education. All of these variables encompass human
development, the definition given by UNDP as ‘a process of enlarging people’s choices’
(Thirlwall, 1999). Increased life expectancy for both men and women and reduced infant
mortality rates have been achieved in Brunei over the last 30 years. The information on HDI is
not sufficient to ascertain the possible negative impact of economic growth on human health
because it does not take into account other types of diseases that afflict the population.
The worrying health trend in Brunei these days is the dominance of heart-related diseases and
other types of so-called “comfort” diseases. These diseases are related to the increased levels
of stress associated with high level of economic progress. The health of a population has a
direct impact on economic performance. A country with weak health infrastructure is more
likely to experience relatively low levels of productivity which in turn translates to lower
income level. On the contrary, if the population of the country have access to adequate
healthcare, productivity and social welfare may be high. We deduct the total costs of
healthcare provision from the unadjusted national income because we consider these costs as
necessary to maintain the standards of living and productivity and social welfare of the
population.
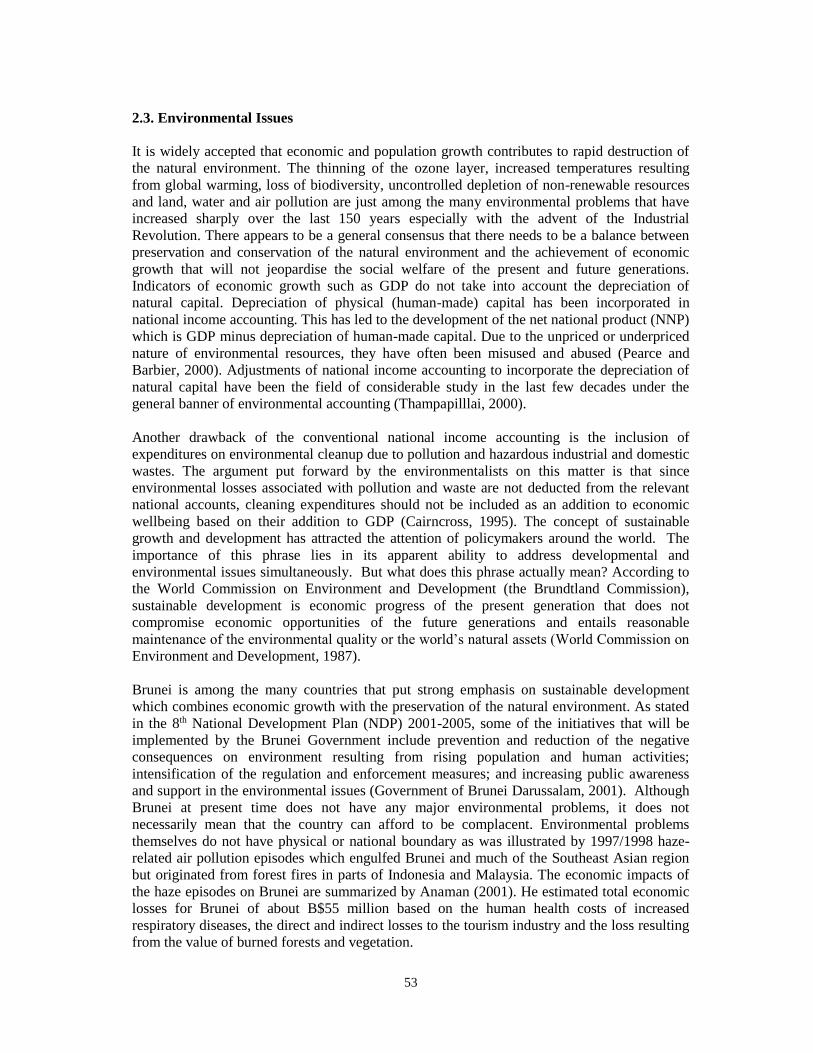
53
2.3. Environmental Issues
It is widely accepted that economic and population growth contributes to rapid destruction of
the natural environment. The thinning of the ozone layer, increased temperatures resulting
from global warming, loss of biodiversity, uncontrolled depletion of non-renewable resources
and land, water and air pollution are just among the many environmental problems that have
increased sharply over the last 150 years especially with the advent of the Industrial
Revolution. There appears to be a general consensus that there needs to be a balance between
preservation and conservation of the natural environment and the achievement of economic
growth that will not jeopardise the social welfare of the present and future generations.
Indicators of economic growth such as GDP do not take into account the depreciation of
natural capital. Depreciation of physical (human-made) capital has been incorporated in
national income accounting. This has led to the development of the net national product (NNP)
which is GDP minus depreciation of human-made capital. Due to the unpriced or underpriced
nature of environmental resources, they have often been misused and abused (Pearce and
Barbier, 2000). Adjustments of national income accounting to incorporate the depreciation of
natural capital have been the field of considerable study in the last few decades under the
general banner of environmental accounting (Thampapilllai, 2000).
Another drawback of the conventional national income accounting is the inclusion of
expenditures on environmental cleanup due to pollution and hazardous industrial and domestic
wastes. The argument put forward by the environmentalists on this matter is that since
environmental losses associated with pollution and waste are not deducted from the relevant
national accounts, cleaning expenditures should not be included as an addition to economic
wellbeing based on their addition to GDP (Cairncross, 1995). The concept of sustainable
growth and development has attracted the attention of policymakers around the world. The
importance of this phrase lies in its apparent ability to address developmental and
environmental issues simultaneously. But what does this phrase actually mean? According to
the World Commission on Environment and Development (the Brundtland Commission),
sustainable development is economic progress of the present generation that does not
compromise economic opportunities of the future generations and entails reasonable
maintenance of the environmental quality or the world’s natural assets (World Commission on
Environment and Development, 1987).
Brunei is among the many countries that put strong emphasis on sustainable development
which combines economic growth with the preservation of the natural environment. As stated
in the 8th National Development Plan (NDP) 2001-2005, some of the initiatives that will be
implemented by the Brunei Government include prevention and reduction of the negative
consequences on environment resulting from rising population and human activities;
intensification of the regulation and enforcement measures; and increasing public awareness
and support in the environmental issues (Government of Brunei Darussalam, 2001). Although
Brunei at present time does not have any major environmental problems, it does not
necessarily mean that the country can afford to be complacent. Environmental problems
themselves do not have physical or national boundary as was illustrated by 1997/1998 haze-
related air pollution episodes which engulfed Brunei and much of the Southeast Asian region
but originated from forest fires in parts of Indonesia and Malaysia. The economic impacts of
the haze episodes on Brunei are summarized by Anaman (2001). He estimated total economic
losses for Brunei of about B$55 million based on the human health costs of increased
respiratory diseases, the direct and indirect losses to the tourism industry and the loss resulting
from the value of burned forests and vegetation.
54
2.4. Social Capital
The increasingly popular term ‘social capital’ though used extensively in the literature was re-
popularised by Putnam (1995). His seminal paper has prompted numerous studies to explain
the significance and implications of social capital. As reported by Temple (2001), Putnam
describes social capital as “…features of social organisation, such as trust, norms, and
networks, that can improve the efficiency of society by facilitating co-ordinated actions”. The
definition of social capital by Putnam emphasises core components of strengthening of the
nuclear and extended family, good neighbourliness or relations between family units living
within a geographical area and social trust among unrelated individuals that interact over a
small or large geographical area. The reasons suggested by Putnam (1995) for the declining
social capital in the United States included the rapid mobility of the labour force that destroys
the roots of acquaintance and trust as people move from place to place due to work-related
factors, and other demographic transformations related to the family such as lesser marriages,
increased rates of divorces and fewer children. Another major cause cited by Putnam for the
decline of social capital in the United States is the technological transformation of leisure
through its privatisation or individualisation with the emergence of television, video cassette
recorder and internet-based entertainment that has increased the time spent by individuals
having personal entertainment in their homes rather than through out-of-home socialising.
A view of social capital advanced by Dasgupta (2002), while similar in some respects to that
given by Putnam, in terms of being a system of interpersonal networks, rejects ‘trust’ as a
component of social capital. Dasgupta also disagrees with the idea of including beliefs and
behavioural rules as interpersonal links. In contrast, social capital, as he puts it, “…is merely a
means to creating trust” considering that there are several means of creating trust (Dasgupta,
2002, p.35). He suggests that it is more proper to analyse social capital, trust, culture and
institutions separately as different objects even though they may be related in one way or the
other. In an article in The Economist Magazine (2003), two opposing opinions concerning the
definition of social capital are cited. One camp consists of scholars who like Putnam
emphasise the existence of vibrant inter-connected community as a form of social capital
similar to environmental capital (such as air and oceans) that are necessary for human beings
to improve their economic well being. The other camp views social capital more from a
narrow neo-classical economic perspective. They regard social capital as a form of investment
by an individual in advancing social skills with the aim of gaining future benefits from this
investment.
But how do we relate social capital to economic growth or the performance of an entire
economy? Does it have any credible influence in determining the wealth of a nation? Defining
social capital from the perspective of Putnam in terms of the stock of interpersonal trust
among members of a community, then the greater the social capital or the more people trust
each other, the more efficient the economy works. This is because transaction costs in the
market economy are reduced and fewer resources are required to enforce formal ‘trust’
agreements such as contracts. Economic cooperation increases since fraud and theft diminish
(Whitely, 2003; The Economist Magazine, 2003). An empirical study on the relationship
between social capital and economic growth based on sample of 34 countries done by Whitely
(2003) indicate that ceteris paribus, social capital as defined in the sense used by Putnam is
highly significant in influencing growth in a positive sense.
55
3. Methods and Procedures
The health and environmental quality adjusted gross domestic product for Brunei was derived
based on specific assumptions concerning variables affecting human health, the state of the
environment and social capital. Due to data availability, only certain variables were
considered in our analysis. The adjustments for various variables including the underlying
assumptions are discussed below.
3.1. Adjustments for Maintenance of Health Status
Public and private health expenditures were used to adjust for gross domestic product. Public
health expenditures were taken from the total expenditures of the Ministry of Health. Private
healthcare expenditures were derived by multiplying the average household private health
expenditures by the number of households in Brunei. Data on household private health
expenditures were based on data from Amin (2002) for the year 2001. The average private
health expenditures were adapted for the years, 1996 to 2000 based on adjustments using the
relevant consumer price index. Both the public and private health expenditures were added
together and denoted as total societal health expenditures.
3.2. Adjustments for the Preservation of the Environment
Under this category, the analysis focused more on the environmental protection aspects rather
than the damage costs function, although the latter was not entirely absent in the analysis. The
main variables of this category were the costs of environmental protection incurred by Brunei
Shell Petroleum Company, various Brunei Government departments charged with the
protection of the environment namely the Department of Drainage and Sewerage, the
Department of Environment, Parks and Recreation and the Department of Fire Services. We
also estimated the costs of solid waste collection services for households. The individual
components are further discussed below.
3.2.1. Brunei Shell Petroleum Company’s environmental expenditures
Oil exports in Brunei are produced as a joint venture between the Brunei Government and the
Royal Dutch Shell Company named as Brunei Shell Petroleum Company Sendirian Berhad
(hereafter known as BSP Company). The environmental-associated costs incurred by the
company comprised of annual environmental management costs, treatment costs for
environmental joint products and expenditures for specific environmental projects. Most of the
environmental expenditures involved treating environmental joint products. Flaring and
venting, for example, resulting from the oil production process, cause considerable
environmental concern because of their effect on global warming. BSP Company has been
undertaking a specific project aimed at reducing its dependence on these two procedures (refer
to Table 3). Appendix 1 shows the environmental joint products, physical units and unit
treatment cost or the environmental tax of the products. Some environmental costs for the joint
products are not expressed in the same physical units. Therefore conversion factors are
included in the notes accompanying Appendix 1.
The specific projects being undertaken by the company are shown in Table 3. Since the
information on the life cycle of the projects was not available, estimates were made whereby
the costs of the projects were amortised over a six-year period in order to arrive at their annual
costs. Annual variable operating expenses related to these projects were not amortised. Annual
56
management costs related to general environmental management were also included in the
total costs of environmental protection for BSP Company. Hence the total annual expenditures
incurred by BSP Company were the sum of the annual environmental treatment costs for joint
products, relevant annual expenditures for specific environmental projects and the annual
environmental management costs.
3.2.2 Expenditures of the Drainage and Sewerage Department
A proper drainage and sewerage system is a vital component to safeguard the environmental
quality and health of the population and maintain sustainable economic growth and
development. Flood control, good sanitation and coastal protection are among the positive
effects derived from a proper drainage and sewerage system. We used the annual expenditures
of the Department of Drainage and Sewerage in the Ministry of Development for the
adjustment of the GDP. This was because this department was mainly responsible for the
maintenance of the drainage and sewerage system in Brunei.
3.2.3. Household expenditures on solid wastes collection services
In Brunei, both the government and the private sector provide solid wastes collection and
disposal services. On behalf of the government, these services are run by the Municipal
Boards, Public Works Department and district offices with a fixed sum of monthly fee charged
for subscribers. In addition to the house-to-house collection services, the government operates
“free” roadside community waste collection centres for households to dump their refuse. The
private sector operated services, varying fees are charged. Based on the study by Anaman and
Jair (2000), one-third of the households subscribe to private/public waste collection services
while the other two-thirds dispose of their household solid wastes at government-operated
roadside waste collection centres. Although the government-operated roadside waste collection
centres do not have any market value, an economic value of the centres exists since they are
used extensively by the population.
The economic value attached to the “free” government-operated roadside waste collection
centres based on the travel cost method was determined as B$6.69 per household per month by
Anaman and Jair (2000). The total costs of solid waste collections services were determined
based on the total number of households and the proportions of households using
private/public waste collection services and government-operated roadside waste collection
services and average monthly costs and economic value for roadside waste collection centres
using figures from Anaman and Jair (2000).
3.2.4. Operating costs of the Environmental Protection and Monitoring Agency
Prior to 1993, Brunei did not have any central agency to look after government matters
pertaining to the environment as different matters were delegated to various government
ministries. Since then, the government has set up a National Committee on Environment
chaired by the Minister of Development whose main responsibilities comprised of exploring
the environmental-related issues, reviewing and advising on the environmental legislation for
appropriate environmental plans and guidelines, and also managing environmental-associated
activities of the government (Government of Brunei, 2001). The ‘linchpin’ of the committee is
the Environmental Unit that oversees environmental monitoring, protection and awareness
programmes. On the 1st May 2002, this unit was transformed into a new department called
Department of Environment, Parks and Recreation (DEPR) with an extended role to include
57
the management of landscape and recreation parks. The costs borne by this environmental
protection agency obviously constitute part of the overall environmental protection
expenditures of Brunei necessary to sustain the environmental ambience of the country.
However, the actual costs could not be obtained due to confidentiality requirement for
government information. Therefore, this study applied an estimation method whereby it was
assumed that annual expenditure of DEPR was 1% of the total annual expenditures of the
Ministry of Development. The total annual expenditures of the Ministry of Development are
published in various issues of the Brunei Darussalam Statistical Yearbook.
3.2.5. Societal fire control expenses
The control of fire incidence is a crucial component of striving towards a safe and healthy
environment and sound functioning of the economy. As economy and population grow, the
probability of fire incidence becomes greater especially if the fire safety precaution and
provision are inadequate. We used the actual annual expenditures of the Department of Fire
Services as societal fire expenses dealing with protection of built and natural environment.
These expenditures for 1996 to 2001 were obtained from the Brunei Darussalam Statistical
Yearbook 2002 (Government of Brunei Darussalam, 2003).
The total costs for maintaining the environment were therefore the sum of the Brunei Shell
Petroleum Company’s environmental costs, the expenditures of the Drainage and Sewerage
Department, the estimated costs of household solid wastes collection services, the assumed
operating costs of the Environmental Protection and Monitoring Agency and actual societal
fire expenses. Costs related to household liquid wastes management services and solid waste
collection services of business firms, other than Brunei Shell Petroleum Company, were
excluded in this analysis due to lack of data.
3.3. Adjustments for Social Capital Preservation
In this study, we view social capital from the trust and community perspective and assume that
an adequate level of social capital is necessary to ensure the orderly and smooth functioning of
the economy. The community therefore spends resources including money to ensure adequate
level of social capital that allows individual householders and firms to operate efficiently in an
environment of peace and stability. We use public expenditures on the enforcement of law and
order as the expenditures necessary to maintain the desired level of social capital stock for
economic activities. We argue that increasing expenditures in maintaining public law and
order reflect the underlying strength of society. A society characterised by numerous litigation
and court cases reflect a breakdown of the social capital stock of trust and mutual cooperation.
The ready use of the court system, rather than arbitration and other out-of-court mechanisms,
to deal with minor disputes, unavoidable through the interactions of imperfect human beings,
needs to be incorporated as a reduction of social welfare and not as contributing to economic
growth.
For our study, we used the annual expenditures of the Royal Brunei Police Force and the
Ministry of Law as the expenditures on the maintenance of social capital stock. The Royal
Brunei Police Force deals essentially with criminal cases. The Ministry of Law deals with both
criminal and civil cases including those related to family breakdown such as family disputes
and divorces. These two organisations are the main agencies charged with the maintenance of
law and order in the country. Increases in the real expenditures of these organisations reflect
increased efforts required to maintain an adequate level of social capital. Such expenditures
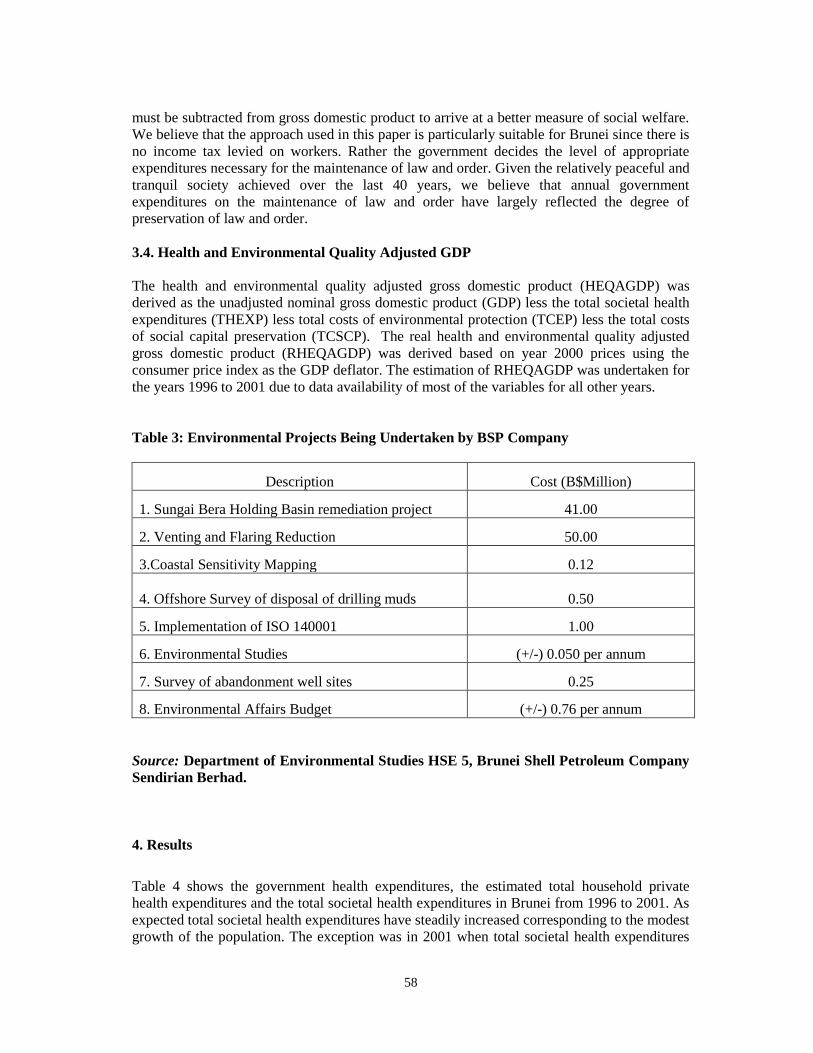
58
must be subtracted from gross domestic product to arrive at a better measure of social welfare.
We believe that the approach used in this paper is particularly suitable for Brunei since there is
no income tax levied on workers. Rather the government decides the level of appropriate
expenditures necessary for the maintenance of law and order. Given the relatively peaceful and
tranquil society achieved over the last 40 years, we believe that annual government
expenditures on the maintenance of law and order have largely reflected the degree of
preservation of law and order.
3.4. Health and Environmental Quality Adjusted GDP
The health and environmental quality adjusted gross domestic product (HEQAGDP) was
derived as the unadjusted nominal gross domestic product (GDP) less the total societal health
expenditures (THEXP) less total costs of environmental protection (TCEP) less the total costs
of social capital preservation (TCSCP). The real health and environmental quality adjusted
gross domestic product (RHEQAGDP) was derived based on year 2000 prices using the
consumer price index as the GDP deflator. The estimation of RHEQAGDP was undertaken for
the years 1996 to 2001 due to data availability of most of the variables for all other years.
Table 3: Environmental Projects Being Undertaken by BSP Company
Description Cost (B$Million)
1. Sungai Bera Holding Basin remediation project 41.00
2. Venting and Flaring Reduction 50.00
3.Coastal Sensitivity Mapping 0.12
4. Offshore Survey of disposal of drilling muds 0.50
5. Implementation of ISO 140001 1.00
6. Environmental Studies (+/-) 0.050 per annum
7. Survey of abandonment well sites 0.25
8. Environmental Affairs Budget (+/-) 0.76 per annum
Source: Department of Environmental Studies HSE 5, Brunei Shell Petroleum Company
Sendirian Berhad.
4. Results
Table 4 shows the government health expenditures, the estimated total household private
health expenditures and the total societal health expenditures in Brunei from 1996 to 2001. As
expected total societal health expenditures have steadily increased corresponding to the modest
growth of the population. The exception was in 2001 when total societal health expenditures
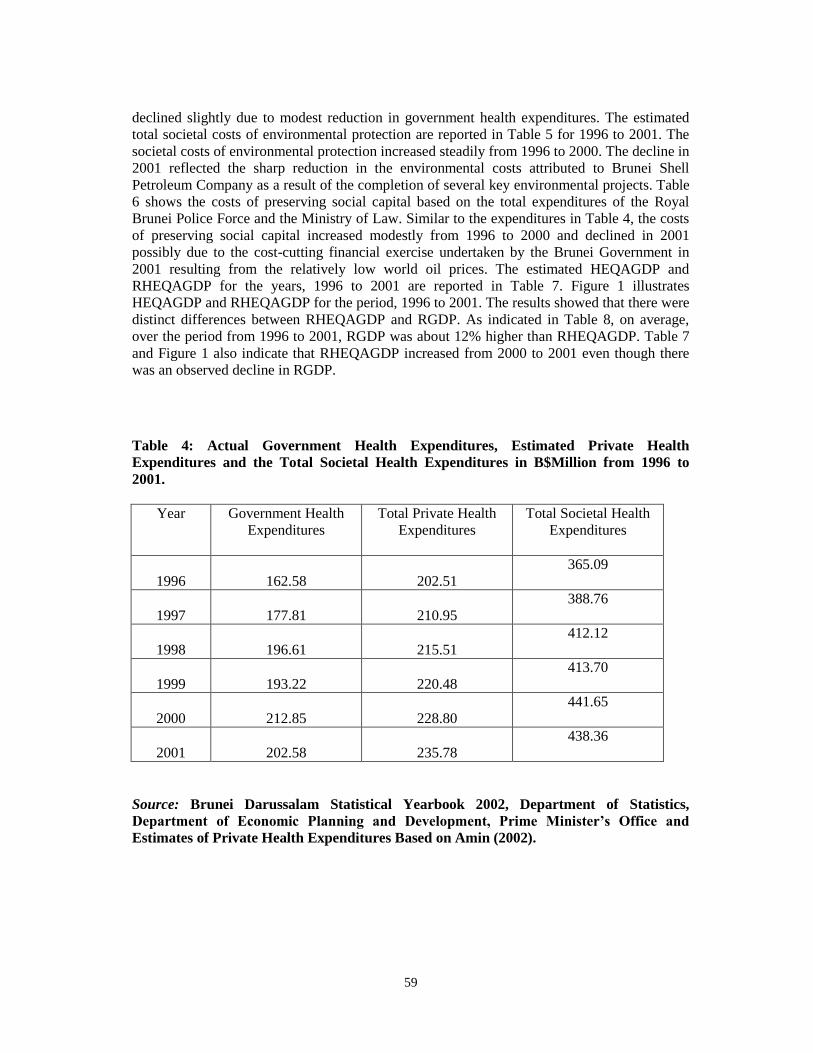
59
declined slightly due to modest reduction in government health expenditures. The estimated
total societal costs of environmental protection are reported in Table 5 for 1996 to 2001. The
societal costs of environmental protection increased steadily from 1996 to 2000. The decline in
2001 reflected the sharp reduction in the environmental costs attributed to Brunei Shell
Petroleum Company as a result of the completion of several key environmental projects. Table
6 shows the costs of preserving social capital based on the total expenditures of the Royal
Brunei Police Force and the Ministry of Law. Similar to the expenditures in Table 4, the costs
of preserving social capital increased modestly from 1996 to 2000 and declined in 2001
possibly due to the cost-cutting financial exercise undertaken by the Brunei Government in
2001 resulting from the relatively low world oil prices. The estimated HEQAGDP and
RHEQAGDP for the years, 1996 to 2001 are reported in Table 7. Figure 1 illustrates
HEQAGDP and RHEQAGDP for the period, 1996 to 2001. The results showed that there were
distinct differences between RHEQAGDP and RGDP. As indicated in Table 8, on average,
over the period from 1996 to 2001, RGDP was about 12% higher than RHEQAGDP. Table 7
and Figure 1 also indicate that RHEQAGDP increased from 2000 to 2001 even though there
was an observed decline in RGDP.
Table 4: Actual Government Health Expenditures, Estimated Private Health
Expenditures and the Total Societal Health Expenditures in B$Million from 1996 to
2001.
Year
Government Health
Expenditures
Total Private Health
Expenditures
Total Societal Health
Expenditures
1996 162.58 202.51
365.09
1997 177.81 210.95
388.76
1998 196.61 215.51
412.12
1999 193.22 220.48
413.70
2000 212.85 228.80
441.65
2001 202.58 235.78
438.36
Source: Brunei Darussalam Statistical Yearbook 2002, Department of Statistics,
Department of Economic Planning and Development, Prime Minister’s Office and
Estimates of Private Health Expenditures Based on Amin (2002).
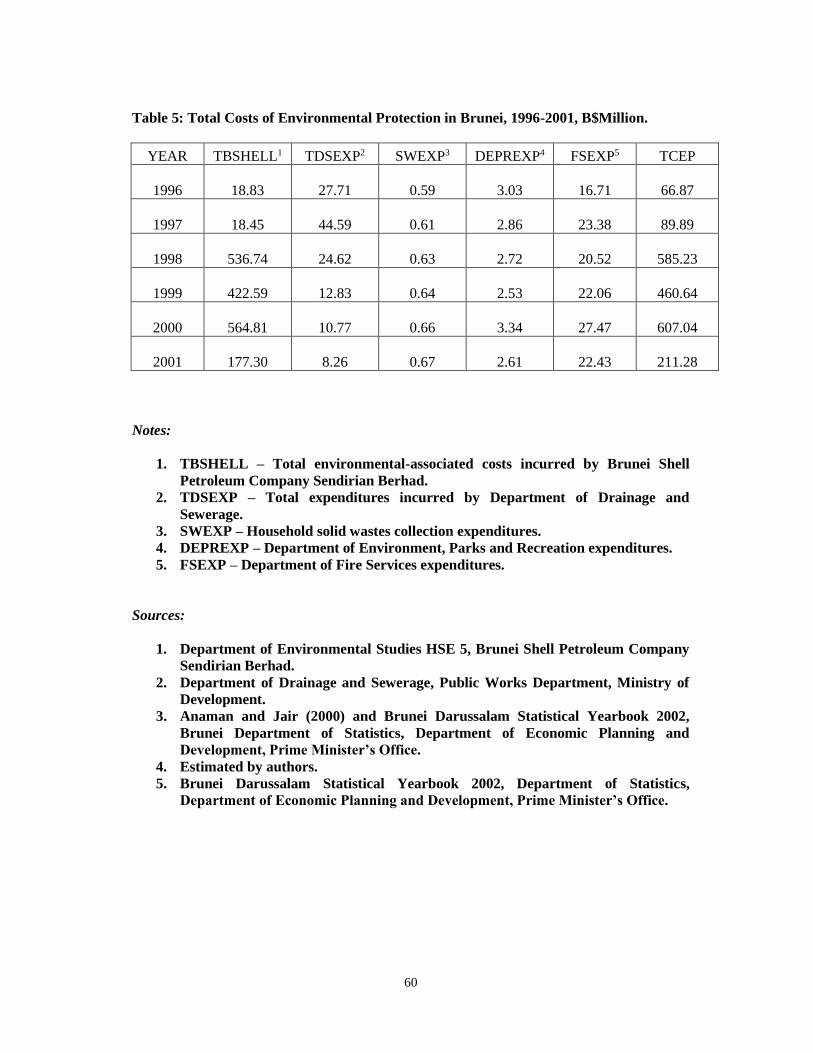
60
Table 5: Total Costs of Environmental Protection in Brunei, 1996-2001, B$Million.
YEAR TBSHELL1 TDSEXP2 SWEXP3 DEPREXP4 FSEXP5 TCEP
1996 18.83 27.71 0.59 3.03 16.71 66.87
1997 18.45 44.59 0.61 2.86 23.38 89.89
1998 536.74 24.62 0.63 2.72 20.52 585.23
1999 422.59 12.83 0.64 2.53 22.06 460.64
2000 564.81 10.77 0.66 3.34 27.47 607.04
2001 177.30 8.26 0.67 2.61 22.43 211.28
Notes:
1. TBSHELL – Total environmental-associated costs incurred by Brunei Shell
Petroleum Company Sendirian Berhad.
2. TDSEXP – Total expenditures incurred by Department of Drainage and
Sewerage.
3. SWEXP – Household solid wastes collection expenditures.
4. DEPREXP – Department of Environment, Parks and Recreation expenditures.
5. FSEXP – Department of Fire Services expenditures.
Sources:
1. Department of Environmental Studies HSE 5, Brunei Shell Petroleum Company
Sendirian Berhad.
2. Department of Drainage and Sewerage, Public Works Department, Ministry of
Development.
3. Anaman and Jair (2000) and Brunei Darussalam Statistical Yearbook 2002,
Brunei Department of Statistics, Department of Economic Planning and
Development, Prime Minister’s Office.
4. Estimated by authors.
5. Brunei Darussalam Statistical Yearbook 2002, Department of Statistics,
Department of Economic Planning and Development, Prime Minister’s Office.
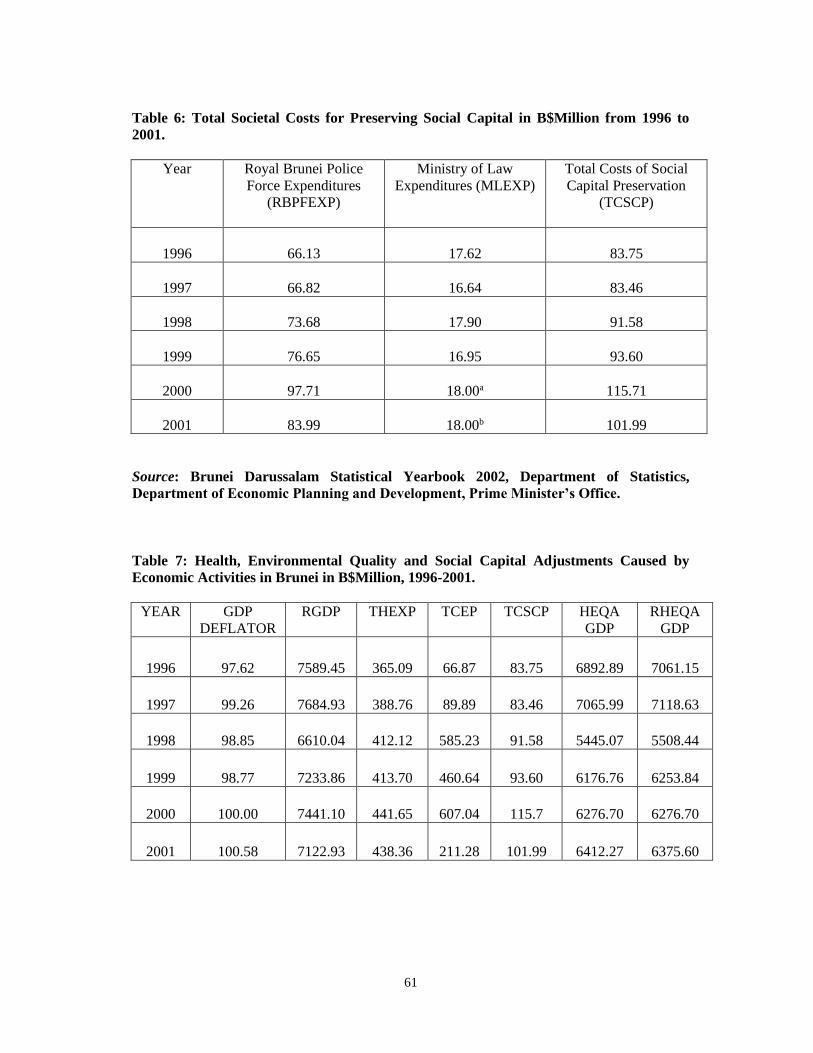
61
Table 6: Total Societal Costs for Preserving Social Capital in B$Million from 1996 to
2001.
Year
Royal Brunei Police
Force Expenditures
(RBPFEXP)
Ministry of Law
Expenditures (MLEXP)
Total Costs of Social
Capital Preservation
(TCSCP)
1996 66.13 17.62 83.75
1997 66.82 16.64 83.46
1998 73.68 17.90 91.58
1999 76.65 16.95 93.60
2000 97.71 18.00a 115.71
2001 83.99 18.00b 101.99
Source: Brunei Darussalam Statistical Yearbook 2002, Department of Statistics,
Department of Economic Planning and Development, Prime Minister’s Office.
Table 7: Health, Environmental Quality and Social Capital Adjustments Caused by
Economic Activities in Brunei in B$Million, 1996-2001.
YEAR
GDP
DEFLATOR
RGDP
THEXP
TCEP
TCSCP
HEQA
GDP
RHEQA
GDP
1996 97.62 7589.45 365.09 66.87 83.75 6892.89 7061.15
1997 99.26 7684.93 388.76 89.89 83.46 7065.99 7118.63
1998 98.85 6610.04 412.12 585.23 91.58 5445.07 5508.44
1999 98.77 7233.86 413.70 460.64 93.60 6176.76 6253.84
2000 100.00 7441.10 441.65 607.04 115.7 6276.70 6276.70
2001 100.58 7122.93 438.36 211.28 101.99 6412.27 6375.60
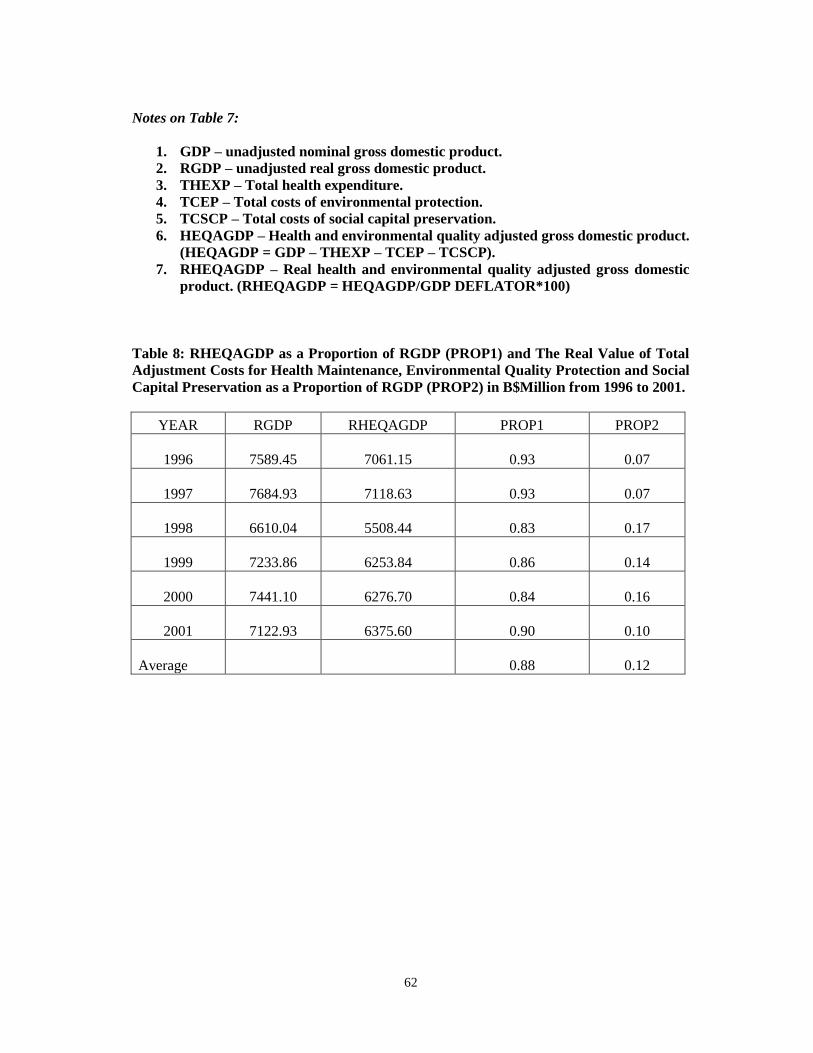
62
Notes on Table 7:
1. GDP – unadjusted nominal gross domestic product.
2. RGDP – unadjusted real gross domestic product.
3. THEXP – Total health expenditure.
4. TCEP – Total costs of environmental protection.
5. TCSCP – Total costs of social capital preservation.
6. HEQAGDP – Health and environmental quality adjusted gross domestic product.
(HEQAGDP = GDP – THEXP – TCEP – TCSCP).
7. RHEQAGDP – Real health and environmental quality adjusted gross domestic
product. (RHEQAGDP = HEQAGDP/GDP DEFLATOR*100)
Table 8: RHEQAGDP as a Proportion of RGDP (PROP1) and The Real Value of Total
Adjustment Costs for Health Maintenance, Environmental Quality Protection and Social
Capital Preservation as a Proportion of RGDP (PROP2) in B$Million from 1996 to 2001.
YEAR RGDP RHEQAGDP PROP1 PROP2
1996 7589.45 7061.15 0.93 0.07
1997 7684.93 7118.63 0.93 0.07
1998 6610.04 5508.44 0.83 0.17
1999 7233.86 6253.84 0.86 0.14
2000 7441.10 6276.70 0.84 0.16
2001 7122.93 6375.60 0.90 0.10
Average 0.88 0.12
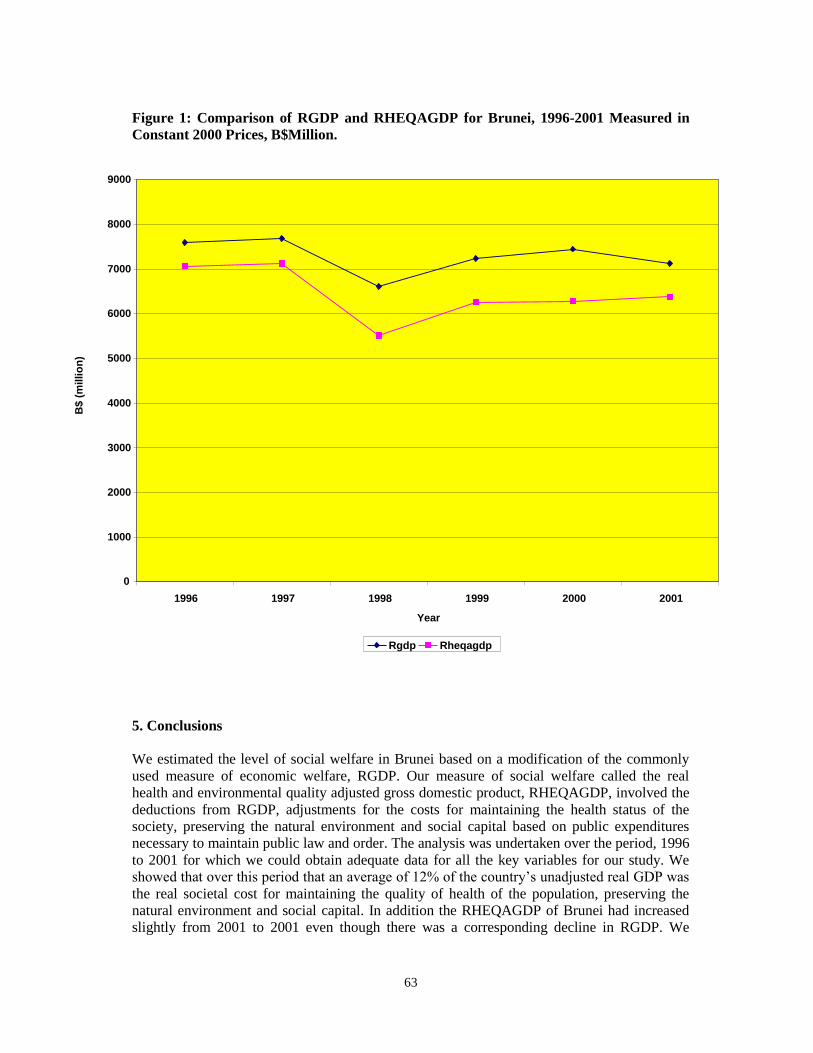
63
Figure 1: Comparison of RGDP and RHEQAGDP for Brunei, 1996-2001 Measured in
Constant 2000 Prices, B$Million.
5. Conclusions
We estimated the level of social welfare in Brunei based on a modification of the commonly
used measure of economic welfare, RGDP. Our measure of social welfare called the real
health and environmental quality adjusted gross domestic product, RHEQAGDP, involved the
deductions from RGDP, adjustments for the costs for maintaining the health status of the
society, preserving the natural environment and social capital based on public expenditures
necessary to maintain public law and order. The analysis was undertaken over the period, 1996
to 2001 for which we could obtain adequate data for all the key variables for our study. We
showed that over this period that an average of 12% of the country’s unadjusted real GDP was
the real societal cost for maintaining the quality of health of the population, preserving the
natural environment and social capital. In addition the RHEQAGDP of Brunei had increased
slightly from 2001 to 2001 even though there was a corresponding decline in RGDP. We
0
1000
2000
3000
4000
5000
6000
7000
8000
9000
1996 1997 1998 1999 2000 2001
Year
B$ (
millio
n)
Rgdp Rheqagdp
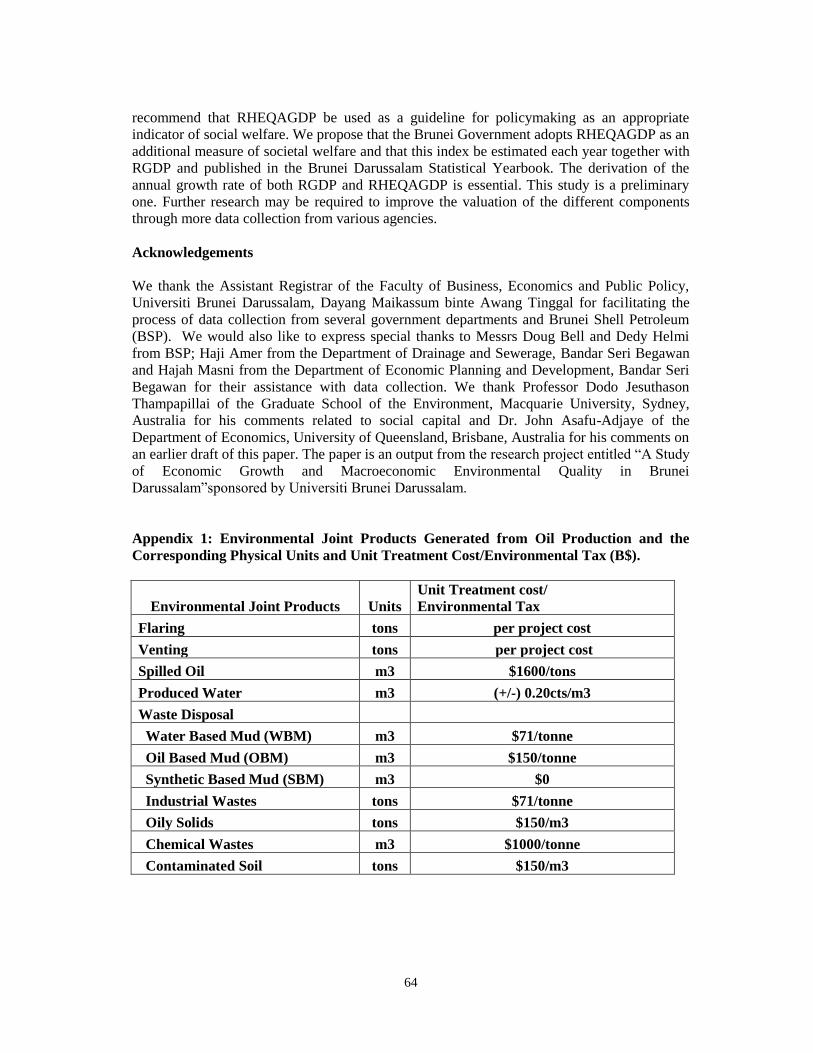
64
recommend that RHEQAGDP be used as a guideline for policymaking as an appropriate
indicator of social welfare. We propose that the Brunei Government adopts RHEQAGDP as an
additional measure of societal welfare and that this index be estimated each year together with
RGDP and published in the Brunei Darussalam Statistical Yearbook. The derivation of the
annual growth rate of both RGDP and RHEQAGDP is essential. This study is a preliminary
one. Further research may be required to improve the valuation of the different components
through more data collection from various agencies.
Acknowledgements
We thank the Assistant Registrar of the Faculty of Business, Economics and Public Policy,
Universiti Brunei Darussalam, Dayang Maikassum binte Awang Tinggal for facilitating the
process of data collection from several government departments and Brunei Shell Petroleum
(BSP). We would also like to express special thanks to Messrs Doug Bell and Dedy Helmi
from BSP; Haji Amer from the Department of Drainage and Sewerage, Bandar Seri Begawan
and Hajah Masni from the Department of Economic Planning and Development, Bandar Seri
Begawan for their assistance with data collection. We thank Professor Dodo Jesuthason
Thampapillai of the Graduate School of the Environment, Macquarie University, Sydney,
Australia for his comments related to social capital and Dr. John Asafu-Adjaye of the
Department of Economics, University of Queensland, Brisbane, Australia for his comments on
an earlier draft of this paper. The paper is an output from the research project entitled “A Study
of Economic Growth and Macroeconomic Environmental Quality in Brunei
Darussalam”sponsored by Universiti Brunei Darussalam.
Appendix 1: Environmental Joint Products Generated from Oil Production and the
Corresponding Physical Units and Unit Treatment Cost/Environmental Tax (B$).
Environmental Joint Products Units
Unit Treatment cost/
Environmental Tax
Flaring tons per project cost
Venting tons per project cost
Spilled Oil m3 $1600/tons
Produced Water m3 (+/-) 0.20cts/m3
Waste Disposal
Water Based Mud (WBM) m3 $71/tonne
Oil Based Mud (OBM) m3 $150/tonne
Synthetic Based Mud (SBM) m3 $0
Industrial Wastes tons $71/tonne
Oily Solids tons $150/m3
Chemical Wastes m3 $1000/tonne
Contaminated Soil tons $150/m3
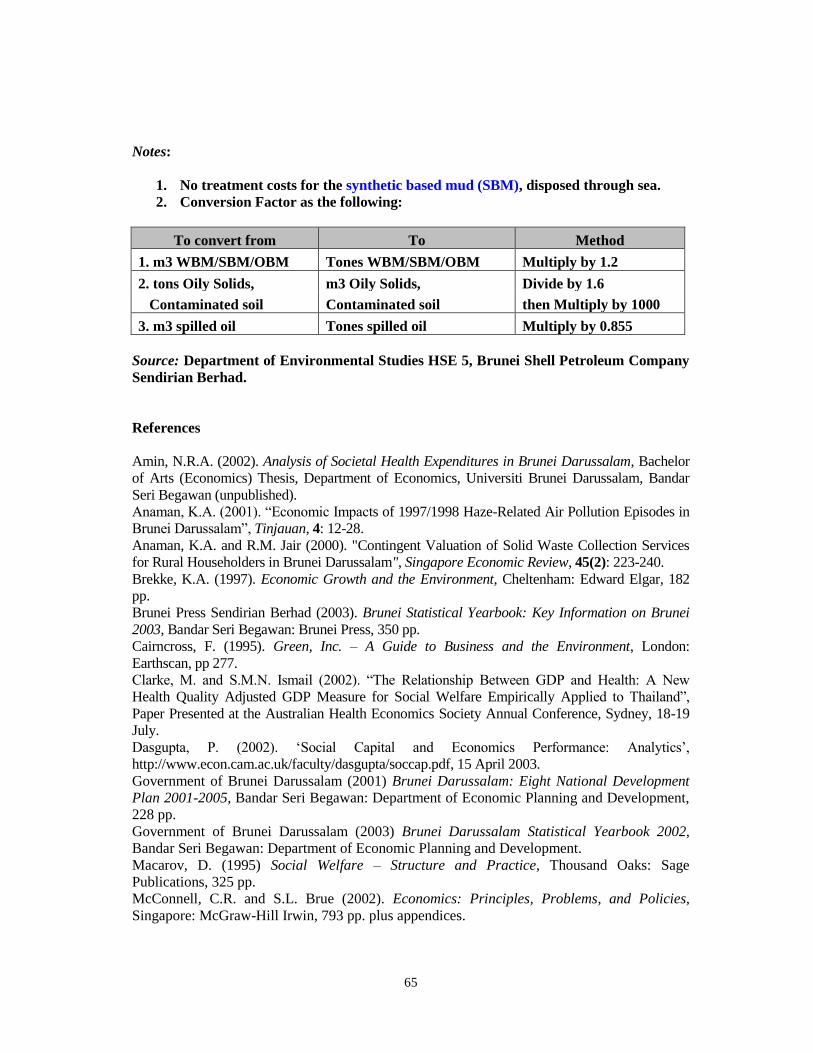
65
Notes:
1. No treatment costs for the synthetic based mud (SBM), disposed through sea.
2. Conversion Factor as the following:
To convert from To Method
1. m3 WBM/SBM/OBM Tones WBM/SBM/OBM Multiply by 1.2
2. tons Oily Solids, m3 Oily Solids, Divide by 1.6
Contaminated soil Contaminated soil then Multiply by 1000
3. m3 spilled oil Tones spilled oil Multiply by 0.855
Source: Department of Environmental Studies HSE 5, Brunei Shell Petroleum Company
Sendirian Berhad.
References
Amin, N.R.A. (2002). Analysis of Societal Health Expenditures in Brunei Darussalam, Bachelor
of Arts (Economics) Thesis, Department of Economics, Universiti Brunei Darussalam, Bandar
Seri Begawan (unpublished).
Anaman, K.A. (2001). “Economic Impacts of 1997/1998 Haze-Related Air Pollution Episodes in
Brunei Darussalam”, Tinjauan, 4: 12-28.
Anaman, K.A. and R.M. Jair (2000). "Contingent Valuation of Solid Waste Collection Services
for Rural Householders in Brunei Darussalam", Singapore Economic Review, 45(2): 223-240.
Brekke, K.A. (1997). Economic Growth and the Environment, Cheltenham: Edward Elgar, 182
pp.
Brunei Press Sendirian Berhad (2003). Brunei Statistical Yearbook: Key Information on Brunei
2003, Bandar Seri Begawan: Brunei Press, 350 pp.
Cairncross, F. (1995). Green, Inc. – A Guide to Business and the Environment, London:
Earthscan, pp 277.
Clarke, M. and S.M.N. Ismail (2002). “The Relationship Between GDP and Health: A New
Health Quality Adjusted GDP Measure for Social Welfare Empirically Applied to Thailand”,
Paper Presented at the Australian Health Economics Society Annual Conference, Sydney, 18-19
July.
Dasgupta, P. (2002). ‘Social Capital and Economics Performance: Analytics’,
http://www.econ.cam.ac.uk/faculty/dasgupta/soccap.pdf, 15 April 2003.
Government of Brunei Darussalam (2001) Brunei Darussalam: Eight National Development
Plan 2001-2005, Bandar Seri Begawan: Department of Economic Planning and Development,
228 pp.
Government of Brunei Darussalam (2003) Brunei Darussalam Statistical Yearbook 2002,
Bandar Seri Begawan: Department of Economic Planning and Development.
Macarov, D. (1995) Social Welfare – Structure and Practice, Thousand Oaks: Sage
Publications, 325 pp.
McConnell, C.R. and S.L. Brue (2002). Economics: Principles, Problems, and Policies,
Singapore: McGraw-Hill Irwin, 793 pp. plus appendices.
66
Mishan, E.J. (2002). “On the Conceptual Underpinning of a Cost-Benefit Analysis”, Singapore
Economic Review, 47(1): 3-16.
Pearce, D. and E.B. Barbier (2000) Blueprint for a Sustainable Economy, London: Earthscan,
273 pp.
Putnam, R.D. (1995). “Bowling Alone: America’s Declining Social Capital”, Journal of
Democracy, 6(1): 65-78.
Sumardi, R.H. (2003). Analysis of the Productivity of the Construction Industry in Brunei
Darussalam, Bachelor of Arts (Economics) Degree, Department of Economics, Universiti Brunei
Darussalam, Bandar Seri Begawan, 140 pp. (unpublished).
Temple, J. (2001) ‘Growth Effects of Education and Social Capital in the OECD countries’,
OECD Economic Studies, 33(2).
Thampapillai, D.J. (2000). “The Internalisation of Environmental Capital Stocks into an
Aggregate Cobb-Douglas Function“, Economic Analysis and Policy, 30(2): 209-215.
The Economist Magazine (2003). “Economics Focus: a Question of Trust”, The Economist
Magazine, 22nd February, p. 74.
Thirlwall, A.P. (1999) Growth and Development, Sixth Edition, London: Macmillan Press,
521 pp.
United Nations Development Programme (UNDP) (2002) Human Development Index,
London: UNDP.
United Nations Development Programme (UNDP) (2003) Human Development Index,
London: UNDP.
Whitely, P. (2003) ‘Economic Growth and Social Capital’, Sheffield University,
http://www.shef.ac.uk/uni/academic/N-Q/perc/Polpaps/Pp6.html, 15 April 2003.
World Commission on Environment and Development (1987). Our Common Future, Oxford:
Oxford University Press.
67
CHAPTER 5
ANALYSIS OF TRADE FLOWS BETWEEN
BRUNEI DARUSSALAM AND OTHER MEMBERS
OF THE ASSOCIATION OF SOUTHEAST ASIAN
NATIONS FROM 1970 TO 2000
SUHAILA MATZAN, KWABENA A. ANAMAN
& ISMAIL DURAMAN
Abstract
This paper analysed merchandise trade flows between Brunei and the nine other members of
the Association of Southeast Asian Nations (ASEAN) over a thirty-one-year period from 1970
to 2000. The main objective was to identify the significant factors influencing the levels of
imports and exports between Brunei and each of the nine members of ASEAN. The analysis
indicated that there was a negative balance of trade against Brunei throughout the 1990s.
However during the 1970s and 1980s, Brunei enjoyed large trade surpluses with ASEAN as a
whole primarily due to the relatively high world market oil prices. Bilateral trade flows, both
imports and exports, between Brunei and the ASEAN countries were driven mainly by the
population of the ASEAN countries, the historical relationships of a few ASEAN countries with
Brunei and the cultural similarities between the ASEAN member countries and Brunei.
1. Introduction
Brunei Darussalam is one of the smallest and least known states in Asia. Despite its small
attributes, an area of 5,765 square kilometers and a population of 340,800 in 2002
(Government of Brunei Darussalam, 2003), Brunei is one of the richest nations in Asia. The
people of this country have attained one of the highest living standards in the developing
world. Brunei’s gross domestic product (GDP) per capita in 2001 was estimated at B$25,065,
the second highest among the member countries of ASEAN and the fourth highest in Asia
(United Nations Development Programme, 2003). This wealth is due to the export of crude oil
and natural gas. Brunei is the third largest oil producer in South East Asia and the fourth
biggest producer of liquefied natural gas in the world. The oil and gas industry is the dominant
economic sector in the country and accounts for about 90% of Brunei’s total exports
(Government of Brunei Darussalam, 2003). The economy of Brunei is a blend of foreign-
owned and locally-owned businesses considerably shaped by government regulations and
welfare measures. The abundance of oil and gas has fashioned Brunei into what is classified as
a ‘rentier economy’. This means the country depends very much on income derived from
hydrocarbon resources. Hence the government undertakes a variety of social projects and
programmes without resort to personal taxation. The rentier characteristics of economies
naturally hold back their efforts at economic diversification. This is exemplified by the
relatively low contribution of Brunei’s non-oil sector to export trade and also to GDP. For
68
example the agriculture, fishing and forestry sector has contributed below 3% to the GDP of
Brunei over the last 12 years (1991-2002) (Government of Brunei Darussalam, 2003).
This phenomenon of oil dependence started back in the 1930s with the discovery of oil in 1929
and its subsequent extraction and development. The extensive revenues derived from the
production of oil and gas made the agriculture and manufacturing sectors less economically
attractive. In order to assure sustainable long-term economic development, the government has
followed an economic diversification policy to reduce the country’s excessive dependence on
the oil and gas sector and to achieve rapid economic growth like other countries in the Asia-
Pacific region.i In the current Five-Year Development Plan (2001-2005), the government’s
plans for rapid economic diversification include the expansion of non-oil exports, the
establishment of an international financial centre, import substitution strategies and tourism
promotion. Therefore, much attention is being devoted to the development of non-oil trade
with traditional and non-traditional partners.
Brunei is a member of a number of international and regional organizations including ASEAN.
Brunei became a member of ASEAN upon gaining its independence from Britain in 1984. It is
a member of the United Nations, The Commonwealth, World Trade Organization, the Asian-
Pacific Economic Cooperation (APEC), Non-Aligned Movement and the Organization of
Islamic Countries. Brunei’s membership in these organizations is partly due to the need to
expand international trade to accelerate its drive for economic diversification (Anaman and Al-
Kharusi, 2003). The main focus of this paper is to analyse Brunei’s merchandise trade flows
with its fellow members in ASEAN; namely: Cambodia, Indonesia, Laos, Malaysia, Myanmar,
the Philippines, Singapore, Thailand and Vietnam. ASEAN was formed in 1967 and Brunei
became the sixth member upon gaining its independence in 1984. ASEAN is the world’s
fourth largest market after the United States (US), the European Union (EU) and Japan, with a
combined GDP of US$685 billion and a total trade of US$720 billion.ii ASEAN, as a regional
organization, has notably succeeded in terms of its economic cooperation efforts. The ASEAN
Free Trade Agreement (AFTA) is one of those cooperation efforts, which was established in
1992 where its objective was to set a wide and open regional market (over 500 million people)
with low tariffs and the removal of non-tariff barriers among ASEAN member states.iii With
such economic cooperation, the attractiveness of the ASEAN as an important market for the
exchange of goods and services produced in the region can be greatly amplified. This study is
undertaken to illustrate and examine Brunei’s trade relationships with the other member
countries of ASEAN. This study builds on recent work on international trade relationships
dealing with Brunei undertaken by Brunei-based economic researchers (for example, Buffong
and Anaman, 1999; Anaman and Buffong, 2001; Mahmod and Anaman, 2001; Chin and
Anaman, 2002; Anaman and Al-Kharusi, 2003; Anaman and Mahmod, 2003).
The first objective of this current study was to analyse the trends, patterns, and characteristics
of trade between Brunei and the ASEAN member countries from 1970 to 2000. Secondly, we
aimed to evaluate the composition of exports and imports between Brunei and the other
ASEAN countries. The third objective was to ascertain the factors affecting the level of trade
between Brunei and each of the nine other ASEAN member countries using a gravity model.
There are several hypotheses concerning trade between Brunei and the ASEAN member
countries that underpin this study. Firstly, the characteristic of being a ‘rentier’ economy
makes Brunei highly dependent on imports. Hence it is expected that Brunei will have balance
of trade deficits with other ASEAN member countries especially in years of low world prices.
Secondly, the high dependence of Brunei on oil and gas and the considerable uncertainty of
69
world oil prices lead to wide fluctuation in the Brunei GDP level. This wide fluctuation can
lead to varying annual total demand of trade with the other ASEAN member countries. Finally,
Brunei’s aim to develop the level of local manufacturing sector based on import substitution
and the promotion of tourism in terms of services and infrastructure will depend on the
expansion of import trade with overseas states including other ASEAN member countries.
Therefore it is expected that ASEAN countries will be a major source of imports for Brunei
given their proximity to Brunei.
The rest of this paper is organized as follows: the next section deals with the literature review
concerning the study. The methods and procedures used for the study are discussed in Section
III. This is followed by a summary of the main results. The conclusions follow.
2. Literature Review
Trade allows countries to specialize in producing the goods and services they are best suited to
make with the resources available to them. With trade, it is possible for more goods to be
produced and for more individual wants to be fulfilled than if each country tried to produce
everything it required on its own. For example, international trade is the driving force of
Japan’s economy. By trading with other countries, Japan obtains the raw materials it lacks, and
in return, it sells the numerous manufactured goods that it produces. Since the 1960s, the
United Nations has held conferences to promote international trade, especially between
developed and developing countries. There have been numerous studies and publications on
the benefits of international trade in terms of accelerating economic growth. The concept that
international trade as an important trait in a country’s economic performance was given early
prominence by Adam Smith in his classic book, The Wealth of Nations, which was published
in 1776.
The theory of comparative advantage is possibly the most important concept in the economics
sub-discipline of international trade. The original idea of comparative advantage dates back to
the early part of the 19th century, although it is commonly referred to as the ‘Ricardian model’,
after David Ricardo. A country is said to have a comparative advantage in production of a
good if it can produce that good at a lower opportunity cost than another country. In other
words, the Ricardian model states that a country tends to specialize in its “comparative
advantage” goods and trade them to the other countries so that all trading countries benefit. In
the early 20th century, two Scandinavian economists, Heckscher and Ohlin extended Ricardo’s
comparative advantage theory by taking into account the source of differences in relative costs
between countries. Their extension is referred to as the Heckscher-Ohlin (HO) theory of trade
also known as the factor endowment theory (Todaro 2000). HO theory implies that efficiently
produced goods of one country are traded for the efficiently produced goods of another
(Hanink, 1994).
Another model used to analyse international trade is the gravity model approach. The gravity
model is more commonly used as a tool for analyzing bilateral trade flows. It can also be used
to explain transportation, migration, and other transactions over a period of time. It originated
from the work of Tinbergen (1962). The gravity model, as its name suggests, is derived from
Isaac Newton's theory of gravitational force which states that the gravitational force between
two celestial bodies is positively related to the product of their masses and inversely related to
the physical distance between these two bodies.iv In reference to this study, the gravity model
holds that bilateral volumes of traded goods (gravitational force of trade) between two
countries are proportional to the two countries’ GDP (products of masses of the two countries)
70
and inversely proportional to the physical distance between the two countries. Gravity models
indicate that bilateral trade flows are determined by three sets of variables: (1) variables
indicating total potential demand of an importing country; (2) variables indicating total
potential supply of an exporting country; and (3) variables aiding or hindering trade flows
between the importing and exporting countries (Hellvin and Nilsson 2000, p.6).
The simplest form of the gravity model can be shown through the adaptation of the work of
Feenstra et al. (2001) similar to the approach used by Chin and Anaman (2002). We assume
that there are M nations (i = 1….M), zero transportation costs between any two nations, i and j.
It is also assumed that any two nations completely specialize in the production of different
goods. Let Yik be the value of production of good k by nation i, GDPi is the income of nation i
(total value of production of all goods in that country) and WORLDGDP as world income
(total production of all goods in all countries of the world). Next, if we assume that there are
identical tastes in all the M nations, then each nation j will demand GDPj/WORLDGDP of the
value of any good k produced. Therefore exports of good k from nation i to nation j will be
Yik * (GDPj/WORLDGDP). Hence, for all k goods, the total exports from country i to
country j is BTRADEij = (GDPi)*(GDPj/WORLDGDP). The exports from country i to j is
determined by the logarithmic function of equation BTRADEij.
Log (BTRADEij) = -log (WORLDGDP) + log (GDPi) + log (GDPj)
where –log (WORLDGDP) can be considered to be constant at a given point in time for cross-
sectional analytic work involving several countries.
Therefore the levels of bilateral trade flows are regressed against the domestic country GDP,
partner country GDP and other controlling factors including physical distance when empirical
analysis, involving gravity models, is undertaken. Controlling factors consist of a number of
elements such as common language, political stability and membership in a common
international or regional organization. For instance, there have been increasing studies
indicating the potential importance of a common language as a contributor to increased trade
flows. Common languages may help to build networks of trust and shared institutions by
increasing the degree of common cultural, literary and educational resources used by countries,
and by increasing the probability of migration.v With reference to political stability, a country
that is stable usually show signs of higher economic growth rates, enhanced international
competitiveness of local firms and often has reduced risk for foreign firms doing business with
local firms (Chwo-Ming and Zietlow 1995).
Although the gravity model has become a popular theory in analyzing international trade due
to its empirical success, it is often criticized apparently for its lack of strong theoretical
foundations. Anderson (1979) notes that the results of various estimated gravity models do not
always correspond to the main known theories of international trade. However the theoretical
foundations of gravity models have been developed by some economists. For example,
Bergstrand (1985) derives gravity models from models of monopolistic competition. Deardorff
(1998) also shows that gravity models are derived within the Ricardian and the Hecksher-
Ohlin theoretical framework. The success of establishing the theoretical foundations of gravity
model within mainstream international trade theories has allowed it to be embraced as a useful
tool for evaluation of trade flows among countries. Gravity models can also be used for
analysis of trade flows among trading blocs. Hellvin and Nilsson (2000) analysed the level of
trade integration between three trading blocs; the European Union, Asia, and the North
American Free Trade Agreement (NAFTA) using gravity models.
71
3. Methods and Procedures
3.1. Specification of Gravity Models for Brunei-ASEAN Trade
The level of trade between Brunei and the ASEAN member countries was analysed based on a
version of the gravity model. This was done by separately estimating the gravity model for
imports and exports. Brunei’s trade with ASEAN countries was assumed to be determined by
among other things, the per capita real GDP of Brunei, per capita real GDP of each ASEAN
country, the population of Brunei, the population of each ASEAN country; distance, historical
connections through British colonial rule, common culture and religion; Thailand factor (for
imports only) and a trend variable. The gravity bilateral trade model was estimated for the
period 1970 to 2000 (31 years). Due to some missing data (especially for Vietnam), 203 cases
of panel data were examined instead of the expected 279 cases (31 years multiplied by nine
countries).
The import and export gravity models were expressed in general form, as follows:
IMPORT = f (PCBRUGDP, PCASEGDP, BRUPOP, ASEPOP, DISTANCE, BRITISH,
CULTURE, THAILAND, TREND)
EXPORT = f (PCBRUGDP, PCASEGDP, BRUPOP, ASEPOP, DISTANCE, BRITISH,
CULTURE, TREND)
where IMPORT was the real value of total annual merchandise import trade between Brunei
and a particular ASEAN member j, in millions of Brunei dollars (B$);
EXPORT was the real value of total annual merchandise export trade between Brunei and a
particular ASEAN member j, in B$Million;
PCBRUGDP was the per capita real gross domestic product of Brunei, measured in B$;
PCASEGDP was the per capita real gross domestic product of each ASEAN member, initially
valued in US dollars, and then converted to B$;
BRUPOP was the population of Brunei;
ASEPOP was the population of the particular ASEAN member country;
DISTANCE was the distance in kilometres between Brunei and capital city of ASEAN
member;
BRITISH was a dummy variable, representing ASEAN members who were once under British
colonial rule; a value of 1 denoted Malaysia and Singapore, and zero was used for the
remaining seven members of ASEAN;
CULTURE was a dummy variable, representing ASEAN members who shared a common
language and religion with Brunei, i.e., Bahasa Melayu and Islam; a value of 1 denoted
Malaysia and Indonesia, and zero for the remaining seven members of ASEAN;
THAILAND was a dummy variable which was only included in the IMPORT gravity model.
It represented the special import agreement between Brunei and Thailand for rice and sugar. A
value of 1 denotes Thailand, and zero for the remaining eight members of ASEAN;
TREND was a trend variable, with 1 for 1970, increasing by one for each year till 31 for 2000.
This trend variable was used to capture any sustained increase or decrease in total bilateral
trade flow not covered by other variables in the model.
72
The two empirical gravity models expressed in natural logarithmic forms are specified below:
LIMPORT = B0 + B1 LPCBRUGDP + B2 LPCASEGDP + B3 LBRUPOP + B4 LASEPOP
+B5 LDISTANCE + B6 BRITISH + B7 CULTURE + B8 THAILAND + B9 TREND + U and
LEXPORT = C0 + C1 LPCBRUGDP + C2 LPASEGDP + C3 LBRUPOP + C4 LASEPOP +
C5 LDISTANCE + C6 BRITISH + C7 CULTURE + C8 TREND + V
where LIMPORT, LEXPORT, LPCBRUGDP, LPCASEGDP, LBRUPOP, LASEPOP,
LDISTANCE were the natural logarithms of IMPORT, EXPORT, PCBRUGDP, PCASEGDP,
BRUPOP, ASEPOP and DISTANCE respectively; Bi and Cj (i = 0,1,2,3,4,5,6,7,8,9) were the
parameters to be estimated; and U and V were the error terms.
The combined cross-sectional time-series data involving nine countries and a period of thirty-
one years constituted panel data. It is now well established that ordinary least squares (OLS)
estimation of panel data often leads to biased estimates because it assumes a single set of slope
coefficients and one overall intercept (Hall and Cummins, 1999; Gujarati, 2003). Panel data
regression estimation procedures account for both fixed and random effects. The fixed effect
model is based on the assumption that there are common slopes but that each cross section unit
(for example, a nation) has its own unique intercept. The random effect model is based on the
assumption that the intercepts are drawn from a common distribution with a mean and constant
variance. It is estimated based on the generalised least squares (GLS) method. Gujarati (2003,
Chapter 16) provides information about several variations of both fixed effect and random
effect models. Greene (2000, Chapter 14) discusses various methods for estimating panel data
models when dynamics are introduced into these models. The OLS method was initially used
for the estimation of the import and export gravity models. We then estimated the fixed effect
and random effect gravity models based on GLS procedures using the Time Series Processor
(TSP) software (Hall and Cummins, 1999).
3.2. Data and Data Sources
Most of the data were obtained from secondary sources, such as various issues of the Brunei
Darussalam Statistical Yearbook published by the Department of Economic Planning and
Development, Government of Brunei, and the International Financial Statistics Yearbook,
published by the International Monetary Fund. We also sourced other macroeconomic data on
ASEAN countries including Brunei from the Internet at the ASEAN Secretariat home page at
www.aseansec.org. Due to unavailability of data for Vietnam, some data for that country were
individually sourced from the Socialist Republic of Vietnam Statistical Yearbook (1996
edition) published by the Statistical Publishing House of Vietnam for the period between 1990
and 1996. In order to calculate the real GDP values of the ASEAN countries in Brunei dollars,
their real GDP values were converted from their local currency into US dollars, and then
converted again into the Brunei dollars using the relevant annual exchange rates for Brunei and
the United States. Other data such as the distance between Brunei and the capital city of the
ASEAN countries were taken from the World Book Encyclopedia 2002 Edition Interactive
CD-ROM.
73
4. Results of the Analysis
4.1. Simple Statistical Analysis of Trade Flows Between Brunei and ASEAN Countries
Table 1 shows the average annual export, import, total merchandise trade, and balance of trade
between Brunei and each of the nine other individual members of ASEAN, in B$Million.
Thailand was Brunei’s most important trading partner. The total trade between Brunei and
Thailand was worth B$1194.57 million in 2000. One reason for the strong Brunei-Thailand
trade was the special government-to-government agreement between the two countries for the
importation of rice and sugar by Brunei from Thailand. The other major trading partners of
Brunei for the year 2000 were Singapore, Malaysia and Indonesia in order of importance. Each
of these three countries had total trade with Brunei exceeding B$80 million. The least
significant ASEAN countries in terms of total trade were Myanmar, Cambodia and Laos, all
relatively new members of ASEAN. Brunei’s total annual exports, imports, total trade, and
balance of trade with all the ASEAN countries combined, from 1970 to 2000, are shown in
Table 2. During the 1990s, Brunei experienced balance of trade deficits with ASEAN as a
whole. This was the period of relatively low world oil prices. However during the 1970s and
1980s, Brunei had large trade surpluses with ASEAN. The 1970s and 1980s were associated
with high world oil prices.
4.2. Brunei’s Composition of Trade with ASEAN
Table 3 indicates Brunei’s exports to other ASEAN members as percentages of the country’s
total exports worldwide, based on various commodity groups from 1970 to 2000. These results
demonstrated that ASEAN was by far the most important destination for Brunei’s exports for
all commodity groups, except oil and gas products, throughout the period, 1970 to 2000.
Another exception involved the miscellaneous manufactured articles group for the period,
1990 to 2000. The prominence of ASEAN as a destination for Brunei’s exports of
miscellaneous manufactured articles (mainly garments) declined sharply during the 1990 to
2000 period. This was the period that Brunei started to export relatively large quantities of
garments to the United States and the European Union. Garments now account for about 5% of
Brunei’s total actual exports with most of these exports going to the United States
(Government of Brunei Darussalam, 2003). The importance of ASEAN as a destination of
Brunei’s oil and gas exports had gradually declined mainly due to the fact that several ASEAN
countries also produced oil and gas products.
Table 4 shows Brunei’s imports from ASEAN as percentages of Brunei’s total imports
worldwide based on various commodity groups from 1970 to 2000. Similar to the results
shown for exports, ASEAN members were the dominant source of Brunei’s imports for all
commodity groups except manufactured goods, machinery and equipment, miscellaneous
manufactured items and other miscellaneous items as a group during the entire 1970 to 2000
period. The relatively low importance of ASEAN as the source of Brunei’s imports of
manufactured goods and equipment (commodity groups 6 to 8) was due to the importance of
other countries such as Japan, the European Union and the United States as leading producers
of these goods. In the most recent period, 1990 to 2000, ASEAN had emerged as a major
source of imported manufactured goods and miscellaneous manufactured items to Brunei.
Nevertheless even for this period, ASEAN was a far less important source of Brunei’s
imported machinery and equipment. Another finding was that ASEAN was the dominant
source of Brunei’s imports of agricultural-related goods such as food and live animals, animal
and vegetable oils and inedible crude materials. This would suggest that for relatively
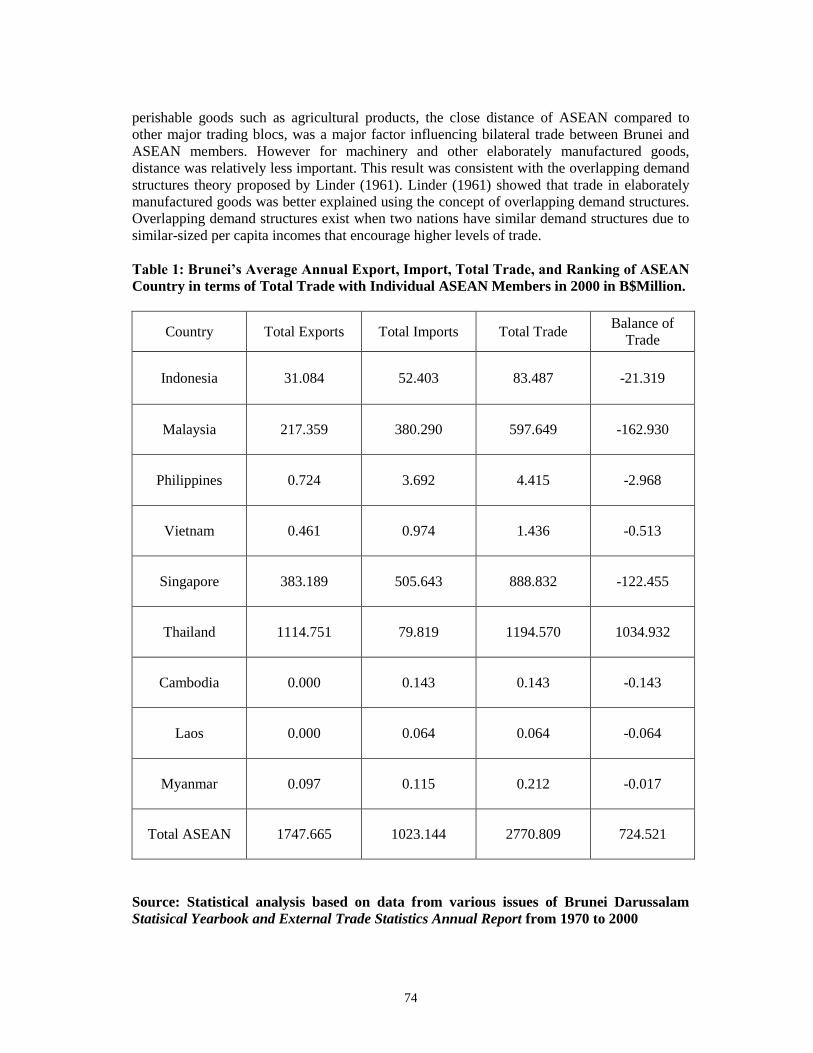
74
perishable goods such as agricultural products, the close distance of ASEAN compared to
other major trading blocs, was a major factor influencing bilateral trade between Brunei and
ASEAN members. However for machinery and other elaborately manufactured goods,
distance was relatively less important. This result was consistent with the overlapping demand
structures theory proposed by Linder (1961). Linder (1961) showed that trade in elaborately
manufactured goods was better explained using the concept of overlapping demand structures.
Overlapping demand structures exist when two nations have similar demand structures due to
similar-sized per capita incomes that encourage higher levels of trade.
Table 1: Brunei’s Average Annual Export, Import, Total Trade, and Ranking of ASEAN
Country in terms of Total Trade with Individual ASEAN Members in 2000 in B$Million.
Country Total Exports Total Imports Total Trade Balance of
Trade
Indonesia 31.084 52.403 83.487 -21.319
Malaysia 217.359 380.290 597.649 -162.930
Philippines 0.724 3.692 4.415 -2.968
Vietnam 0.461 0.974 1.436 -0.513
Singapore 383.189 505.643 888.832 -122.455
Thailand 1114.751 79.819 1194.570 1034.932
Cambodia 0.000 0.143 0.143 -0.143
Laos 0.000 0.064 0.064 -0.064
Myanmar 0.097 0.115 0.212 -0.017
Total ASEAN 1747.665 1023.144 2770.809 724.521
Source: Statistical analysis based on data from various issues of Brunei Darussalam
Statisical Yearbook and External Trade Statistics Annual Report from 1970 to 2000
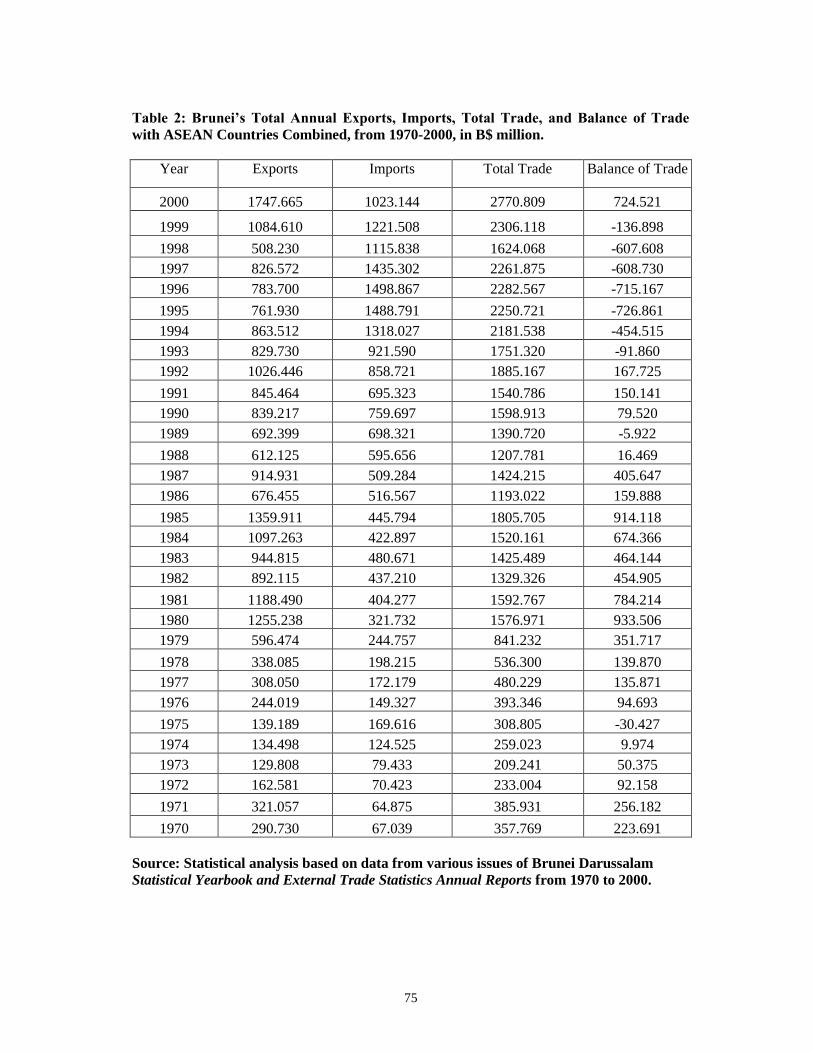
75
Table 2: Brunei’s Total Annual Exports, Imports, Total Trade, and Balance of Trade
with ASEAN Countries Combined, from 1970-2000, in B$ million.
Year Exports Imports Total Trade Balance of Trade
2000 1747.665 1023.144 2770.809 724.521
1999 1084.610 1221.508 2306.118 -136.898
1998 508.230 1115.838 1624.068 -607.608
1997 826.572 1435.302 2261.875 -608.730
1996 783.700 1498.867 2282.567 -715.167
1995 761.930 1488.791 2250.721 -726.861
1994 863.512 1318.027 2181.538 -454.515
1993 829.730 921.590 1751.320 -91.860
1992 1026.446 858.721 1885.167 167.725
1991 845.464 695.323 1540.786 150.141
1990 839.217 759.697 1598.913 79.520
1989 692.399 698.321 1390.720 -5.922
1988 612.125 595.656 1207.781 16.469
1987 914.931 509.284 1424.215 405.647
1986 676.455 516.567 1193.022 159.888
1985 1359.911 445.794 1805.705 914.118
1984 1097.263 422.897 1520.161 674.366
1983 944.815 480.671 1425.489 464.144
1982 892.115 437.210 1329.326 454.905
1981 1188.490 404.277 1592.767 784.214
1980 1255.238 321.732 1576.971 933.506
1979 596.474 244.757 841.232 351.717
1978 338.085 198.215 536.300 139.870
1977 308.050 172.179 480.229 135.871
1976 244.019 149.327 393.346 94.693
1975 139.189 169.616 308.805 -30.427
1974 134.498 124.525 259.023 9.974
1973 129.808 79.433 209.241 50.375
1972 162.581 70.423 233.004 92.158
1971 321.057 64.875 385.931 256.182
1970 290.730 67.039 357.769 223.691
Source: Statistical analysis based on data from various issues of Brunei Darussalam
Statistical Yearbook and External Trade Statistics Annual Reports from 1970 to 2000.
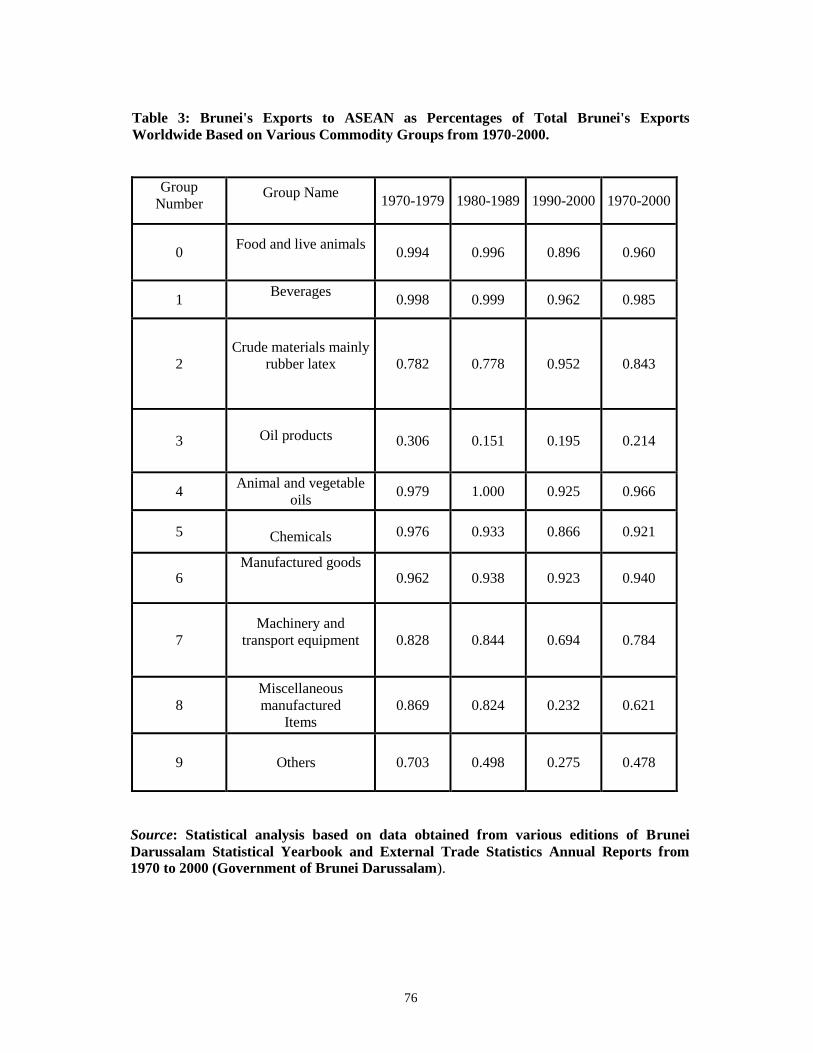
76
Table 3: Brunei's Exports to ASEAN as Percentages of Total Brunei's Exports
Worldwide Based on Various Commodity Groups from 1970-2000.
Group
Number
Group Name
1970-1979 1980-1989 1990-2000 1970-2000
0 Food and live animals
0.994 0.996 0.896 0.960
1 Beverages
0.998 0.999 0.962 0.985
2
Crude materials mainly
rubber latex
0.782 0.778 0.952 0.843
3
Oil products
0.306 0.151 0.195 0.214
4 Animal and vegetable
oils 0.979 1.000 0.925 0.966
5
Chemicals
0.976 0.933 0.866 0.921
6 Manufactured goods
0.962 0.938 0.923 0.940
7
Machinery and
transport equipment
0.828 0.844 0.694 0.784
8
Miscellaneous
manufactured
Items
0.869 0.824 0.232 0.621
9
Others
0.703 0.498 0.275 0.478
Source: Statistical analysis based on data obtained from various editions of Brunei
Darussalam Statistical Yearbook and External Trade Statistics Annual Reports from
1970 to 2000 (Government of Brunei Darussalam).
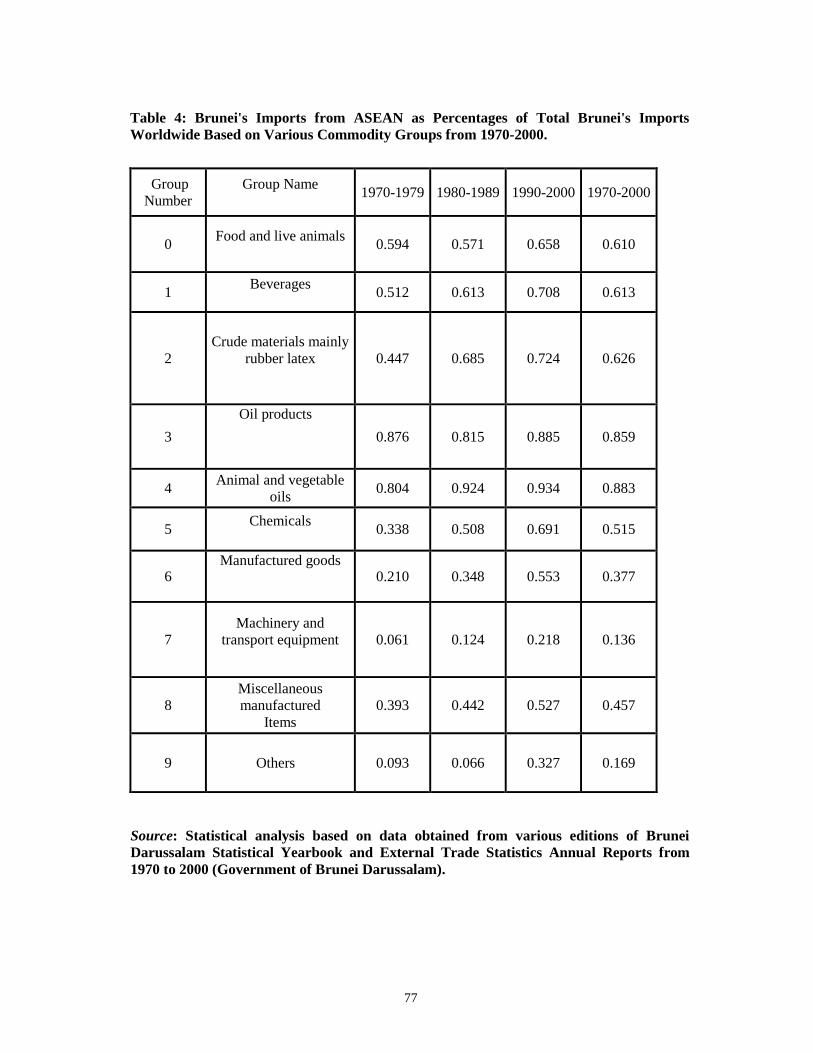
77
Table 4: Brunei's Imports from ASEAN as Percentages of Total Brunei's Imports
Worldwide Based on Various Commodity Groups from 1970-2000.
Group
Number
Group Name
1970-1979 1980-1989 1990-2000 1970-2000
0 Food and live animals
0.594 0.571 0.658 0.610
1 Beverages
0.512 0.613 0.708 0.613
2
Crude materials mainly
rubber latex
0.447 0.685 0.724 0.626
3
Oil products
0.876 0.815 0.885 0.859
4 Animal and vegetable
oils 0.804 0.924 0.934 0.883
5 Chemicals
0.338 0.508 0.691 0.515
6 Manufactured goods
0.210 0.348 0.553 0.377
7
Machinery and
transport equipment
0.061 0.124 0.218 0.136
8
Miscellaneous
manufactured
Items
0.393 0.442 0.527 0.457
9
Others
0.093 0.066 0.327 0.169
Source: Statistical analysis based on data obtained from various editions of Brunei
Darussalam Statistical Yearbook and External Trade Statistics Annual Reports from
1970 to 2000 (Government of Brunei Darussalam).
78
Table 5 shows the relative importance of ASEAN as a destination for Brunei’s exports and as a
source of Brunei’s imports compared to the other major trading blocs in the world: EU, APEC
and North America (United States and Canada). Overall, APEC was clearly the most important
trading partner of Brunei for both imports and exports. The importance of ASEAN as a source
of imports into Brunei had steadily increased from the 1970s to the 1990s. ASEAN accounted
for about 44.2% of Brunei’s total imports compared to 80.2% for APEC over the recent period,
1990 to 2000. For total exports, the relative importance of ASEAN as a destination for
Brunei’s exports had fluctuated over the period, 1970 to 2000. ASEAN accounted for only
22.5% of total Brunei’s exports compared to 98.6% for APEC over the most recent period,
1990 to 2000. Most of the key members of ASEAN are also members of APEC. Hence it
could be argued that non-ASEAN APEC countries such as Japan, Korea, China and the United
States have emerged in recent times as the dominant destinations for Brunei’s exports.
Tables 6 and 7 provide a summary of the results for the estimated log-linear gravity equations
for imports and exports respectively, based on the fixed effect panel data model, estimated by
the GLS method. The fixed effect equations were superior to the random effect equations (for
both imports and exports) based on the Hausman specification test (Hausman, 1978; Gujarati,
2003, p. 651). For the LIMPORT model, the statistically significant determinants of the level
of imports into Brunei were: the real GDP of the ASEAN member country (LASEGDP), the
population of the particular ASEAN country (LASEPOP), the common historical British
connection Brunei had with ASEAN (BRITISH), the cultural connection Brunei shares with
ASEAN countries based on the same religion and language (CULTURE), and the variable
THAILAND (refer to Table 6). These five factors influenced the flow of imports into Brunei
in a positive sense, except for the variable, CULTURE. This indicated that, assuming
everything else constant, Brunei imported significantly less from countries that it shared the
same religion and “vernacular” language. This result appeared to be in conflict with the
expectation that language played a role as an important controlling factor in accelerating trade
flows among nations. The nature of this result might be due to the predominance of English as
the business language in the ASEAN region rather than Malay. The distance variable was not
statistically significant suggesting that distance was not an important factor when Brunei’s
firms chose to import items from the ASEAN region.
For the LEXPORT model, the statistically significant factors were LASEPOP, DISTANCE,
BRITISH, CULTURE (refer to Table 7). LASEPOP and BRITISH influenced export flows
from Brunei to ASEAN in a positive sense while LDISTANCE and CULTURE influenced
export trade flows in the negative sense. These results generally conformed to the theoretical
expectation based on the gravity model. Population of ASEAN countries exerted strong
gravity pull in terms of attracting Brunei’s exports to other ASEAN countries. The negative
sign for the distance variable implied that Brunei exported more intensively to ASEAN
member countries which are of close proximity ceteris paribus. The distance impact clearly
illustrated one of the basic underpinnings of gravity models that countries would export traded
items to those that are closer to them. The British colonial connection Brunei had with some
ASEAN countries, Singapore and Malaysia, was an important positive factor influencing
exports from Brunei to those countries. Brunei, Malaysia and Singapore were governed as a
common entity by the British authorities for several decades. Several common institutional
networks established under colonial rule that aided trade flows remained.
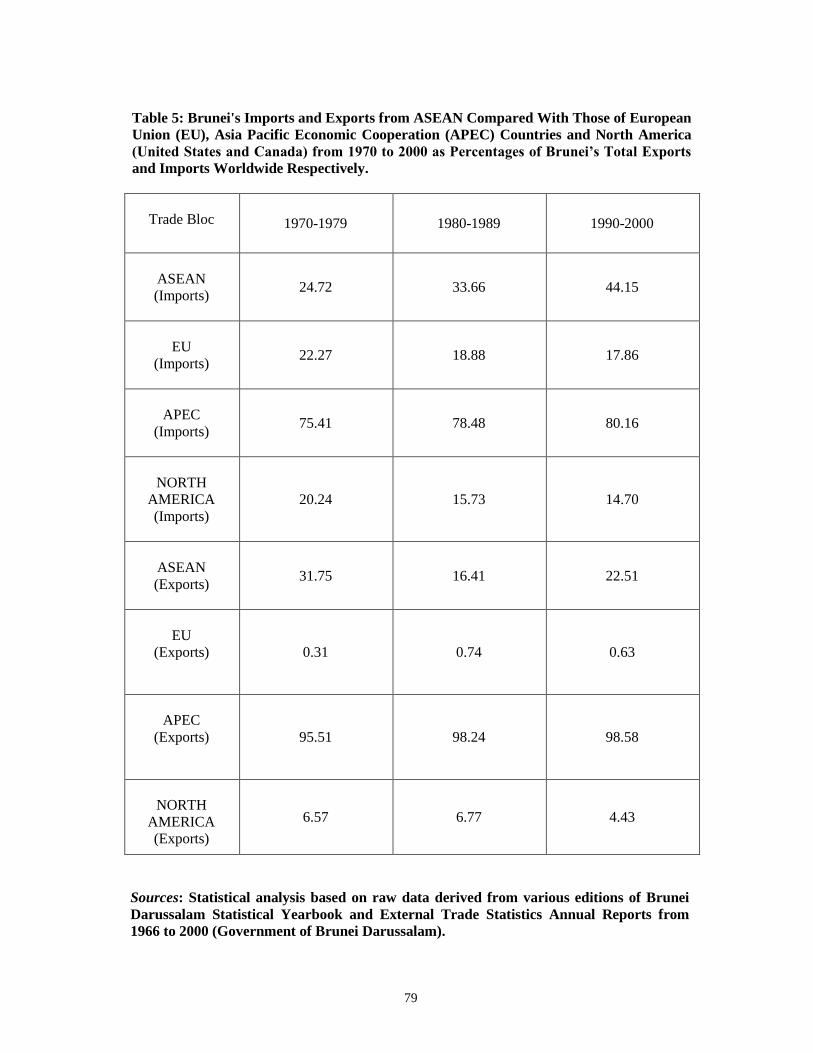
79
Table 5: Brunei's Imports and Exports from ASEAN Compared With Those of European
Union (EU), Asia Pacific Economic Cooperation (APEC) Countries and North America
(United States and Canada) from 1970 to 2000 as Percentages of Brunei’s Total Exports
and Imports Worldwide Respectively.
Trade Bloc 1970-1979 1980-1989 1990-2000
ASEAN
(Imports)
24.72 33.66 44.15
EU
(Imports)
22.27 18.88 17.86
APEC
(Imports)
75.41 78.48 80.16
NORTH
AMERICA
(Imports)
20.24 15.73 14.70
ASEAN
(Exports)
31.75 16.41 22.51
EU
(Exports)
0.31 0.74 0.63
APEC
(Exports)
95.51 98.24 98.58
NORTH
AMERICA
(Exports)
6.57 6.77 4.43
Sources: Statistical analysis based on raw data derived from various editions of Brunei
Darussalam Statistical Yearbook and External Trade Statistics Annual Reports from
1966 to 2000 (Government of Brunei Darussalam).
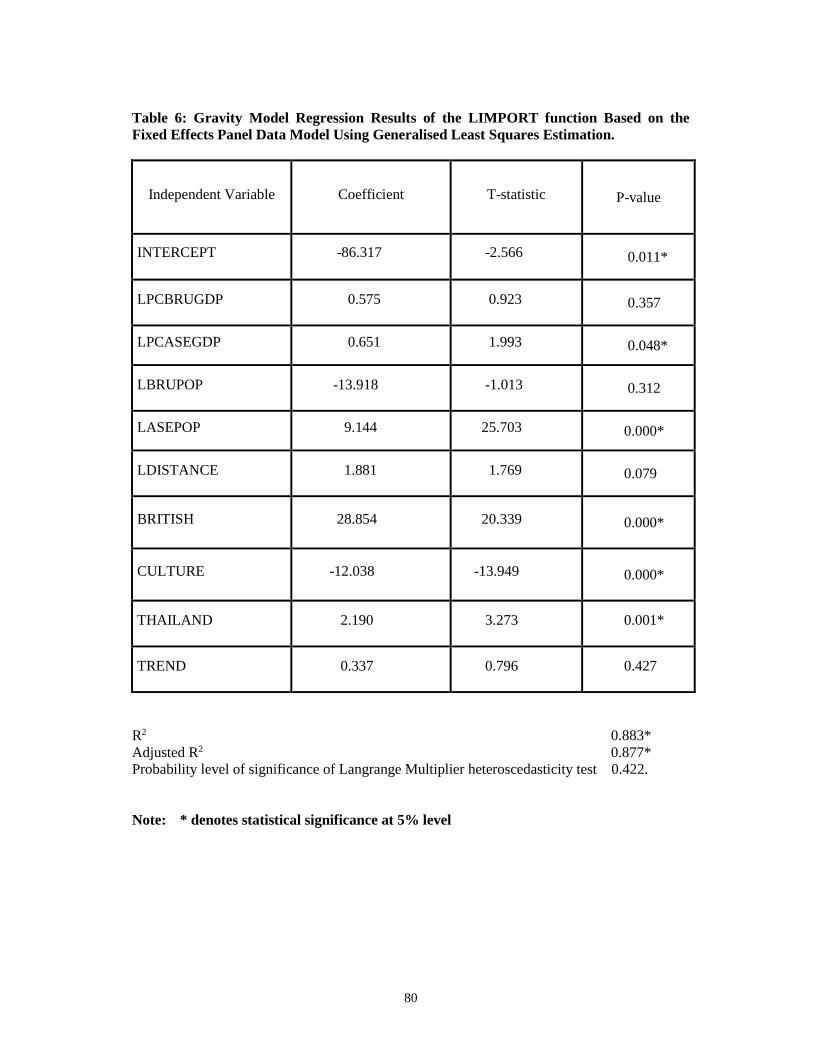
80
Table 6: Gravity Model Regression Results of the LIMPORT function Based on the
Fixed Effects Panel Data Model Using Generalised Least Squares Estimation.
Independent Variable Coefficient T-statistic P-value
INTERCEPT -86.317 -2.566 0.011*
LPCBRUGDP 0.575 0.923 0.357
LPCASEGDP 0.651 1.993 0.048*
LBRUPOP -13.918 -1.013 0.312
LASEPOP 9.144 25.703 0.000*
LDISTANCE 1.881 1.769 0.079
BRITISH 28.854 20.339 0.000*
CULTURE -12.038 -13.949 0.000*
THAILAND 2.190 3.273 0.001*
TREND 0.337 0.796 0.427
R2 0.883*
Adjusted R2 0.877*
Probability level of significance of Langrange Multiplier heteroscedasticity test 0.422.
Note: * denotes statistical significance at 5% level
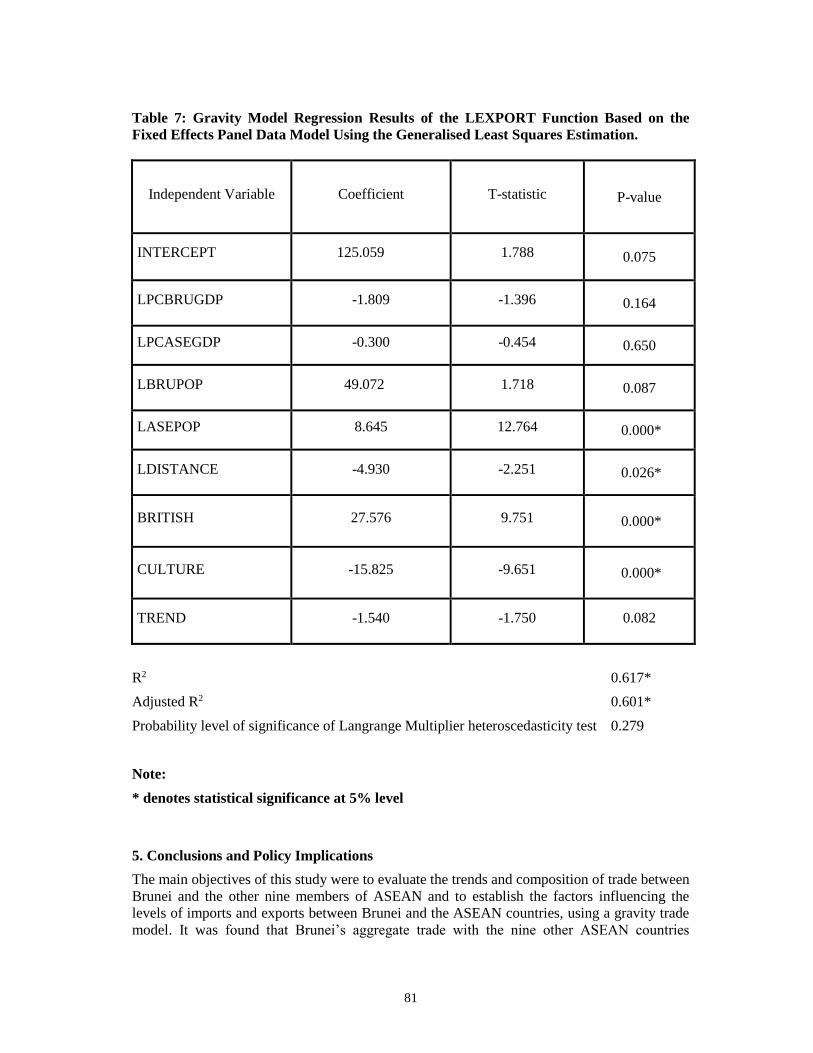
81
Table 7: Gravity Model Regression Results of the LEXPORT Function Based on the
Fixed Effects Panel Data Model Using the Generalised Least Squares Estimation.
Independent Variable Coefficient T-statistic P-value
INTERCEPT 125.059 1.788 0.075
LPCBRUGDP -1.809 -1.396 0.164
LPCASEGDP -0.300 -0.454 0.650
LBRUPOP 49.072 1.718 0.087
LASEPOP 8.645 12.764 0.000*
LDISTANCE -4.930 -2.251 0.026*
BRITISH 27.576 9.751 0.000*
CULTURE -15.825 -9.651 0.000*
TREND -1.540 -1.750 0.082
R2 0.617*
Adjusted R2 0.601*
Probability level of significance of Langrange Multiplier heteroscedasticity test 0.279
Note:
* denotes statistical significance at 5% level
5. Conclusions and Policy Implications
The main objectives of this study were to evaluate the trends and composition of trade between
Brunei and the other nine members of ASEAN and to establish the factors influencing the
levels of imports and exports between Brunei and the ASEAN countries, using a gravity trade
model. It was found that Brunei’s aggregate trade with the nine other ASEAN countries
82
showed persistent deficits against Brunei in the 1990s when world oil prices were relatively
low. In the 1970s and 1980s, with relatively high world oil prices, Brunei had strong balance
of trade surpluses with ASEAN as a whole. Export flows from Brunei to the ASEAN member
countries was driven by the population of the ASEAN member countries, the distance between
Brunei and the ASEAN member countries, the historical British connection of the ASEAN
member countries and also the cultural similarities between Brunei and the ASEAN member
countries. On the other hand, import flows were driven by the per capita GDP of the ASEAN
country, the population of the ASEAN member country, the historical British connection of
the ASEAN member countries, the cultural similarities between Brunei and the ASEAN
member countries and the THAILAND factor.
Despite its small size, Brunei is an important player in trade relationships among the ASEAN
member countries. During the 1999-2000 period, Brunei’s annual total merchandise trade with
the other ASEAN member countries averaged about B$2085.5 million, about 30% of Brunei’s
average annual GDP during that period (B$7000.9 million). In general, Brunei’s trade
relationships with ASEAN are important especially in the area of imports. However Brunei has
been exporting much more to other countries especially in the non-ASEAN APEC region and
relatively less to ASEAN countries. This implies that in the pursuit of its economic
diversification programme, the Brunei Government should continue to search for more trading
partners especially for its exports outside ASEAN. This is due to the fact the major ASEAN
countries are direct competitors to Brunei for both oil and non-oil exports. Brunei also needs to
explore ways for expanding export trade to ASEAN members other than Thailand, Singapore,
Malaysia and Indonesia, its current main ASEAN trading partners. In particular, special steps
may need to be taken by the Brunei government to expand Brunei’s trade with the Philippines
and Vietnam, two relatively large ASEAN economies, especially in the area of exports.
One of the main objectives of ASEAN was to increase economic cooperation between its
members. AFTA was further introduced to increase economic integration among ASEAN
members. As the number of ASEAN members has increased over the past few years, the
organisation has become one of the major economic players in the world. Brunei’s bilateral
trade with the ASEAN member countries is more likely to be driven by economic growth in
ASEAN countries. The complete removal of tariffs on goods across ASEAN as envisaged
under AFTA will help Brunei to reduce the costs of its imports given the role of ASEAN as a
major source of Brunei’s imports. Finally, a policy implication derived from this study is the
need for Brunei to establish more government-to-government trading agreements with member
countries of ASEAN for the importation of selected items. The special agreement between
Brunei and Thailand dealing with the importation of rice and sugar has assured continuous
supply of these essential items at relatively lower cost contributing to the large bilateral trade
surpluses in favour of Brunei.
Notes
i See www.brudirect.com/IFC/International_Financial_Centre.htm
iiSee ASEAN website at http://www.aseansec.org.
83
iii For more in-depth discussions on AFTA, see Kao, K.H and Kanter, S (Eds.) (1997), ASEAN
Free Trade Agreement: Implications and Future Directions, London: ASEAN Academic Press
iv See http://www.usaengage.org/archives/legislative/it/itcellio.html
Acknowledgements
We thank officials of the Department of Economic Planning and Development, Brunei for the
supply of detailed export and import data. This paper is the seventh and last publication of a
special research project entitled “Analysis of Merchandise Exports and Imports in Brunei
Darussalam” undertaken during the period, August 1998 to August 2003 at the Department of
Economics, Faculty of Business, Economics and Policy Studies, Universiti Brunei
Darussalam. We thank Samantha Marsha Buffong and Tuty Hallawaty Mahmod for their
contributions in the area of data collection and data entry and the Universiti Brunei
Darussalam for support and resources to undertake the study.
References
Anaman, K.A. and S.M. Buffong (2001). “Analysis of the Determinants of Aggregate Import
Demand in Brunei Darussalam from 1964 to 1997”, Asian Economic Journal, 15(1): 61-70.
Anaman, K. A. and L.H.S. Al-Kharusi (2003). “An Analysis of Trade Flows between Brunei
Darussalam and the European Union”, ASEAN Economic Bulletin, 20(1): 60-72.
Anaman, K. A. and T.H. Mahmod (2003). “Determinants of the Supply of Non-Oil Exports in
Brunei Darussalam”, ASEAN Economic Bulletin, 20(2): 119-132.
Anderson, J.E. (1979). “A Theoretical Foundation for the Gravity Equation”, American Economic
Review, 69: 106-116.
Bergstrand, J. H. (1985). “The Gravity Equation in International Trade: Some Microeconomic
Foundations and Empirical Evidence”, Review of Economics and Statistics, 67: 474-480.
Buffong, S.M. and K.A. Anaman (1999). "Analysis of the Sources and Composition of Imports
and Demand for Major Categories of Imports in Brunei Darussalam", Southeast Asia: A
Multidisciplinary Journal, 1 & 2: 71-85.
Chin, Y.M. and K. A. Anaman (2002). “Bilateral Merchandise Trade Between Brunei Darussalam
and the United States of America”, Readings on the Economy of Brunei Darussalam, 2: 376-394.
Chwo-Ming, J.Y. and Zietlow, D.S. (1995). “The Determinants of Bilateral Trade Among Asia-
Pacific Countries”, ASEAN Economic Bulletin, 11 (1995): 198-305.
Deardorff, A. (1998). “Determinants of Bilateral Trade: Does Gravity Work in a Frictionless
Model?”, In Frankel, J. (ed.), The Regionalisation of the World Economy, Chicago: University
of Chicago Press, 7-28.
Duraman, I. and J. Asafu-Adjaye (1999). "An Economy-Wide Model of Brunei: Theory, Data
and Application", Tinjauan: Policy and Management Review, 3: 1-20.
Durbin, J. and G.S. Watson (1951). "Testing for Serial Correlation in Least-Squares
Regressor", Biometrika, 38: 159-171.
Feenstra, R.C., J.R. Markusen and A.K. Rose (2001). “Using the Gravity Equation to
Differentiate Among Alternative Theories of Trade”, Canadian Journal of Economics, 34:
430-447.
Greene, W.H. (2000). Econometric Analysis, Fourth Edition, New York: Prentice-Hall.
Government of Brunei Darussalam (2001). Brunei Darussalam: Eighth National Development
Plan 2001-2005, Bandar Seri Begawan: Department of Economic Planning and Development,
228 pp.
84
Government of Brunei Darussalam (2002). Brunei Statistical Yearbook 2000-2001, Bandar
Seri Begawan: Department of Economic Planning and Development.
Government of Brunei Darussalam (2003). Brunei Statistical Yearbook 2002, Bandar Seri
Begawan: Department of Economic Planning and Development.
Greene, W.H. (2000). Econometric Analysis, Fourth Edition, London: Prentice Hall
International, 1004 pp.
Gujarati, N. (2003). Basic Econometrics, Fourth Edition, London: McGraw-Hill, 1002 pp.
Hall, B.H. and C. Cummins (1999). Time Series Processor Version 4.5: User's Guide
Including an Introductory Guide, Palo Alto, California: TSP International.
Hanink, D.M (1994). The International Economy: A Geographical Perspective, New York:
John Wiley & Sons, Inc, 247 pp.
Hausman, J.A. (1978). “Specification Tests in Econometrics”, Econometrica, 46:1251-1271.
Hellvin, L. and L. Nilsson (2000). Trade Flows Between Trading Blocs: The Case of the EU’s
Trade with Asia and NAFTA, Stockholm, Sweden: Ministry of Foreign Affairs
Linder, S.B. (1961). An Essay on Trade and Transformation, New York: Wiley.
Linder, S.B. (1967). Trade and Trade Policy for Development, London: Pall Mall Press.
Mahmod, T.H. and K.A. Anaman (2001). “A Study of the Composition and Destination of
Non-Oil Exports in Brunei”, Journal of International Marketing and Exporting, 6: 47-57.
Tinbergen, J. (1962). Shaping the World Economy: Suggestions for an International Economic
Policy, New York: The Twentieth Century Fund.
Todaro, M.P. (2000). Economic Development, 7th Edition, New York: Addison-Wesley.
United Nations Development Programme (UNDP) (2003). Human Development Report: Human
Development Index, New York: UNDP.
Internet References
(1) Theory of Comparative Advantage- An Overview
http://internationalcon.com/v1.0/40c000.html
(2) On Theories explaining the success of gravity models
http://www.ecoutexas.edu/~keller/sw-abstarct.html
Kalbasi, H., The Gravity Model and Global Trade Flows
http://ecomod.net/conferences/ecomod2001/papers-web/kalbasi.pdf
85
CHAPTER 6
ECONOMIC ANALYSIS OF ADOPTION AND USE
OF INTERNET SERVICES BY HOUSEHOLDERS
IN BANDAR SERI BEGAWAN
KARTINI KABRI, KWABENA A. ANAMAN,
ISMAIL DURAMAN & ROSNAH OPAI
Abstract
We established the major factors influencing the use of internet services based on a random
sampling survey of 114 households involving 189 residents in Mukim Sengkurong, a suburb of
Bandar Seri Begawan, the capital city of Brunei Darussalam. Our analysis identified factors
affecting intensity of internet usage by current users at home, school, workplace and
commercial internet centres (internet cafes). The results indicated that about 67% of
households used internet services. The likelihood of using internet services increased with
longer experience using computers, younger age, higher family incomes and the ability to read
and write English. Males were more likely to use internet than women. The intensity or level
of use of internet services was positively related to internet monthly charges, household
income and the level of education.
1. Introduction
Advancements in telecommunication and computer technologies have led to widespread use of
computer-related information services around the world. The use of computer-related services
has become part and parcel of the working and learning environment and social interactions
among people not only locally but also internationally. The mode of operations of businesses
has drastically changed with modern tools of information communication technology (ICT)
taking over the conventional way of marketing products to potential customers. The
development of the internet has accelerated the pace of communication among householders
and businesses around the world. The use of internet has spread across different groups of
society. As long as one is linked to the world-wide info-communication structure provided by
licensed organisations, one is eligible to access internet services around the world. This allows
one to become a citizen of this information-based invisible world.
A major reason for increasing internet usage is the decreasing costs of connection and usage.
This factor has motivated firms to begin advertising and promoting their products in a more
aggressive way using the internet. Non-business people make use of the internet for other
reasons such as sending and receiving messages and acquiring new information. The
development of what is now called the Information Age based on the internet has impacted the
development of every country. Knowledge, particularly scientific and technological know-
how, has become the key strategic resource that shapes the form and structure of economic
86
growth. Therefore lack of or inadequate participation in the new global system of information
communication means that a community will be left behind the rest of the world. All countries
have responded to this challenge and joined this global information network.
Brunei Darussalam (hereafter Brunei) has a high per capita gross domestic product (GDP) and
a highly educated population. The incorporation of ICT as part of the development agenda of
Brunei is seen as a strategic move to accelerate the economic development of the country.
Being dependent on oil and gas as the main source of exports, Brunei has been trying to
diversify its economy for the past three decades (Government of Brunei Darussalam, 2001).
As part of the broad-based diversification programme of the country, greater emphasis has
been placed on enhancing efficiency and productivity of human resources through access and
use of ICT.
1.1. Historical Background of ICT Development in Brunei
Computers have been used in Brunei since the 1970s when Government departments replaced
the manual systems of implementation and management of population censuses, statistics, pay
rolls, payment of bills and land ownership information with computer-based systems. The
information technology programme (TEMA) was introduced for the civil service in 1995 and
the Information Technology Section in the Ministry of Finance was upgraded into a
department in January 1996 by merging it with the State Store Department into what is now
known as the Department of Information Technology and State Store (Government of Brunei
Darussalam, 2001).
The first Internet Service Provider (ISP) in Brunei was set up in August 1995. Known as the
BruNet (Brunei Network), this provided the gateway for businesses and the public to access
the world’s largest computer network, the Internet. In October 2000, another ISP known as
SimpurNet was launched. The number of Internet subscribers increased from 819 in 1995 to
13,860 in 1999 with the numbers of users expected to increase (Government of Brunei
Darussalam, 2001). As is the norm in other countries, home use of internet services requires
the availability of computers in the house. Many people in Brunei choose to use internet
services available through their workplace or at schools and educational centres. The setting
up of commercial internet centres in most urban areas of Brunei in the last five years has
popularised the use of internet services especially among the younger generation. Many
internet cafes offer cheaper prices for use of internet services than prices paid by subscribers of
monthly dial-up subscription services available through Jabatan Telekom Brunei (JTB) or DST
Communications.
Some internet cafes offer in-house games such as Counter Attack and Half Life. These in-
house games have helped to attract many students to these establishments. Some parents are
concerned about the possibility of such online game competitions promoting gambling which
may result in negative behaviour among the youth. Other concerns of parents and the
government include the misuse of the Internet for searching for pornographic material and
material related to anti-social behaviour such as racism. The introduction of three cents per
minute charge for local calls has led to a shift towards the increasing use of pre-paid internet
use cards such as Netkad. Inefficient provision of internet services has emerged as a major
problem in Brunei. This assertion is supported by many letters of complaints from local
citizens and internet users published in local newspapers on internet charges, accessing speed
and availability of these services.
87
As indicated earlier, the need for Brunei to promote economic diversification to reduce its
overdependence on the oil and gas sector has necessitated the expansion of tertiary services
related to ICT. This thrust in economic diversification is inevitable given the rapid
globalisation and expansion of free trade linked to the expansion of ICT services around the
world. Given the challenges of sluggish economic growth and increasing unemployment in
Brunei, the expansion of the ICT industry is crucial to help to achieve sustainable economic
growth and development.
An understanding of the factors influencing the use of internet services is therefore important
to help to remove or relax the constraints facing the ICT industry. We have carried out a study
of householders in a representative urban community in Brunei in order to ascertain the
intensity of use of internet services and establish the factors influencing the adoption of the
internet as a communication tool. By understanding the relevant factors influencing internet
adoption and the extent of its usage, we hope that we can provide information to policymakers
and businesses to accelerate the growth of ICT services in Brunei.
1.2. Objectives and Hypotheses of the Study
The main objectives of the study were to identify the socioeconomic factors influencing
adoption of internet by householders and to analyse the factors influencing the intensity of
internet use by current users (householders).
There are several hypotheses concerning the adoption and use of internet services by
householders in Brunei. The likelihood of use of internet services is related to socioeconomic
factors such as education, gender, age, household income, exposure to computers, occupation
and government policy. Residents with higher income are more likely to use internet services
due to increased earning power. Males are more likely to use internet than women because the
male literacy rate is higher than female literacy rate. Younger people are more likely to use
internet services than older people due to the higher exposure to computer-based education and
services. English literacy is an important factor in the adoption of internet since most computer
software use the English language as their medium of operation. In general, human capital
variables such as education and exposure to computers are likely to increase the adoption and
use of internet services.
The remainder of this paper is organised as follows: the next section deals with definition of
the internet and a summary of economic theories and models concerning internet. This is
followed by a discussion of the methods and procedures used for the study and specification of
models using econometric analysis. The results are then reported followed by the conclusions
and recommendations.
2. Literature Review
2.1. Definition of Internet
First conceived as an experiment in linking up of non-localized networks of computers for the
distribution of information by the United States (US) Department of Defense in the early
1960s, the internet is now a complex global communication tool (Ellsworth and Ellsworth,
1994). Anonymous (2001) indicates that the internet has the following three main
characteristics:
88
(a) a global information system that is logically linked together by a globally unique address
space based on the Internet Protocol (IP) and subsequent extensions;
(b) ability to support communications by using the Transmission Control Protocol/Internet
Protocol (TCP/IP) suite or other IP-compatible protocols;
(c) allows for high level services layered on communications and related infrastructure.
Services provided by the internet include electronic mail (E-mail) and Telnet and File Transfer
Protocol (FTP). E-mail is a low-cost method for communication based on exchanging text
messages with anyone who has an internet account. Large numbers of remote computers on
the internet can be connected with Telnet software to search for information. The function of
FTP is to obtain or send software and to copy files from one internet computer to another
(Ellsworth and Ellsworth, 1994).
2.2. Economic Theory of Demand for Internet Services
Demand is a schedule which indicates the various amounts of a product consumers are willing
and able to purchase at each price during a specified period of time (McConnell and Brue,
1996). Market demand can be shifted due to several factors such as given income, tastes or
preferences of consumers, prices of alternative goods, the number of consumers in the market
and consumer expectations about future prices and incomes.
Figure 1 illustrates the general case of a downward sloping demand curve of hours of internet
usage in relation to price changes. The demand curve shifts as a result of increase in income
level of household. The inverse relationship between the price and quantity demanded is
generally referred to as the law of demand. The underlying axiom behind the law of demand is
that a rational consumer will prefer more of a good thing to less of it. Hence if the price of
access to internet service (good) is lowered, this attracts more usage as more people are
attracted to use the service. The responsiveness of consumers to a change in price of a product
is measured by the price elasticity of demand. If demand for internet is inelastic, it means that
a 1% increase in internet access price leads to less than 1% decrease in the level of usage of
internet services ceteris paribus.
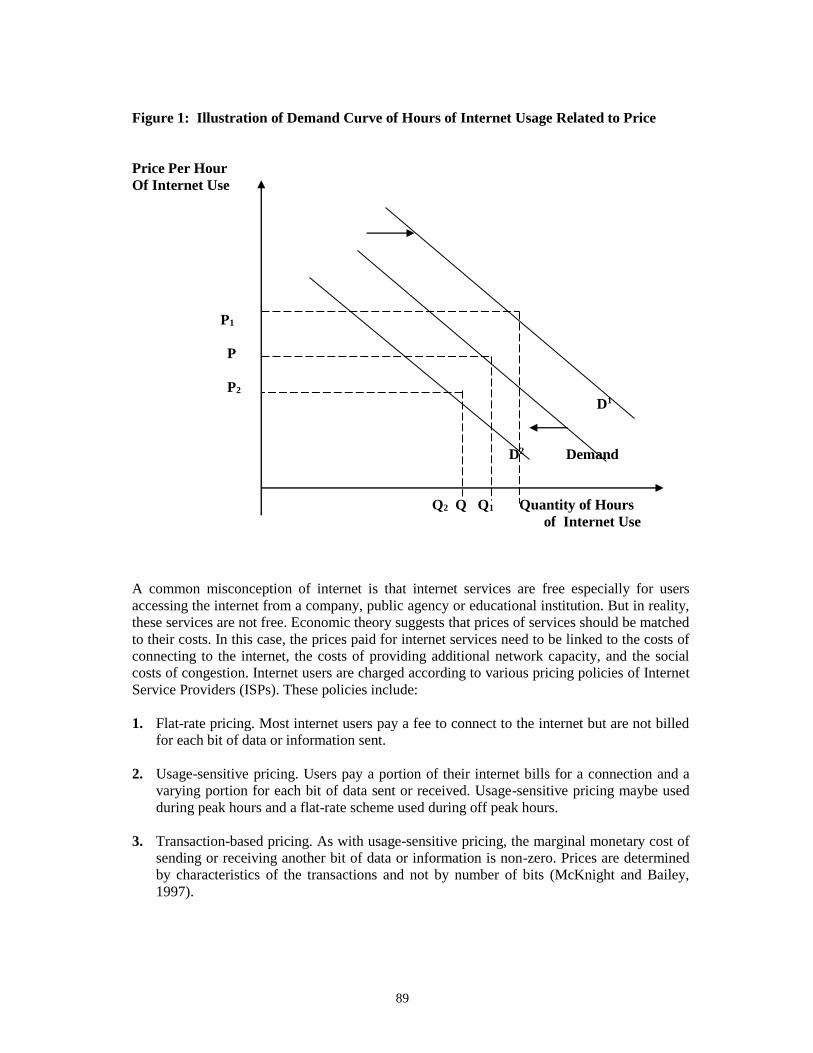
89
Figure 1: Illustration of Demand Curve of Hours of Internet Usage Related to Price
Price Per Hour
Of Internet Use
P1
P
P2
D1
D2 Demand
Q2 Q Q1 Quantity of Hours
of Internet Use
A common misconception of internet is that internet services are free especially for users
accessing the internet from a company, public agency or educational institution. But in reality,
these services are not free. Economic theory suggests that prices of services should be matched
to their costs. In this case, the prices paid for internet services need to be linked to the costs of
connecting to the internet, the costs of providing additional network capacity, and the social
costs of congestion. Internet users are charged according to various pricing policies of Internet
Service Providers (ISPs). These policies include:
1. Flat-rate pricing. Most internet users pay a fee to connect to the internet but are not billed
for each bit of data or information sent.
2. Usage-sensitive pricing. Users pay a portion of their internet bills for a connection and a
varying portion for each bit of data sent or received. Usage-sensitive pricing maybe used
during peak hours and a flat-rate scheme used during off peak hours.
3. Transaction-based pricing. As with usage-sensitive pricing, the marginal monetary cost of
sending or receiving another bit of data or information is non-zero. Prices are determined
by characteristics of the transactions and not by number of bits (McKnight and Bailey,
1997).
90
2.3. Economic Valuation of Internet Services
According to Asafu-Adjaye (2000), the hedonic price method can be used to derive values for
goods or services by using information from the market prices of close substitutes. This is
based on Lancaster consumption theory which assumes a good or service provides a bundle of
characteristics or attributes to the user (Lancaster, 1966). Given the indivisible but excludable
characteristics of most internet services, the quality of various attributes of internet services
determines their economic value to users.
We assume that an internet service is a product made up of several attributes such as speed,
price, level of privacy and accessibility. The decision making process of a potential user can be
envisioned as comparison of indirect utility functions based on the random utility theory.
Assume the conditional utility function for an internet service is given by Ui = U (Ai) where Ai
is a vector of attributes of an internet service. Attributes of an internet service include speed,
accessibility, price and privacy. The indirect utility function for an internet service can be
written as Vi = V(Ai, Pi, Y) where Pi and Y denote price of internet service and income of the
user respectively. The marginal rate of substitution (MRS) between two attributes r and s is
denoted in Equation 1 as follows:
MRS = (Vi/Ar) / (Vi/As) Equation 1
If one of the attributes is price (Pi), for example, attribute r, then the MRS is the marginal value
of the attribute s (say speed).
The individual consumer selects an internet service alternative that yields the highest indirect
utility. If the individual selects an alternative p as against alternative q, then we can say that
indirect utility of alternative p is greater than the indirect utility of alternative q. The random
utility of an alternative internet service can be expressed as observable component and a
random component. Expressing the alternatives in terms of indirect utility functions, then the
choice of alternative p as opposed to alternative q implies that
Vi = V (Ap, Pp, Y) + Ep V (Aq, Pq, Y) + Eq Equation 2
where Ep and Eq are the unobservable components of the indirect utility functions.
For the estimation of a specific random utility function, we need to make assumptions about
the probability distribution of the unobservable components, Ep and Eq. If we assume that they
are normally distributed then we can use probit models to estimate the choice probability for
an internet service. Logistic models may be used if the distribution of the random components
follows cumulative logistic function.
2.4. Review of Empirical Studies on Demand for Internet Services
According to Yu and Koslow (1999), the strategic reasons for internet usage are decreasing
costs and increasing revenues. Cost reductions have been a major motivation for many firms to
begin advertising on the internet. Another path for reducing distribution costs is called
disintermediation, the bypassing of local intermediaries to purchase goods from internet
retailers at lower prices. The purchase of goods is cheaper if wholesalers and retailers could be
eliminated from the traditional value chain through customers ordering via the firm’s web
91
pages. In addition to operational cost efficiencies, marketing communication costs can also
decreased directly by substituting the internet for other communications media. Internet can
act as a powerful factor in increasing sales and reaching new customers. Taupiac (1999) also
notes that the benefit an organization can gain by electronic linking with suppliers is savings in
inventory. Better communication links decrease supply risks and shorten lead times. Internet-
based tools also eliminate errors due to rewriting or re-keying data and they speed up the
payment process by processing invoices electronically.
A report by the National Telecommunications and Information Administration (NTIA) in 1999
on both personal computers (PC) and internet adoption indicates a growing digital divide
among Americans. Research indicates that socioeconomic and demographic factors continue
to be the key variables correlated with home information technology (IT) adoption. Lower
level of IT access is common in households of low-income, African-American, Hispanic or
Native American, less-educated and single-female headed or families located in rural areas.
Children tend to use home PCs more often and for longer hours than adults. Women and girls
appear to use computers less often and less intensively than their male counterparts
(Papadakis, 2000).
Czerwinsky (2001) reports a survey on internet users to gain understanding of issues related to
internet usage such as the characteristics and choices of internet users. A market research firm
was contracted to sample a panel of internet users over the internet. His results indicate that
internet users are more likely to be white and well educated and have higher than average
household incomes. However, gender is not an influencing factor shaping internet usage.
Simon (1996) discusses the problem of the existence of technophobia, defined as the fear of
new technology or using new technology. Consumers, who have technophobia are relatively
older, have negative attitudes towards computers, tend to be female and are in relatively lower
socioeconomic classes than consumers who are more comfortable with using computers.
Increased exposure to computers tends to reduce anxiety in using computers and other aspects
of technophobia.
3. Methodology
3.1. Survey Sampling and Administration Procedures
A scientific survey, based on self-administered questionnaires, was conducted using the multi-
stage cluster random sampling method, for householders aged 15 years and above in Mukim
Sengkurong of Brunei Muara district, one of the four districts in Brunei. The survey covered a
period of eight weeks from January to March 2002. Mukim Sengkurong had eight kampongs.
A random sample size of 114 households was selected based on the population of households
in the eight kampongs. A small pilot survey was initiated in December 2001 involving 15
respondents.
The final questionnaire consisted of six sections. Section A dealt with the respondent’s
experience with personal computers (PC) based on a rating scale of 1 to 5 with 1 denoting no
experience, 2 for little experience, 3 for average experience, 4 for good experience and 5 for
excellent experience. Section B sought information about the adoption of internet services by
respondents. Respondents were also asked to indicate the types of websites visited. In Section
C, respondents were asked to indicate the frequency of internet access in terms of importance
the purpose of using internet based on a list of 21 factors using a Likert rating scale of 1 to 5
with 1 denoting not important, 2 for less important, 3 for moderately important, 4 for very
92
important and 5 for extremely important. Section D sought information on the efficiency of
the ISP used by respondents. In addition, this section also dealt with the economic value of the
internet service by asking respondents to indicate the maximum amount of money they would
be willing to pay for the service under the current and possible future situations. Section E was
targeted towards non-users of internet services and elicited information explaining why these
people did not use any internet service. The last section, Section F was designed to gather
information about the socioeconomic characteristics of the respondents.
The optimal sampling size for the survey was derived using scientific sampling method based
on the works of Babbie (2001) and de Vaus (1996). The minimum optimal sample size was 81.
This was determined based on the assumed probability of internet users being 50% of the
population, using information from the main ISPs in Brunei. Because it was expected that
some householders might refuse to participate, a 40% oversampling was employed. The
optimal size was then increased from 81 to 114.
3.2. Methods of Analysis of Survey Data
The survey data were analysed using simple statistical analysis to establish the means and
standard deviations and frequency analysis of important socioeconomic and internet usage
variables. The identification of important variables influencing the use or non-use of the
internet was based on an index of importance based on respondents’ average scoring of the
importance of a list of 21 possible reasons stated in the questionnaire using a scoring index of
0 to 5. The factors with average scoring index of 3.0 or over were considered to be relatively
important reasons for using internet services.
The second method was the use of logistic regression analysis to identify the socioeconomic
variables influencing the adoption of the internet technology by householders. It was
hypothesised that adoption of internet would depend on the socioeconomic characteristics of
the householder. Logistic regression analysis was employed to determine the important factors
influencing the choice of internet services for the whole group of respondents (users and non-
users). Based on the theoretical framework discussed in Section 2.3, probit and logit models
could be used to determine the choice probability of respondents using internet services. We
used the binary logit model given the simple classification of the respondents into two groups
(users and non-users). This model is fully described by Gujarati (2003, pp. 595-607). The
logit model used in our study is specified as follows:
USEINT = Ao + A1 LFINCOME + A2 AGE + A3 AGESQ + A4 GENDER +
A5 ENGLISH + A6 EDU + A7 USECOMP + A8 OWNCOMPU +
A9 FORMALW + A10 CMWCHILD + Ui Equation 3
where USEINT was a dummy variable with 1 representing use of internet services by
respondent and zero for non-use of internet services;
LFINCOME was the natural logarithm of total monthly family income of respondent;
AGE was the age of the respondent;
AGESQ was the square of AGE;
GENDER was the dummy variable for gender of respondent. A value of 1 was assigned to
male respondents and zero for females;
ENGLISH was a dummy variable with a value of 1 denoting the ability of the respondent
to read and write English and zero otherwise;
EDU was the number of years of formal education acquired by the respondent;
93
USECOMP was a dummy variable with a value of 1 if the respondent had some experience
with using computers and zero if the respondent had no experience with computer;
OWNCOMPU was a dummy variable with 1 denoting respondents who owned a
computer and zero otherwise;
FORMALW was a dummy variable for the type of work that the respondent was involved. A
value of 1 was assigned to those respondents working in the formal sector and zero otherwise;
CMWCHILD was a dummy variable with 1 representing those respondents who were
currently married and had children and zero otherwise;
Ai (i = 1, 2, 3, 4, 5, 6, 7, 8, 9 and 10) were the parameters to be estimated and
Ui was the error term initially assumed to have a mean of zero and constant variance.
The third method was the use of multiple regression analysis to determine factors that
influenced the intensity of internet use (level of demand) by current users. The intensity of
internet use multiple regression model is specified as follows in Equation 4:
LUSEHOUR = B0 + B1 LFINCOME + B2 LMCHARGE + B3 EDU + B4 AGE
+ B5 AGESQ + B6 GENDER + B7 FORMALW + B8 COMPEXP + B9 OWNCOMPU + Ui
Equation 4
where LUSEHOUR was the natural logarithm of total number of hours of use of internet by
respondent;
LFINCOME was the natural logarithm of total monthly family income of respondent;
LMCHARGE was the natural logarithm of total monthly internet charges paid by respondent;
COMPEXP was the total number of years of using computer by the respondent;
EDU, AGE, AGESQ, GENDER, FORMALW, OWNCOMPU have been defined in
the previous section;
Bi (i=1, 2, 3, 4, 5, 6, 7, 8, and 9) were the parameters to be estimated and
Ui was the error term initially assumed to have a mean of zero and constant variance.
4. Results
4.1. Socioeconomic Characteristics of Survey Respondents
Table 1 shows a summary of the selected socioeconomic characteristics of respondents based on
frequency analysis. About 49.5% of the respondents were male. About 67% of respondents used
internet services; 62% of the female respondents and 73% of male respondents used these
services. With regards to the level of education acquired by the respondents, 40% had some
secondary school qualification, 26.7% of the respondents had completed technical college or
school (highest national diploma and teaching certificates) and about 17.6% had received a
university degree (both undergraduate and postgraduate). About 1.4% did not attend any formal
school at all. The respondents were predominantly Bruneian citizens with 56.2% being Malay,
33.8% Kedayan, 1.4% Tutong and 1.4% Chinese. Only about 4.3% were non-Bruneian citizens.
Government workers constituted 43.3% of all respondents. About 10% of respondents worked
in the private sector. Slightly over one-third of respondents (33.8%) were students. Non-users of
internet services (34.4 years) were on average older than users (26.6 years). Non-users also had
less number of years of acquired formal educational training. Not surprisingly, non-users had
lower family income than users.
94
4.2. Use and Non-Use of Internet Services
The six main important reasons for accessing the internet services in order of importance
were (1) sending electronic mails, (2) for research work, (3) visiting websites, (4) reading
news, (5) accessing internet-based facilities and (6) checking databases for personal and
professional use (refer to Table 2). Current internet users suggested several means through
which the Government can encourage the adoption of internet services (refer to Table 3).
The most important suggestion indicated by about 20% of current users was for the reduction
of monthly internet use charges. Other important suggestions included government
awareness campaigns in the mass media, the use of leaflets to promote use of internet
services and expansion of computer and internet related courses in schools and workplaces.
Internet users also offered some suggestions for ISPs to improve upon the delivery of their
services and products.
About 21.5% of current users suggested that the ISPs should upgrade their servers regularly
so that internet connection would be faster and more efficient. Another 6.2% of the
respondents who subscribed the monthly internet plan from the ISPs suggested that the ISPs
must innovate and improve their services and facilities such as access speed, dial-up
connection, surfing, the software and hardware available and monthly billing services to
meet the demands of all level of consumers. About 4.6% suggested that the internet access
fees should be lowered. Table 4 indicates the reasons for non-adoption of internet services.
The six most important reasons in order of importance were high access cost, lack of privacy
on the internet, concerns with hackers and viruses, difficulty in understanding and using the
internet technologies, no need for internet services and lack of access to internet connections.
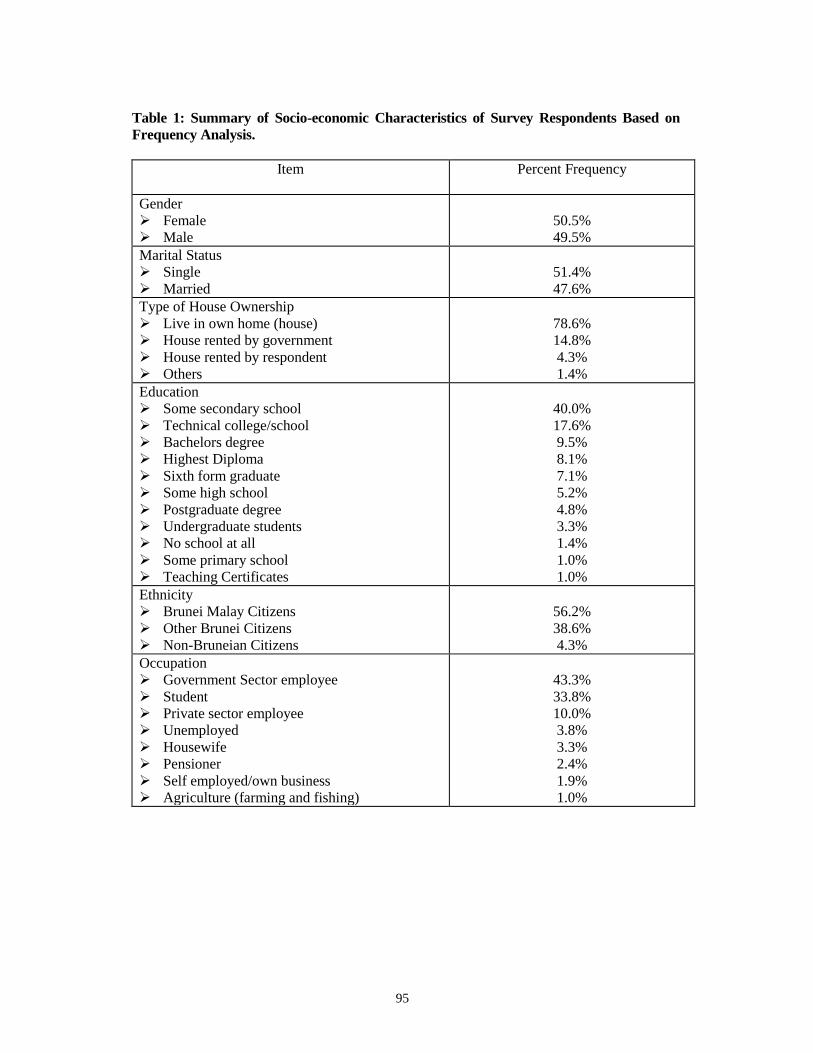
95
Table 1: Summary of Socio-economic Characteristics of Survey Respondents Based on
Frequency Analysis.
Item Percent Frequency
Gender
Female
Male
50.5%
49.5%
Marital Status
Single
Married
51.4%
47.6%
Type of House Ownership
Live in own home (house)
House rented by government
House rented by respondent
Others
78.6%
14.8%
4.3%
1.4%
Education
Some secondary school
Technical college/school
Bachelors degree
Highest Diploma
Sixth form graduate
Some high school
Postgraduate degree
Undergraduate students
No school at all
Some primary school
Teaching Certificates
40.0%
17.6%
9.5%
8.1%
7.1%
5.2%
4.8%
3.3%
1.4%
1.0%
1.0%
Ethnicity
Brunei Malay Citizens
Other Brunei Citizens
Non-Bruneian Citizens
56.2%
38.6%
4.3%
Occupation
Government Sector employee
Student
Private sector employee
Unemployed
Housewife
Pensioner
Self employed/own business
Agriculture (farming and fishing)
43.3%
33.8%
10.0%
3.8%
3.3%
2.4%
1.9%
1.0%
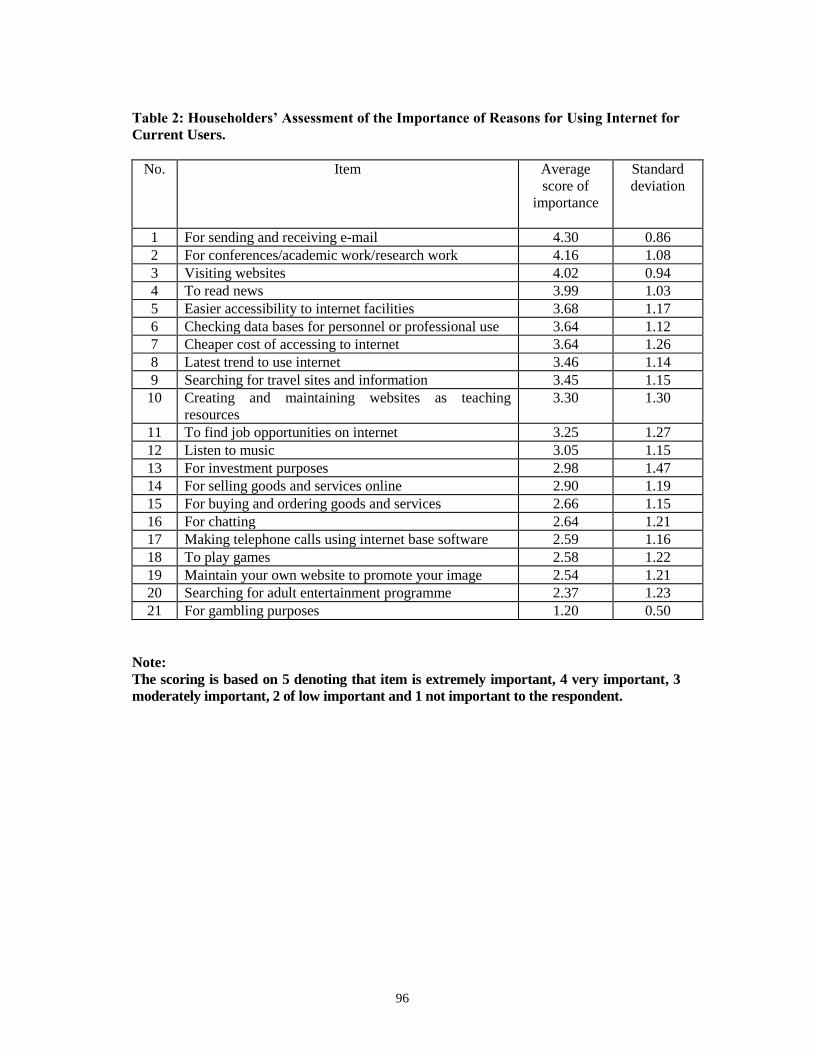
96
Table 2: Householders’ Assessment of the Importance of Reasons for Using Internet for
Current Users.
No. Item Average
score of
importance
Standard
deviation
1 For sending and receiving e-mail 4.30 0.86
2 For conferences/academic work/research work 4.16 1.08
3 Visiting websites 4.02 0.94
4 To read news 3.99 1.03
5 Easier accessibility to internet facilities 3.68 1.17
6 Checking data bases for personnel or professional use 3.64 1.12
7 Cheaper cost of accessing to internet 3.64 1.26
8 Latest trend to use internet 3.46 1.14
9 Searching for travel sites and information 3.45 1.15
10 Creating and maintaining websites as teaching
resources
3.30 1.30
11 To find job opportunities on internet 3.25 1.27
12 Listen to music 3.05 1.15
13 For investment purposes 2.98 1.47
14 For selling goods and services online 2.90 1.19
15 For buying and ordering goods and services 2.66 1.15
16 For chatting 2.64 1.21
17 Making telephone calls using internet base software 2.59 1.16
18 To play games 2.58 1.22
19 Maintain your own website to promote your image 2.54 1.21
20 Searching for adult entertainment programme 2.37 1.23
21 For gambling purposes 1.20 0.50
Note:
The scoring is based on 5 denoting that item is extremely important, 4 very important, 3
moderately important, 2 of low important and 1 not important to the respondent.
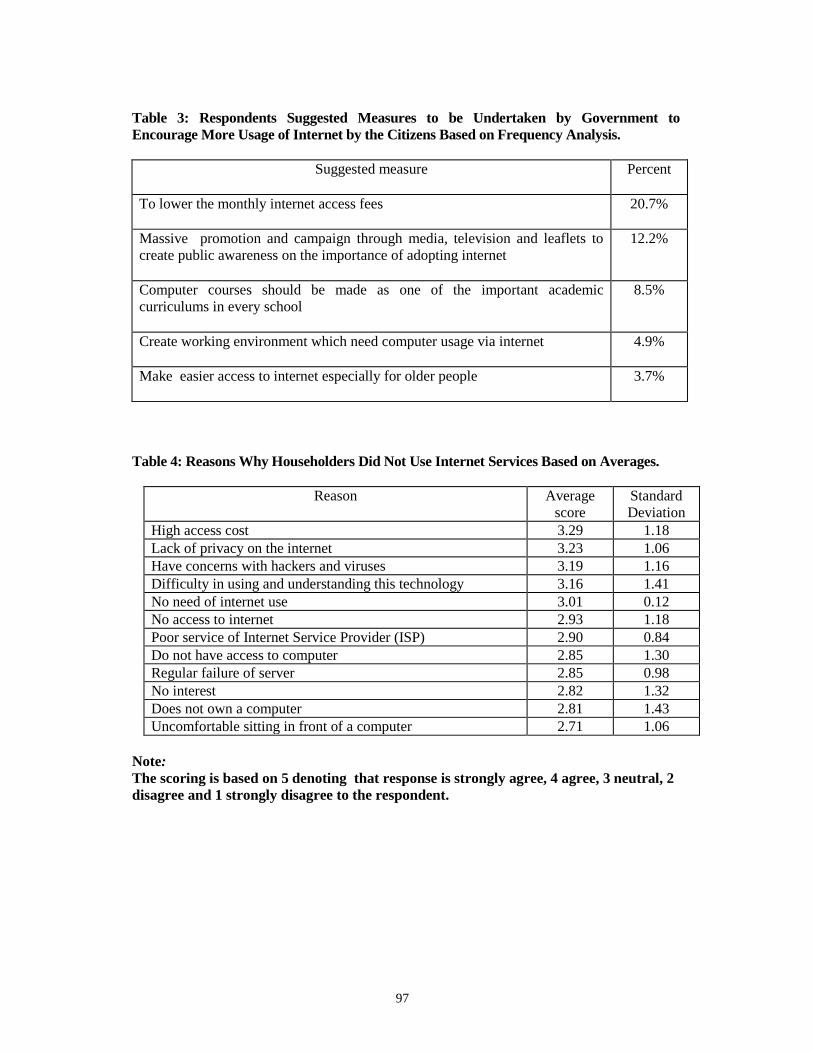
97
Table 3: Respondents Suggested Measures to be Undertaken by Government to
Encourage More Usage of Internet by the Citizens Based on Frequency Analysis.
Suggested measure Percent
To lower the monthly internet access fees 20.7%
Massive promotion and campaign through media, television and leaflets to
create public awareness on the importance of adopting internet
12.2%
Computer courses should be made as one of the important academic
curriculums in every school
8.5%
Create working environment which need computer usage via internet 4.9%
Make easier access to internet especially for older people 3.7%
Table 4: Reasons Why Householders Did Not Use Internet Services Based on Averages.
Reason Average
score
Standard
Deviation
High access cost 3.29 1.18
Lack of privacy on the internet 3.23 1.06
Have concerns with hackers and viruses 3.19 1.16
Difficulty in using and understanding this technology 3.16 1.41
No need of internet use 3.01 0.12
No access to internet 2.93 1.18
Poor service of Internet Service Provider (ISP) 2.90 0.84
Do not have access to computer 2.85 1.30
Regular failure of server 2.85 0.98
No interest 2.82 1.32
Does not own a computer 2.81 1.43
Uncomfortable sitting in front of a computer 2.71 1.06
Note:
The scoring is based on 5 denoting that response is strongly agree, 4 agree, 3 neutral, 2
disagree and 1 strongly disagree to the respondent.
98
4.3. Results of Logistic Regression Analysis of Adoption of Internet Technology
As indicated in Section 3, a logistic regression analysis for the whole group of respondents both
users and non-users of internet was undertaken to clearly establish the socio-economic
characteristics that significantly influence the adoption of the internet technology. The results of
the logistic regression analysis are summarized in Table 5. Two main goodness-of-fit tests were
used to determine the variation in the adoption of the internet technology as explained by the
independent variables. These were (a) the proportion of observations correctly classified and (b)
the likelihood ratio test. Table 5 indicates that the model performed reasonably well with correct
classification of about 84.1% of the observations.
The log-likelihood ratio score was statistically significant at the 0.0001 level indicating the very
high power of the model. Out of the ten independent variables, six variables were statistically
significant in influencing householders’ decision to adopt internet. These significant variables
were total family income, age of respondent, age squared, gender, ability to read and write
English and respondent experience with computer. Increase in total family income increased the
probability of using internet services as postulated in our driving hypotheses discussed in Section
1.2. Human capital variables such as ability to read and write English and respondent’s
experience all led to increased likelihood of use of internet services as expected from economic
theory. As expected the likelihood of adoption of internet services increased with age and then
declined at a certain age level. The age at which the probability of adopting internet services
peaked was about 23.4 years, equivalent to the average age of a student just graduating from
university.
4.4. Results of Regression Analysis of Total Hours of Internet Use
The results of the estimated regression function of total hours of internet use are presented in
Table 6. We tried the linear and log-linear specifications of the model and concluded that the
loglinear model was the appropriate form due to its correct specification based on the Ramsey
test and absence of major econometric problems such as multicollinearity, autocorrelation and
heteroscedasticity. As reported in Table 6, the statistically significant variables that influenced
the intensity of use of internet services were total family income, internet access charge,
education and age. With income and internet access charges measured in natural logarithm
form, the estimates of these variables represented elasticities.
Based on the parameter estimate of 0.238 for LFINCOME, this meant that a 1% increase in
total family income would lead to about 0.24% increase in the total number of hours of use –
an income inelastic demand. The positive sign for total monthly charges reflected the fact that
users paid fixed charges for a certain number of hours of internet surfing per month. Those
paying higher fixed monthly charges were given access to longer hours of internet use. Similar
to the results reported on the adoption of internet services, the intensity of use of these services
generally increased with the level of education. Demand also increased with age and then
levelled of at a certain age level (28.4 years). The statistically insignificant variables were
GENDER, FORMALW, COMPEXP and OWNCOMPU. Another important result was that
the gender of respondent did not have any significant influence on the intensity of use of
services. This result was similar to that obtained by Czerwinsky (2001) in the US.
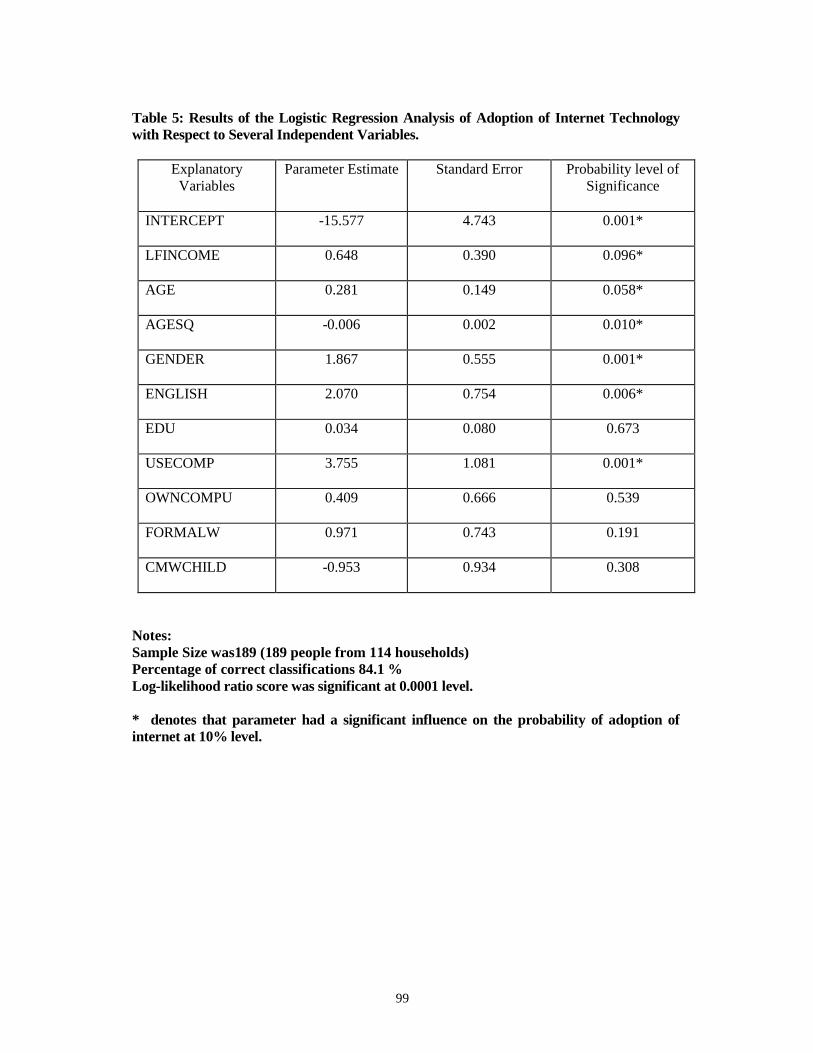
99
Table 5: Results of the Logistic Regression Analysis of Adoption of Internet Technology
with Respect to Several Independent Variables.
Explanatory
Variables
Parameter Estimate Standard Error Probability level of
Significance
INTERCEPT -15.577 4.743 0.001*
LFINCOME 0.648 0.390 0.096*
AGE 0.281 0.149 0.058*
AGESQ -0.006 0.002 0.010*
GENDER 1.867 0.555 0.001*
ENGLISH 2.070 0.754 0.006*
EDU 0.034 0.080 0.673
USECOMP 3.755 1.081 0.001*
OWNCOMPU 0.409 0.666 0.539
FORMALW 0.971 0.743 0.191
CMWCHILD -0.953 0.934 0.308
Notes:
Sample Size was189 (189 people from 114 households)
Percentage of correct classifications 84.1 %
Log-likelihood ratio score was significant at 0.0001 level.
* denotes that parameter had a significant influence on the probability of adoption of
internet at 10% level.
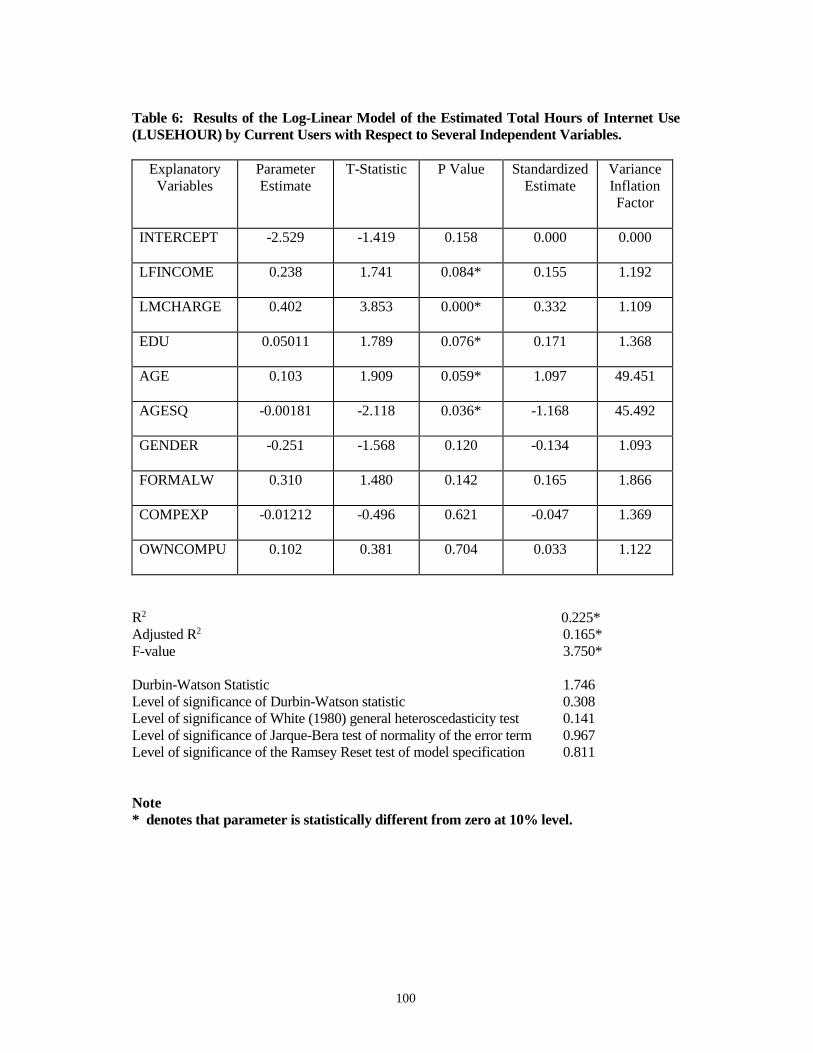
100
Table 6: Results of the Log-Linear Model of the Estimated Total Hours of Internet Use
(LUSEHOUR) by Current Users with Respect to Several Independent Variables.
Explanatory
Variables
Parameter
Estimate
T-Statistic P Value Standardized
Estimate
Variance
Inflation
Factor
INTERCEPT
-2.529 -1.419 0.158 0.000 0.000
LFINCOME
0.238 1.741 0.084* 0.155 1.192
LMCHARGE
0.402 3.853 0.000* 0.332 1.109
EDU
0.05011 1.789 0.076* 0.171 1.368
AGE
0.103 1.909 0.059* 1.097 49.451
AGESQ
-0.00181 -2.118 0.036* -1.168 45.492
GENDER
-0.251 -1.568 0.120 -0.134 1.093
FORMALW
0.310 1.480 0.142 0.165 1.866
COMPEXP
-0.01212 -0.496 0.621 -0.047 1.369
OWNCOMPU
0.102 0.381 0.704 0.033 1.122
R2 0.225*
Adjusted R2 0.165*
F-value 3.750*
Durbin-Watson Statistic 1.746
Level of significance of Durbin-Watson statistic 0.308
Level of significance of White (1980) general heteroscedasticity test 0.141
Level of significance of Jarque-Bera test of normality of the error term 0.967
Level of significance of the Ramsey Reset test of model specification 0.811
Note
* denotes that parameter is statistically different from zero at 10% level.
101
5. Conclusions and Policy Implications
We aimed in this study to identify the main socioeconomic factors influencing adoption of the
internet technology by householders and to analyse the factors influencing the intensity of
internet use by adopters of the technology. The study was conducted our study in a
representative urban subdistrict in Brunei. We hypothesised, based on economic theory, that
family income and human capital variables such as education and experience using computers,
would influence the adoption of internet technology and the intensity of use of internet
services. The results indicated that about 67% of householders had adopted the internet
technology with a higher percentage for males (73%) than for females (62%). The likelihood
of adoption of internet increased with higher family income, longer experience with using
computers and the ability to read and write in English. The intensity or level of use of internet
services was positively related to internet monthly charges, household income and the level of
education.
There are several policy implications that are derived from this study. First, general human
capital variables such as the level of formal schooling acquired did not influence the adoption
of internet technology. However specific human capital variables related to computer and
internet use such as experience using computer and ability to read and write in English (the
main internet operating language) did influence and increase the likelihood of adoption of
internet. Nevertheless the level of formal education acquired influenced the intensity of use of
internet services for those who had already adopted the internet technology. Therefore the
increase in diffusion of the internet technology in Brunei needs to recognize the acquisition of
specific human capital variables related to internet use such as using computers and training in
the English language.
Second, our study confirmed that family income was a key factor in influencing both the
adoption of the internet technology by householders and the intensity of use of internet
services by adopters. With general low level of use of internet services by low-income
householders, the Government may need to establish extensive adult education and continuing
education programmes in internet services especially targeted at low-income households to
increase use of these services. Therefore the Government can make internet and related
computer services and technical support services available at public centres such as mosques,
public libraries, schools and recreational centres in order to allow low-income householders
the opportunity to learn to use internet services. Special efforts also need to be made to
improve and expand internet services for disabled people in the community.
Acknowledgments
We thank the householders in Mukim Sengkurong who patiently gave their time to participate
in the study. We also thank Rosdi Abdul Aziz for his support in the collection of data. Finally
we acknowledge with thanks the support for the study given by the officers of the Brunei-
Muara district office, staff at Jabatan Telekom Brunei and DST Communications, Bandar Seri
Begawan.
102
References
Anonymous (2001). Definition of Internet, available at http://www.fnc.gov/Internet.res html.
APEC (1998). Towards an Information Society: Development in APEC, Singapore: APEC
Secretariat, APEC Economic Committee, (November).
Asafu-Adjaye, J. (2000). Environmental Economics for Non-Economists, Singapore: World
Scientific, 118 pp.
Babbie, E. (2001). The Practice of Social Research, Ninth Edition, New York: Wadsworth
Thomson Learning.
Czerwinsky, S.J. (2001). “Telecommunications –Characteristics and Choices of internet
Users,” FDCH Government Account Reports, Washington: EBSCO Publishing, 10 pp.
De Vaus, D.A. (1996). Surveys in Social Research, Fourth Edition, London: University
College London Press, 411 pp.
Ellsworth, J.H. and M.V. Ellsworth (1994). The Internet Business Book, Toronto: John Wiley
& Sons Inc., 17 pp.
Gujarati, N. (2003). Basic Econometrics, Fourth, London: McGraw-Hill.
Government of Brunei Darussalam (2001). Brunei Darussalam Statistical Yearbook 2000,
Bandar Seri Begawan: Department of Economic Planning and Development.
Government of Brunei Darussalam (2001). Brunei Darussalam Eighth National Development
Plan 2001-2005, Bandar Seri Begawan: Department of Economic Planning and Development.
Hall, B.H. and C. Cummins (1999). Time Series Processor Version 4.5: User's Guide, Palo
Alto, California: TSP International.
Jha, R. and S.K. Majumdar (1999). “A Matter of Connections: OECD Telecommunications
Sector Productivity and the Role of Cellular Technology Diffusion”, Information Economics
and Policy, 11: 243-269
Lancaster, K.J. (1966). “A New Approach to Consumer Theory”, Journal of Political
Economy, 74: 132-157
McConnell, C.R. and S.L. Brue (1996). Economics, Thirteenth Edition, New York: McGraw-
Hill Book Company.
McKnight, L.W. and J.P. Bailey (1997). Internet Economics, Cambridge, MA: MIT Press,
London.
Papadakis, M.C. (2000). “Complex Picture of Computer Use in the Home Emerges, National
Science Foundation”, Directorate for Social, Behavioural and Economic Sciences, 00-314: 1-4
Simon, A. (1996). “Consumers and Cyberspace: Inequitable Distribution of Information”,
Consumer Interests, 42: 1-3
SPSS Inc. (2001). Statistical Package for Social Sciences (SPSS) for Windows, Version 10,
Chicago: SPSS Inc.
Stavins, J.( 1997). “Estimating Demand Elasticities in a Differentiated Product Industry: The
Personal Computer Market,” Journal of Economics and Business, 49: 347-367
Taupiac, Catherine. (1999). “Manage Purchasing with the Internet”, International Trade
Forum, 1: 1-6.

103
White, H. (1980). “A Heteroscedasticity Consistent Covariance Matrix Estimator and a Direct
Test of Heteroscedasticity”, Econometrica, 48: 817-818.
Yu, H.L. and S. Koslow (1999). “How Well Do Firms Implement Strategy When They Design
Internet Web Pages”, Australasian Marketing Journal, 7(2): 59-63.
104
CHAPTER 7
ANALYSIS OF AGGREGATE PRODUCTION
FUNCTION AND TECHNICAL EFFICIENCY
OF THE AGRICULTURAL SECTOR
IN BRUNEI DARUSSALAM
KWABENA A. ANAMAN
SUZELAWATI F. SULAIMAN
HARTINI M. YUSSOF
Abstract
We estimated the aggregate production function for the agricultural sector in Brunei
Darussalam based on a cobb-douglas production function using data from 1971 to 2001. We
showed that labour inputs, machinery and intermediate capital inputs significantly influenced
the output of the sector in the positive sense. However the growth rate of output was influenced
positively only by labour inputs. There had been negative technological change (shift of the
production frontier). The technical inefficiency of the sector was high and could be reduced by
use of more quality capital inputs.
1. Introduction and Problem Statement
Brunei Darussalam (hereafter Brunei) is a coastal state in the northern part of the Borneo
Island with a land area of 5,765 square kilometres (km) and a 130-km coastline fronting the
South China Sea. Most of the population estimated to be 340,800 in 2002 (Government of
Brunei Darussalam, 2003) live in the coastal area in two major cities: Bandar Seri Begawan,
the capital, and Kuala Belait, the centre of the oil industry, the major source of exports and
national income of Brunei. The economy of the country has largely been dependent on the
export of oil and gas since the early 1960s. The oil and gas industry currently accounts for
about 38% of the gross domestic product (GDP) and about 90% of total exports (Government
of Brunei Darussalam, 2003).
The excessive dependence on the oil and gas has prompted the government to make efforts to
diversify the economy in order to ensure long-term economic sustainability. During the current
8th National Development Plan, 2001-2005, the Government has committed itself towards
further progress in achieving enhanced diversification of the economy. It plans to expand the
production of agricultural commodities for local use and reduce the levels of imports of food
(Government of Brunei Darussalam, 2001). Some specific government plans include
expanding local production of rice to 1,300 tonnes or 3% of total national requirements,
increasing local production of vegetables to meet 94% self-sufficiency and achieving 47%
self-sufficiency of fruits by the end of 2005.
105
The contribution of the agriculture and related primary industry sectors such as fishing and
forestry to the economy has generally been low. The poor performance of the agriculture
sector has been due to factors such as lack of competitive markets, lack of interest among local
people in agriculture due to their preference for working in office environment and a host of
marketing problems. The future of agriculture in Brunei depends on important physical and
economic factors. Availability of suitable land is constraint to agricultural expansion. Seventy
percent of the land area is covered with primary and secondary tropical rain forests and 42% of
the land area are designated as forest reserves (Government of Brunei Darussalam, 1989).
Although the contribution of the agriculture sector to GDP is still small, the expansion of the
sector is considered important since it is a source of food and employment. The sector can also
play an important part in the economic diversification programme of the government partly as
a source of raw materials for the development of a modest manufacturing base in the country.
The Department of Agriculture (DOA) is designated as the Government department to support
the development of the agriculture sector, to serve the farming community and to increase the
productivity of the sector. DOA has programmes aimed at increasing local food production, to
ensure the continuity of supply of safe, quality and wholesome food to meet domestic
requirements and to develop an effective market information and distribution system. The
department also helps in delivering sufficient and effective training to strengthen and increase
productivity, capacity, quality and the contribution to the GDP particularly of the agricultural
products (http://www.agriculture.gov.bn/htm).
Table 1 shows data on the level of contribution to the GDP by the agricultural sector
(including fishing and forestry) for Brunei from 1971 to 2001 based on statistics derived from
various annual issues of the Brunei Darussalam Statistical Yearbook. The size of contribution
by the agricultural sector to GDP increased gradually from B$21.4 million in 1971 to B$218.3
million in 1997. But during the year 1998 and 1999, the contribution of the sector declined to
about B$201 million and B$196.5 million respectively. There was a recovery of the sector
from 2000 to 2001. The contribution of the sector to GDP increased from B$202.2 million in
2000 to B$240.5 million in 2001, an annual growth of about 19%. This suggested the
possibility of increasing the value of the sector if appropriate incentives and supporting
infrastructure are put into place. The proportion of the workforce participating in agriculture
sector has fallen over the last 30 years as people have abandoned agriculture in search of
better-paying jobs in the government and private non-agricultural sector. Foreign workers
constitute most of the total workforce of the agricultural sector (refer to Table 2). This is
mainly due to the unwillingness of the local people to participate in agricultural activities.
Local citizens prefer to work in the government sector due to higher salaries and better
working conditions. Brunei also lacks skilled and trained farmers and farm workers. Therefore
agricultural firms prefer to hire foreign workers partly to avoid the training cost of locals
required for certain types of semi-skilled jobs. Based on the above discussion the main
objectives of the study were to estimate the aggregate production function of the agricultural
sector, to derive the efficiency of the inputs used by the sector and the overall efficiency of the
sector.
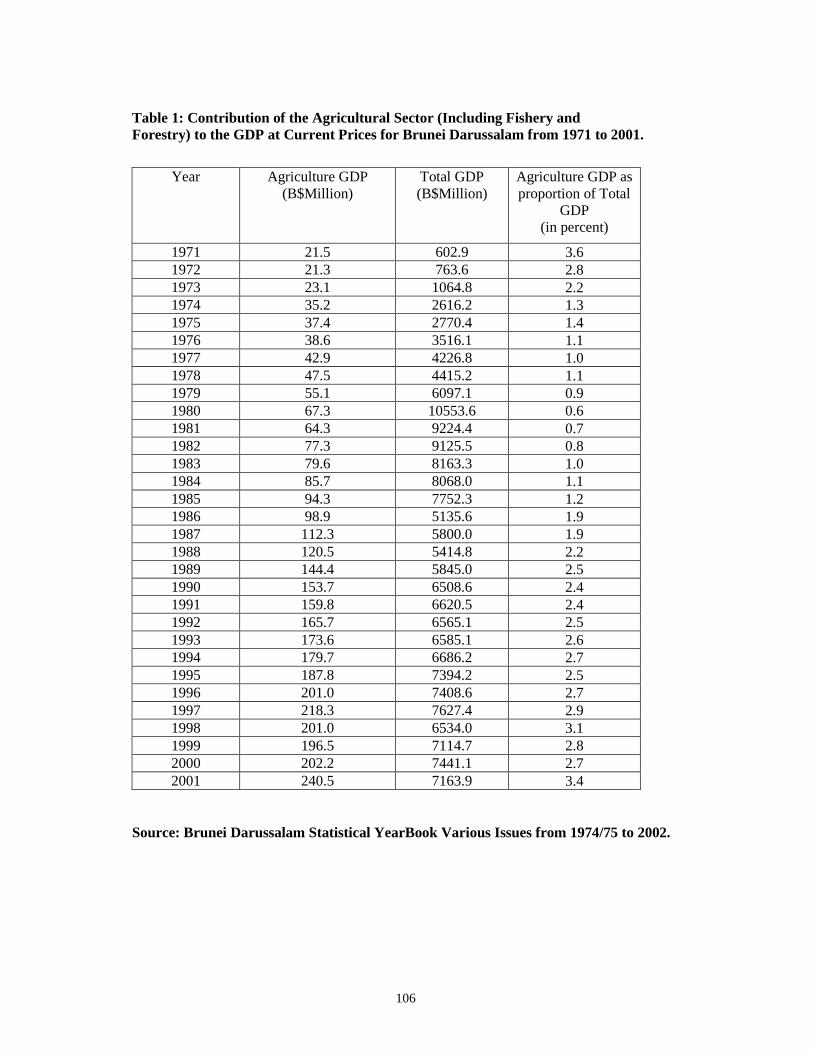
106
Table 1: Contribution of the Agricultural Sector (Including Fishery and
Forestry) to the GDP at Current Prices for Brunei Darussalam from 1971 to 2001.
Year
Agriculture GDP
(B$Million)
Total GDP
(B$Million)
Agriculture GDP as
proportion of Total
GDP
(in percent)
1971 21.5 602.9 3.6
1972 21.3 763.6 2.8
1973 23.1 1064.8 2.2
1974 35.2 2616.2 1.3
1975 37.4 2770.4 1.4
1976 38.6 3516.1 1.1
1977 42.9 4226.8 1.0
1978 47.5 4415.2 1.1
1979 55.1 6097.1 0.9
1980 67.3 10553.6 0.6
1981 64.3 9224.4 0.7
1982 77.3 9125.5 0.8
1983 79.6 8163.3 1.0
1984 85.7 8068.0 1.1
1985 94.3 7752.3 1.2
1986 98.9 5135.6 1.9
1987 112.3 5800.0 1.9
1988 120.5 5414.8 2.2
1989 144.4 5845.0 2.5
1990 153.7 6508.6 2.4
1991 159.8 6620.5 2.4
1992 165.7 6565.1 2.5
1993 173.6 6585.1 2.6
1994 179.7 6686.2 2.7
1995 187.8 7394.2 2.5
1996 201.0 7408.6 2.7
1997 218.3 7627.4 2.9
1998 201.0 6534.0 3.1
1999 196.5 7114.7 2.8
2000 202.2 7441.1 2.7
2001 240.5 7163.9 3.4
Source: Brunei Darussalam Statistical YearBook Various Issues from 1974/75 to 2002.
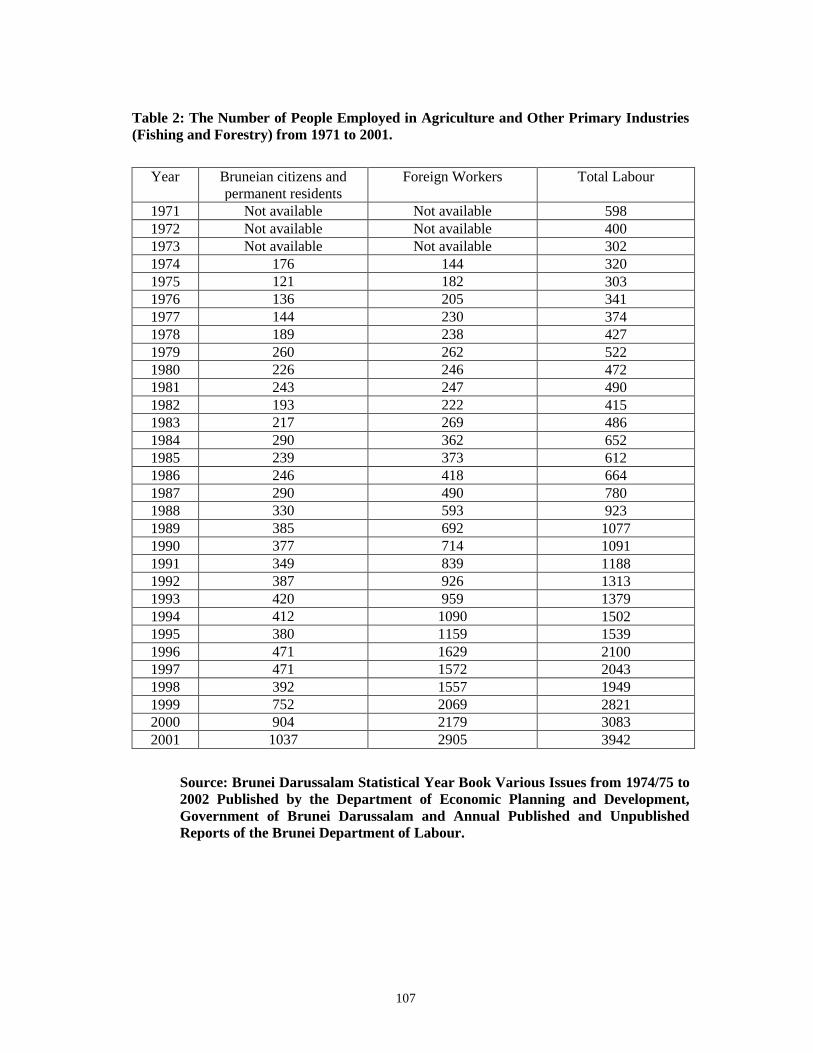
107
Table 2: The Number of People Employed in Agriculture and Other Primary Industries
(Fishing and Forestry) from 1971 to 2001.
Year Bruneian citizens and
permanent residents
Foreign Workers Total Labour
1971 Not available Not available 598
1972 Not available Not available 400
1973 Not available Not available 302
1974 176 144 320
1975 121 182 303
1976 136 205 341
1977 144 230 374
1978 189 238 427
1979 260 262 522
1980 226 246 472
1981 243 247 490
1982 193 222 415
1983 217 269 486
1984 290 362 652
1985 239 373 612
1986 246 418 664
1987 290 490 780
1988 330 593 923
1989 385 692 1077
1990 377 714 1091
1991 349 839 1188
1992 387 926 1313
1993 420 959 1379
1994 412 1090 1502
1995 380 1159 1539
1996 471 1629 2100
1997 471 1572 2043
1998 392 1557 1949
1999 752 2069 2821
2000 904 2179 3083
2001 1037 2905 3942
Source: Brunei Darussalam Statistical Year Book Various Issues from 1974/75 to
2002 Published by the Department of Economic Planning and Development,
Government of Brunei Darussalam and Annual Published and Unpublished
Reports of the Brunei Department of Labour.
108
The rest of this paper is organized as follows: the next section provides a summary of the
literature review on production functions in agriculture. This is followed by a discussion of the
methodology and the results of the analysis. The conclusions and the references are reported at
the end of the paper.
2. Literature Review
2.1. Production Functions
Microeconomic theory defines production function as a schedule that specifies the maximum
output attainable for alternative combinations of all conceivable inputs or factors of production
per period of time (Fischer and Dornbusch, 1994). A production function summarizes the
technically efficient ways of combining inputs to produce output and is sometimes called the
production frontier. Technical efficiency is achieved when the firm produces the maximum
level of output possible at the given level of inputs or factors. Factors of production include
labour, machinery, raw materials and energy. The production function indicates that increases
in potential output can be traced to increases in inputs of the factors of production. According
to McConnell and Brue (1999, pp. 23-24), capital refers to human–made resources, that is,
buildings, machinery and equipment used to produce goods and services Capital does not
directly satisfy human wants.
A production function is illustrated in Figure 1 with one input and one output. It has three
stages (Anaman, 1988, p.15). In the first stage, the input is underused and the producer can
increase the level of input to gain more income. In the third stage, the input is used too much.
Hence the rational producer should cut down the use of input and should not produce in that
stage. The rational producer only produces in the second stage. He/she produces the output
level at which the marginal value product from the use of the input is equal to the marginal
expense (cost) of the input. This ensures the achievement of economic efficiency.
2.2. Discussion of Technical Efficiency and Technical Inefficiency
Technical efficiency deals with the production of the maximum level of output possible given
any level of input. Figure 1 illustrates the technical inefficiency in the production of output by
a firm. The frontier production function shows the maximum possible production of output
with the utilisation of varying amounts of available inputs. Any production inside or below the
frontier production curve is considered to be technically inefficient. In order to achieve
technical efficiency, the firm must produce at a point on the curve (frontier). Technical
inefficiency is therefore measured as –U in Figure 1.
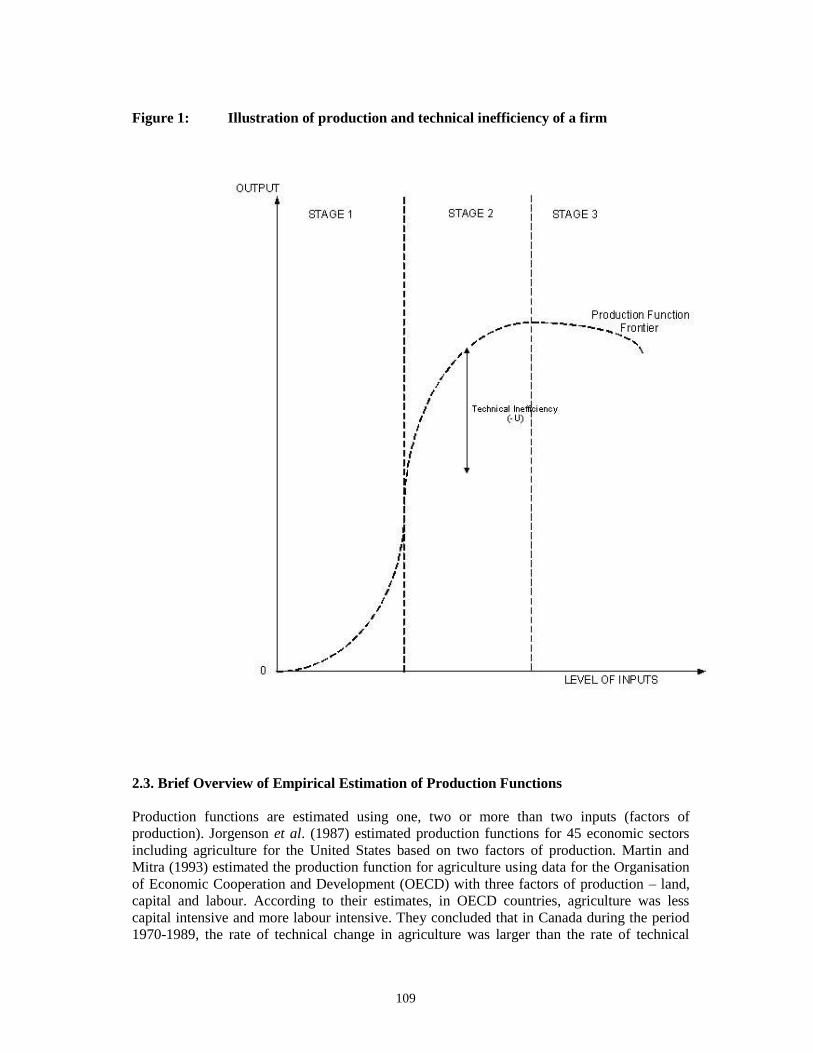
109
Figure 1: Illustration of production and technical inefficiency of a firm
2.3. Brief Overview of Empirical Estimation of Production Functions
Production functions are estimated using one, two or more than two inputs (factors of
production). Jorgenson et al. (1987) estimated production functions for 45 economic sectors
including agriculture for the United States based on two factors of production. Martin and
Mitra (1993) estimated the production function for agriculture using data for the Organisation
of Economic Cooperation and Development (OECD) with three factors of production – land,
capital and labour. According to their estimates, in OECD countries, agriculture was less
capital intensive and more labour intensive. They concluded that in Canada during the period
1970-1989, the rate of technical change in agriculture was larger than the rate of technical
110
change in the other agriculture-related primary sectors. Hayami and Ruttan (1971), using the
cobb-douglas functional form, estimated production functions for agriculture using data for 38
countries. They used more than the three factors of production. Probably the greatest pioneer
of agricultural production functions was the late Professor Earl Heady, formerly at the Iowa
State University, Ames, Iowa, United States. He contributed considerably to the estimation and
study of agricultural production functions in many countries especially in the United States, for
example, refer to Heady and Dillon (1978). Production functions have been estimated for other
sectors of the economy, for construction sector in Brunei, see Sumardi, 2003; for government-
owned industrial enterprises in Vietnam, refer to Vu, 2003 and for manufacturing industries in
Malaysia, see Mahadevan, 2001. There has been limited research work on the estimation of
production functions for agriculture for Brunei. An important purpose of this study is to
contribute to filling this information gap.
3. Methodology
3.1. Theoretical and Analytical Framework
The analysis of technical efficiency requires the estimation of the production frontier or the
maximum possible output. The traditional method of estimating production functions based on
deriving a curve through firm data is not appropriate since it assumes that the firms are
technically efficient. If technical efficiency is being tested, then it is appropriate to assume that
the production frontier is above the observations for the firms (Coelli, 1995). This brings out
the concept of a stochastic frontier production function. The concept of stochastic frontier
production function was developed by Farell (1957) and popularised by Aigner et al. (1977)
and Meeusen and van den Broeck (1977). The total error component of the production
function (E) of a stochastic frontier production function is made up of two components: V and
-U. The random error, V is linked to measurement errors of the dependent variable and other
random errors. The error component, -U is due to technical inefficiency as a result of
organisational factors (Mahadevan, 2001) or possible interactions with dominating external
factor(s) that prevent the firm from producing the maximum possible output for a given level
of inputs.
3.2. Empirical Specification of Stochastic Frontier Function for Agricultural Sector
Assuming a cobb-douglas functional form, the stochastic frontier production function for the
agricultural sector in Brunei is specified in Equation 1 below.
RAGRGDPt = eA0 TLABOURtA1 MACHINERYt
A2 RINTERtA3 eVt-Ut Equation 1
where RAGRGDPt is the real value added to GDP by the agricultural sector (excluding the
fishing and forestry industries) in millions of Brunei dollar (B$) in year t.
TLABOURt is the total labour force employed by the agricultural sector in year t.
MACHINERYt is the real total annual value of machinery services used by the agricultural
sector in year t. The total annual value of imported agricultural machinery is used as a proxy
for annual capital services used by the agricultural sector. This is because Brunei produces
very little agricultural machinery and imports virtually all its agricultural machinery. Due to
the high levels of machinery re-exports from Brunei, imported agricultural machinery are
mainly used to replace re-exported machinery and worn-out machinery arising from the
111
production processes in agriculture. Therefore the amount of imported agricultural machinery
measures to a large extent the level of machinery used in the sector for that year. The ideal
approach is to use total capital stock in the agricultural sector to derive annual capital flows.
However due to the unavailability of data concerning initial capital stock, it is not possible to
derive the annual capital services using this method.
RINTER is the real total annual value of intermediate capital inputs (mainly fertilisers) used by
the agricultural sector.
Vt is the error term component assumed to be normally distributed with zero mean and
constant variance corresponding to statistical white noise error term.
-Ut is the technical inefficiency error term and it follows the half-normal distribution based on
the work of Aigner et al. (1977) and
Ai (i = 0,1,2,3) are parameters to be estimated using the maximum likelihood technique.
Taking the natural logarithms of both sides of Equation 1 we get Equation 2.
LRAGRGDPt = A0 + A1 LTLABOURt + A2 LMACHINERYt + A3 LRINTERt + Vt – Ut
Equation 2
where LRAGRGDP, LTLABOUR, LMACHINERY and LRINTER are the natural logarithms
of RAGRGDP, TLABOUR, MACHINERY and RINTER. The other terms have been defined
earlier.
We use the notation due to Aigner et al. (1977) summarised in Greene (2000, pp. 394-396).
Therefore we define the following parameters as follows in Equations 3 to 5.
E = -U + V or E = V – U Equation 3
λ = σu / σv Equation 4
σ2 = σu
2 + σv2 Equation 5
Assuming a half-normal distribution and the stochastic frontier production function depicted in
Equation 1, the probability density function of the error term, E, in Equation 1 is denoted in
Equation 6 (refer to Greene (2000, p. 394).
Log h (E|β, λ, σ) = [-log σ - log (2 / π) – ½ (E / σ)2 + log Φ (-E λ / σ) ] Equation 6
where Φ is the probability to the left of Z in the standard normal distribution and β is the
vector of parameters identical to A0, A1, A2 and A3 in Equation 1.
Jondrow et al. (1982) introduced several approximations to the half-normal error term model
which allow for the estimation of the error term, U and also the overall technical inefficiency
value. These approximations are illustrated in Equations 7 to 9.
E[U | E ] = σ λ / ( 1 + λ2 ) [ (Φ (Z) / 1 –Φ(Z) ) – Z ] Equation 7
where Z = E λ / σ Equation 8
Var [E] = Var [U] + Var [V] = (1-2/π) σu 2 + σv
2 Equation 9
A TECHNICAL INEFFICIENCY INDEX (I) IS DERIVED AS SHOWN IN EQUATION 10
WHICH INDICATES THE PROPORTION OF THE TOTAL VARIANCE OF ERROR
TERM (E) THAT IS DUE TO THE INEFFICIENCY TERM (U).
Technical Inefficiency Measure I = Var [U] / Var [E] Equation 10
112
3.3. Estimation of Growth Function of the Output of the Agricultural Sector
We assume the stochastic production frontier function depicted in Equations 1 and 2. If we
differentiate Equation 2 with respect to time, we get Equation 11.
GRAGRGDPt = a0 + a1 GTLABOURt + a2GMACHINERYt + a3 GRINTERt
+ gVt – gUt Equation 11
where GRAGRGDP, GTLABOUR, GMACHINERY, GRINTER are the rates of growth or
the percentage changes of RAGRGDP, TLABOUR, MACHINERY and RINTER respectively, a0 is technological change or progress or TFP growth or the shift of the production frontier,
gVt is the growth of the random error term assumed to be zero and can be ignored, -gUt is the
change in technical efficiency, that is a move inside the production frontier, and a1, a2, a3 are
the partial output elasticities with respect to the three inputs, TLABOUR, MACHINERY and
RINTER respectively.
3.4. Data and Data Sources
Time-series data on value added to GDP by the agricultural sector (AGRGDP), consumer price
index and imported machinery and intermediate inputs (fertilisers) used by agricultural sector
were obtained from various issues of the Brunei Darussalam Statistical Yearbook from
1974/75 to the 2002. The consumer price data were used to derive the real value added to GDP
of the agricultural sector (RAGRGDP) using year 2000 as the base year. Data on the annual
number of workers in the agricultural sector were obtained from published and unpublished
annual reports of the Department of Labour from 1971 to 2002. The estimation of the
stochastic frontier production function and technical inefficiency was undertaken based on
maximum likelihood estimation techniques using Time Series Processor (TSP) software (Hall
and Cummins, 1999).
4. Results
The results of the estimated stochastic frontier production function for the agricultural sector in
Brunei are reported in Table 3. They showed that all the three factors of production – labour,
machinery and intermediate capital inputs – were statistically significant in influencing the
level of output of the agricultural sector as measured by the real value added to GDP. With the
estimated parameter values of the three factors representing partial output elasticities, their
sum would measure the returns to scale. The returns to scale was therefore 0.672. This
suggested decreasing returns to scale for the agricultural sector. Based on the estimates for
SIGMAI and LAMBDA reported in Table 3, the overall technical efficiency of the agricultural
sector was estimated based on Equations 9 and 10. The overall technical inefficiency was
about 99%. Hence the decreasing returns to scale for the sector could be explained by the
overall high technical inefficiency over the period of the study
Table 4 shows the results for the estimated function of the growth rate of the output of the
agricultural sector with regards to the growth rate of the three factors. The growth of labour
inputs statistically influenced the growth rate of the output of the agricultural sector in a
positive sense. However the growth of the intermediate capital inputs had an apparent negative
influence on the growth of output of the sector. This implied excessive use of intermediate
113
capital inputs with regards to the scale of output of the sector. This could be also due to the
fact that the intermediate capital inputs could be used for non-agricultural production such as
development of flower gardens and maintenance of lawns. The growth of machinery services
did not have any statistically significant impact on the growth of the output of the sector. The
intercept estimated value of –0.088 implied that there had been a negative TFP growth in the
agricultural sector. This implied that the agricultural sector had undergone negative
technological change over the period, 1971 to 2001.
The above result is similar to the finding by Anaman (2001) that the local rice production
industry in Brunei had undergone negative technological change over the period, 1965 to
2000. This was due to rapid disinvestment based on the use of relatively low quality seedlings
and other variable inputs and the loss of fertile farming land to urban development. Based on
the estimates for SIGMAI and LAMBDA reported in Table 4, we estimated that there had
been about 83% change in the technical inefficiency of the agricultural sector over the period,
1971 to 2001. This meant that over that period technical inefficiency had worsened. Therefore
there had been both a downward shift of the production frontier due to negative technological
change and worsening of technical inefficiency. The worsening of technical inefficiency
would be due to decreased level of production for given levels of inputs.
5. Conclusions
Using the cobb-douglas functional form, we estimated the aggregate production function for
the agricultural sector in Brunei Darussalam based on data from 1971 to 2001. The results of
our analysis indicated that labour inputs, machinery and intermediate capital inputs
significantly influenced the output of the sector in the positive sense. However the growth rate
of output over the period of the study was influenced positively only by labour inputs.
Intermediate capital inputs appeared to have had negative impact on the growth of output of
the sector. There was no statistically significant impact on the growth of output based on the
growth of machinery inputs over the period. We established that there had been negative
technological change (shift of the production frontier) and a high rate of increase in technical
inefficiency for the sector. We established diseconomies of scale for the sector and suggested
that this might be due to the high level of inefficiency experienced by the sector over the
period of the study, 1971 to 2001.
Based on the results of our study, we suggest certain policy recommendations. First, more
efforts should be made by the government to improve the efficiency and competitiveness of
the agricultural sector by addressing the problems currently faced by farmers. These efforts
need to be directed to enhance the quality of the inputs used by farmers as it is apparently
evident that technical inefficiency has increased over time. Hence the government needs to
help to improve access of farmers and other agricultural producers to credit based on flexible
collateral in order to promote access to modern inputs and increase the growth of the sector.
Second, it is evident that the bulk of farm workers are foreigners. The government needs to
improve access of local agricultural firms for foreign workers in order to ensure steady supply
of agricultural commodities. In this regard, the Department of Labour needs to improve its
speed of processing of foreign workers and reduce its length of time for hearing appeals
lodged by firms for rejected applications for foreign workers.
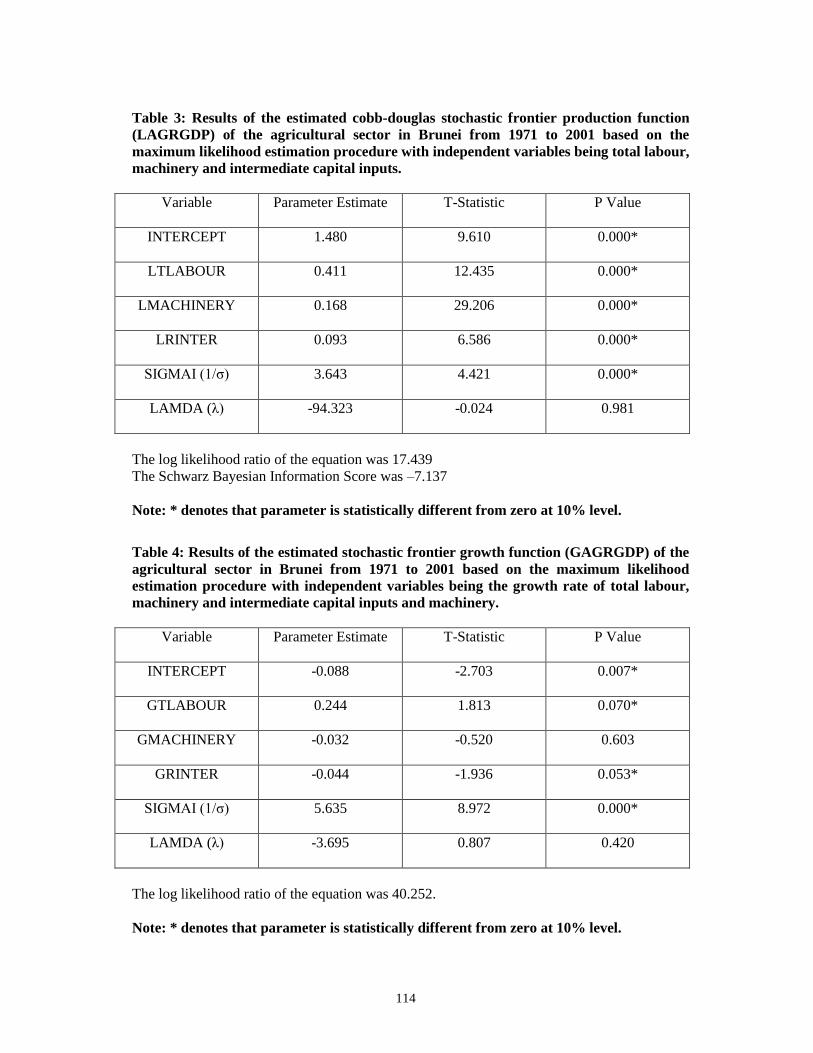
114
Table 3: Results of the estimated cobb-douglas stochastic frontier production function
(LAGRGDP) of the agricultural sector in Brunei from 1971 to 2001 based on the
maximum likelihood estimation procedure with independent variables being total labour,
machinery and intermediate capital inputs.
Variable
Parameter Estimate T-Statistic P Value
INTERCEPT 1.480 9.610 0.000*
LTLABOUR 0.411 12.435 0.000*
LMACHINERY 0.168 29.206 0.000*
LRINTER 0.093 6.586 0.000*
SIGMAI (1/σ) 3.643 4.421 0.000*
LAMDA (λ) -94.323 -0.024 0.981
The log likelihood ratio of the equation was 17.439
The Schwarz Bayesian Information Score was –7.137
Note: * denotes that parameter is statistically different from zero at 10% level.
Table 4: Results of the estimated stochastic frontier growth function (GAGRGDP) of the
agricultural sector in Brunei from 1971 to 2001 based on the maximum likelihood
estimation procedure with independent variables being the growth rate of total labour,
machinery and intermediate capital inputs and machinery.
Variable
Parameter Estimate T-Statistic P Value
INTERCEPT -0.088 -2.703 0.007*
GTLABOUR 0.244 1.813 0.070*
GMACHINERY -0.032 -0.520 0.603
GRINTER -0.044 -1.936 0.053*
SIGMAI (1/σ) 5.635 8.972 0.000*
LAMDA (λ) -3.695 0.807 0.420
The log likelihood ratio of the equation was 40.252.
Note: * denotes that parameter is statistically different from zero at 10% level.
115
Third, the Government through the Department of Agriculture needs to develop extensive
infrastructure support in the form of research and development and physical infrastructure
necessary for the modernization of the sector. The provision of strong infrastructure is urgent
given the negative technological change experienced by the agricultural sector over the last 30
years which is confirmed by our study. With regard to the problem of shortage of skilled
manpower needed for the sector, the government should expand the training of local citizens
as extension officers and agricultural entrepreneurs. Continuous training can help to provide
local people with the latest knowledge in agriculture in order to advance the development of
the sector. Finally, the emphasis in improving the agricultural sector should be in the areas
where economically-efficient production can be undertaken based on the improved physical
and research infrastructure provided by the state.
References
Aigner, D. J., C.A.K. Lovell and P.J. Schmidt (1977). “Formulation and Estimation of
Stochastic Frontier Production Functions”, Journal of Econometrics, 6(1): 21-37.
Anaman, K.A. (1988). African Farm Management: Principles and Applications With
Examples, Accra, Ghana: Ghana Universities Press, 268 pp.
Anaman, K.A. (2001). “Supply Response of Rice in Brunei Darussalam”, Borneo Review, 12(2):
171-183.
Brunei Department of Agriculture (DOA). Introduction to DOA,
http://www.agriculture.gov.bn/htm.
Coelli, T.J. (1995). “Recent Development in Frontier Modelling and Efficiency
Measurement”, Australian Journal of Agricultural Economics, 39:219-245.
Farell, M.J. (1957). “The Measurement of Productive Efficiency”, Journal of the Royal
Statistical Society A, 120(3): 253-281.
Fischer S. and R. Dornbusch (1994). Economics Fourth Edition, New York: McGraw Hill, 666
pp. plus appendices.
Government of Brunei Darussalam (2001a). Brunei Darussalam: Eighth National
Development Plan 2001-2005, Bandar Seri Begawan: Department of Economic Planning and
Development, 228 pp.
Government of Brunei Darussalam (2002). Brunei Statistical Yearbook 2000-2001, Bandar
Seri Begawan: Department of Economic Planning and Development.
Government of Brunei Darussalam (2003). Brunei Statistical Yearbook 2002, Bandar Seri
Begawan: Department of Economic Planning and Development.
Greene, W.H. (2000). Econometric Analysis, Fourth Edition, London: Prentice Hall
International, 1004 pp.Gujarati, N. (2003). Basic Econometrics, Fourth Edition, London:
McGraw-Hill, 1002 pp.
Hall, B.H. and C. Cummins (1999). Time Series Processor Version 4.5: User's Guide
Including an Introductory Guide, Palo Alto, California: TSP International.
Hayami, Yujiro and V.W.Ruttan (1971). Agricultural Development, Baltimore: The Johns
Hopkins Press.
Heady, E.O. and J.R. Dillon (1978). Agricultural Production Functions, Ames, Iowa: Iowa
University Press.
Jondrow, J., K. Lovell, I. Materov and P. Schmidt (1982). “On the Estimation of Technical
Inefficiency in the Stochastic Frontier Production Function Model”, Journal of Econometrics,
19: 223-228.
Jorgenson, Dale W., Frank M. Gollop and Barbara M. Fraumeni (1987). Productivity and U.S.
Economic Growth, Cambridge (MA): Harvard University Press.
116
Mahadevan, R. (2001). "Assessing the Output and Productivity Growth of Malaysia’s
Manufacturing Sector", Journal of Asian Economics, 12: 587-597.
Martin, Will and Devashish Mitra (1993). “Technical Progress in Agriculture and
Manufacturing”, Mimeo.
McConnell, C.R. and S.L. Brue (2002). Economics: Principles, Problems and Policies
Fifteenth Edition, New York: McGraw-Hill, 793 pp. plus appendices.
Meeusen, J and J. van den Broeck (1977). “Efficiency estimation from cobb-douglas production
functions with composed error”, International Economic Review, 18: 435-444.
Sumardi, R.H. (2003). Analysis of the Productivity of the Construction Industry in Brunei
Darussalam, Bachelor of Arts (Economics) Degree, Department of Economics, Universiti Brunei
Darussalam, Bandar Seri Begawan, 140 pp. (unpublished).
Vu, Q.N. (2003). “Technical Efficiency of Industrial State-Owned Enterprises in Vietnam”, Asian
Economic Journal, 17(1): 87-101.
117
CHAPTER 8
A SURVEY-BASED ANALYSIS OF FACTORS
INFLUENCING THE EFFICIENCY OF
THE CONSTRUCTION INDUSTRY
IN BRUNEI DARUSSALAM
RINA H. SUMARDI
Abstract
A scientific survey of construction firms was conducted to determine the factors adversely
affecting the efficiency of their operations. Econometric analysis, based on data acquired from
the survey was the main route used to fulfil the objective. The three most important factors
affecting the efficiency of construction firms were the delay in payments by the government for
completed work done by firms, the delay and late payments of work done for clients other than
the government and the difficulty in accessing loans from local banks. Other key factors were
the unavailability of government projects or contracts, maintenance of the health and safety of
workers, the difficulty in recruiting foreign workers due red tape and other bureaucratic
delays by government departments and inadequate government financial and material support.
1. Introduction
Brunei Darussalam (hereafter Brunei) is a small country situated at the tip of Borneo Island in
Southeast Asia. Brunei has a total land area of 5,765 square kilometres and a population of
about 340,800 in 2002 (Government of Brunei Darussalam, 2003). About 70% of the land
area of the country is undeveloped and is largely covered with tropical rainforests. There are
four administrative districts in the country. The most important district is Brunei-Muara where
Bandar Seri Begawan, the capital city, is situated. The other three districts are Belait,
Temburong and Tutong. Belait is the base of the production of oil and gas, the leading export
of Brunei and the largest contributor to the gross domestic product (GDP) in Brunei.
Temburong and Tutong are rural centres.
In terms of contribution to the GDP, construction industry is the third largest contributor to the
aggregate income in Brunei. The construction industry has been designated by the government
as one of the key sectors to accelerate the drive towards economic growth and diversification
(Government of Brunei Darussalam, 2001). The important role of the construction industry in
economic growth and diversification is not limited to Brunei but is also found in both
developing and developed countries. According to Low and Chan (1997, p.58), in many
developing countries the construction industry contributes more than 10% of the gross
domestic product. In such countries, the industry is considered as a major engine of economic
118
growth. The construction industry is also important in developed countries such as the United
States and Australia. In these countries, the construction industry often leads the economy out
of a recession as governments use policies including lower interest rates to stimulate purchase
of homes by consumers.
The construction industry in Brunei has been in a crisis since the Asian financial crisis of 1998
and the subsequent collapse in the same year of the Amedeo Company, then the largest
company dealing with construction-related business in Brunei. Given the importance of the
industry as the third largest contributor of the national income and the expressed need of the
government to use this industry to support its broad-based economic diversification
programme, it becomes imperative to analyse the factors affecting the overall efficiency of the
construction industry. The analysis needs to look at factors affecting efficiency from different
angles. These include factors emanating from external sources and those within the industry
itself including those at the firm and the construction site levels. The objective of this study is
to identify the major factors affecting the efficiency of construction firms based on a survey of
firms. The rest of the paper is organised as follows: the next section is a description of the
method used to undertake the survey of construction firms and the analysis of the survey data.
Following that the results of the study are presented. The conclusions and references follow.
2. Methodology
2.1. Survey Administration Procedures
In August 2002, the Ministry of Development, Bandar Seri Begawan provided a full list of
1573 construction firms registered with the Ministry from 1998 to 2001. Approximately 50%
of these firms (786) were randomly selected for the survey. The survey was undertaken using
self-administered questionnaires. A small pilot survey was undertaken in August 2002 with three
construction firms. The questionnaire was developed based on the adaptation of questionnaires
that have been used for several surveys in Brunei carried out by students and staff of the
Department of Economics, Universiti Brunei Darussalam (UBD) from 1999 to 2002 and the
survey of construction firms in Singapore undertaken by Ofori et al., (1999). The questionnaire is
divided into eight sections. Section A consists of the general information of the characteristics
of the construction firms. Sections B and C deal with information about the labour and capital
inputs used by the construction firms. Section D requests information about the perceptions of
the construction firms with regards to the role of the government as a client, facilitator and
regulator for the construction industry. Section E and F deal with the role of the oil and gas
industry and other industries as clients of the construction industry. Sections G and F explore
the factors that affect the efficiency and the growth of construction firms. Finally, sections I
and J focus on estimation of value of the gross output of the construction firms in Brunei and
overseas for the year 2001.
Seven hundred and eighty six (786) construction firms were sent the questionnaire in September
and October 2002. A total of 78 firms responded to the survey by the extended deadline of 15th
January 2003, a response rate of about 10%. Of the 78 responses received, only 55 firms provided
adequate information for coding and analysis. The 23 invalid responses were mainly due to the
return of questionnaires due to lack of activity or closure of the firms. A few respondents were not
eager to provide information due to a number of reasons. Such reasons included unavailability of
relevant staff to complete the questionnaire, policies of the firms dealing with provision of
119
confidential information to people belonging to other institutions and lack of time to complete the
ten-page questionnaire.
The author analysed the data provided by the respondents using two statistical software,
Statistical Package for Social Sciences (SPSS) and Time Series Processor (TSP) (Hall and
Cummins, 1999). This analysis was based on use of linking commands and programme synthax
that allow the transfer of spreadsheet data to the two statistical software. Links were also
established between SPSS data outputs and TSP software in order to allow more advanced
econometric analysis to be undertaken using TSP.
2.2. Methods of Analysis of Survey Data
2.2.1. Simple statistical analysis
The survey data were analysed using simple statistical analysis using the statistical software
SPSS. This was done through the compilation of the mean, standard deviation and the
frequency of important variables. The simple statistical analysis also involved the derivation
of the mean and standard deviation of the ranking of various factors that adversely affected
the efficiency and growth of the construction firms. This approach was also used for the
ranking of the respondents’ suggestions with regards to the actions needed to be taken by the
government to improve the efficiency of the construction industry in Brunei. The statistics
derived for these rankings were based on the Likert scoring scale of 1 to 5; with 5 considered
to be extremely important, 1 of not important, 3 moderately important and zero designated as
not applicable to the firm.
2.2.2. Production function analysis
The second method of analysis used for the survey data was the estimation of production
function of construction firms. This analysis used the elicited gross output of the firm in year
2001 as the dependent variable. The two independent variables were the total labour force of
the firm and total capital inputs used by the firm in year 2001. The total capital inputs were
based on operating capital plus the depreciation for machinery and equipment owned by the
firm. The depreciation method used for the machinery and equipment was the straight-line
method based on life span of 10 years. Annual rental expenses on capital equipment were
added to the total capital inputs.
Linear and log-linear specifications of the production function based on the survey data of
construction firms were analysed. Several econometric diagnostic tests including test of correct
model specification based on the Ramsey reset test (Ramsey, 1969) and the Jarque-Bera test of
normality of the error term (Jarque and Bera, 1987) were used to determine the appropriate
functional form. The log-linear model is specified as follows:
LGOUTPUTi = G0 + G1 LTLABOURi + G2 LCAPITALi + Wi
where LGOUTPUTi is the natural logarithm of the value of the gross output of the
construction firm i for work done in Brunei for the year 2001;
LTLABOURi is the natural logarithm of the total labour workforce of the construction firm i
in Brunei for the year 2001;
LCAPITALi is the natural logarithm of the total value of the capital inputs used by the
construction firm in Brunei for the year 2001;
120
Wi is the equation error term initially assumed to have zero mean and constant variance and Gi
(i=0, 1, 2) are the parameters to be estimated.
2.3. Limitations of the Study
About half of the listed total number of firms in Brunei (786 out of 1573 firms) were contacted
to respond to a questionnaire. Only about 10% responded with data on 55 firms found useful
for analysis. Due to limited funds for the study, it was difficult to conduct follow up surveys of
those firms which did not respond to the survey. It could have been possible to have sent the
questionnaire one or two more times to the firms not responding to elicit the requested data.
However this would have entailed substantial costs which the author did not have the means to
bear. Nevertheless, the 10% response rate was not much different from the 15.7% response
rate achieved by the much larger and well-funded study involving a survey of local
construction firms in Singapore conducted by the National University of Singapore over a 14-
month period in 1997 and 1998 (Ofori et al., 1999). This survey of construction firms in
Singapore cost 12,700 Singapore dollars and only 15.7% of the 263 randomly selected local
construction firms contacted took part.
3. Results
3.1. Summary Description of the Characteristics of the Surveyed Firms
Based on the survey with the valid sample size of 55 construction firms, 58.7% of these were
located in the Brunei-Muara district, 21.7% in the Belait district, 17.4% in the Tutong district
and only 2.2% in the Temburong district. In terms of business organization, over two-thirds of
the firms (68.5%) were managed as individual proprietorship. About 14.8% were family
partnerships. Firms categorised as corporations were one-ninth of the sample (11.1%). All the
firms had only one branch within Brunei. Only one of the firm indicated that it had overseas
operations. On average, the average age of the firms was about 9.0 years with a range of 0.25
to 31 years.
3.2. Labour Information of Surveyed Firms
On average there were about 15 workers per firm, three local and 12 foreign workers. Thus
foreign workers constituted about 80.0% of the total number of workers per firm. This figure
was close to the proportion of 89.2% for foreign workers determined from the annual national
survey conducted by the Department of Labour for year 2001 (Government of Brunei
Darussalam, 2003). About 56% of the firms indicated that they did not have any major
problems with their workers. The most important labour problem, indicated by about 10% of
the firms, involved low productivity and lack of interest in their work by local workers.
3.3. Information on Capital Inputs of Surveyed Firms
The average value of capital inputs owned by the construction firms in year 2001 was
B$142,348. The average value of machinery and equipment owned was B$70,592 and the
average value of vehicles owned was B$29,925 both in year 2001. Respondents were
requested to indicate the source of procurement of their raw materials and capital for their
work. Almost half of the firms (48.5%) obtained all their material mainly from local sources,
18.2% procured them from overseas sources and the remaining one-third of firms procured
their capital inputs from both local and overseas sources. The favoured overseas countries for
121
sourcing capital inputs were Malaysia, Singapore, Korea, Taiwan, Japan, United Kingdom and
the Netherlands. The majority of firms (71.9%) indicated that they had no problems in
procuring material. The only significant problem indicated was the delay in transporting
materials, expressed by about 9.4% of the firms.
3.4. Results of the Analysis of Factors Affecting Efficiency and Growth of Firms in the
Construction Industry as Indicated by Survey Respondents
Table 1 provides a summary of the respondents’ assessment of the factors that adversely
affected the efficiency of their operations in Brunei for the years 2001 and 2002. Based on the
average score of importance (out of a maximum of 5), delay in payments for completed
construction work by the government, as the client, was declared as the most important factor
affecting the productivity of firms, with an average score of 4.02. The second most important
problem was the delay and late payments for completed work by clients other than the
government, with an average score of importance of 3.92. The third most important factor
affecting the efficiency of firms was the difficulty in accessing loans from local banks, with an
average score of importance of 3.78. The next four most important problems were
unavailability of government projects or contracts, maintenance of the health and safety of
workers, difficulty in recruiting foreign workers due to red tape and other bureaucratic delays
by government departments and inadequate government financial and material support in order
of importance. Assessment of the seven major factors adversely affecting efficiency of
construction firms indicated that actions or lack of actions related to the government
constituted the key obstacles and problems as declared by the survey respondents.
The least important factors affecting the efficiency of construction firms were labour strikes
and slowdown, very dry weather, very wet weather and poor site conditions in order of least
importance. Therefore weather-related conditions were regarded as the least important
problems affecting the efficiency of firms in the industry. Respondents declared labour strikes
and slowdown as the least important problem. However productivity of foreign workers and
local Bruneian workers were regarded as moderately important factors affecting efficiency of
firms with scores of 3.35 and 3.18 respectively.
Table 2 is a summary of the factors influencing the growth of construction firms. Undertaking
construction projects financed by the Brunei government was the most important factor
influencing growth of firms. The relative low importance of Brunei Shell and the oil and gas
industry in stimulating growth of the construction industry was indicated by respondents. The
oil and gas industry was ranked as less important than other firms in the private sector.
Undertaking construction projects overseas was regarded as the least important source of
growth of construction firms.
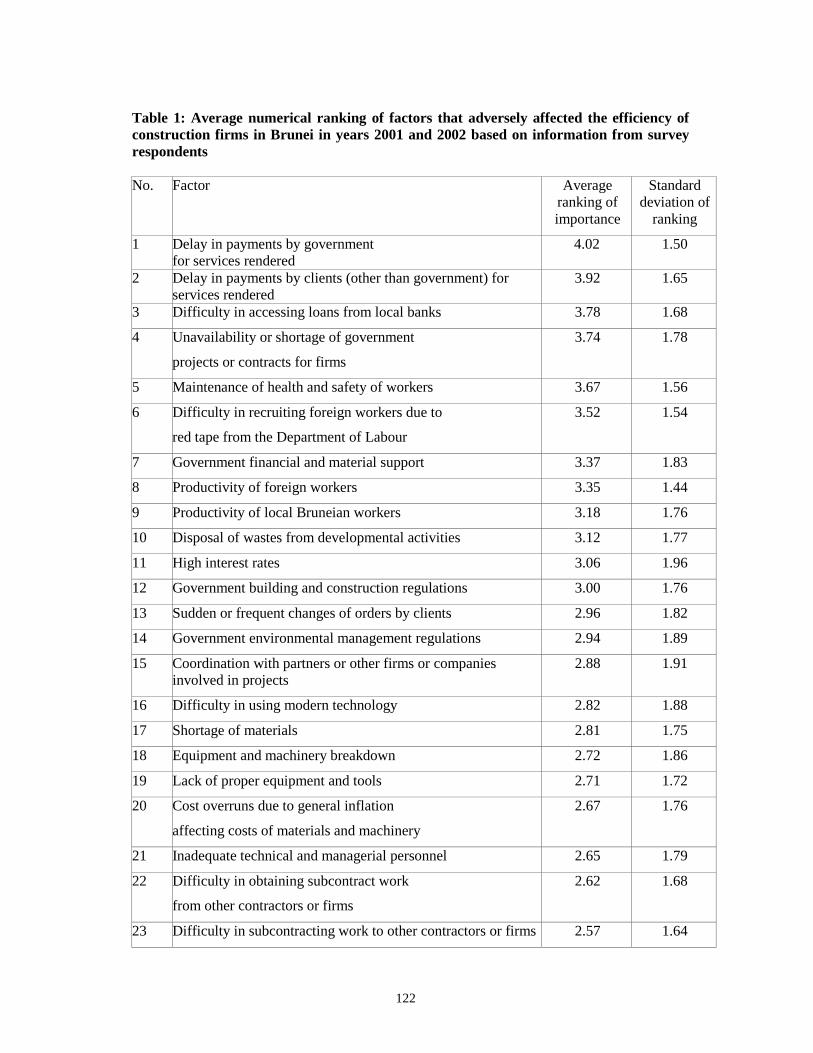
122
Table 1: Average numerical ranking of factors that adversely affected the efficiency of
construction firms in Brunei in years 2001 and 2002 based on information from survey
respondents
No.
Factor Average
ranking of
importance
Standard
deviation of
ranking
1 Delay in payments by government
for services rendered
4.02 1.50
2 Delay in payments by clients (other than government) for
services rendered
3.92 1.65
3 Difficulty in accessing loans from local banks 3.78 1.68
4 Unavailability or shortage of government
projects or contracts for firms
3.74 1.78
5 Maintenance of health and safety of workers 3.67 1.56
6 Difficulty in recruiting foreign workers due to
red tape from the Department of Labour
3.52 1.54
7 Government financial and material support 3.37 1.83
8 Productivity of foreign workers 3.35 1.44
9 Productivity of local Bruneian workers 3.18 1.76
10 Disposal of wastes from developmental activities 3.12 1.77
11 High interest rates 3.06 1.96
12 Government building and construction regulations 3.00 1.76
13 Sudden or frequent changes of orders by clients 2.96 1.82
14 Government environmental management regulations 2.94 1.89
15 Coordination with partners or other firms or companies
involved in projects
2.88 1.91
16 Difficulty in using modern technology 2.82 1.88
17 Shortage of materials 2.81 1.75
18 Equipment and machinery breakdown 2.72 1.86
19 Lack of proper equipment and tools 2.71 1.72
20 Cost overruns due to general inflation
affecting costs of materials and machinery
2.67 1.76
21 Inadequate technical and managerial personnel 2.65 1.79
22 Difficulty in obtaining subcontract work
from other contractors or firms
2.62 1.68
23 Difficulty in subcontracting work to other contractors or firms 2.57 1.64
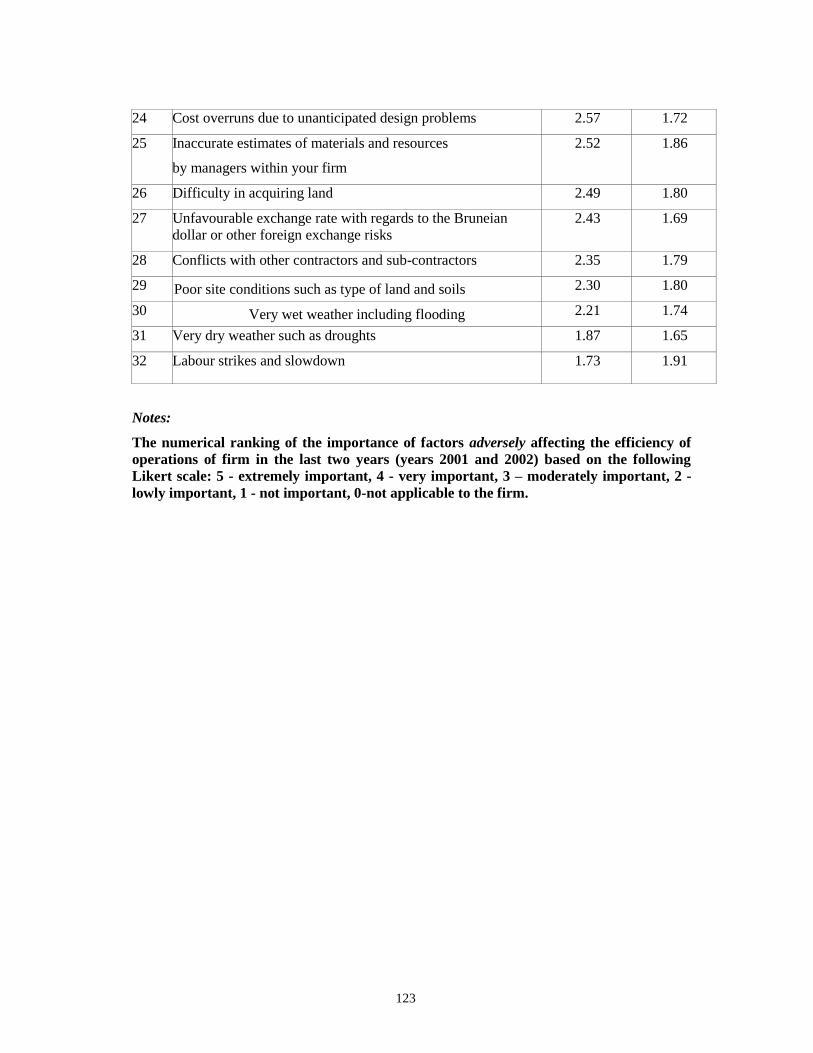
123
24 Cost overruns due to unanticipated design problems 2.57 1.72
25 Inaccurate estimates of materials and resources
by managers within your firm
2.52 1.86
26 Difficulty in acquiring land 2.49 1.80
27 Unfavourable exchange rate with regards to the Bruneian
dollar or other foreign exchange risks
2.43 1.69
28 Conflicts with other contractors and sub-contractors 2.35 1.79
29 Poor site conditions such as type of land and soils 2.30 1.80
30 Very wet weather including flooding 2.21 1.74
31 Very dry weather such as droughts 1.87 1.65
32 Labour strikes and slowdown 1.73 1.91
Notes:
The numerical ranking of the importance of factors adversely affecting the efficiency of
operations of firm in the last two years (years 2001 and 2002) based on the following
Likert scale: 5 - extremely important, 4 - very important, 3 – moderately important, 2 -
lowly important, 1 - not important, 0-not applicable to the firm.
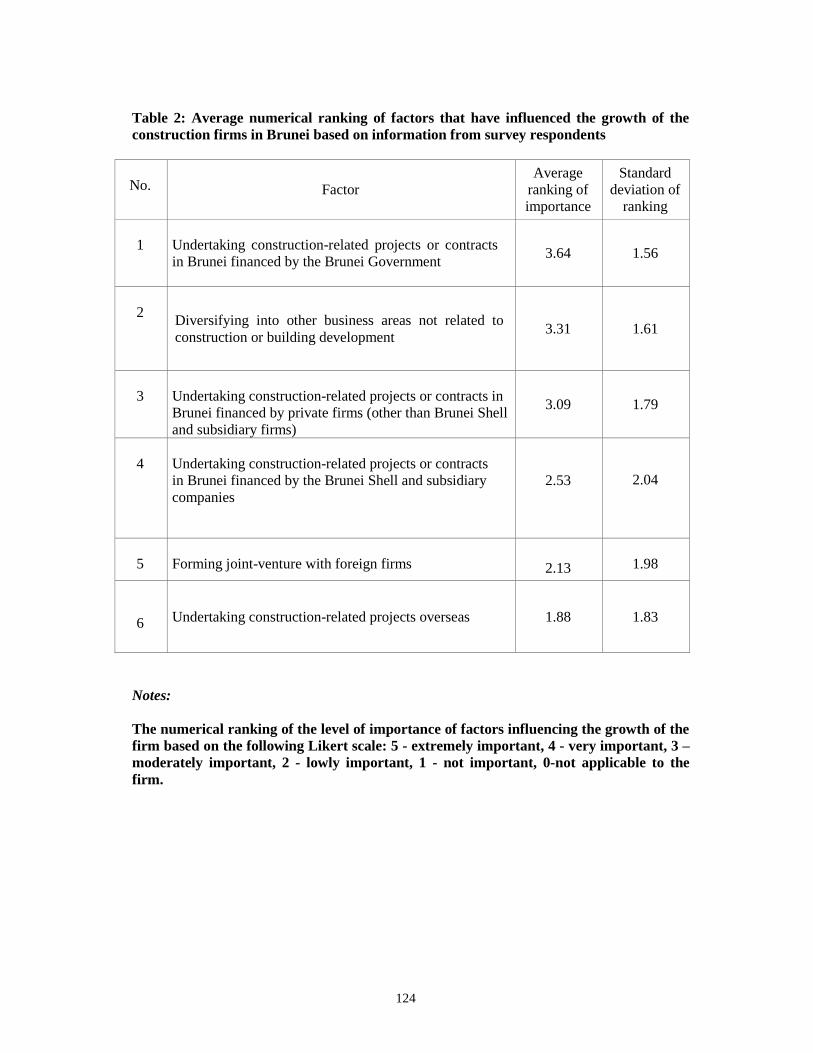
124
Table 2: Average numerical ranking of factors that have influenced the growth of the
construction firms in Brunei based on information from survey respondents
No. Factor
Average
ranking of
importance
Standard
deviation of
ranking
1
Undertaking construction-related projects or contracts
in Brunei financed by the Brunei Government
3.64 1.56
2
Diversifying into other business areas not related to
construction or building development
3.31 1.61
3
Undertaking construction-related projects or contracts in
Brunei financed by private firms (other than Brunei Shell
and subsidiary firms)
3.09 1.79
4
Undertaking construction-related projects or contracts
in Brunei financed by the Brunei Shell and subsidiary
companies
2.53
2.04
5
Forming joint-venture with foreign firms
2.13
1.98
6 Undertaking construction-related projects overseas 1.88 1.83
Notes:
The numerical ranking of the level of importance of factors influencing the growth of the
firm based on the following Likert scale: 5 - extremely important, 4 - very important, 3 –
moderately important, 2 - lowly important, 1 - not important, 0-not applicable to the
firm.
125
3.5. Firms’ Assessment of Actions Needed to be Taken by Brunei Government to Revive
the Construction Industry
About 60% of the surveyed firms indicated that most of their construction-related projects
were financed by the Brunei Government. Another 11% of the firms indicated that they
undertook some construction-related projects for Brunei Shell Petroleum and its subsidiary
agencies such as Brunei Shell Marketing. Comparison of the three main clients of the
construction industry - (1) Brunei Government, (2) Brunei Shell and (3) other firms in the
private sector - revealed that Brunei Shell was perceived as the best client in terms of speedy
payments for work completed. About 80% of the firms that dealt with Brunei Shell indicated
satisfaction with the speed of payments of work done for the company. However Brunei Shell
plays relatively little role in terms of financing projects for the construction industry compared
to the Brunei Government.
The dominance of the government as the major client of the construction industry is clearly
shown by the study. Respondents were requested to indicate what actions the Brunei
Government should undertake to improve the efficiency of the construction industry. The
results of the simple statistical analysis of the numerical ranking of importance of the
suggested actions by survey respondents are presented in Table 3. The most important action
requested was for the government to organize speedy and efficient payments for the work done
by construction firms, with a high score of 4.44. The second most important action was for the
government to introduce more construction-related projects for the industry. Introduction of
small-scale repairs and maintenance works for local firms ranked the third highest of the
recommended actions. Other important recommended actions included improvement in the
access to loans from financial institutions, encouragement of the development of local artisans
and skilled workers in the construction industry and improvement in the efficiency of
processing work permits for foreign workers. The reduction of overall red tape involved with
the implementation of government laws and regulations was also considered an important
action needed to be undertaken by the Brunei Government.
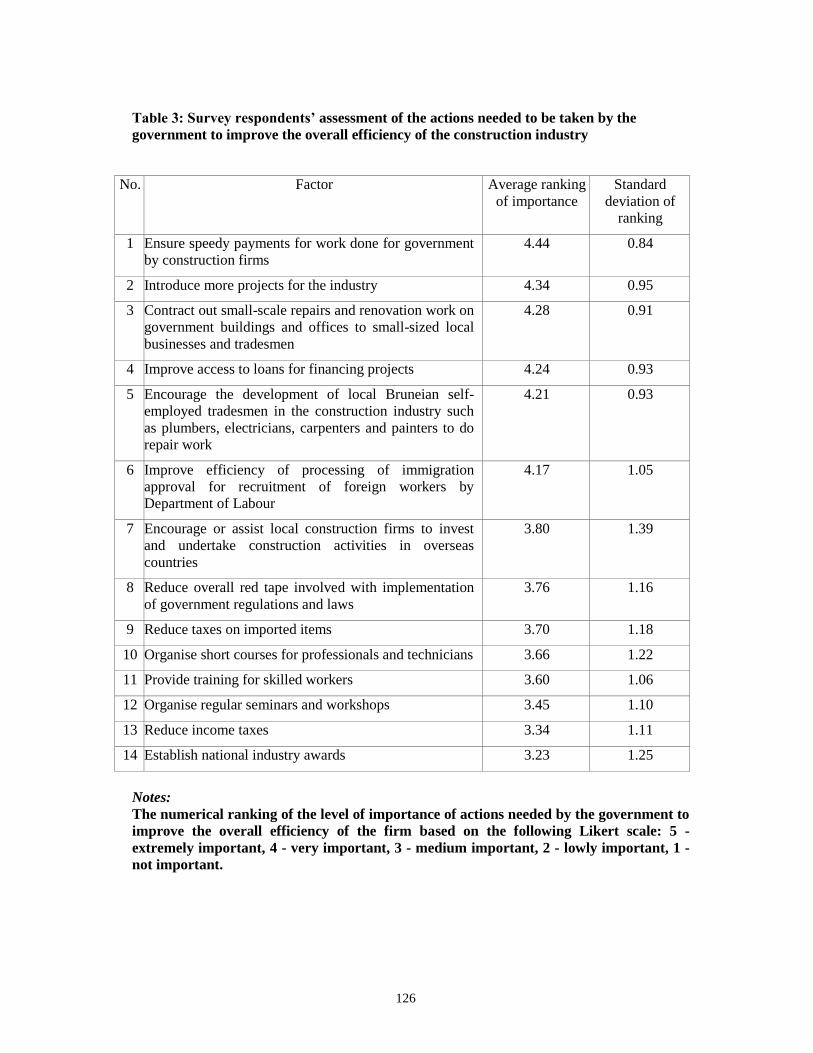
126
Table 3: Survey respondents’ assessment of the actions needed to be taken by the
government to improve the overall efficiency of the construction industry
No.
Factor Average ranking
of importance
Standard
deviation of
ranking
1 Ensure speedy payments for work done for government
by construction firms
4.44 0.84
2 Introduce more projects for the industry 4.34 0.95
3 Contract out small-scale repairs and renovation work on
government buildings and offices to small-sized local
businesses and tradesmen
4.28 0.91
4 Improve access to loans for financing projects 4.24 0.93
5 Encourage the development of local Bruneian self-
employed tradesmen in the construction industry such
as plumbers, electricians, carpenters and painters to do
repair work
4.21 0.93
6 Improve efficiency of processing of immigration
approval for recruitment of foreign workers by
Department of Labour
4.17 1.05
7 Encourage or assist local construction firms to invest
and undertake construction activities in overseas
countries
3.80 1.39
8 Reduce overall red tape involved with implementation
of government regulations and laws
3.76 1.16
9 Reduce taxes on imported items 3.70 1.18
10 Organise short courses for professionals and technicians 3.66 1.22
11 Provide training for skilled workers 3.60 1.06
12 Organise regular seminars and workshops 3.45 1.10
13 Reduce income taxes 3.34 1.11
14 Establish national industry awards 3.23 1.25
Notes:
The numerical ranking of the level of importance of actions needed by the government to
improve the overall efficiency of the firm based on the following Likert scale: 5 -
extremely important, 4 - very important, 3 - medium important, 2 - lowly important, 1 -
not important.
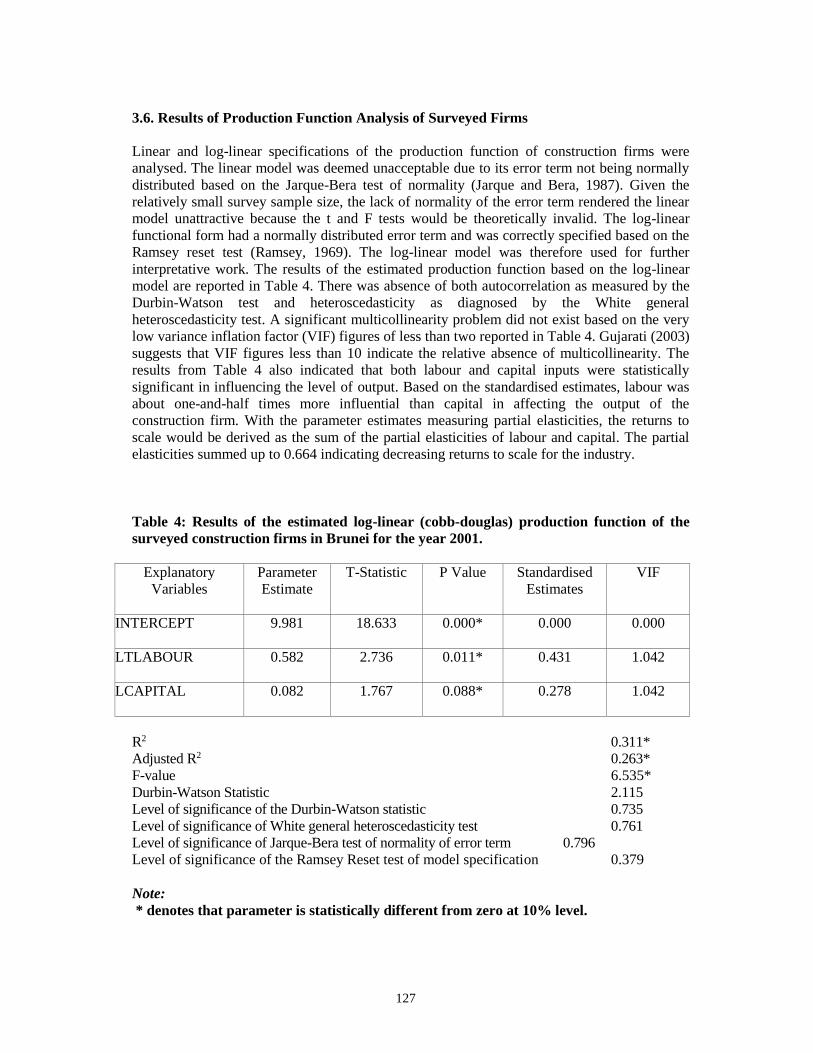
127
3.6. Results of Production Function Analysis of Surveyed Firms
Linear and log-linear specifications of the production function of construction firms were
analysed. The linear model was deemed unacceptable due to its error term not being normally
distributed based on the Jarque-Bera test of normality (Jarque and Bera, 1987). Given the
relatively small survey sample size, the lack of normality of the error term rendered the linear
model unattractive because the t and F tests would be theoretically invalid. The log-linear
functional form had a normally distributed error term and was correctly specified based on the
Ramsey reset test (Ramsey, 1969). The log-linear model was therefore used for further
interpretative work. The results of the estimated production function based on the log-linear
model are reported in Table 4. There was absence of both autocorrelation as measured by the
Durbin-Watson test and heteroscedasticity as diagnosed by the White general
heteroscedasticity test. A significant multicollinearity problem did not exist based on the very
low variance inflation factor (VIF) figures of less than two reported in Table 4. Gujarati (2003)
suggests that VIF figures less than 10 indicate the relative absence of multicollinearity. The
results from Table 4 also indicated that both labour and capital inputs were statistically
significant in influencing the level of output. Based on the standardised estimates, labour was
about one-and-half times more influential than capital in affecting the output of the
construction firm. With the parameter estimates measuring partial elasticities, the returns to
scale would be derived as the sum of the partial elasticities of labour and capital. The partial
elasticities summed up to 0.664 indicating decreasing returns to scale for the industry.
Table 4: Results of the estimated log-linear (cobb-douglas) production function of the
surveyed construction firms in Brunei for the year 2001.
Explanatory
Variables
Parameter
Estimate
T-Statistic P Value Standardised
Estimates
VIF
INTERCEPT 9.981 18.633 0.000* 0.000 0.000
LTLABOUR 0.582 2.736 0.011* 0.431 1.042
LCAPITAL 0.082 1.767 0.088* 0.278 1.042
R2 0.311*
Adjusted R2 0.263*
F-value 6.535*
Durbin-Watson Statistic 2.115
Level of significance of the Durbin-Watson statistic 0.735
Level of significance of White general heteroscedasticity test 0.761
Level of significance of Jarque-Bera test of normality of error term 0.796
Level of significance of the Ramsey Reset test of model specification 0.379
Note:
* denotes that parameter is statistically different from zero at 10% level.
128
4. Conclusions
A survey of construction firms was undertaken to determine the factors adversely affecting the
efficiency of their operations. From the analysis of the production function based on the log-
linear specification, it was ascertained that labour was about one-and-half times more
influential than capital in affecting the construction firm’s output. I established that there were
diseconomies of scale in the industry. This might be due to the high level of technical
inefficiency in the industry (Sumardi, 2003). Another possibility could be that the low
response rate did not allow for the true determination of the economies of scale for the
industry.
It was determined from simple statistical analysis that the most important factor adversely
affecting the efficiency of firms was the delay in payments by the government for completed
work done by firms. The second most important problem was the delay and late payments of
work done for clients other than the government. The third most important factor affecting the
efficiency of firms was the difficulty in accessing loans from local banks. Other important
factors adversely affecting efficiency of construction firms were the unavailability of
government projects or contracts, maintenance of the health and safety of workers, the
difficulty in recruiting foreign workers due to red tape and other bureaucratic delays by
government departments and inadequate government financial and material support in order of
importance.
Respondents declared labour strikes and slowdown as the least important problems affecting
efficiency of their firms. Yet productivity of foreign workers and local Bruneian workers were
regarded as moderately important factors affecting efficiency of firms. This paradox could be
explained by the fact that strikes were generally banned in Brunei. Productivity of workers
however depended on various incentives, both financial and non-financial, that stimulated
workers to produce more efficiently. For foreign workers, productivity would be affected by
the lack of regular payments of their salaries and allowances, which was linked to the delay of
payments for completed work by the government. The low productivity of local workers was
possibly related to the lack of interest of many local citizens for manual work.
An assessment of the seven major factors adversely affecting efficiency of construction firms,
as declared by firms that responded to the survey, indicate that actions or lack of actions
related to the government constitute the key obstacles and problems of the industry. The study
establishes that government is a major player in the construction industry as a regulator,
facilitator and the biggest client. Therefore, the government can reduce the inefficiency of the
industry by addressing and providing solutions to the four major problems faced by
construction firms that are directly related to its practices and policies. These problems are the
frequent delays in payment for completed work done by construction firms for the
government, difficulty in accessing loans from local banks and financial institutions,
inadequate government construction-related projects and difficulty in hiring foreign workers
due to bureaucratic restrictions and delays originating from the Department of Labour. The
policy implications and related actions required from the government are elaborated in the
following paragraphs.
First, considering the shortage of labour for the construction industry, the author recommends
that the stringent measures and rules in processing of foreign workers by the Department of
Labour need to be relaxed to ensure sufficient supply of workers for the construction industry.
The labour policy of Bruneisation whereby local citizens are given priority in the recruitment
129
of workers by the private sector appears to be currently counterproductive for the construction
industry. This is because of the inadequate commitment given by local people to work in the
industry. Therefore rigid enforcement of the Bruneisation labour policy for the construction
industry is likely to hurt the industry and accelerate its current decline. Given that the
efficiency of the construction industry relies on the timely implementation of sequential
operations, the unavailability of skilled and unskilled workers at critical times leads to delay in
project implementation, cost overruns and reduced profits. Therefore the author strongly
recommends an open door policy of labour recruitment specifically for the construction
industry at the present time in order to ensure the revival of the industry. The open-door policy
can be relaxed when locals have made some commitment to work in the construction industry.
Another measure that the government can undertake to reduce the problems associated with
recruitment of workers for the construction industry is to ensure the speedy processing of
applications submitted by local firms for the employment of foreign workers. The current
monthly appeal process for reviewing rejected application cases by the Department of Labour
is too slow and should be changed to a weekly appeal process to allow firms to have their
appeal cases heard more quickly. The speedy processing of applications also requires
government workers to spend more time at work and increase their commitment to work. This
increased commitment can be achieved more readily through some modification of self-
interested behaviour based on religious guidance. In this regard, the government through the
Ministry of Religious Affairs and other religious institutions should use regular weekly prayer
sessions and special religious gatherings to emphasise the need of government workers to
work hard and constantly adopt the time management and work ethics of Islam as laid down
and practised by the Prophet Muhammad (Peace be Upon Him). For example, religious leaders
should urge their followers especially government workers to avoid negative work-related
habits such as longer than approved coffee breaks, absenteeism and early departure from
government offices to attend to personal affairs. Such intervention by religious leaders may
improve the speed of processing and implementation of government business affairs. The
government can also assist in achieving increased availability of workers for the construction
industry by inculcating an interest in the mind of local citizens that manual work is productive
and not denigrating.
Second, with regards to the problem of late payments of completed work done, the government
being the major client of the construction industry should set an example by initiating new
procedures that ensure speedy payments for firms. This may involve the creation of a special
unit in the Ministry of Finance charged only with the processing of payment claims and related
issues of the construction industry. In order to ensure that government workers do their work
quickly and effectively, the Minister of Finance may set up an advisory body of members of
the construction industry to advise him and receive the complaints from the industry with
regards to the problem of slow payments and other issues affecting the industry.
Third, the problem of access to loans by the construction industry can partly be alleviated if
the government acts as a co-guarantor for certain short-term loans required by construction
firms especially in cases where the government itself owes construction firms money and these
firms need money urgently to undertake their operations. As indicated earlier the process of
construction is characterised by timely nature of various operations. Hence construction firms
may want to start certain projects but may find it difficult to get working capital due to the
delay in payment for completed work done for the government. Hence in such cases, the
government can guarantee a certain fixed amount of loans from local banks in order to allow
130
firms some money to start their projects. The government can then directly pay the money to
the local banks when the processing of the payments is finally completed.
Fourth, the problem of unavailability of government projects needs to be addressed. According
to Othman (2002, p.3), construction firms face a gloomy future due to the shortage of
government projects. As the majority of construction firms rely on the government for
projects, many firms have taken tough measures to deal with the problem of inadequate
government construction-related projects. These include reduction of salaries of staff,
involuntary closure and transferring operations overseas. One way to increase projects for the
construction industry is for the government to encourage foreign direct investment in the
construction industry through joint government-foreign investor projects whereby the
government participates in the financing of various projects. Another way of increasing
projects for the industry is for the government to contract repairs and maintenance of many
government buildings to local construction firms. Many government buildings throughout the
country are in a state of disrepair and need urgent renovation. Thus contracting out repairs of
government buildings is likely to contribute to the revival of the industry in the short-term
period.
Finally, the government through the Ministry of Development, especially the Department of
Construction Planning and Research, needs to undertake more comprehensive and regular
research studies on the construction industry in Brunei in order to find solutions to existing and
emerging problems of the industry. Endowed with considerable financial and material
resources and armed with statutory enforcement powers, the Department is capable of
undertaking larger surveys. The information obtained from such research can help to improve
the overall efficiency of the construction industry and assist the industry to play a vital role in
the economic diversification programme of the government.
Acknowledgments
This paper is based on my unpublished Bachelor of Arts (Economics) thesis submitted to
Universiti Brunei Darussalam (UBD) in April 2003. I express my deep appreciation and
gratitude to Dr. Kwabena A. Anaman, my thesis supervisor, for his insightful guidance, advice
and support in the development of this paper. I thank my family who stood by me whenever I
needed the support and encouragement throughout my four-year study at UBD. My sincere
appreciation is extended to Professor George Ofori, Head of the Department of Building,
School of Design and Environment, National University of Singapore for providing me with
his report on a survey of construction firms in Singapore which he conducted in 1997 and
1998. His report was useful in the design of the questionnaire used for my study. Finally, I
sincerely thank all the managers and owners of the construction firms who kindly provided
their time to complete the questionnaires.
References
Durbin, J. and G.S. Watson (1951). "Testing for Serial Correlation in Least-Squares
Regressor", Biometrika, 38: 159-171.
Government of Brunei Darussalam (2003). Brunei Statistical Yearbook 2002, Bandar Seri
Begawan: Department of Economic Planning and Development.
Gujarati, N. (2003). Basic Econometrics, Fourth Edition, London: McGraw-Hill, 1002 pp.
Hall, B.H. and C. Cummins (1999). Time Series Processor Version 4.5: User's Guide
Including an Introductory Guide, Palo Alto, California: TSP International.
131
Jarque, C.M and A.K. Bera (1987). "A Test for Normality of Observations and Regression
Residuals", International Statistical Review, 55: 163-172
Low, S.P. and Y.M. Chan (1997). Managing Productivity in Construction, Ashgate, England:
JIT Operations and Measurements, 240 pp.
Ofori, G., C. Leong and P. Teo (1999). Influence of Foreign Contractors on Development of
Singapore Construction Companies, Final Report of University-Funded Research Project
Number RP 3960057, Centre for Building Performance and Construction, School of Building
and Real Estate, Faculty of Architecture, Building and Real Estate, National University of
Singapore, Singapore, 192 pp.
Othman, A. (2002). “Construction Firms Take Alternatives”, Borneo Bulletin, (September),
p.3.
Ramsey, J.B. (1969). “Tests for Specification Errors in Classical Linear Least Squares
Regression Analysis”, Journal of the Royal Statistical Society Series B, 31:350-371.
Sumardi, R.H. (2003). Analysis of the Productivity of the Construction Industry in Brunei
Darussalam, Bachelor of Arts (Economics) Degree, Department of Economics, Universiti Brunei
Darussalam, Bandar Seri Begawan, 140 pp. (unpublished).
SPSS Inc. (2002). Statistical Package for Social Sciences (SPSS) for Windows, Version 10,
Chicago: SPSS Inc.
White, H. (1980). "A Heteroscedasticity Consistent Covariance Matrix Estimator and a Direct
Test of Heteroscedasticity", Econometrica, 48: 817-818.
132
CHAPTER 9
THE PROSPECTS AND CHALLENGES OF
ISLAMIC BUSINESS TRANSACTIONS
IN BRUNEI DARUSSALAM
SALMA A. LATIFF, ISMAIL DURAMAN AND RAZALI M. ZIN
Abstract
The dawn of the Islamic renaissance emanating from all corners of the modern world creates
the necessity for an Islamic society to not only act as facilitators but more so as conscious
workers promoting an understanding of the various aspects, features and basic principles of
Islam. This paper discusses the various factors that influence the implementation of business
activities in Brunei according to Islamic doctrine. It also considers the important challenges
and issues that need to be addressed to ensure that efforts towards achieving business
transactions predicated on Islamic recommendations are realized.
1. Introduction
The capitalist and the communist economic systems have been in existence for about 230 years
and 85 years respectively. In many developing countries, especially in Asia, rapid economic
development has been achieved over the last 40 years. However the recent economic crises
that swept Asia starting in 1997 and the collapse of centrally planned communist systems of
Eastern Europe in the late 1980s and early 1990s have shown that an economic system based
solely on human thought-processes, regardless as to whether it is a free market economy or
centrally planned, is basically unstable. The recent Asian financial crisis also proved that
countries that have adopted free market systems can be seriously affected by an economic
crisis even after achieving record growth rates in economic advancement over several decades.
The underlying philosophy guiding capitalist economic systems, based on the so-called
“invisible hand”, was first developed by Scottish moral philosopher, Adam Smith in the 18th
century. Many mainstream economists suggest that the capitalist economic system is the most
suitable system for achieving sustainable economic growth. The communist system was
proposed by Karl Marx, in the 19th Century, as a response to the inherent flaws of the capitalist
economic system. The communist system was suggested as an alternative economic system.
The strengths and weaknesses of the two economic systems have been debated extensively. In
this universal debate, economists espousing Islamic economic systems were largely pushed
aside and left behind. As a consequence, the conventional economic doctrine based on
neoclassical economic theories, has succeeded in overshadowing the uniqueness of Islamic
economic systems. Furthermore, the intellectual discipline of economic science is largely
dominated by economists espousing neoclassical economic theories which are based on the
assumption of an underlying self-interested nature of human beings, the so-called economic
rationality. These theories are mainly the products of Western/Christian inspired economies.
133
Despite this development, research and scholarship related to Islamic-based economic systems
and processes have increased since the early 1990s. This has been partly due to the collapse of
centrally planned economic systems of Eastern Europe and the persistent failure of structural
adjustment economic reforms developed by leading international lending organizations such as
the International Monetary Fund and the World Bank to reduce the widespread poverty around
the world. The growing income inequality, between countries in the South and those in the
North, and between various communities within nation states, has revealed the basic
weaknesses of capitalist economic systems. Rather than celebrating the failure of communist-
based economies, many intellectuals have turned their attention to the study of alternative
economic systems. As a result, Islamic economic systems and processes are increasingly being
studied by Muslim and non-Muslim economists around the world.
2. ISLAM AND ITS DEVELOPMENT IN BRUNEI DARUSSALAM
In Brunei, steps to develop an Islamic-based economy had taken root way back in the early
days of the establishment of the country as a self-governing state in the 15th Century. In 1425,
Sharif Ali, the third Sultan of Brunei, a pious ruler, began to introduce Islamic values and
concepts in the administration of the country. Touching on the aspects of Islamic development
process in Brunei, Hashim (1986) explained that: -
In addition to the above statute, titles were bestowed specially on Brunei dignitaries to stress
the importance of Islam, such as “Wazirs”, “Cheteria” and Religious Ministers. Hashim (1986)
further explained that:
(The development of Islam in Brunei, from historical and political
perspectives, is not in name only, but, in fact, practised in the form of living
as a race and a nation. As evident in the reign of Sultan Hassan (the 9th
Sultan of Brunei), a statute was drafted containing 46 articles that
addressed issues relating to the laws of Islam, (page 7)).
(The roles of “Religious Ministers” in the Islamic society and nation
are still significant and strongly upheld to this day. Their role is not
only restricted to official functions, in fact a more pertinent role is
their official authority on Islam and its way of life. Their prescribed
actions form the basis for the community as a whole to emulate. In the
ranking of the country’s administrational structure, the “Religious
Ministers” command a position that is honored in every type of
gathering……………………… …… (page 9)).
134
In order to strengthen the position of Islam within the government, an organisational body
known as “Majlis Ugama Islam” was established under the “Majlis Ugama Islam dan
Mahkamah-Mahkamah Kadhi” Act of 1955 (Hashim, 1986). The main objective of the
establishment of the “Majlis Ugama Islam” was to advise His Majesty The Sultan in all
religious matters. The pinnacle of Islam in Brunei has been the application of the religion as a
complete way of life. This includes the development and implementation of business
transactions and economic instruments for an Islamic-based economic system.
3. Business Transactions and Development of an Islamic-Based Economy
3.1. The Importance of Business as an Economic Activity in Islam
An economic system based on Islamic principles combines elements of spiritual characteristics
and materialism with an objective of creating a balanced society. The requirements of such an
economy are religious duties to Allah S.W.T. which encompass all elements of Tauhid,
Rububiyyah, Khalifah and Tazkiyah. It also provides a surety (or guarantee) of a continuing
prosperous economy. Suraf Al-‘Araf, Verse 96 states that:
”Yet had the people of the towns believed and had been godfearing,
We would have opened upon them our blessings from the heaven
and earth; but they disbelieved, so We took from them what they
had earned”.
Business transaction or commerce is one of the most important factors in the development of
an economy (Sobri, 1992). All economic activities can be classified according to the nature of
the business transactions used for these activities. Thus a farmer who lives in the village, and
whose livelihood is dependent on the production of food for family consumption and the sales
of extra produce in formal markets is engaged in a business activity classified as a semi-
subsistence enterprise. Business transactions and trading are natural processes which are a
necessity for mankind. Hence trade was developed simultaneously with the creation of
mankind on earth. In ancient civilisations, business transactions were carried out based on the
barter system. Ancient historical evidence showed that civilisations such as those of Egypt,
Babylonia, India and China had developed extensive and sophisticated trade and commerce
systems long before the advent of such systems by Europeans (Wolf, 1986).
The Al-Qur’an views wealth and means of achieving material prosperity (trade being one of
the mechanisms) positively. Rasulullah S.A.W. himself worked as a businessman and
continued this occupation even after he was anointed as ‘Rasul”. Ibn Khaldun (1332-1406) in
his effort to show the pervasiveness and prosperity of trade as a ‘halal’ source of income,
mentioned that “where there is a transfer of goods from a distant location or where there are
various risks involved in a business transaction, these provide sufficient basis for increasing
the cost (price) of the goods involved” (Sobri, 1992). This implied the acceptance of a profit
margin to be added to the cost of the goods to compensate for their transfer costs and the
additional risks involved in the business transactions.
135
3.2. The Islamic Concept of Business Transactions
Various definitions have been offered by Islamic experts on the subject of business
transactions. Among those who have offered their opinions on the definition are as follows:
(a) Al-Qurtubi, in his book Al Jami’ Li al Ahkam, explained that trade or the concept of
buying and selling is a business transaction between two parties, who are the seller and the
buyer (Sobri, 1992).
(b) Iman Al Razi, in his book Mafatih al Ghaib, defines trade as a kind of transaction that
involves goods that already exist, do not yet exist or do not exist at all (Sobri, 1992).
(c) Ibnu ‘Abidin in his book Radd al Mukhtar, defines trade as a contract of exchange of
goods for obtaining profits, either for the seller or buyer (Sobri,1992).
(d) Sayid Sabiq in his book Fiqh al Sunnah, defines trade as an exchange of goods with
goods, wealth with wealth, and wealth with goods, in accordance with the agreement of
both parties, that is, the buyer and seller, and following the Shariah principles.
(e) Ibn Khaldun, in his book Al Muqaddimah, defines trade as a method of expending capital
(Sobri, 1992).
(f) Al Syarbini Al Khatib, in his book Al Iqna’ defines trade as exchanging money with
goods or exchanging goods with goods for purposes of making profit (Sobri 1992).
(g) Pofham (1986), in the Encylopaedia Americana, differentiates business with trade.
Business transaction is the exchange of goods with money while trade is the exchange of
money with money or the ‘barter system’.
(h) Pooper (1986) in Encyclopaedia Americana defines business transaction as the exchange
of goods with goods or the exchange of goods with services.
The concept of business transactions as laid out by Islam has a broad scope. It covers two main
aspects, hablumminAllah and hablumminannas (Mustafa, 1994). The main objective of
mankind is to seek the blessings of Allah S.W.T. Hence trading, similar to other human
activities, is a mode for achieving this objective. However trade is instrumental in achieving
hablumminAllah if it is undertaken to fulfill two main conditions as follows:
(a) to apply the framework of fardhu’ain, which comprises of three branches of learning –
Tauhid, Feqah and Tasawuf as its activity framework; and
(b) to perform all business activities in the form of submission to God. This is crucial in all
aspects of human activities including trade. If trade is undertaken not as part of religious duties
to God, then it results in a loss of both effort and time and consequently will not receive Allah
S.W.T’s blessings. Efforts in business may result in enormous wealth. However such wealth
may not generate blessings in life if they are not undertaken in forms acceptable to Allah.
The concept of Hablumminannas is fulfilled through trading activities if they are carried out
for the good of mankind. A man should not become a slave to his trading activities but rather
should use these activities to glorify God while improving his material happiness.
136
4. Prospects for Implementing Islamic Economic Transactions in Brunei
There are several factors that act as catalyst in spearheading efforts aimed at advancing the
implementation of economic transactions based on Islamic doctrine in Brunei. These factors
include the following:
4.1. Visionary Leadership in Upholding Islamic Sovereignty
The ability to lead a nation in accordance with Islamic principles is a process that is predicated
on the virtuous attributes of the leader. This implies that the skills, diplomacy, vision, mission,
plans, direction and control of the leader should all be based on the requirements of the Lord of
the World. A leader has to lead an exemplary life worthy of admiration and respect by his
followers. His manners and behaviour must adhere to the teachings of Allah S.W.T. In this
respect, Rasulullah S.A.W. set the highest standards that should be emulated by all leaders of
the world. Allah S.W.T decreed in Surah Al-Ahzab, Verse 21, as follows:
“Surely there is for you the best example in the Messenger of Allah S.W.T.
for whoever seeks the pleasure of Allah S.W.T and the Last Day, and
remember Allah S.W.T often”
With the blessings derived from divine teachings of Islam, Kebawah Duli Yang Maha Mulia
Paduka Seri Bagnda Sultan Haji Hassanal Bolkiah Mu’izzaddin Waddaulah, Sultan and Yang
Di-Pertuan Negara Brunei Darussalam, the nation’s leader is well disposed. He holds a strong
conviction for instituting Islam as the foundation for the administration of the country. This
conviction is abundantly seen from his pronouncements and practices that continuously stress
Islam as the only choice for achieving happiness and contentment in this world and the after
world. The concept of Malay Muslim Monarchy was proclaimed by His Majesty The Sultan
on the 1st January 1984 (Nazir, 1993). This concept laid down Islam as the principal guidance
in the implementation of government policies for the development of the people of Brunei. In
his decree, during the Silver Jubilee Coronation Ceremony on the 5th October 1992, His
Majesty pledged to uphold and exult Islam as the official religion, which is to be adhered by
his royal descendants, dignitaries and the people of Brunei Darussalam. In the economic
sphere, His Majesty has steadfastly pushed for the introduction and implementation of Islamic
principles in the business operations of both the government and private sector. For example,
his commitment towards reviving Islamic economic system in the country was clearly evident
when the Development Bank of Brunei Berhad was renamed Islamic Development Bank of
Brunei Berhad. Along with adopting a new name, the Bank also conducts all its banking
activities in accordance with the teachings of the Al-Qur’an and the Ahadiths.
4.2. Specific Legislations Undertaken by Government
Several legislations have been enacted by the Government with respect to the safety and
desirability of food consumption consistent with Islamic teachings. Locally-produced and
imported food products must be safe for human consumption in terms of quality, hygiene, and
‘halal’ requirements as underlined by Islam. The government legislations in this area include
“Akta Kesihatan Awan“ (Public Health Act), “Makanan dan Peraturan Nya” (Food and its
Regulations Act),”Akta Daging Halal dan Aturan Yang Perlu“ (Halal Meat and its
Regulations Act), “Akta Racun” (Poison Act), Akta Tanda-Tanda Dagangan” (Trademark Act)
137
and “Akta Tanda Perniagaan” (Business Trademark Act). In line with the legislation, food
products imported into Brunei are required to meet the standards especially in terms of hygiene
and safety. Besides this, Lembaga Mengeluarkan Permit import Halal (Board for Halal Permit
Import) was established by the Government. The Board was formerly known as Jawatankuasa
Ad-Hok Daging Haram (Ad-Hoc Committee for Haram Meat) which comprised of a number
of Cabinet Ministers as committee members. Following the establishment of this committee,
another Board known as “Badan Pengeluaran Permit Impot Daging Halal” was established on
13 October 1997. In the past, due to the fact that the Board did not have the legal power to
authorise its officers to halt or seize meat products in cases where the ‘halalness’ was in doubt,
it had to depend wholly on the Jabatan Kastam dan Eksais DiRaja Brunei (Royal Brunei
Customs and Excise Department) to establish the suitability of food products for consumption
by Muslims. In order to remove this obstacle, legislation was enacted specially for matters
relating to food produced locally or imported for Muslims. This legislation is known as
Perintah Darurat (Daging Halal) 1998 (Emergency Order {Halal Meat} 1998) and became
effective on 17 April 1999.
4.3. Establishment of Banking Institutions Without the Element of Interest
The establishment of Tabung Amanah Islam Brunei (TAIB), Islamic Bank of Brunei (IBB)
and the Islamic Development Bank of Brunei, paved the way for businesses to undertake
activities that do not involve the charging of interest. His Majesty The Sultan decreed that the
Economic Development Board should ensure that the investment services afforded to small
and medium size entrepreneurs apply similar concepts to those used by the Islamic
Development Bank of Brunei. The government has put considerable efforts in providing a
financial system devoid of the use of interest. IBB, the first Islamic bank in Brunei, has clearly
shown the economic viability of interest-free based businesses. This bank has made
satisfactory levels of profits even in times of global recession. Increasingly, local business
entrepreneurs are willing to accept Islamic financial system, as a source of capital for their
business ventures. The over 85,000 accounts held by members of the public is a testimony of
the confidence placed in IBB as the leading player in the development of interest-fee banking
in Brunei.
4.4. The Culture of the Brunei Society
The culture of any society is important for its balanced development as it plays a role in
guiding and establishing standards for actions undertaken by members of the society. There are
several important cultural aspects in the life of Brunei society that have contributed to the
resurgence of Islamic business activities. For example, the concepts of bedangan sanak and
memucang-mucang (Hashim, 1999) which invoke the spirit of working together in unity, is
still very much practised in Brunei society. Similarly, the concepts of ulahatu bisai-bisai,
which emphasizes the maintenance of good working etiquette, and awal galat which stresses
the fear in doing things that are morally wrong, have played some role in the proper
upbringing of noble character (Hashim, 1999) which is essential for the resurgence of Islamic-
based economic activities. Studies carried out by Blunt (1988) and Saim (2000) indicate that
the collective working spirit is alive and strong in Brunei (cited in Latiff, 2001). In a summary,
the art of living and working in groups is still strong in Brunei and augurs well for the revival
of Islamic-based businesses. As elucidated by Sobri (1992), each business organization is
responsible for maintaining the image of the society they live or operate in. Islam makes it an
obligation for each individual who is engaged in business, to contribute to the society in
general, and not to focus only on maximising profits. The culture of placing importance on
138
collectivism paves the way in guiding the business community to undertake social programmes
that benefit low-income people and disabled persons. The popularity of the zakat system of
obligations attests to the resilience of the Brunei culture to sustain the emergence and revival
of Islamic-based businesses and economic activities.
4.5. Importance of Market Demand Based on the Large Muslim Population
Another important aspect that supports the prospect of Islamic business practices in Brunei is
the wide acceptance of the principles of market demand and exchange among the population of
Brunei and the neighbouring countries of Malaysia and Indonesia. Muslims constitute the
majority of the population in these three countries numbering over 200 million people. As
indicated earlier, Islam encourages trade and market-based system of doing business. However
it prohibits usury and excessive profits. With the acceptance of Islamic ethics in the population
and the large market demand available in the Muslim areas of Southeast Asia, the economic
basis of the development and revival of Islamic-based enterprises is promising. The
educational system in this region brings together both the worldly and spiritual aspects of life.
Hence the natural inclination of people is to adopt a business system that stresses, not only on
profits, but also on the well-being of society.
5. Issues and Challenges that Need to be Addressed to Allow for the Full Development of
Islamic-based Economic Transactions in Brunei
Despite the underlying factors discussed earlier that act as catalysts for the advancement and
promotion of Islamic-based economic transactions in Brunei, there are several issues and
challenges that need to be addressed to allow the full development of such transactions in
Brunei. In the following section, we address some of these issues.
5.1. Understanding, Appreciating and Practising Islamic Business Knowledge
All concerted efforts to carry out business based on Islamic ethics and values will be useless
unless, in the transitional process, the human factor is given serious consideration. Islamic-
based business system does not view economic activities as apart from the life of man himself.
It follows, therefore, for Islamic-based business system to take shape in Brunei, it will require
a complete change in definition, objectives and human development framework in order to
step out from darkness (zhulumaat) to the bright ray of Allah S.W.T’s Nur (Nur Allah S.W.T.).
This change will restore man from being a slave of material needs to the status as Viceregent
of Allah S.W.T. The practice of Islamic business methods will not be a reality if man
continues to be defeated by his desires for lust, greed, pride, arrogance, wealth, fame, jealousy,
revenge, treachery, bad intentions and consequently neglect his duties towards Allah S.W.T.
The challenge to educate the people to appreciate Islamic based business system, does not rest
solely on the shoulders of the Government. On the contrary, it rests squarely on the shoulders
of the entire Islamic community in Brunei. The Government may be successful in establishing
institutions, principles and system as a platform for the business community to carry out their
activities, but at the end of the day, it is the primary duty of the business community to
appreciate and carry out Islamic-based business practices to the maximum extent possible.
The efforts undertaken to “Islamise” the business system of Brunei should not be done for
mere cosmetic reasons, just to meet the superficial needs of the community and without any
real commitment. If this is so, then the business community will always be a slave of business
activities, instead of the business activities becoming instrumental in attaining the blessings of
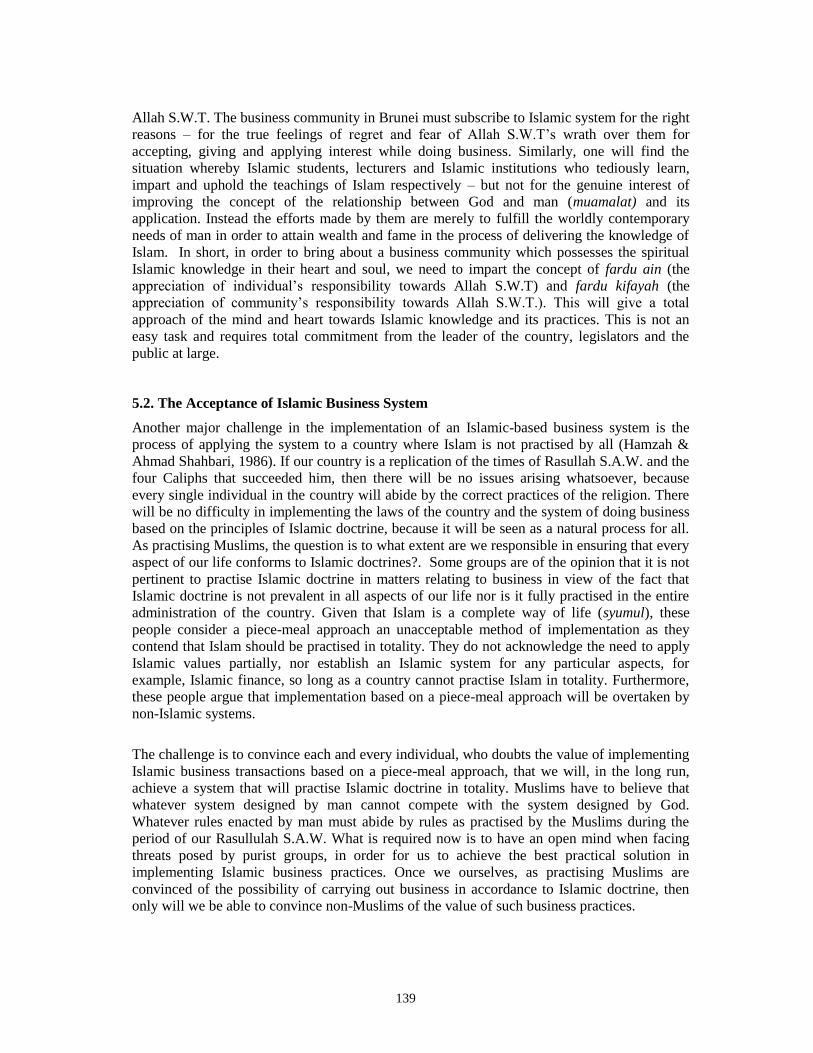
139
Allah S.W.T. The business community in Brunei must subscribe to Islamic system for the right
reasons – for the true feelings of regret and fear of Allah S.W.T’s wrath over them for
accepting, giving and applying interest while doing business. Similarly, one will find the
situation whereby Islamic students, lecturers and Islamic institutions who tediously learn,
impart and uphold the teachings of Islam respectively – but not for the genuine interest of
improving the concept of the relationship between God and man (muamalat) and its
application. Instead the efforts made by them are merely to fulfill the worldly contemporary
needs of man in order to attain wealth and fame in the process of delivering the knowledge of
Islam. In short, in order to bring about a business community which possesses the spiritual
Islamic knowledge in their heart and soul, we need to impart the concept of fardu ain (the
appreciation of individual’s responsibility towards Allah S.W.T) and fardu kifayah (the
appreciation of community’s responsibility towards Allah S.W.T.). This will give a total
approach of the mind and heart towards Islamic knowledge and its practices. This is not an
easy task and requires total commitment from the leader of the country, legislators and the
public at large.
5.2. The Acceptance of Islamic Business System
Another major challenge in the implementation of an Islamic-based business system is the
process of applying the system to a country where Islam is not practised by all (Hamzah &
Ahmad Shahbari, 1986). If our country is a replication of the times of Rasullah S.A.W. and the
four Caliphs that succeeded him, then there will be no issues arising whatsoever, because
every single individual in the country will abide by the correct practices of the religion. There
will be no difficulty in implementing the laws of the country and the system of doing business
based on the principles of Islamic doctrine, because it will be seen as a natural process for all.
As practising Muslims, the question is to what extent are we responsible in ensuring that every
aspect of our life conforms to Islamic doctrines?. Some groups are of the opinion that it is not
pertinent to practise Islamic doctrine in matters relating to business in view of the fact that
Islamic doctrine is not prevalent in all aspects of our life nor is it fully practised in the entire
administration of the country. Given that Islam is a complete way of life (syumul), these
people consider a piece-meal approach an unacceptable method of implementation as they
contend that Islam should be practised in totality. They do not acknowledge the need to apply
Islamic values partially, nor establish an Islamic system for any particular aspects, for
example, Islamic finance, so long as a country cannot practise Islam in totality. Furthermore,
these people argue that implementation based on a piece-meal approach will be overtaken by
non-Islamic systems.
The challenge is to convince each and every individual, who doubts the value of implementing
Islamic business transactions based on a piece-meal approach, that we will, in the long run,
achieve a system that will practise Islamic doctrine in totality. Muslims have to believe that
whatever system designed by man cannot compete with the system designed by God.
Whatever rules enacted by man must abide by rules as practised by the Muslims during the
period of our Rasullulah S.A.W. What is required now is to have an open mind when facing
threats posed by purist groups, in order for us to achieve the best practical solution in
implementing Islamic business practices. Once we ourselves, as practising Muslims are
convinced of the possibility of carrying out business in accordance to Islamic doctrine, then
only will we be able to convince non-Muslims of the value of such business practices.
140
5.3. Implementation of Islamic-based Economic Transactions in the Era of Rapid
Globalisation
The concept of Islamic business transaction in Brunei cannot operate in a vacuum. In this
borderless world, we cannot avoid interacting with the rest of the world. We cannot escape
from the need to establish international relationships that influence the ways and means of
administering the economy of the country. The creation of a global market is a reality that has
reduced the world to a global village where each business agent is able to market its product
and services. The execution of business in accordance with Islamic doctrine will be a dream if
Muslims are not able or are not willing to compete with other forms of business organizations
in the global arena. International and regional forums continue to push for agenda that
maintain or entrench the power of non-Muslim business culture. These forums also advance
business transactions through excessive pursuit of material happiness that lead to rapid moral
decay of the population of the world. As such the use of advertisements in the mass media to
promote cigarette smoking and encourage sexual gratification can be checked if Muslims
participate more fully in the global economy and push for wider use of Islamic-based
economic transactions.
The challenge now is to what extent are we Muslims prepared to uphold our inspiration to
defend Islamic values in the new global era?. Globalisation has had a drastic effect on our style
of living. In the commercial world, the major players continue to compete to seek entry to new
markets by applying modern methods and technology such as Electronic Trade. These
advanced methods of trading, to some extent, tend to confuse the basic understanding of doing
business by Islamic standards. In fact, it is not an overstatement to emphasise that some new
modes of doing business, which are conducted strategically such as investment via internet and
the “Get Rich Quick Schemes”, have the potential to reduce the importance of Islamic
methods of doing business. We have to respond to these challenges with new alternatives built
on the foundations of Islam.
6. Conclusions
It is not an easy task to develop and fully establish business transactions based on Islamic
doctrine as a way of life in the business world. Nevertheless, Islam, a universal religion that is
perpetually applicable to any development setting, stresses that we must not be pessimistic in
our attempts to practise the religion fully. Each and every Muslim in Brunei must have the
confidence and courage to use Islamic-based business transactions so as to create the
foundation for their full development. If the commitment within each of us is seasonal and
sways with time and situation, without the energy to stretch our mind and sweat it out, then the
full development of Islamic-based economic transactions will remain a dream. What is needed
now is for each one of us to ask ourselves how candid are we in our efforts to use Islamic
business transactions. The situation now is likened to a yacht, launched into the sea with oars
all ready for sailing, but with no sailors on board! Are we ready to accept the challenges and
reap the rewards? To conclude, let us ponder seriously the verse from Surah Al Rad (The
Thunder) 13:11 :
“…and surely Allah S.W.T does not change the condition of a people unless
they change what is in themselves…..”
141
Bibliography and References
Blunt, P. (1988). “Cultural Consequences for Organization Change in a Southeast Asian State.” The
Academy of Management EXECUTIVE, vol. II, No.3, p. 235-240.
Cooper, R. N. (1986). “Trade,” Encylopaedia Americana. Connecticut: Grolier Incorporated.
Hamzah, I & S. Ahmad Shahbari (1986). “Ke Arah Pelaksanaan Ekonomi Islam di Malaysia,” di
dalam Mahyudin, Y. (editor), Islam dan Pembangunan Negara. Bangi: Penerbit Universiti
Kebangsaan Malaysia.
Hashim, A. H. (1986). “Pentadbiran Negara Brunei (Hubungannya Dengan Konsep Melayu Islam
Beraja).” Kertas kerja Yang Dibentangkan di International Seminar on Islamic Civilization in the
Malay World , 1-5 Jun, Bandar Seri Begawan, Brunei.
Ibn Khaldun (1979). Muqaddimah. Kaherah: Al-Islami Publications.
Latiff, S.A. (2001). “Management Styles and Doing Business in Brunei Darussalam”, Seminar Doing
Business the ASEAN Way in the 21st Century Bandar Seri Begawan: EC-ASEAN Centre.
Mahmud, S. (1990). Tafsir Al-Quranul Karim. Bandung: CV Diponegoro.
Mustafa, D. (1994). Perniagaan Menurut Islam. Kuala Lumpur: Utusan Publications.
Nazir, M. (1993). Melayu Islam Beraja Sebagai Falsafah Negara Brunei Darussalam. Bandar Seri
Begawan: Akademi Pengajian Brunei, Universiti Brunei Darussalam.
Pofham, E.L. (1986). “Business Careers,” in Encylopaedia Americana, Connecticut: Grolier
Incorporated.
Saim, Sainah. (2000). “The Administration of Brunei Darussalam: Management, Accountability and
Reform.” Kertas Kerja Yang Dibentangkan di Occassional Seminar anjuran Faculty of Business,
Economics and Policy Studies, Universiti Brunei Darussalam, November 4.
Sobri, S. (1992). Perniagaan Menurut Pandangan Islam, Kuala Lumpur: Bahagian Hal Ehwal Islam,
Jabatan Perdana Menteri.
Wolf, H. (1986). “Money,” in in Encylopaedia Americana. Connecticut: Grolier Incorporated.
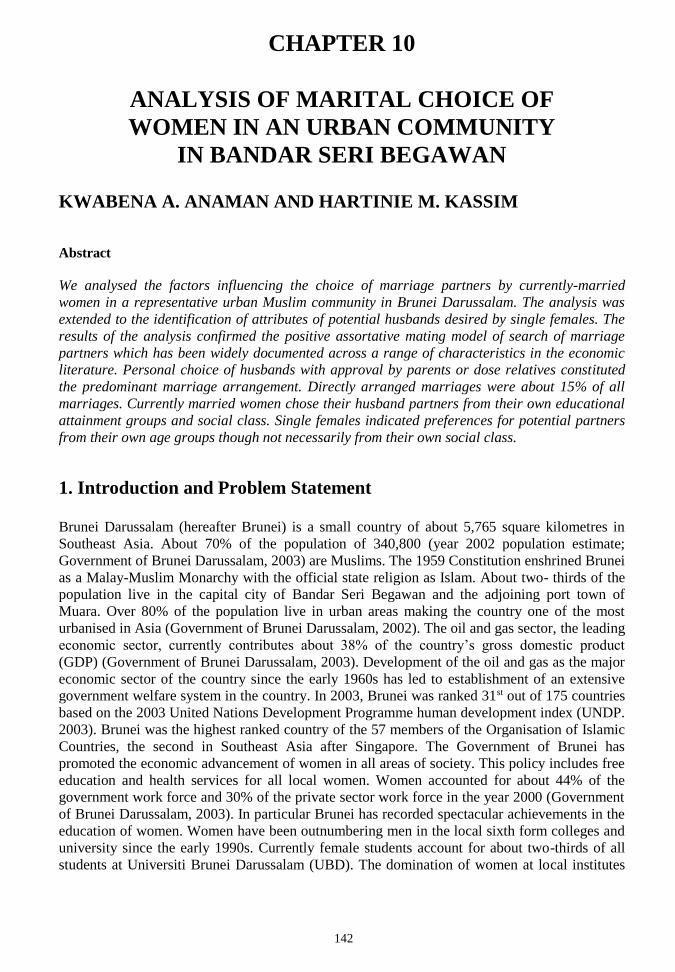
142
CHAPTER 10
ANALYSIS OF MARITAL CHOICE OF
WOMEN IN AN URBAN COMMUNITY
IN BANDAR SERI BEGAWAN
KWABENA A. ANAMAN AND HARTINIE M. KASSIM
Abstract
We analysed the factors influencing the choice of marriage partners by currently-married
women in a representative urban Muslim community in Brunei Darussalam. The analysis was
extended to the identification of attributes of potential husbands desired by single females. The
results of the analysis confirmed the positive assortative mating model of search of marriage
partners which has been widely documented across a range of characteristics in the economic
literature. Personal choice of husbands with approval by parents or dose relatives constituted
the predominant marriage arrangement. Directly arranged marriages were about 15% of all
marriages. Currently married women chose their husband partners from their own educational
attainment groups and social class. Single females indicated preferences for potential partners
from their own age groups though not necessarily from their own social class.
1. Introduction and Problem Statement
Brunei Darussalam (hereafter Brunei) is a small country of about 5,765 square kilometres in
Southeast Asia. About 70% of the population of 340,800 (year 2002 population estimate;
Government of Brunei Darussalam, 2003) are Muslims. The 1959 Constitution enshrined Brunei
as a Malay-Muslim Monarchy with the official state religion as Islam. About two- thirds of the
population live in the capital city of Bandar Seri Begawan and the adjoining port town of
Muara. Over 80% of the population live in urban areas making the country one of the most
urbanised in Asia (Government of Brunei Darussalam, 2002). The oil and gas sector, the leading
economic sector, currently contributes about 38% of the country’s gross domestic product
(GDP) (Government of Brunei Darussalam, 2003). Development of the oil and gas as the major
economic sector of the country since the early 1960s has led to establishment of an extensive
government welfare system in the country. In 2003, Brunei was ranked 31st out of 175 countries
based on the 2003 United Nations Development Programme human development index (UNDP.
2003). Brunei was the highest ranked country of the 57 members of the Organisation of Islamic
Countries, the second in Southeast Asia after Singapore. The Government of Brunei has
promoted the economic advancement of women in all areas of society. This policy includes free
education and health services for all local women. Women accounted for about 44% of the
government work force and 30% of the private sector work force in the year 2000 (Government
of Brunei Darussalam, 2003). In particular Brunei has recorded spectacular achievements in the
education of women. Women have been outnumbering men in the local sixth form colleges and
university since the early 1990s. Currently female students account for about two-thirds of all
students at Universiti Brunei Darussalam (UBD). The domination of women at local institutes
143
of higher learning is likely to be extended to the government workforce within the near future as
the majority of new government employees since 1996 have been women. The Brunei
Government has signalled its intention to continue the advancement of women in all sectors of
life (Government of Brunei Darussalam, 2001).
Marital instability is an increasing phenomenon in Brunei Darussalam. For example, over the
period, 1971 to 2000, based on Muslim marriages, divorces grew at a much faster rate (7.2%
annual constant compound growth rate) than marriages (3.8%). The divorce rate, defined as the
number of divorces divided by the total number of marriages, has increased steadily from 1971
to 2000. The divorce rate increased from an average of 9.54% in the 1971-1975 period to an
average of 20.02% in the 1996-2000 period (refer to Table 1). Stephen (2001) and Garip (2002)
have noted the possible impact on society of the rapid rise in the divorce rate. Table 2
summarises more information on annulled marriages in terms of the proportions based on
average lengths of marriages before dissolution. In 1970s and early 1980s, very short-lived
marriages were relatively common; marriages, which lasted two years or less, comprised 27.9%,
35.9% and 37.5% of all annulled cases in the 1971 to 1975, 1976 to 1980 and 1981 to 1985
periods respectively. This rate dropped to 22.1% and 17.9% during 1991 to 1995 and 1996 to
2000 periods respectively. In recent years, moderate-lived marriages (10 to 14 years) were being
increasingly annulled. Such annulled marriages accounted for about 16.2% of all divorce cases
in the period, 1996 to 2000 up from 10.5% in the 1971 to 1995 period. The trend was that the
number of divorces was small in the 1970s and a relatively large proportion of these divorces
involved short-lived marriages. In the 1990s, the number of divorces had increased substantially
with larger proportions of these divorces involving moderate-lived marriages.
Marriage instability is also evidenced in the increasing age at first marriage and increasing
proportion of women classified as never married. Table 3 shows the percent of women and men
never married in Brunei for the Census years of 1971, 1981, 1991 and 2001. Never married is
defined as those aged between 45 and 49 who remain single consistent with the social science
literature (Jones, 1994). In Brunei, the proportion of Malay women never married increased
from 4.5% in 1971 to 6% in 1981 and further increased to 9% in 1991 and 11.3% in 2001. In
contrast the proportion of Malay men never married remained virtually the same at 4% in 1981
and 1991 and 3.7% in 2001. The proportion of Brunei Chinese women never married increased
from 3% in 1981 to 7% in 1991 and then to 1 1.7% in 2001. This proportion was low at 1% for
women belonging to non-Malay indigenous groups such as Ibans in both 1981 and 1991 but it
increased to 4.2% in 2001. Jones (1994) indicated that Brunei had the highest rate of unmarried
women among Muslims in Southeast Asia. A factor that may be responsible for increasing
divorce rates could be the ratio of marriageable females to marriageable males (those between
20 to 44). This ratio has been consistently greater than 1.0 (see Table 4). Increasing
marriageable female-male ratio is associated with increased divorce and related social problems
(Bergstrom, 1996; Wilson, 1987).
The objective of this study was to determine the factors influencing marital choice by currently
married and single females in a representative urban Muslim community in Brunei. The
remainder of this paper is organised as follows: in the next section we report a summary of the
literature review including marriage in an Islamic setting and economics of marriage. This is
followed by the methods used for the study including description of the survey and the
specification of empirical models of marital choice. The results, conclusions and references
follow at the end of the paper.
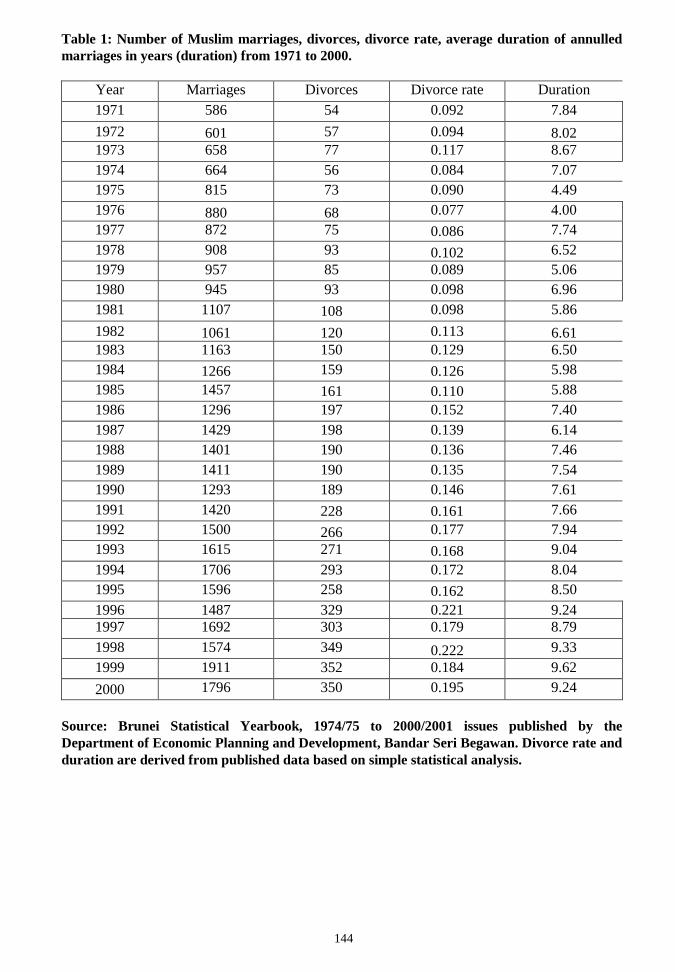
144
Table 1: Number of Muslim marriages, divorces, divorce rate, average duration of annulled
marriages in years (duration) from 1971 to 2000.
Year Marriages Divorces Divorce rate Duration
1971 586 54 0.092 7.84
1972 601 57 0.094 8.02
1973 658 77 0.117 8.67
1974 664 56 0.084 7.07
1975 815 73 0.090 4.49
1976 880 68 0.077 4.00
1977 872 75 0.086 7.74
1978 908 93 0.102 6.52
1979 957 85 0.089 5.06
1980 945 93 0.098 6.96
1981 1107 108 0.098 5.86
1982 1061 120 0.113 6.61
1983 1163 150 0.129 6.50
1984 1266 159 0.126 5.98
1985 1457 161 0.110 5.88
1986 1296 197 0.152 7.40
1987 1429 198 0.139 6.14
1988 1401 190 0.136 7.46
1989 1411 190 0.135 7.54
1990 1293 189 0.146 7.61
1991 1420 228 0.161 7.66
1992 1500 266 0.177 7.94
1993 1615 271 0.168 9.04
1994 1706 293 0.172 8.04
1995 1596 258 0.162 8.50
1996 1487 329 0.221 9.24
1997 1692 303 0.179 8.79
1998 1574 349 0.222 9.33
1999 1911 352 0.184 9.62
2000 1796 350 0.195 9.24
Source: Brunei Statistical Yearbook, 1974/75 to 2000/2001 issues published by the
Department of Economic Planning and Development, Bandar Seri Begawan. Divorce rate and
duration are derived from published data based on simple statistical analysis.
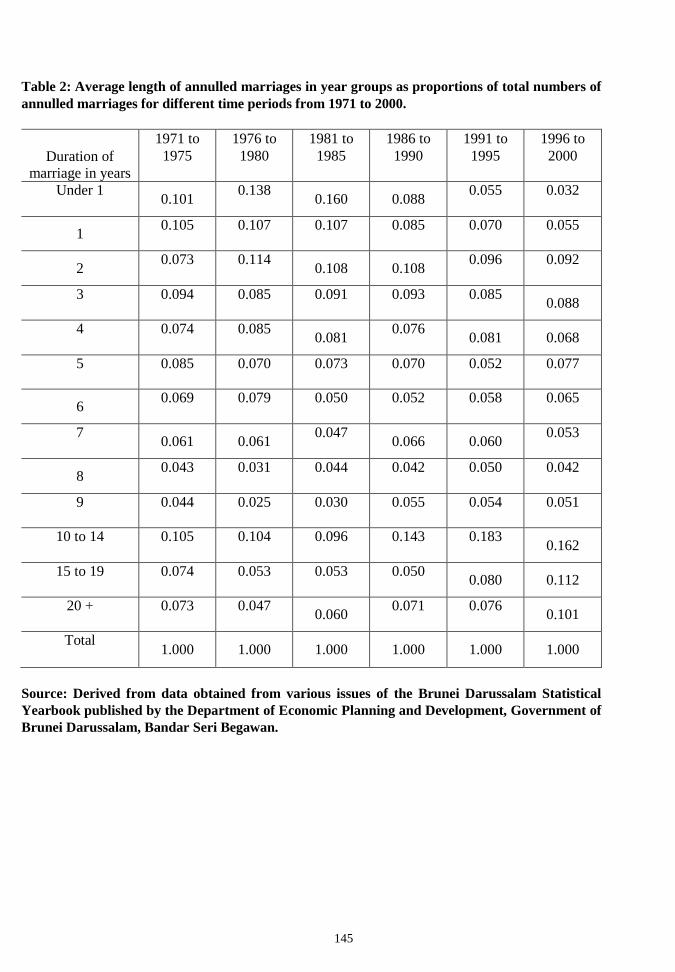
145
Table 2: Average length of annulled marriages in year groups as proportions of total numbers of
annulled marriages for different time periods from 1971 to 2000.
Duration of
marriage in years
1971 to
1975
1976 to
1980
1981 to
1985
1986 to
1990
1991 to
1995
1996 to
2000
Under 1 0.101
0.138 0.160 0.088
0.055 0.032
1 0.105 0.107 0.107 0.085 0.070 0.055
2 0.073 0.114
0.108 0.108 0.096 0.092
3 0.094 0.085 0.091 0.093 0.085 0.088
4 0.074 0.085 0.081
0.076 0.081 0.068
5 0.085 0.070 0.073 0.070 0.052 0.077
6 0.069 0.079 0.050 0.052 0.058 0.065
7 0.061 0.061
0.047 0.066 0.060
0.053
8 0.043 0.031 0.044 0.042 0.050 0.042
9 0.044 0.025 0.030 0.055 0.054 0.051
10 to 14 0.105 0.104 0.096 0.143 0.183 0.162
15 to 19 0.074 0.053 0.053 0.050 0.080 0.112
20 + 0.073 0.047 0.060
0.071 0.076 0.101
Total 1.000 1.000 1.000 1.000 1.000 1.000
Source: Derived from data obtained from various issues of the Brunei Darussalam Statistical
Yearbook published by the Department of Economic Planning and Development, Government of
Brunei Darussalam, Bandar Seri Begawan.
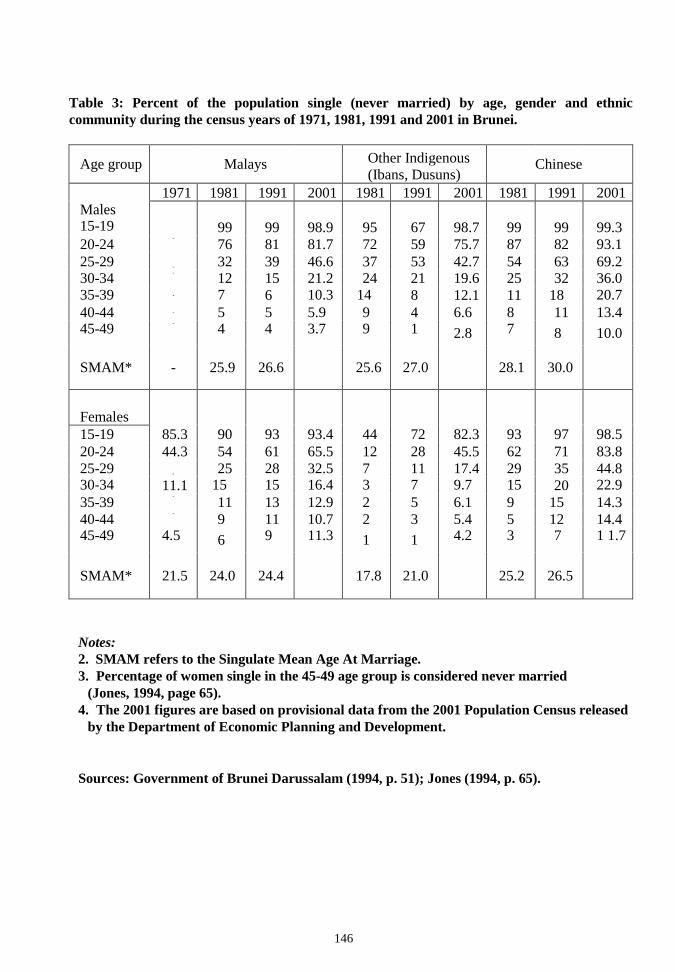
146
Notes:
2. SMAM refers to the Singulate Mean Age At Marriage.
3. Percentage of women single in the 45-49 age group is considered never married
(Jones, 1994, page 65).
4. The 2001 figures are based on provisional data from the 2001 Population Census released
by the Department of Economic Planning and Development.
Sources: Government of Brunei Darussalam (1994, p. 51); Jones (1994, p. 65).
Table 3: Percent of the population single (never married) by age, gender and ethnic
community during the census years of 1971, 1981, 1991 and 2001 in Brunei.
Age group
Malays
Other Indigenous
(Ibans, Dusuns)
Chinese
1971 1981 1991 2001 1981 1991 2001 1981 1991 2001
Males 15-19
99 99 98.9 95 67 98.7 99 99 99.3
20-24 -
76 81 81.7 72 59 75.7 87 82 93.1
25-29 - 32 39 46.6 37 53 42.7 54 63 69.2 30-34
- 12 15 21.2 24 21 19.6 25 32 36.0
35-39 - 7 6 10.3 14 8 12.1 11 18 20.7
40-44 - 5 5 5.9 9 4 6.6 8 11 13.4 45-49
- 4 4 3.7 9 1 2.8 7 8 10.0
SMAM* - 25.9 26.6
25.6 27.0
28.1 30.0
Females
15-19 85.3 90 93 93.4 44 72 82.3 93 97 98.5
20-24 44.3 54 61 65.5 12 28 45.5 62 71 83.8
25-29 - 25 28 32.5 7 11 17.4 29 35 44.8 30-34 11.1 15 15 16.4 3 7 9.7 15 20 22.9
35-39 -
11 13 12.9 2 5 6.1 9 15 14.3
40-44 -
9 11 10.7 2 3 5.4 5 12 14.4 45-49 4.5 6 9 11.3 1 1 4.2 3 7 1 1.7
SMAM* 21.5 24.0 24.4
17.8 21.0
25.2 26.5
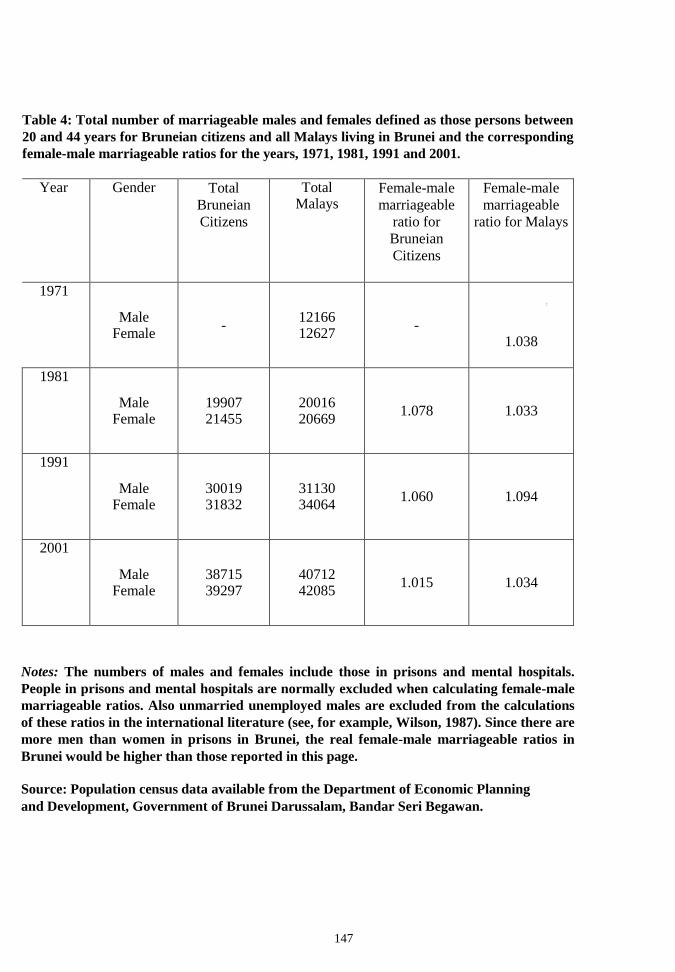
147
Notes: The numbers of males and females include those in prisons and mental hospitals.
People in prisons and mental hospitals are normally excluded when calculating female-male
marriageable ratios. Also unmarried unemployed males are excluded from the calculations
of these ratios in the international literature (see, for example, Wilson, 1987). Since there are
more men than women in prisons in Brunei, the real female-male marriageable ratios in
Brunei would be higher than those reported in this page.
Source: Population census data available from the Department of Economic Planning
and Development, Government of Brunei Darussalam, Bandar Seri Begawan.
Table 4: Total number of marriageable males and females defined as those persons between
20 and 44 years for Bruneian citizens and all Malays living in Brunei and the corresponding
female-male marriageable ratios for the years, 1971, 1981, 1991 and 2001.
Year Gender Total
Bruneian
Citizens
Total Malays
Female-male
marriageable
ratio for
Bruneian
Citizens
Female-male
marriageable
ratio for Malays
1971
Male Female
- 12166 12627
-
t
1.038
1981
Male Female
19907 21455
20016 20669
1.078 1.033
1991
Male Female
30019 31832
31130 34064
1.060 1.094
2001
Male Female
38715 39297
40712 42085
1.015 1.034
148
2. Literature Review
Marriage in the Islamic Setting
Marriage is one of the essential duties of adult human beings strongly recommended for all
(sane and fit) adult Muslims by the Prophet Muhammad, founder of Islam, a world religion
currently embraced by over 1,200 million adherents, 20% of the world population. Marriage is
especially encouraged to allow the human species to reproduce itself, create companionship
between people and tribes and societies (Qadri, 1986). Marriage is also encouraged to prevent
the occurrence of sexual sins and immoral acts in society (Miftahi, 1997). In Islam, a man is
allowed to marry up to four wives provided that he can treat all wives equally. The strict
enforcement of the rule of equal treatment of wives makes monogamy more likely than
polygamy. Islam does not require any believer to have more than one wife (Ali, 1996; Miftahi,
1997, p. 83). Controlled polygamy in Islam was introduced by Prophet Mohammed to reform
the pre-Islamic marriage system in the Arabian Region which previously allowed for unlimited
number of wives and concubines. The major objective of the reform was to ensure good
treatment of women and to give opportunity for women to marry and lead stable married life in
a society that had very high female-male marriageable ratio (Hughes, 1994).
Qadri (1986) states that the rights and duties of Muslim marriages require the husband to
provide proper and adequate maintenance of the wife and children. Maintenance or nafqah in
Islam has two meanings; nafqah zahir and nafqah batin. Nafqah zahir can be in terms of money
given to the wife for the maintenance of their home and children and personal maintenance of
the wife. Nafqah batin deals with provision of love and care for the wife and vice versa. With
regards to the management of a wife by the husband, Hughes (1994) indicates that there are
three important things that need to be done by the husband. First, the husband must constantly
treat his wife with utmost dignity; second, he is to comply with his wife and give her the
maximum affection and confidence; and third, he is to deal fairly with her and treat her politely
and fairly in the presence of her friends and family members. The wife is expected to respect
and obey her husband, to live with him in the abode chosen by him and to agree to reasonable
requests of sexual and companionship services from him (Hughes, 1994; Miftahi, 1997).
Brief Summary of Economic Theory of Marriage
Many writers have incorporated marriage within standard neoclassical economic theory. For
example, Becker (1973, 1974) suggest that the husband and wife enter into marriage for
material benefits. Such benefits of marriage include the production of children as consumption
and/or investment goods, productivity gains due to specialisation of wife and husband, sexual
and other companionship benefits. The concept of search cost and assortative mating provide
the basis of modern economic theories of marriage. Modern economic theories of marriage
assume that potentially marriageable persons search for their partners primarily within well-
defined groups (Behrman et al., 1995; Loughran, 2002). Thus, for example, highly educated
women tend to search for their marriage partners within the highly-educated male sub-
population. This search continues till the person finds his/her partner. At some point as with all
search models, some persons give up searching for partners when they find it increasingly
difficult to find partners. Assortative mating within groups is well documented for age groups,
income classes, ethnic groups and social classes and mixtures of one or more of these groups
(Bergstrom, 1996). Arranged marriages do not necessarily violate the principle of assortative
149
mating; the modification of the concept relates to the shift of' the search of partners from the woman spouse to her parents or close relatives.
♦
The concept of the market process involving demand and supply can be applied not only to
commodities but also to services produced and exchanged by individuals such as marriage
services (Bergstrom, 1996). Applying the neoclassical theory of marriage to the setting in
Brunei and given the relative scarcity of marriageable males, the demanded and supplied
‘product’ can be modelled as eligible adult males available for females who are currently not
married. Eligible male, can be considered as bundle of attributes or characteristics. A woman
looking for a husband to marry looks at potential husbands in terms of certain desirable
characteristics. This approach to demand of product is based on the Lancaster's consumption
theory. This theory states that a product or service provides a bundle of attributes or
characteristics (Lancaster, 1966). It is the quality of the attributes or characteristics that
potential consumers look for. Thus eligible females may be willing to spend considerable time
and other resources to search for eligible males having high quality of desirable attributes. The
economic value of eligible males can be measured by the characteristics of these males such as
the level of education, age, class status, as well as other human capital characteristics, which
may not be easily quantifiable such as attractiveness and intelligence.
2. Methodology
3.1. Description of Survey Methodology
A confidential survey based on the stratified random sampling method of households in Mukim
Mentiri, a centrally located sub-district of Bandar Seri Begawan, the capital city of Brunei was
undertaken based on home interviews using a questionnaire. The questionnaire is available from
the senior author upon request. The survey covered a period of five months from September
2001 to February 2002. Mukim Mentiri has six kampungs (villages). A random sample size of
households was selected based on the population of households using information given by
heads of villages. A pilot survey undertaken in August 2001 involving 10 respondents was used
to develop the final questionnaire. The final survey involved a random sample with a minimum
optimal size of 120 households out of a total of 1342 households in Mukim Mentiri. The
minimum optimal sampling size of 120 was chosen based on statistical theory (de Vaus, 1996;
Babbie, 2001). The actual home interviews were undertaken using cluster sampling method.
This was because it was not possible to obtain the names and addresses of the households. The
heads of kampongs would only provide the numbers of houses in each kampong. The cluster
sampling method involved identifying all houses around each simpang or street as a
subpopulation of the houses in the kampong. Random sampling of houses around each simpang
cluster was done using a random number generator from a standard scientific calculator.
Altogether 151 women aged 18 and over agreed to participate in the survey. About 95% of the
respondents were Muslims. Hence the empirical modelling of marital choice discussed in the
following section is based on Muslim marriage injunctions.
150
3.2. Empirical Analysis of Marital Choice
The theoretical underpinning for empirical analysis of marital choice is derived from the
random utility theory originally developed by McFadden (1981). This theoretical framework is
based on discrete choice modelling involving comparison of indirect utility functions of
alternative options. In our study, it is assumed that the respondent makes a choice of husbands
that maximises her utility. With the random utility model, there is a deterministic component
and a stochastic part of the indirect utility function. The deterministic component is the
measurable part of the function. The stochastic component reflects factors which cannot be
easily quantified by the researcher though they are known to the respondent. Given the
stochastic component, such choice models are often estimated by probit and logit models to
account for the complex error term (Perrson, 2002; Gujarati, 2003).
Two main methods were used to analyse marital choice based on the survey data. The first
method was a multiple regression analysis to determine the husband’s observed characteristics
in the marriage market based on analysis of currently married women. Following the approach
used by Behrman et al. (1995), we hypothesized that the observed characteristics of a woman’s
husband (for example, (1) his level of schooling or educational attainment, (2) his age at
marriage and (3) his income at the time of marriage) were determined in the marriage market by
the wife’s level of schooling, age at first marriage, social class and a number of other attributes
of the wife as shown in Equation 1.
LHUSBAND = B0 + B, AGEMARRY + B2 EDUWIFE + B3 INCOMEMARRY + B4 WCLASS
+ B5 ARRANGEM + V + U Equation 1
where LHUSBAND was a vector of husband’s characteristics expressed in natural logarithm form for correct model specification. The three characteristics analysed were the level of
schooling or formal education acquired (LHUSBEDU), husband’s age at the time of marriage ( L H U S B A G E M A R R Y ) and husband’s income at the time of marriage (LHUSBINCOMEMARRY); AGEMARRY was the age of the wife at the time of marriage;
EDUWIFE was the level of formal education acquired by the wife;
INCOMEMARRY was the income earned by the wife at the time of marriage (B$ per month);
WCLASS was a social class dummy variable with 1 assigned to female respondents who were
Pengiran and zero for respondents who held the title Dayang. Pengiran title holders were distant
relatives of the Royal Family. Dayang title holders were commoners;
ARRANGEM was a dummy variable with a value of 1 if the marriage was arranged at the
request of the female respondent or arranged by her parents and zero if otherwise;
Bi (i=l, 2, 3, 4 and 5) were the parameters to be estimated;
V was the woman’s special human capital attributes such as attractiveness and intelligence
which are difficult to quantify and U was the error term assumed to be normally distributed with
zero mean and constant variance.
Assuming that V and U are additive, Equation 1 can be estimated by ordinary least squares (OLS) method. Other assumptions underlying the distributions of V and U lead to the use of different estimation techniques such as probit and logit models.
151
The second method used in our study was a binary logit regression analysis of factors
influencing the choice of husbands based on their social class status. This model is denoted in
Equation 2:
HCLASS = Co + C, AGEMARRY + C2 EDUWIFE + C3 INCOMEMARRY + C4 WCLASS +
C5 ARRANGEM + W Equation 2
where HCLASS was a social class dummy variable with 1 assigned to husbands who were
Pengiran and zero for respondents who were commoners (Awang);
Cj (i=l, 2, 3, 4 and 5) were the parameters to be estimated and W was the equation error term.
3.3. Testable Hypotheses Dealing with Marital Choice
We hypothesised that age at first marriage of the wife would be positively related to the age at
first marriage of the husband assuming that females chose their husbands from similar age
groups. Concerning consideration of age of the woman spouse, Miftahi (1997, p. 1 1 0 )
indicated that age compatibility or marriage within similar age group was the preferred norm in
Islam due to its great advantages though exceptional cases of wide age disparity between
husband and wife could be allowed. This view supported our hypothesis that primarily women
would marry partners from similar age groups. The level of educational attainment of the wife
was hypothesised to be positively related to the level of educational attainment of the husband
based on the positive assortative mating concept dealing with preferences for partners being
driven by similar educational levels. Similarly we posited that women would be more likely to
marry within their own social class in line with tradition. The extent of fulfillment of this choice
would depend partly on the female-male marriageable ratios. We were not sure of the expected
impact of income at marriage of the wife and arranged marriages on any of the observed
characteristics of the husband and left the evaluation of this impact for our empirical analysis.
4. Results
4.1. Socio-economic Characteristics of Survey Respondents
Table 5 provides a summary of socio-economic characteristics of the 151 female respondents.
Based on the social class status, it was found that 78.1% of total female respondents were
‘Dayang’ (commoners). ‘Dayangku’ (distant female relatives of the Brunei Royal Family)
comprised 9.9% of total number of respondents; while ‘Pengiran’ (distant relatives of the Royal
Family who were married) comprised the remaining 11.9%. More than half of the respondents
were ever-married women; specifically 55.6% were currently married, 2.7% widowed and 4.0%
divorced. The remaining 37.7% were single females including those engaged to be married at
the time of the survey. About 91.4% were Brunei Malay citizens, while other Brunei citizens
and non-Bruneian citizens interviewed were just about 3.3% and 5.3% respectively. Muslims
comprised of 94.7% of the total respondents, Buddhist 4.0% and Christians, the remaining
1.3%. About 47.3% of the respondents were living in their parents’ houses. Those who lived in
their own homes made up of 36.0% of the total respondents.
152
Socio-economic characteristics of survey respondents based on averages are presented in Table
6. The average age at the time of survey of all respondents was 32.9 years. The average age at
the time of marriage for ever married respondents was 21.6 years. The age at the time of
marriage was higher for working women than for non-working women; 23.1 years for working
women and 19.2 years for non-working women. The average number of children was 4.2, 3.0
and 6.0 for all respondents, working women and non-working women respectively. In terms of
educational attainment, the average number of years of formal education received by all
respondents was 11.5, 13.0 years for working women and 10.0 years for non-working women.
The average length of current marriage for all respondents was 16.3 years; 11.0 years for
working women and 24.5 years for non-working women. Personal choice of husbands with
approval by parents or close relatives constituted the predominant marriage arrangement (85%).
Directly arranged marriages were about 15% of all marriages.
4.2. Socio-economic Characteristics of Husbands of Survey Respondents
Based on the social class status, it was found that 77.4% of the husbands were ‘Awang'
(commoners); the remaining 22.6% were ‘Pengiran’ (distant relatives of the Royal Family who
were married). Muslims made up of 94.0% of all husbands; the remainder were Buddhist
(4.8%) and Christians (1.2%). Brunei Malay citizens made up of 90.5% of all husbands. Of the
type of marriage, 95.2% were first marriages and 4.8% were second marriages. The average age
at the time of survey of all married respondents’ husbands was 42.4 years; 37.4 years for
husbands of working women and 50.7 years for husbands of non-working women. The average
age at the time of marriage of all married respondents’ husbands was 25.7 years. This average
age at time of marriage was higher for husbands of working women than for husbands of non-
working women, 26.2 years old versus 25.2 years respectively. Average monthly personal
income for all married respondents’ husbands was 2010.70 Brunei dollars (B$); B$2118.70 for
husbands of working women and BS1835.30 for husbands of nonworking women. In terms of
educational attainment, the average number of years of formal education received by all married
respondents’ husbands was 10.7 years, 12.2 for working women’ husbands and 8.3 for non-
working women’ husbands.
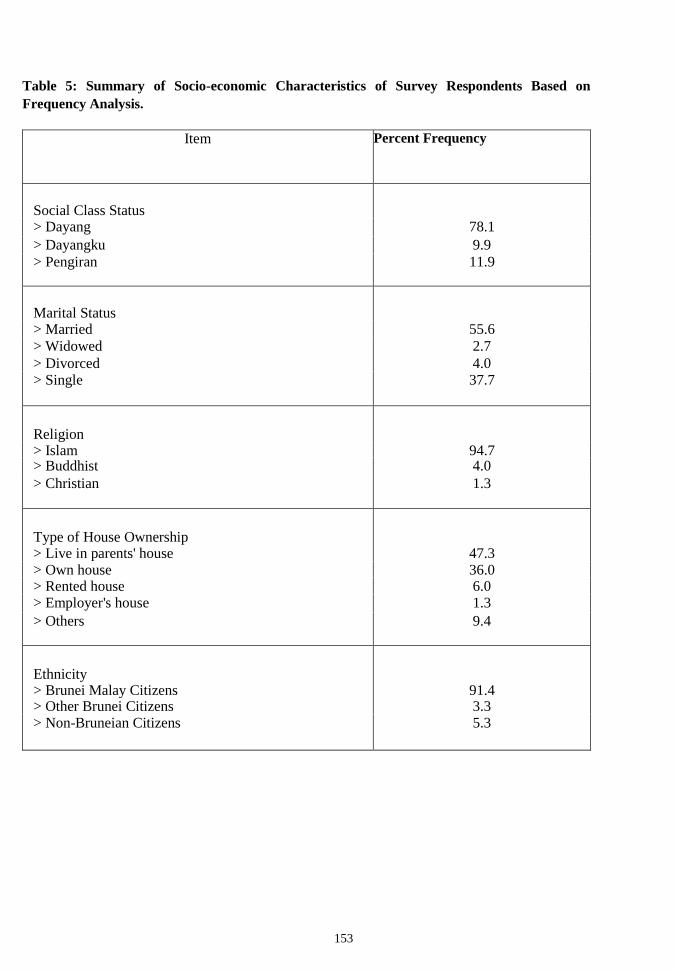
153
Table 5: Summary of Socio-economic Characteristics of Survey Respondents Based on
Frequency Analysis.
Item Percent Frequency
Social Class Status
> Dayang 78.1
> Dayangku 9.9
> Pengiran 11.9
Marital Status
> Married 55.6
> Widowed 2.7
> Divorced 4.0 > Single 37.7
Religion
> Islam 94.7 > Buddhist 4.0
> Christian 1.3
Type of House Ownership
> Live in parents' house 47.3 > Own house 36.0 > Rented house 6.0 > Employer's house 1.3
> Others 9.4
Ethnicity
> Brunei Malay Citizens 91.4 > Other Brunei Citizens 3.3 > Non-Bruneian Citizens 5.3
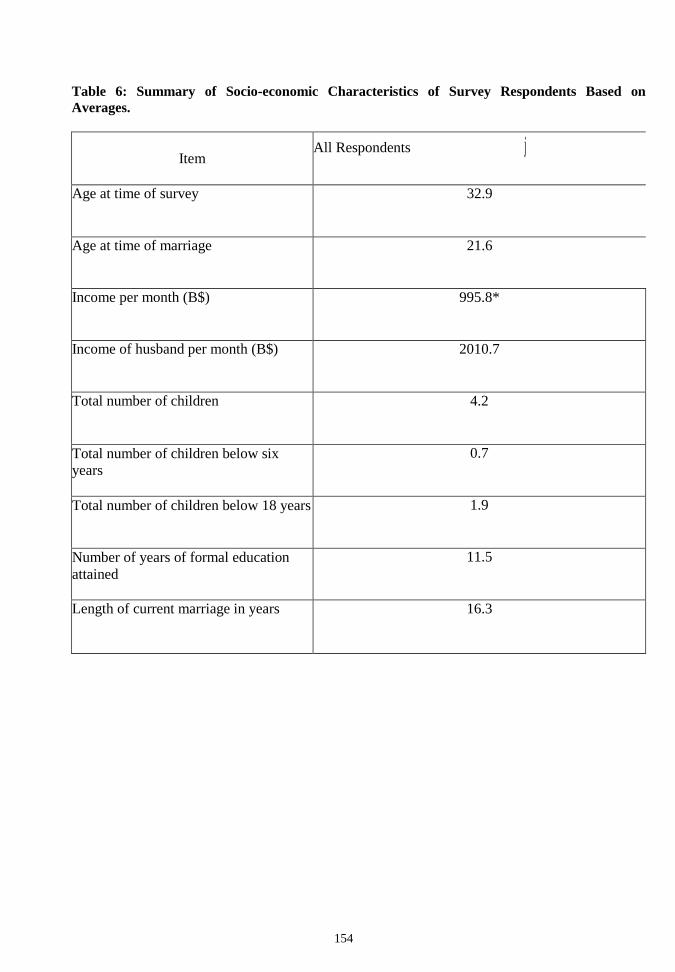
154
Table 6: Summary of Socio-economic Characteristics of Survey Respondents Based on
Averages.
Item All Respondents j
Age at time of survey 32.9
Age at time of marriage 21.6
Income per month (B$) 995.8*
Income of husband per month (B$) 2010.7
Total number of children 4.2
Total number of children below six
years
0.7
Total number of children below 18 years 1.9
Number of years of formal education
attained
11.5
Length of current marriage in years 16.3
________________________________________________
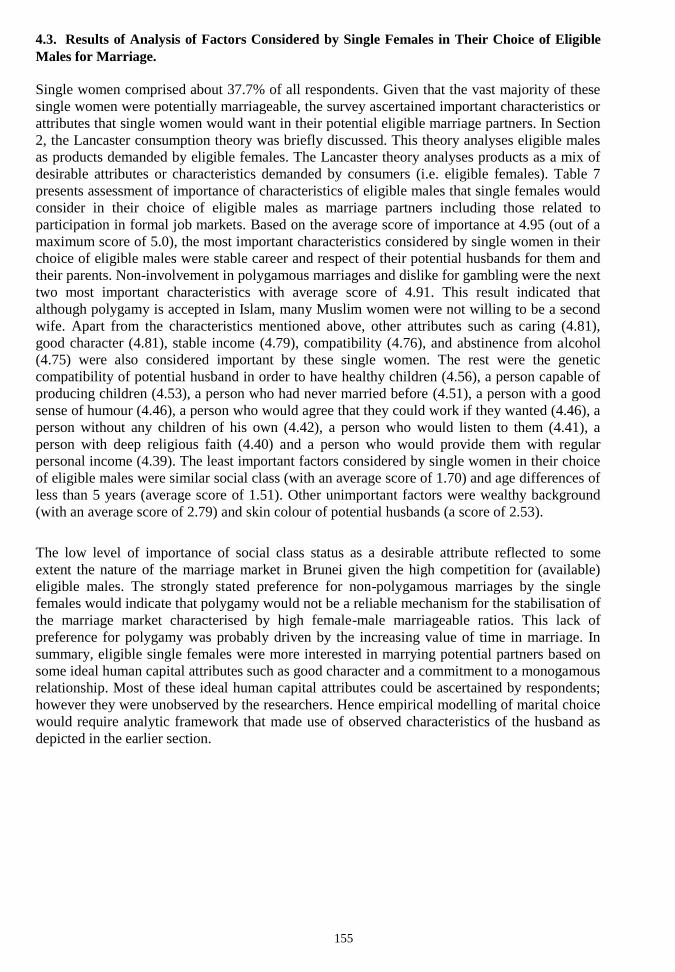
155
4.3. Results of Analysis of Factors Considered by Single Females in Their Choice of Eligible
Males for Marriage.
Single women comprised about 37.7% of all respondents. Given that the vast majority of these
single women were potentially marriageable, the survey ascertained important characteristics or
attributes that single women would want in their potential eligible marriage partners. In Section
2, the Lancaster consumption theory was briefly discussed. This theory analyses eligible males
as products demanded by eligible females. The Lancaster theory analyses products as a mix of
desirable attributes or characteristics demanded by consumers (i.e. eligible females). Table 7
presents assessment of importance of characteristics of eligible males that single females would
consider in their choice of eligible males as marriage partners including those related to
participation in formal job markets. Based on the average score of importance at 4.95 (out of a
maximum score of 5.0), the most important characteristics considered by single women in their
choice of eligible males were stable career and respect of their potential husbands for them and
their parents. Non-involvement in polygamous marriages and dislike for gambling were the next
two most important characteristics with average score of 4.91. This result indicated that
although polygamy is accepted in Islam, many Muslim women were not willing to be a second
wife. Apart from the characteristics mentioned above, other attributes such as caring (4.81),
good character (4.81), stable income (4.79), compatibility (4.76), and abstinence from alcohol
(4.75) were also considered important by these single women. The rest were the genetic
compatibility of potential husband in order to have healthy children (4.56), a person capable of
producing children (4.53), a person who had never married before (4.51), a person with a good
sense of humour (4.46), a person who would agree that they could work if they wanted (4.46), a
person without any children of his own (4.42), a person who would listen to them (4.41), a
person with deep religious faith (4.40) and a person who would provide them with regular
personal income (4.39). The least important factors considered by single women in their choice
of eligible males were similar social class (with an average score of 1.70) and age differences of
less than 5 years (average score of 1.51). Other unimportant factors were wealthy background
(with an average score of 2.79) and skin colour of potential husbands (a score of 2.53).
The low level of importance of social class status as a desirable attribute reflected to some
extent the nature of the marriage market in Brunei given the high competition for (available)
eligible males. The strongly stated preference for non-polygamous marriages by the single
females would indicate that polygamy would not be a reliable mechanism for the stabilisation of
the marriage market characterised by high female-male marriageable ratios. This lack of
preference for polygamy was probably driven by the increasing value of time in marriage. In
summary, eligible single females were more interested in marrying potential partners based on
some ideal human capital attributes such as good character and a commitment to a monogamous
relationship. Most of these ideal human capital attributes could be ascertained by respondents;
however they were unobserved by the researchers. Hence empirical modelling of marital choice
would require analytic framework that made use of observed characteristics of the husband as
depicted in the earlier section.
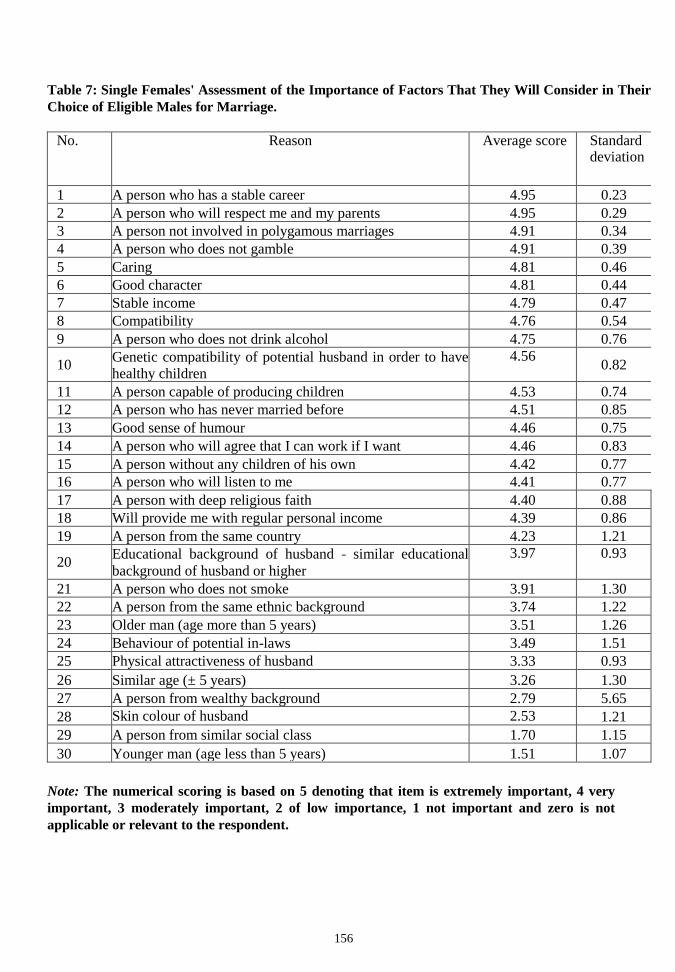
156
Note: The numerical scoring is based on 5 denoting that item is extremely important, 4 very
important, 3 moderately important, 2 of low importance, 1 not important and zero is not
applicable or relevant to the respondent.
Table 7: Single Females' Assessment of the Importance of Factors That They Will Consider in Their
Choice of Eligible Males for Marriage.
No. Reason Average score Standard deviation
1 A person who has a stable career 4.95 0.23
2 A person who will respect me and my parents 4.95 0.29
3 A person not involved in polygamous marriages 4.91 0.34
4 A person who does not gamble 4.91 0.39
5 Caring 4.81 0.46
6 Good character 4.81 0.44
7 Stable income 4.79 0.47
8 Compatibility 4.76 0.54
9 A person who does not drink alcohol 4.75 0.76
10 Genetic compatibility of potential husband in order to have healthy children
4.56 0.82
11 A person capable of producing children 4.53 0.74
12 A person who has never married before 4.51 0.85
13 Good sense of humour 4.46 0.75
14 A person who will agree that I can work if I want 4.46 0.83
15 A person without any children of his own 4.42 0.77
16 A person who will listen to me 4.41 0.77
17 A person with deep religious faith 4.40 0.88
18 Will provide me with regular personal income 4.39 0.86
19 A person from the same country 4.23 1.21
20 Educational background of husband - similar educational
background of husband or higher
3.97 0.93
21 A person who does not smoke 3.91 1.30
22 A person from the same ethnic background 3.74 1.22
23 Older man (age more than 5 years) 3.51 1.26
24 Behaviour of potential in-laws 3.49 1.51
25 Physical attractiveness of husband 3.33 0.93
26 Similar age (± 5 years) 3.26 1.30
27 A person from wealthy background 2.79 5.65
28 Skin colour of husband 2.53 1.21
29 A person from similar social class 1.70 1.15
30 Younger man (age less than 5 years) 1.51 1.07
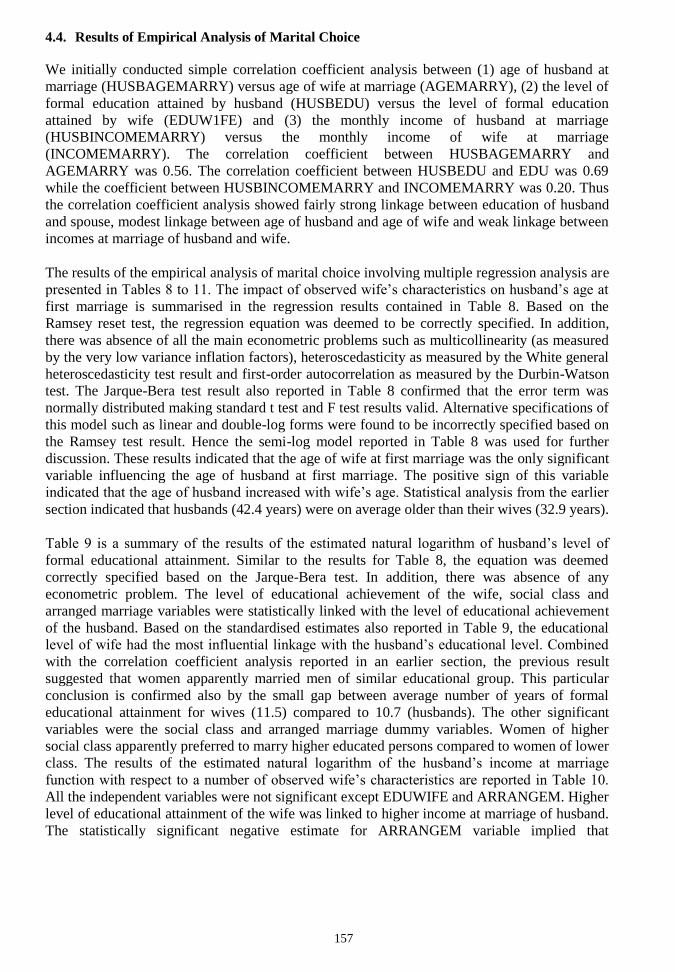
157
4.4. Results of Empirical Analysis of Marital Choice
We initially conducted simple correlation coefficient analysis between (1) age of husband at
marriage (HUSBAGEMARRY) versus age of wife at marriage (AGEMARRY), (2) the level of
formal education attained by husband (HUSBEDU) versus the level of formal education
attained by wife (EDUW1FE) and (3) the monthly income of husband at marriage
(HUSBINCOMEMARRY) versus the monthly income of wife at marriage
(INCOMEMARRY). The correlation coefficient between HUSBAGEMARRY and
AGEMARRY was 0.56. The correlation coefficient between HUSBEDU and EDU was 0.69
while the coefficient between HUSBINCOMEMARRY and INCOMEMARRY was 0.20. Thus
the correlation coefficient analysis showed fairly strong linkage between education of husband
and spouse, modest linkage between age of husband and age of wife and weak linkage between
incomes at marriage of husband and wife.
The results of the empirical analysis of marital choice involving multiple regression analysis are
presented in Tables 8 to 11. The impact of observed wife’s characteristics on husband’s age at
first marriage is summarised in the regression results contained in Table 8. Based on the
Ramsey reset test, the regression equation was deemed to be correctly specified. In addition,
there was absence of all the main econometric problems such as multicollinearity (as measured
by the very low variance inflation factors), heteroscedasticity as measured by the White general
heteroscedasticity test result and first-order autocorrelation as measured by the Durbin-Watson
test. The Jarque-Bera test result also reported in Table 8 confirmed that the error term was
normally distributed making standard t test and F test results valid. Alternative specifications of
this model such as linear and double-log forms were found to be incorrectly specified based on
the Ramsey test result. Hence the semi-log model reported in Table 8 was used for further
discussion. These results indicated that the age of wife at first marriage was the only significant
variable influencing the age of husband at first marriage. The positive sign of this variable
indicated that the age of husband increased with wife’s age. Statistical analysis from the earlier
section indicated that husbands (42.4 years) were on average older than their wives (32.9 years).
Table 9 is a summary of the results of the estimated natural logarithm of husband’s level of
formal educational attainment. Similar to the results for Table 8, the equation was deemed
correctly specified based on the Jarque-Bera test. In addition, there was absence of any
econometric problem. The level of educational achievement of the wife, social class and
arranged marriage variables were statistically linked with the level of educational achievement
of the husband. Based on the standardised estimates also reported in Table 9, the educational
level of wife had the most influential linkage with the husband’s educational level. Combined
with the correlation coefficient analysis reported in an earlier section, the previous result
suggested that women apparently married men of similar educational group. This particular
conclusion is confirmed also by the small gap between average number of years of formal
educational attainment for wives (11.5) compared to 10.7 (husbands). The other significant
variables were the social class and arranged marriage dummy variables. Women of higher
social class apparently preferred to marry higher educated persons compared to women of lower
class. The results of the estimated natural logarithm of the husband’s income at marriage
function with respect to a number of observed wife’s characteristics are reported in Table 10.
All the independent variables were not significant except EDUWIFE and ARRANGEM. Higher
level of educational attainment of the wife was linked to higher income at marriage of husband.
The statistically significant negative estimate for ARRANGEM variable implied that
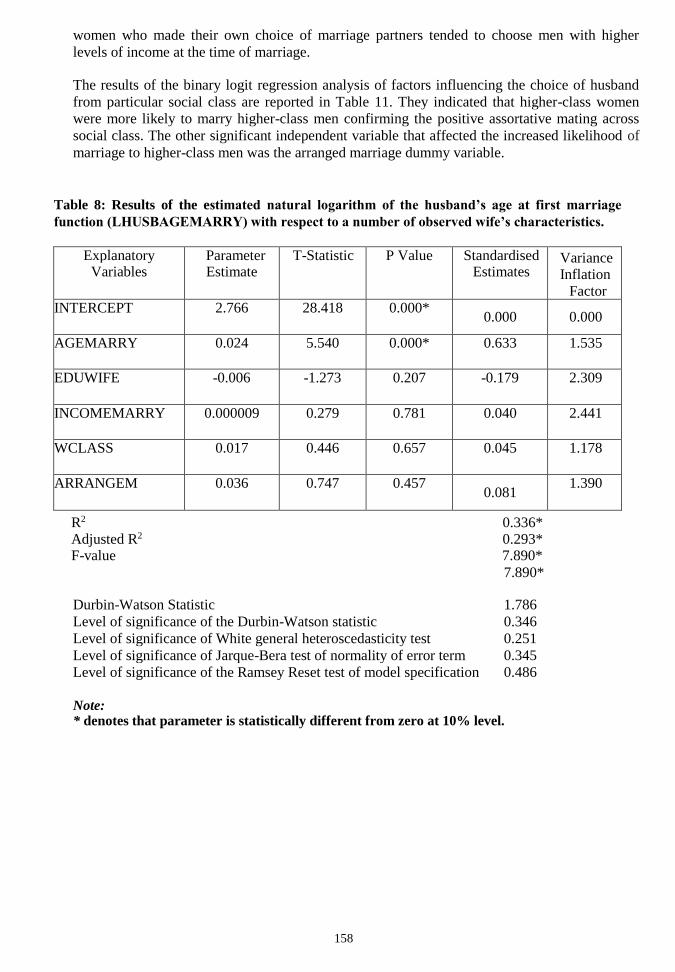
158
R2 0.336* Adjusted R2 0.293* F-value 7.890*
women who made their own choice of marriage partners tended to choose men with higher
levels of income at the time of marriage.
The results of the binary logit regression analysis of factors influencing the choice of husband
from particular social class are reported in Table 11. They indicated that higher-class women
were more likely to marry higher-class men confirming the positive assortative mating across
social class. The other significant independent variable that affected the increased likelihood of
marriage to higher-class men was the arranged marriage dummy variable.
0.336* 0.293*
7.890*
Durbin-Watson Statistic 1.786
Level of significance of the Durbin-Watson statistic 0.346
Level of significance of White general heteroscedasticity test 0.251
Level of significance of Jarque-Bera test of normality of error term 0.345
Level of significance of the Ramsey Reset test of model specification 0.486
Note: * denotes that parameter is statistically different from zero at 10% level.
Table 8: Results of the estimated natural logarithm of the husband’s age at first marriage
function (LHUSBAGEMARRY) with respect to a number of observed wife’s characteristics.
Explanatory Variables
Parameter Estimate
T-Statistic P Value Standardised Estimates
Variance Inflation
Factor
INTERCEPT 2.766 28.418 0.000* 0.000 0.000
AGEMARRY 0.024 5.540 0.000* 0.633 1.535
EDUWIFE -0.006 -1.273 0.207 -0.179 2.309
INCOMEMARRY 0.000009 0.279 0.781 0.040 2.441
WCLASS 0.017 0.446 0.657 0.045 1.178
ARRANGEM 0.036 0.747 0.457 0.081
1.390
__________
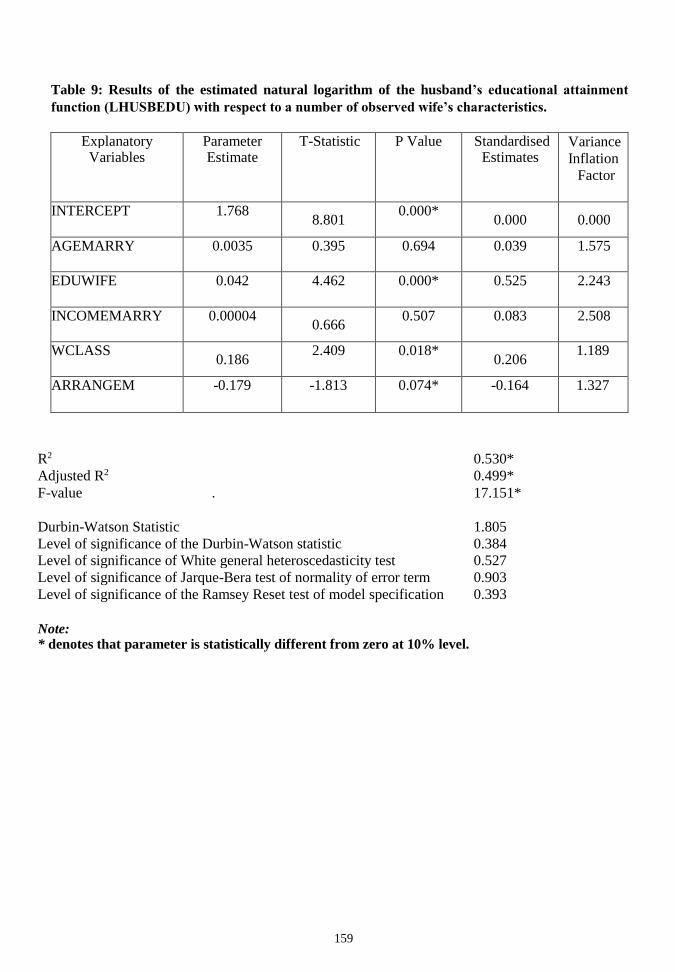
159
R2 0.530*
Adjusted R2 0.499*
F-value . 17.151*
Durbin-Watson Statistic 1.805
Level of significance of the Durbin-Watson statistic 0.384
Level of significance of White general heteroscedasticity test 0.527
Level of significance of Jarque-Bera test of normality of error term 0.903
Level of significance of the Ramsey Reset test of model specification 0.393
Note: * denotes that parameter is statistically different from zero at 10% level.
Table 9: Results of the estimated natural logarithm of the husband’s educational attainment
function (LHUSBEDU) with respect to a number of observed wife’s characteristics.
Explanatory Variables
Parameter Estimate
T-Statistic P Value Standardised Estimates
Variance
Inflation
Factor
INTERCEPT 1.768 8.801
0.000* 0.000 0.000
AGEMARRY 0.0035 0.395 0.694 0.039 1.575
EDUWIFE 0.042 4.462 0.000* 0.525 2.243
INCOMEMARRY 0.00004 0.666
0.507 0.083 2.508
WCLASS 0.186
2.409 0.018* 0.206
1.189
ARRANGEM -0.179 -1.813 0.074* -0.164 1.327
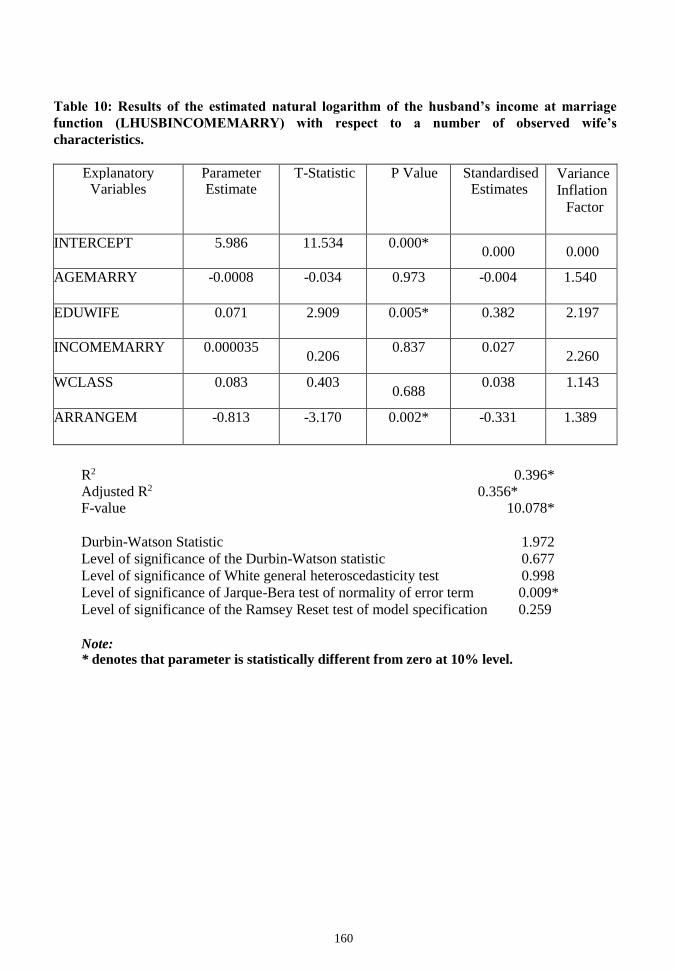
160
R2 0.396* Adjusted R2 0.356* F-value 10.078*
Durbin-Watson Statistic 1.972
Level of significance of the Durbin-Watson statistic 0.677
Level of significance of White general heteroscedasticity test 0.998
Level of significance of Jarque-Bera test of normality of error term 0.009*
Level of significance of the Ramsey Reset test of model specification 0.259
Note: * denotes that parameter is statistically different from zero at 10% level.
Table 10: Results of the estimated natural logarithm of the husband’s income at marriage
function (LHUSBINCOMEMARRY) with respect to a number of observed wife’s
characteristics.
Explanatory Variables
Parameter Estimate
T-Statistic P Value Standardised Estimates
Variance
Inflation
Factor
INTERCEPT 5.986 11.534 0.000* 0.000 0.000
AGEMARRY -0.0008 -0.034 0.973 -0.004 1.540
EDUWIFE 0.071 2.909 0.005* 0.382 2.197
INCOMEMARRY 0.000035 0.206
0.837 0.027 2.260
WCLASS 0.083 0.403 0.688
0.038 1.143
ARRANGEM -0.813 -3.170 0.002* -0.331 1.389
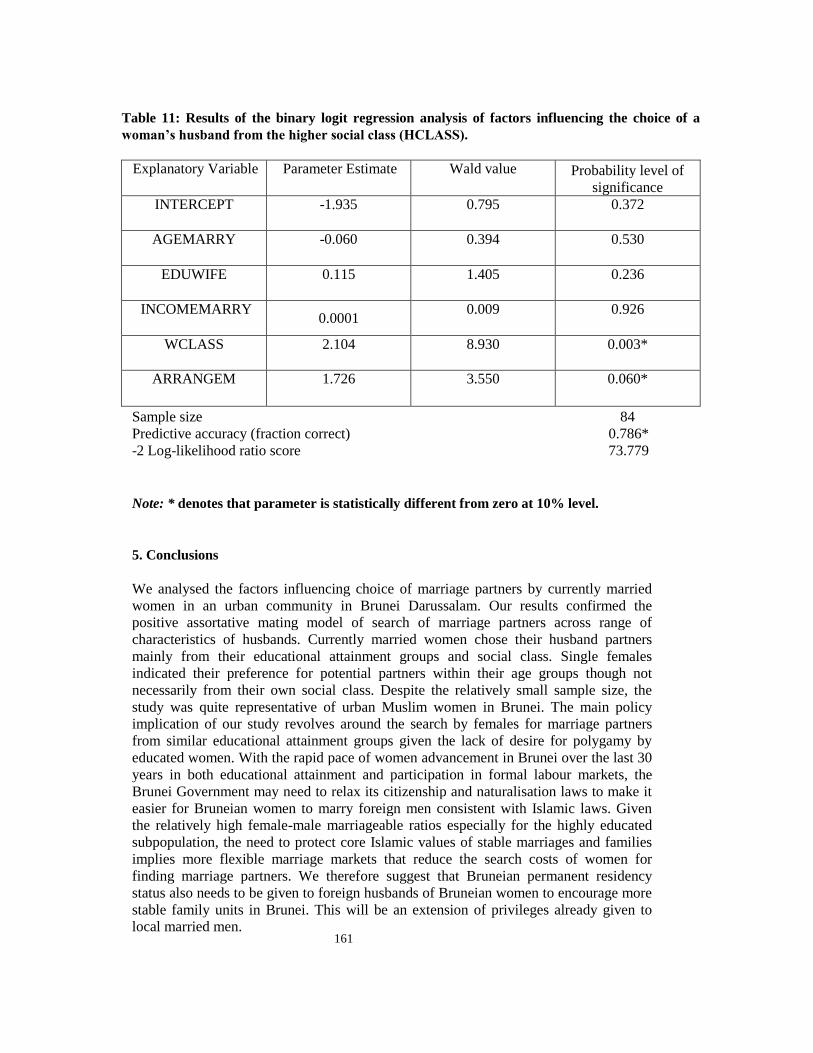
161
Sample size 84
Predictive accuracy (fraction correct) 0.786*
-2 Log-likelihood ratio score 73.779
Note: * denotes that parameter is statistically different from zero at 10% level.
5. Conclusions
We analysed the factors influencing choice of marriage partners by currently married
women in an urban community in Brunei Darussalam. Our results confirmed the
positive assortative mating model of search of marriage partners across range of
characteristics of husbands. Currently married women chose their husband partners
mainly from their educational attainment groups and social class. Single females
indicated their preference for potential partners within their age groups though not
necessarily from their own social class. Despite the relatively small sample size, the
study was quite representative of urban Muslim women in Brunei. The main policy
implication of our study revolves around the search by females for marriage partners
from similar educational attainment groups given the lack of desire for polygamy by
educated women. With the rapid pace of women advancement in Brunei over the last 30
years in both educational attainment and participation in formal labour markets, the
Brunei Government may need to relax its citizenship and naturalisation laws to make it
easier for Bruneian women to marry foreign men consistent with Islamic laws. Given
the relatively high female-male marriageable ratios especially for the highly educated
subpopulation, the need to protect core Islamic values of stable marriages and families
implies more flexible marriage markets that reduce the search costs of women for
finding marriage partners. We therefore suggest that Bruneian permanent residency
status also needs to be given to foreign husbands of Bruneian women to encourage more
stable family units in Brunei. This will be an extension of privileges already given to
local married men.
Table 11: Results of the binary logit regression analysis of factors influencing the choice of a
woman’s husband from the higher social class (HCLASS).
Explanatory Variable Parameter Estimate Wald value Probability level of
significance
INTERCEPT -1.935 0.795 0.372
AGEMARRY -0.060 0.394 0.530
EDUWIFE 0.115 1.405 0.236
INCOMEMARRY 0.0001
0.009 0.926
WCLASS 2.104 8.930 0.003*
ARRANGEM 1.726 3.550 0.060*
162
Acknowledgements
We thank all the 151 householders who kindly took their time to participate in the survey as
well as all the respective Ketua Kampungs (Heads of Villages) in Mukim Mentiri for their
permission and support to undertake the survey.
References
Ali, A.Y. (1996). The Meaning of the Holy Koran. Beltsville, Maryland: Amana Publications.
Babbie, E. (2001). The Practice of Social Research 9,h Edition. Belmont, California:
Wadsworth Publishing Company.
Becker, G.S. (1973). “A Theory of Marriage: Part 1”, Journal of Political Economy,
July/August, 813-846.
Becker, G.S. (1974). “A Theory of Marriage: Part 2”, Journal of Political Economy,
March/April, 511-526.
Behrman, J., N. Birdsall and A. Deolalikar (1995). “Marriage Markets, Labor Markets and
Unobserved Human Capital: An Empirical Exploration for South-Central India”, Economic
Development and Cultural Change, 43(4): 585-601.
Bergstrom, T.C. (1996). “Economics in a Family Way”, Journal of Economic Literature, 34:
1903-1934.
De Vaus, D.A. (1996). Surveys in Social Research, Fourth Edition, London: University
College London Press.
Durbin, J. and G.S. Watson (1951). “Testing for Serial Correlation in Least-Squares
Regressor”, Biometrika, 38: 159-171.
Garip, S. (2002). “Strong Family Unit Necessary”, Borneo Bulletin, (February), p. 5.
Government of Brunei Darussalam (1984). The Laws of Brunei Darussalam, Bandar Seri
Begawan: Ministry of Law.
Government of Brunei Darussalam (1994). Demographic Situation and Population
Projections 1991-2011, Bandar Seri Begawan: Department of Economic Planning and
Development.
Government of Brunei Darussalam (2001). Brunei Darussalam: Eight National Development
Plan 2001-2005, Bandar Seri Begawan: Department of Economic Planning and Development.
Government of Brunei Darussalam (2003). Brunei Statistical Yearbook 2002, Bandar Seri
Begawan: Department of Economic Planning and Development.
Grossbard-Shechtman, S. and S. Neuman (1998). “The Extra Burden of Moslem Wives:
Clues from Israeli Women's Labor Supply”, Economic Development and Cultural Change,
46: 491 - 517.
Gujarati, N. (2003). Basic Econometrics, Fourth Edition, London: McGraw-Hill, 1002 pp.
Hughes, T.P. (1994). Dictionary of Islam, Chicago: Kazi Publications.
Jarque, C.M and A.K. Bera (1987). “A Test for Normality of Observations and Regression
Residuals”, International Statistical Review, 55: 163-172.
Jones, G.W. (1994). Marriage and Divorce in Islamic South-East Asia , London: Oxford
University Press.
Lancaster, KJ. (1966). “A New Approach to Consumer Theory”, Journal of
Political Economy, 74: 132-157.
Loughran, D.S. (2002). “The Effect of Male Wage Inequality on Female Age at
First Marriage”, The Review of Economics and Statistics, 84(2): 237-250. *
163
McFadden, D.(1981). “Econometric Models of Probabilistic Choice”, In Structural
Analysis of Discrete Data with Econometric Applications (eds C. Manski and D.
McFadden), 198-272, Cambridge, MA: MIT Press.
Miftahi, Z. (1997). Modesty and Chastity in Islam, Kuala Lumpur: S. Abdul Majeed and
Company.
Persson, T.FI. (2002). “Flousehold Choice of Drinking-Water Source in the Philippines”,
Asian Economic Journal, 16(4): 303-316.
Qadri, A.A. (1986). Islamic Jurisprudence in the Modern World, Delhi, India: Taj Company.
Ramsey, J.B. (1969). “Tests for Specification Errors in Classical Linear Least Squares
Regression Analysis”, Journal of the Royal Statistical Society, Series B, 31: 350-371.
Stephen, I. ( 2001). “Divorce Rate Soars”, Borneo Bulletin, (February),1-2.
United Nations Development Programme (UNDP) (2003). Human Development Report:
Human Development Index, London: UNDP.
White, H. (1980). “A Heteroscedasticity Consistent Covariance Matrix Estimator and a
Direct Test of Heteroscedasticity”, Econometrica, 48: 817-818.
Wilson, W.J. (1987). The Truly Disadvantaged, Chicago: University of Chicago Press.
164
CHAPTER 11
ANALYSIS OF CAUSALITY LINKS BETWEEN
AGGREGATE WOMEN LABOUR FORCE AND
THE DIVORCE RATE IN BRUNEI DARUSSALAM
SRI JOEDIANNA MOHAMMED AND KWABENA A. ANAMAN
Abstract
For the last 30 years, the number of women participating in formal labour markets in Brunei
Darussalam has risen considerably. During this period of time, the divorce rate (Muslim
divorce rate) has doubled to an average of 19.5% in the 1996 to 2001 period from an average
of about 9.6% during the period, 1971 to 1975. Some scholars have argued that the increase in
the divorce rate in Muslim and non-Muslim societies is partly due to the result of rapidly
increasing women formal labour force participation. However some have also argued that it is
rather the increasing divorce rate (caused by factors other than labour force participation) that
push more women to work to take care of themselves and their children. We undertook a study
that analysed the causality links between the women labour force and the divorce rate in Brunei
using Granger causality test. The results of our analysis rejected the notion that rising women
labour participation led to increasing divorce rate. We found out that it was increasing divorce
rate that was linked to increasing women labour force participation. Our findings appeared to
reject the negativity surrounding the idea of married women working. We have proposed the
implementation of policies to assist married working women through provision of more
childcare facilities and improved welfare system for divorced women.
1. Introduction
Brunei Darussalam (hereafter Brunei), situated on the north-western tip of the Borneo island, is
the smallest country in the Southeast Asian region with a population of only 340,800 in 2002
and a land area of 5,765 square kilometres (Government of Brunei Darussalam, 2003). With the
natural endowment of oil and gas, the country has become the wealthiest country in the Muslim
world based on per capita gross domestic product (GDP). Brunei is also the second wealthiest
country in Southeast Asia after Singapore and the fourth in Asia based on the Human
Development Index developed by the United Nations Development Programme (UNDP, 2003).
The management of the revenues derived from the export of oil and gas has led to the creation
of a welfare state in the country involving the provision of free health care and education for the
citizens of the country. Women in Brunei are given equal opportunity and freedom in many
aspects of life that many women in some Islamic countries lack. Access to education has
enabled women to participate fully in all sectors of the labour market from blue-collar to white-
collar jobs and also as professionals like doctors, lawyers and engineers. Current statistics show
that men are outnumbered by women in filling new government positions (Kassim, 2002) and
for places at Universiti Brunei Darussalam, the country’s only university (Government of
Brunei Darussalam, 2002, p. 116).
165
For the last 30 years the pace of women labour supply has grown rapidly. The share of female
workforce in the total government workforce in 1971 was only 22.4% as compared to 44% in
2001. Table 1 shows the statistics of women working in government sector and the private
sector from 1971 to 2001. The preliminary results of the 2001 Population and Housing Census
indicate that female labour force participation rate increased from 32.6% in 1981 to 48.3% in
1991 and to 58.9% in 2001 (Government of Brunei Darussalam, 2003). These findings are
consistent with what has been noted by Maricar (1997) who observed the importance of
women’s role in Brunei’s development that can been seen from not only the increasing rate of
women labour participation but also the changes in the types of work that they do in the
different sectors of the economy.
Although the economic and social gains of women working are undeniably huge in the sense of
higher productive capacity and greater women emancipation respectively, there are certain
arguments put forward against increasing women labour force participation by some scholars.
One of these arguments is that increasing numbers of marriage failures may be linked to
increasing numbers of women working. Maricar (1997) indicates that in the three censuses
years, 1971, 1981 and 1991, married women comprised over half of the total female workforce.
Over this period, divorces increased considerably as shown in Table 2. The average Muslim
divorce rate which was 9.6% during the 1971-1975 period increased to as much as 22% in both
1996 and 1998. Kassim (2002) points out that as more married women enter the formal
workforce, the marriage institution and traditional family structure may be put under greater
level of stress. The inability to cope with higher level of stress may lead to increased marriage
instability such as higher divorce rates. A counter argument is that it is the increase in the
divorce rate that causes higher female labour participation due to the increasing numbers of
divorced women choosing to work to support themselves and their children. Increasing levels of
divorce reflect a decline in social capital in the community. The two main definitions of social
capital that dominate the literature both view divorce as a decline in social capital. Putnam
(1995) suggests that a core component of social capital involves strengthening of the nuclear
and extended family, good neighbourliness or relations between family units living within a
geographical area. Lin (2001) views social capital primarily as a form of investment by
individuals in advancing social skills that allow them increased access and use of resources
within social structures with the aim of gaining benefits from this investment.
The impact of increased women labour force participation on marital instability especially the
divorce rate is important to understand in an Islamic society given the rapid breakdown of the
family in modern societies including Brunei. Therefore the major objective of this study is to
analyse the causality links between aggregate women labour force and the divorce rate in
Brunei. The rest of the paper is organised as follows: in the next section the literature review is
presented. This is followed by the methodology and the results of the Granger causality
analysis. The final part of the paper contains the conclusions and references.
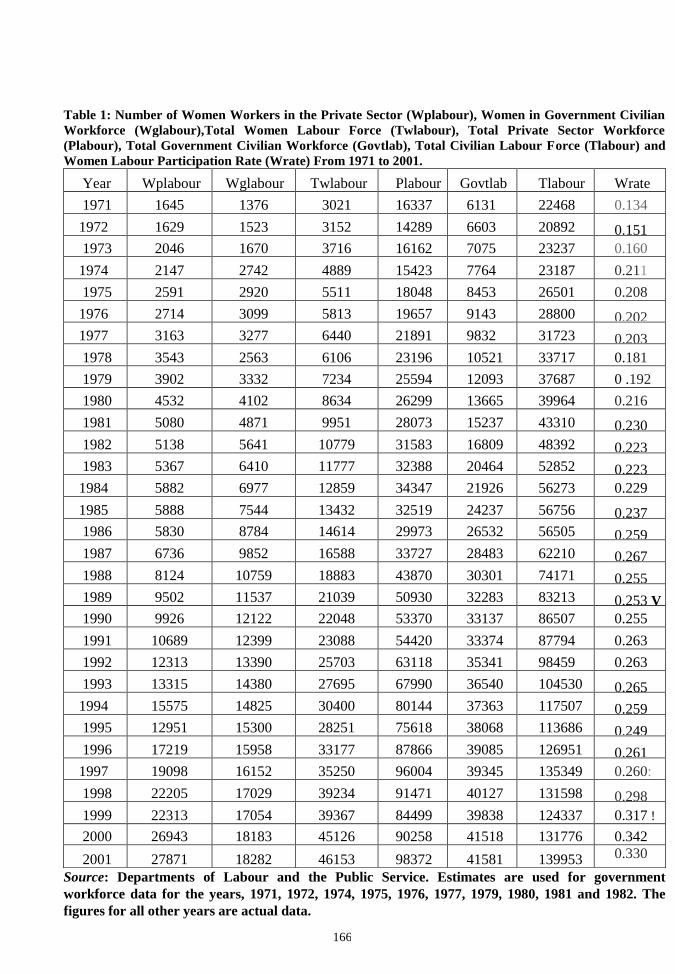
166
Table 1: Number of Women Workers in the Private Sector (Wplabour), Women in Government Civilian
Workforce (Wglabour),Total Women Labour Force (Twlabour), Total Private Sector Workforce
(Plabour), Total Government Civilian Workforce (Govtlab), Total Civilian Labour Force (Tlabour) and
Women Labour Participation Rate (Wrate) From 1971 to 2001.
Year Wplabour Wglabour Twlabour Plabour Govtlab Tlabour Wrate
1971 1645 1376 3021 16337 6131 22468 0.134
1972 1629 1523 3152 14289 6603 20892 0.151
1973 2046 1670 3716 16162 7075 23237 0.160
1974 2147 2742 4889 15423 7764 23187 0.211
1975 2591 2920 5511 18048 8453 26501 0.208
1976 2714 3099 5813 19657 9143 28800 0.202
1977 3163 3277 6440 21891 9832 31723 0.203
1978 3543 2563 6106 23196 10521 33717 0.181
1979 3902 3332 7234 25594 12093 37687 0 .192
1980 4532 4102 8634 26299 13665 39964 0.216
1981 5080 4871 9951 28073 15237 43310 0.230
1982 5138 5641 10779 31583 16809 48392 0.223
1983 5367 6410 11777 32388 20464 52852 0.223
1984 5882 6977 12859 34347 21926 56273 0.229
1985 5888 7544 13432 32519 24237 56756 0.237
1986 5830 8784 14614 29973 26532 56505 0.259
1987 6736 9852 16588 33727 28483 62210 0.267
1988 8124 10759 18883 43870 30301 74171 0.255
1989 9502 11537 21039 50930 32283 83213 0.253 V
1990 9926 12122 22048 53370 33137 86507 0.255
1991 10689 12399 23088 54420 33374 87794 0.263
1992 12313 13390 25703 63118 35341 98459 0.263
1993 13315 14380 27695 67990 36540 104530 0.265
1994 15575 14825 30400 80144 37363 117507 0.259
1995 12951 15300 28251 75618 38068 113686 0.249
1996 17219 15958 33177 87866 39085 126951 0.261
1997 19098 16152 35250 96004 39345 135349 0.260:
1998 22205 17029 39234 91471 40127 131598 0.298
1999 22313 17054 39367 84499 39838 124337 0.317 !
2000 26943 18183 45126 90258 41518 131776 0.342
2001 27871 18282 46153 98372 41581 139953 0.330
Source: Departments of Labour and the Public Service. Estimates are used for government
workforce data for the years, 1971, 1972, 1974, 1975, 1976, 1977, 1979, 1980, 1981 and 1982. The
figures for all other years are actual data.
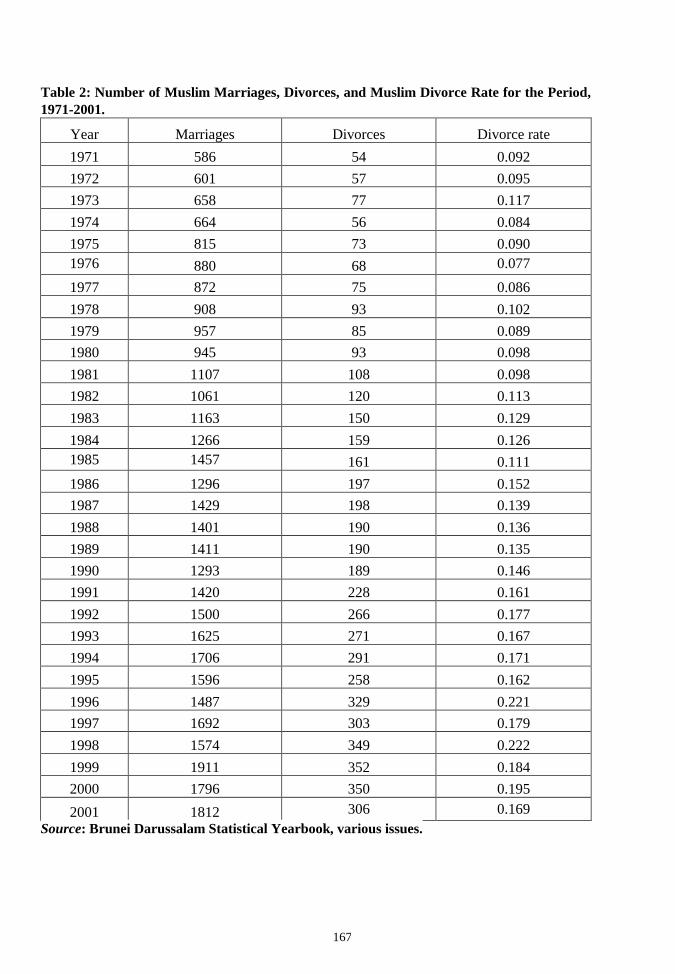
167
Table 2: Number of Muslim Marriages, Divorces, and Muslim Divorce Rate for the Period,
1971-2001.
Year Marriages Divorces Divorce rate
1971 586 54 0.092
1972 601 57 0.095
1973 658 77 0.117
1974 664 56 0.084
1975 815 73 0.090
1976 880 68 0.077
1977 872 75 0.086
1978 908 93 0.102
1979 957 85 0.089
1980 945 93 0.098
1981 1107 108 0.098
1982 1061 120 0.113
1983 1163 150 0.129
1984 1266 159 0.126
1985 1457 161 0.111
1986 1296 197 0.152
1987 1429 198 0.139
1988 1401 190 0.136
1989 1411 190 0.135
1990 1293 189 0.146
1991 1420 228 0.161
1992 1500 266 0.177
1993 1625 271 0.167
1994 1706 291 0.171
1995 1596 258 0.162
1996 1487 329 0.221
1997 1692 303 0.179
1998 1574 349 0.222
1999 1911 352 0.184
2000 1796 350 0.195
2001 1812 306 0.169
Source: Brunei Darussalam Statistical Yearbook, various issues.
168
2. Literature Review
2.1 Marriage and Divorce in Islamic Societies
Since Brunei is an Islamic state with the majority of the citizens being Muslims, an introduction of marriage and divorce in Islamic societies is presented especially for non- Muslim readers. In Islam, marriage is considered a virtuous and sacred institution which brings together a man and
a woman to procreate and live in peace and tranquillity as commanded by God the Almighty. This proclamation is clearly stated in the Holy Koran (Ali, 1989; Ali, 1996) exemplified as follows: “And among His signs is this, that He created for your mates from among yourselves, that ye may dwell in tranquillity with them, and He has put love and mercy between your (hearts): Verily in that are signs for those who reflect”, Surah 30 (Al-Rum) Verse 21.
“And Allah has made for you mates (and companions) of your own nature, and made for you,
out of them, sons and daughters and grandchildren. And provided for your sustenance of the
best: will they then believe in vain things, and be ungrateful for Allah’s favours?”, Surah 16
(Al-Nahl) Verse 72 (Ali, 1989).
The Prophet Muhammad S.A.W. also accentuated the importance of marriage as the natural
way for fulfilling biologically-driven human sexual urges in the correct moral path based on
Islamic teachings. This is exemplified by His statement “Marriage is my sunna (tradition).
Whosoever keeps away from it is not from me”, (Doi, 2002). Furthermore, marriage can help to
ensure modesty and chastity and to prevent the sin of fornication. This is stressed by the saying
of the Prophet as cited by Al-Bukhari, “O ye young men! Those of you who have the
wherewithal of a marriage contract, should marry, since it lowers the gaze and protects against
fornication” (Miftahi, 1997). Additionally, by having the contract, men and women can build
loving family units and from there, the Islamic race may propagate and survive in the present
and into the future.
During the Pre-Islamic period, men in the Arab world could marry as many times and as many
women as they wished. The Islamic Teachings enunciated by the Prophet established controlled
polygamy where men were allowed a maximum of four wives at a time. Based on the teachings
of the Prophet, in Islam, polygamy is allowed under the strict condition that the man has to
prove that he has the means to support the wives financially and he is capable of treating all his
wives justly and equally. Hughes (1994) argues that controlled polygamy was introduced to
deal with the problem of very high female-male marriageable ratios (many marriageable
females compared to marriageable males) in a society that followed very strict laws and rules
dealing with complete abstinence of pre-marital sex and illegality and criminality of extra-
marital sex.
In Islamic societies, divorce is very much frowned upon because the breakup of marriage often
triggers other social problems especially those dealing with raising children. However, in the
event of great and continuing animosity between a married couple, a marriage dissolution is
allowed as written in the Holy Koran, Surah 4 (An Nisa) Verse 130, “If they disagree (and must
part), Allah will provide abundance for all from His all-reaching bounty:
169
For Allah is He that careth for all and is wise” (Ali, 1989). Then again, Abu Dawud quoted
Prophet Mohamed as declaring that “(Of all things permitted by Law, divorce is the most
hateful in the sight of Allah”, (Ali, 1989).
An important characteristic of Islamic divorce is that the power of divorcing rests with the
husbands. This is because, among others, it is claimed that men are more rational and less
emotional in making decisions of such nature which involve hurt feelings. In addition, it is
argued that since men are responsible for the payment of the wife’s dower, maintenance and
alimony during the period of iddah (waiting period for final divorce), they are more likely to
exercise the power of divorcing prudently (Miftahi, 1997). Surah 65 (A1 Talaq) Verses 1-12 in
the Holy Koran provide the details of the rules and procedures involved in divorce especially
the specific provisions made for women. Despite the power given to men to divorce their wives,
Muslim women can ask for a marriage to be dissolved through several processes.
First, a wife can seek a divorce through Ta'alik divorce or divorce by redemption if the husband
breaks the contract of the marriage, for example, if he leaves the wife for a considerable period
of time or he physically or emotionally abuses her. The second method of getting divorce is via
Khul’ divorce where the wife has to pay compensation to her husband in return for her liberty
from the marriage. Third, a marriage can be dissolved by the decree of an Islamic court through
Fasakh divorce if the wife proves to the court that the husband is unable to maintain her
financially or the husband has health and physical problems that seriously affect her happiness
within the marriage (Jones, 1994; Miftahi, 1997).
Since the decision to divorce can be undertaken irrationally in a moment of passion, Islam
permits a waiting period or iddah when the wife is forbidden from marrying other men and the
couple may get back together without having to renew the marriage vows. During the iddah
period, the husband has to pay alimony to support the wife and he is also obliged to support the
children financially. By right, the children should be fully supported by the father and not the
mother especially if the mother has remarried. In Brunei, Muslim marriage and divorce matters
are handled by the official Islamic court. The role of the court in the custody of the children
after divorce is not clear. Often it is observed that the children of a divorced couple live with
their mother until adulthood. When a couple resolves to end their marriage, initially the Islamic
court will refer them to a family counsellor for a resolution of the problems affecting their
marriage with the aim of avoiding divorce if possible (Alli, 2002).
2.2 The Right of Muslim Women to Work
The following verse in the Holy Koran clearly asserts the right of women to work: “7o men is
allotted what they earn, and to women what they earn”, Surah 4 (An Nisa) Verse 32 (Ali,
1989). This suggests that if men have the right to work in order to earn money, then women also
have similar right to work as well. Othman (1993) points out that marriage in Islam does not
take away the right of women to work. Islam recognizes any married woman as an individual
human being who has her own civil rights. The Prophet Mohammad S.A.W. did not prohibit
women from working as a means to earn money to support themselves and their families.
Evidence to support this position that women were allowed to work during the Prophet’s time
was that the cleaner of the mosque of al-Madinah was a woman named Harqa’ (Othman, 1993).
170
However, the apparent right of women to work does not mean that husbands should discharge
themselves from the responsibility of giving maintenance to the wives as enshrined under the
Shari’ah Laws. The move in some Islamic societies to prevent women from participating in
formal labour markets comes from social and cultural practices of these societies which are
touted as “Islamic” injunctions by activists seeking to force women to stay at home. Working
women are regarded as immoral and of lower status because being outside the home, their
modesty and chastity may be more easily violated. This is rather a myopic view since it is
assumed that every time a man and a woman work together, they are likely to commit adultery
or fornication (Othman, 1993). The enormous positive externalities to society associated with
women joining the formal workforce are clearly evident throughout the world. Millions of
women teachers, doctors, civil servants, scientists and other professionals have boosted the
development and growth of all societies including Muslim countries.
2.3 Economic Theoretical Framework of Women Labour Supply
The most important element in any labour supply decision is the attractiveness of the wage rate
apart from the non-pecuniary aspects of the job, the skills and qualifications required and the
level of unemployment in the economy (Stanlake and Grant, 1995). As the average wage
increases, more people are attracted to join the labour market as they substitute work for leisure.
However, further increases in wage beyond a certain point result in the consumption of more
leisure goods which in turn reduces total number of hours worked. Under such a situation, the
substitution effect (more work for less leisure) has less impact than the income effect resulting
from the higher wage rate.
Figure 1 illustrates the combined substitution and income effects based on what is known as the
‘backward-bending’ supply curve of labour. At wage level 0P1, people are prepared to work
OQ1 hours but as the real wage rises to 0P2, the number of hours worked declines to 0Q2. The
reduction in the total number of hours worked does not imply the decline in total income
received. For example, a person may be prepared to work a 40-hour week when the wage rate is
B$10 per hour giving him a total weekly income of BND400. When the hourly wage rate
increases to B$12, he may be willing to work for only 36 hours of work and he then receives a
higher weekly income of B$432.
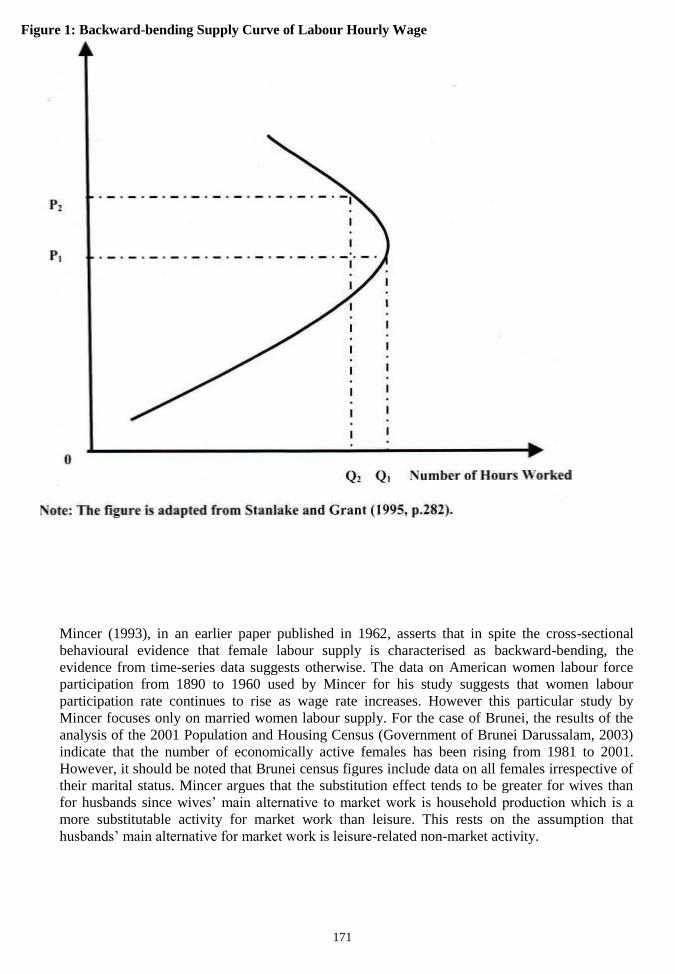
171
Mincer (1993), in an earlier paper published in 1962, asserts that in spite the cross-sectional
behavioural evidence that female labour supply is characterised as backward-bending, the
evidence from time-series data suggests otherwise. The data on American women labour force
participation from 1890 to 1960 used by Mincer for his study suggests that women labour
participation rate continues to rise as wage rate increases. However this particular study by
Mincer focuses only on married women labour supply. For the case of Brunei, the results of the
analysis of the 2001 Population and Housing Census (Government of Brunei Darussalam, 2003)
indicate that the number of economically active females has been rising from 1981 to 2001.
However, it should be noted that Brunei census figures include data on all females irrespective of
their marital status. Mincer argues that the substitution effect tends to be greater for wives than
for husbands since wives’ main alternative to market work is household production which is a
more substitutable activity for market work than leisure. This rests on the assumption that
husbands’ main alternative for market work is leisure-related non-market activity.
Figure 1: Backward-bending Supply Curve of Labour Hourly Wage
172
For single women, their labour supply decision is significantly affected by the potential
husbands’ income on top of their own earning prospects. Van der Klaauw (1996) points out that
higher expected husband’s earnings bring about greater gains to marriage and therefore higher
probability of getting married and in turn lower the probability of the need for women to work.
The above statement is consistent with the hypothesis of compensating differentials in marriage
espoused by Grossbard-Shechtman and Neuman (1988) that greater potential husband’s income
presents a single woman with higher chances of being given compensating differentials after
marriage. What this hypothesis implies is that if a husband has some unattractive traits as
compared to the wife’s traits, for example, being older than the wife, then it is necessary for the
husband to compensate her materially by providing her with higher proportion of his income or
of some joint income. Therefore, the wife will be deterred to work since the income from
marriage is sufficient to satisfy her needs.
A wife may decide to work when the wage or potential wage (w) in the labour market exceeds the
reservation wage (w*) which is the attractiveness of staying home. Grossbard-Shechtman and
Neuman (1988) emphasize that the husband’s income, the number of children and the ages of
children have some impacts on the reservation wage. Other variables such as education and age
have effects on both the wage and the reservation wage. As have been discussed earlier a
husband’s earning level is important because low earning level leads to lower income received by
wife in the form of a share of the husband’s earning. In other words, the wife has lower gains to
marriage (Van der Klaauw, 1996) or lower amount of compensating differential (Grossbard-
Shechtman and Neuman, 1988) which consequently reduces her reservation wage and working
outside the home becomes more attractive. Similar behaviour can be observed when a married
woman does not have many children especially young ones where less of her time in household
production is needed.
Correspondingly, the more educated and younger the married women, the higher their
marketability in formal labour markets and the higher the wages they are likely to receive. So
they are expected to be more likely to participate in the labour force than the less educated and
older cohorts. However Grossbard-Shectman and Neumann (1998) suggest that older cohorts
may also be more productive in household production making the reservation wages higher.
Education always plays a crucial role on working decision either by men or women, single or
married, given that increasingly, jobs need skills and ability which may be acquired from more
years of schooling. It is perceived that the more educated the person, the higher his or her
marginal productivity relative to a less educated person and firms invest in this human capital as
opposed to physical capital because of expectation of higher future profits generated by the
person. Becker (1964) in his book Human Capital, explains that earnings usually increase with
age at a decreasing rate. Therefore, the earlier notion that educated and younger married women
are more likely to work can be supported since education is a type of capital that can increase the
productivity in the workplace.
What other factors influence a woman’s decision to work which may not affect her when she was
married? Apparently, the list of appropriate exogenous variables explaining divorced female
labour supply is still the same as that for married ones. However several other factors need to be
taken into consideration as well (Johnson and Skinner 1986; Haurin 1989; Van der Klaauw,
1996). These other factors which influence the divorced woman’s decision to work include
adequacy of the government welfare support system, adequacy of her extended family support
system, the level of her work-related experience and the need to financially support her children.
173
2.4. The Relationship Between Marital Instability and Career Women
According to Becker et al. (1977), married women who receive high wages are less likely to
benefit from marriage due to reasons outlined in Becker’s (1973, 1974) theory of marriage that
emphasizes utility-maximizing decisions. Given a situation of high wages earned by married
women, the gains to marriage are reduced and hence there is a higher probability of divorce for
these women. Hoffman and Duncan (1995) show that the increasing wage rate of wives reduces
the probability of divorce; this finding contradicts the proposition derived from the theories of
Becker. However Van der Klaauw (1996) argues that high female labour participation rate, as a
result of rising average real female earnings, may have contributed to the observed increasing
divorce rate in the United States during the post-war period. Divorces, he argues, usually result in
the growth of female labour supply; and as more females choose to work, they gain more
experience which then translates into higher future earnings.
High divorce rate and high probabilities of marriage dissolution have an implication on the rate of
female labour participation as theorized by Haurin (1989) and Johnson and Skinner (1986).
Haurin, for example, shows that that female labour supply is positively and strongly affected
when women are divorced rather than if women are widowed or their husbands are sick or
temporarily unemployed. On the other hand, the rise in the divorce rate pushes women to work
outside the home as a response to the loss of the income from the husband. Increased perceptions
of future marital separation also lead married women, at risk of divorce, to seek jobs in order to
gain experience (Johnson and Skinner, 1986).
Apart from high female labour participation as a possible cause for increasing divorce rate, there
are other factors that might contribute to the rise in marriage instability. Among the factors cited
in the literature in the United States are the decline in the number of marriageable men, defined as
the number of employed males between 20 and 44 and who are not in mental institutions or in
prisons, the increase in welfare support for single mothers and divorced women, the decreasing
fertility due to the greater usage of contraception and the revolution in sexual attitudes that
encourages pre-marital sex and extra-marital sex among consenting adults (Loughran, 2002).
For Brunei over the period, 1995 to 1999, incompatibility between husband and wife was the
most important cause of Muslim divorces accounting for 38.4% of all divorces. Other important
causes for Muslim divorces were the neglect by husband of responsibilities to wife and children
(12.5%), infidelity by either marriage partner (8.9%) and refusal by wife to allow polygamous
relationship for current husband (3.6%) (Kassim, 2002; Alli, 2002). Kassim (2002) hypothesises
that incompatibility between husband and wife, the chief cause of divorces in Brunei, may be
related to the inadequate time spent together by married couples due to more married women
working. Perhaps, the incompatibility may also be related to the reduction of economic
dependence of the wife on the husband resulting from the wife working. This is possibly linked to
the increased stress on some Muslim husbands due to the hurt of their pride and ego for failure to
maintain adequately their working wives financially from their own resources. This proposition is
supported by the fact the second leading cause of divorce in Brunei is the neglect of husband of
responsibilities to wife and children.
One possible cause of marriage instability is the decline in the number of marriageable men
relative to marriageable women. This decline may lead to an increase in sexual permissiveness,
promiscuity and infidelity due to many more women looking for prospective husbands who are
increasingly rare to find. Wilson (1987) reports that the rapid increase in the female to male
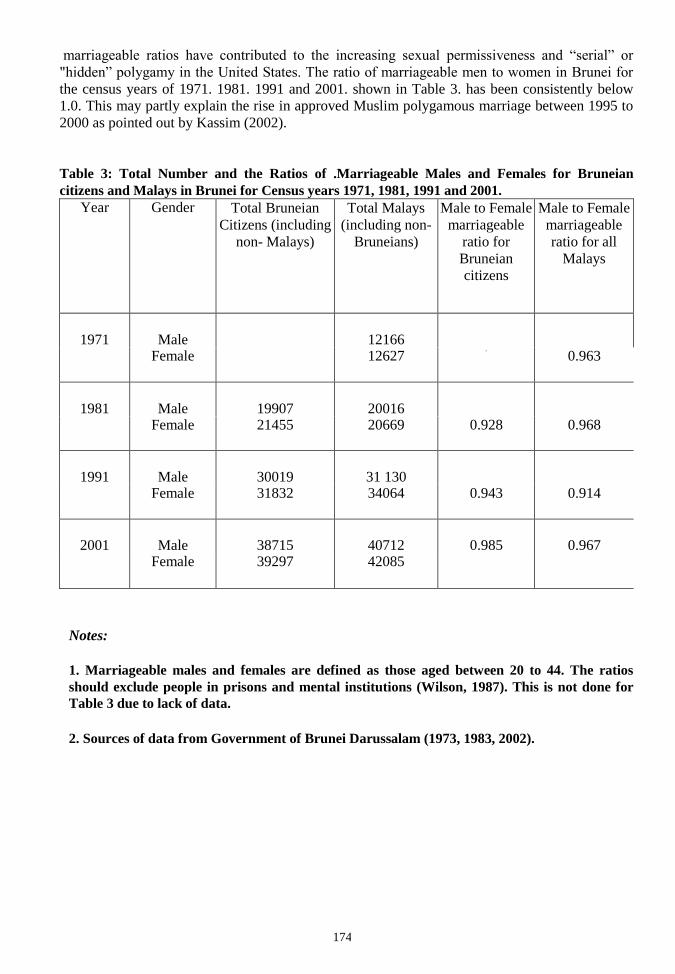
174
marriageable ratios have contributed to the increasing sexual permissiveness and “serial” or
"hidden” polygamy in the United States. The ratio of marriageable men to women in Brunei for
the census years of 1971. 1981. 1991 and 2001. shown in Table 3. has been consistently below
1.0. This may partly explain the rise in approved Muslim polygamous marriage between 1995 to
2000 as pointed out by Kassim (2002).
Notes:
1. Marriageable males and females are defined as those aged between 20 to 44. The ratios
should exclude people in prisons and mental institutions (Wilson, 1987). This is not done for
Table 3 due to lack of data.
2. Sources of data from Government of Brunei Darussalam (1973, 1983, 2002).
Table 3: Total Number and the Ratios of .Marriageable Males and Females for Bruneian
citizens and Malays in Brunei for Census years 1971, 1981, 1991 and 2001.
Year Gender Total Bruneian
Citizens (including
non- Malays)
Total Malays
(including non-
Bruneians)
Male to Female
marriageable
ratio for
Bruneian
citizens
Male to Female
marriageable
ratio for all
Malays
1971 Male
12166
Female
12627
- 0.963
1981 Male 19907 20016
Female 21455 20669 0.928 0.968
1991 Male 30019 31 130
Female 31832 34064 0.943 0.914
2001 Male 38715 40712 0.985 0.967
Female 39297 42085
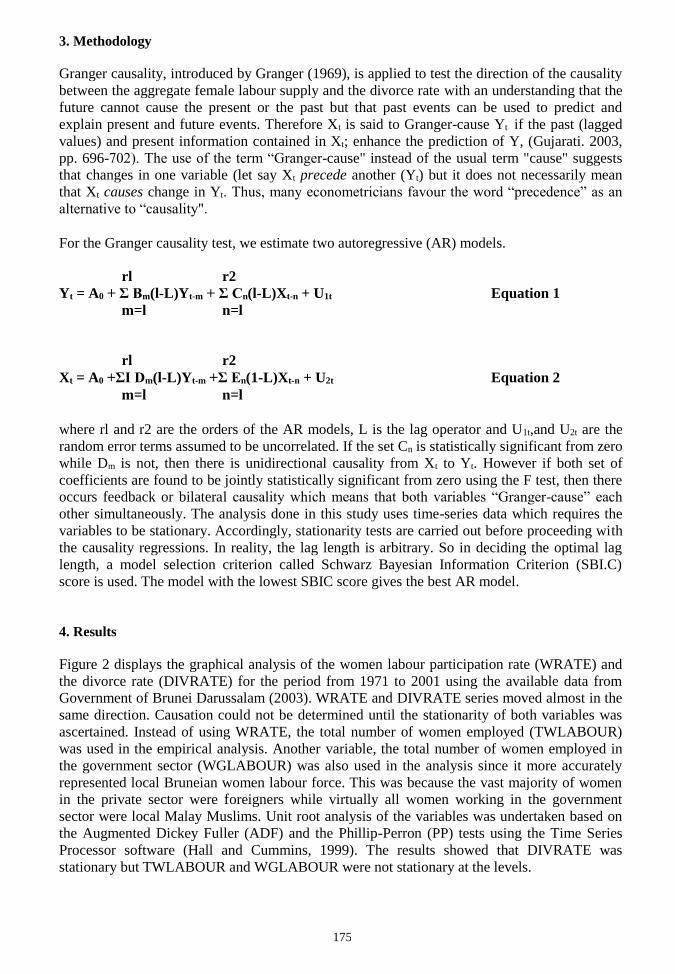
175
3. Methodology
Granger causality, introduced by Granger (1969), is applied to test the direction of the causality
between the aggregate female labour supply and the divorce rate with an understanding that the
future cannot cause the present or the past but that past events can be used to predict and
explain present and future events. Therefore Xt is said to Granger-cause Yt if the past (lagged
values) and present information contained in Xt; enhance the prediction of Y, (Gujarati. 2003,
pp. 696-702). The use of the term “Granger-cause" instead of the usual term "cause" suggests
that changes in one variable (let say Xt precede another (Yt) but it does not necessarily mean
that Xt causes change in Yt. Thus, many econometricians favour the word “precedence” as an
alternative to “causality".
For the Granger causality test, we estimate two autoregressive (AR) models.
rl r2
Yt = A0 + Ʃ Bm(l-L)Yt-m + Ʃ Cn(l-L)Xt-n + U1t Equation 1
m=l n=l
rl r2
Xt = A0 +ƩI Dm(l-L)Yt-m +Ʃ En(1-L)Xt-n + U2t Equation 2
m=l n=l
where rl and r2 are the orders of the AR models, L is the lag operator and U1t,and U2t are the
random error terms assumed to be uncorrelated. If the set Cn is statistically significant from zero
while Dm is not, then there is unidirectional causality from Xt to Yt. However if both set of
coefficients are found to be jointly statistically significant from zero using the F test, then there
occurs feedback or bilateral causality which means that both variables “Granger-cause” each
other simultaneously. The analysis done in this study uses time-series data which requires the
variables to be stationary. Accordingly, stationarity tests are carried out before proceeding with
the causality regressions. In reality, the lag length is arbitrary. So in deciding the optimal lag
length, a model selection criterion called Schwarz Bayesian Information Criterion (SBI.C)
score is used. The model with the lowest SBIC score gives the best AR model.
4. Results
Figure 2 displays the graphical analysis of the women labour participation rate (WRATE) and
the divorce rate (DIVRATE) for the period from 1971 to 2001 using the available data from
Government of Brunei Darussalam (2003). WRATE and DIVRATE series moved almost in the
same direction. Causation could not be determined until the stationarity of both variables was
ascertained. Instead of using WRATE, the total number of women employed (TWLABOUR)
was used in the empirical analysis. Another variable, the total number of women employed in
the government sector (WGLABOUR) was also used in the analysis since it more accurately
represented local Bruneian women labour force. This was because the vast majority of women
in the private sector were foreigners while virtually all women working in the government
sector were local Malay Muslims. Unit root analysis of the variables was undertaken based on
the Augmented Dickey Fuller (ADF) and the Phillip-Perron (PP) tests using the Time Series
Processor software (Hall and Cummins, 1999). The results showed that DIVRATE was
stationary but TWLABOUR and WGLABOUR were not stationary at the levels.
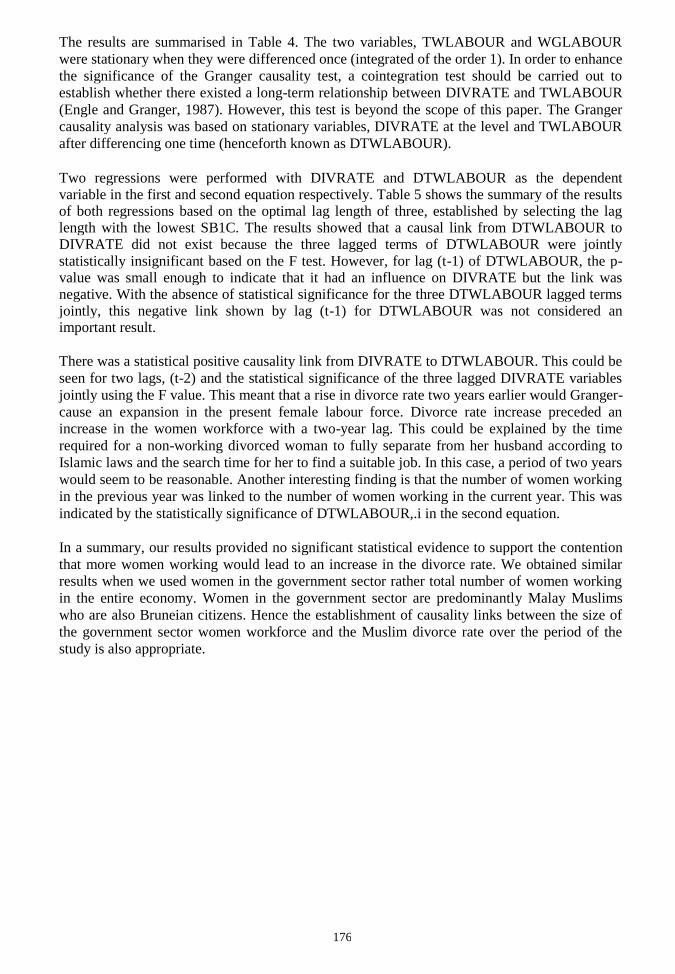
176
The results are summarised in Table 4. The two variables, TWLABOUR and WGLABOUR
were stationary when they were differenced once (integrated of the order 1). In order to enhance
the significance of the Granger causality test, a cointegration test should be carried out to
establish whether there existed a long-term relationship between DIVRATE and TWLABOUR
(Engle and Granger, 1987). However, this test is beyond the scope of this paper. The Granger
causality analysis was based on stationary variables, DIVRATE at the level and TWLABOUR
after differencing one time (henceforth known as DTWLABOUR).
Two regressions were performed with DIVRATE and DTWLABOUR as the dependent variable in the first and second equation respectively. Table 5 shows the summary of the results of both regressions based on the optimal lag length of three, established by selecting the lag length with the lowest SB1C. The results showed that a causal link from DTWLABOUR to DIVRATE did not exist because the three lagged terms of DTWLABOUR were jointly
statistically insignificant based on the F test. However, for lag (t-1) of DTWLABOUR, the p- value was small enough to indicate that it had an influence on DIVRATE but the link was negative. With the absence of statistical significance for the three DTWLABOUR lagged terms jointly, this negative link shown by lag (t-1) for DTWLABOUR was not considered an important result.
There was a statistical positive causality link from DIVRATE to DTWLABOUR. This could be
seen for two lags, (t-2) and the statistical significance of the three lagged DIVRATE variables
jointly using the F value. This meant that a rise in divorce rate two years earlier would Granger-
cause an expansion in the present female labour force. Divorce rate increase preceded an
increase in the women workforce with a two-year lag. This could be explained by the time
required for a non-working divorced woman to fully separate from her husband according to
Islamic laws and the search time for her to find a suitable job. In this case, a period of two years
would seem to be reasonable. Another interesting finding is that the number of women working
in the previous year was linked to the number of women working in the current year. This was
indicated by the statistically significance of DTWLABOUR,.i in the second equation.
In a summary, our results provided no significant statistical evidence to support the contention
that more women working would lead to an increase in the divorce rate. We obtained similar
results when we used women in the government sector rather total number of women working
in the entire economy. Women in the government sector are predominantly Malay Muslims
who are also Bruneian citizens. Hence the establishment of causality links between the size of
the government sector women workforce and the Muslim divorce rate over the period of the
study is also appropriate.
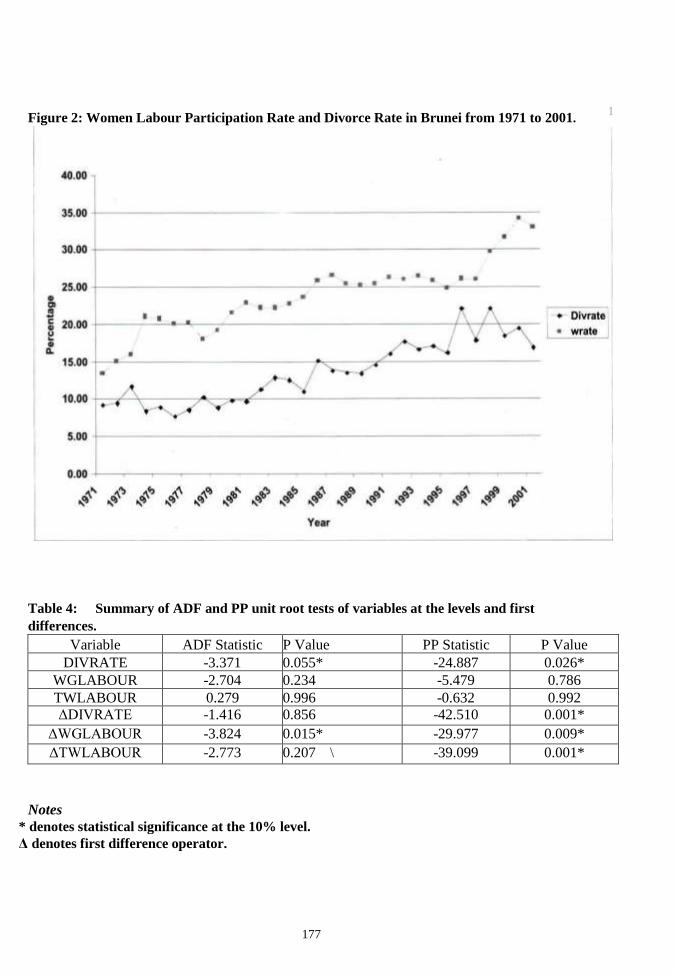
1
177
Notes
* denotes statistical significance at the 10% level.
Δ denotes first difference operator.
Figure 2: Women Labour Participation Rate and Divorce Rate in Brunei from 1971 to 2001.
Table 4: Summary of ADF and PP unit root tests of variables at the levels and first
differences.
Variable ADF Statistic P Value PP Statistic P Value
DIVRATE -3.371 0.055* -24.887 0.026*
WGLABOUR -2.704 0.234 -5.479 0.786
TWLABOUR 0.279 0.996 -0.632 0.992
ΔDIVRATE -1.416 0.856 -42.510 0.001*
ΔWGLABOUR -3.824 0.015* -29.977 0.009*
ΔTWLABOUR -2.773 0.207 \ -39.099 0.001*
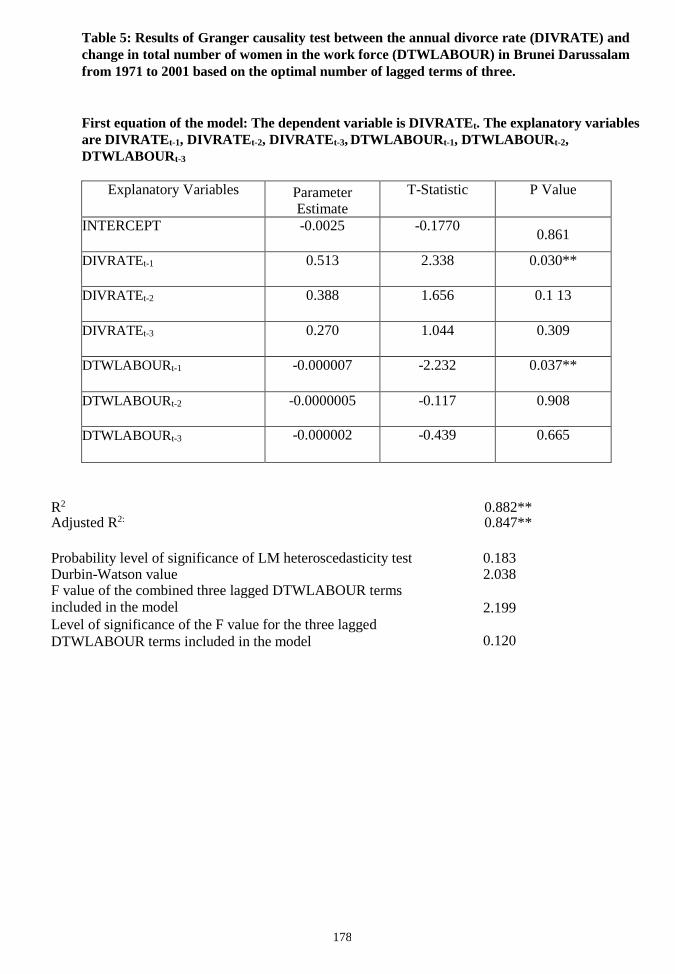
178
Table 5: Results of Granger causality test between the annual divorce rate (DIVRATE) and
change in total number of women in the work force (DTWLABOUR) in Brunei Darussalam
from 1971 to 2001 based on the optimal number of lagged terms of three.
First equation of the model: The dependent variable is DIVRATEt. The explanatory variables
are DIVRATEt-1, DIVRATEt-2, DIVRATEt-3, DTWLABOURt-1, DTWLABOURt-2,
DTWLABOURt-3
Explanatory Variables Parameter Estimate
T-Statistic P Value
INTERCEPT -0.0025 -0.1770 0.861
DIVRATEt-1 0.513 2.338 0.030**
DIVRATEt-2 0.388 1.656 0.1 13
DIVRATEt-3 0.270 1.044 0.309
DTWLABOURt-1 -0.000007 -2.232 0.037**
DTWLABOURt-2 -0.0000005 -0.117 0.908
DTWLABOURt-3
-0.000002 -0.439 0.665
R2 0.882** Adjusted R2: 0.847**
Probability level of significance of LM heteroscedasticity test 0.183 Durbin-Watson value 2.038 F value of the combined three lagged DTWLABOUR terms included in the model 2.199
Level of significance of the F value for the three lagged
DTWLABOUR terms included in the model 0.120
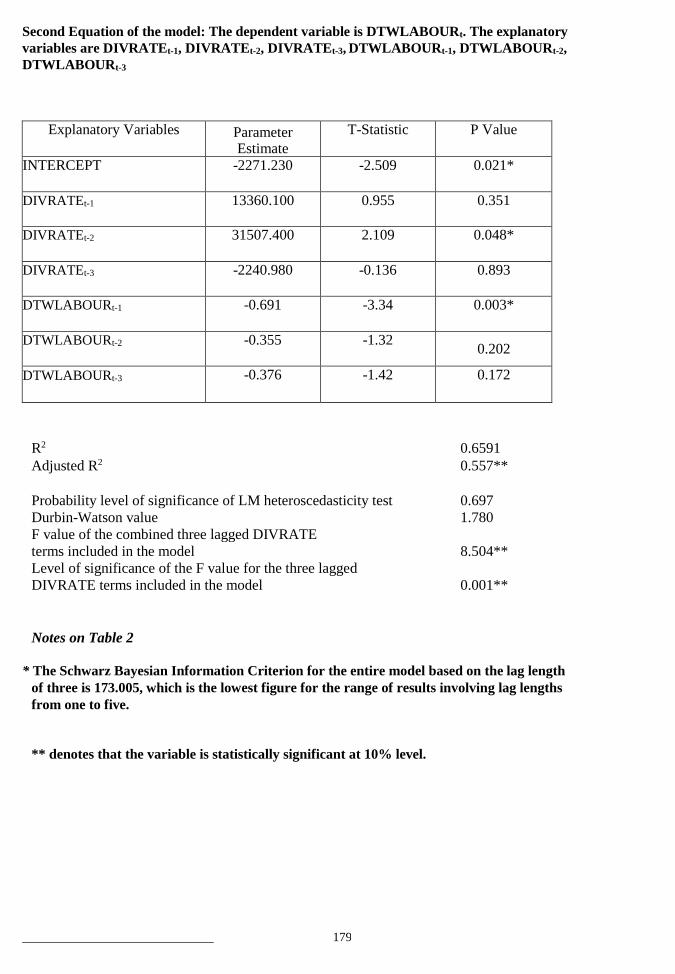
179
J
Second Equation of the model: The dependent variable is DTWLABOURt. The explanatory
variables are DIVRATEt-1, DIVRATEt-2, DIVRATEt-3, DTWLABOURt-1, DTWLABOURt-2,
DTWLABOURt-3
R2 0.6591
Adjusted R2 0.557**
Probability level of significance of LM heteroscedasticity test 0.697
Durbin-Watson value 1.780
F value of the combined three lagged DIVRATE
terms included in the model 8.504**
Level of significance of the F value for the three lagged
DIVRATE terms included in the model 0.001**
Notes on Table 2
* The Schwarz Bayesian Information Criterion for the entire model based on the lag length
of three is 173.005, which is the lowest figure for the range of results involving lag lengths
from one to five.
** denotes that the variable is statistically significant at 10% level.
Explanatory Variables Parameter Estimate
T-Statistic P Value
INTERCEPT -2271.230 -2.509 0.021*
DIVRATEt-1 13360.100 0.955 0.351
DIVRATEt-2 31507.400 2.109 0.048*
DIVRATEt-3 -2240.980 -0.136 0.893
DTWLABOURt-1 -0.691 -3.34 0.003*
DTWLABOURt-2 -0.355 -1.32 0.202
DTWLABOURt-3
-0.376 -1.42 0.172
180
5. Conclusions
An investigation of causality links between female labour participation and the Muslim
divorce rate revealed that there was a positive relationship between these two variables
whereby the divorce rate Granger-caused increased women labour supply. If there was
an increase in the annual divorce rate two years earlier, then the current year’s female
labour force would experience an increase as well. However we found no evidence to
suggest that increased number of women in the workforce led to increased divorce rate.
Thus women participating in formal labour markets in Brunei appeared not to be a
problem in terms of a link to an increase in the divorce rate. This result is in direct
contrast to that established by Van der Klaauw (1996) for the United States.
An implication of our study suggests that more non-working women enter the job market
after divorce possibly to support themselves and their children. The role of the
government rests on ensuring that the welfare of divorced women and their children is
not neglected. The government needs to provide subsidised childcare facilities to enable
mothers to work if they choose. Flexible work arrangements may also need to be
introduced in the workplace, possibly starting with the government sector, to make it
easier for working mothers to combine work in formal markets with home-related jobs.
The government can also provide training programmes to single non-working mothers so
that they can find jobs if they choose. It may also need to institute a child allowance
scheme whereby mothers are paid a certain monthly allowance per child if they stayed at
home to take care of their children. This will reduce the need of divorced women to work
and help them to maintain their children properly. Finally, since women labour force
participation appears not to be a major factor influencing the divorce rate, a further study
is needed to identify the economic and social factors influencing divorce rate in Brunei.
Acknowledgments
We thank Assistant Registrar of the Faculty of Business, Economics and Public Policy,
Universiti Brunei Darussalam, Dayang Maikassum binte Awang Tinggal for facilitating
the process of data collection for this study. We also thank the Department of Economic
Planning and Development, Bandar Seri Begawan for providing us with published and
unpublished data for this study.
References
Ali, A.Y. (1989). The Holy Qur’an-Text, Translation and Commentary, Beltsville,
Maryland: Amana Publications, 1754 pp.
Ali, A.Y. (1996). The Meaning of the Holy Koran, Beltsville, Maryland: Amana
Publications, 1759 pp. ,
Alli, H.H. (2002). Penceraian: Kes Kajian di Daerah Temburong, Latihan llmiah,
Akademi Pengajian Brunei, Universiti Brunei Darussalam.
Becker, G.S. (1964). Human Capital: A Theoretical and Empirical Analysis with Special
Reference to Education, New York: National Bureau of Economic Research.
Becker, G.S. (1973) “Theory of Marriage, Part I”, Journal of Political Economy, 81(4),
81346.
Becker, G.S. (1974) “Theory of Marriage, Part II”, Journal of Political Economy, 82(2):
SI 1- S26.
181
Becker, G.S., E.M. Landes, and R.T. Michael (1977) “An Economic Analysis of Marital
Instability”, Journal of Political Economy, 85(6), 1141-87.
Doi, A.R.I. (2002). Marriage in Islam, Ahmadu Bello University, Zaria, Nigeria: Muslim
Marriage Consultants, also at http://www.muslimmarriage consultants.com Engle, R. F.
and C.W.J. Granger (1987). “Cointegration and error-correction: representation,
estimation and testing", Econometrica, 55, 251-276.
Floffman, S.D. and G.J. Duncan (1995). “The Effect of Incomes, Wages, and AFDC
Benefits on Marital Disruption”, The Journal of Human Resources, 30(1), 20-41
Government of Brunei Darussalam (1973). Report on the Census of Population 1971.
Bandar Seri Begawan: Department of Economic Planning and Development.
Government of Brunei Darussalam (1983). Summary Tables of the Brunei Population
Census 1981, Bandar Seri Begawan: Department of Economic Planning and
Development.
Government of Brunei Darussalam (2001). Brunei Darussalam: Eight National Development
Plan 2001-2005, Bandar Seri Begawan: Department of Economic Planning and Development,
228 pp.
Government of Brunei Darussalam (2002) Brunei Statistical Yearbook 2000-2001, Bandar Seri
Begawan: Department of Economic Planning and Development.
Government of Brunei Darussalam (2002). Preliminary Report: The Population and
Housing Census Brunei Darussalam 2001, Bandar Seri Begawan: Department of
Statistics, Department of Economic Planning and Development.
Government of Brunei Darussalam (2003). Brunei Statistical Yearbook 2002, Bandar Seri
Begawan: Department of Economic Planning and Development.
Granger, C. (1969). “Investigating Causal Relations by Econometric Models and Cross-
Spectral Methods”, Econometrica, 37: 424-438.
Grossbard-Shechtman, S. and S. Neuman (1988). “Women’s Labor Supply and Marital
Choice”, Journal of Political Economy, 96(6), 1294-1302.
Grossbard-Shechtman, S. and S. Neuman (1998). “The Extra Burden of Moslem Wives:
Clues from Israeli Women’s Labor Supply”, Economic Development and Cultural
Change, 46(3), 491-515.
Gujarati, N. (2003). Basic Econometrics, Fourth Edition, London: McGraw-Hill, 1002 pp.
Hall, B.H. and C. Cummins (2001). Time Series Processor Version 4.5 Reference
Manual, Palo Alto, California: TSP International.
Haurin, D. R. (1989). “Women’s Labor Market Reactions to Family Disruptions”, Review
of Economics and Statistics, 71, 54-61
Hoffman, S.D. and G.J. Duncan (1995). “The Effect of Incomes, Wages, and AFDC
Benefits on Marital Disruption”, Journal of Human Resources, XXX (1), 20-41.
Hughes, T.P. (1994) Dictionary of Islam, Chicago: Kazi Publications, 750 pp.
Johnson, W.R. and J. Skinner (1986). “Labor Supply and Marital Separation”, American
Economic Review, 76(3), 455-469.
Jones, G.W. (1994). Marriage and Divorce in Islamic South-East Asia, Kuala Lumpur: Oxford
University Press, 348 pp.
Kassim, H.M. (2002). Economic Analysis of Marriage and Female Labour Supply in Brunei
Darussalam: A Case Study of Urban Women in Brunei-Muara District, Bachelor of Arts
(Economics) Thesis, Department of Economics, Universiti Brunei Darussalam, Bandar Seri
Begawan, 128 pp. (unpublished).
Lin, N. (2001). Social Capital: A Theory of Social Structure and Action, Cambridge:
Cambridge University Press, 278 pp.
182
Loughran, D.S. (2002) “The Effect of Male Wage Inequality on Female Age at First
Marriage”, Review of Economics and Statistics, 84(2), 237-250.
Maricar, H.M.A (1997). Female Labour Participation and Development in Brunei
Darussalam. Paper presented at the International Conference on Women in the Asia-Pacific
Region: Persons, Powers and Politics, Singapore 11-13 August 1997.
Miftahi, Z. (1997). Modesty and Chastity in Islam, Kuala Lumpur: S. Abdul Majeed & Co.,
271 pp.
Mincer, J. (1993). Studies in Labor Supply-Collected Essays of Jacob Mincer, Volume 2,
Hants: Edward Elgar, 330 pp.
Othman, H.F. (1993). Woman, Islam and Nation Building, Kuala Lumpur: Berita
Publishing, 203 pp.
Putnam, R.D. (1995). “Bowling Alone: America’s Declining Social Capital”, Journal of
Democracy, 6(1): 65-78.
Stanlake, G. F. and S.J. Grant (1995). Introductory Economics, Sixth edition, Essex:
Longman, 554 pp.
United Nations Development Programme (UNDP) (2003). Human Development Index,
New York: UNDP.
Van der Klaauw, W. (1996) “Female Labour Supply and Marital Status Decisions: A Life
Cycle Model”, Review of Economic Studies, 63, 199-235.
Wilson, W.J. (1987). The Truly Disadvantaged, Chicago: University of Chicago Press.
183
CHAPTER 12
A STUDY OF SOME SPECIFIC SOCIO-
ECONOMIC PROBLEMS OF LOW-INCOME
IMMIGRANT WORKERS IN BRUNEI
DARUSSALAM
JOHN O. ODIHI
Abstract
Brunei Darussalam has many immigrant workers from many parts of the world. These workers
are present in both public and private sectors of the country’s economy performing skilled,
semi-skilled and unskilled jobs. The source region of the skilled immigrant worker in Brunei
may truly be described as global because expatriates from all six continents (Africa, Asia,
Australasia, Europe, North America and South America) can be found here. However, most of
the workers performing semi-skilled and unskilled jobs are usually from the Association of
Southeast Asian Nations (ASEAN) and South Asia especially the Indian subcontinent (India,
Pakistan, Bangladesh and Sri Lanka). While all immigrants may rightly feel some sense of loss
or degree of alienation because of their severance from home and relatives, and familiar
environment, certain groups of low-income workers in Brunei experience some problems,
which are particular to them. Such problems relate mostly to contractual arrangements prior
to coming to Brunei, their expectations and the burden of responsibility, which these workers
bear. The analysis of the socio-economic problems used in this study is based on a
combination of survey and field research including focus group studies and information
provided by key informants. Some policy interventions and their rigorous enforcement, both in
Brunei and in the countries of origin may be needed to ameliorate the problems of low-income
immigrant workers in this country.
1. Introduction
Immigrants have always experienced degrees of problems in host countries throughout the
history of human migration. Such problems were more serious in the past than they are now. A
number of reasons are responsible for the status quo. For one thing, most of the present
transborder migrations are a response to organised pull factors with arrangements made for the
comfort of the immigrant upon arrival in the host country. In the past this was not likely
because people voted with their feet in response to the push factors of origin (home countries
of the immigrants) without the necessary definite call or beckoning from the destination. In the
speculation-driven migration of the past, immigrants arrived in destinations uninvited and
without jobs, and had to fend for themselves in unfamiliar environments. Today, excepting
cases of forced migrations such as refugees fleeing conflict areas or illegal immigrants, most
immigrants arrive at their destinations with someone or organisation waiting to welcome them
and take them to an accommodation or duty post. Also, there are now international laws,
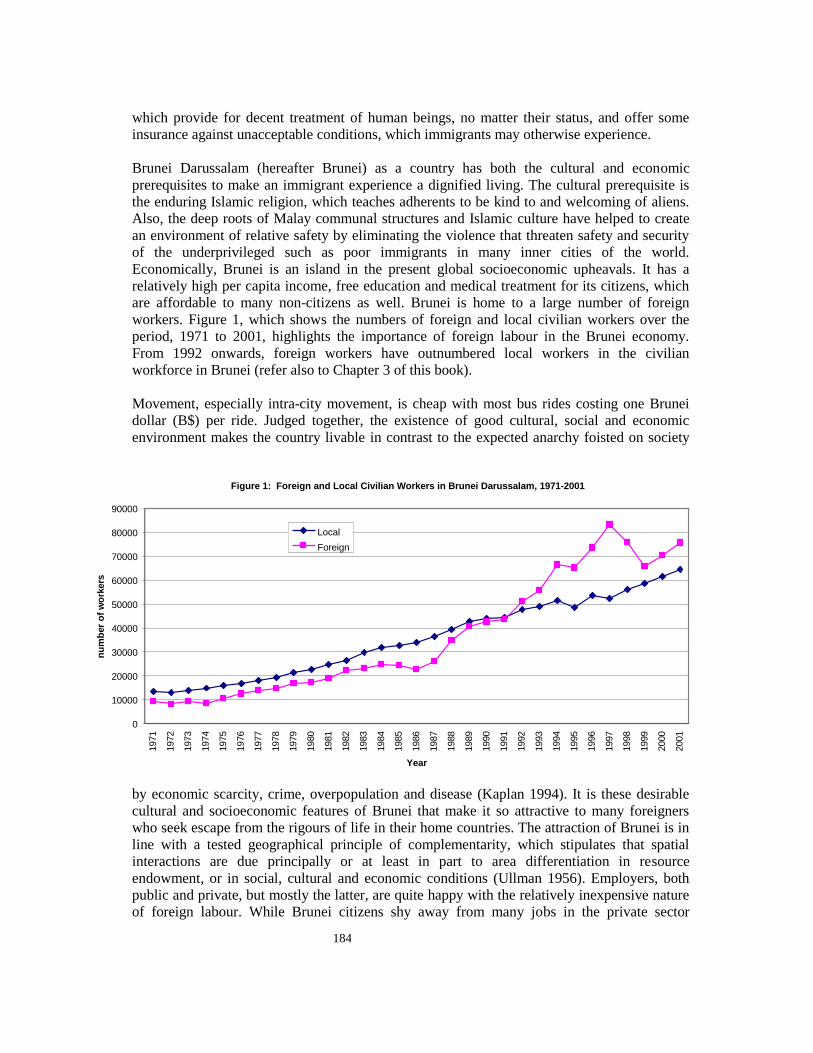
184
which provide for decent treatment of human beings, no matter their status, and offer some
insurance against unacceptable conditions, which immigrants may otherwise experience.
Brunei Darussalam (hereafter Brunei) as a country has both the cultural and economic
prerequisites to make an immigrant experience a dignified living. The cultural prerequisite is
the enduring Islamic religion, which teaches adherents to be kind to and welcoming of aliens.
Also, the deep roots of Malay communal structures and Islamic culture have helped to create
an environment of relative safety by eliminating the violence that threaten safety and security
of the underprivileged such as poor immigrants in many inner cities of the world.
Economically, Brunei is an island in the present global socioeconomic upheavals. It has a
relatively high per capita income, free education and medical treatment for its citizens, which
are affordable to many non-citizens as well. Brunei is home to a large number of foreign
workers. Figure 1, which shows the numbers of foreign and local civilian workers over the
period, 1971 to 2001, highlights the importance of foreign labour in the Brunei economy.
From 1992 onwards, foreign workers have outnumbered local workers in the civilian
workforce in Brunei (refer also to Chapter 3 of this book).
Movement, especially intra-city movement, is cheap with most bus rides costing one Brunei
dollar (B$) per ride. Judged together, the existence of good cultural, social and economic
environment makes the country livable in contrast to the expected anarchy foisted on society
by economic scarcity, crime, overpopulation and disease (Kaplan 1994). It is these desirable
cultural and socioeconomic features of Brunei that make it so attractive to many foreigners
who seek escape from the rigours of life in their home countries. The attraction of Brunei is in
line with a tested geographical principle of complementarity, which stipulates that spatial
interactions are due principally or at least in part to area differentiation in resource
endowment, or in social, cultural and economic conditions (Ullman 1956). Employers, both
public and private, but mostly the latter, are quite happy with the relatively inexpensive nature
of foreign labour. While Brunei citizens shy away from many jobs in the private sector
Figure 1: Foreign and Local Civilian Workers in Brunei Darussalam, 1971-2001
0
10000
20000
30000
40000
50000
60000
70000
80000
90000
1971
1972
1973
1974
1975
1976
1977
1978
1979
1980
1981
1982
1983
1984
1985
1986
1987
1988
1989
1990
1991
1992
1993
1994
1995
1996
1997
1998
1999
2000
2001
Year
nu
mb
er
of
wo
rkers
Local
Foreign
185
because they are considered demeaning to them or to be lacking in long-term built-in securities
such as generous pensions, workers from other countries are happy to accept them.
While it has the potential and actually meets the needs of its citizens and many immigrants,
life in Brunei is not always the oasis that low-income immigrants from other countries seek.
Many of them experience a number of social problems, which result from a mix of their
economic realities in Brunei. Also, actions of hiring agents in the home country of immigrants,
sometimes relatives, and contracts signed prior to coming to Brunei appear to be strongly
related to the dimension of the problems that immigrants experience in Brunei. This paper
deals with socio-economic problems of such low-income immigrant workers in the country.
Data and information used in this paper came principally from the author’s study of haze
pollution related problems of male outdoor workers in Brunei which were gathered from
surveys and field research. The next section of the paper provides the background to the paper
followed by another section that profiles the low-income immigrant worker. Subsequent
sections of the paper then provide a typology as well as explanation of the socio-economic
problems.
2. Background to the Paper
It is proper at this juncture to provide the reader with the background to this paper. The attempt
here is to highlight the studies or research activities that provided data and information for the
present paper and to give the reader some background information on the delineation of “low
income” status, which forms an important concept in the paper. A number of studies formed
the source of information for the paper. The first study was on the impacts of haze-related air
pollution episodes of 1997 and 1998 in Brunei. One aspect of this two-part impact study had
the objective of understanding, in a general way, the impact of the polluted air in the country
(Odihi 1999, Odihi 2001). The second aspect of the haze impact study was more specific and
was actually an attempt to understand more fully the results of the first part of the study,
namely, the differential impacts of haze episodes on segments of the Brunei population. For
instance, results of the first surveys indicated that children under five years, old people (over
60 years) and outdoor construction workers manifested higher than normal adverse haze health
impacts. A study that focused on outdoor construction workers was done to understand why
there was a relatively higher incidence of haze-induced adverse health conditions among this
group of workers.
The third study was related to the last one. The survey of outdoor construction workers showed
that this group of low-income immigrant workers lived in compromised environments and
were victims of adverse contractual arrangements made in their country to enable them to
come and work in Brunei. Several questions cropped up in my mind. Did such contractual
arrangements involve only this group of workers or other groups from the same country as
well? Was the type of the contractual arrangements that victimised low-income workers in
Brunei particular to the countries of the people that were studied initially or did they also exist
in other countries? A related question was, what variants of the contractual arrangements
might exist, where and what effects did they have on different groups of low-income workers
in Brunei?
186
3. Methods and Procedures Used for the Study
The methods employed in the studies differed from study to study. While the general haze-
induced impact study employed household surveys and hospital records obtained from the
Statistical Section, Ministry of Health, Brunei Darussalam, the outdoor construction workers’
study used a potpourri of methods that included questionnaire administration, interviews and
focused group discussions among others. The third survey, which mostly involved indoor low-
income workers, used interviews, focus group discussions and interviews and discussions with
key informants. The key informants were workers who were very knowledgeable about other
workers and their environments because of their relations or roles in the workplace or social
circles. Their involvement in the study was not a one-off event but lasted over a period of
several months. They were charged with reporting problems encountered by low-income
immigrants at their workplace or concerning their contracts with agents at home.
3.1. Delineating Low Income
Central to the issue of low-income status is the basis for the delineation of income into classes
one of which is “low income”. The delineation or the formulation of such a benchmark is not
only difficult to define but can cause confusion. It must be said that a dollar value may not be
sufficient to delineate the line between low and middle or higher incomes because of the
different socioeconomic realities of different groups of people in a particular geographical
area. For example, an income of B$200 per month may be considered low or high relative to
the earner’s needs. For a worker living with his or her family and being maintained by parents
or guardians, any amount earned is an economic extra or an enhancement of the earner’s
purchasing power. A worker who earns a multiple of that income on the other hand, who will
not ordinarily be regarded as low-income worker, could fare much worse than the worker
earning B$200 per month could. This may be so if the latter has to use all the monthly income
to pay various kinds of bills including loan repayments. These examples indicate that income
alone may not appropriately define financial security or insecurity as income requires some
context to become suitable for such delineation or classification. Using income alone has led to
some misconception as the following observation shows:
When the size of income is thought to indicate social
perfection, as it does in the economic model of
society, one is inclined to interpret any other society
which does not follow that model as “low income.”
This way the perception of poverty on a global scale
was nothing more than the result of a statistical
operation…(Sachs 1995:75)
The concept of low income used in this paper is therefore not loaded with the usual socio-
economic meanings that it is associated with. The justification for it is that both employers and
employees tend to agree that B$500 or less per month is low income. In terms of public sector
employment in Brunei, the immigrant employee above the B$500 per month salary in most
cases qualifies for government housing while those below do not. The income range of many
respondents, whose information was used in this paper, was B$150 to B$500/month with an
average of about B$350 per month. The profile of the low-income worker in Brunei is
presented in the next section.
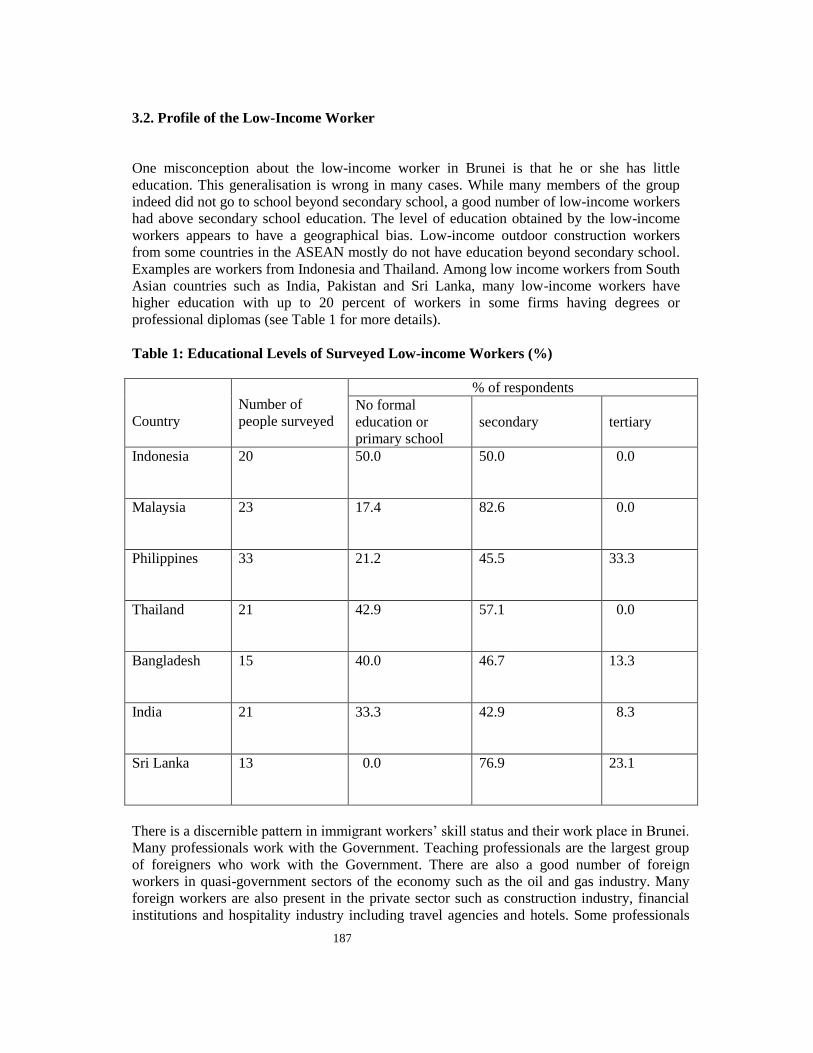
187
3.2. Profile of the Low-Income Worker
One misconception about the low-income worker in Brunei is that he or she has little
education. This generalisation is wrong in many cases. While many members of the group
indeed did not go to school beyond secondary school, a good number of low-income workers
had above secondary school education. The level of education obtained by the low-income
workers appears to have a geographical bias. Low-income outdoor construction workers
from some countries in the ASEAN mostly do not have education beyond secondary school.
Examples are workers from Indonesia and Thailand. Among low income workers from South
Asian countries such as India, Pakistan and Sri Lanka, many low-income workers have
higher education with up to 20 percent of workers in some firms having degrees or
professional diplomas (see Table 1 for more details).
Table 1: Educational Levels of Surveyed Low-income Workers (%)
Country
Number of
people surveyed
% of respondents
No formal
education or
primary school
secondary
tertiary
Indonesia 20 50.0 50.0 0.0
Malaysia 23 17.4 82.6 0.0
Philippines 33 21.2 45.5 33.3
Thailand 21 42.9 57.1 0.0
Bangladesh 15 40.0 46.7 13.3
India 21 33.3 42.9 8.3
Sri Lanka 13 0.0 76.9 23.1
There is a discernible pattern in immigrant workers’ skill status and their work place in Brunei.
Many professionals work with the Government. Teaching professionals are the largest group
of foreigners who work with the Government. There are also a good number of foreign
workers in quasi-government sectors of the economy such as the oil and gas industry. Many
foreign workers are also present in the private sector such as construction industry, financial
institutions and hospitality industry including travel agencies and hotels. Some professionals
188
such as medical doctors, engineers and information communication technologists have
established their own businesses and serve as employers of local as well as foreign labour.
There are many non-professional or non-high skilled immigrant workers in various areas of the
private sector. Areas of the Brunei private sector economy with significant to dominant
proportions of immigrant workers include construction work, hospitality industry (restaurants
and hotels) and automobile repairs and related services. The workers manifest some
discernible gender, work type as well as nationality patterns. Female low-income immigrants
usually work as domestic helps (amahs), salespersons and receptionists in (departmental)
stores, and as waitresses in restaurants. Male workers dominate construction, the automobile
repair and related industries. Maids form the majority of domestic group of workers. Some
local middle class and upper class households have drivers as house helpers. Automobile
mechanics are mostly from Malaysia, Thailand and the Philippines. Filipinos and Indians
dominate electrical repairs and electronic sectors. Actually the available data show that there
are more foreign workers than local workers in the country. The present trend, where foreign
workers outnumber their local counterparts, has been in existence since 1992 (see Figure 1).
Reports of discovery and apprehension of illegal foreign workers by authorities are rather
frequent in the mass media in Brunei are a further pointer to the preponderance of foreign
workers in the country.
3.3. Socio-economic Problems of Immigrant Workers
Apart from gender, work type and nationality immigrant workers in Brunei differ in many
other aspects including, among other things, socio-economic status and its dependent social
networks. Given the varied backgrounds of immigrant workers in Brunei, it is expected that
the problems they face will vary in some aspects. In many cases, the socioeconomic status
determines the type of problems immigrants have as such status places each person into either
relatively privileged or under-privileged groups. The relatively high status immigrant workers
(i.e. middle class) by and large control much of their life, live and share in the abundance of
wealth in Brunei because they have effective access to a wide range of goods and services,
more or less, like the citizens of Brunei.
Low status, less privileged immigrant workers have a more tightly controlled life. Their access
to goods and services is much more limited because they lack both the social and financial
resources to enjoy an affluent lifestyle in this country. Apart from the usual nostalgic feeling,
which is common to people who are outside the places they call home or far away from their
family or other beloved ones, middle class immigrants in Brunei do not have major social
problems. Nostalgia was a temporary problem for some middle class families in 1998 after
they sent their families home or to “safety” from the haze-polluted environment of Southeast
Asia during the first half of that year. The relatively insignificant problems of the middle class
immigrant in the country as opposed to the myriad problems of the low-income immigrant are
not surprising. It is indeed as Raanan Weitz observes, “While humanity shares one planet, it is
a planet on which there are two worlds, the world of the rich and the world of the poor”
(Todaro 2000: 3). What is true at the global level is also often true at the local level. The rest
of this paper will focus on the problems of the poor (low income) immigrants. The focus will
be on problems associated with hiring practices in home countries, gender and place of work.
189
3.3.1. Hiring Problems
Hiring practices and policies of agents that recruit low-income workers to Brunei are an
important part of low-income immigrant workers’ problem. The problem exists somewhat in
Brunei but the biggest and enduring part of it exists in the home country of the worker. I will
briefly review the lesser (Brunei) component of the problem. Many low-income immigrant
workers in Brunei were approached and invited by a local (employment) agent. These low-
income immigrant workers need the local agents to come to the country because the agents act
as job scouts for the prospective employee. Most of the low-income jobs are not advertised in
international or local mass media. Even if jobs are advertised, many of these prospective
employees do not have effective access to the media information because they do not buy
newspapers or subscribe to magazines where international jobs are advertised. When a
prospective employer indicates interest to hire a foreign worker, the local agent activates the
international job network and asks for a candidate that fits the needs of the employer in Brunei.
Although the employer pays the agent for his or her services, the employee usually enters into
another contractual relationship with the agent in addition to the formal contract with the
ultimate employer. A typical example is that the employee upon starting a job in Brunei would
pay the agent a certain amount. Usually, that amount is a multiple of the monthly salary. The
problem is not only with the amount of money paid to the agent, but also the time it is paid. In
many cases, especially with amahs, the payment period is the first three months of working.
The problems associated with this type of arrangement are explored below.
The important problems associated with the contractual relationship between the low- income
immigrant worker and the Brunei hiring agent include lack of financial security, unfulfilled
obligations, and feeling of entrapment. Whether the worker gives all or a part of the salary
earned in the first few months to the hiring agent, he or she experiences some financial
insecurity. The amahs who took part in this study claimed that they felt like slaves because
they could not “earn” money during the period. Related to the insecurity problem is the fact
that the first three months of the average low-income immigrant worker is regarded as a
“probation” period. Unless their employers are satisfied with their services, the employees may
lose their jobs. Many of the workers dread losing their jobs because they would become
heavily indebted as a result of borrowing in their home country in the process of coming to
take up employment in Brunei. It is interesting to know that amahs especially borrow money in
their home country to pay their own transport fares to come to Brunei even though the
prospective employer’s fees paid to the local agent usually include air fares for the amah from
her country of origin.
Job insecurity is the low-income immigrant worker’s problem par excellence. It is reported by
over 90 percent of those who took part in the study as the most important form of anxiety that
they had. Whether they were maids (amahs) working in the house or men working in the
construction industry or other sectors of the economy, they expressed a general feeling of job
insecurity. They recognised that the things that could cause workers to lose their jobs were
many and ever present. One important factor of job insecurity was the general economic
atmosphere in Southeast Asia during the study (1997 to 2000). At the regional level the 1997
economic meltdown that affected most Asian countries created mass unemployment in many
ASEAN countries. That was because “the sustained rapid growth in the developing economies
of East Asia” was arrested by “financial, economic and political disruption throughout the
region in the second half of 1997” (Garnaut 1998: 5). Concomitant with the economic crisis
was the haze-related pollution that affected health, environmental and economic systems in the
190
region (see Jim (1999) for Southeast Asian effects, Anaman (2001), Anaman and Looi (2000),
Anaman and Ibrahim (2003) and Odihi (2001, 2003) for effects on Brunei).
At the level of the workplace, which is the home for the amah, shop for salespersons,
restaurants for waitresses and construction site for construction workers, the threats have a
more personal or human face. It is the employer or the boss who frequently threatens the
worker. One problem, which this type of threats engenders, is the erosion of financial security
for the worker. For example, workers observed that they were frequently asked to accept lower
wages than hitherto agreed on if they wanted to keep their jobs. Others worked without pay for
many months because employers complained about bad business and threatened to sack
workers who insisted on being paid their wages. Non-payment of wages in Brunei places the
low-income immigrant worker in an awkward contractual position in their home country. It
forces them to default in their payments or support obligations risking some serious
consequences. As the wages of these workers are not high enough to make savings possible,
failure to receive salaries or wages is instantly synonymous with failure to give support to
relatives back home.
Another problem that results from the agent-worker contractual relationship is the guilt
workers bear as a result of their inability to meet nuclear and extended family obligations at
home. Generally, workers want to start supporting relatives at home immediately they come
here but they find that they cannot do so because of the contractual arrangements they have
entered with agents. Some workers (about 35 percent) reported experiencing family
relationship problems as a result. When promises of “instant” support are not kept, relatives in
the country of origin accuse workers of “forgetting” them or starting “illicit” relationships in
Brunei at the expense of those at home.
Another problem associated with agent-worker contractual arrangements or relationship is the
feeling of entrapment that it breeds for the worker. Over 50 percent of low income immigrant
workers interviewed said that they experienced this feeling at one time or another while about
20 percent said that they experienced it constantly. The feeling has its concomitant effects on
the worker. Those studied observed that it made them to work harder than necessary in order
to please their bosses because they did not want to lose their employment and be sent home.
Some workers, especially construction workers who worked as groups, felt compelled to
demonstrate their value and sometimes compete unnecessarily rather than cooperate with their
fellow workers to keep their jobs. Over 20 percent of those studied felt that employers used
this feeling to take advantage of them. The multiple nature of causes (excuses) for laying off or
dismissing workers from their jobs made people to work under conditions that they should not.
For example, some people concealed their ill health and continued to work in pain because
they feared dismissal from work.
An important problem facing many low-income immigrants relates to healthcare. Unlike the
high-income immigrant working in public or private sector who is entitled to free or relatively
free medical care, many low-income immigrants do not have such entitlements. This is in spite
of the fact that their objective existence predisposes them more to health problems than others
in the society. For example they are the ones involved in the three “D” jobs (i.e. jobs that are
dangerous, difficult, and dirty); they subsist on comparatively less nutritionally adequate diet;
and have little rest. Some groups such as amahs are by right entitled to medical care in their
contracts. However in our study we observed that sick amahs did not always get the medical
attention they needed because of the refusal of their employers.
191
They could also be accused of faking illness to escape their responsibility as amahs. Many
low-income immigrants especially waitresses, salespeople and construction workers do not
have arrangements that guarantee adequate access to medical care. Concealment of ill health is
a common practice among this group because of job and financial security implications of
sickness.
Some of the problems of this group of workers may be described as psychological. Feelings
associated with this problem include loneliness, alienation, failure or inadequacy. Although
members of both genders male and female studied admitted to having this problem, female
respondents admitted to experiencing more of the feelings and more frequently than their male
counterparts. The feelings became more when the worker was a married female and/or a
mother. Over 80 percent of married females or mothers who were separated from spouses or
children felt that they were being unfair to these relatives although they were contributing to
their upkeep through repatriations of money to their home country. They saw themselves
failing as a wife or mother by not being there with the husband and child(ren) left behind at
home.
Married female workers also entertained fears of their spouses seeking relationships with other
women in their absence. Asked why they thought that might be so, they frequently pointed to
what they saw among unaccompanied male spouses in Brunei. One respondent, a part-time
married cleaner who lived with her husband said, “I will never leave my husband for one day
because of what I see our girls doing here. They will snatch him from you.” Another said that
she found the reason why her husband really never bothered about their separation for 19 years
when the man took up appointment in Brunei and left her in their home country. When she was
employed as a maid and came to Brunei she found that her husband was living with another
woman.
The problem of mismatch between professional skills of some workers and the jobs they held
in Brunei was part of their psychological problem. The surveys for this study captured only a
few cases of skills and job mismatch (less than 10 in all). However those involved experienced
significant problems worth mentioning. One of them was a lady pharmacist from ASEAN who
was doing part-time cleaning jobs. Others included engineers, nurses and teachers from South
Asia and ASEAN working in a fabric industry or as domestic workers. They felt “bad”,
“angry” or “unfulfilled” that they had skills for higher contribution to society or skills that
could entitle them to “better jobs”, “higher salaries” or “more recognition” than the jobs they
were doing.
What made job-skill mismatch rather painful sometimes was the “attitude” of employers or
bosses that “look down” on them. Another painful aspect of skills-job mismatch, which
respondents observed was the difficulty of accepting the “gap” between their life
expectations/dreams as a result of their qualifications and their present objective reality of
destitution and its related insecurity. They are frustrated by their inability to convert or use
their skills to live the life of their dream or expectations.
If the feelings of those involved in this study are typical, and there is a strong reason to believe
they may well be, then low-income immigrant workers who have high professional skills but
are in low-income employment, experience low self-esteem (i.e. a sense of worth and self-
respect). The feeling or experience of this group of low-income immigrants may be better
understood in the light of Goulet’s observation:
192
The relevant point is that underdevelopment is the lot
of the majority of the world’s population. As long as
esteem or respect was dispensed on grounds other
than material achievement, it was possible to resign
oneself to poverty without feeling disdained.
Conversely, once the prevailing image of the better
life includes material welfare as one of its essential
ingredients it becomes difficult for the materially
“underdeveloped” to feel respected or esteemed
(Goulet 1971: 89)
We shall now turn to the consideration of problems that are more specific to certain groups of
low-income workers.
3.3.2. Problems of Maids (Amahs)
Results of this study indicate that housemaids have some problems that may be regarded as
more or less as specific to them. Probably one of the most important amah-specific problems is
the duration of their work. Although, each contract specifies the job for which the amah is
hired, amahs discover that their work often assumes a very general or all-inclusive nature once
they arrive in the household. For example, in the contract, they might be hired to look after a
baby or an infant in the house but would then assume responsibility for cooking, doing
laundry, grocery and general housecleaning for the household. Some amahs think that some
employers are too overbearing. The amahs interviewed cited daily washing of cars (more than
five cars in some cases).
3.3.3. Financial Insecurity and Insolvency
The amahs had one of the highest cases of financial insecurity and insolvency among the low-
income immigrant groups. This situation arises from frequent failure of employers to pay their
monthly salaries. Some amahs could be owed salaries of up to six or more months
consecutively. This situation of financial insecurity causes other problems for amahs. It makes
them to default in their financial obligations to people at home. The “failure” and/or the “guilt”
this group of amahs have can be understood because it is for the love of family that they left
home and people to come to the shores of Brunei. Being here without the ability to support
people at home, and the obstacle, which absence from home places in their path of fulfilling
nuclear and extended family obligations, make them to feel guilty or have a sense of failure.
Not only do amahs generally work long hours (early morning, say 5:50 a.m. to about 9:00 p.m.
in the night), some amahs have contracts that do not entitle them to have a work-free day in the
course of the week. It must be said however that many amahs have at least one work-free day
in a week. Odihi’s (2003) poem dedicated to the amah appears to capture the contribution of
this group of workers well.
193
AMAH
Lady of the morning
Timely like the clock
You wake up early
And retire to bed late
How you work tireless like the heart
Should you stop working
Life will go foul for them
That feed from your sweat
Amah you are mother
In another name
How grateful we are to you
Lady of the late night
You stay up to make sure
Each time we wake up
The house is clean
And the food is ready
Forgive us O Amah forgive us
For taking you for granted
When we should learn from you
To thank the Almighty for His graces
Had our geography been different
Our destiny perhaps would be yours
And yours would be ours
Thank you Amah
God bless you always
Some amahs do not have leisure outside the house. They have little social interaction outside
the household. One reported case shows the extent to which some amahs are being isolated. A
newly hired Indonesian amah wanted to meet her sister who was working as an amah in
Brunei. She called the sister on the phone to arrange a meeting. The sister told the new amah
that they could not meet in Brunei because her employer did not want them (the two sisters) to
meet. The lack of freedom for some group of amahs may pose problems for their self-
fulfillment. If one accepts some of Peter Townsend’s concepts such as “poverty” (Townsend
1970a), “relative deprivation” (Townsend 1970b) and “deprivation index” (Townsend 1979),
many of the amahs must admittedly be poor or deprived. Over four decades ago Harold
Wilensky, an American sociologist noted that routine work offered few opportunities for
personal fulfillment but thought that leisure could lead to increased personal satisfaction and
social integration (Wilensky, 1960). Tom Burns, a British sociologist thought along the same
lines when he noted that leisure provided substantial freedom for the individual to exercise
choices and design ways to create meaning in life (Burns 1973).
194
3.3.4. Specific Problems of Outdoor Construction Workers
The outdoor construction workers that we studied experienced some problems, which were
unique to them. Most of the other groups of low-income immigrant workers such as
salesladies, waitresses and amahs had relatively decent accommodation. The amahs could
upon choice eat at the employer’s family table or prepare her own meal from groceries done
for her by her employer. The waitresses in restaurants could eat meals in the restaurant while
working. Many of the construction workers in housing estates and big complexes that we
studied experienced hunger at work and lacked proper accommodation. They lived in
ramshackle buildings at construction sites or in uncompleted buildings that formed part of
their project. Thus their condition is much like those of the poor in the shanties or favelas of
megacities of developing countries. All workers that participated in the study observed that
they chose to live in these places to minimise cost.
Over 90 percent of workers in a housing project did not at all bother to ask about safe
accommodation in town or away from the project site. Living on site according to these
workers took out the burden of commuting to work and the possibility of lateness to work.
They feared that lateness to work might incur the displeasure of employers or bosses, or
work against their interest in the unpredictable calculus of the job market during the Asian
economic crisis, which the haze episodes deepened. During the survey these workers were
shown the cost of safe accommodation in town and how they could use a combination of
ways including “rooming” and sharing costs with other work mates to afford good
accommodation. They observed that their living on project sites was not because of
ignorance of availability of safe and “cheap” accommodation in town. They had problem of
effective demand – being able to pay for good accommodation without risk. The cost of safe
accommodation was too high for them. The workers mostly pointed to the heavy financial
burden they bore especially the burden of contractual obligations in their home countries and
the insecurity in the job market due to the drying up of contract projects, for their lack of
preference for safer accommodation.
One of the most important problems of this group of workers was associated with their
accommodation. Both their fear of losing jobs and money made them to choose the
compromised shelter or accommodation of the work site. The work site predisposed them to
high dosage of polluted haze air during the haze episodes of 1997-1998. As outdoor workers
they were exposed to haze during work. Although they could have had a reprieve from that
exposure by returning to safer accommodation after work, they increased their exposure by
living in accommodation that had improper ventilation or was little different from staying
outdoors. Haze-related health problems manifested strongly among this group of workers,
sometimes up to five or more times the average for the general population of Brunei. Odihi
(2001, 2003) observed that their living conditions favoured the spread of haze-related
contagious diseases. Examples of such conditions included “rooming” together, community
culture (e.g. sharing of food, buckets and utensils), high room density of occupants, which
made contact between the sick (disease vectors or carriers) and healthy people to be frequent,
and sharing of haze polluted or infection polluted air.
195
Whether it was haze-induced or health problems from other sources, the outdoor worker was
always reluctant to report his health condition. This reluctance made many of the sick to suffer
in silence. Self-medication was prevalent for purposes of concealing sickness among other
things. Consultation with medical doctors was rare and was usually the last resort. Two
reasons were responsible for this behaviour. Consultation with medical doctors at private or
public healthcare centres or clinics always attracted fees. Charges for treatment were an
additional cost. This is unlike what the middle class immigrant worker experiences. The cost
of his or her treatment is free or borne by the employer.
Living close to work solved a number of work-related problems while causing a number of
others. For the group of outdoor workers that we studied, commuting to shopping and religious
centres respectively for grocery and worship, which many described as “very necessary” or
“inevitable”, was a problem. These centres were in most cases far from the site that doubled as
work and residence. In many cases the site where workers lived was not on bus route, and
when they were, the relatively cheap commercial buses did not run during workers’ leisure
time, which was usually in the night. As a result much of the commuting this group of workers
did was by foot. In their observation it added to their tiredness and stress, and reduced the time
available to them for rest. It should be noted that living on the project site did not always lead
to a negative outcome. It had its advantages as well. Those advantages derived from the
culture of the residents, which was mainly supportive. Most projects had workers that came
from the same country and spoke the same language. Their togetherness and the friendships
they forged lessened their loneliness.
3.3.5. The Problem of Violence
Intra-group violence (i.e., violence meted out to low-income immigrant workers by members
of this group) and violence that low-income workers experienced at the hands of other
members of society are not uncommon. Violence can also happen within or across gender and
one is not necessarily more serious than the other. Common types of violence include verbal
tirades or fights over lovers due to the commonplace nature of affection switches. Participants
in the study noted that jilted lovers or those who felt cheated violate those who “cheated”
them. The commonest forms were verbal and physical abuse. Key informants from a particular
country observed that violence had in some cases been carried to the extreme with victims
killing or fatally wounding lovers that they felt cheated them. There was another type of
violence experienced by low-income female workers especially. As recently as 2002, a key
informant indicated how some workers, all of a particular nationality, were asked by their
employer to agree to massage them at locations and times of the employer’s choice or lose
their jobs. Not willing to accept such extra-contract terms, these ladies lost their jobs.
Some male factory workers had experienced violence at their workplace. Key informants
observed that such experience was usually connected to the refusal of the worker to accept
conditions deemed unbefitting to them. Bosses or security agents at the instigation or
encouragement of the former usually meted out the violence to the workers. Newspaper reports
of some riots in factories and their alleged underlying causes seem to confirm the existence of
these problems. Another form of violence may be described as strictly economic. A good
example of this was the case of a worker who had his contract terminated and sent home
because he demanded payment of the substantial amount his employer owed him. It must be
pointed out that the problems of low-income immigrant, which this study has attempted to
highlight are in no way unique to Brunei.

196
4. Suggestions for Improving Welfare of Immigrant Workers
Though the above-mentioned problems of the low-income immigrant worker may be
considered serious, on a positive note, Brunei possesses within its culture all the ingredients
necessary for their termination. My guess is that these problems have continued to exist
because people and especially the authorities are not fully aware of them per se or of their
scale or extent. The following suggestions if carefully implemented should prove useful in
substantially reducing these problems.
1. Hiring agents should be more closely scrutinised by the authorities to ensure their
compliance with each country’s labour laws or culture. Agents’ practice of charging
employers for air tickets to bring in maids and passing the responsibility of buying
tickets or bringing themselves to Brunei to the maids, a responsibility that increases
maids’ indebtedness, should be stopped.
2. The high cost of recruitment to the worker in terms of high agent fees in their home
countries should be looked into with a view to stopping or minimising it. This is
especially necessary as such exorbitant costs serve to reduce workers to serving the
agents’ interests at high personal health and other costs in Brunei. In this regard, all
member countries of the ASEAN and South Asia (Bangladesh, India, Pakistan and Sri
Lanka) can be actively involved through their embassies here in Brunei.
3. The authorities should look into the desirability and possibility of including an
accommodation clause similar to those in the contracts of maids with their employers,
in the contract of construction workers with their employers. This will help to
minimise the problem of accommodation that this group experiences.
4. A culture of economic justice, which the Government of His Majesty always follows
by paying salaries and wages of its workers regularly, should be made binding on all
employers to compel them to pay their employees’ salaries and wages when they are
due. This will go along way to reduce problems of hunger, vice and guilt resulting
from defaulting in social obligations that this group of workers often faces.
5. The authorities should consider the establishment of a forum where victims of
socioeconomic injustice especially the low-income immigrant worker can safely go
and seek justice against those who victimise them. A good education programme
should accompany the establishment of such a forum so that a potential victim knows
what to do and where to go to seek redress.
197
5. Conclusions
Brunei is a demographic magnet pulling people to its shores from places that are near or far
away. Its pulling power is analogous to that of the city in much of today’s developing world
where rural-urban drift continues to swell urban populations. Many immigrants are pulled in
by Brunei’s attraction while being pushed out from their countries by their insalubrious
socioeconomic conditions. This paper has provided a modest review of socio-economic
problems of low-income immigrant workers in Brunei. The problem is a complex one
because of the complex nature of the population and the diverse backgrounds of the
immigrants. Immigrants’ social cultural backgrounds are different, their skills and Brunei’s
demand for them vary almost from one individual to another. One aspect of those variations
in the demand for immigrant workers is the employer of foreign labour. That is important
because that variation creates socioeconomic differences among the immigrant population by
introducing differences in willingness- and ability-to-pay differences among the employers.
For example, government, financial institutions and other businesses that make high levels of
profits are willing to, and actually pay more for services of immigrant workers than
householders who employ domestic workers.
The socio-economic differences among immigrants are a factor of their problems because it
impinges on their socioeconomic conditioning. For the low-income immigrant worker, want
is an ever-present problem. Lacking adequate financial resources, they lack access to many
of the socioeconomic bundles that are seen as part of or defining the “good life”. As Amartya
Sen, an economics Nobel laureate puts it, poverty creates “capability deprivation” (Sen 2000:
87). The study of how this “other half lives” reveals that spatial location, which geographers
emphasize as an important factor of quality of life of urbanites (see Pinch, 1985; Fincher,
1992) does not adequately explain it because of its implications for access. It is apparent
from this study that in addition to physical availability of the “elements” that constitute the
“good life” and one’s spatial location with respect to them, the social location of the
individual is all important because it defines true nearness to goods and services or their
effective availability. For example, the amah, irrespective of location, is a passive consumer
of some goods and services. She may walk the child to the swimming pool but can only
watch him or her swim as she may not be allowed to swim.
The social problems of the low-income immigrant worker have their origins in their home
countries. It is the failure of development or development-induced inequalities (Overton 2000)
in their home countries that is at the root of social problems of these workers in Brunei. Brunei
represents for them the hope of escape from the misery of want and pain, both for them and
those who depend on them. The pain they bear is truly as Peter Berger puts it “the pain
inflicted by men on each other…But some men are vultures in a more active sense. They
produce piles of corpses by their own actions” (Berger 1979:357). The recruitment agents who
profit from the misery of these workers should not be encouraged to continue their diabolical
practice. To safeguard their interests, employers of low-income immigrant workers should sign
and enforce “contracts of necessaries”, which may include the provision of a decent
accommodation. Such contracts may serve to regulate attitudes or behaviour of employers
because they would know that the terms of the contract would have the force of law. It is also
suggested that a forum where the low-income worker could get justice or at least seek redress
should be created because of what Turner (2001:3) called the “inequality of bargaining
strength of the two parties”, the low-income worker being the weaker one in this case.
198
Acknowledgments
The author wishes to acknowledge all low-income workers of different nationalities who
participated in the various survey and field research studies. Though they are anonymous in
this paper because of the need for confidentiality, their faces and struggles are fresh in my
memory. Many thanks are due to Kivuti Nyagah, a fine gentleman, who proved very useful
as a bridge to some respondents. I am grateful to Dr Awang Haji Ismail bin Awang Haji
Duraman and Dr Kwabena A. Anaman whose invitation to me to submit a chapter to this
book helped me to overcome my inertia and provided me the needed momentum to revisit
and use the information from my previous studies to write this paper.
References
Anaman, K.A. (2001). “Economic Impacts of 1997/1998 Haze-Related Air Pollution Episodes
in Brunei Darussalam”, Tinjauan: Policy and Management Review, 4: 12-28.
Anaman, K.A. and C.N. Looi (2000). “Economic Impact of Haze-Related Air Pollution on the
Tourism Industry in Brunei Darussalam”, Economic Analysis and Policy, 30(2): 133-143.
Anaman, K. A. and N. Ibrahim (2003). “Statistical Estimation of Dose-Response Functions of
Respiratory Diseases and Societal Costs of Haze-related Air Pollution in Brunei Darussalam”,
Pure and Applied Geophysics, 160: 279-293.
Berger, P.L. (1979). “Policy and the Calculus of Pain”, In C.K. Wilber (ed.), The Political
Economy of Development and Underdevelopment, New York: Random House,Chapter 25,
357-378.
Fincher, R. (1992). “Urban Geography in the 1990s”, In A. Rogers, H. Viles and A. Goudie
(eds.), The Student’s Companion to Geography. Oxford: Blackwell Publishers. II.11, 104-110.
Garnaut, R. (1998). “The East Asian Crisis”, In R.H. McLeod and R. Garnaut (eds.), East Asia
in Crisis. London: Routledge.
Goulet, D. (1971). The Cruel Choice: A New Concept in the Theory of Development, New
York: Atheneum.
Jim, C.Y. (1999). “Forest Fires in Indonesia 1997-98: Possible Causes and Pervasive
Consequences”, Geography 84(3): 251-260.
Kaplan, R.D. (1995). “The Coming Anarchy: How Scarcity, Crime, Overpopulation, Tribalism
and Disease are Rapidly Destroying the Social Fabric of Our Planet”, In G.R. Pitzl (ed.),
Annual Editions: Geography 95/96. Guilford, Connecticut: The Dushkin Publishing Group,
Inc., 18-33.
Odihi, J.O. (2001). “Haze and Health in Brunei Darussalam: The Case of the 1997-98
Episodes”, Singapore Journal of Tropical Geography, 22(1): 38-51.
Odihi, J.O. (2003). “Haze in Southeast Asia: Needed Local Actions for a Regional Problem”,
Pure and Applied Geophysics, 160: 205-220.
Odihi, J.O. (2003). Tribute to Brunei Darussalam, Bandar Seri Begawan: Borneo Press
Overton, J. (2000). “Three World, Two Worlds, One World or Many? Geographies of Global
Inequalities”, Southeast Asia: A Multidisciplinary Journal 2(1 & 2): 47-54.
Pinch, S. (1985). Cities and Services. London: Routledge.
Rawls, J. (1971). A Theory of Justice. Cambridge, Massachusetts: Harvard University Press.
Sachs, W. (1995). The Discovery of Poverty, In I. Waldron and N. Steinhauer (eds.),
Global Matters. New York: McGraw-Hill Ryerson Limited. Pp. 74-79.
Sen, A. (2000). Development as Freedom, New York: Alfred A. Knopf.
Todaro, M. (2000). Economic Development, Seventh Edition, New York: Addison-Wesley.
Townsend, P. (1970a) (ed.). The Concept of Poverty, London, Heinemann.
199
Townsend, P. (1970b). Measures and Explanations of Poverty in High and Low Income
Countries, In P. Townsend (ed.), The Concept of Poverty. London, Heinemann.
Townsend, P. (1974). Poverty as Relative Deprivation, In D. Wedderburn (ed.), Poverty,
Inequality and Class Structure. Cambridge: Cambridge University Press.
Turner, C. (2001). Contract Law, London: Hodder & Stoughton.
Ullman, E.L. (1956). The Role of Transportation and the Bases for Interaction, In W.L.
Thomas (ed.), Man’s Role in Changing the Face of the Earth, Chicago: Chicago University
Press, 862-880.
Wilensky, H. L. (1960). Work, Careers and Social Integration, In T. Burns (ed.), Industrial
Man, Harmondsworth: Penguin.
200
INDEX
Adam Smith 132
AFTA 68, 82
Agriculture 68, 104-116
Air pollution 185
Amahs 189-193
Amedeo Company 2, 118
APEC 78-79
ASEAN 67-84, 183, 187, 189, 191, 196
Asian financial crisis 25, 33, 132
Asia-Pacific 68, 78-79
Babylonia 134
Bandar Seri Begawan 85, 104, 117, 118
Bangladesh 183, 187, 196
Belait 104, 117, 120
Bilateral trade 67-84
Brunei-Muara 91, 117, 120
BruNet 86
Cambodia 68, 73, 74
Canada 78
Capital inputs 119-121, 127
Capitalist economic system 132
China 78
Cointegration analysis 18-19, 34-35, 39, 44
Communist economic system 132
Computers 85-88, 91, 93, 101
Construction industry 16-23, 117-131
capital inputs in the 119-121, 127
growth of the 121, 124
labour inputs in the 119-121, 127
problems of the 121-123, 126
Culture 71-72, 78, 80-81, 137-138
Divorce 143-145, 164-182
causes 173-174
Islamic perspective 168-169
DST Communications 86
Economic diversification 1, 9-14
Economic growth 1, 4, 7, 14
Egypt 134
Electronic mail 88, 96
Environmental expenditures 55-60
Environmental issues 53, 55-60
Error correction models 34-35, 38
European civilization 134
European Union 68, 78-79
Exports 4, 6, 67-84
201
Fishing 68, 105-107, 110
Food 68, 104-116, 136-137
production 68, 104-116
safety issues 136-137
Forestry 68,105-107, 110
Government deficits 4, 8
Government expenditures 4, 8
Government revenues 4, 8
Government surplus 4, 8
Granger causality analysis 16-18, 22, 164, 175-176, 178-180
Gross domestic product (GDP) 2, 4, 7, 11-12, 14, 16-22, 25-36, 30, 32-43,
47-53, 55, 58-59, 61-63, 67, 70-72, 78, 80-82,
104-106, 117-118, 142, 164
Gurkhas 27
Haze-related air pollution 185
Health and environmental quality 47-64
Health expenditures 59
Health issues 52, 55, 59
Hedonic pricing method 90
Hong Kong 22
Human capital 172
Human Development Index 142, 164
Ibn Khaldun 135
Immigrant workers 183-199
Imports 4, 6, 67-84
India 134, 183, 187, 196
Indonesia 68, 73-74, 187
Information communication technology 85-87
International trade 67-84
comparative advantage model of 69
gravity models of 69-72
Hecksher-Ohlin models of 69
Internet 85-103
adoption of 85, 87, 91-92, 94, 98-99, 101
definition of 88
demand for 88-89
economic valuation of 89-90
empirical studies on 90-91
Internet Service Provider (ISP) 86, 91-92, 94, 97
Islamic Bank of Brunei (IBB) 137
Islamic business systems 132-141
Islamic business transactions 132-141
Islamic economic system 132-133
Istana Nurul Iman 17
Jabatan Telekom Brunei (JTB) 86
Japan 68-69, 78, 121
Job hiring problem 188
Karl Marx 132
Korea 78, 121
202
Labour 24-46, 105-107, 119-120, 164-165,
177-180, 183-197
aggregate demand of 24-46
agriculture sector 105, 107, 115
construction industry 119-120
classical theory of 31
fishery sector 105, 117
foreign 24-25, 27-28, 184
forestry sector 105, 107
government sector 25
hiring problems of 189
Keynesian theory of 31
local 24-25, 27-28
low income 185-187
men 25, 29
private sector 24-25, 27
participation 164-165, 177-180, 184
socio-economic problems of 183-197
theory of demand for 32, 33
women 25, 29, 166
Lancaster demand theory 149
Laos 68, 73-74
Likert rating scale 91-92, 119, 123, 124
Liquefied natural gas 67
Logistic regression analysis 92-93, 98-99
Maids 189-193
Malay-Muslim-Monarchy 1, 142
Malaysia 68, 73, 74, 121, 187
Marital choice 142, 150-151, 157-161
Marital instability 143-146, 165, 172-175
Marriage 142-161, 167
choice of eligible partners 155-156
desirable attributes 149,
economic theory of 148-149
Islamic perspective 148, 168-169
marriageable ratios 143, 147, 148, 174
polygamous 148
search costs of partners in 148
Mismatch of work skills 32, 44, 191
Myanmar 68, 73, 74
Netherlands 121
Non-oil products 9-10, 13-14
Non-stationarity in econometric analysis 17, 18, 20
Oil and gas industry 1, 142, 164
OECD 109
Oil prices 4-5
Oil products 67-69, 73, 76-87, 82
Organisation of Islamic Countries 68,142
203
Pakistan 183, 187, 196
Philippines 68, 74, 187
Polygamy 148, 168
Positive assortative mating 142, 148, 161
Production functions 104, 108, 110-114, 119-120, 127
empirical estimation of 109-110, 119-120, 127
stochastic frontier 110-114
Random utility function 90
Rentier economy 9, 67
Sengkurong 85, 91, 101
Simple statistical analysis 119
SimpurNet 86
Singapore 68, 73, 74, 121, 142
Sri Lanka 183, 187, 196
Social capital 54-55, 57, 61, 165
Social problems 188-197
amahs 192-193
construction workers 194-195
financial insecurity of workers 192-193
hiring problems of workers 189
job insecurity 189
suggestions for reducing 196-197
violence 195-196
Social welfare 51-53, 63
Socioeconomic problems 188-197
(also see social problems)
Southeast Asia 67-82, 142
Stationarity in econometric analysis 17, 18, 20
Surveys 91-92, 118-120, 149-150
limitations of 120
methodology 91-92, 118-119, 149-150
response rate in 118, 120
Taiwan 121
Technical efficiency 104, 108, 128
Technical inefficiency 109-114
Temburong 117-120
Thailand 68, 73, 74, 78, 80-82, 187
Tutong 117, 120
Unemployment 31-32, 44
natural rate of 32
United Kingdom 1, 121
United Nations Development Programme 67, 142, 164
United States 68, 78
Unit roots in econometric analysis 18
Universiti Brunei Darussalam 118, 143, 164
Vietnam 68, 72, 74
Welfare state 164

204
Women
flexible working arrangements for 180
labour force numbers 25, 29
labour supply theories 170-173
right to work in Islam 169-170
200
APPLIED ECONOMIC ANALYSIS
IN BRUNEI DARUSSALAM
EVALUATION OF ECONOMIC GROWTH AND
TRADE, MICROECONOMIC EFFICIENCY
AND ANALYSIS OF SOCIO-ECONOMIC PROBLEMS : ' C? ' / -
This book contains twelve essays dealing with the applications of economic
science to analyse real world problems in Brunei. Based on per capital real
GDP, Brunei has been consistently ranked the richest Muslim country in
the world over the last 30 years. The country is also one of the richest in
Asia. Due to the extensive welfare system created by the oil export revenues
over the last 40 years, the country has become an affluent society with
extensive participation of women and minority ethnic groups in the
workforce, educational and health systems. The country retains strong
religious and traditional cultural links including a monarchial system of
government
Brunei is scarcely covered in the published international economic
literature including databases of key international lending agencies. Based
on the use of the most recently revised government macroeconomic data
and data gathered from several well-organised confidential surveys, the
authors, all based in Brunei, have provided high quality analyst of several
macroeconomic and microeconomic issues and emerging socio-economic
problems in this fascinating country. This book will be useful for students,
consultants, researchers, academics and policy makers around the world
interested in Southeast Asian studies, specific development issues involving
small-sized oil-rich countries and other economic development issues
especially those involving Islamic countries.
'i
t


