Embed Size (px)
Citation preview
1
Edward J. Neth • University of Connecticut
William L MastertonCecile N. HurleyEdward J. Nethcengage.com/chemistry/masterton
Chapter 14Equilibria in Acid-Base Solutions
Outline
1. Buffers
2. Acid-Base Indicators
3. Acid-Base Titrations
Equilibria in Solution
• In Chapter 13, we considered single acid or base equilibria in solution
• The next step is to consider a solution where multiple equilibria are concerned
• Three major concerns
• Solution of a weak acid and its conjugate base (or vice-versa), called a buffer
• Acid-base indicators
• Solutions of acids and bases used in titrations
Strategy
• In any problem involving multiple equilibria
• Identify the key reactions
• Single out one equilibrium and write the reaction and the equilibrium expression
• Always identify one unknown for which to solve
Buffers
• Any solution containing appreciable amounts of both a weak acid and its conjugate base
• Is highly resistant to changes in pH brought about by the addition of a strong acid or base
• Has a pH close to the pKa of the weak acid
• Such a solution is called a buffer
Preparation of a Buffer
• We can prepare a buffer by mixing
• A weak acid, HB
• The conjugate base, B-, as a sodium salt, NaB• Recall that Na+ is a spectator ion so it does not affect
pH
• HB reacts with OH- :
• HB (aq) + OH- (aq) B- (aq) + H2O
• B- reacts with H+ :
• B- (aq) + H+ (aq) HB (aq) + H2O
2
Buffer Reactions
• The (buffer + acid) and (buffer + base) reactions both demonstrate very large equilibrium constants, and go nearly to completion
• Note that
• The strong base is converted to a weak one by the buffer
• The strong acid is converted to a weak one by the buffer
• In this way, a buffer resists large pH changes
Working with Buffers
1. We can determine the pH of a buffer made by mixing a weak acid with its conjugate base
2. We can determine an appropriate buffer system(i.e., combination of acid/base) to maintain a desired pH
3. We can determine the small change in pH of a buffer when a strong acid or base is added to it
4. We can determine the buffer capacity, i.e., the quantitative ability of the buffer to absorb H+ or OH-
ions
Determining [H+] in a Buffer System
• The equations that govern a buffer pH are the same as we have seen in Chapter 13: i.e., they are the weak acid or weak base ionization equations
• The equilibrium constants used are the same Ka and Kb constants that we used in Chapter 13 as well
Determining [H+] in a Buffer System, (Cont’d)
• HB (aq) H+ (aq) + B- (aq)
• The last equation is called the Henderson-Hasselbalch equation
][
][log
][
][][
][
]][[
HB
BpKpH
HB
BKH
HB
BHK
a
a
a
Notes on the Henderson-Hasselbalch Equation
1. You may always assume that equilibrium is established without appreciably changing the original concentrations of HB or B-
2. Because HB and B- are present in the same solution, the ratio of their concentrations is also their mole ratio
• Can work directly with moles, without converting to concentration for each
Figure 14.1: Effect of a Buffer
3
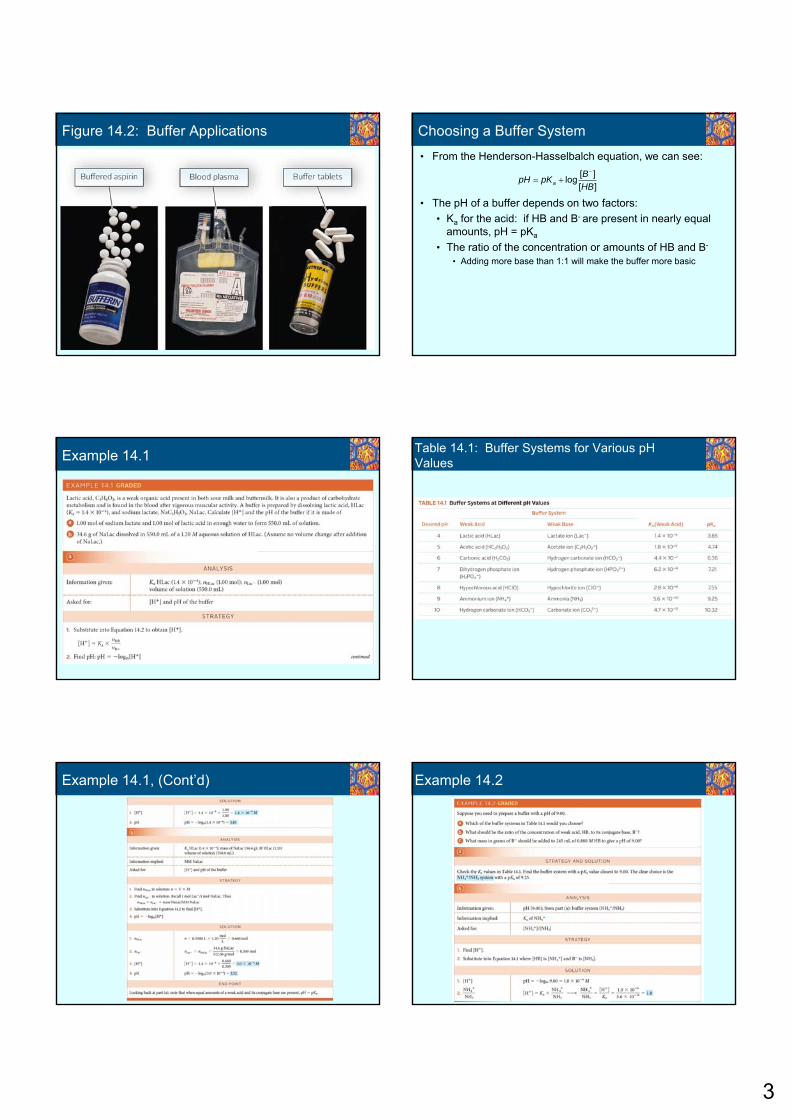
Figure 14.2: Buffer Applications
Example 14.1
Example 14.1, (Cont’d)
• From the Henderson-Hasselbalch equation, we can see:
• The pH of a buffer depends on two factors:
• Ka for the acid: if HB and B- are present in nearly equal amounts, pH = pKa
• The ratio of the concentration or amounts of HB and B-
• Adding more base than 1:1 will make the buffer more basic
Choosing a Buffer System
][
][log
HB
BpKpH a
Table 14.1: Buffer Systems for Various pH Values
Example 14.2
4
Example 14.2, (Cont’d)
Example 14.2, (Cont’d)
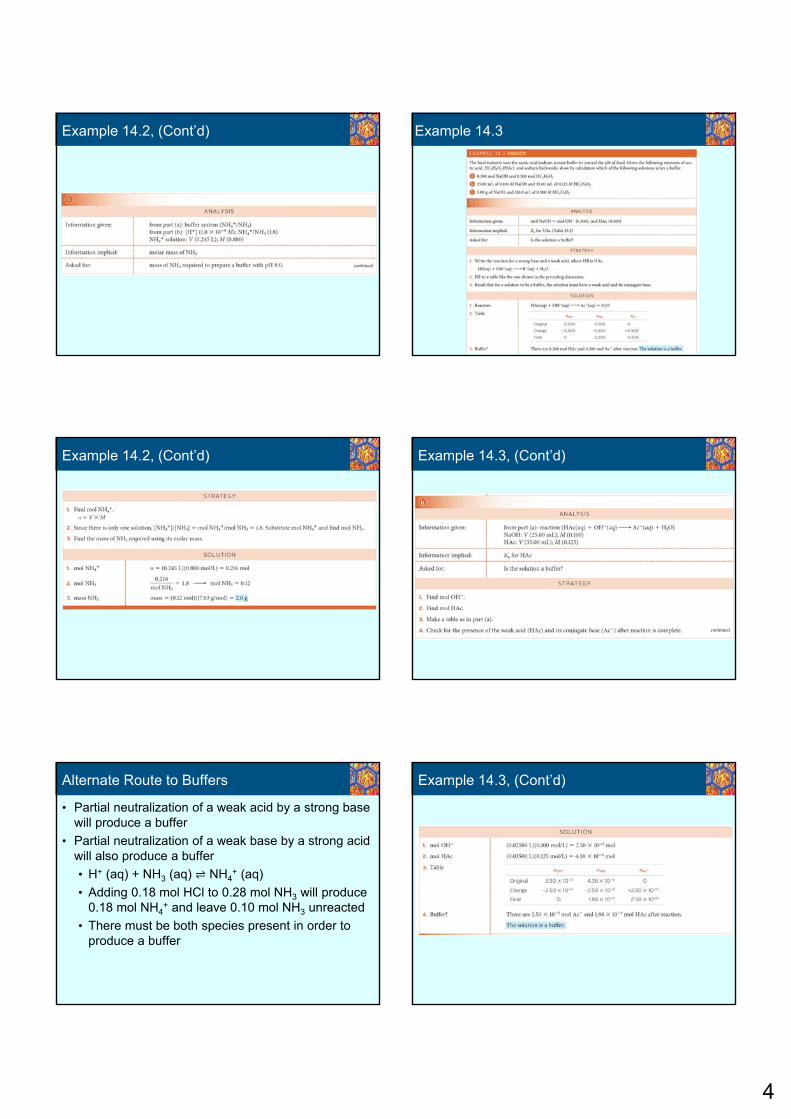
Alternate Route to Buffers
• Partial neutralization of a weak acid by a strong base will produce a buffer
• Partial neutralization of a weak base by a strong acid will also produce a buffer
• H+ (aq) + NH3 (aq) NH4+ (aq)
• Adding 0.18 mol HCl to 0.28 mol NH3 will produce 0.18 mol NH4
+ and leave 0.10 mol NH3 unreacted
• There must be both species present in order to produce a buffer
Example 14.3
Example 14.3, (Cont’d)
Example 14.3, (Cont’d)
5
Example 14.3, (Cont’d)
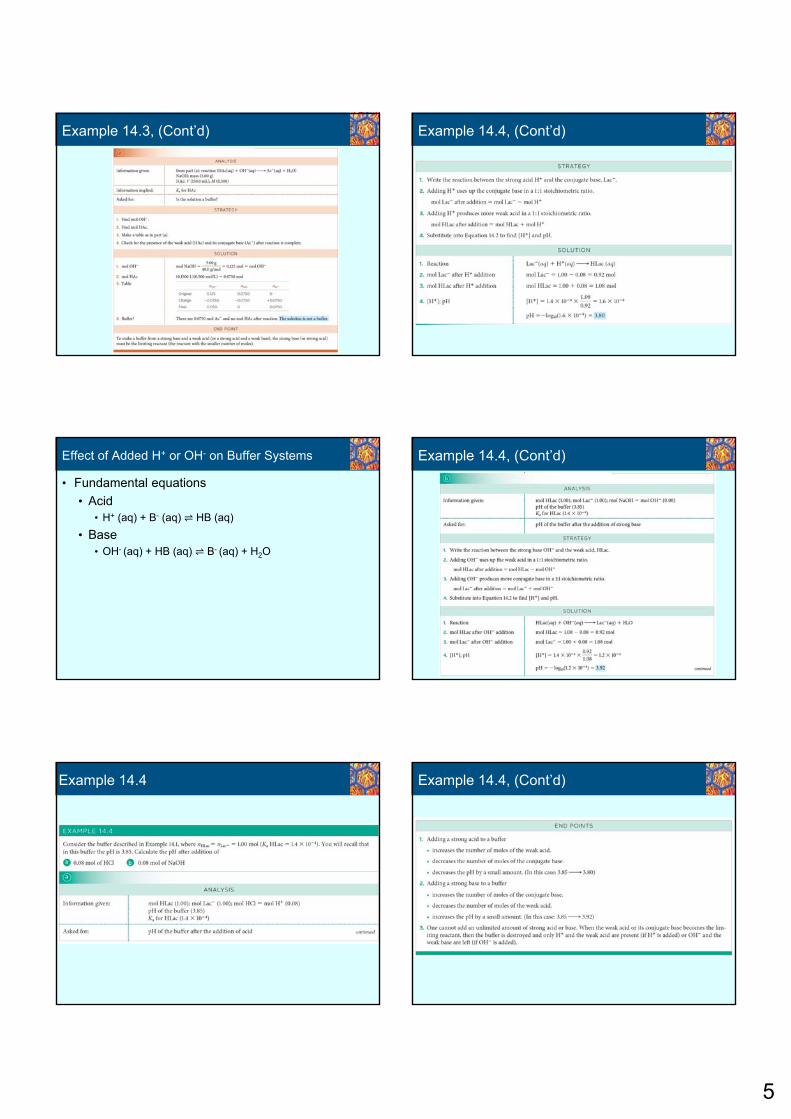
Effect of Added H+ or OH- on Buffer Systems
• Fundamental equations
• Acid• H+ (aq) + B- (aq) HB (aq)
• Base• OH- (aq) + HB (aq) B- (aq) + H2O
Example 14.4
Example 14.4, (Cont’d)
Example 14.4, (Cont’d)
Example 14.4, (Cont’d)
6
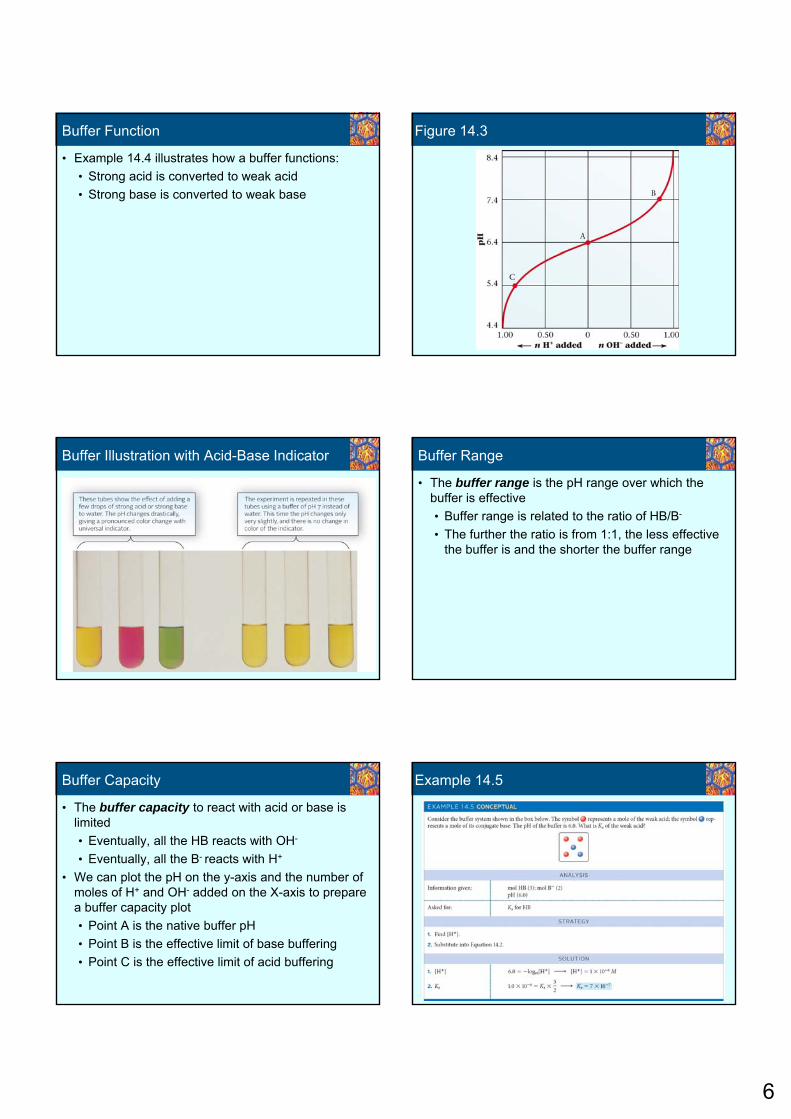
Buffer Function
• Example 14.4 illustrates how a buffer functions:
• Strong acid is converted to weak acid
• Strong base is converted to weak base
Buffer Illustration with Acid-Base Indicator
Buffer Capacity
• The buffer capacity to react with acid or base is limited
• Eventually, all the HB reacts with OH-
• Eventually, all the B- reacts with H+
• We can plot the pH on the y-axis and the number of moles of H+ and OH- added on the X-axis to prepare a buffer capacity plot
• Point A is the native buffer pH
• Point B is the effective limit of base buffering
• Point C is the effective limit of acid buffering
Figure 14.3
Buffer Range
• The buffer range is the pH range over which the buffer is effective
• Buffer range is related to the ratio of HB/B-
• The further the ratio is from 1:1, the less effective the buffer is and the shorter the buffer range
Example 14.5
7
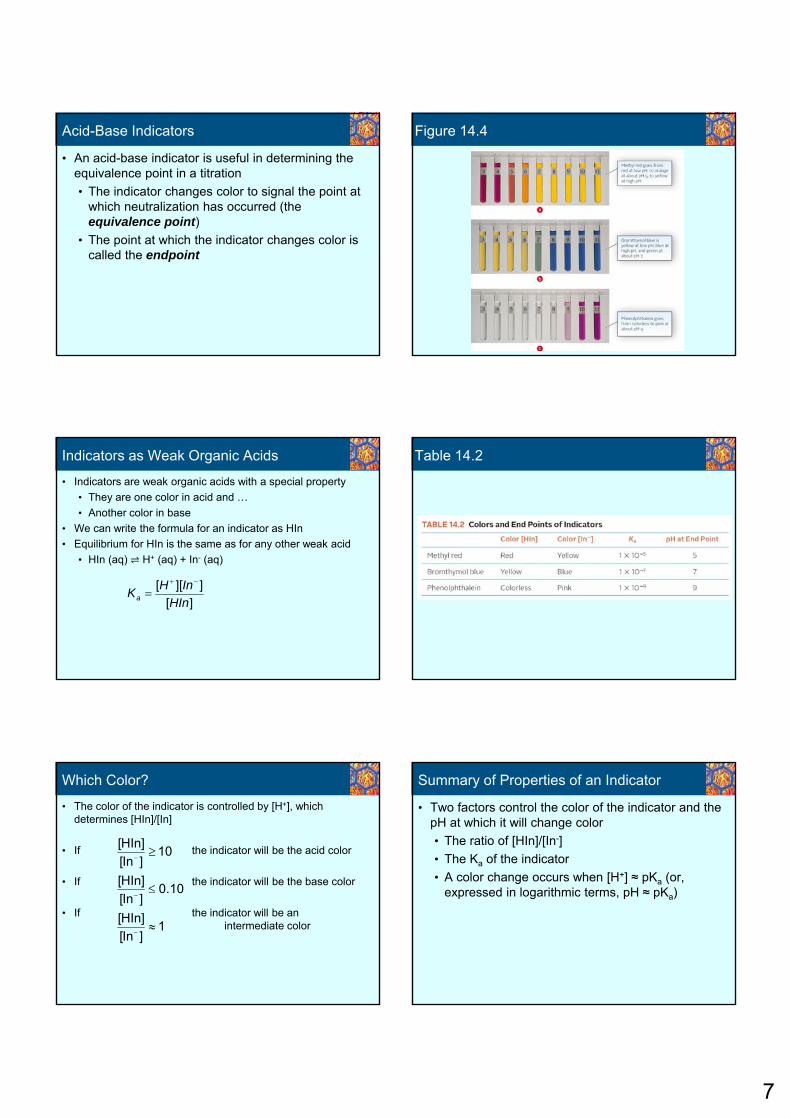
Acid-Base Indicators
• An acid-base indicator is useful in determining the equivalence point in a titration
• The indicator changes color to signal the point at which neutralization has occurred (the equivalence point)
• The point at which the indicator changes color is called the endpoint
Indicators as Weak Organic Acids
• Indicators are weak organic acids with a special property
• They are one color in acid and …
• Another color in base
• We can write the formula for an indicator as HIn
• Equilibrium for HIn is the same as for any other weak acid
• HIn (aq) H+ (aq) + In- (aq)
][
]][[
HIn
InHKa
Which Color?
• The color of the indicator is controlled by [H+], which determines [HIn]/[In]
• If the indicator will be the acid color
• If the indicator will be the base color
• If the indicator will be an intermediate color1
]In[
]HIn[
10.0]In[
]HIn[
10]In[
]HIn[
Figure 14.4
Table 14.2
Summary of Properties of an Indicator
• Two factors control the color of the indicator and the pH at which it will change color
• The ratio of [HIn]/[In-]
• The Ka of the indicator
• A color change occurs when [H+] ≈ pKa (or, expressed in logarithmic terms, pH ≈ pKa)
8
Bromthymol Blue
• Yellow in acid
• Blue in base
• Ka = 1 X 10⁻⁷
• As the pH increases,
• At pH 6, the indicator is yellow
• Between pH 6 and 7, the color changes to green
• At pH 7, we have a green color
• Between pH 7 and 8, the green changes to blue
• At pH 8 (and above) the indicator is blue
Example 14.6
Example 14.6, (Cont’d)
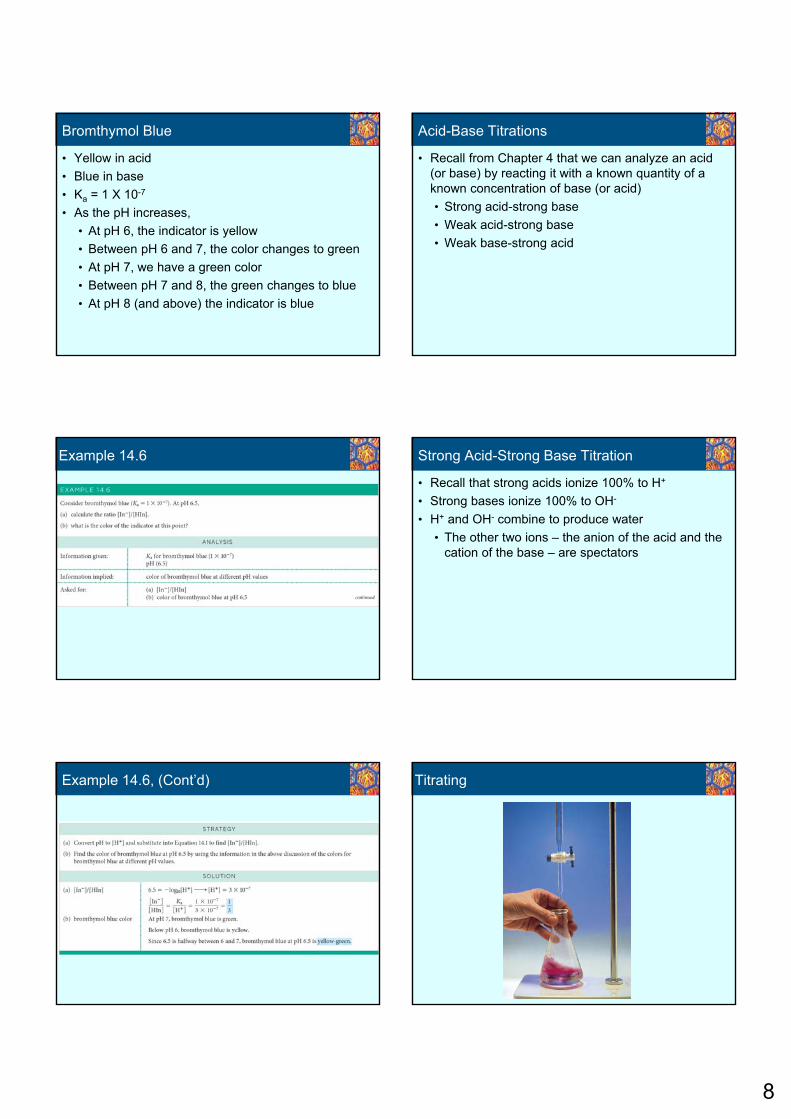
Acid-Base Titrations
• Recall from Chapter 4 that we can analyze an acid (or base) by reacting it with a known quantity of a known concentration of base (or acid)
• Strong acid-strong base
• Weak acid-strong base
• Weak base-strong acid
Strong Acid-Strong Base Titration
• Recall that strong acids ionize 100% to H+
• Strong bases ionize 100% to OH-
• H+ and OH- combine to produce water
• The other two ions – the anion of the acid and the cation of the base – are spectators
Titrating
9
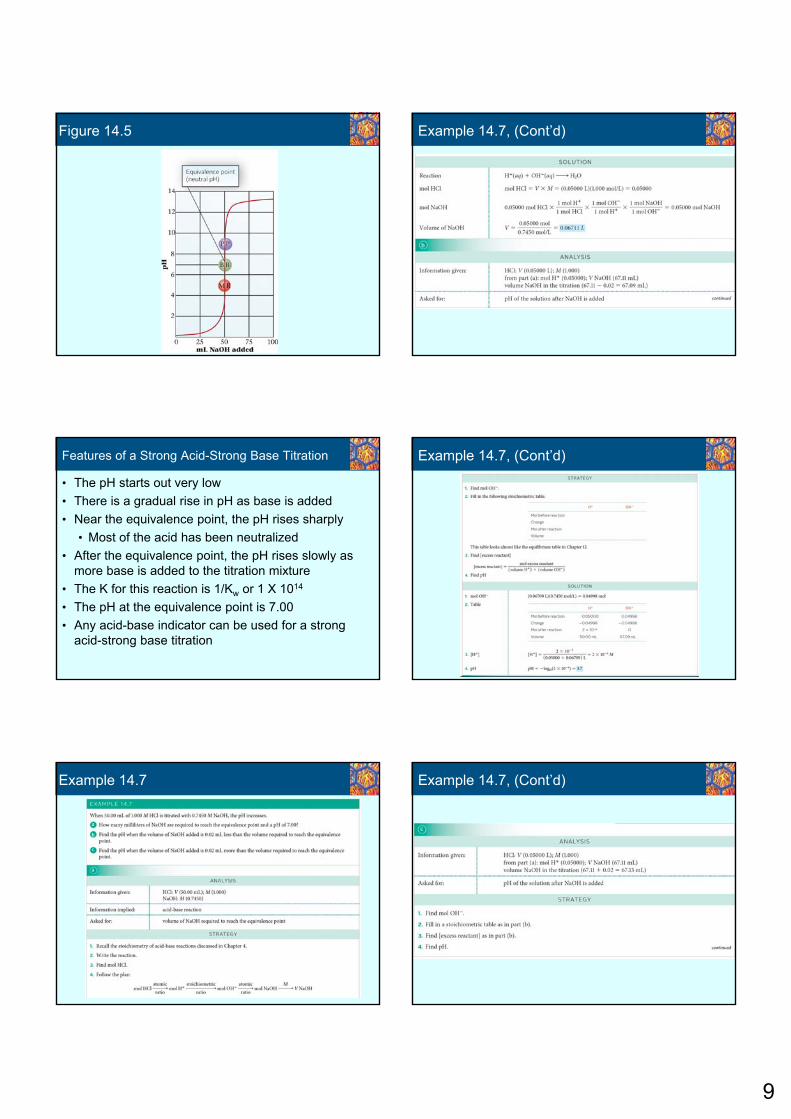
Figure 14.5
Features of a Strong Acid-Strong Base Titration
• The pH starts out very low
• There is a gradual rise in pH as base is added
• Near the equivalence point, the pH rises sharply
• Most of the acid has been neutralized
• After the equivalence point, the pH rises slowly as more base is added to the titration mixture
• The K for this reaction is 1/Kw or 1 X 10¹⁴
• The pH at the equivalence point is 7.00
• Any acid-base indicator can be used for a strong acid-strong base titration
Example 14.7
Example 14.7, (Cont’d)
Example 14.7, (Cont’d)
Example 14.7, (Cont’d)
10
Example 14.7, (Cont’d)
Weak Acid-Strong Base Titration
• Consider the titration of acetic acid with sodium hydroxide
• HC2H3O2 (aq) + OH- (aq) C2H3O2- (aq) + H2O
• K is the inverse of the Kb for C2H3O2-
• K = 1/5.6 X 10-10 = 1.8 X 10⁹
• K is very large, but not as large as that for a strong acid-strong base titration
Figure 14.6
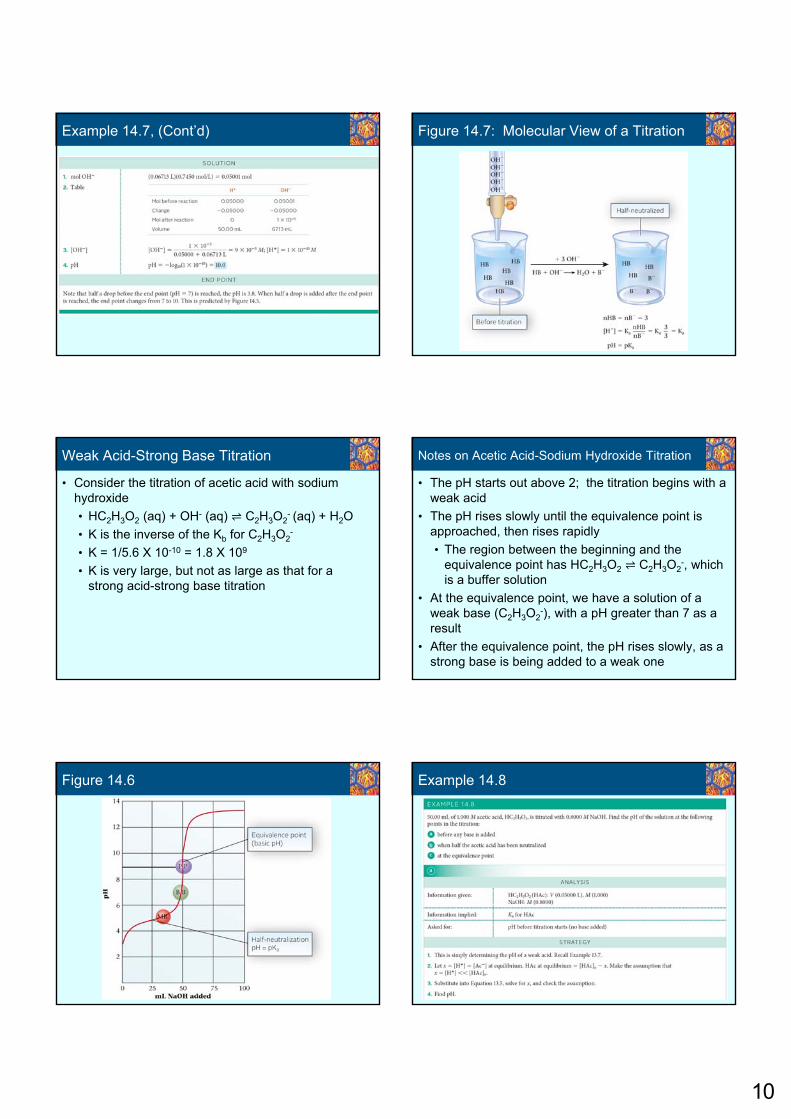
Figure 14.7: Molecular View of a Titration
Notes on Acetic Acid-Sodium Hydroxide Titration
• The pH starts out above 2; the titration begins with a weak acid
• The pH rises slowly until the equivalence point is approached, then rises rapidly
• The region between the beginning and the equivalence point has HC2H3O2 C2H3O2
-, which is a buffer solution
• At the equivalence point, we have a solution of a weak base (C2H3O2
-), with a pH greater than 7 as a result
• After the equivalence point, the pH rises slowly, as a strong base is being added to a weak one
Example 14.8
11
Example 14.8, (Cont’d)
Example 14.8, (Cont’d)
Example 14.8, (Cont’d)
Weak Acid- Strong Base Indicator Selection
• In choosing an indicator for the acetic acid-sodium hydroxide titration, we need one that will change color at basic pH
• Because the product of the titration is a weak base, the equivalence point will be basic
• Phenolphthalein, with endpoint pH = 9, is a good choice for this titration
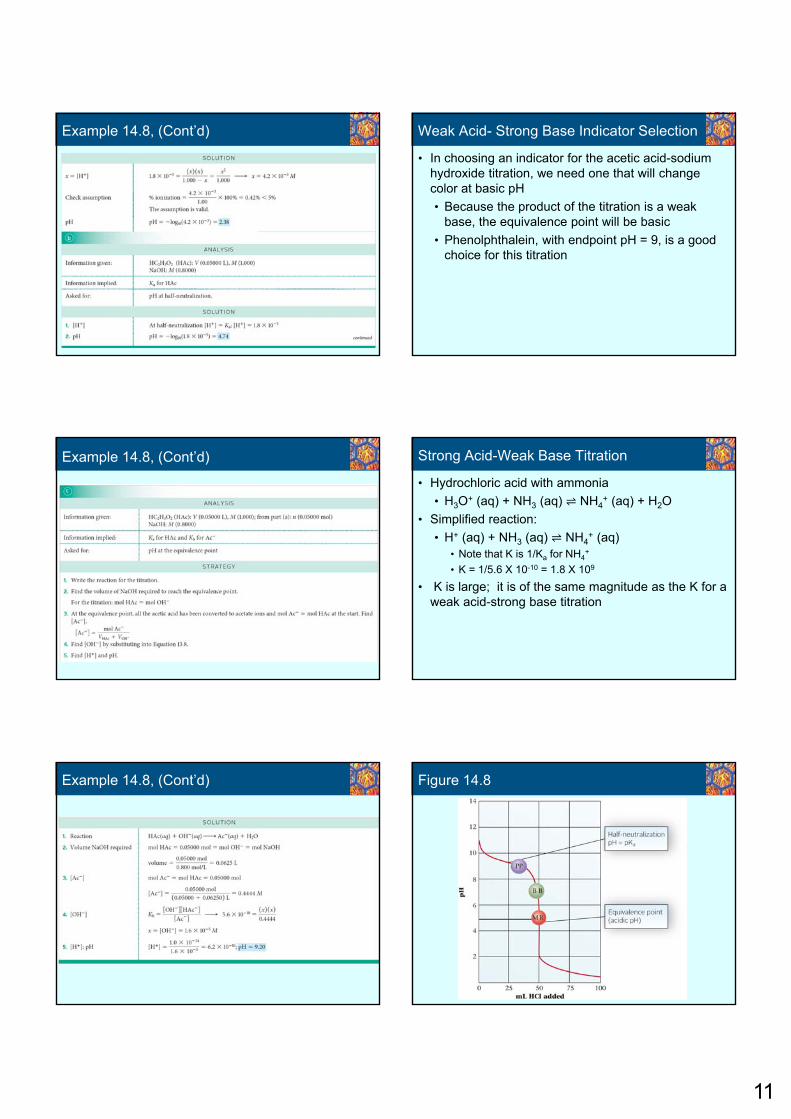
Strong Acid-Weak Base Titration
• Hydrochloric acid with ammonia
• H3O+ (aq) + NH3 (aq) NH4+ (aq) + H2O
• Simplified reaction:
• H+ (aq) + NH3 (aq) NH4+ (aq)
• Note that K is 1/Ka for NH4+
• K = 1/5.6 X 10-10 = 1.8 X 10⁹
• K is large; it is of the same magnitude as the K for a weak acid-strong base titration
Figure 14.8
12
Notes on HCl-NH3 Titration
• The original pH is that of the weak base, which is approximately 12
• The pH falls slowly with the addition of the acid
• Again, the addition of the acid to the weak base produces a buffer solution
• Near the equivalence point, the buffer is exhausted and the pH falls rapidly
• After the equivalence point, the pH falls slowly, as strong acid is being added to weak acid
Strong Acid-Weak Base Indicator Selection
• The pH at the equivalence point of a strong acid-weak base titration is acidic
• The indicator must change color at an acidic pH
• For this titration, methyl red is a suitable choice
• Color change takes place at a pH of approximately 5
Table 14.3
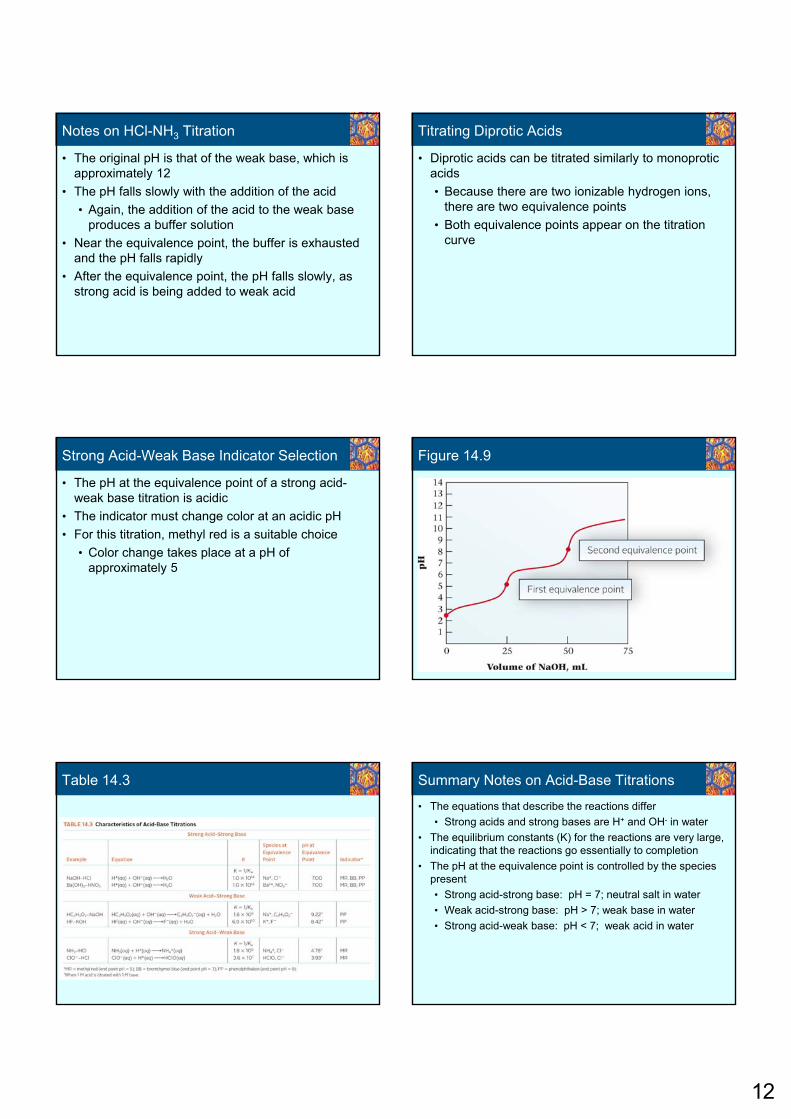
Titrating Diprotic Acids
• Diprotic acids can be titrated similarly to monoprotic acids
• Because there are two ionizable hydrogen ions, there are two equivalence points
• Both equivalence points appear on the titration curve
Figure 14.9
Summary Notes on Acid-Base Titrations
• The equations that describe the reactions differ
• Strong acids and strong bases are H+ and OH- in water
• The equilibrium constants (K) for the reactions are very large, indicating that the reactions go essentially to completion
• The pH at the equivalence point is controlled by the species present
• Strong acid-strong base: pH = 7; neutral salt in water
• Weak acid-strong base: pH > 7; weak base in water
• Strong acid-weak base: pH < 7; weak acid in water
13
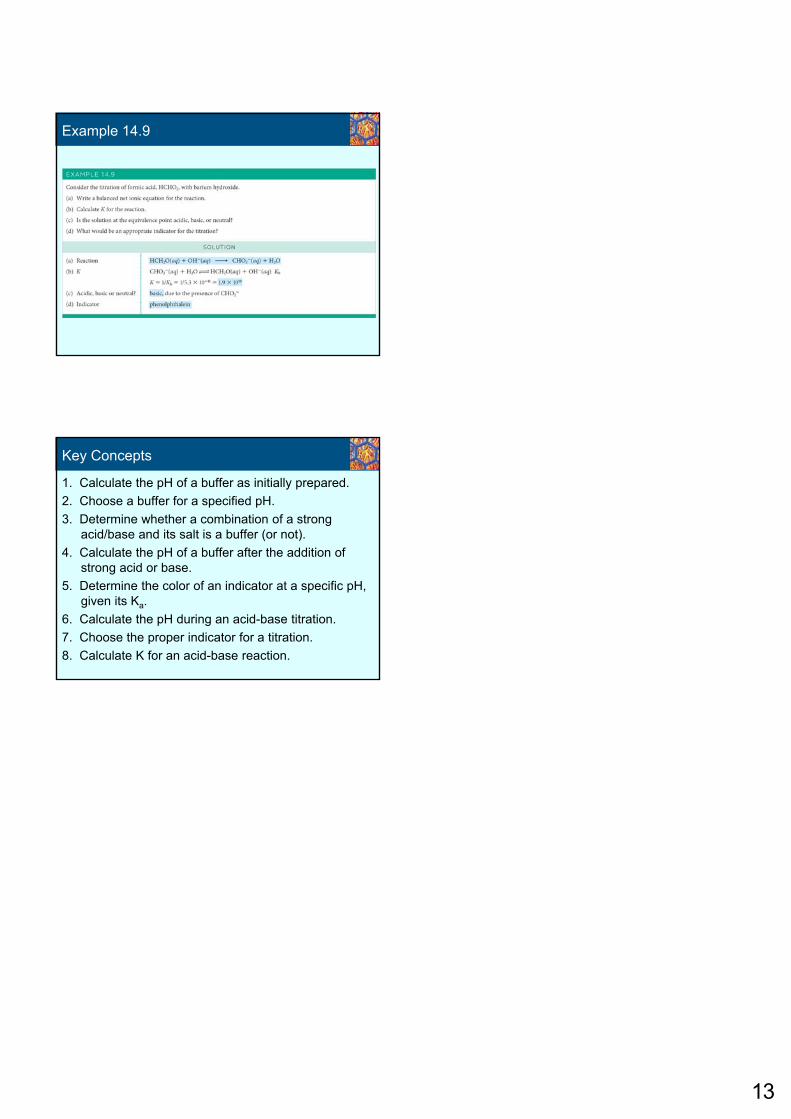
Example 14.9
Key Concepts
1. Calculate the pH of a buffer as initially prepared.
2. Choose a buffer for a specified pH.
3. Determine whether a combination of a strong acid/base and its salt is a buffer (or not).
4. Calculate the pH of a buffer after the addition of strong acid or base.
5. Determine the color of an indicator at a specific pH, given its Ka.
6. Calculate the pH during an acid-base titration.
7. Choose the proper indicator for a titration.
8. Calculate K for an acid-base reaction.


