Embed Size (px)
Citation preview

Chapter 14
LEARNING OBJECTIVESAfter studying this chapter, you should:
• Be able to identify the sequence of events that constitute the in-house development phase of the SDLC.
• Be familiar with the tools used to improve the success of system construction and delivery activities, including prototyping, CASE tools, and the use of PERT and Gantt charts.
• Understand the distinction between the structured and object-oriented design approaches.
• Understand the use of multilevel DFDs in the design of business processes.
• Be familiar with the different types of system documentation and the pur-poses they serve.
• Recognize the role of accountants in the construct and delivery of systems.
• Understand the advantages and disad-vantages of the commercial software option and be able to discuss the decision-making process used to select commercial software.
This chapter covers the final three phases of the systems development life cycle (SDLC). First we examine the many activities associated with in-house development. These activities fall conceptually into two categories:
(1) construct the system and (2) deliver the system. Through these activities, systems selected in the project initiation phase (discussed in Chapter 13) are designed in detail and imple-mented. This involves creating input screen formats, output re-port layouts, database structures, and application logic. Finally, the completed system is tested, documented, and rolled out to the user. The chapter then examines the increasingly important option of using commercial software packages. The majority of companies today, particularly smaller firms and large firms with standardized information needs, employ prewritten software sys-tems rather than develop in-house systems from scratch. Con-ceptually the commercial software approach also consists of construct and delivery activities. In this section we examine the pros, cons, and issues involved in selecting off-the-shelf systems.
Finally, the chapter addresses the important activities asso-ciated with systems maintenance. This stage in the SDLC carries significant financial and operational risks that are of particular importance to management, accountants, and auditors. A trend in systems development, maintenance, and operation within organizations is to outsource part or all system activities. The SDLC does not change in such a case, but its component parts are provided by an outsourcing provider. Therefore, special con-trols should be introduced to prevent increasing costs, decreasing functionality of systems, and loss of strategic advantage.
Construct, Deliver, and Maintain Systems Project*
* This chapter was co-authored by Jiri Polak, PhD, Deloitte & Touche, and Vojtech Merunka, PhD, Deloitte & Touche.

660 Chapter 14 Construct, Deliver, and Maintain Systems Project
In-House Systems DevelopmentOrganizations usually acquire information systems in two ways: (1) they develop cus-tomized systems in-house through formal systems development activities and/or (2) they purchase commercial systems from software vendors. Numerous commercial vendors offer high-quality, general-purpose information systems. These vendors primarily serve organizations with generic information needs. Typically, their client firms have business practices so standardized that they can purchase predesigned information systems and employ them with little or no modifications. However, many organizations require sys-tems that are highly tuned to their unique operations. These firms design their own infor-mation systems through in-house systems development activities.
While each approach has advantages and disadvantages, they are not mutually exclu-sive options. A firm may satisfy some of its information systems needs by purchasing commercial software and developing other systems in-house. This section is concerned with the in-house systems development component of Figure 14-1.
Tools for Improving Systems DevelopmentSystems development projects are not always success stories. In fact, by the time they are implemented, some systems are obsolete or defective and must be replaced. Esti-mates hold that up to 25 percent of all systems projects fail. That is, they are terminated prematurely and never implemented, or they must be redesigned within six months of implementation. Historically, three problems that account for most systems failures have plagued the SDLC.
1. Poorly specified systems requirements. Systems development is not a precise science. The process involves human communications and the sharing of ideas between users and systems professionals. This information exchange is often imperfect. Mistakes are made in identifying problems and needs, new ideas emerge as the true nature of the problem unfolds, and people simply change their minds about what they really want and need from the system.
Because of this uncertainty, the SDLC tends not to be a smooth, linear process, where one stage is completed before the next one begins. In reality, the process is iterative or cyclical. For example, it is not uncommon for a systems designer to return to the analysis stage from the construct stage to gather additional information as his or her perception of the problem changes.
The cyclical nature of this process results in time-consuming false starts, much repeated work, and pressure from all fronts to get the job done. Too often, the result is a system that is poorly designed, over budget, and behind schedule.
2. Ineffective development techniques. The problems cited above are amplified by inef-fective techniques for presenting, documenting, and modifying systems specifications. In the worst-case scenario, systems development tools are simply paper, pencils, rul-ers, templates, and erasers. The use of computer-based graphics software that permits original designs and changes to be made electronically considerably improves the sit-uation. Nevertheless, days or even weeks of work may need to be redone because of a change in a system’s specifications.
3. Lack of user involvement in systems development. The major cause of systems failure is the lack of end-user involvement during critical development stages. At one time, computer systems development was thought to be the exclusive domain of the systems

Part IV Systems Development Activities 661
1. Systems Strategy –Assess Strategic Information Needs –Develop a Strategic Systems Plan –Create an Action Plan
High-Priority ProposalsUndergo Additional Studyand Development
2. Project Initiation –Systems Analysis –Conceptualization of Alternative Designs –Systems Evaluation and Selection
Selected SystemProposals Go Forwardfor Detailed Design
5. Maintenance and Support
4. Commercial Packages –Trends in Commercial Packages –Choosing a Package
3. In-House Systems Development –Construct the System –Deliver the System
New and RevisedSystems Enter intoProduction
Business Needsand Strategy
BusinessRequirements
Legacy Situation
System Interfaces,Architecture and User Requirements
Feedback:User Requests for System Improvementsand Support
Feedback:User Requests for New System
FIGURE 14-1 System Development Life Cycle
professionals. During this period, users (including accountants) abdicated their tradi-tional responsibility for systems design. Too often, this led to business problems because system designs reflected the analyst’s perception of information needs rather than the perception of accountants and other users. Systems often lacked adequate controls and audit trails.
Today, we recognize that user involvement in a system’s development is the key to its ultimate success. However, achieving competent user involvement is still difficult to accomplish. There are two reasons for this: (1) users tend to become discouraged when they discover the amount of time they must actually invest and (2) communication
662 Chapter 14 Construct, Deliver, and Maintain Systems Project
between end users and systems professionals is generally not fluent. It is often said that these groups speak different languages. Each tends to resort to its own jargon when com-municating with the other. Therefore, much time is spent identifying user problems and needs and formulating acceptable solutions. Miscommunications between users and sys-tems professionals lead to mistakes that, sometimes, are discovered too late.
These problems have led researchers to seek ways to improve the development pro-cess. The focus of this effort has been on techniques to reduce development time, facilitate better information transfer, encourage user involvement, and improve overall systems quality. Several widely used techniques for improving systems development are reviewed in the following section.
PrototypingPrototyping is a technique for providing users a preliminary working version of the sys-tem. The prototype is built quickly and inexpensively with the intention that it will be modified. The objective of this technique is for the prototype to represent “an unambigu-ous functional specification, serve as a vehicle for organizing and learning, and evolve ultimately into a fully implemented” system.1 As the users work with the prototype and make suggestions for changes, both they and the systems professional develop a better understanding of the true requirements of the system.
Reducing its features to the essential elements keeps the costs of a prototype model low. For example, the prototype system will not contain the complex code necessary to perform transaction validation, exception-handling capabilities, and internal controls. Typically, prototypes are limited to user input screens, output reports, and some principle functions.
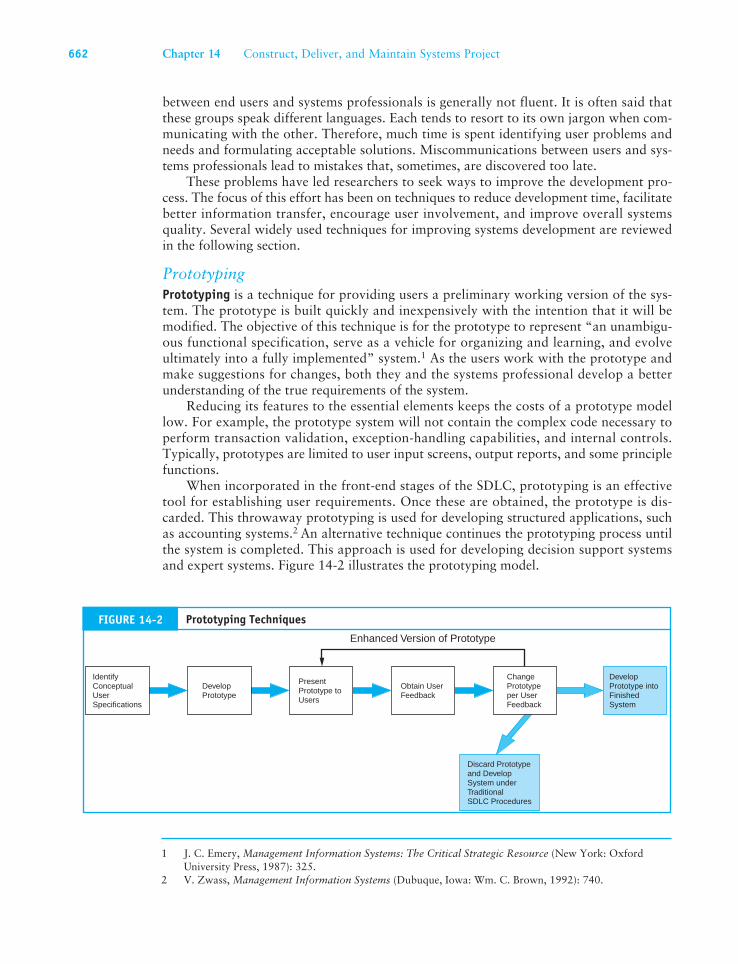
When incorporated in the front-end stages of the SDLC, prototyping is an effective tool for establishing user requirements. Once these are obtained, the prototype is dis-carded. This throwaway prototyping is used for developing structured applications, such as accounting systems.2 An alternative technique continues the prototyping process until the system is completed. This approach is used for developing decision support systems and expert systems. Figure 14-2 illustrates the prototyping model.
Enhanced Version of Prototype
Discard Prototypeand DevelopSystem under TraditionalSDLC Procedures
Obtain UserFeedback
ChangePrototypeper UserFeedback
DevelopPrototype
PresentPrototype toUsers
DevelopPrototype intoFinishedSystem
IdentifyConceptualUserSpecifications
FIGURE 14-2 Prototyping Techniques
1 J. C. Emery, Management Information Systems: The Critical Strategic Resource (New York: Oxford University Press, 1987): 325.
2 V. Zwass, Management Information Systems (Dubuque, Iowa: Wm. C. Brown, 1992): 740.
Part IV Systems Development Activities 663
The CASE ApproachComputer-aided software engineering (CASE) technology involves the use of computer systems to build computer systems. CASE tools are commercial software products con-sisting of highly integrated applications that support a wide range of SDLC activities. This methodology was developed to increase the productivity of systems professionals, improve systems design quality, and expedite the SDLC.
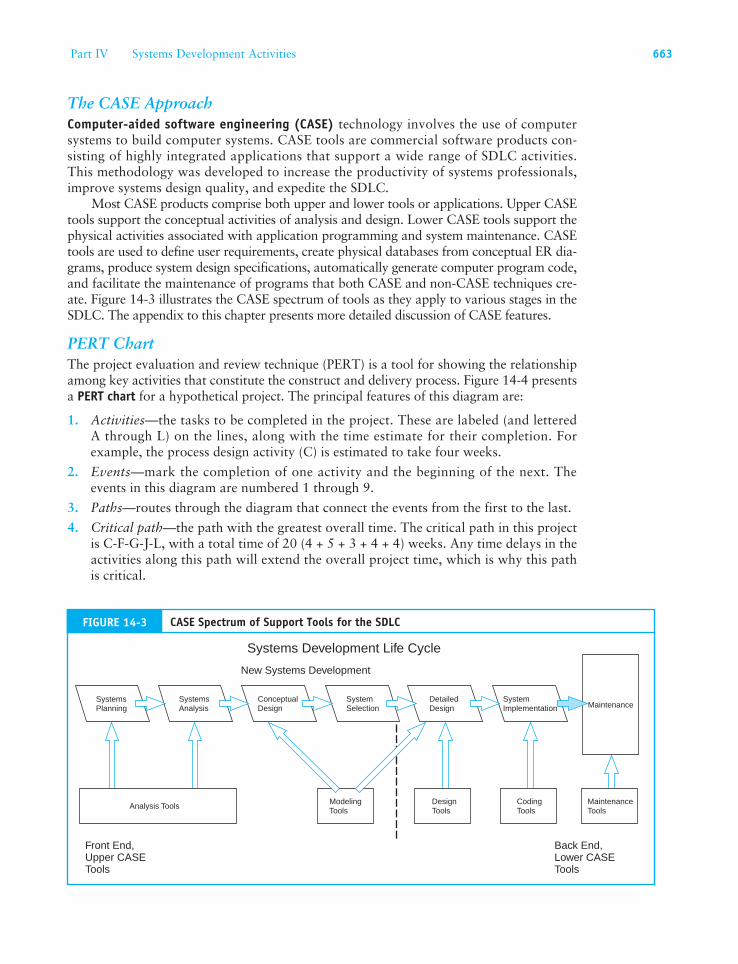
Most CASE products comprise both upper and lower tools or applications. Upper CASE tools support the conceptual activities of analysis and design. Lower CASE tools support the physical activities associated with application programming and system maintenance. CASE tools are used to define user requirements, create physical databases from conceptual ER dia-grams, produce system design specifications, automatically generate computer program code, and facilitate the maintenance of programs that both CASE and non-CASE techniques cre-ate. Figure 14-3 illustrates the CASE spectrum of tools as they apply to various stages in the SDLC. The appendix to this chapter presents more detailed discussion of CASE features.
PERT ChartThe project evaluation and review technique (PERT) is a tool for showing the relationship among key activities that constitute the construct and delivery process. Figure 14-4 presents a PERT chart for a hypothetical project. The principal features of this diagram are:
1. Activities—the tasks to be completed in the project. These are labeled (and lettered A through L) on the lines, along with the time estimate for their completion. For example, the process design activity (C) is estimated to take four weeks.
2. Events—mark the completion of one activity and the beginning of the next. The events in this diagram are numbered 1 through 9.
3. Paths—routes through the diagram that connect the events from the first to the last.
4. Critical path—the path with the greatest overall time. The critical path in this project is C-F-G-J-L, with a total time of 20 (4 + 5 + 3 + 4 + 4) weeks. Any time delays in the activities along this path will extend the overall project time, which is why this path is critical.
Maintenance
New Systems Development
Front End,Upper CASETools
Back End,Lower CASETools
Systems Development Life Cycle
SystemsPlanning
SystemsAnalysis
ConceptualDesign
SystemSelection
DetailedDesign
SystemImplementation
Analysis ToolsModelingTools
MaintenanceTools
DesignTools
CodingTools
FIGURE 14-3 CASE Spectrum of Support Tools for the SDLC

664 Chapter 14 Construct, Deliver, and Maintain Systems Project
Gantt ChartThe Gantt chart is a horizontal bar chart that presents time on a horizontal plane and activities on a vertical plane. Figure 14-5 illustrates a Gantt chart for the same project that the PERT chart represents in Figure 14-4. A bar marking its starting and ending dates represents the time associated with each activity. The Gantt chart is popular because it can show the current status of the project at a glance. By comparing projected time and work completed to date, we can see which projects are on, ahead of, or behind schedule.
Construct the SystemThe main goal of the construct phase is to design and build working software that is ready to be tested and delivered to its user community. This phase involves modeling the system, pro-gramming the applications, and application testing. The design and programming of modern systems follows one of two basic approaches: the structured approach and the object-oriented approach. We begin this section with a review of these competing methodologies. We then examine construct issues related to system design, programming, and testing.
The Structured Design ApproachThe structured design approach is a disciplined way of designing systems from the top down. It consists of starting with the big picture of the proposed system that is gradually decomposed into more and more detail until it is fully understood. Under this approach the business process under design is usually documented by data flow and structure dia-grams. Figure 14-6 shows the use of these techniques to depict the top-down decomposi-tion of a hypothetical business process.
C =
4 Weeks
Design P
rocess
G =
3 W
eeks
Test
Pro
gram
s
1
4
A = 3 WeeksPurchase Equipment
B = 4 Weeks
Design D
ata Model
F = 5 WeeksCode Programs
D = 2 Weeks
Install and Test
Equipment
6
Construct Phase
5
2
3E = 5 Weeks
Create Data Structures
9
7
8
I = 3 WeeksConvert Data Files
J = 4 Weeks
Test System L =
4 W
eeks
Cut
Ove
r to
New
Syste
m
K = 3 Weeks
Train Personnel
H = 3
Wee
ks
Prepa
re D
ocum
enta
tion
Deliver Phase
FIGURE 14-4 PERT Chart for In-House Development Project

Part IV
Systems D
evelopment A
ctivities 665
Purchase Equipment
Design Data Model
Design Process
Install and Test Equipment
Code Programs
Test Programs
Create Data Structures
Convert Data Files
Test System
Prepare Documentation
Train Personnel
Cut Over to New System
0 1 2 3 4 5 6 7 8 9 10 11 12 13 14 15 16
Cur
rent
Poi
nt in
Tim
e
Project WeekBudgeted
Actual
17 18 19 20 21
FIGURE 14-5 Gantt Chart

666 Chapter 14 Construct, Deliver, and Maintain Systems Project
We can see from these diagrams how the systems designer follows a top-down approach. The designer starts with an abstract description of the system and, through successive steps, redefines this view to produce a more detailed description. In our exam-ple, Process 2.0 in the context diagram is decomposed into an intermediate-level data flow diagram (DFD). Process 2.3 in the intermediate DFD is further decomposed into an elementary DFD. This decomposition could involve several levels to obtain sufficient details.
Input Output
Data
1.0
Process
2.0
Process
Input
Data
2.1
Process
2.2
Process
Data
Output
2.3
Process
Input
Input
Data
2.3.1
Process
2.3.2
Process
Data
Output
2.3.3
Process
ProgramModule 1
Module 2 Module 3 Module 4
Module 5 Module 6 Module 7 Module 8
Context-Level DFD
Intermediate-LevelDFD
Elementary-LevelDFD
StructureDiagram
FIGURE 14-6 Top-Down Decomposition of the Structured Design Approach

Part IV Systems Development Activities 667
Let’s assume that three levels are sufficient in this case. The final step transforms Pro-cess 2.3.3 into a structure diagram that defines the program modules that will constitute the process.
The Object-Oriented Design ApproachThe object-oriented design approach is to build information systems from reusable stan-dard components or objects. This approach may be equated to the process of building an automobile. Car manufacturers do not create each new model from scratch. New models are actually built from standard components that also go into other models. For example, each model of car that a particular manufacturer produces may use the same type of engine, gearbox, alternator, rear axle, radio, and so on. Some of the car’s components will be industry-standard products that other manufacturers use. Such things as wheels, tires, spark plugs, and headlights fall into this category. In fact, it may be that the only component actually created from scratch for a new car model is the body.
The automobile industry operates in this fashion to stay competitive. By using stan-dard components, car manufacturers minimize production and maintenance costs. At the same time, they can remain responsive to consumer demands for new products and preserve manufacturing flexibility by mixing and matching components according to the customer’s specification.
The concept of reusability is central to the object-oriented design approach to sys-tems design. Once created, standard modules can be used in other systems with similar needs. Ideally, the systems professionals of the organization will create a library (inven-tory) of modules that other systems designers within the firm can use. The benefits of this approach are similar to those stated for the automobile example. They include reduced time and cost for development, maintenance, and testing and improved user support and flexibility in the development process.
Elements of the Object-Oriented Design ApproachA distinctive characteristic of the object-oriented design approach is that both data and programming logic, such as integrity tests, accounting rules, and updating procedures, are encapsulated in modules to represent objects. The following discussion deals with the principle elements of the object-oriented approach.
Objects. Objects are equivalent to nouns in the English language. For example, vendors, customers, inventory, and accounts are all objects. These objects possess two character-istics: attributes and methods. Attributes are the data that describe the objects. Methods are the actions that are performed on or by objects that may change their attributes. Figure 14-7 illustrates these characteristics with a nonfinancial example. The object in this example is an automobile whose attributes are make, model, year, engine size, mile-age, and color. Methods that may be performed on this object include drive, park, lock, and wash. Note that if we perform a drive method on the object, the mileage attribute will be changed.
Figure 14-8 illustrates these points with an inventory accounting example. In this example, the object is inventory and its attributes are part number, description, quantity on hand, reorder point, order quantity, and supplier number. The methods that may be performed on inventory are reduce inventory (from product sales), review available quan-tity on hand, reorder inventory (when quantity on hand is less than the reorder point), and replace inventory (from inventory receipts). Again, note that performing any of the methods will change the attribute quantity on hand.

668 Chapter 14 Construct, Deliver, and Maintain Systems Project
Classes and Instances. An object class is a logical grouping of individual objects that share the same attributes and methods. An instance is a single occurrence of an object within a class. For example, Figure 14-9 shows the inventory class consisting of several instances or specific inventory types.
Inheritance. Inheritance means that each object instance inherits the attributes and methods of the class to which it belongs. For example, all instances within the inventory class hierarchy share the attributes of part number, description, and quantity on hand. These attributes would be defined once and only once for the inventory object. Thus, the object instances of wheel bearing, water pump, and alternator will inherit these attri-butes. Likewise, these instances will inherit the methods (reduce, review, reorder, and replace) defined for the class.
Object classes can also inherit from other object classes. For example, Figure 14-10 shows an object hierarchy made up of an object class called control and three subclasses called accounts payable, accounts receivable, and inventory. This diagramming technique is an example of unified modeling language (UML). The object is represented as a rect-angle with three levels: name, attributes, and methods.
Attributes
Object
Operations Drive Park Lock Wash
Car
Make Model Year EngineSize
Mileage Color
FIGURE 14-7 Characteristics of Objects
Attributes
Object
Operations Reduce ReviewQuantity
Reorder Replace
Inventory
PartNumber
Description Quantityon Hand
ReorderPoint
OrderQuantity
SupplierNumber
FIGURE 14-8 Characteristics of an Inventory Object

Part IV Systems Development Activities 669
The three object subclasses have certain control methods in common. For example, no account should be updated without first verifying the values Vendor Number, Cus-tomer Number, or Part Number. This method (and others) may be specified for the con-trol object (once and only once), and then all the subclass objects to which this method applies inherit it.
Because object-oriented designs support the objective of reusability, portions of sys-tems, or entire systems, can be created from modules that already exist. For example, any future system that requires the attributes and methods that the existing control module specifies can inherit them by being designated a subclass object.
Finally, the object-oriented approach offers the potential of increased security over the structured model. Each object’s collection of methods, which creates an impenetrable wall of code around the data, determines its functionality (behavior). This means that the internal data of the object can be manipulated only by its methods. Direct access to the object’s internal structure is not permitted.
System DesignThe purpose of the design phase is to produce a detailed description of the proposed sys-tem that both satisfies the system requirements identified during systems analysis and is in accordance with the conceptual design. In this phase, all system components—user views,
Alternator
Object Class
Instance
Inventory
WheelBearing
WaterPump
FIGURE 14-9 Relationship between Object Class and Instance
Control
verifyKeyBeforeUpdate. . .
ACCTS Rec
customerNumber. . .
Inventory
partNumber. . .
ACCTS Pay
vendorNumber. . .
Object NameObject Attributes
Object Methods
The thick arrows are used to depict inheritance(supertype–subtype) relationships among object classes
FIGURE 14-10 Objects, Classes, and Inheritance

670 Chapter 14 Construct, Deliver, and Maintain Systems Project
database tables, processes, and controls—are meticulously specified. At the end of this phase, these components are presented formally in a detailed design report. This report constitutes a set of blueprints that specify input screen formats, output report layouts, data-base structures, and process logic. These completed plans then proceed to the final phase in the SDLC—system implementation—where the system is physically constructed.
The Design SequenceThe systems design phase of the SDLC follows a logical sequence of events: create a data model of the business process, define conceptual user views, design the normalized data-base tables, design the physical user views (output and input views), develop the process modules, specify the system controls, and perform a system walk-through. In this section, each of the design steps is examined in detail.
An Iterative ApproachTypically, the design sequence listed in the previous section is not a purely linear pro-cess. Inevitably, system requirements change during the detailed design phase, causing the designer to revisit previous steps. For example, a last-minute change in the process design may influence data collection requirements that, in turn, changes the user view and requires alterations to the database tables.
To deal with this material as concisely and clearly as possible, the detailed design phase is presented here as a neat linear process. However, the reader should recognize its circular nature. This characteristic has control implications for both accountants and management. For example, a control issue that was previously resolved may need to be revisited as a result of modifications to the design.
Data Modeling, Conceptual Views, and Normalized TablesData modeling is the task of formalizing the data requirements of the business process as a conceptual model. The primary documentation instrument used for data modeling is the entity relationship (ER) diagram. This technique is used to depict the entities or data objects in the system. Once the entities have been represented in the data model, the data attributes that define each entity can then be described. They should be determined by careful analysis of user needs and may include both financial and nonfinancial data. These attributes represent the conceptual user views that must be supported by normal-ized database tables. To the extent that the data requirements of all users have been prop-erly specified in the data model, the resulting databases will support multiple user views. We described data modeling, defining user views, and designing normalized base tables in Chapter 9 and its appendix.
Design Physical User ViewsThe physical views are the media for conveying and presenting data. These include output reports, documents, and input screens. The remainder of this section deals with a number of issues related to the design of physical user views. The discussion examines output and input views separately.
Design Output ViewsOutput is the information the system produces to support user tasks and decisions. Table 14-1 presents examples of output that several AIS subsystems produce. At the transaction processing level, output tends to be extremely detailed. Revenue and

Part IV Systems Development Activities 671
expenditure cycle systems produce control reports for lower-level management and oper-ational documents to support daily activities. Conversion cycle systems produce reports for scheduling production, managing inventory, and cost management. These systems also produce documents for controlling the manufacturing process.
The general ledger/financial reporting system (GL/FRS) and the management report-ing system (MRS) produce output that is more summarized. The intended users of these
System Output
Expenditure cycle
Purchase orders
Cash disbursement voucher
Payment check
Purchases summary report
Cash disbursements summary
Revenue cycle
Sales invoice
Remittance advice
Bill of lading
Packing slip
Customer statements
Deposit slips
Cash receipts prelist
Sales summary
Cash receipts summary
Conversion cycle
Purchase requisitions
Work orders
Move tickets
Materials requisitions
Production schedules
Job tickets
Employee time cards
Work-in-process status reports
Summary of changes to finish goods
General ledger and financial reporting system
Financial statements
Comparative financial statements
Tax returns
Reports to regulatory agencies
Management reporting system
Various status and analysis reports
such as:
Inventory turnover reports
Inventory status reports
Vendor analysis reports
Budget and performance reports
TABLE 14-1 Examples of System Outputs

672 Chapter 14 Construct, Deliver, and Maintain Systems Project
systems are management, stockholders, and other interested parties outside the firm. The GL/FRS is a nondiscretionary reporting system that produces formal reports required by law. These include financial statements, tax returns, and other reports that regulatory agencies demand. The output requirements of the GL/FRS tend to be predictable and stable over time and between organizations.
The management reporting system serves the needs of internal management users. MRS applications may be stand-alone systems, or they may be integrated in the revenue, conversion, and expenditure cycles to produce output that contains both financial and nonfinancial information. The MRS produces problem-specific reports that vary consid-erably between business entities.
Output Attributes. Regardless of their physical form, whether operational documents, financial statements, or discretionary reports, output views should possess the following attributes: relevance, summarization, exceptions orientation, timeliness, accuracy, com-pleteness, and conciseness.
Relevance. Each element of information output must support the user’s decision or task. Irrelevant facts waste resources and detract attention from the information content of the output. Output documents that contain unnecessary facts tend to be cluttered, take time to process, cause bottlenecks, and promote errors.
Summarization. Reports should be summarized according to the level of the user in the organization. The degree of summarization increases as information flows upward from lower-level managers to top management. We see this characteristic clearly in the respon-sibility reports represented in Figure 14-11.
Exception Orientation. Operations control reports should identify activities that are about to go out of control and ignore those that are functioning within normal limits. This allows managers to focus their attention on areas of greatest need. An example of
ABC CompanyManager Plant 2
Production Unit 1Production Unit 2Production Unit 3
Total
XXX1,675XXX
3,600
XXX1,725XXX
3,760
XXX50
XXX
160
Budget Actual Variance
ABC CompanyManager Production Unit 2
MaterialsLaborOverhead
Total
XXXXXXXXX
1,675
XXXXXXXXX
1,725
XXXXXXXXX
50
Budget Actual Variance
ABC CompanyVP Production
Plant #1Plant #2Plant #3
Total
XXX3,600XXXXXXXXX
12,690
XXX3,760XXXXXXXXX
13,120
XXX160
XXXXXXXXX
430
Budget Actual Variance
MiddleManagement
OperationsManagement
SeniorManagement
FIGURE 14-11 Responsibility Reports Showing Consolidation of Information

Part IV Systems Development Activities 673
this is illustrated with the inventory reorder report presented in Figure 14-12. Only the items that need to be ordered are listed on the report.
Timeliness. Timely information that is reasonably accurate and complete is more valu-able than perfect information that comes too late to be useful. Therefore, the system must provide the user with information that is timely enough to support the desired action.
Accuracy. Information output must be free of material errors. A material error is one that causes the user to take an incorrect action or to fail to take the correct action. Opera-tional documents and low-level control reports usually require a high degree of accuracy. However, for certain planning reports and reports that support rapid decision making, the system designer may need to sacrifice accuracy to produce information that is timely. Managers cannot always wait until they have all the facts before they must act. The designer must seek a balance between the competing needs for accuracy and timeliness when designing output reports.
Completeness. Information must be as complete as possible. Ideally, no piece of infor-mation essential to the task or decision should be missing from the output. As with the accuracy attribute, the designer must sometimes sacrifice completeness in favor of timely information.
Conciseness. Information output should be presented as concisely as possible within the report or document. Output should use coding schemes to represent complex data classi-fications. Also, information should be clearly presented with titles for all values. Reports should be visually pleasing and logically organized.
Sports Car FactoryInventory Reorder Report
The following inventory items have fallen below normal levels:
# 12975
Date: 11/22/07
47782
6671
9981
Part
Exhaust Header
Wheel Bearing
Ball Joint
Description
2378
2378
2401
PrimaryVendor
10
500
200
OrderQuantity
2
25
10
QuantityOn Hand
1
20
20
AverageDailyUsage
FIGURE 14-12 Inventory Reorder Report

674 Chapter 14 Construct, Deliver, and Maintain Systems Project
Output Reporting Techniques. While recognizing that differences in cognitive styles exist among managers, systems designers must determine the output type and format most useful to the user. Some managers prefer output that presents information in tables and matrices. Others prefer information that is visually oriented in the form of graphs and charts. The issue of whether the output should be hard copy (paper) or electronic must also be addressed.
Despite predictions for two decades or more, we have not yet achieved a paper-less society. On the contrary, trees continue to be harvested and paper mills continue to be productive. In some firms, top management receives hundreds of pages of paper output each day. Paper documents also continue to flow at lower organizational levels.
On the other hand, many firms are moving to paperless audit trails and support daily tasks with electronic documents. Insurance companies, law firms, and mortgage com-panies make extensive use of electronic documents. The use of electronic output greatly reduces or eliminates the problems associated with paper documents (purchasing, han-dling, storage, and disposal). However, the use of electronic output has obvious implica-tions for accounting and auditing.
The query- and report-generating features of modern database management systems permit the manager to quickly create standard and customized output reports. Custom reports can present information in different formats, including text, matrices, tables, and graphs. Section 1 in the chapter appendix examines these formats and provides some examples.
Design Input ViewsData input views are used to capture the relevant facts about the resources, events, and agents involved in business process transactions. In this section, we divide input into two classes: hard-copy input and electronic input.
Design Hard-Copy Input. Businesses today still make extensive use of paper input docu-ments. In designing hard copy documents, the system designer must keep in mind several aspects of the physical business process.
Handling. How will the document be handled? Will it be on the shop floor around grease and oil? How many hands must it go through? Is it likely to get folded, creased, or torn? Input forms are part of the audit trail and must be preserved in legible form. If they are to be subjected to physical abuse, they must be made of high-quality paper.
Storage. How long will the form be stored? What is the storage environment? Length of storage time and environmental conditions will influence the appearance of the form. Data entered onto poor-quality paper may fade under extreme conditions. Again, this may have audit trail implications. A related consideration is the need to protect the form against erasures.
Numbers of Copies. Source documents are often created in multiple copies to trigger multiple activities simultaneously and provide a basis for reconciliation. For example, the system may require that individual copies of sales orders go to the warehouse, the shipping department, billing, and accounts receivable. Manifold forms are often used in such cases. A manifold form produces several carbon copies from a single writing. The copies are normally color-coded to facilitate distribution to the correct users.

Part IV Systems Development Activities 675
Form Size. The average number of facts captured for each transaction affects the size of the form. For example, if the average number of items received from the supplier for each purchase is 20, the receiving report should be long enough to record them all. Otherwise, additional copies will be needed, which will add to the clerical work, clog the system, and promote processing errors.
Standard forms sizes are full-size, 8½ by 11 inches; and half-size, 8½ by 5½ inches. Card form standards are 8 by 10 inches and 8 by 5 inches. The use of nonstandard forms can cause handling and storage problems and should be avoided.
Form Design. Clerical errors and omissions can cause serious processing problems. Input forms must be designed to be easy to use and collect the data as efficiently and effectively as possible. This requires that forms be logically organized and visually comfortable to the user. Two techniques used in well-designed forms are zones and embedded instructions.
Zones. Zones are areas on the form that contain related data. Figure 14-13 provides an example of a form divided into zones. Each zone should be constructed of lines, captions, or boxes that guide the user’s eye to avoid errors and omissions.
Embedded Instructions. Embedded instructions are contained within the body of the form itself rather than on a separate sheet. It is important to place instructions directly in the zone to which they pertain. If an instruction pertains to the entire form, it should be placed at the top of the form. Instructions should be brief and unambiguous. As an instructive technique, active voice is stronger, more efficient (needing fewer words), and less ambiguous than passive voice. For example, the first instruction below is written in passive voice. The second is in active voice.
1. This form should be completed in ink.
2. Complete this form in ink.
Notice the difference: the second sentence is stronger, shorter, and clearer than the first; it is an instruction rather than a suggestion.
Design Electronic Input. Electronic input techniques fall into two basic types: input from source documents and direct input. Figure 14-14 illustrates the difference in these tech-niques. Input from source documents involves the collection of data on paper forms that are then transcribed to electronic forms in a separate operation. Direct input procedures capture data directly in electronic form, via terminals at the source of the transaction.
Input from Source Documents. Firms use paper source documents for a number of rea-sons. Some firms prefer to maintain a paper audit trail that goes back to the source of an economic event. Some companies capture data onto paper documents because direct input procedures may be inconvenient or impossible. Other firms achieve economies of scale by centralizing electronic data collection from paper documents.
An important aspect of this approach is to design input screens that visually reflect the source document. The captions and data fields should be arranged on the electronic form exactly as they are on the source document. This minimizes eye movement between the source and the screen and maximizes throughput of work.
Direct Input. Direct data input requires that data collection technology be distributed to the source of the transaction. A very common example of this is the point-of-sale terminal in a department store.

676 Chapter 14 Construct, Deliver, and Maintain Systems Project
Document Title
Source DocNumber
Organization Name and Address Control:Date,Reference #
Name, address of object (customer, vendor, product)
Body of report:
Units sold, units ordered, quantities, prices, etc.
Authorizations androuting information
Totals,shippingcharges, taxes
FIGURE 14-13 Zones of a Form
An advantage of direct input is the reduction of input errors that plague downstream processing. By collecting data once, at the source, clerical errors are reduced since the subsequent transcription step associated with paper documents is eliminated. The more times a transaction is manually transcribed, the greater the potential for error.
Direct data collection uses intelligent forms for online editing that help the user complete the form and make calculations automatically. The input screen is attached to

Part IV Systems Development Activities 677
a computer that performs logical checks on the data being entered. This reduces input errors and improves the efficiency of the data collection procedures. During data entry, the intelligent form will detect transcription errors, such as illegal characters in a field, incorrect amounts, and invalid item numbers. A beep can be used to draw attention to an error, an illegal action, or a screen message. Thus, corrections to input can be made on the spot.
Given minimal input, an intelligent form can complete the input process automati-cally. For example, a sales clerk need enter in the terminal only the item numbers and quantities of products sold. The system will automatically provide the descriptions, prices, price extensions, taxes, and freight charges and calculate the grand total. Many time-consuming and error-prone activities are eliminated through this technique. Mod-ern relational database packages have a screen painting feature that allows the user to quickly and easily create intelligent input forms.
Data Entry Devices. A number of data entry devices are used to support direct electronic input. These include point-of-sale terminals, magnetic ink character recognition devices, optical character recognition devices, automatic teller machines, and voice recognition devices.
Design the System ProcessNow that the database tables and user views for the system have been designed, we are ready to design the process component. This starts with the DFDs that were produced in the general design phase. Depending on the extent of the activities performed in the general design phase, the system may be specified at the context level or may be refined in
TransactionFile
TransactionFile
DataCollection
ElectronicInput
File
SourceDocument
SourceDocument
Audit Trail
Audit Trail
EconomicEvent
Input from Source Documents
ElectronicInput
EconomicEvent
Direct Input
FIGURE 14-14 Input from Source Document and Direct Input

678 Chapter 14 Construct, Deliver, and Maintain Systems Project
lower-level DFDs. The first task is to decompose the existing DFDs to a degree of detail that will serve as the basis for creating structure diagrams. The structure diagrams will provide the blueprints for writing the actual program modules.
Decompose High-Level DFDsTo demonstrate the decomposition process, we will use the intermediate DFD of the purchases and cash disbursements system illustrated in Figure 14-15. This DFD was decomposed from the context-level DFD (Figure 13-6, Option A) originally prepared in the conceptual design phase. We will concentrate on the accounts payable process num-bered 1.4 in the diagram. This process is not yet sufficiently detailed to produce program modules.
Figure 14-16 shows Process 1.4 decomposed into the next level of detail. Each of the resulting subprocesses is numbered with a third-level designator, such as 1.4.1, 1.4.2, 1.4.3, and so on. We will assume that this level of DFD provides sufficient detail to pre-pare a structure diagram of program modules. Many CASE tools will automatically con-vert DFDs to structure diagrams. However, to illustrate the concept, we will go through the process manually.
GeneralLedger
AP SubLedger
Vendor
VendorRecords
InventoryRecords
SupportingDocs
VoucherRegister
CheckRegister
ReceiveGoods
1.3
UpdateGeneralLedger
1.6
OrderGoods
1.2
PreparePayment
1.5
AuthorizePurchase
1.1
ProcessAP
1.4
PurchaseReq
PurchaseReq
Rec Report
Payment Voucher Post
Post
File
Post
Post
Journal Voucher
JournalVoucher
Purchase Order
Invo
ice
PackingSlip
Payment
FIGURE 14-15 DFD for Purchases and Cash Disbursements System

Part IV Systems Development Activities 679
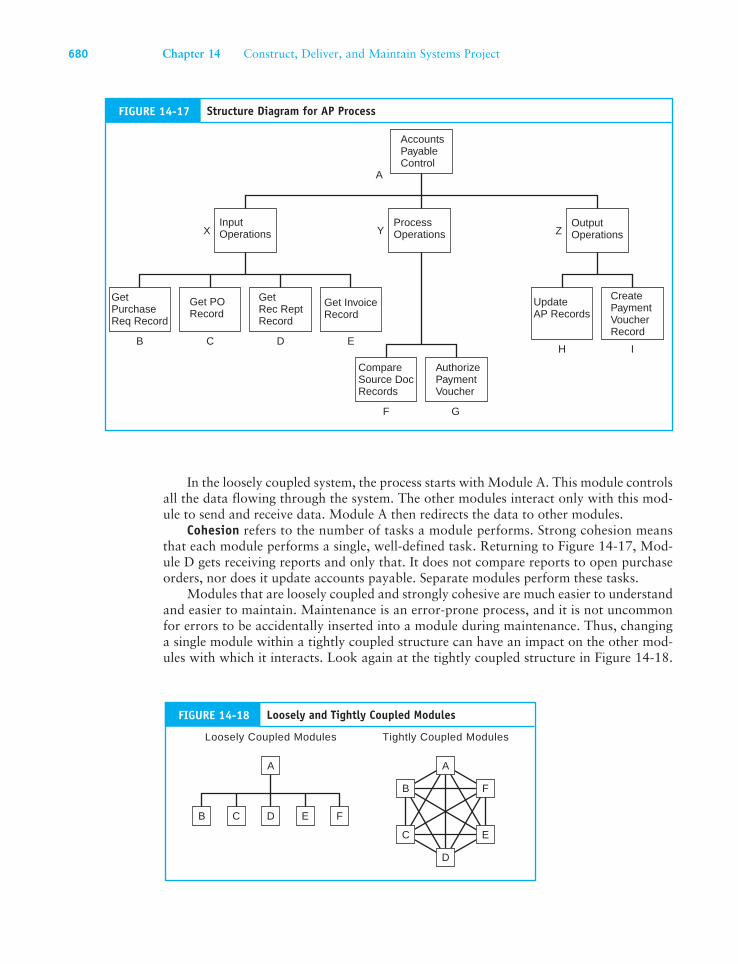
Design Structure DiagramsThe creation of the structure diagram requires analysis of the DFD to divide its processes into input, process, and output functions. Figure 14-17 presents a structure diagram showing the program modules based on the DFD in Figure 14-16.
The Modular ApproachThe modular approach presented in Figure 14-17 involves arranging the system in a hier-archy of small, discrete modules, each of which performs a single task. Correctly designed modules possess two attributes: (1) they are loosely coupled and (2) they have strong cohesion. Coupling measures the degree of interaction between modules. Interaction is the exchange of data between modules. A loosely coupled module is independent of the oth-ers. Modules with a great deal of interaction are tightly coupled. Figure 14-18 shows the relationship between modules in loosely coupled and tightly coupled designs.
InvoiceFile
AP SubLedger
Vendor
OpenPO File
PRFile
RRFile
VoucherRegister
ReceiveGoods
1.3
OrderGoods
1.2
AuthorizePurchase
1.1
ReceiveRec Rept
1.4.3
ReceivePO
1.4.2
ReceivePurchReq
1.4.1
Review andCompareSupportDocuments
1.4.5
PreparePayment
1.5
ReceiveInvoice
1.4.4
UpdateGeneralLedger
1.6
PreparePaymentVoucher
1.4.7
UpdateAP
1.4.6
PurchaseReq
PurchaseOrder
RecRept
Invoice
PostingData
Post
Post
Approved Liabilities
PaymentVoucher
Journal Voucher
FIGURE 14-16 Lower-Level DFD for AP Process 1.4
680 Chapter 14 Construct, Deliver, and Maintain Systems Project
In the loosely coupled system, the process starts with Module A. This module controls all the data flowing through the system. The other modules interact only with this mod-ule to send and receive data. Module A then redirects the data to other modules.
Cohesion refers to the number of tasks a module performs. Strong cohesion means that each module performs a single, well-defined task. Returning to Figure 14-17, Mod-ule D gets receiving reports and only that. It does not compare reports to open purchase orders, nor does it update accounts payable. Separate modules perform these tasks.
Modules that are loosely coupled and strongly cohesive are much easier to understand and easier to maintain. Maintenance is an error-prone process, and it is not uncommon for errors to be accidentally inserted into a module during maintenance. Thus, changing a single module within a tightly coupled structure can have an impact on the other mod-ules with which it interacts. Look again at the tightly coupled structure in Figure 14-18.
AccountsPayableControl
ProcessOperations
CompareSource DocRecords
AuthorizePaymentVoucher
UpdateAP Records
OutputOperations
CreatePaymentVoucherRecord
GetPurchaseReq Record
Get PORecord
GetRec ReptRecord
Get InvoiceRecord
InputOperations
B C D EH I
F G
X Y Z
A
FIGURE 14-17 Structure Diagram for AP Process
DC E F
A
B
Loosely Coupled Modules
D
A
C E
B F
Tightly Coupled Modules
FIGURE 14-18 Loosely and Tightly Coupled Modules

Part IV Systems Development Activities 681
These interactions complicate maintenance by extending the process to the other mod-ules. Similarly, modules with weak cohesion—those that perform several tasks—are more complex and difficult to maintain.
Pseudocode the System ModulesEach module in Figure 14-17 represents a separate computer program. The higher-level programs will communicate with lower-level programs through call commands. System modules are coded in the implementation phase. When we get to that phase, we will examine programming language options. At this point, the designer must specify the functional characteristics of the modules through other techniques.
Next, we illustrate how pseudocode may be used to describe the function of Module F in Figure 14-17. This module authorizes payment of accounts payable by validating the supporting documents.
COMPARE-DOCS (Module F) READ PR-RECORD FROM PR-FILE READ PO-RECORD FROM PO-FILE READ RR-RECORD FROM RR-FILE READ INVOICE-RECORD FROM INVOICE-FILE IF ITEM-NUM, QUANTITY-RECEIVED, TOTAL AMOUNT IS EQUAL FOR ALL RECORDS THEN PLACE “Y” IN AUTHORIZED FIELD OF PO-RECORD ELSE READ ANOTHER RECORD
The use of pseudocode for specifying module functions has two advantages. First, the designer can express the detailed logic of the module, regardless of the programming language to be used. Second, although the end user may lack programming skills, he or she can be actively involved in this technical but crucial step.
Design System ControlsThe last step in the design phase is the design of system controls. This includes computer pro-cessing controls, database controls, manual controls over input to and output from the system, as well as controls over the operational environment (for example, distributed data processing controls). In practice, many controls that are specific to a type of technology or technique will, at this point, have already been designed, along with the modules to which they relate. This step in the design phase allows the design team to review, modify, and evaluate controls with a systemwide perspective that did not exist when each module was being designed independently. Because of the extensive nature of computer-based system controls, treatment of this aspect of the systems design is deferred to Chapters 15, 16, and 17, where they can be covered in depth.
Perform a System Design Walk-ThroughAfter completing the detailed design, the development team usually performs a system design walk-through to ensure the design is free from conceptual errors that could become programmed into the final system. Many firms have formal, structured walk-throughs that a quality assurance group conducts. This is an independent group of programmers, analysts, users, and internal auditors. The job of this group is to simulate the operation of the system to uncover errors, omissions, and ambiguities in the design. Most system errors emanate from poor designs rather than programming mistakes. Detecting and cor-recting errors in the design thus reduces costly reprogramming later.

682 Chapter 14 Construct, Deliver, and Maintain Systems Project
Review System DocumentationThe detailed design report documents and describes the system to this point. This report includes:
Designs of all screen outputs, reports, and operational documents.
ER diagrams describing the data relations in the system.
Third normal form designs for database tables specifying all data elements.
An updated data dictionary describing each data element in the database.
Designs for all screen inputs and source documents for the system.
Context diagrams for the overall system.
Low-level data flow diagrams of specific system processes.
Structure diagrams for the program modules in the system, including a pseudocode description of each module.
The quality control group scrutinizes these documents, and any errors are recorded in a walk-through report. Depending on the extent of the system errors, the quality assur-ance group will make a recommendation. The system design will be either accepted with-out modification, accepted subject to modification of minor errors, or rejected because of material errors.
At this point, a decision is made either to return the system for additional design or to proceed to the next phase—systems implementation. Assuming the design goes for-ward, the documents just mentioned constitute the blueprints that guide programmers and system designers in constructing the physical system.
Program Application SoftwareThe next stage of the in-house development is to select a programming language from among the various languages available and suitable to the application. These include procedural languages such as COBOL, event-driven languages such as Visual Basic, or object-oriented programming (OOP) languages such as Java or C++. This section presents a brief overview of various programming approaches. Systems professionals will make their decision based on the in-house standards, architecture, and user needs.
Procedural LanguagesA procedural language requires the programmer to specify the precise order in which the program logic is executed. Procedural languages are often called third-generation languages (3GLs). Examples of 3GLs include COBOL, FORTRAN, C, and PL1. In busi-ness (particularly in accounting) applications, COBOL was the dominant language for years. COBOL has great capability for performing highly detailed operations on individ-ual data records and handles large files efficiently. On the other hand, it is an extremely wordy language that makes programming a time-consuming task. COBOL has survived as a viable language because many of the legacy systems written in the 1970s and 1980s, which were coded in COBOL, are still in operation today. Major retrofits and routine maintenance to these systems need to be coded in COBOL. More than 12 billion lines of COBOL code are executed daily in the United States.
Event-Driven LanguagesEvent-driven languages are no longer procedural. Under this model, the program’s code is not executed in a predefined sequence. Instead, external actions or events that the user
•
•
•
•
•
•
•
•

Part IV Systems Development Activities 683
initiates dictate the control flow of the program. For example, when the user presses a key or clicks on a computer icon on the screen, the program automatically executes code associated with that event. This is a fundamental shift from the 3GL era. Now, instead of designing applications that execute sequentially from top to bottom in accordance with the way the programmer thinks they should function, the user is in control.
Microsoft’s Visual Basic is the most popular example of an event-driven language. The syntax of the language is simple yet powerful. Visual Basic is used to create real-time and batch applications that can manipulate flat files or relational databases. It has a screen-painting fea-ture that greatly facilitates the creation of sophisticated graphical user interfaces (GUI).
Object-Oriented LanguagesCentral to achieving the benefits of this approach is developing software in an object-oriented programming (OOP) language. The most popular true OOP languages are Java and Smalltalk. However, the learning curve of OOP languages is steep. The time and cost of retooling for OOP is the greatest impediment to the transition process. Most firms are not prepared to discard mil-lions of lines of traditional COBOL code and retrain their programming staffs to implement object-oriented systems. Therefore, a compromise, intended to ease this transition, has been the development of hybrid languages, such as Object COBOL, Object Pascal, and C++.
Programming the SystemRegardless of the programming language used, modern programs should follow a modu-lar approach. This technique produces small programs that perform narrowly defined tasks. The following three benefits are associated with modular programming.
Programming Efficiency. Modules can be coded and tested independently, which vastly reduces programming time. A firm can assign several programmers to a single system. Working in parallel, the programmers each design a few modules. These are then assem-bled into the completed system.
Maintenance Efficiency. Small modules are easier to analyze and change, which reduces the start-up time during program maintenance. Extensive changes can be parceled out to several programmers simultaneously to shorten maintenance time.
Control. By keeping modules small, they are less likely to contain material errors of fraudulent logic. Because each module is independent of the others, errors are contained within the module.
Software TestingPrograms must be thoroughly tested before they are implemented. Program testing issues of direct concern to accountants are discussed in this section.
Testing Individual ModulesProgrammers should test completed modules independently before implementing them. This usually involves the creation of test data. Depending on the nature of the application, this could include test transaction files, test master files, or both. Figure 14-19 illustrates the test data approach. We examine this and several other testing techniques in detail in Chapter 17.
Assume the module under test is the Update AP Records program (Module H) repre-sented in Figure 14-17. The approach taken is to test the application thoroughly within its range of functions. To do this, the programmer must create some test accounts payable

684 Chapter 14 Construct, Deliver, and Maintain Systems Project
master file records and test transactions. The transactions should contain a range of data values adequate to test the logic of the application, including both good and bad data. For example, the programmer may create a transaction with an incorrect account number to see how the application handles such errors. The programmer will then compare the amounts posted to accounts payable records to see if they tally with precalculated results. Tests of all aspects of the logic are performed in this way, and the test results are used to identify and correct errors in the logic of the module.
Deliver the SystemThe system is now ready to be implemented. In this phase, database structures are popu-lated with data, equipment is purchased and installed, employees are trained, and the system is documented. This phase concludes with the roll-out of the new system and the termination of the old system.
The implementation process engages the efforts of designers, programmers, database administrators, users, and accountants. All the steps in this stage warrant careful man-agement. Nevertheless, not all steps are part of every system’s implementation, and not all are of direct concern to accountants. For example, the implementation activities of ordering equipment from vendors, preparing the site, installing equipment, and training employees are not performed with each new system. Moreover, these are technical tasks that do not usually involve the accounting function. This section focuses on those activi-ties that have the greatest direct implications for accountants and auditors.
Testing the Entire SystemWhen all modules have been coded and tested, they must be brought together and tested as a whole. User personnel should direct systemwide testing as a prelude to the formal
PredeterminedResults Test
Master Files
Test Data
Programmer Prepares TestTransactions, Test MasterFiles, and Expected Results
Test ResultsAfter Test Run, ProgrammerCompares Test Results withPredetermined Results
ApplicationBeingTested
Test DataTest Data
Test Transactions Input Sources
FIGURE 14-19 The Test Data Technique

Part IV Systems Development Activities 685
system cutover. The procedure involves using the system to process hypothetical data. The outputs of the system are then reconciled with predetermined results, and the test is documented to provide evidence of the system’s performance. Finally, when those con-ducting the tests are satisfied with the results, a formal acceptance document should be completed. This is an explicit acknowledgment by the user that the system in question meets stated requirements. The user acceptance document becomes important in reconcil-ing differences and assigning responsibility during the post-implementation review of the system.
Saving Test DataThe preparation of test data is a tedious, time-consuming activity. The auditor should save these data during system reviews for future use. By preserving the test data, we cre-ate what is called a base case, which documents how the system performed at a point in time. At any future point, the base case data should generate the same results. System changes (maintenance) that have occurred since system implementation will explain the differences between base case results and current test results. Hence, the base case pro-vides a reference point for analyzing the effects of system changes and eases the burden of creating test data.
Documenting the SystemThe system’s documentation describes how the system works. In this section, we consider the documentation requirements of four groups: systems designers and programmers, computer operators, end users, and accountants.
Designer and Programmer DocumentationSystems designers and programmers need documentation to debug errors and perform maintenance on the system. This group is involved with the system on a highly techni-cal level, which requires both general and detailed information. Some of this is provided through DFDs, ER diagrams, and structure diagrams. In addition, system flowcharts, program flowcharts, and listings of program code are important forms of documenta-tion. The system flowchart shows the relationship of input files, programs, and output files. However, it does not reveal the logic of individual programs that constitute the system. The program flowchart provides a detailed description of the sequential and logi-cal operation of the program. A separate program flowchart represents each program in the system’s flowchart. From these, the programmer can visually review and evaluate the program’s logic. The program code should itself be documented with comments that describe each major program segment.
Operator DocumentationComputer operators use documentation describing how to run the system called a run manual. The typical contents of a run manual include:
The name of the system, such as Purchases System.
The run schedule (daily, weekly, time of day, and so on).
Required hardware devices (tapes, disks, printers, or special hardware).
File requirements specifying all the transaction (input) files, master files, and output files used in the system.
•
•
•
•

686 Chapter 14 Construct, Deliver, and Maintain Systems Project
Run-time instructions describing the error messages that may appear, actions to be taken, and the name and telephone number of the programmer on call, should the system fail.
A list of users who receive the output from the run.
For security and control reasons, system flowcharts, logic flowcharts, and program code listings are not part of the operator documentation. Operators should not have access to the details of a system’s internal logic. We will discuss this point more fully in Chapter 15.
User DocumentationUsers need documentation describing how to use the system. User tasks include such things as entering input for transactions, making inquiries of account balances, updating accounts, and generating output reports. The nature of user documentation will depend on the user’s degree of sophistication with computers and technology. Thus, before designing user documentation, the systems professional must assess and classify the user’s skill level. The following is one classification scheme:
Novices
Occasional users
Frequent light users
Frequent power users
Novices have little or no experience with computers and may be embarrassed to ask questions. Novices also know little about their assigned tasks. User training and docu-mentation for novices must be extensive and detailed.
Occasional users once understood the system but have forgotten some essential com-mands and procedures. They require less training and documentation than novices.
Frequent light users are familiar with limited aspects of the system. Although func-tional, they tend not to explore beneath the surface and lack depth of knowledge. This group knows only what it needs to know and requires training and documentation for unfamiliar areas.
Frequent power users understand the existing system and will readily adapt to new systems. They are intolerant of detailed instructions that waste their time. They like to find shortcuts and use macro commands to improve performance. This group requires only abbreviated documentation.
With these classes in mind, user documentation often takes the form of a user hand-book, as well as online documentation. The typical user handbook will contain the fol-lowing items:
An overview of the system and its major functions
Instructions for getting started
Descriptions of procedures with step-by-step visual references
Examples of input screens and instructions for entering data
A complete list of error message codes and descriptions
A reference manual of commands to run the system
A glossary of key terms
Service and support information
Online documentation will guide the user interactively in the use of the system. Some commonly found online features include tutorials and help features.
•
•
•
•
•
•
•
•
•
•
•
•
•
•

Part IV Systems Development Activities 687
Tutorials. Online tutorials can be used to train the novice or the occasional user. The success of this technique is based on the tutorial’s degree of realism. Tutorials should not restrict the user from access to legitimate functions.
Help Features. Online help features range from simple to sophisticated. A simple help feature may be nothing more than an error message displayed on the screen. The user must walk through the screens in search of the solution to the problem. More sophisti-cated help is context related. When the user makes an error, the system will send the mes-sage, “Do you need help?” The help feature analyzes the context of what the user is doing at the time of the error and provides help with that specific function (or command).
Accountant (Auditor) DocumentationWith responsibility for the design of certain security procedures, accounting controls, and audit trails, accountants are stakeholders in all AIS applications. For these tasks, accountants may draw upon all of the documentation described previously. As internal and external auditors, accountants also require document flowcharts of manual proce-dures. We have encountered numerous examples of document flowcharts in the chap-ters dealing with the revenue, expenditure, and conversion cycles. Document flowcharts differ from DFDs in an important way. DFDs describe the overall logic of the system. Document flowcharts show explicitly the flow of information between departments, the departments in which tasks are actually performed, and the specific types and number of documents that carry information. A physical view such as this is needed to understand the segregation of duties, the adequacy of source documents, and the location of files that support the audit trail. Document flowcharts are not always included as part of the system’s documentation. When not provided, auditors must create their own during the audit process.
Converting the DatabasesDatabase conversion is a critical step in the implementation phase. This is the transfer of data from its current form to the format or medium the new system requires. The degree of conversion depends on the technology leap from the old system to the new one. Some conversion activities are very labor-intensive, requiring data to be entered into new data-bases manually. For example, the move from a manual system to a computer system will require converting files from paper to magnetic disk or tape. In other situations, writing special conversion programs may accomplish data transfer. A case in point is changing the file structure of the databases from sequential direct access files. In any case, data conversion is risky and must be carefully controlled. The following precautions should be taken:
1. Validation. The old database must be validated before conversion. This requires ana-lyzing each class of data to determine whether it should be reproduced in the new database.
2. Reconciliation. After the conversion action, the new database must be reconciled against the original. Sometimes this must be done manually, record by record and field by field. In many instances, writing a program that will compare the two sets of data can automate this process.
3. Backup. Copies of the original files must be kept as backup against discrepancies in the converted data. If the current files are already in magnetic form, they can be conve-niently backed up and stored. However, paper documents can create storage problems.

688 Chapter 14 Construct, Deliver, and Maintain Systems Project
When the user feels confident about the accuracy and completeness of the new data-bases, the paper documents may be destroyed.
Converting to the New SystemThe process of converting from the old system to the new one is called the cutover. A system cutover will usually follow one of three approaches: cold turkey, phased, or parallel operation.
Cold Turkey CutoverUnder the cold turkey cutover approach (also called the Big Bang approach), the firm switches to the new system and simultaneously terminates the old system. When imple-menting simple systems, this is often the easiest and least costly approach. With more complex systems, it is the riskiest. Cold turkey cutover is akin to skydiving without a reserve parachute. As long as the main parachute functions properly, there is no problem. But things don’t always work the way they are supposed to. System errors that were not detected during the walk-through and testing steps may materialize unexpectedly. With-out a backup system, an organization can find itself in serious trouble.
Phased CutoverSometimes an entire system cannot, or need not, be cut over at once. The phased cutover begins operating the new system in modules. For example, Figure 14-20 shows how we might implement a system, starting with the sales subsystem, followed by the inventory control subsystem, and finally the purchases subsystem.
By phasing in the new system in modules, we reduce the risk of a devastating sys-tem failure. However, the phased approach can create incompatibilities between new subsystems and yet-to-be-replaced old subsystems. Implementing special conversion systems that provide temporary interfaces during the cutover period may alleviate this problem.
Parallel Operation CutoverParallel operation cutover involves running the old system and the new system simultane-ously for a period of time. Figure 14-21 illustrates this approach, which is the most time-consuming and costly of the three. Running two systems in parallel essentially doubles
Phased Cutover Points
Time
Old Sales System
Old Inventory Control System
Old Purchases System
New Sales System
New Inventory Control System
New Purchases System
FIGURE 14-20 Phased Cutover

Part IV Systems Development Activities 689
resource consumption. During the cutover period, the two systems require twice the source documents, twice the processing time, twice the databases, and twice the output production.
The advantage of parallel cutover is the reduction in risk. By running two systems, the user can reconcile outputs to identify and debug errors before running the new system solo. Parallel operation should usually extend for one business cycle, such as one month. This allows the user to reconcile the two outputs at the end of the cycle as a final test of the system’s functionality.
Post-Implementation ReviewThe final step in the implementation phase actually takes place some months later in a post-implementation review. The objective is to measure the success of the system and of the process after the dust has settled. Although systems professionals strive to produce systems that are on budget, on time, and meet user needs, this does not always happen. The post-implementation review of the newly installed system can provide insight into ways to improve the process for future systems. The areas discussed in the following sec-tion are of particular concern.
System Design AdequacyThe physical features of the system should be reviewed to see if they meet user needs. The reviewer should seek answers to the following types of questions:
1. Does the output from the system possess such characteristics of information as rel-evance, timeliness, completeness, accuracy, and so on?
2. Is the output in the format most useful and desired by the user (such as tables, graphs, electronic, hard copy, and so on)?
3. Are the databases accurate, complete, and accessible?
4. Did the conversion process lose, corrupt, or duplicate data?
5. Are input forms and screens properly designed and meeting users’ needs?
6. Are the users using the system properly?
Term
ina
te O
ld S
yste
m
Reconcile
Continue Running New System
SimultaneousOperation Period
Output
Output
Old Sales Order System
New Sales Order System
FIGURE 14-21 Parallel Operation Cutover

690 Chapter 14 Construct, Deliver, and Maintain Systems Project
7. Does the processing appear to be correct?
8. Can all program modules be accessed and executed properly, or does the user ever get stuck in a loop?
9. Is user documentation accurate, complete, and easy to follow?
10. Does the system provide the user adequate help and tutorials?
Accuracy of Time, Cost, and Benefit EstimatesUncertainty complicates the task of estimating time, costs, and benefits for a proposed system. This is particularly true for large projects involving many activities and long time frames. The more variables in the process, the greater the likelihood for material error in the estimates. History is often the best teacher for decisions of this sort. Therefore, a review of actual performance compared to budgeted amounts provides critical input for future budgeting decisions. From such information, we can learn where mistakes were made and how to avoid them the next time. The following questions provide some insight:
1. Were PERT and Gantt chart estimates accurate to within 10 percent?
2. What were the areas of significant departures from budget?
3. Were departures from the budget controllable (internal) in the short run or noncon-trollable (for example, supplier problems)?
4. Were estimates of the number of lines of program code accurate?
5. Was the degree of rework due to design and coding errors acceptable?
6. Were actual costs in line with budgeted costs?
7. Are users receiving the expected benefits from the system?
8. Do the benefits seem to have been fairly valued?
The Role of AccountantsThe role of accountants in the construct and deliver phases of the SDLC should be signifi-cant. Most system failures are due to poor designs and improper implementation. Being a major stakeholder in all financial systems, accountants must apply their expertise in this process to guide and shape the finished system. Specifically, accountants should get involved in the following ways.
Provide Technical ExpertiseThe detailed design phase involves precise specifications of procedures, rules, and conven-tions to be used in the system. In the case of an AIS, these specifications must comply with GAAP, GAAS, SEC regulations, and IRS codes. Failure to so comply can lead to legal expo-sure for the firm. For example, choosing the correct depreciation method or asset valuation technique requires a technical background that systems professional don’t necessarily pos-sess. The accountant must provide this expertise to the systems design process.
Specify Documentation StandardsIn the implementation phase, the accountant plays a role in specifying system documen-tation. Because financial systems must periodically be audited, they must be adequately documented. The accountant must actively encourage adherence to effective documenta-tion standards.

Part IV Systems Development Activities 691
Verify Control AdequacyThe applications that emerge from the SDLC must possess controls that are in accor-dance with the provisions of Statement on Auditing Standards No. 78. This requires the accountant’s involvement at both the detailed design and implementation phases. Controls may be programmed or manual procedures. Some controls are part of the daily opera-tion of the system, while others are special actions that precede, follow, or oversee routine processing. The extent of control techniques makes it impossible to treat them within this chapter. Instead, we have devoted the next two chapters to the study of control concepts and design.
Commercial PackagesThus far we have examined system construction and delivery activities pertaining to in-house development. Not all systems are acquired in this fashion; the trend today is toward purchased software. Faced with many competing packages, each with unique features and attributes, management must choose the system and the vendor that best serves the needs of the organization. Making the optimal choice requires that this be an informed decision.
Before moving on to the next phase of the SDLC, we will examine the issues sur-rounding the purchase of commercial software. Our discussion will focus primarily on a technique that can help structure and evaluate the many intangible factors that compli-cate the process of selecting commercial software.
Trends in Commercial PackagesFour factors have stimulated the growth of the commercial software market: (1) the rela-tively low cost of general commercial software as compared to customized software; (2) the emergence of industry-specific vendors who target their software to the needs of particular types of businesses; (3) a growing demand from businesses that are too small to afford an in-house systems development staff; and (4) the trend toward downsizing of organizational units and the resulting move toward the distributed data processing environment, which has made the commercial software option more appealing to larger organizations. Indeed, organizations that maintain their own in-house systems development staff will purchase commercial software when the nature of their need permits. Commercial software can be divided into a number of general groups, which are discussed in the following section.
Turnkey SystemsTurnkey systems are completely finished and tested systems that are ready for implemen-tation. Often these are general-purpose systems or systems customized to a specific indus-try. Turnkey systems are usually sold only as compiled program modules, and users have limited ability to customize such systems to their specific needs. Some turnkey systems have software options that allow the user to customize input, output, and some process-ing through menu choices. Other turnkey system vendors will sell their customers the source code if program changes are desired. For a fee, the user or the vendor can then reprogram the original source code to customize the system. Some examples of turnkey systems are described in the following section.

692 Chapter 14 Construct, Deliver, and Maintain Systems Project
General Accounting Systems. General accounting systems are designed to serve a wide variety of user needs. By mass producing a standard system, the vendor is able to reduce the unit cost of these systems to a fraction of in-house development costs. Powerful sys-tems of this sort can be obtained for under $2,000.
To provide as much flexibility as possible, general accounting systems are designed in modules. This allows users to purchase the modules that meet their specific needs. Typi-cal modules include accounts payable, accounts receivable, payroll processing, inventory control, general ledger, financial reporting, and fixed asset.
Special-Purpose Systems. Some software vendors have targeted their systems to selected segments of the economy. For example, the medical field, the banking industry, and gov-ernment agencies have unique accounting procedures, rules, and conventions that gen-eral-purpose accounting systems do not always accommodate. Software vendors have thus developed standardized systems to deal with industry-specific procedures.
Office Automation Systems. Office automation is the use of computer systems to improve the productivity of office workers. Examples of office automation systems include word processing packages, database management systems, spreadsheet programs, and desktop publishing systems.
Backbone SystemsAs we learned in Chapter 1, backbone systems provide a basic system structure on which to build. Backbone systems come with all the primary processing modules programmed. The vendor designs and programs the user interface to suit the client’s needs. This approach can produce highly customized systems. But customizing a system is expensive and time-consuming. Many vendors thus employ object-oriented systems design, which takes advantage of reusable modules and thereby reduces the costs of tailoring the system to the user.
Vendor-Supported SystemsVendor-supported systems are hybrids of custom systems and commercial software. Under this approach, the vendor develops (and maintains) custom systems for its clients. The systems themselves are custom products, but the systems development service is com-mercially provided. This option is popular in the health care and legal services industries. Because the vendor serves as the organization’s in-house systems development staff, the client organization must rely on the vendor to provide custom programming and on-site maintenance of systems. Much of each client’s system may be developed from scratch, but by using an object-oriented approach, vendors can produce common modules that can be reused in other client systems. This approach helps to reduce development costs charged to the client firms.
ERP SystemsEnterprise resource planning (ERP) systems are difficult to classify into a single category because they have characteristics of all of the above. They are prewritten systems, which in some cases are implemented as turnkey applications. On the other hand, they can be modified to meet user needs. An ERP may be installed as a backbone system that interfaces with other legacy systems, or it may constitute an entirely new system. Because of their complexity, ERP systems are most often vendor-supported packages that an out-side service provider installs.

Part IV Systems Development Activities 693
Advantages of Commercial Packages
Implementation TimeCustom systems often take a long time to develop. Months or even years may pass before a custom system can be developed through in-house procedures. Unless the organization successfully anticipates future information needs and schedules application development accordingly, it may experience long periods of unsatisfied need. On the other hand, small commercial software systems can be implemented almost immediately upon recognizing a need. The user does not need to wait. The implementation of a single module of larger systems such as PeopleSoft, SAP, or ORACLE-FIN, however, could take from several weeks to a few months. An entire ERP could take years, but this is still much quicker than in-house or outsourced development would take.
CostA single user must wholly absorb in-house development costs. However, because the cost of commercial software is spread across many users, the unit cost is reduced to a fraction of the cost of a system developed in-house.
ReliabilityMost reputable commercial software packages are thoroughly tested before their release to the consumer market. Any system errors that were not discovered during testing that organizations likely uncover shortly after release are corrected. Although no system is certified as being free from errors, commercial software is less likely to have errors than an equivalent in-house system.
Disadvantages of Commercial Packages
IndependencePurchasing a vendor-supported system makes the firm dependent on the vendor for main-tenance. The user runs the risk that the vendor will cease to support the system or even go out of business. This is perhaps the greatest disadvantage of vendor-supported systems.
The Need for Customized SystemsThe prime advantage of in-house development is the ability to produce applications to exact specifications. This advantage also describes a disadvantage of commercial soft-ware. Sometimes, the user’s needs are unique and complex, and commercially available software is either too general or too inflexible.
MaintenanceBusiness information systems undergo frequent changes. If the user’s needs change, it may be difficult or even impossible to modify commercial software. On the other hand, in-house development provides users with proprietary applications that can be maintained.
Choosing a PackageHaving made the decision to purchase commercial software, the systems development team is now faced with the task of choosing the package that best satisfies the organi-zation’s needs. On the surface, there may appear to be no clear-cut best choice from

694 Chapter 14 Construct, Deliver, and Maintain Systems Project
the many options available. The following four-step procedure can help structure this decision-making process by establishing decision criteria and identifying key differences between options.
Step 1: Needs AnalysisAs with in-house development, the commercial option begins with an analysis of user needs. These are formally presented in a statement of systems requirements that provides a basis for choosing between competing alternatives. For example, the stated requirement of the new system may be to:
1. Support the accounting and reporting requirements of federal, state, and local agencies.
2. Provide access to information in a timely and efficient manner.
3. Simultaneously support both accrual accounting and fund accounting systems.
4. Increase transaction processing capacity.
5. Reduce the cost of current operations.
6. Improve user productivity.
7. Reduce processing errors.
8. Support batch and real-time processing.
9. Provide automatic general ledger reconciliations.
10. Be expandable and flexible to accommodate growth and changes in future needs.
The systems requirements should be as detailed as the user’s technical background permits. Detailed specifications enable users to narrow the search to only those packages most likely to satisfy their needs. Although computer literacy is a distinct advantage in this step, the technically inexperienced user can still compile a meaningful list of desirable features that the system should possess. For example, the user should address such items of importance as compliance with accounting conventions, special control and transac-tion volume requirements, and so on.
Step 2: Send Out the Request for ProposalsSystems requirements are summarized in a document called a request for proposal (RFP) that is sent to each prospective vendor. A letter of transmittal accompanies the RFP to explain to the vendor the nature of the problem, the objectives of the system, and the deadline for proposal submission.
The RFP provides a format for vendor responses and thus a comparative basis for initial screening. Some vendors will choose not to respond to the RFP, while others will propose packages that clearly do not meet the stated requirements. The reviewer should attempt to select from these responses those proposals that are feasible alternatives.
Step 3: Gather FactsIn this next step in the selection process, the objective is to identify and capture rel-evant facts about each vendor’s system. The following describes techniques for fact gathering.
Vendor Presentations. At some point during the review, vendors should be invited to make formal presentations of their systems at the user’s premises. This provides the prin-ciple decision makers and users with an opportunity to observe the product firsthand.

Part IV Systems Development Activities 695
Technical demonstrations are usually given at these presentations using modified versions of the packages that run on microcomputers. This provides an opportunity to obtain answers to detailed questions. Sufficient time should therefore be allotted for an in-depth demonstration followed by a question-and-answer period. If vendor representa-tives are unable or unwilling to demonstrate the full range of system capabilities or to deal with specific questions from the audience, this may indicate a functional deficiency of the system.
Failure to gain satisfactory responses from vendor representatives may also be a sign of their technical incompetence. The representatives either do not understand the user’s problem or their own system and how it relates to the user’s situation. In either case, the user has cause to question the vendor’s ability to deliver a quality product and to provide adequate support.
Benchmark Problems. One often-used technique for measuring the relative performance of competing systems is to establish a benchmark problem for them to solve. The bench-mark problem could consist of important transactions or tasks that key components of the system perform. In the benchmark example illustrated in Figure 14-22, both systems are given the same data and processing task. The results of processing are compared on criteria such as speed, accuracy, and efficiency in performing the task.
Vendor Support. For some organizations, vendor support is an important criterion in systems selection. The desired level of support should be carefully considered. Organiza-tions with competent in-house systems professionals may need less vendor support than firms without such internal resources. Support can vary greatly from vendor to vendor. Some vendors provide full-service support, including:
Client training
User and technical documentation
Warranties
•
•
•
Master FileRecords
OutputOutput
EvaluateResults
TransactionRecords
System BSystem A
SoftwareBeingTested
SoftwareBeingTested
FIGURE 14-22 Benchmark Approach to Testing Competing Software

696 Chapter 14 Construct, Deliver, and Maintain Systems Project
Maintenance programs to implement system enhancements
Toll-free help numbers
Annual seminars to obtain input from users and apprise them of the latest developments
At the other extreme, some vendors provide virtually no support. The buyer should be wary of a promise of support that seems too good to be true, because it probably is. The level of support the vendor provides can account for a large portion of its product’s price. To avoid dump-and-run vendors, the buyer must be prepared to pay for support.
Contact User Groups. A vendor’s current user list is an important source of information. The prospective user, not the vendor, should select a representative sample of users with the latest version of the package and with similar computer configurations. A standard set of questions directed to these users will provide information for comparing packages. The following list is an example of the type of questions to ask:
When did you purchase the package?
Which other vendors did you review?
Why did you select this package?
Are you satisfied with the package?
Are you satisfied with the vendor support?
Does the system perform as advertised?
Were modifications required?
What type of training did the vendor provide?
What is the quality of the documentation?
Have any major problems been encountered?
Do you subscribe to the vendor’s maintenance program?
If so, do you receive enhancements?
To reiterate an important point, the prospective user, not the vendor, should select the user references. This provides for a more objective appraisal and reduces the possibil-ity of receiving biased information from showcase installations.
Step 4: Analyze the Findings and Make a Final SelectionThe final step in the selection process is to analyze the facts and choose the best pack-age. The principal problem is dealing with the many qualitative aspects of this decision. A popular technique for structuring and analyzing qualitative variables is the weighted factor matrix. The technique requires constructing a table similar to the one illustrated in Table 14-2. This table shows a comparison between only two proposals, those of Ven-dor A and Vendor B. In practice, the approach can be applied to all the vendors under consideration.
The table presents the relevant decision criteria under the heading Factor. Each decision factor is assigned a weight that implies its relative importance to the user. Two steps are critical to this analysis technique: (1) identify all relevant decision factors and (2) assign realistic weights to each factor. As these factors represent all of the relevant decision crite-ria, their weights should total 100 percent. These weights will likely vary among decision makers. One reviewer may consider vendor support an important factor and thus assign a high numeric value to its weight. Another decision maker may give this a low weight because support is not important in his or her firm, relative to other factors.
•
•
•
•
•
•
•
•
•
•
•
•
•
•
•

After assigning weights, each vendor package is evaluated according to its perfor-mance in each factor category. Based upon the facts gathered in the previous steps, each individual factor is scored on a scale of 1 to 5, where 1 is poor performance and 5 is excellent. The weighted scores are computed by multiplying the raw score by the weight for each factor. Using the previous example, a weight of 15 for vendor support is multi-plied by a score of 4 for Vendor A and 3 for Vendor B, yielding the weighted scores of 60 and 45, respectively.
The weighted scores are then totaled, and each vendor is assigned a composite score. This is the vendor’s overall performance index. Table 14-2 shows a score for Vendor B of 391 and 372 for Vendor A. This composite score suggests that Vendor B’s product is rated slightly higher than Vendor A’s.
This analysis must be taken a step further to include financial considerations. For example, assume Proposal A costs $150,000 and Proposal B costs $190,000. An overall performance/cost index is computed as follows.
Proposal A: 372 ________ $150,000
= 2.48 per $1,000
Proposal B: 391 ________ $190,000
= 2.06 per $1,000
This means that Proposal A provides 2.48 units of performance per $1,000 versus only 2.06 units per $1,000 from Proposal B. Therefore, Proposal A provides the greater value for the cost.
The option with the highest performance/cost ratio is the more economically feasible choice. Of course, this analysis rests on the user’s ability to identify all relevant decision factors and assign to them weights that reflect their relative importance to the decision. If any relevant factors are omitted or if their weights are misstated, the results of the analysis will be misleading.
PROPOSAL A PROPOSAL B
Factor WeightRawScore
Weighted Score
RawScore
Weighted Score
Response time 10 5 50 4 40
Compatibility 9 3 27 5 45
Reputation and
experience 5 3 15 5 25
Ability to deliver on
schedule 7 4 28 5 35
Range of capabilities 15 4 60 4 60
Modularity 12 4 48 3 36
User friendliness 15 4 60 3 45
Supports database 9 2 18 5 45
Supports networking 3 2 6 5 15
Vendor support 15 4 60 3 45
Total 100 372 391
TABLE 14-2 Weighted Factor Matrix
Part IV Systems Development Activities 697

Maintenance and SupportMaintenance involves both implementing the latest software versions of commercial packages and making in-house modifications to existing systems to accommodate chang-ing user needs. Maintenance may be relatively trivial, such as modifying an application to produce a new report, or more extensive, such as programming new functionality into a system.
Some organizations view systems maintenance services as commodity activities that should be outsourced to third-party vendors on the low-cost bidder basis. The under-lying justification for this is short-term economic benefit. By outsourcing maintenance and support, management can channel financial resources into the organization’s core competencies. Unfortunately, isolating maintenance activities from the organization also disrupts the flow of system-related knowledge that may be of strategic importance to the organization.
Some organizations take a strategic view of maintenance. Maintenance is an integral part of the SDLC. Rather than representing the end of the line, it can be an incubator for new ideas. If management captures the appropriate data, each currently running sys-tem can be the prototype for the next version. To ensure success, the organization needs to collect all relevant data from comments, requests, observed symptoms, and ideas for improvement from the user community.
User SupportTypically, the first point of contact for such data transfer is through the user support function. This includes help desk services, user training and education classes, and for-mally documented user feedback pertaining to problems and system errors. To facilitate data gathering and analysis, knowledge management systems are effective maintenance tools.
Knowledge Management and Group MemoryKnowledge management is a concept consisting of four basic processes: gathering, orga-nizing, refining, and disseminating. Gathering brings data into the system. Organizing associates data items with subjects, giving them context. Refining adds value by discov-ering relationships between data, performing synthesis, and abstracting. Disseminating gets knowledge to the recipients in a usable form. The most difficult of these processes to automate is refining.
A knowledge management system can be used to create a group memory, which makes an organization more effective, just as human beings become more effective and mature with the accumulation of thoughts and memories. From a technology viewpoint, a knowledge management system is a database-oriented software tool that allows users, developers, and the operations community to contribute to the group memory. Contribu-tors add their comments, suggestions, or complaints about a system or process into forms from their desktop PCs. The knowledge management software uses a parsing utility that takes incoming strings of data and infers relationships from them. A notable strength of the system is that it can deal with both historical and emerging data. The goal of the system is not simply to store information in a central repository for record keeping or archival recall. Rather, it analyzes the heterogeneous data and disseminates information to users and systems management. Group memory is thus a potentially valuable input to the organization’s evolving systems strategy.
698 Chapter 14 Construct, Deliver, and Maintain Systems Project

FIGURE 14-23 CASE Spectrum of Support Tools for the SDLC
Maintenance
New Systems Development
Front End,Upper CASETools
Back End,Lower CASETools
Systems Development Life Cycle
SystemsPlanning
SystemsAnalysis
ConceptualDesign
SystemSelection
DetailedDesign
SystemImplementation
Analysis Tools ModelingTools
MaintenanceTools
DesignTools
CodingTools
Part IV Systems Development Activities 699
SummaryThe chapter dealt with the construction and delivery of information systems. The first section presented topics and issues related to in-house development. This began with a review of techniques used for improv-ing systems construction, including prototyping, CASE technology, PERT charts, and Gantt charts.
Next, we discussed two design approaches: the structured approach and the object-oriented approach. The discussion followed a design sequence that dealt with system components in the following order: create a data model of the business process, define conceptual user views, design the normalized data-base tables, design the physical user views (output and input views), develop the process modules, specify the system controls, and perform a system walk-through. The delivery stage involves populating data-base structures, purchasing and installing equipment, employee training, and system documentation. This phase concludes with the roll-out of the new system and the termination of the old system. The section concluded with a discussion of the accountant’s role in in-house development.
We next examined issues related to commercial software, an option that businesses are increasingly using. After briefly identifying the pros and cons of commercial software, we examined a four-step proce-dure that can be employed in the selection of commercial software packages. The chapter concluded with a brief discussion of the strategic role of system maintenance and the importance of group memory as a key input to systems strategy.
Appendix
Case ToolsFigure 14-23 presents the CASE spectrum of support in relation to the relevant stages of the SDLC. CASE tools are used to define user requirements, create physical databases from conceptual user views, produce systems design specifications, automatically generate computer program code, and facilitate the mainte-nance of programs that both CASE and non-CASE tools create. Figure 14-24 presents an overview dia-gram of a comprehensive CASE system. The sections below follow the main points of this diagram.
60893_14_Ch14_p659-p722.indd Sec1:699 11/1/07 11:38:38 PM

Central RepositoryThe heart of the CASE system is the central repository. Essentially, this is a database of attributes, relations, and elements that describe all the applications created under the CASE system. These items include:
1. Definitions of all databases.
2. Systems documentation, such as context diagrams, data flow diagrams, and structure charts.
3. The program code.
4. Reusable program modules.
5. User prototype screens.
The central repository system helps to integrate the activities of system designers working on the same project or on separate but related projects. For example, if the size or the name of a data attribute must be changed, then all the applications that use that attribute must also be changed. In a moderate-sized firm, this could involve hundreds of programs. Normally, this would require many days of manual searching to identify the affected programs. However, the central repository system can quickly identify and list the applications that use the attribute being changed. Another example of the integration of activities is the ability to reuse program code. Different applications may use the same routines. These routines can be created, tested, and then used many times. The central repository stores reusable modules for immediate implementation in other systems. This reduces the overall development time of subsequent applications.
700 Chapter 14 Construct, Deliver, and Maintain Systems Project
FIGURE 14-24 Overview of CASE System
MaintenanceModel
CodingModel
DesignModel
PrototypeModel
DFDModel
CentralRepository
CASESystem
ContextDFD
IntermediateDFD
ElementaryDFD
PrototypeScreens
StructureDiagrams
ProgramCode
DatabaseStructures
CASE OutputsUpper CASE Models Lower CASE Models
User Workstations
60893_14_Ch14_p659-p722.indd Sec1:700 11/1/07 11:38:39 PM

CASE ModelsCASE products employ several functional models that can be used to support activities in different phases of the SDLC. The following models are representative.
The Data Flow Diagram Model. We introduced the data flow diagram in Chapter 2. This section presents a more extensive use of this documentation technique. The DFD uses a set of symbols to represent the pro-cesses, data sources, data flows, and process sequences of a current or proposed system.
As a systems design tool, DFDs are used to represent multiple levels of detail. From the most general to the most detailed, these are the context level, the intermediate level, and the elementary level.
The Context-Level DFD. The analyst can use the context-level DFD to present an overview model of the business activities and the primary transactions that the system processes. Figure 14-25 presents an example of a context diagram of the revenue cycle for a company. The context diagram is a very high-level representation of the system. It does not include a detailed definition of data files and specific procedures. The focus is on the overall relationship between the entities (data, sources of data, and processes) in the system. This relationship is represented by symbols, lines, and arrows that show the direction of the data flows.
The Intermediate-Level DFD. The next step is to explode the context-level DFD into one or more inter-mediate-level DFDs, as illustrated in Figure 14-26. Notice how Process 1.0 in Figure 14-25 is decomposed into the following subprocesses.
1.1 Sales Approval
1.2 Ship Goods
1.3 Bill Customer
1.4 Update Accounts Receivable
Several levels of intermediate DFDs may be needed to present enough detail for the systems professional and user to fully understand the system. In this example, we show only one intermediate level.
The Elementary-Level DFD. Figure 14-27 presents the elementary-level DFD for Process 1.3 in Figure 14-26. An elementary-level DFD provides a clear and precise definition of all elements of a portion of the
FIGURE 14-25 Context-Level Data Flow Diagram for the Revenue Cycle
Customer AccountingRecords
SalesOrderProcessing
1.0
2.0
CashReceiptsProcessing
Sales Order
Customer BillUpdate
Update
Cash
Part IV Systems Development Activities 701
60893_14_Ch14_p659-p722.indd Sec1:701 11/1/07 11:38:39 PM

702 Chapter 14 Construct, Deliver, and Maintain Systems Project
system. In this example, Process 1.3 (bill customer) is explained in detail. Other elementary-level DFDs will be required for Processes 1.1, 1.2, and 1.4.
The preparation of DFDs in a non-CASE environment can be time-consuming for the analyst. Because of inevitable changes in specifications during the system’s development, the analyst may produce many versions of the DFD documents before arriving at the final product. The graphics capability of CASE tools greatly expedites this task by providing functions for labeling, modifying, and rearranging the DFD. However, the CASE DFD is more than simply a graphic representation of the system. The elementary-level DFD is the physical input to lower CASE models that automatically produce program code and database tables. Any and all changes to the system during its development and maintenance are thus made directly through the DFD.
The Prototype Model. The prototype model supports the prototyping concept presented earlier. This is a powerful feature that helps ensure that user requirements are being met. Systems professionals can imme-diately provide users with input screens and report formats. The user can thus visualize certain features of the system before it is actually designed and evaluate the proposed system. Any changes can be imple-mented before the system is designed and at virtually no cost to the project schedule.
FIGURE 14-26 Intermediate-Level Data Flow Diagram for Sales Order Processing System
Customer Carrier
CreditRecords
PricingData
CustomerAR Records
SalesApproval
1.1
BillCustomer
1.3
ShipGoods
1.2
UpdateAccountsReceivable
1.4
Sales Order
App
rove
dS
ales
Ord
erPacking Slip
Shippin
g Noti
ce
Posting Data
ShippingDocuments
Customer Bill
Post
60893_14_Ch14_p659-p722.indd Sec1:702 11/1/07 11:38:39 PM

Part IV Systems Development Activities 703
The Design Model. The logic of the design model is based on the concept of system decomposition, which was introduced in Chapter 1. Recall that any system can be decomposed from the top down into smaller and smaller subsystems, each with a specific function. The design model takes the elementary-level DFD as input and produces from this a structure diagram. The DFD is a model of the conceptual system, and the structure diagram is a model of the program code that constitutes the physical system. Figure 14-28 shows a structure diagram for the elementary-level DFD in Figure 14-27. The structure diagram shows the overall relationship between the modules that constitute the system. Each of these modules represents a separate program that must be coded, unless it already exists as a reusable program module. We examine the issue of reusable modules later in the chapter.
FIGURE 14-27 Elementary-Level Data Flow Diagram for the Billing Process
GeneralLedgerSystem
Journal Voucher
Customer
Sales OrderPending File
SalesJournal
PricingData
Com
plet
edIn
voic
e
Cus
tom
er B
ill
CompletedInvoice
SalesApproval
1.1
PrepareInvoice
1.3.2
Record inJournal
1.3.3
Reviewand BillCustomer
1.3.4
ReceiveApprovedSalesOrder
1.3.1
UpdateAccountsReceivable
1.4
ApprovedSales Order
Shipp
ing N
otice
Posting Data
PrepareJournalVoucher
1.3.5
Posting Copy
ShipGoods
1.2
60893_14_Ch14_p659-p722.indd Sec1:703 11/1/07 11:38:40 PM

704 Chapter 14 Construct, Deliver, and Maintain Systems Project
Many CASE tools document the details of each module in the form of pseudocode or structured English. Pseudocode explains what the module is supposed to do, regardless of the programming language used.
The Coding Model. One of the great labor-saving advantages of CASE is its facility for transforming the structure diagram into computer modules. Many top-end CASE tools produce program source code, such as COBOL, C, and C++. These source programs must then be compiled (translated) into executable machine code modules.
Some CASE tools convert the structure diagrams directly to machine code and eliminate the source-code stage. The reason for this is to preserve the integrity between the conceptual system model (the DFD) and the physical system (the program). Sometimes during maintenance or original development, systems specialists are tempted to make design changes directly to the source code. If these changes are not also made to the DFDs and structure diagrams that specify the system, there will be a discrepancy between documentation that describes what the program does and the actual program. By eliminating the source code, the systems professional is forced to make all systems changes via the DFDs. The CASE tool will then modify the structure diagrams and rewrite the computer (machine-level) code automatically. This ensures that the system’s description is always consistent with the program code.
The nonsource code approach has two implications for accountants, auditors, and management. The first is a potential control issue. The program source code is part of the system documentation. To prop-erly design their test procedures, auditors sometimes need to review the source code. If it is not available, this may hamper testing and force the auditor to employ alternative, less efficient, and more costly pro-cedures. Second, the nonsource code approach can have the effect of committing the firm to a particular CASE tool and vendor. By creating source code as a by-product of the development process, the applica-tion remains independent of the CASE system. Should the firm’s management decide to switch to another vendor, current applications can still be maintained. Most CASE tools will accept source programs written in standard source code.
The Maintenance Model. Eighty to 90 percent of the total cost of a system is expended during the main-tenance phase of the SDLC. This is often referred to as the iceberg effect. Figure 14-29 illustrates this phenomenon. All systems must be maintained throughout their lives, and some iceberg effect is inevi-table. However, poorly designed systems can significantly contribute to the problem. To make a change to a computer program in a non-CASE environment, the maintenance programmer must first thoroughly
FIGURE 14-28 Structure Diagram for Elementary-Level DFD of the Billing Process in Figure 14-27
UpdateAccountingRecords
PrepareCustomerInvoice
GetShippingNotice
Post toGeneralLedger
PrepareJournalVoucher
Record inJournal
GetApprovedSales Order
Get PricingData
Billing ProcessControl Program
60893_14_Ch14_p659-p722.indd Sec1:704 11/1/07 11:38:40 PM

Part IV Systems Development Activities 705
review the program code in an attempt to understand the original programmer’s logic. This review often requires a great deal of time and is protracted by awkward, inefficient, and redundant program logic. Even companies that use CASE tools will have some badly designed systems. Often these systems are old and precede CASE usage.
The CASE maintenance model facilitates program maintenance and greatly reduces the iceberg effect. Applications originally developed under CASE are relatively easy to maintain. The maintenance program-mer reviews the documentation for the application and makes the required changes, at the conceptual level, to the DFDs. The CASE system then makes the changes to the structure diagrams and program code automatically. Finally, the programmer thoroughly tests and installs the modified application.
CASE tools can also be used to maintain applications that were not originally developed under the CASE system. The CASE maintenance model provides two such tools for this purpose: reverse engineer-ing and reengineering. Reverse engineering extracts from the source code meaningful design specifications that the maintenance programmer can use to understand the application logic. Reengineering restructures and documents the old source code logic to conform to CASE standards. This includes preparing DFDs and structure diagrams. Thus, future maintenance of the system can proceed as if the application were originally created under CASE.
Advantages of CASEThe following is a list of the commonly cited advantages of the CASE approach.
1. Reduced system complexity. CASE systems are more easily comprehended than traditional methods and support structured logic concepts.
2. Increased flexibility. The systems development process does not usually proceed in a purely linear fashion in which each stage is totally complete before the next one begins. Rather, it tends to be a cyclical process. It will be necessary to return to a previous stage if proceeding to the next stage will result in a flawed design or an improper implementation. As the details of the problem unfold in the downstream stages, it may be necessary to reconsider and revise upstream models. Compared to manual techniques, CASE provides a great deal of flexibility to the analyst in making such revisions.
FIGURE 14-29 The Iceberg Effect
New SystemsDevelopment Costs
MaintenanceCosts
60893_14_Ch14_p659-p722.indd Sec1:705 11/1/07 11:38:40 PM

706 Chapter 14 Construct, Deliver, and Maintain Systems Project
3. Capacity to review alternative designs. Because CASE systems can be rapidly produced and changed, users and systems specialists can review prototypes of many alternative designs before committing to a particular system.
4. Quicker development process. The development process under CASE is three to six times faster than traditional methods, depending on the complexity of the system and the degree of CASE expertise within the firm.
5. Promotion of user involvement. Through its prototyping features, CASE has great potential for improving user involvement in the development process. We discuss this point in more detail in the following section.
6. Reusable program code and documentation. The central repository feature allows CASE systems to share common program modules and documentation.
7. Reduced maintenance cost. By maintaining the system at the conceptual level, maintenance time and programming errors are reduced. This translates into a more efficient process that responds more quickly to user needs. The iceberg effect is reduced by as much as 50 percent.
Disadvantages of CASEIn spite of these many virtues, CASE is not without its disadvantages, including:
1. Product cost. The cost of a CASE system is proportional to its features and sophistication. Microcom-puter CASE tools with limited features may be obtained for hundreds of dollars. Fully equipped CASE tools for a mainframe environment can cost hundreds of thousands of dollars.
2. Start-up time and cost. Developing a pool of CASE expertise within the organization takes time. Sys-tems professionals must be trained, and the learning curve for sophisticated CASE systems is steep.
3. Incompatible CASE tools. The hundreds of CASE products on the market are often incompatible with one another. This limits a firm’s choices when selecting CASE tools and tends to tie the firm to a single product and vendor.
4. Program inefficiency. The source code that CASE tools produce is not as efficient as code written by a skilled programmer. To improve program efficiency, programmers often modify the CASE-generated modules. This practice can produce discrepancies between the DFD system logic and the program logic.
Output Reporting AlternativesThis section presents various output design alternatives, along with a number of example output reports.
Tables and MatricesTables and matrices can be used to summarize large amounts of information. A table is a report arranged in columns and rows, such as the supplier analysis report in Figure 14-30. This table shows columns of evaluation data for suppliers with whom the firm does business. This is an effective means for comparing and contrasting relevant facts.
A matrix is a rectangular arrangement of data into rows and columns. Each element (the intersection of a row and a column) is a data value. This form of report is particularly useful for presenting binary state relations—the presence or absence of a state—among elements. Figure 14-31 is a matrix report showing which vendors supply which major inventory items.
Graphs and ChartsGraphs and charts present numeric data as geometric shapes. This visual approach to reporting presumes that a picture is worth a thousand words. Certainly this is true when conveying such summarized messages as the big picture and trends over time and comparing the performance of multiple products. For these purposes, visual reports are far more effective than numeric reports alone. In this section, we examine five visual reporting techniques: line graph, scatter graph, bar graph, pie chart, and layer chart.
60893_14_Ch14_p659-p722.indd Sec1:706 11/1/07 11:38:40 PM

Part IV Systems Development Activities 707
Line Graph. The simple line graph is used to show the fluctuations in an item of interest over time. Figure 14-32 illustrates this approach. We can use different colors and different-shaped lines to track multiple items. In Figure 14-32, the solid line is projected sales and the dashed line is actual sales. The increments of the scale (sales dollars) should be small enough to detect material fluctuations. However, in using line graphs, we must guard against using a scale that is too small, because it might portray an exaggerated picture to the user.
Scatter Graph. The purpose of a scatter graph is to reveal relationships among underlying data. To illus-trate, Figure 14-33 superimposes a line graph and scatter graph. The line graph shows only the movement from Point A to Point B in the form of a trend line that takes the average path through the data. In some instances, this could result in the loss of important information to the user. The points in the scatter graph show the degree of dispersion associated with the underlying activity.
Bar Graph. The purpose of a bar graph is to show the relationship of total quantities or proportions. Figure 14-34 uses a vertical bar graph to show the relationship over time between actual computer usage for a firm and budgeted usage.
The height of the bars represents the total amount of computer usage. If we were to plot the top points of each bar, we could construct a line graph showing the trend in usage and the relationship between actual and budgeted usage. However, the emphasis of a bar graph is on total amounts at specific points rather than on trends.
The horizontal bar graph is used to compare multiple items in the same time frame. For example, Figure 14-35 compares output from four production plants for the month of January.
Pie Chart. A pie chart presents the proportional relationship of different items to the whole. For example, Figure 14-36 shows the proportions of several items that together constitute total manufacturing cost. We can differentiate the segments by using color or by exploding them slightly from the rest of the pie.
FIGURE 14-30 Supplier Analysis Report
VENDOR
Morgan The RoadsterAttribute Acme Motors Supply Norton Co. Factory
Yrs inBusiness 11/2 4 9 3
Terms of Trade 2/10, n/30 offers 40% off retail, 2/10, n/30, Wholesale pricequantity no quantity offers quantity list, no quantitydiscounts discounts discounts discounts
Price Structure Competitive Lowest-priced Competitivesupplier
Lead Time 5–7 days 7–10 days 7–10 days for 3 daysmost Items guaranteed
Rush Service 1 day delivery at None None Overnight—2%3% charge charge
Delivery Reliability Good Good Poor Good
60893_14_Ch14_p659-p722.indd Sec1:707 11/1/07 11:38:41 PM

708 Chapter 14 Construct, Deliver, and Maintain Systems Project
FIGURE 14-31 Matrix Report Showing Vendors (Columns) and Inventory (Rows) Provided
InventoryItemSupplied
AcmeMotors
MorganSupply Norton Co.
The RoadsterFactory
109873 k
1098745
109873 q
1098746
7893279
8237419
9495581
X
X
X
X
X
X
X
X
X X
X
X
X
X
XX X
X
X
X
X
X
X
X
X
X
X
X
X
X
X
X
X
Vendor
FIGURE 14-32 Line Graph Showing Fluctuations in Sales Over Time at One-Month Intervals
J
6
5
4
3
2
1
J F M A M J J A S O N DTime—Months
Sal
es $
Mill
ions
=Projected Sales
=Actual Sales
60893_14_Ch14_p659-p722.indd Sec1:708

Part IV Systems Development Activities 709
FIGURE 14-33 Scatter Graph Superimposed on Line Graph
January February March AprilTime—Months
5
4
3
2
1
A
B
Sal
es U
nits
(100
0s)
FIGURE 14-35 Horizontal Bar Graph Comparing Production of Multiple Plants
Production for January 2001 (Thousands of Units)
4
3
2
1
1 2 3 4 5 6 7 8
ProductionSites
FIGURE 14-34 Bar Graph Showing Actual Computer Usage to Budgeted Usage —Shows CPU Hours per Month
January February March AprilTime—Months
April May June
500
400
300
200
100
Budget Actual
CPUHours
60893_14_Ch14_p659-p722.indd Sec1:709 11/1/07 11:38:41 PM

710 Chapter 14 Construct, Deliver, and Maintain Systems Project
To maintain the visual power of the message, however, the designer should attempt to restrict the number of segments. Too many pie wedges make differentiation difficult and complicate the chart.
Layer Chart. A layer chart also shows proportional relationships but allows the addition of another dimen-sion, such as time or condition. Figure 14-37 illustrates this by showing the change in the proportion of individual item costs to total manufacturing cost under different technology bases.
ColorsColors can greatly enhance the usefulness of a report. Choosing colors that are widely spaced on the color spectrum—such as red, green, and blue—provides for the greatest visual discrimination. This approach can be used to present data that are being compared or contrasted within a report. The level of color intensity can be used to emphasize material items or to de-emphasize normal (or less important) data. For example, the variance report in Figure 14-38 shows budgeted amounts, actual amounts, and the variance from budget for each line item.
FIGURE 14-36 Pie Chart for Manufacturing Costs
EngineeringTechnology
Inventory
Labor
Other
EngineeringLabor
Direct Materials
Technology
InventoryOther
DirectMaterials
Overhead
Overhead
Traditional ManufacturingCost Structure
Computer-IntegratedManufacturing (CIM) CostStructure
FIGURE 14-37 Layer Chart of Cost Proportion Changes Under Different Technology Bases
OtherEngineeringTechnology
InventoryCarrying
Costs
Materials
DirectLabor
Traditional Islands ofTechnology
JIT CIM
60893_14_Ch14_p659-p722.indd Sec1:710 11/1/07 11:38:42 PM

Part IV Systems Development Activities 711
High-intensity color is used here to draw attention to line items with a material variance (for example, a variance greater than 10 percent). Line items whose variance is under this materiality threshold are deemed under control and are deemphasized by the use of low-intensity color.
FIGURE 14-38 Variance Report Using Intensity to Highlight Material Variances
Sports Car FactoryCost Variance Report for Production Dept. 6
Date 11/20/07
***CVAR 1***
Item Budget Actual(Over) UnderBudget
************************************************************************Direct laborDirect materials
Job setupSuppliesScheduledmaintenance
36,000
141,600
4,000
122,000
2,200
1,200
36,800
3,6002,330
1,200
<800>
400<130>
0
<19,600>
K e y T e r m s
attributes (667)backbone systems (692)cohesion (680)cold turkey cutover (688)computer-aided software engineering (CASE) (663)conceptual user views (670)construct (664)coupling (679)cutover (688)data dictionary (682)data modeling (670)database conversion (687)design phase (669)detailed design report (682)disseminating (698)documentation (685)electronic input techniques (675)embedded instructions (675)event-driven languages (682)Gantt chart (664)gathering (698)group memory (698)
hard copy (674)inheritance (668)instance (668)intelligent forms (676)knowledge management (698)methods (667)object class (668)object-oriented design (667)object-oriented programming (OOP) language (683)objects (667)online documentation (686)operations control reports (672)organizing (698)parallel operation cutover (688)PERT chart (663)phased cutover (688)procedural language (682)prototyping (662)pseudocode (681)quality assurance group (681)refining (698)request for proposal (RFP) (694)
60893_14_Ch14_p659-p722.indd Sec1:711 11/1/07 11:38:42 PM

712 Chapter 14 Construct, Deliver, and Maintain Systems Project
run manual (685)structure diagram (679)structured design (664)systems design (670)third-generation languages (682)
turnkey systems (691)user handbook (686)walk-through (681)wall of code (669)zones (675)
R e v i e w Q u e s t i o n s 1. How does a prototype differ from the final
product? Why discard the prototype? What role does the end user play in prototyping?
2. What functions do CASE tools serve? 3. Distinguish between upper and lower CASE
tools. 4. What is a central repository in a CASE
system? 5. How can program code be reused? 6. What is a data flow diagram? What are the
different levels from most general to most detailed? Draw the common symbols used.
7. What is the relationship between an elemen-tary-level DFD and a structure diagram? Which must be prepared first?
8. Is pseudocode programming language-specific? How about the coding model?
9. What is the difference between source code and machine code? Why is it preferable to have the CASE tools convert the structure diagrams into machine code rather than source code?
10. What is the iceberg effect? How can CASE tools help to minimize this phenomenon?
11. Distinguish between reverse engineering and reengineering.
12. Contrast the advantages and disadvantages of CASE tools. What should determine whether CASE is used?
13. What is an object, and what are its characteris-tics in the object-oriented approach? Give two examples.
14. Distinguish between object classes and instances.15. What is meant by inheritance? Give an example.16. Why is the object-oriented approach particu-
larly suited to ERP system design?
17. What are the four factors that have stimulated the growth of commercial software?
18. Distinguish between turnkey and backbone systems. Which is more flexible?
19. What are the four steps involved in choosing a package?
20. What is an RFP?21. Discuss the relative merits of in-house programs
versus commercially developed software.22. List, in sequential order, the system compo-
nents that are designed in the detailed design phase.
23. What is data modeling? What is its primary tool?
24. What are the three basic symbols in an ER diagram?
25. Distinguish between primary and foreign keys.26. What is a data dictionary?27. What document is used to determine which
tables of data are necessary?28. Once the conceptual links between tables have
been determined, how are the physical links incorporated?
29. What attributes should output views possess?30. Why is the quality of the paper a major con-
sideration in the design of a hard-copy input?31. What are the two classes of design input
views?32. What are zones?33. In what form should embedded instructions be
written—active or passive voice? Why?34. What are the relative merits of input from
source documents and direct input?35. What is pseudocode? Are end users or systems
designers involved in this process?
60893_14_Ch14_p659-p722.indd Sec1:712 11/1/07 11:38:43 PM

Part IV Systems Development Activities 713
36. What are the controls designated in the sys-tems controls stage?
37. Typically, which is more difficult to detect and more costly to fix—a design flaw in the pro-cesses or a programming error?
38. Who is included in the quality assurance group? What are their tasks? What documents do they need to perform their tasks?
39. Which activities during the systems implemen-tation phase have the greatest implications for accountants and auditors?
40. Which chart, a PERT or a Gantt, shows the project status at a glance for a given point in time? Which method illustrates the critical path at a glance?
41. Discuss the relative merits and drawbacks to 3GL. How might changing technology affect some of these issues in the future?
42. What is a hybrid language?43. What are the advantages to the modular pro-
gramming approach?44. Why should test data be saved after it has been
used?45. Explain the importance of documentation by
the systems programmers.46. What documents do accountants and auditors
need for the new system that other stakehold-ers typically do not?
47. What very important precautions must be taken during the data conversion procedures?
D i s c u s s i o n Q u e s t i o n s
1. Data flow diagrams are often described as exploding from one level to the next. What is meant by exploding? Also, data flow diagrams must reconcile from the general level to the next level of detail. What is meant by recon-cile? How do you think CASE tools help in this procedure?
2. What issues are accountants concerned with when determining their preference for CASE tools that convert structure diagrams into machine code or source code? What are the costs associated with each?
3. What documentation techniques are used in the structured design approach to conceptual design? What is the purpose of each of these documentation techniques, and how do they vary from each other? How much detail is provided?
4. Compare and contrast the structured design approach and the object-oriented design approach. Which do you feel is most benefi-cial? Why?
5. If a firm decides early to go with a special-purpose system, such as SAP, based upon the recommendations of the external audit firm, should the SDLC be bypassed?
6. Explain how benchmarking works. Should this be conducted on the vendor’s computer or the customer’s computer? What about technical presentations by the vendor? Why?
7. Discuss the importance of the weights assigned to factors in the final selection process. What method might you suggest be used to investi-gate the appropriateness of the weights?
8. Who should select the contact user group—the vendor or the prospective user? Why?
9. What processes should be used to develop use-ful and meaningful output? Who should be involved in the development process?
10. Are input requirements or output requirements examined to determine the attributes of tables? Should all of these attributes physically be in the data file? Why or why not?
11. Are direct input systems (that is, point-of-sale using bar codes) error free? Why or why not?
12. Why is it necessary to decompose the DFD to a level of high detail before preparing the structure diagram? How do you know when to stop this process?
13. A good structure diagram should be loosely coupled yet strongly cohesive. How can you achieve both characteristics simultaneously?
60893_14_Ch14_p659-p722.indd Sec1:713 11/1/07 11:38:43 PM

714 Chapter 14 Construct, Deliver, and Maintain Systems Project
What implications do these characteristics have on error-prone problems during maintenance?
14. Why bother with pseudocode? Why not spend the time developing actual source code?
15. During a test data procedure, why should the developers bother testing bad data?
16. During implementation, if the system is behind schedule and if each program module is tested and no problems are found, is it necessary to test all modules in conjunction with one another? Why or why not?
17. Run manuals for computer operators are simi-lar in theory to the checklists that airplane pilots use for takeoffs and landings. Explain why these are important.
18. How might the decision to use CASE tools affect the choice of a programming language?
19. What are the three implementation (cutover) methods? Which appears to be the most costly up front? Which could very likely end up being the most costly in the long run?
20. Who conducts the post-implementation review? When should it be conducted? If an outside consulting firm were hired to design and implement the new system, or a canned software package were purchased, would a post-implementation review still be useful?
21. Discuss the importance of involving accoun-tants in the detailed design and implementa-tion phases. What tasks should they perform?
M u l t i p l e - C h o i c e Q u e s t i o n s
1. Which of the following is the correct sequence of activities in the systems development life cycle?
a. Design, analysis, implementation, and operation.
b. Design, implementation, analysis, and operation.
c. Analysis, design, implementation, and operation.
d. Programming, analysis, implementation, and operation.
2. Which of the following is NOT an output attribute?
a. relevance b. exception orientation c. zones d. accuracy 3. Which of the following is NOT a principal
feature of a PERT chart? a. starting and ending dates b. events c. paths d. activities 4. Internal auditors would most appropriately
perform which of the following activities dur-ing a review of systems development activity?
a. Serve on the MIS steering committee that determines what new systems are to be developed.
b. Review the methodology used to moni-tor and control the system development function.
c. Recommend specific automated procedures to be incorporated into new systems that will provide reasonable assurance that all data submitted to an application are con-verted to machine-readable form.
d. Recommend specific operational procedures that will ensure that all data submitted for processing are converted to machine-readable form.
5. Which of the following is the least risky strat-egy for converting from a manual to a com-puterized system?
a. file conversion b. parallel conversion c. pilot conversion d. big bang conversion e. direct conversion 6. At which point are errors are most costly to
correct? a. programming b. conceptual design
60893_14_Ch14_p659-p722.indd Sec1:714 11/1/07 11:38:43 PM

Part IV Systems Development Activities 715
c. analysis d. detailed design e. implementation 7. User acceptance testing is more important in
an object-oriented development process than in a traditional environment because of the implications of the
a. absence of traditional design documents. b. lack of a tracking system for changes. c. potential for continuous monitoring. d. inheritance of properties in hierarchies. 8. Which of the following sets of application
characteristics of an accounting application might influence the selection of data entry devices and media for a computerized account-ing system?
a. Timing of feedback needs relative to input, need for documentation of an activity, and the necessity for reliability and accuracy.
b. Cost considerations, volume of input, com-plexity of activity, and liquidity of assets involved.
c. Need for documentation, necessity for accu-racy and reliability, volume of output, and cost considerations.
d. Relevancy of data, volume of input, cost considerations, volume of output, and tim-ing of feedback needs relative to input.
e. Type of file used, reliability of manufac-turer’s service, volume of output, and cost considerations.
9. What is the name given to the systems devel-opment approach used to quickly produce a
model of user interfaces, user interactions with the system, and process logic?
a. neural networking b. prototyping c. reengineering d. application generation10. The PERT is combined with cost data to pro-
duce a PERT cost analysis to a. calculate the total project cost inclusive of
the additional slack time. b. evaluate and optimize trade-offs between
time of an event’s completion and its cost to complete.
c. implement computer-integrated manufac-turing concepts.
d. avoid the problem of time variance analysis.
e. calculate expected activity times.11. Which of the following is NOT part of the sys-
tems implementation process? a. converting databases b. documentation c. systems design d. testing and correction12. What is the critical path in the PERT method
for network analysis? a. shortest path through the network b. longest path through the network c. path with the most slack d. path with the most variability in estimated
times e. least-cost path
P r o b l e m s
1. CASE ToolsReeve Lumber Company has a small informa-tion systems department consisting of five peo-ple. A backlog of approximately 15 months exists for requests for new systems applica-tions to even be considered. Both information users and systems personnel are unhappy with this state of affairs. The users feel that the sys-tems department is not responsive enough to
their needs, while the systems personnel feel overworked, frustrated, and unappreciated.
Janet Hubert, the manager of the sys-tems department, has decided that she needs to take a proactive measure. She is request-ing the funds to purchase a CASE system for approximately $75,000 that takes about two months to install and train workers how to use it. The president of the company,
60893_14_Ch14_p659-p722.indd Sec1:715 11/1/07 11:38:43 PM

716 Chapter 14 Construct, Deliver, and Maintain Systems Project
Mike Cassidy, initially responded by ques-tioning the wisdom of taking the systems per-sonnel away from their duties when they are backlogged so they can learn a system. Prepare a memo from Hubert to Cassidy. In the memo, outline the expected benefits of purchasing and using a CASE system and address Cassidy’s concern regarding the two-month training and implementation period.
2. Data Flow DiagramsSawicki Music Supply is a mail-order business that accepts merchandise orders by telephone and mail. All payments must be prepaid with a major credit card. Once an order is received, either the item is found in inventory and shipped immediately, the item is not found in inventory and is ordered from the manufac-turer, or a notice is sent to the customer indi-cating that the item is no longer stocked.
Required:Prepare a context-, intermediate-, and ele-mentary-level data flow diagram for Sawicki Music Supply. For the elementary-level dia-gram, explode the inventory function.
3. Data Flow DiagramsExamine the context and intermediate (Level 1) data flow diagrams in the next column and indicate what is incorrect about them.
4. Design Input ViewDuring the system design phase of the SDLC, input interfaces or input views must be sketched out so programmers can specify the necessary elements when they program the user interfaces for the system. Figure 14-12 presents an interface for a Reorder Report. Sketch a similar interface that could be used to program a sales invoice interface. Include areas for a document heading, customer infor-mation, shipping information, sales employee information, and items sold.
5. Systems DesignRobin Alper, a manager of the credit collections department for ACME Building Supplies, is extremely unhappy with a new system that was installed three months ago. Her complaint is
that the data flows from the billing and accounts receivable departments are not occurring in the manner originally requested. Further, the updates to the database files are not occurring as frequently as she had envisioned. Thus, the hope that the new system would provide more current and timely information has not materialized. She claims that the systems analysts spent three days interviewing her and other workers. During that time, she and the other workers thought they had clearly conveyed their needs. She feels as if their needs were ignored and their time was wasted.
Required:What went wrong during the systems design process? What suggestions would you make for future projects?
Context-Level Diagram
Customer Order
Out-of-Stock Notice
Disapproved Notice
Goods and Invoice
ABC’sOrder
Processing
Customer1
StockCheck
InventoryFile
Customer
Customer Order Number of
3CreditCheck
4PrepareInvoice
5Ship
Goods
CustomerFile
Credit Status
Open InvoiceFile
Invoice Data
2Out-of-StockNotice
In-Stock Order
Approved Order
Invoice
Out-of-StockNotice
Goods and Invoice
Level 1 Diagram
Items in Stock
Problem 3:Data Flow Diagrams
60893_14_Ch14_p659-p722.indd Sec1:716 11/1/07 11:38:43 PM

Part IV Systems Development Activities 717
6. Attributes and OperationsPrepare a list of attributes and operations for the following items:a. general ledgerb. accounts payable ledgerc. accounts receivable ledgerd. fixed assets ledgere. inventory ledger
7. Commercial SoftwareRobert Hamilton was hired six months ago as the controller of a small oil and gas explora-tion and development company, Gusher, Inc., headquartered in Beaumont, Texas. Before working at Gusher, Hamilton was the con-troller of a larger petroleum company, Eureka Oil Company, based in Dallas.
The joint interest billing and fixed asset accounting systems of Gusher are outdated, and frequent processing problems and errors have been occurring. Hamilton immediately recognized these problems and informed the president, Mr. Barton, that it was crucial to install a new system. Barton concurred and met with Hamilton and Sally Jeffries, the information systems senior manager. Barton instructed Jeffries to make the new system a top priority. Basically, he told Jeffries to deliver the system to meet Hamilton’s needs as soon as possible.
Jeffries left the meeting feeling over-whelmed because the IS department is cur-rently working on two other very big projects, one for the production department and the other for the geological department. The next day, Hamilton sent a memo to Jeffries indicat-ing the name of a system he had 100 percent confidence in—Amarillo Software—and he also indicated that he would very much like this system to be purchased as soon as pos-sible. He stated that the system had been used with much success during the past four years in his previous job.
When commercial software is purchased, Jeffries typically sends out requests for pro-posals to at least six different vendors after conducting a careful analysis of the needed requirements. However, due to the air of
urgency demonstrated in the meeting with the president and the overworked systems staff, she decided to go along with Hamilton’s wishes and sent only one RFP, which went to Amarillo Software. Amarillo promptly returned the completed questionnaire. The purchase price ($75,000) was within the budgeted amount. Jeffries contacted the four references provided and was satisfied with their comments. Further, she felt comfortable because the system was for Hamilton, and he had used the system for four years.
The plan was to install the system during the month of July and try it for the August transaction cycle. Problems were encountered, however, during the installation phase. The system processed extremely slowly on Gush-er’s hardware platform. When Jeffries asked Hamilton how the problem had been dealt with at Eureka, he replied that he did not remember having such a problem. He called the systems manager from Eureka and discov-ered that Eureka has a much more powerful mainframe than Gusher. Further investigation revealed that Gusher has more applications running on its mainframe than Eureka does, because Eureka uses a two-mainframe distrib-uted processing platform.
Further, the data transfer did not go smoothly. A few data elements being stored in the system were not available as an option in the Amarillo system. Jeffries found that the staff at Amarillo was very friendly when she called, but they could not always identify the problem over the phone. They needed to come out to the site and investigate. Hamilton was surprised at the delays between requesting an Amarillo consultant to come out and the time in which he or she actually arrived. Amarillo explained that it had to fly a staff member from Dallas to Beaumont for each trip.
The system finally began to work some-what smoothly in January, after a grueling fiscal year-end close in October. Hamilton’s staff views the project as an unnecessary incon-venience. At one point, two staff accountants threatened to quit. The extra consulting fees amounted to $35,000. Further, the systems department at Gusher spent 500 more hours
60893_14_Ch14_p659-p722.indd Sec1:717 11/1/07 11:38:44 PM
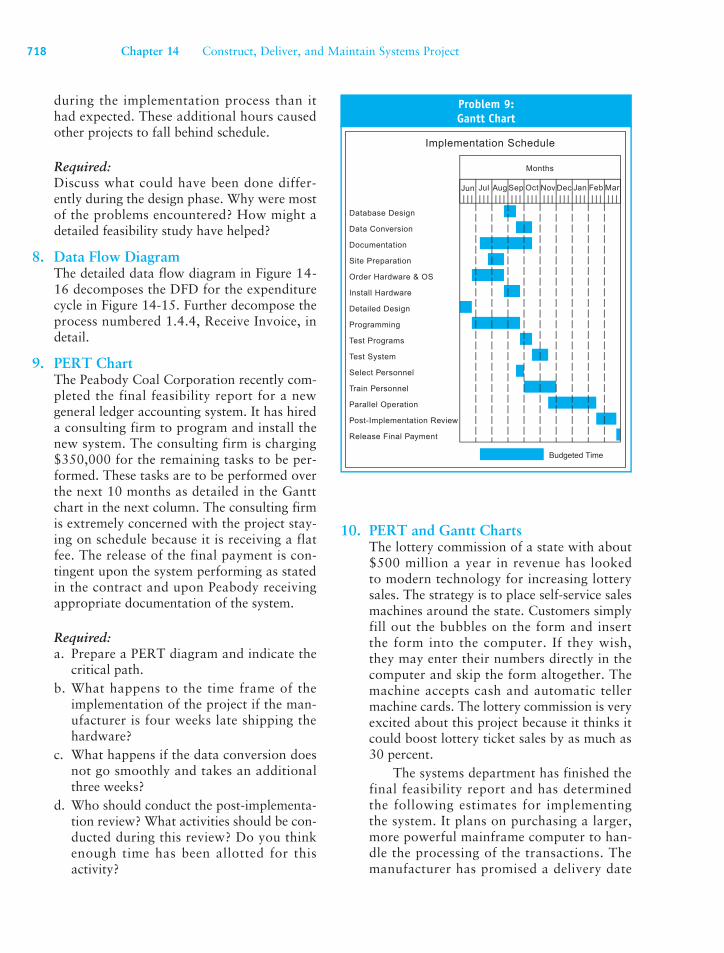
718 Chapter 14 Construct, Deliver, and Maintain Systems Project
during the implementation process than it had expected. These additional hours caused other projects to fall behind schedule.
Required:Discuss what could have been done differ-ently during the design phase. Why were most of the problems encountered? How might a detailed feasibility study have helped?
8. Data Flow DiagramThe detailed data flow diagram in Figure 14-16 decomposes the DFD for the expenditure cycle in Figure 14-15. Further decompose the process numbered 1.4.4, Receive Invoice, in detail.
9. PERT ChartThe Peabody Coal Corporation recently com-pleted the final feasibility report for a new general ledger accounting system. It has hired a consulting firm to program and install the new system. The consulting firm is charging $350,000 for the remaining tasks to be per-formed. These tasks are to be performed over the next 10 months as detailed in the Gantt chart in the next column. The consulting firm is extremely concerned with the project stay-ing on schedule because it is receiving a flat fee. The release of the final payment is con-tingent upon the system performing as stated in the contract and upon Peabody receiving appropriate documentation of the system.
Required:a. Prepare a PERT diagram and indicate the
critical path.b. What happens to the time frame of the
implementation of the project if the man-ufacturer is four weeks late shipping the hardware?
c. What happens if the data conversion does not go smoothly and takes an additional three weeks?
d. Who should conduct the post-implementa-tion review? What activities should be con-ducted during this review? Do you think enough time has been allotted for this activity?
10. PERT and Gantt ChartsThe lottery commission of a state with about $500 million a year in revenue has looked to modern technology for increasing lottery sales. The strategy is to place self-service sales machines around the state. Customers simply fill out the bubbles on the form and insert the form into the computer. If they wish, they may enter their numbers directly in the computer and skip the form altogether. The machine accepts cash and automatic teller machine cards. The lottery commission is very excited about this project because it thinks it could boost lottery ticket sales by as much as 30 percent.
The systems department has finished the final feasibility report and has determined the following estimates for implementing the system. It plans on purchasing a larger, more powerful mainframe computer to han-dle the processing of the transactions. The manufacturer has promised a delivery date
Implementation Schedule
Months
Database Design
Data Conversion
Documentation
Site Preparation
Order Hardware & OS
Install Hardware
Detailed Design
Programming
Test Programs
Test System
Select Personnel
Train Personnel
Parallel Operation
Post-Implementation Review
Release Final Payment
Jun Jul Aug Sep Oct Nov Dec Jan Feb Mar
Budgeted Time
Problem 9:Gantt Chart
60893_14_Ch14_p659-p722.indd Sec1:718 11/1/07 11:38:44 PM

Part IV Systems Development Activities 719
of three months from the time the order is placed. The lottery sales machines must be special ordered and require a lead time of five months. The plan is to initially order 15 machines and test them for 12 weeks. If all goes well, the lottery commission will order a total of 500 machines, with 20 delivered and installed each month. This order will not be placed until the results of the pilot test have been analyzed.
The writing of the programs is expected to take six weeks. The testing of the pro-grams on the mainframe is expected to take four weeks, with an additional three weeks once the sales machines have been received. The state gaming commission is expected to test for another two weeks. The design of the databases is expected to take only two weeks. Not much data transfer is expected to be nec-essary, so only three weeks is budgeted for this task.
An estimated 20 employees need to be hired and trained to install and maintain these machines around the state. The hiring process is expected to take six weeks, and the training should take an additional six weeks. The documentation should take about three months and should be completed before the training of the new employees. As soon as the gaming commission signs off on the pro-grams, the 15 machines are to be installed at test sites around the state. Four weeks are allotted for this installation procedure. A one-week testing period is planned, with commission employees going to the sites and using the machines. An additional week is planned to review the results of these tests. The pilot test then begins and runs for eight weeks. The data will be analyzed for four weeks after the pilot test. The final order for the additional machines will be placed after the data analysis is conducted and the demand for the number of machines is more accurately determined.
Required:a. Prepare a PERT chart for the above pro-
cess. Identify the critical path.b. Prepare a Gantt chart for the above process.
11. Accountants understand their jobs very well. Programmers also understand their jobs. Unfortunately, accountants are rarely programmers and programmers are rarely accountants. While an accountant does not need to program, the accountant must be able to communicate his requirement to the pro-grammer, an individual who may not under-stand the intricate needs of the accountants. To bridge this knowledge gap, the accoun-tant may be called on to produce pseudo-code—a set of detailed instructions written in English without syntax rules. Suppose you need a programmer to prepare code that will read sales information from an input screen; compute extensions for items sold; com-pute a total of these extensions; and update inventory balances, the sales ledger account, and accounts receivable as well as any sub-sidiary accounts. Prepare pseudocode for the programmer.
12. CMA 786 5-Y6
PERT ChartSilver Aviation assembles small aircraft for commercial use. The majority of Silver’s busi-ness is with small freight airlines serving areas where the airport does not accommodate larger planes. The remainder of Silver’s cus-tomers are commuter airlines and individu-als who use planes in their businesses. Silver recently expanded into Central and South America and expects to double its sales over the next three years.
To schedule work and keep track of all projects, Silver uses the PERT. The PERT dia-gram for the construction of a single cargo plane is shown on the following page. The PERT diagram shows that there are four alternative paths, with the critical path being ABGEFJK.
Bob Peterson, president of Coastal Air-lines, has recently placed an order with Silver Aviation for five cargo planes. At the time of contract negotiations, Peterson agreed to a delivery time of 13 weeks (five working days per week) for the first plane, with the balance of the planes being delivered at the rate of one every four weeks. Because of problems with
60893_14_Ch14_p659-p722.indd Sec1:719 11/1/07 11:38:44 PM

720 Chapter 14 Construct, Deliver, and Maintain Systems Project
HJ by 1 dayFJ by 1 dayGH by 2 daysCD by 2 daysEF by 1 dayDE by 2 daysBG by 1 day
ActivityCrashed
$ 400400500700800800
1,000
AdditionalCost
per Day
$65,10065,50065,90066,90068,30069,10070,70071,700
TotalDirectCost
65 days64636159585655
CompletionTime
ABBCCDDEBEBGGEEFGHFJHJJK
Frame fuselageWing placementEngine mountLanding gearCargo doorsElectrical wiringInstrument panelElectrical testsExterior shellInterior finishExterior paintFinal testing
Activity
$1,2001,400
700800—
1,0001,300
800500400400900
Added CrashCost perReduced
Day
ExpectedActivity Times
20 days 6 9 7 315 811 9 8 6 3
Regular
16 days 5 7 5 313 610 7 7 5 2
Crash
Direct Cost
$12,0003,6006,6005,1001,4009,0005,7006,8004,2003,6003,6003,500
$65,100
Regular
$16,8005,0008,0006,7001,400
11,0008,3007,6005,2004,0004,0004,400
$82,400
Crash
Crash Cost Listing
A
H
J KB
G
C
F
Framefuselage20 days
Wing
placement
6 days
Electricalwiring
15 days
Cargo doors3 days
Enginemount9 days
Exterior shell9 days
Exterior paint
6 daysInstrument panel
8 days
Landing gear
7 days Electricaltests
11 days
Interiorfinish
Finaltesting3 days
D
E 8 days
Vander’s planfor accelerated
delivery
Problem 12:PERT Chart
some of the aircraft Coastal is using, Peterson has contacted Grace Vander, sales manager for Silver Aviation, to ask about improving the
delivery date of the first cargo plane. Vander replied that she believed the schedule could be shortened by as much as 10 working days,
60893_14_Ch14_p659-p722.indd Sec1:720 11/1/07 11:38:45 PM

Part IV Systems Development Activities 721
or two weeks, but the cost of construction would increase as a result. Peterson said he would be willing to consider the increased costs, and they agreed to meet the following day to review a revised schedule that Vander would prepare.
Because Silver Aviation has assembled air-craft on an accelerated basis before, the com-pany has compiled a list of crash costs for this purpose. Vander used the data shown in the Crash Cost Listing table below to develop a plan to cut ten working days from the sched-ule at a minimal increase in cost to Coastal Airlines.
Upon completing her plan, Vander was pleased that she could report to Peterson that Silver would be able to cut 10 working days from the schedule. The associated increase in cost would be $6,600. Presented below is Vander’s plan for the accelerated delivery of the cargo plane starting from the regularly scheduled days and costs.
Required: a. PERT is a form of network analysis.
1. Explain how the expected regular times for each activity are derived in using PERT.
2. Define the term critical path and ex-plain why path ABGEFJK is the critical path in this situation.
b. Evaluate the accelerated delivery schedule that Grace Vander prepared.
1. Explain why Vander’s plan as pre-sented is unsatisfactory.
2. Revise the accelerated delivery sched-ule so that Coastal Airlines will take delivery of the first plane two weeks (10 working days) ahead of sched-ule at the least incremental cost to Coastal.
3. Calculate the incremental costs Bob Peterson will have to pay for this revised accelerated delivery.
13. Detailed Systems DesignOn the next page is an ER diagram for the expenditure cycle.
Required:a. List the entity database tables and describe
which entities need representing from an AIS perspective.
b. For each item identified as relevant to AIS, prepare a list of database tables along with primary and embedded foreign keys.
c. Prepare database tables showing attributes in normalized form.
14. Conceptual DesignVince Malloy and Katy Smith, both systems personnel at Shamrock Steelworks, are design-ing a new expenditure cycle system. Vince has worked for Shamrock for 12 years and has been involved in many systems development projects. Katy recently began working for Shamrock. She has four years of experience in systems development with another com-parably sized organization. Yesterday, Vince and Katy met to determine their plan for approaching the conceptual system design. Below is an excerpt of some dialogue that occurred in that meeting.
Katy: I really think that the new system can be designed more efficiently if we use an object-oriented design approach. Further, future enhancements and maintenance will be easier if we use an object approach.
Vince: The method you are suggesting is a creation of modules. I do not have a prob-lem with that concept in general. I just prefer using a top-down approach to design the sys-tem. We have been using that system for the past 12 years, and it has worked out OK.
Katy: Sure, your systems have worked for you, but perhaps they can be developed more efficiently, not to mention maintaining them. Further, we have approximately a two-year backlog of projects. Changing to a more effi-cient design system may help us to reduce that wait.
Vince: We may not end up with the system we want if we do not consider the big picture. I am afraid if we get too tied to using existing modules for future projects, we may design suboptimal systems that will require more
60893_14_Ch14_p659-p722.indd Sec1:721 11/1/07 11:38:45 PM

722 Chapter 14 Construct, Deliver, and Maintain Systems Project
maintenance and have shorter lives in the long run. What good will the more efficient system do us then?
Required:Prepare Katy’s response and develop a strat-egy for systems design that will address both of their concerns.
InventoryControlClerk
PurchaseOrder
PurchaseRequisition
Updates
Supplies
Selects
Sent to
Sent to
Prepares
Prepares
PreparesSelects
Inventory
InventoryRecords
ReceivingReport
PurchasingAgent
ReceivingClerk
VendorRecords
Vendor
Receives
Receives
1 1 1 1
1 11
1
11
1 1
1
1111
M
M
MM
1
Problem 13: Detailed Systems Design
Systems Development CasesSeveral systems development cases that draw upon the material in this and the next chapter are available online at http://academic.cengage.com
60893_14_Ch14_p659-p722.indd Sec1:722 11/1/07 11:38:45 PM


