Embed Size (px)
Citation preview
Salmon, Andrew B (2006) Application of Natural and Modified Biomacromolecules in Miniaturised Separative Analytical Techniques. Doctoral thesis, University of Sunderland.
Downloaded from: http://sure.sunderland.ac.uk/id/eprint/3783/
Usage guidelines
Please refer to the usage guidelines at http://sure.sunderland.ac.uk/policies.html or alternatively contact [email protected].
Application of Natural and Modified
Biomacromolecules in Miniaturised Separative
Analytical Techniques
Andrew B Salmon
A thesis submitted in partial fulfilment of the requirements of the University of Sunderland for the degree of Doctor of Philosophy
December 2006
-i-
Abstract
In pharmaceutical R & D, drug stereochemistry, and consequently the rotation of enantiomers, is
very important. Because they act as chiral selectors in vivo, biomacromolecules have been
extensively used as chiral selectors for the liquid chromatographic (LC) resolution of enantiomers
and more latterly have also been employed in the newer separative technique, capillary
electrophoresis (CE). However, at the outset of this research programme, this had generally been
restricted to common easily accessible biomacromolecules such as plasma-binding proteins. It
was clear that it be would be useful therefore to adapt LC and CE in such a way as would allow
the use of a much wider range of biomacromolecules. Accordingly the general aim of this study
was to develop LC and CE protocols involving biomacromolecules that would give rise to
minimum consumption of the biomacromolecule.
To study biomacromolecules in free solution CE, a number of experimental variables had to be
established for both optimum chiral discrimination and for investigating biomacromolecule-ligand
interactions. The typical and widely used biomacromolecule for chiral discrimination, bovine
serum albumin (BSA) was used to study the variables of pH from pH 5.4 to 8.4, concentration of
BSA form 0 to 60 µM and concentration of organic modifiers in the range 0 – 20 % v/v for chiral
selectivity. This involved an investigation into some unusual artefacts such as ghost peaks and
stepped baselines, but ultimately the outcome was a successful free solution CE protocol suitable
for the rapid evaluation of chiral discrimination of other biomacromolecules. The conditions
were: run buffer (30 µM protein, 67 mM phosphate (pH 7.4) – methanol (97.5 : 2.5, v/v)),
capillary CElect p150, 40 cm (35 cm to detector) x 50 µm i.d., temperature of ambient or 25 °C
and an applied voltage of 10 kV. The ability of other biomacromolecules, such as human serum
albumin (HSA), lactoferrin and protamine, to resolve enantiomers was studied using this protocol
including looking at the effect of the addition of modifiers to the buffer such as metal ions like
manganese and zinc, competing ligands, e.g. warfarin and ibuprofen, and β-cyclodextrin.
As well as using CE, miniaturisation of LC was also studied in view of the success of
biomacromolecule-affinity chiral LC. Two different, but similar, microbore LC protocols were
employed, i.e. using the protein in free solution or as a pseudo stationary phase. For the former, a
Lichrosorb DIOL stationary phase, based on hydroxyl groups immobilised on silica, was chosen
in order to minimise the adsorption of protein to the stationary phase. Using this protocol it was
demonstrated that free solution microbore LC could be easily be carried out, therefore used to
evaluate chiral discrimination and that the use of the system to study in vivo interactions was
feasible.
-ii-
The creation of a biomacromolecule pseudo stationary phase, as opposed to conventional chiral
stationary phases where the protein is permanently bonded to the stationary phases, involves the
biomacromolecule being adsorbed within the pores of the stationary phase. In this way the overall
biomacromolecule structure should not be grossly distorted. Three stationary phases were
evaluated, viz wide-pore Nucleosil silica, Nucleosil C8 and Lichrosorb DIOL, for optimum
biomacromolecule loading and minimal biomacromolecule leakage when mobile phase was
pumped through the column. The Nucleosil silica with adsorbed BSA proved the most successful,
e.g. α of 3.6 and 4.0 for tryptophan and kynurenine respectively, and robust of the stationary
phases with respect to demonstrating the chiral discrimination potential for this system.
All the miniaturised systems evaluated were successful, to a greater or lesser degree, for the
demonstration of chiral selectivity of biomacromolecules. While CE was better for minimisation
of the consumption of the biomacromolecule, it was also important that the biomacromolecule LC
systems could be operated in reduced dimensions since these systems have perhaps greater
potential for exhibiting enantioselectivity and are more appropriate for the ever increasing need
for the study of the interaction of ligands with the biomacromolecule in its ‘natural’ form. With
the knowledge gained from this research programme it will now be possible to more easily carry
out such studies with much smaller amounts of biomacromolecule, and, accordingly be able to
work with biomacromolecules which hitherto it has not been possible to study because of limited
availability.
While some of the protocols have now been superseded by recent developments the system
developed still has potential. The use of such small scale systems offers the potential to study
chiral selectivity and drug-biomacromolecule binding of rare or expensive biomacromolecules.

- iii -
Acknowledgements
I would like to thank the following: -
My supervisor Dr. John Lough for his assistance throughout this project.
My parents for their support.
Louise for sharing the anguish and always being positive.
Bill and Chris for providing wonderful food and accommodation.
Dr. Malcolm Mills for useful discussion.
Anyone else who would listen to me rambling on about chiral separations…
For George and Emma
- iv -
Table of Contents
Abstract i
Acknowledgements iii
Table of Contents iv
List of Figures ix
1 Introduction 1
1.1 Preface 1
1.2 Chirality 1
1.2.1 Overview of chirality 1
1.2.2 Stereoisomers 2
1.2.3 Asymmetric carbon 3
1.2.4 Properties of chiral molecules 5
1.2.4.1 Achiral properties 5
1.2.4.2 Optical properties 5
1.2.4.3 Chemical properties 6
1.2.5 Three point interaction rule 6
1.2.6 Nomenclature of chiral molecules 6
1.2.6.1 Cahn-Ingold R,S notational system 7
1.2.6.2 Nomenclature assigned by the rotation of polarised light 8
1.2.6.3 Fisher convention 8
1.2.6.4 Determination of the absolute configuration of enantiomers 9
1.2.7 Chirality and pharmaceuticals 9
1.2.8 Chiral agrochemicals 10
1.3 The use of biomacromolecules as chiral selectors 11
1.3.1 Proteins 11
1.3.1.1Amino acids 11
1.3.1.2 The peptide bond 12
1.3.1.3 Structure of proteins 13
1.3.2 Serum albumins 14
1.3.2.1 Structure of albumins 14
1.3.3 Binding sites 15
1.4 Capillary electrophoresis 15
- v -
1.4.1 Basic instrumentation for capillary electrophoresis 16
1.4.2 Theory of capillary electrophoresis 17
1.4.2.1 Electroosmotic flow 17
1.4.2.2 Separation of molecules using capillary electrophoresis 19
1.4.3 The role of CE in separating enantiomers 20
1.4.4 Chiral Selectors employed in capillary electrophoresis 22
1.4.4.1 Cyclodextrins 22
1.4.4.2 Chiral micellar electrokinetic capillary chromatography 25
1.4.4.3 Biomacromolecules 25
1.4.4.4 Proteins 26
1.4.5 The measurement of drug-protein binding constants by
chromatographic techniques
30
1.4.5.1 Drug-protein binding studies using high-performance liquid
chromatography (HPLC)
30
1.4.5.2 Drug-protein binding studies using capillary electrophoresis 32
1.5 Aims and Objectives 34
2 Experimental 36
2.1 Equipment for capillary electrophoresis 36
2.2 Equipment for liquid chromatography 36
2.3 Materials 37
2.3.1 Chemical structures of the analytes 38
2.4 Experimental for capillary electrophoresis 40
2.4.1 Capillary Electrophoresis Instrument Set-up 40
2.4.1.1 Dionex CES I 40
2.4.1.2 Beckman PACE 2050 41
2.4.2 Investigation of the experimental variables 42
2.4.2.1 Concentration of bovine serum albumin (BSA) 42
2.4.2.2 The effect of pH of the run buffer 42
2.4.2.3 Investigation of increasing the concentration of organic
solvents to the run buffer
43
2.4.3 Enantioselectivity using a BSA coated capillary 43
- vi -
2.4.4 Enantioselectivity of a range of compounds using BSA as the chiral
selector and standard conditions
44
2.4.5 Enantioselectivity of a range of compounds using standard conditions
to screen other biomacromolecules
44
2.4.6 Investigation of enantioselectivity by adding modifiers to the run
buffer
45
2.4.6.1 β-Cyclodextrin 45
2.4.6.2 Allosteric Interactions 46
2.4.6.3 Metal salts 46
2.5 Experimental for liquid chromatography 47
2.5.1 BSA as a mobile phase additive in microbore LC 47
2.5.2 BSA as a mobile phase additive in capillary LC 48
2.5.3 Adsorption of BSA 48
2.5.3.1 Preparation of the pseudo-stationary phase 49
3 Optimisation of experimental variables using BSA in free-solution CE 50
3.1 Introduction 50
3.2 Variables available for BSA affinity CE 50
3.3 Optimisation of the pH 52
3.4 Optimisation of the concentration of BSA 53
3.5 Addition of organic solvent 59
3.6 Enantioselectivity of a BSA coated capillary 62
3.7 Conclusions 67
4 Evaluation of biomacromolecules for chiral discrimination in free
solution capillary electrophoresis
69
4.1 Introduction 69
4.2 Results and discussion 69
- vii -
4.3 Results for the separation of a range of compounds with BSA with the
protein affinity CE protocol
70
4.4 Results for the separation of a range of compounds with HSA with the
protein affinity CE protocol
84
4.5 Results for the separation of a range of compounds with protamine and
lactoferrin the protein affinity CE protocol
84
4.6 Discussion 93
4.6.1 Evaluation of protein affinity CE 93
4.6.2 Features of the electropherograms 96
5 Addition of modifiers to the CE run buffer 97
5.1 Introduction 97
5.2 Addition of metal ions to protein affinity CE 98
5.3 Addition of β-cyclodextrin to a protein affinity CE buffer 108
5.3.1 Analysis of tryptophan enantiomers 108
5.3.2 Analysis of ibuprofen enantiomers 118
5.4 Allosteric interactions 127
5.4.1 Introduction 127
5.4.2 Discussion 128
5.5 Conclusions 133
6 Practical issues associated with protein affinity CE 135
6.1 Artefacts associated with the Dionex CES I 135
6.1.1 Capillary fill method 135
6.1.2 Reduction of the overall run time 139
6.1.3 Baseline anomalies 141
6.1.4 Ibuprofen ghost peaks 144
6.2 Artefacts associated with the PACE 2050 149
6.2.1 The stepped baseline 149
6.2.2 Buffer depletion 149
6.2.3 Siphoning 151
6.2.4 Overload of BSA in the outlet vial 151
- viii -
6.3 Conclusions 152
7 BSA as a mobile phase additive in microbore HPLC 153
7.1 Introduction 153
7.2 Results and discussion 154
7.2.1 Mechanism of separation 154
7.2.2 Enantioselectivity of the method 155
7.2.3 Method practicalities 159
7.3 BSA as a mobile phase assitive in capillary LC 161
7.4 Conclusions 161
8 BSA as pseudo stationary phase in microbore HPLC 163
8.1 Introduction 163
8.2 Results and discussion 164
8.2.1 Mechanism of separation 164
8.2.2 BSA as a pseudo stationary phase on a C8 stationary phase 165
8.3.3 BSA as a pseudo stationary phase on a DIOL stationary phase 169
8.3.4 BSA as a pseudo stationary phase on Nucleosil silica 169
8.4 Conclusions 177
9 Conclusions 178
References 189
- ix -
List of Figures
Fig. 1 Hands to give an easily recognisable representation of chirality
in nature
2
Fig. 2 Diastereoisomers of 1,1-dichloropentane 3
Fig. 3 Representation of enantiomers where a, b, c and d are different
substituents
4
Fig. 4 Steric overcrowding leading to chiral molecules 4
Equation 5 Specific Rotation 5
Fig. 6 Orientation of chiral molecules to determine the Cahn-Ingold
notation
7
Fig. 7 Glyceraldehyde enantiomers 8
Fig. 8 R-2-[4-(trifluoromethyl-2-pyridyloxy)phenoxy]proprionate 10
Fig. 9 Chemical Structure of an α-amino acid 11
Table 10 Structure of six common amino acid side chains 12
Fig. 11 Proline 13
Fig. 12 The structure of human serum albumin and the possible
location of drug binding sites
14
Fig. 13 Basic capillary electrophoresis instrument 17
Equation 14 Dissociation equilibrium of silanol groups at the capillary
surface.
17
Fig. 15 Schematic representation of the electroosmotic flow 18
Fig. 16 Difference of the flow profiles in CE (plug-like) and HPLC
(parabolic)
18
Fig. 17 Graphical representation for the separation of molecules under
an applied electric field
19
Equation 18 Electrophoretic mobility 20
Equation 19 Association equilibria 21
Equation 20 Apparent electrophoretic mobility 22
Equation 21 Difference in electrophoretic mobilities of enantiomers in the
presence of a chiral selector
22
Fig. 22 Three dimensional structure of the Cyclodextrin ring 23
- x -
Fig. 23 Chemical structure of cyclodextrins 24
Fig. 24 Chemical structure of leucovorin 27
Fig. 25 Chemical structure of quinolone bactericidal reagents
Ofloxacin and DR-3862
27
Fig. 26 Representation of protein pseudo-stationary phase 28
Fig. 27 Stylised chromatogram depicting high-performance frontal
analysis chromatography
32
Fig. 28 Stylised electropherogram depicting the vacancy peak method 33
Fig. 29 Stylised electropherogram depicting frontal analysis capillary
electrophoresis
34
Fig. 30 Representation of the relative migration of BSA at different
pH values
53
Fig. 31 Resolution of tryptophan enantiomers with increasing
concentration of BSA in the run buffer
55
Fig. 32 Migration times of tryptophan enantiomers with increasing
concentration of of BSA in the run buffer
56
Fig. 33 CE of tryptophan enantiomers with 30 µM BSA 57
Fig. 34 CE of tryptophan enantiomers with 60 µM BSA 58
Fig. 35 Resolution of tryptophan enantiomers with increasing organic
additives
60
Fig. 36 Resolution of benzoin enantiomers with increasing organic
additives
61
Fig. 37 The capillary fill method showing the BSA breakthrough 63
Fig. 38 CE of tryptophan enantiomers with the immobilised BSA
capillary
65
Fig. 39 Theoretical calculation for the surface area ratio of a packed
capillary to an open tubular capillary
67
Table 40 Resolution of enantiomers using BSA as the chiral selector
and standard conditions
70
Fig. 41 CE of benzoin enantiomers 72
Fig. 42 CE of thioridazine enantiomers 73
Fig. 43 CE of bepridil enantiomers 74
- xi -
Fig. 44 CE of kynurenine enantiomers 75
Fig. 45 CE of leucovorin enantiomers 76
Fig. 46 CE of ibuprofen enantiomers 77
Fig. 47 CE of 2-(4-methylphenyl) propionic acid enantiomers 78
Fig. 48 CE of tryptophan amide enantiomers 79
Fig. 49 CE of hexabarbitone enantiomers 80
Fig. 50 CE of N-acetyl-DL-tryptophan enantiomers 81
Fig. 51 CE of warfarin enantiomers 82
Fig. 52 CE of tyrosine enantiomers 83
Table 53 Resolution of enantiomers using HSA as the chiral selector
and standard conditions
84
Fig. 54 CE of bepridil enantiomers 86
Fig. 55 CE of promethazine enantiomers 87
Fig. 56 CE of tryptophan enantiomers 88
Fig. 57 CE of thioridazine enantiomers 89
Fig. 58 CE of kynurenine enantiomers 90
Fig. 59 CE of tryptophan enantiomers 91
Fig. 60 CE of leucovorin enantiomers 92
Table 61 Review of chiral separations with proteins in free-solution CE 94
Table 62 Selectivity of tryptophan enantiomers with the addition of
metal ions
99
Fig. 63 CE of tryptophan enantiomers using 67mM Borate buffer 100
Fig. 64 CE of tryptophan enantiomers in the presence of manganese 101
Fig. 65 CE of tryptophan enantiomers in the presence of zinc 102
Table 66 Selectivity of kynurenine enantiomers with the addition of
metal ions
103
Fig. 67 CE of kynurenine enantiomers using 67mM Borate buffer 105
Fig. 68 CE of kynurenine enantiomers in the presence of manganese 106
Fig. 69 CE of kynurenine enantiomers in the presence of zinc 107
Fig. 70 Migration times of tryptophan enantiomers with the addition
of β-cyclodextrin
110
- xii -
Fig. 71 Resolution of tryptophan enantiomers with the addition of β-
cyclodextrin
111
Fig. 72 Resolution of tryptophan enantiomers 112
Fig. 73 Resolution of tryptophan enantiomers with 6 µM β-
cyclodextrin
113
Fig. 74 Resolution of tryptophan enantiomers with 12 µM β-
cyclodextrin
114
Fig. 75 Resolution of tryptophan enantiomers with 18 µM β-
cyclodextrin
115
Fig. 76 Resolution of tryptophan enantiomers with 24 µM β-
cyclodextrin
116
Fig. 77 Resolution of tryptophan enantiomers with 30 µM β-
cyclodextrin
117
Fig. 78 Migration times of tryptophan enantiomers with the addition
of β-cyclodextrin
120
Fig. 79 Resolution of ibuprofen enantiomers with the addition of β-
cyclodextrin
121
Fig. 80 CE of ibuprofen with 12 mM β-cyclodextrin 122
Fig. 81 CE of ibuprofen with 18 µM β-cyclodextrin 123
Fig. 82 CE of ibuprofen with 24 µM β-cyclodextrin 124
Fig. 83 CE of ibuprofen with 30 µM β-cyclodextrin 125
Fig. 84 Area of the ibuprofen-BSA void 126
Table 85 Summary of molecules which bind to specific sites on HSA 127
Table 86 Selectivity of tryptophan enantiomers with the addition of
competing ligands
128
Fig. 87 Resolution of tryptophan enantiomers with addition of
lorazepam
129
Fig. 88 Resolution of tryptophan enantiomers with addition of
digitoxin
130
Fig. 89 Resolution of tryptophan enantiomers with addition of
warfarin
131
- xiii -
Fig. 90 Resolution of tryptophan enantiomers with addition of
ibuprofen
132
Fig. 91 CE of tryptophan using a three minute pressure injection to
load BSA onto the capillary
136
Fig. 92 The capillary fill method showing the BSA breakthrough 137
Fig. 93 CE of tryptophan enantiomers following the BSA
breakthrough
140
Fig. 94 CE of hexabarbitone enantiomers showing a spontaneous peak
marker
142
Fig. 95 CE of N-acetyl-DL-tryptophan enantiomers showing both a
spontaneous peak marker and a baseline shift
143
Fig. 96 CE of ibuprofen enantiomers showing the dip in the baseline 145
Fig. 97 Separation of ibuprofen enantiomers as they migrate towards
the detector
146
Fig. 98 CE of ibuprofen enantiomers injected with 60 µM BSA 148
Fig. 99 CE of ibuprofen enantiomers showing the stepped baseline 150
Fig. 100 Graphical representation between the stationary phase, the
protein and the analytes
154
Table 101 k values of analytes with BSA as a mobile phase additive 156
Fig. 102 Resolution of tryptophan using free-solution BSA and
microbore HPLC
157
Fig. 103 Resolution of kynurenine using free-solution BSA and
microbore HPLC
158
Fig. 104 Selectivity of tryptophan enantiomers with the amount of
mobile phase pumped through the column
160
Fig. 105 Simplified graphical representation of the equilibrium of the
pseudo protein stationary phase and the analytes
164
Fig. 106 Absorption of BSA onto the wide pore C8 stationary phase 166
Fig. 107 Resolution of tryptophan enantiomers with a BSA pseudo
stationary phase
167
Fig. 108 Resolution of kynurenine enantiomers with a BSA pseudo
stationary phase
168
- xiv -
Fig. 109 Absorption of BSA onto the wide pore Lichrosorb DIOL
stationary phase
170
Fig. 110 Absorption of BSA onto the wide pore Nucleosil silica
stationary phase
171
Table 111 k values of analytes with BSA adsorbed on the Nucleosil silica 172
Fig. 112 Resolution of tryptophan enantiomers with a BSA pseudo
stationary phase
173
Fig. 113 Resolution of kynurenine enantiomers with a BSA pseudo
stationary phase
174
Fig. 114 Resolution of benzoin enantiomers with a BSA pseudo
stationary phase
175
Fig. 115 Resolution of warfarin enantiomers with a BSA pseudo
stationary phase
176
Fig. 116 Advantages and disadvantages of each system 179
Fig. 117 A double loop HPLC system 182
- 1 -
Chapter 1 Introduction
1.1 Preface
The research programme described in this thesis involves the general area of the
study of the interaction of analytes, usually drug molecules, with biopolymers in
separative systems. Such systems have potential value in providing the basis for
understanding of separative methods based on bioaffinity, particularly those
involving the resolution of enantiomers. Also they might prove useful in assessing,
at least qualitatively, the ability of drugs to bind to biopolymers. It ought to be
instructive then to consider the over-arching principles and key issues in areas such
as chirality in order to set the scene for the rationale for the aims and objectives at the
outset of the research programme.
1.2 Chirality
1.2.1 Overview of chirality
Chirality is the property of molecules or objects whereby their respective mirror
images cannot be superimposed. It is not necessary to go very far to find an excellent
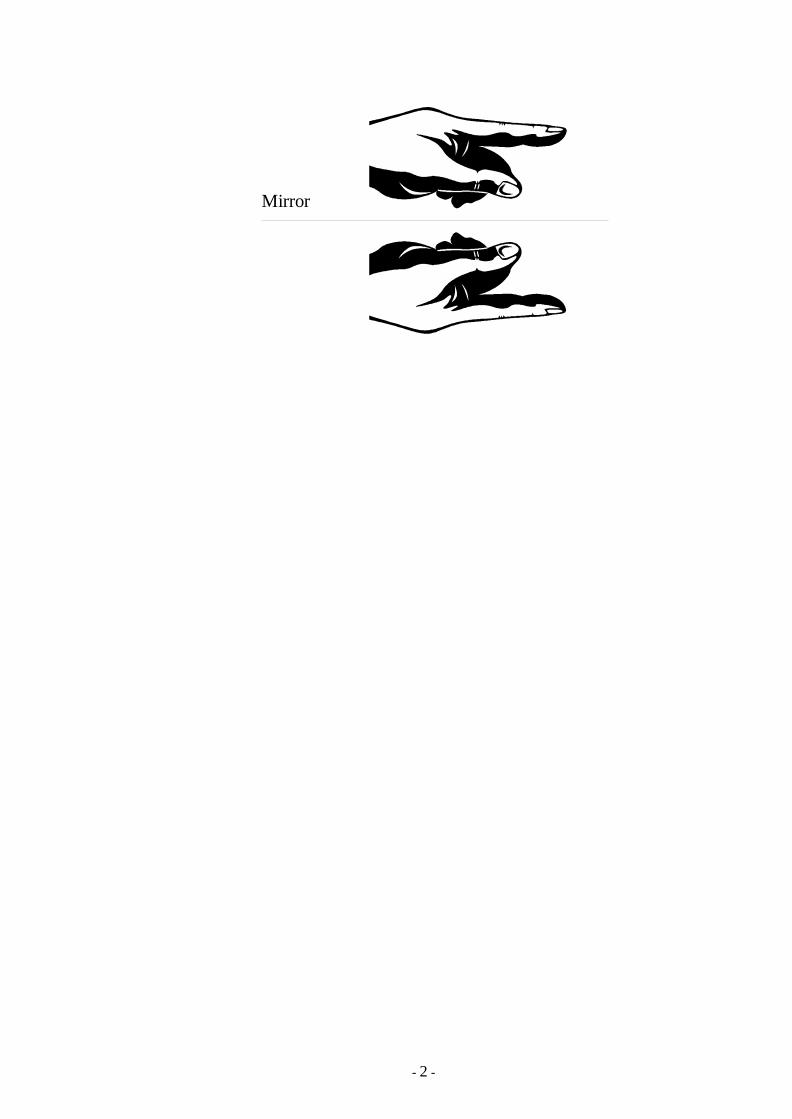
example of chirality. The hands of a human being are chiral. As shown in Fig. 1,
even though they appear identical they are non-superimposable.
- 2 -
Mirror
Plane
Fig. 1 Hands to give an easily recognisable representation of chirality
in nature. No matter which way the lower mirror image hand is translated
or rotated, it cannot be superimposed on the upper original hand
Importantly, chirality such as this exists at the molecular level.
1.2.2 Stereoisomers
Stereoisomers are molecules which have atoms bonded in the same order or
‘connectivities’ but do not have the same arrangement in space. Stereoisomers that
have non-superimposable mirror images are termed enantiomers.
Diastereoisomers are molecules which contain more than one chiral centre. For such
molecules a number of stereoisomers are possible, for example, 2,3-dichloropentane
has four stereoisomers, Fig. 2.
- 3 -
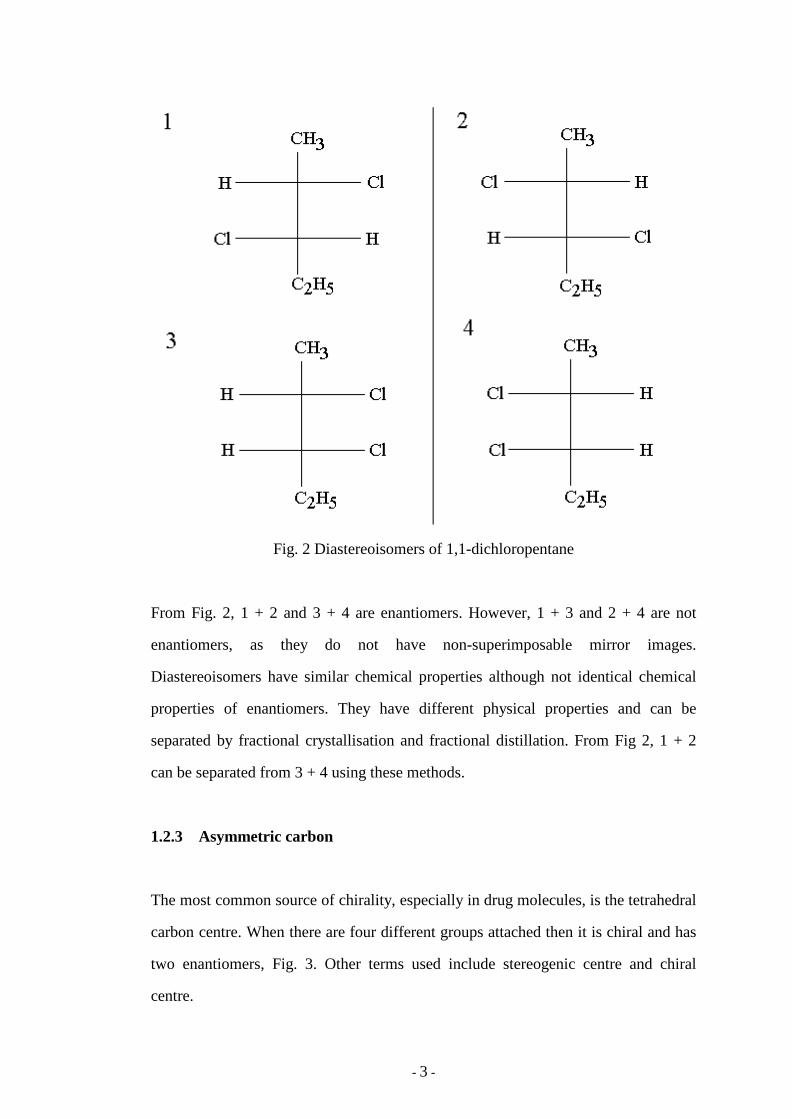
Fig. 2 Diastereoisomers of 1,1-dichloropentane
From Fig. 2, 1 + 2 and 3 + 4 are enantiomers. However, 1 + 3 and 2 + 4 are not
enantiomers, as they do not have non-superimposable mirror images.
Diastereoisomers have similar chemical properties although not identical chemical
properties of enantiomers. They have different physical properties and can be
separated by fractional crystallisation and fractional distillation. From Fig 2, 1 + 2
can be separated from 3 + 4 using these methods.
1.2.3 Asymmetric carbon
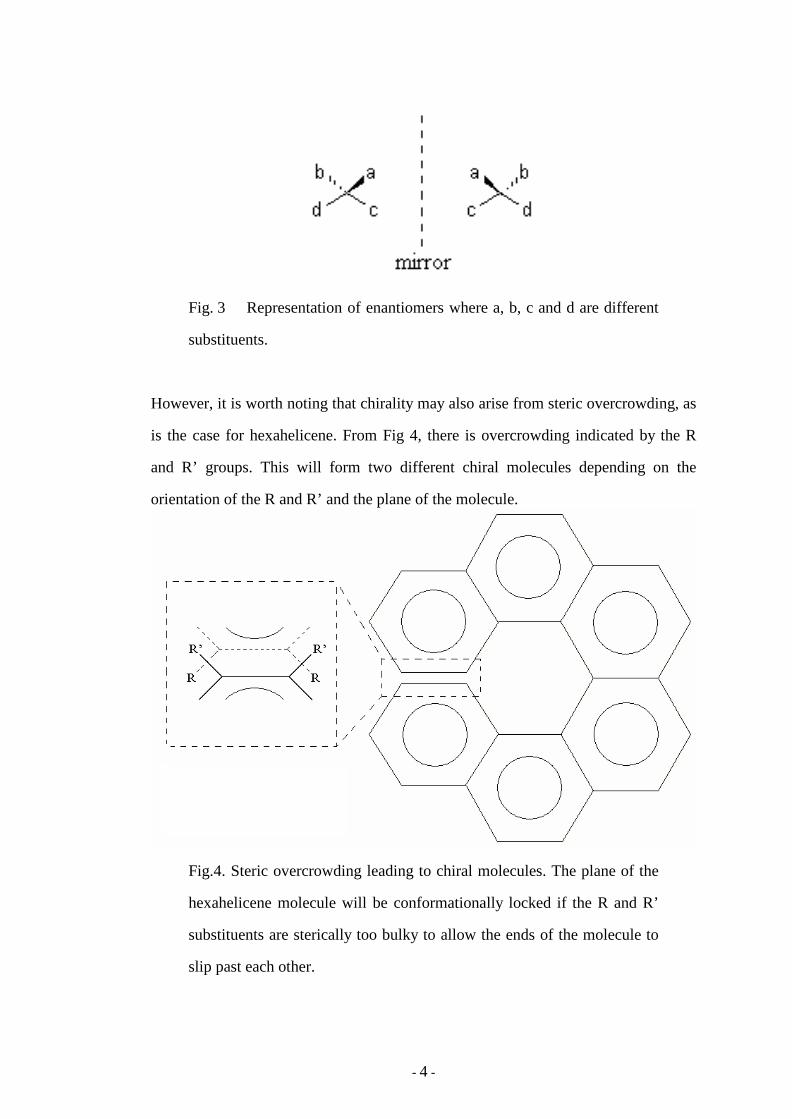
The most common source of chirality, especially in drug molecules, is the tetrahedral
carbon centre. When there are four different groups attached then it is chiral and has
two enantiomers, Fig. 3. Other terms used include stereogenic centre and chiral
centre.
- 4 -
Fig. 3 Representation of enantiomers where a, b, c and d are different
substituents.
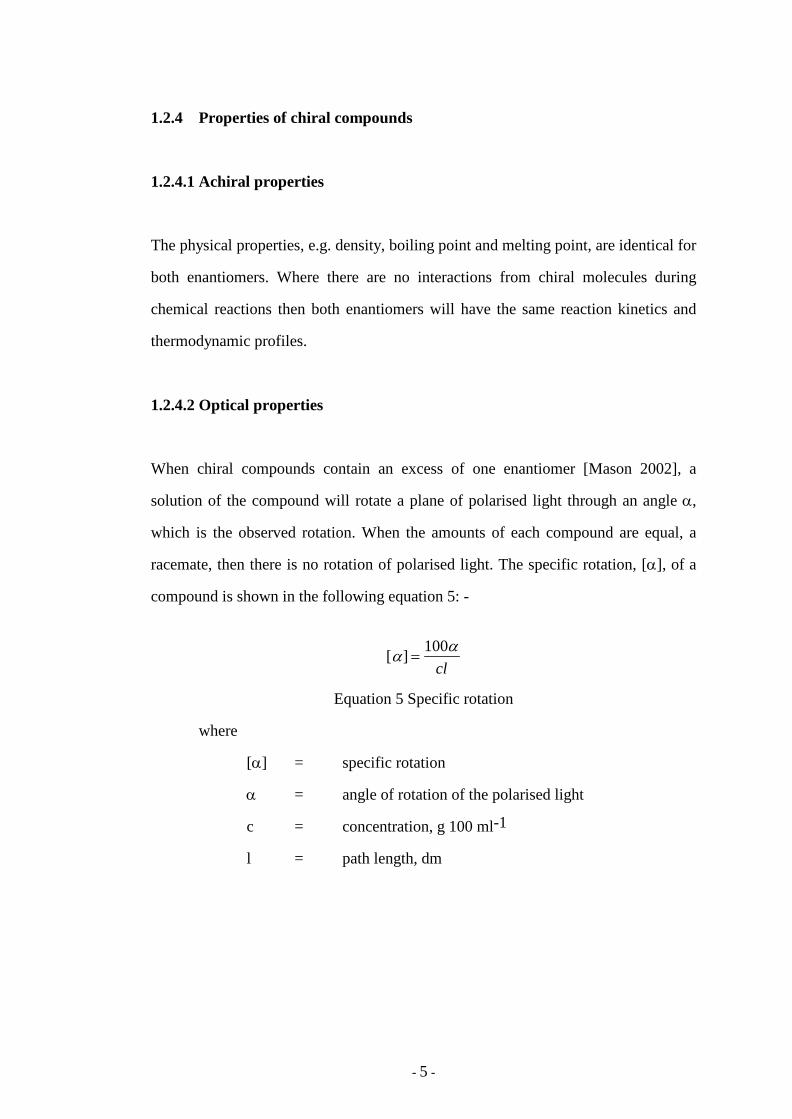
However, it is worth noting that chirality may also arise from steric overcrowding, as
is the case for hexahelicene. From Fig 4, there is overcrowding indicated by the R
and R’ groups. This will form two different chiral molecules depending on the
orientation of the R and R’ and the plane of the molecule.
Fig.4. Steric overcrowding leading to chiral molecules. The plane of the
hexahelicene molecule will be conformationally locked if the R and R’
substituents are sterically too bulky to allow the ends of the molecule to
slip past each other.
- 5 -
1.2.4 Properties of chiral compounds
1.2.4.1 Achiral properties
The physical properties, e.g. density, boiling point and melting point, are identical for
both enantiomers. Where there are no interactions from chiral molecules during
chemical reactions then both enantiomers will have the same reaction kinetics and
thermodynamic profiles.
1.2.4.2 Optical properties
When chiral compounds contain an excess of one enantiomer [Mason 2002], a
solution of the compound will rotate a plane of polarised light through an angle α,
which is the observed rotation. When the amounts of each compound are equal, a
racemate, then there is no rotation of polarised light. The specific rotation, [α], of a
compound is shown in the following equation 5: -
[ ]α α=
100cl
Equation 5 Specific rotation
where
[α] = specific rotation
α = angle of rotation of the polarised light
c = concentration, g 100 ml-1
l = path length, dm
- 6 -
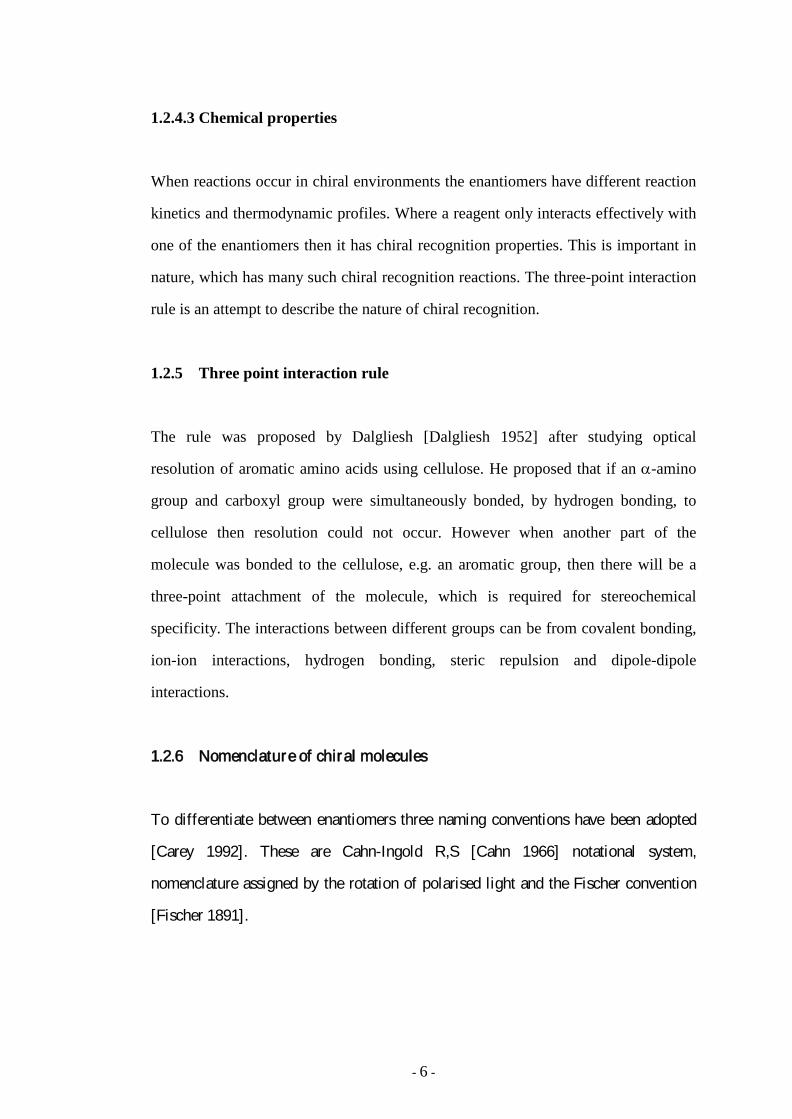
1.2.4.3 Chemical properties
When reactions occur in chiral environments the enantiomers have different reaction
kinetics and thermodynamic profiles. Where a reagent only interacts effectively with
one of the enantiomers then it has chiral recognition properties. This is important in
nature, which has many such chiral recognition reactions. The three-point interaction
rule is an attempt to describe the nature of chiral recognition.
1.2.5 Three point interaction rule
The rule was proposed by Dalgliesh [Dalgliesh 1952] after studying optical
resolution of aromatic amino acids using cellulose. He proposed that if an α-amino
group and carboxyl group were simultaneously bonded, by hydrogen bonding, to
cellulose then resolution could not occur. However when another part of the
molecule was bonded to the cellulose, e.g. an aromatic group, then there will be a
three-point attachment of the molecule, which is required for stereochemical
specificity. The interactions between different groups can be from covalent bonding,
ion-ion interactions, hydrogen bonding, steric repulsion and dipole-dipole
interactions.
1.2.6 Nomenclature of chiral molecules
To differentiate between enantiomers three naming conventions have been adopted
[Carey 1992]. These are Cahn-Ingold R,S [Cahn 1966] notational system,
nomenclature assigned by the rotation of polarised light and the Fischer convention
[Fischer 1891].
- 7 -
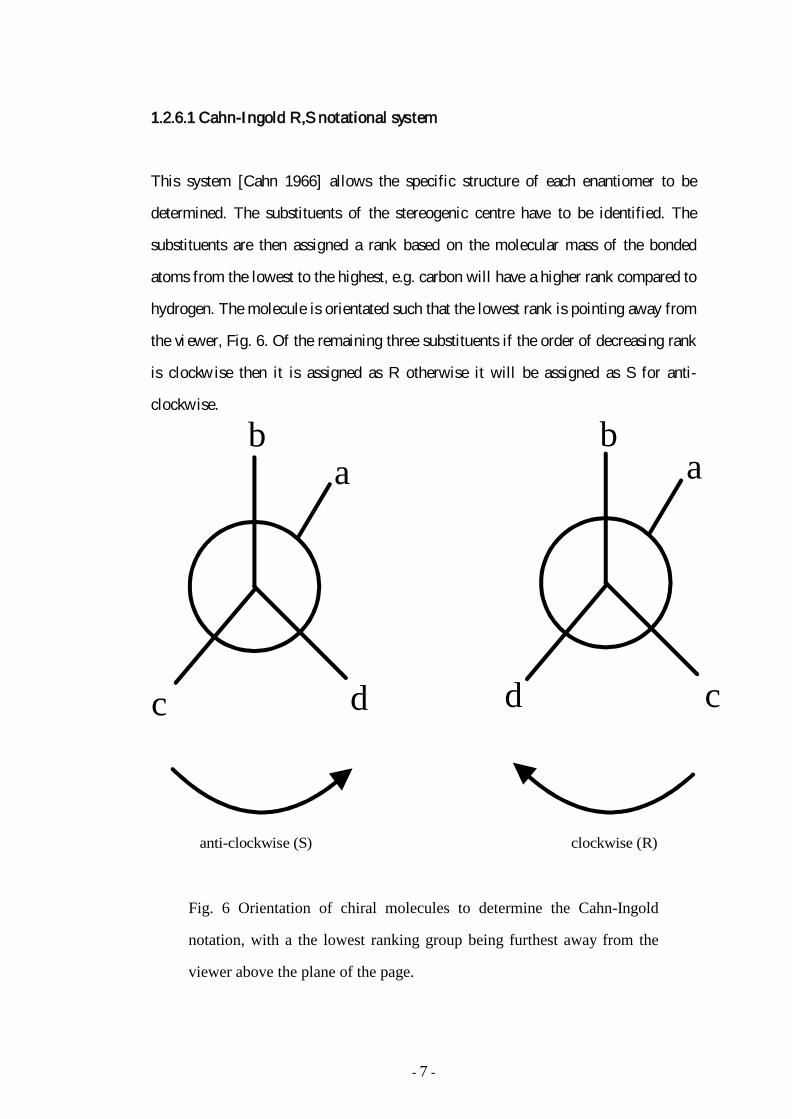
1.2.6.1 Cahn-Ingold R,S notational system
This system [Cahn 1966] allows the specific structure of each enantiomer to be
determined. The substituents of the stereogenic centre have to be identified. The
substituents are then assigned a rank based on the molecular mass of the bonded
atoms from the lowest to the highest, e.g. carbon will have a higher rank compared to
hydrogen. The molecule is orientated such that the lowest rank is pointing away from
the vi ewer, Fig. 6. Of the remaining three substituents if the order of decreasing rank
is clockwise then it is assigned as R otherwise it will be assigned as S for anti-
clockwise.
ba
c d
ba
cd
clockwise (R)anti-clockwise (S)
Fig. 6 Orientation of chiral molecules to determine the Cahn-Ingold
notation, with a the lowest ranking group being furthest away from the
viewer above the plane of the page.
- 8 -
1.2.6.2 Nomenclature assigned by the rotation of polar ised light
When chiral molecules rotate polarised light, the light is a single wavelength and is
typically 589 nm based on the sodium D-line standard, in a clockwise direction then
they are assigned as (d) or (+) molecules. Similarly for anti-clockwise rotation they
are assigned as (l) or (-) molecules. This notational system does not give structural
information about the molecule, unlike the Cahn-Ingold notation.
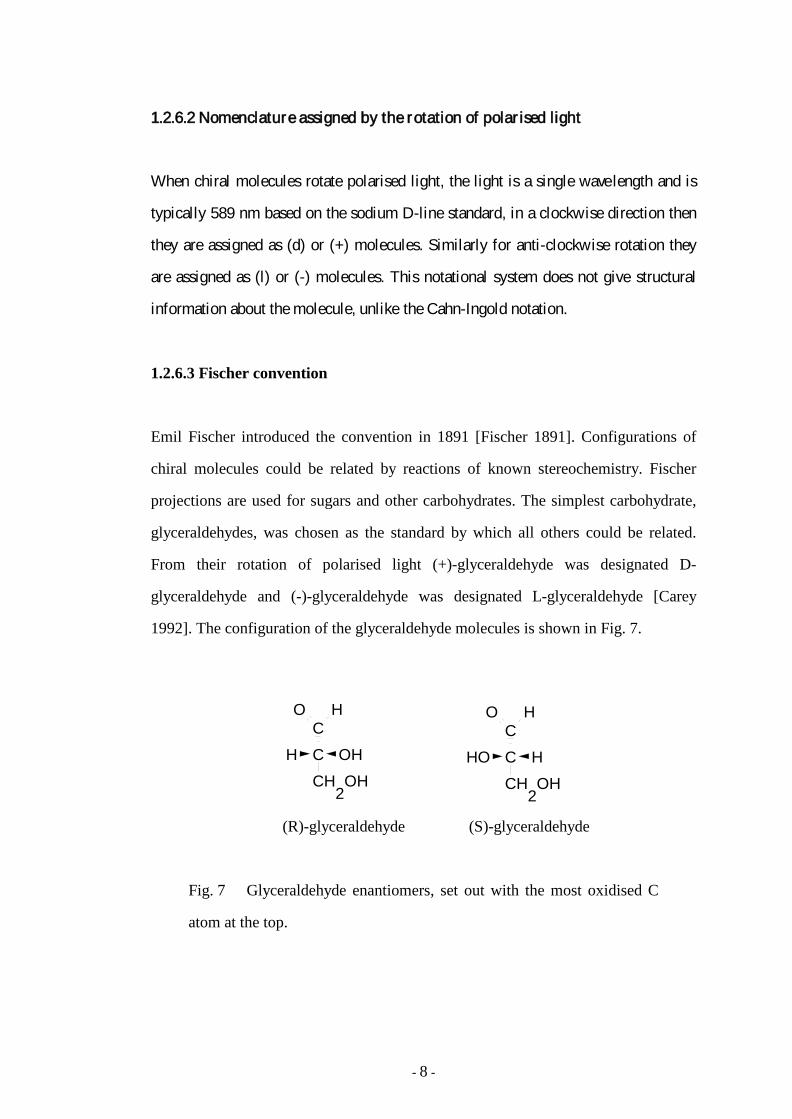
1.2.6.3 Fischer convention
Emil Fischer introduced the convention in 1891 [Fischer 1891]. Configurations of
chiral molecules could be related by reactions of known stereochemistry. Fischer
projections are used for sugars and other carbohydrates. The simplest carbohydrate,
glyceraldehydes, was chosen as the standard by which all others could be related.
From their rotation of polarised light (+)-glyceraldehyde was designated D-
glyceraldehyde and (-)-glyceraldehyde was designated L-glyceraldehyde [Carey
1992]. The configuration of the glyceraldehyde molecules is shown in Fig. 7.
C
C
CH2
OH
O H
C
C
CH2
OH
O H
H HHOOH
(R)-glyceraldehyde (S)-glyceraldehyde
Fig. 7 Glyceraldehyde enantiomers, set out with the most oxidised C
atom at the top.
- 9 -
From the absolute configurations in Fig 7, D-glyceraldehyde has the R configuration
and conversely L-glyceraldehyde has the S configuration. As it transpired from the
studies of Bijvoet in 1951 [Bijvoet 1951 & Bijvoet 1955] the configurations were
indeed as Fischer postulated.
1.2.6.4 Determination of the absolute configuration of enantiomers
The absolute configuration of enantiomers was not determined until 1951 by J.M.
Bijvoet at the University of Utrecht. By using the x-ray analysis method of
anomalous scattering he studied the salt of (+)-tartaric acid to determine the
configuration. Once the configuration of (+)-tartaric acid was known then this was
then related to glyceraldehyde so the configuration of many enantiomers could then
be determined.
1.2.7 Chirality and pharmaceuticals
As biological systems are chiral in nature and since many drugs contain enantiomers
so it is important to understand the pharmacokinetics and pharmacological profile of
all the enantiomeric forms. Both enantiomers can exhibit several different effects
ranging from beneficial activity to inactivity or even extreme toxicity. The case of the
enantiomers of thalidomide has been well documented [The Insight Team 1979].
Thalidomide was employed as a sedative and anti-nausea drug between 1959 and
1962. The R enantiomer was beneficial but the S enantiomer was held responsible
for over 2000 cases of serious birth defects in children born to women who took
thalidomide during pregnancy. It has since been established that the in vitro
racemisation of thalidomide is far more complex [Agranat 2002, Knoche1 1994 &
Knoche2 1994] than had originally been thought.
- 10 -
Where chiral compounds are used then it is important to know the amounts of
enantiomers present. As enantiomers have the same physical properties then normal
analytical techniques cannot be used. However in chiral environments enantiomers
react differently, so in order to separate them a chiral recognition step has to be
incorporated into the analytical procedure. With increased understanding of
separating and the pharmacokinetics of enantiomers by the mid-90s many states were
issuing regulations for chiral medicinal products [Rauws 1994].
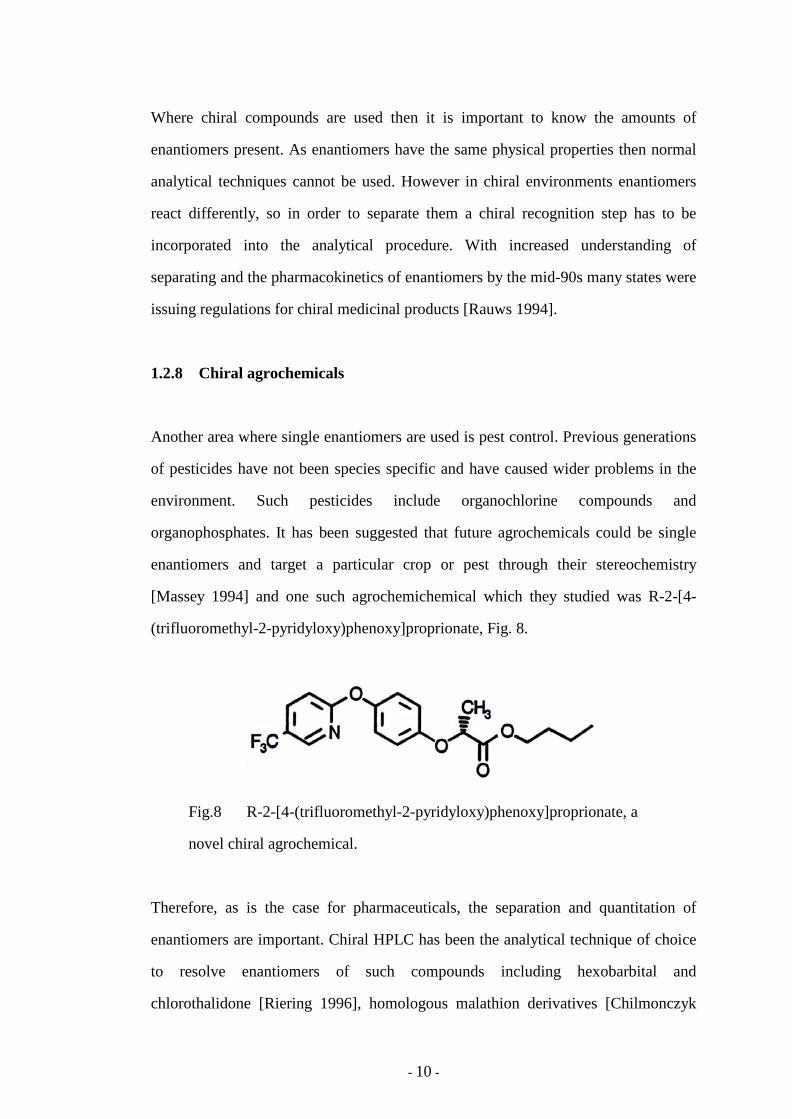
1.2.8 Chiral agrochemicals
Another area where single enantiomers are used is pest control. Previous generations
of pesticides have not been species specific and have caused wider problems in the
environment. Such pesticides include organochlorine compounds and
organophosphates. It has been suggested that future agrochemicals could be single
enantiomers and target a particular crop or pest through their stereochemistry
[Massey 1994] and one such agrochemichemical which they studied was R-2-[4-
(trifluoromethyl-2-pyridyloxy)phenoxy]proprionate, Fig. 8.
Fig.8 R-2-[4-(trifluoromethyl-2-pyridyloxy)phenoxy]proprionate, a
novel chiral agrochemical.
Therefore, as is the case for pharmaceuticals, the separation and quantitation of
enantiomers are important. Chiral HPLC has been the analytical technique of choice
to resolve enantiomers of such compounds including hexobarbital and
chlorothalidone [Riering 1996], homologous malathion derivatives [Chilmonczyk
- 11 -
1998], organophosphorus pesticides [Ellington 2001] and fungicidal triazolyl
alcohols [Spitzer 1999].
1.3 The use of biomacromolecules as chiral selectors
Biomacromolecules such as proteins and polysaccharides are large biological
molecules which are colloidal in nature. In general, they have complex structures
with many points for interaction and so a broad spectrum of drug classes may bind to
them while, at the same time, the binding can be quite selective.
1.3.1 Proteins
1.3.1.1 Amino acids
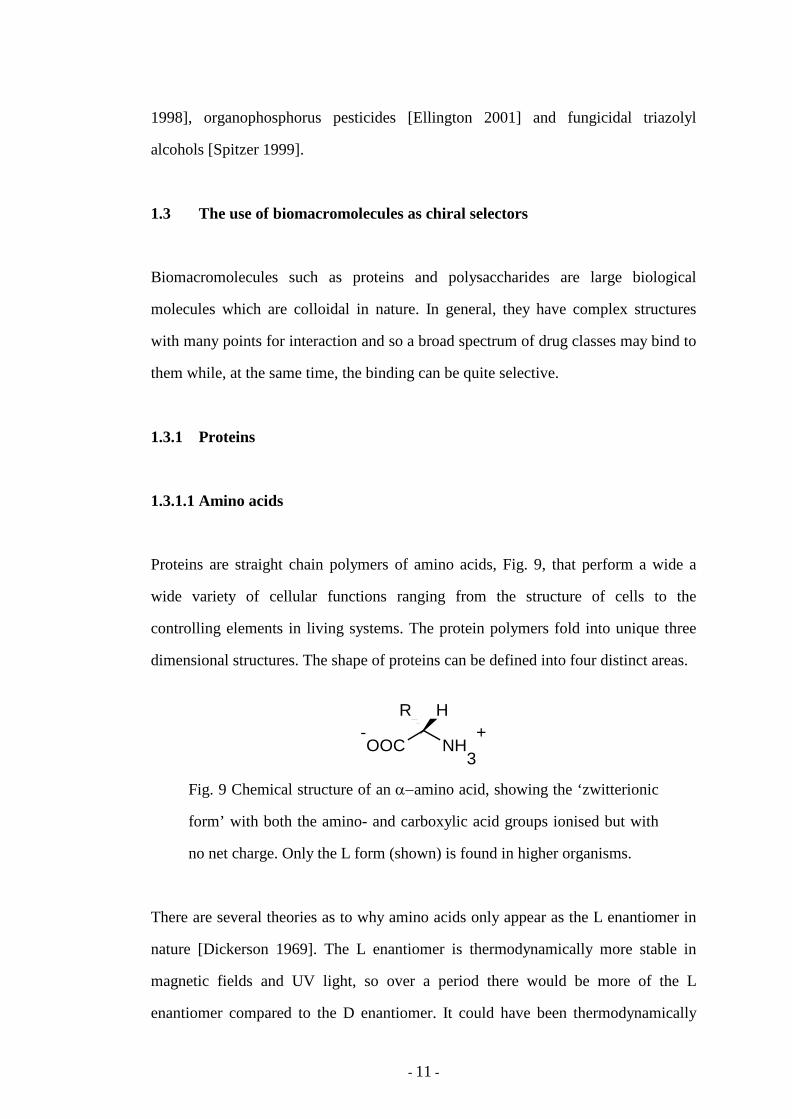
Proteins are straight chain polymers of amino acids, Fig. 9, that perform a wide a
wide variety of cellular functions ranging from the structure of cells to the
controlling elements in living systems. The protein polymers fold into unique three
dimensional structures. The shape of proteins can be defined into four distinct areas.
R H
-OOC NH
3+
Fig. 9 Chemical structure of an α−amino acid, showing the ‘zwitterionic
form’ with both the amino- and carboxylic acid groups ionised but with
no net charge. Only the L form (shown) is found in higher organisms.
There are several theories as to why amino acids only appear as the L enantiomer in
nature [Dickerson 1969]. The L enantiomer is thermodynamically more stable in
magnetic fields and UV light, so over a period there would be more of the L
enantiomer compared to the D enantiomer. It could have been thermodynamically
- 12 -
favourable for the L enantiomers to react in the early stages of life thus leading to a
gradual, but, over time, very marked enrichment [MacDermott 2002].
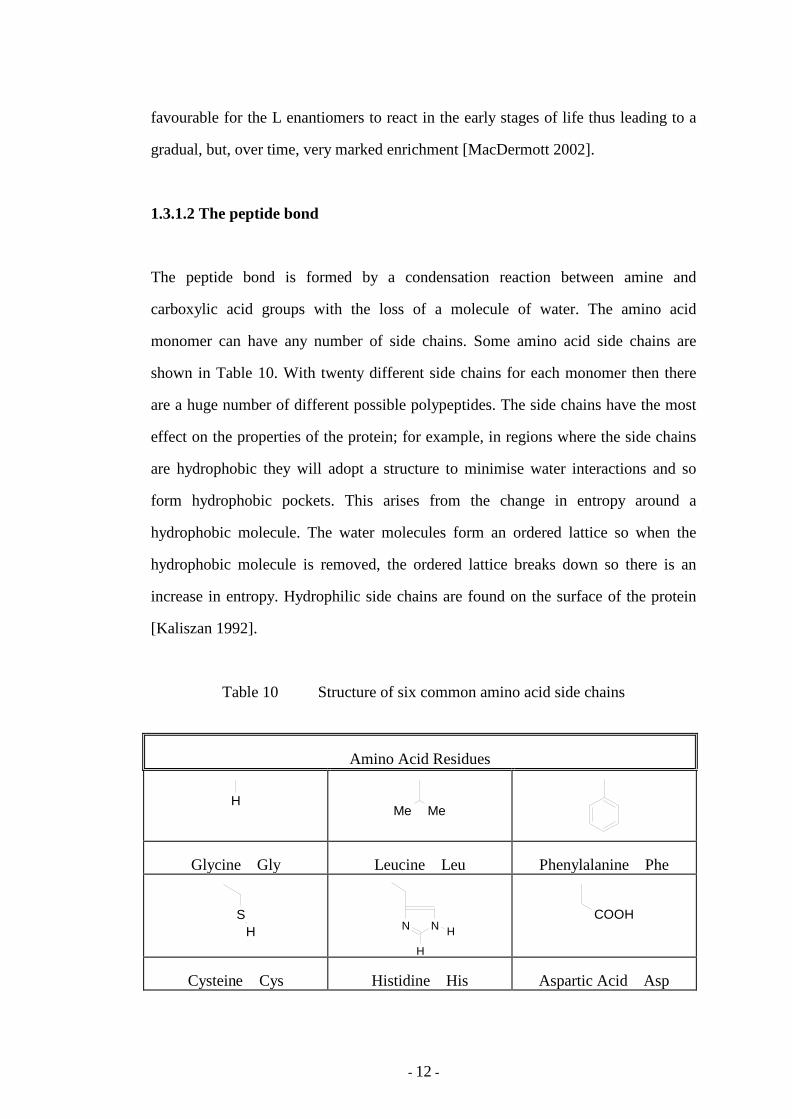
1.3.1.2 The peptide bond
The peptide bond is formed by a condensation reaction between amine and
carboxylic acid groups with the loss of a molecule of water. The amino acid
monomer can have any number of side chains. Some amino acid side chains are
shown in Table 10. With twenty different side chains for each monomer then there
are a huge number of different possible polypeptides. The side chains have the most
effect on the properties of the protein; for example, in regions where the side chains
are hydrophobic they will adopt a structure to minimise water interactions and so
form hydrophobic pockets. This arises from the change in entropy around a
hydrophobic molecule. The water molecules form an ordered lattice so when the
hydrophobic molecule is removed, the ordered lattice breaks down so there is an
increase in entropy. Hydrophilic side chains are found on the surface of the protein
[Kaliszan 1992].
Table 10 Structure of six common amino acid side chains
Amino Acid Residues
H Me Me
Glycine Gly Leucine Leu Phenylalanine Phe
SH N N H
H
COOH
Cysteine Cys Histidine His Aspartic Acid Asp
- 13 -
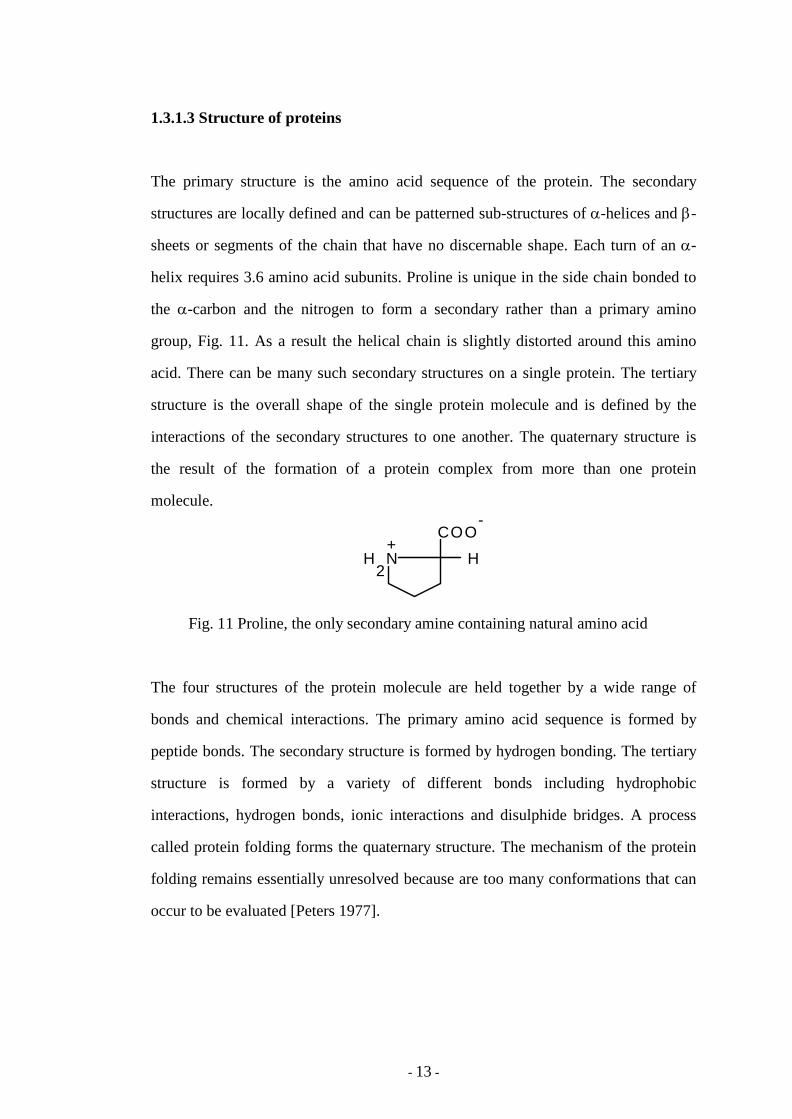
1.3.1.3 Structure of proteins
The primary structure is the amino acid sequence of the protein. The secondary
structures are locally defined and can be patterned sub-structures of α-helices and β-
sheets or segments of the chain that have no discernable shape. Each turn of an α-
helix requires 3.6 amino acid subunits. Proline is unique in the side chain bonded to
the α-carbon and the nitrogen to form a secondary rather than a primary amino
group, Fig. 11. As a result the helical chain is slightly distorted around this amino
acid. There can be many such secondary structures on a single protein. The tertiary
structure is the overall shape of the single protein molecule and is defined by the
interactions of the secondary structures to one another. The quaternary structure is
the result of the formation of a protein complex from more than one protein
molecule.
COO-
H+
H2
N
Fig. 11 Proline, the only secondary amine containing natural amino acid
The four structures of the protein molecule are held together by a wide range of
bonds and chemical interactions. The primary amino acid sequence is formed by
peptide bonds. The secondary structure is formed by hydrogen bonding. The tertiary
structure is formed by a variety of different bonds including hydrophobic
interactions, hydrogen bonds, ionic interactions and disulphide bridges. A process
called protein folding forms the quaternary structure. The mechanism of the protein
folding remains essentially unresolved because are too many conformations that can
occur to be evaluated [Peters 1977].
- 14 -
1.3.2 Serum albumins
Albumins are the main circulatory proteins in the blood plasma [Peters 1977]. A
variety of ligands are reversibly bound to albumins so they can be transported around
the body. This is especially important for hydrophobic molecules like fatty acids
where solubility in aqueous plasma would be problematic.
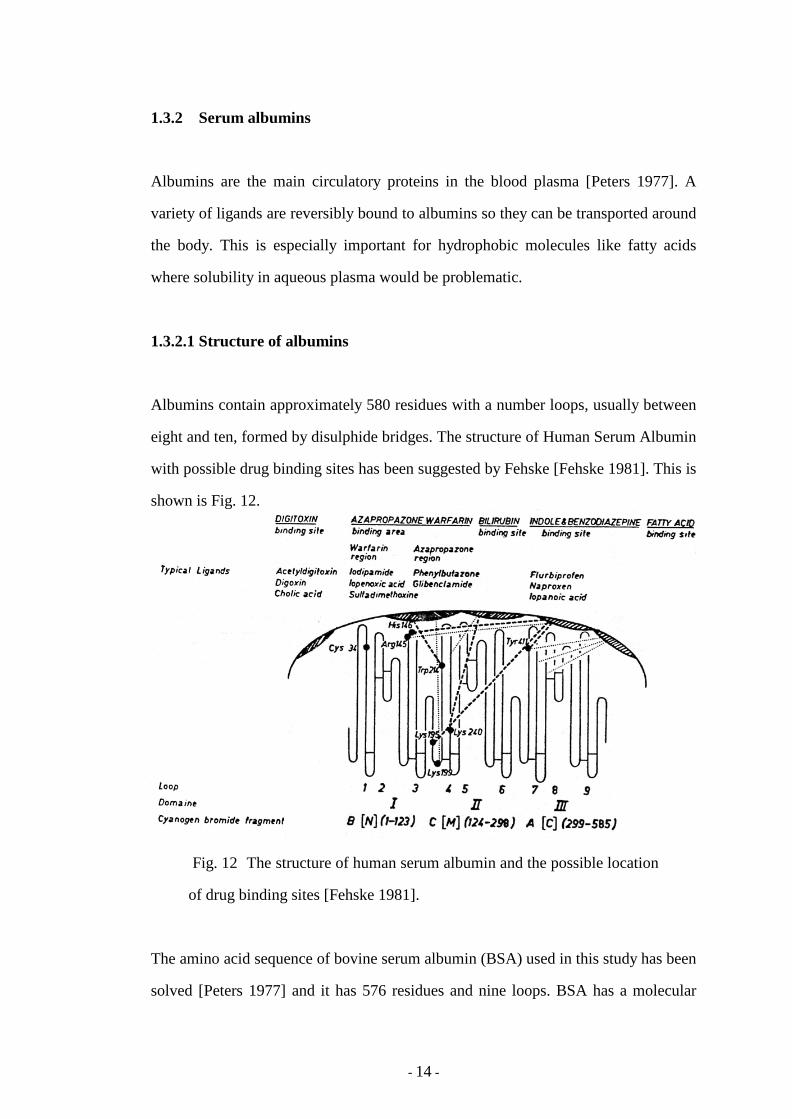
1.3.2.1 Structure of albumins
Albumins contain approximately 580 residues with a number loops, usually between
eight and ten, formed by disulphide bridges. The structure of Human Serum Albumin
with possible drug binding sites has been suggested by Fehske [Fehske 1981]. This is
shown is Fig. 12.
Fig. 12 The structure of human serum albumin and the possible location
of drug binding sites [Fehske 1981].
The amino acid sequence of bovine serum albumin (BSA) used in this study has been
solved [Peters 1977] and it has 576 residues and nine loops. BSA has a molecular
- 15 -
weight of 66000. Models have been used to predict the general structure of albumin
based on physical and chemical measurements. The proposed structures are that of a
prolate ellipsoid with dimensions 141 Å x 42 Å and a three-domain structure of
spheres with approximate diameters of 38, 53 and 38 Å respectively.
1.3.3 Binding sites
As noted previously, a number of low molecular weight compounds can be reversibly
bound to albumins. There are many potential sites of interaction for ligands on
albumins, for example, there are areas of hydrophobic character, which would favour
fatty acid binding, and there are hydrophilic areas on the surface of the albumin,
which favour polar molecules. Where ligands favour a particular area then this is
commonly referred to as a binding site. As albumins contain only L-amino acids then
the binding sites will exhibit one stereoscopic orientation. Assuming that there are
three points of interaction [Dalgleish 1952] at the binding site then enantiomers will
exhibit different binding properties. The basis of the different pharmacological and
toxicological profiles of proteins and in particular albumins is used to separate
enantiomers.
1.4 Capillary electrophoresis
Capillary electrophoresis (CE) is still a relatively new analytical technique and in the
early 1990s was rapidly gaining acceptance as a mainstream separating technique.
Electoosmosis has been known for a number of years in thin-layer chromatographic
systems. Columns with an internal diameter of less than 100 µm, have only been
used experimentally since the early 1980s. These columns are generally referred to as
capillaries. The first experiments were carried by Jorgensen [Jorgensen 1981] to
resolve mixtures of fluorescamine labelled peptides and since then there has been an
exponential growth in the number of publications including books [Camilleri 1993,
- 16 -
Grossman 1992 & Landers 1994] and a launch of a new journal in 1994, Journal of
Capillary Electrophoresis, dedicated to CE. There is also a dedicated capillary
electrophoresis website at www.ceandcec.com. By the end of the 1990s there were
several commercial instruments from different manufacturers (Beckman, Dionex,
Hewlett Packard, BioRad, Spectraphysics and Unicam) which allow full automation
and the use of different detectors including UV, diode-array, conductivity and mass
spectrometry.
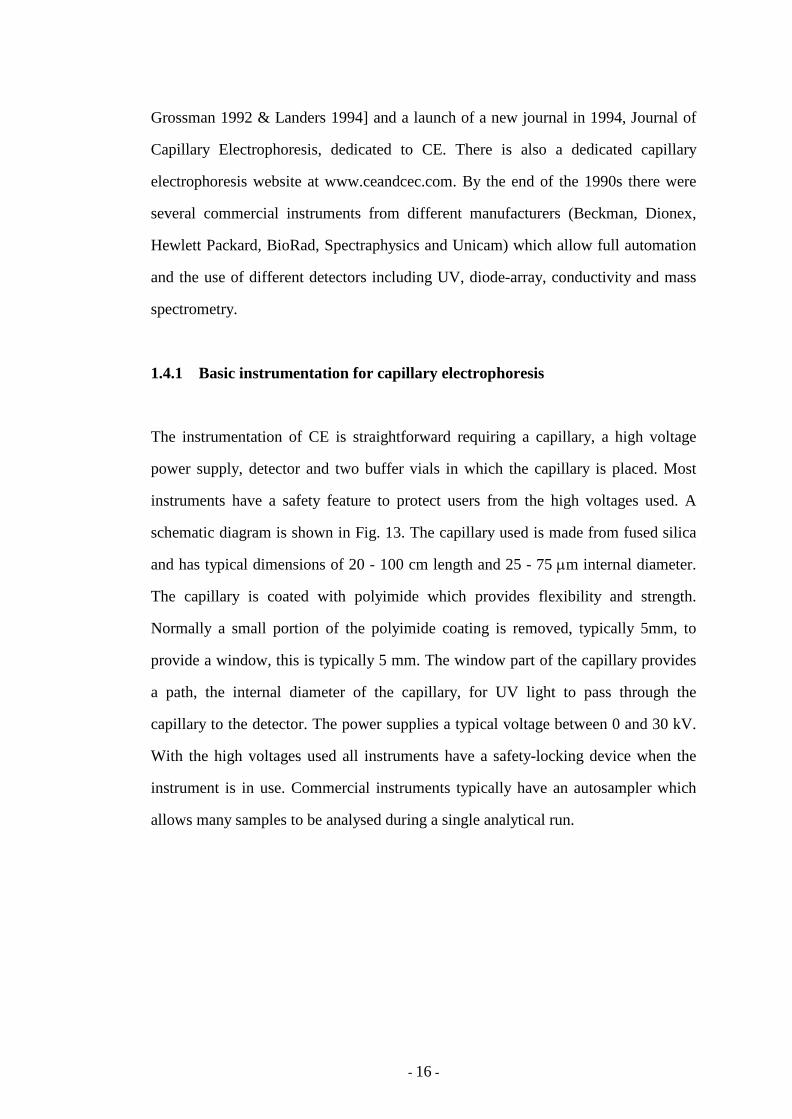
1.4.1 Basic instrumentation for capillary electrophoresis
The instrumentation of CE is straightforward requiring a capillary, a high voltage
power supply, detector and two buffer vials in which the capillary is placed. Most
instruments have a safety feature to protect users from the high voltages used. A
schematic diagram is shown in Fig. 13. The capillary used is made from fused silica
and has typical dimensions of 20 - 100 cm length and 25 - 75 µm internal diameter.
The capillary is coated with polyimide which provides flexibility and strength.
Normally a small portion of the polyimide coating is removed, typically 5mm, to
provide a window, this is typically 5 mm. The window part of the capillary provides
a path, the internal diameter of the capillary, for UV light to pass through the
capillary to the detector. The power supplies a typical voltage between 0 and 30 kV.
With the high voltages used all instruments have a safety-locking device when the
instrument is in use. Commercial instruments typically have an autosampler which
allows many samples to be analysed during a single analytical run.
- 17 -
Fig. 13. Basic capillary electrophoresis instrument. Samples are usually
injected onto the capillary by either applying positive pressure or by the
use of an electric field.
1.4.2 Theory of capillary electrophoresis
1.4.2.1 Electroosmotic flow
The electroosmotic flow (EOF) is the bulk flow of the buffer through a capillary
when a voltage is applied and is only associated with CE. The EOF is pH dependent
and is governed by the dissociation of the silanol groups as shown by equation 14.
− ← → +− +SiOH SiO H
Equation 14. Dissociation equilibrium of silanol groups at the capillary surface.
The pKa of the silanol groups at the surface of the capillary wall is between 4 and 5
so at pH 7 and above the silanol groups will be fully ionised. The cations within the
buffer will then form a double layer to neutralise the excess negative charge, Fig. 15.
- 18 -
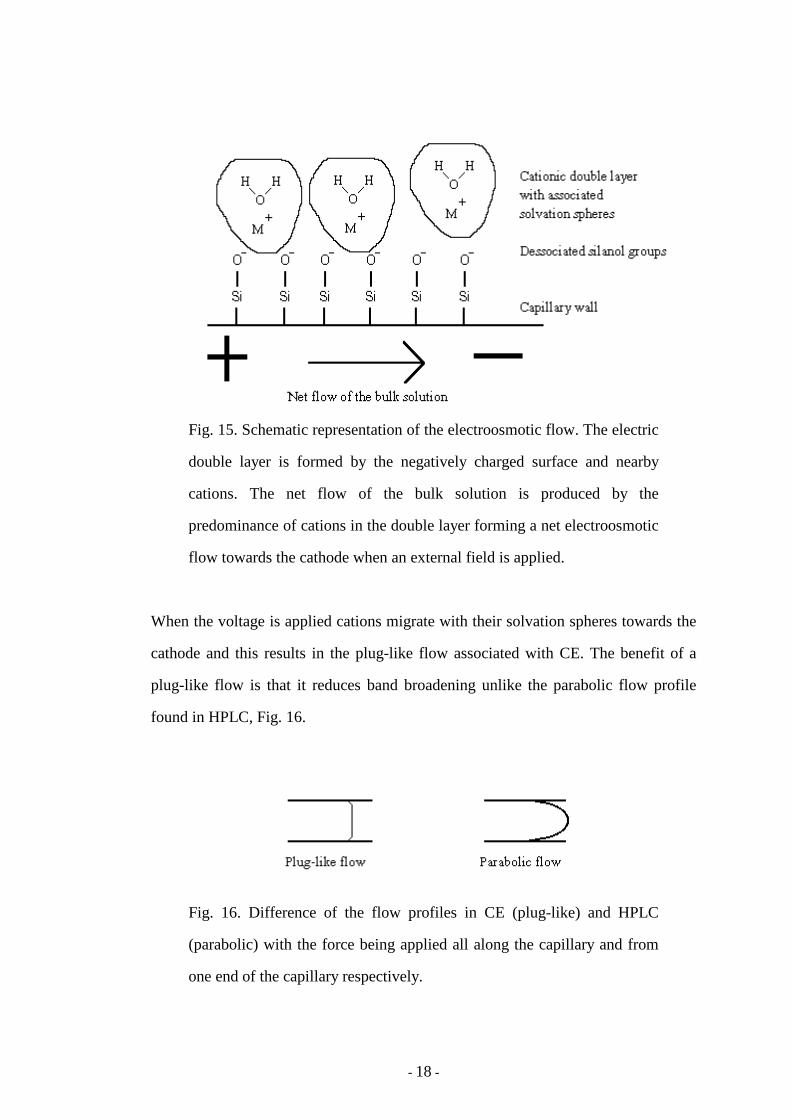
Fig. 15. Schematic representation of the electroosmotic flow. The electric
double layer is formed by the negatively charged surface and nearby
cations. The net flow of the bulk solution is produced by the
predominance of cations in the double layer forming a net electroosmotic
flow towards the cathode when an external field is applied.
When the voltage is applied cations migrate with their solvation spheres towards the
cathode and this results in the plug-like flow associated with CE. The benefit of a
plug-like flow is that it reduces band broadening unlike the parabolic flow profile
found in HPLC, Fig. 16.
Fig. 16. Difference of the flow profiles in CE (plug-like) and HPLC
(parabolic) with the force being applied all along the capillary and from
one end of the capillary respectively.
- 19 -
To have reproducibility for the migration times of analytes the EOF needs to be
constant. This is best achieved when the silanol groups are either completely ionised
or completely unionised. To be fully ionised the pH has to be greater than 7 and
unionised the pH has to be less than 2 so it is not practical to use buffers of pH
between 2 and 7 as a slight difference in the pH can have dramatic effects on the
silanol ionisation and hence on the EOF. Another method to prevent ionisation of the
silanol groups is to react them with protecting groups like small alkyl groups. It is
then possible to reduce the EOF when using buffers greater than pH 7.
1.4.2.2 Separation of molecules using capillary electrophoresis
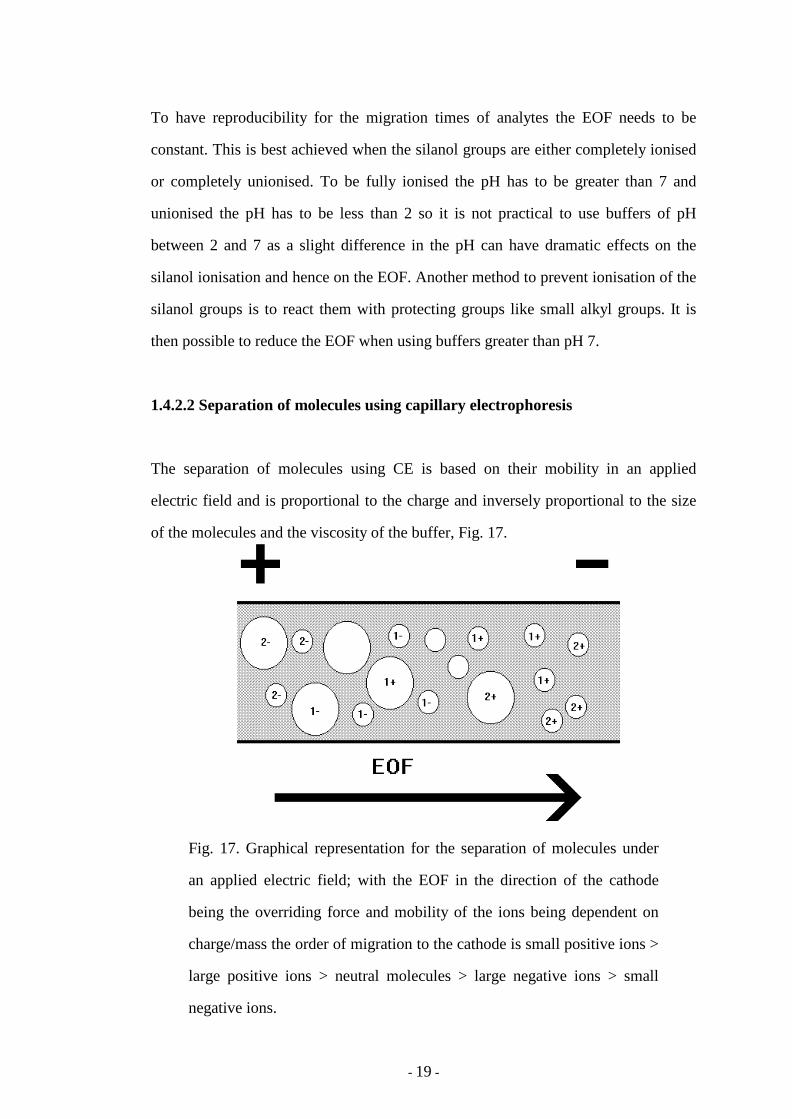
The separation of molecules using CE is based on their mobility in an applied
electric field and is proportional to the charge and inversely proportional to the size
of the molecules and the viscosity of the buffer, Fig. 17.
Fig. 17. Graphical representation for the separation of molecules under
an applied electric field; with the EOF in the direction of the cathode
being the overriding force and mobility of the ions being dependent on
charge/mass the order of migration to the cathode is small positive ions >
large positive ions > neutral molecules > large negative ions > small
negative ions.
- 20 -
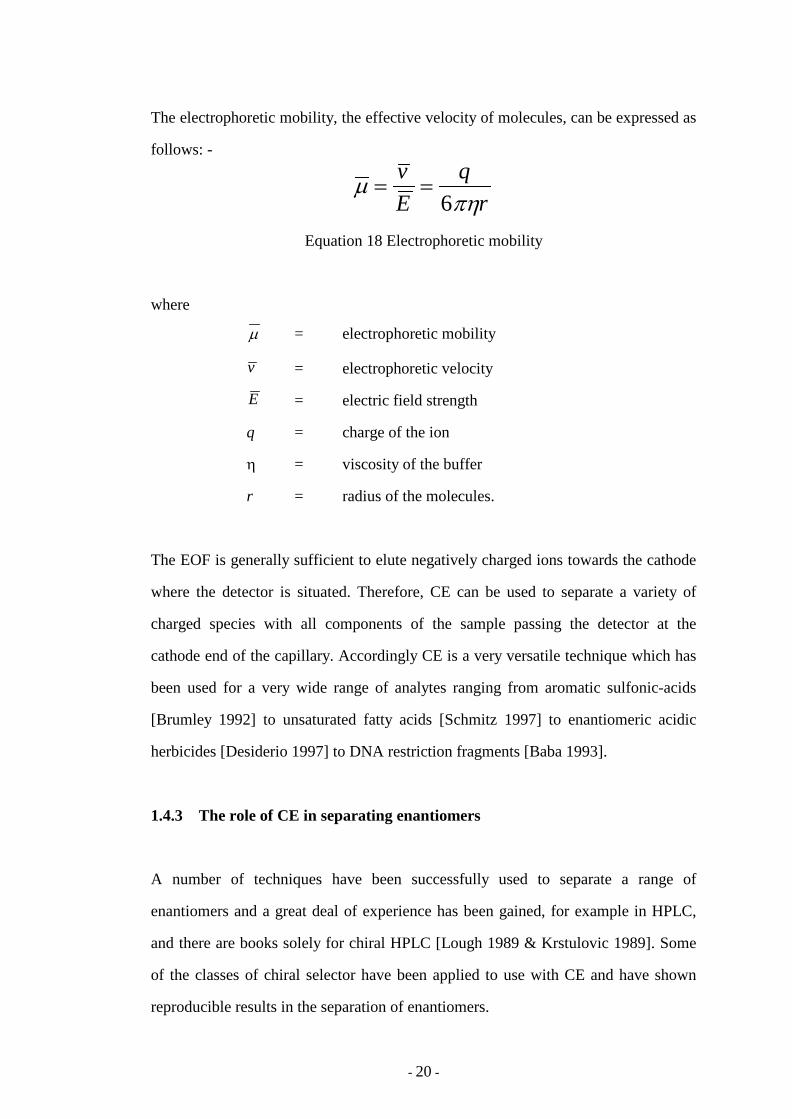
The electrophoretic mobility, the effective velocity of molecules, can be expressed as
follows: -
µπη
= =vE
qr6
Equation 18 Electrophoretic mobility
where
µ = electrophoretic mobility
v = electrophoretic velocity
E = electric field strength
q = charge of the ion
η = viscosity of the buffer
r = radius of the molecules.
The EOF is generally sufficient to elute negatively charged ions towards the cathode
where the detector is situated. Therefore, CE can be used to separate a variety of
charged species with all components of the sample passing the detector at the
cathode end of the capillary. Accordingly CE is a very versatile technique which has
been used for a very wide range of analytes ranging from aromatic sulfonic-acids
[Brumley 1992] to unsaturated fatty acids [Schmitz 1997] to enantiomeric acidic
herbicides [Desiderio 1997] to DNA restriction fragments [Baba 1993].
1.4.3 The role of CE in separating enantiomers
A number of techniques have been successfully used to separate a range of
enantiomers and a great deal of experience has been gained, for example in HPLC,
and there are books solely for chiral HPLC [Lough 1989 & Krstulovic 1989]. Some
of the classes of chiral selector have been applied to use with CE and have shown
reproducible results in the separation of enantiomers.
- 21 -
In the early 1990s, chiral CE is becoming widely used with reviews already being
published [Snopeck 1992, Novotny 1994, Ward 1994 & Nishi 1995]. The most
common form of chiral CE is to add chiral compounds to the run buffer. As the
enantiomers complex with the additives at different rates and the resulting complexes
will have different electrophoretic mobilities compared to the enantiomers then the
effective mobilities of the enantiomers will be different and hence there will be a
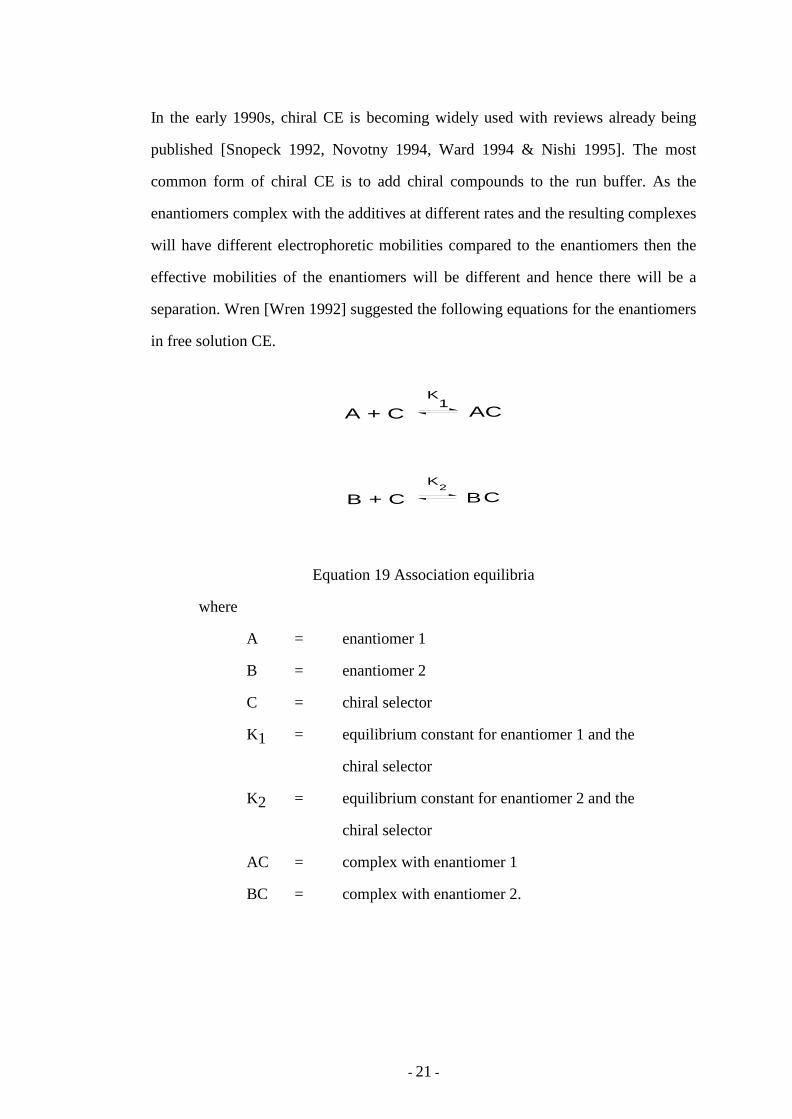
separation. Wren [Wren 1992] suggested the following equations for the enantiomers
in free solution CE.
A + C ACK
1
+ C CK
B B2
Equation 19 Association equilibria
where
A = enantiomer 1
B = enantiomer 2
C = chiral selector
K1 = equilibrium constant for enantiomer 1 and the
chiral selector
K2 = equilibrium constant for enantiomer 2 and the
chiral selector
AC = complex with enantiomer 1
BC = complex with enantiomer 2.
- 22 -
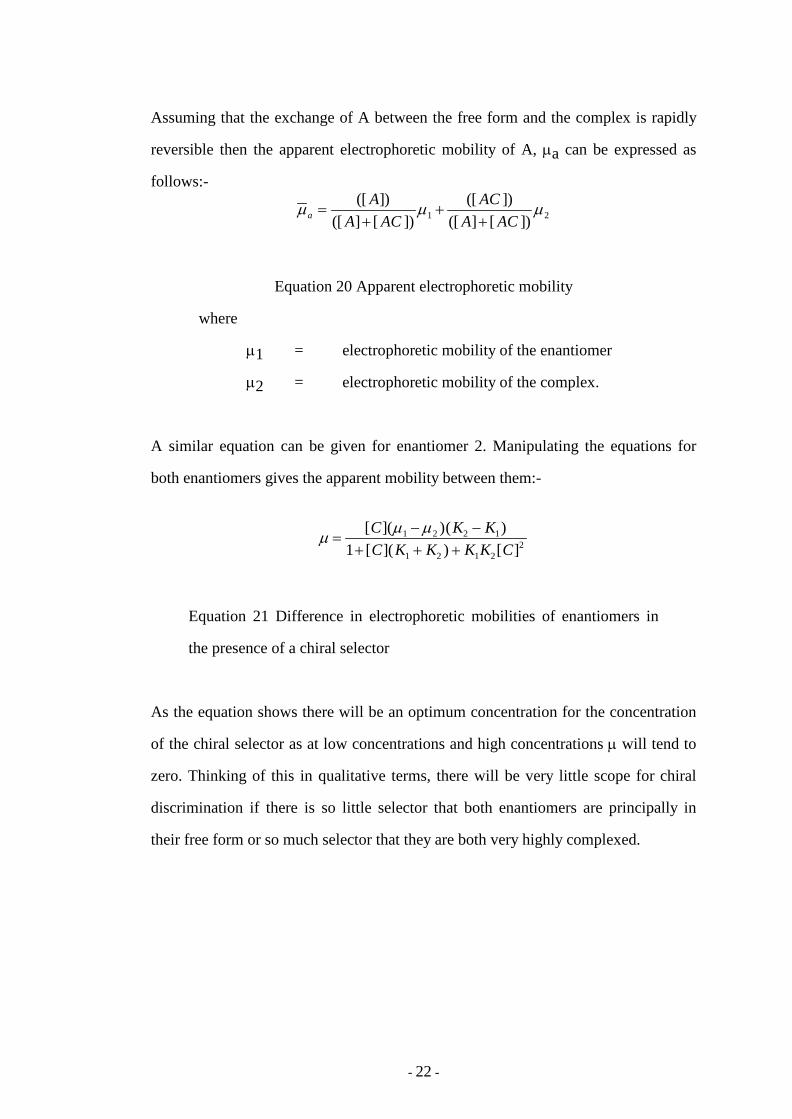
Assuming that the exchange of A between the free form and the complex is rapidly
reversible then the apparent electrophoretic mobility of A, µa can be expressed as
follows:-
µ µ µaA
A ACAC
A AC=
++
+([ ])
([ ] [ ])([ ])
([ ] [ ])1 2
Equation 20 Apparent electrophoretic mobility
where
µ1 = electrophoretic mobility of the enantiomer
µ2 = electrophoretic mobility of the complex.
A similar equation can be given for enantiomer 2. Manipulating the equations for
both enantiomers gives the apparent mobility between them:-
µ µ µ=
− −+ + +
[ ]( )( )[ ]( ) [ ]C K KC K K K K C
1 2 2 1
1 2 1 221
Equation 21 Difference in electrophoretic mobilities of enantiomers in
the presence of a chiral selector
As the equation shows there will be an optimum concentration for the concentration
of the chiral selector as at low concentrations and high concentrations µ will tend to
zero. Thinking of this in qualitative terms, there will be very little scope for chiral
discrimination if there is so little selector that both enantiomers are principally in
their free form or so much selector that they are both very highly complexed.
- 23 -
1.4.4 Chiral selectors employed in capillary electrophoresis
1.4.4.1 Cyclodextrins
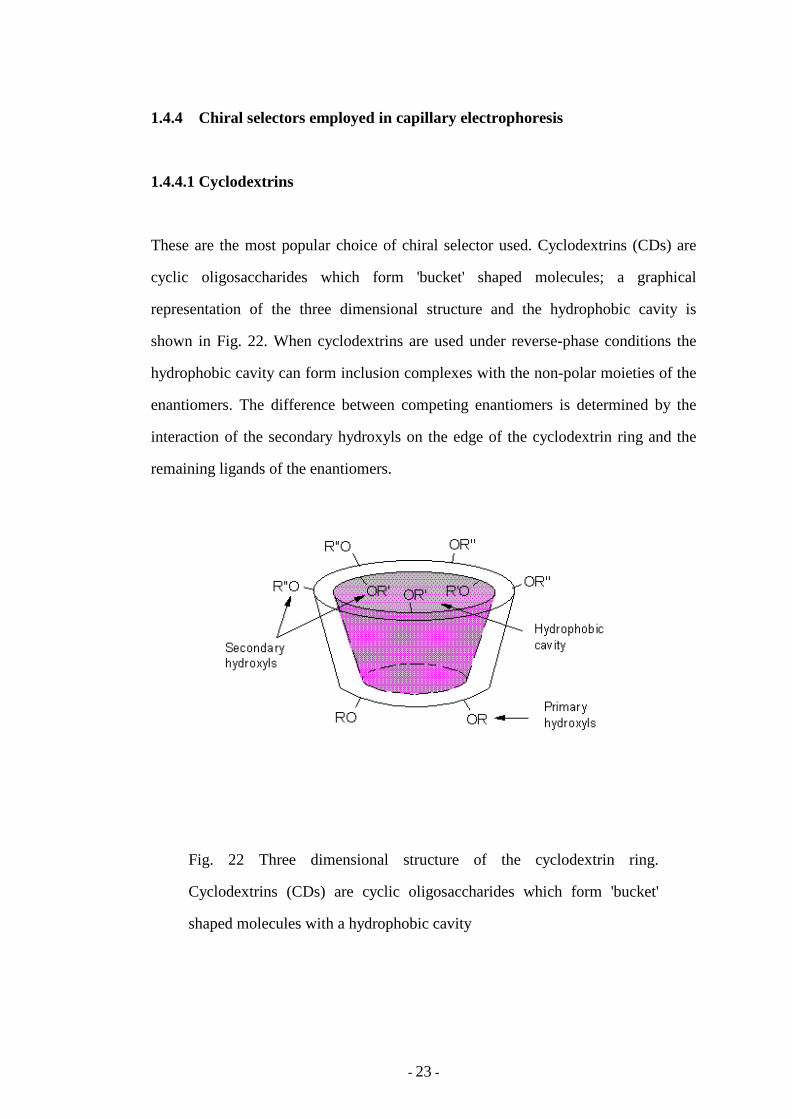
These are the most popular choice of chiral selector used. Cyclodextrins (CDs) are
cyclic oligosaccharides which form 'bucket' shaped molecules; a graphical
representation of the three dimensional structure and the hydrophobic cavity is
shown in Fig. 22. When cyclodextrins are used under reverse-phase conditions the
hydrophobic cavity can form inclusion complexes with the non-polar moieties of the
enantiomers. The difference between competing enantiomers is determined by the
interaction of the secondary hydroxyls on the edge of the cyclodextrin ring and the
remaining ligands of the enantiomers.
Fig. 22 Three dimensional structure of the cyclodextrin ring.
Cyclodextrins (CDs) are cyclic oligosaccharides which form 'bucket'
shaped molecules with a hydrophobic cavity
- 24 -
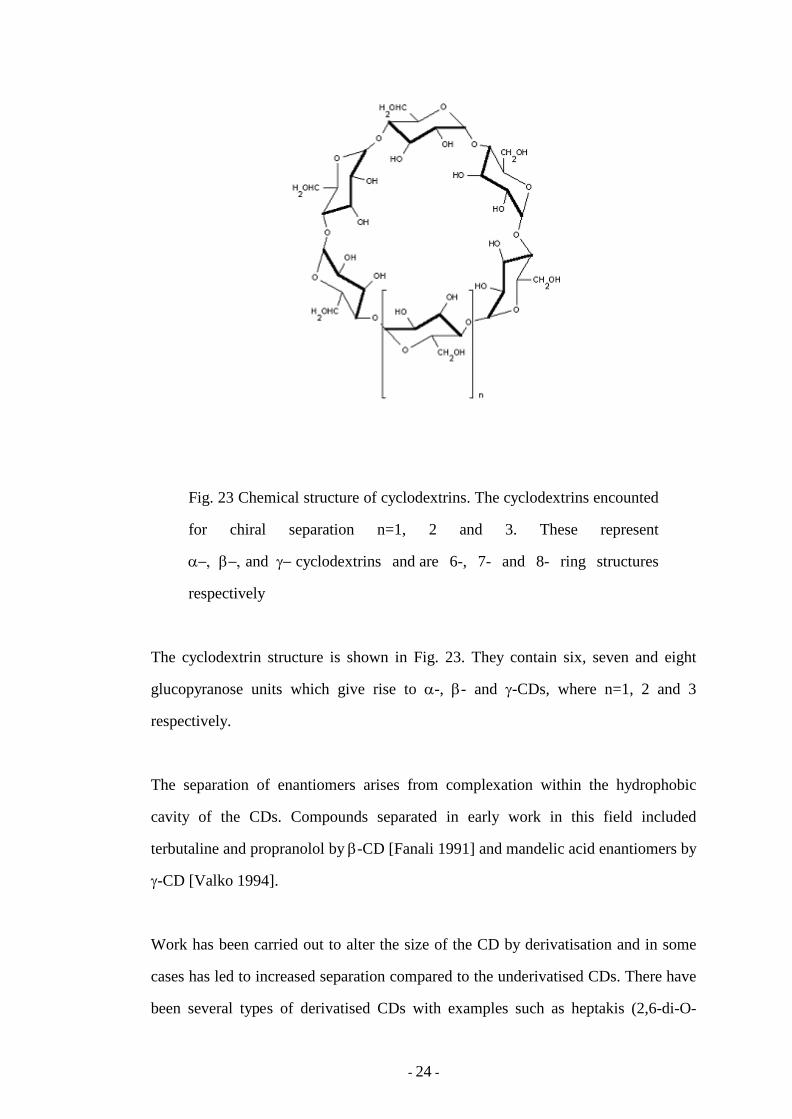
Fig. 23 Chemical structure of cyclodextrins. The cyclodextrins encounted
for chiral separation n=1, 2 and 3. These represent
α−, β−, and γ− cyclodextrins and are 6-, 7- and 8- ring structures
respectively
The cyclodextrin structure is shown in Fig. 23. They contain six, seven and eight
glucopyranose units which give rise to α-, β- and γ-CDs, where n=1, 2 and 3
respectively.
The separation of enantiomers arises from complexation within the hydrophobic
cavity of the CDs. Compounds separated in early work in this field included
terbutaline and propranolol by β-CD [Fanali 1991] and mandelic acid enantiomers by
γ-CD [Valko 1994].
Work has been carried out to alter the size of the CD by derivatisation and in some
cases has led to increased separation compared to the underivatised CDs. There have
been several types of derivatised CDs with examples such as heptakis (2,6-di-O-
- 25 -
methyl)-β-CD to separate terbutaline and propranolol [Fanali 1991] and sulfobutyl
ether β-CD in the separation of ephedrine, pseudoephedrine and related compounds
[Tait 1994]. In the former case the nature of the interaction on the ‘rim’ of the
cyclodextrin ‘bucket’ is modified while in the latter case the charge on the ‘base’ of
the ‘bucket’ serves to open up a ‘window’ of migration between, say, a neutral free
analyte and its charged complexed form.
1.4.4.2 Chiral micellar electrokinetic capillary chromatography
Instead of using sodium dodecyl sulphate (SDS) as the surfactant in micellar
electrokinetic capillary chromatography (MECC), chiral surfactants have been
utilised to form a chiral micellular pseudo stationary phase. There are many naturally
occurring chiral surfactants from which analysts may choose. One example of a
family of natural surfactants are bile salts such as sodium cholate, which along with
sodium deoxycholate, has been used to separate the enantiomers of 3-hydroxy-1,4-
benzodiazepines [Michotte, 1995]. Another approach was used by Warner et al
[Ward 1994] who used a chiral micelle polymer, poly(sodium N-undecylenyl-L-
valinate), as the chiral stationary phase. There were some advantages over
conventional chiral MECC such as improved mass transfer rate and the elimination
of the equilibrium between the monomer and micelle so there is no CMC and so the
methodology can be used at lower concentrations.
1.4.4.3 Biomacromolecules
Biomacromolecules are another source of chiral selectors. With the amount of chiral
selectors needed for CE being very small, expensive and exotic biomacromolecules
can be tested and subsequently used successfully. Typical biomacromolecules
include macrocyclic antibiotics, carbohydrates and proteins. The use of macrocyclic
antibiotics was pioneered by Armstrong et al [Armstrong 1994 & Armstrong 1995]
- 26 -
who were able to separate a range of compounds with vancomycin and ristocetin A.
These chiral selectors were particularly effective in that, as recognised by Armstrong,
they had the structural complexity of proteins without the potential band-broadening
problems that might arise from the large molecular mass and structural heterogeneity
associated with proteins.
As well as the cyclodextrins, non-cyclic oligosaccharides have also been used as
buffer additives in chiral CE. Current research has been limited compared to the CDs
but there are still some examples. Heparin is a naturally, polydisperse, polyionic
glycosaminoglycan and has been used to achieve baseline separations of
oxamniquine [Clark 1995], antimalarial and antihistamine drugs [Stalcup 1994].
Other carbohydrates used are maltooligosaccharides [Novotny 1994 & Verbeke
1994] and linear dextrins [Kano 1995].
Other examples of buffer additives are copper-histidine complexes in the separation
of Dansyl-amino acids [Gozel 1987] and the use of chiral crown ethers [Kuhn 1994].
1.4.4.4 Proteins
Commercial protein chiral stationary phases for HPLC were first introduced into the
UK in 1985 and by the early 1990s, proteins had been extensively used in chiral LC
separations; examples of proteins used were bovine serum albumin (BSA) [Wainer
1998], human serum albumin (HSA) [Loun 1994] and α1-acid glycoprotein (α1-
AGP) [Hermansson 1995]. However, their use as chiral selectors in CE has been
modest with only a few papers having been published by the beginning of 1992.
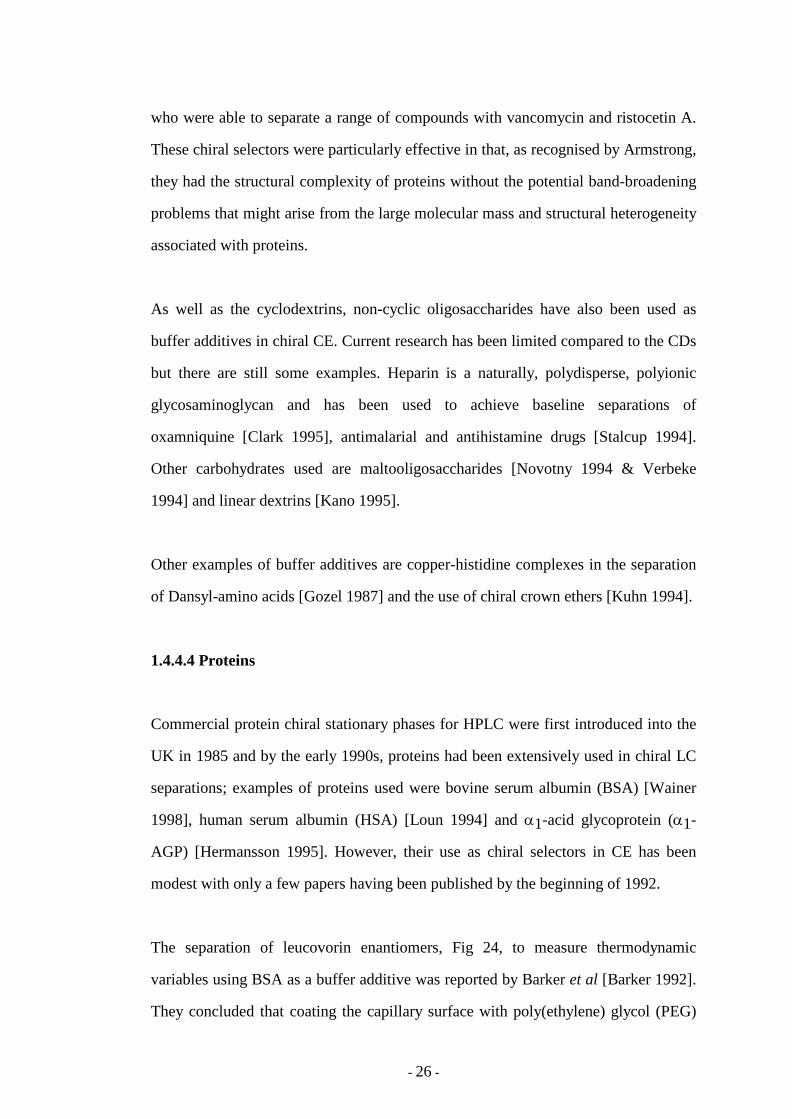
The separation of leucovorin enantiomers, Fig 24, to measure thermodynamic
variables using BSA as a buffer additive was reported by Barker et al [Barker 1992].
They concluded that coating the capillary surface with poly(ethylene) glycol (PEG)
- 27 -
improved run time reproducibility because the PEG coating prevented the BSA
adhering to the capillary wall. Ligands, run buffer modifiers, or both, needed to be
charged for acceptable analysis times. They found the optimum pH to use for run
time, peak shape and resolution to be 7.2.
N N
N N
O C
H H
HH
2N
OH
O
N
H
OHOO
OH
Fig. 24 Chemical structure of Leucovorin
Vespalec [Vespalec 1993] used a 10 mg ml-1 HSA in 10 mM acetic acid-TRIS
buffer, pH 8, to separate enantiomers of kynurenine, tryptophan and 3-indole lactic
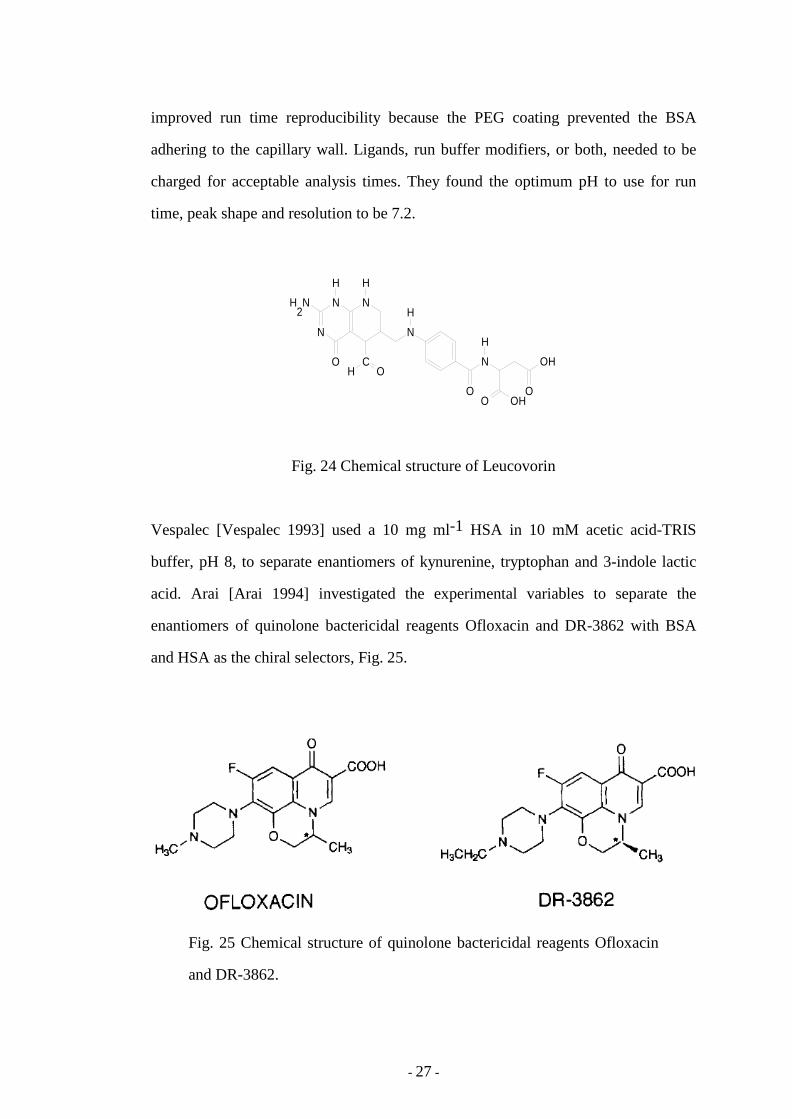
acid. Arai [Arai 1994] investigated the experimental variables to separate the
enantiomers of quinolone bactericidal reagents Ofloxacin and DR-3862 with BSA
and HSA as the chiral selectors, Fig. 25.
Fig. 25 Chemical structure of quinolone bactericidal reagents Ofloxacin
and DR-3862.
- 28 -
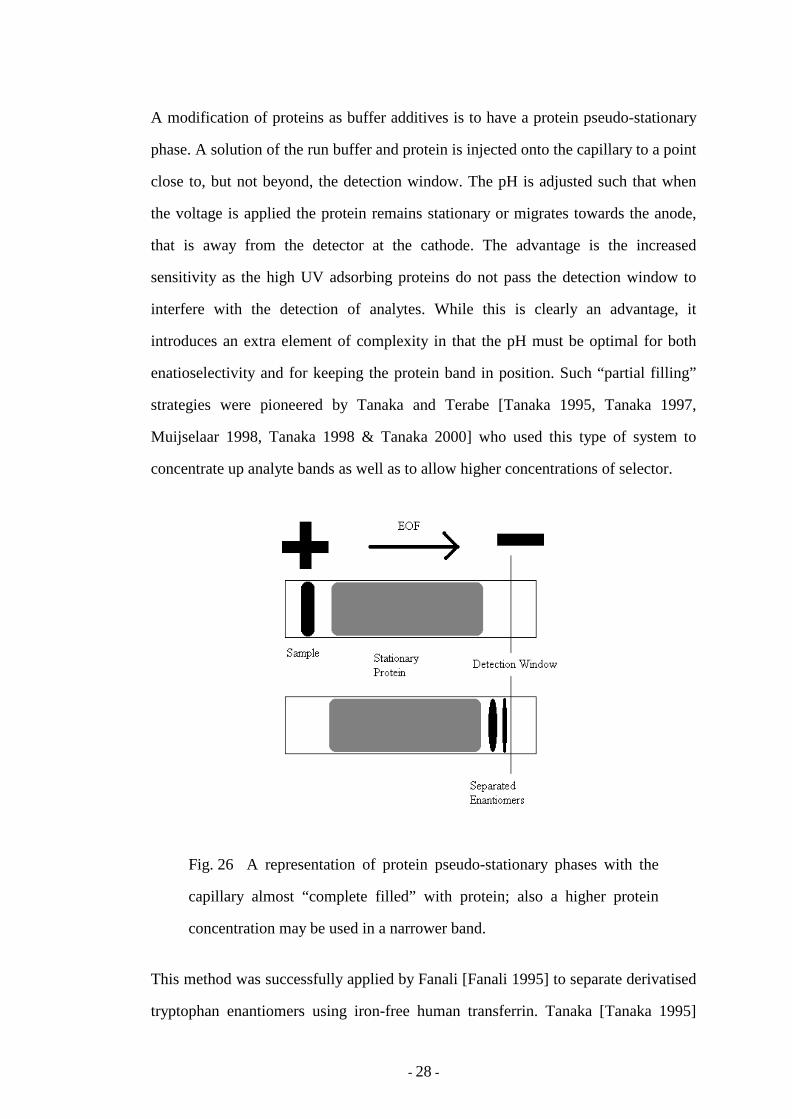
A modification of proteins as buffer additives is to have a protein pseudo-stationary
phase. A solution of the run buffer and protein is injected onto the capillary to a point
close to, but not beyond, the detection window. The pH is adjusted such that when
the voltage is applied the protein remains stationary or migrates towards the anode,
that is away from the detector at the cathode. The advantage is the increased
sensitivity as the high UV adsorbing proteins do not pass the detection window to
interfere with the detection of analytes. While this is clearly an advantage, it
introduces an extra element of complexity in that the pH must be optimal for both
enatioselectivity and for keeping the protein band in position. Such “partial filling”
strategies were pioneered by Tanaka and Terabe [Tanaka 1995, Tanaka 1997,
Muijselaar 1998, Tanaka 1998 & Tanaka 2000] who used this type of system to
concentrate up analyte bands as well as to allow higher concentrations of selector.
Fig. 26 A representation of protein pseudo-stationary phases with the
capillary almost “complete filled” with protein; also a higher protein
concentration may be used in a narrower band.
This method was successfully applied by Fanali [Fanali 1995] to separate derivatised
tryptophan enantiomers using iron-free human transferrin. Tanaka [Tanaka 1995]
- 29 -
also applied the same technique to separate enantiomers with four different proteins,
BSA, ovomucoid, α1-AGP and conalbumin.
Ishihama [Ishihama 1994] studied ovomucoid with effects of changing the
experimental variables of concentration of the run buffer, uncoated and coated
capillaries, concentration of the chiral selector and organic modifiers. Successful
separations occurred in the pH range of 4, but the peaks were severely tailed and it
was suggested that the protein was binding to the capillary wall. Reproducibility was
improved with coated capillaries as the binding of protein to the capillary wall was
reduced. With increasing protein concentration the resolution was enhanced and the
apparent mobilities of the enantiomers were decreased. The enhanced resolution can
be explained by equation 21. With increasing concentration of protein there was
enhanced resolution. However, the amount of chiral selector added was not sufficient
to give the maximum resolution or to give a decrease in resolution. The addition of
organic modifiers improved the peak shape but there was a decrease on the
separation factor.
Another application used to prevent proteins passing through the detection window
was to use an immobilised protein (on spherical silica microparticles) chiral
stationary phase in protein capillary electrochromatography (CEC). Lloyd et al
[Lloyd 1995] immobilised HSA onto 7 µm silica and then compared the HSA
stationary phase with HSA in free solution. A number of enantiomers were separated
with both techniques. Organic modifiers were added to both systems and it was
observed that the greatest enantioselectivity was shown by 2-propanol and
acetonitrile compared to 1-propanol. As there was a similarity between the
electrically driven system of protein CEC and the pressure driven system of HPLC it
was suggested that the electric field had a negligible effect on the immobilised
protein. The separation efficiencies in protein CEC were found to be similar to
protein chiral stationary phases (CSPs) used in HPLC. However, they were found to
- 30 -
be poor when compared to β-cyclodextrins and other chiral selectors used in free
solution CE. While CEC seemed like an attractive technique in principle at the time,
especially with analysts raised with a thorough understanding of packed beds as used
in HPLC, it has since fallen out of favour because of some of the practical difficulties
involved (frit preparation, organic solvents dissolving polyimide coating at the ends
of the capillary, inconsistent chromatography of basic compounds, L Frame, PhD,
University of Sunderland.
1.4.5 The measurement of drug-protein binding constants by
chromatographic techniques
As noted earlier, blood plasma proteins play a significant role in the transport and
release of drugs around the body [Peters 1977]. As such, many studies have been
undertaken to ascertain drug-protein binding and the affects of competing ligands on
drug-protein binding. Such studies now play a very important part in screening
strategies for pre-Development drug candidates and in safety studies with repect to
co-administration with highly bound drugs and chromatographic techniques offer a
practical way of obtaining such very important data in a very rapid, efficient and
accurate manner.
1.4.5.1 Drug-protein binding studies using high-performance liquid
chromatography (HPLC)
Ashton et al [Ashton 1996] used HPLC to study the binding of indolocarbazole
derivatives, which show anti-viral properties, to immobilised human serum albumin
(HSA). They calculated the percentage of drug-protein binding from the retention
times of the analytes when injected onto an immobilised HSA column. They found
that all of the analytes were strongly bound to HSA and required a mobile phase
containing 30% 2-propanol to obtain reasonable retention times. HPLC was also
- 31 -
used by Thaud et al [Thaud 1983] to study diazepam-HSA binding. The first HPLC
method they used was the Hummel-Dreyer method [Thaud 1983] which required
several eluents to cover a range of diazepam concentrations from 0.3 µM to 100 µM.
The second method they described was the equilibrium saturation method. Like the
previous method this required a combination of eluents to include mixtures of 0.4
and 2.0 g l-1 HSA with 10 µM to 100 µM diazepam. A volume of buffer was injected
and the resulting negative peak corresponded to the free-drug concentration of the
mixture studied. They found that lower molar binding ratios could be determined
with the Hummel-Dreyer method than the equilibrium saturation method.
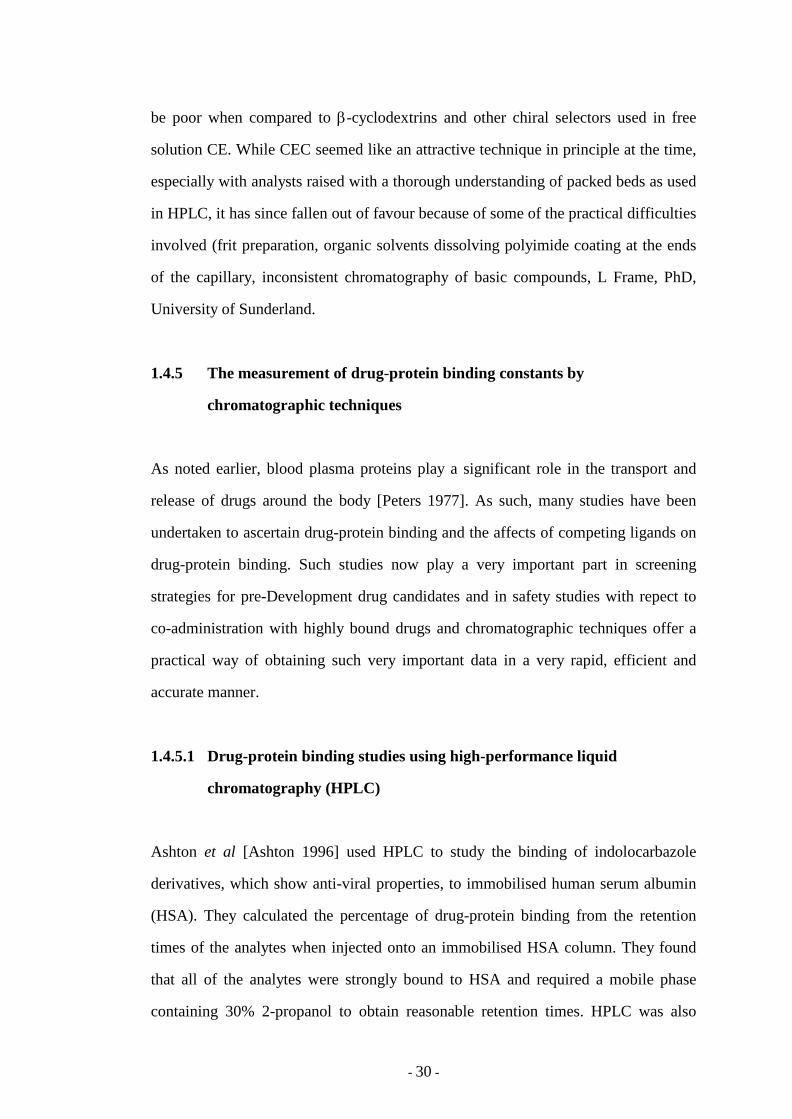
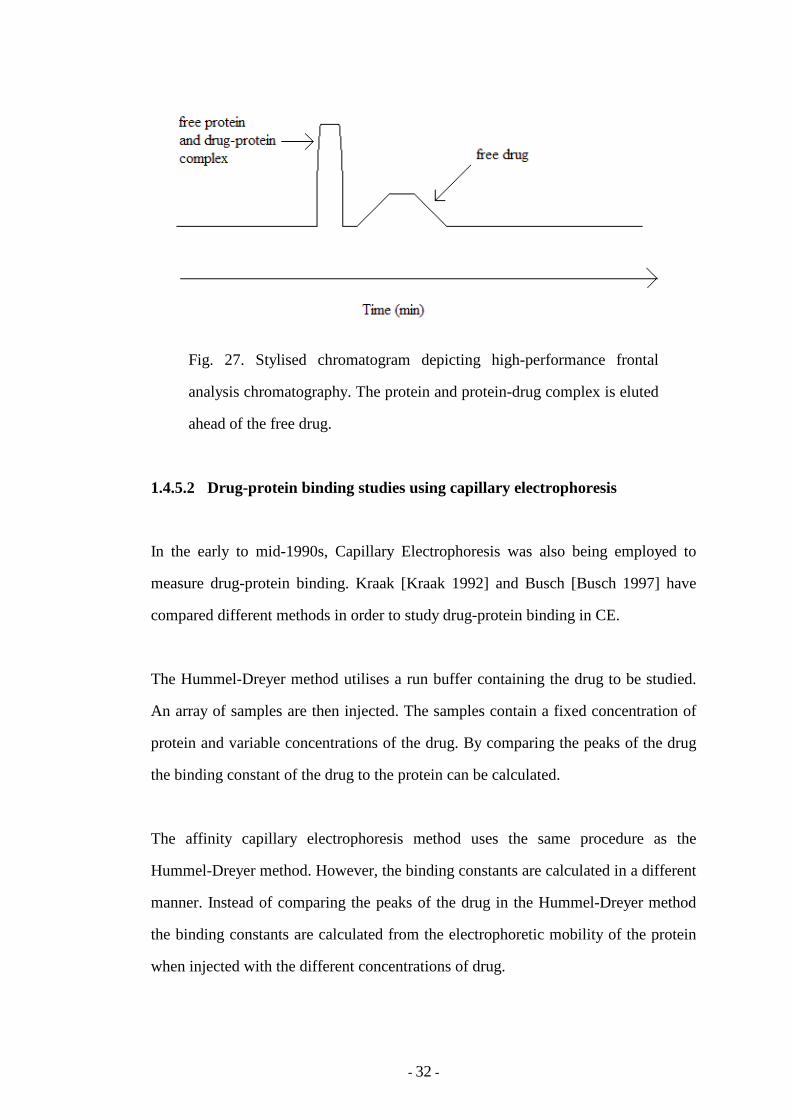
The technique of high performance frontal analysis has proved successful for the
determination of binding constants of warfarin to HSA [Shibukawa 1996 & He
1997]. The technique utilises columns which have stationary phases of small pore
sizes. These columns effectively restrict large protein molecules to the mobile phase.
When a drug-protein mixture is injected onto the column, the drug concentration in
the pore becomes equal to the unbound drug concentration in the sample solution.
The authors stated that the protein eluted first followed by the drug which was
characterised by a trapezoidal peak having a plateau region, Fig. 27. The unbound
drug concentration could then be determined by measuring the drug concentration in
the plateau region.
This method offers some advantages over conventional chromatography such as it
allows a direct sample injection analysis using a simple procedure and the protein
does not form a constituent part of the mobile phase.
- 32 -
Fig. 27. Stylised chromatogram depicting high-performance frontal
analysis chromatography. The protein and protein-drug complex is eluted
ahead of the free drug.
1.4.5.2 Drug-protein binding studies using capillary electrophoresis
In the early to mid-1990s, Capillary Electrophoresis was also being employed to
measure drug-protein binding. Kraak [Kraak 1992] and Busch [Busch 1997] have
compared different methods in order to study drug-protein binding in CE.
The Hummel-Dreyer method utilises a run buffer containing the drug to be studied.
An array of samples are then injected. The samples contain a fixed concentration of
protein and variable concentrations of the drug. By comparing the peaks of the drug
the binding constant of the drug to the protein can be calculated.
The affinity capillary electrophoresis method uses the same procedure as the
Hummel-Dreyer method. However, the binding constants are calculated in a different
manner. Instead of comparing the peaks of the drug in the Hummel-Dreyer method
the binding constants are calculated from the electrophoretic mobility of the protein
when injected with the different concentrations of drug.
- 33 -
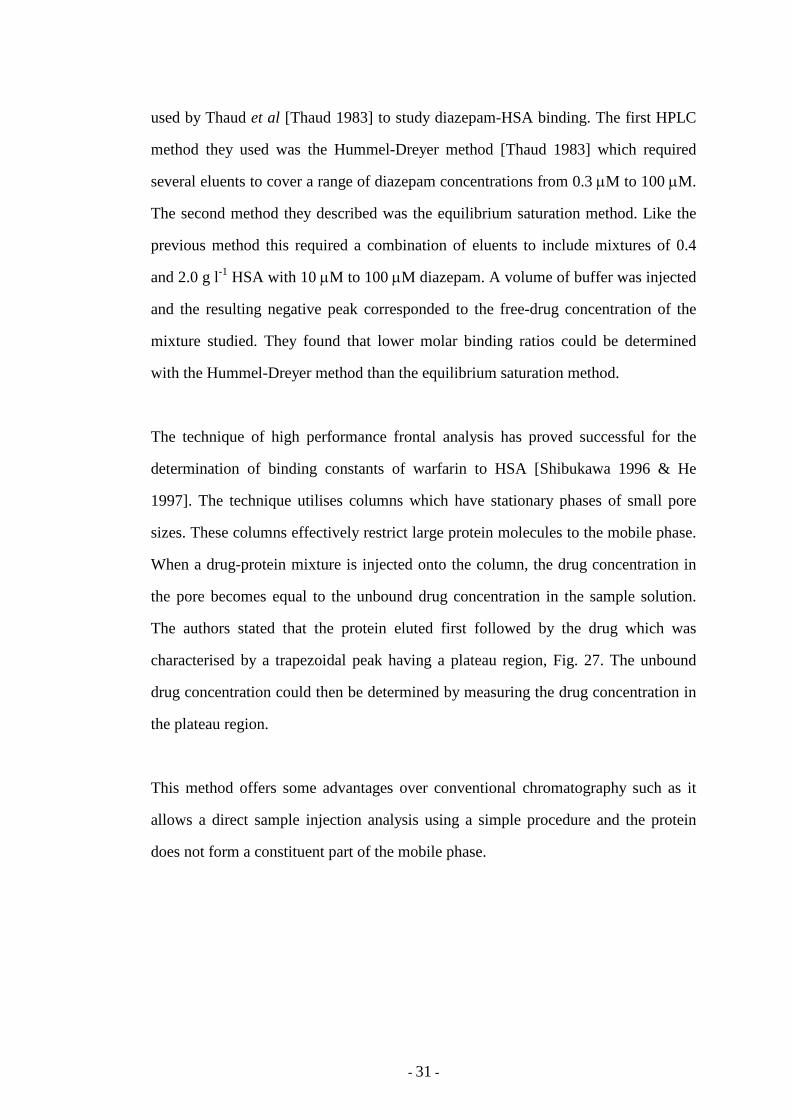
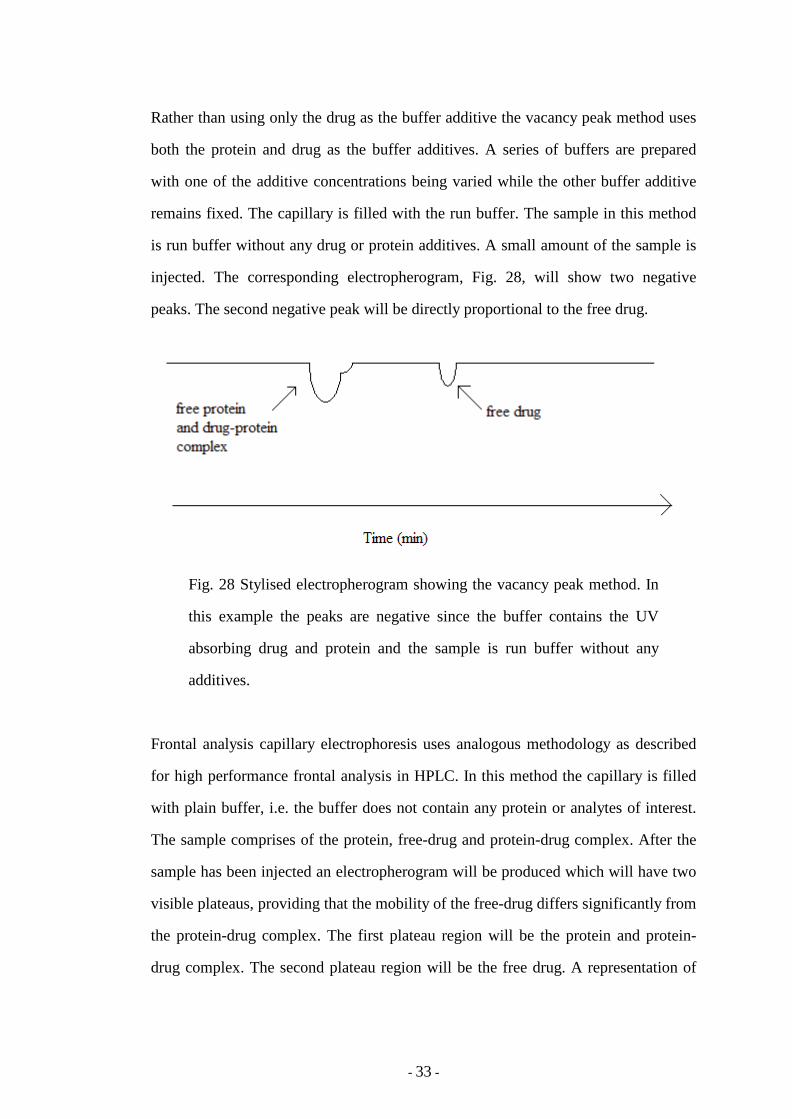
Rather than using only the drug as the buffer additive the vacancy peak method uses
both the protein and drug as the buffer additives. A series of buffers are prepared
with one of the additive concentrations being varied while the other buffer additive
remains fixed. The capillary is filled with the run buffer. The sample in this method
is run buffer without any drug or protein additives. A small amount of the sample is
injected. The corresponding electropherogram, Fig. 28, will show two negative
peaks. The second negative peak will be directly proportional to the free drug.
Fig. 28 Stylised electropherogram showing the vacancy peak method. In
this example the peaks are negative since the buffer contains the UV
absorbing drug and protein and the sample is run buffer without any
additives.
Frontal analysis capillary electrophoresis uses analogous methodology as described
for high performance frontal analysis in HPLC. In this method the capillary is filled
with plain buffer, i.e. the buffer does not contain any protein or analytes of interest.
The sample comprises of the protein, free-drug and protein-drug complex. After the
sample has been injected an electropherogram will be produced which will have two
visible plateaus, providing that the mobility of the free-drug differs significantly from
the protein-drug complex. The first plateau region will be the protein and protein-
drug complex. The second plateau region will be the free drug. A representation of
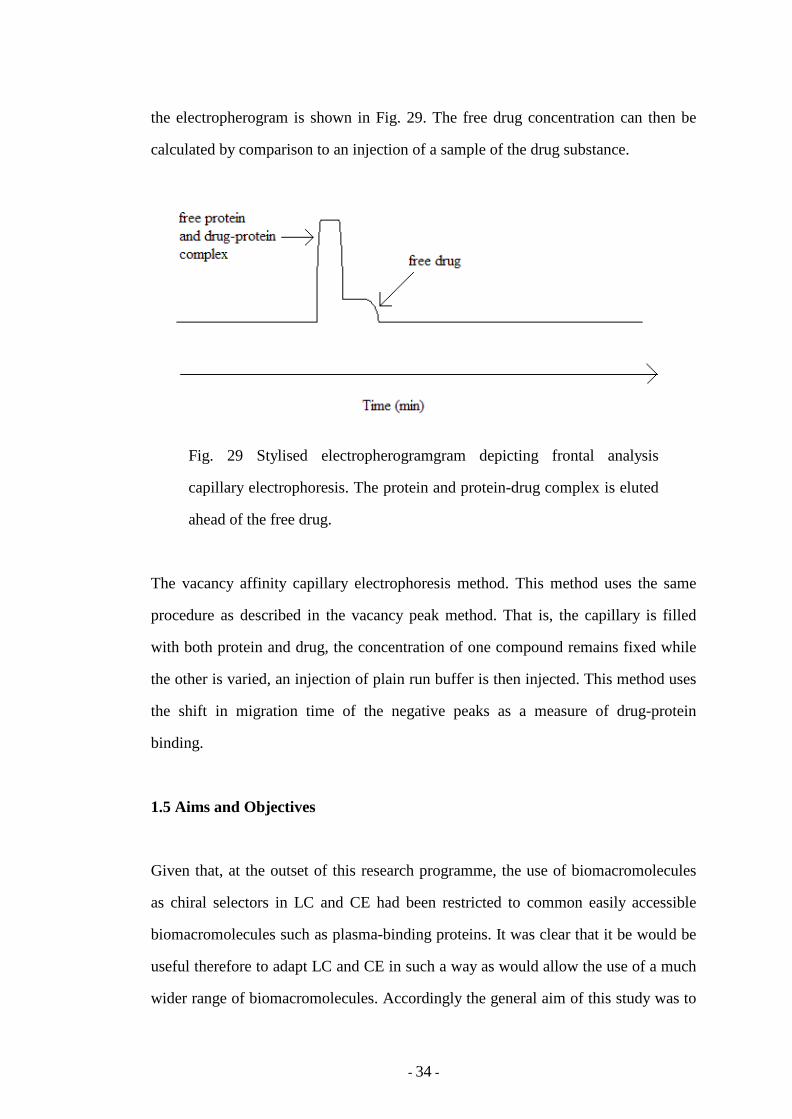
- 34 -
the electropherogram is shown in Fig. 29. The free drug concentration can then be
calculated by comparison to an injection of a sample of the drug substance.
Fig. 29 Stylised electropherogramgram depicting frontal analysis
capillary electrophoresis. The protein and protein-drug complex is eluted
ahead of the free drug.
The vacancy affinity capillary electrophoresis method. This method uses the same
procedure as described in the vacancy peak method. That is, the capillary is filled
with both protein and drug, the concentration of one compound remains fixed while
the other is varied, an injection of plain run buffer is then injected. This method uses
the shift in migration time of the negative peaks as a measure of drug-protein
binding.
1.5 Aims and Objectives
Given that, at the outset of this research programme, the use of biomacromolecules
as chiral selectors in LC and CE had been restricted to common easily accessible
biomacromolecules such as plasma-binding proteins. It was clear that it be would be
useful therefore to adapt LC and CE in such a way as would allow the use of a much
wider range of biomacromolecules. Accordingly the general aim of this study was to
- 35 -
develop LC and CE protocols involving biomacromolecules that would give rise to
minimum consumption of the biomacromolecule.
The strategy was to fulfil this general aim by addressing some specific objectives
which in the main, for CE, involved optimising conditions to allow screening of
biomacromolecules as potential chiral selectors, and, for LC, involved attempting to
prove the concept that chiral resolutions could be achieved on down-sized systems.
For both LC and CE, a secondary consideration was to bear in mind the likely
suitability of the systems being developed as vehicles for the in vitro evaluation of
drug-biomacromolecule binding.
- 36 -
Chapter 2 Experimental
2.1 Equipment for capillary electrophoresis
Two capillary electrophoresis instruments were employed during this study. They
were the CES I from Dionex (UK) Ltd. (Camberley, Surrey, UK) and the PACE
2050 from Beckman Instruments Ltd. (Fullerton, CA, USA). The capillaries of 50
µm i.d. (363 µm o.d.) were CElect P150 from Supelco, (Poole, Dorset, UK) and were
cut to appropriate lengths.
2.2 Equipment for liquid chromatography
The HPLC system consisted of a Shimadzu LC-10AD pump from Dyson Instruments
Ltd. (Hetton-le-Hole, UK), a Rheodyne 7520 microsample injector with 0.5 µl
sample rotor from Supelco (Poole, UK), a Valco 0.5 µl 4 port injector from LC-
Packings (Amsterdam, Holland) and a model 200 detector from Linear Instruments
(Freemont, CA, USA) with a UZ-LI-Mic flow cell from LC-Packings (Amsterdam,
Holland). The detector was connected to a Shimadzu C-R5A Chromatopac integrator
from Dyson Instruments Ltd. (Hetton-le-Hole, UK).
The pH of the mobile phase buffers was adjusted using a model HI8417
Microprocessor pH meter supplied by Hanna Instruments (Leighton Buzzaard, UK).
The packing materials were (1) Lichrosorb DIOL (5 µm, 60 Å) and (2) Lichrosorb
Diol (5 µm, 300 Å) supplied by Merck (Darmstadt, Germany) and (3) Nucleosil C8
(5 µm, 300 Å) and (4) Nucleosil silica (5 µm, 300 Å) from Macherey Nagel
(Duerren, Germany).
- 37 -
2.3 Materials
Acetonitrile, tetrahydrofuran, methanol and propan-1-ol were of HPLC grade and
were obtained from BDH (Lutterworth, Leics., UK). BDH were also the suppliers of
orthophosphoric acid, disodium hydrogen phosphate and disodium tetraborate.
Aldrich (Gillingham, Dorset, UK) was the source of digitoxin, N,N-
dimethyloctylamine, DL-β-indolelactic acid, tyrosine, DL-3-(α-acetyly-4-
chlorobenzyl)-4-hydroxycoumarin, and octanoic acid. Bovine serum albumin (BSA),
kynurenine, tryptophan amide, suprofen, carprofen, protamine, nicardipine,
lormetazepam, bepridil, 2-(4-chlorophenoxy)propionic acid, 2-(3-
chlorophenoxy)propionic acid, 2-(2-chlorophenoxy)propionic acid and warfarin were
purchased from Sigma (Poole, Dorset, UK). May & Baker Ltd. (Dagenham, London,
UK) were the suppliers of promethazine, pentobarbitone, hexabarbitone and
quinalbarbitone. Fluka (Gillingham, Dorset, UK) supplied 4-chloro-DL-mandelic
acid, 4-hydroxy-3-methoxymandelic acid and 3-hydroxymandelic acid. Leucovorin
was from Acros (Hyde, Cheshire, UK), DL-4-hydroxymandelic acid from Lancaster
Synthesis (Morecambe, UK), bupivocaine from Duncan Flockhart & Co. Ltd.
(London, UK), thioridazine from Sandoz Products Ltd. (Horsforth, Leeds, UK) and
naproxen from Secifarma (Milan, Italy). Lorazepam, oxazepam and temazepam were
from Wyeth Laboratories (Maidenhead, Berkshire, UK). The three α-aryl alkanoic
acids, 2-(4-methoxyphenyl) propionic acid, 2-(4-methylphenyl) propionic acid and
2-(4-phenyl-3-fluorophenyl) propionic acid were gifts from Dr. Wang (University of
Sunderland). Recombinant lactoferrin was a gift from Dr. David Small (Zeneca
Biological). All deionised water was obtained from an Elgastat UHQPS system
supplied by Elga Water Systems Equipment (High Wycombe, UK). All solutions
were filtered through 0.2 µm HV filters from Millipore (Bedford, MA, USA) and
degassed by sonication for 15 min using a model V300H ultrasonic bath supplied by
Ultrawave Limited (Cardiff, UK).
- 38 -
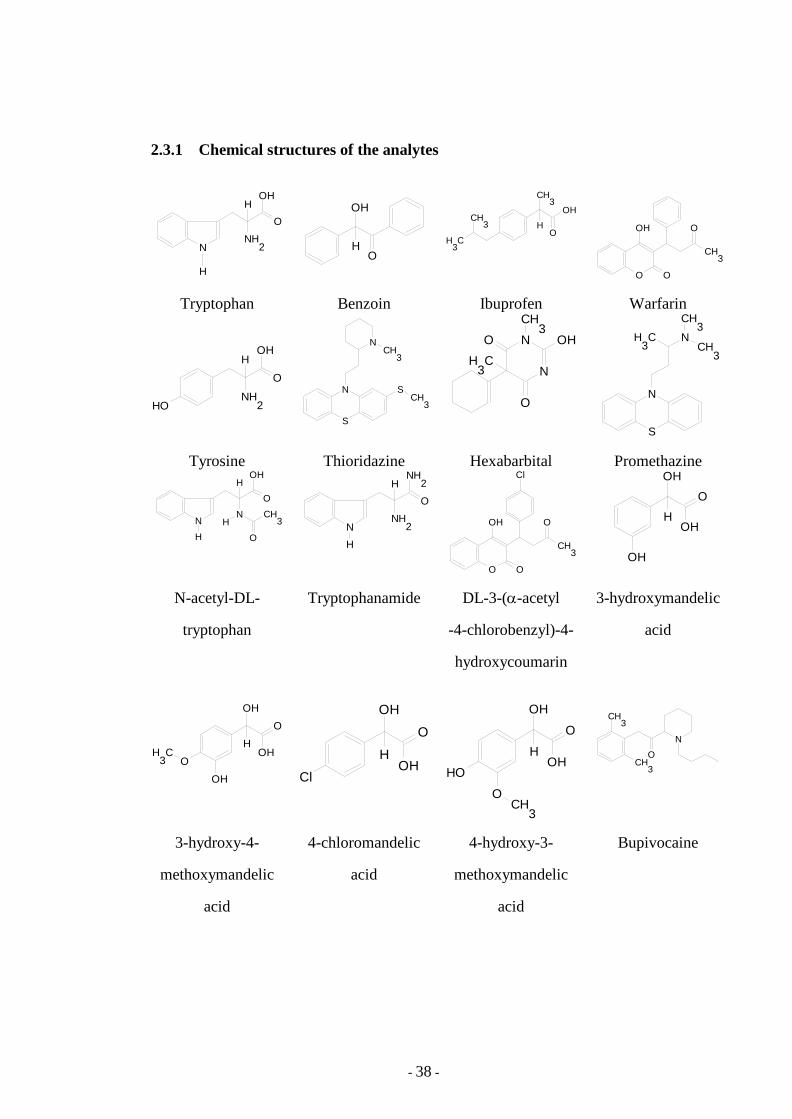
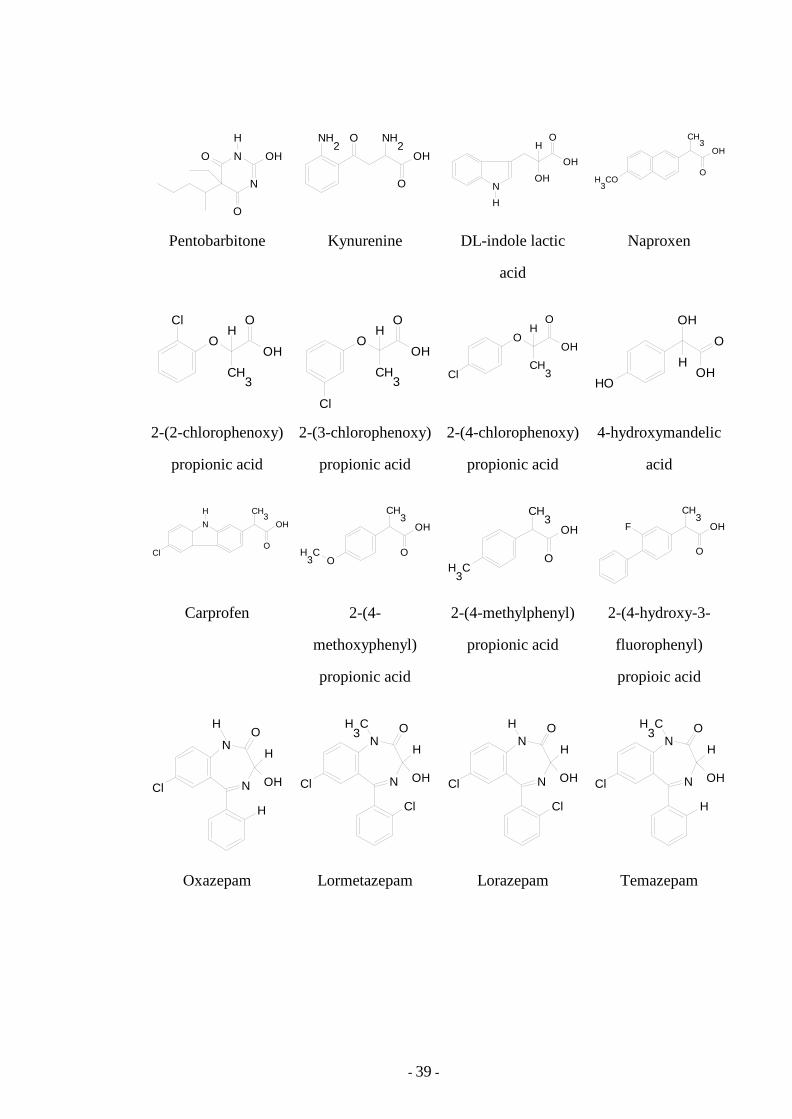
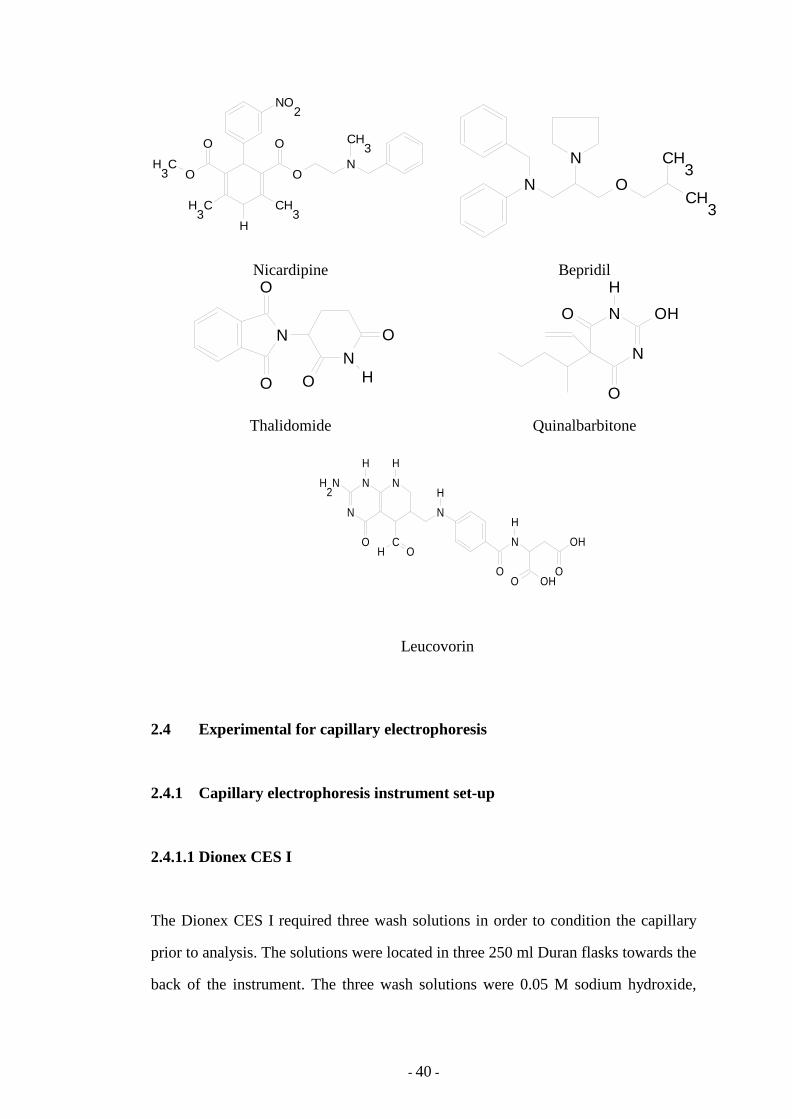
2.3.1 Chemical structures of the analytes
H
OHH
NH2N
O
O
OH
H
H
CH3
OH
OH
3C
CH3
O
OH O
O
CH3
Tryptophan Benzoin Ibuprofen Warfarin
OH
H
NH2
O
HO N
S
SCH
3
CH3
N
O
OHO
CH3
N
NH
3C
N
S
CH3
NH3C
CH3
Tyrosine Thioridazine Hexabarbital Promethazine OH
H
NN
H
O
H
O
CH3
H
NH2N
H
NH2
O
O
OH O
O
CH3
Cl
H
OH
OH
O
OH
N-acetyl-DL-
tryptophan
Tryptophanamide DL-3-(α-acetyl
-4-chlorobenzyl)-4-
hydroxycoumarin
3-hydroxymandelic
acid
H
OH
OH
O
OH
OH
3C
H
OH
OH
O
Cl
H
OH
OH
O
OCH
3
HO
N
CH3
CH3O
3-hydroxy-4-
methoxymandelic
acid
4-chloromandelic
acid
4-hydroxy-3-
methoxymandelic
acid
Bupivocaine
- 39 -
H
OHO
O
N
N
NH2
NH2
O
O
OH
H
H
N
O
OH
OH
OH
CH3
OH
3CO
Pentobarbitone Kynurenine DL-indole lactic
acid
Naproxen
O
CH3
HO
OH
Cl
O
CH3
HO
OH
Cl
O
CH3
HO
OH
Cl
H
OH
OH
O
HO
2-(2-chlorophenoxy)
propionic acid
2-(3-chlorophenoxy)
propionic acid
2-(4-chlorophenoxy)
propionic acid
4-hydroxymandelic
acid
OH
O
CH3NH
Cl
OH
O
CH3
H3C
O
OH
O
CH3
H3C
OH
O
CH3
F
Carprofen 2-(4-
methoxyphenyl)
propionic acid
2-(4-methylphenyl)
propionic acid
2-(4-hydroxy-3-
fluorophenyl)
propioic acid
O
N
NH
H
OH
H
Cl
O
N
NH
OHCl
H3C
Cl
O
N
NH
OHCl
Cl
H
O
N
NH
OH
H
Cl
H3C
Oxazepam Lormetazepam Lorazepam Temazepam
- 40 -
CH3
NO2
NO
O
CH3
H
O
OH
3C
H3C
N
N
CH3
CH3
O
Nicardipine Bepridil O
O O
ONN
H
H
OHO
O
N
N
Thalidomide Quinalbarbitone
N N
N N
O C
H H
HH
2N
OH
O
N
H
OHOO
OH
Leucovorin
2.4 Experimental for capillary electrophoresis
2.4.1 Capillary electrophoresis instrument set-up
2.4.1.1 Dionex CES I
The Dionex CES I required three wash solutions in order to condition the capillary
prior to analysis. The solutions were located in three 250 ml Duran flasks towards the
back of the instrument. The three wash solutions were 0.05 M sodium hydroxide,
- 41 -
water and run buffer. The run buffer was 67 mM disodium hydrogen phosphate
adjusted to pH 7.4 by orthophosphoric acid and sodium hydroxide as described in the
literature [Kraak 1992]. All solutions were filtered and sonicated prior to use to
minimise the possibility of any particulate matter blocking the capillary. There was
no adequate method of controlling the capillary temperature.
Samples were dissolved in run buffer and were placed in small 0.8 ml plastic vials.
The vials were then lightly tapped to remove any air bubbles. The vials were then
placed in the CES I carousel. The analysis schedule was programmed via the keypad
on the CES I. The parameters that were set-up included capillary rinse times, voltage,
injection mode (hydrodynamic pressure, gravity and electrokinetic), injection time
and the run time for each analysis. Before the start of each analysis the interlocked
guard had to be put in place. This was a safety feature to protect the user against the
high voltages used in capillary electrophoresis. All the data was collected and
analysed using the Dionex AI-450 software.
2.4.1.2 Beckman PACE 2050
The wash solutions and buffers were prepared as previously described. All samples,
wash solutions and run buffers were placed in specific 3.5 ml glass vials. The vials
were then covered with a rubber stopper. The vials were placed into two carousels on
the PACE 2050. The outer carousel contained all the samples, wash solutions and
run buffers while the inner carousel contained the run buffer and the waste vials.
Unlike the Dionex CES I, the capillaries used with the Beckman PACE 2050 were
housed in a cartridge. Coolant could then be circulated within the cartridge and
control the capillary temperature. The operation and control was via a PC operating
Beckman System Gold software. The software was also used to collect and analyse
the data.
- 42 -
2.4.2 Investigation of the experimental variables
2.4.2.1 Concentration of bovine serum albumin (BSA)
The wash solutions and the disodium hydrogen phosphate buffer adjusted to pH 7.4
were prepared as described previously. BSA was dissolved in the run buffer to give
concentrations of 0, 15, 30, 45 and 60 µM BSA. The test compound was tryptophan
dissolved in the BSA-run buffers. The capillary was conditioned with 0.05 M sodium
hydroxide for 3 minutes, water for 3 minutes and run buffer for 3 minutes. A blank
run was performed from the vial containing the BSA-run buffer for 20 minutes. The
samples were injected by applying hydrodynamic pressure (0.5 psi) for 2 s. The
separation voltage was 10 kV at ambient temperature using the Dionex CES I.
2.4.2.2 The effect of pH of the run buffer
The wash solutions and the disodium hydrogen phosphate buffers adjusted to pH 4.4,
5.4, 6.4, 7.4 and 8.4 were prepared as described previously. BSA was dissolved in
each of the run buffers at a concentration of 30 µM. The test compound was
tryptophan dissolved in the BSA-run buffers. The capillary was conditioned with
0.05 M sodium hydroxide for 3 minutes, water for 3 minutes and run buffer for 3
minutes. A blank run was performed from the vial containing the BSA-run buffer for
25 minutes. The samples were injected by applying hydrodynamic pressure (0.5 psi)
for 2 s. The separation voltage was 10 kV at ambient temperature using the Dionex
CES I.
- 43 -
2.4.2.3 Investigation of increasing the concentration of organic solvents to the
run buffer
The run buffer consisted of 67 mM disodium hydrogen phosphate adjusted to pH 7.4
using orthophosphoric acid, 30 µM BSA, 0 – 20 %v/v organic solvent. The four
organic solvents used for this study were methanol, propan-1-ol, tetrahydrofuran and
acetonitrile. All solutions were filtered and sonicated as before. The separation
voltage using the CES I was 10 kV at ambient temperature. The capillary was
conditioned with 0.05 M sodium hydroxide for 3 minutes, water for 3 minutes and
run buffer for 3 minutes. A blank run was performed from the vial containing the
BSA-run buffer for 25 minutes. The samples were tryptophan and benzoin at a
concentration of 1 mg ml-1. The samples were injected as solutions in the run buffer
by applying hydrodynamic pressure (0.5 psi) for 2 s. The samples were monitored by
UV at 254 for benzoin and 280 nm for tryptophan. Migration and peak areas were
measured using the Dionex AI-450 software. Each sample was run in duplicate.
The separations using the PACE 2050 were as the CES I except the temperature was
constant at 25 ºC, the separation voltage was 8 kV and samples were injected by
hydrodynamic pressure (0.5 psi) for 2 s. Migration times and peak areas were
measured using the Beckman System Gold software.
2.4.3 Enantioselectivity using a BSA coated capillary
The BSA coated capillary was kindly supplied by H.Burt from the University of
Leeds. The dimensions of the capillary were 50 cm × 75 µm. To maintain the
polyamide-BSA coating the capillary was rinsed with distilled water and run buffer
only.
- 44 -
The run buffer was 67 mM disodium hydrogen phosphate adjusted to pH 7.4 using
orthophosphoric acid. The sample was tryptophan at a concentration of 1 mg ml-1
dissolved in run buffer. The sample was injected by applying hydrodynamic pressure
(0.5 psi) for 2 s.
The PACE 2050 was used throughout this study. The separation voltage was 7 kV
and the temperature was maintained at 25 ̊ C. Migration times and peak areas were
measured using the Beckman System Gold software.
2.4.4 Enantioselectivity of a range of compounds using BSA as the chiral
selector and standard conditions
The run buffer consisted of 67 mM disodium hydrogen phosphate adjusted to pH 7.4
using orthophosphoric acid, 30 µM BSA and 2.5 %v/v organic solvent. A range of
analytes were dissolved in the run buffer at a concentration of 1 mg ml-1 and injected
by hydrodynamic pressure (0.5 psi) for 2 s. The capillary was conditioned with 0.05
M sodium hydroxide for 3 minutes, water for 3 minutes and run buffer for 3 minutes.
The final step was a 1 minute high pressure rinse of the protein-run buffer.
The PACE 2050 was used throughout this study. The separation voltage was 8 kV
and the temperature was maintained at 25 ̊C. Migration times and peak areas were
measured using the Beckman System Gold software.
2.4.5 Enantioselectivity of a range of compounds using standard conditions to
screen other biomacromolecules
The wash solutions of 0.05 M sodium hydroxide, water and 67 mM disodium
hydrogen phosphate buffer adjusted to pH 7.4 were prepared as described previously.
The run buffers were prepared by adding the test biomacromolecule to the 67 mM
- 45 -
disodium hydrogen phosphate, pH 7.4, with 2.5% v/v methanol. The
biomacromolecules screened were human serum albumin (HSA), protamine and
recombinant lactoferrin. The concentration used for the biomacromolecules was 2
mg ml-1.
A range of analytes were dissolved in the run buffer at a concentrations of 1 mg ml-1
and injected by hydrodynamic pressure (0.5 psi) for 2 s. The capillary was
conditioned with 0.05 M sodium hydroxide for 3 minutes, water for 3 minutes and
run buffer for 3 minutes. The final step was a 1 minute high pressure rinse of the
protein-run buffer.
The PACE 2050 was used throughout this study. The separation voltage was 8 kV
and the temperature was maintained at 25 ̊C. Migration times and peak areas were
measured using the Beckman System Gold software.
2.4.6 Investigation of enatioselectivity by adding modifiers to the run buffer
2.4.6.1 β-Cyclodextrin
The wash solutions of 0.05 M sodium hydroxide, water and 67 mM disodium
hydrogen phosphate buffer adjusted to pH 7.4 were prepared as described previously.
The run buffers were made up as follows, 67 mM disodium hydrogen phosphate, pH
7.4, 30 µM HSA and β-cyclodextrin. The amounts of β-cyclodextrin added to the run
buffers were 6, 12, 18, 24 and 30 µM. Samples were dissolved in the run buffer at a
concentration of 0.5 mg ml-1 and injected by hydrodynamic pressure (0.5 psi) for 2 s.
The capillary was conditioned with 0.05 M sodium hydroxide for 3 minutes, water
for 3 minutes and run buffer for 3 minutes. The final step was a 1 minute high
pressure rinse of the protein/β-cyclodextrin-run buffer.
- 46 -
The PACE 2050 was used throughout this study. The separation voltage was 8 kV
and the temperature was maintained at 25 ̊C. Migration times and peak areas were
measured using the Beckman System Gold software.
2.4.6.2 Allosteric interactions
The wash solutions of 0.05 M sodium hydroxide, water and 67 mM disodium
hydrogen phosphate buffer adjusted to pH 7.4 were prepared as described previously.
The run buffers were made up as follows, 67 mM phosphate, pH 7.4, 30 µM HSA
and 3 µM modifier. The concentration of the modifiers were 3 µM so the ratio
between HSA and modifier was 10 : 1. The modifiers were digitoxin, ibuprofen,
warfarin, and lorazepam. Samples were dissolved in the run buffer at a concentration
of 0.5 mg ml-1 and injected by hydrodynamic pressure (0.5 psi) for 2 s. The capillary
was conditioned with 0.05 M sodium hydroxide for 3 minutes, water for 3 minutes
and run buffer for 3 minutes. The final step was a 1 minute high pressure rinse of the
protein/modifier-run buffer.
The PACE 2050 was used throughout this study. The separation voltage was 8 kV
and the temperature was maintained at 25 ̊ C. Migration times and peak areas were
measured using the Beckman System Gold software.
2.4.6.3 Metal salts
The wash solutions of 0.05 M sodium hydroxide, water and 67 mM sodium borate
adjusted to pH 7.4 were prepared as described previously. All the metal salts were
insoluble in 67 mM disodium hydrogen phosphate buffer so the run buffer was
changed to 67 mM sodium borate. The run buffers were made up as follows, 67 mM
sodium borate, pH 7.4, 30 µM HSA and metal salt. The ratios of the metal salt to the
protein were 1 : 1, 2 : 1 and 3 : 1. The metal salts were manganese phosphate, zinc
- 47 -
sulphate, manganese carbonate and nickel phosphate. Samples were dissolved in the
run buffer at a concentration of 0.5 mg ml-1 and injected by hydrodynamic pressure
(0.5 psi) for 2 s. The capillary was conditioned with 0.05 M sodium hydroxide for 3
minutes, water for 3 minutes and run buffer for 3 minutes. The final step was a 1
minute high pressure rinse of the protein/modifier-run buffer.
The PACE 2050 was used throughout this study. The separation voltage was 8 kV
and the temperature was maintained at 25 ̊C. Migration times and peak areas were
measured using the Beckman System Gold software.
2.5 Experimental for liquid chromatography
2.5.1 BSA as a mobile phase additive in microbore LC
Mobile phase buffers were made up by first preparing a stock solution of 67 mM
disodium hydrogen phosphate which was adjusted to pH 7.4 using orthophosphoric
acid. The 30 µM and 60 µM BSA mobile phases were prepared by dissolving 100
mg and 200 mg BSA in 100ml of 67 mM disodium hydrogen phosphate, pH 7.4.
Test analytes were dissolved in mobile phase. All solutions were filtered and
sonicated prior to use.
The column used for this study was 15 cm x 1 mm i.d. with a stationary phase of
Lichrosorb DIOL with a 5 μm particle diameter and 60 Å pore size. Several steps
were undertaken to condition the column prior to analysis. The column was supplied
with a mobile phase of 50:50 acetonitrile – water and was flushed with propan-2-ol,
water and 67 mM disodium hydrogen phosphate, pH 7.4, prior to the introduction of
the BSA containing mobile phase. Analysis was undertaken after the BSA containing
mobile phase had been detected. This was observed as an increase in absorbance
followed by an absorbance plateau.
- 48 -
2.5.2 BSA as a mobile phase additive in capillary LC
Mobile phase buffers were made up by first preparing a stock solution of 67 mM
disodium hydrogen phosphate which was adjusted to pH 7.4 using orthophosphoric
acid. The 60 µM BSA mobile phases were prepared by dissolving and 200 mg BSA
in 100ml of 67 mM disodium hydrogen phosphate, pH 7.4. Test analytes were
dissolved in mobile phase. All solutions were filtered and sonicated prior to use.
The column used for this study was 15 cm x 320 µm i.d. with a stationary phase of
Lichrosorb DIOL with a 5 μm particle diameter and 60 Å pore size. Several steps
were undertaken to condition the column prior to analysis. The column was supplied
with a mobile phase of 50:50 acetonitrile – water and was flushed with propan-2-ol,
water and 67 mM disodium hydrogen phosphate, pH 7.4, prior to the introduction of
the BSA containing mobile phase. The flow rate was set at 3 µl min-1.
2.5.3 Adsorption of BSA
Adsorption of BSA was carried out according to the method of Erlandsson et al
[Erlandsson 1986]. Mobile phase buffers were 67 mM disodium hydrogen phosphate
adjusted to pH 5.0 and 7.4 by orthophosphoric acid. The BSA containing mobile
phase was 15 µM BSA dissolved in 67 mM disodium hydrogen phosphate pH 5.0.
The test analytes were tryptophan and kynurenine. The test analytes were dissolved
in 67 mM disodium hydrogen phosphate pH 7.4. All solutions were filtered and
sonicated prior to use.
The columns used in this study were 15 cm x 1 mm i.d. The three stationary phases
were Lichrosorb DIOL, Nucleosil silica and Nucleosil C8. All three stationary phases
were of 5 µm diameter and pore size of 300 Å.
- 49 -
2.5.3.1 Preparation of the pseudo-stationary phase
The columns were equilibrated with propan-2-ol for 2 h, then equilibrated with water
for 2 h and finally equilibrated with 67 mM disodium hydrogen phosphate, pH 5.0,
for 2 h. A mobile phase of 15 µM BSA and 67 mM disodium hydrogen phosphate,
pH 5.0, was pumped through the columns at a flow rate of 50 µl min-1 until BSA was
detected at 280 nm. At this stage the pseudo-stationary phase was deemed to have
formed. The columns were then equilibrated with 67 mM phosphate, pH 7.4, until a
stable baseline was obtained. The test analytes were then injected.
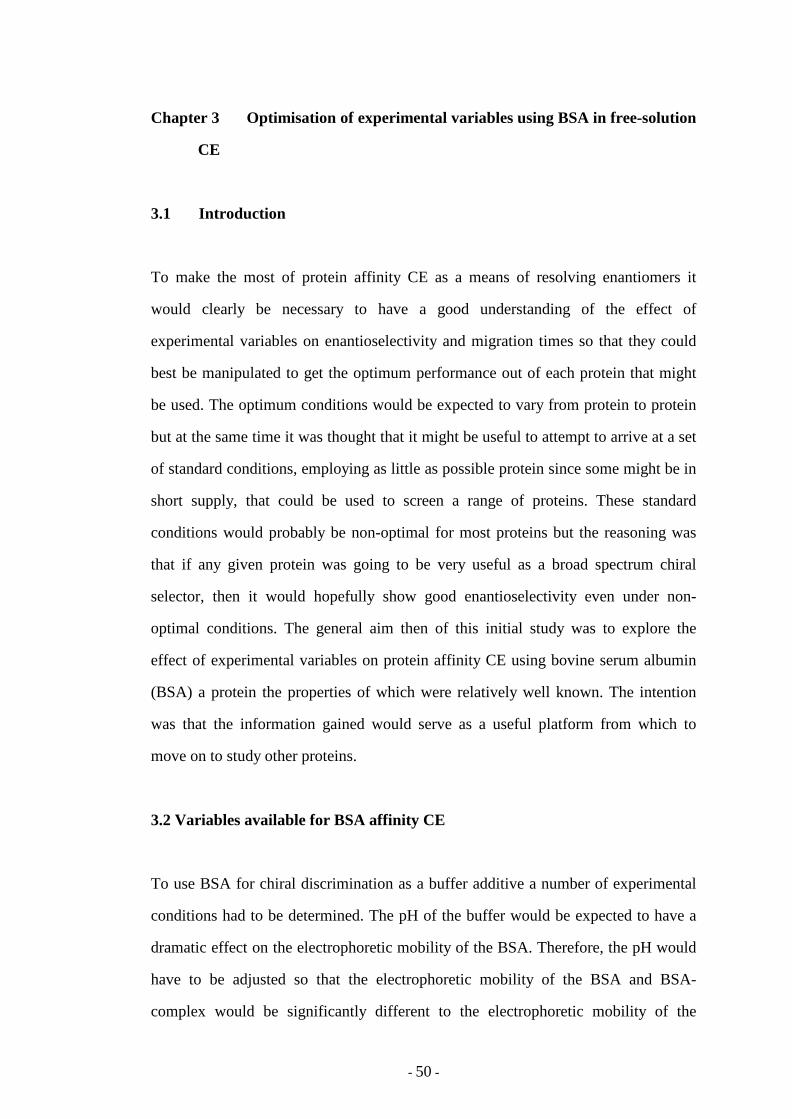
- 50 -
Chapter 3 Optimisation of experimental variables using BSA in free-solution
CE
3.1 Introduction
To make the most of protein affinity CE as a means of resolving enantiomers it
would clearly be necessary to have a good understanding of the effect of
experimental variables on enantioselectivity and migration times so that they could
best be manipulated to get the optimum performance out of each protein that might
be used. The optimum conditions would be expected to vary from protein to protein
but at the same time it was thought that it might be useful to attempt to arrive at a set
of standard conditions, employing as little as possible protein since some might be in
short supply, that could be used to screen a range of proteins. These standard
conditions would probably be non-optimal for most proteins but the reasoning was
that if any given protein was going to be very useful as a broad spectrum chiral
selector, then it would hopefully show good enantioselectivity even under non-
optimal conditions. The general aim then of this initial study was to explore the
effect of experimental variables on protein affinity CE using bovine serum albumin
(BSA) a protein the properties of which were relatively well known. The intention
was that the information gained would serve as a useful platform from which to
move on to study other proteins.
3.2 Variables available for BSA affinity CE
To use BSA for chiral discrimination as a buffer additive a number of experimental
conditions had to be determined. The pH of the buffer would be expected to have a
dramatic effect on the electrophoretic mobility of the BSA. Therefore, the pH would
have to be adjusted so that the electrophoretic mobility of the BSA and BSA-
complex would be significantly different to the electrophoretic mobility of the
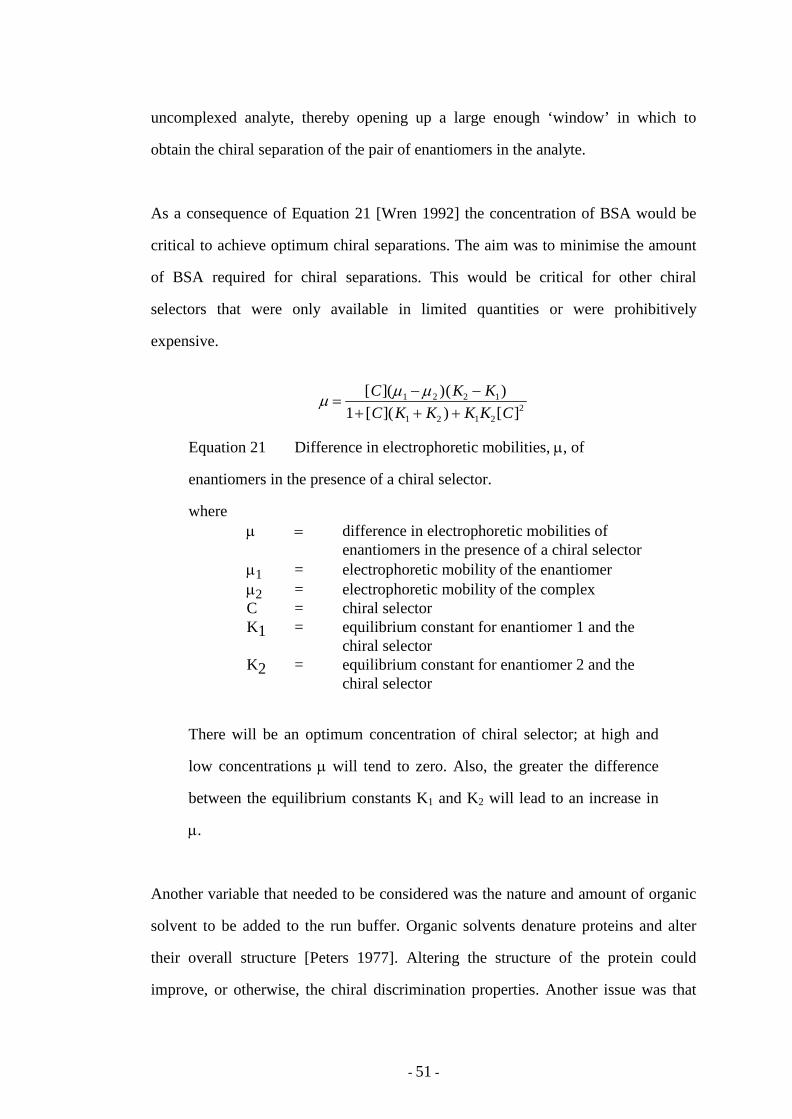
- 51 -
uncomplexed analyte, thereby opening up a large enough ‘window’ in which to
obtain the chiral separation of the pair of enantiomers in the analyte.
As a consequence of Equation 21 [Wren 1992] the concentration of BSA would be
critical to achieve optimum chiral separations. The aim was to minimise the amount
of BSA required for chiral separations. This would be critical for other chiral
selectors that were only available in limited quantities or were prohibitively
expensive.
µ µ µ=
− −+ + +
[ ]( )( )[ ]( ) [ ]C K KC K K K K C
1 2 2 1
1 2 1 221
Equation 21 Difference in electrophoretic mobilities, µ, of
enantiomers in the presence of a chiral selector.
where µ = difference in electrophoretic mobilities of enantiomers in the presence of a chiral selector µ1 = electrophoretic mobility of the enantiomer
µ2 = electrophoretic mobility of the complex C = chiral selector K1 = equilibrium constant for enantiomer 1 and the chiral selector K2 = equilibrium constant for enantiomer 2 and the chiral selector
There will be an optimum concentration of chiral selector; at high and
low concentrations µ will tend to zero. Also, the greater the difference
between the equilibrium constants K1 and K2 will lead to an increase in
µ.
Another variable that needed to be considered was the nature and amount of organic
solvent to be added to the run buffer. Organic solvents denature proteins and alter
their overall structure [Peters 1977]. Altering the structure of the protein could
improve, or otherwise, the chiral discrimination properties. Another issue was that
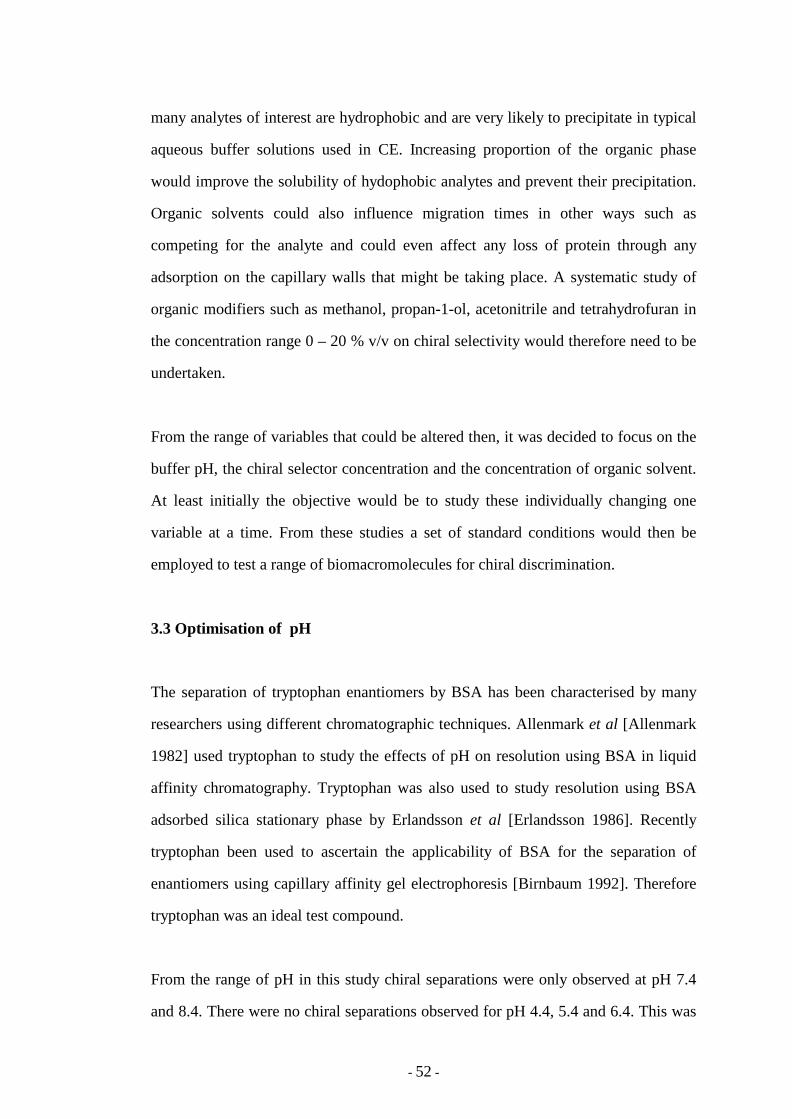
- 52 -
many analytes of interest are hydrophobic and are very likely to precipitate in typical
aqueous buffer solutions used in CE. Increasing proportion of the organic phase
would improve the solubility of hydophobic analytes and prevent their precipitation.
Organic solvents could also influence migration times in other ways such as
competing for the analyte and could even affect any loss of protein through any
adsorption on the capillary walls that might be taking place. A systematic study of
organic modifiers such as methanol, propan-1-ol, acetonitrile and tetrahydrofuran in
the concentration range 0 – 20 % v/v on chiral selectivity would therefore need to be
undertaken.
From the range of variables that could be altered then, it was decided to focus on the
buffer pH, the chiral selector concentration and the concentration of organic solvent.
At least initially the objective would be to study these individually changing one
variable at a time. From these studies a set of standard conditions would then be
employed to test a range of biomacromolecules for chiral discrimination.
3.3 Optimisation of pH
The separation of tryptophan enantiomers by BSA has been characterised by many
researchers using different chromatographic techniques. Allenmark et al [Allenmark
1982] used tryptophan to study the effects of pH on resolution using BSA in liquid
affinity chromatography. Tryptophan was also used to study resolution using BSA
adsorbed silica stationary phase by Erlandsson et al [Erlandsson 1986]. Recently
tryptophan been used to ascertain the applicability of BSA for the separation of
enantiomers using capillary affinity gel electrophoresis [Birnbaum 1992]. Therefore
tryptophan was an ideal test compound.
From the range of pH in this study chiral separations were only observed at pH 7.4
and 8.4. There were no chiral separations observed for pH 4.4, 5.4 and 6.4. This was
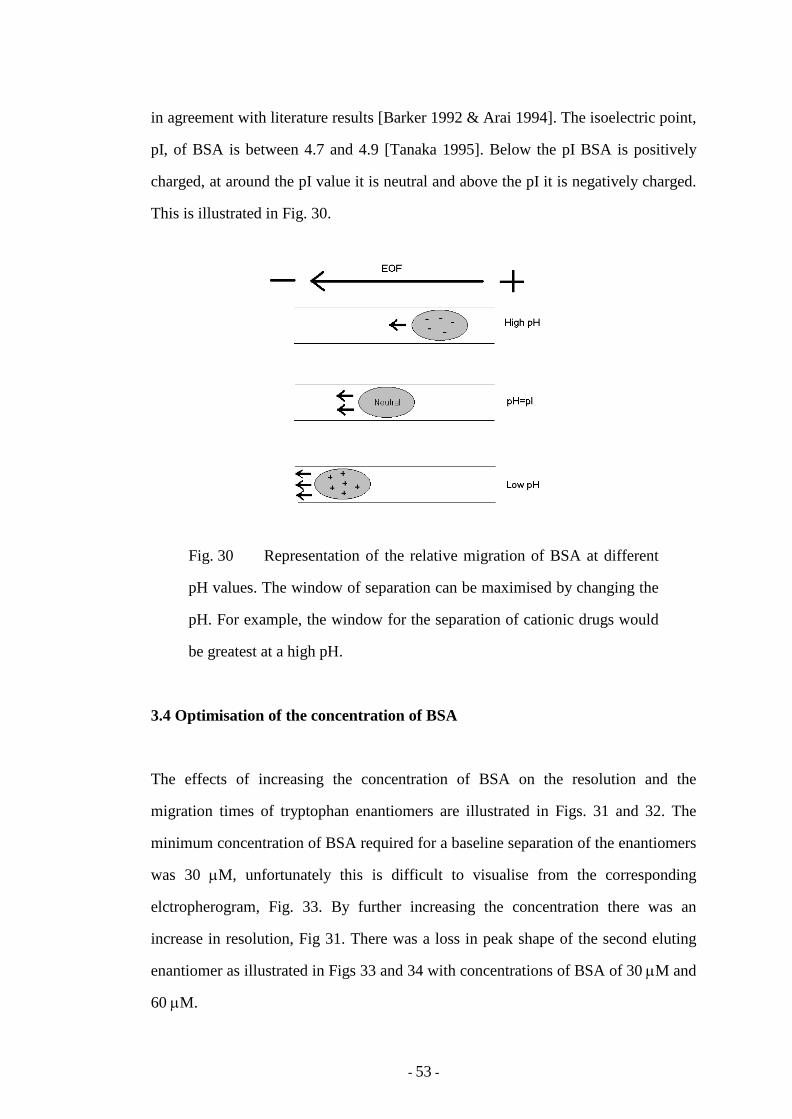
- 53 -
in agreement with literature results [Barker 1992 & Arai 1994]. The isoelectric point,
pI, of BSA is between 4.7 and 4.9 [Tanaka 1995]. Below the pI BSA is positively
charged, at around the pI value it is neutral and above the pI it is negatively charged.
This is illustrated in Fig. 30.
Fig. 30 Representation of the relative migration of BSA at different
pH values. The window of separation can be maximised by changing the
pH. For example, the window for the separation of cationic drugs would
be greatest at a high pH.
3.4 Optimisation of the concentration of BSA
The effects of increasing the concentration of BSA on the resolution and the
migration times of tryptophan enantiomers are illustrated in Figs. 31 and 32. The
minimum concentration of BSA required for a baseline separation of the enantiomers
was 30 µM, unfortunately this is difficult to visualise from the corresponding
elctropherogram, Fig. 33. By further increasing the concentration there was an
increase in resolution, Fig 31. There was a loss in peak shape of the second eluting
enantiomer as illustrated in Figs 33 and 34 with concentrations of BSA of 30 µM and
60 µM.
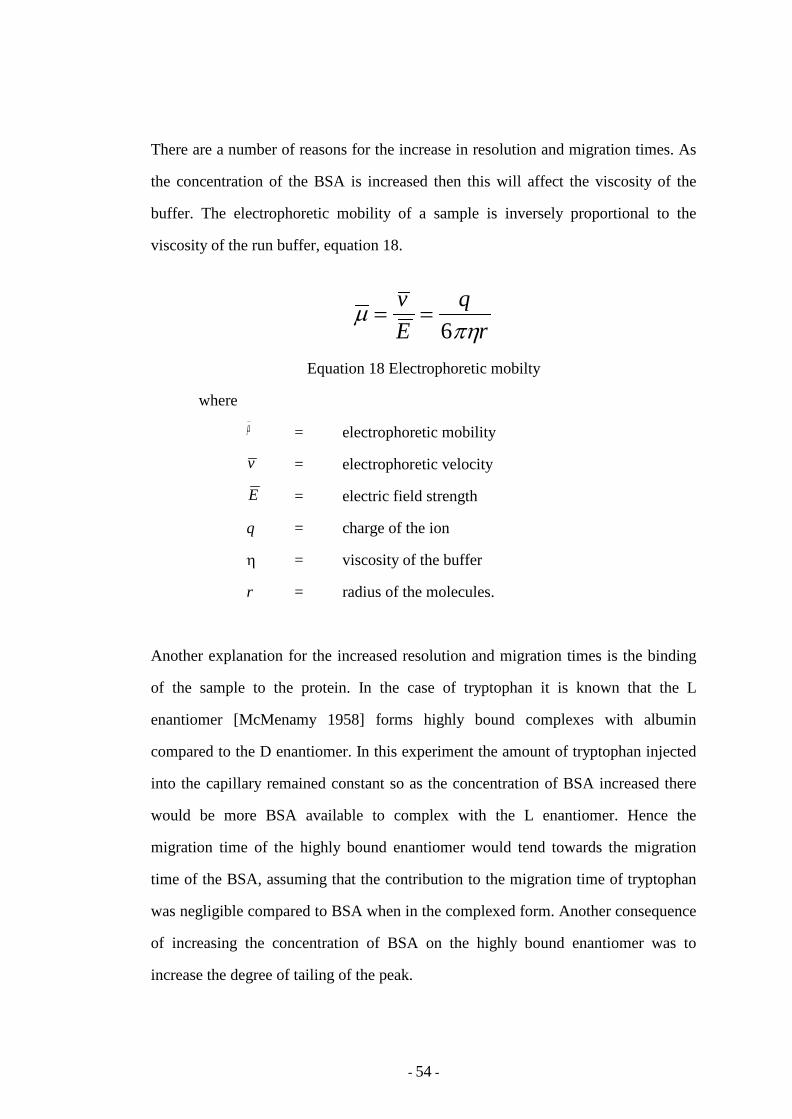
- 54 -
There are a number of reasons for the increase in resolution and migration times. As
the concentration of the BSA is increased then this will affect the viscosity of the
buffer. The electrophoretic mobility of a sample is inversely proportional to the
viscosity of the run buffer, equation 18.
µπη
= =vE
qr6
Equation 18 Electrophoretic mobilty
where
µ = electrophoretic mobility
v = electrophoretic velocity
E = electric field strength
q = charge of the ion
η = viscosity of the buffer
r = radius of the molecules.
Another explanation for the increased resolution and migration times is the binding
of the sample to the protein. In the case of tryptophan it is known that the L
enantiomer [McMenamy 1958] forms highly bound complexes with albumin
compared to the D enantiomer. In this experiment the amount of tryptophan injected
into the capillary remained constant so as the concentration of BSA increased there
would be more BSA available to complex with the L enantiomer. Hence the
migration time of the highly bound enantiomer would tend towards the migration
time of the BSA, assuming that the contribution to the migration time of tryptophan
was negligible compared to BSA when in the complexed form. Another consequence
of increasing the concentration of BSA on the highly bound enantiomer was to
increase the degree of tailing of the peak.
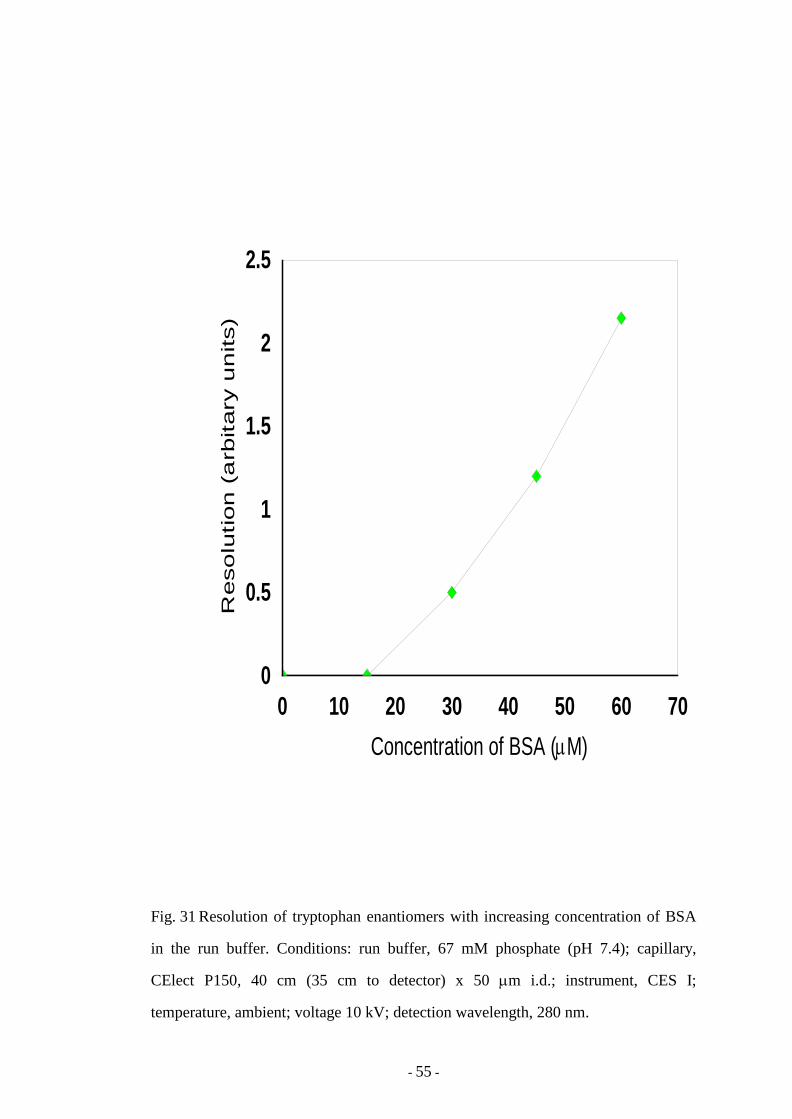
- 55 -
Fig. 31 Resolution of tryptophan enantiomers with increasing concentration of BSA
in the run buffer. Conditions: run buffer, 67 mM phosphate (pH 7.4); capillary,
CElect P150, 40 cm (35 cm to detector) x 50 µm i.d.; instrument, CES I;
temperature, ambient; voltage 10 kV; detection wavelength, 280 nm.
0 10 20 30 40 50 60 70Concentration of BSA ( M)
0
0.5
1
1.5
2
2.5R
eso
lution
(a
rbitary
un
its)
µ
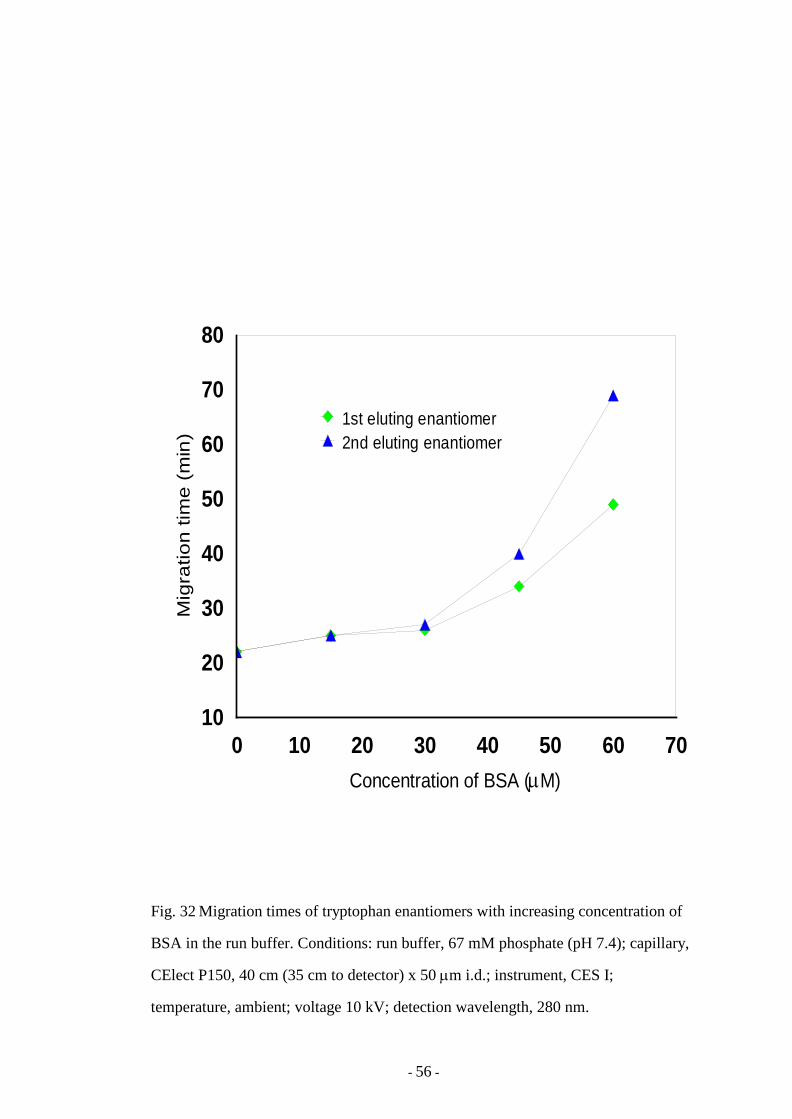
- 56 -
0 10 20 30 40 50 60 70Concentration of BSA ( M)
10
20
30
40
50
60
70
80
Mig
ratio
n tim
e (m
in)
1st eluting enantiomer2nd eluting enantiomer
µ
Fig. 32 Migration times of tryptophan enantiomers with increasing concentration of
BSA in the run buffer. Conditions: run buffer, 67 mM phosphate (pH 7.4); capillary,
CElect P150, 40 cm (35 cm to detector) x 50 µm i.d.; instrument, CES I;
temperature, ambient; voltage 10 kV; detection wavelength, 280 nm.
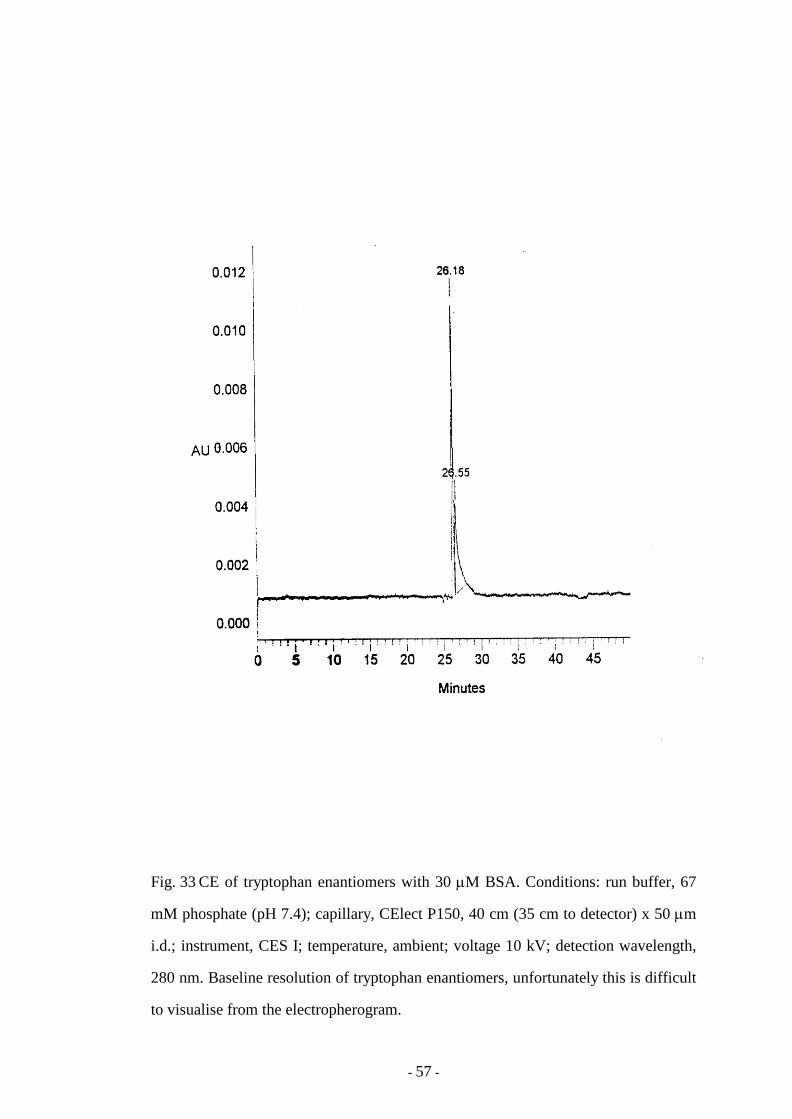
- 57 -
Fig. 33 CE of tryptophan enantiomers with 30 µM BSA. Conditions: run buffer, 67
mM phosphate (pH 7.4); capillary, CElect P150, 40 cm (35 cm to detector) x 50 µm
i.d.; instrument, CES I; temperature, ambient; voltage 10 kV; detection wavelength,
280 nm. Baseline resolution of tryptophan enantiomers, unfortunately this is difficult
to visualise from the electropherogram.
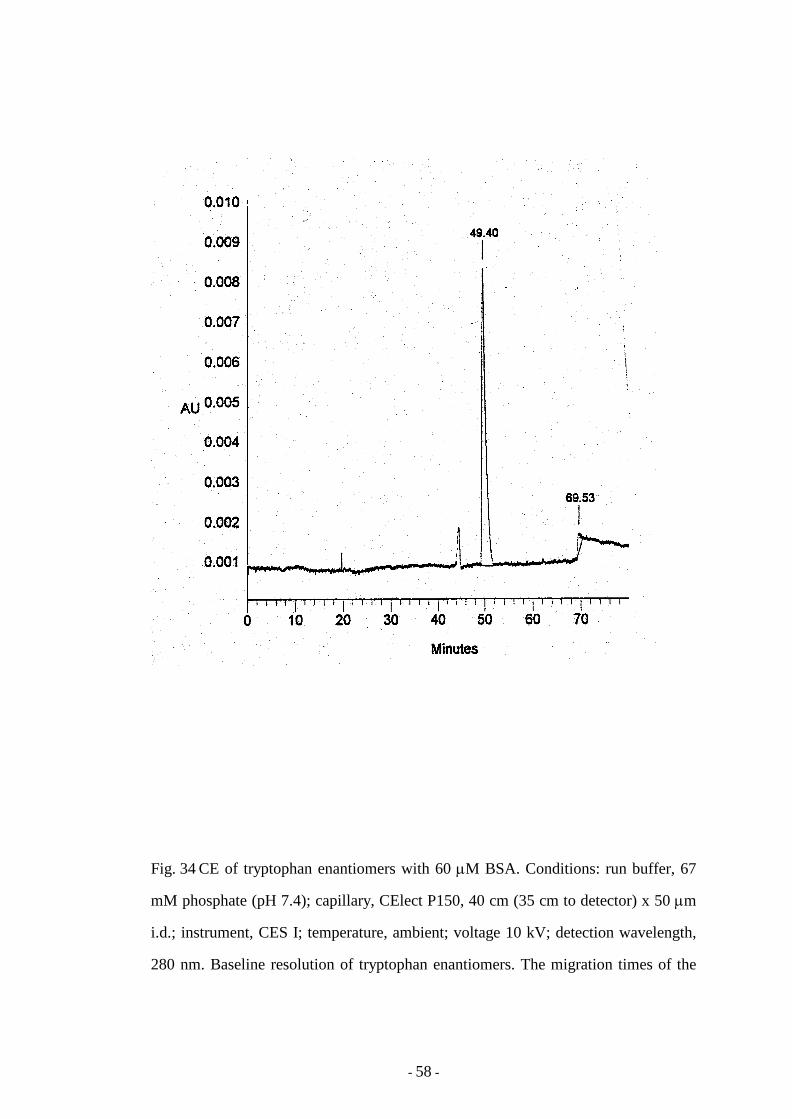
- 58 -
Fig. 34 CE of tryptophan enantiomers with 60 µM BSA. Conditions: run buffer, 67
mM phosphate (pH 7.4); capillary, CElect P150, 40 cm (35 cm to detector) x 50 µm
i.d.; instrument, CES I; temperature, ambient; voltage 10 kV; detection wavelength,
280 nm. Baseline resolution of tryptophan enantiomers. The migration times of the
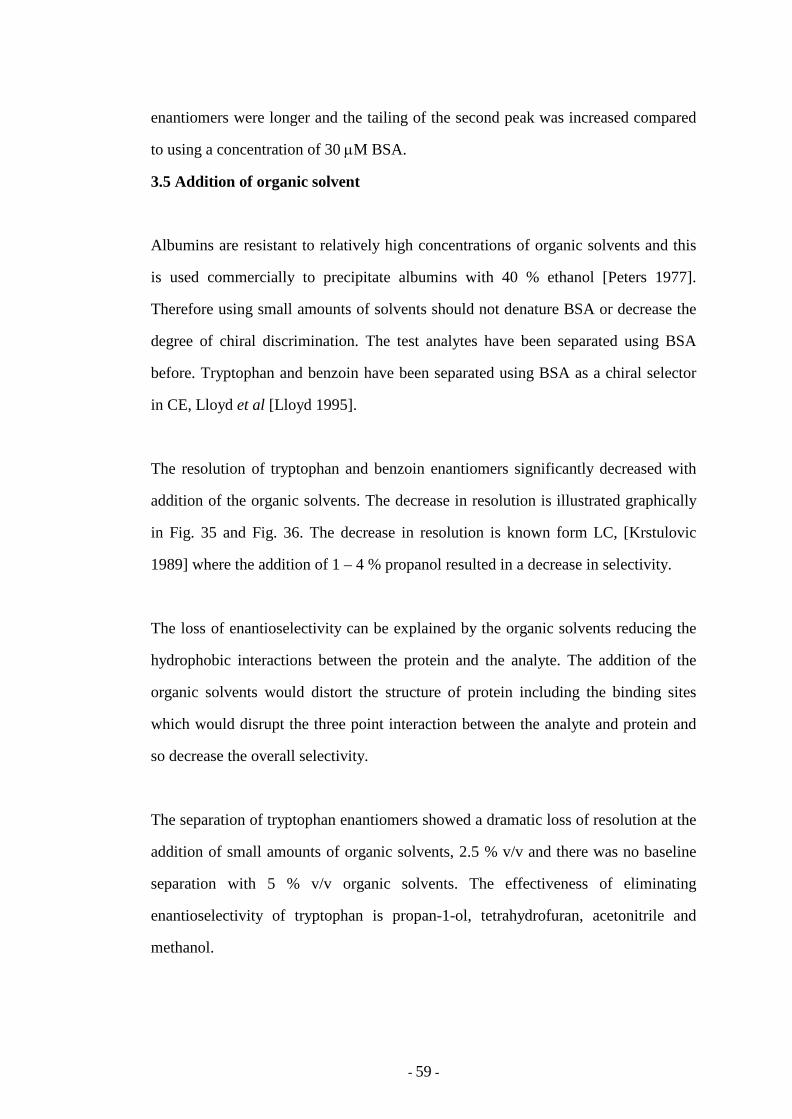
- 59 -
enantiomers were longer and the tailing of the second peak was increased compared
to using a concentration of 30 µM BSA.
3.5 Addition of organic solvent
Albumins are resistant to relatively high concentrations of organic solvents and this
is used commercially to precipitate albumins with 40 % ethanol [Peters 1977].
Therefore using small amounts of solvents should not denature BSA or decrease the
degree of chiral discrimination. The test analytes have been separated using BSA
before. Tryptophan and benzoin have been separated using BSA as a chiral selector
in CE, Lloyd et al [Lloyd 1995].
The resolution of tryptophan and benzoin enantiomers significantly decreased with
addition of the organic solvents. The decrease in resolution is illustrated graphically
in Fig. 35 and Fig. 36. The decrease in resolution is known form LC, [Krstulovic
1989] where the addition of 1 – 4 % propanol resulted in a decrease in selectivity.
The loss of enantioselectivity can be explained by the organic solvents reducing the
hydrophobic interactions between the protein and the analyte. The addition of the
organic solvents would distort the structure of protein including the binding sites
which would disrupt the three point interaction between the analyte and protein and
so decrease the overall selectivity.
The separation of tryptophan enantiomers showed a dramatic loss of resolution at the
addition of small amounts of organic solvents, 2.5 % v/v and there was no baseline
separation with 5 % v/v organic solvents. The effectiveness of eliminating
enantioselectivity of tryptophan is propan-1-ol, tetrahydrofuran, acetonitrile and
methanol.
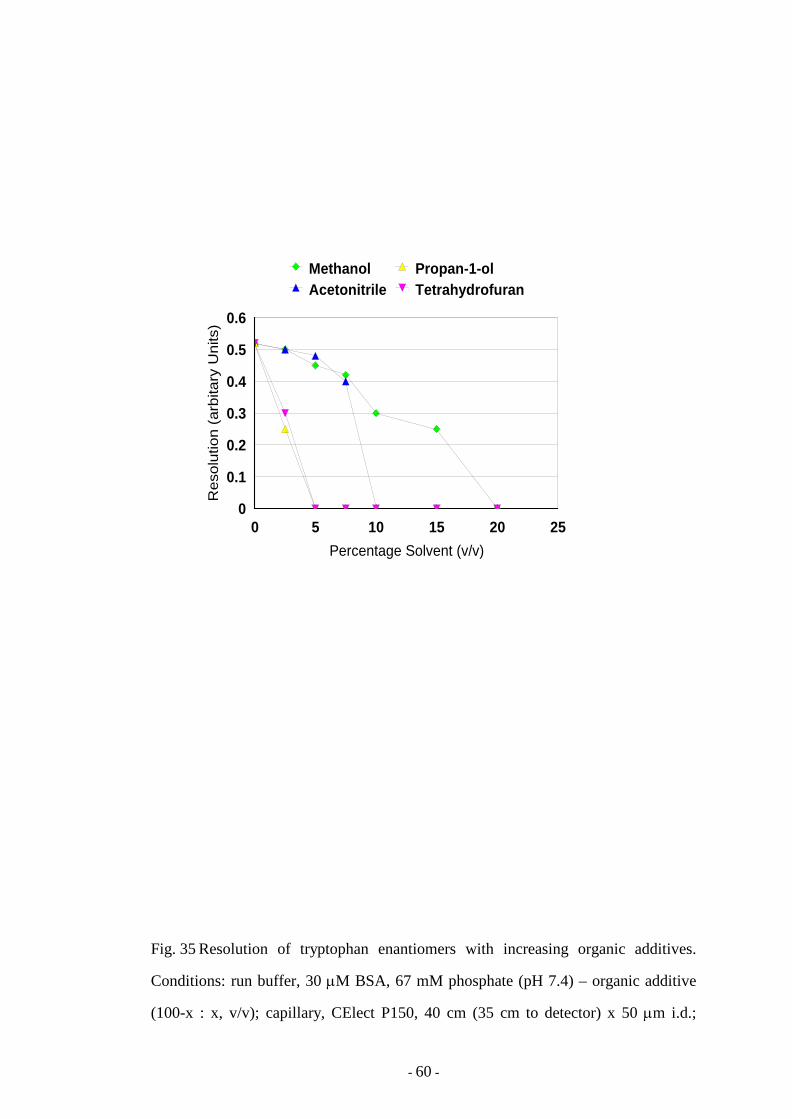
- 60 -
Fig. 35 Resolution of tryptophan enantiomers with increasing organic additives.
Conditions: run buffer, 30 µM BSA, 67 mM phosphate (pH 7.4) – organic additive
(100-x : x, v/v); capillary, CElect P150, 40 cm (35 cm to detector) x 50 µm i.d.;
0 5 10 15 20 25Percentage Solvent (v/v)
0
0.1
0.2
0.3
0.4
0.5
0.6
Res
olut
ion
(arb
itary
Uni
ts)
MethanolAcetonitrile
Propan-1-olTetrahydrofuran
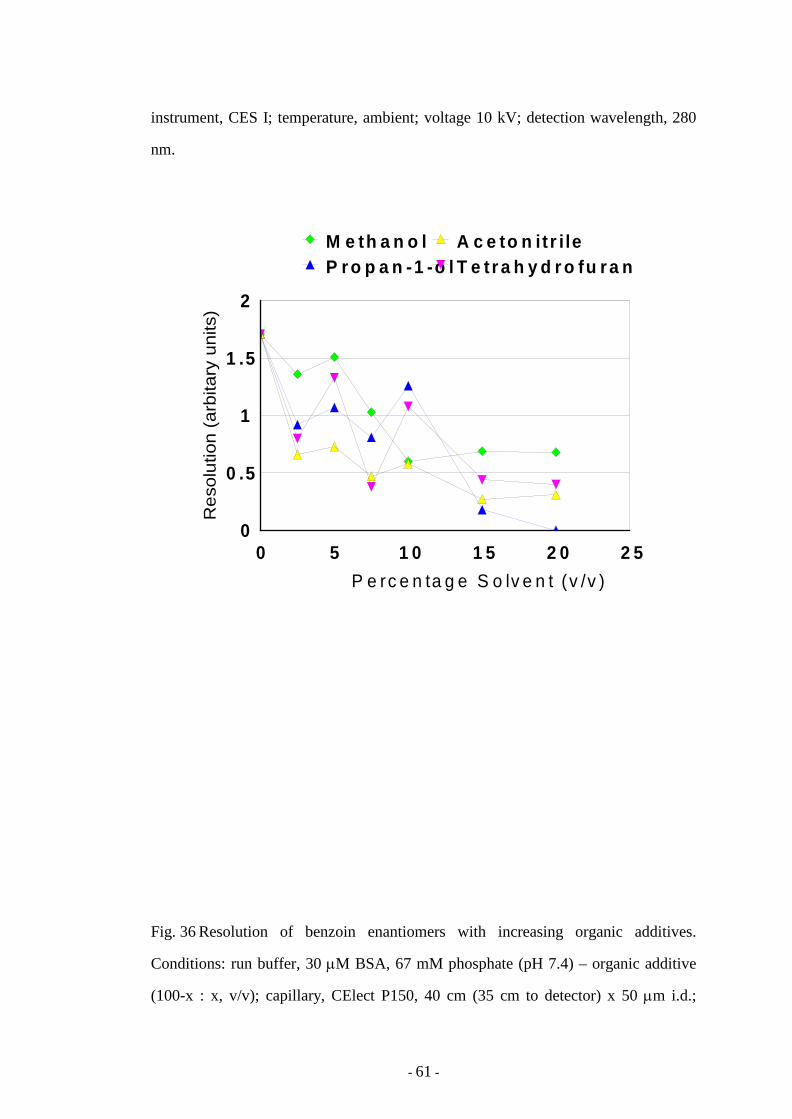
- 61 -
instrument, CES I; temperature, ambient; voltage 10 kV; detection wavelength, 280
nm.
Fig. 36 Resolution of benzoin enantiomers with increasing organic additives.
Conditions: run buffer, 30 µM BSA, 67 mM phosphate (pH 7.4) – organic additive
(100-x : x, v/v); capillary, CElect P150, 40 cm (35 cm to detector) x 50 µm i.d.;
0 5 1 0 1 5 2 0 2 5P e rc e n ta g e S o lv e n t (v /v )
0
0 .5
1
1 .5
2
Res
olut
ion
(arb
itary
uni
ts)
M e th a n o lP r o p a n -1 -o l
A c e to n it r i leT e t r a h y d r o fu r a n
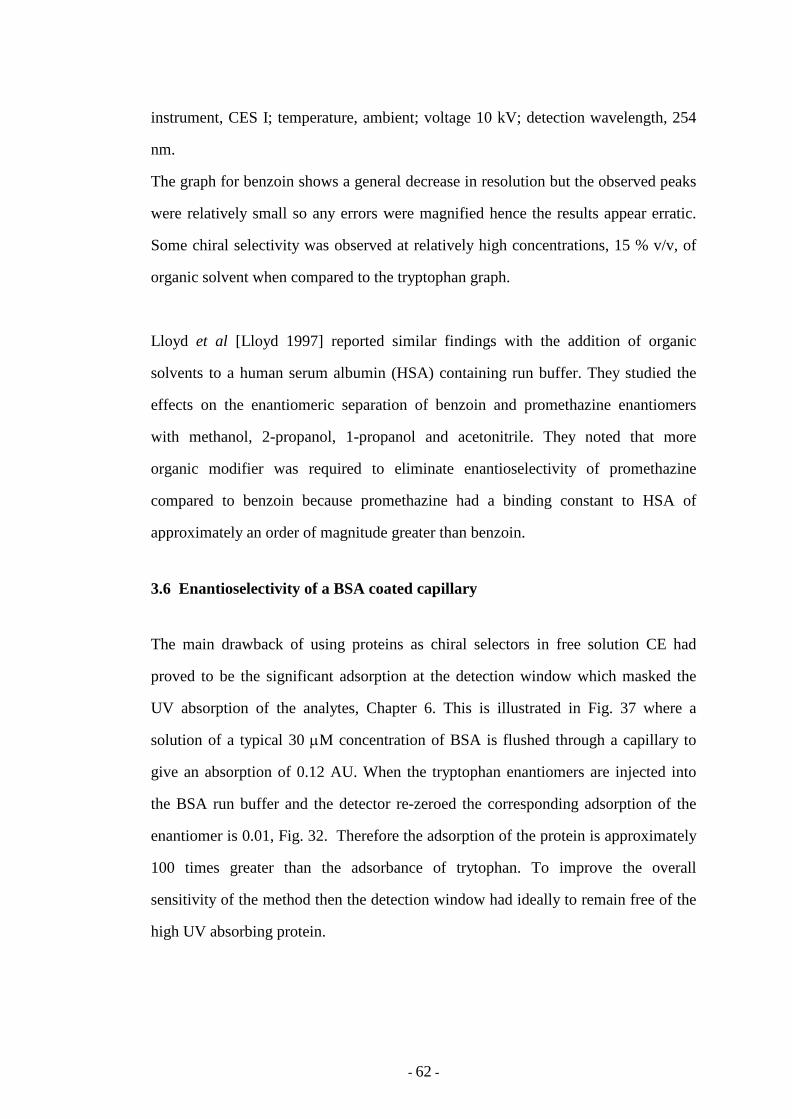
- 62 -
instrument, CES I; temperature, ambient; voltage 10 kV; detection wavelength, 254
nm.
The graph for benzoin shows a general decrease in resolution but the observed peaks
were relatively small so any errors were magnified hence the results appear erratic.
Some chiral selectivity was observed at relatively high concentrations, 15 % v/v, of
organic solvent when compared to the tryptophan graph.
Lloyd et al [Lloyd 1997] reported similar findings with the addition of organic
solvents to a human serum albumin (HSA) containing run buffer. They studied the
effects on the enantiomeric separation of benzoin and promethazine enantiomers
with methanol, 2-propanol, 1-propanol and acetonitrile. They noted that more
organic modifier was required to eliminate enantioselectivity of promethazine
compared to benzoin because promethazine had a binding constant to HSA of
approximately an order of magnitude greater than benzoin.
3.6 Enantioselectivity of a BSA coated capillary
The main drawback of using proteins as chiral selectors in free solution CE had
proved to be the significant adsorption at the detection window which masked the
UV absorption of the analytes, Chapter 6. This is illustrated in Fig. 37 where a
solution of a typical 30 µM concentration of BSA is flushed through a capillary to
give an absorption of 0.12 AU. When the tryptophan enantiomers are injected into
the BSA run buffer and the detector re-zeroed the corresponding adsorption of the
enantiomer is 0.01, Fig. 32. Therefore the adsorption of the protein is approximately
100 times greater than the adsorbance of trytophan. To improve the overall
sensitivity of the method then the detection window had ideally to remain free of the
high UV absorbing protein.
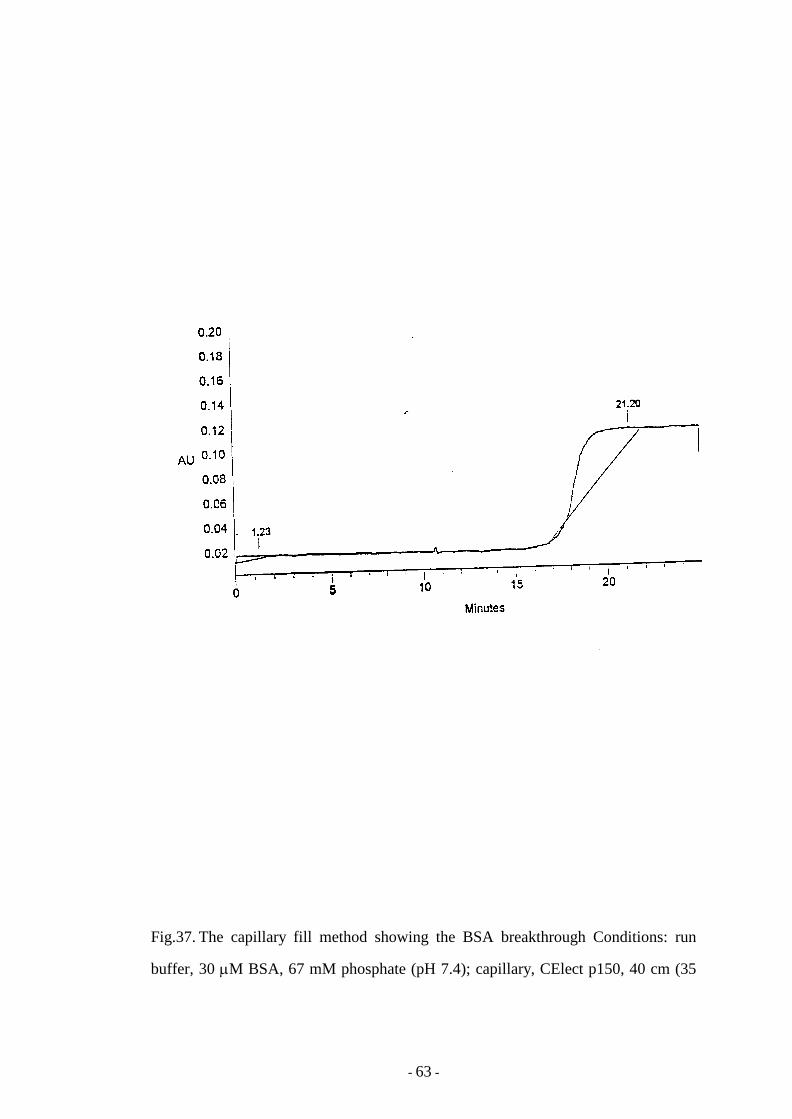
- 63 -
Fig.37. The capillary fill method showing the BSA breakthrough Conditions: run
buffer, 30 µM BSA, 67 mM phosphate (pH 7.4); capillary, CElect p150, 40 cm (35
- 64 -
cm to detector) x 50 µm i.d.; instrument, CES I; temperature, ambient; voltage 10
kV; detection wavelength, 254 nm.
One approach to circumvent this problem was to immobilise or coat the protein onto
the capillary wall. A BSA coated capillary was donated by the University of Leeds
for the evaluation of chiral selectivity. The BSA coated capillary would potentially
offer two major benefits. The first would be to ensure that the detection window
would remain free of the protein while the second was that the method would also
significantly decrease the amount of BSA required providing that the amount used to
coat the capillary was small and that the coated capillary could be extensively re-
used.
The chiral analyte used to test the BSA-coated capillary was tryptophan. This has
been resolved using BSA as a buffer additive in CE from earlier studies.
Unfortunately, no enantiomer separations were observed, Fig. 38. It was thought that
the typical amount of tryptophan injected in free solution CE was overloading the
BSA at the capillary wall. Consequently the concentration of tryptophan was
decreased such that it was just at the limits of detection where the signal to noise
ratio was 5 : 1. However, still no chiral separations were observed for tryptophan
using the immobilised BSA capillary. Decreasing the concentration of tryptophan did
not change the migration of the tryptophan which proved that sample overload was
not the reason for the lack of chiral selectivity of this method.
There are a number of possible reasons why the BSA coated capillary did not resolve
the tryptophan enantiomers. As described earlier BSA is a prolate ellipsoid with
dimensions of 141 Å by 42 Å, so when compared to the capillary internal diameter of
75 µm the BSA would not extend more than 0.2 µm from the capillary surface.
Providing the tryptophan enantiomers were distributed evenly throughout the buffer
solution then only a fraction would be available to interact with the coated BSA
- 65 -
phase. Another reason could be that the structure of the BSA was grossly distorted
during the coating process thereby reducing the chiral selectivity. However, this was
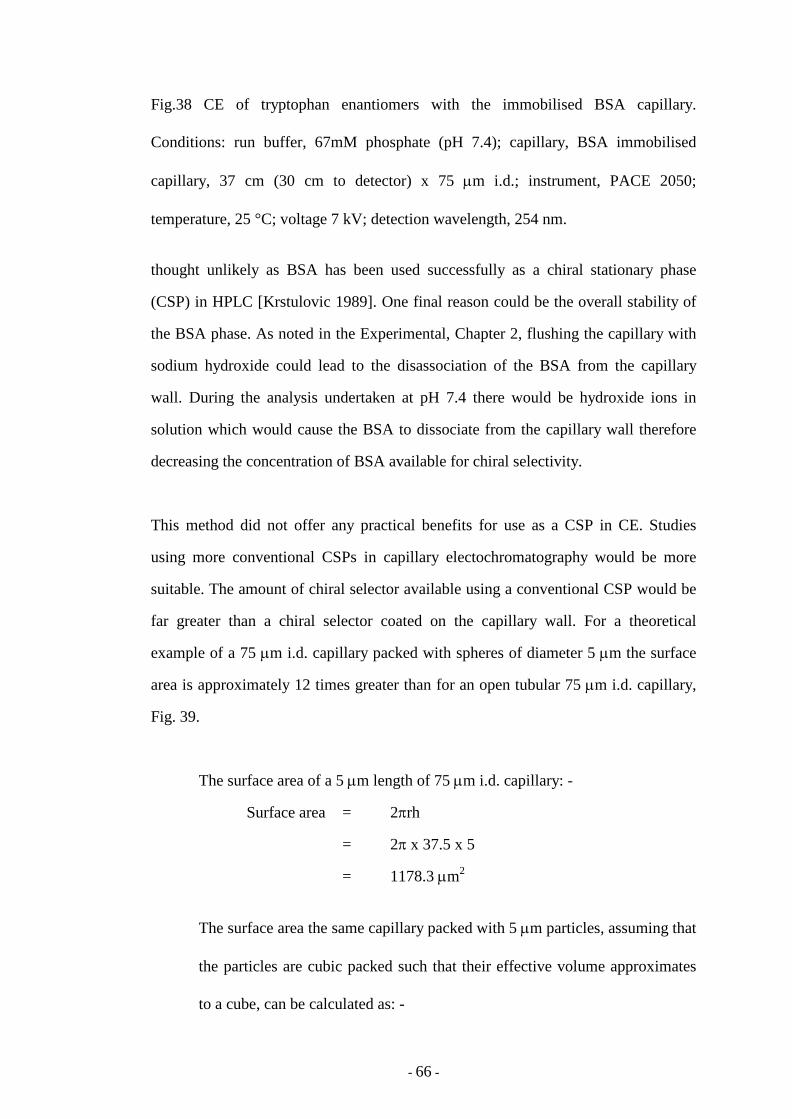
- 66 -
Fig.38 CE of tryptophan enantiomers with the immobilised BSA capillary.
Conditions: run buffer, 67mM phosphate (pH 7.4); capillary, BSA immobilised
capillary, 37 cm (30 cm to detector) x 75 µm i.d.; instrument, PACE 2050;
temperature, 25 °C; voltage 7 kV; detection wavelength, 254 nm.
thought unlikely as BSA has been used successfully as a chiral stationary phase
(CSP) in HPLC [Krstulovic 1989]. One final reason could be the overall stability of
the BSA phase. As noted in the Experimental, Chapter 2, flushing the capillary with
sodium hydroxide could lead to the disassociation of the BSA from the capillary
wall. During the analysis undertaken at pH 7.4 there would be hydroxide ions in
solution which would cause the BSA to dissociate from the capillary wall therefore
decreasing the concentration of BSA available for chiral selectivity.
This method did not offer any practical benefits for use as a CSP in CE. Studies
using more conventional CSPs in capillary electochromatography would be more
suitable. The amount of chiral selector available using a conventional CSP would be
far greater than a chiral selector coated on the capillary wall. For a theoretical
example of a 75 µm i.d. capillary packed with spheres of diameter 5 µm the surface
area is approximately 12 times greater than for an open tubular 75 µm i.d. capillary,
Fig. 39.
The surface area of a 5 µm length of 75 µm i.d. capillary: -
Surface area = 2πrh
= 2π x 37.5 x 5
= 1178.3 µm2
The surface area the same capillary packed with 5 µm particles, assuming that
the particles are cubic packed such that their effective volume approximates
to a cube, can be calculated as: -
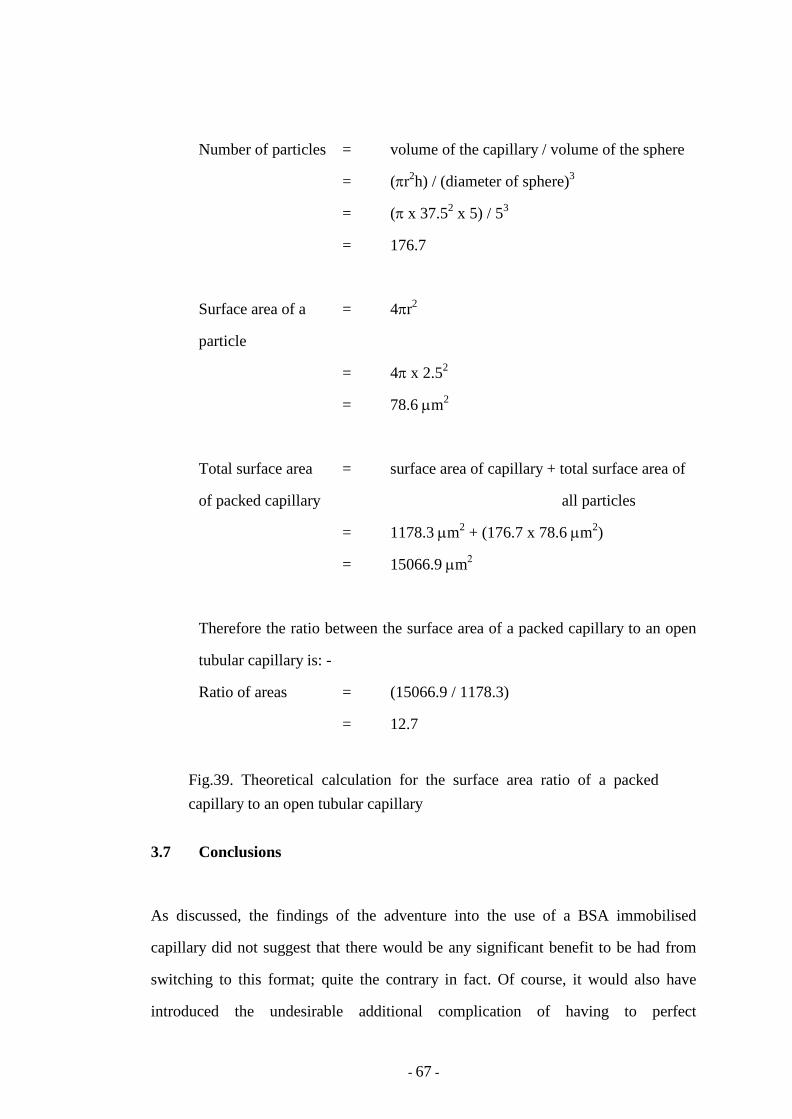
- 67 -
Number of particles = volume of the capillary / volume of the sphere
= (πr2h) / (diameter of sphere)3
= (π x 37.52 x 5) / 53
= 176.7
Surface area of a = 4πr2
particle
= 4π x 2.52
= 78.6 µm2
Total surface area = surface area of capillary + total surface area of
of packed capillary all particles
= 1178.3 µm2 + (176.7 x 78.6 µm2)
= 15066.9 µm2
Therefore the ratio between the surface area of a packed capillary to an open
tubular capillary is: -
Ratio of areas = (15066.9 / 1178.3)
= 12.7
Fig.39. Theoretical calculation for the surface area ratio of a packed capillary to an open tubular capillary
3.7 Conclusions
As discussed, the findings of the adventure into the use of a BSA immobilised
capillary did not suggest that there would be any significant benefit to be had from
switching to this format; quite the contrary in fact. Of course, it would also have
introduced the undesirable additional complication of having to perfect
- 68 -
immobilisation chemistry for every new protein tested. Similarly, protein affinity
CEC was discounted on the grounds of the extra complication of not only having to
address bonding chemistry but also having to perfect packing procedures and frit
formation (L Frame, PhD, University of Sunderland).
The work on the bonded capillary had done nothing to change the impression at the
outset that the use of the protein as a buffer additive would be the most simple,
versatile and easily accessible way of conducting electrophoretic protein affinity
enantioseparations and certainly the most facile way of testing out a range of
proteins, or even protein mixtures, for potential as chiral selectors. From the work on
BSA and tryptophan it appeared that the best combination of variables for the run
buffer to test BSA with a wide range of racemates were 67 mM phosphate (pH 7.4) –
methanol (97.5 : 2.5, v/v) and a chiral selector concentration of 2 mg ml-1
. The length
of the capillary was instrument dependent, they were 40 cm for the Dionex CES I
and 37 cm for the Beckman PACE 2050. The voltage was set to 10 kV.
- 69 -
Chapter 4 Evaluation of biomacromolecules for chiral discrimination in free
solution capillary electrophoresis
4.1 Introduction
Protein affinity CE has been successfully applied to separate the enantiomers of
tryptophan and benzoin, as described in Chapter 3. The protocol developed in
Chapter 3 was designed such that it would easily lend itself to screen many chiral
compounds against biomacromolecules of the analyst’s choice. At the time of the
outset of this element of the practical work only a few enantiomers had been
separated by protein affinity CE using BSA as the chiral selector. However, many
more had been separated using BSA as a chiral stationary phase in HPLC [Barker
1992]. Accordingly it was thought that it would be appropriate to use the CE protocol
for a broader range of enantiomers than had previously been studied by CE.
Similarly, another obvious aim was to apply the protocol to study chiral resolution by
protein affinity CE for a range of other proteins. The use of proteins that had been
used for chiral LC would allow an LC to CE comparison and those not studied by LC
would hopefully illustrate the easier accessibility of CE.
4.2 Results and discusion The enantiomers selected had already been successfully separated using a BSA-CSP
e.g. leucovorin [Barker 1992], or were structurally related to enantiomers separated
previously with this protocol, e.g. promethazine and the propionic acids.
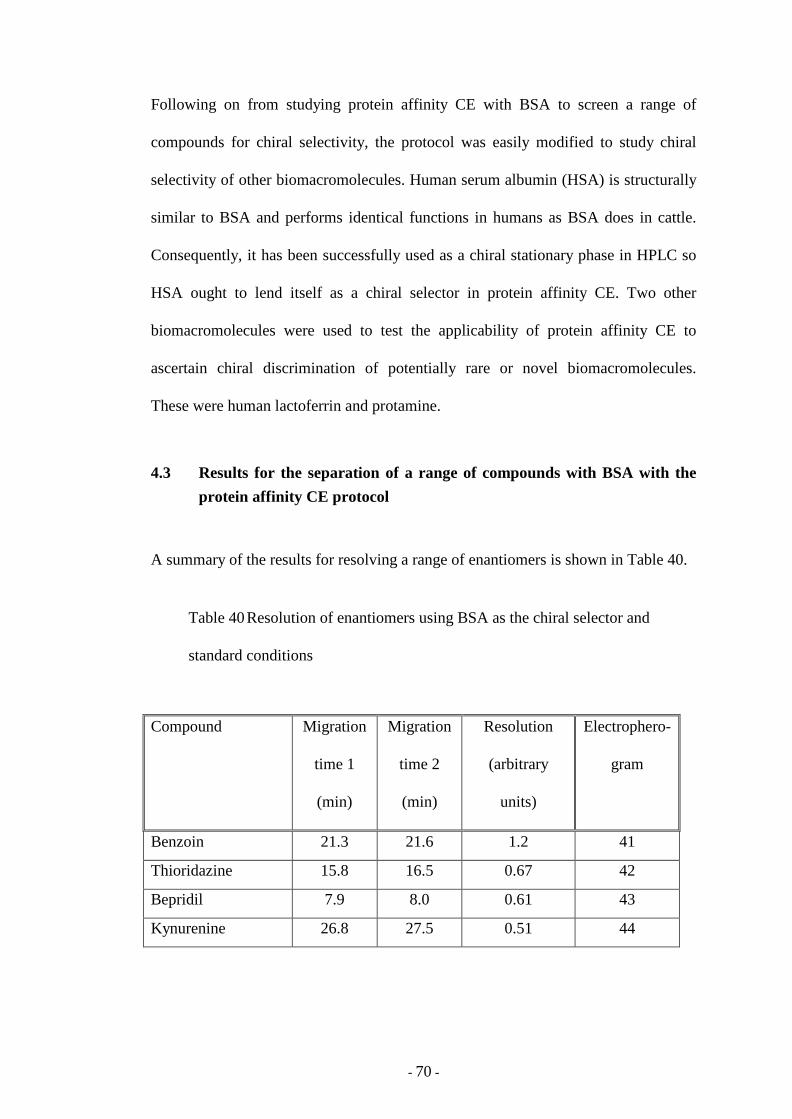
- 70 -
Following on from studying protein affinity CE with BSA to screen a range of
compounds for chiral selectivity, the protocol was easily modified to study chiral
selectivity of other biomacromolecules. Human serum albumin (HSA) is structurally
similar to BSA and performs identical functions in humans as BSA does in cattle.
Consequently, it has been successfully used as a chiral stationary phase in HPLC so
HSA ought to lend itself as a chiral selector in protein affinity CE. Two other
biomacromolecules were used to test the applicability of protein affinity CE to
ascertain chiral discrimination of potentially rare or novel biomacromolecules.
These were human lactoferrin and protamine.
4.3 Results for the separation of a range of compounds with BSA with the
protein affinity CE protocol
A summary of the results for resolving a range of enantiomers is shown in Table 40.
Table 40 Resolution of enantiomers using BSA as the chiral selector and
standard conditions
Compound Migration
time 1
(min)
Migration
time 2
(min)
Resolution
(arbitrary
units)
Electrophero-
gram
Benzoin 21.3 21.6 1.2 41
Thioridazine 15.8 16.5 0.67 42
Bepridil 7.9 8.0 0.61 43
Kynurenine 26.8 27.5 0.51 44
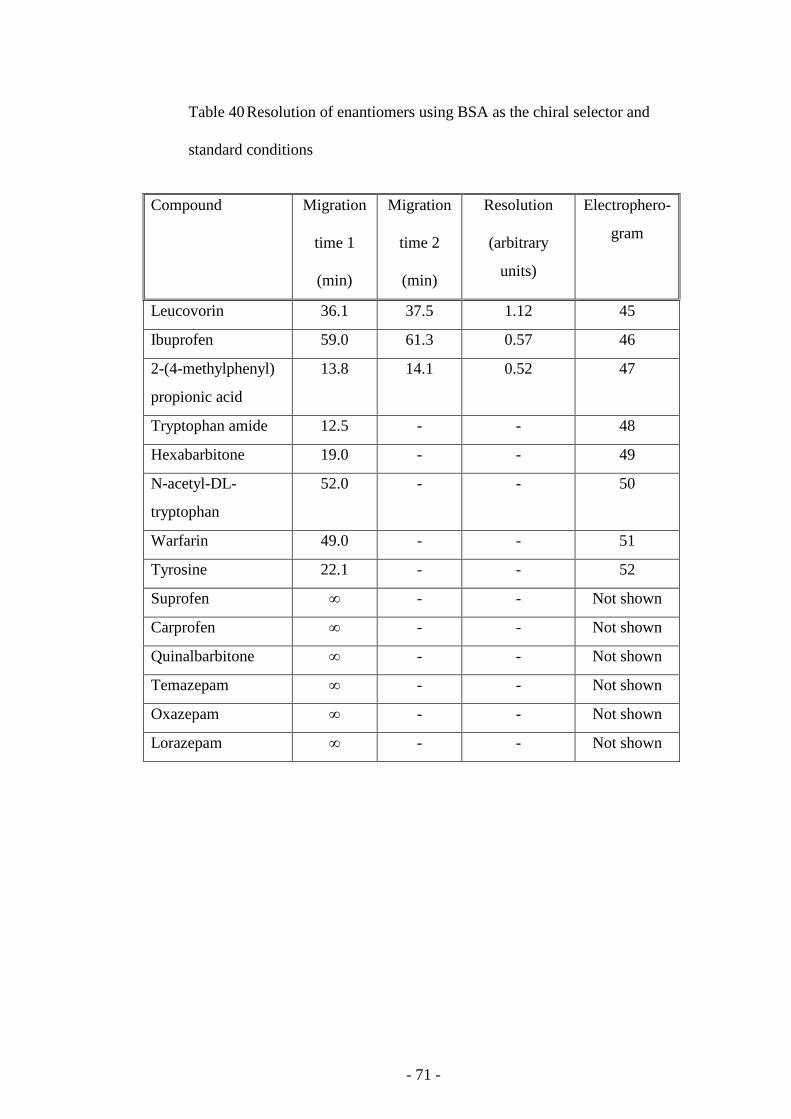
- 71 -
Table 40 Resolution of enantiomers using BSA as the chiral selector and
standard conditions
Compound Migration
time 1
(min)
Migration
time 2
(min)
Resolution
(arbitrary
units)
Electrophero-
gram
Leucovorin 36.1 37.5 1.12 45
Ibuprofen 59.0 61.3 0.57 46
2-(4-methylphenyl)
propionic acid
13.8 14.1 0.52 47
Tryptophan amide 12.5 - - 48
Hexabarbitone 19.0 - - 49
N-acetyl-DL-
tryptophan
52.0 - - 50
Warfarin 49.0 - - 51
Tyrosine 22.1 - - 52
Suprofen ∞ - - Not shown
Carprofen ∞ - - Not shown
Quinalbarbitone ∞ - - Not shown
Temazepam ∞ - - Not shown
Oxazepam ∞ - - Not shown
Lorazepam ∞ - - Not shown
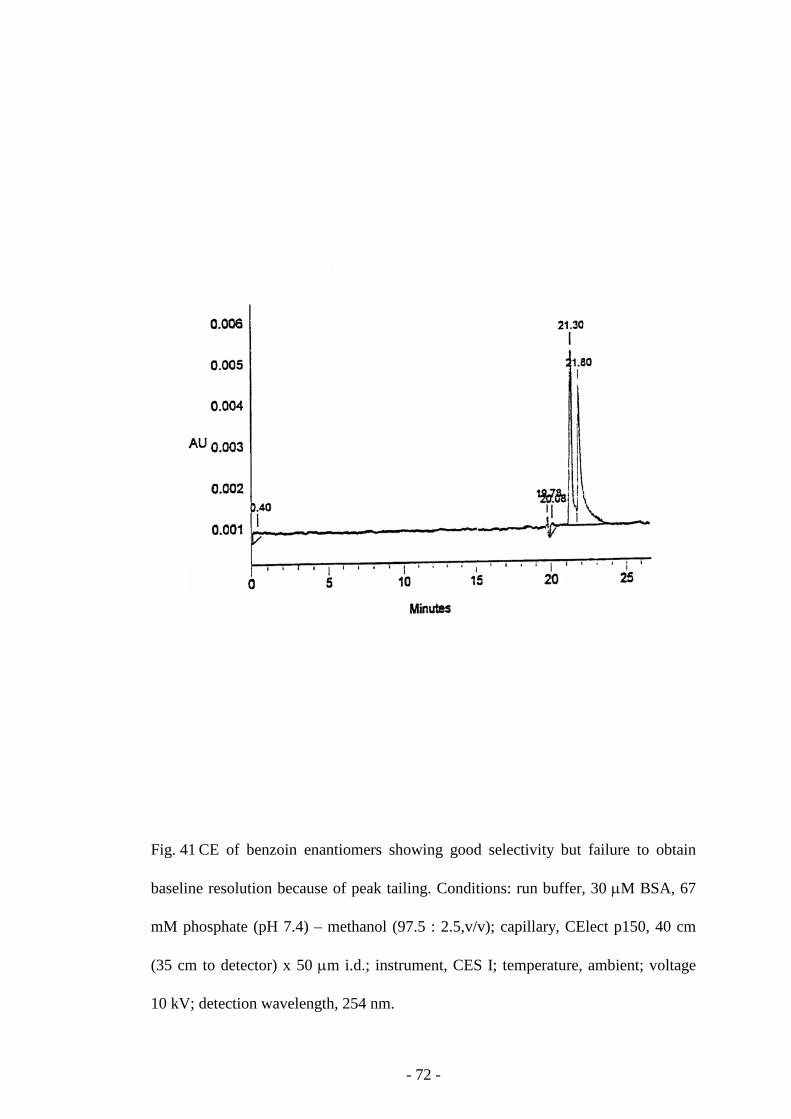
- 72 -
Fig. 41 CE of benzoin enantiomers showing good selectivity but failure to obtain
baseline resolution because of peak tailing. Conditions: run buffer, 30 µM BSA, 67
mM phosphate (pH 7.4) – methanol (97.5 : 2.5,v/v); capillary, CElect p150, 40 cm
(35 cm to detector) x 50 µm i.d.; instrument, CES I; temperature, ambient; voltage
10 kV; detection wavelength, 254 nm.
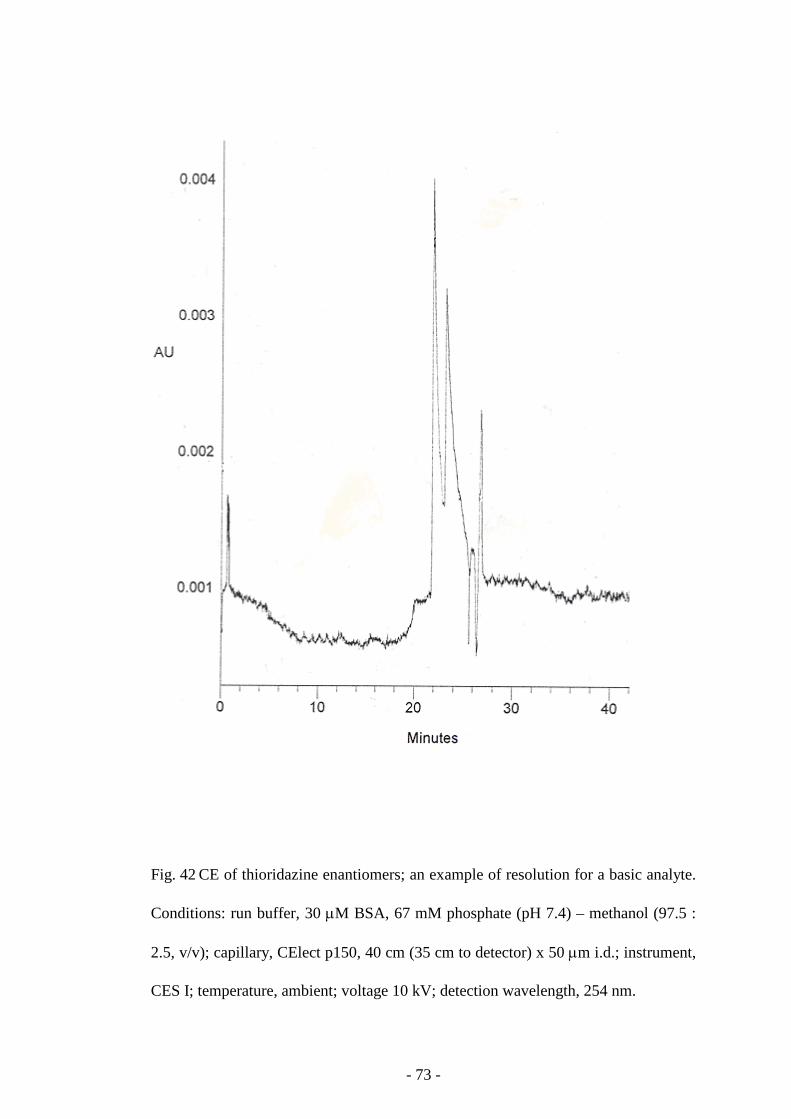
- 73 -
Fig. 42 CE of thioridazine enantiomers; an example of resolution for a basic analyte.
Conditions: run buffer, 30 µM BSA, 67 mM phosphate (pH 7.4) – methanol (97.5 :
2.5, v/v); capillary, CElect p150, 40 cm (35 cm to detector) x 50 µm i.d.; instrument,
CES I; temperature, ambient; voltage 10 kV; detection wavelength, 254 nm.
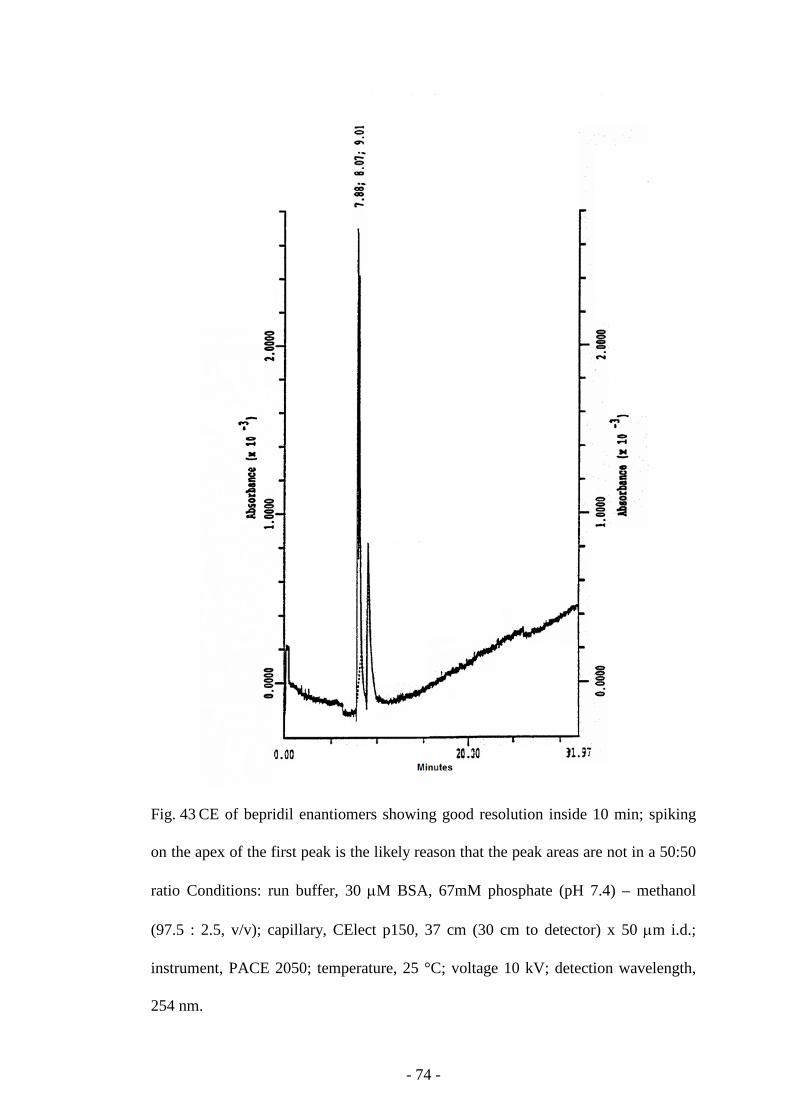
- 74 -
Fig. 43 CE of bepridil enantiomers showing good resolution inside 10 min; spiking
on the apex of the first peak is the likely reason that the peak areas are not in a 50:50
ratio Conditions: run buffer, 30 µM BSA, 67mM phosphate (pH 7.4) – methanol
(97.5 : 2.5, v/v); capillary, CElect p150, 37 cm (30 cm to detector) x 50 µm i.d.;
instrument, PACE 2050; temperature, 25 °C; voltage 10 kV; detection wavelength,
254 nm.
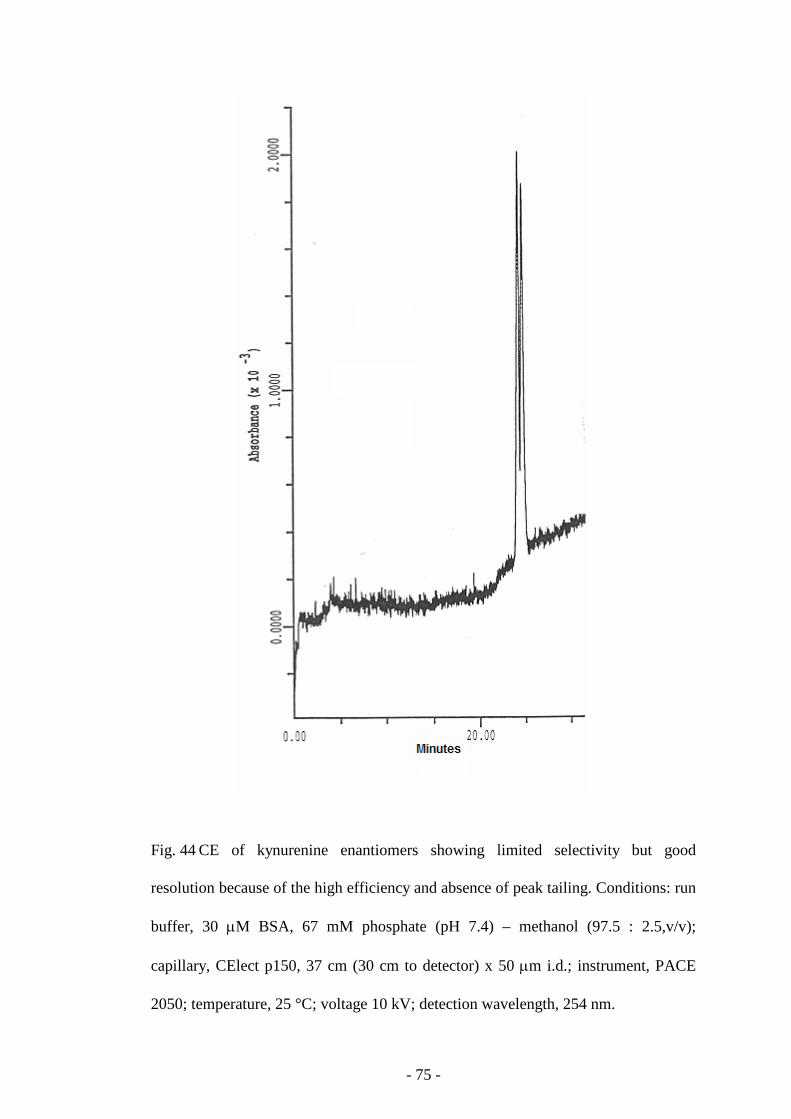
- 75 -
Fig. 44 CE of kynurenine enantiomers showing limited selectivity but good
resolution because of the high efficiency and absence of peak tailing. Conditions: run
buffer, 30 µM BSA, 67 mM phosphate (pH 7.4) – methanol (97.5 : 2.5,v/v);
capillary, CElect p150, 37 cm (30 cm to detector) x 50 µm i.d.; instrument, PACE
2050; temperature, 25 °C; voltage 10 kV; detection wavelength, 254 nm.
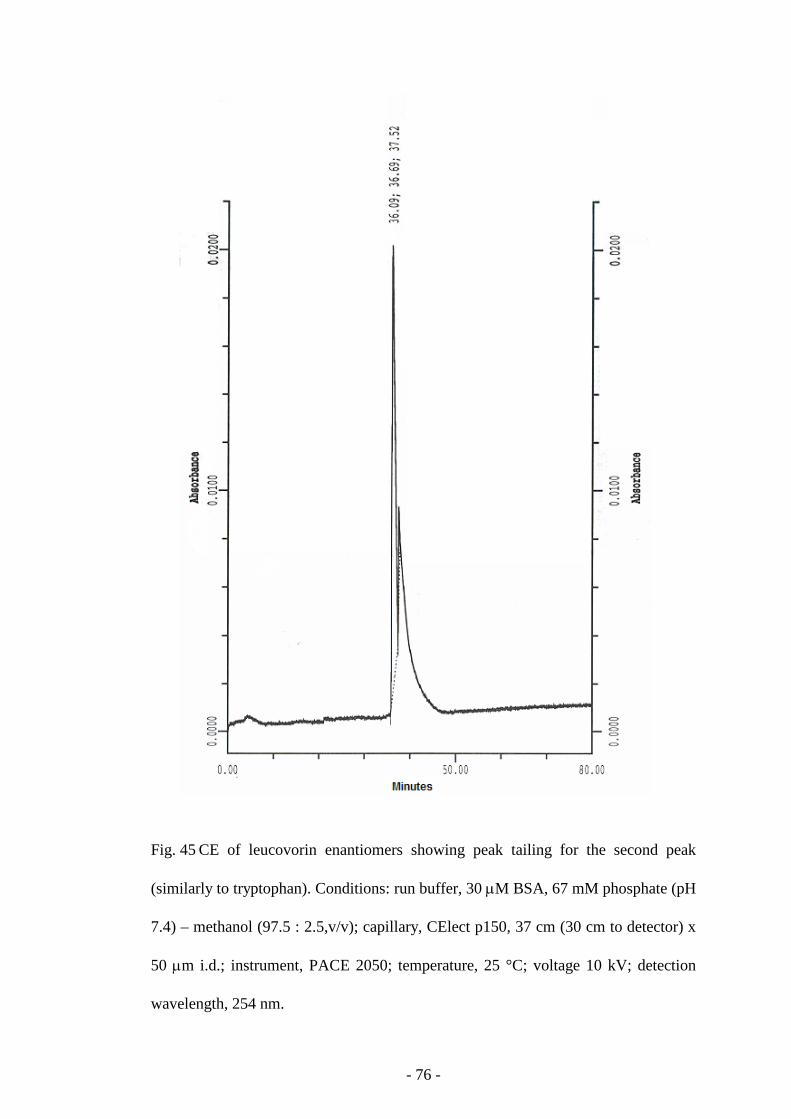
- 76 -
Fig. 45 CE of leucovorin enantiomers showing peak tailing for the second peak
(similarly to tryptophan). Conditions: run buffer, 30 µM BSA, 67 mM phosphate (pH
7.4) – methanol (97.5 : 2.5,v/v); capillary, CElect p150, 37 cm (30 cm to detector) x
50 µm i.d.; instrument, PACE 2050; temperature, 25 °C; voltage 10 kV; detection
wavelength, 254 nm.
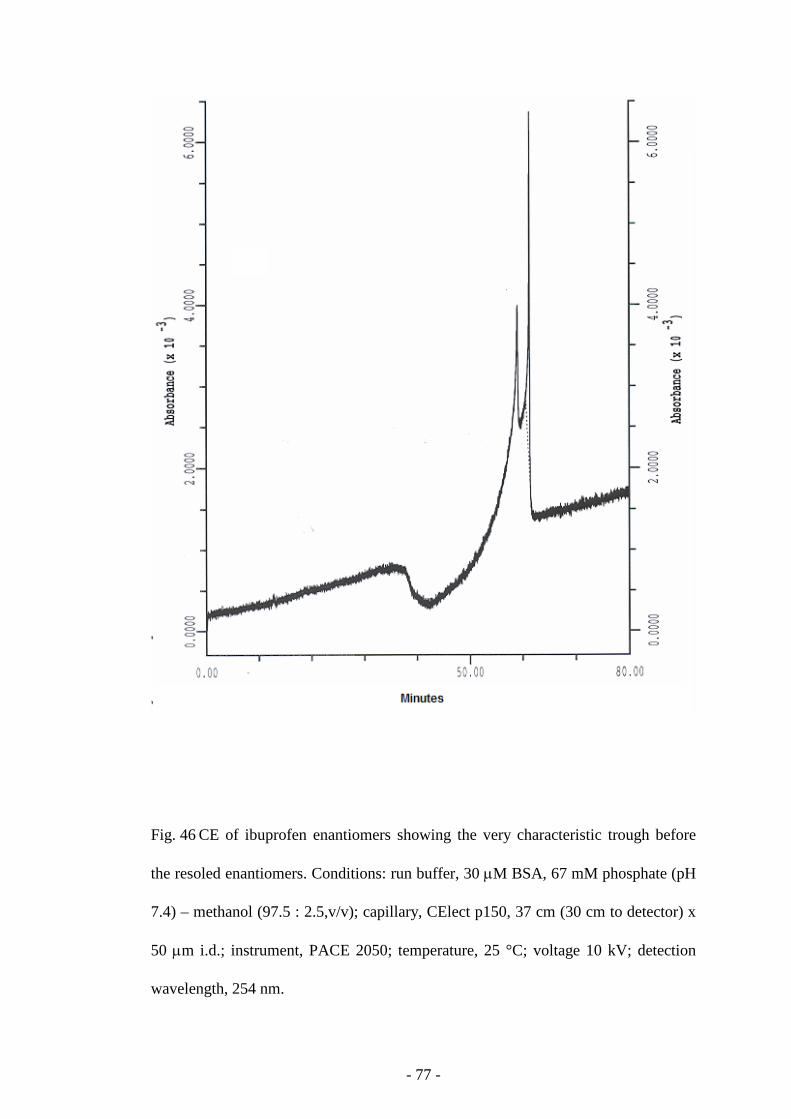
- 77 -
Fig. 46 CE of ibuprofen enantiomers showing the very characteristic trough before
the resoled enantiomers. Conditions: run buffer, 30 µM BSA, 67 mM phosphate (pH
7.4) – methanol (97.5 : 2.5,v/v); capillary, CElect p150, 37 cm (30 cm to detector) x
50 µm i.d.; instrument, PACE 2050; temperature, 25 °C; voltage 10 kV; detection
wavelength, 254 nm.
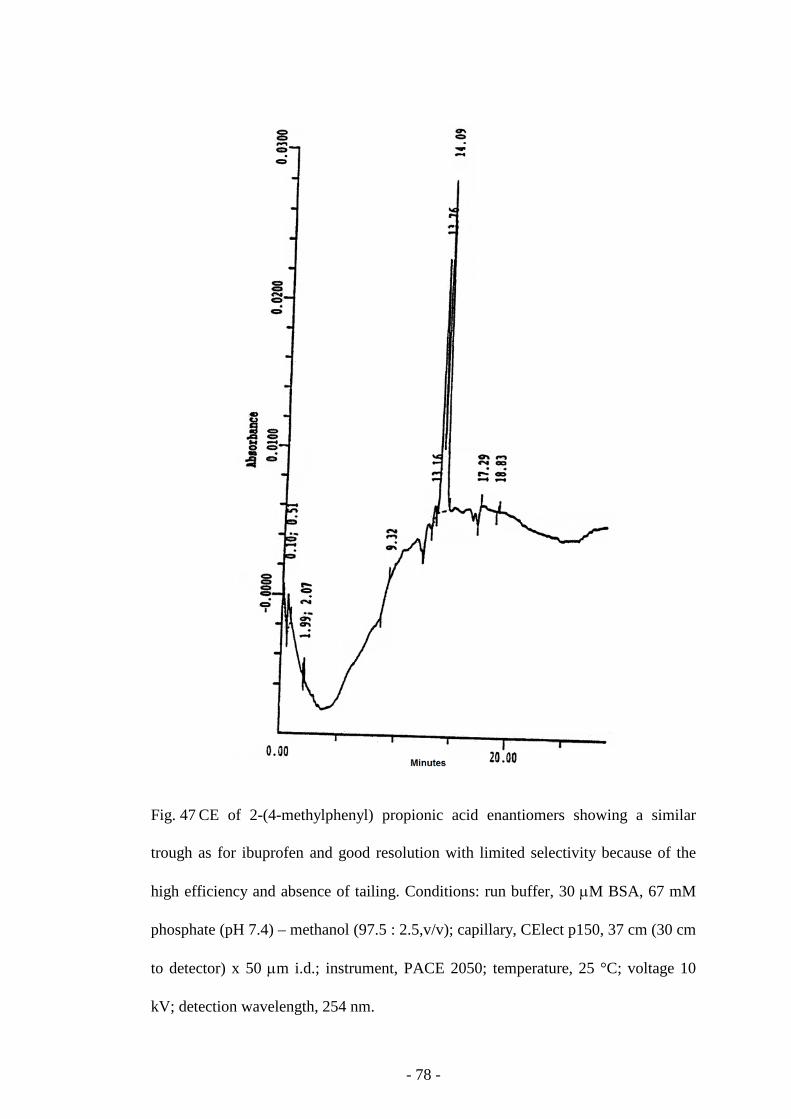
- 78 -
Fig. 47 CE of 2-(4-methylphenyl) propionic acid enantiomers showing a similar
trough as for ibuprofen and good resolution with limited selectivity because of the
high efficiency and absence of tailing. Conditions: run buffer, 30 µM BSA, 67 mM
phosphate (pH 7.4) – methanol (97.5 : 2.5,v/v); capillary, CElect p150, 37 cm (30 cm
to detector) x 50 µm i.d.; instrument, PACE 2050; temperature, 25 °C; voltage 10
kV; detection wavelength, 254 nm.
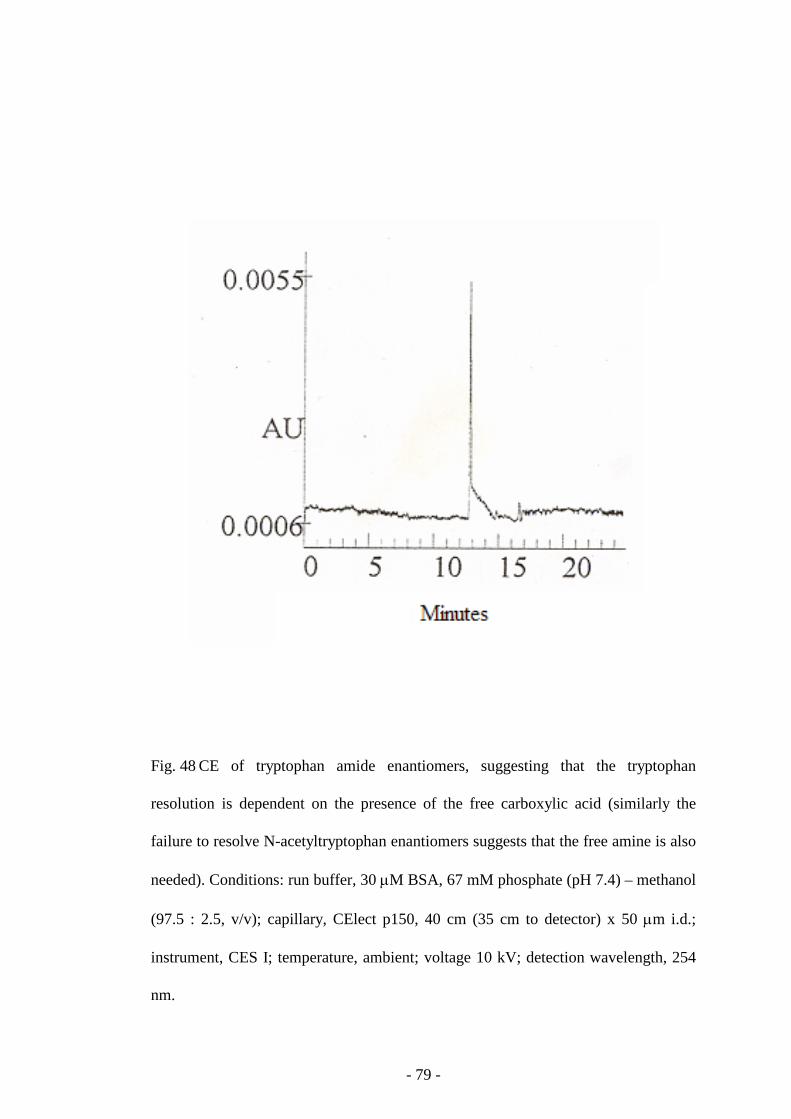
- 79 -
Fig. 48 CE of tryptophan amide enantiomers, suggesting that the tryptophan
resolution is dependent on the presence of the free carboxylic acid (similarly the
failure to resolve N-acetyltryptophan enantiomers suggests that the free amine is also
needed). Conditions: run buffer, 30 µM BSA, 67 mM phosphate (pH 7.4) – methanol
(97.5 : 2.5, v/v); capillary, CElect p150, 40 cm (35 cm to detector) x 50 µm i.d.;
instrument, CES I; temperature, ambient; voltage 10 kV; detection wavelength, 254
nm.
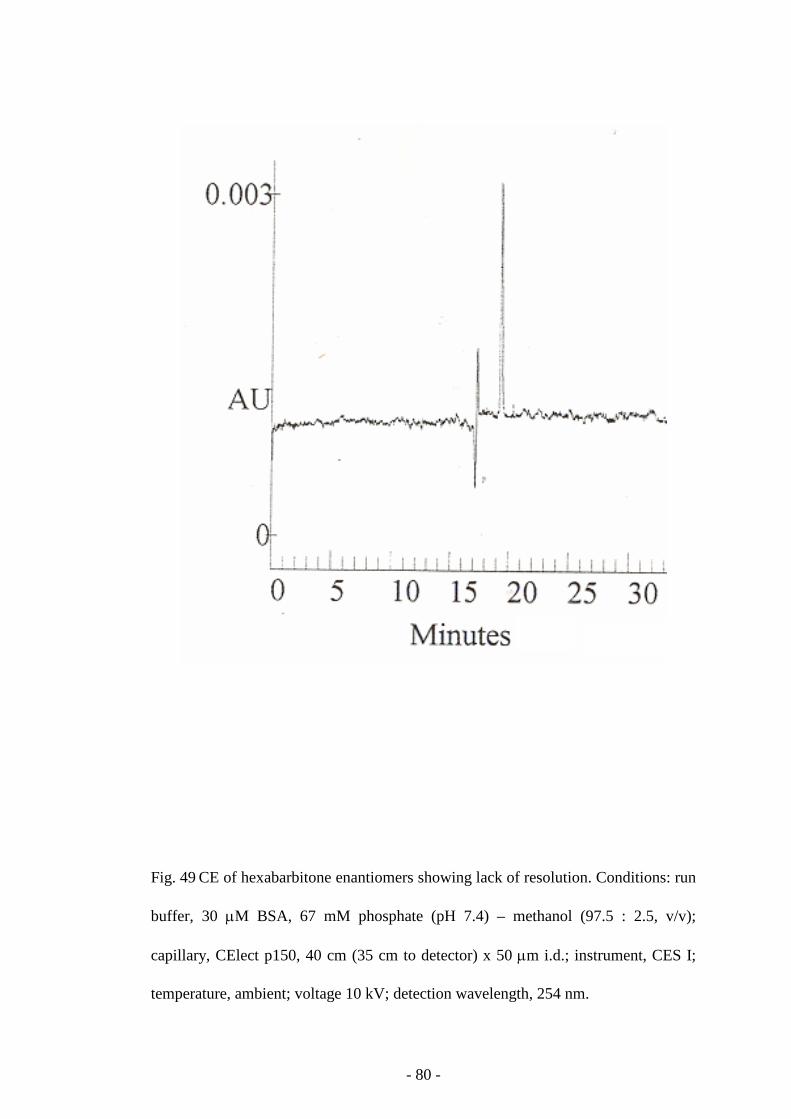
- 80 -
Fig. 49 CE of hexabarbitone enantiomers showing lack of resolution. Conditions: run
buffer, 30 µM BSA, 67 mM phosphate (pH 7.4) – methanol (97.5 : 2.5, v/v);
capillary, CElect p150, 40 cm (35 cm to detector) x 50 µm i.d.; instrument, CES I;
temperature, ambient; voltage 10 kV; detection wavelength, 254 nm.
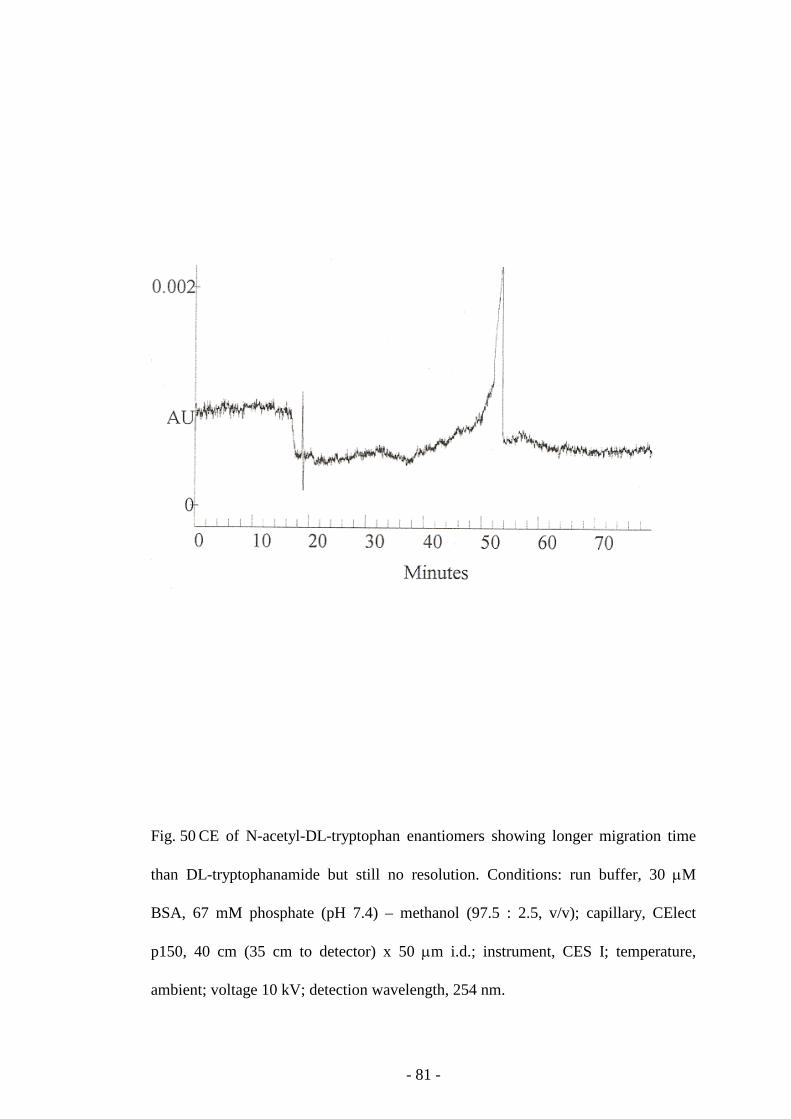
- 81 -
Fig. 50 CE of N-acetyl-DL-tryptophan enantiomers showing longer migration time
than DL-tryptophanamide but still no resolution. Conditions: run buffer, 30 µM
BSA, 67 mM phosphate (pH 7.4) – methanol (97.5 : 2.5, v/v); capillary, CElect
p150, 40 cm (35 cm to detector) x 50 µm i.d.; instrument, CES I; temperature,
ambient; voltage 10 kV; detection wavelength, 254 nm.
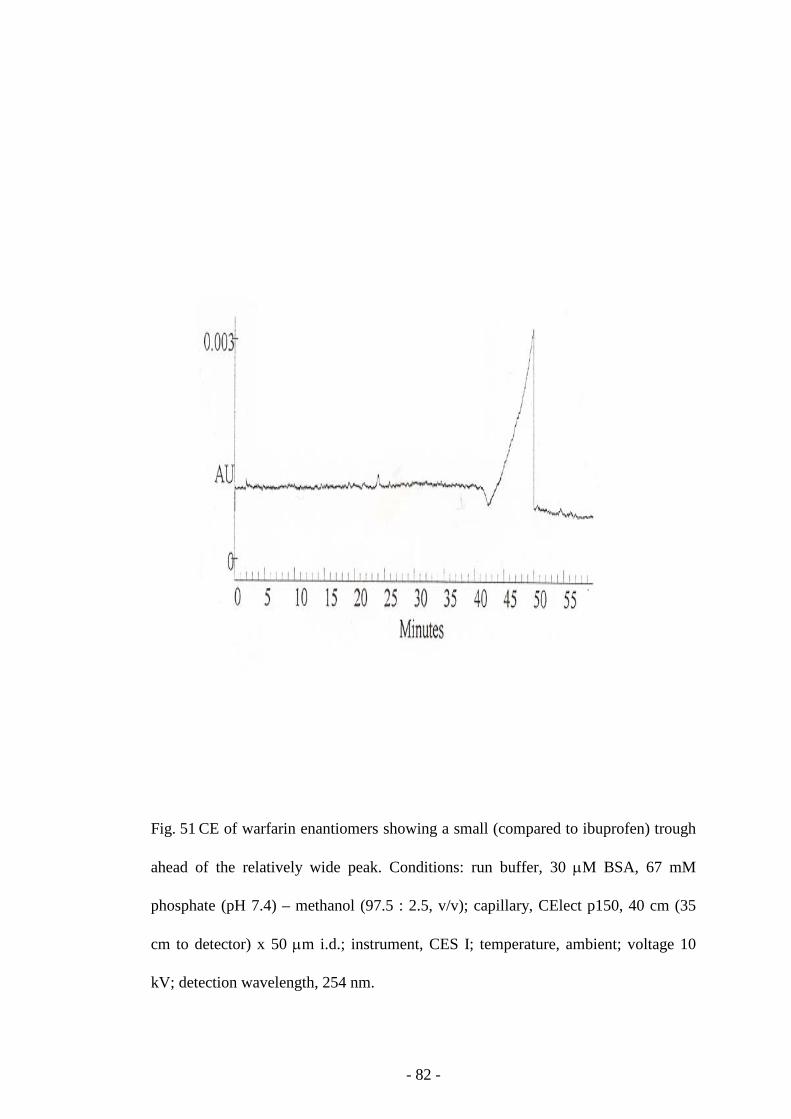
- 82 -
Fig. 51 CE of warfarin enantiomers showing a small (compared to ibuprofen) trough
ahead of the relatively wide peak. Conditions: run buffer, 30 µM BSA, 67 mM
phosphate (pH 7.4) – methanol (97.5 : 2.5, v/v); capillary, CElect p150, 40 cm (35
cm to detector) x 50 µm i.d.; instrument, CES I; temperature, ambient; voltage 10
kV; detection wavelength, 254 nm.
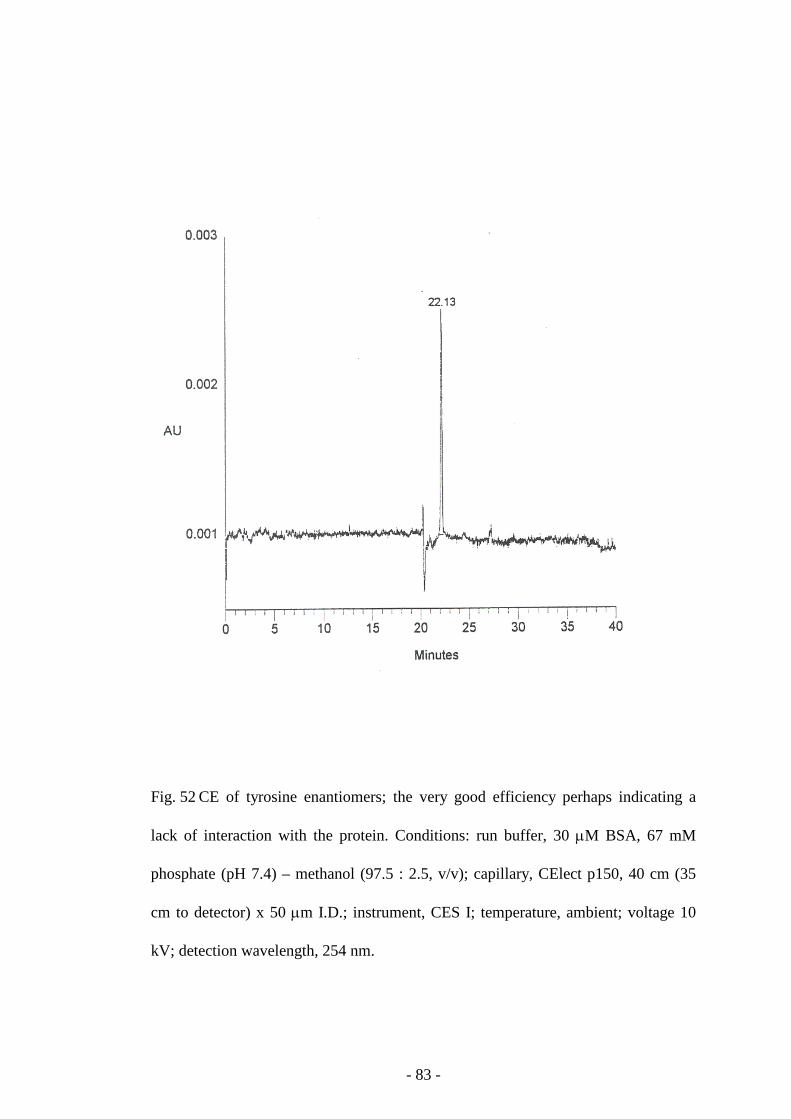
- 83 -
Fig. 52 CE of tyrosine enantiomers; the very good efficiency perhaps indicating a
lack of interaction with the protein. Conditions: run buffer, 30 µM BSA, 67 mM
phosphate (pH 7.4) – methanol (97.5 : 2.5, v/v); capillary, CElect p150, 40 cm (35
cm to detector) x 50 µm I.D.; instrument, CES I; temperature, ambient; voltage 10
kV; detection wavelength, 254 nm.
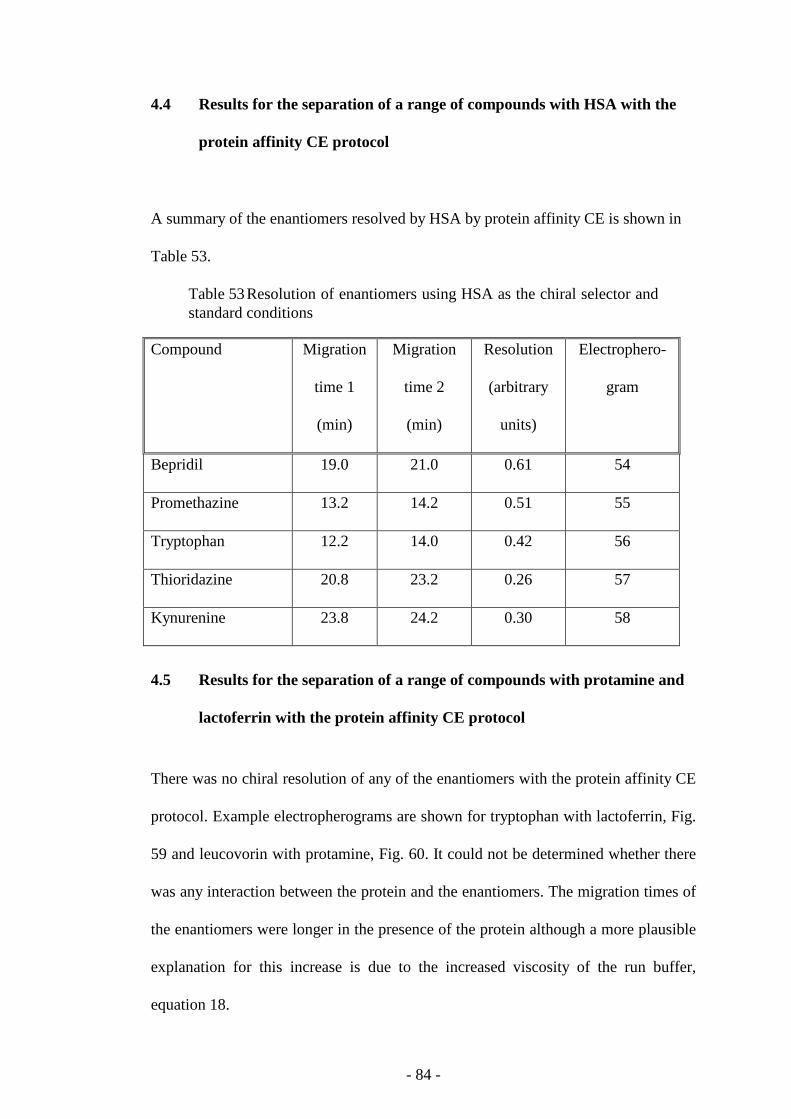
- 84 -
4.4 Results for the separation of a range of compounds with HSA with the
protein affinity CE protocol
A summary of the enantiomers resolved by HSA by protein affinity CE is shown in
Table 53.
Table 53 Resolution of enantiomers using HSA as the chiral selector and standard conditions
Compound Migration
time 1
(min)
Migration
time 2
(min)
Resolution
(arbitrary
units)
Electrophero-
gram
Bepridil 19.0 21.0 0.61 54
Promethazine 13.2 14.2 0.51 55
Tryptophan 12.2 14.0 0.42 56
Thioridazine 20.8 23.2 0.26 57
Kynurenine 23.8 24.2 0.30 58
4.5 Results for the separation of a range of compounds with protamine and
lactoferrin with the protein affinity CE protocol
There was no chiral resolution of any of the enantiomers with the protein affinity CE
protocol. Example electropherograms are shown for tryptophan with lactoferrin, Fig.
59 and leucovorin with protamine, Fig. 60. It could not be determined whether there
was any interaction between the protein and the enantiomers. The migration times of
the enantiomers were longer in the presence of the protein although a more plausible
explanation for this increase is due to the increased viscosity of the run buffer,
equation 18.

- 85 -
µπη
= =vE
qr6
Equation 18 Electrophoretic Mobility
where
µ = electrophoretic mobility
v = electrophoretic velocity
E = electric field strength
q = charge of the ion
η = viscosity of the buffer
r = radius of the molecules.
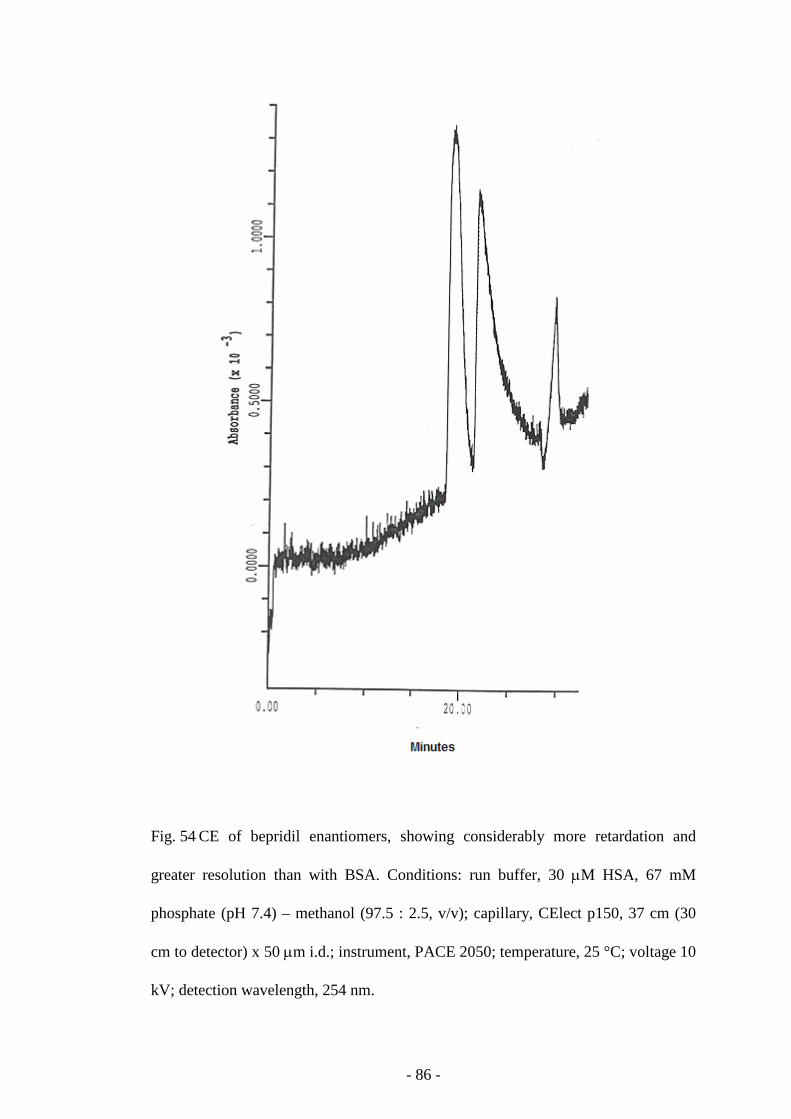
- 86 -
Fig. 54 CE of bepridil enantiomers, showing considerably more retardation and
greater resolution than with BSA. Conditions: run buffer, 30 µM HSA, 67 mM
phosphate (pH 7.4) – methanol (97.5 : 2.5, v/v); capillary, CElect p150, 37 cm (30
cm to detector) x 50 µm i.d.; instrument, PACE 2050; temperature, 25 °C; voltage 10
kV; detection wavelength, 254 nm.
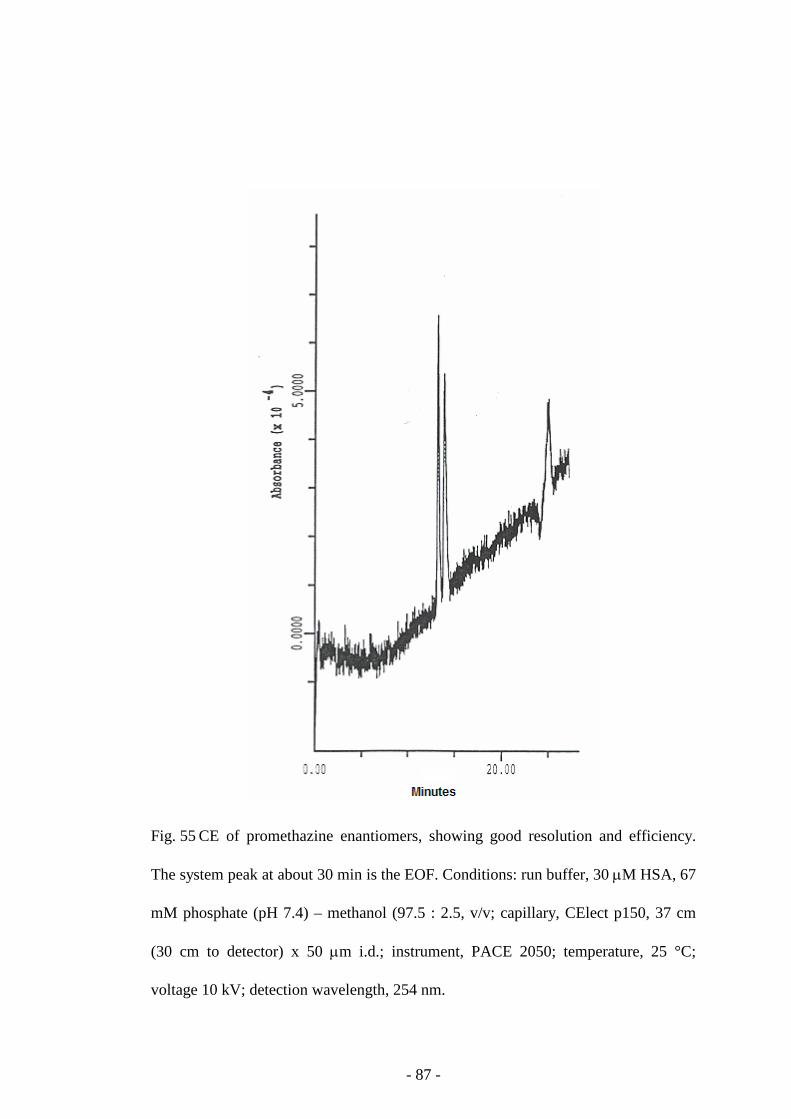
- 87 -
Fig. 55 CE of promethazine enantiomers, showing good resolution and efficiency.
The system peak at about 30 min is the EOF. Conditions: run buffer, 30 µM HSA, 67
mM phosphate (pH 7.4) – methanol (97.5 : 2.5, v/v; capillary, CElect p150, 37 cm
(30 cm to detector) x 50 µm i.d.; instrument, PACE 2050; temperature, 25 °C;
voltage 10 kV; detection wavelength, 254 nm.
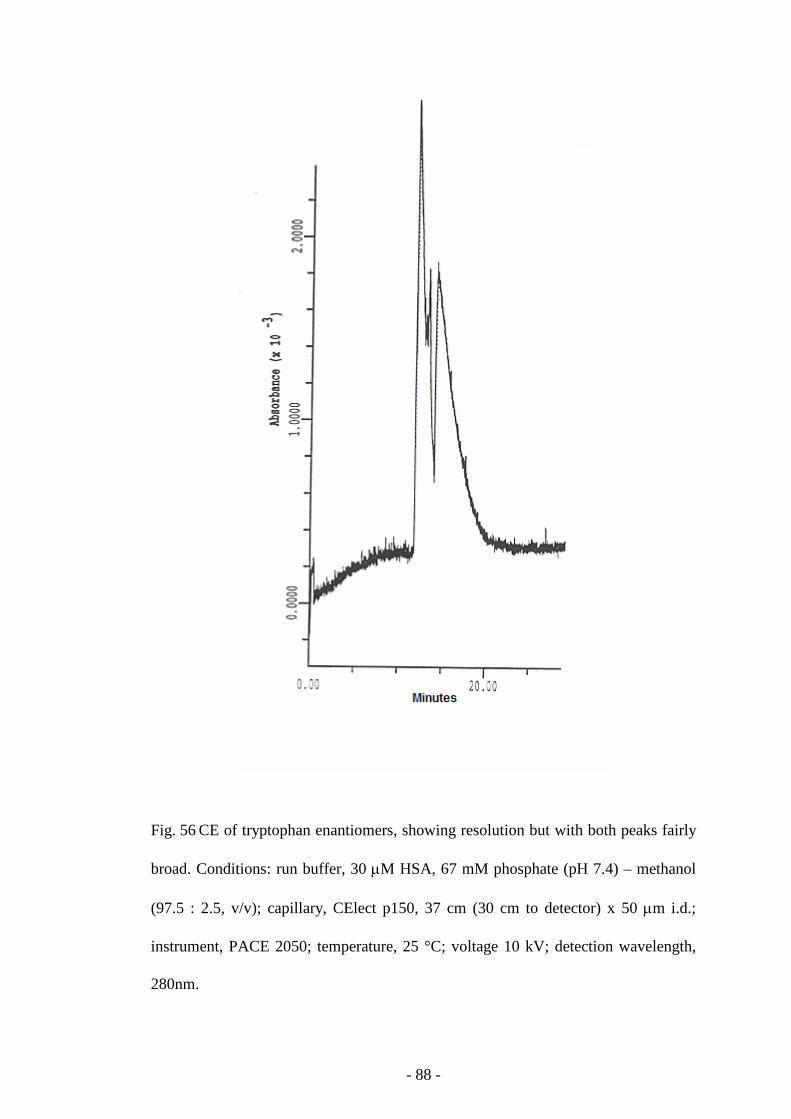
- 88 -
Fig. 56 CE of tryptophan enantiomers, showing resolution but with both peaks fairly
broad. Conditions: run buffer, 30 µM HSA, 67 mM phosphate (pH 7.4) – methanol
(97.5 : 2.5, v/v); capillary, CElect p150, 37 cm (30 cm to detector) x 50 µm i.d.;
instrument, PACE 2050; temperature, 25 °C; voltage 10 kV; detection wavelength,
280nm.
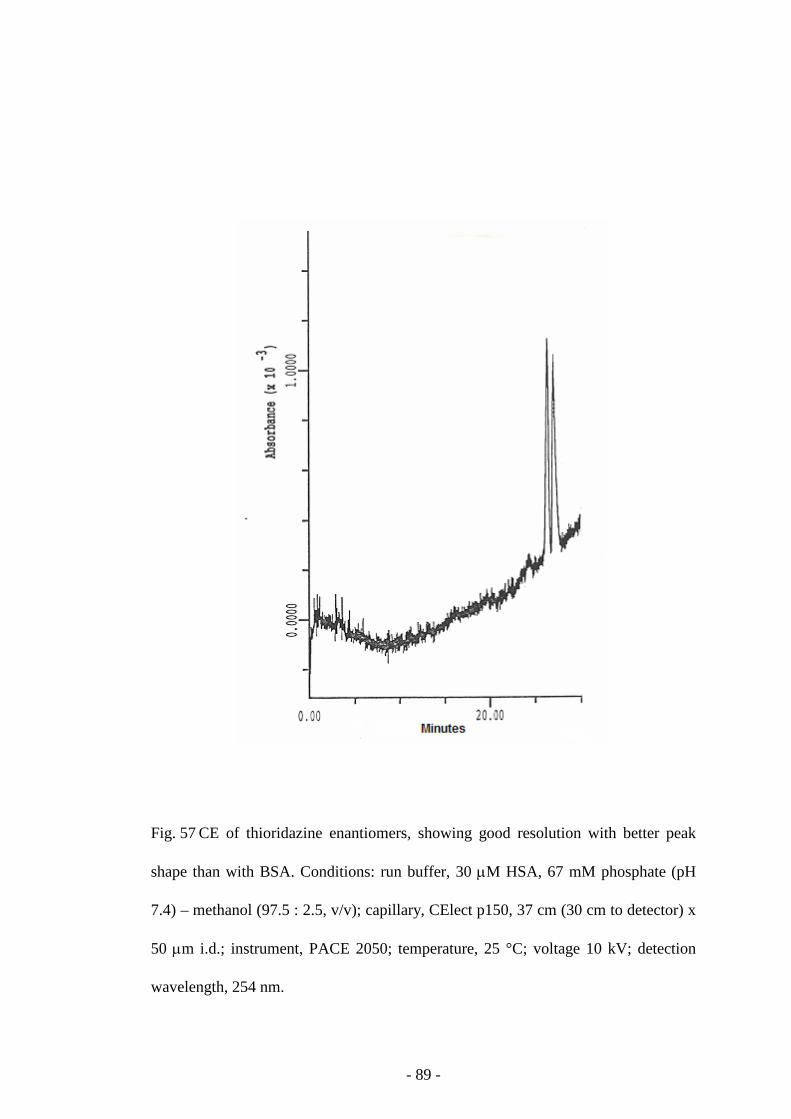
- 89 -
Fig. 57 CE of thioridazine enantiomers, showing good resolution with better peak
shape than with BSA. Conditions: run buffer, 30 µM HSA, 67 mM phosphate (pH
7.4) – methanol (97.5 : 2.5, v/v); capillary, CElect p150, 37 cm (30 cm to detector) x
50 µm i.d.; instrument, PACE 2050; temperature, 25 °C; voltage 10 kV; detection
wavelength, 254 nm.
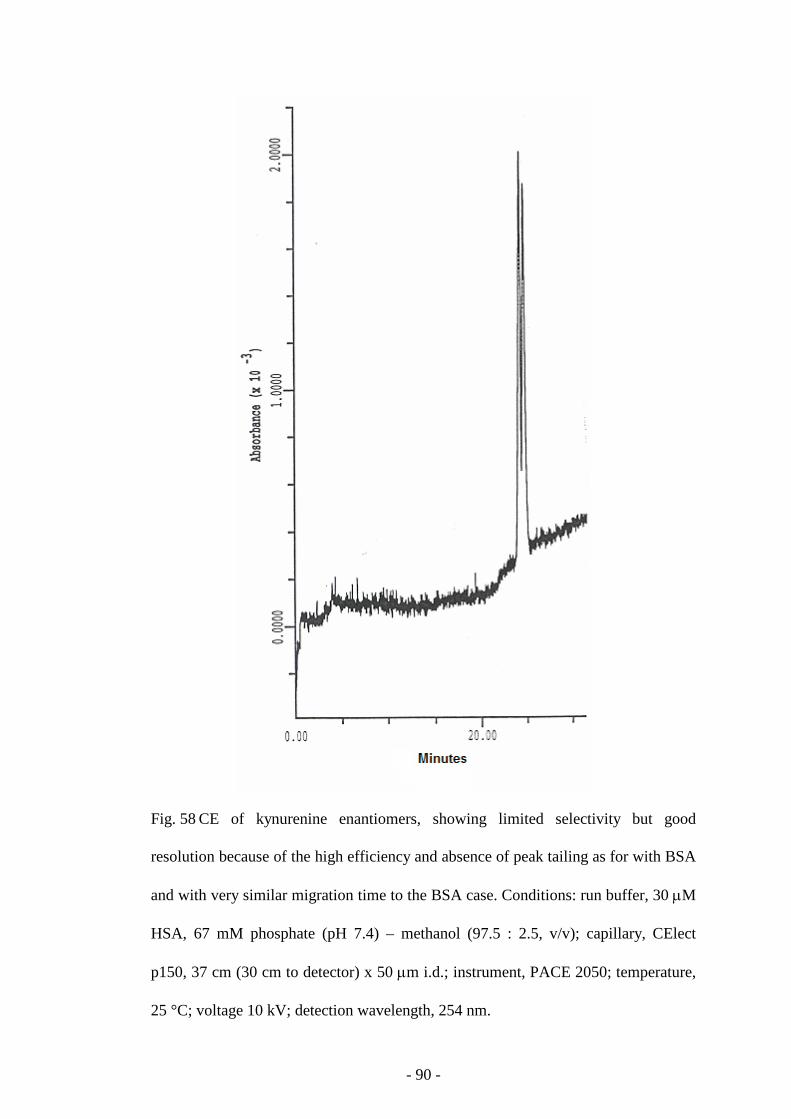
- 90 -
Fig. 58 CE of kynurenine enantiomers, showing limited selectivity but good
resolution because of the high efficiency and absence of peak tailing as for with BSA
and with very similar migration time to the BSA case. Conditions: run buffer, 30 µM
HSA, 67 mM phosphate (pH 7.4) – methanol (97.5 : 2.5, v/v); capillary, CElect
p150, 37 cm (30 cm to detector) x 50 µm i.d.; instrument, PACE 2050; temperature,
25 °C; voltage 10 kV; detection wavelength, 254 nm.
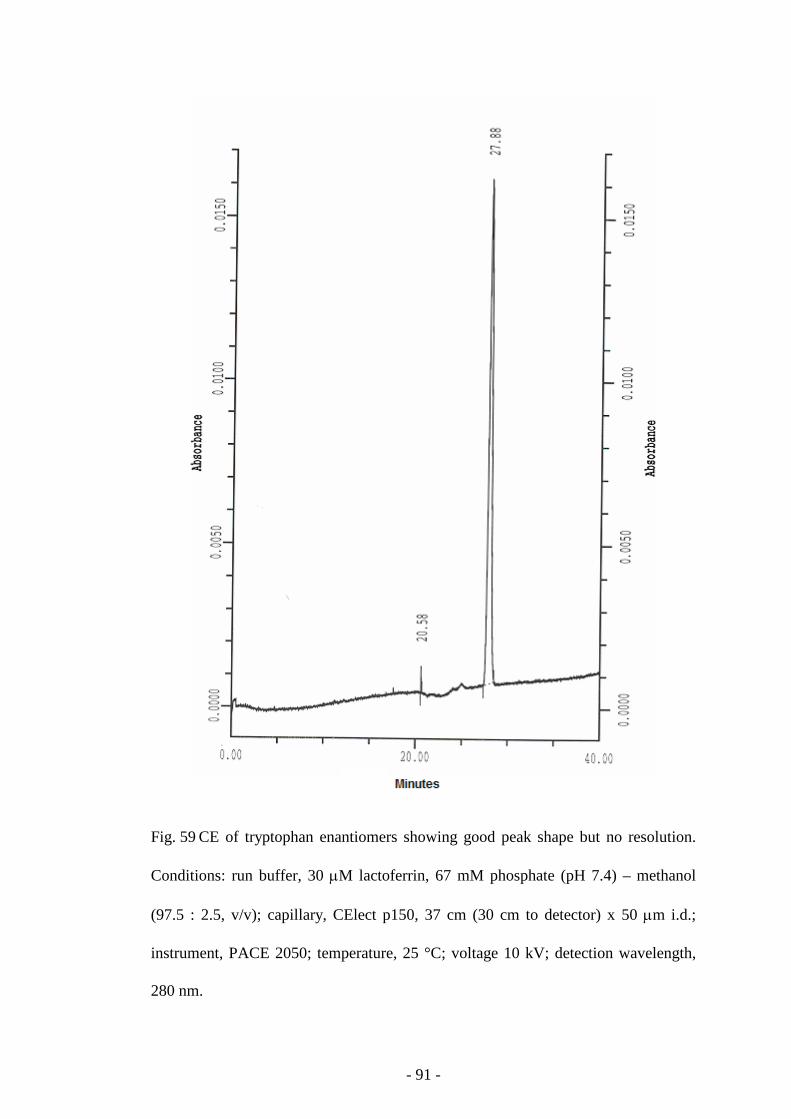
- 91 -
Fig. 59 CE of tryptophan enantiomers showing good peak shape but no resolution.
Conditions: run buffer, 30 µM lactoferrin, 67 mM phosphate (pH 7.4) – methanol
(97.5 : 2.5, v/v); capillary, CElect p150, 37 cm (30 cm to detector) x 50 µm i.d.;
instrument, PACE 2050; temperature, 25 °C; voltage 10 kV; detection wavelength,
280 nm.
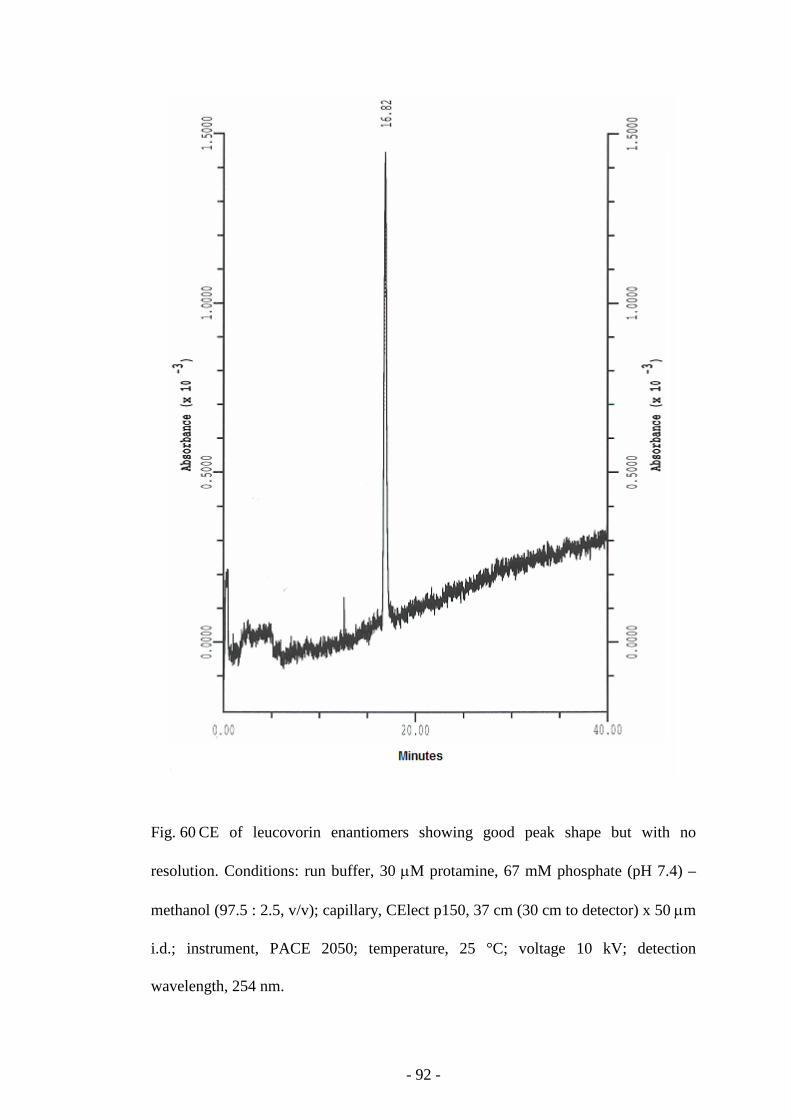
- 92 -
Fig. 60 CE of leucovorin enantiomers showing good peak shape but with no
resolution. Conditions: run buffer, 30 µM protamine, 67 mM phosphate (pH 7.4) –
methanol (97.5 : 2.5, v/v); capillary, CElect p150, 37 cm (30 cm to detector) x 50 µm
i.d.; instrument, PACE 2050; temperature, 25 °C; voltage 10 kV; detection
wavelength, 254 nm.
- 93 -
4.6 Discussion
4.6.1 Evaluation of protein affinity CE
The protocol developed in Chapter 3 was successfully applied to study the range of
enantiomers with different biomacromolecules. Disappointingly, only a few
enantiomers were resolved with HSA and BSA compared to comparable LC methods
[Lloyd 1995] and none were resolved with either lactoferrin or protamine. In some
cases, no peaks were observed at all e.g. temazepam and suprofen. On the whole,
BSA was more successful as a chiral selector than HSA although in some cases when
using HSA there were significant differences in migration times, e.g. Bepridil. While
peak tailing seemed to be less of a problem when using HSA, in the case of
tryptophan it was found that both peaks were broad, as opposed to the BSA case
where only the second peak, L-tryptophan, was broad and tailed. Broadly speaking
the situation in LC is that, because HSA does not offer striking advantages over the
cheaper, first-used BSA as a chiral selector, HSA CSP tend now to be used more as
tools for studying drug – protein binding [Wainer 1993] rather than for resolving
enantiomers. In CE a similar situation would apply. BSA would be used for resolving
enantiomers and, obviously, there would be more interest in studying binding to
HSA than to BSA.
By the time this study was complete and, more so, subsequent to this, other
researchers had also reported limited success in separating enantiomers with proteins
in free-solution CE, Table 61. Massolini [Massolini 1998] reported a surprising lack
of chiral selectivity of β-lactoglobulin. An explanation for the lack of chiral
selectivity is the concentration of biomacromolecule in the run buffer. The
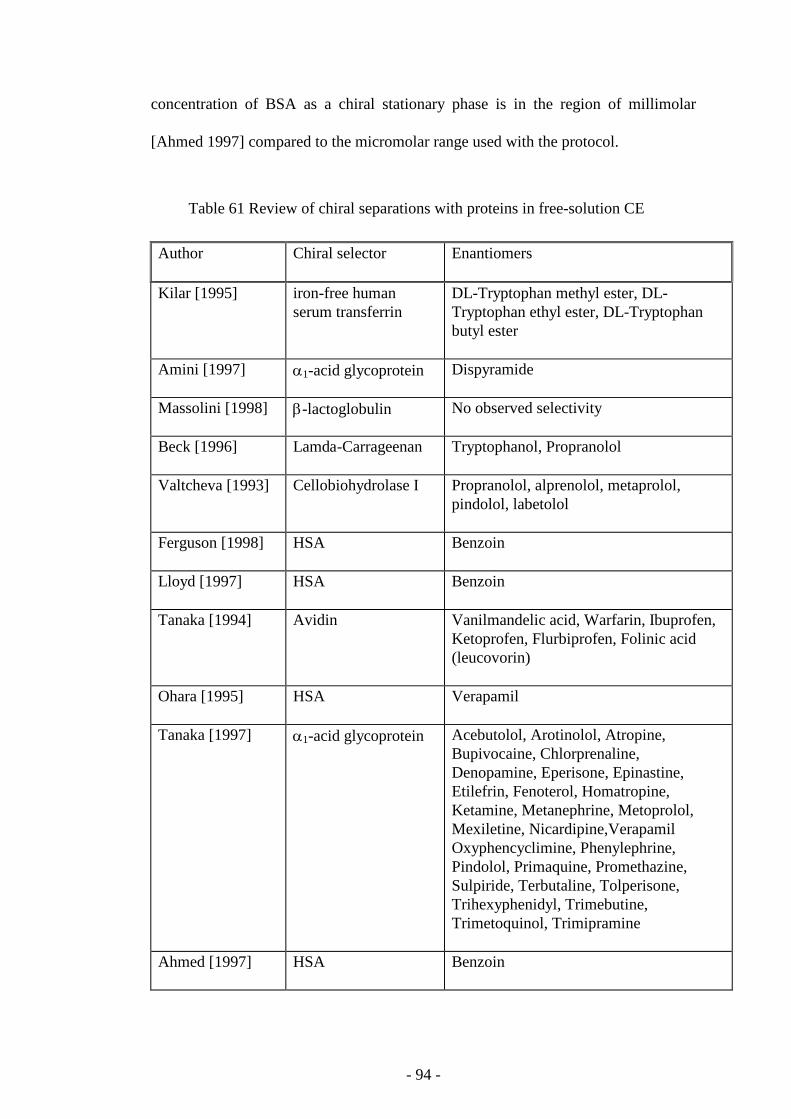
- 94 -
concentration of BSA as a chiral stationary phase is in the region of millimolar
[Ahmed 1997] compared to the micromolar range used with the protocol.
Table 61 Review of chiral separations with proteins in free-solution CE
Author Chiral selector Enantiomers
Kilar [1995] iron-free human serum transferrin
DL-Tryptophan methyl ester, DL-Tryptophan ethyl ester, DL-Tryptophan butyl ester
Amini [1997] α1-acid glycoprotein Dispyramide
Massolini [1998] β-lactoglobulin No observed selectivity
Beck [1996] Lamda-Carrageenan Tryptophanol, Propranolol
Valtcheva [1993] Cellobiohydrolase I Propranolol, alprenolol, metaprolol, pindolol, labetolol
Ferguson [1998] HSA Benzoin
Lloyd [1997] HSA Benzoin
Tanaka [1994] Avidin Vanilmandelic acid, Warfarin, Ibuprofen, Ketoprofen, Flurbiprofen, Folinic acid (leucovorin)
Ohara [1995] HSA Verapamil
Tanaka [1997] α1-acid glycoprotein Acebutolol, Arotinolol, Atropine, Bupivocaine, Chlorprenaline, Denopamine, Eperisone, Epinastine, Etilefrin, Fenoterol, Homatropine, Ketamine, Metanephrine, Metoprolol, Mexiletine, Nicardipine,Verapamil Oxyphencyclimine, Phenylephrine, Pindolol, Primaquine, Promethazine, Sulpiride, Terbutaline, Tolperisone, Trihexyphenidyl, Trimebutine, Trimetoquinol, Trimipramine
Ahmed [1997] HSA Benzoin
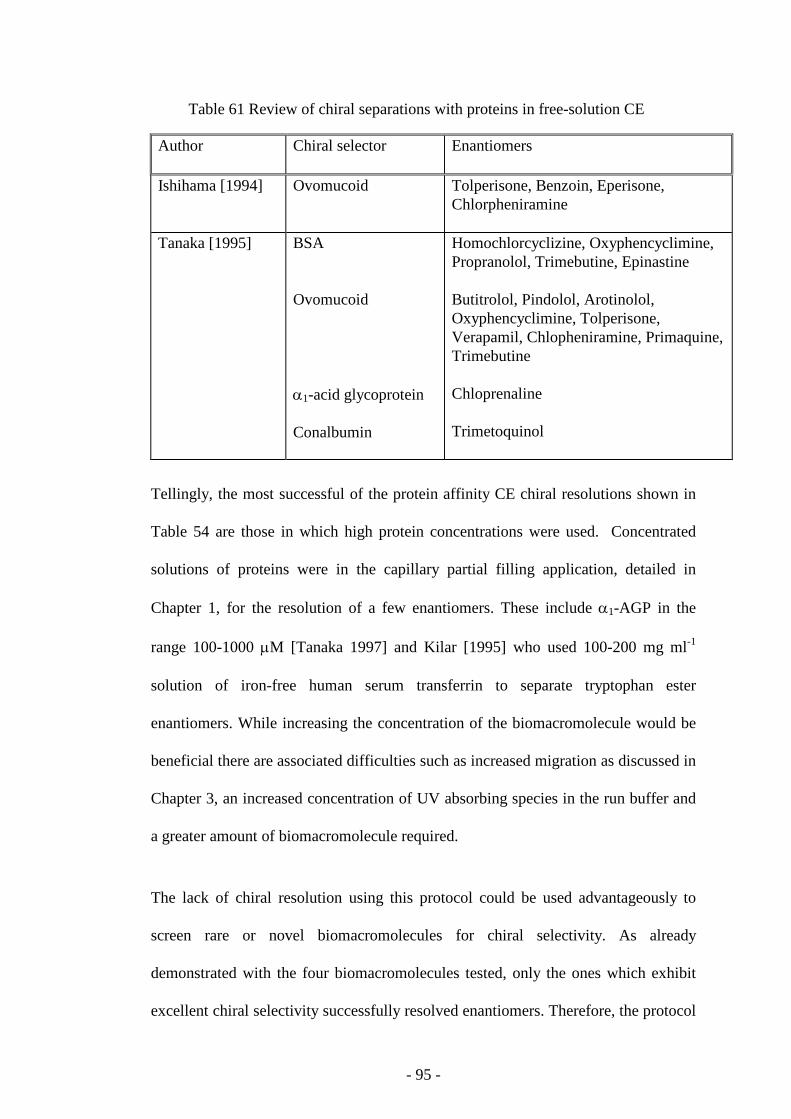
- 95 -
Table 61 Review of chiral separations with proteins in free-solution CE Author Chiral selector Enantiomers
Ishihama [1994] Ovomucoid Tolperisone, Benzoin, Eperisone,
Chlorpheniramine
Tanaka [1995] BSA Ovomucoid α1-acid glycoprotein Conalbumin
Homochlorcyclizine, Oxyphencyclimine, Propranolol, Trimebutine, Epinastine Butitrolol, Pindolol, Arotinolol, Oxyphencyclimine, Tolperisone, Verapamil, Chlopheniramine, Primaquine, Trimebutine Chloprenaline Trimetoquinol
Tellingly, the most successful of the protein affinity CE chiral resolutions shown in
Table 54 are those in which high protein concentrations were used. Concentrated
solutions of proteins were in the capillary partial filling application, detailed in
Chapter 1, for the resolution of a few enantiomers. These include α1-AGP in the
range 100-1000 µM [Tanaka 1997] and Kilar [1995] who used 100-200 mg ml-1
solution of iron-free human serum transferrin to separate tryptophan ester
enantiomers. While increasing the concentration of the biomacromolecule would be
beneficial there are associated difficulties such as increased migration as discussed in
Chapter 3, an increased concentration of UV absorbing species in the run buffer and
a greater amount of biomacromolecule required.
The lack of chiral resolution using this protocol could be used advantageously to
screen rare or novel biomacromolecules for chiral selectivity. As already
demonstrated with the four biomacromolecules tested, only the ones which exhibit
excellent chiral selectivity successfully resolved enantiomers. Therefore, the protocol
- 96 -
could be used initially to discriminate for highly promising chiral selectors before
pursuing in-depth investigations which may be potentially be unrewarding.
Similarly, the use of low protein concentrations as used in the protocol here could
also be advantageous with respect to the study of drug – protein binding by CE. In
studying strongly binding species (which would be being sought if looking at drug –
receptor protein binding), the use of a high concentration of protein with partial
filling would almost certainly lead to the situation where the highly bound drug did
not migrate past the detector. Also it has been found that when using partial filling
with a smaller proportion of the capillary filled in order to reduce the total mass of
selector in the capillary that the reproducibility was not so good as when using larger
filled zones with lower concentrations of selector (Williams, University of
Sunderland, B.Sc. Chemical & Pharmaceutical Science, final year project, 2001).
4.6.2 Features of the electropherograms There were a number of features on some electropherograms observed during these
studies. In cases where no peaks were observed at all could have been caused by the
biomacromolecule masking the UV absorbance of the analyte or that the analyte had
a long migration such that it did not pass the detector during the analytical run. Other
features will be discussed in detail in Chapter 6. These are spontaneous peak markers
and baselines shifts, e.g. Figs. 42, 49 and 50, and the electropherograms of ibuprofen
which exhibit a dip in the baseline prior to a partial resolution of the enantiomers,
Fig. 46.
- 97 -
Chapter 5 Addition of modifiers to the CE run buffer
5.1 Introduction
Using CE, protein affinity chiral separations may be obtained using small amounts of
protein. Another aspect of the use of CE for protein affinity separations is that the
method protocol can easily be modified to include the addition of other chemical
entities to the run buffer. This readily provides a vehicle for the study of a wide range
of variables on protein ligand interactions. Such studies could be used to probe the
very nature of the drug-protein interactions and importantly might in principle
provide a means of improving chiral selectivity.
The addition of certain modifiers to the run buffer may improve the overall chiral
selectivity of the system by slightly altering the tertiary structure of the protein so
that the difference between the three-point interactions of the enantiomers [Dalgliesh
1952] with the protein would be more pronounced. The modifiers used need not be
restricted to those that might occur in nature. For example, the modifier β-
cyclodextrin, could improve the solubility of hydrophobic analytes to give an
obvious practical benefit but also would give rise to a mixed chiral selector system. If
the chiral selectors are complementary with respect to their breadth of spectrum then
it is possible that the mixed system might give chiral separations for a wider range of
compounds and in rare cases it might even be possible to observe synergistic effects.
The addition of competing ligands to the system can be used to probe the different
binding sites of the protein [Hage 1995, Noctor 1993 & Wainer 1993]. Such
information can be used to ascertain, for example, the interaction of different drugs
on the protein and to observe any potential preferential displacement of one
enantiomer over the over. In this way the concentration of an unbound drug could be
predicted in the presence of a competing ligand.
- 98 -
To use CE in this way almost as a model of in vivo behaviour would require
extensive development and validation work to be carried out. The aim here was to
only investigate the extent to which selected modifiers affected migration, selectivity,
resolution and establish the levels of modifiers required to observe the effects.
5.2 Addition of metal ions to protein affinity CE
Metal2+
ions offer interesting possibilities when used to study protein affinity CE.
They are known to bind to proteins and can therefore change the tertiary structure of
the protein [Peters 1977]. This in turn can lead to a change in the chiral selectivity of
the protein and potentially give improved separations. However, the addition of
metal2+
ions to the normal buffer of 67 mM phosphate was not possible since this
caused the precipitation of the inorganic salt. Consequently the make-up of the run
buffer was changed to 67 mM borate which did not cause any inorganic salt
precipitation.
As already demonstrated, only small amounts of protein are consumed in protein
affinity CE. It was therefore possible to study HSA, which was available in more
limited quantities, rather than BSA. The test analytes, tryptophan and kynurenine
enantiomers, had both been separated using HSA (Chapter 4). Since the buffer had
been changed, injections of the test analytes were made without any metal ions
present for comparison.
The results for the addition of metal ions on the resolution of tryptophan enantiomers
are shown in Table 62 and the corresponding electropherograms in Figures 63 – 65.
Table 62 Selectivity of tryptophan enantiomers with the addition of metal ions.
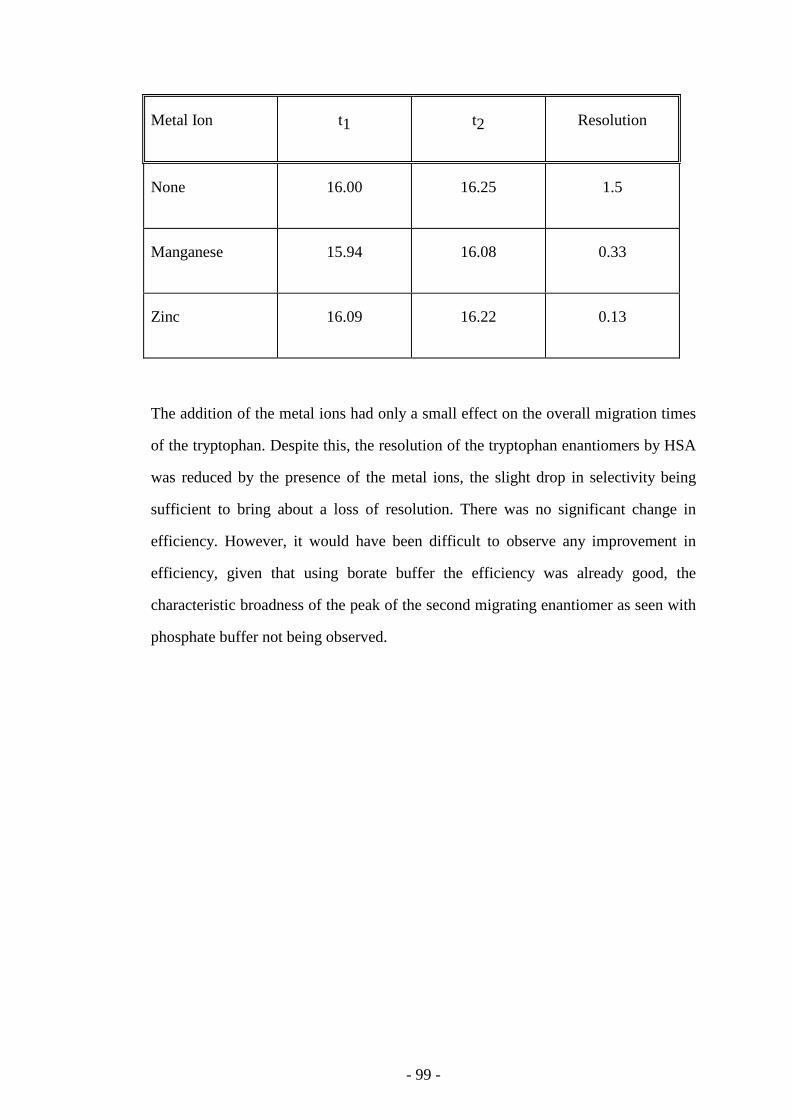
- 99 -
Metal Ion
t1 t2 Resolution
None
16.00 16.25 1.5
Manganese
15.94 16.08 0.33
Zinc
16.09 16.22 0.13
The addition of the metal ions had only a small effect on the overall migration times
of the tryptophan. Despite this, the resolution of the tryptophan enantiomers by HSA
was reduced by the presence of the metal ions, the slight drop in selectivity being
sufficient to bring about a loss of resolution. There was no significant change in
efficiency. However, it would have been difficult to observe any improvement in
efficiency, given that using borate buffer the efficiency was already good, the
characteristic broadness of the peak of the second migrating enantiomer as seen with
phosphate buffer not being observed.
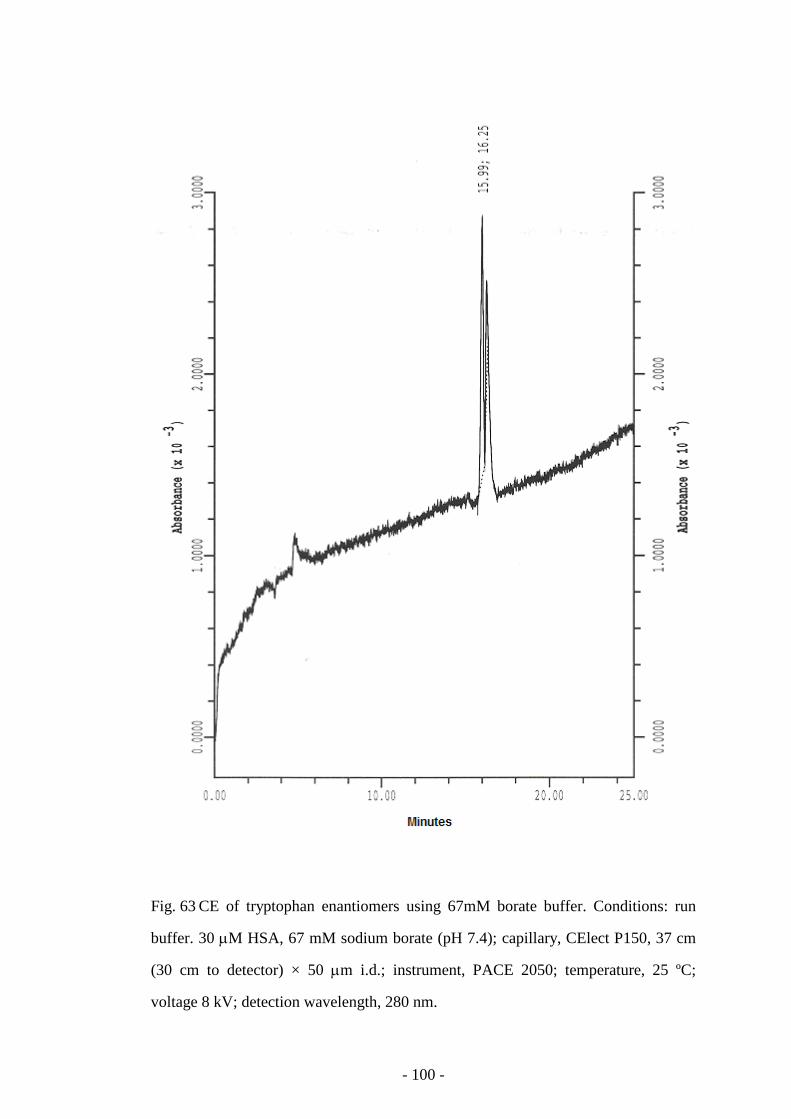
- 100 -
Fig. 63 CE of tryptophan enantiomers using 67mM borate buffer. Conditions: run
buffer. 30 µM HSA, 67 mM sodium borate (pH 7.4); capillary, CElect P150, 37 cm
(30 cm to detector) × 50 µm i.d.; instrument, PACE 2050; temperature, 25 ºC;
voltage 8 kV; detection wavelength, 280 nm.
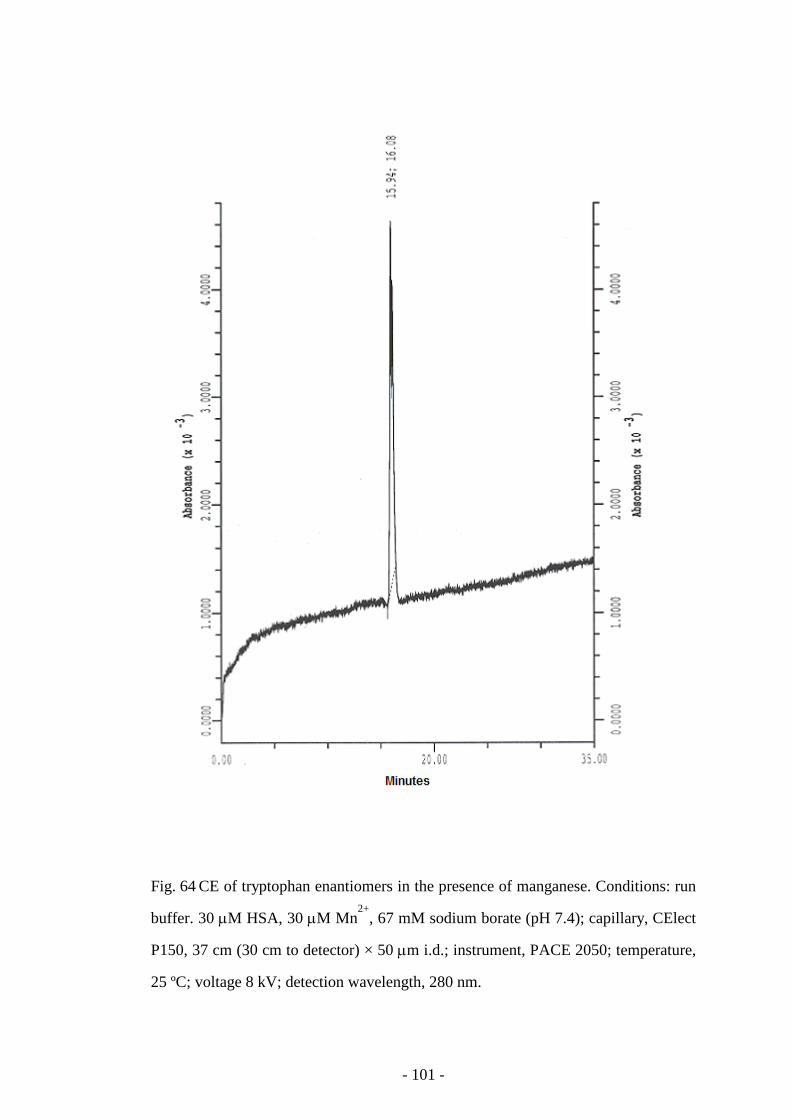
- 101 -
Fig. 64 CE of tryptophan enantiomers in the presence of manganese. Conditions: run
buffer. 30 µM HSA, 30 µM Mn2+
, 67 mM sodium borate (pH 7.4); capillary, CElect
P150, 37 cm (30 cm to detector) × 50 µm i.d.; instrument, PACE 2050; temperature,
25 ºC; voltage 8 kV; detection wavelength, 280 nm.
- 102 -
Fig. 65 CE of tryptophan enantiomers in the presence of zinc . Conditions: run
buffer. 30 µM HSA, 30 µM Zn2+
, 67 mM sodium borate (pH 7.4); capillary, CElect
P150, 37 cm (30 cm to detector) × 50 µm i.d.; instrument, PACE 2050; temperature,
25 ºC; voltage 8 kV; detection wavelength, 280 nm.
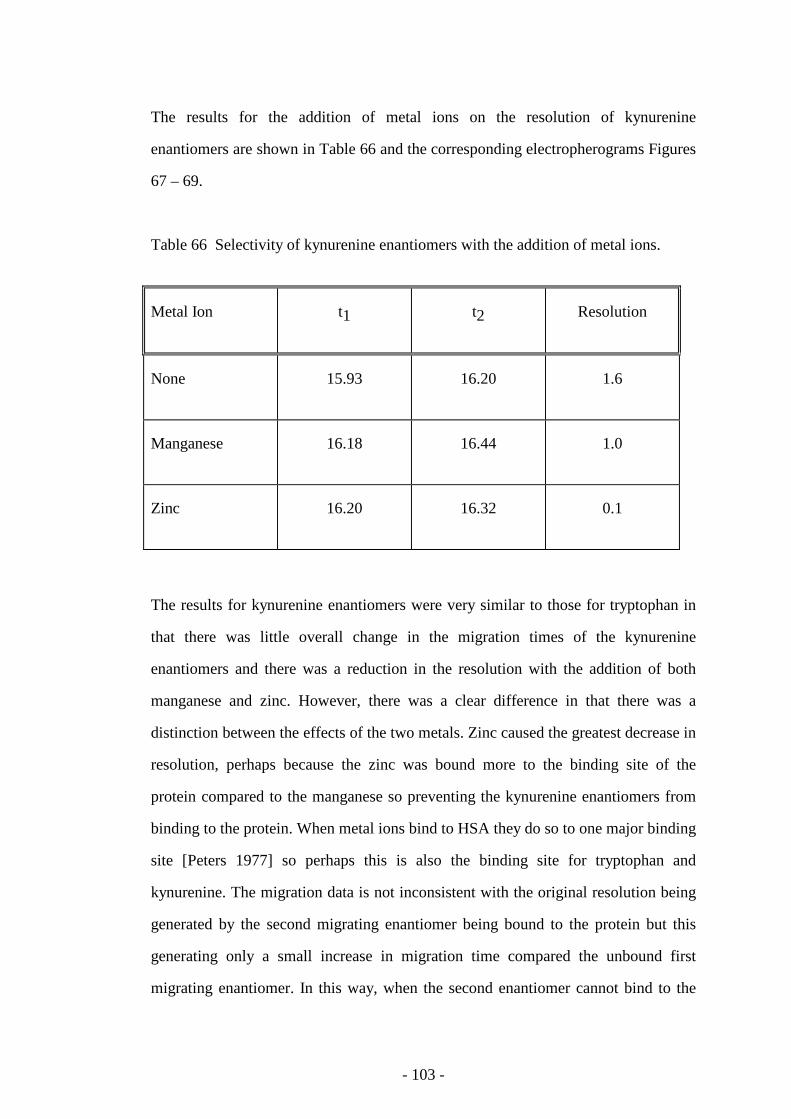
- 103 -
The results for the addition of metal ions on the resolution of kynurenine
enantiomers are shown in Table 66 and the corresponding electropherograms Figures
67 – 69.
Table 66 Selectivity of kynurenine enantiomers with the addition of metal ions.
Metal Ion
t1 t2 Resolution
None
15.93 16.20 1.6
Manganese
16.18 16.44 1.0
Zinc
16.20 16.32 0.1
The results for kynurenine enantiomers were very similar to those for tryptophan in
that there was little overall change in the migration times of the kynurenine
enantiomers and there was a reduction in the resolution with the addition of both
manganese and zinc. However, there was a clear difference in that there was a
distinction between the effects of the two metals. Zinc caused the greatest decrease in
resolution, perhaps because the zinc was bound more to the binding site of the
protein compared to the manganese so preventing the kynurenine enantiomers from
binding to the protein. When metal ions bind to HSA they do so to one major binding
site [Peters 1977] so perhaps this is also the binding site for tryptophan and
kynurenine. The migration data is not inconsistent with the original resolution being
generated by the second migrating enantiomer being bound to the protein but this
generating only a small increase in migration time compared the unbound first
migrating enantiomer. In this way, when the second enantiomer cannot bind to the
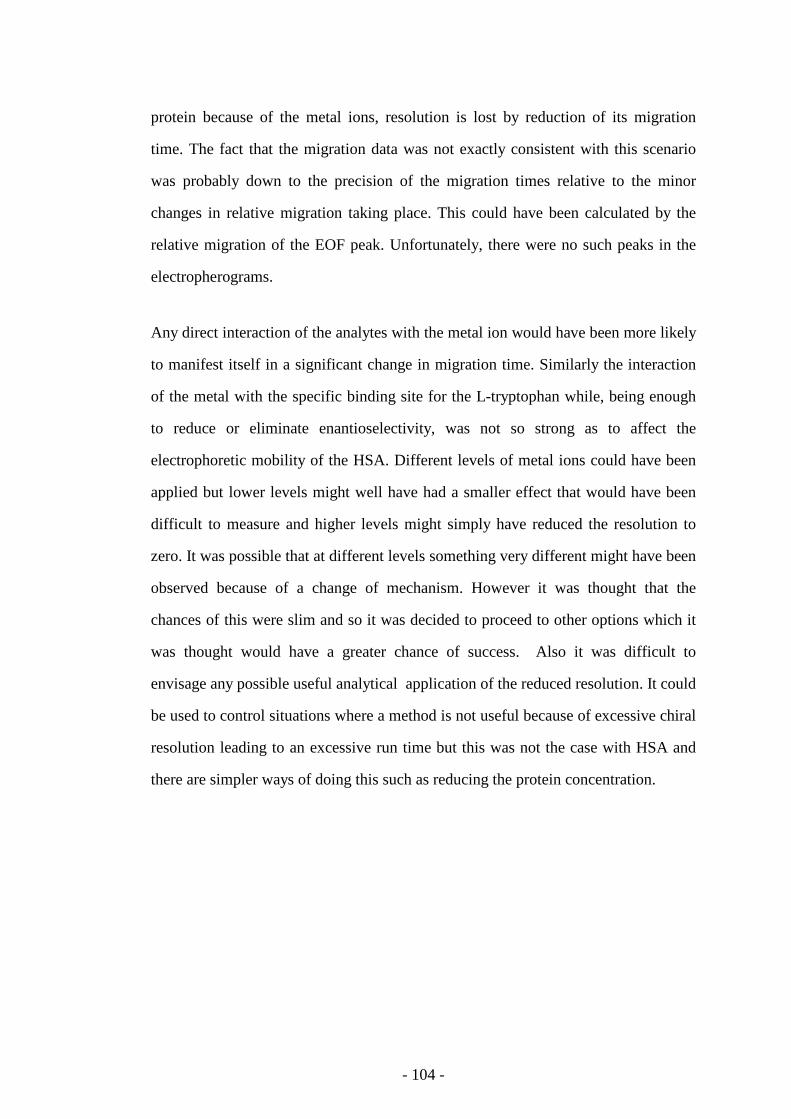
- 104 -
protein because of the metal ions, resolution is lost by reduction of its migration
time. The fact that the migration data was not exactly consistent with this scenario
was probably down to the precision of the migration times relative to the minor
changes in relative migration taking place. This could have been calculated by the
relative migration of the EOF peak. Unfortunately, there were no such peaks in the
electropherograms.
Any direct interaction of the analytes with the metal ion would have been more likely
to manifest itself in a significant change in migration time. Similarly the interaction
of the metal with the specific binding site for the L-tryptophan while, being enough
to reduce or eliminate enantioselectivity, was not so strong as to affect the
electrophoretic mobility of the HSA. Different levels of metal ions could have been
applied but lower levels might well have had a smaller effect that would have been
difficult to measure and higher levels might simply have reduced the resolution to
zero. It was possible that at different levels something very different might have been
observed because of a change of mechanism. However it was thought that the
chances of this were slim and so it was decided to proceed to other options which it
was thought would have a greater chance of success. Also it was difficult to
envisage any possible useful analytical application of the reduced resolution. It could
be used to control situations where a method is not useful because of excessive chiral
resolution leading to an excessive run time but this was not the case with HSA and
there are simpler ways of doing this such as reducing the protein concentration.
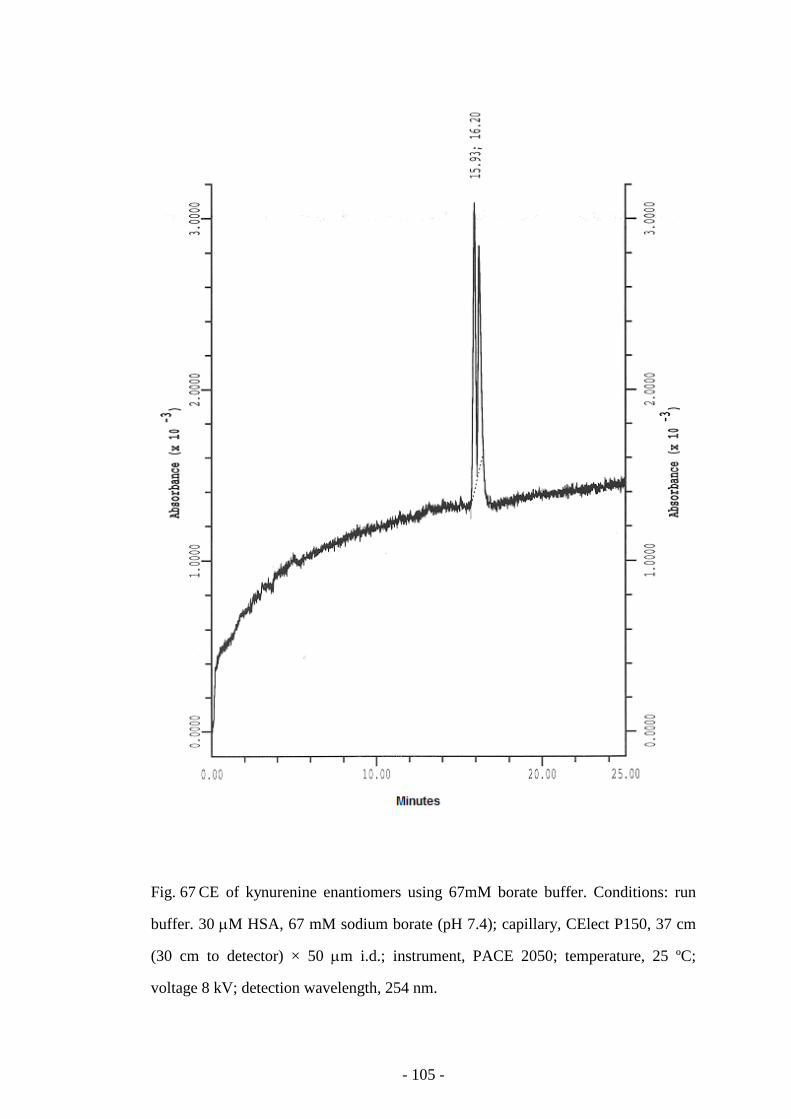
- 105 -
Fig. 67 CE of kynurenine enantiomers using 67mM borate buffer. Conditions: run
buffer. 30 µM HSA, 67 mM sodium borate (pH 7.4); capillary, CElect P150, 37 cm
(30 cm to detector) × 50 µm i.d.; instrument, PACE 2050; temperature, 25 ºC;
voltage 8 kV; detection wavelength, 254 nm.
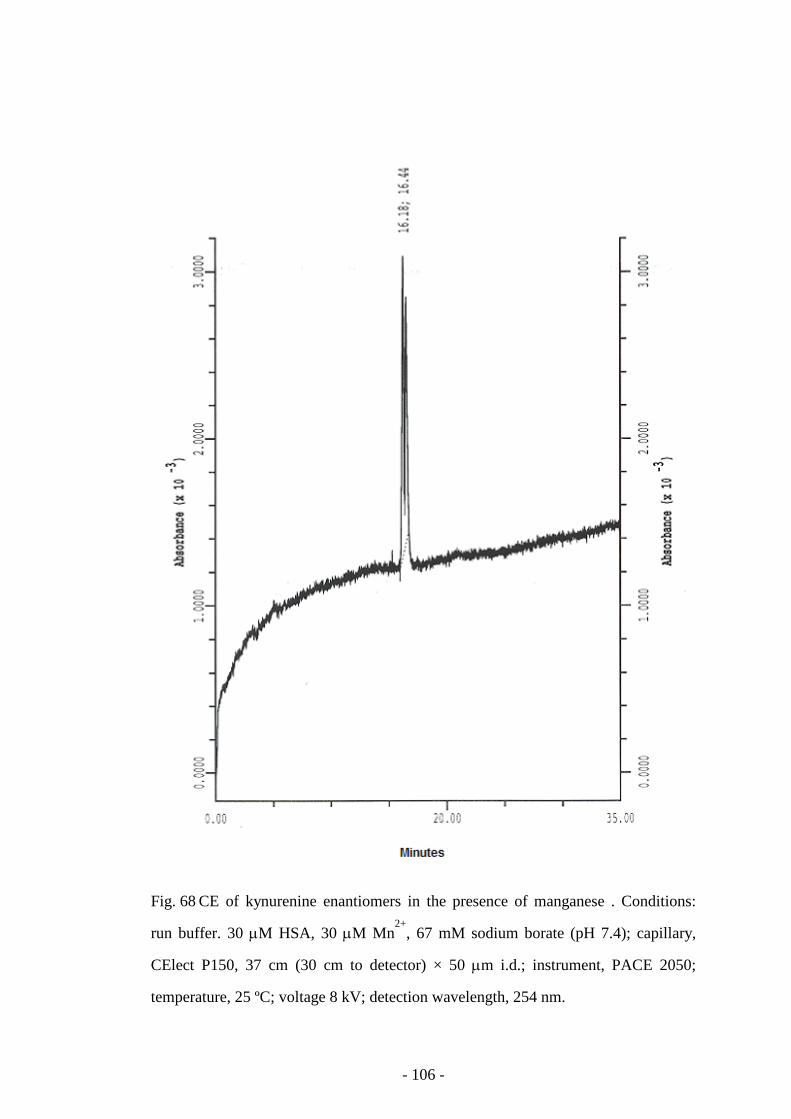
- 106 -
Fig. 68 CE of kynurenine enantiomers in the presence of manganese . Conditions:
run buffer. 30 µM HSA, 30 µM Mn2+
, 67 mM sodium borate (pH 7.4); capillary,
CElect P150, 37 cm (30 cm to detector) × 50 µm i.d.; instrument, PACE 2050;
temperature, 25 ºC; voltage 8 kV; detection wavelength, 254 nm.
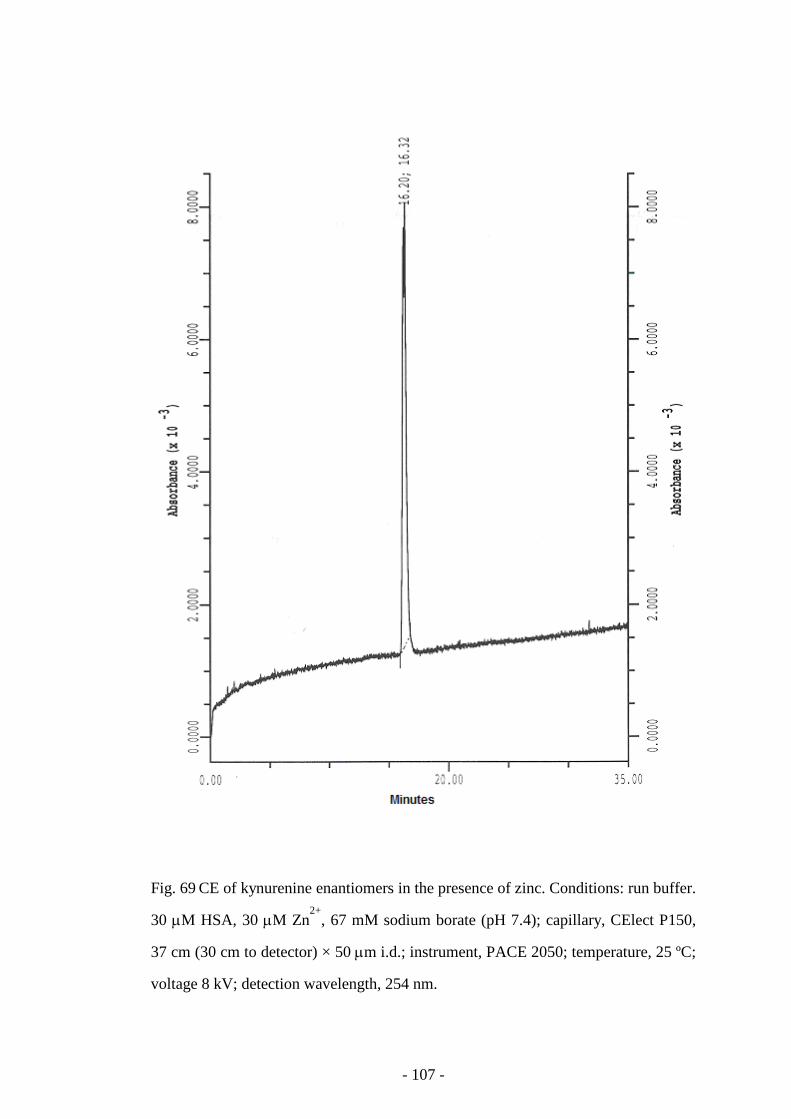
- 107 -
Fig. 69 CE of kynurenine enantiomers in the presence of zinc. Conditions: run buffer.
30 µM HSA, 30 µM Zn2+
, 67 mM sodium borate (pH 7.4); capillary, CElect P150,
37 cm (30 cm to detector) × 50 µm i.d.; instrument, PACE 2050; temperature, 25 ºC;
voltage 8 kV; detection wavelength, 254 nm.
- 108 -
5.3 Addition of β-cyclodextrin to a protein affinity CE buffer
5.3.1 Analysis of tryptophan enantiomers
The protein affinity CE protocol for the resolution of tryptophan enantiomers had
proved to be successful and was the obvious choice to use for studying the addition
of β-cyclodextrin to the run buffer in an attempt to assess the possibilities for
complementary or even synergistic chiral resolution. Interestingly there has been no
mention of using β-cyclodextrins to separate tryptophan or tryptophan derivatives in
the literature. The results are shown graphically in Fig. 70 for the effect on the
migration times of the enantiomers and Fig. 71 for the effect on the resolution. The
corresponding electropherograms are shown in Figs. 72-77.
The addition of β-cyclodextrin to the run buffer gave rise to significant variation of
the resolution and the overall migration times of the tryptophan enantiomers.
Certainly the changes were significant enough to suggest that the cyclodextrin was
having an influence, albeit not necessarily directly. However, there was no specific
trend in either the migration times or the resolution. In all cases the tryptophan
enantiomers were baseline resolved. Therefore it was concluded that the β-
cyclodextrin did not change the binding of the tryptophan to the BSA as was
indicated by the peak shape of the second migrating enantiomer which was
consistent throughout the range of β-cyclodextrin concentrations even though there
was variability in resolution and migration times. Given this and the almost erratic
nature of the changes in resolution, the results were considered to be not sufficiently
encouraging to proceed to a full-scale optimisation exercise. With the benefit of
hindsight gained from the increasing use of sulphated cyclodextrins in CE [Iwata
2002, Aumatell 1994 & Christians 2000], it might have been better to have used a γ-
sulphated (or amino) cyclodextrin, the γ to obtain a better interection with the
tryptophan and the charged cyclodextrin to obtain a better separation window.
- 109 -
One observation from Figs. 73, 74 and 76 was that there was a stepped baseline.
However, the stepped baseline always occurred after the two enantiomers had eluted
and did not interfere with the experiment. Another feature of the stepped baseline
was the apparently random nature of when it occured. This can be seen in the
electropherograms in Figures 72, 75 and 77, which were run using similar
conditions, but where no such stepped baseline was observed. The drop in baseline
could have been caused by BSA depletion but importantly the level of BSA in the
capillary, at least at the point of the detector was constant at the time of the elution of
the enantiomers.
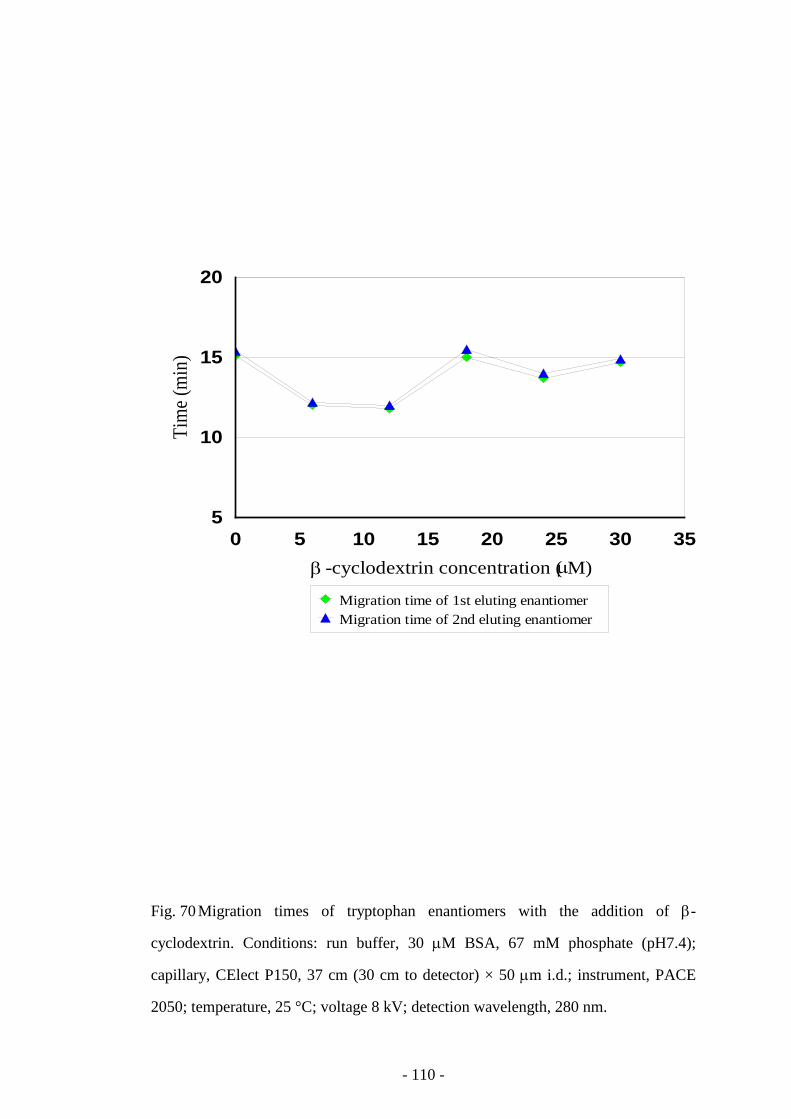
- 110 -
0 5 10 15 20 25 30 35-cyclodextrin concentration ( M)
5
10
15
20
Tim
e (m
in)
Migration time of 1st eluting enantiomerMigration time of 2nd eluting enantiomer
β µ
Fig. 70 Migration times of tryptophan enantiomers with the addition of β-
cyclodextrin. Conditions: run buffer, 30 µM BSA, 67 mM phosphate (pH7.4);
capillary, CElect P150, 37 cm (30 cm to detector) × 50 µm i.d.; instrument, PACE
2050; temperature, 25 °C; voltage 8 kV; detection wavelength, 280 nm.
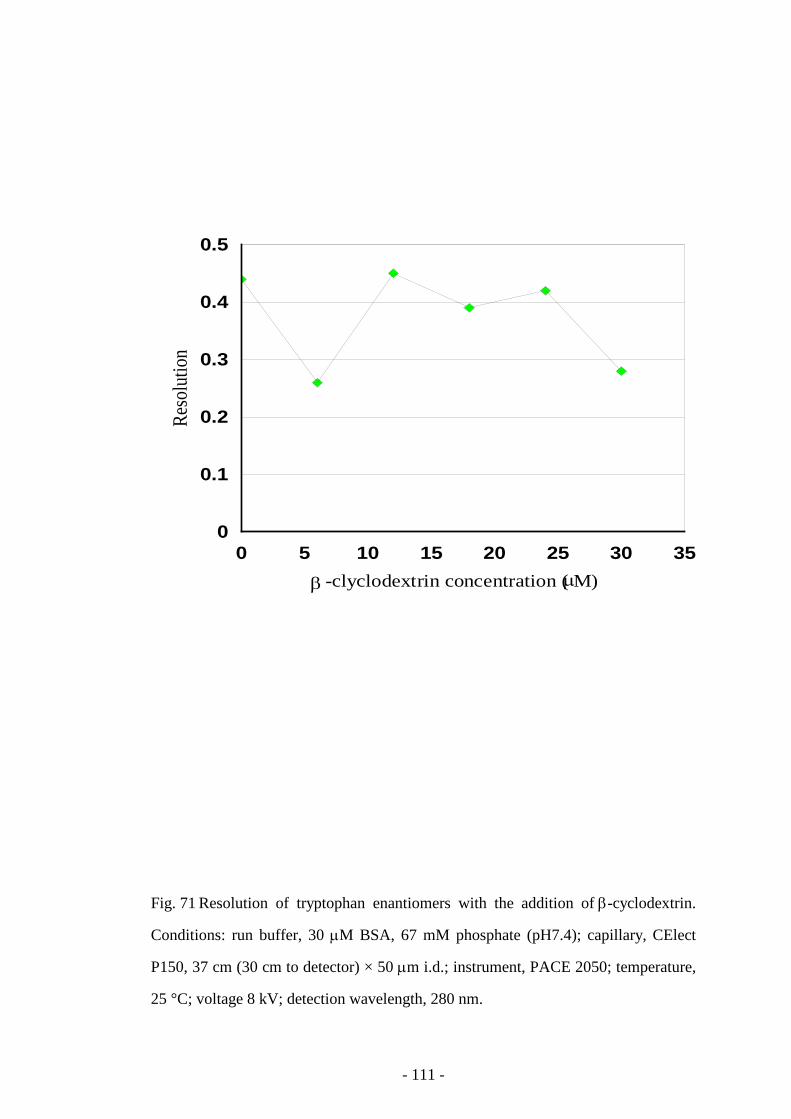
- 111 -
β µ
0 5 10 15 20 25 30 35-clyclodextrin concentration ( M)
0
0.1
0.2
0.3
0.4
0.5
Reso
lutio
n
Fig. 71 Resolution of tryptophan enantiomers with the addition of β-cyclodextrin.
Conditions: run buffer, 30 µM BSA, 67 mM phosphate (pH7.4); capillary, CElect
P150, 37 cm (30 cm to detector) × 50 µm i.d.; instrument, PACE 2050; temperature,
25 °C; voltage 8 kV; detection wavelength, 280 nm.
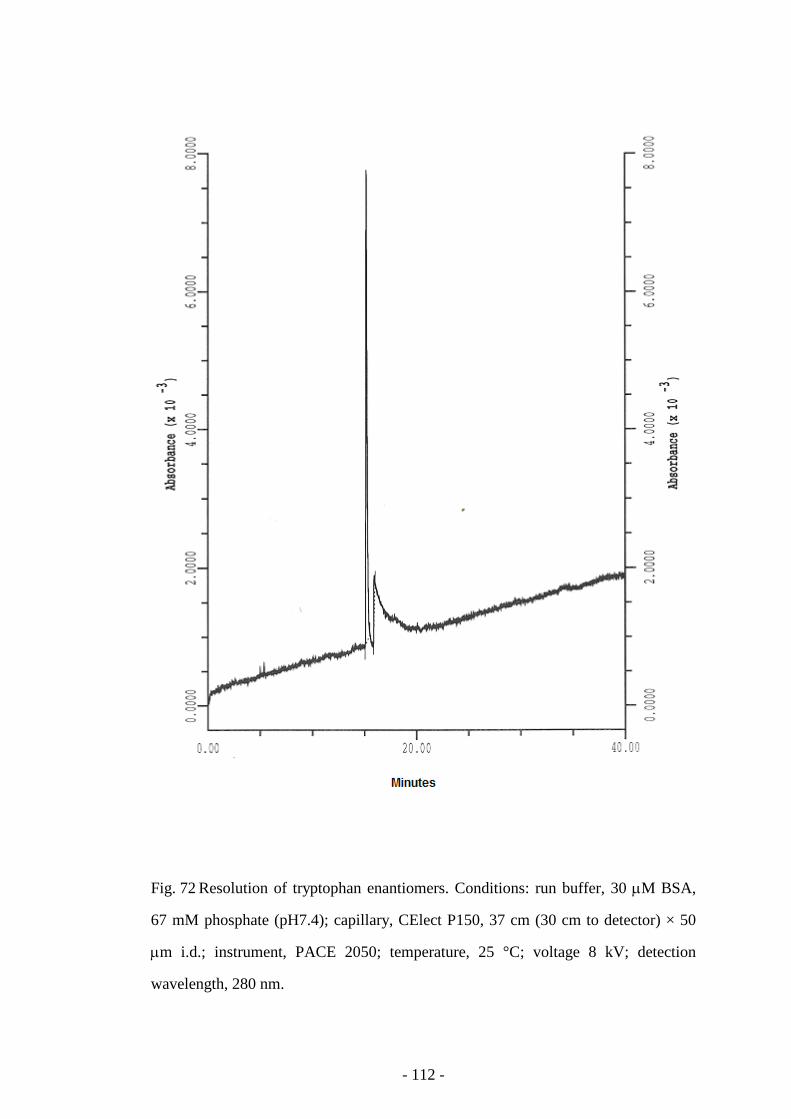
- 112 -
Fig. 72 Resolution of tryptophan enantiomers. Conditions: run buffer, 30 µM BSA,
67 mM phosphate (pH7.4); capillary, CElect P150, 37 cm (30 cm to detector) × 50
µm i.d.; instrument, PACE 2050; temperature, 25 °C; voltage 8 kV; detection
wavelength, 280 nm.
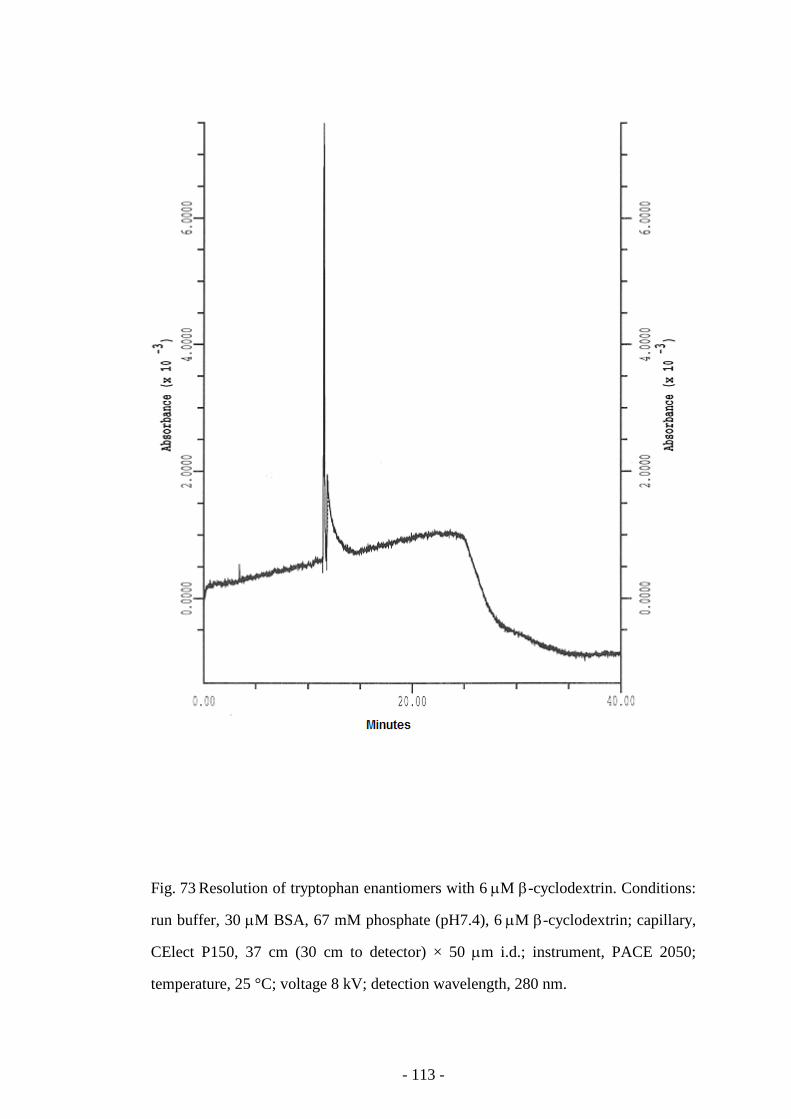
- 113 -
Fig. 73 Resolution of tryptophan enantiomers with 6 µM β-cyclodextrin. Conditions:
run buffer, 30 µM BSA, 67 mM phosphate (pH7.4), 6 µM β-cyclodextrin; capillary,
CElect P150, 37 cm (30 cm to detector) × 50 µm i.d.; instrument, PACE 2050;
temperature, 25 °C; voltage 8 kV; detection wavelength, 280 nm.
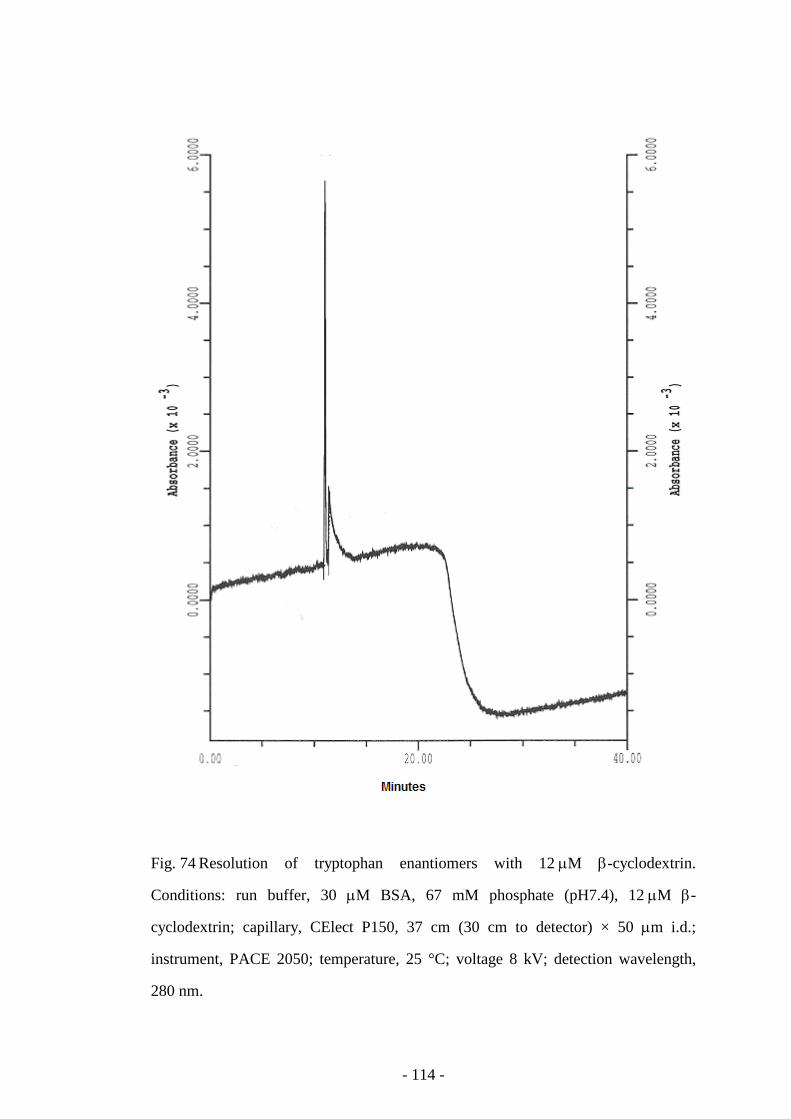
- 114 -
Fig. 74 Resolution of tryptophan enantiomers with 12 µM β-cyclodextrin.
Conditions: run buffer, 30 µM BSA, 67 mM phosphate (pH7.4), 12 µM β-
cyclodextrin; capillary, CElect P150, 37 cm (30 cm to detector) × 50 µm i.d.;
instrument, PACE 2050; temperature, 25 °C; voltage 8 kV; detection wavelength,
280 nm.
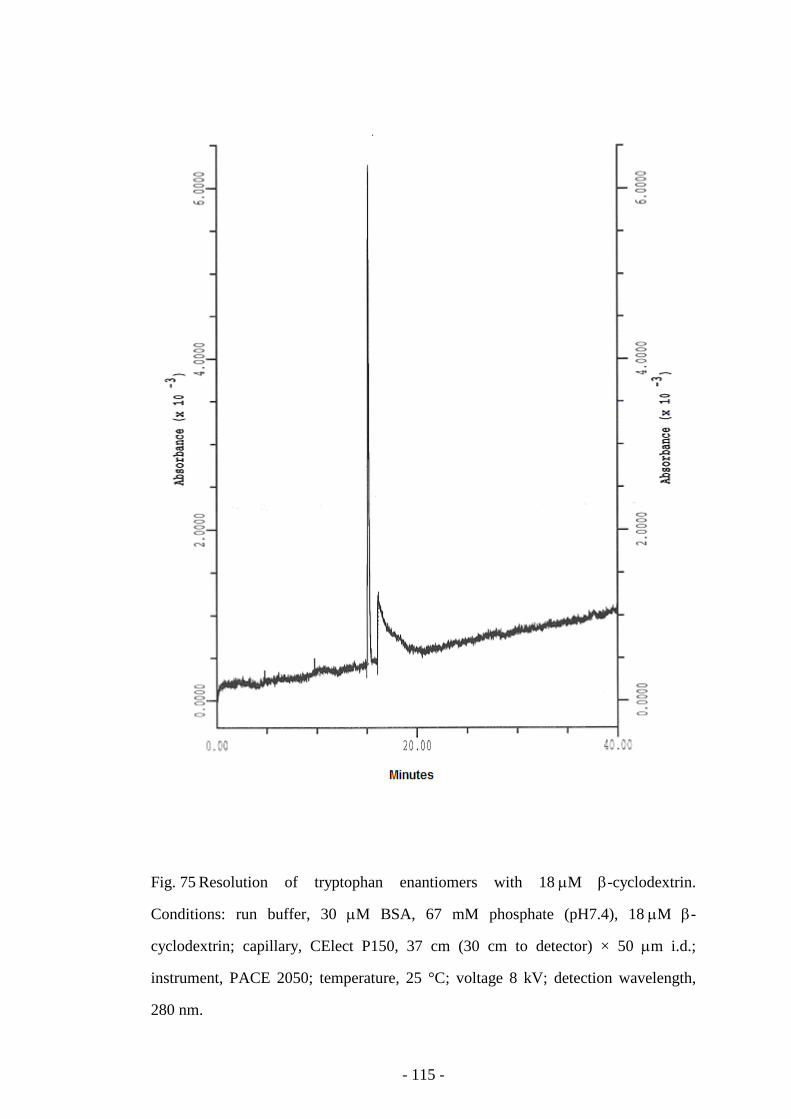
- 115 -
Fig. 75 Resolution of tryptophan enantiomers with 18 µM β-cyclodextrin.
Conditions: run buffer, 30 µM BSA, 67 mM phosphate (pH7.4), 18 µM β-
cyclodextrin; capillary, CElect P150, 37 cm (30 cm to detector) × 50 µm i.d.;
instrument, PACE 2050; temperature, 25 °C; voltage 8 kV; detection wavelength,
280 nm.
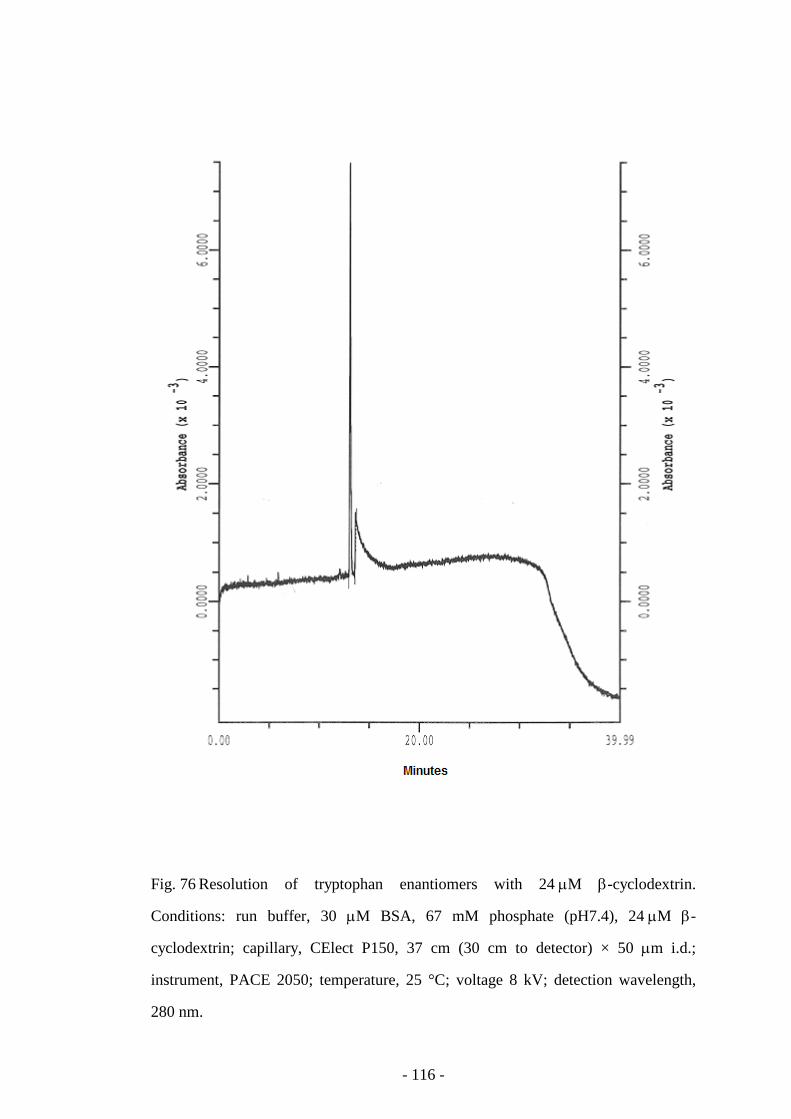
- 116 -
Fig. 76 Resolution of tryptophan enantiomers with 24 µM β-cyclodextrin.
Conditions: run buffer, 30 µM BSA, 67 mM phosphate (pH7.4), 24 µM β-
cyclodextrin; capillary, CElect P150, 37 cm (30 cm to detector) × 50 µm i.d.;
instrument, PACE 2050; temperature, 25 °C; voltage 8 kV; detection wavelength,
280 nm.
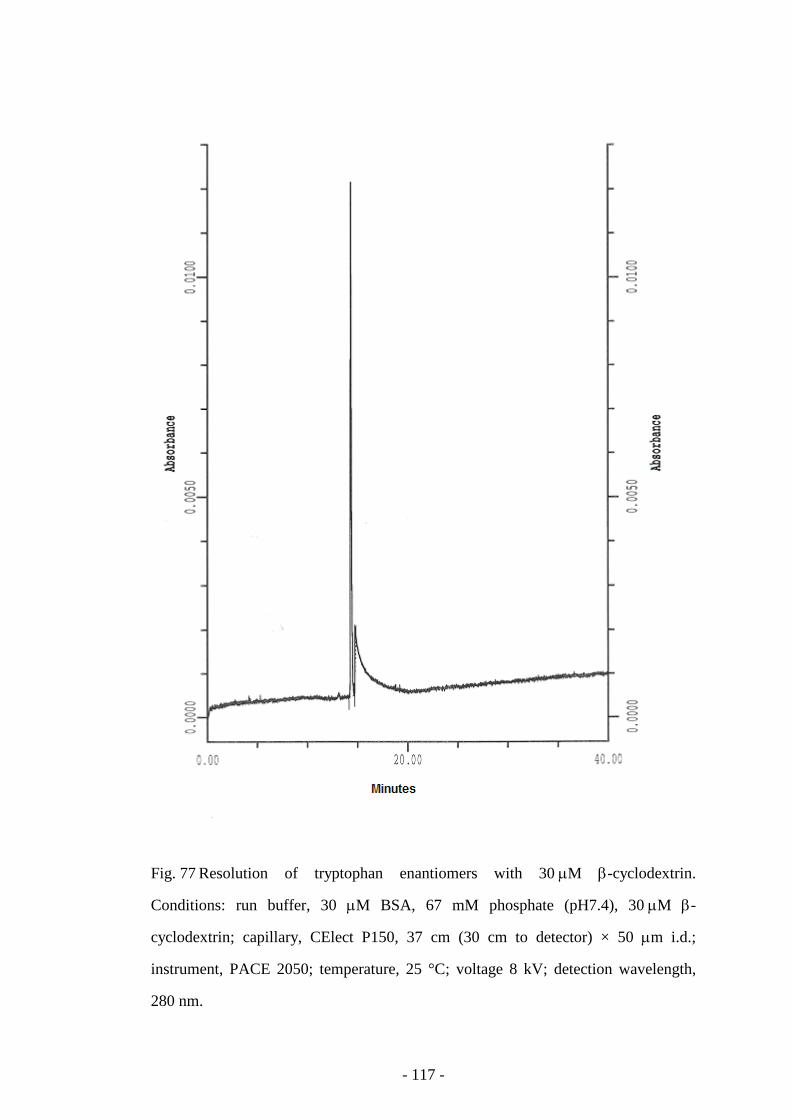
- 117 -
Fig. 77 Resolution of tryptophan enantiomers with 30 µM β-cyclodextrin.
Conditions: run buffer, 30 µM BSA, 67 mM phosphate (pH7.4), 30 µM β-
cyclodextrin; capillary, CElect P150, 37 cm (30 cm to detector) × 50 µm i.d.;
instrument, PACE 2050; temperature, 25 °C; voltage 8 kV; detection wavelength,
280 nm.
- 118 -
5.3.2 Analysis of ibuprofen enantiomers
The same protocol was used to study ibuprofen enantiomers. The results are shown
graphically in Fig. 78 for the effect on the migration times of the enantiomers and
Fig. 79 for the effect on the resolution. The corresponding electropherograms are
shown in Figs. 80-83.
The addition of β-cyclodextrin to the run buffer for the study of ibuprofen
enantiomers did have a dramatic effect on both the migration times and resolution of
the enantiomers. As the concentration of the β-cyclodextrin increased to 30 µM the
migration time was decreased by 50 % and the resolution decreased until no
separations were observed at 30 µM β-cyclodextrin.
Electropherograms of ibuprofen exhibited a void immediately before the main peaks.
It was thought that the electrophoretic mobility of the ibuprofen-BSA complex was
less than BSA and the rate of association and dissociation of the ibuprofen and BSA
was high compared to the length of the experiment, therefore a void of BSA would
develop in the run buffer; a fuller discussion is presented in Chapter 6. As illustrated
from the electropherograms in Figs. 80 to 83 the void was still present. However, as
illustrated by Fig. 84 the area of the void decreased with increasing concentration of
β-cyclodextrin.
Assuming that β-cyclodextrin does not alter the electrophoretic mobilities of either
the BSA-ibuprofen complex or BSA then the area of the void can only be decreased
by the changing of the rate of association and dissociation between ibuprofen and
BSA. This would be the case where the ibuprofen would interact preferentially with
β-cyclodextrin compared to BSA and this was observed as the β-cyclodextrin
concentration increased.
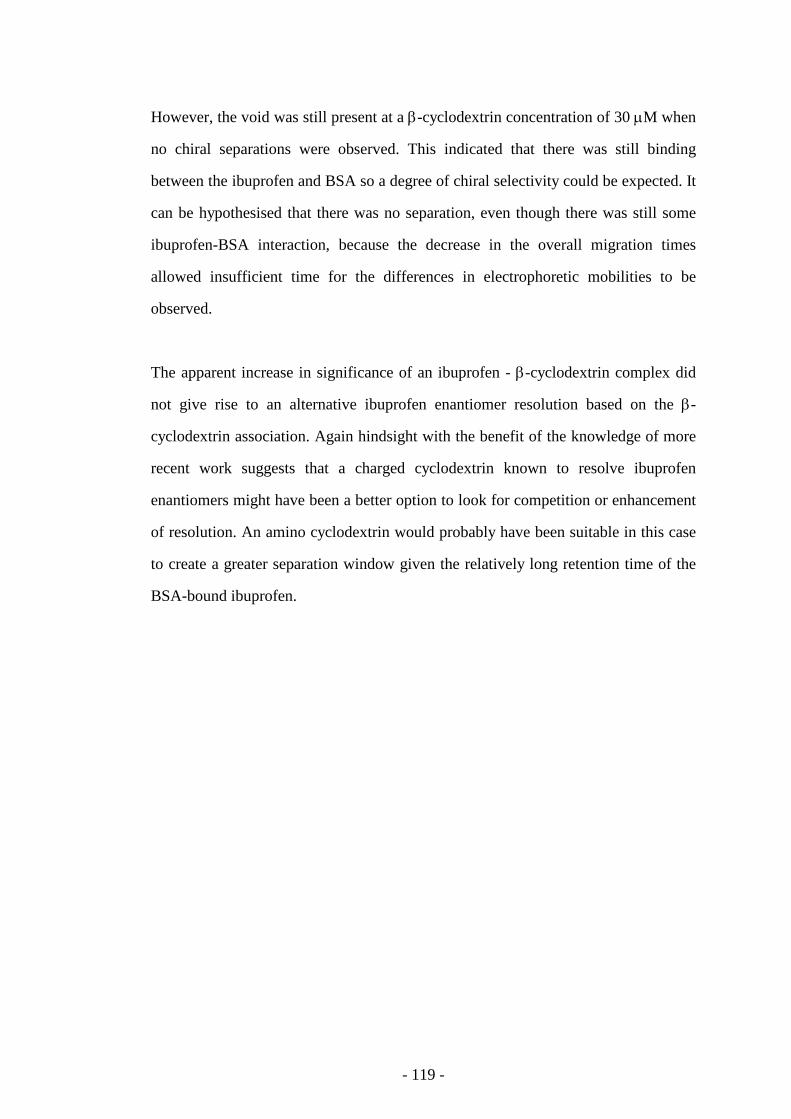
- 119 -
However, the void was still present at a β-cyclodextrin concentration of 30 µM when
no chiral separations were observed. This indicated that there was still binding
between the ibuprofen and BSA so a degree of chiral selectivity could be expected. It
can be hypothesised that there was no separation, even though there was still some
ibuprofen-BSA interaction, because the decrease in the overall migration times
allowed insufficient time for the differences in electrophoretic mobilities to be
observed.
The apparent increase in significance of an ibuprofen - β-cyclodextrin complex did
not give rise to an alternative ibuprofen enantiomer resolution based on the β-
cyclodextrin association. Again hindsight with the benefit of the knowledge of more
recent work suggests that a charged cyclodextrin known to resolve ibuprofen
enantiomers might have been a better option to look for competition or enhancement
of resolution. An amino cyclodextrin would probably have been suitable in this case
to create a greater separation window given the relatively long retention time of the
BSA-bound ibuprofen.
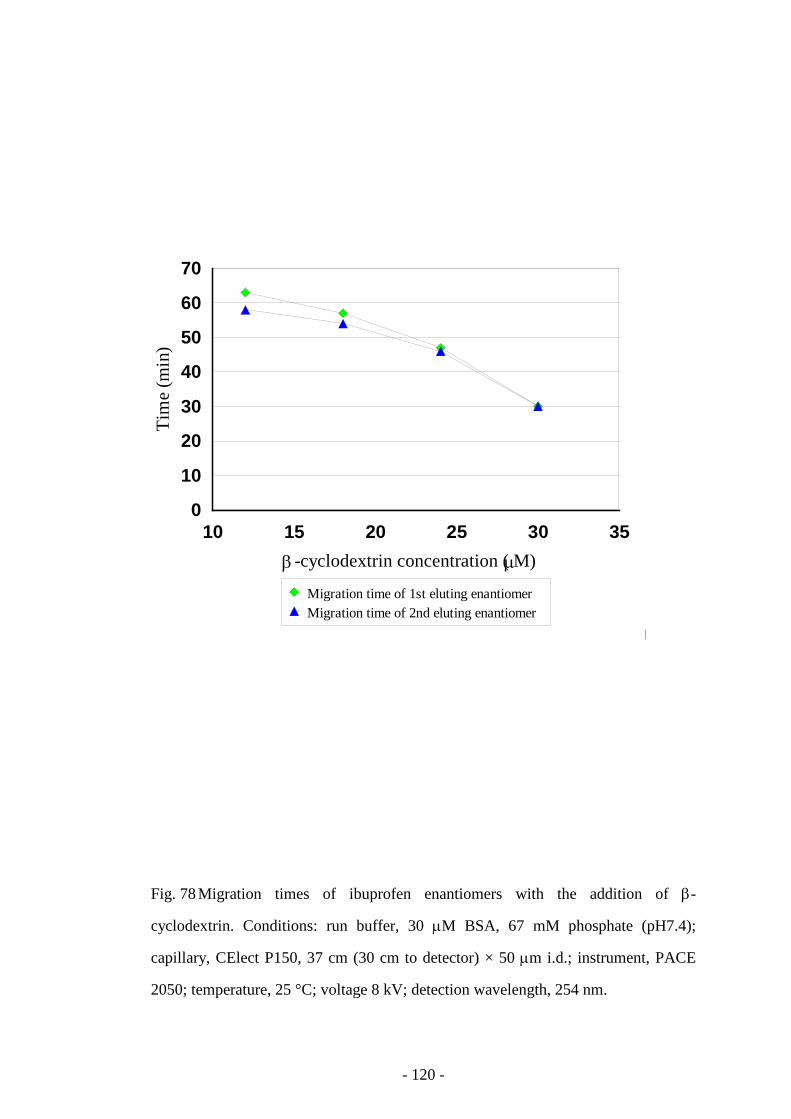
- 120 -
Fig. 78 Migration times of ibuprofen enantiomers with the addition of β-
cyclodextrin. Conditions: run buffer, 30 µM BSA, 67 mM phosphate (pH7.4);
capillary, CElect P150, 37 cm (30 cm to detector) × 50 µm i.d.; instrument, PACE
2050; temperature, 25 °C; voltage 8 kV; detection wavelength, 254 nm.
β µ
10 15 20 25 30 35-cyclodextrin concentration ( M)
0
10
20
30
40
50
60
70
Tim
e (m
in)
Migration time of 1st eluting enantiomerMigration time of 2nd eluting enantiomer
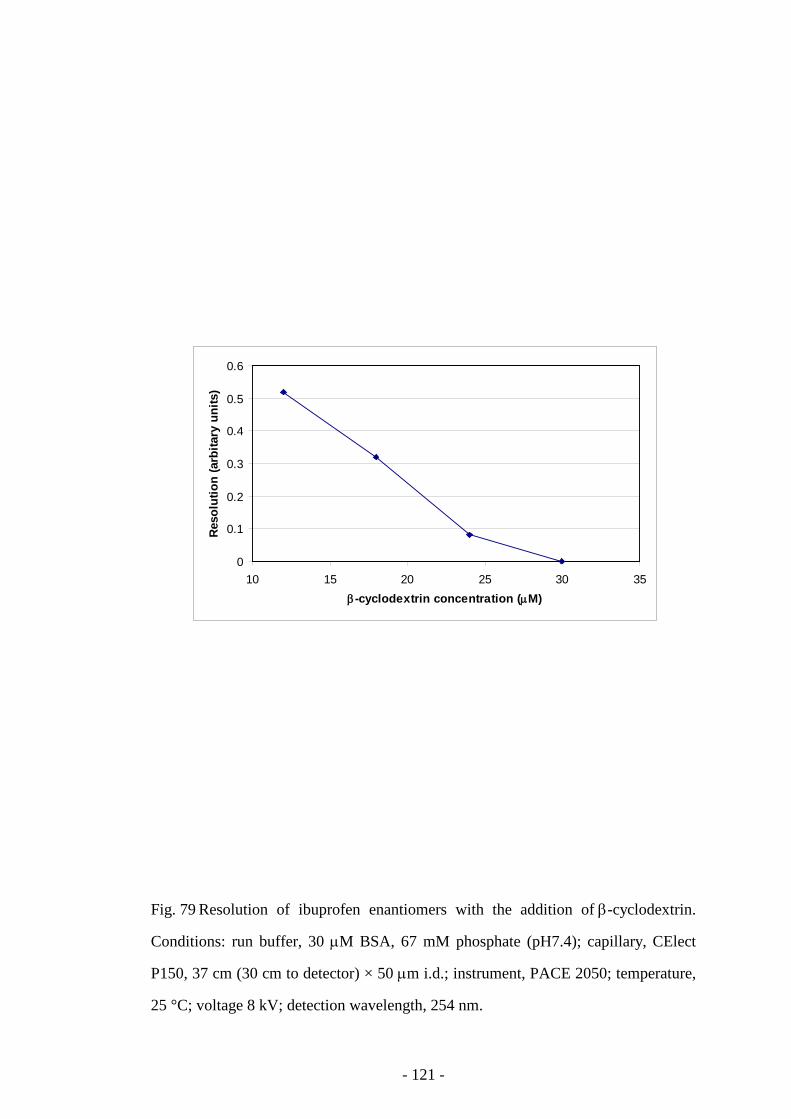
- 121 -
Fig. 79 Resolution of ibuprofen enantiomers with the addition of β-cyclodextrin.
Conditions: run buffer, 30 µM BSA, 67 mM phosphate (pH7.4); capillary, CElect
P150, 37 cm (30 cm to detector) × 50 µm i.d.; instrument, PACE 2050; temperature,
25 °C; voltage 8 kV; detection wavelength, 254 nm.
0
0.1
0.2
0.3
0.4
0.5
0.6
10 15 20 25 30 35β-cyclodextrin concentration (µM)
Reso
lutio
n (a
rbita
ry u
nits
)
- 122 -
Fig. 80 CE of ibuprofen with 12 µM β-cyclodextrin. Conditions: run buffer, 30 µM
BSA, 67 mM phosphate (pH7.4), 12 µM β-cyclodextrin; capillary, CElect P150, 37
cm (30 cm to detector) × 50 µm i.d.; instrument, PACE 2050; temperature, 25 °C;
voltage 8 kV; detection wavelength, 254 nm.
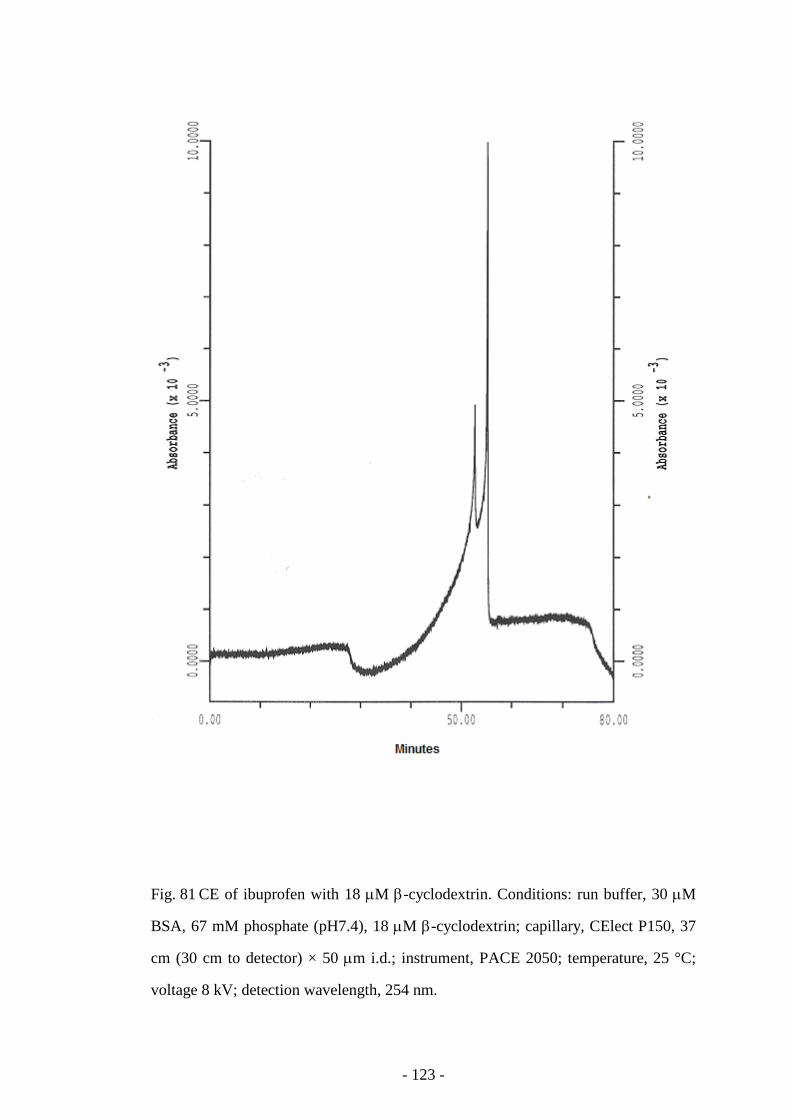
- 123 -
Fig. 81 CE of ibuprofen with 18 µM β-cyclodextrin. Conditions: run buffer, 30 µM
BSA, 67 mM phosphate (pH7.4), 18 µM β-cyclodextrin; capillary, CElect P150, 37
cm (30 cm to detector) × 50 µm i.d.; instrument, PACE 2050; temperature, 25 °C;
voltage 8 kV; detection wavelength, 254 nm.
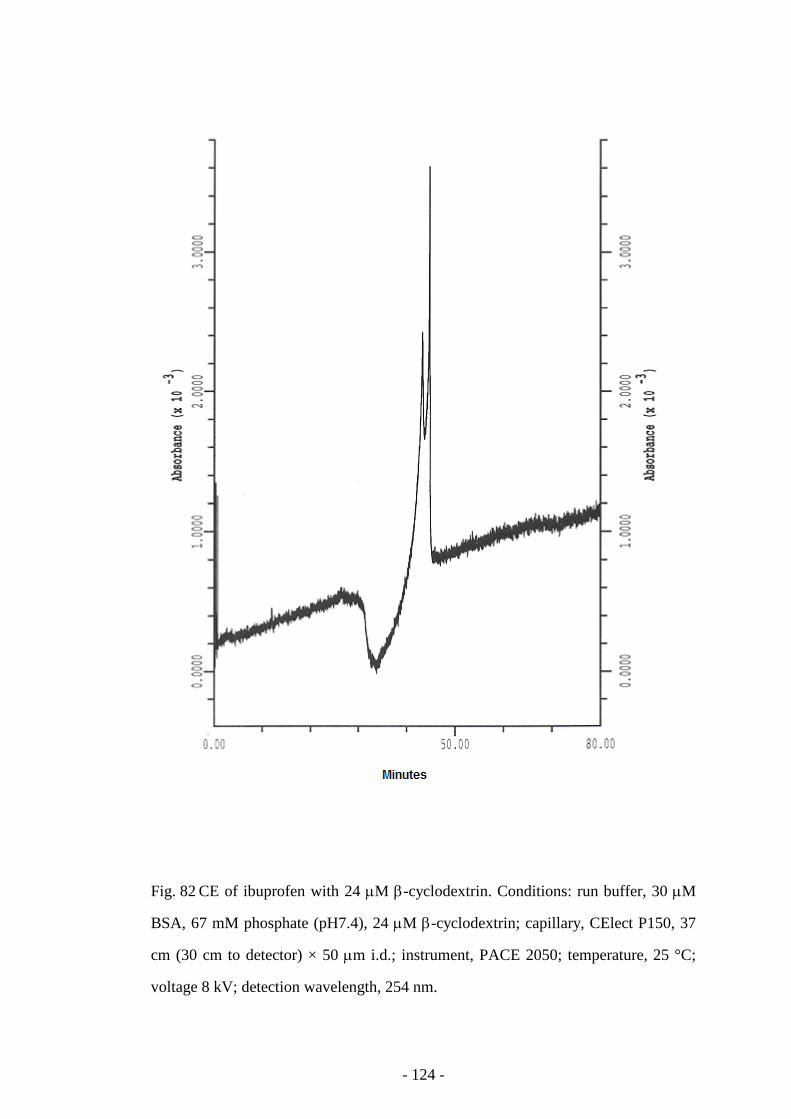
- 124 -
Fig. 82 CE of ibuprofen with 24 µM β-cyclodextrin. Conditions: run buffer, 30 µM
BSA, 67 mM phosphate (pH7.4), 24 µM β-cyclodextrin; capillary, CElect P150, 37
cm (30 cm to detector) × 50 µm i.d.; instrument, PACE 2050; temperature, 25 °C;
voltage 8 kV; detection wavelength, 254 nm.
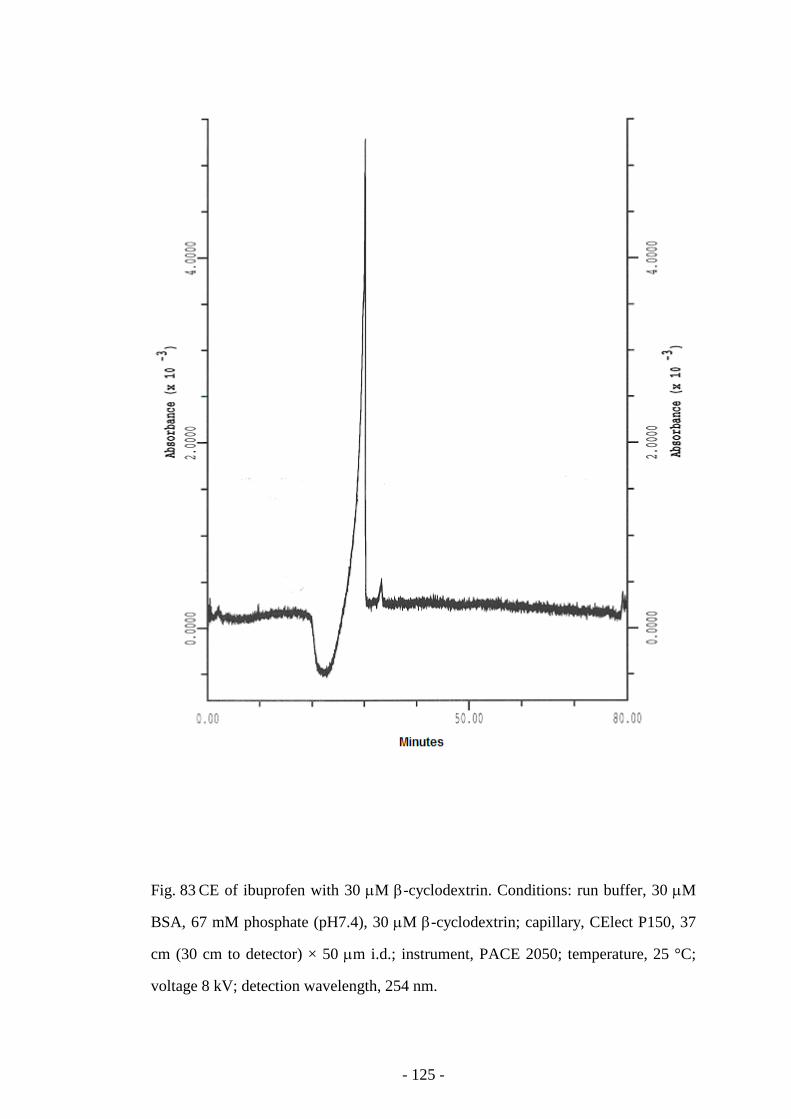
- 125 -
Fig. 83 CE of ibuprofen with 30 µM β-cyclodextrin. Conditions: run buffer, 30 µM
BSA, 67 mM phosphate (pH7.4), 30 µM β-cyclodextrin; capillary, CElect P150, 37
cm (30 cm to detector) × 50 µm i.d.; instrument, PACE 2050; temperature, 25 °C;
voltage 8 kV; detection wavelength, 254 nm.
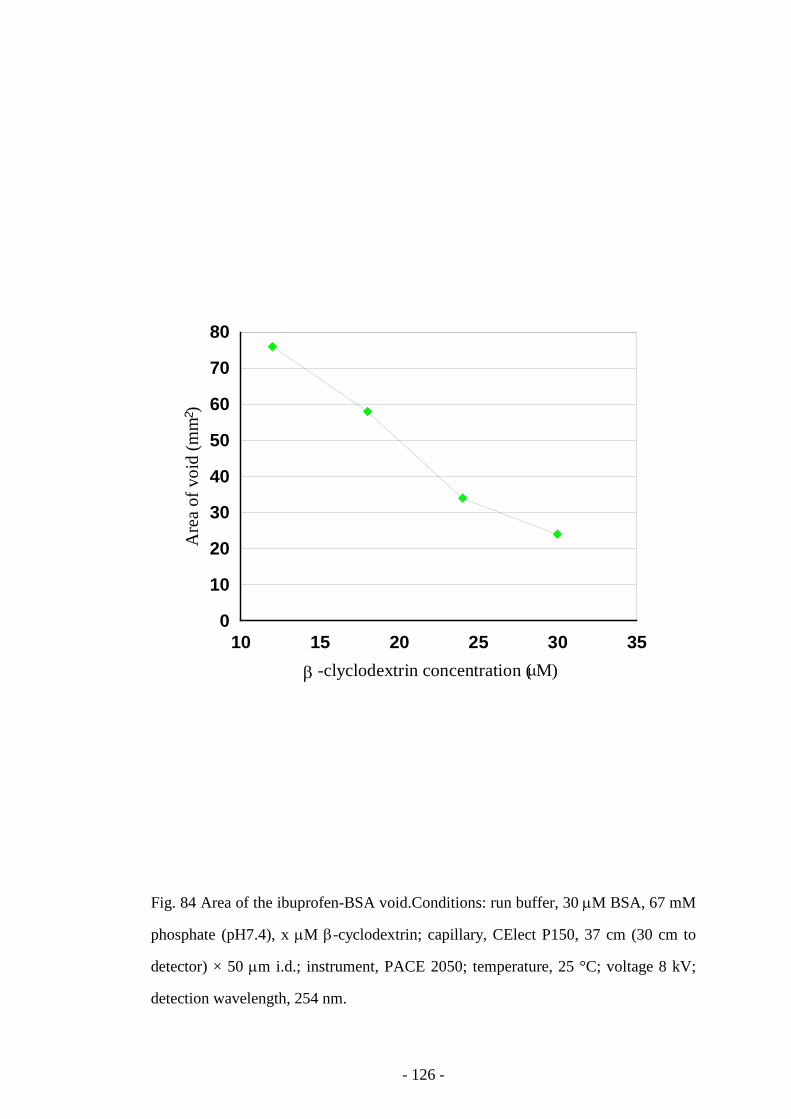
- 126 -
Fig. 84 Area of the ibuprofen-BSA void.Conditions: run buffer, 30 µM BSA, 67 mM
phosphate (pH7.4), x µM β-cyclodextrin; capillary, CElect P150, 37 cm (30 cm to
detector) × 50 µm i.d.; instrument, PACE 2050; temperature, 25 °C; voltage 8 kV;
detection wavelength, 254 nm.
10 15 20 25 30 35-clyclodextrin concentration ( M)
0
10
20
30
40
50
60
70
80
Are
a of
voi
d (m
m )
β µ
2
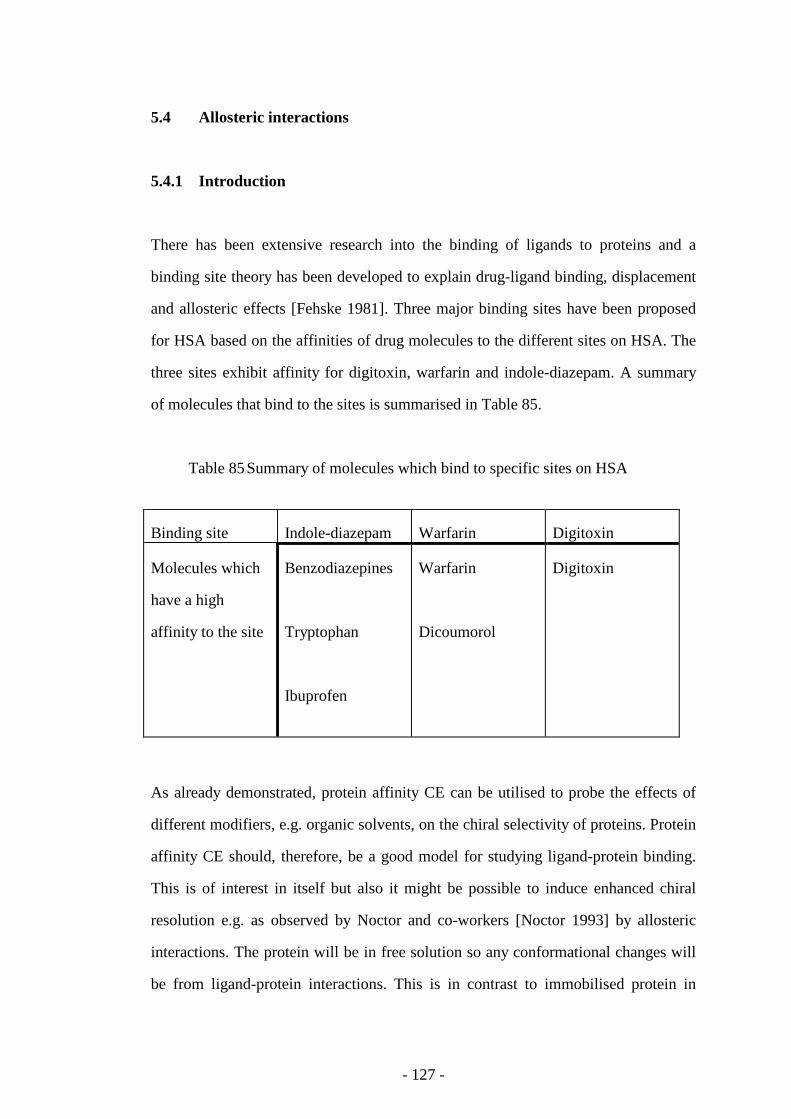
- 127 -
5.4 Allosteric interactions
5.4.1 Introduction
There has been extensive research into the binding of ligands to proteins and a
binding site theory has been developed to explain drug-ligand binding, displacement
and allosteric effects [Fehske 1981]. Three major binding sites have been proposed
for HSA based on the affinities of drug molecules to the different sites on HSA. The
three sites exhibit affinity for digitoxin, warfarin and indole-diazepam. A summary
of molecules that bind to the sites is summarised in Table 85.
Table 85 Summary of molecules which bind to specific sites on HSA
Binding site Indole-diazepam Warfarin Digitoxin
Molecules which
have a high
affinity to the site
Benzodiazepines
Tryptophan
Ibuprofen
Warfarin
Dicoumorol
Digitoxin
As already demonstrated, protein affinity CE can be utilised to probe the effects of
different modifiers, e.g. organic solvents, on the chiral selectivity of proteins. Protein
affinity CE should, therefore, be a good model for studying ligand-protein binding.
This is of interest in itself but also it might be possible to induce enhanced chiral
resolution e.g. as observed by Noctor and co-workers [Noctor 1993] by allosteric
interactions. The protein will be in free solution so any conformational changes will
be from ligand-protein interactions. This is in contrast to immobilised protein in
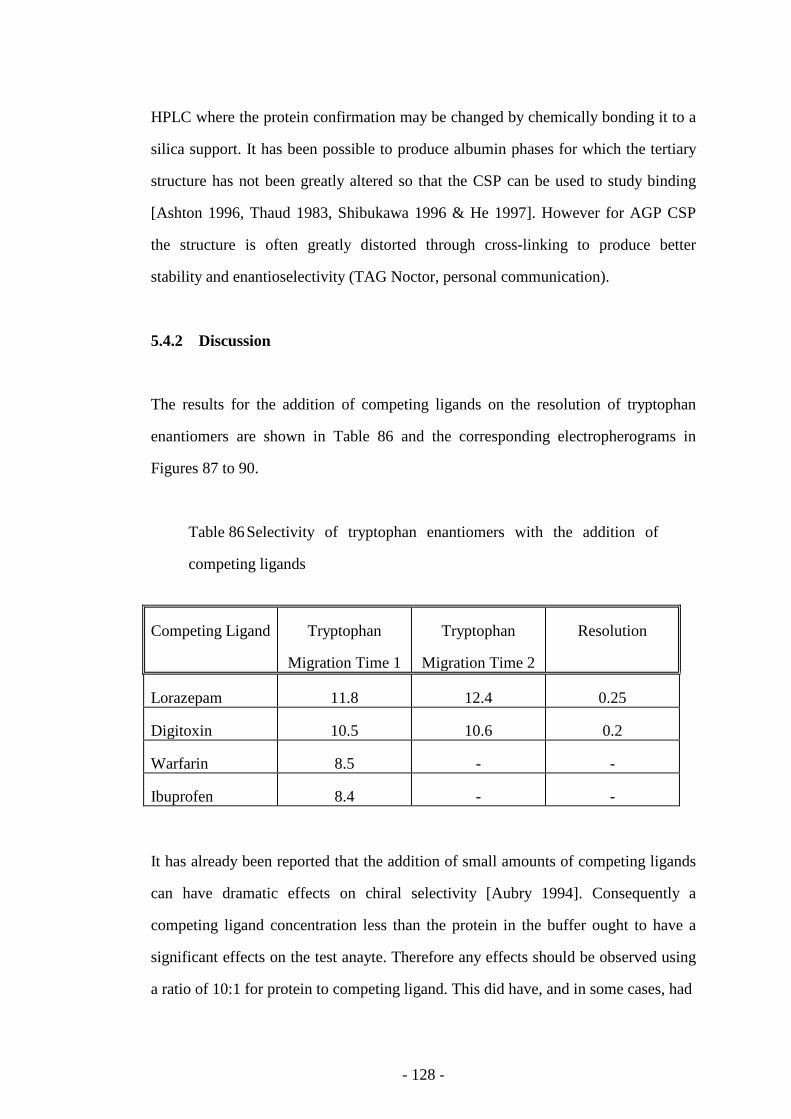
- 128 -
HPLC where the protein confirmation may be changed by chemically bonding it to a
silica support. It has been possible to produce albumin phases for which the tertiary
structure has not been greatly altered so that the CSP can be used to study binding
[Ashton 1996, Thaud 1983, Shibukawa 1996 & He 1997]. However for AGP CSP
the structure is often greatly distorted through cross-linking to produce better
stability and enantioselectivity (TAG Noctor, personal communication).
5.4.2 Discussion
The results for the addition of competing ligands on the resolution of tryptophan
enantiomers are shown in Table 86 and the corresponding electropherograms in
Figures 87 to 90.
Table 86 Selectivity of tryptophan enantiomers with the addition of
competing ligands
Competing Ligand Tryptophan
Migration Time 1
Tryptophan
Migration Time 2
Resolution
Lorazepam 11.8 12.4 0.25
Digitoxin 10.5 10.6 0.2
Warfarin 8.5 - -
Ibuprofen 8.4 - -
It has already been reported that the addition of small amounts of competing ligands
can have dramatic effects on chiral selectivity [Aubry 1994]. Consequently a
competing ligand concentration less than the protein in the buffer ought to have a
significant effects on the test anayte. Therefore any effects should be observed using
a ratio of 10:1 for protein to competing ligand. This did have, and in some cases, had
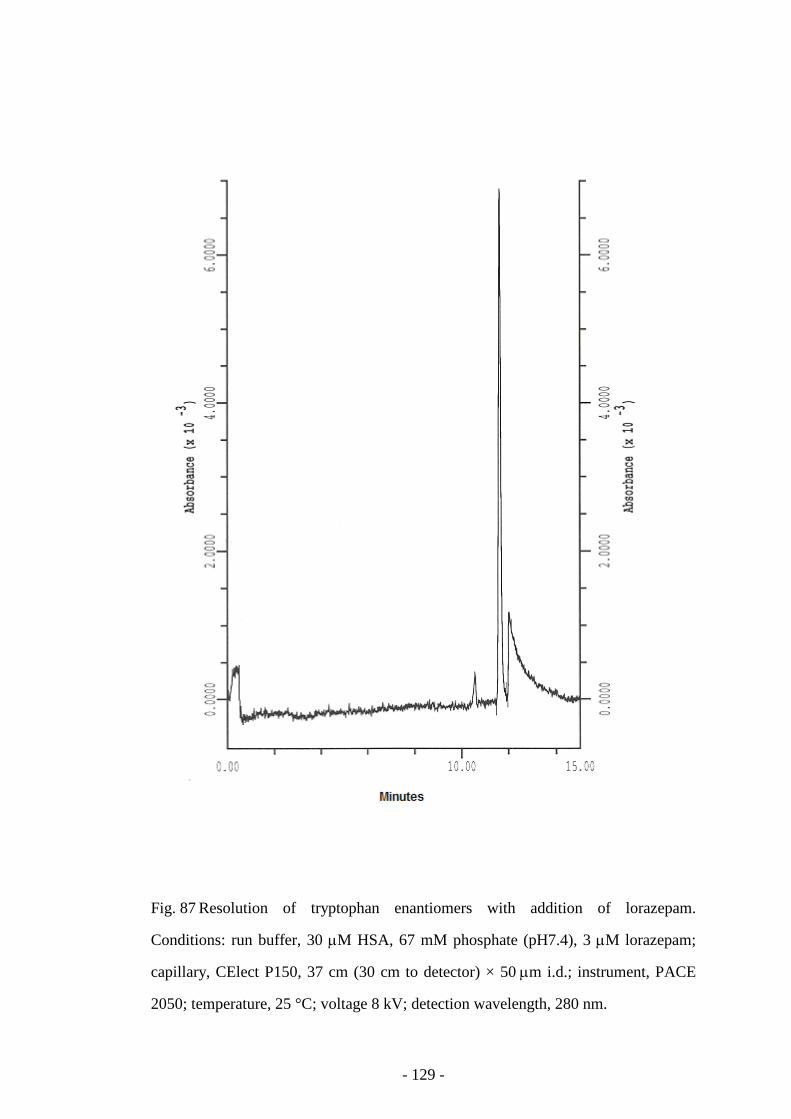
- 129 -
Fig. 87 Resolution of tryptophan enantiomers with addition of lorazepam.
Conditions: run buffer, 30 µM HSA, 67 mM phosphate (pH7.4), 3 µM lorazepam;
capillary, CElect P150, 37 cm (30 cm to detector) × 50 µm i.d.; instrument, PACE
2050; temperature, 25 °C; voltage 8 kV; detection wavelength, 280 nm.
- 130 -
Fig. 88 Resolution of tryptophan enantiomers with addition of digitoxin. Conditions:
run buffer, 30 µM HSA, 67 mM phosphate (pH7.4), 3 µM digitoxin; capillary,
CElect P150, 37 cm (30 cm to detector) × 50 µm i.d.; instrument, PACE 2050;
temperature, 25 °C; voltage 8 kV; detection wavelength, 280 nm.
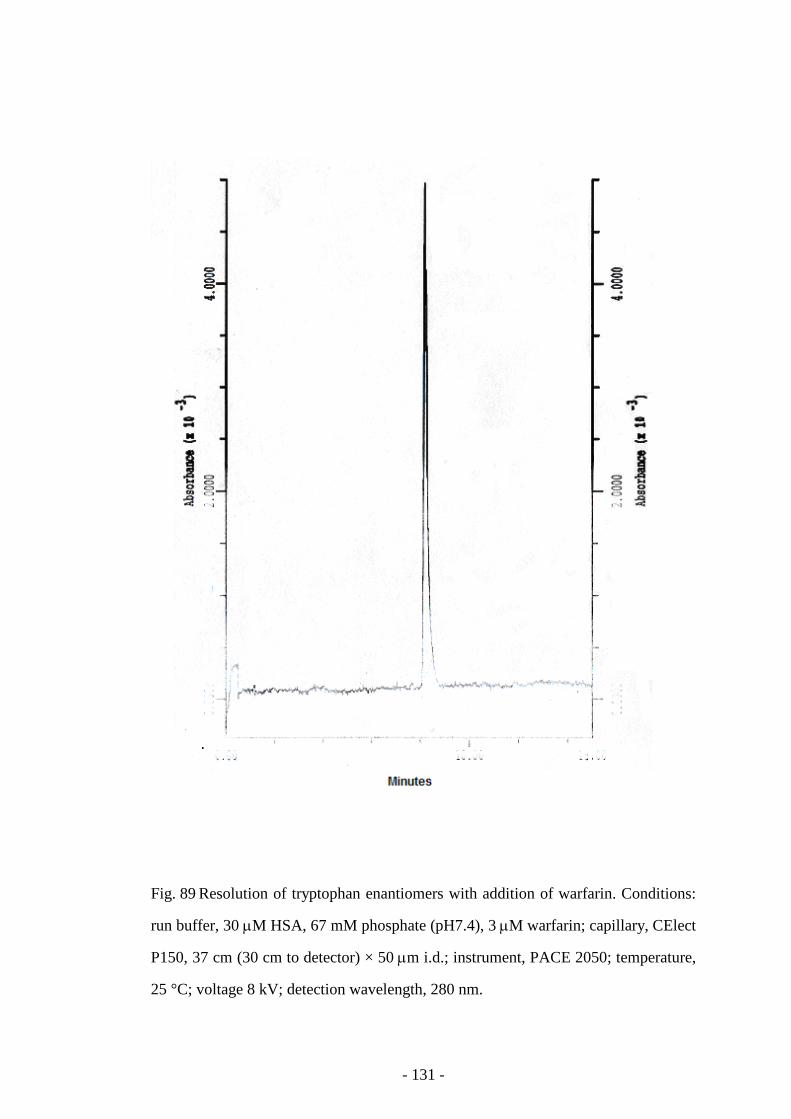
- 131 -
Fig. 89 Resolution of tryptophan enantiomers with addition of warfarin. Conditions:
run buffer, 30 µM HSA, 67 mM phosphate (pH7.4), 3 µM warfarin; capillary, CElect
P150, 37 cm (30 cm to detector) × 50 µm i.d.; instrument, PACE 2050; temperature,
25 °C; voltage 8 kV; detection wavelength, 280 nm.
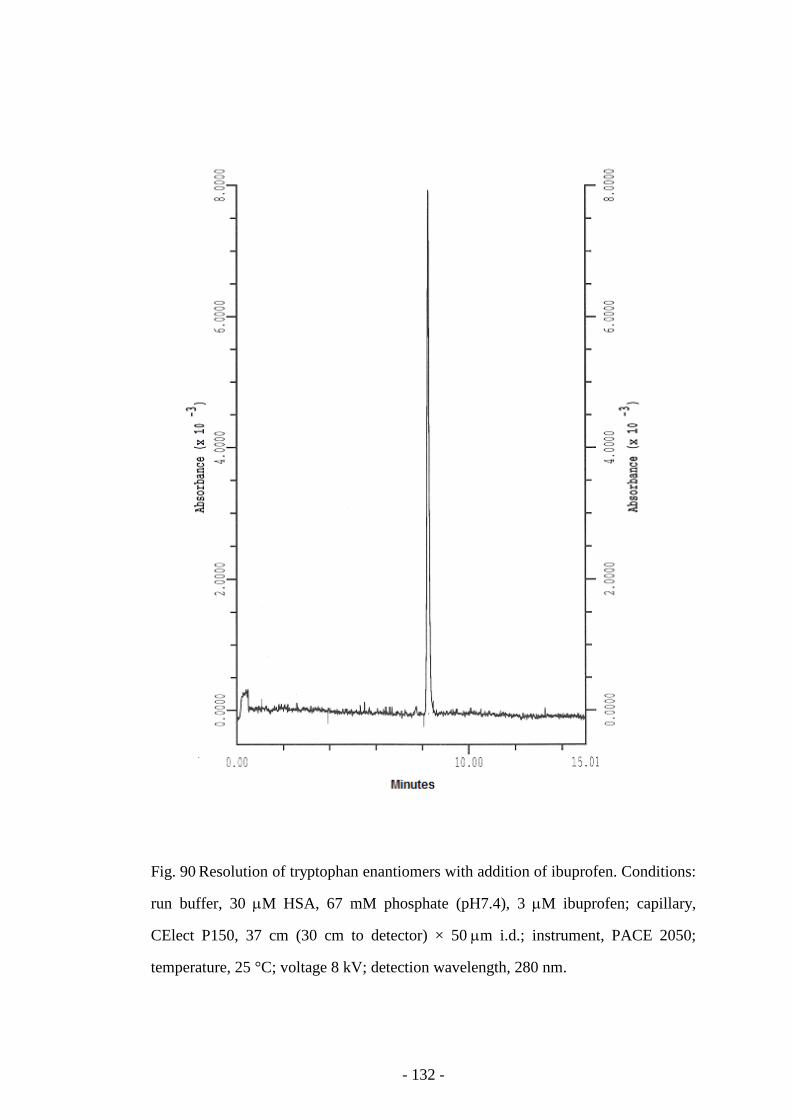
- 132 -
Fig. 90 Resolution of tryptophan enantiomers with addition of ibuprofen. Conditions:
run buffer, 30 µM HSA, 67 mM phosphate (pH7.4), 3 µM ibuprofen; capillary,
CElect P150, 37 cm (30 cm to detector) × 50 µm i.d.; instrument, PACE 2050;
temperature, 25 °C; voltage 8 kV; detection wavelength, 280 nm.
- 133 -
a dramatic effect on the separation and overall migration times of tryptophan
enantiomers. The most significant effects were noticed with ibuprofen and warfarin
and in both cases the resolution of tryptophan enantiomers was decisively eliminated
and there was a reduction in the retention times. Ibuprofen is known to bind to the
same site as tryptophan so it is clear from Fig. 90 that ibuprofen binds more strongly
and displaces tryptophan from HSA. However, from the site binding theory warfarin
binds to a different site compared to tryptophan so clearly there was more going on
than direct competition.
Therefore providing that there is no direct displacement of tryptophan then warfarin
would alter the conformation of HSA when bound so preventing tryptophan binding
to HSA and thus eliminating chiral selectivity and decreasing the migration times.
The addition of lorazepam and digitoxin to the run buffer had little effect on the
resolution or migration times of tryptophan. The benzodiazepine binds to the same
bind site as tryptophan but in this case it would appear that it is the tryptophan that
was bound more strongly to HSA. The binding of digitoxin at a different site
compared to tryptophan appeared not to change the conformation of HSA to prevent
binding of tryptophan since there is still a baseline separation of enantiomers.
5.5 Conclusions
Protein affinity CE had demonstrated the applicability of the technique to probe the
effects of including additives in the run buffer. For the examples studied here there
were no improvements in chiral selectivity and while only a limited range of
examples were studied there was sufficient evidence to suggest that cases where
there were improvements in enantioselectivity would be difficult to find and
therefore that the approach of manipulating additives might not be the best one with
respect to the primary aim of identifying systems that would give rise to good broad
- 134 -
spectrum enantioselectivity by protein affinity CE. However it seemed that the
technique could easily be adapted to show the competitive effects of ligands and this
may be a more promising application area for the future. Providing some technical
difficulties can be overcome, then it may be useful as a tool to monitor the bio-
availability of drugs in vivo, especially in cases where several drugs are taken at the
same time. In particular the use of low concentrations of proteins in CE would seem
to be an ideal solution to the immobilisation difficulties encountered by Wainer’s
group in working with transporter proteins in LC [Wainer 2003, Moaddel 2002 &
2005].
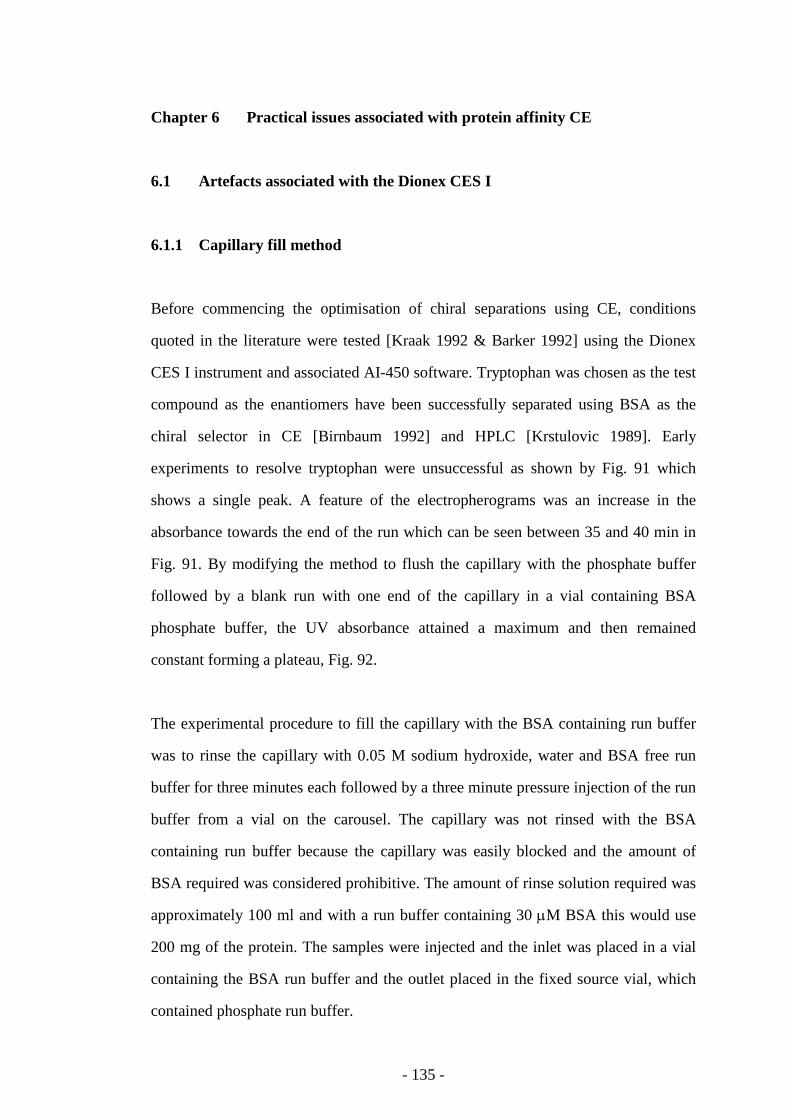
- 135 -
Chapter 6 Practical issues associated with protein affinity CE
6.1 Artefacts associated with the Dionex CES I
6.1.1 Capillary fill method
Before commencing the optimisation of chiral separations using CE, conditions
quoted in the literature were tested [Kraak 1992 & Barker 1992] using the Dionex
CES I instrument and associated AI-450 software. Tryptophan was chosen as the test
compound as the enantiomers have been successfully separated using BSA as the
chiral selector in CE [Birnbaum 1992] and HPLC [Krstulovic 1989]. Early
experiments to resolve tryptophan were unsuccessful as shown by Fig. 91 which
shows a single peak. A feature of the electropherograms was an increase in the
absorbance towards the end of the run which can be seen between 35 and 40 min in
Fig. 91. By modifying the method to flush the capillary with the phosphate buffer
followed by a blank run with one end of the capillary in a vial containing BSA
phosphate buffer, the UV absorbance attained a maximum and then remained
constant forming a plateau, Fig. 92.
The experimental procedure to fill the capillary with the BSA containing run buffer
was to rinse the capillary with 0.05 M sodium hydroxide, water and BSA free run
buffer for three minutes each followed by a three minute pressure injection of the run
buffer from a vial on the carousel. The capillary was not rinsed with the BSA
containing run buffer because the capillary was easily blocked and the amount of
BSA required was considered prohibitive. The amount of rinse solution required was
approximately 100 ml and with a run buffer containing 30 µM BSA this would use
200 mg of the protein. The samples were injected and the inlet was placed in a vial
containing the BSA run buffer and the outlet placed in the fixed source vial, which
contained phosphate run buffer.
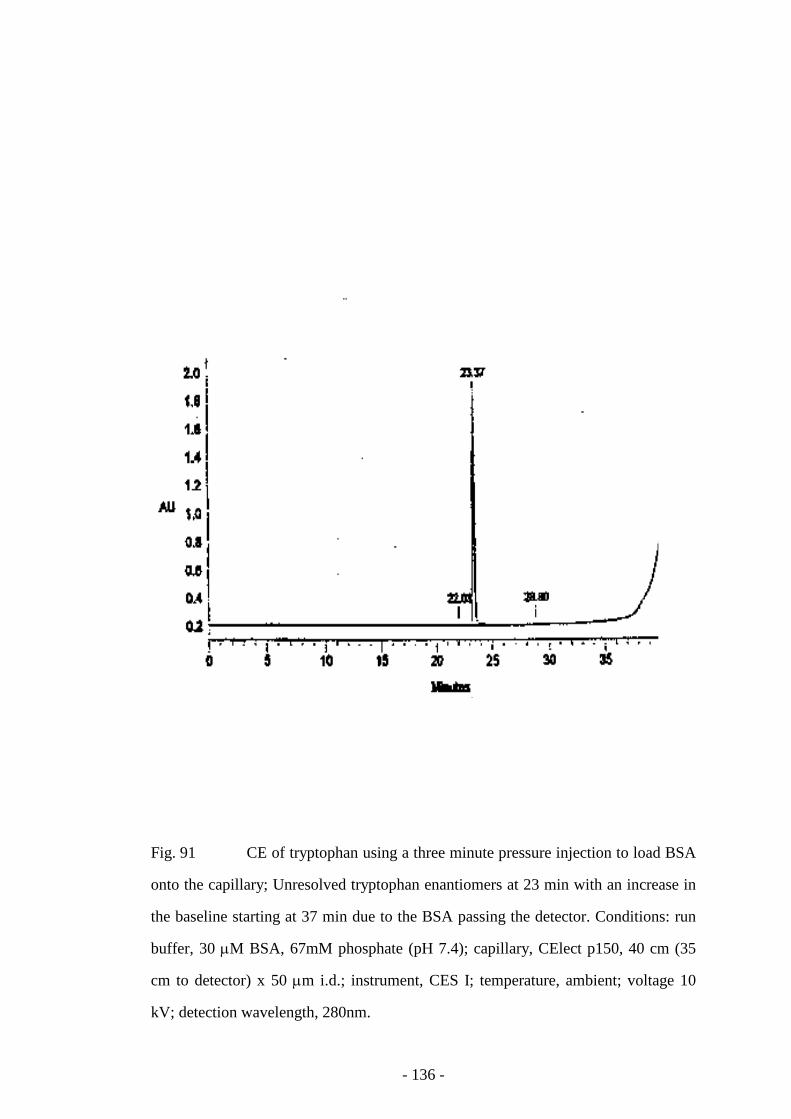
- 136 -
Fig. 91 CE of tryptophan using a three minute pressure injection to load BSA
onto the capillary; Unresolved tryptophan enantiomers at 23 min with an increase in
the baseline starting at 37 min due to the BSA passing the detector. Conditions: run
buffer, 30 µM BSA, 67mM phosphate (pH 7.4); capillary, CElect p150, 40 cm (35
cm to detector) x 50 µm i.d.; instrument, CES I; temperature, ambient; voltage 10
kV; detection wavelength, 280nm.
- 137 -
Fig. 92 The capillary fill method showing the BSA breakthrough starting at 17 min
and plateauing out after 20 min. The capillary was rinsed with 0.05 M sodium
hydroxide, water and 67 mM phosphate buffer. A blank run was performed from a
vial containing BSA-phosphate buffer. Conditions: run buffer, 30 µM BSA, 67 mM
phosphate (pH 7.4); capillary, CElect p150, 40 cm (35 cm to detector) x 50 µm i.d.;
instrument, CES I; temperature, ambient; voltage 10kV; detection wavelength, 254
nm.
- 138 -
The sample mixture of enantiomers was then applied which resulted in unresolved
enantiomers and an increase in UV absorbance after 20 to 25 min.
The increase in absorbance was thought to be BSA passing the detector given that it
was the only UV absorbing species in the run buffer. The main question was whether
there was a BSA breakthrough or an increase in the level of BSA. Experiments were
undertaken to verify the presence of BSA passing the detector. The inlet vial was
replaced with phosphate buffer and the procedure was repeated as before. There was
no enantiomeric separation and there was an increase in UV absorbance after 25 min.
It was concluded that BSA had not been injected into the capillary by the pressure
injection method. BSA was only present in the capillary after a period of time when
the inlet was placed in a vial with the BSA containing buffer. A sample of tryptophan
was injected after the plateau had been established. This resulted in an enantiomeric
separation, Fig. 93, and the baseline remained stable throughout the run. The
experimental procedure was subsequently altered to include a 25 min run with the
BSA-containing run buffer to ensure that the protein was present in the capillary
prior to any sample injections. However, this revised procedure substantially
increased the total analysis time, by 40 %, of the experiment. There were a number of
reasons why the time required for the BSA to pass through the detector was relatively
long. At the pH used, the electrophoretic mobility of the BSA was low, as discussed
in Chapter 3. Also at the concentration used the BSA containing buffer had a high
viscosity which would also lead to a decrease in the electrophoretic mobility of the
BSA, Equation 18, [Camilleri 1983].
µπη
= =vE
qr6
Equation 18 Electrophoretic Mobility
- 139 -
where
µ = electrophoretic mobility
v = electrophoretic velocity
E = electric field strength
q = charge of the ion
η = viscosity of the buffer
r = radius of the molecules.
When these experiments were repeated using the PACE 2050 it was only necessary
to rinse the capillary with the BSA containing buffer to achieve enantiomeric
separations and no breakthrough of the BSA was observed. The time required to
condition the capillary prior to injection was reduced from 34 min to 10 min.
The high pressure rinse of the PACE 2050 was 20 psi compared to the 10 - 15 psi of
the CES I. The difference between 15 and 20 psi had not been expected to make too
much difference but it made a very marked difference in that it significantly
decreased the time to condition capillary by 24 min.
6.1.2 Reduction of the overall run time
Performing a BSA run prior to injecting samples effectively doubled the time of
analysis. Experiments were undertaken to ascertain the reproducibility between
sample injections without rinsing the capillary. The capillary was filled with the BSA
containing buffer as described previously. The test compound was tryptophan. The
run time for each analysis was 40 min. The reproducibility of the system decreased
rapidly after only three injections. The migration times of the enantiomers increased
from 20 min to over 40 min and in one case the enantiomers were detected in a
subsequent analysis. The increase in the migration times could have been due to
protein building up on the surface of the capillary wall during the sequential analyses
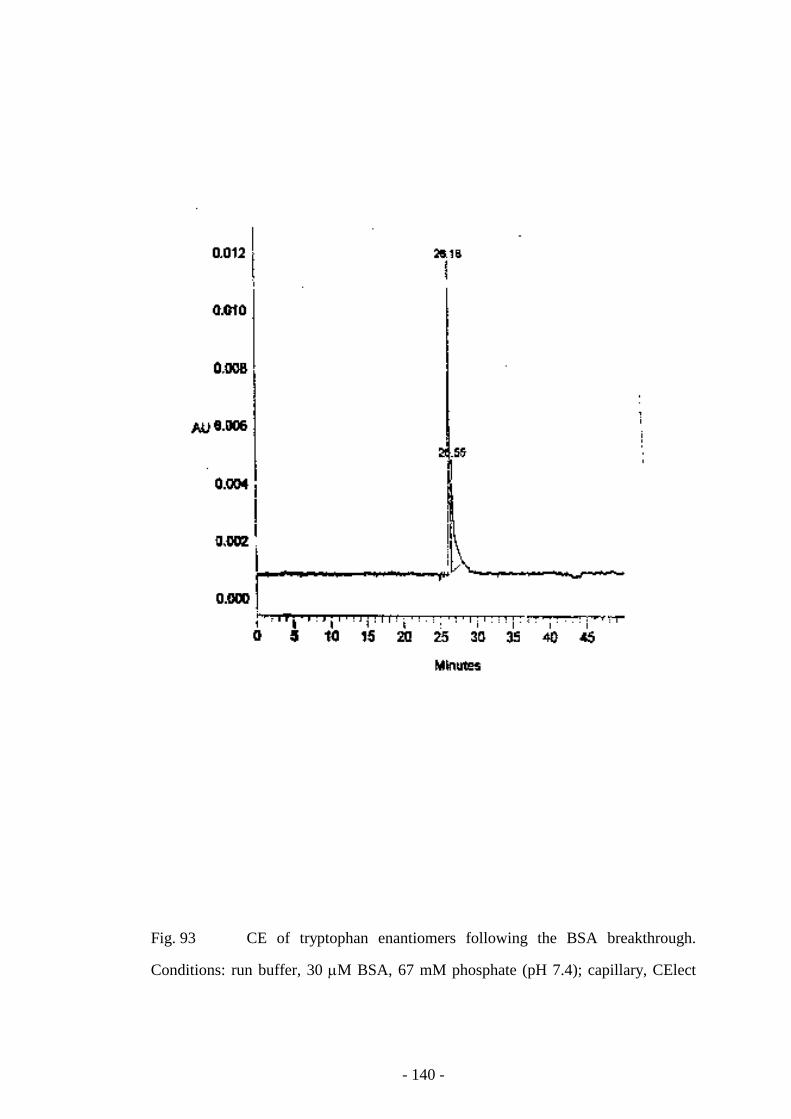
- 140 -
Fig. 93 CE of tryptophan enantiomers following the BSA breakthrough.
Conditions: run buffer, 30 µM BSA, 67 mM phosphate (pH 7.4); capillary, CElect
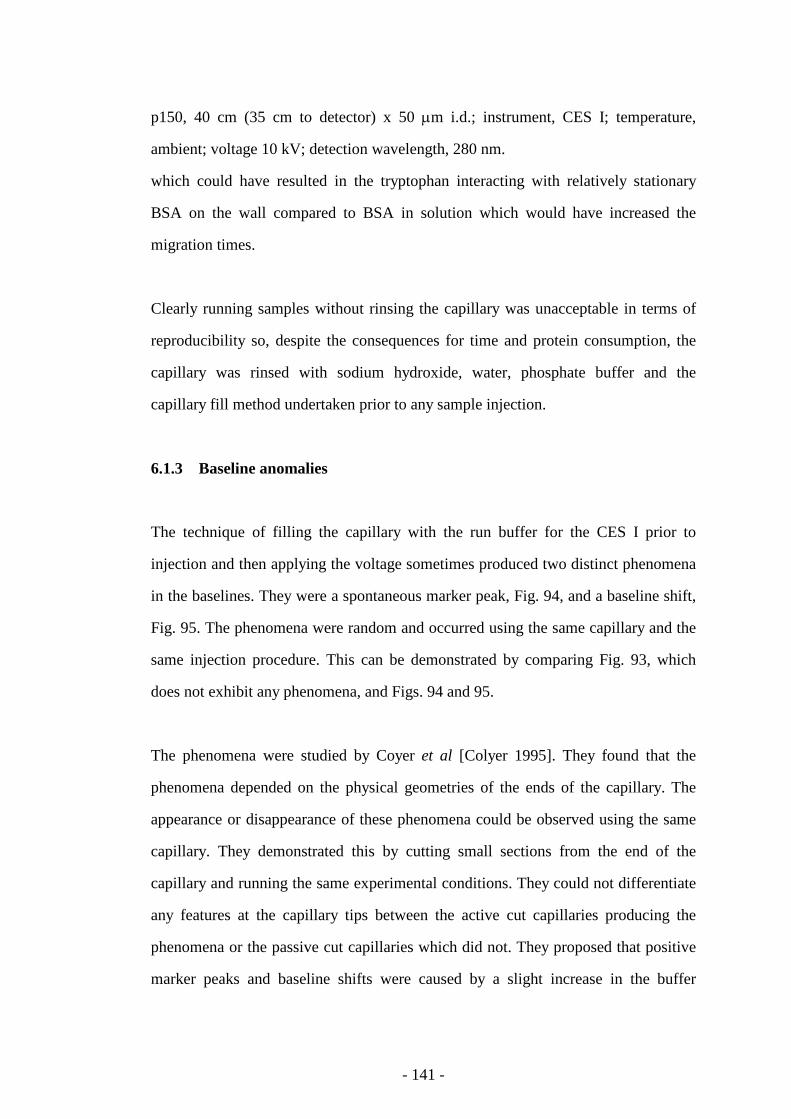
- 141 -
p150, 40 cm (35 cm to detector) x 50 µm i.d.; instrument, CES I; temperature,
ambient; voltage 10 kV; detection wavelength, 280 nm.
which could have resulted in the tryptophan interacting with relatively stationary
BSA on the wall compared to BSA in solution which would have increased the
migration times.
Clearly running samples without rinsing the capillary was unacceptable in terms of
reproducibility so, despite the consequences for time and protein consumption, the
capillary was rinsed with sodium hydroxide, water, phosphate buffer and the
capillary fill method undertaken prior to any sample injection.
6.1.3 Baseline anomalies
The technique of filling the capillary with the run buffer for the CES I prior to
injection and then applying the voltage sometimes produced two distinct phenomena
in the baselines. They were a spontaneous marker peak, Fig. 94, and a baseline shift,
Fig. 95. The phenomena were random and occurred using the same capillary and the
same injection procedure. This can be demonstrated by comparing Fig. 93, which
does not exhibit any phenomena, and Figs. 94 and 95.
The phenomena were studied by Coyer et al [Colyer 1995]. They found that the
phenomena depended on the physical geometries of the ends of the capillary. The
appearance or disappearance of these phenomena could be observed using the same
capillary. They demonstrated this by cutting small sections from the end of the
capillary and running the same experimental conditions. They could not differentiate
any features at the capillary tips between the active cut capillaries producing the
phenomena or the passive cut capillaries which did not. They proposed that positive
marker peaks and baseline shifts were caused by a slight increase in the buffer
- 142 -
concentration. Conversely negative marker peaks and baseline shifts were caused by
a slight decrease in buffer concentration. These theories can explain the
Fig. 94 CE of hexabarbitone enantiomers showing a spontaneous peak marker. The
spontaneous peak marker occurs at 17 min. Conditions: run buffer, 30 µM BSA, 67
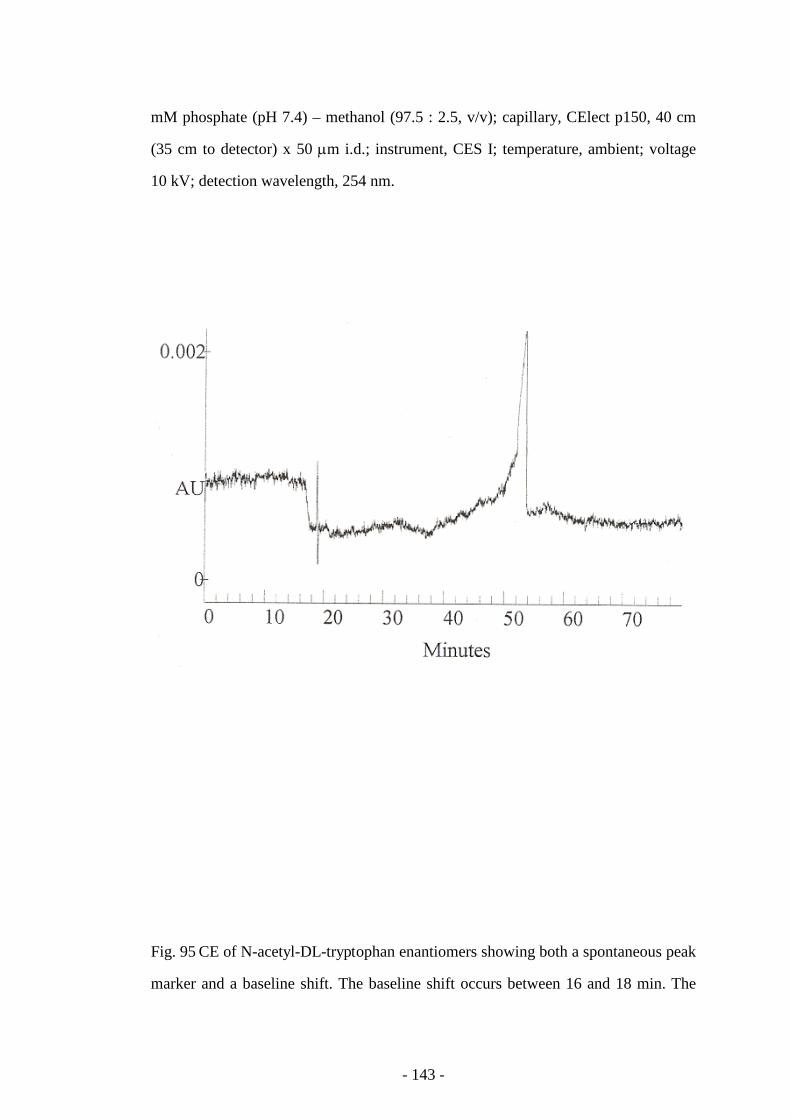
- 143 -
mM phosphate (pH 7.4) – methanol (97.5 : 2.5, v/v); capillary, CElect p150, 40 cm
(35 cm to detector) x 50 µm i.d.; instrument, CES I; temperature, ambient; voltage
10 kV; detection wavelength, 254 nm.
Fig. 95 CE of N-acetyl-DL-tryptophan enantiomers showing both a spontaneous peak
marker and a baseline shift. The baseline shift occurs between 16 and 18 min. The
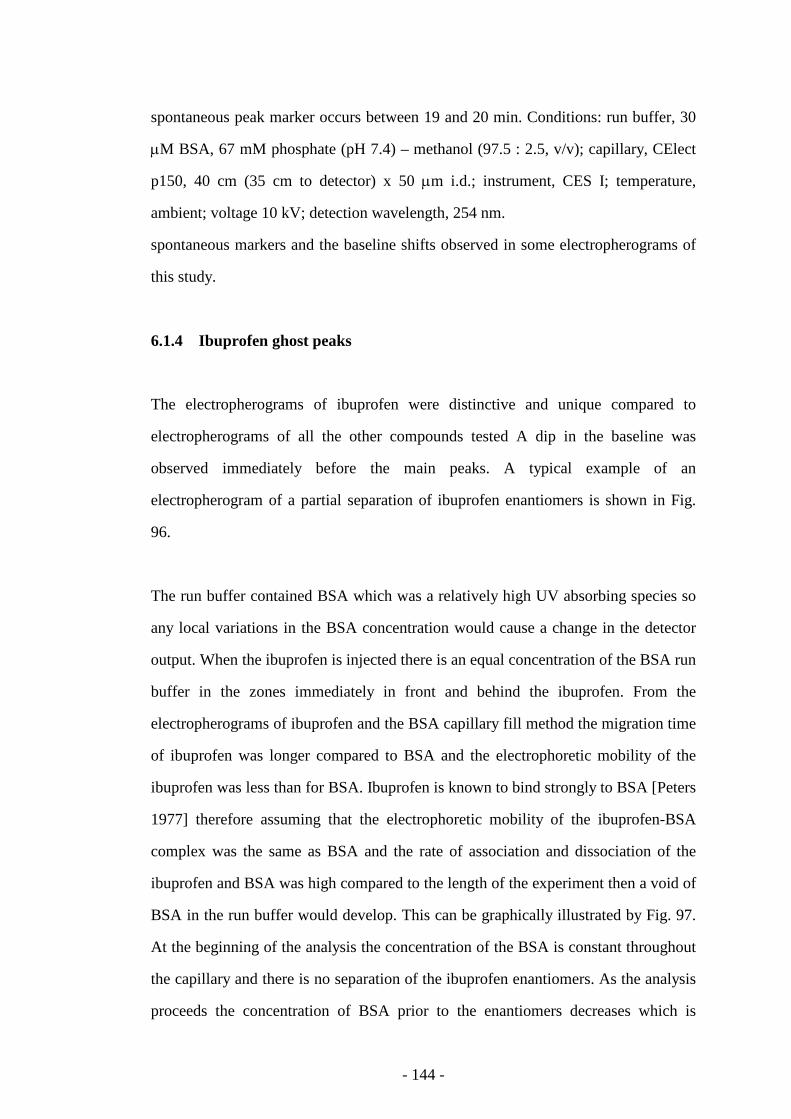
- 144 -
spontaneous peak marker occurs between 19 and 20 min. Conditions: run buffer, 30
µM BSA, 67 mM phosphate (pH 7.4) – methanol (97.5 : 2.5, v/v); capillary, CElect
p150, 40 cm (35 cm to detector) x 50 µm i.d.; instrument, CES I; temperature,
ambient; voltage 10 kV; detection wavelength, 254 nm.
spontaneous markers and the baseline shifts observed in some electropherograms of
this study.
6.1.4 Ibuprofen ghost peaks
The electropherograms of ibuprofen were distinctive and unique compared to
electropherograms of all the other compounds tested A dip in the baseline was
observed immediately before the main peaks. A typical example of an
electropherogram of a partial separation of ibuprofen enantiomers is shown in Fig.
96.
The run buffer contained BSA which was a relatively high UV absorbing species so
any local variations in the BSA concentration would cause a change in the detector
output. When the ibuprofen is injected there is an equal concentration of the BSA run
buffer in the zones immediately in front and behind the ibuprofen. From the
electropherograms of ibuprofen and the BSA capillary fill method the migration time
of ibuprofen was longer compared to BSA and the electrophoretic mobility of the
ibuprofen was less than for BSA. Ibuprofen is known to bind strongly to BSA [Peters
1977] therefore assuming that the electrophoretic mobility of the ibuprofen-BSA
complex was the same as BSA and the rate of association and dissociation of the
ibuprofen and BSA was high compared to the length of the experiment then a void of
BSA in the run buffer would develop. This can be graphically illustrated by Fig. 97.
At the beginning of the analysis the concentration of the BSA is constant throughout
the capillary and there is no separation of the ibuprofen enantiomers. As the analysis
proceeds the concentration of BSA prior to the enantiomers decreases which is
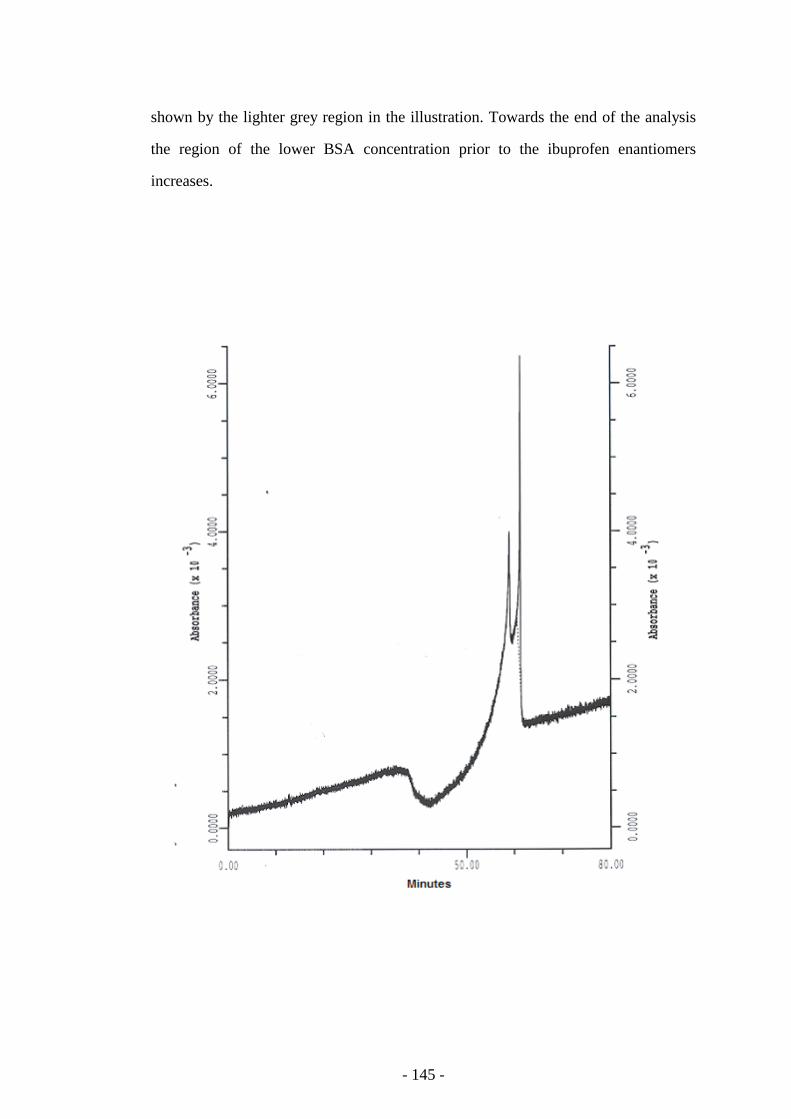
- 145 -
shown by the lighter grey region in the illustration. Towards the end of the analysis
the region of the lower BSA concentration prior to the ibuprofen enantiomers
increases.
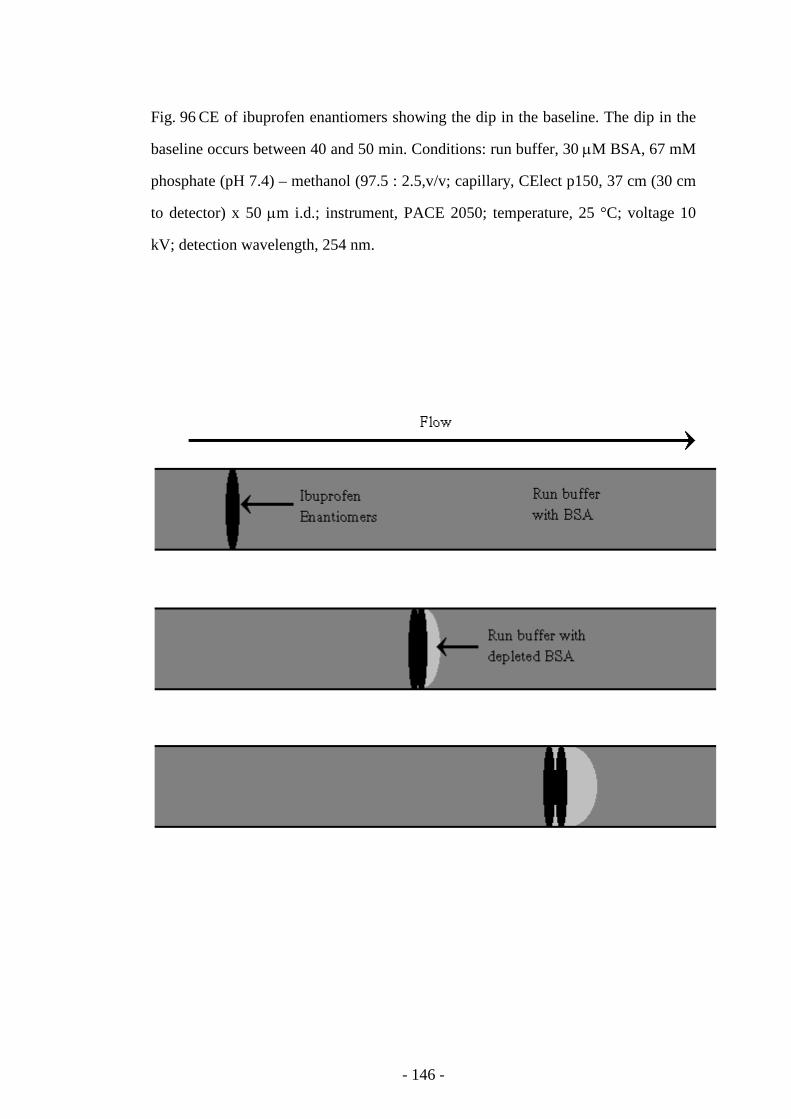
- 146 -
Fig. 96 CE of ibuprofen enantiomers showing the dip in the baseline. The dip in the
baseline occurs between 40 and 50 min. Conditions: run buffer, 30 µM BSA, 67 mM
phosphate (pH 7.4) – methanol (97.5 : 2.5,v/v; capillary, CElect p150, 37 cm (30 cm
to detector) x 50 µm i.d.; instrument, PACE 2050; temperature, 25 °C; voltage 10
kV; detection wavelength, 254 nm.
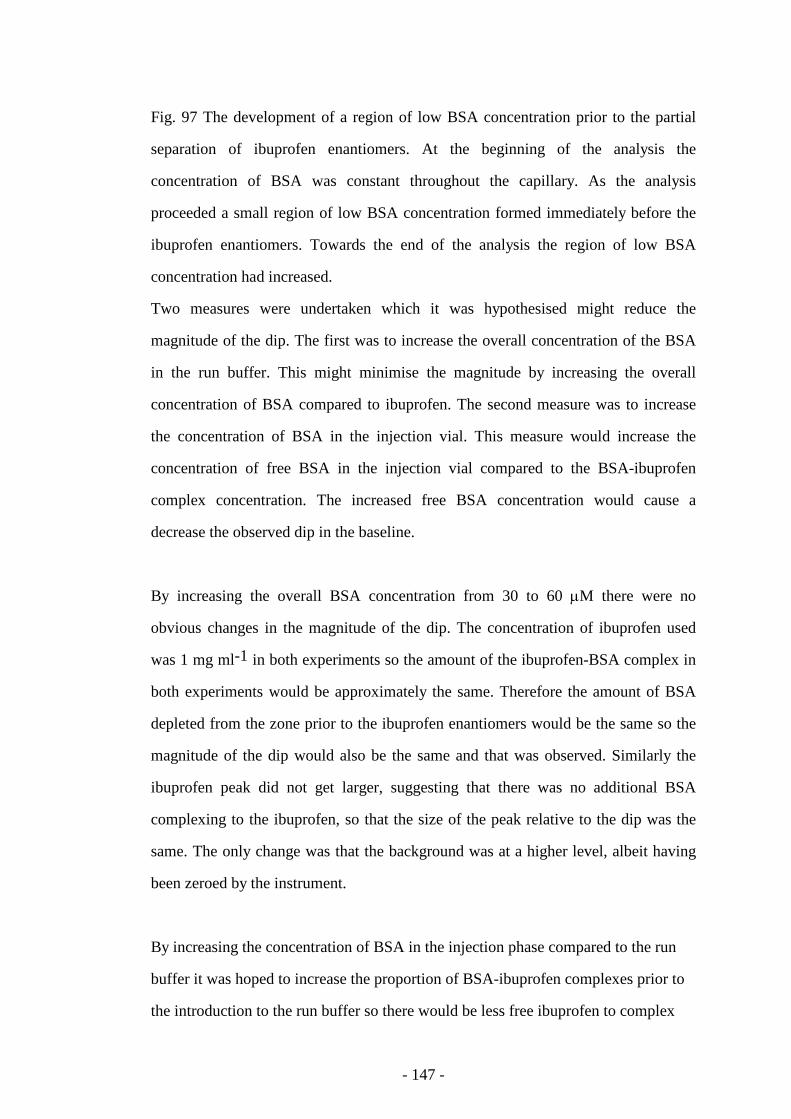
- 147 -
Fig. 97 The development of a region of low BSA concentration prior to the partial
separation of ibuprofen enantiomers. At the beginning of the analysis the
concentration of BSA was constant throughout the capillary. As the analysis
proceeded a small region of low BSA concentration formed immediately before the
ibuprofen enantiomers. Towards the end of the analysis the region of low BSA
concentration had increased.
Two measures were undertaken which it was hypothesised might reduce the
magnitude of the dip. The first was to increase the overall concentration of the BSA
in the run buffer. This might minimise the magnitude by increasing the overall
concentration of BSA compared to ibuprofen. The second measure was to increase
the concentration of BSA in the injection vial. This measure would increase the
concentration of free BSA in the injection vial compared to the BSA-ibuprofen
complex concentration. The increased free BSA concentration would cause a
decrease the observed dip in the baseline.
By increasing the overall BSA concentration from 30 to 60 µM there were no
obvious changes in the magnitude of the dip. The concentration of ibuprofen used
was 1 mg ml-1 in both experiments so the amount of the ibuprofen-BSA complex in
both experiments would be approximately the same. Therefore the amount of BSA
depleted from the zone prior to the ibuprofen enantiomers would be the same so the
magnitude of the dip would also be the same and that was observed. Similarly the
ibuprofen peak did not get larger, suggesting that there was no additional BSA
complexing to the ibuprofen, so that the size of the peak relative to the dip was the
same. The only change was that the background was at a higher level, albeit having
been zeroed by the instrument.
By increasing the concentration of BSA in the injection phase compared to the run
buffer it was hoped to increase the proportion of BSA-ibuprofen complexes prior to
the introduction to the run buffer so there would be less free ibuprofen to complex
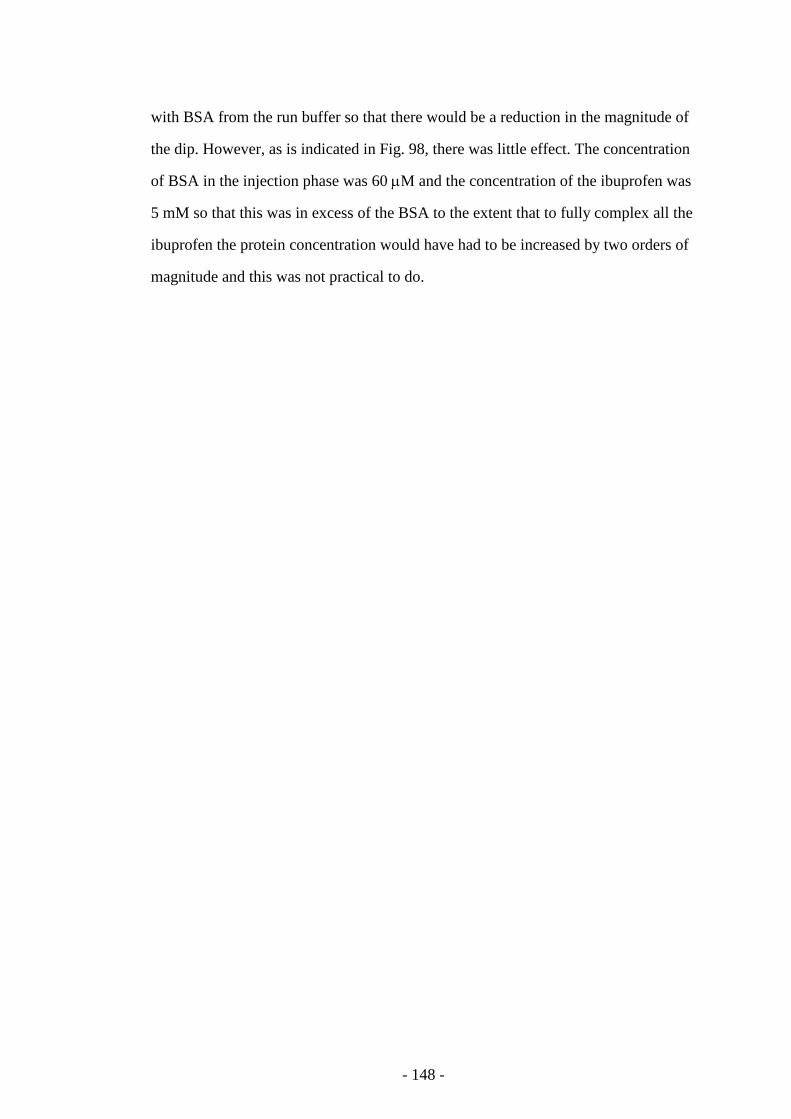
- 148 -
with BSA from the run buffer so that there would be a reduction in the magnitude of
the dip. However, as is indicated in Fig. 98, there was little effect. The concentration
of BSA in the injection phase was 60 µM and the concentration of the ibuprofen was
5 mM so that this was in excess of the BSA to the extent that to fully complex all the
ibuprofen the protein concentration would have had to be increased by two orders of
magnitude and this was not practical to do.
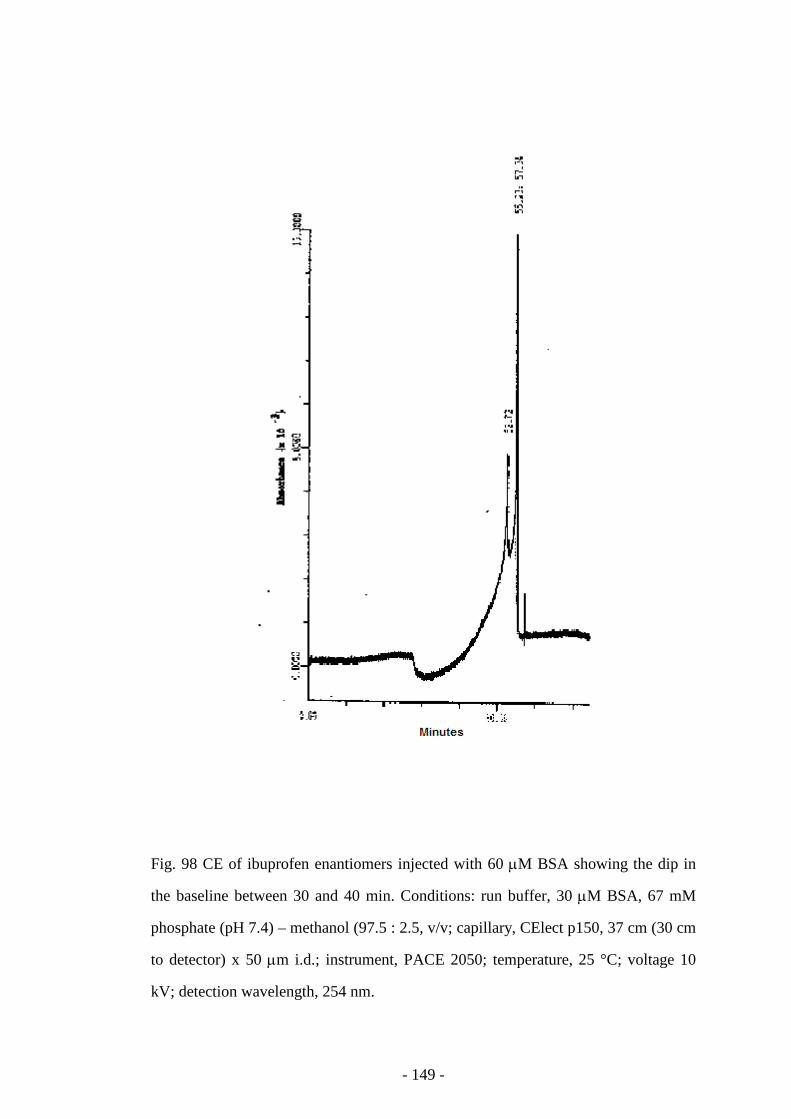
- 149 -
Fig. 98 CE of ibuprofen enantiomers injected with 60 µM BSA showing the dip in
the baseline between 30 and 40 min. Conditions: run buffer, 30 µM BSA, 67 mM
phosphate (pH 7.4) – methanol (97.5 : 2.5, v/v; capillary, CElect p150, 37 cm (30 cm
to detector) x 50 µm i.d.; instrument, PACE 2050; temperature, 25 °C; voltage 10
kV; detection wavelength, 254 nm.
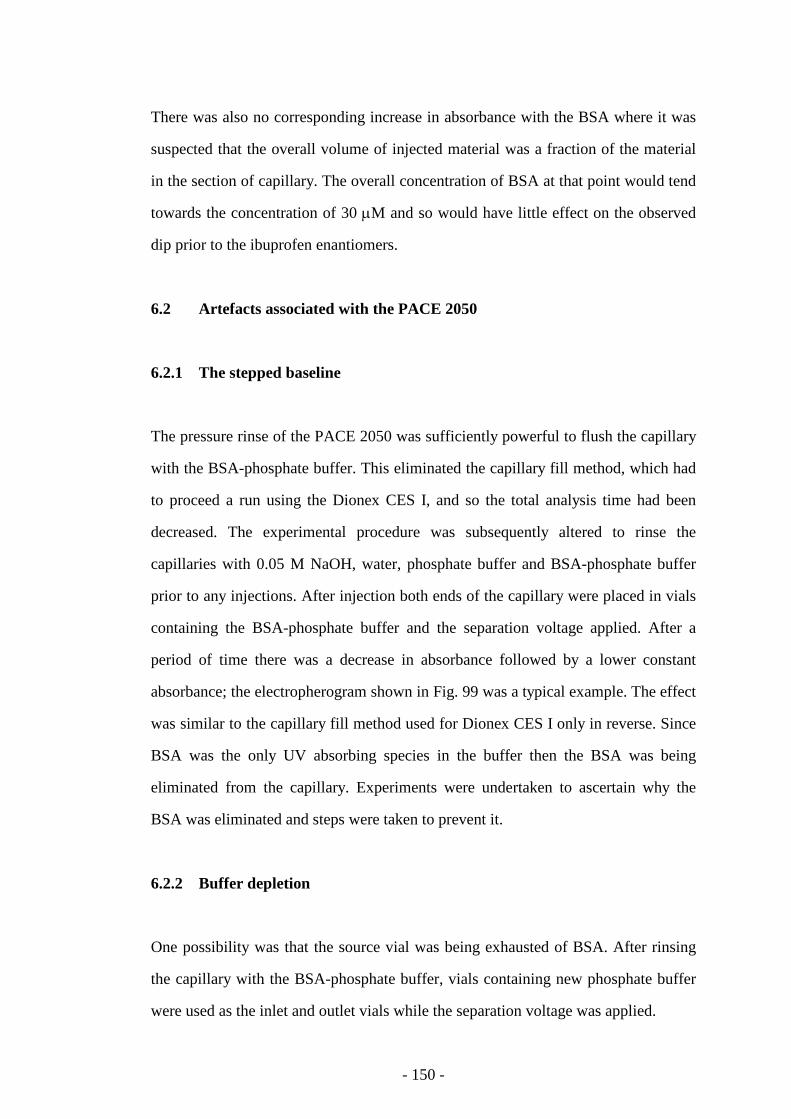
- 150 -
There was also no corresponding increase in absorbance with the BSA where it was
suspected that the overall volume of injected material was a fraction of the material
in the section of capillary. The overall concentration of BSA at that point would tend
towards the concentration of 30 µM and so would have little effect on the observed
dip prior to the ibuprofen enantiomers.
6.2 Artefacts associated with the PACE 2050
6.2.1 The stepped baseline
The pressure rinse of the PACE 2050 was sufficiently powerful to flush the capillary
with the BSA-phosphate buffer. This eliminated the capillary fill method, which had
to proceed a run using the Dionex CES I, and so the total analysis time had been
decreased. The experimental procedure was subsequently altered to rinse the
capillaries with 0.05 M NaOH, water, phosphate buffer and BSA-phosphate buffer
prior to any injections. After injection both ends of the capillary were placed in vials
containing the BSA-phosphate buffer and the separation voltage applied. After a
period of time there was a decrease in absorbance followed by a lower constant
absorbance; the electropherogram shown in Fig. 99 was a typical example. The effect
was similar to the capillary fill method used for Dionex CES I only in reverse. Since
BSA was the only UV absorbing species in the buffer then the BSA was being
eliminated from the capillary. Experiments were undertaken to ascertain why the
BSA was eliminated and steps were taken to prevent it.
6.2.2 Buffer depletion
One possibility was that the source vial was being exhausted of BSA. After rinsing
the capillary with the BSA-phosphate buffer, vials containing new phosphate buffer
were used as the inlet and outlet vials while the separation voltage was applied.
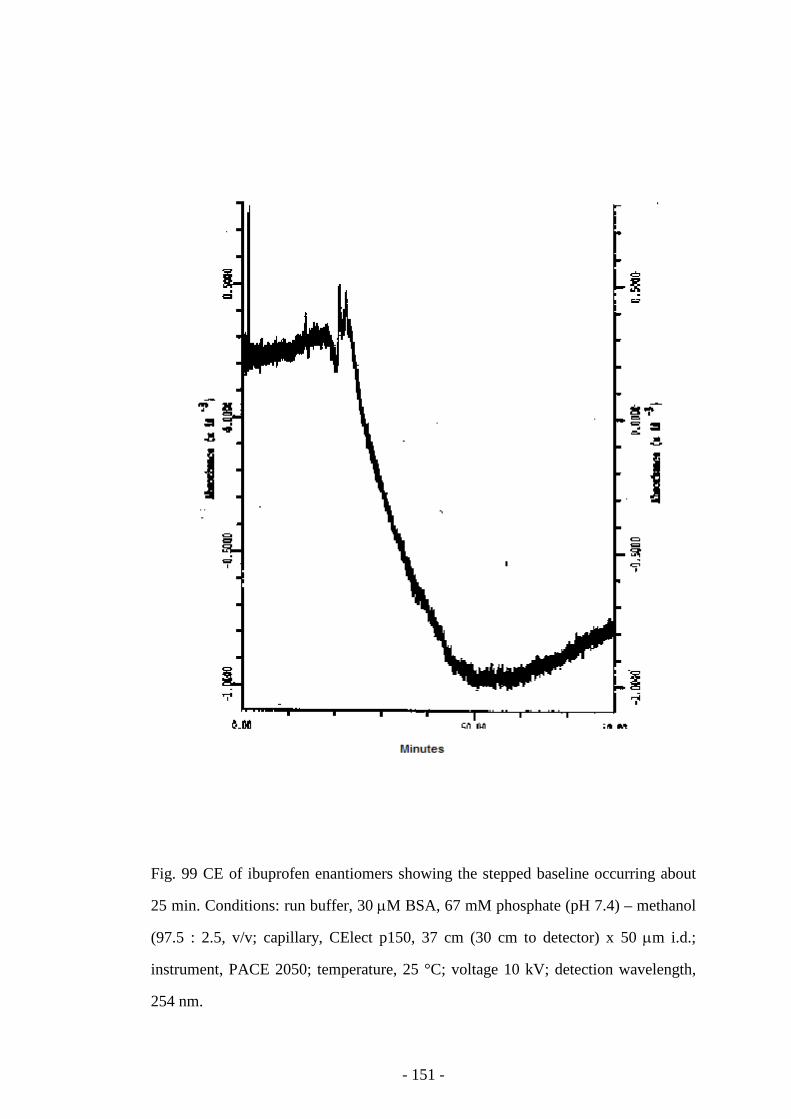
- 151 -
Fig. 99 CE of ibuprofen enantiomers showing the stepped baseline occurring about
25 min. Conditions: run buffer, 30 µM BSA, 67 mM phosphate (pH 7.4) – methanol
(97.5 : 2.5, v/v; capillary, CElect p150, 37 cm (30 cm to detector) x 50 µm i.d.;
instrument, PACE 2050; temperature, 25 °C; voltage 10 kV; detection wavelength,
254 nm.
- 152 -
However, the elimination of BSA still occurred. The UV absorbance of the buffers of
the vials were measured before and after a run. There was no significant difference
between the before and after measurements so there was still 30 µM in both buffer
vials.
The decrease in absorbance was not observed when using the Dionex CES I and the
volume of the BSA-phosphate buffer vial was 0.6 ml compared to the 2.8 ml of the
vials used in the Beckman PACE 2050 so buffer depletion was thought unlikely to be
the cause.
6.2.3 Siphoning
Another possibility was that there was sufficient difference in the levels of the
buffers that siphoning was taking place, which could prevent BSA from being
transported through the capillary. When the levels of the buffer vials were altered to
give all the high and low buffer level combinations available there was the same
decrease in absorbance in all cases. Therefore it was inferred that another mechanism
was causing the effect.
6.2.4 Overload of BSA in the outlet vial
The decrease in absorbance was never observed when using the methods for the
Dionex CES I. The only major difference between the Dionex CES I and the
Beckman PACE 2050 was the buffer in the outlet vial. The fixed outlet vial for the
Dionex CES I contained phosphate buffer from the capillary rinse cycle. Experiments
were undertaken to change the method so that the outlet vial contained only
phosphate buffer. It was demonstrated that using the modified method the
elimination of BSA from the capillary was prevented. This can be clearly shown by
comparing electropherograms of ibuprofen. The stepped baseline was only observed
- 153 -
in Fig. 99 which had BSA-phosphate buffer in the outlet vial. The stepped baseline
was not observed in Fig. 96 and Fig. 98 which had phosphate buffer in the outlet
vial.
The elimination of BSA from the capillary could be due to a combination of
concentration and electrical effects. Before the separation voltage is applied the
concentration of BSA in the capillary and the inlet and outlet vials is the same. When
the separation voltage was applied the EOF was sufficient for the BSA to migrate
from the inlet vial, through the capillary and into the outlet vial. After a period of
time an excess of BSA would be present in the outlet vial compared to the inlet vial.
A concentration gradient of BSA would develop from the outlet vial to the inlet vial.
The concentration gradient would then form an equilibrium with the BSA migrating
through the capillary. The flow of BSA would effectively stop through the capillary
and this was observed by the step in the baseline.
6.3 Conclusions
As with any analytical technique there are some disadvantages of CE. These include
apparent baseline irregularities for neutral markers [Kenndler-Blachkolm 1995] and
adsorption of analytes to the capillary wall [Ermakov 1995]. On the whole on
referencing more recent literature the mechanisms of these artefacts are generally
well understood and even if they could not be eliminated then allowances could be
made for them and accordingly using the CES I the capillary fill method was
employed even though there was an increase in the overall analysis time and an
outlet vial containing only phosphate buffer was employed with the PACE 2050.
- 154 -
Chapter 7 BSA as a mobile phase additive in microbore HPLC
7.1 Introduction
There had been interest in the use of protein affinity CE to develop methodologies
for enantiomer separations and, to a lesser extent, to study protein-ligand binding. In
enantiomer differentiation using CE, very small amounts of chiral selector are
required. Accordingly, a much wider range of biomacromolecules may be used. Also
it may be possible for chiral discrimination to take place in free solution. The
biomacromolecular structure should therefore not be grossly distorted and the
behaviour of the molecule should be similar to how it behaves in vivo. CE with
biomacromolecules ought to be a better model of the pharmacological behaviour of
drugs than HPLC. Despite these seeming advantages and a few success stories,
protein affinity CE was in general not living up to expectations [Lloyd 1995].
Shortcomings of protein affinity CE had included failure to resolve the complete
range of chiral analytes that may be resolved by HPLC using immobilised albumin
stationary phases, broad negative peaks arising from analytes with long run times
[this study], difficulty in the interpretation of data [this study and Lloyd 1995], and
baseline shifts at variable times during analytical runs [Colyer 1995].
Since protein affinity HPLC using miniaturised columns and the protein as a mobile
phase additive might offer the nominal advantages of CE alluded to above, it was
decided to evaluate it using BSA as the chiral selector.
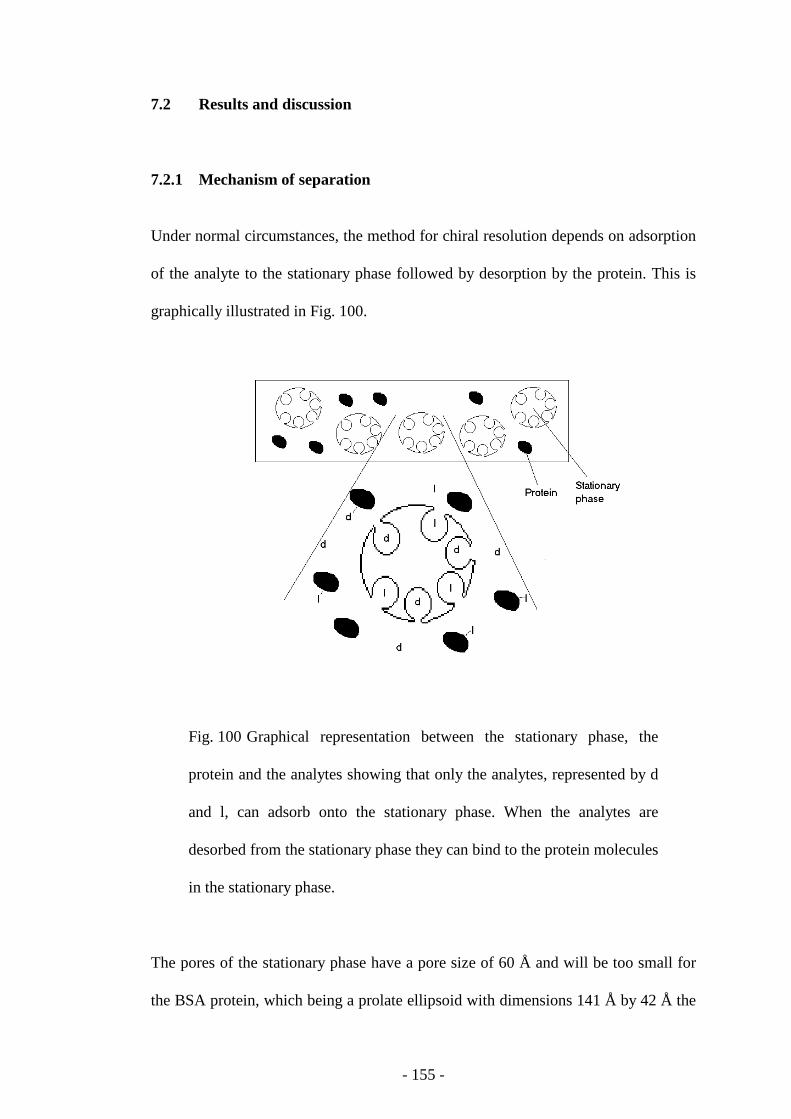
- 155 -
7.2 Results and discussion
7.2.1 Mechanism of separation
Under normal circumstances, the method for chiral resolution depends on adsorption
of the analyte to the stationary phase followed by desorption by the protein. This is
graphically illustrated in Fig. 100.
Fig. 100 Graphical representation between the stationary phase, the
protein and the analytes showing that only the analytes, represented by d
and l, can adsorb onto the stationary phase. When the analytes are
desorbed from the stationary phase they can bind to the protein molecules
in the stationary phase.
The pores of the stationary phase have a pore size of 60 Å and will be too small for
the BSA protein, which being a prolate ellipsoid with dimensions 141 Å by 42 Å the
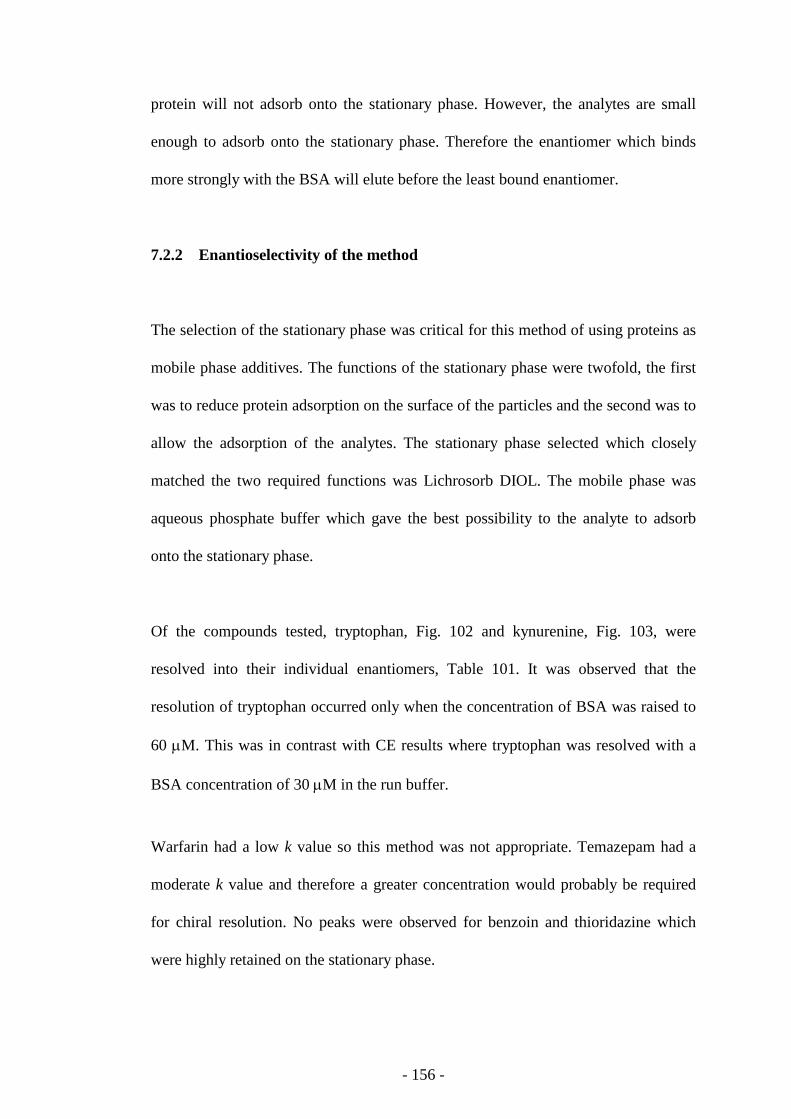
- 156 -
protein will not adsorb onto the stationary phase. However, the analytes are small
enough to adsorb onto the stationary phase. Therefore the enantiomer which binds
more strongly with the BSA will elute before the least bound enantiomer.
7.2.2 Enantioselectivity of the method
The selection of the stationary phase was critical for this method of using proteins as
mobile phase additives. The functions of the stationary phase were twofold, the first
was to reduce protein adsorption on the surface of the particles and the second was to
allow the adsorption of the analytes. The stationary phase selected which closely
matched the two required functions was Lichrosorb DIOL. The mobile phase was
aqueous phosphate buffer which gave the best possibility to the analyte to adsorb
onto the stationary phase.
Of the compounds tested, tryptophan, Fig. 102 and kynurenine, Fig. 103, were
resolved into their individual enantiomers, Table 101. It was observed that the
resolution of tryptophan occurred only when the concentration of BSA was raised to
60 µM. This was in contrast with CE results where tryptophan was resolved with a
BSA concentration of 30 µM in the run buffer.
Warfarin had a low k value so this method was not appropriate. Temazepam had a
moderate k value and therefore a greater concentration would probably be required
for chiral resolution. No peaks were observed for benzoin and thioridazine which
were highly retained on the stationary phase.
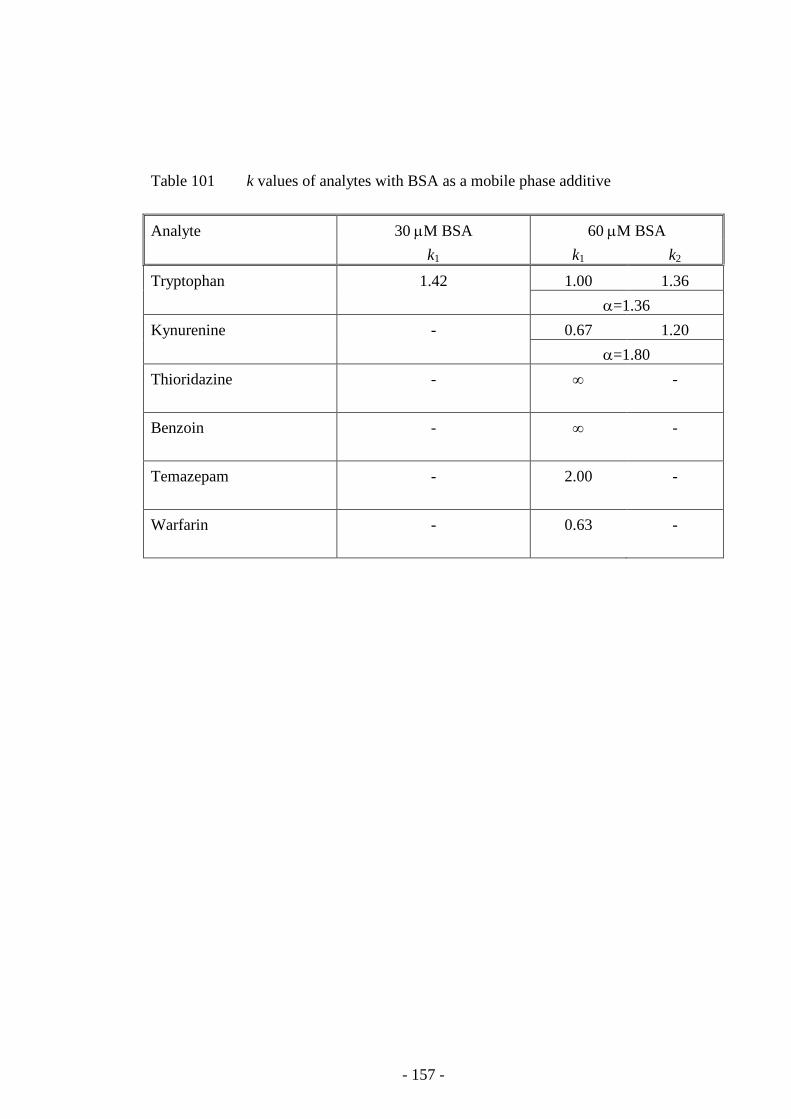
- 157 -
Table 101 k values of analytes with BSA as a mobile phase additive Analyte 30 µM BSA 60 µM BSA k1 k1 k2 Tryptophan 1.42 1.00 1.36
α=1.36 Kynurenine - 0.67 1.20
α=1.80 Thioridazine
- ∞ -
Benzoin
- ∞ -
Temazepam
- 2.00 -
Warfarin
- 0.63 -
- 158 -
Fig. 102 Resolution of tryptophan using free-solution BSA and microbore HPLC.
Conditions: mobile phase, 67 mM phosphate (pH 7.4), 60 µM BSA; column,
Lichrosorb DIOL, 5 µM particle diameter, 60 Å pore size 15 cm x 1 mm i.d.; flow
rate, 50 µl min-1.
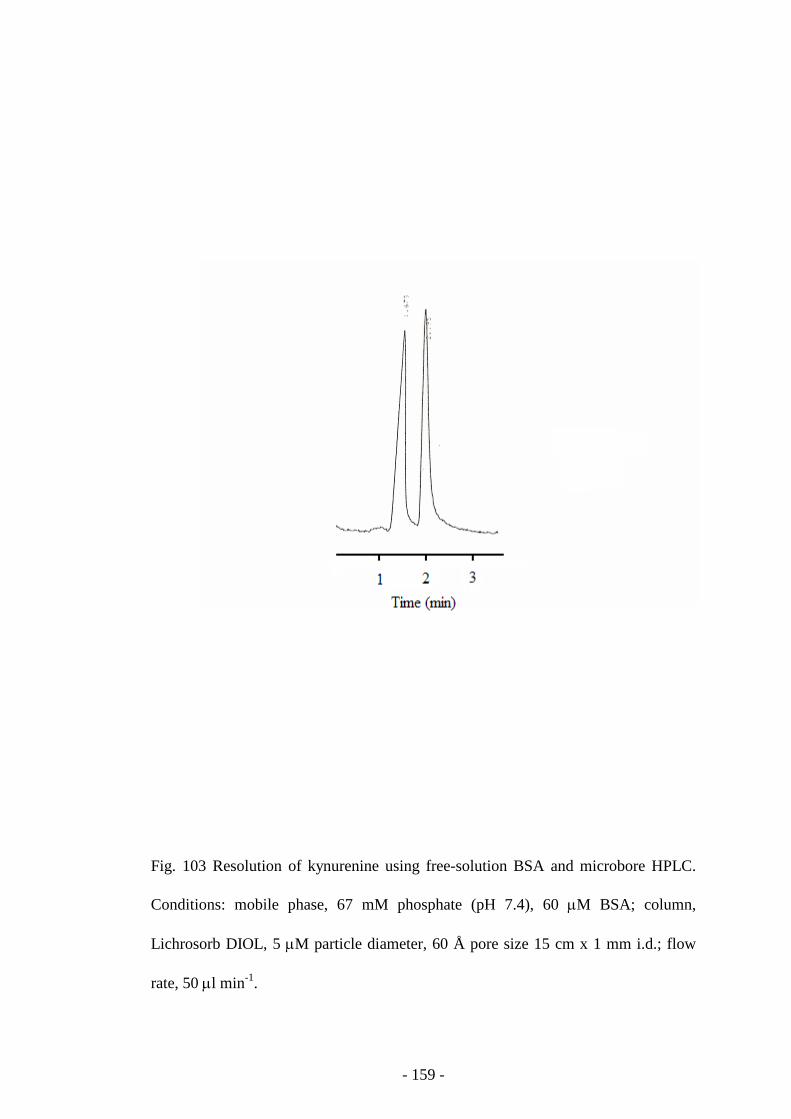
- 159 -
Fig. 103 Resolution of kynurenine using free-solution BSA and microbore HPLC.
Conditions: mobile phase, 67 mM phosphate (pH 7.4), 60 µM BSA; column,
Lichrosorb DIOL, 5 µM particle diameter, 60 Å pore size 15 cm x 1 mm i.d.; flow
rate, 50 µl min-1.
- 160 -
7.2.3 Method practicalities
Although this method provided chiral resolutions and, given the nature of the
retention mechanism, had potential as a viable alternative for exploring potential
drug-protein interactions, there were a few challenges which made the method
difficult to use. For example, over a period of time it was observed that the
enantioselectivity for the tryptophan separation deteriorated, Fig. 104.
With the column being pumped with buffer / protein mobile phase it was possible
that some of the protein would adsorb onto the stationary phase, at least outside of
the pores including at the entrances to the pores. This would have the effect of
blocking the pores and decrease the overall number of sites where the tryptophan
could adsorb onto the stationary phase. Overall the tryptophan enantiomers would
remain more in the mobile phase and as the mechanism for enantioselectivity was for
the least bound enantiomer to adsorb onto the stationary phase then the
enantioselectivity decreased.
This method also suffered the same inherent problems relating to UV detection as
was found for the corresponding CE method. This was more pronounced as the
overall concentration of BSA was 60 µM compared to 30 µM of the CE method.
With the mobile phase used and using a column of 1 mm i.d. there was always the
possibility of some precipitation with the chromatographic system. Indeed this
problem did manifest itself on several occasions, which was indicated by a general
increase in the backpressure of the system.
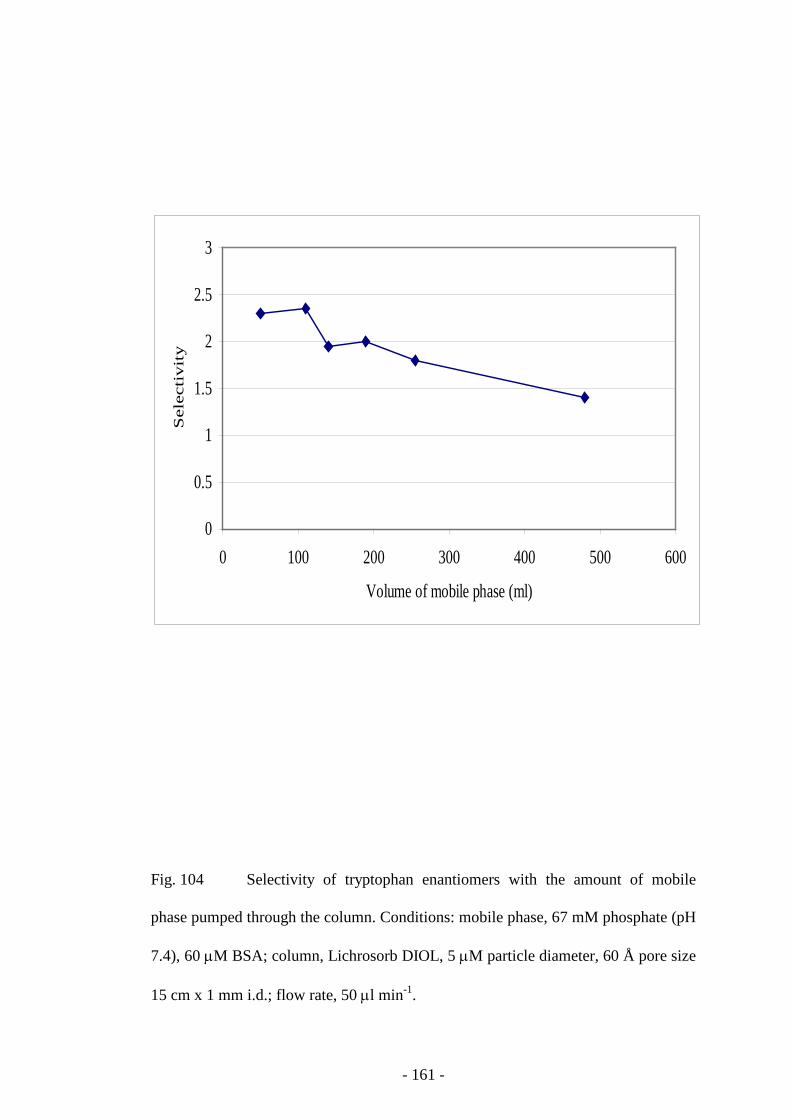
- 161 -
Fig. 104 Selectivity of tryptophan enantiomers with the amount of mobile
phase pumped through the column. Conditions: mobile phase, 67 mM phosphate (pH
7.4), 60 µM BSA; column, Lichrosorb DIOL, 5 µM particle diameter, 60 Å pore size
15 cm x 1 mm i.d.; flow rate, 50 µl min-1.
0
0.5
1
1.5
2
2.5
3
0 100 200 300 400 500 600
Volume of mobile phase (ml)
Sel
ecti
vit
y
- 162 -
Fortunately it was discovered that the principal sites of the adsorption were the
column frits and so the life of the column was extended by replacing the frits when
the system backpressure limit was exceeded.
7.3 BSA as a mobile phase additive in capillary LC
Following the success of using BSA as a mobile phase additive in microbore LC it
was an obvious choice to use the same methodology in capillary LC. This would
have offered a greater saving in protein consumption. To perform a similar amount
of analysis using a 0.3 mm i.d. capillary column compared to a 1 mm i.d. microbore
column with equivalent flow rate would require approximately 10 % of the
corresponding mobile phase. Unfortunately the method practicalities detailed earlier
were such that no analysis was performed. The major issue was the ease by which
the column became blocked with only a small amount of the mobile phase being
pumped through the column. Unlike the microbore columns it was impractical to
clean the frits to perform any analysis.
7.4 Conclusions
Despite the practical problems, which were an inconvenience rather than a major
limitation, this method offered the opportunity of studying enantioselectivity of
proteins in free solution HPLC, i.e. with the in vivo tertiary structure preserved and
without having to deal with the problems posed by the need to find suitable
chemistry for bonding to the stationary phase. Importantly, with respect to proteins
which might not be readily accessible, the amount of protein required was relatively
small and when using a concentration of 60 µM of BSA and a flow rate of
- 163 -
50 µl min-1 the amount of BSA consumed during a 20 min run would be
approximately 4 mg. Therefore, 2 g of BSA allowed a total analysis time of several
days which would be more than adequate to study a range of compounds with this
system.
Provided the practical difficulties of using proteins as mobile phase additives in
capillary LC could be overcome then the consumption of protein could be decreased
further. For example, using the same mobile phase running at 3 µl min-1 would
consume the equivalent of 0.25 mg BSA. Another development which could further
reduce the amount of protein required is nanoscale high-performance liquid
chromatography (nano-LC) [Chervet 1996 & Heron 2000]. Using columns of 0.1
mm i.d. and a flowrate of 0.15 ml min-1 the amount of protein consumed in an
equivalent 20 min run would be approximately 13 µg. Healy [Healy 2001] has
reported a 1000 fold reduction in reagent consumption when using methyl-β-
cyclodextrin as a mobile phase additive to separate naproxen enantiomers using
nano-LC compared to conventional LC. Therefore, with such technologies it would
allow the use of rare and expensive biomacromolecules to study enantioselectivity
and protein-ligand binding.
- 164 -
Chapter 8 BSA as a pseudo stationary phase in microbore HPLC
8.1 Introduction
While the first priority had been to study the use of BSA present in its free form in
the mobile phase, there was still some merit in studying systems in which the BSA
was incorporated into the stationary phase. These types of systems would offer two
key advantages over using the protein as a mobile phase additive. Once the protein
had loosely adsorbed onto the stationary phase then the mobile phase used for the
analysis would be protein free thereby decreasing the amount of protein required
significantly. Also when using a protein free mobile phase, practical issues such as
high UV detector background and possible frit blockage would not arise. The aim
therefore of this part of the research programme was to develop a reduced
dimensions system where the BSA was adsorbed onto the stationary phase in such a
way that the BSA did not bleed off the column after the BSA was removed from the
mobile phase.
A protocol for coating a stationary phase with protein had been reported for a
conventional scale LC system using the ‘bare’ silica material, Nucleosil [Erlandsson
1986]. However, since the protein was thought to be adsorbed through interaction of
the amino-groups with the weakly acidic silica, it was decided to first investigate the
use of a less polar material stationary phase in order to reduce the chance of
distortion of the protein tertiary structure occurring.
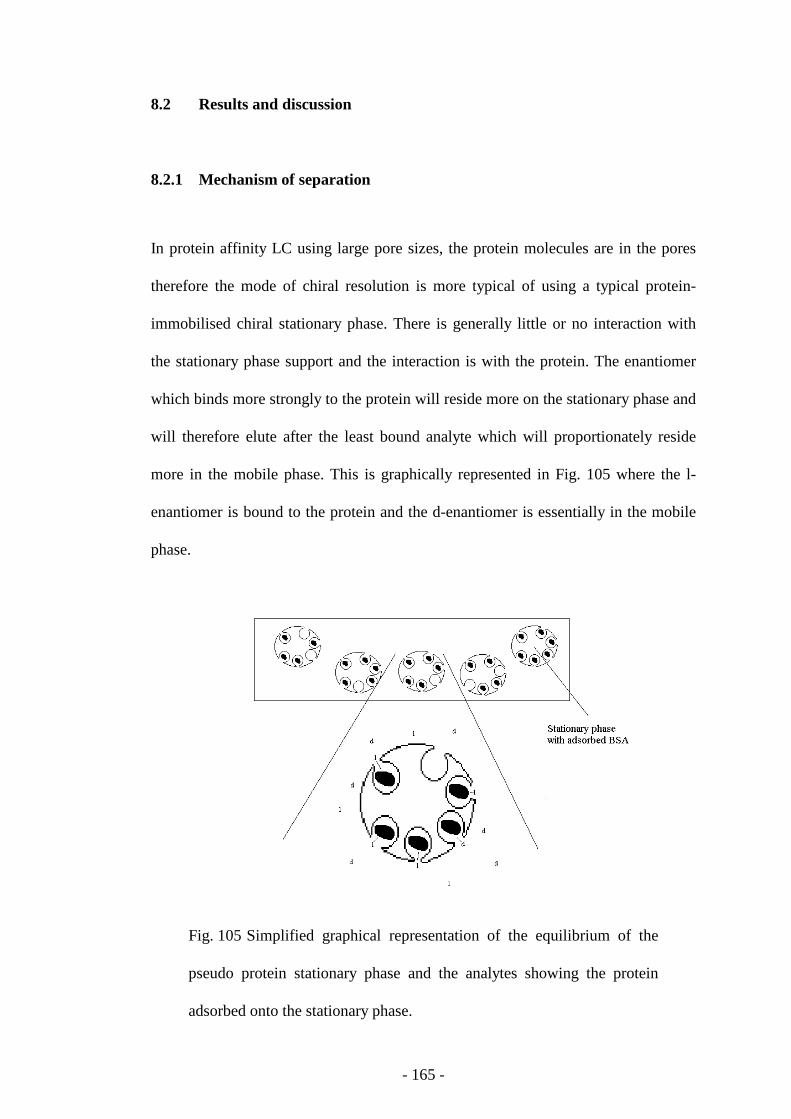
- 165 -
8.2 Results and discussion
8.2.1 Mechanism of separation
In protein affinity LC using large pore sizes, the protein molecules are in the pores
therefore the mode of chiral resolution is more typical of using a typical protein-
immobilised chiral stationary phase. There is generally little or no interaction with
the stationary phase support and the interaction is with the protein. The enantiomer
which binds more strongly to the protein will reside more on the stationary phase and
will therefore elute after the least bound analyte which will proportionately reside
more in the mobile phase. This is graphically represented in Fig. 105 where the l-
enantiomer is bound to the protein and the d-enantiomer is essentially in the mobile
phase.
Fig. 105 Simplified graphical representation of the equilibrium of the
pseudo protein stationary phase and the analytes showing the protein
adsorbed onto the stationary phase.
- 166 -
8.2.2 BSA as a pseudo stationary phase on a C8 stationary phase
Using a very similar protocol to that which had been reported in the literature for
Nucleosil, BSA was strongly adsorbed onto the wide pore C8 stationary phase, Fig.
106. In order to improve the forming of the pseudo stationary phase the BSA was
pumped through the column at pH 5.0. This was approximately at the pI of BSA and
as the BSA would be neutral at this pH it would more easily adsorb into the
hydrophobic pores.
After adsorption at pH 5.0, the mobile phase pH was switched to 7.4 and there was
no evidence, e.g. elevation of baseline, of significant desorption for some time. This
made it possible to undertake more than enough HPLC than would be needed to
evaluate it if it had been an unusual protein only available in small quantities.
From earlier work using BSA as a chiral selector in CE a wide range of test analytes
had been accumulated so it was therefore possible to screen a large number of these
analytes using the LC protocol. Separations of the enantiomers of tryptophan and
kynurenine were achieved on the BSA pseudo stationary phase, Fig. 107 and 108
showing very good selectivity in both cases without the limitation of the previous
method of background UV absorbance from the protein in the mobile phase.
Particularly for kynurenine there was peak tailing of the more strongly bound
enantiomer but this did not compromise the degree of resolution. However, a number
of test analytes were retained with very high k even when some methanol was added
to the mobile phase.
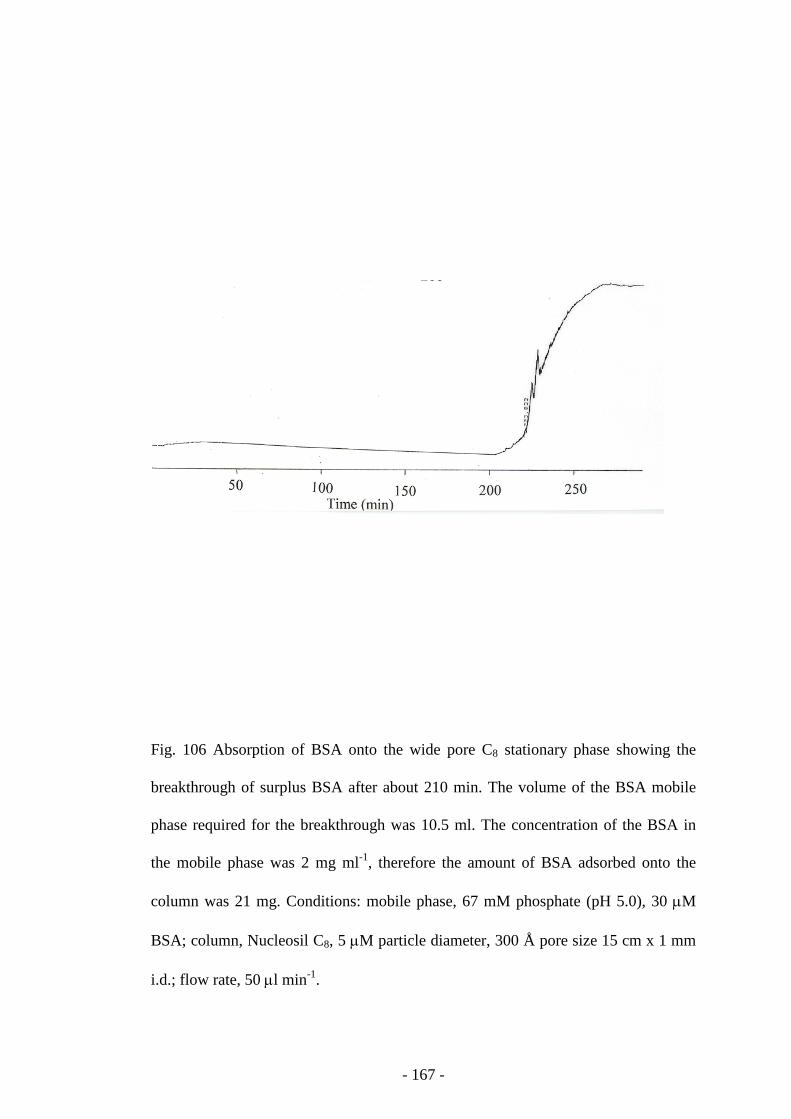
- 167 -
Fig. 106 Absorption of BSA onto the wide pore C8 stationary phase showing the
breakthrough of surplus BSA after about 210 min. The volume of the BSA mobile
phase required for the breakthrough was 10.5 ml. The concentration of the BSA in
the mobile phase was 2 mg ml-1, therefore the amount of BSA adsorbed onto the
column was 21 mg. Conditions: mobile phase, 67 mM phosphate (pH 5.0), 30 µM
BSA; column, Nucleosil C8, 5 µM particle diameter, 300 Å pore size 15 cm x 1 mm
i.d.; flow rate, 50 µl min-1.
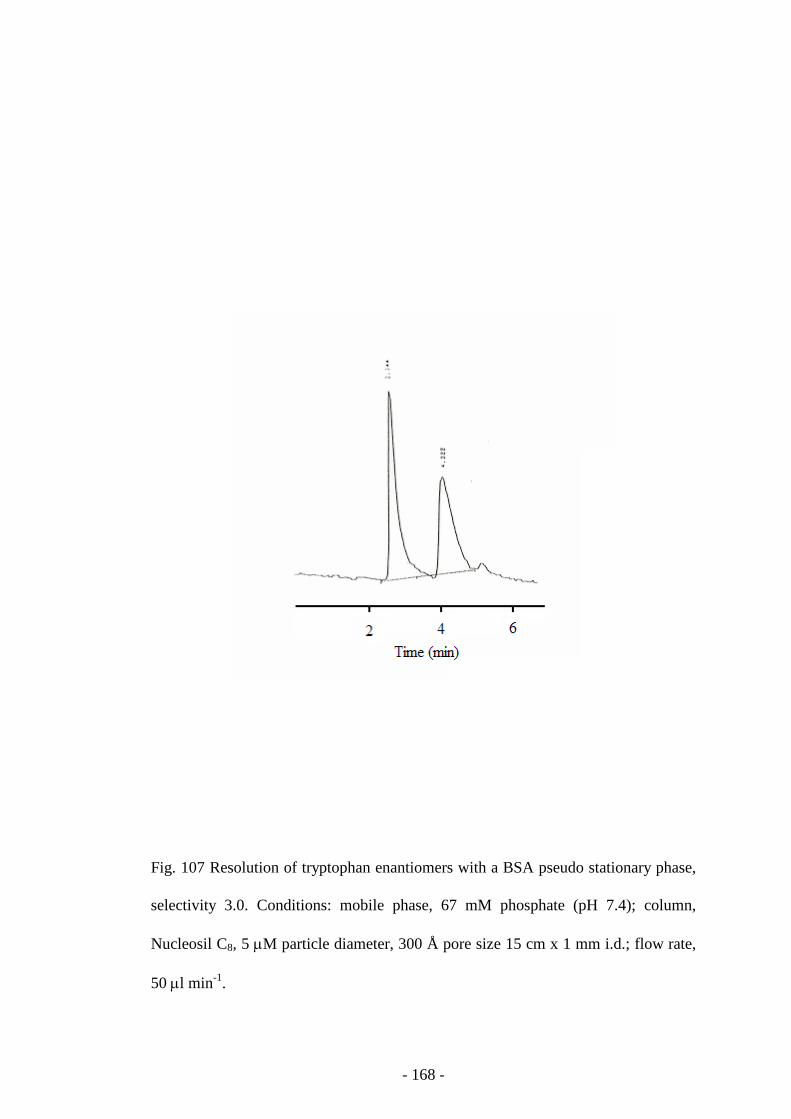
- 168 -
Fig. 107 Resolution of tryptophan enantiomers with a BSA pseudo stationary phase,
selectivity 3.0. Conditions: mobile phase, 67 mM phosphate (pH 7.4); column,
Nucleosil C8, 5 µM particle diameter, 300 Å pore size 15 cm x 1 mm i.d.; flow rate,
50 µl min-1.
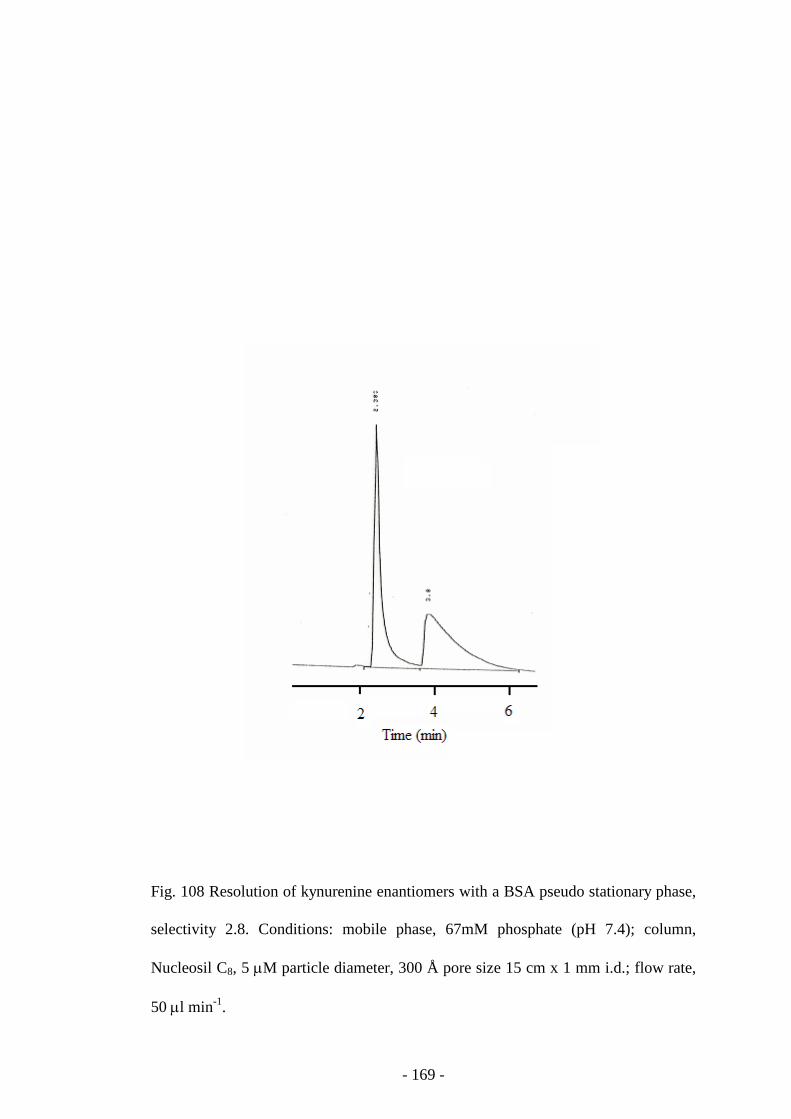
- 169 -
Fig. 108 Resolution of kynurenine enantiomers with a BSA pseudo stationary phase,
selectivity 2.8. Conditions: mobile phase, 67mM phosphate (pH 7.4); column,
Nucleosil C8, 5 µM particle diameter, 300 Å pore size 15 cm x 1 mm i.d.; flow rate,
50 µl min-1.
- 170 -
This would not be expected on, for example, a high density BSA-immobilised chiral
stationary phase [Allenmark 1986 & Zhan 2000]. The logical conclusion then was
that there was still a significant area of exposed C8 surface and that it was this that
was giving rise to the excessive retention.
8.3.3 BSA as a pseudo stationary phase on a DIOL stationary phase
Since the C8 stationary phase appeared to be too hydrophobic, attempts were
therefore made to use a more hydrophilic wide pore DIOL phase but very little, 4 mg
BSA was retained in the pores, Fig. 109. This small amount of adsorbed BSA was
insufficient to give either a chiral separation or even significant retention for either
tryptophan or kynurenine.
8.3.4 BSA as a pseudo stationary phase on Nucleosil silica
Given that neither using wide pore C8 nor DIOL stationary phases had proved to be
satisfactory supports for BSA, it was decided to revert to investigating the use of
wide pore Nucleosil, Fig. 110, despite the aforementioned problem of the interaction
of the amino-groups with the weakly acidic silica. More compounds were eluted than
had been the case with C8 and, as had been observed when a similar system had been
used on a conventional scale column [Erlandsson 1986]. Some chiral separation was
achieved for the majority of the analytes in the test set, Table 111.
The amount of BSA retained by the pores was 70 mg. This was greater than the BSA
retained on the DIOL column, 4 mg, and the C8 column, 21 mg. However, this was
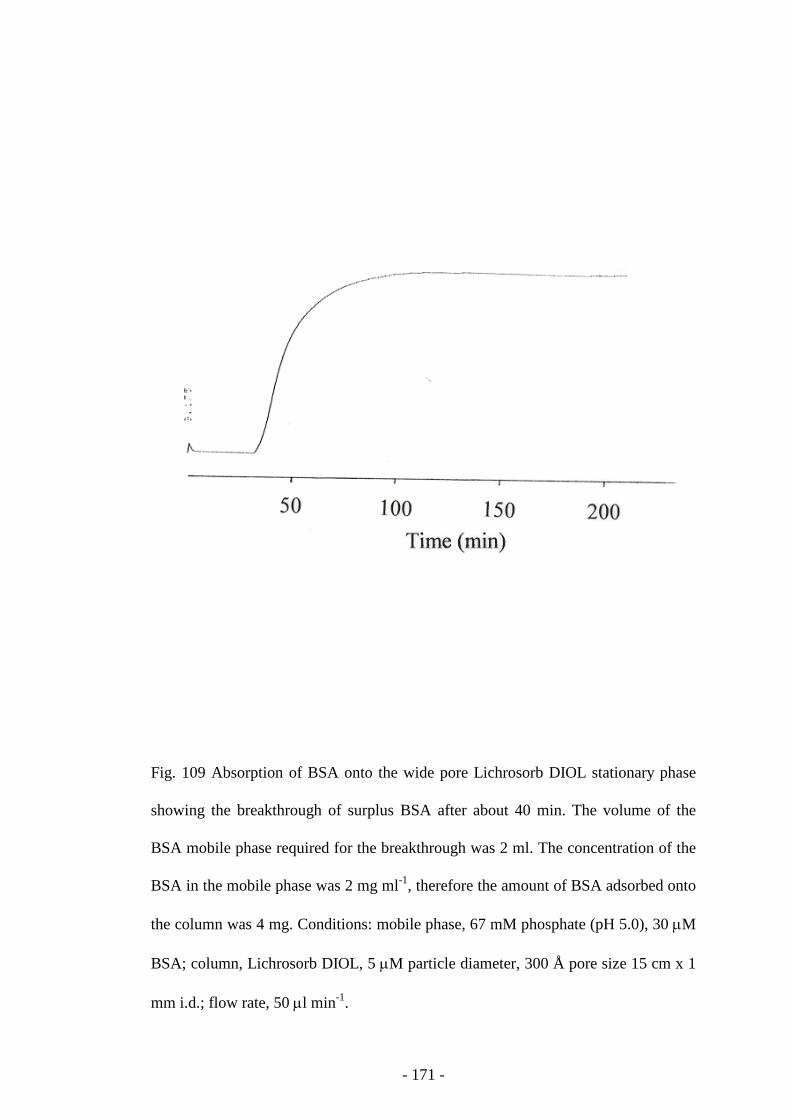
- 171 -
Fig. 109 Absorption of BSA onto the wide pore Lichrosorb DIOL stationary phase
showing the breakthrough of surplus BSA after about 40 min. The volume of the
BSA mobile phase required for the breakthrough was 2 ml. The concentration of the
BSA in the mobile phase was 2 mg ml-1, therefore the amount of BSA adsorbed onto
the column was 4 mg. Conditions: mobile phase, 67 mM phosphate (pH 5.0), 30 µM
BSA; column, Lichrosorb DIOL, 5 µM particle diameter, 300 Å pore size 15 cm x 1
mm i.d.; flow rate, 50 µl min-1.
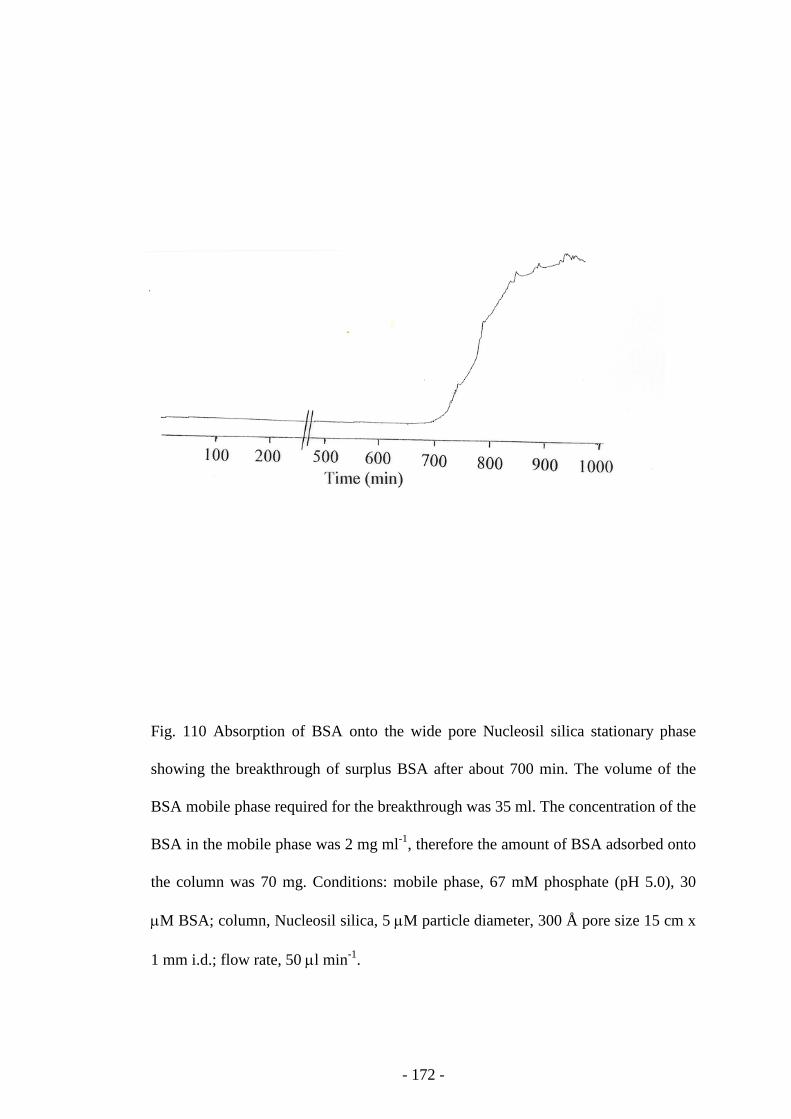
- 172 -
Fig. 110 Absorption of BSA onto the wide pore Nucleosil silica stationary phase
showing the breakthrough of surplus BSA after about 700 min. The volume of the
BSA mobile phase required for the breakthrough was 35 ml. The concentration of the
BSA in the mobile phase was 2 mg ml-1, therefore the amount of BSA adsorbed onto
the column was 70 mg. Conditions: mobile phase, 67 mM phosphate (pH 5.0), 30
µM BSA; column, Nucleosil silica, 5 µM particle diameter, 300 Å pore size 15 cm x
1 mm i.d.; flow rate, 50 µl min-1.
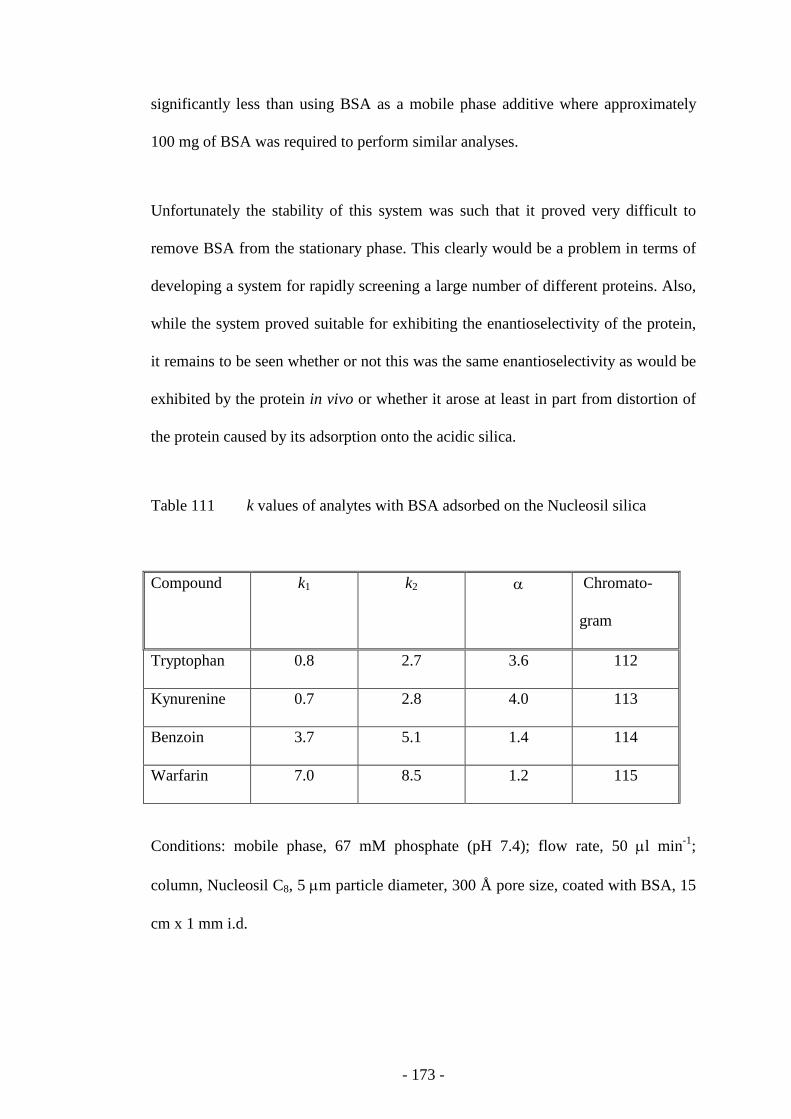
- 173 -
significantly less than using BSA as a mobile phase additive where approximately
100 mg of BSA was required to perform similar analyses.
Unfortunately the stability of this system was such that it proved very difficult to
remove BSA from the stationary phase. This clearly would be a problem in terms of
developing a system for rapidly screening a large number of different proteins. Also,
while the system proved suitable for exhibiting the enantioselectivity of the protein,
it remains to be seen whether or not this was the same enantioselectivity as would be
exhibited by the protein in vivo or whether it arose at least in part from distortion of
the protein caused by its adsorption onto the acidic silica.
Table 111 k values of analytes with BSA adsorbed on the Nucleosil silica
Compound k1 k2 α Chromato-
gram
Tryptophan 0.8 2.7 3.6 112
Kynurenine 0.7 2.8 4.0 113
Benzoin 3.7 5.1 1.4 114
Warfarin 7.0 8.5 1.2 115
Conditions: mobile phase, 67 mM phosphate (pH 7.4); flow rate, 50 µl min-1;
column, Nucleosil C8, 5 µm particle diameter, 300 Å pore size, coated with BSA, 15
cm x 1 mm i.d.
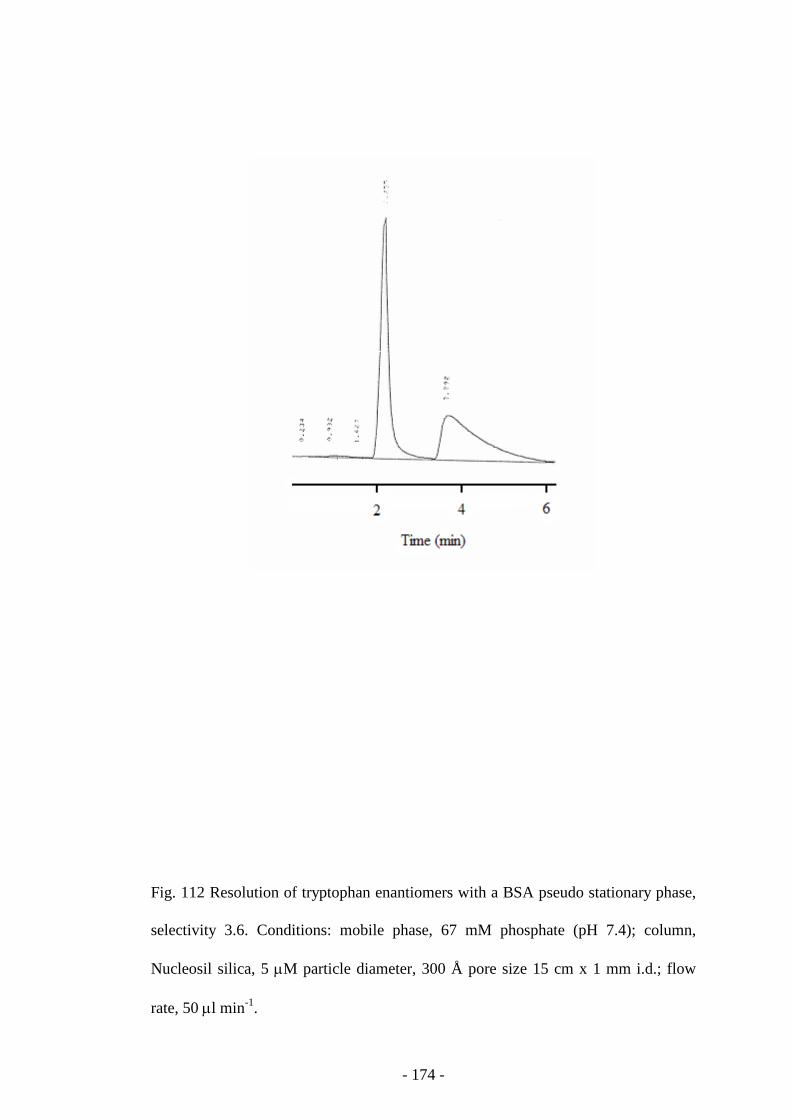
- 174 -
Fig. 112 Resolution of tryptophan enantiomers with a BSA pseudo stationary phase,
selectivity 3.6. Conditions: mobile phase, 67 mM phosphate (pH 7.4); column,
Nucleosil silica, 5 µM particle diameter, 300 Å pore size 15 cm x 1 mm i.d.; flow
rate, 50 µl min-1.
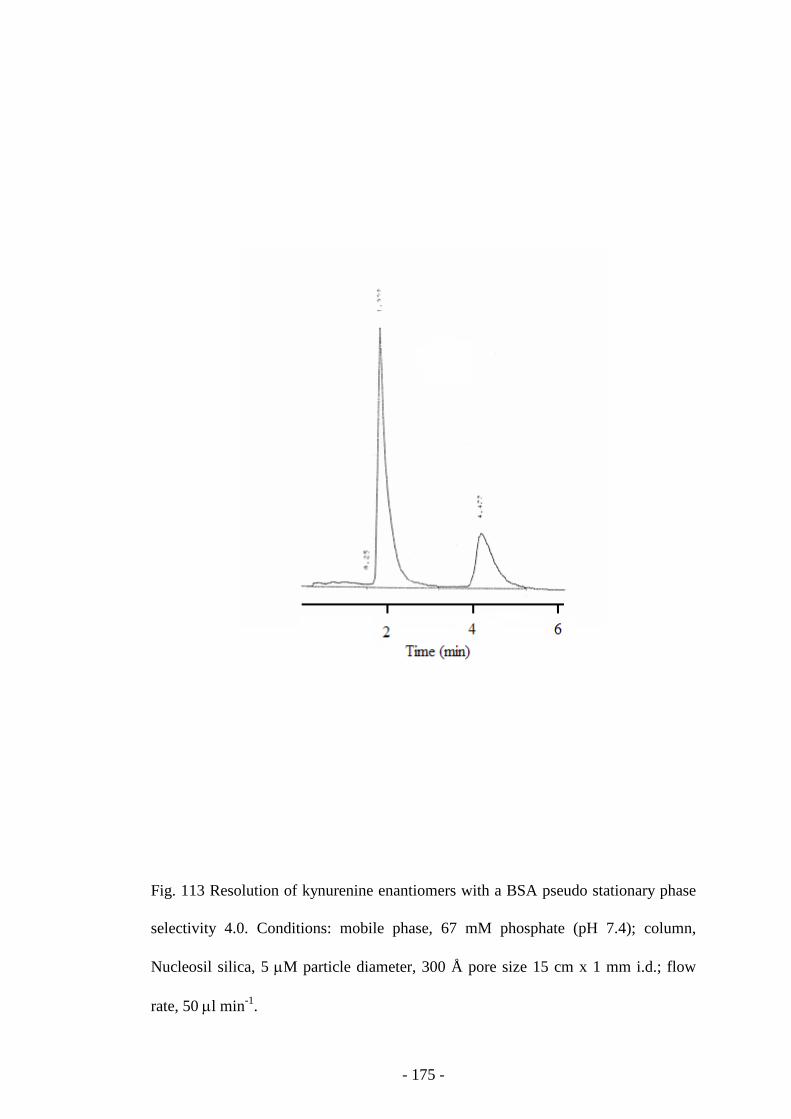
- 175 -
Fig. 113 Resolution of kynurenine enantiomers with a BSA pseudo stationary phase
selectivity 4.0. Conditions: mobile phase, 67 mM phosphate (pH 7.4); column,
Nucleosil silica, 5 µM particle diameter, 300 Å pore size 15 cm x 1 mm i.d.; flow
rate, 50 µl min-1.
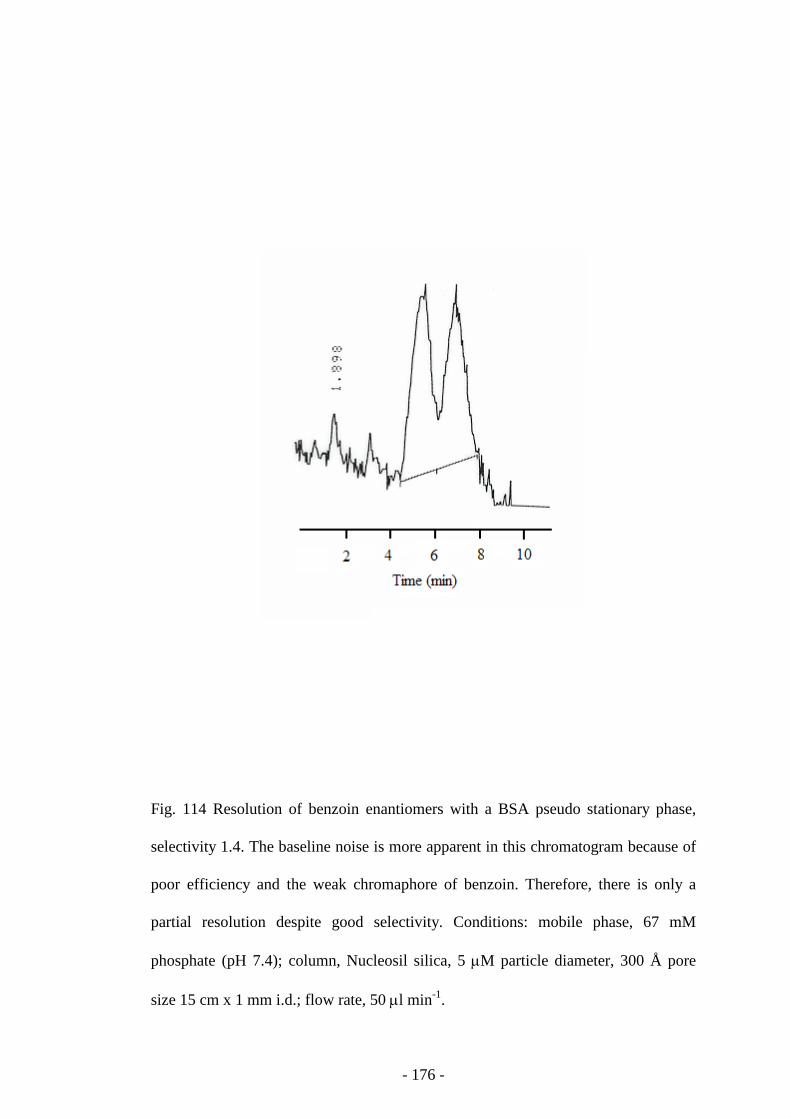
- 176 -
Fig. 114 Resolution of benzoin enantiomers with a BSA pseudo stationary phase,
selectivity 1.4. The baseline noise is more apparent in this chromatogram because of
poor efficiency and the weak chromaphore of benzoin. Therefore, there is only a
partial resolution despite good selectivity. Conditions: mobile phase, 67 mM
phosphate (pH 7.4); column, Nucleosil silica, 5 µM particle diameter, 300 Å pore
size 15 cm x 1 mm i.d.; flow rate, 50 µl min-1.
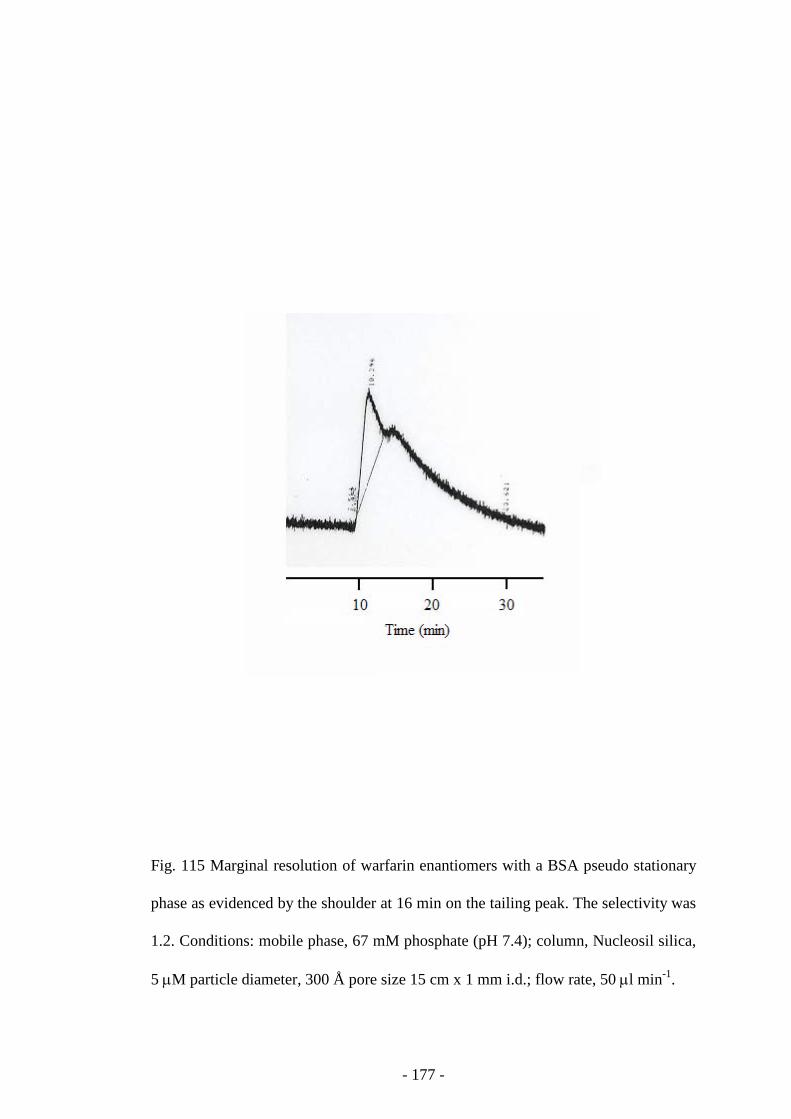
- 177 -
Fig. 115 Marginal resolution of warfarin enantiomers with a BSA pseudo stationary
phase as evidenced by the shoulder at 16 min on the tailing peak. The selectivity was
1.2. Conditions: mobile phase, 67 mM phosphate (pH 7.4); column, Nucleosil silica,
5 µM particle diameter, 300 Å pore size 15 cm x 1 mm i.d.; flow rate, 50 µl min-1.
- 178 -
8.4 Conclusions
Given the problems with the narrow pore DIOL and wide-pore C8 systems and the
fact that the use of the Hummel-Dreyer method with a number of matrix experiments
[Oravcova1 1996 & Oravcova2 1996] and the complexity of immobilised artificial
membrane (IAM) phases [Ong 1996] had already been discounted, the Nucleosil
system looked to have the most potential, certainly for generating good chiral
resolution without consuming too much protein. However, in terms of being used as
a model for studying drug-protein interactions, it would need to be evaluated with
HSA and a large set of common drugs to determine whether the LC retention
reflected known drug-HSA binding properties and some way would have to be found
to quickly remove adsorbed protein before moving on to the study of another.
Alternatively the C8 phase could be used if the set of test analytes could be restricted
to polar compounds. Another perspective, bearing in mind the increasing more recent
importance of screening for drug-protein interactions in drug candidate pre-
development screening [Moaddel 2002] is that the use of one column per protein
need not necessarily be considered as extravagant.
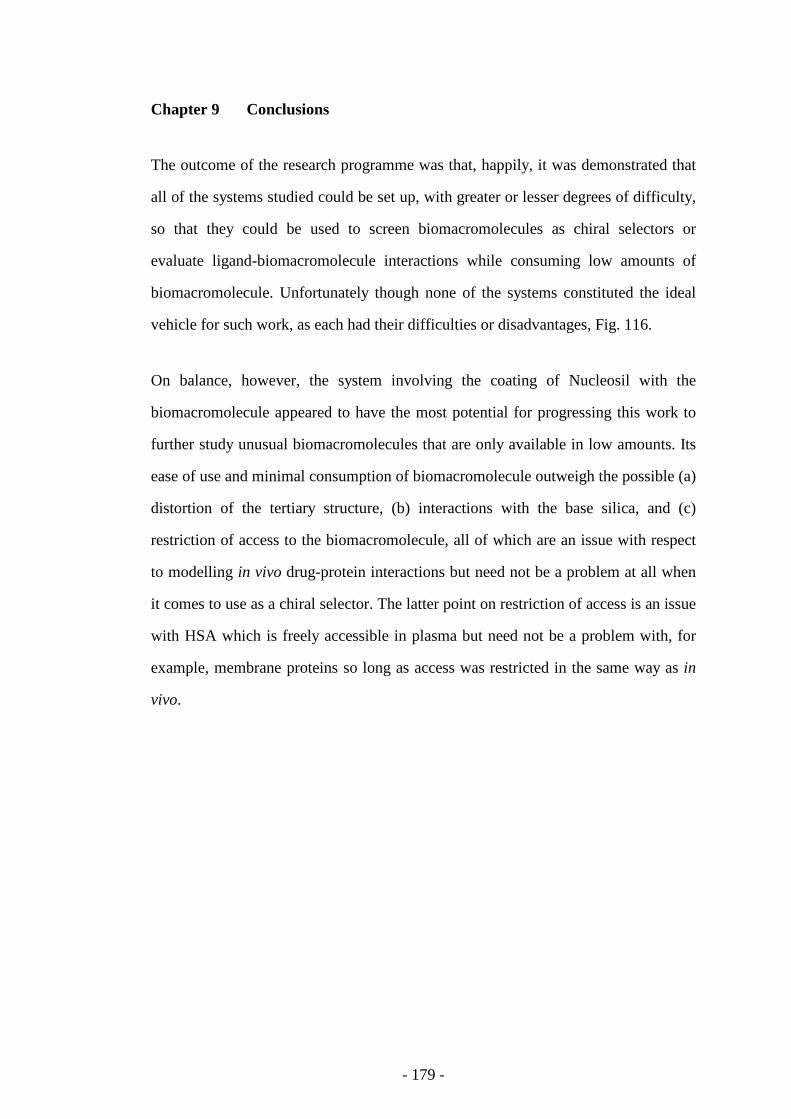
- 179 -
Chapter 9 Conclusions
The outcome of the research programme was that, happily, it was demonstrated that
all of the systems studied could be set up, with greater or lesser degrees of difficulty,
so that they could be used to screen biomacromolecules as chiral selectors or
evaluate ligand-biomacromolecule interactions while consuming low amounts of
biomacromolecule. Unfortunately though none of the systems constituted the ideal
vehicle for such work, as each had their difficulties or disadvantages, Fig. 116.
On balance, however, the system involving the coating of Nucleosil with the
biomacromolecule appeared to have the most potential for progressing this work to
further study unusual biomacromolecules that are only available in low amounts. Its
ease of use and minimal consumption of biomacromolecule outweigh the possible (a)
distortion of the tertiary structure, (b) interactions with the base silica, and (c)
restriction of access to the biomacromolecule, all of which are an issue with respect
to modelling in vivo drug-protein interactions but need not be a problem at all when
it comes to use as a chiral selector. The latter point on restriction of access is an issue
with HSA which is freely accessible in plasma but need not be a problem with, for
example, membrane proteins so long as access was restricted in the same way as in
vivo.
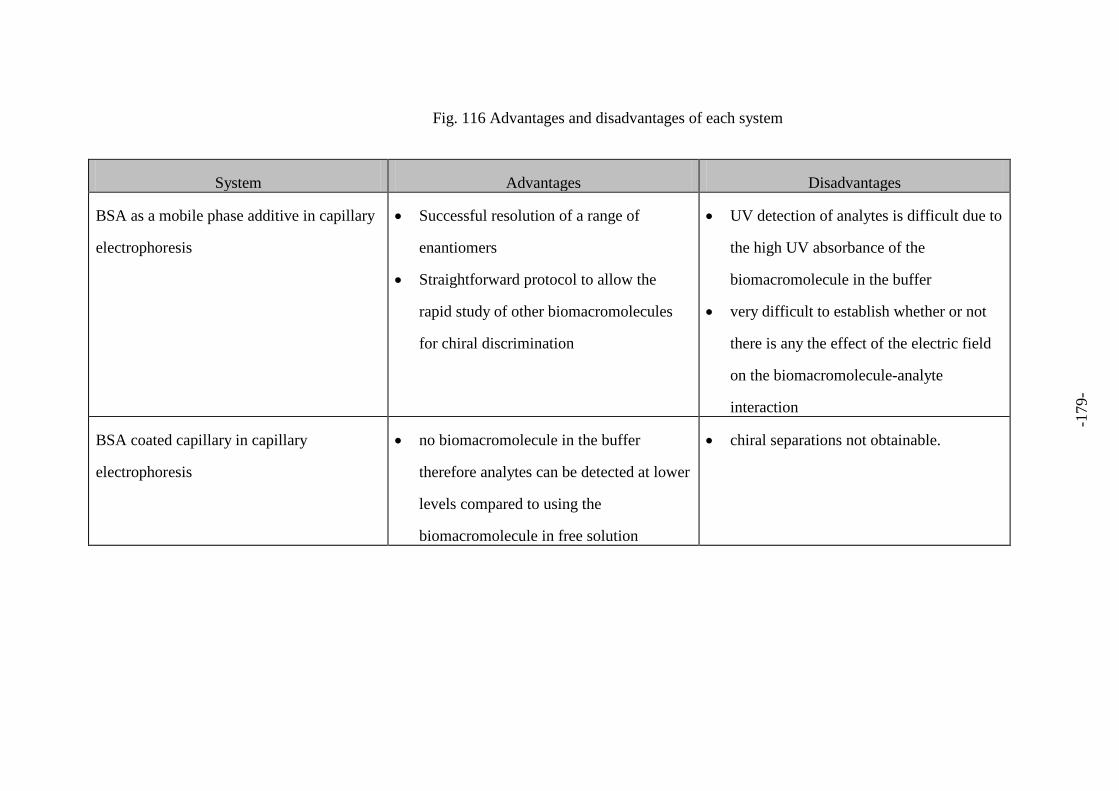
Fig. 116 Advantages and disadvantages of each system
System Advantages Disadvantages
BSA as a mobile phase additive in capillary
electrophoresis
• Successful resolution of a range of
enantiomers
• Straightforward protocol to allow the
rapid study of other biomacromolecules
for chiral discrimination
• UV detection of analytes is difficult due to
the high UV absorbance of the
biomacromolecule in the buffer
• very difficult to establish whether or not
there is any the effect of the electric field
on the biomacromolecule-analyte
interaction
BSA coated capillary in capillary
electrophoresis
• no biomacromolecule in the buffer
therefore analytes can be detected at lower
levels compared to using the
biomacromolecule in free solution
• chiral separations not obtainable.
-179
-
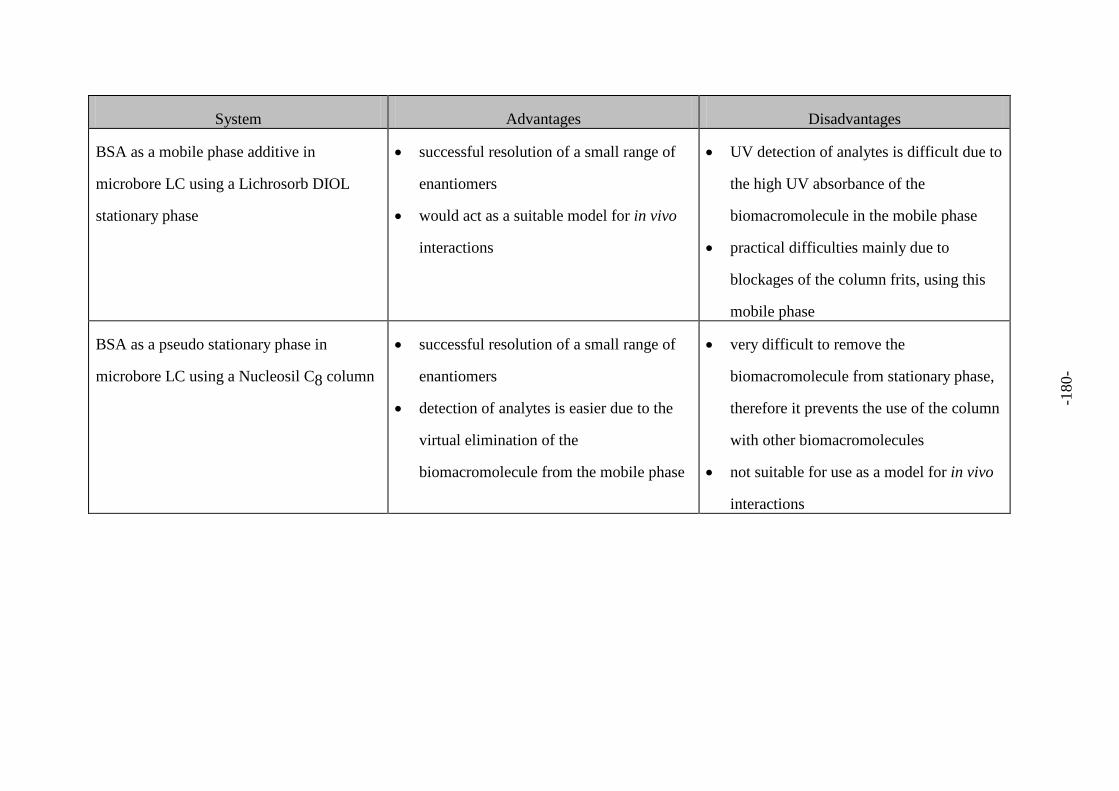
System Advantages Disadvantages
BSA as a mobile phase additive in
microbore LC using a Lichrosorb DIOL
stationary phase
• successful resolution of a small range of
enantiomers
• would act as a suitable model for in vivo
interactions
• UV detection of analytes is difficult due to
the high UV absorbance of the
biomacromolecule in the mobile phase
• practical difficulties mainly due to
blockages of the column frits, using this
mobile phase
BSA as a pseudo stationary phase in
microbore LC using a Nucleosil C8 column
• successful resolution of a small range of
enantiomers
• detection of analytes is easier due to the
virtual elimination of the
biomacromolecule from the mobile phase
• very difficult to remove the
biomacromolecule from stationary phase,
therefore it prevents the use of the column
with other biomacromolecules
• not suitable for use as a model for in vivo
interactions
-180
-
System Advantages Disadvantages
BSA as a pseudo- stationary phase in
microbore LC using a Lichrosorb DIOL
column
• does not adsorb biomacromolecules to the
same extent as the Nucleosil C8 column
• chiral separations not obtainable
BSA as a pseudo stationary phase in
microbore LC using a Nucleosil silica
column
• successful resolution a greater range of
enantiomers when compared to the
Nucleosil C8 column
• detection of analytes easier due to the
virtual elimination of the
biomacromolecule from the mobile phase
• Difficult to analyse in vivo interactions
-181
-
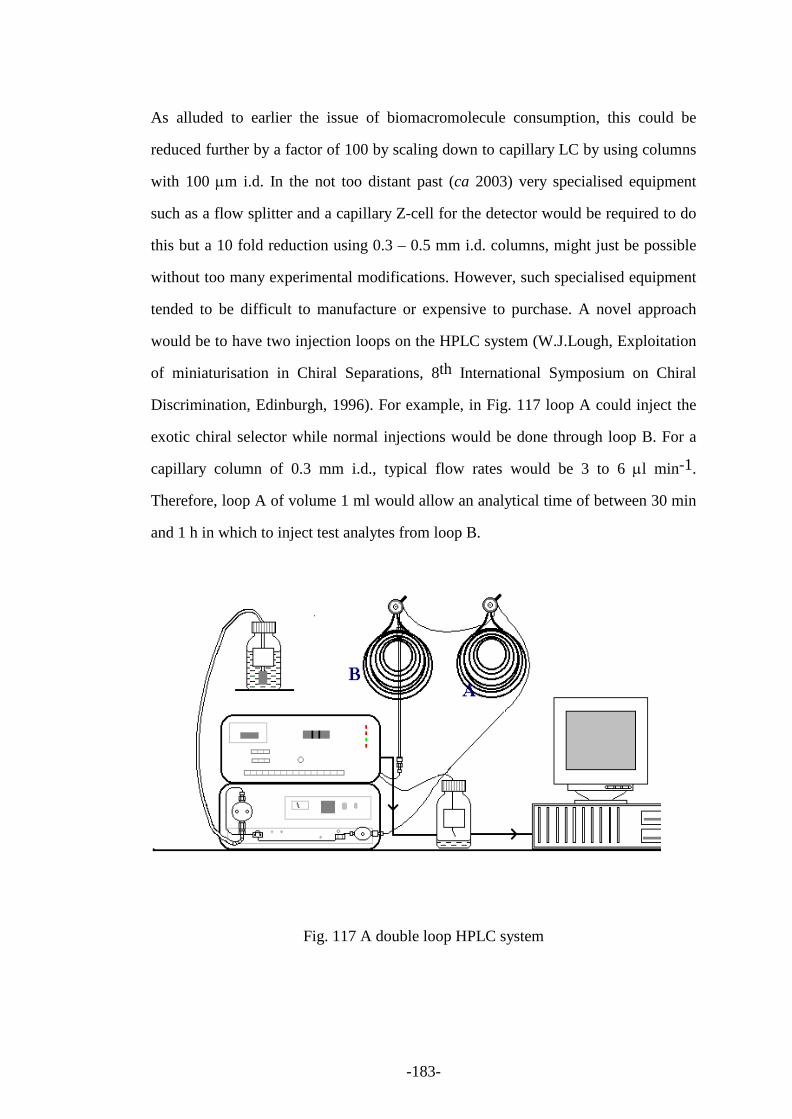
-183-
As alluded to earlier the issue of biomacromolecule consumption, this could be
reduced further by a factor of 100 by scaling down to capillary LC by using columns
with 100 µm i.d. In the not too distant past (ca 2003) very specialised equipment
such as a flow splitter and a capillary Z-cell for the detector would be required to do
this but a 10 fold reduction using 0.3 – 0.5 mm i.d. columns, might just be possible
without too many experimental modifications. However, such specialised equipment
tended to be difficult to manufacture or expensive to purchase. A novel approach
would be to have two injection loops on the HPLC system (W.J.Lough, Exploitation
of miniaturisation in Chiral Separations, 8th International Symposium on Chiral
Discrimination, Edinburgh, 1996). For example, in Fig. 117 loop A could inject the
exotic chiral selector while normal injections would be done through loop B. For a
capillary column of 0.3 mm i.d., typical flow rates would be 3 to 6 µl min-1.
Therefore, loop A of volume 1 ml would allow an analytical time of between 30 min
and 1 h in which to inject test analytes from loop B.
Fig. 117 A double loop HPLC system
-184-
Now in 2005, further miniaturisation than the scale employed in the studies reported
here would be much easier because of the ready availability of a range of nano-LC
systems such as those marketed in the UK by Dionex and Presearch. These systems
come with appropriate fittings for work at nano-scale and options for obtaining
focussing effects.
The work carried out on the individual systems in this research programme suggested
further directions that could be taken and some of these have already been
mentioned:
• prevention of the biomacromolecule masking the detection of analytes when used
in free solution.
• probe the allosteric interactions of different analytes with a range of different
biomacromolecules which could be achieved, for example, by the immobilisation
of the biomacromolecule within the capillary or by ensuring the analytes migrate
through the detector before the biomacromolecule.
• probe drug-protein binding properties on the most suitable system.
• use the most suitable system for modelling in vivo interactions, for example, a
widely used drug and the major blood proteins.
Much progress is still being made into the field of drug-protein binding since the
practical work was completed. Andre has reported the effects of salt modifiers on the
displacement of progesterone by beta-estradiol on human serum albumin by
biochromatogrpahy [ Andre 2003]. The stereoselective binding of 2,3-substituted 3-
hydroxypropionic acids was studied by HPLC and an immobilised human stationary
phase [Andrisano 2000]. HPLC and an immobilised human serum albumin stationary
phase also used to measure the reversible binding of valprolate [Bertucci 2002].
HPLC was also used to study the setereoselective binding of benzodiazepine and
coumarin drugs to serum albumins of human and six other mammalian species [Fitos
2002]. Immobilised-biomembrane affinity chromatography was used to study the
binding properties of human facilitative glucose transporter GLUT 1 [Gottschalk
-185-
2002]. Review articles have also been published on the uses of HPLC and CE to
study drug-protein / biopolymer interactions [Bertucci 2003], the use of the Hummel
and Dreyer method to measure binding parameters of ligand-macromolecule
interactions [Berger 2003] and the use of high-performance affinity chromatography
as a powerful tool to study serum protein binding [Hage 2002].
However, essentially, on the LC side it would now be possible to proceed to use the
systems, as mentioned the ‘biomacromolecule-coated-on-Nucleosil’ system in
particular, for a diverse range of applications.
It is a different matter on the CE side. Since the last practical work in this research
programme, much progress has been made in developing ‘partial filling’ protocols
for CE. Tanaka has used the paratial filling technique to separate enantiomers with
proteins as chiral selectors [Tanaka 1995] and the separation of basic drugs using α1-
acid glycoprotein [Tanaka 1997]. Brown used the same technique to study the
binding of D-Ala-D-Ala terminus peptides to vancomycin [Brown 2004]. A review
article has been written [Tanaka 2002] on the estimation of binding constants by
capillary electrophoresis and this included the use of the partial filling technique.
The partial filling protocol involves carefully filling the capillary with a
biomacromolecule containing buffer to just short of the detection window. The
analytical conditions are such that the analytes are able to migrate through the
biomacromolecules and to the detector while the biomacromolecules remain
stationary or migrate away from the detector, Fig. 26.
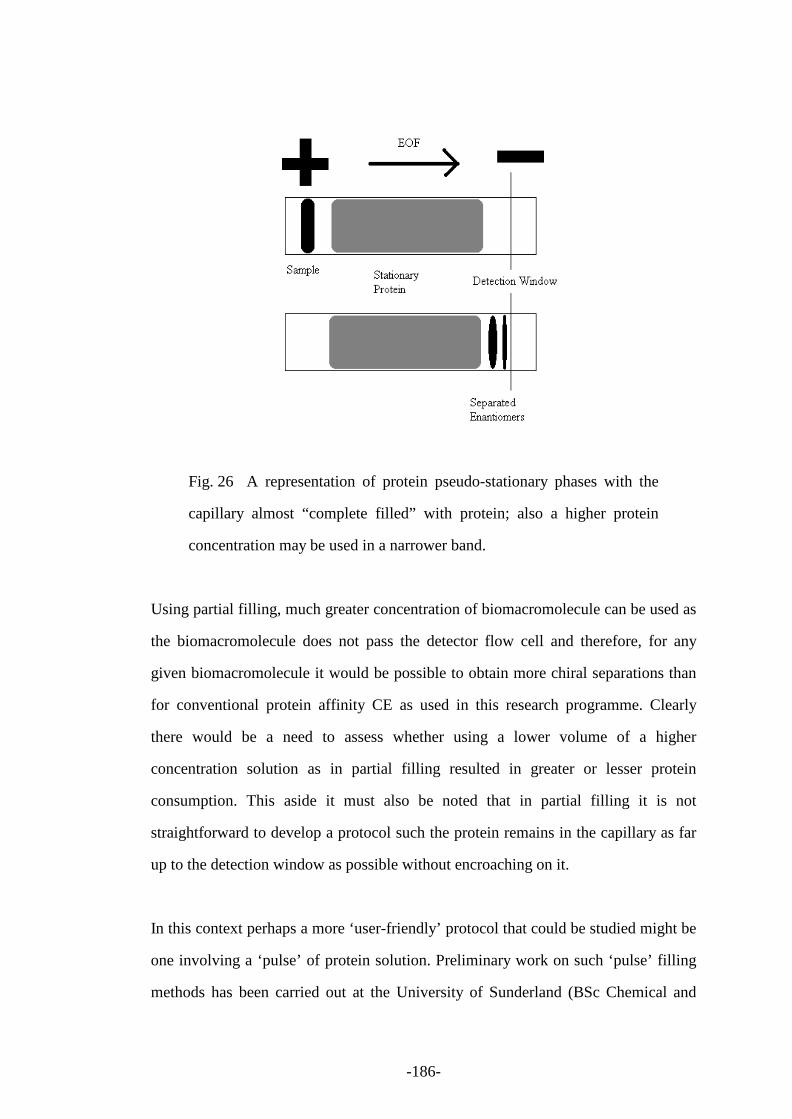
-186-
Fig. 26 A representation of protein pseudo-stationary phases with the
capillary almost “complete filled” with protein; also a higher protein
concentration may be used in a narrower band.
Using partial filling, much greater concentration of biomacromolecule can be used as
the biomacromolecule does not pass the detector flow cell and therefore, for any
given biomacromolecule it would be possible to obtain more chiral separations than
for conventional protein affinity CE as used in this research programme. Clearly
there would be a need to assess whether using a lower volume of a higher
concentration solution as in partial filling resulted in greater or lesser protein
consumption. This aside it must also be noted that in partial filling it is not
straightforward to develop a protocol such the protein remains in the capillary as far
up to the detection window as possible without encroaching on it.
In this context perhaps a more ‘user-friendly’ protocol that could be studied might be
one involving a ‘pulse’ of protein solution. Preliminary work on such ‘pulse’ filling
methods has been carried out at the University of Sunderland (BSc Chemical and
-187-
Pharmaceutical Science final year project, L.Williams, P Conjoyce and P.Wallis).
Unlike the partial-filling protocol, this protocol involves injecting a concentrated
plug of biomacromolecule into the capillary prior to the injection of the analytes. The
experimental conditions are such that the analytes migrate through the plug of protein
before UV detection. Unlike the partial filling protocol the biomacromolecule only
fills a fraction of the capillary so the experimental conditions do not have to be as
exact to prevent the biomacromolecule from being detected at the detector at the
same time as the analyte of interest.In this way ligand-biomacromolecule studies
could be carried out in a very rapid and simple manner. Again the only caveat would
be that checks would need to be made that excessively long or concentrated ‘plugs’
were not needed in order to bring about a chiral separation or (for ligand-
biomacromolecule interaction studies) a measurable shift in migration.
More recent developments such as this ‘pulse’ filling method would seem to
supersede the work carried out in the research programme described in this thesis.
However, it must be noted that quite a few variables need to be kept in check to
perfect these newer methodologies so that they are far less reliable and reproducible
than ‘complete’ or conventional capillary filling techniques. Therefore the CE
protocol developed here could still be used advantageously compared to the more
recent developments provided, for chiral resolution, the enatioselectivity was large
enough to give resolution when using a dilute selector solution and, for studying
ligand-protein interactions, the interactions are strong enough to bring about a change
in migration time when using very dilute protein solutions as the buffer. Happily
these provisos are not a restriction at all when screening for very good protein chiral
selectors or for studying many types of drug-biomacromolecule interaction such as
binding to DNA or receptor protein binding.
Last but not least with respect to CE, it should be noted that for all these systems a
fundamental question remains unanswered, i.e. “Does the application of an electric
-188-
field disturb the ligand-biomacromolecule interaction?” There is no evidence that it
does. Further it would be futile to assess this by an exhaustive comparison of in vivo
data with ‘in-CE’ as there would always be other possible reasons to explain away
any discrepancies. It would be only too easy to ignore this possibility of perturbation
by the electric field. Indeed no mention of this has been made in the literature.
One day someone will have to do a definitive experiment. Applying and electric field
along an NMR flow cell would certainly be a technological challenge. The best bet
therefore might be to carry out molecular modelling and to attempt to model an
electric field.
Having hopefully demonstated that the methods established in the research
programme still offer some advantages when compared to more recent
developments, the other important question that must be addressed when considering
how the work sits in the context of current developments is whether or not there is
still a need for chiral separations employing protein chiral selectors or for the study
of drug – biomacromolecule interactions. The former was very much the main focus
of the research programme with the latter being very much a side issue. However
there is now a much greater need for the latter than the former.
The field of chiral separations has advanced considerably since the mid-90’s to the
point where most enantiomer separation problems may easily be solved and chiral
method development in the pharmaceutical industry is dominated by automated
screening systems employing primarily derivatised polysaccharide chiral stationary
phases for LC [Anderson 2003]. However, proteins are still used when chiral LC
separations are needed with a high proportion of aqueous buffer in the mobile phase
e.g. for compatability with other coupled systems. Chiral CE using proteins is still
used [Tanaka 2001] but cyclodextrins are more popular. Despite the speed with
which method development may be carried out, and other advantages, chiral CE has
-189-
not supplanted chiral LC. CE though still offers better possibilities if it were wished
to carry out an enantiomeric impurity assay and a related substances assay in one
system and protein chiral selectors could have a role in this.
With respect to drug – biomolecule interactions there is definitely now a much
greater need for studies of these (e.g. [Hage 2002] and the work of Wainer [Wainer
1993 & 2003]) especially that much more screening is being carried out in the
Discovery phase of pharmaceutical R&D rather than in Development in order to
prevent expensive late stage failures of drug candidates. It is in this sphere that the
protocols developed in this programme are now more likely to find application. The
use of the microbore LC system adapted to nano-LC has much to commend it over
the immobilsation and frontal analysis strategies employed by Wainer [Moaddel
2005] in his studies of transporter proteins.
-190-
References
Ahmed, A. & D.K.Lloyd (1997) J. Chromatogr. A, 766, 237, “Effect of organic
modifiers on retention and enantiomeric separations by capillary electrophoresis with
human serum albumin as a chiral selector in solution”.
Agranat, I., H.Caner & A.Caldwell (2002) Nature Reviews Drug Discovery, 1, 753.
“Putting chirality to work: The strategy of chiral switches”.
Allenmark, S. (1986) J. Liq. Chromatogr., 9, 425, “Optical resolution by liquid-
chromatography on immobilized bovine serum-albumin”.
Allenmark, S., B.Bomgren & H.Boren (1982) J. Chromatogr., 237, 473, “Direct
resolution of enantiomers by liquid affinity chromatography on albumin-agarose
under isocratic conditions”.
Anderson, M.E., D.Aslan, A.Clarke, J.Roeraade & G.Hagman (2003) J. Chromatogr.
A, 1005, 83, “Evaluation of generic chiral liquid chromatography screens for
pharmaceutical analysis”.
Andre, C., Y.Jacquot, T.T.Truong, M.Thomassin, J.F.Robert & Y.C.Guillaume
(2003) J. Chromatogr. B, 796, 267, “Analysis of the progesterone displacement of its
human serum albumin binding site by β-estradiol using biochromatographic
approaches: effect of two salt modifiers”.
Andrisano, V., C.Bertucci, V.Cavrini, M.Recanatini, A.Cavalli, L.Varoli, G.Felix &
I.W.Wainer (2000) J. Chromatogr. A, 876, 75, “Stereoselective binding of 2,3-
substituted 3-hydroxyproprionic acids on an immobilised human serum albumin
-191-
chiral stationary phase: stereochemical characterisation and quantitative structure-
retention relationship study”.
Amini, A., C.Pettersson & D.Westerlund (1997) Electrophoresis, 18, 950,
“Enantioresolution of disopyramide by capillary affinity electrokinetic
chromatography with human α1-acid glycoprotein (AGP) as chiral selector applying
a partial filling technique”.
Arai, T., M.Ichinose, H.Kuroda, N.Nimura & T.Kinoshita (1994) Anal. Biochem.,
217,7, “Chiral separation by capillary affinity zone electrophoresis using an albumin-
containing support electrolyte”.
Armstrong, D.W., K.L.Rundlett & J-R.Chen (1994) Chirality, 6, 496, “Evaluation of
the macrocyclic antibiotic vancomycin as chiral selector for capillary
electrophoresis”.
Armstrong, D.W., M.P.Gasper & K.L.Rundlett (1995) J. Chromatogr., 689, 285,
“Highly enantioselective capillary electrophoretic separations with dilute solutions of
the macrocyclic antibiotic ristocetin A”.
Ashton, D.S., C.R.Beddell, G.S.Cockerill, K.Gohil, C.Gowrie, J.E.Robinson,
M.J.Slater & K.Valko (1996) J. Chromatogr. B., 677, 194, “Binding measurements
of indolocarbazole derivatives to immobilised human serum albumin by high-
performance liquid chromatography”.
Aubry, A-F. & A.McGann (1994) LC-GC Int., 7, 389, “Applications of
biochromatography to the determination of drug-protein binding interactions”.
-192-
Aumatell, A., R.J.Wells & D.K.Y.Wong (1994) J. Chromatogr. A., 686, 293,
“Enantiomeric differentiation of a wide-range of pharmacologically active substances
by capillary electrophoresis using modified β-cyclodextrins”.
Baba, Y., N. Ishimaru, K. Samata & M. Tsuhako (1993) J. Chromatogr. A, 653, 329,
“High-resolution separation of DNA restriction fragments by capillary
electrophoresis in cellulose derivative solutions”.
Barker, G.E., P.Russo & R.A.Hartwick (1992) Anal. Chem., 64, 3024, “Chiral
separation of leucovorin with bovine serum albumin using affinity capillary
electrophoresis”.
Beck, G.M. & S.N.Neau (1996) Chirality, 8, 503, “Lamda-Carrageenan: A novel
chiral selector for capillary electrophoresis”.
Berger, G. & G.Girault (2003) J. Chromatogr. B, 797, 51, “Macromolecule-ligand
binding studied by the Hummel and Dreyer method: Current state of the
methodology”.
Bertucci, C., V.Andrisano, R.Gotti & V.Cavrini (2002) J. Chromatogr. B, 768, 147,
“Use of an immobilised human serum albumin HPLC column as a probe of drug-
protein interactions: the reversible binding of valporate”.
Bertucci, C., M.Bartolini, R.Gotti & V.Andrisano (2003) J. Chromatogr. B, 797, 111,
“Drug affinity to immobilized target bio-polymers by high-performance liquid
chromatography and capillary electrophoresis”.
Bijvoet, J.M., (1955) Endeavor, 14, 71, “Determination of the absolute configuration
of optical antipodes”.
-193-
Bijvoet, J.M., A.F.Peerdeman & A.J.Van Bommel (1951) Nature, 168, 271.
Birnbaum, S. & S.Nilsson (1992) Anal. Chem. 64, 2872, “Protein-based capillary
affinity gel electrophoresis for the separation of optical isomers”.
Brown, A., I.Silva, D.Chinchilla, L.Hernandez & F.Gomez (2004) LC.GC Europe,
January, 32, “Partial-filling techniques for affinity capillary electrophoresis to probe
receptor-ligand interactions”.
Brumley, W.C., (1992) J. Chromatogr., 603, 267, “Qualitative-analysis of
environmental-samples for aromatic sulfonic-acids by high-performance capillary
electrophoresis”.
Busch, M.H.A., L.B.Carels, H.F.M.Boelens, J.C.Kraak & H.Poppe (1997) J.
Chromaotgr. A, 777, 311, “Comparison of five methods for the study of drug-protein
binding in affinity capillary electrophoresis”.
Cahn, R.S., C.K.Ingold & V.Prelog (1966) Angew. Chem. Int. Ed., 5, 385,
“Specification of molecular chirality”.
Camilleri, P. (1983) “Capillary Electrophoresis: Theory and Practice”, CRC Press.
Carey, F.A. (1992) “Organic Chemistry” McGraw-Hill, inc.
Chervet, J.P., M.Ursem & J.B.Salzmann (1996) Anal. Chem., 68, 1507,
“Instrumental requirements for nanoscale liquid chromatography”.
-194-
Chilmonczyk, Z., H.Ksycinska & I.Polec (1998) J. Chromatogr. B, 720, 65,
“Application of chiral chromatographic parameters in quantitative structure-activity
relationship analysis of homologous malathion derivatives”.
Christians, T. & U.Holzgrabe (2000) Electrophoresis , 21, 3609, “Enantioseparation
of dihydropyridine derivatives by means of neutral and negatively charged β-
cyclodextrin derivatives using capillary electrophoresis”.
Clark, B.J., & A.M.Abushoffa (1995) J. Chromatogr., 700, 51, “Resolution of
enantiomers of oxamniquine by capillary electrophoresis and high-performance
liquid-chromatography with cyclodextrin and heparin as chiral selectors”.
Colyer, C.L., K.B.Oldham & A.V.Sokirko (1995) Anal. Chem., 67, 3234,
“Electroosmotically transported baseline perturbations in capillary elecrophoresis”.
Dalgliesh, C.E. (1952) J.Chem. Soc., 137, 3940,”The optical resolution of aromatic
amino-acids on paper chromatograms”.
Dickerson, R.E. & I.Geis (1969) “The structure and action of proteins”, Harper &
Rowe.
Deiderio, C., C.M. Polcaro, P. Padiglioni & S. Fanali (1997) J. Chromatogr. A, 781,
503, “Enantiomeric separation of acidic herbicides by capillary electrophoresis using
vancomycin as chiral selector”.
Ellington, J.J., J.J. Evans, K.B. Prickett & W.L. Champion (2001) J. Chromatogr. A,
928, 145, “High-performance liquid chromatographic separation of the enantiomers
of organophosphorus pesticides on polysaccharide chiral stationary phases”.
-195-
Erlandsson, P., P.Hanson & R.Iisaksson (1986) J. Chromatogr., 370, 475, “Direct
analytical and preparative resolution of enantiomers using albumin adsorbed to silica
as a stationary phase”.
Ermakov, S.V., M.Y.Zhukov, L.Capelli & P.G.Righetti (1995) J.Chromatogr. A,
699, 297, “Wall adsorption in capillary electrophoresis – experimental study and
computer simulation”.
Fanali, S., (1991) J. Chromatogr., 545, 437, “Use of cyclodextrins in capillary zone
electrophoresis - Resolution of terbutaline and propranolol enantiomers”.
Ferguson, P.D., D.M.Goodall & D.K.Lloyd (1998) Trends in Analytical Chemistry,
17, 148, “Quantitative relatioships between retention in HPLC and CE via binding
constants and selector concentrations”.
Fehske, K.J., W.E.Muller & U.Wollert (1981) Biochemical Pharmacology, 30 687,
“The location of drug binding sites in human serum albumin”.
Fischer, E. (1891) Ber. Dtsch. Chem. Ges., 47, 3181.
Fitos, I., J.Visy & M.Simonyi (2002) J. Biochem. Biophys. Methods, 54, 71,
“Species-dependency in chiral-drug recognition of serum albumin studied by
chromatographic methods”.
Gottschalk, I., C.Lagerquist, S-S Zuo, A.Lundqvist & P.Lindahl (2002) J.
Chromatogr. B, 768, 31, “Immobilized-biomembrane affinity chromatography for
binding studies of membrane proteins”.
-196-
Gozel, P., E.Gassman, H.Michelsen & R.N.Zare (1987) Anal. Chem., 59, 44,
“Electrokinetic resolution of amino-acid enantiomers with copper (II) aspartame
support electrolyte”.
Grossman, P.D. & J.C Colburn (1992) “Capillary Electrophoresis: Theory and
Practice”, Academic Press, Inc.
Hage, D.S., T.A.G.Noctor & I.W.Wainer (1995) J. Chromatogr. A, 693, 23,
“Characterization of the protein-binding of chiral drugs by high-performance
affinity-chromatography – interactions of R-ibuprofen and S-ibuprofen with human
serum albumin”.
Hage, D.S. (2002) J. Chromatogr. B, 768, 3, “High-performance affinity
chromatography: a powerful tool for studying serum protein binding”.
He, T-Y., S.Akimasa, S.Tokunaga & T.Nakagawa (1997) Journal of Pharmaceutical
Sciences, 86, 120, “Protein-binding high-performance frontal analysis of (R)- and
(S)-warfarin with and without phenylbutazone”.
Healy, L.O., J.P.Murrihy, A.Tan, D.Cocker, M.McEnery & J.D.Glennon (2001) J.
Chromatogr. A, 924, 459, “Enantiomeric separation of R,S-naproxen by
conventional and nano-liquid chromatography with methyl-β-cyclodextrin as a
mobile phase additive”.
Hermansson, J. & A.Grahn (1995) J. Chromatogr., 694, 57, “Optimization of the
separation of enantiomers of basic drugs Retention mechanisms and dynamic
modification of the chiral bonding properties on the α1-acid glycoprotein column”.
-197-
Heron, S., A.Tchapla & J.P.Chervet (2000) Chromatographia, 51, 495, “Influence of
injection parameters on column performance in nanoscale high-performance liquid
chromatography”.
Ishihama, Y., Y.Oda, N.Asakawa, Y.Yoshida & T.Sato (1994) J. Chromatogr., 666,
193, “Optical resolution by electrokinetic chromatography using ovomucoid as
pseudo-stationary phase”.
Iwata, Y.T., A.Garcia, T.Kanamori, H.Inoue, T.Kishi & T.S.Lurie (2002)
Electrophoresis, 23, 1328, “The use of a highly sulfated cyclodextrin for the
simultaneous chiral separation of amphetamine-type stimulants by capillary
electrophoresis”.
Jorgenson, J.W. & K.D.Lukacs (1981), J. Chromatogr., 218, 209, “High-Resolution
Separations based on electrophoresis and electroosmosis”.
Kaliiszan, R. (1992), Anal. Chem., 64, 619, “Quantitative structure-retention
relationships”.
Kano, K., K.Minami, K.Horiguchi, T.Ishimura & M.Kodera (1995) J. Chromatogr.
A, 694, 307, “Ability of non-cyclic oligosaccharides to form molecular-complexes
and its use for chiral separation by capillary zone electrophoresis”.
Kenndler-Blachkolm, K., S.Popelka, B.Gas & E.Kenndler (1995) J. Chromatogr. A,
734, 96, “Apparent baseline irregularities for neutral markers in capillary zone
electrophoresis with electroosmotic flow”.
-198-
Kilar, F. & S.Fanali (1995) Electrophoresis, 16, 1510, “Separation of trptophan-
derivative enantiomers with iron-free human serum transferrin by capillary zone
electrophoresis”.
Knoche1, B & G.Blaschke (1994) Chirality, 6, 221, “Stereoselectivity of the in-vitro
metabolism of thalidomide”.
Knoche2, B. & G.Blaschke (1994) J. Chromatogr, A, 666, 235, “Investigations on the
in-vitro racemization of thalidomide by high-performance liquid-chromatography”.
Kraak, J.C., S.Busch & H.Poppe (1992) J. Chromatogr., 608, 257, “Study of protein-
drug binding using capillary zone electrophoresis”.
Krstulovic, A.M. (1989) “Chiral Separations by HPLC: Applications to
pharmaceutical compounds"” John Wiley and Sons
Kuhn, R., C.Steinmetz, T.Bereuter, P.Hass & F.Erni (1994) J. Chromatogr., 666,
367, “Enantiomeric separations in capillary zone electrophoresis using a chiral crown
ether”.
Landers, J.P. (1994) “Handbook of Capillary Electrophoresis”, CRC Press.
Lloyd, D.K., A.Ahmed & F.Pastore (1997) Electrophoresis, 18, 958, “A quantitative
relationship between capacity factor and selector concentration in capillary
electrophoresis and high performance liquid chromatography: Evidence from the
enantioselective resolution of benzoin using human serum albumin as a chiral
selector”.
-199-
Lloyd, D.K., S.Li & P.Ryan (1995) J. Chromatogr., 694, 285, “Protein chiral
selectros in free-solution capillary electrophoresis and packed-capillary
electrochromatography”.
Lough, W.J. (1989) “Chiral Liquid Chromatography”, Blackie and Son Ltd.
Loun, B. & D.S.Hage (1994) Anal.Chem., 66, 3814, “Chiral separation mechanisms
in protein-based HPLC columns. 1. Thermodynamic studies of (R)- and (S)-warfarin
binding to immobilized human serum albumin”.
MacDermott, A.J. (2002) Chirality in Natural and Applied Science (Editors W.J
Lough and I.W Wainer), Blackwell Science Ltd., ISBN 0-632-0543502, Chapter 2,
“The Origin of Biomolecular Chirality”.
Mason S.F. (2002) Chirality in Natural and Applied Science (Editors W.J Lough and
I.W Wainer), Blackwell Science Ltd., ISBN 0-632-0543502, Chapter 1, “Pasteur on
Molecular Handedness – and the sequel”
Massey, P.R. & M.J.Tandy (1994) Chirality, 6, 63, “Challenges and frustrations in
the separation and analysis of chiral agrochemicals”.
Massolini, G., E. De Lorenzi, D.K.Lloyd, A.M.McGann & G.Caccialanza (1998) J.
Chromatogr. B., 712, 83, “Evaluation of β-lactoglobulin as a stationary phase in
high-performance liquid chromatography and as a buffer additive in capillary
electrophoresis: observation of a surprising lack of stereoselectivity”.
McMenamy, R.H. & J.L. Oncley (1958) J. Biol. Chem., 233, 1436, “The specific
binding of L-tryptophan to serum albumin”.
-200-
Michotte, Y., S.Boonkerd, M.R.Dataevernier & J.Vindevogel (1995) J. Chromatogr.
A, 704, 238, “Suppression of chiral recognition of 3-hydroxy-1,4-benzodiazepines
during micellar electrokinetic capillary chromatography with bile salts”.
Moaddel, R., L.L.Lu, M.Baynham & I.W. Wainer (2002) J. Chromatogr. B., 768, 41,
“Immobilized receptor- and transporter-based liquid chromatographic phases for on-
line pharmacological and biochemical studies: a mini-review”.
Moaddel, R., R.Yamaguchi R, P.C.Ho, S.Patel, Hsu C.P., V.Subrahmanyam &
I.W.Wainer (2005) J. Chromatogr. B., 818, 263, “Development and characterization
of an immobilized human organic cation transporter based liquid chromatographic
stationary phase”.
Muijselaar, P.G., K.Otsuka & S.Terabe (1998) J. Chromatogr. A, 802, 3, “On-line
coupling of partial-filling micellar electrokinetic chromatography with mass
spectrometry”.
Nishi, H & S.Terabe (1995) J. Chromatogr. A, 694, 245, “Optical resolution of drugs
by capillary electrophoretic techniques”.
Noctor, T.A.G. & I.W.Wainer (1993) J. Liq. Chromatogr., 16, 783, “The use of
displacement chromatography to alter retention and enantioselectivity of a human
serum albumin-based HPLC chiral stationary phase – a mini-review”.
Novotny, M., H.Soini & M.Stefansson (1994) Anal. Chem., 66, 646, “Malto-oligo
saccharides as chiral selectors for the separation of pharmaceuticals by capillary
electrophoresis”.
-201-
Novotny, M.V., H.Soini, M.Stefansson & M-L.Riekkola (1994) Anal. Chem., 66,
3477, “Chiral separation through capillary electromigration methods”.
Ohara, T., A.Shibukawa & T.Nakagawa (1995) Anal. Chem., 67, 3520, “Capillary
electrophoresis / frontal analysis for microanalysis of enantioselective protein
binding of a basic drug”.
Ong, S., H.Liu & C.Pidgeon (1996) J. Chromatogr. A, 728, 113, “Immobilized-
artificial-membrane chromatography: measurements of membrane partition
coefficient and predicting drug membrane permeability”.
Oravcova1, J., D.Sojkova & W.Lindner (1996) J. Chromatogr. B, 682, 349,
“Comparison of the Hummel-Dreyer method in high-performance liquid
chromatography and capillary electrophoresis conditions for study of the interaction
of (RS)-, (R)- and (S)-carvedilol with isolated plasma proteins”.
Oravcova2, J., B.Bohs & W.Lindner (1996) J. Chromatogr. B, 677, 1, “Drug-protein
binding studies New trends in analytical and experimental methodology”.
Peters, T. & I.Sjoholm, (1977) “Albumin: Structure, Biosynthesis, Function”,
Pergamon Press.
Rauws, A.G. & K.Groen (1994) Chirality, 6, 72, “Current regulatory (draft) guidance
on chiral medicinal products: Canada, EEC, Japan, United States”.
Schmitz, O., & S.Gab (1997) J. Chromatogr. A, 781, 215, “Separation of unsaturated
fatty acids and related isomeric hydroperoxides by micellar electrokinetic
chromatography”.
-202-
Shibukawa, A. & T.Nakagawa (1996) Anal. Chem., 68, 447, “Theoretical study of
High-Performance Frontal Analysis: A chromatographic method for the
determination of drug-protein interaction”.
Riering, H. & M.Sieber (1996) J. Chromatogr. A, 728, 171, “Covalently bonded
permethylated cyclodextrins, new selectors for enantiomeric separations by liquid
chromatography”.
Snopek, J., I.Jelinek & E.Smolkova-Keulemansova (1992) J. Chromatogr., 609, 1,
“Chiral separation by analytical electromigration methods”.
Spitzer, T., E.Yashima & Y.Okamoto (1999) Chirality, 11, 195, “Enantiomer
separation of fungicidal triazolyl alcohols by normal phase HPLC on polysaccharide-
based chiral stationary phases”.
Stalcup, A.M. & N.M.Agyei (1994) Anal. Chem., 66, 3054, “Heparin: A chiral
mobile-phase additive for capillary zone electrophoresis”.
Tait, R.J., D.O.Thompson, V.J.Stella & J.F.Stobaugh (1994) Anal. Chem., 66, 4013,
“Sulfobutyl ether β-cyclodextrin as a chiral discriminator for use with capillary
electrophoresis”.
Takaka, Y., K. Otsuka & S.Terabe (2000) J. Chromatogr. A, 875, 323, “Separation of
enantiomers by capillary electrophoresis-mass spectrometry employing a partial
filling technique with a chiral crown ether”.
Tanaka, Y. & S.Terabe (1995) J. Chromatogr. A, 694, 277, “Partial separation zone
technique for the separation of enantiomers by affinity electrokinetic chromatography
-203-
with proteins by affinity electrokinetic chromatography with proteins as chiral
pseudo-stationary phases”.
Tanaka, Y. & S.Terabe (2001) J. Biochem. And Biophys. Methods, 48, 103, “Recent
advances in enantiomer separations by affinity capillary electrophoresis using
proteins and peptides”.
Tanaka, Y. & S.Terabe (2002) J. Chromatogr. B, 768, 81, “Estimation of binding
constants by capillary electrophoresis”.
Tanaka, Y., N.Matsubara & S.Terabe (1994) Electrophoresis, 15, 848, “Separation of
enantiomers by affinity electrokinetic chromatography using avidin”.
Tanaka, Y. & S.Terabe (1997) Chromatographia, 44, 119, “Separation of
enantiomers of basic drugs by affinity capillary electrophoresis using a partial filling
technique and α1-acid glycoprotein as chiral selector”.
Tanaka, Y., Y.Kishimoto & S.Terabe (1998) J. Chromatogr. A, 802, 83, “Separation
of acidic enantiomers by capillary electrophoresis mass spectrometry employing a
partial filling technique”.
Thuaud, N., B.Sebille, M.H.Livertoux & J.Bessiere (1983) J. Chromatogr., 282, 509,
“Determination of diazepam-human serum albumin binding by polarography and
high-performance liquid chromatography at different protein concentrations”.
The Insight Team (1979) “Suffer the children: The story of thalidomide”, Andrew
Deutsch.
-204-
Valko, I.E., H.A.H.Billiet, J.Frank & K.Ch.A.M.Luyben (1994) Chromatographia,
38, 730, “Factors affecting the separation of mandelic acid enantiomers by capillary
electrophoresis”.
Valtcheva, L., J.Mohammad, G.Pettersson & S.Hjerten (1993) J. Chromatogr., 638,
263, “Chiral separation of β-blockers by high-performance capillary electrophoresis
based on non-immobilized cellulase as enantioselective protein”.
Verbeke, N & A.D’Hulst (1994) Chirality, 6, 225, “Separation of the enantiomers of
coumarinic anticoagulant drugs by capillary electrophoresis using maltodextrins as
chiral modifiers”.
Vespalec, R., V.Sustacek & P.Bocek (1993) J. Chromatogr., 638, 255, “Prospects of
dissolved albumin as a chiral selector in capillary zone electrophoresis”.
Wainer, I.W. & F.Beigi (2003) Anal. Chem., 75, 4480, “Syntheses of immobilized G
protein-coupled receptor chromatographic stationary phases: Characterization of
immobilized mu and kappa opioid receptors”.
Wainer, I.W., R.Kaliszan & T.A.G. Noctor (1993) J. Pharm. Pharmacol., 45, 367,
“Mobile phase additives as probes of solute binding to protein based high-
performance liquid-chromatographic chiral stationary phases”.
Wainer, I.W., & R.M.Stiffen (1988) J. Chromatogr., 424, 158, “Direct resolution of
the stereoisimers of leucovorin and 5-methyltetrahydrofolate using a bovine serum
albumin high-performance liquid chromatographic chiral stationary phase coupled to
an achiral phenyl column”.
-205-
Ward, T.J. (1994) Anal. Chem., 66, 632, “Chiral media for capillary
electrophoresis”.
Wren, S.A.C. & R.C.Rowe (1992) J. Chromatogr., 603, 235, “Theoretical aspects of
chiral separation in capillary electrophoresis, I. Initial evaluation of a model”.
Zhan, Q., H.F.Zou, H.L.Wang & J.Y.Ni (2000) J. Chromatogr. A., 866, 173,
“Synthesis of a silica-bonded bovine serum albumin s-triazine chiral stationary phase
for high-performance liquid chromatographic resolution of enantiomers”.


