Embed Size (px)
Citation preview
sensors
Article
Channel State Estimation in LTE-Based HeterogenousNetworks Using Deep Learning
Krzysztof K. Cwalina * , Piotr Rajchowski , Alicja Olejniczak , Olga Błaszkiewicz and Robert Burczyk
�����������������
Citation: Cwalina, K.K.; Rajchowski,
P.; Olejniczak A.; Błaszkiewicz O.;
Burczyk R.; Channel State Estimation
in LTE-Based Heterogenous
Networks Using Deep Learning.
Sensors 2021, 21, 7716. https://
doi.org/10.3390/s21227716
Academic Editors: Joanna Kolodziej,
Florin Pop and Katarzyna
Wegrzyn-Wolska
Received: 22 October 2021
Accepted: 12 November 2021
Published: 19 November 2021
Publisher’s Note: MDPI stays neutral
with regard to jurisdictional claims in
published maps and institutional affil-
iations.
Copyright: © 2021 by the authors.
Licensee MDPI, Basel, Switzerland.
This article is an open access article
distributed under the terms and
conditions of the Creative Commons
Attribution (CC BY) license (https://
creativecommons.org/licenses/by/
4.0/).
Faculty of Electronics, Telecommunications and Informatics, Gdansk University of Technology,80-233 Gdansk, Poland; [email protected] (P.R.); [email protected] (A.O.);[email protected] (O.B.); [email protected] (R.B.)* Correspondence: [email protected]
Abstract: Following the continuous development of the information technology, the concept ofdense urban networks has evolved as well. The powerful tools, like machine learning, break newground in smart network and interface design. In this paper the concept of using deep learningfor estimating the radio channel parameters of the LTE (Long Term Evolution) radio interface ispresented. It was proved that the deep learning approach provides a significant gain (almost 40%)with 10.7% compared to the linear model with the lowest RMSE (Root Mean Squared Error) 17.01%.The solution can be adopted as a part of the data allocation algorithm implemented in the telemetrydevices equipped with the 4G radio interface, or, after the adjustment, the NB-IoT (NarrowbandInternet of Things), to maximize the reliability of the services in harsh indoor or urban environments.Presented results also prove the existence of the inverse proportional dependence between thenumber of hidden layers and the number of historical samples in terms of the obtained RMSE.The increase of the historical data memory allows using models with fewer hidden layers whilemaintaining a comparable RMSE value for each scenario, which reduces the total computational cost.
Keywords: deep learning; heterogeneous network; channel state; LTE
1. Introduction
Modern radio communication must meet a few fundamental requirements: availabil-ity, user-oriented services, and reliability. These assumptions may be combined into onegoal—creation of a multi-functional network. The new and next generation networks, likeLTE (Long Term Evolution) and 5G, can be adopted to create a flexible heterogeneous envi-ronment, also by using the SDR (Software Defined Radio) technology [1]. Such a conceptassumes the coexistence of at least two RIs (Radio Interfaces) in the UE (User Equipment),so-called multi-link. In fact, the heterogeneity should be considered not only as a presenceof two different technologies. The presence of two different cells (e.g., the macro and nanocells) or two different networks operating at the same area meet the mentioned criteriaas well.
The network heterogeneity implies the extensive changes in the UE software. If thecommunication can be realized by two independent RIs, the decision must be made interms of how to organize the data transmission, minimizing e.g., BLER (Block Error Rate),especially if the data are assigned to different services [2,3]. Henceforth, the effectiveness ofthe radio link must be introduced. In general, when the UE generates data with a differentpriority, the decision process of the DAA (Data Allocation Algorithm) should involve thestates of the RIs to allow estimating the cost of the transfer—probability of loss of theinformation—with an assigned priority. Hence, the analysis of the past and current RIsstates, e.g., the physical layer quality parameters both within “active transmission” and“idle” states, may be essential in terms of general DAA effectiveness.
The goal of the conducted research was to develop a method that will be the part ofthe DAA, and will provide a high efficiency of the transmission quality prediction on the
Sensors 2021, 21, 7716. https://doi.org/10.3390/s21227716 https://www.mdpi.com/journal/sensors
Sensors 2021, 21, 7716 2 of 25
basis of the measured radio channel parameters in the heterogeneous cellular networks.Based on the measurement methodology, commercial radio module that has been used andthe presented DL (Deep Learning) approach, the proposed DAA should be considered asinnovative relative to the state-of-the-art research in a given area. Furthermore, the pro-posed approach has a great utility value in the context of the real applications and it is aresponse to the market needs.
As it has been mentioned, the heterogeneous node has the ability to transmit selecteddata streams through multiple RIs. Thus, the decision to choose the exact communicationinterface for the next successful transmission is treated as the conditional probability ofthe transmission with the certain parameters (e.g., BER - Bit Error Rate, BLER, delay, etc.)under certain propagation conditions. Propagation conditions determine the quality ofthe received signal, which parameters are estimated by the mobile terminals and the basestations of a given network, and are expressed parametrically by e.g., RSSI (Received SignalStrength Indicator), SNR (Signal to Noise Ratio), SINR (Signal to Interference and NoiseRatio), etc. These quality indicators can be estimated during the transmission and stored bythe node for further decision making regarding the next transmission, before it is actuallydone. In the paper, the DL-based implementation of the estimation mechanism is presented,what may be treated as an innovative approach regarding non-linear modelling of theparameters transfer function in that case. It can be used for an effective selection of thecommunication link in the heterogeneous telemetry device in the scope of prediction of theselected metrics for assessing the quality of the radio link.
The rest of the paper is structured as follows. In the Section 2 the related worksregarding the DL and heterogeneous networks are described. In the Section 3 the conceptof the data allocation algorithm is presented. The Section 4 contains the description of themeasurement stand, and in the Section 5 the measurement scenarios are presented. In theSection 6 authors have presented the preliminary results of the conducted research studiesfor the link state estimation. In the Section 7 the DL model is presented as an alternativefor the typical approach. The Section 8 summarizes the paper.
2. Related Work
The DAAs are widely analyzed and discussed in the context of the heterogeneousnetworks [4–6]. This problem is often connected with the throughput profiling [7] or the IoT(Internet of Things) and 5G networks [8,9]. In [7] authors proposed a solution for a denseindustrial IoT network where many influencing to each other cells may be distinguished.It was pointed that the proposed framework [9] can be improved by the DL what will leadto a better accuracy of the RI state estimation.
Generally, the DL support is used due to its effectiveness in terms of solving the non-linear problems, which is desirable in the realm of wireless communication as well [10,11].The concept of the 5G network assumes the existence of many terminals at the samearea [12]. Moreover, the mobility of users is the essential part of radio resource utilizationalgorithms that introduces a stochastic character of the input data. In [13] authors proposedto use the deep neural network to capture the information about the network utilization(considering the behavior of the users) and further adapt the TDD (Time Division Duplex)uplink/downlink organization. Conducted simulation studies [13] showed that it waspossible to increase the network performance, the available throughput, and decrease thepacket loss rate. Consequently, the quality of service can be noted as better for the end user,nevertheless in this example the network remains non-heterogeneous.
In the modern networks the available throughput may be increased not only byextending the bandwidth, but also by creating the coordinated multi-point architecture [14].In this case, besides the macro cells, the smaller micro cells were deployed on the samearea, which implies the heterogeneous structure of the network and allows the terminal totransmit the data using the two RIs with statistically independent propagation conditions.In the paper [14] authors improved the performance of the OFDM (Orthogonal FrequencyDivision Multiplexing) based 5G network by implementing the SINR and RSRP (Reference
Sensors 2021, 21, 7716 3 of 25
Symbol Received Power) as input parameters for the deep neural network managing thedata streams. The presented results showed that DL-based approach allowed for increasingthe downlink throughput. Unfortunately, authors of [14] did not include in the analysisother physical layer quality parameters (described in [15,16]) and they did not assumeincreasing the reliability of the radio link.
Other examples of DL application in the OFDM-based network are the channel influ-ence mitigation [17,18] and the anomalies detection. In [19] authors proposed a methodfor detecting the unexpected traffic fluctuations in the 5G network. To make the decisionprocess reliable the two-level DL model was proposed. The division of the model is impliedby the network architecture. The proposed DL-based framework may be implemented tosupport the RAN (Radio Access Network) architecture to detect characteristic symptomsof the cyberattack. The master layer of the model is based on the LSTM (Long Short-TermMemory) recurrent neural network that is used to judge the potential anomalies and recog-nize the patterns of the cyberattack. The method presented in [19] detects the RAN stateeffectively; nevertheless, the main goal of the presented research is to inspect the operationof the network and make it resistant to intentional attacks. Moreover, there is no possibilityto adjust the operation of the user terminals, e.g., select the RI, depending on the state ofthe network.
Data allocation algorithms presented in the literature are mainly focused on maxi-mizing the throughput offered to the user. Nevertheless, in some applications, like thetelemetry of the critical infrastructure, the most important aspect is the reliability. The mea-surement data or alarm flags may be treated as data with various priorities and differentfrequency of occurrence. Thus, it influences the operation and design of the algorithms,mainly the estimation of the heterogeneous RIs parameters. Taking this issue into consid-eration, authors proposed the DL-based channel state estimation method dedicated forspecial applications that assumes the usage of the LTE RI. The presented solution provideshigher effectiveness regarding the linear model for channel state metrics estimation. Un-doubtedly, the considered issue of determining and predicting the channel state estimates(and as a result the transmission quality) based on the set of parameters is a non-linear de-pendency, which should be deeply investigated especially in the heterogeneous networks.The conducted research has proved that the analyzed wide set of parameters, measuredbefore the transmission by the commercial radio module in the LTE RI combined with thefurther usage of the proposed DL-based methods enabled providing high accuracy of theBLER prediction, which was assumed as the main transmission quality metric.
3. Data Allocation Algorithm
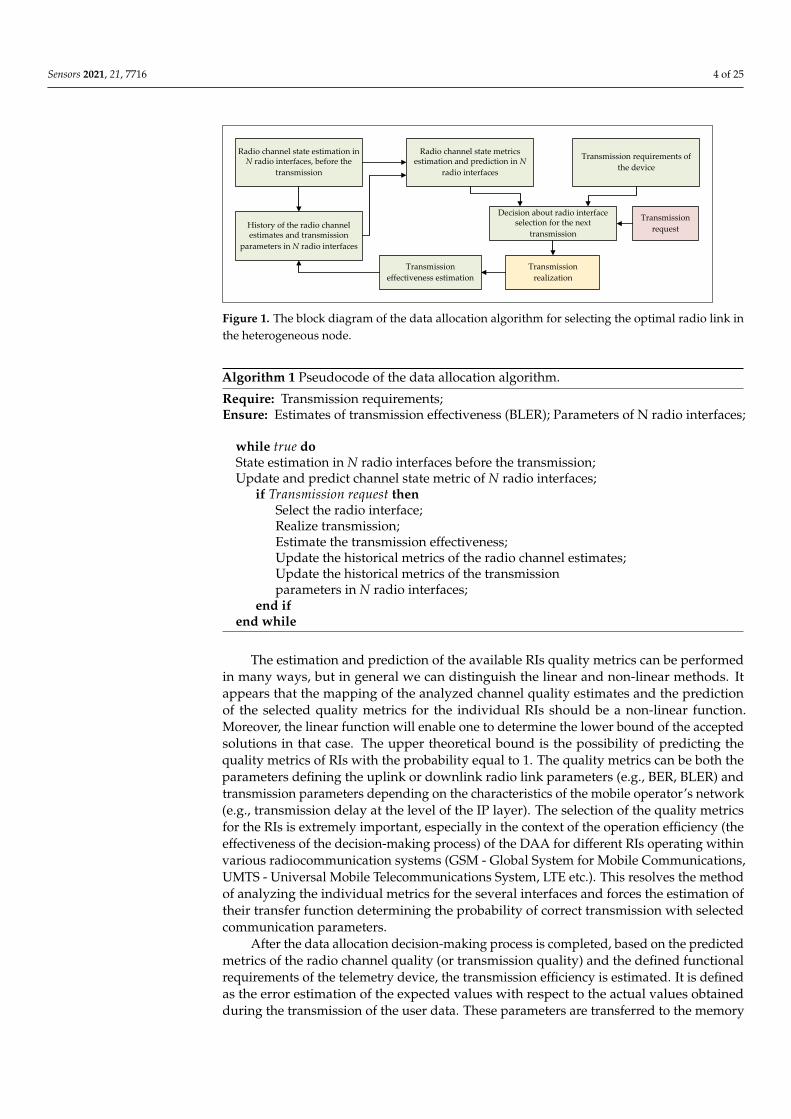
Undoubtedly, the data allocation algorithm must take into account not only theoperating characteristics of the RIs, but also make a decision on the selection of a giveninterface based on the additional requirements and the operational parameters of a giventelemetry device, e.g., total delay in the point-to-point relation, or the cost of transmission(e.g., financial cost, RI delay, energy consumption, etc.). Considering previously mentionedissues, the algorithm for selecting the optimal radio link for the next transmission in aheterogeneous node is shown as a block diagram in the Figure 1 and as a pseudocode inthe Algorithm 1.
For the implementation of the DAA that routes packets with the user data, it isnecessary to determine the measurable quality parameters of the radio channel before thenext transmission will be carried out. However, it should be remembered that the set ofparameters that can be estimated is limited, and generally defined by the radio modem usedas the RI in the heterogeneous node. The determined radio channel quality estimates (theradio channel parameters) provide useful information not only for the currently plannedtransmission, but also to some extent for the subsequent ones, while the length of thehistory of the analyzed samples should be determined through the measurement tests anddeep analysis, which was done in the conducted research studies and is described furtherin the article.
Sensors 2021, 21, 7716 4 of 25
Radio channel state estimation in N radio interfaces, before the
transmission
Radio channel state metrics estimation and prediction in N
radio interfaces
History of the radio channel estimates and transmission
parameters in N radio interfaces
Transmission requirements of
the device
Decision about radio interface selection for the next
transmission
Transmission
effectiveness estimation
Transmission
realization
Transmission
request
Figure 1. The block diagram of the data allocation algorithm for selecting the optimal radio link inthe heterogeneous node.
Algorithm 1 Pseudocode of the data allocation algorithm.
Require: Transmission requirements;Ensure: Estimates of transmission effectiveness (BLER); Parameters of N radio interfaces;
while true doState estimation in N radio interfaces before the transmission;Update and predict channel state metric of N radio interfaces;
if Transmission request thenSelect the radio interface;Realize transmission;Estimate the transmission effectiveness;Update the historical metrics of the radio channel estimates;Update the historical metrics of the transmissionparameters in N radio interfaces;
end ifend while
The estimation and prediction of the available RIs quality metrics can be performedin many ways, but in general we can distinguish the linear and non-linear methods. Itappears that the mapping of the analyzed channel quality estimates and the predictionof the selected quality metrics for the individual RIs should be a non-linear function.Moreover, the linear function will enable one to determine the lower bound of the acceptedsolutions in that case. The upper theoretical bound is the possibility of predicting thequality metrics of RIs with the probability equal to 1. The quality metrics can be both theparameters defining the uplink or downlink radio link parameters (e.g., BER, BLER) andtransmission parameters depending on the characteristics of the mobile operator’s network(e.g., transmission delay at the level of the IP layer). The selection of the quality metricsfor the RIs is extremely important, especially in the context of the operation efficiency (theeffectiveness of the decision-making process) of the DAA for different RIs operating withinvarious radiocommunication systems (GSM - Global System for Mobile Communications,UMTS - Universal Mobile Telecommunications System, LTE etc.). This resolves the methodof analyzing the individual metrics for the several interfaces and forces the estimation oftheir transfer function determining the probability of correct transmission with selectedcommunication parameters.
After the data allocation decision-making process is completed, based on the predictedmetrics of the radio channel quality (or transmission quality) and the defined functionalrequirements of the telemetry device, the transmission efficiency is estimated. It is definedas the error estimation of the expected values with respect to the actual values obtainedduring the transmission of the user data. These parameters are transferred to the memory
Sensors 2021, 21, 7716 5 of 25
block storing the data history with a defined memory length, which will be updated duringthe device operation and used to increase the efficiency of the subsequent transmissions.
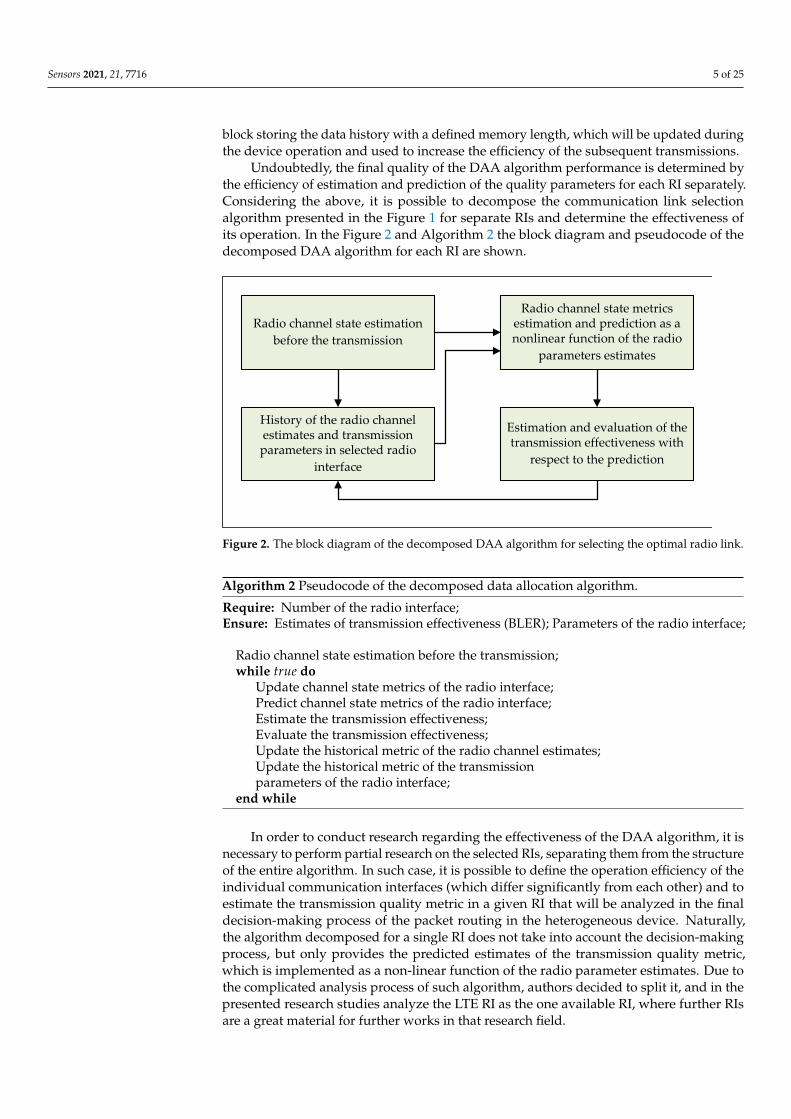
Undoubtedly, the final quality of the DAA algorithm performance is determined bythe efficiency of estimation and prediction of the quality parameters for each RI separately.Considering the above, it is possible to decompose the communication link selectionalgorithm presented in the Figure 1 for separate RIs and determine the effectiveness ofits operation. In the Figure 2 and Algorithm 2 the block diagram and pseudocode of thedecomposed DAA algorithm for each RI are shown.
Radio channel state estimation
before the transmission
Radio channel state metrics estimation and prediction as a nonlinear function of the radio
parameters estimates
History of the radio channel estimates and transmission parameters in selected radio
interface
Estimation and evaluation of the transmission effectiveness with
respect to the prediction
Figure 2. The block diagram of the decomposed DAA algorithm for selecting the optimal radio link.
Algorithm 2 Pseudocode of the decomposed data allocation algorithm.
Require: Number of the radio interface;Ensure: Estimates of transmission effectiveness (BLER); Parameters of the radio interface;
Radio channel state estimation before the transmission;while true do
Update channel state metrics of the radio interface;Predict channel state metrics of the radio interface;Estimate the transmission effectiveness;Evaluate the transmission effectiveness;Update the historical metric of the radio channel estimates;Update the historical metric of the transmissionparameters of the radio interface;
end while
In order to conduct research regarding the effectiveness of the DAA algorithm, it isnecessary to perform partial research on the selected RIs, separating them from the structureof the entire algorithm. In such case, it is possible to define the operation efficiency of theindividual communication interfaces (which differ significantly from each other) and toestimate the transmission quality metric in a given RI that will be analyzed in the finaldecision-making process of the packet routing in the heterogeneous device. Naturally,the algorithm decomposed for a single RI does not take into account the decision-makingprocess, but only provides the predicted estimates of the transmission quality metric,which is implemented as a non-linear function of the radio parameter estimates. Due tothe complicated analysis process of such algorithm, authors decided to split it, and in thepresented research studies analyze the LTE RI as the one available RI, where further RIsare a great material for further works in that research field.

Sensors 2021, 21, 7716 6 of 25
The functional module of the transmission quality estimation and evaluation in rela-tion to the predicted parameters requires to carry out the study of the effective method forthe implementation of the aforementioned non-linear function. However, it can potentiallybe an element used in the real operating conditions of the heterogeneous device. This mayprovide the information about the state and quality of the radio channel in the selectedlocations of the telemetry devices installation, unique for each telemetry device, and thepotential adjustment of the selected method to increase the efficiency of the algorithm for agiven RI.
4. Measurement Stand
In order to carry out the measurement campaigns, the measurement stand was devel-oped. The prepared measurement stand is described in details in [20,21]. In the Figure 3,the block diagram of the measurement stand is presented.
LTE Radiocommunication
tester – R&S CMW 50020 dB Attenuator
LTE UE modem Quectel
RM500Q-GLUSB Hub
Raspberry Pi 4
RFRF
USB
USB
USB
VXI-11
Figure 3. The measurement stand block diagram.
The CMW500 radiocommunication tester emulates the LTE eNodeB (Evolved Node B),and the RM500Q-GL radio module is used as the UE RI. The single-board computer is adevice that allows managing the tester and the radio module using the developed softwarededicated for the automatic measurements.
In order to read the parameter’s values, a connection between the UE and the eNodeBis established. Reading the parameters of interest, the communication is carried out intwo ways: with the tester by using the SCPI (Standard Commands for ProgrammableInstruments) commands, and with the module by using the Hayes commands set.
The RF connections between the elements are wired what ensures stable and repeatablepropagation conditions (with emulated proper fading profile) and no additional influenceof the environment. The additional 20 dB attenuation added in the RF path is neededto provide the acceptable radio signal power at the input of the CMW500. Its value iscompensated during the measurements.
5. Measurement Scenarios
Two measurement campaigns were carried out as a part of the LTE RI research.The first measurement campaign (MC1) was performed for the operating parameters ofthe emulated base station presented in the Table 1.
The second measurement campaign (MC2) was carried out mostly for the same param-eters of the emulated base station, except that the CQI value was not a parameter defineda priori on the radio tester side, but was determined automatically by the radio tester inaccordance with the eNodeB operation method (following the LTE system principles).
Sensors 2021, 21, 7716 7 of 25
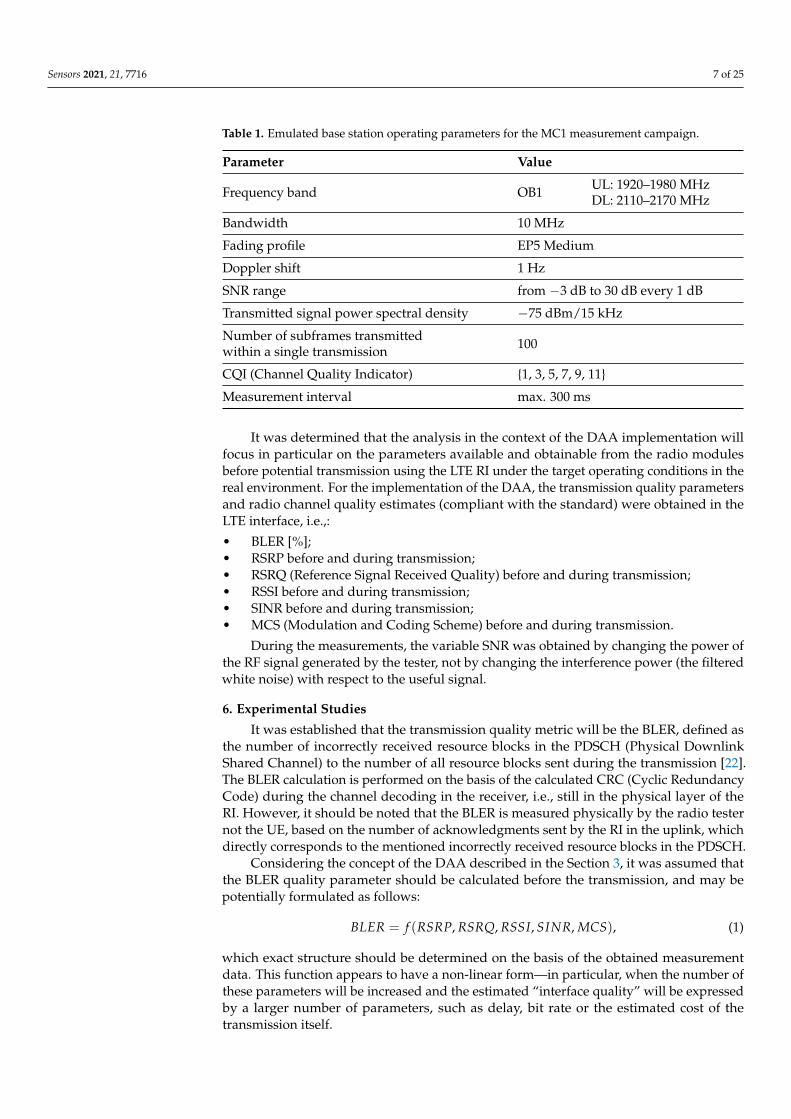
Table 1. Emulated base station operating parameters for the MC1 measurement campaign.
Parameter Value
Frequency band OB1 UL: 1920–1980 MHzDL: 2110–2170 MHz
Bandwidth 10 MHz
Fading profile EP5 Medium
Doppler shift 1 Hz
SNR range from −3 dB to 30 dB every 1 dB
Transmitted signal power spectral density −75 dBm/15 kHz
Number of subframes transmittedwithin a single transmission 100
CQI (Channel Quality Indicator) {1, 3, 5, 7, 9, 11}
Measurement interval max. 300 ms
It was determined that the analysis in the context of the DAA implementation willfocus in particular on the parameters available and obtainable from the radio modulesbefore potential transmission using the LTE RI under the target operating conditions in thereal environment. For the implementation of the DAA, the transmission quality parametersand radio channel quality estimates (compliant with the standard) were obtained in theLTE interface, i.e.,:
• BLER [%];• RSRP before and during transmission;• RSRQ (Reference Signal Received Quality) before and during transmission;• RSSI before and during transmission;• SINR before and during transmission;• MCS (Modulation and Coding Scheme) before and during transmission.
During the measurements, the variable SNR was obtained by changing the power ofthe RF signal generated by the tester, not by changing the interference power (the filteredwhite noise) with respect to the useful signal.
6. Experimental Studies
It was established that the transmission quality metric will be the BLER, defined asthe number of incorrectly received resource blocks in the PDSCH (Physical DownlinkShared Channel) to the number of all resource blocks sent during the transmission [22].The BLER calculation is performed on the basis of the calculated CRC (Cyclic RedundancyCode) during the channel decoding in the receiver, i.e., still in the physical layer of theRI. However, it should be noted that the BLER is measured physically by the radio testernot the UE, based on the number of acknowledgments sent by the RI in the uplink, whichdirectly corresponds to the mentioned incorrectly received resource blocks in the PDSCH.
Considering the concept of the DAA described in the Section 3, it was assumed thatthe BLER quality parameter should be calculated before the transmission, and may bepotentially formulated as follows:
BLER = f (RSRP, RSRQ, RSSI, SINR, MCS), (1)
which exact structure should be determined on the basis of the obtained measurementdata. This function appears to have a non-linear form—in particular, when the number ofthese parameters will be increased and the estimated “interface quality” will be expressedby a larger number of parameters, such as delay, bit rate or the estimated cost of thetransmission itself.
Sensors 2021, 21, 7716 8 of 25
Due to the large statistical sample set, i.e., over 100,000 obtained measurement datafor both measurement campaigns, the dedicated software for visualization and preliminarystatistical analysis of the obtained results was developed. This step of the analysis isimportant, especially in the context of the DL usage and the need of training datasetpreparation, validation and the testing processes.
6.1. Measurement Campaign No. 1
Firstly, on the basis of the results obtained as a part of the MC1 measurement campaign,it was established whether and which radio parameters should be taken into considerationas the arguments of the given function (also for the historical values), i.e., values before thetransmission (i.e., RSRPb, RSRQb, RSSIb, SINRb, MCSb) or values during the transmission(i.e., RSRP, RSRQ, RSSI, SINR, MCS). For this reason, the differences in the values of thecorresponding parameters during and before the transmission were analyzed.
The differences in the values before and during the transmission are normally dis-tributed, with different values of the standard deviations and almost zero mean values.For the RSRP parameter σ = 1.5 dB, for the RSSI parameter σ = 2.6 dB, for the SINRparameter σ = 1.4 dB, for the RSRQ parameter σ = 0.5 dB, and for the MCS parameterσ = 3.6. For this reason the information value, from the point of view of the estimationand prediction of the subsequent transmissions, is the same for the values obtained beforeand during the transmission. At the same time, in the context of the DAA functionality,the usage of the parameters before the transmission is more convenient, e.g., there is noneed to perform the transmission and the fact that the interface does not have to be selectedfor the further transmission of the useful data. As a consequence, the only available metriccan be the estimated parameters before the transmission (the so-called probing values).
Considering previously mentioned aspects, it was decided that the arguments of thetransmission quality metric function for the LTE interface can only be values obtainedbefore the transmission, including the historical values. In this case, there is a need toupdate the form of the transmission quality metric function (1)
BLER = f (RSRPb, RSRQb, RSSIb, SINRb, MCSb), (2)
where the input arguments are the value vectors with lengths corresponding to the timewindows which are analyzed in the process of predicting the quality of the next transmission.
In the first stage of the research, the correlation degree of the selected arguments of thetransmission quality metric function (2), i.e., their mean values, medians and the entire dataset, in relation to the resulting value of BLER, was checked. The degree of correlation isunderstood as the determination of the Pearson correlation coefficient [23]. This coefficientranges from −1 to 1, where 0 means no data correlation, −1 means inversely proportionaldata correlation and 1 means the dependence of the data proportional to each other.
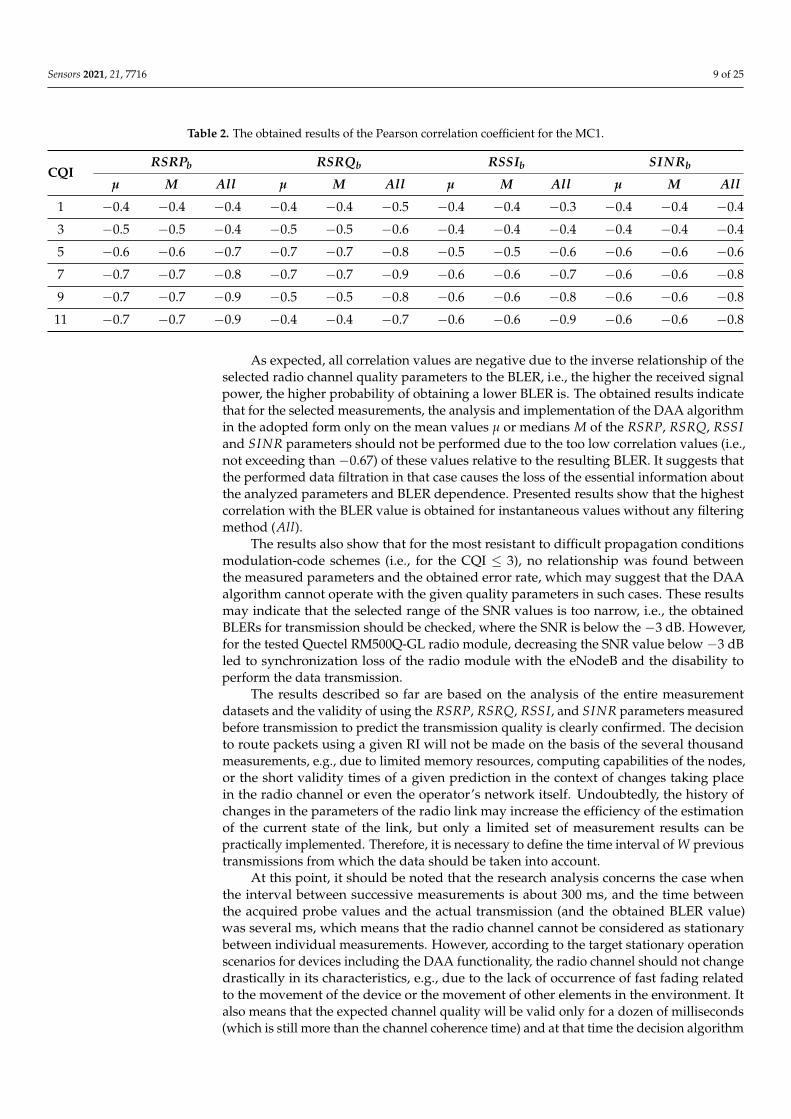
In the Table 2 the correlation results between the parameter mean value µ, medianvalue M and all values with corresponding BLER values obtained for the six measurementseries that determine the set CQI values for a given measurement scenarios are presented.The SNR value was changed by the CMW500 tester emulating the eNodeB station in therange from −3 dB to 30 dB with 1 dB step. It is worth noting that the MCS parameter wasnot included, due to the forced constant value of the CQI parameter, which directly affectsthe selection of the appropriate MCS, regardless of the propagation conditions and thedetermined quality parameters of the channel. Hence, the correlation between the MCSparameter and the BLER metric should not be analyzed at this point, however, undoubtedlythis parameter should be taken into account in the final form of the model for the LTE RI inthe heterogeneous device [24].
Sensors 2021, 21, 7716 9 of 25
Table 2. The obtained results of the Pearson correlation coefficient for the MC1.
CQIRSRPb RSRQb RSSIb SINRb
µ M All µ M All µ M All µ M All
1 −0.4 −0.4 −0.4 −0.4 −0.4 −0.5 −0.4 −0.4 −0.3 −0.4 −0.4 −0.4
3 −0.5 −0.5 −0.4 −0.5 −0.5 −0.6 −0.4 −0.4 −0.4 −0.4 −0.4 −0.4
5 −0.6 −0.6 −0.7 −0.7 −0.7 −0.8 −0.5 −0.5 −0.6 −0.6 −0.6 −0.6
7 −0.7 −0.7 −0.8 −0.7 −0.7 −0.9 −0.6 −0.6 −0.7 −0.6 −0.6 −0.8
9 −0.7 −0.7 −0.9 −0.5 −0.5 −0.8 −0.6 −0.6 −0.8 −0.6 −0.6 −0.8
11 −0.7 −0.7 −0.9 −0.4 −0.4 −0.7 −0.6 −0.6 −0.9 −0.6 −0.6 −0.8
As expected, all correlation values are negative due to the inverse relationship of theselected radio channel quality parameters to the BLER, i.e., the higher the received signalpower, the higher probability of obtaining a lower BLER is. The obtained results indicatethat for the selected measurements, the analysis and implementation of the DAA algorithmin the adopted form only on the mean values µ or medians M of the RSRP, RSRQ, RSSIand SINR parameters should not be performed due to the too low correlation values (i.e.,not exceeding than −0.67) of these values relative to the resulting BLER. It suggests thatthe performed data filtration in that case causes the loss of the essential information aboutthe analyzed parameters and BLER dependence. Presented results show that the highestcorrelation with the BLER value is obtained for instantaneous values without any filteringmethod (All).
The results also show that for the most resistant to difficult propagation conditionsmodulation-code schemes (i.e., for the CQI ≤ 3), no relationship was found betweenthe measured parameters and the obtained error rate, which may suggest that the DAAalgorithm cannot operate with the given quality parameters in such cases. These resultsmay indicate that the selected range of the SNR values is too narrow, i.e., the obtainedBLERs for transmission should be checked, where the SNR is below the −3 dB. However,for the tested Quectel RM500Q-GL radio module, decreasing the SNR value below −3 dBled to synchronization loss of the radio module with the eNodeB and the disability toperform the data transmission.
The results described so far are based on the analysis of the entire measurementdatasets and the validity of using the RSRP, RSRQ, RSSI, and SINR parameters measuredbefore transmission to predict the transmission quality is clearly confirmed. The decisionto route packets using a given RI will not be made on the basis of the several thousandmeasurements, e.g., due to limited memory resources, computing capabilities of the nodes,or the short validity times of a given prediction in the context of changes taking placein the radio channel or even the operator’s network itself. Undoubtedly, the history ofchanges in the parameters of the radio link may increase the efficiency of the estimationof the current state of the link, but only a limited set of measurement results can bepractically implemented. Therefore, it is necessary to define the time interval of W previoustransmissions from which the data should be taken into account.
At this point, it should be noted that the research analysis concerns the case whenthe interval between successive measurements is about 300 ms, and the time betweenthe acquired probe values and the actual transmission (and the obtained BLER value)was several ms, which means that the radio channel cannot be considered as stationarybetween individual measurements. However, according to the target stationary operationscenarios for devices including the DAA functionality, the radio channel should not changedrastically in its characteristics, e.g., due to the lack of occurrence of fast fading relatedto the movement of the device or the movement of other elements in the environment. Italso means that the expected channel quality will be valid only for a dozen of milliseconds(which is still more than the channel coherence time) and at that time the decision algorithm
Sensors 2021, 21, 7716 10 of 25
should decide about the possible data transmission via the LTE RI. Otherwise, it is necessaryto repeat the measurements of the probe values and re-determine the predicted channelquality (if the inertia time of the DAA was for some reason longer than the predictionuseful life).
The most direct method of determining the successive estimates for a selected subsetof the data (the sample history windows) is to perform the low-pass filtration of the dataand adopt the determined value as the predicted value at the next timestamp. The filtrationprocess was carried out as an implementation of the FIR (Finite Impulse Response) filterby determining the so-called moving average filter where each filter tap is multiplied bya 1/W weight and the number of the taps is equal to the length of the analyzed samplewindow W.
For the considered measurements and the channel quality parameters, the correlationof the predicted values with the obtained BLER were analyzed. It should be pointedout that the analysis was conducted considering these parameters as a function of thewindow length W. Basing on the results, it was proved that increasing the history length ofanalyzed data above 15, does not result in a significant (i.e., greater than 0.02) increase inthe correlation coefficient for all the analyzed parameters. It was also confirmed that theresults for the CQI = 1 and CQI = 3 are not correlated with the resulting BLER. However,the determined correlation results indicate a greater degree of correlation of the resultsobtained from a short measurement series before the transmission, than the results fromthe entire data set—which determines the validity of using the selected approach in theDAA algorithm for the LTE RI, at least for the results of the laboratory measurements for aconstant CQI value > 3 in the range of the tested SNR < −3; 30 > dB.
6.2. Measurement Campaign No. 2
Having the predefined and optimized operation parameters of the algorithm for theindividual arguments of the function determining the transmission quality, the form ofthe multidimensional function (2) should be determined. Basing on the results presentedin the Section 6.1, none of the arguments can be reduced, as it can be used to increase theefficiency of the transmission quality metric prediction. As mentioned, the parameters ofthe function are not statistically independent variables and it seems that the best (mostaccurate) estimation of the transmission quality can be obtained for the non-linear functionform. This means that by determining the linear dependence of this function, one candefine the lower bound of the accepted solutions and adopt it as a reference value forfurther work on functions mapping the predicted values of the MCS, RSRP, RSRQ, RSSI,and SINR parameters on the transmission quality, in this case defined as the BLER.
In order to make the obtained results reliable and to best highlight the actual condi-tions in a real network, further tests were carried out for the MC2 measurement campaign.In that case, the CQI value on the side of the radio tester was not manually set. There-fore, depending on the estimated propagation parameters the adaptive selection of themodulation-code scheme for the communication link was chosen automatically based onthe implemented internal algorithms in the emulated eNodeB.
Using the multivariate multiple regression for selected arguments of the function (2),the linear form of the quality metric function for the LTE RI for the KP2 scenario wasdetermined as
BLER = f (RSRPb, RSRQb, RSSIb, SINRb, MCSb) =
a + b·RSRPb + c·RSRQb + d·RSSIb + e·SINRb + f ·MCSb,(3)
where the coefficients of the function take the following values: a = 0.207, b = −0.718, c = −1.673,d = 0.937, e = −0.732, f = −0.102.
The GoF (Goodness of Fit) of the developed linear model with the empirical datawas determined by calculating the determination coefficient R2, which takes values inthe range <0; 1>, where the value 1 means a perfect fit of the model to the empiricaldata [25]. R2 was calculated for all the data and the model values that are consistent with
Sensors 2021, 21, 7716 11 of 25
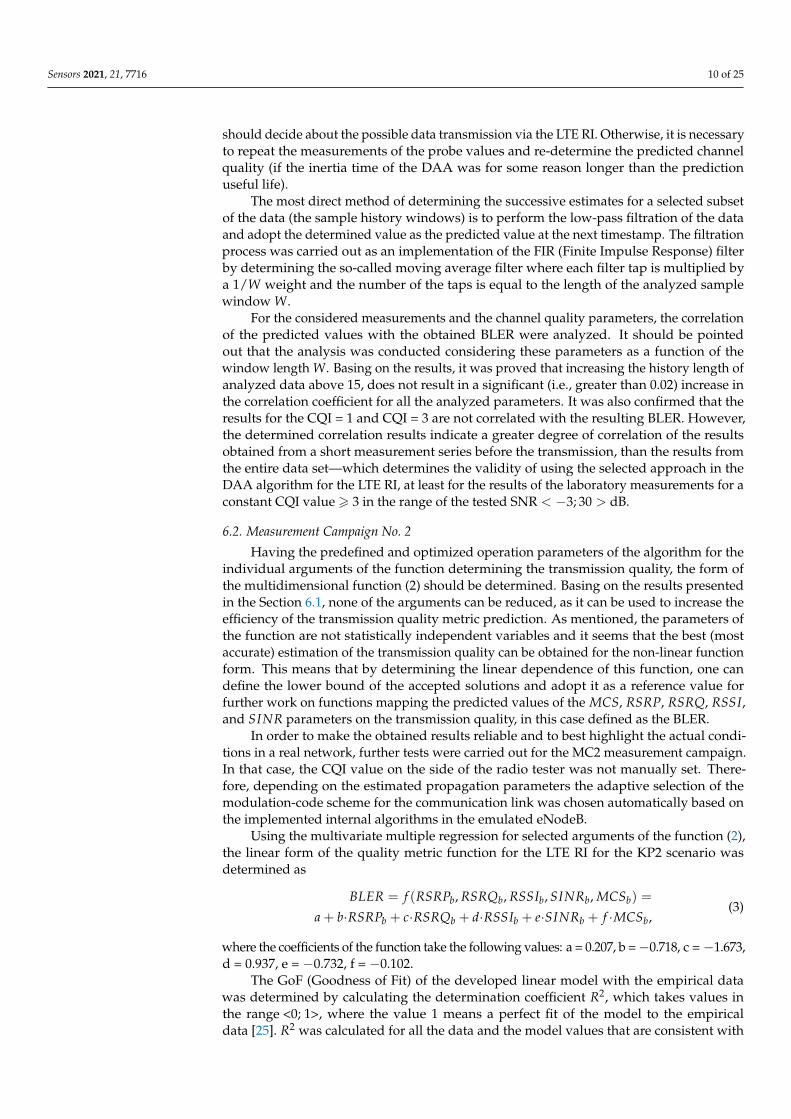
the mathematical calculations of the model, but not with their physical interpretation(e.g., the BLER less than 0% or greater than 100%). The limitation of the values of themodel was done after the actual regression had been performed. It was established thatthe value of the determination coefficient R2 was 0.07, which means that, as expected,the linear model in this case does not accurately describe the measured radio parameterswith the obtained error rate. It is also worth explaining that, in accordance to the form of thefunction (3), its arguments are the instantaneous values, not vectors of radio channel qualityparameters as declared in (2). In general, it should be understood as the implementation ofan additional operation in accordance with the selected radio channel prediction method,which were presented in the Section 6.1. Thus, the input data for the function (3) may bethe instantaneous values (last vector elements) and the previously mentioned predictionwith the use of the FIR filter with estimated length W = 15. In addition, the prediction withthe usage of the median for a window of length W = 15 and prediction with the use ofseparate linear models of the parameters for a window of length W = 15 was also checkedin that case. In the Figures 4–7 the histograms of the estimated errors of the BLER metricprediction, defined as the difference of the actual value of the obtained BLER for the nexttransmission from the predicted value for the selected parameter prediction method in theused multivariate linear model, are shown.
The obtained results confirm that it is possible to determine the transmission qualitywith a given probability on the basis of the channel and network parameters measuredbefore the transmission. The mean values of the errors for all the prediction methodswere about 0%, and the error distributions showed the highest GoF to the Gaussiandistribution with variable values of the RMSE (Root Mean Squared Error), i.e., 17.16%,16.99%, 17.01%, and 17.02% respectively. Taking it into consideration, the lowest efficiencyof the BLER metric prediction, as expected, was obtained for the method based solelyon the instantaneous values of the radio parameters. The other three methods do notshow significant differences for the analyzed MC2 measurement campaign, which in thiscase predestines the method based on the low-pass filtering to be used in the case ofa multivariate linear model due to the computational complexity, which can be furtherreduced by designing the IIR (Infinite Impulse Response) filter.
However, as mentioned earlier, the determination of the BLER prediction error wasdone to estimate the low bound of the accepted solutions, and in the final solution thelinear model should not be used due to the highly non-linear nature of changes in the radioparameters and their dependence on the estimated BLER in the physical layer.
-80 -60 -40 -20 0 20BLER error value [%]
0
500
1000
1500
2000
Occ
urre
nce
freq
uenc
y
Figure 4. The histogram of the estimated errors of the BLER metric prediction for instantaneousradio parameters.

Sensors 2021, 21, 7716 12 of 25
-80 -60 -40 -20 0 20BLER error value [%]
0
500
1000
1500
2000
2500
Occ
urre
nce
freq
uenc
y
Figure 5. The histogram of the estimated BLER metric prediction errors for prediction using the15th-order FIR filter.
-80 -60 -40 -20 0 20BLER error value [%]
0
500
1000
1500
2000
2500
Occ
urre
nce
freq
uenc
y
Figure 6. The histogram of the estimated BLER metric prediction errors for prediction using themedian for the window length W = 15.
-80 -60 -40 -20 0 20BLER error value [%]
0
500
1000
1500
2000
Occ
urre
nce
freq
uenc
y
Figure 7. The histogram of the estimated errors of the BLER metric prediction for prediction with theuse of separate linear models for each parameter for the window length W = 15.
Sensors 2021, 21, 7716 13 of 25
7. Proposed Deep Learning Approach
Due to limited efficiency of the linear model, it is necessary to implement the non-linear function to predict the transmission quality metric, wherein the form of this functionis unknown and generally 5-dimensional. Thus, it was decided that finding a multidi-mensional function that minimizes the transmission quality metric error can be effectivelyaccomplished with the usage of the DL methods. In comparison to other methods, the pro-posed DL approach does not require direct extraction of the dataset features that willdescribe the raw data, but learning the efficient representation of the data by the featuredecomposition, which leads to obtaining the complex transfer function out of simplerones [26]. In that case, to obtain an efficiency gain, the learning process needs to be filledwith a large number of data, however the already estimated model can be used even on aplatform with low computational capabilities.
Contrary to the linear model, there is no justification for implementing the neuralnetwork separately for each parameter and then creation another network for analyzingthe obtained output values. This may lead to a loss of information and relationshipbetween the historical parameter values, which would potentially reduce the effectivenessof this method.
Undoubtedly, the problem of predicting the quality of the next transmission is aregression problem, and the obtained measurement data enable the implementation ofthe DL approach and the supervised learning phase. As a metric for the DL effectiveness,the MSE (Mean Squared Error) was chosen, however due to the interpretation of the results,in the article the RMSE metric is presented. This allowed minimizing the probabilityof a large difference between the predicted BLER value from the actual BLER value,by penalizing outlier values, which would negatively affect the final decision-makingprocess of the DAA algorithm.
The inclusion of the historical data to make predictions in the next moment is a knownissue, for example, to predict changes in the currency market and in the economy (the so-called time series prediction), in the video processing, or in general image analysis [27–30].It has been proven that such a prediction can be performed in many ways with the useof several structures of the deep neural networks depending on the degree of their com-plexity, e.g., networks without feedback, convolutional networks, and recursive networks(including networks with cells). Bearing in mind that nodes of the distributed telemetrynetworks do not have high computing power and in general, it should be assumed thatminimizing the energy consumption of such a device is one of the main goal that shouldbe considered. Therefore, the network should be as low complex as possible and supportthe possibility of parallel computations in the greatest possible extent.
Taking into consideration the previously mentioned requirements and the possibilityof implementing the target network, e.g., as a coprocessor in the structure of the FPGA(Field Programmable Gate Array) programmable matrix, to determine the form of thenon-linear transmission quality function the architecture of the fully connected deep neuralnetwork FFNN (Feedforward Neural Network) was chosen [26]. Recursive networksare characterized by a sequential way of data processing, while convolutional networkssignificantly increase the number of computations necessary to make predictions. Due tothe popularity of the FFNN and the numerous publications, where they are analyzed anddescribed in detail, authors decided to not further describe this architecture and duplicatethe common knowledge, however the description can be found e.g., in [26,31,32].
The optimal network architecture is generally unknown and despite the attempts todefine rules, that can be found in the literature, they can only be used in the limited cases(e.g., for image processing). In the case of the proposed DL method, its hyperparametersshould be determined in terms of:
• number of the input nodes;• number of the hidden layers;• number of nodes in the hidden layers (assuming a constant number of nodes in
all layers);
Sensors 2021, 21, 7716 14 of 25
• the form of the activation functions;• learning rate.
Determining the network architecture hyperparameters is a complicated task andit is mainly solved with the use of [26] grid search method, genetic algorithms andBayesian methods.
Taking into account the proposed architecture of the FFNN network and its relativelylimited number of parameters to be checked, in relation to, for example, the convolutionalnetworks processing images, it was decided to test their combinations without the use of ad-ditional algorithms searching the space of the possible solutions. Similar methodology wasalready used by the authors in [32]. Wherein, the search for the optimal hyperparameterswas planned to be carried out in two stages in current research:
• preliminary grid search analysis and potentially coarse determination of the predic-tion efficiency dependence of the BLER as a function of the network architecturevariable parameters;
• extended grid search analysis.
Based on the number of input nodes, the ranges of the hyperparameter variability andthe learning parameters in the first stage were defined and presented in the Table 3.
Table 3. The hyperparameter variability and the learning parameters in the first stage of the learn-ing process.
Parameter Value
Number of hidden layers from 1 to 5
Number of nodes in the hidden layers from 20 to 200 with the step of 20
Activation function tansig, ReLU, tanh, sigmoid
Number of the input nodes5 parameters and their multipledepending on the length of theanalyzed history, i.e., from 0 to 20;
Learning rate 0.001
Number of the learning iterations max. 5000 or max. 20 validation error rate
Dataset split60% learning20% validation20% testing
The validation error rate is understood as the implementation of the counter, the valueof which is incremented in the case of no reduction of the mean square error for the valida-tion dataset. If the threshold value is reached, the learning process is terminated due to thelack of an increase in the learning efficiency in the next 20 iterations. The learning processwas monitored with the use of the MSE metric and optimized with the use of the ADAM(Adaptive Moment Estimation) algorithm with the selected parameters, i.e., α = 0.001,β1 = 0.9, β2 = 0.999 and ε = 10−8 [26,32]. The ADAM algorithm is described in detailsin [33].
Moreover, the input nodes were arranged similar to the form of (3), where the vectorsof the subsequent parameters were provided to the input layer of the FFNN. It should bementioned that all the input data in the network were normalized to the range of values[0, 1] so that, despite the different possible ranges of the assumed values for all the radioparameters, the learning process could be implemented in the most effective manner. Addi-tionally, due to the obvious different nature of the determining the non-linear function (2)method with respect to the linear function, the length of the sample history window wasre-analyzed to determine the optimal value for the proposed DL model.
Sensors 2021, 21, 7716 15 of 25
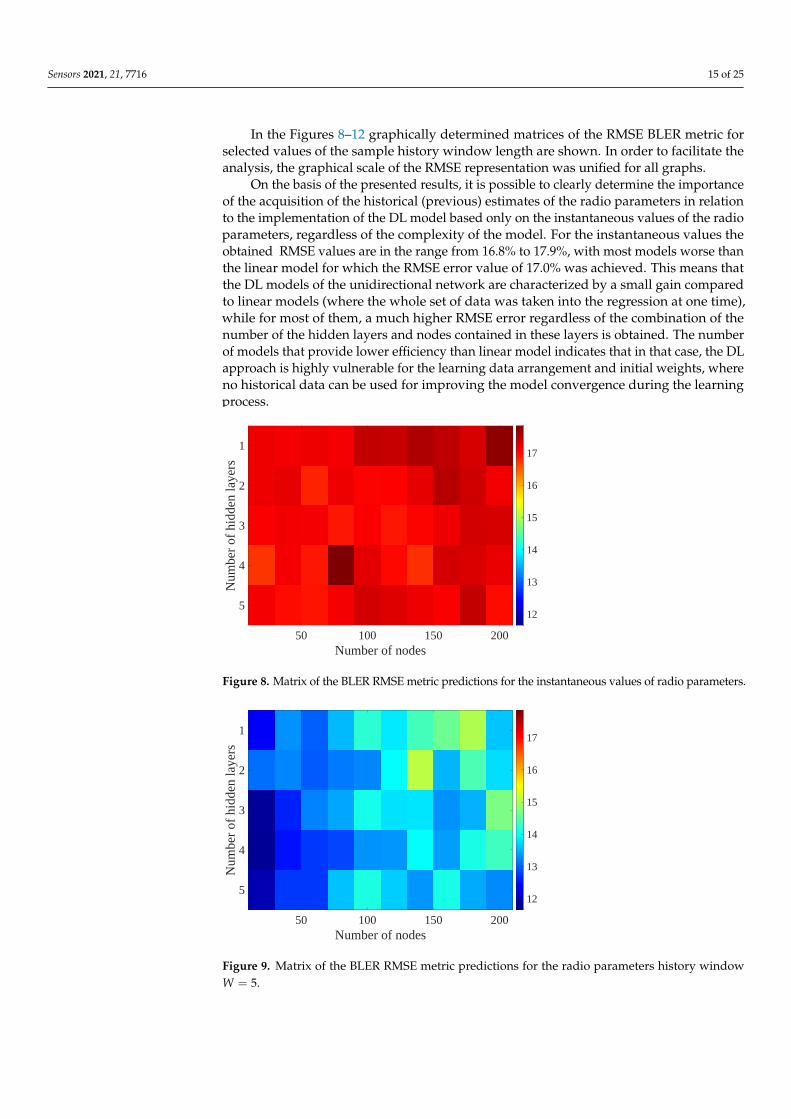
In the Figures 8–12 graphically determined matrices of the RMSE BLER metric forselected values of the sample history window length are shown. In order to facilitate theanalysis, the graphical scale of the RMSE representation was unified for all graphs.
On the basis of the presented results, it is possible to clearly determine the importanceof the acquisition of the historical (previous) estimates of the radio parameters in relationto the implementation of the DL model based only on the instantaneous values of the radioparameters, regardless of the complexity of the model. For the instantaneous values theobtained RMSE values are in the range from 16.8% to 17.9%, with most models worse thanthe linear model for which the RMSE error value of 17.0% was achieved. This means thatthe DL models of the unidirectional network are characterized by a small gain comparedto linear models (where the whole set of data was taken into the regression at one time),while for most of them, a much higher RMSE error regardless of the combination of thenumber of the hidden layers and nodes contained in these layers is obtained. The numberof models that provide lower efficiency than linear model indicates that in that case, the DLapproach is highly vulnerable for the learning data arrangement and initial weights, whereno historical data can be used for improving the model convergence during the learningprocess.
50 100 150 200Number of nodes
1
2
3
4
5
Num
ber
of h
idde
n la
yers
12
13
14
15
16
17
Figure 8. Matrix of the BLER RMSE metric predictions for the instantaneous values of radio parameters.
50 100 150 200Number of nodes
1
2
3
4
5
Num
ber
of h
idde
n la
yers
12
13
14
15
16
17
Figure 9. Matrix of the BLER RMSE metric predictions for the radio parameters history windowW = 5.
Sensors 2021, 21, 7716 16 of 25
50 100 150 200Number of nodes
1
2
3
4
5
Num
ber
of h
idde
n la
yers
12
13
14
15
16
17
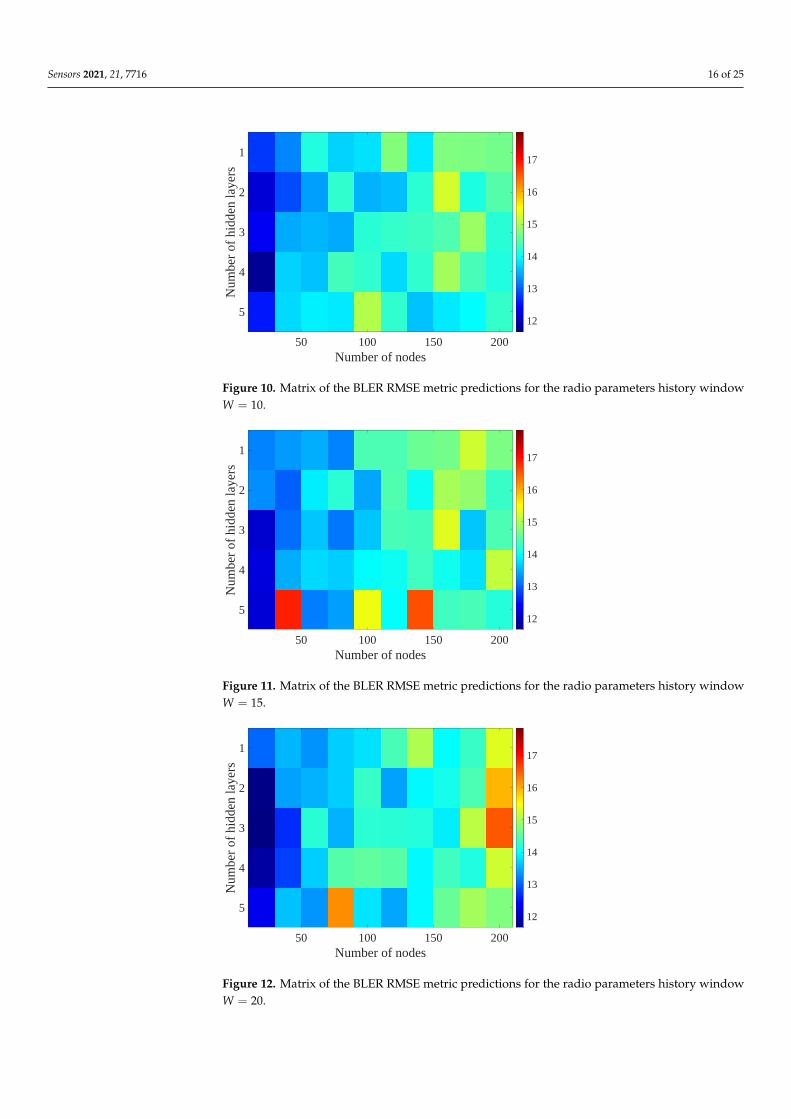
Figure 10. Matrix of the BLER RMSE metric predictions for the radio parameters history windowW = 10.
50 100 150 200Number of nodes
1
2
3
4
5
Num
ber
of h
idde
n la
yers
12
13
14
15
16
17
Figure 11. Matrix of the BLER RMSE metric predictions for the radio parameters history windowW = 15.
50 100 150 200Number of nodes
1
2
3
4
5
Num
ber
of h
idde
n la
yers
12
13
14
15
16
17
Figure 12. Matrix of the BLER RMSE metric predictions for the radio parameters history windowW = 20.
Sensors 2021, 21, 7716 17 of 25
As a part of the research, the activation function influence was also checked. However,the most efficient solutions were obtained for the tansig activation function, thus the furtherresults are presented only for this type of function.
In the case of the DL models analysis for the selected set of sample history windows,all models are characterized by a lower mean square error value compared to the linearmodel and fall in the ranges from 11.7% to 16.9%, with the minimum value achieved for a20-sample history radio parameters estimates. The first stage of the process of learning thegrid search method shows that the reduction of the RMSE is strongly related to the smallernumber of nodes in individual hidden layers, as indicated by the lowest values of RMSEerrors as a function of the number of nodes presented in the Table 4.
Table 4. Calculated the smallest RMSE for selected numbers of nodes in hidden layers.
Number of nodes 20 40 60 80 100 120 140 160 180 200
RMSE [%] 11.7 12.5 12.7 12.9 13.3 13.3 13.3 13.3 13.5 13.3
The obtained results also indicate that increasing the number of the historic samplesof the analyzed radio parameter estimates may increase the effectiveness of the DL models.In the Table 5 the obtained results for selected groups of the models defined in terms of theestimates history number along with the corresponding values of the effectiveness of thesenetworks and the number of layers corresponding to the models is shown.
Table 5. Calculated the smallest RMSE for the selected numbers of nodes in hidden layers.
Number of the history samples 5 10 15 20
RMSE [%] 11.8 11.78 12.17 11.66
Number of the hidden layers 4 4 5 3
Taking into consideration the obtained results, selected parameters of the networkarchitecture using the grid search method were verified and modified in the second stageof the learning process and presented in the Table 6.
Table 6. The hyperparameter variability and the learning parameters in the second stage of thelearning process.
Parameter Value
Number of hidden layers from 1 to 10
Number of nodes in the hidden layers from 20 to 100 with the step of 20
Activation function tansig
Number of the input nodes5 parameters and their multipledepending on the length of theanalyzed history, i.e., from 0 to 30;
Learning rate 0.001
Number of the learning iterations max. 10,000 or max. 50 validation error rate
Dataset split60% learning20% validation20% testing
Apart from increasing the number of hidden layers and the number of the modelinput nodes (related directly to the number of analyzed historical estimates of the radio pa-rameters), the conditions determining the number of iterations in the learning process were
Sensors 2021, 21, 7716 18 of 25
also modified. On the basis of the obtained results and the average value of 1869 numbersof the iterations performed in the first stage, the validation error rate was increased.
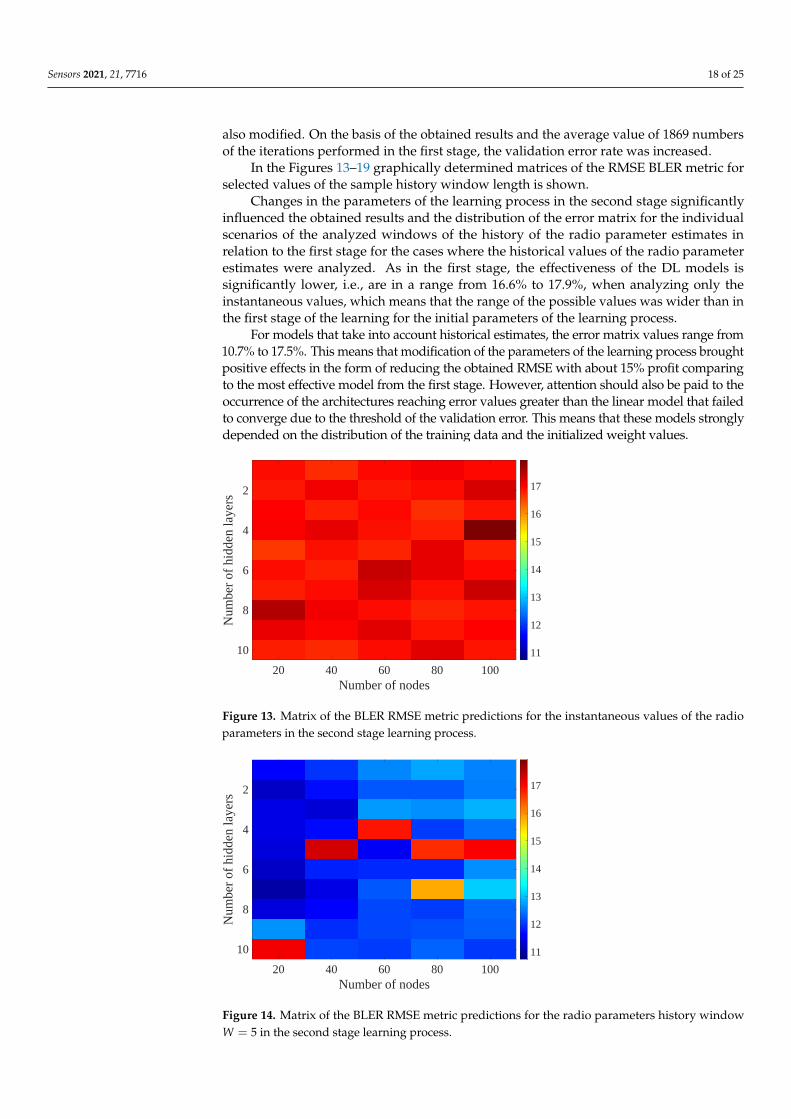
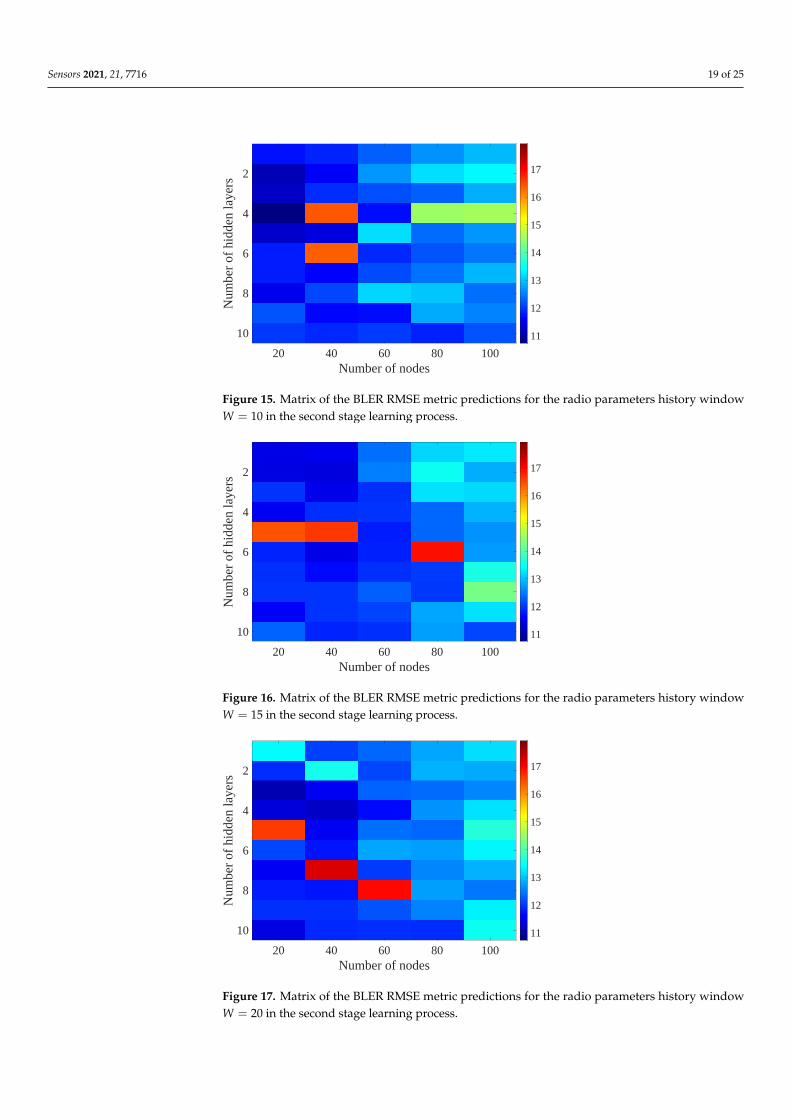
In the Figures 13–19 graphically determined matrices of the RMSE BLER metric forselected values of the sample history window length is shown.
Changes in the parameters of the learning process in the second stage significantlyinfluenced the obtained results and the distribution of the error matrix for the individualscenarios of the analyzed windows of the history of the radio parameter estimates inrelation to the first stage for the cases where the historical values of the radio parameterestimates were analyzed. As in the first stage, the effectiveness of the DL models issignificantly lower, i.e., are in a range from 16.6% to 17.9%, when analyzing only theinstantaneous values, which means that the range of the possible values was wider than inthe first stage of the learning for the initial parameters of the learning process.
For models that take into account historical estimates, the error matrix values range from10.7% to 17.5%. This means that modification of the parameters of the learning process broughtpositive effects in the form of reducing the obtained RMSE with about 15% profit comparingto the most effective model from the first stage. However, attention should also be paid to theoccurrence of the architectures reaching error values greater than the linear model that failedto converge due to the threshold of the validation error. This means that these models stronglydepended on the distribution of the training data and the initialized weight values.
20 40 60 80 100Number of nodes
2
4
6
8
10
Num
ber
of h
idde
n la
yers
11
12
13
14
15
16
17
Figure 13. Matrix of the BLER RMSE metric predictions for the instantaneous values of the radioparameters in the second stage learning process.
20 40 60 80 100Number of nodes
2
4
6
8
10
Num
ber
of h
idde
n la
yers
11
12
13
14
15
16
17
Figure 14. Matrix of the BLER RMSE metric predictions for the radio parameters history windowW = 5 in the second stage learning process.
Sensors 2021, 21, 7716 19 of 25
20 40 60 80 100Number of nodes
2
4
6
8
10
Num
ber
of h
idde
n la
yers
11
12
13
14
15
16
17
Figure 15. Matrix of the BLER RMSE metric predictions for the radio parameters history windowW = 10 in the second stage learning process.
20 40 60 80 100Number of nodes
2
4
6
8
10
Num
ber
of h
idde
n la
yers
11
12
13
14
15
16
17
Figure 16. Matrix of the BLER RMSE metric predictions for the radio parameters history windowW = 15 in the second stage learning process.
20 40 60 80 100Number of nodes
2
4
6
8
10
Num
ber
of h
idde
n la
yers
11
12
13
14
15
16
17
Figure 17. Matrix of the BLER RMSE metric predictions for the radio parameters history windowW = 20 in the second stage learning process.
Sensors 2021, 21, 7716 20 of 25
20 40 60 80 100Number of nodes
2
4
6
8
10
Num
ber
of h
idde
n la
yers
11
12
13
14
15
16
17
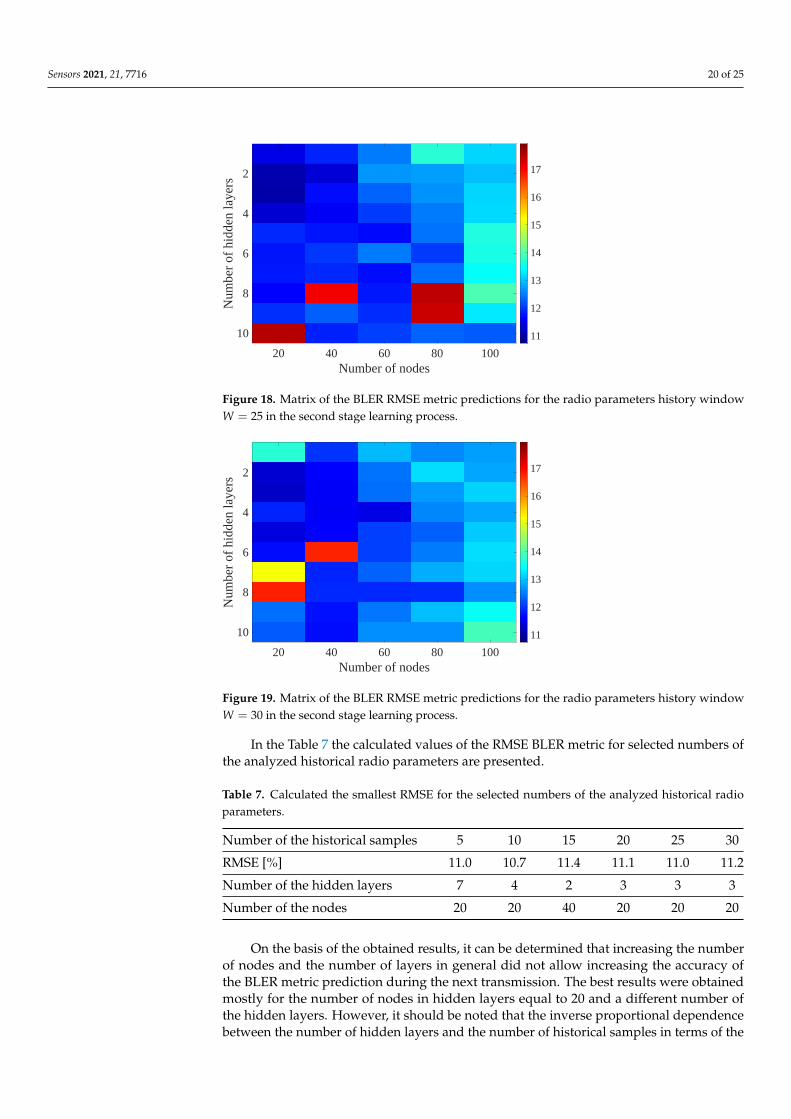
Figure 18. Matrix of the BLER RMSE metric predictions for the radio parameters history windowW = 25 in the second stage learning process.
20 40 60 80 100Number of nodes
2
4
6
8
10
Num
ber
of h
idde
n la
yers
11
12
13
14
15
16
17
Figure 19. Matrix of the BLER RMSE metric predictions for the radio parameters history windowW = 30 in the second stage learning process.
In the Table 7 the calculated values of the RMSE BLER metric for selected numbers ofthe analyzed historical radio parameters are presented.
Table 7. Calculated the smallest RMSE for the selected numbers of the analyzed historical radioparameters.
Number of the historical samples 5 10 15 20 25 30
RMSE [%] 11.0 10.7 11.4 11.1 11.0 11.2
Number of the hidden layers 7 4 2 3 3 3
Number of the nodes 20 20 40 20 20 20
On the basis of the obtained results, it can be determined that increasing the numberof nodes and the number of layers in general did not allow increasing the accuracy ofthe BLER metric prediction during the next transmission. The best results were obtainedmostly for the number of nodes in hidden layers equal to 20 and a different number ofthe hidden layers. However, it should be noted that the inverse proportional dependencebetween the number of hidden layers and the number of historical samples in terms of the
Sensors 2021, 21, 7716 21 of 25
obtained RMSE is clearly visible. The increase of the historical data memory allows usingmodels with the less number of hidden layers while maintaining a comparable RMSE valuefor each scenario. The differences between the individual models are not greater than the0.7% RMSE error relative to the most effective model. For the analyzed error matrices, 2%of the obtained models have the final RMSE error values of the BLER higher than the linearmodel, while 34% of the obtained models are characterized by more than a double profitcompared to the linear model. This indicates the significant increase in the efficiency of theBLER metric prediction using the DL and the high convergence of the developed modelsfor the defined problem.
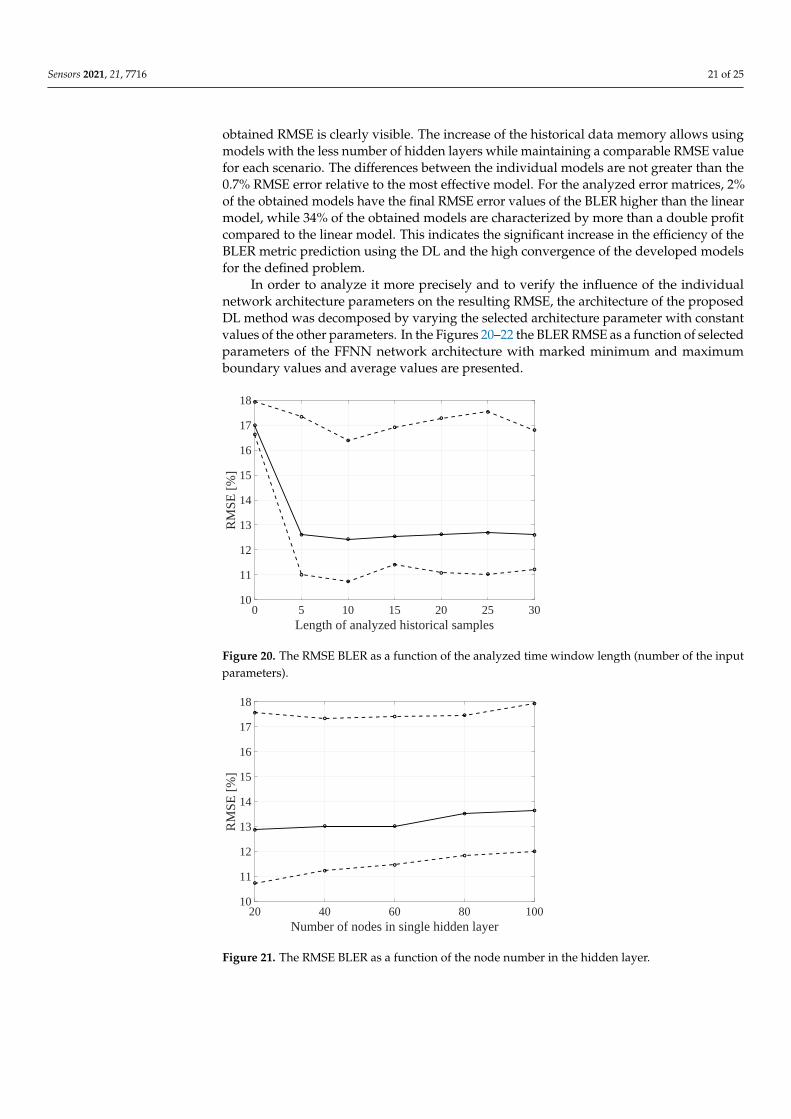
In order to analyze it more precisely and to verify the influence of the individualnetwork architecture parameters on the resulting RMSE, the architecture of the proposedDL method was decomposed by varying the selected architecture parameter with constantvalues of the other parameters. In the Figures 20–22 the BLER RMSE as a function of selectedparameters of the FFNN network architecture with marked minimum and maximumboundary values and average values are presented.
0 5 10 15 20 25 30Length of analyzed historical samples
10
11
12
13
14
15
16
17
18
RM
SE [
%]
Figure 20. The RMSE BLER as a function of the analyzed time window length (number of the inputparameters).
20 40 60 80 100Number of nodes in single hidden layer
10
11
12
13
14
15
16
17
18
RM
SE [
%]
Figure 21. The RMSE BLER as a function of the node number in the hidden layer.
Sensors 2021, 21, 7716 22 of 25
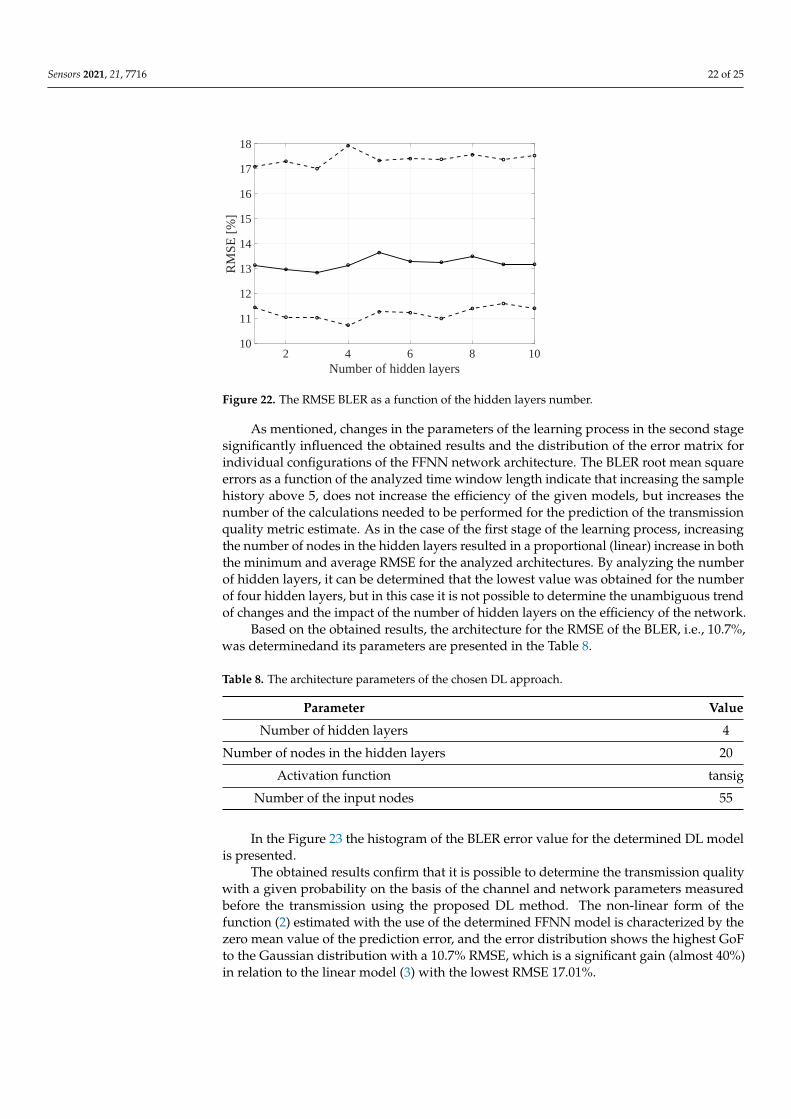
2 4 6 8 10Number of hidden layers
10
11
12
13
14
15
16
17
18
RM
SE [
%]
Figure 22. The RMSE BLER as a function of the hidden layers number.
As mentioned, changes in the parameters of the learning process in the second stagesignificantly influenced the obtained results and the distribution of the error matrix forindividual configurations of the FFNN network architecture. The BLER root mean squareerrors as a function of the analyzed time window length indicate that increasing the samplehistory above 5, does not increase the efficiency of the given models, but increases thenumber of the calculations needed to be performed for the prediction of the transmissionquality metric estimate. As in the case of the first stage of the learning process, increasingthe number of nodes in the hidden layers resulted in a proportional (linear) increase in boththe minimum and average RMSE for the analyzed architectures. By analyzing the numberof hidden layers, it can be determined that the lowest value was obtained for the numberof four hidden layers, but in this case it is not possible to determine the unambiguous trendof changes and the impact of the number of hidden layers on the efficiency of the network.
Based on the obtained results, the architecture for the RMSE of the BLER, i.e., 10.7%,was determinedand its parameters are presented in the Table 8.
Table 8. The architecture parameters of the chosen DL approach.
Parameter Value
Number of hidden layers 4
Number of nodes in the hidden layers 20
Activation function tansig
Number of the input nodes 55
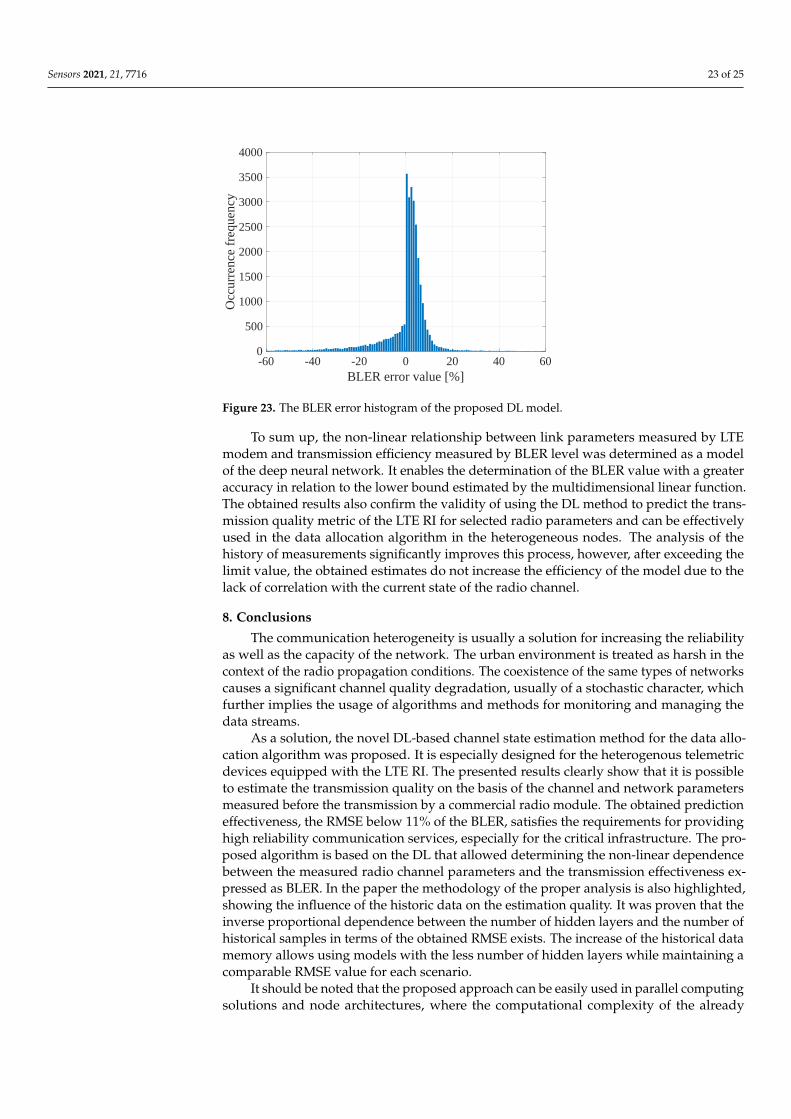
In the Figure 23 the histogram of the BLER error value for the determined DL modelis presented.
The obtained results confirm that it is possible to determine the transmission qualitywith a given probability on the basis of the channel and network parameters measuredbefore the transmission using the proposed DL method. The non-linear form of thefunction (2) estimated with the use of the determined FFNN model is characterized by thezero mean value of the prediction error, and the error distribution shows the highest GoFto the Gaussian distribution with a 10.7% RMSE, which is a significant gain (almost 40%)in relation to the linear model (3) with the lowest RMSE 17.01%.
Sensors 2021, 21, 7716 23 of 25
-60 -40 -20 0 20 40 60BLER error value [%]
0
500
1000
1500
2000
2500
3000
3500
4000
Occ
urre
nce
freq
uenc
y
Figure 23. The BLER error histogram of the proposed DL model.
To sum up, the non-linear relationship between link parameters measured by LTEmodem and transmission efficiency measured by BLER level was determined as a modelof the deep neural network. It enables the determination of the BLER value with a greateraccuracy in relation to the lower bound estimated by the multidimensional linear function.The obtained results also confirm the validity of using the DL method to predict the trans-mission quality metric of the LTE RI for selected radio parameters and can be effectivelyused in the data allocation algorithm in the heterogeneous nodes. The analysis of thehistory of measurements significantly improves this process, however, after exceeding thelimit value, the obtained estimates do not increase the efficiency of the model due to thelack of correlation with the current state of the radio channel.
8. Conclusions
The communication heterogeneity is usually a solution for increasing the reliabilityas well as the capacity of the network. The urban environment is treated as harsh in thecontext of the radio propagation conditions. The coexistence of the same types of networkscauses a significant channel quality degradation, usually of a stochastic character, whichfurther implies the usage of algorithms and methods for monitoring and managing thedata streams.
As a solution, the novel DL-based channel state estimation method for the data allo-cation algorithm was proposed. It is especially designed for the heterogenous telemetricdevices equipped with the LTE RI. The presented results clearly show that it is possibleto estimate the transmission quality on the basis of the channel and network parametersmeasured before the transmission by a commercial radio module. The obtained predictioneffectiveness, the RMSE below 11% of the BLER, satisfies the requirements for providinghigh reliability communication services, especially for the critical infrastructure. The pro-posed algorithm is based on the DL that allowed determining the non-linear dependencebetween the measured radio channel parameters and the transmission effectiveness ex-pressed as BLER. In the paper the methodology of the proper analysis is also highlighted,showing the influence of the historic data on the estimation quality. It was proven that theinverse proportional dependence between the number of hidden layers and the number ofhistorical samples in terms of the obtained RMSE exists. The increase of the historical datamemory allows using models with the less number of hidden layers while maintaining acomparable RMSE value for each scenario.
It should be noted that the proposed approach can be easily used in parallel computingsolutions and node architectures, where the computational complexity of the already
Sensors 2021, 21, 7716 24 of 25
trained model is low. Thus, it can be implemented in the practical applications in theheterogeneous telemetry devices, even based on the microcontrollers.
During the future works, the analysis of other RIs commonly used in the modern het-erogeneous terminals, especially the NB-IoT, should be considered. In addition, the analysisof the activation tansig function mapping accuracy (its resolution) can be also investigated.
Author Contributions: K.K.C., P.R., A.O. and O.B. contributed to developing the deep learningapproach, methodology, designing measurements, data analysis, scientific discussions and writingthe paper. In addition, R.B. contributed to designing and developing the measurement stand,designing and developing the measurements and reviewing the paper. All authors have read andagreed to the published version of the manuscript.
Funding: This work has been partially financed and carried out as part of the project entitled “Powerdata concentrator with innovative decision functionality and gate functionality in AMI, SCADA,HAN, IoT environments”, co-financed under the European Regional Development Fund within theSmart Growth Operational Program, agreement no. POIR.01.01.01-00-0651/19, realized in the GdanskUniversity of Technology, Faculty of Electronics Telecommunication and Informatics, Department ofRadiocommunication Systems and Networks.
Data Availability Statement: Datasets are available for free from the authors with the CC BY license.
Acknowledgments: The authors would like to thank Jarosław Sadowski for a continuous support,substantive discussions, all comments and advices.
Conflicts of Interest: The authors declare no conflict of interest.
References1. Dorner S.; Cammerer S.; Hoydis J.; Ten Brink, S. On Deep Learning-Based Communication Over the Air. IEEE J. Sel. Top. Signal
Process. 2017, 12, 132–143. [CrossRef]2. Moiseev, S.N.; Filin, S.A.; Kondakov, M.S.; Garmonov, A.V.; Savinkov, A.Y.; Park, Y.S.; Yim, D.H.; Lee, J.H.; Cheon, S.H.; Han, K.T.
Practical propagation channel robust BLER estimation in the OFDM/TDMA and OFDMA broadband wireless access networks.IEEE Veh. Technol. Conf. 2006, 1127–1131. [CrossRef]
3. Avidor, D.; Hartmann, C.; Mukherjee, S. On the uplink SIR of a mobile in soft handoff with applications to BLER estimation.IEEE Trans. Wirel. Commun. 2005, 4, 467–474. [CrossRef]
4. Jorke P.; Guldenring, J.; Bocker, S.; Wietfeld, C. Coverage and Link Quality Improvement of Cellular IoT Networks withMulti-Operator and Multi-Link Strategies. In Proceedings of the IEEE 89th Vehicular Technology Conference (VTC2019-Spring),IEEE, Kuala Lumpur, Malaysia, 28 April–1 May 2019.
5. Abdullah, E.; Hidayat, N.M.; Aziz, I.A.A.; Shuhaimi, N.I.; Sifuddin, M.A. Comparison of F-OFDM and FBMC in terms of PAPR,BER and FER in Multilink Scenario. In Proceedings of the ISCAIE 2021—IEEE 11th Symposium on Computer Applications andIndustrial Electronics, Penang, Malaysia 3–4 April 2021; pp. 378–382. [CrossRef]
6. Kántor, P.; Bitó, J. Adaptive link assigment applied in case of video streaming in a multilink environment. In Proceedings of theIEEE Vehicular Technology Conference, San Francisco, CA, USA, 5–8 September 2011. [CrossRef]
7. Saffar, I.; Morel, M.L.A.; Singh, K.D.; Viho, C. Deep learning based speed profiling for mobile users in 5G cellular networks. InProceedings of the 2019 IEEE Global Communications Conference, GLOBECOM 2019, Big Island, HI, USA, 9–13 December 2019;[CrossRef]
8. Lee Loong Y.; Quin D. A Survey on Applications of Deep Reinforcement Learning in Resource Management for 5G HeterogeneousNetworks. In Proceedings of the APSIPA Annual Summit and Conference, Lanzhou, China, 18–21 November 2019.
9. Yu, P.; Yang, M.; Xiong, A.; Ding, Y.; Li, W.; Qiu, X.; Meng, L.; Kadoch, M.; Cheriet, M. Intelligent-Driven Green ResourceAllocation for Industrial Internet of Things in 5G Heterogeneous Networks. IEEE Trans. Ind. Inform. 2020, 18, 18520–530.[CrossRef]
10. Imran, M.; Yin, H.; Chen, T.; Huang, Z.; Zhang, X.; Zheng, K. DDHH: A decentralized deep learning framework for large-scaleheterogeneous networks. In Proceedings of the 2021 IEEE 37th International Conference on Data Engineering (ICDE), Chania,Greece, 19–22 April 2021; Volume 2021, pp. 2033–2038. [CrossRef]
11. Zhang, C.; Patras, P.; Haddadi, H. Deep Learning in Mobile and Wireless Networking: A Survey. IEEE Commun. Surv. Tutor.2019, 21, 2224–2287. [CrossRef]
12. Zhang, Y.; Xiong, L.; Yu, J. Deep learning based user association in heterogeneous wireless networks. IEEE Access 2020,8, 197439–197447. [CrossRef]
13. Tang, F.; Zhou, Y.; Kato, N. Deep Reinforcement Learning for Dynamic Uplink/Downlink Resource Allocation in High Mobility5G HetNet. IEEE J. Sel. Areas Commun. 2020, 38, 2773–2782. [CrossRef]

Sensors 2021, 21, 7716 25 of 25
14. Mismar, F.B.; Evans, B.L. Deep Learning in Downlink Coordinated Multipoint in New Radio Heterogeneous Networks. IEEEWirel. Commun. Lett. 2019, 8, 1040–1043. [CrossRef]
15. Basu, S.S.; Sultania, A.K.; Famaey, J.; Hoebeke, J. Experimental Performance Evaluation of NB-IoT. In Proceedings of theInternational Conference on Wireless and Mobile Computing, Networking and Communications (WiMob), Barcelona, Spain,21–23 October 2019.
16. Afroz, F.; Subramanian, R.; Heidary, R.; Sandrasegaran, K.; Ahmed, S. SINR, RSRP, RSSI and RSRQ Measurements in Long TermEvolution Networks. Int. J. Wirel. Mob. Netw. 2015, 7, 113–123. [CrossRef]
17. Ding, Y.; Kwon, H. Doppler Spread Estimation for 5G NR with Supervised Learning. In Proceedings of the 2020 IEEE GlobalCommunications Conference, GLOBECOM 2020, Taipei, Taiwan, 7–11 December 2020. [CrossRef]
18. Singh, I.; Kalyani, S.; Giridhar, K. A practical compressed sensing approach for channel estimation in OFDM systems. IEEECommun. Lett. 2015, 19, 2146–2149. [CrossRef]
19. Fernandez Maimo, L.; Perales Gomez, A.L.; Garcia Clemente, F.J.; Gil Perez, M.; Martinez Perez, G. A Self-Adaptive DeepLearning-Based System for Anomaly Detection in 5G Networks. IEEE Access 2018, 6, 7700–7712. [CrossRef]
20. Błaszkiewicz, O.; Burczyk, R.; Czapiewska, A.; Gajewska, M.; Gajewski, S.; Marczak, A.; Miszewski, M.; Sadowski, J.; Stefanski, J.Research stand for automatic analysis of transmission quality of the KODES concentrator with LTE, NB-IoT and ISM interfaces(in Polish). Przeglad Telekomunikacyjny - Wiadomosci Telekomunikacyjne 2021, 1, 10–19. [CrossRef]
21. Błaszkiewicz, O.; Burczyk, R.; Czapiewska, A.; Gajewska, M.; Gajewski, S.; Sadowski, J. Transmission quality estimation in LTEbasing on indicators measured by radio module (in Polish). XX Krajowa Konferencja Elektroniki 2021, [CrossRef]
22. Rohde & Schwarz. CMW500 User Manual. Available online: https://www.rohde-schwarz.com/jp/product/cmw500-productstartpage_63493-10341.html (accessed on 19 November 2021).
23. Filliben, J.J. The Probability Plot Correlation Coefficient Test for Normality. Technometrics 1975, 17, 111–117. [CrossRef]24. Pati, P.S.; Sahoo, S.S.; Krishnaswamy, D.; Datta, R. A Novel Machine Learning Approach for Link Adaptation in 5G Wireless
Networks. In Proceedings of the 2020 2nd PhD Colloquium on Ethically Driven Innovation and Technology for Society, PhDEDITS 2020, Bangalore, India, 8 November 2020. [CrossRef]
25. Laskowski, M.; Ambroziak, S.J.; Correia, L.M.; Swider, K. On the usefulness of the generalised additive model for mean path lossestimation in body area networks. IEEE Access 2020, 8, 376873–376882. [CrossRef]
26. Goodfellow I.; Bengio Y.; Courville A. Deep Learning; The MIT Press: London, UK, 2016.27. Li G.; Xiao M.; Guo Y. Application of Deep Learning in Stock Market Valuation Index Forecasting. In Proceedings of the 2019
IEEE 10th International Conference on Software Engineering and Service Science, Beijing,China, 18–20 October 2019.28. Yang, W.; Wang, R.; Wang, B. Detection of anomaly stock price based on time series deep learning models. In Proceedings of
the 2020 Management Science Informatization and Economic Innovation Development Conference, MSIEID 2020, Guangzhou,China, 18–20 December 2020; pp. 110–114. [CrossRef]
29. Zhang, L.; Lu, L.; Wang, X.; Zhu, R.M.; Bagheri, M.; Summers, R.M.; Yao, J. Spatio-Temporal Convolutional LSTMs for TumorGrowth Prediction by Learning 4D Longitudinal Patient Data. IEEE Trans. Med. Imaging 2020, 39, 1114–1126. [CrossRef][PubMed]
30. Xu, L.; Kun, W.; Pengfei, L.; Miaoyu, X. Deep Learning Short-Term Traffic Flow Prediction Based on Lane Changing BehaviorRecognition. In Proceedings of the 2020 2nd International Conference on Information Technology and Computer Application,ITCA 2020, Guangzhou, China, 18–20 December 2020; pp. 760–763. [CrossRef]
31. Patterson, J.; Gibson, A. Deep Learning; O’Reilly Media, Inc.: Newton, MA, USA, 2017.32. Cwalina, K.K.; Rajchowski, P.; Blaszkiewicz, O.; Olejniczak, A.; Sadowski, J. Deep learning-based LOS and NLOS identification in
wireless body area networks. Sensors 2019, 19, 4229. [CrossRef] [PubMed]33. Kingma, D.P.; Ba, J. Adam: A Method for Stochastic Optimization. In Proceedings of the 3rd International Conference on
Learning Representations (ICLR), San Diego, CA, USA, 7–9 May 2015.


