Embed Size (px)
Citation preview
Cell Metabolism
Article
Imbalance between Neutrophil Elastase and itsInhibitor a1-Antitrypsin in Obesity Alters InsulinSensitivity, Inflammation, and Energy ExpenditureVirginie Mansuy-Aubert,1,8 Qiong L. Zhou,1,8 Xiangyang Xie,1,8 Zhenwei Gong,1 Jun-Yuan Huang,1 Abdul R. Khan,1,2
Gregory Aubert,1 Karla Candelaria,1 Shantele Thomas,1 Dong-Ju Shin,1 Sarah Booth,3 Shahid M. Baig,2 Ahmed Bilal,4
Daehee Hwang,5 Hui Zhang,5,6 Robin Lovell-Badge,3 Steven R. Smith,1,7 Fazli R. Awan,2 and Zhen Y. Jiang1,*1Metabolic Signaling and Disease Program, Diabetes and Obesity Research Center, Sanford-Burnham Medical Research Institute atLake Nona, Orlando, FL 32827, USA2Diabetes and Cardio-Metabolic Disorders Laboratory, Health Biotechnology Division, National Institute for Biotechnology and Genetic
Engineering (NIBGE), Faisalabad 38000, Pakistan3Division of Developmental Genetics, MRC National Institute of Medical Research, London NW7 1AA, UK4Department of Medicine, Allied Hospital, Punjab Medical College, Faisalabad 38800, Pakistan5Institute for Systems Biology, Seattle, WA 98109, USA6Department of Pathology, Clinical Chemistry Division, Johns Hopkins University, Baltimore, MD 21287, USA7Translational Research Institute, Florida Hospital, Orlando, FL 32804, USA8These authors contributed equally to this work
*Correspondence: [email protected]
http://dx.doi.org/10.1016/j.cmet.2013.03.005
SUMMARY
The molecular mechanisms involved in the develop-ment of obesity and related complications remainunclear. Here, we report that obese mice and humansubjects have increased activity of neutrophil elas-tase (NE) and decreased serum levels of the NE inhib-itor a1-antitrypsin (A1AT, SerpinA1). NE null (Ela2�/�)mice and A1AT transgenic mice were resistant tohigh-fat diet (HFD)-induced body weight gain, insulinresistance, inflammation, and fatty liver. NE inhibitorGW311616A reversed insulin resistance and bodyweight gain in HFD-fed mice. Ela2�/� mice also aug-mented circulating highmolecular weight (HMW) adi-ponectin levels, phosphorylation of AMP-activatedprotein kinase (AMPK), and fatty acid oxidation(FAO) in the liver and brown adipose tissue (BAT)and uncoupling protein (UCP1) levels in the BAT.These data suggest that the A1AT-NE system regu-lates AMPK signaling, FAO, and energy expenditure.The imbalance between A1AT and NE contributes tothe development of obesity and related inflamma-tion, insulin resistance, and liver steatosis.
INTRODUCTION
Obesity is a major contributing factor to the worldwide preva-
lence of type 2 diabetes, nonalcoholic fatty liver disease, cardio-
vascular disease, and many other disorders. Leptin, a hormone
secreted from adipose tissue, plays a key role in energy balance
and feeding behavior through neuronal regulation, and both
leptin deficiency and leptin resistance are associated with the
development of obesity (Myers et al., 2010). Other factors impli-
cated in the development of obesity-related diseases include
534 Cell Metabolism 17, 534–548, April 2, 2013 ª2013 Elsevier Inc.
adipokines, fatty acids, mitochondrial dysfunction, endoplasmic
reticulum (ER) stress, and hypoxia (Sun et al., 2011). Despite
great progress in the field, the molecular mechanisms that pre-
cede the development of obesity and related complications are
not fully understood.
Many recent studies have suggested that obesity is associ-
ated with chronic adipose tissue inflammation, which results in
increased levels of proinflammatory factors, such as tumor ne-
crosis factor (TNFa) and monocyte chemoattractant protein
(MCP)-1, and decreased production of anti-inflammatory adipo-
kines such as adiponectin (Hotamisligil, 2006; Kamei et al., 2006;
Lumeng and Saltiel, 2011; Ouchi et al., 2011; Shoelson et al.,
2006). Moreover, adipose tissue is infiltrated by proinflammatory
cells such as lymphocytes, mast cells, natural killer (NK) cells,
and neutrophils in the early stages of obesity, and macrophages
accumulate at later times (Elgazar-Carmon et al., 2008; Feuerer
et al., 2009; Liu et al., 2009; Nishimura et al., 2009; Weisberg
et al., 2003; Winer et al., 2011; Xu et al., 2003). Ample evidence
supports that adipose inflammation is related to the develop-
ment of insulin resistance (Osborn and Olefsky, 2012; Ouchi
et al., 2011; Sun et al., 2012). However, little is known about
the molecular events that lead to immune cell infiltration and in-
flammatory cytokine production in adipose tissue and the subse-
quent development of systemic insulin resistance.
In an effort to identify factors involved in the development of
obesity-related metabolic complications, we compared the
serum protein profiles of leptin-deficient obese (ob/ob) mice
and lean wild-type (WT) mice, using a combination of glycopro-
tein enrichment and quantitative proteomic approaches (Tian
et al., 2007). Several proteins showed differential expression;
among them, Ser protease inhibitor a1-antitrypsin [A1AT,
SerpinA1] was dramatically reduced in the serum and liver of
ob/ob mice. A1AT is produced in the liver and is an endogenous
inhibitor of neutrophil elastase (NE), a proteolytic enzyme pro-
duced by neutrophils during inflammation (Korkmaz et al.,
2010; Pham, 2006). Interestingly, leptin treatment increased
Cell Metabolism
Elastase and SerpinA1 Regulate Metabolic Functions
A1AT expression in both cultured hepatocytes and the liver of
ob/ob mice. In contrast, we observed that NE activity was sig-
nificantly elevated in serum of both ob/ob and high-fat diet
(HFD)-fed mice, suggesting that obesity was associated with a
significant increase in the ratio of the NE protease over its natural
inhibitor A1AT. We show here that genetic deletion of NE and
overexpression of human A1AT (hA1AT) dramatically alleviated
the adipose inflammation, insulin resistance, body weight gain,
and liver steatosis in mice fed with HFD. NE null mice also
showed increased serum HMW adiponectin levels, AMP-acti-
vated protein kinase (AMPK) signaling, and fatty acid oxidation
(FAO) in both the liver and BAT and higher UCP1 protein levels
in the BAT. We also confirmed that human obese subjects had
significantly reduced serum A1AT levels and increased NE activ-
ities, which correlated with body mass index (BMI) and leptin
resistance. Collectively, our data provide evidence that leptin
regulates A1AT expression in the liver and suggest that the
imbalance between the activities of NE and its inhibitor A1AT
may be an important contributing factor for the development of
obesity, inflammation, and insulin resistance.
RESULTS
Identification of a1-Antitrypsin as a Serum ProteinDifferentially Expressed in Obese MiceWe sought to identify differentially expressed serum proteins in
the leptin-deficient obese B6.V-Lepob/J (ob/ob) mouse model
using glycoprotein enrichment and quantitative proteomic ap-
proaches (Tian et al., 2007; Zhang et al., 2003). Serum proteins
from 12-week-old obese ob/ob mice or age-matched lean
C57BL/6 mice were purified by solid-phase extraction of N-
linked glycopeptides followed by stable isotope labeling and
subsequent identification and quantification of glycopeptides
using tandemmass spectrometry (Figure 1A). As shown in Table
S1, we detected 11 glycoproteins with significantly different
levels in the serum of obese mice compared with the lean
mice. Among these proteins, multiple members of the Ser prote-
ase inhibitor (Serpin) family, including SerpinA1 (a1-antitrypsin,
A1AT), were significantly reduced in the obese mice. A1AT is
produced and secretedmainly by the liver and plays a critical tis-
sue protective role by inactivation of proteases, including NE,
produced by tissue-resident inflammatory cells such as neutro-
phils. We confirmed by ELISA that serum A1AT levels were
significantly lower (40%) in 13-week-old ob/ob mice than in
lean control mice, whereas NE activity was almost 2-fold higher
(Figures 1B and 1C). In addition, C57BL/6J lean control mice
fed a HFD (60 kcal% fat) showed a decrease in serum A1AT
levels and an increase in serum NE activity with time (Figures
1D and 1E). Thus, serum A1AT decreased and NE activity
increased in a reciprocal manner over the period of HFD feeding
in mice.
Leptin Regulates A1AT ExpressionTo identify the factor(s) involved in the regulation of liver A1AT
expression, we examined the effects of several obesity-related
factors on A1AT gene expression in cultured hepatic cell lines.
A1AT expression was unaffected in HepG2 cells treated with
insulin, docosahexaenoic acid, eicosapentaenoic acid, or palmi-
tate (data not shown). However, A1AT messenger RNA (mRNA)
C
and protein levels were significantly increased by leptin treat-
ment of human HepG2 cells, murine Hep1-6 cells, and primary
murine hepatocytes (Figures 1F, 1G, and S1A–S1C). HepG2
cells treated with leptin also displayed increased phosphoryla-
tion of the transcription factor signal transducer and activator
of transcription 3 (STAT3) (Figure S1D). Analysis of the serpina1
(A1AT) promoter (Kalsheker et al., 2002) revealed the presence of
consensus sequences for binding of STAT3 and several other
transcription factors including hepatocyte nuclear factor (HNF)-
1 and HNF-4 and specificity protein 1 (SP1). To determine the
mechanism by which leptin increases expression of A1AT and
phosphorylation of STAT3, hepatic cells were incubated with
leptin in the presence of inhibitors of key signaling molecules
including JAK2 (AG490), HNF-1 (UCDA), SP1 (mithramycin),
Akt1 and Akt2 (Akti-1/2), andMEK1 andMEK2 (U0126). Notably,
the leptin-induced increase in A1AT expression and STAT3
phosphorylation was specifically abolished by AG490 (Figures
S1A–S1D), demonstrating that leptin stimulates A1AT expres-
sion via the JAK2-STAT3 pathway in hepatocytes. Leptin had
no effect on A1AT mRNA stability (Figure S1E). To examine the
effects of leptin on A1AT expression in vivo, recombinant mouse
leptin was administered to leptin-deficient ob/ob mice for 7 days
through implanted osmotic infusion pumps. In addition to inhib-
iting food intake and body weight gain (Figures S1F and S1G),
leptin treatment also significantly increased A1AT mRNA and
protein expression in the liver and sera of ob/ob mice compared
with vehicle-treated ob/ob mice (Figures 1H and 1I).
Imbalance of Serum A1AT Levels and NE Activitiesin Human Obese SubjectsTo validate whether the expression of A1AT and NE is also
altered in obese human subjects, we examined sera from 62
healthy South Asian males and 17 US males with varying BMIs
(Table S2). In the South Asian subjects, serum leptin levels
were markedly increased in the obese subjects (BMI > 27, stan-
dard for South Asian populations) and positively correlated with
BMI (Figures 2A and S2A). Interestingly, serum A1AT levels were
negatively correlated with BMI and leptin (Figures 2B and 2C).
Serum A1AT levels were significantly reduced by 27% in the
obese group (BMI > 27) compared with the nonobese group
(BMI < 27), and A1AT levels in subjects with a BMI > 30 were
about 40% lower than in the lean subjects with a BMI < 23 (Fig-
ure S2B). We confirmed these findings in sera from 17 US males
(Figures 2D–2J) and found that the obese subjects (classified as
BMI > 30 for US population) had lower serum A1AT levels and
higher leptin levels than their lean counterparts (BMI < 26). We
examined serum NE elastase activity in the US subjects and
noted that, in contrast to A1AT, NE activity in the obese subjects
was significantly higher than in the lean controls (Figure 2F).
Interestingly, serum A1AT levels were negatively correlated to
NE activity (Figure 2G). Furthermore, serum leptin levels were
negatively correlated with A1AT levels (Figure 2H) and positively
correlated with both NE activity and the ratio of NE activity to
A1AT levels (Figures 2I and 2J). However, both serum A1AT
levels and NE activity were not associated with blood glucose
levels (Figure S2C and S2D). Together, these data suggest that
obesity and leptin resistance are associated with an imbalance
of serum NE activity and A1AT levels in those subjects.
ell Metabolism 17, 534–548, April 2, 2013 ª2013 Elsevier Inc. 535
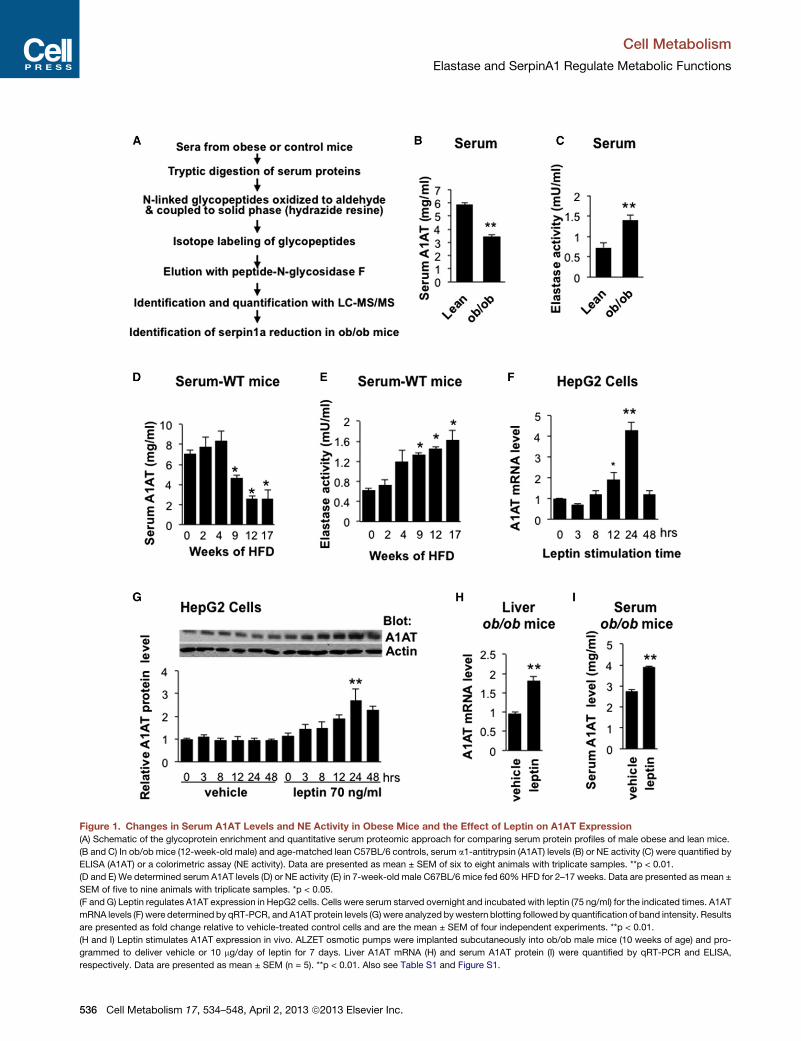
Figure 1. Changes in Serum A1AT Levels and NE Activity in Obese Mice and the Effect of Leptin on A1AT Expression
(A) Schematic of the glycoprotein enrichment and quantitative serum proteomic approach for comparing serum protein profiles of male obese and lean mice.
(B and C) In ob/ob mice (12-week-old male) and age-matched lean C57BL/6 controls, serum a1-antitrypsin (A1AT) levels (B) or NE activity (C) were quantified by
ELISA (A1AT) or a colorimetric assay (NE activity). Data are presented as mean ± SEM of six to eight animals with triplicate samples. **p < 0.01.
(D and E) We determined serum A1AT levels (D) or NE activity (E) in 7-week-old male C67BL/6 mice fed 60%HFD for 2–17 weeks. Data are presented as mean ±
SEM of five to nine animals with triplicate samples. *p < 0.05.
(F and G) Leptin regulates A1AT expression in HepG2 cells. Cells were serum starved overnight and incubated with leptin (75 ng/ml) for the indicated times. A1AT
mRNA levels (F) were determined by qRT-PCR, and A1AT protein levels (G) were analyzed bywestern blotting followed by quantification of band intensity. Results
are presented as fold change relative to vehicle-treated control cells and are the mean ± SEM of four independent experiments. **p < 0.01.
(H and I) Leptin stimulates A1AT expression in vivo. ALZET osmotic pumps were implanted subcutaneously into ob/ob male mice (10 weeks of age) and pro-
grammed to deliver vehicle or 10 mg/day of leptin for 7 days. Liver A1AT mRNA (H) and serum A1AT protein (I) were quantified by qRT-PCR and ELISA,
respectively. Data are presented as mean ± SEM (n = 5). **p < 0.01. Also see Table S1 and Figure S1.
Cell Metabolism
Elastase and SerpinA1 Regulate Metabolic Functions
536 Cell Metabolism 17, 534–548, April 2, 2013 ª2013 Elsevier Inc.
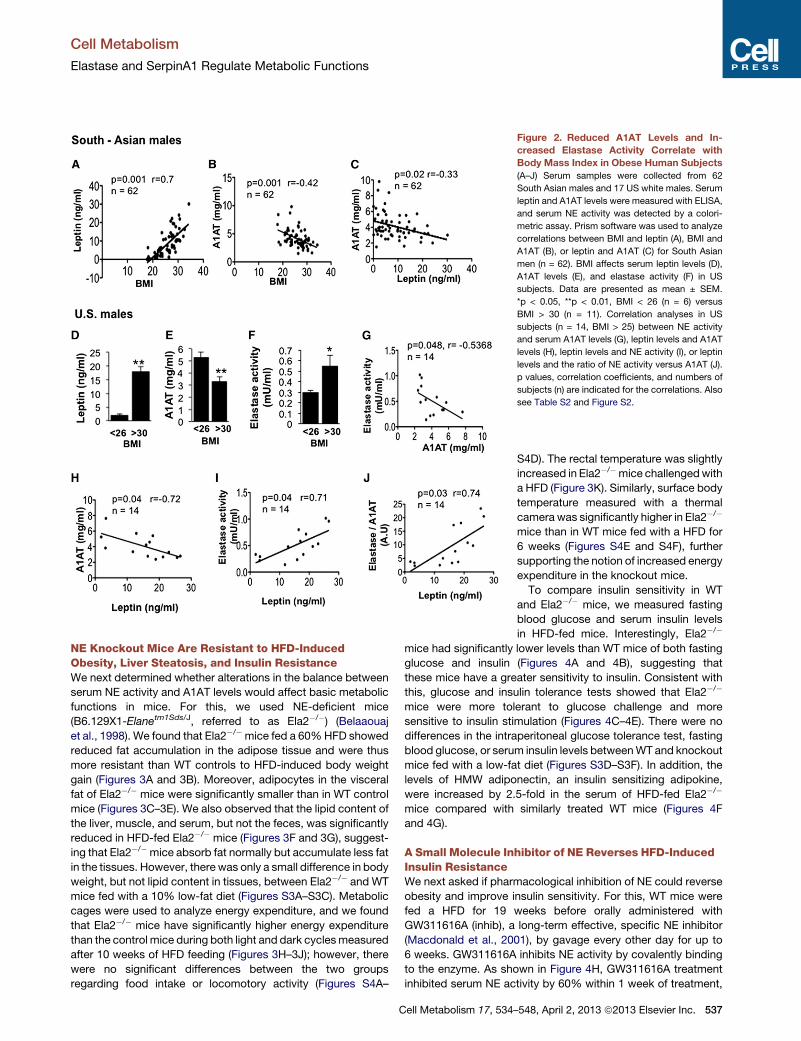
Figure 2. Reduced A1AT Levels and In-
creased Elastase Activity Correlate with
Body Mass Index in Obese Human Subjects
(A–J) Serum samples were collected from 62
South Asian males and 17 US white males. Serum
leptin and A1AT levels were measured with ELISA,
and serum NE activity was detected by a colori-
metric assay. Prism software was used to analyze
correlations between BMI and leptin (A), BMI and
A1AT (B), or leptin and A1AT (C) for South Asian
men (n = 62). BMI affects serum leptin levels (D),
A1AT levels (E), and elastase activity (F) in US
subjects. Data are presented as mean ± SEM.
*p < 0.05, **p < 0.01, BMI < 26 (n = 6) versus
BMI > 30 (n = 11). Correlation analyses in US
subjects (n = 14, BMI > 25) between NE activity
and serum A1AT levels (G), leptin levels and A1AT
levels (H), leptin levels and NE activity (I), or leptin
levels and the ratio of NE activity versus A1AT (J).
p values, correlation coefficients, and numbers of
subjects (n) are indicated for the correlations. Also
see Table S2 and Figure S2.
Cell Metabolism
Elastase and SerpinA1 Regulate Metabolic Functions
NE Knockout Mice Are Resistant to HFD-InducedObesity, Liver Steatosis, and Insulin ResistanceWe next determined whether alterations in the balance between
serum NE activity and A1AT levels would affect basic metabolic
functions in mice. For this, we used NE-deficient mice
(B6.129X1-Elanetm1Sds/J, referred to as Ela2�/�) (Belaaouaj
et al., 1998). We found that Ela2�/�mice fed a 60%HFD showed
reduced fat accumulation in the adipose tissue and were thus
more resistant than WT controls to HFD-induced body weight
gain (Figures 3A and 3B). Moreover, adipocytes in the visceral
fat of Ela2�/� mice were significantly smaller than in WT control
mice (Figures 3C–3E). We also observed that the lipid content of
the liver, muscle, and serum, but not the feces, was significantly
reduced in HFD-fed Ela2�/� mice (Figures 3F and 3G), suggest-
ing that Ela2�/�mice absorb fat normally but accumulate less fat
in the tissues. However, there was only a small difference in body
weight, but not lipid content in tissues, between Ela2�/� and WT
mice fed with a 10% low-fat diet (Figures S3A–S3C). Metabolic
cages were used to analyze energy expenditure, and we found
that Ela2�/� mice have significantly higher energy expenditure
than the control mice during both light and dark cyclesmeasured
after 10 weeks of HFD feeding (Figures 3H–3J); however, there
were no significant differences between the two groups
regarding food intake or locomotory activity (Figures S4A–
Cell Metabolism 17, 534–
S4D). The rectal temperature was slightly
increased in Ela2�/�mice challengedwith
a HFD (Figure 3K). Similarly, surface body
temperature measured with a thermal
camera was significantly higher in Ela2�/�
mice than in WT mice fed with a HFD for
6 weeks (Figures S4E and S4F), further
supporting the notion of increased energy
expenditure in the knockout mice.
To compare insulin sensitivity in WT
and Ela2�/� mice, we measured fasting
blood glucose and serum insulin levels
in HFD-fed mice. Interestingly, Ela2�/�
mice had significantly lower levels than WT mice of both fasting
glucose and insulin (Figures 4A and 4B), suggesting that
these mice have a greater sensitivity to insulin. Consistent with
this, glucose and insulin tolerance tests showed that Ela2�/�
mice were more tolerant to glucose challenge and more
sensitive to insulin stimulation (Figures 4C–4E). There were no
differences in the intraperitoneal glucose tolerance test, fasting
blood glucose, or serum insulin levels betweenWT and knockout
mice fed with a low-fat diet (Figures S3D–S3F). In addition, the
levels of HMW adiponectin, an insulin sensitizing adipokine,
were increased by 2.5-fold in the serum of HFD-fed Ela2�/�
mice compared with similarly treated WT mice (Figures 4F
and 4G).
A Small Molecule Inhibitor of NE Reverses HFD-InducedInsulin ResistanceWe next asked if pharmacological inhibition of NE could reverse
obesity and improve insulin sensitivity. For this, WT mice were
fed a HFD for 19 weeks before orally administered with
GW311616A (inhib), a long-term effective, specific NE inhibitor
(Macdonald et al., 2001), by gavage every other day for up to
6 weeks. GW311616A inhibits NE activity by covalently binding
to the enzyme. As shown in Figure 4H, GW311616A treatment
inhibited serum NE activity by 60% within 1 week of treatment,
548, April 2, 2013 ª2013 Elsevier Inc. 537
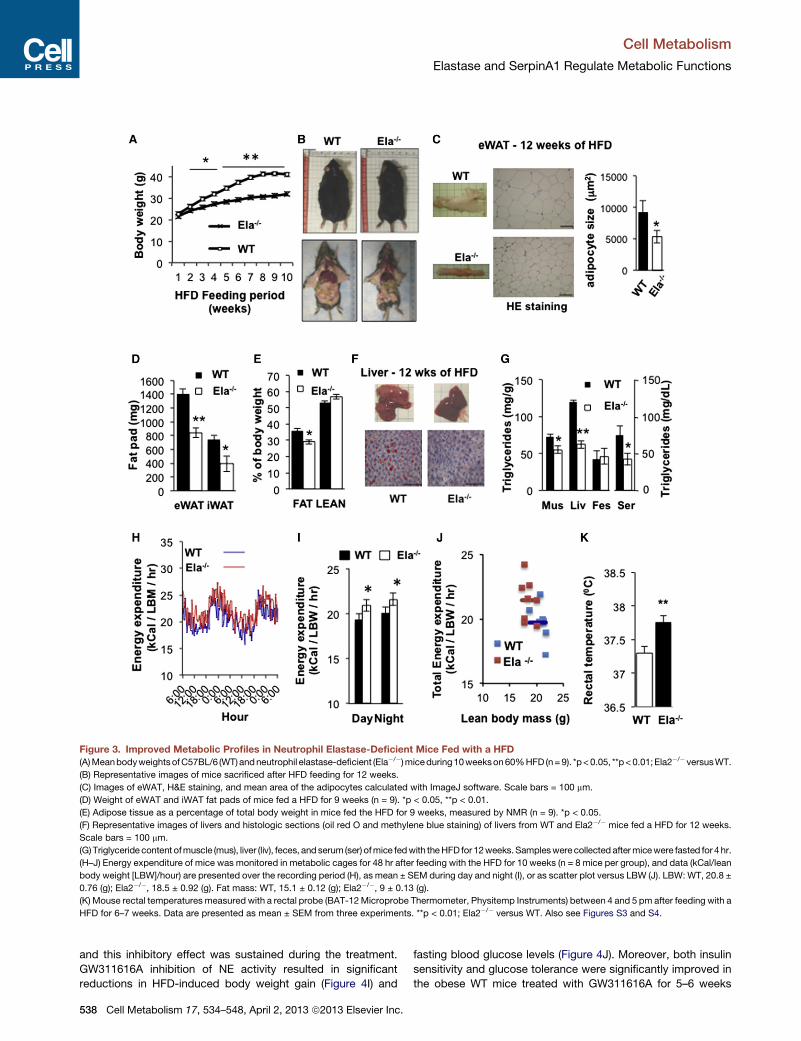
Figure 3. Improved Metabolic Profiles in Neutrophil Elastase-Deficient Mice Fed with a HFD(A)MeanbodyweightsofC57BL/6 (WT)andneutrophil elastase-deficient (Ela�/�)miceduring10weekson60%HFD (n=9). *p<0.05, **p<0.01;Ela2�/� versusWT.
(B) Representative images of mice sacrificed after HFD feeding for 12 weeks.
(C) Images of eWAT, H&E staining, and mean area of the adipocytes calculated with ImageJ software. Scale bars = 100 mm.
(D) Weight of eWAT and iWAT fat pads of mice fed a HFD for 9 weeks (n = 9). *p < 0.05, **p < 0.01.
(E) Adipose tissue as a percentage of total body weight in mice fed the HFD for 9 weeks, measured by NMR (n = 9). *p < 0.05.
(F) Representative images of livers and histologic sections (oil red O and methylene blue staining) of livers from WT and Ela2�/� mice fed a HFD for 12 weeks.
Scale bars = 100 mm.
(G)Triglyceride content ofmuscle (mus), liver (liv), feces, andserum(ser) ofmice fedwith theHFDfor12weeks.Sampleswerecollected aftermicewere fasted for 4hr.
(H–J) Energy expenditure of mice was monitored in metabolic cages for 48 hr after feeding with the HFD for 10 weeks (n = 8 mice per group), and data (kCal/lean
body weight [LBW]/hour) are presented over the recording period (H), as mean ± SEM during day and night (I), or as scatter plot versus LBW (J). LBW: WT, 20.8 ±
0.76 (g); Ela2�/�, 18.5 ± 0.92 (g). Fat mass: WT, 15.1 ± 0.12 (g); Ela2�/�, 9 ± 0.13 (g).
(K) Mouse rectal temperatures measured with a rectal probe (BAT-12Microprobe Thermometer, Physitemp Instruments) between 4 and 5 pm after feeding with a
HFD for 6–7 weeks. Data are presented as mean ± SEM from three experiments. **p < 0.01; Ela2�/� versus WT. Also see Figures S3 and S4.
Cell Metabolism
Elastase and SerpinA1 Regulate Metabolic Functions
and this inhibitory effect was sustained during the treatment.
GW311616A inhibition of NE activity resulted in significant
reductions in HFD-induced body weight gain (Figure 4I) and
538 Cell Metabolism 17, 534–548, April 2, 2013 ª2013 Elsevier Inc.
fasting blood glucose levels (Figure 4J). Moreover, both insulin
sensitivity and glucose tolerance were significantly improved in
the obese WT mice treated with GW311616A for 5–6 weeks
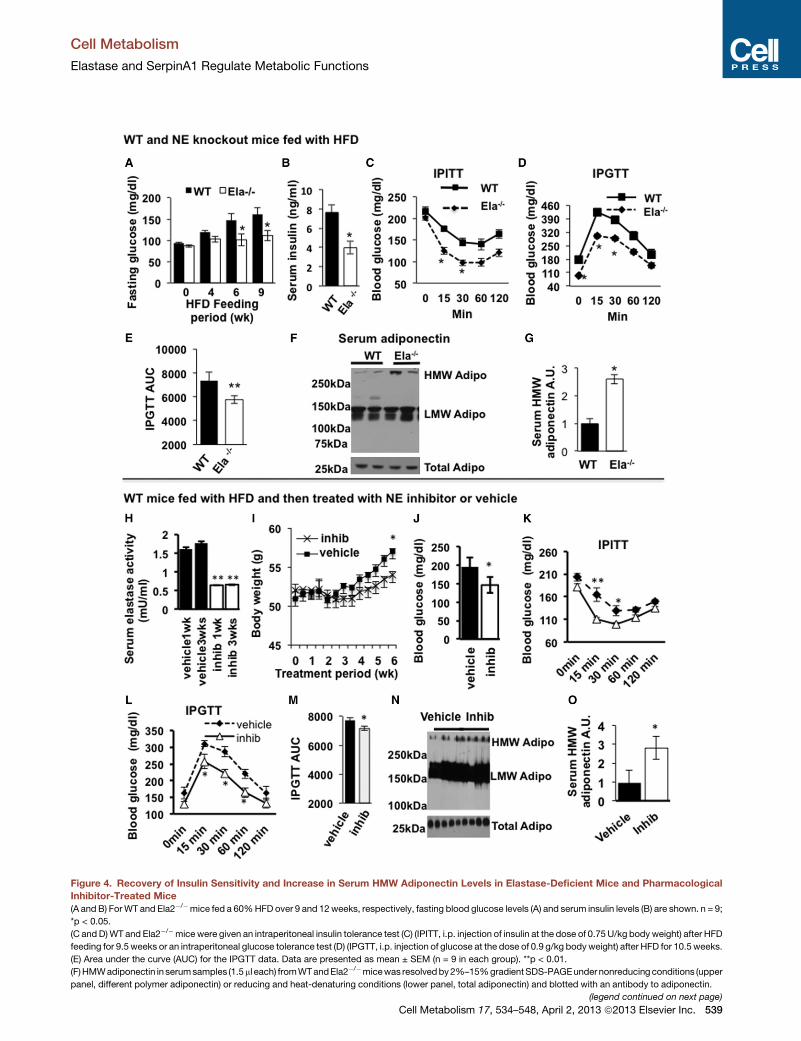
Figure 4. Recovery of Insulin Sensitivity and Increase in Serum HMW Adiponectin Levels in Elastase-Deficient Mice and Pharmacological
Inhibitor-Treated Mice
(A and B) ForWT and Ela2�/�mice fed a 60%HFD over 9 and 12weeks, respectively, fasting blood glucose levels (A) and serum insulin levels (B) are shown. n = 9;
*p < 0.05.
(C and D)WT and Ela2�/�mice were given an intraperitoneal insulin tolerance test (C) (IPITT, i.p. injection of insulin at the dose of 0.75U/kg body weight) after HFD
feeding for 9.5 weeks or an intraperitoneal glucose tolerance test (D) (IPGTT, i.p. injection of glucose at the dose of 0.9 g/kg bodyweight) after HFD for 10.5weeks.
(E) Area under the curve (AUC) for the IPGTT data. Data are presented as mean ± SEM (n = 9 in each group). **p < 0.01.
(F)HMWadiponectin in serumsamples (1.5ml each) fromWTandEla2�/�micewas resolvedby2%–15%gradientSDS-PAGEundernonreducing conditions (upper
panel, different polymer adiponectin) or reducing and heat-denaturing conditions (lower panel, total adiponectin) and blotted with an antibody to adiponectin.
(legend continued on next page)
Cell Metabolism
Elastase and SerpinA1 Regulate Metabolic Functions
Cell Metabolism 17, 534–548, April 2, 2013 ª2013 Elsevier Inc. 539
Cell Metabolism
Elastase and SerpinA1 Regulate Metabolic Functions
compared with the vehicle-treated mice (Figures 4K–4M).
Interestingly, GW311616A also significantly increased the level
of HMW adiponectin and the ratio of HMW adiponectin to total
adiponectin in the sera of HFD-induced obese mice (Figures
4N and 4O).
Depletion of NE Increases Insulin and AMP-ActivatedProtein Kinase Signaling, Fatty Acid Oxidation inPeriphery Tissues, and UCP1 Protein Levels in the BATTo explore the molecular mechanisms whereby the altered ratio
of NE to A1AT might regulate metabolic functions, we further
analyzed biochemical parameters involved in the regulation of
glucose and fatty acid metabolisms. Ela2�/� and WT mice
were fed a 60%HFD for 12 weeks, andmuscle, liver, and epidid-
ymal white adipose tissue (eWAT) were then used for analyzing
AMPK signaling and expression of genes important for fatty
acid metabolism (Kahn et al., 2005). For detection of insulin-
induced Akt phosphorylation, mice were fasted before insulin in-
jection (intraperitoneally [i.p.]). As shown in Figures 5A, 5B, and
5C, treatment of mice with insulin increased the phosphorylation
of Akt in the liver, skeletal muscle, and eWAT of both Ela2�/� and
WT mice, but the effect was significantly higher in Ela2�/� mice.
We also observed that the protein levels of IRS1 in eWAT and
of IRS2 in both liver and eWAT, but not skeletal muscle, were
significantly increased in Ela2�/� mice. Interestingly, basal
phosphorylation of AMPK and acetyl-CoA carboxylase 2
(ACC2), two enzymes involved in the regulation of fatty acid
oxidation, were increased 3-fold and 2-fold, respectively, in
the liver of HFD-fed Ela2�/� mice compared with WT mice
(Figure 5A). Notably, the total protein levels of ACC2 were
significantly lower in the liver of Ela2�/� mice. Increased AMPK
phosphorylation was also observed in the liver from control
low-fat diet-fed Ela2�/� mice (Figures S3G and S3H). We also
examined the expression of genes involved in glucose and lipid
metabolism in the HFD-fed Ela2�/� and WT mice. Expression
levels of genes involved in gluconeogenesis, such as phospho-
enolpyruvate carboxykinase (PEPCK) and glucose-6-phospha-
tase (G6P), were significantly decreased in the liver of Ela2�/�
mice (Figure S5A). However, there were no differences in the
phosphorylation of AMPK or ACC (Figure 5B) or the expression
of G6P, PEPCK, SREBP1c, or PGC1a (Figure S5B) in skeletal
muscle from Ela2�/� and WT mice.
Interestingly, both AMPKprotein levels and phosphorylation of
AMPK and ACC2 in the BAT from Ela2�/�mice were significantly
higher than inWTmice fed with a HFD for 2 weeks (Figure 5D). In
addition, BAT from Ela2�/� mice expressed significantly higher
levels of UCP1 protein than WT mice fed with HFD for 12 weeks
(Figure 5E); however, there was no significant difference in the
(G) Quantification of serum HMW adiponectin in WT and Ela2�/� mice (mean ± S
inhibitor, C57BL/6mice at 8 weeks of age were fed a 60%HFD for 19weeks; then,
administered by gavage every other day for up to 6 weeks. All data are mean ± S
(H) Serum NE activity after treatment for 1 or 3 weeks. **p < 0.01.
(I) Change in body weight during 6 weeks of treatment. **p < 0.01 comparing be
(J) Fasting glucose levels were measured after 6 weeks of treatment. *p < 0.05.
(K) IPITT was performed in mice treated with vehicle or GW311616A for 6 weeks
(L) IPGTT was performed in mice treated with vehicle or GW311616A for 5 week
(M) IPGTT data are presented as mean ± SEM of area under the curve (AUC). *p
(N and O) Serum adiponectin levels in mice treated with vehicle or GW311616A fo
used for quantifying the ratio of HMW adiponectin over total adiponectin (O). *p
540 Cell Metabolism 17, 534–548, April 2, 2013 ª2013 Elsevier Inc.
expression of ucp1, ucp3, or other mitochondrial genes, except
ucp2 and cox7a, in the BAT between the two groups of mice
(Figure S5D). Since the AMPK-ACC2 pathway is involved in the
regulation of FAO, we also measured palmitate oxidation rates
in the liver and BAT homogenates. Interestingly, palmitate oxida-
tion rates were increased 43% in the liver and 38% in the BAT
from Ela2�/� mice when compared with WT mice both fed with
a HFD for only 5 days (Figures 5F and 5G), consistent with the in-
crease of the AMPK signaling in both tissues.
These data suggest that the insulin/Akt signaling is signifi-
cantly increased in the periphery tissues while the activity of
the AMPK pathway is increased in the liver and BAT of Ela2�/�
mice, leading to the decreased expression of genes involved in
gluconeogenesis in the liver and the increase of FAO rates in
both the liver and BAT. Together, the increase of FAO and
UCP1 protein levels contribute, at least partially, to the resis-
tance of HFD-induced body weight gain and liver steatosis in
Ela2�/� mice.
We did not observe significant differences between the two
groups of mice in expression of genes involved in the regulation
of adipose differentiation or in expression of adiponectin (Fig-
ure S5C). However, HMW adiponectin levels were increased in
the serum of HFD-fed Ela2�/� mice (Figures 4F and 4G). HMW
adiponectin is the active form of the adipokine involved in the
regulation of insulin sensitivity and fatty acid metabolism through
activation of the AMPK pathway (Kadowaki et al., 2006; Turer
and Scherer, 2012). This finding is consistent with the observa-
tion that the AMPK pathway is more active in the liver, but not
muscle, of Ela2�/� mice because HMW adiponectin has a
greater effect on liver (Kadowaki et al., 2006; Shetty et al.,
2009). The observed increase in serum HMW adiponectin in
Ela2�/� mice could be due to increased secretion from adipose
tissues or depletion of NE that cleaves adiponectin (Waki et al.,
2005). Consistent with the latter notion, we demonstrated that in-
cubation of purified leukocyte elastase with adiponectin-con-
taining conditioned medium from 3T3-L1 adipocytes reduced
the level of HMW adiponectin and increased the production of
small fragments of adiponectin (Figure S6). Our data suggest
that Ela2�/�mice express increased levels of HMW adiponectin,
which is involved in regulating lipid metabolism and insulin sensi-
tivity via activation of the AMPK pathway in the liver.
Depletion of NE Blocks Inflammation in Mouse WhiteAdipose Tissues at the Early and Late Stages of HFDFeedingBecause low-grade chronic inflammation plays an important
role in obesity-related insulin resistance, we examined HFD-
induced macrophage infiltration into visceral eWAT in the
EM, n = 8, *p < 0.05, Ela2�/� versus WT). For the experiment with NE chemical
an NE inhibitor (GW311616A; inhib) (2mg/kg body weight) or vehicle (H2O) was
EM of five mice per group.
fore and after treatment.
.
s.
< 0.05, **p < 0.01, vehicle group versus GW311616A-treated group.
r 6 weeks after HFD feeding, and images of adiponectin immunoblot (N) were
< 0.05. Also see Figure S6.
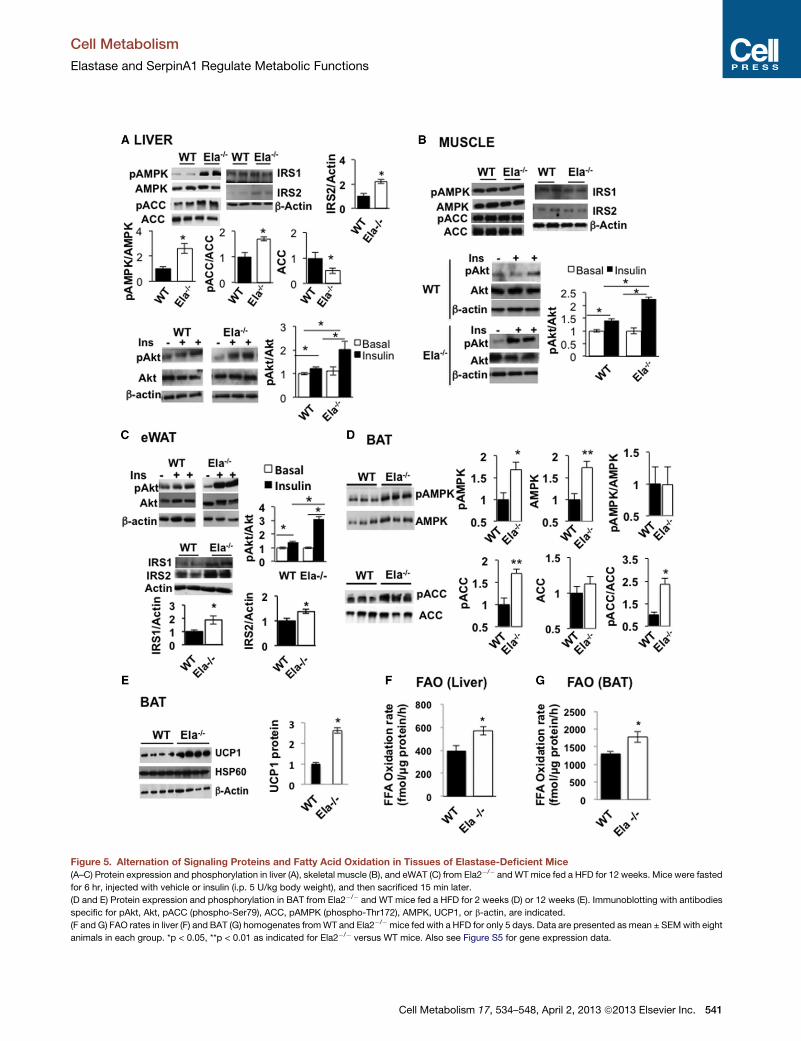
Figure 5. Alternation of Signaling Proteins and Fatty Acid Oxidation in Tissues of Elastase-Deficient Mice
(A–C) Protein expression and phosphorylation in liver (A), skeletal muscle (B), and eWAT (C) from Ela2�/� andWTmice fed a HFD for 12 weeks. Mice were fasted
for 6 hr, injected with vehicle or insulin (i.p. 5 U/kg body weight), and then sacrificed 15 min later.
(D and E) Protein expression and phosphorylation in BAT from Ela2�/� and WT mice fed a HFD for 2 weeks (D) or 12 weeks (E). Immunoblotting with antibodies
specific for pAkt, Akt, pACC (phospho-Ser79), ACC, pAMPK (phospho-Thr172), AMPK, UCP1, or b-actin, are indicated.
(F and G) FAO rates in liver (F) and BAT (G) homogenates fromWT and Ela2�/�mice fed with a HFD for only 5 days. Data are presented as mean ± SEMwith eight
animals in each group. *p < 0.05, **p < 0.01 as indicated for Ela2�/� versus WT mice. Also see Figure S5 for gene expression data.
Cell Metabolism
Elastase and SerpinA1 Regulate Metabolic Functions
Cell Metabolism 17, 534–548, April 2, 2013 ª2013 Elsevier Inc. 541
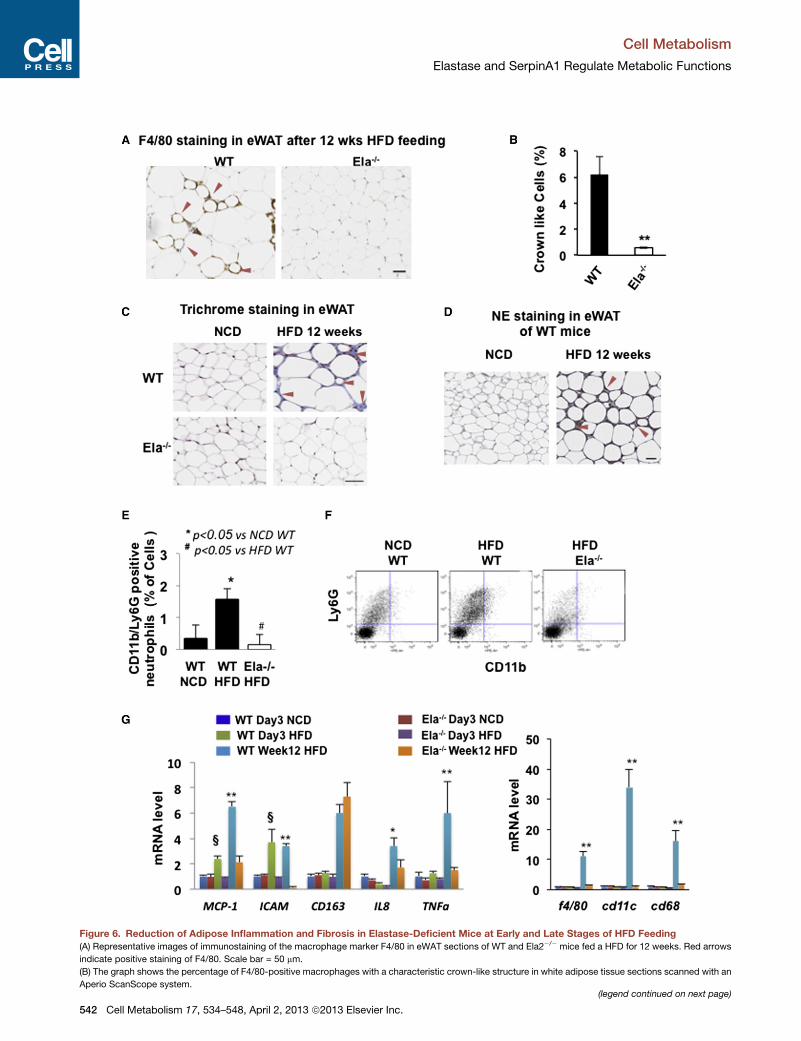
Figure 6. Reduction of Adipose Inflammation and Fibrosis in Elastase-Deficient Mice at Early and Late Stages of HFD Feeding
(A) Representative images of immunostaining of the macrophage marker F4/80 in eWAT sections of WT and Ela2�/� mice fed a HFD for 12 weeks. Red arrows
indicate positive staining of F4/80. Scale bar = 50 mm.
(B) The graph shows the percentage of F4/80-positive macrophages with a characteristic crown-like structure in white adipose tissue sections scanned with an
Aperio ScanScope system.(legend continued on next page)
Cell Metabolism
Elastase and SerpinA1 Regulate Metabolic Functions
542 Cell Metabolism 17, 534–548, April 2, 2013 ª2013 Elsevier Inc.
Cell Metabolism
Elastase and SerpinA1 Regulate Metabolic Functions
NE-deficient mice. The eWAT of WT mice fed a HFD for
12 weeks contained about 6% macrophage crown-like cells
(CLCs), as revealed by positive F4/80 immunohistochemical
staining (Figures 6A and 6B). Remarkably, CLCs were reduced
to less than 0.6% in the eWAT from Ela2�/� mice fed a HFD for
12 weeks. Using Masson’s trichrome stain, we observed the
accumulation of connective tissues (blue staining) between ad-
ipocytes in eWAT of WT mice, but not Ela2�/� mice, fed with
the HFD for 12 weeks (Figure 6C). These data suggest that
Ela2�/� mice are resistant to HFD-induced macrophage infiltra-
tion, tissue damage, and fibrosis. NE expression in eWAT was
also examined with immunohistochemical staining. As shown in
Figure 6D, similar to F4/80 and connective tissue staining, NE
accumulated around small adipocytes in eWAT from WT mice
fed with the HFD for 12 weeks, suggesting that NE may
contribute to tissue damage and consequent fibrosis in eWAT
due to HFD feeding.
We next determinedwhether short-term feeding of a 60%HFD
affected metabolic function in Ela2�/� mice. After feeding with
HFD for 3 days, WT and Ela2�/� mice showed no significant
change in total bodyweight or epididymal fat padweight (Figures
S7A and S7B), but blood glucose levels following a 6 hr fast were
significantly lower in Ela2�/� mice than in WT mice (Figure S7C).
Surprisingly, after 3 days on the HFD, WT mice showed an in-
crease of about 2-fold in serum NE activity; however, serum
A1AT levels were unchanged (Figures S7D and S7E).
Neutrophils are among the first immune cells to be activated
during tissue inflammation (Elgazar-Carmon et al., 2008). Using
a fluorescence-activated cell sorting (FACS) analysis approach,
we detected neutrophils (1.6%) positively expressing both cell
surface markers Ly6G and CD11b in the stromal vascular frac-
tions (SVF) isolated from eWAT of WT mice fed a HFD for
2 weeks, but not in HFD-fed Ela2�/�mice or WTmice fed normal
chow (Figures 6E and 6F). These data suggest neutrophil infiltra-
tion in eWAT at the early stage of HFD feeding in WT mice, but
not Ela2�/�mice.We further compared the expression of several
inflammation markers in eWAT from WT and Ela2�/� mice fed
with a HFD for either 3 days or 12 weeks. Ela2�/� mice fed a
HFD for 3 days showed no increase in expression of other early
inflammation markers such as the chemoattractants MCP-1 and
IL-8 or the leukocyte adhesion molecule ICAM-1 as observed in
WT mice (Figure 6G). In comparison with WT mice, eWAT from
Ela2�/�mice fed with the HFD for 12 weeks showed significantly
lower levels of the chemoattractants MCP-1, IL-8, and markers
of classically activated M1 macrophages such as F4/80, CD68,
TNFa, and CD11c; in contrast, there was no difference in the
expression of CD163, a marker of the alternatively activated
M2 macrophages. There were no significant changes in these
macrophage markers in eWAT from either mouse strain after
only 3 days of HFD feeding. These data therefore suggest that
(C) Representative images of Masson’s trichrome stain in eWAT fromWT and Ela2
indicates connective tissue fibrosis. Red arrows indicate positive staining of fibro
(D) Representative images of immunohistochemical stain of NE in eWAT of WT m
NE. Scale bar = 50 mm.
(E and F) For WT and Ela2�/� mice fed a normal chow diet or a 60% HFD for 2
stromal fractions from eWAT (E) and representative FACS profiles (F) are shown
(G) qRT-PCR analysis of mRNA extracted from eWAT of WT and Ela2�/� mice
12 weeks (Week12 HFD). Data presented asmean ± SEM; n = 6. *p < 0.05, **p < 0.
Ela2�/� mice (both fed a HFD for 3 days). Also see Figure S7.
C
Ela2�/� mice are resistant to adipose inflammation induced by
both short-term and long-term feeding with a HFD. Thus, NE is
an important factor involved in HFD-induced adipose inflamma-
tion and tissue damage.
Mice Overexpressing Human a1-Antitrypsin AreResistant to HFD-Induced Obesity, Fatty Liver, InsulinResistance, and InflammationTo evaluate the effect of overexpression of hA1AT on HFD-
induced insulin resistance, obesity, and inflammation, trans-
genic mice expressing hA1AT on C57BL/6J 3 CBA background
(Kelsey et al., 1987) were backcrossed with C57BL/6J mice for
six generations before feeding them with 60% HFD. As shown
in Figure 7A, mice overexpressing hA1AT had high-level expres-
sion of hA1AT in the serum. Worth noting, transgenic mice
were resistant to HFD-induced body weight gain, fat mass and
blood glucose increase (Figures 7B–7D), and were more insulin
sensitive and glucose tolerant than WT littermates (Figures 7E–
7G). The transgenic mice showed increased AMPK protein
phosphorylation and palmitate oxidation rates in the liver, and
reduced HFD-induced liver steatosis after 11 weeks on 60%
HFD (Figures 7H–7J). Overexpression of hA1AT also protected
the HFD-induced decrease of mouse endogenous A1AT expres-
sion in the liver (data not shown). In addition, HFD-induced
infiltration of F4/80-positive CLCs and mRNA expression of in-
flammatory markers F4/80, CD11c, andMCP1 were significantly
decreased in the eWAT from hA1AT mice (Figures 7K and 7L).
These data suggest that hA1AT has multiple protective effects
on obesity-related complications.
DISCUSSION
We applied a quantitative proteomic approach to detect serum
proteins that might be differentially expressed during obesity,
and identified A1AT as a major serum protein that is significantly
reduced in both leptin-deficient ob/ob and HFD-induced obese
mice. We showed that leptin stimulated A1AT expression
through the JAK2-STAT3 pathway in cultured hepatocytes.
This finding is consistent with previous reports that a STAT3
consensus sequence is present in the 30 enhancer region of
the serpina1 gene (Kalsheker et al., 2002). Moreover, leptin
infusion into ob/obmice increased serum A1AT levels, validating
the significance of the in vitro findings. Importantly, studies with
clinical samples from lean and obese South Asian and US sub-
jects revealed that serum A1AT levels were significantly reduced
in obese leptin-resistant subjects. Thus, it is possible that leptin
is a physiological regulator of A1AT expression and function. Our
data suggest that leptin deficiency and leptin resistance are both
related to the observed obesity-related reduction in A1AT
expression and secretion.
�/�mice fed with a normal chow diet (NCD) or HFD for 12 weeks. The blue stain
sis. Scale bar = 50 mm.
ice fed with NCD or HFD for 12 weeks. Red arrows indicate positive staining of
weeks, percentage of CD11b+/LY6G+/F480�/CD11c� neutrophils in vascular
. n = 4 for (E).
fed with NCD for 3 days (Day3 NCD), HFD for 3 days (Day3 HFD), or HFD for
01, WT versus Ela2�/�mice (both fed a HFD for 12 weeks); xp < 0.01,WT versus
ell Metabolism 17, 534–548, April 2, 2013 ª2013 Elsevier Inc. 543
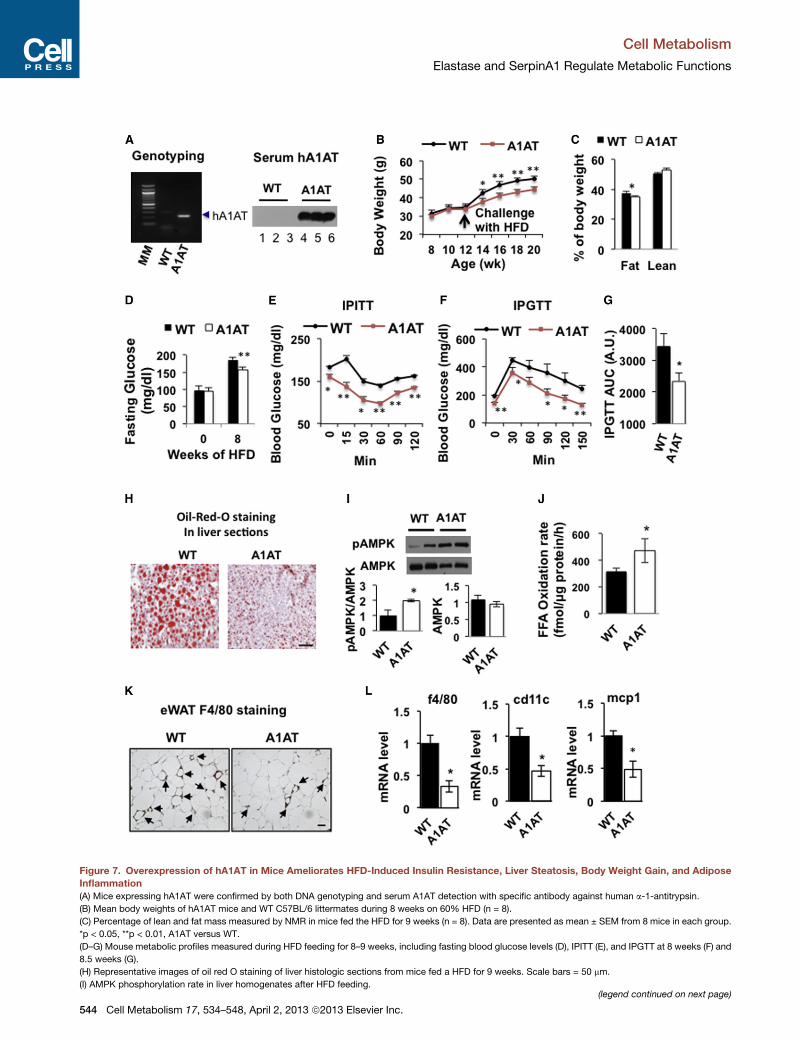
Figure 7. Overexpression of hA1AT in Mice Ameliorates HFD-Induced Insulin Resistance, Liver Steatosis, Body Weight Gain, and Adipose
Inflammation
(A) Mice expressing hA1AT were confirmed by both DNA genotyping and serum A1AT detection with specific antibody against human a-1-antitrypsin.
(B) Mean body weights of hA1AT mice and WT C57BL/6 littermates during 8 weeks on 60% HFD (n = 8).
(C) Percentage of lean and fat mass measured by NMR in mice fed the HFD for 9 weeks (n = 8). Data are presented as mean ± SEM from 8 mice in each group.
*p < 0.05, **p < 0.01, A1AT versus WT.
(D–G) Mouse metabolic profiles measured during HFD feeding for 8–9 weeks, including fasting blood glucose levels (D), IPITT (E), and IPGTT at 8 weeks (F) and
8.5 weeks (G).
(H) Representative images of oil red O staining of liver histologic sections from mice fed a HFD for 9 weeks. Scale bars = 50 mm.
(I) AMPK phosphorylation rate in liver homogenates after HFD feeding.(legend continued on next page)
Cell Metabolism
Elastase and SerpinA1 Regulate Metabolic Functions
544 Cell Metabolism 17, 534–548, April 2, 2013 ª2013 Elsevier Inc.
Cell Metabolism
Elastase and SerpinA1 Regulate Metabolic Functions
NE plays an important role in host defense and inflammation
(Pham, 2006). NE also breaks down a range of matrix substrates
including elastin and other circulating proteins such as adipo-
nectin (Waki et al., 2005). The catalytic function of NE is blocked
by A1AT through covalent binding to each other; thus, A1AT pro-
tects tissues from Ser protease-induced damage. Here, we
report that serum NE activity was significantly increased in
leptin-deficient ob/ob mice, HFD-induced obese mice, and
obese human subjects, consistent with the reciprocal reductions
in the level of the NE inhibitor A1AT. Notably, we also observed
that NE activity increased in the sera of mice fed with a HFD
for only three days (Figure S7D) before the development of leptin
resistance. Therefore, the imbalance between NE and A1AT oc-
curs in HFD-induced obesity at both the early stage due to the
increase of NE activity and the later stage due to the decrease
of A1AT expression. It is possible that increased NE activity is
related to neutrophil activation in the early stage (Elgazar-
Carmon et al., 2008) and decreased A1AT expression is related
to the development of leptin resistance and fatty liver at the later
stage of HFD feeding. We hypothesized that this imbalance
might be related to the pathological changes observed in
obesity. This hypothesis was tested using NE null mice, hA1AT
transgenic mice, and NE chemical inhibitor. Both NE null mice
and hA1AT transgenic mice were resistant to multiple HFD-
induced metabolic disturbances including weight gain, glucose
intolerance, insulin resistance, fatty liver, and macrophage
infiltration in adipose tissues. Our data support the concept
that the imbalance between NE and A1AT is a key factor con-
tributing to the development of HFD-induced obesity, insulin
resistance, and liver steatosis. This is particularly important
because increased NE activity is observed at an early stage of
overnutrition in WT mice. Our data suggest that NE and A1AT
are potential drug targets for treatment of obesity and insulin
resistance. Thus, reversing the ratio of NE to A1AT could be
beneficial for obesity and insulin resistance due to overnutrition.
This notion is further supported by the benefits of overexpression
of hA1AT and treatment with an NE inhibitor on metabolic
profiles in HFD-fed mice.
It is well established that obesity is accompanied by low-grade
inflammation of adipose tissue, which manifests as infiltration of
inflammatory cells such as macrophages, lymphocytes, mast
cells, and neutrophils, as well as production of inflammatory
cytokines and chemokines that contribute to leukocyte infiltra-
tion and insulin resistance (Lumeng and Saltiel, 2011; Osborn
and Olefsky, 2012). Notably, we observed that visceral fat of
Ela2�/� mice fed a HFD contained less than 10% of the number
of macrophages present in fat of WT mice. The expression of
proinflammatory M1 macrophage markers, but not M2 macro-
phage markers, was significantly lower in adipose tissue of
Ela2�/� mice. This is consistent with the observation of classi-
cally activated M1 macrophages in inflamed adipose tissue in
obesity (Lumeng et al., 2007). In addition, we observed no in-
crease in early inflammation markers such as chemoattractant
MCP-1 or adhesion molecule ICAM-1 after 3 days of HFD
(J) FAO rate in liver homogenates after HFD feeding.
(K) Immunostaining of the macrophage marker F4/80 in eWAT sections from mic
(L) Inflammatory markers in eWAT from mice fed with a HFD for 9 weeks. Data
A1AT mice.
C
feeding of Ela2�/� mice. Furthermore, our data demonstrated
that NE accumulated in eWAT in a similar pattern asmacrophage
infiltration and fibrosis. These data therefore suggest that NE is a
key regulator of HFD-induced inflammation and tissue damage
in eWAT throughout the development of obesity. It is possible
that activation of NE by HFD feeding may induce vascular dam-
age, which allows entry of neutrophils and M1 macrophages.
Thus, this study supports the notion that the imbalance of NE
and A1AT is a key pathological mechanism linking overnutrition
to leukocyte infiltration, adipose fibrosis, and subsequent insulin
resistance in obesity.
Adiponectin is a cytokine secreted by adipose tissue that
exists in high, medium, and low molecular weight forms in the
circulation. Compelling evidence suggests that adiponectin
plays an important role in the regulation of insulin sensitivity, lipid
and glucose metabolism, and inflammation (Kadowaki et al.,
2006; Ohashi et al., 2010; Shetty et al., 2009). Multiple studies
have reported that circulating adiponectin levels, particularly
the HMW adipokine, are significantly reduced in obese and
type 2 diabetic patients compared with lean subjects (Pajvani
et al., 2003; Semple et al., 2007; Waki et al., 2003). HMW adipo-
nectin has been shown to regulate expression of IRS2 and phos-
phorylation of AMPK and ACC2 in the liver, which are thought to
be important for HMW adiponectin-mediated insulin sensitiza-
tion and fatty acid oxidation (Awazawa et al., 2011; Kadowaki
et al., 2006; Shetty et al., 2012; Yamauchi et al., 2002). In this
study, Ela2�/�mice were resistant to the HFD-induced decrease
in serum HMW adiponectin, suggesting that NE is a regulator of
HMW adiponectin homeostasis. Interestingly, Ela2�/� mice
showed increased phosphorylation of AMPK and FAO in the
liver. These results are consistent not only with the observation
that circulating HMW adiponectin levels are increased in Ela2�/�
mice, but also with the functional analyses showing that those
mice have improved insulin sensitivity and are resistant to
HFD-induced liver steatosis. The reduced expression of PEPCK
and glucose-6-phosphatase in the liver of Ela2�/� mice further
supports these observations. Thus, our data suggest that NE
may regulate insulin sensitivity and fat deposition by increasing
the serum HMW adiponectin level and activating the AMPK
pathway in the liver. It is possible that NE directly cleaves adipo-
nectin, resulting in lower levels of HMW adiponectin. Alterna-
tively, the inflammatory damage of adipose tissue may lead to
less HMW adiponectin secretion and, therefore, less serum
HMW adiponectin in WT mice than in Ela2�/� mice.
Our data also provide a potential molecular mechanism
whereby the imbalance of NE and A1AT affects HFD-induced
body weight gain. We observed that both AMPK protein expres-
sion and phosphorylation were significantly increased in the BAT
of Ela2�/�mice. The increase of the inhibitory phosphorylation of
ACC2 by the activated AMPK may contribute to the increase in
FAO in the BAT of NE null mice. Therefore, our data provide
the molecular link between the NE-A1AT system and the
pathway of AMPK signaling-FAO-energy expenditure. In addi-
tion, UCP1 protein levels were significantly increased in the
e fed a HFD for 9 weeks. Scale bars = 50 mm.
are presented as mean ± SEM (n = 8 in each group); **p < 0.01. WT versus
ell Metabolism 17, 534–548, April 2, 2013 ª2013 Elsevier Inc. 545
Cell Metabolism
Elastase and SerpinA1 Regulate Metabolic Functions
BAT of NE null mice after HFD feeding. These data are consistent
with the observation that Ela2�/� mice had higher body temper-
ature, more energy expenditure, and less body weight gain than
WT mice fed with a HFD. It is possible that increased UCP1
expression in the BAT from NE null mice may be due to the
decrease of inflammation and chemokine production in the
BAT (data not shown). However, it remains to be evaluated
how depletion of NE leads to the activation of the AMPK pathway
and the increase of UCP1 protein levels in the BAT.
Taken together, our data suggest that elevation of serum and
tissue NE and reduction of A1AT are key events in obesity.
Furthermore, the imbalance between NE and A1AT is associated
with leptin resistance, and it precedes the decrease of HMW
adiponectin. This study also suggests that the imbalance of NE
and A1AT affects energy expenditure through the regulation of
the AMPK pathway and contributes to the development of
obese-related inflammation, adipose tissue remodeling, insulin
resistance, and liver steatosis. Hence, both NE and A1AT are
important molecular markers for obesity and may be potential
drug targets for treatment of obesity and related diseases. Our
proteomic profiling-based study is validated with clinical sam-
ples and is consistent with a recent independent report suggest-
ing that elastase is involved in the development of inflammation
and insulin resistance (Talukdar et al., 2012).
EXPERIMENTAL PROCEDURES
Experimental Animals
NE-deficient (Ela2�/�, B6.129X1-Elanetm1Sds/J) mice, B6.V-Lepob/J (ob/ob)
mice, and C57BL/6 control mice were initially purchased from The Jackson
Laboratory (Bar Harbor, ME). hA1AT transgenic mice were generated and
maintained on a mixed C57BL/6J 3 CBA background (Kelsey et al., 1987)
and then backcrossed with C57BL/6J mice. All mouse work was performed
according to the Institutional Animal Care and Use Committee guidelines.
Insulin and Glucose Tolerance Tests and Leptin Infusion
For insulin and glucose tolerance tests, mice were fasted for 6 hr and over-
night, respectively, before intraperitoneal injection with insulin (0.75 U/kg
body weight) or glucose (0.9 g/kg body weight). Glucose levels in tail vein
blood samples were measured with a blood glucometer (Bayer) at different
time points postinjection. To test leptin’s function in vivo, mouse recombinant
leptin was delivered at 10 mg/day for 7 days via an ALZET pump (model 1007D,
ALZA Corporation, Palo Alto, CA) implanted subcutaneously in ob/ob mice.
Body Composition Analysis and Comprehensive Laboratory Animal
Monitoring System
Body composition of live mice was measured using Minispec LF90II Time-
Domain Nuclear Magnetic Resonance (TD-NMR) Analyzer (Bruker Optics,
Inc., Billerica, MA). Energy expenditure, food intake, and locomotory activity
were measured using a comprehensive laboratory animal monitoring system
(CLAMS) from Columbus Instruments (Columbus, OH) as described in the
Supplemental Experimental Procedures.
Human Blood Samples
Sera were collected from both South Asian and US men with different BMIs
according to the guidelines of the Institutional Review Board. Serum A1AT
and leptin levels were measured with ELISA kits according to the instructions
provided by Immunology Consultants Laboratory (Newberg, OR) and Millipore
(Danvers, MA), respectively.
Measurement of Elastase Activity
Both human and mouse serum NE activities were measured with N-methoxy-
succinyl-Ala-Ala-Pro-Val p-nitroanilide, a highly specific synthetic substrate
546 Cell Metabolism 17, 534–548, April 2, 2013 ª2013 Elsevier Inc.
for NE, according to the methods described previously (Labow et al., 1996;
Yoshimura et al., 1982).
Serum Proteomics Analysis
Glycosylated secreted proteins in serum samples from 12-week-old ob/ob
and C57BL/6 control mice were analyzed using glycoprotein enrichment and
quantitative proteomic approaches as previously described (Tian et al.,
2007; Zhang et al., 2003).
Cell Culture, Immunoblotting, and Histological Analysis
Hepatic cell lines HepG2 and Hep1-6 were obtained from the American
Type Culture Center (ATCC). Proteins were extracted from cells or tissues
and immunoblotted with different antibodies as described in the Supple-
mental Experimental Procedures. Histological analyses of macrophage infil-
tration, neutrophil elastase deposition, lipid accumulation, and fibrosis in
different tissue sections are described in the Supplemental Experimental
Procedures.
Gene Expression
Total RNAs were extracted from tissues or cultured cells, reverse transcribed
into first-strand complementary DNA (cDNA), and then quantified with real-
time PCR using methods and PCR primers described in the Supplemental
Experimental Procedures.
Fatty Acid Oxidation
Crude homogenates from freshly collected liver (500 mg protein) or brown fat
tissues (100 mg protein) were used to induce fatty acid oxidation in a buffer
containing [1-14C]palmitate for 30 min at 37�C. Palmitate oxidation rate was
quantified by measuring 14C-labeled carbon dioxide production as described
in the Supplemental Experimental Procedures.
Isolation of the SVF and FACS Analysis
Anesthetized mice were perfused with PBS via left ventricles before perigo-
nadal fat pads were excised and used for isolation of SVF as described in
the Supplemental Experimental Procedures. The cells in SVF were blocked
with 1 mg Fc receptor for 15 min at 4�C before incubation with 0.5 mg
fluorochrome-conjugated primary antibodies for 30 min at 4�C in PBS
containing 1 mM CaCl2 and 0.5% BSA. After staining with allophycocyanin
(APC)-conjugated anti-Ly-6G antibody, phycoerythrin (PE)-conjugated anti-
CD11b antibody, fluorescein isothiocyanate (FITC)-conjugated anti-F4/80
antibody, peridinin chlorophyll protein complex (PerCP)-conjugated anti-
CD11c antibody, and respective isotype controls, the cells were analyzed
by BD FACSCanto flow cytometer and data were analyzed using FlowJo
7.5.5 software. Neutrophils were identified as CD11c�F4/80�CD11b+
Ly-6G+ cells.
Analysis of Adiponectin Complexes
Mouse sera were diluted into nonreducing sample buffer (3% SDS, 50 mM
Tris-HCl [pH 6.8], and 10% glycerol) before subjection to SDS-PAGE for
detecting adiponectin complexes under nonreducing and non-heat-
denaturing conditions. For detecting total denatured adiponectin, sera
diluted in sample buffer containing 5% 2-mercaptoethanol and 10 mM di-
thiothreitol were heated at 95�C for 10 min before dissolving in SDS-PAGE
by electrophoresis and immunoblotting with primary anti-adiponectin
antibody.
Statistics
For correlation studies with human samples, p value and Pearson correlation
coefficient (r) were generated by theGraphPadPrism 5.0 (La Jolla, CA). Group-
wise differences were assessed by two-tailed unpaired t test with Welch
correction. For mouse studies, evaluations were performed by two-way
ANOVA and unpaired Student’s t test. Error bar represents SEM.
SUPPLEMENTAL INFORMATION
Supplemental Information includes seven figures, two tables, and Supple-
mental Experimental Procedures and can be found with this article online at
http://dx.doi.org/10.1016/j.cmet.2013.03.005.
Cell Metabolism
Elastase and SerpinA1 Regulate Metabolic Functions
ACKNOWLEDGMENTS
We wish to thank Julio Ayala, Jennifer Ayala, John Shelley, and the Sanford-
Burnham Medical Research Institute (SBMRI) Cardiometabolic Phenotyping
Core for excellent help with the CLAMS study and histology and Annette
Khaled, Rebecca Boohaker, Mangala Soundarapandian, Ling Lai, Rita Luther,
Darrin Kuystermans, and Teresa Leone for technical help. We appreciate Phil-
ipp Scherer, Tim Osborne, Guy Salvesen, Dan Kelly, Dev Sikder, and Sheila
Collin for comments and Shonna Small for administrative support. Z.Y.J. is
supported by research grants from the American Diabetes Association (7-
11-BS-72) and NIH grant R01 DK094025. X.X. is supported by a James and
Esther King Postdoctoral Fellowship. R.L.-B. is funded by the UK Medical
Research Council (U117512772). K.C. is supported by a minority undergradu-
ate internship from the American Diabetes Association (1-13-MUI-04). Z.Y.J.
wrote the manuscript. The authors have no conflict of interest regarding this
work.
Received: August 20, 2012
Revised: January 2, 2013
Accepted: March 11, 2013
Published: April 2, 2013
REFERENCES
Awazawa, M., Ueki, K., Inabe, K., Yamauchi, T., Kubota, N., Kaneko, K.,
Kobayashi, M., Iwane, A., Sasako, T., Okazaki, Y., et al. (2011). Adiponectin
enhances insulin sensitivity by increasing hepatic IRS-2 expression via a
macrophage-derived IL-6-dependent pathway. Cell Metab. 13, 401–412.
Belaaouaj, A., McCarthy, R., Baumann, M., Gao, Z., Ley, T.J., Abraham, S.N.,
and Shapiro, S.D. (1998). Mice lacking neutrophil elastase reveal impaired host
defense against gram negative bacterial sepsis. Nat. Med. 4, 615–618.
Elgazar-Carmon, V., Rudich, A., Hadad, N., and Levy, R. (2008). Neutrophils
transiently infiltrate intra-abdominal fat early in the course of high-fat feeding.
J. Lipid Res. 49, 1894–1903.
Feuerer, M., Herrero, L., Cipolletta, D., Naaz, A., Wong, J., Nayer, A., Lee, J.,
Goldfine, A.B., Benoist, C., Shoelson, S., and Mathis, D. (2009). Lean, but
not obese, fat is enriched for a unique population of regulatory T cells that
affect metabolic parameters. Nat. Med. 15, 930–939.
Hotamisligil, G.S. (2006). Inflammation and metabolic disorders. Nature 444,
860–867.
Kadowaki, T., Yamauchi, T., Kubota, N., Hara, K., Ueki, K., and Tobe, K. (2006).
Adiponectin and adiponectin receptors in insulin resistance, diabetes, and the
metabolic syndrome. J. Clin. Invest. 116, 1784–1792.
Kahn, B.B., Alquier, T., Carling, D., and Hardie, D.G. (2005). AMP-activated
protein kinase: ancient energy gauge provides clues to modern understanding
of metabolism. Cell Metab. 1, 15–25.
Kalsheker, N., Morley, S., and Morgan, K. (2002). Gene regulation of the serine
proteinase inhibitors alpha1-antitrypsin and alpha1-antichymotrypsin.
Biochem. Soc. Trans. 30, 93–98.
Kamei, N., Tobe, K., Suzuki, R., Ohsugi, M., Watanabe, T., Kubota, N.,
Ohtsuka-Kowatari, N., Kumagai, K., Sakamoto, K., Kobayashi, M., et al.
(2006). Overexpression of monocyte chemoattractant protein-1 in adipose
tissues causes macrophage recruitment and insulin resistance. J. Biol.
Chem. 281, 26602–26614.
Kelsey, G.D., Povey, S., Bygrave, A.E., and Lovell-Badge, R.H. (1987).
Species- and tissue-specific expression of human alpha 1-antitrypsin in trans-
genic mice. Genes Dev. 1, 161–171.
Korkmaz, B., Horwitz, M.S., Jenne, D.E., and Gauthier, F. (2010). Neutrophil
elastase, proteinase 3, and cathepsin G as therapeutic targets in human dis-
eases. Pharmacol. Rev. 62, 726–759.
Labow, R.S., Erfle, D.J., and Santerre, J.P. (1996). Elastase-induced hydrolysis
of synthetic solid substrates: poly(ester-urea-urethane) and poly(ether-urea-
urethane). Biomaterials 17, 2381–2388.
Liu, J., Divoux, A., Sun, J., Zhang, J., Clement, K., Glickman, J.N., Sukhova,
G.K., Wolters, P.J., Du, J., Gorgun, C.Z., et al. (2009). Genetic deficiency
C
and pharmacological stabilization of mast cells reduce diet-induced obesity
and diabetes in mice. Nat. Med. 15, 940–945.
Lumeng, C.N., and Saltiel, A.R. (2011). Inflammatory links between obesity and
metabolic disease. J. Clin. Invest. 121, 2111–2117.
Lumeng, C.N., Bodzin, J.L., and Saltiel, A.R. (2007). Obesity induces a pheno-
typic switch in adipose tissue macrophage polarization. J. Clin. Invest. 117,
175–184.
Macdonald, S.J., Dowle, M.D., Harrison, L.A., Shah, P., Johnson, M.R., Inglis,
G.G., Clarke, G.D., Smith, R.A., Humphreys, D., Molloy, C.R., et al. (2001). The
discovery of a potent, intracellular, orally bioavailable, long duration inhibitor of
human neutrophil elastase—GW311616A a development candidate. Bioorg.
Med. Chem. Lett. 11, 895–898.
Myers, M.G., Jr., Leibel, R.L., Seeley, R.J., and Schwartz, M.W. (2010). Obesity
and leptin resistance: distinguishing cause from effect. Trends Endocrinol.
Metab. 21, 643–651.
Nishimura, S., Manabe, I., Nagasaki, M., Eto, K., Yamashita, H., Ohsugi, M.,
Otsu, M., Hara, K., Ueki, K., Sugiura, S., et al. (2009). CD8+ effector T cells
contribute to macrophage recruitment and adipose tissue inflammation in
obesity. Nat. Med. 15, 914–920.
Ohashi, K., Parker, J.L., Ouchi, N., Higuchi, A., Vita, J.A., Gokce, N., Pedersen,
A.A., Kalthoff, C., Tullin, S., Sams, A., et al. (2010). Adiponectin promotes
macrophage polarization toward an anti-inflammatory phenotype. J. Biol.
Chem. 285, 6153–6160.
Osborn, O., and Olefsky, J.M. (2012). The cellular and signaling networks link-
ing the immune system and metabolism in disease. Nat. Med. 18, 363–374.
Ouchi, N., Parker, J.L., Lugus, J.J., and Walsh, K. (2011). Adipokines in inflam-
mation and metabolic disease. Nat. Rev. Immunol. 11, 85–97.
Pajvani, U.B., Du, X., Combs, T.P., Berg, A.H., Rajala, M.W., Schulthess, T.,
Engel, J., Brownlee, M., and Scherer, P.E. (2003). Structure-function studies
of the adipocyte-secreted hormone Acrp30/adiponectin. Implications fpr
metabolic regulation and bioactivity. J. Biol. Chem. 278, 9073–9085.
Pham, C.T. (2006). Neutrophil serine proteases: specific regulators of inflam-
mation. Nat. Rev. Immunol. 6, 541–550.
Semple, R.K., Halberg, N.H., Burling, K., Soos, M.A., Schraw, T., Luan, J.,
Cochran, E.K., Dunger, D.B., Wareham, N.J., Scherer, P.E., et al. (2007).
Paradoxical elevation of high-molecular weight adiponectin in acquired
extreme insulin resistance due to insulin receptor antibodies. Diabetes 56,
1712–1717.
Shetty, S., Kusminski, C.M., and Scherer, P.E. (2009). Adiponectin in health
and disease: evaluation of adiponectin-targeted drug development strategies.
Trends Pharmacol. Sci. 30, 234–239.
Shetty, S., Ramos-Roman, M.A., Cho, Y.R., Brown, J., Plutzky, J., Muise, E.S.,
Horton, J.D., Scherer, P.E., and Parks, E.J. (2012). Enhanced fatty acid flux
triggered by adiponectin overexpression. Endocrinology 153, 113–122.
Shoelson, S.E., Lee, J., and Goldfine, A.B. (2006). Inflammation and insulin
resistance. J. Clin. Invest. 116, 1793–1801.
Sun, K., Kusminski, C.M., and Scherer, P.E. (2011). Adipose tissue remodeling
and obesity. J. Clin. Invest. 121, 2094–2101.
Sun, S., Ji, Y., Kersten, S., and Qi, L. (2012). Mechanisms of inflammatory
responses in obese adipose tissue. Annu. Rev. Nutr. 32, 261–286.
Talukdar, S., Oh, Y., Bandyopadhyay, G., Li, D., Xu, J., McNelis, J., Lu, M., Li,
P., Yan, Q., Zhu, Y., et al. (2012). Neutrophils mediate insulin resistance inmice
fed a high-fat diet through secreted elastase. Nat. Med. 18, 1407–1412.
Tian, Y., Zhou, Y., Elliott, S., Aebersold, R., and Zhang, H. (2007). Solid-phase
extraction of N-linked glycopeptides. Nat. Protoc. 2, 334–339.
Turer, A.T., and Scherer, P.E. (2012). Adiponectin: mechanistic insights and
clinical implications. Diabetologia 55, 2319–2326.
Waki, H., Yamauchi, T., Kamon, J., Ito, Y., Uchida, S., Kita, S., Hara, K., Hada,
Y., Vasseur, F., Froguel, P., et al. (2003). Impaired multimerization of human
adiponectin mutants associated with diabetes. Molecular structure and multi-
mer formation of adiponectin. J. Biol. Chem. 278, 40352–40363.
Waki, H., Yamauchi, T., Kamon, J., Kita, S., Ito, Y., Hada, Y., Uchida, S.,
Tsuchida, A., Takekawa, S., and Kadowaki, T. (2005). Generation of globular
ell Metabolism 17, 534–548, April 2, 2013 ª2013 Elsevier Inc. 547
Cell Metabolism
Elastase and SerpinA1 Regulate Metabolic Functions
fragment of adiponectin by leukocyte elastase secreted by monocytic cell line
THP-1. Endocrinology 146, 790–796.
Weisberg, S.P., McCann, D., Desai, M., Rosenbaum, M., Leibel, R.L., and
Ferrante, A.W., Jr. (2003). Obesity is associated with macrophage accumula-
tion in adipose tissue. J. Clin. Invest. 112, 1796–1808.
Winer, D.A., Winer, S., Shen, L., Wadia, P.P., Yantha, J., Paltser, G., Tsui, H.,
Wu, P., Davidson, M.G., Alonso, M.N., et al. (2011). B cells promote insulin
resistance through modulation of T cells and production of pathogenic IgG
antibodies. Nat. Med. 17, 610–617.
Xu, H., Barnes, G.T., Yang, Q., Tan, G., Yang, D., Chou, C.J., Sole, J., Nichols,
A., Ross, J.S., Tartaglia, L.A., and Chen, H. (2003). Chronic inflammation in fat
plays a crucial role in the development of obesity-related insulin resistance.
J. Clin. Invest. 112, 1821–1830.
548 Cell Metabolism 17, 534–548, April 2, 2013 ª2013 Elsevier Inc.
Yamauchi, T., Kamon, J., Minokoshi, Y., Ito, Y., Waki, H., Uchida, S.,
Yamashita, S., Noda, M., Kita, S., Ueki, K., et al. (2002). Adiponectin stimulates
glucose utilization and fatty-acid oxidation by activating AMP-activated
protein kinase. Nat. Med. 8, 1288–1295.
Yoshimura, T., Barker, L.N., and Powers, J.C. (1982). Specificity and reactivity
of human leukocyte elastase, porcine pancreatic elastase, human granulocyte
cathepsin G, and bovine pancreatic chymotrypsin with arylsulfonyl fluorides.
Discovery of a new series of potent and specific irreversible elastase inhibitors.
J. Biol. Chem. 257, 5077–5084.
Zhang, H., Li, X.J., Martin, D.B., and Aebersold, R. (2003). Identification and
quantification of N-linked glycoproteins using hydrazide chemistry, stable
isotope labeling and mass spectrometry. Nat. Biotechnol. 21, 660–666.


