Embed Size (px)
Citation preview

C(
M
a Bb L
a
ArReReAcAv
KeHBCeMTrCh
1
rodlmafTti(H19(i
itynuliz
caH
01do
Molecular Immunology 46 (2009) 2613–2622
Contents lists available at ScienceDirect
Molecular Immunology
journa l homepage: www.e lsev ier .com/ locate /mol imm
ell- and stage-specific chromatin structure across the Complement receptor 2CR2/CD21) promoter coincide with CBF1 and C/EBP-� binding in B cells
ark N. Cruickshanka,b, Emily Fenwicka,b, Mahdad Karimia,b, Lawrence J. Abrahama, Daniela Ulgiati a,b,∗
iochemistry and Molecular Biology, School of Biomedical, Biomolecular and Chemical Sciences, The University of Western Australia, Australiaaboratory for Cancer Medicine, UWA Centre for Medical Research, Western Australian Institute for Medical Research, Australia
r t i c l e i n f o
ticle history:ceived 18 March 2009ceived in revised form 1 May 2009cepted 2 May 2009ailable online 31 May 2009
ywords:uman
a b s t r a c t
Stringent developmental transcription requires multiple transcription factor (TF) binding sites, cell-specific expression of signaling molecules, TFs and co-regulators and appropriate chromatin structure.During B-lymphopoiesis, human Complement receptor 2 (CR2/CD21) is detected on immature and matureB cells but not on B cell precursors and plasma cells. We examined cell- and stage-specific human CR2gene regulation using cell lines modeling B-lymphopoiesis. Chromatin accessibility assays revealed aregion between −409 and −262 with enhanced accessibility in mature B cells and pre-B cells, comparedto either non-lymphoid or plasma cell-types, however, accessibility near the transcription start site (TSS)
cellsll differentiationolecular biologyanscription factorsromatin
was elevated only in CR2-expressing B cells. A correlation between histone acetylation and CR2 expres-sion was observed, while histone H3K4 dimethylation was enriched near the TSS in both CR2-expressingB cells and non-expressing pre-B cells. Candidate sites within the CR2 promoter were identified whichcould regulate chromatin, including a matrix attachment region associated with CDP, SATB1/BRIGHT andCEBP-� sites as well as two CBF1 sites. ChIP assays verified that both CBF1 and C/EBP-� bind the CR2 pro-
e posming
moter in B cells raising thstructure to control the ti
. Introduction
Expression of the human cell surface receptor Complementeceptor 2 (CR2/CD21) is restricted during development and isbserved on sub-populations of B cells (Iida et al., 1983), follicularendritic cells (Reynes et al., 1985), T cells (Levy et al., 1992), epithe-
ial cells (Levine and Davidson, 2005), basophils (Bacon et al., 1993),ast cells (Gommerman et al., 2000) and keratinocytes (Hunyadi et
l., 1991). During B-lymphopoiesis, CR2 is first observed on newlyormed immature B cells in the bone marrow (Takahashi et al., 1997;edder et al., 1984) and is up-regulated following negative selec-
on and migration to the periphery as transitional intermediatesartley et al., 1993; Melamed et al., 1998; Melamed and Nemazee,97). CR2 is undetectable during early stages of developmentncluding pro-B cells and pre-B cells in the bone marrow) and
Abbreviations: bHLH, basic helix-loop-helix; CHART-PCR, chromatin accessibil-measured by real-time PCR; MAR, matrix attachment region; MNase, micrococcalclease; Q-PCR, quantitative real-time PCR; SIDD, stress-induced duplex destabi-ation; TF, transcription factor; TSA, trichostatin A; TSS, transcription start site.∗ Corresponding author at: Biochemistry & Molecular Biology, School of Biomedi-l, Biomolecular and Chemical Sciences, University of Western Australia, 35 Stirlingighway, Crawley, WA 6009, Australia. Tel.: +61 8 6488 4423; fax: +61 8 6488 1148.
E-mail address: [email protected] (D. Ulgiati).
61-5890/$ – see front matter © 2009 Elsevier Ltd. All rights reserved.i:10.1016/j.molimm.2009.05.001
sibility that these factors facilitate or respond to alterations in chromatinand/or level of CR2 transcription.
© 2009 Elsevier Ltd. All rights reserved.
upon terminal differentiation into antibody secreting plasma cells.As such, the relative expression level of CR2 has been widely usedto classify distinct peripheral B cell sub-populations (e.g. Type 1–3transitional B cells, FO B cells and MZ B cells) along with other sur-face markers such as CD23, CD11a, AA4, B220, IgG and IgM (Hardyand Hayakawa, 2001; Loder et al., 1999; Thomas et al., 2006). Whilethese stages of B cell differentiation represent key check pointsfor positive (Diamant et al., 2005; Wang et al., 1999; Wen et al.,2005) and negative (Carsetti et al., 1995; Wardemann et al., 2003)selection, molecular pathways establishing their identity remainto be fully elucidated (Sims et al., 2005). Since the expression levelof CR2 is a marker of distinct B cell sub-populations, understandingmolecular mechanisms regulating CR2 expression may also pro-vide insight into the regulation of B cell differentiation and factorswhich regulate the identity of distinct B cell sub-populations.
In eukaryotes, highly restricted stage- and lineage-dependenttranscription involves the concerted action of multiple cis-actingregulatory elements which function as recognition modules fortranscription factors (TFs). Restricted developmental transcrip-
tional activity is achieved by the cell-specific background ofsignaling molecules, TFs and co-regulators (Beer and Tavazoie,2004; Bolouri and Davidson, 2003; Segal et al., 2003) in the cell andalso depends upon chromatin structure at cis-elements (Hatzis andTalianidis, 2002; Pondel et al., 1995; Tagoh et al., 2004). In this study,
2 lar Imm
wClssssPgoaispdTwtMatTotC
2
2
smAhw(1mra
2
mPdwMa3Pq3Ptapl53aoa
614 M.N. Cruickshank et al. / Molecu
e have utilized cell- and stage-specific expression of the humanR2 gene as a model system of developmental transcription regu-
ation in order to understand molecular processes underlying latertages of B cell maturation. Our bioinformatic analysis revealed con-erved features of the CR2 proximal promoter including TF bindingites which may regulate chromatin structure and CR2 gene expres-ion. We performed chromatin accessibility assays using real-timeCR (CHART-PCR) to scan the proximal promoter of the human CR2ene to identify regions showing cell-specific variations in a panelf cell lines representing different stages of hematopoiesis and alsonalyzed the correlation between histone post-translational mod-fications and gene expression. Our data demonstrates chromatintructural heterogeneity across specific regions of the CR2 proximalromoter amongst cell lines which correlates with cell-lineage andifferentiation state. Sequence analysis revealed novel candidateF binding sites and a putative matrix attachment region (MAR)ithin the CR2 promoter suggesting that these putative regula-
ory regions coordinate both chromatin structure CR2 transcription.oreover, two candidate TFs known to regulate B cell maturation
nd chromatin structure, namely CBF1 and C/EBP-�, were foundo specifically bind the CR2 proximal promoter in mature B cells.ogether, our results demonstrate cell-specific chromatin structurever key regulatory regions of the CR2 proximal promoter and iden-ify CR2 as a direct target of the transcriptional regulators, CBF1 and/EBP-�.
. Materials and methods
.1. Cell culture
Cell cultures were maintained at 37 ◦C with 5% CO2 in RPMI-1640upplemented with 10% FCS, 50 U/ml penicillin, 50 �g/ml strepto-ycin and 4 mM l-glutamine. Cell lines were obtained from theTCC (Manassas, VA) and chosen to represent different stages ofuman B cell development or non-B cell-types. Reh cells (CRL-8286)ere used as a precursor B cell model, Ramos (CRL-1596) and Raji
CCL-86) cell lines were used to represent mature B cells and SKW-(TIB-215) were used as a terminally differentiated plasma cellodel. K562 (CCL-243) and U937 (CRL-1593.2) cells were used to
epresent non-lymphoid cell-types and Jurkat (TIB-152) were useds a model T cell line.
.2. PCR
Conventional PCR was performed using the PTC-100 Ther-ocycler (MJ Research, Waltham, MA) and Platinum® Taq DNA
olymerase (Invitrogen, Carlsbad, CA) according to manufacturer’sirections. Briefly, 5 �l template was amplified in 20 �l reactionsith 0.2 mM dNTPs (Roche Diagnostics, Indianapolis, IN), 1.5 mMgCl2, and 0.5 �M each primer. Thermal-cycling conditions were
s follows: 95 ◦C for 5 min; followed by 26–34 cycles of 95 ◦C for0 s, 55 ◦C for 30 s and 72 ◦C for 1 min; followed by 72 ◦C for 7 min.CR products were electrophoresed on a 1.5% agarose gel. Real-timeuantitative PCR (Q-PCR) was performed on either a Rotor-GeneTM
000 (Corbett Research, Mortlake, NSW) or the CFX96 Real-TimeCR Detection System (Bio-Rad Laboratories, Hercules, CA) usinghe QuantiTectTM SYBR® Green PCR kit (QIAGEN, Valencia, CA)ccording to the manufacturers’ instructions with 0.5 �M eachrimer in 20 �l reaction. Thermal-cycling conditions were as fol-
ows: 95 ◦C for 15 min; followed by 40 cycles of 95 ◦C for 15 s,
0–60 ◦C (Table 1, annealing temperature) for 20 s and 72 ◦C for0 s; followed by a melt-curve cycle (gradual increase in temper-ture from 60 ◦C up to 99 ◦C). Acquisition of sample fluorescenceccurred after 72 ◦C steps and at 1 ◦C increments during melt-curvenalysis. The efficacy of Q-PCR primers was verified by amplifica-unology 46 (2009) 2613–2622
tion of serially diluted genomic DNA or plasmid DNA to ensurelinear detection of template and by agarose gel electrophore-sis of PCR products and routine melt-curve analysis to ensurespecificity.
2.3. mRNA expression analysis
Total RNA from 5 to 10 × 106 cells was isolated using Trizol®
reagent (Gibco BRL, Melbourne, VIC) according to the manufac-turer’s instructions. cDNA was prepared from 1 �g total RNA usingSuperScriptTM II Reverse Transcriptase (Invitrogen) according to themanufacturer’s instructions in 20 �l reactions with random primers(Promega, Madison, WI). Synthesized cDNA was diluted 5 timeswith 0.1× TE (1 mM Tris, 0.1 mM EDTA [pH 8.0]) supplementedwith 0.008% (w/v) BSA (New England Biolabs, Beverly, MA). GAPDHwas used as a positive control for conventional PCR and Q-PCR wasperformed using the Quantitative Method (Rotor-GeneTM v6.1) tonormalize CR2 levels to �-actin.
2.4. Flow cytometry
Cell surface expression of CR2 was assessed as described pre-viously (Guthridge et al., 2001) using b-�-hCR2 (mAB171) or anisotype matched control (MOPC-21; BD Biosciences PharMingen,San Diego, CA) and secondary staining with phycoerythrin (PE)-conjugated streptavidin (BD Biosciences PharMingen). Cells wereanalyzed using the BD FACSCaliburTM flow cytometer (BD Bio-sciences PharMingen). Data was collected with CellQuest ProTM (BDBiosciences PharMingen) and processed using FCS Express v3 (DeNovo Software, Thornhill, OT, Canada).
2.5. CHART-PCR
Chromatin accessibility assays were performed as previouslydescribed (Rao et al., 2001) with minor modifications. Approx-imately 1.25 × 10⁶ nuclei in 100 �l digestion buffer (10 mM Tris[pH 7.4], 15 mM NaCl, 60 mM KCl, 0.15 mM spermine, 0.5 mM sper-midine, 1 mM CaCl2) ± 5 U MNase/ml (Worthington Biochemicals,Lakewood, NJ) were incubated at 37 ◦C for 10 min. Reactions wereterminated with 20 �l stop solution (100 mM EDTA, 10 mM EGTA[pH 8.1]) and 10 �l SDS 10% (w/v). DNA was isolated using theQIAmp DNA blood mini-kit (QIAGEN), eluted in 150 �l 0.1× TE,supplemented with 0.008% BSA (w/v). 5 �l of DNA recovered from“Cut” (+MNase) and “Uncut” samples were used in Q-PCR assays tomeasure the relative abundance of targeted regions using a seriesof primer pairs (Table 1). Chromatin accessibility ratios were cal-culated using the Rotor-GeneTM v6.1, Comparative Quantitationmethod to determine the ratio of “Uncut”/“Cut” for independentpairs of samples.
2.6. Chromatin immunoprecipitation
ChIPs were performed using the Upstate Biotechnology (LakePlacid, NY) ChIP assay kit according to the manufacturer’s proto-col with minor modifications. Histone ChIPs used 1 × 10⁷ cells fixedwith formaldehyde (Sigma–Aldrich, St. Louis, MO) to 0.5% for 10 minat 37 ◦C. Cells were washed in PBS, lysed in 2 ml SDS lysis bufferand then sonicated 10 times for 5 s (pulses separated by 3 min onice) using a Sonifier 250 (Branson Ultrasonics Corporation, Dan-bury, CT) set at duty cycle 100% and output 4.5. Soluble chromatinwas isolated, diluted 1:10 and pre-cleared with Salmon Sperm
DNA/Protein A/G-agarose beads (Upstate Biotechnology) for 1 h at4 ◦C. The resulting soluble chromatin was divided into 2 ml aliquots(1 × 10⁶ cells) and incubated overnight with either 10 �g antibody(Upstate Biotechnology; �-acetyl-H3K9/14 [Cat#06-599], �-acetyl-H4K5/8/12/16 [Cat#06-866] or �-dimethyl-H3K4 [Cat#07-030]) or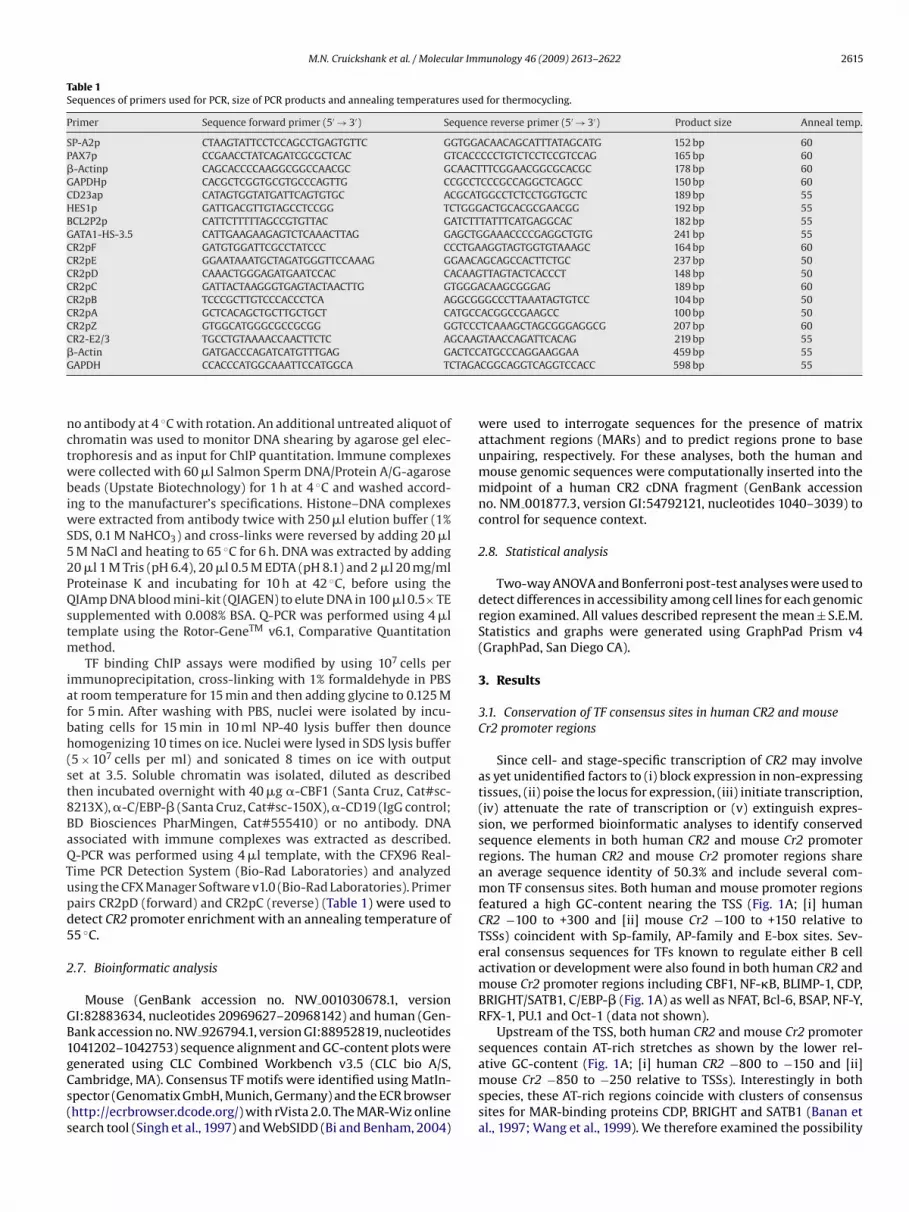
M.N. Cruickshank et al. / Molecular Immunology 46 (2009) 2613–2622 2615
Table 1Sequences of primers used for PCR, size of PCR products and annealing temperatures used for thermocycling.
Primer Sequence forward primer (5′ → 3′) Sequence reverse primer (5′ → 3′) Product size Anneal temp.
SP-A2p CTAAGTATTCCTCCAGCCTGAGTGTTC GGTGGACAACAGCATTTATAGCATG 152 bp 60PAX7p CCGAACCTATCAGATCGCGCTCAC GTCACCCCCTGTCTCCTCCGTCCAG 165 bp 60�-Actinp CAGCACCCCAAGGCGGCCAACGC GCAACTTTCGGAACGGCGCACGC 178 bp 60GAPDHp CACGCTCGGTGCGTGCCCAGTTG CCGCCTCCCGCCAGGCTCAGCC 150 bp 60CD23ap CATAGTGGTATGATTCAGTGTGC ACGCATGGCCTCTCCTGGTGCTC 189 bp 55HES1p GATTGACGTTGTAGCCTCCGG TCTGGGACTGCACGCGAACGG 192 bp 55BCL2P2p CATTCTTTTTAGCCGTGTTAC GATCTTTATTTCATGAGGCAC 182 bp 55GATA1-HS-3.5 CATTGAAGAAGAGTCTCAAACTTAG GAGCTGGAAACCCCGAGGCTGTG 241 bp 55CR2pF GATGTGGATTCGCCTATCCC CCCTGAAGGTAGTGGTGTAAAGC 164 bp 60CR2pE GGAATAAATGCTAGATGGGTTCCAAAG GGAACAGCAGCCACTTCTGC 237 bp 50CR2pD CAAACTGGGAGATGAATCCAC CACAAGTTAGTACTCACCCT 148 bp 50CR2pC GATTACTAAGGGTGAGTACTAACTTG GTGGGACAAGCGGGAG 189 bp 60CR2pB TCCCGCTTGTCCCACCCTCA AGGCGGGCCCTTAAATAGTGTCC 104 bp 50CR2pA GCTCACAGCTGCTTGCTGCT CATGCCACGGCCGAAGCC 100 bp 50CR2pZ GTGGCATGGGCGCCGCGG GGTCCCTCAAAGCTAGCGGGAGGCG 207 bp 60CR2-E2/3 TGCCTGTAAAACCAACTTCTC AGCAAGTAACCAGATTCACAG 219 bp 55� CTCCG TAGA
nctwbiwS52PQstm
iafbh(st8BaQTupd5
2
GB1gCs(s
-Actin GATGACCCAGATCATGTTTGAG GAAPDH CCACCCATGGCAAATTCCATGGCA TC
o antibody at 4 ◦C with rotation. An additional untreated aliquot ofhromatin was used to monitor DNA shearing by agarose gel elec-rophoresis and as input for ChIP quantitation. Immune complexesere collected with 60 �l Salmon Sperm DNA/Protein A/G-agaroseeads (Upstate Biotechnology) for 1 h at 4 ◦C and washed accord-
ng to the manufacturer’s specifications. Histone–DNA complexesere extracted from antibody twice with 250 �l elution buffer (1%
DS, 0.1 M NaHCO3) and cross-links were reversed by adding 20 �lM NaCl and heating to 65 ◦C for 6 h. DNA was extracted by adding0 �l 1 M Tris (pH 6.4), 20 �l 0.5 M EDTA (pH 8.1) and 2 �l 20 mg/mlroteinase K and incubating for 10 h at 42 ◦C, before using theIAmp DNA blood mini-kit (QIAGEN) to elute DNA in 100 �l 0.5× TE
upplemented with 0.008% BSA. Q-PCR was performed using 4 �lemplate using the Rotor-GeneTM v6.1, Comparative Quantitation
ethod.TF binding ChIP assays were modified by using 107 cells per
mmunoprecipitation, cross-linking with 1% formaldehyde in PBSt room temperature for 15 min and then adding glycine to 0.125 Mor 5 min. After washing with PBS, nuclei were isolated by incu-ating cells for 15 min in 10 ml NP-40 lysis buffer then dounceomogenizing 10 times on ice. Nuclei were lysed in SDS lysis buffer5 × 107 cells per ml) and sonicated 8 times on ice with outputet at 3.5. Soluble chromatin was isolated, diluted as describedhen incubated overnight with 40 �g �-CBF1 (Santa Cruz, Cat#sc-213X), �-C/EBP-� (Santa Cruz, Cat#sc-150X), �-CD19 (IgG control;D Biosciences PharMingen, Cat#555410) or no antibody. DNAssociated with immune complexes was extracted as described.-PCR was performed using 4 �l template, with the CFX96 Real-ime PCR Detection System (Bio-Rad Laboratories) and analyzedsing the CFX Manager Software v1.0 (Bio-Rad Laboratories). Primerairs CR2pD (forward) and CR2pC (reverse) (Table 1) were used toetect CR2 promoter enrichment with an annealing temperature of5 ◦C.
.7. Bioinformatic analysis
Mouse (GenBank accession no. NW 001030678.1, versionI:82883634, nucleotides 20969627–20968142) and human (Gen-ank accession no. NW 926794.1, version GI:88952819, nucleotides041202–1042753) sequence alignment and GC-content plots were
enerated using CLC Combined Workbench v3.5 (CLC bio A/S,ambridge, MA). Consensus TF motifs were identified using MatIn-pector (Genomatix GmbH, Munich, Germany) and the ECR browserhttp://ecrbrowser.dcode.org/) with rVista 2.0. The MAR-Wiz onlineearch tool (Singh et al., 1997) and WebSIDD (Bi and Benham, 2004)ATGCCCAGGAAGGAA 459 bp 55CGGCAGGTCAGGTCCACC 598 bp 55
were used to interrogate sequences for the presence of matrixattachment regions (MARs) and to predict regions prone to baseunpairing, respectively. For these analyses, both the human andmouse genomic sequences were computationally inserted into themidpoint of a human CR2 cDNA fragment (GenBank accessionno. NM 001877.3, version GI:54792121, nucleotides 1040–3039) tocontrol for sequence context.
2.8. Statistical analysis
Two-way ANOVA and Bonferroni post-test analyses were used todetect differences in accessibility among cell lines for each genomicregion examined. All values described represent the mean ± S.E.M.Statistics and graphs were generated using GraphPad Prism v4(GraphPad, San Diego CA).
3. Results
3.1. Conservation of TF consensus sites in human CR2 and mouseCr2 promoter regions
Since cell- and stage-specific transcription of CR2 may involveas yet unidentified factors to (i) block expression in non-expressingtissues, (ii) poise the locus for expression, (iii) initiate transcription,(iv) attenuate the rate of transcription or (v) extinguish expres-sion, we performed bioinformatic analyses to identify conservedsequence elements in both human CR2 and mouse Cr2 promoterregions. The human CR2 and mouse Cr2 promoter regions sharean average sequence identity of 50.3% and include several com-mon TF consensus sites. Both human and mouse promoter regionsfeatured a high GC-content nearing the TSS (Fig. 1A; [i] humanCR2 −100 to +300 and [ii] mouse Cr2 −100 to +150 relative toTSSs) coincident with Sp-family, AP-family and E-box sites. Sev-eral consensus sequences for TFs known to regulate either B cellactivation or development were also found in both human CR2 andmouse Cr2 promoter regions including CBF1, NF-�B, BLIMP-1, CDP,BRIGHT/SATB1, C/EBP-� (Fig. 1A) as well as NFAT, Bcl-6, BSAP, NF-Y,RFX-1, PU.1 and Oct-1 (data not shown).
Upstream of the TSS, both human CR2 and mouse Cr2 promotersequences contain AT-rich stretches as shown by the lower rel-
ative GC-content (Fig. 1A; [i] human CR2 −800 to −150 and [ii]mouse Cr2 −850 to −250 relative to TSSs). Interestingly in bothspecies, these AT-rich regions coincide with clusters of consensussites for MAR-binding proteins CDP, BRIGHT and SATB1 (Banan etal., 1997; Wang et al., 1999). We therefore examined the possibility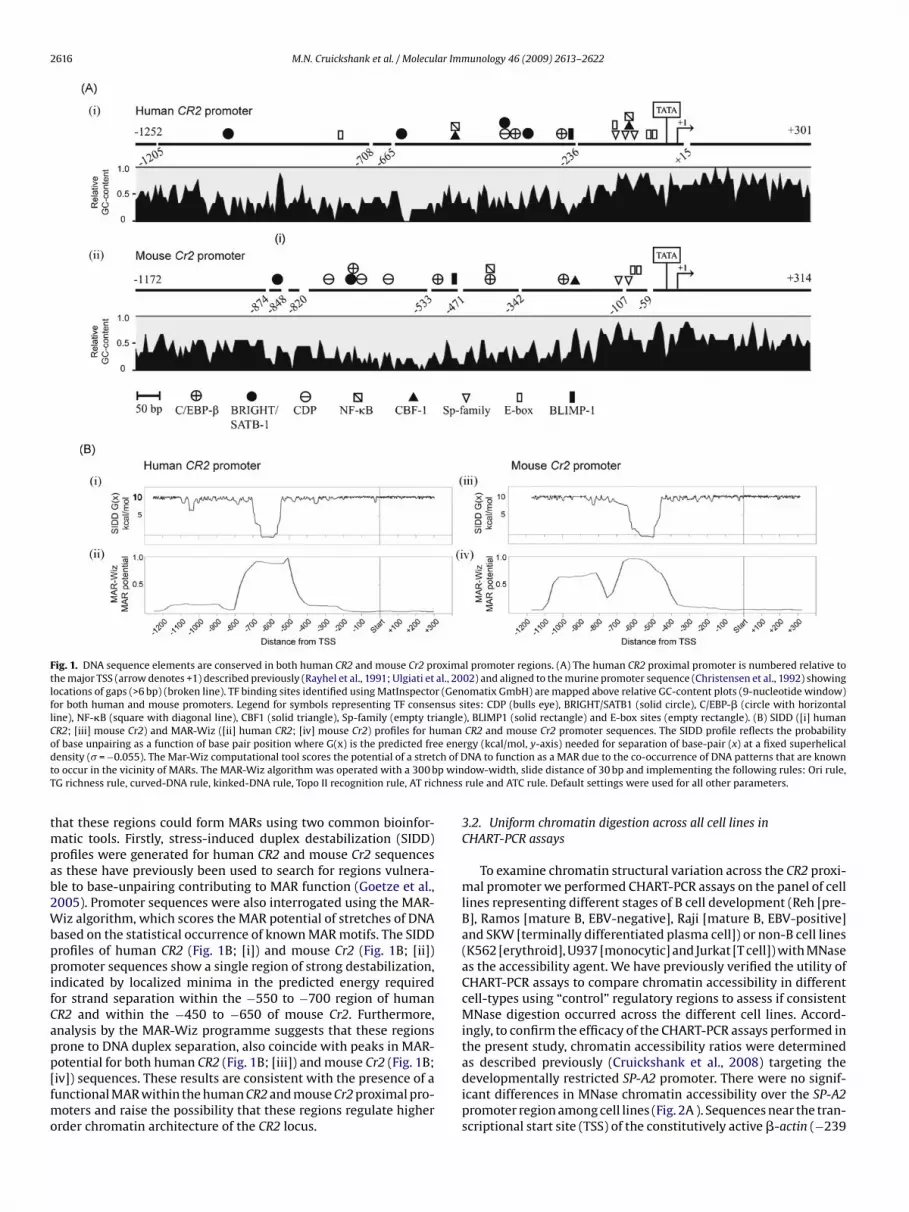
2616 M.N. Cruickshank et al. / Molecular Immunology 46 (2009) 2613–2622
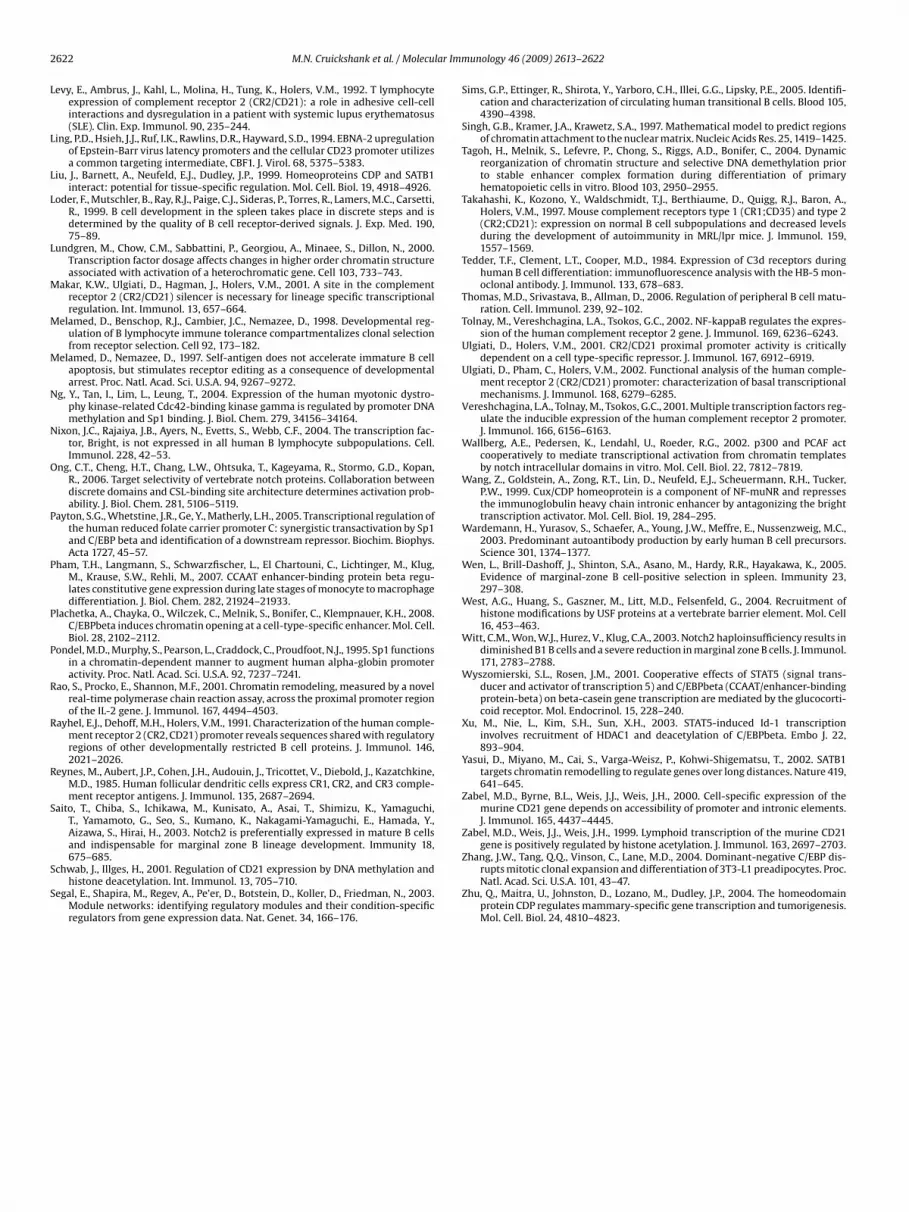
Fig. 1. DNA sequence elements are conserved in both human CR2 and mouse Cr2 proximal promoter regions. (A) The human CR2 proximal promoter is numbered relative tothe major TSS (arrow denotes +1) described previously (Rayhel et al., 1991; Ulgiati et al., 2002) and aligned to the murine promoter sequence (Christensen et al., 1992) showinglocations of gaps (>6 bp) (broken line). TF binding sites identified using MatInspector (Genomatix GmbH) are mapped above relative GC-content plots (9-nucleotide window)for both human and mouse promoters. Legend for symbols representing TF consensus sites: CDP (bulls eye), BRIGHT/SATB1 (solid circle), C/EBP-� (circle with horizontalline), NF-�B (square with diagonal line), CBF1 (solid triangle), Sp-family (empty triangle), BLIMP1 (solid rectangle) and E-box sites (empty rectangle). (B) SIDD ([i] humanCR2; [iii] mouse Cr2) and MAR-Wiz ([ii] human CR2; [iv] mouse Cr2) profiles for human CR2 and mouse Cr2 promoter sequences. The SIDD profile reflects the probabilityo e ened ch of Dt p winT hness
tmpab2WbppifCapp[fmo
f base unpairing as a function of base pair position where G(x) is the predicted freensity (� = −0.055). The Mar-Wiz computational tool scores the potential of a streto occur in the vicinity of MARs. The MAR-Wiz algorithm was operated with a 300 bG richness rule, curved-DNA rule, kinked-DNA rule, Topo II recognition rule, AT ric
hat these regions could form MARs using two common bioinfor-atic tools. Firstly, stress-induced duplex destabilization (SIDD)
rofiles were generated for human CR2 and mouse Cr2 sequencess these have previously been used to search for regions vulnera-le to base-unpairing contributing to MAR function (Goetze et al.,005). Promoter sequences were also interrogated using the MAR-iz algorithm, which scores the MAR potential of stretches of DNA
ased on the statistical occurrence of known MAR motifs. The SIDDrofiles of human CR2 (Fig. 1B; [i]) and mouse Cr2 (Fig. 1B; [ii])romoter sequences show a single region of strong destabilization,
ndicated by localized minima in the predicted energy requiredor strand separation within the −550 to −700 region of humanR2 and within the −450 to −650 of mouse Cr2. Furthermore,nalysis by the MAR-Wiz programme suggests that these regionsrone to DNA duplex separation, also coincide with peaks in MAR-
otential for both human CR2 (Fig. 1B; [iii]) and mouse Cr2 (Fig. 1B;iv]) sequences. These results are consistent with the presence of aunctional MAR within the human CR2 and mouse Cr2 proximal pro-oters and raise the possibility that these regions regulate higherrder chromatin architecture of the CR2 locus.
rgy (kcal/mol, y-axis) needed for separation of base-pair (x) at a fixed superhelicalNA to function as a MAR due to the co-occurrence of DNA patterns that are known
dow-width, slide distance of 30 bp and implementing the following rules: Ori rule,rule and ATC rule. Default settings were used for all other parameters.
3.2. Uniform chromatin digestion across all cell lines inCHART-PCR assays
To examine chromatin structural variation across the CR2 proxi-mal promoter we performed CHART-PCR assays on the panel of celllines representing different stages of B cell development (Reh [pre-B], Ramos [mature B, EBV-negative], Raji [mature B, EBV-positive]and SKW [terminally differentiated plasma cell]) or non-B cell lines(K562 [erythroid], U937 [monocytic] and Jurkat [T cell]) with MNaseas the accessibility agent. We have previously verified the utility ofCHART-PCR assays to compare chromatin accessibility in differentcell-types using “control” regulatory regions to assess if consistentMNase digestion occurred across the different cell lines. Accord-ingly, to confirm the efficacy of the CHART-PCR assays performed inthe present study, chromatin accessibility ratios were determined
as described previously (Cruickshank et al., 2008) targeting thedevelopmentally restricted SP-A2 promoter. There were no signif-icant differences in MNase chromatin accessibility over the SP-A2promoter region among cell lines (Fig. 2A ). Sequences near the tran-scriptional start site (TSS) of the constitutively active �-actin (−239
M.N. Cruickshank et al. / Molecular Imm
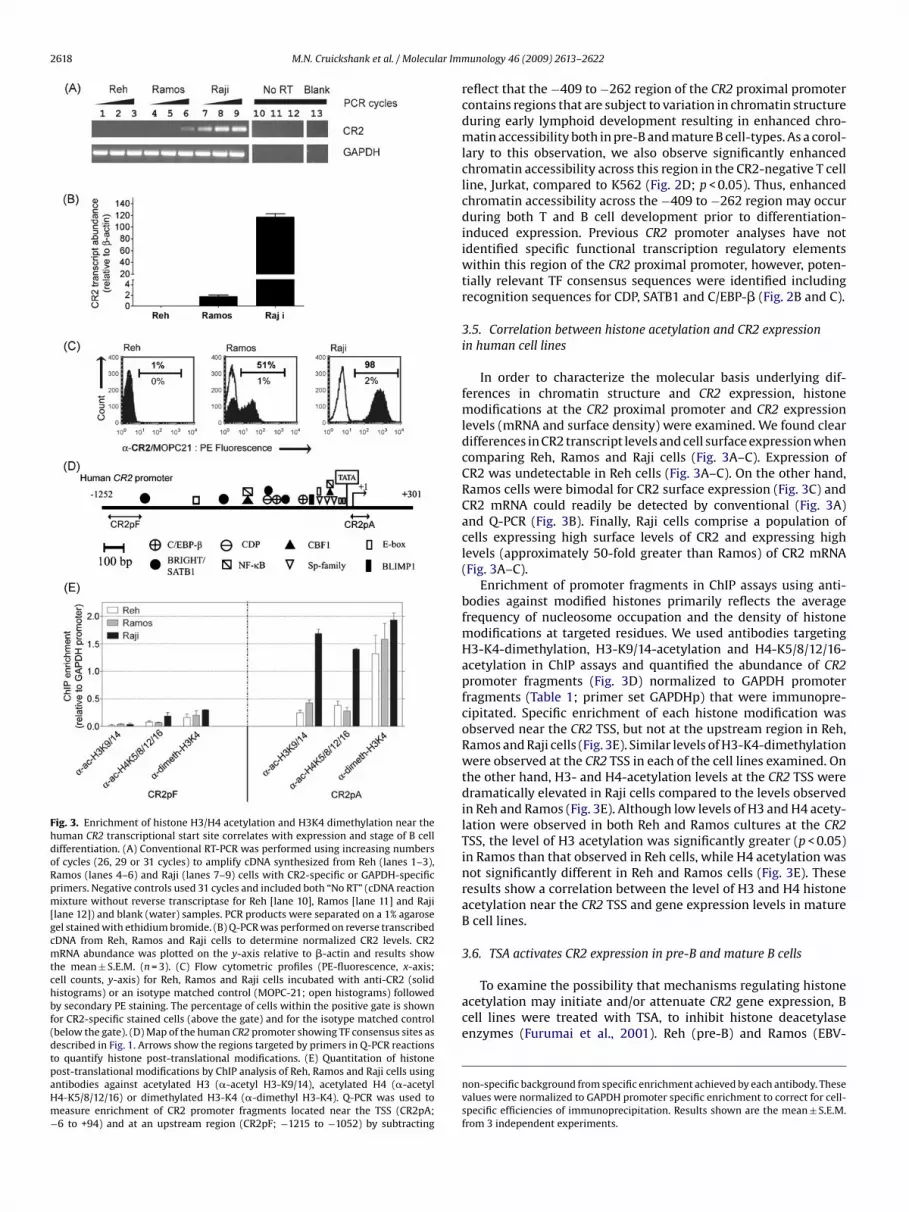
Fig. 2. Distinct differences in MNase chromatin accessibility across the CR2proximal promoter in B cell lines at different stages of differentiation. (A) Pairs of“Uncut” and “Cut” samples from CHART-PCR assays were used as template in Q-PCRreactions with primer pairs targeting the SP-A2 promoter region to compare MNasedigestion levels. MNase chromatin accessibility ratios were calculated as describedand plotted as the mean ± S.E.M. (Reh, Ramos, Raji, K562, U937 and SKW [n = 4–6])from independent pairs of “Uncut” and “Cut” samples. (B) Map of the CR2 proximalpromoter showing the locations of putative TF binding sites (see legend, Fig. 1A)and the regions amplified by primers used in CHART-PCR assays. (C) Cell-specificMNase chromatin accessibility ratios were determined across intervals spanningthe CR2 proximal promoter and plotted against the distance from TSS using themidpoint of each primer pair. Results shown are the mean chromatin accessibilityratios ± S.E.M., calculated from n = 4 to 6 independent pairs of “Uncut” and “Cut”samples. (D) Lymphoid-specific MNase chromatin accessibility across the −409 to−262 region. Results show mean chromatin accessibility ratios ± S.E.M with K562
unology 46 (2009) 2613–2622 2617
to −62) and GAPDH (−217 to −68) promoters showed enhancedMNase chromatin accessibility compared to the SP-A2 promoterregion (data not shown). Therefore, CHART-PCR assays detectedsite-specific variation in chromatin accessibility in the cell linesexamined.
3.3. Enhanced accessibility across −289 to −12 of the CR2promoter in mature B cells
We next used the CHART-PCR assay to analyze cell-specificMNase accessibility targeting fragments of the CR2 proximal pro-moter (Fig. 2B; primer locations). Regions flanking the TSS ofthe human CR2 gene, showed enhanced MNase digestion in CR2-expressing B cell lines (Raji and Ramos) compared to all othercell lines examined (Fig. 2C). Significant differences in chromatinaccessibility were detected across regions spanned by primer pairsCR2pC (−289 to −101) and CR2pB (−115 to −12) when compar-ing Ramos or Raji (CR2-expressing B cell lines) to other cell-types(Fig. 2B and C; all comparisons ranged between p < 0.05 andp < 0.001). The level of chromatin accessibility across the −289to −101 region was similar in Raji and Ramos cell lines. In con-trast, the level of chromatin accessibility across the −115 to −12region was significantly higher in Raji cells compared to Ramos cells(p < 0.05), which were in turn significantly more accessible acrossthis region than Reh (p < 0.01), U937 (p < 0.01), K562 (p < 0.01) andSKW (p < 0.01).
These results demonstrate that sequences between −289 and−12 of the CR2 proximal promoter harbours regions that are sig-nificantly more accessible to MNase in CR2-expressing B cells thanother cell-types examined. This region contains known functionalregulatory elements including tandem E-box motifs, Sp-family andAP-family sites, in addition to putative consensus sites for C/EBP-�, BLIMP-1, CBF1 and CREB. Furthermore, since we demonstratethat an intermediate level of chromatin accessibility was observedspecifically within the −115 to −12 region in Ramos cells, this regionmay contain sites which vary in accessibility depending on tran-scriptional status.
Non-expressing cell-types (K562, U937, Reh and SKW) werehighly resistant to MNase digestion across several CR2 proximalpromoter regions including −115 to −12, −6 to +94 and +87 to+293 (Fig. 2B and C; CR2pB, CR2pA and CR2pZ) with accessibilityratios approaching one. Low level accessibility across the −289 to−101 region was also observed (Fig. 2B and C; CR2pC). Therefore,chromatin from myeloid (K562 and U937) and CR2 non-expressinglymphoid cells (Reh and SKW) is assembled into structures thatare highly inaccessible to MNase between −115 and +293 of theCR2 proximal promoter with low level MNase accessibility acrossan adjacent upstream sequences (Fig. 2C). The T cell line, Jurkat,which is also CR2-negative, showed similar patterns of chromatinaccessibility across each of these regions of the CR2 promoter also(data not shown).
3.4. Enhanced accessibility across −409 to −262 of the CR2promoter in lymphoid cells
Significantly enhanced MNase accessibility across the −409 to−262 sequence of the human CR2 proximal promoter was observedin the pre-B (Fig. 2C; Reh) and mature B cell lines compared to allother cell lines analyzed (Fig. 2C; Ramos and Raji) (all comparisonsranged between p < 0.05 and p < 0.001). These observations may
cells used to test statistical significance of differences using data from (C) and n = 3independent pairs of “Uncut” and “Cut” samples from CHART-PCR experiments onJurkat cells (*p < 0.05, ***p < 0.001).
2618 M.N. Cruickshank et al. / Molecular Imm
Fig. 3. Enrichment of histone H3/H4 acetylation and H3K4 dimethylation near thehuman CR2 transcriptional start site correlates with expression and stage of B celldifferentiation. (A) Conventional RT-PCR was performed using increasing numbersof cycles (26, 29 or 31 cycles) to amplify cDNA synthesized from Reh (lanes 1–3),Ramos (lanes 4–6) and Raji (lanes 7–9) cells with CR2-specific or GAPDH-specificprimers. Negative controls used 31 cycles and included both “No RT” (cDNA reactionmixture without reverse transcriptase for Reh [lane 10], Ramos [lane 11] and Raji[lane 12]) and blank (water) samples. PCR products were separated on a 1% agarosegel stained with ethidium bromide. (B) Q-PCR was performed on reverse transcribedcDNA from Reh, Ramos and Raji cells to determine normalized CR2 levels. CR2mRNA abundance was plotted on the y-axis relative to �-actin and results showthe mean ± S.E.M. (n = 3). (C) Flow cytometric profiles (PE-fluorescence, x-axis;cell counts, y-axis) for Reh, Ramos and Raji cells incubated with anti-CR2 (solidhistograms) or an isotype matched control (MOPC-21; open histograms) followedby secondary PE staining. The percentage of cells within the positive gate is shownfor CR2-specific stained cells (above the gate) and for the isotype matched control(below the gate). (D) Map of the human CR2 promoter showing TF consensus sites asdescribed in Fig. 1. Arrows show the regions targeted by primers in Q-PCR reactionsto quantify histone post-translational modifications. (E) Quantitation of histonepost-translational modifications by ChIP analysis of Reh, Ramos and Raji cells usingantibodies against acetylated H3 (�-acetyl H3-K9/14), acetylated H4 (�-acetylH4-K5/8/12/16) or dimethylated H3-K4 (�-dimethyl H3-K4). Q-PCR was used tomeasure enrichment of CR2 promoter fragments located near the TSS (CR2pA;−6 to +94) and at an upstream region (CR2pF; −1215 to −1052) by subtracting
unology 46 (2009) 2613–2622
reflect that the −409 to −262 region of the CR2 proximal promotercontains regions that are subject to variation in chromatin structureduring early lymphoid development resulting in enhanced chro-matin accessibility both in pre-B and mature B cell-types. As a corol-lary to this observation, we also observe significantly enhancedchromatin accessibility across this region in the CR2-negative T cellline, Jurkat, compared to K562 (Fig. 2D; p < 0.05). Thus, enhancedchromatin accessibility across the −409 to −262 region may occurduring both T and B cell development prior to differentiation-induced expression. Previous CR2 promoter analyses have notidentified specific functional transcription regulatory elementswithin this region of the CR2 proximal promoter, however, poten-tially relevant TF consensus sequences were identified includingrecognition sequences for CDP, SATB1 and C/EBP-� (Fig. 2B and C).
3.5. Correlation between histone acetylation and CR2 expressionin human cell lines
In order to characterize the molecular basis underlying dif-ferences in chromatin structure and CR2 expression, histonemodifications at the CR2 proximal promoter and CR2 expressionlevels (mRNA and surface density) were examined. We found cleardifferences in CR2 transcript levels and cell surface expression whencomparing Reh, Ramos and Raji cells (Fig. 3A–C). Expression ofCR2 was undetectable in Reh cells (Fig. 3A–C). On the other hand,Ramos cells were bimodal for CR2 surface expression (Fig. 3C) andCR2 mRNA could readily be detected by conventional (Fig. 3A)and Q-PCR (Fig. 3B). Finally, Raji cells comprise a population ofcells expressing high surface levels of CR2 and expressing highlevels (approximately 50-fold greater than Ramos) of CR2 mRNA(Fig. 3A–C).
Enrichment of promoter fragments in ChIP assays using anti-bodies against modified histones primarily reflects the averagefrequency of nucleosome occupation and the density of histonemodifications at targeted residues. We used antibodies targetingH3-K4-dimethylation, H3-K9/14-acetylation and H4-K5/8/12/16-acetylation in ChIP assays and quantified the abundance of CR2promoter fragments (Fig. 3D) normalized to GAPDH promoterfragments (Table 1; primer set GAPDHp) that were immunopre-cipitated. Specific enrichment of each histone modification wasobserved near the CR2 TSS, but not at the upstream region in Reh,Ramos and Raji cells (Fig. 3E). Similar levels of H3-K4-dimethylationwere observed at the CR2 TSS in each of the cell lines examined. Onthe other hand, H3- and H4-acetylation levels at the CR2 TSS weredramatically elevated in Raji cells compared to the levels observedin Reh and Ramos (Fig. 3E). Although low levels of H3 and H4 acety-lation were observed in both Reh and Ramos cultures at the CR2TSS, the level of H3 acetylation was significantly greater (p < 0.05)in Ramos than that observed in Reh cells, while H4 acetylation wasnot significantly different in Reh and Ramos cells (Fig. 3E). Theseresults show a correlation between the level of H3 and H4 histoneacetylation near the CR2 TSS and gene expression levels in matureB cell lines.
3.6. TSA activates CR2 expression in pre-B and mature B cells
To examine the possibility that mechanisms regulating histoneacetylation may initiate and/or attenuate CR2 gene expression, Bcell lines were treated with TSA, to inhibit histone deacetylaseenzymes (Furumai et al., 2001). Reh (pre-B) and Ramos (EBV-
non-specific background from specific enrichment achieved by each antibody. Thesevalues were normalized to GAPDH promoter specific enrichment to correct for cell-specific efficiencies of immunoprecipitation. Results shown are the mean ± S.E.M.from 3 independent experiments.
M.N. Cruickshank et al. / Molecular Imm
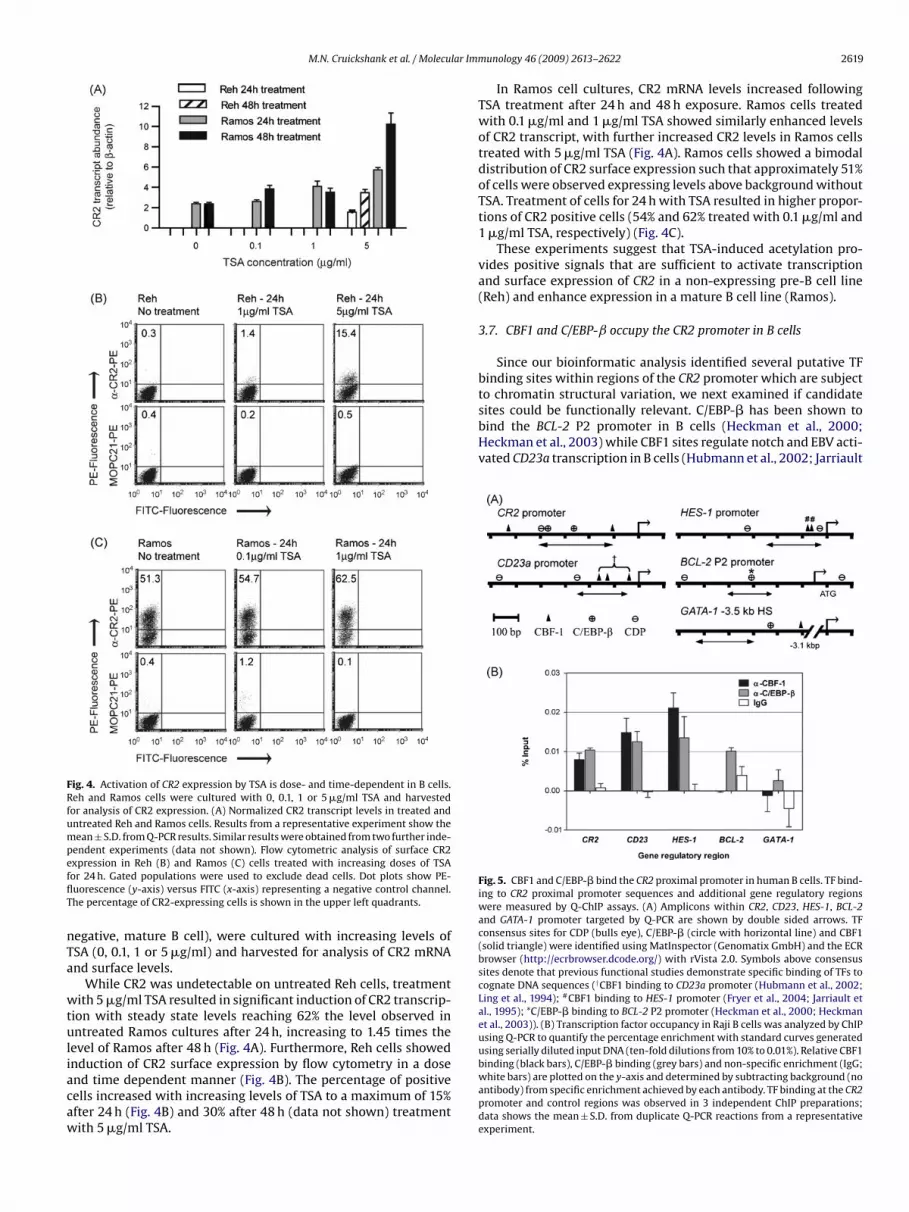
Fig. 4. Activation of CR2 expression by TSA is dose- and time-dependent in B cells.Reh and Ramos cells were cultured with 0, 0.1, 1 or 5 �g/ml TSA and harvestedfor analysis of CR2 expression. (A) Normalized CR2 transcript levels in treated anduntreated Reh and Ramos cells. Results from a representative experiment show themean ± S.D. from Q-PCR results. Similar results were obtained from two further inde-pendent experiments (data not shown). Flow cytometric analysis of surface CR2efflT
nTa
wtuliacaw
to chromatin structural variation, we next examined if candidatesites could be functionally relevant. C/EBP-� has been shown tobind the BCL-2 P2 promoter in B cells (Heckman et al., 2000;Heckman et al., 2003) while CBF1 sites regulate notch and EBV acti-vated CD23a transcription in B cells (Hubmann et al., 2002; Jarriault
Fig. 5. CBF1 and C/EBP-� bind the CR2 proximal promoter in human B cells. TF bind-ing to CR2 proximal promoter sequences and additional gene regulatory regionswere measured by Q-ChIP assays. (A) Amplicons within CR2, CD23, HES-1, BCL-2and GATA-1 promoter targeted by Q-PCR are shown by double sided arrows. TFconsensus sites for CDP (bulls eye), C/EBP-� (circle with horizontal line) and CBF1(solid triangle) were identified using MatInspector (Genomatix GmbH) and the ECRbrowser (http://ecrbrowser.dcode.org/) with rVista 2.0. Symbols above consensussites denote that previous functional studies demonstrate specific binding of TFs tocognate DNA sequences (†CBF1 binding to CD23a promoter (Hubmann et al., 2002;Ling et al., 1994); #CBF1 binding to HES-1 promoter (Fryer et al., 2004; Jarriault etal., 1995); *C/EBP-� binding to BCL-2 P2 promoter (Heckman et al., 2000; Heckmanet al., 2003)). (B) Transcription factor occupancy in Raji B cells was analyzed by ChIPusing Q-PCR to quantify the percentage enrichment with standard curves generatedusing serially diluted input DNA (ten-fold dilutions from 10% to 0.01%). Relative CBF1
xpression in Reh (B) and Ramos (C) cells treated with increasing doses of TSAor 24 h. Gated populations were used to exclude dead cells. Dot plots show PE-uorescence (y-axis) versus FITC (x-axis) representing a negative control channel.he percentage of CR2-expressing cells is shown in the upper left quadrants.
egative, mature B cell), were cultured with increasing levels ofSA (0, 0.1, 1 or 5 �g/ml) and harvested for analysis of CR2 mRNAnd surface levels.
While CR2 was undetectable on untreated Reh cells, treatmentith 5 �g/ml TSA resulted in significant induction of CR2 transcrip-
ion with steady state levels reaching 62% the level observed inntreated Ramos cultures after 24 h, increasing to 1.45 times the
evel of Ramos after 48 h (Fig. 4A). Furthermore, Reh cells showed
nduction of CR2 surface expression by flow cytometry in a dosend time dependent manner (Fig. 4B). The percentage of positiveells increased with increasing levels of TSA to a maximum of 15%fter 24 h (Fig. 4B) and 30% after 48 h (data not shown) treatmentith 5 �g/ml TSA.unology 46 (2009) 2613–2622 2619
In Ramos cell cultures, CR2 mRNA levels increased followingTSA treatment after 24 h and 48 h exposure. Ramos cells treatedwith 0.1 �g/ml and 1 �g/ml TSA showed similarly enhanced levelsof CR2 transcript, with further increased CR2 levels in Ramos cellstreated with 5 �g/ml TSA (Fig. 4A). Ramos cells showed a bimodaldistribution of CR2 surface expression such that approximately 51%of cells were observed expressing levels above background withoutTSA. Treatment of cells for 24 h with TSA resulted in higher propor-tions of CR2 positive cells (54% and 62% treated with 0.1 �g/ml and1 �g/ml TSA, respectively) (Fig. 4C).
These experiments suggest that TSA-induced acetylation pro-vides positive signals that are sufficient to activate transcriptionand surface expression of CR2 in a non-expressing pre-B cell line(Reh) and enhance expression in a mature B cell line (Ramos).
3.7. CBF1 and C/EBP-ˇ occupy the CR2 promoter in B cells
Since our bioinformatic analysis identified several putative TFbinding sites within regions of the CR2 promoter which are subject
binding (black bars), C/EBP-� binding (grey bars) and non-specific enrichment (IgG;white bars) are plotted on the y-axis and determined by subtracting background (noantibody) from specific enrichment achieved by each antibody. TF binding at the CR2promoter and control regions was observed in 3 independent ChIP preparations;data shows the mean ± S.D. from duplicate Q-PCR reactions from a representativeexperiment.

2 lar Imm
efdCmCw(pCfiioai2itnTwcBact(ib(tsi
4
ctBcaCceiipC
cadlcCuatmtwwdda
620 M.N. Cruickshank et al. / Molecu
t al., 1995). Since both factors are known regulators of B cell dif-erentiation and can also alter chromatin structure, we wished toetermine if they bind the CR2 promoter in B cells. We performedhIP assays to measure CBF1 and C/EBP-� binding at the CR2 pro-oter in Raji B cells. Our results show significant enrichment of
R2 promoter sequences in Raji chromatin immunoprecipitatedith antibodies against both CBF1 and C/EBP-� compared to IgG
antibody against the cell surface marker, CD19) (Fig. 5B). The CR2romoter sequence targeted by Q-PCR is flanked on both sides byBF1 sites and contains two C/EBP-� sites (Fig. 5A). To ensure speci-city of ChIP assays, we also show that a GATA-1 regulatory element
s not enriched by either specific antibodies used (Fig. 5B). More-ver, CBF1 binding was observed within the CD23a promoter acrossregion previously shown to contain CBF1 sites which play a role
n notch signaling and EBV activation in B cells (Hubmann et al.,002). Further, our assays show CBF1 binding at the HES-1 promoter
n Raji cells which is in agreement with previous studies showinghat CBF1 sites within the HES-1 promoter play a role in notch sig-aling in several cell-types (Fryer et al., 2004; Ong et al., 2006).o validate the efficacy of ChIP assays detecting C/EBP-� binding,e show specific enrichment of the BCL-2 P2 promoter in Raji B
ells (Fig. 5C) which has previously found to bind C/EBP-� in DHL-4cells (Heckman et al., 2003). We also observe C/EBP-� binding
t both the HES-1 and CD23a promoter regions in Raji cells. Weould not identify consensus sites for C/EBP-� within the either ofhese promoter regions, however several CDP sites were uncoveredFig. 5A). Since CDP antagonizes binding of C/EBP-family members,t is possible that these sites prevent C/EBP-� binding which maye mediated by low affinity DNA sequences or protein-interactionsLee et al., 1994; Payton et al., 2005). In summary, our results showhat CR2 is a direct target of the TFs, C/EBP-� and CBF1, and identifyeveral sites within the promoter which may contribute to regulat-ng CR2 activity during B cell development.
. Discussion
Since the level of surface CR2 serves as a marker of different Bell subsets during differentiation, it is possible that factors con-rolling CR2 transcription may also play a general role in regulatingcell maturation. Our laboratory has previously discovered several
ritical elements involved in cell-type-specific repression (Makar etl., 2001; Ulgiati and Holers, 2001) and basal activation of humanR2 (Ulgiati et al., 2002). In this study, the nature of cell-type spe-ific chromatin structural variation over CR2 regulatory regions wasxamined using a cell line model of B cell development. Our resultsdentified several regions within the CR2 proximal promoter show-ng cell-specific alterations to chromatin accessibility or histoneost-translational modifications and this variation correlated withR2 expression and/or stage of development.
We have identified a region of the CR2 proximal promoter adja-ent to the TSS which shows cell-specific differences in chromatinccessibility correlating with gene expression. Furthermore, ourata indicated that histone acetylation near the TSS also corre-
ates with transcription levels of CR2 in cell lines. These results areonsistent with previous studies examining control of the muriner2 gene by histone acetylation (Zabel et al., 1999) and extend ournderstanding of the role of cell-specific chromatin structural vari-tion at human CR2 regulatory regions (Schwab and Illges, 2001). Onhe other hand, while we detect clear cell-specific patterns of chro-
atin accessibility over the CR2 proximal promoter, we were unableo demonstrate cell-specific differences over a regulatory region
ithin the first intron (data not shown) as previously reportedithin the murine Cr2 intronic element (Zabel et al., 2000). Thisiscrepancy may reflect that these intronic regions are subject toiffering control in humans and mice. Alternatively, as differentccessibility agents were used to measure chromatin accessibilityunology 46 (2009) 2613–2622
over the murine Cr2 intronic segment compared to the work pre-sented here, this observation may reflect the differing experimentalapproaches. We note, however, that no cell-specific differences inchromatin accessibility over the human intronic regulatory regionwere observed using a range of restriction enzymes as well asMNase (data not shown).
Several functionally relevant (Tolnay et al., 2002; Ulgiati andHolers, 2001; Ulgiati et al., 2002; Vereshchagina et al., 2001) andputative TF binding sites are located within the vicinity of regionsnow shown to be subject to cell- and stage-specific chromatin struc-tural variation. Candidate TFs binding these sites, including E2A(Lundgren et al., 2000), USF1 (West et al., 2004), Sp1 (Ng et al.,2004; Pondel et al., 1995) CBF1 (Kao et al., 1998; Wallberg et al.,2002), NF-�B (Covic et al., 2005; Edelstein et al., 2003), BLIMP-1(Gyory et al., 2004), CDP (Wang et al., 1999), BRIGHT (Kaplan etal., 2001; Wang et al., 1999) and C/EBP-� (Plachetka et al., 2008),are known to either regulate or respond to changes in chromatinstructure to modulate transcription.
The data presented in this paper shows specific binding ofCBF1 to the CR2 promoter in CR2-expressing B cells, which is con-sistent with previous findings that CBF1 binds the murine Cr2gene in mouse splenocytes (Debnath et al., 2007). CBF1 can func-tion as either a repressor (Kao et al., 1998; Ling et al., 1994) oractivator (Fryer et al., 2004; Wallberg et al., 2002) by nucleatingmulti-subunit complexes containing factors which modulate chro-matin structure. Since CBF1 is a key TF mediating notch signaling(Ehebauer et al., 2006), it is possible that, in some contexts, CR2is a direct target of this pathway. The observation that Notch2 isrequired for differentiation of MZ B cells (Saito et al., 2003), whichare characterized by up-regulation of CR2, is consistent with thishypothesis. Furthermore, since Notch2+/− mice show defects inB1 cell development (Witt et al., 2003), it is possible that notchsignaling directly regulates CR2 via CBF1 sites during B1 cell differ-entiation.
Interestingly, enhanced MNase chromatin accessibility withinthe −409 to −262 region of the CR2 proximal promoter wasobserved specifically in the pre-B (Reh) and mature B cell lines(Ramos and Raji) suggesting that alterations to chromatin structurehere occur in B cell or lymphoid precursors prior to CR2 activation.We also demonstrated elevated levels of chromatin accessibilityspecifically within this region of the CR2 promoter in Jurkat cellswhich are a CR2-negative T cell line. Since a subset thymocytesexpress CR2 in vivo, this observation suggests that the alterationto chromatin structure within this region may correlate with thedevelopmental potential for CR2 expression. Analysis of this regionrevealed a CDP consensus site, two SATB1 consensus sites and aC/EBP-� consensus site. Furthermore, our bioinformatic analysesidentified a putative MAR directly upstream of this region (within−500 to −700). Functional CDP and SATB1/BRIGHT sites have beenidentified within several MARs in mammals (Chattopadhyay etal., 1998; Hawkins et al., 2001). SATB1 and BRIGHT are MAR-binding proteins which are up-regulated in T cells (Alvarez et al.,2000; Yasui et al., 2002) and B cells, respectively (Kaplan et al.,2001; Nixon et al., 2004), and are thought to facilitate interactionsbetween AT-rich MAR elements and the nuclear matrix to regu-late stage-specific gene activity (Banan et al., 1997; Wang et al.,1999). On the other hand, CDP competes for DNA binding to MARsbut does not interact with the nuclear matrix (Liu et al., 1999).Furthermore, CDP and C/EBP-� are cell-type specific transcriptionregulators with antagonistic roles in differentiation-induced geneexpression, functioning in repression (Zhu et al., 2004) and activa-
tion (Wyszomierski and Rosen, 2001), respectively. CDP is widelyexpressed in undifferentiated cells and is down-regulated duringdevelopment of several cell-types. Conversely, C/EBP-� plays a rolein differentiating cells of specific lineages including adipocytes(Zhang et al., 2004), macrophages (Pham et al., 2007), granulocytes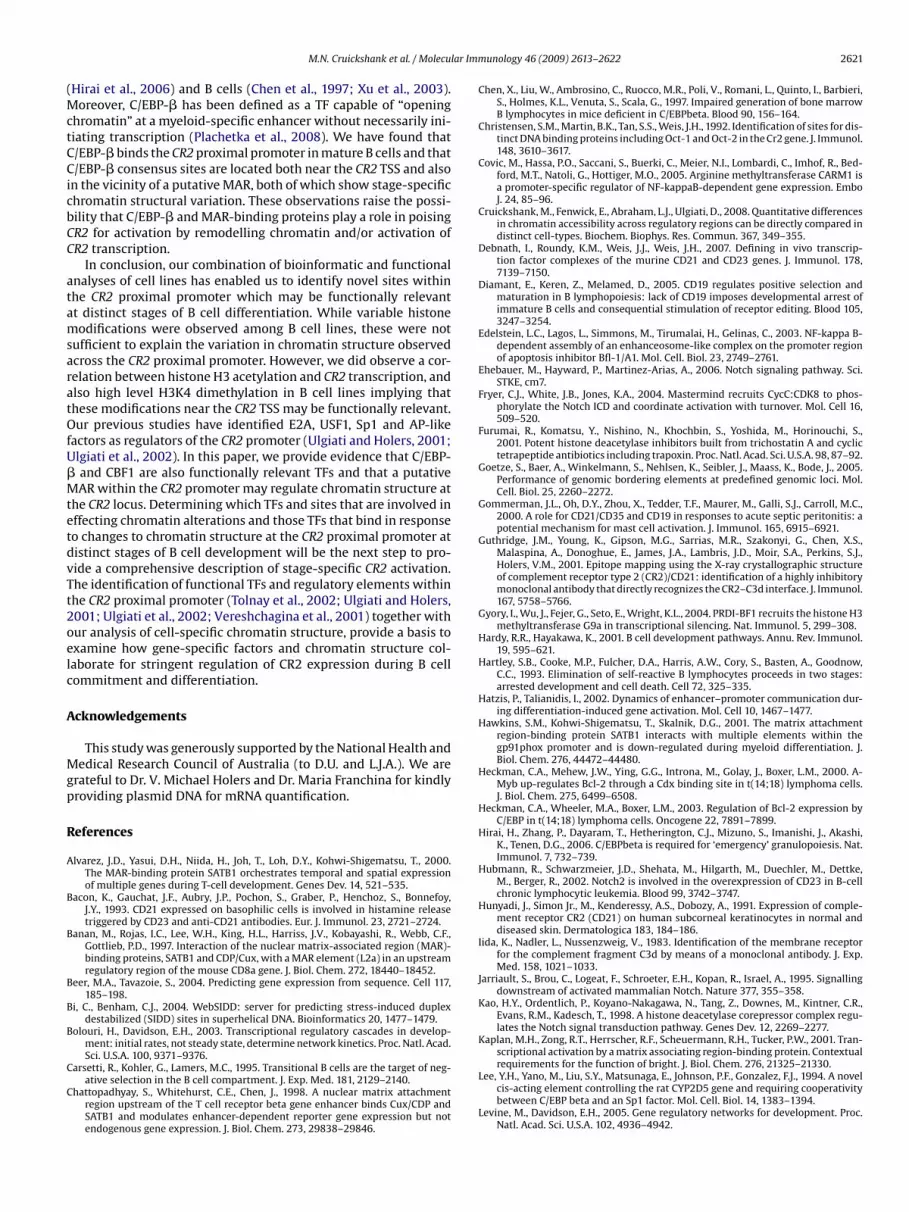
lar Imm
(MctCCicbCC
atamsaratOfU�MtetdvTt2oelc
A
Mgp
R
A
B
B
B
B
B
C
C
M.N. Cruickshank et al. / Molecu
Hirai et al., 2006) and B cells (Chen et al., 1997; Xu et al., 2003).oreover, C/EBP-� has been defined as a TF capable of “opening
hromatin” at a myeloid-specific enhancer without necessarily ini-iating transcription (Plachetka et al., 2008). We have found that/EBP-� binds the CR2 proximal promoter in mature B cells and that/EBP-� consensus sites are located both near the CR2 TSS and also
n the vicinity of a putative MAR, both of which show stage-specifichromatin structural variation. These observations raise the possi-ility that C/EBP-� and MAR-binding proteins play a role in poisingR2 for activation by remodelling chromatin and/or activation ofR2 transcription.
In conclusion, our combination of bioinformatic and functionalnalyses of cell lines has enabled us to identify novel sites withinhe CR2 proximal promoter which may be functionally relevantt distinct stages of B cell differentiation. While variable histoneodifications were observed among B cell lines, these were not
ufficient to explain the variation in chromatin structure observedcross the CR2 proximal promoter. However, we did observe a cor-elation between histone H3 acetylation and CR2 transcription, andlso high level H3K4 dimethylation in B cell lines implying thathese modifications near the CR2 TSS may be functionally relevant.ur previous studies have identified E2A, USF1, Sp1 and AP-like
actors as regulators of the CR2 promoter (Ulgiati and Holers, 2001;lgiati et al., 2002). In this paper, we provide evidence that C/EBP-and CBF1 are also functionally relevant TFs and that a putativeAR within the CR2 promoter may regulate chromatin structure at
he CR2 locus. Determining which TFs and sites that are involved inffecting chromatin alterations and those TFs that bind in responseo changes to chromatin structure at the CR2 proximal promoter atistinct stages of B cell development will be the next step to pro-ide a comprehensive description of stage-specific CR2 activation.he identification of functional TFs and regulatory elements withinhe CR2 proximal promoter (Tolnay et al., 2002; Ulgiati and Holers,001; Ulgiati et al., 2002; Vereshchagina et al., 2001) together withur analysis of cell-specific chromatin structure, provide a basis toxamine how gene-specific factors and chromatin structure col-aborate for stringent regulation of CR2 expression during B cellommitment and differentiation.
cknowledgements
This study was generously supported by the National Health andedical Research Council of Australia (to D.U. and L.J.A.). We are
rateful to Dr. V. Michael Holers and Dr. Maria Franchina for kindlyroviding plasmid DNA for mRNA quantification.
eferences
lvarez, J.D., Yasui, D.H., Niida, H., Joh, T., Loh, D.Y., Kohwi-Shigematsu, T., 2000.The MAR-binding protein SATB1 orchestrates temporal and spatial expressionof multiple genes during T-cell development. Genes Dev. 14, 521–535.
acon, K., Gauchat, J.F., Aubry, J.P., Pochon, S., Graber, P., Henchoz, S., Bonnefoy,J.Y., 1993. CD21 expressed on basophilic cells is involved in histamine releasetriggered by CD23 and anti-CD21 antibodies. Eur. J. Immunol. 23, 2721–2724.
anan, M., Rojas, I.C., Lee, W.H., King, H.L., Harriss, J.V., Kobayashi, R., Webb, C.F.,Gottlieb, P.D., 1997. Interaction of the nuclear matrix-associated region (MAR)-binding proteins, SATB1 and CDP/Cux, with a MAR element (L2a) in an upstreamregulatory region of the mouse CD8a gene. J. Biol. Chem. 272, 18440–18452.
eer, M.A., Tavazoie, S., 2004. Predicting gene expression from sequence. Cell 117,185–198.
i, C., Benham, C.J., 2004. WebSIDD: server for predicting stress-induced duplexdestabilized (SIDD) sites in superhelical DNA. Bioinformatics 20, 1477–1479.
olouri, H., Davidson, E.H., 2003. Transcriptional regulatory cascades in develop-ment: initial rates, not steady state, determine network kinetics. Proc. Natl. Acad.Sci. U.S.A. 100, 9371–9376.
arsetti, R., Kohler, G., Lamers, M.C., 1995. Transitional B cells are the target of neg-ative selection in the B cell compartment. J. Exp. Med. 181, 2129–2140.
hattopadhyay, S., Whitehurst, C.E., Chen, J., 1998. A nuclear matrix attachmentregion upstream of the T cell receptor beta gene enhancer binds Cux/CDP andSATB1 and modulates enhancer-dependent reporter gene expression but notendogenous gene expression. J. Biol. Chem. 273, 29838–29846.
unology 46 (2009) 2613–2622 2621
Chen, X., Liu, W., Ambrosino, C., Ruocco, M.R., Poli, V., Romani, L., Quinto, I., Barbieri,S., Holmes, K.L., Venuta, S., Scala, G., 1997. Impaired generation of bone marrowB lymphocytes in mice deficient in C/EBPbeta. Blood 90, 156–164.
Christensen, S.M., Martin, B.K., Tan, S.S., Weis, J.H., 1992. Identification of sites for dis-tinct DNA binding proteins including Oct-1 and Oct-2 in the Cr2 gene. J. Immunol.148, 3610–3617.
Covic, M., Hassa, P.O., Saccani, S., Buerki, C., Meier, N.I., Lombardi, C., Imhof, R., Bed-ford, M.T., Natoli, G., Hottiger, M.O., 2005. Arginine methyltransferase CARM1 isa promoter-specific regulator of NF-kappaB-dependent gene expression. EmboJ. 24, 85–96.
Cruickshank, M., Fenwick, E., Abraham, L.J., Ulgiati, D., 2008. Quantitative differencesin chromatin accessibility across regulatory regions can be directly compared indistinct cell-types. Biochem. Biophys. Res. Commun. 367, 349–355.
Debnath, I., Roundy, K.M., Weis, J.J., Weis, J.H., 2007. Defining in vivo transcrip-tion factor complexes of the murine CD21 and CD23 genes. J. Immunol. 178,7139–7150.
Diamant, E., Keren, Z., Melamed, D., 2005. CD19 regulates positive selection andmaturation in B lymphopoiesis: lack of CD19 imposes developmental arrest ofimmature B cells and consequential stimulation of receptor editing. Blood 105,3247–3254.
Edelstein, L.C., Lagos, L., Simmons, M., Tirumalai, H., Gelinas, C., 2003. NF-kappa B-dependent assembly of an enhanceosome-like complex on the promoter regionof apoptosis inhibitor Bfl-1/A1. Mol. Cell. Biol. 23, 2749–2761.
Ehebauer, M., Hayward, P., Martinez-Arias, A., 2006. Notch signaling pathway. Sci.STKE, cm7.
Fryer, C.J., White, J.B., Jones, K.A., 2004. Mastermind recruits CycC:CDK8 to phos-phorylate the Notch ICD and coordinate activation with turnover. Mol. Cell 16,509–520.
Furumai, R., Komatsu, Y., Nishino, N., Khochbin, S., Yoshida, M., Horinouchi, S.,2001. Potent histone deacetylase inhibitors built from trichostatin A and cyclictetrapeptide antibiotics including trapoxin. Proc. Natl. Acad. Sci. U.S.A. 98, 87–92.
Goetze, S., Baer, A., Winkelmann, S., Nehlsen, K., Seibler, J., Maass, K., Bode, J., 2005.Performance of genomic bordering elements at predefined genomic loci. Mol.Cell. Biol. 25, 2260–2272.
Gommerman, J.L., Oh, D.Y., Zhou, X., Tedder, T.F., Maurer, M., Galli, S.J., Carroll, M.C.,2000. A role for CD21/CD35 and CD19 in responses to acute septic peritonitis: apotential mechanism for mast cell activation. J. Immunol. 165, 6915–6921.
Guthridge, J.M., Young, K., Gipson, M.G., Sarrias, M.R., Szakonyi, G., Chen, X.S.,Malaspina, A., Donoghue, E., James, J.A., Lambris, J.D., Moir, S.A., Perkins, S.J.,Holers, V.M., 2001. Epitope mapping using the X-ray crystallographic structureof complement receptor type 2 (CR2)/CD21: identification of a highly inhibitorymonoclonal antibody that directly recognizes the CR2–C3d interface. J. Immunol.167, 5758–5766.
Gyory, I., Wu, J., Fejer, G., Seto, E., Wright, K.L., 2004. PRDI-BF1 recruits the histone H3methyltransferase G9a in transcriptional silencing. Nat. Immunol. 5, 299–308.
Hardy, R.R., Hayakawa, K., 2001. B cell development pathways. Annu. Rev. Immunol.19, 595–621.
Hartley, S.B., Cooke, M.P., Fulcher, D.A., Harris, A.W., Cory, S., Basten, A., Goodnow,C.C., 1993. Elimination of self-reactive B lymphocytes proceeds in two stages:arrested development and cell death. Cell 72, 325–335.
Hatzis, P., Talianidis, I., 2002. Dynamics of enhancer–promoter communication dur-ing differentiation-induced gene activation. Mol. Cell 10, 1467–1477.
Hawkins, S.M., Kohwi-Shigematsu, T., Skalnik, D.G., 2001. The matrix attachmentregion-binding protein SATB1 interacts with multiple elements within thegp91phox promoter and is down-regulated during myeloid differentiation. J.Biol. Chem. 276, 44472–44480.
Heckman, C.A., Mehew, J.W., Ying, G.G., Introna, M., Golay, J., Boxer, L.M., 2000. A-Myb up-regulates Bcl-2 through a Cdx binding site in t(14;18) lymphoma cells.J. Biol. Chem. 275, 6499–6508.
Heckman, C.A., Wheeler, M.A., Boxer, L.M., 2003. Regulation of Bcl-2 expression byC/EBP in t(14;18) lymphoma cells. Oncogene 22, 7891–7899.
Hirai, H., Zhang, P., Dayaram, T., Hetherington, C.J., Mizuno, S., Imanishi, J., Akashi,K., Tenen, D.G., 2006. C/EBPbeta is required for ‘emergency’ granulopoiesis. Nat.Immunol. 7, 732–739.
Hubmann, R., Schwarzmeier, J.D., Shehata, M., Hilgarth, M., Duechler, M., Dettke,M., Berger, R., 2002. Notch2 is involved in the overexpression of CD23 in B-cellchronic lymphocytic leukemia. Blood 99, 3742–3747.
Hunyadi, J., Simon Jr., M., Kenderessy, A.S., Dobozy, A., 1991. Expression of comple-ment receptor CR2 (CD21) on human subcorneal keratinocytes in normal anddiseased skin. Dermatologica 183, 184–186.
Iida, K., Nadler, L., Nussenzweig, V., 1983. Identification of the membrane receptorfor the complement fragment C3d by means of a monoclonal antibody. J. Exp.Med. 158, 1021–1033.
Jarriault, S., Brou, C., Logeat, F., Schroeter, E.H., Kopan, R., Israel, A., 1995. Signallingdownstream of activated mammalian Notch. Nature 377, 355–358.
Kao, H.Y., Ordentlich, P., Koyano-Nakagawa, N., Tang, Z., Downes, M., Kintner, C.R.,Evans, R.M., Kadesch, T., 1998. A histone deacetylase corepressor complex regu-lates the Notch signal transduction pathway. Genes Dev. 12, 2269–2277.
Kaplan, M.H., Zong, R.T., Herrscher, R.F., Scheuermann, R.H., Tucker, P.W., 2001. Tran-scriptional activation by a matrix associating region-binding protein. Contextual
requirements for the function of bright. J. Biol. Chem. 276, 21325–21330.Lee, Y.H., Yano, M., Liu, S.Y., Matsunaga, E., Johnson, P.F., Gonzalez, F.J., 1994. A novelcis-acting element controlling the rat CYP2D5 gene and requiring cooperativitybetween C/EBP beta and an Sp1 factor. Mol. Cell. Biol. 14, 1383–1394.
Levine, M., Davidson, E.H., 2005. Gene regulatory networks for development. Proc.Natl. Acad. Sci. U.S.A. 102, 4936–4942.
2 lar Imm
L
L
L
L
L
M
M
M
N
N
O
P
P
P
P
R
R
R
S
S
S
622 M.N. Cruickshank et al. / Molecu
evy, E., Ambrus, J., Kahl, L., Molina, H., Tung, K., Holers, V.M., 1992. T lymphocyteexpression of complement receptor 2 (CR2/CD21): a role in adhesive cell-cellinteractions and dysregulation in a patient with systemic lupus erythematosus(SLE). Clin. Exp. Immunol. 90, 235–244.
ing, P.D., Hsieh, J.J., Ruf, I.K., Rawlins, D.R., Hayward, S.D., 1994. EBNA-2 upregulationof Epstein-Barr virus latency promoters and the cellular CD23 promoter utilizesa common targeting intermediate, CBF1. J. Virol. 68, 5375–5383.
iu, J., Barnett, A., Neufeld, E.J., Dudley, J.P., 1999. Homeoproteins CDP and SATB1interact: potential for tissue-specific regulation. Mol. Cell. Biol. 19, 4918–4926.
oder, F., Mutschler, B., Ray, R.J., Paige, C.J., Sideras, P., Torres, R., Lamers, M.C., Carsetti,R., 1999. B cell development in the spleen takes place in discrete steps and isdetermined by the quality of B cell receptor-derived signals. J. Exp. Med. 190,75–89.
undgren, M., Chow, C.M., Sabbattini, P., Georgiou, A., Minaee, S., Dillon, N., 2000.Transcription factor dosage affects changes in higher order chromatin structureassociated with activation of a heterochromatic gene. Cell 103, 733–743.
akar, K.W., Ulgiati, D., Hagman, J., Holers, V.M., 2001. A site in the complementreceptor 2 (CR2/CD21) silencer is necessary for lineage specific transcriptionalregulation. Int. Immunol. 13, 657–664.
elamed, D., Benschop, R.J., Cambier, J.C., Nemazee, D., 1998. Developmental reg-ulation of B lymphocyte immune tolerance compartmentalizes clonal selectionfrom receptor selection. Cell 92, 173–182.
elamed, D., Nemazee, D., 1997. Self-antigen does not accelerate immature B cellapoptosis, but stimulates receptor editing as a consequence of developmentalarrest. Proc. Natl. Acad. Sci. U.S.A. 94, 9267–9272.
g, Y., Tan, I., Lim, L., Leung, T., 2004. Expression of the human myotonic dystro-phy kinase-related Cdc42-binding kinase gamma is regulated by promoter DNAmethylation and Sp1 binding. J. Biol. Chem. 279, 34156–34164.
ixon, J.C., Rajaiya, J.B., Ayers, N., Evetts, S., Webb, C.F., 2004. The transcription fac-tor, Bright, is not expressed in all human B lymphocyte subpopulations. Cell.Immunol. 228, 42–53.
ng, C.T., Cheng, H.T., Chang, L.W., Ohtsuka, T., Kageyama, R., Stormo, G.D., Kopan,R., 2006. Target selectivity of vertebrate notch proteins. Collaboration betweendiscrete domains and CSL-binding site architecture determines activation prob-ability. J. Biol. Chem. 281, 5106–5119.
ayton, S.G., Whetstine, J.R., Ge, Y., Matherly, L.H., 2005. Transcriptional regulation ofthe human reduced folate carrier promoter C: synergistic transactivation by Sp1and C/EBP beta and identification of a downstream repressor. Biochim. Biophys.Acta 1727, 45–57.
ham, T.H., Langmann, S., Schwarzfischer, L., El Chartouni, C., Lichtinger, M., Klug,M., Krause, S.W., Rehli, M., 2007. CCAAT enhancer-binding protein beta regu-lates constitutive gene expression during late stages of monocyte to macrophagedifferentiation. J. Biol. Chem. 282, 21924–21933.
lachetka, A., Chayka, O., Wilczek, C., Melnik, S., Bonifer, C., Klempnauer, K.H., 2008.C/EBPbeta induces chromatin opening at a cell-type-specific enhancer. Mol. Cell.Biol. 28, 2102–2112.
ondel, M.D., Murphy, S., Pearson, L., Craddock, C., Proudfoot, N.J., 1995. Sp1 functionsin a chromatin-dependent manner to augment human alpha-globin promoteractivity. Proc. Natl. Acad. Sci. U.S.A. 92, 7237–7241.
ao, S., Procko, E., Shannon, M.F., 2001. Chromatin remodeling, measured by a novelreal-time polymerase chain reaction assay, across the proximal promoter regionof the IL-2 gene. J. Immunol. 167, 4494–4503.
ayhel, E.J., Dehoff, M.H., Holers, V.M., 1991. Characterization of the human comple-ment receptor 2 (CR2, CD21) promoter reveals sequences shared with regulatoryregions of other developmentally restricted B cell proteins. J. Immunol. 146,2021–2026.
eynes, M., Aubert, J.P., Cohen, J.H., Audouin, J., Tricottet, V., Diebold, J., Kazatchkine,M.D., 1985. Human follicular dendritic cells express CR1, CR2, and CR3 comple-ment receptor antigens. J. Immunol. 135, 2687–2694.
aito, T., Chiba, S., Ichikawa, M., Kunisato, A., Asai, T., Shimizu, K., Yamaguchi,T., Yamamoto, G., Seo, S., Kumano, K., Nakagami-Yamaguchi, E., Hamada, Y.,Aizawa, S., Hirai, H., 2003. Notch2 is preferentially expressed in mature B cellsand indispensable for marginal zone B lineage development. Immunity 18,
675–685.chwab, J., Illges, H., 2001. Regulation of CD21 expression by DNA methylation andhistone deacetylation. Int. Immunol. 13, 705–710.
egal, E., Shapira, M., Regev, A., Pe’er, D., Botstein, D., Koller, D., Friedman, N., 2003.Module networks: identifying regulatory modules and their condition-specificregulators from gene expression data. Nat. Genet. 34, 166–176.
unology 46 (2009) 2613–2622
Sims, G.P., Ettinger, R., Shirota, Y., Yarboro, C.H., Illei, G.G., Lipsky, P.E., 2005. Identifi-cation and characterization of circulating human transitional B cells. Blood 105,4390–4398.
Singh, G.B., Kramer, J.A., Krawetz, S.A., 1997. Mathematical model to predict regionsof chromatin attachment to the nuclear matrix. Nucleic Acids Res. 25, 1419–1425.
Tagoh, H., Melnik, S., Lefevre, P., Chong, S., Riggs, A.D., Bonifer, C., 2004. Dynamicreorganization of chromatin structure and selective DNA demethylation priorto stable enhancer complex formation during differentiation of primaryhematopoietic cells in vitro. Blood 103, 2950–2955.
Takahashi, K., Kozono, Y., Waldschmidt, T.J., Berthiaume, D., Quigg, R.J., Baron, A.,Holers, V.M., 1997. Mouse complement receptors type 1 (CR1;CD35) and type 2(CR2;CD21): expression on normal B cell subpopulations and decreased levelsduring the development of autoimmunity in MRL/lpr mice. J. Immunol. 159,1557–1569.
Tedder, T.F., Clement, L.T., Cooper, M.D., 1984. Expression of C3d receptors duringhuman B cell differentiation: immunofluorescence analysis with the HB-5 mon-oclonal antibody. J. Immunol. 133, 678–683.
Thomas, M.D., Srivastava, B., Allman, D., 2006. Regulation of peripheral B cell matu-ration. Cell. Immunol. 239, 92–102.
Tolnay, M., Vereshchagina, L.A., Tsokos, G.C., 2002. NF-kappaB regulates the expres-sion of the human complement receptor 2 gene. J. Immunol. 169, 6236–6243.
Ulgiati, D., Holers, V.M., 2001. CR2/CD21 proximal promoter activity is criticallydependent on a cell type-specific repressor. J. Immunol. 167, 6912–6919.
Ulgiati, D., Pham, C., Holers, V.M., 2002. Functional analysis of the human comple-ment receptor 2 (CR2/CD21) promoter: characterization of basal transcriptionalmechanisms. J. Immunol. 168, 6279–6285.
Vereshchagina, L.A., Tolnay, M., Tsokos, G.C., 2001. Multiple transcription factors reg-ulate the inducible expression of the human complement receptor 2 promoter.J. Immunol. 166, 6156–6163.
Wallberg, A.E., Pedersen, K., Lendahl, U., Roeder, R.G., 2002. p300 and PCAF actcooperatively to mediate transcriptional activation from chromatin templatesby notch intracellular domains in vitro. Mol. Cell. Biol. 22, 7812–7819.
Wang, Z., Goldstein, A., Zong, R.T., Lin, D., Neufeld, E.J., Scheuermann, R.H., Tucker,P.W., 1999. Cux/CDP homeoprotein is a component of NF-muNR and repressesthe immunoglobulin heavy chain intronic enhancer by antagonizing the brighttranscription activator. Mol. Cell. Biol. 19, 284–295.
Wardemann, H., Yurasov, S., Schaefer, A., Young, J.W., Meffre, E., Nussenzweig, M.C.,2003. Predominant autoantibody production by early human B cell precursors.Science 301, 1374–1377.
Wen, L., Brill-Dashoff, J., Shinton, S.A., Asano, M., Hardy, R.R., Hayakawa, K., 2005.Evidence of marginal-zone B cell-positive selection in spleen. Immunity 23,297–308.
West, A.G., Huang, S., Gaszner, M., Litt, M.D., Felsenfeld, G., 2004. Recruitment ofhistone modifications by USF proteins at a vertebrate barrier element. Mol. Cell16, 453–463.
Witt, C.M., Won, W.J., Hurez, V., Klug, C.A., 2003. Notch2 haploinsufficiency results indiminished B1 B cells and a severe reduction in marginal zone B cells. J. Immunol.171, 2783–2788.
Wyszomierski, S.L., Rosen, J.M., 2001. Cooperative effects of STAT5 (signal trans-ducer and activator of transcription 5) and C/EBPbeta (CCAAT/enhancer-bindingprotein-beta) on beta-casein gene transcription are mediated by the glucocorti-coid receptor. Mol. Endocrinol. 15, 228–240.
Xu, M., Nie, L., Kim, S.H., Sun, X.H., 2003. STAT5-induced Id-1 transcriptioninvolves recruitment of HDAC1 and deacetylation of C/EBPbeta. Embo J. 22,893–904.
Yasui, D., Miyano, M., Cai, S., Varga-Weisz, P., Kohwi-Shigematsu, T., 2002. SATB1targets chromatin remodelling to regulate genes over long distances. Nature 419,641–645.
Zabel, M.D., Byrne, B.L., Weis, J.J., Weis, J.H., 2000. Cell-specific expression of themurine CD21 gene depends on accessibility of promoter and intronic elements.J. Immunol. 165, 4437–4445.
Zabel, M.D., Weis, J.J., Weis, J.H., 1999. Lymphoid transcription of the murine CD21gene is positively regulated by histone acetylation. J. Immunol. 163, 2697–2703.
Zhang, J.W., Tang, Q.Q., Vinson, C., Lane, M.D., 2004. Dominant-negative C/EBP dis-rupts mitotic clonal expansion and differentiation of 3T3-L1 preadipocytes. Proc.Natl. Acad. Sci. U.S.A. 101, 43–47.
Zhu, Q., Maitra, U., Johnston, D., Lozano, M., Dudley, J.P., 2004. The homeodomainprotein CDP regulates mammary-specific gene transcription and tumorigenesis.Mol. Cell. Biol. 24, 4810–4823.


