Embed Size (px)
Citation preview

DOI: 10.1126/science.1105809 , 523 (2005); 308Science
et al.Karen Sachs,Multiparameter Single-Cell DataCausal Protein-Signaling Networks Derived from
www.sciencemag.org (this information is current as of March 30, 2008 ):The following resources related to this article are available online at
http://www.sciencemag.org/cgi/content/full/sci;309/5738/1187a A correction has been published for this article at:
http://www.sciencemag.org/cgi/content/full/308/5721/523version of this article at:
including high-resolution figures, can be found in the onlineUpdated information and services,
http://www.sciencemag.org/cgi/content/full/308/5721/523/DC1 can be found at: Supporting Online Material
found at: can berelated to this articleA list of selected additional articles on the Science Web sites
http://www.sciencemag.org/cgi/content/full/308/5721/523#related-content
http://www.sciencemag.org/cgi/content/full/308/5721/523#otherarticles, 11 of which can be accessed for free: cites 18 articlesThis article
118 article(s) on the ISI Web of Science. cited byThis article has been
http://www.sciencemag.org/cgi/content/full/308/5721/523#otherarticles 35 articles hosted by HighWire Press; see: cited byThis article has been
http://www.sciencemag.org/cgi/collection/cell_biolCell Biology
: subject collectionsThis article appears in the following
http://www.sciencemag.org/about/permissions.dtl in whole or in part can be found at: this article
permission to reproduce of this article or about obtaining reprintsInformation about obtaining
registered trademark of AAAS. is aScience2005 by the American Association for the Advancement of Science; all rights reserved. The title
CopyrightAmerican Association for the Advancement of Science, 1200 New York Avenue NW, Washington, DC 20005. (print ISSN 0036-8075; online ISSN 1095-9203) is published weekly, except the last week in December, by theScience
on
Mar
ch 3
0, 2
008
ww
w.s
cien
cem
ag.o
rgD
ownl
oade
d fr
om
Our scenario is akin to the magnetic
furnace model proposed by Axford and
McKenzie (14–16) and to ideas invoking
reconnection of mesoscale loops (38, 39).
We adopt from the furnace model the idea
that reconnection plays a major role, as it will
release plasma, set free magnetic energy, and
produce Alfven waves. However, our model
of the nascent solar wind is intrinsically 3-D,
and the magnetic field geometry is derived
empirically. The plasma is accelerated in the
funnel above a critical height of 5 Mm but
originates below from the neighboring loops.
The initial heating of the solar wind plasma is
achieved in the side loops.
References and Notes1. L. Biermann, Zeitschrift fur Astrophysik 29, 274 (1951).2. E. N. Parker, Astrophys. J. 128, 664 (1958).3. M. Neugebauer, C. W. Snyder, Science 138, 1095 (1962).4. M. Neugebauer, C. W. Snyder, J. Geophys. Res. 71,
4469 (1966).5. Y. C. Whang, C. C. Chang, J. Geophys. Res. 70, 4175
(1965).6. R. E. Hartle, P. A. Sturrock, Astrophys. J. 151, 1155 (1968).7. A. J. Hundhausen, Coronal Expansion and Solar Wind
(Springer-Verlag, Heidelberg, 1972).8. E. Leer, T. E. Holzer, Solar Phys. 63, 143 (1979).9. E. Leer, T. E. Holzer, J. Geophys. Res. 85, 4681 (1980).
10. C.-Y. Tu, Solar Phys. 109, 149 (1987).11. J. V. Hollweg, J. Geophys. Res. 91, 4111 (1986).
12. V. H. Hansteen, E. Leer, J. Geophys. Res. 100, 21577(1995).
13. C.-Y. Tu, E. Marsch, Solar Phys. 171, 363 (1997).14. J. F. McKenzie, G. V. Sukhorukova, W. I. Axford,
Astron. Astrophys. 330, 1145 (1998).15. W. I. Axford, J. F. McKenzie, in Solar Wind Seven,
E. Marsch and R. Schwenn, Eds., (Pergamon Press,Oxford, 1992), pp. 1–5.
16. W. I. Axford, J. F. McKenzie, in Cosmic Winds and theHeliosphere, J. R. Jokipii, C. P. Sonett, M. S. Giampapa,Eds. (Arizona University Press, Tucson, 1997), pp. 31–66.
17. E. Marsch, C.-Y. Tu, Solar Phys. 176, 87 (1997).18. P. Hackenberg, E. Marsch, G. Mann, Astron. Astrophys.
360, 1139 (2000).19. A. H. Gabriel, Philos. Trans. R. Soc. A281, 339 (1976).20. J. F. Dowdy Jr., A. G. Emslie, R. L. Moore, Solar Phys.
112, 255 (1987).21. K. Wilhelm et al., Solar Phys. 170, 75 (1997).22. P. Lemaire et al., Solar Phys. 170, 105 (1997).23. D. M. Hassler et al., Science 283, 810 (1999).24. K. Wilhelm, I. E. Dammasch, E. Marsch, D. M. Hassler,
Astron. Astrophys. 353, 749 (2000).25. L. D. Xia, E. Marsch, W. Curdt, Astron. Astrophys. 399,
L5 (2003).26. L. D. Xia, E. Marsch, K. Wilhelm, Astron. Astrophys.
424, 1025 (2004).27. T. Wiegelmann, T. Neukirch, Solar Phys. 208, 233
(2002).28. P. H. Scherrer et al., Solar Phys. 162, 129 (1995).29. E. Marsch, T. Wiegelmann, L. D. Xia, Astron. Astrophys.
428, 629 (2004).30. Ø. Lie-Svendsen, V. H. Hansteen, E. Leer, Astrophys. J.
596, 621 (2003).31. J. P. Delaboudiniere et al., Solar Phys. 162, 291 (1995).32. Materials and methods are available as supporting
material on Science Online.
33. N. Seehafer, Solar Phys. 58, 215 (1978).34. H. Peter, Astron. Astrophys. 374, 1108 (2001).35. H. Peter, B. V. Gudiksen, A. Nordlund, Astrophys. J.
617, L85 (2004).36. I. E. Dammasch, K. Wilhelm, W. Curdt, D. M. Hassler,
Astron. Astrophys. 346, 285 (1999).37. T. J. M. Boyd and J. J. Sanderson, Plasma Dynamics
(Thomas Nelson and Sons, London, 1969).38. W. C. Feldman, B. L. Barraclough, J. L. Phillips, Y.-M.
Wang, Astron. Astrophys. 316, 355 (1996).39. L. A. Fisk, J. Geophys. Res. 108, 1157 (2003).40. The National Natural Science Foundation of China
supported C.-Y.T., C.Z., and L. Z. under projects withthe contract nos. 40336053, 40174045 and40436015; J.-X.Wang, contract no. 10233050; andL.-D.X., contract no. 40436015. The foundationMajor Project of National Basic Research supportedC.-Y.T., C.Z., L.-D.X., L. Z., and J.-X.W. under contractno. G-200078405. C.-Y.T. is supported by the BeijingEducation Project XK100010404. The SUMER projectis financially supported by DLR, CNES, NASA, and theESA PRODEX program (Swiss contribution). SUMER,EIT, and MDI are instruments on SOHO, an ESA andNASA mission. We thank the teams of MDI and EITfor providing the magnetic field data and the contextimage.
Supporting Online Materialwww.sciencemag.org/cgi/content/full/308/5721/519/DC1Materials and MethodsFig. S1References
6 January 2005; accepted 1 March 200510.1126/science.1109447
Causal Protein-SignalingNetworks Derived from
Multiparameter Single-Cell DataKaren Sachs,1* Omar Perez,2* Dana Pe’er,3*
Douglas A. Lauffenburger,1. Garry P. Nolan2.
Machine learning was applied for the automated derivation of causal influ-ences in cellular signaling networks. This derivation relied on the simultaneousmeasurement of multiple phosphorylated protein and phospholipid componentsin thousands of individual primary human immune system cells. Perturbing thesecells with molecular interventions drove the ordering of connections betweenpathway components, wherein Bayesian network computational methods auto-matically elucidated most of the traditionally reported signaling relationshipsand predicted novel interpathway network causalities, which we verified ex-perimentally. Reconstruction of network models from physiologically relevantprimary single cells might be applied to understanding native-state tissue signal-ing biology, complex drug actions, and dysfunctional signaling in diseased cells.
Extracellular cues trigger a cascade of infor-
mation flow, in which signaling molecules
become chemically, physically, or location-
ally modified; gain new functional capabil-
ities; and affect subsequent molecules in the
cascade, culminating in a phenotypic cellular
response. Mapping of signaling pathways typ-
ically has involved intuitive inferences arising
from the aggregation of studies of individual
pathway components from diverse experimen-
tal systems. Although pathways are often con-
ceptualized as distinct entities responding to
specific triggers, it is now understood that in-
terpathway cross-talk and other properties of
networks reflect underlying complexities that
cannot be explained by the consideration of
individual pathways or model systems in isola-
tion. To properly understand normal cellular
responses and their potential disregulation in
disease, a global multivariate approach is re-
quired (1). Bayesian networks (2), a form of
graphical models, have been proffered as a
promising framework for modeling complex
systems such as cell signaling cascades, be-
cause they can represent probabilistic depen-
dence relationships among multiple interacting
components (3–5). Bayesian network models
illustrate the effects of pathway components on
each other (that is, the dependence of each
biomolecule in the pathway on other biomol-
ecules) in the form of an influence diagram.
These models can be automatically derived
from experimental data through a statistically
founded computational procedure termed net-
work inference. Although the relationships are
statistical in nature, they can sometimes be in-
terpreted as causal influence connections when
interventional data are used; for example, with
the use of kinase-specific inhibitors (6, 7).
There are several attractive properties of
Bayesian networks for the inference of sig-
naling pathways from biological data sets.
Bayesian networks can represent complex
stochastic nonlinear relationships among mul-
tiple interacting molecules, and their proba-
bilistic nature can accommodate noise that is
inherent to biologically derived data. They
can describe direct molecular interactions as
well as indirect influences that proceed through
additional unobserved components, a property
crucial for discovering previously unknown
effects and unknown components. Therefore,
very complex relationships that likely exist in
1Biological Engineering Division, Massachusetts Insti-tute of Technology (MIT), Cambridge, MA 02139, USA.2Stanford University School of Medicine, The BaxterLaboratory of Genetic Pharmacology, Department ofMicrobiology and Immunology, Stanford, CA 94305,USA. 3Harvard Medical School, Department of Genet-ics, Boston, MA 02115, USA.
*These authors contributed equally to this work..To whom correspondence should be addressed.E-mail: [email protected] (D.A.L.); [email protected](G.P.N.)
R E S E A R C H A R T I C L E S
www.sciencemag.org SCIENCE VOL 308 22 APRIL 2005 523
on
Mar
ch 3
0, 2
008
ww
w.s
cien
cem
ag.o
rgD
ownl
oade
d fr
om
signaling pathway architectures can be mod-
eled and discovered. The Bayesian network
inference algorithm constructs a graph dia-
gram in which nodes represent the measured
molecules, and arcs (drawn as lines between
nodes) represent statistically meaningful rela-
tions and dependencies between these mole-
cules. When inferring a Bayesian network
from experimental data, the network infer-
ence algorithm aims to discern a model that
closely predicts the observations made. The
algorithm approximates the most likely mod-
els by traversing the space of possibilities
via single-arc changes that improve the score.
There is a trade-off between simple models
and those that accurately capture the em-
pirical distribution observed in the data. The
employed Bayesian scoring metric captures
this trade-off; thus, a high-scoring model is a
both simple and accurate representation of
the data (8, 9). Bayesian networks have been
applied to gene expression data for the study
and discovery of genetic regulatory pathways
(4, 6, 10). However, because of the probabilis-
tic nature of the Bayesian modeling approach,
effective inference requires many observations
of the system. Thus, such studies have often
been limited by data sets of insufficient size;
for instance, those made up of measurements
based on averaged samples derived from heter-
ogeneous cell populations (a necessary limita-
tion when using lysates from large numbers
of cells) (5, 11).
In contrast to lysate-based methods, intra-
cellular multicolor flow cytometry (12, 13)
allows more quantitative simultaneous obser-
vations of multiple signaling molecules in
many thousands of individual cells. Hence, it
is an especially appropriate source of data for
Bayesian network modeling of signaling path-
ways; for instance, because it allows for simul-
taneous measurement of biological states in
more native contexts, as well as for large sam-
ple sets. Flow cytometry can be used to quan-
titatively measure a given protein_s expression
level and can also include measures of protein-
modification states such as phosphorylation
(13–15). Because each cell is treated as an
independent observation, flow cytometric data
provide a statistically large sample that could
enable Bayesian network inference to accu-
rately predict pathway structure (Fig. 1A). As
demonstrated in this article, interrogating sig-
naling networks in populations of single cells
provides a robust source of statistically power-
ful dependencies that can be used to automat-
ically infer signaling causality using Bayesian
network computation.
Modeling Bayesian networks withmultivariable individual-cell data. Fig. 1B
(panel a) presents a sample Bayesian network
representing four hypothetical biomolecules.
A directed arc from X to Y is interpreted as a
causal influence from X onto Y; in this case,
we say X is Y’s ‘‘parent’’ in the network. In
the case that X activates Y, where activation
can be read out by phosphorylation status, we
expect and observe correlation in levels of
phosphorylation as measured by flow cytom-
etry (simulated data in Fig. 1C, panel a). Criti-
cal to causal interpretation of Bayesian network
models is the inclusion of interventional cues
(whether activating or inhibiting) that directly
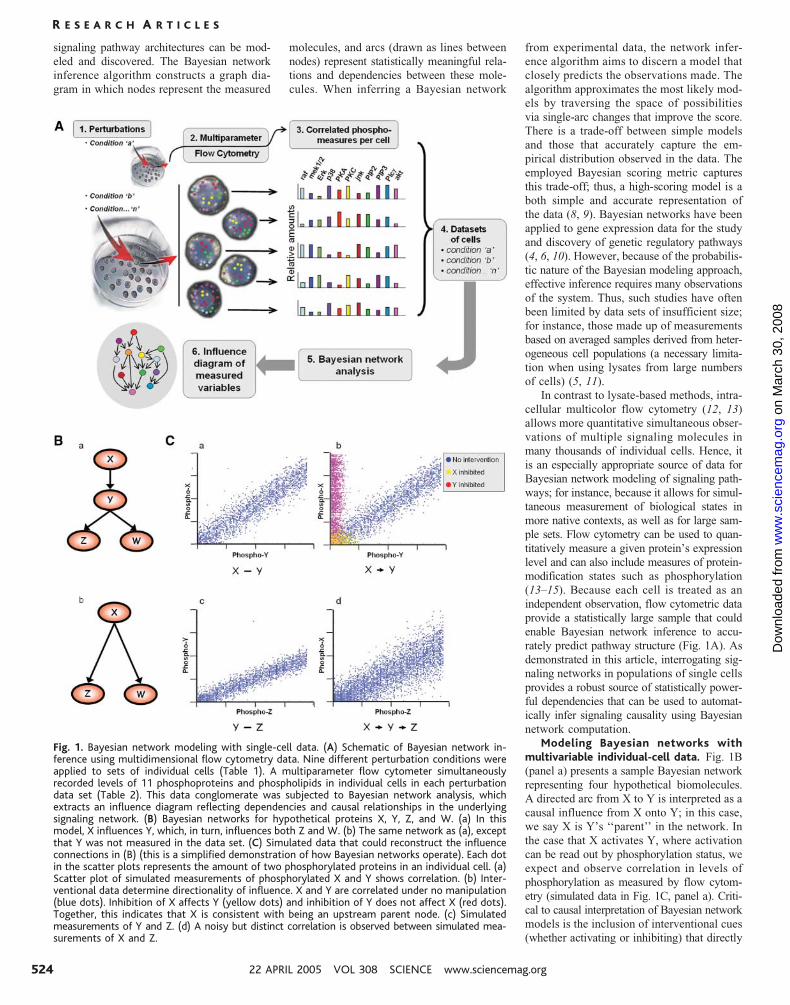
Fig. 1. Bayesian network modeling with single-cell data. (A) Schematic of Bayesian network in-ference using multidimensional flow cytometry data. Nine different perturbation conditions wereapplied to sets of individual cells (Table 1). A multiparameter flow cytometer simultaneouslyrecorded levels of 11 phosphoproteins and phospholipids in individual cells in each perturbationdata set (Table 2). This data conglomerate was subjected to Bayesian network analysis, whichextracts an influence diagram reflecting dependencies and causal relationships in the underlyingsignaling network. (B) Bayesian networks for hypothetical proteins X, Y, Z, and W. (a) In thismodel, X influences Y, which, in turn, influences both Z and W. (b) The same network as (a), exceptthat Y was not measured in the data set. (C) Simulated data that could reconstruct the influenceconnections in (B) (this is a simplified demonstration of how Bayesian networks operate). Each dotin the scatter plots represents the amount of two phosphorylated proteins in an individual cell. (a)Scatter plot of simulated measurements of phosphorylated X and Y shows correlation. (b) Inter-ventional data determine directionality of influence. X and Y are correlated under no manipulation(blue dots). Inhibition of X affects Y (yellow dots) and inhibition of Y does not affect X (red dots).Together, this indicates that X is consistent with being an upstream parent node. (c) Simulatedmeasurements of Y and Z. (d) A noisy but distinct correlation is observed between simulated mea-surements of X and Z.
R E S E A R C H A R T I C L E S
22 APRIL 2005 VOL 308 SCIENCE www.sciencemag.org524
on
Mar
ch 3
0, 2
008
ww
w.s
cien
cem
ag.o
rgD
ownl
oade
d fr
om
perturb the states of the measured molecules
(Fig. 1C, panel b) and strengthen inference di-
rectionality. For instance, inhibition of mole-
cule X might lead to inhibition of both X and
Y, whereas inhibition of molecule Y leads only
to inhibition of Y. Thus, we would infer X to
be upstream of Y as shown in Fig. 1B, panel a.
Moreover, because flow cytometry can mea-
sure multiple molecules within each cell, it is
possible to identify complex causal influence
relationships involving multiple proteins. Con-
sider the signaling cascade from X onto Y onto
Z (Fig. 1B, panel a), where correlation exists
between the measured activities of each pair,
including between X and Z (Fig. 1C, panel d).
Bayesian network inference yields the most
concise model, automatically excluding arcs
based on dependencies already explained by the
model. Thus, despite the correlation between
them, the arc between X and Z is omitted,
because the X-Y and the Y-Z relationships
explain the X-Z correlation. Similarly, because
Z and W are both activated by their common
cause Y, we expect their activities to be cor-
related, but no arc appears between them be-
cause their respective arcs from Y mediate
this dependency. Finally, consider a scenario
in which molecule Y was not measured. The
statistical correlation between the observed
activities of X and Z does not depend on ob-
serving Y; therefore, their correlation would
still be detected. An indirect arc would be de-
tected from X onto Z (Fig. 1B, panel b).
Expanding this concept to a real data set,
we applied Bayesian network analysis to mul-
tivariate flow cytometry data. Data were col-
lected after a series of stimulatory cues and
inhibitory interventions (Table 1), with cell
reactions stopped at 15 min after stimulation
by fixation, to profile the effects of each con-
dition on the intracellular signaling networks
of human primary naıve CD4þ T cells, down-
stream of CD3, CD28, and LFA-1 activation
(Fig. 2 shows a currently accepted consensus
network). We made flow cytometry mea-
surements of 11 phosphorylated proteins and
phospholipids [Raf phosphorylated at posi-
tion S259, mitogen-activated protein kinases
(MAPKs) Erk1 and Erk2 phosphorylated at
T202 and Y204, p38 MAPK phosphorylated
at T180 and Y182, Jnk phosphorylated at
T183 and Y185, AKT phosphorylated at S473,
Mek1 and Mek2 phosphorylated at S217 and
S221 (both isoforms of the protein are recog-
nized by the same antibody), phosphorylation
of protein kinase A (PKA) substrates [cAMP
response element–binding protein (CREB),
PKA, calcium/calmodulin-dependent protein
kinase II (CaMKII), caspase-10, and caspase-2]
containing a consensus phosphorylation motif,
phosphorylation of phospholipase C–g (PLC-g)
on Y783, phosphorylation of PKC on S660,
phosphatidylinositol 4,5-bisphosphate (PIP2),
and phosphatidylinositol 3,4,5-triphosphate
(PIP3)] (Table 2) (8, 16). Each independent
Table 1. Known biological effects of perturbations employed. The left-hand column lists the specificreagents used in each perturbation condition, and the right-hand column classifies the reagent class intoeither a general perturbation that overall stimulated the cell or a specific perturbation that acted on adefined set of molecules. The conditions used in the study were as follows: (i) anti-CD3 þ anti-CD28, (ii)anti-CD3/CD28 þ ICAM-2 (intercellular adhesion molecule–2), (iii) anti-CD3/CD28 þ U0126, (iv) anti-CD3/CD28 þ AKT inhibitor, (v) anti-CD3/CD28 þ G06976, (vi) anti-CD3/CD28 þ psitectorigenin, (vii)anti-CD3/CD28 þ LY294002, (viii) phorbol 12-myristate 13-acetate (PMA), and (ix) b2 cyclic adenosine3¶,5¶-monophosphate (b2cAMP).
Reagent Reagent class
Anti-CD3/CD28 General perturbation: Activates T cells and induces proliferation and cytokineproduction. Induced signaling through the T cell receptor (TCR), activated ZAP70,Lck, PLC-g, Raf, Mek, Erk, and PKC. The TCR signaling converges on transcriptionfactors NFkB, NFAT, and AP-1 to initiate IL-2 transcription.
ICAM-2 General perturbation: Induces LFA-1 signaling and contributes to CD3/CD28signaling that converges on AP-1 and NFAT transcriptional activity.
b2cAMP Specific perturbation: cAMP analog that activates PKA. PKA can regulate NFATactivation and T cell commitment processes.
AKT inhibitor Specific perturbation: Binds inositol pleckstrin domain of AKT and blocks AKTtranslocation to the membrane where normally AKT becomes phosphorylated andactive [median inhibitory concentration (IC50) 0 5 mM]. Inhibition of AKT andphosphorylation of AKT substrates are needed to enhance cell survival.
U0126 Specific perturbation: Inhibits MEK1 (IC50 0 72 nm) and MEK2 (IC50 0 58 nm) in anoncompetitive manner (ATP and Erk substrates). Inhibits activation of Erk,arresting T cell proliferation and cytokine synthesis.
PMA Specific perturbation: PMA activates PKC and initiates some aspects of T cellactivation.
G06976 Specific perturbation: Inhibits PKC isozymes (IC50 G 8 nM). Inhibits PKC and arrestsT cell activation.
Psitectorigenin Specific perturbation: Inhibits phosphoinositide hydrolysis. Inhibits PIP2 productionand disrupts phosphoinositol turnover.
LY294002 Specific perturbation: Phosphatidylinosital 3-kinase (PI3K inhibitor. Inhibits PI3K andsubsequent activation of AKT.
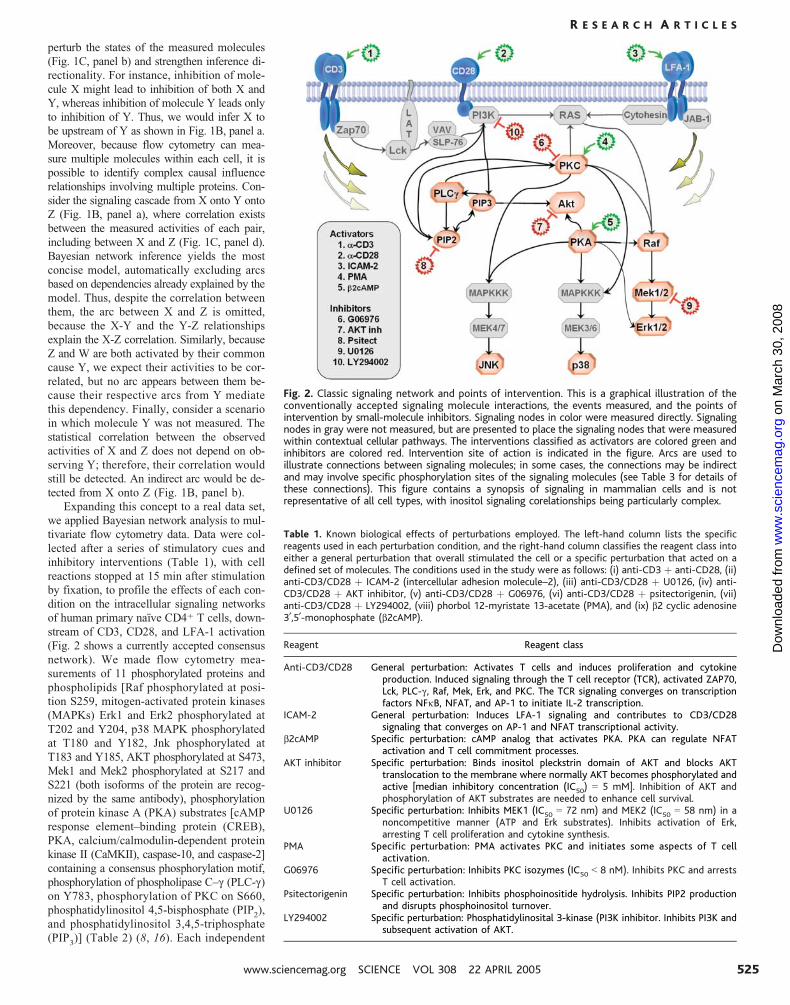
Fig. 2. Classic signaling network and points of intervention. This is a graphical illustration of theconventionally accepted signaling molecule interactions, the events measured, and the points ofintervention by small-molecule inhibitors. Signaling nodes in color were measured directly. Signalingnodes in gray were not measured, but are presented to place the signaling nodes that were measuredwithin contextual cellular pathways. The interventions classified as activators are colored green andinhibitors are colored red. Intervention site of action is indicated in the figure. Arcs are used toillustrate connections between signaling molecules; in some cases, the connections may be indirectand may involve specific phosphorylation sites of the signaling molecules (see Table 3 for details ofthese connections). This figure contains a synopsis of signaling in mammalian cells and is notrepresentative of all cell types, with inositol signaling corelationships being particularly complex.
R E S E A R C H A R T I C L E S
www.sciencemag.org SCIENCE VOL 308 22 APRIL 2005 525
on
Mar
ch 3
0, 2
008
ww
w.s
cien
cem
ag.o
rgD
ownl
oade
d fr
om
sample in this data set consists of quantita-
tive amounts of each of the 11 phosphorylated
molecules, simultaneously measured from sin-
gle cells [data sets are downloadable (8)]. For
purposes of illustration, examples of actual
fluorescence-activated cell sorter (FACS) data
plotted in prospective corelationship form are
shown in fig. S1. In most cases, this reflects the
activation state of the kinases monitored, or in
the cases of PIP3
and PIP2, the levels of these
secondary messenger molecules in primary cells,
under the condition measured. Nine stimula-
tory or inhibitory interventional conditions were
used (Table 1) (8). The complete data sets were
analyzed with the Bayesian network structure
inference algorithm (6, 9, 17).
A high-accuracy human primary T cellsignaling causality map. The resulting de
novo causal network model was inferred
(Fig. 3A) with 17 high-confidence causal arcs
between various components. To evaluate the
validity of this model, we compared the mod-
el arcs (and absent potential arcs) with those
described in the literature. Arcs were catego-
rized as the following: (i) expected, for con-
nections well-established in the literature that
have been demonstrated under numerous con-
ditions in multiple model systems; (ii) reported,
for connections that are not well known, but
for which we were able to find at least one
literature citation; and (iii) missing, which indi-
cates an expected connection that our Bayesian
network analysis failed to find. Of the 17 arcs
in our model, 15 were expected, all 17 were
either expected or reported, and 3 were missed
(Fig. 3A and table S1) (8, 18–22). Table 3
enumerates the probable paths of influence
corresponding to model arcs determined by
surveying published reports.
Several of the known connections from
our model are direct enzyme-substrate rela-
tionships (Fig. 3B) (PKA to Raf, Raf to Mek,
Mek to Erk, and Plc-g to PIP2), and one has a
relationship of recruitment leading to phos-
phorylation (Plc-g to PIP3). In almost all cases,
the direction of causal influence was correctly
inferred (an exception was Plc-g to PIP3, in
which case the arc was inferred in the reverse
direction). All the influences are contained
within one global model; thus, the causal di-
rection of arcs is often compelled so that these
are consistent with other components in the
model. These global constraints allowed de-
tection of certain causal influences from mole-
cules that were not perturbed in our assay.
For instance, although Raf was not perturbed
in any of the measured conditions, the meth-
od correctly inferred a directed arc from Raf
to Mek, which was expected for the well-
characterized Raf-Mek-Erk signal transduc-
tion pathway. In some cases, the influence of
one molecule on another was mediated by in-
termediate molecules that were not measured
in the data set. In the results, these indirect
connections were detected as well (Fig. 3B,
panel b). For example, the influence of PKA
and PKC on the MAPKs p38 and Jnk likely
proceeded via their respective (unmeasured)
MAPK kinase kinases. Thus, unlike some
other approaches used to elucidate signaling
networks [for example, protein-protein inter-
action maps (23, 24)] that provide static bio-
chemical association maps with no causal
links, our Bayesian network method can de-
tect both direct and indirect causal connections
and therefore provide a more contextual pic-
ture of the signaling network.
Another feature demonstrated in our mod-
el is the ability to dismiss connections that
are already explained by other network arcs
(Fig. 3B, panel c). This is seen in the Raf-
Mek-Erk cascade. Erk, also known as p44/42,
is downstream of Raf and therefore dependent
on Raf, yet no arc appears from Raf to Erk,
because the connection from Raf to Mek and
the connection from Mek to Erk explain the
dependence of Erk on Raf. Thus, an indirect
arc should appear only when one or more
intermediate molecules is not present in the
data set, otherwise the connection will proceed
via this molecule. The intervening molecule
may also be a shared parent. For example,
the phosphorylation statuses of p38 and Jnk
are correlated (fig. S2), yet they are not di-
rectly connected, because their shared parents
(PKC and PKA) mediate the dependence be-
tween them. Although we cannot know wheth-
er an arc in our model represents a direct or
indirect influence, it is unlikely that our model
contains an indirect arc that is mediated by
any molecule observed in our measurements.
Correlation exists between most molecule
pairs in this data set [per Bonferroni corrected
P value (fig. S2)], which can occur with close-
ly connected pathways. Therefore, the relative
lack of arcs in our model (Fig. 3A) contrib-
uted greatly to the accuracy and interpret-
ability of the inferred model.
A more complex example is the influence
of PKC on Mek, which is known to be me-
diated by Raf (Fig. 3B, panel d). PKC is
known to affect Mek through two paths of
influence, each mediated by a different ac-
tive phosphorylated form of the protein Raf.
Although PKC phosphorylates Raf directly
at S499 and S497, this event is not detected
by our measurements, because we use only
an antibody specific to Raf phosphorylation
at S259 (Table 2) (16). Therefore, our algo-
rithm detects an indirect arc from PKC to
Mek that is mediated by the presumed un-
measured intermediate Raf phosphorylated
at S497 and S499 (18). The PKC-to-Raf arc
represents an indirect influence that proceeds
via an unmeasured molecule, presumed to be
Ras (19, 20). We discussed above the ability
of our approach to dismiss redundant arcs. In
this case, there are two paths leading from
PKC to Mek, because each path corresponds
to a separate means of influence from PKC
to Mek: one via Raf phosphorylated at S259
and the other through Raf phosphorylated at
S497 and S499. Thus, neither path is redun-
dant. This result demonstrates the distinction
that this analysis is sensitive to specific phos-
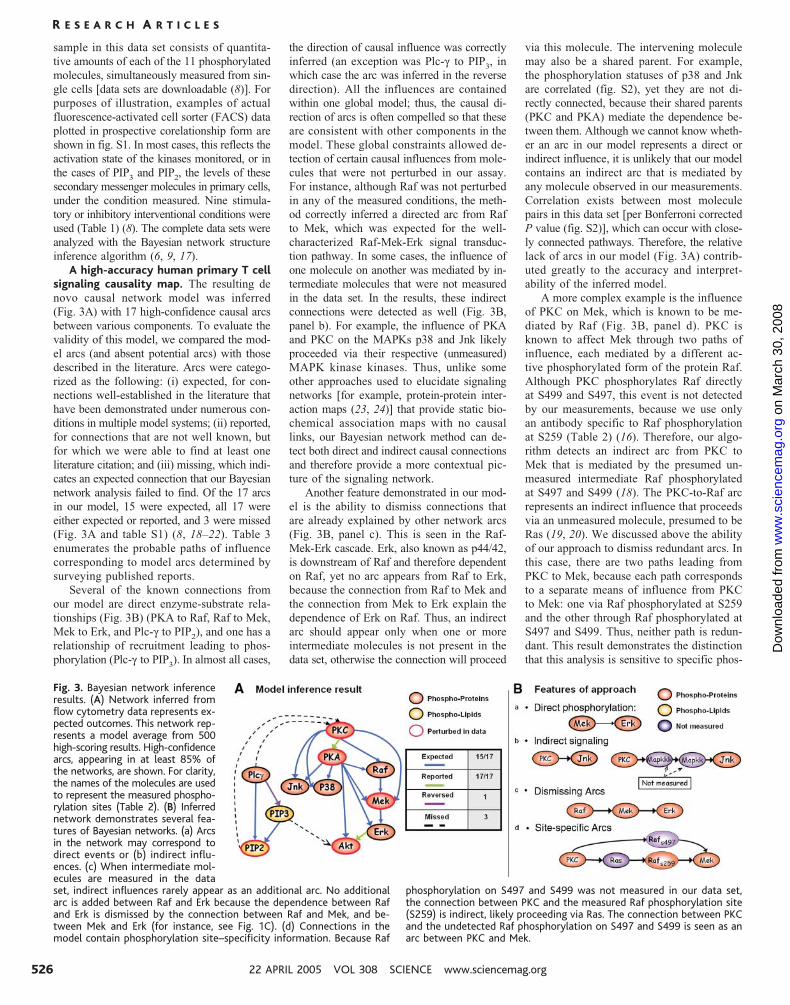
Fig. 3. Bayesian network inferenceresults. (A) Network inferred fromflow cytometry data represents ex-pected outcomes. This network rep-resents a model average from 500high-scoring results. High-confidencearcs, appearing in at least 85% ofthe networks, are shown. For clarity,the names of the molecules are usedto represent the measured phospho-rylation sites (Table 2). (B) Inferrednetwork demonstrates several fea-tures of Bayesian networks. (a) Arcsin the network may correspond todirect events or (b) indirect influ-ences. (c) When intermediate mol-ecules are measured in the dataset, indirect influences rarely appear as an additional arc. No additionalarc is added between Raf and Erk because the dependence between Rafand Erk is dismissed by the connection between Raf and Mek, and be-tween Mek and Erk (for instance, see Fig. 1C). (d) Connections in themodel contain phosphorylation site–specificity information. Because Raf
phosphorylation on S497 and S499 was not measured in our data set,the connection between PKC and the measured Raf phosphorylation site(S259) is indirect, likely proceeding via Ras. The connection between PKCand the undetected Raf phosphorylation on S497 and S499 is seen as anarc between PKC and Mek.
R E S E A R C H A R T I C L E S
22 APRIL 2005 VOL 308 SCIENCE www.sciencemag.org526
on
Mar
ch 3
0, 2
008
ww
w.s
cien
cem
ag.o
rgD
ownl
oade
d fr
om

phorylation sites on molecules and is capable
of detecting more than one route of influence
between molecules.
Three well-established influence connec-
tions do not appear in our model: PIP2
to
PKC, PLC-g to PKC, and PIP3
to Akt. Bayes-
ian networks are constrained to be acyclic,
so if the underlying network contains feedback
loops, we cannot necessarily expect to un-
cover all connections (fig. S3). Availability
of suitable temporal data could possibly per-
mit this limitation to be overcome using dy-
namic Bayesian networks (25, 26).
Experimental confirmation of predictednetwork causality. Two influence connec-
tions in our model are not well established in
the literature: PKC on PKA and Erk on Akt.
To probe the validity of these proposed causal
influences, we searched for reports in the lit-
erature. Both connections have previously been
reported: the PKC-to-PKA connection in rat
ventricular myocytes and the Erk-to-Akt con-
nection in colon cancer cell lines (21, 22). An
important goal of our work was to test the abil-
ity of Bayesian network analysis of flow cytom-
etry data to correctly infer causal influences
from unperturbed molecules within a network.
For example, Erk was not directly acted on by
any activator or inhibitor in the sample sets,
yet Erk showed an influence connection to Akt.
Our model thus predicts that direct perturba-
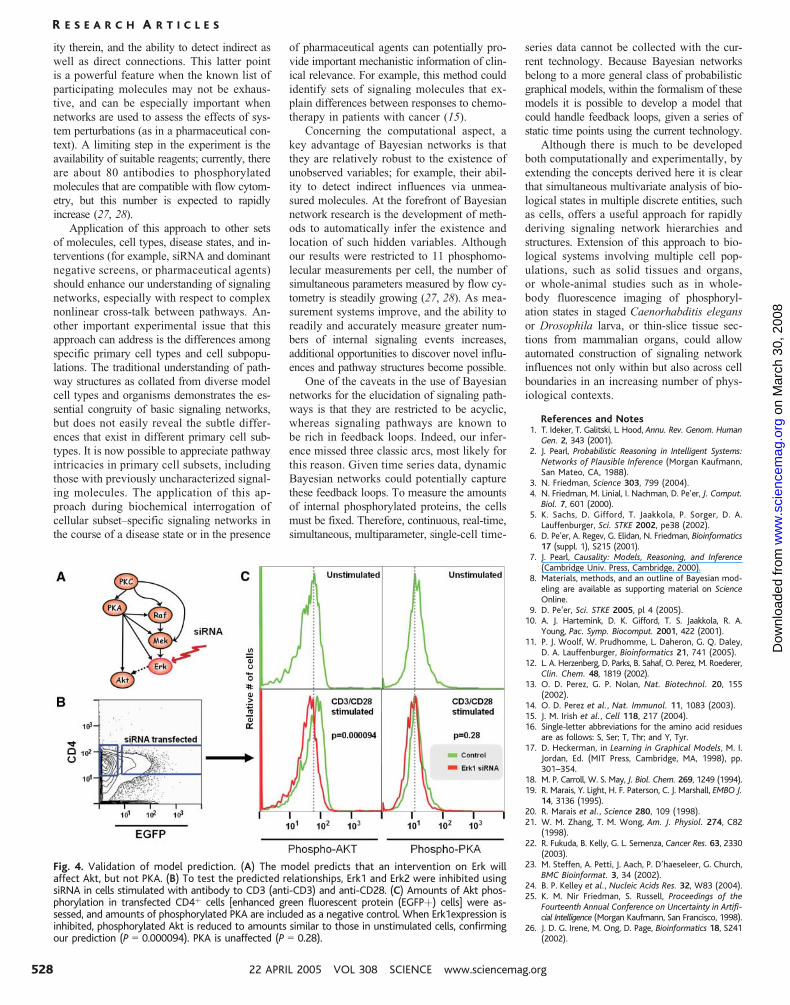
tion of Erk would influence Akt (Fig. 4A).
On the other hand, although Erk and PKA are
correlated (fig. S2), the model predicts that
perturbation of Erk should not influence PKA.
As a test of these predictions (Fig. 3A),
we used small interfering RNA (siRNA) inhi-
bition of either Erk1 or Erk2, and the amounts
of S473-phosphorylated Akt and phosphoryl-
ated PKA were then measured. In accord with
the model predictions, Akt (P G 9.4 � 10j5)
phosphorylation was reduced after siRNA
inhibition of Erk1 but the activity of PKA (P G0.28) was not (Fig. 3, B and C). Akt phos-
phorylation was not affected by the inhibition
of Erk2. The connection between Erk1 and Akt
may be direct or indirect, involving mediatory
molecules yet to be understood, but the con-
nection is supported by both the model and
the validation experiment.
Enablers of accurate inference: networkinterventions and sufficient numbers ofsingle cells. Three features distinguish our
data from the majority of currently attainable
biological data sets. First, we simultaneously
measured multiple protein states in individ-
ual cells, eliminating population-averaging
effects that could obscure interesting corre-
lations. Second, because the measurements
were on single cells, thousands of data points
were collected in each experiment. This feature
constitutes a tremendous asset for Bayesian
network modeling, because the large number
of observations allows for accurate assessment
of underlying probabilistic relationships, and
therefore allows for the extraction of complex
relationships from noisy data. Third, interven-
tional assays generated hundreds of individual
data points per intervention (because flow
cytometry measures single cells in popula-
tion), allowing for an increase in inferences of
causality. To evaluate the importance of these
features, we created the following variations
on our original data set: (i) an observation-only
data set (that is, without any interventional
data) of 1200 data points; (ii) a population-
averaged (that is, a simulated Western blot)
data set; and (iii) a truncated individual-cell
data set of size comparable to the simulated
Western blot data set (that is, the original data
set with most of the data randomly excluded
to reduce its size) (8).
Bayesian network inference was perform-
ed on each set of data. The network inferred
from 1200 observational data points included
only 10 arcs, all undirected, of which 8 were
expected or reported, and 10 arcs were missing
(fig. S4A). This result demonstrates that inter-
ventions are critical for effective inference,
particularly to establish directionality of the
connections (Fig. 1B). The truncated single-
cell data set (420 data points) shows a large
(11-arc) decline in accuracy, missing more
connections and reporting more unexplained
arcs than its larger (5400 data points) counter-
part (fig. S4B). This result emphasizes the
importance of sufficiently large data set size
in network inference. The network inferred
from averaged data (fig. S4C) shows a fur-
ther five-arc decline in accuracy relative to
that inferred from an equal number of single-
cell data points, emphasizing the importance
of single-cell data. The fact that population
averaging destroys some of the signals pre-
sent in the data may reflect the presence of
heterogeneous cellular subsets that are masked
by averaging techniques.
Discussion and summary. As shown, we
correctly reverse-engineered and rapidly in-
ferred the basic structure of a classically under-
stood signaling network that connects a number
of key phosphorylated proteins in human T cell
signaling, a map built by classical biochemistry
and genetic analysis over the past two decades.
The network was automatically constructed
with no a priori knowledge of pathway connec-
tivity. The application of Bayesian networks
to single-cell flow cytometry has distinct ad-
vantages, including an ability to measure events
in primary cells after in vivo interventions (thus
measuring context-specific signaling biology in
tissues), inference of directed arcs and causal-
Table 2. Nodes measured in pathway andspecificity antibodies used. The left-hand columnshows target molecules measured in this studythat were assayed using monoclonal antibody tothe target residues (site of phosphorylation orphosphorylated product as described) (16).
Measuredmolecule
Antibodyspecificity
Raf Phosphorylation at S259Erk1 and
Erk2Phosphorylation at T202 and Y204
p38 Phosphorylation at T180 and Y182Jnk Phosphorylation at T183 and Y185AKT Phosphorylation at S473Mek1 and
Mek2Phosphorylation at S217 and S221
PKAsubstrates
Detects proteins and peptides con-taining a phospho-Ser/Thr res-idue with arginine at the –3position
PKC Detects phosphorylated PKC-a, -bI,-bII, -d, -e, -h, and -q isoformsonly at C-terminal residue homol-ogous to S660 of PKC-bII
PLC-g Phosphorylation at Y783PIP2 Detects PIP2
PIP3 Detects PIP3
Table 3. Possible molecular pathways of influence represented by arcs in the model. Shown are thepossible pathways of influence inferred from the data, with the connection shown in Fig. 3A and theunmeasured molecules (in bold) that might mediate indirect influences. E, expected; R, reported. Seemain text for further discussion. Specific phosphorylation sites are included as subscripts. See table S1for citations that support the inferences.
Connection Influence path Type Category
PKCYRaf PKCYRasYRafS259 Indirect EPKCYMek PKCYRafS497/S499YMek Indirect EPKCYJnk PKCYYMKKsYJnk Indirect EPKCYp38 PKCYYMKKsYp38 Indirect EPKCYPKA PKCYcAMPYPKA Indirect RPKAYRaf PKAYRafS259 Direct EPKAYMek PKAYRafS621YMek Indirect EPKAYErk PKAYHePTPYErk Indirect EPKAYJnk PKAYYMKKsYJnk Indirect EPKAYp38 PKAYYMKKsYp38 Indirect ERafYMek Direct phosphorylation Direct EPKAYAkt PKAYCaMKKYAktT308YAktS473 Indirect EMekYErk Direct phosphorylation Direct EPlc-gYPIP2 Direct hydrolysis to IP3 Direct EPlc-gYPIP3 Recruitment leading to phosphorylation Reversed EPIP3YPIP2 Precursor-product EErkYAkt Direct or indirect R
R E S E A R C H A R T I C L E S
www.sciencemag.org SCIENCE VOL 308 22 APRIL 2005 527
on
Mar
ch 3
0, 2
008
ww
w.s
cien
cem
ag.o
rgD
ownl
oade
d fr
om
ity therein, and the ability to detect indirect as
well as direct connections. This latter point
is a powerful feature when the known list of
participating molecules may not be exhaus-
tive, and can be especially important when
networks are used to assess the effects of sys-
tem perturbations (as in a pharmaceutical con-
text). A limiting step in the experiment is the
availability of suitable reagents; currently, there
are about 80 antibodies to phosphorylated
molecules that are compatible with flow cytom-
etry, but this number is expected to rapidly
increase (27, 28).
Application of this approach to other sets
of molecules, cell types, disease states, and in-
terventions (for example, siRNA and dominant
negative screens, or pharmaceutical agents)
should enhance our understanding of signaling
networks, especially with respect to complex
nonlinear cross-talk between pathways. An-
other important experimental issue that this
approach can address is the differences among
specific primary cell types and cell subpopu-
lations. The traditional understanding of path-
way structures as collated from diverse model
cell types and organisms demonstrates the es-
sential congruity of basic signaling networks,
but does not easily reveal the subtle differ-
ences that exist in different primary cell sub-
types. It is now possible to appreciate pathway
intricacies in primary cell subsets, including
those with previously uncharacterized signal-
ing molecules. The application of this ap-
proach during biochemical interrogation of
cellular subset–specific signaling networks in
the course of a disease state or in the presence
of pharmaceutical agents can potentially pro-
vide important mechanistic information of clin-
ical relevance. For example, this method could
identify sets of signaling molecules that ex-
plain differences between responses to chemo-
therapy in patients with cancer (15).
Concerning the computational aspect, a
key advantage of Bayesian networks is that
they are relatively robust to the existence of
unobserved variables; for example, their abil-
ity to detect indirect influences via unmea-
sured molecules. At the forefront of Bayesian
network research is the development of meth-
ods to automatically infer the existence and
location of such hidden variables. Although
our results were restricted to 11 phosphomo-
lecular measurements per cell, the number of
simultaneous parameters measured by flow cy-
tometry is steadily growing (27, 28). As mea-
surement systems improve, and the ability to
readily and accurately measure greater num-
bers of internal signaling events increases,
additional opportunities to discover novel influ-
ences and pathway structures become possible.
One of the caveats in the use of Bayesian
networks for the elucidation of signaling path-
ways is that they are restricted to be acyclic,
whereas signaling pathways are known to
be rich in feedback loops. Indeed, our infer-
ence missed three classic arcs, most likely for
this reason. Given time series data, dynamic
Bayesian networks could potentially capture
these feedback loops. To measure the amounts
of internal phosphorylated proteins, the cells
must be fixed. Therefore, continuous, real-time,
simultaneous, multiparameter, single-cell time-
series data cannot be collected with the cur-
rent technology. Because Bayesian networks
belong to a more general class of probabilistic
graphical models, within the formalism of these
models it is possible to develop a model that
could handle feedback loops, given a series of
static time points using the current technology.
Although there is much to be developed
both computationally and experimentally, by
extending the concepts derived here it is clear
that simultaneous multivariate analysis of bio-
logical states in multiple discrete entities, such
as cells, offers a useful approach for rapidly
deriving signaling network hierarchies and
structures. Extension of this approach to bio-
logical systems involving multiple cell pop-
ulations, such as solid tissues and organs,
or whole-animal studies such as in whole-
body fluorescence imaging of phosphoryl-
ation states in staged Caenorhabditis elegans
or Drosophila larva, or thin-slice tissue sec-
tions from mammalian organs, could allow
automated construction of signaling network
influences not only within but also across cell
boundaries in an increasing number of phys-
iological contexts.
References and Notes1. T. Ideker, T. Galitski, L. Hood, Annu. Rev. Genom. Human
Gen. 2, 343 (2001).2. J. Pearl, Probabilistic Reasoning in Intelligent Systems:
Networks of Plausible Inference (Morgan Kaufmann,San Mateo, CA, 1988).
3. N. Friedman, Science 303, 799 (2004).4. N. Friedman, M. Linial, I. Nachman, D. Pe’er, J. Comput.
Biol. 7, 601 (2000).5. K. Sachs, D. Gifford, T. Jaakkola, P. Sorger, D. A.
Lauffenburger, Sci. STKE 2002, pe38 (2002).6. D. Pe’er, A. Regev, G. Elidan, N. Friedman, Bioinformatics
17 (suppl. 1), S215 (2001).7. J. Pearl, Causality: Models, Reasoning, and Inference
(Cambridge Univ. Press, Cambridge, 2000).8. Materials, methods, and an outline of Bayesian mod-
eling are available as supporting material on ScienceOnline.
9. D. Pe’er, Sci. STKE 2005, pl 4 (2005).10. A. J. Hartemink, D. K. Gifford, T. S. Jaakkola, R. A.
Young, Pac. Symp. Biocomput. 2001, 422 (2001).11. P. J. Woolf, W. Prudhomme, L. Daheron, G. Q. Daley,
D. A. Lauffenburger, Bioinformatics 21, 741 (2005).12. L. A. Herzenberg, D. Parks, B. Sahaf, O. Perez, M. Roederer,
Clin. Chem. 48, 1819 (2002).13. O. D. Perez, G. P. Nolan, Nat. Biotechnol. 20, 155
(2002).14. O. D. Perez et al., Nat. Immunol. 11, 1083 (2003).15. J. M. Irish et al., Cell 118, 217 (2004).16. Single-letter abbreviations for the amino acid residues
are as follows: S, Ser; T, Thr; and Y, Tyr.17. D. Heckerman, in Learning in Graphical Models, M. I.
Jordan, Ed. (MIT Press, Cambridge, MA, 1998), pp.301–354.
18. M. P. Carroll, W. S. May, J. Biol. Chem. 269, 1249 (1994).19. R. Marais, Y. Light, H. F. Paterson, C. J. Marshall, EMBO J.
14, 3136 (1995).20. R. Marais et al., Science 280, 109 (1998).21. W. M. Zhang, T. M. Wong, Am. J. Physiol. 274, C82
(1998).22. R. Fukuda, B. Kelly, G. L. Semenza, Cancer Res. 63, 2330
(2003).23. M. Steffen, A. Petti, J. Aach, P. D’haeseleer, G. Church,
BMC Bioinformat. 3, 34 (2002).24. B. P. Kelley et al., Nucleic Acids Res. 32, W83 (2004).25. K. M. Nir Friedman, S. Russell, Proceedings of the
Fourteenth Annual Conference on Uncertainty in Artifi-cial Intelligence (Morgan Kaufmann, San Francisco, 1998).
26. J. D. G. Irene, M. Ong, D. Page, Bioinformatics 18, S241(2002).
Fig. 4. Validation of model prediction. (A) The model predicts that an intervention on Erk willaffect Akt, but not PKA. (B) To test the predicted relationships, Erk1 and Erk2 were inhibited usingsiRNA in cells stimulated with antibody to CD3 (anti-CD3) and anti-CD28. (C) Amounts of Akt phos-phorylation in transfected CD4þ cells [enhanced green fluorescent protein (EGFPþ) cells] were as-sessed, and amounts of phosphorylated PKA are included as a negative control. When Erk1expression isinhibited, phosphorylated Akt is reduced to amounts similar to those in unstimulated cells, confirmingour prediction (P 0 0.000094). PKA is unaffected (P 0 0.28).
R E S E A R C H A R T I C L E S
22 APRIL 2005 VOL 308 SCIENCE www.sciencemag.org528
on
Mar
ch 3
0, 2
008
ww
w.s
cien
cem
ag.o
rgD
ownl
oade
d fr
om
27. M. Roederer, J. M. Brenchley, M. R. Betts, S. C. De Rosa,Clin. Immunol. 110, 199 (2004).
28. A. Perfetto, P. Chattopadhyay, M. Roederer, Nat. Rev.Immunol. 4, 648 (2004).
29. The authors thank G. Church, N. Friedman, J. Albeck,P. Jasper, L. Garwin, R. Tibshirani, T. Jaakkola, D. Gifford,and D. Koller for helpful discussions or readings of themanuscript and R. Balderas and BD-PharMingen Bio-sciences for reagents. K.S. and D.A.L. were supportedby the National Intitute of General Medical SciencesCenter of Excellence in Complex Biomedical Systems
at MIT. O.D.P. was supported as a Bristol-Meyer SquibbIrvington Fellow and a Dana Foundation human immu-nology award. D.P. was supported by a PhRMA Centerof Excellence in Integration of Genomics and Infor-matics grant, an NIH Center of Excellence in GenomicStudies grant to G. Church, and an NSF PostdoctoralResearch Fellowship in Biological Informatics. G.P.N.was supported in this work by NIH grants P01-AI39646and AI35304, a grant from the Juvenile Diabetes Foun-dation, and National Heart, Lung, and Blood InstituteProteomics Center contract N01-HV-28183I.
Supporting Online Materialwww.sciencemag.org/cgi/content/full/308/5721/523/DCMaterials and MethodsFigs. S1 to S4Table S1Data Sets S1 to S14References
29 September 2004; accepted 19 January 200510.1126/science.1105809
Parallel and Serial NeuralMechanisms for Visual Search
in Macaque Area V4Narcisse P. Bichot,1* Andrew F. Rossi,2,3 Robert Desimone1,4
To find a target object in a crowded scene, a face in a crowd for example, thevisual system might turn the neural representation of each object on and offin a serial fashion, testing each representation against a template of thetarget item. Alternatively, it might allow the processing of all objects in par-allel but bias activity in favor of those neurons that represent critical fea-tures of the target, until the target emerges from the background. To testthese possibilities, we recorded neurons in area V4 of monkeys freely scanninga complex array to find a target defined by color, shape, or both. Throughoutthe period of searching, neurons gave enhanced responses and synchronizedtheir activity in the gamma range whenever a preferred stimulus in their re-ceptive field matched a feature of the target, as predicted by parallel models.Neurons also gave enhanced responses to candidate targets that were se-lected for saccades, or foveation, reflecting a serial component of visual search.Thus, serial and parallel mechanisms of response enhancement and neuralsynchrony work together to identify objects in a scene.
In a crowded visual scene, we typically focus
our attention on behaviorally relevant stimuli.
When subjects know the location of a relevant
object, the brain mechanisms that guide their
spatial attention to the object largely overlap
with those for selecting the targets for eye
movements (1). The outcome of this selection
for attention or eye movements is to enhance
the responses of visual cortex neurons to the
relevant object, at the expense of distracters
(2–6). As a result, object recognition mecha-
nisms in the temporal cortex are typically con-
fronted with only a single relevant stimulus
at a time (7). However, in most common vi-
sual scenes, people rarely know the specific
location of the relevant object in advance—
instead, they must search for it, based on its
distinguishing features, such as color or shape,
which is commonly termed visual search. A
long-standing issue has been whether object
selection in visual search is also mediated by
neural mechanisms for spatial attention, which
scan the objects in the scene sequentially until
the target is identified (serial search), whether
or not eye movements are made. If so, then
visual attention could be broadly served by a
unitary mechanism, linked to the neural sys-
tems that control gaze. Alternatively, search
may be mediated by nonspatial attentional
mechanisms that are sensitive to features
such as color and shape and that bias visual
processing in favor of neurons that represent
the target features throughout the visual field,
all at once (parallel search) (7). Search could
also be mediated by hybrid mechanisms such
as guided search (8).
Previous studies of visual search (9–11)
and attention to stimuli with particular fea-
tures (12–14) in brain area V4 have found
that neuronal responses to attended target
stimuli were enhanced over time, but the studies
were not designed to test whether the targets
were Bfound[ by serial or parallel neural mech-
anisms. In one of these studies, monkeys did
not search for a specific feature but instead
searched for a singleton (i.e., popout) stimulus
in one of two feature dimensions (11). In an-
other study that used backgrounds of natural
scenes, the average neural activity throughout
the trial varied according to the searched-for
target features, but the authors could not rule
out that these effects were due to differences
in eye scan paths across the scene for differ-
ent targets rather than feature-selective effects
on neuronal responses (10).
We tested for parallel and serial attentional
mechanisms in area V4 in monkeys perform-
ing a search task with free gaze. We recorded
not only neuronal responses but also the syn-
chrony between neuronal responses and the
local field potential (LFP) (15, 16), because V4
neurons synchronize their activity when atten-
tion is directed to their receptive fields (RFs)
(17), similar to neurons in parietal cortex dur-
ing a memory-saccade task (18). Such syn-
chrony, especially in the gamma frequency
range, could potentially amplify their effect
on postsynaptic neurons, similar to increases
in firing rate (19). The monkeys freely scanned
multielement arrays composed of colored
shapes to find a target defined by color or
shape (20). During color feature search (Fig.
1A), the cue was a colored square, and the
monkey was rewarded for fixating the stim-
ulus in the array that matched the cue color.
During shape feature search (fig. S1), the cue
was a gray shape, and the monkeys were re-
warded for fixating the stimulus in the array
that matched the cue shape. When shape was
relevant, color was irrelevant, and vice versa.
We selected two colors and two shapes as cues
for each recording session, on the basis of ini-
tial recordings in which we determined a pre-
ferred (strong response) and nonpreferred (weak
response) color and shape for a given neuron.
Overall, monkeys performed similarly dur-
ing color and shape search, finding the target
on 86% and 91% of the trials, respectively.
Both tasks were demanding, taking an average
of 6.3 saccades to find the target out of 20
items (Fig. 1A and fig. S1) (21). In separate
behavioral studies in which we varied the num-
ber of display items, the monkeys took an aver-
age of 160 ms per item to find the target, again
indicating that the target did not Bpop out.[Parallel selection during feature
search. The key element of parallel search
models is that the neural bias in favor of
stimuli containing features of the searched-for
target occurs throughout the visual field, and
throughout the time period of the search, long
before a target is identified. Thus, we reasoned
that the critical neurons to test for this bias
were not the neurons whose RF contained
the stimulus that was the target for a saccade
at a given moment. Rather, the critical neurons
1Laboratory of Neuropsychology, 2Laboratory of Brainand Cognition, National Institute of Mental Health(NIMH), National Institutes of Health, Bethesda, MD20892, USA. 3Department of Psychology, VanderbiltUniversity, Nashville, TN 37203, USA. 4McGovern In-stitute for Brain Research at the Massachusetts In-stitute of Technology, Cambridge, MA 02139, USA.
*To whom correspondence should be addressed.E-mail: [email protected]
R E S E A R C H A R T I C L E S
www.sciencemag.org SCIENCE VOL 308 22 APRIL 2005 529
on
Mar
ch 3
0, 2
008
ww
w.s
cien
cem
ag.o
rgD
ownl
oade
d fr
om

1www.sciencemag.org SCIENCE Erratum post date 19 AUGUST 2005
post date 19 August 2005
ERRATUM
C O R R E C T I O N S A N D C L A R I F I C A T I O N S
RReeppoorrttss:: “Causal protein-signaling networks derived from multiparame-
ter single-cell data” by K. Sachs et al. (22 Apr. 2005, p. 523). The author
names in reference (26) were incorrect. The authors are I. M. Ong, J. D.
Glasner, D. Page. The URL for the supporting online material was incor-
rect; it should be www.sciencemag.org/cgi/content/full/308/5721/523/
DC1. There was also a reference missing in the last sentence of the last
paragraph on page 527 that continues on page 528. The new reference
(29) is P. O. Krutzik, G. P. Nolan, Cytometry 5555, 61 (2003). The acknowl-
edgments should now be reference (30).
on
Mar
ch 3
0, 2
008
ww
w.s
cien
cem
ag.o
rgD
ownl
oade
d fr
om


