Embed Size (px)
Citation preview
Año 14 • Volumen 14 • Número 4 • abril, 2021
Economic impact of Melanaphis sacchari (Zehntner) on Sorghum bicolor (L.) Moench, and its management in the Southwestern of Puebla, Mexico 3
Analysis of Copra and Coconut Oil Markets in Mexico 11Ecclesiastical strategy as a factor on territorial organization in Santa Ana de Guadalupe,
Jalisco, Mexico 21Conservation of the Tropical Rainforest in the Usumacinta Canyon Flora and Fauna
Protection Area in Mexico 25Sociocultural aspects of nourishment and the use of the plot in the rural community of
Bandera de Juárez 33
Cocoa (Theobroma cacao L.) harvest and postharvest in Tabasco, Mexico 39y más artículos de interés...
pág. 93
ISSN: 2594-0252
Hybridization of
Castor BeanCastor Bean in Morelos, México
(Ricinus communis L.)

AGROPRODUCTIVIDAD
®
Año 14 Volumen 14 Número 4 abril, 2021C
ON
TE
NID
O
3 Economic impact of Melanaphis sacchari (Zehntner) on Sorghum bicolor (L.) Moench, and its management in the Southwestern of Puebla, Mexico
11 Analysis of Copra and Coconut Oil Markets in Mexico
21 Ecclesiastical strategy as a factor on territorial organization in Santa Ana de Guadalupe, Jalisco, Mexico
25 Conservation of the Tropical Rainforest in the Usumacinta Canyon Flora and Fauna Protection Area in Mexico
33 Sociocultural aspects of nourishment and the use of the plot in the rural community of Bandera de Juárez
39 Cocoa (Theobroma cacao L.) harvest and postharvest in Tabasco, Mexico
47 Amaranth Microgreens as a Potential Ingredient for Healthy Salads: Sensory Liking and Purchase Intent
53 Agricultural credit use in papaya agroecosystems in the central region of Veracruz, Mexico
59 Cerium (Ce) Affects the Phenological Cycle and the Quality of Tulip (Tulipa gesneriana L.)
65 The melliferous flora of Veracruz, Mexico
81 Evaluation of Surgical Castration vs Immunocastration in Fattening Pigs
87 Pre-Weaning Growth of Criollo Tropical Milking Calves fed with Milk from Silvopastoral Systems
93 Hybridization of Castor Bean (Ricinus communis L.) in Morelos, México
99 Livestock resources and their conservation facing climate change
105 Generation of socio-environmental indicators in the territorial structure of San Luis Huexotla, Texcoco, México
113 Analysis of the Tilapia (Oreochromis spp.) Value Chain in the State of Veracruz Rural Aquaculture for the Small Producer
119 Strategy to strengthen the traditional milpa family production systems
127 Physical and chemical attributes of prickly pear cactus (Opuntia ficus-indica) varieties Copena, Pelon Blanco and Pelon Rojo
135 Plastic colored paddings and its effect on the foliar micromorphology of husk tomato (Physalis ixocarpa Brot.)
143 In vitro anthelmintic activity of Musa balbisiana Colla (square banana) against Haemonchus contortus eggs
149 Physicochemical and microbiological evaluation of traditional queso molido (ground cheese) during maturation
155 Economic Impact and Feasibility of Striped Catfish Farming (Pangasius hypophthalmus) in Mexico

1AGROPRODUCTIVIDAD
Directrices para Autores/asNaturaleza de los trabajos: Las contribuciones que se reciban para su eventual publicación deben ser resultados originales derivados de un trabajo académico de alto nivel sobre los tópicos presentados en la sección de temática y alcance de la revista.
Extensión y formato: Los artículos deberán estar escritos en proce-sador de textos, con una extensión de 15 cuartillas, tamaño carta con márgenes de 2.5 centímetros, Arial de 12 puntos, interlineado doble, sin espacio entre párrafos. Las páginas deberán estar foliadas desde la primera hasta la última en el margen inferior derecho. La extensión total incluye abordaje textual, bibliografía, gráficas, figuras, imágenes y todo material adicional. Debe evitarse el uso de sangría al inicio de los párrafos. Las secciones principales del artículo deberán escribirse en mayúsculas, negritas y alineadas a la izquierda. Los subtítulos de las secciones se escribirán con mayúsculas sólo la primera letra, negritas y alineadas a la izquierda.
Exclusividad: Los trabajos enviados a Agro Productividad deberán ser inéditos y sus autores se comprometen a no someterlos simultánea-mente a la consideración de otras publicaciones; por lo que es nece-sario adjuntar este documento: Carta de originalidad.
Comité Científico
Dr. Giuseppe CollaUniversity of Tuscia, Italia
ORCID: 0000-0002-3399-3622
Dra. Magaly Sánchez de Chial Universidad de Panamá, Panamá
ORCID: 0000-0002-6393-9299
Dra. Maritza EscalonaUniversidad de Ciego de Ávila, Cuba
ORCID: 0000-0002-8755-6356
Dr. Kazuo WatanabeUniversidad de Tsukuba, Japón
ORCID: 0000-0003-4350-0139
Dra. Ryoko Machida HiranoOrganización Nacional de Investigación en Agricultura y
Alimentación (NARO-Japón)
ORCID: 0000-0002-7978-0235
Dr. Ignacio de los Ríos CarmenadoUniversidad Politécnica de Madrid, España
ORCID: 0000-0003-2015-8983
Dra. María de Lourdes Arévalo GalarzaColegio de Postgraduados, México
ORCID: 0000-0003-1474-2200
Dra. Libia Iris Trejo TéllezColegio de Postgraduados, México
ORCID: 0000-0001-8496-2095
Comité EditorialDr. Rafael Rodríguez Montessoro† - Director Fundador
Dr. Jorge Cadena Iñiguez - Editor en Jefe
Dr. Fernando Carlos Gómez Merino - Editor de sección
Dr. Ángel Bravo Vinaja - Curador de metadatos
M.A. Ana Luisa Mejia Sandoval - Asistente
M.C. Moisés Quintana Arévalo - Cosechador de metadatos
M.C. Valeria Abigail Martínez Sias - Diagramador
Lic. Hannah Infante Lagarda - Filologo
Biól. Valeria J. Gama Ríos - Traductor
Téc. Mario Alejandro Rojas Sánchez - Diseñador
Frecuencia de publicación: Cuando un autor ha publicado en la re-vista como autor principal o de correspondencia, deberá esperar tres números de ésta para publicar nuevamente como autor principal o de correspondencia.
Idiomas de publicación: Se recibirán textos en español con títulos, resúmenes y palabras clave en español e inglés.
ID Autores: El nombre de los autores se escribirán comenzando con el apellido o apellidos unidos por guion, sólo las iniciales del nom-bre, separados por comas, con un índice progresivo en su caso. Es indispensable que todos y cada uno de los autores proporcionen su número de identificador normalizado ORCID, para mayor información ingresar a (https://orcid.org).
Institución de adscripción: Es indispensable señalar la institución de adscripción y país de todos y cada uno de los autores, indicando ex-clusivamente la institución de primer nivel, sin recurrir al uso de siglas o acrónimos. Se sugiere recurrir al uso de la herramienta wyta (http://wayta.scielo.org/) de Scielo para evitar el uso incorrecto de nombres de instituciones.
AGROPRODUCTIVIDAD
®
Es responsabilidad del autor el uso de las ilustracio-nes, el material gráfico y el contenido creado para esta publicación.
Las opiniones expresadas en este documento son de exclusiva responsabilidad de los autores, y no reflejan necesariamente los puntos de vista del Colegio de Postgraduados, de la Editorial del Colegio de Postgra-duados, ni de la Fundación Colegio de Postgraduados en Ciencias Agrícolas.
CCAABB AABBSSTTRRAACCTTSS
CCAABBII
Master Journal List
Año 14, Volumen 14, Número 4, abril 2021, Agro productividad es una publicación mensual editada por el Colegio de Postgraduados. Carretera México-Texcoco Km. 36.5, Montecillo, Texcoco, Estado de México. CP 56230. Tel. 5959284427. www.colpos.mx. Editor responsable: Dr. Jorge Cadena Iñiguez. Reservas de Derechos al Uso Exclusivo No. 04-2017-031313492200-203. ISSN: 2594-0252, ambos otorgados por el Instituto Nacional del Derecho de Autor. Responsable de la última actualización de este número, M.C. Valeria Abigail Martínez Sias. Fecha de última modificación, 30 de abril de 2021.
Las opiniones expresadas por los autores no necesariamente reflejan la postura del editor de la publicación.
Contacto principalJorge Cadena IñiguezGuerrero 9, esquina avenida Hidalgo, C.P. 56220, San Luis Huexotla, Texcoco, Estado de Mé[email protected]
Contacto de [email protected]
Bases de datos de contenido científico Directorios
2 AGROPRODUCTIVIDAD
Anonimato en la identidad de los autores: Los artículos no deberán incluir en ni en cuerpo del artículo, ni en las notas a pie de página nin-guna información que revele su identidad, esto con el fin de asegurar una evaluación anónima por parte de los pares académicos que rea-lizarán el dictamen. Si es preciso, dicha información podrá agregarse una vez que se acredite el proceso de revisión por pares.
Estructura de los artículos: Los artículos incluirán los siguientes elementos: Título, title, autores y adscripción, abstract, keywords, resumen, palabras clave, introducción, objetivos, materiales y méto-dos, resultados y discusión, conclusiones y literatura citada en for-mato APA.
Título: Debe ser breve y reflejar claramente el contenido, debe-rá estar escrito en español e inglés. Cuando se incluyan nombres científicos deben escribirse en itálicas. No deberá contener abre-viaturas ni exceder de 20 palabras, se usará solo letras mayúsculas, en negritas, centrado y no llevará punto final.Resumen y Abstract: Deberá integrarse un resumen en inglés y español (siguiendo ese orden), de máximo 250 palabras, donde se destaque obligatoriamente y en este orden: a) objetivo; b) diseño / metodología / aproximación; c) resultados; d) limitaciones / impli-caciones; e) hallazgos/ conclusiones. El resumen no deberá incluir citas, referencias bibliográficas, gráficas ni figuras.Palabras clave y Keywords: Se deberá incluir una lista de 3 a 5 pa-labras clave en español e inglés que permitan identificar el ámbito temático que aborda el artículo.Introducción: Se asentará con claridad el estado actual del cono-cimiento sobre el tema investigado, su justificación e importan-cia, así como los objetivos del trabajo. No deberá ser mayor a dos cuartillas.Materiales y Métodos: Se especificará cómo se llevó a cabo la in-vestigación, incluyendo el tipo de investigación, diseño experimen-tal (cuando se traten de investigaciones experimentales), equipos, substancias y materiales empleados, métodos, técnicas, procedi-mientos, así como el análisis estadístico de los datos obtenidos.Resultados y Discusión: Puede presentarse en una sola sección. En caso de presentarse de forma separada, la discusión debe enfo-carse a comentar los resultados (sin repetirlos), en términos de sus características mismas, su congruencia con la hipótesis planteada y sus semejanzas o diferencias con resultados de investigaciones similares previamente realizadas.Conclusiones: Son la generalización de los resultados obtenidos; deben ser puntuales, claras y concisas, y no deben llevar discusión, haciendo hincapié en los aspectos nuevos e importantes de los resultados obtenidos y que establezcan los parámetros finales de lo observado en el estudio.Agradecimientos: Son opcionales y tendrán un máximo de tres renglones para expresar agradecimientos a personas e institucio-nes que hayan contribuido a la realización del trabajo.Cuadros: Deben ser claros, simples y concisos. Se ubicarán inme-diatamente después del primer párrafo en el que se mencionen o al inicio de la siguiente cuartilla. Los cuadros deben numerarse progresivamente, indicando después de la referencia numérica el título del mismo (Cuadro 1. Título), y se colocarán en la parte supe-rior. Al pie del cuadro se incluirán las aclaraciones a las que se hace mención mediante un índice en el texto incluido en el cuadro. Se recomienda que los cuadros y ecuaciones se preparen con el edi-tor de tablas y ecuaciones del procesador de textos.Uso de siglas y acrónimos: Para el uso de acrónimos y siglas en el texto, la primera vez que se mencionen, se recomienda escribir el nombre completo al que corresponde y enseguida colocar la sigla entre paréntesis. Ejemplo: Petróleos Mexicanos (Pemex), después sólo Pemex.Elementos gráficos: Corresponden a dibujos, gráficas, diagramas y fotografías. Deben ser claros, simples y concisos. Se ubicarán in-mediatamente después del primer párrafo en el que se mencionen o al inicio de la siguiente cuartilla. Las figuras deben numerarse
progresivamente, indicando después de la referencia numérica el título del mismo (Figura 1. Título), y se colocarán en la parte inferior. Las fotografías deben ser de preferencia a colores y con una reso-lución de 300 dpi en formato JPEG, TIFF O RAW. El autor deberá enviar 2 fotografías adicionales para ilustrar la página inicial de su contribución. Las gráficas o diagramas serán en formato de vecto-res (CDR, EPS, AI, WMF o XLS).Unidades. Las unidades de pesos y medidas usadas serán las acep-tadas en el Sistema Internacional.Citas bibliográficas: deberán insertarse en el texto abriendo un paréntesis con el apellido del autor, el año de la publicación y la página, todo separado por comas. Ejemplo (Zheng et al., 2017). El autor puede introducir dos distintos tipos de citas:
Citas directas de menos de 40 palabras: Cuando se transcriben textualmente menos de 40 palabras, la cita se coloca entre comi-llas y al final se añade entre paréntesis el autor, el año y la página. Ejemplo:
Alineado al Plan Nacional de Desarrollo 2013-2018, (DOF, 2013), el Programa Sectorial de Desarrollo Agropecuario, Pes-quero y Alimentario 2013-2018 establece “Construir un nuevo rostro del campo sustentado en un sector agroalimentario pro-ductivo, competitivo, rentable, sustentable y justo que garanti-ce la seguridad alimentaria del país” (DOF, 2013).
Citas indirectas o paráfrasis: Cuando se interpretan o se comen-tan ideas que son tomadas de otro texto, o bien cuando se expresa el mismo contenido pero con diferente estructura sintáctica. En este caso se debe indicar el apellido del autor y el año de la refe-rencia de donde se toman las ideas. Ejemplo:
Los bajos rendimientos del cacao en México, de acuerdo con Avendaño et al. (2011) y Hernández-Gómez et al. (2015); se debe principalmente a la edad avanzada de las plantaciones.
Las referencias bibliográficas: al final del artículo deberán indicar-se todas y cada una de las fuentes citadas en el cuerpo del texto (incluyendo notas, fuentes de los cuadros, gráficas, mapas, tablas, figuras etcétera). El autor(es) debe revisar cuidadosamente que no haya omisiones ni inconsistencias entre las obras citadas y la bi-bliografía. Se incluirá en la lista de referencias sólo las obras citadas en el cuerpo y notas del artículo. La bibliografía deberá presentarse estandarizada recurriendo a la norma APA, ordenarse alfabética-mente según los apellidos del autor. De haber dos obras o más del mismo autor, éstas se listan de ma-nera cronológica iniciando con la más antigua. Obras de un mismo autor y año de publicación se les agregará a, b, c… Por ejemplo:
Ogata N. (2003a).Ogata N. (2003b).
Artículo de revista:Wang, P., Zhang, Y., Zhao, L., Mo, B., & Luo, T. (2017). Effect of Gamma Rays on Sophora davidii and Detection of DNA Polymorphism through ISSR Marker [Research article]. https://doi.org/10.1155/2017/8576404
Libro:Turner J. (1972). Freedom to build, dweller control of the housing process. New York: Macmillan.
Uso de gestores bibliográficos: Se dará prioridad a los artículos enviados con la bibliografía gestionada electrónicamente, y pre-sentada con la norma APA. Los autores podrán recurrir al uso de cualquier gestor disponible en el mercado (Reference Manager, Crossref o Mendeley entre otros), o de código abierto tal como Refworks o Zotero.

3AGROPRODUCTIVIDAD 3AGROPRODUCTIVIDAD
https://doi.org/10.32854/agrop.v14i4.1718
Agroproductividad: Vol. 14, Núm. 4, abril. 2021. pp: 3-9.
Recibido: junio, 2020. Aceptado: febrero, 2021.
Economic impact of Melanaphis sacchari (Zehntner) on Sorghum bicolor (L.) Moench, and its management
in the Southwestern of Puebla, Mexico
Serratos-Tejeda, Carlos1, Morales-Jiménez, Juan1*, Huerta-de la Peña, Arturo1, Hernández-Salgado, José Hilario1,
Villanueva-Jiménez, Juan A.2, Aragón-García, Agustín3
1Colegio de Postgraduados Campus Puebla, Puebla, México, C.P. 72760. 2Colegio de Postgradua-
dos Campus Córdoba, Córdoba, Veracruz, México, C.P. 94946. 3Centro de Agroecología, Instituto
de Ciencias, Benemérita Universidad Autónoma de Puebla, Puebla, México, C.P. 72960.
*Corresponding author: [email protected]
ABSTRACT Objective: To evaluate the economic impact of sorghum aphid (Melanaphis sacchari) and the sorghum crop profitability in
Western Puebla, Mexico, considering the management practices application-index (IAPM), related to the control practices
suggested by the State Plant Health Committee (CESAVEG).
Design/Methodology/Approach: Data on socioeconomic aspects of the producer and the production units were
collected. The questionnaire was applied to producers affiliated to PROAGRO. Results are shown using descriptive
statistics.
Results: The aphid infestation in sorghum had its most relevant effect on yield during 2014-2016. Income obtained from
sorghum sales is decreasing due to a downward trend in the purchase price per ton. After the arrival of M. sacchari, the
primary control strategy was to increase the number of insecticide applications, increasing production costs.
Limitations of the study/implications: Since producers’ incomes do not depend solely on sorghum production, the
effect of the pest on their economy was relatively minor.
Findings/Conclusions: The management practices application index indicates a moderate use of the recommended
practices to manage this pest. The B/C ratio suggests that even after the establishment of M. sacchari, sorghum is still a
profitable activity.
Keywords: Pest management, injuries, profitability.
Imagen de prashant290 en Pixabay

4 AGROPRODUCTIVIDAD
Agro productividad 14 (4): 3-9. 2021
INTRODUCTION
Sorghum (Sorghum bicolor L.
Moench) is one of the
main crops in Mexico; it is a raw material for balanced
feed for livestock industry (SAGARPA, 2012). 75.7% of
the production of Puebla state is concentrated in 46
municipalities of the Southwestern region (Vargas, 2009;
SIAP, 2017). Sorghum yellow aphid [Melanaphis sacchari
(Zehntner)] represents a phytosanitary problem in this
region. In 2013, this pest was detected for the first time
in Mexico in the state of Tamaulipas, where infestation
levels caused severe damages and losses ranging from
30 to 100%. It is currently present in all states where
sorghum is sown (INIFAP-CIRNE, 2015). Damages
caused by M. sacchari include desiccation, necrosis,
delayed seedling growth and panicle appearance. If
damage is severe, the plant dies. These damages have
an impact on crop yield (Singh et al., 2004; Bowling et
al., 2016). In addition, expenses on control tactics are
associated with the application of insecticides (Oliveira
et al., 2013).
Although there are strategies to control sorghum aphid,
their implementation depend on the cultural, physical,
biological, technical, social, and economic context in
which the crop is grown (Rivas and Sermeño, 2004;
Savary et al., 2006a, b).
Production costs have increased due to a greater number
of insecticide applications used to control M. sacchari.
In addition, there has been a continuous reduction
in the price paid per ton of sorghum. Nevertheless,
this crop is still sown in the region. It is necessary to
know the strategies and modifications implemented
in the production system to reduce damages caused
by sorghum aphid, as well as to analyze the costs and
benefits obtained from planting this grain in order to
determine the reason for its continued use. For these
purposes, the objective of this study was to assess
the economic impact of M. sacchari and sorghum
crop profitability in the Southwestern region of Puebla
state, Mexico, considering the Management Practices
Application-Index (IAPM) recommended by CESAVEG
for sorghum production systems.
MATERIALS AND METHODSGeographical Framework of the Study
The research was carried out in the Southwestern region
of Puebla state, between parallels 18° 00’ and 19° 51’ N
and meridians 97° 49’ and 98° 47’ W.
Sample Size
A questionnaire containing questions regarding
socioeconomic aspects, production process and
commercialization of sorghum was prepared. A
sample (n) of beneficiary producers of the "PROAGRO
PRODUCTIVO" federal program responded the
questionnair. The sample was estimated with a maximum
variance based on the following formula:
nN Z
N d Z=
( )
+ ( )α
α
/
/
.
.
22
22
2
25
25
Where: N1730 producers who are beneficiaries of
“PROAGRO”; Z/22 1.96 (value of normal distribution
table); and 0.05 (95% reliability).
The sample consisted of 91 producers producers were
distributed as follows: Tepexco: 20, Izúcar de Matamoros:
19, Atzizihuacán: 14, Acteopan: 10, Tilapa: 8, Huehuetlán
el Chico: 6, Xochiltepec: 7, Atzala: 5, Jolalpan: 1, and
Huehuetlán el Grande: 1.
Economic Impact of M. sacchari on Sorghum
Production
The following topics were covered in the questionnaire:
producers’ perception of the impact of sorghum aphid
on sorghum yields, their knowledge of the damage
it causes, the first cycle with infestation, the varieties
planted, the insecticides applied, and the technical
assistance received.
Changes Implemented into Agricultural System to
Manage Sorghum Aphid Populations
Producers were sought to represent the changes
in sorghum production system, and other activities
developed to reduce losses due to sorghum aphid.
Management Practices Application-Index (IAPM,
for its Spanish Acronym)
The IAPM, derived from the one proposed by Damián-
Huato et al. (2019), was calculated, and applied to
compare the recommendations set out in M. sacchari
Management Guide by CESAVEG (2017), with practices
implemented by producers. A value of 100 points was
assigned to the total number of recommendations
and these were weighed according to their impact
on M. sacchari management: 10 points if they know
how to locate and identify it, 5 points if they know the
damage, 10 points if they identify beneficial fauna, 15
5AGROPRODUCTIVIDAD
Serratos-Tejeda et al. (2021)
points if they eliminate infestation sources, 5 points if
they use a certified seed, 10 points if they use seeds
treated with insecticide, 15 points if they check the
crop frequently, 10 points if they protect and allow
beneficial fauna to act, and 20 points if they apply
recommended products at the proposed dosage.
Each weighted value was divided by two, where the
first quotient represented the use recommended
practice, and the second one to the practices actually
carried out. The IAPM was calculated with the
following equation:
IAPM pi PAPi PGMii
k
= ( )( ) =∑ /
1
Where: Management Practices Application-Index
(IAPM); KNumber of Best Practices contained in
Sorghum Aphid Management Guide prepared by
CESAVEG (2017), where max K9; Pi: Weighing
given to the i-th element the recommendation;
PAPiPractices applied for the i-th recommendation
element; i1,2…k; where Ki pii
k
= ( )==∑ 1 100
1
, i1, 2… K;
PGMi: Practices of the management guide for the i-th
component of the recommendation; i1,2… K, where
(PAPi/PGMi)Ratio of practices applied against those
recommended.
Once the IAPM has been calculated, the typology of
producers was prepared by grouping them according
to the value obtained: low (33.33) medium (33.34 to
66.66) and high (66.66).
Crop Profitability both Under Traditional Farming
and No-Till Farming Systems
Crop profitability was examined for 2017 cycle, under
both systems implemented within the area: traditional
farming and no-till farming. In both cases, production
costs per hectare were determined based on the type
of technology used by an average producer. Land
preparation, inputs, contracted services, and indirect
production costs were considered. Benefit-cost ratio
was used as a profitability indicator, calculated according
to Sobrado (2005):
C BR SI CH=( ) ( )/
Where: C/BRCost-benefit ratio; SISales Income;
CHCost per hectare.
If the C/BR index is higher than 1.0, the portion in which
it exceeds the unit will indicate the level of profitability of
the crop.
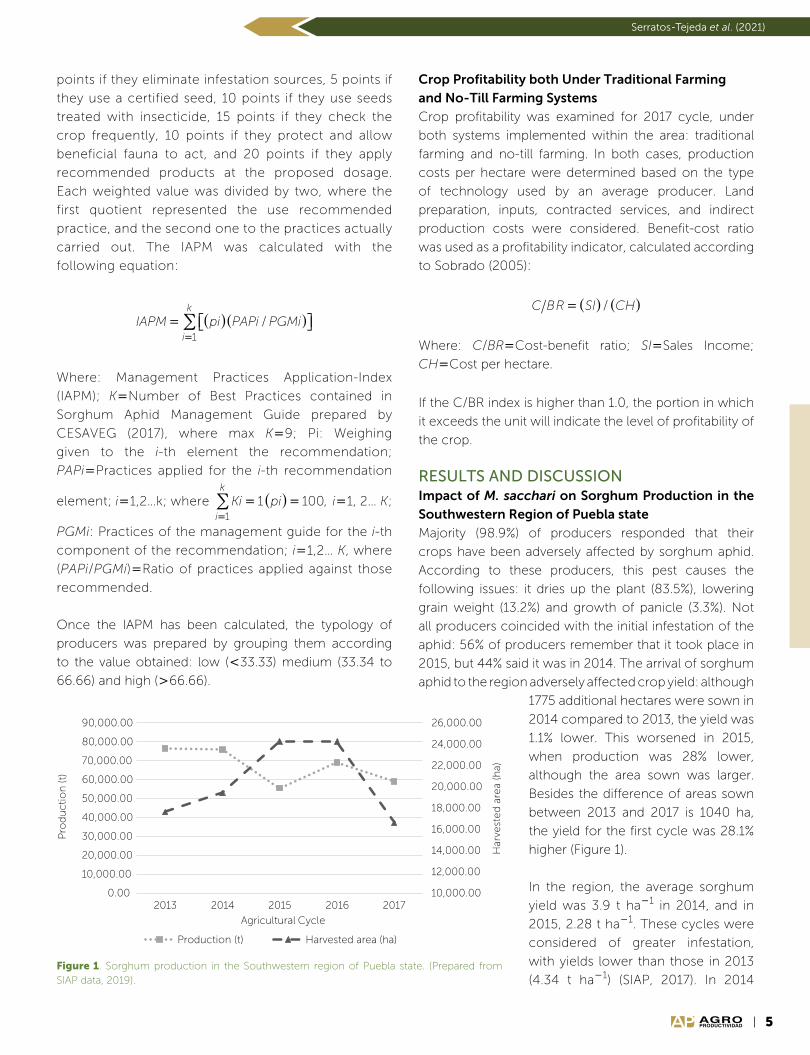
RESULTS AND DISCUSSIONImpact of M. sacchari on Sorghum Production in the
Southwestern Region of Puebla state
Majority (98.9%) of producers responded that their
crops have been adversely affected by sorghum aphid.
According to these producers, this pest causes the
following issues: it dries up the plant (83.5%), lowering
grain weight (13.2%) and growth of panicle (3.3%). Not
all producers coincided with the initial infestation of the
aphid: 56% of producers remember that it took place in
2015, but 44% said it was in 2014. The arrival of sorghum
aphid to the region adversely affected crop yield: although
1775 additional hectares were sown in
2014 compared to 2013, the yield was
1.1% lower. This worsened in 2015,
when production was 28% lower,
although the area sown was larger.
Besides the difference of areas sown
between 2013 and 2017 is 1040 ha,
the yield for the first cycle was 28.1%
higher (Figure 1).
In the region, the average sorghum
yield was 3.9 t ha1 in 2014, and in
2015, 2.28 t ha1. These cycles were
considered of greater infestation,
with yields lower than those in 2013
(4.34 t ha1) (SIAP, 2017). In 2014 Figure 1. Sorghum production in the Southwestern region of Puebla state. (Prepared from SIAP data, 2019).
10,000.00
12,000.00
14,000.00
16,000.00
18,000.00
20,000.00
22,000.00
24,000.00
26,000.00
0.00
10,000.00
20,000.00
30,000.00
40,000.00
50,000.00
60,000.00
70,000.00
80,000.00
90,000.00
2013 2014 2015 2016 2017
Har
vest
ed
are
a (h
a)
Pro
du
ctio
n (t
)
Agricultural Cycle
Production (t) Harvested area (ha)
6 AGROPRODUCTIVIDAD
Agro productividad 14 (4): 3-9. 2021
and 2015 nine varieties were
sown (ACA506, ACA6001,
ACA642, AMBAR, ANZU310,
ARGOS, DEKALB, El CAMINO
and GALIO). DEKALB, the variety
sown to a greater extent (57.1 %
of producers), is classified as a
hybrid tolerant to M. sacchari
(SAGARPA-INIFAP, 2017). The
use of plant resistance is part of
a strategy to reduce damages
caused by sorghum aphid to grain sorghum
crops (Haar et al., 2019).
In 2014 and 2015 cycles, 87.9% of the producers
applied insecticides. Imidacloprid (imidacloprid)
was the most used product (84.1%), followed by
Curacron (profenofos, 4.9%), Folidol (parathion,
3.7%), Disparo (chlorpyrifos-ethyl, 1.2%), and
Malathion (malathion, 1.2%); while 3.7% of
producers applied a mix of two or more of these
insecticides and 1.2% applied alternative methods
such as soap or ammonia. A low number (12.1%)
of producers did not implement any control
strategy, since they did not know the pest.
Yield distribution for 2014-2017 cycles is shown in Table
1. In 2014 and 2015 cycles, the yield observed is lower
than 3 t ha1 for a higher percentage of producers, as
opposed to what was recorded in 2016 and 2017, when
yields were higher than 3 t ha1 for most of them.
Purchase price per ton has been falling in the region.
In 2015, average purchase price was MX$3337.91, which
was the highest price detected (Figure 2).
Due to a reduction in purchase price, combined with less
production, revenues were lower than 2013, the cycle
previous to the arrival of M. sacchari to the Southwestern
region of Puebla state. The lowest income was obtained
during 2014 and 2015 cycles (Table 2).
Changes Implemented into Agricultural System to
Manage Sorghum Aphid Populations
The strategies implemented
to control M. sacchari are
an increased frequency
of insecticide application
(44%); crop inspection
(21%); and change of
insecticide (14%). Due to losses, 9% of producers did
not seed in the next cycle, 10% sought advice, and and
only 2% continued with the insecticide applied in the
previous cycle. According to Aguilar (2005), intrusive
species reduce crop yield, increase production costs,
and the frequency of agrochemical use, which also was
observed in this research.
In 91% of the cases, the effect of sorghum aphid on the
producer’s economy was relatively minor, since their
income does not depend solely on sorghum profits.
Their primary activities are: sugarcane sowing (35%),
amaranth sowing (15%), peanut sowing (12%), corn
sowing (11%), onion sowing (2%), stockbreeding (3%),
aquaculture (1%); in addition to secondary activities, such
as pottery (10%), as well as tertiary activities, such as their
small businesses (2%) (grocery store and "huarache"
shoe sale). The above agrees with that stated by FAO
(2012): family farming represents the main source of
income, but it can be supplemented with other non-
Table 1. Distribution of sorghum yields by 2014-2017 sorghum growing cycle.
Cycle
Yield (t ha1)
1 t 1 a 1.9 2 a 2.9 3 a 3.9 4 a 4.5 NS
Percentage of producers within range
2014 14.28 31.87 49.45 1.10 3.30 0.0
2015 15.39 29.67 27.47 16.48 4.40 6.59
2016 0.0 7.69 31.87 36.26 21.98 2.20
2017 0.0 1.10 8.79 43.96 46.15 0.0
NSProducer did not seed. Developed by author.
Table 2. Average sales revenue for 2013-2017 cycles in the study region.
Agricultural Cycle 2013 2014 2015 2016 2017
Data from SIAP $12,558.65 $8,514.59 $6,070.97 $9,154.08 $11,621.12
Data from surveys -- $6,161.57 $6,178.36 $9,910.19 $11,843.46
Prepared with data from survey and data from SIAP 2019.
Figure 2. Average purchase price per ton of sorghum in the study region (Developed by author).
$3,100.00
$3,150.00
$3,200.00
$3,250.00
$3,300.00
$3,350.00
2014 2015 2016 2017
Ave
rag
e p
urc
has
e p
rice
pe
r t/
sorg
hu
m
Agricultural Cycle
7AGROPRODUCTIVIDAD
Serratos-Tejeda et al. (2021)
agricultural activities. In this context, FAO
(2001) stated that the effect of pests on
producers’ economy is mitigated by extra
sources of income. However, this effect also
depends on the producer’s own adaptation,
the reconsideration of the productive system,
the availability of economic reserves, or even
selling or pawning goods.
Management Practices Application
Index (IAPM)
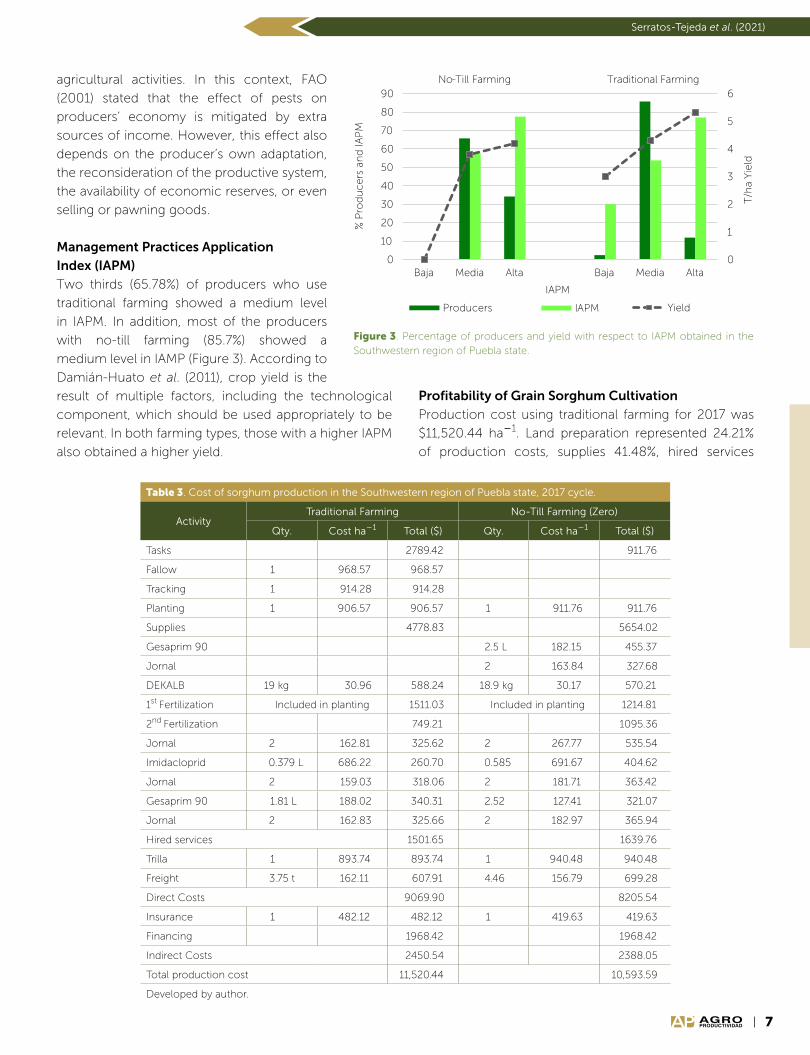
Two thirds (65.78%) of producers who use
traditional farming showed a medium level
in IAPM. In addition, most of the producers
with no-till farming (85.7%) showed a
medium level in IAMP (Figure 3). According to
Damián-Huato et al. (2011), crop yield is the
result of multiple factors, including the technological
component, which should be used appropriately to be
relevant. In both farming types, those with a higher IAPM
also obtained a higher yield.
Figure 3. Percentage of producers and yield with respect to IAPM obtained in the Southwestern region of Puebla state.
0
1
2
3
4
5
6
0
10
20
30
40
50
60
70
80
90
Baja Media Alta Baja Media Alta
T/h
a Yie
ld
% P
rod
uce
rs a
nd
IAP
M
IAPM
No-Till Farming Traditional Farming
Producers IAPM Yield
Profitability of Grain Sorghum Cultivation
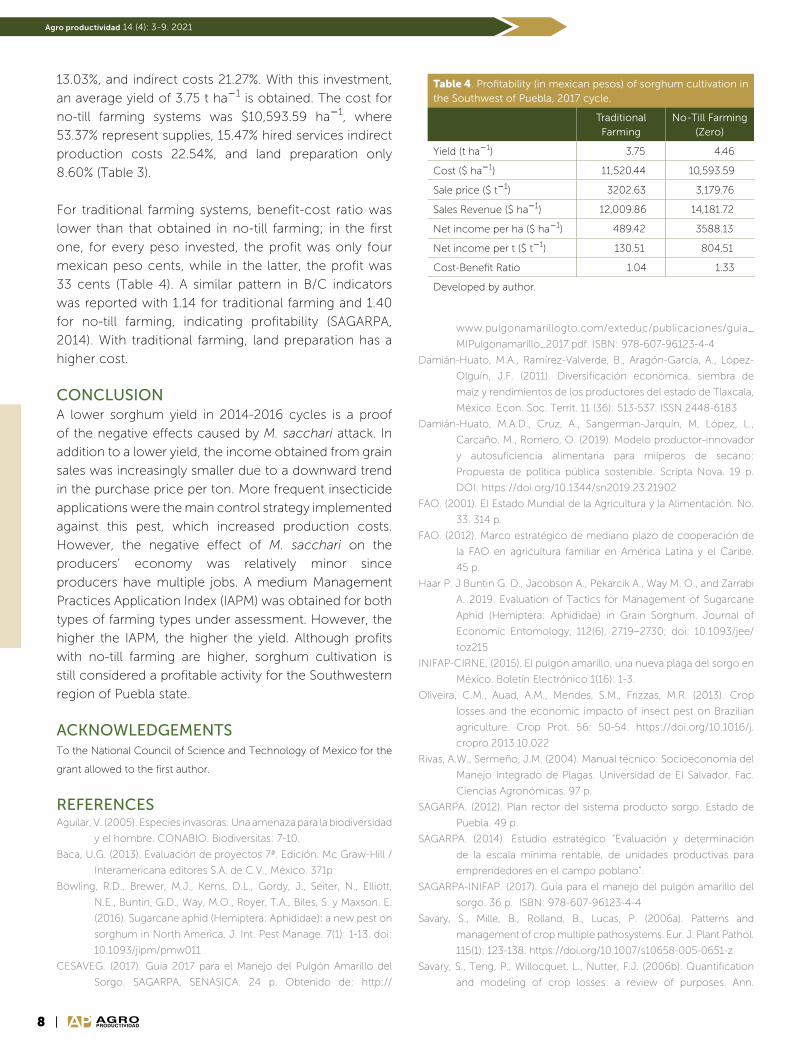
Production cost using traditional farming for 2017 was
$11,520.44 ha1. Land preparation represented 24.21%
of production costs, supplies 41.48%, hired services
Table 3. Cost of sorghum production in the Southwestern region of Puebla state, 2017 cycle.
ActivityTraditional Farming No-Till Farming (Zero)
Qty. Cost ha1 Total ($) Qty. Cost ha1 Total ($)
Tasks 2789.42 911.76
Fallow 1 968.57 968.57
Tracking 1 914.28 914.28
Planting 1 906.57 906.57 1 911.76 911.76
Supplies 4778.83 5654.02
Gesaprim 90 2.5 L 182.15 455.37
Jornal 2 163.84 327.68
DEKALB 19 kg 30.96 588.24 18.9 kg 30.17 570.21
1st Fertilization Included in planting 1511.03 Included in planting 1214.81
2nd Fertilization 749.21 1095.36
Jornal 2 162.81 325.62 2 267.77 535.54
Imidacloprid 0.379 L 686.22 260.70 0.585 691.67 404.62
Jornal 2 159.03 318.06 2 181.71 363.42
Gesaprim 90 1.81 L 188.02 340.31 2.52 127.41 321.07
Jornal 2 162.83 325.66 2 182.97 365.94
Hired services 1501.65 1639.76
Trilla 1 893.74 893.74 1 940.48 940.48
Freight 3.75 t 162.11 607.91 4.46 156.79 699.28
Direct Costs 9069.90 8205.54
Insurance 1 482.12 482.12 1 419.63 419.63
Financing 1968.42 1968.42
Indirect Costs 2450.54 2388.05
Total production cost 11,520.44 10,593.59
Developed by author.
8 AGROPRODUCTIVIDAD
Agro productividad 14 (4): 3-9. 2021
13.03%, and indirect costs 21.27%. With this investment,
an average yield of 3.75 t ha1 is obtained. The cost for
no-till farming systems was $10,593.59 ha1, where
53.37% represent supplies, 15.47% hired services indirect
production costs 22.54%, and land preparation only
8.60% (Table 3).
For traditional farming systems, benefit-cost ratio was
lower than that obtained in no-till farming; in the first
one, for every peso invested, the profit was only four
mexican peso cents, while in the latter, the profit was
33 cents (Table 4). A similar pattern in B/C indicators
was reported with 1.14 for traditional farming and 1.40
for no-till farming, indicating profitability (SAGARPA,
2014). With traditional farming, land preparation has a
higher cost.
CONCLUSIONA lower sorghum yield in 2014-2016 cycles is a proof
of the negative effects caused by M. sacchari attack. In
addition to a lower yield, the income obtained from grain
sales was increasingly smaller due to a downward trend
in the purchase price per ton. More frequent insecticide
applications were the main control strategy implemented
against this pest, which increased production costs.
However, the negative effect of M. sacchari on the
producers’ economy was relatively minor since
producers have multiple jobs. A medium Management
Practices Application Index (IAPM) was obtained for both
types of farming types under assessment. However, the
higher the IAPM, the higher the yield. Although profits
with no-till farming are higher, sorghum cultivation is
still considered a profitable activity for the Southwestern
region of Puebla state.
ACKNOWLEDGEMENTSTo the National Council of Science and Technology of Mexico for the
grant allowed to the first author.
REFERENCESAguilar, V. (2005). Especies invasoras: Una amenaza para la biodiversidad
y el hombre. CONABIO. Biodiversitas: 7-10.
Baca, U.G. (2013). Evaluación de proyectos 7ª. Edición. Mc Graw-Hill /
Interamericana editores S.A. de C.V., México. 371p
Bowling, R.D., Brewer, M.J., Kerns, D.L., Gordy, J., Seiter, N., Elliott,
N.E., Buntin, G.D., Way, M.O., Royer, T.A., Biles, S. y Maxson. E.
(2016). Sugarcane aphid (Hemiptera: Aphididae): a new pest on
sorghum in North America. J. Int. Pest Manage. 7(1): 1-13. doi:
10.1093/jipm/pmw011
CESAVEG. (2017). Guía 2017 para el Manejo del Pulgón Amarillo del
Sorgo. SAGARPA, SENASICA. 24 p. Obtenido de: http://
www.pulgonamarillogto.com/exteduc/publicaciones/guia_
MIPulgonamarillo_2017.pdf. ISBN: 978-607-96123-4-4
Damián-Huato, M.A., Ramírez-Valverde, B., Aragón-García, A., López-
Olguín, J.F. (2011). Diversificación económica, siembra de
maíz y rendimientos de los productores del estado de Tlaxcala,
México. Econ. Soc. Territ. 11 (36): 513-537. ISSN 2448-6183
Damián-Huato, M.A.D., Cruz, A., Sangerman-Jarquín, M, López, L.,
Carcaño, M., Romero, O. (2019). Modelo productor-innovador
y autosuficiencia alimentaria para milperos de secano:
Propuesta de política pública sostenible. Scripta Nova. 19 p.
DOI: https://doi.org/10.1344/sn2019.23.21902
FAO. (2001). El Estado Mundial de la Agricultura y la Alimentación. No.
33. 314 p.
FAO. (2012). Marco estratégico de mediano plazo de cooperación de
la FAO en agricultura familiar en América Latina y el Caribe.
45 p.
Haar P. J Buntin G. D., Jacobson A., Pekarcik A., Way M. O., and Zarrabi
A. 2019. Evaluation of Tactics for Management of Sugarcane
Aphid (Hemiptera: Aphididae) in Grain Sorghum. Journal of
Economic Entomology, 112(6), 2719–2730; doi: 10.1093/jee/
toz215
INIFAP-CIRNE, (2015). El pulgón amarillo, una nueva plaga del sorgo en
México. Boletín Electrónico 1(16): 1-3.
Oliveira, C.M., Auad, A.M., Mendes, S.M., Frizzas, M.R. (2013). Crop
losses and the economic impacto of insect pest on Brazilian
agriculture. Crop Prot. 56: 50-54. https://doi.org/10.1016/j.
cropro.2013.10.022
Rivas, A.W., Sermeño, J.M. (2004). Manual técnico: Socioeconomía del
Manejo Integrado de Plagas. Universidad de El Salvador, Fac.
Ciencias Agronómicas. 97 p.
SAGARPA. (2012). Plan rector del sistema producto sorgo. Estado de
Puebla. 49 p.
SAGARPA. (2014). Estudio estratégico “Evaluación y determinación
de la escala mínima rentable, de unidades productivas para
emprendedores en el campo poblano”.
SAGARPA-INIFAP. (2017). Guía para el manejo del pulgón amarillo del
sorgo. 36 p. ISBN: 978-607-96123-4-4
Savary, S., Mille, B., Rolland, B., Lucas, P. (2006a). Patterns and
management of crop multiple pathosystems. Eur. J. Plant Pathol.
115(1): 123-138. https://doi.org/10.1007/s10658-005-0651-z
Savary, S., Teng, P., Willocquet, L., Nutter, F.J. (2006b). Quantification
and modeling of crop losses: a review of purposes. Ann.
Table 4. Profitability (in mexican pesos) of sorghum cultivation in the Southwest of Puebla, 2017 cycle.
Traditional Farming
No-Till Farming (Zero)
Yield (t ha1) 3.75 4.46
Cost ($ ha1) 11,520.44 10,593.59
Sale price ($ t1) 3202.63 3,179.76
Sales Revenue ($ ha1) 12,009.86 14,181.72
Net income per ha ($ ha1) 489.42 3588.13
Net income per t ($ t1) 130.51 804.51
Cost-Benefit Ratio 1.04 1.33
Developed by author.
9AGROPRODUCTIVIDAD
Serratos-Tejeda et al. (2021)
AGROPRODUCTIVIDAD
Rev. Phytopathol. 44: 89-112. DOI: 10.1146/annurev.
phyto.44.070505.143342
SIAP. (2017). Anuario estadístico de la producción agrícola. Obtenido
de http://nube.siap.gob.mx/cierre_agricola/
SIAP. (2019). Anuario estadístico de la producción agrícola. Obtenido
de http://nube.siap.gob.mx/cierre_agricola/
Singh, B. U., Padmaja, P.G., Seetharama, N. (2004). Biology and
management of the sugarcane aphid, Melanaphis sacchari
(Zehntner) (Homoptera:Aphididae), in sorghum: a review. Crop
Prot. 23: 739–755. DOI: 10.1016/j.cropro.2004.01.004
Sobrado. (2005) Cited in: SAGARPA.2012. Plan rector del sistema
producto sorgo. Estado de Puebla. 49 p.
Vargas, G. (2009). Producción y comercialización de sorgo grano
en México y en el estado de Puebla: Caso DDR Izúcar de
Matamoros. Tesis. Universidad Autónoma Agraria Antonio
Narro. Saltillo, México. 58 p.

11AGROPRODUCTIVIDAD
Imagen de miguelcruz30 en Pixabay
https://doi.org/ 10.32854/agrop.v14i4.1806
Agroproductividad: Vol. 14, Núm. 4, abril. 2021. pp: 11-20.
Recibido: septiembre, 2020. Aceptado: marzo, 2021.
Analysis of Copra and Coconut Oil Markets in Mexico
Lagunes-Fortiz, Edgar R.1; Gómez-Gómez, Alma A.1*; Leos-Rodríguez, Juan A.2;
Omaña-Silvestre, José Miguel3; Lagunes-Fortiz, Erika4
1Universidad Autónoma Chapingo. División de Ciencias Económico Administrativas. Texcoco,
Estado de México. 2Universidad Autónoma Chapingo. Centro de Investigaciones Económicas,
Sociales y Tecnológicas de la Agroindustria y la Agricultura Mundial. Texcoco, Estado de México. 3Colegio de Posgraduados Campus Montecillos. Texcoco, Estado de México. 4Universidad
Autónoma Chapingo. Departamento de Fitotecnia. Texcoco, Estado de México.
*Corresponding author: [email protected]
ABSTRACTObjective: To assess the economic impact of the implementation of different production systems (real, traditional,
intensive and organic) on the profits of copra-producing states and major coconut oil companies.
Design/Methodology/Approach: A linear programming model was formulated which considered the main costs and
production revenues, and the transport costs of the copra and coconut oil market, in order to maximize the profit of copra
producers and the oil industry simultaneously.
Results: The states that were most suitable in the distribution of copra were Guerrero and Tabasco, which proved to be
the main suppliers of all the production systems evaluated; within production systems, the intensive system presented a
higher level of profit in the scenarios raised.
Study Limitations/Implications: The model considered the sale of copra as the sole income of producers, leaving aside
the marketing of other products and economic transfers, thus underestimating their total profit. Future research is required
to help collect data on alternative sources of income for producers.
Findings/Conclusions: Increasing copra production without taking into account the installed capacity in the industry
results in the creation of a copra surplus in most producing states, which would result in a fall in the prices of this product,
therefore reducing the profit of most states.
Keywords: Spatial equilibrium Model, Profit Maximization, Production Planning.
INTRODUCTION
Copra is an agricultural product obtained from the drying of coconut pulp,
which is used to produce a wide range of agroindustrial products
on which a large number of industries depend, the most important of which is
coconut oil (Granados and Lopéz, 2002). This crop is of special importance for
the states of Guerrero, Colima and Tabasco, where more than 90% of the
national production is concentrated, which in 2018 reached a value
of 1,949.28 million pesos in those states (SIAP, 2019). However,
during the last decades, national copra production has been
negatively affected by different factors such as: advanced
age of the plantations; diseases such as lethal coconut

12 AGROPRODUCTIVIDAD
Agro productividad 14 (4): 11-20. 2021
yellowing; low investment and use
of inefficient agricultural practices,
which have led to low yields in the
plantations (INIFAP, 2019).
According to the United States
Department of Agriculture (USDA,
2019), Mexico is the eighth largest
consumer of coconut oil worldwide.
This consumption, because of
the low productivity of the copra-
producing sector and the limited
capacity of the agroindustry to
produce coconut oil domestically,
has meant that consumption has
been satisfied thanks to imports that
come mainly from the United States,
which in 2017 reached 86,864 tons.
In recent years, coconut oil imports
have shown a growing trend due to
increased demand and stagnation of
domestic production (SIAVI, 2020).
Although copra has a growing
market (SAGARPA, 2017), the real
price has stagnated at $6,638.00
pesos (MX) per ton during the period
2012-2017, so that many producers
have decided to abandon or change
the crop, putting at risk the agrifood
and cosmetic industry that depends
on this product. As a result, different
organizations such as: Institutional
Fund for Regional Promotion
of Scientific, Technological and
Innovation Development (Fondo
Institucional de Fomento Regional
para el Desarrollo Científico,
Tecnológico y de Innovación,
FORDECYT, 2018); the House of
Representatives in conjunction with
the National Council of Science and
Technology (Consejo Nacional de
Ciencia y Tecnología, CONACYT,
2015); the Ministry of Agriculture,
Livestock, Rural Development,
Fisheries and Food (Secretaría de
Agricultura, Ganadería, Desarrollo
Rural, Pesca y Alimentación,
SAGARPA, 2010); the National
Institute of Forestry, Agricultural
and Livestock Research (Instituto Nacional de Investigaciones Forestales,
Agrícolas y Pecuarias, INIFAP, 2015); have set themselves the task of looking
for alternatives that will have a positive impact on profits from producers, the
main one being to increase production directly through the application of
new techniques.
In order to solve problems related to production optimization, several studies
have been carried out where spatial equilibrium models have been applied, for
example: the study conducted to analyze the effects of the North American
Free Trade Agreement on tomato exports from Mexico to the United States,
and the impact that the application or elimination of foreign trade instruments
such as tariffs would have (Garcia, Williams and Malaga, 2015); the work carried
out to analyze the optimal temporal and spatial storage of sorghum in Mexico
(Rebollar, García and Rodríguez, 2006); the study focused on the analysis of
the bean market, in which the structure of the bean market in Mexico was
determined through the application of a spatial equilibrium model (Torres
and García, 2008); and the mathematical model to improve the distribution
of prickly pear for Mexico through the minimization of costs of transportation
routes from producing to consuming areas, obtaining the optimal distribution
to market it (Ayllon et al., 2015).
The importance of copra cultivation lies in the large number of hectares
dedicated to this crop, the byproducts obtained from its industrialization, and
the jobs that depend directly and indirectly on the national copra-producing
sector. The objective of this study was to evaluate how policies aimed at
increasing copra production at the field level would impact the profits of
copra producers and coconut oil companies, analyzing the functioning of
the copra and coconut oil markets together.
MATERIALS AND METHODS A linear programming model (Badole and Jain, 2012) was formulated for
the distribution of the copra and coconut oil market, in order to analyze
the coconut oil market and to determine how agents would respond to the
proposed scenarios. The model takes into account the economic variables
that determine the main revenues and costs of economic agents; it is a
spatial equilibrium model (Takayama and Judge, 1971), similar to the linear
programming model for the maximization of profits of prickly pear producers
through optimization in the distribution network for the supply chain (Granillo-
Macias et al., 2019). It seeks to optimize the profit of coconut producers and
companies dedicated to coconut oil production, maximizing the income of
copra producers and national oil companies simultaneously, and minimizing
the value of the costs of copra production, oil processing, transportation, as
well as the costs of acquiring and distributing coconut oil imports from the
borders to the states of consumption.
The model considered four different types of technology in copra production:
real, which is the one observed in official sources; traditional, which is the one
that is carried out using few technical and technological advances; intensive,
which uses advances in techniques and products, such as agrochemicals
and improved palms; and organic, which uses improvements in agricultural

13AGROPRODUCTIVIDAD
Lagunes-Fortiz et al. (2021)
techniques, but is free from the use of synthetic
agrochemicals.
Formulation of the market profit maximization model
Max f x p x t x c x
p
ij ijin
ij ijin
in
ij ijin
jk
( )= − −
+
= == =∑ ∑∑ ∑α α α α α α1 11 1
ββ β β β β β
β β
x t x c x
p x
jkin
jk jkkn
jn
j jkjn
lk lkkn
= == =
=
∑ ∑∑ ∑
∑
− −
− −
1 11 1
1lln
lk lkkn
ln
t x= ==∑ ∑∑1 11β β
(1)
x xij ijn α α≤=∑ 1 (2)
x x aj ij ijnβ α γα= =∑ 1
(3)
x x aj ij iβ α γα≤ (4)
x x yjkjn
lk llnβ β β
= =∑ ∑+ ≥1 1
(5)
Where:
pij purchase price of copra in the purchase zone; xij
quantity of copra produced in i to be taken to j; tij
transportation cost per ton of copra from production
zone i to plant j; ci copra production cost in the
production zone; pjk purchase price of coconut oil
produced at the national level; x jk quantity of coconut
oil produced at production plant k that will be taken to
state k; t jk transportation cost per ton of coconut oil
from production plant j to consumption center k; c j
cost of transformation of copra to coconut oil at plant
j; xlk imported quantity of coconut oil at border l that
will be taken to state k; plk acquisition price of coconut
oil at the border; tlk transportation cost per ton of
coconut oil from border l to consumption center k; aiγα
transformation rate from copra to coconut oil.
Assuming:
i1,2...I12 copra-producing regions; j1, 2...J7
coconut oil producing plants; l1,22 ports of entry
for coconut oil imports; k1, 2...3232 coconut oil
consumption centers.
Equation (1) is the profit maximization function of the
domestic market, which is obtained by subtracting the
costs of production, processing and transportation
from the income from the sale of copra and coconut
oil produced in the territory; the cost of purchasing
and transporting coconut oil from abroad was also
considered.
The objective function is restricted by four equations
described next:
Equation (2) establishes that the sum of copra shipments
from the production zone to the oil processing plants
should not be greater than their production; if the plants’
demand is satisfied or it is not possible to produce more
oil, the surplus production remains in these regions.
Equation (3) indicates that the amount of coconut oil
that domestic plants offer is equal to the transformation
coefficient (the amount of copra needed to produce
one ton of coconut oil) multiplied by the amount of
copra they demanded from copra-producing regions;
this restriction implies that the plants cannot function as
product warehouses.
Equation (4) establishes that the oil supply of the
companies should be less than or equal to the installed
capacity of the plants; that is, the plants cannot sell more
coconut oil than they are able to produce on their own.
Equation (5) shows how coconut oil is distributed, the
sum of the shipments of coconut oil produced in the
companies at the national level and imported at the
possible borders should be greater than or equal to the
demand of each consumer state; this restriction shows
that no demand should be left unsatisfied.
To feed the model, the quantities produced, different costs
and prices during 2017 were considered. The quantities
of copra produced were compiled from the main copra-
producing states in Mexico, and were disaggregated by
municipality in the case of Colima, since Tecomán is
located in this state, which is the municipality with the
largest production in the country. The model has 12
production regions; production for traditional, intensive
and organic production technologies was obtained by
multiplying the calculated yield of these technologies by
the area of copra available in the state or municipality
(Table 1).
According to data from the National Statistical Directory
of Economic Units (Directorio Estadístico Nacional
de Unidades Económicas, DENUE, 2019), in Mexico
the leading companies in coconut oil processing are:
Calahua (Lerma, State of Mexico); A de Coco (Armería,
Colima); San Lucas (Iztacalco, CDMX); Campo Vivo
(Colima, Colima); Soy de Aceite (Zapopan, Jalisco);
DEICOCO (Tecomán, Colima) and ICOSA (Miguel
14 AGROPRODUCTIVIDAD
Agro productividad 14 (4): 11-20. 2021
Hidalgo, CDMX), the first three being
the most important because they
concentrate most of the production.
An installed capacity of between 30
and 21 thousand tons of oil was
estimated for each, depending on
their size. The transformation rate
is .6 tons of oil per ton of copra, a
transformation cost of 28,830 pesos
per ton, which was calculated from
a process of extraction by pressing,
evaporation and filtering.
According to official information,
there are 49 customs offices in
Mexico: 19 on the northern border
and 2 on the southern border,
17 maritime, 11 inland (SNICE,
2020); however, more than 95% of
coconut oil imports transit through
the customs offices located in
Manzanillo (Colima) and Piedras
Negras (Coahuila). The model made
it possible to calculate the quantity
of product, the destination and the
routes to be taken by the imports
derived from the different scenarios
proposed.
To estimate the national demand for
coconut oil, the 31 states and Mexico
Table 1. Main copra producing regions (tons), period 2017.
Producer region Real production Trational production Intensive production Organic production
Campeche 354.57 655.11 831.75 676.51
Chiapas 805.10 3237.90 4110.97 3343.68
Armería 5439.00 20477.84 25999.51 21146.83
Coquimatlán 160.00 602.40 764.83 622.08
Ixtlahuacán 47.00 176.96 224.67 182.74
Tecomán 8794.00 33109.41 42037.08 34191.07
Guerrero 187963.90 314393.69 399167.25 324664.72
Jalisco 1317.64 3034.59 3852.84 3133.73
Michoacán 2872.65 10843.20 13766.98 11197.44
Oaxaca 8772.83 30383.55 38576.21 31376.16
Tabasco 10749.51 47144.50 59856.61 48684.68
Veracruz 1020.26 5677.62 7208.54 5863.10
Total 228296.46 469736.76 596397.26 485082.74
Source: Own elaboration with data from SIAP (2019), FIRA (2019), INIFAP (2019) and information from producers.
City were considered as separate
consumer regions. Apparent
consumption was obtained by
multiplying per capita consumption
by population using official data
from the National Institute of
Statistics and Geography (INEGI) for
2017; an apparent consumption of
222,700.26 tons of coconut oil at
the national level was calculated.
Transportation costs were
calculated, using the distance
in kilometers reported between
supply and demand regions by
the Ministry of Communications
and Transportation (Secretaría de
Comunicaciones y Transporte, SCT,
2019), the costs of diesel, transport
operator, toll booths and transport
insurance. With this information,
the transportation cost per ton
of product between routes was
calculated.
Regional production costs were
calculated for the four types
of production analyzed (real,
traditional, intensive and organic),
obtained by multiplying the
total production of each region
by the cost of producing one
ton of copra. The production
cost per ton reflects the prices
of labor, organic and synthetic
agrochemicals, and the machinery
necessary for the application of
agrochemicals. This information
was compiled and analyzed using
the methodology presented by the
Agro-costs System of the Instituted
Trust in Relation to Agriculture
(Fideicomisos Instituidos en
Relación con la Agricultura, FIRA);
this methodology allows estimating
agricultural production costs
parametrically in a given area or
region under a specific production
technology (SADER, 2020).
Programming the model was
carried out in the mathematical
optimization package LINDO 18.0
(Cunningham and Schrage, 2004),
and three scenarios were established
for each technology: an increase
for each state in the quantity of
coconut oil demanded of 10%, an
increase in copra production of 10%
in each state, and an increase in the
installed capacity of the companies
of 10% for each.
15AGROPRODUCTIVIDAD
Lagunes-Fortiz et al. (2021)
RESULTS AND DISCUSSIONAccording to the table of total revenues from the
market obtained by the LINGO software, the intensive
production mode is the one that generates the largest
profit in all the scenarios (Table 9). Tables 2, 4 and 6
show the result of the quantities shipped from the
copra-producing states to the coconut oil production
plants, the surplus in regional copra production, and the
profit for each production region. It should be noted
that it is natural to expect a negative value in regional
profits, because the model only considers the profit
from the sale of copra and discards income derived
from the sale of byproducts, such as coconut fiber,
coconut shell, among others; the model also does
not consider government economic transfers such as
support and subsidies, which increase the profits of
regional producers. Tables 3, 5 and 7 are the results for
the coconut oil market and show the total shipments
from the producing plants to the consuming states and
the profits they obtain, as well as the amount and cost
of imports. Finally, Table 8 presents the total profits of
each type of production given the scenarios presented.
The results for the base model (where demand and
installed capacity reflect current data), indicate that the
states with the greatest potential for copra distribution
are Guerrero and Tabasco (Table 2). This is due to the
low cost of transporting copra from these states to
the coconut oil producing plants. According to the
base model, if the state of Guerrero increases its copra
production, it would be able to satisfy the demand
of several coconut oil production companies; if this
happens, the states geographically close to Guerrero
(especially Colima and Jalisco) would not be able to
place their production in the market, which would be
counterproductive for them, due to the economic
importance they represent.
Regarding the coconut oil market, the base model (Table
3) shows that the principal brands are the ones that
obtain a higher profit, and Campo Vivo and Soy Aceite
de Coco are the ones that make the least shipments.
It is remarkable that, when analyzing the traditional,
intensive and organic technologies, all companies are
able to produce at their peak, however, the quantities
imported do not change even when there is enough
copra to produce the demanded oil, so it is correct
to assume that this limitation in the industry prevents
the domestic coconut oil market from reaching its
maximum potential.
The results for a scenario where the demand for coconut
oil has a 10% increase at the national level, are very
similar to those of the base model (Table 4). The states
Table 2. Results of the base model for the copra market; shipments and surpluses in tons, earnings in millions of Mexican pesos.
Copra market – Baseline scenario
Region
Real Traditional Intensive Organic
Ship
pin
gs
Pro
fit
Ship
pin
gs
Surp
lus
Pro
fit
Ship
pin
gs
Surp
lus
Pro
fit
Ship
pin
gs
Surp
lus
Pro
fit
Campeche 354.6 1.8 0.0 655.1 3.3 0.0 831.8 4.1 0.0 676.5 4.5
Chiapas 805.1 4.1 0.0 3237.9 16.1 0.0 4111.0 20.4 0.0 3343.7 22.1
Armería 5439.0 25.4 0.0 20477.8 101.8 0.0 25999.5 129.2 0.0 21146.8 139.7
Coquimatlán 160.0 0.7 0.0 602.4 3.0 0.0 764.8 3.8 0.0 622.1 4.1
Ixtlahuacán 47.0 0.2 0.0 177.0 0.9 0.0 224.7 1.1 0.0 182.7 1.2
Tecomán 8794.0 40.9 0.0 33109.4 164.6 0.0 42037.1 208.8 0.0 34191.1 225.9
Guerrero 187963.9 914.7 234522.2 0.0 778.7 221810.1 87856.8 1206.1 232982.0 2182.3 1340.3
Jalisco 1317.6 6.3 0.0 0.0 7.4 0.0 3852.8 19.1 0.0 3133.7 20.7
Michoacán 2872.7 13.6 0.0 9926.5 51.5 0.0 13767.0 68.4 0.0 11197.4 74.0
Oaxaca 8772.8 43.3 0.0 30383.6 151.1 0.0 38576.2 191.7 0.0 31376.2 207.3
Tabasco 10749.5 53.3 47144.5 0.0 122.6 59856.6 0.0 155.4 48684.7 0.0 206.2
Veracruz 1020.3 5.0 0.0 0.0 14.4 0.0 7208.5 35.8 0.0 5863.1 38.7
Total 228296.4 1109.5 281666.7 98569.6 1415.4 281666.7 225230.1 2044.0 281666.7 113915.6 2284.5
Source: Own elaboration with results of the Lingo program.

16 AGROPRODUCTIVIDAD
Agro productividad 14 (4): 11-20. 2021
Table 3. Results of the base model for the coconut oil market; shipments in tons, earnings in millions of Mexican pesos.
Coconut oil market – Baseline Scenario
CompanyReal Traditional Intensive Organic
Shippings Profit Shippings Profit Shippings Profit Shippings Profit
Calahua 30000 5129.61 30000 5129.62 30000 5131.49 30000 5131.49
A De Coco 29978 5122.65 30000 5127.79 30000 5126.47 30000 5126.13
San Lucas 25000 4274.22 25000 4275.32 25000 4272.14 25000 4272.14
Campo Vivo 5000 854.41 21000 3588.66 21000 3588.88 21000 3588.88
Soy Aceite De Coco 5000 855.84 21000 3593.74 21000 3593.69 21000 3593.03
Deicoco 21000 3588.00 21000 3587.93 21000 3589.08 21000 3590.09
Icosa 21000 3592.78 21000 3591.67 21000 3592.99 21000 3592.99
Total 136978 23417.51 169000 28894.73 169000 28894.74 169000 28894.73
Port of entryReal Traditional Intensive Organic
Shippings Cost Shippings Cost Shippings Cost Shippings Cost
Manzanillo 39840.8 565.0 7818.7 110.0 7818.7 110.0 7818.7 110.0
Piedras Negras 45881.6 658.6 45881.6 658.6 45881.6 658.6 45881.6 658.6
Total 85722.4 1223.6 53700.3 768.6 53700.3 768.6 53700.3 768.6
Source: Own elaboration with results of the Lingo program.
Table 4. Results of the model for the scenario with a 10% increase in demand for the copra market; shipments and surpluses in tons, earnings in millions of Mexican pesos.
Copra Market 10% increase in coconut oil demanda
Region
Real Traditional Intensive Organic
Ship
pin
gs
Pro
fit
Ship
pin
gs
Surp
lus
Pro
fit
Ship
pin
gs
Surp
lus
Pro
fit
Ship
pin
gs
Surp
lus
Pro
fit
Campeche 354.6 1.8 0.0 655.1 3.3 0.0 831.8 4.1 0.0 676.5 4.5
Chiapas 805.1 4.1 0.0 3237.9 16.1 0.0 4111.0 20.4 0.0 3343.7 22.1
Armería 5439.0 25.4 0.0 20477.8 101.8 0.0 25999.5 129.2 0.0 21146.8 139.7
Coquimatlán 160.0 0.7 0.0 602.4 3.0 0.0 764.8 3.8 0.0 622.1 4.1
Ixtlahuacán 47.0 0.2 0.0 177.0 0.9 0.0 224.7 1.1 0.0 182.7 1.2
Tecomán 8794.0 41.0 0.0 33109.4 164.6 0.0 42037.1 208.8 0.0 34191.1 225.9
Guerrero 187963.9 910.6 234522.2 79871.5 978.2 221810.1 177357.2 1429.3 232982.0 91682.7 1563.5
Jalisco 1317.6 6.3 0.0 3034.6 15.1 0.0 3852.8 19.1 0.0 3133.7 20.7
Michoacán 2872.7 13.6 0.0 10843.2 53.9 0.0 13767.0 68.4 0.0 11197.4 74.0
Oaxaca 8772.8 43.3 0.0 30383.6 151.1 0.0 38576.2 191.7 0.0 31376.2 207.3
Tabasco 10749.5 53.3 47144.5 0.0 122.6 59856.6 0.0 155.4 48684.7 0.0 206.2
Veracruz 1020.3 5.0 0.0 5677.6 28.2 0.0 7208.5 35.8 0.0 5863.1 38.7
Total 228296.4 1105.5 281666.7 188070.1 1638.8 281666.7 314730.6 2267.2 281666.7 203416.1 2507.7
Source: Own elaboration with results of the Lingo program.
of Guerrero and Tabasco turned out to be those that
have priority in the distribution of copra according to the
model; it is observed that shipments from the producing
states to the companies did not increase despite the
increase in demand for coconut oil, due to the limited
capacity in coconut processing.
For the coconut oil market, a 10% increase in the
demand for this product can be observed according to
the model that all plants would work at their maximum
capacity; however, domestic production would not
be sufficient to meet this increase in demand, so it
would be necessary to increase imports of coconut
17AGROPRODUCTIVIDAD
Lagunes-Fortiz et al. (2021)
oil, reducing the potential gain of the market (Table 5).
When compared to the previous situation, the model
indicates that an increase in the demand for coconut
oil is detrimental in all scenarios, despite the increase in
copra production resulting from the application of more
efficient techniques.
According to the results of the model, with a 10%
increase in the production capacity of coconut oil for
Table 5. Results of the model for the scenario with a 10% increase in demand for the coconut oil market; shipments in tons, earnings in millions of Mexican pesos.
Coconut oil market – 10% increase in coconut oil demand
CompanyReal Traditional Intensive Organic
Shippings Profit Shippings Profit Shippings Profit Shippings Profit
Calahua 30000.00 5130 30000 5131.16 30000 5131.16 30000 5131.16
A De Coco 29977.86 5122 30000 5126.07 30000 5126.07 30000 5126.07
San Lucas 25000.00 4279 25000 4271.98 25000 4271.98 25000 4271.98
Campo Vivo 5000.00 854 21000 3588.89 21000 3588.89 21000 3588.89
Soy Aceite De Coco 5000.00 856 21000 3593.09 21000 3593.74 21000 3593.09
Deicoco 21000.00 3588 21000 3589.69 21000 3589.03 21000 3589.69
Icosa 21000.00 3588 21000 3593.14 21000 3593.14 21000 3593.14
TOTAL 136978 23417 169000 28894 169000 28894 169000 28894
Port of entryReal Traditional Intensive Organic
Shippings Cost Shippings Cost Shippings Cost Shippings Cost
Manzanillo 44659.4 633.6 12637.2 178.5 12637.2 178.5 12637.2 178.5
Piedras Negras 47132.0 676.6 47132.0 676.6 47132.0 676.6 47132.0 676.6
TOTAL 91791.3 1310.2 59769.2 855.1 59769.2 855.1 59769.2 855.1
Source: Own elaboration with results of the Lingo program.
Table 6. Results of the model for the scenario with a 10% increase in the productive capacity for the copra market; shipments and surpluses in tons, earnings in millions of Mexican pesos.
Copra market 10% productive capacity increase by the coconut oil industry
RegionReal Traditional Intensive Organic
Shippings Profit Shippings Surplus Profit Shippings Surplus Profit Shippings Surplus Profit
Campeche 354.6 1.8 0.0 655.1 3.26 0.0 831.8 4.1 0.0 676.5 4.5
Chiapas 805.1 4.1 0.0 3237.9 16.10 0.0 4111.0 20.4 0.0 3343.7 22.1
Armería 5439.0 25.4 0.0 20477.8 101.82 0.0 25999.5 129.2 0.0 21146.8 139.7
Coquimatlán 160.0 0.7 0.0 602.4 3.00 0.0 764.8 3.8 0.0 622.1 4.1
Ixtlahuacán 47.0 0.2 0.0 177.0 0.88 0.0 224.7 1.1 0.0 182.7 1.2
Tecomán 8794.0 40.9 0.0 33109.4 164.62 0.0 42037.1 208.8 0.0 34191.1 225.9
Guerrero 187963.9 914.7 314393.7 0.0 778.66 311310.5 87856.8 1206.1 322482.4 2182.3 1340.3
Jalisco 1317.6 6.3 3034.6 0.0 7.42 0.0 3852.8 19.1 0.0 3133.7 20.7
Michoacán 2872.7 13.6 916.7 9926.5 51.55 0.0 13767.0 68.4 0.0 11197.4 74.0
Oaxaca 8772.8 43.3 0.0 30383.6 151.07 0.0 38576.2 191.7 0.0 31376.2 207.3
Tabasco 10749.5 53.3 47144.5 0.0 122.60 59856.6 0.0 155.4 48684.7 0.0 206.2
Veracruz 1020.3 5.0 5677.6 0.0 14.45 0.0 7208.5 35.8 0.0 5863.1 38.7
TOTAL 228296.4 1109.5 371167.1 98569.6 1415.4 371167.1 225230.1 2044.0 371167.1 113915.6 2284.5
Source: Own elaboration with results of the Lingo program.
each company in the market, the results show that:
for the real production where the current situation is
reflected, the results are the same as for Table 3. In the
case of traditional technology, copra-producing states
near the coconut oil companies manage to distribute
part of their production, these being the states of Jalisco,
Michoacán and Veracruz, because the states of Guerrero
and Tabasco are unable to meet the demand for copra;
for the other two technologies, it is observed that the
18 AGROPRODUCTIVIDAD
Agro productividad 14 (4): 11-20. 2021
states of Guerrero and Tabasco
alone are capable of meeting this
demand (Table 6).
Finally, for the coconut oil market,
with a 10% increase in the production
capacity of domestic companies, it
is observed that for the scenarios
where copra production increases in
the states (traditional, intensive and
organic production), the plants are
capable of supplying the domestic
market completely, eliminating the
need to import coconut oil to satisfy
domestic demand. This has resulted
in an improvement of the situation
of the copra and coconut oil market
as a whole (Table 7).
When analyzing the total market
revenues for each scenario
suggested obtained by the LINGO
software (Table 8), we observe
that the highest value is reached
when intensive production is used
together with an increase in the
installed capacity of the companies;
and the lowest when demand
Table 7. Model results for the scenario with a 10% increase in the productive capacity for the coconut oil market; shipments in tons, earnings in millions of Mexican pesos.
Coconut oil market - 10% productive capacity increase by the coconut oil industry
CompanyReal Traditional Intensive Organic
Shippings Profit Shippings Profit Shippings Profit Shippings Profit
Calahua 40000 6844.40 40000 6844.40 40000 6844.40 40000 6844.40
A De Coco 5000 854.46 40000 6835.19 40000 6835.19 40000 6835.19
San Lucas 35000 5983.04 35000 5984.56 35000 5984.56 35000 5984.56
Campo Vivo 5000 854.14 35000 5976.75 35000 5976.75 35000 5976.75
Soy Aceite De Coco 5000 855.84 22700 3883.56 22700 3883.56 22700 3883.56
Deicoco 21978 3755.70 25000 4270.58 25000 4270.58 25000 4270.58
Icosa 25000 4277.38 25000 4275.87 25000 4275.87 25000 4275.87
TOTAL 136978 23425 222700 38071 222700 38071 222700 38071
Port of entryReal Traditional Intensive Organic
Shippings Cost Shippings Cost Shippings Cost Shippings Cost
Manzanillo 39840.8 565.0 0.0 0.0 0.0 0.0 0.0 0.0
Piedras Negras 45881.6 658.6 0.0 0.0 0.0 0.0 0.0 0.0
TOTAL 85722.4 1223.6 0.0 0.0 0.0 0.0 0.0 0.0
Source: Own elaboration with results of the Lingo program.
Table 8. Total profit of the copra and coconut oil market; in millions of Mexican pesos.
Copra and coconut oil industry markets profits
Baseline scenario - Real production 22 504.83
Baseline scenario - Traditional production 29 254.73
Baseline scenario - Intensive production 29 259.47
Baseline scenario - Organic production 28 794.97
Increase coconut oil demand - Real Production Increase 21 294.63
Increase coconut oil demand - Traditional production 29 167.55
Increase coconut oil demand - Intensive production 29 172.29
Increase coconut oil demand - Organic production 28 707.79
Productive capacity increase - Real production 22 508.3
Productive capacity increase - Traditional production 39 546.34
Productive capacity increase - Intensive production 39 559.5
Productive capacity increase - Organic production 38 948.42
Source: Own elaboration with results of the Lingo program.
increases under a base production. This is due to the fact that a greater
amount of imports is needed to satisfy the demand, which implies a higher
cost in its import and distribution. It is also notable that the best results are
obtained when the productive capacity is increased, with the exception of
the baseline situation, which does not show significant improvement.
CONCLUSIONS The model determined that the most suitable states for copra distribution
are Guerrero and Tabasco, due to their low transportation costs toward
the coconut oil production plants; this is true for all scenarios and types of
production.
19AGROPRODUCTIVIDAD
Lagunes-Fortiz et al. (2021)
When comparing the results of the profit scenarios, a
higher profit is obtained when the productive capacity
of the industry is increased, and this is true for three
scenarios suggested (base scenario, 10% increase in
the demand for coconut oil, and 10% increase in the
productive capacity of the national oil-producing plants).
Therefore, the most efficient policies for maximizing
market profit are technology transfer policies, focused
on increasing the productive capacity of industries,
either through modernization or the creation of new
companies.
When observing the base scenarios and those where the
demand for coconut oil increases, regardless of the type
of production (real, traditional, intensive and organic),
it is possible to note the creation of copra surpluses in
most states, with the exception of the states of Guerrero
and Tabasco. According to the results of the model, it
is concluded that policies that result in an increase in
copra production at the farm level will have as a direct
consequence the creation of producer surpluses in most
copra-producing regions, if conditions are not created to
help expand the production capacity of the coconut oil
industry; if an alternative market is not found, this surplus
would cause a drop in copra prices at the national level,
reducing the revenues of the copra sector in most of the
states dedicated to this activity.
REFERENCESAyllon-Benítez, J. C., Omaña-Silvestre, J. M., Sangerman-Jarquín, D.
Ma., Garza-Bueno, L E., Quintero-Ramírez, J. M., & González-
Razo, F. de J. (2015). Modelo de transporte en méxico para
la minimización de costos de distribución de tuna (Opuntia
spp.) en fresco. Revista Mexicana de Ciencias Agrícolas, 6(7),
1615-1628.
Badole, C. M., Jain, R., Rathore, A. P, & Nepal, B. (2012). Research and
opportunities in supply chain modeling: a review. International
Journal of Supply Chain Management 1(3), 63-86.
CONACYT. (2015). El Panorama Mundial de la Industria del Cocotero.
Consejo Nacional de Ciencia y Tecnología-Cámara de
Diputados. Consultado el 30 de junio de 2020, disponible
en linea en http://www3.diputados.gob.mx/camara/content/
download/332320/1181428/file/C%20Oropeza%20-%20
Panorama%20Mundial%20Cocotero.pdf
Cunningham K., & Schrage L. (2004). The Lingo algebraic modeling
language. In: Kallrath J. (18), Modelling Languages in
Mathematical Optimization. Applied Optimization, 88(1).
Springer, Boston, Massachusetts.
DENUE. (2019). Directorio Estadístico Nacional de Unidades
Económicas. Instituto NAcional de Estadistica y Geografia.
Consultado el 30 de junio de 2020, disponible en https://www.
inegi.org.mx/app/mapa/denue/default.aspx
FIRA. (2020). Agrocostos. Fideicomisos Instituidos en Relacion con la
Agricultura, Consultado el 30 de junio de 2020, disponible en
https://www.fira.gob.mx/Nd/Agrocostos.jsp
FORDECYT. (2018). Impulso a la cadena de valor del cocotero para
incrementar su competitividad y contribuir al desarrollo
socioeconómico en la región Pacífico Sur y otros estados
productores. Fondo Institucional de Fomento Regional
para el Desarrollo Científico, Tecnológico y de Innovación.
Consultado el 30 de junio de 2020, disponible en https://
www.conacyt.gob.mx
García-Salazar J. A., Williams G. W., & Javier-Malaga J. E. (2015). Efectos
del TLCAN sobre las exportaciones de tomate de México a los
Estados Unidos. Revista Fitotecnia Mexicana 28(4), 299-309.
Granados-Sánchez D., & Lopéz-Ríos G.F. (2002). Manejo de la palma
de coco (Cocos nucifera L.) en México. Revista Chapingo erie
Ciencias Forestales y del Ambiente 8(1). 39-48.
Granillo-Macías R., González-Hernández I. J., Santana-Robles F.,
& Martínez-Flores, J. L. (2019). Estrategia de centros de
consolidación para la distribución de tuna en México. Revista
Mexicana de Ciencias Agrícolas 10(2), 265-276.
INIFAP. (2015). Instituto Nacional de Investigaciones Forestales,
Agrícolas y Pecuarias. Infraestructura para la Producción y
la Comercialización en el Desarrollo Regional- Programa
Estratégico Para Impulsar la Cadena de Valor del Cocotero,
PRO-COCO. Consultado el 30 de junio de 2020, dispoible en
https://www.gob.mx/inifap
INIFAP. (2019). Secretaría de Agricultura y Desarrollo Rural. Instituto
Nacional de Investigaciones Forestales, Agrícolas y Pecuarias.
Consultado el 30 de junio de 2020, dispoible en https://www.
gob.mx/inifap
Rebollar R. S., García-Salazar J. A., & Rodríguez-Licea G. (2006). Análisis
espacial e intertemporal sobre el almacenamiento del sorgo en
México. Ciencia Ergo Sum 12(3). 245-254.
SADER. (2020). Gobierno de México. Fideicomisos Instituidos en
Relación con la Agricultura. Consultado el 4 de mayo de 2020,
dispoible en https://www.gob.mx/fira/documentos/sistema-
de-agrocostos-fira
SAGARPA. (2010). Secretaría de Agricultura, Ganadería, Desarrollo
Rural, Pesca y Alimentación. Programa Estratégico para el
Desarrollo Rural Sustentable de La Región Sur Sureste de
México-Trópico Húmedo. Consultado el 1 de junio de 2020,
dispoible en https://www.gob.mx/agricultura
SAGARPA. (2017). Secretaría de Agricultura, Ganadería, Desarrollo
Rural, Pesca y Alimentación. Planeación Agrícola Nacional,
Palma de Coco Mexicana. Consultado el 1 de junio de 2020,
dispoible en https://www.gob.mx/cms/uploads/attachment/
file/257082/Potencial-Palma_de_Coco.pdf
SCT. (2019). Rutas Punto a Punto. Secretaría de Comunicaciones y
Transportes. Consultado el 15 de junio de 2020, dispobinle en
http://app.sct.gob.mx/sibuac_internet/ControllerUI?action=c
mdEscogeRuta
SIAP. (2019). Secretaría de Agricultura y Desarrollo Rural. Servicio de
Información Agroalimentaria y Pesquera. Consultado el 11 de
junio de 2020, disponible en https://www.gob.mx/siap
SIAVI. (2020). Secretaria de Economía. Sistema de Información
Arancelaria Vía Internet. Consultado el 30 de junio de 2020,
dispoible en http://siavi.economia.gob.mx/
20 AGROPRODUCTIVIDAD
Agro productividad 14 (4): 11-20. 2021
SNICE. (2020). Secretaria de Economía. Servicio Nacional de Información de
Comercio Exterior. Consultado el 15 de junio de 2020, dispoible en
https://www.snice.gob.mx/
Takayama T, G G Judge. (1971). Spatial and Temporal Price and Allocation
Models. Amsterdam, Holland. North-Holland, Publishing Company.
528.
Torres-Sandoval, C., & García-Salzar, J. A. (2008). Aplicación de un modelo
de equilibrio espacial para determinar la estructura del mercado de
frijol en México. Revista Agrociencia, 42(6), 731-740 .
USDA. (2019). Oilseeds: World Markets and Trade. United States Department
of Agriculture. Consultado el 30 de junio de 2020, disponible en
https://usda.library.cornell.edu/?locale=en
AGROPRODUCTIVIDAD
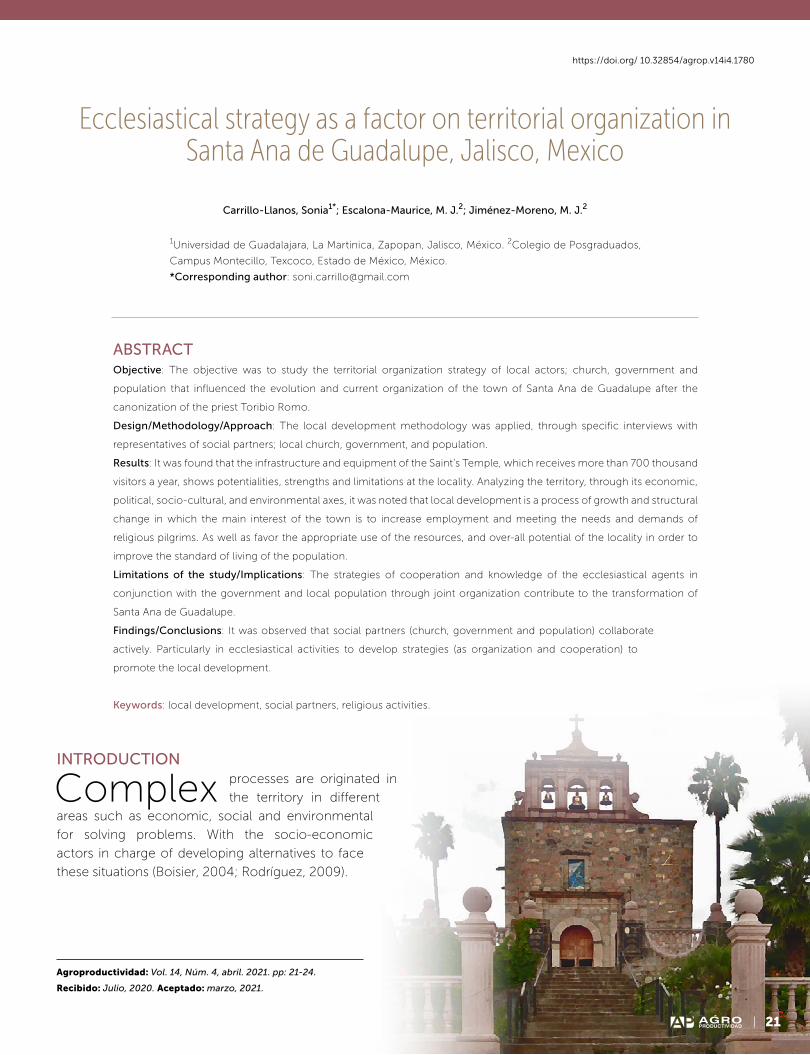
21AGROPRODUCTIVIDAD
https://doi.org/ 10.32854/agrop.v14i4.1780
Agroproductividad: Vol. 14, Núm. 4, abril. 2021. pp: 21-24.
Recibido: Julio, 2020. Aceptado: marzo, 2021.
Ecclesiastical strategy as a factor on territorial organization in Santa Ana de Guadalupe, Jalisco, Mexico
Carrillo-Llanos, Sonia1*; Escalona-Maurice, M. J.2; Jiménez-Moreno, M. J.2
1Universidad de Guadalajara, La Martinica, Zapopan, Jalisco, México. 2Colegio de Posgraduados,
Campus Montecillo, Texcoco, Estado de México, México.
*Corresponding author: [email protected]
ABSTRACTObjective: The objective was to study the territorial organization strategy of local actors; church, government and
population that influenced the evolution and current organization of the town of Santa Ana de Guadalupe after the
canonization of the priest Toribio Romo.
Design/Methodology/Approach: The local development methodology was applied, through specific interviews with
representatives of social partners; local church, government, and population.
Results: It was found that the infrastructure and equipment of the Saint’s Temple, which receives more than 700 thousand
visitors a year, shows potentialities, strengths and limitations at the locality. Analyzing the territory, through its economic,
political, socio-cultural, and environmental axes, it was noted that local development is a process of growth and structural
change in which the main interest of the town is to increase employment and meeting the needs and demands of
religious pilgrims. As well as favor the appropriate use of the resources, and over-all potential of the locality in order to
improve the standard of living of the population.
Limitations of the study/Implications: The strategies of cooperation and knowledge of the ecclesiastical agents in
conjunction with the government and local population through joint organization contribute to the transformation of
Santa Ana de Guadalupe.
Findings/Conclusions: It was observed that social partners (church, government and population) collaborate
actively. Particularly in ecclesiastical activities to develop strategies (as organization and cooperation) to
promote the local development.
Keywords: local development, social partners, religious activities.
INTRODUCTION
Complex processes are originated in
the territory in different
areas such as economic, social and environmental
for solving problems. With the socio-economic
actors in charge of developing alternatives to face
these situations (Boisier, 2004; Rodríguez, 2009).
21AGROPRODUCTIVIDAD
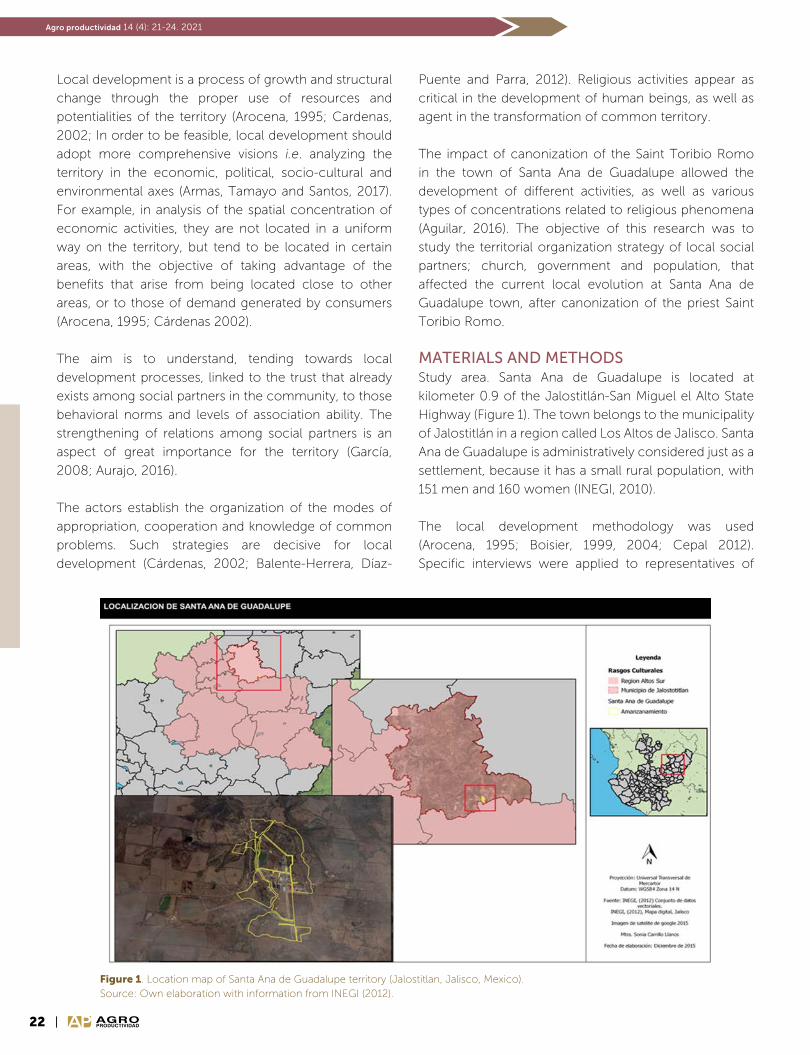
22 AGROPRODUCTIVIDAD
Agro productividad 14 (4): 21-24. 2021
Local development is a process of growth and structural
change through the proper use of resources and
potentialities of the territory (Arocena, 1995; Cardenas,
2002; In order to be feasible, local development should
adopt more comprehensive visions i.e. analyzing the
territory in the economic, political, socio-cultural and
environmental axes (Armas, Tamayo and Santos, 2017).
For example, in analysis of the spatial concentration of
economic activities, they are not located in a uniform
way on the territory, but tend to be located in certain
areas, with the objective of taking advantage of the
benefits that arise from being located close to other
areas, or to those of demand generated by consumers
(Arocena, 1995; Cárdenas 2002).
The aim is to understand, tending towards local
development processes, linked to the trust that already
exists among social partners in the community, to those
behavioral norms and levels of association ability. The
strengthening of relations among social partners is an
aspect of great importance for the territory (García,
2008; Aurajo, 2016).
The actors establish the organization of the modes of
appropriation, cooperation and knowledge of common
problems. Such strategies are decisive for local
development (Cárdenas, 2002; Balente-Herrera, Díaz-
Puente and Parra, 2012). Religious activities appear as
critical in the development of human beings, as well as
agent in the transformation of common territory.
The impact of canonization of the Saint Toribio Romo
in the town of Santa Ana de Guadalupe allowed the
development of different activities, as well as various
types of concentrations related to religious phenomena
(Aguilar, 2016). The objective of this research was to
study the territorial organization strategy of local social
partners; church, government and population, that
affected the current local evolution at Santa Ana de
Guadalupe town, after canonization of the priest Saint
Toribio Romo.
MATERIALS AND METHODSStudy area. Santa Ana de Guadalupe is located at
kilometer 0.9 of the Jalostitlán-San Miguel el Alto State
Highway (Figure 1). The town belongs to the municipality
of Jalostitlán in a region called Los Altos de Jalisco. Santa
Ana de Guadalupe is administratively considered just as a
settlement, because it has a small rural population, with
151 men and 160 women (INEGI, 2010).
The local development methodology was used
(Arocena, 1995; Boisier, 1999, 2004; Cepal 2012).
Specific interviews were applied to representatives of
Figure 1. Location map of Santa Ana de Guadalupe territory (Jalostitlan, Jalisco, Mexico).Source: Own elaboration with information from INEGI (2012).
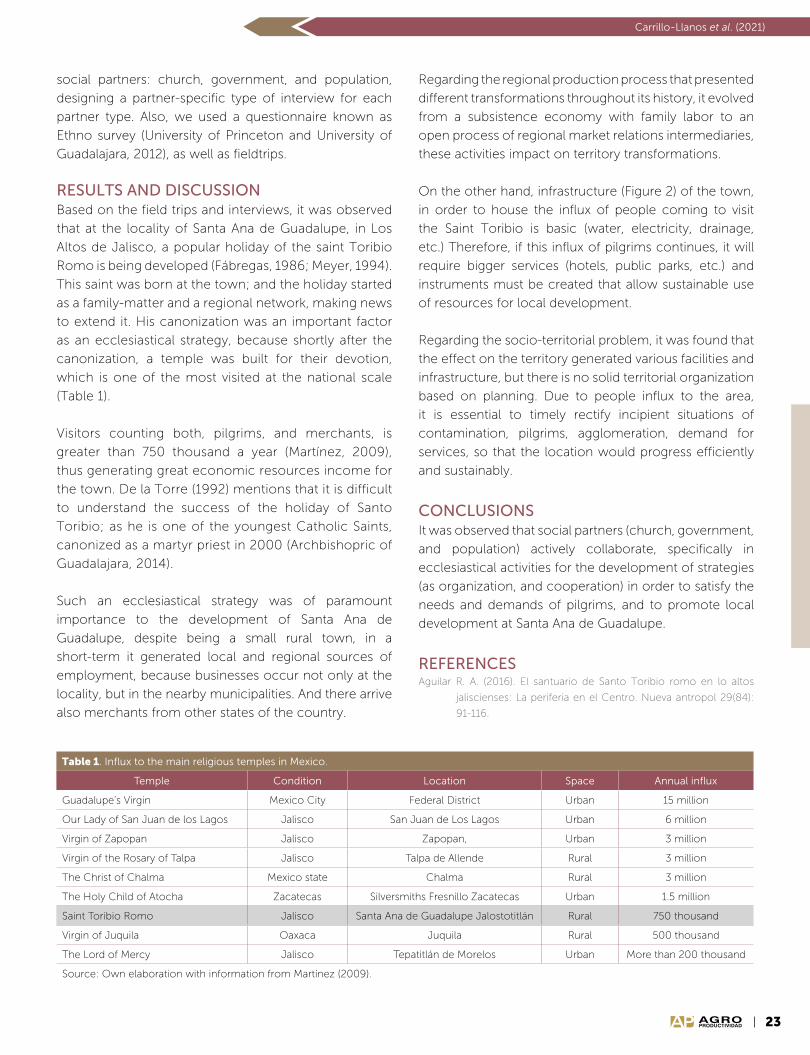
23AGROPRODUCTIVIDAD
Carrillo-Llanos et al. (2021)
social partners: church, government, and population,
designing a partner-specific type of interview for each
partner type. Also, we used a questionnaire known as
Ethno survey (University of Princeton and University of
Guadalajara, 2012), as well as fieldtrips.
RESULTS AND DISCUSSIONBased on the field trips and interviews, it was observed
that at the locality of Santa Ana de Guadalupe, in Los
Altos de Jalisco, a popular holiday of the saint Toribio
Romo is being developed (Fábregas, 1986; Meyer, 1994).
This saint was born at the town; and the holiday started
as a family-matter and a regional network, making news
to extend it. His canonization was an important factor
as an ecclesiastical strategy, because shortly after the
canonization, a temple was built for their devotion,
which is one of the most visited at the national scale
(Table 1).
Visitors counting both, pilgrims, and merchants, is
greater than 750 thousand a year (Martínez, 2009),
thus generating great economic resources income for
the town. De la Torre (1992) mentions that it is difficult
to understand the success of the holiday of Santo
Toribio; as he is one of the youngest Catholic Saints,
canonized as a martyr priest in 2000 (Archbishopric of
Guadalajara, 2014).
Such an ecclesiastical strategy was of paramount
importance to the development of Santa Ana de
Guadalupe, despite being a small rural town, in a
short-term it generated local and regional sources of
employment, because businesses occur not only at the
locality, but in the nearby municipalities. And there arrive
also merchants from other states of the country.
Regarding the regional production process that presented
different transformations throughout its history, it evolved
from a subsistence economy with family labor to an
open process of regional market relations intermediaries,
these activities impact on territory transformations.
On the other hand, infrastructure (Figure 2) of the town,
in order to house the influx of people coming to visit
the Saint Toribio is basic (water, electricity, drainage,
etc.) Therefore, if this influx of pilgrims continues, it will
require bigger services (hotels, public parks, etc.) and
instruments must be created that allow sustainable use
of resources for local development.
Regarding the socio-territorial problem, it was found that
the effect on the territory generated various facilities and
infrastructure, but there is no solid territorial organization
based on planning. Due to people influx to the area,
it is essential to timely rectify incipient situations of
contamination, pilgrims, agglomeration, demand for
services, so that the location would progress efficiently
and sustainably.
CONCLUSIONSIt was observed that social partners (church, government,
and population) actively collaborate, specifically in
ecclesiastical activities for the development of strategies
(as organization, and cooperation) in order to satisfy the
needs and demands of pilgrims, and to promote local
development at Santa Ana de Guadalupe.
REFERENCESAguilar R. A. (2016). El santuario de Santo Toribio romo en lo altos
jaliscienses: La periferia en el Centro. Nueva antropol 29(84):
91-116.
Table 1. Influx to the main religious temples in Mexico.
Temple Condition Location Space Annual influx
Guadalupe’s Virgin Mexico City Federal District Urban 15 million
Our Lady of San Juan de los Lagos Jalisco San Juan de Los Lagos Urban 6 million
Virgin of Zapopan Jalisco Zapopan, Urban 3 million
Virgin of the Rosary of Talpa Jalisco Talpa de Allende Rural 3 million
The Christ of Chalma Mexico state Chalma Rural 3 million
The Holy Child of Atocha Zacatecas Silversmiths Fresnillo Zacatecas Urban 1.5 million
Saint Toribio Romo Jalisco Santa Ana de Guadalupe Jalostotitlán Rural 750 thousand
Virgin of Juquila Oaxaca Juquila Rural 500 thousand
The Lord of Mercy Jalisco Tepatitlán de Morelos Urban More than 200 thousand
Source: Own elaboration with information from Martínez (2009).
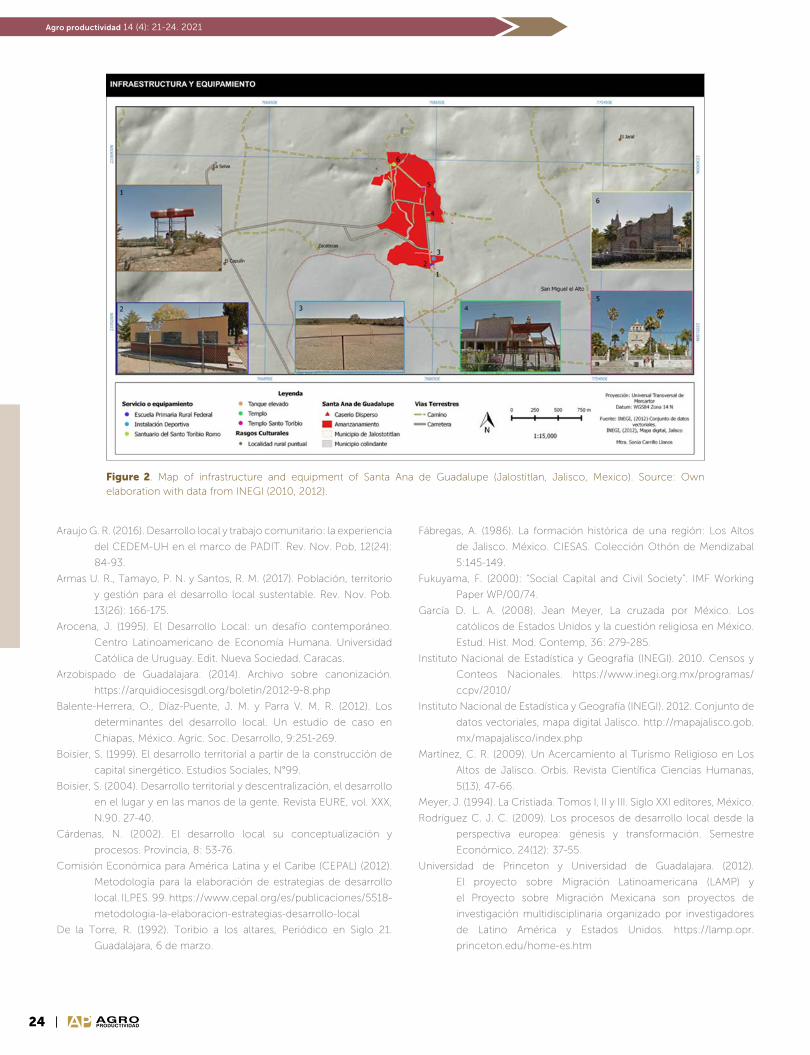
24 AGROPRODUCTIVIDAD
Agro productividad 14 (4): 21-24. 2021
Araujo G. R. (2016). Desarrollo local y trabajo comunitario: la experiencia
del CEDEM-UH en el marco de PADIT. Rev. Nov. Pob, 12(24):
84-93.
Armas U. R., Tamayo, P. N. y Santos, R. M. (2017). Población, territorio
y gestión para el desarrollo local sustentable. Rev. Nov. Pob.
13(26): 166-175.
Arocena, J. (1995). El Desarrollo Local: un desafío contemporáneo.
Centro Latinoamericano de Economía Humana. Universidad
Católica de Uruguay. Edit. Nueva Sociedad. Caracas.
Arzobispado de Guadalajara. (2014). Archivo sobre canonización.
https://arquidiocesisgdl.org/boletin/2012-9-8.php
Balente-Herrera, O., Díaz-Puente, J. M. y Parra V. M. R. (2012). Los
determinantes del desarrollo local. Un estudio de caso en
Chiapas, México. Agric. Soc. Desarrollo, 9:251-269.
Boisier, S. (1999). El desarrollo territorial a partir de la construcción de
capital sinergético. Estudios Sociales, N°99.
Boisier, S. (2004). Desarrollo territorial y descentralización, el desarrollo
en el lugar y en las manos de la gente. Revista EURE, vol. XXX,
N.90. 27-40.
Cárdenas, N. (2002). El desarrollo local su conceptualización y
procesos. Provincia, 8: 53-76.
Comisión Económica para América Latina y el Caribe (CEPAL) (2012).
Metodología para la elaboración de estrategias de desarrollo
local. ILPES. 99. https://www.cepal.org/es/publicaciones/5518-
metodologia-la-elaboracion-estrategias-desarrollo-local
De la Torre, R. (1992). Toribio a los altares, Periódico en Siglo 21.
Guadalajara, 6 de marzo.
Figure 2. Map of infrastructure and equipment of Santa Ana de Guadalupe (Jalostitlan, Jalisco, Mexico). Source: Own elaboration with data from INEGI (2010, 2012).
Fábregas, A. (1986). La formación histórica de una región: Los Altos
de Jalisco. México. CIESAS. Colección Othón de Mendizabal
5:145-149.
Fukuyama, F. (2000): “Social Capital and Civil Society”. IMF Working
Paper WP/00/74.
García D. L. A. (2008). Jean Meyer, La cruzada por México. Los
católicos de Estados Unidos y la cuestión religiosa en México.
Estud. Hist. Mod. Contemp, 36: 279-285.
Instituto Nacional de Estadística y Geografía (INEGI). 2010. Censos y
Conteos Nacionales. https://www.inegi.org.mx/programas/
ccpv/2010/
Instituto Nacional de Estadística y Geografía (INEGI). 2012. Conjunto de
datos vectoriales, mapa digital Jalisco. http://mapajalisco.gob.
mx/mapajalisco/index.php
Martínez, C. R. (2009). Un Acercamiento al Turismo Religioso en Los
Altos de Jalisco. Orbis. Revista Científica Ciencias Humanas,
5(13), 47-66.
Meyer, J. (1994). La Cristiada. Tomos I, II y III. Siglo XXI editores, México.
Rodríguez C. J. C. (2009). Los procesos de desarrollo local desde la
perspectiva europea: génesis y transformación. Semestre
Económico, 24(12): 37-55.
Universidad de Princeton y Universidad de Guadalajara. (2012).
El proyecto sobre Migración Latinoamericana (LAMP) y
el Proyecto sobre Migración Mexicana son proyectos de
investigación multidisciplinaria organizado por investigadores
de Latino América y Estados Unidos. https://lamp.opr.
princeton.edu/home-es.htm

25AGROPRODUCTIVIDAD
https://doi.org/10.32854/agrop.v14i4.1836
Agroproductividad: Vol. 14, Núm. 4, abril. 2021. pp: 25-31.
Recibido: septiembre, 2020. Aceptado: marzo, 2021.
Conservation of the Tropical Rainforest in the Usumacinta Canyon Flora and Fauna Protection Area in Mexico
Palomeque-De la Cruz, Miguel Ángel1; Ruiz-Acosta, Silvia del Carmen2; Sánchez, Alberto J;
Ramos-Reyes, Rodimiro3; Galindo-Alcántara, Adalberto1
1Universidad Juárez Autónoma de Tabasco. División Académica de Ciencias Biológicas.
Villahermosa, Tabasco, México. 2Tecnológico Nacional de México. Instituto Tecnológico
de la Zona Olmeca, Ocuiltzapotlán, Tabasco, México. 3El Colegio de la Frontera Sur Campus
Villahermosa. Ranchería Guineo 2da Sección, Tabasco, México.
*Corresponding author: [email protected]
ABSTRACTObjective: To study the conservation status of the tropical rainforest in the “Cañón del Usumacinta” Flora and Fauna
Protection Area in Mexico, through an analysis of the change in land use and vegetation (1997, 2009 and 2016).
Design/Methodology/Approach: Vegetation and land use shapefiles at 1:250,000 scale (national continuum)
corresponding to 1997 (series I), 2009 (series IV), and 2016 (series VI) were downloaded. Finally, a spatial analysis was
generated with calculation of exchange rates, using the Land Change Modeler between 1997-2009 and 2009-2016.
Results: During 1997-2009, the tropical rainforest occupied 31.2% and the greatest impact of the period seen was a
change rate of 7.4%. Subsequently, between 2009 and 2016 there was a great decrease in the land use change rate in the
forest (0.8%), due to its decree as a federal Protected Area in 2008, as well as natural regeneration and the promotion of
ecological restoration programs.
Study Limitations/Implications: Absence of geographic variables to analyze factors driving change in land use.
Conclusions: It is essential to promote the sustainable management of the Usumacinta Canyon based on what is
established in the land use planning program and the management plan, and to redouble efforts to implement actions
for restoring ecosystem services and the continuous monitoring of change in land use.
Keywords: Biological conservation; Protected areas; High Evergreen Forest; Territorial Ecological Planning.
INTRODUCTION
The Usumacinta Canyon Flora and Fauna Protection Area contains unique biotic
characteristics, as it is the entrance to the Petén department
of Guatemala and to the Mesoamerican Biological Corridor, which spans from Mexico to Central America and
constitutes the second most extensive mass of tropical rainforest after the Amazon (Arriaga et al., 2000; DOF, 2008;
25AGROPRODUCTIVIDAD
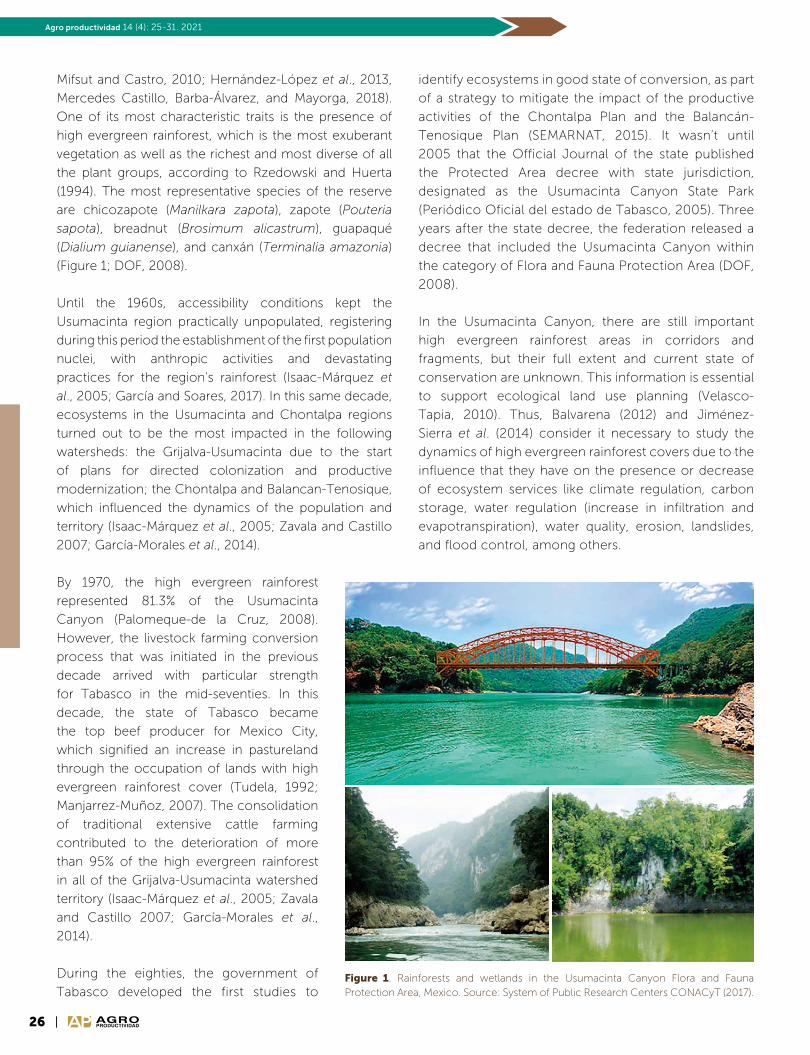
26 AGROPRODUCTIVIDAD
Agro productividad 14 (4): 25-31. 2021
Mifsut and Castro, 2010; Hernández-López et al., 2013,
Mercedes Castillo, Barba-Álvarez, and Mayorga, 2018).
One of its most characteristic traits is the presence of
high evergreen rainforest, which is the most exuberant
vegetation as well as the richest and most diverse of all
the plant groups, according to Rzedowski and Huerta
(1994). The most representative species of the reserve
are chicozapote (Manilkara zapota), zapote (Pouteria
sapota), breadnut (Brosimum alicastrum), guapaqué
(Dialium guianense), and canxán (Terminalia amazonia)
(Figure 1; DOF, 2008).
Until the 1960s, accessibility conditions kept the
Usumacinta region practically unpopulated, registering
during this period the establishment of the first population
nuclei, with anthropic activities and devastating
practices for the region’s rainforest (Isaac-Márquez et
al., 2005; García and Soares, 2017). In this same decade,
ecosystems in the Usumacinta and Chontalpa regions
turned out to be the most impacted in the following
watersheds: the Grijalva-Usumacinta due to the start
of plans for directed colonization and productive
modernization; the Chontalpa and Balancan-Tenosique,
which influenced the dynamics of the population and
territory (Isaac-Márquez et al., 2005; Zavala and Castillo
2007; García-Morales et al., 2014).
By 1970, the high evergreen rainforest
represented 81.3% of the Usumacinta
Canyon (Palomeque-de la Cruz, 2008).
However, the livestock farming conversion
process that was initiated in the previous
decade arrived with particular strength
for Tabasco in the mid-seventies. In this
decade, the state of Tabasco became
the top beef producer for Mexico City,
which signified an increase in pastureland
through the occupation of lands with high
evergreen rainforest cover (Tudela, 1992;
Manjarrez-Muñoz, 2007). The consolidation
of traditional extensive cattle farming
contributed to the deterioration of more
than 95% of the high evergreen rainforest
in all of the Grijalva-Usumacinta watershed
territory (Isaac-Márquez et al., 2005; Zavala
and Castillo 2007; García-Morales et al.,
2014).
During the eighties, the government of
Tabasco developed the first studies to
identify ecosystems in good state of conversion, as part
of a strategy to mitigate the impact of the productive
activities of the Chontalpa Plan and the Balancán-
Tenosique Plan (SEMARNAT, 2015). It wasn’t until
2005 that the Official Journal of the state published
the Protected Area decree with state jurisdiction,
designated as the Usumacinta Canyon State Park
(Periódico Oficial del estado de Tabasco, 2005). Three
years after the state decree, the federation released a
decree that included the Usumacinta Canyon within
the category of Flora and Fauna Protection Area (DOF,
2008).
In the Usumacinta Canyon, there are still important
high evergreen rainforest areas in corridors and
fragments, but their full extent and current state of
conservation are unknown. This information is essential
to support ecological land use planning (Velasco-
Tapia, 2010). Thus, Balvarena (2012) and Jiménez-
Sierra et al. (2014) consider it necessary to study the
dynamics of high evergreen rainforest covers due to the
influence that they have on the presence or decrease
of ecosystem services like climate regulation, carbon
storage, water regulation (increase in infiltration and
evapotranspiration), water quality, erosion, landslides,
and flood control, among others.
Figure 1. Rainforests and wetlands in the Usumacinta Canyon Flora and Fauna Protection Area, Mexico. Source: System of Public Research Centers CONACyT (2017).
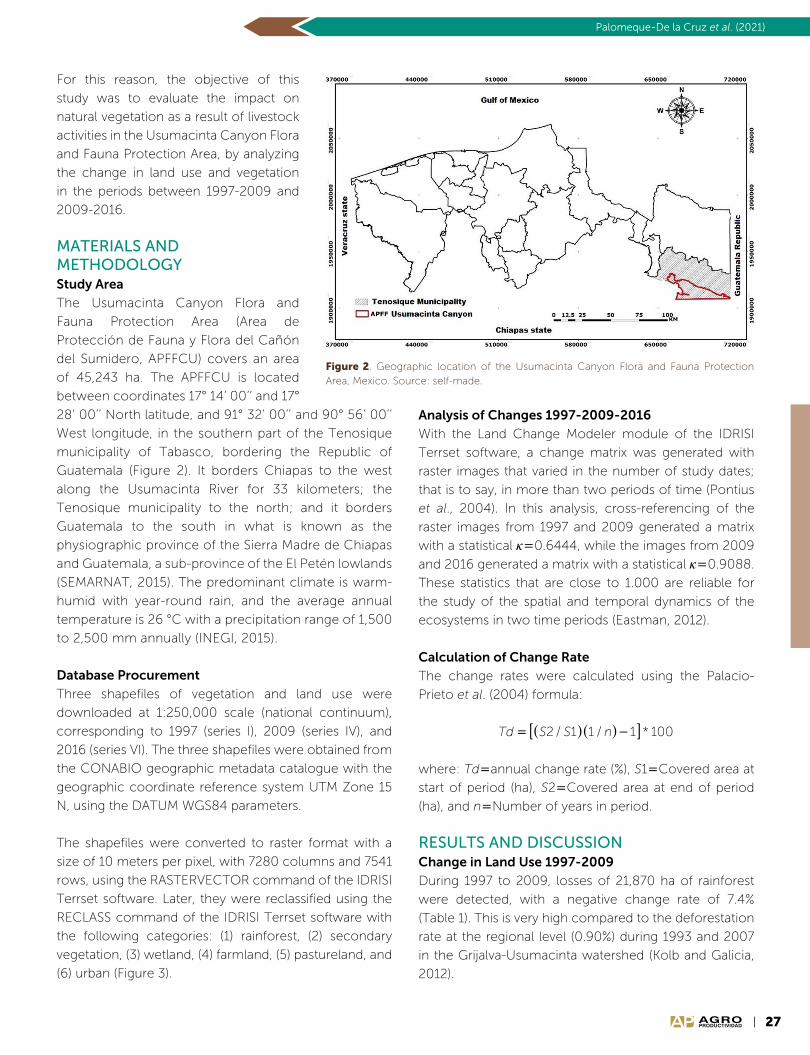
27AGROPRODUCTIVIDAD
Palomeque-De la Cruz et al. (2021)
For this reason, the objective of this
study was to evaluate the impact on
natural vegetation as a result of livestock
activities in the Usumacinta Canyon Flora
and Fauna Protection Area, by analyzing
the change in land use and vegetation
in the periods between 1997-2009 and
2009-2016.
MATERIALS AND METHODOLOGYStudy Area
The Usumacinta Canyon Flora and
Fauna Protection Area (Area de
Protección de Fauna y Flora del Cañón
del Sumidero, APFFCU) covers an area
of 45,243 ha. The APFFCU is located
between coordinates 17° 14’ 00’’ and 17°
28’ 00’’ North latitude, and 91° 32’ 00’’ and 90° 56’ 00’’
West longitude, in the southern part of the Tenosique
municipality of Tabasco, bordering the Republic of
Guatemala (Figure 2). It borders Chiapas to the west
along the Usumacinta River for 33 kilometers; the
Tenosique municipality to the north; and it borders
Guatemala to the south in what is known as the
physiographic province of the Sierra Madre de Chiapas
and Guatemala, a sub-province of the El Petén lowlands
(SEMARNAT, 2015). The predominant climate is warm-
humid with year-round rain, and the average annual
temperature is 26 °C with a precipitation range of 1,500
to 2,500 mm annually (INEGI, 2015).
Database Procurement
Three shapefiles of vegetation and land use were
downloaded at 1:250,000 scale (national continuum),
corresponding to 1997 (series I), 2009 (series IV), and
2016 (series VI). The three shapefiles were obtained from
the CONABIO geographic metadata catalogue with the
geographic coordinate reference system UTM Zone 15
N, using the DATUM WGS84 parameters.
The shapefiles were converted to raster format with a
size of 10 meters per pixel, with 7280 columns and 7541
rows, using the RASTERVECTOR command of the IDRISI
Terrset software. Later, they were reclassified using the
RECLASS command of the IDRISI Terrset software with
the following categories: (1) rainforest, (2) secondary
vegetation, (3) wetland, (4) farmland, (5) pastureland, and
(6) urban (Figure 3).
Figure 2. Geographic location of the Usumacinta Canyon Flora and Fauna Protection Area, Mexico. Source: self-made.
Analysis of Changes 1997-2009-2016
With the Land Change Modeler module of the IDRISI
Terrset software, a change matrix was generated with
raster images that varied in the number of study dates;
that is to say, in more than two periods of time (Pontius
et al., 2004). In this analysis, cross-referencing of the
raster images from 1997 and 2009 generated a matrix
with a statistical 0.6444, while the images from 2009
and 2016 generated a matrix with a statistical 0.9088.
These statistics that are close to 1.000 are reliable for
the study of the spatial and temporal dynamics of the
ecosystems in two time periods (Eastman, 2012).
Calculation of Change Rate
The change rates were calculated using the Palacio-
Prieto et al. (2004) formula:
Td S S n= ( )( )−[ ]2 1 1 1 100/ / *
where: Tdannual change rate (%), S1Covered area at
start of period (ha), S2Covered area at end of period
(ha), and nNumber of years in period.
RESULTS AND DISCUSSIONChange in Land Use 1997-2009
During 1997 to 2009, losses of 21,870 ha of rainforest
were detected, with a negative change rate of 7.4%
(Table 1). This is very high compared to the deforestation
rate at the regional level (0.90%) during 1993 and 2007
in the Grijalva-Usumacinta watershed (Kolb and Galicia,
2012).

28 AGROPRODUCTIVIDAD
Agro productividad 14 (4): 25-31. 2021
Figure 3. Maps of land use and vegetation 1997a, 2009b and 2016c in the Usumacinta Canyon Flora and Fauna Protection Area, Mexico. Source: self-made.
Table 1. Quantification of land use and vegetation change 1997-2009 in the Usumacinta Canyon Flora and Fauna Protection Area, Mexico.
Category 1997 % 2009 % Losses Gains Net change Exchange rate
Tropical Rain forest 35,696 78.9 14,121 31.2 21,870 295 21,575 7.4
Secondary vegetation 1,611 3.6 13,682 30.2 929 13,001 12,071 19.5
Wetlands 416 0.9 419 0.9 268 270 2 0.0
Agricultural 81 0.2 374 0.8 0 293 293 13.6
Grassland 7,439 16.4 16,648 36.8 1,490 10,699 9,209 6.9
Even though Tabasco is not a completely cattle-farming
state, it sends large amounts of fattened livestock to the
north of Mexico. Thus, cattle farming and agriculture
are the dominant activities in the rural setting, both with
a high degree of environmental deterioration. In the
case at hand, deforestation of the high evergreen forest
begins with the establishment of maize (Zea mays) plots
that make up a significant part of the country’s diet, and
which are then transformed into pastureland (Galindo-
Alcántara et al., 2006, Mifsut and Castro, 2010; Velasco-
Tapia, 2010). The environmental impact generated
by these farming systems is high; for cattle farming,
because it is based on the transformation of natural
vegetation with extensive grazing practices in pastures
with low rates of summer pasture; and for agriculture,
because the old slash-and-burn system continues to be
maintained (Galindo-Alcantara, 1999).
The above shows that deforestation of the rainforest is
not solely connected to population growth, but also to
farming activities and external uses (Velasco-Tapia, 2010;
Gallardo-Cruz et al., 2019).
At the start of the new century, deforested areas were
rising due to the creation of programs supporting
livestock ranches, such as PROGAN. This program aided
2,126 projects in Balancán and Tenosique between
2003 and 2005. In contrast, the program for rainforest
restoration (PRODEFOR) only benefitted between 17 and
28 projects during 2004 and 2005 (Manjarrez-Muñoz et
al., 2007). Notably, during 2000-2012, the municipality
of Tenosique supplied between 20 and 40% of the total
hectares of lost tree vegetation per year in the lower
Usumacinta watershed (Gallardo-Cruz et al., 2019).
Conversely, the areas of succession or secondary
vegetation (acahuales) increased by 13,682 ha, with a
growth rate of 19.5 % (Table 1). This increase is generally
the result of a recovery process within abandoned
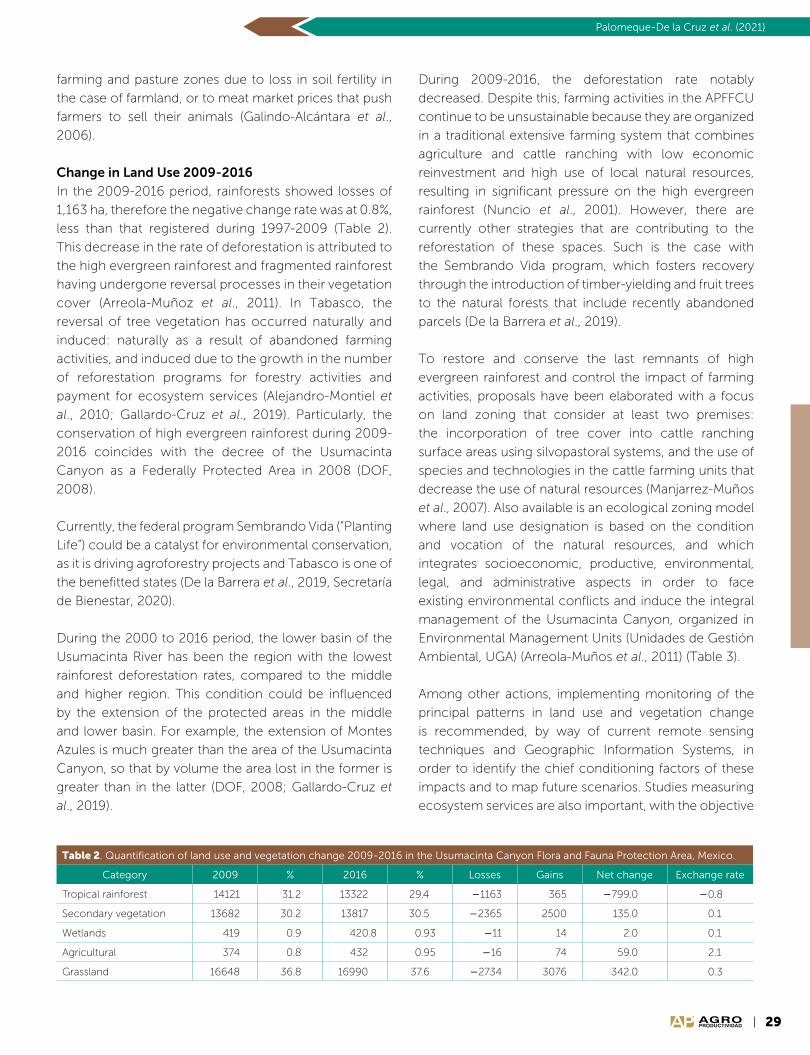
29AGROPRODUCTIVIDAD
Palomeque-De la Cruz et al. (2021)
farming and pasture zones due to loss in soil fertility in
the case of farmland, or to meat market prices that push
farmers to sell their animals (Galindo-Alcántara et al.,
2006).
Change in Land Use 2009-2016
In the 2009-2016 period, rainforests showed losses of
1,163 ha, therefore the negative change rate was at 0.8%,
less than that registered during 1997-2009 (Table 2).
This decrease in the rate of deforestation is attributed to
the high evergreen rainforest and fragmented rainforest
having undergone reversal processes in their vegetation
cover (Arreola-Muñoz et al., 2011). In Tabasco, the
reversal of tree vegetation has occurred naturally and
induced: naturally as a result of abandoned farming
activities, and induced due to the growth in the number
of reforestation programs for forestry activities and
payment for ecosystem services (Alejandro-Montiel et
al., 2010; Gallardo-Cruz et al., 2019). Particularly, the
conservation of high evergreen rainforest during 2009-
2016 coincides with the decree of the Usumacinta
Canyon as a Federally Protected Area in 2008 (DOF,
2008).
Currently, the federal program Sembrando Vida (“Planting
Life”) could be a catalyst for environmental conservation,
as it is driving agroforestry projects and Tabasco is one of
the benefitted states (De la Barrera et al., 2019, Secretaría
de Bienestar, 2020).
During the 2000 to 2016 period, the lower basin of the
Usumacinta River has been the region with the lowest
rainforest deforestation rates, compared to the middle
and higher region. This condition could be influenced
by the extension of the protected areas in the middle
and lower basin. For example, the extension of Montes
Azules is much greater than the area of the Usumacinta
Canyon, so that by volume the area lost in the former is
greater than in the latter (DOF, 2008; Gallardo-Cruz et
al., 2019).
During 2009-2016, the deforestation rate notably
decreased. Despite this, farming activities in the APFFCU
continue to be unsustainable because they are organized
in a traditional extensive farming system that combines
agriculture and cattle ranching with low economic
reinvestment and high use of local natural resources,
resulting in significant pressure on the high evergreen
rainforest (Nuncio et al., 2001). However, there are
currently other strategies that are contributing to the
reforestation of these spaces. Such is the case with
the Sembrando Vida program, which fosters recovery
through the introduction of timber-yielding and fruit trees
to the natural forests that include recently abandoned
parcels (De la Barrera et al., 2019).
To restore and conserve the last remnants of high
evergreen rainforest and control the impact of farming
activities, proposals have been elaborated with a focus
on land zoning that consider at least two premises:
the incorporation of tree cover into cattle ranching
surface areas using silvopastoral systems, and the use of
species and technologies in the cattle farming units that
decrease the use of natural resources (Manjarrez-Muños
et al., 2007). Also available is an ecological zoning model
where land use designation is based on the condition
and vocation of the natural resources, and which
integrates socioeconomic, productive, environmental,
legal, and administrative aspects in order to face
existing environmental conflicts and induce the integral
management of the Usumacinta Canyon, organized in
Environmental Management Units (Unidades de Gestión
Ambiental, UGA) (Arreola-Muños et al., 2011) (Table 3).
Among other actions, implementing monitoring of the
principal patterns in land use and vegetation change
is recommended, by way of current remote sensing
techniques and Geographic Information Systems, in
order to identify the chief conditioning factors of these
impacts and to map future scenarios. Studies measuring
ecosystem services are also important, with the objective
Table 2. Quantification of land use and vegetation change 2009-2016 in the Usumacinta Canyon Flora and Fauna Protection Area, Mexico.
Category 2009 % 2016 % Losses Gains Net change Exchange rate
Tropical rainforest 14121 31.2 13322 29.4 1163 365 799.0 0.8
Secondary vegetation 13682 30.2 13817 30.5 2365 2500 135.0 0.1
Wetlands 419 0.9 420.8 0.93 11 14 2.0 0.1
Agricultural 374 0.8 432 0.95 16 74 59.0 2.1
Grassland 16648 36.8 16990 37.6 2734 3076 342.0 0.3

30 AGROPRODUCTIVIDAD
Agro productividad 14 (4): 25-31. 2021
Table 3. Environmental Management Units (UGA) for the Usumacinta Canyon Flora and Fauna Protection Area, Mexico.
Land use area (ha)
Rural human settlements 963,79
Rainfed agriculture 445,14
Fruit tree 83,28
Holistic Semi-Intensive Livestock 7.750,21
Plantaciones Forestales 7.364,10
Productive restoration 1.654,33
Agroforestry systems 1.362,76
Silvopastoral System 9.790,17
Environmental Rehabilitation 14.232,16
Ecoturism 360,3
Xate and Motusay plantations 11,04
Research work 11.966,89
Source: Arreola-Muñoz et al. (2011).
of avoiding or reverting disturbance and conserving the
original remains of the high rainforest, soil, and natural
water flows that all maximize the provision of ecosystem
services, since it is recognized that the Usumacinta
rainforests are carbon sinks with relevance in America
(Mifsut and Castro, 2010).
CONCLUSIONSThe study of the state of conservation in the high
evergreen rainforest of the Usumacinta Canyon Flora
and Fauna Protection Area determined that between
1997 and 2016, a total of 23,033 ha of rainforest were
lost. Notably, the greatest negative change rate of
rainforest was recorded in the period from 1997 to 2009,
which it decreased in 2016 possibly as a result of the
decree of the Protected Area and the implementation
of programs driving ecological restoration. Since
the decrease in natural cover entails the loss of other
organisms from habitat loss, including silvopastoral
systems in farming units is recommended, as well as the
use of new technologies that lower the use of natural
resources. Even the Sembrando Vida program could play
a fundamental role in the development and conservation
of the area. In addition, execution and follow-up of
the policies established in the land zoning model is
recommended, as well as the promotion of permanent
monitoring of changes in land use and of ecosystem
services.
REFERENCESAlejandro-Montiel, C., Galmiche-Tejeda, Á., Domínguez-Domínguez,
M., & Rincón-Ramírez, A. (2010). Cambios en la cubierta
forestal del área ecoturística de la Reserva ecológica de Agua
Selva, México. Tropical and Subtropical Agroecosystems 12 (3):
605-617.
Arreola-Muñoz, A., Reyes-Barrón, M.C., Segura-Bertollini, E.C., Hernández-
Zárate, L.O., & Llergo-Juárez, J.G. (2011). Ordenamiento
Territorial de la Microrregión Cañón del Usumacinta, Municipio
de Tenosique, Tabasco. Villahermosa, México: SERNAPAM.
Arriaga, L.J., Espinoza, J.C., Aguilar, C., & Martínez, E. (2000). Regiones
terrestres prioritarias de México. Ciudad de México: CONABIO.
De la Barrera, P. (2012). Los servicios ecosistémicos que ofrecen los
bosques tropicales. Revista Ecosistemas, 21(1-2): 136-147.
De la Barrera, E., Villalvazo-Figueroa, E.A., Díaz-Álvarez E. A. et al. (2019).
4T don’t stand for tacos: An analysis of food and environmental
security considerations in the new Mexican government’s
agricultural agenda. Food Research 8:1768.
Diario Oficial de la Federación. (2008). Decreto por el que se declara
área natural protegida con la categoría de área de protección
de flora y fauna, la región conocida como Cañón del
Usumacinta, localizada en el Municipio de Tenosique, en el
Estado de Tabasco. Ciudad de México: Congreso de la Unión
Eastman, J.R. 2012. IDRISI Selva GIS and image processing software
version 17.0. Clark Labs. Massachusetts., USA. 321 p
Gallardo-Cruz, A., Fernández-Montes de Oca, A., & Rives, C. (2019).
Detección de amenazas y oportunidades para la conservación
en la cuenca baja del Usumacinta a partir de técnicas de
percepción remota. Revista Ecosistemas 28 (2): 82-99. doi:
10.7818/ECOS.1611
Galindo-Alcántara, A., Gama-Campillo, L. M., Ruiz-Acosta, S., & Morales-
Hernández, A. (2006). Programa de conservación y manejo del
Parque Estatal Cañón del Usumacinta. Villahermosa, México:
SEDESPA
García-Morales, R., Gordillo-Chávez, E. J., Valdez-Leal, J. D. D. y
Pacheco-Figueroa, C. (2014). Las áreas naturales protegidas y
su papel en la conservación de los murciélagos del estado de
Tabasco, México. Therya 5(3): 725-736.
García, G. D., & Soares, D. (2017). Introducción. En D. Soares y A. García
(Eds.), En La cuenca del río Usumacinta desde la perspectiva del
cambio climático. Ciudad de México: CONACYT-SEMARNAT-
IMTA
Hernández-López, A., López-Alamilla, E., Ramírez, A. R., & Aquino-
Bravata, V. (2013). Diagnóstico del uso de la fauna silvestre, en
el área de protección de flora y fauna. Ra Ximhai 9 (1): 1-14.
Instituto Nacional de Estadística, Geografía e Informática (INEGI).
(2015). Prontuario de información geográfica municipal de los
Estados Unidos Mexicanos. Tenosique, Tenosique, Tabasco.
Clave geoestadística 27017. INEGI. México.
Isaac-Márquez, R., De-Jong, B., Eastmond, A., Ochoa-Gaona, S.,
Hernández, S., & Kantún, M.D. (2005). Estrategias productivas
campesinas: un análisis de los factores condicionantes del
uso del suelo en el oriente de Tabasco, México. Universidad y
Ciencia 21(42): 57-73.
Jiménez-Sierra, C.L., Sosa-Ramírez, J., Cortés-Calva, P., Breceda-
Solia, C.A., Íñiguez Dávalos, L.I., & Ortega-Rubio, A. (2014).
México país megadiverso y la relevancia de las áreas naturales
protegidas. Investigación y Ciencia 22 (60): 16-22.
Kolb, M., & Galicia, L. (2012). Challenging the linear forestation
narrative in the Neo-tropic: regional patterns and processes
of deforestation and regeneration in southern Mexico. The
Geographical Journal 178 (2): 147-161.
31AGROPRODUCTIVIDAD
Palomeque-De la Cruz et al. (2021)
Manjarrez-Muñoz, B., Hernández-Daumás, S., De-Jong, B., Nahed-Toral, J., Dios-Vallejo, O. O. D., & Salvatierra-
Zaba, E. B. (2007). Configuración territorial y perspectivas de ordenamiento de la ganadería bovina en los
municipios de Balancán y Tenosique, Tabasco. Investigaciones Geográficas (64): 90-115.
Mifsut, I. M., & Castro, M. (2010). La cuenca del Río Usumacinta: perfil y perspectivas para su conservación
y desarrollo sustentable. Las cuencas hidrográficas de México. Diagnóstico y priorización. Ciudad de
México: SEMARNAT
Nuncio-Ochoa, G., Nahed-Toral, J., Díaz-Hernández, B., Escobedo-Amezcua, F. & Salvatierra-Izaba, B. (2001).
Caracterización de los sistemas de producción ovina en el estado de Tabasco. Agrociencia 35(4): 469-
477.
Palacio-Prieto, J.L., Sánchez-Salazar, M.T., Casado, J.M., Propin, F.E., Delgado, C.J., Velázquez, M.A., & Camacho,
R.C.G. (2004). Indicadores para la caracterización y el ordenamiento territorial. Ciudad de México:
SEMARNAT.
Palomeque de la Cruz, M. Á. (2008). Análisis del cambio de uso del suelo y las actividades productivas en el
parque estatal Cañón del Usumacinta en Tenosique, Tabasco. Tesis de Maestría en Ciencias Ambientales.
División Académica de Ciencias Biológicas, Universidad Juárez Autónoma de Tabasco. Villahermosa,
México.
Periódico Oficial del Estado de Tabasco. (2005). Decreto por el cual se declara Área Natural Protegida de
Carácter estatal, el Parque Estatal Cañón del Usumacinta Tenosique Tabasco. Villahermosa, México:
Oficialía Mayor de Gobierno.
Pontius J., R.G., Huffaker, D., & Denman, K. (2004). Useful techniques of validation for spatially explicit land-
change models. Ecological Modelling 179(4): 445-461.
Rzedowski, J., & Huerta, L. (1994). Vegetación de México. Ciudad de México: Limusa, Noriega Editores.
Sistema de Centros Públicos de Investigación CONACYT (2017). Explorando el Usumacinta. Conociendo
Tenosique. Recuperado de https://centrosconacyt.mx/objeto/usumacinta/
Secretaría de Medio Ambiente y Recursos Naturales (SEMARNAT). (2015). Programa de Manejo Área de
Protección de Flora y Fauna Cañón del Usumacinta. Ciudad de México: SEMARNAT-CONANP
Tudela, F. (1992). La modernización forzada del trópico: el caso de Tabasco. Ciudad de México: El Colegio de
México
Velasco-Tapia (2010). Identificación de cambios en el uso del suelo y vegetación, y cálculo de la tasa de
transformación del hábitat en el periodo 2000-2010, Área de Protección de Flora y Fauna Cañón del
Usumacinta. Ciudad de México: CONANP
Zavala, J., & Castillo, A. O. (2007). Cambio de uso de la tierra en el estado de Tabasco. En D. J. Palma y A. Triano
(Eds.), Plan de uso sustentable de los suelos del estado de Tabasco (vol, II, pp. 38–56). Villahermosa,
México: Colegio de Posgraduados.
AGROPRODUCTIVIDAD

33AGROPRODUCTIVIDAD
https://doi.org/10.32854/agrop.v14i4.2011
Agroproductividad: Vol. 14, Núm. 4, abril. 2021. pp: 33-38.
Recibido: septiembre, 2020. Aceptado: marzo, 2021.
Sociocultural aspects of nourishment and the use of the plot in the rural community of Bandera de Juárez
Valle-Domenech, Diego1; Álvarez-Ávila, María del Carmen1*; Olguín-Palacios, Carlos1†; Ávila Reséndiz, Catarino1†
1Colegio de Postgraduados, Veracruz Campus. Carretera Federal Xalapa-Veracruz km 88.5,
Tepetates, Manlio Fabio Altamirano, Veracruz, México. C. P. 91690
*Corresponding author: [email protected]
ABSTRACTObjective: To analyze sociocultural aspects related to human nourishment and the use of family plots in the community
of Bandera de Juárez, Veracruz, México.
Methodology: A literature review, together with open interviews and on-field participative observations, knowledge
exchange workshops and life storytelling were made.
Results: The celebration of the feasts of San Isidro Labrador and All Saints Day were identified as moments for the re-
creation of identities and strengthening of links that constitute social networks. They represent major occasions for
understanding different productive and sociocultural uses of plots. In these phenomena nourishment is an essential
factor. The family plot agroecosystem as a space of social importance sets a socialization and identity development
process.
Implication: The process players generate awareness on the value of traditional nourishment, the nutritional quality
thereof and the rescue of their cultural identity.
Findings: The importance of how nourishment “feeds” cultural processes is outlined. Some useful concepts, both for
understanding sociocultural aspects of nourishment, the handling and uses of the plot, as well as the justification for the
choice of the research method are discussed.
Keywords: traditional foodstuffs, identity, socialization.
INTRODUCTION
Human nourishment is a social activity: the manner of production of
foodstuffs, distribution and consumption patterns are
historical processes that show cultural features, according to specific temporary and spatial contexts (Harris, 2011).
The diet of persons is defined by foodstuff access factors, social appraisal by some and individual taste; also, this is
related to weather and social phenomena, such as speculation or ritual-religious matters. The analyses of nourishment
patterns or cultural nourishment identities refer to this. Cultural phenomena for these habits, customs and practices
are addressed by food anthropology (Ortiz et al., 2005). What, when and how much is produced in the plot are
33AGROPRODUCTIVIDAD
Imagen de kitti851 en Pixabay
34
Agro productividad 14 (4): 33-38. 2021
AGROPRODUCTIVIDAD
questions that relate to biophysical and sociocultural
factors. In this research, such factors are addressed from
the society-nature metabolism idea (Toledo, 2013); i.e.
the determinations given in such relationship are mutual.
Studying the plot is fundamental for understanding the
development of agriculture, as its handling has assumed
domestication and genetic improvement. It is an “farming
lab”, where a good result allows the appropriation of a
species the replication of which is attained in the plot.
Plots used as agroecosystems are found in several
latitudes, assume features in form and use, according to
specific biophysical and sociocultural contexts (Mariaca
et al., 2010). Biophysical and social aspects were
researched (Bello & Estrada, 2011). The concepts of plot,
yard or orchard are varied. For this research, the authors
define a plot as a vital space, a place where activities
for the social reproduction of families are performed,
from the attainment of comforts such as foodstuffs
to the exchange of goods and knowledge. Therefore,
the objectives for this research were: 1) to analyze
sociocultural aspects intervening significantly in the
constitution of family plots; 2) to study the relationships
between the plot productive calendar, cultural calendar
and food cultural identity; and 3) to characterize the
sociocultural functions that meet family plots in Bandera
de Juárez, Veracruz, Mexico.
MATERIALS AND METHODSBandera de Juárez us a town that belongs to the
Municipality of Paso de Ovejas, Veracruz, Mexico (19° 12’
01.25’’ N, 96° 25’ 19.37’’ O). The methods used in the
research have the “participative action research” (IAP)
precepts as an integrating axle in concordance with the
management model proposed by Álvarez et al. (2011).
The work was performed in four stages.
1) Motivation: Municipal and local authorities were
contacted, and they invited families from the
community to take part in the work in turn. A
motivational workshop was made at the Learning and
Knowledge Exchange Center (CAIS) of Colegio de
Posgraduados, Veracruz Campus, where knowledge
about regional construction materials, crops
(vegetables, fruits, legumes, medicinal, aromatic and
ornamental herbs) and ecotechnologies were shared:
This activity allowed motivating ten families the work
was performed with.
2) Diagnosis: The socioeconomic situation in Bandera
de Juárez was found in the census made by INEGI,
(2010). The health diagnosis was made with the
support of students from the School of Nutrition
of Universidad Veracruzana, Veracruz Campus; the
body mass index (IMC) from 42 persons attending the
community’s Health Center was obtained. The plots
were characterized based on cropped vegetable
biodiversity and animal breeding that the relation
thereof with nourishment (López-Armas et al., 2017).
3) Community development. Training through
knowledge exchange workshops was performed in
family plots, with women who normally handle the
management thereof, as this situation occurs derived
from social gender roles. At the workshops, human
nutrition was dimensioned with the feasibility of family
production (plot and parcel) to meet their food needs.
Participative research was performed through life
storytelling about nourishment in Bandera de Juárez
both as a historical, social and cultural phenomenon;
a participative observation and open interviews were
performed and this allowed approaching cultural
features of the social group (García et al., 2008); the
lessons learned from the participation were validated
in exchange workshops and community inputs were
acknowledged.
4) Assessment: each phase was assessed in order to
feedback the process. The information obtained was
analyzed and systematized and a joint reflection and
analysis exercise that supported result socialization
was performed.
RESULTS AND DISCUSSIONSocioeconomic Diagnosis. Bandera de Juárez has
an approximate population of 733 inhabitants, 357
men (48.70%) and 376 women (51.30%). The average
education years account for 4.83 years, 5.02 years
in average for men and 4.73 years for women. 654
persons (89.22% of the population) are Catholics;
19 (2.59%) stated practicing another religion and 42
(5.72%) practice no religion. 211 households, of which
163 (77.25%) are led by a man and 48 (22.75%) are led
by a woman. Households with earth floor covered with
materials account for 184 (87.20%); 202 (95.73%) have
electric power. The drinking water utility is present
in 151 households (71.56%) and 185 have bathrooms
(87.67%). 189 households (89.57%) have a television and
153 (72.51%) have a refrigerator. The census performed
in this work showed that 626 persons do not have
access to health services (85.40%); 69 persons (9.37%)
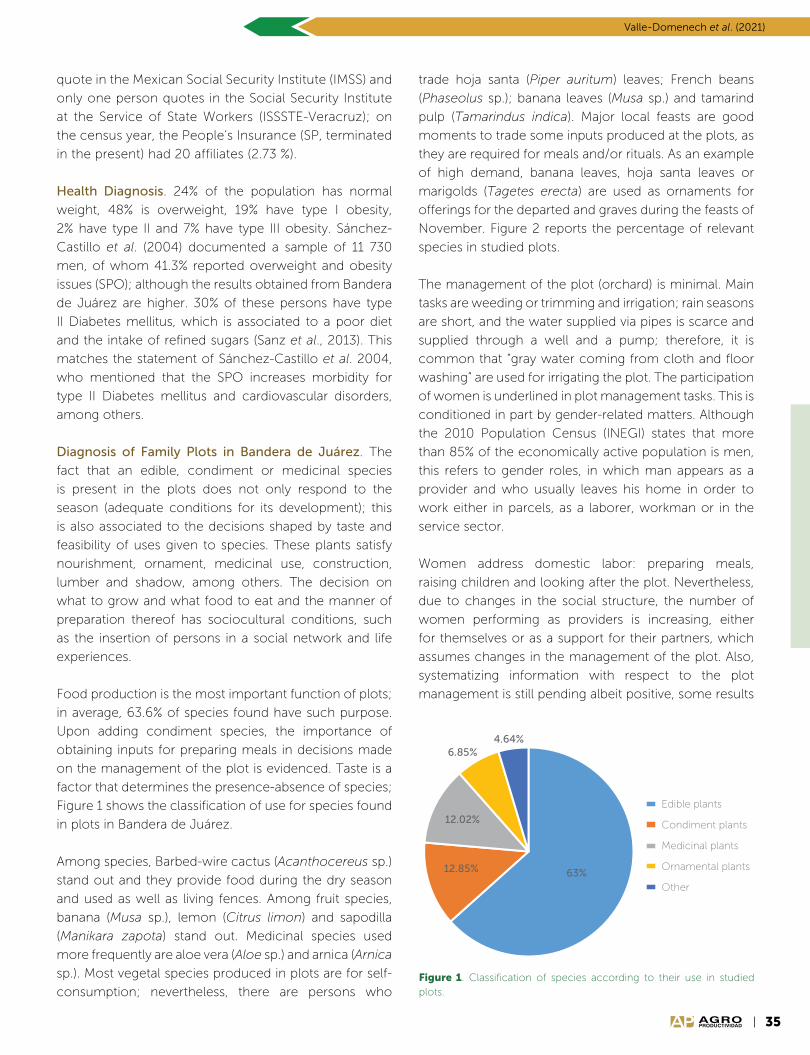
35
Valle-Domenech et al. (2021)
AGROPRODUCTIVIDAD
quote in the Mexican Social Security Institute (IMSS) and
only one person quotes in the Social Security Institute
at the Service of State Workers (ISSSTE-Veracruz); on
the census year, the People’s Insurance (SP, terminated
in the present) had 20 affiliates (2.73 %).
Health Diagnosis. 24% of the population has normal
weight, 48% is overweight, 19% have type I obesity,
2% have type II and 7% have type III obesity. Sánchez-
Castillo et al. (2004) documented a sample of 11 730
men, of whom 41.3% reported overweight and obesity
issues (SPO); although the results obtained from Bandera
de Juárez are higher. 30% of these persons have type
II Diabetes mellitus, which is associated to a poor diet
and the intake of refined sugars (Sanz et al., 2013). This
matches the statement of Sánchez-Castillo et al. 2004,
who mentioned that the SPO increases morbidity for
type II Diabetes mellitus and cardiovascular disorders,
among others.
Diagnosis of Family Plots in Bandera de Juárez. The
fact that an edible, condiment or medicinal species
is present in the plots does not only respond to the
season (adequate conditions for its development); this
is also associated to the decisions shaped by taste and
feasibility of uses given to species. These plants satisfy
nourishment, ornament, medicinal use, construction,
lumber and shadow, among others. The decision on
what to grow and what food to eat and the manner of
preparation thereof has sociocultural conditions, such
as the insertion of persons in a social network and life
experiences.
Food production is the most important function of plots;
in average, 63.6% of species found have such purpose.
Upon adding condiment species, the importance of
obtaining inputs for preparing meals in decisions made
on the management of the plot is evidenced. Taste is a
factor that determines the presence-absence of species;
Figure 1 shows the classification of use for species found
in plots in Bandera de Juárez.
Among species, Barbed-wire cactus (Acanthocereus sp.)
stand out and they provide food during the dry season
and used as well as living fences. Among fruit species,
banana (Musa sp.), lemon (Citrus limon) and sapodilla
(Manikara zapota) stand out. Medicinal species used
more frequently are aloe vera (Aloe sp.) and arnica (Arnica
sp.). Most vegetal species produced in plots are for self-
consumption; nevertheless, there are persons who
trade hoja santa (Piper auritum) leaves; French beans
(Phaseolus sp.); banana leaves (Musa sp.) and tamarind
pulp (Tamarindus indica). Major local feasts are good
moments to trade some inputs produced at the plots, as
they are required for meals and/or rituals. As an example
of high demand, banana leaves, hoja santa leaves or
marigolds (Tagetes erecta) are used as ornaments for
offerings for the departed and graves during the feasts of
November. Figure 2 reports the percentage of relevant
species in studied plots.
The management of the plot (orchard) is minimal. Main
tasks are weeding or trimming and irrigation; rain seasons
are short, and the water supplied via pipes is scarce and
supplied through a well and a pump; therefore, it is
common that “gray water coming from cloth and floor
washing” are used for irrigating the plot. The participation
of women is underlined in plot management tasks. This is
conditioned in part by gender-related matters. Although
the 2010 Population Census (INEGI) states that more
than 85% of the economically active population is men,
this refers to gender roles, in which man appears as a
provider and who usually leaves his home in order to
work either in parcels, as a laborer, workman or in the
service sector.
Women address domestic labor: preparing meals,
raising children and looking after the plot. Nevertheless,
due to changes in the social structure, the number of
women performing as providers is increasing, either
for themselves or as a support for their partners, which
assumes changes in the management of the plot. Also,
systematizing information with respect to the plot
management is still pending albeit positive, some results
63%12.85%
12.02%
6.85%4.64%
Edible plants
Condiment plants
Medicinal plants
Ornamental plants
Other
Figure 1. Classification of species according to their use in studied plots.

36
Agro productividad 14 (4): 33-38. 2021
AGROPRODUCTIVIDAD
Figure 2. Significant species found in the 10 backyards of the rural community of Bandera de Juárez, Veracruz, Mexico.
0%
10%
20%
30%
40%
50%
60%
70%
Banan
a (M
usa
sp.)
Cross
tree
(Aca
ntho
cere
us sp
.)
Lem
on (C
itrus
limon)
Chico
zapo
te (M
anika
ra zap
ota)
Aloe
(Alo
e sp
.)
Acuyo
(Pip
er aur
ium
)
Tam
arin
d (Ta
mar
indu
s ind
ica)
Izote
(Yuc
a sp
.)
Guaje (L
euca
ena leuc
oceph
ala)
Ora
nge
tree
(Citr
us si
nens
is)
Papay
a m
arad
ol (Car
ica pa
paya
)
Epaz
ote (D
ysph
ania
ambr
osioid
es)
Chilp
aya
(Cap
sicum
sp.)
Ore
gano
o. (So
leno
steam
sp.)
Arnica
(Arn
ica
sp.)
Yello
w p
apay
a (C
arica pa
paya
)
appear to be accidental, as they are
not replicated in an orderly fashion.
Table 1 shows work performed
at the ten plots of study. Animals
bred at the plot are pigs (Sus scrofa
domesticus), turkeys (Meleagris
gallopavo) and hens (Gallus gallus
domesticus), which are destined to
self-consumption or the sale thereof.
Hens are consumed regularly;
turkeys and pigs are destined to the
market or prepared as a meal during
a celebration (baptism, wedding,
birthday, San Isidro Labrador or All
Saints Day). In order to breed and
feed animals, food waste, corn
and purchased balanced food
are used. The handling of the plot
incorporates external inputs related
to technology packages for farming
production. For example, apart
from using droppings as fertilizer,
agrochemicals are used as well in
plots. Table 1 shows activities and
persons responsible thereof in the
plots in study.
The territory appropriation also
utilizes regional biodiversity through
gathering or hunting, which reflects
an ancestral knowledge on species
and their use. An interviewer stated:
“Armadillo (Dasypus sp.), rabbit
(Oryctolagus cuniculus), green
iguana (Iguana iguana), everything
is well prepared here; even the
raccoon (Procyonlotor sp.) is
delicious as barbacoa; armadillo is
prepared with marinade”.
Community Development
Nourishment in Bandera de
Juárez is a particular expression of
syncretism. The food inheritance
Table 1. Activities carried out and those responsible, in ten study backyards in Bandera de Juárez, Veracruz, Mexico.
Family Pruning Weeding Irrigation Loosen the soil Fertilization Responsible
1 Yes Yes Yes No No Ms. (of the house)
2 Yes Yes Yes No No Mr. And Ms.
3 Yes Yes No No Yes (compost they use on corn) Ms.
4 Yes Yes Yes No No Ms.
5 No No Yes Yes Yes (donkey manure) Ms.
6 No Yes Yes Yes Compost Mr. And Ms.
7 No Yes No No No Mr. And Ms.
8 No Yes Yes No No Ms.
9 Yes No Yes No No Ms.
10 No No Yes Yes Yes (compost they use on corn) Ms.
Source: Self preparation.
37
Valle-Domenech et al. (2021)
AGROPRODUCTIVIDAD
of the Mesoamerican civilization-building process that
justifies the preparation of meals with corns in several
forms is notorious. In Bandera de Juárez, cuisine and
meal preparation continue to be a female space and
work; a strong social role division emanating from
gender matters is persistent. Women know about meal
preparation, food and condiments. There are some
exceptions to the rule: “He, with one uncle, would go to
the river to fish shrimp; he says that, when he was a boy,
he would take up to one week at the river and then they
would cook whatever they wanted, shrimp dishes.” The
scientific names of both species located in the region
are (Macrobrachium acanthurus and Macrobrachium
carcinus). Men cook when they go fishing in groups,
without female company.
In Bandera de Juárez, agriculture loses weight as
an economic activity as paid work in the industry or
services gains terrain. Among factors that influence the
devaluation of farming work as an activity that assures
family reproduction (in a wide sense), there are the low
cost-benefit ratio, excessive work for attaining good
production, the uncertainty of the result, dependence on
environmental and market factors, the proximity of the
port of Veracruz and its industrial zone as a development
pole and its paid labor offer. Changes in the society-
nature relationship are important as economic activities
transform. Urbanization is the path to the improvement
life conditions. Services have been recent transformation
processes present among the inhabitants. A participant
states that now women do their work more easily. She
remembers when she had to go get water from the
river: “women have turned lazy now.” These changes
simplify activities. Currently, most of the population have
drinking water and electric energy services. With the
arrival of electricity, the use of appliances that changed
the manner of preparing and preserving food began. The
urbanization process is usually related to wellbeing in
this town. In part, this is due to the simplification of some
works and the influence of messages that associate
an urbanized and modern lifestyle to success and/or
comfort.
There are foodstuffs that may be associated to a
poverty condition; for some, it is proper to consume
them privately and indoors regularly and off the sight of
others. Nevertheless, the situation changes when there
is a ritual, feast or shared dinner is involved (weddings,
baptisms, or even funerals). Especially, both feasts
continue being important for most of the population in
Bandera de Juárez: May 15, San Isidro Labrador, feast of
the patron saint of the town, and November 2, All Saints
Day. The economic contingency may mark the presence
of a species in the plot; for example, during “All Saints
Day:” An interviewee stated: “Ever since I remember,
my mother always prepared mole for the feast (May 15),
mole for “All Saints Day”, for weddings, sweet fifteen
and baptisms. It is rare to know about someone who
chooses not to prepare mole. It’s delicious”. “It’s not the
same to make it on May 15 for someone who can offer a
banquet for his guests than making it for someone who
barely knows what’s going on that day; and neither is it to
offer stuffed peppers instead of barbacoa tamales”. This
is also a moment of social distinction, a visualization of
power relations: Those who had a good year, successful
in financial terms are separated stand out; those who
gained benefits or whose salary allows them to have a
little extra and share food with others.
Television may be a symbol of financial wellbeing and
modernity. As children are the most vulnerable public
before advertisements, they associate food products
with ideas of wellbeing. The impact of this has been
an increase in children obesity and associated chronic
degenerative conditions of no benefit whatsoever for
the development of capacities in the population (Luján-
Carpio et al., 2015). Advertisements do not promote
a balanced diet based on fruits and vegetables; they
mostly promote sugar beverages, candy and cereals
with added sugar, with greater content of calories, fats
and carbohydrates. Among adults, a rooted habit is to
quench the thirst or drink bottled soft drinks during the
meal. Coca-Cola is the most popular, as it is consumed
since childhood. Nevertheless, the idea that soft drinks
different than cola do not affect health that much is
popular. Rivera et al. (2018) state that overweight and
obesity issues are due mainly to a high intake of calories,
ultraprocessed foods rich in calories (refined sugars and
flours), fats and sugar drinks, the result of which is an
overconsumption of energy and, therefore, chronic
degenerative conditions.
The diet of inhabitants in Bandera de Juárez is varied.
Despite the fact that food has social and family
determinants, individual taste also determines the choice
of a person on his/her intake when there are options to
choose from. Food scarcity situations leave no options
on nourishment options. Thus, nourishment reflects
both personal taste and power relationships within the
social structure (Toledo, 2013).
38
Agro productividad 14 (4): 33-38. 2021
AGROPRODUCTIVIDAD
CONCLUSIONSChanges in social, structure, with
more women as providers, assumes
changes in the management
of the plot. The community
urbanization process, changes in
economic activities and the idea
of associating urbanization with
wellbeing are determinants on
how families allocate resources to
the family plot as this space fulfills
a social function in identity and
bond strengthening processes.
Significant knowledge of family
experiences are transferred to
younger members. This knowledge
is touched by the insertion of the
family in social networks. The plot’s
productive function is influenced by
celebrations; there are temporary
biophysical conditions about what
is planted; although the use of the
crops is a human decision that has
incidence on the agroecosystem.
In Bandera de Juárez, nourishment
is a reference of identity. Its
inhabitants define themselves
facing others with the food that
they consume and forms in which
they prepare meals. The feasts of
San Isidro Labrador and All Saints
Day are a framework of community
and identity bonds.
REFERENCESÁlvarez A., M.C., Alfonso G., A. & Díaz C., H. (2011). Modelo de gestión para pequeñas explotaciones
agrarias, orientado a la seguridad alimentaria en México. En: Modelos para el Desarrollo
Rural con Enfoque Territorial en México. Puebla, México. Colegio de Postgraduados. pp.
263-287.
Bello B., E., & Estrada L., E.I.J. (2011). El solar: espacio social y conocimiento local. En: Bello B.,
E. & Estrada L., E. I. J. (comp.). Cultivar el Territorio Maya, Conocimiento y Organización
Social en el Uso de la Selva. México. Universidad Iberoamericana-El Colegio de la
Frontera Sur. pp. 45-66.
García C., M., Pardío L., J, P. Arroyo A., P., & Fernández G., V. (2008). Dinámica familiar y su relación
con hábitos alimentarios. Estudios sobre Culturas Contemporáneas 14(27): 9-46.
Harris, M. (2011). Bueno para comer: enigmas de alimentación y cultura. España. Alianza Editorial.
pp. 331.
INEGI (Instituto Nacional de Estadística y Geografía). (2010). Censo Nacional de Población y
Vivienda 2010. Datos por localidad. internet.contenidos.inegi.org.mx/.../censos/poblaci
on/2010/.../702825047610_1.pdf (Consultado: mayo, 2012).
López-Armas, M.H., Álvarez-Ávila, M.C. & Olguín-Palacios, C. (2017). Diversidad de solares
familiares: diseño de una estrategia de desarrollo comunitario en una microregión de
Veracruz, México. Agroproductividad 10(7): 9-14.
Luján-Carpio, E., Ponce-Chafloque, J., Gálvez-Marticorena, B. & Taype-Rondán, A. (2015). Cartas
al editor. La publicidad televisiva de alimentos: un riesgo latente para los niños de
Latinoamérica. Salud Pública de México. 57(5): 362-363.
Mariaca M., R., González J., A. & Arias R., L.M. (2010). El Huerto Maya yucateco en el siglo XVI.
México. ECOSUR. pp. 180.
Ortiz G., A.S., Vázquez G., V. & Montes E., M. (2005). La alimentación en México: enfoques y
visión a futuro. Estudios Sociales 13(25): 8-34.
Rivera D., J.A., Colchero, M.A., Fuentes, M.L., González De C.M., T., Aguilar S., C. A., Hernández L.,
G., Barquera, S., García C., C.G., Unar M., M. & Hernández F., M. (2018). Recomendaciones
para una política de Estado para la prevención y control de la obesidad en México en el
período 2018-2024. En: Rivera D., J.A., Colchero, M.A., Fuentes, M. L., González de C.M.,
T., Aguilar S., C., Hernández L., G. & Barquera S., S. (Ed.). La obesidad en México. Estado
de la política pública y recomendaciones para su prevención y control. Cuernavaca,
México. Instituto Nacional de Salud Pública. pp. 15-30.
Sánchez-Castillo, C.P., Pichardo-Ontiveros, E. & López-R., P. (2004). Epidemiología de la
obesidad. Gaceta Médica de México 140(2): 3-20.
Sanz P., A., Boj C., D., Melchor L., I. & Albero G., R. (2013) Sugar and diabetes; international
recommendations Endocrinology and Nutrition Service. Nutrition Hospital 28 (Supl. 4):
72-80.
Toledo, M.V. (2013). El metabolismo social: una nueva teoría sociológica. Revista Relaciones.
36: 41-71.
AGROPRODUCTIVIDAD
39AGROPRODUCTIVIDAD
https://doi.org/10.32854/agrop.vi.1631
Agroproductividad: Vol. 14, Núm. 4, abril. 2021. pp: 39-45.
Recibido: febrero, 2020. Aceptado: marzo, 2021.
Cocoa (Theobroma cacao L.) harvest and postharvest in Tabasco, Mexico
Pérez-Flores, Julián1; Mendoza-Hernández, José Rodolfo H.1, Cleomé Abel2, Córdova-Ávalos, Víctor1*
1Colegio de Postgraduados, Campus Tabasco, Cárdenas, Tabasco. 2Institut National du Café
d´Haiti (INCAH/MARNDR), Damien, Route Nationale, MARNDR, Puerto Príncipe, Haití.
*Corresponding author: [email protected]
ABSTRACTObjective: To characterize the harvest and postharvest of the cocoa management system at La Chontalpa, Tabasco,
Mexico.
Design/methodology/approach: The study took place in the towns of Francisco Trujillo Gurría and Ernesto Aguirre
Colorado de Huimanguillo, Tabasco, Mexico. The study was descriptive and accounted for 51 producers and those
responsible for the cocoa profit centers. Producers were chosen through targeted sampling. A survey on their harvest
and postharvest was applied, in addition to direct assessment in plantations and profit centers.
Results: The cocoa harvesting is manual. The producers cut the ripe and almost ripe fruits, do not store and 58.8% of
them do not make "quebraderos" with the fruits. With a “machete” cut the fruit in half and manually extract the grains. The
fresh grains are sold at a profit. The cocoa is then fermented in wooden boxes, dried artificially, natural, or in a combined
way, and packed in “yute” bags for sale. Profit centers do not keep track of their grain origin and make no selection or
determine product quality.
Study limitations/implications: All producers harvest in the same way, but the processes during post-harvest could differ
at different collection centers.
Findings/conclusions: The harvest of cocoa fruits at different maturity and the lack of storage causes a heterogeneous
fermentation. The humidity level during the drying process is empirically determined.
Key words: Harvest, cacao, fermentation, drying.
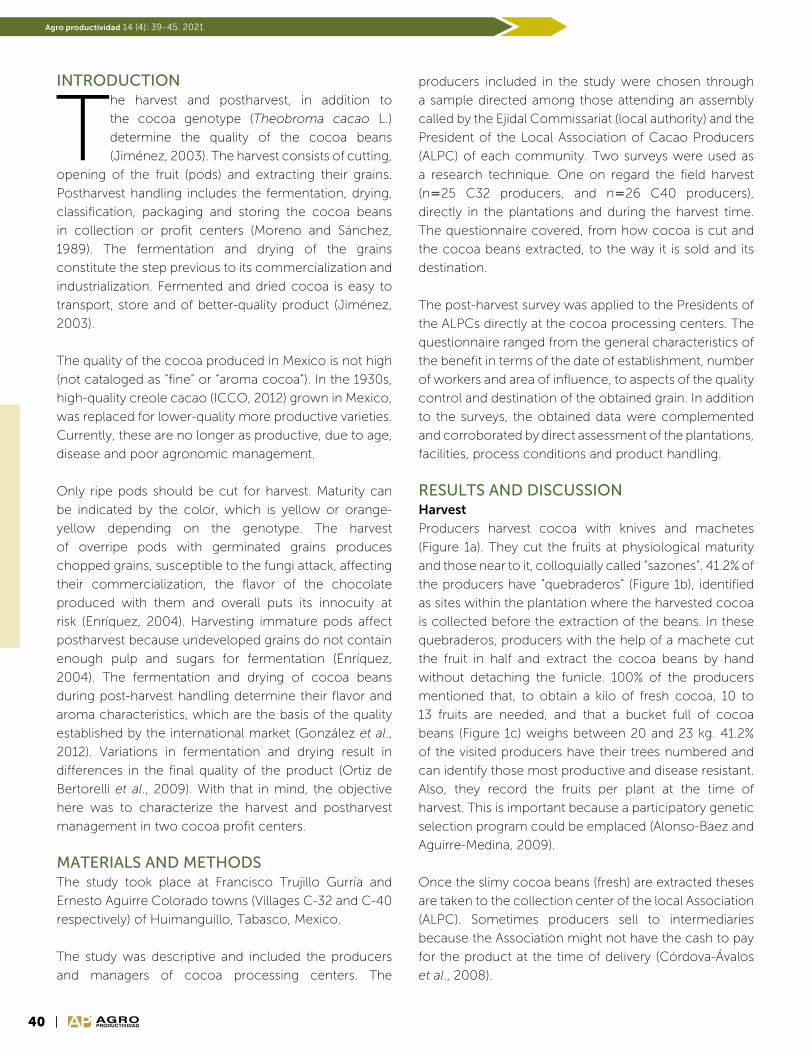
40
Agro productividad 14 (4): 39-45. 2021
AGROPRODUCTIVIDAD
INTRODUCTION
The harvest and postharvest, in addition to
the cocoa genotype (Theobroma cacao L.)
determine the quality of the cocoa beans
(Jiménez, 2003). The harvest consists of cutting,
opening of the fruit (pods) and extracting their grains.
Postharvest handling includes the fermentation, drying,
classification, packaging and storing the cocoa beans
in collection or profit centers (Moreno and Sánchez,
1989). The fermentation and drying of the grains
constitute the step previous to its commercialization and
industrialization. Fermented and dried cocoa is easy to
transport, store and of better-quality product (Jiménez,
2003).
The quality of the cocoa produced in Mexico is not high
(not cataloged as “fine” or “aroma cocoa”). In the 1930s,
high-quality creole cacao (ICCO, 2012) grown in Mexico,
was replaced for lower-quality more productive varieties.
Currently, these are no longer as productive, due to age,
disease and poor agronomic management.
Only ripe pods should be cut for harvest. Maturity can
be indicated by the color, which is yellow or orange-
yellow depending on the genotype. The harvest
of overripe pods with germinated grains produces
chopped grains, susceptible to the fungi attack, affecting
their commercialization, the flavor of the chocolate
produced with them and overall puts its innocuity at
risk (Enríquez, 2004). Harvesting immature pods affect
postharvest because undeveloped grains do not contain
enough pulp and sugars for fermentation (Enríquez,
2004). The fermentation and drying of cocoa beans
during post-harvest handling determine their flavor and
aroma characteristics, which are the basis of the quality
established by the international market (González et al.,
2012). Variations in fermentation and drying result in
differences in the final quality of the product (Ortiz de
Bertorelli et al., 2009). With that in mind, the objective
here was to characterize the harvest and postharvest
management in two cocoa profit centers.
MATERIALS AND METHODSThe study took place at Francisco Trujillo Gurría and
Ernesto Aguirre Colorado towns (Villages C-32 and C-40
respectively) of Huimanguillo, Tabasco, Mexico.
The study was descriptive and included the producers
and managers of cocoa processing centers. The
producers included in the study were chosen through
a sample directed among those attending an assembly
called by the Ejidal Commissariat (local authority) and the
President of the Local Association of Cacao Producers
(ALPC) of each community. Two surveys were used as
a research technique. One on regard the field harvest
(n25 C32 producers, and n26 C40 producers),
directly in the plantations and during the harvest time.
The questionnaire covered, from how cocoa is cut and
the cocoa beans extracted, to the way it is sold and its
destination.
The post-harvest survey was applied to the Presidents of
the ALPCs directly at the cocoa processing centers. The
questionnaire ranged from the general characteristics of
the benefit in terms of the date of establishment, number
of workers and area of influence, to aspects of the quality
control and destination of the obtained grain. In addition
to the surveys, the obtained data were complemented
and corroborated by direct assessment of the plantations,
facilities, process conditions and product handling.
RESULTS AND DISCUSSIONHarvest
Producers harvest cocoa with knives and machetes
(Figure 1a). They cut the fruits at physiological maturity
and those near to it, colloquially called “sazones”. 41.2% of
the producers have “quebraderos” (Figure 1b), identified
as sites within the plantation where the harvested cocoa
is collected before the extraction of the beans. In these
quebraderos, producers with the help of a machete cut
the fruit in half and extract the cocoa beans by hand
without detaching the funicle. 100% of the producers
mentioned that, to obtain a kilo of fresh cocoa, 10 to
13 fruits are needed, and that a bucket full of cocoa
beans (Figure 1c) weighs between 20 and 23 kg. 41.2%
of the visited producers have their trees numbered and
can identify those most productive and disease resistant.
Also, they record the fruits per plant at the time of
harvest. This is important because a participatory genetic
selection program could be emplaced (Alonso-Baez and
Aguirre-Medina, 2009).
Once the slimy cocoa beans (fresh) are extracted theses
are taken to the collection center of the local Association
(ALPC). Sometimes producers sell to intermediaries
because the Association might not have the cash to pay
for the product at the time of delivery (Córdova-Ávalos
et al., 2008).
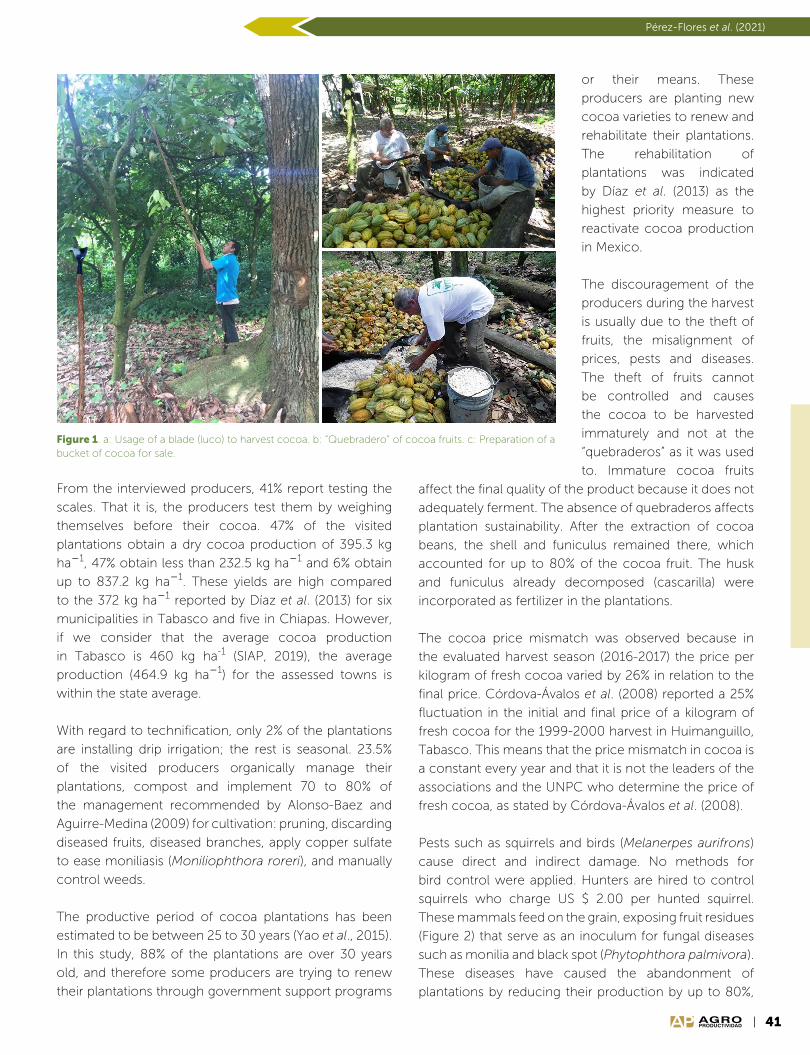
41
Pérez-Flores et al. (2021)
AGROPRODUCTIVIDAD
From the interviewed producers, 41% report testing the
scales. That it is, the producers test them by weighing
themselves before their cocoa. 47% of the visited
plantations obtain a dry cocoa production of 395.3 kg
ha1, 47% obtain less than 232.5 kg ha1 and 6% obtain
up to 837.2 kg ha1. These yields are high compared
to the 372 kg ha1 reported by Díaz et al. (2013) for six
municipalities in Tabasco and five in Chiapas. However,
if we consider that the average cocoa production
in Tabasco is 460 kg ha-1 (SIAP, 2019), the average
production (464.9 kg ha1) for the assessed towns is
within the state average.
With regard to technification, only 2% of the plantations
are installing drip irrigation; the rest is seasonal. 23.5%
of the visited producers organically manage their
plantations, compost and implement 70 to 80% of
the management recommended by Alonso-Baez and
Aguirre-Medina (2009) for cultivation: pruning, discarding
diseased fruits, diseased branches, apply copper sulfate
to ease moniliasis (Moniliophthora roreri), and manually
control weeds.
The productive period of cocoa plantations has been
estimated to be between 25 to 30 years (Yao et al., 2015).
In this study, 88% of the plantations are over 30 years
old, and therefore some producers are trying to renew
their plantations through government support programs
Figure 1. a: Usage of a blade (luco) to harvest cocoa. b: “Quebradero” of cocoa fruits. c: Preparation of a bucket of cocoa for sale.
or their means. These
producers are planting new
cocoa varieties to renew and
rehabilitate their plantations.
The rehabilitation of
plantations was indicated
by Díaz et al. (2013) as the
highest priority measure to
reactivate cocoa production
in Mexico.
The discouragement of the
producers during the harvest
is usually due to the theft of
fruits, the misalignment of
prices, pests and diseases.
The theft of fruits cannot
be controlled and causes
the cocoa to be harvested
immaturely and not at the
“quebraderos” as it was used
to. Immature cocoa fruits
affect the final quality of the product because it does not
adequately ferment. The absence of quebraderos affects
plantation sustainability. After the extraction of cocoa
beans, the shell and funiculus remained there, which
accounted for up to 80% of the cocoa fruit. The husk
and funiculus already decomposed (cascarilla) were
incorporated as fertilizer in the plantations.
The cocoa price mismatch was observed because in
the evaluated harvest season (2016-2017) the price per
kilogram of fresh cocoa varied by 26% in relation to the
final price. Córdova-Ávalos et al. (2008) reported a 25%
fluctuation in the initial and final price of a kilogram of
fresh cocoa for the 1999-2000 harvest in Huimanguillo,
Tabasco. This means that the price mismatch in cocoa is
a constant every year and that it is not the leaders of the
associations and the UNPC who determine the price of
fresh cocoa, as stated by Córdova-Ávalos et al. (2008).
Pests such as squirrels and birds (Melanerpes aurifrons)
cause direct and indirect damage. No methods for
bird control were applied. Hunters are hired to control
squirrels who charge US $ 2.00 per hunted squirrel.
These mammals feed on the grain, exposing fruit residues
(Figure 2) that serve as an inoculum for fungal diseases
such as monilia and black spot (Phytophthora palmivora).
These diseases have caused the abandonment of
plantations by reducing their production by up to 80%,

42
Agro productividad 14 (4): 39-45. 2021
AGROPRODUCTIVIDAD
making the crop unaffordable. As mentioned by Díaz
et al. (2013) from 2000 to 2011, cocoa production in
Mexico decreased 43.7% due to the attack of moniliasis,
among other factors.
Postharvest and cocoa collection center
characterization
The post-harvest of cocoa begins in the fields and ends
in the ALPC collection centers. Postharvest begins the
moment the cocoa pods are removed from the tree. It
ends when the grain is dry and ready for sale or industrial
processing. Postharvest includes the fermentation and
drying processes, which largely determine the quality of
chocolate.
In the present study, the producers do not pre-condition
the cocoa pods, and once they are cut from the tree,
they are split with a machete and their grains are
extracted by hand. Afoakwa (2011) recommends splitting
the cocoa pods with a wooden pillar or a machete.
Preconditioning is the storage of harvested cocoa pods
for a period before pod opening and bean fermentation
(Afoakwa et al., 2014). The storage of the cocoa pods
before its opening and grains extraction influences
their fermentation (Kongor et al., 2013) and improves
the quality of chocolate produced with it (González et
al., 2012). The fermentation, drying, selection, packing
and storage of the cocoa bean for sale, constitute the
benefits process of the cocoa bean. The characteristics
and infrastructure of the profit centers are shown in
Table 1.
Figure 2. Cacao fruit damaged by squirrels (left) and birds (right).
In relation to the type and material of
construction, both profit centers are closed
cement buildings. This is important because
the fermentation process requires constant
climatic conditions. Likewise, these profit
centers have office areas and equipment,
but do not have hygrometers or a guillotine
to test grain cutting. This test and moisture
determination are essential to assess the
physical quality of the fermented grain.
Regarding the type of cocoa received,
both profit centers receive fresh cocoa
(Rodríguez et al., 2012).
Characteristics of the fermentation,
drying and storage of cocoa
At the profit centers, once the fresh
beans are received, they are transferred
to wooden boxes for fermentation (Figure
3). Fermentation takes place for 8 d. The fermentation
of cocoa beans in boxes has been classified as a low
uniformity method since it results in an incomplete use
of sugars and a high presence of defective beans (Guehi
et al., 2010). The fermentation process in these centers
is inadequate since the producers do not classify the
grains before their fermentation, which does not favor
a homogeneity of the fermented grains. On the other
hand, the lack of instruments for moisture determination
and cutting tests makes it difficult to know if the beans
are well fermented.
The drying of cocoa consists of the loss of moisture
from the grains that go from 60% to 8% for their
safe storage (Afoakwa et al., 2014). At the C40 Town,
only artificial drying is used, in C32 it is combined with
natural drying (Figure 4). However, in the latter, the
drying capacity is lower. In both profit centers, dry
cocoa is packed in 50 to 60 kg jute bags and stored
until marketed.
Quality control and regulatory aspects
Both centers have no certification to process cocoa,
do not classify the beans, and do not perform cutting
tests. The beans are sold without information of their
origin. There is no process for packaging and tracking
the grains (the bags does not keep information of the
batch from the producer, fermentation, drying and
packaging). A traceability system allows the chocolate
industry to know how the beans were processed (Saltini
et al., 2013).

43
Pérez-Flores et al. (2021)
AGROPRODUCTIVIDAD
Table 1. Characteristics of postharvest cocoa handling in two towns of The Chontalpa Plan, Tabasco, Mexico.
Collection center characteristicsTown
Francisco Trujillo Gurría (C-32) Ernesto Aguirre Colorado (C-40)
Foundation year 2005 1940
Type of bought cocoa Fresh Fresh
Working months Nov-Jan y April-Jun Nov-Jan y Feb- April
Construction type Closed Closed
Construction material Concrete Concrete
Office supplies Furniture and files Furniture and files
Moisture meter and guillotine No No
Balances Si Si
Incorporation as a company No Si
Collection center capacity
Number of workers 10 14
Installed capacity to ferment * 50 140
Used capacity to ferment * 10 15
Installed drying capacity * 10 32
Used capacity for drying * 4 32
Cocoa received * 18 35
Producers served 70 170
Average area per producer (ha) 1.5 1.5
Fermentation
Do you ferment your cocoa? Yes Yes
Fermenters type Wooden boxes Wooden boxes
Days to ferment 7 8
Drier type in use
Natural drying Yes No
Time (days) 3
Turning frequency 2 h
Artificial drying Yes Yes
Time (hours) 12 a 16 24 a 36
Daily drying capacity (ton) 1.5 4
Storage
Do you store your product? Yes Yes
Infrastructure type Concrete Concrete
Do you classify grains and do cutting test? No No
Each bag keeps the lote information from the producer, ferment, drying and packaging?
No No
Regulatory aspects
Are you certified to benefit cocoa? No No
What company does the certification? AMCO ** -
Final product and its destination
Standard type? Yes Yes
Who do you sell your cocoa to? Agroindustry (AMCO) NUCP ***
Product destination National market National market
* t sem1 per week; ** Agroindustrias Unidas de Cacao S.A. de C.V.*** National Union of Cocoa Producers.
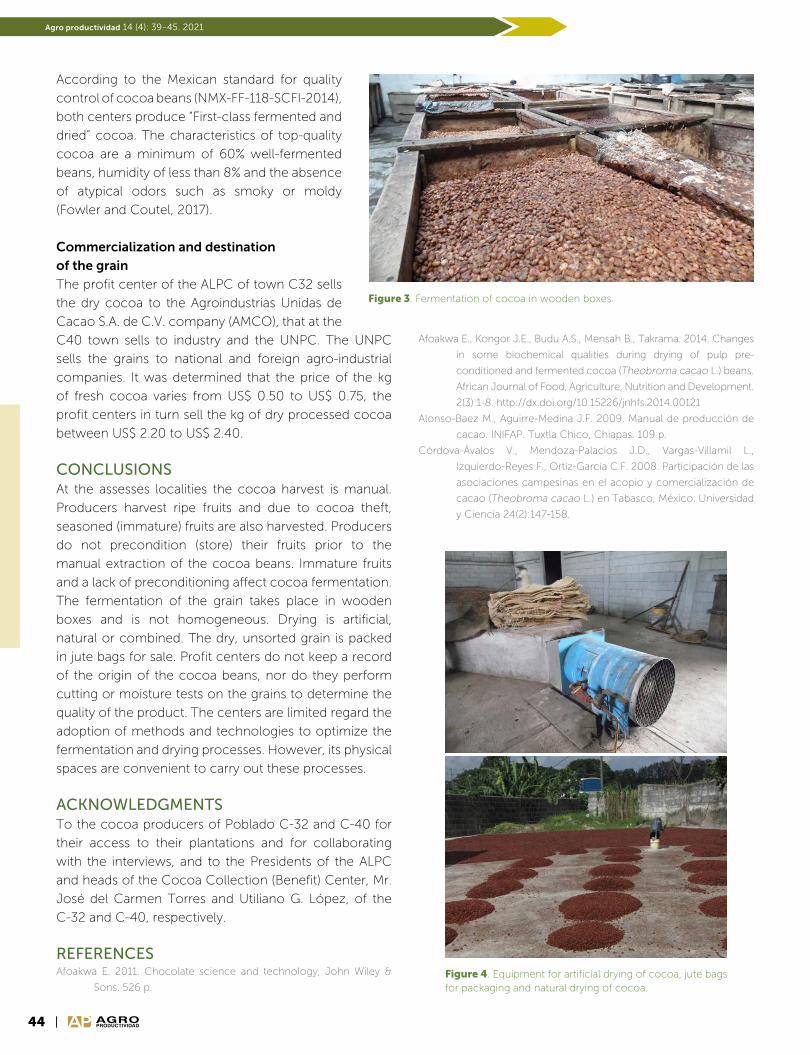
44
Agro productividad 14 (4): 39-45. 2021
AGROPRODUCTIVIDAD
Figure 4. Equipment for artificial drying of cocoa, jute bags for packaging and natural drying of cocoa.
Figure 3. Fermentation of cocoa in wooden boxes.
According to the Mexican standard for quality
control of cocoa beans (NMX-FF-118-SCFI-2014),
both centers produce “First-class fermented and
dried” cocoa. The characteristics of top-quality
cocoa are a minimum of 60% well-fermented
beans, humidity of less than 8% and the absence
of atypical odors such as smoky or moldy
(Fowler and Coutel, 2017).
Commercialization and destination
of the grain
The profit center of the ALPC of town C32 sells
the dry cocoa to the Agroindustrias Unidas de
Cacao S.A. de C.V. company (AMCO), that at the
C40 town sells to industry and the UNPC. The UNPC
sells the grains to national and foreign agro-industrial
companies. It was determined that the price of the kg
of fresh cocoa varies from US$ 0.50 to US$ 0.75, the
profit centers in turn sell the kg of dry processed cocoa
between US$ 2.20 to US$ 2.40.
CONCLUSIONSAt the assesses localities the cocoa harvest is manual.
Producers harvest ripe fruits and due to cocoa theft,
seasoned (immature) fruits are also harvested. Producers
do not precondition (store) their fruits prior to the
manual extraction of the cocoa beans. Immature fruits
and a lack of preconditioning affect cocoa fermentation.
The fermentation of the grain takes place in wooden
boxes and is not homogeneous. Drying is artificial,
natural or combined. The dry, unsorted grain is packed
in jute bags for sale. Profit centers do not keep a record
of the origin of the cocoa beans, nor do they perform
cutting or moisture tests on the grains to determine the
quality of the product. The centers are limited regard the
adoption of methods and technologies to optimize the
fermentation and drying processes. However, its physical
spaces are convenient to carry out these processes.
ACKNOWLEDGMENTSTo the cocoa producers of Poblado C-32 and C-40 for
their access to their plantations and for collaborating
with the interviews, and to the Presidents of the ALPC
and heads of the Cocoa Collection (Benefit) Center, Mr.
José del Carmen Torres and Utiliano G. López, of the
C-32 and C-40, respectively.
REFERENCESAfoakwa E. 2011. Chocolate science and technology, John Wiley &
Sons. 526 p.
Afoakwa E., Kongor J.E., Budu A.S., Mensah B., Takrama. 2014. Changes
in some biochemical qualities during drying of pulp pre-
conditioned and fermented cocoa (Theobroma cacao L.) beans.
African Journal of Food, Agriculture, Nutrition and Development.
2(3):1-8. http://dx.doi.org/10.15226/jnhfs.2014.00121
Alonso-Baez M., Aguirre-Medina J.F. 2009. Manual de producción de
cacao. INIFAP. Tuxtla Chico, Chiapas. 109 p.
Córdova-Ávalos V., Mendoza-Palacios J.D., Vargas-Villamil L.,
Izquierdo-Reyes F., Ortíz-García C.F. 2008. Participación de las
asociaciones campesinas en el acopio y comercialización de
cacao (Theobroma cacao L.) en Tabasco, México. Universidad
y Ciencia 24(2):147-158.
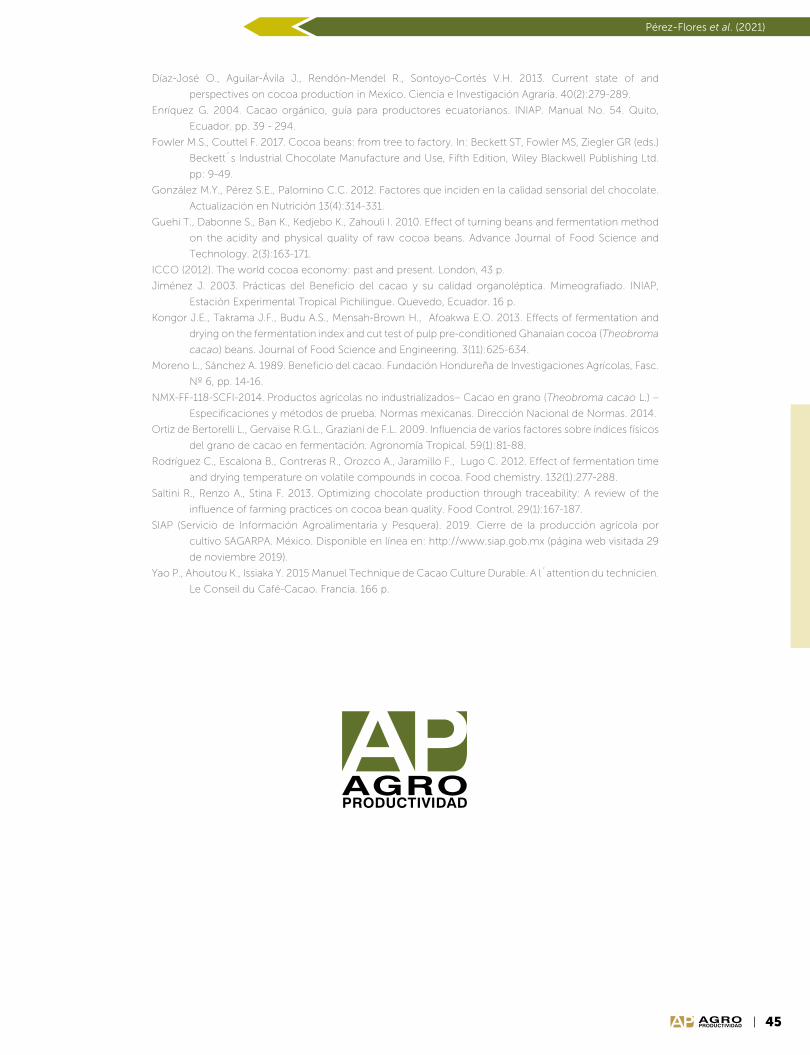
45
Pérez-Flores et al. (2021)
AGROPRODUCTIVIDAD
Díaz-José O., Aguilar-Ávila J., Rendón-Mendel R., Sontoyo-Cortés V.H. 2013. Current state of and
perspectives on cocoa production in Mexico. Ciencia e Investigación Agraria. 40(2):279-289.
Enríquez G. 2004. Cacao orgánico, guía para productores ecuatorianos. INIAP. Manual No. 54. Quito,
Ecuador. pp. 39 - 294.
Fowler M.S., Couttel F. 2017. Cocoa beans: from tree to factory. In: Beckett ST, Fowler MS, Ziegler GR (eds.)
Beckett´s Industrial Chocolate Manufacture and Use, Fifth Edition, Wiley Blackwell Publishing Ltd.
pp: 9-49.
González M.Y., Pérez S.E., Palomino C.C. 2012. Factores que inciden en la calidad sensorial del chocolate.
Actualización en Nutrición 13(4):314-331.
Guehi T., Dabonne S., Ban K., Kedjebo K., Zahouli I. 2010. Effect of turning beans and fermentation method
on the acidity and physical quality of raw cocoa beans. Advance Journal of Food Science and
Technology. 2(3):163-171.
ICCO (2012). The world cocoa economy: past and present. London, 43 p.
Jiménez J. 2003. Prácticas del Beneficio del cacao y su calidad organoléptica. Mimeografiado. INIAP,
Estación Experimental Tropical Pichilingue. Quevedo, Ecuador. 16 p.
Kongor J.E., Takrama J.F., Budu A.S., Mensah-Brown H., Afoakwa E.O. 2013. Effects of fermentation and
drying on the fermentation index and cut test of pulp pre-conditioned Ghanaian cocoa (Theobroma
cacao) beans. Journal of Food Science and Engineering. 3(11):625-634.
Moreno L., Sánchez A. 1989. Beneficio del cacao. Fundación Hondureña de Investigaciones Agrícolas, Fasc.
Nº 6, pp. 14-16.
NMX-FF-118-SCFI-2014. Productos agrícolas no industrializados– Cacao en grano (Theobroma cacao L.) –
Especificaciones y métodos de prueba. Normas mexicanas. Dirección Nacional de Normas. 2014.
Ortiz de Bertorelli L., Gervaise R.G.L., Graziani de F.L. 2009. Influencia de varios factores sobre índices físicos
del grano de cacao en fermentación. Agronomía Tropical. 59(1):81-88.
Rodríguez C., Escalona B., Contreras R., Orozco A., Jaramillo F., Lugo C. 2012. Effect of fermentation time
and drying temperature on volatile compounds in cocoa. Food chemistry. 132(1):277-288.
Saltini R., Renzo A., Stina F. 2013. Optimizing chocolate production through traceability: A review of the
influence of farming practices on cocoa bean quality. Food Control. 29(1):167-187.
SIAP (Servicio de Información Agroalimentaria y Pesquera). 2019. Cierre de la producción agrícola por
cultivo SAGARPA. México. Disponible en línea en: http://www.siap.gob.mx (página web visitada 29
de noviembre 2019).
Yao P., Ahoutou K., Issiaka Y. 2015 Manuel Technique de Cacao Culture Durable. A l´attention du technicien.
Le Conseil du Café-Cacao. Francia. 166 p.
AGROPRODUCTIVIDAD


47AGROPRODUCTIVIDAD
https://doi.org/10.32854/agrop.v14i4.1933
Agroproductividad: Vol. 14, Núm. 4, abril. 2021. pp: 47-51.
Recibido: agosto, 2020. Aceptado: marzo, 2021.
Amaranth Microgreens as a Potential Ingredient for Healthy Salads: Sensory Liking and Purchase Intent
Domínguez-Domínguez, Aimeé1; Herrera-Corredor, José Andrés2; Argumedo-Macias, Adrián3;
Ramírez-Rivera, Emmanuel de Jesús4; López-Aranda, Erika1; Romero-Cruz, Anabel1; López-Espíndola Mirna2*
1Instituto Tecnológico Superior de Acatlán de Osorio. Ingeniería en Industrias Alimentarias. Acatlán
de Osorio, Puebla, México. 2Colegio de Postgraduados Campus Córdoba. Manuel León, Amatlán
de los Reyes, Veracruz, México. 3Colegio de Postgraduados, Campus Puebla. Cholula, Puebla,
México. 4Tecnológico Nacional de México /ITS de Zongolica, Zongolica, Veracruz, México
*Corresponding author: [email protected]
ABSTRACTObjective: To identify liking, acceptability, and purchase intent of salads prepared from amaranth microgreens in a mixture
with lettuce and carrots.
Design/Methodology/Approach: Seven formulations of amaranth microgreens, lettuce, and carrots were evaluated. The
study was conducted through a centralized location consumer study. The level of liking was measured with a 9-point
hedonic scale. Acceptability and purchase intent were measured with a binomial scale.
Results: In general, consumers indicated they liked salad samples within a range of 6 (liked slightly) and 7 (liked moderately).
Formulation 7 (with the highest proportion of carrot) was liked by consumers in aftertaste, flavor, and overall liking.
Formulation 3 (a balanced mixture of its three ingredients) was liked in its attributes: colors, texture, appearance, and
smell. Overall liking had a significant impact on purchase intent.
Study Limitations/Implications: Study results represent only the segment of the surveyed population, most of which
were young people between 18 and 25 years old (60%).
Findings/Conclusions: Amaranth aroma can impact the liking of amaranth microgreen-based salads without causing
rejection. The use of carrots in combination with amaranth microgreens can improve the acceptability of salads. Salad
formulations with amaranth proportions of 22 to 33.3% have more opportunity in their purchase intent.
Keywords: amaranth, microgreens, consumers, acceptability, purchase.
INTRODUCTION
Microgreens are immature plants that have completely developed cotyledons and can
have or not their first true leaves. They generally measure between 2.5 and
7.6 cm in height, and they are usually harvested between 7 and 14 days after germination (Xiao et al., 2016). They
represent an alternative for food consumption with functional properties (Xiao et al., 2015). In addition, a small portion
of microgreens can provide around 89% of the daily required intake of vitamins (Kou et al., 2013). Amaranth cultivation
in Mexico is primarily directed toward grain production for different processed products, and although the crop is
Imagen de Luisella Planeta Leoni en Pixabay 47AGROPRODUCTIVIDAD
48
Agro productividad 14 (4): 47-51. 2021
AGROPRODUCTIVIDAD
consumed as a plant in rural areas, it is not common
to find these products in supermarkets with similar
packaging to other leafy vegetables such as lettuce.
The cultivation of amaranth for the production of
microgreens could be a diversifying option for the
crop, to be used in nutrient-rich foods with functional
properties. In order to accomplish this goal, it is necessary
to identify the reactions of consumers regarding the use
of microgreens, to successfully introduce them into the
market. A consumer study will allow the determination
of key sensory attributes that impact the level of liking,
acceptability, and purchase intent in salads formulated
with amaranth microgreens.
Various studies have demonstrated that there is a direct
correlation between vegetable consumption and a
reduction in the development of chronic illnesses, such
as cardiovascular diseases and cancer (Slavin and Lloyd,
2012). It has been found that microgreens generally
contain more phytonutrients (such as ascorbic acid,
-tocopherol, and -carotene) than mature plants,
and are excellent sources of vitamins and carotenoids
(Chloe et al., 2008). On the sensory side, microgreens
can provide intense flavors, vivid colors, and specific
textures, while also being able to function as a
decorative element in salads or as a new ingredient.
In general, the quality of fresh products is related to
various sensory attributes such as appearance, texture,
and flavor (Xiao et al., 2015). Among all the quality
attributes, appearance is the initial attribute that attracts
consumers and affects their choice to buy for the first
time. However, other characteristics play a crucial role
in consumer satisfaction and repeating purchases. To
date, there is no information from studies published
in the literature about the integration of amaranth
microgreens in salads evaluated by consumers.
The use of amaranth microgreens in salads could
represent a strategy for
diversifying the application
of the amaranth crop.
Nonetheless, a lack of
awareness of this use in
consumers can be a limitation.
The objective of this study
was to identify the liking level,
acceptability, and purchase
intent of salads prepared using
amaranth microgreens mixed
with lettuce and carrots.
MATERIALS AND METHODOLOGYThe study was conducted in the Sensory Testing Laboratory
of Colegio de Postgraduados, Córdoba Campus,
located on km 348 of the Córdoba-Veracruz Federal
Highway, in Amatlán de los Reyes, Veracruz, Mexico.
Plant Material
For the production of amaranth microgreens, seeds of
the Areli variety were used, which were planted in the
municipality of Xayacatlán de Bravo, Puebla. The soil used
consisted of 60% loam, 25% sand, and 15% compost. The
seeds were sprinkled evenly, covered lightly with soil,
and fully moistened. They were watered twice a day:
morning and afternoon. After 5 days, the seeds began to
germinate. By the seventh day after planting, the watering
schedule was modified: in the morning, around midday,
and in the afternoon. This procedure was maintained
for 11 days, which was the time it took for the plants to
reach the height and characteristics required for cutting.
The microgreens were harvested using previously
disinfected scissors by cutting the stem approximately
one centimeter above the soil. The plants were placed in
a plastic container and stored in refrigeration at 4 °C to
avoid oxidation or darkening.
The carrots and romaine lettuce were purchased the local
market one day before conducting the consumer study.
Mixture Design
The design of the salad mixtures was based on a simplex
triangle where the total proportions of each ingredient
(amaranth microgreens, lettuce, and carrots) in the salad
were adjusted to sum 100% according to Table 1. As
constraints, a maximum of 80% and a minimum of 10%
were set for all the ingredients.
Salad Preparation
Before preparing the salads, the ingredients were
selected to verify the
absence of physical
damage, contamination, or
undesirable materials. All the
ingredients were washed and
disinfected in a 1% sodium
hypochlorite solution for
3 to 5 min. The lettuce and
carrots were cut into long
segments of approximately
5 cm 1 cm, adequate for
the salad presentation. The
Table 1. Percentages of ingredients used for salads formulation.
FormulationLettuce
%Amaranth
%Carrot
%Total
%
F1 80.0 10.0 10.0 100
F2 56.0 22.0 22.0 100
F3 33.3 33.3 33.3 100
F4 22.0 56.0 22.0 100
F5 22.0 22.0 56.0 100
F6 10.0 80.0 10.0 100
F7 10.0 10.0 80.0 100

49
Domínguez-Domínguez et al. (2021)
AGROPRODUCTIVIDAD
amaranth microgreens were only trimmed of excess
stem. Given that salads are usually eaten with dressing,
a neutral dressing of lime and honey (1:1) was used in
all the formulations. The dressing selection sought one
that was simple, easy to prepare, and appropriate for
the mix of ingredients while having the lowest impact
on salad taste.
All the ingredients in the formulations presented to the
consumers were weighed individually to guarantee
proportions according to the mixture design. Weighing
was done using a Scout ®Pro (Ohaus Corporation,
194 Chapin Road NJ07058, USA) analytical scale.
The ingredients were manually placed and mixed on
disposable plates. The total weight of the amaranth
microgreens, lettuce and carrots that was presented
to the consumer was 30 g, and as a final step, 5 ml of
dressing was added.
Consumer Study
The study was conducted with consumers in a central
location modality. The evaluation was carried out at
Córdoba Campus of Colegio de Postgraduados. To
collect the answers, a questionnaire was used with three
sections: 1) consumer demographic data; 2) evaluation
of salad liking for 7 sensory attributes (appearance, color,
aroma, mouth feel or texture, flavor, aftertaste, and
general liking) on a 9-point hedonic scale (1Extremely
dislike, 5neutral, 9Extremely like); and 3) evaluation
of the “acceptability,” “purchase intent,” and “purchase
intent after knowing that the salad contains amaranth
microgreens” on a binomial scale (yes/no). All the
panelists were instructed to rinse their mouths with
water between each sample to minimize the effect of
the order of presentation. Participation was voluntary
and the consumers were informed about the ingredients,
and the use of the hedonic scale with respect to the 7
attributes.
In total, there were 63 consumers. Their ages were
within a range of 18-24 years old in around 59% and
between 25-34 years old in 29%. Among the consumers,
59% were women and 41% were men.
Statistical Analysis
Given the total quantity of formulations (7), a balanced
incomplete block design was used ro reduce consumer
fatigue. With this statistical design, each consumer
evaluated only 2 formulations according to the plan
11.2a (t7, k2, r6, b21, 1, E0.58; Cochran and
Cox, 1957). The design was repeated 3 times. For the
analysis of liking data collected from the hedonic scale,
a balanced incomplete block design was used ro reduce
consumer fatigue with a significance level of 0.05. For
means comparison among formulations, Tukey’s test
was applied. To identify similarities among formulations
considering all the attributes simultaneously, Principal
Components Analysis and Cluster Analysis were used.
To identify the critical attributes for acceptability and
purchase intent, a multiple logistic regression analysis
was used (Prinyawiwatkul and Chompreeda, 2007),
where the significance of each of the coefficients
associated to each attribute was determined according
to the following model:
lnP
PAppearance Color
Aroma Texture F
1 0 1 2
3 4 5
−
= + +
+ + +
β β β
β β β llavor
Aftertaste Overall Liking+ +β β6 7
To identify the effect of providing additional information
to the consumer (the use of amaranth microgreens
in the salad ingredients) on the purchase intent, the
McNemar test was used. The R software version 4.0.2
was used with the integrated development environment
of RStudio 1.3.959.
RESULTS AND DISCUSSIONIn the variance analysis of the liking level for sensory
attributes, no significant difference was found among
the formulations for attributes of color, texture, flavor,
aftertaste, and overall liking. In general, consumers
indicated that they liked the salad samples in a range
of 6 (like slightly) and 7 (like moderately). These
results suggest that even with different proportions of
ingredients in the formulations, consumers liked most
of the attributes of the salads, and adding amaranth
microgreens had no significant impact on consumer
liking. A significant difference was found for the
appearance and aroma attributes in a range of 5 (neutral)
and 7 (like moderately). In the case of appearance,
the lowest value was for formulation 4 (lettuce 22%,
amaranth 56%, and carrot 22%), which was one of the
formulations with the highest proportion of amaranth.
Paakki et al. (2019) studied the impact of color intensity
and color contrasts in mixed salads. These authors found
that salads with more contrast in their colors were more
attractive to consumers since they were associated with
freshness, variety, and complexity. In the case of aroma,
the lowest values were for formulations 4 and 6, both
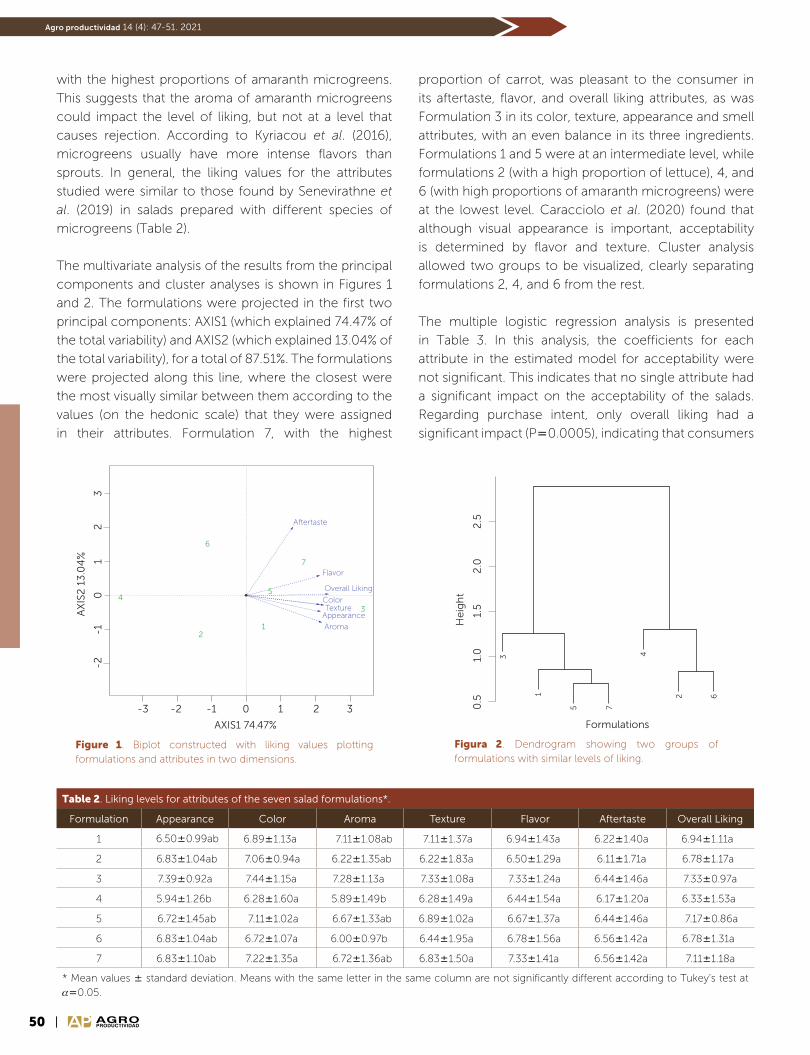
50
Agro productividad 14 (4): 47-51. 2021
AGROPRODUCTIVIDAD
with the highest proportions of amaranth microgreens.
This suggests that the aroma of amaranth microgreens
could impact the level of liking, but not at a level that
causes rejection. According to Kyriacou et al. (2016),
microgreens usually have more intense flavors than
sprouts. In general, the liking values for the attributes
studied were similar to those found by Senevirathne et
al. (2019) in salads prepared with different species of
microgreens (Table 2).
The multivariate analysis of the results from the principal
components and cluster analyses is shown in Figures 1
and 2. The formulations were projected in the first two
principal components: AXIS1 (which explained 74.47% of
the total variability) and AXIS2 (which explained 13.04% of
the total variability), for a total of 87.51%. The formulations
were projected along this line, where the closest were
the most visually similar between them according to the
values (on the hedonic scale) that they were assigned
in their attributes. Formulation 7, with the highest
Table 2. Liking levels for attributes of the seven salad formulations*.
Formulation Appearance Color Aroma Texture Flavor Aftertaste Overall Liking
1 6.500.99ab 6.891.13a 7.111.08ab 7.111.37a 6.941.43a 6.221.40a 6.941.11a
2 6.831.04ab 7.060.94a 6.221.35ab 6.221.83a 6.501.29a 6.111.71a 6.781.17a
3 7.390.92a 7.441.15a 7.281.13a 7.331.08a 7.331.24a 6.441.46a 7.330.97a
4 5.941.26b 6.281.60a 5.891.49b 6.281.49a 6.441.54a 6.171.20a 6.331.53a
5 6.721.45ab 7.111.02a 6.671.33ab 6.891.02a 6.671.37a 6.441.46a 7.170.86a
6 6.831.04ab 6.721.07a 6.000.97b 6.441.95a 6.781.56a 6.561.42a 6.781.31a
7 6.831.10ab 7.221.35a 6.721.36ab 6.831.50a 7.331.41a 6.561.42a 7.111.18a
* Mean values standard deviation. Means with the same letter in the same column are not significantly different according to Tukey’s test at 0.05.
Figura 2. Dendrogram showing two groups of formulations with similar levels of liking.
1 2
3 4
5
6
70.5
1.0
1.5
2.0
2.5
He
igh
t
Formulations
Aftertaste
Flavor
Overall Liking
ColorTexture
Appearance
Aroma12
3
45
6
7
-3 -2 -1 0 1 2 3
-2-1
01
23
AX
IS2
13
.04
%
AXIS1 74.47%
Figure 1. Biplot constructed with liking values plotting formulations and attributes in two dimensions.
proportion of carrot, was pleasant to the consumer in
its aftertaste, flavor, and overall liking attributes, as was
Formulation 3 in its color, texture, appearance and smell
attributes, with an even balance in its three ingredients.
Formulations 1 and 5 were at an intermediate level, while
formulations 2 (with a high proportion of lettuce), 4, and
6 (with high proportions of amaranth microgreens) were
at the lowest level. Caracciolo et al. (2020) found that
although visual appearance is important, acceptability
is determined by flavor and texture. Cluster analysis
allowed two groups to be visualized, clearly separating
formulations 2, 4, and 6 from the rest.
The multiple logistic regression analysis is presented
in Table 3. In this analysis, the coefficients for each
attribute in the estimated model for acceptability were
not significant. This indicates that no single attribute had
a significant impact on the acceptability of the salads.
Regarding purchase intent, only overall liking had a
significant impact (P0.0005), indicating that consumers

51
Domínguez-Domínguez et al. (2021)
AGROPRODUCTIVIDAD
relied on the combination of salad attributes to determine
purchase intent. Formulation 4 was rated with the lowest
acceptability and purchase intent (50%) and Formulation
5 with the highest (100%). Michell et al. (2020) found that
familiarity with microgreens, cost, availability, and shelf
life are also key factors in determining purchase intent of
microgreens.
In general, the results of the analysis of variance,
Principal Components Analysis, and Multiple Logistic
Regression Analysis suggest that salad formulations that
are balanced in their ingredient proportions and those
with a slightly higher proportion of carrots were the best
rated by consumers (Formulations 3 and 5).
The result of McNemar’s test was not significant,
indicating that informing consumers that the salad
contains amaranth microgreens does not change their
purchase intent, which was generally favorable for most
formulations. Renna et al. (2017) emphasize that the
culinary promotion of microgreens has great potential to
integrate these ingredients into international gastronomy
and foster the use of local edible species.
CONCLUSIONSThe aroma of amaranth can impact the level of liking
of salads prepared with this crop’s microgreens without
reaching rejection. The use of carrots in combination with
amaranth microgreens can improve the acceptability of
salads. Salad formulations with amaranth proportions of
22 to 33.3% have more opportunity in purchase intent.
In general, salads with amaranth microgreens were well
received by consumers and represent an alternative for
the diversification of the crop.
ACKOWLEDGEMENTSThe authors thank the Colegio de Postgraduados Córdoba Campus for
the support granted to carry out the study.
REFERENCESCaracciolo, F., El-Nakhel, C., Raimondo, M., Kyriacou, M.C., Cembalo,
L., De Pascale, S. & Rouphael Y. (2020). Sensory Attributes and
Consumer Acceptability of 12 Microgreens Species. Agronomy.
10(7): 1043. doi: 10.3390/agronomy10071043
Choe, U., Lucy, L., Thomas, Y., & Whang, T. (2018). The science behind
Microgreens as an exciting new food for the XX century. Journal
of Agricultural and Food Chemistry, 66(44):11519–11530. doi:
10.1021/acs.jafc.8b03096
Cochran, W.G. & Cox, G.M. 1957. Experimental designs. 2nd ed., New
York: John Wiley & Sons. 617 p
Kyriacou, M.C., Rouphael, Y., Di Gioia, F. Kyratzis, A., Serio, F., Renna,
M., De Pascale, S., Santamaria, P. (2016) Micro-scale vegetable
production and the rise of microgreens. Trends in Food Science
& Technology. 57 (1): 103-115. http://dx.doi.org/10.1016/j.
tifs.2016.09.005
Kou, L., Lou, Y., Yang, T., Xiao, Z., Turner, E. R., Lester, G. E., Camp, M. J.
(2013). Postharvest biology, quality and shelf life of buckwheat
microgreens. LWT - Food Science and Technology 51:73-78.
doi:10.1016/j.lwt.2012.11.017
Michell, K.A., Isweiri, H., Newman, S.E., Bunning, M., Bellows, L.L., Dinges,
M.M., Grabos, L.E., Rao, S., Foster, M.T., Heuberger, A.L., Prenni,
J.E., Thompson, H.J., Uchanski, M.E., Weir, T.L., & Johnson
S.A. (2020). Microgreens: Consumer sensory perception and
acceptance of an emerging functional food crop. Journal of
Food Science. 85 (4): 926-935. doi: 10.1111/1750-3841.15075
Paakki, M., Sandel, M., Hopia, A. (2019) Visual attractiveness depends
on colorfulness and color contrasts in mixed salads. Food
Quality and Preference. 76(1): 81-90. https://doi.org/10.1016/j.
foodqual.2019.04.004
Prinyawiwatkul, W., & Chompreeda P. (2007). Applications of discriminant
and logistic regression analysis for consumer acceptance and
consumer-oriented product optimization study (chapter 16).
In: Beckley JH, Foley M, Topp EJ, Huang JC, Prinyawiwatkul
W, editors. Accelerating new food product design and
development. Ames, Iowa: Blackwell Publishing Professional
Rennaa, M., Di Gioiab, F., Leonia, B., Mininnib, C., & Santamariaa, P.
(2017). Culinary Assessment of Self-Produced Microgreens
as Basic Ingredients in Sweet and Savory Dishes. Journal of
Culinary Science & Technology. 15(2):126-142. doi:10.1080/1
5428052.2016.1225534
Slavin, J.L. & Lloyd, B. (2012). Health Benefits of Fruits and Vegetables.
Advances in Nutrition 3(4):506–516, doi:10.3945/an.112.002154
Xiao, Z., Codling, E. E., Luo, Y., Nou, X., Lester, G. E., & Wang, Q. (2016).
Microgreens of Brassicaceae: Mineral composition and content
of 30 varieties. Journal of Food Composition and Analysis 49
(1): 87-93. doi:10.1016/j.jfca.2016.04.006
Xiao, Z. L., Lester, G. E.; Park, E. H., Saftner, R. A., Luo, Y. G., & Wang,
Q. (2015). Evaluation and correlation of sensory attributes
and chemical compositions of emerging fresh produce:
Microgreens. Postharvest Biology and Technology. 110:140-
148. doi:10.1016/j.postharvbio.2015.07.021
Table 3. Coefficients for the multiple logistic regression model for acceptability and purchase intent.
AttibutesAcceptability Purchase Intent
Estimated Pr (|z|) Estimated Pr (|z|)
Appearance 0.2678 0.7135 0.3688 0.2211
Color 1.2512 0.1058 0.1120 0.2211
Aroma 0.2982 0.6160 0.0195 0.9458
Texture 0.0515 0.9165 0.0552 0.8458
Flavor 0.8699 0.2461 0.5406 0.1282
AfterTaste 0.0722 0.9096 0.0016 0.9956
Overall Liking 0.6879 0.3679 1.3909 0.0005
Pr (|z|) values smaller than 0.05 indicate a significant impact of the attribute on salad acceptability or purchase intent.


53AGROPRODUCTIVIDAD
https://doi.org/10.32854/agrop.v14i4.2012
Agroproductividad: Vol. 14, Núm. 4, abril. 2021. pp: 53-58.
Recibido: noviembre, 2020. Aceptado: abril, 2021.
Agricultural credit use in papaya agroecosystems in the central region of Veracruz, Mexico
Zarrabal-Prieto, Alba A.1; García-Pérez, Eliseo1*; Ávila-Reséndiz, Catarino1; Escobedo-Garrido, José S.2
1Colegio de Postgraduados, Campus Veracruz, Manlio Fabio Altamirano, Veracruz, Mexico. 2Colegio de Postgraduados, Campus Puebla, Santiago Momoxpan, San Pedro Cholula, Puebla,
México.
*Corresponding author: [email protected]
ABSTRACTObjective: To analyze the use of agricultural credit and the profitability of their papaya agroecosystem.
Design/methodology/approach: A survey was applied using a questionnaire to 114 producers in seven municipalities in
the central area of Veracruz, Mexico.
Results: 75% of papaya growers do not know about formal sources of credit that support their productive activity. Only
22.8% have used some type of financing, and only 2.6% came from formal credit sources, even though, 97.4% used semi-
formal and informal financing options. 77.2 % of growers use their own economic resources for papaya production. This
generates a great heterogeneity on production costs and crop management (level of technology) that reflects the final
yield. Even under these conditions the crop is profitable.
Limitations of the study/implications: Information from public or private credit institutions, does not reach potential
users. The few farmers who have accessed a formal credit, have had bad experiences, such as embargoes and legal
actions due to special situations that made them not paying on time, that discourage growers from using this type of
credit.
Findings/Conclusions: Lack of knowledge of the growers about financing sources. Low use of agricultural or other
formal private credits, as 77.2% of growers used their own economic resources, which generates great heterogeneity in
production costs associated with the level of technology, that is reflected in the crop yield, even so the papaya crop still
is profitable.
Keywords: Carica papaya, farmer credits, production costs, yield, profitability.
INTRODUCTION
Commercial agriculture depends on technology packages, which include technical advice
and credits for the purchase of machinery, seeds, fertilizers, irrigation systems,
herbicides, pesticides and other inputs, although this agriculture has negative effects on the environment and human
health from the ecology viewpoint, their contribution to world food production cannot be denied (FAO, 2009).
Imagen de Juan Carlos Torrico en Pixabay
54
Agro productividad 14 (4): 53-58. 2021
AGROPRODUCTIVIDAD
In Mexico, the banking system comprises the multiple
banking system and development bank system. As of
2002, the creation of Bancos Asociados a Cadenas
Comerciales (BACC) was authorized. It was considered
to be a multiple banking institution (SHCP, 2012). As of
late 2002 to early 2014, as a de-centralized body of the
Federal Public Administration, Rural Financing (FR) is the
Federal Government’s official agency that encourages
agriculture and livestock raising, forest, fishing and all
other activities linked to the rural environment, as well
as the formation of first-floor financial intermediaries
(SHCP, 2009).
According to Carranza (2007), financing sources by
which agriculture and livestock raising producer get
resources from may be classified as domestic and
foreign, as well as formal (banking and non-banking),
semi-formal (cooperation, producer organization) and
informal (local lenders, loan sharks and usurers), credit
from agents from inside the production chain (input
producers, final product purchasers) and friend and
family credit.
As papaya is a fully commercial crop, completely
addressed to the market, it shows certain technical
demands for its production process in order to reach
performance and quality required by the market. Small
producers in the state of Veracruz try to incorporate
innovations such as fertilization and pests combat,
which represents strong amounts of money for their
purchase and application; also, the fruit’s growth
requires a major amount of contracted labor. These
items mean major expenses for the producer who does
not have access to financing sources, with amounts,
periods and interest rates adequate for their activity.
Mexico falls on fifth place as a papaya producer at a
world level, with a production of around 961,768 t in year
2017; it is also one of the main exporting countries with
around 168 mil t, 99% of which are bound for the US.
In order of importance, exporter countries that follow
are Brazil, Belize, Malasia and India (FAOSTAT, 2017). The
Agroalimentary and Fishing Information System (SIAP)
reports that there is papaya production in 20 states of
Mexico, of which Veracruz, Michoacán, Colima, Oaxaca,
Chiapas and Guerrero stand out by their sown area,
which concentrate more than 73% of sown surface with
19,845 ha, with a production volume of 1,093,487 t of
fruit (SIAP, 2017; SIAP, 2019).
The Maradol papaya has a Cuban origin and was
introduced in Mexico in 1977. It had an extended
growth in the state of Veracruz in the last 20 years and
currently prevails in the national market. Its features
are productivity, post-crop handling strength and fruit
quality. Nevertheless, it is prone to acquiring the Papaya
ringspot virus (VMAP or PRSV-p) (FPS, 2009; Semillas del
Caribe, 2017).
By the end of 2019, the state of Veracruz leads the
national statistics as a main papaya producer; with a sown
surface of 3,455 ha, an average yield of 32,759 t ha1,
and a production of 112 mil t; followed by Michoacán
and Colima, with yields greater that, in some occasions,
outweigh the national average that amounts to 43.45 t
ha1 (SIAP, 2010; SIAP, 2019).
The production cost for the placement of this crop is
not smooth. Variability depends on the country zone
involved and financial resources the producer has for
technology management. 76% of production in the state
of Veracruz is focused on the municipalities of Cotaxtla,
Isla, Tierra Blanca, Soledad de Doblado and Tlalixcoyan,
located mainly in the central region. The objective was to
analyze the use of agricultural credit and the profitability
of their papaya agroecosystem in the central region of
the state of Veracruz.
MATERIALS AND METHODS Research was made in the municipalities of Cotaxtla,
Tierra Blanca, Tlalixcoyan, Soledad de Doblado, Manlio
Fabio Altamirano, Puente Nacional and Actopan,
Veracruz, Mexico. The first four are located between the
first papaya producers, with 60% of production and 48%
of the surface grown in the state (SIAP, 2017).
A mixed research was made with qualitative and
quantitative variables through a poll, for which a semi-
structured questionnaire that considered open and
closed questions, with Likert scale and multiple choice
dichotomous-type answers, was applied. Questionnaire
sections were: i) general producer aspects, ii) property
features, iii) financial culture, iv) access to credits, v) crop
management vi), training in papaya growing and vii)
marketing.
In order to determine the sample size, the snowball non-
probability sampling method was considered (Briones,
1996). Its objective was to understand cultural or personal
55
Zarrabal-Prieto et al. (2021)
AGROPRODUCTIVIDAD
realities (Quintana-Peña, 2006). The choice criterion was
being a papaya producer with a farming area established
in any chose municipality and with availability to take part
in the research. The final sample was of 114 producers
located in the 45 towns in seven municipalities.
The information obtained was recorded in Excel
2007®. A data exploratory analysis was made to obtain
frequencies, central trend measures and charts in Excel
2007®, together with measures and correlation in
Statistica® version 7 (Spiegel & Stephens, 2002).
RESULTS AND DISCUSSION Identification and use of financing sources by
papaya producers
The following formal financing agencies are located in
the area of influence for the seven municipalities of study
in central Veracruz: Rural Financing (FR), an institution
with branch offices in the cities of Veracruz and Xalapa.
Only 10 producers (8.8%), in three municipalities knew
that FR is a potential financing source for the activity that
they develop; two more (1.8%) mentioned FIRA.
85 producers (74.6%) stated that they did not know about
any formal financing sources in support to their activity,
albeit they stated that they did know Bancos Asociados
a Cadenas Comerciales (BACC), who represent a semi-
formal source. The experience of these banks integrated
to commercial chains, which rose in order to address
sectors not covered by traditional banks is based on
the marketing of their products through credit schemes
(SHCP, 2012) and are not banks specialized in agricultural
credit. Producers also consider agrochemical stores, the
producer organization they are affiliated to and a micro-
financing company located in the region as a potential
financing source. As these businesses have grown, they
represent a real resource source option and, according
to the classification of Carranza (2007), they are internal
production chain agents.
In four of seven municipalities, 26 producers (22.8%) used
some sort of financing or loan for addressing papaya
crops. Six of these cases indicated obtaining financing
from formal sources; out of these, three were granted
by FR and two from commercial banking; in three of the
four remaining cases, credits were granted by the BACC,
which is a semi-formal source, and one chose to obtain
cash through a credit card, with interest rates that are
from 15.8 to 71.2%, according to the banking institution
(CONDUSEF, 2012).
Agrochemical stores and other inputs are other financing
options used by six papaya producers (5.2%) that fall
within the internal production chain agents according
to Carranza (2007). The input granted as a credit was
provided by one of the companies located in the zones
of influence and municipalities of study, practically in
the beginning of the harvest, with the commitment of
selling products and short installments that go from one
week to one month. The term derives from fruit cut
frequency (8 to 10 days), during the harvest performance
period. Preference for granting financing is not limited to
papaya or small producers. BANXICO (2012) states that
commercial banking and input suppliers have been the
main financing sources; i.e., suppliers provided 81.9% of
financing in the last four-month period of year 2012.
77% of interviewed producers stated that their own
resources are those supplied to finance the establishment
and maintenance of papaya growth. One of them states
that “agriculture is uncertain; therefore, one cannot
mortgage one’s property”. This common opinion among
producers matches that of Landini (2011), who states
that the trend in farmer objectives and preferences lies
toward risk reduction, before profit maximization.
General Aspects of Producers
Out of the interviewed producers, 100% are male. They
have an average schooling of 5.7 years; i.e. they have an
incomplete primary education; in contrast the maximum
degree of one producer is a post-graduate degree. The
average age is of 48 years, within an age range of 21
to 74 years. This age interval is similar than the one
identified in peach producers (33 to 75 years) in the State
of Mexico (Larqué-Saavedra et al., 2009). INEGI (2009)
states that the average age of independent producers
in the agricultural sector is 51 years (Cabello, 2012).
Un municipalities that comprise this research, 9.5% of
interviewed producers are older than 65 years of age.
A diversity of papaya-grown surface in the central
Veracruz zone of 0.75 to 20 ha was identified, with a
greater frequency in intervals lower than 3 ha, which
represent 69% of the sample. These results match the
sown area classification for papaya by Cerdas & Sáenz
(1993), where the greater percentage is located among
“small producers” that grow more than one crop and
have less than 4 ha.
The average time in the papaya growing activity is 17.7
years, within an age range of 21 to 52 years. Interviewed
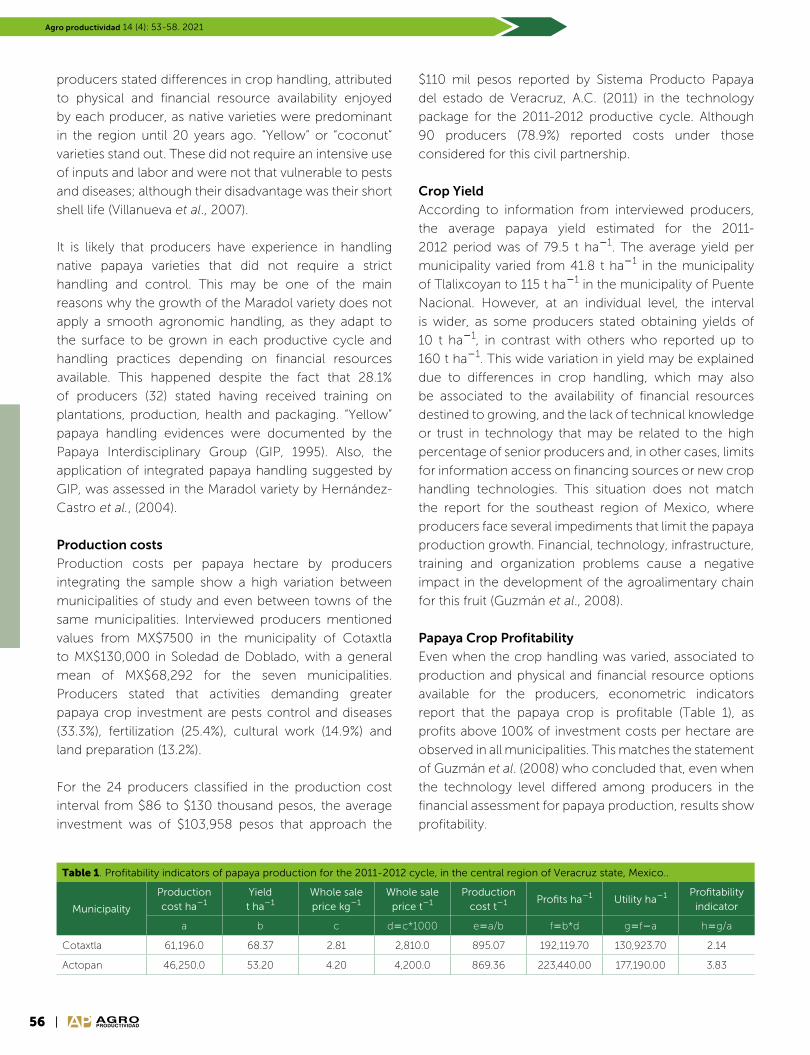
56
Agro productividad 14 (4): 53-58. 2021
AGROPRODUCTIVIDAD
producers stated differences in crop handling, attributed
to physical and financial resource availability enjoyed
by each producer, as native varieties were predominant
in the region until 20 years ago. “Yellow” or “coconut”
varieties stand out. These did not require an intensive use
of inputs and labor and were not that vulnerable to pests
and diseases; although their disadvantage was their short
shell life (Villanueva et al., 2007).
It is likely that producers have experience in handling
native papaya varieties that did not require a strict
handling and control. This may be one of the main
reasons why the growth of the Maradol variety does not
apply a smooth agronomic handling, as they adapt to
the surface to be grown in each productive cycle and
handling practices depending on financial resources
available. This happened despite the fact that 28.1%
of producers (32) stated having received training on
plantations, production, health and packaging. “Yellow”
papaya handling evidences were documented by the
Papaya Interdisciplinary Group (GIP, 1995). Also, the
application of integrated papaya handling suggested by
GIP, was assessed in the Maradol variety by Hernández-
Castro et al., (2004).
Production costs
Production costs per papaya hectare by producers
integrating the sample show a high variation between
municipalities of study and even between towns of the
same municipalities. Interviewed producers mentioned
values from MX$7500 in the municipality of Cotaxtla
to MX$130,000 in Soledad de Doblado, with a general
mean of MX$68,292 for the seven municipalities.
Producers stated that activities demanding greater
papaya crop investment are pests control and diseases
(33.3%), fertilization (25.4%), cultural work (14.9%) and
land preparation (13.2%).
For the 24 producers classified in the production cost
interval from $86 to $130 thousand pesos, the average
investment was of $103,958 pesos that approach the
$110 mil pesos reported by Sistema Producto Papaya
del estado de Veracruz, A.C. (2011) in the technology
package for the 2011-2012 productive cycle. Although
90 producers (78.9%) reported costs under those
considered for this civil partnership.
Crop Yield
According to information from interviewed producers,
the average papaya yield estimated for the 2011-
2012 period was of 79.5 t ha1. The average yield per
municipality varied from 41.8 t ha1 in the municipality
of Tlalixcoyan to 115 t ha1 in the municipality of Puente
Nacional. However, at an individual level, the interval
is wider, as some producers stated obtaining yields of
10 t ha1, in contrast with others who reported up to
160 t ha1. This wide variation in yield may be explained
due to differences in crop handling, which may also
be associated to the availability of financial resources
destined to growing, and the lack of technical knowledge
or trust in technology that may be related to the high
percentage of senior producers and, in other cases, limits
for information access on financing sources or new crop
handling technologies. This situation does not match
the report for the southeast region of Mexico, where
producers face several impediments that limit the papaya
production growth. Financial, technology, infrastructure,
training and organization problems cause a negative
impact in the development of the agroalimentary chain
for this fruit (Guzmán et al., 2008).
Papaya Crop Profitability
Even when the crop handling was varied, associated to
production and physical and financial resource options
available for the producers, econometric indicators
report that the papaya crop is profitable (Table 1), as
profits above 100% of investment costs per hectare are
observed in all municipalities. This matches the statement
of Guzmán et al. (2008) who concluded that, even when
the technology level differed among producers in the
financial assessment for papaya production, results show
profitability.
Table 1. Profitability indicators of papaya production for the 2011-2012 cycle, in the central region of Veracruz state, Mexico..
Municipality
Production cost ha1
Yield t ha1
Whole saleprice kg1
Whole sale price t1
Production cost t1 Profits ha1 Utility ha1 Profitability
indicator
a b c dc*1000 ea/b fb*d gfa hg/a
Cotaxtla 61,196.0 68.37 2.81 2,810.0 895.07 192,119.70 130,923.70 2.14
Actopan 46,250.0 53.20 4.20 4,200.0 869.36 223,440.00 177,190.00 3.83

57
Zarrabal-Prieto et al. (2021)
AGROPRODUCTIVIDAD
In an interview for La Jornada del Campo (2009), the
director of FIRA mentioned that outside assessment made
for FIRA by Universidad Autónoma Chapingo (UACh) and
Grupo de Economistas y Asociados (GEA) showed that
the credit itself increased producer risk in 24%, technical
assistance in 28% and 42% when going together. This
statement must refer to those producers who obtained a
FIRA credit and those who were provided with technical
assistance. This situation was not observed in papaya
producers in the central region of the state of Veracruz.
CONCLUSIONSSomething remarkable is that every four producers do
not know the formal financing sources for those that
may support their activity, reason why the use of the
agricultural credit come from formal sources is very
low among papaya producers in the central region of
the state of Veracruz; the main financing source is their
own financial resources. Other semi-formal and informal
financing sources are input suppliers, friends, family and
BACC.
There is a wide variety in production costs per hectare
in the growth of papaya, which is associated to the
technology level with handling practices that demand
greater investment and is finally reflected in the
understanding of the crop. Even with low access to
financing, the papaya crop is profitable.
ACKNOWLEDGMENTSTo papaya growers in the seven sampled municipalities for their trust
and kind and attentive participation. To Colegio de Postgraduados,
Veracruz Campus, for the financial support and granted facilities.
REFERENCESBANXICO (Banco de México) (2012). Evolución del financiamiento a las
empresas durante octubre-diciembre 2011. http://www.banxico.
org.mx/informacion-para-la-prensa/comunicados/sector-
financiero/financiamiento-empresas/%7BF96331BA-586C-3FDC-
0C80-FD897D6180DB%7D.pdf. Consultado 4 de junio de 2012.
Briones, G. (1996). Metodología de la investigación cuantitativa en las
ciencias sociales. Instituto Colombiano para el Fomento de la
Educación Superior. ICFES. Bogotá, Colombia. p. 58.
Cabello V. M. A. (2012). Edad y crédito agropecuario. El Economista,
1° de noviembre, México, Subdirector de Diseño de
Programas en FIRA. http://eleconomista.com.mx/columnas/
agro-negocios/2012/11/01/edad-credito-agropecuario. 15 de
diciembre de 2012.
Carranza, C. F. (2007). Probabilidad de acceso al crédito en productores
agropecuarios: estimación con variable dependiente censurada
y muestras truncadas. Revista Centroamericana de Ciencias
Sociales 4 (2): 103-131.
CONDUSEF (Comisión Nacional de Protección a los Derechos de
los Usuarios de Servicios Financieros) (2012). Comparativo de
tarjetas de crédito, crédito hipotecario y crédito de nómina.
http://www.condusef.org.mx/comparativos/index.php/
bancos. Consultado 8 de junio de 2012.
FAO (Food and Agriculture Organization of the Nations United’s)
(2009). El desafío de la tecnología. Foro de Expertos de
Alto Nivel. 12-13 octubre. Roma, Italia. http://www.fao.org/
fileadmin/templates/wsfs/docs/Issues_papers. Consultado 10
de octubre de 2012.
FAOSTAT (Food and Agriculture Organization of the Nation United’s)
(2017). FAO Statical Database. http://faostat.fao.org/site/342/
default.aspx. 10 de marzo de 2020.
FPS, A.C. (Fundación Produce Sinaloa, A.C.) (2009). Paquete
tecnológico para la producción de papaya en Sinaloa. Muñoz-
Cano R. M. y Martínez A. C. O. http://www.fps.org.mx/
divulgacion/attachments/article/813. Consultado 6 de agosto
de 2012.
FR (Financiera Rural). (2011). Reglas de operación. www.financierarural.
gob.mx. Consultado octubre de 2011.
Guzmán R. E., Gómez A. R., Pohlan H. A. J., Álvarez-R. J. C., Pat
F. J. M. y Geissen V. (2008). La producción de papaya en
Tabasco y los retos del desarrollo sustentable. El Cotidiano
23: 99-106.
GIP (Grupo Interdisciplinario del papayo). Flores-Revilla C., García-
Pérez E., Nieto-Ángel, Téliz Ortíz D. and Villanueva-Jiménez J.
A. (1995). Integrated management of papaya in Mexico. Acta
Horticulturae 370:151-158.
INEGI (Instituto Nacional de Estadística Geografía e Informática)
(2009). Prontuario de municipios. http://www.inegi.org.mx/
sistemas/mexicocifras/datos-geograficos/30/pdf. Consultado
enero de 2012.
Hernández-Castro E., Villanueva-Jiménez J.A., Mosqueda Vázquez R.
y Mora-Aguilera A. (2004). Efecto de la Erradicación de Plantas
Enfermas por el PRSV-P en un Sistema de Manejo Integrado
del Papayo (Carica papaya L.) en Veracruz, México. Revista
Mexicana de Fitopatología 22 (3): 382-388.
La Jornada del Campo. (2009). Solo 30 por ciento de productores
acceden a crédito. Abril 17. http://www.jornada.unam.
mx/2009/04/17/delcampo.html. Consultado 15 de febrero
2010.
Landini, F. (2011). Racionalidad económica campesina. Mundo Agrario.
Facultad de Humanidades y Ciencias de la Educación de
la Universidad Nacional de La Plata, Argentina. Memoria
Académica 12(23) 27 p. http://www.memoria.fahce.unlp.edu.
ar/art_revistas/pr.5045/pr.5045.pdf. 12 de marzo de 2012.
Larqué-Saavedra, B. S., Sangerman-Jarquín S. D. M., Ramírez-Valverde
B., Navarro-Bravo A. y Serrano-Flores M.E. (2009). Aspectos
técnicos y caracterización del productor de durazno en el
Estado de México, México. Agricultura Técnica en México, 35
(3): 305-313.
Quintana-Peña, A. 2006. Metodología de investigación científica
cualitativa. Quintana Alberto y Montgomery W. (Eds) En:
Psicología: Tópicos de actualidad. Lima: UNMSM pp. 58-
59. http://es.scribd.com/doc/3634305/Metodologia-de-
Investigacion-Cualitativa-A-Quintana.
Semillas del Caribe (2017). Papaya. www.semillasdelcaribe.com.mx.
Consultado marzo de 2018.

58
Agro productividad 14 (4): 53-58. 2021
AGROPRODUCTIVIDAD
SHCP (Secretaria de Hacienda y Crédito Público/Banca de Desarrollo) (2009). Banca de
desarrollo. www.secretariadehaciendaycreditopublico/bancadedesarrollo.gob.mx.
Consultado febrero 2010.
SHCP (Secretaria de Hacienda y Crédito Público) (2012). Unidad de Banca, Valores y Ahorro.
www.apartados.hacienda.gob.mx. Consultado diciembre 2013.
SIAP (Servicio de Información Agroalimentaria y Pesquera) (2010). Cierre de la producción
agrícola por cultivo. www.siap.gob.mx. marzo de 2012.
SIAP (Servicio de Información Agroalimentaria y Pesquera) (2017). Cierre de la producción
agrícola por cultivo. www.siap.gob.mx. marzo de 2018.
SIAP (Servicio de Información Agroalimentaria y Pesquera) (2019). Cierre de la producción
agrícola por cultivo. www.siap.gob.mx. marzo de 2020.
Sistema producto papaya del estado de Veracruz, A.C. 2011. www.productopapayaveracruz.
org. Consultado abril de 2011.
Spiegel, M. R., y Stephens L. J. (2002). Estadística. L. E. Pineda A. (trad.) 3ª Edición. McGraw-
Hill/Interamericana (Ed.). México, D.F. 531 p.
Villanueva-Jiménez, J. A., Hernández-Castro E., Ávila C., Osorio-Acosta F., Teliz-Ortíz D., Mora-
Aguilera A. y García-Pérez E. (2007). El papayo, estado del arte de la investigación y la
transferencia de tecnología. Parte 1 de 2. Agroentorno 87:19-22.
AGROPRODUCTIVIDAD

59AGROPRODUCTIVIDAD
https://doi.org/10.32854/agrop.v14i4.1981
Agroproductividad: Vol. 14, Núm. 4, abril. 2021. pp: 59-63.
Recibido: noviembre, 2020. Aceptado: marzo, 2021.
Cerium (Ce) Affects the Phenological Cycle and the Quality of Tulip (Tulipa gesneriana L.)
Gómez-Navor, Tsujmejy1; Gómez-Merino, Fernando C.1; Alcántar-González, Gabriel1;
Fernández-Pavía, Y. Leticia1; Trejo-Téllez, Libia I.1*
1Colegio de Postgraduados Campus Montecillo. Montecillo, Texcoco, Estado de México, México.
C. P. 56230.
*Corresponding author: [email protected]
ABSTRACTObjective: To study the effect of cerium (Ce) applied in a nutrient solution during the productive cycle, on the duration of
the phases of the phenological cycle of tulip (Tulipa gesneriana L.) cv. Jan van Nes.
Design/Methodology/Approach: Commercial bulbs (caliber 12) were planted under shade cloth conditions during the
autumn-winter period. The levels of Ce used were 5, 15 and 15 M from CeCl3 7H2O; Ce was applied in the nutrient
solution from the first day of the sowing, apart from the control without its application.
Results: The different concentrations of Ce stimulated bulb sprouting. The low concentration of Ce (5 M) promoted
the early formation of floral buds and their coloration. Hence, the application of 5 M Ce induces flowering of the tulip
without exhibiting changes in the period of time to reach senescence. When 25 M Ce were applied, the opposite effects
were observed. The duration of the flower was not significantly affected by the treatments.
Study Limitations/Implications: This study was made only in one cultivar of tulip.
Findings/Conclusions: The application of 5 M of Ce had a positive effect in the tulip cycle, by stimulating bulb sprouting,
the formation of the floral bud, the coloration, and the induction of the flowering cycle.
Keywords: biostimulation, rare earth elements, hormesis, ornamentals.
INTRODUCTION
Rare earth elements (REE) are a family of 17 chemical elements formed by group III of the periodic table
(scandium and yttrium) and the series of lanthanides (from lanthanum and lutetium) which exhibit chemical
similarities as a group, while they express individually distinctive and varied electronic properties (Voncken,
2016; Cheisson and Schelter, 2019).
Imagen de PublicDomainPictures en Pixabay
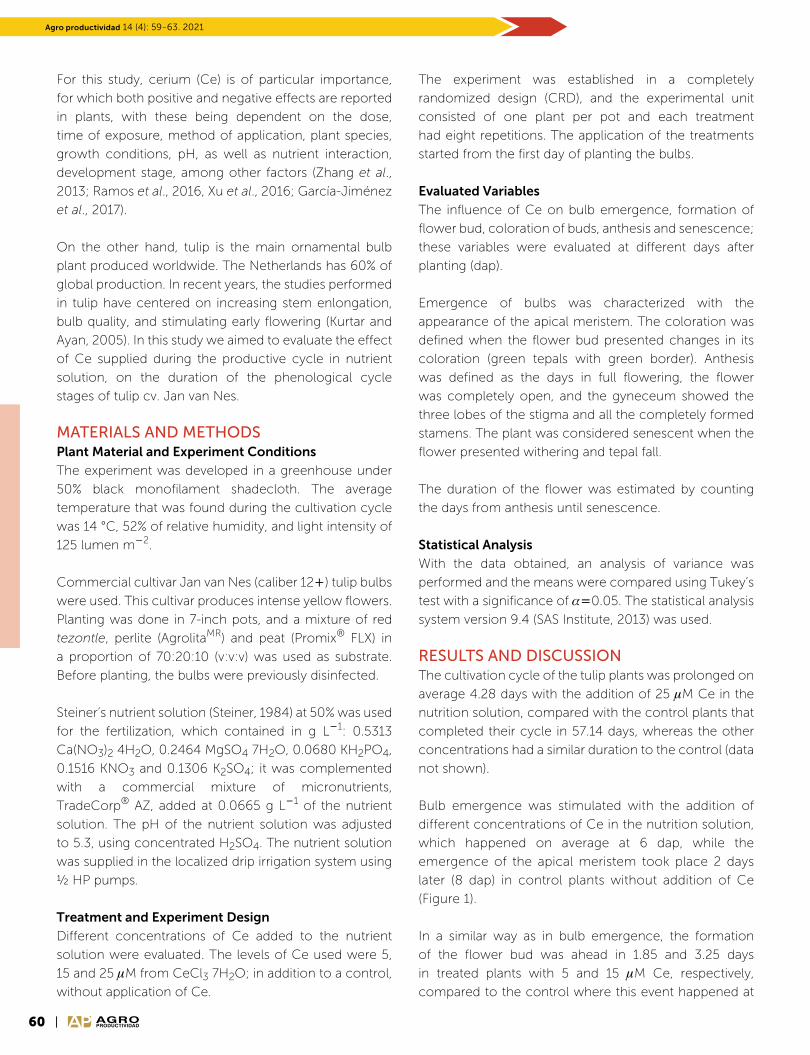
60
Agro productividad 14 (4): 59-63. 2021
AGROPRODUCTIVIDAD
For this study, cerium (Ce) is of particular importance,
for which both positive and negative effects are reported
in plants, with these being dependent on the dose,
time of exposure, method of application, plant species,
growth conditions, pH, as well as nutrient interaction,
development stage, among other factors (Zhang et al.,
2013; Ramos et al., 2016, Xu et al., 2016; García-Jiménez
et al., 2017).
On the other hand, tulip is the main ornamental bulb
plant produced worldwide. The Netherlands has 60% of
global production. In recent years, the studies performed
in tulip have centered on increasing stem enlongation,
bulb quality, and stimulating early flowering (Kurtar and
Ayan, 2005). In this study we aimed to evaluate the effect
of Ce supplied during the productive cycle in nutrient
solution, on the duration of the phenological cycle
stages of tulip cv. Jan van Nes.
MATERIALS AND METHODSPlant Material and Experiment Conditions
The experiment was developed in a greenhouse under
50% black monofilament shadecloth. The average
temperature that was found during the cultivation cycle
was 14 °C, 52% of relative humidity, and light intensity of
125 lumen m2.
Commercial cultivar Jan van Nes (caliber 12) tulip bulbs
were used. This cultivar produces intense yellow flowers.
Planting was done in 7-inch pots, and a mixture of red
tezontle, perlite (AgrolitaMR) and peat (Promix® FLX) in
a proportion of 70:20:10 (v:v:v) was used as substrate.
Before planting, the bulbs were previously disinfected.
Steiner’s nutrient solution (Steiner, 1984) at 50% was used
for the fertilization, which contained in g L1: 0.5313
Ca(NO3)2 4H2O, 0.2464 MgSO4 7H2O, 0.0680 KH2PO4,
0.1516 KNO3 and 0.1306 K2SO4; it was complemented
with a commercial mixture of micronutrients,
TradeCorp® AZ, added at 0.0665 g L1 of the nutrient
solution. The pH of the nutrient solution was adjusted
to 5.3, using concentrated H2SO4. The nutrient solution
was supplied in the localized drip irrigation system using
½ HP pumps.
Treatment and Experiment Design
Different concentrations of Ce added to the nutrient
solution were evaluated. The levels of Ce used were 5,
15 and 25 M from CeCl3 7H2O; in addition to a control,
without application of Ce.
The experiment was established in a completely
randomized design (CRD), and the experimental unit
consisted of one plant per pot and each treatment
had eight repetitions. The application of the treatments
started from the first day of planting the bulbs.
Evaluated Variables
The influence of Ce on bulb emergence, formation of
flower bud, coloration of buds, anthesis and senescence;
these variables were evaluated at different days after
planting (dap).
Emergence of bulbs was characterized with the
appearance of the apical meristem. The coloration was
defined when the flower bud presented changes in its
coloration (green tepals with green border). Anthesis
was defined as the days in full flowering, the flower
was completely open, and the gyneceum showed the
three lobes of the stigma and all the completely formed
stamens. The plant was considered senescent when the
flower presented withering and tepal fall.
The duration of the flower was estimated by counting
the days from anthesis until senescence.
Statistical Analysis
With the data obtained, an analysis of variance was
performed and the means were compared using Tukey’s
test with a significance of 0.05. The statistical analysis
system version 9.4 (SAS Institute, 2013) was used.
RESULTS AND DISCUSSIONThe cultivation cycle of the tulip plants was prolonged on
average 4.28 days with the addition of 25 M Ce in the
nutrition solution, compared with the control plants that
completed their cycle in 57.14 days, whereas the other
concentrations had a similar duration to the control (data
not shown).
Bulb emergence was stimulated with the addition of
different concentrations of Ce in the nutrition solution,
which happened on average at 6 dap, while the
emergence of the apical meristem took place 2 days
later (8 dap) in control plants without addition of Ce
(Figure 1).
In a similar way as in bulb emergence, the formation
of the flower bud was ahead in 1.85 and 3.25 days
in treated plants with 5 and 15 M Ce, respectively,
compared to the control where this event happened at
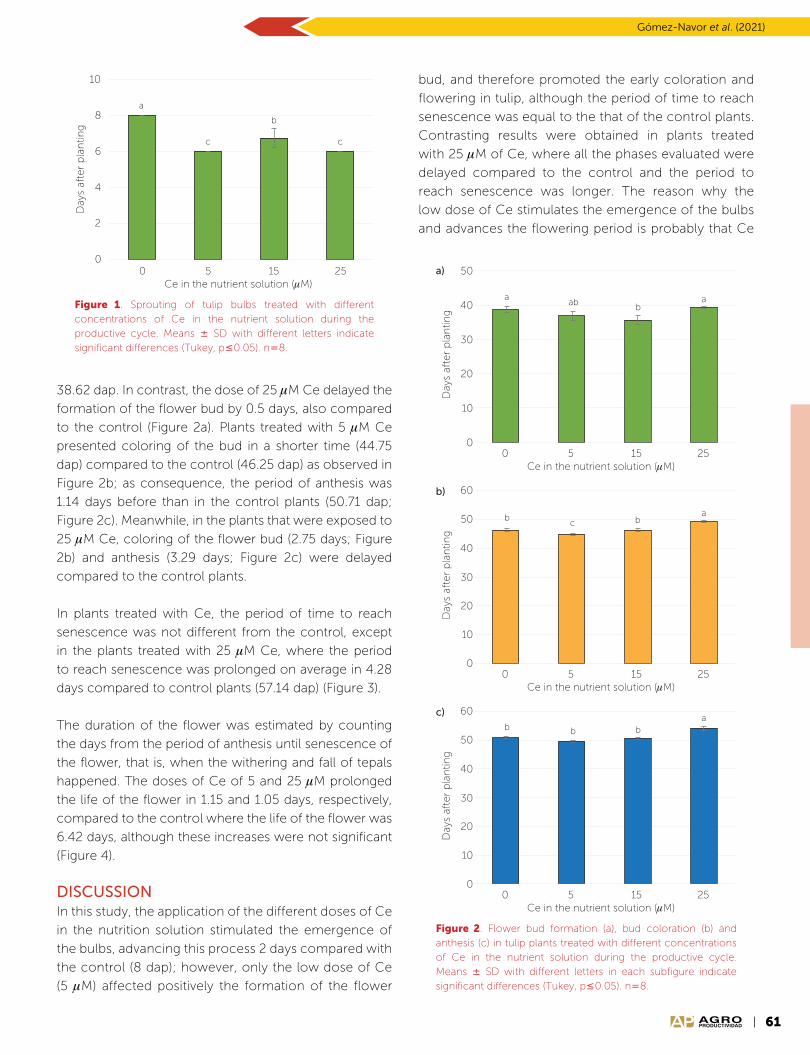
61
Gómez-Navor et al. (2021)
AGROPRODUCTIVIDAD
Figure 1. Sprouting of tulip bulbs treated with different concentrations of Ce in the nutrient solution during the productive cycle. Means SD with different letters indicate significant differences (Tukey, p0.05). n8.
a
c
b
c
0
2
4
6
8
10
0 5 15 25
Day
s af
ter
pla
ntin
g
Ce in the nutrient solution (M)
38.62 dap. In contrast, the dose of 25 M Ce delayed the
formation of the flower bud by 0.5 days, also compared
to the control (Figure 2a). Plants treated with 5 M Ce
presented coloring of the bud in a shorter time (44.75
dap) compared to the control (46.25 dap) as observed in
Figure 2b; as consequence, the period of anthesis was
1.14 days before than in the control plants (50.71 dap;
Figure 2c). Meanwhile, in the plants that were exposed to
25 M Ce, coloring of the flower bud (2.75 days; Figure
2b) and anthesis (3.29 days; Figure 2c) were delayed
compared to the control plants.
In plants treated with Ce, the period of time to reach
senescence was not different from the control, except
in the plants treated with 25 M Ce, where the period
to reach senescence was prolonged on average in 4.28
days compared to control plants (57.14 dap) (Figure 3).
The duration of the flower was estimated by counting
the days from the period of anthesis until senescence of
the flower, that is, when the withering and fall of tepals
happened. The doses of Ce of 5 and 25 M prolonged
the life of the flower in 1.15 and 1.05 days, respectively,
compared to the control where the life of the flower was
6.42 days, although these increases were not significant
(Figure 4).
DISCUSSIONIn this study, the application of the different doses of Ce
in the nutrition solution stimulated the emergence of
the bulbs, advancing this process 2 days compared with
the control (8 dap); however, only the low dose of Ce
(5 M) affected positively the formation of the flower
0
10
20
30
40
50
0 5 15 25D
ays
afte
r p
lan
ting
Ce in the nutrient solution (M)
aab b
a
a)
0
10
20
30
40
50
0 5 15 25
Day
s af
ter
pla
ntin
g
Ce in the nutrient solution (M)
bc b
a
b) 60
0
10
20
30
40
50
0 5 15 25
Day
s af
ter
pla
ntin
g
Ce in the nutrient solution (M)
b ba
c) 60
b
Figure 2. Flower bud formation (a), bud coloration (b) and anthesis (c) in tulip plants treated with different concentrations of Ce in the nutrient solution during the productive cycle. Means SD with different letters in each subfigure indicate significant differences (Tukey, p0.05). n8.
bud, and therefore promoted the early coloration and
flowering in tulip, although the period of time to reach
senescence was equal to the that of the control plants.
Contrasting results were obtained in plants treated
with 25 M of Ce, where all the phases evaluated were
delayed compared to the control and the period to
reach senescence was longer. The reason why the
low dose of Ce stimulates the emergence of the bulbs
and advances the flowering period is probably that Ce
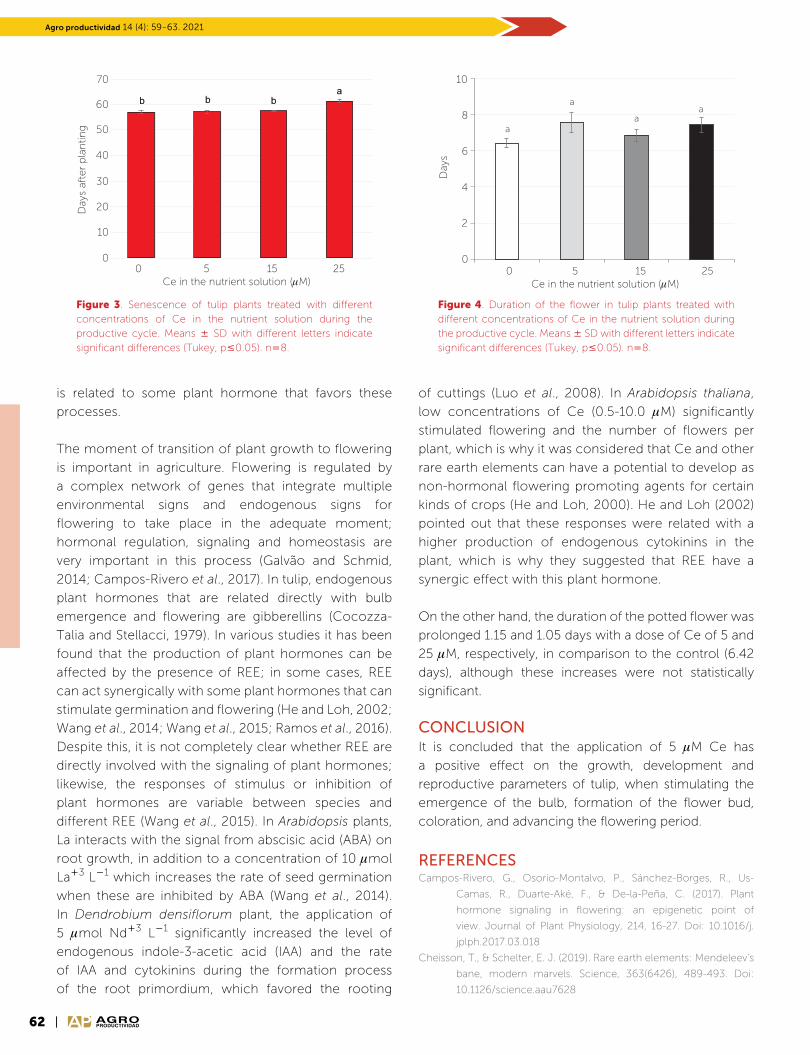
62
Agro productividad 14 (4): 59-63. 2021
AGROPRODUCTIVIDAD
Figure 4. Duration of the flower in tulip plants treated with different concentrations of Ce in the nutrient solution during the productive cycle. Means SD with different letters indicate significant differences (Tukey, p0.05). n8.
0
2
4
6
8
10
0 5 15 25
Day
s
Ce in the nutrient solution (M)
a
a
aa
b b ba
0
10
20
30
40
50
0 5 15 25
Day
s af
ter
pla
ntin
g
Ce in the nutrient solution (M)
b ba
60 b
70
Figure 3. Senescence of tulip plants treated with different concentrations of Ce in the nutrient solution during the productive cycle. Means SD with different letters indicate significant differences (Tukey, p0.05). n8.
is related to some plant hormone that favors these
processes.
The moment of transition of plant growth to flowering
is important in agriculture. Flowering is regulated by
a complex network of genes that integrate multiple
environmental signs and endogenous signs for
flowering to take place in the adequate moment;
hormonal regulation, signaling and homeostasis are
very important in this process (Galvão and Schmid,
2014; Campos-Rivero et al., 2017). In tulip, endogenous
plant hormones that are related directly with bulb
emergence and flowering are gibberellins (Cocozza-
Talia and Stellacci, 1979). In various studies it has been
found that the production of plant hormones can be
affected by the presence of REE; in some cases, REE
can act synergically with some plant hormones that can
stimulate germination and flowering (He and Loh, 2002;
Wang et al., 2014; Wang et al., 2015; Ramos et al., 2016).
Despite this, it is not completely clear whether REE are
directly involved with the signaling of plant hormones;
likewise, the responses of stimulus or inhibition of
plant hormones are variable between species and
different REE (Wang et al., 2015). In Arabidopsis plants,
La interacts with the signal from abscisic acid (ABA) on
root growth, in addition to a concentration of 10 mol
La3 L1 which increases the rate of seed germination
when these are inhibited by ABA (Wang et al., 2014).
In Dendrobium densiflorum plant, the application of
5 mol Nd3 L1 significantly increased the level of
endogenous indole-3-acetic acid (IAA) and the rate
of IAA and cytokinins during the formation process
of the root primordium, which favored the rooting
of cuttings (Luo et al., 2008). In Arabidopsis thaliana,
low concentrations of Ce (0.5-10.0 M) significantly
stimulated flowering and the number of flowers per
plant, which is why it was considered that Ce and other
rare earth elements can have a potential to develop as
non-hormonal flowering promoting agents for certain
kinds of crops (He and Loh, 2000). He and Loh (2002)
pointed out that these responses were related with a
higher production of endogenous cytokinins in the
plant, which is why they suggested that REE have a
synergic effect with this plant hormone.
On the other hand, the duration of the potted flower was
prolonged 1.15 and 1.05 days with a dose of Ce of 5 and
25 M, respectively, in comparison to the control (6.42
days), although these increases were not statistically
significant.
CONCLUSION It is concluded that the application of 5 M Ce has
a positive effect on the growth, development and
reproductive parameters of tulip, when stimulating the
emergence of the bulb, formation of the flower bud,
coloration, and advancing the flowering period.
REFERENCESCampos-Rivero, G., Osorio-Montalvo, P., Sánchez-Borges, R., Us-
Camas, R., Duarte-Aké, F., & De-la-Peña, C. (2017). Plant
hormone signaling in flowering: an epigenetic point of
view. Journal of Plant Physiology, 214, 16-27. Doi: 10.1016/j.
jplph.2017.03.018
Cheisson, T., & Schelter, E. J. (2019). Rare earth elements: Mendeleev’s
bane, modern marvels. Science, 363(6426), 489-493. Doi:
10.1126/science.aau7628

63
Gómez-Navor et al. (2021)
AGROPRODUCTIVIDAD
Cocozza-Talia, M., & Stellacci, P. (1979). A research on the effect of gibberellin upon tulip flowering. Acta
Horticulturae, 91, 167-172. Doi: 10.17660/ActaHortic.1979.91.18
Galvão, V. C., & Schmid, M. (2014). Regulation of flowering by endogenous signals. In F. Fornara (Ed.),
Advances in Botanical Research (pp. 63-102). Amsterdam, The Netherlands: Elsevier.
García-Jiménez, A., Gómez-Merino, F. C., Tejeda-Sartorius, O., & Trejo-Téllez, L. I. (2017). Lanthanum affects
bell pepper seedling quality depending on the genotype and time of exposure by differentially
modifying plant height, stem diameter and concentrations of chlorophylls, sugars, amino acids, and
proteins. Frontiers in Plant Science, 8, 308. Doi: 10.3389/fpls.2017.00308
He, Y. W., & Loh, C. S. (2000). Cerium and lanthanum promote floral initiation and reproductive growth of
Arabidopsis thaliana. Plant Science, 159(1), 117-124. Doi: 10.1016/S0168-9452(00)00338-1
He, Y. W., & Loh, C. S. (2002). Induction of early bolting in Arabidopsis thaliana by triacontanol, cerium
and lanthanum is correlated with increased endogenous concentration of isopentenyl adenosine
(iPAdos). Journal of Experimental Botany, 53(368), 505-512. Doi: 10.1093/jexbot/53.368.505
Kurtar, E. S., & Ayan, A. K. (2005). Effect of gibberellic acid (GA3) and indole-3-acetic acid (IAA) on flowering,
stalk elongation and bulb characteristics of tulip (Tulipa gesneriana var. cassini). Pakistan Journal of
Biological Sciences, 8(2), 273-277.
Luo, J., Zhang, J., & Wang, Y. (2008). Changes in endogenous hormone levels and redox status during
enhanced adventitious rooting by rare earth element neodymium of Dendrobium densiflorum
shoot cuttings. Journal of Rare Earths, 26(6), 869-874. Doi: 10.1016/S1002-0721(09)60023-5
Ramos, S. J., Dinali, G. S., Oliveira, C., Martins, G. C., Moreira, C. G., Siqueira, J. O., & Guilherme, L. R. (2016).
Rare earth elements in the soil environment. Current Pollution Reports, 2(1), 28-50. Doi: 10.1007/
s40726-016-0026-4
SAS Institute. (2013). Base SAS 9.4. Procedures Guide: Statistical Procedures. Second edition. Cary, NC, USA:
SAS Institute Inc.
Steiner, A. A. (1984). The universal nutrient solution. In Proceedings Sixth International Congress on Soilless
Culture (pp. 633-650). Lunteren, Wageningen, The Netherlands: ISOSC.
Voncken, J. H. L. (2016). The ore minerals and major ore deposits of the rare earths. In J. H. L. Voncken (Ed.),
The Rare Earth Elements (pp. 15-52). Cham, Switzerland, Springer. doi: 10.1007/978-3-319-26809-5
Wang, J., Wang, L., Hu, T., Li, W., & Xue, S. (2014). Effects of lanthanum on abscisic acid regulation of root
growth in Arabidopsis. Journal of Rare Earths, 32(1), 78-82. Doi: 10.1016/S1002-0721(14)60035-1
Wang, L., Zhang, X., Zhou, Q., & Huang, X. (2015). Effects of terbium (III) on signaling molecules in
horseradish. Biological Trace Element Research, 164(1), 122-129. Doi: 10.1007/s12011-014-0209-z
Xu, Q. M., Wang, Y. Z., Liu, H., & Cheng, J. S. (2016). Physiological responses and chromosomal aberration
in root tip cells of Allium sativum L. to cerium treatments. Plant and Soil, 409(1-2), 447-458. Doi:
10.1007/s11104-016-2978-y
Zhang, C., Li, Q., Zhang, M., Zhang, N., & Li, M. (2013). Effects of rare earth elements on growth and
metabolism of medicinal plants. Acta Pharmaceutica Sinica B, 3(1), 20-24. Doi: 10.1016/j.
apsb.2012.12.005
AGROPRODUCTIVIDAD


65AGROPRODUCTIVIDAD
https://doi.org/10.32854/agrop.v14i4.1932
Agroproductividad: Vol. 14, Núm. 4, abril. 2021. pp: 65-80.
Recibido: septiembre, 2020. Aceptado: marzo, 2021.
The melliferous flora of Veracruz, Mexico
Real-Luna, Natalia1,2; Rivera-Hernández, Jaime E.3; Alcántara-Salinas, Graciela1;
Zalazar-Marcial, Edgardo1; Pérez-Sato, Juan A.1*
1Colegio de Postgraduados Campus Córdoba. Carretera Federal Córdoba-Veracruz km 348,
Manuel León, Amatlán de los Reyes, Veracruz, México. C. P. 94953. 2Doctorado en Ciencias
Naturales para el Desarrollo (DOCINADE) Instituto Tecnológico de Costa Rica, Universidad
Nacional, Universidad Estatal a Distancia, Costa Rica. 3Centro de Estudios Geográficos, Biológicos
y Comunitarios, S.C. Córdoba, Veracruz, México. C. P. 94500.
*Corresponding author: [email protected]
ABSTRACTObjective: To contribute to the knowledge of the situation of the melliferous flora in Veracruz for pollinators and to
communicate it for the benefit of beekeepers and stingless beekeepers, as well as to develop comprehensive strategies
with these activities.
Design/Methodology/Approach: The information was obtained through a bibliographic review in reference databases
such as Scopus, Web of Science Group, Academic Google, Elsevier and Springer Link, using the following keywords: flora,
bees, pollinators, honey, pollen.
Results: 63 families were recorded, with 176 genera and 216 species of melliferous flora, finding that the largest number
of species are found in the Fabaceae family (20%) and Asteraceae (16.55%). There were also 44 crops with 22 families.
Study Limitations/Implications: There were no limitations in conducting this study.
Findings/Conclusions: The greatest diversity of melliferous flora species is related to wild plants, and strategies need to
be implemented for their protection and multiplication. For these actions, various actors must be involved at different
levels of government, educational and private institutions, civil society, farmers, beekeepers, and stingless beekeeping.
Conservation actions include the use of melliferous plants in gardens and their protection in crops, sites surrounding
crops and on edges. It is necessary to preserve natural landscapes and restore damaged ones, as well as to lead favorable
practices in pollinator-dependent crops.
Keywords: flora, bees, pollinators, honey, pollen.
INTRODUCTION
Bees maintain a close relationship with melliferous flora, since they depend on them for their food, when
consuming nectar and pollen obteined from the flowers. Likewise, they also collect resinous material
that they use for the construction of their nest and for the elaboration of propolis, which serve as protection against
pathogens and predators (Bonet and Vergara, 2016).
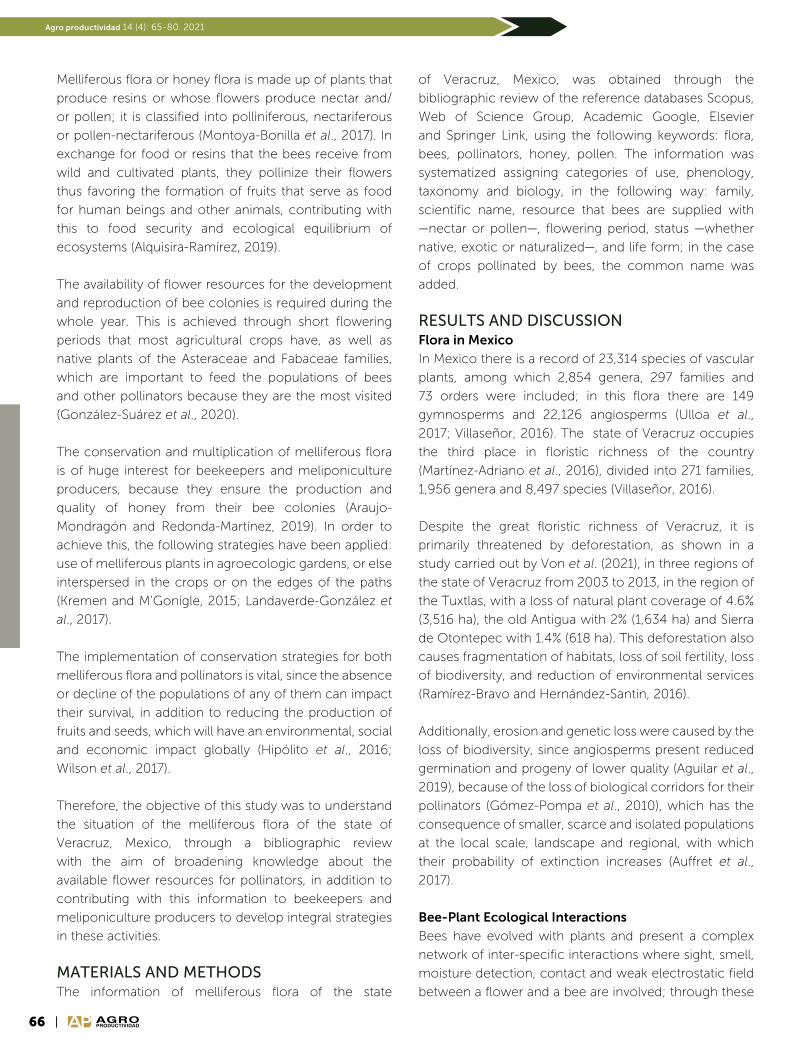
66
Agro productividad 14 (4): 65-80. 2021
AGROPRODUCTIVIDAD
Melliferous flora or honey flora is made up of plants that
produce resins or whose flowers produce nectar and/
or pollen; it is classified into polliniferous, nectariferous
or pollen-nectariferous (Montoya-Bonilla et al., 2017). In
exchange for food or resins that the bees receive from
wild and cultivated plants, they pollinize their flowers
thus favoring the formation of fruits that serve as food
for human beings and other animals, contributing with
this to food security and ecological equilibrium of
ecosystems (Alquisira-Ramírez, 2019).
The availability of flower resources for the development
and reproduction of bee colonies is required during the
whole year. This is achieved through short flowering
periods that most agricultural crops have, as well as
native plants of the Asteraceae and Fabaceae families,
which are important to feed the populations of bees
and other pollinators because they are the most visited
(González-Suárez et al., 2020).
The conservation and multiplication of melliferous flora
is of huge interest for beekeepers and meliponiculture
producers, because they ensure the production and
quality of honey from their bee colonies (Araujo-
Mondragón and Redonda-Martínez, 2019). In order to
achieve this, the following strategies have been applied:
use of melliferous plants in agroecologic gardens, or else
interspersed in the crops or on the edges of the paths
(Kremen and M’Gonigle, 2015; Landaverde-González et
al., 2017).
The implementation of conservation strategies for both
melliferous flora and pollinators is vital, since the absence
or decline of the populations of any of them can impact
their survival, in addition to reducing the production of
fruits and seeds, which will have an environmental, social
and economic impact globally (Hipólito et al., 2016;
Wilson et al., 2017).
Therefore, the objective of this study was to understand
the situation of the melliferous flora of the state of
Veracruz, Mexico, through a bibliographic review
with the aim of broadening knowledge about the
available flower resources for pollinators, in addition to
contributing with this information to beekeepers and
meliponiculture producers to develop integral strategies
in these activities.
MATERIALS AND METHODSThe information of melliferous flora of the state
of Veracruz, Mexico, was obtained through the
bibliographic review of the reference databases Scopus,
Web of Science Group, Academic Google, Elsevier
and Springer Link, using the following keywords: flora,
bees, pollinators, honey, pollen. The information was
systematized assigning categories of use, phenology,
taxonomy and biology, in the following way: family,
scientific name, resource that bees are supplied with
—nectar or pollen—, flowering period, status —whether
native, exotic or naturalized—, and life form; in the case
of crops pollinated by bees, the common name was
added.
RESULTS AND DISCUSSIONFlora in Mexico
In Mexico there is a record of 23,314 species of vascular
plants, among which 2,854 genera, 297 families and
73 orders were included; in this flora there are 149
gymnosperms and 22,126 angiosperms (Ulloa et al.,
2017; Villaseñor, 2016). The state of Veracruz occupies
the third place in floristic richness of the country
(Martínez-Adriano et al., 2016), divided into 271 families,
1,956 genera and 8,497 species (Villaseñor, 2016).
Despite the great floristic richness of Veracruz, it is
primarily threatened by deforestation, as shown in a
study carried out by Von et al. (2021), in three regions of
the state of Veracruz from 2003 to 2013, in the region of
the Tuxtlas, with a loss of natural plant coverage of 4.6%
(3,516 ha), the old Antigua with 2% (1,634 ha) and Sierra
de Otontepec with 1.4% (618 ha). This deforestation also
causes fragmentation of habitats, loss of soil fertility, loss
of biodiversity, and reduction of environmental services
(Ramírez-Bravo and Hernández-Santin, 2016).
Additionally, erosion and genetic loss were caused by the
loss of biodiversity, since angiosperms present reduced
germination and progeny of lower quality (Aguilar et al.,
2019), because of the loss of biological corridors for their
pollinators (Gómez-Pompa et al., 2010), which has the
consequence of smaller, scarce and isolated populations
at the local scale, landscape and regional, with which
their probability of extinction increases (Auffret et al.,
2017).
Bee-Plant Ecological Interactions
Bees have evolved with plants and present a complex
network of inter-specific interactions where sight, smell,
moisture detection, contact and weak electrostatic field
between a flower and a bee are involved; through these
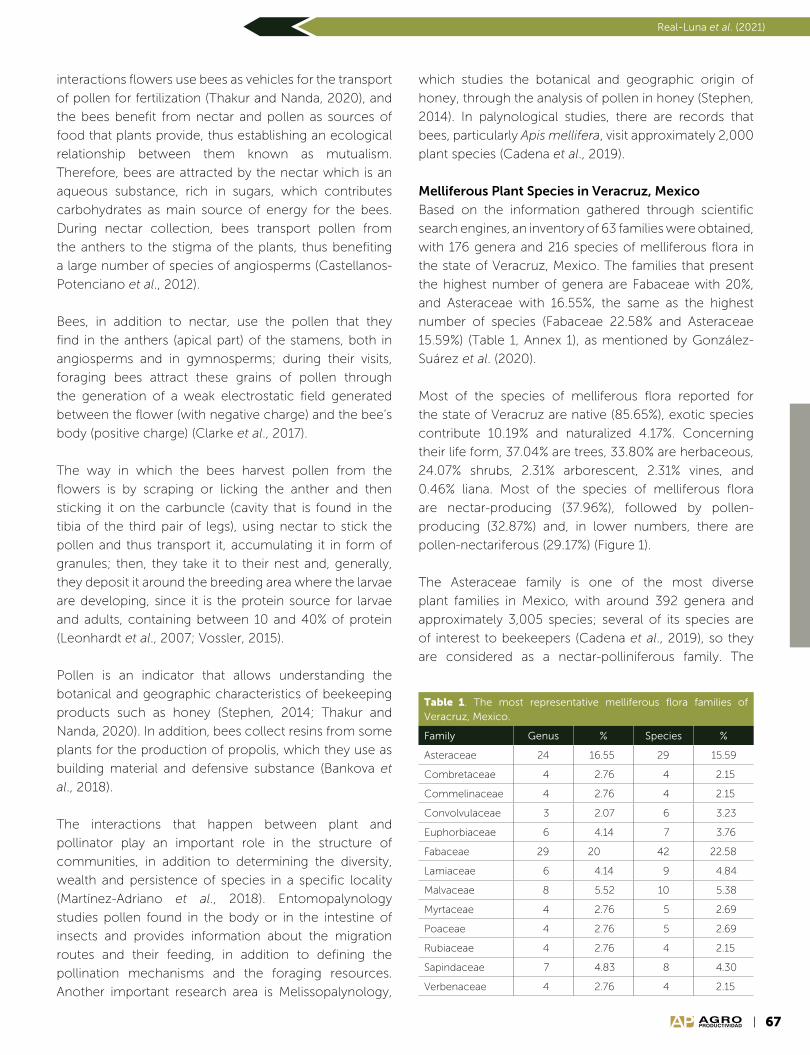
67
Real-Luna et al. (2021)
AGROPRODUCTIVIDAD
interactions flowers use bees as vehicles for the transport
of pollen for fertilization (Thakur and Nanda, 2020), and
the bees benefit from nectar and pollen as sources of
food that plants provide, thus establishing an ecological
relationship between them known as mutualism.
Therefore, bees are attracted by the nectar which is an
aqueous substance, rich in sugars, which contributes
carbohydrates as main source of energy for the bees.
During nectar collection, bees transport pollen from
the anthers to the stigma of the plants, thus benefiting
a large number of species of angiosperms (Castellanos-
Potenciano et al., 2012).
Bees, in addition to nectar, use the pollen that they
find in the anthers (apical part) of the stamens, both in
angiosperms and in gymnosperms; during their visits,
foraging bees attract these grains of pollen through
the generation of a weak electrostatic field generated
between the flower (with negative charge) and the bee’s
body (positive charge) (Clarke et al., 2017).
The way in which the bees harvest pollen from the
flowers is by scraping or licking the anther and then
sticking it on the carbuncle (cavity that is found in the
tibia of the third pair of legs), using nectar to stick the
pollen and thus transport it, accumulating it in form of
granules; then, they take it to their nest and, generally,
they deposit it around the breeding area where the larvae
are developing, since it is the protein source for larvae
and adults, containing between 10 and 40% of protein
(Leonhardt et al., 2007; Vossler, 2015).
Pollen is an indicator that allows understanding the
botanical and geographic characteristics of beekeeping
products such as honey (Stephen, 2014; Thakur and
Nanda, 2020). In addition, bees collect resins from some
plants for the production of propolis, which they use as
building material and defensive substance (Bankova et
al., 2018).
The interactions that happen between plant and
pollinator play an important role in the structure of
communities, in addition to determining the diversity,
wealth and persistence of species in a specific locality
(Martínez-Adriano et al., 2018). Entomopalynology
studies pollen found in the body or in the intestine of
insects and provides information about the migration
routes and their feeding, in addition to defining the
pollination mechanisms and the foraging resources.
Another important research area is Melissopalynology,
which studies the botanical and geographic origin of
honey, through the analysis of pollen in honey (Stephen,
2014). In palynological studies, there are records that
bees, particularly Apis mellifera, visit approximately 2,000
plant species (Cadena et al., 2019).
Melliferous Plant Species in Veracruz, Mexico
Based on the information gathered through scientific
search engines, an inventory of 63 families were obtained,
with 176 genera and 216 species of melliferous flora in
the state of Veracruz, Mexico. The families that present
the highest number of genera are Fabaceae with 20%,
and Asteraceae with 16.55%, the same as the highest
number of species (Fabaceae 22.58% and Asteraceae
15.59%) (Table 1, Annex 1), as mentioned by González-
Suárez et al. (2020).
Most of the species of melliferous flora reported for
the state of Veracruz are native (85.65%), exotic species
contribute 10.19% and naturalized 4.17%. Concerning
their life form, 37.04% are trees, 33.80% are herbaceous,
24.07% shrubs, 2.31% arborescent, 2.31% vines, and
0.46% liana. Most of the species of melliferous flora
are nectar-producing (37.96%), followed by pollen-
producing (32.87%) and, in lower numbers, there are
pollen-nectariferous (29.17%) (Figure 1).
The Asteraceae family is one of the most diverse
plant families in Mexico, with around 392 genera and
approximately 3,005 species; several of its species are
of interest to beekeepers (Cadena et al., 2019), so they
are considered as a nectar-polliniferous family. The
Table 1. The most representative melliferous flora families of Veracruz, Mexico.
Family Genus % Species %
Asteraceae 24 16.55 29 15.59
Combretaceae 4 2.76 4 2.15
Commelinaceae 4 2.76 4 2.15
Convolvulaceae 3 2.07 6 3.23
Euphorbiaceae 6 4.14 7 3.76
Fabaceae 29 20 42 22.58
Lamiaceae 6 4.14 9 4.84
Malvaceae 8 5.52 10 5.38
Myrtaceae 4 2.76 5 2.69
Poaceae 4 2.76 5 2.69
Rubiaceae 4 2.76 4 2.15
Sapindaceae 7 4.83 8 4.30
Verbenaceae 4 2.76 4 2.15

68
Agro productividad 14 (4): 65-80. 2021
AGROPRODUCTIVIDAD
Figure 1. Main characteristics of melliferous flora: A) Status, B) Life form and C) Resource offered to pollinators.
Fabaceae family is also one of the most important in Mexico, since it presents
139 genera and 1,850 species (Ramírez-Arriaga et al., 2016).
On the other hand, there is a record of 44 plant species that are cultivated
and visited by bees to obtain their food; these crops belong to 23 botanical
families, of which 43.18% are nectariferous and the same percentage are also
pollen-nectariferous, and only 9.09% are polliniferous (Annex 2, Figure 2).
The crops that depend on pollination are soybean, coffee, tomato and orange;
the importance of pollinators in agricultural crops is that they improve the
yield and quality of the seeds and fruits, so this service presents a social and
economic impact (Giannini et al., 2020); however, some of the crops only
provide food to pollinators during a few weeks, that is, during a short period,
and then they must survive a long scarcity, and although some may migrate,
Figure 2. Crops pollinated by bees: A) Persea americana Mill., B) Citrus limon (L.) Osbeck, C) Macadamia integrifolia Maiden & Betche D) Byrsonima crassifolia (L.) Kunth, E) Capsicum annuum L. y F) Zea mays L. Photographs: Diana Caballero Alvarado.
A B C
D E F
social pollinators require accessible
floral resources throughout the year
for survival of the colony. For that,
wild melliferous flora can provide
food and nesting sites, so changes
must be made in agricultural
practices to foster biodiversity and
restore, at least to a certain degree,
the complexity of the ecosystem,
as well as its functionality and
sustainability (Kevan and Silva, 2020).
On the other hand, regional and
local crops could depend on more
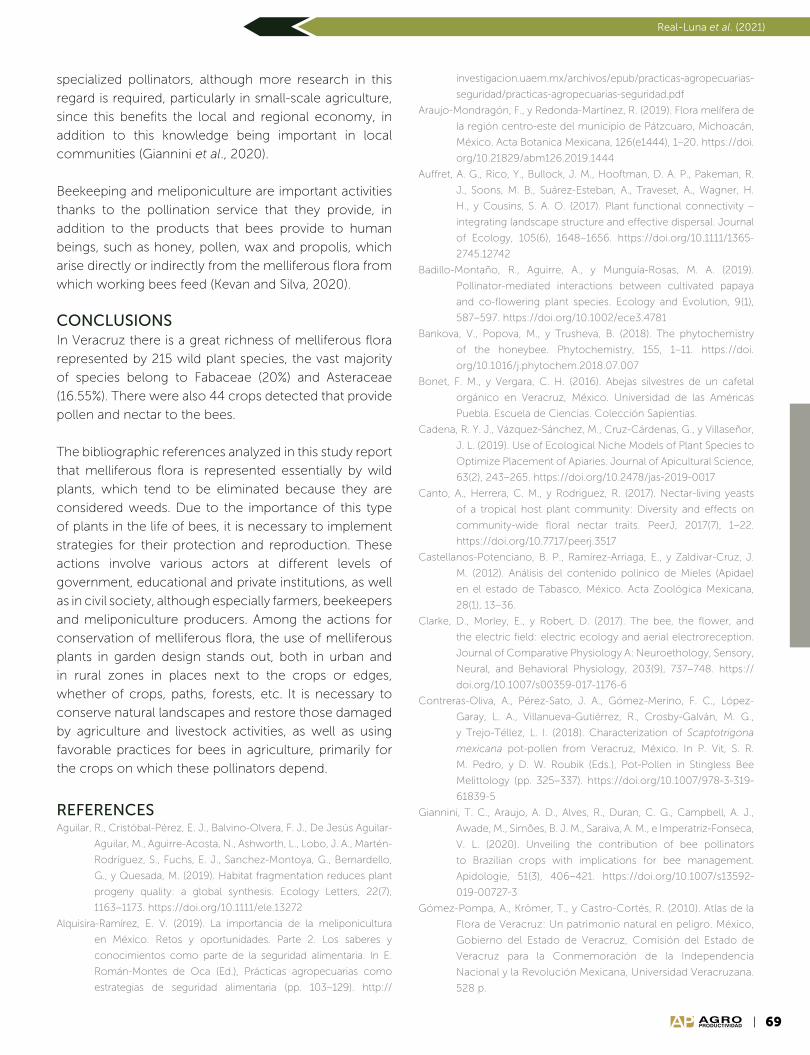
69
Real-Luna et al. (2021)
AGROPRODUCTIVIDAD
specialized pollinators, although more research in this
regard is required, particularly in small-scale agriculture,
since this benefits the local and regional economy, in
addition to this knowledge being important in local
communities (Giannini et al., 2020).
Beekeeping and meliponiculture are important activities
thanks to the pollination service that they provide, in
addition to the products that bees provide to human
beings, such as honey, pollen, wax and propolis, which
arise directly or indirectly from the melliferous flora from
which working bees feed (Kevan and Silva, 2020).
CONCLUSIONSIn Veracruz there is a great richness of melliferous flora
represented by 215 wild plant species, the vast majority
of species belong to Fabaceae (20%) and Asteraceae
(16.55%). There were also 44 crops detected that provide
pollen and nectar to the bees.
The bibliographic references analyzed in this study report
that melliferous flora is represented essentially by wild
plants, which tend to be eliminated because they are
considered weeds. Due to the importance of this type
of plants in the life of bees, it is necessary to implement
strategies for their protection and reproduction. These
actions involve various actors at different levels of
government, educational and private institutions, as well
as in civil society, although especially farmers, beekeepers
and meliponiculture producers. Among the actions for
conservation of melliferous flora, the use of melliferous
plants in garden design stands out, both in urban and
in rural zones in places next to the crops or edges,
whether of crops, paths, forests, etc. It is necessary to
conserve natural landscapes and restore those damaged
by agriculture and livestock activities, as well as using
favorable practices for bees in agriculture, primarily for
the crops on which these pollinators depend.
REFERENCESAguilar, R., Cristóbal-Pérez, E. J., Balvino-Olvera, F. J., De Jesús Aguilar-
Aguilar, M., Aguirre-Acosta, N., Ashworth, L., Lobo, J. A., Martén-
Rodríguez, S., Fuchs, E. J., Sanchez-Montoya, G., Bernardello,
G., y Quesada, M. (2019). Habitat fragmentation reduces plant
progeny quality: a global synthesis. Ecology Letters, 22(7),
1163–1173. https://doi.org/10.1111/ele.13272
Alquisira-Ramírez, E. V. (2019). La importancia de la meliponicultura
en México. Retos y oportunidades. Parte 2. Los saberes y
conocimientos como parte de la seguridad alimentaria. In E.
Román-Montes de Oca (Ed.), Prácticas agropecuarias como
estrategias de seguridad alimentaria (pp. 103–129). http://
investigacion.uaem.mx/archivos/epub/practicas-agropecuarias-
seguridad/practicas-agropecuarias-seguridad.pdf
Araujo-Mondragón, F., y Redonda-Martínez, R. (2019). Flora melífera de
la región centro-este del municipio de Pátzcuaro, Michoacán,
México. Acta Botanica Mexicana, 126(e1444), 1–20. https://doi.
org/10.21829/abm126.2019.1444
Auffret, A. G., Rico, Y., Bullock, J. M., Hooftman, D. A. P., Pakeman, R.
J., Soons, M. B., Suárez-Esteban, A., Traveset, A., Wagner, H.
H., y Cousins, S. A. O. (2017). Plant functional connectivity –
integrating landscape structure and effective dispersal. Journal
of Ecology, 105(6), 1648–1656. https://doi.org/10.1111/1365-
2745.12742
Badillo-Montaño, R., Aguirre, A., y Munguía-Rosas, M. A. (2019).
Pollinator-mediated interactions between cultivated papaya
and co-flowering plant species. Ecology and Evolution, 9(1),
587–597. https://doi.org/10.1002/ece3.4781
Bankova, V., Popova, M., y Trusheva, B. (2018). The phytochemistry
of the honeybee. Phytochemistry, 155, 1–11. https://doi.
org/10.1016/j.phytochem.2018.07.007
Bonet, F. M., y Vergara, C. H. (2016). Abejas silvestres de un cafetal
orgánico en Veracruz, México. Universidad de las Américas
Puebla. Escuela de Ciencias. Colección Sapientias.
Cadena, R. Y. J., Vázquez-Sánchez, M., Cruz-Cárdenas, G., y Villaseñor,
J. L. (2019). Use of Ecological Niche Models of Plant Species to
Optimize Placement of Apiaries. Journal of Apicultural Science,
63(2), 243–265. https://doi.org/10.2478/jas-2019-0017
Canto, A., Herrera, C. M., y Rodriguez, R. (2017). Nectar-living yeasts
of a tropical host plant community: Diversity and effects on
community-wide floral nectar traits. PeerJ, 2017(7), 1–22.
https://doi.org/10.7717/peerj.3517
Castellanos-Potenciano, B. P., Ramírez-Arriaga, E., y Zaldivar-Cruz, J.
M. (2012). Análisis del contenido polínico de Mieles (Apidae)
en el estado de Tabasco, México. Acta Zoológica Mexicana,
28(1), 13–36.
Clarke, D., Morley, E., y Robert, D. (2017). The bee, the flower, and
the electric field: electric ecology and aerial electroreception.
Journal of Comparative Physiology A: Neuroethology, Sensory,
Neural, and Behavioral Physiology, 203(9), 737–748. https://
doi.org/10.1007/s00359-017-1176-6
Contreras-Oliva, A., Pérez-Sato, J. A., Gómez-Merino, F. C., López-
Garay, L. A., Villanueva-Gutiérrez, R., Crosby-Galván, M. G.,
y Trejo-Téllez, L. I. (2018). Characterization of Scaptotrigona
mexicana pot-pollen from Veracruz, México. In P. Vit, S. R.
M. Pedro, y D. W. Roubik (Eds.), Pot-Pollen in Stingless Bee
Melittology (pp. 325–337). https://doi.org/10.1007/978-3-319-
61839-5
Giannini, T. C., Araujo, A. D., Alves, R., Duran, C. G., Campbell, A. J.,
Awade, M., Simões, B. J. M., Saraiva, A. M., e Imperatriz-Fonseca,
V. L. (2020). Unveiling the contribution of bee pollinators
to Brazilian crops with implications for bee management.
Apidologie, 51(3), 406–421. https://doi.org/10.1007/s13592-
019-00727-3
Gómez-Pompa, A., Krömer, T., y Castro-Cortés, R. (2010). Atlas de la
Flora de Veracruz: Un patrimonio natural en peligro. México,
Gobierno del Estado de Veracruz, Comisión del Estado de
Veracruz para la Conmemoración de la Independencia
Nacional y la Revolución Mexicana, Universidad Veracruzana.
528 p.

70
Agro productividad 14 (4): 65-80. 2021
AGROPRODUCTIVIDAD
González-Suárez, M., Mora-Olivgio, V., y Guerra-Pérez, A. (2020).
Diversidad de la flora de interés apícola en el estado de
Tamaulipas, México. Revista Mexicana de Ciencias Pecuarias,
11(3), 914–932. https://doi.org/10.22319/rmcp.v11i3.4717
Gónzalez, R. R. M. (2014). Evaluación de Gymnopodium floribundium
Rolfe como recurso nectarífero. Centro de Investigación
Científica de Yucatán, A. C.
Hernández-Villa, V., Vibrans, H., Uscanga-Mortera, E., y Aguirre-Jaimes,
A. (2020). Floral visitors and pollinator dependence are related
to floral display size and plant height in native weeds of central
Mexico. Flora: Morphology, Distribution, Functional Ecology of
Plants, 262,151505. https://doi.org/10.1016/j.flora.2019.151505
Herrera-López, M. G., Rubio-Hernández, E. I., Leyte-Lugo, M. A.,
Schinkovitz, A., Richomme, P., Calvo-Irabién, L. M., y Peña-
Rodríguez, L. M. (2019). Botanical origin of triterpenoids from
Yucatecan propolis. Phytochemistry Letters, 29, 25–29. https://
doi.org/10.1016/j.phytol.2018.10.015
Hipólito, J., Viana, B. F., y Garibaldi, L. A. (2016). The value of
pollinator-friendly practices: Synergies between natural and
anthropogenic assets. Basic and Applied Ecology, 17(8), 659–
667. https://doi.org/10.1016/j.baae.2016.09.003
Kevan, P., y Silva, P. N. (2020). Pollination and Agriculture. Encyclopedia
of Social Insects, 1–9. https://doi.org/10.1007/978-3-319-
90306-4_176-1
Kremen, C., y M’Gonigle, L. K. (2015). Small-scale restoration in intensive
agricultural landscapes supports more specialized and less
mobile pollinator species. Journal of Applied Ecology, 52(3),
602–610. https://doi.org/10.1111/1365-2664.12418
Landaverde-González, P., Quezada-Euán, J. J. G., Theodorou, P.,
Murray, T. E., Husemann, M., Ayala, R., Moo-Valle, H., Vandame,
R., y Paxton, R. J. (2017). Sweat bees on hot chillies: provision
of pollination services by native bees in traditional slash-and-
burn agriculture in the Yucatán Peninsula of tropical Mexico.
Journal of Applied Ecology, 54(6), 1814–1824. https://doi.
org/10.1111/1365-2664.12860
Leonhardt, S. D., Dworschak, K., Eltz, T., y Blüthgen, N. (2007). Foraging
loads of stingless bees and utilisation of stored nectar for pollen
harvesting. Apidologie, 38(2), 125–135. https://doi.org/10.1051/
apido:2006059
Martínez-Adriano, C. A., Aguirre-Jaimes, A., y Díaz-Castelazo, C.
(2016). Floristic survey of flowering plants in a tropical coastal
ecosystem in Veracruz, Mexico. Botanical Sciences, 94(1), 185–
197. https://doi.org/10.17129/botsci.272
Martínez-Adriano, C. A., Díaz-Castelazo, C., y Aguirre-Jaimes, A.
(2018). Flower-mediated plant-butterfly interactions in an
heterogeneous tropical coastal ecosystem. PeerJ, 2018(9).
https://doi.org/10.7717/peerj.5493
Meléndez, R. V., Ayala, R., y Delfín, G. H. (2018). Crop pollination by
stingless bees. In P. Vit, S. R. M. Pedro, y D. W. Roubik (Eds.),
Pot-Pollen in Stingless Bee Melittology (pp. 139–153). https://
doi.org/10.1007/978-3-319-61839-5
Montoya-Bonilla, B. P., Baca- Gamboa, A. E., y Bonilla, B. L. (2017). Flora
melífera y su oferta de recursos en cinco veredas del municipio
de Piendamó, Cauca. Biotecnología En El Sector Agropecuario
y Agroindustrial, 1, 20–28. https://doi.org/10.18684/BSAA
Parra-Tabla, V., Angulo-Pérez, D., Albor, C., Campos-Navarrete, M. J.,
Tun-Garrido, J., Sosenski, P., Alonso, C., Ashman, T. L., y Arceo-
Gómez, G. (2019). The role of alien species on plant-floral
visitor network structure in invaded communities. PLoS ONE,
14(11), 1–19. https://doi.org/10.1371/journal.pone.0218227
Ramírez-Arriaga, E., Pacheco-Palomo, K. G., Moguel-Ordoñez, Y. B.,
Zepeda, G. M. R., y Godínez-García, L. M. (2018). Angiosperm
resources for stingless bees (Apidae, Meliponini): A pot-pollen
melittopalynological study in the gulf of Mexico. In P. Vit, S.
R. M. Pedro, y D. W. Roubik (Eds.), Pot-Pollen in Stingless Bee
Melittology (pp. 111–130). Springer International Publishing AG.
https://doi.org/10.1007/978-3-319-61839-5
Ramírez-Arriaga, Elia, Martínez-Bernal, A., Maldonado, N. R., y Martínez-
Hernández, E. (2016). Palynological analysis of honeys and
pollen loads of Apis mellifera (Apidae) from the central and
northern regions of the state of Guerrero, Mexico. Botanical
Sciences, 94(1), 141–156. https://doi.org/10.17129/botsci.217
Ramírez-Bravo, O. E., y Hernández-Santin, L. (2016). Plant diversity
along a disturbance gradient in a semi-arid ecosystem in
Central Mexico. Acta Botanica Mexicana, 117, 11–25. https://
doi.org/10.21829/abm117.2016.1164
Stephen, A. (2014). Pollen - A microscopic wonder of plant kingdom.
International Journal of Advanced Research in Biological
Sciences, 1(9), 127–130.
Thakur, M., y Nanda, V. (2020). Composition and functionality of bee
pollen: A review. Trends in Food Science and Technology, 98,
82–106. https://doi.org/10.1016/j.tifs.2020.02.001
Ulloa, C. U., Acevedo-Rodríguez, P., Beck, S., Belgrano, M. J., Bernal, R.,
Berry, P. E., Brako, L., Celis, M., Davidse, G., León-yánez, S., Magill,
R. E., Neill, D. A., Nee, M., Raven, P. H., Stimmel, H., Strong, M. T.,
Villaseñor, J. L., Zarucchi, J. L., Zuloaga, F. O., y Jørgensen, P. M.
(2017). An integrated assessment of the vascular plant species of
the Americas. Science, 358, 1614–1617.
Villaseñor, J. L. (2016). Catálogo de las plantas vasculares nativas de
México. Revista Mexicana de Biodiversidad, 87(3), 559–902.
https://doi.org/10.1016/j.rmb.2016.06.017
Villegas, D. G., Bolaños, M. A., Miranda, S. J., Sandoval, H. R., y Lizama,
M. J. M. (2000). Flora nectarifera y polinifera en el estado de
Veracruz. Secretaria de Agricultura, Ganadería y Desarrollo
Rural. https://atlasapi2019.github.io/pdfs/FloraNectarifera y
polinifera Chiapas.pdf
Von, T. J., Manson, R. H., Congalton, R. G., López-Barrera, F., y Jones,
K. W. (2021). Evaluating the environmental effectiveness of
payments for hydrological services in Veracruz, México:
A landscape approach. Land Use Policy, 100. https://doi.
org/10.1016/j.landusepol.2020.105055
Vossler, F. G. (2015). Broad Protein Spectrum in Stored Pollen of
Three Stingless Bees from the Chaco Dry Forest in South
America (Hymenoptera, Apidae, Meliponini) and Its Ecological
Implications. Psyche (London), 2015, 13–15. https://doi.
org/10.1155/2015/659538
Wilson, J. S., Forister, M. L., y Carril, O. M. (2017). Interest exceeds
understanding in public support of bee conservation. Frontiers
in Ecology and the Environment, 15(8), 460–466. https://doi.
org/10.1002/fee.1531
71
Real-Luna et al. (2021)
AGROPRODUCTIVIDAD
Ap
pen
dix
1. M
elli
fero
us
flo
ra in
Ve
rac
ruz
stat
e, M
exi
co
Fam
ilyP
lan
t sp
ec
ies
Po
llen
Ne
cta
rFl
ow
eri
ng
Stat
us
Life
-fo
rmR
efe
ren
ce
Acan
thac
eae
Avi
cen
nia
germ
inan
s (L
.) L.
XX
Ap
ril-
July
Nat
ive
Tree
Cas
tella
no
s-P
ote
ncia
no
et
al. (
20
12);
Nie
mb
ro-
Ro
cas
et
al. (
20
10);
Vill
eg
as e
t al
. (2
00
0)
Bra
vais
ia in
teg
err
ima
(Sp
ren
g.)
Stan
dl.
XJa
nu
ary-
Ap
ril
Nat
ive
Tree
Vill
eg
as e
t al
. (2
00
0)
Altin
gia
ceae
Liq
uid
amb
ar s
p.
XJa
nu
ary-
Mar
ch
Nat
ive
Tree
Nie
mb
ro-R
ocas
et
al. (
20
15);
Ram
írez-
Arr
iag
a et
al. (
20
18)
Am
aran
thac
eae
Ch
amis
soa
altis
sim
a (J
acq
.) K
un
thX
Feb
ruar
y-A
pri
lN
ativ
eSh
rub
Vill
eg
as e
t al
. (2
00
0)
Dys
ph
ania
am
bro
sio
ides
(L.)
Mo
syak
in
& C
lem
ants
X
Ap
ril-
Decem
ber
Nat
ive
Herb
aceo
us
Co
ntr
era
s-O
liva
et
al. (
20
18)
Iresi
ne d
iffu
sa H
um
b. &
Bo
np
l. ex
Will
d.
XN
ativ
eH
erb
Bo
net
y V
erg
ara
(20
16)
An
acar
dia
ceae
Spo
nd
ias
mo
mb
in L
.X
Ap
ril-
May
Nat
ive
Tree
Cas
tella
no
s-P
ote
ncia
no
et
al. (
20
12);
Co
ntr
era
s-O
liva
et
al. (
20
18);
Nie
mb
ro-R
ocas
et
al. (
20
10)
Ap
ocyn
aceae
Asc
lep
ias
cu
rass
avic
a L.
XM
ay-A
ug
ust
Nat
ive
Herb
aceo
us
Vill
eg
as e
t al
. (2
00
0)
Plu
meria
rub
ra L
.X
XM
arch
-Sep
tem
ber
Nat
ive
Tree
Vill
eg
as e
t al
. (2
00
0)
Tab
ern
aem
on
tan
a citr
ifolia
L.
XFe
bru
ary-
Ap
ril
Nat
ive
Shru
bV
illeg
as e
t al
. (2
00
0)
Ara
liaceae
Den
dro
pan
ax a
rbo
reu
s (L
.) D
ecn
e. &
P
lan
ch
.X
XD
ecem
ber-
Au
gu
stN
ativ
eTr
ee
Co
ntr
era
s-O
liva
et
al. (
20
18);
Nie
mb
ro-R
ocas
et
al. (
20
10);
Vill
eg
as e
t al
. (2
00
0)
Ore
op
anax
sp
.X
Sep
tem
ber-
Decem
ber
Nat
ive
Tree
Ram
írez-
Arr
iag
a et
al. (
20
18)
Are
cac
eae
Acro
co
mia
acu
leat
a (J
acq
.) Lo
dd
. ex
Mar
t.X
Mar
ch
-Sep
tem
ber
Nat
ive
Arb
ore
scen
tV
illeg
as e
t al
. (2
00
0)
Att
alea
bu
tyra
cea
(Mu
tis e
x L.
f.)
Wess
. B
oer
XJa
nu
ary-
May
Nat
ive
Arb
ore
scen
tV
illeg
as e
t al
. (2
00
0)
Sab
al m
exi
can
a M
art.
XX
Decem
ber-
Ap
ril
Nat
ive
Arb
ore
scen
tV
illeg
as e
t al
. (2
00
0)
Asp
arag
aceae
Ech
ean
dia
alb
iflo
ra (
Sch
ltd
l. &
Ch
am.)
M. M
arte
ns
& G
aleo
tti
XM
arch
-Ju
ne
Nat
ive
Herb
aceo
us
Bo
net
y V
erg
ara
(20
16);
Ló
pez-
Ferr
ari y
Esp
ejo
(1
99
5)
No
lina
par
viflo
ra (
Ku
nth
) H
em
sl.
XJa
nu
ary-
Mar
ch
Nat
ive
Arb
ore
scen
tV
illeg
as e
t al
. (2
00
0)
Yucca
gig
ante
a Le
m.
XJa
nu
ary-
Ap
ril
Nat
ive
Arb
ore
scen
tV
illeg
as e
t al
. (2
00
0)
Ast
era
ceae
Ach
illea
mill
efo
lium
L.
XM
ay-N
ove
mb
er
Nat
ive
Herb
aceo
us
Vill
eg
as e
t al
. (2
00
0)
Ag
era
tum
ho
ust
on
ian
um
Mill
.X
All
year
Nat
ive
Herb
aceo
us
Vill
eg
as e
t al
. (2
00
0)
Am
bro
sia
peru
vian
a W
illd
.X
XM
ay-J
uly
Nat
ive
Herb
aceo
us
Vill
eg
as e
t al
. (2
00
0)
Bac
ch
aris
co
nfe
rta
Ku
nth
XJa
nu
ary-
Mar
ch
Nat
ive
Shru
bV
illeg
as e
t al
. (2
00
0)
Bac
ch
aris
trin
erv
is (
Ch
am.)
Pers
.X
XJa
nu
ary-
Mar
ch
Nat
ive
Shru
bV
illeg
as e
t al
. (2
00
0)
Bal
timo
ra r
ecta
L.
XX
July
-Sep
tem
ber
Nat
ive
Herb
aceo
us
Vill
eg
as e
t al
. (2
00
0)
Bar
kleya
nth
us
salic
ifoliu
s (K
un
th)
H.
Ro
b &
Bre
ttell
XX
Jan
uar
y-M
arch
Nat
ive
Shru
bV
illeg
as e
t al
. (2
00
0)
Bid
en
s p
ilosa
L.
XX
Sep
tem
ber-
Ja
nu
ary
Nat
ive
Herb
aceo
us
Co
ntr
era
s-O
liva
et
al. (
20
18);
Par
ra-T
abla
et
al.
(20
19);
Vill
eg
as e
t al
. (2
00
0)
Bid
en
s re
pta
ns
(L.)
G. D
on
XA
ll ye
arN
ativ
eH
erb
aceo
us
Vill
eg
as e
t al
. (2
00
0)
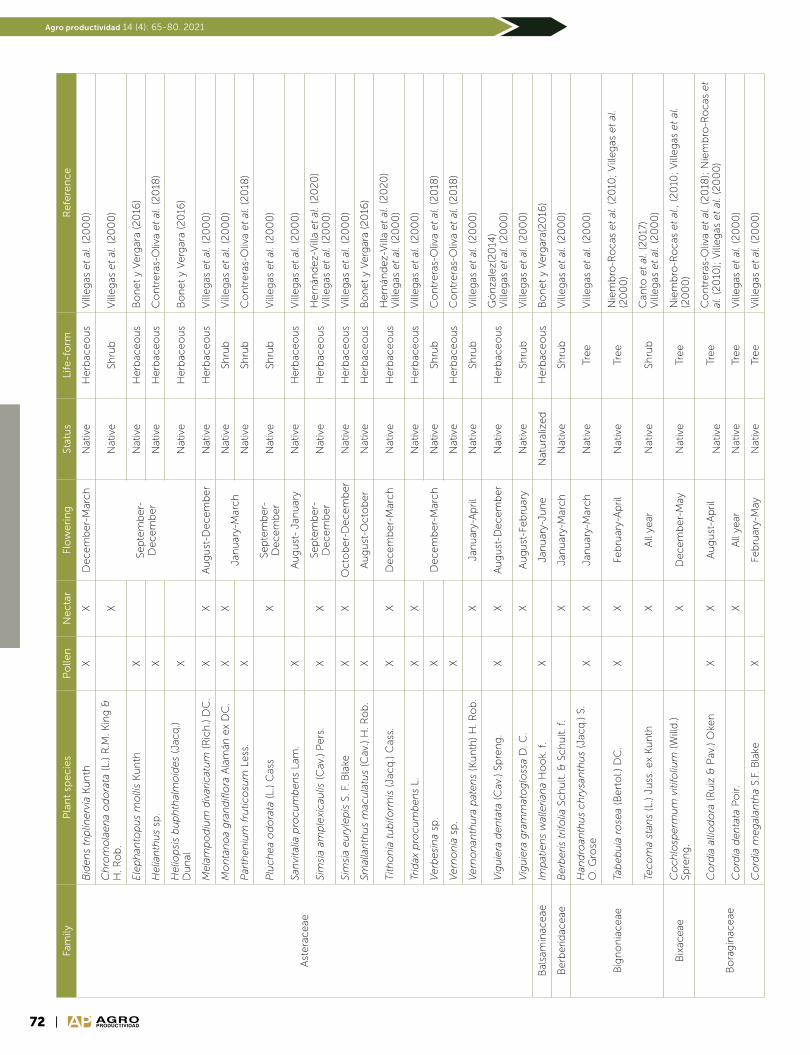
72
Agro productividad 14 (4): 65-80. 2021
AGROPRODUCTIVIDAD
Fam
ilyP
lan
t sp
ec
ies
Po
llen
Ne
cta
rFl
ow
eri
ng
Stat
us
Life
-fo
rmR
efe
ren
ce
Ast
era
ceae
Bid
en
s tr
iplin
erv
ia K
un
thX
XD
ecem
ber-
Mar
ch
Nat
ive
Herb
aceo
us
Vill
eg
as e
t al
. (2
00
0)
Ch
rom
ola
en
a o
do
rata
(L.
) R
.M. K
ing
&
H. R
ob
.X
Sep
tem
ber-
Decem
ber
Nat
ive
Shru
bV
illeg
as e
t al
. (2
00
0)
Ele
ph
anto
pu
s m
olli
s K
un
thX
Nat
ive
Herb
aceo
us
Bo
net
y V
erg
ara
(20
16)
Helia
nth
us
sp.
XN
ativ
eH
erb
aceo
us
Co
ntr
era
s-O
liva
et
al. (
20
18)
Helio
psi
s b
up
hth
alm
oid
es
(Jac
q.)
Du
nal
XN
ativ
eH
erb
aceo
us
Bo
net
y V
erg
ara
(20
16)
Mela
mp
od
ium
div
aric
atu
m (
Ric
h.)
DC
.X
XA
ug
ust
-Decem
ber
Nat
ive
Herb
aceo
us
Vill
eg
as e
t al
. (2
00
0)
Mo
nta
no
a g
ran
difl
ora
Ala
mán
ex
DC
.X
XJa
nu
ary-
Mar
ch
Nat
ive
Shru
bV
illeg
as e
t al
. (2
00
0)
Par
then
ium
fru
tico
sum
Less
. X
Nat
ive
Shru
bC
on
trera
s-O
liva
et
al. (
20
18)
Plu
ch
ea
od
ora
ta (
L.)
Cas
sX
Sep
tem
ber-
Decem
ber
Nat
ive
Shru
bV
illeg
as e
t al
. (2
00
0)
San
vita
lia p
rocu
mb
en
s La
m.
XA
ug
ust
- Ja
nu
ary
Nat
ive
Herb
aceo
us
Vill
eg
as e
t al
. (2
00
0)
Sim
sia
amp
lexi
cau
lis (
Cav
.) P
ers
.X
XSe
pte
mb
er-
Decem
ber
Nat
ive
Herb
aceo
us
Hern
ánd
ez-
Vill
a et
al. (
20
20
)V
illeg
as e
t al
. (2
00
0)
Sim
sia
eu
ryle
pis
S. F
. Bla
keX
XO
cto
ber-
Decem
ber
Nat
ive
Herb
aceo
us
Vill
eg
as e
t al
. (2
00
0)
Smal
lan
thu
s m
acu
latu
s (C
av.)
H. R
ob
.X
Au
gu
st-O
cto
ber
Nat
ive
Herb
aceo
us
Bo
net
y V
erg
ara
(20
16)
Tith
on
ia t
ub
iform
is (
Jacq
.) C
ass.
XX
Decem
ber-
Mar
ch
Nat
ive
Herb
aceo
us
Hern
ánd
ez-
Vill
a et
al. (
20
20
)V
illeg
as e
t al
. (2
00
0)
Trid
ax p
rocu
mb
en
s L.
XX
Decem
ber-
Mar
ch
Nat
ive
Herb
aceo
us
Vill
eg
as e
t al
. (2
00
0)
Verb
esi
na
sp.
XN
ativ
eSh
rub
Co
ntr
era
s-O
liva
et
al. (
20
18)
Vern
on
ia s
p.
XN
ativ
eH
erb
aceo
us
Co
ntr
era
s-O
liva
et
al. (
20
18)
Vern
on
anth
ura
pat
en
s (K
un
th)
H. R
ob
.X
Jan
uar
y-A
pri
lN
ativ
eSh
rub
V
illeg
as e
t al
. (2
00
0)
Vig
uie
ra d
en
tata
(C
av.)
Spre
ng
.X
XA
ug
ust
-Decem
ber
Nat
ive
Herb
aceo
us
Gó
nza
lez(
20
14)
Vill
eg
as e
t al
. (2
00
0)
Vig
uie
ra g
ram
mat
og
loss
a D
. C.
XA
ug
ust
-Feb
ruar
yN
ativ
eSh
rub
Vill
eg
as e
t al
. (2
00
0)
Bal
sam
inac
eae
Imp
atie
ns
wal
lerian
a H
oo
k. f
.X
Jan
uar
y-Ju
ne
Nat
ura
lized
Herb
aceo
us
Bo
net
y V
erg
ara(
20
16)
Berb
eri
dac
eae
Berb
eris
trifo
lia S
ch
ult. &
Sch
ult. f
.X
Jan
uar
y-M
arch
Nat
ive
Shru
bV
illeg
as e
t al
. (2
00
0)
Big
no
nia
ceae
Han
dro
anth
us
ch
rysa
nth
us
(Jac
q.)
S.
O. G
rose
XX
Jan
uar
y-M
arch
Nat
ive
Tree
Vill
eg
as e
t al
. (2
00
0)
Tab
eb
uia
ro
sea
(Bert
ol.)
DC
.X
XFe
bru
ary-
Ap
ril
Nat
ive
Tree
Nie
mb
ro-R
ocas
et
al. (
20
10;
Vill
eg
as e
t al
. (2
00
0)
Teco
ma
stan
s (L
.) Ju
ss. e
x K
un
thX
All
year
Nat
ive
Shru
bC
anto
et
al. (
20
17)
Vill
eg
as e
t al
. (2
00
0)
Bix
aceae
Co
ch
losp
erm
um
viti
foliu
m (
Will
d.)
Spre
ng
.X
Decem
ber-
May
Nat
ive
Tree
Nie
mb
ro-R
ocas
et
al.,
(20
10;
Vill
eg
as e
t al
. (2
00
0)
Bo
rag
inac
eae
Co
rdia
alli
od
ora
(R
uiz
& P
av.)
Oke
nX
XA
ug
ust
-Ap
ril
Nat
ive
Tree
Co
ntr
era
s-O
liva
et
al. (
20
18);
Nie
mb
ro-R
ocas
et
al. (
20
10);
Vill
eg
as e
t al
. (2
00
0)
Co
rdia
den
tata
Po
ir.X
All
year
Nat
ive
Tree
Vill
eg
as e
t al
. (2
00
0)
Co
rdia
meg
alan
tha
S.F.
Bla
keX
Feb
ruar
y-M
ayN
ativ
eTr
ee
Vill
eg
as e
t al
. (2
00
0)

73
Real-Luna et al. (2021)
AGROPRODUCTIVIDAD
Fam
ilyP
lan
t sp
ec
ies
Po
llen
Ne
cta
rFl
ow
eri
ng
Stat
us
Life
-fo
rmR
efe
ren
ce
Bra
ssic
aceae
Bra
ssic
a ra
pa
L.X
XM
ay-D
ecem
ber
Nat
ura
lized
Herb
aceo
us
Vill
eg
as e
t al
. (2
00
0)
Bra
ssic
a n
igra
(L.
) W
.D.J
. Ko
ch
XD
ecem
ber-
Feb
ruar
yN
atu
raliz
ed
Herb
aceo
us
Vill
eg
as e
t al
. (2
00
0)
Rap
han
us
rap
han
istr
um
L.
XX
Sep
tem
ber-
May
Exo
ticH
erb
aceo
us
Vill
eg
as e
t al
. (2
00
0)
Bu
rsera
ceae
Bu
rsera
sim
aru
ba
(L.)
Sarg
.X
XFe
bru
ary-
Au
gu
stN
ativ
eTr
ee
Co
ntr
era
s-O
liva
et
al. (
20
18);
Herr
era
-Ló
pez
et
al. (
20
19);
Vill
eg
as e
t al
. (2
00
0)
Cac
taceae
Cili
nd
rop
un
tia im
bricat
a (H
aw.)
F.M
. K
nu
thX
XJa
nu
ary-
Ap
ril
Nat
ive
Shru
bV
illeg
as e
t al
. (2
00
0)
Op
un
tia h
uaj
uap
en
sis
Bra
voX
XFe
bru
ary-
May
Nat
ive
Shru
bV
illeg
as e
t al
. (2
00
0)
Op
un
tia s
tric
ta (
Haw
.) H
aw.
XX
Feb
ruar
y-A
pri
lN
ativ
eSh
rub
Vill
eg
as e
t al
. (2
00
0)
Cam
pan
ula
ceae
Lob
elia
xal
apen
sis
Ku
nth
XJa
nu
ary-
Ap
ril
Nat
ive
Herb
aceo
us
Bo
net
y V
erg
ara
(20
16)
Can
nab
aceae
Trem
a m
icra
nth
a (L
.) B
lum
eX
Feb
ruar
y-A
pri
lN
ativ
eTr
ee
Nie
mb
ro-R
ocas
et
al. (
20
10);
Vill
eg
as e
t al
. (2
00
0)
Ch
lora
nth
aceae
Hed
yosm
um
mexi
can
um
C. C
ord
em
.X
Nat
ive
Shru
bR
amírez-
Arr
iag
a et
al. (
20
18)
Co
mb
reta
ceae
Co
mb
retu
m f
arin
osu
m K
un
thX
Decem
ber-
Mar
ch
Nat
ive
Vin
eV
illeg
as e
t al
. (2
00
0)
Co
no
car
pu
s ere
ctu
s L.
XX
Ap
ril-
Jun
eN
ativ
eTr
ee
Par
ra-T
abla
et
al. (
20
19)
Vill
eg
as e
t al
. (2
00
0)
Lag
un
cu
laria
racem
osa
(L.
) C
.F. G
aert
n.
XFe
bru
ary-
May
Nat
ive
Tree
Nie
mb
ro-R
ocas
et
al. (
20
10);
Vill
eg
as e
t al
. (2
00
0)
Term
inal
ia c
atap
pa
L.X
Feb
ruar
y-M
arch
Nat
ura
lized
Tree
Vill
eg
as e
t al
. (2
00
0)
Co
mm
elin
aceae
Co
mm
elin
a d
iffu
sa B
urm
. f.
XA
ll ye
arN
ativ
eH
erb
aceo
us
Bo
net
y V
erg
ara
(20
16);
Ló
pez-
Ferr
ari e
t al
. (2
014
)
Gib
asis
pellu
cid
a (M
. Mar
ten
s &
G
aleo
tti)
D.R
. Hu
nt
XA
ll ye
arN
ativ
eH
erb
aceo
us
Bo
net
y V
erg
ara
(20
16);
Ló
pez-
Ferr
ari e
t al
. (2
014
)
Tin
antia
ere
cta
(Ja
cq
.) Sc
hltd
l.X
Au
gu
st-N
ove
mb
er
Nat
ive
Herb
aceo
us
Bo
net
y V
erg
ara,
20
16;
Hern
ánd
ez-
Vill
a et
al.,
20
20
Trip
og
and
ra s
err
ula
ta (
Vah
l) H
and
los
XA
ll ye
arN
ativ
eH
erb
aceo
us
Bo
net
y V
erg
ara
(20
16);
Ló
pez-
Ferr
ari e
t al
. (2
014
)
Co
nvo
lvu
laceae
Co
nvo
lvu
lus
no
difl
oru
s D
esv
.X
XM
ay-D
ecem
ber
Nat
ive
Herb
aceo
us
Vill
eg
as e
t al
. (2
00
0)
Ipo
mo
ea
arb
ore
scen
s (H
um
b. &
B
on
pl.
ex
Will
d.)
G. D
on
XD
ecem
ber-
Mar
ch
Nat
ive
Tree
Vill
eg
as e
t al
. (2
00
0)
Ipo
mo
ea
car
nea
sub
sp. fi
stu
losa
(M
art.
ex
Ch
ois
y) D
.F. A
ust
inX
No
vem
ber-
May
Nat
ive
Shru
bV
illeg
as e
t al
. (2
00
0)
Ipo
mo
ea
ind
ica
(Bu
rm.)
Merr
.X
All
year
Nat
ive
Vin
eB
on
et
y V
erg
ara
(20
16)
Ipo
mo
ea
trilo
ba
L.X
Octo
ber-
Feb
ruar
yN
ativ
eH
erb
aceo
us
Can
to e
t al
. (2
017
)V
illeg
as e
t al
. (2
00
0)
Merr
em
ia d
isse
cta
(Ja
cq
.) H
allie
r f.
XX
All
year
Nat
ive
Vin
eC
anto
et
al. 2
017
)V
illeg
as e
t al
. (2
00
0)
Cra
ssu
laceae
Sed
um
pra
eal
tum
A. D
C.
XJa
nu
ary-
Feb
ruar
yN
ativ
eH
erb
aceo
us
Vill
eg
as e
t al
. (2
00
0)
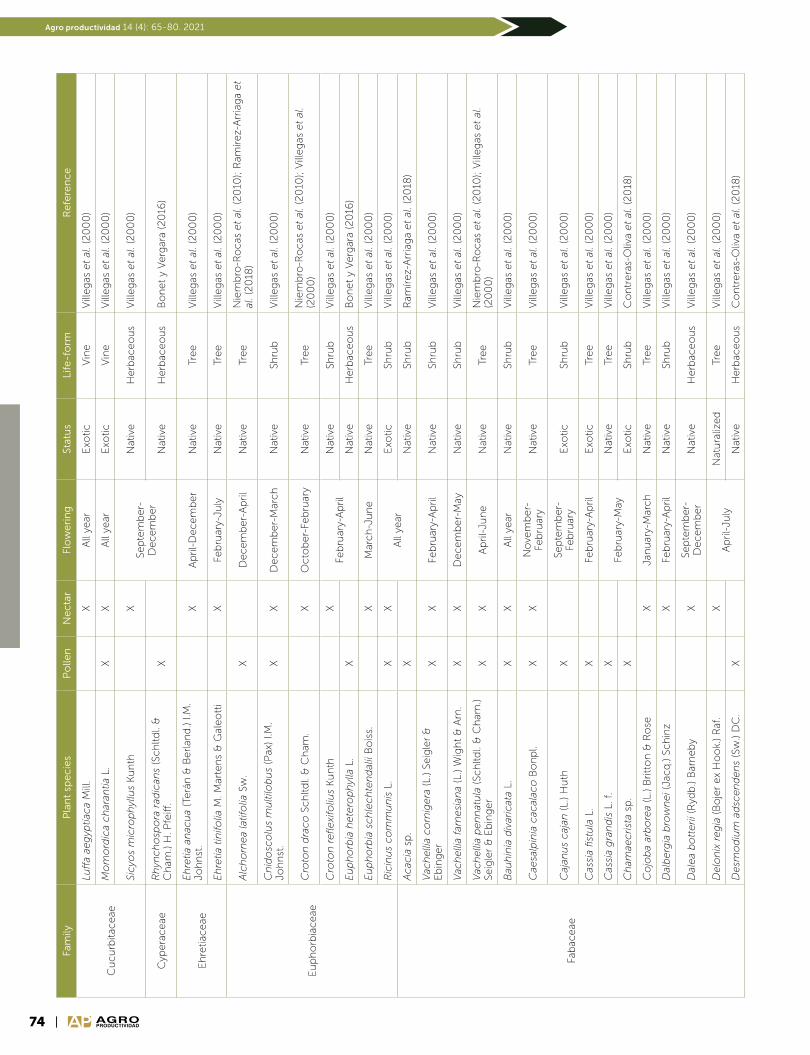
74
Agro productividad 14 (4): 65-80. 2021
AGROPRODUCTIVIDAD
Fam
ilyP
lan
t sp
ec
ies
Po
llen
Ne
cta
rFl
ow
eri
ng
Stat
us
Life
-fo
rmR
efe
ren
ce
Cu
cu
rbita
ceae
Luff
a ae
gyp
tiaca
Mill
. X
All
year
Exo
ticV
ine
Vill
eg
as e
t al
. (2
00
0)
Mo
mo
rdic
a ch
aran
tia L
.X
XA
ll ye
arE
xotic
Vin
eV
illeg
as e
t al
. (2
00
0)
Sicyo
s m
icro
ph
yllu
s K
un
thX
Sep
tem
ber-
Decem
ber
Nat
ive
Herb
aceo
us
Vill
eg
as e
t al
. (2
00
0)
Cyp
era
ceae
Rh
ynch
osp
ora
rad
ican
s (S
ch
ltd
l. &
C
ham
.) H
. Pfe
iff.
XN
ativ
eH
erb
aceo
us
Bo
net
y V
erg
ara
(20
16)
Eh
retia
ceae
Eh
retia
an
acu
a (T
erá
n &
Berl
and
.) I.M
. Jo
hn
st.
XA
pri
l-D
ecem
ber
Nat
ive
Tree
Vill
eg
as e
t al
. (2
00
0)
Eh
retia
tin
ifolia
M. M
arte
ns
& G
aleo
tti
XFe
bru
ary-
July
Nat
ive
Tree
Vill
eg
as e
t al
. (2
00
0)
Eu
ph
orb
iaceae
Alc
ho
rnea
latif
olia
Sw
.X
Decem
ber-
Ap
ril
Nat
ive
Tree
Nie
mb
ro-R
ocas
et
al. (
20
10);
Ram
írez-
Arr
iag
a et
al. (
20
18)
Cn
ido
sco
lus
mu
ltilo
bu
s (P
ax)
I.M.
Joh
nst
.X
XD
ecem
ber-
Mar
ch
Nat
ive
Shru
bV
illeg
as e
t al
. (2
00
0)
Cro
ton
dra
co
Sch
ltd
l. &
Ch
am.
XO
cto
ber-
Feb
ruar
yN
ativ
eTr
ee
Nie
mb
ro-R
ocas
et
al. (
20
10);
Vill
eg
as e
t al
. (2
00
0)
Cro
ton
refle
xifo
lius
Ku
nth
XFe
bru
ary-
Ap
ril
Nat
ive
Shru
bV
illeg
as e
t al
. (2
00
0)
Eu
ph
orb
ia h
ete
rop
hyl
la L
.X
Nat
ive
Herb
aceo
us
Bo
net
y V
erg
ara
(20
16)
Eu
ph
orb
ia s
ch
lech
ten
dal
ii B
ois
s.X
Mar
ch
-Ju
ne
Nat
ive
Tree
Vill
eg
as e
t al
. (2
00
0)
Ric
inu
s co
mm
un
is L
.X
XA
ll ye
arE
xotic
Shru
bV
illeg
as e
t al
. (2
00
0)
Fab
aceae
Acac
ia s
p.
XN
ativ
eSh
rub
Ram
írez-
Arr
iag
a et
al. (
20
18)
Vac
helli
a co
rnig
era
(L.
) Se
igle
r &
E
bin
ger
XX
Feb
ruar
y-A
pri
lN
ativ
eSh
rub
Vill
eg
as e
t al
. (2
00
0)
Vac
helli
a fa
rnesi
ana
(L.)
Wig
ht
& A
rn.
XX
Decem
ber-
May
Nat
ive
Shru
bV
illeg
as e
t al
. (2
00
0)
Vac
helli
a p
en
nat
ula
(Sc
hltd
l. &
Ch
am.)
Seig
ler
& E
bin
ger
XX
Ap
ril-
Jun
eN
ativ
eTr
ee
Nie
mb
ro-R
ocas
et
al. (
20
10);
Vill
eg
as e
t al
. (2
00
0)
Bau
hin
ia d
ivar
icat
a L.
XX
All
year
Nat
ive
Shru
bV
illeg
as e
t al
. (2
00
0)
Cae
salp
inia
cac
alac
o B
on
pl.
XX
No
vem
ber-
Feb
ruar
yN
ativ
eTr
ee
Vill
eg
as e
t al
. (2
00
0)
Caj
anu
s caj
an (
L.)
Hu
thX
Sep
tem
ber-
Feb
ruar
yE
xotic
Shru
bV
illeg
as e
t al
. (2
00
0)
Cas
sia
fistu
la L
.X
Feb
ruar
y-A
pri
lE
xotic
Tree
Vill
eg
as e
t al
. (2
00
0)
Cas
sia
gra
nd
is L
. f.
XFe
bru
ary-
May
Nat
ive
Tree
Vill
eg
as e
t al
. (2
00
0)
Ch
amae
crist
a sp
.X
Exo
ticSh
rub
Co
ntr
era
s-O
liva
et
al. (
20
18)
Co
job
a ar
bo
rea
(L.)
Bri
tto
n &
Ro
seX
Jan
uar
y-M
arch
Nat
ive
Tree
Vill
eg
as e
t al
. (2
00
0)
Dal
berg
ia b
row
nei (
Jacq
.) Sc
hin
zX
Feb
ruar
y-A
pri
lN
ativ
eSh
rub
Vill
eg
as e
t al
. (2
00
0)
Dal
ea
bo
tterii (
Ryd
b.)
Bar
neb
yX
Sep
tem
ber-
Decem
ber
Nat
ive
Herb
aceo
us
Vill
eg
as e
t al
. (2
00
0)
Delo
nix
reg
ia (
Bo
jer
ex
Ho
ok.
) R
af.
XA
pri
l-Ju
lyN
atu
raliz
ed
Tree
Vill
eg
as e
t al
. (2
00
0)
Desm
od
ium
ad
scen
den
s (S
w.)
DC
.X
Nat
ive
Herb
aceo
us
Co
ntr
era
s-O
liva
et
al. (
20
18)
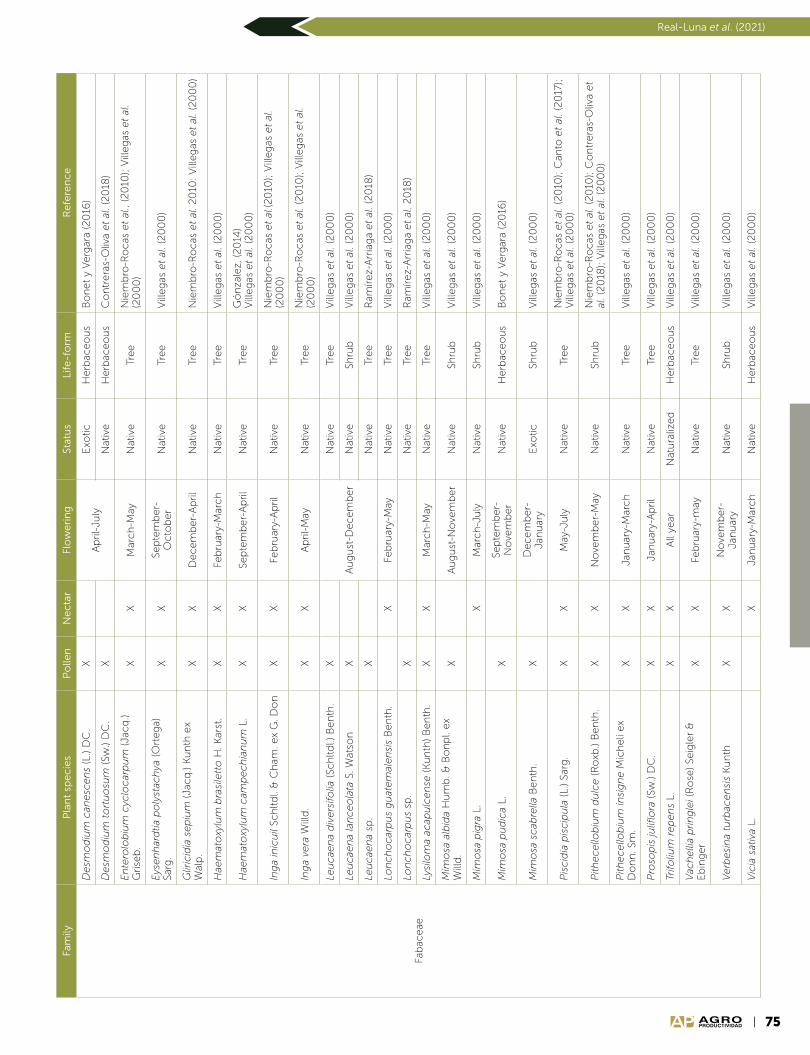
75
Real-Luna et al. (2021)
AGROPRODUCTIVIDAD
Fam
ilyP
lan
t sp
ec
ies
Po
llen
Ne
cta
rFl
ow
eri
ng
Stat
us
Life
-fo
rmR
efe
ren
ce
Fab
aceae
Desm
od
ium
can
esc
en
s (L
.) D
C.
XA
pri
l-Ju
lyE
xotic
Herb
aceo
us
Bo
net
y V
erg
ara
(20
16)
Desm
od
ium
to
rtu
osu
m (
Sw.)
DC
.X
Nat
ive
Herb
aceo
us
Co
ntr
era
s-O
liva
et
al. (
20
18)
En
tero
lob
ium
cyc
locar
pu
m (
Jacq
.) G
rise
b.
XX
Mar
ch
-May
Nat
ive
Tree
Nie
mb
ro-R
ocas
et
al.,
(20
10);
Vill
eg
as e
t al
. (2
00
0)
Eys
en
har
dtia
po
lyst
ach
ya (
Ort
eg
a)
Sarg
.X
XSe
pte
mb
er-
Octo
ber
Nat
ive
Tree
Vill
eg
as e
t al
. (2
00
0)
Glir
icid
ia s
ep
ium
(Ja
cq
.) K
un
th e
x W
alp
.X
XD
ecem
ber-
Ap
ril
Nat
ive
Tree
Nie
mb
ro-R
ocas
et
al. 2
010
: V
illeg
as e
t al
. (2
00
0)
Hae
mat
oxy
lum
bra
sile
tto
H. K
arst
.X
XFe
bru
ary-
Mar
ch
Nat
ive
Tree
Vill
eg
as e
t al
. (2
00
0)
Hae
mat
oxy
lum
cam
pech
ian
um
L.
XX
Sep
tem
ber-
Ap
ril
Nat
ive
Tree
Gó
nza
lez,
(2
014
)V
illeg
as e
t al
. (2
00
0)
Ing
a in
icu
il Sc
hltd
l. &
Ch
am. e
x G
. Do
nX
XFe
bru
ary-
Ap
ril
Nat
ive
Tree
Nie
mb
ro-R
ocas
et
al.(2
010
); V
illeg
as e
t al
. (2
00
0)
Ing
a ve
ra W
illd
.X
XA
pri
l-M
ayN
ativ
eTr
ee
Nie
mb
ro-R
ocas
et
al. (
20
10);
Vill
eg
as e
t al
. (2
00
0)
Leu
cae
na
div
ers
ifolia
(Sc
hltd
l.) B
en
th.
X
Au
gu
st-D
ecem
ber
Nat
ive
Tree
Vill
eg
as e
t al
. (2
00
0)
Leu
cae
na
lan
ceo
lata
S. W
atso
nX
Nat
ive
Shru
bV
illeg
as e
t al
. (2
00
0)
Leu
cae
na
sp.
XN
ativ
eTr
ee
Ram
írez-
Arr
iag
a et
al. (
20
18)
Lon
ch
ocar
pu
s g
uat
em
alen
sis
Ben
th.
XFe
bru
ary-
May
Nat
ive
Tree
Vill
eg
as e
t al
. (2
00
0)
Lon
ch
ocar
pu
s sp
.X
Nat
ive
Tree
Ram
írez-
Arr
iag
a et
al. 2
018
)
Lysi
lom
a ac
apu
lcen
se (
Ku
nth
) B
en
th.
XX
Mar
ch
-May
Nat
ive
Tree
Vill
eg
as e
t al
. (2
00
0)
Mim
osa
alb
ida
Hu
mb
. & B
on
pl.
ex
Will
d.
XA
ug
ust
-No
vem
ber
Nat
ive
Shru
bV
illeg
as e
t al
. (2
00
0)
Mim
osa
pig
ra L
.X
Mar
ch
-Ju
lyN
ativ
eSh
rub
Vill
eg
as e
t al
. (2
00
0)
Mim
osa
pu
dic
a L.
XSe
pte
mb
er-
No
vem
ber
Nat
ive
Herb
aceo
us
Bo
net
y V
erg
ara
(20
16)
Mim
osa
scab
rella
Ben
th.
XD
ecem
ber-
Ja
nu
ary
Exo
ticSh
rub
Vill
eg
as e
t al
. (2
00
0)
Pis
cid
ia p
iscip
ula
(L.
) Sa
rg.
XX
May
-Ju
lyN
ativ
eTr
ee
Nie
mb
ro-R
ocas
et
al. (
20
10);
Can
to e
t al
. (2
017
);
Vill
eg
as e
t al
. (2
00
0)
Pith
ecello
biu
m d
ulc
e (
Ro
xb.)
Ben
th.
XX
No
vem
ber-
May
Nat
ive
Shru
bN
iem
bro
-Ro
cas
et
al. (
20
10);
Co
ntr
era
s-O
liva
et
al. (
20
18);
Vill
eg
as e
t al
. (2
00
0)
Pith
ecello
biu
m in
sig
ne M
ich
eli
ex
Do
nn
. Sm
.X
XJa
nu
ary-
Mar
ch
Nat
ive
Tree
Vill
eg
as e
t al
. (2
00
0)
Pro
sop
is ju
liflo
ra (
Sw.)
DC
.X
XJa
nu
ary-
Ap
ril
Nat
ive
Tree
Vill
eg
as e
t al
. (2
00
0)
Trifo
lium
rep
en
s L.
XX
All
year
Nat
ura
lized
Herb
aceo
us
Vill
eg
as e
t al
. (2
00
0)
Vac
helli
a p
rin
gle
i (R
ose
) Se
igle
r &
E
bin
ger
XX
Feb
ruar
y-m
ayN
ativ
eTr
ee
Vill
eg
as e
t al
. (2
00
0)
Verb
esi
na
turb
acen
sis
Ku
nth
XX
No
vem
ber-
Ja
nu
ary
Nat
ive
Shru
bV
illeg
as e
t al
. (2
00
0)
Vic
ia s
ativ
a L.
XJa
nu
ary-
Mar
ch
Nat
ive
Herb
aceo
us
Vill
eg
as e
t al
. (2
00
0)
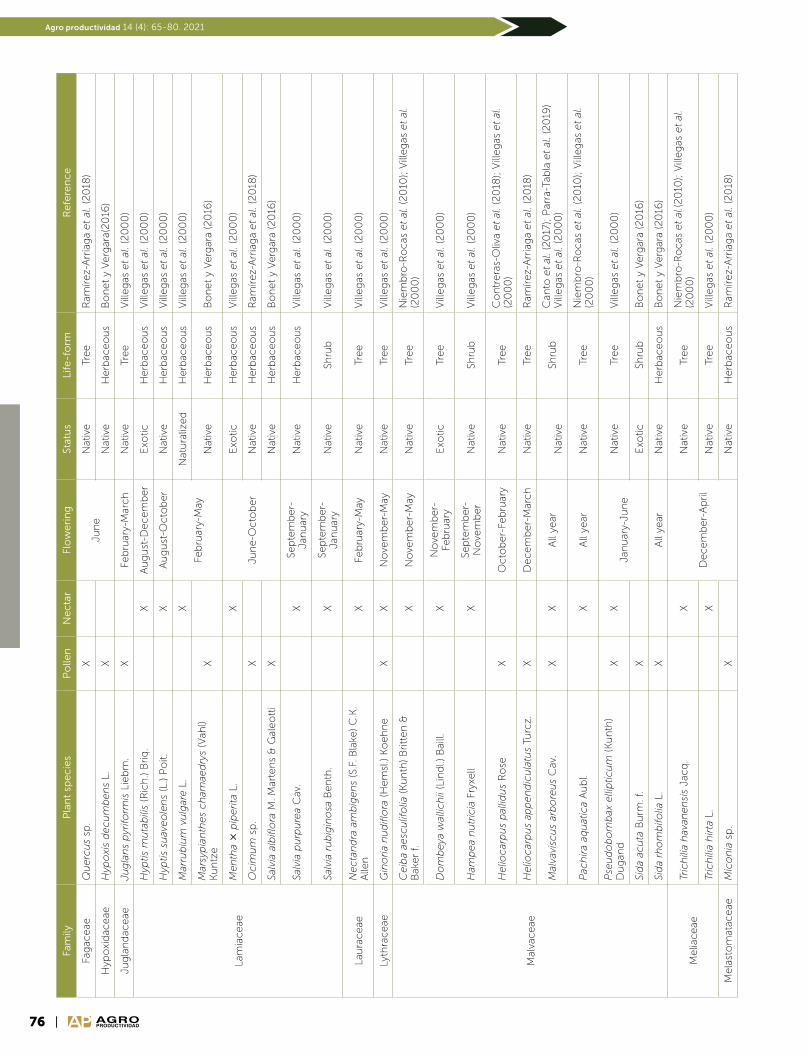
76
Agro productividad 14 (4): 65-80. 2021
AGROPRODUCTIVIDAD
Fam
ilyP
lan
t sp
ec
ies
Po
llen
Ne
cta
rFl
ow
eri
ng
Stat
us
Life
-fo
rmR
efe
ren
ce
Fag
aceae
Qu
erc
us
sp.
XJu
ne
Nat
ive
Tree
Ram
írez-
Arr
iag
a et
al. (
20
18)
Hyp
oxi
dac
eae
Hyp
oxi
s d
ecu
mb
en
s L.
XN
ativ
eH
erb
aceo
us
Bo
net
y V
erg
ara(
20
16)
Jug
lan
dac
eae
Jug
lan
s p
yrifo
rmis
Lie
bm
.X
Feb
ruar
y-M
arch
Nat
ive
Tree
Vill
eg
as e
t al
. (2
00
0)
Lam
iaceae
Hyp
tis m
uta
bili
s (R
ich
.) B
riq
.X
Au
gu
st-D
ecem
ber
Exo
ticH
erb
aceo
us
Vill
eg
as e
t al
. (2
00
0)
Hyp
tis s
uav
eo
len
s (L
.) P
oit.
XA
ug
ust
-Octo
ber
Nat
ive
Herb
aceo
us
Vill
eg
as e
t al
. (2
00
0)
Mar
rub
ium
vu
lgar
e L
.X
Feb
ruar
y-M
ay
Nat
ura
lized
Herb
aceo
us
Vill
eg
as e
t al
. (2
00
0)
Mar
syp
ian
thes
ch
amae
dry
s (V
ahl)
Ku
ntz
eX
Nat
ive
Herb
aceo
us
Bo
net
y V
erg
ara
(20
16)
Men
tha
p
iperita
L.
X
Jun
e-O
cto
ber
Exo
ticH
erb
aceo
us
Vill
eg
as e
t al
. (2
00
0)
Ocim
um
sp
.X
Nat
ive
Herb
aceo
us
Ram
írez-
Arr
iag
a et
al. (
20
18)
Salv
ia a
lbifl
ora
M. M
arte
ns
& G
aleo
tti
XN
ativ
eH
erb
aceo
us
Bo
net
y V
erg
ara
(20
16)
Salv
ia p
urp
ure
a C
av.
XSe
pte
mb
er-
Ja
nu
ary
Nat
ive
Herb
aceo
us
Vill
eg
as e
t al
. (2
00
0)
Salv
ia r
ub
igin
osa
Ben
th.
XSe
pte
mb
er-
Ja
nu
ary
Nat
ive
Shru
bV
illeg
as e
t al
. (2
00
0)
Lau
raceae
Necta
nd
ra a
mb
igen
s (S
.F. B
lake
) C
.K.
Alle
nX
Feb
ruar
y-M
ayN
ativ
eTr
ee
Vill
eg
as e
t al
. (2
00
0)
Lyth
raceae
Gin
oria
nu
difl
ora
(H
em
sl.)
Ko
eh
ne
XX
No
vem
ber-
May
Nat
ive
Tree
Vill
eg
as e
t al
. (2
00
0)
Mal
vaceae
Ceib
a ae
scu
lifo
lia (
Ku
nth
) B
ritt
en
&
Bak
er
f.X
No
vem
ber-
May
Nat
ive
Tree
Nie
mb
ro-R
ocas
et
al. (
20
10);
Vill
eg
as e
t al
. (2
00
0)
Do
mb
eya
wal
lich
ii (L
ind
l.) B
aill.
XN
ove
mb
er-
Feb
ruar
yE
xotic
Tree
Vill
eg
as e
t al
. (2
00
0)
Ham
pea
nu
tric
ia F
ryxe
llX
Sep
tem
ber-
No
vem
ber
Nat
ive
Shru
bV
illeg
as e
t al
. (2
00
0)
Helio
car
pu
s p
allid
us
Ro
seX
Octo
ber-
Feb
ruar
yN
ativ
eTr
ee
Co
ntr
era
s-O
liva
et
al. (
20
18);
Vill
eg
as e
t al
. (2
00
0)
Helio
car
pu
s ap
pen
dic
ula
tus
Turc
z.X
Decem
ber-
Mar
ch
Nat
ive
Tree
Ram
írez-
Arr
iag
a et
al. (
20
18)
Mal
vavi
scu
s ar
bo
reu
s C
av.
XX
All
year
Nat
ive
Shru
bC
anto
et
al. (
20
17);
Par
ra-T
abla
et
al. (
20
19)
Vill
eg
as e
t al
. (2
00
0)
Pac
hira
aqu
atic
a A
ub
l.X
All
year
Nat
ive
Tree
Nie
mb
ro-R
ocas
et
al. (
20
10);
Vill
eg
as e
t al
. (2
00
0)
Pse
ud
ob
om
bax
elli
ptic
um
(K
un
th)
Du
gan
dX
XJa
nu
ary-
Jun
eN
ativ
eTr
ee
Vill
eg
as e
t al
. (2
00
0)
Sid
a ac
uta
Bu
rm. f
.X
Exo
ticSh
rub
Bo
net
y V
erg
ara
(20
16)
Sid
a rh
om
bifo
lia L
.X
All
year
Nat
ive
Herb
aceo
us
Bo
net
y V
erg
ara
(20
16)
Melia
ceae
Tric
hili
a h
avan
en
sis
Jacq
.X
Decem
ber-
Ap
ril
Nat
ive
Tree
Nie
mb
ro-R
ocas
et
al.(2
010
); V
illeg
as e
t al
. (2
00
0)
Tric
hili
a h
irta
L.
XN
ativ
eTr
ee
Vill
eg
as e
t al
. (2
00
0)
Mela
sto
mat
aceae
Mic
on
ia s
p.
XN
ativ
eH
erb
aceo
us
Ram
írez-
Arr
iag
a et
al. (
20
18)
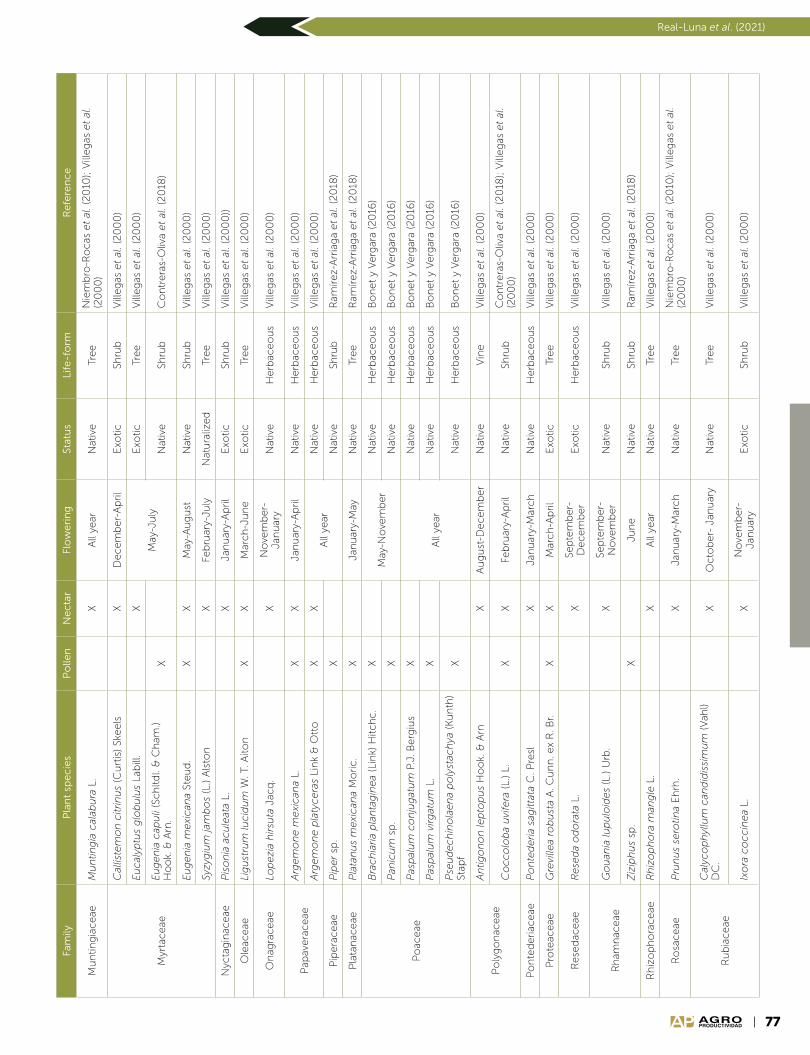
77
Real-Luna et al. (2021)
AGROPRODUCTIVIDAD
Fam
ilyP
lan
t sp
ec
ies
Po
llen
Ne
cta
rFl
ow
eri
ng
Stat
us
Life
-fo
rmR
efe
ren
ce
Mu
ntin
gia
ceae
Mu
ntin
gia
cal
abu
ra L
.X
All
year
Nat
ive
Tree
Nie
mb
ro-R
ocas
et
al. (
20
10);
Vill
eg
as e
t al
. (2
00
0)
Myr
taceae
Cal
liste
mo
n c
itrin
us
(Cu
rtis
) Sk
eels
XD
ecem
ber-
Ap
ril
Exo
ticSh
rub
Vill
eg
as e
t al
. (2
00
0)
Eu
cal
yptu
s g
lob
ulu
s La
bill
.X
May
-Ju
ly
Exo
ticTr
ee
Vill
eg
as e
t al
. (2
00
0)
Eu
gen
ia c
apu
li (S
ch
ltd
l. &
Ch
am.)
Ho
ok.
& A
rn.
XN
ativ
eSh
rub
Co
ntr
era
s-O
liva
et
al. (
20
18)
Eu
gen
ia m
exi
can
a St
eu
d.
XX
May
-Au
gu
stN
ativ
eSh
rub
Vill
eg
as e
t al
. (2
00
0)
Syzy
giu
m ja
mb
os
(L.)
Als
ton
XFe
bru
ary-
July
Nat
ura
lized
Tree
Vill
eg
as e
t al
. (2
00
0)
Nyc
tag
inac
eae
Pis
on
ia a
cu
leat
a L.
XJa
nu
ary-
Ap
ril
Exo
ticSh
rub
Vill
eg
as e
t al
. (2
00
0))
Ole
aceae
Lig
ust
rum
lucid
um
W. T
. Aito
nX
XM
arch
-Ju
ne
Exo
ticTr
ee
Vill
eg
as e
t al
. (2
00
0)
On
agra
ceae
Lop
ezi
a h
irsu
ta J
acq
.X
No
vem
ber-
Ja
nu
ary
Nat
ive
Herb
aceo
us
Vill
eg
as e
t al
. (2
00
0)
Pap
avera
ceae
Arg
em
on
e m
exi
can
a L.
XX
Jan
uar
y-A
pri
lN
ativ
eH
erb
aceo
us
Vill
eg
as e
t al
. (2
00
0)
Arg
em
on
e p
laty
cera
s Li
nk
& O
tto
X
XA
ll ye
arN
ativ
eH
erb
aceo
us
Vill
eg
as e
t al
. (2
00
0)
Pip
era
ceae
Pip
er
sp.
XN
ativ
eSh
rub
Ram
írez-
Arr
iag
a et
al. (
20
18)
Pla
tan
aceae
Pla
tan
us
mexi
can
a M
ori
c.
XJa
nu
ary-
May
Nat
ive
Tree
Ram
írez-
Arr
iag
a et
al. (
20
18)
Po
aceae
Bra
ch
iaria
pla
nta
gin
ea
(Lin
k) H
itch
c.
XM
ay-N
ove
mb
er
Nat
ive
Herb
aceo
us
Bo
net
y V
erg
ara
(20
16)
Pan
icu
m s
p.
XN
ativ
eH
erb
aceo
us
Bo
net
y V
erg
ara
(20
16)
Pas
pal
um
co
nju
gat
um
P.J
. Berg
ius
X
All
year
Nat
ive
Herb
aceo
us
Bo
net
y V
erg
ara
(20
16)
Pas
pal
um
virg
atu
m L
.X
Nat
ive
Herb
aceo
us
Bo
net
y V
erg
ara
(20
16)
Pse
ud
ech
ino
laen
a p
oly
stac
hya
(K
un
th)
Stap
fX
Nat
ive
Herb
aceo
us
Bo
net
y V
erg
ara
(20
16)
Po
lyg
on
aceae
An
tigo
no
n le
pto
pu
s H
oo
k. &
Arn
XA
ug
ust
-Decem
ber
Nat
ive
Vin
eV
illeg
as e
t al
. (2
00
0)
Co
cco
lob
a u
vife
ra (
L.)
L.X
XFe
bru
ary-
Ap
ril
Nat
ive
Shru
bC
on
trera
s-O
liva
et
al. (
20
18);
Vill
eg
as e
t al
. (2
00
0)
Po
nte
deri
aceae
Po
nte
deria
sag
ittat
a C
. Pre
slX
Jan
uar
y-M
arch
Nat
ive
Herb
aceo
us
Vill
eg
as e
t al
. (2
00
0)
Pro
teac
eae
Gre
ville
a ro
bu
sta
A. C
un
n. e
x R
. Br.
XX
Mar
ch
-Ap
ril
Exo
ticTr
ee
Vill
eg
as e
t al
. (2
00
0)
Rese
dac
eae
Rese
da
od
ora
ta L
.X
Sep
tem
ber-
Decem
ber
Exo
ticH
erb
aceo
us
Vill
eg
as e
t al
. (2
00
0)
Rh
amn
aceae
Go
uan
ia lu
pu
loid
es
(L.)
Urb
.X
Sep
tem
ber-
No
vem
ber
Nat
ive
Shru
bV
illeg
as e
t al
. (2
00
0)
Ziz
iph
us
sp.
XJu
ne
Nat
ive
Shru
bR
amírez-
Arr
iag
a et
al. (
20
18)
Rh
izo
ph
ora
ceae
Rh
izo
ph
ora
man
gle
L.
XA
ll ye
arN
ativ
eTr
ee
Vill
eg
as e
t al
. (2
00
0)
Ro
saceae
Pru
nu
s se
rotin
a E
hrh
.X
Jan
uar
y-M
arch
Nat
ive
Tree
Nie
mb
ro-R
ocas
et
al. (
20
10);
Vill
eg
as e
t al
. (2
00
0)
Ru
bia
ceae
Cal
yco
ph
yllu
m c
and
idis
sim
um
(V
ahl)
DC
.X
Octo
ber-
Jan
uar
y N
ativ
eTr
ee
Vill
eg
as e
t al
. (2
00
0)
Ixo
ra c
occin
ea
L.X
No
vem
ber-
Ja
nu
ary
Exo
ticSh
rub
Vill
eg
as e
t al
. (2
00
0)
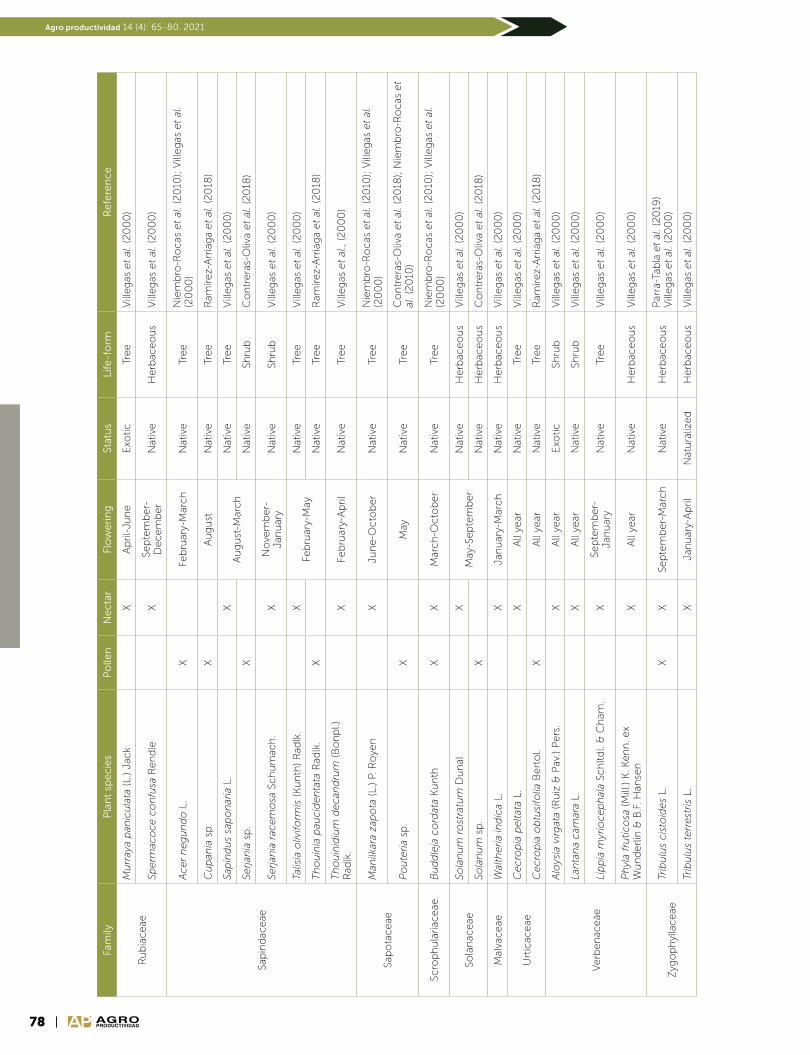
78
Agro productividad 14 (4): 65-80. 2021
AGROPRODUCTIVIDAD
Fam
ilyP
lan
t sp
ec
ies
Po
llen
Ne
cta
rFl
ow
eri
ng
Stat
us
Life
-fo
rmR
efe
ren
ce
Ru
bia
ceae
Mu
rray
a p
anic
ula
ta (
L.)
Jack
XA
pri
l-Ju
ne
Exo
ticTr
ee
Vill
eg
as e
t al
. (2
00
0)
Sperm
aco
ce c
on
fusa
Ren
dle
XSe
pte
mb
er-
Decem
ber
Nat
ive
Herb
aceo
us
Vill
eg
as e
t al
. (2
00
0)
Sap
ind
aceae
Acer
neg
un
do
L.
XFe
bru
ary-
Mar
ch
Nat
ive
Tree
Nie
mb
ro-R
ocas
et
al. (
20
10);
Vill
eg
as e
t al
. (2
00
0)
Cu
pan
ia s
p.
XA
ug
ust
Nat
ive
Tree
Ram
írez-
Arr
iag
a et
al. (
20
18)
Sap
ind
us
sap
on
aria
L.
XA
ug
ust
-Mar
ch
Nat
ive
Tree
Vill
eg
as e
t al
. (2
00
0)
Serjan
ia s
p.
XN
ativ
eSh
rub
Co
ntr
era
s-O
liva
et
al. (
20
18)
Serjan
ia r
acem
osa
Sch
um
ach
.X
No
vem
ber-
Ja
nu
ary
Nat
ive
Shru
bV
illeg
as e
t al
. (2
00
0)
Talis
ia o
livifo
rmis
(K
un
th)
Rad
lk.
XFe
bru
ary-
May
Nat
ive
Tree
Vill
eg
as e
t al
. (2
00
0)
Th
ou
inia
pau
cid
en
tata
Rad
lk.
XN
ativ
eTr
ee
Ram
írez-
Arr
iag
a et
al. (
20
18)
Th
ou
inid
ium
decan
dru
m (
Bo
np
l.)
Rad
lk.
XFe
bru
ary-
Ap
ril
Nat
ive
Tree
Vill
eg
as e
t al
., (2
00
0)
Sap
ota
ceae
Man
ilkar
a za
po
ta (
L.)
P. R
oye
nX
Jun
e-O
cto
ber
Nat
ive
Tree
Nie
mb
ro-R
ocas
et
al. (
20
10);
Vill
eg
as e
t al
. (2
00
0)
Po
ute
ria
sp.
XM
ayN
ativ
eTr
ee
Co
ntr
era
s-O
liva
et
al. (
20
18);
Nie
mb
ro-R
ocas
et
al. (
20
10)
Scro
ph
ula
riac
eae
Bu
dd
leja
co
rdat
a K
un
thX
XM
arch
-Octo
ber
Nat
ive
Tree
Nie
mb
ro-R
ocas
et
al. (
20
10);
Vill
eg
as e
t al
. (2
00
0)
Sola
nac
eae
Sola
nu
m r
ost
ratu
m D
un
alX
May
-Sep
tem
ber
Nat
ive
Herb
aceo
us
Vill
eg
as e
t al
. (2
00
0)
Sola
nu
m s
p.
XN
ativ
eH
erb
aceo
us
Co
ntr
era
s-O
liva
et
al. (
20
18)
Mal
vaceae
Wal
theria
ind
ica
L.X
Jan
uar
y-M
arch
Nat
ive
Herb
aceo
us
Vill
eg
as e
t al
. (2
00
0)
Urt
icac
eae
Cecro
pia
pelta
ta L
.X
All
year
Nat
ive
Tree
Vill
eg
as e
t al
. (2
00
0)
Cecro
pia
ob
tusi
folia
Bert
ol.
XA
ll ye
arN
ativ
eTr
ee
Ram
írez-
Arr
iag
a et
al. (
20
18)
Verb
en
aceae
Alo
ysia
virg
ata
(Ru
iz &
Pav
.) P
ers
.X
All
year
Exo
ticSh
rub
Vill
eg
as e
t al
. (2
00
0)
Lan
tan
a cam
ara
L.X
All
year
Nat
ive
Shru
bV
illeg
as e
t al
. (2
00
0)
Lip
pia
myr
iocep
hal
a Sc
hltd
l. &
Ch
am.
XSe
pte
mb
er-
Jan
uar
yN
ativ
eTr
ee
Vill
eg
as e
t al
. (2
00
0)
Ph
yla
fru
tico
sa (
Mill
.) K
. Ken
n. e
x W
un
derl
in &
B.F
. Han
sen
XA
ll ye
ar
Nat
ive
Herb
aceo
us
Vill
eg
as e
t al
. (2
00
0)
Zyg
op
hyl
laceae
Trib
ulu
s cis
toid
es
L.X
XSe
pte
mb
er-
Mar
ch
Nat
ive
Herb
aceo
us
Par
ra-T
abla
et
al. (
20
19)
Vill
eg
as e
t al
. (2
00
0)
Trib
ulu
s te
rrest
ris
L.X
Jan
uar
y-A
pri
lN
atu
raliz
ed
Herb
aceo
us
Vill
eg
as e
t al
. (2
00
0)

79
Real-Luna et al. (2021)
AGROPRODUCTIVIDAD
Ap
pen
dix
2. C
rop
s p
olli
nat
ed
by
be
es
in M
exi
co
.
Fam
ilyC
rop
Co
mm
on
nam
eP
olle
nN
ec
tar
Flo
we
rin
gSt
atu
sR
efe
ren
ce
An
acar
dia
ceae
Man
gife
ra in
dic
a L.
“man
go
”X
XN
ove
mb
er-
Mar
ch
Nat
ura
lized
Melé
nd
ez
et
al. (
20
18);
Vill
eg
as e
t al
. (2
00
0)
Spo
nd
ias
mo
mb
in L
.“jo
bo
”X
Mar
ch
-May
Nat
ive
Vill
eg
as e
t al
. (2
00
0)
Spo
nd
ias
pu
rpu
rea
L.“c
iru
elo
”X
XD
ecem
ber-
Mar
ch
Nat
ive
Vill
eg
as e
t al
. (2
00
0)
Are
cac
eae
Co
co
s n
ucife
ra L
.“c
oco
tero
”X
XA
ll ye
ar
Nat
ura
lized
Cas
tella
no
s-P
ote
ncia
no
et
al. (
20
12);
Melé
nd
ez
et
al.
(20
18);
Ram
írez-
Arr
iag
a et
al. (
20
18);
Vill
eg
as e
t al
. (2
00
0)
Ast
era
ceae
Helia
nth
us
ann
uu
s L.
“gir
aso
l”X
XM
arch
-Ju
lyN
ativ
eV
illeg
as e
t al
. (2
00
0)
Bra
ssic
aceae
Bra
ssic
a n
apu
s L.
“can
ola
”X
XSe
pte
mb
er-
Decem
ber
Exo
ticV
illeg
as e
t al
. (2
00
0)
Car
icac
eae
Car
ica
pap
aya
L.“p
apay
a”X
XA
ll ye
arN
ativ
eB
adill
o-M
on
tañ
o e
t al
. (2
019
)V
illeg
as e
t al
. (2
00
0)
Co
nvo
lvu
laceae
Ipo
mo
ea
bat
atas
(L.
) La
m.
“cam
ote
”X
XJu
ly-A
pri
lN
ativ
eV
illeg
as e
t al
. (2
00
0)
Cu
cu
rbita
ceae
Citr
ullu
s la
nat
us
(Th
un
b.)
Mat
sum
. & N
akai
“san
día
”X
All
year
Exo
ticV
illeg
as e
t al
. (2
00
0)
Cu
cu
rbita
ficifo
lia B
ou
ch
é“c
alab
aza”
XM
ay-A
ug
ust
Nat
ive
Vill
eg
as e
t al
. (2
00
0)
Cu
cu
rbita
max
ima
Du
ch
esn
e
“cal
abaz
a”X
XM
ay-A
ug
ust
Exo
ticV
illeg
as e
t al
. (2
00
0)
Cu
cu
mis
melo
L.
“meló
n”
X
Jan
uar
y-Ju
ne
Exo
ticV
illeg
as e
t al
. (2
00
0)
Cu
cu
rbita
mo
sch
ata
Du
ch
esn
e
“cal
abaz
a”X
Nat
ive
(elé
nd
ez
et
al. (
20
18)
Cu
cu
mis
sat
ivu
s L.
“pep
ino
”X
XJa
nu
ary-
Jun
eE
xotic
Vill
eg
as e
t al
. (2
00
0)
Sech
ium
ed
ule
(Ja
cq
.) Sw
.“c
hay
ote
”X
All
year
Nat
ive
Vill
eg
as e
t al
. (2
00
0)
Eb
en
aceae
Dio
spyr
os
dig
yna
Jacq
.“z
apo
te n
eg
ro”
XM
arch
-Ju
ne
Nat
ura
lized
Vill
eg
as e
t al
. (2
00
0)
Eu
ph
orb
iaceae
Heve
a b
rasi
lien
sis
(Will
d. e
x A
. Ju
ss.)
Mü
ll. A
rg.
“hu
le”
XFe
bru
ary-
Ap
ril
Exo
ticV
illeg
as e
t al
. (2
00
0)
Fab
aceae
Med
icag
o s
ativ
a L.
“alfa
lfa”
XA
ll ye
arE
xotic
Vill
eg
as e
t al
. (2
00
0)
Ph
aseo
lus
co
ccin
eu
s L.
“ayo
co
te”
“fri
jol c
olo
rad
o”
XSe
pte
mb
er-
Octo
ber
Nat
ive
Vill
eg
as e
t al
. (2
00
0)
Tam
arin
du
s in
dic
a L.
“tam
arin
do
”X
May
-No
vem
ber
Nat
ura
lized
Vill
eg
as e
t al
. (2
00
0)
Lau
raceae
Pers
ea
american
a M
ill.
“ag
uac
ate”
XFe
bru
ary-
May
Nat
ive
Melé
nd
ez
et
al. (
20
18);
Vill
eg
as e
t al
. (2
00
0)
Mal
pig
hia
ceae
Byr
son
ima
cra
ssifo
lia (L.
) K
un
th“n
anch
e”
XX
Mar
ch
-Ju
ne
Nat
ive
Vill
eg
as e
t al
. (2
00
0)
Mal
vaceae
Go
ssyp
ium
hirsu
tum
L.
“alg
od
ón
”X
XA
ug
ust
, Feb
ruar
y,
May
Nat
ive
Can
to e
t al
. (2
017
)
Mu
saceae
Mu
sa p
arad
isia
ca
L.“p
láta
no
”X
XA
ll ye
arN
atu
raliz
ed
Vill
eg
as e
t al
. (2
00
0)
Myr
taceae
Psi
diu
m g
uaj
ava
L.“g
uay
aba”
XX
Ap
ril-
Jun
eN
ativ
eV
illeg
as e
t al
. (2
00
0)
Po
aceae
Zea
may
s L.
“maí
z”X
XFe
bru
ary-
Mar
ch
,Ju
ly-A
ug
ust
Nat
ive
Vill
eg
as e
t al
. (2
00
0)
Pro
teac
eae
Mac
adam
ia in
teg
rifo
lia M
aid
en
&
Betc
he
“mac
adam
ia”
XJa
nu
ary-
Mar
ch
Exo
ticV
illeg
as e
t al
. (2
00
0)
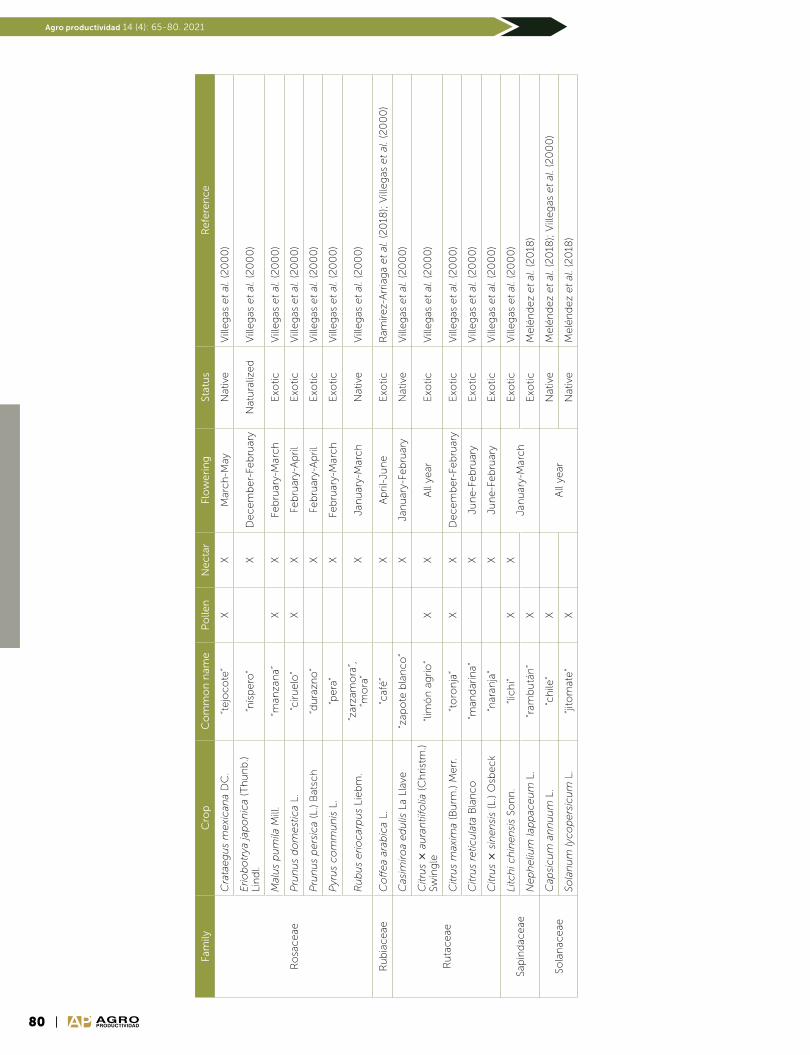
80
Agro productividad 14 (4): 65-80. 2021
AGROPRODUCTIVIDAD
Fam
ilyC
rop
Co
mm
on
nam
eP
olle
nN
ec
tar
Flo
we
rin
gSt
atu
sR
efe
ren
ce
Ro
saceae
Cra
taeg
us
mexi
can
a D
C.
“tejo
co
te”
XX
Mar
ch
-May
Nat
ive
Vill
eg
as e
t al
. (2
00
0)
Erio
bo
trya
jap
on
ica
(Th
un
b.)
Lin
dl.
“nís
pero
”X
Decem
ber-
Feb
ruar
yN
atu
raliz
ed
Vill
eg
as e
t al
. (2
00
0)
Mal
us
pu
mila
Mill
.“m
anza
na”
XX
Feb
ruar
y-M
arch
Exo
ticV
illeg
as e
t al
. (2
00
0)
Pru
nu
s d
om
est
ica
L.“c
iru
elo
”X
XFe
bru
ary-
Ap
ril
Exo
ticV
illeg
as e
t al
. (2
00
0)
Pru
nu
s p
ers
ica
(L.)
Bat
sch
“du
razn
o”
XFe
bru
ary-
Ap
ril
Exo
ticV
illeg
as e
t al
. (2
00
0)
Pyr
us
co
mm
un
is L
.“p
era
”X
Feb
ruar
y-M
arch
Exo
ticV
illeg
as e
t al
. (2
00
0)
Ru
bu
s erio
car
pu
s Li
eb
m.
“zar
zam
ora
”, “m
ora
”X
Jan
uar
y-M
arch
Nat
ive
Vill
eg
as e
t al
. (2
00
0)
Ru
bia
ceae
Co
ffea
arab
ica
L.
“caf
é”
XA
pri
l-Ju
ne
Exo
ticR
amírez-
Arr
iag
a et
al. (
20
18);
Vill
eg
as e
t al
. (2
00
0)
Ru
taceae
Cas
imiro
a ed
ulis
La
Llav
e“z
apo
te b
lan
co
”X
Jan
uar
y-Fe
bru
ary
Nat
ive
Vill
eg
as e
t al
. (2
00
0)
Citr
us
a
ura
ntii
folia
(C
hri
stm
.) Sw
ing
le“li
mó
n a
gri
o”
XX
All
year
E
xotic
Vill
eg
as e
t al
. (2
00
0)
Citr
us
max
ima
(Bu
rm.)
Merr
.“t
oro
nja
”X
XD
ecem
ber-
Feb
ruar
yE
xotic
Vill
eg
as e
t al
. (2
00
0)
Citr
us
retic
ula
ta B
lan
co
“man
dar
ina”
XJu
ne-F
eb
ruar
yE
xotic
Vill
eg
as e
t al
. (2
00
0)
Citr
us
s
inen
sis
(L.)
Osb
eck
“nar
anja
”X
Jun
e-F
eb
ruar
yE
xotic
Vill
eg
as e
t al
. (2
00
0)
Sap
ind
aceae
Litc
hi c
hin
en
sis
Son
n.
“lich
i”X
XJa
nu
ary-
Mar
ch
Exo
ticV
illeg
as e
t al
. (2
00
0)
Nep
heliu
m la
pp
aceu
m L
.“r
amb
utá
n”
XE
xotic
Melé
nd
ez
et
al. (
20
18)
Sola
nac
eae
Cap
sicu
m a
nn
uu
m L
.“c
hile
”X
All
year
N
ativ
eM
elé
nd
ez
et
al. (
20
18);
Vill
eg
as e
t al
. (2
00
0)
Sola
nu
m ly
co
pers
icu
m L
.“ji
tom
ate”
XN
ativ
eM
elé
nd
ez
et
al. (
20
18)
81AGROPRODUCTIVIDAD
https://doi.org/10.32854/agrop.v14i4.1864
Agroproductividad: Vol. 14, Núm. 4, abril. 2021. pp: 81-86.
Recibido: octubre, 2020. Aceptado: marzo, 2021.
Evaluation of Surgical Castration vs Immunocastration in Fattening Pigs
Pérez-Sato, Marcos1; Cruz-Cortés, Ariadna1; Castro-González, Numa Pompilio1; Valencia-Franco Edgar1;
Pérez-Martínez, Jennifer2; Escobar-Hernández, Ramiro1; Soní-Guillermo, Eutiquio1*
1Benemérita Universidad Autónoma de Puebla. Ingeniería Agronómica y Zootecnia. Reforma
165, Tlatlauquitepec, Puebla, México. 2Benemérita Universidad Autónoma de Puebla. Ingeniería
Agronómica y Zootecnia. Carretera Tecamachalco-Cañada Morelos km 7.5, El Salado,
Tecamachalco, Puebla, México.
*Corresponding author: [email protected]
ABSTRACTObjective: To determine the effect of surgical castration and immunocastration on productive parameters, carcass
quality, as well as the physicochemical characteristics of the meat of fattening pigs.
Design/Metodology/Aproach: Ten male pigs of the York/Pietrain/Landrace breed with a body weight of 255 kg were
used per treatment. They were housed in individual pens and fed diets according to their physiological state. The variables
evaluated were analyzed with a student’s t-test for independent samples.
Results: Results do not show differences (p0.05) in the productive variables, quality of the carcass or physicochemical
characteristics.
Study Limitations/Implications: The study did not consider qualitative variables such as flavor and smell of the treatments.
Findings/Conclusions: Immunocastration is an alternative to surgical castration since the quality of the carcass, the
productive variables and the physicochemical characteristics of the meat are not affected, and it favors animal welfare.
Keywords: surgical castration, immunocastration, carcass quality, physicochemical characteristics.
INTRODUCTION
The odor and taste of pork meat is caused primarily by the accumulation of
androstenone and skatole in the fatty tissue, which is a
significant quality problem of the carcass of complete males (Clarke et al., 2008). There are two castration alternatives
to raise fattening pigs and thus avoid meat contamination, which are surgical castration and immunocastration
(Batorek et al., 2012). Surgical castration of males before sexual maturity is carried out in many countries to avoid
81AGROPRODUCTIVIDAD
Imagen de Siggy Nowak en Pixabay
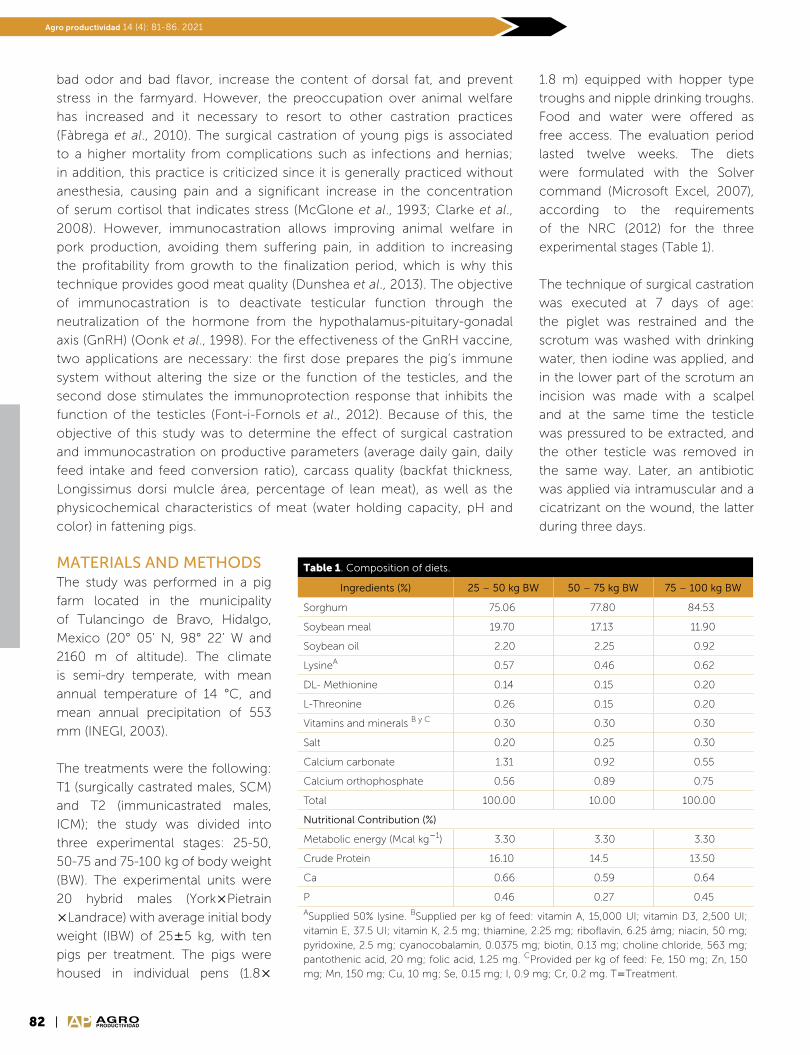
82
Biofertilizantes y producción de caña de azúcarAgro productividad 14 (4): 81-86. 2021
AGROPRODUCTIVIDAD
bad odor and bad flavor, increase the content of dorsal fat, and prevent
stress in the farmyard. However, the preoccupation over animal welfare
has increased and it necessary to resort to other castration practices
(Fàbrega et al., 2010). The surgical castration of young pigs is associated
to a higher mortality from complications such as infections and hernias;
in addition, this practice is criticized since it is generally practiced without
anesthesia, causing pain and a significant increase in the concentration
of serum cortisol that indicates stress (McGlone et al., 1993; Clarke et al.,
2008). However, immunocastration allows improving animal welfare in
pork production, avoiding them suffering pain, in addition to increasing
the profitability from growth to the finalization period, which is why this
technique provides good meat quality (Dunshea et al., 2013). The objective
of immunocastration is to deactivate testicular function through the
neutralization of the hormone from the hypothalamus-pituitary-gonadal
axis (GnRH) (Oonk et al., 1998). For the effectiveness of the GnRH vaccine,
two applications are necessary: the first dose prepares the pig’s immune
system without altering the size or the function of the testicles, and the
second dose stimulates the immunoprotection response that inhibits the
function of the testicles (Font-i-Fornols et al., 2012). Because of this, the
objective of this study was to determine the effect of surgical castration
and immunocastration on productive parameters (average daily gain, daily
feed intake and feed conversion ratio), carcass quality (backfat thickness,
Longissimus dorsi mulcle área, percentage of lean meat), as well as the
physicochemical characteristics of meat (water holding capacity, pH and
color) in fattening pigs.
MATERIALS AND METHODSThe study was performed in a pig
farm located in the municipality
of Tulancingo de Bravo, Hidalgo,
Mexico (20° 05’ N, 98° 22’ W and
2160 m of altitude). The climate
is semi-dry temperate, with mean
annual temperature of 14 °C, and
mean annual precipitation of 553
mm (INEGI, 2003).
The treatments were the following:
T1 (surgically castrated males, SCM)
and T2 (immunicastrated males,
ICM); the study was divided into
three experimental stages: 25-50,
50-75 and 75-100 kg of body weight
(BW). The experimental units were
20 hybrid males (YorkPietrain
Landrace) with average initial body
weight (IBW) of 255 kg, with ten
pigs per treatment. The pigs were
housed in individual pens (1.8
1.8 m) equipped with hopper type
troughs and nipple drinking troughs.
Food and water were offered as
free access. The evaluation period
lasted twelve weeks. The diets
were formulated with the Solver
command (Microsoft Excel, 2007),
according to the requirements
of the NRC (2012) for the three
experimental stages (Table 1).
The technique of surgical castration
was executed at 7 days of age:
the piglet was restrained and the
scrotum was washed with drinking
water, then iodine was applied, and
in the lower part of the scrotum an
incision was made with a scalpel
and at the same time the testicle
was pressured to be extracted, and
the other testicle was removed in
the same way. Later, an antibiotic
was applied via intramuscular and a
cicatrizant on the wound, the latter
during three days.
Table 1. Composition of diets.
Ingredients (%) 25 – 50 kg BW 50 – 75 kg BW 75 – 100 kg BW
Sorghum 75.06 77.80 84.53
Soybean meal 19.70 17.13 11.90
Soybean oil 2.20 2.25 0.92
LysineA 0.57 0.46 0.62
DL- Methionine 0.14 0.15 0.20
L-Threonine 0.26 0.15 0.20
Vitamins and minerals B y C 0.30 0.30 0.30
Salt 0.20 0.25 0.30
Calcium carbonate 1.31 0.92 0.55
Calcium orthophosphate 0.56 0.89 0.75
Total 100.00 10.00 100.00
Nutritional Contribution (%)
Metabolic energy (Mcal kg1) 3.30 3.30 3.30
Crude Protein 16.10 14.5 13.50
Ca 0.66 0.59 0.64
P 0.46 0.27 0.45
ASupplied 50% lysine. BSupplied per kg of feed: vitamin A, 15,000 UI; vitamin D3, 2,500 UI; vitamin E, 37.5 UI; vitamin K, 2.5 mg; thiamine, 2.25 mg; riboflavin, 6.25 ámg; niacin, 50 mg; pyridoxine, 2.5 mg; cyanocobalamin, 0.0375 mg; biotin, 0.13 mg; choline chloride, 563 mg; pantothenic acid, 20 mg; folic acid, 1.25 mg. CProvided per kg of feed: Fe, 150 mg; Zn, 150 mg; Mn, 150 mg; Cu, 10 mg; Se, 0.15 mg; I, 0.9 mg; Cr, 0.2 mg. TTreatment.

83
Pérez-Sato et al. (2021)
AGROPRODUCTIVIDAD
For immunocastration, two doses of the Improvac®
vaccine by Zoetis of 2 mL were applied via subcutaneous
at the neck’s base, immediately behind the right ear.
This contains analogous protein conjugate from the
gonadotropin liberation factor, the first at ten weeks of
age and the second four weeks after the first dose.
Productive Variables: The variables evaluated in each
stage were: daily weight gain (DWG); average daily feed
intake (ADFI); feed conversión ratio (FCR). These variables
were measured weekly.
Characteristics of the carcass: Backfat thickness (BT) and
Longissimus dorsi muscle area (LMA) were measured at
the beginning of the experiment and later at 50, 75 and
100 kg of BW. Ultrasound equipment was used in real
time (Landwind CU30VET, Shenzhen, China), performing
the measurement on the loin at the height of the tenth
rib. Lean meat percentage (%LM) was calculated with
these data and those of Initial body weight (IBW) and final
body weight (FBW), using the equation from the National
Pork Producers Council (1991).
Physicochemical characteristics of the meat: These
characteristics were evaluated at the end of the third
experimental stage. When the pigs reached 100 kg of BW,
five animals were slaughtered per treatment and samples
were taken from the pigs’ lumbar area to determine:
pH, color, and the water holding capacity (WHC). The
slaughter was performed in the farm complying with
the Official Mexican Norm NOM-033-SAG/ZOO-2014
(SEGOB, 2015).
The pH and the color were measured in the loin
muscle 24 h post mortem. The pH was measured with
a potentiometer (model pH1100), according to the
measurement of pH in meat homogenates (Braña et al.,
2011). The color measurements were performed with the
help of a colorimeter (Hunter Lab, Chroma meter CR-
410, Konica Milolta Sesning, Inc., Japan) following the
scale of the International Commission on Illumination
(CIE) L*a*b*, where (L*) luminosity, (a*) red-green
index, and (b*) yellow-blue.
The WHC was determined in the samples according to
the method proposed by Guerrero et al. (2002) at 24 h
post mortem: 5 g of finely chopped meat were used,
which were placed in tubes for centrifuge with 8 mL of
0.6 M sodium chloride solution. Later, they were placed
in ice during 30 min, stirred in a vortex during 1 min, and
centrifuged for 15 min at 10,000 rpm. The supernatant
was collected by decanting and measured in a test tube.
The retained water volume is reported as the amount of
water retained in 100 g of meat.
Statistical analysis: The variables evaluated were
analyzed with a student’s t- test for independent samples,
which compares the means of two populations, with
two treatments of 10 repetitions each, a degree of
confidence of 95%, and 0.05 degree of error, using the
Statistical Analysis System software (SAS, 2010).
RESULTS AND DISCUSSIONProductive Variables and Carcass Quality
The productive variables DWG, ADFI and FCR in pigs of
both treatments in the three stages evaluated were similar
(Tables 2, 3 and 4) since they do not present differences
(P0.05). These results differ from those of other studies,
which reported that the best productive parameters
(DWG and FCR) were for the ICM in comparison to those
of SCM in animals of 71-115 kg BW (Fábrega et al., 2010;
Fernandes et al., 2017; Grela et al., 2020).
Poulsen Nautrup et al. (2018) performed a meta-analysis
of 78 studies where different parameters of SCM and
ICM were compared and they found that the ICM had an
increase in DWG (32.54 g day1) compared to the SCM;
the FCR was lower during the entire period in the ICM,
which resulted in 0.23 kg of ADFI less than kg of livestock
weight; it was also found that the BW was approximately
2 kg higher in the MCI compared to the SCM.
However, in this study despite not showing differences
(p0.05), the ICM had a lower DWG and higher index of
FCR in the first period of evaluation (Table 2) and a better
response in the productive characteristics compared
with the SCM, in the stages of 50-75 kg and 75-100 kg
(Table 3 and 4). The variation in the results from the
different studies can be because of the age at which
castration is done, since it can affect the growth rhythm
of the animals and the higher growth of the muscular
tissue as it approaches puberty (Quiles, 2005).
On the contrary, Morales et al. (2013) found that the
ICM had a lower DWG compared to the SCM, and at the
same time the ICM had a lower CAL (P0.001) than the
SCM with 2.33 and 2.77 kg day1, respectively. Fàbrega
et al. (2010) mention that this could be justified due to
the stress that pigs suffer when being injected, and to an
increase in body temperature.
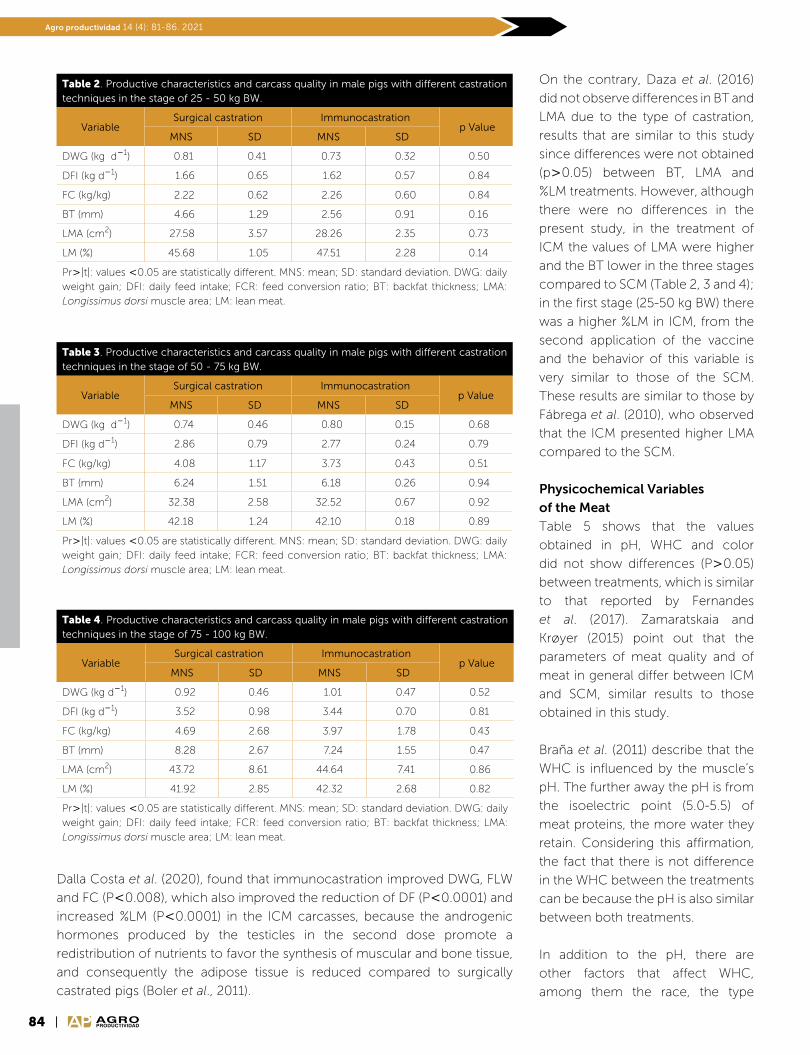
84
Biofertilizantes y producción de caña de azúcarAgro productividad 14 (4): 81-86. 2021
AGROPRODUCTIVIDAD
Table 2. Productive characteristics and carcass quality in male pigs with different castration techniques in the stage of 25 - 50 kg BW.
VariableSurgical castration Immunocastration
p ValueMNS SD MNS SD
DWG (kg d1) 0.81 0.41 0.73 0.32 0.50
DFI (kg d1) 1.66 0.65 1.62 0.57 0.84
FC (kg/kg) 2.22 0.62 2.26 0.60 0.84
BT (mm) 4.66 1.29 2.56 0.91 0.16
LMA (cm2) 27.58 3.57 28.26 2.35 0.73
LM (%) 45.68 1.05 47.51 2.28 0.14
Pr|t|: values 0.05 are statistically different. MNS: mean; SD: standard deviation. DWG: daily weight gain; DFI: daily feed intake; FCR: feed conversion ratio; BT: backfat thickness; LMA: Longissimus dorsi muscle area; LM: lean meat.
Table 3. Productive characteristics and carcass quality in male pigs with different castration techniques in the stage of 50 - 75 kg BW.
VariableSurgical castration Immunocastration
p ValueMNS SD MNS SD
DWG (kg d1) 0.74 0.46 0.80 0.15 0.68
DFI (kg d1) 2.86 0.79 2.77 0.24 0.79
FC (kg/kg) 4.08 1.17 3.73 0.43 0.51
BT (mm) 6.24 1.51 6.18 0.26 0.94
LMA (cm2) 32.38 2.58 32.52 0.67 0.92
LM (%) 42.18 1.24 42.10 0.18 0.89
Pr|t|: values 0.05 are statistically different. MNS: mean; SD: standard deviation. DWG: daily weight gain; DFI: daily feed intake; FCR: feed conversion ratio; BT: backfat thickness; LMA: Longissimus dorsi muscle area; LM: lean meat.
Table 4. Productive characteristics and carcass quality in male pigs with different castration techniques in the stage of 75 - 100 kg BW.
VariableSurgical castration Immunocastration
p ValueMNS SD MNS SD
DWG (kg d1) 0.92 0.46 1.01 0.47 0.52
DFI (kg d1) 3.52 0.98 3.44 0.70 0.81
FC (kg/kg) 4.69 2.68 3.97 1.78 0.43
BT (mm) 8.28 2.67 7.24 1.55 0.47
LMA (cm2) 43.72 8.61 44.64 7.41 0.86
LM (%) 41.92 2.85 42.32 2.68 0.82
Pr|t|: values 0.05 are statistically different. MNS: mean; SD: standard deviation. DWG: daily weight gain; DFI: daily feed intake; FCR: feed conversion ratio; BT: backfat thickness; LMA: Longissimus dorsi muscle area; LM: lean meat.
Dalla Costa et al. (2020), found that immunocastration improved DWG, FLW
and FC (P0.008), which also improved the reduction of DF (P0.0001) and
increased %LM (P0.0001) in the ICM carcasses, because the androgenic
hormones produced by the testicles in the second dose promote a
redistribution of nutrients to favor the synthesis of muscular and bone tissue,
and consequently the adipose tissue is reduced compared to surgically
castrated pigs (Boler et al., 2011).
On the contrary, Daza et al. (2016)
did not observe differences in BT and
LMA due to the type of castration,
results that are similar to this study
since differences were not obtained
(p0.05) between BT, LMA and
%LM treatments. However, although
there were no differences in the
present study, in the treatment of
ICM the values of LMA were higher
and the BT lower in the three stages
compared to SCM (Table 2, 3 and 4);
in the first stage (25-50 kg BW) there
was a higher %LM in ICM, from the
second application of the vaccine
and the behavior of this variable is
very similar to those of the SCM.
These results are similar to those by
Fábrega et al. (2010), who observed
that the ICM presented higher LMA
compared to the SCM.
Physicochemical Variables
of the Meat
Table 5 shows that the values
obtained in pH, WHC and color
did not show differences (P0.05)
between treatments, which is similar
to that reported by Fernandes
et al. (2017). Zamaratskaia and
Krøyer (2015) point out that the
parameters of meat quality and of
meat in general differ between ICM
and SCM, similar results to those
obtained in this study.
Braña et al. (2011) describe that the
WHC is influenced by the muscle’s
pH. The further away the pH is from
the isoelectric point (5.0-5.5) of
meat proteins, the more water they
retain. Considering this affirmation,
the fact that there is not difference
in the WHC between the treatments
can be because the pH is also similar
between both treatments.
In addition to the pH, there are
other factors that affect WHC,
among them the race, the type

85
Pérez-Sato et al. (2021)
AGROPRODUCTIVIDAD
of fiber, the oxidative stability of
their membranes, the maturation
process, and if the case may be, the
system used to freeze and thaw the
meats (Braña et al., 2011).
CONCLUSIONSImmunocastration does not
affect the productive parameters,
carcass quality, or physicochemical
characteristics of the pork meat
compared with surgical castration,
which is why the first is an
alternative to surgical castration,
since this technique produces less stress in the pig and
is more in accordance to animal welfare, in addition to
immunocastration demanding less time invested.
REFERENCESBatorek, N., Škrlep, M., Prunier, A., Louveau, I., Noblet, J., Bonneau,
M., & Čandek-Potokar, M. (2012). Effect of feed restriction
on hormones, performance, carcass traits, and meat quality
in immunocastrated pigs. Jounal of Animal Science, 90(12),
4593-4603. https://doi.org/ 10.2527/jas.2012-5330.
Boler, D.D., Kutzler, L.W., Meeuwse, D.M., King, V.L., Campion, D.R.,
McKeith, F.K., & Killefer, J. (2011). Effects of increasing lysine
on carcass composition and cutting yields of immunologically
castrated male pigs. Journal of Animal Sicence, 89(7), 2189-
2199. DOI: 10.2527/jas.2010-3640
Braña, V.D., Ramírez, R. E., Rubio, L.M.S., Sánchez, E.A., Torrescano,
U.A., Arenas, M. M.L., Partida, de la P., J.A., Ponce, A.E. y Ríos,
R.F.G. (2011). Manual de Análisis de Calidad en Muestras de
Carne. Centro Nacional de Investigación Disciplinaria en
Fisiología y Mejoramiento Animal. 91 p.
Clarke, I., Wlaker, J., Hennessy, D., Kreeger J., Nappier, J., & Crane,
J. (2008). Inherent food safety of a sinthetic gonadotropin-
releasing factor (GnRF) vaccine for the control of boar taint in
entire male pigs. International Journal of Applied Research in
Veterinary Medicine, 6(1), 7-14.
Claus, R., Lacorn, M., Danowski, K., Pearce, M.C., & Bauer, A. (2007).
Short-term endocrine and metabolic reactions before an after
second immunization against GnRH in boars. Vaccine, (25),
489-4696.
Dalla Costa O.A., Tavernari, F.C., Lopes, L.S., Dalla Costa, F.A.,
Feddern, V. & De Lima G. J.MM. (2020). Performance carcass
and meat quality of pigs submitted to immunocastration and
different feedeng programs. Research in Veterinary Science,
131, 137-145.
Daza, A., Latorre, M.A., Olivares, A., & López B.C.J. (2016). The effects of
male and female immunocastration on growth performances
and carcass and meat quality of pigs intended for dry-cured ham
production: A preliminary study. Livestock Sience, 190, 20-26.
Dunshea, F.R., Allison, J.R.D., Bertram, M., Boler, D.D., Brossard, L.,
Campbell, R., Crane, J.P., Hennessy, D.P., Huber, L., De Lange,
C., Ferguson, N., Matzat, P., Mckeith, F., Moraes, P.J.U., Mullan,
B.P., Noblet, J., Quiniou, N., & Tokach, M. (2013). The effect of
immunization against GnRF on nutrient requirements of male
pigs: A review. Animal, 7, 1769-1778.
Fàbrega, E., Velarde, A., Cros, J., Gispert, M., Suárez, P., Tibau, Jb, &
Soler, J. (2010). Effect of vaccination against gonadotrophin-
releasing hormone, using Improvac®, on growth performance,
body composition, behaviour and acute phase proteins.
Livestock Science, 132, 53-59.
Fernandes, A.R., de Pena, M.S., do Carmo, M.A., Coutinho, G.A.,
& Benevenuto, A.A., Jr. (2017). Performance, carcass
characteristics and meat quality of pigs under surgical or
immunological castration. Revista Brasileira de Saude e
Producao Animal, 18(2): 303-312.
Grela, E. R., Świątkiewicz, M., Kowalczuk, V.E., Florekc, M., Kosior
K.U., & Skałeckic, P. (2020). An attempt of implementation
of immunocastration in swine production–impact on
meat physicochemical quality and boar taint compound
concentration in the meat of two native pig breeds. Livestock
Science, 232, 103905. DOI:10.1016/j.livsci.2019.103905.
Guerreo, L.I., Pérez, C. M. L. y Ponce, A. E. (2002), Curso práctico de
tecnología de carnes y pescado. Universidad Metropolitana,
Unidad Iztapalapa. D.F. México.
Instituto Nacional de Estadística, Geografía e Informática (INEGI).
1993. Aspectos Geográficos. In: Tulancingo de Bravo Estado
de Hidalgo Cuaderno Estadístico Municipal. INEGI. México. pp:
3-5.
McGlone, J.J., Nicholson, R.I., Hellman, J.M., & Herzog, D.N. (1993). The
development of pain in young pigs associated with castration
and attempts to prevent castration-induced behavioral
changes. Journal Animal Science, 71, 1441-1446.
Morales, J.I., Serrano, M.P., Cámara, L., Berrocoso, J.D., López, J.P.,
& Mateos, G.G. (2013). Growth performance and carcass
quality of immunocastrated and surgically castrated pigs from
crossbreds from Duroc and Pietrain sires. Journal of Animal
Science, 91(8), 3955-3964.
National Pork Producers Council (NPPC). 1991. Procedures to evaluate
market hogs. National Pork Producers Council. Des Moines.
IA, USA. p: 16.
National Research Council (NRC). (2012). Nutrient requirements tables
and feed ingredient composition. Nutrient Requirements of
swine 11th. National Academy Press, Washintong, D.C. pp:
208-239.
Table 5. Physico-chemical characteristics of loin meat in male pigs with different castration techniques.
VariableSurgical castration Immunocastration
p ValueMNS SD MNS SD
pH 5.28 0.30 5.15 0.27 0.19
WHC (ml) 14.0 8.55 11.40 4.72 0.24
Color:
L* 45.97 3.91 43.96 2.41 0.05
a* 6.12 2.18 6.11 1.61 0.99
b* 6.59 1.71 6.05 1.41 0.27
Pr|t|: valores 0.05 existe diferencia significativa, MNS: mean; SD: standard deviation, WHC: water holding capacity, Color: CIEL*a*b*, L* scale: brightness a*: red-green index b*: yellow-blue index.
86
Biofertilizantes y producción de caña de azúcarAgro productividad 14 (4): 81-86. 2021
AGROPRODUCTIVIDAD
Oonk, H. B., Turkstra, J.A., Shcaaper, W.M.M, Erkens, J. H.F., Schuitermaker-de Weerd, M.H., van
Nes, A., Verheijden, J.H.M., & Meloen, R.H. (1998). New GnRH-like peptide construct to
optimize efficient immunocastration of male pigs by immunoneutralization of GnRH.
Vaccine, 16, 1074-1082.
Poulsen Nautrup, B., Van Vlaenderen, I., Aldaz, A., & Mah C.K. (2018). The effect of immunization
against gonadotropin-releasing factor on growth performance, carcass characteristics
and boar taint relevant to pig producers and the pork packing industry: A meta-analysis.
Research in Veterinary Science, 119, 182-195.
Quiles, A. 2005. Castración de lechones: Ventajas e inconvenientes. Revista Cría y Salud, 24,
54-62.
Runier, A., Mounier, A.M., & Hay, M. (2005). Effects of castration, tooth resection, or tail docking
on plasma metabolites and stress hormones in young pigs. Journal of Animal Science,
83,216-222.
Secretaría de Gobernación (SEGOB). (2015). Diario Oficial de la Federación: Norma Oficial
Mexicana NOM-033-SAG/ZOO-2014, Métodos para dar muerte a los animales
domésticos y silvestres.
Statistical Analysis System (SAS). (2010). The SAS system for Windows V8. SAS 9.3. Institute, Cary,
N.C, USA.
Zamaratskaia, G., & Krøyer, R. G. (2015). Immunocastration of male pigs-situation today. Procedia
Food Sience, (5) 324-327.
AGROPRODUCTIVIDAD

87AGROPRODUCTIVIDAD
Pre-Weaning Growth of Criollo Tropical Milking Calves fed with Milk from Silvopastoral Systems
Becerril-Pérez, Carlos M.1; Sánchez-Gómez, Adrián1; Morales-Trejo, Fredy1;
Vargas-Romero, Juan M.2; Platas-Rosado, Diego E.1; Rosendo-Ponce, Adalberto1*
1Colegio de Postgraduados, Veracruz Campus. Manlio Fabio Altamirano, Veracruz, Mexico. 2Universidad Autónoma Metropolitana, Iztapalapa Unit. Iztapalapa, Mexico City, Mexico.
*Corresponding author: [email protected]
ABSTRACTObjective: Tropical Milking Calf (LT) growth and milk consumption and chemical composition were analyzed in two
shepherding systems.
Methodology: 26 LT cows were used in rotational shepherding in monoculture (PRM) and intensive silvopastoral system
(SSPi). Cows were milked by hand once per day in the morning with the presence of the calf, which consumed milk from
one nipple. Live weight (PV), daily weight gain (GDP), milk consumption (CL) by the calf and the chemical composition of
the milk were studied.
Results: PV was greater at 198 days in SSPi (p0.05) with 142.63.31 kg, and one GDP that outweighed the PRM (p0.05)
in 80 g per day1. There were no differences in CL (p0.05). Non-fatty solids, protein, lactose and total solids were greater
(p0.05) for SSPi with 8.10.07, 3.00.02, 4.50.04 and 12.10.21 %, respectively; although fat was similar (3.7 and 3.3
%, p0.05) in both systems.
Implication: The chemical composition of milk should be assessed from the nutritional perspective for the calf and the
more appropriate techniques for its measurement should be implemented.
Conclusions: PV and GDP were greater in SSPi than in PRM due to the chemical composition and not the amount of
ingested milk. The chemical composition of milk affected the pre-weaning growth of calves. The tropical milking race and
SSPi are an alternative for tropical livestock raising in warm weathers.
Keywords: warm weathers, livestock raising, river tamarind, gene resources, agroecology systems.
INTRODUCTION
Milk production systems in Mexican warm weather intertropical zones supply
25% of domestic production (Orantes-Zebadúa et al., 2014) while
boosting local economy; their products are marketed locally and represent income for families. Nevertheless, the
seasonality of the rain period, the use of technology, managerial abilities and local traditions affect their productivity
https://doi.org/10.32854/agrop.v14i4.2013
Agroproductividad: Vol. 14, Núm. 4, abril. 2021. pp: 87-92.
Recibido: noviembre, 2020. Aceptado: febrero, 2021.
87AGROPRODUCTIVIDAD
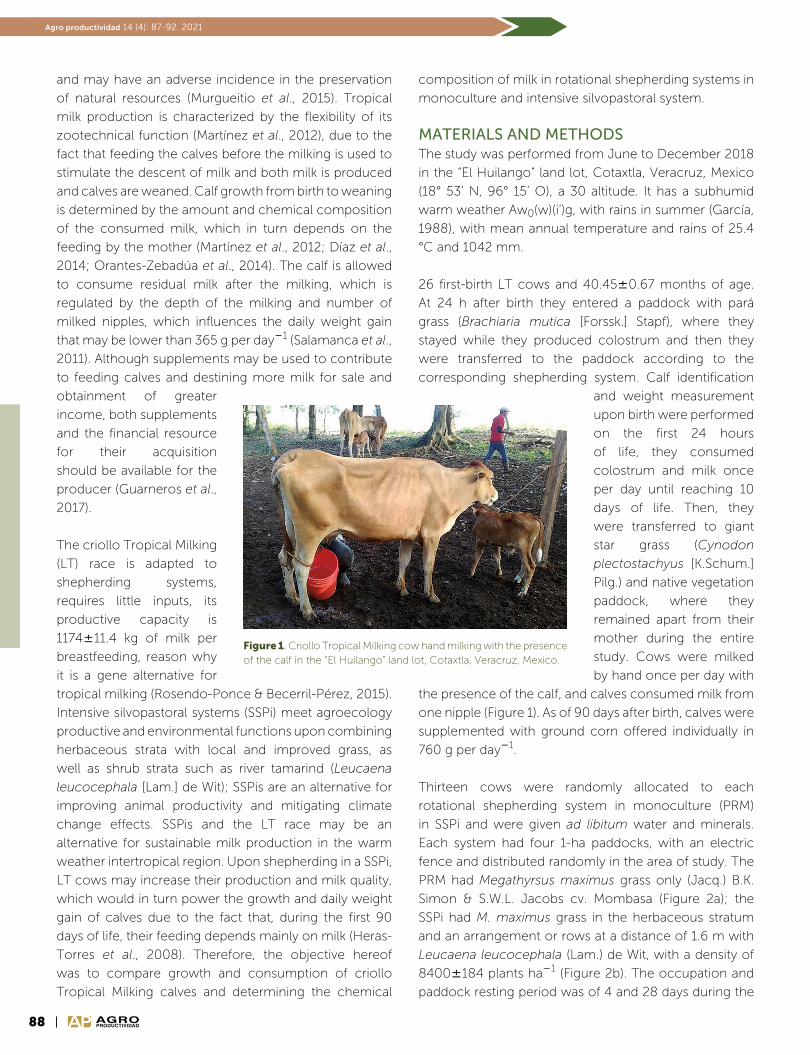
88
Biofertilizantes y producción de caña de azúcarAgro productividad 14 (4): 87-92. 2021
AGROPRODUCTIVIDAD
and may have an adverse incidence in the preservation
of natural resources (Murgueitio et al., 2015). Tropical
milk production is characterized by the flexibility of its
zootechnical function (Martínez et al., 2012), due to the
fact that feeding the calves before the milking is used to
stimulate the descent of milk and both milk is produced
and calves are weaned. Calf growth from birth to weaning
is determined by the amount and chemical composition
of the consumed milk, which in turn depends on the
feeding by the mother (Martínez et al., 2012; Díaz et al.,
2014; Orantes-Zebadúa et al., 2014). The calf is allowed
to consume residual milk after the milking, which is
regulated by the depth of the milking and number of
milked nipples, which influences the daily weight gain
that may be lower than 365 g per day1 (Salamanca et al.,
2011). Although supplements may be used to contribute
to feeding calves and destining more milk for sale and
obtainment of greater
income, both supplements
and the financial resource
for their acquisition
should be available for the
producer (Guarneros et al.,
2017).
The criollo Tropical Milking
(LT) race is adapted to
shepherding systems,
requires little inputs, its
productive capacity is
117411.4 kg of milk per
breastfeeding, reason why
it is a gene alternative for
tropical milking (Rosendo-Ponce & Becerril-Pérez, 2015).
Intensive silvopastoral systems (SSPi) meet agroecology
productive and environmental functions upon combining
herbaceous strata with local and improved grass, as
well as shrub strata such as river tamarind (Leucaena
leucocephala [Lam.] de Wit); SSPis are an alternative for
improving animal productivity and mitigating climate
change effects. SSPis and the LT race may be an
alternative for sustainable milk production in the warm
weather intertropical region. Upon shepherding in a SSPi,
LT cows may increase their production and milk quality,
which would in turn power the growth and daily weight
gain of calves due to the fact that, during the first 90
days of life, their feeding depends mainly on milk (Heras-
Torres et al., 2008). Therefore, the objective hereof
was to compare growth and consumption of criollo
Tropical Milking calves and determining the chemical
composition of milk in rotational shepherding systems in
monoculture and intensive silvopastoral system.
MATERIALS AND METHODSThe study was performed from June to December 2018
in the “El Huilango” land lot, Cotaxtla, Veracruz, Mexico
(18° 53’ N, 96° 15’ O), a 30 altitude. It has a subhumid
warm weather Aw0(w)(i’)g, with rains in summer (García,
1988), with mean annual temperature and rains of 25.4
°C and 1042 mm.
26 first-birth LT cows and 40.450.67 months of age.
At 24 h after birth they entered a paddock with pará
grass (Brachiaria mutica [Forssk.] Stapf), where they
stayed while they produced colostrum and then they
were transferred to the paddock according to the
corresponding shepherding system. Calf identification
and weight measurement
upon birth were performed
on the first 24 hours
of life, they consumed
colostrum and milk once
per day until reaching 10
days of life. Then, they
were transferred to giant
star grass (Cynodon
plectostachyus [K.Schum.]
Pilg.) and native vegetation
paddock, where they
remained apart from their
mother during the entire
study. Cows were milked
by hand once per day with
the presence of the calf, and calves consumed milk from
one nipple (Figure 1). As of 90 days after birth, calves were
supplemented with ground corn offered individually in
760 g per day1.
Thirteen cows were randomly allocated to each
rotational shepherding system in monoculture (PRM)
in SSPi and were given ad libitum water and minerals.
Each system had four 1-ha paddocks, with an electric
fence and distributed randomly in the area of study. The
PRM had Megathyrsus maximus grass only (Jacq.) B.K.
Simon & S.W.L. Jacobs cv. Mombasa (Figure 2a); the
SSPi had M. maximus grass in the herbaceous stratum
and an arrangement or rows at a distance of 1.6 m with
Leucaena leucocephala (Lam.) de Wit, with a density of
8400184 plants ha1 (Figure 2b). The occupation and
paddock resting period was of 4 and 28 days during the
Figure 1. Criollo Tropical Milking cow hand milking with the presence of the calf in the “El Huilango” land lot, Cotaxtla, Veracruz, Mexico.
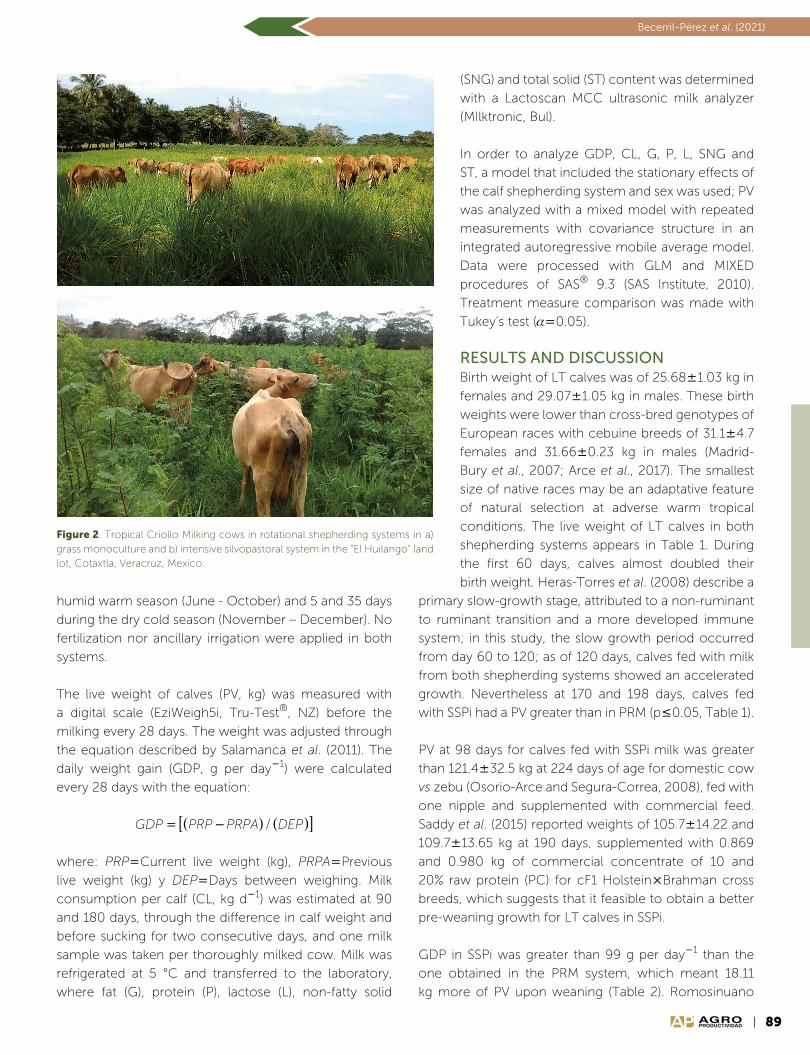
89
Becerril-Pérez et al. (2021)
AGROPRODUCTIVIDAD
humid warm season (June - October) and 5 and 35 days
during the dry cold season (November – December). No
fertilization nor ancillary irrigation were applied in both
systems.
The live weight of calves (PV, kg) was measured with
a digital scale (EziWeigh5i, Tru-Test®, NZ) before the
milking every 28 days. The weight was adjusted through
the equation described by Salamanca et al. (2011). The
daily weight gain (GDP, g per day1) were calculated
every 28 days with the equation:
GDP PRP PRPA DEP= −( ) ( )[ ]/
where: PRPCurrent live weight (kg), PRPAPrevious
live weight (kg) y DEPDays between weighing. Milk
consumption per calf (CL, kg d1) was estimated at 90
and 180 days, through the difference in calf weight and
before sucking for two consecutive days, and one milk
sample was taken per thoroughly milked cow. Milk was
refrigerated at 5 °C and transferred to the laboratory,
where fat (G), protein (P), lactose (L), non-fatty solid
(SNG) and total solid (ST) content was determined
with a Lactoscan MCC ultrasonic milk analyzer
(MIlktronic, Bul).
In order to analyze GDP, CL, G, P, L, SNG and
ST, a model that included the stationary effects of
the calf shepherding system and sex was used; PV
was analyzed with a mixed model with repeated
measurements with covariance structure in an
integrated autoregressive mobile average model.
Data were processed with GLM and MIXED
procedures of SAS® 9.3 (SAS Institute, 2010).
Treatment measure comparison was made with
Tukey’s test (0.05).
RESULTS AND DISCUSSIONBirth weight of LT calves was of 25.681.03 kg in
females and 29.071.05 kg in males. These birth
weights were lower than cross-bred genotypes of
European races with cebuine breeds of 31.14.7
females and 31.660.23 kg in males (Madrid-
Bury et al., 2007; Arce et al., 2017). The smallest
size of native races may be an adaptative feature
of natural selection at adverse warm tropical
conditions. The live weight of LT calves in both
shepherding systems appears in Table 1. During
the first 60 days, calves almost doubled their
birth weight. Heras-Torres et al. (2008) describe a
primary slow-growth stage, attributed to a non-ruminant
to ruminant transition and a more developed immune
system; in this study, the slow growth period occurred
from day 60 to 120; as of 120 days, calves fed with milk
from both shepherding systems showed an accelerated
growth. Nevertheless at 170 and 198 days, calves fed
with SSPi had a PV greater than in PRM (p0.05, Table 1).
PV at 98 days for calves fed with SSPi milk was greater
than 121.432.5 kg at 224 days of age for domestic cow
vs zebu (Osorio-Arce and Segura-Correa, 2008), fed with
one nipple and supplemented with commercial feed.
Saddy et al. (2015) reported weights of 105.714.22 and
109.713.65 kg at 190 days, supplemented with 0.869
and 0.980 kg of commercial concentrate of 10 and
20% raw protein (PC) for cF1 HolsteinBrahman cross
breeds, which suggests that it feasible to obtain a better
pre-weaning growth for LT calves in SSPi.
GDP in SSPi was greater than 99 g per day1 than the
one obtained in the PRM system, which meant 18.11
kg more of PV upon weaning (Table 2). Romosinuano
Figure 2. Tropical Criollo Milking cows in rotational shepherding systems in a) grass monoculture and b) intensive silvopastoral system in the “El Huilango” land lot, Cotaxtla, Veracruz, Mexico.
90
Biofertilizantes y producción de caña de azúcarAgro productividad 14 (4): 87-92. 2021
AGROPRODUCTIVIDAD
Table 1. Live weight (kg) in Tropical Milking calves fed with milk from two shepherding systems.
DayRotational
shepherding in monoculture
Intensive silvopastoral
system
Standard error
p value
0 27.8 27.4 3.22 0.943
22 42.2 41.2 3.22 0.832
60 49.1 52.1 3.22 0.510
88 52.7 58.7 3.22 0.189
116 63.7 69.1 3.22 0.233
142 76.1 83.7 3.26 0.105
170 90.4a 103.9b 3.29 0.004
198 123.6a 142.6b 3.31 0.001
a,b Different letters on the same row indicate differences (p0.05).
calves cross-bred with Jersey calves during the restricted
5-hour breastfeeding had a GDP of 299 g per day1 and
a weaning weight adjusted to 106.15 kg at 270 days
(Salamanca et al., 2011), lower than LT calves; genotype,
technology and environment affect calf response.
There were no differences (p0.05) in GDP for females
and males, similar to zebu cross-bred calves (Cárdenas
et al., 2015); nevertheless, other studies state differences
in GDP and weaning weight between sexes (Heras-
Torres et al., 2008; Salamanca et al., 2011). CL in LT
calves was similar in both shepherding systems (p0.05,
Table 2) and at 30.2 kg per day1 for cross-bred calves
fed with one nipple for the first 100 days of life (Chirinos
et al., 2011);nevertheless, their GDP was of 28720 g
per day d1, supplemented with 300 g of concentrated
Table 2. Daily weight gain and milk consumption by Tropical Milking calves fed with milk from two shepherding systems.
CharacteristicIntensive rotational
shepherdingStandard error
Intensive silvopastoral
systemStandard error p value
Daily weight gain (g d1) 488.7a 0.12 587.7b 0.14 0.01
Milk consumption in 90 days (kg d1) 2.7a 0.21 3.2a 0.21 0.10
Milk consumption in 180 days (kg d1) 2.6a 0.23 2.8a 0.21 0.54
a,b different letters on the same row indicate differences (p0.05).
feed (20% PC), lower than the GDP of LT calves.
The difference in GDP obtained in PRM and SSPi
systems in relation to other studies, evidence that
the chemical composition of milk is a determining
factor for calf growth (Table 3) (Chirinos et al., 2011;
Salamanca et al., 2011).
The chemical composition of milk in both shepherding
systems was not different in fat (p0.05); results
match those of 3.7 and 3.60.05 for milk produced
in a PRM and an SSPi system with cross-bred cows
supplemented with concentrate (Mohammed et al.,
2016). Prieto-Manrique et al. (2016) obtained 2.88
and 4.41% in similar shepherding conditions, while
Hernández and Ponce (2004) obtained 4.070.16
and 4.20.22% fat for PGM and SSPi, respectively. The
proportion of volatile acetic and propionic fatty acids in
rumen determined the milk fat content (Ramos et al.,
1998); the difference in fat content with respect to other
studies may be attributed to the forage-concentrate
ratio and the amount of fiber in diet, due to the fact that
the proportion of acetic and propionic acid in rumen is
sensitive to these factors; in this sense, legumes affect
the quality of milk as their degradability in rumen is
more similar than that of grain, as it shows lower neutral
effective detergent fiber compared with grass (Silva et
al., 2016).
SNGs were greater in the SSPi at 90 and 180 days
(p0.05), due to the fact that their main components,
protein and lactose, were also found in greater amounts
Table 3. Chemical composition of milk consumed by Tropical Milking calf in two shepherding systems during their pre-weaning stage at 90 and 180 days.
Fat Non-fatty solids Protein Lactose Total solids
90 180 90 180 90 180 90 180 90 180
Intensive rotational shepherding 3.5a 3.7a 7.9b 8.0b 2.9b 2.9b 4.3b 4.4b 11.4b 11.7a
Intensive silvopastoral system 3.9a 3.3a 8.1a 8.5a 3.0a 3.1a 4.5a 4.7a 12.1a 11.8a
Standard error 0.2 0.3 0.1 0.1 0.02 0.04 0.04 0.07 0.21 0.25
a,b different letters on the same column indicate a significant amount (p0.05).
91
Becerril-Pérez et al. (2021)
AGROPRODUCTIVIDAD
(p0.05). Cows fed in SSPi have access to a diet with
greater protein content (Murgueitio et al., 2015), which
may be related to the difference in protein and lactose
content in milk between shepherding systems; the
mammary gland synthetizes milk protein from the
availability of aminoacids and greater propionic acid
levels increase lactose synthesis (Ramos et al., 1998);
SNG, protein and lactose contents were similar in PRM
and SSPi with 8.1, 2.9 and 4.3% and 8.2, 3.0 and 4.5%
(Mohammed et al., 2016).
ST were greater in SSPi milk at 90 days; this difference
in milk chemical composition influenced the productive
behavior of calves, as they depend on the consumed milk;
albeit there were no differences between shepherding
systems at 180 days (p0.05). Protein and lactose
amounts were greater for SSPi related to greater GDP of
calves. Rumen begins to become functional at 60 days
of life in calves, reason why the daily ingestion of milk is
considered to be a diet supplement, capable of favoring
greater growth rates (Cárdenas et al., 2015). Martínez et
al. (2010) found a significant correlation between weight
at 210 days and protein present in milk. Estimated STs
were similar than those obtained by Mohammed et al.
(2016), although lower than 1% for PRM and 0.5% for SSPi
(Hernández & Ponce, 2004), the difference is attributable
to a different supplementation.
CONCLUSIONSIn an intensive silvopastoral system with legume
availability, criollo Tropical Milking calves had a greater
weight at 180 days and a greater daily weight gain,
although milk consumption per day was similar than
that of calves within a grass monoculture shepherding
systems. The chemical composition of milk for cows in
the intensive silvopastoral system had greater content of
components, except for fat. Also, the difference in the
chemical composition of milk had differential effects in
the productive behavior of calves.
REFERENCESArce R., C.; Aranda I., E.M.; Osorio A., M.M.; González G., R.; Díaz R., P. &
Hinojosa C., J.A. (2017). Evaluación de parámetros productivos
y reproductivos en un hato de doble propósito en Tabasco,
México. Revista Mexicana de Ciencias Pecuarias. 8(1), 83-91.
Cárdenas J., E.G.; Maza A., L. & Cardona J., A. (2015). Comportamiento
productivo de terneros lactantes suplementados con maíz más
torta de algodón en el departamento de Córdoba, Colombia.
Revista Colombiana de Ciencia Animal. 7(2), 171-178.
Chirinos, Z.; Faría-Mármol, J.; Gómez, A.; León, L. & Quiñones, R.
(2011). Efecto de la estrategia de amamantamiento sobre
el crecimiento de becerros y la producción de leche en
un sistema de doble propósito del Zulia, Venezuela. Actas
Iberoamericanas de Conservación Animal. 1, 268-271.
Díaz, C.; Sardiñas, L.; Castillo, C.; Padilla, C.; Jordán, V.; Martínez, Z.;
Ruiz, V.; Díaz, S.; Moo, C.; Gómez, C.; Alpide, T.; Arjona, R. &
Ortega, G. (2014). Caracterización de ranchos ganaderos de
Campeche, México. Resultados de proyectos de transferencia
de tecnologías. Avances en Investigación Agropecuaria. 18(2),
41-61.
García, E. (1988). Modificaciones al sistema de clasificación climática de
Köppen. Instituto de Geografía. México. Universidad Nacional
Autónoma de México. 191 p.
Guarneros A., R.; Gutiérrez O., E.; Bernal B., H.; Avalos R., R.; Castillo
G., E. & Olivares S., E. (2017). Acondicionamiento de becerros
previo a la recría bajo pastoreo en trópico seco: efectos sobre
el peso corporal y la condición sanitaria. Revista Mexicana de
Ciencias Pecuarias. 8(4), 341-351.
Heras-Torres, J.G.; Osorio-Arce, M.M. & Segura-Correa, J.C. (2008).
Crecimiento de becerros en un sistema de doble propósito
en el trópico húmedo de México. Revista Científica Maracaibo.
18(2), 170-174.
Hernández R., R. & Ponce C., P. (2004). Efecto del silvopastoreo como
sistema sostenible de explotación bovina sobre la composición
de la leche. Livestock Research for Rural Development. 16(6),
Art. #43. http://www.lrrd.org/lrrd16/6/hern16043.htm
Madrid-Bury, N.; González-Stagnaro, C.; Goicochea-Llaque, J.;
González-Villalobos, D. & Rodríguez-Urbina, M.A. (2007). Peso
al nacimiento en hembras bovinas doble propósito. Revista de
la Facultad de Agronomía (LUZ). 24, 690-708.
Martínez C., C.J.; Cotera R., J. & Abad Z., J. (2012). Características de la
producción y comercialización de leche bovina en sistemas de
doble propósito en Dobladero, Veracruz. Revista Mexicana de
Agronegocios. 16(30), 816-824.
Martínez V., G.; Palacios F., J.A.; Bustamante G., J.J.; Ríos U., A.; Eliezer
V., M.V. & Montaño B., M. (2010). Composición de leche de
vacas Criollo, Guzerat y sus cruzas F1 y su relación con el peso
al destete de las crías. Revista Mexicana de Ciencias Pecuarias.
1(4), 311-324.
Mohammed M., A.; Aguilar-Pérez, C.; Ayala-Burgos, A.; Bottini-Luzardo,
M.; Solorio-Sánchez, F. & Ku-Vera, J. (2016). Evaluation of
milk composition and fresh soft cheese from an intensive
silvopastoral system in the tropics. Dairy Science & Technology.
96, 159-172.
Murgueitio, E.; Barahona, R.; Chará, J.; Flores M., X.; Mauricio, R. &
Molina J., J. (2015). The intensive silvopastoral systems in
Latin America sustainable alternative to face climatic change
in animal husbandry. Cuban Journal of Agricultural Science.
49(4), 541-554.
Orantes-Zebadúa, M.A.; Platas-Rosado, D.; Córdova-Avalos, V.; De los
Santos-Lara, M.C. & Córdova-Avalos, A. (2014). Caracterización
de la ganadería de doble propósito en una región de Chiapas,
México. Ecosistemas y Recursos Agropecuarios. 1(1), 49-58.
Osorio-Arce, M.M. & Segura-Correa, J.C. (2008). Factores que afectan
el peso al nacer y al destete de becerros de doble propósito
en el trópico. Livestock Research for Rural Development. 20(1),
Art. #15. http://www.lrrd.org/lrrd20/1/osor20015.htm
Prieto-Manrique, E.; Vargas-Sánchez, J.E.; Angulo-Arizala, J. &
Mahecha-Ledesma, L. (2016). Grasa y ácidos grasos en leche

92
Biofertilizantes y producción de caña de azúcarAgro productividad 14 (4): 87-92. 2021
AGROPRODUCTIVIDAD
de vacas pastoreando, en cuatro sistemas de producción.
Agronomía Mesoamericana. 28(1), 19-42.
Ramos, R.; Pabón, M. & Carulla, J. (1998). Factores nutricionales y no
nutricionales que determinan la composición de la leche. Revista
de la Facultad de Medicina Veterinaria y de Zootecnia. 46(2), 2-7.
Rosendo-Ponce, A. & Becerril-Pérez, C.M. (2015). Avance en el
conocimiento del bovino criollo Lechero Tropical en México.
Ecosistemas y Recursos Agropecuarios. 2(5), 233-249.
Saddy, J.; Depablos, L.; Colina, Y. & Vargas, D. (2015). Evaluación de
concentrados comerciales sobre el crecimiento de becerros
doble propósito en la zona central de Venezuela. Zootecnia
Tropical. 33(1), 89-96.
Salamanca C., A.; Quintero V., R. & Benitez M., J. (2011). Características de
crecimiento predestete en becerros del sistema doble propósito
en el municipio de Arauca. Zootecnia Tropical. 29(4), 455-465.
SAS Institute. (2010). SAS 9.3 for Windows. Cary, North Carolina. United
States of America.
Silva, T.; Takiya, C.; Vendramini, T.; Ferreira, J. & Renno, F. (2016) Effects of
dietary fibrolytic enzymes on chewing time, ruminal fermentation,
and performance of mid-lactating dairy cows. Animal Feed
Science and Technology. 221, 35-43.
AGROPRODUCTIVIDAD
93AGROPRODUCTIVIDAD
https://doi.org/10.32854/agrop.v14i4.1865
Agroproductividad: Vol. 14, Núm. 4, abril. 2021. pp: 93-97.
Recibido: octubre, 2020. Aceptado: marzo, 2021.
Hybridization of Castor Bean (Ricinus communis L.) in Morelos, México
Canul-Ku, Jaime1*; Barrios-Gómez, Edwin J.1; Hernández-Meneses, Eleodoro2; Rangel-Estrada, Sandra E.1
1Instituto Nacional de Investigaciones Forestales, Agrícolas y Pecuarias. Campo Experimental
Zacatepec. Zacatepec, Morelos, México. C. P. 62780. 2Tecnológico Nacional de México Campus
Región Sierra. Francisco Javier Mina, Tabasco, México. C. P. 86801.
*Corresponding author: [email protected]
ABSTRACTObjective: To determine the stigma receptivity and the pollen viability in order to make manual crosses and obtain viable
progeny in castor bean (Ricinus communis L.).
Design/Methodology/Approach: Pollen viability tests were made on breeding materials by staining with acetocarmine
solution. In elite materials, the receptivity of the stigma was evaluated with hydrogen peroxide. From the inflorescences,
the male ones were removed and the female ones were preserved, which were covered with a glassine bag. After six days,
they were checked and when they were considered receptive, manual pollinations were carried out between viable pollen
materials and receptive stigma. The pollen of the male parent was impregnated in the stigmas and the inflorescence was
covered again.
Results: The breeding materials exhibited viable pollen since they were stained red. Whereas, the application of
hydrogen peroxide to the stigmas of the elite materials showed bubbling, indicative that they were receptive. In 2014,
400 inflorescences were pollinated with 8 flowers on average and a fruit pollinated percentage of 61.21. In 2015, 245
inflorescences with 12 flowers on average and 61.24% of fruit were pollinated.
Study Limitations/Implications: Temperature and relative humidity were fundamental factors for the success of castor
bean fertilization.
Findings/Conclusions: The elite castor bean materials presented receptive stigmas and the improved viable pollen
materials. Manual crosses produced fruits and seeds. The fruits pollinated were 61%.
Keywords: Pollen viability, stigma receptivity, fruits pollinated, hybridization, genetic improvement.
INTRODUCTION
The irreversible exhaustion of oil reserves globally led to the search for alternative sources of renewable energies
such as bioenergy. Biofuels in their solid, liquid and gas forms are currently of great importance, and therefore
their study, production and use have intensified in the last 15 years (Guo et al., 2015). The search for new
bioenergetics sources have centered on the production of ethanol and biodiesel from biomass of sugarcane
93AGROPRODUCTIVIDAD
94
Biofertilizantes y producción de caña de azúcarAgro productividad 14 (4): 93-97. 2021
AGROPRODUCTIVIDAD
(Saccharum spp. hybrids), maize (Zea mays L.) and grain
sorghum (Sorghum bicolor L.). Advances have also been
made in the research and technological development
of other crops such as castor bean (Ricinus communis
L.). Castor bean belongs to the Euphorbiaceae family,
with chromosome number 2n2x20. Their area of
distribution is extensive worldwide, from tropical and
subtropical regions to temperate zones (Lu et al., 2019).
In Mexico, it is possible to find it throughout the country,
and it is common for it to grow on the edges of paths
and disturbed vegetation areas.
At the commercial scale, castor bean is cultivated in
1.5 million hectares in the world, where India, China,
Brazil, Russia and Thailand stand out as main producers
(Rukhsar et al., 2018). The oil from the seeds has
chemical and physical properties that are unique and
exceptional for industrial use (Lu et al., 2019; Rodrigues et
al., 2019). In Brazil its cultivation is considered for family
subsistence, interspersed with maize and bean, using
local varieties with long cycles whose seed maturation is
heterogeneous (Milani and Nóbrega, 2013).
In Mexico there are native populations of castor bean
with wide morphological, productive, genetic and
adaptive variability (Barrios-Gómez et al., 2018; García-
Herrera et al., 2019). However, the productive potential
is limited because they are normally tall plants with
abundant aerial biomass, lax bunches (sparse) of small
size, sometimes indehiscent, with few fruits per bunch
and seeds per fruit, and lower grain yield.
The commercial cultivation of castor bean in Mexico
uses landrace and imported breeding materials. The
landrace varieties are tall with low yield potential,
but with tolerance to adverse factors, a useful trait
to generate hybrid or improved varieties. These two
groups of materials, together with the germplasm from
native populations from Mexico, represent a valuable
opportunity for genetic improvement of the species.
Generating breeding materials that are adapted to
particular production zones in Mexico require strategies
that include the selection, mutagenesis, use of molecular
markers and hybridization.
The success of hybridization in any plant species
is sustained on understanding the moment when
the stigmas are receptive and the time lapse when
pollen grains are liberated during the day. In genetic
improvement of cultivated species it is difficult to find
two parents that originate a progeny with the highest
amount of desirable traits (Ferreira et al., 2015). However,
it should be considered that the quantitative traits of
greatest economic importance are controlled by many
pairs of genes.
The inflorescence of castor bean is a monoecious bunch
with female flowers in the higher part and male in the
lower part (Merkouropoulos et al., 2016). It is considered
to be a crossed-pollination species (Ramesh et al., 2017)
where wind is the main pollinating agent (Anjani et al.,
2018). The liberation period of the pollen grains lasts 1
to 2 days, with optimal temperature conditions between
26 and 29 °C and relative humidity of 60%. Meanwhile,
the stigma is completely receptive for a period of 5 to 10
days depending on environmental conditions (Milani and
Nóbrega, 2013). With the aim of establishing the bases of
hybridization in castor bean in Mexico this study had the
objectives of determining the receptivity of the stigma
and viability of pollen, and making manual crosses to
obtain viable progeny.
MATERIALS AND METHODSThis study was carried out in the Zacatepec
Experimental Field of the National Institute for Forest,
Agricultural and Livestock Research (Instituto Nacional
de Investigaciones Forestales, Agrícolas y Pecuarias,
INIFAP), located in the Zacatepec-Galeana Highway km
0.5, on coordinates 18° 39’ 16’’ LN, 99° 11’ 54.7’’ LW and
an altitude of 911.8 m. The zone presents warm sub-
humid climate with summer rains (Aw0), where average
annual precipitation is 800 mm and average annual
temperature 24 °C (Ornelas et al., 1997).
The genetic material used consisted of six elite materials
of castor bean collected in many states of the country,
which were selected for having greater size, weight and
seed yield (Barrios et al., 2013), and three commercial
varieties liberated by foreign seed companies. Receptivity
tests were made on the stigma of elite materials, and
pollen viability tests were applied on the breeding
materials.
In 2014, pollen viability tests were made with the
method proposed by Dempsey (1993), which consists
in staining with acetocarmine (Meyer® coloring solution)
and observing the change of color in the stereoscopic
microscope. The stigma receptivity tests were applied
following the method proposed by Osborn et al. (1988),
which consists in placing a drop of hydrogen peroxide
95
Canul-Ku et al. (2021)
AGROPRODUCTIVIDAD
at 3% on the stigmas; if bubbles are produced in the
reaction then they are considered as receptive.
The genetic materials that resulted with viable pollen and
receptive stigmas were used as parents to make manual
crosses in November 2014 and October 2015. From the
inflorescences, 10 female flowers were chosen that were
in the same phenological state and the male flowers
were eliminated (Figure 1a); then the inflorescence was
covered with a glassine bag. The state of development
of the stigmas was checked six days later and, when
they were considered receptive, manual pollination
impregnating the male parent’s pollen on the stigmas
was done; then the inflorescence was covered again
(Figure 1b). Pollination was carried out from 9:20 a.m.
to 11:30 a.m. in 2014 and from 10:00 a.m. to 1:30 p.m.
in 2015. In the Zacatepec Experimental Field, in Morelos,
the values of mean maximum, mean minimum, and
mean daytime temperatures were 30.8, 15.9 and 27.4
°C in October and 30.8, 12.1 and 26.7 °C in November,
respectively. The monthly average precipitation was
67.2 mm in October and 10.4 mm in November. These
means come from records that cover from 1961 to 2003
(Díaz et al., 2008). For each cross the variables that were
found were the number of pollinized flowers, number of
harvested fruits, and percentage of fruit pollinated.
RESULTS AND DISCUSSIONIn the pollen viability tests in breeding materials, pollen
grains stained with red color were observed, which
indicated that they were viable so they could be used
as male parents. Likewise, the application of hydrogen
peroxide to the stigmas of the elite materials showed
bubbling, indicative that they are receptive (Figure 1c).
The results of pollen viability and stigma receptivity
indicated that the environmental conditions in the
zone were optimal to carry out the pollination and later
fertilization. Studies about the determination of pollen
viability and stigma receptivity are essential activities
to carry out genetic recombination. These tests have
been useful in hybridization processes in species of
the Echeveria genus (Rodríguez-Rojas et al., 2015) and
in poinsettia (Euphorbia pulcherrima Willd. ex Klotszch)
(Canul-Ku et al., 2015; Rodríguez et al., 2017).
In the year 2014, 400 inflorescences were pollinized,
with 8 flowers on average each and fruit pollinated was
61.21%. In 2015, 245 inflorescences were pollinized, with
12 flowers on average and fruit pollinated of 61.24%
(Figure 1d).
Figure 1. Hybridization process in castor. a) Emasculated inflorescence. b) Manual pollination. c) Receptive stigma. d) Fruit development.
a
b
c
d
96
Biofertilizantes y producción de caña de azúcarAgro productividad 14 (4): 93-97. 2021
AGROPRODUCTIVIDAD
In the evaluation of the behavior of fruit pollinated
in function of the time of pollination in 2014, it was
observed that the highest percentage was obtained
from pollinized flowers at 9:20 in the morning and
the lowest at 10:30 (Figure 2). These results show
that the minimal differences of time to do the manual
pollinations are dependent on climate conditions.
In the year 2015 the pollinations performed at 10:20
in the morning presented the lowest percentage of
fruit pollinated with 33% and at 12:30 the highest
with 77%. In that year, the lowest fruit pollinated was
during the period of 10:20 to 10:50 (Figure 3).
The best behavior of fruit pollination was obtained
in 2014 (Figure 2). The next year increases and
decreases were observed during the pollination
period (Figure 3). This response is probably due to the
environmental conditions that were present. Historical
data show that the mean daytime temperature in
the Zacatepec Experimental Field is 26.7 to 27.4 °C
(Díaz et al., 2008) during the time period when the
pollinations were performed. If it considered that
pollen grains from castor bean are liberated in optimal
conditions of temperature between 26 and 29 °C for
1 to 2 days and the stigma is completely receptive 5
to 10 days (Milani and Nóbrega, 2013), it is deduced
that the environmental conditions of the zone favored
fertilization.
In the pollination of five species from the Echeveria
genus, 100% of fruit pollinated was obtained, although
the viable seeds only formed in intra and interspecific
crossed pollination (Rodríguez-Rojas et al., 2015). In
Figure 3. Percentage of fruit set as a function of pollination time. Zacatepec Experimental Field. 2015.
Figure 2. Percentage of fruit set as a function of pollination time. Zacatepec Experimental Field. 2014.
poinsettia it was reported that fruit pollinated is 68%
with the technique of modified emasculation and it is
crucial for hybrid generation. The process consists in
cutting two thirds of the bract from the apex to the base
of the inflorescence, eliminating male flowers, leaving
between three and five non-receptive female flowers
with the same phenological state covered with a waxed
bag (Canul-Ku et al., 2015).
The knowledge generated about pollen viability, stigma
receptivity and fruit pollinated in these castor bean
materials establish the bases that will allow generating
genetic variants. With this information it would be
possible to undertake the genetic improvement of castor
bean and to obtain varieties and hybrids for specific
environmental conditions in Mexico. The main goal of
this genetic improvement will be to reduce the varietal
dependency on imported breeding material.
CONCLUSIONSThe elite materials of castor bean
presented receptive stigmas and the
breeding materials viable pollen. Manual
crosses produced fruits and seeds. Fruit
pollination was 61%. This indicates that
there is genetic potential to generate
new combinations through hybridization
in castor bean.
ACKNOWLEDGEMENTSThe authors thoroughly thank INIFAP for the
economic support granted to research projects,
validation and transference of technology, which
made this scientific contribution possible.
97
Canul-Ku et al. (2021)
AGROPRODUCTIVIDAD
REFERENCESAnjani, K., Raoof, M. A., Prasad, M., Duraimurugan, P., Lucose, C., Yadav, P., Prasad, R. D., Lal, J., Sarada, C. (2018).
Trait-specific accesions in global castor (Ricinus communis L.) germplasm core set for utilization in
castor improvement. Industrial Crops and Products 112: 766-774.
Barrios, G. E., Zamarripa, C. A., Canul, K. J., Hernández, A. M., Alarcón, C. N., Chepetla, C. V. (2013). Evaluación
de materiales élite de higuerilla (Ricinus communis L.) en Morelos. Ciencia y Tecnología Agropecuaria
de México 1(2): 27-32.
Barrios-Gómez, E. J., Canul-Ku, J., Hernández-Arenas, M., Solís-Bonilla, J. L. (2018). Evaluación de dos ciclos
de higuerilla en Morelos, México: siembra y rebrote. Revista Mexicana de Ciencias Agrícolas 9(8): 1663-
1673.
Canul-Ku, J., García-Pérez, F., Barrios-Gómez, E. J., Campos-Bravo, E., Osuna-Canizalez, F., Ramírez-Rojas, S.
G., Rangel-Estrada, S. E. (2015). Técnica para producir híbridos en nochebuena (Euphorbia pulcherrima
Willd. ex Klotszch). Agroproductividad 8:32-37.
Díaz, G. P., Serrano, A. V., Ruiz, C. J., Ambriz, C. R., Cano, G. M. (2008). Estadísticas climatológicas básicas del
estado de Morelos, período 1961-2003. INIFAP, CIRPAS, Campo Experimental Zacatepec. Libro Técnico
Número 3. 153 p.
Dempsey, E. (1993). Traditional analysis of maize pachytene chromosomes. pp. 432 – 441. En: Freeling, M;
Walbot, V. (eds.) The Maize Handbook. New York: Springer.
Ferreira, A. A., Menesez, J. J., Silva, V. M., Souza, C. J., Souza, C. P., Ferreira, A. A. (2015). Genetic progress
and potential of common bean families obtained by recurrent selection. Crop Breeding and Applied
Biotechnology 15: 218-226.
García-Herrera, E. J., Olivares-Ramírez, A., Amante-Orozco, A., Hernández-Ríos, I., Rössel-Kipping, E. D.,
Pimentel-López, J., Delgadillo-Ruiz, O., Gómez-González, A. (2019). Evaluación de colectas de higuerilla
(Ricinus communis L.) del Altiplano centro-norte de México. Agroproductividad 12(1): 25-31.
Guo, M., Song, W., Buhain, J. (2015). Bioenergy and biofuels: history, status, and perspective. Renewable and
Sustainable Energy Reviews 42: 712-725.
Lu, J., Shi, Y., Yin, X., Liu, S., Liu, C., Wen, D., Li, W., He, X, Yang, T. (2019). The genetic mechanism of sex type, a
complex quantitative trait, in Ricinus communis L. Industrial Crops and Products 128: 590-598.
Merkouropoulos, G., Kapazoglou, A., Drosou, V., Jacobs, E., Krolzig, A., Papadopoulus, C., Hilioti, Z. (2016). Dwarf
hybrids of the bioenergy crop Ricinus communis suitable for mechanized harvesting reveal differences
in morpho-physiological characteristics and seed metabolic profiles. Euphytica 210: 207-219.
Milani, M., Nóbrega, M. B. (2013). Castor breeding. pp. 239-254. En: Sven Bode Andersen (ed.). Plant Breeding
from Laboratories to Fields.
Ornelas, R. F., Ambriz, C. R., Bustamante, O. J. (1997). Delimitación y definición de agrohábitats en el estado de
Morelos. Instituto Nacional de Investigaciones Forestales, Agrícolas y Pecuarias. Publicación especial
Número 11. 19 p.
Osborn M., P. Kevan and A. Meredith. (1998). Pollination biology of Opuntia polycantha and Opuntia phaeacantha
(Cactaceae) in Sourther Colorado. Plant Systematics and Evolution 159: 139-144.
Ramesh, M., Lavanya, C., Sujatha, M., Bhave, M. H., Aruna, J. (2017). Inheritance of morphological characters and
sex expression in castor (Ricinus communis L.). Journal of Oilseeds Research 34: 247-250.
Rodrigues, S. A., Alves, S. S., Araujo, S. L., Souza, D., Araujo, G., Loyola, D. J., Silva, L. E., Loyola, D. A. (2019).
Characterization and performance of castor bean lineages and parents at the UFRB germplasm bank.
PLoS ONE 14(1): e0209335.
Rodríguez-Rojas, T., Andrade-Rodríguez, M., Canul-Ku, J., Castillo-Gutiérrez, A., Martínez-Fernández, E., Guillén-
Sánchez, D. (2015). Viabilidad de polen, receptividad del estigma y tipo de polinización en cinco especies
Echeveria en condiciones de invernadero. Revista Mexicana de Ciencias Agrícolas 6(1): 111-123.
Rodríguez, R. T., Andrade-Rodríguez, M., Villegas-Torres, O., Castillo-Gutiérrez, A., Colinas-León, M., Avitia-García,
E., Alia-Tejacal, I. (2017). Características reproductivas de nueve variedades de nochebuena (Euphorbia
pulcherrima Willd. ex Klotzsch). Revista Mexicana de Ciencias Agrícolas 8: 295-306.
Rukhsar, S., Patel, M. P., Parmar, D. J. (2018). Genetic variability, character association and genetic divergence
studies in castor (Ricinus communis L.). Annals of Agrarian Science 16: 143-148.

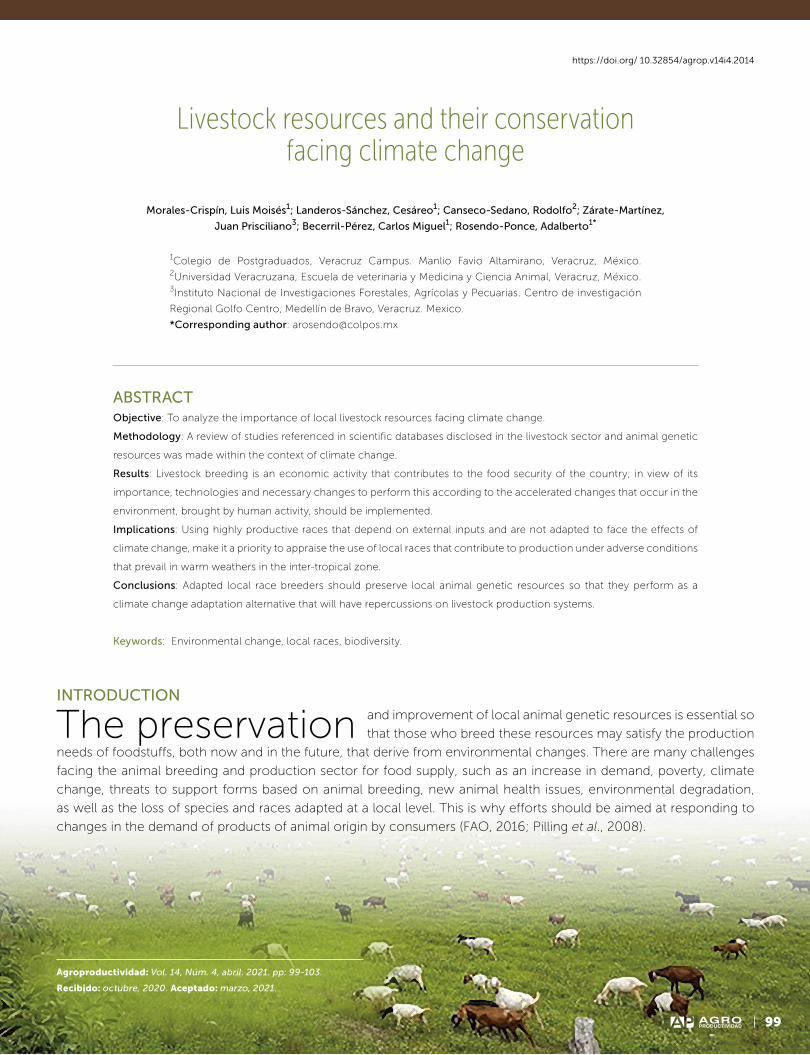
99AGROPRODUCTIVIDAD
https://doi.org/ 10.32854/agrop.v14i4.2014
Agroproductividad: Vol. 14, Núm. 4, abril. 2021. pp: 99-103.
Recibido: octubre, 2020. Aceptado: marzo, 2021.
Livestock resources and their conservation facing climate change
Morales-Crispín, Luis Moisés1; Landeros-Sánchez, Cesáreo1; Canseco-Sedano, Rodolfo2; Zárate-Martínez,
Juan Prisciliano3; Becerril-Pérez, Carlos Miguel1; Rosendo-Ponce, Adalberto1*
1Colegio de Postgraduados, Veracruz Campus. Manlio Favio Altamirano, Veracruz, México. 2Universidad Veracruzana, Escuela de veterinaria y Medicina y Ciencia Animal, Veracruz, México. 3Instituto Nacional de Investigaciones Forestales, Agrícolas y Pecuarias. Centro de investigación
Regional Golfo Centro, Medellín de Bravo, Veracruz. Mexico.
*Corresponding author: [email protected]
ABSTRACTObjective: To analyze the importance of local livestock resources facing climate change.
Methodology: A review of studies referenced in scientific databases disclosed in the livestock sector and animal genetic
resources was made within the context of climate change.
Results: Livestock breeding is an economic activity that contributes to the food security of the country; in view of its
importance, technologies and necessary changes to perform this according to the accelerated changes that occur in the
environment, brought by human activity, should be implemented.
Implications: Using highly productive races that depend on external inputs and are not adapted to face the effects of
climate change, make it a priority to appraise the use of local races that contribute to production under adverse conditions
that prevail in warm weathers in the inter-tropical zone.
Conclusions: Adapted local race breeders should preserve local animal genetic resources so that they perform as a
climate change adaptation alternative that will have repercussions on livestock production systems.
Keywords: Environmental change, local races, biodiversity.
INTRODUCTION
The preservation and improvement of local animal genetic resources is essential so
that those who breed these resources may satisfy the production
needs of foodstuffs, both now and in the future, that derive from environmental changes. There are many challenges
facing the animal breeding and production sector for food supply, such as an increase in demand, poverty, climate
change, threats to support forms based on animal breeding, new animal health issues, environmental degradation,
as well as the loss of species and races adapted at a local level. This is why efforts should be aimed at responding to
changes in the demand of products of animal origin by consumers (FAO, 2016; Pilling et al., 2008).
99AGROPRODUCTIVIDAD
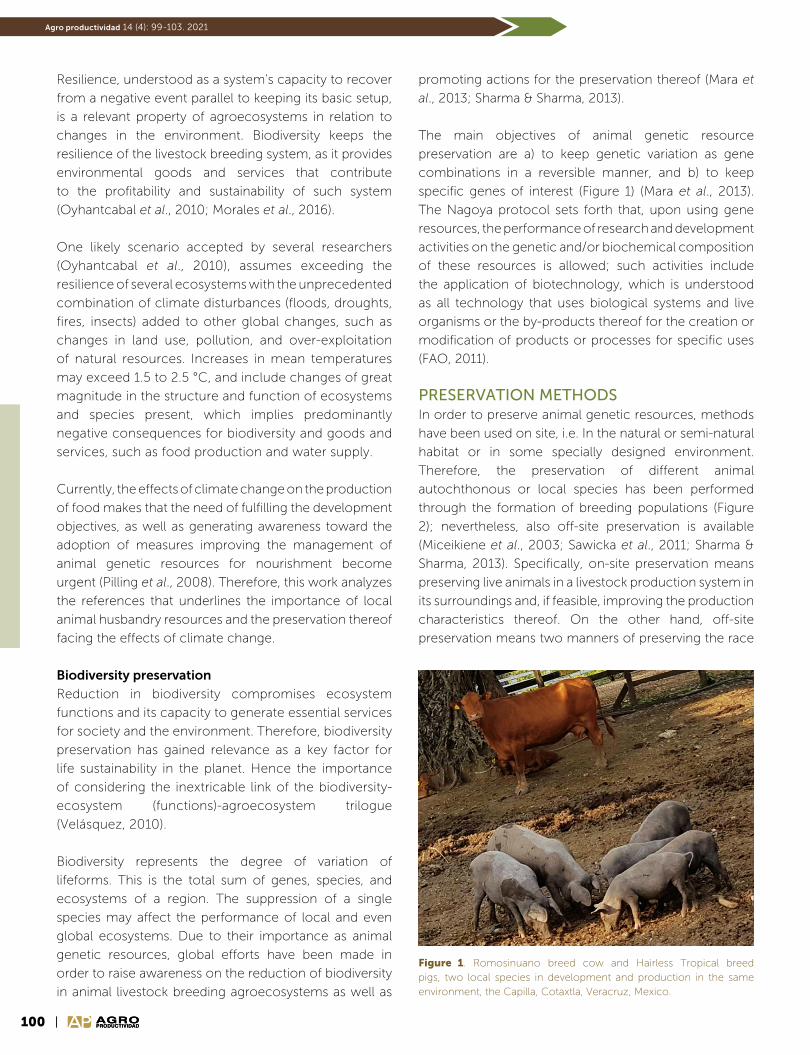
100 AGROPRODUCTIVIDADAGROPRODUCTIVIDAD
Biofertilizantes y producción de caña de azúcarAgro productividad 14 (4): 99-103. 2021
Resilience, understood as a system’s capacity to recover
from a negative event parallel to keeping its basic setup,
is a relevant property of agroecosystems in relation to
changes in the environment. Biodiversity keeps the
resilience of the livestock breeding system, as it provides
environmental goods and services that contribute
to the profitability and sustainability of such system
(Oyhantcabal et al., 2010; Morales et al., 2016).
One likely scenario accepted by several researchers
(Oyhantcabal et al., 2010), assumes exceeding the
resilience of several ecosystems with the unprecedented
combination of climate disturbances (floods, droughts,
fires, insects) added to other global changes, such as
changes in land use, pollution, and over-exploitation
of natural resources. Increases in mean temperatures
may exceed 1.5 to 2.5 °C, and include changes of great
magnitude in the structure and function of ecosystems
and species present, which implies predominantly
negative consequences for biodiversity and goods and
services, such as food production and water supply.
Currently, the effects of climate change on the production
of food makes that the need of fulfilling the development
objectives, as well as generating awareness toward the
adoption of measures improving the management of
animal genetic resources for nourishment become
urgent (Pilling et al., 2008). Therefore, this work analyzes
the references that underlines the importance of local
animal husbandry resources and the preservation thereof
facing the effects of climate change.
Biodiversity preservation
Reduction in biodiversity compromises ecosystem
functions and its capacity to generate essential services
for society and the environment. Therefore, biodiversity
preservation has gained relevance as a key factor for
life sustainability in the planet. Hence the importance
of considering the inextricable link of the biodiversity-
ecosystem (functions)-agroecosystem trilogue
(Velásquez, 2010).
Biodiversity represents the degree of variation of
lifeforms. This is the total sum of genes, species, and
ecosystems of a region. The suppression of a single
species may affect the performance of local and even
global ecosystems. Due to their importance as animal
genetic resources, global efforts have been made in
order to raise awareness on the reduction of biodiversity
in animal livestock breeding agroecosystems as well as
promoting actions for the preservation thereof (Mara et
al., 2013; Sharma & Sharma, 2013).
The main objectives of animal genetic resource
preservation are a) to keep genetic variation as gene
combinations in a reversible manner, and b) to keep
specific genes of interest (Figure 1) (Mara et al., 2013).
The Nagoya protocol sets forth that, upon using gene
resources, the performance of research and development
activities on the genetic and/or biochemical composition
of these resources is allowed; such activities include
the application of biotechnology, which is understood
as all technology that uses biological systems and live
organisms or the by-products thereof for the creation or
modification of products or processes for specific uses
(FAO, 2011).
PRESERVATION METHODSIn order to preserve animal genetic resources, methods
have been used on site, i.e. In the natural or semi-natural
habitat or in some specially designed environment.
Therefore, the preservation of different animal
autochthonous or local species has been performed
through the formation of breeding populations (Figure
2); nevertheless, also off-site preservation is available
(Miceikiene et al., 2003; Sawicka et al., 2011; Sharma &
Sharma, 2013). Specifically, on-site preservation means
preserving live animals in a livestock production system in
its surroundings and, if feasible, improving the production
characteristics thereof. On the other hand, off-site
preservation means two manners of preserving the race
Figure 1. Romosinuano breed cow and Hairless Tropical breed pigs, two local species in development and production in the same environment, the Capilla, Cotaxtla, Veracruz, Mexico.
101AGROPRODUCTIVIDAD
Morales-Crispín et al. (2021)
Figure 2. The creole hen is a local genetic resource of greater importance in feeding rural families. Flock of chickens in the selection process as breeders at the Huilango farm, Cotaxtla, Veracruz, Mexico.
outside the natural habitat: off-site in
vivo refers to safekeeping live animals
in zoos, natural parks, experimental
farms or other specialized centers; off-
site in vitro is cryopreservation of gene
material in haploid form (semen and
oocytes), diploids (embryos) or DNA
sequences (Lascuráin et al., 2009;
Mara et al., 2013).
In recent years, off-site in vitro
preservation programs of livestock
gene resources have centered their
interest on the cryopreservation of
gametes, embryos and somatic cells,
as well as testicles and ovary tissues in a cryogenic bank.
A cryogenic bank is a place where biological samples
are frozen or cryopreserved to keep their integrity for
a variety of foreseen and unforeseen uses; it offers
unique opportunities to advance basic knowledge on
biological systems and the evolution thereof. Also, it
represents a useful form for re-directing selection or
limiting the loss of gene diversity of a selected race
and it is a vital component of efforts to recover gene
variability of endangered races or restore races that have
extinguished as a consequence of disuse, an epidemic
or the destruction of their natural habitat (Lermen et al.,
2009; Leroy et al., 2011; Sawicka et al., 2011; Mara et al.,
2013). The above actions do not apply as an exclusion;
they may be incorporated into a preservation program
that integrates, organizes, and coordinates different
preservation alternatives with congruency, efficiency
and reasoning (Delgado, 2012).
Livestock breeding and climate change
Animal production systems, climate change and animal
health are related among themselves through complex
mechanisms. Animal production influences climate
change upon emitting greenhouse effect gases (GEI)
such as methane and nitrous oxide. This situation allows
animal production to present significant opportunities
for reducing emissions, as well as increasing greenhouse
effect gas capture (Oyhantcabal et al., 2010).
On the other hand, the effect that climate change exerts
on livestock breeding may be analyzed from several
viewpoints:
a) Nutritional - the bovine will consume more lignified
pastures, resulting from the increase in temperature,
more frequent extreme events, and a decrease in
rain.
b) Health - animal health may be affected both
by extreme events (e.g., temperature) and the
emergence and re-emergence of infectious diseases,
some transmitted by vectors, highly dependent on
weather conditions, as the climate effect also affects
plague insect populations, as they move through
thermal floors.
c) Social - there are changes in plant comfort zones
and, together with this, cultivation zones in order to
improve production, as well as the increase in the
incidence of frosts, droughts and floods; and
d) Environmental - heat detrimental effects reduce
reproduction rates and livestock productions.
Livestock breeding produces greenhouse effect
gases (methane and nitrous oxide), the enteric
fermentation in ruminants and manure are the
main contributing factors for gas emissions in
animal production. On the other hand, livestock
breeding is one of the few economic sectors that
have the possibility to decrease the emission of
these gases and extract CO2 from the atmosphere
through mitigation practices as the great potential of
pastoralism to increase the efficiency of productive
processes, reduce deforestation and sequestrate
carbon in soils under grasslands (Figure 3) (FAO,
2016; Garzón, 2011; Oyhantcabal et al., 2010).
Local livestock resources and climate change
It is likely that livestock breeding is one of the activities
that suffer more with climate change due to the
modification of the agroecosystem that it inhabits.
Therefore it is necessary to analyze the part of local
races, traditional production systems and, above all,

102 AGROPRODUCTIVIDADAGROPRODUCTIVIDAD
Biofertilizantes y producción de caña de azúcarAgro productividad 14 (4): 99-103. 2021
Figure 3. Herd of goats in grazing system in dry tropical environment in Copalillo, northern zone of the state of Guerrero, Mexico.
grazing, as this activity searches balance between
greenhouse effect gas emission and production upon
correctly dimensioning the number of animals per
sustainable territory unit (Delgado, 2011). For many, it
is easy to distinguish between animal production with
good environmental sustainability practices and criteria
(either traditional or extensive) that generate multiple
benefits and animal production that pollutes water,
degrades soil, generates deforestation, and erodes
biodiversity. Nevertheless, today both types of livestock
breeding search the implementation of a greater
number of technologies and handling practices that
allow improving production processes and reducing
GEI emissions (Morales et al., 2016).
The advance toward a sustainable livestock breeding
that optimizes systems would be a more intelligent
response than reducing meat production and
consumption (Oyhantcabal et al., 2010). Local races
and their gene biodiversity make it possible to produce
in the most diverse conditions and territories; they
support the spread of production in great areas and offer
the capacity for soil to sequestrate carbon and perform
other mechanisms, such as balancing the emission
of GEI with its capacity of fixation thereof, which
contributes to the ecology balance of agroecosystems.
Therefore, the preservation of animal genetic resources
becomes even more necessary before global warming
(Delgado, 2011; Delgado, 2012).
Both traditional livestock breeding and that of high
technology based on local races, grazing and the
balance of livestock loads is related to the preservation
of biodiversity and cultural diversity and takes part
in the correct management of GEI, especially in
the sequestration of carbon
(Rodríguez et al., 2011; Delgado,
2011).
CONCLUSIONSThe preservation of local animal
genetic resources consists
in preserving gene variability
and genes of economic
interest in animal populations
used in production. Upon
fostering practices that favor
diversification and the interaction
of local races within the livestock
agroecosystem, the use of local
livestock resources is fostered,
and these constitute a development alternative in
the intertropical warm weather zone of the Mexican
territory. Livestock breeding production systems that
use local races represent a competitive economic
reconversion alternative that reduces the environmental
impact before climate change.
REFERENCESDelgado, V.J. (2011). Las Razas Locales y el Cambio Climático. Actas
Iberoamericanas de Conservación Animal, (1). 20-24.
Delgado, V.J. (2012). Conservación y utilización de los recursos
genéticos de los animales de granja. Actas Iberoamericanas de
Conservación animal, (2). 19-23.
FAO (Organización de las Naciones Unidas para la Agricultura y la
Alimentación). (2011). Protocolo de Nagoya sobre acceso a
los recursos genéticos y participación justa y equitativa en
los beneficios que se deriven de su utilización al convenio
sobre la diversidad biológica. Monreal, Canadá: Secretaria del
Convenio sobre la diversidad biológica. https://www.cbd.int/
abs/doc/protocol/nagoya-protocol-es.pdf
FAO (2016). El estado mundial de la agricultura y la alimentación:
cambio climático, agricultura y seguridad alimentaria. Roma:
Departamento de comunicación de la Organización de las
Naciones Unidas para la Agricultura y la Alimentación. http://
www.fao.org/3/a-i6030s.pdf
Garzón, A. J. E. (2011). Cambio climático ¿Cómo afecta la producción
ganadera? Revista Electrónica de Veterinaria, 12 (8). 1-8.
Lascuráin, M., List, R., Barraza, L., Díaz, E., Gual, F., Maunder, M.,
Dorantes, J. & Luna, V. (2009). Conservación de especies ex
situ. pp: 517-544. In: Capital natural de México, vol. II: Estado
de conservación y tendencias de cambio. México, Comisión
Nacional para el Conocimiento y uso de la Biodiversidad.
https://www.biodiversidad.gob.mx/v_ingles/country/
pdf/CapNatMex/Vol%20II/II12_Conservacion%20de%20
especies%20ex%20situ.pdf
Lermen, D., Blömeke, B., Browne, R., Clarke, A., Dyce, P., Fixemer,
T., & Müller, P. (2009). Cryobanking of viable biomaterials:
implementation of new strategies for conservation purposes.
Molecular Ecology, 18(6). 1030-1033.

103AGROPRODUCTIVIDAD
Morales-Crispín et al. (2021)
Leroy, G., Danchin-Burge, C. & Verrier, E. (2011). Impact of de use of cryobank samples in
a select cattle breed: a simulation study. Genetics Selection Evolution, 43(1). 36.
Mara, L., Casu, S., Carta, A. & Dattena, M. (2013). Cryobanking of farm animal gametes
and embryos as a means of conserving livestock genetics . Animal Reproduction
Science, 138(1-2). 25-38.
Miceikiene, I., Krasnapiorova, N. & Petraškienė, R. (2003). Ex-situ and in-situ conservation
of Lithuanian domestic animal genetic. Farm animal reproduction: conserving
local genetic resources (pp. 13-15). Kaunas, Lithuania: Swedish University of
Agricultural Sciences. https://www.slu.se/globalassets/ew/org/centrb/cru/cru-
reports/crureport17.pdf
Morales, V.S., Vivas, Q.N.J., & Teran, G.V.F. (2016). Ganadería eco-eficiente y la adaptación
al cambio climático. Biotecnología en el Sector Agropecuario y Agroindustrial,
14(1). 135-144.
Oyhantcabal, W., Vitale, E., & Lagarmilla, P. (2010). Pilling, D., Boerma , D., Scherf, B., &
Hoffman, I. (2008). Mantener la biodiversidad animal de la evaluación a la acción.
Biodiversity, 14-19.
Rodríguez, G., Zaragoza, M., & Perezgrovas, G. (2011). Cambio climático: definiciones
internacionales usadas en contra de la conservación de los recursos
zoogenéticos. Actas Iberoamericanas de Conservación Animal, (1). 342-346.
Sawicka, D., Bednarczyk, M., & Brzezinzka, J. (2011). Cryoconservation of embryonic
cells and gametes as a poultry biodiversity preservation method. Folia Biologica,
59 (1-2). 1-5.
Sharma, D., & Sharma, T. (2013). Biotechnological approaches for biodiversity
conservation. Indian Journal Science Research, 4 (1). 183-186.
Velásquez, M.D. (2010). La funcion de la biodiversidad para la existencia de agua en el
ecosistema y en el agroecosistema. LEISA Revista de Agroecología, 27(2). 32-35.
AGROPRODUCTIVIDAD

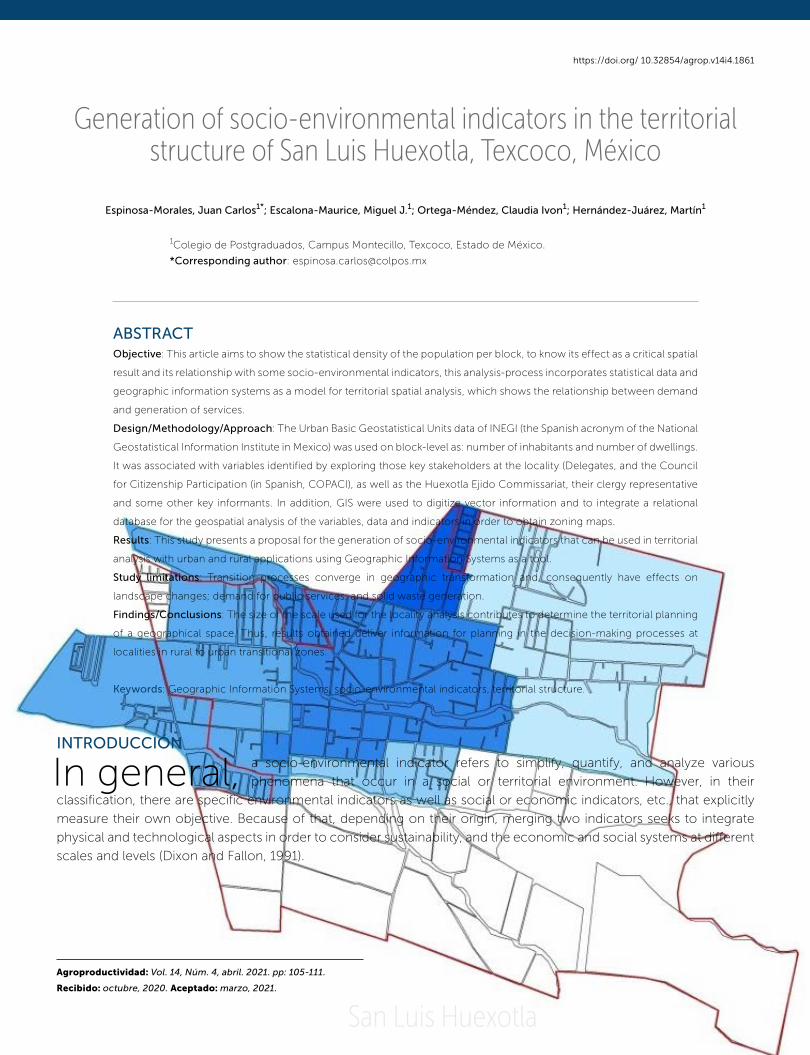
105AGROPRODUCTIVIDAD
Generation of socio-environmental indicators in the territorial structure of San Luis Huexotla, Texcoco, México
Espinosa-Morales, Juan Carlos1*; Escalona-Maurice, Miguel J.1; Ortega-Méndez, Claudia Ivon1; Hernández-Juárez, Martín1
1Colegio de Postgraduados, Campus Montecillo, Texcoco, Estado de México.
*Corresponding author: [email protected]
ABSTRACTObjective: This article aims to show the statistical density of the population per block, to know its effect as a critical spatial
result and its relationship with some socio-environmental indicators, this analysis-process incorporates statistical data and
geographic information systems as a model for territorial spatial analysis, which shows the relationship between demand
and generation of services.
Design/Methodology/Approach: The Urban Basic Geostatistical Units data of INEGI (the Spanish acronym of the National
Geostatistical Information Institute in Mexico) was used on block-level as: number of inhabitants and number of dwellings.
It was associated with variables identified by exploring those key stakeholders at the locality (Delegates, and the Council
for Citizenship Participation (in Spanish, COPACI), as well as the Huexotla Ejido Commissariat, their clergy representative
and some other key informants. In addition, GIS were used to digitize vector information and to integrate a relational
database for the geospatial analysis of the variables, data and indicators in order to obtain zoning maps.
Results: This study presents a proposal for the generation of socio-environmental indicators that can be used in territorial
analysis with urban and rural applications using Geographic Information Systems as a tool.
Study limitations: Transition processes converge in geographic transformation and, consequently have effects on
landscape changes; demand for public services; and solid waste generation.
Findings/Conclusions: The size of the scale used for the locality analysis contributes to determine the territorial planning
of a geographical space. Thus, results obtained deliver information for planning in the decision-making processes at
localities in rural to urban transitional zones.
Keywords: Geographic Information Systems, socio-environmental indicators, territorial structure.
INTRODUCCIÓN
In general, a socio-environmental indicator refers to simplify, quantify, and analyze various
phenomena that occur in a social or territorial environment. However, in their
classification, there are specific environmental indicators as well as social or economic indicators, etc., that explicitly
measure their own objective. Because of that, depending on their origin, merging two indicators seeks to integrate
physical and technological aspects in order to consider sustainability, and the economic and social systems at different
scales and levels (Dixon and Fallon, 1991).
https://doi.org/ 10.32854/agrop.v14i4.1861
Agroproductividad: Vol. 14, Núm. 4, abril. 2021. pp: 105-111.
Recibido: octubre, 2020. Aceptado: marzo, 2021.
San Luis Huexotla
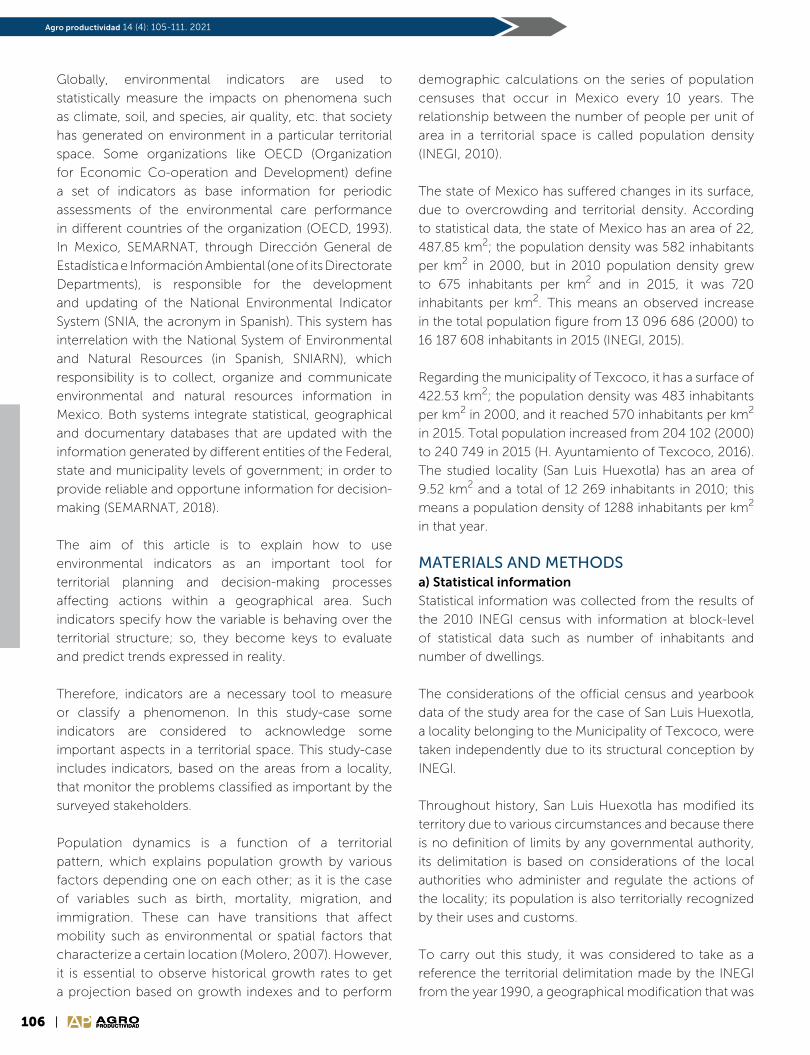
106 AGROPRODUCTIVIDADAGROPRODUCTIVIDAD
Biofertilizantes y producción de caña de azúcarAgro productividad 14 (4): 105-111. 2021
Globally, environmental indicators are used to
statistically measure the impacts on phenomena such
as climate, soil, and species, air quality, etc. that society
has generated on environment in a particular territorial
space. Some organizations like OECD (Organization
for Economic Co-operation and Development) define
a set of indicators as base information for periodic
assessments of the environmental care performance
in different countries of the organization (OECD, 1993).
In Mexico, SEMARNAT, through Dirección General de
Estadística e Información Ambiental (one of its Directorate
Departments), is responsible for the development
and updating of the National Environmental Indicator
System (SNIA, the acronym in Spanish). This system has
interrelation with the National System of Environmental
and Natural Resources (in Spanish, SNIARN), which
responsibility is to collect, organize and communicate
environmental and natural resources information in
Mexico. Both systems integrate statistical, geographical
and documentary databases that are updated with the
information generated by different entities of the Federal,
state and municipality levels of government; in order to
provide reliable and opportune information for decision-
making (SEMARNAT, 2018).
The aim of this article is to explain how to use
environmental indicators as an important tool for
territorial planning and decision-making processes
affecting actions within a geographical area. Such
indicators specify how the variable is behaving over the
territorial structure; so, they become keys to evaluate
and predict trends expressed in reality.
Therefore, indicators are a necessary tool to measure
or classify a phenomenon. In this study-case some
indicators are considered to acknowledge some
important aspects in a territorial space. This study-case
includes indicators, based on the areas from a locality,
that monitor the problems classified as important by the
surveyed stakeholders.
Population dynamics is a function of a territorial
pattern, which explains population growth by various
factors depending one on each other; as it is the case
of variables such as birth, mortality, migration, and
immigration. These can have transitions that affect
mobility such as environmental or spatial factors that
characterize a certain location (Molero, 2007). However,
it is essential to observe historical growth rates to get
a projection based on growth indexes and to perform
demographic calculations on the series of population
censuses that occur in Mexico every 10 years. The
relationship between the number of people per unit of
area in a territorial space is called population density
(INEGI, 2010).
The state of Mexico has suffered changes in its surface,
due to overcrowding and territorial density. According
to statistical data, the state of Mexico has an area of 22,
487.85 km2; the population density was 582 inhabitants
per km2 in 2000, but in 2010 population density grew
to 675 inhabitants per km2 and in 2015, it was 720
inhabitants per km2. This means an observed increase
in the total population figure from 13 096 686 (2000) to
16 187 608 inhabitants in 2015 (INEGI, 2015).
Regarding the municipality of Texcoco, it has a surface of
422.53 km2; the population density was 483 inhabitants
per km2 in 2000, and it reached 570 inhabitants per km2
in 2015. Total population increased from 204 102 (2000)
to 240 749 in 2015 (H. Ayuntamiento of Texcoco, 2016).
The studied locality (San Luis Huexotla) has an area of
9.52 km2 and a total of 12 269 inhabitants in 2010; this
means a population density of 1288 inhabitants per km2
in that year.
MATERIALS AND METHODS a) Statistical information
Statistical information was collected from the results of
the 2010 INEGI census with information at block-level
of statistical data such as number of inhabitants and
number of dwellings.
The considerations of the official census and yearbook
data of the study area for the case of San Luis Huexotla,
a locality belonging to the Municipality of Texcoco, were
taken independently due to its structural conception by
INEGI.
Throughout history, San Luis Huexotla has modified its
territory due to various circumstances and because there
is no definition of limits by any governmental authority,
its delimitation is based on considerations of the local
authorities who administer and regulate the actions of
the locality; its population is also territorially recognized
by their uses and customs.
To carry out this study, it was considered to take as a
reference the territorial delimitation made by the INEGI
from the year 1990, a geographical modification that was

107AGROPRODUCTIVIDAD
Espinosa-Morales et al. (2021)
Figure 1. Historical population growth at San Luis Huexotla (Espinosa, 2017).
0
2,000
4,000
6,000
8,000
10,000
12,000
14,000
1526 1548 1569 1570 1623 1698 1895 1900 1910 1921 1930 1940 1950 1960 1970 1980 1990 2000 2005 2010
10,000
1771 2005 20001109
668 350 685 466 564 661 720 8201262
2539
3681
7079
999210970
12269
implemented by that Institute, in order to guarantee the
national geographic coverage of the General Census of
Population and Housing No. XI. It is stated as well, that in
cases such as Huexotla which had some modifications,
this data had a code number and statistical information
registered. However, such coded data were discarded in
1980, and Huexotla was integrated as a conurbation into
the Municipality of Texcoco de Mora, México (Figure 1).
Due to the merging and subsequent integration as a
metropolitan area, Huexotla lost its code and name in the
National Geostatistical Framework (Marco Geoestadístico
Nacional) and became a part of the urban Texcoco,
thus sharing features of a population greater than 2500
inhabitants. The division of geostatistical areas includes
three levels of desegregation: state (AGEE), municipal
(AGEM) and basic (AGEB), the latter divided into rural and
urban (INEGI, 2010b). Huexotla is territorially integrated
by 5 urban AGEBs (basic geostatistical units), and rural/
Ejidal zones, delimited as (Figure 2).
b) Interviews with local key informants
To obtain additional information in this research, we
resorted looking for stakeholders within the locality
(a.k.a., key informants), who have privileged information
that will allow understanding some important elements
of the locality. By applying 50
surveys taking a sample from
a total of 181 ejidatarios. The
key informants according to
Martínez (1991) are those “people
with special knowledge, status
and good information capacity”.
In our selection, the informants
considered pertinent to address
the research topic were some
auxiliary authorities (Delegates),
the former commissariate of the
ejido, historians at the locality,
clergy representative, the
commissioned anthropologist in
the INAH zone. The information
obtained with each of the
key stakeholders helped to
determine four indicators
(population density, housing,
water consumption, and solid
waste production).Figure 2. Map of urban and rural geostatistical areas of San Luis Huexotla.
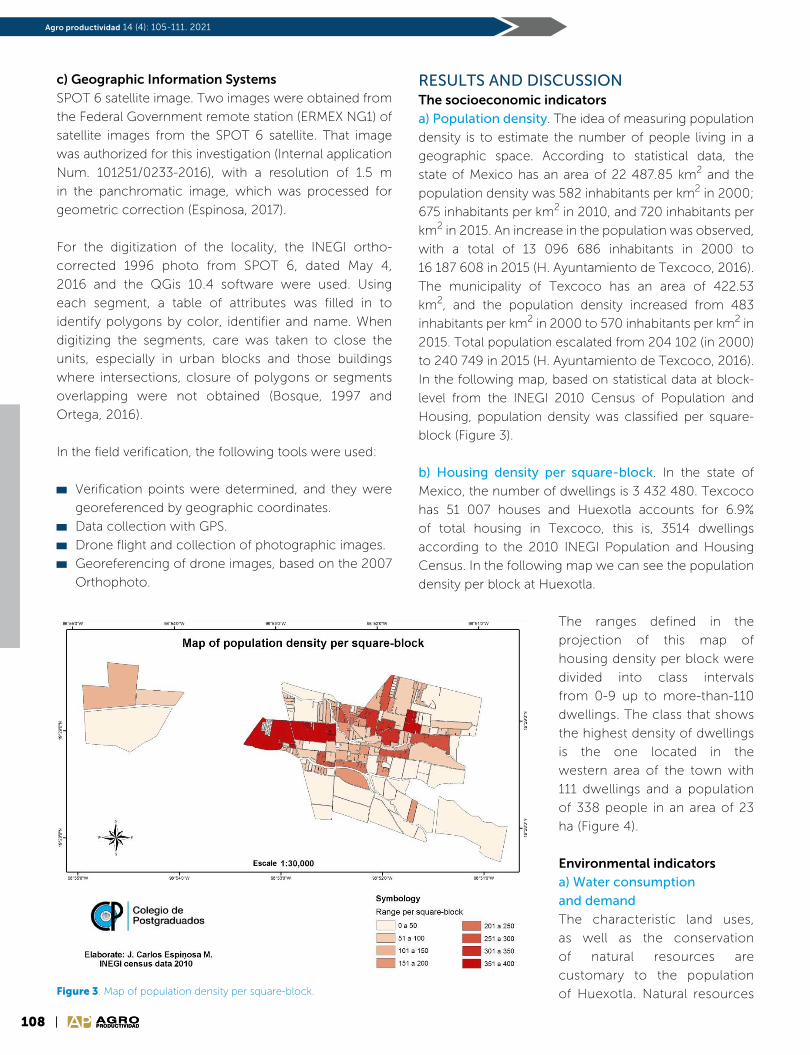
108 AGROPRODUCTIVIDADAGROPRODUCTIVIDAD
Biofertilizantes y producción de caña de azúcarAgro productividad 14 (4): 105-111. 2021
c) Geographic Information Systems
SPOT 6 satellite image. Two images were obtained from
the Federal Government remote station (ERMEX NG1) of
satellite images from the SPOT 6 satellite. That image
was authorized for this investigation (Internal application
Num. 101251/0233-2016), with a resolution of 1.5 m
in the panchromatic image, which was processed for
geometric correction (Espinosa, 2017).
For the digitization of the locality, the INEGI ortho-
corrected 1996 photo from SPOT 6, dated May 4,
2016 and the QGis 10.4 software were used. Using
each segment, a table of attributes was filled in to
identify polygons by color, identifier and name. When
digitizing the segments, care was taken to close the
units, especially in urban blocks and those buildings
where intersections, closure of polygons or segments
overlapping were not obtained (Bosque, 1997 and
Ortega, 2016).
In the field verification, the following tools were used:
Verification points were determined, and they were
georeferenced by geographic coordinates.
Data collection with GPS.
Drone flight and collection of photographic images.
Georeferencing of drone images, based on the 2007
Orthophoto.
RESULTS AND DISCUSSION The socioeconomic indicators
a) Population density. The idea of measuring population
density is to estimate the number of people living in a
geographic space. According to statistical data, the
state of Mexico has an area of 22 487.85 km2 and the
population density was 582 inhabitants per km2 in 2000;
675 inhabitants per km2 in 2010, and 720 inhabitants per
km2 in 2015. An increase in the population was observed,
with a total of 13 096 686 inhabitants in 2000 to
16 187 608 in 2015 (H. Ayuntamiento de Texcoco, 2016).
The municipality of Texcoco has an area of 422.53
km2, and the population density increased from 483
inhabitants per km2 in 2000 to 570 inhabitants per km2 in
2015. Total population escalated from 204 102 (in 2000)
to 240 749 in 2015 (H. Ayuntamiento de Texcoco, 2016).
In the following map, based on statistical data at block-
level from the INEGI 2010 Census of Population and
Housing, population density was classified per square-
block (Figure 3).
b) Housing density per square-block. In the state of
Mexico, the number of dwellings is 3 432 480. Texcoco
has 51 007 houses and Huexotla accounts for 6.9%
of total housing in Texcoco, this is, 3514 dwellings
according to the 2010 INEGI Population and Housing
Census. In the following map we can see the population
density per block at Huexotla.
The ranges defined in the
projection of this map of
housing density per block were
divided into class intervals
from 0-9 up to more-than-110
dwellings. The class that shows
the highest density of dwellings
is the one located in the
western area of the town with
111 dwellings and a population
of 338 people in an area of 23
ha (Figure 4).
Environmental indicators
a) Water consumption
and demand
The characteristic land uses,
as well as the conservation
of natural resources are
customary to the population
of Huexotla. Natural resources Figure 3. Map of population density per square-block.
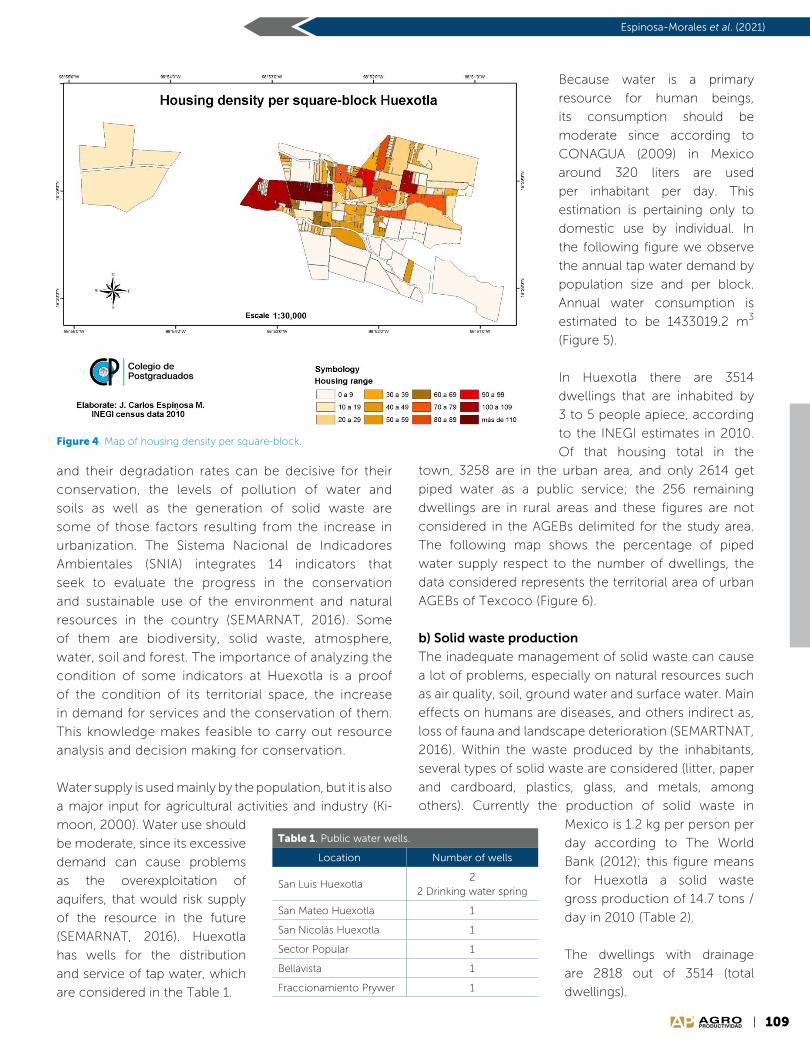
109AGROPRODUCTIVIDAD
Espinosa-Morales et al. (2021)
and their degradation rates can be decisive for their
conservation, the levels of pollution of water and
soils as well as the generation of solid waste are
some of those factors resulting from the increase in
urbanization. The Sistema Nacional de Indicadores
Ambientales (SNIA) integrates 14 indicators that
seek to evaluate the progress in the conservation
and sustainable use of the environment and natural
resources in the country (SEMARNAT, 2016). Some
of them are biodiversity, solid waste, atmosphere,
water, soil and forest. The importance of analyzing the
condition of some indicators at Huexotla is a proof
of the condition of its territorial space, the increase
in demand for services and the conservation of them.
This knowledge makes feasible to carry out resource
analysis and decision making for conservation.
Water supply is used mainly by the population, but it is also
a major input for agricultural activities and industry (Ki-
moon, 2000). Water use should
be moderate, since its excessive
demand can cause problems
as the overexploitation of
aquifers, that would risk supply
of the resource in the future
(SEMARNAT, 2016). Huexotla
has wells for the distribution
and service of tap water, which
are considered in the Table 1.
Figure 4. Map of housing density per square-block.
Because water is a primary
resource for human beings,
its consumption should be
moderate since according to
CONAGUA (2009) in Mexico
around 320 liters are used
per inhabitant per day. This
estimation is pertaining only to
domestic use by individual. In
the following figure we observe
the annual tap water demand by
population size and per block.
Annual water consumption is
estimated to be 1433019.2 m3
(Figure 5).
In Huexotla there are 3514
dwellings that are inhabited by
3 to 5 people apiece, according
to the INEGI estimates in 2010.
Of that housing total in the
town, 3258 are in the urban area, and only 2614 get
piped water as a public service; the 256 remaining
dwellings are in rural areas and these figures are not
considered in the AGEBs delimited for the study area.
The following map shows the percentage of piped
water supply respect to the number of dwellings, the
data considered represents the territorial area of urban
AGEBs of Texcoco (Figure 6).
b) Solid waste production
The inadequate management of solid waste can cause
a lot of problems, especially on natural resources such
as air quality, soil, ground water and surface water. Main
effects on humans are diseases, and others indirect as,
loss of fauna and landscape deterioration (SEMARTNAT,
2016). Within the waste produced by the inhabitants,
several types of solid waste are considered (litter, paper
and cardboard, plastics, glass, and metals, among
others). Currently the production of solid waste in
Mexico is 1.2 kg per person per
day according to The World
Bank (2012); this figure means
for Huexotla a solid waste
gross production of 14.7 tons /
day in 2010 (Table 2).
The dwellings with drainage
are 2818 out of 3514 (total
dwellings).
Table 1. Public water wells.
Location Number of wells
San Luis Huexotla2
2 Drinking water spring
San Mateo Huexotla 1
San Nicolás Huexotla 1
Sector Popular 1
Bellavista 1
Fraccionamiento Prywer 1
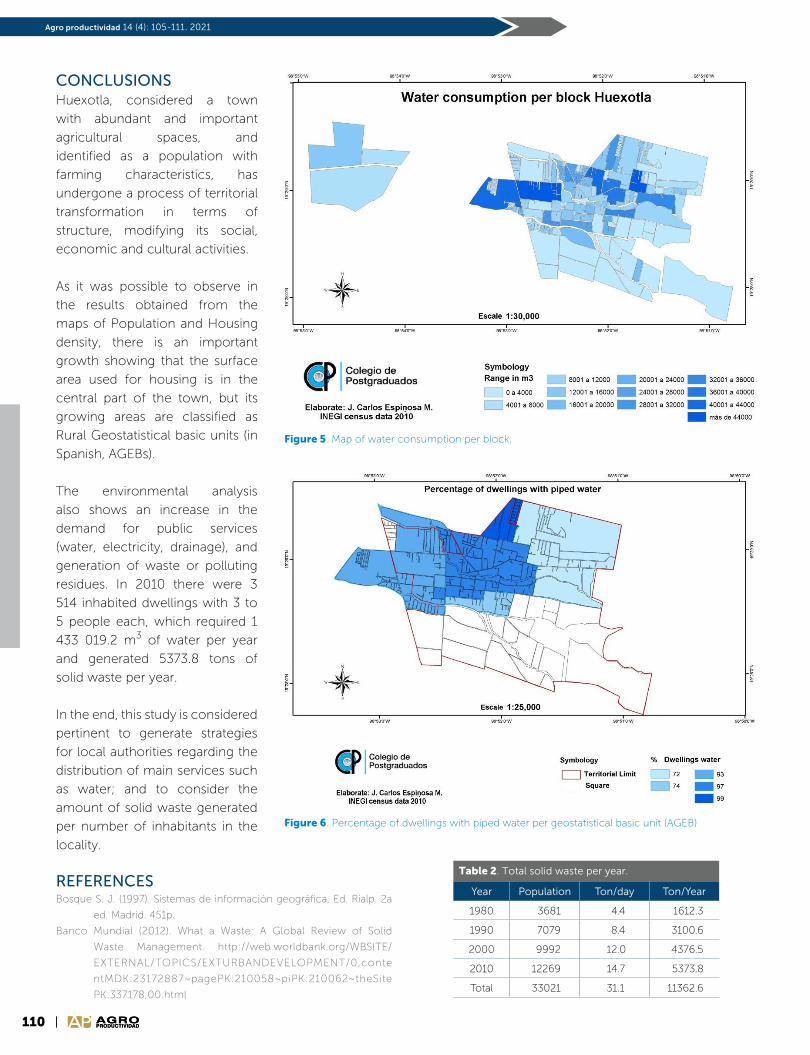
110 AGROPRODUCTIVIDADAGROPRODUCTIVIDAD
Biofertilizantes y producción de caña de azúcarAgro productividad 14 (4): 105-111. 2021
Table 2. Total solid waste per year.
Year Population Ton/day Ton/Year
1980 3681 4.4 1612.3
1990 7079 8.4 3100.6
2000 9992 12.0 4376.5
2010 12269 14.7 5373.8
Total 33021 31.1 11362.6
Figure 6. Percentage of dwellings with piped water per geostatistical basic unit (AGEB)
Figure 5. Map of water consumption per block.
CONCLUSIONSHuexotla, considered a town
with abundant and important
agricultural spaces, and
identified as a population with
farming characteristics, has
undergone a process of territorial
transformation in terms of
structure, modifying its social,
economic and cultural activities.
As it was possible to observe in
the results obtained from the
maps of Population and Housing
density, there is an important
growth showing that the surface
area used for housing is in the
central part of the town, but its
growing areas are classified as
Rural Geostatistical basic units (in
Spanish, AGEBs).
The environmental analysis
also shows an increase in the
demand for public services
(water, electricity, drainage), and
generation of waste or polluting
residues. In 2010 there were 3
514 inhabited dwellings with 3 to
5 people each, which required 1
433 019.2 m3 of water per year
and generated 5373.8 tons of
solid waste per year.
In the end, this study is considered
pertinent to generate strategies
for local authorities regarding the
distribution of main services such
as water; and to consider the
amount of solid waste generated
per number of inhabitants in the
locality.
REFERENCESBosque S. J. (1997). Sistemas de información geográfica, Ed. Rialp. 2a
ed. Madrid. 451p.
Banco Mundial (2012). What a Waste: A Global Review of Solid
Waste Management. http://web.worldbank.org/WBSITE/
EXTERNAL/TOPICS/EXTURBANDEVELOPMENT/0,conte
ntMDK:23172887~pagePK:210058~piPK:210062~theSite
PK:337178,00.html
111AGROPRODUCTIVIDAD
Espinosa-Morales et al. (2021)
CONAGUA (2009). Y tú, ¿Derrochas el agua? Revista del Consumidor en línea. Posted 26
octubre. Consultado en: http://revistadelconsumidor.gob.mx/?p=5226.
Dixon, J.A. y Fallon, L.A. (1991) El concepto de sustentabilidad: sus orígenes, alcance y
utilidad en la formulación de políticas», Desarrollo y medio ambiente Vidal, J. (Comp.),
Santiago de Chile, CIEPLAN.
Espinosa Morales J.C., Escalona Maurice M.J., Fernández Ordoñez Y.M., (2017) Análisis
territorial mediante un modelo cartográfico en San Luis Huexotla, Texcoco México.
Revista Agroproductividad Vol. 10, Núm. 5. Pp:77-85.
H. Ayuntamiento de Texcoco (2016). Plan de Desarrollo Municipal de Texcoco 2016 - 2018
INEGI, (2010). Censos Generales de Población y Vivienda 1980, 1990, 2000 y 2010.
INEGI (2010b). Áreas Geoestadísticas Básicas Rurales y Urbanas. INEGI, México.
INEGI (2015). Encuesta Intercensal. México.
Ki-moon Ban (2000). El agua es vida. Artículo de opinión. Naciones Unidas. Consultado en:
http://www.cinu.org.mx/prensa/opeds/2008OPEDaguaesvida.html
López, B. J.; Rodríguez G. M. L. 2008. Desarrollo de indicadores ambientales y de
sustentabilidad en México. Instituto de Geografía, UNAM. P 21.
Martínez, M. (1991). La investigación cualitativa etnográfica en educación: Manual teórico
práctico. Venezuela. Texto.
Molero M. E., Grindlay Moreno, A. L. Asensio Rodríguez, J. J. (2007): “Escenarios de aptitud y
modelización cartográfica del crecimiento urbano mediante técnicas de evaluación
multicriterio”, GeoFocus (Artículos), nº 7, p. 120- 147. ISSN: 1578-5157.
OCDE (1993). Indicators for the Integration of Environmental Concerns into Energy Policies.
Environment Monographs 79. France.
Ortega Pérez E., Martin Ramos R., Ezquerra Canalejo A., Otero Pastor I., (2016). Sistemas de
Información Geográfica. Teoría y Práctica. Drextra. España.
SEMARNAT (2016). Sistema Nacional de Indicadores Ambientales (SNIA). México.
SEMARNAT (2018). Informe de la situación de Medio Ambiente en México. “Compendio de
estadísticas ambientales, Indicadores clave, desempeño ambiental y crecimiento
verde.
AGROPRODUCTIVIDAD

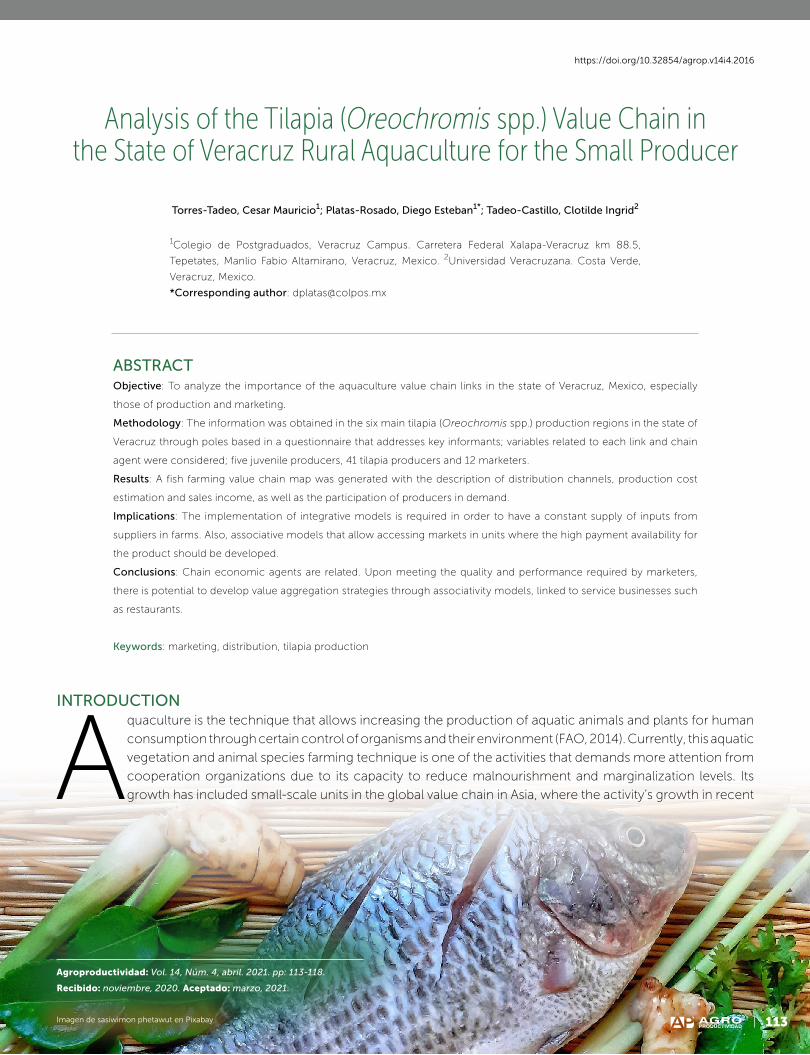
113AGROPRODUCTIVIDAD
https://doi.org/10.32854/agrop.v14i4.2016
Agroproductividad: Vol. 14, Núm. 4, abril. 2021. pp: 113-118.
Recibido: noviembre, 2020. Aceptado: marzo, 2021.
Analysis of the Tilapia (Oreochromis spp.) Value Chain in the State of Veracruz Rural Aquaculture for the Small Producer
Torres-Tadeo, Cesar Mauricio1; Platas-Rosado, Diego Esteban1*; Tadeo-Castillo, Clotilde Ingrid2
1Colegio de Postgraduados, Veracruz Campus. Carretera Federal Xalapa-Veracruz km 88.5,
Tepetates, Manlio Fabio Altamirano, Veracruz, Mexico. 2Universidad Veracruzana. Costa Verde,
Veracruz, Mexico.
*Corresponding author: [email protected]
ABSTRACTObjective: To analyze the importance of the aquaculture value chain links in the state of Veracruz, Mexico, especially
those of production and marketing.
Methodology: The information was obtained in the six main tilapia (Oreochromis spp.) production regions in the state of
Veracruz through poles based in a questionnaire that addresses key informants; variables related to each link and chain
agent were considered; five juvenile producers, 41 tilapia producers and 12 marketers.
Results: A fish farming value chain map was generated with the description of distribution channels, production cost
estimation and sales income, as well as the participation of producers in demand.
Implications: The implementation of integrative models is required in order to have a constant supply of inputs from
suppliers in farms. Also, associative models that allow accessing markets in units where the high payment availability for
the product should be developed.
Conclusions: Chain economic agents are related. Upon meeting the quality and performance required by marketers,
there is potential to develop value aggregation strategies through associativity models, linked to service businesses such
as restaurants.
Keywords: marketing, distribution, tilapia production
INTRODUCTION
Aquaculture is the technique that allows increasing the production of aquatic animals and plants for human
consumption through certain control of organisms and their environment (FAO, 2014). Currently, this aquatic
vegetation and animal species farming technique is one of the activities that demands more attention from
cooperation organizations due to its capacity to reduce malnourishment and marginalization levels. Its
growth has included small-scale units in the global value chain in Asia, where the activity’s growth in recent
113AGROPRODUCTIVIDAD
Imagen de sasiwimon phetawut en Pixabay
114 AGROPRODUCTIVIDADAGROPRODUCTIVIDAD
Biofertilizantes y producción de caña de azúcarAgro productividad 14 (4): 113-118. 2021
years has been exponential. According to the National
Geography and Statistics Institute (INEGI), in 2019 the
state of Veracruz had 2321 fisheries and aquaculture
units, which accounts to 9.5% with respect to the national
total. Due to its production volume, tilapia (Oreochromis
spp.) is positioned in the fifth position in Mexico and third
in production value. The mean annual growth rate from
2009 to 2018 was of 9.08% (CONAPESCA, 2018). In 2017,
179 900 t of bream-tilapia were produced; out of these,
30 800 t account for sea bream captures and 149 100
t account for tilapia, of which 93 700 t are produced
in aquaculture fisheries consisting in repopulating
dams and inland water bodies; the rest is produced in
controlled systems (Téllez, 2019). The four main tilapia
producing states are Jalisco (20.51%), Chiapas (16.12%),
Veracruz (11.25%) and Michoacán (9.45%) (CONAPESCA,
2018). The aquaculture gross domestic product for 2014
accounted for 3.3%, and it is the lowest economic activity
in the country and does not represent significant growth
(World Bank, 2015).
The value chain methodology applied to aquaculture has
been useful in several regions of the world (Macfadyen
et al., 2012). This model allows assessing problematic
aspects of equal distribution and growth aspects that
favors the poor, benchmarking assessment, costs and
competitiveness, as well as critical points and action
programs. Mayoux et al. (2007)
propose a methodology guideline for
the development of research with this
approach. Among works of this kind,
those of Veliu et al. (2009), Ndanga
(2013), Engle & Stone (2013), Vivanco
et al. (2010), El-Sayed et al. (2015) and
Ponte et al., stand out (2014). As a
baseline for the generation of market
strategies that benefit tilapia value
chain competitiveness in the state, the
objective of analyzing the importance
of aquaculture value chain links in
the State of Veracruz with respect to
production and marketing, through
the value chain approach in the
producing regions of the state of
Veracruz is posed.
MATERIALS AND METHODSThe study was performed from
September to October 2015 in six
administrative regions of the state
Table 1. Regions and municipalities where the types of interviewed producers live.
Region Municipality
Questionnaires
Juvenile Producers
Tilapia Producers
MarketerTotal per Region
Totonaca Papantla 1 1
Nautla
Atzalan 4 4
Martínez de la Torre 4 4
Tlapacoyan 1 1
Capital Emiliano Zapata 2 2
Sotavento
Cotaxtla 1 1 2
Jamapa 1 1
La Antigua 3 3
Manlio F. Altamirano 2 2
Medellín de Bravo 1 11 12
Veracruz 2 12 14
Paso de Ovejas 1 1
Tlalixcoyan 1 2 3
PapaloapanAlvarado 2 4 6
Chacaltianguis 1 1
Olmeca Minatitlan 1 1
Total 58
of Veracruz: Totonaca, Nautla, Capital, Sotavento,
Papaloapan and Olmeca. 46 interviews were made to
producers, biological input suppliers, tilapia feeders and
marketers (Table 1) in the municipalities of Papantla,
Atzalan, Martínez de la Torre, Tlapacoyan, Emiliano
Zapata, Cotaxtla, Jamapa, La Antigua, Manlio Fabio
Altamirano, Medellín de Bravo, Veracruz, Paso de
Ovejas, Tlalixcoyan, Alvarado, Chacaltianguis and
Minatitlán.
The methodological proposal was based on the input by
Tallec & Bockel (2005) upon considering elements for a
value chain analysis from a functional perspective, hence
addressed through flow charts and a baseline economic
analysis. Modernization proposals in economic agents
foresee market strategies that correspond to market
strategies posed by Sandhusen (2002).
Farms were classified based on Reta’s typology (2009).
The main aquaculture value chain links of Oreochromis
spp. were identified and structured questionnaires were
applied to key informants: producers, researchers,
producer associations, technicians and biological input
suppliers. Also, questionnaires structured with biological
input supplier agents, feeding aquaculture farms and
marketers were used to obtain detailed information
of production volumes through different incurred
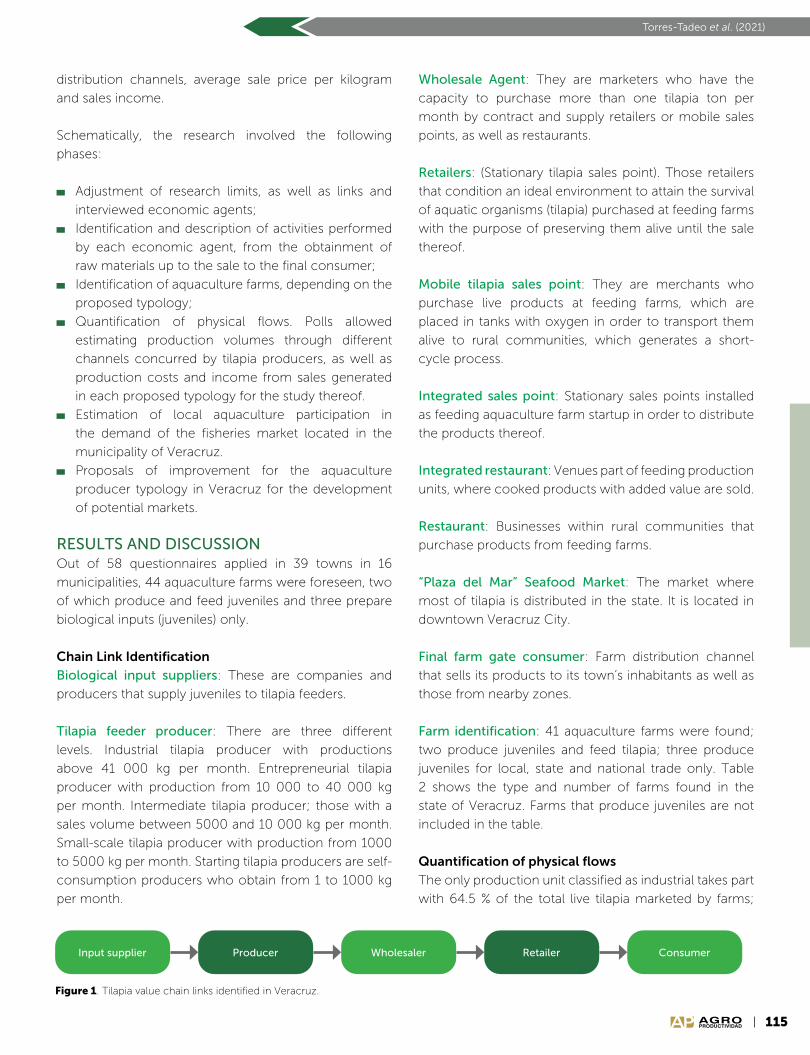
115AGROPRODUCTIVIDAD
Torres-Tadeo et al. (2021)
distribution channels, average sale price per kilogram
and sales income.
Schematically, the research involved the following
phases:
Adjustment of research limits, as well as links and
interviewed economic agents;
Identification and description of activities performed
by each economic agent, from the obtainment of
raw materials up to the sale to the final consumer;
Identification of aquaculture farms, depending on the
proposed typology;
Quantification of physical flows. Polls allowed
estimating production volumes through different
channels concurred by tilapia producers, as well as
production costs and income from sales generated
in each proposed typology for the study thereof.
Estimation of local aquaculture participation in
the demand of the fisheries market located in the
municipality of Veracruz.
Proposals of improvement for the aquaculture
producer typology in Veracruz for the development
of potential markets.
RESULTS AND DISCUSSIONOut of 58 questionnaires applied in 39 towns in 16
municipalities, 44 aquaculture farms were foreseen, two
of which produce and feed juveniles and three prepare
biological inputs (juveniles) only.
Chain Link Identification
Biological input suppliers: These are companies and
producers that supply juveniles to tilapia feeders.
Tilapia feeder producer: There are three different
levels. Industrial tilapia producer with productions
above 41 000 kg per month. Entrepreneurial tilapia
producer with production from 10 000 to 40 000 kg
per month. Intermediate tilapia producer; those with a
sales volume between 5000 and 10 000 kg per month.
Small-scale tilapia producer with production from 1000
to 5000 kg per month. Starting tilapia producers are self-
consumption producers who obtain from 1 to 1000 kg
per month.
Wholesale Agent: They are marketers who have the
capacity to purchase more than one tilapia ton per
month by contract and supply retailers or mobile sales
points, as well as restaurants.
Retailers: (Stationary tilapia sales point). Those retailers
that condition an ideal environment to attain the survival
of aquatic organisms (tilapia) purchased at feeding farms
with the purpose of preserving them alive until the sale
thereof.
Mobile tilapia sales point: They are merchants who
purchase live products at feeding farms, which are
placed in tanks with oxygen in order to transport them
alive to rural communities, which generates a short-
cycle process.
Integrated sales point: Stationary sales points installed
as feeding aquaculture farm startup in order to distribute
the products thereof.
Integrated restaurant: Venues part of feeding production
units, where cooked products with added value are sold.
Restaurant: Businesses within rural communities that
purchase products from feeding farms.
“Plaza del Mar” Seafood Market: The market where
most of tilapia is distributed in the state. It is located in
downtown Veracruz City.
Final farm gate consumer: Farm distribution channel
that sells its products to its town’s inhabitants as well as
those from nearby zones.
Farm identification: 41 aquaculture farms were found;
two produce juveniles and feed tilapia; three produce
juveniles for local, state and national trade only. Table
2 shows the type and number of farms found in the
state of Veracruz. Farms that produce juveniles are not
included in the table.
Quantification of physical flows
The only production unit classified as industrial takes part
with 64.5 % of the total live tilapia marketed by farms;
Figure 1. Tilapia value chain links identified in Veracruz.
Input supplier Producer Wholesaler Retailer Consumer

116 AGROPRODUCTIVIDADAGROPRODUCTIVIDAD
Biofertilizantes y producción de caña de azúcarAgro productividad 14 (4): 113-118. 2021
that is, 66 666 kg per month. Entrepreneurial-type farms
take part with 29.1% of the volume (30 118 kg per month);
intermediate type participate with 3.6% (3700 kg per
month); small-scale with 2.5% (2532 kg per month); self-
consumption or startups barely participate with 0.3%.
Aquaculture farms generating biological inputs produce
3.3 million juveniles per month in the territory for the
sale thereof here and in other states of the country.
In tilapia feeding farms, industrial types destine 65.9%
to wholesalers. That is, Plaza del Mar in Veracruz City.
Entrepreneurial-type producers market 4.3% to the
wholesale link and 4.0% to Plaza del Mar. The retailer link,
which sales the product within the chain, accounts for
72.0%, comprising restaurants (6.1%), mobile sales points
(36.9%); stationary sales points (7.2%); integrated sales
points (9.3%) and restaurants integrated to production
units (12.6%). Farm gate sale accounts for 23.6%.
Intermediate tilapia feeders supply 5.8% of the total
production volume for wholesalers; these are represented
by restaurants located in rural areas. Stationary tilapia
sales points account for 10.8%, mobile sale points 6.5%,
restaurants integrated to farms 14.1%, and farm gate
sales 62.8%, and this distribution channel gets most of
sales. Due to their low volume, small-scale producers
are related to three distribution channels: in the retailer
link, restaurants absorb 10.8%; in the retailer link, mobile
sale points take 13.4%; finally, the final consumer farm
gate sales account for 75.8% of sales. Startup or self-
consumption producers consume their own tilapias.
Plaza del Mar sells 142.5 t of tilapia in the Veracruz-Boca
del Río-Medellín metro area; aquaculture participation
of the state in urban demand accounts for 40.8%; the
only company of industrial type supplies 98.2% and
entrepreneurial producers supply 1.8%. In Plaza del Mar,
Table 2. Classification and number of feeding aquaculture farms recorded in the research in the state of Veracruz.
Type of farm Industrial Entrepreneurial Intermediary Small-scale Startup Total
Number 1 14 8 3 12 38
products supplied from outside the state come from
Chiapas (43.1%), Nayarit (8.4%), Mexico City (La Viga
Market, 2.3%), and other marketers (5.4%).
Production costs
According to the Veracruz State Tilapia Master Plan,
the main costs are: Variable costs, attributed to labor,
food, juveniles (breeding), electricity, water, gasoline,
maintenance and telephone; fixed costs refer to
professional salaries, office expenses, construction and
machinery.
Analysis of variable costs
Entrepreneurial-type producers destine 65% of their
variable costs to fish food, which is the main input for
production; intermediate producers destine 56.0% while
small-scale ones destine up to 97.2%. In that same order,
electric power accounts for 28.8%, 21.3% and 2.20% of
variable costs. Last, the cost of juveniles considers 5.3%,
22.7% and 0.6% of costs, respectively. Some farms,
mostly those far away from distribution centers, choose
to reproduce their own offspring; in some cases, small-
scale farms feed juveniles found in feeding ponds.
Sales income
Entrepreneurial typology producers. Eight links are
found with entrepreneurial producers that market their
production (Table 4). They have both mobile sales
points and marketers, and these represents the highest
sales income (31.48%) and their income adds up to
MX$527 682 per month.
Intermediate typology producers. As shown in Table
5, intermediate production units showed commercial
relations among five distribution channels; based on sales,
the most relevant one is the farm gate sale, followed by
restaurants integrated to aquaculture farms and, in third
place, stationary sales points.
Small-scale typology producers
Small-scale producers market tilapia
within three distribution channels. 8.52%
for restaurants (MX$12 000). Mobile
sales points account for 9.95% of their
income (MX$14 000), and farm gate
Table 3. Unitary production costs per state tilapia producer typology.
Entrepreneurial Intermediate Small-scale
Average variable cost (MX$) 33.40 36.60 50.71
Average fixed cost (MX$) 8.28 19.66 14.74
Unitary total cost (MX$) 41.68 56.26 65.44
Average sale price (MX$) 51.66 68.17 50.46
Gross margin (MX$) 9.98 11.91 14.98
117AGROPRODUCTIVIDAD
Torres-Tadeo et al. (2021)
sales account for the main income source (81.52 %). The
total monthly sales amount to MX$140 691 for 2232 kg
(Table 6).
DISCUSSIONThe agent involved in the industrial typology tilapia
value chain shows an orientation toward the wholesale
market; the sale price that they get is the lowest one in
all the above mentioned typologies and they access the
Fisheries Market or Plaza del Mar in Veracruz City, which
demand the highest production volumes in the state.
According to Trienekens (2011), market access sought
by producers in developing countries depends mostly
on technological capabilities, available infrastructures,
Table 4. Monthly marketing in entrepreneurial typology producers.
Trade linksAverage sale price (MX$)
Monthly sales (kg)
Income (%)Sales income
(MX$)
PVTVCP 43.00 100 0.25 4 300
Plaza del Mar 35.00 1200 2.50 42 000
Restaurant 38.60 1850 5.46 91 600
Mobile PVTV 47.00 11 100 31.48 527 682
Stationary PVTV 50.52 2175 6.71 112 525
Integrated PVTV 60.00 2800 10.24 168 000
Integrated restaurant 84.00 3796 20.30 340 261
Farm Gate 55.42 7097 23.24 389 525
Total 62.49 15 868 100.00 1 672 893
*PVTCP (Colegio de Postgraduados’ Tilapia Sales Point), a rural innovation project with public financing implemented in certain towns of Veracruz to promote tilapia marketing and consumption. PVTV (Live Tilapia Sales Point).
Table 5. Monthly marketing in intermediate typology producers.
Trade linksAverage sale price (MX$)
Sales volume (kg)
Income (%) Sales income (MX$)
Restaurant 50.00 215 4.53 10 750
Mobile PVTV 50.52 240 6.07 18 000
Stationary PVTV 45.00 400 7.59 14 400
Integrated restaurant 84.00 520 28.52 67 600
Farm Gate 55.42 2325 53.26 126 225
Total 56.99 3700 100.00 236 975
Table 6. Monthly marketing in small-scale typology producers.
Trade linksAverage sale price (MX$)
Sales volume (kg) Income (%)Sales income
(MX$)
Restaurant 50.00 240 8.52 12 000
Mobile PVTV 47.00 300 9.95 14 000
Farm Gate 54.38 1692 81.52 114 691
Total 50.46 2232 100.00 140 691
negotiation capacity, as well
as market knowledge and
advice. The farm has a single-
segment strategy, according
to Stanton et al. (1980), which
involves choosing the goal
of a single open segment
in the whole market, with a
mixture of marketing in order
to reach that single segment.
Farms that manage to keep
production through high
investments decide to supply
markets where the sale price is
substantially lower (MX$20.00
cheaper) than the average
pool gate price. In relation
to the wholesale link, among
entrepreneurial producers, on-
farm sales account only to one
fourth of sales. According to
Asche et al. (2001), the market
structure is important for the
potential growth in aquaculture
production, as the channels that
demands lower tilapia volumes
are those that offer a higher
price for producers. Within
the entrepreneurial typology,
retail sales represent the most
important link; mobile sale points
contribute with 3/10 of the total
income. These marketers have
a rapid product capacity in rural
areas and purchase live tilapia at
aquaculture farms very frequently.
The sale price for final consumers in rural zones is higher
than the one offered at the fisheries market. Tilapia sale
points integrated to farms were identified. According
to Sandhusen (2002) this is called an integrated growth
strategy and occurs whenever the company increases
its control on its distribution system. Also farms that
provide added value to their products upon integrating
restaurants to their production units were found.
Intermediate typology tilapia producer sales are mostly
made through the farm gate distribution channel. This
represents half of the total income in the classification,
as well as integrated restaurants that account for 3/10 of
their income. This shows horizontal integration strategies
118 AGROPRODUCTIVIDADAGROPRODUCTIVIDAD
Biofertilizantes y producción de caña de azúcarAgro productividad 14 (4): 113-118. 2021
in a group of tilapia feeders upon purchasing live tilapias
among themselves at a preferential price in case their
farm stock were depleted. Small-scale aquaculture farms
foresee most of their income from farm gate sales:
Finally, starting producers produce only for their family’s
consumption and sale to neighbors from their own
communities.
CONCLUSIONSAquaculture farmers determine the number of
distribution channels depending on their sales volume.
Upon having a farm gate sale incapacity when having a
high production level; that is, when the offer outweighs
the local demand, the amount of distribution channels
and physical flows to each of them increases. Market
strategies identified among producers seek to keep
constant sales beyond the obtainment of higher
income through the addition of value to production.
The implementation of integration models may supply
constant inputs to farms from suppliers. Also, association
models that allow accessing or developing markets with
a greater availability of better payments for products
should be developed.
REFERENCESAsche, F. T. Bjørndal, & J. A. Young. (2001). Market interactions for
aquaculture products. Aquaculture Economics & Management,
5 (5-6): 303-318.
Banco Mundial. (2015). Economía y crecimiento. www.bancomundial.org
CONAPESCA (Comisión Nacional de Acuacultura y Pesca). (2018).
Anuario Estadístico de Acuacultura y Pesca 2018. www.
gob.mx/conapesca/documentos/anuario-estadistico-de-
acuacultura-y-pesca
El-Sayed, A.F.M., Dickson, M.W. & El-Naggar, G.O. (2015). Value chain
analysis of the aquaculture feed sector in Egypt. Aquaculture,
437: 92-101.
Engle, C.R., & Stone, N. M. (2013). Competitiveness of US aquaculture
within the current US regulatory framework. Aquaculture
Economics & Management, 17(3), 251-280.
FAO (Organización para la Alimentación y la Agricultura de las Naciones
Unidad). (2014). El estado mundial de la pesca y la acuicultura.
Oportunidades y desafíos. Roma. FAO. 274 p. www.fao.org/3/
a-i3720s.pdf
INEGI (Instituto Nacional de Geografía y Estadística). (2019). Censos
Económicos 2019. www.inegi.org.mx/programas/ce/2019/
Macfadyen, G., Nasr-Alla, A.M., Al-Kenaway, D., Fathi, M., Hebicha,
H., Diab, A.M. & El-Naggar, G. (2012). Value-chain analysis: an
assessment methodology to estimate Egyptian aquaculture
sector performance. Aquaculture, 362: 18-27.
Mayoux, L., & Mackie, G. (2007). Making the strongest links: A
practical guide to mainstreaming gender analysis in value
chain development. www.ilo.org/empent/Publications/
WCMS_106538/lang--en/index.htm
Ndanga, L.Z., Quagrainie, K.K., & Dennis, J.H. (2013). Economically
feasible options for increased women participation in Kenyan
aquaculture value chain.Aquaculture, 414: 183-190.
Ponte, S., Kelling, I., Jespersen, K.S. & Kruijssen, F. (2014). The blue
revolution in Asia: upgrading and governance in aquaculture
value chains. World Development, 64, 52-64.
Reta M, J.L. (2009). Programa maestro tilapia para el Estado
de Veracruz. Colegio de Postgraduados-CONAPESCA.
cadenasproductivas.conapesca.gob.mx/pdf_documentos/
comites/csp/Programa_Maestro_Estatal_Tilapia_Veracruz.pdf
Sandhusen, R.L. (2002). Marketing. Mercadotecnia. México. Compañía
Editorial Continente, S.A. (CECSA) 660 p.
Stanton, W.J., Etzel, M.J., Walker, B.J., Báez, E.P., Martínez, J.F.J.D.,
Nicolesco, J.D. & Garza, A.C. (1980). Fundamentos de
marketing. México. McGraw-Hill. 680 p.
Tallec, F., & Bockel, L. (2005). Commodity chain analysis: constructing the
commodity chain functional analysis and flow charts. Rome. Food
and Agriculture Organization. 22 p. www.fao.org/3/a-bq645e.pdf
Téllez C., M. (2019). 12 de marzo de 2019, El Financiero. México D.F. 46 p.
Trienekens, J.H. (2011). Agricultural value chains in developing countries
a framework for analysis. International Food and Agribusiness
Management Review, 14(2): 51-82.
Veliu, A., N. Gessese, C., Ragasa, & C. Okali. (2009). Gender analysis
of aquaculture value chain in northeast Vietnam and Nigeria.
World Bank agriculture and rural development discussion
paper, 44 p. www.fao.org/3/a-at243e.pdf
Vivanco A., M., Martínez C., F.J. & Taddei B., I.C. (2010). Análisis de
competitividad de cuatro sistema-producto estatales de tilapia
en México. Estudios Sociales 18(35): 165-207.
AGROPRODUCTIVIDAD
119AGROPRODUCTIVIDAD
https://doi.org/10.32854/agrop.v14i4.1840
Agroproductividad: Vol. 14, Núm. 4, abril. 2021. pp: 119-125.
Recibido: septiembre, 2020. Aceptado: marzo, 2021.
Strategy to strengthen the traditional milpa family production systems
Uzcanga-Pérez, Nelda1*; Cano-González, Alejandro2; Cadena-Iñiguez, Pedro3
1Instituto Nacional de Investigaciones Forestales, Agrícolas y Pecuarias, Mocochá, Yucatán,
México. 2INIFAP Dirección Regional del CIR-SURESTE. Mérida, Yucatán, México. 3INIFAP Campo
Experimental Centro de Chiapas, Ocozocoautla de Espinosa, Chiapas, México.
*Corresponding author: [email protected]
ABSTRACTObjective: To characterize family production units (FPUs) to identify critical points for their activities and propose
intervention strategies for them.
Design/methodology/approach: The research took place at Yaxcabá municipality, state of Yucatán, Mexico. It is descriptive
and its information obtained through 1) a questionnaire in a mobile application compatible with the Android operating
system, structured by modules: producer data, FPU characteristics, crops, infrastructure, machinery, equipment, and
marketing. The sample size was randomized with replacement, under the maximum variance condition, 2) assessment
visits to the farmer’s plots and 3) participatory community diagnosis workshops.
Results: The traditional milpa system was oriented to the cultivation of corn, beans and squash of creole origin, for
consumption by the FPUs with minimum technologies usage. Through apiculture, producers obtain an economic
resource to finance other activities, including those of the milpa. It is, therefore, necessary to strengthen their productive
capacities of this activity with a chain approach, for the diversification of their products and derivatives of their hives that
allow their income to increase.
Limitations on study/implications: The proposals and intervention strategies may only be applied to the production
system in the evaluated area.
Findings/conclusions: The strategies for the traditional milpa production should be oriented to food security, biodiversity
preservation and the nutritional health of their related population. Apuculture strategies should aim to include producers
in the value chain.
Keywords: PRODETER, UPF, milpa, rural development, apiculture.
INTRODUCTION
The main objective of the current rural development program in Mexico is to
increase the productivity of family production units (FPUs)
in rural areas, to increase the rural population’s income. For this, four components have been structured: 1) FPUs
119AGROPRODUCTIVIDAD
Imagen de Franz W. en Pixabay
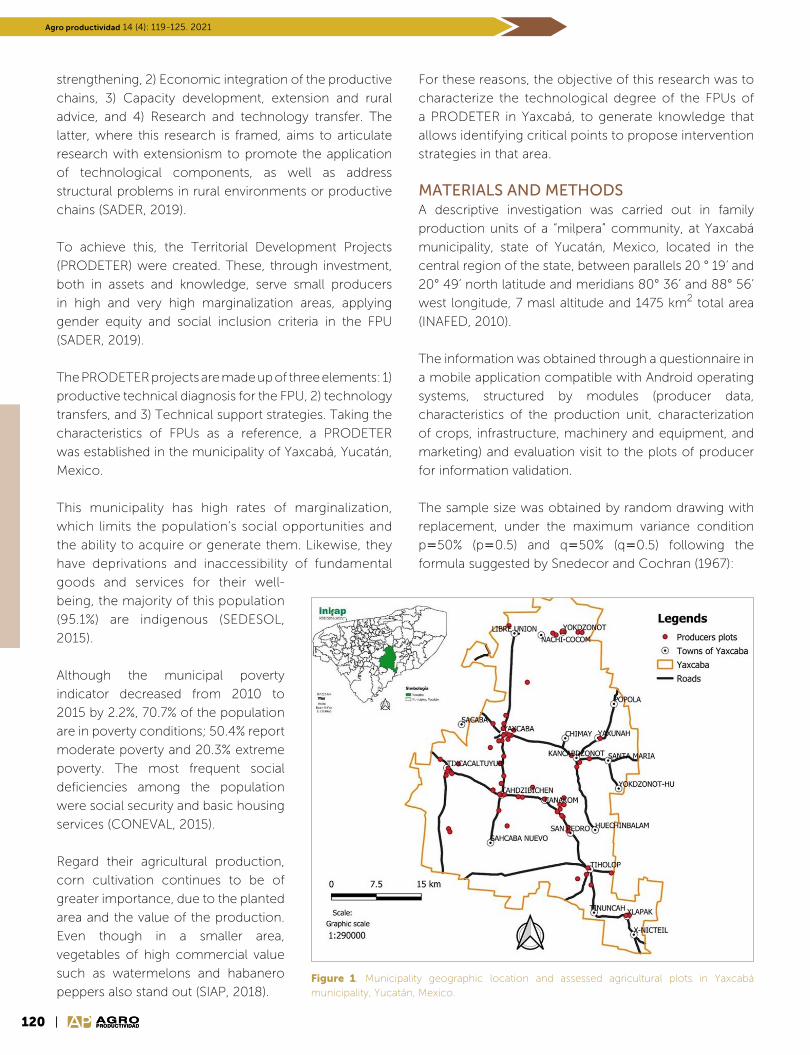
120 AGROPRODUCTIVIDADAGROPRODUCTIVIDAD
Biofertilizantes y producción de caña de azúcarAgro productividad 14 (4): 119-125. 2021
strengthening, 2) Economic integration of the productive
chains, 3) Capacity development, extension and rural
advice, and 4) Research and technology transfer. The
latter, where this research is framed, aims to articulate
research with extensionism to promote the application
of technological components, as well as address
structural problems in rural environments or productive
chains (SADER, 2019).
To achieve this, the Territorial Development Projects
(PRODETER) were created. These, through investment,
both in assets and knowledge, serve small producers
in high and very high marginalization areas, applying
gender equity and social inclusion criteria in the FPU
(SADER, 2019).
The PRODETER projects are made up of three elements: 1)
productive technical diagnosis for the FPU, 2) technology
transfers, and 3) Technical support strategies. Taking the
characteristics of FPUs as a reference, a PRODETER
was established in the municipality of Yaxcabá, Yucatán,
Mexico.
This municipality has high rates of marginalization,
which limits the population’s social opportunities and
the ability to acquire or generate them. Likewise, they
have deprivations and inaccessibility of fundamental
goods and services for their well-
being, the majority of this population
(95.1%) are indigenous (SEDESOL,
2015).
Although the municipal poverty
indicator decreased from 2010 to
2015 by 2.2%, 70.7% of the population
are in poverty conditions; 50.4% report
moderate poverty and 20.3% extreme
poverty. The most frequent social
deficiencies among the population
were social security and basic housing
services (CONEVAL, 2015).
Regard their agricultural production,
corn cultivation continues to be of
greater importance, due to the planted
area and the value of the production.
Even though in a smaller area,
vegetables of high commercial value
such as watermelons and habanero
peppers also stand out (SIAP, 2018).
For these reasons, the objective of this research was to
characterize the technological degree of the FPUs of
a PRODETER in Yaxcabá, to generate knowledge that
allows identifying critical points to propose intervention
strategies in that area.
MATERIALS AND METHODSA descriptive investigation was carried out in family
production units of a “milpera” community, at Yaxcabá
municipality, state of Yucatán, Mexico, located in the
central region of the state, between parallels 20 ° 19’ and
20° 49’ north latitude and meridians 80° 36’ and 88° 56’
west longitude, 7 masl altitude and 1475 km2 total area
(INAFED, 2010).
The information was obtained through a questionnaire in
a mobile application compatible with Android operating
systems, structured by modules (producer data,
characteristics of the production unit, characterization
of crops, infrastructure, machinery and equipment, and
marketing) and evaluation visit to the plots of producer
for information validation.
The sample size was obtained by random drawing with
replacement, under the maximum variance condition
p50% (p0.5) and q50% (q0.5) following the
formula suggested by Snedecor and Cochran (1967):
Figure 1. Municipality geographic location and assessed agricultural plots in Yaxcabá municipality, Yucatán, Mexico.
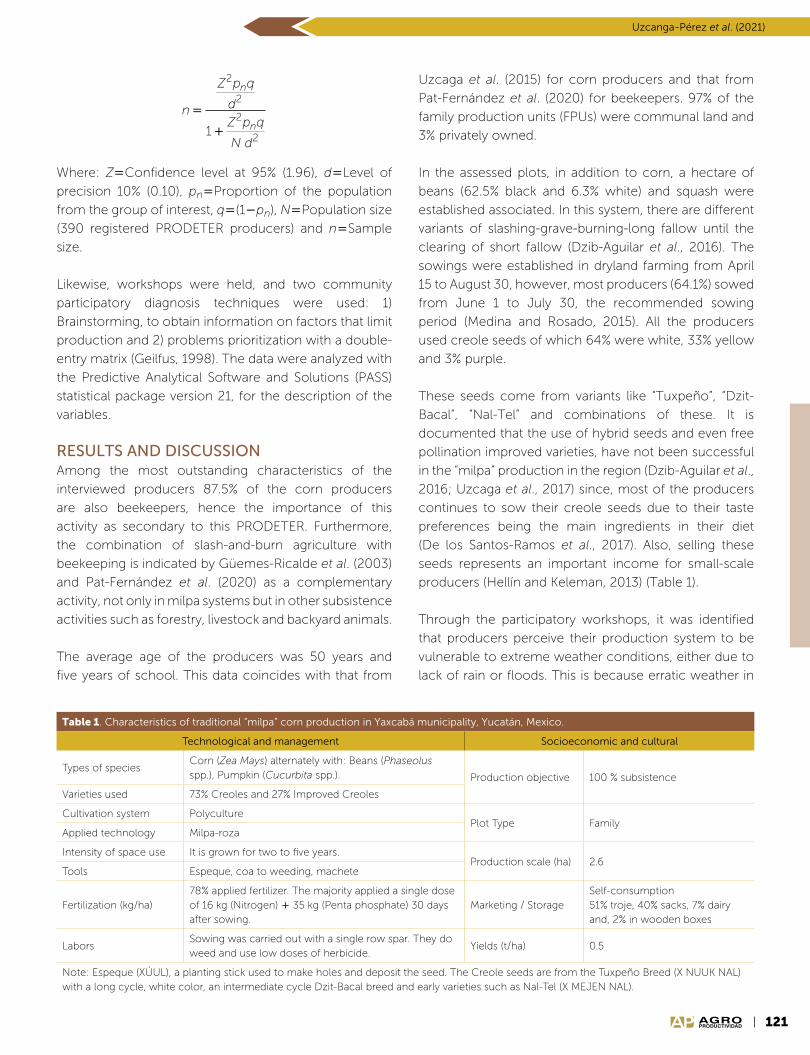
121AGROPRODUCTIVIDAD
Uzcanga-Pérez et al. (2021)
n
Z p q
d
Z p q
N d
n
n
=
+
2
2
2
21
Where: ZConfidence level at 95% (1.96), dLevel of
precision 10% (0.10), pnProportion of the population
from the group of interest, q(1pn), NPopulation size
(390 registered PRODETER producers) and nSample
size.
Likewise, workshops were held, and two community
participatory diagnosis techniques were used: 1)
Brainstorming, to obtain information on factors that limit
production and 2) problems prioritization with a double-
entry matrix (Geilfus, 1998). The data were analyzed with
the Predictive Analytical Software and Solutions (PASS)
statistical package version 21, for the description of the
variables.
RESULTS AND DISCUSSIONAmong the most outstanding characteristics of the
interviewed producers 87.5% of the corn producers
are also beekeepers, hence the importance of this
activity as secondary to this PRODETER. Furthermore,
the combination of slash-and-burn agriculture with
beekeeping is indicated by Güemes-Ricalde et al. (2003)
and Pat-Fernández et al. (2020) as a complementary
activity, not only in milpa systems but in other subsistence
activities such as forestry, livestock and backyard animals.
The average age of the producers was 50 years and
five years of school. This data coincides with that from
Uzcaga et al. (2015) for corn producers and that from
Pat-Fernández et al. (2020) for beekeepers. 97% of the
family production units (FPUs) were communal land and
3% privately owned.
In the assessed plots, in addition to corn, a hectare of
beans (62.5% black and 6.3% white) and squash were
established associated. In this system, there are different
variants of slashing-grave-burning-long fallow until the
clearing of short fallow (Dzib-Aguilar et al., 2016). The
sowings were established in dryland farming from April
15 to August 30, however, most producers (64.1%) sowed
from June 1 to July 30, the recommended sowing
period (Medina and Rosado, 2015). All the producers
used creole seeds of which 64% were white, 33% yellow
and 3% purple.
These seeds come from variants like “Tuxpeño”, “Dzit-
Bacal”, “Nal-Tel” and combinations of these. It is
documented that the use of hybrid seeds and even free
pollination improved varieties, have not been successful
in the “milpa” production in the region (Dzib-Aguilar et al.,
2016; Uzcaga et al., 2017) since, most of the producers
continues to sow their creole seeds due to their taste
preferences being the main ingredients in their diet
(De los Santos-Ramos et al., 2017). Also, selling these
seeds represents an important income for small-scale
producers (Hellín and Keleman, 2013) (Table 1).
Through the participatory workshops, it was identified
that producers perceive their production system to be
vulnerable to extreme weather conditions, either due to
lack of rain or floods. This is because erratic weather in
Table 1. Characteristics of traditional “milpa” corn production in Yaxcabá municipality, Yucatán, Mexico.
Technological and management Socioeconomic and cultural
Types of speciesCorn (Zea Mays) alternately with: Beans (Phaseolus spp.), Pumpkin (Cucurbita spp.). Production objective 100 % subsistence
Varieties used 73% Creoles and 27% Improved Creoles
Cultivation system PolyculturePlot Type Family
Applied technology Milpa-roza
Intensity of space use It is grown for two to five years.Production scale (ha) 2.6
Tools Espeque, coa to weeding, machete
Fertilization (kg/ha)78% applied fertilizer. The majority applied a single dose of 16 kg (Nitrogen) 35 kg (Penta phosphate) 30 days after sowing.
Marketing / StorageSelf-consumption51% troje, 40% sacks, 7% dairy and, 2% in wooden boxes
LaborsSowing was carried out with a single row spar. They do weed and use low doses of herbicide.
Yields (t/ha) 0.5
Note: Espeque (XÚUL), a planting stick used to make holes and deposit the seed. The Creole seeds are from the Tuxpeño Breed (X NUUK NAL) with a long cycle, white color, an intermediate cycle Dzit-Bacal breed and early varieties such as Nal-Tel (X MEJEN NAL).
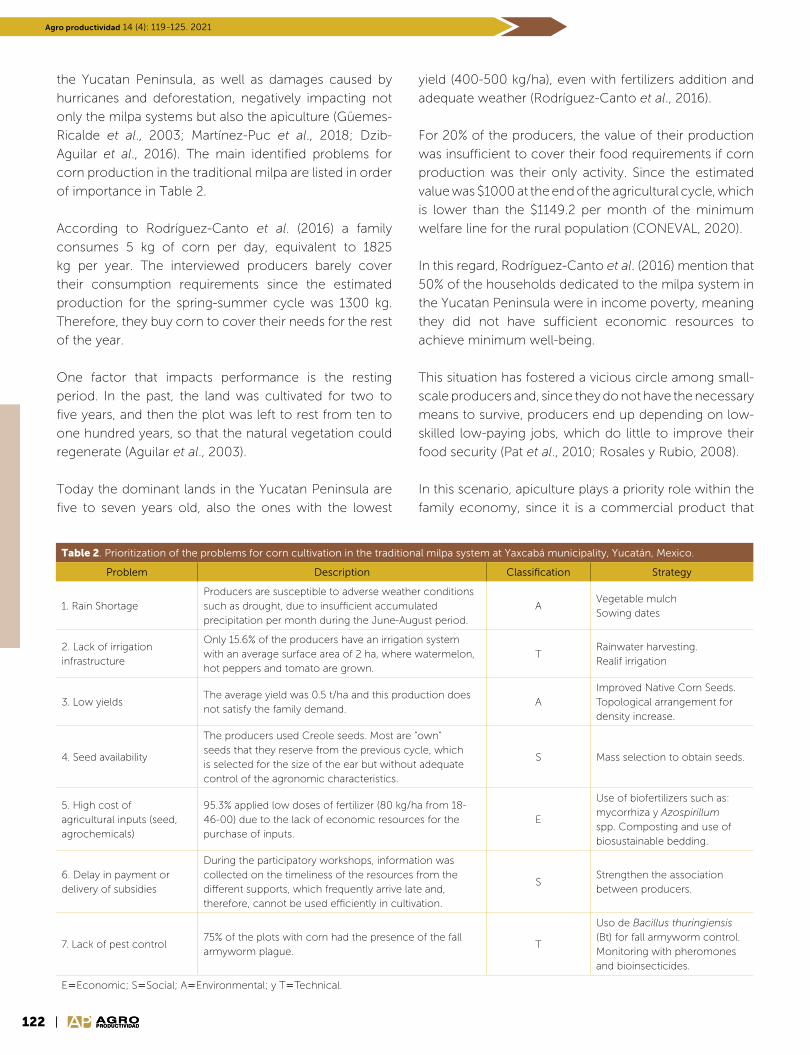
122 AGROPRODUCTIVIDADAGROPRODUCTIVIDAD
Biofertilizantes y producción de caña de azúcarAgro productividad 14 (4): 119-125. 2021
the Yucatan Peninsula, as well as damages caused by
hurricanes and deforestation, negatively impacting not
only the milpa systems but also the apiculture (Güemes-
Ricalde et al., 2003; Martínez-Puc et al., 2018; Dzib-
Aguilar et al., 2016). The main identified problems for
corn production in the traditional milpa are listed in order
of importance in Table 2.
According to Rodríguez-Canto et al. (2016) a family
consumes 5 kg of corn per day, equivalent to 1825
kg per year. The interviewed producers barely cover
their consumption requirements since the estimated
production for the spring-summer cycle was 1300 kg.
Therefore, they buy corn to cover their needs for the rest
of the year.
One factor that impacts performance is the resting
period. In the past, the land was cultivated for two to
five years, and then the plot was left to rest from ten to
one hundred years, so that the natural vegetation could
regenerate (Aguilar et al., 2003).
Today the dominant lands in the Yucatan Peninsula are
five to seven years old, also the ones with the lowest
Table 2. Prioritization of the problems for corn cultivation in the traditional milpa system at Yaxcabá municipality, Yucatán, Mexico.
Problem Description Classification Strategy
1. Rain ShortageProducers are susceptible to adverse weather conditions such as drought, due to insufficient accumulated precipitation per month during the June-August period.
AVegetable mulchSowing dates
2. Lack of irrigation infrastructure
Only 15.6% of the producers have an irrigation system with an average surface area of 2 ha, where watermelon, hot peppers and tomato are grown.
TRainwater harvesting.Realif irrigation
3. Low yieldsThe average yield was 0.5 t/ha and this production does not satisfy the family demand.
AImproved Native Corn Seeds.Topological arrangement for density increase.
4. Seed availability
The producers used Creole seeds. Most are “own” seeds that they reserve from the previous cycle, which is selected for the size of the ear but without adequate control of the agronomic characteristics.
S Mass selection to obtain seeds.
5. High cost of agricultural inputs (seed, agrochemicals)
95.3% applied low doses of fertilizer (80 kg/ha from 18-46-00) due to the lack of economic resources for the purchase of inputs.
E
Use of biofertilizers such as: mycorrhiza y Azospirillum spp. Composting and use of biosustainable bedding.
6. Delay in payment or delivery of subsidies
During the participatory workshops, information was collected on the timeliness of the resources from the different supports, which frequently arrive late and, therefore, cannot be used efficiently in cultivation.
SStrengthen the association between producers.
7. Lack of pest control75% of the plots with corn had the presence of the fall armyworm plague.
T
Uso de Bacillus thuringiensis (Bt) for fall armyworm control. Monitoring with pheromones and bioinsecticides.
EEconomic; SSocial; AEnvironmental; y TTechnical.
yield (400-500 kg/ha), even with fertilizers addition and
adequate weather (Rodríguez-Canto et al., 2016).
For 20% of the producers, the value of their production
was insufficient to cover their food requirements if corn
production was their only activity. Since the estimated
value was $1000 at the end of the agricultural cycle, which
is lower than the $1149.2 per month of the minimum
welfare line for the rural population (CONEVAL, 2020).
In this regard, Rodríguez-Canto et al. (2016) mention that
50% of the households dedicated to the milpa system in
the Yucatan Peninsula were in income poverty, meaning
they did not have sufficient economic resources to
achieve minimum well-being.
This situation has fostered a vicious circle among small-
scale producers and, since they do not have the necessary
means to survive, producers end up depending on low-
skilled low-paying jobs, which do little to improve their
food security (Pat et al., 2010; Rosales y Rubio, 2008).
In this scenario, apiculture plays a priority role within the
family economy, since it is a commercial product that

123AGROPRODUCTIVIDAD
Uzcanga-Pérez et al. (2021)
has allows obtaining the monetary income that the milpa
systems no longer provides (Rosales and Rubio, 2008).
Besides, these resources also finance other productive
activities, since on average apiculturists invest 2.25 days
for this activity (Martínez-Puc et al., 2018).
However, apiculture is also an activity where the honey
is traditionally extracted to obtain both, honey and wax.
Most of the 87% of apiculturists carried out their work
manually, with a production scale of three apiaries,
which coincides with the national average (Magaña et al.,
2016) and 30 hives per beekeeper. However, the number
of hives can vary over time. For example, Magaña and
Leyva (2011) estimated 17.9 hives and Magaña et al.
(2016) estimated 35.6 hives per beekeeper in Yucatán.
Likewise, the other two apiculture-producing entities
in the Yucatan Peninsula had reduced their hives over
time. Magaña et al. (2016) estimated 30.4 beehives for
Campeche and 30.6 for Quintana Roo, Mexico, and,
recently, Martínez-Puc et al. (2018) estimated 20.26
beehives for Campeche, Mexico, and 20.6 beehives for
Quintana Roo.
On other hand, a production of 362 kg of honey was
estimated per beekeeper, out of which, 50 kg were
for self-consumption and 312 kg marketed in different
sales points a $19 per kg price, below that registered for
the municipality by the SIAP (2018) of $37.1 per kg. The
average wax production was 25 kg, for self-consumption.
This panorama has not changed and coincides with the
primary vocation where productive diversification is
limited to honey and wax.
Like the production in milpa systems, apiculture has
been undercapitalized by the unfavorable economic
conditions in the country (Magaña and Leyva, 2011).
This decapitalization has limited the adoption of new
technological practices, which means lower returns
(Table 3).
The main problem identified by apiculture was the high
cost of its inputs and, in sixth place, the labor shortage.
In this regard, Magaña et al. (2016) showed that in the
costs of the structure for honey production in Mexico
67.1% corresponds to variable costs, of these 31.2%
corresponds to the wages value and 12.2% to food inputs
acquisition such as sugar.
Another identified problem was the commercialization
of the honey due to the different factors (Table 4).
Studies carried out in the Yucatan Peninsula highlight
that apiculturists have no bargaining power in most
markets (Magaña and Leyva, 2011). Also, there are
two marketing channels: 1) conventional honey for
export marketed by apiculturist, local collectors,
cooperatives and private trading companies and
exporters and 2) conventional honey for the local
market, marketed otherwise through apiculturist,
local retailers and to the consumer (Pat-Fernández
et al., 2020).
Regard pests and diseases, 94.6% of the apiculturist
reported experienced a disease transmitted by the
Varroa destructor mite. In another study carried out in
Yucatán, Martínez-Puc et al. (2018) found that 93.1% of
the interviewed apiculturist reported the presence of
that disease in their apiaries. However, unlike that study
where all the beekeepers knew about the mite, only 35%
of the Yaxcabá beekeepers could identify the Varroa
destructor mite.
Table 3. Characteristics of honey production in Yaxcabá municipality, state of Yucatán, Mexico.
Technological and management Socioeconomic and cultural
Species Honeybee (Apis mellifera L.) Production objective 13.8% subsistence, 86.2% sale
Applied technology 87.7 % manual, 12.3% mechanical Type of plot Family
ToolsSmoked, veil, alzaprima, gloves, boots, extractor, overalls.
Production scaleNumber of apiaries: 3, number of hives: 30
FeedingJune-November; with granulated sugar, sugar syrup, or honey
Commercialization
34% contract with the industry, 32% direct to the consumer, 18% collection center, 12% producer organization and 4% foot of plot.
Method used36% with feeder, 31% with plastic bottles and 33% others.
Yields (kg/hive) 4
Labors Obtaining queens, changing panels, dividing colonies, changing queens, dealing with colonies, swarming, joining hives and capturing swarms.
Sales volume/year (kg) 312
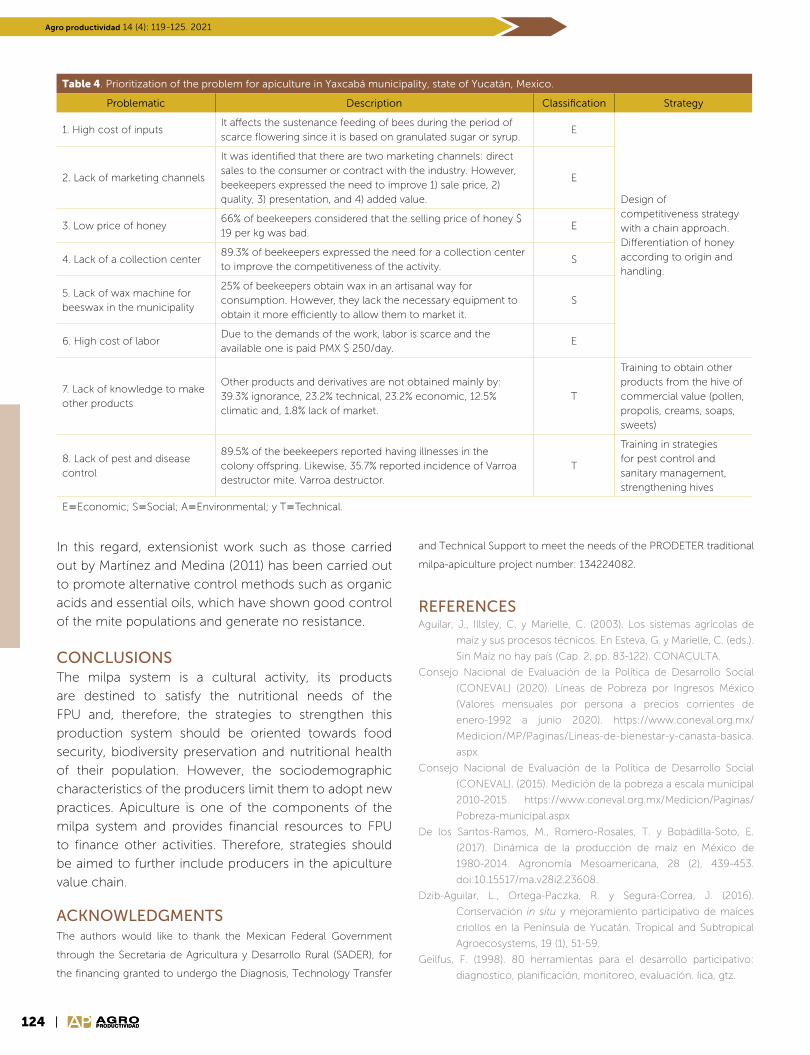
124 AGROPRODUCTIVIDADAGROPRODUCTIVIDAD
Biofertilizantes y producción de caña de azúcarAgro productividad 14 (4): 119-125. 2021
Table 4. Prioritization of the problem for apiculture in Yaxcabá municipality, state of Yucatán, Mexico.
Problematic Description Classification Strategy
1. High cost of inputsIt affects the sustenance feeding of bees during the period of scarce flowering since it is based on granulated sugar or syrup.
E
Design of competitiveness strategy with a chain approach.Differentiation of honey according to origin and handling.
2. Lack of marketing channels
It was identified that there are two marketing channels: direct sales to the consumer or contract with the industry. However, beekeepers expressed the need to improve 1) sale price, 2) quality, 3) presentation, and 4) added value.
E
3. Low price of honey66% of beekeepers considered that the selling price of honey $ 19 per kg was bad.
E
4. Lack of a collection center89.3% of beekeepers expressed the need for a collection center to improve the competitiveness of the activity.
S
5. Lack of wax machine for beeswax in the municipality
25% of beekeepers obtain wax in an artisanal way for consumption. However, they lack the necessary equipment to obtain it more efficiently to allow them to market it.
S
6. High cost of laborDue to the demands of the work, labor is scarce and the available one is paid PMX $ 250/day.
E
7. Lack of knowledge to make other products
Other products and derivatives are not obtained mainly by:39.3% ignorance, 23.2% technical, 23.2% economic, 12.5% climatic and, 1.8% lack of market.
T
Training to obtain other products from the hive of commercial value (pollen, propolis, creams, soaps, sweets)
8. Lack of pest and disease control
89.5% of the beekeepers reported having illnesses in the colony offspring. Likewise, 35.7% reported incidence of Varroa destructor mite. Varroa destructor.
T
Training in strategies for pest control and sanitary management, strengthening hives
EEconomic; SSocial; AEnvironmental; y TTechnical.
In this regard, extensionist work such as those carried
out by Martínez and Medina (2011) has been carried out
to promote alternative control methods such as organic
acids and essential oils, which have shown good control
of the mite populations and generate no resistance.
CONCLUSIONSThe milpa system is a cultural activity, its products
are destined to satisfy the nutritional needs of the
FPU and, therefore, the strategies to strengthen this
production system should be oriented towards food
security, biodiversity preservation and nutritional health
of their population. However, the sociodemographic
characteristics of the producers limit them to adopt new
practices. Apiculture is one of the components of the
milpa system and provides financial resources to FPU
to finance other activities. Therefore, strategies should
be aimed to further include producers in the apiculture
value chain.
ACKNOWLEDGMENTSThe authors would like to thank the Mexican Federal Government
through the Secretaria de Agricultura y Desarrollo Rural (SADER), for
the financing granted to undergo the Diagnosis, Technology Transfer
and Technical Support to meet the needs of the PRODETER traditional
milpa-apiculture project number: 134224082.
REFERENCESAguilar, J., Illsley, C. y Marielle, C. (2003). Los sistemas agrícolas de
maíz y sus procesos técnicos. En Esteva, G. y Marielle, C. (eds.).
Sin Maíz no hay país (Cap. 2, pp. 83-122). CONACULTA.
Consejo Nacional de Evaluación de la Política de Desarrollo Social
(CONEVAL) (2020). Líneas de Pobreza por Ingresos México
(Valores mensuales por persona a precios corrientes de
enero-1992 a junio 2020). https://www.coneval.org.mx/
Medicion/MP/Paginas/Lineas-de-bienestar-y-canasta-basica.
aspx.
Consejo Nacional de Evaluación de la Política de Desarrollo Social
(CONEVAL). (2015). Medición de la pobreza a escala municipal
2010-2015. https://www.coneval.org.mx/Medicion/Paginas/
Pobreza-municipal.aspx
De los Santos-Ramos, M., Romero-Rosales, T. y Bobadilla-Soto, E.
(2017). Dinámica de la producción de maíz en México de
1980-2014. Agronomía Mesoamericana, 28 (2), 439-453.
doi:10.15517/ma.v28i2.23608.
Dzib-Aguilar, L., Ortega-Paczka, R. y Segura-Correa, J. (2016).
Conservación in situ y mejoramiento participativo de maíces
criollos en la Península de Yucatán. Tropical and Subtropical
Agroecosystems, 19 (1), 51-59.
Geilfus, F. (1998). 80 herramientas para el desarrollo participativo:
diagnostico, planificación, monitoreo, evaluación. Iica, gtz.
125AGROPRODUCTIVIDAD
Uzcanga-Pérez et al. (2021)
Güemes-Ricalde, F. J., Echazarreta-González, C., Villanueva-G, R., Pat-Fernández, J. M. y Gómez-Álvarez, R.
(2003). La apicultura en la península de Yucatán. Actividad de subsistencia en un entorno globalizado.
Revista Mexicana del Caribe, 8 (16), 117-132.
Hellin, J. y Keleman, A. (2013). Las variedades criollas del maíz, los mercados especializados, y la estrategia de
vida de los productores. LEISA Revista de Agroecología, 29 (3), 7-9.
Instituto Nacional para el Federalismo y el Desarrollo Municipal (INAFED). (2010). Enciclopedia de los municipios
y delegaciones de México. Estado de Yucatán. http://www.inafed.gob.mx/work/enciclopedia/
EMM31yucatan/municipios/31104a.html
Magaña, M. y Leyva, C. (2011). Costos y rentabilidad del proceso de producción apícola en México. Contaduría
y administración, (235), 99-119.
Magaña, M., Tavera, M., Salazar, L. y Sanginés, J. (2016). Productividad de la apicultura en México y su impacto
sobre la rentabilidad. Revista Mexicana de Ciencias Agrícolas, 7 (5), 1103-1115.
Martínez, F. y Medina, N. (2011). Evolución de la resistencia del ácaro Varroa destructor al fluvalinato en colonias
de abejas (Apis mellifera) en Yucatán México. Revista Mexicana de Ciencias Pecuarias, 2 (1), 93-99.
Martínez-Puc, J., Cetzal-Ix, W., González-Valdivia, N., Casanova-Lugo, F. y Saikat-Kumar, B. (2018). Caracterización
de la actividad apícola en los principales municipios productores de miel en Campeche, México. Journal
of the Selva Andina Animal Science, 5 (1), 44-53.
Medina, J. y Rosado, A. (2015). Maíz de temporal. In Agenda Técnica Agrícola de Campeche (pp. 87-93).
SAGARPA-SENASICA-INIFAP.
Pat, L., Nahed, J., Parra, M., García, L., Nazar, A. y Bello, E. (2010). Impacto de las estrategias de ingresos sobre la
seguridad alimentaria en comunidades rurales del norte de Campeche. Archivos Latinoamericanos de
Nutrición, 60 (1), 48-55.
Pat-Fernández, L., Romero-Duran, P., Anguebes-Franceschi, F. y Pat-Fernández, N. (2020). Eficiencia económica
y organización de la cadena productiva de la miel en Campeche, México. Agricultura, Sociedad y
Desarrollo, 17 (1), 71-90.
Rodríguez-Canto, A., González-Moctezuma, P., Flores-Torres, J., Nava-Montero, R., Dzib-Aguilar, L. A., Pérez-
Pérez, J. R., Thüerbeck, N. y González-Iturbe, J. A. (2016). Milpas de las comunidades mayas y dinámica de
uso del suelo en la Península de Yucatán. Agencia de los Estados Unidos para el Desarrollo Internacional
(USAID) Proyecto México para la Reducción de Emisiones por deforestación y degradación (M-REDD+),
The Nature Conservancy, Rainforest Alliance, Woods Hole Research Center, Espacios Naturales y
Desarrollo Sustentable AC.
Rosales, M. y Rubio, A. (2010). Apicultura y organizaciones de apicultores entre los mayas de Yucatán. Estudios
de cultura maya, 35 (2010), 163-183.
Secretaría de Agricultura y Desarrollo Rural (SADER). (2019). Lineamientos de Operación del Programa de
Desarrollo Rural de la Secretaría de Agricultura y Desarrollo Rural para el ejercicio fiscal 2019. https://
www.dof.gob.mx/nota_detalle.php?codigo=5577584&fecha=01/11/2019.
Secretaria de desarrollo social (SEDESOL). (2015). Catálogo de localidades. http://www.microrregiones.gob.mx/
catloc/LocdeMun.aspx?tipo=clave&campo=loc&ent=31&mun=104
Servicio de Información agroalimentaria y Pesquera (SIAP). (2018). Avance de siembras y cosechas,
resumen Nacional por cultivo. /http://infosiap.siap.gob.mx:8080/agricola_siap_gobmx/
AvanceNacionalSinPrograma.do.
Snedecor, G. W. and Cochran, W. G. (1967). Statistical methods. Iowa State University Press.
Uzcanga, N., Cano, A., Medina, J. y Espinoza, J. (2015). Caracterización de los productores de maíz de temporal
en el Estado de Campeche, México. Revista Mexicana de Agronegocios, 36 (19) ,1295-1305.
Uzcanga, N., Larqué, B., del Ángel, A., Rangel, M.A. y Cano, A. (2017). Preferencias de los agricultores por semillas
mejoradas y nativas de maíz en la Península de Yucatán, México. Revista Mexicana de Ciencias Agrícolas,
8 (5), 1021-1033.

127AGROPRODUCTIVIDAD
https://doi.org/10.32854/agrop.v14i4.1843
Agroproductividad: Vol. 14, Núm. 4, abril. 2021. pp: 127-134.
Recibido: octubre, 2020. Aceptado: febrero, 2021.
Physical and chemical attributes of prickly pear cactus (Opuntia ficus-indica) varieties Copena, Pelon Blanco
and Pelon Rojo
Rössel-Kipping, Erich Dietmar1*, Ortiz-Laurel, Hipolito2, Moreno-Ovalle, Flor Margarita1;
López-Martínez, Laura Araceli3; Amante-Orozco, Alejandro1
1Colegio de Postgraduados, Campus San Luis Potosí. Iturbide 73, Salinas de Hgo., S.L.P., México. 2Colegio de Postgraduados, Campus Córdoba. Manuel León, Amatlán de los Reyes, Veracruz,
México. 3Universidad Autónoma de San Luis Potosí, Coordinación Académica Región Altiplano
Oeste. Salinas de Hidalgo, S.L.P., México.
*Corresponding author: [email protected]
ABSTRACTObjective: attest and compare the fundamental attributes for fresh raw cactus cladodes and its chemical constituent’s
quality when dried and grounded for three varieties of prickly pear cactus “Copena”, “Pelon blanco” and “Pelon rojo”.
Design/methodology/approach: measurements of the physical attributes and chemical constituents were made by
using proved and reliable techniques. Data will aid to explore the potential for these cactus materials when being handled
from basic to complex processes, considering its need for size and quality of storage and their effect when they interact
with processing devices and handling apparatus for the new product being elaborated.
Results: the physical attributes among the three assessed cactus varieties showed slight differences in their parameters,
but length, wide and electric conductivity. While for their chemical analysis, cactus cladodes were chopped, dried and
grounded. Chemical compounds showed slight differences between the three varieties, but Pelon blanco had a higher
fat percentage and the lowest zinc and potassium concentration. None of the varieties had iron.
Limitations on study/implications: there was no management on the prickly pear cactus production. The assessment of
the cultivars’ attributes was as they were from the field. Stabilization of the chemical constituents of Pelon blanco could
be necessary, according to the expected features of new products, or lead to a new line of by-products.
Findings/conclusions: mechanical handling of raw cladodes around the premises is facilitated, and its uses and
maintenance are fewer management costs. Flour from each variety was kept at around 10% water content to safeguarding
storage. Regard the protein and carbohydrates content, flour of the three varieties ensure integration with other
compounds and guarantees new products with high protein content.
Keywords: agri-food, byproducts, physical-chemical, measurement techniques, prickly cactus.
127AGROPRODUCTIVIDAD
Imagen de evondue en Pixabay
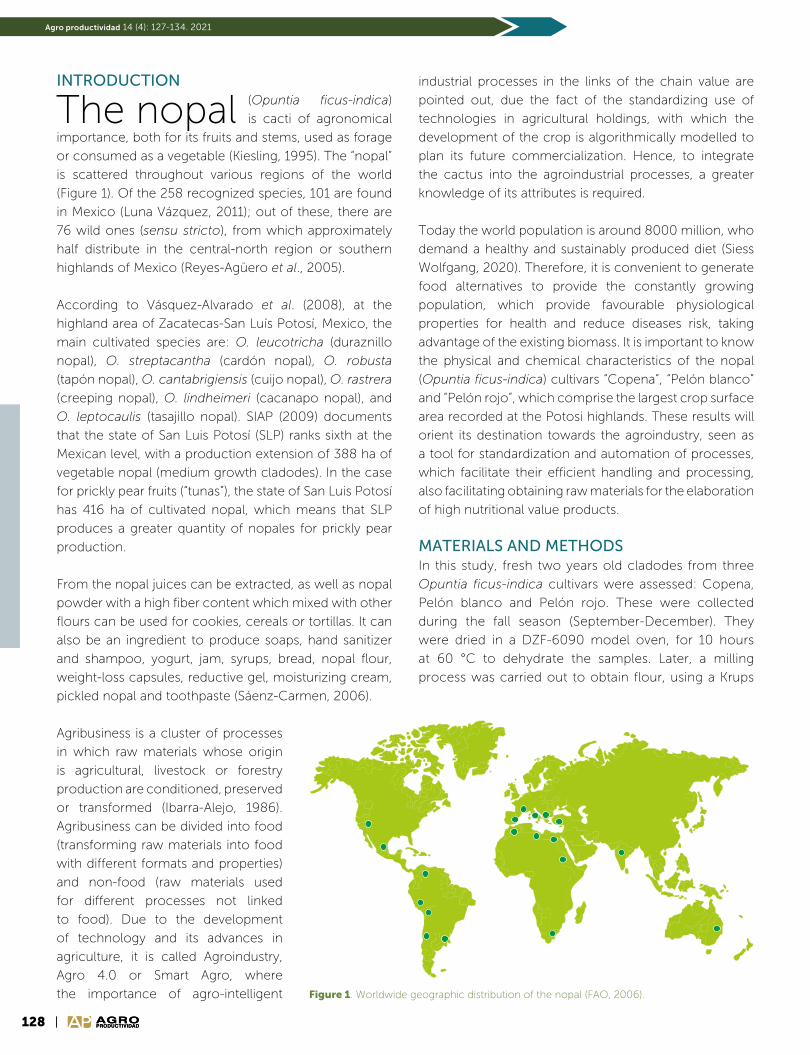
128 AGROPRODUCTIVIDADAGROPRODUCTIVIDAD
Biofertilizantes y producción de caña de azúcarAgro productividad 14 (4): 127-134. 2021
INTRODUCTION
The nopal (Opuntia ficus-indica)
is cacti of agronomical
importance, both for its fruits and stems, used as forage
or consumed as a vegetable (Kiesling, 1995). The “nopal”
is scattered throughout various regions of the world
(Figure 1). Of the 258 recognized species, 101 are found
in Mexico (Luna Vázquez, 2011); out of these, there are
76 wild ones (sensu stricto), from which approximately
half distribute in the central-north region or southern
highlands of Mexico (Reyes-Agüero et al., 2005).
According to Vásquez-Alvarado et al. (2008), at the
highland area of Zacatecas-San Luís Potosí, Mexico, the
main cultivated species are: O. leucotricha (duraznillo
nopal), O. streptacantha (cardón nopal), O. robusta
(tapón nopal), O. cantabrigiensis (cuijo nopal), O. rastrera
(creeping nopal), O. lindheimeri (cacanapo nopal), and
O. leptocaulis (tasajillo nopal). SIAP (2009) documents
that the state of San Luis Potosí (SLP) ranks sixth at the
Mexican level, with a production extension of 388 ha of
vegetable nopal (medium growth cladodes). In the case
for prickly pear fruits (“tunas”), the state of San Luis Potosí
has 416 ha of cultivated nopal, which means that SLP
produces a greater quantity of nopales for prickly pear
production.
From the nopal juices can be extracted, as well as nopal
powder with a high fiber content which mixed with other
flours can be used for cookies, cereals or tortillas. It can
also be an ingredient to produce soaps, hand sanitizer
and shampoo, yogurt, jam, syrups, bread, nopal flour,
weight-loss capsules, reductive gel, moisturizing cream,
pickled nopal and toothpaste (Sáenz-Carmen, 2006).
Agribusiness is a cluster of processes
in which raw materials whose origin
is agricultural, livestock or forestry
production are conditioned, preserved
or transformed (Ibarra-Alejo, 1986).
Agribusiness can be divided into food
(transforming raw materials into food
with different formats and properties)
and non-food (raw materials used
for different processes not linked
to food). Due to the development
of technology and its advances in
agriculture, it is called Agroindustry,
Agro 4.0 or Smart Agro, where
the importance of agro-intelligent
industrial processes in the links of the chain value are
pointed out, due the fact of the standardizing use of
technologies in agricultural holdings, with which the
development of the crop is algorithmically modelled to
plan its future commercialization. Hence, to integrate
the cactus into the agroindustrial processes, a greater
knowledge of its attributes is required.
Today the world population is around 8000 million, who
demand a healthy and sustainably produced diet (Siess
Wolfgang, 2020). Therefore, it is convenient to generate
food alternatives to provide the constantly growing
population, which provide favourable physiological
properties for health and reduce diseases risk, taking
advantage of the existing biomass. It is important to know
the physical and chemical characteristics of the nopal
(Opuntia ficus-indica) cultivars “Copena”, “Pelón blanco”
and “Pelón rojo”, which comprise the largest crop surface
area recorded at the Potosi highlands. These results will
orient its destination towards the agroindustry, seen as
a tool for standardization and automation of processes,
which facilitate their efficient handling and processing,
also facilitating obtaining raw materials for the elaboration
of high nutritional value products.
MATERIALS AND METHODSIn this study, fresh two years old cladodes from three
Opuntia ficus-indica cultivars were assessed: Copena,
Pelón blanco and Pelón rojo. These were collected
during the fall season (September-December). They
were dried in a DZF-6090 model oven, for 10 hours
at 60 °C to dehydrate the samples. Later, a milling
process was carried out to obtain flour, using a Krups
Figure 1. Worldwide geographic distribution of the nopal (FAO, 2006).

129AGROPRODUCTIVIDAD
Rössel-Kipping et al. (2021)
GX 410011 model mill ending in a 0.00381 mm mesh
screen (Figure 2).
The values and possible differences exhibited by the
physical and chemical attributes between the nopal
(Opuntia ficus-indica) cultivars, were processed through
an analysis of variance (ANOVA) and subsequently
by means of contrasts for each parameter, using the
STATISTICA software. V.12 (StatSoft, Inc., Tulsa, OK, USA)
confronting in all cases to a significance level of p0.05.
The physical dimensions of the cladodes were
determined (n5 measurements) using a ruler (length
and width) and a vernier (thickness) with digital caliper
(0.001 mm precision). In the length measured from the
apex base, the equatorial width was determined in the
widest central zone of the cladode and the thickness
was measured on the profile of the cladode.
The conductivity depends on the atomic and molecular
structure of the material. The unit of electrical conductivity
is Siemens (S) which gives the definition of 1 S is the
electrical conductivity of a conductor of resistance 1.
According to Crespo Villalaz (2004) 1 S * m1 is the
electrical conductivity in a homogeneous conductor
with a 1 m2 cross section and a 1 m length, whose
conductance is 1 S. The electrical conductivity of the
prickly pear cladodes of the Copena, Pelón blanco and
Pelón rojo cultivars were assessed with a Kinzo model
18d265 CE multimeter at five different points of the
cladode with two repetitions at the same points in each
cladode of each variety, in the lower part of cladode, in
the center and lateral ends of the cladode and in their
upper part. The values obtained by the multimeter in k
were converted to mS, following equations:
first conversion to mS: mSk
=Ω
1
second conversion mS to mS/m
considering the distance coefficient between electrodes,
which was 5 cm.
Conversion to mS mmS
mmS/ : * 20
Where: mSmillisiemens and kkilo Ohm.
The determination of internal friction and internal friction
angle were determined for the flours of the three nopal
cultivars. The internal friction and the internal friction
angle were determined using the formula:
tanφ µ= =ih
r
Where: h corresponds to the height of the inverted cone
formed by the flour and r to the corresponding radius.
To determine the density of the cladodes, 10 L of
water were placed in a square polyethylene container
measuring 83 cm 50 cm 35.4 cm (length, width and
height), subsequently the water level in the container
was noted and each cladode was introduced into the
container. The reached height with the cladode was
again marked, five repetitions per cultivar. The densities
were determined using the equation:
ρ=m
v
Where: m corresponds to the weight in kg of the nopal
cladode and v corresponds to the displaced amount of
water in m3.
The moisture content of the nopal flour was
determined following to the AOAC (1990)
technique, with:
H Ph Ps Ps° = −( ) ×/ 100
Where: Phweight of the fresh sample
(g) weight of the empty tray (dry) (g);
Pstray weight (g) dry sample (g).
The quantification of fat in the flour of the
cultivars was carried out following the AOCS
920.39 technique, using a Soxhlet ST243 SoxhletTM Figure 2. Nopal cladodes prepared to assess their characteristics.

130 AGROPRODUCTIVIDADAGROPRODUCTIVIDAD
Biofertilizantes y producción de caña de azúcarAgro productividad 14 (4): 127-134. 2021
Extraction unit. Three repetitions were done, using the
formula:
% *Grasa=−Vaab Vab
h100
Where: VaabWeight in g of the aluminum beaker oil
three borosilicate beads (b). VabAluminum cup (Va)
three borosilicate beads (b) hflour.
The determination of proteins in the flours was carried
out taking as reference the Standard NMX-F-068-S
(1980). which determine of the total nitrogen of the
sample by sulfuric acid digestion. The total nitrogen (%)
present in the sample was calculated using the equation:
N V N m% * * . * /=( )0 014 100
Where: N% corresponds to the nitrogen percentage (%),
V to the hydrochloric acid volume of used in the titration
(ml), N the normality of hydrochloric acid, m the mass of
the sample (g), 0.014nitrogen milliequivalent.
The proteins percentage (%) was obtained by multiplying
the (%) of nitrogen obtained by the corresponding factor.
The carbohydrate content determination was carried
out following the standard NMX-F-066-S (1978). The
determination of direct and total reducers in the
feed with the equation:
A T V P% * *( )=25000
The phosphorus in de cladodes determination
was carried out based on the phosphorus method
by spectrophotometry, which is a quantitative
titration colorimetric method. The method is
based on the formation of a hetero polyacid
with a vanadate-molybdate reagent (yellow in
color and soluble in water) that absorbs light at
430 nm, the equipment used was a visible range
spectrophotometer, model Genesys 105 vis. The
determination of Zn, Fe, K was carried out by
atomic absorption spectrophotometry, using the
Aurora Instruments-1200 equipment.
RESULTS AND DISCUSSIONThe results of the sizes of the prickly pear cladodes
in the three cultivars (Copena, Pelón blanco and
Pelón rojo) is shown in Table 1. Where the five
determinations for each of the parameters described
are included, as well as their mean and respective
standard deviation.
The Copena and Pelón blanco cultivars do not show a
significant difference (p0.05), the Pelón rojo cultivar is
the one with the smallest cladodes (p0.05). Regarding
width, the cv. Copena with 26.20 cm is significantly bigger
compared to the Pelón blanco with 22.60 cm and Pelón
rojo vcultivars with 21.10 cm (p0.05). Regard thickness,
there is no significant difference (p0.05) regardless of
the variety. The foregoing presupposes the ease and
feasibility of the technical and technological application,
since the length, width and thickness dimensions of the
evaluated varieties meet the characteristic parameters
of the nopales from the Opuntia ficus-indica genus,
measured in 38 crops aged between 2 and 3 years
(Reyes-Agüero et al., 2005).
The electrical conductivity directly depends on the atomic
structure of the material, as well as on the temperature
at which it is found or the state in which it is (liquid, solid,
gaseous) and is representative of the thermal, optical,
acoustic conductivity, etc., hence its importance to
define technological processes. The obtained results
in the Opuntia cladodes are shown in Table 2, where
it is observed that the electrical conductivity of the cv.
Pelón rojo with a value of 3.27 was significantly lower
Table 1. Size of the Opuntia ficus-indica prickly pear cladodes.
Variety Length (cm) Width (cm) Thickness (cm)
Copena 45.00 26.00 3.60
Copena 48.00 33.00 4.20
Copena 47.50 20.50 1.80
Copena 46.00 24.50 2.00
Copena 42.00 27.00 1.90
Average 45.70 (2.39)a 26.20(2.54)a 2.70(1.12)a
Pelón Blanco 44.00 23.00 2.50
Pelón Blanco 34.00 19.00 2.00
Pelón Blanco 43.00 26.00 2.40
Pelón Blanco 42.00 24.00 1.70
Average 42.20 (5.12)a 22.60 2.70)b 2.26 (0.40)a
Pelón Rojo 36.50 19.00 2.00
Pelón Rojo 32.00 19.50 1.50
Pelón Rojo 34.50 20.00 2.00
Pelón Rojo 45.00 25.00 2.20
Pelón Rojo 39.00 22.00 2.00
Average 37.40 (4.97)b 21.10 (2.46)b 1.94 (0.26)a
a & b for the same analyzed parameter, a different superscript shows a significant difference between varieties. (p0.05).

131AGROPRODUCTIVIDAD
Rössel-Kipping et al. (2021)
compared to the Copena and Pelón Blanco cultivars,
which reported values of 4.28 and 4.70 respectively
(p0.05).
Table 3 shows the results obtained from the internal
friction i / - /.
The angle of internal friction which corresponds to the
angle whose tangent is the relation between the sliding
resists force, along a plane, and the normal force applied
to said plane and depends on the forces that intervene
in the flow of the powder, such as gravity, friction,
cohesion (Crespo Villalaz, 2004). With values of 15.65,
16.24 and 14.79 for the Copena, Pelón blanco and Pelón
rojo varieties respectively, they show no significant
differences (p0.05).
The above indicates that they are free-flowing powders.
When the attraction forces between the particles,
that is to say, cohesion is high, there are problems
with the flow of the powders, which can present
flow problems in the silos. Hence, technological
applications represent reduction in processing costs,
since approximately one third of energy resources are
lost due to friction, in addition to extending the useful
life of the machinery.
Density is an inherent characteristic for both solids and
liquids and is related to buoyancy. Table 4 shows the
results obtained for the humidity determinations of the
cladodes of Opuntia ficus-indica. The results of 0.82,
0.81 and 0.92 g cm31 for the Copena, Pelón blanco
and Pelón rojo cultivars respectively, which show that
there is no significant difference between their densities
(p0.05).
The moisture content determination, particularly for
dehydrated or dry foods, is of utmost importance, since
if the moisture content is high, the shelf life of the flour
will decrease significantly, due to the proliferation of
fungi and bacteria, as well as chemical reactions. (i.e.,
enzymatic reactions) and physical such as fluidity change,
condensation, corrosion, adhesion, etc.
Therefore, it is recommended that
the maximum humidity percentage in
dehydrated products is not greater than
10% for long-term storage. The obtained
moisture percentages in Opuntia ficus-
indica flours are shown in Table 5. The
cv. Pelón rojo had the lowest moisture
content with a value of 5.01%; However,
the difference is not significant compared
Table 2. Electric conductivity of cactus prickly (Opuntia ficus-indica).
V k mS mS/m V k mS mS/m V k mS mS/m
1 5.00 0.20 4.00 2 5.00 0.20 4.00 3 7.00 0.14 2.86
1 5.00 0.20 4.00 2 4.00 0.25 5.00 3 8.00 0.13 2.50
1 5.00 0.20 4.00 2 4.00 0.25 5.00 3 6.00 0.17 3.33
1 5.00 0.20 4.00 2 4.00 0.25 5.00 3 6.00 0.17 3.33
1 5.00 0.20 4.00 2 5.00 0.20 4.00 3 6.00 0.17 3.33
1 5.00 0.20 4.00 2 4.00 0.25 5.00 3 6.00 0.17 3.33
1 6.00 0.19 3.33 2 4.00 0.25 5.00 3 6.00 0.17 3.33
1 3.50 0.29 5.71 2 4.00 0.25 5.00 3 5.00 0.20 4.00
1 5.00 0.20 4.00 2 4.00 0.25 5.00 3 6.00 0.17 3.33
1 3.50 0.29 5.71 2 5.00 0.20 4.00 3 6.00 0.17 3.33
4.80 0.22 4.28a 4.30 0.24 4.70a 6.20 0.17 3.27b
(0.75) (0.04) (0.78) (0.48) (0.02) (0.48) (0.79) (0.02) (0.38)
Vcactus prickly variety, 1Copena; 2Pelon Blanco, 3Pelon rojo , average, deviation; a & b for the same analyzed parameter, a different superscript shows a significant difference between varieties. (p0.05).
Table 3. Internal friction i /-/ for each studied variety.
Characteristic Copena Pelón blanco Pelón rojo
Height (cm) 1.29 (0.15) 1.34 (0.16) 1.24 (0.19)
Wide (cm) 9.18 (0.19) 9.25 (0.45) 9.37 (0.36)
Radious (cm) 4.59 (0.10) 4.62 (0.22) 4.68 (0.18)
Internal friction i 0.28 (0.28)a 0.29 (0.04)a 0.26 (0.04)a
Angle of internal friction /tan/ 15.65 (1.94)b 16.24 (2.31)b 14.79 (2.40)b
**all average values are displayed n100 repetitions; a & b for the same analyzed parameter, an equal superscript shows that there is not a significant difference between varieties. (p0.05).
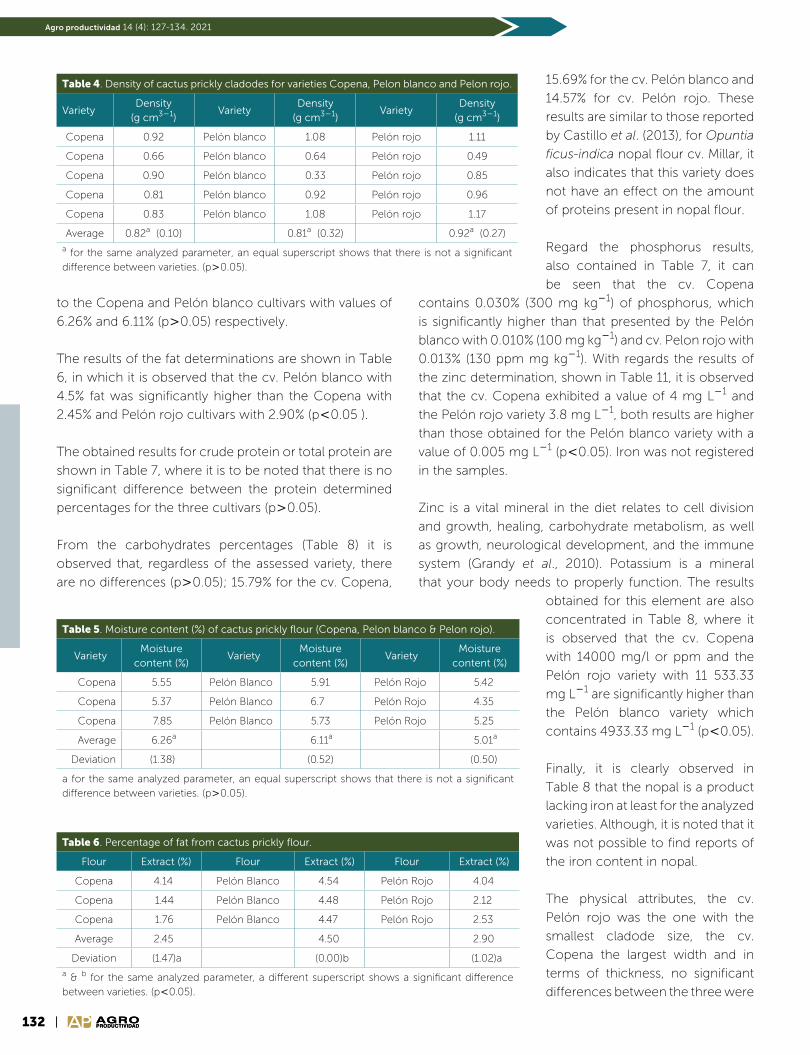
132 AGROPRODUCTIVIDADAGROPRODUCTIVIDAD
Biofertilizantes y producción de caña de azúcarAgro productividad 14 (4): 127-134. 2021
Table 4. Density of cactus prickly cladodes for varieties Copena, Pelon blanco and Pelon rojo.
VarietyDensity
(g cm31)Variety
Density(g cm31)
VarietyDensity
(g cm31)
Copena 0.92 Pelón blanco 1.08 Pelón rojo 1.11
Copena 0.66 Pelón blanco 0.64 Pelón rojo 0.49
Copena 0.90 Pelón blanco 0.33 Pelón rojo 0.85
Copena 0.81 Pelón blanco 0.92 Pelón rojo 0.96
Copena 0.83 Pelón blanco 1.08 Pelón rojo 1.17
Average 0.82a (0.10) 0.81a (0.32) 0.92a (0.27)
a for the same analyzed parameter, an equal superscript shows that there is not a significant difference between varieties. (p0.05).
to the Copena and Pelón blanco cultivars with values of
6.26% and 6.11% (p0.05) respectively.
The results of the fat determinations are shown in Table
6, in which it is observed that the cv. Pelón blanco with
4.5% fat was significantly higher than the Copena with
2.45% and Pelón rojo cultivars with 2.90% (p0.05 ).
The obtained results for crude protein or total protein are
shown in Table 7, where it is to be noted that there is no
significant difference between the protein determined
percentages for the three cultivars (p0.05).
From the carbohydrates percentages (Table 8) it is
observed that, regardless of the assessed variety, there
are no differences (p0.05); 15.79% for the cv. Copena,
15.69% for the cv. Pelón blanco and
14.57% for cv. Pelón rojo. These
results are similar to those reported
by Castillo et al. (2013), for Opuntia
ficus-indica nopal flour cv. Millar, it
also indicates that this variety does
not have an effect on the amount
of proteins present in nopal flour.
Regard the phosphorus results,
also contained in Table 7, it can
be seen that the cv. Copena
contains 0.030% (300 mg kg1) of phosphorus, which
is significantly higher than that presented by the Pelón
blanco with 0.010% (100 mg kg1) and cv. Pelon rojo with
0.013% (130 ppm mg kg1). With regards the results of
the zinc determination, shown in Table 11, it is observed
that the cv. Copena exhibited a value of 4 mg L1 and
the Pelón rojo variety 3.8 mg L1, both results are higher
than those obtained for the Pelón blanco variety with a
value of 0.005 mg L1 (p0.05). Iron was not registered
in the samples.
Zinc is a vital mineral in the diet relates to cell division
and growth, healing, carbohydrate metabolism, as well
as growth, neurological development, and the immune
system (Grandy et al., 2010). Potassium is a mineral
that your body needs to properly function. The results
obtained for this element are also
concentrated in Table 8, where it
is observed that the cv. Copena
with 14000 mg/l or ppm and the
Pelón rojo variety with 11 533.33
mg L1 are significantly higher than
the Pelón blanco variety which
contains 4933.33 mg L1 (p0.05).
Finally, it is clearly observed in
Table 8 that the nopal is a product
lacking iron at least for the analyzed
varieties. Although, it is noted that it
was not possible to find reports of
the iron content in nopal.
The physical attributes, the cv.
Pelón rojo was the one with the
smallest cladode size, the cv.
Copena the largest width and in
terms of thickness, no significant
differences between the three were
Table 5. Moisture content (%) of cactus prickly flour (Copena, Pelon blanco & Pelon rojo).
VarietyMoisture
content (%) Variety
Moisture content (%)
VarietyMoisture
content (%)
Copena 5.55 Pelón Blanco 5.91 Pelón Rojo 5.42
Copena 5.37 Pelón Blanco 6.7 Pelón Rojo 4.35
Copena 7.85 Pelón Blanco 5.73 Pelón Rojo 5.25
Average 6.26a 6.11a 5.01a
Deviation (1.38) (0.52) (0.50)
a for the same analyzed parameter, an equal superscript shows that there is not a significant difference between varieties. (p0.05).
Table 6. Percentage of fat from cactus prickly flour.
Flour Extract (%) Flour Extract (%) Flour Extract (%)
Copena 4.14 Pelón Blanco 4.54 Pelón Rojo 4.04
Copena 1.44 Pelón Blanco 4.48 Pelón Rojo 2.12
Copena 1.76 Pelón Blanco 4.47 Pelón Rojo 2.53
Average 2.45 4.50 2.90
Deviation (1.47)a (0.00)b (1.02)a
a & b for the same analyzed parameter, a different superscript shows a significant difference between varieties. (p0.05).
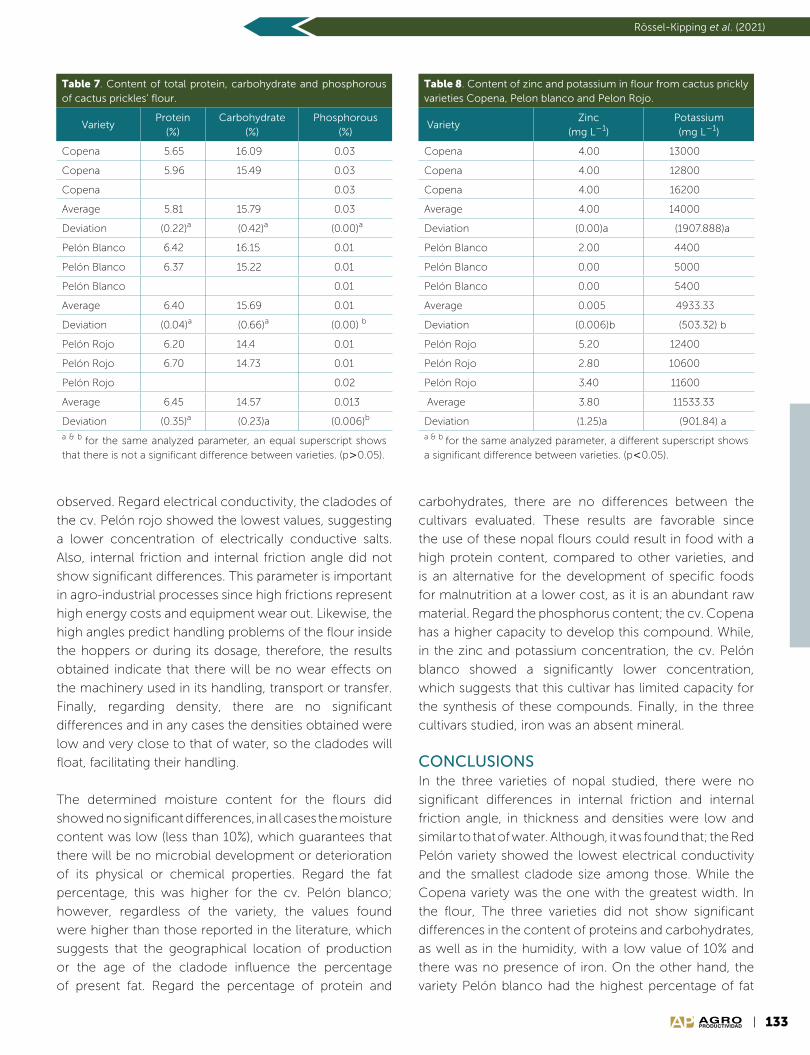
133AGROPRODUCTIVIDAD
Rössel-Kipping et al. (2021)
Table 8. Content of zinc and potassium in flour from cactus prickly varieties Copena, Pelon blanco and Pelon Rojo.
VarietyZinc
(mg L1)Potassium(mg L1)
Copena 4.00 13000
Copena 4.00 12800
Copena 4.00 16200
Average 4.00 14000
Deviation (0.00)a (1907.888)a
Pelón Blanco 2.00 4400
Pelón Blanco 0.00 5000
Pelón Blanco 0.00 5400
Average 0.005 4933.33
Deviation (0.006)b (503.32) b
Pelón Rojo 5.20 12400
Pelón Rojo 2.80 10600
Pelón Rojo 3.40 11600
Average 3.80 11533.33
Deviation (1.25)a (901.84) a
a & b for the same analyzed parameter, a different superscript shows a significant difference between varieties. (p0.05).
Table 7. Content of total protein, carbohydrate and phosphorous of cactus prickles’ flour.
VarietyProtein
(%)Carbohydrate
(%)Phosphorous
(%)
Copena 5.65 16.09 0.03
Copena 5.96 15.49 0.03
Copena 0.03
Average 5.81 15.79 0.03
Deviation (0.22)a (0.42)a (0.00)a
Pelón Blanco 6.42 16.15 0.01
Pelón Blanco 6.37 15.22 0.01
Pelón Blanco 0.01
Average 6.40 15.69 0.01
Deviation (0.04)a (0.66)a (0.00) b
Pelón Rojo 6.20 14.4 0.01
Pelón Rojo 6.70 14.73 0.01
Pelón Rojo 0.02
Average 6.45 14.57 0.013
Deviation (0.35)a (0.23)a (0.006)b
a & b for the same analyzed parameter, an equal superscript shows that there is not a significant difference between varieties. (p0.05).
observed. Regard electrical conductivity, the cladodes of
the cv. Pelón rojo showed the lowest values, suggesting
a lower concentration of electrically conductive salts.
Also, internal friction and internal friction angle did not
show significant differences. This parameter is important
in agro-industrial processes since high frictions represent
high energy costs and equipment wear out. Likewise, the
high angles predict handling problems of the flour inside
the hoppers or during its dosage, therefore, the results
obtained indicate that there will be no wear effects on
the machinery used in its handling, transport or transfer.
Finally, regarding density, there are no significant
differences and in any cases the densities obtained were
low and very close to that of water, so the cladodes will
float, facilitating their handling.
The determined moisture content for the flours did
showed no significant differences, in all cases the moisture
content was low (less than 10%), which guarantees that
there will be no microbial development or deterioration
of its physical or chemical properties. Regard the fat
percentage, this was higher for the cv. Pelón blanco;
however, regardless of the variety, the values found
were higher than those reported in the literature, which
suggests that the geographical location of production
or the age of the cladode influence the percentage
of present fat. Regard the percentage of protein and
carbohydrates, there are no differences between the
cultivars evaluated. These results are favorable since
the use of these nopal flours could result in food with a
high protein content, compared to other varieties, and
is an alternative for the development of specific foods
for malnutrition at a lower cost, as it is an abundant raw
material. Regard the phosphorus content; the cv. Copena
has a higher capacity to develop this compound. While,
in the zinc and potassium concentration, the cv. Pelón
blanco showed a significantly lower concentration,
which suggests that this cultivar has limited capacity for
the synthesis of these compounds. Finally, in the three
cultivars studied, iron was an absent mineral.
CONCLUSIONSIn the three varieties of nopal studied, there were no
significant differences in internal friction and internal
friction angle, in thickness and densities were low and
similar to that of water. Although, it was found that; the Red
Pelón variety showed the lowest electrical conductivity
and the smallest cladode size among those. While the
Copena variety was the one with the greatest width. In
the flour, The three varieties did not show significant
differences in the content of proteins and carbohydrates,
as well as in the humidity, with a low value of 10% and
there was no presence of iron. On the other hand, the
variety Pelón blanco had the highest percentage of fat
134 AGROPRODUCTIVIDADAGROPRODUCTIVIDAD
Biofertilizantes y producción de caña de azúcarAgro productividad 14 (4): 127-134. 2021
and the lowest concentration of zinc and potassium, while the variety
Copena obtained the highest concentration of phosphorus.
REFERENCESCrespo Villalaz, C. (2004). Mecánica de suelos y cimentaciones. Limusa, 5ta ed. México.
Grandy, G., Weisstaub, G., & López de Romaña, D. (2010). Deficiencia de hierro y zinc en
niños. Rev Soc Bol Ped, 49(1): 25–31.
Ibarra Alejo, j. R. (1986). Agroindustria, estado y proceso científico-técnico en la agricultura
mexicana. Seminario Internacional de Investigación UACh- Universidad Humboldt.
Kiesling, R. (1995). Origen, domesticación y distribución de Opuntia ficus-indica. J. Profess.
Assoc. Cact. Develop, 22(1642): 4747-4748.
Luna Vázquez, J. (2011). Producción intensiva de nopal de verdura. INIFAP. Folleto para
productores No. 52. MX-0-310305-32-03-17-10-52. 34p.
Reyes-Agüero, J. A., Aguirre-Rivera, J. R., & Hernández, H. M. (2005). Systematic notes and a
detailed description of Opuntia ficus-indica (L.) mill. (Cactaceae). Agrociencia, 39(4):
395–408.
Sáenz, Carmen. (2006). Producción industrial de productos no alimentarios. Utilización
Agroindustrialdel Nopal, 99–112. BOLETÍN DE SERVICIOS AGRÍCOLAS DE LA FAO,
162.
Siess Wolfgang. (2020). Goldene Zwanziger für das 21. Jahrhundert; WILEY-VCH 1-2, 23.
Jahrgang, Feburuar 2020, CIT plus, D47412ISSN1436-2597 pp.3
Vázquez-Alvarado, R. E., Valdez-Cepeda, R., Gutiérrez-Ornelas, E., & Blanco-Macias, F.
(1992). Caracterización e Identificación de Nopal Forrajero en el Noreste de México.
VI Simposium Taller Producción y Aprovechamiento del Nopal en el Noreste de
México, 21–36.
AGROPRODUCTIVIDAD
135AGROPRODUCTIVIDAD
https://doi.org/10.32854/agrop.v14i4.1853
Agroproductividad: Vol. 14, Núm. 4, abril. 2021. pp: 135-142.
Recibido: octubre, 2020. Aceptado: febrero, 2021.
Plastic colored paddings and its effect on the foliar micromorphology of husk tomato (Physalis ixocarpa Brot.)
Marín-Cortez, María del P.1; Rodríguez-Luna, Daniela1; Flores-Naveda, Antonio2; Álvarez-Vázquez, Perpetuo3;
García-López, Josué I.2; Camposeco-Montejo, Neymar2*
1Universidad Autónoma Agraria Antonio Narro. Departamento de Horticultura. Saltillo, Coahuila,
México. 2Universidad Autónoma Agraria Antonio Narro. Departamento de Fitomejoramiento. 3Universidad Autónoma Agraria Antonio Narro. Departamento de Recursos Naturales Renovables.
*Corresponding author: [email protected]
ABSTRACTObjective: To assess the effect of colored plastic paddings on the foliar micromorphology of husk tomato (Physalis
ixocarpa Brot.).
Design/methodology/approach: A completely randomized statistical model was used with five treatments (black, white,
blue, red and green paddings) with three repetitions each, 95% reliability and Tukey’s mean test (P0.05). To quantify the
normalized difference vegetation index (NDVI) a portable GreenSeeker® sensor was used. To measurement of total soluble
solids a Atago® Digital refractometer, the density and stomatal index, length and width of stomata were determined with a
Carl Zeiss microscope with an integrated camera and the AxionVisionRel measurement software 4.8.
Results: The results show no significant differences in the NDVI and total soluble solids. The micromorphological variables
of adaxial stomatal density and adaxial stomatal index were superior in the blue paddings and exceeded black paddings in
95 % and 50 % respectively. The rest of the micromorphological variables were statistically similar, the yield per plant was
statistically similar in the black, white, red and green, while blue paddings yield less.
Study limitations/implications: blue paddings improve micromorphological characteristics, but not the yield of husk
tomato crops.
Findings/conclusions: Some of the foliar micromorphological characteristics of the husk tomato crop are modified by
colored plastic paddings; however, the improvement in these variables does not necessarily improve the crop yield,
probably due to the absorbed and reflected radiation by the colored plastic paddings.
Keywords: Physalis sp., stomatic density, stomatic index, epidermal cells.
INTRODUCTION
Husk tomato (Physalis ixocarpa Brot.) is a vegetable of great economic importance in
Mexico. Between 2012 and 2019, Mexican exports of it increased by nine
thousand tons on average per year, the United States the main export destination. In 2018, 42,464 hectares were
planted and a production of 830 thousand tons was obtained, with a value of 4,352 million pesos. The states that
135AGROPRODUCTIVIDAD
Imagen de John Hayse en Pixabay

136 AGROPRODUCTIVIDADAGROPRODUCTIVIDAD
Biofertilizantes y producción de caña de azúcarAgro productividad 14 (4): 135-142. 2021
lead the production are Sinaloa, Jalisco, Zacatecas,
Michoacán and Puebla (SIAP, 2019). Its importance
also lies in its nutritional value, given that it represents
a concentrated source of bioactive elements and
micronutrients (Vargas et al., 2015). However, like any
crop, the species faces problems, which have to be
addressed with technical or technological innovation
that enhances its production. One of these long-time
used innovations is plastic. The most used paddings
are black and white, which allows water-saving and
increased yields (Canul et al., 2017), decreases weeds
incidence in the crops and increases soil temperature
(Quintero, 2015; Ruiz et al., 2014). However, paddings
are also manufactured in white, silver and to a lesser
extent blue, green, red and brown. The above, seek
and provide plants with adequate radiation and
temperature to enhance their maximum development
and productivity (Oliva, 2015), since plants are
photosynthetic organisms and depend on solar
radiation quality to obtain energy and transform it into
carbohydrates (Ganesh et al., 2013).
Radiation is the main factor regulating the different
growth stages, development and the vital physiological
process throughout a plant’s life cycle. In response
to radiation, plants developed different structures
(photoreceptors) for their perception, through which
they can assess the radiation quality (wavelength),
intensity, duration and direction (Heijde and Ulm,
2012). Studies related to the quality of radiation under
photo-selective meshes indicate that the red mesh
transmits more total solar radiation, photosynthetic,
red, far-red and infrared than the black mesh, while
the aluminated mesh transmits more ultraviolet-A light,
therefore the blue mesh consequently more blue light
and photosynthetically active radiation. In general,
under these colored covers, the relative humidity and
temperature of the upper leaves increase by 0.2-0.9 °C,
as well as their photosynthetic properties: transpiration,
stomatal conductance and CO2 assimilation (Ayala et
al., 2013). Other studies indicate that photoselective
plastics improve the environment and therefore the
physiological processes in plants, which translates
into higher productivity compared to traditionally
marketed plastics (Ramos et al., 2017; Alsadon et
al., 2016). Hogewoning et al. (2010) point out that
for photosynthesis to adequately happen, without
any alterations, it needs a minimum of 7% blue light
and, on the contrary, when there is only red light,
the photosynthetic process diminishes and affects
growth and development. Therefore, there must be a
combination of both for photosynthetic processes to
be carried out efficiently. Similar negative effects occur
if wavelengths of less than 300 and greater than 900
nm and climatic-environmental factors are equally
involved (Casierra et al., 2011).
To express their maximum phenotypic potential, crops
need optimal radiation ranges, which vary depending
on the species. To address these particular radiation
demands and achieve better use by crops, different plastic
color covers and paddings are offered throughout the
horticultural market, the above is reflected in increased
yield and improvements in the morphological characters
of the plant and fruit quality, as previously mentioned.
However, the effect of those films and their coloration
on the micromorphological component of the plants
is not studied. Therefore, in this work, the effect of the
coloration of plastic pads on the foliar micromorphology
and some performance components of a husk tomato
crop was assessed.
MATERIALS AND METHODSExperimental site location
The experiment was established in a experimental field
at the Horticulture Department, Universidad Autónoma
Agraria Antonio Narro (UAAAN), Saltillo, Coahuila,
Mexico; located at 25° 21’ 24’’ N and 101° 02’ 05’’ W, an
altitude of 1,762 m above sea level, mean annual rainfall
of 400 mm, mean annual temperature between 12 and
18 °C, and a BS0 k(x’) dry temperate climate. The used
vegetable material was of the “Siquerios F1” variety husk
tomato from the Harris Moran seed house.
Seedlings production
For the seedlings production, 200-cavity polystyrene
trays were filled with peat and perlite substrate
in a 70:30% proportion, previously moistened to
field capacity. One seed per cavity was sown at an
approximate 0.5 cm depth and covered with a thin
layer of the same mixture substrate, later it was covered
with black plastic and kept in a greenhouse to induce
germination. After 72 hours the plastic cover was
removed and left in the greenhouse for the emergence
and the seedlings growth. The seedlings were fertilized
with triple 20 (20-20-20) soluble N-P2O5-K2O, at a 0.8
g L1 rate, the first application 6 days after emergence
(DAE), the second, third and fourth at 13, 19 and 26 DAE
respectively. The seedlings were ready for transplant 35
days after sowing.
137AGROPRODUCTIVIDAD
Marín-Cortez et al. (2021)
Field establishment and crop management
The crop was established during the Spring-Summer
2019 cycle, in 25 cm high and 30 cm wide, by 25 m
long seedbeds. The distance between plants within
the planting beds was 30 cm in a single row, and
1.8 m between beds, covered with the colored plastic
pads that were the tested treatments: black, white,
red, blue and green. The plants were arranged under
a completely randomized experimental arrangement
with five treatments and three repetitions each, with five
plants for repetition. Fertilization took place every third
day via a drench, with global N-P-K fertilization of 55-45-
35 kg/ha respectively. Drip irrigation was daily applied,
which for one hour and a flow rate of 0.5 L/h for each
dropper, with 20 cm distances between droppers. For
the pests prevention and control (cochineal and snail)
weekly applications of agricultural lime were made at the
base of the stem of each plant (5 g approximately), the
first three weeks. For whiteflies, ROMA® biodegradable
detergent soap was sprayed at a rate of 5 g/L each week.
Determination of the normalized difference vegetation
index (NDVI)
The normalized difference vegetation index was
determined with a GreenSeeker® brand portable
sensor, on fully developed mature leaves with the
same orientation, randomly sampled (the third most
developed leaf from the apex down), in three plants for
each repetition. The sensor was placed on the adaxial
side of the leaf to later record the data.
Total soluble solids (TSS) determination in petioles
For the determination of the total soluble solids in
petioles, leaf petiole was used to determine the NDVI.
Each petiole was removed from the plants with a scalpel,
later in the laboratory, each sample was macerated in a
porcelain mortar, until its sap was obtained, from which
a drop was placed in an Atago® digital refractometer,
their data recorded in Brix degrees.
Epidermal sampling and determination of
foliar micromorphology
The photographs to count and the micro-morphological
analysis were carried out at the Citogenética laboratory
at the Departamento de Fitomejoramiento of the
Universidad Autónoma Agraria Antonio Narro. The
epidermal samples were collected 50 days after
transplant. Epidermal impressions were made on fully
mature leaves with the same orientation and from three
useful plants. With a brush, transparent PVC glue was
applied in an approximate 2 cm2 area. In the middle of
the leaves and in secondary veins, the adaxial and abaxial
sides. After the glue dried (approximately 2 min later),
the glue layer was removed with transparent adhesive
tape, which was then placed on a glass slide. Three
photographs were taken at random of each epidermal
impression, for a total of nine photographs per repeat
and 27 for each treatment, in a Carl Zeiss microscope
with an integrated camera (Pixera Winder Pro). With the
10X objective, the adaxial and abaxial stomatal density
(SD) was determined by counting the existing stomata
in the photographed area (0.3965 mm2) following
formula:
DE= −
Number of stomata
area of the photograph mm( . )0 3965 2
to obtain the number of stomata per 1 mm2. For the
stomatal index (EI), photographs of the adaxial and
abaxial areas were taken with a 40X objective. With them,
the stomatal index was estimated with the following
equation:
EI ED ED ECD= +( )( )/ * 100
where: EDstomatal density and ECDepidermal cell
density, which were also assessed (Salisbury and Roos
2000).
The area of the photograph was 0.0240 mm2 and then
adjusted to 1 mm2. With the photographs taken with
the 40X objective, the length and width of the stomata
were measured, recorded in micrometers, for which the
Axion Vision Rel.4.8 software was used.
Crop yield
To calculate the crop yield, the filled fruits were harvested
in a bag to contain them. To determine the yield per
plant, the fruits were weighed on an OHAUS® Scout®-
Pro digital scale and the total of the three harvests was
added. At the same time, the number of fruits per plant
was counted. To calculate the average fruit weight, the
total yield of each plant was divided by the total number
of fruits that plant.
Statistical analysis of the data
For the statistical analysis of the foliar micromorphology,
NDVI, total soluble solids and some yield components,
a completely randomized statistical model was used
with five treatments and three repetitions each, with

138 AGROPRODUCTIVIDADAGROPRODUCTIVIDAD
Biofertilizantes y producción de caña de azúcarAgro productividad 14 (4): 135-142. 2021
a reliability of 95% and the Tukey’s test (P0.05), with
the SAS® statistical software version 9.02, where the
treatments were the black, white, red, blue and green
paddings.
RESULTS AND DISCUSSIONThe averages of NDVI and total soluble solids are shown
in Table 1. The amount of NDVI evaluated in husk tomato
leaves was not significantly affected by the quantity and
quality of solar radiation absorbed and reflected by the
paddings. although the 0.87 NDVI average of the white
and red paddings is an increase compared to 8.7% of
control. These values are high compared to 0.68 NDVI
obtained in watermelon crops (Saiz et al., 2017), and
0.14 and 0.35 found in two coriander varieties (Ortiz
and Torres, 2018). The high NDVI values found in the
husk tomato plants grown with the colored paddings,
were probably due to the applied nutrition since this
variable directly correlates with the amount of N in the
plant and therefore with its greenness, which can also
be interpreted as chlorophyll content (Padilla et al.,
2014 and 2017). According to Hernández et al. (2017),
chlorophyll content in plants increases when using light-
colored paddings and directly attributed it to a higher
incidence of total solar radiation and photosynthetically
active radiation on the plants. The results were found
to correspond to that reported by Paredes et al. (2019),
with much higher photosynthetically active radiation in
red mesh followed by white one. In the total soluble
solids in leaf petioles variable, no significant differences
were found between treatments. Although the average
of the red padding stands out with 2.18 °Brix, followed by
the blue with 0.99 °Brix. The °Brix indicates the amount
of soluble solids in a plant sample, generally sugars
(Gutiérrez et al., 2017), since the more photosynthesis
a plant performs, the more C it will be fixing to convert
them into carbohydrates and transport them to areas of
demand (von Caemmerer and Furbank, 2016).
The means test showed no significant differences
between treatments in the variables of adaxial and
abaxial epidermal cell density, or abaxial stomatal index
(Table 2). This contrasts with that reported by Peralta et
al. (2016), who had statistically significant differences in
the stomatal index in grafted cucumbers but coincides
with that by Camposeco et al. (2018) who found no
significant differences in the density of epidermal cells
of the adaxial part in grafted and ungrafted peppers.
Therefore, it is inferred that colored plastic paddings
have no significant effect on the previously described
variables in husk tomato cultivation.
In the comparison of the mean of adaxial
and abaxial stomatal density and adaxial
stomatal index, significant differences
(Tukey; P0.05) were observed between
treatments (Figure 1). This result
coincides with Peralta et al. (2016), who
report statistically significant differences
in adaxial and abaxial stomatal index and
density in grafted cucumbers. Similar
results were documented in grafted
and ungrafted watermelons (González
et al., 2017) and in grafted peppers
(Camposeco et al., 2018). With the above
differences, it is observed how the plants
grown with blue paddings are favored in
Table 1. Variance and comparison of means of NDVI and total soluble solids in husk tomatoes grown with colored plastic padded.
Treatments(Padded)
NDVISST
(°Brix)
Black (Control) 0.800.12 a& 0.960.32 a
Red 0.870.03 a 2.180.81 a
White 0.870.03 a 0.970.60 a
Blue 0.810.14 a 0.990.21 a
Green 0.860.04 a 0.970.55 a
Significance ns ns
DFE 8 8
CV (%) 10.36 49.09
nsnot significant, DFEdegrees of freedom of error, CVcoefficient of variation, &mean followed by the same letter in the columns are statistically equal Tukey P0.05, TSStotal soluble solids.
Table 2. Variance and comparison of means, of three foliar epidermal characters evaluated in husk tomato cultivated with different padded colors.
Treatments(Padded)
Adaxial Abaxial
ECD(Cell mm2)
SI(%)
ECD(Cell mm2)
Black (Control) 512.3519.27 a& 28.733.67 a 620.3771.87 a
Red 561.7335.05 a 32.770.66 a 527.7848.33 a
White 569.4412.24 a 30.121.32 a 606.4825.77 a
Blue 575.6223.32 a 31.245.66 a 728.40192.91 a
Green 557.1046.37 a 31.030.09 a 620.3761.12 a
Significance ns ns ns
DFE 8 8 8
CV (%) 5.72 9.85 15.94
nsnot significant, DFEdegrees of freedom of error, CVcoefficient of variation, &mean followed by the same letter in the columns are statistically equal Tukey P0.05, SIstomatic index, ECDepidermal cell density.
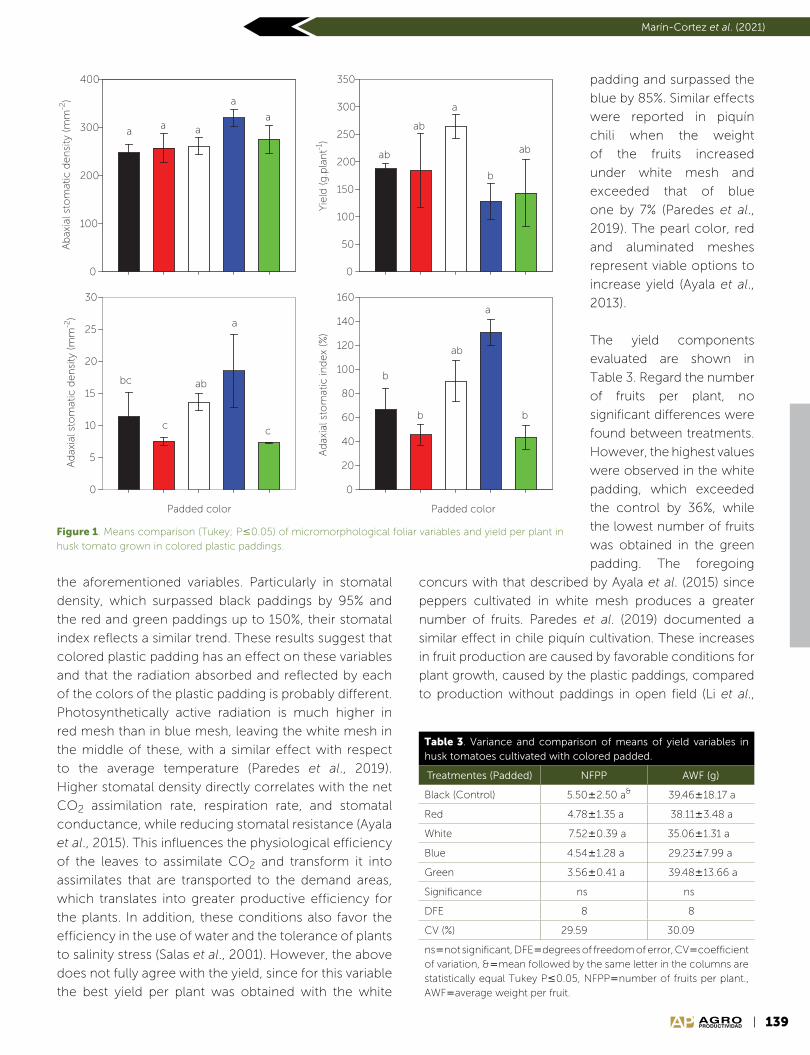
139AGROPRODUCTIVIDAD
Marín-Cortez et al. (2021)
the aforementioned variables. Particularly in stomatal
density, which surpassed black paddings by 95% and
the red and green paddings up to 150%, their stomatal
index reflects a similar trend. These results suggest that
colored plastic padding has an effect on these variables
and that the radiation absorbed and reflected by each
of the colors of the plastic padding is probably different.
Photosynthetically active radiation is much higher in
red mesh than in blue mesh, leaving the white mesh in
the middle of these, with a similar effect with respect
to the average temperature (Paredes et al., 2019).
Higher stomatal density directly correlates with the net
CO2 assimilation rate, respiration rate, and stomatal
conductance, while reducing stomatal resistance (Ayala
et al., 2015). This influences the physiological efficiency
of the leaves to assimilate CO2 and transform it into
assimilates that are transported to the demand areas,
which translates into greater productive efficiency for
the plants. In addition, these conditions also favor the
efficiency in the use of water and the tolerance of plants
to salinity stress (Salas et al., 2001). However, the above
does not fully agree with the yield, since for this variable
the best yield per plant was obtained with the white
Figure 1. Means comparison (Tukey; P0.05) of micromorphological foliar variables and yield per plant in husk tomato grown in colored plastic paddings.
Ab
axia
l sto
mat
ic d
en
sity
(m
m-2
)
0
100
200
300
400
Yie
ld (
g.p
lan
t-1)
0
50
100
150
200
250
300
350
Ad
axia
l sto
mat
ic in
dex
(%)
0
20
40
60
80
100
120
140
160
Padded color
Ad
axia
l sto
mat
ic d
en
sity
(m
m-2
)
0
5
10
15
20
25
30
aa a
a
a
ab
ab
a
b
ab
a
bc ab
c c
b
b
ab
b
a
Padded color
padding and surpassed the
blue by 85%. Similar effects
were reported in piquín
chili when the weight
of the fruits increased
under white mesh and
exceeded that of blue
one by 7% (Paredes et al.,
2019). The pearl color, red
and aluminated meshes
represent viable options to
increase yield (Ayala et al.,
2013).
The yield components
evaluated are shown in
Table 3. Regard the number
of fruits per plant, no
significant differences were
found between treatments.
However, the highest values
were observed in the white
padding, which exceeded
the control by 36%, while
the lowest number of fruits
was obtained in the green
padding. The foregoing
concurs with that described by Ayala et al. (2015) since
peppers cultivated in white mesh produces a greater
number of fruits. Paredes et al. (2019) documented a
similar effect in chile piquín cultivation. These increases
in fruit production are caused by favorable conditions for
plant growth, caused by the plastic paddings, compared
to production without paddings in open field (Li et al.,
Table 3. Variance and comparison of means of yield variables in husk tomatoes cultivated with colored padded.
Treatmentes (Padded) NFPP AWF (g)
Black (Control) 5.502.50 a& 39.4618.17 a
Red 4.781.35 a 38.113.48 a
White 7.520.39 a 35.061.31 a
Blue 4.541.28 a 29.237.99 a
Green 3.560.41 a 39.4813.66 a
Significance ns ns
DFE 8 8
CV (%) 29.59 30.09
nsnot significant, DFEdegrees of freedom of error, CVcoefficient of variation, &mean followed by the same letter in the columns are statistically equal Tukey P0.05, NFPPnumber of fruits per plant., AWFaverage weight per fruit.

140 AGROPRODUCTIVIDADAGROPRODUCTIVIDAD
Biofertilizantes y producción de caña de azúcarAgro productividad 14 (4): 135-142. 2021
Adaxial Abaxial Padded color
Black padded
Red padded
White padded
Blue padded
Green padded
Figure 2. Epidermis impressions of the adaxial and abaxial part of husk tomato leaves cultivated with colored paddings.
20 m
141AGROPRODUCTIVIDAD
Marín-Cortez et al. (2021)
2015). In average, fruit weights have no significant
differences between treatments and the control,
although the highest average values were observed in the
green padding and the control, with 39.48 and 39.46 g
respectively. Therefore, compared with Rodríguez et
al. (2011), under protected agriculture conditions, husk
tomato var. Querétaro obtained the highest average fruit
weight with 37.65 g, similar to that in this experiment with
colored paddigs, while Valdivia et al. (2016) documented
that in Physalis pubescens, up to 730 g per plant were
obtained.
CONCLUSIONWith the colored plastic paddings, some of the foliar
micromorphological characteristics of the husk tomato
crop are modified. The adaxial and abaxial stomatal
density, as well as the adaxial stomatal index, are favored
by blue plastic paddings. However, an improvement in
these variables does not necessarily increase the yield of
this crop.
REFERENCESAlsadon, A., Al-Helal, I., Abdullah, I., Ahmed, A. G., Al-Zarani, S. & Ashour,
T. (2016). The effects of plastic greenhouse covering on
cucumber (Cucumis sativus L.) growth. Ecological Engineering
87: 305-312.
Ayala, T. F., Yáñez, J. M. G., Partida, R. L., Ruiz, E. F. H., Campos, G. F. H.,
Vásquez, M. O., Velázquez A. T. & Díaz V. T. (2013). Producción
de pepino en ambientes diferenciado por mallas de sombreo
fotoselectivo. ITEA 111: 3-17.
Ayala, T.F., Sánchez, M. R., Partida, R. L., Yáñez, J. M. G., Ruiz, E. F.
H., Velázquez, A. M. T., Valenzuela, L. M. & Parra J. (2015).
Producción de pimiento morrón con mallas sombra de
colores. Revista Fitotecnia Mexicana 38(1): 93-99.
Camposeco, M. N., Robledo, T. V., Ramírez, G. F., Valdez, A. L. A.,
Cabrera, de la F. M & Mendoza, V. R. (2018). Efecto del
portainjerto en el índice y densidad estomática de pimiento
morrón Capsicum annuum var. annuum. Ecosistemas y
Recursos Agropecuarios 5(15): 555-561.
Canul, T. C. E., Ibarra, J. L., Valdez, A. L. A., Lozano, del R. J., Cárdenas,
F. A. & Zermeño G. A. (2017). Influence of colored plastic mulch
op soil temperature, growth, nutrimental status and yield of
bell pepper under shade house conditions. Journal of Plant
Nutrition 40(8):1083-1090.
Casierra, P. F., Peña, O. J. E. & Ulrichs, C. (2011). Crecimiento y
eficiencia fotoquímica del fotosistema II en plantas de fresa
(Fragaria sp.) afectadas por la calidad de la luz: implicaciones
agronómicas. Revista U.D.C.A Actualidad y Divulgación
Científica 14(2): 43-53.
Ganesh, M. N., Punyakishore, M., Jung H. P., Vaidurya, P. S, Sang Y.
L. K. & Chang H. K. (2013). UV-induced cell death in plants.
International Journal of Molecular Sciences 14(1)1608-1628.
González, G. H., Ramírez, G. F., Ortega, O. H., Benavides, M. A.,
Robledo, T. V. & Cabrera de la F., M. (2017). Use of chitosan-PVA
hydrogels with copper nanoparticles to improve the growth of
grafted watermelon. Molecules 22: 1-9.
Gutiérrez, J. A., Reyes, H. & Castañeda, J. F. (2017). Análisis fisicoquímico
de las hojas de Eucalipto camaldulensis y su hidrolizado, como
sustrato en la producción de xilitol. Entre Ciencia e Ingeniería
11(22): 76-83.
Heijde, M. & Ulm, R. (2012). UV-B photoreceptor-mediated signaling in
plants. Trends in Plant Science 17(4): 230-237.
Hernández, M. A., Zermeño, G. A., Melendres, A. A., Campos, M. S. G.,
Cadena, Z. M. & Del Bosque V. G. A. (2017). Características de la
cubierta de un túnel efecto en radiación, clorofila y rendimiento
de calabacita. Revista Mexicana de Ciencias Agrícolas 8(5):
1127-1142.
Hogewoning, S. W., Trouwborst, G., Maljaars, H., Poorter, H., van
Ieperen, W. & Harbinson, J. (2010). Blue light dose–responses
of leaf photosynthesis, morphology, and chemical composition
of Cucumis sativus grown under different combinations of red
and blue light. Journal of Experimental Botany. 61(11): 3107-3117.
Li, X., Shi, H., Simunek, J., Gong, X. & Peng, Z. (2015). Modeling soil
water dynamics in a drip-irrigated intercropping field under
plastic mulch. Irrigation Science 33: 289-302
Oliva, M. Z. M. (2015). Efecto de colores de cubierta plástica al suelo y
del manejo de poda de chile pimiento variedad Nathalie, bajo
casa malla. Tesis de grado. Universidad Rafael Landivar. La
Fragua, Zacapa, Guatemala.
Ortiz, E. & Torres, E. (2018). Determinación de las necesidades hídricas
de dos variedades de cilantro mediante sensores remotos.
Agronomía Colombiana 36: 274-283.
Padilla, F. M., Peña, F. M T., Gallardo, M. & Thompsom, R. B. (2017).
Determination of sufficiency values of canopy reflectance
vegetation index for maximum growth and yield of cucumber.
European Journal of Agronomy 84: 1-15.
Padilla, F. M., Peña, F. M T., Gallardo, M. & Thompsom, R. B. (2014).
Evaluation of optical sensor measurements of canopy
reflectance and of leaf flavonols and chlorophyll contents to
assess crop nitrogen status of muskmelon. European Journal
of Agronomy 58: 39-52.
Paredes, J. J. R., Mendoza, V. R., Pérez, R. M. A., Torres, V. R. & Moreno
L. S. (2019). Agronomic behavior of piquin pepper ecotypes
under photoselective covers. Ingeniería Agrícola y Biosistemas
11(1): 53-67.
Peralta, M. R. M., Cabrera, de la F. M., Morelos, M. A., Benavides, M.
A., Ramírez, G. F. & Gonzales, F. J. A. (2016). Micromorfologia
del pepino obtenido mediante injerto y desarrollado en
dos sistemas de fertilización. Revista Mexicana de Ciencias
Agrícolas 17: 3453-3463.
Quintero, G. M. M. (2015). Efecto del acolchado plástico y orgánico
sobre la temperatura del suelo y el rendimiento de tomate
en invernadero. Tesis de Maestría. Universidad Autónoma de
Nuevo León. Disponible en: http://eprints.uanl.mx/9703/
Ramos, L. B. E., Martínez, G. G. A., Morales, I., Escamirosa, C. T. & Pérez,
H. A. (2017). Consumo de agua y rendimiento de tomate de
cáscara bajo diferentes cubiertas de invernadero. Horticultura
Brasileira 35(2): 265-270.
Rodríguez, B. A., Ayala, G. O. J., Hernández, L. A., Leal, L. V. M. & Cortez,
M. E. (2011). Desarrollo de fruto y semilla de cinco variedades
de tomate de cáscara en Sinaloa. Revista Mexicana de Ciencias
Agrícolas 2(5): 673-687.
142 AGROPRODUCTIVIDADAGROPRODUCTIVIDAD
Biofertilizantes y producción de caña de azúcarAgro productividad 14 (4): 135-142. 2021
Ruiz, M. L. M., Ibarra, J. L., Valdez, A. L. A., Robledo, T. V., Benavides, M. A. & Cabrera
de la F., M. (2014). Cultivation of potato-use of plastic mulch and row covers on
soil temperature, growth nutrients status and yield. Acta Agriculturae Scandinavica
Section B. Soil and Plant Science 65(1): 30-35.
Saiz, R. R., Aguirre, L. G. L., Rodríguez, J. C., Watts, T. C. J., Saiz, R. J. A., Ochoa, G. A. & Saiz,
H. J. A. (2017). Estimación de evapotranspiración con imágenes de PROBA-V de un
cultivo de sandía en la costa de Hermosillo, Sonora, México. Terra Latinoamericana
35: 301-308.
Salas, J. A., Sanabria, M.E., & Pire, R. (2001). Variación en el índice y densidad estomática
en plantas de tomate (Lycopersicum esculentum Mill.) sometidas a tratamientos
salinos. Bioagro 13(3): 99-104.
SIAP. (2019). Sistema de Información Agrícola y Pesquera. Disponible en: https://nube.siap.
gob.mx/cierreagricola/
Valdivia, M. L. E., Rodríguez, Z. F. A., Sánchez, G. J. J. & Vargas, P. O. (2016). Phenology,
agronomic and nutritional potential of three wild husk tomato species (Physalis,
Solanaceae) from Mexico. Scientia Horticulturae 200: 83-94.
Vargas, P. P., Valdivia M. L. E., Sánchez M. J. (2015) Potencial alimenticio de los tomates de
cáscara (Physalis spp.) de México. Agroproductividad 8: 17-23.
von Caemmerer, S. & Furbank, R. (2016). Strategies for improving C4 photosynthesis.
Current Opinion in Plant Biology 31: 125-134.
AGROPRODUCTIVIDAD
143AGROPRODUCTIVIDAD
https://doi.org/10.32854/agrop.v14i4.1877
Agroproductividad: Vol. 14, Núm. 4, abril. 2021. pp: 143-147.
Recibido: noviembre, 2020. Aceptado: febrero, 2021.
In vitro anthelmintic activity of Musa balbisiana Colla (square banana) against Haemonchus contortus eggs
Rivera-Torrez, Diana L.1; Hernández-Villegas, Manuel M.1*; Bolio-López, Gloria I.1; Almenares-López, Damianys1;
Córdova-Sánchez, Samuel1; De la Cruz-Burelo, Patricia1
1Universidad Popular de la Chontalpa. División Académica de Ingenierías y Ciencias Agropecuarias.
Carretera Cárdenas-Huimanguillo km 2.0. Cárdenas, Tabasco, México. C. P. 86500.
*Corresponding author: [email protected]
ABSTRACTObjective: To evaluate the anthelmintic activity of aqueous and ethanolic extracts of Musa balbisiana Colla, against H.
contortus eggs.
Design/methodology/approach: The anthelmintic activity was evaluated using an egg hatching inhibition test. The
aqueous extracts from leaves, peels and roots were obtained by infusion and subsequently lyophilized. Ethanolic extracts
were obtained by maceration and later concentrated in a rotary evaporator. Spectroscopic, phytochemical, chemical
and total polyphenol content analyzes were performed. The 50% lethal concentration to inhibit H. contortus eggs from
hatching was calculated following a Probit analysis.
Results: The identified functional groups in the FT-IR analysis were hydroxyl (OH) and methyl groups (CH3). The proximal
analysis revealed significant differences in the dry matter percentage (P0.05). No significant differences were found in
the protein content (P0.05). The egg hatching inhibition rates at the highest concentration 4.8 mg/mL were 100% for the
aqueous and ethanolic extracts from leaves, and 93.7 and 62% for the peel and roots, respectively.
Study limitations/implications: Further studies are required in in vivo systems.
Findings/Conclusions: With a LC50 of 225 g/mL and a 95% confidence interval, with a range between 33 and 418.4 g/
mL, the aqueous extract from the leaves was the most active.
Key words: Anthelmintics, Haemonchus contortus, Musa balbisiana, gastrointestinal nematodes, bioactive plants.
INTRODUCTION
Haemonchus contortus represents the most frequent nematode in both temperate and tropical regions, induces
large economic losses and has shown resistance to available anthelmintics. This nematode is considered
one of the most pathogenic parasites due to its hematophagous habits, high prolificacy and high prevalence
(Jasso Díaz et al., 2017). The treatment of hemoncosis depends on repeated applications of commercial
synthetic anthelmintics, such as benzimidazoles, imidazothiazoles, macrocyclic lactones (ivermectin, moxidectin,
nemadectin and doramectin) and lately aminoacetonitrile (monepantel) and spiro-indoles (derquantelindoles). (García-
143AGROPRODUCTIVIDAD
Imagen de Adriano Gadini en Pixabay
144 AGROPRODUCTIVIDADAGROPRODUCTIVIDAD
Biofertilizantes y producción de caña de azúcarAgro productividad 14 (4): 143-147. 2021
Bustos et al., 2019). Its indiscriminate and inappropriate
use has led to emerging resistant populations of
gastrointestinal nematodes (GIN) (Muchiut et al., 2018).
Another important issue related to treatments with
synthetic chemicals is that their residues can be found
in animal products such as meat and milk (Kang et al.,
2017).
Given the impact of GIN infections in small ruminants
and the increasing anthelmintic resistance, there
is an urgency to develop strategies to identify new
compounds for the sustainable and effective control
of GIN. One of those strategies is the treatment of
bioactive plants with anthelmintic activity. There are two
mechanisms responsible for the anthelmintic effects of
bioactive plants. One is the direct interaction of the active
compounds of the plant with the parasite. The second
is through interaction with the host’s immune system
(Zajícková et al., 2020). Musa balbisiana Colla (genome
B), belongs to the Musaceae family, which has three
genera, Musa, Ensete and Musella (Mathew and Singh,
2016). Musa spp. has been used in traditional medicine
in America, Asia, Oceania, India and Africa (Pereira and
Maraschin, 2014). All parts of the plant including its roots,
pseudostem, stems, leaves, and flowers have long been
used to treat various ailments.
Although there is not enough information on M. balbisiana
on its usage, biological and pharmacological activity.
Nonetheless, there is information on M. acuminata.
Among the reported applications for this species is are
antioxidant, antidiabetic, hypolipidemic, anticancer,
antimicrobial, especially anti-HIV and antiparasitic (Sarah
and Singh, 2016).
The secondary compounds identified in the Musa
species include alkaloids, dopamine, steroids, phenols,
flavonoids, saponins, tannins and terpenes (Vilela et
al., 2014; Pereira and Maraschin, 2015). Some of these
secondary compounds have been tested and shown
anthelmintic effects. Therefore, the objective of this study
was to evaluate the anthelmintic activity of aqueous and
ethanolic extracts from Musa balbisiana Colla against H.
contortus eggs.
MATERIALS AND METHODSCollection of plant material
The studied M. balbisiana plant material was collected
at the Ranchería Habanero 1st section of Cárdenas
municipality, estate of Tabasco. The site is located
between the coordinates 17° 97’ 08’’ north latitude and
93° 32’ 05’’ west longitude. A total of 3 kg of material
were collected, corresponding to 1 kg for each organ of
the plant (leaves, root and peel) of young plants.
Extracts obtention
Five g of dry and ground material from each of the M.
balbisiana organs were placed in a beaker, to which 100
mL of distilled water were added and boiled for 5 min.
Subsequently, the resulting solution was filtered and
then placed in flasks for deep-freezing at 18 °C and
lyophilization (LABCONCO® model 117). The ethanolic
extract of leaves was obtained using 50 g of ground
plant material and 500 mL of ethyl alcohol (98% purity)
and macerated for 24 h. Subsequently, the solution was
filtered and concentrated on a BUCHI® brand rotary
evaporator; this process was repeated three times to
extract the greatest number of compounds. The extract
was then stored at 4 °C until its use.
Phytochemical and chemical analysis
For the detection of secondary metabolites (alkaloids,
sterols, flavonoids, saponins, tannins) from M. balbisiana,
the following qualitative tests were used: foam test
(saponins), Stiasny reaction (tannins), Liebermann-
Burchard test and Salkowski (sterols), Wagner test
(alkaloids) and hydrochlorination reaction (flavonoids).
These tests are based on the visual observation of color
change and/or the formation of precipitates after adding
a specific reagent. The chemical composition such
as moisture content, crude protein and ashes were
determined following the standard methods described
by the A.O.A.C. (2000).
Extractable polyphenols (EP) determination
The total phenols content in the extract was quantified
following the Folin-Ciocalteu spectrophotometric
method with some modifications. The results were
expressed as gallic acid equivalents (GAE) (mg/GAE g1
BS) (Makkar et al., 1993).
Infrared analysis
To assess the presence of some functional groups
present in these extracts, an infrared analysis with a
Fourier transformation (FTIR) THERMO SCIENTIFIC® was
carried out.
GIN egg hatch test
To obtain eggs, a sheep artificially infected with an H.
contortus resistant strain was used. The eggs recollection
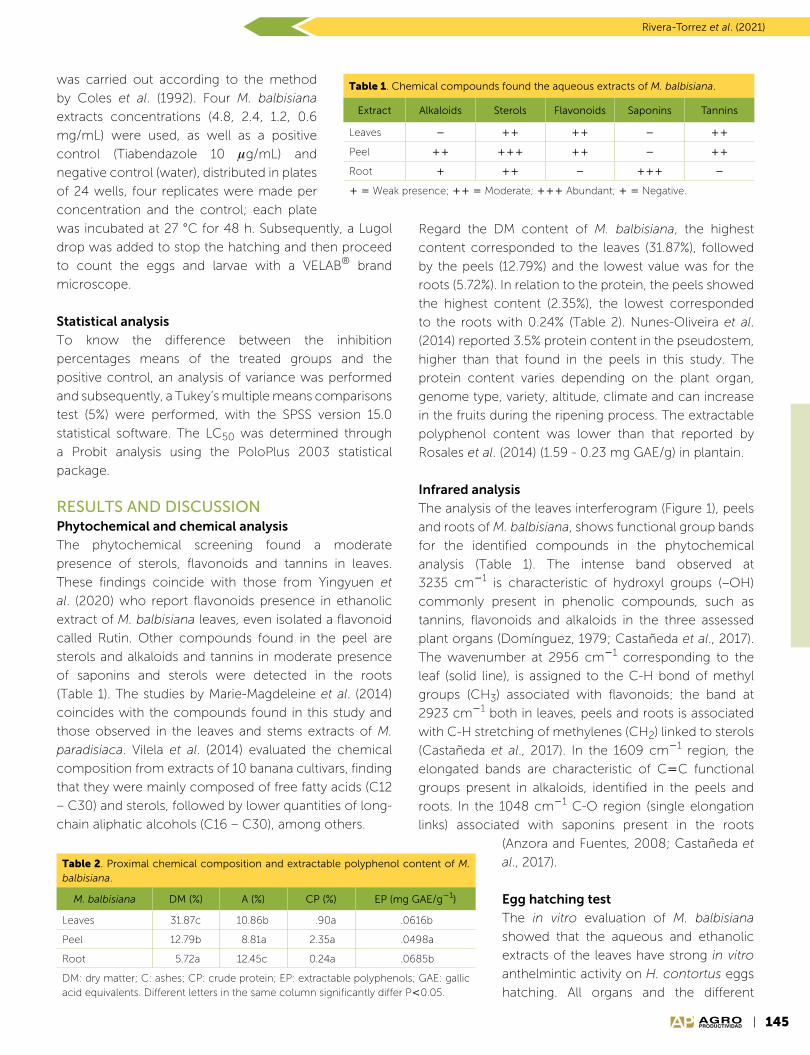
145AGROPRODUCTIVIDAD
Rivera-Torrez et al. (2021)
was carried out according to the method
by Coles et al. (1992). Four M. balbisiana
extracts concentrations (4.8, 2.4, 1.2, 0.6
mg/mL) were used, as well as a positive
control (Tiabendazole 10 g/mL) and
negative control (water), distributed in plates
of 24 wells, four replicates were made per
concentration and the control; each plate
was incubated at 27 °C for 48 h. Subsequently, a Lugol
drop was added to stop the hatching and then proceed
to count the eggs and larvae with a VELAB® brand
microscope.
Statistical analysis
To know the difference between the inhibition
percentages means of the treated groups and the
positive control, an analysis of variance was performed
and subsequently, a Tukey’s multiple means comparisons
test (5%) were performed, with the SPSS version 15.0
statistical software. The LC50 was determined through
a Probit analysis using the PoloPlus 2003 statistical
package.
RESULTS AND DISCUSSIONPhytochemical and chemical analysis
The phytochemical screening found a moderate
presence of sterols, flavonoids and tannins in leaves.
These findings coincide with those from Yingyuen et
al. (2020) who report flavonoids presence in ethanolic
extract of M. balbisiana leaves, even isolated a flavonoid
called Rutin. Other compounds found in the peel are
sterols and alkaloids and tannins in moderate presence
of saponins and sterols were detected in the roots
(Table 1). The studies by Marie-Magdeleine et al. (2014)
coincides with the compounds found in this study and
those observed in the leaves and stems extracts of M.
paradisiaca. Vilela et al. (2014) evaluated the chemical
composition from extracts of 10 banana cultivars, finding
that they were mainly composed of free fatty acids (C12
– C30) and sterols, followed by lower quantities of long-
chain aliphatic alcohols (C16 – C30), among others.
Regard the DM content of M. balbisiana, the highest
content corresponded to the leaves (31.87%), followed
by the peels (12.79%) and the lowest value was for the
roots (5.72%). In relation to the protein, the peels showed
the highest content (2.35%), the lowest corresponded
to the roots with 0.24% (Table 2). Nunes-Oliveira et al.
(2014) reported 3.5% protein content in the pseudostem,
higher than that found in the peels in this study. The
protein content varies depending on the plant organ,
genome type, variety, altitude, climate and can increase
in the fruits during the ripening process. The extractable
polyphenol content was lower than that reported by
Rosales et al. (2014) (1.59 - 0.23 mg GAE/g) in plantain.
Infrared analysis
The analysis of the leaves interferogram (Figure 1), peels
and roots of M. balbisiana, shows functional group bands
for the identified compounds in the phytochemical
analysis (Table 1). The intense band observed at
3235 cm1 is characteristic of hydroxyl groups (–OH)
commonly present in phenolic compounds, such as
tannins, flavonoids and alkaloids in the three assessed
plant organs (Domínguez, 1979; Castañeda et al., 2017).
The wavenumber at 2956 cm1 corresponding to the
leaf (solid line), is assigned to the C-H bond of methyl
groups (CH3) associated with flavonoids; the band at
2923 cm1 both in leaves, peels and roots is associated
with C-H stretching of methylenes (CH2) linked to sterols
(Castañeda et al., 2017). In the 1609 cm1 region, the
elongated bands are characteristic of CC functional
groups present in alkaloids, identified in the peels and
roots. In the 1048 cm1 C-O region (single elongation
links) associated with saponins present in the roots
(Anzora and Fuentes, 2008; Castañeda et
al., 2017).
Egg hatching test
The in vitro evaluation of M. balbisiana
showed that the aqueous and ethanolic
extracts of the leaves have strong in vitro
anthelmintic activity on H. contortus eggs
hatching. All organs and the different
Table 1. Chemical compounds found the aqueous extracts of M. balbisiana.
Extract Alkaloids Sterols Flavonoids Saponins Tannins
Leaves
Peel
Root
Weak presence; Moderate; Abundant; Negative.
Table 2. Proximal chemical composition and extractable polyphenol content of M. balbisiana.
M. balbisiana DM (%) A (%) CP (%) EP (mg GAE/g1)
Leaves 31.87c 10.86b .90a .0616b
Peel 12.79b 8.81a 2.35a .0498a
Root 5.72a 12.45c 0.24a .0685b
DM: dry matter; C: ashes; CP: crude protein; EP: extractable polyphenols; GAE: gallic acid equivalents. Different letters in the same column significantly differ P0.05.
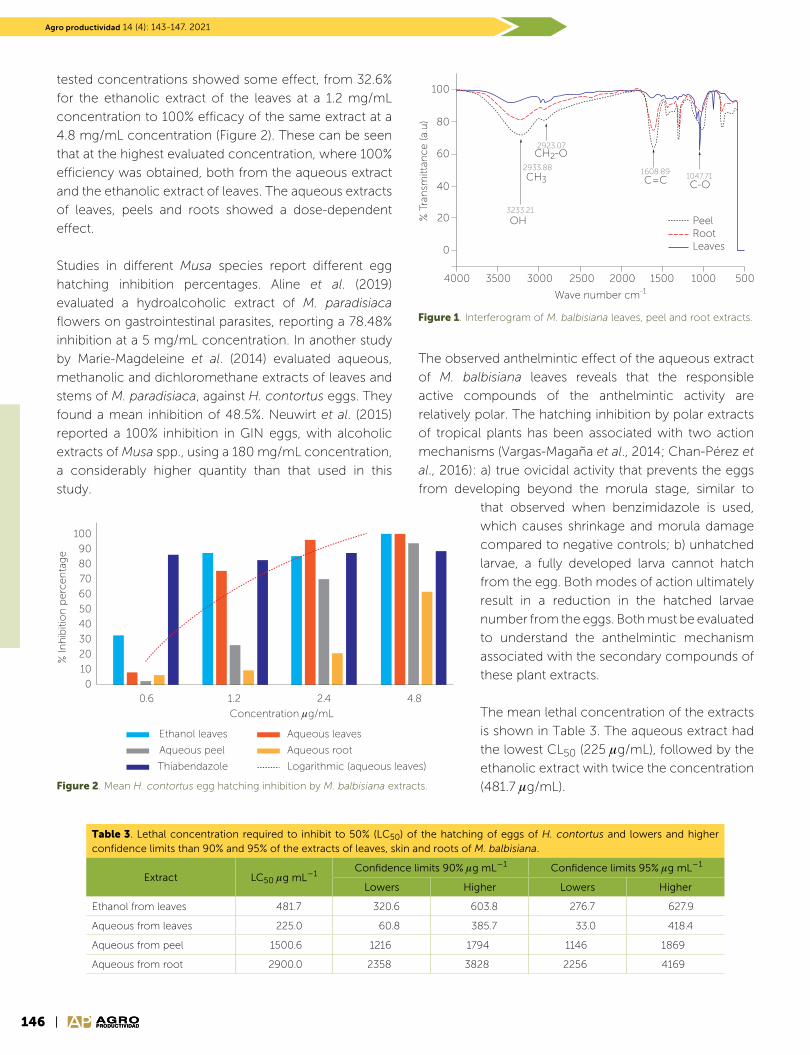
146 AGROPRODUCTIVIDADAGROPRODUCTIVIDAD
Biofertilizantes y producción de caña de azúcarAgro productividad 14 (4): 143-147. 2021
PeelRootLeaves
CH2-O
CH3
OH
C=C C-O
2923.07
2933.88
3233.21
1608.891047.71
4000 3500 3000 2500 2000 1500 1000 500
Wave number cm-1
100
80
60
40
20
0
% T
ran
smitt
ance (
a.u
)
Figure 1. Interferogram of M. balbisiana leaves, peel and root extracts.
tested concentrations showed some effect, from 32.6%
for the ethanolic extract of the leaves at a 1.2 mg/mL
concentration to 100% efficacy of the same extract at a
4.8 mg/mL concentration (Figure 2). These can be seen
that at the highest evaluated concentration, where 100%
efficiency was obtained, both from the aqueous extract
and the ethanolic extract of leaves. The aqueous extracts
of leaves, peels and roots showed a dose-dependent
effect.
Studies in different Musa species report different egg
hatching inhibition percentages. Aline et al. (2019)
evaluated a hydroalcoholic extract of M. paradisiaca
flowers on gastrointestinal parasites, reporting a 78.48%
inhibition at a 5 mg/mL concentration. In another study
by Marie-Magdeleine et al. (2014) evaluated aqueous,
methanolic and dichloromethane extracts of leaves and
stems of M. paradisiaca, against H. contortus eggs. They
found a mean inhibition of 48.5%. Neuwirt et al. (2015)
reported a 100% inhibition in GIN eggs, with alcoholic
extracts of Musa spp., using a 180 mg/mL concentration,
a considerably higher quantity than that used in this
study.
The observed anthelmintic effect of the aqueous extract
of M. balbisiana leaves reveals that the responsible
active compounds of the anthelmintic activity are
relatively polar. The hatching inhibition by polar extracts
of tropical plants has been associated with two action
mechanisms (Vargas-Magaña et al., 2014; Chan-Pérez et
al., 2016): a) true ovicidal activity that prevents the eggs
from developing beyond the morula stage, similar to
that observed when benzimidazole is used,
which causes shrinkage and morula damage
compared to negative controls; b) unhatched
larvae, a fully developed larva cannot hatch
from the egg. Both modes of action ultimately
result in a reduction in the hatched larvae
number from the eggs. Both must be evaluated
to understand the anthelmintic mechanism
associated with the secondary compounds of
these plant extracts.
The mean lethal concentration of the extracts
is shown in Table 3. The aqueous extract had
the lowest CL50 (225 g/mL), followed by the
ethanolic extract with twice the concentration
(481.7 g/mL).Figure 2. Mean H. contortus egg hatching inhibition by M. balbisiana extracts.
Ethanol leaves
Aqueous peel
Thiabendazole
Aqueous leaves
Aqueous root
Logarithmic (aqueous leaves)
Concentration g/mL
100
90
80
70
60
50
40
30
20
10
0
0.6 1.2 2.4 4.8
% In
hib
itio
n p
erc
en
tag
e
Table 3. Lethal concentration required to inhibit to 50% (LC50) of the hatching of eggs of H. contortus and lowers and higher confidence limits than 90% and 95% of the extracts of leaves, skin and roots of M. balbisiana.
Extract LC50 g mL1Confidence limits 90% g mL1 Confidence limits 95% g mL1
Lowers Higher Lowers Higher
Ethanol from leaves 481.7 320.6 603.8 276.7 627.9
Aqueous from leaves 225.0 60.8 385.7 33.0 418.4
Aqueous from peel 1500.6 1216 1794 1146 1869
Aqueous from root 2900.0 2358 3828 2256 4169
147AGROPRODUCTIVIDAD
Rivera-Torrez et al. (2021)
CONCLUSIONSThe aqueous and ethanolic extracts of M. balbisiana
leaves showed 100% efficacy on H. contortus eggs. The
compounds that could be involved in its anthelmintic
activity are sterols, flavonoids and tannins.
REFERENCESAline-Kakimori, M.T., Rostirolla-Debiage, R., Ferreira-Gonçalves, F.,
Gonçalves-da-Silva, R.M., Yoshihara, E., Toledo-de-Mello, E.C.
(2019). Anthelmintic and antioxidant potential of banana bracts
(Musa paradisiaca) extract in ruminants. Veterinaria Brasilica 13:
18-23.
Anzora Vásquez, A. D., Fuentes Cañas, C. E. (2008): “Obtención de
un colorante a partir de Musa paradisiaca (Plátano verde) con
aplicación en la industria textil”. Tesis Licenciatura, Universidad
de El Salvador.
Association of Official Analytical Chemistry (AOAC). (2000). Official
Methods of Analysis of the Association of Official Analytical
Chemistry. 17a ed. Maryland, USA. Association Official Analytical
Chemists.
Castañeda-Castillo J.G., Hernández-Almanza A.Y., Sáenz-Galindo A.,
Ascacio-Valdés J.A. (2017). Extracción asistida por ultrasonido
de compuestos fenólicos de la cáscara de plátano maduro
(Musa cavendish) y evaluación de su actividad antioxidante.
Memorias de los congresos de la sociedad química de México
52° congreso mexicano de química y 36° congreso nacional
de educación Química de Productos Naturales (QPNT). pp.
33-35.
Chan-Pérez, J.I., Torres-Acosta, J.F.J., Sandoval-Castro, C.A., Hoste,
H., Castañeda-Ramírez, G.S., Vilarem, G., Mathieu, C. (2016). In
vitro susceptibility of ten Haemonchus contortus isolates from
different geographical origins towards acetone: - water extracts
of two tannin rich plants. Veterinary Parasitology 217: 53-60.
Coles, G.C., Bauer, C., Borgsteede, F.H., Geerts, S., Klei, T.R., Taylor,
M.A., Waller, P.J., (1992). (W.A.A.V.P.) Methods for the detection
of anthelmintic resistance in nematodes of veterinary
importance. Veterinary Parasitology 44: 35-44.
Dominguez-Xorge-Alejandro.1979. Métodos de Investigación
fitoquímica. Editorial: Limusa, S.A. México, D.F.
García-Bustos, J.F., Sleebs, E.B., Gasser B.R. (2019). An appraisal of
natural products active against parasitic nematodes of animals.
Parasites and Vectors 12; 306.
Jasso-Díaz, G., Torres-Hernández, G., Zamilpa, A., Becerril-Pérez, C.M.,
Ramírez Bribiesca, J.E., Hernández-Mendoza, O., Sánchez-
Arroyo, H., González-Cortazar, M., Mendoza-de Gives, P.
(2017). In vitro assessment of Argemone mexicana, Taraxacum
officinale, Ruta chalepensis and Tagetes filifolia against
Haemonchus contortus nematode eggs and infective (L3)
larvae. Microbial Pathogenesis 109: 62-68.
Kang, J., Park, S.J., Park, H.C., Hossain, M.A., Kim, M.A., Son, S.W.,
Lim, C.M., Kim, T.W., Cho, B.H. (2017). Multiresidue screening
of veterinary drugs in meat, milk, egg, and fish using liquid
chromatography coupled with ion trap time-of-flight mass
spectrometry. Applied Biochemestry and Biotechnology 182:
635-652.
Marie-Magdeleine, C., Udino, L., Philibert, L., Bocage, B., Archimede, H.
(2014). In vitro effects of Musa paradisiaca extracts on four
developmental stages of Haemonchus contortus. Research in
Veterinary Science 96: 127-132.
Makkar, H.P.S., Bluemmel M., Borowy N. K., Becker K. (1993). Gravimetric
determination of tannins and their correlation with Chemical
and protein precipitation methods. Journal of Science Food
Agriculture 61: 161-165.
Muchiut, S.M., Fernández, A.S., Steffan, P.E., Riva, E., Fiel, C.A. (2018).
Anthelmintic resistance: management of parasite refugia for
Haemonchus contortus through the replacement of resistant
with susceptible populations. Veterinary Parasitology 254: 43-
48.
Nunes-Oliveira, L., Cabral-Filho, S.L.S., Castro, G.L., Robson, D.E., Luiz,
A.A., (2014). Chemical composition, degradability and methane
emission potential of banana crop residues for ruminants.
Tropical and Subtropical Agroecosystems 17: 197-206.
Neuwirt, N., Gregory, L., Yoshihara, E., Lima, G.S. (2015). Effect of Musa
spp. Extract on eggs and larvae of gastrointestinal nematodes
from infected sheep. Semina: Ciências Agrárias 36: 3751-3757.
Pereira, A., Maraschin, M. (2015). Banana (Musa spp) from peel to pulp:
ethnopharmacology, source of bioactive compounds and its
relevance for human health. Journal of Ethnopharmacology
160: 149-163.
Rosales, Reynoso, L.O., Agama, Acevedo, E., Aguirre, Cruz, A.,
Bello, Pérez, L., Dufour, D., Gibert, O., (2014). Evaluación
fisicoquímica de variedades de plátanos (Musa spp.) Cocción
y postre. Agrociencia 48: 387-401.
Sarah, M.N., Singh, N.P. (2017). Traditional uses, Phytochemistry and
Pharmacology of wild Banana (Musa acuminata Colla): A
review. Journal of Ethnopharmacology 196: 124-140.
Vargas-Magaña, J.J., Torres-Acosta, J.F.J., Aguilar-Caballero, A.J.,
Sandoval-Castro, C.A., Hoste, H., Chan-Pérez, J.I. (2014).
Anthelmintic activity of acetone-water extracts against
Haemonchus contortus eggs: interactions between tannins
and other plant secondary compounds. Veterinary Parasitology
206: 322-327.
Vilela, C., Santos, S.A.O., Villaverde, J.J., Oliveira, L., Nunes, A.,
Cordeiro, N., Freire, C.S.R., Sivestre, A.J.D. (2014). Lipophilic
phytochemicals from banana fruits of several Musa species.
Food Chemistry 162: 247-252.
Yingyuen, P., Sukrong, S., Phisalaphong, M. (2020). Isolation, separation
and purification of rutin from Banana leaves (Musa balbisiana).
Industrial Crops & Products 149; 112307.
Zajicková, M., Thuy, N.L., Skálová, L., Raisová, S.L., Matousková, P. (2020).
Anthelmintics in the future: current trends in the discovery and
development of new drugs against gastrointestinal nematodes.
Drug Discovery Today 25: 430-437.

149AGROPRODUCTIVIDAD
https://doi.org/10.32854/agrop.v14i4.1907
Agroproductividad: Vol. 14, Núm. 4, abril. 2021. pp: 149-153.
Recibido: noviembre, 2020. Aceptado: marzo, 2021.
Physicochemical and microbiological evaluation of traditional queso molido (ground cheese) during maturation
Montes de Oca-Flores, Eric1; Cruz-Flores, Maryan A.1; Espinoza-Ortega, Angélica1*
1Universidad Autónoma del Estado de México. Instituto de Investigación en Ciencias Agropecuarias
(ICAR), Toluca, Estado de México, México.
*Corresponding author: [email protected]
ABSTRACTObjective: To evaluate the changes in the main microorganisms groups and the physicochemical properties of Queso
Molido (Ground Cheese) from the Central Mexican Highlands, during a 90 days maturation period.
Methodology: The fat, protein, moisture, ash and chloride contents, acidity and pH were analyzed. Microbiological
analyzes of total coliforms, lactic acid bacteria, yeasts and Staphylococcus were also assessed. An ANOVA and a principal
component analysis were performed to analyze the effect maturation had on the physicochemical and microbiological
characteristics.
Results: Both the physicochemical and microbiological parameters showed significant differences (p0.05) during the
evaluated maturation period. The protein concentration increased, fat and acidity at the end of maturation, along with
the absence of coliform bacteria, a decrease in lactic acid bacteria (LAB) and a high concentration of Staphylococcus and
yeasts.
Limitations: It is necessary to evaluate these variables in other locations and similar production systems in other latitudes
of the country.
Conclusion: The maturation of Queso Molido does not improve its microbiological quality.
Keywords: Main components, raw milk, fresh cheese, traditional.
INTRODUCTION
The onset of the Official Mexican Standard. Products and services. Milk, milk formula, combined dairy products
and dairy derivatives. Sanitary provisions and specifications (NOM-243-SSA1-2010), prohibits cheese production
from raw milk, specifically due to problems in their microbiological quality, which may present alterations
for the consumer’s health. Prates et al. (2017) indicate that fresh cheese consumption has been associated
with foodborne disease outbreaks in different parts of the world, due to the potential survival of pathogenic bacteria
in the unpasteurized milk cheeses. Because of that, there is an undeniable concern regarding the (artisan) production
systems, that to date, use this method for the elaboration of their products, a situation shared both nationally and
internationally (Alvarado et al., 2007; Ercan et al., 2014; Cámara et al., 2017).
The importance of artisan cheese production worldwide involves specific characteristics to each one depending
on their region (Martins et al., 2015), its connection with its regional culture, territory, history and lifestyle (De la
Rosa-Alcaraz et al., 2020), which distinguish them as a product with typical aromas and flavors, conferred by the

150 AGROPRODUCTIVIDADAGROPRODUCTIVIDAD
Biofertilizantes y producción de caña de azúcarAgro productividad 14 (4): 149-153. 2021
milk’s microorganisms (Ordiales et al., 2013). These
peculiarities are affected by pasteurization and starter
cultures. Furthermore, most producers do not have
enough technology to improve the quality of their
products. Despite this, the manufacture of these cheeses
on a small scale has taken on greater importance, as they
are highly accepted products by consumers, as well as
an important economic source (Longaray et al., 2012).
The cheese maturation process is an alternative to
address the health problems associated with this kind of
fresh cheeses made from fresh unpasteurized milk. This
process comprises a period in which the cheese remains
stored at a certain temperature and relative humidity
conditions. Depending on the cheese type, their final
characteristics (physicochemical and microbiological)
directly depend on the natural microflora of their milk,
given that its bacterial population is high and due to the
effect of the proteolysis and lipolysis associated with the
maturation, that gives these cheeses their characteristic
flavors and aromas (Sant’Anna et al., 2018).
Various studies have shown that after a maturation
period of at least 60 days, this product is suitable for
consumption (Mas et al., 2002). Other sources indicate
that just two weeks of maturation is enough to achieve a
safe cheese (Cámara et al., 2017; González et al., 2019),
due to the effect lactic acid bacteria that prevail during
maturity and that acts as a natural selector inhibiting
pathogens (Caridi et al., 2003), coupled with pH decrease
(Ercan et al., 2014).
In the Central Highlands of Mexico, the so-called
queso Molido Cheese is produced with raw cow’s milk,
following a traditional process. This cheese is a fresh,
soft paste, not pressed. Its presentation is in the form of
a low cylinder, with a weight ranging between 200 g to
about 1 kg (Cervantes et al., 2006).
To place fresh cheese in a market with greater added
value, there is the proposal to pass it through a maturing
process. Therefore, this study focused on evaluating
the main microorganisms groups, as well as their
physicochemical characteristics of queso Molido Cheese
during a 90 days maturation period.
MATERIAL AND METHODSExperiment location
The experimental study took place in the Central
Highlands of Mexico, located between the coordinates
20° 06’’ north and 99° 50’’ west. The altitude is 2400 m
above sea level and a maximum temperature of 24.3 °C,
a minimum of 2.3 °C and a mean of 13.2 °C, semi-cold,
subhumid climate, with rains in summer, its average
annual rainfall is 699.6 mm (INAFED, 2015).
Cheese samples
A batch of 12 pieces of Queso Molido (ground cheese)
of an approximate weight of 250 g each was evaluated.
The samples were refrigerated at 4 °C, and wrapped
in poly-paper, maintaining the same conditions for all
cheeses. Four maturation periods were evaluated: 1) 1
day, 30 days, 60 days and 90 days after been elaborated.
Of each period, three cheese pieces were evaluated. The
samples were transported at 4 °C and kept refrigerated
for later analysis, according to the aging period.
Physicochemical analysis
The fat (933.05), protein (991.2), moisture (926.08) and
ash (935.42) were determined following the official
AOAC methods (1990). The acidity was estimated using
0.1 M NaOH/phenophthalein as an indicator; pH using
an Orion 520A potentiometer (Montes de Oca-Flores
et al., 2009) and chlorides with the Volhard method
(NMX-F-360-1981). All analyzes were done by triplicate.
Microbiological analysis
At each stage, 10 g cheese was aseptically sampled
from the center of the sample and placed in 90 mL of
peptone solution (AOAC 966.23). Total coliforms were
assessed following the NOM-113-SSA1-1994; lactic acid
bacteria following Lancelle and Vasek (2002); yeasts
following the AOAC 997.02; staphylococcus following
the NOM-115-SSA1-1994. Microbial counts were
performed in a colony counter and calculations were
performed to obtain colony-forming units per gram
(CFU/g).
Statistical analysis
The microbiological counts were transformed to log10
cfu/g. An ANOVA by completely randomized blocks
was performed to evaluate the differences in the
physicochemical and microbiological parameters. The
existing differences were calculated using the Tukey test
(p0.05), using the statistical package Statgraphics 18.
RESULTS AND DISCUSSIONPhysicochemical properties during Queso Molido
maturation
There were significant differences (p0.05) in all the

151AGROPRODUCTIVIDAD
Montes de Oca-Flores et al. (2021)
physicochemical properties of Queso
Molido during the maturation period
(Table 1).
The percentages of fat and protein
behaved in a similar way during the
first three maturation periods (1 to 60
days), the last period with the highest
percentage. Brandielli et al. (2019), in
a cheese from pasteurized cow’s milk,
during its maturation stages (0, 60 and
120 days) reported differences in the
protein and fat percentages, with the
highest concentration at the end of the period (24.09
and 28.1 %, respectively).
The moisture percentage behaved inversely decreasing
at the end of maturation period (49.97-46.62%), a fact
that promotes an protein and fat content increase.
In determining the milk acidity, various methods are
used, which give different interpretations. For example,
pH measures actual or acquired acidity and titratable
acidity measures both natural and actual or acquired
acidity. The latter, measured through titration with a
NaOH solution, which according to its concentration
allows to express the acidity under different scales regard
to the NaOH concentration: in Dornic degrees (°D) if the
concentration of NaOH is 0.11 N, Thörner degrees (°Th)
if the solution concentration is 0.1 N, Sohxlet-Henkel
degrees (°SH) if the solution concentration is 0.25 N
(Pulgar, 1988).
The acidity concentration increased at the end of
maturation (21.44-25.56 °D), although it presented its
maximum value on day 30 (26.11 °D), observing an
inconsistent behavior. Dervisoglu and Aydemir (2007)
reported a progressive increase in acidity for each of
the stages, until the end of maturation (120 days) and as
a consequence a pH decrease due to the production
of lactic acid by the effect of lactic bacteria (Dalla et
al., 2008). The opposite was obtained in this research
with a pH increase (4.67 to 5.1). Mas et al. (2002) and
Temizkan et al. (2014) reported increased pH values
at the end of the maturation. Kongo et al. (2009)
indicate that this behavior may be related to secondary
proteolytic activity by bacteria and yeasts and as a
consequence of the accumulation of free fatty amino
acids and ammonia.
There was a decrease in the percentage of chlorides at
the end of the maturation (3.4-1.72), a situation that may
be related to ash decrease. On the contrary, Çetinkaya
and Fatih (2019) reported an increase in chlorides at
the end of it. Lima et al. (2008) compared the salt and
moisture content and/or water activity in the maturation
process, mentioning that there is an inverse relationship
between these, a behavior not observed in this research.
The decrease in the ash percentage (1.99-1.62) does not
coincide with that reported by Arenas et al. (2015) and
Cakır and Cakmakc (2018) who found
progressive increases until the end of it,
due to the effect of decreased humidity.
Microbiological properties during the
maturation of Queso Molido
The microbiological properties are
shown in Table 2. All the parameters
evaluated in the maturation process
showed significant differences
(p0.05). High values were observed
at the beginning regard total coliforms,
yeasts and Staphylococcus, a factor
Table 1. Physicochemical composition during the maturation period of Queso Molido.
Maturation of the cheese (days)EEM
1 30 60 90
Fat (%) 20,55a 22,0ab 22,9ab 25,41b 1,76
Protein (%) 18,53a 18,93a 18,94a 21,75b 0,27
Moisture (%) 49,97bc 50,35c 48,71b 46,62a 0,6
Ash (%) 1,98c 1,87b 1,9bc 1,62a 0,03
Acidity (oD) 21,44a 26,11b 21,88a 25,56b 1,11
pH 4,67a 4,6a 5,34b 5,1b 0,14
Chlorides (%) 3,4b 1,67a 1,95a 1,72a 0,15
SEMStandard error of the mean. a, b, cDifferent letters in the same column indicate statistical differences (p0.05).
Table 2. Microbiological composition during the maturation period of Queso Molido (log10)
Maturation of the cheese (days)EEM
1 30 60 90
CT 6,2c 4,19b 5,85c 0,0a 0,25
BAL 9,59c 7,69a 8,31b 7,66a 0,09
Lev. 9,59d 7,66a 8,80c 8,53b 0,09
St. 7,14c 5,96a 6,50b 7,44c 0,19
SEMStandard error from the mean.a-dDifferent letters indicate statistical differences (p0.05). TCTotal Coliforms. LABLactic Acid Bacteria. St.Staphylococcus.

152 AGROPRODUCTIVIDADAGROPRODUCTIVIDAD
Biofertilizantes y producción de caña de azúcarAgro productividad 14 (4): 149-153. 2021
that could be related to mishandling and the conditions
during the transport of the raw materials.
Staphylococcus and yeast colony-forming units
decrease by the end of the maturation process (7.44
and 8.53, respectively), although this decrease cannot
be considered sufficient compared to a product for
direct human consumption. The maximum permissible
limits by Mexican regulations are 100 cfu/g and 500
cfu/g respectively. In our study, the greatest decrease
occurred at 30 years of maturation, possibly due to a
greater increase in acidity during the same stage (26.11
°D) and at the lowest pH (4.6), increasing again during
the last two periods.
There were no total coliform counts in the last maturation
period (90 days). Ceylan et al. (2007) reported a decrease
at day 30 and 90 of maturation (1 cfu/g), in a cheese
made with unpasteurized milk, while Dolci et al. (2010),
obtained 1.4 cfu/g at day 90 and 5.0 cfu/g up to the
day 150 of maturation.
There was a decrease in ALB at the end of the maturation
period (9.6-7.67 log). Similar behaviors were reported
by Cakır and Cakmakc (2018) in relation to bacteria
of the Lactobacillus and Lactococcus genera, due to
the increase in salt concentrations and acidic during
maturing, in addition to low pH (4.04-4.29) (Bontinis et
al., 2008). For this research, there was only an acidity
increase (21.4-25.5), not the case of the salt percentage
(3.4-1.7).
CONCLUSIONSAlthough by the end of the maturation period the
complete decrease of coliform bacteria is observed, it is
not due to the effect of the physicochemical properties.
The presence of Staphylococcus and yeasts at the end
of maturation in cheeses indicate that they are not
suitable for consumption, since they represent a health
risk to consumers. The above indicates that the 90 days
of maturation period is not enough time for the product
to be considered suitable for consumption. Although
at the end of the maturation period they showed a
slight decrease in pathogenic bacteria, it is important to
improve the transport conditions of the raw materials, in
addition to better control of its storage conditions.
REFERENCESAlvarado, C., Chacón, Z., Otoniel, J., Guerrero, B., & López, G. (2007).
Aislamiento, identificación y caracterización de bacterias ácido
lácticas de un queso venezolano ahumado andino artesanal.
Su uso como cultivo iniciador. Revista Científica. FCV-LUZ
17(3): 301–308.
Arenas, R., González, L., Sacristán, N., Tornadijo, M.E., & Fresno, J.M.
(2015). Compositional and biochemical changes in Genestoso
cheese, a Spanish raw cow’s milk variety, during ripening.
Journal Science Food and Agriculture 95: 851–859.
AOAC (1990). Association of Official Analytical Chemists International.
Official Methods of Analysis, 15th ed. Washington, DC:
Association of Official Analytical Chemists International (AOAC).
Bontinis, T.G., Mallatou, H., Alichanidis, E., Kakouri, A., & Samelis,
J. (2008). Physicochemical, microbiological and sensory
changes during ripening and storage of Xinotyri, a traditional
Greek cheese from raw goat’s milk. International Journal of
Dairy Technology 61 (3): 229–236.
Brandielli, M.C., Fonseca, B.V.C., Hiromi, H.E., Benedetti, T.I., Zemiani, A.,
Furtado, S.A., Regina, O.S., Francisco, M.J., Leal, B.A.C., Castro-
Cislaghi, F.P., & Machado-Lunkes, A. (2019). Physicochemical
parameters and lactic acid bacteria count during ripening of
Brazilian regional cheese manufactured with the addition
of autochthonous cultures. Food Science and Technology
Campinas 40 (4): 877–884
Cakır, Y., & Cakmakc, S. (2018). Some microbiological, physicochemical
and ripening properties of Erzincan Tulum cheese produced
with added black cumin (Nigella sativa L.). Journal Food
Science and Technology 55 (4):1435–1443.
Cámara, S.C., Dapkevicius, A., Rosa, H.J.D., Silva, C.C.G., Malcata, F.X.,
& Dapkevicius, M.L.N.E. (2017). Physicochemical, biochemical,
microbiological and safety aspects of Pico cheese: assessment
throughout maturation and on the final product. International
Journal of Dairy Technology 70(4): 542–555.
Caridi, A., Micari, P., Foti, F., Ramondino, D., & Sarullo, V. (2003).
Ripening and seasonal changes in microbiological and
chemical parameters of the artisanal cheese Caprino
d’Aspromonte produced from raw or thermized goat’s milk.
Food Microbiology 20: 201–209.
Cervantes, E.F., Villegas de Gante, A., Cesín, V.A., & Espinoza, O.A.
(2006). Los quesos mexicanos genuinos: un saber hacer que
se debe rescatar y preservar. ALTER III Congreso Internacional
de la Red SIAL Alimentación y Territorios. Universidad
Internacional de Andalucía, Baeza, Jaen, España.
Çetinkaya, A., & Fatih, Ö.Z. (2019). Composition and microbiological
analysis for quality evaluation of Kars Gravyer cheese: influence
of ripening period. Food Science and Technology 39(4):1052–
1058.
Ceylan, Z.G., Çaglar, A., & Çakmakci, S. (2007). Some physicochemical,
microbiological, and sensory properties of tulum cheese
produced from ewe’s milk via a modified method. International
Journal of Dairy Technology 60(3): 191–197.
Dalla, R.T., Wassermann, G.E., Volken de Souza, C.F., Caron, D.,
Regina, C.C., & Záchia, A.M.A. (2008). Microbiological and
physicochemical characteristics and aminopeptidase activities
during ripening of Serrano cheese. International Journal of
Dairy Technology 61(1): 70–79.
De la Rosa-Alcaraz, M.A., Ortiz-Estrada, A.M., Heredia-Castro, P.Y.,
Hernández-Mendoza, A., Reyes-Díaz, R., Vallejo-Córdoba, B.,
& González-Córdova, A.F. (2020). Poro de Tabasco cheese:
Chemical composition and microbiological quality during
153AGROPRODUCTIVIDAD
Montes de Oca-Flores et al. (2021)
its artisanal manufacturing process. Journal of Dairy Science
103(4): 3025–3037.
Dervisoglu, M., & Aydemir, O. (2007). Physicochemical and
microbiological characteristics of Kulek cheese made from
raw and heat-treated milk. World Journal Microbiology
Biotechnology 23:451–460.
Dolci, P., Alessandria, V., Rantsiou, K., Bertolino, M., & Cocolin, L.
(2010). Microbial diversity, dynamics and activity throughout
manufacturing and ripening of Castelmagno PDO cheese.
International Journal of Food Microbiology 143: 71–75.
Ercan, D., Korel, F., & Ors_ahin, H. (2014). Microbiological quality
of artisanal Sepet cheese. International Journal of Dairy
Technology 67(3): 384–393.
González, A.C.C., Inam, A.M., Umer, M., Abbas, S., Ahmad, H., Sajjad,
M., Parvaiz, F., Imdad, K., Imran, M., Aslam, M.A., Iqbal,
K.M.K., Ullah, A., Hernández-Montes, A., Aguirre-Mandujano,
E., Villegas de Gante, A., Jacquot, M., & Cailliez-Grimal, C.
(2019). Physicochemical, Sensorial and Microbiological
Characterization of Poro Cheese, an Artisanal Mexican
Cheese Made from Raw Milk. Foods 8 (10); 509. https://doi.
org/10.3390/foods8100509.
INAFED. Instituto Nacional para el Federalismo y Desarrollo Municipal.
2015. Enciclopedia de los Municipios y Delegaciones de
México; Toluca, Estado de México. ttp://www.inafed.gob.mx/
work/enciclopedia/EMM15mexico/municipios/ 15106a.html
(28 de octubre del 2019).
Kongo, J.M., Gomes, A.M., Malcata, F.X., & McSweeney, P.L.H. (2009).
Microbiological, biochemical and compositional changes
during ripening of São Jorge – a raw milk cheese from the
Azores (Portugal). Food Chemistry 112:131–138.
Lancelle, M., & Vasek, O.M. (2002). Calidad microbiológica de leche
cruda usada en queserías de la provincia de Corrientes
Laboratorio de Bromatología, Facultad de Ciencias Exactas y
Naturales y Agrimensura. Universidad Nacional del Nordeste.
Argentina. [documento de internet] URL www.unne.edu.ar/
cyt/2002/08-Exactas/E-008.pdf. (Acceso 09/12/09).
Longaray, D.A.P., Conte, P.C., Mandelli, F., Chequeller de Almeida, R.,
& Echeverrigara, S. (2012). Microbiological, Physico-Chemical
and Sensorial Characteristics of Serrano, an Artisanal Brazilian
Cheese. Food and Nutrition Sciences 3: 1068–1075.
Martins, J.M., Galinari, E., Pimentel-Filho, N.J., Ribeiro, J.I., Furtado,
M.M., & Ferreira, C.L.L.F. (2015). Determining the minimum
ripening time of artisanal Minas cheese, a traditional Brazilian
cheese. Brazilian Journal of Microbiology 46(1): 219–230.
Mas, M., Tabla, R., Moriche, J., Roa, I., González, J., Rebollo, J.E., &
Cáceres, P. (2002). Ibores goat’s milk cheese: Microbiological
and physicochemical changes throughout ripening. Lait 82:
579–587.
Montes de Oca-Flores, E., Castelán-Ortega, O.A., Estrada-Flores, J.G.,
& Espinoza-Ortega, A. (2009). Oaxaca cheese: Manufacture
process and physicochemical characteristics. International
Journal of Dairy Technology 62: 535–540.
NMX-F-360 (1981). Alimentos para humanos. Determinación de
cloruros como cloruro de sodio (método de volhard). México.
NOM-113-SSA1-1994 (1994): Bienes y servicios. Método para la cuenta
de microorganismos Coliformes totales en placa. Secretaría de
Salud. México, D.F. México.
NOM-115-SSA1-1994. (1994). Bienes y servicios. Método para la
determinación de Staphylococcus aureus en alimentos.
México. Secretaría de Salud. México, D.F. México.
Ordiales, E., Martín, A., José, B.A., Hernández, A., Ruiz-Moyano, S., &
De Guía, C.M. (2013). Role of the microbial population on the
flavor of the soft-bodied cheese Torta del Casar. Journal of
Dairy Science 96: 5477–5486.
Prates, D.F., Rauber, W.S., Coswig, G.J., Saldanha de Lima, A., Volz, L.G.,
& Padilha da Silva, W. (2017). Microbiological quality and safety
assessment in the production of moderate and high humidity
cheeses. Ciencia Rural 47(11); e20170363. http://dx.doi.
org/10.1590/0103-8478cr20170363.
Pulgar, J. (1988). Curso de Quesería. Proyecto de Desarrollo Lechero.
CLUSA-USAID. Ciudad de Guatemala. 103 p.
Sant’Anna, F.M., Silva, C.I.L., Silva, F.F., & Borges, A.L. (2018).
Microbiological Quality of Minas Artisanal Cheeses from
Certified Properties at Serra da Canastra Region, Minas Gerais,
Brazil in 2016. Journal of Dairy and Veterinary Science 6 (2);
555682. https://doi.org/10.19080/JDVS.2018.06.555682.
Temizkan, R., Yasar, k., & Hayaloglu, A.A. (2014). Changes during
ripening in chemical composition, proteolysis, volatile
composition and texture in Kashar cheese made using raw
bovine, ovine or caprine milk. International Journal of Food
Science and Technology 49: 2643–2649.
AGROPRODUCTIVIDAD


155AGROPRODUCTIVIDAD
https://doi.org/10.32854/agrop.v14i4.2015
Agroproductividad: Vol. 14, Núm. 4, abril. 2021. pp: 155-159.
Recibido: octubre, 2020. Aceptado: abril, 2021.
Economic Impact and Feasibility of Striped Catfish Farming (Pangasius hypophthalmus) in Mexico
Platas-Rosado, Diego Esteban1*; González-Reynoso, Luis1; Hernández-Arzaba, Juan Cristobal2; Torres-Tadeo, Cesar Mauricio1
1Colegio de Postgraduados, Veracruz Campus. Manlio Fabio Altamirano, Veracruz, Mexico. 2Universidad Iberoamericana. Circuito Ahuehuete 224, Fraccionamiento Sierra Nogal, Puebla,
Mexico.
*Corresponding author: [email protected]
ABSTRACTObjective: To assess the productive behavior of Pangasius hypophthalmus in actual rural aquaculture farming conditions
for the state of Veracruz, Mexico.
Methodology: The study had a duration of 331 days in a circular pond of 135 m3, with no aeration. 2000 juveniles were
bred upon attaining 7.9 g; they were fed once a day, four days a week. Their weight and length were assessed every 15
days.
Results: The growth of P. hypophthalmus reached 900 g in 150 days at temperatures between 26 y 34 °C, with growths of
100 g in 150 days at temperatures between 22 and 26 °C. An average final weight of 1254 kg and a survival of 87.8% were
attained for a total production of 2.2 t. These organisms may attain 2 kg per year at 26 to 35 °C1.
Study limitations: For a period of 153 days, water temperatures greater than 26 °C limited the growth of this fish.
Conclusions: The Pangasius hypophthalmus species represents an aquaculture alternative with high potential for tropical
areas of Mexico, mainly where electric power availability is limited.
Keywords: aquaculture; Mexican tropic, employment.
INTRODUCTION
Mexico imports US$129 million per year in frozen striped catfish from Vietnam (VASEP, 2020). The
amount spent on striped catfish fillets amounts to MX$204.25 million per month, which equals
to 55 203 monthly minimum wages (MX$3 700), upon considering import price (self-estimates with information from
VASEP, 2020). Should consumer price be considered, this amount doubles to 110 606 monthly minimum wages. On
the other hand, the import of striped catfish fillet accounted for 150 mil t in 2015; nevertheless, it was decreased to
100 mil t in 2019, and Mexico was a country with 130 million inhabitants and the biggest importer of striped catfish on
the planet only second to the United States (US), which has 327.2 million inhabitants (VASEP, 2020). (Figures 1 and 2).
The world per capita consumption of fish amounts to 20 kg year1 (FAO, 2020c).
Imagen de chenspec en Pixabay

156 AGROPRODUCTIVIDADAGROPRODUCTIVIDAD
Biofertilizantes y producción de caña de azúcarAgro productividad 14 (4): 155-159. 2021
Mexico has a per capita fish consumption of around 10
kg yr1, one of the lowest on the planet, despite having
a great productive potential, in view of the amount of
natural resources (water, light and temperature) that
it has. Should Mexico wish to attain the 2030 United
Nations Goal of consuming 36 kg of fish per capita per
year1 (FAO, 2020b), it needs to decrease its import,
quadruplicate its supply and increase its aquaculture
production 10-fold (Platas et al., 2017).
Pangasius hypophthalmus (Pangasiidae Family),
commonly marketed in Mexican markets as striped
catfish fillet, is a tropical fish that originates from
Vietnam’s Mekong River and Thailand’s Chao Phraya
River (FAO, 2020a). Its farming began in Vietnam in the
decade of 1970 from juveniles captures from the rural
medium. Striped catfish aquaculture began in 1996, with
the development of controlled reproduction techniques
(Phan et al., 2009). After one decade, it grew from a small
backyard production to an industry producing more than
1.4 million t per year and generates more than 1.8 million
rural jobs, with performances from 200 to 400 t ha1 (De
Silva & Phuong, 2011). Vietnam grew from 10 000 to 1.3
million t in 10 years (Figure 3).
As a commercial aquaculture species,
production, and distribution levels for
Pangasius in world markets attain values
nearby those of other species widely
farmed, such as tilapia, white shrimp,
and salmon. FAO (2018) reports that
humanity consumes around 150 million
t of fish and seafood. Currently, Vietnam
is the greatest producer for this species
and exports to more than 130 countries
(Figure 4).
China23%
United States24%
Mexico5%
Brazil4%
Asian 9%
European Union 11%
Others 24%
Figure 1. World Pangasius Imports from Vietnam (Percent). Source: Vietnam Association of Seafood Exporters and Producers (VASEP, 2020).
0
20
40
60
80
100
120
Tilapia Basa Tuna Shrim Salmon
Figure 2. Mexican Imports of Fish and Seafood 2017 (Thousand t). Source: Ministry of Economy (2018).
The striped catfish has an increasing trend which
will place it as an aquaculture species with greater
production and consumption on the planet in the future.
Above all, its production potential in units lower than 1 ha
requires little capital; it is a mass consumption product
by population with scarce resources, rich in high-quality
protein and omega 3 and 6. (Platas et al., 2014).
Mexico is the fourth world importer of striped catfish
only behind China and the US, although it shows a
greater per capita consumption than the first two
countries, as it consumes more than 150 mil t of fillets
per yr1. (Platas et al., 2014). Nevertheless, Mexico
does not produce striped catfish, reason why it
imports 100% of its consumption and it is the second
importing country behind the US (Figure 5). Should it
be considered that 3 kg of live weight are needed for
producing 1 kg of fillets, Mexico would import more
than 300 000 t of whole fish from Vietnam. In Mexico,
1.0 t of whole striped catfish is sold at MX$70 000 (self-
research in supermarkets of Veracruz City, Mexico, April
2019), which would represent the yearly rural income
of one person. This represents thousands of jobs that
Mexico pays to Vietnam producers, which could be
0
0.2
0.4
0.6
0.8
1
1.2
1.4
1.6
199
8
199
9
20
00
20
01
20
02
20
03
20
04
20
05
20
06
20
07
20
08
20
09
20
10
20
11
20
12
20
13
20
14
20
15
20
16
20
17
Mill
ion
t
Years
Figure 3. Vietnam Pangasius hypophthalmus Production 1998-2017. Source: VASEP (2020).
157AGROPRODUCTIVIDAD
Platas-Rosado et al. (2021)
Figure 5. Vietnam’s top Pangasius fish importing countries (Percent). Source: VASEP (2012).
0
5
10
15
20
25
30
35
40
Others European Union
United States
Mexico Brazil Asian China
1186.825 1172.525 1237.75 1301.67 1295
404.545 471.449554.256
646.593 749.746400 425
550600
625
100100
100
125150
0
500
1000
1500
2000
2500
3000
2015 2016 2017 2018 2019
Vietnam Bangladesh India Indonesia
Figure 4. Pangasius production in selected countries (Thousand t). Sources: Global Aquaculture Alliance (2020).
created in Mexico. Striped catfish production would
have a great economic and social impact in poor rural
regions of the country.
The biological features of Pangasius are the baseline of
its high production and have favored that it had reached
world markets in little time; also, they make it an
aquaculture alternative with great potential for tropical
regions of Mexico (Platas et al., 2014). According to
McGee (2009), this species has a rapid growth at 26
and 35 °C, its growth is reduced at 20 and 25 °C and it
does not perform well under 20 °C. The farming adapts
to high densities and direct oxygen may be extracted
from atmospheric air, reason why no artificial aeration
is required for the intensive farming thereof. It may
also accept foodstuffs based on agricultural products
and sub-products with no requirement of high animal
protein content; also, it has a compensatory growth
(Rohul et al., 2005). These features considerably reduce
production costs and allow their farming in zones
where electric power is limited or absent. Pangasius
gathers biological features that allow it to adapt to
low investment handling conditions, such as alternate
feeding, no aeration and low maintenance. Natural
conditions in Mexico are similar to those of Vietnam;
the south-southeastern part of the country is a priority
economic zone for rural development public policy and
has sweet water; earth ponds for the production of this
fish may be produced there. In Gulf of Mexico coastal
zones, the only limitation would be a variation of low
temperatures during winter, which is brought about by
North winds.
Therefore, this study had the objective of assessing the
productive behavior of Pangasius hypophthalmus in
actual rural aquaculture farming conditions for the
state of Veracruz.
MATERIALS AND METHODS The study was made on a tilapia (Oreochromis
niloticus) farm, located in the municipality of
Paso de Ovejas, Veracruz, Mexico (19.293375 N,
96.370759 O, 13 masl). The commercial operation
allocated a circular geomembrane pool of 12 m in
diameter, 135 m3 in capacity and with no aeration
for the experiment. In autumn (30 August), with a
water temperature of 30.5 °C, 2000 juveniles were
farmed, and they had an average humid weight
of 7.90.48 (standard error) g. They were fed on
alternate days, once per day, 4 days per week.
Commercial food with 35% protein and 8% fat was used.
Before each feeding, water was discharged from the
main drain for 3 min to partially remove accumulated
sediment, and then the level was replaced with well water.
A replacement of 20 to 30 % of water was performed
once per week, depending on turbidity conditions. This
handling procedure was performed for the 331 days
of duration of the study. During feeding days, water
temperature information was taken. A random sample
was captured every 15 days for 30 individuals to assess
standard weight and length.
RESULTS AND DISCUSSION The water temperature record evidenced the stationary
variation of temperature (Figure 6), which was important
for this study.
The study began on 30 August (day 0), with a water
temperature of 30.5 °C. As of this date, the water
temperature was gradually decreased for 66 days
until reaching 26.1 °C. On 19 November (day 81), the
158 AGROPRODUCTIVIDADAGROPRODUCTIVIDAD
Biofertilizantes y producción de caña de azúcarAgro productividad 14 (4): 155-159. 2021
temperature decreased rapidly down to 22 °C. This
fall in temperature was due to the entrance of strong
north winds derived from cold fronts characteristic
of the central Veracruz region in winter. The gradual
temperature recovery pattern, followed by a decrease
thereof, repeated itself in winter. When spring began
(21 March, day 203), a rapid temperature increase was
produced up to 30 °C, followed by a gradual increase
until 34 °C were reached on 24 May (day 268). This
yearly variation of 12 °C, with a maximum of 34 °C and
a minimum of 22 °C, influenced the growth of striped
catfish.
Growth patterns in humid weight (Figure 7) truly
reflected the temperature trends. Pangasius growth
may be divided into three clear periods - the first
appears before winter, with temperatures 26 °C,
where an increase in average weight of 1.73 g per day1
is seen. During the second period, corresponding to
winter and temperatures 26 °C, fish grew 0.77 g per
day1 only. During the third period, with temperatures
30 °C, fish grew 7.3 g per day1 in average;
this growth rate is similar to that recorded by
Cremer et al. (2002). In this period, fish grew
from 217.1 g to 1254 g in 142 days; that is, a live
weight increase of 1.04 kg per fish in 4.7 months.
This is an accelerated growth if compared with
the typical tilapia growth, which grows in the
same farm and usually reaches 0.5 kg in 6 to 7
months, which is attained with greater handling,
feeding and supplementary aeration (Rakocy,
1989).
The accelerated growth of Pangasius, even
without requiring aeration and under limiting
35
33
31
29
27
25
23
21
19
17
1530 60 91 121 152 182 213 244 274 305 335
Figure 6. Water temperature (C) for the period of the Pangasius hypophthalmus growth trial on a rural farm in Veracruz state, Mexico. Short vertical lines delimit the winter period with temperatures below 26 °C.
feeding conditions alternated once per day for 4 days
per week, represents an extremely simple handling that
requires little labor and low production costs. This means
that the striped catfish may be produced easily in several
conditions present in Veracruz. Nevertheless, low water
temperatures present naturally are to be considered
upon the arrival of cold fronts. Juveniles, the most
sensitive stages, may be kept in controlled temperature
conditions within small greenhouses. Likewise, breeders
are to be kept at the same temperature conditions.
Under this handling and feeding system, with previously
mentioned market prices, the striped catfish in Mexico
turns out to be highly profitable, with production costs
of MX$22.00 kg1 (self-estimation based on the cost of
inputs for 2018).
During the winter period, fish considerably decreased
food consumption (observed indirectly as it showed
more non-consumed food residues during the periodic
pond draining); also, it was observed that its abdominal
area was flattened (with no food). The above suggests
that growth decrease was due to a decrease in food
consumption, brought by the decrease of metabolic
activity at low temperatures. Despite its low growth
during winter, 87.8% survived, which allowed a
total production of 2.2 t. This amount is considered
to be adequate for a pond of 12 m in diameter and
represents an outstanding alternative both for
backward aquaculture and commercial aquaculture.
It also represents a great potential for tropical regions
in Mexico, mainly where there is no electric power
available. Several rapidly growing individuals reached
2 kg or more during this study, which does not discard
the possibility of obtaining even greater yields with
better handling of feeding, temperature and water
quality.
Figure 7. Pangasius hypophthalmus wet weight (g) growth curve on a rural farm in Veracruz State, Mexico. Short vertical lines delimit the winter period with temperatures below 26 °C.
1400
1200
1000
800
600
400
200
0
0 15 30 45
60 75 90
105
120
135
150
165
180
195
210
22
5
240
255
270
28
5
30
0
315
33
0
34
5
159AGROPRODUCTIVIDAD
Platas-Rosado et al. (2021)
Temperature influence in growth has important
implications for the development of aquaculture farming
handling for this species. Hence, when spring begins,
stripe catfish juveniles could be farmed to seize the
entire period of temperatures greater than 26 °C without
going through the winter period. In order to attain this,
a controlled breeding program is required during the
winter in order to supply juveniles upon the occurrence
of adequate temperatures. Another option is to breed
when winter begins in order for the offspring to grow
under greenhouse conditions and farming juveniles of an
advanced size in uncovered ponds when spring begins.
Each of both forms requires a controlled breeding
program. Despite the limitations for this preliminary
essay, results offer a clear feasibility insight for the
farming thereof and show the importance of keeping
temperatures above 26 °C during their growth period.
This information also shows the need of research on
this species in order to adapt the farming of this species
consumed widely in Mexico to local rural conditions.
Mexico has approximately 30 million hectares of tropical
lands that allow producing Pangasius in the south-
southeast region of the country and has an unsatisfied
demand in the market. This simple production system
may create hundreds of thousands of rural jobs, as well
as supply high-quality protein rich in omega 3 and 6 for
mass consumption by the population with low income.
CONCLUSIONSPangasius production is an aquaculture alternative
that may be adapted successfully to the conditions
of rural farms in tropical zones of Mexico, with water
temperatures greater than 26 °C, both for rural backyard
aquaculture and commercial aquaculture with potential
to generate a great amount of jobs and quality protein
at low cost.
REFERENCESCremer, M.C., Jian, Z. & Enhua, Z. (2002). Pangasius catfish production
in ponds with soy-based feeds. American Soy Association/
China, 35: 02-116.
De Silva, S.S. & Phuong, N.T. (2011). Striped catfish farming in the
Mekong delta, Vietnam: a tumultuous path to a global success.
Reviews in Aquaculture 3: 45-73.
FAO (Food and Agricultural Organization of United Nations). (2018).
Fishery Statistical Collections Global Aquaculture Production.
Rome. FAO. http://www.fao.org/fishery/statistics/global-
aquaculture-production/en
FAO. (2020a). Fisheries and aquaculture resources. Rome. FAO.
http://www.fao.org/fishery/culturedspecies/Pangasius_
hypophthalmus/en
FAO. (2020b). Objetivos de Desarrollo Sostenible. Rome. FAO. http://
www.fao.org/sustainable-development-goals/es/.
FAO. (2020c). The State of World Fisheries and Aquaculture, 2020.
Rome. FAO. http://www.fao.org/publications/sofia/2020/en/.
Global Aquaculture Alliance (Alianza Global de Acuacultura). (2020).
The Advocate Global Aquaculture Alliance. Portsmouth, EUA.
https://www.aquaculturealliance.org/advocate/goal-2020-
finfish-production-survey/
McGee, M. (2009). WAS, World Aquaculture Society. The Blue
Revolution to Feed the World. (La Revolución Azul para
Alimentar el Mundo). Veracruz, México.
Phan, L. T., T. M. Bui, T. T. Nguyen, G. J. Gooley, and B. A. Ingram.
(2009). Current status of farming practices of striped catfish,
Pangasianodon hypophthalmus in the Mekong delta, Vietnam.
Aquaculture 296: 227-236.
Platas R., D.E., González, R.L. & Luna, F.J. (2014). Impacto económico y
social de la producción del pez basa Pangasius hypophthalmus
en México. Panorama Acuícola Magazine 20: 20-26.
Platas R., D.E., Hernández A., J.C. & Gonzales, R.L. (2017). Importancia
Económico y Social del Sector Acuícola en México.
AGROProductividad, 82: 19-25.
Rakocy, J.E. (1989). Tank culture of tilapia. Southern Regional
Aquaculture Center. Publication number 282. USA.
Rohul A., K.M., Bapary M., A.J., Islam, M.S., Shahjahnan, M. & Hossain
M, A.R. (2005). The impacts of compensatory growth on
food intake, grow rate and efficiency of feed utilization in
Thai Pangas (Pangasius hypophthalmus). Pakistan Journal of
Biological Sciences 8: 766-770.
Secretaría de Economía. (2018). Estadística de comercio exterior
importaciones y exportaciones de México. Importaciones
Mexicanas de Pescados y Mariscos. www.se.gob-mx.
VASEP (Vietnam Association of Seafood Exporters and Producers).
(2012). Vietnam Pangasius export in 2012 Asociación de
Productores y Exportadores de Pescados y Mariscos de
Vietnam. www.vasep.com.vn.
VASEP. (2020). Report on Vietnam Pangasius Sector, 2015 – 2019.
www.vasep.com.vn
AGROPRODUCTIVIDAD


