Embed Size (px)
Citation preview
CASE WESTERN RESERVE UNIVERSITY Report on Federal Financial Assistance Programs in Accordance with the Uniform Guidance For the Year Ended June 30, 2020 Federal Entity Identification Number 1-341018992-A1
CASE WESTERN RESERVE UNIVERSITY REPORT ON FEDERAL FINANCIAL ASSISTANCE PROGRAMS IN ACCORDANCE WITH THE UNIFORM GUIDANCE June 30, 2020 TABLE OF CONTENTS Pages PART I FINANCIAL Report of Independent Auditors 1-2 Financial Statements 3-5 Notes to the Financial Statements
Financial Responsibility Supplemental Schedule and Notes
6-27
28-30
Schedule of Expenditures of Federal Awards 31-54 Notes to the Schedule of Expenditures of Federal Awards
55
PART II REPORTS ON INTERNAL CONTROL AND COMPLIANCE Report of Independent Auditors on Internal Control over Financial Reporting
and on Compliance and Other Matters Based on an Audit of Financial Statements Performed in Accordance with Government Auditing Standards
56-57
Report of Independent Auditors on Compliance with Requirements That Could Have a Direct and Material Effect on Each Major Program and on Internal Control Over Compliance in Accordance with the Uniform Guidance
58-59
PART III SCHEDULE OF FINDINGS AND QUESTIONED COSTS Section I – Summary of Auditors’ Results 60 Section II – Financial Statement Findings 60 Section III – Federal Award Findings and Questioned Costs 60 Summary Schedule of Prior Audit Findings and Status 61

FINANCIAL
Report of Independent Auditors To the Board of Trustees Case Western Reserve University: Report on the Financial Statements We have audited the accompanying financial statements of Case Western Reserve University (the “University”), which comprise the statements of financial position as of June 30, 2020 and 2019, and the related statements of activities for the year ended June 30, 2020 and of cash flows for the years ended June 30, 2020 and 2019, and the related notes to the financial statements. Management’s Responsibility for the Financial Statements Management is responsible for the preparation and fair presentation of the financial statements in accordance with accounting principles generally accepted in the United States of America; this includes the design, implementation, and maintenance of internal control relevant to the preparation and fair presentation of financial statements that are free from material misstatement, whether due to fraud or error. Auditors’ Responsibility Our responsibility is to express an opinion on the financial statements based on our audits. We conducted our audits in accordance with auditing standards generally accepted in the United States of America and the standards applicable to financial audits contained in Government Auditing Standards, issued by the Comptroller General of the United States. Those standards require that we plan and perform the audit to obtain reasonable assurance about whether the financial statements are free from material misstatement. An audit involves performing procedures to obtain audit evidence about the amounts and disclosures in the financial statements. The procedures selected depend on our judgment, including the assessment of the risks of material misstatement of the financial statements, whether due to fraud or error. In making those risk assessments, we consider internal control relevant to the University's preparation and fair presentation of the financial statements in order to design audit procedures that are appropriate in the circumstances, but not for the purpose of expressing an opinion on the effectiveness of the University's internal control. Accordingly, we express no such opinion. An audit also includes evaluating the appropriateness of accounting policies used and the reasonableness of significant accounting estimates made by management, as well as evaluating the overall presentation of the financial statements. We believe that the audit evidence we have obtained is sufficient and appropriate to provide a basis for our audit opinion. Opinion In our opinion, the financial statements referred to above present fairly, in all material respects, the financial position of Case Western Reserve University as of June 30, 2020 and 2019, and the changes in its net assets for the year ended June 30, 2020 and its cash flows for the years ended June 30, 2020 and 2019 in accordance with accounting principles generally accepted in the United States of America.
PricewaterhouseCoopers LLP, 200 Public Square, 19th Floor, Cleveland, OH 44114-2301 T: (216) 875 3000, F: (216) 566 7846, www.pwc.com/us
Other Matters We previously audited the statement of financial position as of June 30, 2019 and the related statements of activities and of cash flows for the year then ended (not presented herein), and in our report dated October 19, 2019, we expressed an unmodified opinion on these financial statements. In our opinion, the information set forth in the accompanying summarized financial information as of June 30, 2019 and for the year then ended is consistent, in all material respects, with the audited financial statement from which it has been derived. Other Information Our audit was conducted for the purpose of forming an opinion on the financial statements as a whole. The accompanying schedule of expenditures of federal awards for the year ended June 30, 2020 and financial responsibility supplemental schedule as of and for the year ended June 30, 2020 are presented for purposes of additional analysis as required by Title 2 U.S. Code of Federal Regulations Part 200, Uniform Administrative Requirements, Cost Principles, and Audit Requirements for Federal Awards (Uniform Guidance) and the U.S. Department of Education, respectively, and are not a required part of the financial statements. The information is the responsibility of management and was derived from and relates directly to the underlying accounting and other records used to prepare the financial statements. The information has been subjected to the auditing procedures applied in the audit of the financial statements and certain additional procedures, including comparing and reconciling such information directly to the underlying accounting and other records used to prepare the financial statements or to the financial statements themselves, and other additional procedures, in accordance with auditing standards generally accepted in the United States of America. In our opinion, the schedule of expenditures of federal awards and financial responsibility supplemental schedule are fairly stated, in all material respects, in relation to the financial statements taken as a whole. Other Reporting Required by Government Auditing Standards In accordance with Government Auditing Standards, we have also issued our report dated October 16, 2020, except with respect to footnote 19 to the financial statements and the opinion on the financial responsibility supplemental schedule, as to which the date is March 29, 2021, on our consideration of the University’s internal control over financial reporting and on our tests of its compliance with certain provisions of laws, regulations, contracts and grant agreements and other matters for the year ended June 30, 2020. The purpose of that report is to describe the scope of our testing of internal control over financial reporting and compliance and the results of that testing and not to provide an opinion on the effectiveness of internal control over financial reporting or on compliance. That report is an integral part of an audit performed in accordance with Government Auditing Standards in considering the University's internal control over financial reporting and compliance.
October 16, 2020, except with respect to footnote 19 to the financial statements and the opinion on the
financial responsibility supplemental schedule, as to which the date is March 29, 2021.
3 | FINANCIAL STATEMENTS
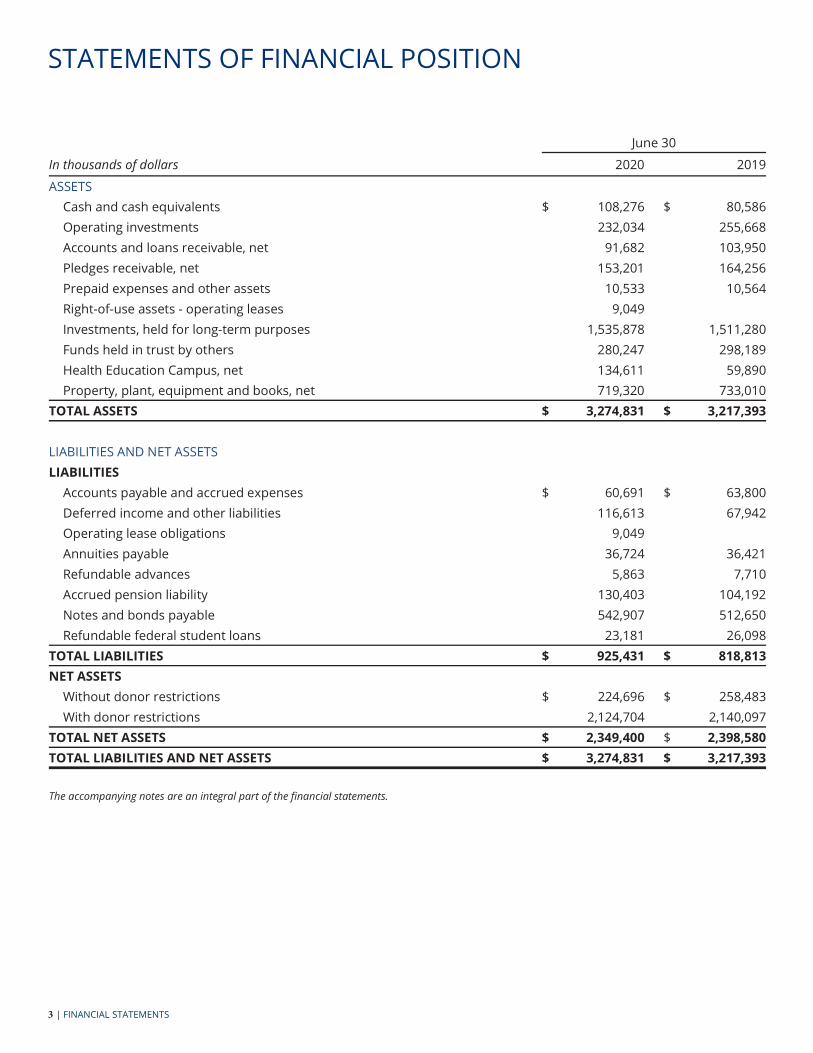
STATEMENTS OF FINANCIAL POSITION
June 30
In thousands of dollars 2020 2019
ASSETSCash and cash equivalents $ 108,276 $ 80,586 Operating investments 232,034 255,668 Accounts and loans receivable, net 91,682 103,950 Pledges receivable, net 153,201 164,256Prepaid expenses and other assets 10,533 10,564Right-of-use assets - operating leases 9,049Investments, held for long-term purposes 1,535,878 1,511,280Funds held in trust by others 280,247 298,189Health Education Campus, net 134,611 59,890Property, plant, equipment and books, net 719,320 733,010
TOTAL ASSETS $ 3,274,831 $ 3,217,393
LIABILITIES AND NET ASSETSLIABILITIES
Accounts payable and accrued expenses $ 60,691 $ 63,800Deferred income and other liabilities 116,613 67,942Operating lease obligations 9,049Annuities payable 36,724 36,421Refundable advances 5,863 7,710Accrued pension liability 130,403 104,192Notes and bonds payable 542,907 512,650Refundable federal student loans 23,181 26,098
TOTAL LIABILITIES $ 925,431 $ 818,813NET ASSETS
Without donor restrictions $ 224,696 $ 258,483With donor restrictions 2,124,704 2,140,097
TOTAL NET ASSETS $ 2,349,400 $ 2,398,580TOTAL LIABILITIES AND NET ASSETS $ 3,274,831 $ 3,217,393
The accompanying notes are an integral part of the nancial statements.
CASE WESTERN RESERVE UNIVERSITY FY20 FINANCIAL REPORT | 4
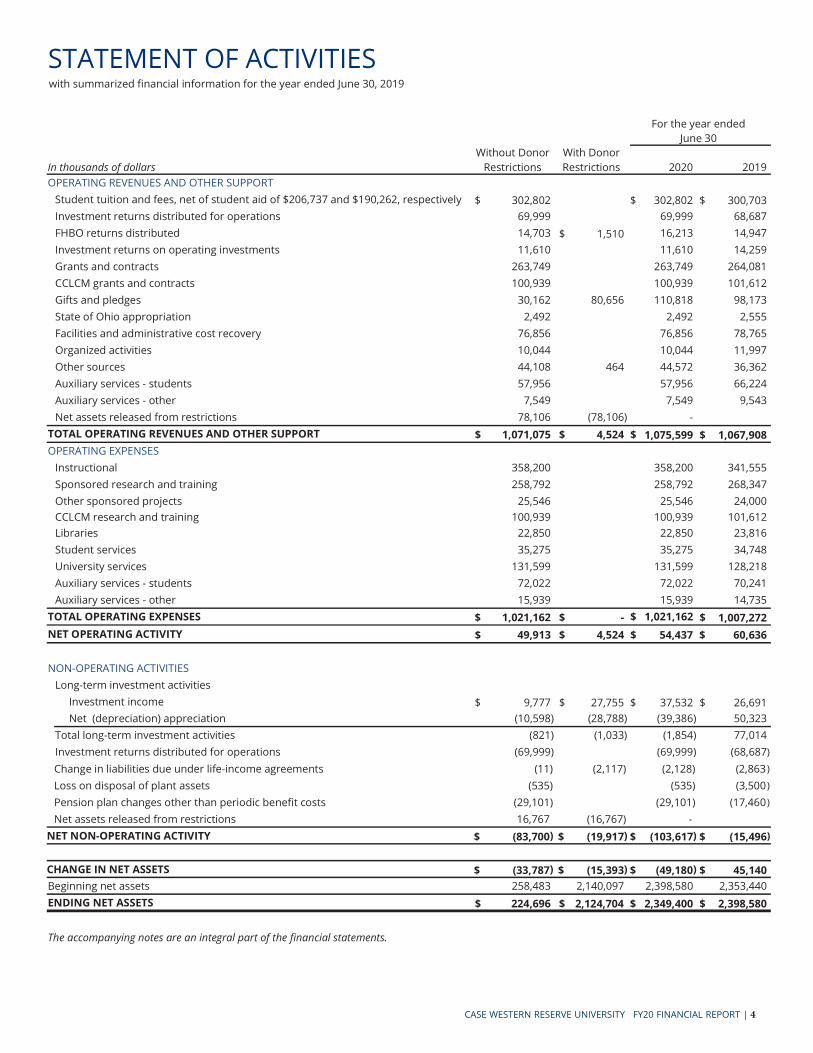
STATEMENT OF ACTIVITIES
For the year endedJune 30
In thousands of dollarsWithout Donor
RestrictionsWith Donor Restrictions 2020 2019
OPERATING REVENUES AND OTHER SUPPORTStudent tuition and fees, net of student aid of $206,737 and $190,262, respectively $ 302,802 $ 302,802 $ 300,703Investment returns distributed for operations 69,999 69,999 68,687FHBO returns distributed 14,703 $ 1,510 16,213 14,947Investment returns on operating investments 11,610 11,610 14,259Grants and contracts 263,749 263,749 264,081CCLCM grants and contracts 100,939 100,939 101,612Gifts and pledges 30,162 80,656 110,818 98,173State of Ohio appropriation 2,492 2,492 2,555Facilities and administrative cost recovery 76,856 76,856 78,765Organized activities 10,044 10,044 11,997Other sources 44,108 464 44,572 36,362Auxiliary services - students 57,956 57,956 66,224Auxiliary services - other 7,549 7,549 9,543Net assets released from restrictions 78,106 (78,106) -
TOTAL OPERATING REVENUES AND OTHER SUPPORT $ 1,071,075 $ 4,524 $ 1,075,599 $ 1,067,908OPERATING EXPENSES
Instructional 358,200 358,200 341,555Sponsored research and training 258,792 258,792 268,347Other sponsored projects 25,546 25,546 24,000CCLCM research and training 100,939 100,939 101,612Libraries 22,850 22,850 23,816Student services 35,275 35,275 34,748University services 131,599 131,599 128,218Auxiliary services - students 72,022 72,022 70,241Auxiliary services - other 15,939 15,939 14,735
TOTAL OPERATING EXPENSES $ 1,021,162 $ - $ 1,021,162 $ 1,007,272NET OPERATING ACTIVITY $ 49,913 $ 4,524 $ 54,437 $ 60,636
NON-OPERATING ACTIVITIESLong-term investment activities
Investment income $ 9,777 $ 27,755 $ 37,532 $ 26,691 Net (depreciation) appreciation (10,598) (28,788) (39,386) 50,323
Total long-term investment activities (821) (1,033) (1,854) 77,014Investment returns distributed for operations (69,999) (69,999) (68,687)
Change in liabilities due under life-income agreements (11) (2,117) (2,128) (2,863)
Loss on disposal of plant assets (535) (535) (3,500)
Pension plan changes other than periodic bene t costs (29,101) (29,101) (17,460)
Net assets released from restrictions 16,767 (16,767) -NET NON-OPERATING ACTIVITY $ (83,700) $ (19,917) $ (103,617) $ (15,496)
CHANGE IN NET ASSETS $ (33,787) $ (15,393) $ (49,180) $ 45,140Beginning net assets 258,483 2,140,097 2,398,580 2,353,440ENDING NET ASSETS $ 224,696 $ 2,124,704 $ 2,349,400 $ 2,398,580
The accompanying notes are an integral part of the nancial statements.
with summarized nancial information for the year ended June 30, 2019
5 | FINANCIAL STATEMENTS
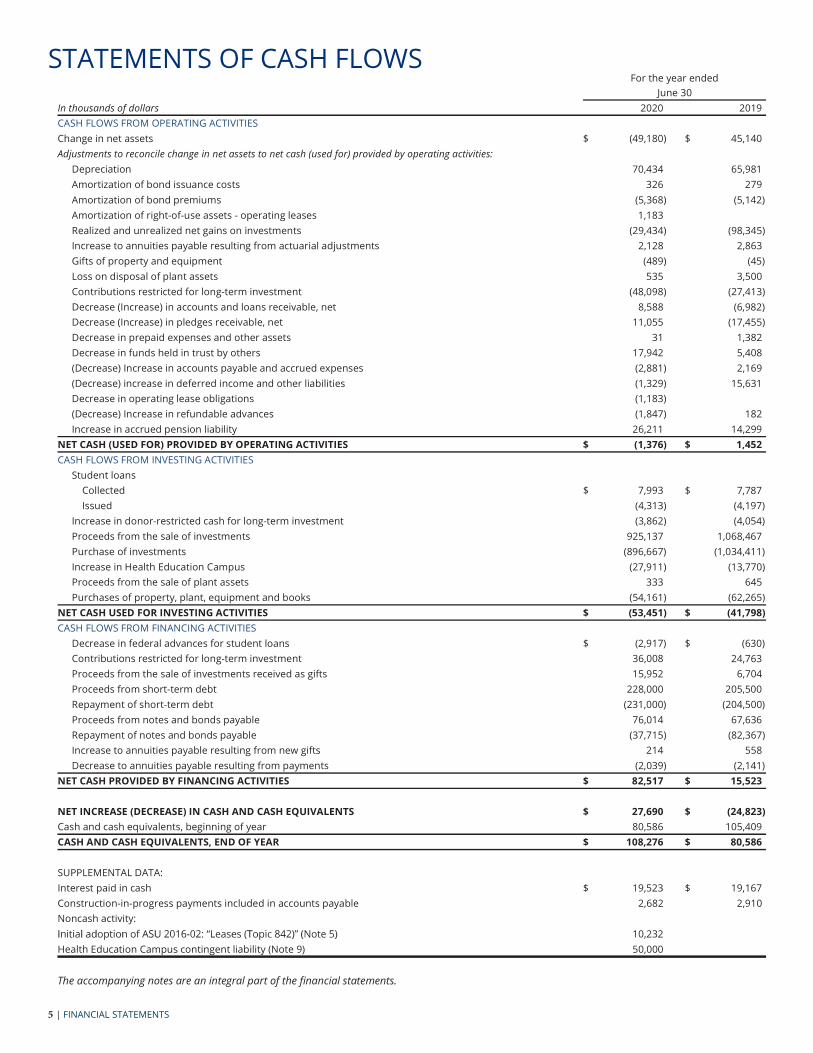
STATEMENTS OF CASH FLOWSFor the year ended
June 30In thousands of dollars 2020 2019CASH FLOWS FROM OPERATING ACTIVITIESChange in net assets $ (49,180 ) $ 45,140 Adjustments to reconcile change in net assets to net cash (used for) provided by operating activities:
Depreciation 70,434 65,981Amortization of bond issuance costs 326 279Amortization of bond premiums (5,368) (5,142)Amortization of right-of-use assets - operating leases 1,183Realized and unrealized net gains on investments (29,434) (98,345)Increase to annuities payable resulting from actuarial adjustments 2,128 2,863Gifts of property and equipment (489) (45)Loss on disposal of plant assets 535 3,500Contributions restricted for long-term investment (48,098) (27,413)Decrease (Increase) in accounts and loans receivable, net 8,588 (6,982)Decrease (Increase) in pledges receivable, net 11,055 (17,455)Decrease in prepaid expenses and other assets 31 1,382Decrease in funds held in trust by others 17,942 5,408(Decrease) Increase in accounts payable and accrued expenses (2,881) 2,169(Decrease) increase in deferred income and other liabilities (1,329) 15,631Decrease in operating lease obligations (1,183)(Decrease) Increase in refundable advances (1,847) 182Increase in accrued pension liability 26,211 14,299
NET CASH (USED FOR) PROVIDED BY OPERATING ACTIVITIES $ (1,376) $ 1,452CASH FLOWS FROM INVESTING ACTIVITIES
Student loans Collected $ 7,993 $ 7,787
Issued (4,313) (4,197)Increase in donor-restricted cash for long-term investment (3,862) (4,054)Proceeds from the sale of investments 925,137 1,068,467Purchase of investments (896,667) (1,034,411)Increase in Health Education Campus (27,911) (13,770)Proceeds from the sale of plant assets 333 645Purchases of property, plant, equipment and books (54,161) (62,265)
NET CASH USED FOR INVESTING ACTIVITIES $ (53,451) $ (41,798)CASH FLOWS FROM FINANCING ACTIVITIES
Decrease in federal advances for student loans $ (2,917) $ (630)Contributions restricted for long-term investment 36,008 24,763Proceeds from the sale of investments received as gifts 15,952 6,704Proceeds from short-term debt 228,000 205,500Repayment of short-term debt (231,000) (204,500)Proceeds from notes and bonds payable 76,014 67,636Repayment of notes and bonds payable (37,715) (82,367)Increase to annuities payable resulting from new gifts 214 558Decrease to annuities payable resulting from payments (2,039) (2,141)
NET CASH PROVIDED BY FINANCING ACTIVITIES $ 82,517 $ 15,523
NET INCREASE (DECREASE) IN CASH AND CASH EQUIVALENTS $ 27,690 $ (24,823)Cash and cash equivalents, beginning of year 80,586 105,409 CASH AND CASH EQUIVALENTS, END OF YEAR $ 108,276 $ 80,586
SUPPLEMENTAL DATA:Interest paid in cash $ 19,523 $ 19,167 Construction-in-progress payments included in accounts payable 2,682 2,910 Noncash activity:
10,232Health Education Campus contingent liability (Note 9) 50,000
The accompanying notes are an integral part of the nancial statements.
CASE WESTERN RESERVE UNIVERSITY FY20 FINANCIAL REPORT | 6
1. SUMMARY OF SIGNIFICANT ACCOUNTING POLICIES
Basis of Presentation
Ohio not-for-pro t corporation that operates a private research university in Cleveland, Ohio. The nancial statements of the University as of June 30, 2020 and 2019, and for the years then ended, have been prepared in accordance with accounting principles generally
Accordingly, the accompanying nancial statements have been prepared on the accrual basis of accounting.
Net Asset Categories
Standards for external nancial reporting by not-for-pro t organizations require that resources be classi ed for reporting purposes into two net asset categories according to donor-imposed restrictions (Note 17):
Without Donor Restrictions are those net assets not subject to donor-imposed restrictions. All revenues, gains and losses that are not restricted by donors are included in this classi cation. All operating expenses are reported as decreases in net assets without donor restrictions.
Contributions not subject to donor-imposed restrictions and donor-restricted contributions that are received and either spent, or deemed spent, for the restricted purpose within the same year are reported as increases to net assets without donor restrictions.
Net assets without donor restrictions include certain funds that are Board-designated as functioning as endowment and a liquidity reserve.
With Donor Restrictions are those net assets subject to donor-imposed time or purpose restrictions that are expected to be met and those subject to donor-imposed perpetual restrictions. These net assets include donor-restricted endowment, unconditional pledges, certain funds restricted for capital projects, split-interest agreements, and interests in perpetual trusts held by others.
For donor-imposed time or purpose restrictions, the University meets such donor restrictions through the passage of time, the appropriation of endowment earnings, placing gift-funded capital projects into service, and/or the University incurring expenses. When such restrictions are met, the related net assets are reported as Net assets released from restrictions in the statement of
activities.
Contributions
Contributions, including unconditional pledges to give and irrevocable trusts held by others with the University as the bene ciary, are recognized as revenues in the period received or promised. They are classi ed as net assets without donor restrictions or with donor
Contributions restricted for the acquisition of land, buildings and equipment are reported as revenues with donor restrictions. These contributions are reclassi ed to net assets without donor restrictions when the assets are placed in service. Promises to give that are subject to donor-imposed stipulations that the corpus be maintained in perpetuity are recognized as increases in net assets with donor restrictions.
Conditional promises to give are not recognized until the conditions on which they depend are substantially met. Contributions of assets other than cash are reported at their estimated fair value at the date of gift. Contributions scheduled to be received after one year are discounted using a market rate (Note 4).
Grants and Contracts (Government and Private)
Government and private grant contracts are reviewed to determine whether they constitute an exchange transaction or a contribution, and whether conditions are present that would a ect the timing of revenue recognition. Those determined to be contributions without conditions will have revenue recognized in the period the grant or contract is entered into and those determined to have conditions will have revenue recognized once the condition has been met. Those determined to be exchange transactions will have revenue recognized when barriers to the grant or contract funding have been overcome as qualifying expenses are incurred. Any payment received before barriers to funding have been overcome is recorded as a refundable advance. Once recognition is allowed, projects funded by grants and contracts that incur expenses prior to payment receipts are recorded as revenue with a corresponding receivable.
Investment Returns on Operating Investments
The University has invested excess operating funds and
investment pool. The operating funds are invested alongside other funds and receive a pro-rata portion of income, expenses, gains, and losses of the pool.
Cash and Cash Equivalents
The University considers all highly liquid investments with an original maturity of 90 days or less when purchased as cash and cash equivalents, except those amounts managed by investment managers as part of the investment pool that do not belong to operations, or unspent bond proceeds, which are classi ed as investments. The University maintains operating cash and reserves for replacement balances in nancial institutions which, from time to time, may exceed federally insured limits. The University periodically assesses the nancial condition of these institutions and believes that the risk of loss is minimal.
Operating Investments
Operating investments are stated at fair value and include all other current investments with original maturities greater than 90 days that are used to support operations. These investments may include obligations of triple A-rated banks, various United States Government agencies, other investments, and internal
pool. Although the pool primarily invests in mid- to long-term investments, the pool maintains a su cient investment mix that allows operating assets to be liquidated upon demand.
Leases
The University determines if an arrangement is a lease at inception. The University has both leases under which it is obligated as a lessee and leases for which it is a lessor. Operating leases as a lessee are included in Right-of-use assets - operating leases and Operating lease obligations in the statements of nancial position. Right-of-use assets
asset for the lease term. Lease obligations represent the
the lease. Operating lease right-of-use assets and related obligations are recognized at commencement date based on the present value of lease payments over the lease term and discounted using an appropriate incremental borrowing rate. The incremental borrowing rate is based on the information available at commencement date. The value of an option to extend a lease is re ected
7 | NOTES TO THE FINANCIAL STATEMENTS - in thousands of dollars
to the extent it is reasonably certain management will exercise that option.
Investments
Investments are made within guidelines authorized
Investments are initially recorded at cost at date of acquisition or fair value at date of donation in the case of gifts.
Ownership of marketable securities is recognized as of the trade date. Endowment returns are calculated net of internal and external investment management expenses.
Investments are stated at fair value as de ned by Accounting Standards Codi
ned under ASC 820 as the exchange price that would be received for an asset or paid to transfer a liability, i.e., an exit price, in the principal or most advantageous market for the asset or liability in an orderly transaction between market participants on the measurement date.
The fair value of all debt and equity securities with readily determinable fair values are based on quotations obtained from national securities exchanges. The alternative investments, which are not readily marketable, are carried at estimated fair values based
value of the total fund as provided by the investment managers. The University reviews and evaluates the values provided by the investment managers including the valuation methods and assumptions used in determining the fair value of the alternative investments. Those estimated fair values may di er signi cantly from the values that would have been used had a ready market for these securities existed.
Realized gains and losses on investments are included in Investment income in the statement of activities. Average cost is generally used to determine gains or losses on securities sold. Unrealized changes in the fair value of investments are shown as net unrealized appreciation or depreciation.
The following describes the hierarchy of inputs used to measure fair value and the primary valuation methodologies used by the University for nancial instruments measured at fair value on a recurring basis (Note 8). The three levels of inputs are as follows:
Level 1for identical assets or liabilities. An active market
CASE WESTERN RESERVE UNIVERSITY FY20 FINANCIAL REPORT | 8
is one in which transactions occur with su cient frequency and volume to produce pricing information on an ongoing basis. Market price data are generally obtained from exchange or dealer markets.
Level 2observable, either directly or indirectly, such as quoted prices for similar assets or liabilities; quoted prices in markets that are not active; or other inputs that are observable or can be corroborated by observable market data for substantially the same term of the assets or liabilities. Inputs are obtained from various sources including market participants, dealers and brokers.
Level 3little or no market activity and that are signi cant to the fair value of the assets or liabilities.
Collections
cant artifacts, scienti c specimens, and art objects are held for education, research, scienti c inquiry, and public exhibition. They are neither disposed of for nancial gain nor encumbered in any manner. Accordingly, their value is not re nancial statements.
Funds Held in Trust by Others
Funds held in trust by others are assets held and administered by outside trustees from which the University derives income or residual interest. Funds held in trust by others are reported at their fair value as of June 30, 2020 and 2019.
Income received from funds held in trust by others is classi ed as net assets with donor restrictions until those amounts are appropriated and expended by the University. Income appropriated within the same year earned/received is classi ed as without donor restrictions. Unrealized changes in the fair value of investments are shown as net unrealized appreciation or depreciation in net assets with donor restrictions.
Health Education Campus
The University currently has shared interests in the
scal year 2014, the University and CCF began a joint e ort to raise funds for the construction of the HEC project. Occupancy of the HEC, which includes an academic building and
separate dental clinic, began in spring 2019 and the
the HEC project. Upon the completion of fundraising and nal funding of the project, the parties are committed to joint ownership of the above described properties (Note 9).
Fixed Assets
When capital assets are sold or disposed, the carrying value of such assets and any accumulated depreciation are removed from the asset accounts. Any resulting gain or loss on disposal is recognized in the non-operating portion of the statement of activities.
Expenditures for construction-in-progress are capitalized as incurred and depreciated over the estimated life of the asset when placed into service. All identi able direct costs including other costs incurred to ready the asset for its intended use are included in the cost of the project. The University capitalizes interest on borrowings to nance facilities, net of any investment income earned through the temporary investment of project borrowings, during construction until the project has been substantially completed.
Split-Interest Agreements
The University has split-interest agreements consisting primarily of pooled income funds, charitable gift annuities and charitable remainder unitrusts and annuities. Contributions are recognized at the date the trusts and annuities are established, net of a liability for the present value of the estimated future cash out ows to bene ciaries, using a discount rate of 1.20% and 2.4% for June 30, 2020 and 2019, respectively. These assets are invested and payments are made to donors and bene ciaries in accordance with the respective agreements.
Allocation of Certain Expenses
The statement of activities presents expenses by
amortization, and expenses related to the operation of
Interest expense is allocated to the functions that derive the greatest bene t from the facilities nanced (Note 16).
Retirement Plans
The University accounts for its de ned bene t postretirement plan in accordance with ASC 715,
recognizes the overfunded or underfunded status of a de ned bene t postretirement plan as an asset or liability in its statements of nancial position in the year in which the change occurs, with an o setting impact to net assets without donor restriction.
Use of Estimates
Financial statements using U.S. GAAP rely on estimates. At June 30, management makes certain estimates and assumptions, which a ect assets and liabilities, disclosures of contingent assets and liabilities, and reported revenues and expenses during the period. Actual results may di er from these estimates.
Comparative Information
The statement of activities includes prior year summarized comparative information in total, but not by net asset category. Such information does not include enough detail to constitute a presentation in conformity with U.S. GAAP. Accordingly, such information should
nancial statements for the year ended June 30, 2019, from which it was derived.
Income Taxes
The University is exempt from federal income tax to the extent provided under section 501(c) (3) of the
ed as an organization that is not a private foundation under section 509(a) of the IRC, and as such, gifts to the University qualify for deduction as charitable contributions. The University is exempt from federal income tax; however, it is required to pay federal income tax on unrelated business income. The University did not have any material income tax liabilities for the years
prescribes a recognition threshold and measurement requirements for nancial statement recognition and measurement of a tax position taken or expected to be taken in a tax return. In addition, ASC 740 provides guidance on recognition, classi cation and disclosure requirements for uncertain tax provisions. The University has no nancial reporting requirements associated with ASC 740 for the years ended June 30, 2020 and 2019.
Revenue Recognition
During the year ended June 30, 2019, the University
9 | NOTES TO THE FINANCIAL STATEMENTS - in thousands of dollars
nancial statements to understand the nature, amount, timing, and uncertainty of revenues and cash ows arising from contracts with customers. The University applied the modi ed retrospective method for implementation, applying the guidance to all contracts at the date of initial application resulting in no material changes to the presentation of nancial statement line items. This framework ensures that entities appropriately re ect the consideration to which they expect to be entitled in exchange for goods and services by allocating transaction price to identi ed performance obligations and recognizing revenue as performance obligations are satis ed. Signi cant judgments, such as the timing of satisfaction of performance obligation and associated transaction prices, may be required in the recognition of revenue, and certain economic factors, such as varying student class sizes, may a ect revenue recognized in future years. Student tuition and fees are recorded as revenues during the year the related academic services are provided and are displayed net of student aid on the statement of activities. Student tuition and fees received in advance of services provided are recorded as deferred revenue.
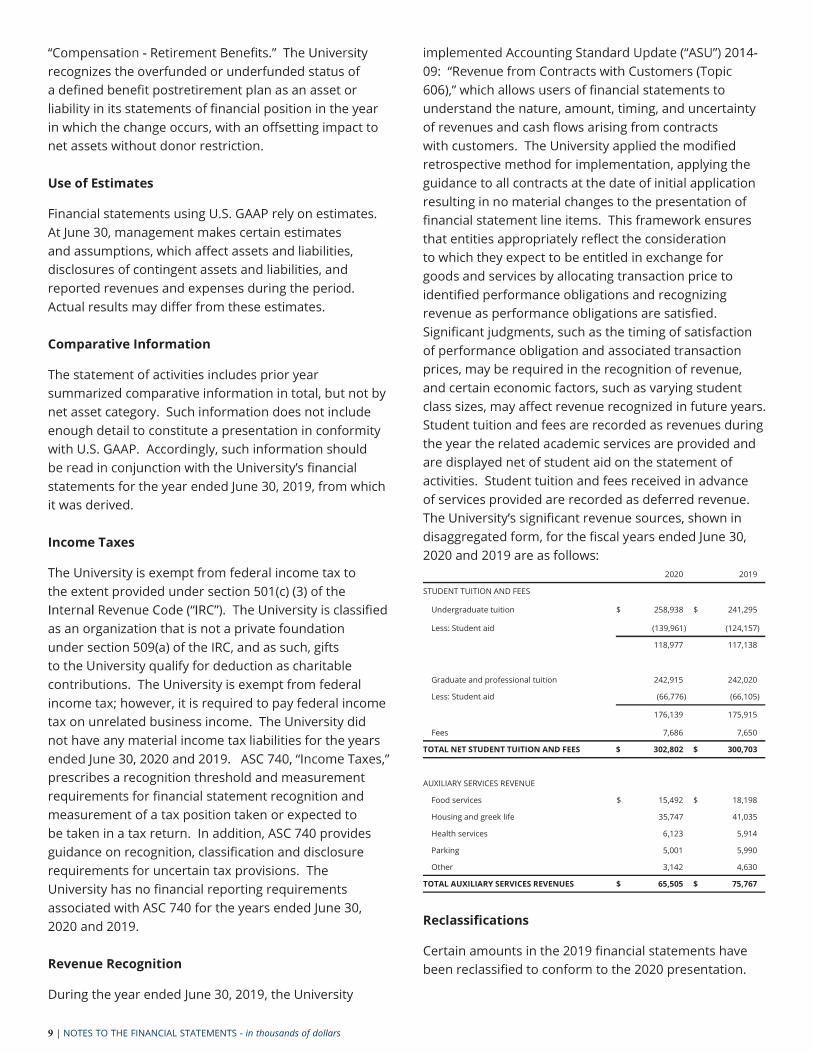
cant revenue sources, shown in disaggregated form, for the scal years ended June 30, 2020 and 2019 are as follows:
2020 2019
STUDENT TUITION AND FEES
Undergraduate tuition $ 258,938 $ 241,295
Less: Student aid (139,961) (124,157)
118,977 117,138
Graduate and professional tuition 242,915 242,020
Less: Student aid (66,776) (66,105)
176,139 175,915
Fees 7,686 7,650
TOTAL NET STUDENT TUITION AND FEES $ 302,802 $ 300,703
AUXILIARY SERVICES REVENUE
Food services $ 15,492 $ 18,198
Housing and greek life 35,747 41,035
Health services 6,123 5,914
Parking 5,001 5,990
Other 3,142 4,630
TOTAL AUXILIARY SERVICES REVENUES $ 65,505 $ 75,767
Reclassi cations
Certain amounts in the 2019 nancial statements have been reclassi ed to conform to the 2020 presentation.
CASE WESTERN RESERVE UNIVERSITY FY20 FINANCIAL REPORT | 10
current scal year and did not have a material e ect on the nancial statements.
In March 2017, the FASB issued ASU 2017-07: ts (Topic 715):
Improving the Presentation of Net Periodic Pension Cost and Net Periodic Postretirement Benewhich requires an employer report the service cost component in the same line item or items as other compensation costs arising from services rendered by the pertinent employees during the period, among other improvements to bene t cost presentation. The standard is e ective for scal years beginning after December 15, 2018, and has been adopted by the University in the current scal year and did not have a material e ect on the nancial statements.
In March 2017, the FASB issued ASU 2017-08:
(Subtopic 310-20): Premium Amortization on Purchased
period of premiums on certain purchased callable debt securities to the earliest call date. The standard is e ective for scal years beginning after December 15, 2019. The University is evaluating the impact this will have on the nancial statements for the scal year ending June 30, 2021, the rst year in which the standard is e ective.
which improves the nancial reporting of hedging relationships to better portray the economic results of
nancial statements. The standard is e ective for scal years beginning after December 15, 2020. The University is evaluating the impact this will have on the nancial statements for the scal year ending June 30, 2022, the rst year in which the standard is e ective.
Value Measurement (Topic 820): Disclosure Framework - Changes to the Disclosure Requirements for Fair
es the disclosure requirements on fair value measurements in Topic 820, including disclosure related to Level 3 investments. The standard is e ective for scal years beginning after December 15, 2019. The University is evaluating the impact this will have on the nancial statements for the scal year ending June 30, 2021, the rst year in which the standard is e ective.
In August 2018, the FASB issued ASU 2018-14:
New Pronouncements
In February 2016, the FASB issued ASU 2016-02:
comparability among organizations by recognizing lease assets and lease liabilities on the statements of nancial position and disclosing key information about leasing arrangements. This standard requires the recognition of lease assets and lease liabilities by lessees for those leases previously classi ed as operating leases. The standard is e ective for scal years beginning after December 15, 2018, and has been adopted by the University in the current scal year using the e ective date method (Note 5). As permitted by the standard the University has elected to not reassess prior lease identi cation, lease classi cation, initial indirect cost, and certain land easements.
Instruments-Credit Losses (Topic 326): Measurement
nancial reporting by requiring earlier recognition of credit losses on nancing receivables and other nancial assets in scope. The standard is e ective for scal years beginning after December 31, 2022. The University is evaluating the impact this will have on nancial statements for the scal year ending June 30, 2024, the rst year in which the standard is e ective.
In August 2016, the FASB issued ASU 2016-15: cation
attempts to eliminate the diversity in practice in how certain cash receipts and cash payments are presented and classi ed in the statement of cash ows. This includes debt prepayment or debt extinguishment costs, certain contingent consideration payments and proceeds from the settlement of insurance claims, among others. The standard is e ective for scal years beginning after December 15, 2018, and has been adopted by the University in the current scal year and did not have a material e ect on the nancial statements.
In November 2016, the FASB issued ASU 2016-18:
which requires amounts generally described as restricted cash and restricted cash equivalents to be included with cash and cash equivalents when reconciling the beginning-of-period and end-of-period total amounts shown on the statement of cash ows. The standard is e ective for scal years beginning after December 15, 2018, and has been adopted by the University in the
2019. The University is evaluating the impact this will have on the nancial statements for the scal year ending June 30, 2021, the rst year in which the standard is e ective.
Rate Reform (Topic 848): Facilitation of the E ects of
standard provides temporary optional expedients and exceptions to U.S. GAAP guidance on contract modi cations and hedge accounting to ease the nancial reporting burdens of the expected market transition from the London Inter-Bank Oother interbank o ered rates to alternative reference rates, such as the Secured Overnight Financing Rate. The standard is e ective March 12, 2020 through December 31, 2022. The University is evaluating the impact this will have on the nancial statements for the scal year ending June 30, 2023.
2. LIQUIDITY
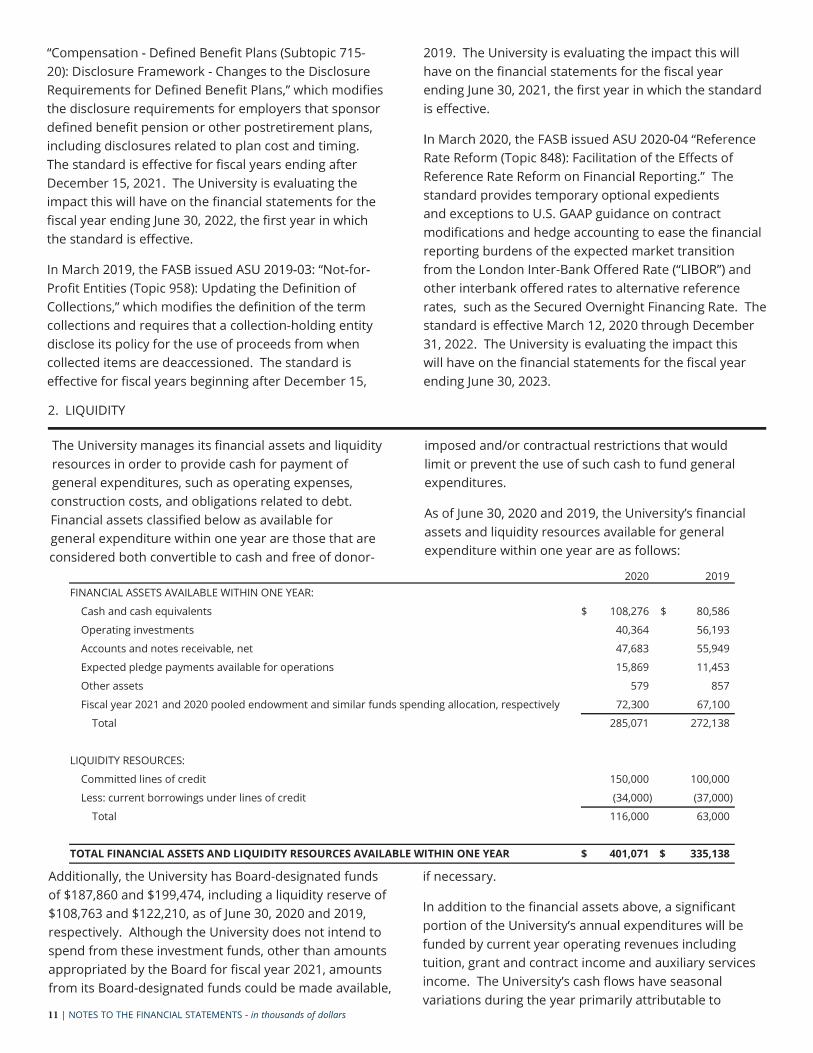
The University manages its nancial assets and liquidity resources in order to provide cash for payment of general expenditures, such as operating expenses, construction costs, and obligations related to debt. Financial assets classi ed below as available for general expenditure within one year are those that are considered both convertible to cash and free of donor-
imposed and/or contractual restrictions that would limit or prevent the use of such cash to fund general expenditures.
nancial assets and liquidity resources available for general expenditure within one year are as follows:
2020 2019FINANCIAL ASSETS AVAILABLE WITHIN ONE YEAR:
Cash and cash equivalents $ 108,276 $ 80,586
Operating investments 40,364 56,193
Accounts and notes receivable, net 47,683 55,949
Expected pledge payments available for operations 15,869 11,453
Other assets 579 857
Fiscal year 2021 and 2020 pooled endowment and similar funds spending allocation, respectively 72,300 67,100
Total 285,071 272,138
LIQUIDITY RESOURCES:
Committed lines of credit 150,000 100,000
Less: current borrowings under lines of credit (34,000) (37,000)
Total 116,000 63,000
TOTAL FINANCIAL ASSETS AND LIQUIDITY RESOURCES AVAILABLE WITHIN ONE YEAR $ 401,071 $ 335,138
ned Bene t Plans (Subtopic 715-20): Disclosure Framework - Changes to the Disclosure Requirements for De ned Bene es the disclosure requirements for employers that sponsor de ned bene t pension or other postretirement plans, including disclosures related to plan cost and timing. The standard is e ective for scal years ending after December 15, 2021. The University is evaluating the impact this will have on the nancial statements for the scal year ending June 30, 2022, the rst year in which the standard is e ective.
Pro t Entities (Topic 958): Updating the De nition of es the de nition of the term
collections and requires that a collection-holding entity disclose its policy for the use of proceeds from when collected items are deaccessioned. The standard is e ective for scal years beginning after December 15,
Additionally, the University has Board-designated funds of $187,860 and $199,474, including a liquidity reserve of $108,763 and $122,210, as of June 30, 2020 and 2019, respectively. Although the University does not intend to spend from these investment funds, other than amounts appropriated by the Board for scal year 2021, amounts from its Board-designated funds could be made available,
11 | NOTES TO THE FINANCIAL STATEMENTS - in thousands of dollars
if necessary.
In addition to the nancial assets above, a signi cant
funded by current year operating revenues including tuition, grant and contract income and auxiliary services
ows have seasonal variations during the year primarily attributable to
CASE WESTERN RESERVE UNIVERSITY FY20 FINANCIAL REPORT | 12
student billings and the concentration of contributions received at calendar and scal year ends. As part of the
cash in excess of daily requirements in various short-term investment instruments.
received from endowment spending related to either
funds functioning as endowment or donor-restricted endowments is available for general expenditure. Endowment spending distributed from donor-restricted endowments is rewith donor restrictions until the expenditures actually are incurred; such expenditures are funded by available liquidity resources at the time they are paid.
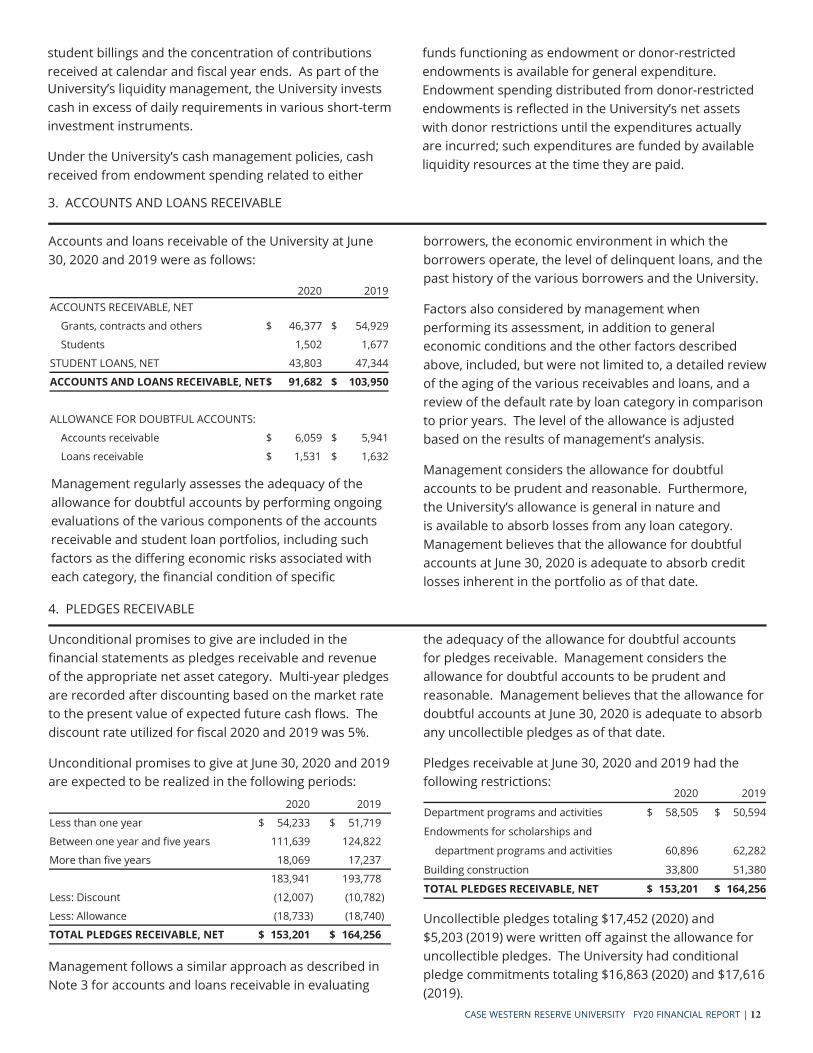
3. ACCOUNTS AND LOANS RECEIVABLE
Accounts and loans receivable of the University at June 30, 2020 and 2019 were as follows:
2020 2019ACCOUNTS RECEIVABLE, NET
Grants, contracts and others $ 46,377 $ 54,929
Students 1,502 1,677
STUDENT LOANS, NET 43,803 47,344
ACCOUNTS AND LOANS RECEIVABLE, NET$ 91,682 $ 103,950
ALLOWANCE FOR DOUBTFUL ACCOUNTS:
Accounts receivable $ 6,059 $ 5,941
Loans receivable $ 1,531 $ 1,632
Management regularly assesses the adequacy of the allowance for doubtful accounts by performing ongoing evaluations of the various components of the accounts receivable and student loan portfolios, including such factors as the di ering economic risks associated with each category, the nancial condition of speci c
borrowers, the economic environment in which the borrowers operate, the level of delinquent loans, and the past history of the various borrowers and the University.
Factors also considered by management when performing its assessment, in addition to general economic conditions and the other factors described above, included, but were not limited to, a detailed review of the aging of the various receivables and loans, and a review of the default rate by loan category in comparison to prior years. The level of the allowance is adjusted
Management considers the allowance for doubtful accounts to be prudent and reasonable. Furthermore,
is available to absorb losses from any loan category. Management believes that the allowance for doubtful accounts at J une 30, 2020 is adequate to absorb credit losses inherent in the portfolio as of that date.
4. PLEDGES RECEIVABLE
Unconditional promises to give are included in the nancial statements as pledges receivable and revenue of the appropriate net asset category. Multi-year pledges are recorded after discounting based on the market rate to the present value of expected future cash ows. The discount rate utilized for scal 2020 and 2019 was 5%.
Unconditional promises to give at June 30, 2020 and 2019 are expected to be realized in the following periods:
2020 2019
Less than one year $ 54,233 $ 51,719
Between one year and ve years 111,639 124,822
More than ve years 18,069 17,237
183,941 193,778
Less: Discount (12,007) (10,782)
Less: Allowance (18,733) (18,740)
TOTAL PLEDGES RECEIVABLE, NET $ 153,201 $ 164,256
Management follows a similar approach as described in Note 3 for accounts and loans receivable in evaluating
the adequacy of the allowance for doubtful accounts for pledges receivable. Management considers the allowance for doubtful accounts to be prudent and reasonable. Management believes that the allowance for doubtful accounts at June 30, 2020 is adequate to absorb any uncollectible pledges as of that date.
Pledges receivable at June 30, 2020 and 2019 had the following restrictions:
2020 2019
Department programs and activities $ 58,505 $ 50,594
Endowments for scholarships and
department programs and activities 60,896 62,282
Building construction 33,800 51,380
TOTAL PLEDGES RECEIVABLE, NET $ 153,201 $ 164,256
Uncollectible pledges totaling $17,452 (2020) and $5,203 (2019) were written o against the allowance for uncollectible pledges. The University had conditional pledge commitments totaling $16,863 (2020) and $17,616 (2019).
13 | NOTES TO THE FINANCIAL STATEMENTS - in thousands of dollars
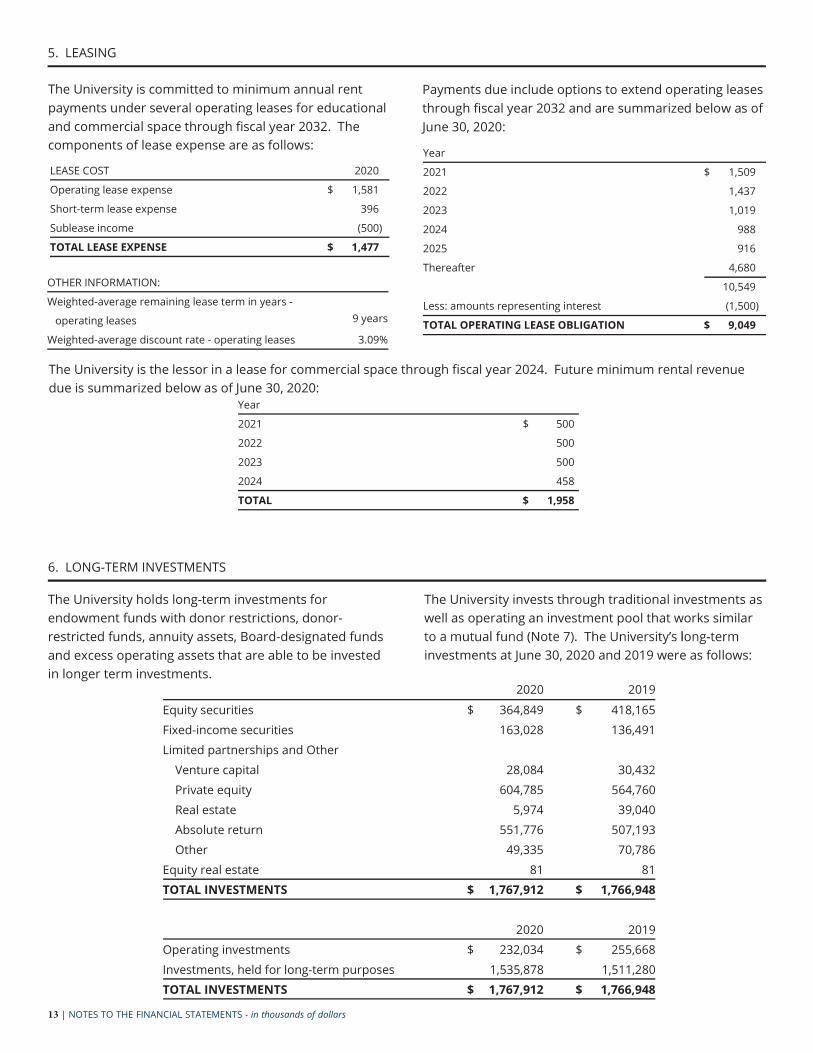
6. LONG-TERM INVESTMENTS
The University holds long-term investments for endowment funds with donor restrictions, donor-restricted funds, annuity assets, Board-designated funds and excess operating assets that are able to be invested in longer term investments.
The University invests through traditional investments as well as operating an investment pool that works similar
investments at June 30, 2020 and 2019 were as follows:
2020 2019
Equity securities $ 364,849 $ 418,165 Fixed-income securities 163,028 136,491 Limited partnerships and Other
Venture capital 28,084 30,432 Private equity 604,785 564,760 Real estate 5,974 39,040 Absolute return 551,776 507,193 Other 49,335 70,786
Equity real estate 81 81TOTAL INVESTMENTS $ 1,767,912 $ 1,766,948
2020 2019Operating investments $ 232,034 $ 255,668 Investments, held for long-term purposes 1,535,878 1,511,280 TOTAL INVESTMENTS $ 1,767,912 $ 1,766,948
5. LEASING
The University is committed to minimum annual rent payments under several operating leases for educational and commercial space through scal year 2032. The components of lease expense are as follows:
Payments due include options to extend operating leases through scal year 2032 and are summarized below as of June 30, 2020:
Year
2021 $ 1,509
2022 1,437
2023 1,019
2024 988
2025 916
Thereafter 4,680
10,549
Less: amounts representing interest (1,500 )
TOTAL OPERATING LEASE OBLIGATION $ 9,049
The University is the lessor in a lease for commercial space through scal year 2024. Future minimum rental revenue due is summarized below as of June 30, 2020:
Year
2021 $ 500
2022 500
2023 500
2024 458
TOTAL $ 1,958
OTHER INFORMATION:
Weighted-average remaining lease term in years - 9 yearsoperating leases
Weighted-average discount rate - operating leases 3.09%
LEASE COST 2020
Operating lease expense $ 1,581
Short-term lease expense 396
Sublease income (500 )
TOTAL LEASE EXPENSE $ 1,477
CASE WESTERN RESERVE UNIVERSITY FY20 FINANCIAL REPORT | 14
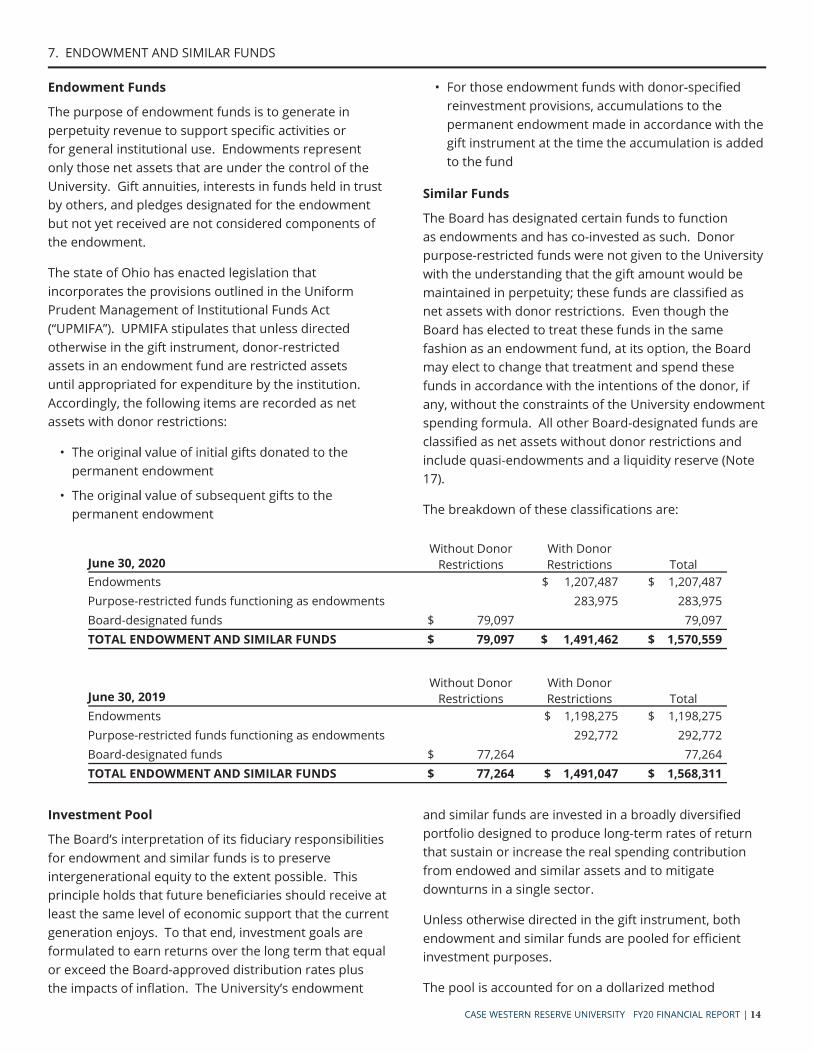
7. ENDOWMENT AND SIMILAR FUNDS
Endowment Funds
The purpose of endowment funds is to generate in perpetuity revenue to support speci c activities or for general institutional use. Endowments represent only those net assets that are under the control of the University. Gift annuities, interests in funds held in trust by others, and pledges designated for the endowment but not yet received are not considered components of the endowment.
The state of Ohio has enacted legislation that incorporates the provisions outlined in the Uniform Prudent Management of Institutional Funds Act
otherwise in the gift instrument, donor-restricted assets in an endowment fund are restricted assets until appropriated for expenditure by the institution. Accordingly, the following items are recorded as net assets with donor restrictions:
permanent endowment
permanent endowment
ed reinvestment provisions, accumulations to the permanent endowment made in accordance with the gift instrument at the time the accumulation is added to the fund
Similar Funds
The Board has designated certain funds to function as endowments and has co-invested as such. Donor purpose-restricted funds were not given to the University with the understanding that the gift amount would be maintained in perpetuity; these funds are classi ed as net assets with donor restrictions. Even though the Board has elected to treat these funds in the same fashion as an endowment fund, at its option, the Board may elect to change that treatment and spend these funds in accordance with the intentions of the donor, if any, without the constraints of the University endowment spending formula. All other Board-designated funds are classi ed as net assets without donor restrictions and include quasi-endowments and a liquidity reserve (Note 17).
The breakdown of these classi cations are:
Without DonorRestrictions
With DonorRestrictions TotalJune 30, 2020
Endowments $ 1,207,487 $ 1,207,487 Purpose-restricted funds functioning as endowments 283,975 283,975Board-designated funds $ 79,097 79,097TOTAL ENDOWMENT AND SIMILAR FUNDS $ 79,097 $ 1,491,462 $ 1,570,559
Without DonorRestrictions
With DonorRestrictions TotalJune 30, 2019
Endowments $ 1,198,275 $ 1,198,275 Purpose-restricted funds functioning as endowments 292,772 292,772 Board-designated funds $ 77,264 77,264 TOTAL ENDOWMENT AND SIMILAR FUNDS $ 77,264 $ 1,491,047 $ 1,568,311
Investment Pool
duciary responsibilities for endowment and similar funds is to preserve intergenerational equity to the extent possible. This principle holds that future bene ciaries should receive at least the same level of economic support that the current generation enjoys. To that end, investment goals are formulated to earn returns over the long term that equal or exceed the Board-approved distribution rates plus the impacts of in
and similar funds are invested in a broadly diversi ed portfolio designed to produce long-term rates of return that sustain or increase the real spending contribution from endowed and similar assets and to mitigate downturns in a single sector.
Unless otherwise directed in the gift instrument, both endowment and similar funds are pooled for e cient investment purposes.
The pool is accounted for on a dollarized method
15 | NOTES TO THE FINANCIAL STATEMENTS - in thousands of dollars
of accounting similar to a money market fund and accounted for on an account basis. The total investment return for the pooled investments, net of external manager fees, approximated 1.30% (2020) and 6.04% (2019).
Spending Policy
The Board has approved an endowment spending policy for pooled investments based on a rolling ten-year average methodology. This approach takes into consideration the long-term e ect of total return, spending, university support and in ation. The objective of this approach is to provide support for operations, preserve intergenerational equity, and insulate programming supported by endowment and similar funds from short-term uctuations in the investment markets.
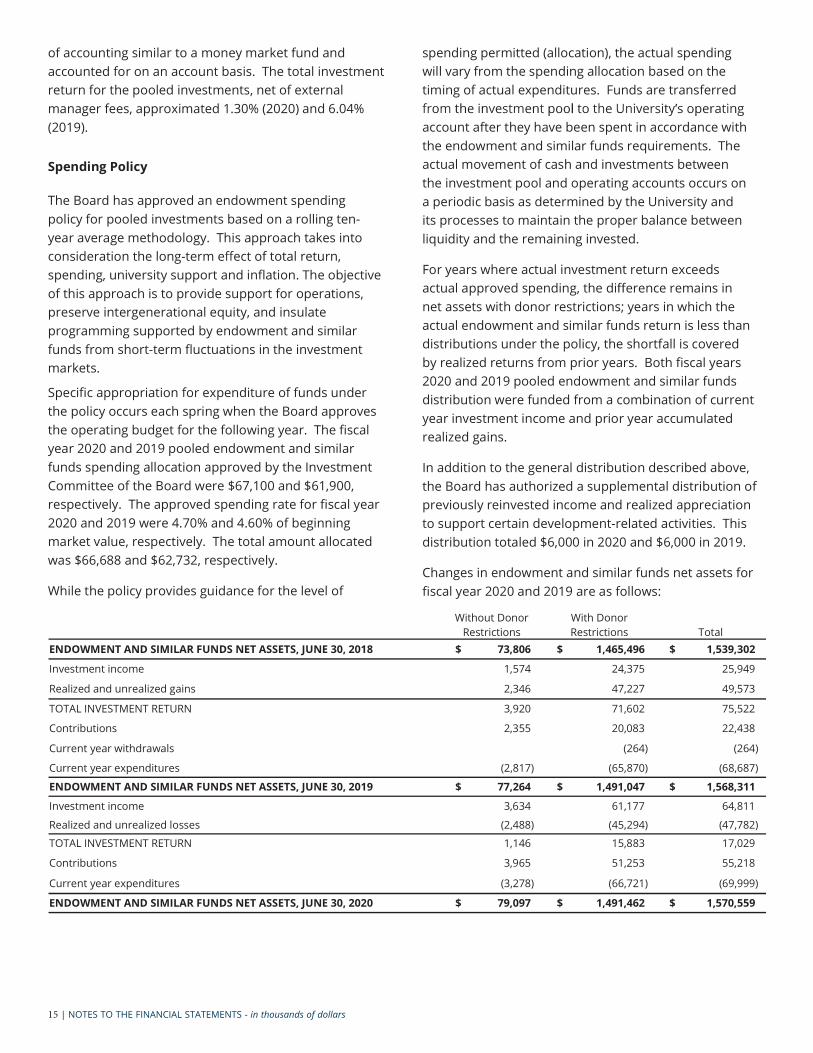
Speci c appropriation for expenditure of funds under the policy occurs each spring when the Board approves the operating budget for the following year. The scal year 2020 and 2019 pooled endowment and similar funds spending allocation approved by the Investment Committee of the Board were $67,100 and $61,900, respectively. The approved spending rate for scal year 2020 and 2019 were 4.70% and 4.60% of beginning market value, respectively. The total amount allocated was $66,688 and $62,732, respectively.
While the policy provides guidance for the level of
spending permitted (allocation), the actual spending will vary from the spending allocation based on the timing of actual expenditures. Funds are transferred
account after they have been spent in accordance with the endowment and similar funds requirements. The actual movement of cash and investments between the investment pool and operating accounts occurs on a periodic basis as determined by the University and its processes to maintain the proper balance between liquidity and the remaining invested.
For years where actual investment return exceeds actual approved spending, the di erence remains in net assets with donor restrictions; years in which the actual endowment and similar funds return is less than distributions under the policy, the shortfall is covered by realized returns from prior years. Both scal years 2020 and 2019 pooled endowment and similar funds distribution were funded from a combination of current year investment income and prior year accumulated realized gains.
In addition to the general distribution described above, the Board has authorized a supplemental distribution of previously reinvested income and realized appreciation to support certain development-related activities. This distribution totaled $6,000 in 2020 and $6,000 in 2019.
Changes in endowment and similar funds net assets for scal year 2020 and 2019 are as follows:
Without Donor Restrictions
With Donor Restrictions Total
ENDOWMENT AND SIMILAR FUNDS NET ASSETS, JUNE 30, 2018 $ 73,806 $ 1,465,496 $ 1,539,302
Investment income 1,574 24,375 25,949
Realized and unrealized gains 2,346 47,227 49,573
TOTAL INVESTMENT RETURN 3,920 71,602 75,522
Contributions 2,355 20,083 22,438
Current year withdrawals (264) (264)
Current year expenditures (2,817) (65,870) (68,687)
ENDOWMENT AND SIMILAR FUNDS NET ASSETS, JUNE 30, 2019 $ 77,264 $ 1,491,047 $ 1,568,311
Investment income 3,634 61,177 64,811
Realized and unrealized losses (2,488) (45,294) (47,782)
TOTAL INVESTMENT RETURN 1,146 15,883 17,029
Contributions 3,965 51,253 55,218
Current year expenditures (3,278) (66,721) (69,999)
ENDOWMENT AND SIMILAR FUNDS NET ASSETS, JUNE 30, 2020 $ 79,097 $ 1,491,462 $ 1,570,559
CASE WESTERN RESERVE UNIVERSITY FY20 FINANCIAL REPORT | 16
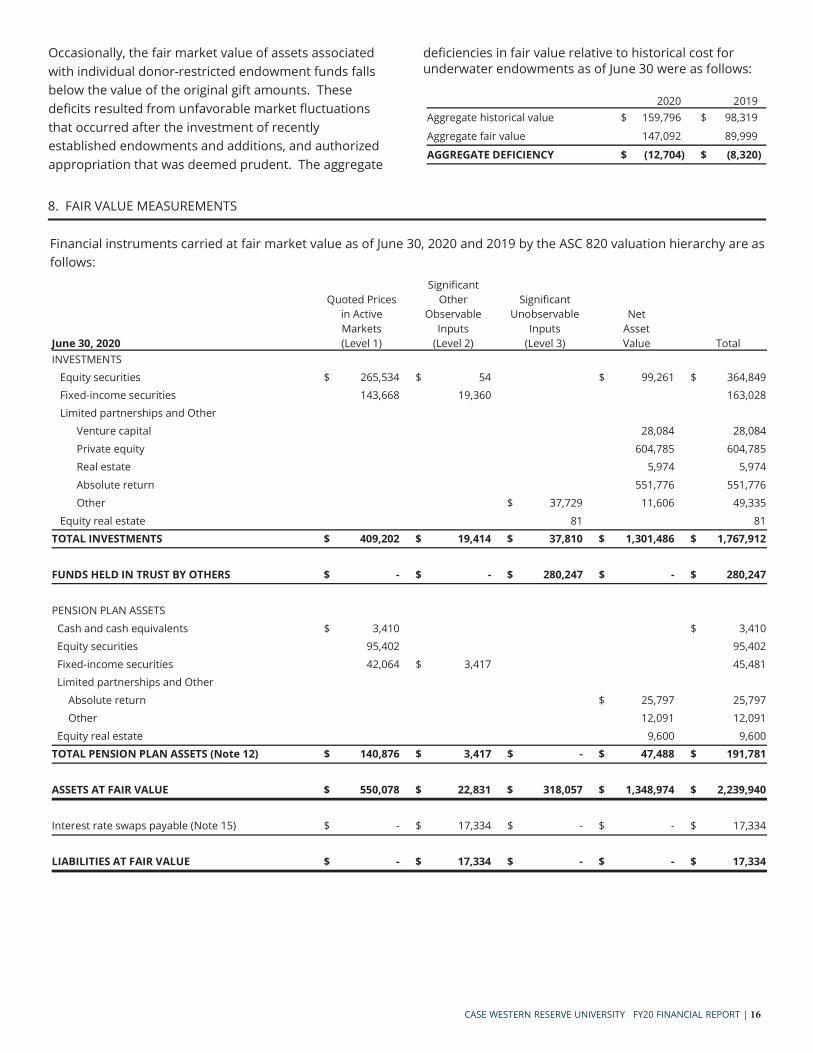
Occasionally, the fair market value of assets associated with individual donor-restricted endowment funds falls below the value of the original gift amounts. These de cits resulted from unfavorable market uctuations that occurred after the investment of recently established endowments and additions, and authorized appropriation that was deemed prudent. The aggregate
de ciencies in fair value relative to historical cost for underwater endowments as of June 30 were as follows:
2020 2019Aggregate historical value $ 159,796 $ 98,319
Aggregate fair value 147,092 89,999
AGGREGATE DEFICIENCY $ (12,704) $ (8,320)
Financial instruments carried at fair market value as of June 30, 2020 and 2019 by the ASC 820 valuation hierarchy are as follows:
June 30, 2020
Quoted Pricesin ActiveMarkets(Level 1)
Signi cantOther
ObservableInputs
(Level 2)
Signi cantUnobservable
Inputs(Level 3)
NetAssetValue Total
INVESTMENTS Equity securities $ 265,534 $ 54 $ 99,261 $ 364,849 Fixed-income securities 143,668 19,360 163,028 Limited partnerships and Other
Venture capital 28,084 28,084 Private equity 604,785 604,785 Real estate 5,974 5,974
Absolute return 551,776 551,776 Other $ 37,729 11,606 49,335
Equity real estate 81 81TOTAL INVESTMENTS $ 409,202 $ 19,414 $ 37,810 $ 1,301,486 $ 1,767,912
FUNDS HELD IN TRUST BY OTHERS $ - $ - $ 280,247 $ - $ 280,247
PENSION PLAN ASSETS Cash and cash equivalents $ 3,410 $ 3,410 Equity securities 95,402 95,402 Fixed-income securities 42,064 $ 3,417 45,481 Limited partnerships and Other
Absolute return $ 25,797 25,797 Other 12,091 12,091 Equity real estate 9,600 9,600TOTAL PENSION PLAN ASSETS (Note 12) $ 140,876 $ 3,417 $ - $ 47,488 $ 191,781
ASSETS AT FAIR VALUE $ 550,078 $ 22,831 $ 318,057 $ 1,348,974 $ 2,239,940
Interest rate swaps payable (Note 15) $ - $ 17,334 $ - $ - $ 17,334
LIABILITIES AT FAIR VALUE $ - $ 17,334 $ - $ - $ 17,334
8. FAIR VALUE MEASUREMENTS
17 | NOTES TO THE FINANCIAL STATEMENTS - in thousands of dollars
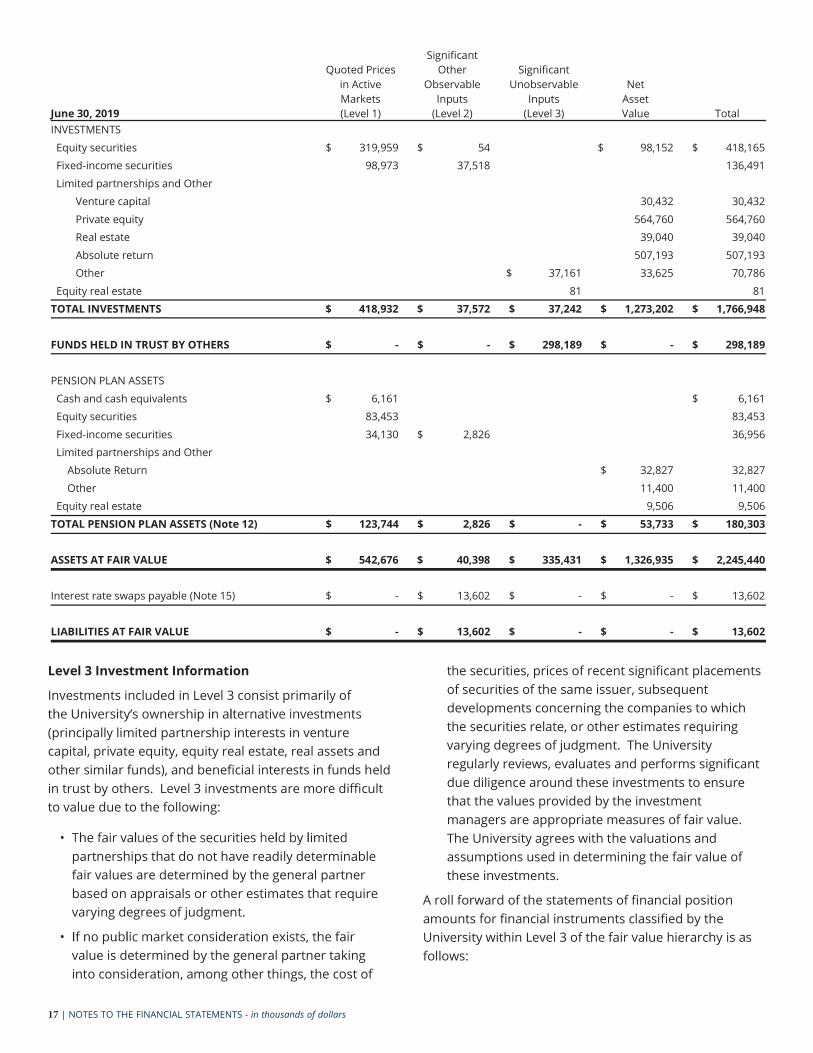
June 30, 2019
Quoted Pricesin ActiveMarkets(Level 1)
Signi cantOther
ObservableInputs
(Level 2)
Signi cantUnobservable
Inputs(Level 3)
NetAssetValue Total
INVESTMENTS Equity securities $ 319,959 $ 54 $ 98,152 $ 418,165 Fixed-income securities 98,973 37,518 136,491 Limited partnerships and Other
Venture capital 30,432 30,432 Private equity 564,760 564,760 Real estate 39,040 39,040 Absolute return 507,193 507,193 Other $ 37,161 33,625 70,786
Equity real estate 81 81 TOTAL INVESTMENTS $ 418,932 $ 37,572 $ 37,242 $ 1,273,202 $ 1,766,948
FUNDS HELD IN TRUST BY OTHERS $ - $ - $ 298,189 $ - $ 298,189
PENSION PLAN ASSETS Cash and cash equivalents $ 6,161 $ 6,161 Equity securities 83,453 83,453 Fixed-income securities 34,130 $ 2,826 36,956 Limited partnerships and Other
Absolute Return $ 32,827 32,827 Other 11,400 11,400 Equity real estate 9,506 9,506TOTAL PENSION PLAN ASSETS (Note 12) $ 123,744 $ 2,826 $ - $ 53,733 $ 180,303
ASSETS AT FAIR VALUE $ 542,676 $ 40,398 $ 335,431 $ 1,326,935 $ 2,245,440
Interest rate swaps payable (Note 15) $ - $ 13,602 $ - $ - $ 13,602
LIABILITIES AT FAIR VALUE $ - $ 13,602 $ - $ - $ 13,602
Level 3 Investment Information
Investments included in Level 3 consist primarily of
(principally limited partnership interests in venture capital, private equity, equity real estate, real assets and other similar funds), and bene cial interests in funds held in trust by others. Level 3 investments are more di cult to value due to the following:
partnerships that do not have readily determinable fair values are determined by the general partner based on appraisals or other estimates that require varying degrees of judgment.
value is determined by the general partner taking into consideration, among other things, the cost of
the securities, prices of recent signi cant placements of securities of the same issuer, subsequent developments concerning the companies to which the securities relate, or other estimates requiring varying degrees of judgment. The University regularly reviews, evaluates and performs signi cant due diligence around these investments to ensure that the values provided by the investment managers are appropriate measures of fair value. The University agrees with the valuations and assumptions used in determining the fair value of these investments.
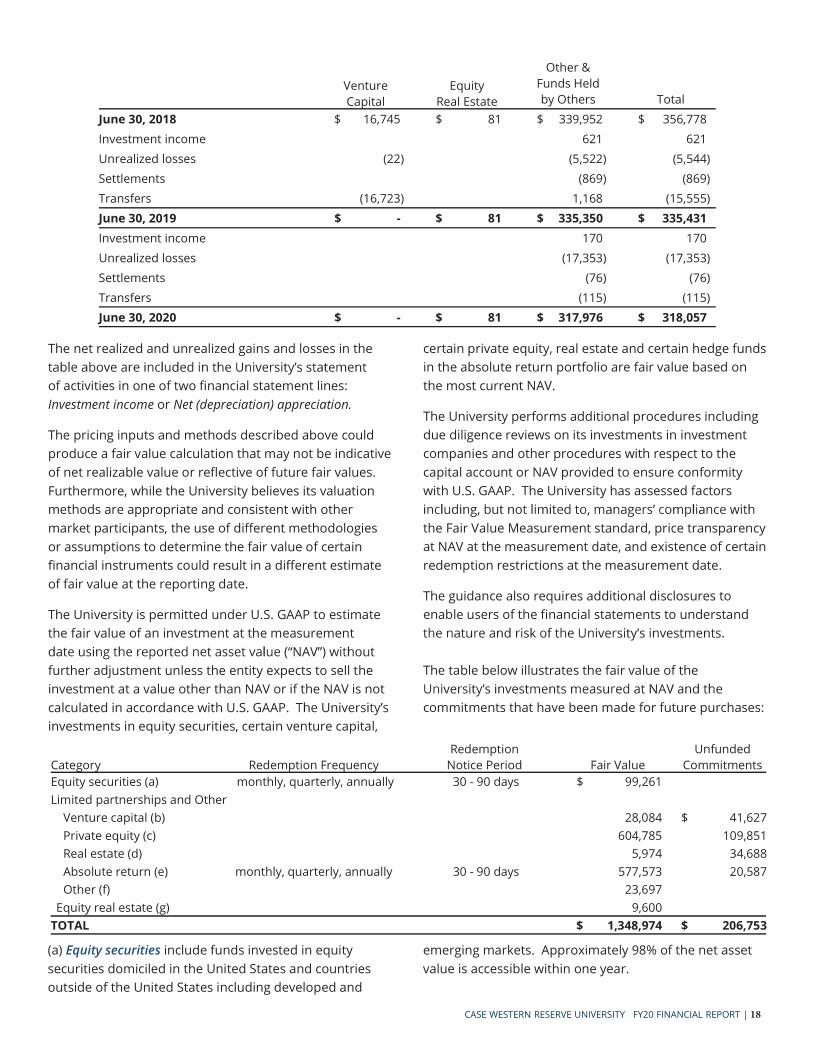
A roll forward of the statements of nancial position amounts for nancial instruments classi ed by the University within Level 3 of the fair value hierarchy is as follows:
CASE WESTERN RESERVE UNIVERSITY FY20 FINANCIAL REPORT | 18
The net realized and unrealized gains and losses in the
of activities in one of two nancial statement lines: Investment income or Net (depreciation) appreciation.
The pricing inputs and methods described above could produce a fair value calculation that may not be indicative of net realizable value or re ective of future fair values. Furthermore, while the University believes its valuation methods are appropriate and consistent with other market participants, the use of di erent methodologies or assumptions to determine the fair value of certain nancial instruments could result in a di erent estimate of fair value at the reporting date.
The University is permitted under U.S. GAAP to estimate the fair value of an investment at the measurement
further adjustment unless the entity expects to sell the investment at a value other than NAV or if the NAV is not calculated in accordance with U.S. GAAP.investments in equity securities, certain venture capital,
certain private equity, real estate and certain hedge funds in the absolute return portfolio are fair value based on the most current NAV.
The University performs additional procedures including due diligence reviews on its investments in investment companies and other procedures with respect to the capital account or NAV provided to ensure conformity with U.S. GAAP. The University has assessed factors
the Fair Value Measurement standard, price transparency at NAV at the measurement date, and existence of certain redemption restrictions at the measurement date.
The guidance also requires additional disclosures to enable users of the nancial statements to understand
The table below illustrates the fair value of the
commitments that have been made for future purchases:
VentureCapital
EquityReal Estate
Other &Funds Heldby Others Total
June 30, 2018 $ 16,745 $ 81 $ 339,952 $ 356,778 Investment income 621 621Unrealized losses (22) (5,522) (5,544)Settlements (869) (869)Transfers (16,723) 1,168 (15,555)June 30, 2019 $ - $ 81 $ 335,350 $ 335,431 Investment income 170 170Unrealized losses (17,353) (17,353)Settlements (76) (76)Transfers (115) (115)June 30, 2020 $ - $ 81 $ 317,976 $ 318,057
(a) Equity securities include funds invested in equitysecurities domiciled in the United States and countriesoutside of the United States including developed and
emerging markets. Approximately 98% of the net asset value is accessible within one year.
Category Redemption FrequencyRedemption
Notice Period Fair ValueUnfunded
CommitmentsEquity securities (a) monthly, quarterly, annually 30 - 90 days $ 99,261 Limited partnerships and Other
Venture capital (b) 28,084 $ 41,627 Private equity (c) 604,785 109,851 Real estate (d) 5,974 34,688 Absolute return (e) monthly, quarterly, annually 30 - 90 days 577,573 20,587 Other (f) 23,697
Equity real estate (g) 9,600TOTAL $ 1,348,974 $ 206,753
19 | NOTES TO THE FINANCIAL STATEMENTS - in thousands of dollars
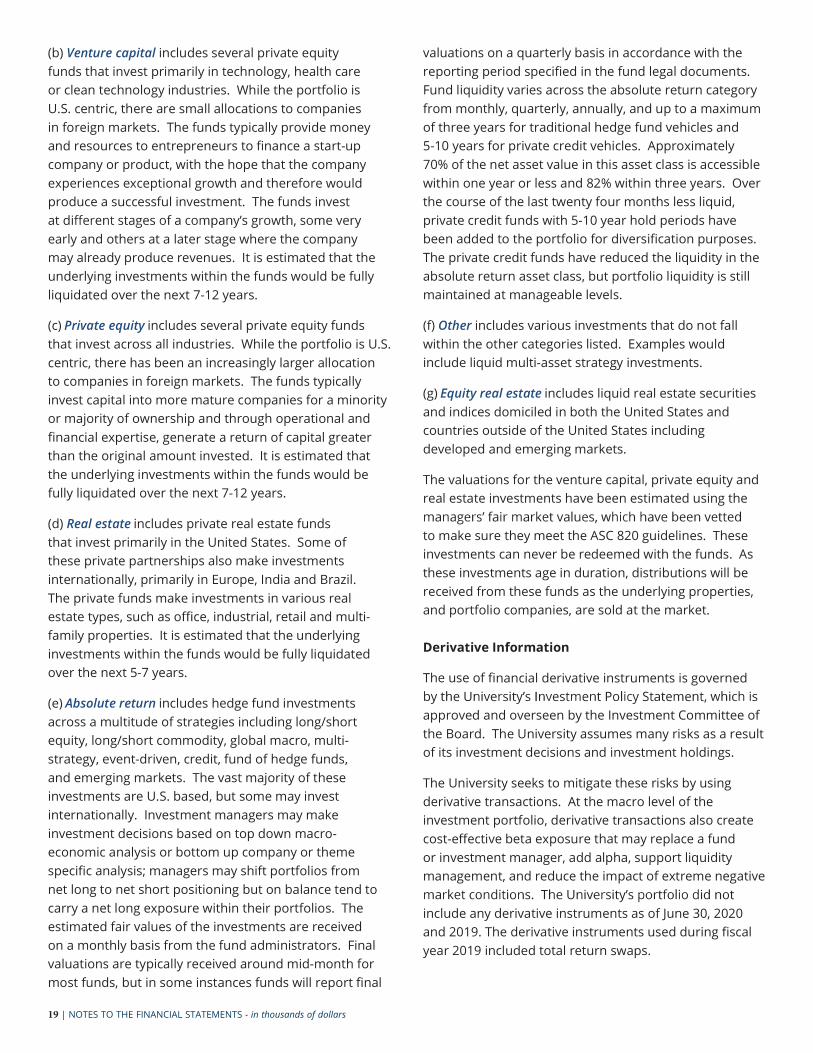
(b) Venture capital includes several private equityfunds that invest primarily in technology, health careor clean technology industries. While the portfolio isU.S. centric, there are small allocations to companiesin foreign markets. The funds typically provide moneyand resources to entrepreneurs to nance a start-upcompany or product, with the hope that the companyexperiences exceptional growth and therefore wouldproduce a successful investment. The funds investat diearly and others at a later stage where the companymay already produce revenues. It is estimated that theunderlying investments within the funds would be fullyliquidated over the next 7-12 years.
(c) Private equity includes several private equity fundsthat invest across all industries. While the portfolio is U.S.centric, there has been an increasingly larger allocationto companies in foreign markets. The funds typicallyinvest capital into more mature companies for a minorityor majority of ownership and through operational and nancial expertise, generate a return of capital greaterthan the original amount invested. It is estimated thatthe underlying investments within the funds would befully liquidated over the next 7-12 years.
(d) Real estate includes private real estate fundsthat invest primarily in the United States. Some ofthese private partnerships also make investmentsinternationally, primarily in Europe, India and Brazil.The private funds make investments in various realestate types, such as o ce, industrial, retail and multi-family properties. It is estimated that the underlyinginvestments within the funds would be fully liquidatedover the next 5-7 years.
(e) Absolute return includes hedge fund investmentsacross a multitude of strategies including long/shortequity, long/short commodity, global macro, multi-strategy, event-driven, credit, fund of hedge funds,and emerging markets. The vast majority of theseinvestments are U.S. based, but some may investinternationally. Investment managers may makeinvestment decisions based on top down macro-economic analysis or bottom up company or themespeci c analysis; managers may shift portfolios fromnet long to net short positioning but on balance tend tocarry a net long exposure within their portfolios. Theestimated fair values of the investments are receivedon a monthly basis from the fund administrators. Finalvaluations are typically received around mid-month formost funds, but in some instances funds will report nal
valuations on a quarterly basis in accordance with the reporting period speci ed in the fund legal documents. Fund liquidity varies across the absolute return category from monthly, quarterly, annually, and up to a maximum of three years for traditional hedge fund vehicles and 5-10 years for private credit vehicles. Approximately70% of the net asset value in this asset class is accessiblewithin one year or less and 82% within three years. Overthe course of the last twenty four months less liquid,private credit funds with 5-10 year hold periods havebeen added to the portfolio for diversi cation purposes.The private credit funds have reduced the liquidity in theabsolute return asset class, but portfolio liquidity is stillmaintained at manageable levels.
(f) Other includes various investments that do not fallwithin the other categories listed. Examples wouldinclude liquid multi-asset strategy investments.
(g) Equity real estate includes liquid real estate securitiesand indices domiciled in both the United States andcountries outside of the United States includingdeveloped and emerging markets.
The valuations for the venture capital, private equity and real estate investments have been estimated using the
to make sure they meet the ASC 820 guidelines. These investments can never be redeemed with the funds. As these investments age in duration, distributions will be received from these funds as the underlying properties, and portfolio companies, are sold at the market.
Derivative Information
The use of nancial derivative instruments is governed
approved and overseen by the Investment Committee of the Board. The University assumes many risks as a result of its investment decisions and investment holdings.
The University seeks to mitigate these risks by using derivative transactions. At the macro level of the investment portfolio, derivative transactions also create cost-e ective beta exposure that may replace a fund or investment manager, add alpha, support liquidity management, and reduce the impact of extreme negative
include any derivative instruments as of June 30, 2020 and 2019. The derivative instruments used during scal year 2019 included total return swaps.
CASE WESTERN RESERVE UNIVERSITY FY20 FINANCIAL REPORT | 20
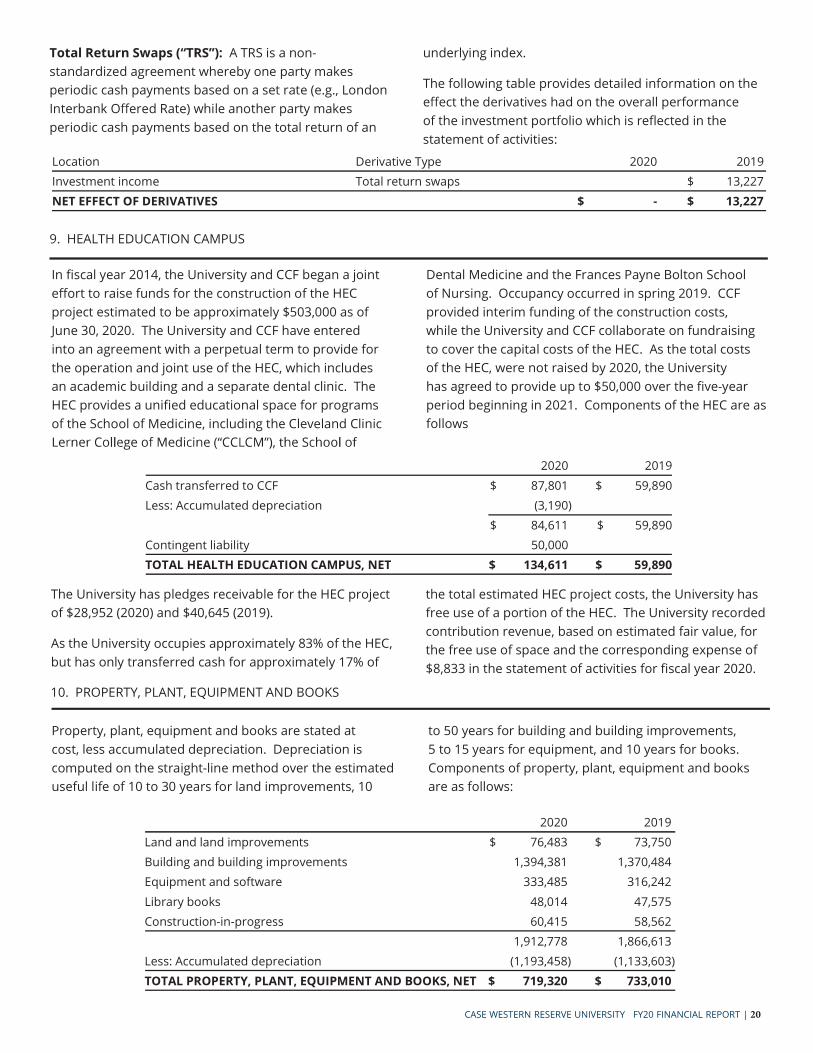
Total Return Swaps A TRS is a non-standardized agreement whereby one party makes periodic cash payments based on a set rate (e.g., London Interbank O ered Rate) while another party makes periodic cash payments based on the total return of an
underlying index.
The following table provides detailed information on the e ect the derivatives had on the overall performance of the investment portfolio which is re ected in the statement of activities:
Location Derivative Type 2020 2019. Investment income Total return swaps $ 13,227. NET EFFECT OF DERIVATIVES $ - $ 13,227.
9. HEALTH EDUCATION CAMPUS
In scal year 2014, the University and CCF began a joint e ort to raise funds for the construction of the HEC project estimated to be approximately $503,000 as of June 30, 2020. The University and CCF have entered into an agreement with a perpetual term to provide for the operation and joint use of the HEC, which includes an academic building and a separate dental clinic. The HEC provides a uni ed educational space for programs of the School of Medicine, including the Cleveland Clinic
Dental Medicine and the Frances Payne Bolton School of Nursing. Occupancy occurred in spring 2019. CCF provided interim funding of the construction costs, while the University and CCF collaborate on fundraising to cover the capital costs of the HEC. As the total costs of the HEC, were not raised by 2020, the University has agreed to provide up to $50,000 over the ve-year period beginning in 2021. Components of the HEC are as follows
2020 2019 Cash transferred to CCF $ 87,801 $ 59,890 Less: Accumulated depreciation (3,190)
$ 84,611 $ 59,890Contingent liability 50,000TOTAL HEALTH EDUCATION CAMPUS, NET $ 134,611 $ 59,890
The University has pledges receivable for the HEC project of $28,952 (2020) and $40,645 (2019).
As the University occupies approximately 83% of the HEC, but has only transferred cash for approximately 17% of
the total estimated HEC project costs, the University has free use of a portion of the HEC. The University recorded contribution revenue, based on estimated fair value, for the free use of space and the corresponding expense of $8,833 in the statement of activities for scal year 2020.
10. PROPERTY, PLANT, EQUIPMENT AND BOOKS
Property, plant, equipment and books are stated at cost, less accumulated depreciation. Depreciation is computed on the straight-line method over the estimated useful life of 10 to 30 years for land improvements, 10
2020 2019 Land and land improvements $ 76,483 $ 73,750 Building and building improvements 1,394,381 1,370,484Equipment and software 333,485 316,242Library books 48,014 47,575Construction-in-progress 60,415 58,562
1,912,778 1,866,613Less: Accumulated depreciation (1,193,458) (1,133,603)TOTAL PROPERTY, PLANT, EQUIPMENT AND BOOKS, NET $ 719,320 $ 733,010
to 50 years for building and building improvements, 5 to 15 years for equipment, and 10 years for books. Components of property, plant, equipment and books are as follows:
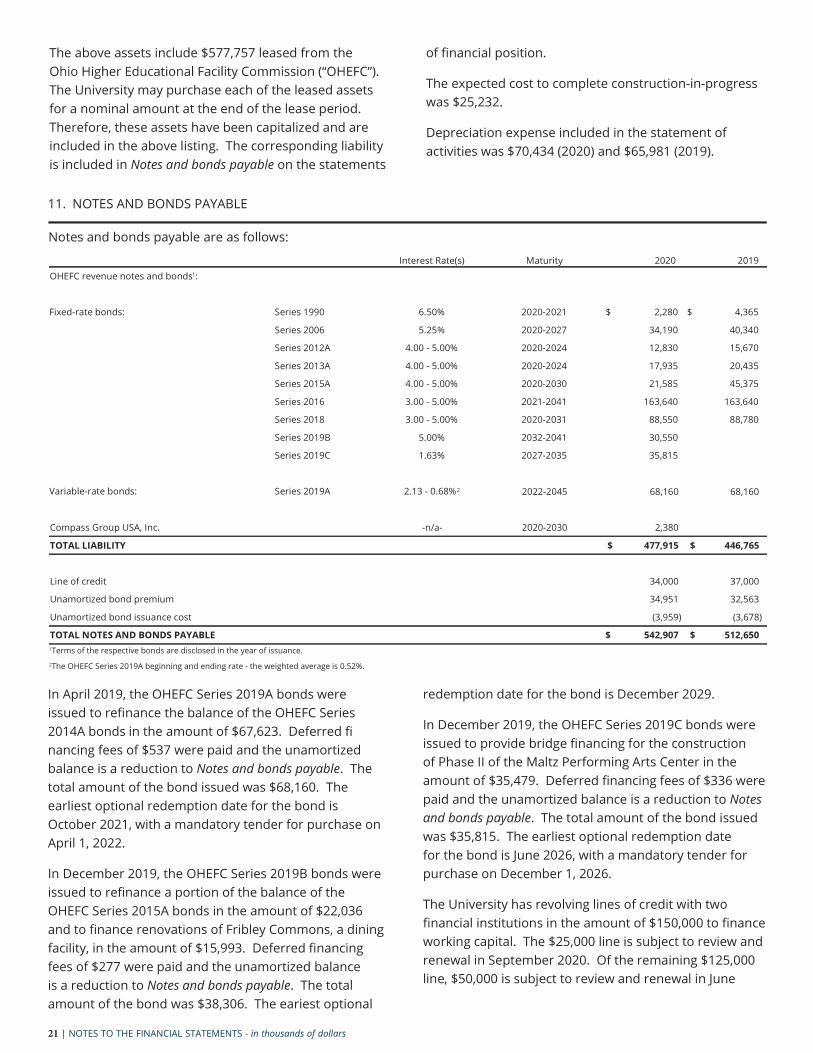
The above assets include $577,757 leased from the
The University may purchase each of the leased assets for a nominal amount at the end of the lease period. Therefore, these assets have been capitalized and are included in the above listing. The corresponding liability is included in Notes and bonds payable on the statements
of nancial position.
The expected cost to complete construction-in-progress was $25,232.
Depreciation expense included in the stat ement of activities was $70,434 (2020) and $65,981 (2019).
11. NOTES AND BONDS PAYABLE
Notes and bonds payable are as follows:
Interest Rate(s) Maturity 2020. 2019OHEFC revenue notes and bonds1: . .
Fixed-rate bonds: Series 1990 6.50% 2020-2021 $ 2,280 $ 4,365
Series 2006 5.25% 2020-2027 34,190 40,340
Series 2012A 4.00 - 5.00% 2020-2024 12,830 15,670
Series 2013A 4.00 - 5.00% 2020-2024 17,935 20,435
Series 2015A 4.00 - 5.00% 2020-2030 21,585 45,375
Series 2016 3.00 - 5.00% 2021-2041 163,640 163,640
Series 2018 3.00 - 5.00% 2020-2031 88,550 88,780
Series 2019B 5.00% 2032-2041 30,550
Series 2019C 1.63% 2027-2035 35,815
Variable-rate bonds: Series 2019A 2.13 - 0.68%2 2022-2045 68,160 68,160
Compass Group USA, Inc. -n/a- 2020-2030 2,380
TOTAL LIABILITY $ 477,915 $ 446,765
Line of credit 34,000 37,000
Unamortized bond premium 34,951 32,563
Unamortized bond issuance cost (3,959) (3,678)
TOTAL NOTES AND BONDS PAYABLE $ 542,907 $ 512,650 1Terms of the respective bonds are disclosed in the year of issuance.2The OHEFC Series 2019A beginning and ending rate - the weighted average is 0.52%.
In April 2019, the OHEFC Series 2019A bonds were issued to re nance the balance of the OHEFC Series 2014A bonds in the amount of $67,623. Deferred nancing fees of $537 were paid and the unamortized balance is a reduction to Notes and bonds payable. The total amount of the bond issued was $68,160. The earliest optional redemption date for the bond is October 2021, with a mandatory tender for purchase on April 1, 2022.
In December 2019, the OHEFC Series 2019B bonds were issued to re nance a portion of the balance of the OHEFC Series 2015A bonds in the amount of $22,036 and to nance renovations of Fribley Commons, a dining facility, in the amount of $15,993. Deferred nancing fees of $277 were paid and the unamortized balance is a reduction to Notes and bonds payable. The total amount of the bond was $38,306. The eariest optional
21 | NOTES TO THE FINANCIAL STATEMENTS - in thousands of dollars
redemption date for the bond is December 2029.
In December 2019, the OHEFC Series 2019C bonds were issued to provide bridge nancing for the construction of Phase II of the Maltz Performing Arts Center in the amount of $35,479. Deferred nancing fees of $336 were paid and the unamortized balance is a reduction to Notes and bonds payable. The total amount of the bond issued was $35,815. The earliest optional redemption date for the bond is June 2026, with a mandatory tender for purchase on December 1, 2026.
The University has revolving lines of credit with two nancial institutions in the amount of $150,000 to nance working capital. The $25,000 line is subject to review and renewal in September 2020. Of the remaining $125,000 line, $50,000 is subject to review and renewal in June
CASE WESTERN RESERVE UNIVERSITY FY20 FINANCIAL REPORT | 22
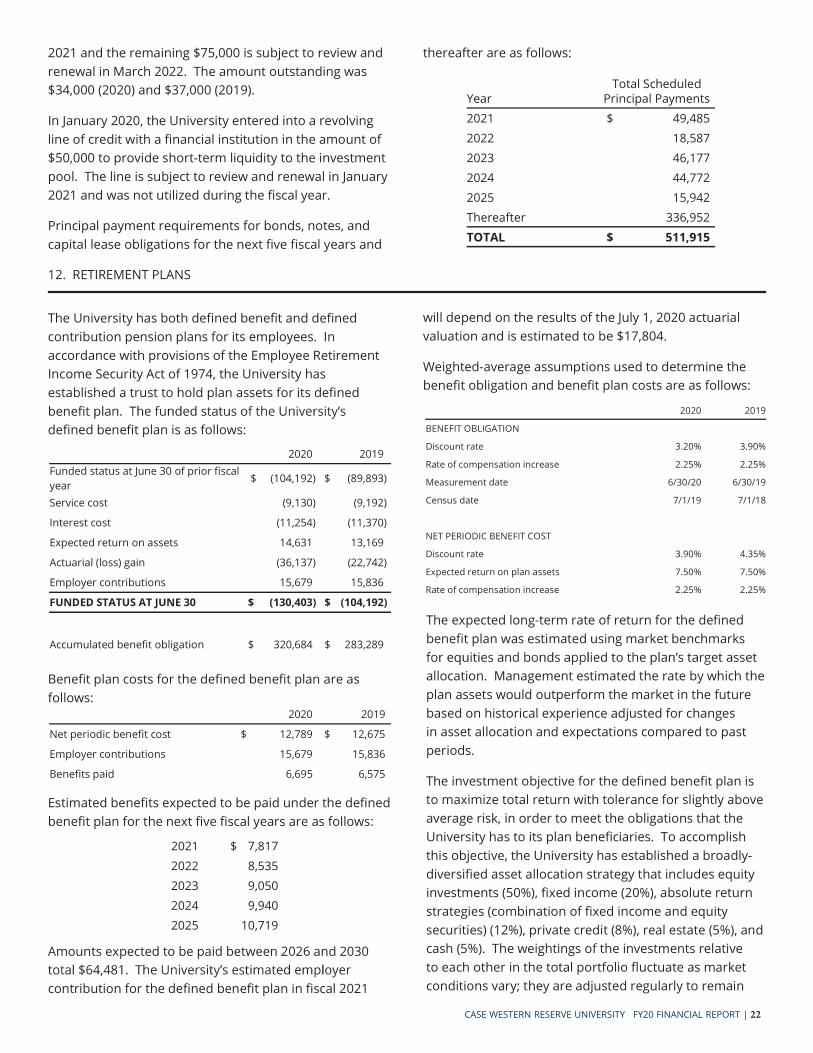
2021 and the remaining $75,000 is subject to review and renewal in March 2022. The amount outstanding was $34,000 (2020) and $37,000 (2019).
In January 2020, the University entered into a revolving line of credit with a nancial institution in the amount of $50,000 to provide short-term liquidity to the investment pool. The line is subject to review and renewal in January 2021 and was not utilized during the scal year.
Principal payment requirements for bonds, notes, and capital lease obligations for the next ve scal years and
thereafter are as follows:
YearTotal Scheduled
Principal Payments2021 $ 49,4852022 18,587 2023 46,177 2024 44,772 2025 15,942 Thereafter 336,952 TOTAL $ 511,915
Amounts expected to be paid between 2026 and 2030
contribution for the de ned bene t plan in scal 2021
Estimated bene ts expected to be paid under the de ned bene t plan for the next ve scal years are as follows:
2021 $ 7,8172022 8,5352023 9,0502024 9,9402025 10,719
12. RETIREMENT PLANS
The University has both de ned bene t and de ned contribution pension plans for its employees. In accordance with provisions of the Employee Retirement Income Security Act of 1974, the University has established a trust to hold plan assets for its de ned benede ned bene t plan is as follows:
Bene t plan costs for the de ned bene t plan are as follows:
2020 2019
Net periodic bene t cost $ 12,789 $ 12,675
Employer contributions 15,679 15,836
Bene ts paid 6,695 6,575
2020 2019Funded status at June 30 of prior scal year
$ (104,192) $ (89,893)
Service cost (9,130) (9,192)
Interest cost (11,254) (11,370)
Expected return on assets 14,631 13,169
Actuarial (loss) gain (36,137) (22,742)
Employer contributions 15,679 15,836
FUNDED STATUS AT JUNE 30 $ (130,403) $ (104,192)
Accumulated bene t obligation $ 320,684 $ 283,289
will depend on the results of the July 1, 2020 actuarial valuation and is estimated to be $17,804.
Weighted-average assumptions used to determine the bene t obligation and bene t plan costs are as follows:
2020 2019
BENEFIT OBLIGATION
Discount rate 3.20% 3.90%
Rate of compensation increase 2.25% 2.25%
Measurement date 6/30/20 6/30/19
Census date 7/1/19 7/1/18
NET PERIODIC BENEFIT COST
Discount rate 3.90% 4.35%
Expected return on plan assets 7.50% 7.50%
Rate of compensation increase 2.25% 2.25%
The expected long-term rate of return for the de ned bene t plan was estimated using market benchmarks
allocation. Management estimated the rate by which the plan assets would outperform the market in the future based on historical experience adjusted for changes in asset allocation and expectations compared to past periods.
The investment objective for the de ned bene t plan is to maximize total return with tolerance for slightly above average risk, in order to meet the obligations that the University has to its plan bene ciaries. To accomplish this objective, the University has established a broadly-diversi ed asset allocation strategy that includes equity investments (50%), xed income (20%), absolute return strategies (combination of xed income and equity securities) (12%), private credit (8%), real estate (5%), and cash (5%). The weightings of the investments relative to each other in the total portfolio uctuate as market conditions vary; they are adjusted regularly to remain
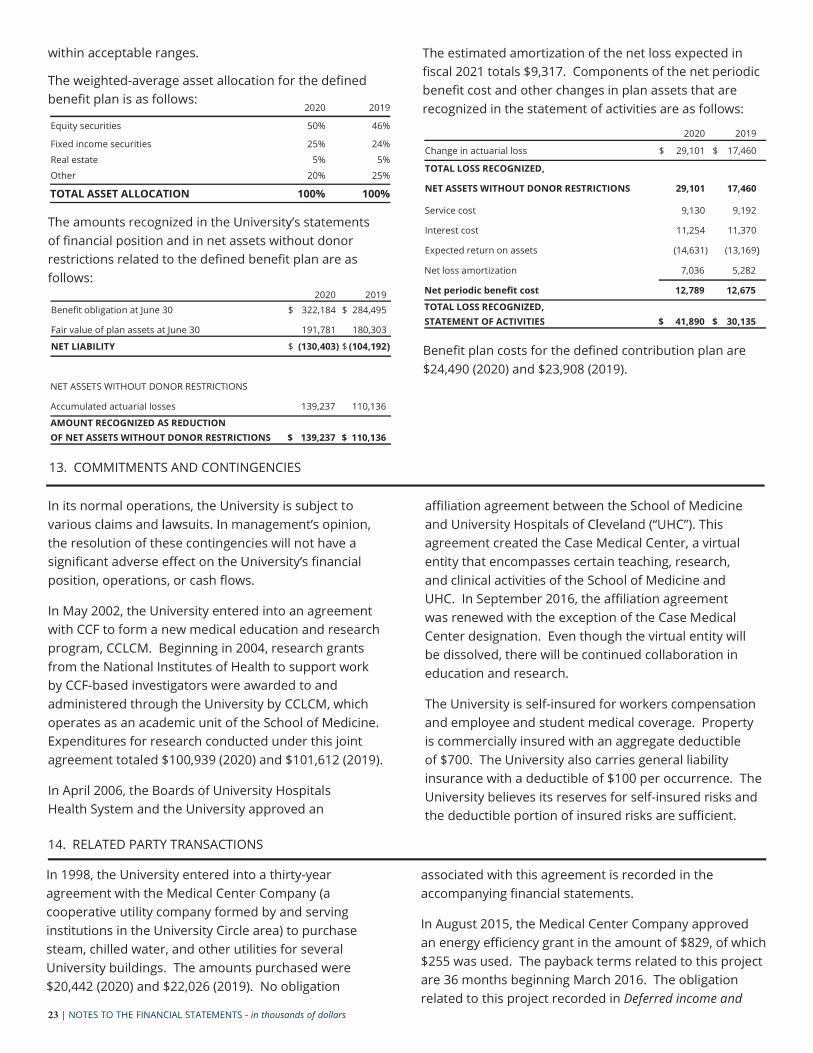
2020 2019
Equity securities 50% 46%
Fixed income securities 25% 24%
Real estate 5% 5%
Other 20% 25%
TOTAL ASSET ALLOCATION 100% 100%
within acceptable ranges.
2020 2019Bene t obligation at June 30 $ 322,184 $ 284,495
Fair value of plan assets at June 30 191,781 180,303
NET LIABILITY $ (130,403) $ (104,192)
NET ASSETS WITHOUT DONOR RESTRICTIONS
Accumulated actuarial losses 139,237 110,136
AMOUNT RECOGNIZED AS REDUCTIONOF NET ASSETS WITHOUT DONOR RESTRICTIONS $ 139,237 $ 110,136
2020 2019
Change in actuarial loss $ 29,101 $ 17,460
TOTAL LOSS RECOGNIZED,
NET ASSETS WITHOUT DONOR RESTRICTIONS 29,101 17,460
Service cost 9,130 9,192
Interest cost 11,254 11,370
Expected return on assets (14,631) (13,169)
Net loss amortization 7,036 5,282
Net periodic bene t cost 12,789 12,675
TOTAL LOSS RECOGNIZED,STATEMENT OF ACTIVITIES $ 41,890 $ 30,135
13. COMMITMENTS AND CONTINGENCIES
In its normal operations, the University is subject to
the resolution of these contingencies will not have a signi cant adverse e nancial position, operations, or cash ows.
In May 2002, the University entered into an agreement with CCF to form a new medical education and research program, CCLCM. Beginning in 2004, research grants from the National Institutes of Health to support work by CCF-based investigators were awarded to and administered through the University by CCLCM, which operates as an academic unit of the School of Medicine. Expenditures for research conducted under this joint agreement totaled $100,939 (2020) and $101,612 (2019).
In April 2006, the Boards of University Hospitals Health System and the University approved an
a liation agreement between the School of Medicine
agreement created the Case Medical Center, a virtual entity that encompasses certain teaching, research, and clinical activities of the School of Medicine and UHC. In September 2016, the a liation agreement was renewed with the exception of the Case Medical Center designation. Even though the virtual entity will be dissolved, there will be continued collaboration in education and research.
The University is self-insured for workers compensation and employee and student medical coverage. Property is commercially insured with an aggregate deductible of $700. The University also carries general liability insurance with a deductible of $100 per occurrence. The University believes its reserves for self-insured risks and the deductible portion of insured risks are su cient.
Bene t plan costs for the de ned contribution plan are $24,490 (2020) and $23,908 (2019).
14. RELATED PARTY TRANSACTIONS
In 1998, the University entered into a thirty-year agreement with the Medical Center Company (a cooperative utility company formed by and serving institutions in the University Circle area) to purchase steam, chilled water, and other utilities for several University buildings. The amounts purchased were $20,442 (2020) and $22,026 (2019). No obligation
23 | NOTES TO THE FINANCIAL STATEMENTS - in thousands of dollars
associated with this agreement is recorded in the accompanying nancial statements.
In August 2015, the Medical Center Company approved an energy e ciency grant in the amount of $829, of which $255 was used. The payback terms related to this project are 36 months beginning March 2016. The obligation related to this project recorded in Deferred income and
of nancial position and in net assets without donor restrictions related to the de ned bene t plan are as follows:
The estimated amortization of the net loss expected in scal 2021 totals $9,317. Components of the net periodic bene t cost and other changes in plan assets that are recognized in the statement of activities are as follows:
The weighted-average asset allocation for the de ned bene t plan is as follows:
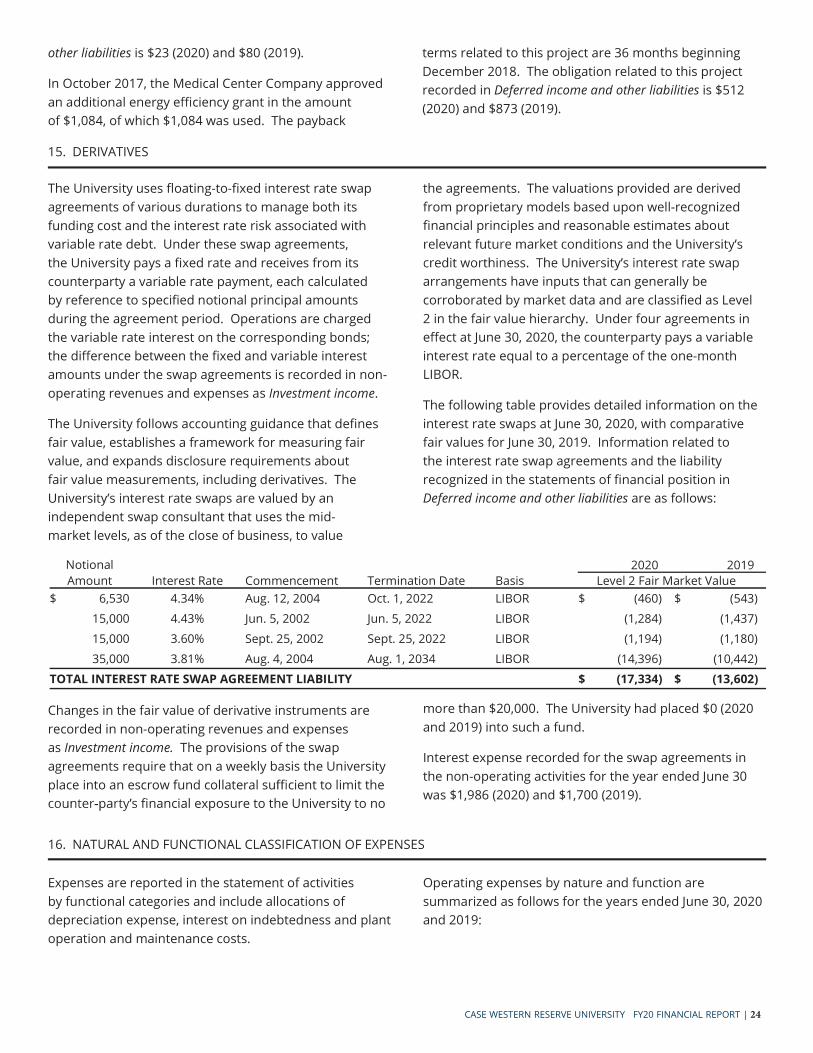
CASE WESTERN RESERVE UNIVERSITY FY20 FINANCIAL REPORT | 24
other liabilities is $23 (2020) and $80 (2019).
In October 2017, the Medical Center Company approved an additional energy e ciency grant in the amount of $1,084, of which $1,084 was used. The payback
terms related to this project are 36 months beginning December 2018. The obligation related to this project recorded in Deferred income and other liabilities is $512 (2020) and $873 (2019).
15. DERIVATIVES
The University uses oating-to- xed interest rate swap agreements of various durations to manage both its funding cost and the interest rate risk associated with variable rate debt. Under these swap agreements, the University pays a xed rate and receives from its counterparty a variable rate payment, each calculated by reference to speci ed notional principal amounts during the agreement period. Operations are charged the variable rate interest on the corresponding bonds; the di erence between the xed and variable interest amounts under the swap agreements is recorded in non-operating revenues and expenses as Investment income.
The University follows accounting guidance that de nes fair value, establishes a framework for measuring fair value, and expands disclosure requirements about fair value measurements, including derivatives. The
independent swap consultant that uses the mid-market levels, as of the close of business, to value
the agreements. The valuations provided are derived from proprietary models based upon well-recognized nancial principles and reasonable estimates about
arrangements have inputs that can generally be corroborated by market data and are classi ed as Level 2 in the fair value hierarchy. Under four agreements in e ect at June 30, 2020, the counterparty pays a variable interest rate equal to a percentage of the one-month LIBOR.
The following table provides detailed information on the interest rate swaps at June 30, 2020, with comparative fair values for June 30, 2019. Information related to the interest rate swap agreements and the liability recognized in the statements of nancial position in Deferred income and other liabilities are as follows:
Notional Amount Interest Rate Commencement Termination Date Basis
2020 2019 Level 2 Fair Market Value
$ 6,530 4.34% Aug. 12, 2004 Oct. 1, 2022 LIBOR $ (460) $ (543) 15,000 4.43% Jun. 5, 2002 Jun. 5, 2022 LIBOR (1,284) (1,437) 15,000 3.60% Sept. 25, 2002 Sept. 25, 2022 LIBOR (1,194) (1,180) 35,000 3.81% Aug. 4, 2004 Aug. 1, 2034 LIBOR (14,396) (10,442)
TOTAL INTEREST RATE SWAP AGREEMENT LIABILITY $ (17,334) $ (13,602)
Changes in the fair value of derivative instruments are recorded in non-operating revenues and expenses as Investment income. The provisions of the swap agreements require that on a weekly basis the University place into an escrow fund collateral su cient to limit the
nancial exposure to the University to no
more than $20,000. The University had placed $0 (2020 and 2019) into such a fund.
Interest expense recorded for the swap agreements in the non-operating activities for the year ended June 30 was $1,986 (2020) and $1,700 (2019).
16. NATURAL AND FUNCTIONAL CLASSIFICATION OF EXPENSES
Expenses are reported in the statement of activities by functional categories and include allocations of depreciation expense, interest on indebtedness and plant operation and maintenance costs.
Operating expenses by nature and function are summarized as follows for the years ended June 30, 2020 and 2019:
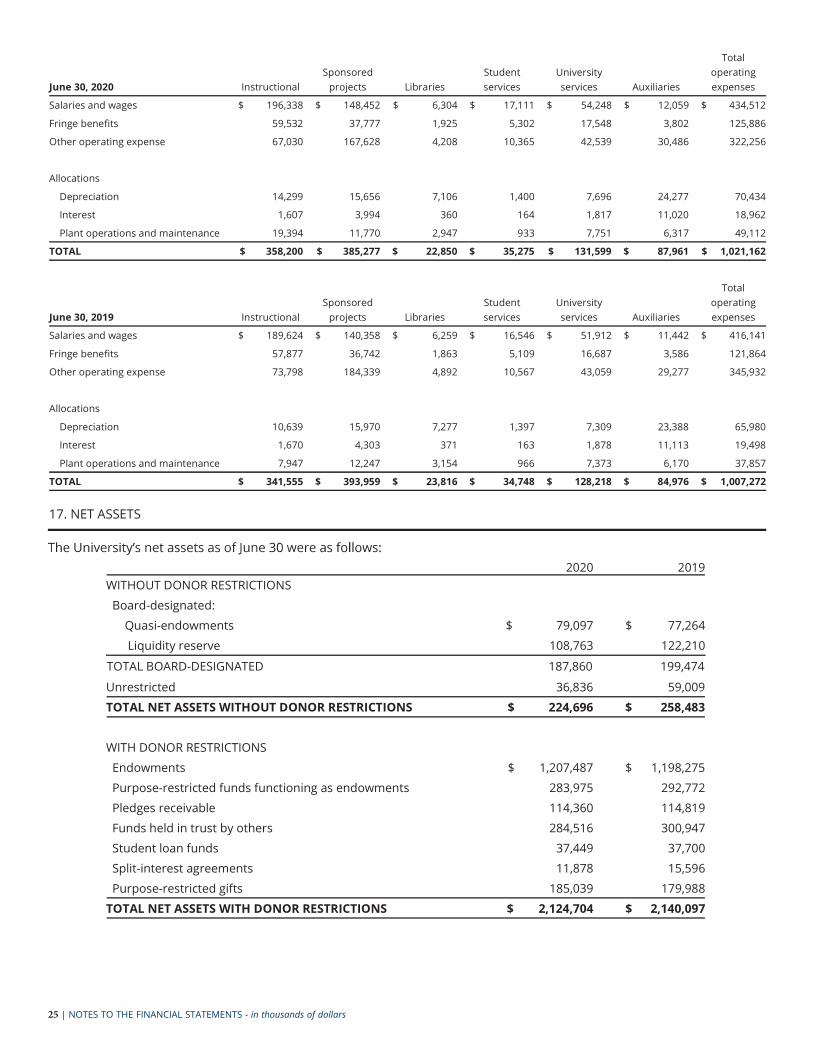
25 | NOTES TO THE FINANCIAL STATEMENTS - in thousands of dollars
June 30, 2020 InstructionalSponsored
projects LibrariesStudent services
University services Auxiliaries
Total operating expenses
Salaries and wages $ 196,338 $ 148,452 $ 6,304 $ 17,111 $ 54,248 $ 12,059 $ 434,512
Fringe bene ts 59,532 37,777 1,925 5,302 17,548 3,802 125,886
Other operating expense 67,030 167,628 4,208 10,365 42,539 30,486 322,256
Allocations
Depreciation 14,299 15,656 7,106 1,400 7,696 24,277 70,434
Interest 1,607 3,994 360 164 1,817 11,020 18,962
Plant operations and maintenance 19,394 11,770 2,947 933 7,751 6,317 49,112
TOTAL $ 358,200 $ 385,277 $ 22,850 $ 35,275 $ 131,599 $ 87,961 $ 1,021,162
June 30, 2019 InstructionalSponsored
projects LibrariesStudent services
University services Auxiliaries
Total operating expenses
Salaries and wages $ 189,624 $ 140,358 $ 6,259 $ 16,546 $ 51,912 $ 11,442 $ 416,141
Fringe bene ts 57,877 36,742 1,863 5,109 16,687 3,586 121,864
Other operating expense 73,798 184,339 4,892 10,567 43,059 29,277 345,932
Allocations
Depreciation 10,639 15,970 7,277 1,397 7,309 23,388 65,980
Interest 1,670 4,303 371 163 1,878 11,113 19,498
Plant operations and maintenance 7,947 12,247 3,154 966 7,373 6,170 37,857
TOTAL $ 341,555 $ 393,959 $ 23,816 $ 34,748 $ 128,218 $ 84,976 $ 1,007,272
17. NET ASSETS
2020 2019WITHOUT DONOR RESTRICTIONS Board-designated:
Quasi-endowments $ 79,097 $ 77,264 Liquidity reserve 108,763 122,210
TOTAL BOARD-DESIGNATED 187,860 199,474
Unrestricted 36,836 59,009TOTAL NET ASSETS WITHOUT DONOR RESTRICTIONS $ 224,696 $ 258,483
WITH DONOR RESTRICTIONS Endowments $ 1,207,487 $ 1,198,275 Purpose-restricted funds functioning as endowments 283,975 292,772 Pledges receivable 114,360 114,819 Funds held in trust by others 284,516 300,947 Student loan funds 37,449 37,700 Split-interest agreements 11,878 15,596 Purpose-restricted gifts 185,039 179,988TOTAL NET ASSETS WITH DONOR RESTRICTIONS $ 2,124,704 $ 2,140,097
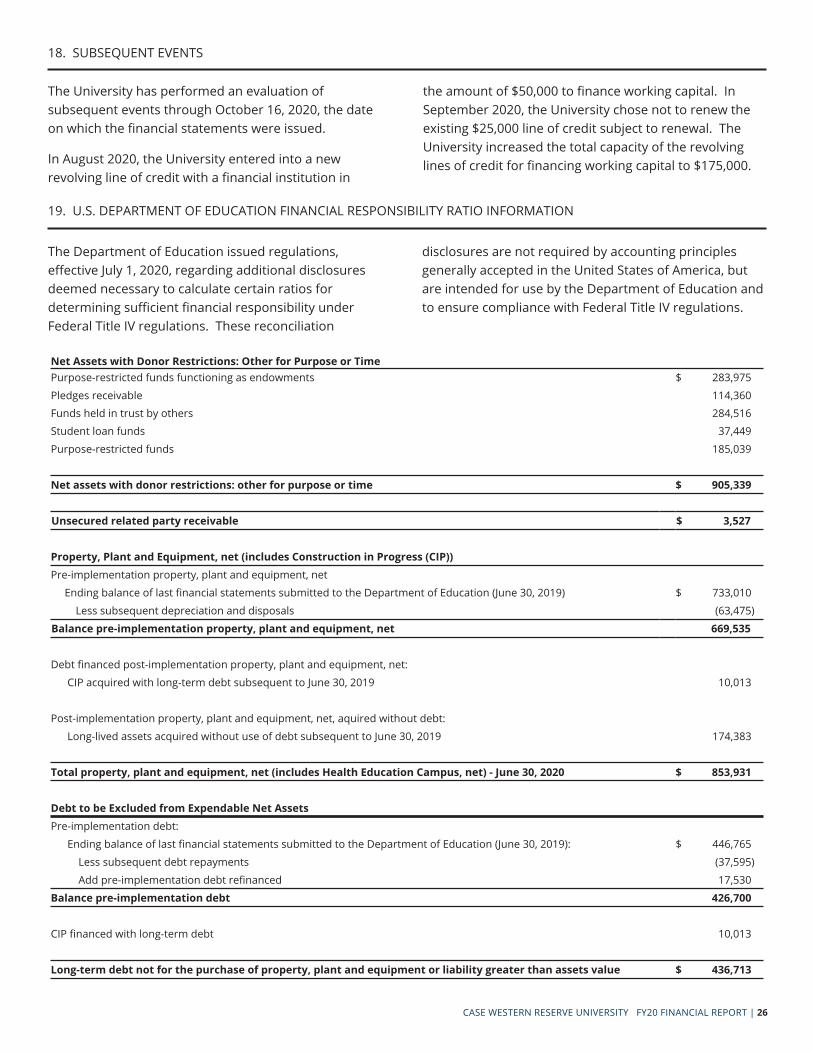
CASE WESTERN RESERVE UNIVERSITY FY20 FINANCIAL REPORT | 26
18. SUBSEQUENT EVENTS
The University has performed an evaluation of subsequent events through October 16, 2020, the date on which the fi nancial statements were issued.
In August 2020, the University entered into a new revolving line of credit with a fi nancial institution in
the amount of $50,000 to fi nance working capital. In September 2020, the University chose not to renew the existing $25,000 line of credit subject to renewal. The University increased the total capacity of the revolving lines of credit for fi nancing working capital to $175,000.
The Department of Education issued regulations, eff ective July 1, 2020, regarding additional disclosures deemed necessary to calculate certain ratios for determining suffi cient fi nancial responsibility under Federal Title IV regulations. These reconciliation
disclosures are not required by accounting principles generally accepted in the United States of America, but are intended for use by the Department of Education and to ensure compliance with Federal Title IV regulations.
Net Assets with Donor Restrictions: Other for Purpose or TimePurpose-restricted funds functioning as endowments $ 283,975
Pledges receivable 114,360
Funds held in trust by others 284,516
Student loan funds 37,449
Purpose-restricted funds 185,039
Net assets with donor restrictions: other for purpose or time $ 905,339
Unsecured related party receivable $ 3,527
Property, Plant and Equipment, net (includes Construction in Progress (CIP))Pre-implementation property, plant and equipment, net
Ending balance of last fi nancial statements submitted to the Department of Education (June 30, 2019) $ 733,010
Less subsequent depreciation and disposals (63,475)
Balance pre-implementation property, plant and equipment, net 669,535
Debt fi nanced post-implementation property, plant and equipment, net:
CIP acquired with long-term debt subsequent to June 30, 2019 10,013
Post-implementation property, plant and equipment, net, aquired without debt:
Long-lived assets acquired without use of debt subsequent to June 30, 2019 174,383
Total property, plant and equipment, net (includes Health Education Campus, net) - June 30, 2020 $ 853,931
Debt to be Excluded from Expendable Net AssetsPre-implementation debt:
Ending balance of last fi nancial statements submitted to the Department of Education (June 30, 2019): $ 446,765
Less subsequent debt repayments (37,595)
Add pre-implementation debt refi nanced 17,530
Balance pre-implementation debt 426,700
CIP fi nanced with long-term debt 10,013
Long-term debt not for the purchase of property, plant and equipment or liability greater than assets value $ 436,713
19. U.S. DEPARTMENT OF EDUCATION FINANCIAL RESPONSIBILITY RATIO INFORMATION
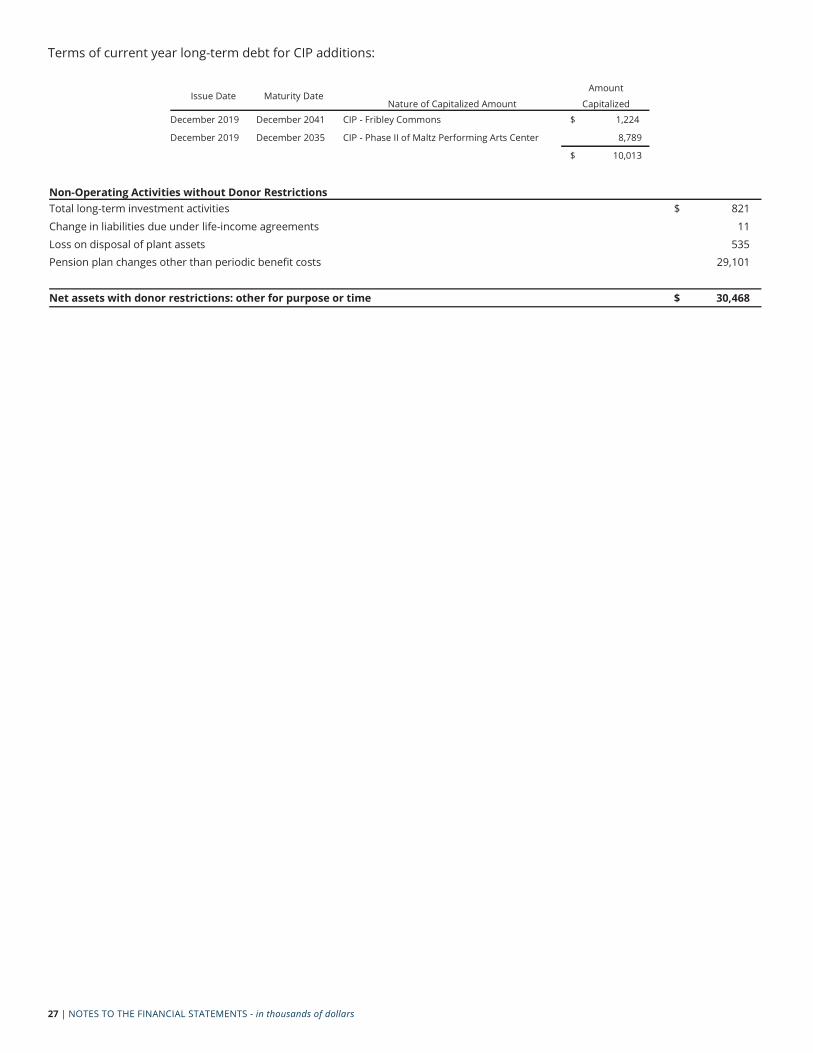
27 | NOTES TO THE FINANCIAL STATEMENTS - in thousands of dollars
Non-Operating Activities without Donor RestrictionsTotal long-term investment activities $ 821Change in liabilities due under life-income agreements 11Loss on disposal of plant assets 535Pension plan changes other than periodic bene t costs 29,101
Net assets with donor restrictions: other for purpose or time $ 30,468
Issue Date Maturity DateNature of Capitalized Amount
Amount
CapitalizedDecember 2019 December 2041 CIP - Fribley Commons $ 1,224.
December 2019 December 2035 CIP - Phase II of Maltz Performing Arts Center 8,789
$ 10,013
Terms of current year long-term debt for CIP additions:

FINANCAL RESPONSIBILITY SUPPLEMENTAL SCHEDULE AND NOTES
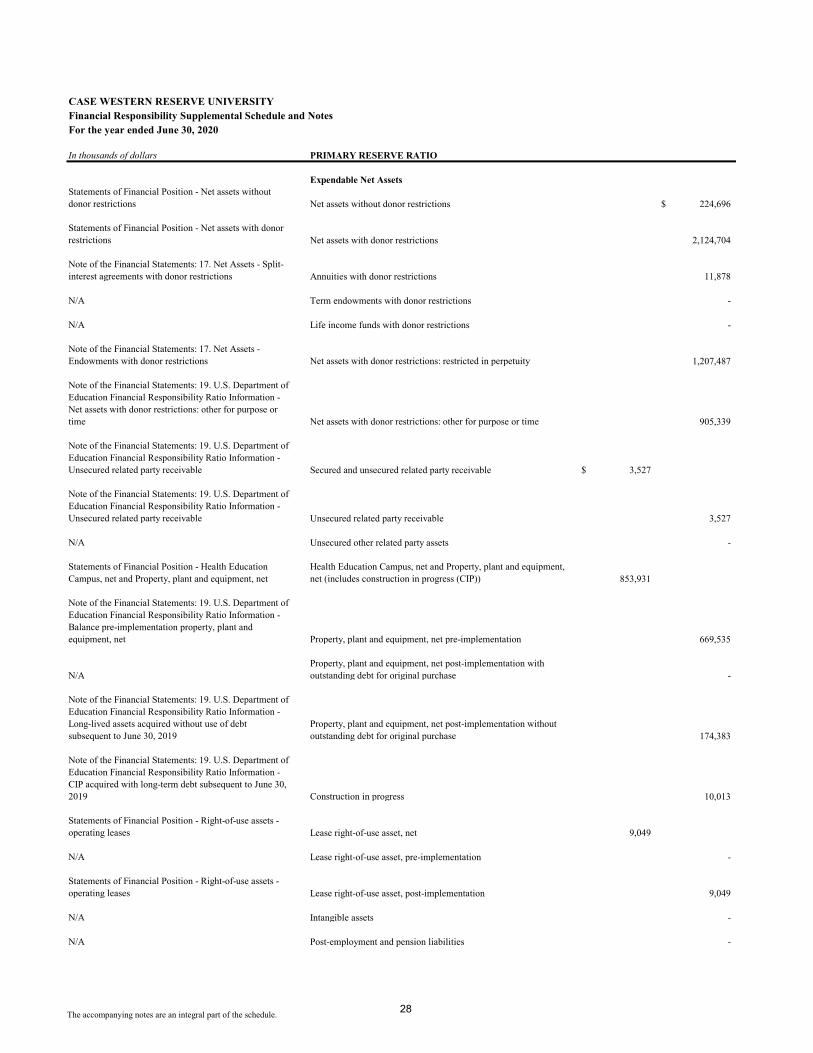
The accompanying notes are an integral part of the schedule.
CASE WESTERN RESERVE UNIVERSITYFinancial Responsibility Supplemental Schedule and NotesFor the year ended June 30, 2020
In thousands of dollars PRIMARY RESERVE RATIO
Expendable Net AssetsStatements of Financial Position - Net assets without donor restrictions Net assets without donor restrictions 224,696$
Statements of Financial Position - Net assets with donor restrictions Net assets with donor restrictions 2,124,704
Note of the Financial Statements: 17. Net Assets - Split-interest agreements with donor restrictions Annuities with donor restrictions 11,878
N/A Term endowments with donor restrictions -
N/A Life income funds with donor restrictions -
Note of the Financial Statements: 17. Net Assets - Endowments with donor restrictions Net assets with donor restrictions: restricted in perpetuity 1,207,487
Note of the Financial Statements: 19. U.S. Department of Education Financial Responsibility Ratio Information - Net assets with donor restrictions: other for purpose or time Net assets with donor restrictions: other for purpose or time 905,339
Note of the Financial Statements: 19. U.S. Department of Education Financial Responsibility Ratio Information - Unsecured related party receivable Secured and unsecured related party receivable 3,527$
Note of the Financial Statements: 19. U.S. Department of Education Financial Responsibility Ratio Information - Unsecured related party receivable Unsecured related party receivable 3,527
N/A Unsecured other related party assets -
Statements of Financial Position - Health Education Campus, net and Property, plant and equipment, net
Health Education Campus, net and Property, plant and equipment, net (includes construction in progress (CIP)) 853,931
Note of the Financial Statements: 19. U.S. Department of Education Financial Responsibility Ratio Information - Balance pre-implementation property, plant and equipment, net Property, plant and equipment, net pre-implementation 669,535
N/AProperty, plant and equipment, net post-implementation with outstanding debt for original purchase -
Note of the Financial Statements: 19. U.S. Department of Education Financial Responsibility Ratio Information - Long-lived assets acquired without use of debt subsequent to June 30, 2019
Property, plant and equipment, net post-implementation without outstanding debt for original purchase 174,383
Note of the Financial Statements: 19. U.S. Department of Education Financial Responsibility Ratio Information - CIP acquired with long-term debt subsequent to June 30, 2019 Construction in progress 10,013
Statements of Financial Position - Right-of-use assets - operating leases Lease right-of-use asset, net 9,049
N/A Lease right-of-use asset, pre-implementation -
Statements of Financial Position - Right-of-use assets - operating leases Lease right-of-use asset, post-implementation 9,049
N/A Intangible assets -
N/A Post-employment and pension liabilities -
28
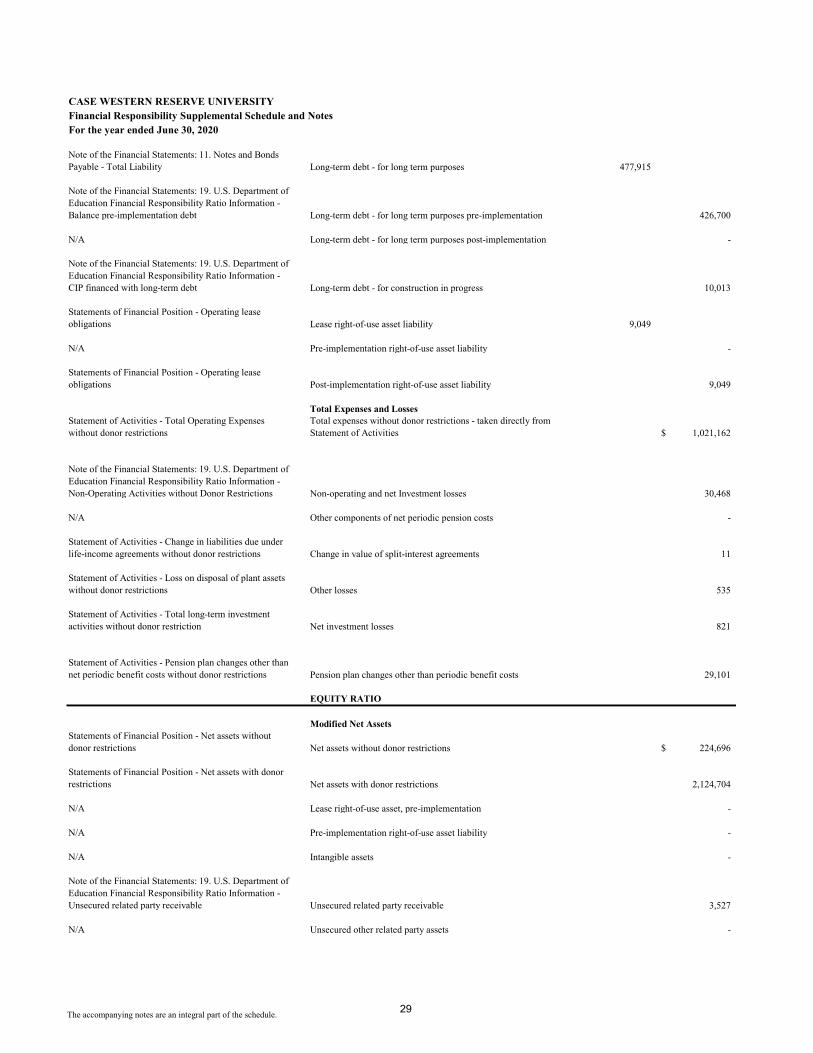
The accompanying notes are an integral part of the schedule.
CASE WESTERN RESERVE UNIVERSITYFinancial Responsibility Supplemental Schedule and NotesFor the year ended June 30, 2020
Note of the Financial Statements: 11. Notes and Bonds Payable - Total Liability Long-term debt - for long term purposes 477,915
Note of the Financial Statements: 19. U.S. Department of Education Financial Responsibility Ratio Information - Balance pre-implementation debt Long-term debt - for long term purposes pre-implementation 426,700
N/A Long-term debt - for long term purposes post-implementation -
Note of the Financial Statements: 19. U.S. Department of Education Financial Responsibility Ratio Information - CIP financed with long-term debt Long-term debt - for construction in progress 10,013
Statements of Financial Position - Operating lease obligations Lease right-of-use asset liability 9,049
N/A Pre-implementation right-of-use asset liability -
Statements of Financial Position - Operating lease obligations Post-implementation right-of-use asset liability 9,049
Total Expenses and LossesStatement of Activities - Total Operating Expenses without donor restrictions
Total expenses without donor restrictions - taken directly from Statement of Activities 1,021,162$
Note of the Financial Statements: 19. U.S. Department of Education Financial Responsibility Ratio Information - Non-Operating Activities without Donor Restrictions Non-operating and net Investment losses 30,468
N/A Other components of net periodic pension costs -
Statement of Activities - Change in liabilities due under life-income agreements without donor restrictions Change in value of split-interest agreements 11
Statement of Activities - Loss on disposal of plant assets without donor restrictions Other losses 535
Statement of Activities - Total long-term investment activities without donor restriction Net investment losses 821
Statement of Activities - Pension plan changes other than net periodic benefit costs without donor restrictions Pension plan changes other than periodic benefit costs 29,101
EQUITY RATIO
Modified Net AssetsStatements of Financial Position - Net assets without donor restrictions Net assets without donor restrictions 224,696$
Statements of Financial Position - Net assets with donor restrictions Net assets with donor restrictions 2,124,704
N/A Lease right-of-use asset, pre-implementation -
N/A Pre-implementation right-of-use asset liability -
N/A Intangible assets -
Note of the Financial Statements: 19. U.S. Department of Education Financial Responsibility Ratio Information - Unsecured related party receivable Unsecured related party receivable 3,527
N/A Unsecured other related party assets -
29
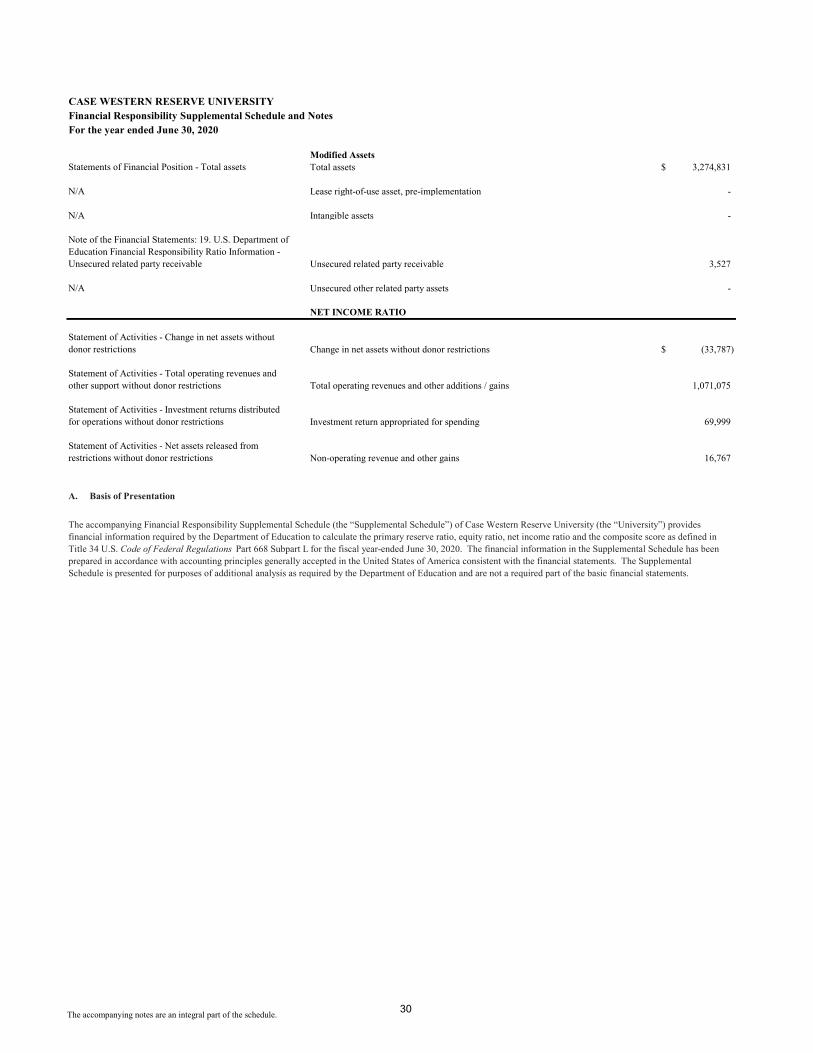
The accompanying notes are an integral part of the schedule.
CASE WESTERN RESERVE UNIVERSITYFinancial Responsibility Supplemental Schedule and NotesFor the year ended June 30, 2020
Modified AssetsStatements of Financial Position - Total assets Total assets 3,274,831$
N/A Lease right-of-use asset, pre-implementation -
N/A Intangible assets -
Note of the Financial Statements: 19. U.S. Department of Education Financial Responsibility Ratio Information - Unsecured related party receivable Unsecured related party receivable 3,527
N/A Unsecured other related party assets -
NET INCOME RATIO
Statement of Activities - Change in net assets without donor restrictions Change in net assets without donor restrictions (33,787)$
Statement of Activities - Total operating revenues and other support without donor restrictions Total operating revenues and other additions / gains 1,071,075
Statement of Activities - Investment returns distributed for operations without donor restrictions Investment return appropriated for spending 69,999
Statement of Activities - Net assets released from restrictions without donor restrictions Non-operating revenue and other gains 16,767
A. Basis of Presentation
The accompanying Financial Responsibility Supplemental Schedule (the “Supplemental Schedule”) of Case Western Reserve University (the “University”) provides financial information required by the Department of Education to calculate the primary reserve ratio, equity ratio, net income ratio and the composite score as defined in Title 34 U.S. Code of Federal Regulations Part 668 Subpart L for the fiscal year-ended June 30, 2020. The financial information in the Supplemental Schedule has been prepared in accordance with accounting principles generally accepted in the United States of America consistent with the financial statements. The Supplemental Schedule is presented for purposes of additional analysis as required by the Department of Education and are not a required part of the basic financial statements.
30
SCHEDULE OF EXPENDITURES OF FEDERAL AWARDS
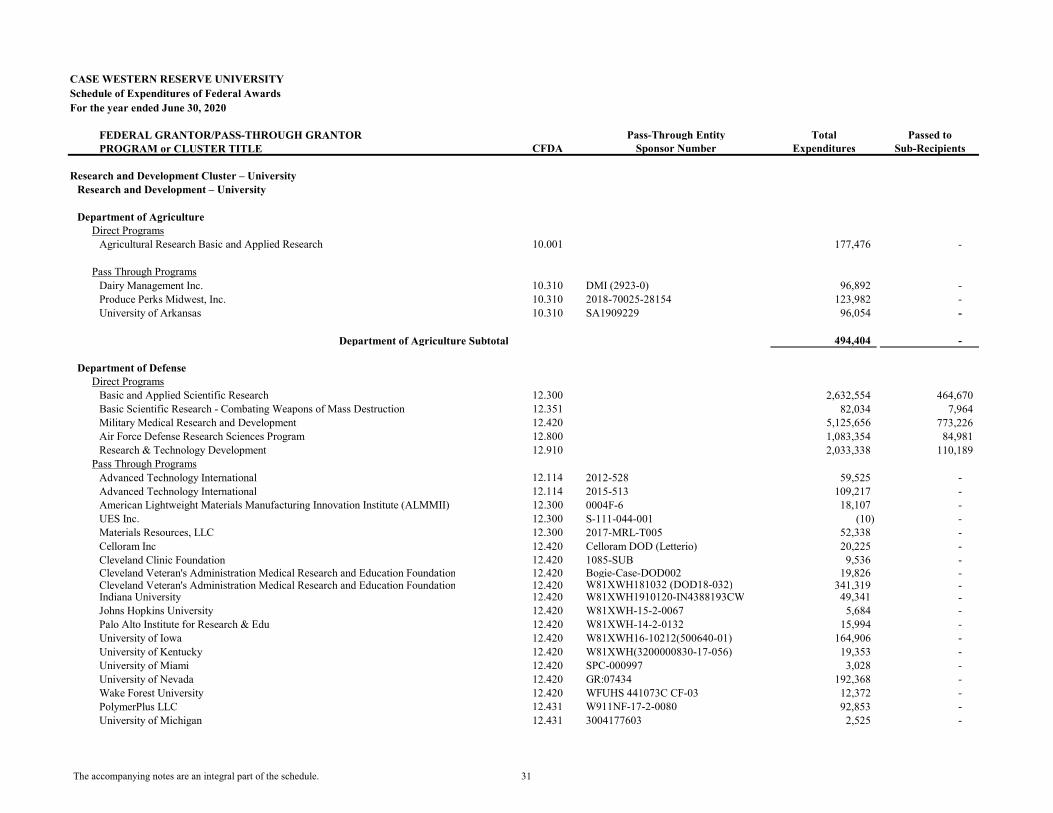
CASE WESTERN RESERVE UNIVERSITYSchedule of Expenditures of Federal AwardsFor the year ended June 30, 2020
FEDERAL GRANTOR/PASS-THROUGH GRANTOR Pass-Through Entity Total Passed toPROGRAM or CLUSTER TITLE CFDA Sponsor Number Expenditures Sub-Recipients
Research and Development Cluster – UniversityResearch and Development – University
Department of AgricultureDirect Programs
Agricultural Research Basic and Applied Research 10.001 177,476 -
Pass Through ProgramsDairy Management Inc. 10.310 DMI (2923-0) 96,892 - Produce Perks Midwest, Inc. 10.310 2018-70025-28154 123,982 - University of Arkansas 10.310 SA1909229 96,054 -
Department of Agriculture Subtotal 494,404 -
Department of DefenseDirect Programs
Basic and Applied Scientific Research 12.300 2,632,554 464,670 Basic Scientific Research - Combating Weapons of Mass Destruction 12.351 82,034 7,964 Military Medical Research and Development 12.420 5,125,656 773,226 Air Force Defense Research Sciences Program 12.800 1,083,354 84,981 Research & Technology Development 12.910 2,033,338 110,189
Pass Through ProgramsAdvanced Technology International 12.114 2012-528 59,525 - Advanced Technology International 12.114 2015-513 109,217 - American Lightweight Materials Manufacturing Innovation Institute (ALMMII) 12.300 0004F-6 18,107 - UES Inc. 12.300 S-111-044-001 (10) - Materials Resources, LLC 12.300 2017-MRL-T005 52,338 - Celloram Inc 12.420 Celloram DOD (Letterio) 20,225 - Cleveland Clinic Foundation 12.420 1085-SUB 9,536 - Cleveland Veteran's Administration Medical Research and Education Foundation 12.420 Bogie-Case-DOD002 19,826 - Cleveland Veteran's Administration Medical Research and Education Foundation 12.420 W81XWH181032 (DOD18-032) 341,319 - Indiana University 12.420 W81XWH1910120-IN4388193CW 49,341 - Johns Hopkins University 12.420 W81XWH-15-2-0067 5,684 - Palo Alto Institute for Research & Edu 12.420 W81XWH-14-2-0132 15,994 - University of Iowa 12.420 W81XWH16-10212(500640-01) 164,906 - University of Kentucky 12.420 W81XWH(3200000830-17-056) 19,353 - University of Miami 12.420 SPC-000997 3,028 - University of Nevada 12.420 GR:07434 192,368 - Wake Forest University 12.420 WFUHS 441073C CF-03 12,372 - PolymerPlus LLC 12.431 W911NF-17-2-0080 92,853 - University of Michigan 12.431 3004177603 2,525 -
The accompanying notes are an integral part of the schedule. 31
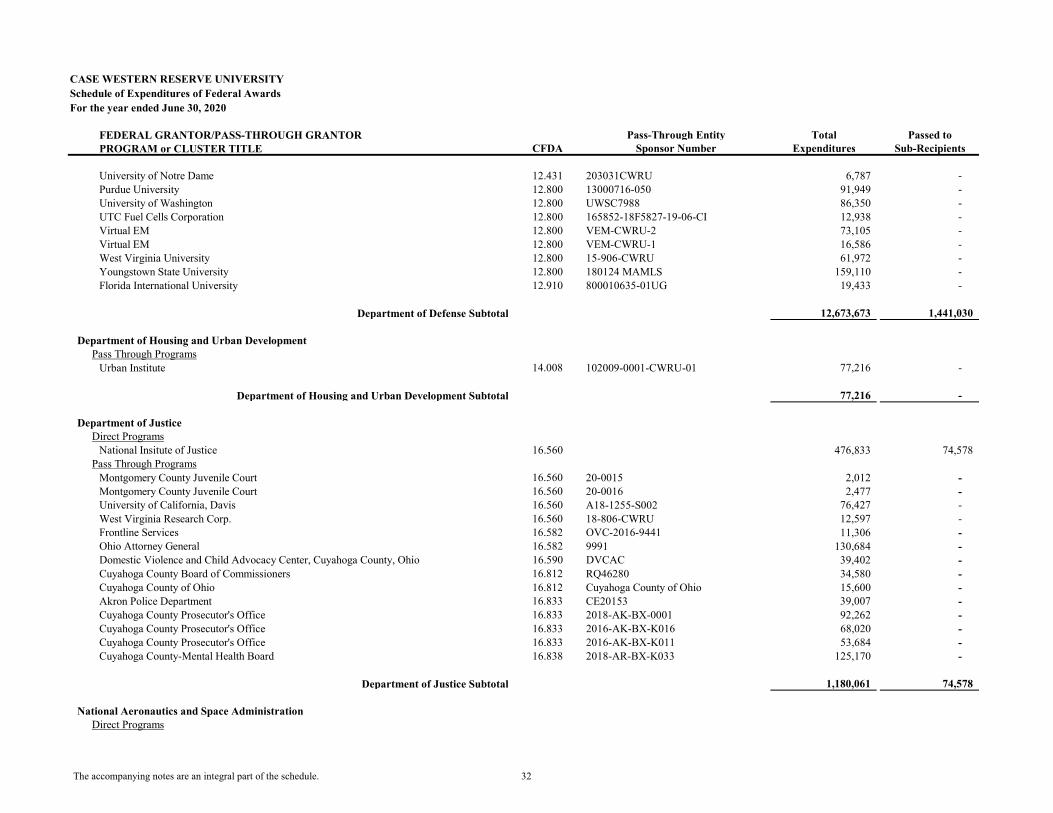
CASE WESTERN RESERVE UNIVERSITYSchedule of Expenditures of Federal AwardsFor the year ended June 30, 2020
FEDERAL GRANTOR/PASS-THROUGH GRANTOR Pass-Through Entity Total Passed toPROGRAM or CLUSTER TITLE CFDA Sponsor Number Expenditures Sub-Recipients
University of Notre Dame 12.431 203031CWRU 6,787 - Purdue University 12.800 13000716-050 91,949 - University of Washington 12.800 UWSC7988 86,350 - UTC Fuel Cells Corporation 12.800 165852-18F5827-19-06-CI 12,938 - Virtual EM 12.800 VEM-CWRU-2 73,105 - Virtual EM 12.800 VEM-CWRU-1 16,586 - West Virginia University 12.800 15-906-CWRU 61,972 - Youngstown State University 12.800 180124 MAMLS 159,110 - Florida International University 12.910 800010635-01UG 19,433 -
Department of Defense Subtotal 12,673,673 1,441,030
Department of Housing and Urban DevelopmentPass Through Programs
Urban Institute 14.008 102009-0001-CWRU-01 77,216 -
Department of Housing and Urban Development Subtotal 77,216 -
Department of JusticeDirect Programs
National Insitute of Justice 16.560 476,833 74,578 Pass Through Programs
Montgomery County Juvenile Court 16.560 20-0015 2,012 - Montgomery County Juvenile Court 16.560 20-0016 2,477 - University of California, Davis 16.560 A18-1255-S002 76,427 - West Virginia Research Corp. 16.560 18-806-CWRU 12,597 - Frontline Services 16.582 OVC-2016-9441 11,306 - Ohio Attorney General 16.582 9991 130,684 - Domestic Violence and Child Advocacy Center, Cuyahoga County, Ohio 16.590 DVCAC 39,402 - Cuyahoga County Board of Commissioners 16.812 RQ46280 34,580 - Cuyahoga County of Ohio 16.812 Cuyahoga County of Ohio 15,600 - Akron Police Department 16.833 CE20153 39,007 - Cuyahoga County Prosecutor's Office 16.833 2018-AK-BX-0001 92,262 - Cuyahoga County Prosecutor's Office 16.833 2016-AK-BX-K016 68,020 - Cuyahoga County Prosecutor's Office 16.833 2016-AK-BX-K011 53,684 - Cuyahoga County-Mental Health Board 16.838 2018-AR-BX-K033 125,170 -
Department of Justice Subtotal 1,180,061 74,578
National Aeronautics and Space AdministrationDirect Programs
The accompanying notes are an integral part of the schedule. 32
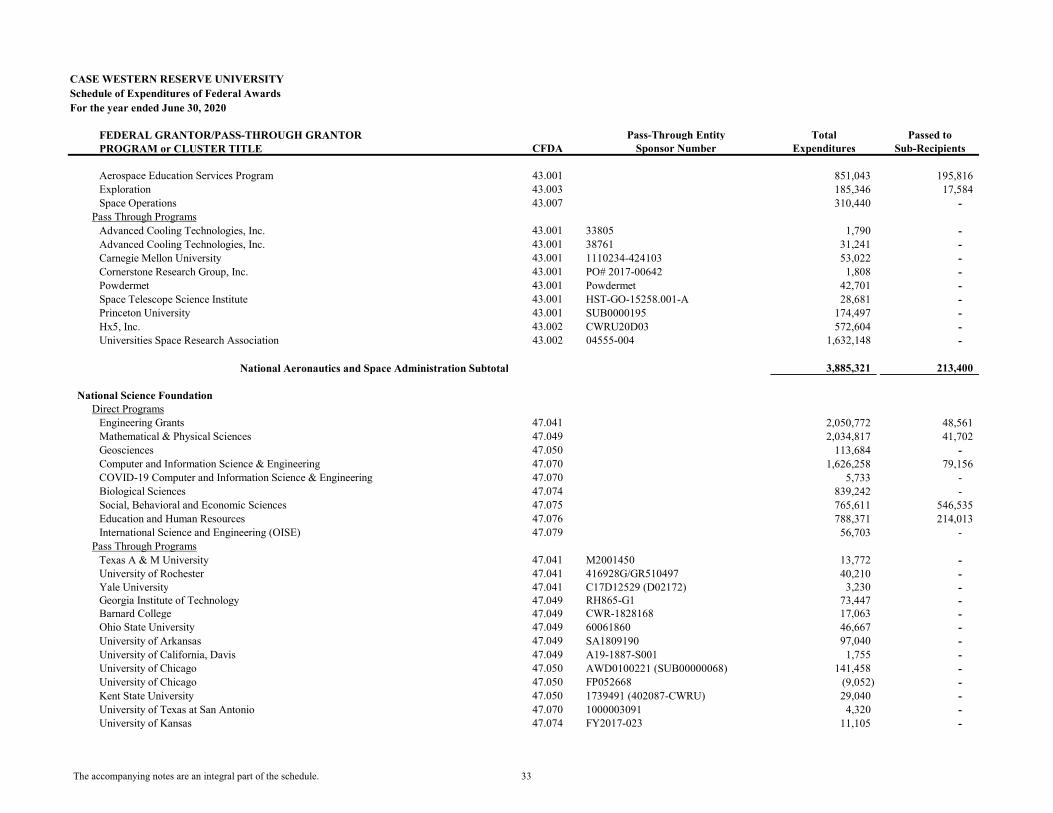
CASE WESTERN RESERVE UNIVERSITYSchedule of Expenditures of Federal AwardsFor the year ended June 30, 2020
FEDERAL GRANTOR/PASS-THROUGH GRANTOR Pass-Through Entity Total Passed toPROGRAM or CLUSTER TITLE CFDA Sponsor Number Expenditures Sub-Recipients
Aerospace Education Services Program 43.001 851,043 195,816 Exploration 43.003 185,346 17,584 Space Operations 43.007 310,440 -
Pass Through ProgramsAdvanced Cooling Technologies, Inc. 43.001 33805 1,790 - Advanced Cooling Technologies, Inc. 43.001 38761 31,241 - Carnegie Mellon University 43.001 1110234-424103 53,022 - Cornerstone Research Group, Inc. 43.001 PO# 2017-00642 1,808 - Powdermet 43.001 Powdermet 42,701 - Space Telescope Science Institute 43.001 HST-GO-15258.001-A 28,681 - Princeton University 43.001 SUB0000195 174,497 - Hx5, Inc. 43.002 CWRU20D03 572,604 - Universities Space Research Association 43.002 04555-004 1,632,148 -
National Aeronautics and Space Administration Subtotal 3,885,321 213,400
National Science FoundationDirect Programs
Engineering Grants 47.041 2,050,772 48,561 Mathematical & Physical Sciences 47.049 2,034,817 41,702 Geosciences 47.050 113,684 - Computer and Information Science & Engineering 47.070 1,626,258 79,156 COVID-19 Computer and Information Science & Engineering 47.070 5,733 - Biological Sciences 47.074 839,242 - Social, Behavioral and Economic Sciences 47.075 765,611 546,535 Education and Human Resources 47.076 788,371 214,013 International Science and Engineering (OISE) 47.079 56,703 -
Pass Through ProgramsTexas A & M University 47.041 M2001450 13,772 - University of Rochester 47.041 416928G/GR510497 40,210 - Yale University 47.041 C17D12529 (D02172) 3,230 - Georgia Institute of Technology 47.049 RH865-G1 73,447 - Barnard College 47.049 CWR-1828168 17,063 - Ohio State University 47.049 60061860 46,667 - University of Arkansas 47.049 SA1809190 97,040 - University of California, Davis 47.049 A19-1887-S001 1,755 - University of Chicago 47.050 AWD0100221 (SUB00000068) 141,458 - University of Chicago 47.050 FP052668 (9,052) - Kent State University 47.050 1739491 (402087-CWRU) 29,040 - University of Texas at San Antonio 47.070 1000003091 4,320 - University of Kansas 47.074 FY2017-023 11,105 -
The accompanying notes are an integral part of the schedule. 33
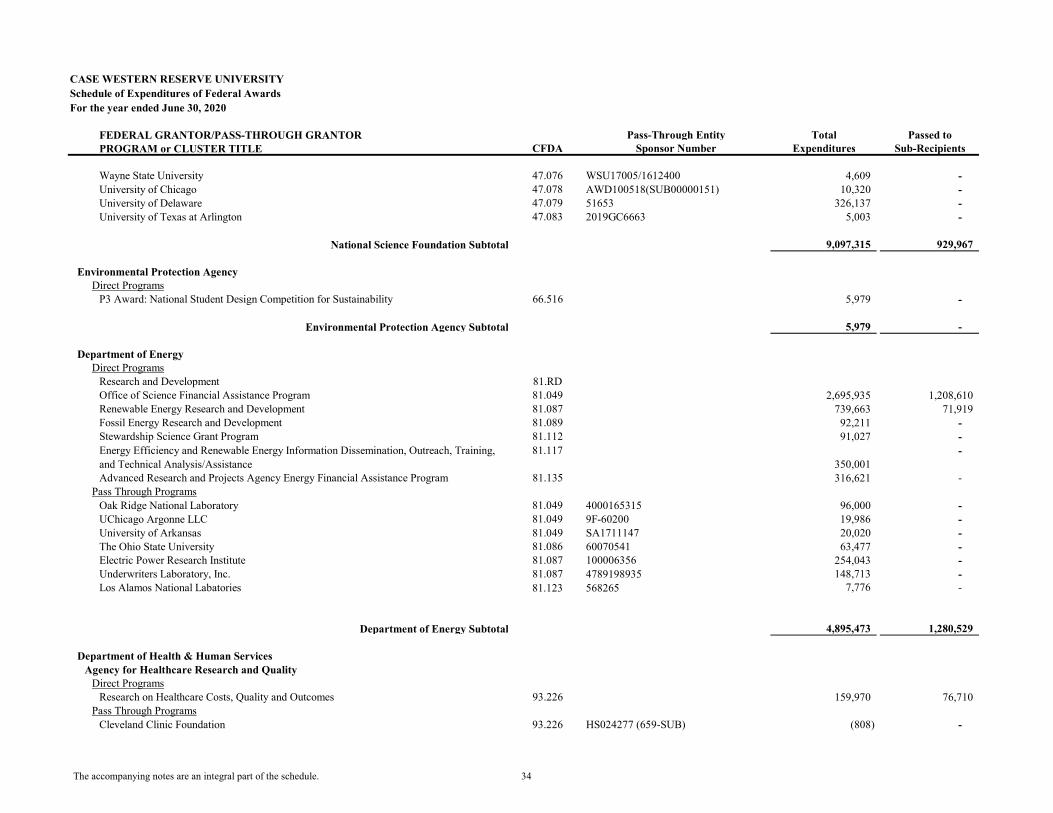
CASE WESTERN RESERVE UNIVERSITYSchedule of Expenditures of Federal AwardsFor the year ended June 30, 2020
FEDERAL GRANTOR/PASS-THROUGH GRANTOR Pass-Through Entity Total Passed toPROGRAM or CLUSTER TITLE CFDA Sponsor Number Expenditures Sub-Recipients
Wayne State University 47.076 WSU17005/1612400 4,609 - University of Chicago 47.078 AWD100518(SUB00000151) 10,320 - University of Delaware 47.079 51653 326,137 - University of Texas at Arlington 47.083 2019GC6663 5,003 -
National Science Foundation Subtotal 9,097,315 929,967
Environmental Protection AgencyDirect Programs
P3 Award: National Student Design Competition for Sustainability 66.516 5,979 -
Environmental Protection Agency Subtotal 5,979 -
Department of EnergyDirect Programs
Research and Development 81.RDOffice of Science Financial Assistance Program 81.049 2,695,935 1,208,610 Renewable Energy Research and Development 81.087 739,663 71,919 Fossil Energy Research and Development 81.089 92,211 - Stewardship Science Grant Program 81.112 91,027 - Energy Efficiency and Renewable Energy Information Dissemination, Outreach, Training, and Technical Analysis/Assistance
81.117350,001
-
Advanced Research and Projects Agency Energy Financial Assistance Program 81.135 316,621 - Pass Through Programs
Oak Ridge National Laboratory 81.049 4000165315 96,000 - UChicago Argonne LLC 81.049 9F-60200 19,986 - University of Arkansas 81.049 SA1711147 20,020 - The Ohio State University 81.086 60070541 63,477 - Electric Power Research Institute 81.087 100006356 254,043 - Underwriters Laboratory, Inc. 81.087 4789198935 148,713 - Los Alamos National Labatories 81.123 568265 7,776 -
Department of Energy Subtotal 4,895,473 1,280,529
Department of Health & Human ServicesAgency for Healthcare Research and Quality
Direct ProgramsResearch on Healthcare Costs, Quality and Outcomes 93.226 159,970 76,710
Pass Through ProgramsCleveland Clinic Foundation 93.226 HS024277 (659-SUB) (808) -
The accompanying notes are an integral part of the schedule. 34
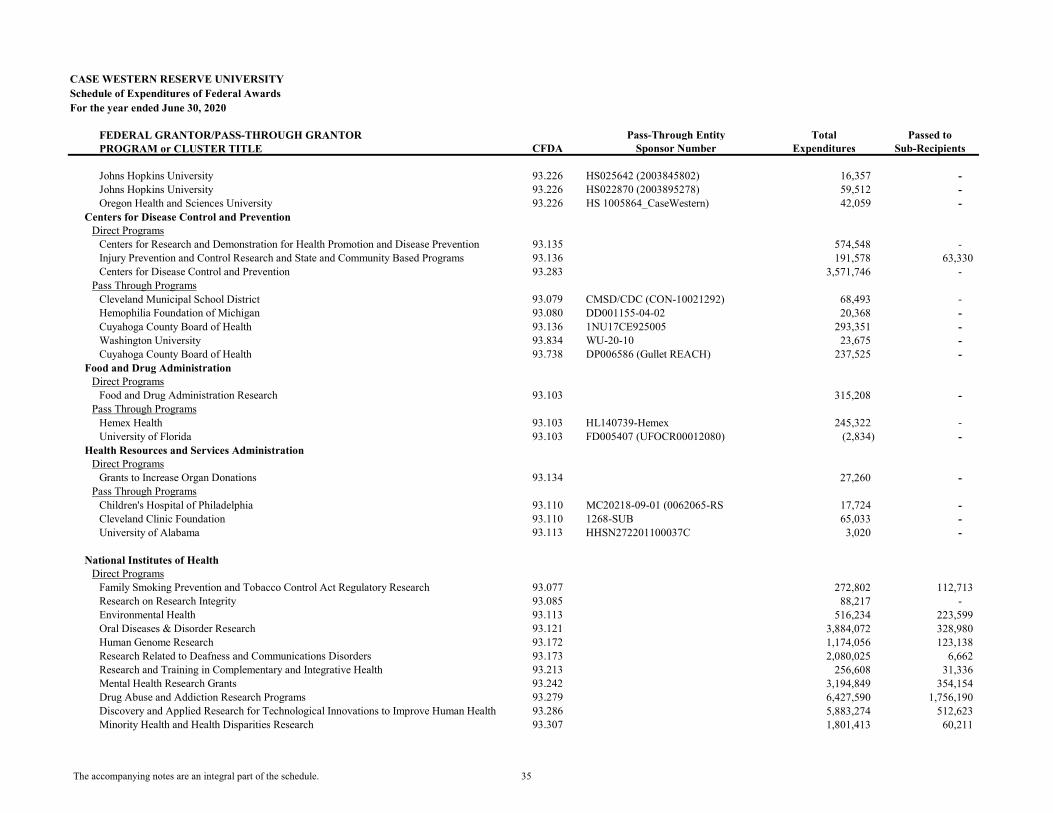
CASE WESTERN RESERVE UNIVERSITYSchedule of Expenditures of Federal AwardsFor the year ended June 30, 2020
FEDERAL GRANTOR/PASS-THROUGH GRANTOR Pass-Through Entity Total Passed toPROGRAM or CLUSTER TITLE CFDA Sponsor Number Expenditures Sub-Recipients
Johns Hopkins University 93.226 HS025642 (2003845802) 16,357 - Johns Hopkins University 93.226 HS022870 (2003895278) 59,512 - Oregon Health and Sciences University 93.226 HS 1005864_CaseWestern) 42,059 -
Centers for Disease Control and PreventionDirect Programs
Centers for Research and Demonstration for Health Promotion and Disease Prevention 93.135 574,548 - Injury Prevention and Control Research and State and Community Based Programs 93.136 191,578 63,330 Centers for Disease Control and Prevention 93.283 3,571,746 -
Pass Through ProgramsCleveland Municipal School District 93.079 CMSD/CDC (CON-10021292) 68,493 - Hemophilia Foundation of Michigan 93.080 DD001155-04-02 20,368 - Cuyahoga County Board of Health 93.136 1NU17CE925005 293,351 - Washington University 93.834 WU-20-10 23,675 - Cuyahoga County Board of Health 93.738 DP006586 (Gullet REACH) 237,525 -
Food and Drug AdministrationDirect Programs
Food and Drug Administration Research 93.103 315,208 - Pass Through Programs
Hemex Health 93.103 HL140739-Hemex 245,322 - University of Florida 93.103 FD005407 (UFOCR00012080) (2,834) -
Health Resources and Services AdministrationDirect Programs
Grants to Increase Organ Donations 93.134 27,260 - Pass Through Programs
Children's Hospital of Philadelphia 93.110 MC20218-09-01 (0062065-RS 17,724 - Cleveland Clinic Foundation 93.110 1268-SUB 65,033 - University of Alabama 93.113 HHSN272201100037C 3,020 -
National Institutes of HealthDirect Programs
Family Smoking Prevention and Tobacco Control Act Regulatory Research 93.077 272,802 112,713 Research on Research Integrity 93.085 88,217 - Environmental Health 93.113 516,234 223,599 Oral Diseases & Disorder Research 93.121 3,884,072 328,980 Human Genome Research 93.172 1,174,056 123,138 Research Related to Deafness and Communications Disorders 93.173 2,080,025 6,662 Research and Training in Complementary and Integrative Health 93.213 256,608 31,336 Mental Health Research Grants 93.242 3,194,849 354,154 Drug Abuse and Addiction Research Programs 93.279 6,427,590 1,756,190 Discovery and Applied Research for Technological Innovations to Improve Human Health 93.286 5,883,274 512,623 Minority Health and Health Disparities Research 93.307 1,801,413 60,211
The accompanying notes are an integral part of the schedule. 35
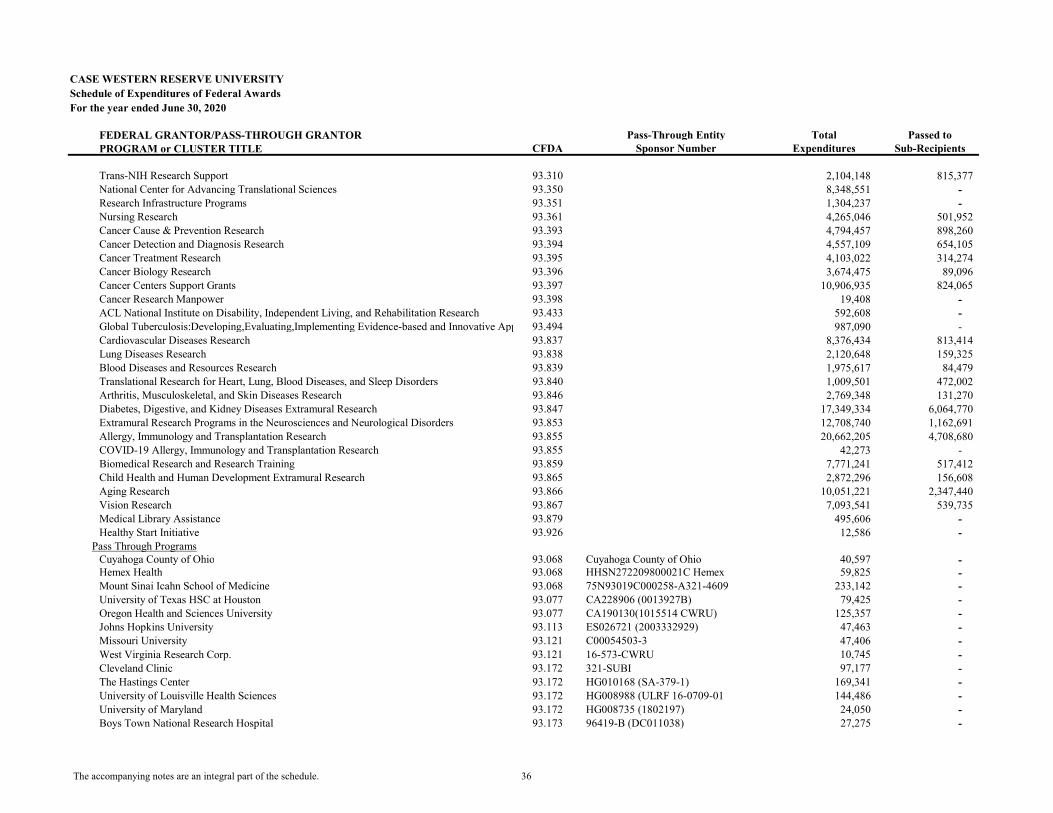
CASE WESTERN RESERVE UNIVERSITYSchedule of Expenditures of Federal AwardsFor the year ended June 30, 2020
FEDERAL GRANTOR/PASS-THROUGH GRANTOR Pass-Through Entity Total Passed toPROGRAM or CLUSTER TITLE CFDA Sponsor Number Expenditures Sub-Recipients
Trans-NIH Research Support 93.310 2,104,148 815,377 National Center for Advancing Translational Sciences 93.350 8,348,551 - Research Infrastructure Programs 93.351 1,304,237 - Nursing Research 93.361 4,265,046 501,952 Cancer Cause & Prevention Research 93.393 4,794,457 898,260 Cancer Detection and Diagnosis Research 93.394 4,557,109 654,105 Cancer Treatment Research 93.395 4,103,022 314,274 Cancer Biology Research 93.396 3,674,475 89,096 Cancer Centers Support Grants 93.397 10,906,935 824,065 Cancer Research Manpower 93.398 19,408 - ACL National Institute on Disability, Independent Living, and Rehabilitation Research 93.433 592,608 - Global Tuberculosis:Developing,Evaluating,Implementing Evidence-based and Innovative Approaches to Find, Cure, and Prevent Tuberculosis Globally93.494 987,090 - Cardiovascular Diseases Research 93.837 8,376,434 813,414 Lung Diseases Research 93.838 2,120,648 159,325 Blood Diseases and Resources Research 93.839 1,975,617 84,479 Translational Research for Heart, Lung, Blood Diseases, and Sleep Disorders 93.840 1,009,501 472,002 Arthritis, Musculoskeletal, and Skin Diseases Research 93.846 2,769,348 131,270 Diabetes, Digestive, and Kidney Diseases Extramural Research 93.847 17,349,334 6,064,770 Extramural Research Programs in the Neurosciences and Neurological Disorders 93.853 12,708,740 1,162,691 Allergy, Immunology and Transplantation Research 93.855 20,662,205 4,708,680 COVID-19 Allergy, Immunology and Transplantation Research 93.855 42,273 - Biomedical Research and Research Training 93.859 7,771,241 517,412 Child Health and Human Development Extramural Research 93.865 2,872,296 156,608 Aging Research 93.866 10,051,221 2,347,440 Vision Research 93.867 7,093,541 539,735 Medical Library Assistance 93.879 495,606 - Healthy Start Initiative 93.926 12,586 -
Pass Through ProgramsCuyahoga County of Ohio 93.068 Cuyahoga County of Ohio 40,597 - Hemex Health 93.068 HHSN272209800021C Hemex 59,825 - Mount Sinai Icahn School of Medicine 93.068 75N93019C000258-A321-4609 233,142 - University of Texas HSC at Houston 93.077 CA228906 (0013927B) 79,425 - Oregon Health and Sciences University 93.077 CA190130(1015514 CWRU) 125,357 - Johns Hopkins University 93.113 ES026721 (2003332929) 47,463 - Missouri University 93.121 C00054503-3 47,406 - West Virginia Research Corp. 93.121 16-573-CWRU 10,745 - Cleveland Clinic 93.172 321-SUBI 97,177 - The Hastings Center 93.172 HG010168 (SA-379-1) 169,341 - University of Louisville Health Sciences 93.172 HG008988 (ULRF 16-0709-01 144,486 - University of Maryland 93.172 HG008735 (1802197) 24,050 - Boys Town National Research Hospital 93.173 96419-B (DC011038) 27,275 -
The accompanying notes are an integral part of the schedule. 36
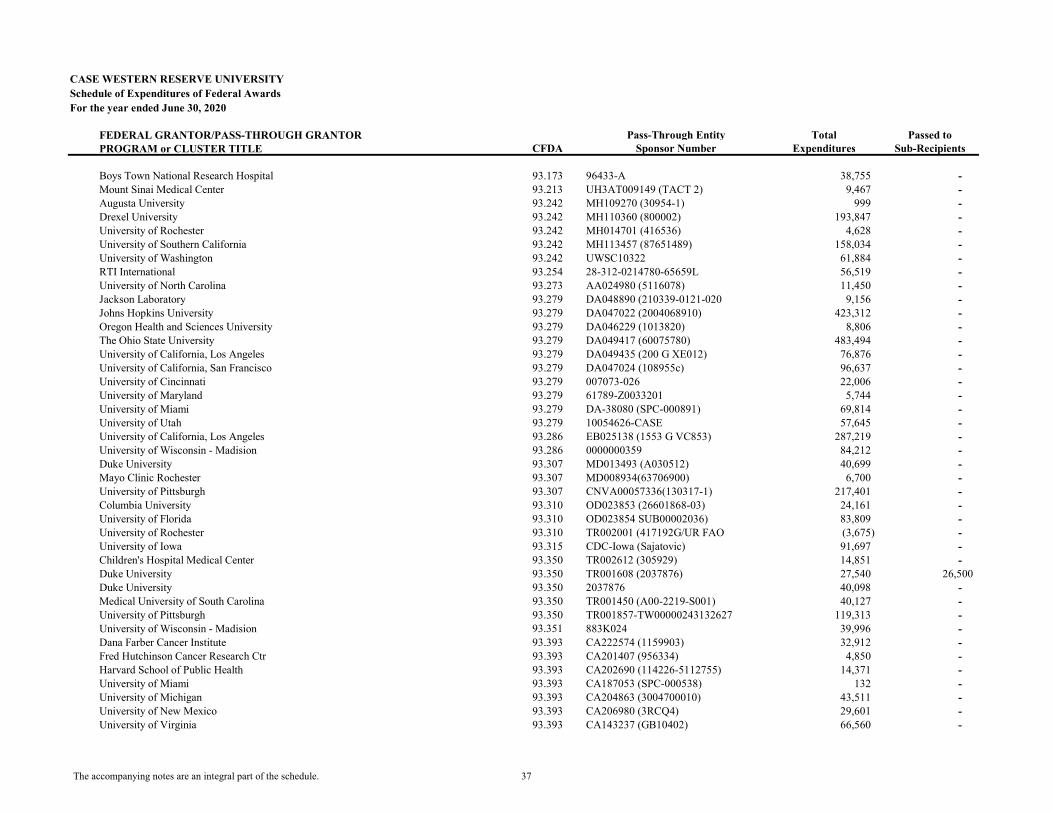
CASE WESTERN RESERVE UNIVERSITYSchedule of Expenditures of Federal AwardsFor the year ended June 30, 2020
FEDERAL GRANTOR/PASS-THROUGH GRANTOR Pass-Through Entity Total Passed toPROGRAM or CLUSTER TITLE CFDA Sponsor Number Expenditures Sub-Recipients
Boys Town National Research Hospital 93.173 96433-A 38,755 - Mount Sinai Medical Center 93.213 UH3AT009149 (TACT 2) 9,467 - Augusta University 93.242 MH109270 (30954-1) 999 - Drexel University 93.242 MH110360 (800002) 193,847 - University of Rochester 93.242 MH014701 (416536) 4,628 - University of Southern California 93.242 MH113457 (87651489) 158,034 - University of Washington 93.242 UWSC10322 61,884 - RTI International 93.254 28-312-0214780-65659L 56,519 - University of North Carolina 93.273 AA024980 (5116078) 11,450 - Jackson Laboratory 93.279 DA048890 (210339-0121-020 9,156 - Johns Hopkins University 93.279 DA047022 (2004068910) 423,312 - Oregon Health and Sciences University 93.279 DA046229 (1013820) 8,806 - The Ohio State University 93.279 DA049417 (60075780) 483,494 - University of California, Los Angeles 93.279 DA049435 (200 G XE012) 76,876 - University of California, San Francisco 93.279 DA047024 (108955c) 96,637 - University of Cincinnati 93.279 007073-026 22,006 - University of Maryland 93.279 61789-Z0033201 5,744 - University of Miami 93.279 DA-38080 (SPC-000891) 69,814 - University of Utah 93.279 10054626-CASE 57,645 - University of California, Los Angeles 93.286 EB025138 (1553 G VC853) 287,219 - University of Wisconsin - Madision 93.286 0000000359 84,212 - Duke University 93.307 MD013493 (A030512) 40,699 - Mayo Clinic Rochester 93.307 MD008934(63706900) 6,700 - University of Pittsburgh 93.307 CNVA00057336(130317-1) 217,401 - Columbia University 93.310 OD023853 (26601868-03) 24,161 - University of Florida 93.310 OD023854 SUB00002036) 83,809 - University of Rochester 93.310 TR002001 (417192G/UR FAO (3,675) - University of Iowa 93.315 CDC-Iowa (Sajatovic) 91,697 - Children's Hospital Medical Center 93.350 TR002612 (305929) 14,851 - Duke University 93.350 TR001608 (2037876) 27,540 26,500 Duke University 93.350 2037876 40,098 - Medical University of South Carolina 93.350 TR001450 (A00-2219-S001) 40,127 - University of Pittsburgh 93.350 TR001857-TW00000243132627 119,313 - University of Wisconsin - Madision 93.351 883K024 39,996 - Dana Farber Cancer Institute 93.393 CA222574 (1159903) 32,912 - Fred Hutchinson Cancer Research Ctr 93.393 CA201407 (956334) 4,850 - Harvard School of Public Health 93.393 CA202690 (114226-5112755) 14,371 - University of Miami 93.393 CA187053 (SPC-000538) 132 - University of Michigan 93.393 CA204863 (3004700010) 43,511 - University of New Mexico 93.393 CA206980 (3RCQ4) 29,601 - University of Virginia 93.393 CA143237 (GB10402) 66,560 -
The accompanying notes are an integral part of the schedule. 37
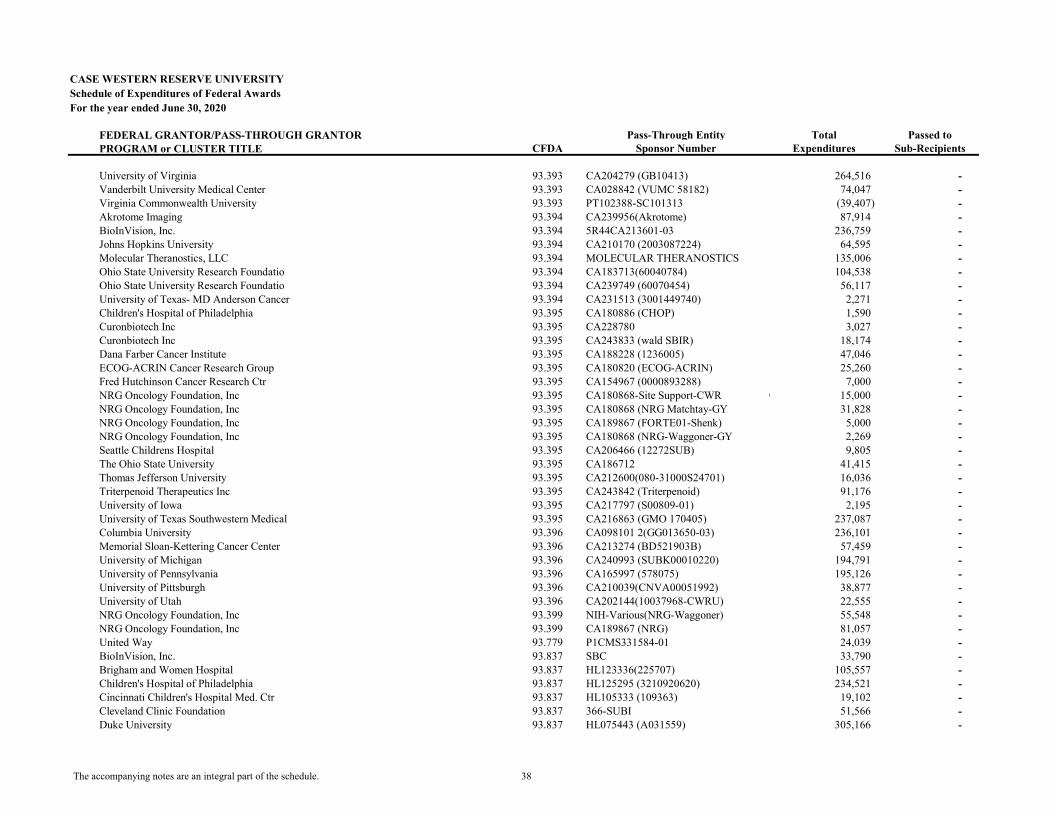
CASE WESTERN RESERVE UNIVERSITYSchedule of Expenditures of Federal AwardsFor the year ended June 30, 2020
FEDERAL GRANTOR/PASS-THROUGH GRANTOR Pass-Through Entity Total Passed toPROGRAM or CLUSTER TITLE CFDA Sponsor Number Expenditures Sub-Recipients
University of Virginia 93.393 CA204279 (GB10413) 264,516 - Vanderbilt University Medical Center 93.393 CA028842 (VUMC 58182) 74,047 - Virginia Commonwealth University 93.393 PT102388-SC101313 (39,407) - Akrotome Imaging 93.394 CA239956(Akrotome) 87,914 - BioInVision, Inc. 93.394 5R44CA213601-03 236,759 - Johns Hopkins University 93.394 CA210170 (2003087224) 64,595 - Molecular Theranostics, LLC 93.394 MOLECULAR THERANOSTICS 135,006 - Ohio State University Research Foundatio 93.394 CA183713(60040784) 104,538 - Ohio State University Research Foundatio 93.394 CA239749 (60070454) 56,117 - University of Texas- MD Anderson Cancer 93.394 CA231513 (3001449740) 2,271 - Children's Hospital of Philadelphia 93.395 CA180886 (CHOP) 1,590 - Curonbiotech Inc 93.395 CA228780 3,027 - Curonbiotech Inc 93.395 CA243833 (wald SBIR) 18,174 - Dana Farber Cancer Institute 93.395 CA188228 (1236005) 47,046 - ECOG-ACRIN Cancer Research Group 93.395 CA180820 (ECOG-ACRIN) 25,260 - Fred Hutchinson Cancer Research Ctr 93.395 CA154967 (0000893288) 7,000 - NRG Oncology Foundation, Inc 93.395 CA180868-Site Support-CWR CCLCM-NIH Flow-thru15,000 - NRG Oncology Foundation, Inc 93.395 CA180868 (NRG Matchtay-GY 31,828 - NRG Oncology Foundation, Inc 93.395 CA189867 (FORTE01-Shenk) 5,000 - NRG Oncology Foundation, Inc 93.395 CA180868 (NRG-Waggoner-GY 2,269 - Seattle Childrens Hospital 93.395 CA206466 (12272SUB) 9,805 - The Ohio State University 93.395 CA186712 41,415 - Thomas Jefferson University 93.395 CA212600(080-31000S24701) 16,036 - Triterpenoid Therapeutics Inc 93.395 CA243842 (Triterpenoid) 91,176 - University of Iowa 93.395 CA217797 (S00809-01) 2,195 - University of Texas Southwestern Medical 93.395 CA216863 (GMO 170405) 237,087 - Columbia University 93.396 CA098101 2(GG013650-03) 236,101 - Memorial Sloan-Kettering Cancer Center 93.396 CA213274 (BD521903B) 57,459 - University of Michigan 93.396 CA240993 (SUBK00010220) 194,791 - University of Pennsylvania 93.396 CA165997 (578075) 195,126 - University of Pittsburgh 93.396 CA210039(CNVA00051992) 38,877 - University of Utah 93.396 CA202144(10037968-CWRU) 22,555 - NRG Oncology Foundation, Inc 93.399 NIH-Various(NRG-Waggoner) 55,548 - NRG Oncology Foundation, Inc 93.399 CA189867 (NRG) 81,057 - United Way 93.779 P1CMS331584-01 24,039 - BioInVision, Inc. 93.837 SBC 33,790 - Brigham and Women Hospital 93.837 HL123336(225707) 105,557 - Children's Hospital of Philadelphia 93.837 HL125295 (3210920620) 234,521 - Cincinnati Children's Hospital Med. Ctr 93.837 HL105333 (109363) 19,102 - Cleveland Clinic Foundation 93.837 366-SUBI 51,566 - Duke University 93.837 HL075443 (A031559) 305,166 -
The accompanying notes are an integral part of the schedule. 38
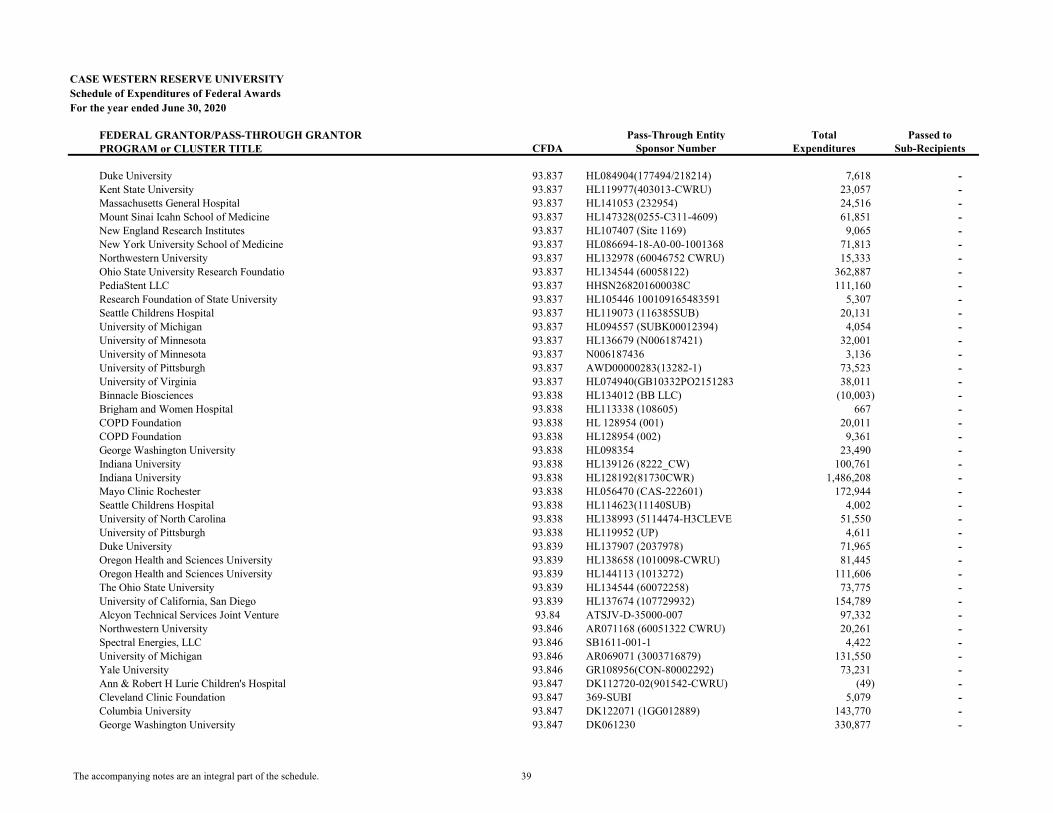
CASE WESTERN RESERVE UNIVERSITYSchedule of Expenditures of Federal AwardsFor the year ended June 30, 2020
FEDERAL GRANTOR/PASS-THROUGH GRANTOR Pass-Through Entity Total Passed toPROGRAM or CLUSTER TITLE CFDA Sponsor Number Expenditures Sub-Recipients
Duke University 93.837 HL084904(177494/218214) 7,618 - Kent State University 93.837 HL119977(403013-CWRU) 23,057 - Massachusetts General Hospital 93.837 HL141053 (232954) 24,516 - Mount Sinai Icahn School of Medicine 93.837 HL147328(0255-C311-4609) 61,851 - New England Research Institutes 93.837 HL107407 (Site 1169) 9,065 - New York University School of Medicine 93.837 HL086694-18-A0-00-1001368 71,813 - Northwestern University 93.837 HL132978 (60046752 CWRU) 15,333 - Ohio State University Research Foundatio 93.837 HL134544 (60058122) 362,887 - PediaStent LLC 93.837 HHSN268201600038C 111,160 - Research Foundation of State University 93.837 HL105446 100109165483591 5,307 - Seattle Childrens Hospital 93.837 HL119073 (116385SUB) 20,131 - University of Michigan 93.837 HL094557 (SUBK00012394) 4,054 - University of Minnesota 93.837 HL136679 (N006187421) 32,001 - University of Minnesota 93.837 N006187436 3,136 - University of Pittsburgh 93.837 AWD00000283(13282-1) 73,523 - University of Virginia 93.837 HL074940(GB10332PO2151283 38,011 - Binnacle Biosciences 93.838 HL134012 (BB LLC) (10,003) - Brigham and Women Hospital 93.838 HL113338 (108605) 667 - COPD Foundation 93.838 HL 128954 (001) 20,011 - COPD Foundation 93.838 HL128954 (002) 9,361 - George Washington University 93.838 HL098354 23,490 - Indiana University 93.838 HL139126 (8222_CW) 100,761 - Indiana University 93.838 HL128192(81730CWR) 1,486,208 - Mayo Clinic Rochester 93.838 HL056470 (CAS-222601) 172,944 - Seattle Childrens Hospital 93.838 HL114623(11140SUB) 4,002 - University of North Carolina 93.838 HL138993 (5114474-H3CLEVE 51,550 - University of Pittsburgh 93.838 HL119952 (UP) 4,611 - Duke University 93.839 HL137907 (2037978) 71,965 - Oregon Health and Sciences University 93.839 HL138658 (1010098-CWRU) 81,445 - Oregon Health and Sciences University 93.839 HL144113 (1013272) 111,606 - The Ohio State University 93.839 HL134544 (60072258) 73,775 - University of California, San Diego 93.839 HL137674 (107729932) 154,789 - Alcyon Technical Services Joint Venture 93.84 ATSJV-D-35000-007 97,332 - Northwestern University 93.846 AR071168 (60051322 CWRU) 20,261 - Spectral Energies, LLC 93.846 SB1611-001-1 4,422 - University of Michigan 93.846 AR069071 (3003716879) 131,550 - Yale University 93.846 GR108956(CON-80002292) 73,231 - Ann & Robert H Lurie Children's Hospital 93.847 DK112720-02(901542-CWRU) (49) - Cleveland Clinic Foundation 93.847 369-SUBI 5,079 - Columbia University 93.847 DK122071 (1GG012889) 143,770 - George Washington University 93.847 DK061230 330,877 -
The accompanying notes are an integral part of the schedule. 39
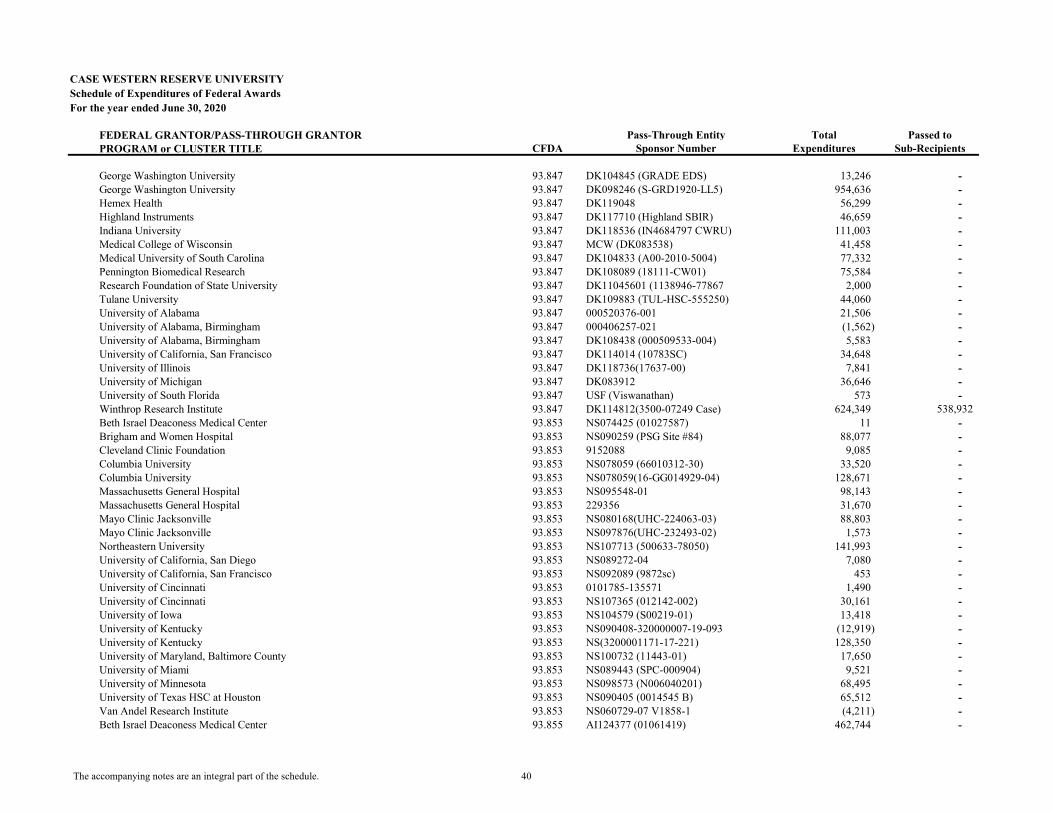
CASE WESTERN RESERVE UNIVERSITYSchedule of Expenditures of Federal AwardsFor the year ended June 30, 2020
FEDERAL GRANTOR/PASS-THROUGH GRANTOR Pass-Through Entity Total Passed toPROGRAM or CLUSTER TITLE CFDA Sponsor Number Expenditures Sub-Recipients
George Washington University 93.847 DK104845 (GRADE EDS) 13,246 - George Washington University 93.847 DK098246 (S-GRD1920-LL5) 954,636 - Hemex Health 93.847 DK119048 56,299 - Highland Instruments 93.847 DK117710 (Highland SBIR) 46,659 - Indiana University 93.847 DK118536 (IN4684797 CWRU) 111,003 - Medical College of Wisconsin 93.847 MCW (DK083538) 41,458 - Medical University of South Carolina 93.847 DK104833 (A00-2010-5004) 77,332 - Pennington Biomedical Research 93.847 DK108089 (18111-CW01) 75,584 - Research Foundation of State University 93.847 DK11045601 (1138946-77867 2,000 - Tulane University 93.847 DK109883 (TUL-HSC-555250) 44,060 - University of Alabama 93.847 000520376-001 21,506 - University of Alabama, Birmingham 93.847 000406257-021 (1,562) - University of Alabama, Birmingham 93.847 DK108438 (000509533-004) 5,583 - University of California, San Francisco 93.847 DK114014 (10783SC) 34,648 - University of Illinois 93.847 DK118736(17637-00) 7,841 - University of Michigan 93.847 DK083912 36,646 - University of South Florida 93.847 USF (Viswanathan) 573 - Winthrop Research Institute 93.847 DK114812(3500-07249 Case) 624,349 538,932 Beth Israel Deaconess Medical Center 93.853 NS074425 (01027587) 11 - Brigham and Women Hospital 93.853 NS090259 (PSG Site #84) 88,077 - Cleveland Clinic Foundation 93.853 9152088 9,085 - Columbia University 93.853 NS078059 (66010312-30) 33,520 - Columbia University 93.853 NS078059(16-GG014929-04) 128,671 - Massachusetts General Hospital 93.853 NS095548-01 98,143 - Massachusetts General Hospital 93.853 229356 31,670 - Mayo Clinic Jacksonville 93.853 NS080168(UHC-224063-03) 88,803 - Mayo Clinic Jacksonville 93.853 NS097876(UHC-232493-02) 1,573 - Northeastern University 93.853 NS107713 (500633-78050) 141,993 - University of California, San Diego 93.853 NS089272-04 7,080 - University of California, San Francisco 93.853 NS092089 (9872sc) 453 - University of Cincinnati 93.853 0101785-135571 1,490 - University of Cincinnati 93.853 NS107365 (012142-002) 30,161 - University of Iowa 93.853 NS104579 (S00219-01) 13,418 - University of Kentucky 93.853 NS090408-320000007-19-093 (12,919) - University of Kentucky 93.853 NS(3200001171-17-221) 128,350 - University of Maryland, Baltimore County 93.853 NS100732 (11443-01) 17,650 - University of Miami 93.853 NS089443 (SPC-000904) 9,521 - University of Minnesota 93.853 NS098573 (N006040201) 68,495 - University of Texas HSC at Houston 93.853 NS090405 (0014545 B) 65,512 - Van Andel Research Institute 93.853 NS060729-07 V1858-1 (4,211) - Beth Israel Deaconess Medical Center 93.855 AI124377 (01061419) 462,744 -
The accompanying notes are an integral part of the schedule. 40
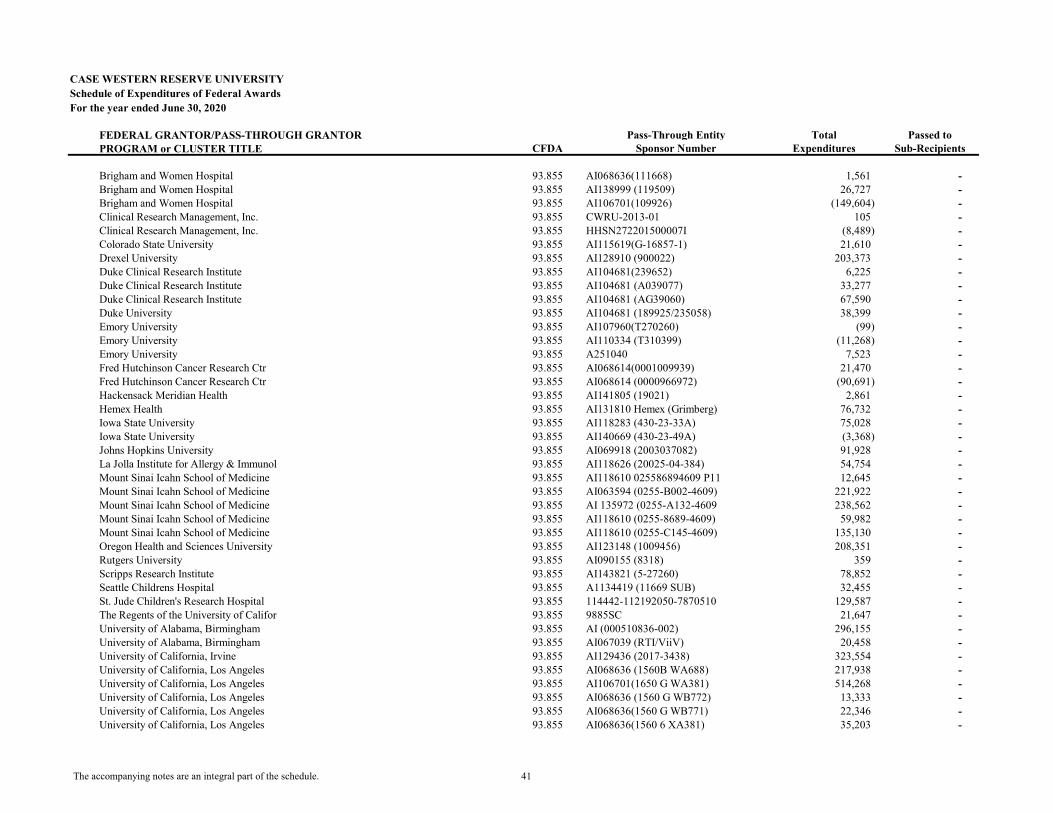
CASE WESTERN RESERVE UNIVERSITYSchedule of Expenditures of Federal AwardsFor the year ended June 30, 2020
FEDERAL GRANTOR/PASS-THROUGH GRANTOR Pass-Through Entity Total Passed toPROGRAM or CLUSTER TITLE CFDA Sponsor Number Expenditures Sub-Recipients
Brigham and Women Hospital 93.855 AI068636(111668) 1,561 - Brigham and Women Hospital 93.855 AI138999 (119509) 26,727 - Brigham and Women Hospital 93.855 AI106701(109926) (149,604) - Clinical Research Management, Inc. 93.855 CWRU-2013-01 105 - Clinical Research Management, Inc. 93.855 HHSN272201500007I (8,489) - Colorado State University 93.855 AI115619(G-16857-1) 21,610 - Drexel University 93.855 AI128910 (900022) 203,373 - Duke Clinical Research Institute 93.855 AI104681(239652) 6,225 - Duke Clinical Research Institute 93.855 AI104681 (A039077) 33,277 - Duke Clinical Research Institute 93.855 AI104681 (AG39060) 67,590 - Duke University 93.855 AI104681 (189925/235058) 38,399 - Emory University 93.855 AI107960(T270260) (99) - Emory University 93.855 AI110334 (T310399) (11,268) - Emory University 93.855 A251040 7,523 - Fred Hutchinson Cancer Research Ctr 93.855 AI068614(0001009939) 21,470 - Fred Hutchinson Cancer Research Ctr 93.855 AI068614 (0000966972) (90,691) - Hackensack Meridian Health 93.855 AI141805 (19021) 2,861 - Hemex Health 93.855 AI131810 Hemex (Grimberg) 76,732 - Iowa State University 93.855 AI118283 (430-23-33A) 75,028 - Iowa State University 93.855 AI140669 (430-23-49A) (3,368) - Johns Hopkins University 93.855 AI069918 (2003037082) 91,928 - La Jolla Institute for Allergy & Immunol 93.855 AI118626 (20025-04-384) 54,754 - Mount Sinai Icahn School of Medicine 93.855 AI118610 025586894609 P11 12,645 - Mount Sinai Icahn School of Medicine 93.855 AI063594 (0255-B002-4609) 221,922 - Mount Sinai Icahn School of Medicine 93.855 AI 135972 (0255-A132-4609 238,562 - Mount Sinai Icahn School of Medicine 93.855 AI118610 (0255-8689-4609) 59,982 - Mount Sinai Icahn School of Medicine 93.855 AI118610 (0255-C145-4609) 135,130 - Oregon Health and Sciences University 93.855 AI123148 (1009456) 208,351 - Rutgers University 93.855 AI090155 (8318) 359 - Scripps Research Institute 93.855 AI143821 (5-27260) 78,852 - Seattle Childrens Hospital 93.855 A1134419 (11669 SUB) 32,455 - St. Jude Children's Research Hospital 93.855 114442-112192050-7870510 129,587 - The Regents of the University of Califor 93.855 9885SC 21,647 - University of Alabama, Birmingham 93.855 AI (000510836-002) 296,155 - University of Alabama, Birmingham 93.855 AI067039 (RTI/ViiV) 20,458 - University of California, Irvine 93.855 AI129436 (2017-3438) 323,554 - University of California, Los Angeles 93.855 AI068636 (1560B WA688) 217,938 - University of California, Los Angeles 93.855 AI106701(1650 G WA381) 514,268 - University of California, Los Angeles 93.855 AI068636 (1560 G WB772) 13,333 - University of California, Los Angeles 93.855 AI068636(1560 G WB771) 22,346 - University of California, Los Angeles 93.855 AI068636(1560 6 XA381) 35,203 -
The accompanying notes are an integral part of the schedule. 41
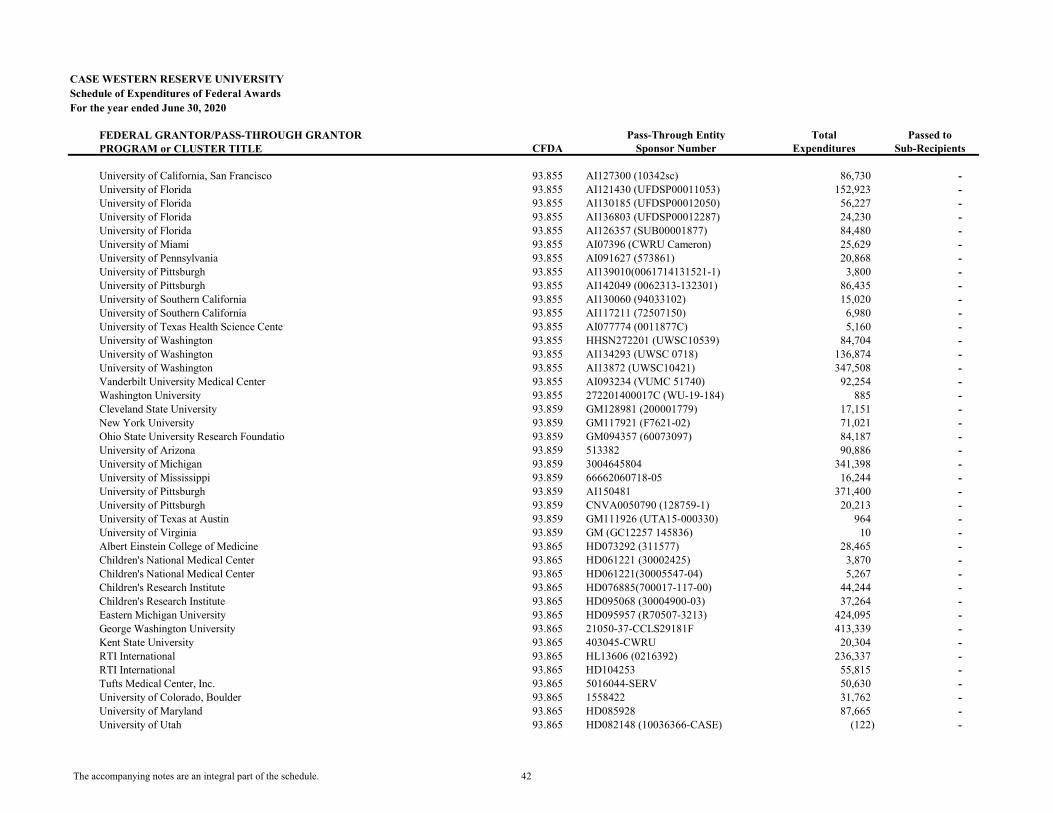
CASE WESTERN RESERVE UNIVERSITYSchedule of Expenditures of Federal AwardsFor the year ended June 30, 2020
FEDERAL GRANTOR/PASS-THROUGH GRANTOR Pass-Through Entity Total Passed toPROGRAM or CLUSTER TITLE CFDA Sponsor Number Expenditures Sub-Recipients
University of California, San Francisco 93.855 AI127300 (10342sc) 86,730 - University of Florida 93.855 AI121430 (UFDSP00011053) 152,923 - University of Florida 93.855 AI130185 (UFDSP00012050) 56,227 - University of Florida 93.855 AI136803 (UFDSP00012287) 24,230 - University of Florida 93.855 AI126357 (SUB00001877) 84,480 - University of Miami 93.855 AI07396 (CWRU Cameron) 25,629 - University of Pennsylvania 93.855 AI091627 (573861) 20,868 - University of Pittsburgh 93.855 AI139010(0061714131521-1) 3,800 - University of Pittsburgh 93.855 AI142049 (0062313-132301) 86,435 - University of Southern California 93.855 AI130060 (94033102) 15,020 - University of Southern California 93.855 AI117211 (72507150) 6,980 - University of Texas Health Science Cente 93.855 AI077774 (0011877C) 5,160 - University of Washington 93.855 HHSN272201 (UWSC10539) 84,704 - University of Washington 93.855 AI134293 (UWSC 0718) 136,874 - University of Washington 93.855 AI13872 (UWSC10421) 347,508 - Vanderbilt University Medical Center 93.855 AI093234 (VUMC 51740) 92,254 - Washington University 93.855 272201400017C (WU-19-184) 885 - Cleveland State University 93.859 GM128981 (200001779) 17,151 - New York University 93.859 GM117921 (F7621-02) 71,021 - Ohio State University Research Foundatio 93.859 GM094357 (60073097) 84,187 - University of Arizona 93.859 513382 90,886 - University of Michigan 93.859 3004645804 341,398 - University of Mississippi 93.859 66662060718-05 16,244 - University of Pittsburgh 93.859 AI150481 371,400 - University of Pittsburgh 93.859 CNVA0050790 (128759-1) 20,213 - University of Texas at Austin 93.859 GM111926 (UTA15-000330) 964 - University of Virginia 93.859 GM (GC12257 145836) 10 - Albert Einstein College of Medicine 93.865 HD073292 (311577) 28,465 - Children's National Medical Center 93.865 HD061221 (30002425) 3,870 - Children's National Medical Center 93.865 HD061221(30005547-04) 5,267 - Children's Research Institute 93.865 HD076885(700017-117-00) 44,244 - Children's Research Institute 93.865 HD095068 (30004900-03) 37,264 - Eastern Michigan University 93.865 HD095957 (R70507-3213) 424,095 - George Washington University 93.865 21050-37-CCLS29181F 413,339 - Kent State University 93.865 403045-CWRU 20,304 - RTI International 93.865 HL13606 (0216392) 236,337 - RTI International 93.865 HD104253 55,815 - Tufts Medical Center, Inc. 93.865 5016044-SERV 50,630 - University of Colorado, Boulder 93.865 1558422 31,762 - University of Maryland 93.865 HD085928 87,665 - University of Utah 93.865 HD082148 (10036366-CASE) (122) -
The accompanying notes are an integral part of the schedule. 42
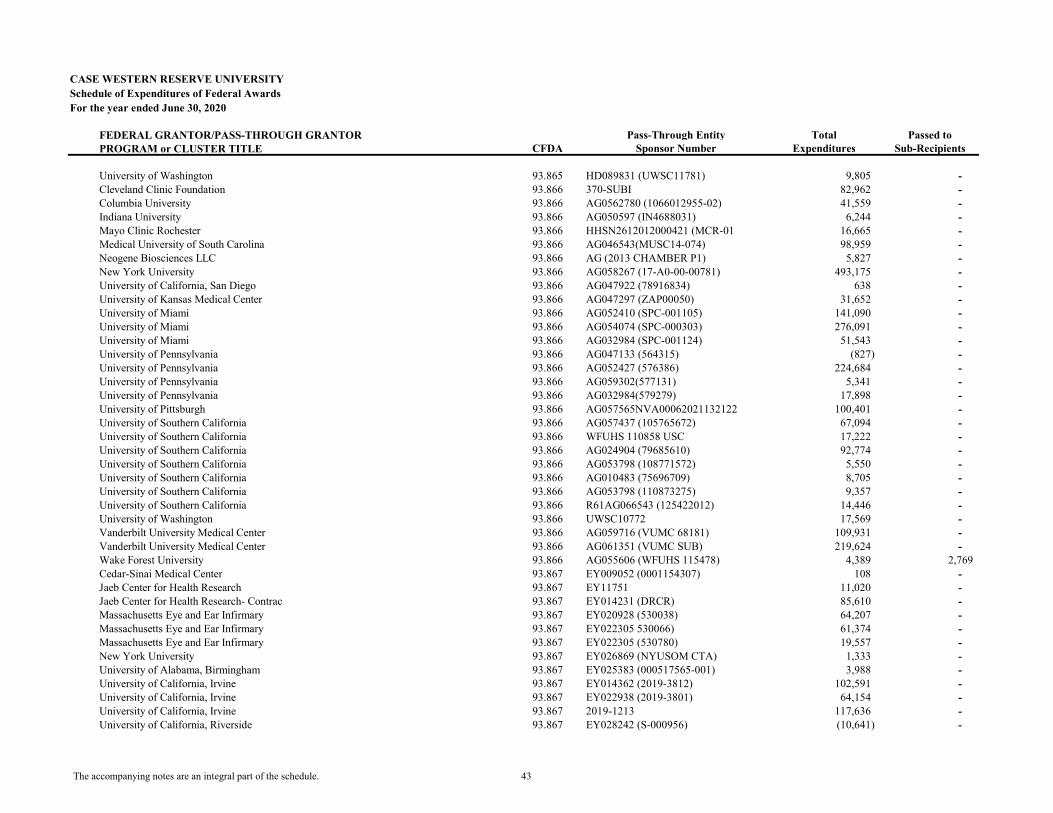
CASE WESTERN RESERVE UNIVERSITYSchedule of Expenditures of Federal AwardsFor the year ended June 30, 2020
FEDERAL GRANTOR/PASS-THROUGH GRANTOR Pass-Through Entity Total Passed toPROGRAM or CLUSTER TITLE CFDA Sponsor Number Expenditures Sub-Recipients
University of Washington 93.865 HD089831 (UWSC11781) 9,805 - Cleveland Clinic Foundation 93.866 370-SUBI 82,962 - Columbia University 93.866 AG0562780 (1066012955-02) 41,559 - Indiana University 93.866 AG050597 (IN4688031) 6,244 - Mayo Clinic Rochester 93.866 HHSN2612012000421 (MCR-01 16,665 - Medical University of South Carolina 93.866 AG046543(MUSC14-074) 98,959 - Neogene Biosciences LLC 93.866 AG (2013 CHAMBER P1) 5,827 - New York University 93.866 AG058267 (17-A0-00-00781) 493,175 - University of California, San Diego 93.866 AG047922 (78916834) 638 - University of Kansas Medical Center 93.866 AG047297 (ZAP00050) 31,652 - University of Miami 93.866 AG052410 (SPC-001105) 141,090 - University of Miami 93.866 AG054074 (SPC-000303) 276,091 - University of Miami 93.866 AG032984 (SPC-001124) 51,543 - University of Pennsylvania 93.866 AG047133 (564315) (827) - University of Pennsylvania 93.866 AG052427 (576386) 224,684 - University of Pennsylvania 93.866 AG059302(577131) 5,341 - University of Pennsylvania 93.866 AG032984(579279) 17,898 - University of Pittsburgh 93.866 AG057565NVA00062021132122 100,401 - University of Southern California 93.866 AG057437 (105765672) 67,094 - University of Southern California 93.866 WFUHS 110858 USC 17,222 - University of Southern California 93.866 AG024904 (79685610) 92,774 - University of Southern California 93.866 AG053798 (108771572) 5,550 - University of Southern California 93.866 AG010483 (75696709) 8,705 - University of Southern California 93.866 AG053798 (110873275) 9,357 - University of Southern California 93.866 R61AG066543 (125422012) 14,446 - University of Washington 93.866 UWSC10772 17,569 - Vanderbilt University Medical Center 93.866 AG059716 (VUMC 68181) 109,931 - Vanderbilt University Medical Center 93.866 AG061351 (VUMC SUB) 219,624 - Wake Forest University 93.866 AG055606 (WFUHS 115478) 4,389 2,769 Cedar-Sinai Medical Center 93.867 EY009052 (0001154307) 108 - Jaeb Center for Health Research 93.867 EY11751 11,020 - Jaeb Center for Health Research- Contrac 93.867 EY014231 (DRCR) 85,610 - Massachusetts Eye and Ear Infirmary 93.867 EY020928 (530038) 64,207 - Massachusetts Eye and Ear Infirmary 93.867 EY022305 530066) 61,374 - Massachusetts Eye and Ear Infirmary 93.867 EY022305 (530780) 19,557 - New York University 93.867 EY026869 (NYUSOM CTA) 1,333 - University of Alabama, Birmingham 93.867 EY025383 (000517565-001) 3,988 - University of California, Irvine 93.867 EY014362 (2019-3812) 102,591 - University of California, Irvine 93.867 EY022938 (2019-3801) 64,154 - University of California, Irvine 93.867 2019-1213 117,636 - University of California, Riverside 93.867 EY028242 (S-000956) (10,641) -
The accompanying notes are an integral part of the schedule. 43
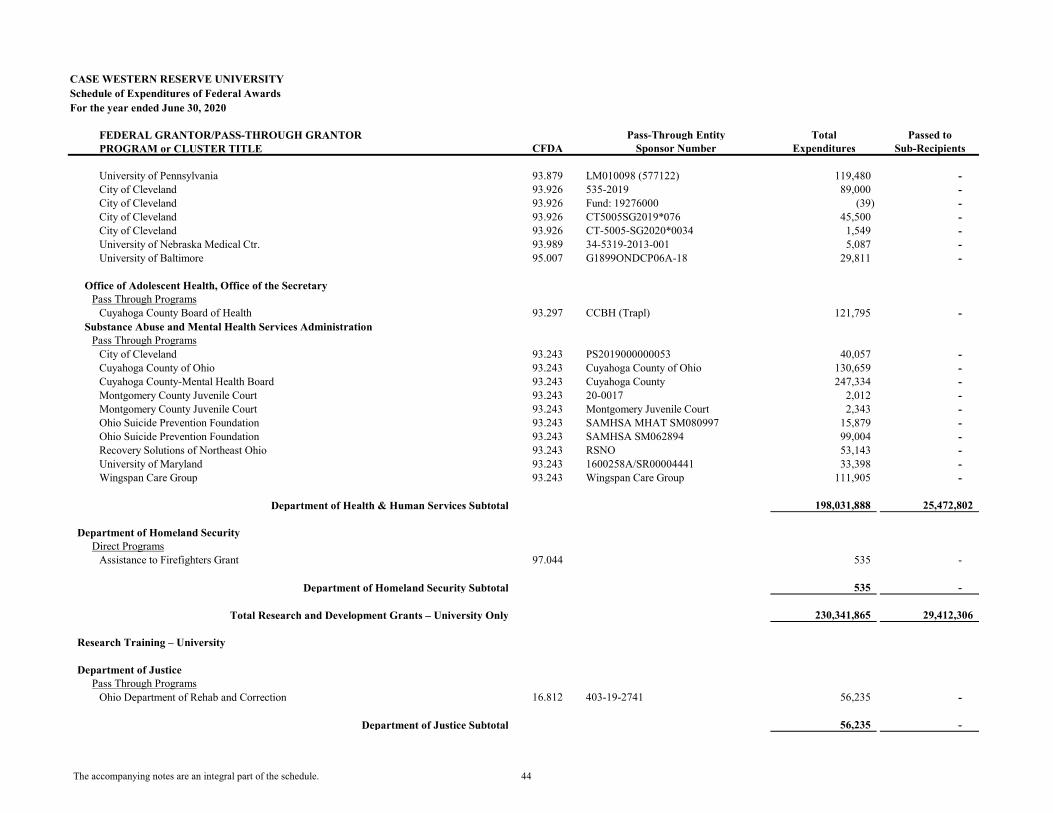
CASE WESTERN RESERVE UNIVERSITYSchedule of Expenditures of Federal AwardsFor the year ended June 30, 2020
FEDERAL GRANTOR/PASS-THROUGH GRANTOR Pass-Through Entity Total Passed toPROGRAM or CLUSTER TITLE CFDA Sponsor Number Expenditures Sub-Recipients
University of Pennsylvania 93.879 LM010098 (577122) 119,480 - City of Cleveland 93.926 535-2019 89,000 - City of Cleveland 93.926 Fund: 19276000 (39) - City of Cleveland 93.926 CT5005SG2019*076 45,500 - City of Cleveland 93.926 CT-5005-SG2020*0034 1,549 - University of Nebraska Medical Ctr. 93.989 34-5319-2013-001 5,087 - University of Baltimore 95.007 G1899ONDCP06A-18 29,811 -
Office of Adolescent Health, Office of the SecretaryPass Through Programs
Cuyahoga County Board of Health 93.297 CCBH (Trapl) 121,795 - Substance Abuse and Mental Health Services Administration
Pass Through ProgramsCity of Cleveland 93.243 PS2019000000053 40,057 - Cuyahoga County of Ohio 93.243 Cuyahoga County of Ohio 130,659 - Cuyahoga County-Mental Health Board 93.243 Cuyahoga County 247,334 - Montgomery County Juvenile Court 93.243 20-0017 2,012 - Montgomery County Juvenile Court 93.243 Montgomery Juvenile Court 2,343 - Ohio Suicide Prevention Foundation 93.243 SAMHSA MHAT SM080997 15,879 - Ohio Suicide Prevention Foundation 93.243 SAMHSA SM062894 99,004 - Recovery Solutions of Northeast Ohio 93.243 RSNO 53,143 - University of Maryland 93.243 1600258A/SR00004441 33,398 - Wingspan Care Group 93.243 Wingspan Care Group 111,905 -
Department of Health & Human Services Subtotal 198,031,888 25,472,802
Department of Homeland SecurityDirect Programs
Assistance to Firefighters Grant 97.044 535 -
Department of Homeland Security Subtotal 535 -
Total Research and Development Grants – University Only 230,341,865 29,412,306
Research Training – University
Department of JusticePass Through Programs
Ohio Department of Rehab and Correction 16.812 403-19-2741 56,235 -
Department of Justice Subtotal 56,235 -
The accompanying notes are an integral part of the schedule. 44
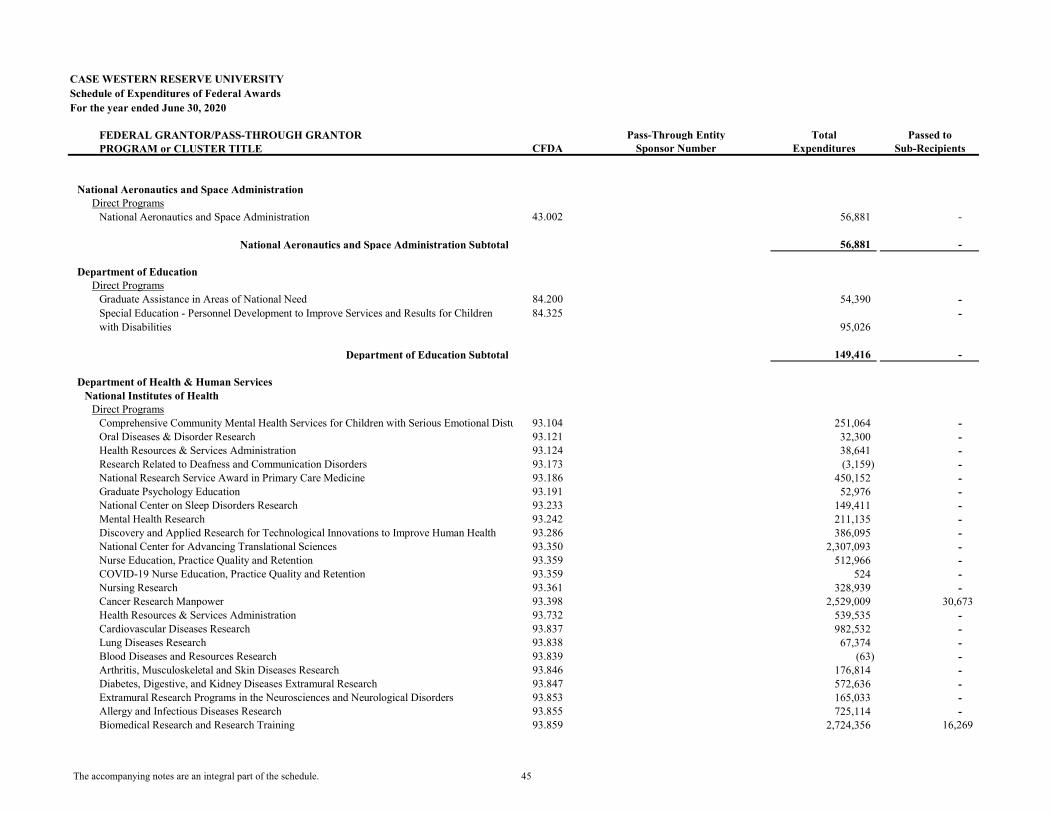
CASE WESTERN RESERVE UNIVERSITYSchedule of Expenditures of Federal AwardsFor the year ended June 30, 2020
FEDERAL GRANTOR/PASS-THROUGH GRANTOR Pass-Through Entity Total Passed toPROGRAM or CLUSTER TITLE CFDA Sponsor Number Expenditures Sub-Recipients
National Aeronautics and Space AdministrationDirect Programs
National Aeronautics and Space Administration 43.002 56,881 -
National Aeronautics and Space Administration Subtotal 56,881 -
Department of EducationDirect Programs
Graduate Assistance in Areas of National Need 84.200 54,390 - Special Education - Personnel Development to Improve Services and Results for Children with Disabilities
84.32595,026
-
Department of Education Subtotal 149,416 -
Department of Health & Human ServicesNational Institutes of Health
Direct ProgramsComprehensive Community Mental Health Services for Children with Serious Emotional Disturbances (SED)93.104 251,064 - Oral Diseases & Disorder Research 93.121 32,300 - Health Resources & Services Administration 93.124 38,641 - Research Related to Deafness and Communication Disorders 93.173 (3,159) - National Research Service Award in Primary Care Medicine 93.186 450,152 - Graduate Psychology Education 93.191 52,976 - National Center on Sleep Disorders Research 93.233 149,411 - Mental Health Research 93.242 211,135 - Discovery and Applied Research for Technological Innovations to Improve Human Health 93.286 386,095 - National Center for Advancing Translational Sciences 93.350 2,307,093 - Nurse Education, Practice Quality and Retention 93.359 512,966 - COVID-19 Nurse Education, Practice Quality and Retention 93.359 524 - Nursing Research 93.361 328,939 - Cancer Research Manpower 93.398 2,529,009 30,673 Health Resources & Services Administration 93.732 539,535 - Cardiovascular Diseases Research 93.837 982,532 - Lung Diseases Research 93.838 67,374 - Blood Diseases and Resources Research 93.839 (63) - Arthritis, Musculoskeletal and Skin Diseases Research 93.846 176,814 - Diabetes, Digestive, and Kidney Diseases Extramural Research 93.847 572,636 - Extramural Research Programs in the Neurosciences and Neurological Disorders 93.853 165,033 - Allergy and Infectious Diseases Research 93.855 725,114 - Biomedical Research and Research Training 93.859 2,724,356 16,269
The accompanying notes are an integral part of the schedule. 45
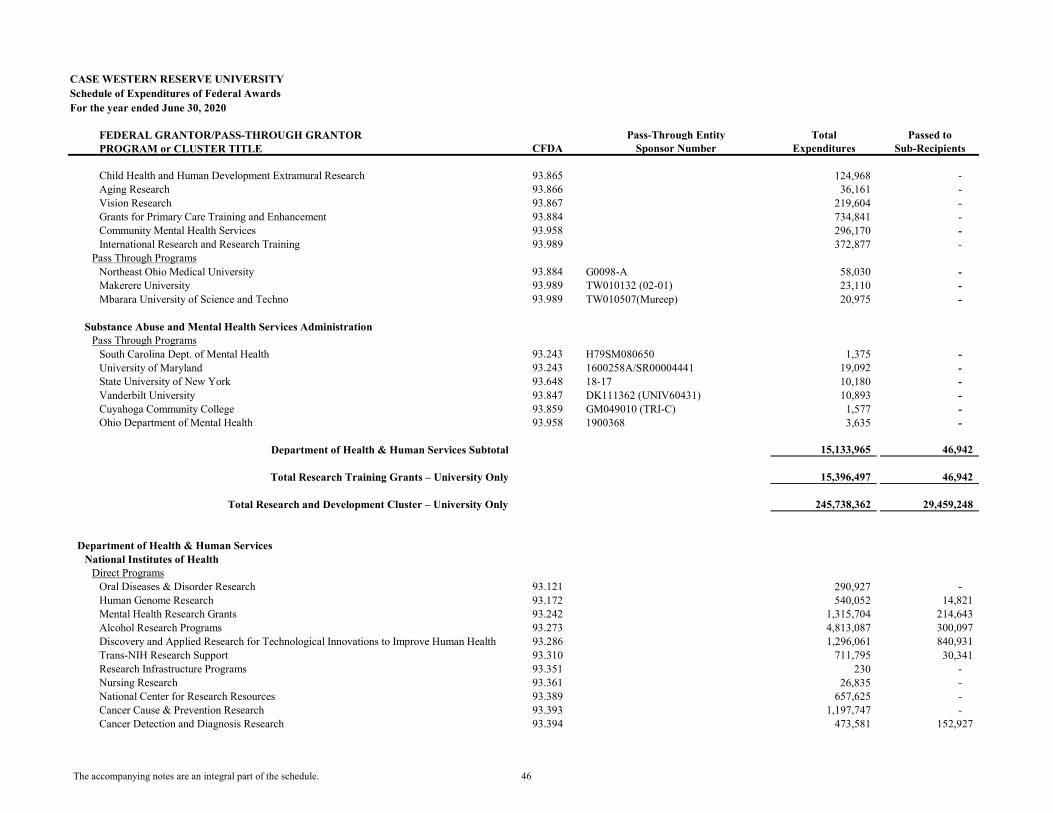
CASE WESTERN RESERVE UNIVERSITYSchedule of Expenditures of Federal AwardsFor the year ended June 30, 2020
FEDERAL GRANTOR/PASS-THROUGH GRANTOR Pass-Through Entity Total Passed toPROGRAM or CLUSTER TITLE CFDA Sponsor Number Expenditures Sub-Recipients
Child Health and Human Development Extramural Research 93.865 124,968 - Aging Research 93.866 36,161 - Vision Research 93.867 219,604 - Grants for Primary Care Training and Enhancement 93.884 734,841 - Community Mental Health Services 93.958 296,170 - International Research and Research Training 93.989 372,877 -
Pass Through ProgramsNortheast Ohio Medical University 93.884 G0098-A 58,030 - Makerere University 93.989 TW010132 (02-01) 23,110 - Mbarara University of Science and Techno 93.989 TW010507(Mureep) 20,975 -
Substance Abuse and Mental Health Services AdministrationPass Through Programs
South Carolina Dept. of Mental Health 93.243 H79SM080650 1,375 - University of Maryland 93.243 1600258A/SR00004441 19,092 - State University of New York 93.648 18-17 10,180 - Vanderbilt University 93.847 DK111362 (UNIV60431) 10,893 - Cuyahoga Community College 93.859 GM049010 (TRI-C) 1,577 - Ohio Department of Mental Health 93.958 1900368 3,635 -
Department of Health & Human Services Subtotal 15,133,965 46,942
Total Research Training Grants – University Only 15,396,497 46,942
Total Research and Development Cluster – University Only 245,738,362 29,459,248
Department of Health & Human ServicesNational Institutes of Health
Direct ProgramsOral Diseases & Disorder Research 93.121 290,927 - Human Genome Research 93.172 540,052 14,821 Mental Health Research Grants 93.242 1,315,704 214,643 Alcohol Research Programs 93.273 4,813,087 300,097 Discovery and Applied Research for Technological Innovations to Improve Human Health 93.286 1,296,061 840,931 Trans-NIH Research Support 93.310 711,795 30,341 Research Infrastructure Programs 93.351 230 - Nursing Research 93.361 26,835 - National Center for Research Resources 93.389 657,625 - Cancer Cause & Prevention Research 93.393 1,197,747 - Cancer Detection and Diagnosis Research 93.394 473,581 152,927
The accompanying notes are an integral part of the schedule. 46
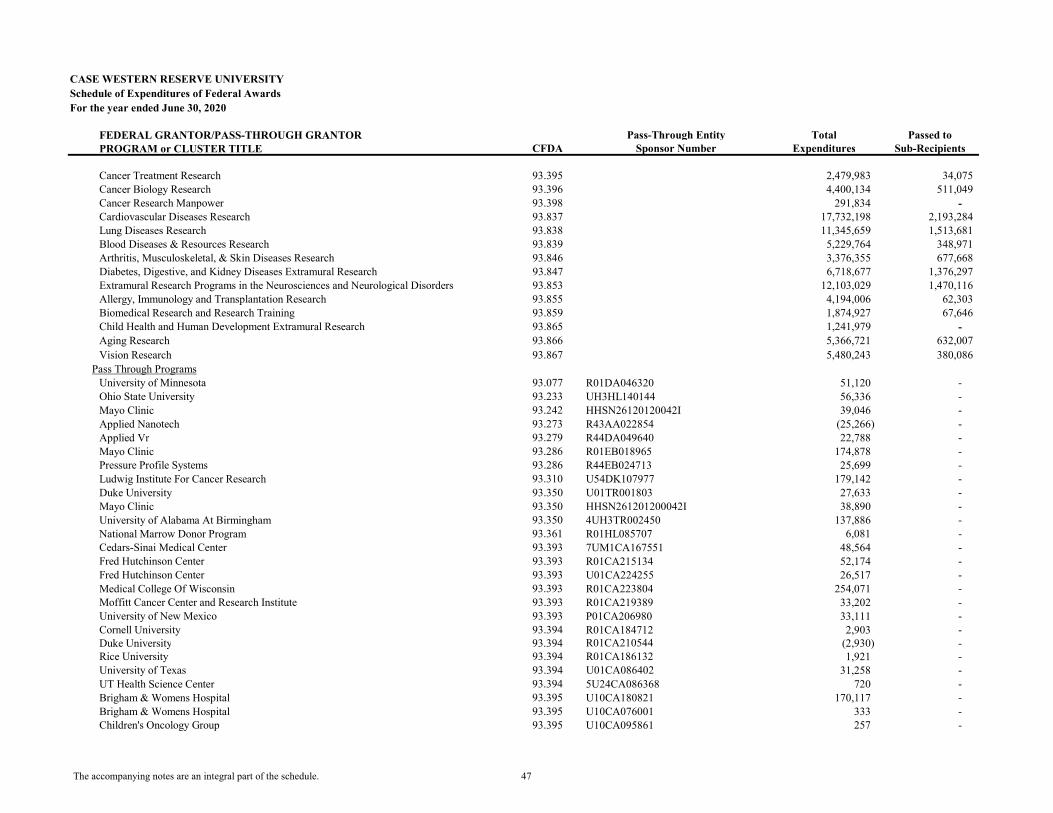
CASE WESTERN RESERVE UNIVERSITYSchedule of Expenditures of Federal AwardsFor the year ended June 30, 2020
FEDERAL GRANTOR/PASS-THROUGH GRANTOR Pass-Through Entity Total Passed toPROGRAM or CLUSTER TITLE CFDA Sponsor Number Expenditures Sub-Recipients
Cancer Treatment Research 93.395 2,479,983 34,075 Cancer Biology Research 93.396 4,400,134 511,049 Cancer Research Manpower 93.398 291,834 - Cardiovascular Diseases Research 93.837 17,732,198 2,193,284 Lung Diseases Research 93.838 11,345,659 1,513,681 Blood Diseases & Resources Research 93.839 5,229,764 348,971 Arthritis, Musculoskeletal, & Skin Diseases Research 93.846 3,376,355 677,668 Diabetes, Digestive, and Kidney Diseases Extramural Research 93.847 6,718,677 1,376,297 Extramural Research Programs in the Neurosciences and Neurological Disorders 93.853 12,103,029 1,470,116 Allergy, Immunology and Transplantation Research 93.855 4,194,006 62,303 Biomedical Research and Research Training 93.859 1,874,927 67,646 Child Health and Human Development Extramural Research 93.865 1,241,979 - Aging Research 93.866 5,366,721 632,007 Vision Research 93.867 5,480,243 380,086
Pass Through ProgramsUniversity of Minnesota 93.077 R01DA046320 51,120 - Ohio State University 93.233 UH3HL140144 56,336 - Mayo Clinic 93.242 HHSN26120120042I 39,046 - Applied Nanotech 93.273 R43AA022854 (25,266) - Applied Vr 93.279 R44DA049640 22,788 - Mayo Clinic 93.286 R01EB018965 174,878 - Pressure Profile Systems 93.286 R44EB024713 25,699 - Ludwig Institute For Cancer Research 93.310 U54DK107977 179,142 - Duke University 93.350 U01TR001803 27,633 - Mayo Clinic 93.350 HHSN261201200042I 38,890 - University of Alabama At Birmingham 93.350 4UH3TR002450 137,886 - National Marrow Donor Program 93.361 R01HL085707 6,081 - Cedars-Sinai Medical Center 93.393 7UM1CA167551 48,564 - Fred Hutchinson Center 93.393 R01CA215134 52,174 - Fred Hutchinson Center 93.393 U01CA224255 26,517 - Medical College Of Wisconsin 93.393 R01CA223804 254,071 - Moffitt Cancer Center and Research Institute 93.393 R01CA219389 33,202 - University of New Mexico 93.393 P01CA206980 33,111 - Cornell University 93.394 R01CA184712 2,903 - Duke University 93.394 R01CA210544 (2,930) - Rice University 93.394 R01CA186132 1,921 - University of Texas 93.394 U01CA086402 31,258 - UT Health Science Center 93.394 5U24CA086368 720 - Brigham & Womens Hospital 93.395 U10CA180821 170,117 - Brigham & Womens Hospital 93.395 U10CA076001 333 - Children's Oncology Group 93.395 U10CA095861 257 -
The accompanying notes are an integral part of the schedule. 47
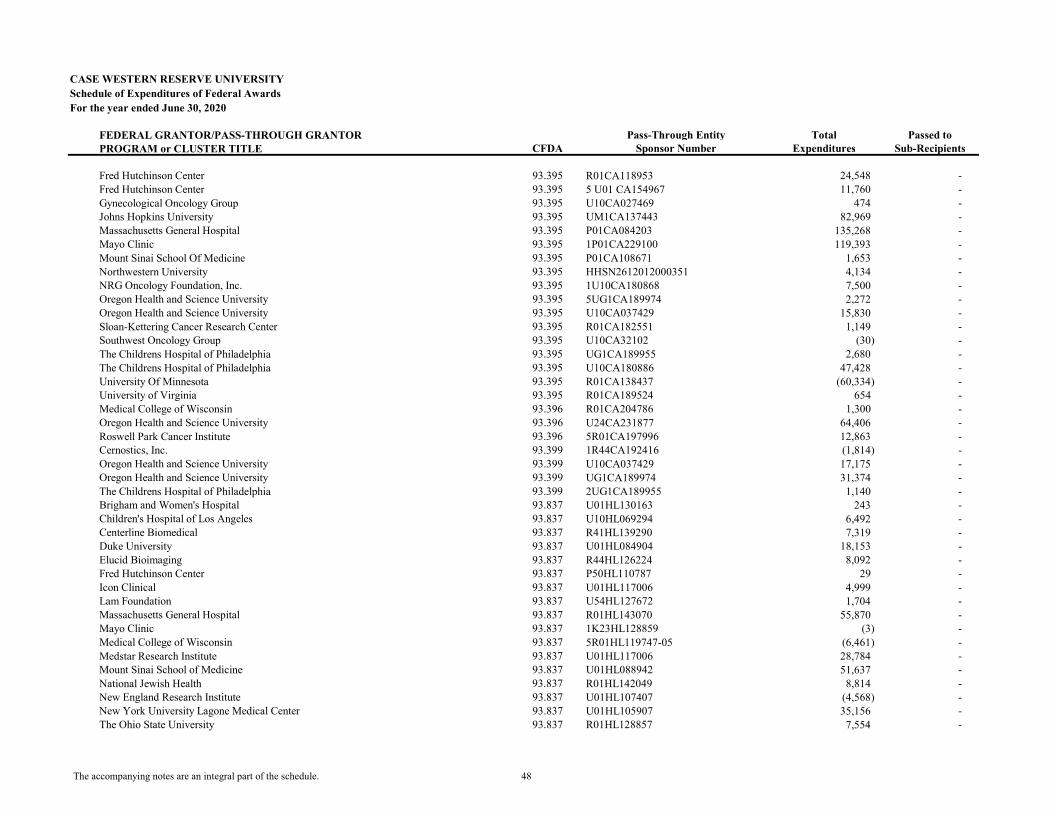
CASE WESTERN RESERVE UNIVERSITYSchedule of Expenditures of Federal AwardsFor the year ended June 30, 2020
FEDERAL GRANTOR/PASS-THROUGH GRANTOR Pass-Through Entity Total Passed toPROGRAM or CLUSTER TITLE CFDA Sponsor Number Expenditures Sub-Recipients
Fred Hutchinson Center 93.395 R01CA118953 24,548 - Fred Hutchinson Center 93.395 5 U01 CA154967 11,760 - Gynecological Oncology Group 93.395 U10CA027469 474 - Johns Hopkins University 93.395 UM1CA137443 82,969 - Massachusetts General Hospital 93.395 P01CA084203 135,268 - Mayo Clinic 93.395 1P01CA229100 119,393 - Mount Sinai School Of Medicine 93.395 P01CA108671 1,653 - Northwestern University 93.395 HHSN2612012000351 4,134 - NRG Oncology Foundation, Inc. 93.395 1U10CA180868 7,500 - Oregon Health and Science University 93.395 5UG1CA189974 2,272 - Oregon Health and Science University 93.395 U10CA037429 15,830 - Sloan-Kettering Cancer Research Center 93.395 R01CA182551 1,149 - Southwest Oncology Group 93.395 U10CA32102 (30) - The Childrens Hospital of Philadelphia 93.395 UG1CA189955 2,680 - The Childrens Hospital of Philadelphia 93.395 U10CA180886 47,428 - University Of Minnesota 93.395 R01CA138437 (60,334) - University of Virginia 93.395 R01CA189524 654 - Medical College of Wisconsin 93.396 R01CA204786 1,300 - Oregon Health and Science University 93.396 U24CA231877 64,406 - Roswell Park Cancer Institute 93.396 5R01CA197996 12,863 - Cernostics, Inc. 93.399 1R44CA192416 (1,814) - Oregon Health and Science University 93.399 U10CA037429 17,175 - Oregon Health and Science University 93.399 UG1CA189974 31,374 - The Childrens Hospital of Philadelphia 93.399 2UG1CA189955 1,140 - Brigham and Women's Hospital 93.837 U01HL130163 243 - Children's Hospital of Los Angeles 93.837 U10HL069294 6,492 - Centerline Biomedical 93.837 R41HL139290 7,319 - Duke University 93.837 U01HL084904 18,153 - Elucid Bioimaging 93.837 R44HL126224 8,092 - Fred Hutchinson Center 93.837 P50HL110787 29 - Icon Clinical 93.837 U01HL117006 4,999 - Lam Foundation 93.837 U54HL127672 1,704 - Massachusetts General Hospital 93.837 R01HL143070 55,870 - Mayo Clinic 93.837 1K23HL128859 (3) - Medical College of Wisconsin 93.837 5R01HL119747-05 (6,461) - Medstar Research Institute 93.837 U01HL117006 28,784 - Mount Sinai School of Medicine 93.837 U01HL088942 51,637 - National Jewish Health 93.837 R01HL142049 8,814 - New England Research Institute 93.837 U01HL107407 (4,568) - New York University Lagone Medical Center 93.837 U01HL105907 35,156 - The Ohio State University 93.837 R01HL128857 7,554 -
The accompanying notes are an integral part of the schedule. 48
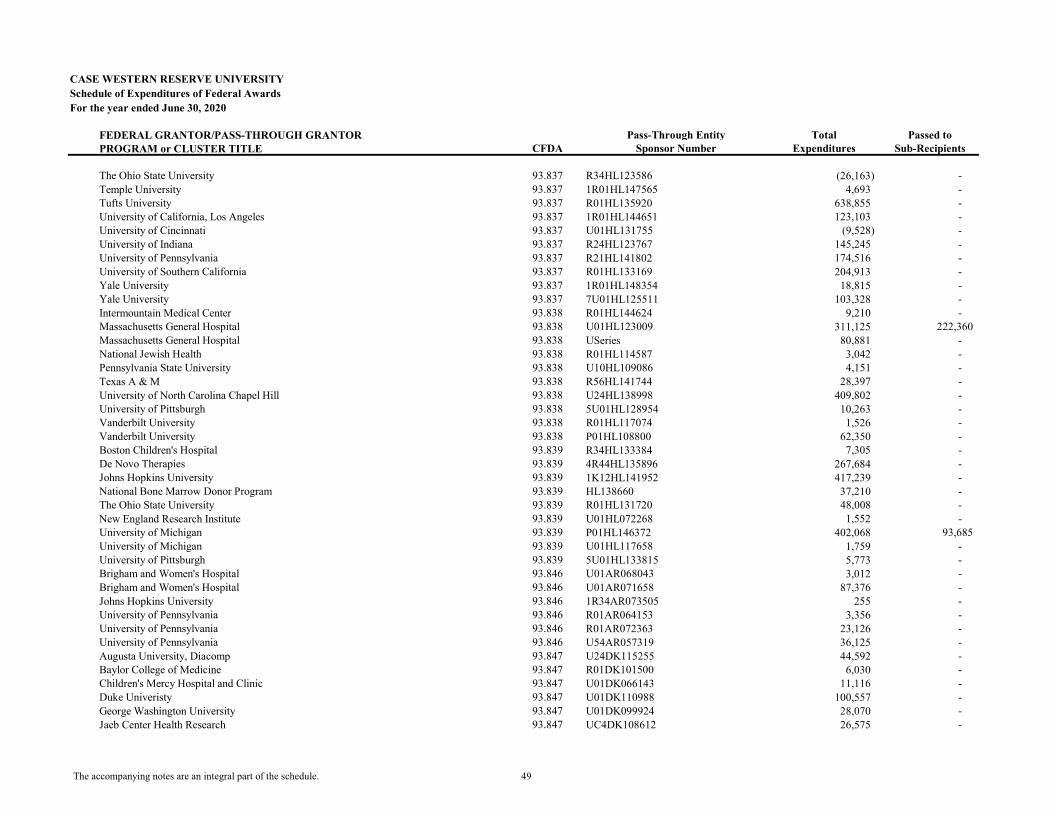
CASE WESTERN RESERVE UNIVERSITYSchedule of Expenditures of Federal AwardsFor the year ended June 30, 2020
FEDERAL GRANTOR/PASS-THROUGH GRANTOR Pass-Through Entity Total Passed toPROGRAM or CLUSTER TITLE CFDA Sponsor Number Expenditures Sub-Recipients
The Ohio State University 93.837 R34HL123586 (26,163) - Temple University 93.837 1R01HL147565 4,693 - Tufts University 93.837 R01HL135920 638,855 - University of California, Los Angeles 93.837 1R01HL144651 123,103 - University of Cincinnati 93.837 U01HL131755 (9,528) - University of Indiana 93.837 R24HL123767 145,245 - University of Pennsylvania 93.837 R21HL141802 174,516 - University of Southern California 93.837 R01HL133169 204,913 - Yale University 93.837 1R01HL148354 18,815 - Yale University 93.837 7U01HL125511 103,328 - Intermountain Medical Center 93.838 R01HL144624 9,210 - Massachusetts General Hospital 93.838 U01HL123009 311,125 222,360 Massachusetts General Hospital 93.838 USeries 80,881 - National Jewish Health 93.838 R01HL114587 3,042 - Pennsylvania State University 93.838 U10HL109086 4,151 - Texas A & M 93.838 R56HL141744 28,397 - University of North Carolina Chapel Hill 93.838 U24HL138998 409,802 - University of Pittsburgh 93.838 5U01HL128954 10,263 - Vanderbilt University 93.838 R01HL117074 1,526 - Vanderbilt University 93.838 P01HL108800 62,350 - Boston Children's Hospital 93.839 R34HL133384 7,305 - De Novo Therapies 93.839 4R44HL135896 267,684 - Johns Hopkins University 93.839 1K12HL141952 417,239 - National Bone Marrow Donor Program 93.839 HL138660 37,210 - The Ohio State University 93.839 R01HL131720 48,008 - New England Research Institute 93.839 U01HL072268 1,552 - University of Michigan 93.839 P01HL146372 402,068 93,685 University of Michigan 93.839 U01HL117658 1,759 - University of Pittsburgh 93.839 5U01HL133815 5,773 - Brigham and Women's Hospital 93.846 U01AR068043 3,012 - Brigham and Women's Hospital 93.846 U01AR071658 87,376 - Johns Hopkins University 93.846 1R34AR073505 255 - University of Pennsylvania 93.846 R01AR064153 3,356 - University of Pennsylvania 93.846 R01AR072363 23,126 - University of Pennsylvania 93.846 U54AR057319 36,125 - Augusta University, Diacomp 93.847 U24DK115255 44,592 - Baylor College of Medicine 93.847 R01DK101500 6,030 - Children's Mercy Hospital and Clinic 93.847 U01DK066143 11,116 - Duke Univeristy 93.847 U01DK110988 100,557 - George Washington University 93.847 U01DK099924 28,070 - Jaeb Center Health Research 93.847 UC4DK108612 26,575 -
The accompanying notes are an integral part of the schedule. 49
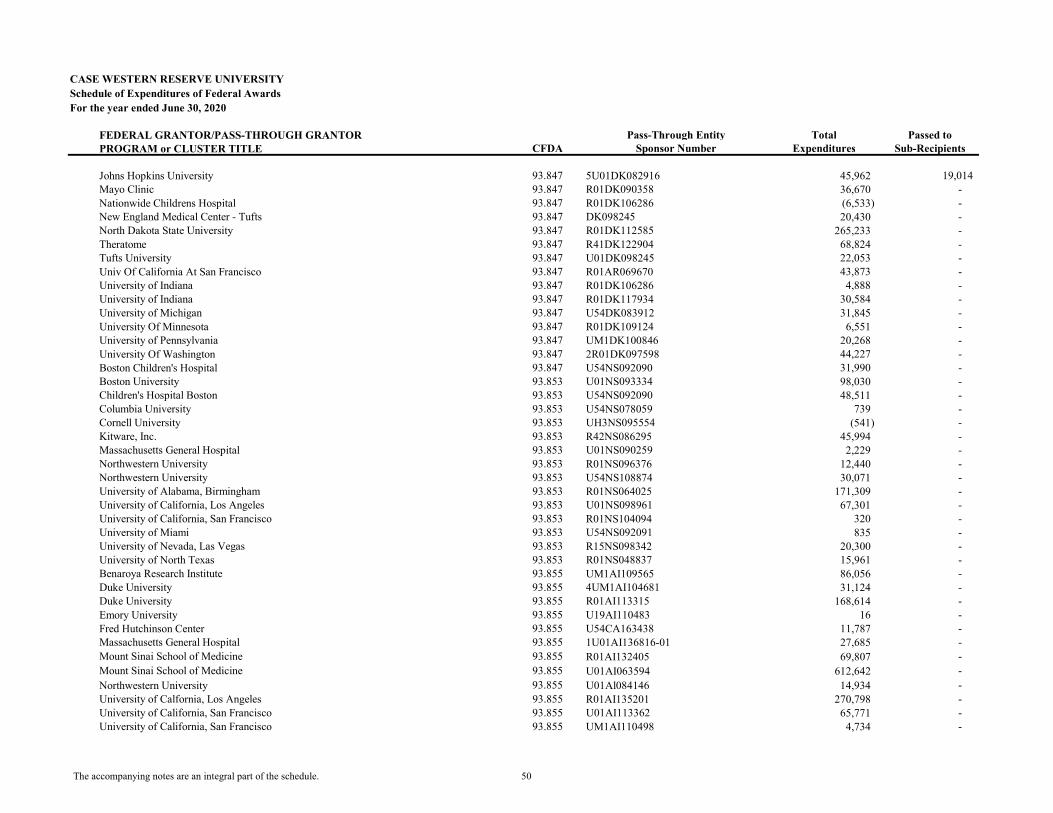
CASE WESTERN RESERVE UNIVERSITYSchedule of Expenditures of Federal AwardsFor the year ended June 30, 2020
FEDERAL GRANTOR/PASS-THROUGH GRANTOR Pass-Through Entity Total Passed toPROGRAM or CLUSTER TITLE CFDA Sponsor Number Expenditures Sub-Recipients
Johns Hopkins University 93.847 5U01DK082916 45,962 19,014 Mayo Clinic 93.847 R01DK090358 36,670 - Nationwide Childrens Hospital 93.847 R01DK106286 (6,533) - New England Medical Center - Tufts 93.847 DK098245 20,430 - North Dakota State University 93.847 R01DK112585 265,233 - Theratome 93.847 R41DK122904 68,824 - Tufts University 93.847 U01DK098245 22,053 - Univ Of California At San Francisco 93.847 R01AR069670 43,873 - University of Indiana 93.847 R01DK106286 4,888 - University of Indiana 93.847 R01DK117934 30,584 - University of Michigan 93.847 U54DK083912 31,845 - University Of Minnesota 93.847 R01DK109124 6,551 - University of Pennsylvania 93.847 UM1DK100846 20,268 - University Of Washington 93.847 2R01DK097598 44,227 - Boston Children's Hospital 93.847 U54NS092090 31,990 - Boston University 93.853 U01NS093334 98,030 - Children's Hospital Boston 93.853 U54NS092090 48,511 - Columbia University 93.853 U54NS078059 739 - Cornell University 93.853 UH3NS095554 (541) - Kitware, Inc. 93.853 R42NS086295 45,994 - Massachusetts General Hospital 93.853 U01NS090259 2,229 - Northwestern University 93.853 R01NS096376 12,440 - Northwestern University 93.853 U54NS108874 30,071 - University of Alabama, Birmingham 93.853 R01NS064025 171,309 - University of California, Los Angeles 93.853 U01NS098961 67,301 - University of California, San Francisco 93.853 R01NS104094 320 - University of Miami 93.853 U54NS092091 835 - University of Nevada, Las Vegas 93.853 R15NS098342 20,300 - University of North Texas 93.853 R01NS048837 15,961 - Benaroya Research Institute 93.855 UM1AI109565 86,056 - Duke University 93.855 4UM1AI104681 31,124 - Duke University 93.855 R01AI113315 168,614 - Emory University 93.855 U19AI110483 16 - Fred Hutchinson Center 93.855 U54CA163438 11,787 - Massachusetts General Hospital 93.855 1U01AI136816-01 27,685 - Mount Sinai School of Medicine 93.855 R01AI132405 69,807 - Mount Sinai School of Medicine 93.855 U01AI063594 612,642 - Northwestern University 93.855 U01Al084146 14,934 - University of Calfornia, Los Angeles 93.855 R01AI135201 270,798 - University of California, San Francisco 93.855 U01AI113362 65,771 - University of California, San Francisco 93.855 UM1AI110498 4,734 -
The accompanying notes are an integral part of the schedule. 50
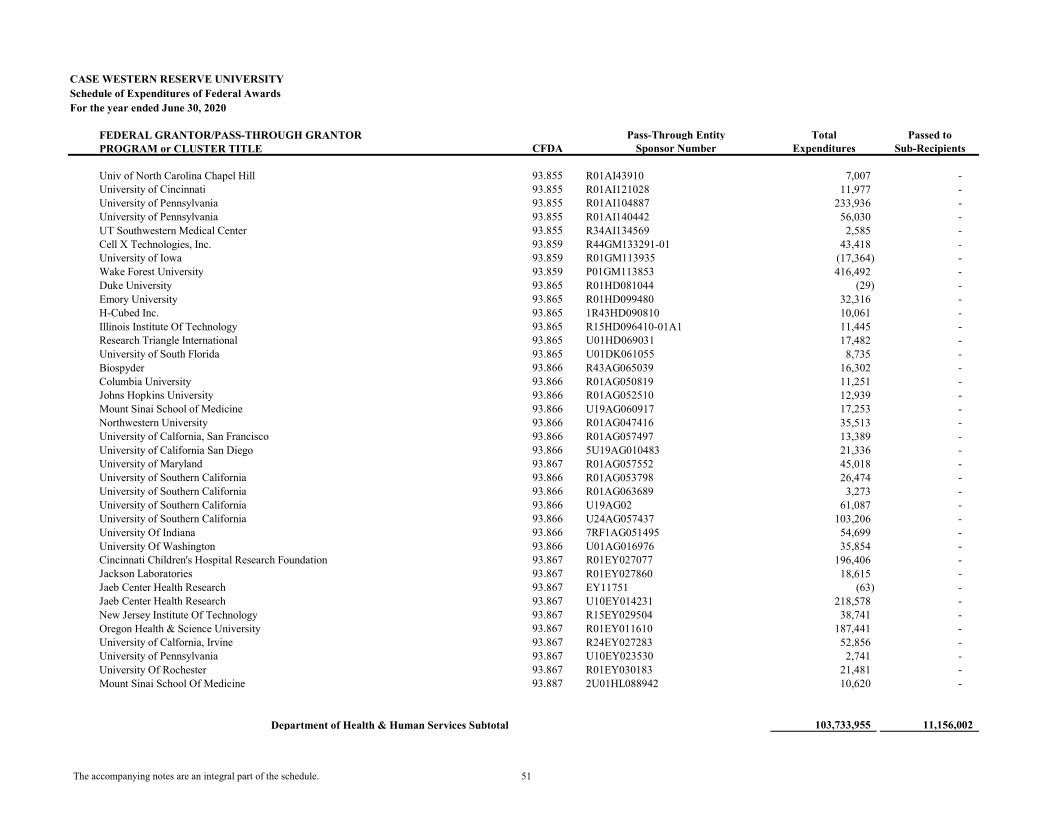
CASE WESTERN RESERVE UNIVERSITYSchedule of Expenditures of Federal AwardsFor the year ended June 30, 2020
FEDERAL GRANTOR/PASS-THROUGH GRANTOR Pass-Through Entity Total Passed toPROGRAM or CLUSTER TITLE CFDA Sponsor Number Expenditures Sub-Recipients
Univ of North Carolina Chapel Hill 93.855 R01AI43910 7,007 - University of Cincinnati 93.855 R01AI121028 11,977 - University of Pennsylvania 93.855 R01AI104887 233,936 - University of Pennsylvania 93.855 R01AI140442 56,030 - UT Southwestern Medical Center 93.855 R34AI134569 2,585 - Cell X Technologies, Inc. 93.859 R44GM133291-01 43,418 - University of Iowa 93.859 R01GM113935 (17,364) - Wake Forest University 93.859 P01GM113853 416,492 - Duke University 93.865 R01HD081044 (29) - Emory University 93.865 R01HD099480 32,316 - H-Cubed Inc. 93.865 1R43HD090810 10,061 - Illinois Institute Of Technology 93.865 R15HD096410-01A1 11,445 - Research Triangle International 93.865 U01HD069031 17,482 - University of South Florida 93.865 U01DK061055 8,735 - Biospyder 93.866 R43AG065039 16,302 - Columbia University 93.866 R01AG050819 11,251 - Johns Hopkins University 93.866 R01AG052510 12,939 - Mount Sinai School of Medicine 93.866 U19AG060917 17,253 - Northwestern University 93.866 R01AG047416 35,513 - University of Calfornia, San Francisco 93.866 R01AG057497 13,389 - University of California San Diego 93.866 5U19AG010483 21,336 - University of Maryland 93.867 R01AG057552 45,018 - University of Southern California 93.866 R01AG053798 26,474 - University of Southern California 93.866 R01AG063689 3,273 - University of Southern California 93.866 U19AG02 61,087 - University of Southern California 93.866 U24AG057437 103,206 - University Of Indiana 93.866 7RF1AG051495 54,699 - University Of Washington 93.866 U01AG016976 35,854 - Cincinnati Children's Hospital Research Foundation 93.867 R01EY027077 196,406 - Jackson Laboratories 93.867 R01EY027860 18,615 - Jaeb Center Health Research 93.867 EY11751 (63) - Jaeb Center Health Research 93.867 U10EY014231 218,578 - New Jersey Institute Of Technology 93.867 R15EY029504 38,741 - Oregon Health & Science University 93.867 R01EY011610 187,441 - University of Calfornia, Irvine 93.867 R24EY027283 52,856 - University of Pennsylvania 93.867 U10EY023530 2,741 - University Of Rochester 93.867 R01EY030183 21,481 - Mount Sinai School Of Medicine 93.887 2U01HL088942 10,620 -
Department of Health & Human Services Subtotal 103,733,955 11,156,002
The accompanying notes are an integral part of the schedule. 51
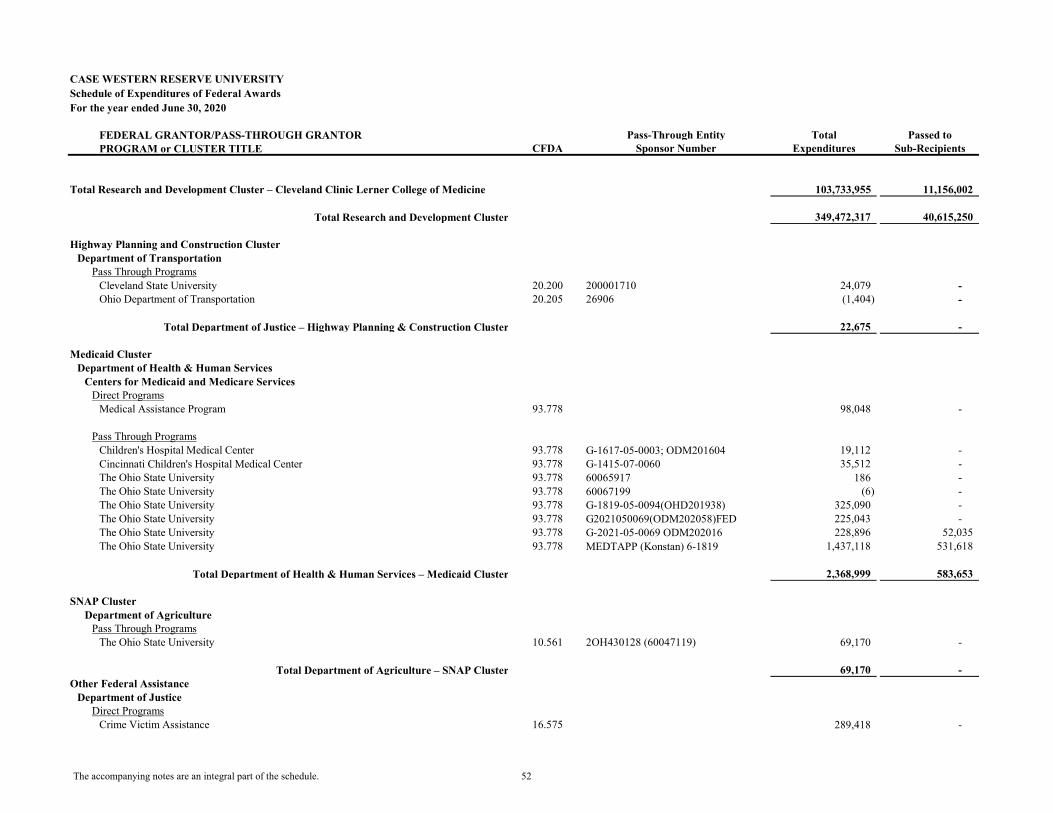
CASE WESTERN RESERVE UNIVERSITYSchedule of Expenditures of Federal AwardsFor the year ended June 30, 2020
FEDERAL GRANTOR/PASS-THROUGH GRANTOR Pass-Through Entity Total Passed toPROGRAM or CLUSTER TITLE CFDA Sponsor Number Expenditures Sub-Recipients
Total Research and Development Cluster – Cleveland Clinic Lerner College of Medicine 103,733,955 11,156,002
Total Research and Development Cluster 349,472,317 40,615,250
Highway Planning and Construction ClusterDepartment of Transportation
Pass Through ProgramsCleveland State University 20.200 200001710 24,079 - Ohio Department of Transportation 20.205 26906 (1,404) -
Total Department of Justice – Highway Planning & Construction Cluster 22,675 -
Medicaid ClusterDepartment of Health & Human Services
Centers for Medicaid and Medicare ServicesDirect Programs
Medical Assistance Program 93.778 98,048 -
Pass Through ProgramsChildren's Hospital Medical Center 93.778 G-1617-05-0003; ODM201604 19,112 - Cincinnati Children's Hospital Medical Center 93.778 G-1415-07-0060 35,512 - The Ohio State University 93.778 60065917 186 - The Ohio State University 93.778 60067199 (6) - The Ohio State University 93.778 G-1819-05-0094(OHD201938) 325,090 - The Ohio State University 93.778 G2021050069(ODM202058)FED 225,043 - The Ohio State University 93.778 G-2021-05-0069 ODM202016 228,896 52,035 The Ohio State University 93.778 MEDTAPP (Konstan) 6-1819 1,437,118 531,618
Total Department of Health & Human Services – Medicaid Cluster 2,368,999 583,653
SNAP ClusterDepartment of Agriculture
Pass Through ProgramsThe Ohio State University 10.561 2OH430128 (60047119) 69,170 -
Total Department of Agriculture – SNAP Cluster 69,170 - Other Federal Assistance
Department of JusticeDirect Programs
Crime Victim Assistance 16.575 289,418 -
The accompanying notes are an integral part of the schedule. 52
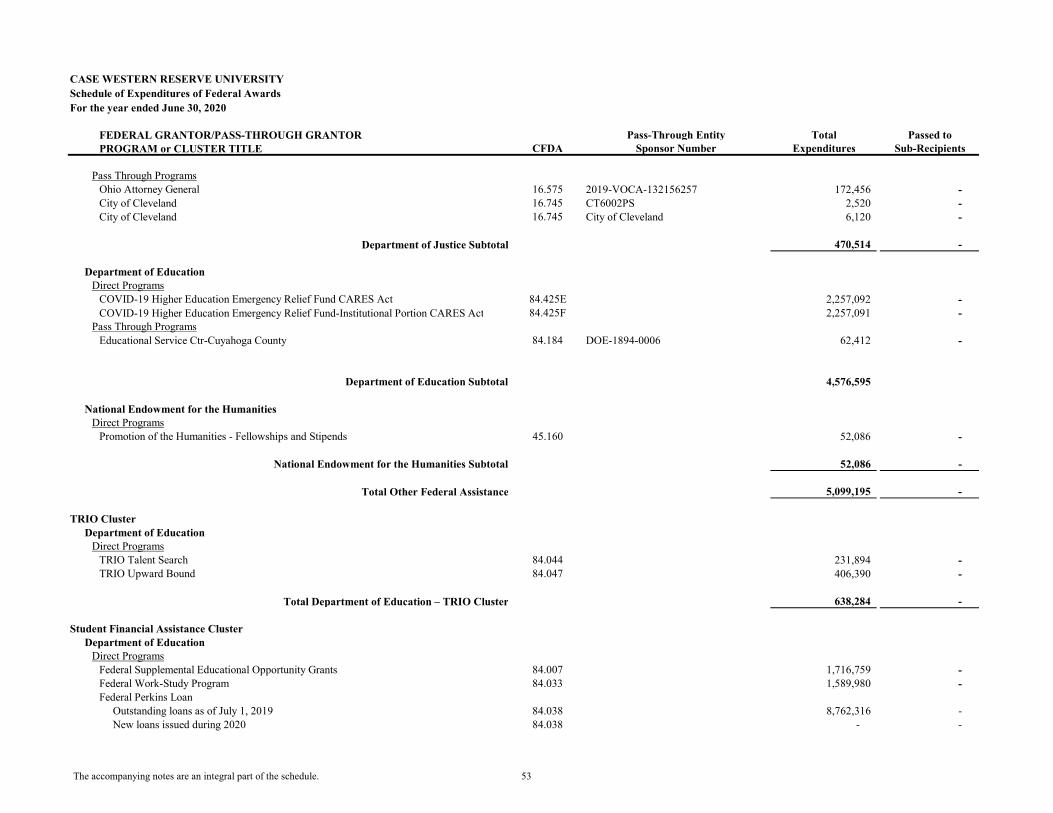
CASE WESTERN RESERVE UNIVERSITYSchedule of Expenditures of Federal AwardsFor the year ended June 30, 2020
FEDERAL GRANTOR/PASS-THROUGH GRANTOR Pass-Through Entity Total Passed toPROGRAM or CLUSTER TITLE CFDA Sponsor Number Expenditures Sub-Recipients
Pass Through ProgramsOhio Attorney General 16.575 2019-VOCA-132156257 172,456 - City of Cleveland 16.745 CT6002PS 2,520 - City of Cleveland 16.745 City of Cleveland 6,120 -
Department of Justice Subtotal 470,514 -
Department of EducationDirect Programs
COVID-19 Higher Education Emergency Relief Fund CARES Act 84.425E 2,257,092 - COVID-19 Higher Education Emergency Relief Fund-Institutional Portion CARES Act 84.425F 2,257,091 -
Pass Through ProgramsEducational Service Ctr-Cuyahoga County 84.184 DOE-1894-0006 62,412 -
Department of Education Subtotal 4,576,595
National Endowment for the HumanitiesDirect Programs
Promotion of the Humanities - Fellowships and Stipends 45.160 52,086 -
National Endowment for the Humanities Subtotal 52,086 -
Total Other Federal Assistance 5,099,195 -
TRIO ClusterDepartment of Education
Direct ProgramsTRIO Talent Search 84.044 231,894 - TRIO Upward Bound 84.047 406,390 -
Total Department of Education – TRIO Cluster 638,284 -
Student Financial Assistance ClusterDepartment of Education
Direct ProgramsFederal Supplemental Educational Opportunity Grants 84.007 1,716,759 - Federal Work-Study Program 84.033 1,589,980 - Federal Perkins Loan Outstanding loans as of July 1, 2019 84.038 8,762,316 - New loans issued during 2020 84.038 - -
The accompanying notes are an integral part of the schedule. 53
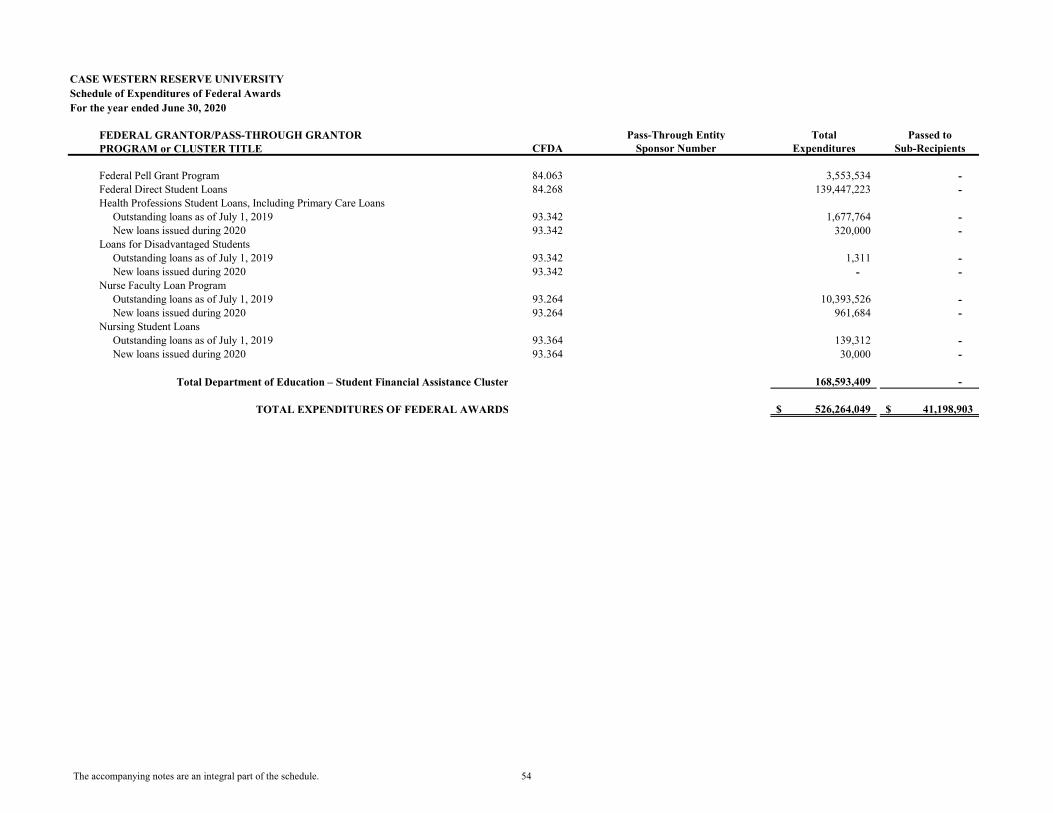
CASE WESTERN RESERVE UNIVERSITYSchedule of Expenditures of Federal AwardsFor the year ended June 30, 2020
FEDERAL GRANTOR/PASS-THROUGH GRANTOR Pass-Through Entity Total Passed toPROGRAM or CLUSTER TITLE CFDA Sponsor Number Expenditures Sub-Recipients
Federal Pell Grant Program 84.063 3,553,534 - Federal Direct Student Loans 84.268 139,447,223 - Health Professions Student Loans, Including Primary Care Loans Outstanding loans as of July 1, 2019 93.342 1,677,764 - New loans issued during 2020 93.342 320,000 - Loans for Disadvantaged Students Outstanding loans as of July 1, 2019 93.342 1,311 - New loans issued during 2020 93.342 - - Nurse Faculty Loan Program Outstanding loans as of July 1, 2019 93.264 10,393,526 - New loans issued during 2020 93.264 961,684 - Nursing Student Loans Outstanding loans as of July 1, 2019 93.364 139,312 - New loans issued during 2020 93.364 30,000 -
Total Department of Education – Student Financial Assistance Cluster 168,593,409 -
TOTAL EXPENDITURES OF FEDERAL AWARDS 526,264,049$ 41,198,903$
The accompanying notes are an integral part of the schedule. 54
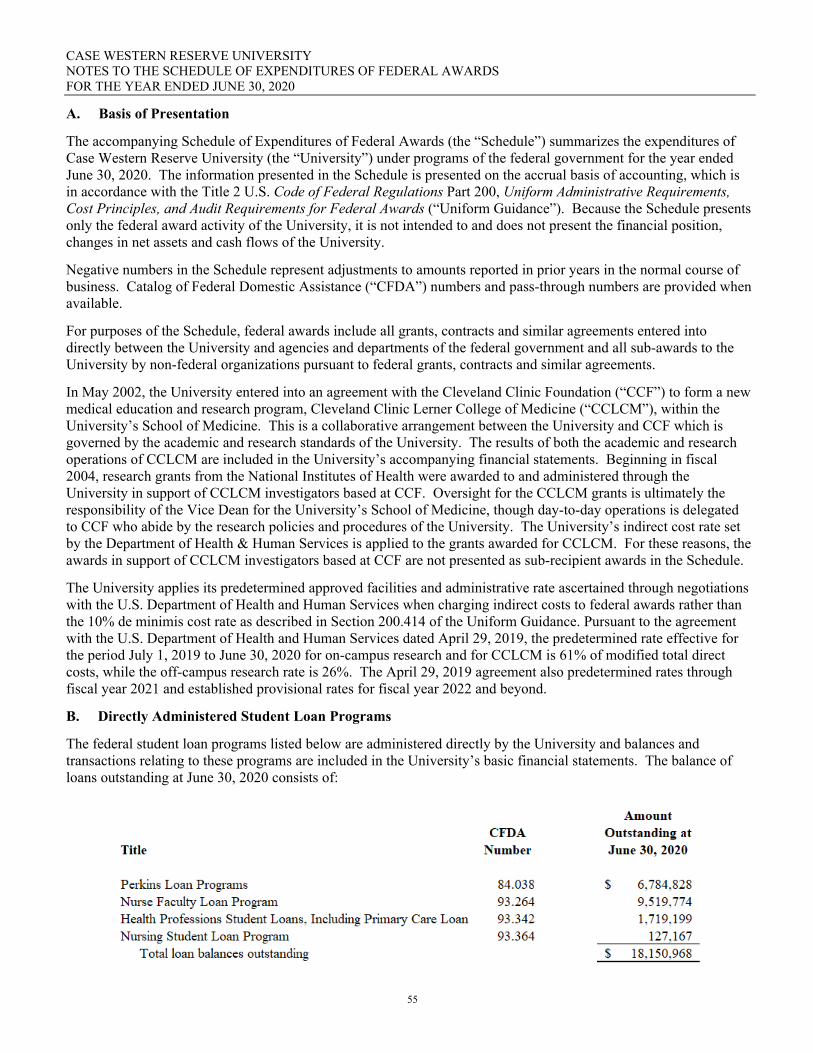
CASE WESTERN RESERVE UNIVERSITY NOTES TO THE SCHEDULE OF EXPENDITURES OF FEDERAL AWARDS FOR THE YEAR ENDED JUNE 30, 2020
55
A. Basis of Presentation
The accompanying Schedule of Expenditures of Federal Awards (the “Schedule”) summarizes the expenditures of Case Western Reserve University (the “University”) under programs of the federal government for the year ended June 30, 2020. The information presented in the Schedule is presented on the accrual basis of accounting, which is in accordance with the Title 2 U.S. Code of Federal Regulations Part 200, Uniform Administrative Requirements, Cost Principles, and Audit Requirements for Federal Awards (“Uniform Guidance”). Because the Schedule presents only the federal award activity of the University, it is not intended to and does not present the financial position, changes in net assets and cash flows of the University.
Negative numbers in the Schedule represent adjustments to amounts reported in prior years in the normal course of business. Catalog of Federal Domestic Assistance (“CFDA”) numbers and pass-through numbers are provided when available.
For purposes of the Schedule, federal awards include all grants, contracts and similar agreements entered into directly between the University and agencies and departments of the federal government and all sub-awards to the University by non-federal organizations pursuant to federal grants, contracts and similar agreements.
In May 2002, the University entered into an agreement with the Cleveland Clinic Foundation (“CCF”) to form a new medical education and research program, Cleveland Clinic Lerner College of Medicine (“CCLCM”), within the University’s School of Medicine. This is a collaborative arrangement between the University and CCF which is governed by the academic and research standards of the University. The results of both the academic and research operations of CCLCM are included in the University’s accompanying financial statements. Beginning in fiscal 2004, research grants from the National Institutes of Health were awarded to and administered through the University in support of CCLCM investigators based at CCF. Oversight for the CCLCM grants is ultimately the responsibility of the Vice Dean for the University’s School of Medicine, though day-to-day operations is delegated to CCF who abide by the research policies and procedures of the University. The University’s indirect cost rate set by the Department of Health & Human Services is applied to the grants awarded for CCLCM. For these reasons, the awards in support of CCLCM investigators based at CCF are not presented as sub-recipient awards in the Schedule.
The University applies its predetermined approved facilities and administrative rate ascertained through negotiations with the U.S. Department of Health and Human Services when charging indirect costs to federal awards rather than the 10% de minimis cost rate as described in Section 200.414 of the Uniform Guidance. Pursuant to the agreement with the U.S. Department of Health and Human Services dated April 29, 2019, the predetermined rate effective for the period July 1, 2019 to June 30, 2020 for on-campus research and for CCLCM is 61% of modified total direct costs, while the off-campus research rate is 26%. The April 29, 2019 agreement also predetermined rates through fiscal year 2021 and established provisional rates for fiscal year 2022 and beyond.
B. Directly Administered Student Loan Programs
The federal student loan programs listed below are administered directly by the University and balances and transactions relating to these programs are included in the University’s basic financial statements. The balance of loans outstanding at June 30, 2020 consists of:
REPORTS ON INTERNAL CONTROL AND COMPLIANCE
PricewaterhouseCoopers LLP, 200 Public Square, 19th Floor, Cleveland, OH 44114-2301 T: (216) 875 3000, F: (216) 566 7846, www.pwc.com/us
56
Report of Independent Auditors on Internal Control Over Financial Reporting and on Compliance and Other Matters Based on an Audit of Financial Statements Performed in
Accordance with Government Auditing Standards
To the Board of Trustees, Case Western Reserve University: We have audited, in accordance with auditing standards generally accepted in the United States of America and the standards applicable to financial audits contained in Government Auditing Standards, issued by the Comptroller General of the United States, the financial statements of Case Western Reserve University (the “University”), which comprise the statement of financial position as of June 30, 2020, and the related statements of activities and of cash flows for the year then ended, and the related notes to the financial statements, and have issued our report thereon dated October 16, 2020, except with respect to footnote 19 to the financial statements and the opinion on the financial responsibility supplemental schedule, as to which the date is March 29, 2021. Internal Control Over Financial Reporting In planning and performing our audit of the financial statements, we considered the University’s internal control over financial reporting (“internal control”) to determine the audit procedures that are appropriate in the circumstances for the purpose of expressing our opinion on the financial statements, but not for the purpose of expressing an opinion on the effectiveness of the University's internal control. Accordingly, we do not express an opinion on the effectiveness of the University's internal control. A deficiency in internal control exists when the design or operation of a control does not allow management or employees, in the normal course of performing their assigned functions, to prevent, or detect and correct, misstatements on a timely basis. A material weakness is a deficiency, or a combination of deficiencies, in internal control such that there is a reasonable possibility that a material misstatement of the entity's financial statements will not be prevented, or detected and corrected on a timely basis. A significant deficiency is a deficiency, or a combination of deficiencies, in internal control that is less severe than a material weakness, yet important enough to merit attention by those charged with governance. Our consideration of internal control was for the limited purpose described in the first paragraph of this section and was not designed to identify all deficiencies in internal control that might be material weaknesses or significant deficiencies. Given these limitations, during our audit we did not identify any deficiencies in internal control that we consider to be material weaknesses. However, material weaknesses may exist that have not been identified. Compliance and Other Matters As part of obtaining reasonable assurance about whether the University’s financial statements are free from material misstatement, we performed tests of its compliance with certain provisions of laws, regulations, contracts and grant agreements, noncompliance with which could have a direct and material effect on the determination of financial statements. However, providing an opinion on compliance with those provisions was not an objective of our audit, and accordingly, we do not express such an opinion. The results of our tests disclosed no instances of noncompliance or other matters that are required to be reported under Government Auditing Standards.
57
Purpose of this Report The purpose of this report is solely to describe the scope of our testing of internal control and compliance and the results of that testing, and not to provide an opinion on the effectiveness of the entity’s internal control or on compliance. This report is an integral part of an audit performed in accordance with Government Auditing Standards in considering the entity’s internal control and compliance. Accordingly, this communication is not suitable for any other purpose. Cleveland, Ohio
October 16, 2020, except with respect to footnote 19 to the financial statements and the opinion on the
financial responsibility supplemental schedule, as to which the date is March 29, 2021.
PricewaterhouseCoopers LLP, 200 Public Square, 19th Floor, Cleveland, OH 44114-2301 T: (216) 875 3000, F: (216) 566 7846, www.pwc.com/us
58
Report of Independent Auditors on Compliance with Requirements That Could Have a Direct and Material Effect on Each Major Program and on Internal
Control Over Compliance in Accordance with the Uniform Guidance
To the Board of Trustees, Case Western Reserve University:
Report on Compliance for Each Major Federal Program We have audited Case Western Reserve University’s (the “University”) compliance with the types of compliance requirements described in the OMB Compliance Supplement that could have a direct and material effect on each of the University’s major federal programs for the year ended June 30, 2020. The University’s major federal programs are identified in the summary of auditors’ results section of the accompanying schedule of findings and questioned costs. Management’s Responsibility Management is responsible for compliance with federal statutes, regulations and the terms and conditions of its federal awards applicable to its federal programs. Auditors’ Responsibility Our responsibility is to express an opinion on compliance for each of the University’s major federal programs based on our audit of the types of compliance requirements referred to above. We conducted our audit of compliance in accordance with auditing standards generally accepted in the United States of America; the standards applicable to financial audits contained in Government Auditing Standards, issued by the Comptroller General of the United States; and the audit requirements of Title 2 U.S. Code of Federal Regulations Part 200, Uniform Administrative Requirements, Cost Principles, and Audit Requirements for Federal Awards (Uniform Guidance). Those standards and the Uniform Guidance require that we plan and perform the audit to obtain reasonable assurance about whether noncompliance with the types of compliance requirements referred to above that could have a direct and material effect on a major federal program occurred. An audit includes examining, on a test basis, evidence about the University’s compliance with those requirements and performing such other procedures as we considered necessary in the circumstances. We believe that our audit provides a reasonable basis for our opinion on compliance for each major federal program. However, our audit does not provide a legal determination of the University’s compliance. Opinion on Each Major Federal Program In our opinion, Case Western Reserve University complied, in all material respects, with the types of compliance requirements referred to above that could have a direct and material effect on each of its major federal programs for the year ended June 30, 2020. Report on Internal Control Over Compliance Management of the University is responsible for establishing and maintaining effective internal control over compliance with the types of compliance requirements referred to above. In planning and performing our
59
audit of compliance, we considered the University’s internal control over compliance with the types of requirements that could have a direct and material effect on each major federal program to determine the auditing procedures that are appropriate in the circumstances for the purpose of expressing an opinion on compliance for each major federal program and to test and report on internal control over compliance in accordance with the Uniform Guidance, but not for the purpose of expressing an opinion on the effectiveness of internal control over compliance. Accordingly, we do not express an opinion on the effectiveness of the University’s internal control over compliance. A deficiency in internal control over compliance exists when the design or operation of a control over compliance does not allow management or employees, in the normal course of performing their assigned functions, to prevent, or detect and correct, noncompliance with a type of compliance requirement of a federal program on a timely basis. A material weakness in internal control over compliance is a deficiency, or combination of deficiencies, in internal control over compliance, such that there is a reasonable possibility that material noncompliance with a type of compliance requirement of a federal program will not be prevented, or detected and corrected, on a timely basis. A significant deficiency in internal control over compliance is a deficiency, or a combination of deficiencies, in internal control over compliance with a type of compliance requirement of a federal program that is less severe than a material weakness in internal control over compliance, yet important enough to merit attention by those charged with governance. Our consideration of internal control over compliance was for the limited purpose described in the first paragraph of this section and was not designed to identify all deficiencies in internal control over compliance that might be material weaknesses or significant deficiencies. We did not identify any deficiencies in internal control over compliance that we consider to be material weaknesses. However, material weaknesses may exist that have not been identified. The purpose of this report on internal control over compliance is solely to describe the scope of our testing of internal control over compliance and the results of that testing based on the requirements of the Uniform Guidance. Accordingly, this report is not suitable for any other purpose. Cleveland, Ohio March 29, 2021
SCHEDULE OF FINDINGS AND QUESTIONED COSTS
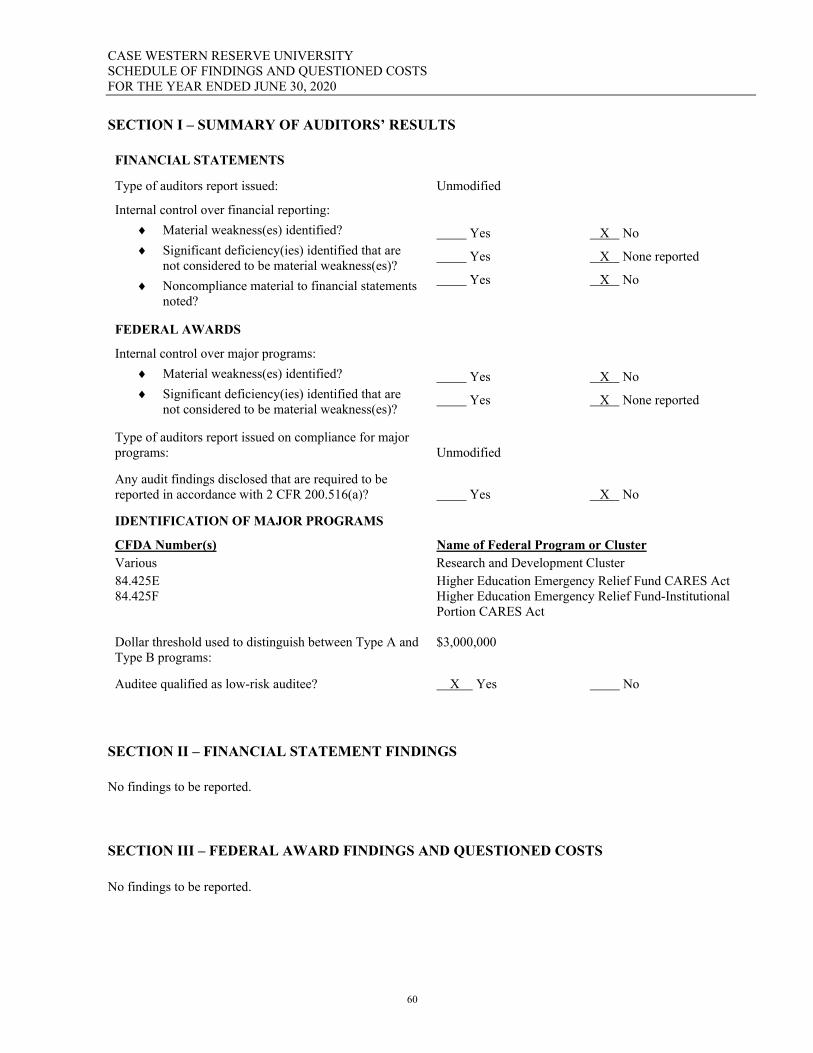
CASE WESTERN RESERVE UNIVERSITY SCHEDULE OF FINDINGS AND QUESTIONED COSTS FOR THE YEAR ENDED JUNE 30, 2020
60
SECTION I – SUMMARY OF AUDITORS’ RESULTS
FINANCIAL STATEMENTS
Type of auditors report issued: Unmodified
Internal control over financial reporting:
Material weakness(es) identified?
Significant deficiency(ies) identified that are not considered to be material weakness(es)?
Noncompliance material to financial statements noted?
Yes
Yes
Yes
X No
X None reported
X No
FEDERAL AWARDS
Internal control over major programs:
Material weakness(es) identified?
Significant deficiency(ies) identified that are not considered to be material weakness(es)?
Yes
Yes
X No
X None reported
Type of auditors report issued on compliance for major programs:
Unmodified
Any audit findings disclosed that are required to be reported in accordance with 2 CFR 200.516(a)?
Yes
X No
IDENTIFICATION OF MAJOR PROGRAMS
CFDA Number(s) Name of Federal Program or Cluster Various Research and Development Cluster 84.425E 84.425F
Higher Education Emergency Relief Fund CARES Act Higher Education Emergency Relief Fund-Institutional Portion CARES Act
Dollar threshold used to distinguish between Type A and Type B programs:
$3,000,000
Auditee qualified as low-risk auditee? X Yes No
SECTION II – FINANCIAL STATEMENT FINDINGS No findings to be reported. SECTION III – FEDERAL AWARD FINDINGS AND QUESTIONED COSTS No findings to be reported.
SUMMARY SCHEDULE OF PRIOR AUDIT FINDINGS AND STATUS

CASE WESTERN RESERVE UNIVERSITY SUMMARY SCHEDULE OF PRIOR AUDIT FINDINGS AND STATUS FOR THE YEAR ENDED JUNE 30, 2020
61
There are no findings from prior years that require an update in this report.