Embed Size (px)
Citation preview

C A R B O N 6 5 ( 2 0 1 3 ) 2 1 4 – 2 2 7
.sc iencedi rect .com
Avai lab le at wwwScienceDirect
journal homepage: www.elsev ier .com/ locate /carbon
Carbon meringues derived from flavonoid tannins
0008-6223/$ - see front matter � 2013 Elsevier Ltd. All rights reserved.http://dx.doi.org/10.1016/j.carbon.2013.08.017
* Corresponding author at: Institut Jean Lamour, UMR CNRS – Universite de Lorraine n�7198, ENSTIB, 27 rue Philippe Seguin,88026 Epinal cedex, France. Fax: +33 329 29 61 38.
E-mail address: [email protected] (A. Celzard).
A. Szczurek a, V. Fierro a, A. Pizzi b,c,d, M. Stauber e, A. Celzard a,b,*
a Institut Jean Lamour, UMR CNRS – Universite de Lorraine n�7198, ENSTIB, 27 rue Philippe Seguin, CS 60036, 88026 Epinal cedex, Franceb Universite de Lorraine, ENSTIB, 27 rue Philippe Seguin, CS 60036, 88026 Epinal cedex, Francec LERMAB, EA 4370, ENSTIB, 27 rue Philippe Seguin, CS 60036, 88026 Epinal cedex, Franced King Abdulaziz University, Jeddah, Saudi Arabiae b-cube AG, Fabrikweg 2, 8306 Bruttisellen, Switzerland
A R T I C L E I N F O
Article history:
Received 10 May 2013
Accepted 9 August 2013
Available online 16 August 2013
A B S T R A C T
New macro-cellular carbons, called carbon meringues, have been prepared by whipping
until stiff an aqueous solution of tannin until liquid foam was obtained, which was next
stabilized in an oven and pyrolysed, hence their name. With such cheap, fast and very easy
process, flawless, homogeneous carbon foams were obtained in a wider range of density
than that of more conventional cellular vitreous carbon (CVC) foams derived from similar
formulations but made by physical foaming. The porosity, the average cell size and the cell
wall thickness were only controlled by the initial concentration of tannin, all other things
being equal. The resultant carbon meringues were fully investigated by electron micros-
copy, X-ray tomography, mercury porosimetry, Kr and N2 adsorption, thermal conductivity
and mechanical compression studies. Differences with former CVC foams, and advantages
of the new process and materials have been emphasised.
� 2013 Elsevier Ltd. All rights reserved.
1. Introduction
Carbon foams are versatile materials which can be prepared
by different processes and from various precursors [1–5].
Thus, two main families exist having either a reticulated or
a cellular porous structure. Reticulated foams are based on
very open, polyhedral, cells from which only struts remain.
In cellular foams, cell walls exist, leading to either polyhedral
or spherical cells, depending on the total porosity. Cellular
carbon foams have less open structure than reticulated ones,
given that their cells are connected with each others through
much smaller windows. As a general rule, reticulated carbon
foams are obtained by pyrolysis of reticulated thermosetting
polymers. Therefore the resultant carbon is glasslike, and
the corresponding foams are called reticulated vitreous car-
bon (RVC) foams [6,7]. However, reticulated graphitic foams
have also been prepared from template methods [8,9]. On
the other hand, cellular carbons may be prepared either from
the pyrolysis of cellular, non fusible, polymers, or from foam-
ing, stabilization and carbonisation of petroleum, coal tar or
synthetic pitches. The resultant materials are thus called cel-
lular vitreous carbon (CVC) [4,10] or cellular graphitic carbon
(CGC) foams [11–13], respectively.
Because of their different porous structures and carbon
textures, RVC, CVC and CGC foams have different properties
and thus different applications. RVC foams have thus been
suggested as materials for various kinds of electrodes [14],
including for microbial fuel cells [15], for photocatalysis [16],
for thermal insulation and aerospace applications [17], for
acoustic devices [18] and Refs. therein and for clinical applica-
tions [19]. CVC foams have higher mechanical properties than
RVC foams of similar density due to their less open structure,
and have been suggested as impact absorbers by irreversible
deformation [20,21]. They were also shown to be valuable
CS 60036,
C A R B O N 6 5 ( 2 0 1 3 ) 2 1 4 – 2 2 7 215
materials for electromagnetic applications [22,23] and are
excellent thermal insulators [24]. Finally, CGC foams being
highly thermally and electrically conducting have been sug-
gested as heat exchangers [25–27], as host for phase change
materials [28,29], and as electrode materials for electrochem-
ical energy storage and conversion [30,31]. GVC foams were
also found to be excellent sound absorbing materials [32].
Few works have been reported on CVC foams, and mainly
two kinds of precursors were used: phenolic resins on one
hand, either of natural origin such as flavonoid tannins
[4,10,18,20,21,23,24,33–35] or of synthetic origin [36], and su-
crose on the other hand [3,37,38]. All led to macro-cellular,
brittle, solids having disordered carbon structure. Most of
times, such materials were prepared by physical or chemical
foaming, or both together, whether a non-reactive blowing
agent was used or a gas was formed from the reactants,
respectively, see [10]. In a few cases, CVC foams were also ob-
tained by emulsion-templating, but their structure is different
from that of typical materials obtained by foaming [39–42],
especially their average pore size is typically two orders of
magnitude smaller.
Each preparation method has its own drawbacks. Foaming
can be controlled by the composition of the initial mixture,
and requires a low-boiling point, most of times highly flam-
mable, solvent in physical foaming, whereas chemical foam-
ing depends on the decomposition of some compounds into a
gas. Finally, emulsion-templating is also not so easy to control
in terms of final pore size, and the porosity of the resultant
materials is generally lower than that of true foams. We thus
wondered if a simpler method, free of porogen and not
involving the evolution of a gas might be possible. Consider-
ing how highly porous and repeatable materials can be pre-
pared in a kitchen by careful selection and treatment of a
small number of ingredients, we made carbon foams by whip-
ping tannin solutions containing a surfactant and carbonising
the resultant liquid foams. We called these new materials
‘‘carbon meringues’’ by complete analogy with the classical
meringues made by whipping egg whites until stiff and stabi-
lizing them in an oven. This term also allows separating these
new materials from other cellular carbons made by classical
foaming. The advantage is the extreme easiness, fastness
and repeatability of the procedure, requiring less chemicals,
no washing but only a curing step in an oven before pyrolysis.
Additionally, the pore sizes can be controlled by the concen-
tration of the initial solution.
2. Experimental
2.1. Foams preparation
‘‘Green’’ meringues were first prepared from tannin extract,
using the same commercially raw available material as in
our past works on tannin-based foams, i.e. a light-brown
powder sold under the name Tupafin by the company Silva-
Chimica (St. Michele Mondovi, Italy). Details about composi-
tion, chemical formula, reactivity and impurities have been
abundantly given elsewhere [43–45]. Briefly, such commercial
Mimosa (Acacia mearnsii, de Wild) tannin extract, mainly used
for leatherwork, consists of 80–82% of actual phenolic flavo-
noid materials having a reactivity similar to that of resorcinol
with aldehydes. Therefore, high-quality resins can be derived
from flavonoid tannins, and indeed already have applications
as base of ecological wood adhesives [46]. In addition to tan-
nin, being the base of the resin, the following chemicals were
used: a surfactant (Cremophor EFP�, being an ethoxylated
castor oil) allowing to obtain a stable foam, a crosslinker
(hexamethylenetetramine, referred to as hexamine in the fol-
lowing, widely used in medicine and much less toxic than
formaldehyde), and a catalyst (para toluene sulphonic acid
(pTSA)).
In our experiments, 15–25 g of tannin, 1.06–1.76 g of hexa-
mine in powder, 3.09–3.14 g of surfactant, and 1.12 g of pTSA
were used with 25–35 mL of distilled water. These formula-
tions were such that the tannin concentrations could range
from 30 to 50 wt.%, the hexamine/tannin weight ratio was
kept constant at 0.071, and the concentration of surfactant
was always 5.6 wt.%. First, tannin, hexamine and pTSA were
dissolved in water at room temperature to obtain a homoge-
neous, brown, solution. The mixture was mechanically stirred
with a Teflon-lined blade mixer at 500 rpm for 10 min. Next,
the surfactant was added, and the rotation speed of the blade
mixer was increased to 2000 rpm and left for a period of
20 min. During this time, aeration of the solution gradually
converted it into liquid foam. Stirring time had an influence
on the result, since low mixing times were not enough for a
complete foaming, but without apparent influence on the cell
size. Due to the presence of surfactant, the foam was stable
but within a limited time. The material was thus protected
with an aluminium sheet, and transferred into a ventilated
oven preheated at 85 �C, in which stabilization was carried
out. Crosslinking was assumed to be complete after 24 h, after
which the protective cover was removed and the foam was
left to cool and dry at room temperature. In a few cases, some
cracks appear at the surface of the foams during drying,
which visually disappeared when the drying process was
completed. Such problem could be avoided by longer curing
times, up to 72 h spent in the oven, after which drying was
no more necessary, leading to crack-free ‘‘green’’ meringues.
The whole step-by-step process is shown in Fig. 1.
The solid foams were finally carbonised at 900 �C in high-
purity nitrogen atmosphere flowing at 100 mL min�1. The
heating rate was 3 �C min�1 and dwell time 2 h, after which
the furnace was allowed to cool down to room temperature
under nitrogen flow. The resultant carbon meringues re-
mained fully monolithic and homogeneous. No crack was ob-
served despite significant volume shrinkage of 55–60%. The
weight loss was the same, so that the bulk density of the car-
bon foams was the same as that of their precursors, as al-
ready observed for previous tannin-based foams made by
physical foaming [33]. The resultant materials were called
CMx, where CM means carbon meringue and x is the wt.%
of tannin in the initial solution.
2.2. Foams characterization
2.2.1. Determination of bulk and skeletal densityThe total porosity, U (dimensionless), was calculated accord-
ing to the following Eq. (1), in which qb and qs are the bulk
density and the skeletal density of the foams, respectively:

Tannin solution 5 min of stirring 15 min of stirring Curing at 85oC
Organic meringue Carbon meringue
Fig. 1 – Step-by-step preparation of tannin-based organic and carbon meringues.
216 C A R B O N 6 5 ( 2 0 1 3 ) 2 1 4 – 2 2 7
U ¼ 1� qb
qs
ð1Þ
qb, being simply the mass of material divided by the total vol-
ume it occupies, was determined by accurately measuring the
dimensions of parallelepiped samples and weighing them. qs,
being the density of the solid from which the considered
materials are made, was estimated by helium pycnometry
using an Accupyc II 1340 (Micromeritics) automatic appara-
tus. For that purpose, all samples were crushed in an agate
mortar and evacuated at 160 �C, so errors due to possible
closed porosity could be avoided. From such measurements,
the specific pore volume Vp (cm3 g�1) was obtained by applica-
tion of Eq. (2):
Vp ¼1qb
� 1qs
ð2Þ
2.2.2. Adsorption experimentsPore texture parameters were obtained by krypton or nitrogen
adsorption at �196 �C using an ASAP 2020 (Micromeritics)
automatic apparatus. All the samples were first studied using
nitrogen as the probe molecule, and those leading to very low
surface areas, typically lower than 8 m2 g�1, were also investi-
gated with krypton to obtain a much higher accuracy. In all
the cases, carbon foams were degassed for 48 h under vac-
uum at 250 �C prior to any adsorption experiment. From Kr
and N2 adsorption isotherms, the surface area, SBET (m2 g�1)
was determined from the BET calculation method applied to
a range of relative pressures such that the BET constant was
always positive [47].
2.2.3. Mercury porosimetryIn addition to these methods, meso and macropore size dis-
tributions were determined by mercury intrusion, using an
AutoPore IV 9500 (Micrometrics) porosimeter. The experi-
ments were performed in two steps, first in the low pressure
range (0.001–0.24 MPa) and next in the high pressure range
(0.24–414 MPa). Thus, investigating pores as narrow as
3.6 nm was possible by application of Washburn’s equation:
Dp ¼ �4c cos h
Pð3Þ
in which Dp (nm) is the pore diameter, and P (MPa), c
(485 mJ m�2) and h (140�) are the isostatic pressure, surface
tension and contact angle of mercury, respectively.
2.2.4. Scanning electron microscope (SEM) observationsThe main structural and morphological characteristics of car-
bon foams: cell structure, average cell size, and average win-
dow diameter, were evaluated with two SEM microscopes: a
FEI Quanta 600 FEG equipped with a detector of secondary
electrons (SE) on one hand, and a Hitachi TM3000 equipped
with a backscattered electrons (BSE) detector on the other
hand. The former indeed provided best evidence of the topo-
logical contrast, whereas the latter allowed visualising the
chemical contrast. Such complementary images are of great
interest, since cells and pore walls are very well defined using
SE, but struts and cell windows are much more clearly dis-
cernible with BSE. Consequently, average cell sizes and aver-
age window diameters were estimated from images
obtained with SE and BSE, respectively. The samples were first
metallised with carbon for ensuring a perfect electrical con-
tact with the sample-holder, and average cell and windows
diameters were estimated by a method suggested elsewhere
[48] and briefly described as follows. The numbers of cells,
Nc, or windows, Nw, per unit length of straight line drawn par-
allel to the principal directions of a number of pictures made
with SE or BSE detectors, respectively, were obtained by use of
the Image Pro-Plus 6.0 software. From such values, the aver-
age diameters of cells, Dc, and of windows, Dp, were calculated
according to the following equations:
Dc ¼1:5Nc
and Dp ¼1:5Nw
ð4Þ
2.2.5. Micro-computed tomography (lCT)All samples were scanned using a lCT100 microCT system
(Scanco Medical AG, Bruttisellen, Switzerland) to assess the
porous structure. Measurements were stored in three-dimen-

Table 1 – Definitions of morphometric quantities derived from lCT studies.
Quantity Description Detail or references
TV Total volume of the VOIBV Backbone volumePV Pore volume PV = TV � BVBS Backbone surfaceBV/TV Backbone volume densityPV/TV Pore volume density PV/TV = 1 � BV/TVBS/TV Backbone surface densityBS/BV Specific backbone surfaceS.Th Mean strut thickness Hildebrand et al. [51]C.Dm Mean cell diameter Hildebrand et al. [51]B.Conn.D Backbone connectivity density Odgaard et al. [52]C.Conn.D Cell connectivity density Odgaard et al. [52]
C A R B O N 6 5 ( 2 0 1 3 ) 2 1 4 – 2 2 7 217
sional image arrays with isotropic voxel sizes of 7.4 lm. The
reconstructed images were filtered using a constrained 3D
Gaussian filter with finite filter support (1 voxel) and filter
width (0.8) to partially suppress noise in the volumes. The
images were then binarised to separate the object from back-
ground using a global thresholding procedure. A component
labelling algorithm was subsequently applied to remove all
unconnected parts which typically arise from image noise.
A centered cuboid (2.96 · 2.96 · 2.96 mm edge length) vol-
ume of interest (VOI) was digitally extracted from the mea-
sured data. Selecting a digital sub-volume indeed reduces
boundary artefacts that may occur from sample preparation.
The final images of the VOI were then analysed with standard
morphometric algorithms [49,50]. The quantities which were
calculated in the present study are summarized in Table 1.
2.2.6. Thermal conductivityThermal conductivity measurements were carried out at
room temperature for carbon foams having different densi-
ties. Thermal conductivity was measured by the transient
plane source method (Hot Disk TPS 2500, ThermoConcept,
France). The method is based on a transiently heated plane
sensor, used both as a heat source and as a dynamic temper-
ature sensor. It consists of an electrically conducting pattern
in the shape of a double spiral, which has been etched out
of a thin nickel foil and sandwiched between two thin sheets
of Kapton�. The plane sensor was fitted between two identi-
cal parallelepiped pieces of foam, each one having a smooth,
flat, surface facing the sensor. From the temperature profile
following a heat pulse delivered by one spiral, the thermal
conductivity was calculated by the Hot Disk 6.1 software.
2.2.7. Compression testsThe mechanical properties were investigated by compression
in quasi static conditions using an Instron 5944 universal test-
ing machine equipped with a 2 kN head. The compression
tests were carried out at a constant load rate of 1 mm min�1
during which deformation and load were continuously re-
corded. All the materials exhibited the expected elastic-brittle
behaviour already observed for other CVC foams [4,10,20], so
that the stress–strain characteristics presented three consec-
utive regimes: a linear part at low strain, typically up to 10%
strain, a long serrated plateau corresponding to the collapse
of successive cell layers, typically from 10% to 80% strain,
and further a densification regime after most of the porosity
disappeared. The compressive modulus and the compressive
strength were determined according to the method described
elsewhere [21]: the modulus was defined as the slope of the
linear, initial, part of the curve presenting the steepest slope,
whereas the strength was defined as the highest height of the
long serrated plateau. The densification strain was defined as
the strain at the point of intersection between the horizontal
axis of the plot and the backward extended densification line.
3. Results and discussion
3.1. Foams structure and characteristics
The skeletal density of carbon meringues was found to be,
whatever the samples, 1.98 ± 0.02 g cm�3. This value is ex-
actly the same as [4], or almost equal to [10], that already
measured for other tannin-based CVC foams. Measured bulk
densities and total porosities and specific pore volumes calcu-
lated from Eqs. (1) and (2) are listed in Table 2. The most strik-
ing result is how the density, and hence the porosity, changed
with the concentration of tannin in the initial solution, all
other things being equal. Meringues made from concentra-
tions lower 30 wt.% of tannin were extremely lightweight,
fragile, and hard to handle without breaking them. Concen-
trations higher than 50 wt.% led to phase separation after
whipping of the solution, giving strong foam on the upper
part and a poorly porous, glasslike, solid at the bottom. As a
consequence, only the concentration range 30–50 wt.% was
explored, which very easily led to a much broader range of
bulk densities than what could be obtained by physical foam-
ing, for which typical densities were 0.045–0.159 g cm�3 [33].
As a result, the range of porosity was also broader than that
of classical tannin-based CVC foams, see Table 2.
Raw and differential mercury intrusion curves, plotted as a
function of pressure and pore diameter, respectively, are pre-
sented in Fig. 2. Large cumulative intruded volumes were al-
ways found within the pressure range 0.01–0.1 MPa,
corresponding to window size of 150–15 lm. However, the
data of Fig. 2(a) should be considered with care, since in-
truded volumes were not always correlated with bulk density.
This finding is explained by the fact that, in low-density

Table 2 – Name, bulk density, specific pore volume, highest peak window size and linear cell density of tannin-based carbonmeringues.
Sample name Bulkdensity (g cm�3)
Total porositya
(%)Specific porevolumeb (cm3 g�1)
Peak windowsizec (lm)
Linear celldensityd (ppi)
CM30 0.027 98.6 36.5 169 45CM35 0.039 98.0 25.1 150 55CM40 0.043 97.8 22.8 106 60CM45 0.075 96.2 12.8 84 70CM50 0.187 90.6 4.8 16 100a Calculated from Eq. (1).b Calculated from Eq. (2).c Derived from Fig. 2(b).d Derived from SEM observations.
0
5
10
15
20
0.001 0.01 0.1 1 10 100 1000
CM30CM35CM40CM45CM50
Pressure (MPa)
Cum
ulat
ive
intr
usio
n (c
m3 g
-1)
Incr
emen
tal i
ntru
sion
(cm
3 g-1
)
Pore size (µm)
0
1
2
3
4
10 100
CM30CM35CM40CM45CM50
(a) (b)
Fig. 2 – (a) Mercury intrusion curves; (b) Corresponding pore size distributions.
218 C A R B O N 6 5 ( 2 0 1 3 ) 2 1 4 – 2 2 7
foams, the pores (windows and cells) were so big (larger than
200 lm) that a significant part of the porosity was already
filled by mercury far before the porosimeter attributes to the
actual sample the mercury volume which penetrated the
sample holder at low pressure. On the contrary, high-density
foams had a significant number of cells whose windows were
closed by thin membranes, as clearly shown by SEM images
(see below). However, despite such a fraction of closed win-
dows, all the materials remained open cells foams.
From Fig. 2(a), the window-size distributions were calcu-
lated by application of Eq. (3), see Fig. 2(b). The average pore
sizes were clearly shifted towards lower values when the den-
sity increased, from 160 lm in CM30 to 16 lm in CM50. All
pore-size distributions (PSDs) were indeed rather unimodal,
presenting a clear peak corresponding to the main window
size whose values are reported in Table 2.
SEM pictures taken with both secondary and backscat-
tered electron detectors are given in Fig. 3. As the density in-
creased, the cells clearly changed from polyhedral to
spherical. Thus, at low density, typically below 0.05 g cm�3,
the observed porous structure cannot be separated from that
of CVC foams made by physical foaming [33]. But at higher
density, the cells are more evenly rounded and have a nar-
rower distribution of sizes, and the connectivity is also much
lower than in previous tannin-based CVC foams. The reason
of such change of cell morphology may be associated to the
viscosity of initial mixtures, which increased with the con-
centration of tannin. Viscosity is indeed known to influence
the structure of foams, higher viscosity limiting the drainage
of liquid out of the cell walls and generating forces which are
larger than those of surface tension, thus giving structures
which are not at equilibrium (in the sense of having cell walls
which meet at 120�) [53].
Cell sizes and windows sizes were measured on SEM pic-
tures as explained in subsection 2.2.4. The values of the for-
mer allowed calculating the linear cell density, usually
expressed in pores per inch (ppi) (here ‘‘pores’’ meaning
‘‘cells’’), which has been reported in Table 2, and which ranged
from 45 to 100 ppi. Both cell sizes and windows sizes de-
creased when the density increased, as shown in Fig. 4. Such
behaviours were expected and are well known in most foams,
whatever the way they were prepared. The corresponding
curves could be fitted by power laws such as:
Dc / qxb ð5Þ
Dw / qyb ð6Þ
in which Dc and Dw are average cell and window diameters,
respectively, and x and y are the corresponding exponents
whose values describe how Dc and Dw change with bulk den-

1mm
1mm
1mm
1mm
1mm
1mm
1mm
1mm
1mm
1mm
a
b
c
d
e
f
g
h
i
j
1mm
1mm
1mm
1mm
1mm
1mm
1mm
1mm
1mm
1mm
1mm1mm1mm
1mm1mm1mm
1mm1mm1mm
1mm1mm1mm
1mm1mm1mm
1mm1mm1mm
1mm1mm1mm
1mm1mm1mm
1mm1mm1mm
1mm1mm1mm
a
b
c
d
e
f
g
h
i
j
Fig. 3 – SEM images of carbon meringues prepared with
different concentrations of tannin, obtained with secondary
(left) and backscattered electron (right) detectors. From (a) to
(e) and from (f) to (j): CM30 (top), CM35, CM40, CM 45 and
CM50 (bottom).
0
100
200
300
400
500
600
0 0.05 0.1 0.15 0.2
Cells
Windows
Bulk density (g cm-3)
Pore
siz
e (µ
m)
Fig. 4 – Average cell and windows diameters derived from
SEM pictures by application of Eq. (4). The curves were
calculated from Eqs. (5) and (6).
C A R B O N 6 5 ( 2 0 1 3 ) 2 1 4 – 2 2 7 219
sity. In the present case, x and y were found to be �0.4 and �1,
respectively, as shown in Fig. 4. In tannin-based CVC foams
made by physical foaming, the same exponents took values
of �1 and �0.7, respectively [33]. In our previous work, we
had demonstrated that x = �1 was directly related to the
amount of blowing agent, but we could not predict the theo-
retical value of y. We could just come to the conclusion that
cell and window diameters were not proportional. Finding
very different exponents in carbon meringues simply sug-
gests a completely different way of forming the porous struc-
ture. Interestingly, carbon meringues were almost fully
isotropic, unlike all other foams for which vertical rising al-
ways produced more or less elongated cells, due to such
directional evolution of a gas within the resin. A final remark
concerns the window sizes, which were found to be very close
to the peak values estimated by mercury porosimetry (see
again Fig. 2(b)).
SEM pictures taken at higher magnification (Fig. 5(a and b))
show that cell walls are smooth but pierced with very small
holes, having typical diameters within the range 0.5–5 lm.
When cell walls are broken, it can be seen that the structure
of the solid is based on microspheres whose typical sizes
range from 1 to 4 lm. The spherical nodules observed in
Fig. 5(a and b) had never been observed in any former tan-
nin-based CVC foam. Their occurrence is explained by the
use of hexamine instead of formaldehyde as a crosslinker.
The reaction between hexamine and flavonoid tannin was in-
deed thoroughly documented by Pichelin et al. [54], and the
same nodular structures were observed and explained as fol-
lows. Briefly, mixing tannin and hexamine solutions instantly
leads to a gel, forming a stiff ‘‘chewing gum’’-like mass of very
high viscosity which can, however, be brought down to al-
most the viscosity of water by just adding a few drops of extra
water and applying very vigorous stirring [55]. Doing this, the
solution changes remarkably in colour, becoming much paler,
and shows microscopic particles, in certain cases even obser-
vable to the naked eye. This unusual behaviour of hexamine
indicates that some form of complexation has occurred. It
was indeed demonstrated that hexamine forms complexes
with flavonoid tannins involving the positive charge of the
protonated nitrogen, as shown in Fig. 5(c) [54]. The micro-
spheres are a product of such complexation of tannin with
hexamine occurring in polar solution, in this case in water.
The presence of water or any other polar solvent is required
in order to observe the ‘‘chewing gum’’ effect, since solvents
induce the hydrophobic effect and cause the tannin complex
to become insoluble and thus fall out of solution. The above
can exist with any, or most of all of the tannin hydroxyl
groups [54]. It was found that polar solvents induce a hydro-
phobic effect and cause that tannin–hexamine complexes be-
come insoluble and thus fall out of solution [54]. Finally, such
microspheres were demonstrated to be solid, hard spheres,
hence not micelles.
However, after pyrolysis, a very thin porosity might have
developed. Indeed, all samples but CM30 required very long
adsorption studies, since in most cases 8 days were just en-

N
N
N
N+
H OO
OH
OH
OH
OH
OH
( )
( )
(a) (b)
(c)
Fig. 5 – Details of the structure of: (a) CM40, and (b) CM50, showing the smooth, porous cell surface and the constitutive
microspheres existing beneath the surface. (c) Tannin–hexamine complex accounting for the observed microspheres (after
[54]).
0
20
40
60
80
100
120
140
0 0.2 0.4 0.6 0.8 1
CM35CM40CM45CM50
Relative pressure
Ads
orbe
d N
2 vo
lum
e (S
TP
cm3 g
-1)
Fig. 6 – Nitrogen adsorption isotherms at 77 K of CM35,
CM40, CM45 and CM50 carbon meringues.
0
100
200
300
400
500
0 0.05 0.1 0.15 0.2
Bulk density (g cm-3)
BE
T s
urfa
ce a
rea
(m2 g
-1)
Fig. 7 – BET surface area of carbon meringues, as calculated
from Kr and N2 adsorption at 77 K. The line is just a guide for
the eye.
220 C A R B O N 6 5 ( 2 0 1 3 ) 2 1 4 – 2 2 7
ough for getting complete isotherms at 77 K (see Fig. 6). Nitro-
gen adsorption isotherms of materials CM35, CM40, CM45 and
CM50 were type I, indicating a dominant microporous charac-
ter. Extremely narrow hysteresis cycles were found at the
highest relative pressures (not shown for clarity), suggesting
the existence of a minor amount of mesoporosity.
Such results were totally unexpected, given the macro-cel-
lular structure of these materials, very similar to that of other
tannin-based carbon foams for which the surface area was
typically 1 m2 g�1 [4,20,33]. So low values were indeed corre-
sponding to a purely geometrical surface area, which can be
roughly estimated by Eq. (7), giving the area of a dense pack-
ing (compacity C � 74%) of hollow spheres of diameter Dc:
S ¼ 6Cqb Dc
ð7Þ
In the present case, it seems that diffusion of nitrogen
throughout the bulk of carbon meringues was very difficult,
probably due to very narrow pores. Only CM30 led to a low
surface area, so that krypton was used as a probe molecule in-
stead of nitrogen. The other materials, investigated by nitro-
gen adsorption, led to surprisingly high surface areas, as
shown in Fig. 7.
A maximum of surface area was observed at a bulk density
close to 0.05 g cm�3. This phenomenon was also observed in
carbon foams prepared by physical foaming of a tannin-based
resin [20,33], with a peak value near 0.07 g cm�3. Such a max-
imum was explained on the basis of two antagonistic effects
related to the increase of density: (i) lower porosity leading to
lower surface area at constant cell size, and (ii) lower pore size
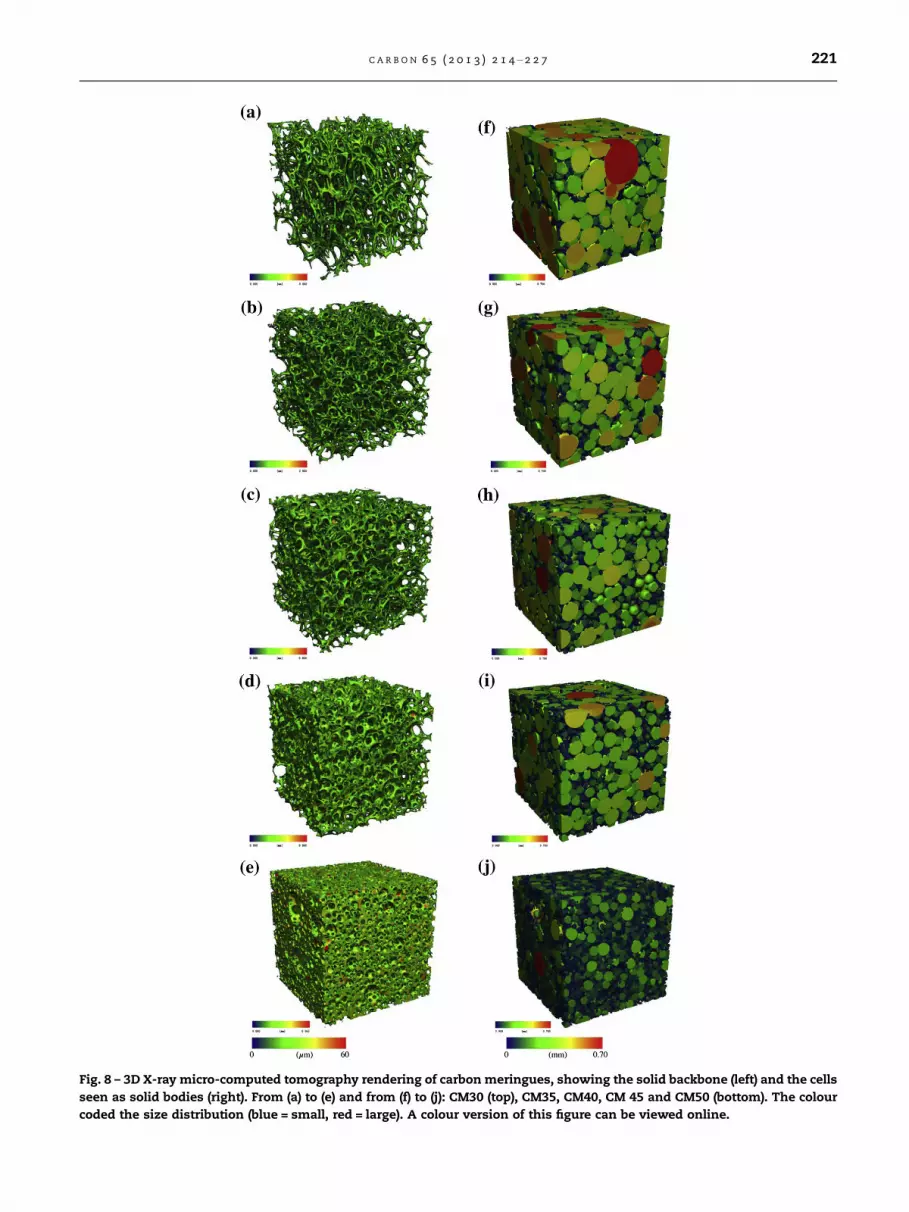
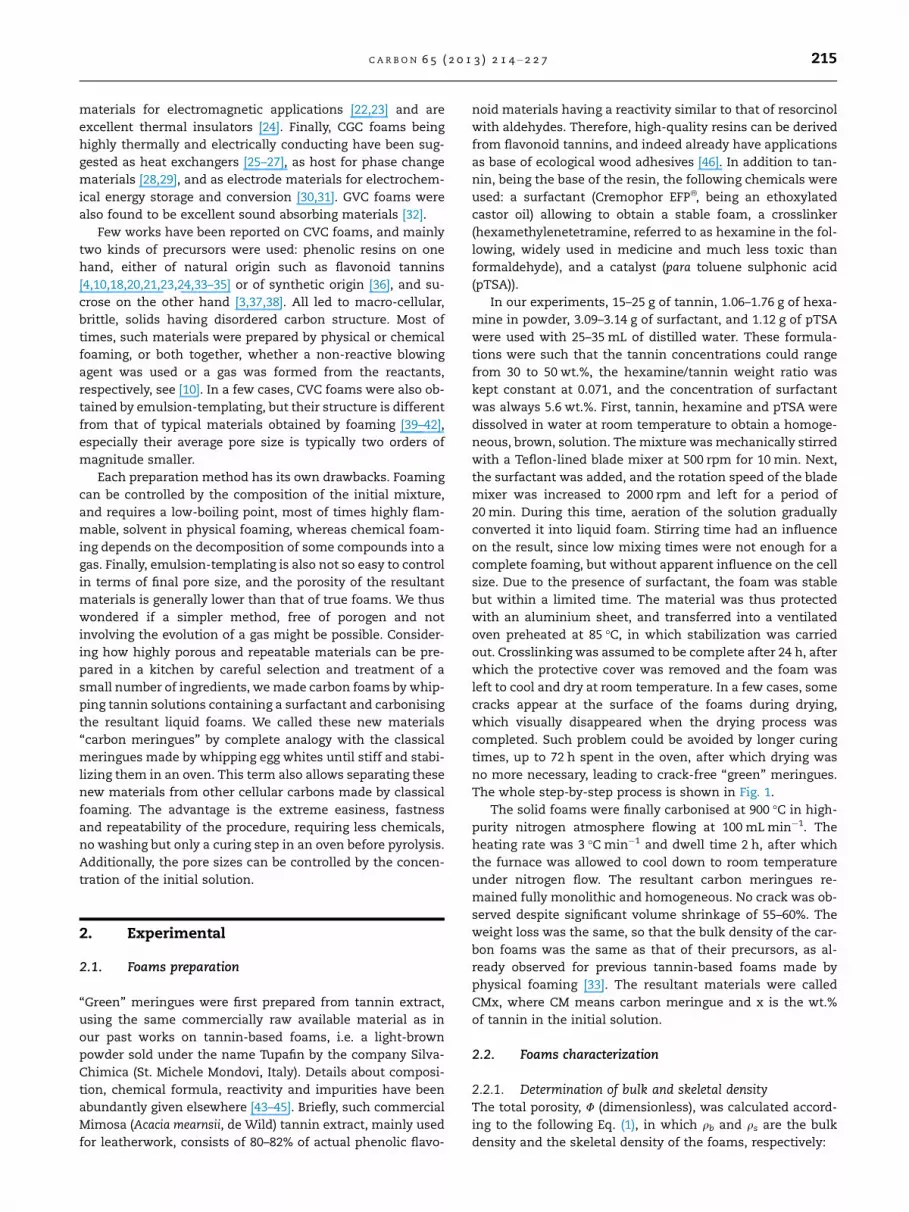
Fig. 8 – 3D X-ray micro-computed tomography rendering of carbon meringues, showing the solid backbone (left) and the cells
seen as solid bodies (right). From (a) to (e) and from (f) to (j): CM30 (top), CM35, CM40, CM 45 and CM50 (bottom). The colour
coded the size distribution (blue = small, red = large). A colour version of this figure can be viewed online.
C A R B O N 6 5 ( 2 0 1 3 ) 2 1 4 – 2 2 7 221

Table 3 – Values of morphometric quantities derived from lCT studies.
Quantity CM30 CM35 CM40 CM45 CM50
TV (mm3) 25.74 25.74 25.74 25.74 25.74BV (mm3) 0.88 1.25 1.75 2.89 7.55PV (mm3) 24.87 24.49 23.99 22.85 18.19BS (mm2) 115.85 167.16 210.81 300.38 574.06BV/TV (%) 3.40 4.86 6.80 11.24 29.33PV/TV (%) 96.60 95.14 93.20 88.76 70.67BS/TV (m2 m�3) 4501 6494 8190 11670 22302BS/BV (m2 m�3) 131648 133728 120463 103938 76034SMI 1.99 1.74 1.49 0.94 �0.20DA 1.29 1.32 1.13 1.14 1.09S.Th (lm) 19.46 18.81 20.17 22.84 30.08C.Dm (lm) 445.28 383.67 383.53 309.41 161.53B.Conn.D (mm�3) 442.73 696.34 988.92 1203.00 2387.30C.Conn.D (mm�3) 552.05 990.79 1144.42 1493.35 2286.95
Cell size (µm)
% o
f vo
xel
0
1
2
3
4
5
0 100 200 300 400 500 600 700 800
CM30CM35CM40CM45CM50
Strut thickness (µm)
% o
f vo
xel
0
10
20
30
40
50
0 10 20 30 40 50 60 70 80
CM30CM35CM40CM45CM50
(a) (b)
Fig. 9 – (a) Cell size distribution, and (b) strut thickness distribution derived from lCT studies and given as relative values.
222 C A R B O N 6 5 ( 2 0 1 3 ) 2 1 4 – 2 2 7
leading to higher surface area. Given that cell size and appar-
ent density varied in opposite ways, a maximum of surface
area was expected. Thus, the former results were easily ex-
plained by such geometrical considerations, and the changes
of surface area were indeed low. In the case of carbon merin-
gues, the huge values of surface area can only be accounted
for by the existence of a narrow microporosity. How and
why the latter mainly developed for samples of medium bulk
density is still unclear.
3D rendering images from lCT are given in Fig. 8. The
aforementioned trends were clearly confirmed by a simple vi-
sual inspection of such images, with a thickening of the struts
and a decrease of cell sizes when the concentration of tannin
in the initial solution increased from 30 to 50 wt.%. The corre-
sponding quantitative information is reported in Table 3,
namely: relative density (BV/TV,%), porosity (PV/TV,%), spe-
cific surface area (BS/TV, m2 m�3), degree of anisotropy (DA,
dimensionless), mean strut thickness (S.Th, lm), mean cell
diameter (C.Dm, lm), backbone connectivity density
(B.Conn.D, mm�3) and cell connectivity density (C.Conn.D,
mm�3). Furthermore, cell size and strut thickness distribu-
tions have been plotted in Fig. 9.
As expected, the variation of porous structure of carbon
meringues is relatively large, with a corresponding range of
relative density of 3.4–29.4%. Such values are higher than
the values calculated as the ratio qb/qs from the data of Table 2.
However, there is an excellent correlation (R2 = 0.998, not
shown) of these two measures. The absolute difference can
be explained by the limited nominal resolution of 7.4 lm in
the lCT images used in this study. First, as the voxel size is
in the order of the strut thickness, segmentation of the struc-
tures is challenging and partial volume effect can lead to an
overestimation of the backbone volume. Second, very small
pores as seen in SEM (i.e. pores <15 lm) cannot be captured,
which again leads to an overestimation of the backbone vol-
ume. Nevertheless, the excellent agreement indicates that
these two effects are scalable and that the two methods
might be calibrated to yield the same result.
These two artefacts also affect the other indices to larger
or lower extents. The effect on strut thickness (S.Th), which
is only 2.5–4 times larger than the voxel size, can be expected
to be relatively large, whereas the effect on cell diameter
(C.Dm), which is about 50 times larger than voxel, can be ex-
pected to be relatively low. Thus, the thinner struts may not

0.04
0.05
0.06
0.07
0.08
0.09
0.1
0.11
0.12
0 0.05 0.1 0.15 0.2
CM
CVC foams xy
CVC foams z
Bulk density (g cm-3)
The
rmal
con
duct
ivity
(W
m-1
K-1
)
Fig. 10 – Thermal conductivity of vitreous carbon foams
derived from tannin: carbon meringues (CM) and CVC foams
made by physical foaming and measured along 2
orthogonal axes, z being the growing direction of the foam
(after [10]).
C A R B O N 6 5 ( 2 0 1 3 ) 2 1 4 – 2 2 7 223
be well represented at this resolution and the average strut
thickness was slightly overestimated.
The specific surface area is considerably lower than that
measured by adsorption, due again to the obvious impossibil-
ity of visualising the very small pores accounting for the ma-
jor part of the surface area. The values of BS/TV listed in
Table 3 indeed correspond to surface areas within the range
0.12–0.19 m2 g�1, using the bulk densities of Table 2, and
should be correct if the inner surface of the carbon foams
was smooth and non porous. Indeed, using Eq. (7) and the lin-
ear density data of Table 2, the calculated surface areas have
the same order of magnitude and range from 0.09 to
0.29 m2 g�1. The values of BS/BV also listed in Table 3 can be
used with the density of carbon for calculating the same,
and the results now range from 0.15 to 0.27 m2 g�1. The agree-
ment between these sets of values is acceptable, and defi-
nitely proves that the much higher surface areas measured
by adsorption are due to a narrow microporosity within the
carbon structure, as already demonstrated by Fig. 6.
The structure model index (SMI) is designed to be 0, 3, and
4 for ideal plates, cylinders, and spheres, respectively. This in-
dex decreased from 1.99 for CM30 to �0.20 for CM50, indicat-
ing a change from more rod-like to more plate-like structures.
Negative values indicate that the structure is of ‘‘Swiss-
cheese’’ type, i.e. a solid structure with many partly closed
pores. Furthermore, the structure change was also accompa-
nied by an increasing isotropy as the density increased.
Whereas CM30 had a slightly preferred orientation
(DA = 1.29), CM50 was more isotropic (DA = 1.09).
The porosity, ranging from 71% to 97%, is also lower than
that given in Table 2, especially for the densest materials. This
finding is obvious, since the materials having the highest den-
sity are also those having the lowest pore sizes (cells and win-
dows), i.e. those which cannot be detected by lCT. However,
for large objects such as cells, lCT could lead some informa-
tion not available from other techniques, especially the cell
size distribution shown in Fig. 9(a). There is a shift towards
lower cell sizes as the density increases, the mean cell diam-
eter (C.Dm) decreasing from 445 lm to 162 lm (Table 3). The
distributions are rather broad and jagged, except for CM50,
which indicates that there is no typical cell size but rather
cells of various sizes. Moreover, as the very small cells cannot
be seen by lCT, it can be expected that some peaks below
15 lm should be added to get the full picture. The values re-
ported in Table 3 are typically 20% lower than the sizes esti-
mated from SEM images. The power law described by Eq. (4)
also applies to these values (not shown), and the correspond-
ing exponent is now �0.5, instead of �0.4 as found above. De-
spite the uncertainties on strut thickness, the latter clearly
increased with density, as shown in Fig. 9(b).
As seen from Table 3, both strut and cell connectivity in-
creased with density. The structures thus become more com-
plex and well interconnected, from low-density specimens
made up of a few struts to high-density specimens made up
of relatively well-connected but largely fenestrated cell-walls.
3.2. Foams properties
The thermal conductivity of carbon meringues is presented in
Fig. 10 as a function of bulk density. As expected, the conduc-
tivity increased with density, and such increase was appar-
ently linear. This kind of behaviour is very usual for foams
having constant porous structure but different total porosi-
ties, especially in such narrow range of porosity (here 90.6–
98.6%) [10,56,57]. The results show that carbon meringues
are excellent thermal insulators, whose properties are very
similar to those of CVC foams derived from foamed tannin-
based resin [10]. Due to their vertical growth, such foams were
slightly anisotropic, as shown in Fig. 10. The present, much
more isotropic, carbon meringues present intermediary val-
ues, although those at low density are higher than those of
our previous foams, probably because the porosity in merin-
gues is more open and interconnected, as suggested by SEM
images. Compared to other non graphitic carbon foams hav-
ing similar densities, the present thermal conductivities are
lower than that of ‘‘Ultramet’’ RVC foam (0.04 g cm�3, 60 ppi:
0.085 W m�1 K�1) and that of foams made of more organised
carbon: ‘‘Touchstone’’ foam (density 0.16 g cm�3: 0.40 W m�1 -
K�1) and ‘‘MER’’ foam (density 0.016 g cm�3: 0.05 W m�1 K�1)
[2] and Refs. therein.
Stress–strain compression curves of carbon meringues
submitted to compression are given in Fig. 11. In order to sep-
arate them, the curves have been plotted in a semi-log graph.
All the materials presented the elastic-brittle behaviour ex-
pected for cellular vitreous carbons, and already described
in Section 2.2.7. All indeed showed a short linear part whose
slope is the compressive modulus, followed by a plateau cor-
responding to brittle crushing and whose height is the com-
pressive strength, and by a final region of rapidly increasing
stress, i.e. the densification regime, when the cells have al-
most completely collapsed. The special shape of the CM50
curve is due to a vertical fracture which occurred during the
test, leading to a block detached from the sample: the com-
pressed surface and thus the stress were decreased accord-
ingly. Once the height of the compressed sample became as
low as that of the detached block, the compression strength
then abruptly increased before densification begun.
0.001
0.01
0.1
1
10
0 20 40 60 80 100
CM30CM35CM40CM45CM50
Strain (%)
Stre
ss (
MPa
)
Fig. 11 – Stress–strain compression curves of tannin-based
carbon meringues.
224 C A R B O N 6 5 ( 2 0 1 3 ) 2 1 4 – 2 2 7
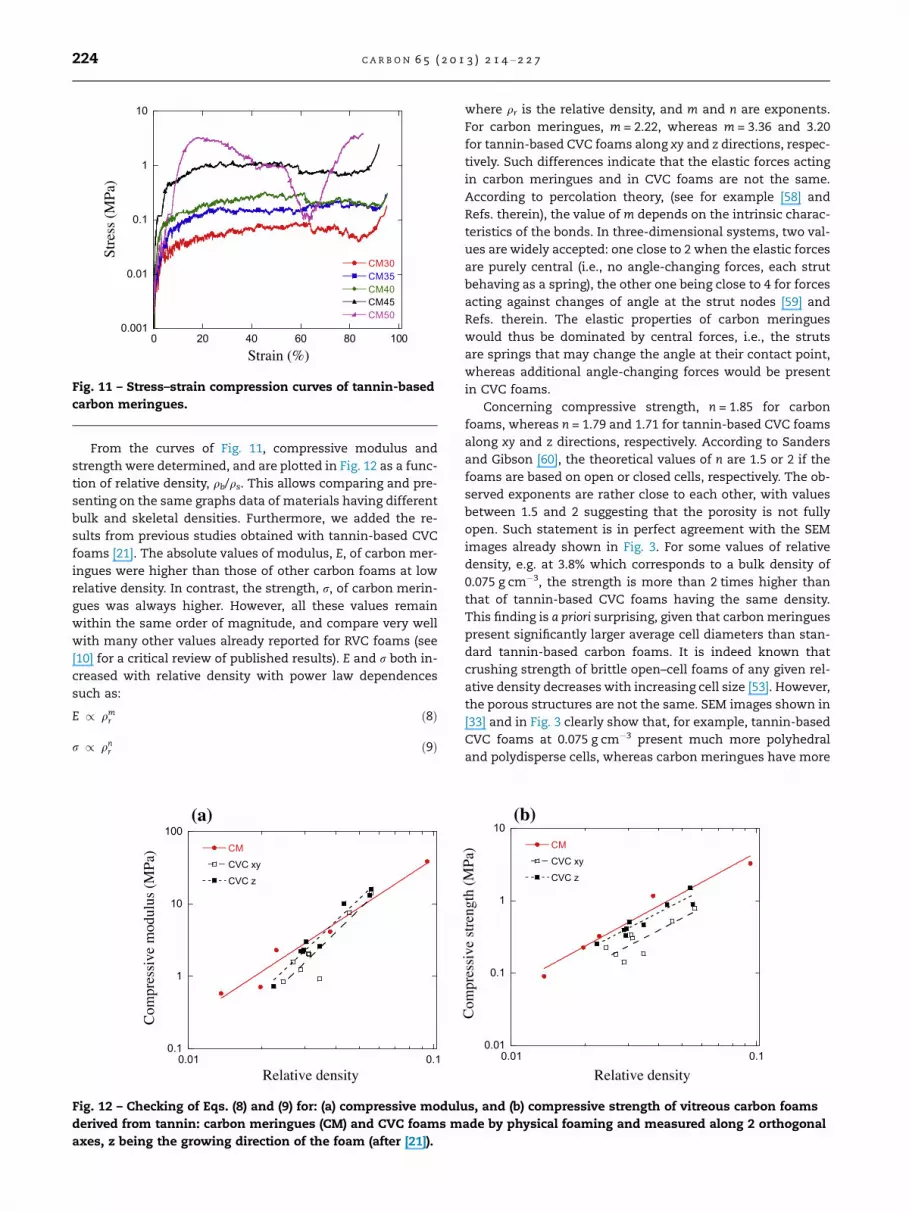
From the curves of Fig. 11, compressive modulus and
strength were determined, and are plotted in Fig. 12 as a func-
tion of relative density, qb/qs. This allows comparing and pre-
senting on the same graphs data of materials having different
bulk and skeletal densities. Furthermore, we added the re-
sults from previous studies obtained with tannin-based CVC
foams [21]. The absolute values of modulus, E, of carbon mer-
ingues were higher than those of other carbon foams at low
relative density. In contrast, the strength, r, of carbon merin-
gues was always higher. However, all these values remain
within the same order of magnitude, and compare very well
with many other values already reported for RVC foams (see
[10] for a critical review of published results). E and r both in-
creased with relative density with power law dependences
such as:
E / qmr ð8Þ
r / qnr ð9Þ
0.1
1
10
100
0.10.01
CM
CVC xy
CVC z
Relative density
Com
pres
sive
mod
ulus
(M
Pa)
(a)
Fig. 12 – Checking of Eqs. (8) and (9) for: (a) compressive modul
derived from tannin: carbon meringues (CM) and CVC foams m
axes, z being the growing direction of the foam (after [21]).
where qr is the relative density, and m and n are exponents.
For carbon meringues, m = 2.22, whereas m = 3.36 and 3.20
for tannin-based CVC foams along xy and z directions, respec-
tively. Such differences indicate that the elastic forces acting
in carbon meringues and in CVC foams are not the same.
According to percolation theory, (see for example [58] and
Refs. therein), the value of m depends on the intrinsic charac-
teristics of the bonds. In three-dimensional systems, two val-
ues are widely accepted: one close to 2 when the elastic forces
are purely central (i.e., no angle-changing forces, each strut
behaving as a spring), the other one being close to 4 for forces
acting against changes of angle at the strut nodes [59] and
Refs. therein. The elastic properties of carbon meringues
would thus be dominated by central forces, i.e., the struts
are springs that may change the angle at their contact point,
whereas additional angle-changing forces would be present
in CVC foams.
Concerning compressive strength, n = 1.85 for carbon
foams, whereas n = 1.79 and 1.71 for tannin-based CVC foams
along xy and z directions, respectively. According to Sanders
and Gibson [60], the theoretical values of n are 1.5 or 2 if the
foams are based on open or closed cells, respectively. The ob-
served exponents are rather close to each other, with values
between 1.5 and 2 suggesting that the porosity is not fully
open. Such statement is in perfect agreement with the SEM
images already shown in Fig. 3. For some values of relative
density, e.g. at 3.8% which corresponds to a bulk density of
0.075 g cm�3, the strength is more than 2 times higher than
that of tannin-based CVC foams having the same density.
This finding is a priori surprising, given that carbon meringues
present significantly larger average cell diameters than stan-
dard tannin-based carbon foams. It is indeed known that
crushing strength of brittle open–cell foams of any given rel-
ative density decreases with increasing cell size [53]. However,
the porous structures are not the same. SEM images shown in
[33] and in Fig. 3 clearly show that, for example, tannin-based
CVC foams at 0.075 g cm�3 present much more polyhedral
and polydisperse cells, whereas carbon meringues have more
Relative density
Com
pres
sive
str
engt
h (M
Pa)
0.01
0.1
1
10
0.10.01
CM
CVC xy
CVC z
(b)
us, and (b) compressive strength of vitreous carbon foams
ade by physical foaming and measured along 2 orthogonal

0.7
0.75
0.8
0.85
0.9
0.95
1
0 0.02 0.04 0.06 0.08 0.1
Relative density
Den
sifi
catio
n st
rain
Fig. 13 – Densification strain of carbon meringues plotted as
a function of relative density. The solid curve was calculated
with Eq. (10).
C A R B O N 6 5 ( 2 0 1 3 ) 2 1 4 – 2 2 7 225
monodisperse and more spherical cells. As a consequence,
carbon meringues have a more even porous structure and a
higher compressive strength than those of classical carbon
foams having the same density and derived from the same
precursor.
The densification strains, eD, determined from Fig. 11 with
the method described in [21], are given in Fig. 13. The follow-
ing equation has been suggested for describing the linear de-
crease of eD when the relative density increases:
eD ¼ 1� Aqr ð10Þ
where A is a constant experimentally found to be 1.4 in many
polymer foams [53]. It would have been expected that A = 1,
i.e. that eD simply equals the porosity, because eD is the strain
at which all the pore space has been squeezed out. In fact, it is
observed that the cell walls jam together at a lower strain
than eD, and it is especially true for the present carbon merin-
gues, for which A took a value of 3.22. Almost the same value
had been already observed for tannin-based CVC foams [21].
Finding a value of A about two times higher than that of poly-
mer foams should be due to the fact that vitreous carbon is
hard and brittle, leading to fragments with sharp edges able
to form blocking structures made by particles rubbing against
each others. Such phenomenon, observed in packings of car-
bon grains (see [61] and Refs. therein) and sometimes called
‘‘arching effects’’, hinders the decrease of porosity when the
grain packing is compressed.
4. Conclusion
New carbon materials, called carbon meringues, were pre-
pared from tannin-based aqueous solutions and were thor-
oughly described in terms of porous structure and physical
properties. As far as the authors know, it is the first time that
liquid foam was successfully stabilised and converted into
valuable carbon foams, whose features were found to be
somewhat different from those of more classical cellular vit-
reous carbon (CVC) foams made from similar formulations.
The process offered here is certainly the fastest, the cheapest
and the easiest one for preparing macro-cellular carbons hav-
ing controlled properties.
Compared to classical CVC foams made by physical foam-
ing, carbon meringues presented a wider range of bulk densi-
ties, and hence a wider range of porosities (90.6–98.6%). A key
point is that the total porosity and the average cell size were
easily tuned only by changing the concentration of precursor
in the initial solution, all other things being equal. Tomogra-
phy studies also showed that the strut thickness was changed
accordingly. For most of materials, the surface area was sur-
prisingly high, up to 400 m2 g�1, probably due to the nodular
structure observed beneath the smooth skin of the carbon
surface. Although the thermal conductivity of carbon merin-
gues was a little higher than that of tannin-based CVC foams
of low density, these materials remain excellent thermal
insulators which have, furthermore, higher mechanical
strength in the same range of density. All these findings make
carbon meringues definitely interesting, cheap, easily pre-
pared, new materials.
Acknowledgements
The authors from IJL gratefully acknowledge the financial
support of the CPER 2007-2013 ‘‘Structuration du Pole de
Competitivite Fibres Grand’Est’’ (Competitiveness Fibre Clus-
ter), through local (Conseil General des Vosges), regional (Re-
gion Lorraine), national (DRRT and FNADT) and European
(FEDER) funds.
R E F E R E N C E S
[1] Chen C, Kennel EB, Stiller AH, Stansberry PG, Zondlo JW.Carbon foam derived from various precursors. Carbon2006;44(8):1535–43.
[2] Gallego NC, Klett JW. Carbon foams for thermal management.Carbon 2003;41(7):1462–6.
[3] Prabhakaran K, Singh PK, Gokhale NM, Sharma SC.Processing of sucrose to low density carbon foams. J MaterSci 2007;42:3894–900.
[4] Tondi G, Fierro V, Pizzi A, Celzard A. Tannin-based carbonfoams. Carbon 2009;47(6):1480–92.
[5] Rogers DK, Plucinski J, Stansberry PG, Stiller AH, Zondlo JW.Low-cost carbon foams for thermal protection andreinforcement applications. In: Proceedings, 45th int. SAMPEsymposium and exhibition. Long Beach (California, USA):Society for the Advancement of Material and, ProcessEngineering; 2000. p. 293–305.
[6] Han YS, Lee SM, Kim HT. Effects of heat-treatmenttemperature on mechanical properties of reticulated carbonfoams. J Korean Ceram Soc 2012;49(3):236–40.
[7] Manocha SM, Kalpesh P, Manocha LM. Development ofcarbon foam from phenolic resin via template route. Indian JEng Mat Sci 2010;17(5):338–42.
[8] Chen Y, Chen BZ, Shi XC, Xu H, Hu YJ, Yuan Y, et al.Preparation of pitch-based carbon foam using polyurethanefoam template. Carbon 2007;45(10):2132–4.
[9] Yadav A, Kumar R, Bhatia G, Verma GL. Development ofmesophase pitch derived high thermal conductivity graphitefoam using a template method. Carbon 2011;49(11):3622–30.
[10] Li X, Basso MC, Braghiroli FL, Fierro V, Pizzi A, Celzard A.Tailoring the structure of cellular vitreous carbon foams.Carbon 2012;50(5):2026–36.
226 C A R B O N 6 5 ( 2 0 1 3 ) 2 1 4 – 2 2 7
[11] Klett J, Hardy R, Romine E, Walls C, Burchell T. High-thermalconductivity, mesophase-pitch-derived carbon foams: effectof precursor on structure and properties. Carbon2000;38:953–73.
[12] Klett J, Klett L, Hardy R, Burchell T, Walls C. Graphitic foamthermal management materials for electronic packaging.Extended abstracts. Soc Automotive Eng Future CarCongress, Crystal City, Washington, DC, April 2–6; 2000.
[13] Klett J, McMillan A, Gallego N, Walls C. The role of structureon the thermal properties of graphitic foams. J Mater Sci2004;39:3659–76.
[14] Friedrich JM, Ponce-de-Leon C, Reade GW, Walsh FC.Reticulated vitreous carbon as an electrode material. JElectroanal Chem 2004;561:203–17.
[15] Lepage G, Albernaz FO, Perrier G, Merlin G. Characterizationof a microbial fuel cell with reticulated carbon foamelectrodes. Biores Technol 2012;124:199–207.
[16] Hajiesmaili S, Josset S, Begin D, Pham-Huu C, Keller N, KellerV. 3D solid carbon foam-based photocatalytic materials forvapor phase flow-through structured photoreactors. ApplCatal A 2010;382(1):122–30.
[17] Spradling DM, Guth RA. Carbon foams. Adv Mater Proc2003;161(11):29–31.
[18] Amaral-Labat G, Gourdon E, Fierro V, Pizzi A, Celzard A.Acoustic properties of cellular vitreous carbon foams. Carbon2013;58(1):76–86.
[19] Pec MK, Reyes R, Sanchez E, Carballar D, Delgado A,Santamarıa J, et al. Reticulated vitreous carbon: a usefulmaterial for cell adhesion and tissue invasion. Eur CellsMater 2010;20:282–94.
[20] Zhao W, Fierro V, Pizzi A, Du G, Celzard A. Effect ofcomposition and processing parameters on thecharacteristics of tannin–based rigid foams. Part II: physicalproperties. Mat Chem Phys 2010;123(1):210–7.
[21] Celzard A, Zhao W, Pizzi A, Fierro V. Mechanical properties oftannin–based rigid foams undergoing compression. Mater SciEng A 2010;527(16–17):4438–46.
[22] Moglie F, Micheli D, Laurenzi S, Marchetti M, Mariani PrimianiV. Electromagnetic shielding performance of carbon foams.Carbon 2012;50(5):1972–80.
[23] Kuzhir PP, Paddubskaya AG, Shuba MV, Maksimenko SA,Celzard A, Fierro V, et al. Electromagnetic shielding efficiencyin Ka-band: carbon foam versus epoxy/carbon nanotubecomposites. J Nanophotonics 2012;6:061715-1–061715-18.
[24] Celzard A, Tondi G, Lacroix D, Jeandel G, Monod B, Fierro V,et al. Radiative properties of tannin–based, glasslike, carbonfoams. Carbon 2012;50(11):4102–13.
[25] Lin W, Sunden B, Yuan J. A performance analysis of porousgraphite foam heat exchangers in vehicles. Appl Therml Eng2013;50(1):1201–10.
[26] Gyekenyesi AL, Singh M, Smith CE, Stansberry PG, Alam MK,Vrable DL. Development and characterization of highconductivity graphite foams for thermal managementapplications. Ceram Eng Sci Proc 2010;31(9):75–81.
[27] Leong KC, Jin LW. Study of highly conductive graphite foamsin thermal management applications. Adv Eng Mater2008;10(4):338–45.
[28] Acem Z, Lopez J, Palomo Del Barrio E. KNO3/NaNO3-Graphitematerials for thermal energy storage at high temperature:Part I.-Elaboration methods and thermal properties. ApplTherm Eng 2010;30(13):1580–5.
[29] Zhong Y, Guo Q, Li S, Shi J, Liu L. Heat transfer enhancementof paraffin wax using graphite foam for thermal energystorage. Sol Energy Mater Sol Cells 2010;94(6):1011–4.
[30] Dudney NJ, Tiegs TN, Kiggans JO, Jang YI, Klett JW. Graphitefoams for lithium-ion battery current collectors. ECS Trans2007;3(27):23–8.
[31] Armand M, Tarascon JM. Building better batteries. Nature2008;451:652–7.
[32] Gaeta RJ. The sound absorbing potential of carbon-graphitefoam. Collection of technical papers – 12th AIAA/CEASaeroacoustics conference. vol. 1, 2006, 75–88. 12th AIAA/CEASaeroacoustics conference, Cambridge, MA; 8–10 May 2006.
[33] Zhao W, Pizzi A, Fierro V, Du G, Celzard A. Effect ofcomposition and processing parameters on thecharacteristics of tannin–based rigid foams. Part I: cellstructure. Mat Chem Phys 2010;122(1):175–82.
[34] Tondi G, Blacher S, Leonard A, Pizzi A, Fierro V, Leban JM,et al. X-ray microtomography studies of tannin–derivedorganic and carbon foams. Microsc Microanal2009;15(5):384–94.
[35] Tondi G, Pizzi A, Pasch H, Celzard A. Structure degradation,conservation and rearrangement in the carbonisation ofpolyflavonoid tannin/furanic rigid foams – A MALDI–TOFinvestigation. Polym Degrad Stab 2008;93(5):968–75.
[36] Gan L, Liu M, Wang X, Tian C. Synthesis of porous carbonfoams blowing by pentane. J Tongji Univ 2008;36(11):1552–5.
[37] Narasimman R, Prabhakaran K. Preparation of low densitycarbon foams by foaming molten sucrose using analuminium nitrate blowing agent. Carbon2012;50(5):1999–2009;Jana P, Ganesan V. Synthesis, characterization andradionuclide (137Cs) trapping properties of a carbon foam.Carbon 2009;47(13):3001–9.
[38] Narasimman R, Prabhakaran K. Preparation of carbon foamsby thermo-foaming of activated carbon powder dispersionsin an aqueous sucrose resin. Carbon 2012;50(15):5583–93.
[39] Xiong W, Liu M, Gan L, Lv Y, Xu Z, Hao Z, et al. Preparation ofnitrogen-doped macro-/mesoporous carbon foams aselectrode material for supercapacitors. Colloids Surf A2012;411:34–9.
[40] Thongprachan N, Yamamoto T, Chaichanawong J, Ohmori T,Endo A. Preparation of macroporous carbon foam usingemulsion templating method. Adsorption 2011;17(1):205–10.
[41] Szczurek A, Fierro V, Pizzi A, Celzard A. Mayonnaise, whippedcream and meringue, a new carbon cuisine. Carbon2013;58(1):245–8.
[42] Xiong W, Liu MX, Gan LH, Wang XG, Xu ZJ, Hao ZX, et al.Synthesis and electrochemical properties of macro-/microporous carbon foams. Adv Mater Res 2011;239–242:1396–9.
[43] Amaral-Labat G, Szczurek A, Fierro V, Stein N, Boulanger C,Pizzi A, et al. Pore structure and electrochemicalperformances of tannin–based carbon cryogels. BiomassBioenerg 2012;39:274–82.
[44] Amaral-Labat G, Grishechko LI, Szczurek A, Fierro V,Kuznetsov BN, Pizzi A, et al. Highly mesoporous organicaerogels derived from soy and tannin. Green Chem2012;14(11):3099–106.
[45] Lacoste C, Basso MC, Pizzi A, Laborie MP, Celzard A, Fierro V.Pine tannin–based rigid foams: Mechanical and thermalproperties. Ind Crops Prod 2013;43:245–50.
[46] Pizzi A. Advanced wood adhesives technology. NewYork: Marcel Dekker; 1994.
[47] Brunauer S, Emmet PH, Teller E. Adsorption of gases inmultimolecular layers. J Am Chem Soc 1938;60(2):309–19.
[48] De Hoff RT, Rhines FN. Quantitative microscopy. NewYork: McGraw-Hill; 1968.
[49] Hildebrand T, Laib A, Muller R, Dequeker J, Ruegsegger P.Direct three-dimensional morphometric analysis of humancancellous bone: microstructural data from spine, femur,iliac crest, and calcaneus. J Bone Miner Res1999;14(7):1167–74.
[50] Odgaard A. Three-dimensional methods for quantification ofcancellous bone architecture. Bone 1997;20(6):315–28.

C A R B O N 6 5 ( 2 0 1 3 ) 2 1 4 – 2 2 7 227
[51] Hildebrand T, Ruegsegger P. A new method for the model-independent assessment of thickness in three-dimensionalimages. J Microsc 1996;185:57–75.
[52] Odgaard A, Gundersen HJ. Quantification of connectivity incancellous bone, with special emphasis on 3-Dreconstructions. Bone 1993;14(2):173–82.
[53] Gibson LJ, Ashby MF. Cellular solids: structure and properties.2nd ed. Cambridge University Press: Cambridge Solid StatePress; 1997.
[54] Pichelin F, Kamoun C, Pizzi A. Hexamine hardener behaviour:effects on wood glueing, tannin and other wood adhesives.Holz Roh Werkstoff 1999;57(4):305–17.
[55] Pizzi A. Ambient temperature gelling of tannin adhesiveswith hexamine. Holz Roh Werkstoff 1994;52(5):286.
[56] Wang M, Pan N. Modeling and prediction of the effectivethermal conductivity of random open-cell porous foams. Int JHeat Mass Transfer 2008;51(5–6):1325–31.
[57] Druma AM, Alam MK, Druma C. Analysis of thermalconduction in carbon foams. Int J Thermal Sci2004;43(7):689–95.
[58] Sahimi M. Non-linear and non-local transport processes inheterogeneous media: from long-range correlatedpercolation to fracture and materials breakdown. Phys Rep1998;306(4):213–395.
[59] Celzard A, Mareche JF, Furdin G. Modelling of exfoliatedgraphite. Prog Mater Sci 2005;50(1):93–179.
[60] Sanders WS, Gibson LJ. Mechanics of hollow sphere foams.Mater Sci Eng A 2003;347(1–2):70–85.
[61] Celzard A, Mareche JF, Payot F, Furdin G. Electricalconductivity of carbonaceous powders. Carbon2002;40(15):2801–15.


