Embed Size (px)
Citation preview
Valtteri Torikka
Bachelor’s Thesis, Finance
Fall 2016
Abstract
The amount of investor attention has been found to affect stock returns. Recently, a novel and
unique attention measure – the volume of Google searches – has been found to predict IPO
returns in the US market (Da et al., 2011). This study brings insight on the same issue and
confirms that similar dynamics prevail in the European markets. Using search volume indices
from Google Trends as the main explanatory variable, I study a sample of 254 IPOs from the
beginning of 2004 to the late 2015 by various controlled cross-sectional regressions and
robustness checks. I find that search volumes can predict IPOs’ first-day returns significantly
and show signs of predicting long-term returns in continental European markets. The results
of this study are mostly in line with attention-induced price pressure hypothesis by Barber
and Odean (2008) that suggests that stocks that gather an unusually high amount of attention
experience a positive short-term price pressure accompanied by long-term price reversal.
Aalto University School of Business
Department of Finance
Thesis instructor: Matthijs Lof
Capturing Investor Attention – Do pre-IPO Google Searches Predict Stock Performance? Evidence from Europe
1
Table of Contents
1. Introduction ................................................................................................................. 2
2. Literature review ......................................................................................................... 7
3. Data and methodology .............................................................................................. 10
4. Results ....................................................................................................................... 17
5. Conclusions ............................................................................................................... 25
References ......................................................................................................................... 27
Tables
Table 1. Large European stock exchanges by domestic market capitalization. ............... 11
Table 2. The final sample size and the phases of its formation. ....................................... 13
Table 3. All variable definitions. ...................................................................................... 15
Table 4. Sample descriptive statistics. .............................................................................. 16
Table 5. Methods used to test hypotheses. ....................................................................... 17
Table 6. ASVI and IPO First-Day Return. ....................................................................... 22
Table 7. ASVI and Post-IPO long-term stock performance. ............................................ 23
Table 8. ASVI and IPO returns in the short and long term, pre-crisis and post-crisis. .... 25
Figures
Figure 1. The three most popular search engines in Europe by market share .................... 4
Figure 2. SVI trend of the search term “winter jackets”. ................................................... 4
Figure 3. Sample mean SVI development prior to the IPO. ............................................. 12
Figure 4. Cumulative abnormal returns on high-ASVI and low-ASVI stocks................. 18
Figure 5. ASVI, average first-day IPO returns and long-run absolute IPO returns. ........ 19
2
1. Introduction
In the contemporary world where internet search volume information is easily accessible
by virtually anyone and is more valuable than ever, it has become relevant to ask the
question, whether search volumes possess the power of prediction. Internet searches have
been found to predict various economic phenomena in the recent past but have yet remained
fairly unused in the field of finance and more precisely, in the field of IPOs.
A paper concerning the US stock market – studied by Da et al (2011) – found that
Google search volumes can predict IPO stock returns. However, no extensive research has
been done on this question considering continental European markets. Inspired by the paper
‘In search of attention’ by Da et al. (2011) I study the effect of the volume of pre-IPO Google
searches on a company name on their IPO performance with empirical evidence from the
largest continental European stock exchanges.
The contribution of this study is the insight on the behavior of European IPO stock
returns within the framework of investor attention represented by Google search volumes. I
find that an increase in Google search volumes prior to the company’s IPO predicts
significantly temporary positive stock price pressure in the short term, but cannot sufficiently
explain returns in the longer term, although providing some indications of predictability.
Background of the study
The background of my study lies in the context of Efficient-Market Hypothesis (EMH)
and deriving from that: investor attention. As widely known, the semi-strong-form of EMH
implies that all new public information should transfer into share prices with no delay (Fama,
1970). It seems though that retail investors pay different amounts of attention on different
stocks and particularly on different IPOs (Ritter and Welch, 2002). This implies that the
information on different stocks is transferred into stock prices at unequal pace. Variance in
the promptness of information transfer into stock prices thus creates a state of inefficiency.
In this study I test whether the attention-induced price pressure hypothesis by Barber and
Odean (2008) holds true in the European IPO markets, as Da et al. (2011) have found it to be
in the US markets. Attention-induced price pressure hypothesis suggests that retail investors
tend to be net buyers of stocks that gather a lot of attention. Therefore, an increase in retail
investors’ attention should result in temporary positive price pressure on a particular stock.
3
Moreover, the effect should reverse and attention-grabbing stocks should experience a price
reversal in the long-run and even underperform the less popular stocks (Da et al., 2011).
Whereas many indirect proxies of attention have been formulated in the past, the first
direct measure of investor attention was introduced in 2011 in the study by Da et al. They
show that Google search volume represents an indicator that undeniably captures attention.
The goodness of Google searches as a measure is largely based on its popularity, since
Google continues to be the most used internet search engine.1 Direct measurability of
attention by Google searches is also justified by reason: if you search for a term from Google,
you are unambiguously directing attention to it. Da et al. (2011) also show that Google
searches indeed capture the attention of retail investors differentiating them from institutional
investors, that find their information through more sophisticated systems. They also show that
search volume is different from but correlates with former indirect measures of attention.
Moreover, since no trading information exists prior to a company’s IPO, Google searches
present a one-of-a-kind possibility to test the effect of retail attention on IPO returns.
Google Trends
Google Trends is a public Google Search –based analysis tool that allows users to
obtain search volume data free of charge. Google Trends was launched in 2006 and it
contains search volume data from 2004 for various languages and different regions. Google
Insights for Search was introduced in 2008 and provided a significant improvement in the
usability and reliability of Google search data. In 2012 Insights was merged into Google
Trends.
Search Volume Index (SVI) is an indexed and normalized measure of Google search
volume on a chosen search term provided by Google Trends. It takes values between 0 and
100 and is relative to the chosen time period. For example, if one chooses the time period
from 2004 to 2016, the week with the highest search volume takes the SVI value of 100. If
then one chooses e.g. 1.1.2015 – 31.12.2015 as the time period, there is also in this case one
point in time where the SVI takes the value of 100. The value of SVI is hence always
comparative to the chosen time range. SVIs are easily importable as CSV-files which makes
it very user-friendly to obtain and handle the data. The main explanatory variable of this
1 http://gs.statcounter.com/#all-search_engine-ww-monthly-201508-201608 (14.10.2016)
4
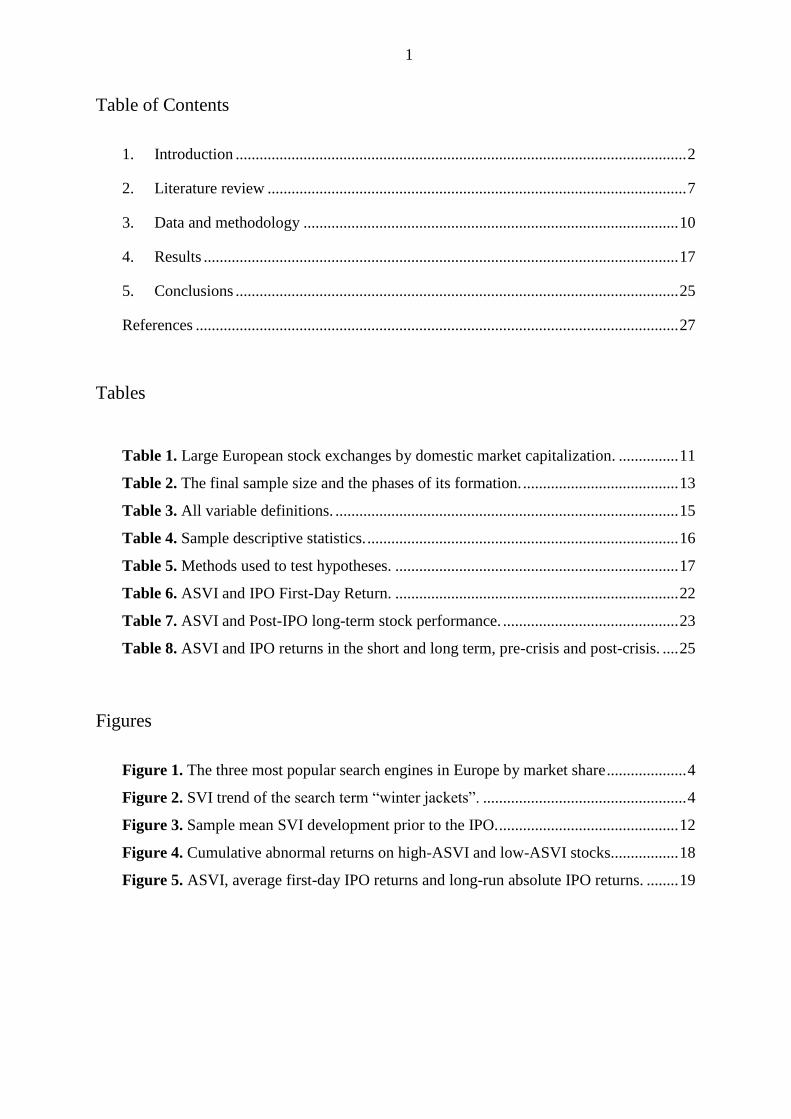
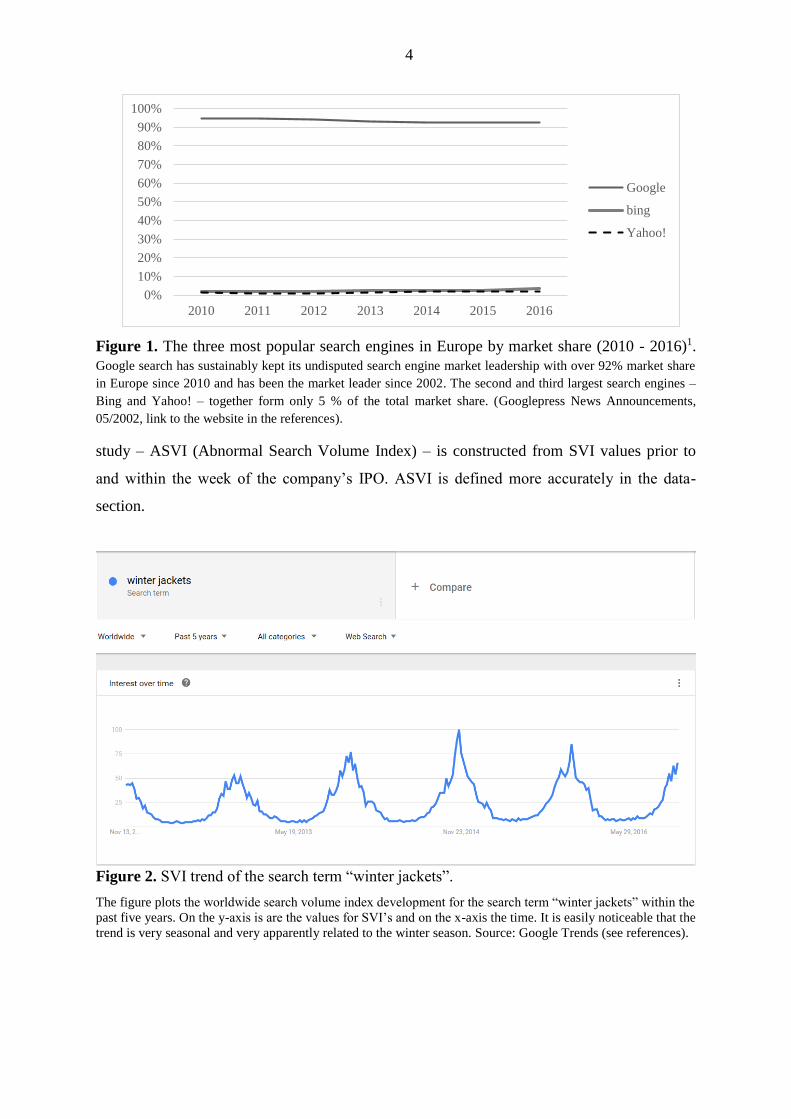
Figure 1. The three most popular search engines in Europe by market share (2010 - 2016)1.
Google search has sustainably kept its undisputed search engine market leadership with over 92% market share
in Europe since 2010 and has been the market leader since 2002. The second and third largest search engines –
Bing and Yahoo! – together form only 5 % of the total market share. (Googlepress News Announcements,
05/2002, link to the website in the references).
study – ASVI (Abnormal Search Volume Index) – is constructed from SVI values prior to
and within the week of the company’s IPO. ASVI is defined more accurately in the data-
section.
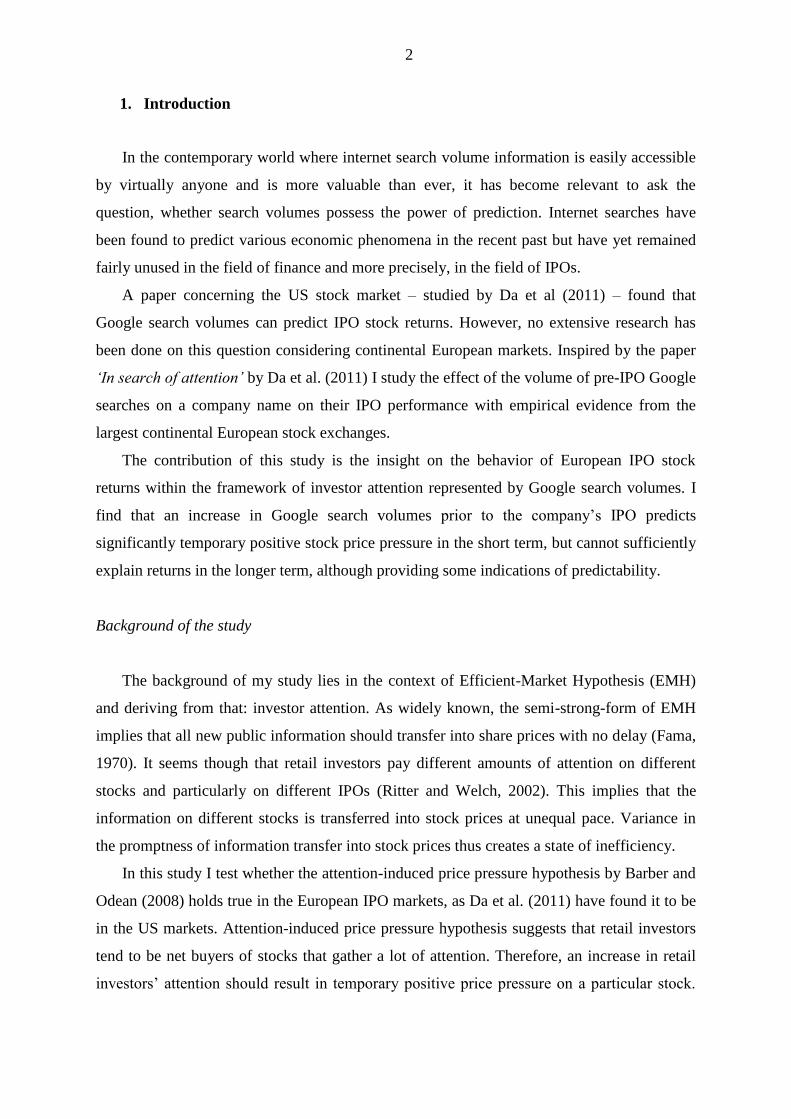
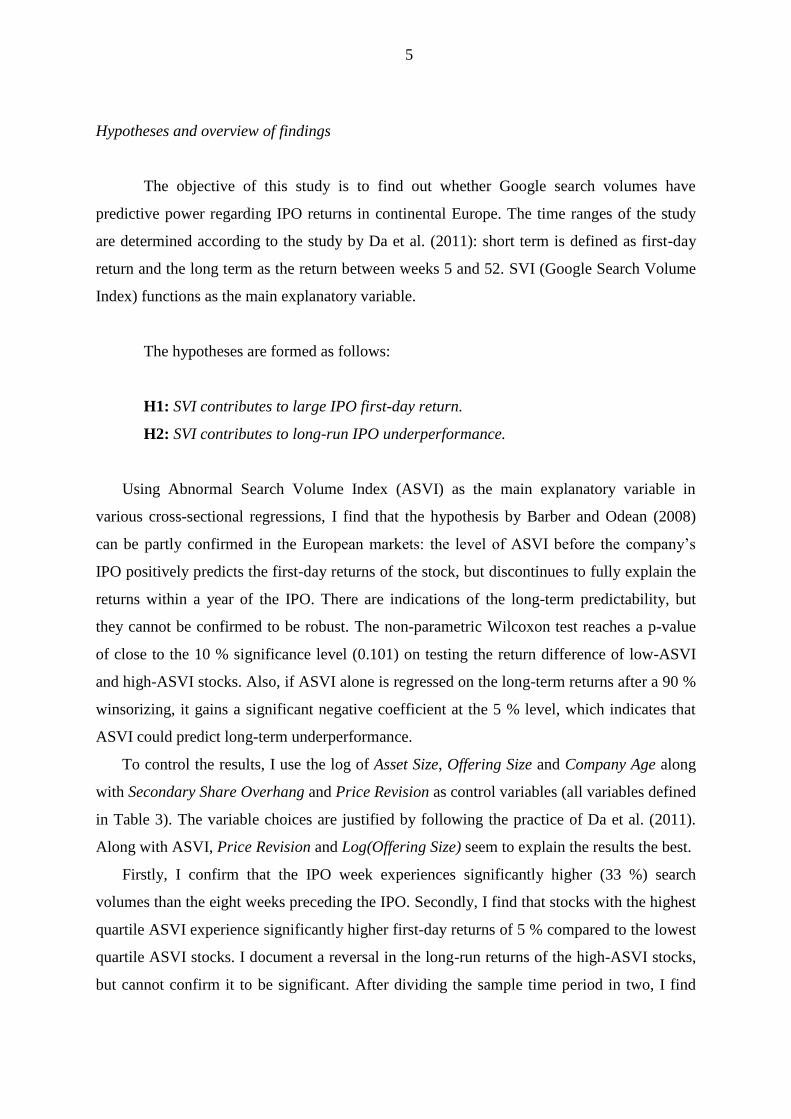
Figure 2. SVI trend of the search term “winter jackets”.
The figure plots the worldwide search volume index development for the search term “winter jackets” within the
past five years. On the y-axis is are the values for SVI’s and on the x-axis the time. It is easily noticeable that the
trend is very seasonal and very apparently related to the winter season. Source: Google Trends (see references).
0%
10%
20%
30%
40%
50%
60%
70%
80%
90%
100%
2010 2011 2012 2013 2014 2015 2016
bing
Yahoo!
5
Hypotheses and overview of findings
The objective of this study is to find out whether Google search volumes have
predictive power regarding IPO returns in continental Europe. The time ranges of the study
are determined according to the study by Da et al. (2011): short term is defined as first-day
return and the long term as the return between weeks 5 and 52. SVI (Google Search Volume
Index) functions as the main explanatory variable.
The hypotheses are formed as follows:
H1: SVI contributes to large IPO first-day return.
H2: SVI contributes to long-run IPO underperformance.
Using Abnormal Search Volume Index (ASVI) as the main explanatory variable in
various cross-sectional regressions, I find that the hypothesis by Barber and Odean (2008)
can be partly confirmed in the European markets: the level of ASVI before the company’s
IPO positively predicts the first-day returns of the stock, but discontinues to fully explain the
returns within a year of the IPO. There are indications of the long-term predictability, but
they cannot be confirmed to be robust. The non-parametric Wilcoxon test reaches a p-value
of close to the 10 % significance level (0.101) on testing the return difference of low-ASVI
and high-ASVI stocks. Also, if ASVI alone is regressed on the long-term returns after a 90 %
winsorizing, it gains a significant negative coefficient at the 5 % level, which indicates that
ASVI could predict long-term underperformance.
To control the results, I use the log of Asset Size, Offering Size and Company Age along
with Secondary Share Overhang and Price Revision as control variables (all variables defined
in Table 3). The variable choices are justified by following the practice of Da et al. (2011).
Along with ASVI, Price Revision and Log(Offering Size) seem to explain the results the best.
Firstly, I confirm that the IPO week experiences significantly higher (33 %) search
volumes than the eight weeks preceding the IPO. Secondly, I find that stocks with the highest
quartile ASVI experience significantly higher first-day returns of 5 % compared to the lowest
quartile ASVI stocks. I document a reversal in the long-run returns of the high-ASVI stocks,
but cannot confirm it to be significant. After dividing the sample time period in two, I find
6
that the IPOs before 2008 mainly seem to explain the effect, especially in the short term.
Post-crisis results show similar direction and magnitude as the pre-crisis results, but due to
the very low sample size of IPOs after the crisis, the effect in that time period cannot be
confirmed to be significant. In the light of the results, it is however fairly safe to assume that
the effect persists in the post-crisis term.
Limitations of the study
The study is limited to examining continental European IPOs only. Other issues and
securities in other regions are left undiscovered. The set of control variables is also limited to
the ones available in Europe within reasonable effort considering the time constraint of the
thesis work. Most of the indirect proxies for investor attention such as the number of
published news and investor sentiment are not within reasonable reach in Europe. The control
variables are however chosen with the priority of having found to have an effect in the US
study by Da et al. (2011).
SVI as a variable holds many weaknesses and is not sufficient at all times. Also its nature
of being indexed and normalized makes it difficult to estimate whether the changes in the
number of searches are happening on a large or a small scale compared to the sample. The
zero-level SVI is left vaguely defined by Google. Also, whether SVI captures individual
investor attention in Europe or not is left as an assumption relying on the work of Da et al.
(2011), who recognize SVI as a direct measure of individual investor attention. The study
does not take a stand on the differences in retail investor cultures of Europe and the US. The
time period is limited to begin from 2004, since it is the starting point of SVI data.
The rest of the paper is organized as follows. Section 2 sheds light on the theoretical
context of investor attention, existing attention proxies and SVI in literature. Section 3
introduces the sample data, variables and the methodology of the study. Section 4 walks
through results with section 5 concluding the study.

7
2. Literature review
Attention-induced price pressure hypothesis
The base of traditional asset pricing models builds on the assumption that stock prices
adapt new information instantly when it is available (Fama, 1970). This assumption clearly
further implies, that markets need an adequate amount of attention to be paid to the particular
stocks in question. As Kahneman (1973) has quite famously shown, attention is a scarce
cognitive resource, which forces investors to select a limited number of options at a time to
pay attention to.
Merton’s paper from 1987 sheds light on the issues relating to the challenges of
perfect market model, the costs of seeking information and the market equilibrium formed on
incomplete information. As a pioneer of investor attention research, he introduces the
“investor recognition hypothesis” that suggests that individual investors prefer only to buy
stocks that they already know (Merton, R., 1987).
Odean develops Merton’s (1987) idea and argues in his paper “Do investors trade too
much?” (1999) that investors are unable to wisely choose stocks from thousands of
alternatives and tend solve this problem by buying stocks that have recently caught their
attention. The attention-induced price pressure hypothesis by Barber and Odean (2008) is an
even further developed version of the previous argument, and is explained through the
inevitability of limited choices for the individual investors.
As the set of buyable assets for individual investors is vast and they tend to only sell
what they own (they very rarely sell short2), they are faced with unequal possibilities of
buying and selling. Barber and Odean (2008) suggest that since limited attention determines
the set of choices, investors tend to more likely buy stocks that grab their attention than the
ones that do not. Therefore, an increase in retail attention should lead to aggregate net buying
from individual investors. This should then create a temporary positive price pressure on the
stocks in question, which then should reverse when the pressure eventually clears away.
2
Only 0.29 % of all individual investor positions are short (Barber and Odean, 2008). This is also consistent
with the finding of Dorn (2009), who shows that long positions in Europe are mostly taken by individual
investors whereas short positions are taken by institutional investors.
8
Investor attention proxies
Investor attention as such is an abstract non-quantifiable phenomenon, that
nonetheless drives many other phenomena. To quantify and measure investor attention, some
proxies for it are needed.
Number of papers on different proxies for investor attention have been published.
Barber and Odean have probably found the most proxies for attention: media attention
measured by news (2008), extreme returns (2008) and retail investor trading volumes (2009)
all represent significant measures of investor attention. Advertising expenses have found to
affect stock returns positively, even after controlling for various other price predictors
(Chemmanur and Yan, 2009). The advertising expenses not only seem to affect stock returns
but the number of stockholders and better liquidity as well (Grullon et al.). Seasholes and Wu
(2007) argue that stocks hitting upper price limits experience higher returns, which however
reverse within the following week. Gervais, Kaniel, and Mingelgrin (2001) have also studied
the effect of extreme trading activity and have come to the conclusion that high volume
return premium exists for as long as a month after the week of unusually high trading
volume. Along with studying the effect of trading volume, Hou, Peng and Xiong (2008) find
that market state has an effect on the profitability of price momentum strategies. It seems that
when investors pay attention to earnings news, the price underreactions are weaker than in
the setting of low attention. (Hou et al., 2008).
Along with the study by Da et al., Mondria and Wu (2011) present another novel and
very relevant finding relating to attention measured by SVI. What they find is that measured
by geographical SVI, local investors tend to pay abnormally high attention to local stocks,
and the stocks that gather a lot of local attention compared to nonlocal attention, tend to earn
higher returns.
It is very intuitive, that when information is pushed towards investors, they will pay more
attention to them. However, news does not necessarily guarantee attention, if investors do not
read them, and turnover can also be affected by various other factors than attention (Da et al.,
2011). Google search is by definition attention-grabbing, since users actively search
information that they are already paying attention to. This makes SVI the first genuinely
direct measure of attention.
9
Google Trends in literature
Google Trends was published a decade ago and it has been utilized vastly in many areas
of research since. Already now there are over four million search results on Google Scholar
on the search term ‘Google Trends’. Perhaps most famously, search volume indices have
been used to estimate influenza-like diseases in epidemiology research. Examples of this
include the studies by Polgreen et al. (2008) and Ginsberg et al. (2009), who find Google
searches to be a timely and a robust way to predict influenza occurrences. The study by
Ginsberg et al. (2009) has even inspired a tool for the use of predicting flu incidence: Google
Flu Trends (www.google.com/flutrends/), which speaks for the relevance and predictive
power of Google Trends. The findings of the above-mentioned researchers have then further
inspired various more recent epidemiology studies as well.
Google Trends has also been used in the field of economics. As a pioneer of web search
analytics research, the Chief Economist of Google – Hal Varian (2009) – has shown that
search volume data has the power of estimating the activity in different economic
phenomena. With H. Choi they bring insight on predicting car part sales, tourism, consumer
confidence and initial claims for unemployment benefits (Choi and Varian, 2009). Vosen and
Schmidt (2009) examine private consumption and find that Google searches are a better
indicator than survey-based methods in predicting retail sales. Guzmán (2011) even suggests
that Google could be used as a measure of inflation expectations.
Some research has also been done on the explanatory power of search volumes regarding
popularity of institutions and individuals. Vaughan and Romero-Frías (2014) validate that
Google search volumes on university names have significant correlation with the university
reputation. One of the examples where search volumes have not been able to predict results is
a study by Lui, et al. (2011), that finds that search volumes poorly predict election results in
The United States.
Generally, Google search volumes seem to have predictive power within numerous
contexts and the methodology related to their use has been applied extensively throughout
different disciplines.
10
3. Data and methodology
In addition to Google trends data that is freely accessible by anyone, I obtain the
remaining event data from Thomson Reuters SDC Platinum and time series data from
Datastream.
Sample
The criteria for the selection of the sample companies are as follows. All companies are
found in the SDC Platinum database under the selection of Public Continental European
listings, unit issues excluded. Listings are narrowed down to IPOs (first listings in the market)
that have occurred between 1.1.2004 and 1.9.2015. The sample size with these criteria is
1262. To increase the feasibility of the sample and availability of the data, only common and
ordinary shares are included and REITs (Real Estate Investment Trusts) are excluded. Also
the list of companies is restricted to the ones that SDC can identify an ISIN for. This is done
to ensure further data availability. Moreover, the exchanges where the companies are
primarily traded are limited to the six largest (by market cap) continental European stock
exchanges and their predecessors to form a geographically unified and market-wise
developed enough sample. London Stock Exchange is left out of the sample because a similar
study in the form of a Master’s thesis with a broader market sight has been done in Aalto
University (Wuoristo, L., 2012). Wuoristo has confirmed that Google search volumes have
predictive power on FTSE AllShare index stocks’ returns in the UK market. Even though
Wuoristo has not examined IPO returns, I find it relevant to concentrate on the yet
undiscovered European continental markets.
Even though for example the Euronext exchange was formed in 2000 in collaboration
with Belgium, Portugal, France, and the Netherlands (and UK, though excluded here), and
the time series begin in 2004, SDC still shows some listings by the former exchange names.
Therefore, also all the preceding exchanges are included in the sample. The viable sample
size with above mentioned criteria is finally 332.
11
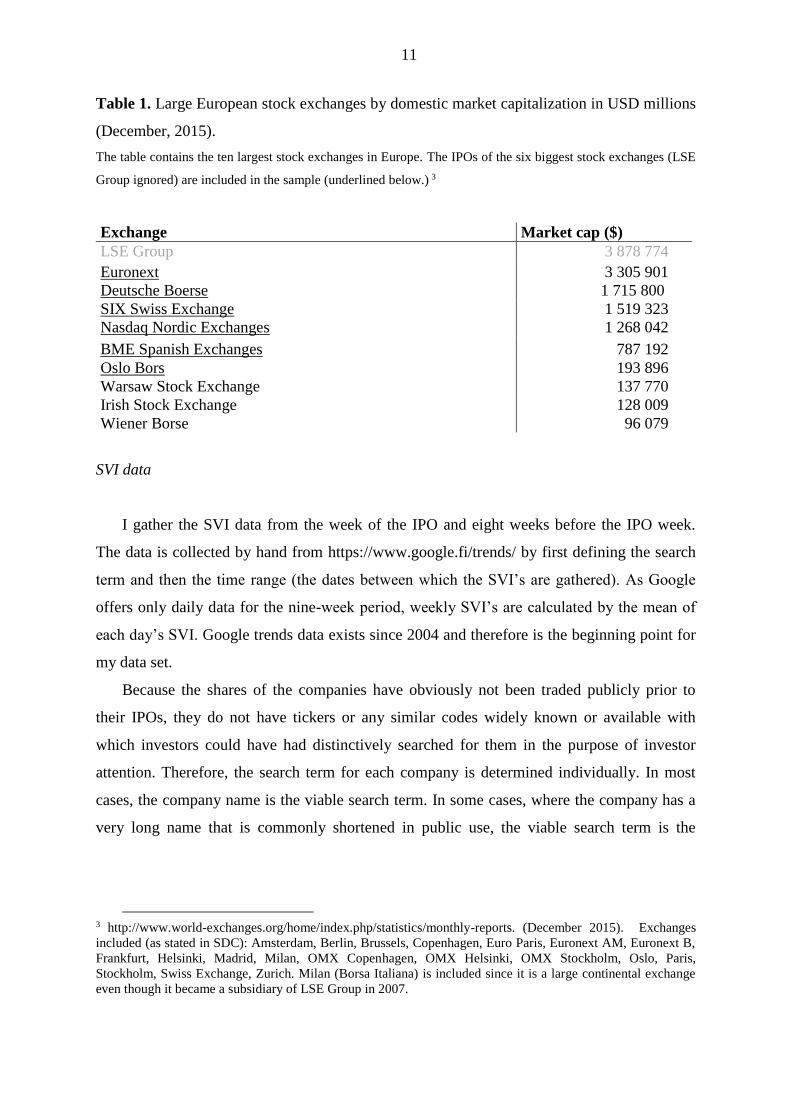
Table 1. Large European stock exchanges by domestic market capitalization in USD millions
(December, 2015).
The table contains the ten largest stock exchanges in Europe. The IPOs of the six biggest stock exchanges (LSE
Group ignored) are included in the sample (underlined below.) 3
Exchange Market cap ($)
LSE Group 3 878 774
Euronext 3 305 901
Deutsche Boerse 1 715 800
SIX Swiss Exchange 1 519 323
Nasdaq Nordic Exchanges 1 268 042
BME Spanish Exchanges 787 192
Oslo Bors 193 896
Warsaw Stock Exchange 137 770
Irish Stock Exchange 128 009
Wiener Borse 96 079
SVI data
I gather the SVI data from the week of the IPO and eight weeks before the IPO week.
The data is collected by hand from https://www.google.fi/trends/ by first defining the search
term and then the time range (the dates between which the SVI’s are gathered). As Google
offers only daily data for the nine-week period, weekly SVI’s are calculated by the mean of
each day’s SVI. Google trends data exists since 2004 and therefore is the beginning point for
my data set.
Because the shares of the companies have obviously not been traded publicly prior to
their IPOs, they do not have tickers or any similar codes widely known or available with
which investors could have had distinctively searched for them in the purpose of investor
attention. Therefore, the search term for each company is determined individually. In most
cases, the company name is the viable search term. In some cases, where the company has a
very long name that is commonly shortened in public use, the viable search term is the
3 http://www.world-exchanges.org/home/index.php/statistics/monthly-reports. (December 2015). Exchanges
included (as stated in SDC): Amsterdam, Berlin, Brussels, Copenhagen, Euro Paris, Euronext AM, Euronext B,
Frankfurt, Helsinki, Madrid, Milan, OMX Copenhagen, OMX Helsinki, OMX Stockholm, Oslo, Paris,
Stockholm, Swiss Exchange, Zurich. Milan (Borsa Italiana) is included since it is a large continental exchange
even though it became a subsidiary of LSE Group in 2007.
12
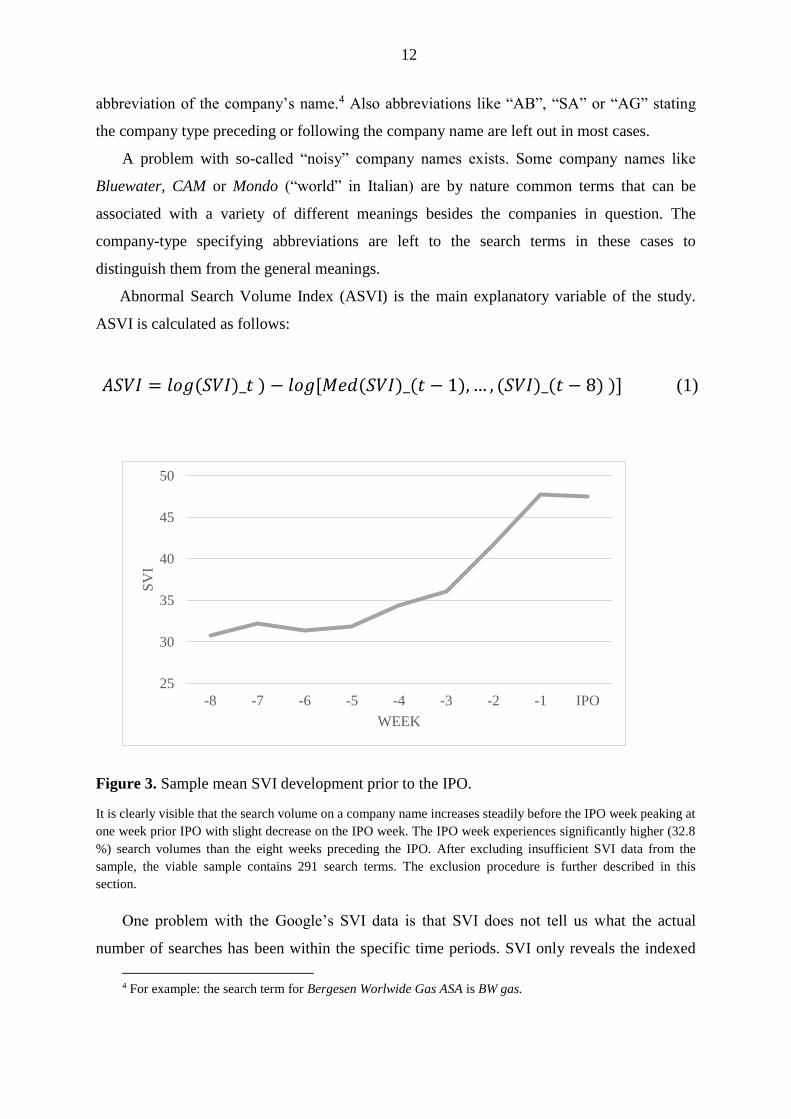
𝐴𝑆𝑉𝐼 = 𝑙𝑜𝑔(𝑆𝑉𝐼)_𝑡) − 𝑙𝑜𝑔[𝑀𝑒𝑑(𝑆𝑉𝐼)_(𝑡 − 1),… , (𝑆𝑉𝐼)_(𝑡 − 8))] (1)
abbreviation of the company’s name.4 Also abbreviations like “AB”, “SA” or “AG” stating
the company type preceding or following the company name are left out in most cases.
A problem with so-called “noisy” company names exists. Some company names like
Bluewater, CAM or Mondo (“world” in Italian) are by nature common terms that can be
associated with a variety of different meanings besides the companies in question. The
company-type specifying abbreviations are left to the search terms in these cases to
distinguish them from the general meanings.
Abnormal Search Volume Index (ASVI) is the main explanatory variable of the study.
ASVI is calculated as follows:
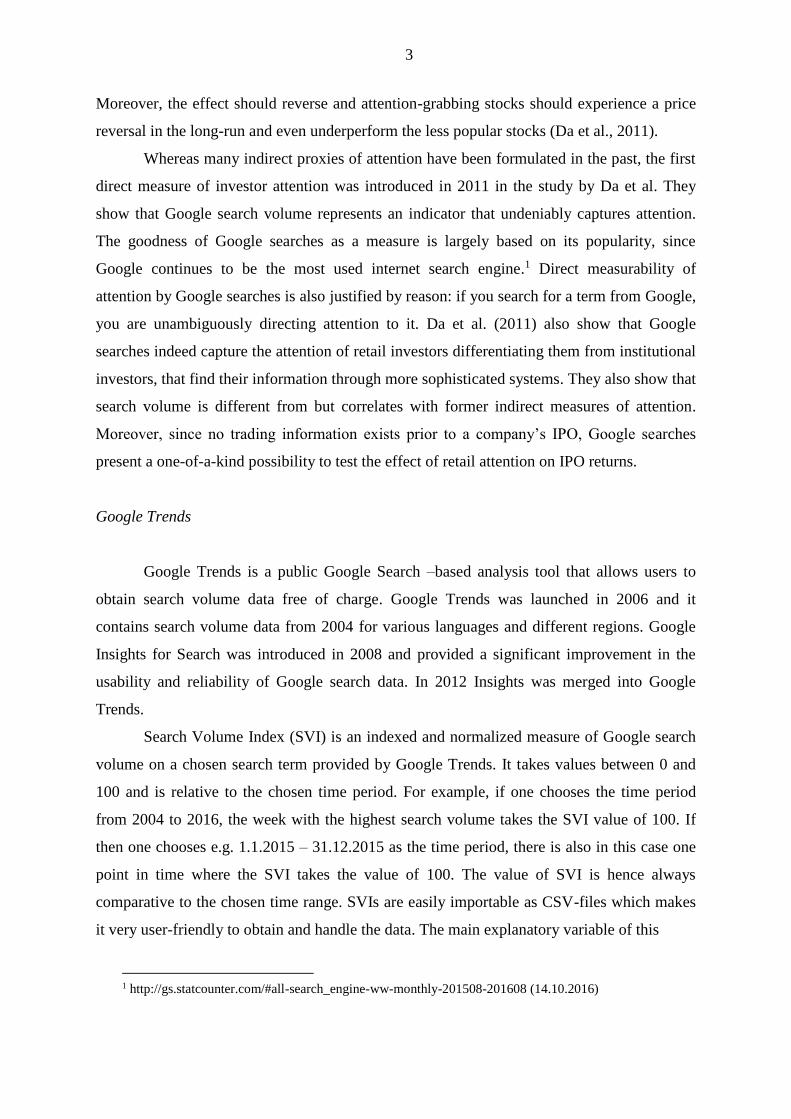
Figure 3. Sample mean SVI development prior to the IPO.
It is clearly visible that the search volume on a company name increases steadily before the IPO week peaking at
one week prior IPO with slight decrease on the IPO week. The IPO week experiences significantly higher (32.8
%) search volumes than the eight weeks preceding the IPO. After excluding insufficient SVI data from the
sample, the viable sample contains 291 search terms. The exclusion procedure is further described in this
section.
One problem with the Google’s SVI data is that SVI does not tell us what the actual
number of searches has been within the specific time periods. SVI only reveals the indexed
4 For example: the search term for Bergesen Worlwide Gas ASA is BW gas.
25
30
35
40
45
50
-8 -7 -6 -5 -4 -3 -2 -1 IPO
SV
I
WEEK
13
and normalized development of the search volume on a specific term. There is obviously
variance – quite possibly a very high variance – within the volumes of the searches done on
different company names. Therefore, in the case of a company that is searched for very little,
a big change in a relatively small number of searches should not necessarily have a large
effect on total attention of the firm. However, SVI captures this change and it is impossible to
balance out the effect with the limited information that SVI offers. Also, as SVI is
normalized, it makes it hard to estimate what Google considers as the “zero-level” of
searches. Google gives very vague definitions of this on their website.5 Due to this
uncertainty, to make the sample more accurate, I exclude from the sample all the queries
where more than 50 % of the daily SVI’s are zero. I identify 32 of these company names.
There are also 9 search terms with no SVI data at all. After these corrections the sample size
is 291. Sufficient return data is available for 254 of these companies.
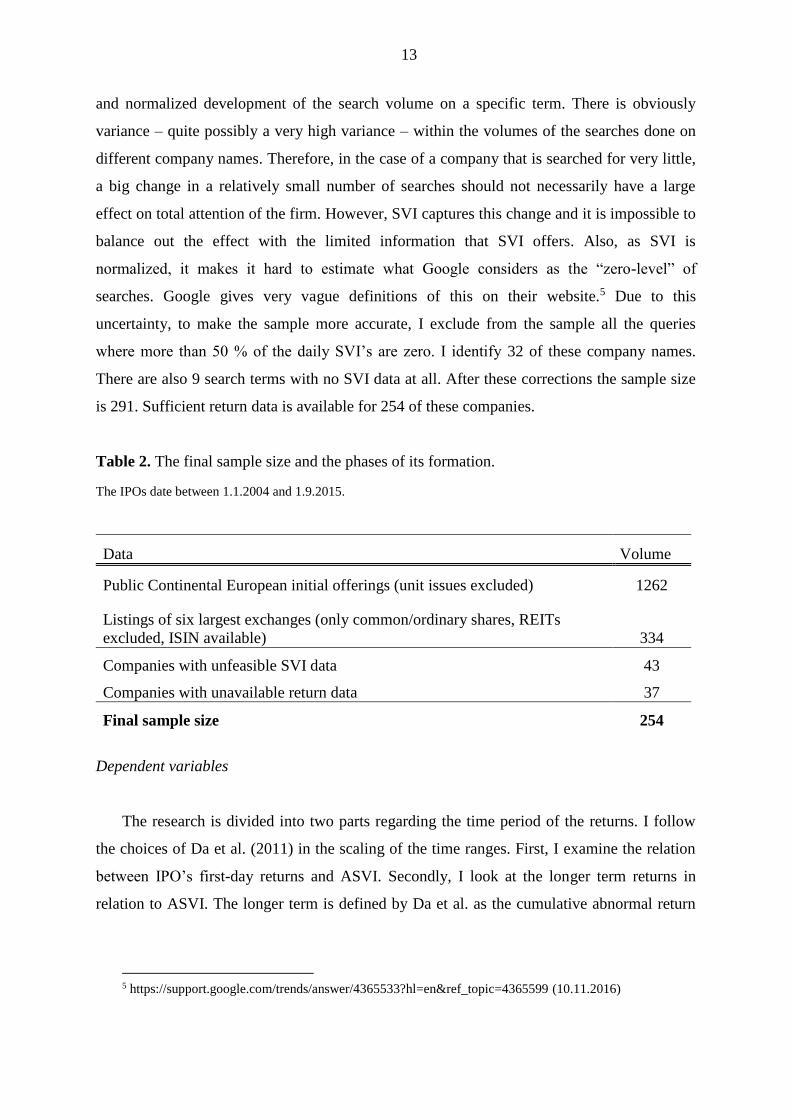
Table 2. The final sample size and the phases of its formation.
The IPOs date between 1.1.2004 and 1.9.2015.
Data Volume
Public Continental European initial offerings (unit issues excluded) 1262
Listings of six largest exchanges (only common/ordinary shares, REITs
excluded, ISIN available) 334
Companies with unfeasible SVI data 43
Companies with unavailable return data 37
Final sample size 254
Dependent variables
The research is divided into two parts regarding the time period of the returns. I follow
the choices of Da et al. (2011) in the scaling of the time ranges. First, I examine the relation
between IPO’s first-day returns and ASVI. Secondly, I look at the longer term returns in
relation to ASVI. The longer term is defined by Da et al. as the cumulative abnormal return
5 https://support.google.com/trends/answer/4365533?hl=en&ref_topic=4365599 (10.11.2016)
14
between weeks 5 and 52 after the IPO. However, simple regression results of ASVI’s effect
of monthly cumulative returns are also reviewed in the results-section.
First-day returns are calculated simply as the price change between offer price and the
first available closing price of the stock, whereas the long-run abnormal returns are calculated
from the cumulative monthly returns. The definition of the abnormal returns is further
explained in the following paragraph.
As I study returns occurring only shortly after the IPO (the longest studied period is
twelve months after the IPO), there is no suitable asset pricing model for my purposes to
calculate abnormal returns. This is of course due to the lack of historical return data on my
sample companies. Therefore, I adjust the monthly returns with industry returns, as Da et al.
(2011) have also done in one of their regression sets.
The industries are identified by 4-digit SIC codes, that I obtain from Datastream with
lists of ISINs that I gather from the different stock exchanges’ websites. To get large enough
industry portfolio sizes, the 4-digit SIC codes are then reduced to 2-digit codes that express a
broader industry definition. The sample companies are then also assigned a 2-digit SIC code
deriving from the 4-digit one. Every sample company’s returns are then compared to the
industry at the specific time of the IPO. The industry sample contains 2478 companies listed
in the largest European stock exchanges between 2004 and 2016.
Sample companies’ monthly returns and industry returns are calculated with the
Datastream variable RI (Return Index) that is defined as follows: “Return index (RI) shows a
theoretical growth in value of a share holding over a specified period, assuming that
dividends are re-invested to purchase additional units of an equity or unit trust at the closing
price applicable on the ex-dividend date.” Although RI does not bring much added value as a
measure to the calculation of returns compared to simple price development, it takes into
account possible exceptional dividend practices within the sample companies.
The returns are calculated as the percentage development of RI’s beginning four
weeks from the IPO and ending at 52 weeks from the IPO. The first month is left out of the
long-run return horizon because retail attention seems to revert largely four weeks after the
IPO, as shown in Da et al. (2011).
RI (Return Index) (2)
𝑅𝐼𝑡 = 𝑅𝐼𝑡−1 ×𝑃𝐼𝑡𝑃𝐼𝑡−1
× (1 +𝐷𝑌𝑡100
×1
𝑁)

15
Where:
RIt = return index on day t
RIt-1 = return index on previous day
PIt = price index on day t
PIt-1 = price index on previous day
DYt = dividend yield % on day t
N = number of working days in the year (taken to be 260)
Control variables
The control variables used in the study are adapted from the paper by Da et al. considering
the availability of data and the time frame at hand. In choosing the variables, attention is
given to the level of significance they have produced in the reference study. There are five
control variables and two additional interaction control variables. All the variable definitions
are listed in Table 3.
Table 3. All variable definitions.
Variable Definition
Dependent variables
First-day return Absolute first-day return of a stock. First Datastream available closing price
index (PI) divided by 100 minus one (100 represents the value of the offering
price).
Cumulative industry-adjusted
long-term return
Abnormal cumulative returns between the weeks 5 and 52 after the IPO
adjusted by industry returns defined by 2-digit SIC codes. The industry
companies are obtained from public stock exchange websites and the returns
for the companies are obtained from Datastream.
Independent variables
ASVI Abnormal Search Volume Index. The log of SVI during the IPO week minus
the log of median SVI during the eight weeks before the IPO. (Da et al., 2011)
Log(Asset Size) Log of Total Assets of the company prior to the IPO. Obtained from
Datastream.
Log(Offering Size) Log of total number of shares offered in the market multiplied by the offer
price in MEUR. Obtained from Datastream.
Log(Age) Log of number of years between the company's founding year and the year of
the IPO. The dates are obtained from SDC.
Secondary Share Overhang Secondary shares offered divided by the total number of shares offered in the
market. Obtained from Datastream.
Price Revision Ratio of the final offering price divided by the original middle of the filing
price range. IPO final offering prices and initial offering price ranges are
obtained from SDC.
16
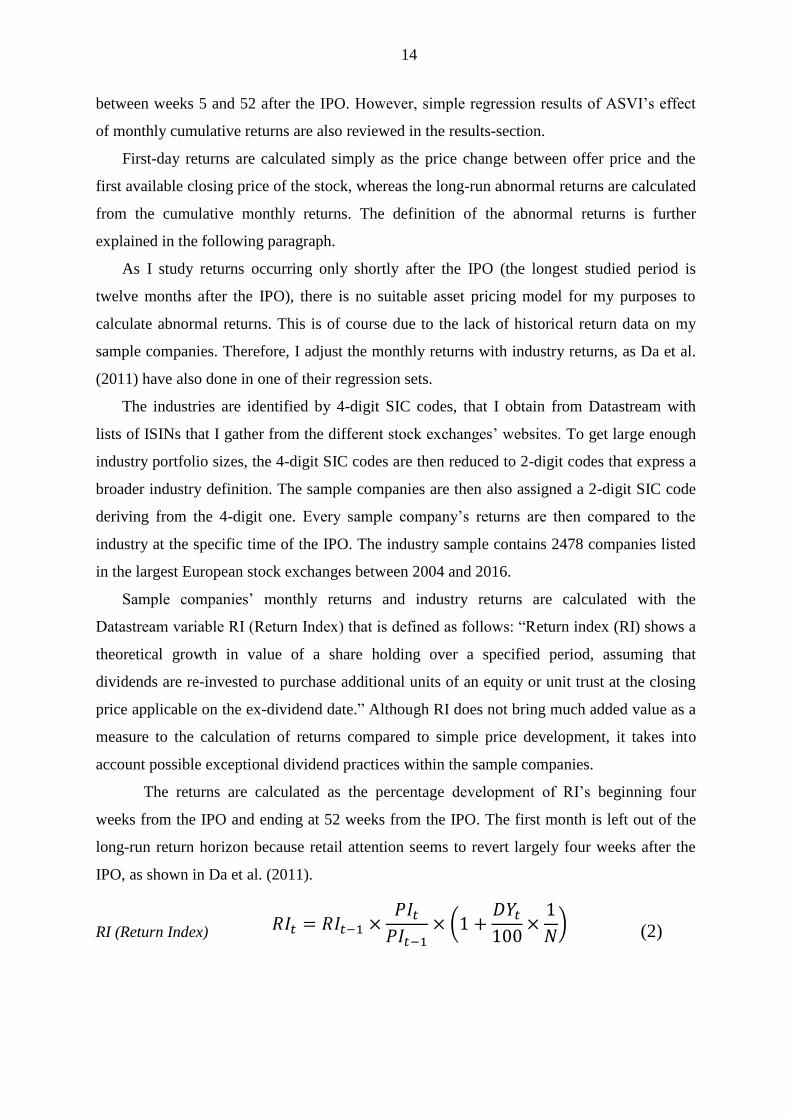
Sample descriptive statistics
The descriptive statistics concerning all the variables in the study are stated in Table
4. Firstly, the table shows that on average the sample stocks produce positive, but
surprisingly low first-day returns (3.4 %). The maximum first-day return of the sample is not
extremely high either (55.3 %). The mean of cumulative long-term abnormal returns is
slightly negative; within a year of the IPOs, the companies in the sample underperform their
industries on average. The finding is consistent with the result of the study by Loughran and
Ritter (1995). The phenomenon is also widely acknowledged in other literature as well. The
standard deviation of long-term returns is however notably high (48.5 %).
Secondly, it is noticeable that both the mean and the median of ASVI are positive,
which means that firms on average are googled more than usual during the week of their IPO.
Price Revision is lower than one on average, which means that the companies are listed on
average with a lower offering price than the middle of the filing price. This finding is
consistent with the findings of Ritter (2003), who shows that in Europe IPOs are very rarely
priced above the maximum filing price.
Table 4. Sample descriptive statistics.
Variable Mean Median
Standard
Deviation Minimum Maximum Observations
First-day return 0.034 0.007 0.102 -0.206 0.553 248
Cumulative long-term
abnormal return -0.017 -0.093 0.485 -0.963 2.642 254
ASVI 0.434 0.300 0.886 -4.079 3.181 254
Secondary Share
Overhang 0.342 0.000 0.413 0.000 1.000 251
Log(Offering Size) 17.046 17.416 2.321 8.124 21.609 251
Log(Asset Size) 12.609 12.511 2.315 6.759 19.943 224
Price Revision 0.764 0.771 0.083 0.567 0.944 157
Log(Age) 2.508 2.398 0.982 0.000 4.466 160
Methodology
The methodology contains cross-sectional multiple regressions on the short- and long-
term returns constructed with various combinations of explanatory variables as well as a
robustness check by dividing the time period into two. The robustness is also verified by
17
comparing the returns of low-ASVI and high-ASVI stocks and tested with t-tests and non-
parametric Wilcoxon tests. A statistically significant relation between abnormal stock returns
and abnormal level of Google searches within the short-term is found in addition to the
insignificant results within longer term. Some of the robustness checks however indicate
ASVI’s possible explainability of the long-term returns.
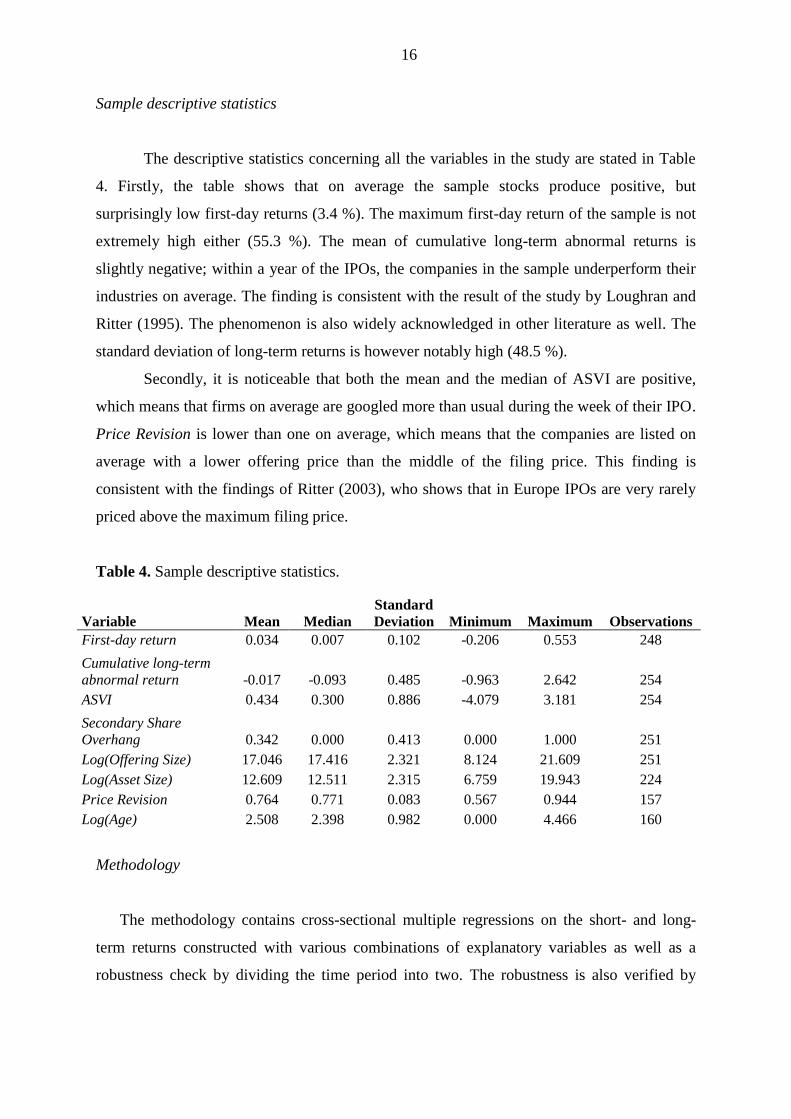
Table 5. Methods used to test hypotheses.
The table describes the methods to test the two hypotheses of the study.
Multiple cross-sectional regressions
H1 The relation between ASVI and first-day returns (also with sample winsorized)
H2
The relation between ASVI and long-term returns (also with sample winsorized)
H2
Simple regressions on the monthly cumulative abnormal returns of months 1 … 12
after the IPO
Robustness checks
H1 & H2
T-test and non-parametric Wilcoxon test on the difference between high-ASVI and
low-ASVI stock returns
H1 & H2 Regression by dividing the time period into pre-2008 and post-2008
4. Results
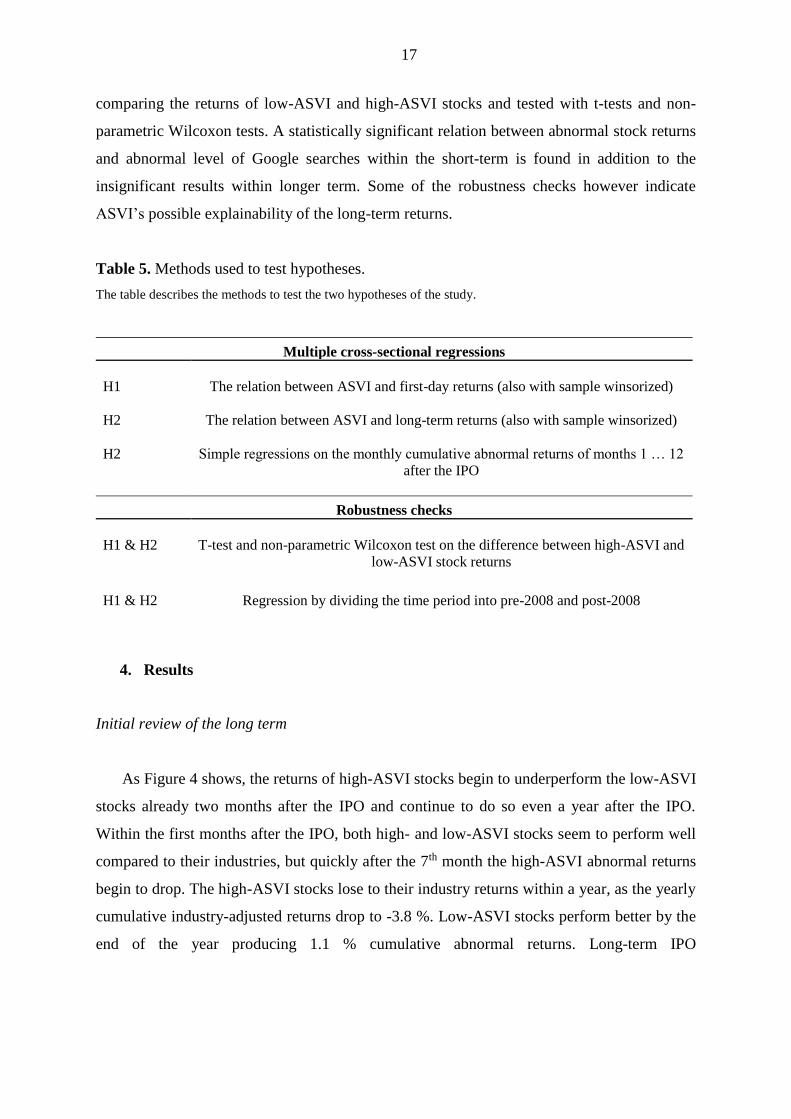
Initial review of the long term
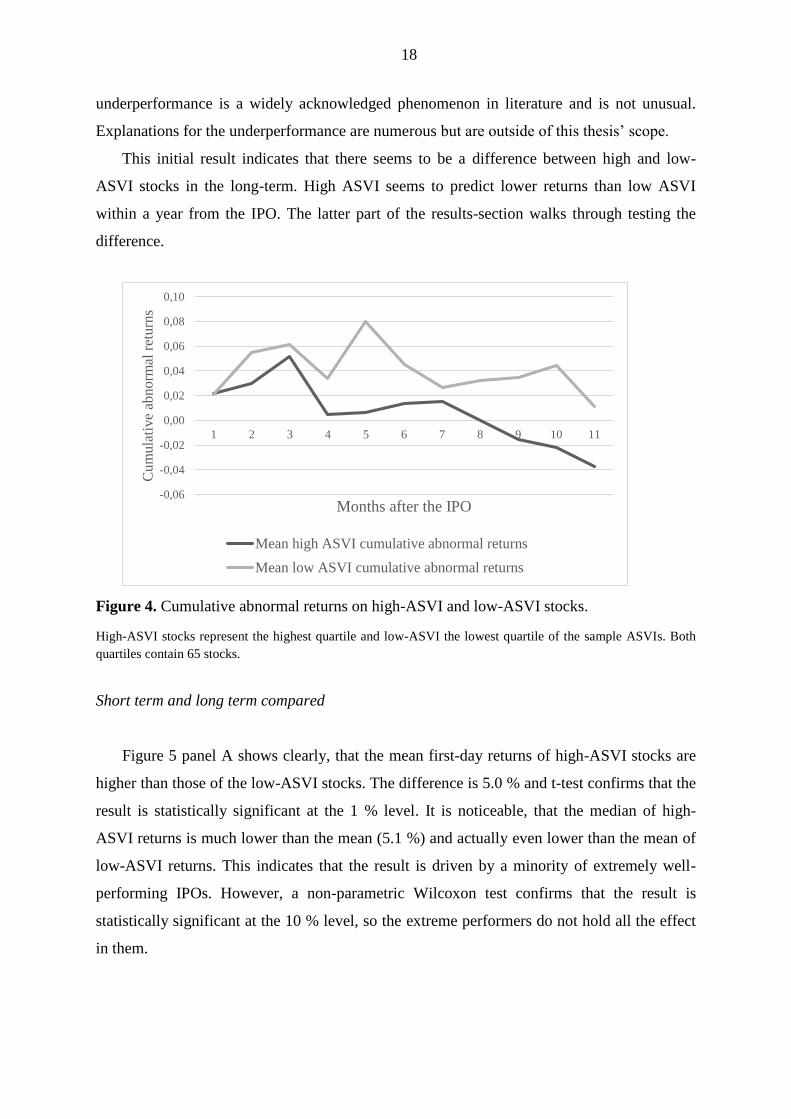
As Figure 4 shows, the returns of high-ASVI stocks begin to underperform the low-ASVI
stocks already two months after the IPO and continue to do so even a year after the IPO.
Within the first months after the IPO, both high- and low-ASVI stocks seem to perform well
compared to their industries, but quickly after the 7th month the high-ASVI abnormal returns
begin to drop. The high-ASVI stocks lose to their industry returns within a year, as the yearly
cumulative industry-adjusted returns drop to -3.8 %. Low-ASVI stocks perform better by the
end of the year producing 1.1 % cumulative abnormal returns. Long-term IPO
18
underperformance is a widely acknowledged phenomenon in literature and is not unusual.
Explanations for the underperformance are numerous but are outside of this thesis’ scope.
This initial result indicates that there seems to be a difference between high and low-
ASVI stocks in the long-term. High ASVI seems to predict lower returns than low ASVI
within a year from the IPO. The latter part of the results-section walks through testing the
difference.
Figure 4. Cumulative abnormal returns on high-ASVI and low-ASVI stocks.
High-ASVI stocks represent the highest quartile and low-ASVI the lowest quartile of the sample ASVIs. Both
quartiles contain 65 stocks.
Short term and long term compared
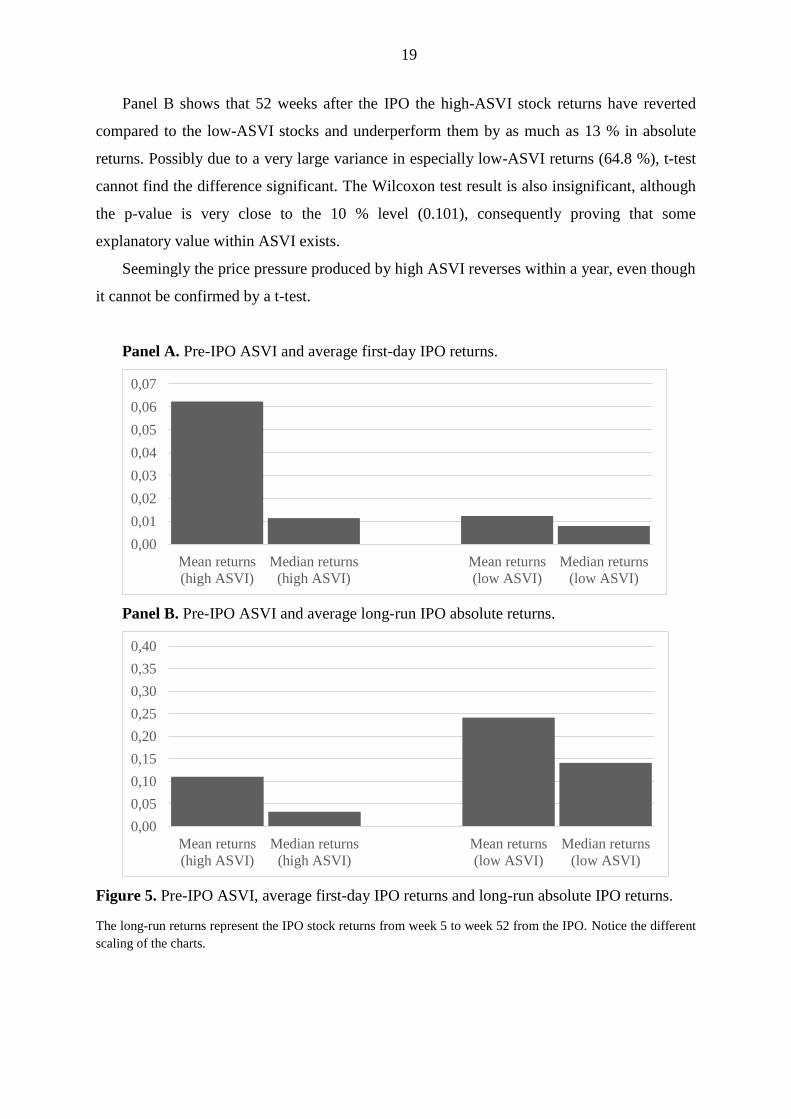
Figure 5 panel A shows clearly, that the mean first-day returns of high-ASVI stocks are
higher than those of the low-ASVI stocks. The difference is 5.0 % and t-test confirms that the
result is statistically significant at the 1 % level. It is noticeable, that the median of high-
ASVI returns is much lower than the mean (5.1 %) and actually even lower than the mean of
low-ASVI returns. This indicates that the result is driven by a minority of extremely well-
performing IPOs. However, a non-parametric Wilcoxon test confirms that the result is
statistically significant at the 10 % level, so the extreme performers do not hold all the effect
in them.
-0,06
-0,04
-0,02
0,00
0,02
0,04
0,06
0,08
0,10
1 2 3 4 5 6 7 8 9 10 11
Cum
ula
tive
abn
orm
al r
etu
rns
Months after the IPO
Mean high ASVI cumulative abnormal returns
Mean low ASVI cumulative abnormal returns
19
Panel B shows that 52 weeks after the IPO the high-ASVI stock returns have reverted
compared to the low-ASVI stocks and underperform them by as much as 13 % in absolute
returns. Possibly due to a very large variance in especially low-ASVI returns (64.8 %), t-test
cannot find the difference significant. The Wilcoxon test result is also insignificant, although
the p-value is very close to the 10 % level (0.101), consequently proving that some
explanatory value within ASVI exists.
Seemingly the price pressure produced by high ASVI reverses within a year, even though
it cannot be confirmed by a t-test.
Panel A. Pre-IPO ASVI and average first-day IPO returns.
Panel B. Pre-IPO ASVI and average long-run IPO absolute returns.
Figure 5. Pre-IPO ASVI, average first-day IPO returns and long-run absolute IPO returns.
The long-run returns represent the IPO stock returns from week 5 to week 52 from the IPO. Notice the different
scaling of the charts.
0,00
0,01
0,02
0,03
0,04
0,05
0,06
0,07
Mean returns
(high ASVI)
Median returns
(high ASVI)
Mean returns
(low ASVI)
Median returns
(low ASVI)
0,00
0,05
0,10
0,15
0,20
0,25
0,30
0,35
0,40
Mean returns
(high ASVI)
Median returns
(high ASVI)
Mean returns
(low ASVI)
Median returns
(low ASVI)
20
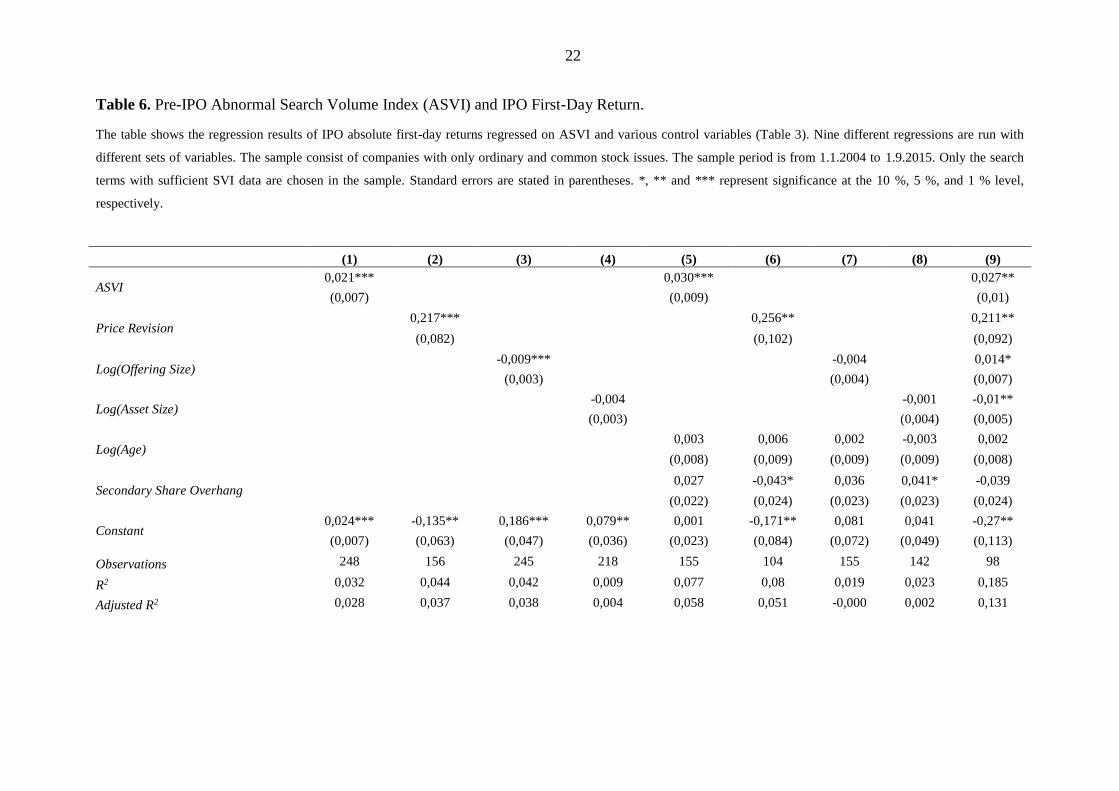
Cross-sectional regressions
From the regression Table 6 we can see that ASVI remains the only variable along with
Price Revision that continues to explain the first-day returns at the 1 % or 5 % level. Price
Revision, which is defined as offering price divided by median of filing price, alone explains
the variance in first-day returns with adjusted R2 of 3.7 %. Along with Log(Offering Size), it
is the best single explainer of the return variance. The result is consistent with the study by
Hanley (1993), which suggests that a bigger revision of the offering price compared to the
filing price predicts higher first-day returns. Log(Offering Size) is also a strong explainer in
regression 3, where no other factors are controlled. The return variance is best explained by
the regression where every variable is taken into account (R2 of 13.1 %).
In the regressions where ASVI is included, its coefficient varies from 0.021 to 0.030.
Even after controlling for all other variables, one standard deviation (0.886) increase in ASVI
results in 2.39 % (=0.886 × 0.027) increase in first-day returns. ASVI clearly seems to be a
very strong predictor of first-day returns; even after a 90 % winsorizing ASVI maintains its
significance at the 1 % level.
Secondary Share Overhang and Log(Age) seem to be rather weak explainers of the first-
day returns, whereas Log(Asset Size) of the company turns out to have significant effect in the
last regression. However, the effect is negative and very close to zero.
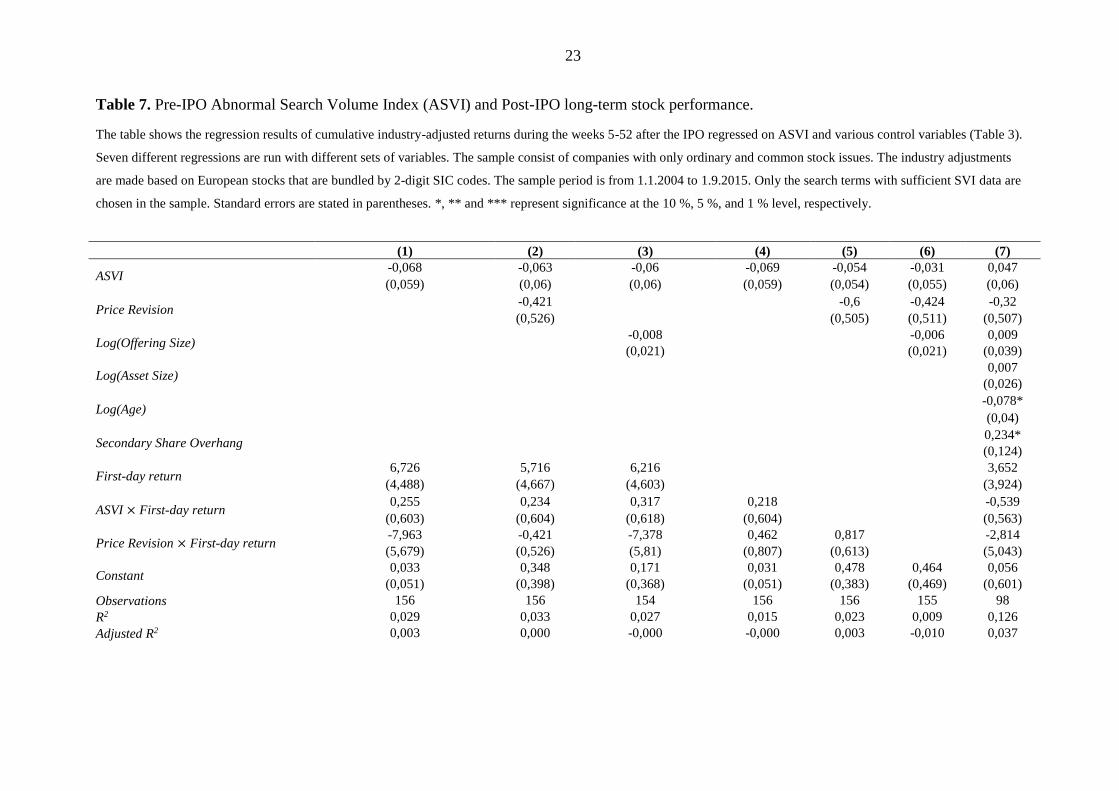
Table 7 shows us the summary of the results of independent variables regressed on the
long-term returns. It is immediately evident, that almost none of the variables show
significant difference in any direction. ASVI coefficient itself takes negative values in all but
one regression – which is in line with previous research – but is unable to produce significant
difference in any of them. Contrary to the results of the study by Da et al. (2011), the
interaction variable Price Revision × First-day return does not represent any significance and
produces positive coefficients in all but one regression (7).
In the simple regressions where ASVI is regressed on monthly cumulative abnormal
returns for months 1 to 12 after the IPO, ASVI loses its explanatory role already after the first
month. ASVI does not show any significant effect on the cumulative returns during the first
year of the IPO, but the coefficient does turn to negative after the 12th month (-0.011). The
result is however not even near significant (t-stat of -0,308).
Interestingly, when ASVI alone is regressed on the 12-month abnormal cumulative
returns after a 90 % winsorizing, it gains a significant coefficient of -0.091 at the 5 % level,
21
which implies that ASVI would predict long-term underperformance. This result is however
not controlled. It can be concluded that ASVI along with the control variables are not directly
able to predict long-term returns of the European IPOs but show some signs of return
predictability.
One possible explanation for the low explanatory level of ASVI on the long-term returns
might be the very high deviation of the long-term IPO returns within the sample. As seen in
Table 4 (descriptive statistics) the standard deviation of the long-term abnormal returns is
48.5 %. The high deviation is likely contributed by the fragmentation of European markets,
since Europe is not financially a very coherent area like USA, where the effect exists (Da et
al., 2011). Every country has its own regulation, investor culture and level of financial
activity.
In my sample, Belgian companies do best in the long-run with mean abnormal returns of
4.2 % (N = 90), whereas Finnish companies lose to their industries by 20.3 % (N = 13) within
a year of the IPO on average. The finding is consistent with the findings of European Capital
Markets Institute’s paper ‘A survey of the European IPO market’ from 2006, that records
high variance between different European countries long-term IPO returns. The paper also
indicates that the IPO return variance is explained by the variance of returns between
industries as well. In my sample this issue could have been solved by using industry-clustered
standard deviations, but as the industry sample size leaves too little comparable companies in
most industry classes, the result would have likely been more biased than in the chosen
practice.
22
Table 6. Pre-IPO Abnormal Search Volume Index (ASVI) and IPO First-Day Return.
The table shows the regression results of IPO absolute first-day returns regressed on ASVI and various control variables (Table 3). Nine different regressions are run with
different sets of variables. The sample consist of companies with only ordinary and common stock issues. The sample period is from 1.1.2004 to 1.9.2015. Only the search
terms with sufficient SVI data are chosen in the sample. Standard errors are stated in parentheses. *, ** and *** represent significance at the 10 %, 5 %, and 1 % level,
respectively.
(1) (2) (3) (4) (5) (6) (7) (8) (9)
ASVI 0,021***
0,030***
0,027**
(0,007)
(0,009)
(0,01)
Price Revision 0,217***
0,256**
0,211**
(0,082)
(0,102)
(0,092)
Log(Offering Size) -0,009***
-0,004
0,014*
(0,003)
(0,004)
(0,007)
Log(Asset Size) -0,004
-0,001 -0,01**
(0,003)
(0,004) (0,005)
Log(Age) 0,003 0,006 0,002 -0,003 0,002
(0,008) (0,009) (0,009) (0,009) (0,008)
Secondary Share Overhang 0,027 -0,043* 0,036 0,041* -0,039
(0,022) (0,024) (0,023) (0,023) (0,024)
Constant 0,024*** -0,135** 0,186*** 0,079** 0,001 -0,171** 0,081 0,041 -0,27**
(0,007) (0,063) (0,047) (0,036) (0,023) (0,084) (0,072) (0,049) (0,113)
Observations 248 156 245 218 155 104 155 142 98
R2 0,032 0,044 0,042 0,009 0,077 0,08 0,019 0,023 0,185
Adjusted R2 0,028 0,037 0,038 0,004 0,058 0,051 -0,000 0,002 0,131
23
Table 7. Pre-IPO Abnormal Search Volume Index (ASVI) and Post-IPO long-term stock performance.
The table shows the regression results of cumulative industry-adjusted returns during the weeks 5-52 after the IPO regressed on ASVI and various control variables (Table 3).
Seven different regressions are run with different sets of variables. The sample consist of companies with only ordinary and common stock issues. The industry adjustments
are made based on European stocks that are bundled by 2-digit SIC codes. The sample period is from 1.1.2004 to 1.9.2015. Only the search terms with sufficient SVI data are
chosen in the sample. Standard errors are stated in parentheses. *, ** and *** represent significance at the 10 %, 5 %, and 1 % level, respectively.
(1) (2) (3) (4) (5) (6) (7)
ASVI -0,068 -0,063 -0,06 -0,069 -0,054 -0,031 0,047
(0,059) (0,06) (0,06) (0,059) (0,054) (0,055) (0,06)
Price Revision -0,421
-0,6 -0,424 -0,32
(0,526)
(0,505) (0,511) (0,507)
Log(Offering Size) -0,008
-0,006 0,009
(0,021)
(0,021) (0,039)
Log(Asset Size) 0,007
(0,026)
Log(Age) -0,078*
(0,04)
Secondary Share Overhang 0,234*
(0,124)
First-day return 6,726 5,716 6,216
3,652
(4,488) (4,667) (4,603)
(3,924)
ASVI × First-day return 0,255 0,234 0,317 0,218
-0,539
(0,603) (0,604) (0,618) (0,604)
(0,563)
Price Revision × First-day return -7,963 -0,421 -7,378 0,462 0,817
-2,814
(5,679) (0,526) (5,81) (0,807) (0,613)
(5,043)
Constant 0,033 0,348 0,171 0,031 0,478 0,464 0,056
(0,051) (0,398) (0,368) (0,051) (0,383) (0,469) (0,601)
Observations 156 156 154 156 156 155 98
R2 0,029 0,033 0,027 0,015 0,023 0,009 0,126
Adjusted R2 0,003 0,000 -0,000 -0,000 0,003 -0,010 0,037
24
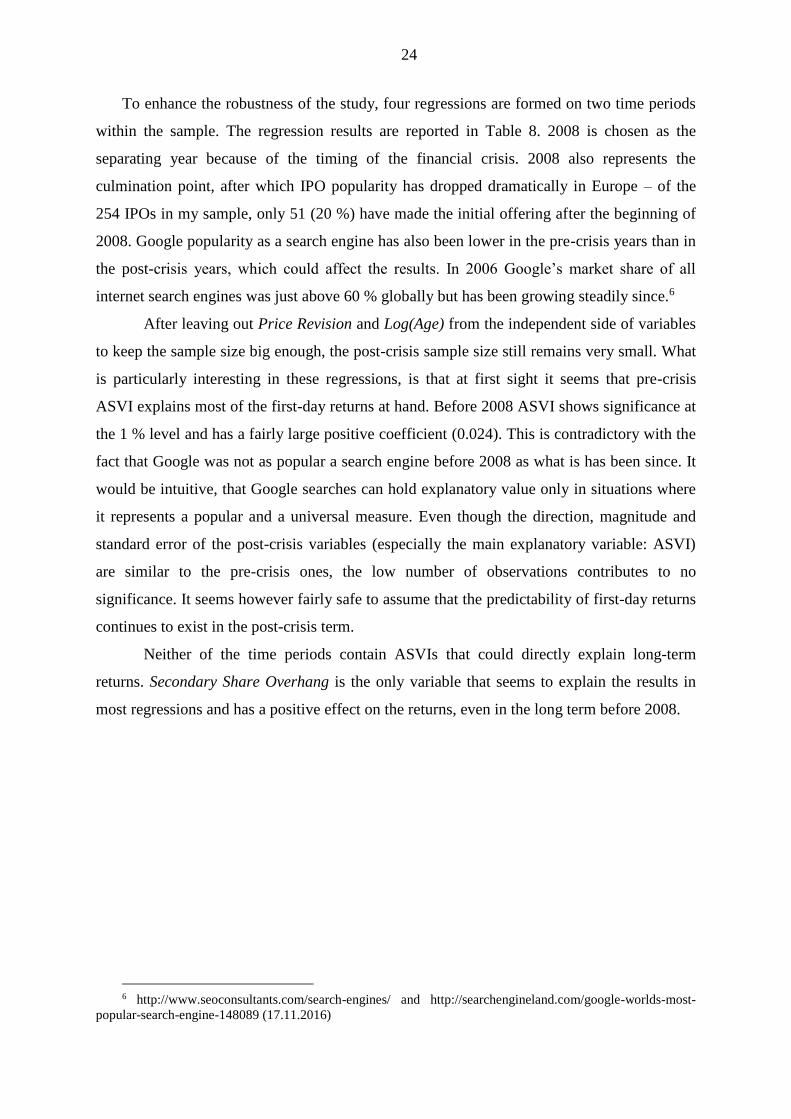
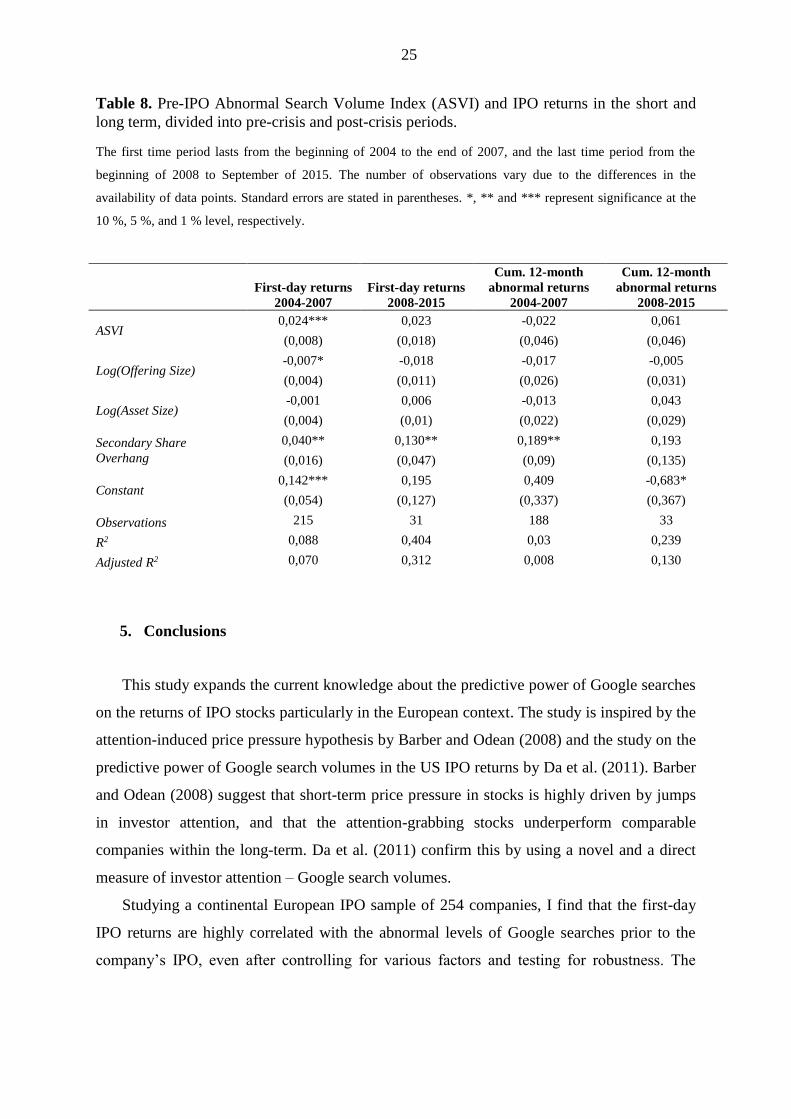
To enhance the robustness of the study, four regressions are formed on two time periods
within the sample. The regression results are reported in Table 8. 2008 is chosen as the
separating year because of the timing of the financial crisis. 2008 also represents the
culmination point, after which IPO popularity has dropped dramatically in Europe – of the
254 IPOs in my sample, only 51 (20 %) have made the initial offering after the beginning of
2008. Google popularity as a search engine has also been lower in the pre-crisis years than in
the post-crisis years, which could affect the results. In 2006 Google’s market share of all
internet search engines was just above 60 % globally but has been growing steadily since.6
After leaving out Price Revision and Log(Age) from the independent side of variables
to keep the sample size big enough, the post-crisis sample size still remains very small. What
is particularly interesting in these regressions, is that at first sight it seems that pre-crisis
ASVI explains most of the first-day returns at hand. Before 2008 ASVI shows significance at
the 1 % level and has a fairly large positive coefficient (0.024). This is contradictory with the
fact that Google was not as popular a search engine before 2008 as what is has been since. It
would be intuitive, that Google searches can hold explanatory value only in situations where
it represents a popular and a universal measure. Even though the direction, magnitude and
standard error of the post-crisis variables (especially the main explanatory variable: ASVI)
are similar to the pre-crisis ones, the low number of observations contributes to no
significance. It seems however fairly safe to assume that the predictability of first-day returns
continues to exist in the post-crisis term.
Neither of the time periods contain ASVIs that could directly explain long-term
returns. Secondary Share Overhang is the only variable that seems to explain the results in
most regressions and has a positive effect on the returns, even in the long term before 2008.
6 http://www.seoconsultants.com/search-engines/ and http://searchengineland.com/google-worlds-most-
popular-search-engine-148089 (17.11.2016)
25
Table 8. Pre-IPO Abnormal Search Volume Index (ASVI) and IPO returns in the short and
long term, divided into pre-crisis and post-crisis periods.
The first time period lasts from the beginning of 2004 to the end of 2007, and the last time period from the
beginning of 2008 to September of 2015. The number of observations vary due to the differences in the
availability of data points. Standard errors are stated in parentheses. *, ** and *** represent significance at the
10 %, 5 %, and 1 % level, respectively.
First-day returns
2004-2007
First-day returns
2008-2015
Cum. 12-month
abnormal returns
2004-2007
Cum. 12-month
abnormal returns
2008-2015
ASVI 0,024*** 0,023 -0,022 0,061
(0,008) (0,018) (0,046) (0,046)
Log(Offering Size) -0,007* -0,018 -0,017 -0,005
(0,004) (0,011) (0,026) (0,031)
Log(Asset Size) -0,001 0,006 -0,013 0,043
(0,004) (0,01) (0,022) (0,029)
Secondary Share
Overhang
0,040** 0,130** 0,189** 0,193
(0,016) (0,047) (0,09) (0,135)
Constant 0,142*** 0,195 0,409 -0,683*
(0,054) (0,127) (0,337) (0,367)
Observations 215 31 188 33
R2 0,088 0,404 0,03 0,239
Adjusted R2 0,070 0,312 0,008 0,130
5. Conclusions
This study expands the current knowledge about the predictive power of Google searches
on the returns of IPO stocks particularly in the European context. The study is inspired by the
attention-induced price pressure hypothesis by Barber and Odean (2008) and the study on the
predictive power of Google search volumes in the US IPO returns by Da et al. (2011). Barber
and Odean (2008) suggest that short-term price pressure in stocks is highly driven by jumps
in investor attention, and that the attention-grabbing stocks underperform comparable
companies within the long-term. Da et al. (2011) confirm this by using a novel and a direct
measure of investor attention – Google search volumes.
Studying a continental European IPO sample of 254 companies, I find that the first-day
IPO returns are highly correlated with the abnormal levels of Google searches prior to the
company’s IPO, even after controlling for various factors and testing for robustness. The
26
abnormal returns of the first year of the IPO are however not that clearly predicted by search
volumes. There are some indications of the predictability, but no robust results can be formed
on the long-term underperformance of the highly searched IPOs. The price pressure seems to
be largely explained by pre-crisis results, but a safe assumption of the explainability of the
post-crisis results can be made as well.
In theory, by utilizing the results of this study, one could benefit from buying into IPOs
that hold abnormal search volumes and liquidating the position very shortly after the IPO. In
practice the procedure would contain numerous possible problems ranging from winner’s
curse to transaction costs that eat the abnormal returns.
Search Volume Index (SVI) by Google Trends is a valuable tool in the field of finance
and contains endless possibilities for future research. There is room for future research in the
subject of whether the behavior of other security returns could also be predicted by Google
searches. An area of interesting research would also be to test how different proxies of
attention behave in the European markets.
27
References
Barber, B. and Odean, T., 2008, All That Glitters: The Effect of Attention and News on
the Buying Behavior of Individual and Institutional Investors, The review of Financial
Studies, 21, 2, 785-818.
Barber, B. and Odean, T., and Ning Z., 2009, Do retail trades move markets? Review of
Financial Studies, 21, 151–186.
Chemmanur, T. and Yan, A., 2009. Advertising, attention, and stock returns, Working
paper, Boston College and Fordham University.
Choi H, Varian H., 2009a, Predicting the present with Google Trends, Google technical
report.
Choi H, Varian H., 2009b, Predicting initial claims for unemployment benefits, Google
technical report.
Da, Z., Engelberg, J., and Gao, P., 2011, In Search of Attention, Journal Of Finance, 66,
5, 1461-1499.
Dorn, D., 2009, Does Sentiment Drive the Retail Demand for IPOs?, Journal of
Financial and Quantitative Analysis, 44, 1, 85–108.
Fama, E. F., 1970, Efficient capital markets: A review of theory and empirical work,
Journal of Finance 25, 2, 3, 83–417.
Gervais, S., Kaniel, R., and Mingelgrin, D., 2001, The high-volume return premium,
Journal of Finance, 56, 877–919.
Ginsberg, J., Mohebbi, M.H., Patel, R.S., Brammer, L., Smolinski, M.S. and Brilliant, L.,
2009, Detecting Influenza Epidemics Using Search Engine Query Data, Nature, 1012–14.
Grullon, G., Kanatas, G., and James P. Weston, 2004, Advertising, breath of ownership,
and liquidity, Review of Financial Studies, 17, 439–461.
Guzmán, G., 2011, Internet search behavior as an economic forecasting tool: The case of
inflation expectations, Journal Of Economic & Social Measurement, 36, 3, 119-167.
Hanley, K., 1993, The underpricing of initial public offerings and the partial adjustment
phenomenon, Journal of Financial Economics, 34, 231–250.
Hou, K., Peng, L., and Xiong, W., 2008, A tale of two anomalies: The implications of
investor attention for price and earnings momentum, Working paper, Ohio State University
and Princeton University.
Kahneman, D., 1973, Attention and Effort Prentice-Hall, Englewood Cliffs, New Jersey.
Ljungqvist, A, Nanda, V, & Singh, R, 2006, Hot Markets, Investor Sentiment, and IPO
Pricing, Journal Of Business, 79, 4, 1667-1702.
Loughran, T, & Ritter, J, 1995, The New Issues Puzzle, Journal Of Finance, 50, 1, 23-
51.
Merton, R., 1987, A simple model of capital market equilibrium with incomplete
information, Journal of Finance, 42, 483–510.
Odean, T., 1999, Do investors trade too much? American Economic Review, 89, 5, 1279–
1298.
28
Polgreen, P. M., Yiling, C., David, M., and Nelson, F. D., 2008, Using Internet Searches
for Influenza Surveillance, Clinical Infectious Diseases, 47, 11, 1443-1448.
Ritter, J., 2003, Differences between European and American IPO Markets, European
Financial Management, 9, 4, 421-434.
Ritter, J. & Welch, I., 2002, A Review of IPO Activity, Pricing, and Allocations, Journal
Of Finance, 57, 4, 1795-1828.
Seasholes, Mark S., and Guojun Wu, 2007, Predictable behavior, profits, and attention,
Journal of Empirical Finance, 14, 590–610.
Vaughan, L., and Romero-Frías, E., 2014, Web Search Volume as a Predictor of
Academic Fame: An Exploration of Google Trends, Journal Of The Association For
Information Science & Technology, 65, 4, 707-720.
Vosen, S., and Schmidt, T., 2011, Forecasting private consumption: survey-based
indicators vs. Google trends, Journal Of Forecasting, 30, 6, 565-578.
European Capital Markets Institute (Gresse, C., Gajewski, J-F.), 2006, A survey of the
European IPO market, Centre for European Policy Studies, Bruxelles.
[Online]. Available: https://basepub.dauphine.fr/handle/123456789/8670. Accessed:
3.12.2016
Euronext equity directory. [Online]. Available:
https://www.euronext.com/en/equities/directory/ Accessed: 16.10.2016
Google Press Blog. [Online]. Available:
http://googlepress.blogspot.fi/2002/05/googles-award-winning-search-engine-to.html.
Accessed: 6.10.2016
Google Trends, search for “winter jackets”. [Online]. Available:
https://www.google.com/trends/explore?q=winter%20jackets Accessed: 21.10.2016
Nasdaq OMX Nordic listed companies. [Online]. Available:
http://www.nasdaqomxnordic.com/shares/listed-companies/ Accessed: 6.10.2016
SIX Swiss Exchange issuer list. [Online]. Available:
https://www.six-swiss-exchange.com/shares/companies/issuer_list_en.html. Accessed:
16.10.2016
Xetra list of tradable shares. [Online]. Available: http://www.xetra.com/xetra-
en/instruments/shares/list-of-tradable-shares. Accessed: 16.10.2016


