Embed Size (px)
Citation preview
Faculty of Science and TechnologyDepartment of Computer Science
Capturing High Rate Satellite DataAn Analysis of Lossless, Persistent Reception, Local Storage and Transmission ofHigh Rate Satellite Data From Time Window Based Datastream—Ruben MælandINF-3981 Master’s Thesis in Computer Science, June 2016


Dear family,
this is for you.

AbstractSatellites generate data through their instruments as they hover in orbit. Satel-lite data is widely used in weather forecasts, environmental science, for militarypurposes, earth observation and more. The world depend on satellite data, formany purposes.
As satellite technology moves forward, the amount of data generated per orbitincreases. Satellites are not equipped with unlimited storage capacity, meaningthat the generated data must be transmitted to a ground station at some pointin orbit. Satellites transmit data through the use of radio waves, and havethe later years used X-, S-, L-band, among others. An increase in generateddata, require an increase in the transfer rates between the satellite and groundstation. Therefore, the satellite industry will, in near future, build satellitesusing KA-band using a higher frequency area providing larger bandwidth. Theincrease in generated data forces the increase in data transmission rate, whichrequire high performance ground stations that can capture incoming high ratedata.
A ground station’s purpose is to capture the received satellite data,without dataloss. Until today several capturing systems provide rates between 1 and 3gbps,depending on the band used, modulation, whether near real-time processing isoffered or not andwhether data is actually captured and stored within the samechassis[60, 4, 73, 36]. With KA-band, the rates can exceed 10gbps, and it is theindustry mission to provide systems that can capture such data rates.
This thesis evaluate the next generation technology used to capture data,determining the bottleneck in the setup used today through the analysis tooldeveloped, and further resolving them. The changes suggested in this thesisare tested and evaluated, and show that the next generation servers can capture10gbps with the hardware and software available, which is higher than anyother related system found.

AcknowledgementsFirst of all I would like to express my gratitude to my supervisor, ProfessorRandi Karlsen, for guiding me through this project. Your constructive feedbackand support through this project is invaluable. Thank you very much.
I would like to thank my co-supervisors from Kongsberg Spacetec, HansBerglund andHårekGamst, for spending your valuable time guidingme throughthis project. Your help, advice, visions and knowledge is really invaluable. Ireally appreciate getting to know you and to work as close as we have throughthis semester.
I want to express my gratitude to Kenneth K. Johnsen for helping me out withthe test data generator and providing me with software to easily configurethe test environment. Hans Sandsdalen, I really admire your knowledge ofcomputer networking, security and sense of humor. Thank you for all your helpand support, both of you.
Next I would like to express my gratitude to Kongsberg Spacetec for giving methe opportunity to work with one of your profiled systems. Providing me withaccess to one of your systems, and handing me the opportunity to learn theindustry is much appreciated.
To all my fellow students, thank you for 5 fantastic years through the studies.I would never get through this without you all. Specially, I want to expressmy gratitude to Jarl Fagerli, Morten Grønnesby and Eirik “EM” Mortensen forall the cooperation through the years of study. I am honored to call you myfriends.
Finally, I would like to thank my family for always being there for me.

ContentsReferences Title
Abstract iii
Acknowledgements v
List of Figures xi
List of Tables xvii
List of Abbreviations xix
List of definitions xxiii
List of Listings xxv
1 Introduction 11.1 Motivation . . . . . . . . . . . . . . . . . . . . . . . . . . . 11.2 Goal . . . . . . . . . . . . . . . . . . . . . . . . . . . . . . 31.3 Approach . . . . . . . . . . . . . . . . . . . . . . . . . . . . 41.4 Contributions . . . . . . . . . . . . . . . . . . . . . . . . . . 51.5 Outline . . . . . . . . . . . . . . . . . . . . . . . . . . . . . 5
2 Technical Background 72.1 Satellites . . . . . . . . . . . . . . . . . . . . . . . . . . . . 82.2 Satellite Data . . . . . . . . . . . . . . . . . . . . . . . . . . 10
2.2.1 Data Modulation . . . . . . . . . . . . . . . . . . . . 102.2.2 High Rate Data . . . . . . . . . . . . . . . . . . . . . 11
2.3 Data Storage . . . . . . . . . . . . . . . . . . . . . . . . . . 122.3.1 From Punched Cards to Flash Based Storage . . . . . 122.3.2 Storing Satellite Data . . . . . . . . . . . . . . . . . 13
2.4 Data Transmission and Storage Components . . . . . . . . . 132.4.1 Computer Bus . . . . . . . . . . . . . . . . . . . . . 132.4.2 I/O Software . . . . . . . . . . . . . . . . . . . . . . 14
vii
viii CONTENTS
2.4.3 Redundant Array of Inexpensive Disks (RAID) . . . . 152.5 Challenges and Tradeoffs . . . . . . . . . . . . . . . . . . . 16
2.5.1 Fault Tolerance vs. Performance . . . . . . . . . . . . 162.5.2 Bottlenecks . . . . . . . . . . . . . . . . . . . . . . . 172.5.3 Field Programmable Gate Array (FPGA) . . . . . . . 18
2.6 Related Work . . . . . . . . . . . . . . . . . . . . . . . . . . 18
3 MEOS Capture 213.1 MEOS Capture HRDFEP v4 . . . . . . . . . . . . . . . . . . 21
3.1.1 Architecture . . . . . . . . . . . . . . . . . . . . . . 213.2 Server Hardware and Configuration . . . . . . . . . . . . . . 23
3.2.1 Server Hardware Specs and Software . . . . . . . . . 233.2.2 Configuration . . . . . . . . . . . . . . . . . . . . . 23
3.3 Execution Flow . . . . . . . . . . . . . . . . . . . . . . . . . 253.3.1 Known Bottlenecks . . . . . . . . . . . . . . . . . . . 26
3.4 Related Systems . . . . . . . . . . . . . . . . . . . . . . . . 26
4 Analysis Tool 294.1 Design and Architecture . . . . . . . . . . . . . . . . . . . . 30
4.1.1 Architecture . . . . . . . . . . . . . . . . . . . . . . 324.2 Implementation . . . . . . . . . . . . . . . . . . . . . . . . 344.3 Discussion . . . . . . . . . . . . . . . . . . . . . . . . . . . 34
4.3.1 Setup for production purposes . . . . . . . . . . . . 364.3.2 Evaluation . . . . . . . . . . . . . . . . . . . . . . . 37
4.4 Future Work . . . . . . . . . . . . . . . . . . . . . . . . . . 38
5 Experiments and Evaluation 395.1 Test Environment . . . . . . . . . . . . . . . . . . . . . . . 39
5.1.1 Hardware Specs and Software . . . . . . . . . . . . . 405.1.2 Perfio . . . . . . . . . . . . . . . . . . . . . . . . . . 41
5.2 Determining Maximum Throughput . . . . . . . . . . . . . . 445.2.1 Simulating Capture Only . . . . . . . . . . . . . . . 445.2.2 Simulating Capture and Processing . . . . . . . . . . 50
5.3 Determining the Bottlenecks . . . . . . . . . . . . . . . . . . 545.3.1 From Data Receiver to Memory Performance . . . . . 545.3.2 From Memory to Disk . . . . . . . . . . . . . . . . . 57
5.4 Summary . . . . . . . . . . . . . . . . . . . . . . . . . . . . 59
6 Resolving the Bottlenecks 636.1 Disk Configurations . . . . . . . . . . . . . . . . . . . . . . 63
6.1.1 Ingest Disks With No Redundancy . . . . . . . . . . . 646.1.2 Increasing the Number of Disks . . . . . . . . . . . . 736.1.3 Introducing Redundancy With RAID 5 . . . . . . . . 806.1.4 Increasing the RAID 5 participants . . . . . . . . . . 84
CONTENTS ix
6.1.5 Changing Disk Technology . . . . . . . . . . . . . . . 866.2 Two Test Generators . . . . . . . . . . . . . . . . . . . . . . 96
6.2.1 SSDs as Ingest Disks . . . . . . . . . . . . . . . . . . 976.2.2 HDDs as Ingest Disks . . . . . . . . . . . . . . . . . . 102
6.3 Summary and Discussion . . . . . . . . . . . . . . . . . . . 107
7 Conclusion 1117.1 Future Work . . . . . . . . . . . . . . . . . . . . . . . . . . 112
A Test Result Figures 115A.1 8 HDDs Striped . . . . . . . . . . . . . . . . . . . . . . . . . 115
A.1.1 Data Capture and Near Real-time Processing . . . . . 115A.2 RAID 5 . . . . . . . . . . . . . . . . . . . . . . . . . . . . . 117
A.2.1 Four HDDs Performing Data Capture . . . . . . . . . 117A.2.2 Four HDDs As Ingest Disks With Near Real Time Pro-
cessing Enabled . . . . . . . . . . . . . . . . . . . . 119A.2.3 8 HDDs As Ingest Disks Performing Capture Only . . 119A.2.4 8 HDDs As Ingest Disks Performing Capture and Near
Real-time Processing . . . . . . . . . . . . . . . . . . 123
B Analysis Tool Script 127
Bibliography 131

List of Figures1.1 The figure illustrate satellite in orbit transmitting data to ground
station. Note that when out of antenna bounds, the satelliteis not reachable for the ground station. . . . . . . . . . . . . 2
2.1 An example of how a bit string can be modulated using BPSK.[40] 102.2 Programmed I/O, CPU is in control of a device’s I/O within
the device’s memory space. . . . . . . . . . . . . . . . . . . 152.3 The DMA controller provide a device access to its I/O space
within memory for data transfer. . . . . . . . . . . . . . . . 152.4 Visualization of RAID-0 and RAID-5. As the picture illustrates
RAID-5 use parity partitions and require at least 3 disks, whileRAID-0 only distribute data across disks and require at leasttwo disks. . . . . . . . . . . . . . . . . . . . . . . . . . . . 16
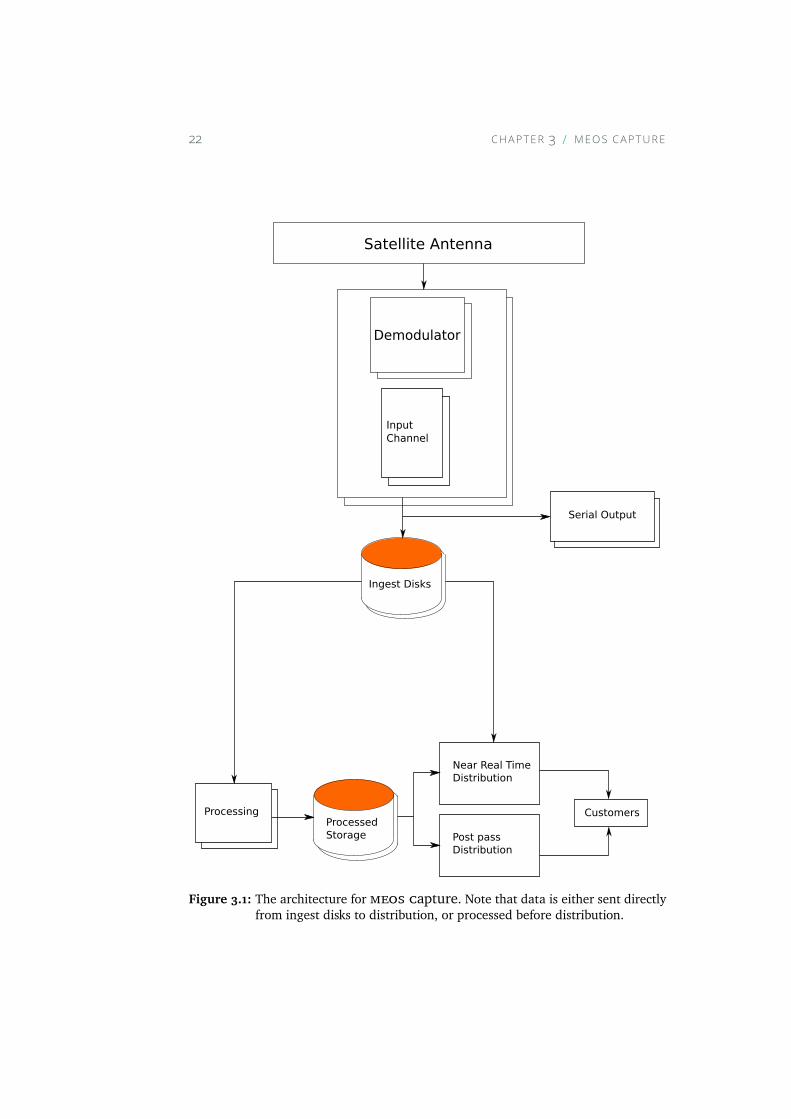
3.1 The architecture for MEOS Capture. Note that data is eithersent directly from ingest disks to distribution, or processedbefore distribution. . . . . . . . . . . . . . . . . . . . . . . 22
3.2 Two RAID level 1 are striped with RAID level 0, theoreticallyallowing two disks failures if and only if it happens withindifferent mirroring RAIDs. . . . . . . . . . . . . . . . . . . . 24
4.1 The analysis tool architecture . . . . . . . . . . . . . . . . . 33
5.1 Figure illustrates the architecture for Perfio, and it is consid-ered equivalent with MEOS Capture. . . . . . . . . . . . . . 42
5.2 Figure shows the amount of time the CPU spends idle, and thetotal amount of time user and system level processes actuallyrun on the CPU. The figure suggests that the CPU is not abottleneck within this system. . . . . . . . . . . . . . . . . . 46
5.3 Figure illustrates the memory usage for the whole experimentexecution. Note that the disk caches use almost all memoryavailable. . . . . . . . . . . . . . . . . . . . . . . . . . . . . 47
xi
xii L IST OF FIGURES
5.4 The amount of data written to disk per second. The spikesindicates that a lot of data have been written to the disk cache,and one can see that the general write speed is just below500MBps, as the results in table 5.2 suggests. . . . . . . . . 48
5.5 The graph illustrates the number of processes waiting in queueto run on the two CPUs. Pay the most attention to 5 and 15minutes, as they are the ones most stable ones due to thelonger integration time. . . . . . . . . . . . . . . . . . . . . 49
5.6 Figure shows the amount of time the CPU spends idle, and thetotal amount of time user and system level processes actuallyrun on the CPU. The CPU usage when simulating capture andprocessing are lower than when performing capture only. . . 52
5.7 The graph illustrates the memory usage during simulation ofcapture and processing of data. Note that the disk caches startat about 112GB, which is a result of the RAM disk used to limitthe memory available. . . . . . . . . . . . . . . . . . . . . . 52
5.8 Figure illustrates the disk load generated on the ingest disks,configured in RAID level 1+0 during capture and process-ing. The samples are from the experiment conducted with thehighest successful capturing rate of 104.19 MBps and readingdata at a rate of 100MBps. . . . . . . . . . . . . . . . . . . 53
5.9 Figure illustrates the data path from receiving board to hostmemory, which is the components tested through this experi-ment. . . . . . . . . . . . . . . . . . . . . . . . . . . . . . . 55
5.10 Figure illustrates the data path from host memory to ingestdisks, and the components in action through this experiment. 58
5.11 Visualization of average transfer rate between host memoryand ingest disks with RAID 1+0 over 20 experiments. . . . . 60
6.1 Figure visualizes the disk behaviour when four HDDs are stripedand used as ingest disks. . . . . . . . . . . . . . . . . . . . . 66
6.2 Figure shows the difference in memory usage with two differ-ent configurations for the ingest disks. . . . . . . . . . . . . 66
6.3 Figure visualizes the average load when executing Perfio tofour striped HDDs as ingest disks. . . . . . . . . . . . . . . . 67
6.4 Figure shows the amount of time the CPU spends idle, and thetotal amount of time user and system level processes actuallyrun on the CPU. The figure suggests that the CPU is not abottleneck with rates above 7Gbps. . . . . . . . . . . . . . . 67
6.5 Figure visualizes the average load with four HDDs as ingestdisks, and performing near real-time processing concurrently. 69
L IST OF FIGURES xiii
6.6 Figure shows the disk activity, when using four HDDs stripedas ingest disks. Note that the system have only accessed thephysical disk once, after 240 seconds, without causing anyoverflow. . . . . . . . . . . . . . . . . . . . . . . . . . . . . 70
6.7 Illustration of the disks used to store processed data. TheRAID consist of 8 HDDs, striped. . . . . . . . . . . . . . . . 71
6.8 Illustration of the memory usage when using four disks asingest disks. Note that the usage peaks after 200 seconds ofexperiment runtime. . . . . . . . . . . . . . . . . . . . . . . 72
6.9 Visualization of disk activity when using 8 striped HDDs asingest disks. . . . . . . . . . . . . . . . . . . . . . . . . . . 74
6.10 Visualization of memory usage when using 8 HDDs, striped,as ingest disks. . . . . . . . . . . . . . . . . . . . . . . . . . 75
6.11 Visualization of average load when using 8 HDDs, striped, asingest disks. . . . . . . . . . . . . . . . . . . . . . . . . . . 76
6.12 Figure shows the general load on the CPU during experimentexecution. . . . . . . . . . . . . . . . . . . . . . . . . . . . 77
6.13 The figure shows the memory usage when performing datacapture and near real-time processing with 8 HDDs striped asingest disks. . . . . . . . . . . . . . . . . . . . . . . . . . . 79
6.14 The figure shows that not a single read access was performedto the physical RAID used as ingest disks. . . . . . . . . . . . 79
6.15 Example of how RAID-5 rotates parity partitions along alldisks. Note that disk 0 hold the parity partition for partitionC, disk 1 holds the parity partition for partition B and disk 2holds the parity partition for partition A. . . . . . . . . . . . 80
6.16 Visualization of disk activity when using 4 HDDs organized inRAID 5 as ingest disks. . . . . . . . . . . . . . . . . . . . . . 82
6.17 Visualization of memory usage when using 4 HDDs organizedin RAID 5 as ingest disks. . . . . . . . . . . . . . . . . . . . 83
6.18 Visualization of average load when using two SSDs striped, asingest disks. . . . . . . . . . . . . . . . . . . . . . . . . . . 88
6.19 Visualization of memory usage when using two SSDs striped,as ingest disks. . . . . . . . . . . . . . . . . . . . . . . . . . 89
6.20 Visualization of disk activity when using two SSDs striped, asingest disks. . . . . . . . . . . . . . . . . . . . . . . . . . . 90
6.21 Figure shows the general load on the CPU during experimentexecution when using two SSDs as ingest disks. . . . . . . . 92
6.22 Visualization of memory usage when using two SSDs striped,as ingest disks. . . . . . . . . . . . . . . . . . . . . . . . . . 93
6.23 Visualization of disk activity when using two SSDs striped, asingest disks. . . . . . . . . . . . . . . . . . . . . . . . . . . 94
6.24 Visualization of the average load when using two SSDs striped,as ingest disks. . . . . . . . . . . . . . . . . . . . . . . . . . 95
xiv L IST OF FIGURES
6.25 Figure show the CPU utilization when performing data cap-ture from two input channels. . . . . . . . . . . . . . . . . . 98
6.26 Average load when using SSDs as ingest disks and two inputchannels. . . . . . . . . . . . . . . . . . . . . . . . . . . . . 99
6.27 Memory usage when using SSDs as ingest disks and two inputchannels. . . . . . . . . . . . . . . . . . . . . . . . . . . . . 100
6.28 Disk activity when using SSDs as ingest disks and two inputchannels. . . . . . . . . . . . . . . . . . . . . . . . . . . . . 101
6.29 The figure shows the average load on the server during theexperiment, with 8 HDDs as ingest disks and two input chan-nels. . . . . . . . . . . . . . . . . . . . . . . . . . . . . . . 103
6.30 The figure shows the amount of time the CPU spent idle throughthe experiment. Note that we have never recorded values be-low 90% in any experiment. . . . . . . . . . . . . . . . . . . 104
6.31 The figure shows the amount of time, in percent, the CPU hasspent on executing system and user level processes. . . . . . 105
6.32 The figure shows the ingest disks activity through the experi-ment. . . . . . . . . . . . . . . . . . . . . . . . . . . . . . . 106
6.33 The figure shows the memory usage through this experiment.Note that the caches peaks after 100 seconds, which we haveseen before. . . . . . . . . . . . . . . . . . . . . . . . . . . 107
A.1 The figure shows the average load during the experiment.The average load is the average number of queued processes,where 1, 5 and 15 minutes representing the integration time.1 minute seems much more unstable than 5 and 15 minutes,because of the integration time length. . . . . . . . . . . . . 115
A.2 The figure shows the amount of time the CPU has spent idlethrough the experiment. . . . . . . . . . . . . . . . . . . . . 116
A.3 The figure shows the amount of time the CPU has spent exe-cuting user level and system level processes through the ex-periment. . . . . . . . . . . . . . . . . . . . . . . . . . . . . 116
A.4 The figure shows the ingest disks write activity through theexperiment. . . . . . . . . . . . . . . . . . . . . . . . . . . 116
A.5 The figure shows the write accesses to the disks used to storeprocessed data. . . . . . . . . . . . . . . . . . . . . . . . . . 117
A.6 The figure shows the average load (queued processes) throughthis experiment. . . . . . . . . . . . . . . . . . . . . . . . . 117
A.7 The figure shows the amount of time, in percent, the CPUhave spent idle through the experiment. . . . . . . . . . . . 118
A.8 The figure shows the amount of time the CPU have spent onuser- and system-level processes during the experiment. . . . 118
A.9 The figure shows the disk activity when using 4 HDDs in RAID5 during both capture and processing. . . . . . . . . . . . . 119
L IST OF FIGURES xv
A.10 The figure shows the disk activity representing the RAID thatstores the processed data. . . . . . . . . . . . . . . . . . . . 119
A.11 The figure shows the amount of time the CPU has spent idleduring the experiment. . . . . . . . . . . . . . . . . . . . . 120
A.12 The figure shows the amount of time the CPU have spent onuser and system level processes during the experiment. . . . 120
A.13 The figure shows how many processes have been queued onaverage, to run on the CPU during the experiments. . . . . . 120
A.14 The figure shows the memory usage through this experiment. 121A.15 The figure shows the average load for this experiment. . . . 121A.16 The figure shows the amount of time the CPU has spent idle
through the experiment. The figure suggest that it has beenidling for more than 90% of the execution time. . . . . . . . 121
A.17 The figure shows the amount of time the CPU has spent onuser and system level processes during the experiment. . . . 122
A.18 The figure shows the activity in which the total RAID has per-formed through this experiment. . . . . . . . . . . . . . . . 122
A.19 The figure shows the memory usage through this experiment.Note that the usage is at its maximum from about 150 seconds.122
A.20 The figure shows the average load through the experiment. . 123A.21 The figure shows the amount of time the CPU spent idling
through the experiment. Not surprisingly it stay above 90%. 123A.22 The figure shows the amount of time the CPU spent on user
and system level processes. . . . . . . . . . . . . . . . . . . 124A.23 The figure shows the ingest disk write activity. The spiking
behaviour is caused by the combination of low rates and thatfile system caching is enabled. . . . . . . . . . . . . . . . . . 124
A.24 The figure show the ingests disk reading activity. As with pre-vious experiments, all read accesses fetch data from somecache, resulting in absolutely no read accesses from the phys-ical RAID. . . . . . . . . . . . . . . . . . . . . . . . . . . . 124
A.25 The figure shows the processing storage activity. These disksare only written to, as their mission is to store processed data. 125
A.26 The figure shows the memory usage through this experiment.The usage peaks after about 220 seconds, and show a stablebehaviour throughout the experiment. . . . . . . . . . . . . 125

List of Tables5.1 Perfio input parameters for highest successful data rate, with
next generation servers. . . . . . . . . . . . . . . . . . . . . 455.2 Perfio output for testrun with the highest successful data rate 455.3 Perfio input parameters for maximum successful rate when
simulating capture and processing. . . . . . . . . . . . . . . 505.4 Perfio output for testrun with the highest successful data rate,
when simulating capture and processing. . . . . . . . . . . . 515.5 Perfio output for test run when writing directly to memory
when requesting the FPGAs max rate. . . . . . . . . . . . . . 56
6.1 Perfio output for experiment with highest successful rate, withstriped ingest disks. . . . . . . . . . . . . . . . . . . . . . . 65
6.2 Perfio output for experiment with highest successful rate, withfour striped ingest disks. . . . . . . . . . . . . . . . . . . . . 68
6.3 Summary of test results and improvement when changingdisk configuration from RAID level 1+0 to striping. . . . . . 71
6.4 Perfio output for experiment with highest successful rate, with8 striped ingest disks. . . . . . . . . . . . . . . . . . . . . . 73
6.5 Perfio output for experiment with highest successful rate, with8 striped ingest disks. . . . . . . . . . . . . . . . . . . . . . 78
6.6 Summary of test results and improvement when changingdisk configuration from RAID level 1+0 to striping. Note that8 striped HDDs was outperformed by 4 striped HDDs. . . . . 80
6.7 Perfio output for experiment with highest successful rate, whenusing four HDDs configured in RAID 5, as ingest disks. . . . . 81
6.8 Perfio output for experiment performing data capture withprocessing enabled, using 4 HDDs organized in RAID 5 as in-gest disks. . . . . . . . . . . . . . . . . . . . . . . . . . . . 83
6.9 Summary of test results, introducing RAID level 5 results with4 HDDs. . . . . . . . . . . . . . . . . . . . . . . . . . . . . 84
6.10 Perfio output for experiment performing data capture only,using 8 HDDs organized in RAID 5 as ingest disks. . . . . . . 85
xvii
xviii L IST OF TABLES
6.11 Perfio output for experiment performing data capture withprocessing enabled, using 8 HDDs organized in RAID 5 as in-gest disks. . . . . . . . . . . . . . . . . . . . . . . . . . . . 86
6.12 Summary of test results, introducing RAID level 5 results with8 HDDs. The two best configurations is presented with boldnumbers. . . . . . . . . . . . . . . . . . . . . . . . . . . . . 86
6.13 Perfio output for experiment with highest successful rate, whenusing two SSDs, striped, as ingest disks. . . . . . . . . . . . 87
6.14 Perfio output for experiment with highest successful rate whenusing two striped SSDs as ingest disks. This experiment wasexecuted with processing enabled. . . . . . . . . . . . . . . 91
6.15 Summary of test results, introducing two SSDs striped. . . . 966.16 Perfio output for experiment with highest successful rate when
using two striped SSDs as ingest disks, and two test gen-erators. Note that both input channels have achieved over630MBps. . . . . . . . . . . . . . . . . . . . . . . . . . . . 98
6.17 Summary of test results, introducing SSDs when using twoinput channels. Note that the goal of 1250MBps has beenachieved through the last experiment. The setup has not beentested with near real-time processing, which is why the twoare missing. . . . . . . . . . . . . . . . . . . . . . . . . . . 101
6.18 Perfio output for experiment with highest successful rate whenusing 8 striped HDDs as ingest disks. This rates combined justachieves above 10Gbps. . . . . . . . . . . . . . . . . . . . . 102
6.19 Summary of test results, introducing two input channels with8 HDDs as ingest disks. Note that the goal of 1250MBps hasbeen achieved when using two input channels for both SSDsand HDDs. The setup has not been tested with near real-timeprocessing, which is why the two are missing. . . . . . . . . 108
List of AbbreviationsALOS Advanced Land Observing Satellite
APSK amplitude and phase shift keying
BPSK binary phase shift keying
CCSDS The Consultative Comittee for Space Data Systems
CPU Central Processing Unit
CSV comma separated values
DMA Direct Memory Access
DMAc Direct Memory Access Controller
FPGA Field-Programmable Gate Array
FTL flash translation layer
GB GigaByte
Gbps Gigabit Per Second
HDD Hard Disk Drive
HDFS Hadoop Distributed File System
HRD High Rate Data
HRDFEP high rate demodulator and front end processor
IDE Integrated Drive Electronics
xix
xx L IST OF ABBREV IAT IONS
IOPS I/O Operations Per Second
JAXA Japan Aerospace Exploration Agency
KSPT Kongsberg Spacetec A/S
MB MegaByte
MBps Megabyte Per Second
Mbps Megabit Per Second
MEOS Capture Multimission Earth Observation Systems Capture
NAND Not-And
NASA National Aeronautics and Space Administration
NVMe Non-Volatile Memory Express
OS operating System
P-ATA parallell ATA
PCI Peripheral Component Interconnect
PCIe Peripheral Component Interconnect Express
PV Pipe Viewer
QAM Quadrature amplitude modulation
QPSK Quadrature phase shift keying
RAID Redundant Array of Inexpensive Disks
RAM Random Access Memory
RPM Revolutions Per Minute
SAR Synthetic Aperture Radar
SAS Serial Attached SCSI
L IST OF ABBREV IAT IONS xxi
SATA Serial Advanced Technology Attachments
SCCC serial concatenated convolutional coding
SCSI Small Computer Systems Interconnect
SRAM Static Random Access Memory
SSD Solid-State Drive
TCP Transmission Control Protocol
Tmux terminal multiplexer
UDP User Datagram Protocol

List of definitions2.1 data sets, typically consisting of billions or trillions of records,
that are so vast and complex that they require new and pow-erful computational resources to process.[14] . . . . . . . . 13
2.2 Department, facility, machine, or resource already working atits full capacity and which, therefore, cannot handle any ad-ditional demand placed on it. Also called critical resource, abottleneck limits the throughput of associated resources.[7] . 17
2.3 A type of gate array that is programmed in the field ratherthan in a semiconductor fab.[51] . . . . . . . . . . . . . . . 18
xxiii

List of Listings4.1 List of analysis requirements. The list names all devices that
require monitoring during experiment execution. . . . . . . 304.2 Example of Tail usage, to display and follow the last 15 lines
of a file. . . . . . . . . . . . . . . . . . . . . . . . . . . . . 324.3 Example of kernel log message reporting number of used ker-
nel buffers. . . . . . . . . . . . . . . . . . . . . . . . . . . . 37
5.1 Example output from Perfio, with the syncword intact. . . . . 435.2 Example command illustrating the input parameters used to
determine execution flow for Perfio. . . . . . . . . . . . . . 435.3 Command used in fstab to set up temporary file system in
computer memory, exposed as a logical harddisk. . . . . . . 545.4 Script used to move data from the disk in memory to the
configured ingest disks. Deleting the file makes sure that onewrites to an empty disk. . . . . . . . . . . . . . . . . . . . . 59
B.1 The code used to launch the analysis tool . . . . . . . . . . . 127
xxv

1IntroductionIn this chapter the motivation, goal, approach and a formulation of the thesisis presented. The layout for this document is also provided.
1.1 MotivationThe satellite industry has seen increasing transfer rates used by satelliteswhen they transmit data to a ground station on earth. The first ever satellitewas Sputnik-1 launched in 1957 according to National Aeronautics and SpaceAdministration (nasa)[48]. Over the years, thousands, or even millions, ofsatellites has been launched since 1957 with different missions. The one thingall satellites have in common, is the limited storage capacity forcing them totransmit data to a ground station located somewhere on earth, in order toarchive valuable data generated by sensors located on the satellites.
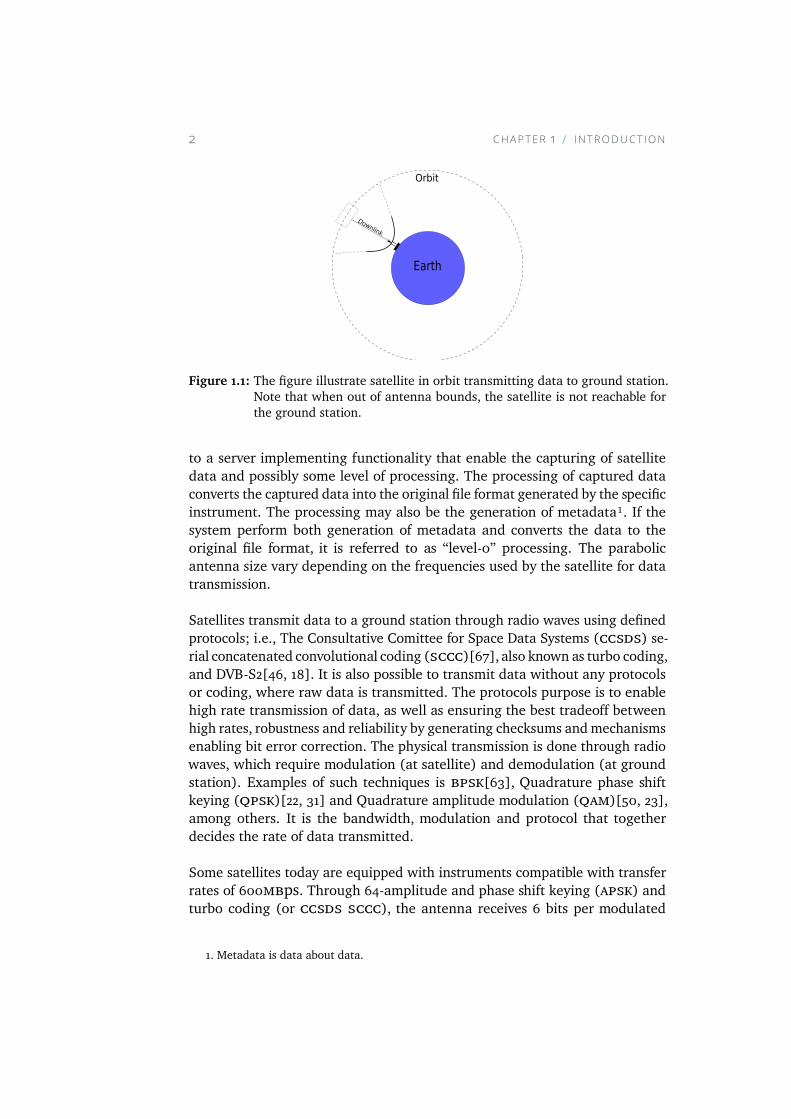
Satellites in orbit are visible for ground stations in a very limited time window,as shown in figure 1.1, which introduces some requirements with respect toreceiving and storing the data transmitted at a particular ground station. Thesatellite is typically visible for an antenna when it is in a specific part of itsorbit. This time window vary from satellite to satellite, usually from 1 to 15minutes long. A ground station typically consists of an parabolic antennawhich is connected to a demodulator that demodulate the received signal. Thisis typically a analogue to digital converter. The demodulated signal is sent
1
2 CHAPTER 1 INTRODUCT ION
Downlink
Earth
Orbit
Figure 1.1: The figure illustrate satellite in orbit transmitting data to ground station.Note that when out of antenna bounds, the satellite is not reachable forthe ground station.
to a server implementing functionality that enable the capturing of satellitedata and possibly some level of processing. The processing of captured dataconverts the captured data into the original file format generated by the specificinstrument. The processing may also be the generation of metadata¹. If thesystem perform both generation of metadata and converts the data to theoriginal file format, it is referred to as “level-0” processing. The parabolicantenna size vary depending on the frequencies used by the satellite for datatransmission.
Satellites transmit data to a ground station through radio waves using definedprotocols; i.e., The Consultative Comittee for Space Data Systems (ccsds) se-rial concatenated convolutional coding (sccc)[67], also known as turbo coding,and DVB-S2[46, 18]. It is also possible to transmit data without any protocolsor coding, where raw data is transmitted. The protocols purpose is to enablehigh rate transmission of data, as well as ensuring the best tradeoff betweenhigh rates, robustness and reliability by generating checksums andmechanismsenabling bit error correction. The physical transmission is done through radiowaves, which require modulation (at satellite) and demodulation (at groundstation). Examples of such techniques is bpsk[63], Quadrature phase shiftkeying (qpsk)[22, 31] and Quadrature amplitude modulation (qam)[50, 23],among others. It is the bandwidth, modulation and protocol that togetherdecides the rate of data transmitted.
Some satellites today are equipped with instruments compatible with transferrates of 600mbps. Through 64-amplitude and phase shift keying (apsk) andturbo coding (or ccsds sccc), the antenna receives 6 bits per modulated
1. Metadata is data about data.
1.2 GOAL 3
symbol². The main increase in transfer speed has evolved through advancedalgorithms such as ccsds sccc and modulation algorithms, since the X-bandbandwidth is more or less constant. This increasing transmission rate forcesthe need for powerful machines with high performance hardware to receiveand make sure the data is persistently stored and above all, not lost. Data isconsidered safe when it has been written to persistent storage.
The industry and agencies within the satellite business, want to distribute thenewly received data as fast as possible to their customers. This complicates theprocess of receiving data without data loss. And to complicate the process evenmore, some customers demand data in specific formats which require somelevel of processing before it is distributed.
This thesis is done in cooperation with Kongsberg Spacetec A/S, using one oftheir systems, meos capture v4.5[36], for receiving satellite data. Currentstatus is that through X-band[57, 5] and qpsk modulation, 1− 3gbps transferrate is considered as the maximum rate for the industry in general, to guaranteelossless receiving of data during a pass. The satellite industry wants to assesshow to reach rates up to 10gbps, by testing and evaluating candidate tech-nologies for future systems as the satellite agencies want to use KA-band[56]providing larger bandwidth than X-band. This is the main motivation for thethesis.
When data is demodulated and decoded, it is sent to a server which missionis to make sure the data is persistently stored. As the transfer rate seems toincrease by an order of magnitude in near future, the receiving system hasto increase performance equally, or more. When the incoming data rate getsabove 1 Gbit/s, the systems in general does not dump the incoming data todisk fast enough, which may cause buffer overflow in memory and data loss.Lost data cannot be restored during this process, and customers depend on thefunctionality of this system to capture satellite data without any loss.
1.2 GoalThe main goal for this thesis is to create a new baseline for the next generationHP ProLiant servers, determining the rate at which it can capture satellitedata, lossless. In order to achieve this, the first part is to develop an analysistool that monitors the load on the server hardware components in order tolocate bottlenecks within the server. The second step, is to use the resultsproduced to increase the overall performance for the server with respect to
2. A symbol is a radio wave carrying data, which is received by the satellite antenna.
4 CHAPTER 1 INTRODUCT ION
the use case it can face when used in a system such as meos capture. Theterm performance means the capacity at which the system can receive andpersistently store incoming data at high rates, without any data loss. The aimfor this study is to determine whether the next generation HP ProLiant serverscan be used in future versions ofmeos capture, where the transmission ratesreach 10gbps and above.
To increase the performance for the next generation HP ProLiant servers thisthesis will use the information generated by an analysis, in order to makequalified decisions to solve the located bottlenecks. Based upon the analysisresults the thesis will re-design and evaluate the changes made for the serverwith respect to performance. No analysis of this particular server, was foundfor this specific set of hardware. The hardware was used in one study [39] asthe controller host connected to another HP machine, and it is the only foundstudy that use the same server[21].
1.3 ApproachTo achieve the goal mentioned above, thorough analysis of the server through-put will be done in order to locate existing bottlenecks. The analysis willinclude the creation of an analysis setup, based on existing analysis tools, thatmonitors the throughput throughout the system pipeline, and provide live in-formation about the momentary performance by different parts of the system.This analysis tool will also be used to determine whether changes to the systemgives improved performance.
When the analysis of the system is available, the thesis will present qualifieddecisions to where the system has potential for improvement. This includespresentation of a new design for the system, new implementation and newtesting of the system.
The analysis tool developed provides runtime statistics with respect to the loadthat computer components are exposed to. To do so, the analysis tool usesalready existing tools such as Htop and Dstat, and by monitoring the kernel log.The output from Dstat is stored in a file for further analysis purposes.
To locate possible bottlenecks, parts of the total pipeline will be tested inisolation in order to determine the maximum throughput between criticalcomponents. By testing the maximum achieved throughput between the datareceiving board and host memory (or ram), and between ram and the ingestdisks, we will be able to tell which part of the system pipeline offers thelowest rate. From there one can determine where the system has potential for
1.4 CONTR IBUT IONS 5
improvements.
Kongsberg Spacetec A/S (kspt) has implemented a data generator that cangenerate and send out data at the required rate to simulate a satellite pass.This data generator is a Peripheral Component Interconnect Express (pcie)board that is implemented to simulate a high rate stream of data. This testgenerator will be used to simulate satellite passes, in which the server willattempt to capture without data loss.
Further experimentation will determine maximum throughput when perform-ing near real-time processing of data, to examine the system robustness. Thenear real-time processing conducted in this thesis will not generate metadata,or convert any data into any fileformats. The processing will only be simulated,meaning that the captured data is read from the ingest disk, and written to an-other set of disks storing processed data, in order not to have any further impacton the data capture. No further processing of the data will be performed.
1.4 ContributionsThis thesis provide the following contributions:
• We have successfully built an setup for analysis tools that provides valu-able information and statistics about the computer components andprocesses as a satellite pass occurs. Through the analysis tools we wereable to determine where in the pipeline bottlenecks occurred. Basedon the data provided by the analysis tool, we were able to resolve thebottlenecks.
• We evaluate a new baseline for the 9th generation HP ProLiant serversin terms of supported rates with the configurations used today, and theimprovements made reached the goal of 10gbps which is higher thanany related system found.
1.5 OutlineThe remainder of this thesis is structured as follows.Chapter 2 presents an overview of technology used both in this thesis andcurrently used in the existing system.
Chapter 3 provides an introduction to the configurations used in the data
6 CHAPTER 1 INTRODUCT ION
receiving front end server, and explains how the server receives and processdata.
Chapter 4 gives an overview of the analysis tool setup developed. The ar-chitecture, design, and implementation are all presented in this chapter.
Chapter 5 presents the experiments performed on the test environment, usingthe configurations presented in chapter 3. The system evaluation is presented,in order to make qualified decisions to where the system can be improved.
Chapter 6 presents, tests and evaluates the changes performed.
Chapter 7 concludes the thesis and outlines future work.
2Technical BackgroundThis chapter introduces several topics related to satellites and satellite data.The chapter is divided into five main parts, each presented below.
Satellites Through section 2.1 some theory on satellites and how satellitesgenerate their data is presented. The chapter also covers some theory onsatellites in orbit.
Data transmission The theory behind data transmission between satellitesand ground stations is presented in section 2.2.
Data storage What happens when data is received by the antenna? Thetheory on how data travel from the satellite antenna to a hdd is presented insection 2.3 and 2.4.
Challenges and tradeoffs Section 2.5 present some theory on fault tol-erance and its impact on performance. Bottlenecks are also defined in thissection.
Related work Some related work are presented in section 2.6.
7
8 CHAPTER 2 TECHN ICAL BACKGROUND
2.1 SatellitesSince the launch of Sputnik-1, several satellites have been launched in orbitaround the Earth. Examples of satellitemissions can be routing of telephone traf-fic across continents, global positioning system (GPS), military and aerospacepurposes and sampling of weather data. This divides satellites into two maincategories; Communication satellites and earth observation satellites, whereearth observation satellites is the one most relevant for this thesis. However,satellites consist of a chassis in which instruments and components are attachedto. The satellite has an infrastructure in terms of connecting the instrumentsto a temporarily storage system. The instruments are typically photographicsensors taking pictures of the earth. The instruments may also be equipmentfor radio transmission and reception, in order for the satellite to dump data toa ground station, and receive updated firmware if needed.
One of the big issues with satellites is that once it is launched you cannot do anyphysical changes to it, at least in terms of changing the construction. Satelliteshave to use the equipment it is launched with. Due to this fact planning is doneover several years to determine in detail how the satellite must be designed,built and function.
All vehicles launched to space are exposed to extreme conditions. Shocks,vibrations and temperature change during launch and radiation when in space.Especially electronic devices are prone to radiation, and it is proven thatelectronics are malfunctioning when exposed for high altitude radiation[55].This means that all components on board have been thoroughly tested toprove that it will work in the environment in which it will operate. When acomponent pass all tests, it is radiation hardened and space qualified. EuropeanSpace Components Coordination (ESCC) have published a list of qualified partsand manufacturers on their websites[19, 20]. This contributes to the high costwithin satellite industries. In the work by P. Dieleman et al.[16] they testet anHeterodyne Instrument for the Far-Infrared (HIFI) for use on satellites, andexplains how they tested their instrument for space qualification.
Once a satellite is launched it has to deploy all its modules containing instru-ments. The orbit is determined due to the mission for the particular satellite.Some satellite missions can be to gather data about polar areas, equator andor other interesting areas. This requires the satellites orbit to cross over thearea of interest at some point. Orbital mechanics describe satellite orbits aselliptic curves[11]. The reason that satellites can mange to stay in orbit, is acombination of the earth’s gravitation and the satellites velocity. One can thinkof this as a ball in a rope when you give the ball speed in some direction andhold the rope at the other end. When the ball is given speed, it rotates aroundyour hand (representing the earth). If the ball lose speed it lose altitude and
2.1 SATELL ITES 9
finally fall to the ground. Reversible, if the ball increase velocity, it wants to getfurther away from your hand and hence gain altitude. The principle also appliesfor satellites; The higher the velocity gained at launch, the higher the altitude.It is important that the velocity does not exceed escape velocity which is therequired velocity for a vehicle to break out of earths field of gravity[13].
The satellite mission determine the altitude the satellite will orbit. Polar satel-lites orbit at a much lower altitude than geostationary satellites. One issuewith polar satellites is that they are affected by the earths gravity. To preventaltitude loss, polar orbit satellites are equipped with thrust engines to maintainthe orbit. On-board fuel is a limited resource which means that the satellite willbe forced out of orbit at some point by gravity and land on earth. Geostationarysatellites have an orbital speed equal to the earth rotation speed, which meansthat it is kind of hovering above the earth at the same point at all times. Becauseof the great altitude the earth gravity do not affect geostationary satellites asmuch as polar satellites, enabling much less need for orbital correction.
The key features with satellites is that they can be used to produce data that onecan not produce from on earth locations because one achieves a much betterperspective from above. Data produced on satellites are produced by severalsensors. Said sensors can measure temperatures, capture pictures throughcameras of some pre defined area among others. The data generated is highlyrelated to the sensor technology available and what sensors the satellite isequipped with.
As the satellite sample data in orbit, the satellite has to transmit data to aground station to free memory for new samples. The amount of data a satellitepossibly can produce during an orbit is determined by the sensors it is equippedwith. Important aspects are the amount of time the satellite is within reach ofthe ground station antenna, the downlink speed, and how data is modulated.Some satellites may dump data to several ground stations during one orbit.The protocols implemented does not support any form of retransmission oflost data, such as Transmission Control Protocol (tcp)¹. Satellites transmitdata through radio waves which protocol is very similar to the User DatagramProtocol (udp).
A lot of work has been published on how to design a satellite. Examples ofpublishedwork on satellites are the successor of Landsat 7[30] for earth observa-tions and METSAT[34] for weather and climate purposes. The Landsat projecthave also published a survey of current status of all Landsat satellites[41].
1. http://www.diffen.com/difference/TCP_vs_UDP
10 CHAPTER 2 TECHN ICAL BACKGROUND
2.2 Satellite DataTo understand how satellite data are transmitted from satellite to a ground sta-tion, one must understand several topics. Each of them are presented through-out this section.
2.2.1 Data ModulationSatellites generate data as they travel in orbit. A particular satellite is onlyvisible for an antenna in a very small part of the orbit. The satellite use radiowaves to communicate with the ground station, which requires the satellite toboth have a modulator and demodulator. The downlink is typically much morepowerful and faster than the uplink.
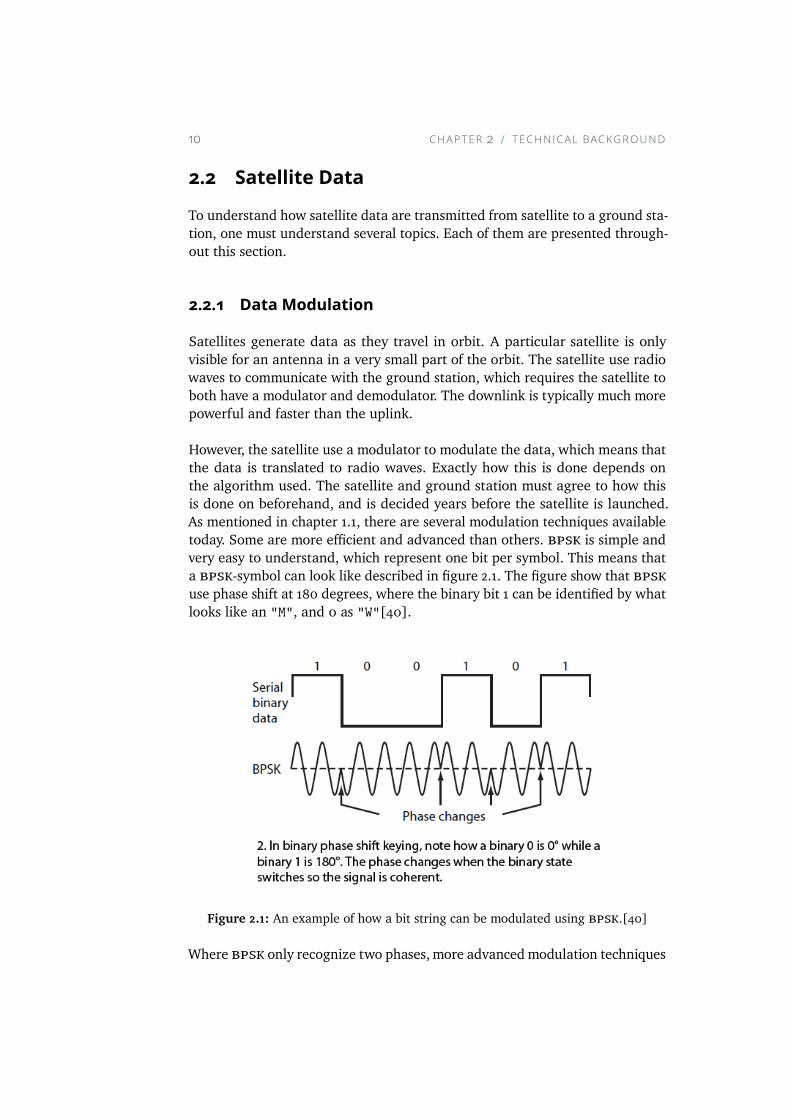
However, the satellite use a modulator to modulate the data, which means thatthe data is translated to radio waves. Exactly how this is done depends onthe algorithm used. The satellite and ground station must agree to how thisis done on beforehand, and is decided years before the satellite is launched.As mentioned in chapter 1.1, there are several modulation techniques availabletoday. Some are more efficient and advanced than others. bpsk is simple andvery easy to understand, which represent one bit per symbol. This means thata bpsk-symbol can look like described in figure 2.1. The figure show that bpskuse phase shift at 180 degrees, where the binary bit 1 can be identified by whatlooks like an "M", and 0 as "W"[40].
Figure 2.1: An example of how a bit string can be modulated using bpsk.[40]
Where bpsk only recognize two phases,more advancedmodulation techniques
2.2 SATELL ITE DATA 11
use 4, 8, 16, 32 and even 64 phases. These modulation techniques allow x −bitsper modulated symbol depending on the technique used, which again increasethe data rate.
This technology is also the very foundation of what we know as the internettoday. Satellites have enabledworld-wide communication through both internetand mobile cellphones[32, 10, 69].
2.2.2 High Rate DataThe data rate is now defined by the following formula:
Datarate = (SymbolRate ∗ BitsPerSymbol) − p (2.1)
where data rate is the effective rate when the data is demodulated, symbolrate is the frequency at which symbols arrive at the antenna, bits per symbolrefers to the modulation technique used, and p refers overhead generated bythe used protocol, if any. Protocols are said to steal between 1 and 10% of thebandwidth due to checksums and methods to enable bit error correction[67],depending on the protocol and modulation used. The newer satellites, yet tobe launched, plan to use 2 × 620Mbit/s downlinks in combination with scccturbo coding and 64-apsk modulation. The transfer rate is determined by theformula 2.1.
Incoming data rate = ((620 Mbit/s * 2) * 6 bits per symbol) - 10%Incoming data rate = 7 Gbit / s
This example is however not very representative, because very few satelliteshave implemented 64-apsk. But it shows that the limitations does not lie withinfuture satellites. A more natural setup is as follows.
Two downlinks of 310 Mbit/s each, with qpsk modulation and no coding ofthe data, which generate no overhead in protocol. qpsk deliver 2 bits persymbol[40], which gives the following rate.
Incoming data rate = ((310 Mbit/s * 2 downlinks) * 2 bits per symbol) - 0%Incoming data rate = 1240 Mbit/s
As we can see, this configuration achieves just over 1,2 Gbit/s, which is consid-ered “state of the art".
12 CHAPTER 2 TECHN ICAL BACKGROUND
2.3 Data StorageData storage have experienced vast improvements in storage capacity persquare inch and performance. According to PCWorld[58], IBM launched a5MegaByte (mb) drive in 1956, as big as two refrigerators, using 50 24-inchplatters. In 2006 Cornice and Seagate launched a 1-inch hdd with 12gb.[58].Throughout this section some background on hdds and storing techniques arepresented.
2.3.1 From Punched Cards to Flash Based StorageComputer storage has evolved from punched cards, punched tapes, to floppydisks and to the most used storage today; hdds. The evolution has compressedthe bytes per square inch by orders of magnitude, from bytes per inch to mbper inch.
hdds typically consist of several platters coatedwithmagnetic material stackedon top of each other, with a mechanical arm that is able to swipe over the diskto access the different cylinders on each disk. When the arm moves fromone sector to another is called seeking. The seek time vary from disk to diskdepending on the diameter of the disk platters. The disks are often connectedto the computer through Small Computer Systems Interconnect (scsi) drivesusing the Serial Advanced Technology Attachments (sata) bus, which is builton top of Integrated Drive Electronics (ide). The downside with hdds is thatthey are slow compared to ram, even with the high end hdds, typically with10, 000 Revolutions Per Minute (rpm) and 15, 000 rpm. More informationon hdds general architecture can be found in [61].
As hdds have proven themselves to be slow, a new generation of storage haveentered the market. Flash based storage, or ssds, have become more popularfor high performance systems because of their high performance. The last fewyears, ssds also have become more affordable. ssds consist of logical Not-And(nand) gates and can be connected to sata via scsi drivers. An even fasterssd is Non-Volatile Memory Express (nvme), which can be connected to thepcie bus. A previous study has proven that nvme can achieve 120, 000 I/OOperations Per Second (iops) with random writes and 40, 000 iops withrandom reads of 4 KB data[17].
The corresponding mechanism for hdds moving arm, is the flash translationlayer (ftl)[44]. Because ssds do not have any moving parts and are purelyelectronic devices, they are less power consuming, have lower access latencyand are more resistant to shocks[42]. However, the expected lifetime is lowerthan hdds. The reason ssds are expected not to live as long as hdds is
2.4 DATA TRANSM ISS ION AND STORAGE COMPONENTS 13
because they use something called “tunnel oxide layer” which get worn out aftersome number of accesses. This is why load balancing for ssds are important.Algorithms have been developed to spread load over all logical circuits, toincrease expected lifetime.
The load balancing algorithms developed for ssds makes sure that one evenlydistributes written data across all sectors. Reads are a bit different, since theymust read data from the block in which the data exist. The distribution ofwritten data takes into consideration the total wear of all available blocks andchose the least used one.
2.3.2 Storing Satellite DataSatellite data is expensive, encouraging involved parties to engage long termstorage in order for the data to be used for science and historical purposes.As satellites can generate several gbs of data per orbit, the stored datasetincreases per pass. When dealing with datasets constantly (or at least per pass)increasing size, one will at some point deal with the term “Big Data”. Accordingto Dictionary.com, big data is defined as follows;
The Definition 1. data sets, typically consisting of billions or trillions ofrecords, that are so vast and complex that they require new and powerfulcomputational resources to process.[14]
The definition address several issues related to big data, where one shouldconsider highly effective compression algorithms to store the data effectively.The desire is to store as much data as possible, using the least storage capacitypossible.
2.4 Data Transmission and Storage ComponentsThe section provides some theory on how data are transferred from hostmemory to the storage device, typically hdds or ssds.
2.4.1 Computer BusA computer bus enables peripheral devices to be connected to a host, andestablish data transfer between the host and the device. Several buses has beendeveloped over the years, but this section will only consider the buses used inthis thesis.
14 CHAPTER 2 TECHN ICAL BACKGROUND
PCI Express All devices within a computer are connected to a bus, thatallow transmission of data between devices. A bus consist of hardware (i.e.,wire), software and some communictaion protocols. There exist several typesof computer buses, where sata is widely used in personal computers. pcie ismostly used in systems that require high performance which makes it moreexpensive than for example sata[68, 37].
pcie is the result of work based upon Peripheral Component Interconnect(pci), and have been released in several versions. The first generation pciewas released with 2.5 Gbit/s raw bandwidth per lane, and its successor provide5 Gbit/s[53] . The latest version, 3.0, released in 2010, which provide transferspeeds of 7.8 Gbit/s[54]. Another vast improvement is that version 3.0 supportup to 32 lanes, each lane with transfer speed 7.8 Gbit/s. pcie is based uponlanes that are bi-directional, meaning that one link is can send data one way,where the other can send the opposite way. One lane consist of two links, whichis why the lane is bi-directional. The pcie initially negotiates with the deviceon how many lanes to use. One link must support at least one lane, enablinga link to consist of N lanes in each direction. pcie 3.0 can support up to 32links[54].
Serial Attached SCSI (SAS) Serial Attached SCSI (sas) is the successor ofparallell ATA (p-ata) which was limited to a maximum of 16 devices connectedto the same bus, where one must be a host bus adapter[64]. p-ata provide amaximum transfer rate of 320 MB/s. sas support up to 127 devices connectedwith a fibre channel, and transmission speed of 600 MB/s. The main differenceis that p-ata use parallel transfers where sas transfer data in a serial mannerusing frames[64].
An interesting observation is that while the rest of computer hardware movesmore and more towards parallel solutions for better performance, data transferto hdds are moving away from parallel design to serial communication.
2.4.2 I/O SoftwareThere exist at least three different schemes when dealing with I/O software.First there is programmed I/O[65] which have the cpu to do all the work. Thisscheme may be good for some use cases, for example when the cpu do nothave anything else to do. When the cpu can spend time doing other work, it isconsidered a inefficient method. This is also where the second scheme is betteroff.
Interrupt-driven I/O[65] allow the cpu to schedule the I/O operation, do a
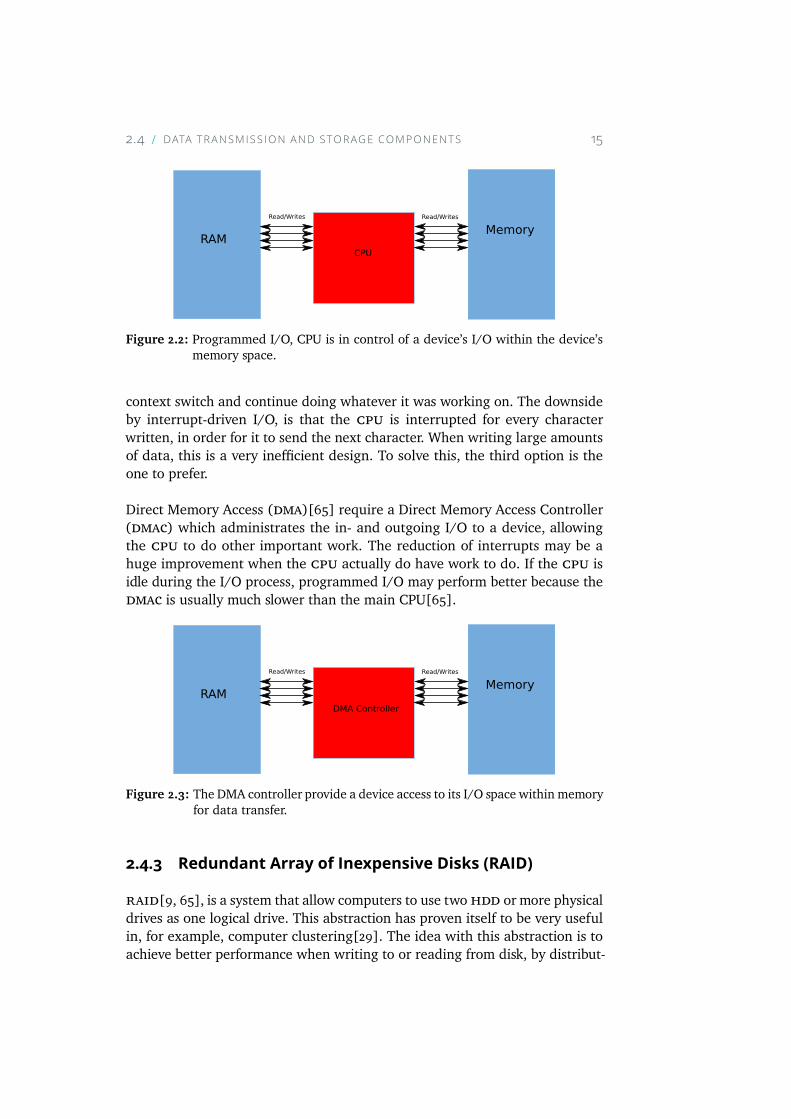
2.4 DATA TRANSM ISS ION AND STORAGE COMPONENTS 15
RAMMemory
CPU
Read/Writes Read/Writes
Figure 2.2: Programmed I/O, CPU is in control of a device’s I/O within the device’smemory space.
context switch and continue doing whatever it was working on. The downsideby interrupt-driven I/O, is that the cpu is interrupted for every characterwritten, in order for it to send the next character. When writing large amountsof data, this is a very inefficient design. To solve this, the third option is theone to prefer.
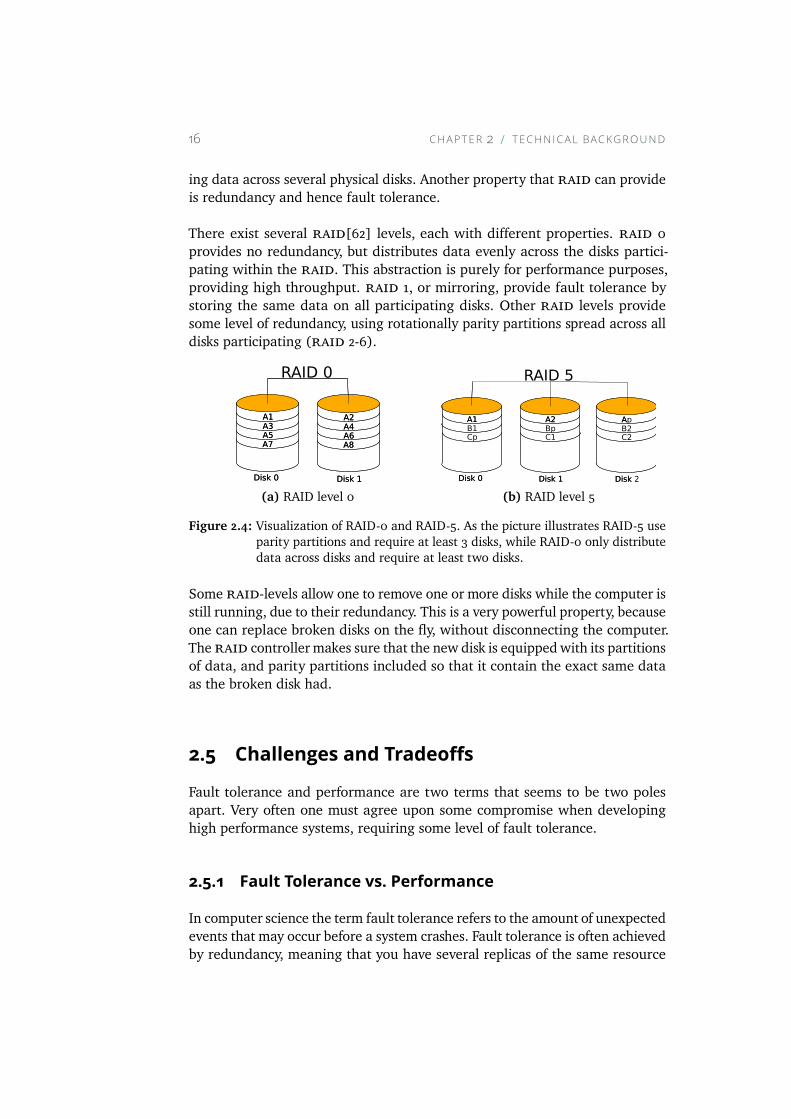
Direct Memory Access (dma)[65] require a Direct Memory Access Controller(dmac) which administrates the in- and outgoing I/O to a device, allowingthe cpu to do other important work. The reduction of interrupts may be ahuge improvement when the cpu actually do have work to do. If the cpu isidle during the I/O process, programmed I/O may perform better because thedmac is usually much slower than the main CPU[65].
RAMMemory
DMA Controller
Read/Writes Read/Writes
Figure 2.3: The DMA controller provide a device access to its I/O space within memoryfor data transfer.
2.4.3 Redundant Array of Inexpensive Disks (RAID)raid[9, 65], is a system that allow computers to use twohdd or more physicaldrives as one logical drive. This abstraction has proven itself to be very usefulin, for example, computer clustering[29]. The idea with this abstraction is toachieve better performance when writing to or reading from disk, by distribut-
16 CHAPTER 2 TECHN ICAL BACKGROUND
ing data across several physical disks. Another property that raid can provideis redundancy and hence fault tolerance.
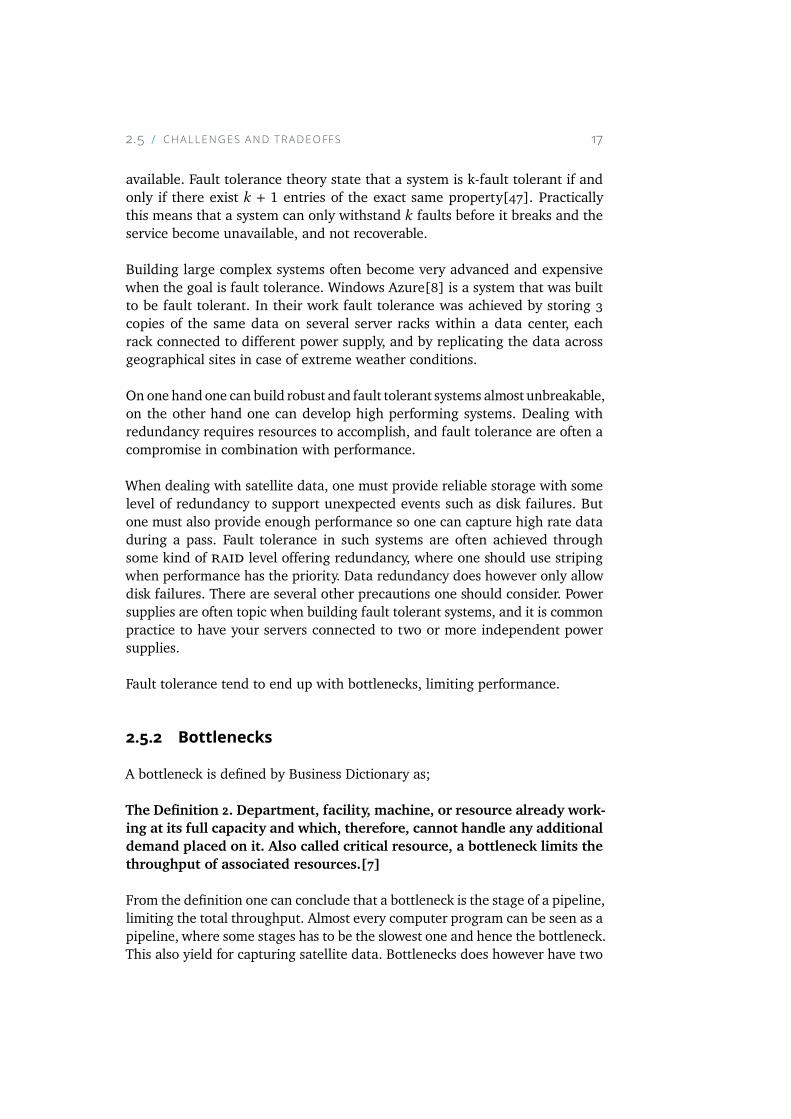
There exist several raid[62] levels, each with different properties. raid 0provides no redundancy, but distributes data evenly across the disks partici-pating within the raid. This abstraction is purely for performance purposes,providing high throughput. raid 1, or mirroring, provide fault tolerance bystoring the same data on all participating disks. Other raid levels providesome level of redundancy, using rotationally parity partitions spread across alldisks participating (raid 2-6).
A1A3A5A7
A2A4A6A8
Disk 0 Disk 1
A1A3A5A7
A2A4A6A8
RAID 0
Disk 0 Disk 1
(a) RAID level 0
A1B1
A2
C1
Disk 0 Disk 1
A1
Cp
A2Bp
RAID 5
Disk 0 Disk 1
ApB2C2
Disk 2
A
Disk
(b) RAID level 5
Figure 2.4: Visualization of RAID-0 and RAID-5. As the picture illustrates RAID-5 useparity partitions and require at least 3 disks, while RAID-0 only distributedata across disks and require at least two disks.
Some raid-levels allow one to remove one or more disks while the computer isstill running, due to their redundancy. This is a very powerful property, becauseone can replace broken disks on the fly, without disconnecting the computer.The raid controller makes sure that the new disk is equippedwith its partitionsof data, and parity partitions included so that it contain the exact same dataas the broken disk had.
2.5 Challenges and TradeoffsFault tolerance and performance are two terms that seems to be two polesapart. Very often one must agree upon some compromise when developinghigh performance systems, requiring some level of fault tolerance.
2.5.1 Fault Tolerance vs. PerformanceIn computer science the term fault tolerance refers to the amount of unexpectedevents that may occur before a system crashes. Fault tolerance is often achievedby redundancy, meaning that you have several replicas of the same resource
2.5 CHALLENGES AND TRADEOFFS 17
available. Fault tolerance theory state that a system is k-fault tolerant if andonly if there exist k + 1 entries of the exact same property[47]. Practicallythis means that a system can only withstand k faults before it breaks and theservice become unavailable, and not recoverable.
Building large complex systems often become very advanced and expensivewhen the goal is fault tolerance. Windows Azure[8] is a system that was builtto be fault tolerant. In their work fault tolerance was achieved by storing 3copies of the same data on several server racks within a data center, eachrack connected to different power supply, and by replicating the data acrossgeographical sites in case of extreme weather conditions.
On one handone can build robust and fault tolerant systems almost unbreakable,on the other hand one can develop high performing systems. Dealing withredundancy requires resources to accomplish, and fault tolerance are often acompromise in combination with performance.
When dealing with satellite data, one must provide reliable storage with somelevel of redundancy to support unexpected events such as disk failures. Butone must also provide enough performance so one can capture high rate dataduring a pass. Fault tolerance in such systems are often achieved throughsome kind of raid level offering redundancy, where one should use stripingwhen performance has the priority. Data redundancy does however only allowdisk failures. There are several other precautions one should consider. Powersupplies are often topic when building fault tolerant systems, and it is commonpractice to have your servers connected to two or more independent powersupplies.
Fault tolerance tend to end up with bottlenecks, limiting performance.
2.5.2 BottlenecksA bottleneck is defined by Business Dictionary as;
The Definition 2. Department, facility, machine, or resource already work-ing at its full capacity and which, therefore, cannot handle any additionaldemand placed on it. Also called critical resource, a bottleneck limits thethroughput of associated resources.[7]
From the definition one can conclude that a bottleneck is the stage of a pipeline,limiting the total throughput. Almost every computer program can be seen as apipeline, where some stages has to be the slowest one and hence the bottleneck.This also yield for capturing satellite data. Bottlenecks does however have two
18 CHAPTER 2 TECHN ICAL BACKGROUND
properties associated with them; They are limiting throughput and they maybe solved. The hardest part with bottlenecks are to locate them. It requiresthorough testing and evaluation of every stage within the pipeline to concludewhere the bottleneck appear.
2.5.3 Field Programmable Gate Array (FPGA)fpgas is a type of gate array that is programmed post manufacture[6]. PCMag define fpga as follows.
The Definition 3. A type of gate array that is programmed in the fieldrather than in a semiconductor fab.[51]
This enables fpgas to be programmed on site where they shall be used.According to PC Mag, the majority of fpgas are Static Random Access Memory(sram)-based, which require power to hold its content[52]. fpgas are oftenused to enhance performance on some specific part of a process, becauseone may connect an fpga to a circuit board, implementing functionalityearlier done in software, now on hardware. The advantage is that there is noinstruction, which requires the cpu to invoke it, to perform the operations.Dedicated hardware as used in fpga may enhance performance by order of100[6].
2.6 Related WorkDue to the very specific test environment for this thesis, not much relatedwork has been found. One can relate some work regarding software and hard-ware configurations and performance. The most important ones is presentedhere.
The work done by McLemore et. al.[43], published in 2012, demonstrate suc-cessful capture of satellite data transmitted at 277 Megabit Per Second (mbps)per second. The work used an older version of the exact same system as thesystem evaluated in this thesis, and it gives a perspective on the developmentof transfer rates from 2012 until today, where 1 gbps is considered state of theart. The study enlighten a new perspective within satellites, where the satelliteAdvanced Land Observing Satellite (alos) was able to produce more data perorbit than it was able to transmit to earth. This enabled a cooperation betweennasa and Japan Aerospace Exploration Agency (jaxa), which was its first ofits kind. nasa offered several ground stations, enabling several passes per orbitand hence allowing the satellite to produce more data per orbit. jaxa provided
2.6 RELATED WORK 19
nasa with access to valuable Synthetic Aperture Radar (sar) data.
When dealing with incoming High Rate Data (hrd) from satellites, one mustensure that the data is persistently stored lossless. The ingest disks are exposedfor heavy load during a pass, which require some level of disk performanceto enable lossless storage. Much recent work report impressing results whenusing nvme[28] ssds. In [33] they used nvme to create a workload-awarebudget compensating scheduler. The reason for using nvme in that study is toembrace the performance offered by pcie, instead of using what they call thebottleneck sas. In [45] they used nvme ssds to enhance Hadoop MapReduceperformance using Hadoop Distributed File System (hdfs). And in the workby Elsebø[17] they developed an nvme driver for Vortex[38] that is exposed asa scsi device. Vortex is an experimental implementation of the omni-kernelarchitecture. The study also measures disk performance, proving nvme to bethe best performing disks on the market today in terms of reads, writes andiops. Other studies have applied disk caching disks[26] to reduce latency andincreasing performance, and placing data in the disks free blocks by observingthe disk access patterns at runtime[27].

3MEOS CaptureIn this chapter the current state is documented for Kongsberg Spacetec’s (KSPT)Multimission Earth Observation System (MEOS) Capture, introducing the archi-tecture and execution flow. The test environment specifications are presentedin section 3.2.meos capture is a capturing system that receives, demodulates,frame synchronizes and bit error corrects hrd from satellites. The systemcaptures satellite data, lossless, at high incoming rates. The system can bedelivered with a satellite antenna, spanning from 3.0 meters dish to 5.0 meterdish as specified in their data sheet[35].
3.1 MEOS Capture HRDFEP v4The system architecture, hardware and configurations are documented in thissection.
3.1.1 ArchitectureThe architecture is illustrated in figure 3.1, where the main components withinmeos capture and execution flow is presented.
The system consist of following modules:
21
22 CHAPTER 3 MEOS CAPTURE
Satellite Antenna
Demodulator
InputChannel
Ingest Disks
ProcessedStorage
Processing
Near Real TimeDistribution
Post passDistribution
Serial Output
Customers
Figure 3.1: The architecture for meos capture. Note that data is either sent directlyfrom ingest disks to distribution, or processed before distribution.
3.2 SERVER HARDWARE AND CONFIGURAT ION 23
• Satellite antenna
• Demodulator
• Input Channel (Frame synchronization and decoding)
• Serial Output
• Ingest Disks
• Processing
• Processed storage
• Near Real Time Processing and Distribution
• Post Pass Processing and Distribution
Each and every one of these stages are further elaborated on in 3.3
3.2 Server Hardware and ConfigurationThis section presents the front end server, and how the server is configured.Note that this is what kspt offer to customers as of today, and is under constantrevision.
3.2.1 Server Hardware Specs and SoftwareThe server delivered to customers today is an HP ProLiant ML350 Gen8, rackmounted chassis. The server use SUSE Linux Enterprise Server version 11 (SLES-11) as operating System (os), and all disks installed use the XFS file system.The total storage capacity on the server is 8.7 terrabyte, where 2.4 terrabyteis used for data capture storage. The rest is allocated to store processed data,and to the os.
3.2.2 ConfigurationThe different configuration details for the server ingest disks, system disks andprocessing storage are covered in this section.
24 CHAPTER 3 MEOS CAPTURE
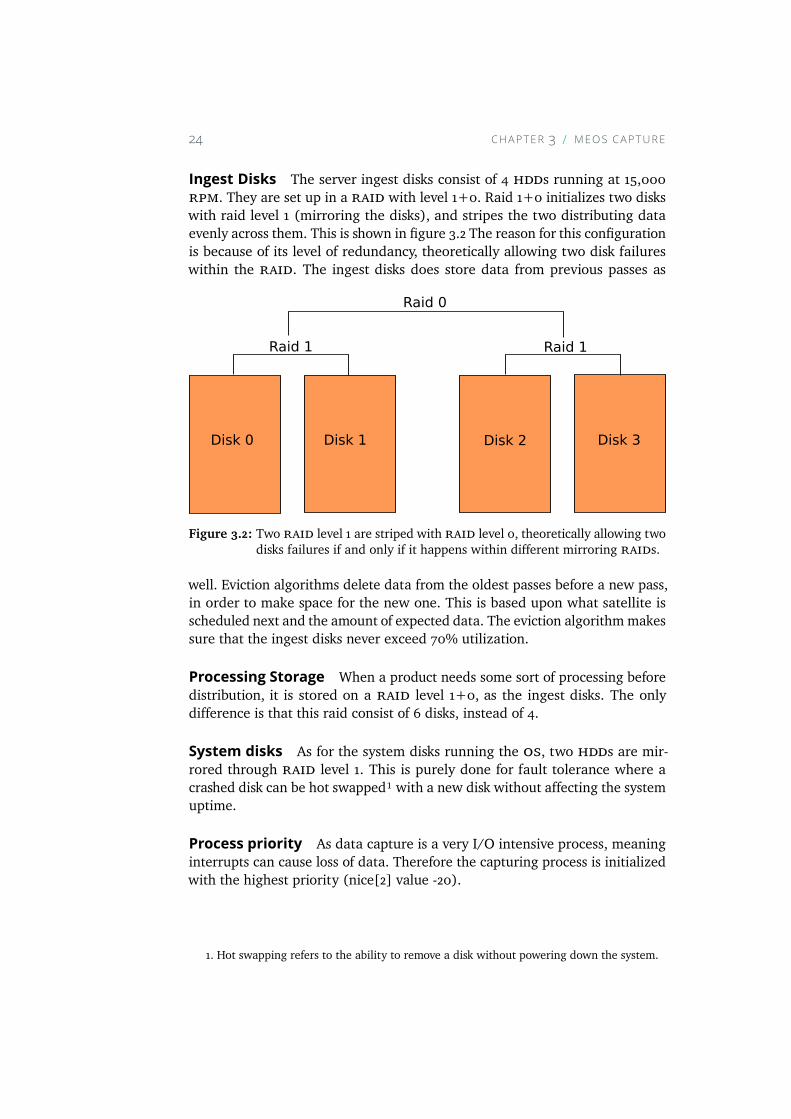
Ingest Disks The server ingest disks consist of 4 hdds running at 15,000rpm. They are set up in a raid with level 1+0. Raid 1+0 initializes two diskswith raid level 1 (mirroring the disks), and stripes the two distributing dataevenly across them. This is shown in figure 3.2 The reason for this configurationis because of its level of redundancy, theoretically allowing two disk failureswithin the raid. The ingest disks does store data from previous passes as
Disk 0 Disk 1 Disk 2 Disk 3
Raid 1 Raid 1
Raid 0
Figure 3.2: Two raid level 1 are striped with raid level 0, theoretically allowing twodisks failures if and only if it happens within different mirroring raids.
well. Eviction algorithms delete data from the oldest passes before a new pass,in order to make space for the new one. This is based upon what satellite isscheduled next and the amount of expected data. The eviction algorithm makessure that the ingest disks never exceed 70% utilization.
Processing Storage When a product needs some sort of processing beforedistribution, it is stored on a raid level 1+0, as the ingest disks. The onlydifference is that this raid consist of 6 disks, instead of 4.
System disks As for the system disks running the os, two hdds are mir-rored through raid level 1. This is purely done for fault tolerance where acrashed disk can be hot swapped¹ with a new disk without affecting the systemuptime.
Process priority As data capture is a very I/O intensive process, meaninginterrupts can cause loss of data. Therefore the capturing process is initializedwith the highest priority (nice[2] value -20).
1. Hot swapping refers to the ability to remove a disk without powering down the system.
3.3 EXECUT ION FLOW 25
3.3 Execution Flowmeos capture support two different initialization schemes where the first isdata driven,as described by Cordier et. al.[12], and the second is schedule driven.The difference between the two is that schedule driven is pre programmed,based upon the time forwhen the satellite becomes visible to the ground station,and data driven are based upon automatic detection of data. Independent ofthe reception initialization scheme, the high rate demodulator and front endprocessor (hrdfep) is configured and programmed to execute the steps listedin section 3.1.1.
The first module is the demodulator which demodulates radio signals receivedby the antenna, creating a digital stream of data. Demodulated data is sent tothe server, ormore specific, the data receiving board (marked as input channel infigure 3.1) which performs several operations on the received data. The data isframe synchronized and de-randomized through ccsds coding[67]. At last thedata is error corrected via algorithms such as Reed-Solomon decoding[36, 72]and Viterbi[71], timestamped and placed in an on-board memory pool[36].From this memory pool, the data is fetched by an fpga which implements aninterface to the pcie bus and puts the data onto said bus through dma. Thedata then arrives in host ram before it is written to disk. For some customerspersistently stored data has to be processed before distribution. The data isthen read from that particular ingest disk, processed and written to anotherdisk before it is distributed.
Through serial output, it is possible to send all received data to tape recordersor other machines for further storage, processing and/or distribution. Thedifferent processing modules represent the different processing necessary fordifferent customers. This processing can be the generation of metadata (alsoknown as data about data) and source packet generation which convert the datato a specific file format which is the format delivered by the specific instrument.However, processed data are also stored to disk for persistent storage before itis distributed. Do note that there are two types of distribution. Near real-timedistribution and post pass distribution. The difference is that near-real timedistribution distributes processed data as soon as it is available, where post-passdistribution waits until the satellite moved out of antenna bounds (or finishedthe pass), and all data requiring processing have been processed before thedistribution takes place.
Even though it is possible to send received data through the serial output toother computers, this is not common practice as the system would requireseveral computers which would increase the total cost. Everything is normallyhandled by one single front end server with the hardware specifications andconfigurations it was installed with.
26 CHAPTER 3 MEOS CAPTURE
3.3.1 Known BottlenecksOn the data generator board there is one known bottleneck. A memory bufferused for temporary storage before data is sent out on the pcie bus, limiting thesystem because it must be written to and read simultaneously, which providessome “read my writes" constraints. However, this issue is not within the scopefor this thesis because this occur on the data generator board on some of thefpgas used.
3.4 Related Systemskspt is not the only provider of systems capturing satellite data. This chapterfocuses on related systems, presenting their manufacturers and some keynumbers and functionality to compare with meos capture.
ViaSat offer a high rate receiver with an optional front end processor whichthey claim to support up to 3200mbps per channel, with support for twochannels[70]. In effect, ViaSat guarantee lossless data capture of rates up to6400mb per second. With processing and data archive enabled, they guaranteerates up to 4000mbps per second.
Zodiac Aerospace deliver a system called Cortex HDR XXL[73], which theyclaim to support rates up to 2gbps, over two input channels. Their data sheetsay that they do deliver a front end processor as well, but they do not statewhether they guarantee 2gbps with processing enabled, or if it is only datacapture.
RT Logic have developed a system called T1200HDR[60], which they claim tobe capable of capturing rates up to 2gbps according to their data sheet.
Antwerp Space’s Omnisat[4] claim that their system support rates up to975mbps. Omnisat offer a front end processor, capable of data distribution, butit is not informed whether this is near real-time, or post pass distribution.
All mentioned systems report to support turbo coding from ccsds, and sev-eral different modulation schemes. The differences seems to be within therates guaranteed, and to what level of processing is offered on the captureddata.
The information presented in this section is based upon the information pro-vided in the systems data sheet, and the rate the system claims to support.When assessing capturing systems, there are several parameters one must
3.4 RELATED SYSTEMS 27
consider. Such parameters are;
• Claimed rate
• Functionality
• Implementation loss
• Decoding
• Static and dynamic status logging
• Level of automation
• To what extent claimed performance is valid for all functionality simul-taneously
The claimed rate is limited for a system providing near real-time processing,since the captured data may have to be read from disks which is exposedto heavy load as they capture data. The functionality provided refers to theability to process the captured data, and to what level. The implementationloss typically occurs within the demodulator, and will degrade recorded dataquality. The decoding may be iterative which again affect the quality of theframes received by the demodulator. The more iterations supported, the betterthe data quality.

4Analysis ToolThis chapter presents the analysis tool, with its design and implementation.Some requirements to the analysis tool is presented, for evaluation purposes.The analysis tool purpose is to monitor hardware components during a simu-lated satellite pass and store the sampled data for further analysis. This createsthe foundation for determining where possible bottlenecks may appear withinthe data capture system, and further, resolving them.
In order to determine where the bottlenecks appear, one must monitor severalcomponents within the computer. To determine what components to monitorone must take meos capture architecture into consideration, presented infigure 3.1. As the incoming bitstream from the satellite antenna arrives at thereceiving server, the data receiving board place it in host memory through thepcie bus. This requires cooperation between five components to accomplish,the pcie bus, the dmac, the cpu, kernel buffers and host memory. Therefore,one must monitor these five components to achieve an understanding of howthe components cope with the incoming bitstream.
As data moves on from host memory to the ingest disks, there are other com-ponents in action. A raid controller fetch data from host memory, distributingdata across the raid used as ingest disks. Therefore the raid controller andthe disks used as ingest disks must be monitored, in addition to those men-tioned above. This provides a complete list of required components to monitorin order to achieve a precise picture of where possible bottlenecks may occur.The list of required devices to monitor is presented in listing 4.1.
29
30 CHAPTER 4 ANALYS IS TOOL
Listing 4.1: List of analysis requirements. The list names all devices that requiremonitoring during experiment execution.
• pcie bus
• dmac
• cpu
• Memory usage
• Kernel buffer usage
• raid controller
• Ingest disks
The analysis tool is configured to be a scientific tool within this thesis, and somechanges must be done before it can be used in production. Production refersto existing systems performing data capture on a daily basis for customers. Asuggestion for production setup is presented in section 4.3.
4.1 Design and ArchitectureThe analysis tool is designed as an overlay on top of existing monitoring toolswithin Linux. As all tools used, except for Dstat, are part of the Linux packageeveryone is free to use these tools. One may have to download and install Dstatmanually, and the Dstat package can be found on GitHub¹. The total packageis a combination of several programs that allow you to monitor the total loadon the computer at any time. The idea is to split a terminal window into severalsub-windows, each window executing a carefully chosen tool to provide itsuser with information. Terminal multiplexer (tmux) is a tool that implementsthis functionality, where one can configure the size of each window within thescreen bounds.
Terminal Multiplexer tmux² is a tool that allow its user to create, deleteand switch between panes within a single terminal window. This is useful
1. https://github.com/dagwieers/dstat2. http://www.openbsd.org/cgi-bin/man.cgi/OpenBSD-current/man1/tmux.
1?query=tmux&sec=1
4.1 DES IGN AND ARCH ITECTURE 31
when one needs several windows within a terminal, such as when one want tomonitor the system load on a computer using several tools.
Dstat Dstat[1] is a monitoring tool that allows its users to monitor the loadcomponents within a computer are exposed to. Dstat supports logging whichenables further analysis when needed. Dstat is built on top of the Sysstat³group, which consists of several system monitoring tools⁴. Throughout thisproject, Dstat is used to monitor cpu usage, memory usage, disk input andoutput requests and the amount of data read or written to disk per second. Onelimitation in the monitoring of the ingest disks are that Dstat does not allow itsuser to monitor each and every physical disk. It is based upon the logical disks,and this thesis does only experiment with several physical disks, arranged insome raid which is exposed to the os as one, big, logical disk.
Dstat allows creation of your own plugins. Through this feature, one can tailorDstat to your requirements without any larger effort. Since Dstat is built ontop of the Sysstat group, it utilizes the files and catalogs within /proc whereLinux keeps its device logs. The device logs’ purpose is to log the current loadper device, that be cpu utilization, memory usage, disk IO statistics and more.Dstat can be invoked with a delay, which says how often the statistics shouldbe read. This must be an integer, and default is set to 1 second. According tothe Dstat Linux manual page⁵, Dstat does not display snapshots but rather theaverage system usage since the last update.
Dstat supports several flags[1], and the most relevant for this project are theones that collect information about cpu usage, memory usage, disk utilizationand I/O. The samples also include a timestamp for when the sample was taken.One may also set for how long Dstat should run before it terminates. Dstatalso has support for logging its generated data samples, writing it to a file incomma separated values (csv) format.
Other tools that monitor the same components does exist, achieving the sameresult. Since Dstat is an overlay over the Sysstat group, one could use the toolswithin Sysstat such as Iostat⁶,whichmonitor disk transactions and input/output,and Vmstat⁷ that monitors virtual memory usage. This would however requirea combination of several tools to achieve the same result, which does notsupport logging files out of the box. The convenience of using Dstat, is that allthis is gathered within one single tool, reducing the needed number of tools tomonitor the same components in addition to its logging features.
3. http://man7.org/linux/man-pages/man5/sysstat.5.html4. http://sebastien.godard.pagesperso-orange.fr/documentation.html5. http://linux.die.net/man/1/dstat6. http://linux.die.net/man/1/iostat7. http://linux.die.net/man/8/vmstat
32 CHAPTER 4 ANALYS IS TOOL
Kernel Log The analysis tool include a tmux pane displaying a log that isonly used by the os kernel. Since the data receiving board device driver runwithin the kernel, it has access to the kernel logs. Therefore, the device driverreports to the kernel log whenever an unexpected event occurs. Because thekernel logs tend to be very long, a program called Tail⁸ is used to watch thelast part of the log. Tail accepts user specified amount of lines to display, asshown in listing 4.2,
Listing 4.2: Example of Tail usage, to display and follow the last 15 lines of a file.
t a i l − f −n 15 <path / to / f i l e >
will only show the 15 last lines of a specified file, and follow these lines asnew messages are appended to it. For convenience, this file is the kernel logthroughout this project.
All device drivers has access to the kernel logs, where the message printedfrom the data receiving boards driver is very specific for this particular system.Therefore, there does not exist any alternative monitoring tool. kspt have notimplemented any tool with this feature, this is purely based on human revision.Therefore it is included within this tool, in order to display it immediately toits user when the event occur.
Htop Htop is an interactive process viewer that, according to the manualpage⁹, allows its users to monitor the resource usage for each process runningon the computer. Htop is included into this system because it provides overallCPU statistics per core, and it allows the user to manage processes runtime.Because of the non existent logging feature within this tool, the cpu statisticsare logged from Dstat instead. But for monitoring momentary CPU usage andprocess management, this tool is invaluable.
Top is an alternative process manager that could be used. However, Htop offersmore statistics, with a graphical visualization for per cpu core utilization,and memory usage, in addition to the process management. Htop is a morepowerful tool than Top, which is why Htop was preferred over Top.
4.1.1 ArchitectureBased on the design described, the architecture is shown in figure 4.1. The figurereflect the design proposed, where Tmux is used to split the terminal windowinto sub-windows, each presenting one tool used for the analysis.
8. http://man7.org/linux/man-pages/man1/tail.1.html9. http://linux.die.net/man/1/htop
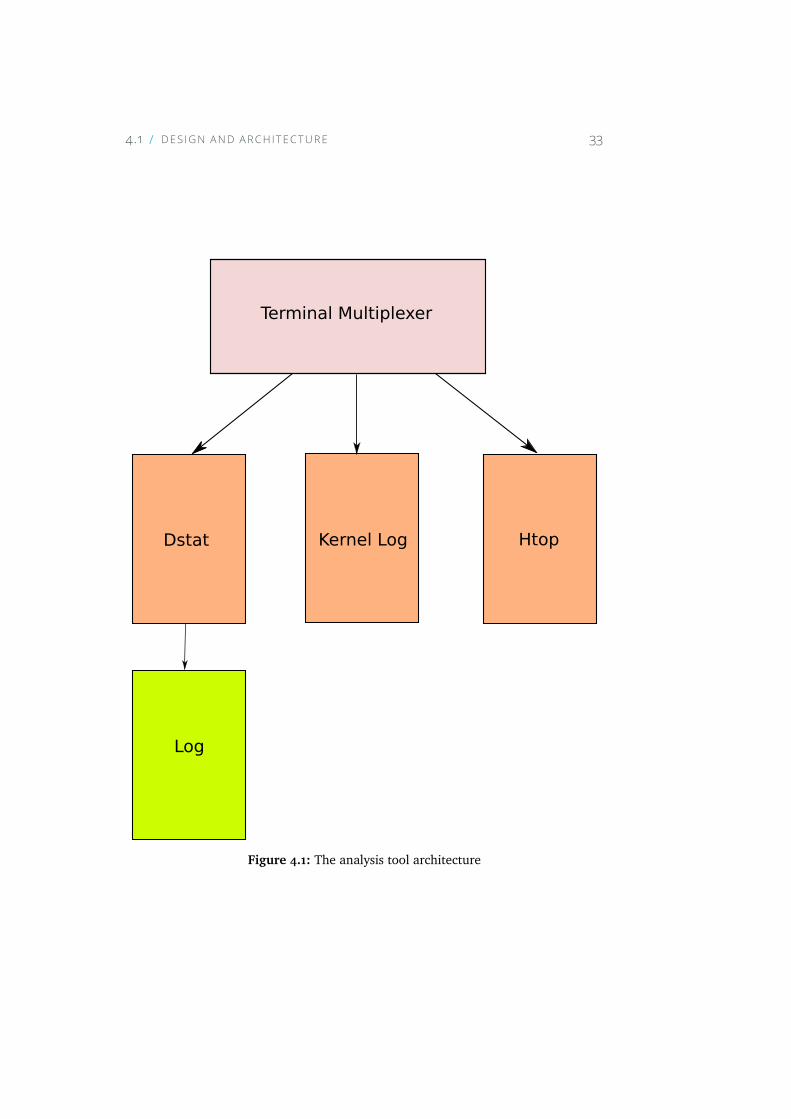
4.1 DES IGN AND ARCH ITECTURE 33
Terminal Multiplexer
Dstat Kernel Log Htop
Log
Figure 4.1: The analysis tool architecture
34 CHAPTER 4 ANALYS IS TOOL
4.2 ImplementationSince the analysis tool exclusively consists of already existing tools native toLinux, the implementation became trivial as no new tools had to be developed.A script written in Bash launch tmux before each and every tool presented infigure 4.1. Dstat is launched with several parameters in order to inform Dstatwhat to monitor. The decisions on what to monitor was based upon the analysisrequirement stated in listing 4.1. Htop did not require any further parameters,while Linux kernel buffer usage was monitored by following the last 15 lines ofthe Linux kernel log, as presented in listing 4.2. Now, the implementation doesonly start different programs, with carefully chosen parameters.
The implementation was however a bit varying between the different experi-ments, due to the difference in experiments. When testing the ability to onlycapture data, Dstat only logged the read and write accesses to the ingest disks.When simulating both the capture of data and near real-time processing, Dstatwas configured to log both the activity on the ingest disks as well as the activityon the disks used to store processed data.
The bash script first initializes an array of commands to run, which reflect whatto monitor during execution. Next the script checks if a tmux session namedmonitors already exists. If such session already exist, tmux just attachesitself to that session, in order not to have several instances of the same processrunning during experiment execution. This is a neat feature when several userswant to monitor the same server, from their personal computers. However, ifthe session does not already exist, each and every of the tools are launchedand the terminal window split into several panes, with each pane executingone tool. The script is presented in its entirety in appendix B.
The implementation enables the gathering of several tools within one terminalwindow, which again offers its users an overview of what is happening on thecomputer in a meaningful manner.
4.3 DiscussionAs the analysis requirements was stated in listing 4.1, one may have noticedthat not all components are monitored with the system used within this thesis.The components not monitored are the pcie bus, the dmac and the raidcontroller. In order to be able to monitor these components, one must be inpossession of the driver source code implementing the components interface.The pcie bus can be monitored through a pcie bus analyzer, which have notbeen used in this thesis. kspt is not in possession of the source code for any of
4.3 D ISCUSS ION 35
these components, as they are bought from third parties. This means that ksptconsider them as “black boxes”. With the source code available, one couldexpand the analysis tool by implementing a Dstat plugin using the componentinterface to retrieve run time statistics.
The statistics that would be interesting to know from the different componentsnot monitored today are discussed below.
PCIe bus To monitor the pcie bus, which is provided as an extra device onemust place between the pcie connector and the pcie compliant device. Tele-dyne LeCroy offers such a device[66] compliant with pcie version 2.0 and 1.0.Through this device one will gain valuable information about per lane through-put in real time. Interesting metrics to pull out from this would be how muchtime the bus spend per transaction, and the total per lane throughput.
Since a pcie analyzer is not provided in this project, one must determine thethroughput by performing isolated experiments between the data receivingboard and host memory. Through modifying the data receiving boards drivers,one could achieve some level of run time statistics such as how many clockcycles the fpgas actually put data out on the bus, and how many they have tohold data back.
DMAc The dmac requests a list of page descriptors from host memory. Thismemory reflect the kernel buffer size, which is configurable in meos capture.As data are written to host memory (or ram), page by page, the file systemmakes sure that the raid controller begin to write data to disk. The list ofpage descriptors works as a circular list. When the raid controller cannotfetch data fast enough from ram, meaning that the ingest disks are too slow,the dmac can run through the list of page descriptors and overwrite data notwritten to disk yet. As of today, there are no mechanisms to stop this fromhappening. Therefore, it would be interesting to monitor where in the list ofpage descriptors the fpgas on the data receiving card is, compared to how farthe raid controller has come. This could be implemented in the data receivingboard device driver, as the dmac is implemented on the fpga placed on thedata receiving board.
RAID controller Theraid controller usedwithin this thesis is fromHewlett-Packard. It is specified to support 12gbps which is equal to the specificationsof the sas bus. If one is in the possession of the firmwares source code, onewould learn more about how the raid controller distributes data across disksparticipating in the raid, and one could monitor per physical disk statisticsinstead of per logical disk statistics as done today. This would provide a moreprecise picture of how the ingest disks cope with incoming rates as they increase.
36 CHAPTER 4 ANALYS IS TOOL
This is very dependant on which raid level one chose to use, especially whenusing data redundancy.
Since kspt solely depend on the Linux kernel and file system to take careof captured data after it is placed in host memory, this is also considered a“black box”, offering reliable data transfer from host memory to the ingest disks.Monitoring the raid controller could offer more detailed information aboutthis part of the pipeline, and possibly reveal existing bottlenecks.
Kernel Log Monitoring the kernel log is purely based upon human revision,through this tool. An attempt was made to implement a Dstat plugin retrievingthe current buffer usage, but this was only partly successful. The reason forthis is that the kernel print messages to its log per microsecond when thebuffer usage is exceeds one buffer. As system fetched the last line from thekernel log and extracted the number of used buffers, if any, the buffer usagecould have been much larger just few microseconds ago. The issue is that Dstatonly update the numbers per second. One could fetch the 10 latest lines anddisplay an average of the 10, but as the number of buffers used becomes equalto the number of buffers available, or worse, larger, the user must be informedin some way. Therefore an average is not a suitable solution. One could logthe maximum recorded value and print that to screen, but it would not be asinformative as the momentary usage of buffers. It would only inform whetherthere was an overflow or not during the experiment, in which there are othermechanisms embracing this feature. Logging the maximum value would beredundant. Therefore, the monitoring of buffer usage in kernel, is purely basedupon human revision and not integrated into Dstat through a plugin.
4.3.1 Setup for production purposesThe analysis tool can very easily be configured for production use. The firstchange to do is to create a mechanism that enables logging of events, i.e.,when resource utilization gets very high. This can be implemented, becausemeos capture writes the currently used numbers of buffers in kernel to/var/log/messages, which is the kernel log. Whenmeos capture uses morethan one buffer in kernel, the incoming rate is greater than what the ingestdisks can write per second for a short period of time. The analysis tool mayprovide information about what caused this drop in disk performance.
For example, if meos capture is invoked with kernel buffer size of 64mb, thekernel has 16 buffers of 4mb each available. To set this in context, when thesatellite transmits data at a higher rate than the system can write to disk, thebuffers in kernel quickly get filled up. Normally, meos capture uses one, and
4.3 D ISCUSS ION 37
only one buffer in kernel. When meos capture has to use more than onebuffer in kernel, it writes the number of used buffers to its log. This can bemonitored, and invoke this analysis tool for logging purposes on the wholesystem only on this event. To do this sort of mechanism, what one must do isto to use tail displaying the last 10 lines of the kernel log. The last 10 linesshould at first contain old values, where the last line should inform when thedata receiving board device driver was initiated. The message in listing 4.3occur within the kernel log during meos capture execution and inform thenumber of buffers used.
Listing 4.3: Example of kernel log message reporting number of used kernel buffers.
2016−04−05T13:28:29.864062+00:00 fes39−vlan5 kerne l :[362474.731050] s fep : (0x20) in t count=2
The message show a timestamp for when the message was reported and thehost name. Next there is a timestamp in microseconds determining when themessage was reported since the device driverwas initiated. After the timestamp,the message display that it is the data receiving board device driver that reportsthe message (sfep), and at last the intcount is the number of currently usedbuffers.
4.3.2 EvaluationAs the analysis tool does not implement all requirements mentioned in list-ing 4.1, one can still achieve a good idea of where the bottlenecks appear withinthe system. Nevertheless, one can gain information about the parts not moni-tored by isolating parts of the pipeline, and hence determine where bottlenecksoccur. With this approach, one must rely more upon qualified assumptions tofill in the missing parts within the analysis.
The analysis is very reliant upon Dstat, in order to produce runtime statistics.The fact that Dstat does support creation of logs is invaluable, which is notprovided natively in many other monitoring tools within the Sysstat group.Htop is used as process manager due to its user interface and runtime processmanagement. As Htop visualizes per core cpu utilization and memory usage,it provides instant feedback to its user whether the server is under heavy loadsor not. In addition, its process management is very powerful, as it allows oneto sort processes by resource usage.
In total, the analysis tool provides its users with much valuable information,gathered in one window. The support of logging features enables users to createweb pages with live graphs showing computer load, in order to monitor it
38 CHAPTER 4 ANALYS IS TOOL
remotely. The analysis tool is highly configurable through the tools used.
4.4 Future WorkSince some components in the system pipeline are not monitored as of today,it is regarded as future work. As discussed in section 4.3 monitoring the dmac,raid controller and pcie bus would provide useful statistics when determiningwhere bottlenecks occur. In addition, defining a suitable solution formonitoringthe instantaneously buffer usage during a satellite pass would instantly informthe user whether the data capture is successful or not. It is possible that onemust develop a system only focusing on the kernel log in order to display themomentary usage of buffers. The issue is that messages are posted to the kernellog very rapidly once the buffer usage exceeds one buffer. One may have to lookat other solutions, i.e., store the highest value reported per pass. If one justdisplay the values naïvely to screen, the buffer usage may not be very humanreadable since the update frequency may become per millisecond.
In addition the changes needed for production purposes presented in sec-tion 4.3.1, is left out as future work.
5Experiments andEvaluationAs meos capture is a large and complex system, this chapter embrace onlya small part of it as the device under test is the next generation HP ProLiantserver with candidate hardware and technology. This chapter presents theexperiments performed on the test environment, determining the performanceprovided withconfigurations kspt use today.
The analysis tool presented in chapter 4 will be used to monitor the computerload for all experiments. As the first few seconds of the experiments will containvalues from other processes and daemons, we will ignore the first few secondsof all experiments.
5.1 Test EnvironmentThe test environment differ from the system kspt deliver to their customersfor production. The main difference is that the test environment use a 9thgeneration HP ProLiant server, where the production system use 8th generationHP ProLiant server.
39
40 CHAPTER 5 EXPER IMENTS AND EVALUAT ION
5.1.1 Hardware Specs and SoftwareThe test environment includes the following components.
Chassis The server chassis is a rackmountedHP ProLiantML350Gen9¹.
CPU The processors are two Intel Xeon E5-2623v3² running on 3Ghz, quad-core, with 10 mb cache and 64-bit instruction set.
Memory The memory is 128gb ofram, divided over four 16GB Dual Rank x4DDR4-2133 CAS-15-15-15 Registered Memory Kit³ running at 2133 MHz.
Storage It is installed with 10 HP 600gb 12G sas 15k rpm hdd⁴, and twoHP 200GB 12G sas Mainstream Endurance SFF 2.5-in ENT Mainstream SC 3yrWty H2 Solid State Drive⁵ capable of 70,000 read iops and 51,000 write iopsaccording to HP’s sites[25]. It is also equipped with two HP 146GB 6G SAS 15Krpm SFF (2.5-inch) SC Enterprise 3yr Warranty Hard Drive⁶.
RAID-controller The raid-controller is a HP Smart Array P440/4GB FBWC12Gb 1-port Int FIO SAS Controller⁷.
Data Receiving Board The data receiver runs in testmode during all exper-iments. When testmode is enabled the fpga generates a pre defined sequenceof data at a user defined rate, and sends it out on the bus.
Software As for the software, the server run SUSE Linux Enterprise Serverversion 12 (SLES-12) and XFS file system.
Configurations Finally, the system configurations will initially be as definedin section 3.2.2, where the only differences are the hardware available withinthe test environment.
1. http://h20195.www2.hp.com/v2/GetPDF.aspx/c04346270.pdf2. http://ark.intel.com/products/83354/Intel-Xeon-Processor-E5-
2623-v3-10M-Cache-3_00-GHz3. http://www8.hp.com/us/en/products/smartmemory/product-detail.
html?oid=69874374. http://www8.hp.com/us/en/products/server-hard-drives/product-
detail.html?oid=6826123#!tab=specs5. http://www8.hp.com/ph/en/products/proliant-servers/product-
detail.html?oid=7153470#!tab=specs6. http://www8.hp.com/lamerica_nsc_carib/en/products/oas/product-
detail.html?oid=51945157. http://www8.hp.com/h20195/v2/getpdf.aspx/c04346277.pdf?ver=1.0
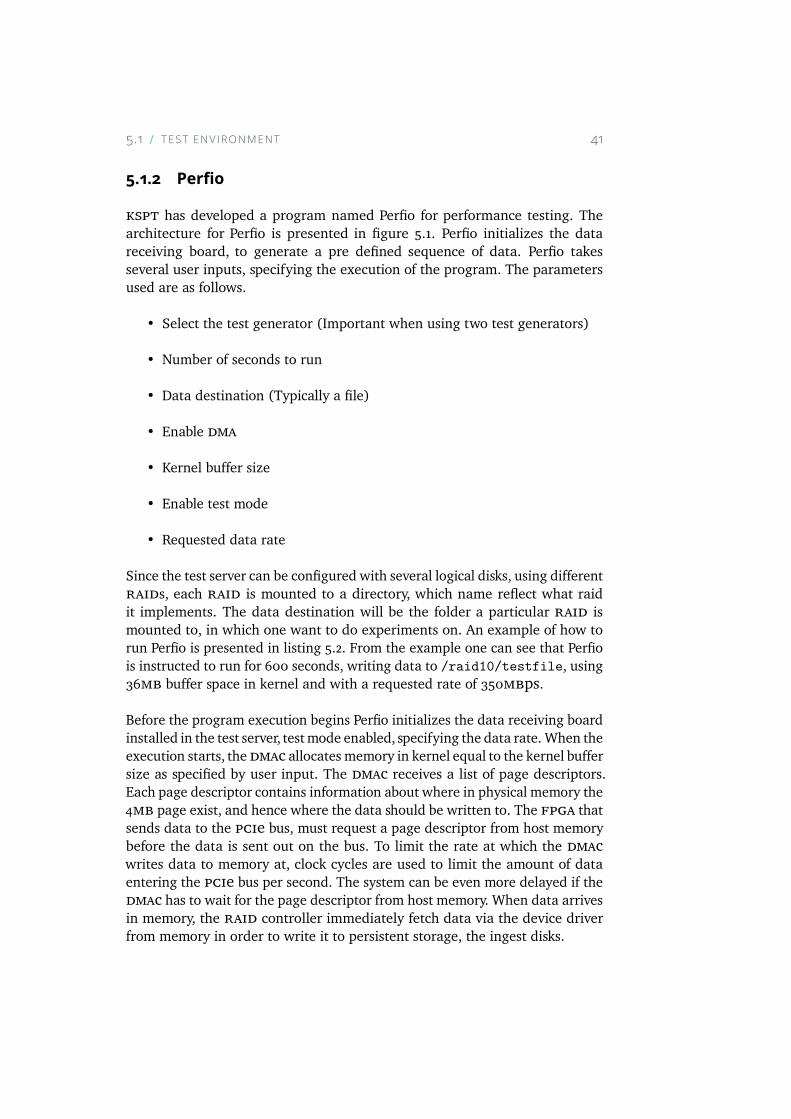
5.1 TEST ENV IRONMENT 41
5.1.2 Perfiokspt has developed a program named Perfio for performance testing. Thearchitecture for Perfio is presented in figure 5.1. Perfio initializes the datareceiving board, to generate a pre defined sequence of data. Perfio takesseveral user inputs, specifying the execution of the program. The parametersused are as follows.
• Select the test generator (Important when using two test generators)
• Number of seconds to run
• Data destination (Typically a file)
• Enable dma
• Kernel buffer size
• Enable test mode
• Requested data rate
Since the test server can be configured with several logical disks, using differentraids, each raid is mounted to a directory, which name reflect what raidit implements. The data destination will be the folder a particular raid ismounted to, in which one want to do experiments on. An example of how torun Perfio is presented in listing 5.2. From the example one can see that Perfiois instructed to run for 600 seconds, writing data to /raid10/testfile, using36mb buffer space in kernel and with a requested rate of 350mbps.
Before the program execution begins Perfio initializes the data receiving boardinstalled in the test server, testmode enabled, specifying the data rate. When theexecution starts, thedmac allocates memory in kernel equal to the kernel buffersize as specified by user input. The dmac receives a list of page descriptors.Each page descriptor contains information about where in physical memory the4mb page exist, and hence where the data should be written to. The fpga thatsends data to the pcie bus, must request a page descriptor from host memorybefore the data is sent out on the bus. To limit the rate at which the dmacwrites data to memory at, clock cycles are used to limit the amount of dataentering the pcie bus per second. The system can be even more delayed if thedmac has to wait for the page descriptor from host memory. When data arrivesin memory, the raid controller immediately fetch data via the device driverfrom memory in order to write it to persistent storage, the ingest disks.
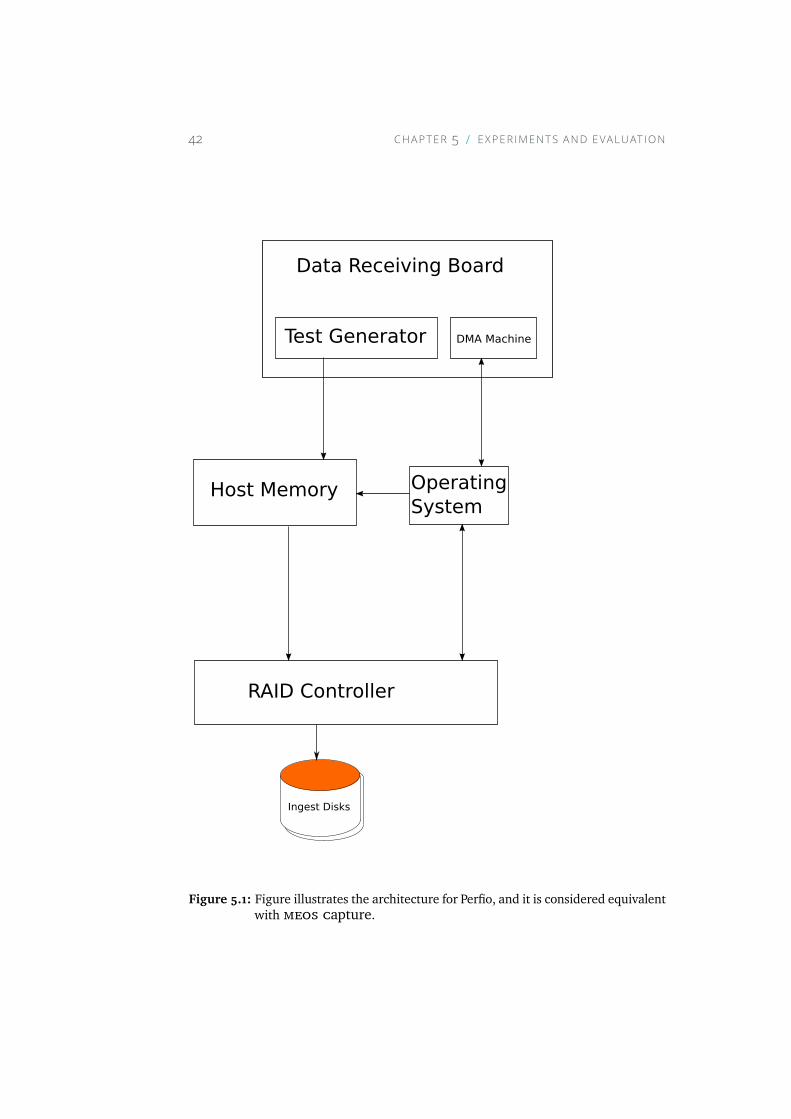
42 CHAPTER 5 EXPER IMENTS AND EVALUAT ION
Data Receiving Board
Test Generator
Host Memory OperatingSystem
RAID Controller
Ingest Disks
DMA Machine
Figure 5.1: Figure illustrates the architecture for Perfio, and it is considered equivalentwith meos capture.
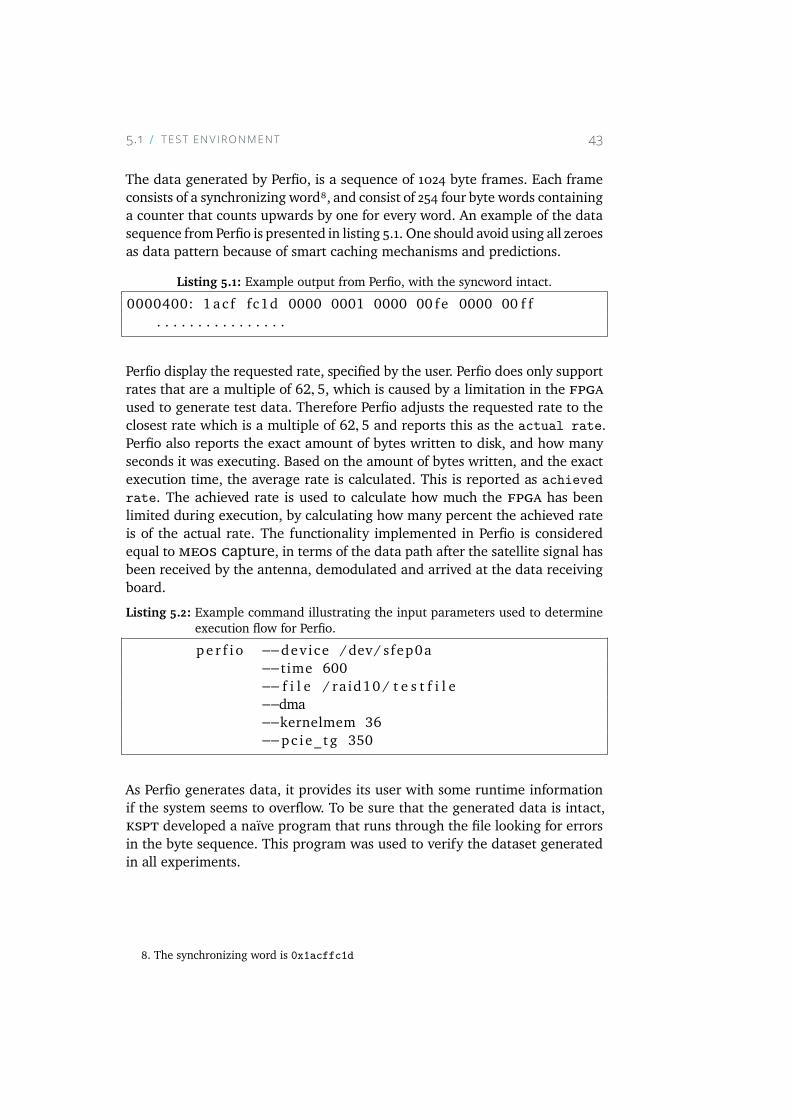
5.1 TEST ENV IRONMENT 43
The data generated by Perfio, is a sequence of 1024 byte frames. Each frameconsists of a synchronizing word⁸, and consist of 254 four byte words containinga counter that counts upwards by one for every word. An example of the datasequence from Perfio is presented in listing 5.1. One should avoid using all zeroesas data pattern because of smart caching mechanisms and predictions.
Listing 5.1: Example output from Perfio, with the syncword intact.
0000400: 1 ac f fc1d 0000 0001 0000 00 fe 0000 00 f f. . . . . . . . . . . . . . . .
Perfio display the requested rate, specified by the user. Perfio does only supportrates that are a multiple of 62, 5, which is caused by a limitation in the fpgaused to generate test data. Therefore Perfio adjusts the requested rate to theclosest rate which is a multiple of 62, 5 and reports this as the actual rate.Perfio also reports the exact amount of bytes written to disk, and how manyseconds it was executing. Based on the amount of bytes written, and the exactexecution time, the average rate is calculated. This is reported as achievedrate. The achieved rate is used to calculate how much the fpga has beenlimited during execution, by calculating how many percent the achieved rateis of the actual rate. The functionality implemented in Perfio is consideredequal to meos capture, in terms of the data path after the satellite signal hasbeen received by the antenna, demodulated and arrived at the data receivingboard.
Listing 5.2: Example command illustrating the input parameters used to determineexecution flow for Perfio.
pe r f i o −−dev ice /dev/ sfep0a−−time 600−− f i l e / raid10 / t e s t f i l e−−dma−−kernelmem 36−−pc i e_ tg 350
As Perfio generates data, it provides its user with some runtime informationif the system seems to overflow. To be sure that the generated data is intact,kspt developed a naïve program that runs through the file looking for errorsin the byte sequence. This program was used to verify the dataset generatedin all experiments.
8. The synchronizing word is 0x1acffc1d
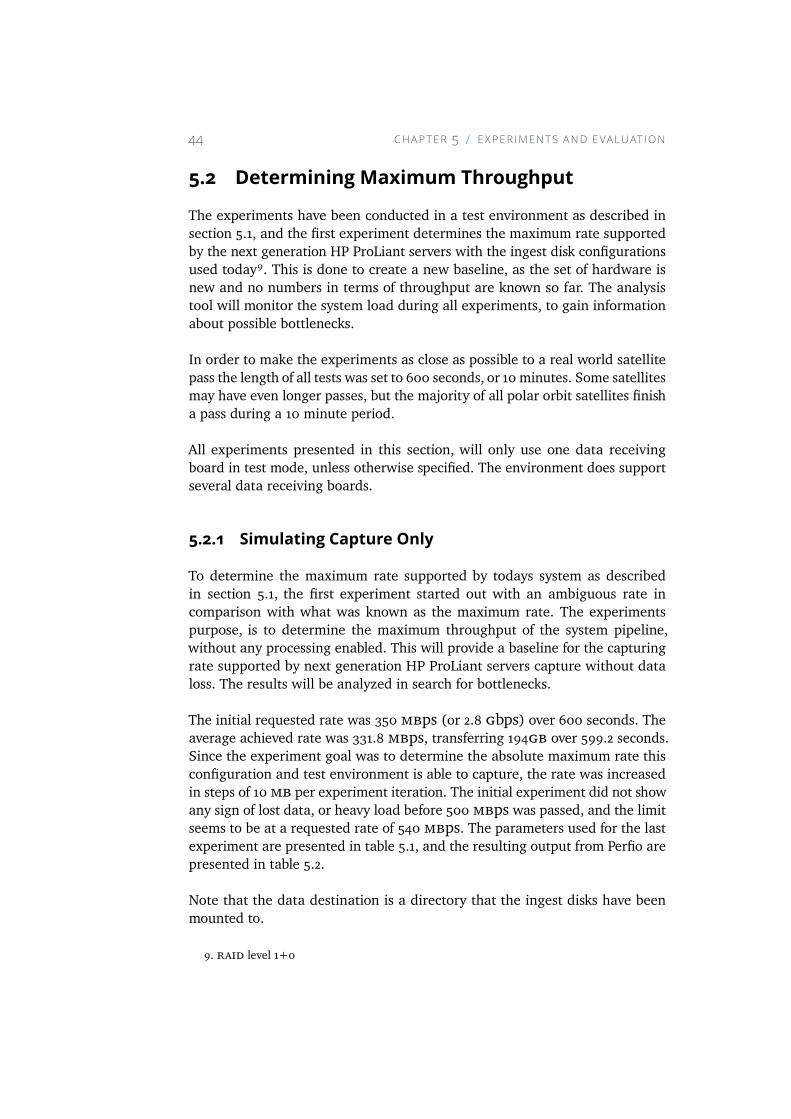
44 CHAPTER 5 EXPER IMENTS AND EVALUAT ION
5.2 Determining Maximum ThroughputThe experiments have been conducted in a test environment as described insection 5.1, and the first experiment determines the maximum rate supportedby the next generation HP ProLiant servers with the ingest disk configurationsused today⁹. This is done to create a new baseline, as the set of hardware isnew and no numbers in terms of throughput are known so far. The analysistool will monitor the system load during all experiments, to gain informationabout possible bottlenecks.
In order to make the experiments as close as possible to a real world satellitepass the length of all tests was set to 600 seconds, or 10 minutes. Some satellitesmay have even longer passes, but the majority of all polar orbit satellites finisha pass during a 10 minute period.
All experiments presented in this section, will only use one data receivingboard in test mode, unless otherwise specified. The environment does supportseveral data receiving boards.
5.2.1 Simulating Capture OnlyTo determine the maximum rate supported by todays system as describedin section 5.1, the first experiment started out with an ambiguous rate incomparison with what was known as the maximum rate. The experimentspurpose, is to determine the maximum throughput of the system pipeline,without any processing enabled. This will provide a baseline for the capturingrate supported by next generation HP ProLiant servers capture without dataloss. The results will be analyzed in search for bottlenecks.
The initial requested rate was 350 mbps (or 2.8 gbps) over 600 seconds. Theaverage achieved rate was 331.8 mbps, transferring 194gb over 599.2 seconds.Since the experiment goal was to determine the absolute maximum rate thisconfiguration and test environment is able to capture, the rate was increasedin steps of 10mb per experiment iteration. The initial experiment did not showany sign of lost data, or heavy load before 500 mbps was passed, and the limitseems to be at a requested rate of 540 mbps. The parameters used for the lastexperiment are presented in table 5.1, and the resulting output from Perfio arepresented in table 5.2.
Note that the data destination is a directory that the ingest disks have beenmounted to.
9. raid level 1+0
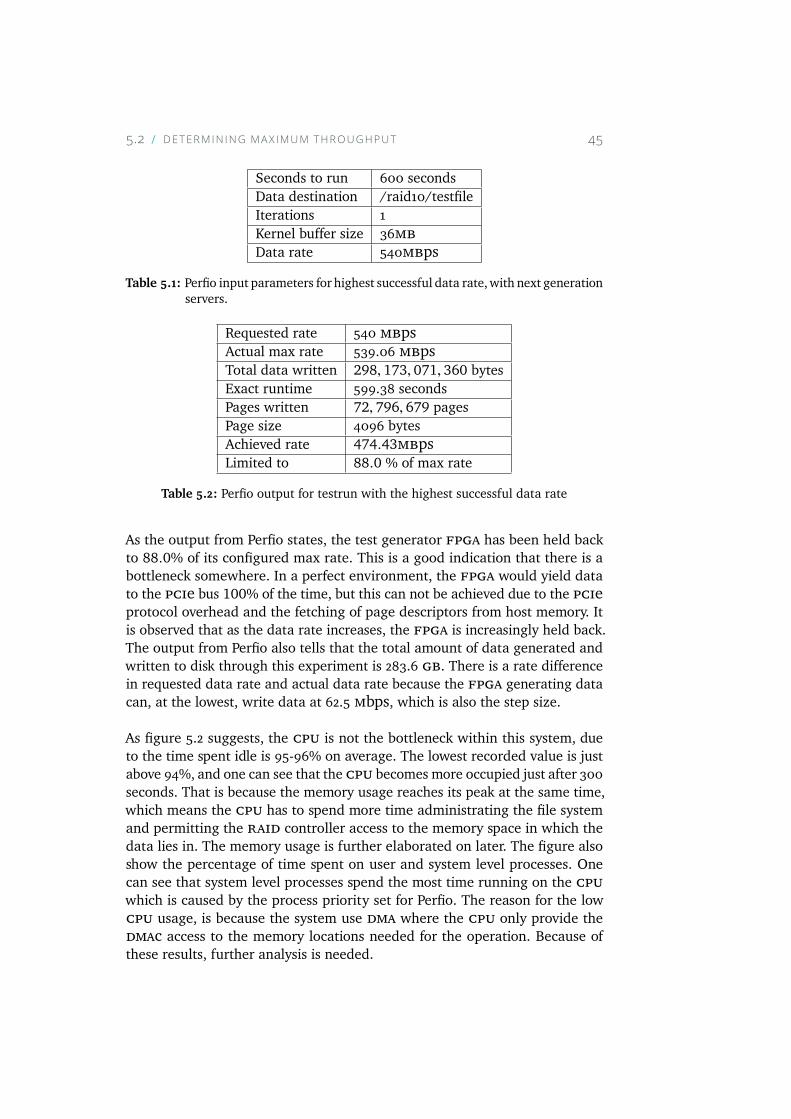
5.2 DETERM IN ING MAX IMUM THROUGHPUT 45
Seconds to run 600 secondsData destination /raid10/testfileIterations 1Kernel buffer size 36mbData rate 540mbps
Table 5.1: Perfio input parameters for highest successful data rate,with next generationservers.
Requested rate 540 mbpsActual max rate 539.06 mbpsTotal data written 298, 173, 071, 360 bytesExact runtime 599.38 secondsPages written 72, 796, 679 pagesPage size 4096 bytesAchieved rate 474.43mbpsLimited to 88.0 % of max rate
Table 5.2: Perfio output for testrun with the highest successful data rate
As the output from Perfio states, the test generator fpga has been held backto 88.0% of its configured max rate. This is a good indication that there is abottleneck somewhere. In a perfect environment, the fpga would yield datato the pcie bus 100% of the time, but this can not be achieved due to the pcieprotocol overhead and the fetching of page descriptors from host memory. Itis observed that as the data rate increases, the fpga is increasingly held back.The output from Perfio also tells that the total amount of data generated andwritten to disk through this experiment is 283.6 gb. There is a rate differencein requested data rate and actual data rate because the fpga generating datacan, at the lowest, write data at 62.5 mbps, which is also the step size.
As figure 5.2 suggests, the cpu is not the bottleneck within this system, dueto the time spent idle is 95-96% on average. The lowest recorded value is justabove 94%, and one can see that the cpu becomes more occupied just after 300seconds. That is because the memory usage reaches its peak at the same time,which means the cpu has to spend more time administrating the file systemand permitting the raid controller access to the memory space in which thedata lies in. The memory usage is further elaborated on later. The figure alsoshow the percentage of time spent on user and system level processes. Onecan see that system level processes spend the most time running on the cpuwhich is caused by the process priority set for Perfio. The reason for the lowcpu usage, is because the system use dma where the cpu only provide thedmac access to the memory locations needed for the operation. Because ofthese results, further analysis is needed.
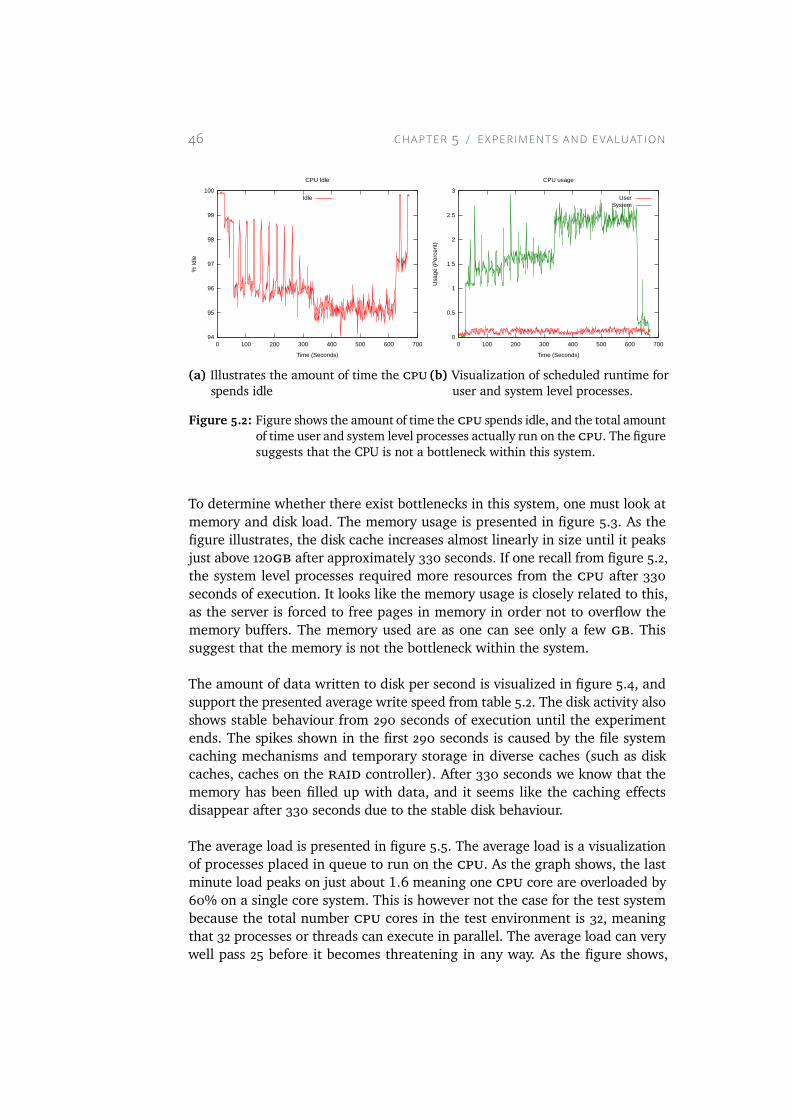
46 CHAPTER 5 EXPER IMENTS AND EVALUAT ION
94
95
96
97
98
99
100
0 100 200 300 400 500 600 700
% Id
le
Time (Seconds)
CPU Idle
Idle
(a) Illustrates the amount of time the cpuspends idle
0
0.5
1
1.5
2
2.5
3
0 100 200 300 400 500 600 700
Usa
ge (
Per
cen
t)
Time (Seconds)
CPU usage
UserSystem
(b) Visualization of scheduled runtime foruser and system level processes.
Figure 5.2: Figure shows the amount of time the cpu spends idle, and the total amountof time user and system level processes actually run on the cpu. The figuresuggests that the CPU is not a bottleneck within this system.
To determine whether there exist bottlenecks in this system, one must look atmemory and disk load. The memory usage is presented in figure 5.3. As thefigure illustrates, the disk cache increases almost linearly in size until it peaksjust above 120gb after approximately 330 seconds. If one recall from figure 5.2,the system level processes required more resources from the cpu after 330seconds of execution. It looks like the memory usage is closely related to this,as the server is forced to free pages in memory in order not to overflow thememory buffers. The memory used are as one can see only a few gb. Thissuggest that the memory is not the bottleneck within the system.
The amount of data written to disk per second is visualized in figure 5.4, andsupport the presented average write speed from table 5.2. The disk activity alsoshows stable behaviour from 290 seconds of execution until the experimentends. The spikes shown in the first 290 seconds is caused by the file systemcaching mechanisms and temporary storage in diverse caches (such as diskcaches, caches on the raid controller). After 330 seconds we know that thememory has been filled up with data, and it seems like the caching effectsdisappear after 330 seconds due to the stable disk behaviour.
The average load is presented in figure 5.5. The average load is a visualizationof processes placed in queue to run on the cpu. As the graph shows, the lastminute load peaks on just about 1.6 meaning one cpu core are overloaded by60% on a single core system. This is however not the case for the test systembecause the total number cpu cores in the test environment is 32, meaningthat 32 processes or threads can execute in parallel. The average load can verywell pass 25 before it becomes threatening in any way. As the figure shows,
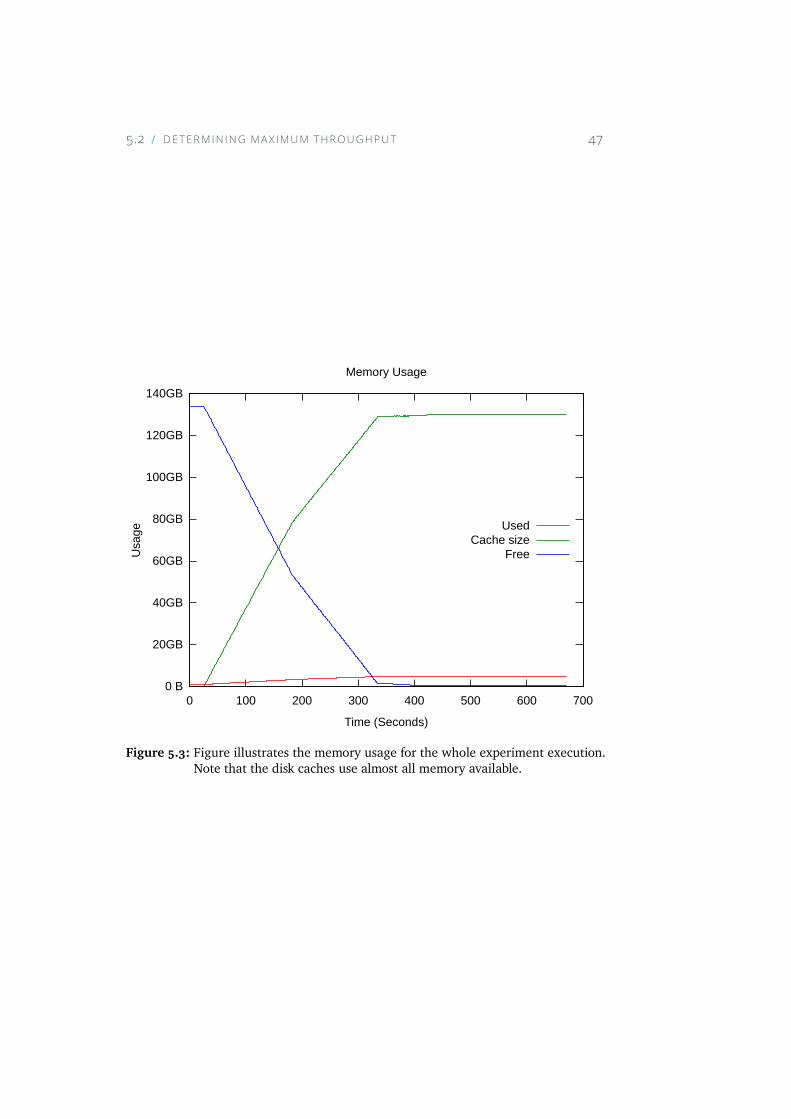
5.2 DETERM IN ING MAX IMUM THROUGHPUT 47
0 B
20GB
40GB
60GB
80GB
100GB
120GB
140GB
0 100 200 300 400 500 600 700
Usa
ge
Time (Seconds)
Memory Usage
UsedCache size
Free
Figure 5.3: Figure illustrates the memory usage for the whole experiment execution.Note that the disk caches use almost all memory available.
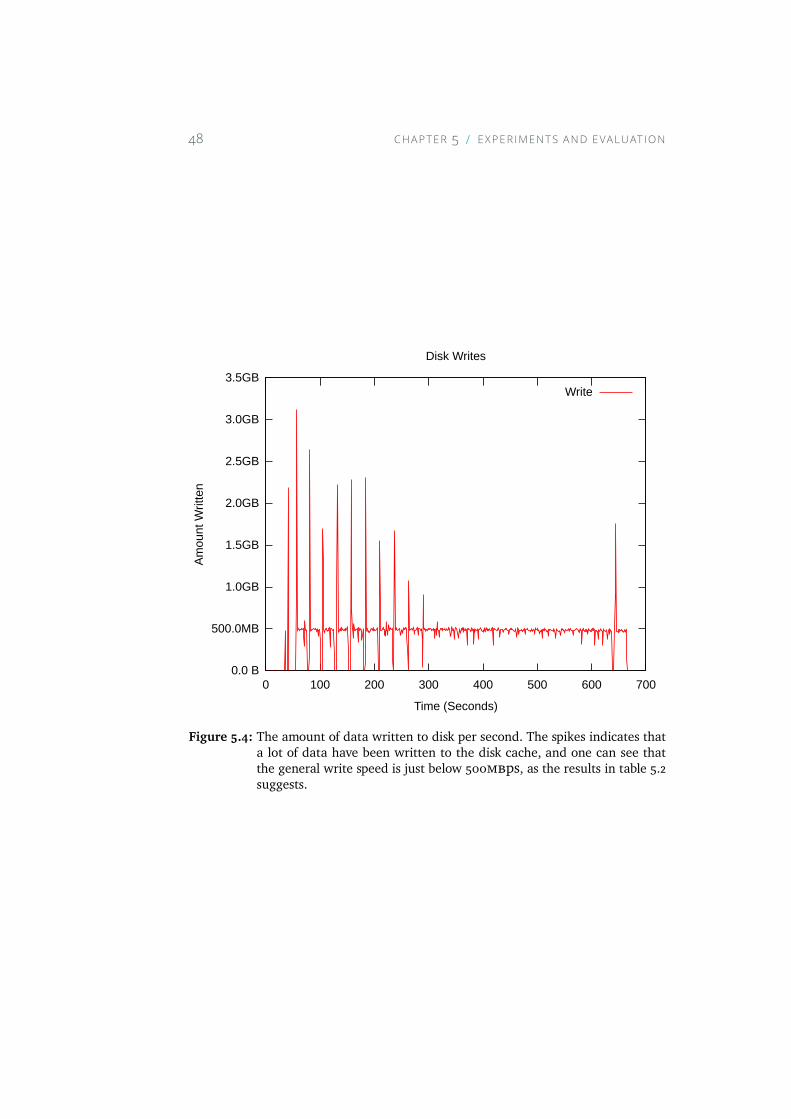
48 CHAPTER 5 EXPER IMENTS AND EVALUAT ION
0.0 B
500.0MB
1.0GB
1.5GB
2.0GB
2.5GB
3.0GB
3.5GB
0 100 200 300 400 500 600 700
Am
ount
Writ
ten
Time (Seconds)
Disk Writes
Write
Figure 5.4: The amount of data written to disk per second. The spikes indicates thata lot of data have been written to the disk cache, and one can see thatthe general write speed is just below 500mbps, as the results in table 5.2suggests.
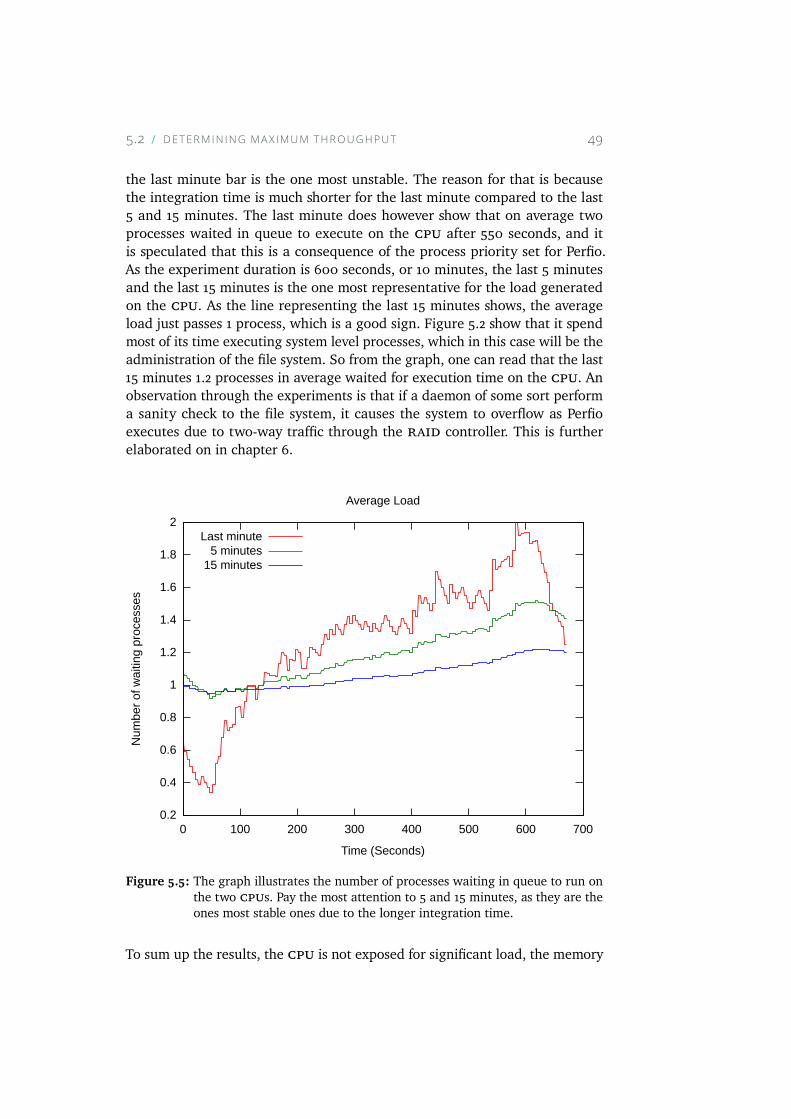
5.2 DETERM IN ING MAX IMUM THROUGHPUT 49
the last minute bar is the one most unstable. The reason for that is becausethe integration time is much shorter for the last minute compared to the last5 and 15 minutes. The last minute does however show that on average twoprocesses waited in queue to execute on the cpu after 550 seconds, and itis speculated that this is a consequence of the process priority set for Perfio.As the experiment duration is 600 seconds, or 10 minutes, the last 5 minutesand the last 15 minutes is the one most representative for the load generatedon the cpu. As the line representing the last 15 minutes shows, the averageload just passes 1 process, which is a good sign. Figure 5.2 show that it spendmost of its time executing system level processes, which in this case will be theadministration of the file system. So from the graph, one can read that the last15 minutes 1.2 processes in average waited for execution time on the cpu. Anobservation through the experiments is that if a daemon of some sort performa sanity check to the file system, it causes the system to overflow as Perfioexecutes due to two-way traffic through the raid controller. This is furtherelaborated on in chapter 6.
0.2
0.4
0.6
0.8
1
1.2
1.4
1.6
1.8
2
0 100 200 300 400 500 600 700
Num
ber
of w
aitin
g pr
oces
ses
Time (Seconds)
Average Load
Last minute5 minutes
15 minutes
Figure 5.5: The graph illustrates the number of processes waiting in queue to run onthe two cpus. Pay the most attention to 5 and 15 minutes, as they are theones most stable ones due to the longer integration time.
To sum up the results, the cpu is not exposed for significant load, the memory
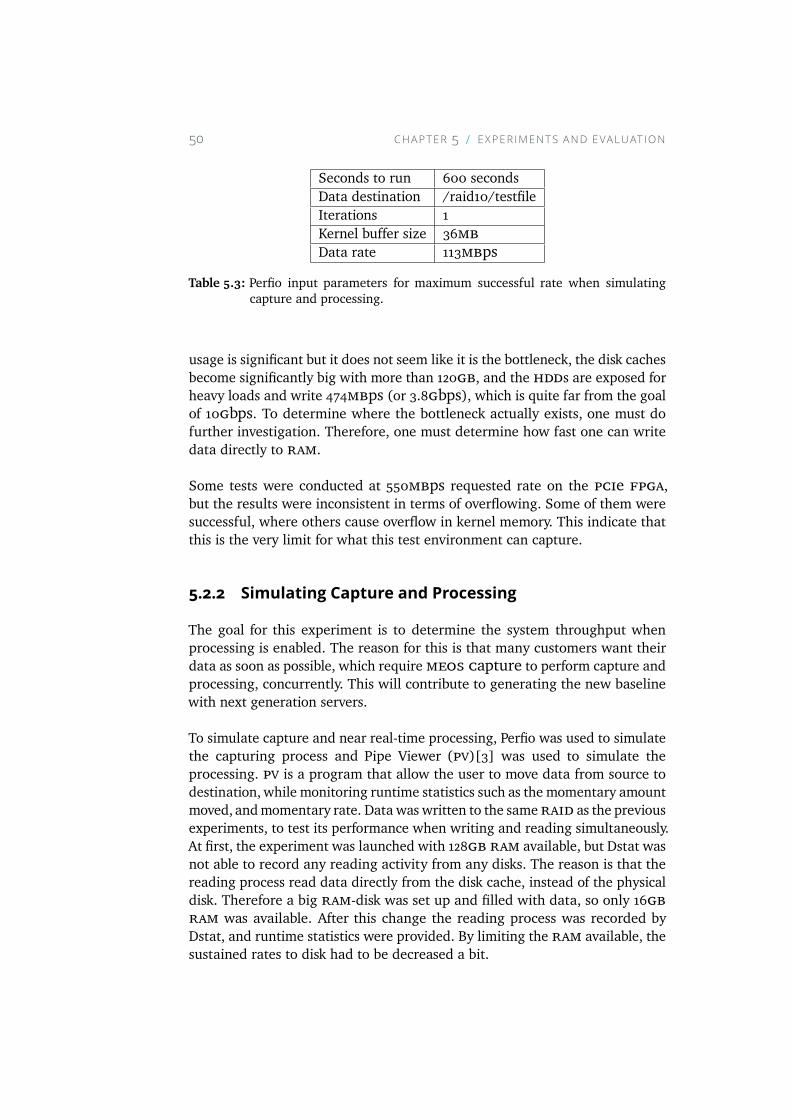
50 CHAPTER 5 EXPER IMENTS AND EVALUAT ION
Seconds to run 600 secondsData destination /raid10/testfileIterations 1Kernel buffer size 36mbData rate 113mbps
Table 5.3: Perfio input parameters for maximum successful rate when simulatingcapture and processing.
usage is significant but it does not seem like it is the bottleneck, the disk cachesbecome significantly big with more than 120gb, and the hdds are exposed forheavy loads and write 474mbps (or 3.8gbps), which is quite far from the goalof 10gbps. To determine where the bottleneck actually exists, one must dofurther investigation. Therefore, one must determine how fast one can writedata directly to ram.
Some tests were conducted at 550mbps requested rate on the pcie fpga,but the results were inconsistent in terms of overflowing. Some of them weresuccessful, where others cause overflow in kernel memory. This indicate thatthis is the very limit for what this test environment can capture.
5.2.2 Simulating Capture and ProcessingThe goal for this experiment is to determine the system throughput whenprocessing is enabled. The reason for this is that many customers want theirdata as soon as possible, which requiremeos capture to perform capture andprocessing, concurrently. This will contribute to generating the new baselinewith next generation servers.
To simulate capture and near real-time processing, Perfio was used to simulatethe capturing process and Pipe Viewer (pv)[3] was used to simulate theprocessing. pv is a program that allow the user to move data from source todestination, while monitoring runtime statistics such as the momentary amountmoved, andmomentary rate. Data was written to the sameraid as the previousexperiments, to test its performance when writing and reading simultaneously.At first, the experiment was launched with 128gb ram available, but Dstat wasnot able to record any reading activity from any disks. The reason is that thereading process read data directly from the disk cache, instead of the physicaldisk. Therefore a big ram-disk was set up and filled with data, so only 16gbram was available. After this change the reading process was recorded byDstat, and runtime statistics were provided. By limiting the ram available, thesustained rates to disk had to be decreased a bit.
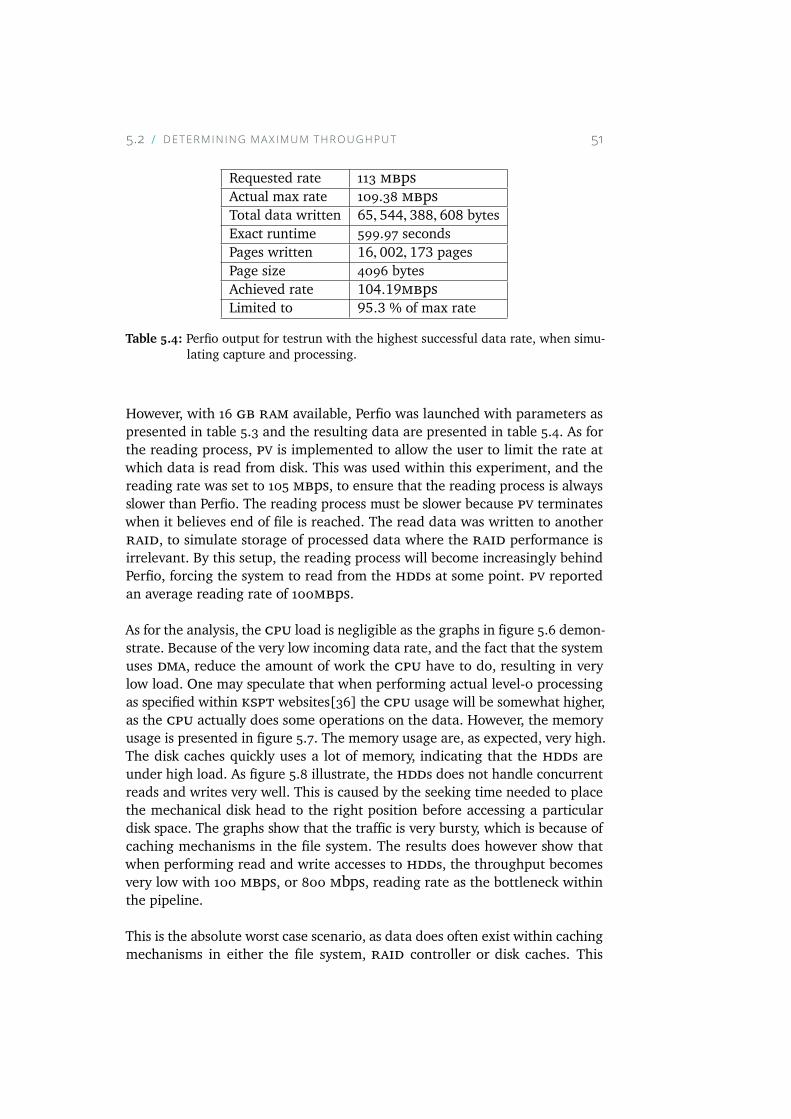
5.2 DETERM IN ING MAX IMUM THROUGHPUT 51
Requested rate 113 mbpsActual max rate 109.38 mbpsTotal data written 65, 544, 388, 608 bytesExact runtime 599.97 secondsPages written 16, 002, 173 pagesPage size 4096 bytesAchieved rate 104.19mbpsLimited to 95.3 % of max rate
Table 5.4: Perfio output for testrun with the highest successful data rate, when simu-lating capture and processing.
However, with 16 gb ram available, Perfio was launched with parameters aspresented in table 5.3 and the resulting data are presented in table 5.4. As forthe reading process, pv is implemented to allow the user to limit the rate atwhich data is read from disk. This was used within this experiment, and thereading rate was set to 105 mbps, to ensure that the reading process is alwaysslower than Perfio. The reading process must be slower because pv terminateswhen it believes end of file is reached. The read data was written to anotherraid, to simulate storage of processed data where the raid performance isirrelevant. By this setup, the reading process will become increasingly behindPerfio, forcing the system to read from the hdds at some point. pv reportedan average reading rate of 100mbps.
As for the analysis, the cpu load is negligible as the graphs in figure 5.6 demon-strate. Because of the very low incoming data rate, and the fact that the systemuses dma, reduce the amount of work the cpu have to do, resulting in verylow load. One may speculate that when performing actual level-0 processingas specified within kspt websites[36] the cpu usage will be somewhat higher,as the cpu actually does some operations on the data. However, the memoryusage is presented in figure 5.7. The memory usage are, as expected, very high.The disk caches quickly uses a lot of memory, indicating that the hdds areunder high load. As figure 5.8 illustrate, the hdds does not handle concurrentreads and writes very well. This is caused by the seeking time needed to placethe mechanical disk head to the right position before accessing a particulardisk space. The graphs show that the traffic is very bursty, which is because ofcaching mechanisms in the file system. The results does however show thatwhen performing read and write accesses to hdds, the throughput becomesvery low with 100 mbps, or 800 mbps, reading rate as the bottleneck withinthe pipeline.
This is the absolute worst case scenario, as data does often exist within cachingmechanisms in either the file system, raid controller or disk caches. This
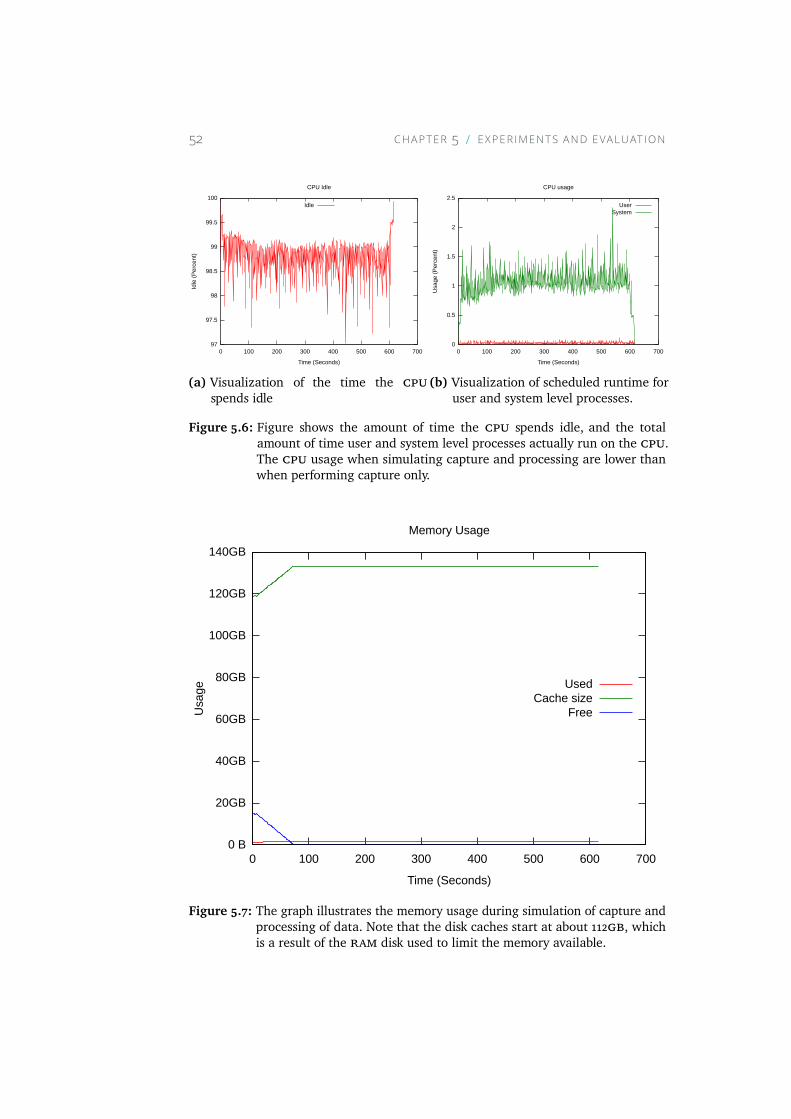
52 CHAPTER 5 EXPER IMENTS AND EVALUAT ION
97
97.5
98
98.5
99
99.5
100
0 100 200 300 400 500 600 700
Idle
(P
erc
ent)
Time (Seconds)
CPU Idle
Idle
(a) Visualization of the time the cpuspends idle
0
0.5
1
1.5
2
2.5
0 100 200 300 400 500 600 700
Usa
ge (
Per
cen
t)
Time (Seconds)
CPU usage
UserSystem
(b) Visualization of scheduled runtime foruser and system level processes.
Figure 5.6: Figure shows the amount of time the cpu spends idle, and the totalamount of time user and system level processes actually run on the cpu.The cpu usage when simulating capture and processing are lower thanwhen performing capture only.
0 B
20GB
40GB
60GB
80GB
100GB
120GB
140GB
0 100 200 300 400 500 600 700
Usa
ge
Time (Seconds)
Memory Usage
UsedCache size
Free
Figure 5.7: The graph illustrates the memory usage during simulation of capture andprocessing of data. Note that the disk caches start at about 112gb, whichis a result of the ram disk used to limit the memory available.
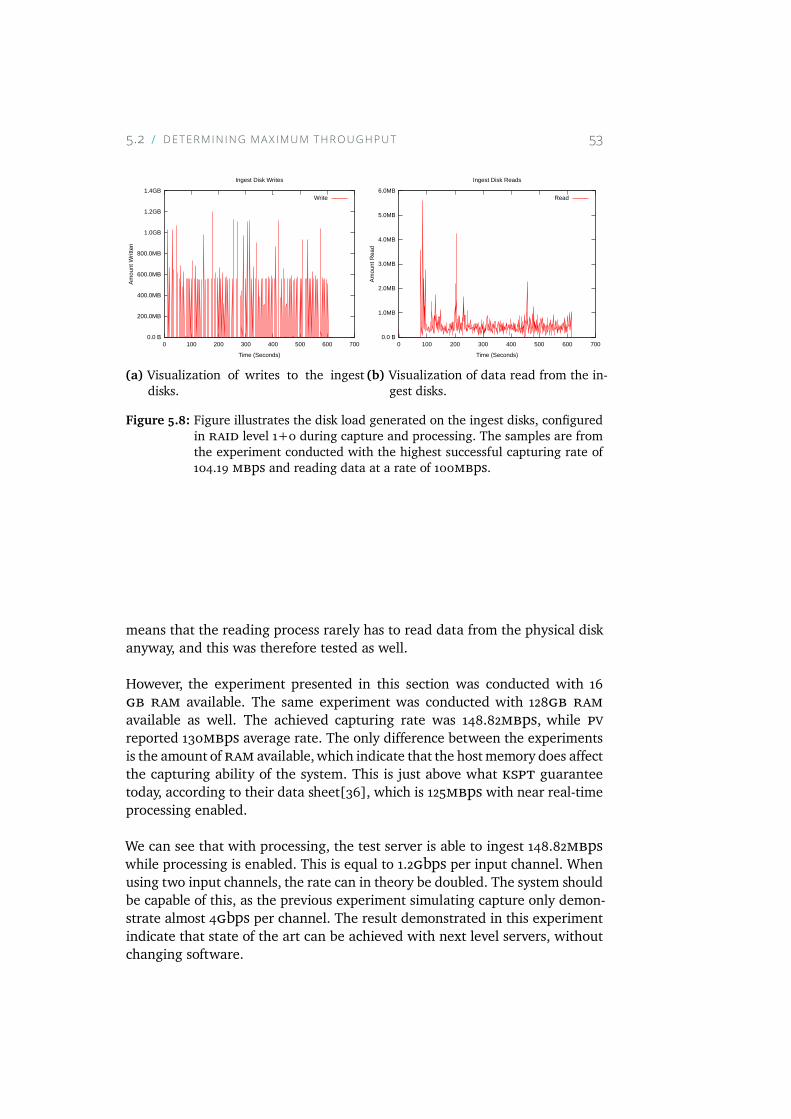
5.2 DETERM IN ING MAX IMUM THROUGHPUT 53
0.0 B
200.0MB
400.0MB
600.0MB
800.0MB
1.0GB
1.2GB
1.4GB
0 100 200 300 400 500 600 700
Am
ount
Writ
ten
Time (Seconds)
Ingest Disk Writes
Write
(a) Visualization of writes to the ingestdisks.
0.0 B
1.0MB
2.0MB
3.0MB
4.0MB
5.0MB
6.0MB
0 100 200 300 400 500 600 700
Am
ount
Rea
d
Time (Seconds)
Ingest Disk Reads
Read
(b) Visualization of data read from the in-gest disks.
Figure 5.8: Figure illustrates the disk load generated on the ingest disks, configuredin raid level 1+0 during capture and processing. The samples are fromthe experiment conducted with the highest successful capturing rate of104.19 mbps and reading data at a rate of 100mbps.
means that the reading process rarely has to read data from the physical diskanyway, and this was therefore tested as well.
However, the experiment presented in this section was conducted with 16gb ram available. The same experiment was conducted with 128gb ramavailable as well. The achieved capturing rate was 148.82mbps, while pvreported 130mbps average rate. The only difference between the experimentsis the amount ofram available,which indicate that the hostmemory does affectthe capturing ability of the system. This is just above what kspt guaranteetoday, according to their data sheet[36], which is 125mbps with near real-timeprocessing enabled.
We can see that with processing, the test server is able to ingest 148.82mbpswhile processing is enabled. This is equal to 1.2gbps per input channel. Whenusing two input channels, the rate can in theory be doubled. The system shouldbe capable of this, as the previous experiment simulating capture only demon-strate almost 4gbps per channel. The result demonstrated in this experimentindicate that state of the art can be achieved with next level servers, withoutchanging software.
54 CHAPTER 5 EXPER IMENTS AND EVALUAT ION
5.3 Determining the BottlenecksTo determinewhere the bottleneck lie within this system, further examination isrequired. The experiments above suggest that the hdds can be one bottleneck,so more experiments must be conducted to reveal any other possibilities. Inorder to do so, one must have a look at the pipeline of components the incomingdata pass through and test the performance between each component. Thedata path is from the data receiving boards fpga to ram via the dmac. Fromram the data is written to hdds via the raid-controller. Therefore, twoadditional experiments should be enough to determine whether the hdds arethe bottleneck or not; Write data directly to ram, and next determine thesupported rate between ram and hdds.
5.3.1 From Data Receiver to Memory PerformanceBy isolating parts of the production pipeline, one can determine the throughputbetween components. With such numbers available, one achieves a muchmore detailed picture of the practical throughput. This experiments purposeis to determine the maximum throughput one can achieve between the datareceiving board and host memory. The cooperation between the receivingboard, pcie bus and host memory as described in figure 5.9 is tested throughthis experiment.
To accomplish this experiment, a chunk of memory in ram was allocated andexposed as a ram disk. By using such a ram disk, one can create files anduse that disk as one use disks traditionally. One can also use it to capturesimulated satellite data, which is this experiments intention. One exposes achunk of memory as a logical disk by adding a line in the file /etc/fstabwhich initializes all mounting points added in the file on startup. Since the testenvironment are equipped with 128gb ofram, 120gbwas allocated for storagewithin this experiment. Adding the line in listing 5.3 to the file /etc/fstabenables this feature.
Listing 5.3: Command used in fstab to set up temporary file system in computermemory, exposed as a logical harddisk.
tmpfs <mountpoint> tmpfs s i z e=120G
where <mountpoint> is the directory the memory area is mounted to. In thiscase, the ram disk is mounted to a directory named disk_ram. It is a problemmonitoring reads and writes to such mounting points because Dstat requireusers to specify which physical device to monitor through the directories withinthe /dev/ directory. This means that the ram disk stats as presented above cannot be provided in the same manner through this experiment as the previous
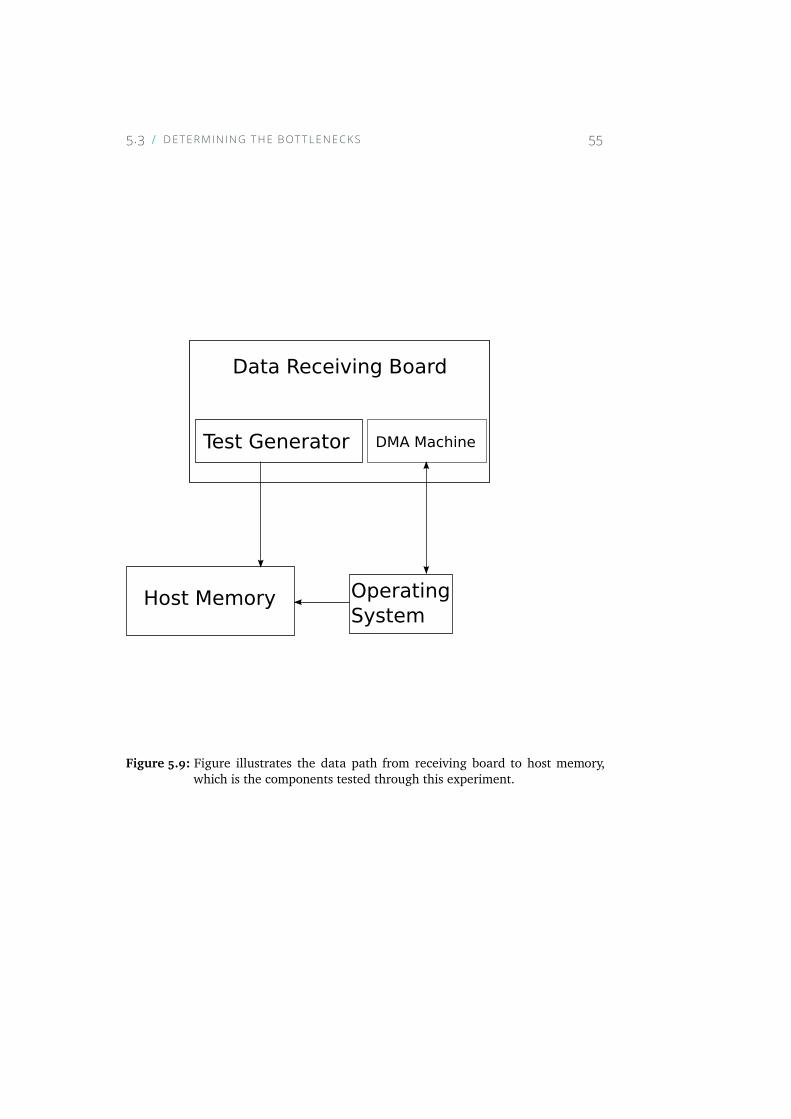
5.3 DETERM IN ING THE BOTTLENECKS 55
Data Receiving Board
Test Generator DMA Machine
Host Memory OperatingSystem
Figure 5.9: Figure illustrates the data path from receiving board to host memory,which is the components tested through this experiment.
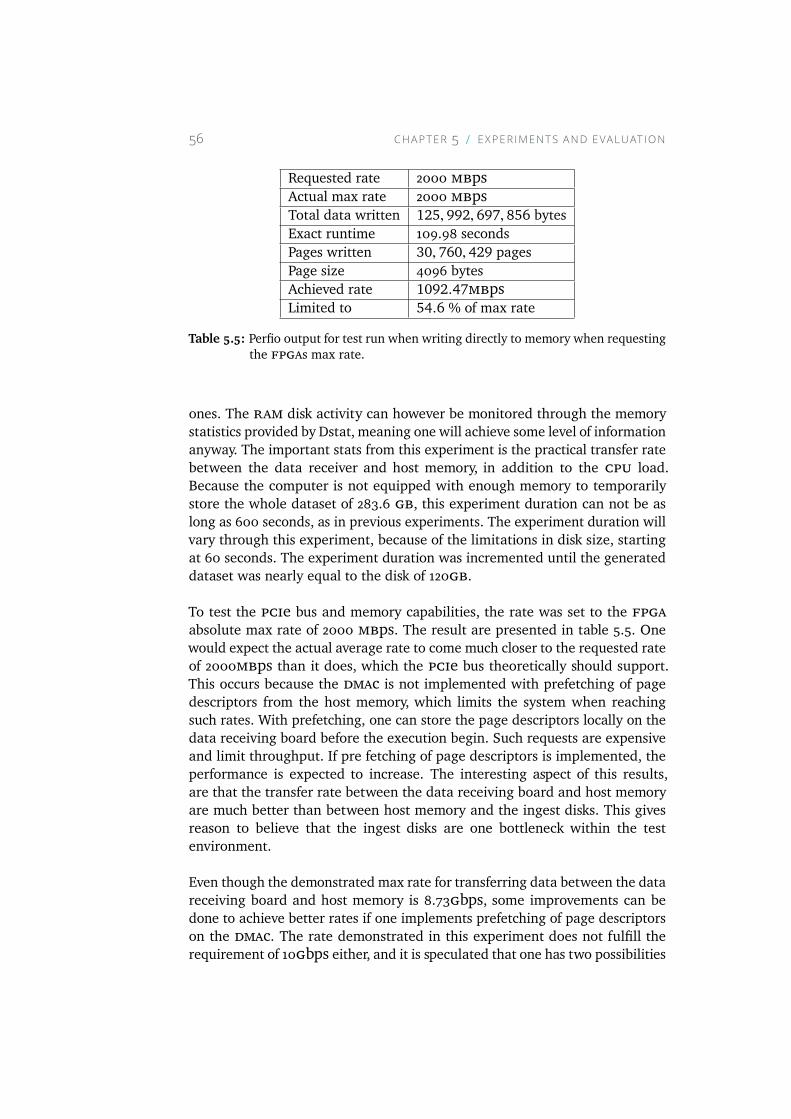
56 CHAPTER 5 EXPER IMENTS AND EVALUAT ION
Requested rate 2000 mbpsActual max rate 2000 mbpsTotal data written 125, 992, 697, 856 bytesExact runtime 109.98 secondsPages written 30, 760, 429 pagesPage size 4096 bytesAchieved rate 1092.47mbpsLimited to 54.6 % of max rate
Table 5.5: Perfio output for test run when writing directly to memory when requestingthe fpgas max rate.
ones. The ram disk activity can however be monitored through the memorystatistics provided by Dstat, meaning one will achieve some level of informationanyway. The important stats from this experiment is the practical transfer ratebetween the data receiver and host memory, in addition to the cpu load.Because the computer is not equipped with enough memory to temporarilystore the whole dataset of 283.6 gb, this experiment duration can not be aslong as 600 seconds, as in previous experiments. The experiment duration willvary through this experiment, because of the limitations in disk size, startingat 60 seconds. The experiment duration was incremented until the generateddataset was nearly equal to the disk of 120gb.
To test the pcie bus and memory capabilities, the rate was set to the fpgaabsolute max rate of 2000 mbps. The result are presented in table 5.5. Onewould expect the actual average rate to come much closer to the requested rateof 2000mbps than it does, which the pcie bus theoretically should support.This occurs because the dmac is not implemented with prefetching of pagedescriptors from the host memory, which limits the system when reachingsuch rates. With prefetching, one can store the page descriptors locally on thedata receiving board before the execution begin. Such requests are expensiveand limit throughput. If pre fetching of page descriptors is implemented, theperformance is expected to increase. The interesting aspect of this results,are that the transfer rate between the data receiving board and host memoryare much better than between host memory and the ingest disks. This givesreason to believe that the ingest disks are one bottleneck within the testenvironment.
Even though the demonstrated max rate for transferring data between the datareceiving board and host memory is 8.73gbps, some improvements can bedone to achieve better rates if one implements prefetching of page descriptorson the dmac. The rate demonstrated in this experiment does not fulfill therequirement of 10gbps either, and it is speculated that one has two possibilities
5.3 DETERM IN ING THE BOTTLENECKS 57
in order to achieve the result. The first alternative is to move the data receivingboard from pcie version 2.0 and over to a newer version of the bus with bettertheoretical throughput, as the server support version 3.0. This is also the onlyalternative to achieve 10gbps per input channel. The other alternative, is to relyupon two input channels, and hopefully achieve 10gbps in total, which seemsto be possible as each input channel are placed on separate pcie buses, andhence can achieve 8.73gbps per channel to host memory. This must howeverbe tested in order to confirm.
5.3.2 From Memory to DiskThe purpose of this experiment is to determine the actual throughput betweenhost memory and the ingest disks. Figure 5.10 shows the different componentsthat this test exploits, as well as how they are connected. This experiment isa big part of gaining a detailed picture of the systems throughput with nextgeneration servers. To test the transmission speed between memory and theingest disks pv is used. The program monitors the progress of data through apipe, and can be intentionally used to transfer data from one file to another. Byusing the file generated in the previous experiment, where data was transferredfrom the data receiving board to host memory one can transfer the exact samedata from host memory to the ingest disks while the process is monitored.When launching pv without specifying any data rates, it moves the data asfast as possible without any limitations in software. When pv has terminated,the final statistics from its execution is presented. The final statistics are totalamount of data moved, the total time spent and average transfer rate. For thisexperiment, pv was invoked as shown in listing 5.4.
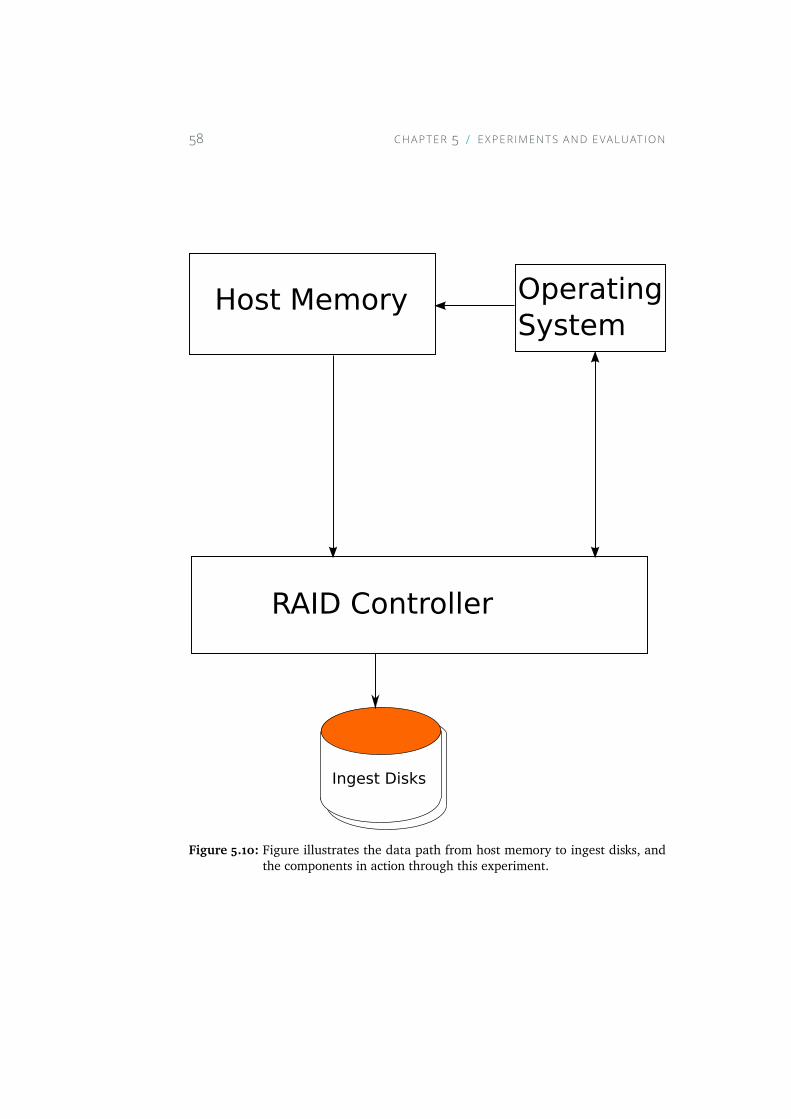
58 CHAPTER 5 EXPER IMENTS AND EVALUAT ION
Host Memory OperatingSystem
RAID Controller
Ingest Disks
Figure 5.10: Figure illustrates the data path from host memory to ingest disks, andthe components in action through this experiment.
5.4 SUMMARY 59
Listing 5.4: Script used to move data from the disk in memory to the configured ingestdisks. Deleting the file makes sure that one writes to an empty disk.
#!/ bin /bash
i t e r a t i o n s="$1 "i=0
while [ $ i − l t $ i t e r a t i o n s ]do
#Copy data from disk_ram to inge s t d i s k spv /disk_ram/ t e s t > / raid10 / t e s t f i l e
#Delete the f i l e , need empty d i s k s .rm / raid10 / t e s t f i l e
#Pv requ i r e e x i s t i n g f i l e s .touch / raid10 / t e s t f i l e
#Increment sequence counter .( ( i++))
done
This experiment is executed 20 times to eliminate the impact of high and lowvalues in disk activity, often caused by the file system caching mechanisms. Theresults are presented in figure 5.11. The output from pv report the maximumaverage transfer rate of 479mb/s and the minimum to be 464mb/s, which isjust below the 474mb/s reported by Perfio presented in table 5.2. This seemsto be legitimate results as the hdds most likely cannot write data faster, whichalso means that this is the maximum rates that the test system used can capturedata.
5.4 SummaryThrough the experiments conducted on the test server within the test environ-ment presented in section 5.1, it is demonstrated that the maximum supporteddata rate is 474.43mbps (or 3.8gbps), when capturing a satellite pass withoutany processing involved. It is demonstrated that the computer is exposed tovery little load, except for memory usage and the hdds. This is further con-firmed by the experiment where the pass was stored in memory, achievingrates above 1000mbps. Further experiments show that the ingest disks useddo not support rates above 480mbps, which is not sufficient when the future
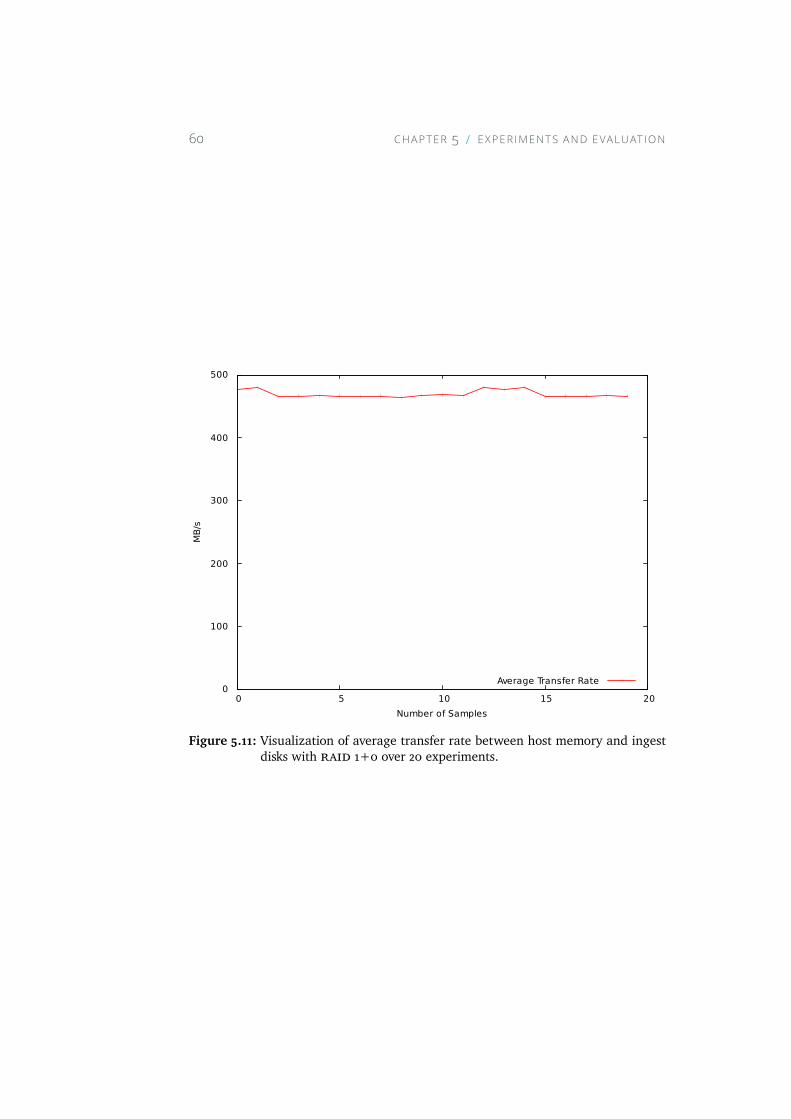
60 CHAPTER 5 EXPER IMENTS AND EVALUAT ION
0
100
200
300
400
500
0 5 10 15 20
MB/
s
Number of Samples
Average Transfer Rate
Figure 5.11: Visualization of average transfer rate between host memory and ingestdisks with raid 1+0 over 20 experiments.
5.4 SUMMARY 61
required rates will exceed 10 gbps. This leads to a conclusion that the ingestdisks are the bottleneck within the test system.

6Resolving the BottlenecksThis chapter will, based upon the results presented in chapter 5, describe howmeos capture can improve the data throughput. The redesign mainly concerndifferent raid configurations to achieve better throughput, as the bottleneckwas the ingest disks. All changes will be tested and evaluated, in isolation inorder to determine whether it was an improvement or not.
6.1 Disk ConfigurationsIn chapter 5, the ingest disks were revealed as the bottleneck within the testenvironment. Therefore the first changes will be done based on this experience.meos capture has until now been using raid level 1+0, meaning 50%redundancy of data, which is useful for long term storage of valuable data.During a satellite pass, the desire for capturing lossless data is considered moreimportant than keeping the data consistent in a long term perspective. Onemust make sure that the data is lossless as it is captured, but in a long termperspective, a capturing system does not offer long term storage. Redundancyin data storage generates overhead as auxiliary data is created. As the overheadincreases, the performance must necessarily decrease. Therefore this chapterwill mainly focus on how kspt can configure their ingest disks in order toachieve better throughput, both focusing on capture only and with near real-time processing enabled.
63
64 CHAPTER 6 RESOLV ING THE BOTTLENECKS
The remaining of this chapter will focus on determining the maximum through-put with new configurations for the ingest disks when performing data capture,and data capture with near real-time processing enabled. The raids testedare striping¹ and raid level 5. Both setups will be tested with both 4 and 8physical hdds participating in the raid.
6.1.1 Ingest Disks With No RedundancyThe goal of the experiment is to determine how much data the test system cantheoretically capture with a new setup for the ingest disks. In order to determinehow much the raid level limits the system throughput, this experiment onlychanges the ingest disk raid level. Therefore, the four hdds were striped,because this provides the best writing performance according to Peter M. Chenet. al.[9].
One must be aware that when using striping, one does not have any formfor redundancy of data. When a disk participating in a striped raid fail, thewhole array of data is broken with no possibility for recovery. For a systemsuch asmeos capture, the level of redundancy required is as much a politicaldecision as it is a question of the desired performance. Disks do fail, andaccording to Murphy’s law, everything that can go wrong will go wrong[15].By using two servers that is mirrored², one can tolerate disk failures duringa satellite pass, even though the ingest disks are striped. This will result ina much more expensive system, because it requires two servers instead ofone. Some customers do however require capturing redundancy through twoservers.
The striped raid will be tested through two experiments. The first experimenttests data capture. The second experiment tests both data capture and nearreal-time processing.
Capture The baseline created in section 5.2.1 reported a maximum capturerate of 474,43mbps when performing capture only. The experiment startedwith a requested rate of 540mbps. The requested rate was increased in stepsof 10mb until the system lost data due to overflowing buffers. The experimentresults are presented in table 6.1.
The highest rate achieved is 931.12mbps (or 7.45gbps) which is almost twiceas much as the baseline. The reason for this is that instead of striping the dataacross two mirrored raids, one stripes the data across four. One can, through
1. raid 02. Mirroring — the servers contain the exact same data
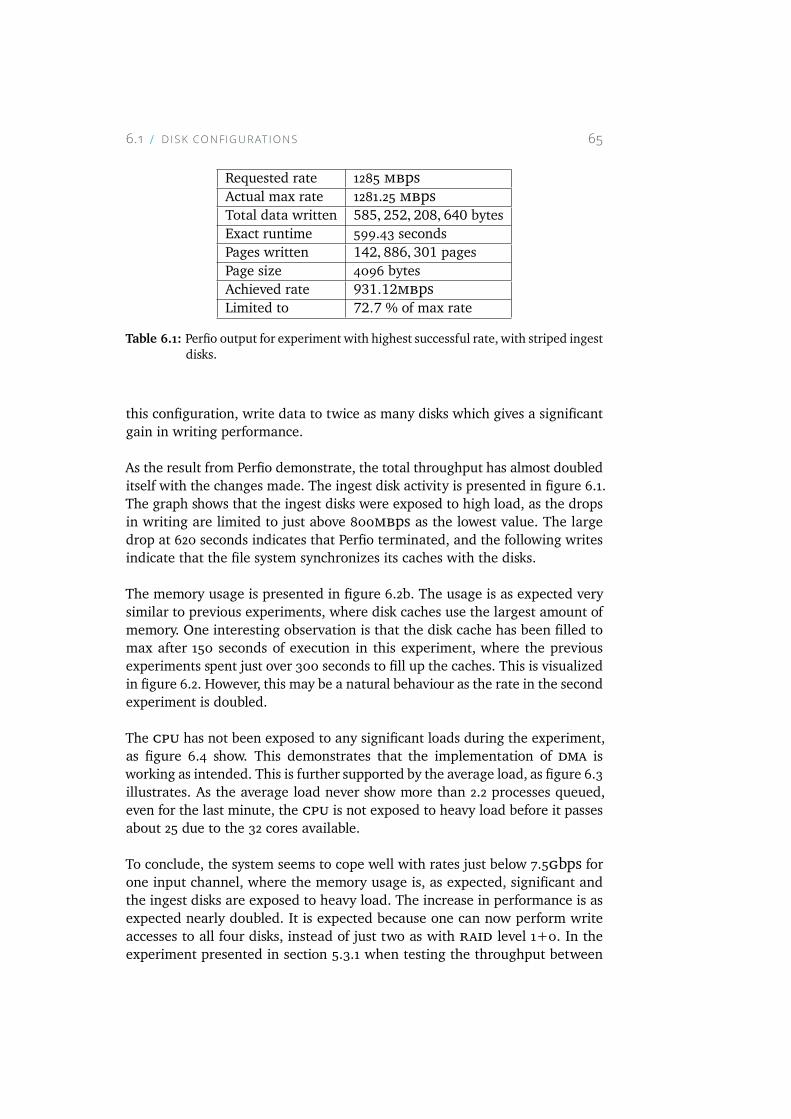
6.1 D ISK CONFIGURAT IONS 65
Requested rate 1285 mbpsActual max rate 1281.25 mbpsTotal data written 585, 252, 208, 640 bytesExact runtime 599.43 secondsPages written 142, 886, 301 pagesPage size 4096 bytesAchieved rate 931.12mbpsLimited to 72.7 % of max rate
Table 6.1: Perfio output for experiment with highest successful rate, with striped ingestdisks.
this configuration, write data to twice as many disks which gives a significantgain in writing performance.
As the result from Perfio demonstrate, the total throughput has almost doubleditself with the changes made. The ingest disk activity is presented in figure 6.1.The graph shows that the ingest disks were exposed to high load, as the dropsin writing are limited to just above 800mbps as the lowest value. The largedrop at 620 seconds indicates that Perfio terminated, and the following writesindicate that the file system synchronizes its caches with the disks.
The memory usage is presented in figure 6.2b. The usage is as expected verysimilar to previous experiments, where disk caches use the largest amount ofmemory. One interesting observation is that the disk cache has been filled tomax after 150 seconds of execution in this experiment, where the previousexperiments spent just over 300 seconds to fill up the caches. This is visualizedin figure 6.2. However, this may be a natural behaviour as the rate in the secondexperiment is doubled.
The cpu has not been exposed to any significant loads during the experiment,as figure 6.4 show. This demonstrates that the implementation of dma isworking as intended. This is further supported by the average load, as figure 6.3illustrates. As the average load never show more than 2.2 processes queued,even for the last minute, the cpu is not exposed to heavy load before it passesabout 25 due to the 32 cores available.
To conclude, the system seems to cope well with rates just below 7.5gbps forone input channel, where the memory usage is, as expected, significant andthe ingest disks are exposed to heavy load. The increase in performance is asexpected nearly doubled. It is expected because one can now perform writeaccesses to all four disks, instead of just two as with raid level 1+0. In theexperiment presented in section 5.3.1 when testing the throughput between
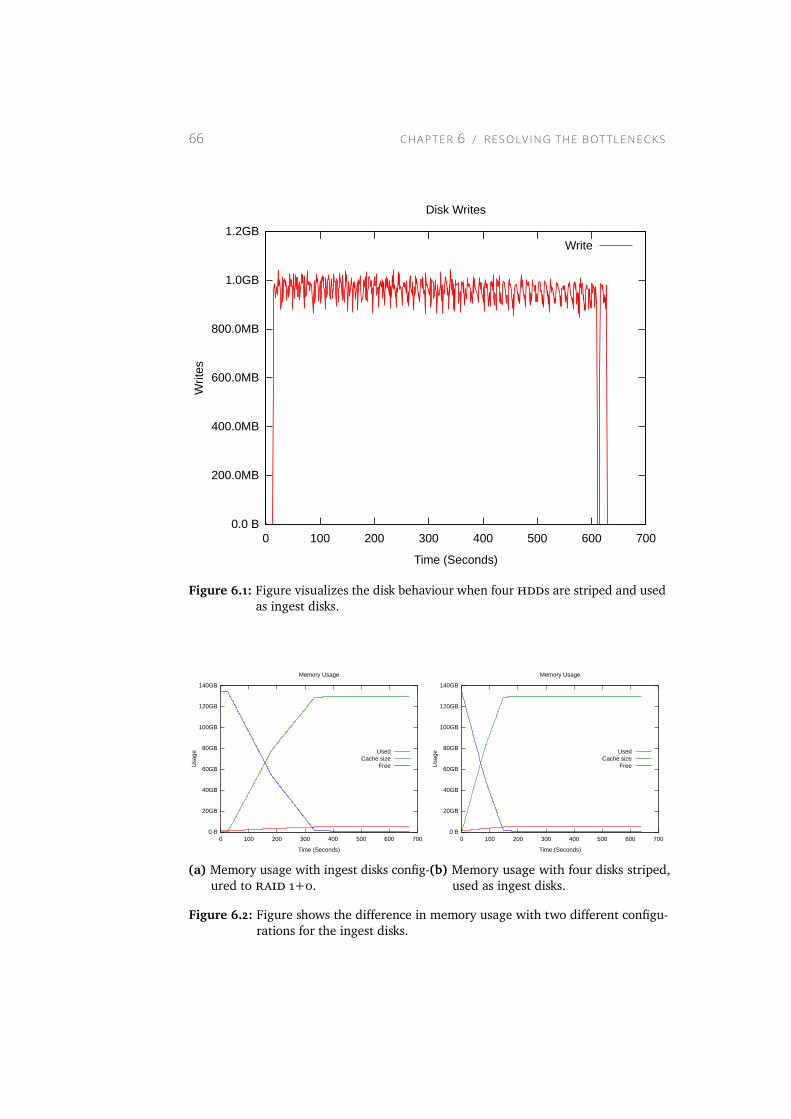
66 CHAPTER 6 RESOLV ING THE BOTTLENECKS
0.0 B
200.0MB
400.0MB
600.0MB
800.0MB
1.0GB
1.2GB
0 100 200 300 400 500 600 700
Writ
es
Time (Seconds)
Disk Writes
Write
Figure 6.1: Figure visualizes the disk behaviour when four hdds are striped and usedas ingest disks.
0 B
20GB
40GB
60GB
80GB
100GB
120GB
140GB
0 100 200 300 400 500 600 700
Usa
ge
Time (Seconds)
Memory Usage
UsedCache size
Free
(a) Memory usage with ingest disks config-ured to raid 1+0.
0 B
20GB
40GB
60GB
80GB
100GB
120GB
140GB
0 100 200 300 400 500 600 700
Usa
ge
Time (Seconds)
Memory Usage
UsedCache size
Free
(b) Memory usage with four disks striped,used as ingest disks.
Figure 6.2: Figure shows the difference in memory usage with two different configu-rations for the ingest disks.
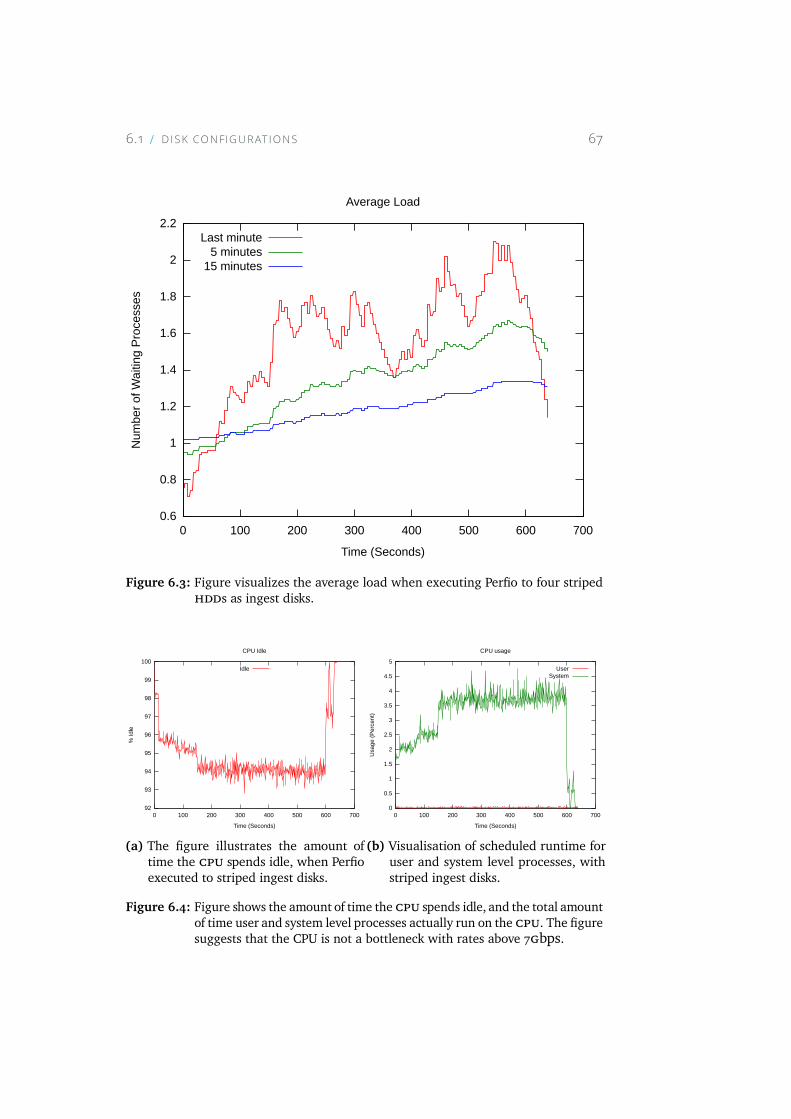
6.1 D ISK CONFIGURAT IONS 67
0.6
0.8
1
1.2
1.4
1.6
1.8
2
2.2
0 100 200 300 400 500 600 700
Num
ber
of W
aitin
g P
roce
sses
Time (Seconds)
Average Load
Last minute5 minutes
15 minutes
Figure 6.3: Figure visualizes the average load when executing Perfio to four stripedhdds as ingest disks.
92
93
94
95
96
97
98
99
100
0 100 200 300 400 500 600 700
% Id
le
Time (Seconds)
CPU Idle
Idle
(a) The figure illustrates the amount oftime the cpu spends idle, when Perfioexecuted to striped ingest disks.
0
0.5
1
1.5
2
2.5
3
3.5
4
4.5
5
0 100 200 300 400 500 600 700
Usa
ge (
Per
cen
t)
Time (Seconds)
CPU usage
UserSystem
(b) Visualisation of scheduled runtime foruser and system level processes, withstriped ingest disks.
Figure 6.4: Figure shows the amount of time the cpu spends idle, and the total amountof time user and system level processes actually run on the cpu. The figuresuggests that the CPU is not a bottleneck with rates above 7gbps.
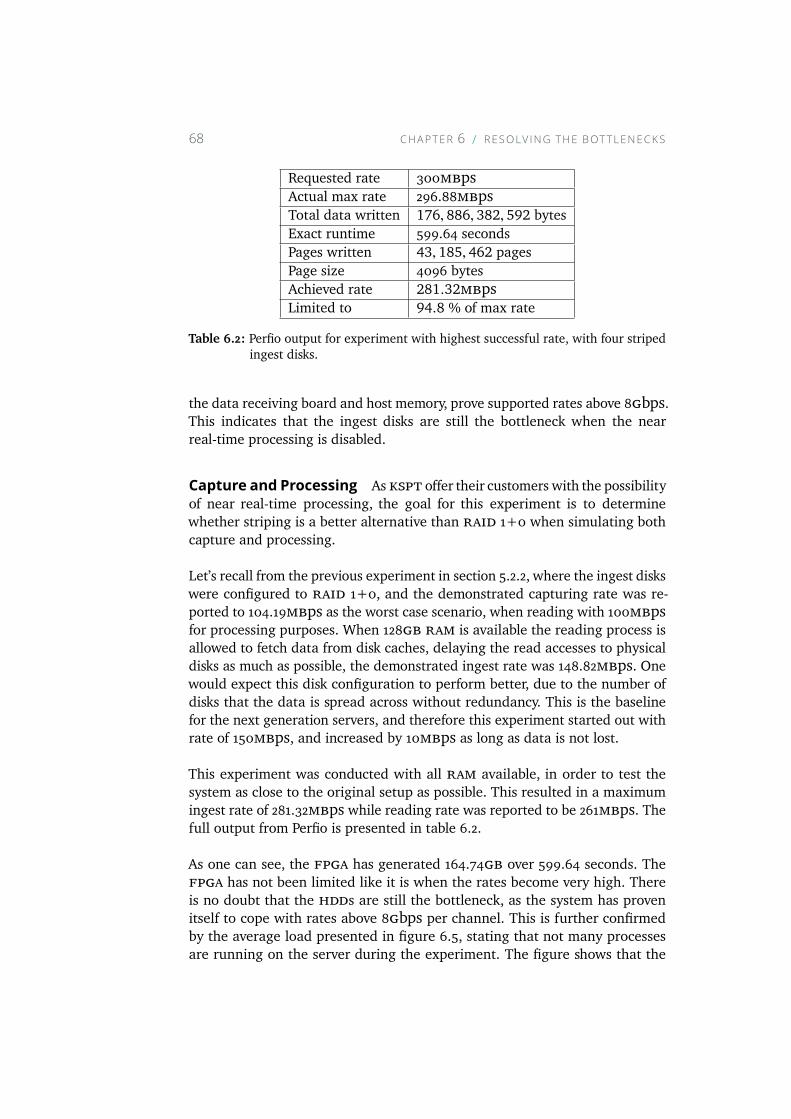
68 CHAPTER 6 RESOLV ING THE BOTTLENECKS
Requested rate 300mbpsActual max rate 296.88mbpsTotal data written 176, 886, 382, 592 bytesExact runtime 599.64 secondsPages written 43, 185, 462 pagesPage size 4096 bytesAchieved rate 281.32mbpsLimited to 94.8 % of max rate
Table 6.2: Perfio output for experiment with highest successful rate, with four stripedingest disks.
the data receiving board and host memory, prove supported rates above 8gbps.This indicates that the ingest disks are still the bottleneck when the nearreal-time processing is disabled.
Capture and Processing As kspt offer their customers with the possibilityof near real-time processing, the goal for this experiment is to determinewhether striping is a better alternative than raid 1+0 when simulating bothcapture and processing.
Let’s recall from the previous experiment in section 5.2.2, where the ingest diskswere configured to raid 1+0, and the demonstrated capturing rate was re-ported to 104.19mbps as the worst case scenario, when reading with 100mbpsfor processing purposes. When 128gb ram is available the reading process isallowed to fetch data from disk caches, delaying the read accesses to physicaldisks as much as possible, the demonstrated ingest rate was 148.82mbps. Onewould expect this disk configuration to perform better, due to the number ofdisks that the data is spread across without redundancy. This is the baselinefor the next generation servers, and therefore this experiment started out withrate of 150mbps, and increased by 10mbps as long as data is not lost.
This experiment was conducted with all ram available, in order to test thesystem as close to the original setup as possible. This resulted in a maximumingest rate of 281.32mbps while reading rate was reported to be 261mbps. Thefull output from Perfio is presented in table 6.2.
As one can see, the fpga has generated 164.74gb over 599.64 seconds. Thefpga has not been limited like it is when the rates become very high. Thereis no doubt that the hdds are still the bottleneck, as the system has provenitself to cope with rates above 8gbps per channel. This is further confirmedby the average load presented in figure 6.5, stating that not many processesare running on the server during the experiment. The figure shows that the
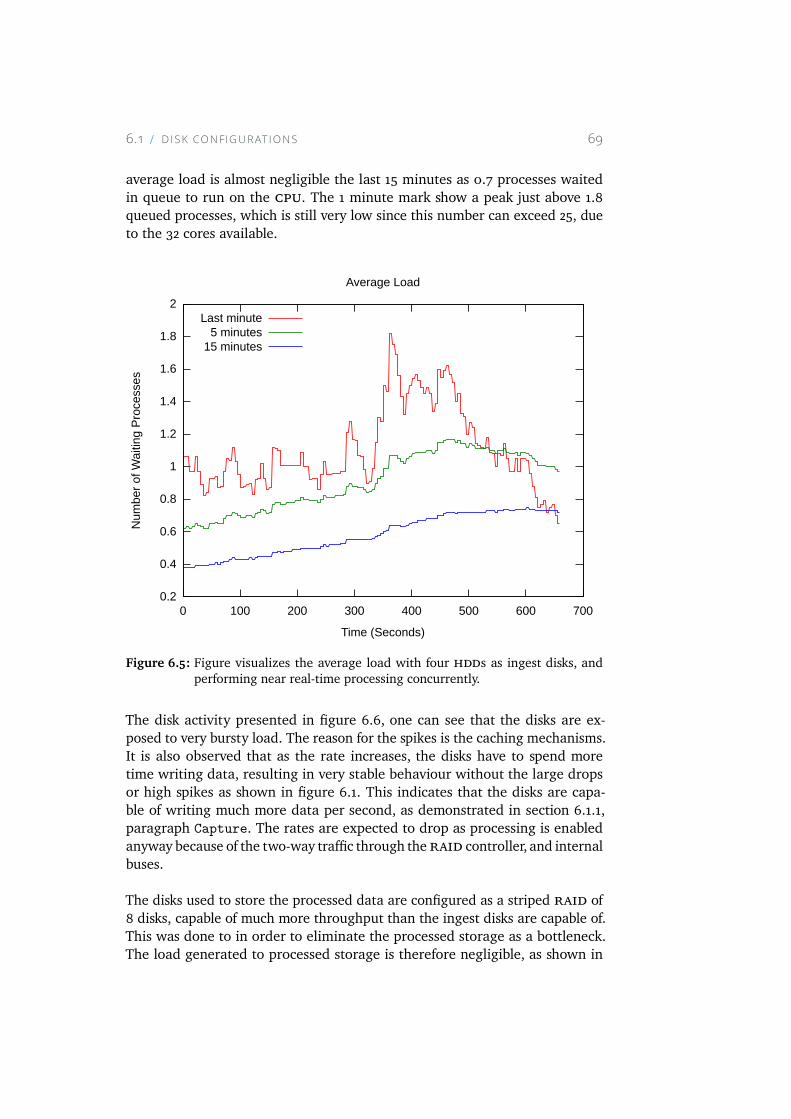
6.1 D ISK CONFIGURAT IONS 69
average load is almost negligible the last 15 minutes as 0.7 processes waitedin queue to run on the cpu. The 1 minute mark show a peak just above 1.8queued processes, which is still very low since this number can exceed 25, dueto the 32 cores available.
0.2
0.4
0.6
0.8
1
1.2
1.4
1.6
1.8
2
0 100 200 300 400 500 600 700
Num
ber
of W
aitin
g P
roce
sses
Time (Seconds)
Average Load
Last minute5 minutes
15 minutes
Figure 6.5: Figure visualizes the average load with four hdds as ingest disks, andperforming near real-time processing concurrently.
The disk activity presented in figure 6.6, one can see that the disks are ex-posed to very bursty load. The reason for the spikes is the caching mechanisms.It is also observed that as the rate increases, the disks have to spend moretime writing data, resulting in very stable behaviour without the large dropsor high spikes as shown in figure 6.1. This indicates that the disks are capa-ble of writing much more data per second, as demonstrated in section 6.1.1,paragraph Capture. The rates are expected to drop as processing is enabledanyway because of the two-way traffic through theraid controller, and internalbuses.
The disks used to store the processed data are configured as a striped raid of8 disks, capable of much more throughput than the ingest disks are capable of.This was done to in order to eliminate the processed storage as a bottleneck.The load generated to processed storage is therefore negligible, as shown in
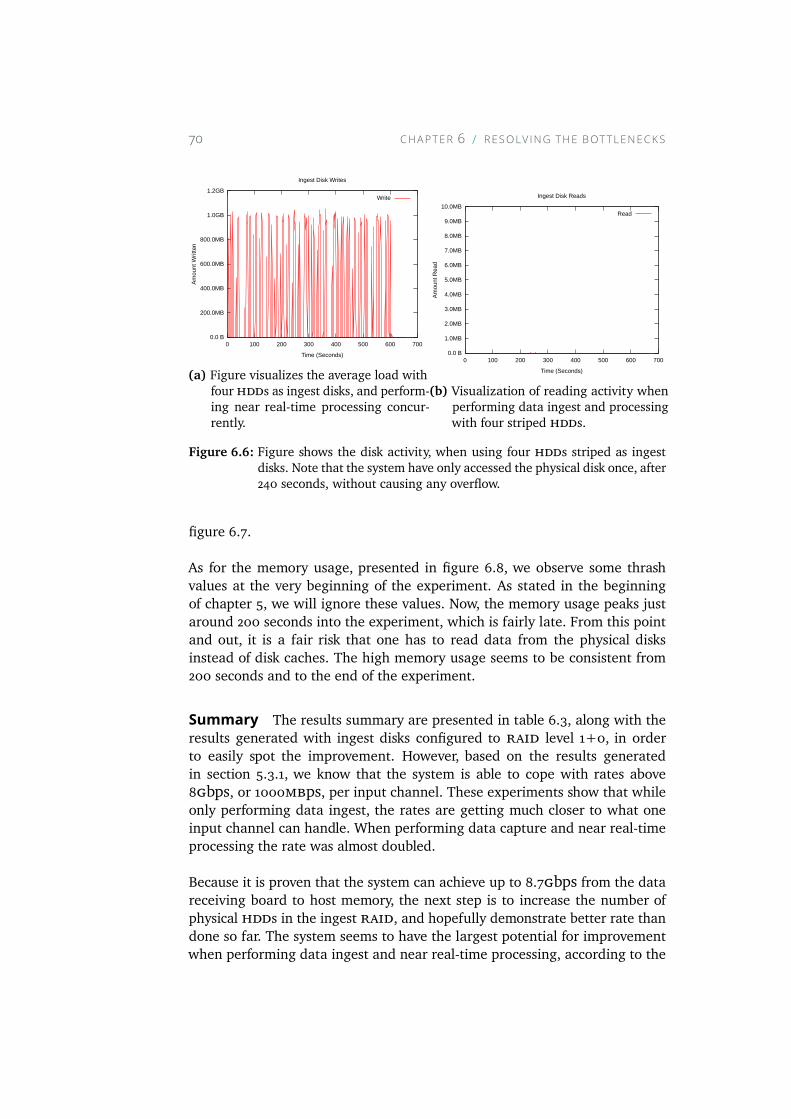
70 CHAPTER 6 RESOLV ING THE BOTTLENECKS
0.0 B
200.0MB
400.0MB
600.0MB
800.0MB
1.0GB
1.2GB
0 100 200 300 400 500 600 700
Am
ount
Writ
ten
Time (Seconds)
Ingest Disk Writes
Write
(a) Figure visualizes the average load withfour hdds as ingest disks, and perform-ing near real-time processing concur-rently.
0.0 B
1.0MB
2.0MB
3.0MB
4.0MB
5.0MB
6.0MB
7.0MB
8.0MB
9.0MB
10.0MB
0 100 200 300 400 500 600 700
Am
ount
Rea
d
Time (Seconds)
Ingest Disk Reads
Read
(b) Visualization of reading activity whenperforming data ingest and processingwith four striped hdds.
Figure 6.6: Figure shows the disk activity, when using four hdds striped as ingestdisks. Note that the system have only accessed the physical disk once, after240 seconds, without causing any overflow.
figure 6.7.
As for the memory usage, presented in figure 6.8, we observe some thrashvalues at the very beginning of the experiment. As stated in the beginningof chapter 5, we will ignore these values. Now, the memory usage peaks justaround 200 seconds into the experiment, which is fairly late. From this pointand out, it is a fair risk that one has to read data from the physical disksinstead of disk caches. The high memory usage seems to be consistent from200 seconds and to the end of the experiment.
Summary The results summary are presented in table 6.3, along with theresults generated with ingest disks configured to raid level 1+0, in orderto easily spot the improvement. However, based on the results generatedin section 5.3.1, we know that the system is able to cope with rates above8gbps, or 1000mbps, per input channel. These experiments show that whileonly performing data ingest, the rates are getting much closer to what oneinput channel can handle. When performing data capture and near real-timeprocessing the rate was almost doubled.
Because it is proven that the system can achieve up to 8.7gbps from the datareceiving board to host memory, the next step is to increase the number ofphysical hdds in the ingest raid, and hopefully demonstrate better rate thandone so far. The system seems to have the largest potential for improvementwhen performing data ingest and near real-time processing, according to the
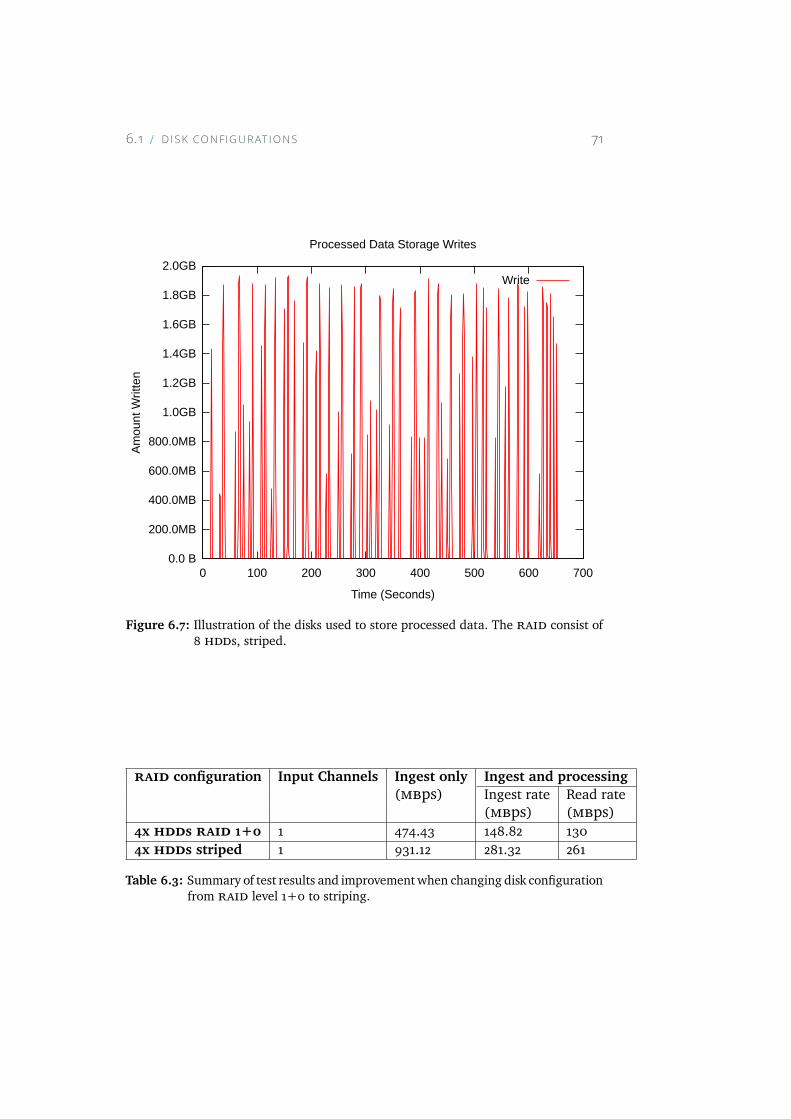
6.1 D ISK CONFIGURAT IONS 71
0.0 B
200.0MB
400.0MB
600.0MB
800.0MB
1.0GB
1.2GB
1.4GB
1.6GB
1.8GB
2.0GB
0 100 200 300 400 500 600 700
Am
ount
Writ
ten
Time (Seconds)
Processed Data Storage Writes
Write
Figure 6.7: Illustration of the disks used to store processed data. The raid consist of8 hdds, striped.
raid configuration Input Channels Ingest only Ingest and processing(mbps) Ingest rate Read rate
(mbps) (mbps)4x hdds raid 1+0 1 474.43 148.82 1304x hdds striped 1 931.12 281.32 261
Table 6.3: Summary of test results and improvementwhen changing disk configurationfrom raid level 1+0 to striping.
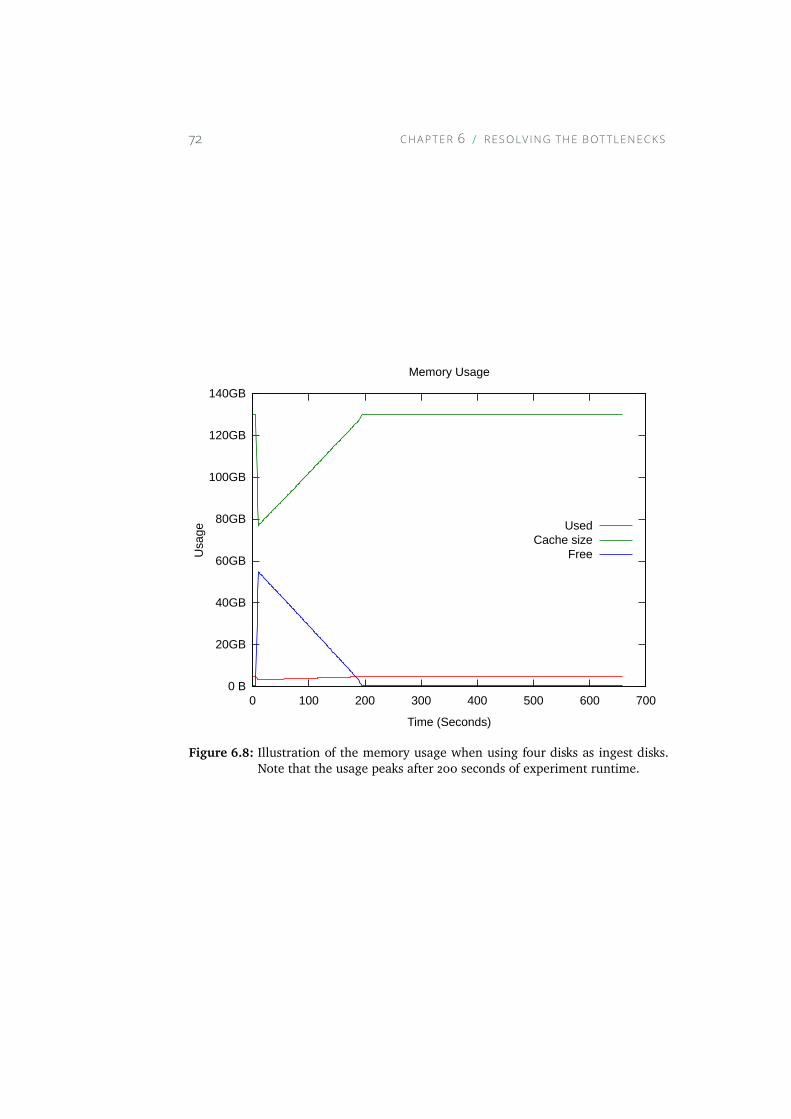
72 CHAPTER 6 RESOLV ING THE BOTTLENECKS
0 B
20GB
40GB
60GB
80GB
100GB
120GB
140GB
0 100 200 300 400 500 600 700
Usa
ge
Time (Seconds)
Memory Usage
UsedCache size
Free
Figure 6.8: Illustration of the memory usage when using four disks as ingest disks.Note that the usage peaks after 200 seconds of experiment runtime.
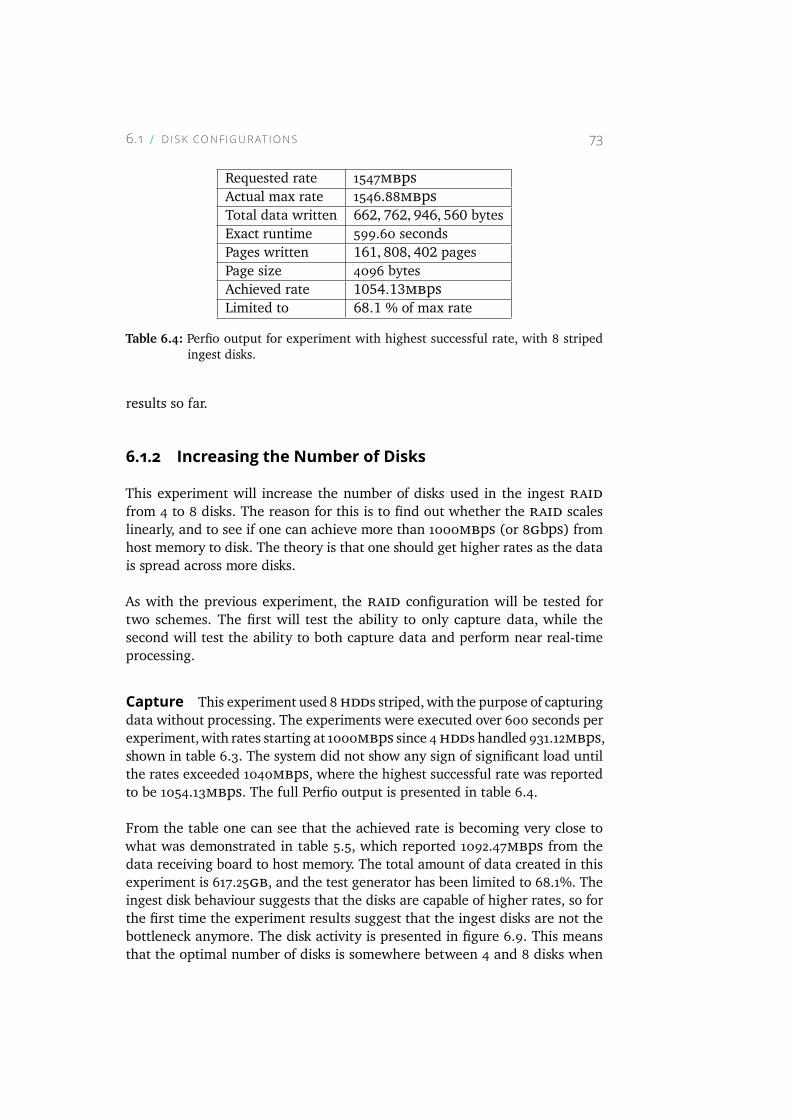
6.1 D ISK CONFIGURAT IONS 73
Requested rate 1547mbpsActual max rate 1546.88mbpsTotal data written 662, 762, 946, 560 bytesExact runtime 599.60 secondsPages written 161, 808, 402 pagesPage size 4096 bytesAchieved rate 1054.13mbpsLimited to 68.1 % of max rate
Table 6.4: Perfio output for experiment with highest successful rate, with 8 stripedingest disks.
results so far.
6.1.2 Increasing the Number of DisksThis experiment will increase the number of disks used in the ingest raidfrom 4 to 8 disks. The reason for this is to find out whether the raid scaleslinearly, and to see if one can achieve more than 1000mbps (or 8gbps) fromhost memory to disk. The theory is that one should get higher rates as the datais spread across more disks.
As with the previous experiment, the raid configuration will be tested fortwo schemes. The first will test the ability to only capture data, while thesecond will test the ability to both capture data and perform near real-timeprocessing.
Capture This experiment used 8hdds striped,with the purpose of capturingdata without processing. The experiments were executed over 600 seconds perexperiment,with rates starting at 1000mbps since 4hdds handled 931.12mbps,shown in table 6.3. The system did not show any sign of significant load untilthe rates exceeded 1040mbps, where the highest successful rate was reportedto be 1054.13mbps. The full Perfio output is presented in table 6.4.
From the table one can see that the achieved rate is becoming very close towhat was demonstrated in table 5.5, which reported 1092.47mbps from thedata receiving board to host memory. The total amount of data created in thisexperiment is 617.25gb, and the test generator has been limited to 68.1%. Theingest disk behaviour suggests that the disks are capable of higher rates, so forthe first time the experiment results suggest that the ingest disks are not thebottleneck anymore. The disk activity is presented in figure 6.9. This meansthat the optimal number of disks is somewhere between 4 and 8 disks when
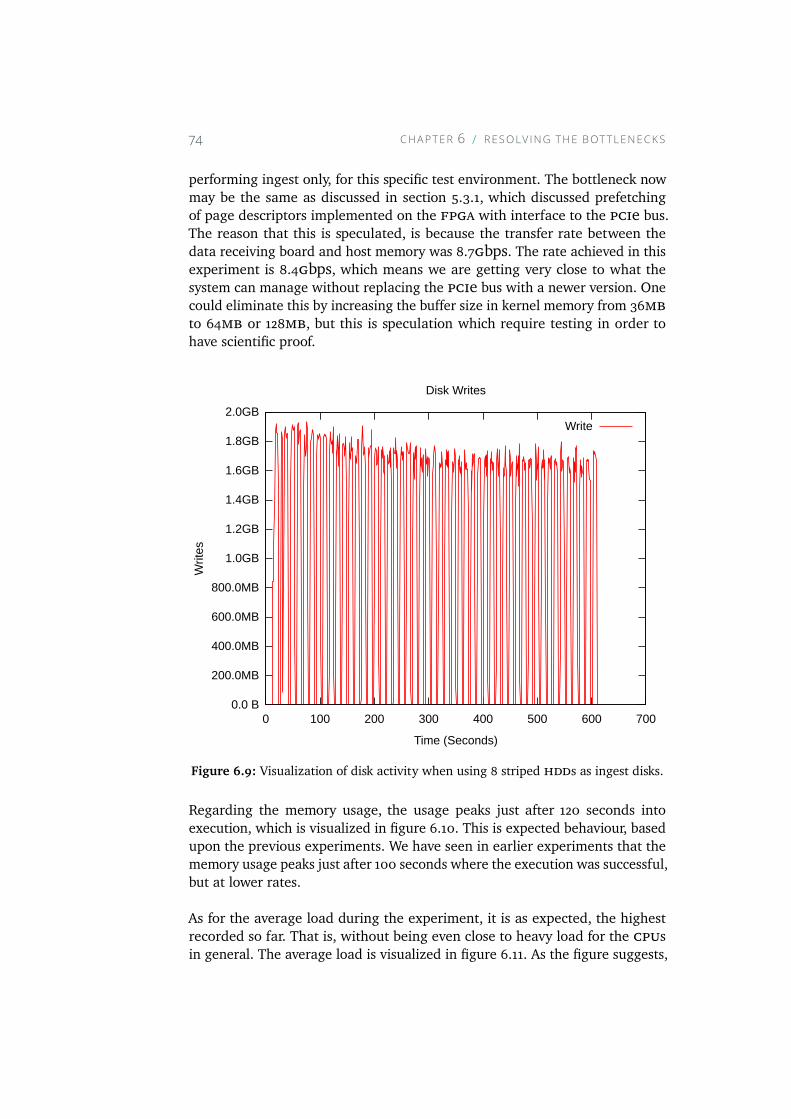
74 CHAPTER 6 RESOLV ING THE BOTTLENECKS
performing ingest only, for this specific test environment. The bottleneck nowmay be the same as discussed in section 5.3.1, which discussed prefetchingof page descriptors implemented on the fpga with interface to the pcie bus.The reason that this is speculated, is because the transfer rate between thedata receiving board and host memory was 8.7gbps. The rate achieved in thisexperiment is 8.4gbps, which means we are getting very close to what thesystem can manage without replacing the pcie bus with a newer version. Onecould eliminate this by increasing the buffer size in kernel memory from 36mbto 64mb or 128mb, but this is speculation which require testing in order tohave scientific proof.
0.0 B
200.0MB
400.0MB
600.0MB
800.0MB
1.0GB
1.2GB
1.4GB
1.6GB
1.8GB
2.0GB
0 100 200 300 400 500 600 700
Writ
es
Time (Seconds)
Disk Writes
Write
Figure 6.9: Visualization of disk activity when using 8 striped hdds as ingest disks.
Regarding the memory usage, the usage peaks just after 120 seconds intoexecution, which is visualized in figure 6.10. This is expected behaviour, basedupon the previous experiments. We have seen in earlier experiments that thememory usage peaks just after 100 seconds where the execution was successful,but at lower rates.
As for the average load during the experiment, it is as expected, the highestrecorded so far. That is, without being even close to heavy load for the cpusin general. The average load is visualized in figure 6.11. As the figure suggests,
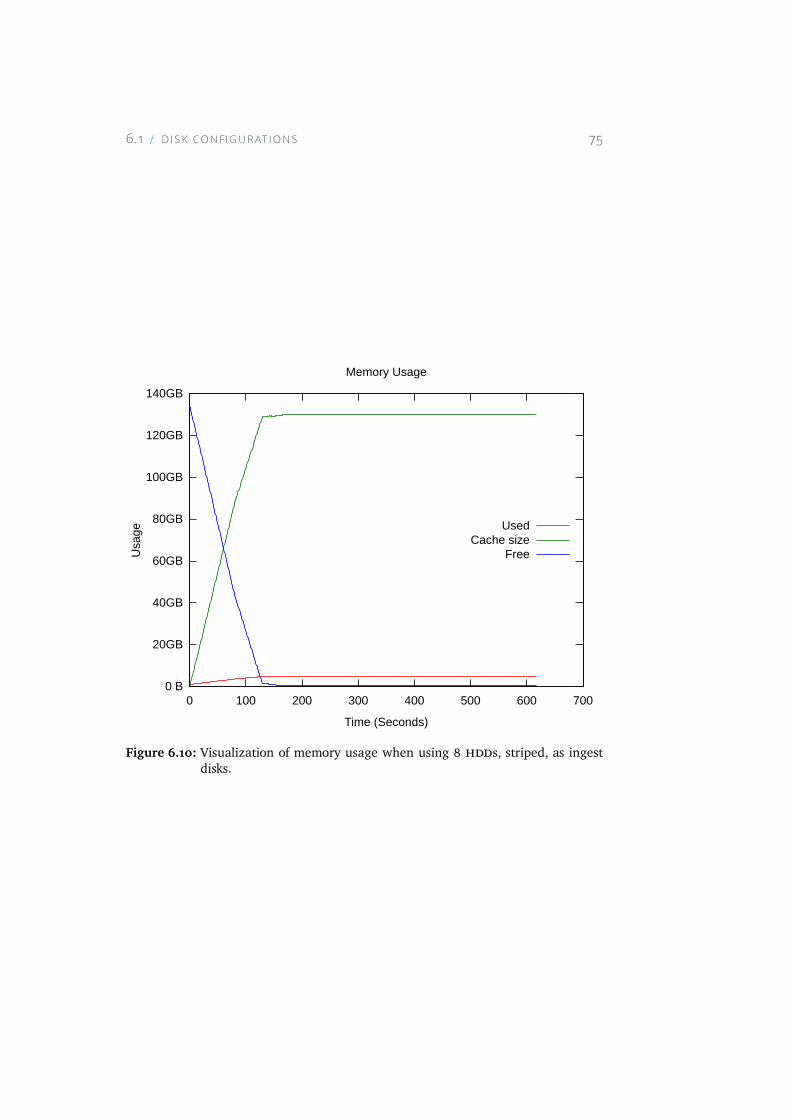
6.1 D ISK CONFIGURAT IONS 75
0 B
20GB
40GB
60GB
80GB
100GB
120GB
140GB
0 100 200 300 400 500 600 700
Usa
ge
Time (Seconds)
Memory Usage
UsedCache size
Free
Figure 6.10: Visualization of memory usage when using 8 hdds, striped, as ingestdisks.
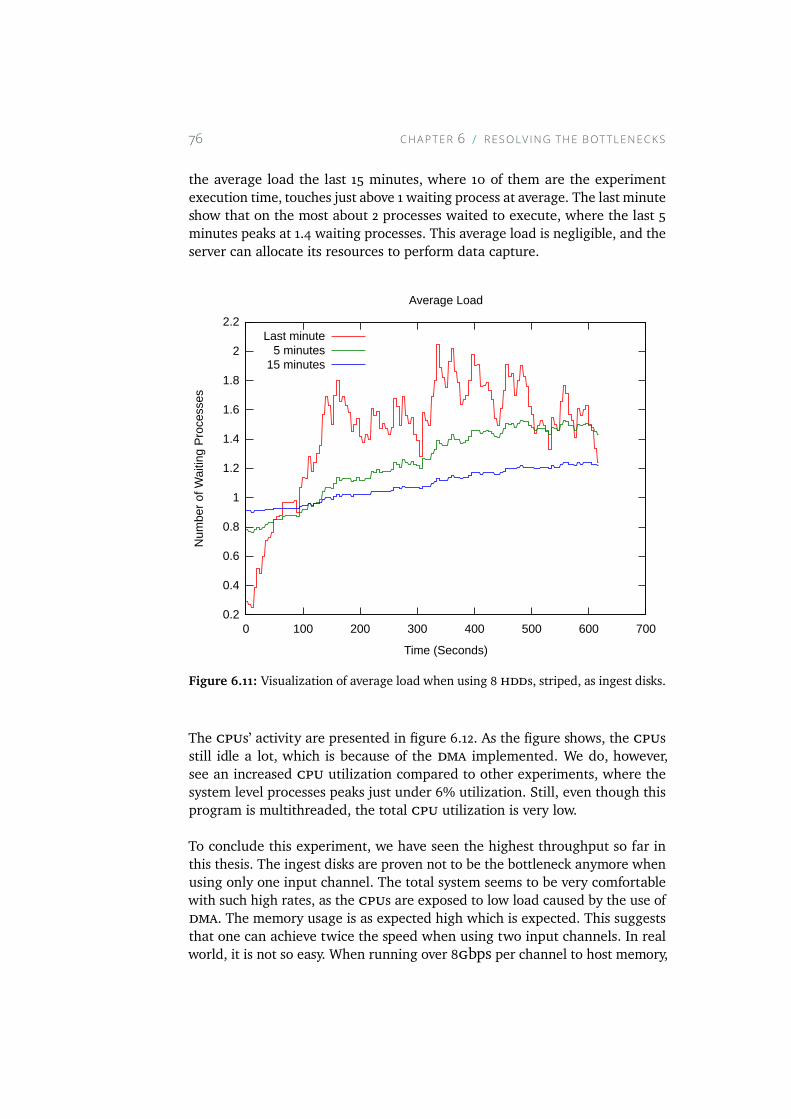
76 CHAPTER 6 RESOLV ING THE BOTTLENECKS
the average load the last 15 minutes, where 10 of them are the experimentexecution time, touches just above 1 waiting process at average. The last minuteshow that on the most about 2 processes waited to execute, where the last 5minutes peaks at 1.4 waiting processes. This average load is negligible, and theserver can allocate its resources to perform data capture.
0.2
0.4
0.6
0.8
1
1.2
1.4
1.6
1.8
2
2.2
0 100 200 300 400 500 600 700
Num
ber
of W
aitin
g P
roce
sses
Time (Seconds)
Average Load
Last minute5 minutes
15 minutes
Figure 6.11: Visualization of average load when using 8 hdds, striped, as ingest disks.
The cpus’ activity are presented in figure 6.12. As the figure shows, the cpusstill idle a lot, which is because of the dma implemented. We do, however,see an increased cpu utilization compared to other experiments, where thesystem level processes peaks just under 6% utilization. Still, even though thisprogram is multithreaded, the total cpu utilization is very low.
To conclude this experiment, we have seen the highest throughput so far inthis thesis. The ingest disks are proven not to be the bottleneck anymore whenusing only one input channel. The total system seems to be very comfortablewith such high rates, as the cpus are exposed to low load caused by the use ofdma. The memory usage is as expected high which is expected. This suggeststhat one can achieve twice the speed when using two input channels. In realworld, it is not so easy. When running over 8gbps per channel to host memory,
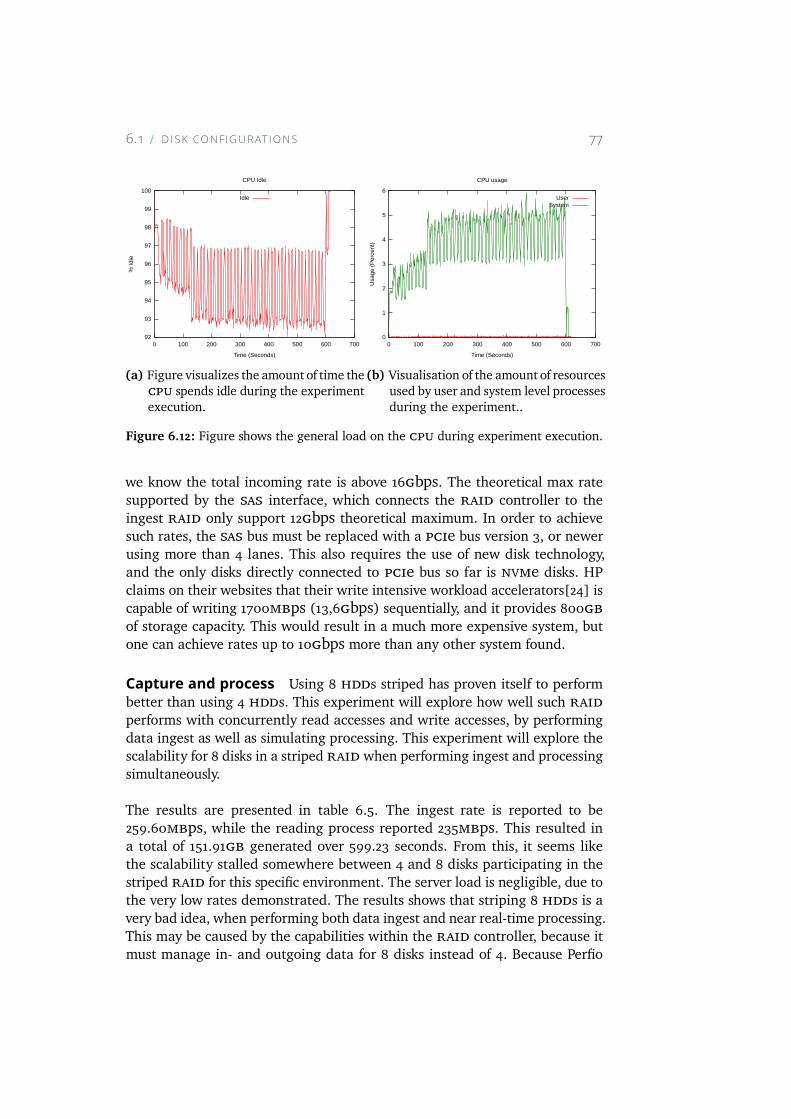
6.1 D ISK CONFIGURAT IONS 77
92
93
94
95
96
97
98
99
100
0 100 200 300 400 500 600 700
% Id
le
Time (Seconds)
CPU Idle
Idle
(a) Figure visualizes the amount of time thecpu spends idle during the experimentexecution.
0
1
2
3
4
5
6
0 100 200 300 400 500 600 700
Usa
ge (
Per
cen
t)
Time (Seconds)
CPU usage
UserSystem
(b) Visualisation of the amount of resourcesused by user and system level processesduring the experiment..
Figure 6.12: Figure shows the general load on the cpu during experiment execution.
we know the total incoming rate is above 16gbps. The theoretical max ratesupported by the sas interface, which connects the raid controller to theingest raid only support 12gbps theoretical maximum. In order to achievesuch rates, the sas bus must be replaced with a pcie bus version 3, or newerusing more than 4 lanes. This also requires the use of new disk technology,and the only disks directly connected to pcie bus so far is nvme disks. HPclaims on their websites that their write intensive workload accelerators[24] iscapable of writing 1700mbps (13,6gbps) sequentially, and it provides 800gbof storage capacity. This would result in a much more expensive system, butone can achieve rates up to 10gbps more than any other system found.
Capture and process Using 8 hdds striped has proven itself to performbetter than using 4 hdds. This experiment will explore how well such raidperforms with concurrently read accesses and write accesses, by performingdata ingest as well as simulating processing. This experiment will explore thescalability for 8 disks in a striped raid when performing ingest and processingsimultaneously.
The results are presented in table 6.5. The ingest rate is reported to be259.60mbps, while the reading process reported 235mbps. This resulted ina total of 151.91gb generated over 599.23 seconds. From this, it seems likethe scalability stalled somewhere between 4 and 8 disks participating in thestriped raid for this specific environment. The server load is negligible, due tothe very low rates demonstrated. The results shows that striping 8 hdds is avery bad idea, when performing both data ingest and near real-time processing.This may be caused by the capabilities within the raid controller, because itmust manage in- and outgoing data for 8 disks instead of 4. Because Perfio
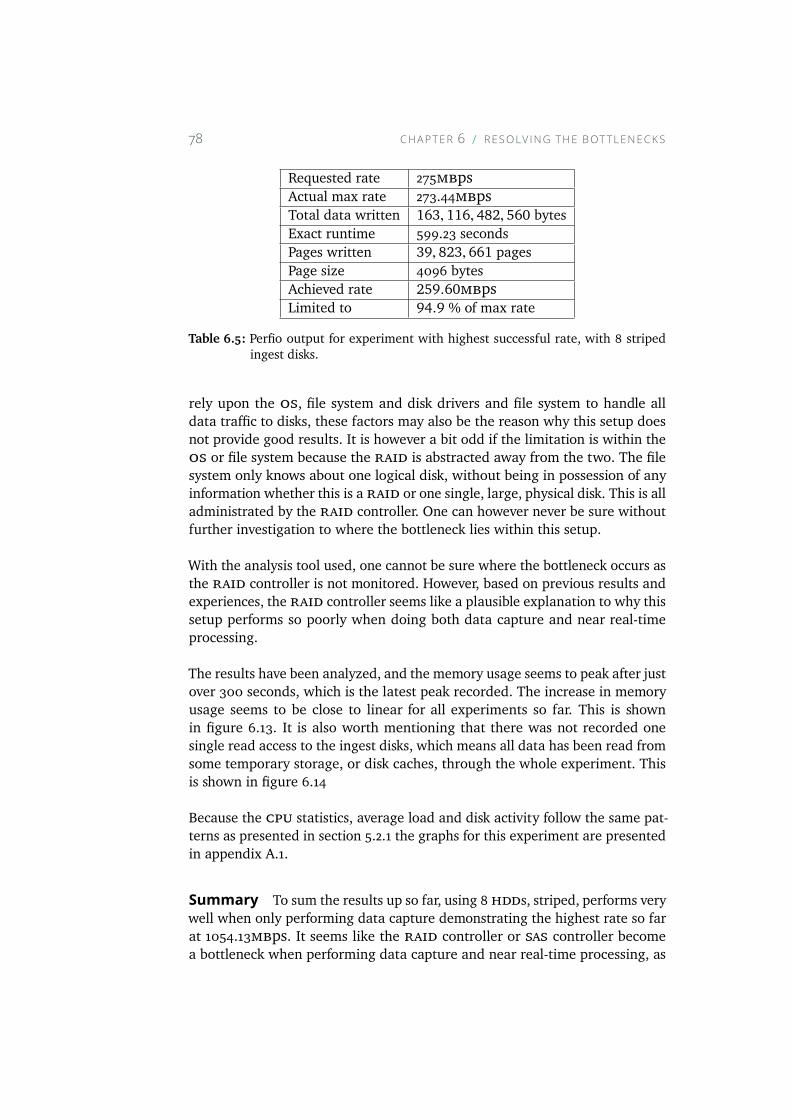
78 CHAPTER 6 RESOLV ING THE BOTTLENECKS
Requested rate 275mbpsActual max rate 273.44mbpsTotal data written 163, 116, 482, 560 bytesExact runtime 599.23 secondsPages written 39, 823, 661 pagesPage size 4096 bytesAchieved rate 259.60mbpsLimited to 94.9 % of max rate
Table 6.5: Perfio output for experiment with highest successful rate, with 8 stripedingest disks.
rely upon the os, file system and disk drivers and file system to handle alldata traffic to disks, these factors may also be the reason why this setup doesnot provide good results. It is however a bit odd if the limitation is within theos or file system because the raid is abstracted away from the two. The filesystem only knows about one logical disk, without being in possession of anyinformation whether this is a raid or one single, large, physical disk. This is alladministrated by the raid controller. One can however never be sure withoutfurther investigation to where the bottleneck lies within this setup.
With the analysis tool used, one cannot be sure where the bottleneck occurs asthe raid controller is not monitored. However, based on previous results andexperiences, the raid controller seems like a plausible explanation to why thissetup performs so poorly when doing both data capture and near real-timeprocessing.
The results have been analyzed, and the memory usage seems to peak after justover 300 seconds, which is the latest peak recorded. The increase in memoryusage seems to be close to linear for all experiments so far. This is shownin figure 6.13. It is also worth mentioning that there was not recorded onesingle read access to the ingest disks, which means all data has been read fromsome temporary storage, or disk caches, through the whole experiment. Thisis shown in figure 6.14
Because the cpu statistics, average load and disk activity follow the same pat-terns as presented in section 5.2.1 the graphs for this experiment are presentedin appendix A.1.
Summary To sum the results up so far, using 8 hdds, striped, performs verywell when only performing data capture demonstrating the highest rate so farat 1054.13mbps. It seems like the raid controller or sas controller becomea bottleneck when performing data capture and near real-time processing, as
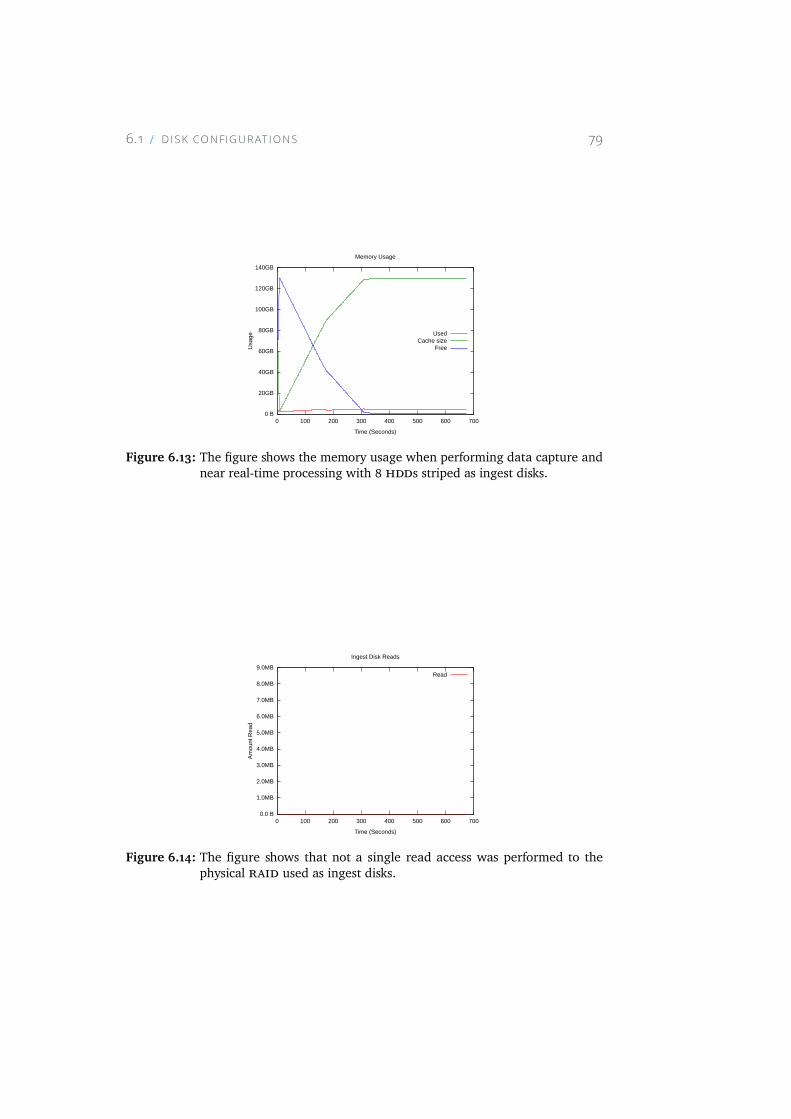
6.1 D ISK CONFIGURAT IONS 79
0 B
20GB
40GB
60GB
80GB
100GB
120GB
140GB
0 100 200 300 400 500 600 700
Usa
ge
Time (Seconds)
Memory Usage
UsedCache size
Free
Figure 6.13: The figure shows the memory usage when performing data capture andnear real-time processing with 8 hdds striped as ingest disks.
0.0 B
1.0MB
2.0MB
3.0MB
4.0MB
5.0MB
6.0MB
7.0MB
8.0MB
9.0MB
0 100 200 300 400 500 600 700
Am
ount
Rea
d
Time (Seconds)
Ingest Disk Reads
Read
Figure 6.14: The figure shows that not a single read access was performed to thephysical raid used as ingest disks.
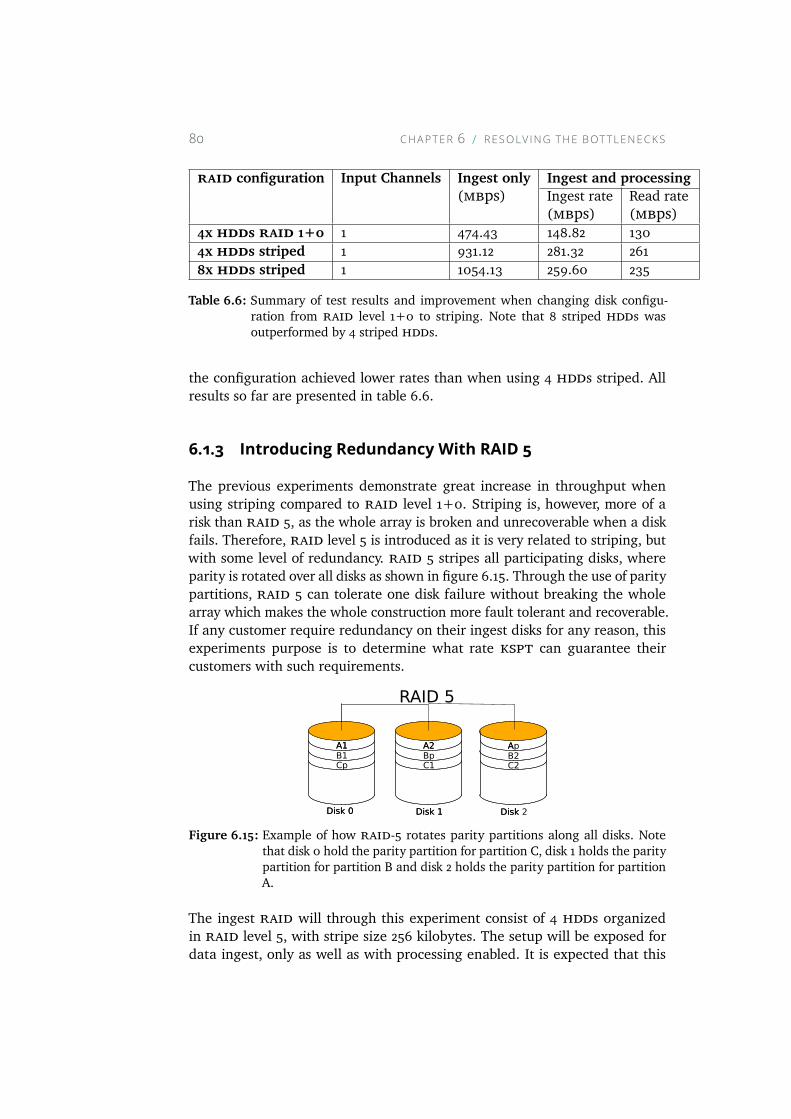
80 CHAPTER 6 RESOLV ING THE BOTTLENECKS
raid configuration Input Channels Ingest only Ingest and processing(mbps) Ingest rate Read rate
(mbps) (mbps)4x hdds raid 1+0 1 474.43 148.82 1304x hdds striped 1 931.12 281.32 2618x hdds striped 1 1054.13 259.60 235
Table 6.6: Summary of test results and improvement when changing disk configu-ration from raid level 1+0 to striping. Note that 8 striped hdds wasoutperformed by 4 striped hdds.
the configuration achieved lower rates than when using 4 hdds striped. Allresults so far are presented in table 6.6.
6.1.3 Introducing Redundancy With RAID 5The previous experiments demonstrate great increase in throughput whenusing striping compared to raid level 1+0. Striping is, however, more of arisk than raid 5, as the whole array is broken and unrecoverable when a diskfails. Therefore, raid level 5 is introduced as it is very related to striping, butwith some level of redundancy. raid 5 stripes all participating disks, whereparity is rotated over all disks as shown in figure 6.15. Through the use of paritypartitions, raid 5 can tolerate one disk failure without breaking the wholearray which makes the whole construction more fault tolerant and recoverable.If any customer require redundancy on their ingest disks for any reason, thisexperiments purpose is to determine what rate kspt can guarantee theircustomers with such requirements.
A1B1
A2
C1
Disk 0 Disk 1
A1
Cp
A2Bp
RAID 5
Disk 0 Disk 1
ApB2C2
Disk 2
A
Disk
Figure 6.15: Example of how raid-5 rotates parity partitions along all disks. Notethat disk 0 hold the parity partition for partition C, disk 1 holds the paritypartition for partition B and disk 2 holds the parity partition for partitionA.
The ingest raid will through this experiment consist of 4 hdds organizedin raid level 5, with stripe size 256 kilobytes. The setup will be exposed fordata ingest, only as well as with processing enabled. It is expected that this
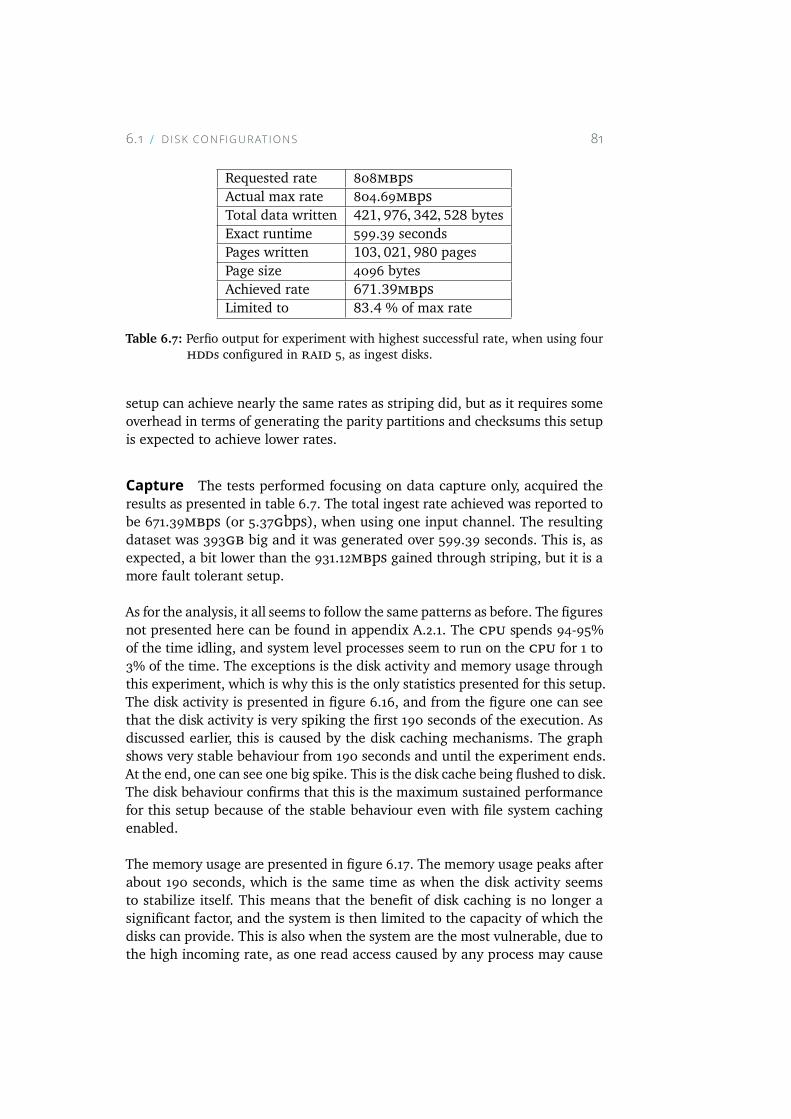
6.1 D ISK CONFIGURAT IONS 81
Requested rate 808mbpsActual max rate 804.69mbpsTotal data written 421, 976, 342, 528 bytesExact runtime 599.39 secondsPages written 103, 021, 980 pagesPage size 4096 bytesAchieved rate 671.39mbpsLimited to 83.4 % of max rate
Table 6.7: Perfio output for experiment with highest successful rate, when using fourhdds configured in raid 5, as ingest disks.
setup can achieve nearly the same rates as striping did, but as it requires someoverhead in terms of generating the parity partitions and checksums this setupis expected to achieve lower rates.
Capture The tests performed focusing on data capture only, acquired theresults as presented in table 6.7. The total ingest rate achieved was reported tobe 671.39mbps (or 5.37gbps), when using one input channel. The resultingdataset was 393gb big and it was generated over 599.39 seconds. This is, asexpected, a bit lower than the 931.12mbps gained through striping, but it is amore fault tolerant setup.
As for the analysis, it all seems to follow the same patterns as before. The figuresnot presented here can be found in appendix A.2.1. The cpu spends 94-95%of the time idling, and system level processes seem to run on the cpu for 1 to3% of the time. The exceptions is the disk activity and memory usage throughthis experiment, which is why this is the only statistics presented for this setup.The disk activity is presented in figure 6.16, and from the figure one can seethat the disk activity is very spiking the first 190 seconds of the execution. Asdiscussed earlier, this is caused by the disk caching mechanisms. The graphshows very stable behaviour from 190 seconds and until the experiment ends.At the end, one can see one big spike. This is the disk cache being flushed to disk.The disk behaviour confirms that this is the maximum sustained performancefor this setup because of the stable behaviour even with file system cachingenabled.
The memory usage are presented in figure 6.17. The memory usage peaks afterabout 190 seconds, which is the same time as when the disk activity seemsto stabilize itself. This means that the benefit of disk caching is no longer asignificant factor, and the system is then limited to the capacity of which thedisks can provide. This is also when the system are the most vulnerable, due tothe high incoming rate, as one read access caused by any process may cause
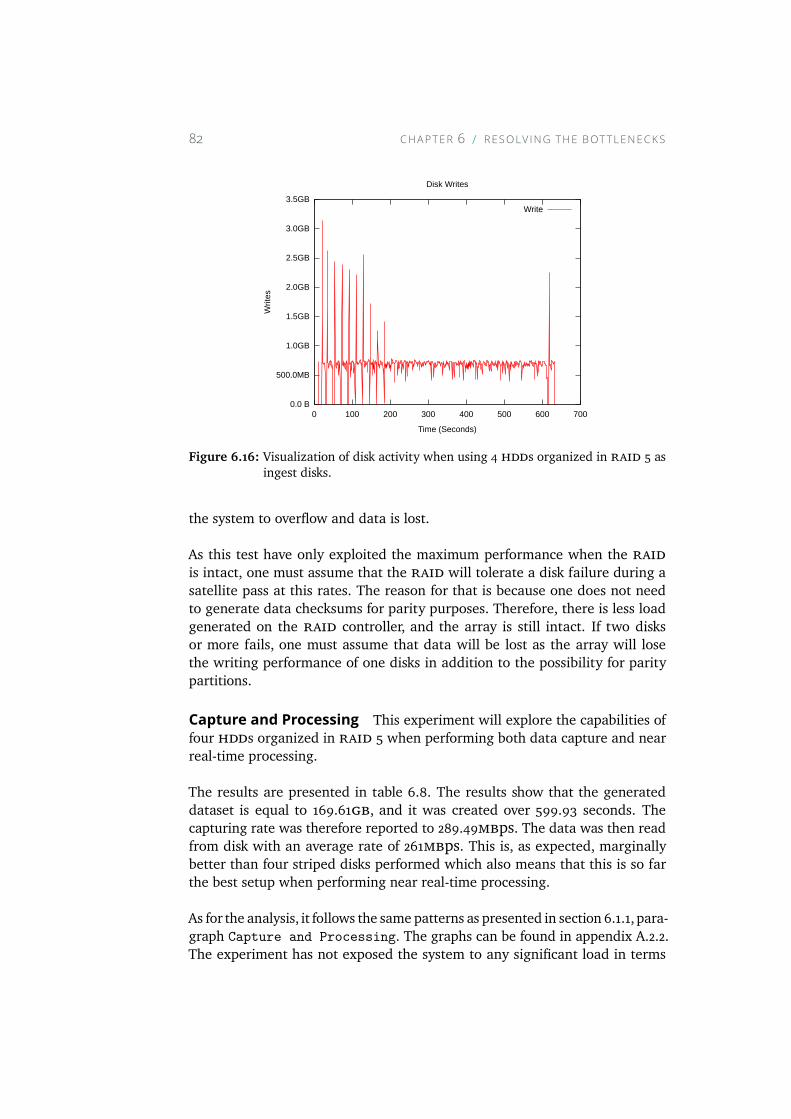
82 CHAPTER 6 RESOLV ING THE BOTTLENECKS
0.0 B
500.0MB
1.0GB
1.5GB
2.0GB
2.5GB
3.0GB
3.5GB
0 100 200 300 400 500 600 700
Writ
es
Time (Seconds)
Disk Writes
Write
Figure 6.16: Visualization of disk activity when using 4 hdds organized in raid 5 asingest disks.
the system to overflow and data is lost.
As this test have only exploited the maximum performance when the raidis intact, one must assume that the raid will tolerate a disk failure during asatellite pass at this rates. The reason for that is because one does not needto generate data checksums for parity purposes. Therefore, there is less loadgenerated on the raid controller, and the array is still intact. If two disksor more fails, one must assume that data will be lost as the array will losethe writing performance of one disks in addition to the possibility for paritypartitions.
Capture and Processing This experiment will explore the capabilities offour hdds organized in raid 5 when performing both data capture and nearreal-time processing.
The results are presented in table 6.8. The results show that the generateddataset is equal to 169.61gb, and it was created over 599.93 seconds. Thecapturing rate was therefore reported to 289.49mbps. The data was then readfrom disk with an average rate of 261mbps. This is, as expected, marginallybetter than four striped disks performed which also means that this is so farthe best setup when performing near real-time processing.
As for the analysis, it follows the same patterns as presented in section 6.1.1, para-graph Capture and Processing. The graphs can be found in appendix A.2.2.The experiment has not exposed the system to any significant load in terms
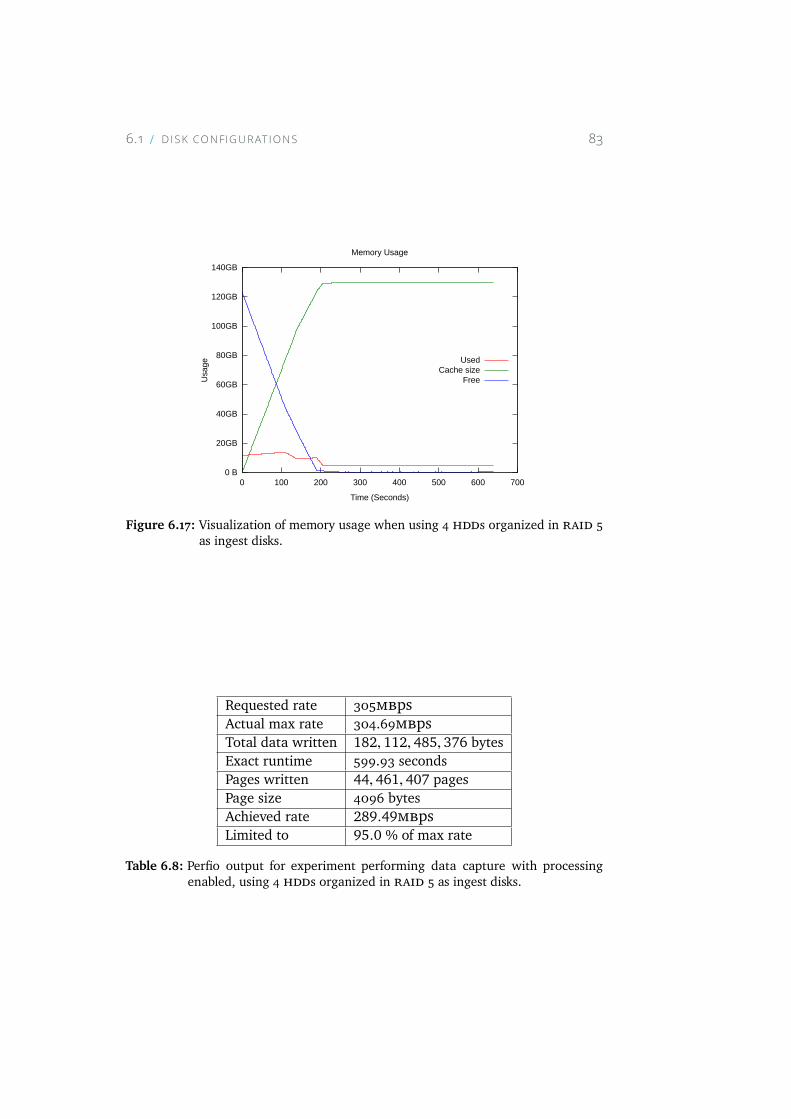
6.1 D ISK CONFIGURAT IONS 83
0 B
20GB
40GB
60GB
80GB
100GB
120GB
140GB
0 100 200 300 400 500 600 700
Usa
ge
Time (Seconds)
Memory Usage
UsedCache size
Free
Figure 6.17: Visualization of memory usage when using 4 hdds organized in raid 5as ingest disks.
Requested rate 305mbpsActual max rate 304.69mbpsTotal data written 182, 112, 485, 376 bytesExact runtime 599.93 secondsPages written 44, 461, 407 pagesPage size 4096 bytesAchieved rate 289.49mbpsLimited to 95.0 % of max rate
Table 6.8: Perfio output for experiment performing data capture with processingenabled, using 4 hdds organized in raid 5 as ingest disks.
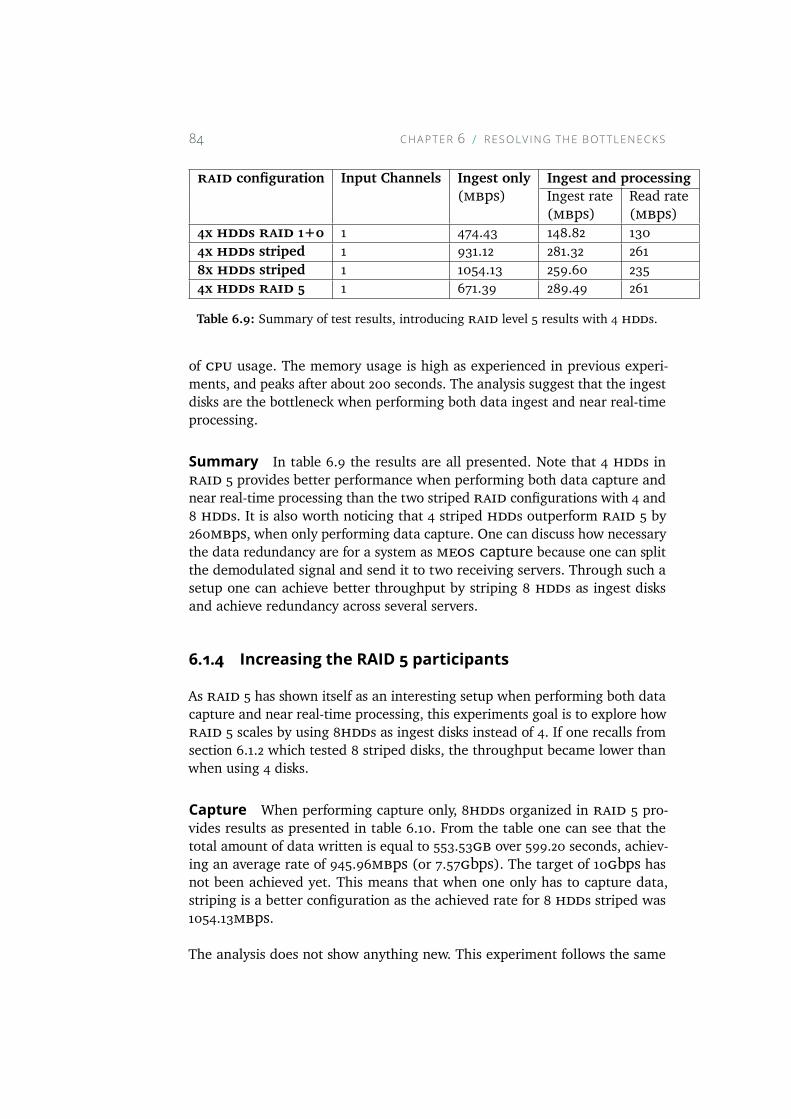
84 CHAPTER 6 RESOLV ING THE BOTTLENECKS
raid configuration Input Channels Ingest only Ingest and processing(mbps) Ingest rate Read rate
(mbps) (mbps)4x hdds raid 1+0 1 474.43 148.82 1304x hdds striped 1 931.12 281.32 2618x hdds striped 1 1054.13 259.60 2354x hdds raid 5 1 671.39 289.49 261
Table 6.9: Summary of test results, introducing raid level 5 results with 4 hdds.
of cpu usage. The memory usage is high as experienced in previous experi-ments, and peaks after about 200 seconds. The analysis suggest that the ingestdisks are the bottleneck when performing both data ingest and near real-timeprocessing.
Summary In table 6.9 the results are all presented. Note that 4 hdds inraid 5 provides better performance when performing both data capture andnear real-time processing than the two striped raid configurations with 4 and8 hdds. It is also worth noticing that 4 striped hdds outperform raid 5 by260mbps, when only performing data capture. One can discuss how necessarythe data redundancy are for a system as meos capture because one can splitthe demodulated signal and send it to two receiving servers. Through such asetup one can achieve better throughput by striping 8 hdds as ingest disksand achieve redundancy across several servers.
6.1.4 Increasing the RAID 5 participantsAs raid 5 has shown itself as an interesting setup when performing both datacapture and near real-time processing, this experiments goal is to explore howraid 5 scales by using 8hdds as ingest disks instead of 4. If one recalls fromsection 6.1.2 which tested 8 striped disks, the throughput became lower thanwhen using 4 disks.
Capture When performing capture only, 8hdds organized in raid 5 pro-vides results as presented in table 6.10. From the table one can see that thetotal amount of data written is equal to 553.53gb over 599.20 seconds, achiev-ing an average rate of 945.96mbps (or 7.57gbps). The target of 10gbps hasnot been achieved yet. This means that when one only has to capture data,striping is a better configuration as the achieved rate for 8 hdds striped was1054.13mbps.
The analysis does not show anything new. This experiment follows the same
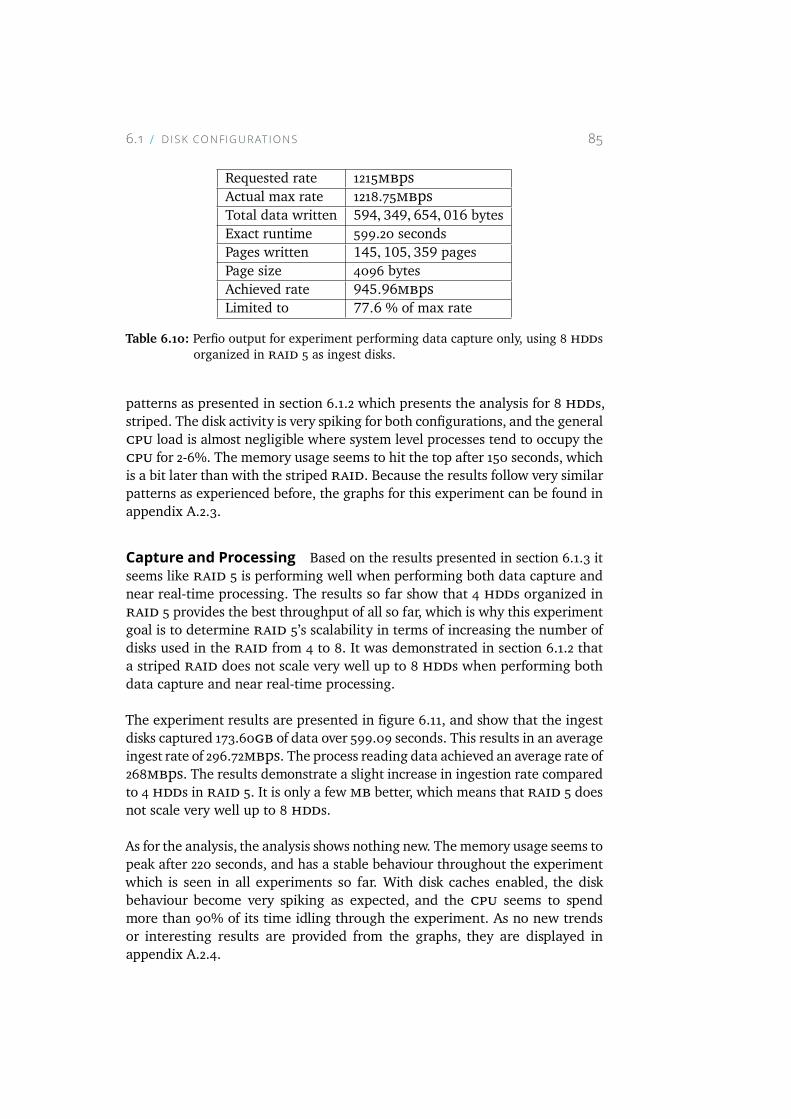
6.1 D ISK CONFIGURAT IONS 85
Requested rate 1215mbpsActual max rate 1218.75mbpsTotal data written 594, 349, 654, 016 bytesExact runtime 599.20 secondsPages written 145, 105, 359 pagesPage size 4096 bytesAchieved rate 945.96mbpsLimited to 77.6 % of max rate
Table 6.10: Perfio output for experiment performing data capture only, using 8 hddsorganized in raid 5 as ingest disks.
patterns as presented in section 6.1.2 which presents the analysis for 8 hdds,striped. The disk activity is very spiking for both configurations, and the generalcpu load is almost negligible where system level processes tend to occupy thecpu for 2-6%. The memory usage seems to hit the top after 150 seconds, whichis a bit later than with the striped raid. Because the results follow very similarpatterns as experienced before, the graphs for this experiment can be found inappendix A.2.3.
Capture and Processing Based on the results presented in section 6.1.3 itseems like raid 5 is performing well when performing both data capture andnear real-time processing. The results so far show that 4 hdds organized inraid 5 provides the best throughput of all so far, which is why this experimentgoal is to determine raid 5’s scalability in terms of increasing the number ofdisks used in the raid from 4 to 8. It was demonstrated in section 6.1.2 thata striped raid does not scale very well up to 8 hdds when performing bothdata capture and near real-time processing.
The experiment results are presented in figure 6.11, and show that the ingestdisks captured 173.60gb of data over 599.09 seconds. This results in an averageingest rate of 296.72mbps. The process reading data achieved an average rate of268mbps. The results demonstrate a slight increase in ingestion rate comparedto 4 hdds in raid 5. It is only a fewmb better, which means that raid 5 doesnot scale very well up to 8 hdds.
As for the analysis, the analysis shows nothing new. The memory usage seems topeak after 220 seconds, and has a stable behaviour throughout the experimentwhich is seen in all experiments so far. With disk caches enabled, the diskbehaviour become very spiking as expected, and the cpu seems to spendmore than 90% of its time idling through the experiment. As no new trendsor interesting results are provided from the graphs, they are displayed inappendix A.2.4.
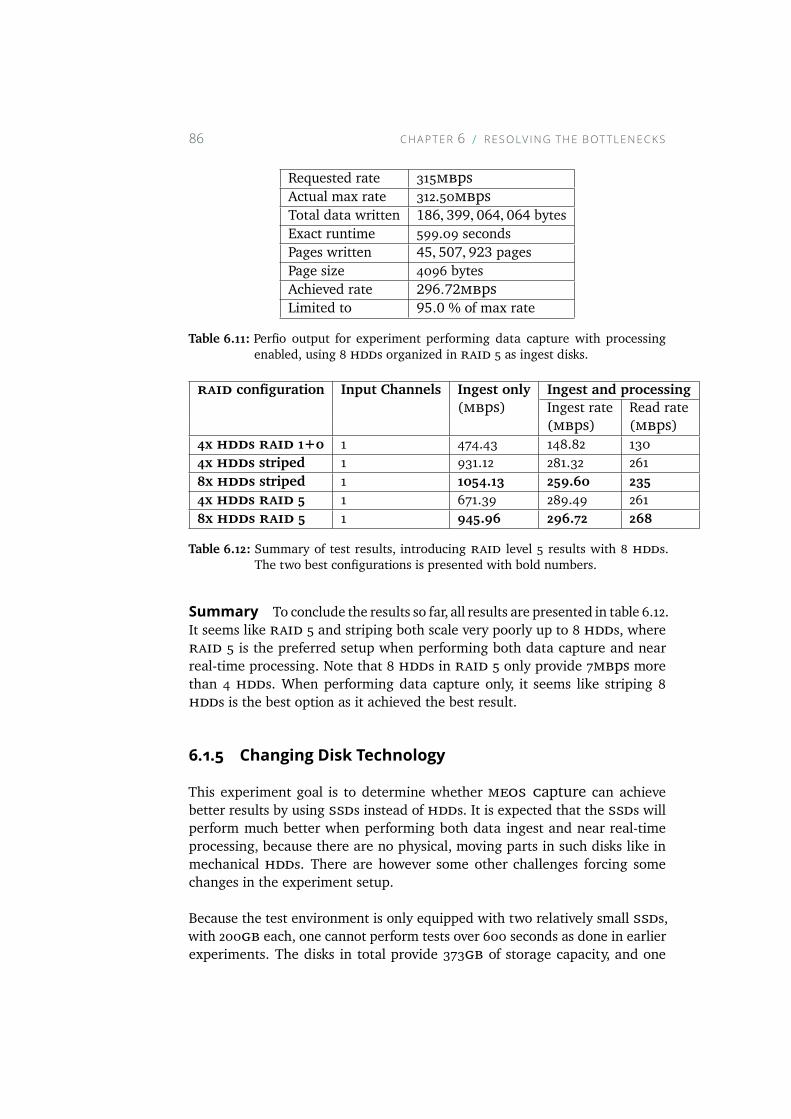
86 CHAPTER 6 RESOLV ING THE BOTTLENECKS
Requested rate 315mbpsActual max rate 312.50mbpsTotal data written 186, 399, 064, 064 bytesExact runtime 599.09 secondsPages written 45, 507, 923 pagesPage size 4096 bytesAchieved rate 296.72mbpsLimited to 95.0 % of max rate
Table 6.11: Perfio output for experiment performing data capture with processingenabled, using 8 hdds organized in raid 5 as ingest disks.
raid configuration Input Channels Ingest only Ingest and processing(mbps) Ingest rate Read rate
(mbps) (mbps)4x hdds raid 1+0 1 474.43 148.82 1304x hdds striped 1 931.12 281.32 2618x hdds striped 1 1054.13 259.60 2354x hdds raid 5 1 671.39 289.49 2618x hdds raid 5 1 945.96 296.72 268
Table 6.12: Summary of test results, introducing raid level 5 results with 8 hdds.The two best configurations is presented with bold numbers.
Summary To conclude the results so far, all results are presented in table 6.12.It seems like raid 5 and striping both scale very poorly up to 8 hdds, whereraid 5 is the preferred setup when performing both data capture and nearreal-time processing. Note that 8 hdds in raid 5 only provide 7mbps morethan 4 hdds. When performing data capture only, it seems like striping 8hdds is the best option as it achieved the best result.
6.1.5 Changing Disk TechnologyThis experiment goal is to determine whether meos capture can achievebetter results by using ssds instead of hdds. It is expected that the ssds willperform much better when performing both data ingest and near real-timeprocessing, because there are no physical, moving parts in such disks like inmechanical hdds. There are however some other challenges forcing somechanges in the experiment setup.
Because the test environment is only equipped with two relatively small ssds,with 200gb each, one cannot perform tests over 600 seconds as done in earlierexperiments. The disks in total provide 373gb of storage capacity, and one
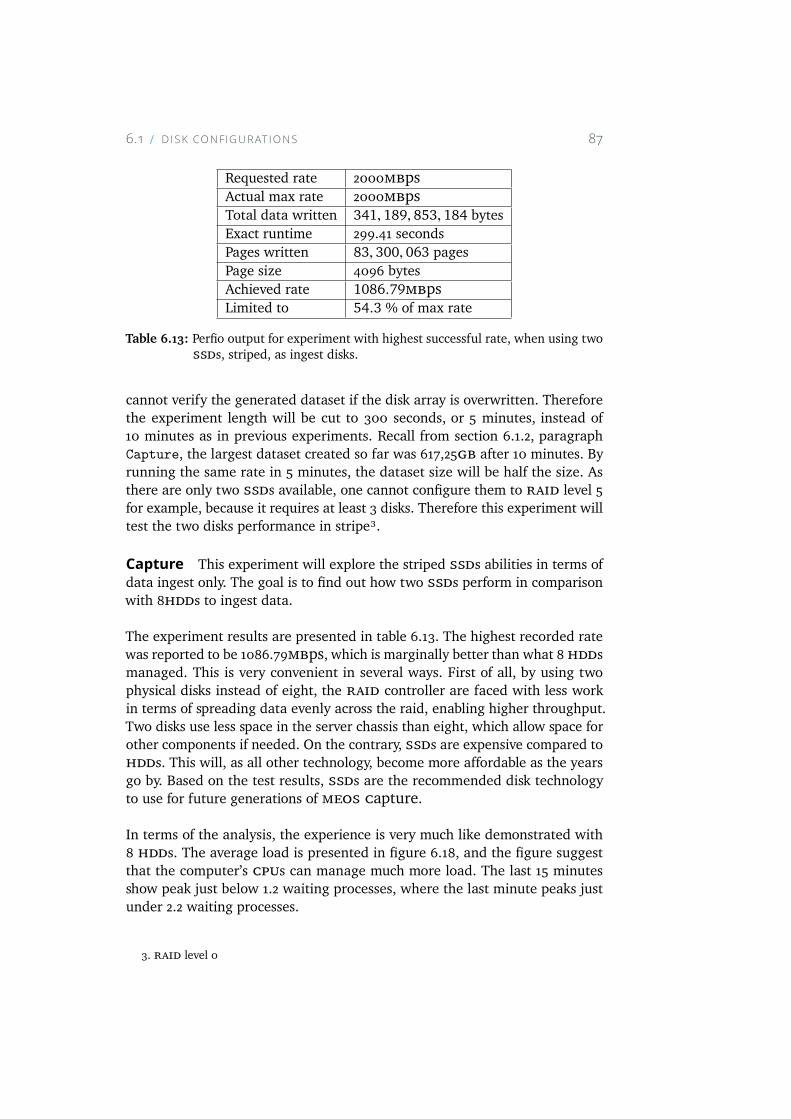
6.1 D ISK CONFIGURAT IONS 87
Requested rate 2000mbpsActual max rate 2000mbpsTotal data written 341, 189, 853, 184 bytesExact runtime 299.41 secondsPages written 83, 300, 063 pagesPage size 4096 bytesAchieved rate 1086.79mbpsLimited to 54.3 % of max rate
Table 6.13: Perfio output for experiment with highest successful rate, when using twossds, striped, as ingest disks.
cannot verify the generated dataset if the disk array is overwritten. Thereforethe experiment length will be cut to 300 seconds, or 5 minutes, instead of10 minutes as in previous experiments. Recall from section 6.1.2, paragraphCapture, the largest dataset created so far was 617,25gb after 10 minutes. Byrunning the same rate in 5 minutes, the dataset size will be half the size. Asthere are only two ssds available, one cannot configure them to raid level 5for example, because it requires at least 3 disks. Therefore this experiment willtest the two disks performance in stripe³.
Capture This experiment will explore the striped ssds abilities in terms ofdata ingest only. The goal is to find out how two ssds perform in comparisonwith 8hdds to ingest data.
The experiment results are presented in table 6.13. The highest recorded ratewas reported to be 1086.79mbps, which is marginally better than what 8 hddsmanaged. This is very convenient in several ways. First of all, by using twophysical disks instead of eight, the raid controller are faced with less workin terms of spreading data evenly across the raid, enabling higher throughput.Two disks use less space in the server chassis than eight, which allow space forother components if needed. On the contrary, ssds are expensive compared tohdds. This will, as all other technology, become more affordable as the yearsgo by. Based on the test results, ssds are the recommended disk technologyto use for future generations of meos capture.
In terms of the analysis, the experience is very much like demonstrated with8 hdds. The average load is presented in figure 6.18, and the figure suggestthat the computer’s cpus can manage much more load. The last 15 minutesshow peak just below 1.2 waiting processes, where the last minute peaks justunder 2.2 waiting processes.
3. raid level 0
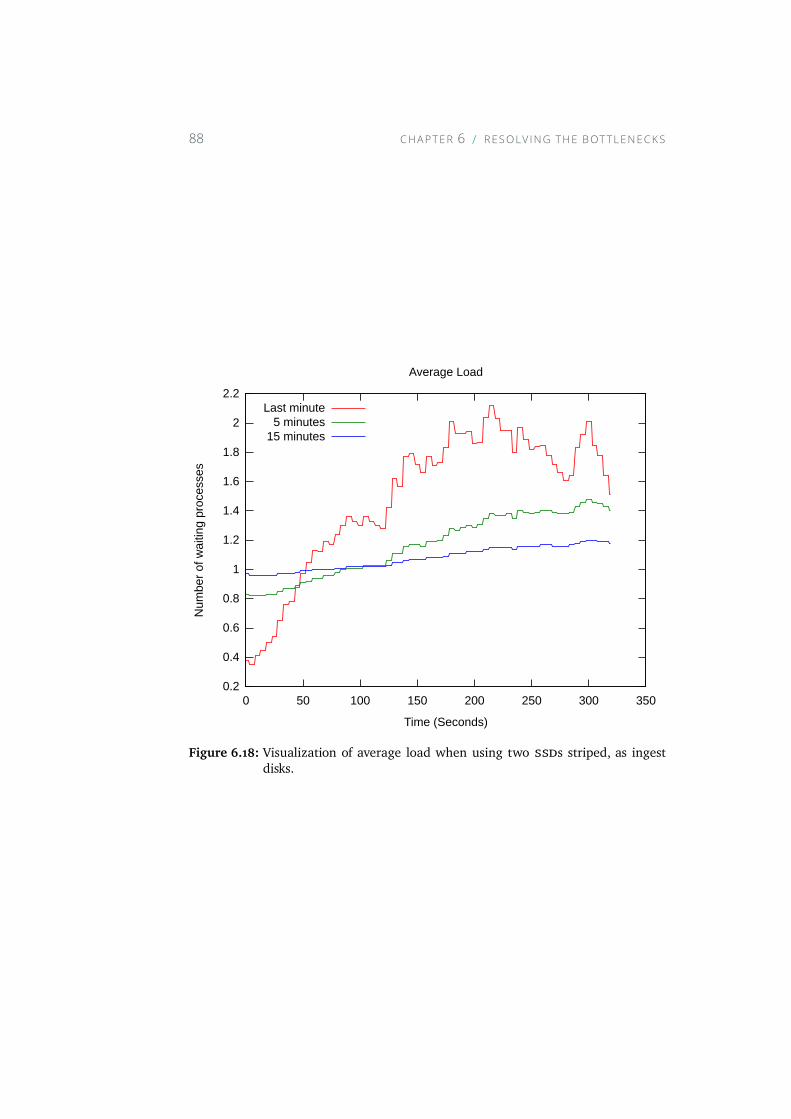
88 CHAPTER 6 RESOLV ING THE BOTTLENECKS
0.2
0.4
0.6
0.8
1
1.2
1.4
1.6
1.8
2
2.2
0 50 100 150 200 250 300 350
Num
ber
of w
aitin
g pr
oces
ses
Time (Seconds)
Average Load
Last minute5 minutes
15 minutes
Figure 6.18: Visualization of average load when using two ssds striped, as ingestdisks.
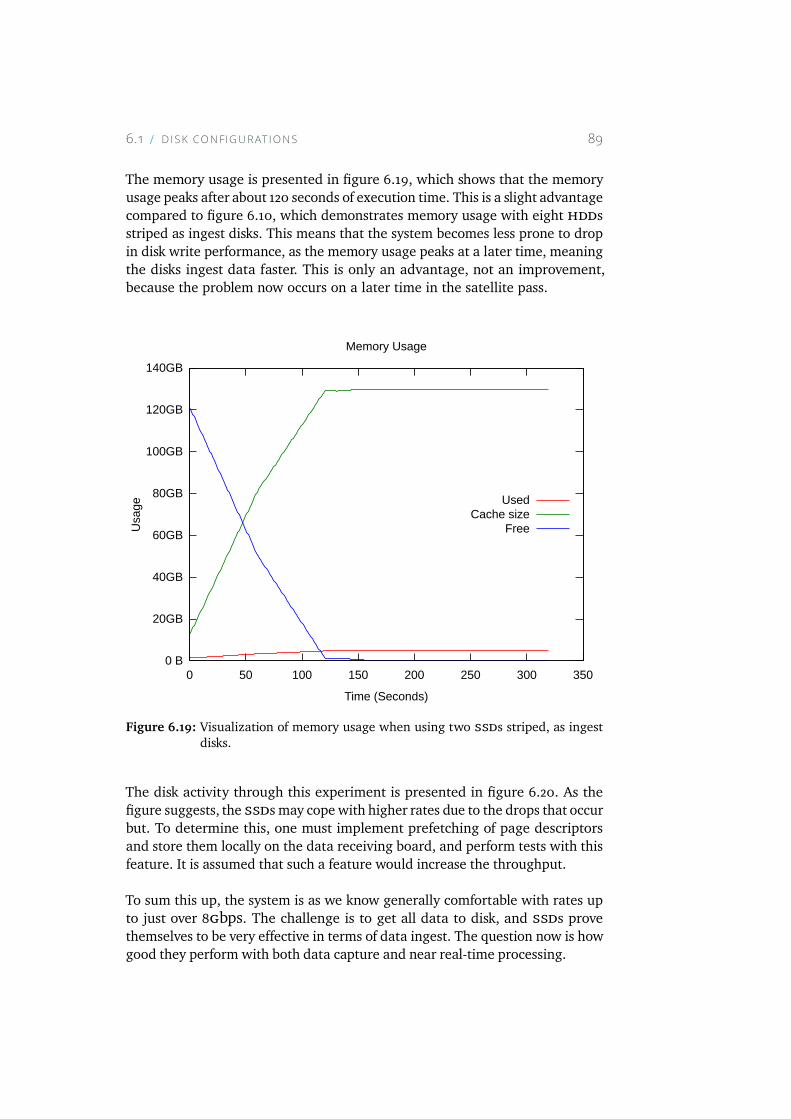
6.1 D ISK CONFIGURAT IONS 89
The memory usage is presented in figure 6.19, which shows that the memoryusage peaks after about 120 seconds of execution time. This is a slight advantagecompared to figure 6.10, which demonstrates memory usage with eight hddsstriped as ingest disks. This means that the system becomes less prone to dropin disk write performance, as the memory usage peaks at a later time, meaningthe disks ingest data faster. This is only an advantage, not an improvement,because the problem now occurs on a later time in the satellite pass.
0 B
20GB
40GB
60GB
80GB
100GB
120GB
140GB
0 50 100 150 200 250 300 350
Usa
ge
Time (Seconds)
Memory Usage
UsedCache size
Free
Figure 6.19: Visualization of memory usage when using two ssds striped, as ingestdisks.
The disk activity through this experiment is presented in figure 6.20. As thefigure suggests, the ssds may cope with higher rates due to the drops that occurbut. To determine this, one must implement prefetching of page descriptorsand store them locally on the data receiving board, and perform tests with thisfeature. It is assumed that such a feature would increase the throughput.
To sum this up, the system is as we know generally comfortable with rates upto just over 8gbps. The challenge is to get all data to disk, and ssds provethemselves to be very effective in terms of data ingest. The question now is howgood they perform with both data capture and near real-time processing.
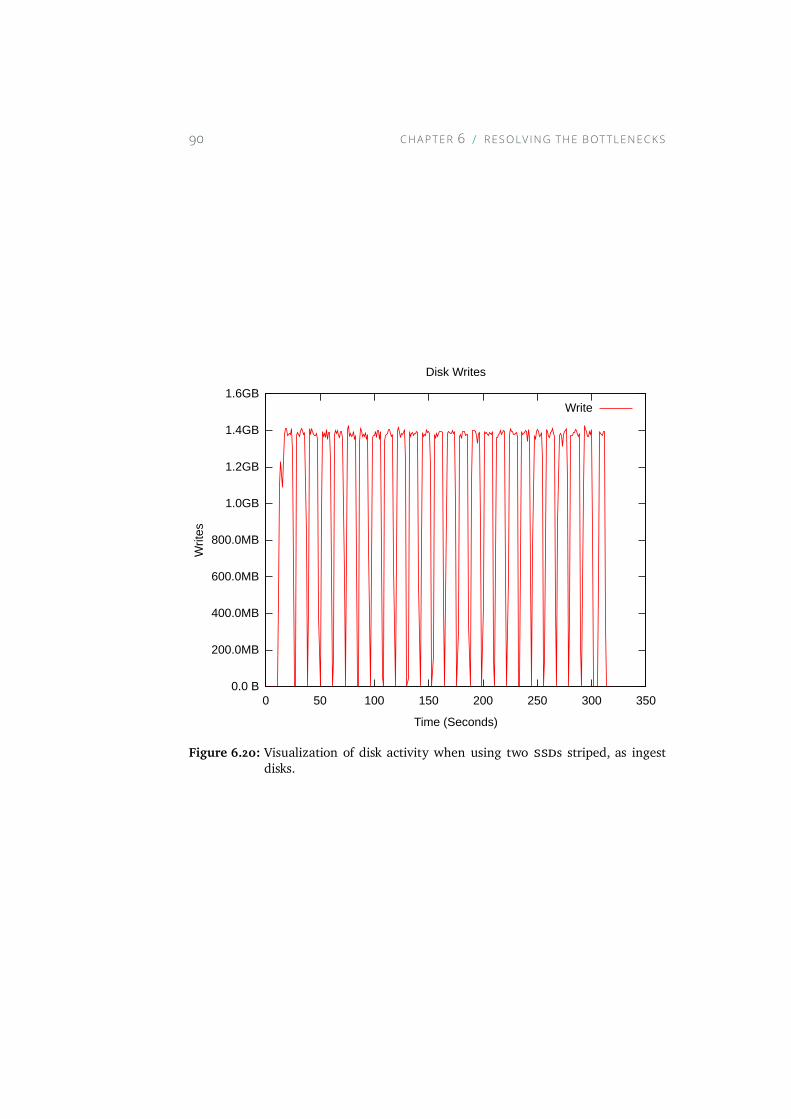
90 CHAPTER 6 RESOLV ING THE BOTTLENECKS
0.0 B
200.0MB
400.0MB
600.0MB
800.0MB
1.0GB
1.2GB
1.4GB
1.6GB
0 50 100 150 200 250 300 350
Writ
es
Time (Seconds)
Disk Writes
Write
Figure 6.20: Visualization of disk activity when using two ssds striped, as ingestdisks.
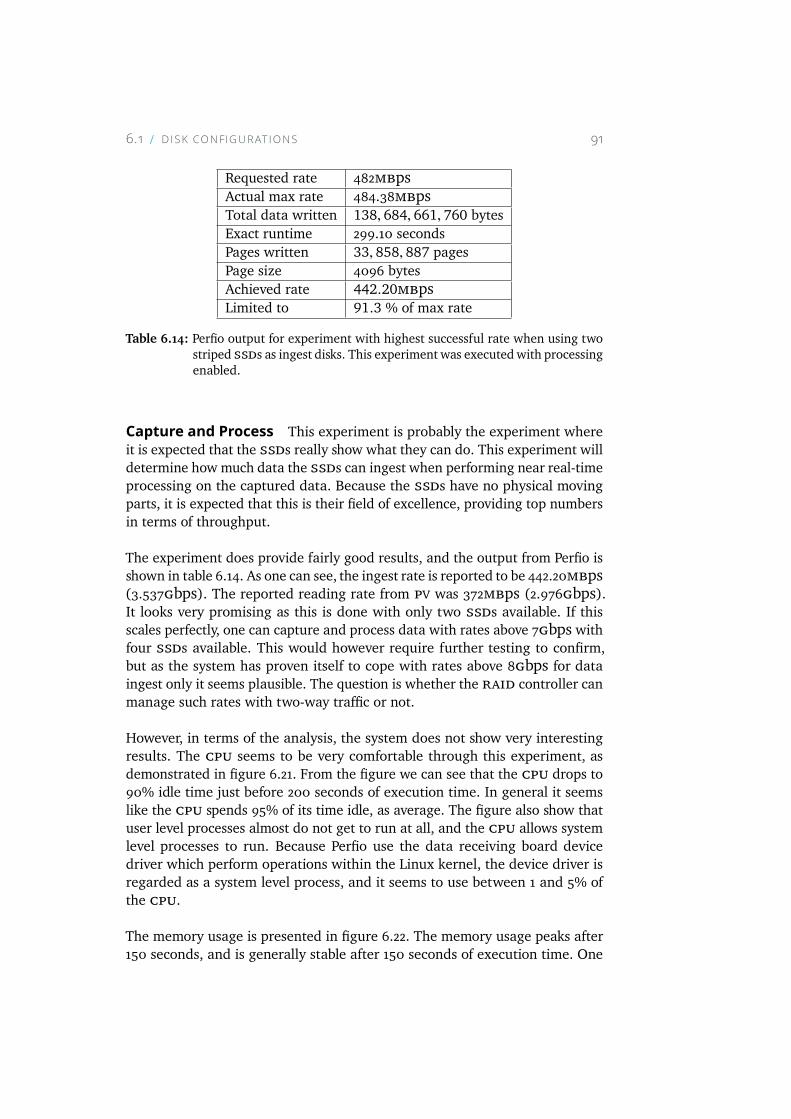
6.1 D ISK CONFIGURAT IONS 91
Requested rate 482mbpsActual max rate 484.38mbpsTotal data written 138, 684, 661, 760 bytesExact runtime 299.10 secondsPages written 33, 858, 887 pagesPage size 4096 bytesAchieved rate 442.20mbpsLimited to 91.3 % of max rate
Table 6.14: Perfio output for experiment with highest successful rate when using twostriped ssds as ingest disks. This experiment was executedwith processingenabled.
Capture and Process This experiment is probably the experiment whereit is expected that the ssds really show what they can do. This experiment willdetermine how much data the ssds can ingest when performing near real-timeprocessing on the captured data. Because the ssds have no physical movingparts, it is expected that this is their field of excellence, providing top numbersin terms of throughput.
The experiment does provide fairly good results, and the output from Perfio isshown in table 6.14. As one can see, the ingest rate is reported to be 442.20mbps(3.537gbps). The reported reading rate from pv was 372mbps (2.976gbps).It looks very promising as this is done with only two ssds available. If thisscales perfectly, one can capture and process data with rates above 7gbps withfour ssds available. This would however require further testing to confirm,but as the system has proven itself to cope with rates above 8gbps for dataingest only it seems plausible. The question is whether the raid controller canmanage such rates with two-way traffic or not.
However, in terms of the analysis, the system does not show very interestingresults. The cpu seems to be very comfortable through this experiment, asdemonstrated in figure 6.21. From the figure we can see that the cpu drops to90% idle time just before 200 seconds of execution time. In general it seemslike the cpu spends 95% of its time idle, as average. The figure also show thatuser level processes almost do not get to run at all, and the cpu allows systemlevel processes to run. Because Perfio use the data receiving board devicedriver which perform operations within the Linux kernel, the device driver isregarded as a system level process, and it seems to use between 1 and 5% ofthe cpu.
The memory usage is presented in figure 6.22. The memory usage peaks after150 seconds, and is generally stable after 150 seconds of execution time. One
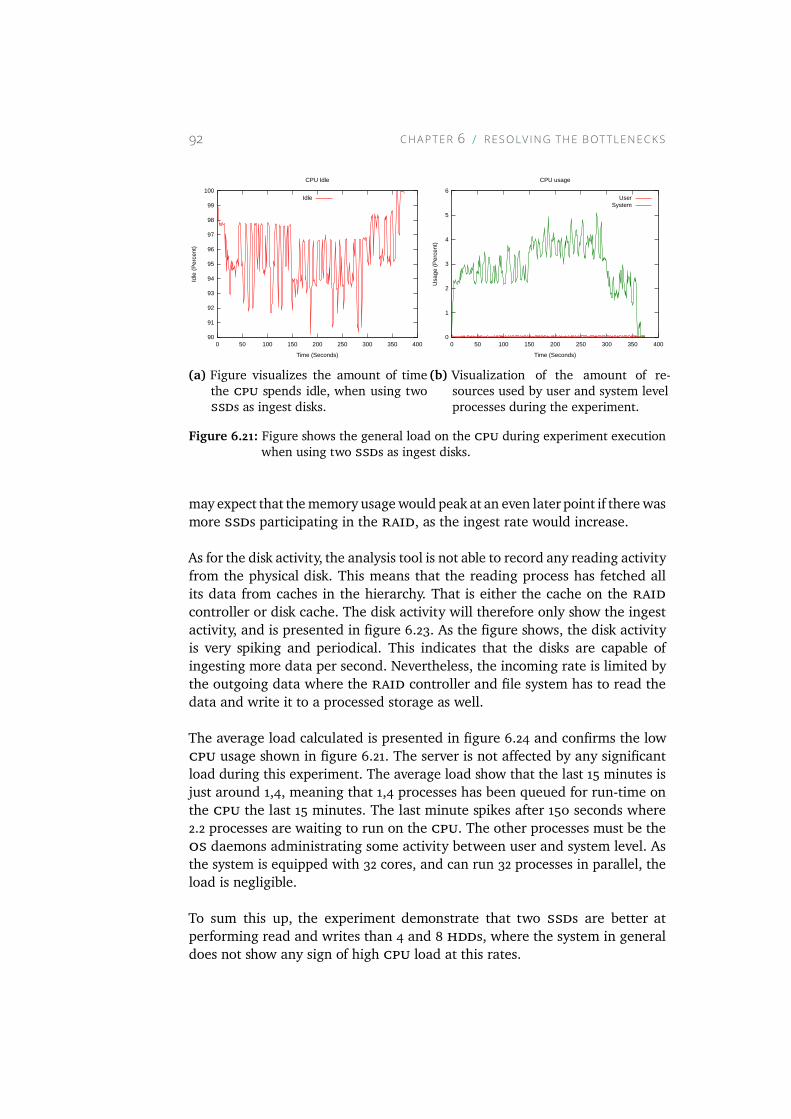
92 CHAPTER 6 RESOLV ING THE BOTTLENECKS
90
91
92
93
94
95
96
97
98
99
100
0 50 100 150 200 250 300 350 400
Idle
(P
erc
ent)
Time (Seconds)
CPU Idle
Idle
(a) Figure visualizes the amount of timethe cpu spends idle, when using twossds as ingest disks.
0
1
2
3
4
5
6
0 50 100 150 200 250 300 350 400
Usa
ge (
Per
cen
t)
Time (Seconds)
CPU usage
UserSystem
(b) Visualization of the amount of re-sources used by user and system levelprocesses during the experiment.
Figure 6.21: Figure shows the general load on the cpu during experiment executionwhen using two ssds as ingest disks.
may expect that thememory usagewould peak at an even later point if there wasmore ssds participating in the raid, as the ingest rate would increase.
As for the disk activity, the analysis tool is not able to record any reading activityfrom the physical disk. This means that the reading process has fetched allits data from caches in the hierarchy. That is either the cache on the raidcontroller or disk cache. The disk activity will therefore only show the ingestactivity, and is presented in figure 6.23. As the figure shows, the disk activityis very spiking and periodical. This indicates that the disks are capable ofingesting more data per second. Nevertheless, the incoming rate is limited bythe outgoing data where the raid controller and file system has to read thedata and write it to a processed storage as well.
The average load calculated is presented in figure 6.24 and confirms the lowcpu usage shown in figure 6.21. The server is not affected by any significantload during this experiment. The average load show that the last 15 minutes isjust around 1,4, meaning that 1,4 processes has been queued for run-time onthe cpu the last 15 minutes. The last minute spikes after 150 seconds where2.2 processes are waiting to run on the cpu. The other processes must be theos daemons administrating some activity between user and system level. Asthe system is equipped with 32 cores, and can run 32 processes in parallel, theload is negligible.
To sum this up, the experiment demonstrate that two ssds are better atperforming read and writes than 4 and 8 hdds, where the system in generaldoes not show any sign of high cpu load at this rates.
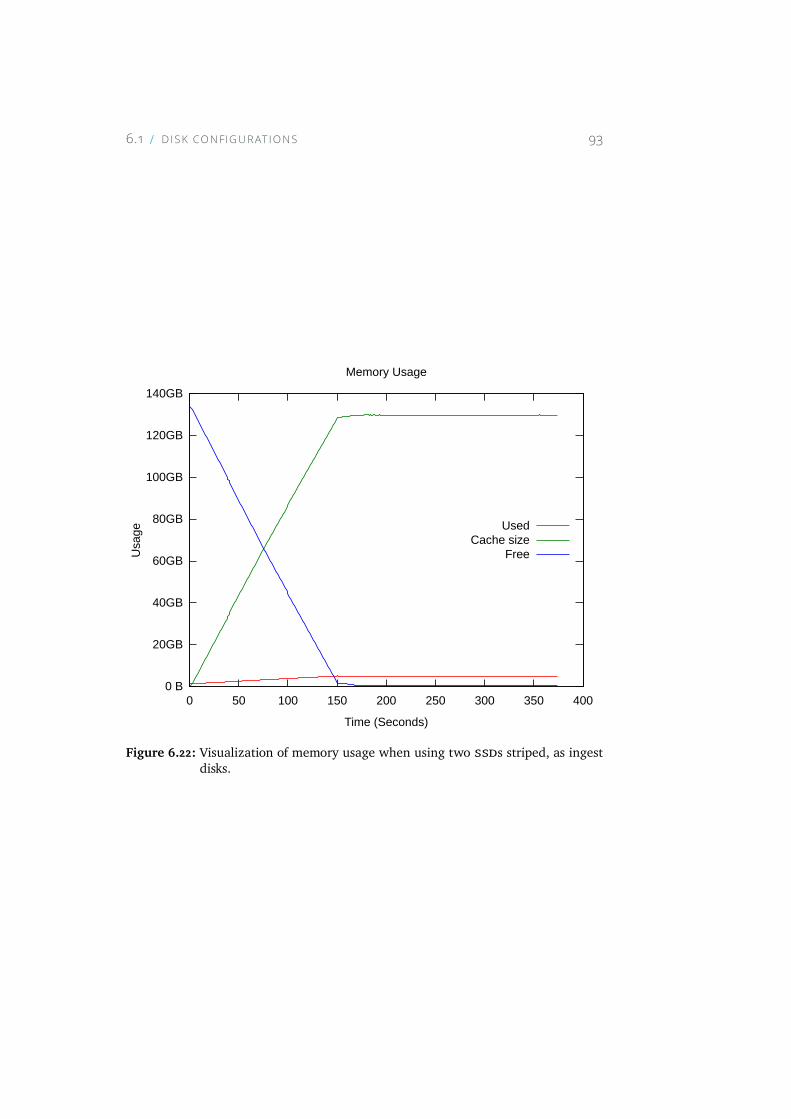
6.1 D ISK CONFIGURAT IONS 93
0 B
20GB
40GB
60GB
80GB
100GB
120GB
140GB
0 50 100 150 200 250 300 350 400
Usa
ge
Time (Seconds)
Memory Usage
UsedCache size
Free
Figure 6.22: Visualization of memory usage when using two ssds striped, as ingestdisks.
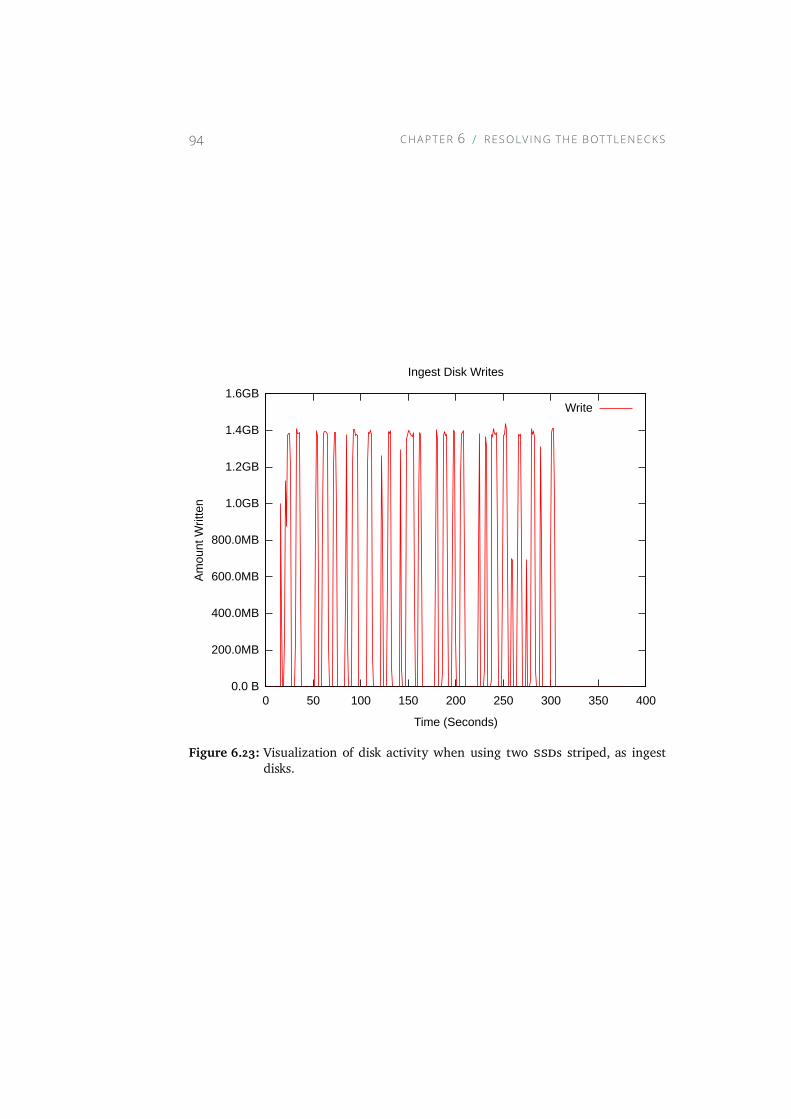
94 CHAPTER 6 RESOLV ING THE BOTTLENECKS
0.0 B
200.0MB
400.0MB
600.0MB
800.0MB
1.0GB
1.2GB
1.4GB
1.6GB
0 50 100 150 200 250 300 350 400
Am
ount
Writ
ten
Time (Seconds)
Ingest Disk Writes
Write
Figure 6.23: Visualization of disk activity when using two ssds striped, as ingestdisks.
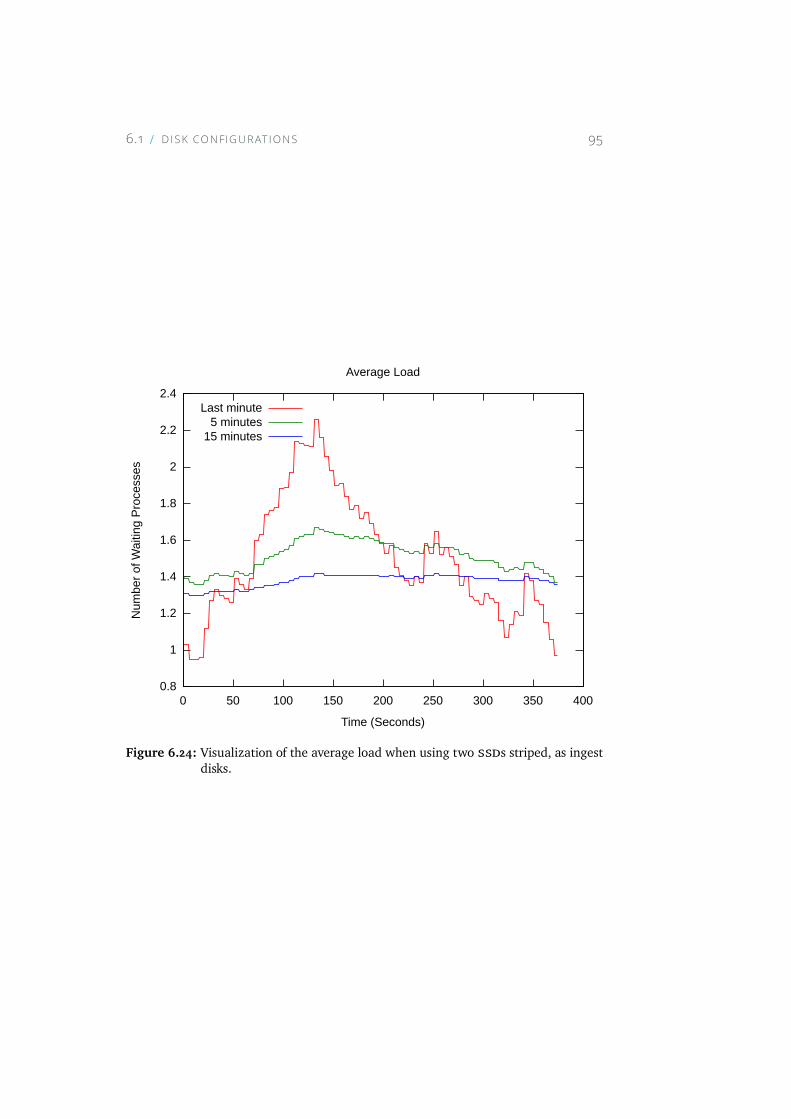
6.1 D ISK CONFIGURAT IONS 95
0.8
1
1.2
1.4
1.6
1.8
2
2.2
2.4
0 50 100 150 200 250 300 350 400
Num
ber
of W
aitin
g P
roce
sses
Time (Seconds)
Average Load
Last minute5 minutes
15 minutes
Figure 6.24: Visualization of the average load when using two ssds striped, as ingestdisks.
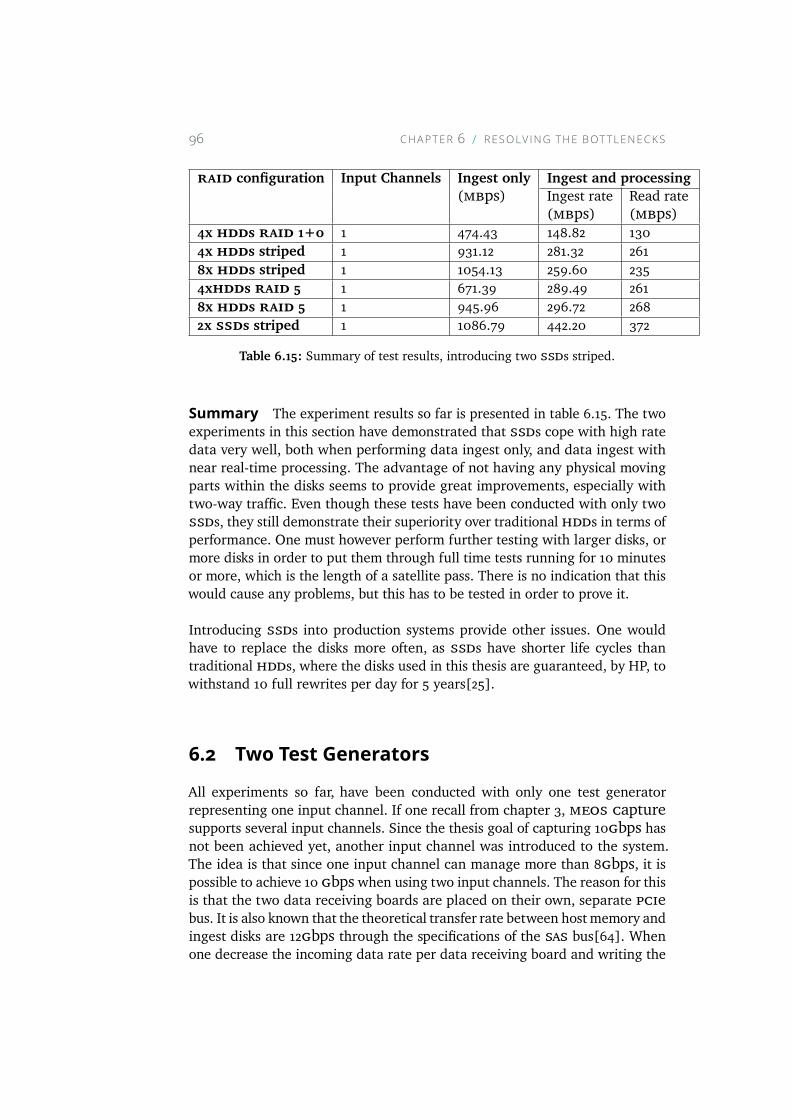
96 CHAPTER 6 RESOLV ING THE BOTTLENECKS
raid configuration Input Channels Ingest only Ingest and processing(mbps) Ingest rate Read rate
(mbps) (mbps)4x hdds raid 1+0 1 474.43 148.82 1304x hdds striped 1 931.12 281.32 2618x hdds striped 1 1054.13 259.60 2354xhdds raid 5 1 671.39 289.49 2618x hdds raid 5 1 945.96 296.72 2682x ssds striped 1 1086.79 442.20 372
Table 6.15: Summary of test results, introducing two ssds striped.
Summary The experiment results so far is presented in table 6.15. The twoexperiments in this section have demonstrated that ssds cope with high ratedata very well, both when performing data ingest only, and data ingest withnear real-time processing. The advantage of not having any physical movingparts within the disks seems to provide great improvements, especially withtwo-way traffic. Even though these tests have been conducted with only twossds, they still demonstrate their superiority over traditional hdds in terms ofperformance. One must however perform further testing with larger disks, ormore disks in order to put them through full time tests running for 10 minutesor more, which is the length of a satellite pass. There is no indication that thiswould cause any problems, but this has to be tested in order to prove it.
Introducing ssds into production systems provide other issues. One wouldhave to replace the disks more often, as ssds have shorter life cycles thantraditional hdds, where the disks used in this thesis are guaranteed, by HP, towithstand 10 full rewrites per day for 5 years[25].
6.2 Two Test GeneratorsAll experiments so far, have been conducted with only one test generatorrepresenting one input channel. If one recall from chapter 3, meos capturesupports several input channels. Since the thesis goal of capturing 10gbps hasnot been achieved yet, another input channel was introduced to the system.The idea is that since one input channel can manage more than 8gbps, it ispossible to achieve 10 gbpswhen using two input channels. The reason for thisis that the two data receiving boards are placed on their own, separate pciebus. It is also known that the theoretical transfer rate between host memory andingest disks are 12gbps through the specifications of the sas bus[64]. Whenone decrease the incoming data rate per data receiving board and writing the
6.2 TWO TEST GENERATORS 97
data generated by the two test generators to separate files, one can achievehigher combined throughput as the data run through different buses into hostmemory. From there the raid controller, os and file system takes care ofingesting the data into two separate files within the file system.
These experiments will only perform data capture in order to determine thehighest rate supported, for this specific test environment and configurations.Based on previous results, performing near real-time processing significantlylimits the ingest rate. Therefore, near real-time processing will not be testedwith this setup.
6.2.1 SSDs as Ingest DisksSince the server are equipped with two data receiving boards and the fact thatPerfio does specify what data receiving board to use, one can run two instancesof Perfio, each instance are assigned to its own data receiving board, writingdata to its own file. In terms of the analysis, no changes must be done as it runswithin the os, and the ingest disks are exposed to the os as one logical disk.The ingest disks will consist of the two ssds used in previous experiments, asthey demonstrated the best performance when performing capture only. Theexperiment runtime will be 300 seconds, because of the limitation in disk sizeas discussed in section 6.1.5.
The experiment result are presented in table 6.16, and as one can see the twoinput channels reached rates of 636.76mbps and 632.88mbps. This representsa combined rate of 1269.64mbps, which is equal to 10.16gbps. This meansthat the goal of capturing 10gbps has been achieved in this experiment. Now,as the amount of data captured at this rate became 371gb, the system havenot been tested with higher rates as the ingest disks only provide 373gb. Thedisks are not big enough to handle higher rates over 300 seconds. One coulddecrease the experiment runtime to 150 seconds, but that would be even lessrepresentative for a satellite pass making the experiment more a proof ofconcept. But the proof of concept would not be very good, because the systemtends to become vulnerable after the memory usage peaks, which is typicallyaround 100 seconds at rates above 8gbps. The system vulnerability is causedby the full disk caches which means the system are down to the raw rate atwhich the ingest disks can write in order not to overflow in memory. Therefore,it is the time after 100 seconds that is interesting where the ingest disks reallyhave to ingest data in order to not suffer from buffer overflow in ram.
As for the analysis, the graphs follow very similar patterns as demonstratedbefore. The cpu utilization visualized in figure 6.25, shows that the cpu idletime drops to between 92 and 93%, which is reflected by the usage represented
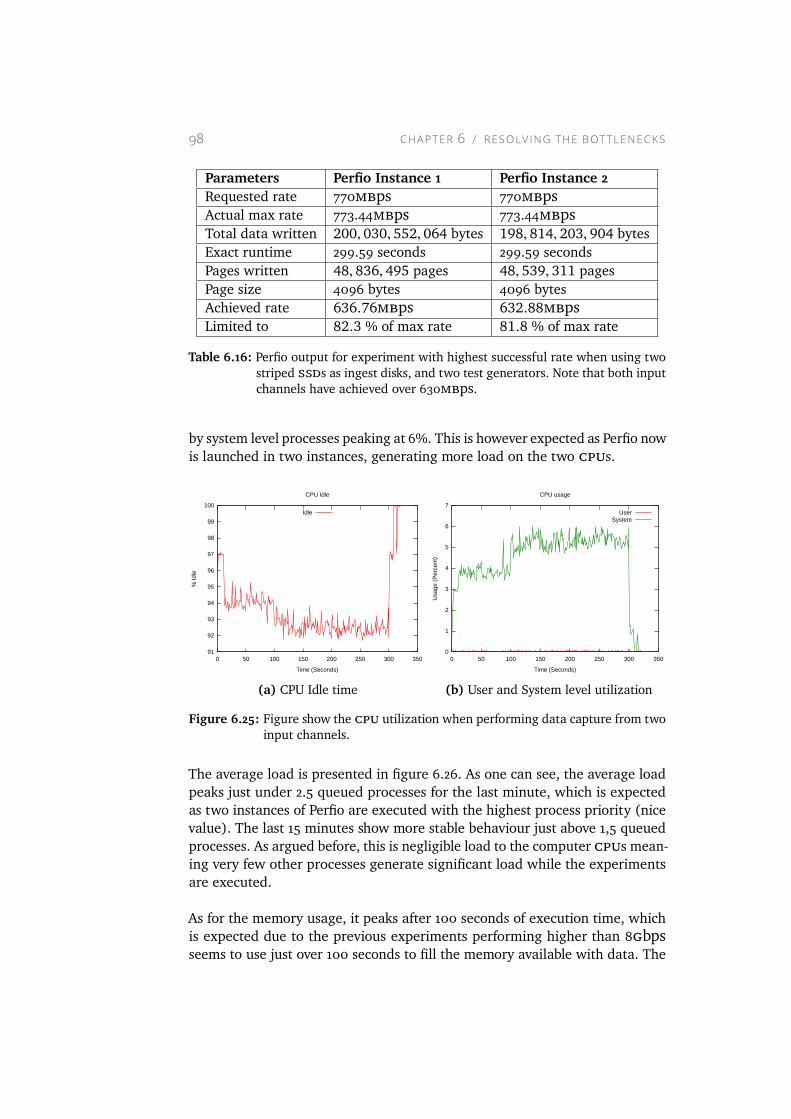
98 CHAPTER 6 RESOLV ING THE BOTTLENECKS
Parameters Perfio Instance 1 Perfio Instance 2Requested rate 770mbps 770mbpsActual max rate 773.44mbps 773.44mbpsTotal data written 200, 030, 552, 064 bytes 198, 814, 203, 904 bytesExact runtime 299.59 seconds 299.59 secondsPages written 48, 836, 495 pages 48, 539, 311 pagesPage size 4096 bytes 4096 bytesAchieved rate 636.76mbps 632.88mbpsLimited to 82.3 % of max rate 81.8 % of max rate
Table 6.16: Perfio output for experiment with highest successful rate when using twostriped ssds as ingest disks, and two test generators. Note that both inputchannels have achieved over 630mbps.
by system level processes peaking at 6%. This is however expected as Perfio nowis launched in two instances, generating more load on the two cpus.
91
92
93
94
95
96
97
98
99
100
0 50 100 150 200 250 300 350
% Id
le
Time (Seconds)
CPU Idle
Idle
(a) CPU Idle time
0
1
2
3
4
5
6
7
0 50 100 150 200 250 300 350
Usa
ge (
Per
cen
t)
Time (Seconds)
CPU usage
UserSystem
(b) User and System level utilization
Figure 6.25: Figure show the cpu utilization when performing data capture from twoinput channels.
The average load is presented in figure 6.26. As one can see, the average loadpeaks just under 2.5 queued processes for the last minute, which is expectedas two instances of Perfio are executed with the highest process priority (nicevalue). The last 15 minutes show more stable behaviour just above 1,5 queuedprocesses. As argued before, this is negligible load to the computer cpus mean-ing very few other processes generate significant load while the experimentsare executed.
As for the memory usage, it peaks after 100 seconds of execution time, whichis expected due to the previous experiments performing higher than 8gbpsseems to use just over 100 seconds to fill the memory available with data. The
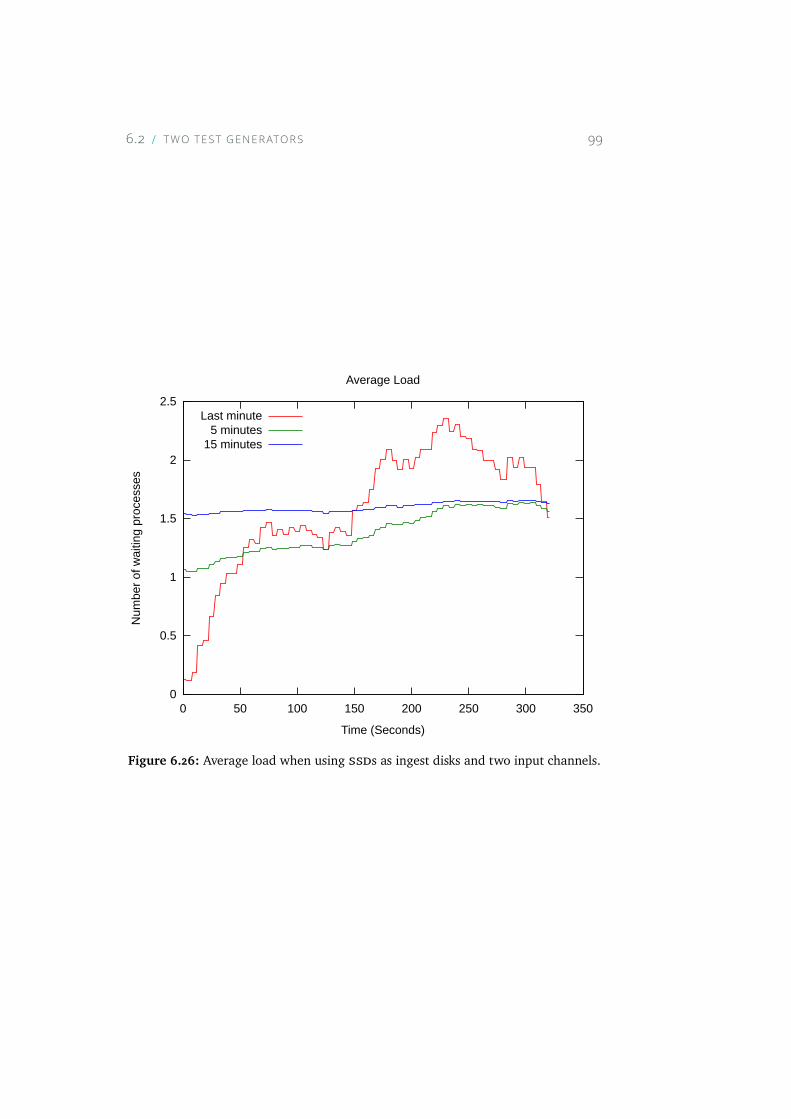
6.2 TWO TEST GENERATORS 99
0
0.5
1
1.5
2
2.5
0 50 100 150 200 250 300 350
Num
ber
of w
aitin
g pr
oces
ses
Time (Seconds)
Average Load
Last minute5 minutes
15 minutes
Figure 6.26: Average load when using ssds as ingest disks and two input channels.
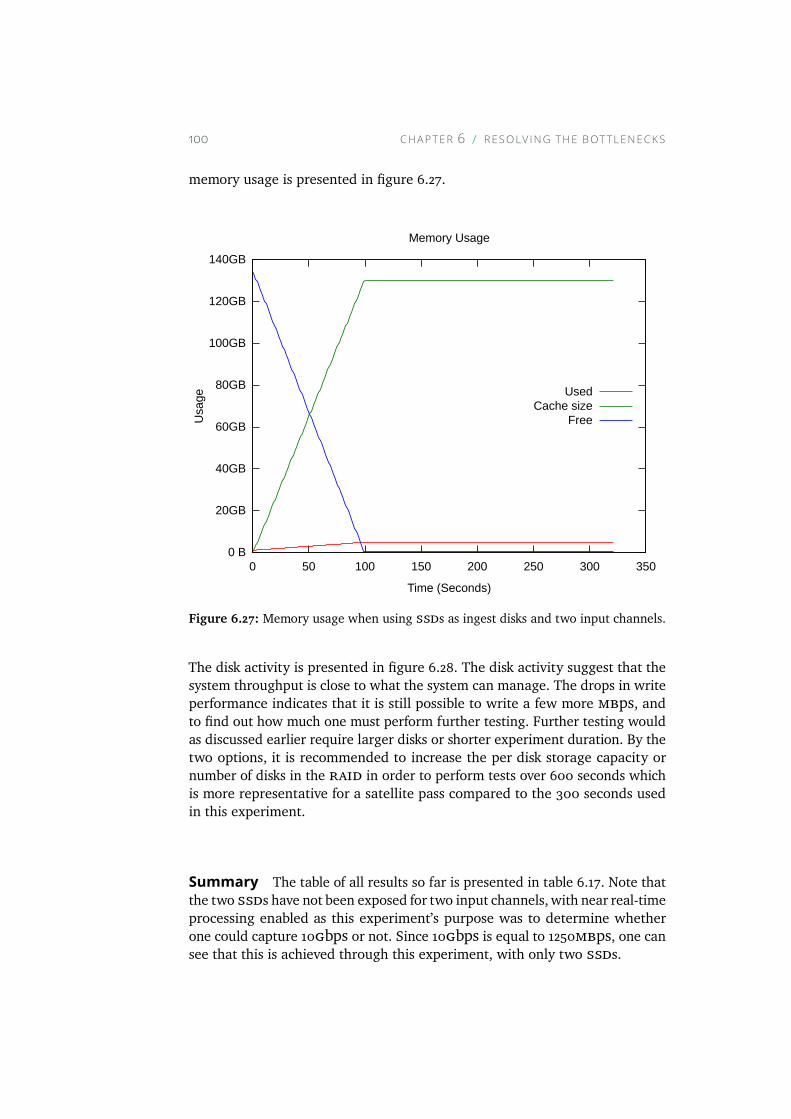
100 CHAPTER 6 RESOLV ING THE BOTTLENECKS
memory usage is presented in figure 6.27.
0 B
20GB
40GB
60GB
80GB
100GB
120GB
140GB
0 50 100 150 200 250 300 350
Usa
ge
Time (Seconds)
Memory Usage
UsedCache size
Free
Figure 6.27: Memory usage when using ssds as ingest disks and two input channels.
The disk activity is presented in figure 6.28. The disk activity suggest that thesystem throughput is close to what the system can manage. The drops in writeperformance indicates that it is still possible to write a few more mbps, andto find out how much one must perform further testing. Further testing wouldas discussed earlier require larger disks or shorter experiment duration. By thetwo options, it is recommended to increase the per disk storage capacity ornumber of disks in the raid in order to perform tests over 600 seconds whichis more representative for a satellite pass compared to the 300 seconds usedin this experiment.
Summary The table of all results so far is presented in table 6.17. Note thatthe two ssds have not been exposed for two input channels, with near real-timeprocessing enabled as this experiment’s purpose was to determine whetherone could capture 10gbps or not. Since 10gbps is equal to 1250mbps, one cansee that this is achieved through this experiment, with only two ssds.
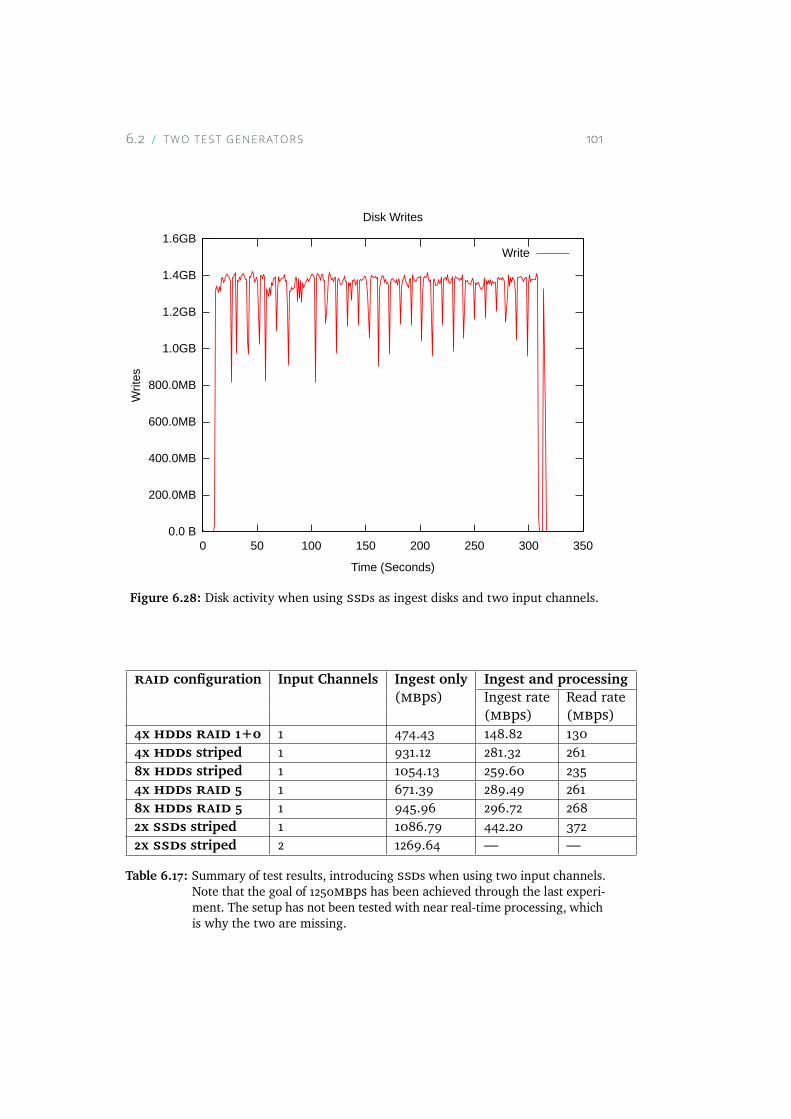
6.2 TWO TEST GENERATORS 101
0.0 B
200.0MB
400.0MB
600.0MB
800.0MB
1.0GB
1.2GB
1.4GB
1.6GB
0 50 100 150 200 250 300 350
Writ
es
Time (Seconds)
Disk Writes
Write
Figure 6.28: Disk activity when using ssds as ingest disks and two input channels.
raid configuration Input Channels Ingest only Ingest and processing(mbps) Ingest rate Read rate
(mbps) (mbps)4x hdds raid 1+0 1 474.43 148.82 1304x hdds striped 1 931.12 281.32 2618x hdds striped 1 1054.13 259.60 2354x hdds raid 5 1 671.39 289.49 2618x hdds raid 5 1 945.96 296.72 2682x ssds striped 1 1086.79 442.20 3722x ssds striped 2 1269.64 — —
Table 6.17: Summary of test results, introducing ssds when using two input channels.Note that the goal of 1250mbps has been achieved through the last experi-ment. The setup has not been tested with near real-time processing, whichis why the two are missing.
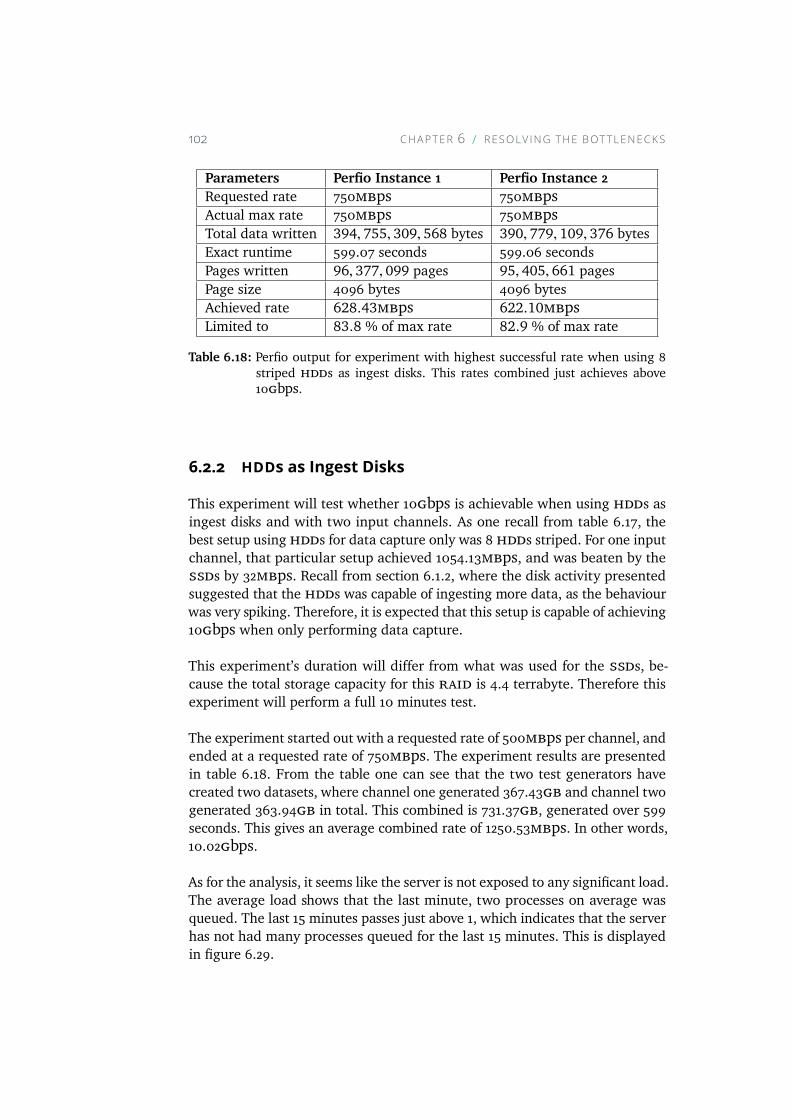
102 CHAPTER 6 RESOLV ING THE BOTTLENECKS
Parameters Perfio Instance 1 Perfio Instance 2Requested rate 750mbps 750mbpsActual max rate 750mbps 750mbpsTotal data written 394, 755, 309, 568 bytes 390, 779, 109, 376 bytesExact runtime 599.07 seconds 599.06 secondsPages written 96, 377, 099 pages 95, 405, 661 pagesPage size 4096 bytes 4096 bytesAchieved rate 628.43mbps 622.10mbpsLimited to 83.8 % of max rate 82.9 % of max rate
Table 6.18: Perfio output for experiment with highest successful rate when using 8striped hdds as ingest disks. This rates combined just achieves above10gbps.
6.2.2 HDDs as Ingest DisksThis experiment will test whether 10gbps is achievable when using hdds asingest disks and with two input channels. As one recall from table 6.17, thebest setup using hdds for data capture only was 8 hdds striped. For one inputchannel, that particular setup achieved 1054.13mbps, and was beaten by thessds by 32mbps. Recall from section 6.1.2, where the disk activity presentedsuggested that the hdds was capable of ingesting more data, as the behaviourwas very spiking. Therefore, it is expected that this setup is capable of achieving10gbps when only performing data capture.
This experiment’s duration will differ from what was used for the ssds, be-cause the total storage capacity for this raid is 4.4 terrabyte. Therefore thisexperiment will perform a full 10 minutes test.
The experiment started out with a requested rate of 500mbps per channel, andended at a requested rate of 750mbps. The experiment results are presentedin table 6.18. From the table one can see that the two test generators havecreated two datasets, where channel one generated 367.43gb and channel twogenerated 363.94gb in total. This combined is 731.37gb, generated over 599seconds. This gives an average combined rate of 1250.53mbps. In other words,10.02gbps.
As for the analysis, it seems like the server is not exposed to any significant load.The average load shows that the last minute, two processes on average wasqueued. The last 15 minutes passes just above 1, which indicates that the serverhas not had many processes queued for the last 15 minutes. This is displayedin figure 6.29.
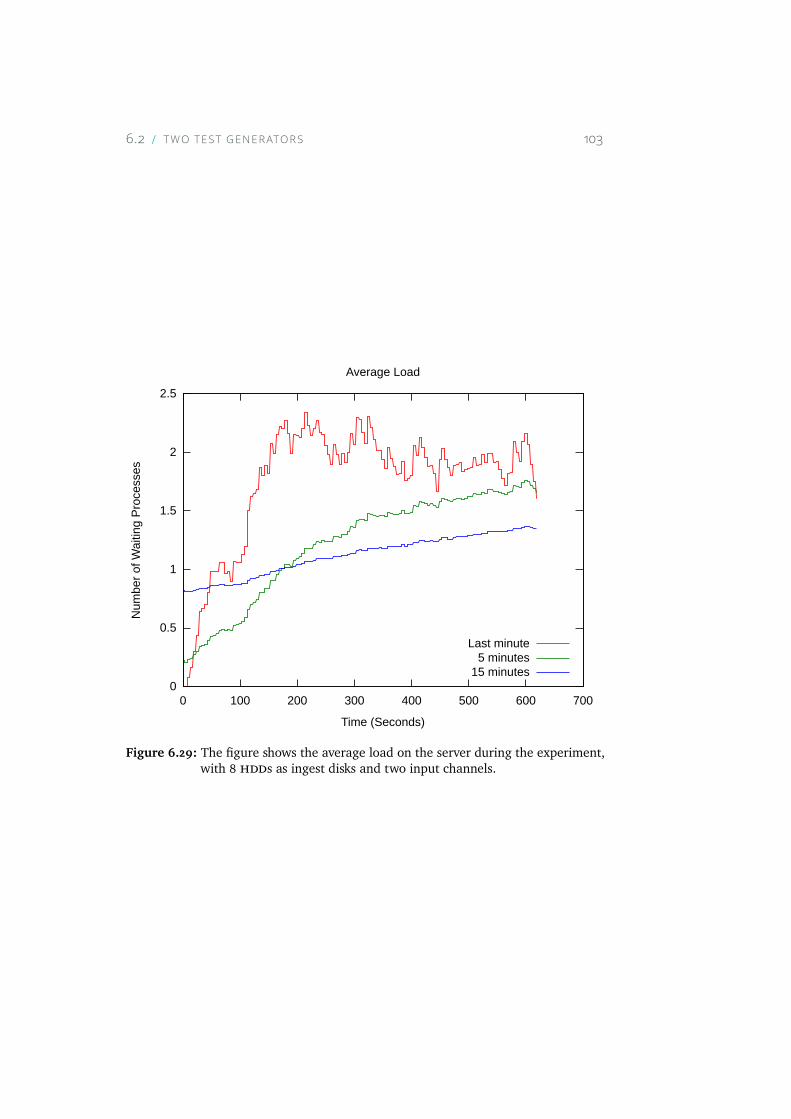
6.2 TWO TEST GENERATORS 103
0
0.5
1
1.5
2
2.5
0 100 200 300 400 500 600 700
Num
ber
of W
aitin
g P
roce
sses
Time (Seconds)
Average Load
Last minute5 minutes
15 minutes
Figure 6.29: The figure shows the average load on the server during the experiment,with 8 hdds as ingest disks and two input channels.
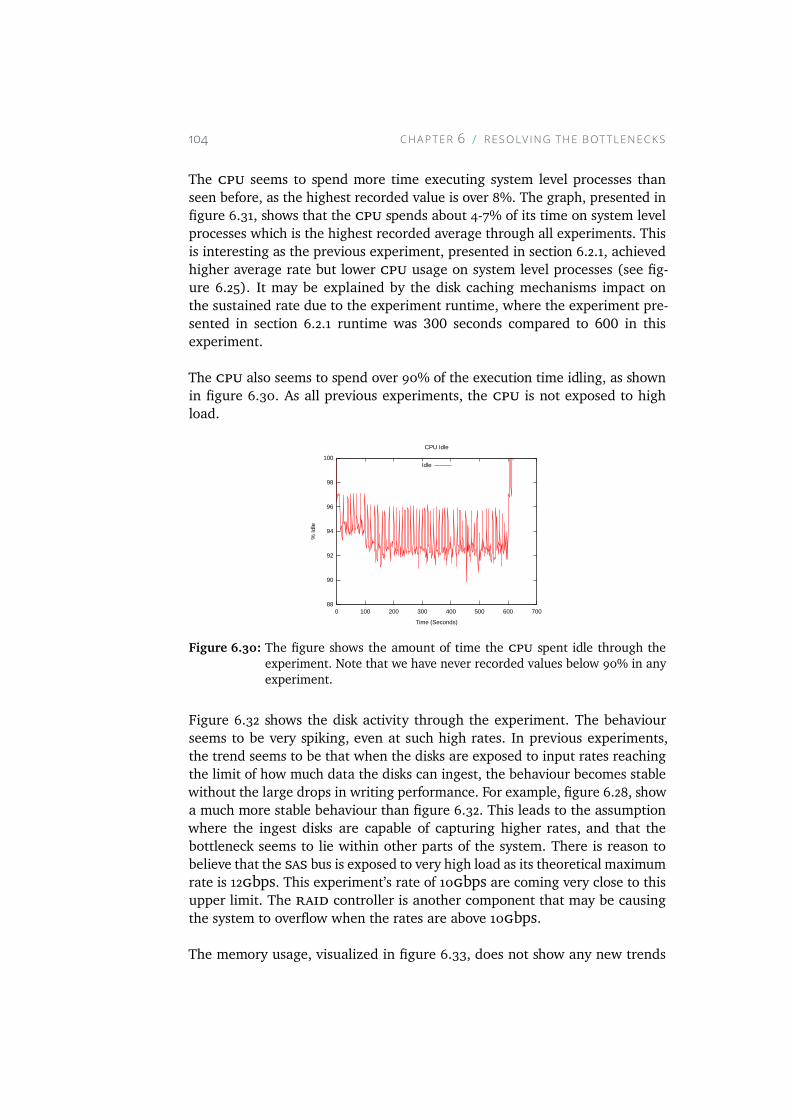
104 CHAPTER 6 RESOLV ING THE BOTTLENECKS
The cpu seems to spend more time executing system level processes thanseen before, as the highest recorded value is over 8%. The graph, presented infigure 6.31, shows that the cpu spends about 4-7% of its time on system levelprocesses which is the highest recorded average through all experiments. Thisis interesting as the previous experiment, presented in section 6.2.1, achievedhigher average rate but lower cpu usage on system level processes (see fig-ure 6.25). It may be explained by the disk caching mechanisms impact onthe sustained rate due to the experiment runtime, where the experiment pre-sented in section 6.2.1 runtime was 300 seconds compared to 600 in thisexperiment.
The cpu also seems to spend over 90% of the execution time idling, as shownin figure 6.30. As all previous experiments, the cpu is not exposed to highload.
88
90
92
94
96
98
100
0 100 200 300 400 500 600 700
% Id
le
Time (Seconds)
CPU Idle
Idle
Figure 6.30: The figure shows the amount of time the cpu spent idle through theexperiment. Note that we have never recorded values below 90% in anyexperiment.
Figure 6.32 shows the disk activity through the experiment. The behaviourseems to be very spiking, even at such high rates. In previous experiments,the trend seems to be that when the disks are exposed to input rates reachingthe limit of how much data the disks can ingest, the behaviour becomes stablewithout the large drops in writing performance. For example, figure 6.28, showa much more stable behaviour than figure 6.32. This leads to the assumptionwhere the ingest disks are capable of capturing higher rates, and that thebottleneck seems to lie within other parts of the system. There is reason tobelieve that the sas bus is exposed to very high load as its theoretical maximumrate is 12gbps. This experiment’s rate of 10gbps are coming very close to thisupper limit. The raid controller is another component that may be causingthe system to overflow when the rates are above 10gbps.
The memory usage, visualized in figure 6.33, does not show any new trends
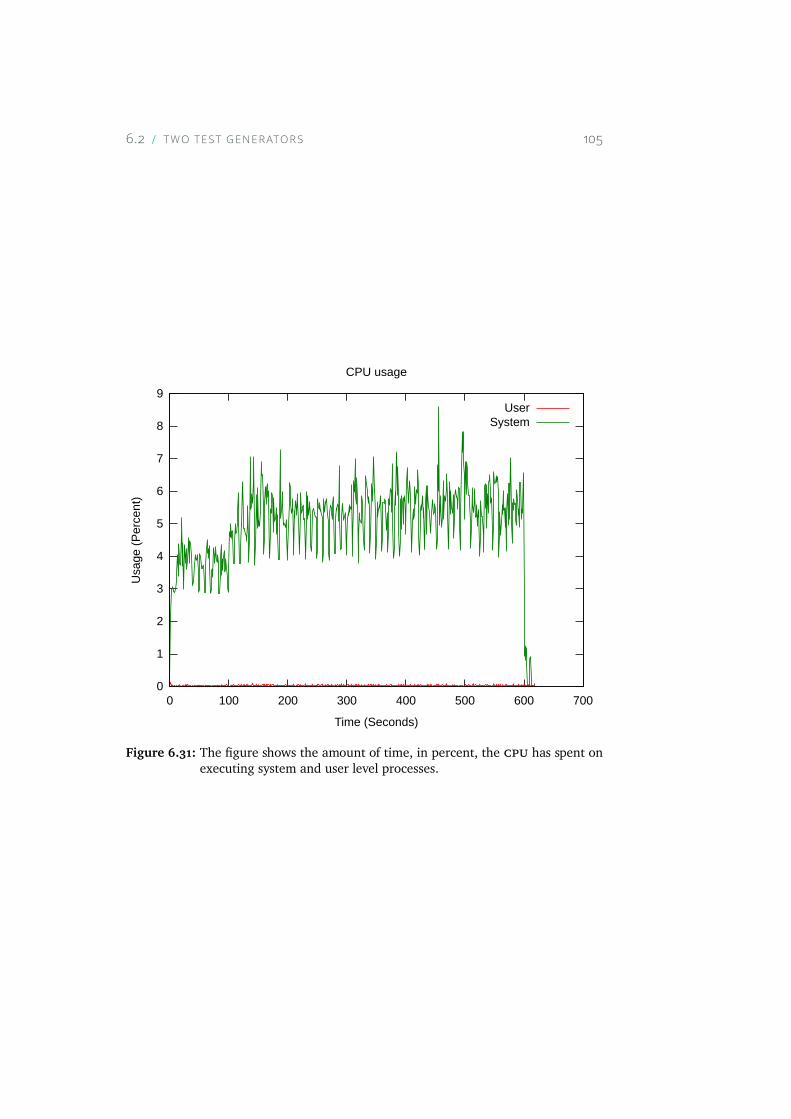
6.2 TWO TEST GENERATORS 105
0
1
2
3
4
5
6
7
8
9
0 100 200 300 400 500 600 700
Usa
ge (
Per
cen
t)
Time (Seconds)
CPU usage
UserSystem
Figure 6.31: The figure shows the amount of time, in percent, the cpu has spent onexecuting system and user level processes.
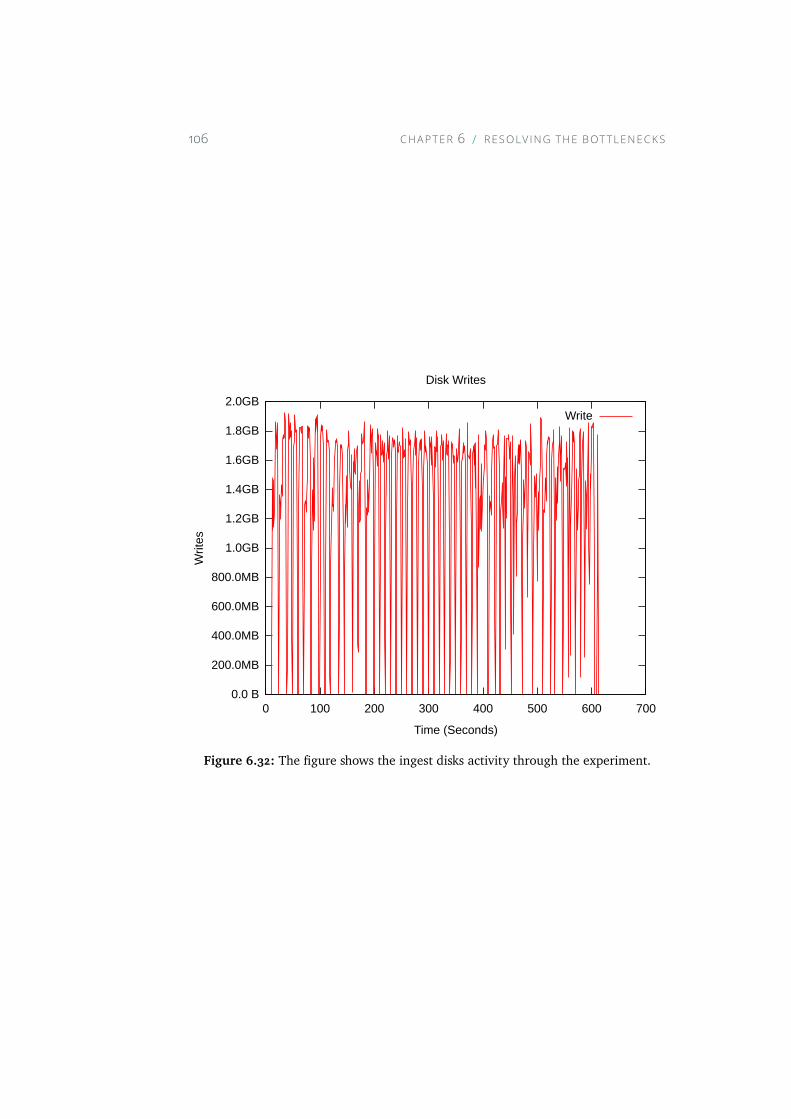
106 CHAPTER 6 RESOLV ING THE BOTTLENECKS
0.0 B
200.0MB
400.0MB
600.0MB
800.0MB
1.0GB
1.2GB
1.4GB
1.6GB
1.8GB
2.0GB
0 100 200 300 400 500 600 700
Writ
es
Time (Seconds)
Disk Writes
Write
Figure 6.32: The figure shows the ingest disks activity through the experiment.
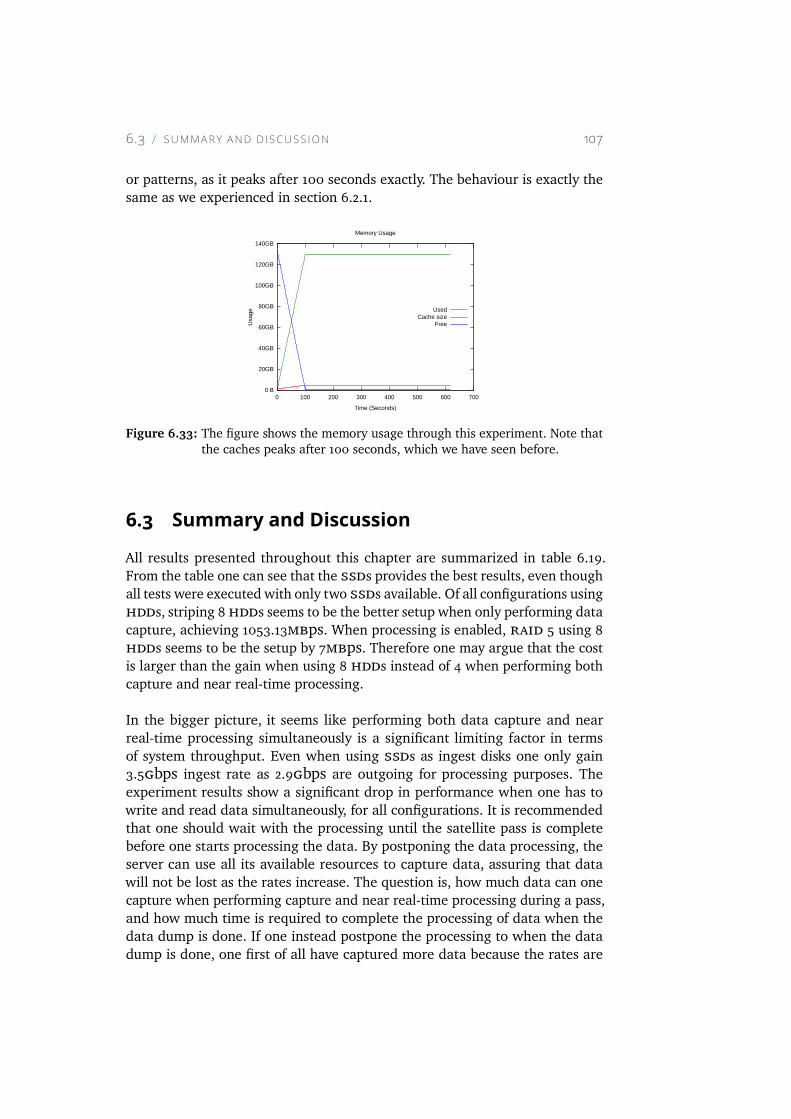
6.3 SUMMARY AND D ISCUSS ION 107
or patterns, as it peaks after 100 seconds exactly. The behaviour is exactly thesame as we experienced in section 6.2.1.
0 B
20GB
40GB
60GB
80GB
100GB
120GB
140GB
0 100 200 300 400 500 600 700
Usa
ge
Time (Seconds)
Memory Usage
UsedCache size
Free
Figure 6.33: The figure shows the memory usage through this experiment. Note thatthe caches peaks after 100 seconds, which we have seen before.
6.3 Summary and DiscussionAll results presented throughout this chapter are summarized in table 6.19.From the table one can see that the ssds provides the best results, even thoughall tests were executed with only two ssds available. Of all configurations usinghdds, striping 8hdds seems to be the better setup when only performing datacapture, achieving 1053.13mbps. When processing is enabled, raid 5 using 8hdds seems to be the setup by 7mbps. Therefore one may argue that the costis larger than the gain when using 8 hdds instead of 4 when performing bothcapture and near real-time processing.
In the bigger picture, it seems like performing both data capture and nearreal-time processing simultaneously is a significant limiting factor in termsof system throughput. Even when using ssds as ingest disks one only gain3.5gbps ingest rate as 2.9gbps are outgoing for processing purposes. Theexperiment results show a significant drop in performance when one has towrite and read data simultaneously, for all configurations. It is recommendedthat one should wait with the processing until the satellite pass is completebefore one starts processing the data. By postponing the data processing, theserver can use all its available resources to capture data, assuring that datawill not be lost as the rates increase. The question is, how much data can onecapture when performing capture and near real-time processing during a pass,and how much time is required to complete the processing of data when thedata dump is done. If one instead postpone the processing to when the datadump is done, one first of all have captured more data because the rates are
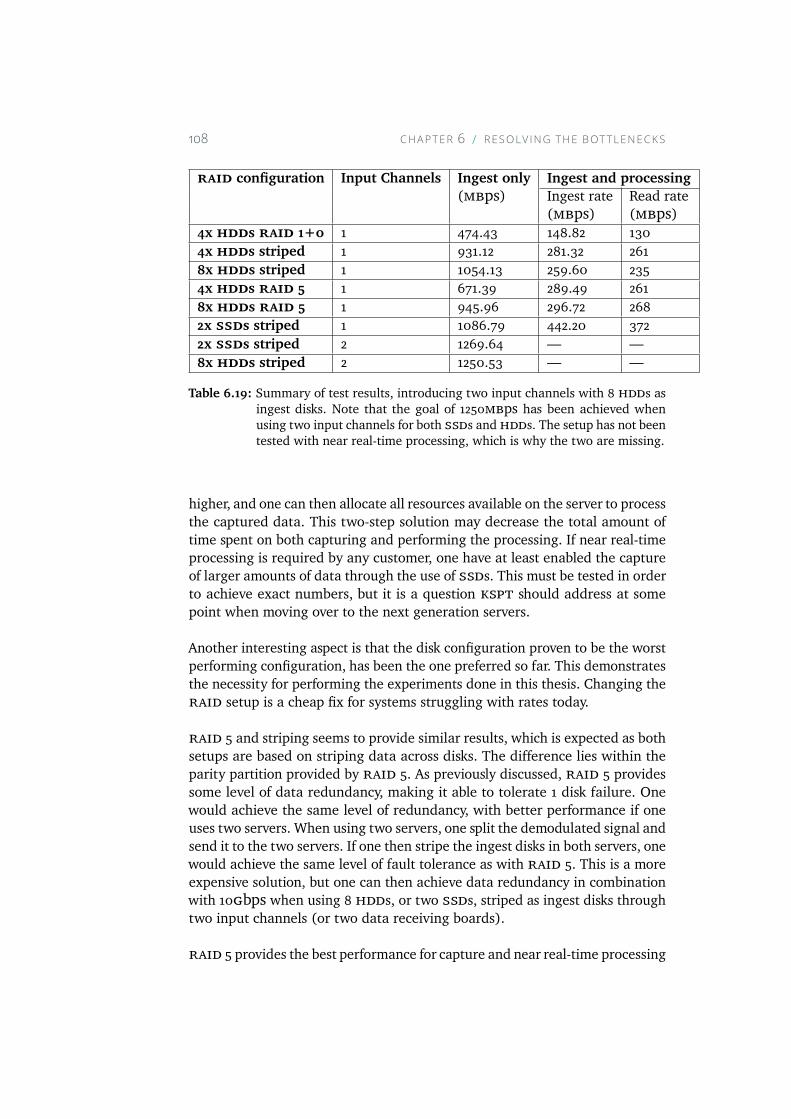
108 CHAPTER 6 RESOLV ING THE BOTTLENECKS
raid configuration Input Channels Ingest only Ingest and processing(mbps) Ingest rate Read rate
(mbps) (mbps)4x hdds raid 1+0 1 474.43 148.82 1304x hdds striped 1 931.12 281.32 2618x hdds striped 1 1054.13 259.60 2354x hdds raid 5 1 671.39 289.49 2618x hdds raid 5 1 945.96 296.72 2682x ssds striped 1 1086.79 442.20 3722x ssds striped 2 1269.64 — —8x hdds striped 2 1250.53 — —
Table 6.19: Summary of test results, introducing two input channels with 8 hdds asingest disks. Note that the goal of 1250mbps has been achieved whenusing two input channels for both ssds andhdds. The setup has not beentested with near real-time processing, which is why the two are missing.
higher, and one can then allocate all resources available on the server to processthe captured data. This two-step solution may decrease the total amount oftime spent on both capturing and performing the processing. If near real-timeprocessing is required by any customer, one have at least enabled the captureof larger amounts of data through the use of ssds. This must be tested in orderto achieve exact numbers, but it is a question kspt should address at somepoint when moving over to the next generation servers.
Another interesting aspect is that the disk configuration proven to be the worstperforming configuration, has been the one preferred so far. This demonstratesthe necessity for performing the experiments done in this thesis. Changing theraid setup is a cheap fix for systems struggling with rates today.
raid 5 and striping seems to provide similar results, which is expected as bothsetups are based on striping data across disks. The difference lies within theparity partition provided by raid 5. As previously discussed, raid 5 providessome level of data redundancy, making it able to tolerate 1 disk failure. Onewould achieve the same level of redundancy, with better performance if oneuses two servers. When using two servers, one split the demodulated signal andsend it to the two servers. If one then stripe the ingest disks in both servers, onewould achieve the same level of fault tolerance as with raid 5. This is a moreexpensive solution, but one can then achieve data redundancy in combinationwith 10gbps when using 8 hdds, or two ssds, striped as ingest disks throughtwo input channels (or two data receiving boards).
raid 5 provides the best performance for capture and near real-time processing
6.3 SUMMARY AND D ISCUSS ION 109
for both 4 and 8 hdds. In this thesis, raid 5 was not tested with ssds becauseit is required at least 3 disks in such a raid. We know, from the test results, thatssds performs much better thanhdds when performing data capture and nearreal-time processing. It would be interesting to see how ssds perform whenconfigured in raid 5. The results suggests that raid 5 may achieve betterperformance than striping when using ssds as ingest disks as well.
When performing data capture, we have seen through the experiments insection 5.3.1 that the system today supports 8.7gbps. It is expected that onecan achieve near 16gbps when using two input channels with some changesto the system. By using two raid controllers, with their own set of ingestdisks, one has reason to believe that 16gbps is achievable. That is because thedata would follow completely separate paths from the data receiving boardsto the ingest disks, except for when it is placed in host memory. The raidconfiguration is essential here. One must use either 8 hdds or two, or more,ssds striped in order to achieve such rates to disk.
If kspt implement prefetching of page descriptors, so that a list of all availablepage descriptors are stored locally on the data receiving board, it is expectedthat the system may achieve better performance per input channel. Implement-ing such a feature is recommended as one can improve the total throughputby a few gbps. If the future rates exceed 20 gbps and beyond, kspt shouldconsider moving the data receiving board to a newer version of the pcie bus.Through such a change one may exceed 10gbps per input channel, and 20gbpswith two or more input channels. Since pcie version 3.0 supports 7.7gbps perlane[54], with support for up to 32 lanes, one achieves much bigger throughputbetween the data receiving board and host memory. Such rates would alsorequire pcie version 3.0 from host memory to the raid controller, and furtherto the ingest disks. When moving over to the newest version of the pcie bus,the rates will not be supported by the sas bus, which is used between theraid controller and the ingest disks. Therefore, it is suggested that when thepcie bus is replaced with a newer version, one also changes the ingest disks tonvme disks which may be connected to the pcie bus directly. Such a setup willbe expensive, but the rates will possibly exceed 20gbps and beyond.

7ConclusionThe goal for this thesis was to create a new baseline for the use of nextgeneration HP ProLiant servers, in terms of the ability to capture very high ratedata. More specific, the goal was to test whether the system can capture a rateof 10gbpswithout data loss. To achieve this goal, I developed an analysis setup,as an overlay over already existing tools, that monitors critical componentswithin the server, which purpose was to identify bottlenecks. The analysis tooldeveloped presents much information to the user about what the computerdoes on a per second basis. Several tools were gathered within the sameterminal window through tmux. The monitoring programs used are alreadyexisting systems available in Linux os’s. The analysis tool evaluation showssome room for improvement, as some important components are notmonitored.The experiments performed in chapter 5 show that one can gain informationabout the components not monitored through isolating parts of the pipeline,in order to fill in information about the non-monitored components.
The analysis tool was used to evaluate the next generation HP ProLiant serverswith the configurations used in the current generation HP servers, as used inmeos capture as of today. The analysis shows that the ingest disks are thebottleneck, and the experiments conducted demonstrate that, with suitableconfiguration, the next generation HP ProLiant servers support rates above10gbps when performing data capture.
The experiments demonstrate that two ssds in stripe achieved a total rateof 10,1gbps when performing data capture using two input channels. One
111
112 CHAPTER 7 CONCLUS ION
does effectively achieve 5gbps per input channel, where the maximum ratedemonstrated per input channel was 8.7gbps. When performing both datacapture and near-real time processing, I demonstrate significant increase inperformance when using ssds instead ofhdds as ingest disks. The experimentsshow that with two ssds one can achieve 3.5gbps capturing rate and 2.9gbpsreading rate for processing purposes. With hdds the best setup is by using8hdds in raid 5, providing 2.3gbps capturing rate and 2.1gbps reading rate.The changes made to the system are considered low cost changes as many ofthem only require a new raid configuration. However, as the raids testedseems to provide poor scalability from 4 to 8 disks, it seems like using 8 hddsprovides more cost than what one gain as the increase in data throughput wasnot significant at all.
We have also seen through the discussion in section 6.3 that there existshardware providing far better transfer rate than used in this thesis exist, whichis why it was speculated that one could achieve more than 10gbps per inputchannel. This would however be an expensive improvement to the system askspt must develop a new data receiving board with support for pcie version3.0 or newer. It would also require a new set of raid controllers, and disksused in the ingest raid.
The work performed through this thesis has been limited to the equipmentavailable in the server provided by kspt. No further hardware was madeavailable through the thesis, and it is known that there exist hardware withbetter specifications. Another limitation is obviously that the thesis must becompleted within the time constraints of the semester.
Some lessons learned through this project is that it is wise to start early and failearly. One can detect flaws and errors before the “point of no return”, whereone do not have time to change them before delivery. Make decisions early, andbe faithful to the decisions made. These lessons was put to the test through thisthesis, and they made the whole process of completing this thesis much moreenjoyable. With this, the thesis is concluded by outlining future work.
7.1 Future WorkThe topics I did not have time to explore as much as desired, or at all, arepresented. The server still possess a large potential for improvement, and theareas for improvement are addressed in this section.
Exploring the features for supporting large transfer rates in software, such asthe file system used would be a natural step towards higher rates, as some file
7.1 FUTURE WORK 113
systems may be more effective in terms of throughput to disk. Many file systems,such as XFS which is used in this thesis, keep track of changes done (also knownas journaling) to the file system which generate overhead. Other file systemsworth testing are Btrfs[59], as it has support for both ssds¹ and hdds. Italso has raid support built into the file system. The negative side of Btrfs, isthat it does a lot of housekeeping which increase the overhead per write. It ishowever possible that it would increase the overall performance.
When using two input channels, exploring the use of two raid controllerscan be an improvement to the system. Through two raid controllers oneallows two sets of ingest disks each with its own raid controller, connectedwith separate pcie buses. This could increase the performance, as the datafrom both channels only share the address space in the os kernel and hostmemory along the pipeline. It is also expected that one could increase theperformance when performing data capture and near-real time processingthrough the use of two raid controllers and two input channels. This woulddecrease the total load generated per controller, which may provide betteroverall throughput.
The satellite industry faces transmission rates of 10gbps in near future. Atsome point kspt must consider moving their data receiving board over to anewer version of the pcie bus, because the server supports pcie version 3.0.The backward compatibility within the pcie bus enables the use of the datareceiving board with pcie version 2.0. This would require nvme disks in orderto ingest the incoming rate. This is regarded as an expensive solution as thenvme disks can cost 6.000$ and more[24], and it would require large amountof development to accomplish as one must develop a new set of drivers for thedata receiving board.
According to Network Computing[49], HP will introduce a new series of non-volatile ram. This means data can be stored persistently in ram even underunexpected events such as the loss of power. This can be used to store a satellitepass in ram instead of disks as the ram provide persistent storage. With suchmemory, one can remove several components from meos capture used today.Examples are the ingest disks, raid controller and sas controller, which allhave been suspected as the bottleneck when the rate increases. Not much areknown about such technology yet, as they are not available on the market. Oneproblem is however the amount of provided storage per ram brick, in additionto the price tag.
The kernel buffer size has not been exploited as much as it should have in this
1. Evenly distribute write accesses across the whole disk in order to increase the expectedlife time.
114 CHAPTER 7 CONCLUS ION
thesis. Therefore it would be a natural step to play around with different buffersizes. It is especially important when performing data capture and near-realtime processing, as the kernel buffer space is temporary storage before it iswritten to disk. It is expected that using a larger buffer size can reduce the riskof buffer overflows, creating a system much more tolerant against drops in diskwriting performance as we have seen through the experiments.
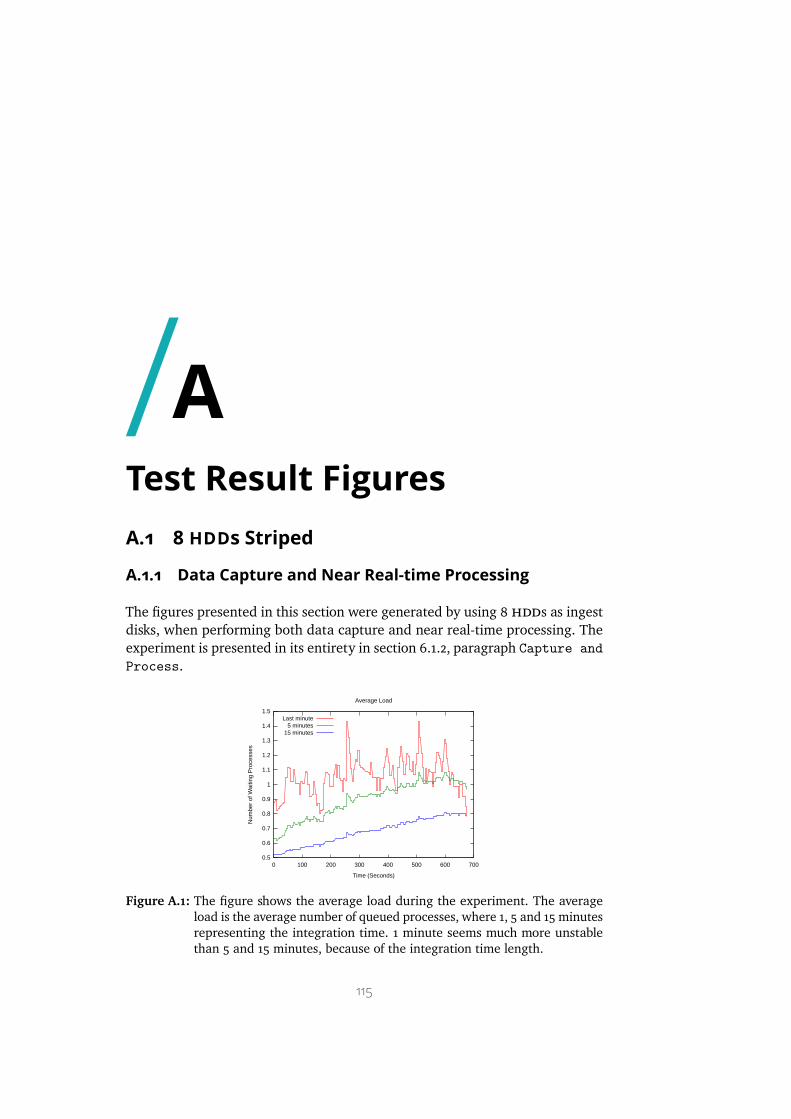
ATest Result FiguresA.1 8 HDDs StripedA.1.1 Data Capture and Near Real-time ProcessingThe figures presented in this section were generated by using 8 hdds as ingestdisks, when performing both data capture and near real-time processing. Theexperiment is presented in its entirety in section 6.1.2, paragraph Capture andProcess.
0.5
0.6
0.7
0.8
0.9
1
1.1
1.2
1.3
1.4
1.5
0 100 200 300 400 500 600 700
Num
ber
of W
aitin
g P
roce
sses
Time (Seconds)
Average Load
Last minute5 minutes
15 minutes
Figure A.1: The figure shows the average load during the experiment. The averageload is the average number of queued processes, where 1, 5 and 15 minutesrepresenting the integration time. 1 minute seems much more unstablethan 5 and 15 minutes, because of the integration time length.
115
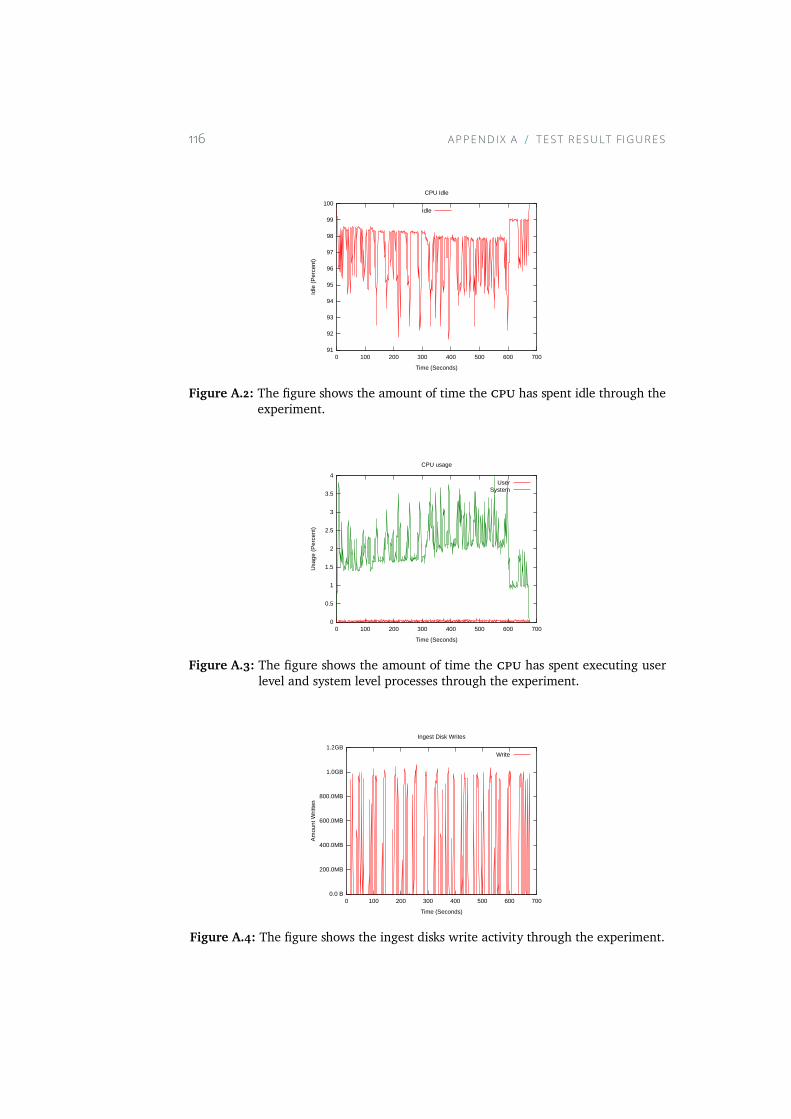
116 APPEND IX A TEST RESULT FIGURES
91
92
93
94
95
96
97
98
99
100
0 100 200 300 400 500 600 700
Idle
(P
erc
ent)
Time (Seconds)
CPU Idle
Idle
Figure A.2: The figure shows the amount of time the cpu has spent idle through theexperiment.
0
0.5
1
1.5
2
2.5
3
3.5
4
0 100 200 300 400 500 600 700
Usa
ge (
Per
cen
t)
Time (Seconds)
CPU usage
UserSystem
Figure A.3: The figure shows the amount of time the cpu has spent executing userlevel and system level processes through the experiment.
0.0 B
200.0MB
400.0MB
600.0MB
800.0MB
1.0GB
1.2GB
0 100 200 300 400 500 600 700
Am
ount
Writ
ten
Time (Seconds)
Ingest Disk Writes
Write
Figure A.4: The figure shows the ingest disks write activity through the experiment.
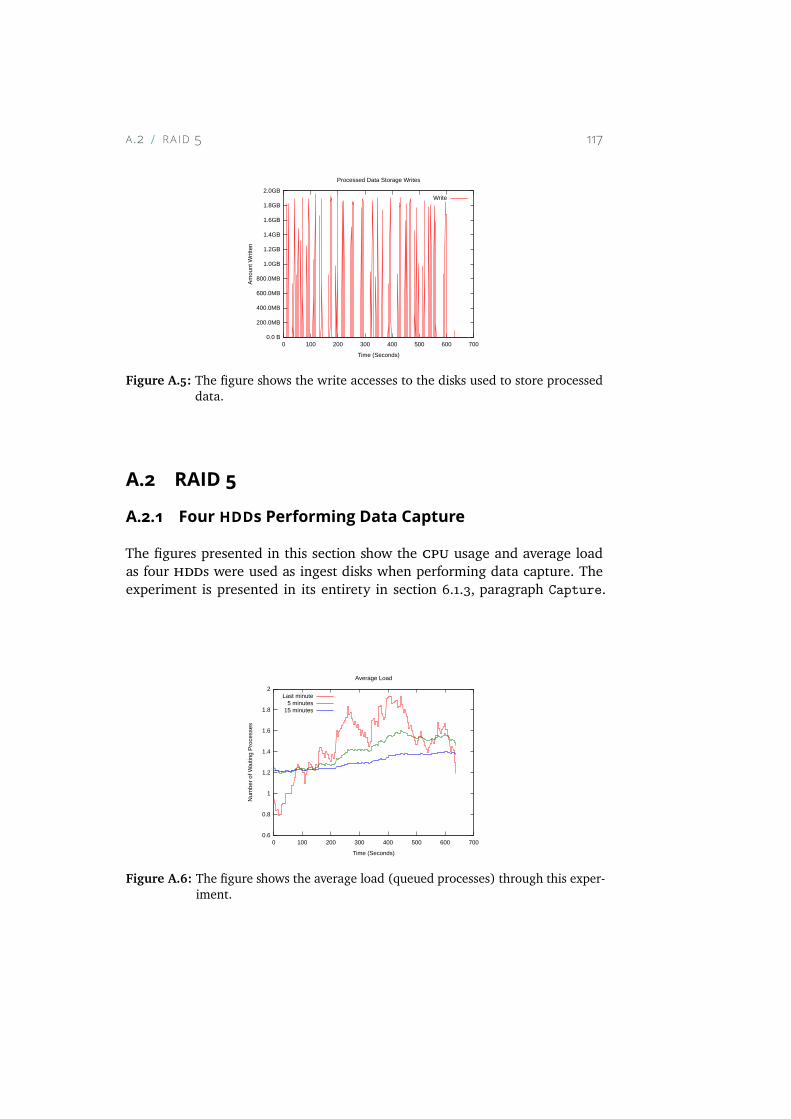
A .2 RA ID 5 117
0.0 B
200.0MB
400.0MB
600.0MB
800.0MB
1.0GB
1.2GB
1.4GB
1.6GB
1.8GB
2.0GB
0 100 200 300 400 500 600 700
Am
ount
Writ
ten
Time (Seconds)
Processed Data Storage Writes
Write
Figure A.5: The figure shows the write accesses to the disks used to store processeddata.
A.2 RAID 5A.2.1 Four HDDs Performing Data CaptureThe figures presented in this section show the cpu usage and average loadas four hdds were used as ingest disks when performing data capture. Theexperiment is presented in its entirety in section 6.1.3, paragraph Capture.
0.6
0.8
1
1.2
1.4
1.6
1.8
2
0 100 200 300 400 500 600 700
Num
ber
of W
aitin
g P
roce
sses
Time (Seconds)
Average Load
Last minute5 minutes
15 minutes
Figure A.6: The figure shows the average load (queued processes) through this exper-iment.
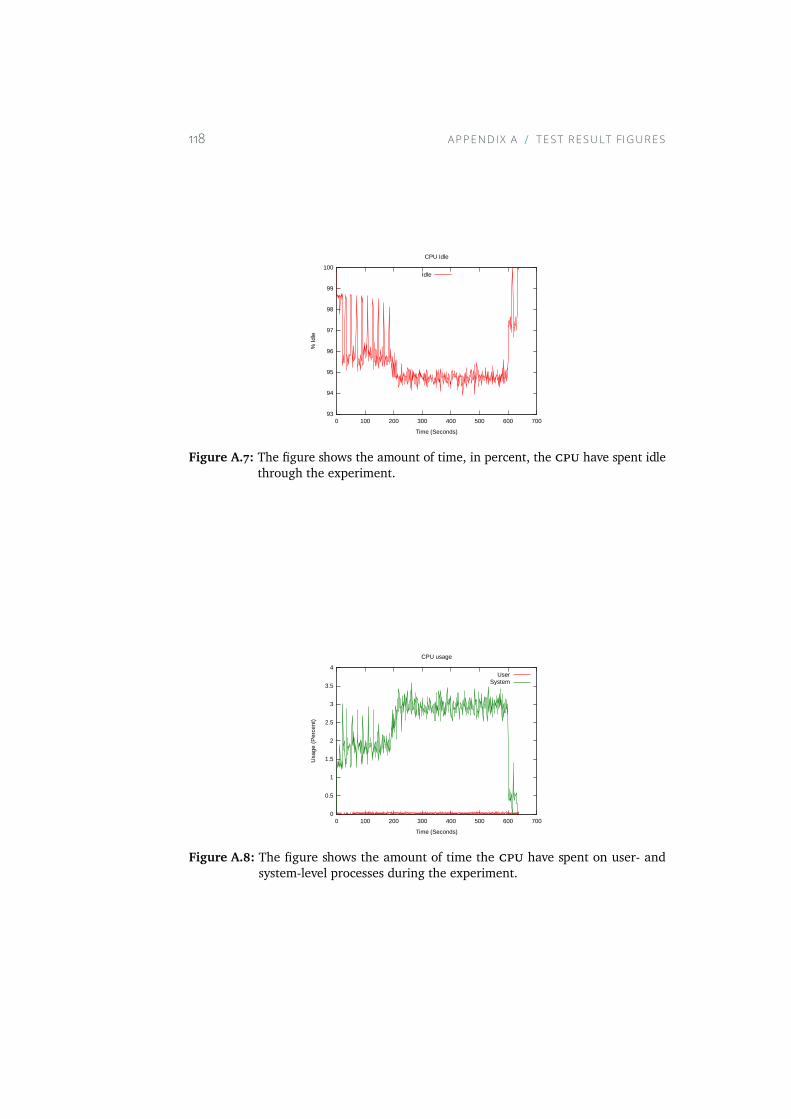
118 APPEND IX A TEST RESULT FIGURES
93
94
95
96
97
98
99
100
0 100 200 300 400 500 600 700
% Id
le
Time (Seconds)
CPU Idle
Idle
Figure A.7: The figure shows the amount of time, in percent, the cpu have spent idlethrough the experiment.
0
0.5
1
1.5
2
2.5
3
3.5
4
0 100 200 300 400 500 600 700
Usa
ge (
Per
cen
t)
Time (Seconds)
CPU usage
UserSystem
Figure A.8: The figure shows the amount of time the cpu have spent on user- andsystem-level processes during the experiment.
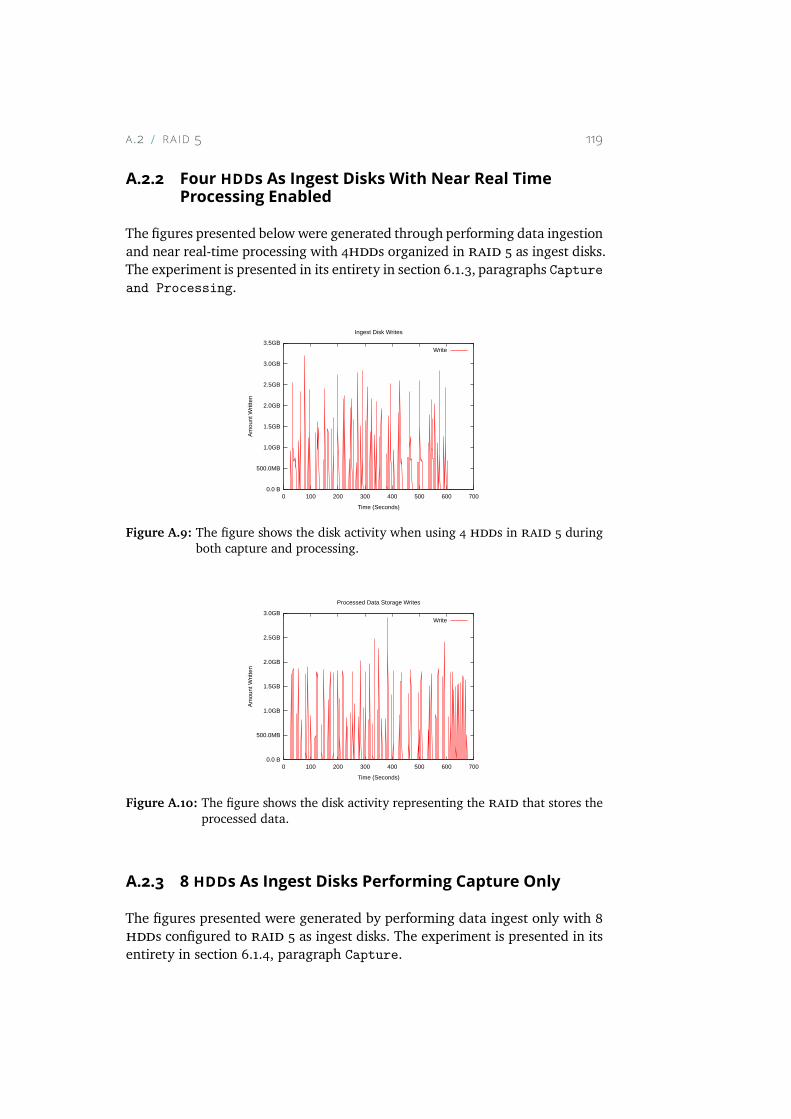
A .2 RA ID 5 119
A.2.2 Four HDDs As Ingest Disks With Near Real TimeProcessing Enabled
The figures presented belowwere generated through performing data ingestionand near real-time processing with 4hdds organized in raid 5 as ingest disks.The experiment is presented in its entirety in section 6.1.3, paragraphs Captureand Processing.
0.0 B
500.0MB
1.0GB
1.5GB
2.0GB
2.5GB
3.0GB
3.5GB
0 100 200 300 400 500 600 700
Am
ount
Writ
ten
Time (Seconds)
Ingest Disk Writes
Write
Figure A.9: The figure shows the disk activity when using 4 hdds in raid 5 duringboth capture and processing.
0.0 B
500.0MB
1.0GB
1.5GB
2.0GB
2.5GB
3.0GB
0 100 200 300 400 500 600 700
Am
ount
Writ
ten
Time (Seconds)
Processed Data Storage Writes
Write
Figure A.10: The figure shows the disk activity representing the raid that stores theprocessed data.
A.2.3 8 HDDs As Ingest Disks Performing Capture OnlyThe figures presented were generated by performing data ingest only with 8hdds configured to raid 5 as ingest disks. The experiment is presented in itsentirety in section 6.1.4, paragraph Capture.
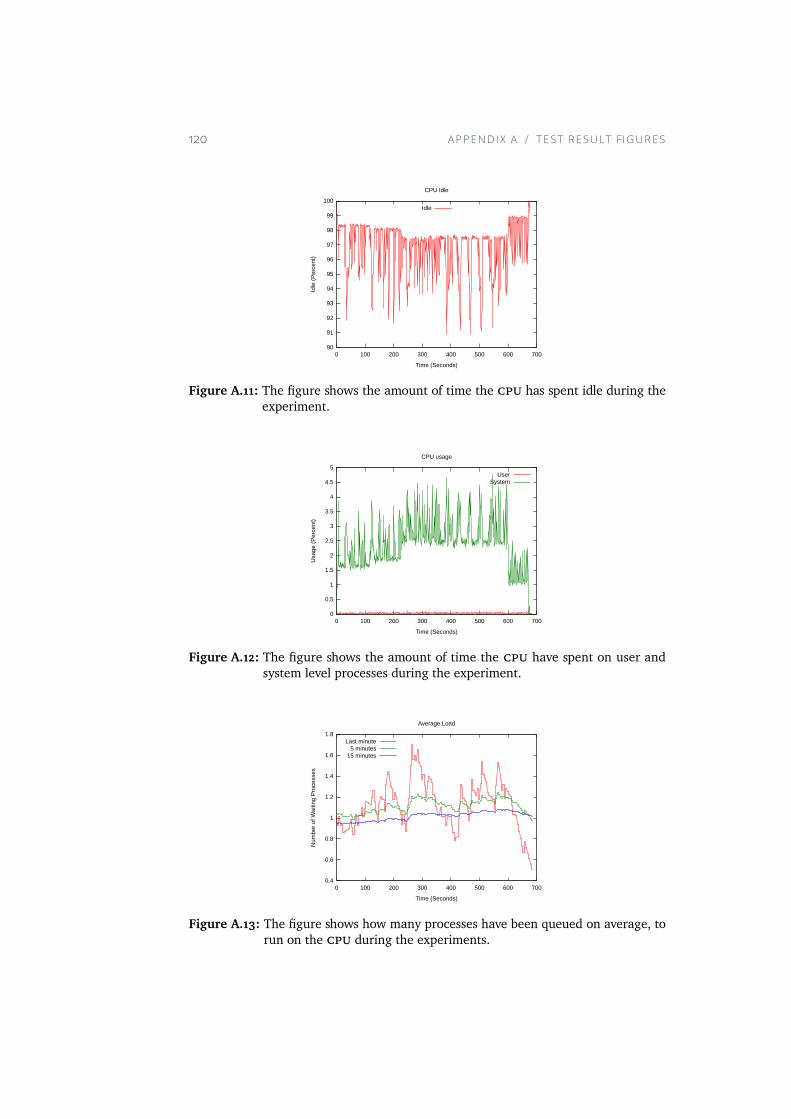
120 APPEND IX A TEST RESULT FIGURES
90
91
92
93
94
95
96
97
98
99
100
0 100 200 300 400 500 600 700
Idle
(P
erc
ent)
Time (Seconds)
CPU Idle
Idle
Figure A.11: The figure shows the amount of time the cpu has spent idle during theexperiment.
0
0.5
1
1.5
2
2.5
3
3.5
4
4.5
5
0 100 200 300 400 500 600 700
Usa
ge (
Per
cen
t)
Time (Seconds)
CPU usage
UserSystem
Figure A.12: The figure shows the amount of time the cpu have spent on user andsystem level processes during the experiment.
0.4
0.6
0.8
1
1.2
1.4
1.6
1.8
0 100 200 300 400 500 600 700
Num
ber
of W
aitin
g P
roce
sses
Time (Seconds)
Average Load
Last minute5 minutes
15 minutes
Figure A.13: The figure shows how many processes have been queued on average, torun on the cpu during the experiments.
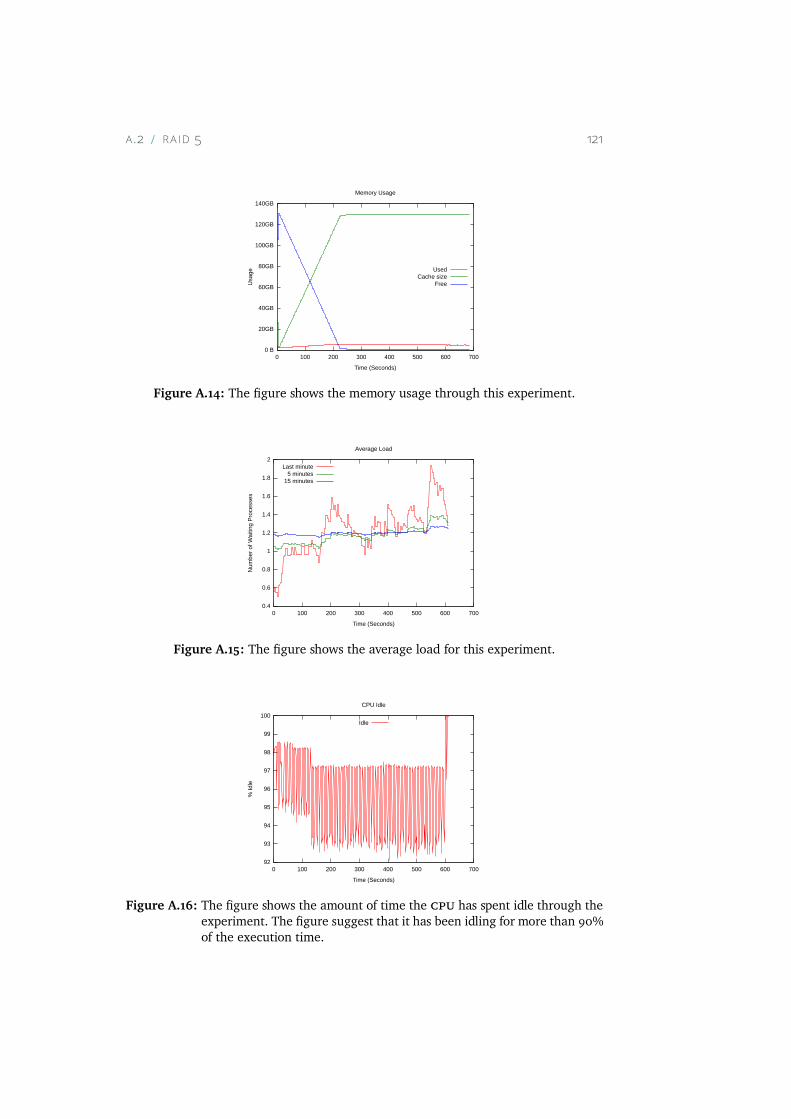
A .2 RA ID 5 121
0 B
20GB
40GB
60GB
80GB
100GB
120GB
140GB
0 100 200 300 400 500 600 700
Usa
ge
Time (Seconds)
Memory Usage
UsedCache size
Free
Figure A.14: The figure shows the memory usage through this experiment.
0.4
0.6
0.8
1
1.2
1.4
1.6
1.8
2
0 100 200 300 400 500 600 700
Num
ber
of W
aitin
g P
roce
sses
Time (Seconds)
Average Load
Last minute5 minutes
15 minutes
Figure A.15: The figure shows the average load for this experiment.
92
93
94
95
96
97
98
99
100
0 100 200 300 400 500 600 700
% Id
le
Time (Seconds)
CPU Idle
Idle
Figure A.16: The figure shows the amount of time the cpu has spent idle through theexperiment. The figure suggest that it has been idling for more than 90%of the execution time.
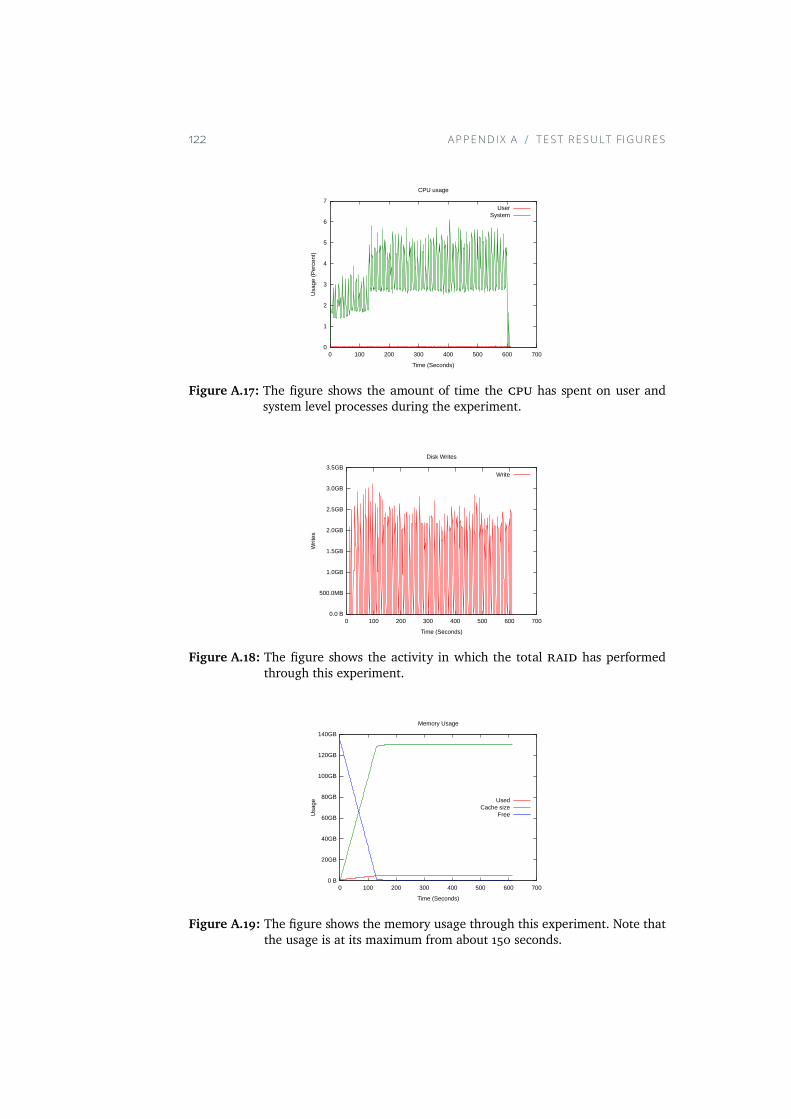
122 APPEND IX A TEST RESULT FIGURES
0
1
2
3
4
5
6
7
0 100 200 300 400 500 600 700
Usa
ge (
Per
cen
t)
Time (Seconds)
CPU usage
UserSystem
Figure A.17: The figure shows the amount of time the cpu has spent on user andsystem level processes during the experiment.
0.0 B
500.0MB
1.0GB
1.5GB
2.0GB
2.5GB
3.0GB
3.5GB
0 100 200 300 400 500 600 700
Writ
es
Time (Seconds)
Disk Writes
Write
Figure A.18: The figure shows the activity in which the total raid has performedthrough this experiment.
0 B
20GB
40GB
60GB
80GB
100GB
120GB
140GB
0 100 200 300 400 500 600 700
Usa
ge
Time (Seconds)
Memory Usage
UsedCache size
Free
Figure A.19: The figure shows the memory usage through this experiment. Note thatthe usage is at its maximum from about 150 seconds.
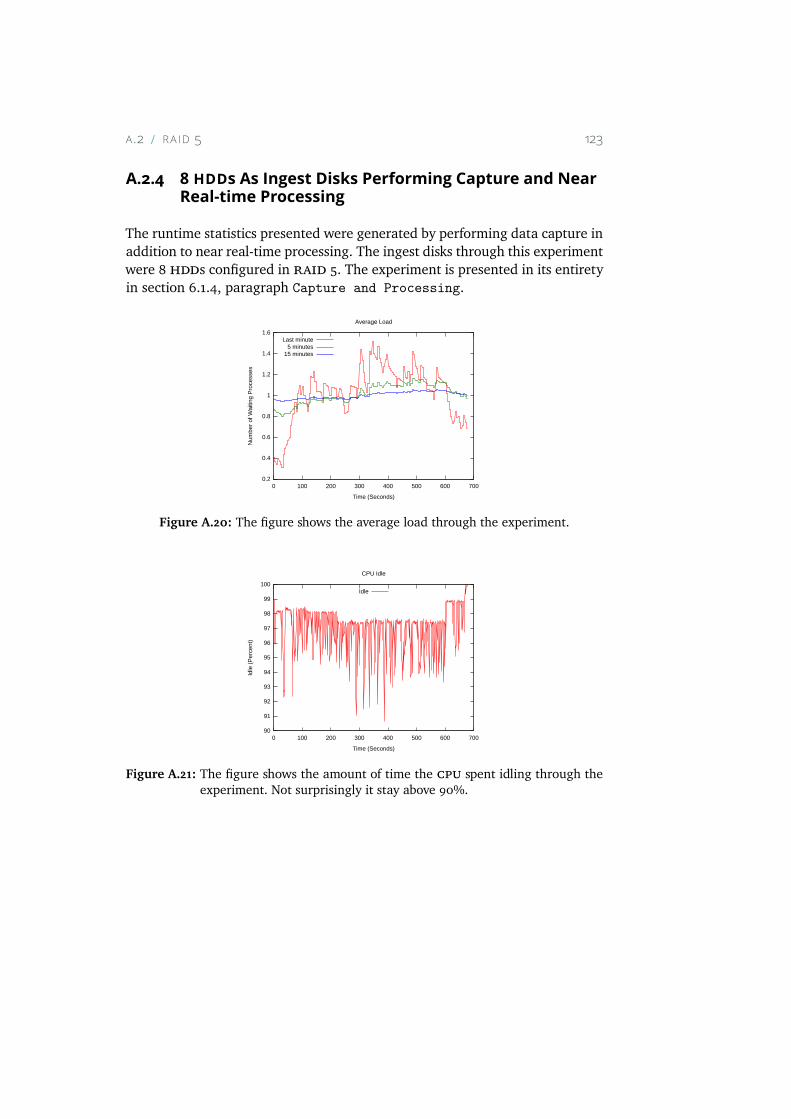
A .2 RA ID 5 123
A.2.4 8 HDDs As Ingest Disks Performing Capture and NearReal-time Processing
The runtime statistics presented were generated by performing data capture inaddition to near real-time processing. The ingest disks through this experimentwere 8 hdds configured in raid 5. The experiment is presented in its entiretyin section 6.1.4, paragraph Capture and Processing.
0.2
0.4
0.6
0.8
1
1.2
1.4
1.6
0 100 200 300 400 500 600 700
Num
ber
of W
aitin
g P
roce
sses
Time (Seconds)
Average Load
Last minute5 minutes
15 minutes
Figure A.20: The figure shows the average load through the experiment.
90
91
92
93
94
95
96
97
98
99
100
0 100 200 300 400 500 600 700
Idle
(P
erc
ent)
Time (Seconds)
CPU Idle
Idle
Figure A.21: The figure shows the amount of time the cpu spent idling through theexperiment. Not surprisingly it stay above 90%.
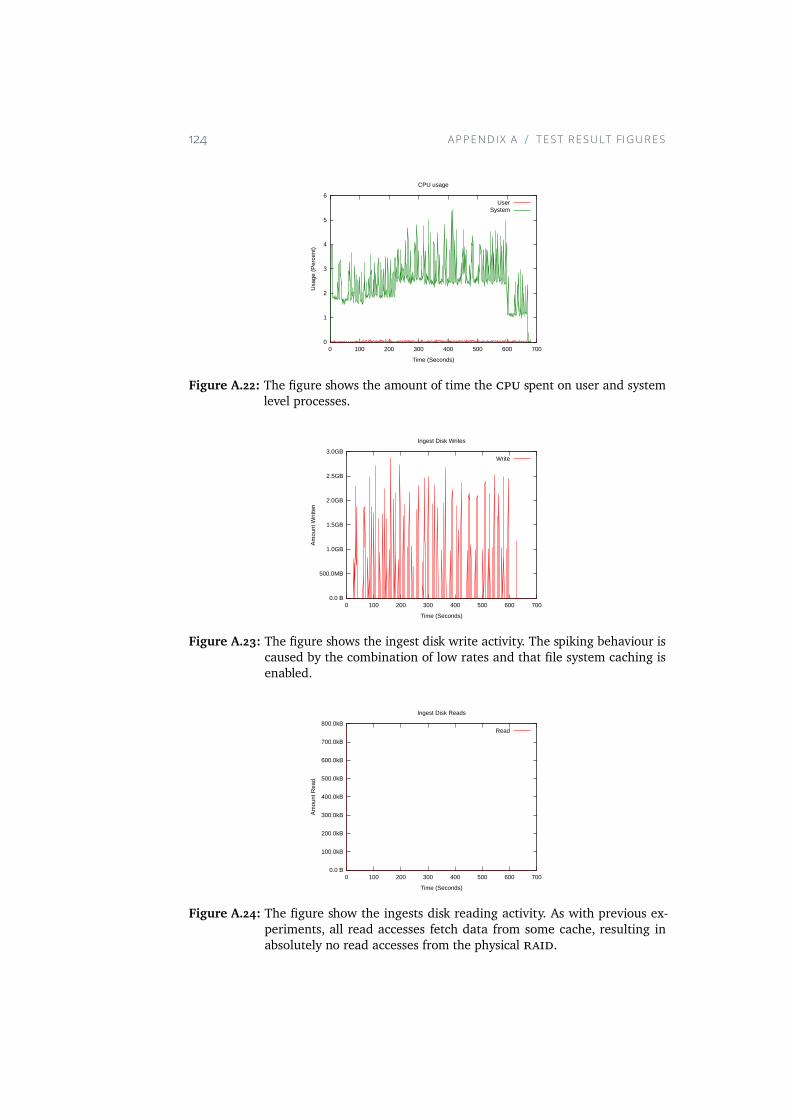
124 APPEND IX A TEST RESULT FIGURES
0
1
2
3
4
5
6
0 100 200 300 400 500 600 700
Usa
ge (
Per
cen
t)
Time (Seconds)
CPU usage
UserSystem
Figure A.22: The figure shows the amount of time the cpu spent on user and systemlevel processes.
0.0 B
500.0MB
1.0GB
1.5GB
2.0GB
2.5GB
3.0GB
0 100 200 300 400 500 600 700
Am
ount
Writ
ten
Time (Seconds)
Ingest Disk Writes
Write
Figure A.23: The figure shows the ingest disk write activity. The spiking behaviour iscaused by the combination of low rates and that file system caching isenabled.
0.0 B
100.0kB
200.0kB
300.0kB
400.0kB
500.0kB
600.0kB
700.0kB
800.0kB
0 100 200 300 400 500 600 700
Am
ount
Rea
d
Time (Seconds)
Ingest Disk Reads
Read
Figure A.24: The figure show the ingests disk reading activity. As with previous ex-periments, all read accesses fetch data from some cache, resulting inabsolutely no read accesses from the physical raid.
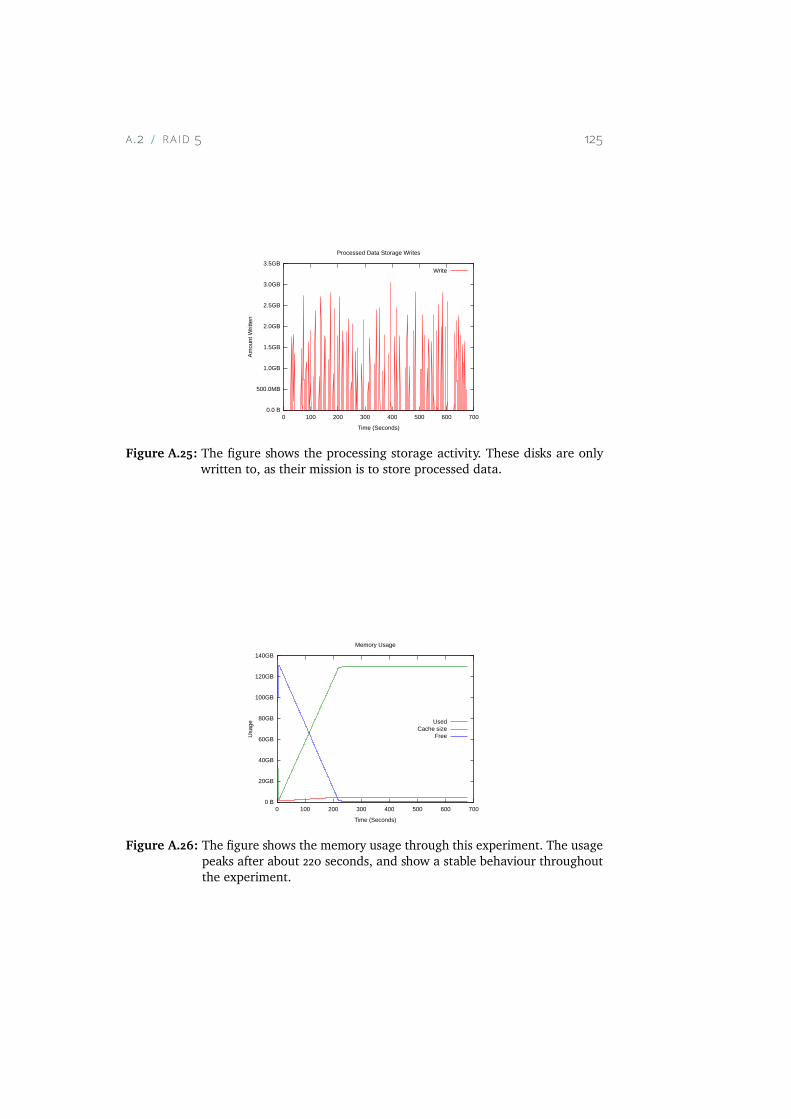
A .2 RA ID 5 125
0.0 B
500.0MB
1.0GB
1.5GB
2.0GB
2.5GB
3.0GB
3.5GB
0 100 200 300 400 500 600 700
Am
ount
Writ
ten
Time (Seconds)
Processed Data Storage Writes
Write
Figure A.25: The figure shows the processing storage activity. These disks are onlywritten to, as their mission is to store processed data.
0 B
20GB
40GB
60GB
80GB
100GB
120GB
140GB
0 100 200 300 400 500 600 700
Usa
ge
Time (Seconds)
Memory Usage
UsedCache size
Free
Figure A.26: The figure shows the memory usage through this experiment. The usagepeaks after about 220 seconds, and show a stable behaviour throughoutthe experiment.

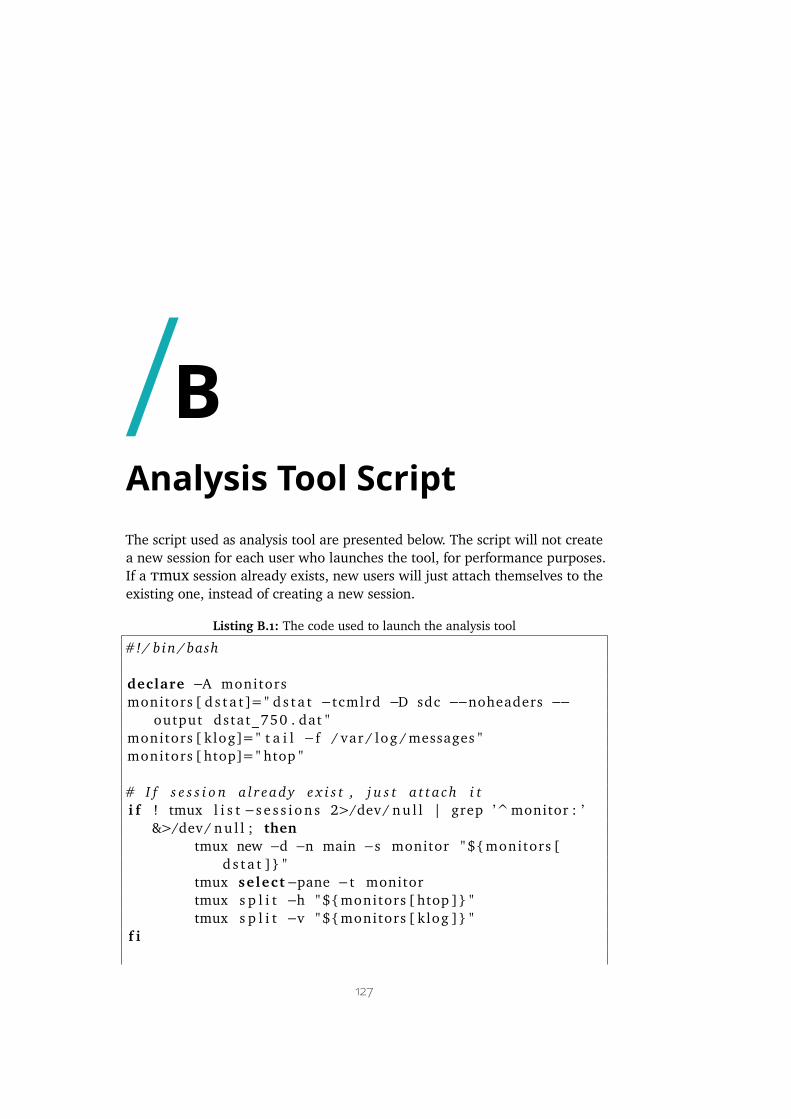
BAnalysis Tool ScriptThe script used as analysis tool are presented below. The script will not createa new session for each user who launches the tool, for performance purposes.If a tmux session already exists, new users will just attach themselves to theexisting one, instead of creating a new session.
Listing B.1: The code used to launch the analysis tool
#!/ bin / bash
declare −A monitorsmonitors [ d s t a t ]=" d s t a t −tcmlrd −D sdc −−noheaders −−
output dstat_750 . dat "monitors [ klog]=" t a i l − f / var / log /messages "monitors [ htop]=" htop "
# I f s e s s i o n a l r eady e x i s t , j u s t a t t a ch i ti f ! tmux l i s t −s e s s i on s 2>/dev/ nu l l | grep ’^monitor : ’
&>/dev/ nu l l ; thentmux new −d −n main −s monitor " ${monitors [
d s t a t ]} "tmux se lect−pane − t monitortmux s p l i t −h " ${monitors [ htop ]} "tmux s p l i t −v " ${monitors [ klog ]} "
f i
127
128 APPEND IX B ANALYS IS TOOL SCR IPT
tmux a t tach − t monitor


Bibliography[1] dstat(1) — linux man page. http://linux.die.net/man/1/dstat. [On-
line; Accessed 8-April-2016].
[2] Nice — Linux Man Page. http://linux.die.net/man/2/nice. [Online;Accessed 22-February-2016].
[3] pv(1) — Linux man page. http://linux.die.net/man/1/pv. [Online;Accessed 16-March-2016].
[4] Antwerp Space. Omnisat. http://www.antwerpspace.be/sites/default/files/products/as-spe-110234-05-00-omnisat-g3_leaflet.pdf. [On-line; Accessed 29-April-2016].
[5] Piermario Besso, Maurizio Bozzi, Luca Perregrini, Luca Salghetti Drioli,and Will Nickerson. Deep-space antenna for rosetta mission: Design andtesting of the s/x band dichroic mirror. Antennas and Propagation, IEEETransactions on, 51(3):388–394, 2003.
[6] Stephen D Brown,Robert J Francis, Jonathan Rose, and Zvonko G Vranesic.Field-programmable gate arrays, volume 180. Springer Science & BusinessMedia, 2012.
[7] Business Dictionary. Bottleneck. http://www.businessdictionary.com/definition/bottleneck.html. [Online; Accessed 7-March-2016].
[8] Brad Calder, Ju Wang, Aaron Ogus, Niranjan Nilakantan, Arild Skjolsvold,Sam McKelvie, Yikang Xu, Shashwat Srivastav, Jiesheng Wu, HuseyinSimitci, et al. Windows azure storage: a highly available cloud storageservice with strong consistency. In Proceedings of the Twenty-Third ACMSymposium on Operating Systems Principles, pages 143–157. ACM, 2011.
[9] Peter M. Chen, Edward K. Lee, Garth A. Gibson, Randy H. Katz, andDavid A. Patterson. Raid: High-performance, reliable secondary storage.ACM Comput. Surv., 26(2):145–185, June 1994.
131
[10] Prakash Chitre and Ferit Yegenoglu. Next-generation satellite networks:architectures and implementations. Communications Magazine, IEEE,37(3):30–36, 1999.
[11] Vladimir A Chobotov. Orbital mechanics. Aiaa, 2002.
[12] Guy Cordier, Carlos Gomez-Rosa, Gene Knoble, and Fred McCaleb. Au-tonomous multi-missions, multi-sites x-band data capture systems. InSpaceOps 2006 Conference, page 5688, 2006.
[13] Mark Dery. Escape velocity: cyberculture at the end of the century. GrovePress, 1996.
[14] Dictionary.com, LLC. big data. http://dictionary.reference.com/browse/big-data. [Online; Accessed 4-March-2016].
[15] Dictionary.com, LLC. Murphy’s Law. http://www.dictionary.com/browse/murphy-s-law. [Online; Accessed 28-April-2016].
[16] P Dieleman, W Luinge, ND Whyborn, D Teyssier, JW Kooi, WM Laauwen,andMWM de Graauw. Hifi flight model testing at instrument and satellitelevel. In Proceedings 19th International Symposium on Space TerahertzTechnology, pages 106–110, 2008.
[17] Kristian Elsebø. Improving disk performance in vortex with nvme. 2015.
[18] Mustafa Eroz, Feng-Wen Sun, and Lin-Nan Lee. Dvb-s2 low density paritycheck codes with near shannon limit performance. International Journalof Satellite Communications and Networking, 22(3):269–279, 2004.
[19] European Space Components Coordination (ESCC). https://escies.org/webdocument/showArticle?id=119. [Online; Accessed 18-February-2016].
[20] European Space Components Coordination (ESCC). https://escies.org/webdocument/showArticle?id=727&groupid=6. [Online; Accessed 18-February-2016].
[21] Tomoya Fukami. Experiment of 348 mbps downlink from 50-kg classsatellite. In Proc. Small Satellites for Earth Observation, 10th InternationalSymposium of the International Academy of Astronautics (IAA), IAA-B10-1302, Berlin, Germany, 2015.
[22] M.J. Gans, M.V. Schneider, and R.F. Trambarulo. Qpsk modulator or
demodulator using subharmonic pump carrier signals, September 16 1986.US Patent 4,612,518.
[23] Lajos Hanzo, Soon Xin Ng,WTWebb, and T Keller. Quadrature amplitudemodulation: From basics to adaptive trellis-coded, turbo-equalised andspace-time coded ofdm, cdma and mc-cdma systems. 2004.
[24] Hewlett Packard. HP 800GB NVMe Write Intensive HH/HL PCIe Work-load Accelerator. http://www8.hp.com/us/en/products/accelerators/product-detail.html?oid=7876058#!tab=features. [Online; Accessed25-May-2016].
[25] HP. QuickSpecks, HPE Solid State Drives (SSD). http://www8.hp.com/h20195/v2/GetPDF.aspx%2Fc04154378.pdf. [Online; Accessed 19-February-2016].
[26] YimingHu andQing Yang. Dcd—disk caching disk: A new approachfor boosting i/o performance. SIGARCH Comput. Archit. News, 24(2):169–178, May 1996.
[27] Hai Huang,Wanda Hung, and Kang G Shin. Fs2: dynamic data replicationin free disk space for improving disk performance and energy consumption.In ACM SIGOPSOperating Systems Review, volume 39,pages 263–276. ACM,2005.
[28] Ji Jun Hung, Kai Bu, Zhao Lin Sun, Jie Tao Diao, and Jian Bin Liu. Pciexpress-based nvme solid state disk. In Applied Mechanics and Materials,volume 464, pages 365–368. Trans Tech Publ, 2014.
[29] Kai Hwang, Hai Jin, and Roy Ho. Raid-x: A new distributed disk array fori/o-centric cluster computing. In High-Performance Distributed Computing,2000. Proceedings. The Ninth International Symposium on, pages 279–286.IEEE, 2000.
[30] James R Irons, John L Dwyer, and Julia A Barsi. The next landsat satellite:The landsat data continuity mission. Remote Sensing of Environment,122:11–21, 2012.
[31] Mohammed Safiqul Islam, Gouri Rani Barai, and Atiq Mahmood. Perfor-mance analysis of different modulation schemes using ofdm techniquesin rayleigh fading channel. International journal of fundamental Physicalsciences, 1(1):22–27, 2011.
[32] A. Jamalipour and T. Tung. The role of satellites in global it: trends and
implications. IEEE Personal Communications, 8(3):5–11, Jun 2001.
[33] Byunghei Jun and Dongkun Shin. Workload-aware budget compensationscheduling for nvme solid state drives. In Non-Volatile Memory Systemand Applications Symposium (NVMSA), 2015 IEEE, pages 1–6, Aug 2015.
[34] VK Kaila, AS Kirankumar, TK Sundaramurthy, S Ramakrishnan, MYSPrasad, Pranav S Desai, V Jayaraman, and B Manikiam. Metsat-a uniquemission for weather and climate. CURRENT SCIENCE-BANGALORE-,83(9):1081–1087, 2002.
[35] Kongsberg Spacetec AS. MEOS Antenna. http://www.spacetec.no/pdf/meos-antenna-l-s-x-band-antenna. [Online; Accessed 11-March-2016].
[36] Kongsberg Spacetec AS. MEOS Capture HRDFEP v4 High Rate Demodula-tor & Front End Processor. http://www.spacetec.no/pdf/meos-capture-hrdfep-v4. [Online; Accessed 22-February-2016].
[37] M.J. Koop, Wei Huang, K. Gopalakrishnan, and D.K. Panda. Performanceanalysis and evaluation of pcie 2.0 and quad-data rate infiniband. InHigh Performance Interconnects, 2008. HOTI ’08. 16th IEEE Symposium on,pages 85–92, Aug 2008.
[38] Åge Andre Kvalnes. The omni-kernel architecture: Scheduler control overall resource consumption in multi-core computing systems. 2014.
[39] Jiyang Liu, Liang Zhu, Weiqiang Sun, and Weisheng Hu. Scalableapplication-aware resource management in software defined network-ing. In Transparent Optical Networks (ICTON), 2015 17th InternationalConference on, pages 1–5, July 2015.
[40] Lou Frenzel — Electronic Design. http://electronicdesign.com/communications/understanding-modern-digital-modulation-techniques, January 2012. [Online; Accessed 28-January-2016].
[41] Thomas R Loveland and John L Dwyer. Landsat: Building a strong future.Remote Sensing of Environment, 122:22–29, 2012.
[42] Dongzhe Ma, Jianhua Feng, and Guoliang Li. A survey of address trans-lation technologies for flash memories. ACM Comput. Surv., 46(3):36:1–36:39, January 2014.
[43] Bruce McLemore, Guy R Cordier, Terri Wood, and Hårek Gamst. Edosdata capture for alos. 2012.
[44] Micron. http://d1.amobbs.com/bbs_upload782111/files_46/ourdev_684405XFKZAB.pdf. [Online; Accessed 27-January-2016].
[45] SangwhanMoon, Jaehwan Lee, Xiling Sun, and Yang-suk Kee. Optimizingthe hadoopmapreduce frameworkwith high-performance storage devices.The Journal of Supercomputing, 71(9):3525–3548, 2015.
[46] Alberto Morello and Vittoria Mignone. Dvb-s2: The second genera-tion standard for satellite broad-band services. Proceedings of the IEEE,94(1):210–227, 2006.
[47] W. Najjar and J.-L. Gaudiot. Network resilience: a measure of networkfault tolerance. Computers, IEEE Transactions on, 39(2):174–181, Feb 1990.
[48] National Aeronautics and Space Administration. Sputnik 1. http://nssdc.gsfc.nasa.gov/nmc/spacecraftDisplay.do?id=1957-001B. [On-line; Accessed 19-January-2016].
[49] Network Computing — Howard Marks. Welcome To The Per-sistent Memory Era. http://www.networkcomputing.com/storage/welcome-persistent-memory-era/232589253?_mc=NL_NWC_EDT_NWC_converations_20160419&cid=NL_NWC_EDT_NWC_converations_20160419&elqTrackId=de463c549cbc4838be8827edf4e889ae&elq=ae997492d7cf4b39a3affac8b6abde66&elqaid=69205&elqat=1&elqCampaignId=20669. [Online; Accessed 18-May-2016].
[50] Woo H Paik, Scott A Lery, and John M Fox. Mode selective quadratureamplitude modulation communication system, November 8 1994. USPatent 5,363,408.
[51] PC Mag. Definition of: FPGA. http://www.pcmag.com/encyclopedia/term/43445/fpga. [Online; Accessed 25-February-2016].
[52] PCMag. Definition of: static RAM. http://www.pcmag.com/encyclopedia/term/52041/static-ram. [Online; Accessed 25-February-2016].
[53] PCI-SIG. PCI Express Base Specification, Revision 2.1. http://iu4ever.org/files/Skhemotekhnika_JEVS9/1697_Skhemotekhnika_JEVS9_PCI_Express_Base_r2_1.pdf, 03 2009. [Online; Accessed22-February-2016].
[54] PCI-SIG. PCI Express Base Specification Revision 3.0. http://composter.com.ua/documents/PCI_Express_Base_Specification_Revision_3.0.pdf, November 2010. [Online; Accessed 22-February-
2016].
[55] R.L. Pease, A.H. Johnston, and Joseph L. Azarewicz. Radiation testingof semiconductor devices for space electronics. Proceedings of the IEEE,76(11):1510–1526, Nov 1988.
[56] B Pillans, S Eshelman, A Malczewski, J Ehmke, and C Goldsmith. Ka-band rf mems phase shifters. Microwave and Guided Wave Letters, IEEE,9(12):520–522, 1999.
[57] PD Potter. S-and x-band rf feed system. The Deep Space Network ProgressReport, pages 53–60, 1972.
[58] Rex Farrance, PCWorld. Timeline: 50 Years of Hard Drives. http://www.pcworld.com/article/127105/article.html. [Online; Accessed 4-March-2016].
[59] Ohad Rodeh, Josef Bacik, and Chris Mason. Btrfs: The linux b-treefilesystem. ACM Transactions on Storage (TOS), 9(3):9, 2013.
[60] RT Logic. T1200HDR High Data Rate Receiver. http://www.rtlogic.com/~/media/datasheets/rtl-dst_t1200hdr.pdf. [Online; Accessed 29-April-2016].
[61] Chris Ruemmler and John Wilkes. An introduction to disk drive modeling.Computer, 27(3):17–28, 1994.
[62] Samara Lynn. RAID Levels Explained. PCmag Digital Group, March 27th2014. [Online; Accessed 22-January-2016].
[63] H.B. Sanderford. Binary phase shift keying modulation system and/orfrequency multiplier, June 23 1998. US Patent RE35,829.
[64] Seagate. Serial Attached SCSI (SAS) Product Manual, Revi-sion C. http://www.seagate.com/staticfiles/support/disc/manuals/Interface%20manuals/100293071c.pdf, December 2009. [Online; Ac-cessed 22-February-2016].
[65] Andrew S. Tanenbaum. Modern Operating Systems. Prentice Hall Press,Upper Saddle River, NJ, USA, 3rd edition, 2007.
[66] Teledyne LeCroy. Summit T24 Analyzer. http://teledynelecroy.com/protocolanalyzer/protocoloverview.aspx?seriesid=445&capid=103&mid=511. [Online; Accessed 20-April-2016].
[67] The Consultative Committee for Space Data Systems, CCSDS. FlexibleAdvanced Coding and Modulation Scheme for High Rate Telemetry Ap-plications, 2012.
[68] B. Tierney, E. Kissel, M. Swany, and E. Pouyoul. Efficient data transferprotocols for big data. In E-Science (e-Science), 2012 IEEE 8th InternationalConference on, pages 1–9, Oct 2012.
[69] Chai-Keong Toh and Victor OK Li. Satellite atm network architectures:an overview. IEEE network, 12(5):61–71, 1998.
[70] ViaSat. ViaSat High Rate Receiver 3200. https://www.viasat.com/sites/default/files/legacy/High_rate_modem_3200_Datasheet_005_web.pdf.[Online; Accessed 29-April-2016].
[71] A. Viterbi. Error bounds for convolutional codes and an asymptoticallyoptimum decoding algorithm. IEEE Transactions on Information Theory,13(2):260–269, April 1967.
[72] Stephen B Wicker and Vijay K Bhargava. Reed-Solomon codes and theirapplications. John Wiley & Sons, 1999.
[73] Zodiac Aerospace. Cortex HDR XXL – High Data Rate Re-ceiver. http://www.zodiacaerospace.com/en/cortex-hdr-xxl-high-data-rate-receiver. [Online; Accessed 29-April-2016].


