Embed Size (px)
Citation preview

ON THE INTERPLAY BETWEEN SOCIETY AND CULTURE: CAUSES, CONSEQUENCES AND STABILITY OF SPERM WHALE CLANS
by
Maurício Cantor
Submitted in partial fulfilment of the requirements for the degree of Doctor of Philosophy
at
Dalhousie University Halifax, Nova Scotia
July 2016
© Copyright by Maurício Cantor, 2016

ii
I dedicate my work to:
The circle of life—Leonilda Cantor Magnani (in memoriam), Edite Abicalaf Neves (in
memoriam), Alcilena de Souza Magnani (in memoriam), and Lucas Aiden Prince;
The birds—for teaching what really matters;
The whales—for not caring about the ideas, intentions, or conclusions herein presented.
“Ê lá no mar Eu vi uma maravilha
Vi o rosto de uma ilha Numa noite de luar
Êta luar
Lumiou meu navio, Quem vai lá no mar bravio Não sabe o que vai achar”
Lenine, ‘Miragem do porto’

iii
TABLE OF CONTENTS
List of Tables ..................................................................................................................... viii
List of Figures ........................................................................................................................ x
Abstract ................................................................................................................................ xx
List of Abbreviations and Symbols Used ......................................................................... xxi
Acknowledgements ......................................................................................................... xxiii
Chapter 1: Introduction ......................................................................................................... 1
1.1 Societies: Emergent Patterns from Adaptive Social Behaviour ................................... 2
1.2 Culture: The Way We Do It, They Way They Do It .................................................... 3
1.3 Society and Culture: A Two-Way Relationship ........................................................... 6
1.4 Everything Changes: Adding Time to the Mix ............................................................ 9
1.5 Oceanic Cultural Societies: Whales and Dolphins ..................................................... 12
1.6 Study System: Society and Culture in Sperm Whales ............................................... 15
1.7 Thesis Objectives and Organization ........................................................................... 18
Chapter 2: The Interplay Between Social Networks and Culture: Theoretically and Among Whales and Dolphins ............................................................................................... 22
2.1 Abstract ...................................................................................................................... 22
2.2 Introduction ................................................................................................................ 23
2.3 How Social Structure Affects Culture ........................................................................ 28
2.4 How Culture Affects Social Structure: Behavioural Matching .................................. 35
2.5 Conformism and Symbolic Marking .......................................................................... 39
2.6 Conclusions and The Way Forward ........................................................................... 43
2.7 Acknowledgements .................................................................................................... 46
Chapter 3: Multilevel Animal Societies Can Emerge from Cultural Transmission ............ 47
3.1 Abstract ...................................................................................................................... 47
3.2 Introduction ................................................................................................................ 48
3.3 Results ........................................................................................................................ 51
3.3.1 Empirical Social Patterns ................................................................................... 51

iv
3.3.2 Emergent Social Patterns in Simulations ........................................................... 54
3.3.3 Robustness of The Emergence of Clans ............................................................. 61
3.4 Discussion .................................................................................................................. 62
3.5 Methods ...................................................................................................................... 66
3.5.1 Empirical Data and Social Levels Definition ..................................................... 67
3.5.2 Agent-Based Modeling ....................................................................................... 67
3.5.3 Coda Repertoire Similarity ................................................................................. 73
3.5.4 Clan Partition in Empirical and Simulated Data ................................................ 74
3.5.5 Sensitivity Analysis and Robustness of Clan Emergence .................................. 75
3.5.6 Code and Data Availability ................................................................................ 77
3.6 Acknowledgements .................................................................................................... 77
Chapter 4: How Does Social Behaviour Differ Among Sperm Whale Clans? ................... 79
4.1 Abstract ...................................................................................................................... 79
4.2 Introduction ................................................................................................................ 80
4.3 Methods ...................................................................................................................... 82
4.3.1 Photographic and Acoustic Sampling Effort ...................................................... 82
4.3.2 Sperm Whale Clans ............................................................................................ 84
4.3.3 Social Metrics ..................................................................................................... 85
4.3.4 Clan Comparison ................................................................................................ 88
4.4 Results ........................................................................................................................ 90
4.5 Discussion .................................................................................................................. 95
4.6 Acknowledgements .................................................................................................. 100
Chapter 5: Cultural Shift Among Galápagos Sperm Whales ............................................ 101
5.1 Abstract .................................................................................................................... 102
5.2 Introduction .............................................................................................................. 100
5.3 Methods .................................................................................................................... 105
5.3.1 Field Methods, Photo-Identification, And Acoustic Recordings ..................... 105
5.3.2 Assigning Coda Repertoires to Photo-Identified Groups ................................. 107
5.3.3 Continuous and Categorical Similarity Between Coda Repertoires ................. 107

v
5.3.4 Assigning Photo-Identified Groups to Vocal Clans ......................................... 108
5.4 Results ...................................................................................................................... 109
5.4.1 Photographic Matching and Movements .......................................................... 109
5.4.2 Acoustic Repertoires ........................................................................................ 111
5.4.3 Clan Structure ................................................................................................... 111
5.5 Discussion ................................................................................................................ 115
5.5.1 Why Were the Clans Replaced? ....................................................................... 117
5.5.2 Conclusions ....................................................................................................... 120
5.6 Acknowledgements .................................................................................................. 121
Chapter 6: Conclusions ..................................................................................................... 123
6.1. Research Findings ................................................................................................... 124
6.1.1 Interplay: Society and Culture of Sperm Whales .......................................... 124
6.1.2 Cause: Biased Social Learning ...................................................................... 124
6.1.3 Consequence: Social Behaviour Diversity ..................................................... 125
6.1.4 Stability: Temporal but Not Spatial ............................................................... 126
6.2 Research Contributions ............................................................................................ 127
6.3 Limitations and The Way Forward .......................................................................... 128
6.4 Closing Remarks ...................................................................................................... 132
Bibliography ...................................................................................................................... 135
Appendices ......................................................................................................................... 194
A2.1 Table S2.1. Glossary of Network Terminology and Its Interpretation in the Context of Animal Societies, Based on Refs. 1-7 ...................................... 194
A2.2 Supplementary References ............................................................................... 196
A2.3 Copyright Release: Permission to Reproduce Published Article ..................... 197
B3.1 Supplementary Figure S3.1. Sensitivity Analysis of Parameterization and Initial Conditions in the Emergence of Clans in The 20 Simulated Scenarios .......................................................................................................... 198
B3.2 Supplementary Figure S3.2. Sensitivity Analysis of the Weighted Modularity Metric Along a Gradient of Increasing Sampling of the Link Weights in the Acoustic Networks .................................................................. 200
B3.3 Supplementary Figure S3.3. Typical Simulated Dataset ................................. 201

vi
B3.4 Supplementary Table 3.1. Modularity Results and Averaged Acoustic Similarity in All 20 Agent-Based Models ....................................................... 203
B3.5 Supplementary Table 3.2. Parameters Tested in Sensitivity Analysis of the Agent-Based Model Parameterization and Initial Conditions. .................. 204
B3.6 Supplementary Note 3.1 ................................................................................... 205
B3.7 Supplementary Note 3.2 ................................................................................... 206
B3.8 Supplementary Methods 3.1. The balabm R Package ..................................... 207
B3.9 Supplementary Methods 3.2. Empirical Support for the Agent-Based Models .............................................................................................................. 207
B3.10 Supplementary Methods 3.3. Sensitivity Analysis of Parameterization and Initial Conditions in the Agent-Based Models .......................................... 214
B3.11 Supplementary Methods 3.4. Sensitivity Analysis of Clan Partition ............... 216
B3.12 Supplementary Methods 3.5. Differences Between Empirical and Simulated Coda Types ..................................................................................... 217
B3.13 Supplementary Methods 3.6. Differences Between Empirical and Simulated Coda Transmission ......................................................................... 218
B3.14 Supplementary Methods 3.7. Differences Between Empirical and Simulated Coda Repertoire Comparison.......................................................... 220
B3.15 Supplementary References ............................................................................... 222
B3.16 Copyright Release: Permission to Reproduce Published Article ..................... 227
C4.1 Table S4.1. Summary of The Social Metrics Among Social Units of Two Vocal Clans of Sperm Whales off the Galápagos Islands. .............................. 228
C4.2 Copyright Release: Permission to Reproduce Published Article ..................... 229
D5.1 Supplementary Table S5.1. Sampling Effort Summary of Dedicated Visual and Acoustic Surveys for Sperm Whales in the Eastern Tropical Pacific............................................................................................................... 231
D5.2 Supplementary Table S5.2. Number of Photo-Identified (Quality Rating Q 3) Individual Adult Females Sperm Whales and Immatures of Both Sexes (Males in Parentheses) in the Tropical Pacific by Study Area and Year. ................................................................................................................. 232
D5.3 Supplementary Table S5.3. Number of Codas Analyzed from Groups of Female and Immature Sperm Whales Photo-Identified Together in the Eastern Tropical Pacific by Study Area and Year. .......................................... 233
D5.4 Supplementary Figure S5.1. Schematic of the Analyses of Acoustic Recordings and Coda Repertoires to Define Vocal Clans of Sperm Whales .............................................................................................................. 234

vii
D5.5 Supplementary Figure S5.2. Codas Up to 12 Clicks Produced by Sperm Whales Across the Eastern Tropical Pacific and Classified into Discrete Types. ............................................................................................................... 236
D5.6 Supplementary Figure S5.3. Discovery Curves for Coda Types Per Photo-Identified Group of Sperm Whales Across the Eastern Tropical Pacific............................................................................................................... 237
D5.7 Supplementary Figure S5.4. Codas Classified into Discrete Types According to Rhythm, Produced by Photo-Identified Groups of Sperm Whales Across the Eastern Tropical Pacific .................................................... 238
D5.8 Supplementary Figure S5.5. Coda Repertoire Similarity Among Only the Groups of Sperm Whales Recorded Off the Galápagos Islands in 2013 and 2014. .......................................................................................................... 240
D5.9 Supplementary Figure S5.6. Coda Types and Vocal Clans of the Pacific Sperm Whales. Principal Component Analysis on the Absolute Inter-Click Intervals (ICI) For Each Coda Length (Number of Clicks). .................. 241
D5.10 Supplementary Figure S5.7. Coda Types and ‘Noise’ Coda Samples from Sperm Whales Off the Eastern Tropical Pacific. ............................................. 244
D5.11 Supplementary Methods 5.1: Acoustic Recordings ......................................... 245
D5.12 Supplementary Methods 5.2: Permutation Tests for Differences Between Group Repertoires ............................................................................................ 245
D5.13 Supplementary Methods 5.3: Details on Continuous Similarity of Coda Repertoires. ...................................................................................................... 246
D5.14 Supplementary Methods 5.4: Details on Categorical Analysis of Coda Repertoires ....................................................................................................... 247
D5.15 Supplementary Methods 5.5: Social Level Definitions ................................... 249
D5.16 Supplementary References ............................................................................... 250

viii
LIST OF TABLES
Chapter 2
Table S2.1 Glossary of network terminology and its interpretation in the context of animal societies, based on refs. 1-7. ....................................................... 194
Chapter 3
Table S3.1 Modularity results and averaged acoustic similarity in all 20 agent-based models ............................................................................................... 203
Table S3.2 Parameters tested in sensitivity analysis of the agent-based model parameterization and initial conditions ....................................................... 204
Chapter 4
Table 4.1 Definition and estimation methods for the seven social metrics ................... 86
Table 4.2 Mean values of social metrics for units of the Regular and Plus-One clans off the Galápagos Islands. Only social units to which we have data for all social metrics (except group sizes; see text) were included in the tests. SD: standard deviation; t: Student’s t statistic; DF: degrees of freedom; P-values significant at P<0.05 are italicized; Cohen’s d: effect size and 95% confidence intervals (CI). HWI: half-weight association index; S: social differentiation (estimated coefficient of variation of the true HWIs). .......................................................................... 92
Table 4.3 Models fit to Standardized Lagged Association Rates (SLAR) ranked by the lowest quasi-Akaike Information Criteria (QAIC) for each of the two clans of sperm whales off the Galápagos (Plus-One, Regular). ΔQAIC, QAIC weights and likelihood indicates the relative support for each model. Details on the interpretation of the model parameters are available elsewhere (Whitehead 1995, 2008a). ....................................... 94
Table S4.1 Summary of the social metrics among social units of two vocal clans of sperm whales off the Galápagos Islands (Plus-One and Regular): unit size (number of photo-identified individuals), mean cluster size while foraging (number of individuals), dive synchrony (residuals of no-dive gap in minutes, from the dive synchrony regression model), social differentiation (S), association indices (HWI). ................................. 228
Chapter 5
Table S5.1 Sampling effort summary of dedicated visual and acoustic surveys for sperm whales in the Eastern Tropical Pacific (ETP). Study areas: Galápagos Islands (1), Panamá, Ecuador, and northern Peru (2), southern Peru and Chile (3), Gulf of California (4) and Western

ix
Pacific (5). Days following whales: total days tracking and in visual contact with sperm whale groups; Photographic records: total number of pictures taken of tail flukes for photo-identification (see also [1]); Codas analyzed: total number of coda samples manually identified and included in the continuous analyses (see also [2]). .............................. 231
Table S5.2 Number of photo-identified (quality rating Q 3) individual adult female sperm whales and immatures of both sexes (males in parentheses) in the Tropical Pacific by study area and year. Only individuals with a recorded position are presented. Calves were not quantified. Data from 1985-2004 (3,947 individuals) came from [1]. ........ 232
Table S5.3 Number of codas analyzed from groups of female and immature sperm whales photo-identified together in the Eastern Tropical Pacific by study area and year. Year correspond to the photo-identification effort in Table S5.1. Data from 1985-1999 (14,065 codas) came from [2]. ............................................................................................................... 233

x
LIST OF FIGURES
Chapter 1
Figure 1.1 Schematic representation of the fundamental social levels of a female sperm whale society from the Pacific Ocean (see Whitehead et al. 2012). In a population, individual females and their young live in nearly-permanent social units for several years (presumably their entire lives). Social units form temporary groups (from hours to few days) with other units, but tend to do so with units with which they have high similarity in the repertoire of codas (stereotyped patterns of click sounds used in social communication), forming a vocal clan. A clan of sperm whale is identified as such collections of social units that share an identifiable part of their coda repertoire, where that part of the repertoire both forms a large portion of the coda production of those social units and is readily distinguishable from the coda repertoires of social units from other clans (see Rendell & Whitehead 2003). This multilevel structure applies only to the females and immature individuals; males disperse from their natal groups to live nearly-solitary lives near the poles, returning to tropical waters to mate (Whitehead 2003). ................................................................................ 17
Chapter 2
Figure 2.1 Two representations of the dynamic relationship between social structure and culture. (A) Individual characteristics ultimately influence both social structure, through their effects on social relationships (a), and the cultural context, through variation in both behaviour and the individuals’ partialities for social learning (b). Overall, the interplay between individuals and social relationships influences—and is influenced by—the interplay between social structure and information transmission. (B) This is represented by a coevolutionary social network in which the coevolution of nodes (circles representing individuals) and edges (links representing relationships) (g, h) shapes and is shaped by (k, l) the coevolution of network topology and transmission mechanisms (i, j). Thick dashed arrows illustrate the Hinde’s [18] conceptual framework for social structure (a). Thick black arrows illustrate the elements of the concept of culture from Laland & Hoppitt [12] (b). Thin arrows (c-f) represent additional effects hypothesized in this review. For further details on network terminology please see Appendix A2.1, Table S2.1 ....................... 27
Figure 2.2 How social networks affect information transmission at two structural scales: the large-scale structure of the population and the structure within social modules. In both, the lower the connectance of the network, the longer the path length; thus more time is required for the information flow, which makes the information more susceptible to

xi
loss and transcription errors but more prone to generate diversity. Arrows represent the overall directions of effects of network topology on network properties and on the transmission of information (described by their respective metrics) as indicated by the theoretical literature [15-17,46,49]. Arrows in parentheses represent our own speculations. Up arrows indicate a positive relationship and down-arrows a negative relationship. In both, the lower the connectance of the network, the longer the path length; thus more time is required for the information flow, which makes the information more susceptible to loss and transcription errors but more prone to generate diversity. In the hypothetical networks, nodes representing individuals are connected by weighted edges whose thickness is proportional to the rate of social interaction, assumed to be proportional to probability of social learning. Efficiency was measured by the number of steps until all individuals acquired the new information (speed) [15]; consistency was measured by the average path length (minimum number of steps along a chain of relationships from one individual to another), reasonably assuming that longer paths are more likely to be subjected to transcription errors [15]; persistence over time was assessed by simulating the forgetting of acquired information and estimating its extinction risk [15]; and diversity was measured by the standard deviation of continuous behavioural measures or the Shannon diversity index for categorical behaviour [17]. See Table S2.1 (Appendix 2.1) for definitions and interpretation of the network terminology; network metrics formulae can be found in elsewhere [e.g. 14,19,93,94] .......................................................................................... 30
Figure 2.3 Humpback whale song in the Pacific. Principal breeding grounds are shown by star symbols in the North Pacific (dark grey), South Pacific (light grey) and Indian Ocean (black). Seasonal migration routes are indicated by dashed lines, and routes of information flow by thick arrows. The evolution of the South Pacific song between 1998 and 2008 is shown by the block diagram [adapted from 62]. The different song types are indicated by different colours and missing data by white boxes. The vertical columns of the block diagram are aligned approximately above the study areas where the songs were recorded in the South Pacific map. ................................................................................... 34
Figure 2.4 (A) Hypothetical effects of behaviour matching (i.e. when individuals tend to associate with those with similar behaviour) on social structure as influenced by patterns of behavioural specialization. The columns indicate different distributions of individual behaviour within the populations: unspecialized niches with similar widths; individual variation in niche width and location; individual variation in niche width around a common central value; and specializations around several modal values with similar niche widths. The first row represents the distribution of continuous behaviour (thicker lines:

xii
population behavioural repertoires; thinner lines: individual repertoires); the second row uses binary two-mode networks to represent equivalent distributions of categorical behaviour types (squares) used by individuals (white circles: “generalists”; grey circles: “specialists”); and the third row represents the weighted social network that behaviour matching might induce in each case (individuals connect by edges whose thicknesses are proportional to the rate of social interaction). (B) Adding conformism, behavioural repertoires become narrower. With low and moderate individual specialization, the social networks tend to random topologies, but when modules of individuals with specialized behaviour are present, conformism increases their isolation. Definitions and interpretation of network terms are available in the Appendix A2.1 (Table S2.1) .................. 37
Chapter 3
Figure 3.1 Empirical multilevel network depicting the three nested levels in the sperm whale society off the Galápagos Islands: individuals within social units within vocal clans. In the social network, modules of individual whales (coloured small nodes) connected by their social relationships (black lines with thicknesses proportional to the time individuals were identified in the same group) define the social units (letter-labeled large nodes). In the overlapped acoustic network, modules of social units connected by the similarity in acoustic behaviour (grey lines whose thicknesses are proportional to multivariate similarity of coda repertoires) represent the vocal clans (blue: Regular clan, characterized by codas with regularly-spaced clicks; red: Plus-One clan, characterized by codas with extended pause before the final click [35]). Social relationships and acoustic similarities are re-plotted results from ref. [52] and [30], respectively ......... 53
Figure 3.2 Schematic representation of the agent-based models. (a) Coda transmission mechanisms are represented as changes in the coda repertoires vector (squares: coda types; colors: frequency of usage: absent=0, always=100%). Calf agents change repertoires three times (between 0-2 years old) under one of following mechanisms. (i) Individual learning: newborn agent a starts with an empty coda vector; half of the elements are randomly selected to receive absolute frequencies of usage from a uniform distribution ϵ[0,100]. (ii) Genetic inheritance: newborn agent b starts with an empty coda vector, which is filled with the same coda types and frequencies of its mother B. (iii) Oblique social learning: newborn agent c starts with an empty coda vector; at the age 0 it randomly samples 62 elements from the coda vector of other adult agents, kin-related or not (including zeroed elements); at ages 1 and 2 the calf repeats the process, replacing

xiii
sampled elements. For iv-vi, calves gain an initial repertoire via oblique social learning, then at ages 1 and 2 the following effects were included. (iv) Homophily: calf d copies from adult agents of the social unit A, which has the highest coda repertoire similarity with its own social unit. (v) Conformism: calf e preferentially copies the coda types with higher frequencies of usage, here the three codas commonly performed by the adults. (vi) Symbolic marking: calves f and g were born in different social units, which have a specific subset of codas (“symbol”) that all members always perform to mark the identity of the unit (the sequences of red codas). Both calves copy codas from other adults, but also deliberately copy their units’ “symbols”. (b) Oblique social learning (iii) and the additional effects (iv-iv) occurred at three social levels. (vii) Social unit: calf agents copy only from agents of their own social unit. (viii) Predefined clans: simulation started with predefined clan labels and calves copy from any agent inside of its predefined clan. (ix) Population: calves copy from any agent in the population. In all scenarios, calves had a low individual learning probability (replacing 1 random coda type by a random frequency) per year. ...................................................................................... 55
Figure 3.3 Coda repertoire similarities and clan partitioning across simulated scenarios. (a) Agent-based models (ABMs) differed in how a coda was transmitted (individual learning, genetic inheritance, social learning), if there was any transmission biases (homophily, conformism, symbolic marking), and the social level at which the transmission operated (population, social units, and predefined clans). Columns represent ABMs and filled cells represent the presence of the model features (transmission mechanisms, biases, social levels) indicated in the rows. Color code denotes similar transmission mechanisms operating at different social levels. (b) Average coda repertoire similarity of all emergent social units. Whiskers represent standard deviation (s.d.). (c) Modularity (Q-values) of the resultant acoustic networks from each ABM. Significantly high modularity values (P < 0.001) fall outside of the 95% confidence intervals (whiskers) generated by a theoretical model (1000 replicates) and indicate the emergence of vocal clans, i.e. modules of highly connected social units due to high coda repertoire similarity in the acoustic network. Number of emergent vocal clans is listed on the top of the plot; symbol shapes denote the social level where the transmission mechanisms operated (circle: population; square: social unit; triangle: pre-defined clans). .................................................................. 58
Figure 3.4 Acoustic networks simulated by the 20 agent-based models (ABMs). Nodes representing social units are connected by links representing coda repertoire similarity. Colour code indicates similar transmission mechanisms operating at different social levels across the ABMs, which differed in the coda transmission process (individual learning,

xiv
genetic inheritance, social learning), in the presence, type and combination of transmission biases (columns: homophily, conformism, symbolic marking), and in the social level at which the transmission operated (rows: population, social units, and predefined geographically-segregated clans). ABMs 01 and 02 represent the null agent-based models with no social learning, but individual learning and genetic inheritance of codas, respectively. From ABM03 to 20, all models contain social learning of codas, with and without biases. Distinct clans (modules in blue shades) emerged only when codas were transmitted by social learning (SL) biased by conformism (C) and homophily (H) operating in tandem at the population (ABM15), social unit (ABM16) and pre-defined clan levels (ABM17). In all remaining scenarios, the acoustic network resembled the null models (ABM1-2), with no distinct clans. ................................................................. 60
Figure S3.1 Sensitivity analysis of parameterization and initial conditions in the emergence of clans in the 20 simulated scenarios. Clan emergence is evaluated by the weighted modularity Q-value (y-axis) in each of the acoustic networks simulated by the 20 agent-based models (x-axis). Color code denotes similar transmission mechanisms of coda types among agents operating at different social levels (see Figure 3.3A, main text); shapes represent the social level at which the transmission operated (circle: population, square: social unit, circle: predefined geographical clan); whiskers represent the 95% confidence intervals (CI) estimated by an appropriate theoretical model, based on 1000 iterations and 10 replicates for each model. Significant Q-values, those falling outside of the 95% CI of the benchmark distribution (P < 0.001), indicate a reliable partition in the acoustic networks, i.e. a modular topology with subsets of social units (nodes) more strongly connected with each other than with the rest of the network (see Figure 3.4, main text). The top plot illustrates our main results (Figure 3.3C, main text), followed by their initial parameters values. In each of the 16 new scenarios below (a-h), a single parameter was changed at a time for all 20 models with values representing the extremes of a biologically meaningful range (the parameter value is indicated in the top left of the plot). Note that each small plot resembles very much the main pattern shown in the top plot, indicating that the clan emergence presented in the main text is robust to variation in the parameters and initial conditions. ......................................................................................... 198
Figure S3.2 Sensitivity analysis of the weighted modularity metric along a gradient of increasing sampling of the link weights in the acoustic networks. The modularity metric defines a reliable partition in the acoustic networks (i.e. emergent clans) simulated by each of the 20 agent-based models (ABMs). Whiskers represent the 95% confidence intervals (CI) given by 1000 replicates in the bootstrap procedure (link weight resampling with replacement). Color code denotes similar

xv
transmission mechanisms of coda types among agents operating at different social levels (following Figure 3.3A, main text). Note the strikingly similar pattern in all scenarios, conferring robustness to our chosen metric for clan partition across the range of possible weights for a link (coda repertoire similarity) between nodes (social units) in the simulated networks ................................................................................ 200
Figure S3.3 Typical simulated dataset. Output of a representative simulated dataset, with social learning of coda types within social units (ABM04), after 700 simulated years: (A) Social unit size distribution (number of agents); (B) Age distribution (in simulated years, i.e. time steps in the simulation); (C) Population size over time (number of agents); (D) Coda frequency of all repertoires of all agents within each social unit. Each boxplot represents the frequency distribution of a social unit; boxes represent 1st and 3rd quantiles; black horizontal bar represent median; dashed whiskers represent minimum and maximum frequencies; circles indicate outliers ........................................................... 201
Chapter 4
Figure 4.1 Spatio-temporal sampling effort off the Galápagos Islands, Ecuador, in the South Pacific Ocean. (a) The islands (dashed box) have darker shading, lighter shading represents waters less than 1,000 m deep (rarely used by sperm whales) and black lines represent the tracks of followed whales. (b) Black bars represent days following whales per year (of both clans); and gray bars represent the number of high-quality pictures (Q≥3) used for photo-identification ..................................... 84
Figure 4.2 Social behaviour variation among sperm whale vocal clans (Plus-One, Regular): (a) Social unit size (number of photo-identified individuals); (b) Group size (number of individuals in temporary association) ; (c) Mean cluster size while foraging (number of individuals seen together at the surface); (d) Dive synchrony (residuals of no-dive gap in minutes, from the dive synchrony regression model); (e) Social differentiation (S, estimated CV of the actual rate of association); (f) Half-weight association indices (mean HWI within units, estimated proportion of times pairs of individuals were seen together). Boxplots show mean values (black dots), median (horizontal bar), 1st and 3rd quartiles (box, which widths are proportional to sample sizes), minimum and maximum values (whiskers). Asterisks represent Student’s t-test statistical significance at P<0.05 (Table 4.2) ....................... 91
Figure 4.3 Standardized lagged association rates (thicker lines) and best fit models (thinner lines; Table 4.3) among whales within each vocal clan (black: Regular; gray: Plus-One). Low overlapping of the standard

xvi
errors (vertical bars, from a jackknife procedure) suggests significant differences ..................................................................................................... 94
Chapter 5
Figure 5.1 Re-sightings of individual female and immature sperm whales in the eastern Tropical Pacific, between (a) 1985-2004 and (b) 2013-2014. Dashed circles loosely indicate study areas, with numbers indicating total of photo-identified individuals. Numbers by arrows indicate match of individuals between areas. ........................................................... 106
Figure 5.2 Encounter rates of sperm whale off the Galápagos Islands over 30 years across clans. Rates were higher in early 1980’s, started declining during the 1990’s and, after a hiatus in 2000’s, started rising again. Color code indicates clan membership (Figure 5.3) of whales for which both photo-identification and acoustic data were available in that year. Whiskers represent standard errors (SE). Asterisks indicate years with no dedicated surveys off Galápagos (but in some of these years there were surveys in surrounding areas; Tables S5.1-S5.3). ............ 110
Figure 5.3 Coda repertoire similarity and clan structure of sperm whale groups from the Pacific between 1985 and 2014. (a) Hierarchical clustering dendrogram (CCC=0.896) depicts the multivariate similarity (Euclidean distances on absolute inter-click intervals) among coda repertoires of photo-identified groups of sperm whales (branches). Colour code and clan names follow original results [14]; ‘g’ indicate groups observed off Galápagos; dashed branches indicate new groups observed in 2013-2014; arrows indicate mean similarity between and within clans; numbers besides nodes indicate the number of replications (out of 100) in bootstrap analysis. (b) Frequency of coda types containing up to 12 clicks (rows) classified into discrete types for each photo-identified group (columns). Shades of grey indicate the frequency of occurrence of coda types in a given group repertoire; coda type labels represent rhythm (see Figure S5.2); numbers under columns indicate total number of recorded codas from each group of whale used in the continuous analysis; numbers on the right indicate the total codas per type used in the categorical analysis. ............................ 113
Figure S5.1 Schematic of the analyses of acoustic recordings and coda repertoires to define vocal clans of sperm whales. In the processing phase, raw acoustic recordings were listened at ¼ speed and codas were marked in the Rainbow Click software. Coda repertoires were composed of coda recordings assigned to groups of whales photo-identified together. In the analysis phase, we used the absolute inter-click intervals (ICI, the actual time between the onset of one click to another in a coda sequence) to characterize the temporal structure of the codas. We then used two complementary analyses, continuous and

xvii
categorical. With the continuous measure, we compared coda repertoires similarity among groups of whales, using customized MATLAB routines to calculate the multivariate Euclidean distance between repertoires and hierarchical clustering algorithm (supported by a bootstrap procedure) to define the partition of groups into clans of whales (Figure 5.3A). With the categorical measure, we qualitatively described the differences between clan repertoires. We used the OPTICS algorithm to identify clusters of very similar coda samples, with stereotyped rhythm and tempo (Figure S5.2), which we called coda types. We performed a sensitivity analysis to define the most parsimonious initial parameters for the OPTICS algorithm (Figure S5.4). Many coda samples were disregarded as ‘noise’ and not included in a coda type cluster; however nearly asymptotic discovery curves suggested that nearly all coda types made by the sampled groups were represented (Figure S5.3). We then used contingency tables (Figure 5.3B) to illustrate the principal differences between the repertoires of the different clans (Figure 5.3A), and Principal Component Analysis (Figures S5.6, S5.7) to visualize with more details these differences in coda type usage by different clans. This schematic was adapted from [3]. ................................................................. 234
Figure S5.2 Codas up to 12 clicks produced by sperm whales across the Eastern Tropical Pacific and classified into discrete types. Coda types (y-axis) were defined by the OPTICS algorithm (fixed ξ=0.025 and minpts ~4% of the sample size) based on absolute time (x-axis) between inter-click intervals (ICIs). Dots represent mean time of each click in the coda, and whiskers represent 95% Confidence Intervals around the mean time. Coda type labels were based on the rhythm, where the first number indicates the number of clicks; “R” indicates regularly spaced clicks; “I” indicates increasing click intervals along the coda; “+” indicates extended interval between clicks; and the sequential number distinguishes between codas with the same number of clicks and rhythm but of increasing duration (e.g. 9R1, 9R2, 9R3). ............................ 236
Figure S5.3 Discovery curves for coda types per photo-identified group of sperm whales across the Eastern Tropical Pacific. Coda types were identified using the OPTICSxi algorithm, under three initial values for the key parameters ξ (drop in sample density) and minpts (number of minimum points): a) low ξ = 0.005, high minpts = 8% sample size; b) intermediate ξ = 0.025, intermediate minpts = 4% sample size; and c) high ξ = 0.050, low minpts = 2%. Black lines represent a repertoire of a photo-identified group of whales, red lines represent the mean discovery curve and red shades represent the standard errors for the mean curve. ................................................................................................. 237
Figure S5.4 Codas classified into discrete types according to rhythm, produced by photo-identified groups of sperm whales across the Eastern Tropical

xviii
Pacific. Coda types up to 12 clicks (y-axis) were based on absolute time (x-axis) between inter-click intervals (ICIs). Dots represent mean time of each click in the coda, and whiskers represent 95% Confidence Intervals around the mean time. Coda types were defined by the OPTICSxi algorithm, under three alternative initial parameterization, varying contrast parameter ξ (threshold in reachability distance drop, establishing the relative decrease in density within clusters) and minpts (defines the minimum number of samples that can be considered a cluster) but fixing ξ (maximum reachability distance within which clusters will be searched for): (a) ξ = 0.025, minpts ~ 4% of sample size; (b) ξ = 0.005, minpts = about 8% of sample size; (c) ξ = 0.05, minpts ~ 2% of sample size. Coda type labels (y-axis) were based on the rhythm, where the first number indicates number of clicks, “R” indicates regularly spaced clicks; “I” indicates increasing click intervals along the coda; “+” indicates extended interval between clicks; and the sequential number or letters distinguishes between coda with same length and rhythm but of increasing duration (e.g. 9R1, 9R2; 2+1A, 2+1B). “N” indicate the coda samples regarded as ‘noise’ by the OPTICS algorithm (note low accuracy, i.e. large 95% confidence intervals) and so discarded from the categorical analyses. The matrices illustrate coda types (rows) for each photo-identified group (columns). Shades of grey indicate the frequency of occurrence of coda types in a given group repertoire (x>10%: black; 5%<x<=10%: dark grey; 1%<x <=5%: grey; 0<x<=1%: light grey; 0: white). Color code for photo-identified groups follow original clan partition in [2] and in the Figure 5.3 (main text). Numbers on the right indicate the total codas per type used in the categorical analysis. Note the high number of coda samples discarded as noise (“N”). Overall, there were some variations across the three parameterization schemes. For instance, the number of coda types would be 25 for the restrictive (a) or 29 for the permissive (c) parameterization schemes, mainly because some 3- and 6-click codas were merged into the same or split into more types. The intermediate parameterization (b) described more clearly the clan segregation based on the continuous analysis data. .................................................................. 238
Figure S5.5 Coda repertoire similarity among only the groups of sperm whales recorded off the Galápagos Islands in 2013 and 2014. The hierarchical clustering dendrogram (average linkage, CCC=0.89) depicts the multivariate similarity (Euclidean distances on absolute inter-click intervals) among coda repertoires of groups of sperm whales (branches), colored by clans (as in [2]; see also Figure 5.3A). Numbers besides the clustering branches indicated the number of times (out of 100) they were replicated by in bootstrap analyses; numbers underneath are the year of recording. ........................................... 240

xix
Figure S5.6 Coda types used by vocal clans of the sperm whales. Principal component analysis was used to reduce the dimensionality of the raw absolute inter-click intervals (ICI) for each coda length (number of clicks) for better visualization of the clusters of codas classified by OPTICSxi into categorical types (Figure S5.2, represented by icon shape) using the intermediate parameterization scheme (Figures 5.3B, S5.2, S5.4B). Coda samples are colored by clans, a categorical variable defined by hierarchical clustering analysis (Figure 5.3A; as in [2]). Loading plots indicate the direction of variation according to each ICI. The amount of variance explained by the first two principal components (PC) is given at the axes. The new data set recorded off Galápagos in 2013 and 2014 is marked in black. For clarity, all coda samples regarded as ‘noise’ by the OPTICSxi algorithm (Figure S5.4) were not plotted. Overall, coda types (here, defined by distinct clusters) were usually defined by the presence/absence of extended pauses (‘+’), as suggested by the direction of loadings of the longer ICIs. Note that clans shared some coda types (e.g. 5R, 11R, 12R) but also produced coda types which were nearly exclusive of their own clan. For instance, the Regular clan mainly produced regularly-spaced codas from 6 to 12 clicks (e.g. 6-12R); the Short clan mainly produced codas with 3 to 5 clicks; Plus-One groups produced mainly short codas with an extended pause before the final click (e.g. 3+1, 1+3+1, 5+1, 4+1+1); Four-Plus groups produced codas with four regular clicks (e.g. 4R, 4+1+1, 2+4). These characteristic codas used more frequently by specific clans (Figure 5.3B) appears to have driven the clan partitions in the dendrogram presented in the main text (Figure 5.3A). ........................................................................................................... 241
Figure S5.7 All codas sampled from sperm whales in the Eastern Tropical Pacific as categorized by OPTICSxi including unclassified samples (‘noise’). Principal component analysis on the inter-click intervals (ICI) for each coda length (number of clicks) was used here to reduce the dimensionality of the data for better visualization and interpretation. The amount of variance explained by the first two principal components (PC) is given at the axes. Codas are colored by type, as defined by the OPTICSxi algorithm using the intermediate parameterization scheme (Figure S5.4B). Samples sizes by type and proportion of unclassified samples (‘noise’) by coda length are presented. Note our classification analysis was conservative and discarded a large portion of the samples regarded as ‘noise’ by the OPTICSxi algorithm. This creates a scenario in which we only define new coda types when there exists many, highly similar codas. .................. 244

xx
ABSTRACT
The overarching goal of my thesis is to formalize the interplay between animal society
and culture, using sperm whales as a model. Sperm whales live in multilevel societies,
characterized by cooperation and social learning. Females form nearly-permanent social
units and communicate using codas, stereotyped patterns of clicks. Units temporarily
group with other units that use similar codas, forming vocal clans—whales of the same
population with distinct coda dialects. I investigate the causes, consequences and
temporal stability of the sympatric sperm whale clans in the Pacific Ocean. First, I
explore the relationship between social structure and social learning as a phenomenon
non-exclusive of human societies. Social relationships demarcate how information flows
among individuals, as well as its content, while social learning affects who interacts with
whom. Second, I show that culture affects sperm whale society by creating clans. With
computer models mimicking the dynamics of empirical populations, I test multiple
mechanisms of coda transmission—individual learning, genetic inheritance, pure and
biased social learning. Clans with different dialects emerge only when whales learn codas
from each other, conforming to the most similar individuals around them. Third, I
evaluate the consequences of clan membership. Using a long-term dataset, I show
differences in social behaviour among clans: members of one clan dived more
synchronously and had more homogeneous, briefer relationships than the other. Cultural
drift may explain such divergence, with whales replicating within-clan social norms.
Finally, I investigate temporal stability of clans by studying the Galápagos population
over 30 years. I document a complete population turnover leading to cultural shift: sperm
whales studied in 2013-2014 do not belong to two clans that used the area between 1985-
1995; instead they are members of clans previously found in other areas of the Pacific. In
conclusion, culture gave rise to sperm whale clans, which in turn drives social behaviour,
in a two-way relationship that is stable over time but dynamic over space. These findings
strengthen the evidence for culture among sperm whales, highlighting that processes
driving behavioural flexibility in humans—information transmission through biased
social learning and cultural drift—also operate in non-human animal populations.

xxi
LIST OF ABBREVIATIONS AND SYMBOLS USED
ABM Agent-based model
AIC Akaike information criterion
bemp Empirical birth rate
c Probability of migrating to another social unit
C conformism
CCC Cophenetic correlation coefficient
CI Confidence intervals
CV Coefficient of variation
d day
dB decibel
DF Degrees of freedom
DGDD Different groups, different days
DNA Deoxyribonucleic acid
ΔQAIC Delta quasi-likelihood Akaike information criterion
ENSO El Niño Southern Oscillation
ETP Eastern tropical Pacific Ocean
ξ Maximum reachability distance
g group size
GI Genetic inheritance
h hour
H Homophily
Hz Hertz
HWI Half-weight index
I Increasing click intervals along the coda
ICI Inter-click interval
IL Individual learning
ilearn Individual learning rate
KHz Kilohertz
km kilometer

xxii
LDA Linear discriminant analysis
N Noise
N0 Initial population size
m meter
min Minute
minpts Minimum number of coda samples
mt Mortality rate
P p-value
Q Quality of photograph
PC Principal component
PCA Principal component analysis
QAIC quasi-likelihood Akaike information criterion
R Regularly spaced clicks
S Social differentiation
SD Standard deviation
SE Standard error
SGDD Same group, different days
SL Social learning
SLAR Standardized lagged association rates
SLR Single-lens reflex camera
SM Symbolic marking
t Time step
+ Extended interval between clicks

xxiii
ACKNOWLEDGEMENTS
To my supervisor. I would like to express my deep gratitude to my supervisor for
his patient guidance both at sea and land, at work and life. The last years under his
mentoring granted me an immense personal and professional growth, and helped many of
my dreams to become reality. I am very grateful for the knowledge shared and the many
opportunities created to experience the offshore world—then to share our work with the
rest of world. His contagious passion for science and nature, exemplar care for the work
minutia, and refreshing cheerfulness will inspire my next steps, at sea and land, work and
life.
To my family. No words can describe my gratitude for their support and love. My
parents, sisters, grandparents, uncles, aunts and cousins equipped me the necessary
resources—intellectual, emotional, material, and erva mate—to achieve my goals, and
enjoy the long journeys towards them. I would like to express my special thanks to my
father, mother, and two sisters. Their multiple support helped me wake up every day
feeling grateful for being alive. Their hard work assured I had the conditions to dedicate
my time to work towards my goals. Their good principles and examples assured I lead a
happy and healthy life. Their frugality assured I grew to contemplate nature and to
cultivate a desire to preserve it. I thank them for understanding my need to be far away,
even when life closes and starts its cycles—the departure of my beloved grandmothers
and aunt, and the arrival of my dear first nephew.
To my co-workers. I am extremely grateful to those friends who directly made my
work possible. I thank all the volunteers during the field work for donating their time and
hard work that allowed data collection, for making life on Balaena even more enjoyable,
and for sharing long hours looking for whales, sometimes seeing not much more than
water, other times freaking out with so many flukes to photograph, skin and feces to
collect, codas to record. Special thanks to all the skippers of the R/V Balaena for their
patience, hard work, leadership and multiple skills (specially those related to fixing boat
parts and cooking great meals in the middle of nowhere). These capitanes were essential
in every aspect of the field work, including the time running around from the Capitania
to the agent office to the gas station to the market to the mechanic to the Capitania again

xxiv
and again, carrying 140 gallons of diesel and 100 gallons of water on our backs, rowing
the dingy from and to the port with all food and ice we could find, doing and re-doing
paperwork, finding ways to bring liquid nitrogen to the boat and many other adventures. I
also thank the colleagues in Galápagos (Parque Nacional Galápagos, Charles Darwin
Station), in Guayaquil (Concepto Azul), Quito (Universidad San Francisco de Quito) and
Boston (New England Aquarium) for helping with the logistics and paperwork for skin
and feces samples. In the lab, I am very grateful for all the undergraduate students for
volunteering hours to helped me with data entry, coda detection and database
management. Finally, I thank all the students who trust my first teaching and supervising
steps, such as in the Analysis of Biological Data class, the high-school project, the M.Sc.
dissertation in Brazil, and the workshop in South Africa.
To my co-authors. These friends helped me improve the quality of my work,
contributing several insightful ideas, game-changing suggestions, and opportunities for
me to rethink everything through a different point of view. Some of them contributed
directly to the thesis (chapters 3 and 5) and others challenged me to think and write about
other systems, perform other analysis, and reach other conclusions together. A thesis on
sperm whales would not be complete without side projects on opossums, cassava, peer-
review system, white sharks, spliceosome proteins, aquatic and terrestrial food-webs, reef
fish, biological networks of all kinds (molecular, morphometric, social, gene flow, food
web, metacommunity), elephant seals, frogs, bats, giraffes, elephants, Guiana dolphins,
bottlenose dolphins, humpback dolphins. I thank them all for allow me to be part of other
projects, which have broadened my skills, perspectives and passion for nature in many
different ways.
To my supervisory committee. I thank the members for their guidance and for
challenging me and my research outcomes with different points of view. I also thank the
external members of my committee, who were essential to my Admission to Candidacy
proposal, my Preliminary Exam, and now the defence of the Ph.D. thesis. I am very
grateful for the time providing thoughtful comments with the right mixture of criticism
and encouragement. Finally, I thank the encouragement from the committee members to
reach out and communicate my research to a wider audience. Similarly, I thank the staff

xxv
at the Media Centre at Dalhousie for triggering a long series of interviews with journalists
that featured part of our work in the interational media.
To my funding sources. I thank the funding received during the last 4 years that
made my work and living possible. I received a 4-year doctoral scholarship by the
Conselho Nacional de Pesquisa e Desenvolvimento Tecnológico (CNPq Brazil),
supplemented by a Killam Trusts (Canada) scholarship. Funding from the Natural
Sciences and Engineering Research Council of Canada and the National Geographic
Society (both granted to my supervisor) made possible the field work in the Galápagos in
2013 and 2014. A research grant by the Cetacean Society International (USA) allowed
me to participate in the Complex Systems Summer School at the Santa Fe Institute (USA)
in 2013, which initiated the Chapter 3. Grants by the Dalhousie Faculty of Graduate
Studies and the Dalhousie Graduate Students Association assisted me to present Chapters
3 and 4 at a conference in Dunedin, New Zealand, in 2013. A research grant by the
Animal Behaviour Society (USA) allowed me to visit the University of St. Andrews
(Scotland) in 2015, which initiated the Chapter 5. The Maui Whale Trust provided me the
unique opportunity to communicate results Chapters 3 to 5 to a very large audience in
Hawai’i at the Whale Tales in 2016. Finally, a research grant by the Natural Sciences and
Engineering Research Council of Canada (granted to my supervisor) and funding from
the Dr. Patrick F. Lett Graduate Student Bursary made possible my 4-month extension to
complete the thesis in 2016. I am also very thankful for the informal, and much
appreciated, support by the Magnani-Prince, Abicalaf-Neves, and Cantor-Magnani
families.
To my friends. They are the reasons why life and work are fun and purposeful.
Throughout these years, there were so many special people who crossed my path and
shared adventures, experiences, inspiring conversations, supportive advice and feeling of
belonging wherever I was. Any attempt to list names would yield another chapter in this
thesis and yet it would not be enough to express how grateful I am. I thank my long-term
friends across the world (many from Brazil) for being the core of who I am. I equally
thank all the new friends I have made during this thesis work (from Canada, Galápagos,
Australia, Germany, Ecuador, New Zealand, USA, UK, Perú, Colombia, Scotland,
Greece, Iceland, South Africa, Hawai’i) who helped me grow, learn, laugh and shape my

xxvi
values. Thank you all for being supportive, curious or not about my work, and just be
there, close or far, whenever needed. Regarding the 2012-2016 Ph.D. period, I thank my
dear friends: a) members of the Whitehead Lab, for contributing directly and indirectly to
my work, and for sharing the daily life—some at the lab, some at sea, some both—and
for insightful discussions about science, life and beyond; b) fellow grad students from
Dalhousie University, especially Department of Biology, Geology, Oceanography for
sharing the unique combination of freedom, long working hours, and foraging techniques
for free food that only grad school offers; and the Biology faculty members and
employees, who made my staying at Dalhousie very pleasant; c) from Halifax, in especial
the Ralston and Rockhead housemates for the decompressing times; the Dalplex gym,
yoga and Karate mates for inspiring a sane body and mind; the coffee shop mates, for
making the countless extra working hours count; d) from Galápagos, for making my
staying in the paradise even more satisfying; e) from other parts of the world for hosting
me in your homes, sharing time with your family and friends during working trips. I hope
I can thank each of these friends—and those special individuals—in a more personal
way, by nurturing our relationships for many years ahead.
To my inspiration. I am eternally grateful to the sperm whales for patiently
allowing me to spy on their private social lives, eavesdrop on their secret conversations,
and try to make my own sense of how their lives may be. I thank them for not being
interested in us as we are in them, and for not caring at all about what I came up with in
the following pages. May the whales remain communicating secretly and living privately
in remote places, indifferent to my curiosity. It is more exciting for both of us that way.

1
CHAPTER 1
INTRODUCTION
“I to be nature looking into nature with such easy sympathy as the blue-eyed grass in the
meadow looks in the face of the sky”
~H.D. Thoreau, 1841
Behaviour pervades Life. Simply put, behaviour is everything an individual—be it
Procaryota or Eucaryota—does from the moment it comes into life until the moment it
dies (Lehner 1998). It is inside and all around us, on the interface between individuals
and their environments (Kapeller et al. 2013). Behaviour is one of Nature’s essential
ingredients. Any system in Nature—be it simple, complicate or complex—can be fleshed
out by studying two fundamental characteristics: the elements composing the system, and
the rules of their interactions (Amaral & Ottino 2004); expressly, how these elements
behave and interact with each other. Societies are one of such complex biological
systems—an organized complexity (Weaver 1948) within which we and other animals
are inserted. As biological complex systems, societies intrigue the attentive observer with
their self-organizing and dynamic elements (Camazine et al. 2001): individuals with
adaptive behaviour.

2
1.1 SOCIETIES: EMERGENT PATTERNS FROM ADAPTIVE SOCIAL BEHAVIOUR
A society is a collection of individuals of the same species, and the nature, quality
and patterning of their social relationships, which are themselves a synthesis of the
behavioural interactions between individuals (Hinde 1976). While the individuals’
behaviours are usually intricate, the emergent behavioural rules in a society are often
simple. So how do complex patterns arise in a society from simple behavioural rules
(Hemelrijk 2005)?
The basics of sociality are dictated by the interactions among individuals and with
their environment in the search for individual or collective solutions to the challenges of
reproducing and staying alive (e.g. Wilson 1975, Krause & Ruxton 2002). Thus sociality
evolves where there is tension between cooperation and conflict (Tinbergen 1953,
Hamilton 1964, Frank 1998). The spatiotemporal predictability of resources, together
with predation risks, regulate the trade-offs of group-living; they are the general
underlying mechanisms of social structure (e.g. Connor 2000, Krause & Ruxton 2002,
Gowans et al. 2007). However, the big picture is more complex—and fascinating.
Social behaviour is diverse, flexible and adaptive among highly cognitive
animals, which is one of the reasons why their societies are dynamic (e.g. Lott 1984). A
wide range of animal social structures emerges in response to varied ecological pressures,
constrained by historic phylogenetic signals (Clutton-Brock 1989, Mann et al. 2000,
Smuts et al. 2008). But such social plasticity is also a product of proximate mechanisms
operating at the individual level—physiological, hormonal, developmental, genetic
factors (e.g. Oliveira 2005, Crossin et al. 2013, Schradin 2013, Kappeler et al. 2013).

3
Therefore, individual characteristics can have major effects on social structure, especially
at small spatial and temporal scales.
We now have evidence that social behaviour flexibility can also be a product of
processes occurring over shorter scales than evolutionary time—one or few generations
(see Laland & O’Brien 2012, Perreault 2012). Individuals adjust their behaviour by
observing the changing environment and/or the behaviour of conspecifics (e.g. Heyes
1994, Laland 2004, Lefebvre et al. 2004, Rendell et al. 2011). Both, individual and social
learning, can be efficient solutions to track varying environments (Richerson & Boyd
2005, Perreault et al. 2012). When socially learned behaviours are shared within subsets
of a population, they are considered culture (Boyd & Richerson 1985, Laland & Hoppitt
2003), which has been increasingly understood as an important driver of mammalian
phenotypes (e.g. Rendell & Whitehead 2001, Whiten & Whiten 2011).
1.2 CULTURE: THE WAY WE DO IT, THEY WAY THEY DO IT
Culture is pervasive in human societies. It has propelled recent human evolution
and transformed our lives in unprecedented ways, by broadening niches (e.g. Laland et
al. 2001, 2014), improving individual fitness (e.g. Boyd et al. 2011) and, likely, cognition
(Ji & Yap 2016). Via social learning, information flows within and between generations
at a faster pace than via genetic transmission (Cavalli-Sforza & Feldman 1981). Thus
culture allows for a rapid spread of (generally) adaptive behaviours (Boyd & Richerson
2004). Culture is not an exclusively human feature. The fundamentals of culture extend

4
to societies of other taxa (e.g. Laland & Hoppitt 2003, Laland & Janik 2006), though
human cultures are arguably different than those of other animals (Laland & Galef 2009).
The key distinctions between the two cultural realms seem to be that human
cultures are more cumulative and symbolic. Human cultural evolution is clearly
incremental: achievements are improved in successive generations. Perhaps because
human learning is more process-oriented whereas animal social learning is more product-
oriented (Tennie et al. 2009), the evidence for cumulative culture among animals remains
embryonic, and contentious (e.g. Marshall-Pescini & Whiten 2008). Human culture is
also clearly based on a symbolic system for thinking and communicating (Ernst 1944).
Symbols—as shared conventions, socially-agreed and self-referential signs—are part of
everyday lives of humans in any corner of the world. They seem to be lacking in animal
cultures (e.g. Perry 2009, Jablonka & Lamb 2014), at least in the rich forms observed
across human societies.
While accumulation and symbolism primarily define the divergence between
human and animal cultures, there is much debate about how to define culture. Some
definitions are very specific and anthropocentric, occasionally only including humans
(e.g. Braidwood 1975), while others are more inclusive (e.g. Boyd & Richerson 2004).
Here I consider the working definition of culture as behaviour that is socially transmitted
and shared within subsets of a population (e.g. Rendell & Whitehead 2001, Laland &
Hoppitt 2003). This is permissive enough to be measurable across species, while
retaining two main underlying properties of the more restrictive definitions of culture: 1)
a behavioural trait distinguishable between groups; and 2) a transmission process
involving social learning (acquiring behaviour via observation of conspecifics). This

5
broader concept of culture facilitates interdisciplinary research ultimately interested in
tracking its evolutionary origins and trajectories.
As such, the chasm between human and other animal cultures has been slowly
bridged by data painstakingly collected during long-term field studies (e.g. Whiten et al.
1999) and carefully-designed controlled experiments (e.g. Whiten et al. 2005). We can
now appreciate that culture also pervades animal societies—birds, fishes, terrestrial and
aquatic mammals to name but a few (Laland & Hoppitt 2003, Laland & Janik 2006).
Semantic disputes aside (e.g. Laland & Galef 2009), the point is culture evolves shaped
by population-dynamic processes both among humans and other animals (Mesoudi 2011,
Perreault et al. 2012).
The cultural inheritance system can act together with genetic transmission driving
phenotypes (Boyd & Richerson 1985, Laland et al. 2010) and shaping the behavioural
repertoire (Rendell & Whitehead 2001, Laland & O’Brien 2012). Cultural transmission
of information is one of the determinants of behavioural syndromes and intrapopulational
behavioural variation (see Araújo et al. 2011, Sih et al. 2012, Wolf & Weissing 2012).
Although many social and biological theories are built upon the assumption that
individuals are ecologically equivalent, individual heterogeneity is no longer being
neglected as insignificant noise. It has profound implications for individual survival and
fitness (e.g. Curio et al. 1978) and population (e.g. Whitehead & Richerson 2009),
community (Bolnick et al. 2011, Sih et al. 2012) and social dynamics (e.g. Krause et al.
2010, Castellano et al. 2009). In consequence, the resultant heterogeneity in individual
behavioural repertoire influences the structure of a society, and how information spreads

6
over it. In turn, information transmission via learning processes can also influence social
structure (Timbergen 1953, Nunn et al. 2009, Whitehead & Lusseau 2012).
1.3 SOCIETY AND CULTURE: A TWO-WAY RELATIONSHIP
The way individuals behave can affect, and be affected by their social ties.
Essentially, this is how culture and society influence each other. Culture is founded on
the transmission of behaviour through social learning among individuals (Boyd &
Richerson 1985, Franz & Nunn 2009). Social learning can occur through a variety of
psychological mechanisms (Heyes 1994, Laland 2004, Hoppitt & Laland 2008), such as
emulation, teaching, social facilitation, local enhancement, product imitation and others
(for a recent review and definitions, see Rendell et al. 2011). Thus, with learning clearly
taking place during individual interactions, social structure—who interacts with whom—
affects the transmission of learned behaviours (e.g. Voelkl & Noë 2008, 2010, Whitehead
& Lusseau 2012). In fact, social structure influences the efficiency, consistency and
persistence of behavioural transmission through social learning (Cantor & Whitehead
2013). Moreover, social structure can define the content of information being socially
transmitted, and thus becomes a cause of cultural diversity (Norenzayan 2011, Whitehead
& Lusseau 2012).
For example, consider two hypothetical populations, one in which all individuals
interact with each other on a regular basis (a highly connected society), and another
structured into two groups whose members tend interact more often with themselves than
with the rest of the population (a socially segregated society). Now consider that a novel,

7
more efficient way of finding a food resource was introduced in both populations by
individual learning, i.e. by an individual creating the new technique by itself. If
individuals learn from each other (for example by observing, copying the behaviours of
their social contacts), the new foraging technique is likely to spread more quickly in the
first population because there all individuals will have a chance to interact with the
innovator or with the innovator’s close friends. In the first population, the innovation
would also be learned more accurately, since individuals are more likely to learn from the
source (the innovator) than through a long chain of social connections. In contrast, in the
second, socially segregated population the foraging technique may change faster over
time, due to learning errors or deliberate introduced modifications. Thus, in general, the
higher the structure of the society, the lower the speed, fidelity and robustness of the
information being transmitted (e.g. Cantor & Whitehead 2013, Duboscq et al. 2016). All
of these illustrate how social structure can affect culture when behavioural traits flows
among individuals via learning.
In turn, culture can shape social structure by influencing the opportunities for
social interactions (see Boyd & Richerson 2004, Morgan & Laland 2012). In humans, for
example, culture affects higher-level social attributes (e.g. Boyd & Richerson 1985)
directly—for instance individuals learning that they must accept and live in a
monarchical society—as well as indirectly—a socially-learned deference to elders or
members of one sex will drive the social structure into particular forms. Through either,
or both, of these routes, populations may possess different social structures. In other
species for which culture is important, social learning can enhance social cohesion—
through activity synchronization and behavioural homogenization within groups (Coussi-

8
Korbel & Fragaszy 1995)—and sometimes split the population into subsets of individuals
with distinct behavioural repertoires. Individuals may prefer to interact with individuals
who perform similar behaviours; and during these interactions, they can learn other
behaviours from one another. Thus, through social influence (social relationships leading
to behavioural similarity) and behaviour matching (vice-versa), a population of social
learners can be structured into distinct cultural groups (Axelrod 1997, Centola et al.
2007). For example, socially-learned foraging techniques and communication signals
among animals can lead to the coexistence of sympatric groups with distinct behavioural
repertoires.
Some examples come from populations of whales and dolphins. Cetaceans have
diverse and flexible behavioural repertoires, and even subsets of individuals from the
same population may be split into groups according to behavioural repertoires. In south
Brazil, for example, this is clear in a small population of bottlenose dolphins, in which
nearly half of the individuals cooperate with artisanal fishermen when hunting mullet fish
schools. The dolphins that perform the foraging technique are more socially connected
with each other than with those who do not, dividing the population into distinct social
modules (Daura-Jorge et al. 2012). Among whales that live in multilevel societies,
learned acoustic communication signals are also important in defining who interacts with
whom. For example, pods of killer whales form vocal clans with distinct repertoires of
calls (Ford 1991, Filatova & Miller 20015), and sperm whales form clans with distinct
repertoires of sequences of clicks used for communication (Rendell & Whitehead 2003,
Gero et al. 2016a). In both cases, individual whales primarily interact with—and so learn

9
from—their clan members, reinforcing behavioural boundaries within the same
population.
Neither these cultural behaviours nor these cultural groups are static. Rather, they
are evolving products of individual and collective experiences. Over time, cultural groups
may change their composition, and cultural repertoires may change as cultural traits are
fixed and selected, lost and changed due to innovations, founder effects, transmission
errors and biases (Koerper & Stickel 1980, Cavalli-Sforza & Feldman 1981).
1.4 EVERYTHING CHANGES: ADDING TIME TO THE MIX
Culture and society are closely linked by dynamic ties. They coevolve as social
learning is based upon association, and association may be biased by shared learned
behaviours. Add time to the mix and who interacts with whom and what they learn from
one another may change, influencing the outcomes of the culture-society interplay.
Individuals change as they grow, and so do their behaviour and social affiliates (e.g. Biro
et al. 2006, Matsuzawa et al. 2006, White et al. 2012, Patterson et al. 2015). Populations
change in composition as individuals enter and leave via birth/immigration and
death/emigration, and so do the social relationships within the society (e.g. Cantor et al.
2012). Culture changes over time, as both individual traits and the groups bearing them
spread and decline (Cavalli-Sforza & Feldman 1981, Richerson & Boyd 2005), and so a
population’s behavioural repertoire changes (e.g. Avital & Jablonka 2000).
Cultural change is now recognized as one pillar of evolution, along with genetic
and epigenetic (non-DNA cellular transmission of traits) inheritance systems (e.g.

10
Jablonka & Lamb 2014). Culture evolves with analogous ingredients of Darwinian
evolution: variation (“mutations” by transmission errors or deliberate innovations),
heredity (transmission of information via vertical, horizontal, oblique social learning),
differential survival and multiplication (cultural selection) and drift (see Cavalli-Sforza &
Feldman 1981, Richerson & Boyd 1985, Boyd & Richerson 2005). Here, I illustrate
cultural changes in acoustic communication systems, since they are strongly linked to
social structure (see Freeberg et al. 2012) and change over time, at least partially, through
cultural processes.
While communication systems adapt over the time scales of genetic evolution,
significant changes can also happen during few generations time (e.g. Podos & Warren
2007, Nelson et al. 2004), and even much more rapidly, within the same generation
(Deecke et al. 2000, Noad et al. 2000, Garland et al. 2011) due to cultural processes.
Cultural selection may guide changes stabilizing specific behavioural variants that
perform better in a given context. For instance, culturally-transmitted bird songs can be
well adapted to a habitat (e.g. Tobias et al. 2010) thus stable over time (e.g. Byers et al.
2010); or show directional change in parallel to shifts in the acoustic environment (e.g.
Slabbekoorn & Boer-Visser 2006). Similarly, the structure and meaning of human
acoustic signals can be shaped by cultural pressures to become compressible and
maintain distinctions (e.g. Kirby et al. 2015, Tamariz & Kirby 2016). Alternatively,
neutral cultural processes can alter learned repertoires but with no apparent fitness
benefits (Koerper & Stickel 1980). An example is random-copying, which can induce
rapid shifts in frequency of cultural variants, as observed in the high turnover of
popularity in several human behaviours (Hahn & Bentley 2003, Bentley et al. 2004,

11
2007, Rendell et al. 2010). Simultaneously, behavioural repertoires can change as
individuals, while learning from one another (Janik & Slater 2000), introduce errors and
innovations that can be selected or fixed by cultural drift (e.g. Williams et al. 2013,
Filatova & Miller 2015).
Demographic mechanisms can significantly affect the dynamics of
communication systems with socially learned vocal signals. In allopatric groups or
populations, variation becomes evident (e.g. songbirds: Krebs & Kroodsma 1980, Podos
& Warren 2007; primates: Tanaka et al. 2006; cetaceans: Filatova et al. 2015), as spatial
segregation generally promotes cultural diversity and reinforces divergences (Whiten et
al. 1999, van Schaik et al. 2003). In sympatric groups or populations connected by
movement of individuals, repertoires tend to either maintain their differences or
homogenize, depending on the strength of opposite cultural forces. As behaviourally
distinct groups meet, or individuals leave and enter populations, behavioural differences
could be used to label group identities and so reinforcing cultural boundaries (e.g. Boyd
& Richerson 1987). On the other hand, differences can be successfully introduced and
diffuse through the population (e.g. Fayet et al. 2014, Whiten et al. 2016), causing
immigrant and local cultures to merge (e.g. Mesoudi et al. 2016). In acoustic cultural
repertoires, such changes are usually gradual (e.g. Slater & Ince 1979, Nelson et al.
2004); but a local cultural revolution may be triggered when an injected foreign trait is
adopted rapidly and collectively (e.g. Noad et al. 2000, Garland et al. 2011).
For the social animal, a communication system is of paramount importance. It
tends to increase in complexity with higher social demands (e.g. Freeberg et al. 2012), as
more diverse communication helps one to navigate through multiple social relationships

12
(e.g. Dunbar & Shultz 2007). Arguably, vocal communication may have peaked in
complexity in human languages—a symbolic system with unrestricted range of meanings
(Jablonka & Lamb 2014, Tamariz & Kirby 2016). Yet, acoustic communication is
imperative for many non-human animals (e.g. Horn & Leonard 2005, McGregor 2005,
McGregor & Horn 2015), particularly in the aquatic environment where light is usually
limited but sounds travel farther and more effectively (Tyack 1998, Janik 2005).
Vocal communication in whales and dolphins is sophisticated (e.g. Tyack 1998,
Janik 2014), in line with their complex sociality (May-Collado et al. 2007). The sounds
they produce are crucial to every aspect of their lives, including a range of social skills
such as grouping cohesively (e.g. King et al. 2014), maintaining long-term relationships
(Bruck 2013), addressing and remembering affiliates (King & Janik 2013, King et al.
2013), coordinating foraging strategies (e.g. King & Janik 2015), attracting mates (Smith
et al. 2008) and marking multiple social tiers (Gero et al. 2016a). Partially in
consequence, cetaceans have particularly complex and varied social systems (Connor et
al. 1998) based on evolving acoustic communication systems, which gives considerable
evidence for culture being an important driver of behaviour in these species (Rendell &
Whitehead 2001, Whitehead & Rendell 2014).
1.5: OCEANIC CULTURAL SOCIETIES: WHALES AND DOLPHINS
I begin with a caveat. Logistics may constrain studies on the interplay between
social structure and cultural transmission in cetaceans. There are many challenges in
studying long-lived, deep-diving animals that range over thousands of kilometers in

13
offshore waters. But as data accumulate in long-term multidisciplinary efforts, we begin
to accurately depict the social systems (e.g. Mann et al. 2000). Cetacean cognitive
capacities are highly developed (Marino et al. 2007) and confer behavioural plasticity
and diversity to their social systems (e.g. Connor et al. 1998), which inspired a number of
conceptual models and empirical analyses of cetacean socioecology (e.g. Mann et al.
2000, Whitehead 2003, Gowans et al. 2007).
These outcomes from the sea counterbalance the theoretical expectations of
socioecological theory build upon animals from the terrestrial environment (e.g. Wilson
1975). Cetaceans live in a tridimensional, mobile environment characterized by red noise
(Whitehead 2008a), where risk and resources are more unpredictable in space and time
(Gowans et al. 2007). Consequently, cetacean societies are not bounded by defended
territories, and are generally larger than those of primates and other terrestrial animals.
All of these attributes give power and potential to the dynamic relationships between
culture and society (see Gero & Rendell 2015).
Cetacean societies are diverse. While ephemeral associations may be the general
pattern among baleen whales (Mysticeti), the social relationships of toothed whales
(Odontoceti) contain both labile and stable features (Connor et al. 2000). A variety of
ecological (e.g. Gowans et al. 2007), biological (e.g. Lusseau et al. 2006) and
spatiotemporal mechanisms (e.g. Cantor et al. 2012) underpin the variation in cetacean
social structures. It is becoming clear that social learning is an important part of how
individual whales and dolphins cope with their ecological and social environments,
especially in foraging, communication and social behaviours (e.g. Boran & Heimlich

14
1999). In other words, culture adds another layer of social complexity in cetacean
societies (Rendell & Whitehead 2001, Whitehead & Rendell 2014).
The evidence for culture among whales and dolphins grows as we refine our
understanding on their social complexity, geographical distribution, life history, memory
and learning abilities (reviewed in Whitehead & Rendell 20014). Captivity experiments
show that cetaceans do learn from their peers (e.g. Janik 2014), supporting that social
learning can underlie sympatric behavioural divergence, fast spread of innovations within
populations, and rapid evolution and long-term maintenance of behavioural variants
observed in the wild. For instance, the rapid evolution and spread of complex songs
(Noad et al. 2000, Garland et al. 2011) and rapid spread of innovative foraging tactics
(Allen et al. 2013) of humpback whales can only be explained by individuals learning
from those whom they interact with. Similarly, the vocal tradition (Ford 1991) and
dietary differences (Ford et al. 1998) among killer whale ecotypes are compelling
examples of the influence of social learning in sympatry and over large spatial scales.
Finally, the role of learning is clear in the emergence and maintenance of highly
specialized foraging techniques among cetaceans—some of which lasting for many
generations (e.g. Simões-Lopes et al. 1998). Examples include the spontaneous stranding
(Lopez & Lopez 1985) and (potentially) the cooperating hunting (Pitman & Durban
2012) of pods of mammal-eating killer whales, as well as the long list of feeding tactics
of bottlenose dolphins, such as sponging, mud-ring, barrier and trawler feeding (reviewed
in Whitehead & Rendell 2014). In some of these cases, it seems that the spread of a local
foraging variant via social learning can shape the structure of the society (e.g. Daura-
Jorge et al. 2012, Ansmann et al. 2012, Mann et al. 2012).

15
The effect of culture on cetacean societies is not restricted to localized and small
populations. We also find impressive examples at a vast, oceanic scale. Sperm whales
(Physeter macrocephalus) have one of the most complex social structures among all sea
creatures (sensu Bergman & Beehner 2015) as they form multilevel societies (Whitehead
et al. 2012), in which cooperation, social communication, and culture are important
underlying mechanisms (Whitehead 2003). These traits make sperm whale societies a
very good model to address cultural processes (Rendell and Whitehead 2001, Whitehead
& Rendell 2014), social structure (Whitehead 2008b) and their interdependence—along
with the many particularities of their natural history that make such studies challenging
and exciting.
1.6 STUDY SYSTEM: SOCIETY AND CULTURE IN SPERM WHALES
Sperm whales are circumglobally distributed in offshore, deep waters (Jaquet
1996). There they perform deep (~200-2000m) and long (~40min) dives to forage,
mainly, for squids (Rice 1989). Sperm whales have two distinctive behavioural states:
75% of the time foraging at depth, and the rest resting/socializing at the surface
(Whitehead 1989, Whitehead & Weilgart 1991). For both, acoustic communication is
essential. Sperm whales possess a sonar-like apparatus—the spermaceti organ—with
which they produce series of broad-band clicks to echolocate prey. During social
contexts, they use the same system to produce a range of stereotyped patterns of clicks,
called codas (Watkins & Schevill 1977), used for communication (e.g. Schulz et al. 2008,
Frantzis & Alexiadou 2008).

16
The social patterns of sperm whales reflect their sexual divergences in life styles.
Males depart from their natal groups to live quasi-solitary lives near the poles and return
to tropical waters to breed (Whitehead 2003). On the other hand, females and immatures
spend their lives in the tropics, living together in stable, nearly-matrilineal social units of
about 11 related, as well as unrelated, individuals (Richard et al. 1996, Christal et al.
1998, Lyrholm et al. 1999). The social lives of females are cooperative. There is evidence
for communal care of the young (Gero et al. 2009, 2013), as well as for defending against
predators (Arnbom et al. 1987), and suggestions that females might finding food together
(by sharing, or eavesdropping on, information about ephemeral but somewhat predictable
food patches) (Whitehead 1989). In addition, the absence of territoriality and within-unit
mating suggest reduced competition among unit members (Christal & Whitehead 2001).
These cooperative activities take place within and between social units of females.
Sperm whale societies are multilevel: individuals living in nearly-permanent
social units that form temporary groups within a larger vocal clan (Figure 1.1, Whitehead
et al. 2012). Members from different social units form temporary groups (travelling
together for periods from hours to few days; Whitehead et al. 1991), within which they
preferentially associate in close spatial proximity (Whitehead & Arnbom 1987) with
members of their own unit (Christal & Whitehead 2001). But more strikingly, these
temporary groups are formed by social units that share a similar repertoire of codas. Thus
a higher level of social organization is recognized: the vocal clans (Rendell & Whitehead
2003, Gero et al. 2016a,b). Vocal clans span large areas, are sympatric and genetically
indistinct (in the nuclear genome), which strongly supports the hypothesis of culture

17
driving their social structure (Rendell & Whitehead 2003, Rendell et al. 2012, Whitehead
et al. 2012, Gero et al. 2016b).
Figure 1.1. Schematic representation of the fundamental social levels of a female sperm
whale society from the Pacific Ocean (see Whitehead et al. 2012). In a population,
individual females and their young live in nearly-permanent social units for several years
(presumably their entire lives). Social units form temporary groups (from hours to few
days) with other units, but tend to do so with units with which they have high similarity
in the repertoire of codas (stereotyped patterns of click sounds used in social
communication), forming a vocal clan. A clan of sperm whales is identified as such
collections of social units that share an identifiable part of their coda repertoire, where
that part of the repertoire both forms a large portion of the coda production of those social
units and is readily distinguishable from the coda repertoires of social units from other
clans (see Rendell & Whitehead 2003). This multilevel structure applies only to the

18
females and immature individuals; males disperse from their natal groups to live nearly-
solitary lives near the poles, returning to tropical waters to mate (Whitehead 2003).
Clans of sperm whales are different from most other animals’ social structures
(but see orca acoustic clans; Ford 1991). They may be the largest cooperative social
entity outside of humans (Whitehead & Rendell 2014). But what are the drivers of clan
structure in sperm whale societies? What are the consequences of a cultural population
structure for the individuals? How stable is this structure over time? In my research, I
describe and explain these three aspects of the interplay between social structure and
culture in sperm whales.
1.7 THESIS OBJECTIVES AND ORGANIZATION
The overarching goal of my thesis is to investigate the interplay between society
and culture and infer its behavioural mechanisms, behavioural consequences and
temporal stability, using the multilevel sperm whale society as a model. To accomplish
that, I employed an array of analytical methods to combine fieldwork, simulations and a
long-term empirical database, representing a multidisciplinary study that spans over
nearly 30 years.
In the second chapter, I delineate how social structure and learned behaviour are
mutually dependent, putting forth a conceptual framework for the interplay between
animal culture and society. I further explore theoretical expectations of this two-way
relationship, and back them up with recent advances in empirical studies with cetaceans.

19
This chapter is a review essay that sets the theoretical ground for the thesis. I have
reviewed the relevant literature on the theory and methods to propose the formalism of
adaptive networks as a feasible tool to explore the society-culture interplay. This chapter
was published in 2013 in the theme issue of Philosophical Transactions of the Royal
Society B entitled “Flexibility and constraint in the evolution of mammalian social
behaviour”.
In the third chapter, I explore the mechanisms that give rise to the cultural
segregation that structures sperm whale populations. Here I focus on one side of the
culture-society interplay: whether cultural transmission can shape social structure. The
aim is to backtrack the empirically-observed social pattern (sperm whales organized in
sympatric clans with distinct repertoires of communicative signals) to infer on its causes.
By building mechanistic agent-based models informed by 18 years of empirical data, I
tested competing mechanisms—namely genetic inheritance, individual learning, pure or
biased social learning—that could give rise to vocal clans, the social level that crowns the
sperm whale multilevel society. I show that clans are unlikely products of stochastic
processes such as genetic or cultural drift but likely originate from cultural transmission
via biased social learning of acoustic communicative signals. I then suggest cultural
transmission as a key ingredient in the emergence of sympatric clans of sperm whales,
which increases the similarities between human and non-human societies. This chapter
was published open-access in 2015 in the journal Nature Communications and has
received considerable attention in the media (featured in over 200 news outlets from 18
countries).

20
In the fourth chapter, I switch gears to the other side of the culture-society
equation, and test whether the known social structure into vocal clans could have
consequences for their members. Using a long-term database from 1985 to 2003, I
quantify the fine-scale social behavioural differences of the members of the two main
vocal clans of sperm whales off the Galápagos Islands. I show the clans differed
consistently in diving synchrony, heterogeneity, and temporal stability of social
relationships, and suggest that disparities in surface-time coordination and quality of
social relationships are byproducts of clan segregation, with potential effects in
alloparental care giving and calf survival rates. This chapter was published in 2015 the
journal Marine Mammal Science.
In the fifth chapter, I add time to the mix and evaluate the temporal stability of the
clan structure in the sperm whales off the Galápagos Islands over the last thirty years.
Populations are dynamic, and so are societies and culture. I updated the long-term
database on population structure acoustic behaviour with new data I collected off
Galápagos in 2013 and 2014 to compare acoustic repertoires that defines the vocal clans
and clan membership through individual identification. I present the curious case of the
bimodal cultural makeup of this population, in which the two original sympatric cultures
may have been replaced by two different culturally-defined groups. Previous data
indicate members of two clans using the Galápagos waters until about 1995, whereas new
data indicate that two different clans, formerly common elsewhere across the South
Pacific, are now using this area. In brief, I document a local cultural turnover triggered by
a complete population turnover using the area. While these findings suggest some
temporal stability in clan structure (long-lasting clan membership), it also points to low

21
spatial stability (clans with large and dynamic ranges). This chapter is in review in the
journal Royal Society Open Science.
In the final chapter, I conclude my “sympathetic look” in the face of the nature of
animal societies and cultures. I discuss the combined relevance of my research by
reviewing the four key highlights of the thesis. Here I argue that information transmission
through biased social learning and cultural drift—key drivers of human behaviour—can
also be at play in wild animal populations structuring their social relationships. Finally, I
suggest the future steps for advancing the field on the relationship between cultures and
societies of animals. This chapter is followed by four appendices containing
supplementary material for the chapters 2 to 5.

22
CHAPTER 2
ON THE INTERPLAY BETWEEN SOCIAL NETWORKS AND CULTURE:
THEORETICALLY AND AMONG WHALES AND DOLPHINS 1,2,3
“The universe is wider than our views of it”
~ H.D. Thoreau, 1854
2.1 ABSTRACT
Culture is increasingly being understood as a driver of mammalian phenotypes. Defined as
group-specific behaviour transmitted by social learning, culture is shaped by social
structure. However, culture can itself affect social structure if individuals preferentially
interact with others whose behaviour is similar, or cultural symbols are used to mark
groups. Using network formalism, this interplay can be depicted by the coevolution of
1This chapter has been published in the theme issue of the Philosophical Transactions of the Royal Society Series B “Flexibility and constraint in the evolution of mammalian social behaviour” compiled and edited by Peter M. Kappeler, Louise Barrett, Daniel T. Blumstein and Tim H. Clutton-Brock. The full reference is: Cantor M. & Whitehead H. 2013. The interplay between social networks and culture: theoretically and among whales and dolphins. Philosophical Transactions of the Royal Society B. 368. 1618, 20120340. doi:10.1098/rstb.2012.0340 2 Authors’ contributions: Mauricio Cantor (MC), Hal Whitehead (HW): Developed the conceptual framework; MC: reviewed literature; MC: created the figures; MC: drafted the manuscript; HW contributed several ideas, comments, edits in the figures and manuscript; MC reviewed the manuscript during the peer-review process.
3 Publication history: Manuscript First Submission: 14 SEP 2012; Reviewed Manuscript Received: 21 NOV 2012; Manuscript Accepted: 26 NOV 2012; Manuscript Published: 08 ABR 2013.

23
nodes and edges together with the coevolution of network topology and transmission
patterns. We review attempts to model the links between the spread, persistence and
diversity of culture and the network topology of non-human societies. We illustrate these
processes using cetaceans. The spread of socially learned begging behaviour within a
population of bottlenose dolphins followed the topology of the social network, as did the
evolution of the song of the humpback whale between breeding areas. In three bottlenose
dolphin populations, individuals preferentially associated with animals using the same
socially-learned foraging behaviour. Homogeneous behaviour within the tight, nearly-
permanent social structures of the large matrilineal whales seems to result from
transmission bias, with cultural symbols marking social structures. We recommend the
integration of studies of culture and society in species for which social learning is an
important determinant of behaviour.
2.2 INTRODUCTION
Social complexity essentially emerges from individual efforts in creating mutual
solutions to maintaining and propagating life. The diversity and flexibility of social
behaviour are prominent ingredients of complex mammalian societies. Such plasticity has
been carved over evolutionary time by the interaction of ecological, phylogenetic,
developmental and genetic factors [1]. But behavioural flexibility can also be an adaptive
product of challenges occurring at shorter time scales [see 2,3].
When the environment varies unpredictably within periods of the order of tens of
generations, genetic determination of behaviour may not be optimal. In such cases,
environmentally-induced phenotypic plasticity [4] through learning [5] may emerge as a

24
more efficient solution [e.g. 6]. Individuals regulate their behaviour by tracking the
environment as it changes and/or by tracking their conspecifics’ behaviour [e.g. 7-9]. The
former, individual learning, is an asocial trial-and-error strategy that may be time-
consuming, energetically costly or risky; the latter defines social learning, a nongenetic
mechanism of information transfer [5,10,11]. When behaviour is socially transmitted and
then shared within subsets of a population, it may be called culture [12]. Thus culture, as
defined in this way, can have a major role in structuring behavioural diversity within a
population [7,13].
As culture is fundamentally built upon social learning [e.g. 5], social structure and
culture are linked (Figure 2.1). If we express the social structure of a community as a
network, i.e. nodes depicting individuals linked according to their social relationships
[e.g. 14; see Appendix A2.1, Table S2.1], then we can envisage that social learning
occurs along the network edges (i.e. the links between individuals; Table S2.1). In
network depictions of animal societies the edge weights usually represent estimates of the
proportion of time that each pair of individuals spends together [14], and so may
represent the probabilities that individuals learn from one another [e.g. 15-17]. Thus, as
illustrated in Figure 2.1A, we suggest that the process of culture can be placed alongside,
and linked to, the process of social structure. Social structure can be conceptualized using
Hinde’s [18] framework in which social structure is the nature, quality and patterning of
the relationships among its members, and where relationships are formed from the
content, quality and patterning of dyadic interactions (Figure 2.1A). Then we can think of
social learning occurring during interactions, or being governed by relationships (Figure
2.1A, d). Network thinking is implicated by another element of the general definition of

25
culture: “shared” [see 12]. If some pairs of individuals share behaviour, the implication is
that others do not. Thus, we suggest that the network representing the entire population
should be modular, i.e. showing strongly connected clusters of individuals with shared
behaviour [see 19; see also Table S2.1], for the results of social learning to be called
culture. Thus, in Figure 2.1A we show a second major link (e) from social structure to
culture.
But culture can also affect social structure. If individuals preferentially associate
with those who behave similarly [e.g. 20-22] (Figure 2.1A, c) and behaviour has a
cultural element, then elements of social structure may reflect culture. This may
especially be the case when conformism homogenizes behaviour though social learning
[e.g. 23], and/or when cultural symbols are used to mark social entities [24] (Figure 2.1A,
f).
Although depicted as static diagrams, social networks encode dynamic and
coevolutionary systems. Network topology evolves, as changes in node states affect
edges, and changes in edges affect node states [reviewed in 25,26]. In a society with
social learners and behaviour matching, that means changes in behaviour affecting
relationships, and changes in relationships affecting behaviour. Thus, individuals
influence and are influenced by their social network [e.g. 27-29], due to behaviour
matching (Figure 2.1B, g) [21] and social influence (Figure 2.1B, h) [20]. Either way,
both the network structure and the transmission dynamics can be transformed, subtly or
profoundly (Figure 2.1B, k). Social structure influences how information flows through
the population [e.g. 15] (Figure 2.1B, i), at the same time that the transmission of
information can affect the network structure. For instance, stable modules in dynamical

26
systems can emerge when interactions are more likely to form between nodes that have
similar states [30], while the dense connections within a module can reinforce the nodes’
similar states [e.g. 31]. In the social context, we get emergent structures if individuals
associate primarily with individuals with whom they share behaviour, and learn
behaviour primarily from their social associates [see 22,32,33] (Figure 2.1B, j). Finally,
interplay between social structure and transmission dynamics closes this cycle (Figure
2.1B, l), since behaviour defines the cultural context, with its norms and transmission
biases, that influences how individuals behave and interact [see 5,12,23,24].
There are many theoretical studies of the potential relationships between network
structure and information flow over human-like social networks [e.g. 22,26-29,31-34].
However, non-human networks are generally smaller—fewer nodes—and need to be
represented with weighted rather than binary edges, because animal social relationships
are rarely all-or-nothing [35]. Thus the human-calibrated models are not necessarily
applicable, providing at best a rough starting point for exploring animal societies.
However, there have a few theoretical, agent-based models of the relationship between
social structure and culture calibrated for non-human societies. We review their results,
exploring theoretical facets of the interplay between culture and social structure in animal
societies.
We illustrate some of these ideas using results on cetaceans (whales and
dolphins). Cetaceans have particularly complex and varied social systems [36], and there
is considerable evidence for culture being an important driver of behaviour in these
species [37]. Among animal groups, cetacean societies have been particularly frequently
studied using network methods. Cetacean social relationships are not bounded by

27
defended territories, and individuals usually have large home ranges and more social
associates than is typical for terrestrial mammals. These attributes give power and
potential to investigations of the relationships between culture and society among
cetaceans [see 38]. However cetacean cultural behaviour is difficult to study, and has
rarely been the focus of research. Thus our examples only illustrate small sections of the
rich interplay between society and culture illustrated in Figure 2.1, and those imperfectly.
Figure 2.1. Two representations of the dynamic relationship between social structure and
culture. (A) Individual characteristics ultimately influence both social structure, through
their effects on social relationships (a), and the cultural context, through variation in both
behaviour and the individuals’ partialities for social learning (b). Overall, the interplay
between individuals and social relationships influences—and is influenced by—the
interplay between social structure and information transmission. (B) This is represented
by a coevolutionary social network in which the coevolution of nodes (circles
representing individuals) and edges (links representing relationships) (g, h) shapes and is

28
shaped by (k, l) the coevolution of network topology and transmission mechanisms (i, j).
Thick dashed arrows illustrate the Hinde’s [18] conceptual framework for social structure
(a). Thick black arrows illustrate the elements of the concept of culture from Laland &
Hoppitt [12] (b). Thin arrows (c-f) represent additional effects hypothesized in this
review. For further details on network terminology please see the Appendix A2.1, Table
S2.1.
We illustrate these dynamic relationships between culture and social structure
using the formalism of coevolutionary networks (also called “adaptive networks”) [25],
characterized by a feedback loop between the dynamics of the nodes (individuals) and
topological evolution (social structure) mediated by transmission processes (social
learning) (Figure 2.1B). Even though disentangling cause and effect in this two-way
relationship is not trivial, we first summarize how social structure may affect culture
(section 2), then how culture may affect social structure (section 3). We also consider the
potential effects of social learning biases and symbolic marking (section 4). We conclude
by considering how understanding will advance in this area and by suggesting ways to
bridge the gap between theory and real-world cetacean societies (section 5).
2.3 HOW SOCIAL STRUCTURE AFFECTS CULTURE
We generally expect the spreading dynamics of information, or other quantities
like disease, through a society to be highly dependent on its network structure [e.g. 39-
45]. Agent-based models that roughly mimic non-human social systems and social
learning predict that large-scale structure [15,17,46], within-group hierarchy structure

29
[16; see also 47,48] and the differentiation of individual social roles [49] affect
information flow on social networks (Figure 2.2).
Generally, increases in social network structure mean more heterogeneity in the
number and intensity of social relationships and longer path lengths (i.e. distance from
one node to another; see Table S2.1) which decrease speed, fidelity and robustness of
information flow [15]. Learning errors promote behavioural diversity in the population
[17]. In these simulations, as the large-scale structure of the social network increases,
behavioural diversity generally increases. As modules become increasingly separate
socially, they develop independent behavioural trajectories, leading to higher behavioural
diversity in the population. If culture is defined such that socially-learned behaviour is
consistently different between segments of the population [e.g. 12], one could conclude
that social structure can produce culture when the network is clearly modular [17]. These
modules are generally called “groups” by primatologists, and “communities”, “clusters”
or “units” in cetacean and proboscidean studies. All these terms have contradictory
connotations, so here we use “social modules” from the network literature to generalize
sets of individuals in which interaction and association rates, as well as social learning
opportunities, are consistently greater within social modules than between them. In some
societies, different types of social modules can be hierarchically arranged into social tiers
[e.g. 50].

30
Figure 2.2. How social networks affect information transmission at two structural scales:
the large-scale structure of the population and the structure within social modules. In both,
the lower the connectance of the network, the longer the path length; thus more time is
required for the information flow, which makes the information more susceptible to loss
and transcription errors but more prone to generate diversity. Arrows represent the overall
directions of effects of network topology on network properties and on the transmission of
information (described by their respective metrics) as indicated by the theoretical literature
[15-17,46,49]. Arrows in parentheses represent our own speculations. Up arrows indicate
a positive relationship and down-arrows a negative relationship. In both, the lower the
connectance of the network, the longer the path length; thus more time is required for the
information flow, which makes the information more susceptible to loss and transcription
errors but more prone to generate diversity. In the hypothetical networks, nodes
representing individuals are connected by weighted edges whose thickness is proportional

31
to the rate of social interaction, assumed to be proportional to probability of social
learning. Efficiency was measured by the number of steps until all individuals acquired the
new information (speed) [15]; consistency was measured by the average path length
(minimum number of steps along a chain of relationships from one individual to another),
reasonably assuming that longer paths are more likely to be subjected to transcription
errors [15]; persistence over time was assessed by simulating the forgetting of acquired
information and estimating its extinction risk [15]; and diversity was measured by the
standard deviation of continuous behavioural measures or the Shannon diversity index for
categorical behaviour [17]. See Table S2.1 (Appendix A2) for definitions and
interpretation of the network terminology; network metrics formulae can be found in
elsewhere [e.g. 14,19,93,94].
Agent-based models suggest that within small social networks that may be
representative of social modules in non-humans, social structure also determines the
spread of socially-learned information. Transmission speed and vulnerability of
information to extinction vary markedly according to the level of hierarchy among animals
within such networks [16]. Social learning homogenizes behaviour in egalitarian networks
more quickly and effectively than in despotic ones [16]. Scaling down to the individuals,
the social role an animal plays, inferred through the node position in the network, affects
the flow of information [see 51]. For instance, individuals with high centrality, towards the
centre of networks, (see Table S2.1) may be key dispersers, funnelling information flow
between different social modules, or controlling the access or the quality of information
[see 49]. Thus, even fine-scale social structure influences social learning [47,48,52].

32
We have summarized these theoretical results on how social structure affects
culture in Figure 2.2. What about the real world? There are a few cases where we have
been able to trace the spread of information through a reasonably well-mapped social
network of whales and dolphins. Sophisticated analytical tools that separate social learning
from genetic, environmental, demographic and other factors in the acquisition of
behaviour are just beginning to be employed [e.g. 48,53,54]. Although we recognize a
dearth of empirical evidence, we will present current examples suggesting that social
learning follows network structure both within and between social modules.
In southwestern Australia, some bottlenose dolphins (Tursiops aduncus) beg for
food from recreational fishermen [55]. Two factors were strongly implicated in the
acquisition and spread of this behaviour through the population: how much time an
individual spent in areas of high boat density, and how much it associated with other
dolphins that were already begging. So begging behaviour seems to have spread through
the population by a combination of individual learning (dolphins spending time with
boats) and social learning (spending time with conditioned dolphins) [55].
Our second example is on a much larger scale. Male humpback whales (Megaptera
novaeangliae) on and near their winter breeding grounds sing long, elaborate songs [56],
“the most elaborate single display known in any animal species” [57, p.108]. Nearly all
whales on any breeding ground at any time essentially sing the same song, but it evolves
over the months of the breeding season. These characteristics are only consistent with
social learning, and mean that the humpback song provides “some of the most compelling
evidence for animal cultures” [58, p. 543]. We will consider the humpback whales in the
Pacific, with breeding grounds being the network nodes. Migrations and winter breeding

33
grounds are shown in Figure 2.3. Even though the northern and southern hemisphere
breeding grounds overlap off Costa Rica [59], they are used at different times of year. The
North Pacific and South Pacific songs have different content. Within the North Pacific,
though, the songs on at least two different breeding grounds, those off Mexico and
Hawaii, have nearly identical content and evolve synchronously [60,61]. Possible
mechanisms for this synchronicity in behaviour on nodes 4,800 km apart include
information exchange on common feeding grounds or during migration (Figure 2.3),
movement of animals between the grounds in successive winters, or the same winter,
innate templates of change, and song in intermediate parts of the ocean [see 60,61].

34
Figure 2.3. Humpback whale song in the Pacific. Principal breeding grounds are shown
by star symbols in the North Pacific (dark grey), South Pacific (light grey) and Indian
Ocean (black). Seasonal migration routes are indicated by dashed lines, and routes of
information flow by thick arrows. The evolution of the South Pacific song between 1998
and 2008 is shown by the block diagram [adapted from 62]. The different song types are
indicated by different colours and missing data by white boxes. The vertical columns of
the block diagram are aligned approximately above the study areas where the songs were
recorded in the South Pacific map.

35
In contrast, song evolution on the South Pacific breeding grounds occurs
sequentially, and in a west-to-east direction [62]. A song heard off eastern Australia in one
winter might be heard off New Caledonia—2,000km to the east—12 months later, and off
French Polynesia after another year (Figure 2.3). In at least one case, a totally new, Indian
Ocean, song was injected into the South Pacific system in eastern Australia, perhaps by
animals whose autumn migration from Antarctica went up the eastern rather than the
western side of the Australian continent [63]. The reasons for the one-way movement of
songs across the Pacific are uncertain [62], as are the contrasts with the picture in the
North Pacific where songs on breeding grounds more separated than those in the South
Pacific evolve in synchrony. Perhaps the constriction of the North Pacific at temperate
latitudes (Figure 2.3) connects humpbacks that use well-separated winter breeding
grounds—the whales sing on migration [see 64]—in a manner that does not happen in the
southern hemisphere where the high latitude ocean circles the globe.
In summary, the structures of animal social networks over a range of scales reflect
the heterogeneous opportunities for individuals, or social modules themselves, to interact
and then for cultural traits to emerge, flow and evolve. The topology of social networks
generates and moulds culture (Figure 2.2).
2.4 HOW CULTURE AFFECTS SOCIAL STRUCTURE: BEHAVIOUR MATCHING
While social structure affects culture, the direction of causation can be reversed. In
this section we consider situations in which animals with similar culturally-determined
behaviour preferentially associate. General models have predicted that such behaviour

36
matching, sometimes called assortativity or homophily, can become an important driver of
social network structure [e.g. 22,29,31,33]. Since behaviour matching breeds relationships,
edges between individuals with distinct behaviour tend to dissolve [21] and modules of
behavioural homogeneity emerge [e.g. 22,34,65]. We are not aware of quantitative models
of this phenomenon calibrated for non-human societies. However, in Figure 2.4A we
illustrate graphically how social network topology might be shaped by variation in
individual behaviour and social learning.
Individuals differ in many ways [e.g. 66], including their social experiences [67],
and behavioural repertoires [e.g. 68], and these characteristics can influence the social
network [69]. Natural populations are often composed of individuals displaying different
repertoires of behaviour, and/or degrees of specialization [see 70]. These patterns can
partially result from cultural transmission of behaviour [e.g. 68,71]. If individuals have
behavioural repertoires of different central values but similar width, randomly or
uniformly distributed through the population’s behavioural range, then preferential
association between individuals with similar behaviour will not tend to structure the
network (Figure 2.4A a-c). However, when individuals have different degrees of
specialization (i.e. repertoires differ in their widths) but there is no social learning, then
behaviour matching will lead to the “generalists” becoming central to a “small-world”
type (see Appendix A2.1, Table S2.1) network as these “generalists” are more likely to be
performing the same act as a randomly-chosen individual and so will associate with them
more often (Figure 2.4A d-f). Add social learning to the mix, so that individuals converge
on similar mean behaviour but with different degrees of specialization, and now the
“specialists” become central to the network (Figure 2.4A g-i) [see also 29]. In our final

37
example, specialization is fairly uniform within the population but social learning clusters
the individuals’ behaviour into several modes, which then through behaviour matching
become the characteristic features of semi-discrete social modules (Figure 2.4A j-l) [see
also 22].
Figure 2.4. (A) Hypothetical effects of behaviour matching (i.e. when individuals tend to
associate with those with similar behaviour) on social structure as influenced by patterns
of behavioural specialization. The columns indicate different distributions of individual
behaviour within the populations: unspecialized niches with similar widths; individual
variation in niche width and location; individual variation in niche width around a

38
common central value; and specializations around several modal values with similar niche
widths. The first row represents the distribution of continuous behaviour (thicker lines:
population behavioural repertoires; thinner lines: individual repertoires); the second row
uses binary two-mode networks to represent equivalent distributions of categorical
behaviour types (squares) used by individuals (white circles: “generalists”; grey circles:
“specialists”); and the third row represents the weighted social network that behaviour
matching might induce in each case (individuals connect by edges whose thicknesses are
proportional to the rate of social interaction). (B) Adding conformism, behavioural
repertoires become narrower. With low and moderate individual specialization, the social
networks tend to random topologies, but when modules of individuals with specialized
behaviour are present, conformism increases their isolation. Definitions and interpretation
of network terms are available in the Appendix A2 (Table S2.1).
Two recently-published studies suggest that the matching of socially-learned
behaviour structures the societies of bottlenose dolphins (Tursiops spp.) [72,73].
Identifying such processes is difficult as the more parsimonious alternative that social
differences explain the behavioural patterns must be eliminated, or at least shown not to be
sufficient. However, in these examples the studies have gone some way towards doing
this.
Perhaps most famous among the many foraging specializations of bottlenose
dolphins is sponging, a cultural behaviour [74], largely transmitted from mothers to
daughters [75]. Bottlenose dolphins of Shark Bay, Australia, place sponges on their rostra,
a behaviour that is thought to help them when foraging in rocky substrate [76]. Sponging

39
is performed singly and the sponging dolphins live in the same habitat as non-spongers,
but the spongers preferentially associate with other spongers. After accounting for other
possible causes of these preferred associations— range overlap, gender and kinship—
Mann et al. concluded that spongers prefer to associate with other spongers, and hence
that behaviour matching is an underlying mechanism driving the social network structure
[72].
This is pretty conclusive evidence, but we would really like an experiment, in
which we compare the social system with and without the behaviour. This is what
happened in Moreton Bay, on the east coast of Australia. In the 1990’s some bottlenose
dolphins followed prawn trawlers feeding on the discards and debris, while others did not
[77]. The trawler dolphins associated with one another, and the non-trawler dolphins with
one another, but there was very little social interaction between the two social modules
even though they lived in the same physical habitat [77]. By 2005 the prawn trawling,
which was not sustainable, had been virtually eliminated from the bay by fisheries’
managers. When the dolphins’ social system was studied again between 2008-2010 the
social segregation marked by association with trawlers had disappeared. Trawler and non-
trawler dolphins that had formed discrete social modules were now well integrated within
one social network [73].
Sponging in Shark Bay is almost certainly socially learned [58,74] and it is very
likely that exploiting trawlers in Moreton Bay [73] was as well. Thus these two examples
indicate the potential for culture to be a driver of cetacean social structure.
2.5 CONFORMISM AND SYMBOLIC MARKING

40
In addition to the social context within which the individuals operate, the manner
by which behaviour is socially learned can also critically affect the dynamics of cultural
transmission [e.g. 46]. Behaviour can be socially transmitted through several
psychological mechanisms [e.g. 10] that are subjected to biases. Individuals may
disproportionately learn from individuals with particular traits [prestige; e.g. 78] or being
increasingly likely to adopt the most frequent behaviour [conformism; e.g. 5,23,79]. Such
learning biases affect the probability that information will be transmitted from one
individual to another [9], and thus the interplay between behaviour, information flow and
network structure. The effect of some of these processes on information flow has been
investigated using simulated non-human social networks [46]. In these simulations,
prestige or conformism biases had small effects on the transmission of a trait when
compared to other demographic or social features.
However, when there is a diversity of behaviour within a population, conformism
can strongly affect the manner in which this diversity influences social structure through
behaviour matching. This is illustrated in Figure 2.4B. With conformism at play,
individual behavioural repertoires become narrower and more like those of other
individuals. In consequence, there is an increase in the likelihood that the behaviour of
individuals matches. This can increase connectedness, dismantling small-world type
networks (Figure 2.4B d-i). However, in an already modular social system, conformism
decreases variation in behaviour within the different modules, leading to their increased
isolation (Figure 2.4B j-l).
This role of conformism in augmenting and maintaining behavioural homogeneity
within modules as well as separation between them is of particular interest to cetologists

41
because of the social structures and behavioural partitioning of the large toothed whales.
Sperm whales (Physeter macrocephalus), killer whales (Orcinus orca), pilot whales
(Globicephala spp.) and probably some of the other larger Odontoceti, have matrilineal
social systems in which females, and sometimes males as well, usually remain in the same
social units as their mothers [36]. However, at least in sperm whales, the units may contain
related as well as unrelated animals [80]. The social units may be part of larger,
hierarchically-organized social tiers, such as “pods”, “clans”, “communities” and
“ecotypes” [81,82]. In sperm and killer whales at least, members of these social tiers have
characteristic behaviour—vocalizations, foraging methods, social and play behaviour—
that is thought to be socially-learned and so culture [37]. This is despite substantial social
connectivity. An individual frequently encounters different units, clans, etc. that have
dissimilar behaviour. But it does not adopt this behaviour, and we know that some
characteristic behaviour of the elements of the different social tiers varies over time [e.g.
83,84], so the behavioural repertoire cannot be purely inherited from the mother during
ontogeny. There is some horizontal, within-generational, learning, and this almost entirely
involves transmission within the social module, whether it is a unit, pod, clan, or
community. To maintain strict homogeneity, it seems that there must be some
transmission bias, probably conformism (bias toward “leader” figures could also have this
effect). Then, if behaviour matching is operating, behavioural conformism will feed back
into even tighter social modules (Figure 2.4B j-l).
Another mechanism that can increase social cohesion within social modules and
social differentiation between them is symbolic marking, when a particular cultural
behaviour acts as a marker of a module, and individuals primarily interact only with others

42
who share the marker [24]. Symbolic markers of group identity are sometimes seen as the
most fundamental difference between the cultures of humans, which use such markers,
and non-humans, which do not [85]. And, the argument goes, this is an important reason
why human societies are tighter, richer, and more complex than those of non-humans.
However there are two indications that cultural symbolic marking may be a factor
in the social structures of the large toothed whales. Killer whales use complex sets of
stereotypical pulsed calls for communication [86]. Members of the same pod use the same
repertoire of calls, different from those of other pods [87]. In the “resident” ecotype of
killer whales, a pod’s repertoire may be quite similar to that of other pods within its clan,
but completely different from the repertoires of pods from other clans [88]. Specific call
types can evolve over time. Over 10 years the evolution of a specific call (the “N4” call)
occurred in parallel in two neighbouring pods [83]. The call changed in both pods, but in a
way that kept the inter-pod difference constant, more constant than if the changes in each
pod had been independent. This indicates that the inter-pod differences in the usage of the
call were important to the whales, and suggests that the call functioned as a symbolic
marker of pod identity.
Sperm whales also have vocalizations that are characteristic of their social entities.
But, in the South Pacific these entities are large. Clans of sperm whales, each containing
thousands of animals, have distinctive behaviour, characteristic vocalizations and
sympatric distributions [89,90]. So animals will from time to time encounter members of
other clans. In the North Atlantic, there is no evidence of sympatric clans [91]. Atlantic
sperm whale vocal repertoires vary geographically. However, the level of distinction in
sperm whale dialects among areas thousands of kilometres apart in the Atlantic is

43
considerably less than that between clans that use the same area in the Pacific [91]. The
implication is that the sperm whale clans of the Pacific actively differentiate their
repertoires to symbolically mark clan membership [82]. This marking is not required in
the Atlantic where there are no sympatric clans.
Conformism and other transmission biases drive culture so that behavioural
variation closely reflects the underlying social structure. Then these behavioural contrasts
can shape and reinforce network topology. Symbolic marking is a particularly potent link
between the realm of culture and the realm of society. It may not be restricted to humans.
2.6 CONCLUSIONS AND THE WAY FORWARD
We have outlined conceptual frameworks for how culture and society interact in
non-humans. There are also interesting theoretical examinations of this relationship. Most
of these are calibrated for the human case, but several agent-based models aligned for non-
human societies have produced interesting results [e.g. 15-17,46]. The primary challenge
is in the real world, collecting and analyzing empirical data that can illuminate the
interplay between these systems (Figures 2.1 and 2.4). At least for cetaceans, and probably
for other mammals such as primates and elephants, it seems that the relationships between
society and culture are important drivers of how these animals interact with each other and
with their environment. So how should we proceed?
A primary requirement is to describe social structure. Recording associations or
interactions among identifying individuals provides the raw data for analyses of social
structure [92]. Recent reviews offer guidelines for measuring and quantifying social
relationships, testing social features against null models, describing the spatiotemporal

44
structure of a society [92] and examining the multiscale structure of animal social
networks [e.g. 14,19,93-95]. The detection and quantification of social learning in animal
populations has proved challenging, especially distinguishing between asocial and social
processes. To meet this challenge a number of techniques have been introduced. These
include option-bias [96] and network-based [see 53,97,98] methods of analyzing the
spread of innovations through populations [e.g. 48,54]. Regression-type methods, such as
multiple regression quadratic assignment procedure, try to tease apart the contributions of
social learning, genes, ecology, ontogeny and potentially other factors to the distribution
of behaviour among individuals within a population [see 38,99,100].
The formalism of coevolutionary networks [25], in which the interplay between
individual behaviour and social relationships is explicitly coupled with the interplay of
social network structure and social learning (Figure 2.1B k,l), is an effective way to
conceptualize the mutual relationship between social structure and culture. Computer
simulations can illuminate these issues. Agent-based models are well-established tools for
examining social dynamics that can enlighten the social structure-culture interplay among
animals. A recent promising approach is mimicking transmission processes using
epidemiological models contextualized in coevolutionary social networks within
heterogeneous populations [e.g. 101,102].
Disentangling the direction of cause and effect between social structure and
culture, and investigating the roles of transmission biases, are non-trivial tasks. For
instance, consider the case of dolphins that forage with artisanal fishermen off Laguna,
Brazil [103]. For at least one hundred years, generations of dolphins have worked
cooperatively with generations of human fishermen to catch mullet, using mutually-

45
understood communicative symbols [104]. Not all dolphins in the Laguna population take
part in the cooperative fishing, even though they use the same habitat. The distribution of
this unique foraging is coupled with its social structure – cooperative and non-cooperative
dolphins form distinct social modules [103]. While cooperative foraging with humans
could have driven this social segregation through behaviour matching, the behaviour could
be propagated through social learning within a pre-existing social module [103]. Perhaps,
cause and effect between social structure and culture is most directly approached
experimentally. Manipulative experiments either in the laboratory or field can examine the
effects of social structure and transmission biases on the spread of behaviour [e.g.
48,52,105]. Although feasible for some taxa, experimental intervention with large-bodied,
free-ranging cetaceans is still logistically challenging, aesthetically and ethically
questionable, and impractical in many cases. Alternatively, natural experiments in which
objects of cultural behaviour are introduced or removed from the environment, can be
highly revealing, as in the case of the trawler dolphins of Moreton Bay [73]. More
generally though, for cetaceans and other large, large-brained and long-lived animals,
most progress is likely to come from large-scale, long-term, systematic studies of social
relationships and behaviour, as in the case of the bottlenose dolphins of Shark Bay [72].
In conclusion, when behaviour is learned from conspecifics during social
interactions the distribution and dynamics of behavioural phenotypes within the
population can be shaped by its social structure. In turn, this behavioural repertoire
produces a cultural context for the population that can drive patterns of social interactions
and relationships. This feedback can make both societies and cultures structurally and
dynamically complex, strongly affecting the ecology of a species, and thus should be

46
considered when studying species in which social learning is an important determinant of
behaviour. Combining network formalism with meticulous observational studies,
experimental intervention and computer simulations will allow us to look at both
directions of the relationship between social structure and culture.
2.7 ACKNOWLEDGEMENTS
I am very grateful to the editors of the themed issue in Philosophical Transactions
of the Royal Society B, especially Peter Kappeler, for the invitation to Hal Whitehead to
contribute. This invitation initiated discussions between Hal and I which led to rethink the
entire thesis proposal. I am also thankful to Manolo Álvarez-Torres and two anonymous
referees for comments that greatly improved the manuscript. I was supported by doctoral
scholarships by the Conselho Nacional de Pesquisa e Desenvolvimento Tecnológico
(CNPq Brazil #202581/2011-0) and the Killam Trusts through Dalhousie University
(Canada) during the preparation of the manuscript.

47
CHAPTER 3
MULTILEVEL ANIMAL SOCIETIES CAN EMERGE FROM CULTURAL
TRANSMISSION 4,5,6
“Life can only be understood backwards; but it must be lived forwards”
~ S. Kierkegaard, 1844
3.1 ABSTRACT
Multilevel societies, containing hierarchically nested social levels, are remarkable social
structures whose origins are unclear. The social relationships of sperm whales are
organized in a multilevel society with an upper level composed of clans of individuals
communicating using similar patterns of clicks (codas). Using agent-based models
informed by an 18-year empirical study, we show that clans are unlikely products of
4 This chapter has been published in the journal Nature Communications as: Cantor M, Shoemaker LG, Cabral RB, Flores CO, Varga M, Whitehead H. 2015. Multilevel animal societies can emerge from cultural transmission. Nature Communications 6: 8091. doi:10.1038/ncomms9091
5 Authors’ contributions: Mauricio Cantor (MC), Hal Whitehead (HW) conceived the research idea; MC, Lauren Shoemaker (LS) wrote the models; HW contributed empirical data; MC analyzed the data with several contributions of LS, Reniel Cabral (RC), Cesar Flores (CF), Melinda Varga (MV), HW; MC wrote the manuscript; LS, RC, CF, MV, HW contributed several ideas, comments, edits in the models and manuscript; MC reviewed the manuscript during the peer-review process.
6 Publication history: Manuscript First Submission: 22 NOV 2014; Reviewed Manuscript Received: 12 APR 2015; Manuscript Accepted: 16 JUL 2015; Manuscript Published: 08 SEP 2015.

48
stochastic processes (genetic or cultural drift) but likely originate from cultural
transmission via biased social learning of codas. Distinct clusters of individuals with
similar acoustic repertoires, mirroring the empirical clans, emerge when whales learn
preferentially the most common codas (conformism) from behaviourally similar
individuals (homophily). Cultural transmission seems key in the partitioning of sperm
whales into sympatric clans. These findings suggest that processes similar to those that
generate complex human cultures could not only be at play in non-human societies but
also create multilevel social structures in the wild.
3.2 INTRODUCTION
Selection for effective reproduction, foraging, and survival shapes social
interactions and relationships—both in current ecological conditions and historic
evolutionary pathways—and produces a variety of animal social structures [1-3].
Multilevel societies, consisting of hierarchically-nested social levels, are particularly
interesting as they suggest multi-level selection. Such societies are found in human [4-5]
and non-human primates [6,7], African elephants [7,8], and orca whales [7,9]. The
origins of multilevel social structures remain unclear, and are likely to be complex [4-7].
They likely include general drivers of social patterns—the ecological, evolutionary and
social contexts regulating group-living trade-offs [10,11]—as well as individual variation
in behaviour [3] and the time and cognitive constraints involved in managing multiple
social relationships [12,13].
A frequently neglected potential driver of animal sociality is culture—socially
learned behaviour shared within subsets of a population [14]. Experiments in captivity

49
and the wild, as well as long-term observational studies and computer simulations, all
suggest that culture can be important drivers of phenotypic variation in several animal
taxa [14,15] and shape social structures [16]. One hypothesized effect occurs when
individuals who behave similarly preferentially interact (homophily) [17] and thus learn
from each other, resulting in groups or sub-populations with increasingly homogenous
behaviour [18]. Particularly strong homogenization may occur when individuals
disproportionately learn the most common behavioural variant from their social contacts
(conformism) to assist group integration or because a well-spread behavioural trait may
generally be adaptive [19]. Since social relationships are cognitively and energetically
costly, particular cultural behaviours can be used to mark the identity of a social group
(symbolic marking) [20,21], which facilitate interactions among individuals who behave
similarly. Therefore, biases such as conformism, homophily and symbolic marking affect
the learning of behaviours among individuals [22,23] segregating them into groups with
increasingly distinctive behavioural patterns [16,24-26]. Examples include the cultural
boundaries delineated by specialized foraging techniques and traditions [27,28] and
distinct dialects and communication signals [29,30] observed in primates, birds, and
cetaceans.
Cultural segregation can naturally follow geographic segregation [31,32]. With
little or no contact between sets of individuals, behavioural repertoires tend to diverge
over time. Therefore, pure spatial and/or demographic factors can lead to the
accumulation of behavioural variations, with drift over time generating behavioural
heterogeneity between sets of individuals [33]. Typically, the more distant these sets of
individuals are [31], and the lower the levels of dispersal, migration and population

50
mixing among them [34], the more divergent their cultural traits [32,35]. Among
allopatric cultural groups, large distances or limited movement of individuals can
complicate the understanding of true drivers of behavioural divergence, since
environmental and genetic differences make it difficult to isolate cultural determinants of
behavioural variation [15]. We know little about how behaviourally-distinct animal
groups evolve and are maintained in sympatry, but in a common environment the effects
of culture can be clearer (for human examples, see [23, 26, 36]).
Long-term observational studies have unveiled social complexity [37] and
cultural diversity among cetaceans using the same waters at the same time [38]. For
instance, female sperm whales (Physeter macrocephalus) form matrilineally-based social
units with about twelve members each [39]. These units are organized into clans with
distinctive behaviour in several realms, including vocal repertoires [30], creating a
multilevel society [39]. Social units have characteristic repertoires of codas [40]—
patterns of clicks used for communication—and unit members are observed to only group
with other social units from their own clan, with whom they have similar coda repertoires
[30]. In sperm whales, as in other cetaceans, information flow through social learning is a
key driver of behaviour [38]. As learned acoustic signals can be important in social
relationship mediation [41], they could also possibly shape social structure [16]; for
instance, learned vocalizations are hypothesized to underlay the partition of sperm whales
into clans [30,39]. The sperm whale clans in the Pacific are sympatric [30,42] and include
genetically-similar individuals of all ages [43], thus systematic differences between them
are likely to be cultural, representing a good model for investigating how sympatric
animal cultural groups form in the wild.

51
Here, we investigate the mechanisms giving rise to the nested social levels of
sperm whale society observed empirically. We build mechanistic agent-based models,
using empirical data collected over 18 years in offshore waters of the eastern Pacific
Ocean, to test whether clans could emerge in sympatry solely via cultural or genetic drift
of communication signals over time, or if social learning is required. We also consider
more sophisticate scenarios in which social learning is biased by homophily, conformism,
and/or symbolic marking. With homophily, communication similarity drives social
relationships so coda learning is preferentially from individuals with similar vocal
repertoires [17]. With conformism, the most common coda types that an individual is
exposed to are learned disproportionately more often [18]. In symbolic marking,
particular codas are used by all members of a social entity [20]. We accounted for
different degrees of population mixing by allowing coda transmission processes to
operate in the entire population, within social units or within pre-existent allopatric clans,
such as the geographically-based clans observed in the North Atlantic [39,44]. Our
investigation of the social patterns that emerge from animal collective behaviour is the
first formal effort to our knowledge to relate the formation of multilevel societies to
cultural evolution. We show that the higher social level of sperm whale societies unlikely
originates from stochastic processes but rather from biased cultural transmission of
acoustic communication signals.
3.3 RESULTS
3.3.1 Empirical Social Patterns

52
Over our 18-year study of sperm whales in the Eastern Pacific, the sperm whale
society showed a hierarchical structure with three conspicuous nested levels: individuals
in social units forming vocal clans (Figure 3.1). The social network of photo-identified
individuals (nodes) connected by their social relationships (weighted links estimated by
half-weight association indices) displayed a modular topology (Q = 0.886), in which
modules of highly connected nodes delineated social units of individuals that live and
move together for several years or more [45]. These modules representing social units
formed larger modules in an overlapped acoustic network of social units (nodes)
connected by acoustic behaviour similarity (weighted links estimated by multivariate
similarity of coda repertoires). The acoustic network also displayed a modular topology
(Q = 0.154, 95% CI = 0-0.124): here modules of social units with shared coda repertoires
depicted the vocal clans [30]. The multilevel sperm whale society exhibited high within-
clan acoustic similarity but very low between-clan acoustic similarity, and no between-
clan social interactions (Figure 3.1).

53
Figure 3.1. Empirical multilevel network depicting the three nested levels in the sperm
whale society off the Galápagos Islands: individuals within social units within vocal
clans. In the social network, modules of individual whales (coloured small nodes)
connected by their social relationships (black lines with thicknesses proportional to the
time individuals were identified in the same group) define the social units (letter-labeled
large nodes). In the overlapped acoustic network, modules of social units connected by
the similarity in acoustic behaviour (grey lines whose thicknesses are proportional to
multivariate similarity of coda repertoires) represent the vocal clans (blue: Regular clan,
characterized by codas with regularly-spaced clicks; red: Plus-One clan, characterized by

54
codas with extended pause before the final click [30]). Social relationships and acoustic
similarities are re-plotted results from [52] and [30], respectively.
3.3.2 Emergent Social Patterns in Simulations
With agent-based models (ABMs) grounded on empirical evidence (Figure 3.2,
Appendices B3.8, B3.9: Supplementary Methods 3.1, 3.2), we simulated 20 scenarios
(Figure 3.3A) to test which transmission processes of coda types between individuals—
individual learning, genetic inheritance, pure and biased oblique social learning—could
split individuals into sympatric clans with similar acoustic behaviour, as observed
empirically (Figure 3.1). We focused on two high-level attributes of the simulated data:
similarity of coda repertoires among social units, and the emergence of modules of social
units with distinct repertoires.

55
Figure 3.2. Schematic representation of the agent-based models. (a) Coda transmission
mechanisms are represented as changes in the coda repertoires vector (squares: coda
types; colors: frequency of usage: absent=0, always=100%). Calf agents change

56
repertoires three times (between 0-2 years old) under one of following mechanisms. (i)
Individual learning: newborn agent a starts with an empty coda vector; half of the
elements are randomly selected to receive absolute frequencies of usage from a uniform
distribution ϵ[0,100]. (ii) Genetic inheritance: newborn agent b starts with an empty coda
vector, which is filled with the same coda types and frequencies of its mother B. (iii)
Oblique social learning: newborn agent c starts with an empty coda vector; at the age 0 it
randomly samples 62 elements from the coda vector of other adult agents, kin-related or
not (including zeroed elements); at ages 1 and 2 the calf repeats the process, replacing
sampled elements. For iv-vi, calves gain an initial repertoire via oblique social learning,
then at ages 1 and 2 the following effects were included. (iv) Homophily: calf d copies
from adult agents of the social unit A, which has the highest coda repertoire similarity
with its own social unit. (v) Conformism: calf e preferentially copies the coda types with
higher frequencies of usage, here the three codas commonly performed by the adults. (vi)
Symbolic marking: calves f and g were born in different social units, which have a
specific subset of codas (“symbol”) that all members always perform to mark the identity
of the unit (the sequences of red codas). Both calves copy codas from other adults, but
also deliberately copy their units’ “symbols”. (b) Oblique social learning (iii) and the
additional effects (iv-iv) occurred at three social levels. (vii) Social unit: calf agents copy
only from agents of their own social unit. (viii) Predefined clans: simulation started with
predefined clan labels and calves copy from any agent inside of its predefined clan. (ix)
Population: calves copy from any agent in the population. In all scenarios, calves had a
low individual learning probability (replacing 1 random coda type by a random
frequency) per year.

57
The similarity of coda repertoires of social units varied considerably across the 20
simulated scenarios (Figure 3.3B), which only differed in how and at which social level
the codas were transmitted (Figure 3.3A). Scenarios with individual learning (ABM1),
genetic inheritance (ABM2), and pure oblique social learning (ABM3) yielded the lowest
acoustic similarities. Neither vertical transmission (when agents received the same codas
from their mothers mimicking genetic transmission and/or mother-to-offspring learning)
nor pure social learning of codas (when agents copied coda types from each other) were
sufficient for coda repertoires to diverge between social units. Instead, differences among
individuals propagated over time and did not significantly deviate from the structure seen
with the null agent-based model with just individual learning of codas (when coda types
and frequencies of use were randomly assigned to agents) (ABM1).
However, the coda repertoires of social units tended to become more similar and
less variable when social learning was biased via two distinct effects: homophily (agents
copying preferentially from adults of those social units with similar repertoires to their
own) (ABM6-8) or conformism (agents copying preferentially the most common coda
types) (ABM9-11). By introducing symbolic marking (when agents of different social
units were assigned to specific subsets of codas) (ABM12-14), simulations had more
distinct starting points which were maintained over time reducing similarity among social
units’ repertoires. While the combination of symbolic marking with homophily pushed all
agents to a homogeneous repertoire (ABM18-20), the combined effect of homophily and
conformism led to an overall high similarity, but specially more variability among
repertoires than other scenarios (ABM15-17) (Figure 3.3B).

58
Figure 3.3. Coda repertoire similarities and clan partitioning across simulated scenarios.
(a) Agent-based models (ABMs) differed in how a coda was transmitted (individual
learning, genetic inheritance, social learning), if there was any transmission biases
(homophily, conformism, symbolic marking), and the social level at which the
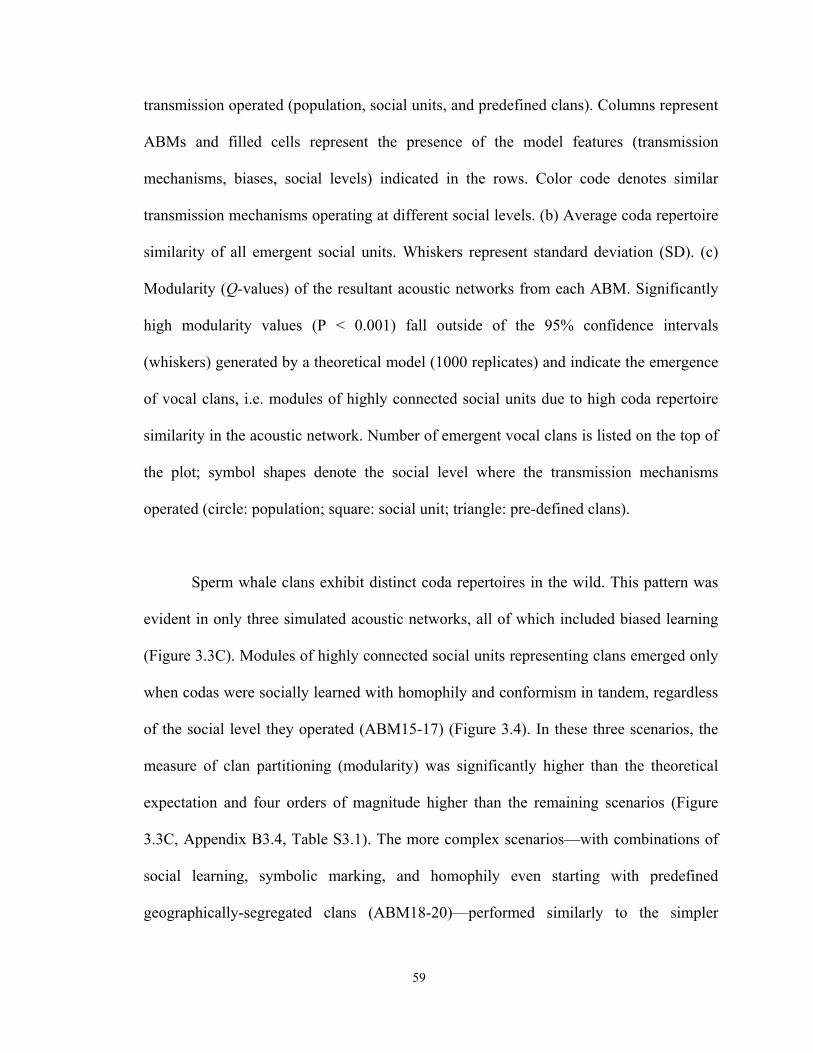
59
transmission operated (population, social units, and predefined clans). Columns represent
ABMs and filled cells represent the presence of the model features (transmission
mechanisms, biases, social levels) indicated in the rows. Color code denotes similar
transmission mechanisms operating at different social levels. (b) Average coda repertoire
similarity of all emergent social units. Whiskers represent standard deviation (SD). (c)
Modularity (Q-values) of the resultant acoustic networks from each ABM. Significantly
high modularity values (P < 0.001) fall outside of the 95% confidence intervals
(whiskers) generated by a theoretical model (1000 replicates) and indicate the emergence
of vocal clans, i.e. modules of highly connected social units due to high coda repertoire
similarity in the acoustic network. Number of emergent vocal clans is listed on the top of
the plot; symbol shapes denote the social level where the transmission mechanisms
operated (circle: population; square: social unit; triangle: pre-defined clans).
Sperm whale clans exhibit distinct coda repertoires in the wild. This pattern was
evident in only three simulated acoustic networks, all of which included biased learning
(Figure 3.3C). Modules of highly connected social units representing clans emerged only
when codas were socially learned with homophily and conformism in tandem, regardless
of the social level they operated (ABM15-17) (Figure 3.4). In these three scenarios, the
measure of clan partitioning (modularity) was significantly higher than the theoretical
expectation and four orders of magnitude higher than the remaining scenarios (Figure
3.3C, Appendix B3.4, Table S3.1). The more complex scenarios—with combinations of
social learning, symbolic marking, and homophily even starting with predefined
geographically-segregated clans (ABM18-20)—performed similarly to the simpler

60
scenarios (ABM3-11) with almost zeroed modularity values. In consequence, the
topology of the acoustic networks produced by these remaining scenarios was almost
completely connected, with no emergent clans (Figures 3.3C, 3.4), resembling the
networks produced by the null models, with no social learning (ABM1-2). While clans
did not emerge in the complex scenarios due to the convergence of the repertoires into a
single and homogeneous one, in the simpler scenarios clans did not emerge due to the
overall low similarity among social unit repertoires.
Figure 3.4. Acoustic networks simulated by the 20 agent-based models (ABMs). Nodes
representing social units are connected by links representing coda repertoire similarity.
Colour code indicates similar transmission mechanisms operating at different social
levels across the ABMs, which differed in the coda transmission process (individual
learning, genetic inheritance, social learning), in the presence, type and combination of
transmission biases (columns: homophily, conformism, symbolic marking), and in the

61
social level at which the transmission operated (rows: population, social units, and
predefined geographically-segregated clans). ABMs 01 and 02 represent the null agent-
based models with no social learning, but individual learning and genetic inheritance of
codas, respectively. From ABM03 to 20, all models contain social learning of codas, with
and without biases. Distinct clans (modules in blue shades) emerged only when codas
were transmitted by social learning (SL) biased by conformism (C) and homophily (H)
operating in tandem at the population (ABM15), social unit (ABM16) and pre-defined
clan levels (ABM17). In all remaining scenarios, the acoustic network resembled the null
models (ABM1-2), with no distinct clans.
3.3.3 Robustness of the Emergence of Clans
Our findings emphasize the importance of transmission mechanisms, particularly
biased social learning, on similarity and divergence of acoustic behaviour of sperm
whales, showing that behavioural learning can create social hierarchies in sympatry. We
accounted for the effect of movements of individuals—while respecting the structure of
the sperm whale societies with nearly-permanent social units—in coda transmission by
replicating the transmission mechanisms in the three social levels relevant for the sperm
whales (social units, predefined geographically-segregated clans, and population).
Similarity and modularity patterns were consistent across the different social levels where
the transmission mechanisms operated (Figures 3.3B,C) indicating that different degrees
of population mixing had negligible effects on the emergence of clans.
Furthermore, clan emergence was robust regardless of initial conditions and
across varying parameterizations (Appendix B3.10: Supplementary Methods 3.3). A

62
sensitivity analysis yielded similar outputs (Appendix B3.1, Figure S3.1): only the very
same three scenarios with biased social learning of coda types (ABMs 15-17) yielded
significant modules in the acoustic networks, regardless of model parameterization.
Therefore, the proportion and dispersal of potential tutors (adult agents) and learners (calf
agents), and copying errors or innovations as source of cultural traits (coda types) are
shown to have a minor effect on the diversity of cultural traits (coda types) and thus the
emergence distinct cultural clans of whales (Appendix B3.6, Supplementary Note 3.1).
Moreover, the metric of clan emergence was robust to variation in the sampling of
acoustic similarity among social units (Appendix B3.11, Supplementary Methods 3.4).
For all of the 20 ABMs, modularity was high, stable, and consistent across the range of
possible weights for a link (coda repertoire similarity) between nodes (social units) in the
simulated networks (Appendix B3.2: Supplementary Figure 3.2, Appendix B3.7:
Supplementary Note 3.2).
3.4 DISCUSSION
Our empirical findings and simulations combined reveal how the social levels of
sperm whales are nested and point out cultural transmission as the most likely candidate
mechanism giving rise to the upper social level of their multilevel society. Whale clans
are based on learning of communication signals, and biased learning may be necessary to
generate sympatric culturally-driven social tiers. By modelling the processes that give
rise to the complex yet highly structured social system of sperm whales, we show that
key processes attributed to human culture may not only be present in non-human
societies, but also likely created the social structure we observe in sperm whales. While

63
ecological, cognitive, and time constraints and benefits [11,12,13] may delineate the
lower sperm whale social level (social units) as in other multilevel societies [7], we
suggest that the process that has produced the higher level (clans) is information flow.
In small multilevel human societies, the flow of information, materials, energy,
genes and/or culture among individuals plays an important role in regulating the quantity
and quality of social relationships [5,46]. Would the flow principles of a two-dimensional
terrestrial world create similar additional selective forces for sociality in the three-
dimensional marine environment [7]? While predation and resource availability are
thought to be basal for sociality in both environments, marine resources generally tend to
be more dispersed and less predictable in space and time [47,48], making it logistically
impossible for marine mammals to defend or transfer resources among individuals
(though they are sometimes shared). We hypothesized that, in this situation, information
is the primary resource that can be stored and transferred among selected companions;
the way such information flows can subsequently shape the structure of their society [16].
Take for example the knowledge of how to manipulate a certain food resource: it can
certainly flow within a population through social learning among individuals, but
sometimes not among all of them, which demarcates subsets of the society with distinct
behavioural repertoires [28,49]. In addition to foraging and movement behaviours [50],
sperm whales, and other cetaceans, can learn acoustic communication signals from each
other [41]. In the aquatic environment, where sounds spread particularly well, acoustic
communication—the likely function of codas [51]—may help maintain group cohesion,
reinforce bonds, aid negotiations and collective decision-making [52,53]. Since vocal
learning in cetaceans is an output of complex social behaviour and may assist the

64
maintenance of multiple social relationships [41], we asked if it could trigger the
formation of the vocal clans.
This question is logistically unable to be answered using experimental
manipulations or observational studies (which would not provide a mechanism), making
an agent-based simulation an ideal approach. Our simulations suggest that clans are
unlikely products of stochastic processes, such as genetic or cultural drift. The simulated
acoustic behavioural segregation seems not to be a collection of individual innovations
diverging over time, or an artefact of genetic transmission. Whereas vertical, mother-
offspring, social learning can establish and maintain behavioural traits in some cetacean
populations (e.g. tool use and foraging tactics in bottlenose dolphins) [49,54], our models
suggest that oblique social learning is necessary to promote clan-like vocal repertoires
among sperm whales.
Still, social learning alone was not enough to segregate social units into clans, and
our vocal clan recipe needed additional ingredients. Social learning is susceptible to
biases [22], which affect flow of information and potentially the emergence of cultural
patterns. The theoretical expectation is that unbiased transmission can only lead to
marked cultural differences among allopatric, strictly isolated groups of individuals [55].
Yet, how are different coda repertoires maintained in the same Pacific waters? Our results
suggest that the answer may be in biased transmission, which can maintain similarities
within, and disparities between, sympatric cultural groups through time [55,56]. By
means of feedback between homophily and social influence [17,18], individuals who
behave similarly preferentially associate and learn from one another, increasing their
behavioural similarity. This process breeds relationships among like-minded individuals,

65
and simultaneously tends to dissolve relationships between individuals with distinct
behaviour. As seen in our simulations, this effect is leveraged when individuals are
conformists and disproportionately learn the most common behavioural traits [19,57].
Combined, behavioural matching and majority-biased transmission can promote a
segregation of individuals into behaviourally distinct groups [16,26].
This is the case in our simulations: when the whales were more prone to learn the
most common coda types from those who already had similar coda repertoires, clans of
social units with distinct acoustic repertoires emerged and matched the pattern observed
empirically. Increasing behavioural homogeneity with some peers, and so reinforcing
social differentiation and cultural boundaries between subsets of the population, can be
particularly striking in sympatric large toothed whale societies. As with Pacific sperm
whales, killer whales (Orcinus orca) can display remarkable intrapopulation behavioural
segregation, seemingly marked by an intricate system of pulsed calls for communication
[9,58]. These calls can change over space and time, but tend to do so in a way that
preserves the differences between pods [59], suggesting that acoustic signals can allow
pods to distinguish themselves.
Our findings highlight the contribution of behavioural transmission mechanisms,
as opposed to purely demographic or spatial factors, in the emergence of the sympatric
cultural groups. Other factors, such as population size and proportion of tutors as source
of cultural traits, age distributions, dispersal rates, or copying errors/innovations
[34,35,60,61] played a minor role and have had no substantial impact in the emergence of
clans of sperm whales. Additionally, the complete spatial isolation into predefined
geographically-segregated clans [44], with members learning only within their clans, did

66
not produce the acoustic divergence required to split the population into distinct dialects.
This show that multilevel social structures can arise even in the absence of spatial and
temporal heterogeneity, implying that learning mechanisms may have more influence in
driving social structure than previously thought.
In conclusion, sperm whales are distinctive among multilevel animal societies
with the higher social level produced by biased cultural transmission. By modelling the
evolution of the repertoire of acoustic communication signals, we were able to overcome
the logistical impossibilities of field experiments in the vast spatio-temporal scales that
are relevant for sperm whales, and show that the sympatric behavioural segregation that
delineates the sperm whale clans is not controlled by genes, neither by genetic or cultural
drift. Our empirically-founded models incorporating population dynamics and multiple
transmission mechanisms indicate that learning coda types plays a crucial role in
promoting similarity in acoustic behaviour, and, more strikingly, that biases in social
learning are required to split the sperm whales into sympatric clans with distinct dialects
observed in the wild. We suggest therefore that empirical clans have emerged like the
simulated ones: as a cultural segregation. While transmission biases drive culture and
social structure in humans [56], there is much debate about whether or not they are
exclusive features of human culture [62]. Providing evidence that the processes
generating the complex and diverse cultures in human populations could also be at play
in non-human societies is a crucial step towards evaluating the contrasts and
convergences between human and non-human cultures.
3.5 METHODS

67
3.5.1 Empirical Data and Social Levels Definition
Sperm whale groups were tracked visually and acoustically, day and night, during
2 to 4 week research trips between 1985 and 2003 in the Eastern Pacific Ocean, mainly
off the Galápagos Islands (summarized in [39]). Three nested social levels were evident
within the Pacific sperm whale society: individuals, social units, and vocal clans.
Individuals were identified by photographic records, comparing the natural markings on
the trailing edge of tail flukes [63]. Social units were sets of about 12 individuals [39]
that live and move together for years, delineated using association indices on long-term
photo-identification data [45]. Clans were sets of social units with high similarity in their
coda repertoires, the stereotyped patterns of clicks used for communication [40]. Codas
were recorded with hydrophones and repertoires were assigned to the social units whose
members were photo-identified within 2h of the recording and had at least 25 codas
recorded [30]. The social units’ repertoires were compared to define the best partition of
social units with distinct repertoires into clans [30]. Clans are estimated to contain many
social units and several thousands of members, based on the estimated abundance of
sperm whales in the Pacific and number of clans [30]. Social units are typically found in
behaviourally-coherent groups with other units from their own clan, but never with units
from different clans even though sperm whales from several clans may use the same
waters [30].
3.5.2 Agent-Based Modeling
We simulated the interactions of multiple individual whales using an agent-based
modelling framework (ABM) to test whether the clan structure observed in the sperm

68
whale society could arise from evolving vocal behaviour. The ABMs were built in R [64]
based on empirical parameters (Appendix B3.8, B3.9: Supplementary Methods 3.1, 3.2),
and are described according to the Overview, Design concepts and Details protocol [65]
as follows:
a) Purpose. The models test which transmission mechanisms for acoustic behaviour, if
any, can give rise to clans of social units of sperm whales with distinct acoustic
repertoires, and explain the multilevel social structure observed empirically.
b) Entities, state variables and scales. The models have one kind of agent, which
behaves under realistic life-history parameters (empirical support for model
parameters available in the Appendix 3.9, Supplementary Methods 3.2): female
whales that learn coda types at ages of 0 up to 3 years old. Because male sperm
whales lead quasi-solitary lives and rarely produce codas [63,66] they were not
represented in the models. The agents are characterized by their age (years), their
coda repertoire (a vector of frequencies of use of different coda types), and which
social unit and vocal clan they belong to (nested categorical variables). The models
were explicitly temporally-structured and implicitly spatially-structured. However,
we accounted for different levels of population mixing (and so implicitly for
individual movements), with coda transmission operating among individuals of three
different social levels (see ‘d’). Simulations lasted for 700 time steps (years).
c) Process overview and scheduling: During each time step, biological processes
occurred in the following order: birth, coda repertoire composition and changes (at
ages up to 3 years old), social unit membership change (or not), and death. Calves
have high probability of staying with their natal group, and migration of individuals

69
among social units is rare [45]; thus nearly-permanent and nearly-matrilineal social
units are an emergent property. In these respects, the models mimic several
transmission processes characteristic of some socially complex species. We started
with two null models without social learning: in one the agents only learn their codas
individually; in the other they receive their mothers’ coda repertoire, representative of
genetic inheritance (as well as stable vertical cultural transmission). We then
simulated a total of 20 complementary scenarios with combinations of oblique social
learning of coda types and transmission biases operating at the three different social
levels (see ‘g’).
d) Design concepts. There are two emergent properties of the interactions among agents:
social units (sets of females and their offspring who stay together along the simulated
time) and vocal clans (sets of social units with highly similar vocal repertoires).
Social units emerge in all models and vocal clans can be predefined (see ‘g’), or may
emerge. All demographic processes were modeled with demographic stochasticity
and parameterized from empirical studies (see Appendix B3.9, Supplementary
Methods 2). Birth rates were age-specific, and mortality rates were density- and age-
dependent (calf agents had higher probability of dying than adult agents [67]), and
migration rates of individuals between units were low and decreased with age. The
main process of interest modeled is changes in individual coda repertoires, i.e. in
frequencies of use of coda types. Each agent has a repertoire represented by a vector
with 62 elements denoting continuous absolute frequencies of different coda types
from 0 (absent) to 100 (always performed coda type) (Figure 3.2A) (details in
Appendices B3.12, B3.13: Supplementary Methods 3.5, 3.6). Calves compose

70
repertoires at early ages (although precise age is inherently difficult to estimate
empirically; Appendix B3.9, Supplementary Methods 3.2). Repertoire composition
was represented by calf agents replacing some coda types and frequencies once a
year, while at ages of 0, 1 and 2. After age 3, all agents’ repertoires were fixed.
Depending on the sub model (see ‘g’), the repertoire change occurred according to
one of the three main transmission processes (see Figure 3.2A): (i) Individual
learning—calf agents compose their own coda repertoires, i.e. are assigned to random
coda types and frequencies drawn from uniform distribution ϵ[0,100]; (ii) Genetic
inheritance (which also represent vertical social learning)—calf agents receive their
mothers’ coda repertoires; and (iii) Oblique social learning—calf agents copy coda
types and frequencies from adult agents, of different generations, kin-related or not.
To the models with oblique social learning, the three following effects were included:
(iv) Homophily—calf agents preferentially copy codas from adult agents of social
units with the highest repertoire similarity with the calf’s social unit’s repertoire. (The
homophily effect posits that behaviourally-similar individuals tend to interact more
often [17]; since social learning occurs during social interaction, the homophily effect
on learning can be represented as individuals with similar behaviour learning
preferentially from each other.); (v) Conformism—calf agents disproportionately
copy the most common coda types; and (vi) Symbolic marking—all agents of a given
social unit are assigned to a random sequence of 6 coda types with frequency of usage
100 (a “symbol”) at time t=1, to mark the identity of their units; all calf agents from
t=1 deliberately copy the “symbol” of the unit they belong to. To account for different
degrees of population mixing, we replicated the models with oblique social learning

71
and additional effects (iii-iv) across the three levels of the sperm whale society: social
unit, predefined clans and population (Figure 3.2B): (vii) Social units—calf agents
randomly copy codas from agents of their own social unit; (viii) Predefined clan—
agents were arbitrarily assigned to three clans and calf agents learned only from adult
agents of their own clan. (Since clan partition could be driven by non-learning
mechanisms, we simulated the pre-existence of clans representing geographically-
segregated clans such as those that seem to occur in the Atlantic where acoustic
variation is driven by spatial isolation [44]. We refer to these as ‘predefined clans’ as
opposed to the ‘emergent clans’ that may arise in the simulations due to acoustic
similarity.); (ix) Population—calf agents learn from any agent in the population. We
combined transmission mechanisms, effects, and social levels in a total set of 20
ABMs (see ‘g’, Figure 3.3A). At the end of each simulation, we observed the number
and size of social units and vocal clans and how similar their coda repertoires were
(methods below).
e) Initialization. Simulations were initialized with the following parameters based on
empirical data (details, justification, and references in Appendix B3.9, Supplementary
Methods 3.2). At the first time step, year t=1, all simulations started with a population
of N0=1000 agents, to which ages were randomly assigned from a negative
exponential distribution (so the initial population was mostly young, with ages
typically varying from 0 to about 70 years old), and social unit membership labels
were assigned with equal probabilities. Each agent received an empty vector of 62
elements (i.e. coda types) representing their coda repertoire. For each agent, half of
the elements in its coda repertoire vector were randomly selected to receive an

72
absolute frequency of usage from a uniform distribution ϵ[0,100] (absent coda
type=0; always performed=100). Agents are considered calves when they are 0, 1,
and 2 years old, during which changes in the coda repertoire occurred. Adult female
agents became sexually mature after 9 years old, stopped reproducing after 41 years
old, and lived 70 years on average. Population was modeled density-dependent, with
age-dependent reproduction, mortality and migration rates, such that the population
fluctuated around the carrying capacity (N0) over time. The initial number of social
units was based on the initial population size (N0) and empirical average unit size in
the Pacific (about 12 members). Social units split in half when double the maximum
initial unit size. Calf agents remained in the mother’s social unit since they highly
depend on their mothers; and adult agents had low probability of randomly migrating
to other social units during their lives (c=0.05). Repertoire changes were represented
by replacement of frequencies of coda types and occurred three times for each agent
(repertoires were fixed after the age of 3). Newborn agents started the simulation with
empty coda repertoires; each simulated year, all calf agents changed their coda
repertoires under one of the three main mechanisms—with additional effects or not—
operating at one of three social levels (see ‘g’, Figure 3.2B). In all models calf agents
also had low individual learning rate (ilearn = 0.02), i.e., each year replacing the
frequency of one coda type (62 codas*0.02≈1) chosen at random by a frequency
drawn from a uniform distribution ϵ[0,100], which accounted for random learning
errors or deliberate innovations [61]. Supplementary Figure S3.3 (Appendix B3.3)
illustrates the population output measures of a typical simulation.

73
f) Input. The models have no external input data, but initial parameters differed in sub
models.
g) Sub models. We created a total of 20 sub models (Figure 3.3A), all of which have the
same structure but differ in the way calves compose their coda repertoires (Figure
3.2). In the first null model (ABM01), calf agents learn their coda repertoire only
through individual learning. In the second null, model (ABM02), calves receive the
exact repertoire of their mothers, mimicking the genetic or vertical-cultural
transmission of coda repertoires. In all the following models (ABM03-20), calves
change repertoires with oblique social learning, some with combinations of the three
transmission biases: homophily (ABM06-08, 15-10); conformism (ABM09-11, 15-
17); and symbolic marking (ABM12-14, 18-20). Oblique social learning and its
biases occurred within social units (ABM04, 07, 11, 13, 16, 19), across social units of
the same predefined clans (ABM05, 10, 14, 17, 20); and in the entire population
(ABM03, 06, 09, 12, 15, 18).
3.5.3 Coda Repertoire Similarity
The empirical repertoires of the social units were compared based on the inter-
click intervals of each coda using an averaged multivariate similarity metric [30].
Because in the agent-based models we simulated frequencies of usage of coda type—and
not the inter-click intervals of each coda—we compared repertoires of each pair of
simulated social unit with the weighted Bray-Curtis index between the average frequency
of usage of codas of all agents of these units. We adjusted the index to represent
similarity, which ranged from 0 (completely different) to 1 (exactly the same repertoire).

74
We detail the differences between empirical and simulated codas and repertoire
comparison in the Appendix B3.14 (Supplementary Methods 3.7).
3.5.4 Clan Partition in Empirical and Simulated Data
Clan partitioning in the simulated data was adapted from the original methods for
vocal clan definition: the social units’ coda repertoires were compared and the best
partition into clans was based on the repertoire similarity [30]. While the original
approach included hierarchical clustering, we used the network formalism to depict social
units (nodes) connected by similarity of coda repertoires (links) and modularity to define
the emergence of clans (see below). To allow direct comparisons, we reanalyzed the
empirical social and acoustic data [30,45] with the same network framework. First, we
built a social network of photo-identified individuals (nodes) connected by the strength of
social relationships (links), i.e. the proportion of time individuals were seen together [45]
estimated by the half-weight association index. We then overlapped the empirical
acoustic network, in which the social units (nodes) were connected by the similarity in
their averaged coda repertoires (links).
For both empirical and simulated data, vocal clans were defined by modules in the
acoustic networks, i.e. subsets of nodes (social units) that are highly and strongly linked
within each other (by acoustic similarity) and weakly linked with the rest of the network.
We searched for the best module partition using the Walktrap algorithm [68], which is
based in the assumption that random walks in a network will tend to get “trapped” inside
strong connected modules. More specifically, this algorithm uses an agglomerative
approach to form modules, using a distance metric based on the probability of a random

75
walk go from node i to node j. Hence, nodes belonging to a given module will share
similar probabilities of going to nodes outside their module. To the resultant hierarchy of
modules, the largest increase ratio of the total distance is used to infer the best partition
into modules. Subsequently, we assigned a value to this partition using the weighted
version of modularity metric Q [69]:
∑ /2 , (1)
where A is a weighted adjacency matrix, with elements representing the acoustic
similarity between social units, ∑ is the weighted number of links, ki is the
weighted degree of node i, ∑ and gi gives the label of the module (herein clan) the
node (herein social unit) i belongs to.
The significance of clan emergence, both in empirical and simulated data sets, was
assessed comparing the modularity Q-values to a benchmark distribution generated from
1000 theoretical networks. We created theoretical networks with same size (number of
nodes, i.e. social units), same link weight distribution (i.e. acoustic similarity) and
connectance (proportion of realized links) using a model that randomizes the link weights
among nodes [70]. Clan emergence was considered significant whenever the modularity
Q-values of the observed acoustic networks lied outside of the 95% confidence intervals
of the benchmark distribution.
3.5.5 Sensitivity Analysis and Robustness of Clan Emergence
The parameters and initial conditions of the agent-based models (ABMs) were
grounded on empirical evidence (Appendix B3.9, Supplementary Methods 3.2) and fixed
across scenarios to allow directly comparison of learning strategies without any

76
confounding influence of other changing parameter values. To evaluate whether the
observed partition of social units into clans was robust to varying the initial conditions in
the models, we performed a sensitivity analysis of the 6 initial demographic and 2
learning parameters that were common to all of the 20 ABMs (population size and
carrying capacity, reproductive age, migration rate, mortality rates, age distribution,
initial average social unit size, individual learning rate, coda repertoire size) (full
description in Appendix B3.10, Supplementary Methods 3.3). We ran each ABM
changing a single parameter value at a time to two extreme parameter estimates of a
biologically-meaningful range (Appendix B3.5, Table S3.2) and calculated modularity
and 95% confidence intervals with the theoretical model described above. Specifically,
we tested whether changing the ABMs initial setup would still yield emergence of clans
in the scenarios with biased social learning (ABMs 15-17); and conversely, whether clans
would emerge in the rest of the scenarios in which they originally have not emerged
(ABMs 1-14, 18-20) (see Figures 3.3C, 3.4).
In addition, we evaluated the robustness of the metric for clan partition
(modularity) by bootstrapping the links of the 20 simulated acoustic networks (Appendix
B3.11, Supplementary Methods 3.4). The simulation of coda repertoires by the ABMs
represented a complete sampling, in the sense that all codas of all agents of all social
units were recorded and compared. This is clearly not the case for the empirical data, in
which field logistics inherently yield incomplete sampling of the social units’ coda
repertoires. To make empirical and simulated data more comparable and assess whether
the modularity patterns in the simulated data were consistent in subsets of the simulated
data, we re-sampled the acoustic network weighted links (i.e. coda repertoire similarity

77
between social units) with replacement (bootstrap, 1000 iterations) and calculated the
weighted modularity with increasing sampling, from 5% to 100% with increment of 5%
of the links at a time.
3.5.6 Code and Data Availability
Agent-based models and data are available in the R package balabm v.1.1
(Appendix B3.8, Supplementary Methods 3.1).
3.6 ACKNOWLEDGEMENTS
I am very thankful to L. Rendell and L. Weilgart for contributing empirical data;
to E. Robinson, T. Wimmer, B. McGill, J. Vickers for assisting with coda identification
and J. Christal, N. Jaquet, S. Lusseau, A. Coakes, T. Arnbom, S. Waters for assisting with
photoidentification; to all researchers and volunteers who helped with data collection
since 1985. Support by National Sciences and Engineering Research Council of Canada
(granted to Hal Whitehead) allowed collection of empirical data. I thank the Santa Fe
Institute (U.S.A) and Complex Systems Summer School 2013 for the logistics that
initiate this chapter. I am especially grateful for my co-authors and friends (L.
Shoemaker, R. Cabral, C. Flores, M. Varga) for embarking on this project and teaching
me so much about modelling; and the two anonymous referees of this manuscript, whose
very thoughtful comments challenged us to improve the quality of this work. During the
preparation of this manuscript, I was supported by doctoral scholarships by the Conselho
Nacional de Pesquisa e Desenvolvimento Tecnológico (CNPq Brazil #202581/2011-0)
and Killam Trusts (Canada), and research grants by the Cetacean Society International,

78
and the Animal Behaviour Society. I thank N. Comeau, and all journalists that were
interested in this work, for the long series of interviews that featured this work in more
than 200 outlets from 18 different countries, in online and printed news, radio and
podcasts. Finally, I would like to thank the individual who stole my computer and
backups when I was close to conclude the analysis and review of this chapter. This
unfortunate event helped me improve self-motivation. By restarting the work nearly from
the beginning, the final product turned out better.

79
CHAPTER 4
HOW DOES SOCIAL BEHAVIOUR DIFFER AMONG SPERM WHALE CLANS? 7,8,9
“Four snakes gliding up and down for no purpose that I could see. Not to eat. Not for
love. But only gliding”
~ R.W. Emerson, 1834
4.1 ABSTRACT
When individuals primarily associate with and learn from those who behave similarly,
society and culture become closely tied. Sperm whales (Physeter macrocephalus) exhibit
multilevel social structure, the levels of which are differentiated in part by characteristic
cultural behaviours. Sperm whales are organized into sympatric clans, with distinctive
vocal repertoires that are socially learned. Other behaviours, such as movement patterns
and foraging, also differ among clans. Here we ask whether the clan partition also
7 This chapter has been published in the journal Marine Mammal Science as: Cantor M, Whitehead H. 2015. How does social behavior vary among sperm whale clans? Marine Mammal Science. 31(4): 1275–1290. doi: 10.1111/mms.12218
8 Authors’ contributions: Hal Whitehead (HW), Mauricio Cantor (MC) conceived the research idea; HW contributed empirical data; MC analyzed the data with contributions of HW; MC wrote the manuscript; HW contributed several ideas, comments and edits in the manuscript. MC reviewed the manuscript during the peer-review process.
9 Publication history: Manuscript Received: 19 AUG 2014; Manuscript Accepted: 15 JAN 2015; Article first published online: 2 APR 2015; Issue published online: 19 OCT 2015.

80
includes divergences in social behaviour. Off the Galápagos Islands, members of two
clans differed consistently in diving synchrony, heterogeneity, and temporal stability of
social relationships. While number of associates (indicated by social unit, group, and
cluster sizes) was similar between clans, Regular clan members dived more
synchronously and had more homogeneous relationships than the Plus-One clan
members. Plus-One social units had generally longer associations than those of the
Regular clan. Differences in surface-time coordination and quality of social relationships
are likely byproducts of the clan segregation, which could affect alloparental care giving,
therefore scaling up to differential calf survival rates between clans. This new dimension
of behavioural divergence between sperm whale clans indicates that sympatric, socio-
cultural entities of nonhumans can also display characteristic social behaviour.
4.2 INTRODUCTION
Culture, defined as socially-learned and group-specific behaviour, is increasingly
being recognized in primates, cetaceans, and some other nonhuman species (e.g., Laland
and Hoppitt 2003, Laland and Galef 2009). Culturally-recognized behaviours in these
species include food preferences, foraging techniques, migratory and movement
behaviour, vocalizations, play, and social conventions (Laland and Hoppitt 2003).
Because cultural behaviour is socially learned, social structure drives and moulds cultural
behavioural diversity, but it is important to consider that cultural diversity can in turn
influence social structure (Cantor and Whitehead 2013).
Social learning of behaviour among peers—the foundation of culture (e.g., Boyd
and Richerson 1985)—can affect the patterns of social relationships, thus shaping social

81
structure. This could be direct, for instance, if individuals directly learn social norms
from one another. It could also be indirect if socially learned behaviour sets up conditions
in which different social structures emerge. For instance the social structures of
bottlenose dolphins (Tursiops spp.) may be structured by individually-characteristic
solitary or communal foraging methods, at least some of which are socially learned, as
individuals preferentially associate with others using the same methods (e.g., Ansmann et
al. 2012, Daura-Jorge et al. 2012, Mann et al. 2012). Furthermore, cultural tendencies to
engage in individual vs. communal foraging will affect attributes and measures of social
structure. Even more indirectly, culturally-learned foraging behaviour may set up
conditions, e.g., a particular spatial or temporal distribution of the selected resources, in
which different social structures are expected to be favoured (e.g., Krause and Ruxton
2002).
In some cases, social learning can promote the emergence of sympatric,
behaviourally-distinct groups (e.g., Centola et al. 2007). Social behaviour within such
groups may tend to diverge over time due to behavioural innovations, founder effects, as
well as transmission errors and biases (Koerper and Stickel 1980, Whitehead and Lusseau
2012). Alternatively, conformism and symbolic marking can homogenize behaviour
within social groups and accentuate differences between them (Cantor and Whitehead
2013). These processes could be operating on social behaviour, or in other kinds of
socially-learned behaviour such as foraging, that directly or indirectly impacts social
structure, as in the case of the bottlenose dolphins mentioned above (Cantor and
Whitehead 2103). Thus culture can augment and interact with the most-generally invoked
factors driving interspecific and intraspecific variation in social organization: the

82
spatiotemporal availability and predictability of resources, predation risk, and individual
differences in social behaviour (e.g., Lott 1984, Kappeler et al. 2013, Schradin 2013,
Sacher et al. 2013, Wolf and Krause 2014).
Here we investigate whether two sympatric clans of sperm whales in the eastern
tropical Pacific that possess distinct foraging, movement, and vocalization (Whitehead
2003, Rendell and Whitehead 2003, Whitehead and Rendell 2004) also show differences
in their social behaviour. While male sperm whales lead quasi-solitary lives, females and
immatures live in nearly-permanent social units (see Whitehead 2003), within which
social relationships tend to be fairly homogenous. Social units form temporary groups,
but only with other units from their own clan. These clans can overlap spatially and have
minimal genetic differences between them, especially in the nuclear genome (Rendell et
al. 2012, Whitehead et al. 2012). Thus differences in their social behaviour are likely due
directly or indirectly to culture. Individuals may be learning from each other ways of
organizing social relationships, or, probably more likely, cultural behaviour leads
indirectly to differences in social structure between clans. In the latter, the candidate
processes are different foraging behaviours, differences in microhabitat use, or simple
stochasticity within socially isolated sets of animals.
4.3 MATERIAL AND METHODS
4.3.1 Photographic and Acoustic Sampling Effort
Groups of sperm whales were tracked visually and acoustically with a directional
hydrophone, day and night (Whitehead 2003) during 2- to 4-week research trips between
1985 and 2003 off the Galápagos Islands, Ecuador (Figure 4.1). Recordings of sperm

83
whale codas (stereotypical patterns of clicks used for communication) were made using a
variety of hydrophones (frequency responses: 6 Hz–10 kHz, ±3 dB; 1–10 kHz, ±3 dB),
recorders and amplifiers (details in Rendell and Whitehead 2003). Females and immature
individuals were identified from photographs of natural markings on the trailing edge of
tail flukes with the assistance of a computer program (Whitehead 2003). Black and white
photographs were taken with 35 mm film SLR cameras until 2001, when we switched to
equivalent digital equipment. The quality of each photograph was rated (from Q=1, very
poor, to Q=5, very high quality) based on focus, exposure, orientation of the fluke in the
frame, percent cover and tilt of the fluke in relation to the water surface (see Whitehead
2003). We excluded from the analyses photographs with Q<3, calves (distinctively small
individuals, likely less than 2 year old) and mature males (distinctively large animals).
Our long-term data set comprised 3,943 coda recordings, 6,193 high-quality Q≥3
photographs, and social behaviour data of photo-identified individuals collected during
12,550 d of group follows (that varied from hours to a maximum of 12 consecutive days
and nights) over a period of 18 years (Figure 4.1).

84
Figure 4.1. Spatio-temporal sampling effort off the Galápagos Islands, Ecuador, in the
South Pacific Ocean. (a) The islands (dashed box) have darker shading, lighter shading
represents waters less than 1,000 m deep (rarely used by sperm whales) and black lines
represent the tracks of followed whales. (b) Black bars represent days following whales
per year (of both clans); and gray bars represent the number of high-quality pictures
(Q≥3) used for photo-identification.
4.3.2 Sperm Whale Clans
Vocal clans were defined as sets of social units of sperm whales (see Table 4.1)
with high similarity in the repertoires of their coda vocalizations (Rendell and Whitehead

85
2003). In the South Pacific clans span ranges of several thousand kilometers and in all
well-studied areas two or more clans are present. Social units were assigned to clans as in
Rendell and Whitehead (2003), so we will summarize the methodology. The vocal
repertoires of social units were identified based on inter-click intervals of the codas.
Codas were assigned to social units whose members were photo-identified within 2 h of
the recording. We analyzed repertoires of social units that had at least 25 codas recorded.
Coda repertoires were compared with an averaged multivariate similarity method and
hierarchical cluster analyses were used to define the best partition of social units into
vocal clans (see Rendell and Whitehead 2003). We examined social variation between
the two principal clans found off the Galápagos Islands: ‘Plus-One clan’ (predominantly
codas with the final inter-click-interval extended), and ‘Regular clan’ (predominantly
codas with 4-8 regularly-spaced clicks).
4.3.3 Social metrics
We compared clans using seven social metrics, all direct measures of the extent to
which individuals were photo-identified together: three estimates of the number of
individuals in different social levels (1: social unit size, 2: group size, and 3: cluster size),
and four measures of interindividual association (4: dive synchrony within groups, 5:
social differentiation, S, among all pairs of individuals within social units, 6: half-weight
association indices, HWI, among all pairs of individuals within social units, 7:
standardized lagged association rates, SLAR, among all pairs of individuals within clans).
We chose the first three because they indicate the number of associates that individuals
experience with different definitions of association; the remainder are good proxies for,

86
and inform different aspects of, the quality of relationships (4: behavioural coordination
within groups; 5: heterogeneity of relationships within social units, 6: strength of
relationships within social units, and 7: temporal stability of relationships among
members of different units within the same clan). Definitions of social metrics and
methods of estimation are presented in Table 4.1.
Table 4.1. Definition and estimation methods for the seven social metrics.
Social metric Definition Estimates based on Method Units of analysis
1. Social unit size1,2,3
Number of individuals in a social unit, which is a set of adult females and immature individuals that live and move together over periods of years, generally of one or more matrilines.
Individuals associated with at least two other individuals during at least two 12h-identification periods spaced out by at least 30 d.
We considered the number of individuals assigned to the same social unit as in Christal et al. (1998).
Social unit
2. Mean group size3,4,5
Number of individuals in a group, which is a set of individuals moving together in a coordinated manner over periods of few hours to few days.
The number of photo-identified individuals for each day.
Two-occasion closed-population Lincoln-Petersen mark-recapture estimator:
∙1, where
x1 are the number of individuals identified in the first half of the photo-identifications on that day, x2 in the second half, and x12 in both.
Days (estimated group size on day)
3. Cluster size4,6,7
Temporary subsets of a group, composed of the individuals at the surface swimming in the same direction and speed, side by side in a coordinated manner a few body lengths or less apart usually for a matter of minutes.
Observations of number of individuals in clusters within 500m of boat only when whales were engaged in foraging. Clusters of socializing whales were not considered because they are very variable in size and can sometimes include all group members.
Mean cluster size for all records of cluster size for a social unit
Social unit

87
Social metric Definition Estimates based on Method Units of analysis
4. Dive synchrony4,6,7,
Expression of behavioural coordination among group members when foraging.
The maximum interval (in min) between the starts of consecutive deep dives of grouped individuals during each hour, minus its expected value, as predicted by group size and the presence of calves, averaged first over hours of each day, and then over those days in which a particular clan was sampled with at least 5 of such hours.
Expected intervals for any hour are given by the regression model
∙ , where
d is the longest interval between consecutive dives for each hour, n is the number of dives made by the group during the hour, c is presence (1) or absence (0) of calves during the hour, and b and β are regression coefficients.
Days with groups of different clans
5. Social differentiation 4,8
Variability in social relationships (homogeneous S=0; heterogeneous S>>0), here used to estimate the variation in dyadic probabilities of association within social units.
The estimated coefficient of variation (CV) of the true association indices (S). Higher S-values indicate more heterogeneity within-social unit relationships.
S was estimated from the photo-identification data with association defined as for metric 6, using the maximum likelihood method described in the appendix of Whitehead (2008b), with standard errors estimated by bootstrap resampling technique.
Mean S-values within social units
6. Strength of social relationships 3
Proportion of time a pair of individuals was observed together in relation to the number of times that they were observed.
Associations among pairs of individuals diving within 10-min intervals. Within this period individuals are usually in well-synchronized diving cycles, at close spatial proximity (<600 m).
Half-weight association index:
, where, x
is the number of 10-min sampling intervals that individuals a and b were observed together; yab is the number of intervals with a and b identified but not together; ya and yb are the number of intervals with only individual a, or b, were identified.
Mean HWI among pairs of members of a social unit
7.Temporal stability 4,9
Temporal stability of association between two individuals is given by the average probability of re-association after a given time lag.
The rate of association over time, for instance if individuals A and B were identified as associates, then a randomly chosen associate of A after lag t was B.
Plotting of the Standardized lagged association rates (SLAR) over increasing time lags and fitting exponential decay models to the observed SLARs (Table 4.3).
SLAR for all members of each clan
1Christal et al. 1998, 2Christal and Whitehead 2001, 3Whitehead 2003, 4 Whitehead 2008a, 5Otis et al.
1978, 6Whitehead 1996, 7Whitehead 1999, 8 Whitehead 2008b, 9Whitehead 1995.

88
4.3.4 Clan Comparison
We primarily asked whether there are differences in the social metrics between
the social units from the two main vocal clans. As a cross-validation, we further asked the
reversed question: how can we best separate the two clans using these metrics? To
answer the former, we used Student’s t-tests (two-sample unequal variance) to test the
null hypothesis of no mean difference between the Regular and Plus-One clan, for all
social metrics other than SLAR (see below). We also measured the magnitude of the
differences with Cohen’s d effect size (difference in means divided by combined standard
deviation, SD), which informs how many SDs difference there is between the means of
the two groups on a given social metric. In these tests, the unit of analysis was the mean
value of the social metric for each available social unit. However, group size data
typically involved individuals from two or more social units at the same time, so we used
days spent following sperm whale groups as the units of analyses (Table 4.1).
To answer the latter, we applied a linear discriminant analysis (LDA). We aimed
to express how different were the two clans as a linear function, evaluating which of the
social metrics were important in quantifying their differences. We further aimed to
predict the classification of a new unknown social unit into a clan, given the descriptors
of its social behaviour. Here, the mean value of a metric for each social unit was also
used as the unit of analysis, thus standardized lagged association rates (SLAR) and group
sizes were not considered. We started by building the saturated LDA model with all the
five remaining social metrics; then used forward and backward stepwise leave one out
cross-validation to test whether models with fewer variables would have higher

89
prediction accuracy. At each step, a new LDA model was created—by including
variables not in the model (forward) or excluding those already in the model
(backward)—and its prediction accuracy was estimated. The processes stopped when the
accuracy did not improve, indicating that the resultant model was more efficient than
other formulations.
Finally, we compared how social relationships changed over time in each clan by
fitting four exponential decay models (SLAR1-4) with different possibilities for the
decay of relationships over time to the lagged association rate data within clans (Table
4.3). Because members of a social unit are, by definition, permanent associates, in this
context the lagged association rate primarily summarizes the dynamics of the associations
among social units as they form groups. The first model, SLAR1, is constant, with no
decay, representing permanent associations; in SLAR2, the association rate decays down
to zero, representing associations that occurred for a given time lag and then never again;
in SLAR3 the rate decays down to a lower level after a given time lag and then levels off,
representing a mix of long-lasting and more temporary associations; the last model,
SLAR4, is a sum of two exponential decay processes down to zero, representing two
levels of disassociation, at a shorter and a longer time lag (the full description of the
models and their parameter interpretation are available elsewhere: Whitehead 1995,
2008a). The SLAR models were fitted by iterative convergence to the original
association data. We selected the most parsimonious model for each clan with the lowest
quasi-Akaike Information Criterion (QAIC) (Burnham and Anderson 2002), to account
for the overdispersion of the association data. The degree of support for the models was
given by differences in the QAIC with the best fit model (ΔQAIC) and standardized

90
relative QAIC weights ( . ∙ ) (Burnham and Anderson 2002). We obtained
standard errors for the model parameters using the temporal jackknife procedure
(omitting 30 day periods of data each time) (Whitehead 2008a). SLAR and related
analyses were performed in SOCPROG (Whitehead 2009), while the remaining analyses
were done in R environment (R 2014).
4.4 RESULTS
There was generally greater variation in the social level sizes between units in the
same clan than between the clans (Figure 4.2A-C, Appendix C4.1 Table S4.1). The Plus-
One clan appeared to contain smaller social units (mean unit size: Regular 13.6; Plus-
One 10.7 individuals), that formed larger groups (mean group size: Regular 16.7; Plus-
One 22.9 individuals), and larger clusters (mean cluster size: Regular 1.6; Plus-One 1.8
individuals) but such differences were not statistically significant at the 5% level (Table
4.2).

91
Figure 4.2. Social behaviour variation among sperm whale vocal clans (Plus-One,
Regular): (a) Social unit size (number of photo-identified individuals); (b) Group size
(number of individuals in temporary association); (c) Mean cluster size while foraging
(number of individuals seen together at the surface); (d) Dive synchrony (residuals of no-

92
dive gap in minutes, from the dive synchrony regression model); (e) Social differentiation
(S, estimated CV of the actual rate of association); (f) Half-weight association indices
(mean HWI within units, estimated proportion of times pairs of individuals were seen
together). Boxplots show mean values (black dots), median (horizontal bar), 1st and 3rd
quartiles (box, which widths are proportional to sample sizes), minimum and maximum
values (whiskers). Asterisks represent Student’s t-test statistical significance at P<0.05
(Table 4.2).
Table 4.2. Mean values of social metrics for units of the Regular and Plus-One clans off
the Galápagos Islands. Only social units to which we have data for all social metrics
(except group sizes; see text) were included in the tests. SD: standard deviation; t:
Student’s t statistic; DF: degrees of freedom; P-values significant at P<0.05 are italicized;
Cohen’s d: effect size and 95% confidence intervals (CI). HWI: half-weight association
index; S: social differentiation (estimated coefficient of variation of the true HWIs).
Social metric Regular clan ( ̅ ± SD)
Plus-One clan ( ̅ ± SD)
t DF P-value Cohen’s d (95% CI)
Social unit size (individuals)
13.6 ± 7.0 10.7 ± 4.2 -0.9 6.41 0.42 0.46 (-0.89, 1.79)
Group size (individuals)
16.7 ± 6.6 22.9 ± 14.6 -1.4 12.74 0.18 0.66 (-0.03, 1.33)
Cluster size (individuals)
1.6 ± 0.2 1.8 ± 0.3 0.9 2.62 0.45 0.74 (-0.65, 2.08)
Dive synchrony (residual no-dive gap in minutes)
6.3 ±3.5 0.7 ± 2.3 -3.2 5.84 0.02 1.74 (0.16, 3.25)
Social differentiation S
0.35 ± 0.34 0.00 ± 0.00 -2.8 7.00 0.03 1.13 (-.032, 2.52)
Dyadic relationships (mean within-unit HWI)
0.15 ± 0.06 0.20 ± 0.06 1.2 3.64 0.31 0.80 (-0.60, 2.16)

93
In contrast, between-clan variation was clearer for interindividual association
measures (Figure 4.2 D-F). Average association indices were not statistically different
between clans (mean HWI: Regular 0.15; Plus-One 0.20). Social units that were
members of the Plus-One clan dived less synchronously (mean residual no-dive gap:
Regular 6.3; Plus-One 0.7 min). They were also more homogeneously associated, with
less variable association indices (mean S: Regular 0.4; Plus-One 0.0) (Table 4.2).
Moreover, the SLAR plots (Figure 4.3) and the most parsimonious models for temporal
stability of within-clan relationships (Table 4.3) suggest that the Regular clan units were
engaged in briefer associations: mean of 1.0 d (1/1.00) for the Regular clan vs. 2.0 d
(1/0.491) for the Plus-One clan. The higher SLAR rates for the Regular compared with
the Plus-One clan can be explained by the greater degree of social differentiation
(individuals keep associating preferentially with the same small set of preferred
companions).

94
Figure 4.3. Standardized lagged association rates (thicker lines) and best fit models
(thinner lines; Table 4.3) among whales within each vocal clan (black: Regular; gray:
Plus-One). Low overlapping of the standard errors (vertical bars, from a jackknife
procedure) suggests significant differences.
In the linear discriminant analysis, the prior probability (i.e., the observed
proportion) of social units being from the Plus-One clan was 0.27, and 0.73 from the
Regular clan. The saturated LDA model ( 0.12 ∙ 1.12 ∙
0.35 ∙ 0.36 ∙ 1.64 ∙ ) had only moderate
prediction accuracy: 63% of correctly a posteriori assignment of social units to clans. By
removing variables from the saturated model, the resultant reduced models were more
efficient. Both forward and backward stepwise procedures yielded predictive models
(forward: 0.15 ∙ 0.38 ∙ ; backward: 0.14 ∙
0.38 ∙ 0.28 ∙ ) that were equally accurate (correctness
rates of 91% for both). Along the linear discriminant, the Plus-One social units clustered
towards the negative, and the Regular’s clustered towards the positive values. The
reduced models endorsed t-test results, which indicated that dive synchrony and S were
significantly different between clans. Dive synchrony seemed to be the most divergent
social metric between the two clans (see also Cohen’s d in Table 4.2).
Table 4.3. Models fit to Standardized Lagged Association Rates (SLAR) ranked by the
lowest quasi-Akaike Information Criteria (QAIC) for each of the two clans of sperm
whales off the Galápagos (Plus-One, Regular). ΔQAIC, QAIC weights and likelihood

95
indicates the relative support for each model. Details on the interpretation of the model
parameters are available elsewhere (Whitehead 1995, 2008a).
SLAR Model QAIC ΔQAIC QAIC weight
Likelihood
Plus-One Clan
SLAR3 0.015 0.027 ∙ . ∙ 1,232.06 0 0.68 1.00
SLAR4 0.069 ∙ . ∙ 0.088 ∙ . ∙ 1,233.98 1.92 0.26 0.38
SLAR2 0.025 ∙ . ∙ 1,237.44 5.38 0.05 0.07
SLAR1 0.023 1,240.95 8.89 0.01 0.01
Regular Clan
SLAR4 0.043 ∙ . ∙ 0.028 ∙ . ∙ 8,011.47 0.00 0.65 1.00
SLAR2 0.046 ∙ . ∙ 8,012.73 1.26 0.35 0.53
SLAR3 0.038 0.061 ∙ . ∙ 8,036.69 25.22 0.00 0.00
SLAR1 0.041 8,052.07 40.60 0.00 0.00
In summary, the two clans principally differed in behavioural coordination (dive
synchrony), heterogeneity of relationships within units (S) and the temporal stability of
social relationships among units (SLAR). We should, however, bear in mind a few
caveats regarding the nature of our comparison. We reported social differences between
two, out of five, known vocal clans (Rendell and Whitehead 2003). There are substantial
logistical challenges in collecting long-term data on deep-diving cetaceans in offshore
waters over large spatial scales. Thus at the moment we can only speculate whether the
social contrasts would extend to other clans.
4.5 DISCUSSION
In addition to vocal, movement and foraging behaviours (Rendell and Whitehead
2003, Whitehead and Rendell 2004, Marcoux et al. 2007a), our long-term study adds
social behaviour to the distinctions among the sperm whale clans inhabiting the Pacific

96
waters. While clan partitioning is likely driven by cultural processes at a broad scale
(Rendell and Whitehead 2003, Whitehead et al. 2012), we suggest that fine-scale social
variation was shaped by a pre-defined clan partition, and therefore is a by-product—
rather than a cause—of cultural segregation.
Overall, our findings indicate variation in the social behaviour of sperm whales
from different clans. Most obviously, clan memberships imply differences in diving
synchrony, heterogeneity and temporal stability of social relationships, with members
from Regular clan diving more synchronously but with associations that are relatively
more heterogeneous and briefer than the Plus-One clan. However, the clans showed no
statistically significant variation in the sizes of lower social level, such as social units,
groups, clusters. Taken together, our results suggest that social life is more unit-oriented
for members of the Regular clan. Compared with a member of the Plus-One clan, a
Regular-clan sperm whale has relatively more equivalent relationships with its co-
members. Grouping with other units is less frequent and less prolonged for these Regular
units. In the Plus-One clan the emphasis seems more on dyadic individual relationships,
expressed by larger social differentiation, as well as associating with other units in the
clan, rather than the unit itself.
Such fine-scale social variation may ultimately propagate into fitness differences
between members of different clans (see also Marcoux et al. 2007b). Dive synchrony is
an expression of social affiliation and behavioural coordination among group members.
Primarily, it is an inverse measure of the quality of calf-protection at the surface: the
more synchronous their characteristic 40 min dives are, the less reliably there will be
babysitters at the surface for calves (Whitehead 1996). Because the provision of

97
alloparental care seems to be a key function of the social units (Gero et al. 2013),
differences in diving and surface-time synchrony, along with variation in quality and
duration of social relationships among females, could lead to different rates of calf
survival between clans. Additionally, diving synchrony serves as a proxy for foraging
coordination and perhaps cooperation at depths, where more echolocating individuals
might be more likely to find a food patch and could potentially assist one another in prey
capture. Thus, differences in diving coordination could lead to differences in feeding
success between clans (see also Marcoux et al. 2007a). Fitness differences between clans
could also arise indirectly, through learning of other behavioural patterns exclusively
within a clan. Social patterns affect the flow of behaviours through social learning (e.g.,
Voelkl and Nöe 2010, Cantor and Whitehead 2013), thus the between-clan variation in
social relationships could indicate different paths by which innovations and predominant
behaviours are transmitted within the clans over time. For instance, as is the case for
some other species in which variation in fine-scale social interactions can affect foraging
strategies (e.g., Aplin et al. 2012, Atton et al. 2014), movement patterns and micro-
habitat use of sperm whales can be socially learned within the clan (Whitehead and
Rendell 2004) and determine diet composition (see Marcoux et al. 2007a) as well as
potentially feeding success of clan members.
There are a few explanatory mechanisms for the emergence of behaviourally-
distinct clusters in a population, such as the sperm whale vocal clans. Intrapopulation
variations in social behaviour are usually assigned to genetic, ontogenetic, ecological,
and/or cultural factors (e.g., Schradin 2013, Cantor and Whitehead 2013, Cronin et al.
2014). Pinning down the principal mechanism can be challenging (e.g., Whitehead 2009,

98
Allen et al. 2013, Mace 2014). In our case, sperm whale vocal clans are sympatric, span
large areas (Whitehead et al. 1998, Rendell and Whitehead 2003), are not genetically
distinguishable (Whitehead et al. 1998, Rendell et al. 2012), and contain individuals from
all age classes (Rendell and Whitehead 2003). Therefore behavioural differences between
clans are unlikely to be environmental, genetic, or ontogenetically-driven; they are more
parsimoniously ascribed to social learning (Rendell and Whitehead 2003, Whitehead et
al. 2012, Whitehead and Rendell 2014). More specifically, behavioural distinctions
between clans can emerge when: a) individuals with similar behaviour preferentially
associate (also called assortment, homophily), and b) associations reinforce behavioural
similarity (social influence) through social learning (see Centola et al. 2007, Cantor and
Whitehead 2013). In this way, the population would segregate into clans if sperm whales
with similar social behaviour tend to associate more often—either actively by preferential
association among like-minded individuals; or passively by differences in habitat use
strategies (see Croft et al. 2009, Farine 2014). However, it is much more likely that
matching of acoustic behaviour structures the associations among sperm whales (see
Rendell and Whitehead 2003, Schulz et al. 2008): coda types are used for
communication, are learned socially and only individuals with highly similar vocal
repertoires tend to associate. Indeed vocal similarity is how the clans were initially
recognized (Rendell and Whitehead 2003).
Once the sperm whale population is structured into vocal clans, other behavioural
variations, which may be functionally neutral (e.g., Hahn and Bentley 2003) such as the
social behaviour we report here, may emerge and disappear through drift over time
(Cavalli-Sforza and Feldman 1981). Analogously to phylogenetic processes (Koerper and

99
Stickel 1980, Boyd and Richerson 1985), such changes in frequencies of socially-learned
behaviours occurring by neutral processes involving no selection or preference would
amplify the differences between the behavioural repertoires of the segregated clans.
Therefore, it may be parsimonious to view the social variation between clans as a
consequence of a predefined partition in the whales’ social network, with individuals and
social units replicating the patterns in dive synchrony and social behaviour of their clan
members, and drift leading to distinctive variation among clans in either the social
behaviour itself or other behaviour that directly or indirectly affects social structure (e.g.,
Whitehead and Lusseau 2012).
Behavioural segregation within populations adds another layer of complexity to
intraspecific variation in social structure (Kappeler et al. 2013). We showed that some
elements of the sociality of sperm whales are mapped onto the upper level divisions of
their society. These findings are among the few showing that culturally-marked groups of
nonhumans living in the same area have characteristic social behaviour (see also Cronin
et al. 2014). In perhaps the closest known parallel, sympatric killer whale (Orcinus orca)
ecotypes in the eastern North Pacific have distinctive social structures (Baird 2000), and
the evolution of these ecotypes may have been driven by cultural differences (Riesch et
al. 2012). However the ecotypes are now so different that there have been calls to
recognize them as distinct species (Morin et al. 2010). Social variation between sperm
whale clans further shows that their behavioural segregation is not limited to
communicative signals. The presence of sympatric clans with rich, divergent, culturally-
initiated behavioural norms suggest that sperm whale populations could carry multiple
traditions. Multiple traditions within populations are considered a rare trait for nonhuman

100
societies (e.g., Whiten et al. 1999, Allen et al. 2013), but they might remain unrecognized
either because behavioural ecologists have failed to look for them, or because
intrapopulation behavioural variation is fully, but incorrectly, attributed to ecological or
genetic differences. Sorting out the contribution of culture from other factors in driving
intraspecific variation remains a timely challenge (Kappeler et al. 2013, Mace 2014).
4.6 ACKNOWLEDGMENTS
I thank all colleagues and volunteers who assisted field research since 1985; the
Charles Darwin Station, Parque Nacional Galápagos and G. Merlen for logistical support;
the World Wide Fund for equipment; D. Farine for insightful comments, and the editors
and three anonymous referees for the review that improved the manuscript. This work
was supported by National Sciences and Engineering Research Council of Canada, The
National Geographic Society, International Whaling Commission, Whale and Dolphin
Conservation, M. Clark, Green Island Foundation, Dalhousie University (granted to
H.W.). I was supported by doctoral scholarships by the Conselho Nacional de
Desenvolvimento Científico e Tecnológico (CNPq Brazil #202581/2011-0) and Killam
Trusts (Canada) through Dalhousie University.

101
CHAPTER 5
CULTURAL TURNOVER AMONG GALÁPAGOS SPERM WHALES 10,11,12
“All change is a miracle to contemplate, but it is a miracle which is taking place every
instant.”
~ H.D. Thoreau, 1854
5.1 ABSTRACT
While populations may wax and wane, it is rare for an entire population to be replaced by
a completely different set of individuals. We document the large-scale relocation of
cultural groups of sperm whale off the Galápagos Islands, in which two sympatric vocal
clans were entirely replaced by two different ones. Between 1985-1999, whales from two
clans (called Regular and Plus-One) defined by cultural dialects in coda vocalizations
were repeatedly photo-identified off Galápagos. Their occurrence in the area declined
10 This chapter is being considered for publication in the journal Royal Society Open Science as: Cantor M, Whitehead H, Gero S, Rendell L. Cultural turnover among Galápagos sperm whales. Royal Society Open Science.
11 Authors’ contributions: Hal Whitehead (HW), Mauricio Cantor (MC) conceived the study idea; HW, Luke Rendell (LR) designed the study; HW, LR, MC collected data; LR, MC processed data; MC, Shane Gero (SG) performed statistical analyses; SG, LR, HW, MC programmed computer analyses; MC drafted manuscript and HW, SG, LR edited and contributed to writing. All authors gave final approval for publication.
12 Publication history: Manuscript First Submission: 11 JUN 2016; Reviewed Manuscript Received:04 AUG 2016; Revised Manuscript Submitted: 19 AUG 2016.

102
through the 1990’s; by 2000 none remained. We reassessed Galápagos sperm whales in
2013-2014, identifying 463 new females. However, re-sighting rates were low, with no
matches with the Galápagos 1985-1999 population, suggesting an eastward shift to
coastal areas. Their vocal repertoires matched those of two other clans (called Short and
Four-Plus) found across the Pacific but previously rare or absent around Galápagos. The
mechanisms behind this cultural turnover may include large-scale environmental regime
shifts, and cascading responses to heavy whaling in the region. The fall and rise of sperm
whale cultures off Galápagos reflect the structuring of the Pacific population into large,
enduring clans with dynamic ranges. Long-lasting clan membership illustrates how
culture can be bound up in the structure and dynamics of animal populations and how
tracking cultural traits can reveal large-scale population shifts
5.2 INTRODUCTION
Behavioural repertoires of animal populations change over time. Changes may
result from adaptive genetic evolution and genetic drift, phenotypic plasticity, individual
or social learning [e.g. 1,2]. Changes can take many generations (typical for genetic
evolution) or occur over a small part of the life cycle (e.g. phenotypic plasticity in the
face of rapid environmental change). When behaviour is socially learned and shared,
hence culture, evolutionary processes influence these dynamics at various scales [2,3].
When cultural behaviour changes rapidly relative to generation time, it can do so in two
distinct ways. First, by replacement of behaviours: individuals learn new behaviours and
those spread through the standing population. Second, by replacement of the individuals

103
themselves: the population using that area dramatically changes in composition such that
entire cultural trait groups are replaced by others.
There are multiple non-human examples of the first case—replacement of
behaviours. Take humpback whales (Megaptera novaeangliae) for example. Male
humpbacks sing a continuously evolving population-specific song [4], but in the South
Pacific populations regularly discard entire songs in favor of a new song from a
neighboring population in a revolutionary transition that takes less than a year [5,6].
Similarly, humpback populations can rapidly diffuse foraging innovations in response to
ecological shifts [7]. As for the second case—replacement of individuals—there are
examples from human history of cultural groups replacing each other in a given territory.
One is the history of the Sahel, the sub-Saharan semiarid vegetation belt that was once
home for different cultural groups with two distinct feeding strategies—nomadic
pastoralism and sedentary farming [8]. Following large-scale environmental changes after
the French colonial rule—a combination of natural and anthropogenic desertification—
groups whose feeding strategies no longer fit the habitat were forced to move [8,9],
resulting in a cultural turnover caused by the replacement of individuals by those from
different culturally-defined groups. However, examples outside humans are much rarer.
Here, we document rapid cultural turnover in an animal population caused by the
replacement of cultural groups on an oceanic scale: the sperm whales (Physeter
macrocephalus) off the Galápagos Islands.
Female sperm whales live in multilevel societies [10]. The fundamental social
level is the nearly-permanent social units of about 11 females and their young [10-12].
The largest level is the vocal clan, that we distinguish using characteristic repertoires of

104
codas—stereotyped patterns of broad-band clicks used in social communication [13].
Vocal clans are sympatric (groups from multiple clans are found around the Galápagos
and off the coasts of Chile and mainland Ecuador [14]) but socially segregated such that
social units only form temporary groups (about 2-3 social units typically over periods of
days) with other units that share the same repertoires of coda types united by a common
structural theme [14]. Two vocal clans were common around the Galápagos Islands in
1980-1990’s: the Regular clan, consisting of social units that mostly make codas with
regularly-spaced clicks; and Plus-One clan, most of whose codas have an extended
interval before the last click. Two other clans were identified across the wider Tropical
Pacific: the Short clan which mostly produced brief codas with fewer than 5 clicks; and
the Four-Plus clan which mostly produced codas with a base of 4-regular clicks [14].
These distinct coda dialects are stable over at least a decade [15]. Among clans, there is
extensive sharing of mitochondrial DNA haplotypes, thus, taken with the degree of
sympatry, it is almost certain that these dialect variations are cultural in nature [16]. Clans
also differ in habitat use, foraging success, diet, social behaviour, and possibly calving
rates [17-19], suggesting that clan membership has much wider implications than just
vocal dialect. Thus, clans appear to be a significant structuring factor in sperm whale
society.
Although highly socially structured, sperm whales in the Tropical Pacific display
little geographic structure: clans overlap over very large areas [10,14]. While social units
have ranges spanning about 2,000km, the clans to which they belong have wider
distributions, spanning across the Tropical Pacific [14,20]. This nomadic behaviour likely
reflects adaptive space use, probably driven by the effects of oceanographic conditions on

105
variation in the distribution of their prey, deep ocean squid [20,21]. We surveyed sperm
whale populations and coda repertoires over the last three decades, and use these data
here to show a complete turnover in cultural dialects concurrent with a turnover in the
pool of individuals around the Galápagos Islands.
5.3 METHODS
5.3.1 Field Methods, Photo-Identification, and Acoustic Recordings
Sperm whales were tracked visually and acoustically in deep waters (>1,000m)
across the Tropical Pacific, day and night during 2- to 4-week surveys between 1985 and
2014 (Figure 5.1, Appendix D Tables S5.1- S5.3). Given the logistical challenges of
offshore surveys, sampling was unevenly distributed; the Galápagos archipelago was the
main study area (Appendix D, Tables S5.1-S5.3). Annual encounter rates off the
Galápagos were calculated as number of groups of female and immature whales
encountered divided by total hours of acoustic and visual search (i.e. total effort minus
time following whales) [22].

106
Figure 5.1. Re-sightings of individual female and immature sperm whales in the eastern
Tropical Pacific, between (a) 1985-2004 and (b) 2013-2014. Dashed circles loosely
indicate study areas, with numbers indicating total of photo-identified individuals.
Numbers by arrows indicate match of individuals between areas.
Individuals were identified from photographs based on patterns of natural marks
on the trailing edge of their tails, assisted by a semi-automated photo-identification
protocol [23]. We rated each photograph from poor to very high quality (Q=1 to 5) based
on focus, exposure, orientation, percent cover and tilt of the fluke [24]. Distinctively
small animals (of about <2 years) were considered calves; distinctively large animals as
mature males; the others were considered females and immatures [24]. We analyzed only
Q≥3 photographs of females and immatures. From a total of 14,286 photographs, we
identified 4,468 individuals (Appendix D5.1, Table S5.2).
Sperm whale codas were recorded using various hydrophone arrays and recording
devices over the duration of the study (Appendix D5.11, Supplementary Methods 5.1)

107
[14]. All recordings were analyzed using Rainbow Click software [25] in which
individual clicks were manually marked and designated as part of codas. From acoustic
recordings from across the Pacific, we sampled 17,045 codas (Appendix D5.2, Table
S5.3).
5.3.2 Assigning Coda Repertoires to Photo-Identified Groups
We assigned coda recordings to groups of individual whales photo-identified
together. We considered all recordings made on the same day when continuously
following a group of sperm whales to be of the same group [14]. Codas recorded on two
different days were considered to be from the same group if least 25% of the photo-
identified individuals were re-sighted [26]: mab>0.25*min{na, nb}, where mab is the
number of individuals photo-identified on both days, na is the number of individuals
identified on the first day, and nb on the second day. We discarded groups whose recorded
repertoires contained less then 25 codas [14].
To account for any potential autocorrelation in coda production during the same
day, all coda recordings on a given day from a given group represented a single
repertoire. Under the assumption that coda production of a given group on a given day is
independent of its production on a subsequent day, repertoires from different days were
treated as replicates of a group’s repertoire and were considered independent samples of a
group’s coda production [27]. We used permutations to test differences between group
repertoires (Appendix D5.12, Supplementary Methods 5.2) [27].
5.3.3 Continuous and Categorical Similarity Between Coda Repertoires

108
We compared group repertoires using the absolute inter-click intervals (ICI, i.e.
the time between the onset of one click to another in a coda sequence) to represent the
temporal structure (rhythm and tempo) of their codas [27,28]. To quantify similarity
between coda repertoires, we applied continuous and categorical metrics to this
multivariate data set. The former was used to define the vocal clan partitions; the latter
was used to define coda types that illustrate the differences in the patterning theme of the
codas between clans (analyses pathway in Appendix D5.4, Figure S5.1).
For the continuous approach, we calculated the multivariate similarity of two
codas of the same click length (i.e. same number of clicks) using the Euclidean distance
between their inter-click interval vectors (Appendix D5.13, Supplementary Methods 5.3)
[14]. With the categorical approach, we classified codas into discrete types based on their
rhythm and tempo, illustrating how repertoires differed among clans. We assigned codas
to categories using OPTICSxi hierarchical clustering [29] (in this context: [27]). We ran
OPTICSxi on the absolute inter-click intervals independently for each set of codas of the
same click length, using a sensitivity analysis to define the algorithm initial parameters
(Appendix D5.14, Supplementary Methods 5.4). We labeled the coda types according to
number of clicks and rhythm, based on previous nomenclature [14,26].
5.3.4 Assigning Photo-Identified Groups to Vocal Clans
The original partition of vocal repertoires into clans ([14], Supplementary
Methods 5) used hierarchical clustering analyses based on the continuous multivariate
similarities of standardized ICIs of codas, and the k-means algorithm to categorize codas
into types [14]. Here we used the updated methods for comparing repertoires described

109
above to re-analyze this data set together with the repertoires recorded off Galápagos in
2013 and 2014 (Appendices D5.3, D5.15: Table S5.3, Supplementary Methods 5.5). To
assign the 2013 and 2014 groups to clans, we first built an average-linkage clustering
dendrogram using the continuous multivariate similarity matrix for the combined dataset;
then we identified whether these groups clustered together into a distinctive branch
(indicating a new clan) or whether they clustered with previous clans. We measured the
accuracy of the dendrogram representation using the cophenetic correlation coefficient
(CCC), and considered CCC>0.8 to indicate a reliable representation. The dendrogram
robustness was measured by bootstrap resampling [14]: all groups’ coda repertoires were
randomly sampled with replacement (100 replicates), their similarities were recalculated
and the proportion of times a given branch was replicated used to indicate the robustness
of that branch.
5.4 RESULTS
5.4.1 Photographic Matching and Movements
We identified 4,468 individuals across the Pacific study areas (Appendix D5.2,
Table S5.2) with re-sightings illustrating the scale of movements individuals could
undertake (Figure 5.1). Most individuals were identified off the Galápagos Islands;
however, overall encounter rates there declined over the period 1985-2000 (Figure 5.2).
Between 1985-1995, female and immature sperm whales were repeatedly found (1,085
identified individuals); encounters with whale groups became rarer in the late 1990’s and
by the 2000’s they seemed to have left the area (Figure 5.2). Surveys from 1985-2004
suggested an eastward movement away from Galápagos (Figure 5.1A). Our 2013-2014

110
surveys indicated a modest, recent return of sperm whales to this area (Figures 5.1B, 5.2);
however, this was by new individuals. The photographic recapture rate was very low:
only 1% of the females and immatures (5/463) were sighted in both 2013 and 2014. From
these recently photo-identified whales, none matched with the previous whales seen off
Galápagos and only 6 females had been seen in in the Gulf of California in 2003 (Figure
5.1B).
Figure 5.2. Encounter rates of sperm whale off the Galápagos Islands over 30 years
across clans. Rates were higher in early 1980’s, started declining during the 1990’s and,
after a hiatus in 2000’s, started rising again. Color code indicates clan membership
(Figure 5.3) of whales for which both photo-identification and acoustic data were
available in that year. Whiskers represent standard errors (SE). Asterisks indicate years
with no dedicated surveys off Galápagos (the larger gap in 2000’s was mainly motivated
by a lack of opportunistic sightings in the area), but in some of these years there were
surveys in surrounding areas (Tables S5.1-S5.3).

111
5.4.2 Acoustic Repertoires
From 1985 to 1999, coda repertoires of 64 groups of female and immature were
recorded across the Tropical Pacific [14]; in 2013-2014 we recorded 15 new groups off
the Galápagos (Appendix D5.3, Table S5.3). Mantel tests confirmed that repertoire
similarity between acoustic recordings from the same group was greater than between
different groups indicating that groups had significantly different repertoires (Galápagos
2013-2014: r=0.413, p<0.001; Pacific 1985-1999: r=0.170, p<0.001; Combined: r=0.176,
p<0.001).
The categorical analysis of the full data set identified 27 distinct coda types
containing from 3 to 12 clicks varying in rhythm and tempo (Figure S5.2). Although the
OPTICSxi algorithm classified only the most stereotyped codas (4,091/17,045 codas;
24%), discovery curves of classified coda types were nearly asymptotic (Figure S5.3),
suggesting that most coda types made by the sampled groups were represented. Coda
types were robust to variation across the OPTICSxi input parameter space (Figure S5.4).
Coda type classification was used to describe the thematic differences in coda patterning
driving clan partitioning defined by the continuous analysis that includes all codas
(Figure 5.3).
5.4.3 Clan Structure
The original partitioning of clans in the Tropical Pacific [14] was preserved in our
analysis, with Regular, Four-Plus, and Short clans depicted in our dendrogram as largely
similar to the original analysis (Figure 5.3A). There were some minor changes: the

112
groups recorded off Tonga and in the western Caribbean (branches with lower bootstrap
support in the original analysis) clustered with groups belonging to the Plus-One clan;
and four groups (two designated as Short, and two as Regular) clustered with different
clan branches (Figure 5.3A). We expected some changes because our new analysis was
different from the original [14] in two ways. First, we included the newer groups
recorded off Galápagos (Figure S5.5). Second, we used absolute instead of the relative
inter-click intervals used in the original clan partition, since recent studies [27,28] suggest
that tempo, in addition to rhythm, is an important element of coda diversity.
Nevertheless, the dendrogram in Figure 5.3A is an appropriate depiction of the coda
repertoire similarity among groups of whales (CCC=0.896), with good support from the
bootstrap analysis.
The new categorical coda classification reproduced the main thematic patterning
expected for codas types in each clan (Figure 5.3B). For instance, groups belonging to the
Regular clan mainly produced regularly-spaced codas from 6 to 12 clicks (e.g. 6R1, 6R2,
7R1, 7R2, 8R2, 9R2, 9R3, 10R2, 11R, 12R); groups from the Short clan mainly produced
codas with 3 to 5 clicks (e.g. 3R, 2+1, 1+2, 4R, 1+2+1, 1+3+1); Plus-One groups
produced mainly codas with an extended pause before the last click (e.g. 3+1, 1+3+1,
5+1, 4+1+1); Four-Plus groups produced codas with four regular clicks (e.g. 4R, 4+1+1).
The groups recorded off Tonga and in the western Caribbean contained dominant codas
with longer pauses at the end (e.g. Tonga: 4+1+1; Caribbean: 1+3+1, 5+1, 6I, 10I). These
coda types may explain the tendency for Tonga and Caribbean groups to cluster with the
Plus-One clan in our analysis. The patterns seen in the clustering analysis agreed with the
distribution of coda types per clan in the multivariate space: some types were made by

113
many clans, whereas other types were characteristic of some clans as described above
(Figures S5.6, S5.7).
Figure 5.3. Coda repertoire similarity and clan structure of sperm whale groups from the
Pacific between 1985 and 2014. (a) Hierarchical clustering dendrogram (CCC=0.896)
depicts the multivariate similarity (Euclidean distances on absolute inter-click intervals)
among coda repertoires of photo-identified groups of sperm whales (branches). Colour
code and clan names follow original results [14]; ‘g’ indicate groups observed off

114
Galápagos; dashed branches indicate new groups observed in 2013-2014; arrows indicate
mean similarity between and within clans; numbers besides nodes indicate the number of
replications (out of 100) in bootstrap analysis. (b) Frequency of coda types containing up
to 12 clicks (rows) classified into discrete types for each photo-identified group
(columns). Shades of grey indicate the frequency of occurrence of coda types in a given
group repertoire; coda type labels represent rhythm (see Figure S5.2); numbers under
columns indicate total number of recorded codas from each group of whale used in the
continuous analysis; numbers on the right indicate the total codas per type used in the
categorical analysis.
The repertoires of groups recorded in 2013 and 2014 off Galápagos did not cluster
by year of recording (Figure S5.5), indicating that different clans were present in both
years. When these new groups were added into the Tropical Pacific clan analysis, they
clustered with existing branches representing the Four-Plus and Short clans and not with
the Regular and Plus-One clans previously heard off Galápagos (Figures 5.2, 5.3A).
Four-Plus and Short were heard previously off Chile, Kiribati, and the Marshall Islands,
and were very rare or absent off Galápagos in the past: in fact, only a single social unit of
the Short clan was recorded in 1999 (Figure 5.2) [14]. Our acoustic results concurred
with the photo-identification results: the lack of matches between the Galápagos whales
from 1985-1999 and 2013-2014 (Appendix D5.2, Table S5.2); and the 6 whales seen in
2003 in the Gulf of California (Figure 5.1B) were found to be members of the Four-Plus
clan in 2013 off Galápagos.

115
5.5 DISCUSSION
Our study demonstrates cultural turnover in the sperm whale dialects off the
Galápagos Islands over the last 30 years. We attribute these changes to a turnover in the
clans utilizing these waters: the shift in the acoustic repertoires matches the complete
replacement of sperm whales identified off the Galápagos. These findings confirm
previous suggestions that clans are stable over time (at least in repertoire, and almost
certainly in membership) but dynamic over space [15]. Our long-term analysis indicates
the coda repertoires remain little changed across three decades in the Pacific, highlighting
that Pacific sperm whales roam over very wide geographical areas as members of large,
long-lasting cultural clans [14,30].
None of the individual sperm whales using the waters off Galápagos in 2013 and
2014 were seen in the area during the previous three decades. Our photo-identification
findings increased the number of individual sperm whales catalogued across the Tropical
Pacific, but the rate of photographic recaptures off the Galápagos between 2013-2014
was low despite our long-term and large-scale sampling. Offshore surveys, however,
impose several logistical challenges, making our sampling effort patchy in time and space
(Table S5.1). We acknowledge the consequent uncertainty regarding presence of whales
in waters near the Galápagos, as well as in unsampled years. Yet, our photo-identification
data provide strong evidence for large-scale movements between discrete study areas and
across years. We propose, therefore, that the drastic demographic change we report was
driven by emigration of groups of whales from different clans.
There are four lines of evidence that support emigration out of Galápagos, rather
than changes in the composition of the clans themselves, as the most likely mechanism

116
for the local decline in sperm whale sightings. First, there were several re-identifications
of Galápagos groups and clans off northern Chile and Gulf of California (Figure 5.1A,
see also [20, 31]) evidencing that sperm whales do move long distances. Second, sperm
whales seem not change their clan membership, or if so, only very rarely [24]. Third,
sperm whales are slow-reproducing, long-living animals [24] and the last three decades is
a relatively short window in their life span during which no high mortality was evident
[22]; all of these make death and birth very unlikely the drivers of the replacement of
individuals off Galápagos. Finally, errors in individual identification cannot be a major
factor because marks used to photo-identify animals rarely change [32]; indeed, Atlantic
sperm whale individuals have been re-identified across 30 years within a single study
area much smaller than ours [12]. Combining these facts with our findings on coda
repertoires, we suggest the same clans from three decades ago still populate the Tropical
Pacific, but what seems to have occurred is a large shift in the habitat used by each of the
clans.
Sperm whales are nomadic. In the Pacific, social units have wide ranges,
performing long distance movements (mostly span about 2000 km, some over 4000 km)
within relatively short temporal scales [20], emphasizing the magnitude of the spatial
scale relevant for sperm whales. The long-distance movements are made by individuals
travelling together, since sperm whales live in nearly-permanent social units [11]. These
units belong to large clans with dynamic ranges [10,15], which are stable emergent social
structures [30] within which coda usage is conserved over time [15]. Therefore, the
radical cultural turnover in sperm whale dialects off Galápagos reflected a clan
replacement, i.e. a local turnover in whales using the area in consequence of their natural

117
movements in search for resources over large spatiotemporal scales. This contrasts with
the cultural revolutions among humpback whales where songs changed dramatically but
with little turnover of individuals [4-6].
The sperm whales recently identified off Galápagos are not members from the
Regular and Plus-One clans once common in the area. Instead, they are members of two
existing clans (Four-Plus and Short) previously heard across the Pacific but very rare or
absent in Galápagos waters. The Four-Plus clan was consistently heard off northern
Chile, while the Short clan spread over the Tropical Pacific and only few of its members
(a single social unit) had been previously identified off Galápagos [14]. The new whales
immigrated from neighboring waters in the wider Pacific. Our photo-identification data
may give some indication of origin: there were some matches with Four-Plus clan
members seen previously in Gulf of California, where both Short and Four-Plus clans
may be present [33].
5.5.1 Why Were the Clans Replaced?
The Galápagos Islands, and more broadly the eastern Pacific, were historically
important grounds for sperm whales [34]. Although there were numerous whales when
our Galápagos studies started in 1985, emigration drastically reduced their numbers
between 1990-2000. Following this exodus, members of different clans have been slowly
repopulating the Galápagos. The fall and rise of cultural clans of sperm whale off
Galápagos lead to two questions. Why did members of the original clans leave? Why are
the new whales from other clans rather than return of the original clans? While our data
show a clear shift in Galápagos sperm whale dialects, the underlying mechanisms for the

118
large-scale displacement of clans are necessarily speculative. In what follows we describe
two non-exclusive hypotheses.
The first scenario involves large-scale environmental shifts. Drastic
environmental changes force cultural groups to adapt their strategies or move [e.g. 8].
Like many other predators as well as some herbivores, food availability is a major driver
of movement for sperm whales. They tend to go where the prey is, moving from areas of
low to high feeding success [35]. The abundance of preferred prey, for instance jumbo
squid (Dosidicus gigas [21]), may fluctuate naturally across the Pacific and in response to
environmental changes such as the El Niño Southern Oscillation (ENSO). ENSO events
impose massive changes in the Pacific [36], including anomalous sea surface warming,
large influx of deep warm waters, and fluctuations in primary productivity and nutrient
cycling [36,37]. In particular, the extreme ENSO events in early 1980’s and late 1990’s
represented remarkable warming in the equatorial Pacific, devastating marine fauna
[36,38], including marine communities in the Galápagos region [39]. The reduced
productivity of tropical and equatorial Pacific waters considerably decreased the feeding
success of sperm whales off Galápagos [40]. ENSO events are becoming more frequent
and intense [36,41]; due to cetaceans’ high and adaptive mobility, leaving affected areas
is their immediate response [42]. We know sperm whales from different clans tend to
move and forage differently [17]. In years of normal temperatures, the foraging strategy
of the Regular clan outperforms the Plus-One; whereas in the warmer, less productive
ENSO years the foraging successes of both clans is reduced considerably but the Plus-
One’s strategy becomes more efficient than the Regular’s [17]. Clans may conserve their
foraging strategies even during remarkable environmental changes [17], thus living in

119
this large-scale dynamic habitat, groups of whales from particular clans may relocate,
moving to areas where their foraging strategies are likely to maximize their food intake.
This assumed cultural inertia of foraging strategy—not uncommon in marine mammals
[43,44]—implies that large-scale movement is favoured over remaining in a changing
habitat and adapting to the new conditions. This may explain both why the original clans
left and why the new immigrants are from different clans, but implies that changes to the
ecosystem around Galápagos [37-39] are perceived differently by sperm whales from
different clans.
The second scenario involves lagged responses to the population decline caused
by modern whaling [22]. Sperm whales in the general vicinity of the Galápagos were
heavily hit by nearly-unregulated, as well as pirate, whaling between 1957-1981 [45,46].
The extreme depletion of sperm whales of the eastern Pacific in those years focused on
the relatively-inshore waters of the Humboldt Current off Perú and Chile as the legal
whaling used catcher-boats operating from mainland ports [34,46]. The whaling may
have left a surplus of sperm whale prey, re-opening a niche in the rich Humboldt Current
waters. In case of density-dependent habitat selection [47], whales would redistribute
themselves according to habitat quality—low whale density in productive coastal waters
may have stimulated the eastward migration out of the Galápagos in the 1990’s [22]. If
the population slowly recovers, it would redistribute to first occupy high-quality coastal
waters then adjacent areas [47], which may explain the modest and recent return to
Galápagos waters documented here. In this scenario, the turnover of clans off the
Galápagos would result from a general eastward movement: first of the Regular and
Plus-One clans from the Galápagos to more coastal waters, and then of the Four-Plus and

120
Short clans from oceanic and northern waters to the Galápagos. The underlying
assumption is that different cultural foraging strategies characteristic of each clan [17]
performs similarly in different areas.
In both scenarios, the turnover of clans using Galápagos indicates that there may
be social dynamics driving movement decisions. Group displacement implies a
compromise between individual decision and group conformity [e.g. 48]. Thus, once
some members of one clan have decided to leave a particular habitat, other members may
choose to move with clan-mates rather than remain within that habitat—a within-clan
gregariousness that could be mediated by specific codas identifying clan membership
[27]. As associations with familiar conspecifics can facilitate acclimation to novel habitat
[49], the benefits of foraging and associating with behaviourally similar clan members
may outweigh the cost of displacement to a new habitat. This assumes that clan
membership is important for the success of the individuals and social units that comprise
them, which fits well with recent evidence that sperm whale movement decisions are
shared [50] and that individuals conform to the predominant behaviour of clan members
[30]. Overall, these findings show that tracking cultural traits can reveal large-scale
population shifts, which further illustrates the key role culture can play in the structure
and dynamics of animal populations and their communication systems.
5.5.2 Conclusions
Learned communication repertoires can be either stable across or change within
generations in response to cultural selection and drift [51-53]; yet a population’s
repertoire is rarely completely replaced. We found an influx of immigrants from different

121
cultural clans replacing those that used to be in the area decades ago. This local cultural
turnover was an epiphenomenon of large-scale displacement of sperm whales organized
by vocal clan, suggesting that clan structure is temporally stable but spatially flexible.
The changes in sperm whale acoustic repertoires off Galápagos are clear, but the ultimate
causes of this cultural turnover remain hypothetical. Unraveling the drivers of large-scale
relocation of cultural groups will allow us to better understand animals’ response to the
changing ocean, the dynamics of depressed populations, and the importance of culture in
animal societies.
5.6 ACKNOWLEDGEMENTS
I thank research permits by Parque Nacional Galápagos (PC-10-13, PC-12-14),
Ministerio de la Defensa Nacional (005-2013, 002-14) and Ministerio de Ambiente
Ecuador (IC-FAU-DNB/MA 002-12, 009-13) to research in Ecuadorean waters in 2013-
14. I thank the doctoral scholarships from Conselho Nacional de Pesquisa e
Desenvolvimento Tecnológico (CNPq Brazil #202581/2011-0) and Killam Trust
(Canada) and research grant from Animal Behaviour Society. Field work was funded by
The Natural Sciences and Engineering Research Council of Canada (NSERC), National
Geographic (granted to H.W.). I am very grateful for the important assistance by: M.
Kean, G. Merlen, F. Félix, V. Cedeños, E. Espinoza, G. Quezada, R. Arenas with
research logistics in Ecuador and Galápagos; all volunteer crewmembers since 1985 with
fieldwork, with special thanks for the Balaena crew of 2013-2014 seasons (M. Kean, E.
Larrañaga, J. Oña, X. Avalos, M. Milligan, J. Modigliani, T. Gomes, M. Marroquin, A.
Eguiguren, J. Biondi, S. Brown, M. Brown, E. Zwamborn, L. Hoogenboom, T. Kirchner,

122
L. Rendell, D. Rendell, K. O’Brien, C. Konrad, P. Sangolquí); L. Weilgart with coda
data; W. Beslin, J. Madsen, I. Hurley, M. Evans, H. Arriojas, A. Eguiguren with recent
coda identification, as well as E. Robinson, T. Wimmer, B. McGill, J. Vickers for
previous coda identification; G. Renaux, H. Arriojas, M. Fraser, L. Randell with recent
database management; L. Hoogenboom with recent photo-identification as well as J.
Christal, N. Jaquet, S. Lusseau, A. Coakes, T. Arnbom, S. Waters with previous
photoidentification. I thank my co-authors, S. Gero and L. Rendell for the essential help
with analyses, providing data, and insightful discussions that tailored the arguments of
this chapter. I also thank the insightful comments of the two anonymous referees and
editors whose comments improved the quality of earlier manuscripts. Finally, I specially
thank L. Rendell and his family (Claudia, Dylan, Nico, Bridget, Ruby) for hosting me in
Scotland and in his lab at St. Andrews, which allowed me to initiate this chapter.

123
CHAPTER 6
CONCLUSIONS
“The most beautiful thing we can experience is the mysterious. It is the true source of all
art and science. He to whom the emotion is a stranger, who can no longer pause to
wonder and stand wrapped in awe, is as good as dead—his eyes are closed.”
~ A. Einstein, 1930
In my thesis I posed the question on the interplay between animal society and
culture, taking eastern Tropical Pacific sperm whales as a model. I investigated the
causes, consequences and temporal stability of the highest level of their multilevel
society—the vocal clans. I showed cultural processes giving rise to clans of sperm
whales, which in turn affect the social behaviour of their members, in a two-way
relationship that can be stable over temporal, but dynamic over spatial scales. This
research fits within a formal conceptual framework of the study of the dynamic
interactions between social structure and social learning in non-humans. My results on
sperm whales strengthens the evidence for culture as a key aspect of their lives, as
individuals, as members of family groups, and members of a larger population structured
into sympatric cultural communities. These results further illustrate that important
processes driving behavioural flexibility in humans—information transmission through

124
biased social learning and cultural drift—can also operate in wild animal populations and
structure their social relationships.
6.1. RESEARCH FINDINGS
6.1.1 Interplay: Society and Culture of Sperm Whales
Chapter 2 was set out to explore the reciprocal relationship between social
structure and social learning, highlighting it as a wide-spread phenomenon, non-exclusive
of human societies. I argued that social relationships define the content and the way
information flows among individuals during social relationships, at the same time that
social learning adjusts who socially interacts with whom. Using the formalism of adaptive
networks (e.g. Gross & Blasius 2008), I delineated frameworks that organize the current
findings in the topic, and also generate hypotheses to be later on confronted by data
(Figures 2.1 and 2.4 in Chapter 2). While learning cultural behaviours during social
relationships may be inherently tied to our lives, in my research I show the same two-way
relationship playing a major role in the lives of cetaceans—especially sperm whales—
shaping the large-scale structure of their societies.
6.1.2 Cause: Biased Social Learning
Sperm whales off the eastern Tropical Pacific are organized into sympatric clans of
individuals with high similarity in their vocal communication repertoire (Rendell &
Whitehead 2003). This is not only an emblematic example of culture structuring an animal
society in the wild, but may be, potentially, the largest cooperative entity outside humans

125
(Whitehead & Rendell 2014). However, while the empirical pattern was clear, the
literature was inconclusive about its causes. Chapter 3 sought to identify the underlying
mechanisms giving rise to the vocal clans, and formally test the hypothesis of social
learning being involved in the clan partition. It is logistically impossible to perform
experiments over the large temporal and spatial scales relevant for the whales, so I
developed a series of computer models in which virtual whale populations behave and live
accordingly to the empirical rules observed for wild populations. Thus by trying to
replicate the empirical pattern in the presence and absence of different transmission
mechanisms of coda vocalization—individual learning, genetic inheritance, pure and
biased social learning—I could backtrack the formation of clans to infer on its major
drivers. I show that clans of whales with different dialects emerge when whales learn from
each other, but in a specific way: conforming to the most similar individuals around them.
So, on this side of the interplay, culture is a key ingredient in the partition of sperm whales
into sympatric clans with different acoustic repertoires.
6.1.3 Consequence: Social Behaviour Diversity
Chapter 4 looked into the other side of the interplay—the consequences of clan
membership for social behaviour. Using a long-term dataset, I found that the clan partition
propels differences in a range of social metrics: individuals of one clan dived more
synchronously and had more homogeneous and briefer relationships than the members of
the other clan. I proposed cultural drift as a potential explanation for the such
divergence—with individuals replicating the social norms experienced within their clans.
Given that the social units are the fundamental social level in sperm whale societies, for

126
which alloparental care giving is thought to be the primary driver (e.g. Gero et al. 2013), I
speculated that differences in social relationship quality and duration, as well as surface
time, can potentially cause differences in calf survival between clans. Much of what we
know about mammal social learning and culture comes from foraging behaviour (e.g. Box
& Gibson 1999). My findings expand the cultural divergence of sperm whales, by adding
distinct social norms between clans. Combined with previous findings on movement and
diet preferences (Whitehead & Rendell 2004, Marcoux et al. 2007), my results suggest
that sperm whale culture is more diverse than previously recognized, encompassing a
wider portion of their behavioural repertoire. This places sperm whales among few other
animal species with rich, divergent cultural repertoires, such as primates (e.g. Whiten et al.
1999, van Schaik et al. 2003) and other cetaceans (e.g. Ford et al. 2000, Garland et al.
2011, Allen et al. 2013, Whitehead & Rendell 2014).
6.1.4 Stability: Temporal But Not Spatial
To this point, much of my research had been theoretical and/or based on previously
collected data. By revisiting the sperm whales off the Galápagos Islands nearly thirty years
after the start of behavioural studies (Chapter 5), I updated the current picture of the sperm
whale societies using the waters off the archipelago with new empirical data. I
documented the decline in occurrence of sperm whales off Galápagos through the 1990’s,
followed later by a slow return to these waters. This is a rare case of all individuals of a
population being replaced by new ones; what is more, I found that the new individuals
were members of different cultural clans. While the local population composition changed
dramatically, the coda repertoires in the pool of sampled individuals in the Tropical

127
Pacific remained quite stable. Thus, I found that clan structure can be temporally stable,
but spatially flexible. That is, sperm whales roam over very large areas but as members of
long-lasting cultural clans. I hypothesize that such large-scale displacement of cultural
clans could be a response to recent environment shifts, or to the collapse of the population
following whaling in the area; but these remain hypotheses for future studies.
6.2. RESEARCH CONTRIBUTIONS
The outcomes of my thesis may be of interest of a wide portion of the academic
community—from theoreticians interested in emergence of patterns in nature, to
empiricists interested in the underlying mechanisms of social behaviour in the wild. I
believe these findings are also relevant to a general audience beyond, interested in the
lives of the enigmatic sperm whales. In what follows, I frame the specific contributions of
my research into three different levels.
At the population level, my research adds important pieces to the unusual picture
of sperm population structure that has emerged from studies of the eastern Tropical
Pacific. After modern whaling decimated the population in the 1950’s, 1960’s and 1970’s
and uncertainty over the next few decades (Whitehead et al. 1997), my research brings
good news. Sperm whales are persisting in the eastern Tropical Pacific, and show signs of
return to areas where they were once abundant. As a cultural society, composed of
matrilineally-based social units and clans, sperm whales have been roaming around the
Tropical Pacific, eventually returning to the Galápagos archipelago.

128
At the species level, my research adds to our growing picture of sperm whale
society: how much behaviour is culturally-driven, what factors contribute to the culturally-
driven social patterns, how these patterns change over time and the implications they have
for the social behaviour of the individuals. My findings provide new lines of evidence for
social learning as a major driver of the large-scale structure of their populations, and
added social behavioural variability to the diversity of their cultural repertoires. Taken
together, these findings reinforce that membership of cultural groupings plays an
important role in the structure and dynamics of sperm whale populations.
More broadly, my research contributes to the literature on animal culture, a much
debated topic in academia. My findings illustrate and reinforce transmission of
information as a source of phenotype diversity and behavioural flexibility, implying that
proximate mechanisms occurring in shorter (few generations) time scales have profound
implications for population and social structures of animals. By strengthening the
hypotheses that culture is a source of intrapopulational variation in behaviour, and a driver
of phenotypes, this research helps to bridge the unnecessarily large gap we have created
between our conceptions of humans and other animals (e.g. Corbey & Lanjouw 2013).
6.3. LIMITATIONS AND THE WAY FORWARD
We may “never know a man to become as good at [distinguishing between
individuals] as the animals themselves” (Timbergen 1953, pp. 108), let alone how they
perceive each other, how they feel (Safina 2015) and what it means to be inside of an
animal’s mind (Gould 1998). The scientific advances in the fields of animal cognition,

129
learning and sociality are remarkable; we think we already have a good—yet blurry and
incomplete—picture of the cultural processes that operate in animal societies. But, truly,
studying animal culture remains a challenge.
I learned throughout my research some of the numerous difficulties involved in
studying societies and culture—starting with the basics, i.e. finding elusive animals in
remote places. The amount of effort put by the research group over years in field work
offshore is immense. The time invested in collecting data on sperm whales—months at the
sea patiently waiting to hear the faintest clicks, spot a blow in the horizon; then making
sure we keep tracking, recording, photographing the whales for as long as possible—and
painstakingly processing these data in the lab is huge. The magnitude of the spatial and
temporal scales relevant for sperm whales make it hard to eavesdrop informatively on
their private lives. There are clear limitations in addressing culture and society of whales
based on simulations and direct observations. At best, our approach provides sometimes
sparse data—collected during short periods at the surface—other times cluttered data—
during long periods of exchange of communication sounds among many whales
underwater.
To afford a more comprehensive view of the mutual relationship of animal culture
and societies, there is room for improvement in at least three basic aspects: collect more
refined data, employ novel analytical methods, and consider other taxa. First, the more
refined data one can get at the individual level, the better. The challenges of data
collection are taxa-specific. The most used measure of social relationships in of
vertebrates (and particularly in cetaceans) assumes the gambit-of-the-group, meaning
individuals observed in close spatio-temporal proximity have had conditions to socially

130
interact (Whitehead & Dufault 1999). This is a very useful proxy (e.g. Farine 2015) but it
provides limited, coarse information on the content and quality of the social interactions
(e.g. Castles et al. 2014) that ultimately make up the social structure of the population
(Hinde 1976). Improving the recorded details of social interactions may not be much of a
problem for species which behaviours are visible and easy to distinguish, such as
terrestrial mammals. For cetaceans, new technologies for automated data collection (such
as D-Tags, crittercams; e.g. Johnson & Tyack 2003, Calombokidis et al. 2007), are
becoming increasingly available and promise to provide an incredibly detailed picture of
how individuals behave and communicate above and underwater. However, these are still
expensive and time-consuming techniques, so the number of sampled individuals is likely
to be limited. More likely, observational studies may continue to provide the best quality
of data at the individual level for many cetacean species in the near future (e.g. Mann et al.
2012, Gero et al. 2016). Continuing efforts to amass data in long-term field studies is
imperative.
As individual identification data accumulate over the years, in addition to genetic,
hormonal, behavioural information, we can begin to tease apart other drivers of social
relationships of animals that may come along with learning and cultural processes (e.g.
Whitehead 2009). These richer data can feed more sophisticated analytical tools to better
describe social relationships (e.g. Whitehead & James 2015), social structure (e.g. Farine
& Whitehead 2015) and account for other biological and ecological factors (e.g. Pinter-
Wollman et al. 2013) that could mask whether aspects of the large-scale social structure
are products of culture (e.g. Whitehead 2009, Mann et al. 2012). With long-term and
detailed empirical data, network-based diffusion models on time-ordered data (e.g.

131
Hoppitt & Laland 2013) have been proven very powerful ways of tracking the spread of
behaviours among individuals in the wild (e.g. Allen et al. 2013). Finally, experiments
with natural populations can be great tools to test the function of a particular behaviour
(e.g. through playback experiments; Sayigh et al. 1998) and if this behaviour is learned
among conspecifics. For cetaceans, however, experiments in the wild are usually
logistically challenging and some may be impractical—for instance seeding in a
behavioural innovation to monitor how it spreads among social contacts (as done for
primates and birds; e.g. Aplin et al. 2015, Whiten et al. 2016). Likewise, experiments
removing the effect of a particular behaviour in a wild cetacean population is not only
very difficult but ethically questionable. When a behavioural variation is naturally
removed, one may be fortunate to test its effect on the social structure of a wild population
without direct interference; although fortuitous, this approach is very revealing (e.g.
Ansmann et al. 2012). Thus, theoretical work based on models and computer
simulations—such set evolutionary theory (Tartina et al. 2011) and the agent-based
modeling (Railsback & Grimm 2012) exercised in this thesis, to name a few—may
continue to illuminate the dynamics of the interplay between social structure, learning, and
their coevolution (see Nowak 2006).
Finally, the field will benefit from a broader investigation by increasing the
number of taxa for which the interplay between society and culture is considered. Here I
focused on oceanic examples, but I recommend the incorporation of culture in the context
of social structure of any species for which social learning can drive behaviour; good
candidates include birds, fish, terrestrial herbivore and carnivore mammals (e.g. Box &
Gibson 1999, Laland & Hoppitt 2003). For some of these species, we are more likely to be

132
able to directly test the interplay, for instance with diffusion and playback experiments
(e.g. Whiten et al. 2016) both in captivity (e.g. Whiten et al. 2005) and in the wild (e.g.
Aplin et al. 2015). Tying together observational, experimental, and theoretical work would
be the ideal next leap for future studies; but meeting this agenda will not come without
massive challenges.
6.4. CLOSING REMARKS
We have always “feared and worshipped, loved and hunted whales”—they are part
of human cultures (e.g. Estes 2006, Sakakibara 2009). But there is still much debate as to
whether culture is exclusive to humans (e.g. Laland & Galef 2009). My research
strengthens the evidence for whales having their own kinds of culture (Rendell &
Whitehead 2001), which is an important piece in the puzzle of the evolution of sociality.
More personally, it fascinated me to see a society of completely different animals, living
on a completely different environment, displaying key similarities with our own society.
The outcomes of this work made me remember the similarities we have with other
animals. Throughout the thesis I argued that similar individuals tend to interact—
similarity breeds good relationships (e.g. McPherson et al. 2001). So I hope we improve
our relationship with Nature before sperm whale societies, and other fascinating biological
systems, are severely depleted.
The most obvious clash between human and whale cultures—the whaling
industry—has already collapsed largely as a consequence of our societies’ greedy
decisions. But the destructive potential of our culture is far from finished. Culture,

133
undoubtedly, equipped humans with unparalleled means to live abundantly in every corner
of the planet (e.g. Boyd et al. 2011, Marean 2015)—this is arguably what distinguishes us
from other life forms (e.g. Boyd & Richerson 1996, Tomasello 1999). I posit that just
possessing culture may not be what makes us humans different; it may be the leftovers of
our cultural decisions. Surely our culture is more complex, diverse and cumulative than
other animals’ (e.g. Tomasello 1999, Tennie et al. 2009). And so are its negative
consequences.
Our culture promotes, directly and indirectly, many threats to the entire biosphere.
This is not news to anyone: humans have caused rapid, drastic changes in all ecosystems
(e.g. Estes et al. 2011), perhaps even triggering a sixth mass extinction (e.g. Koch &
Barnosky 2006, Wake & Vredenburg 2008, Yeakel et al. 2014) and changing the pace of
evolution (Palumbi 2002). Global warming (e.g. Whitehead et al. 2008, Cai et al. 2014),
resource overexploitation (e.g. Myers & Worm 2003, Worm et al. 2006), noise and
chemical pollution (e.g. Weilgart 2007, Jambeck et al. 2015)—to cite few perils—are
increasingly threatening life on land and in the ocean, including the pelagic ecosystems
whose remoteness may make them be erroneously perceived as pristine or of least
concern.
Throughout the thesis, I also emphasized the importance of the individual, and
individual behaviour. Individual actions may seem minor in comparison to the magnitude
of the problems our society causes to nature; but yet these actions can, collectively, help
to alleviate some of these major problems (e.g. Springmann et al. 2016). Let us learn
from predecessors: our technological culture may not keep us insulated from
environmental problems for as long as we hope (Diamond 2005, 2012). If culture makes

134
humans change and adapt (Boyd et al. 2011), then it is time for us to change again.
Minimizing, at least retarding, the malign by-products of our cultural behaviour is urgent.
So may our minds be open to refrain from unsustainable life styles; may our eyes be open
to look into Nature and wonder in awe with that Thoreauvian sympathy.

135
BIBLIOGRAPHY
CHAPTER 1
Allen, J., Weinrich, M., Hoppitt, W. and Rendell, L. 2013. Network-based diffusion
analysis reveals cultural transmission of lobtail feeding in humpback whales. Science
340:485-488.
Amaral, L.A. and Ottino, J.M. 2004. Complex networks. The European Physical Journal
B-Condensed Matter and Complex Systems 38:47-162.
Ansmann, I.C., Parra, G.J., Chilvers, B.L. and Lanyon, J.M. 2012. Dolphins restructure
social system after reduction of commercial fisheries. Animal Behaviour 84:575-581.
Araújo, M.S., Bolnick, D.L. and Layman, C.A. 2011. The ecological causes of individual
specialisation. Ecology Letters 14:948-958.
Arnbom, T., Papastavrou, V., Weilgart, L.S. and Whitehead, H. 1987. Sperm whales
react to an attack by killer whales. Journal of Mammalogy 68: 450-453
Avital, E. and Jablonka, E. 2000. Animal traditions: Behavioural inheritance in evolution.
Cambridge University Press.
Axelrod, R. 1997. The dissemination of culture: a model with local convergence and
global polarization. Journal of Conflict Resolution 41:203-226.
Bentley, R.A., Lipo, C.P., Herzog, H.A. and Hahn, M.W. 2007. Regular rates of popular
culture change reflect random copying. Evolution and Human Behavior 28:151-158.
Bentley, R.A., Hahn, M.W. and Shennan, S.J. 2004. Random drift and culture change.
Proceedings of the Royal Society of London B 271:1443-1450.

136
Bergman, T.J. and Beehner, J.C. 2015. Measuring social complexity. Animal Behaviour
103:203-209.
Biro, D., Sousa, C. and Matsuzawa, T. 2006. Ontogeny and cultural propagation of tool
use by wild chimpanzees at Bossou, Guinea: case studies in nut cracking and leaf
folding. In: Cognitive development in chimpanzees (Matsuzawa, T., Tomonaga, M.
and Tanaka, M., eds). Springer. 476-508pp.
Bolnick, D.I., Amarasekare, P., Araújo, M.S., Bürger, R., Levine, J.M., Novak, M.,
Rudolf, V.H., Schreiber, S.J., Urban, M.C. and Vasseur, D.A. 2011 Why intraspecific
trait variation matters in community ecology. Trends in Ecology Evolution 26:183-
192.
Boran, J.R., and Heimlich, S.L. 1999. Social learning in cetaceans: hunting, hearing,
hierarchies. In: Mammalian social learning: comparative and ecological perspectives
(Box, H.O. and Gibson, K.R., eds). Cambridge University Press. 282-307pp.
Boyd, R. and Richerson, P.J. 2004. The origin and evolution of cultures. Oxford
University Press.
Boyd, R. and Richerson, P.J. 1987. The evolution of ethnic markers. Cultural
Anthropology 2:65-79.
Boyd, R. and Richerson, P. 1985. Culture and the evolutionary process. Chicago
University Press.
Boyd, R., Richerson, P. and Henrich, J. 2011. The cultural niche: Why social learning is
essential for human adaptation. Proceedings of the National Academic of Sciences
USA 108:10918–10925
Braidwood, R.J. 1975. Prehistoric Men. Scott, Foresman and Company.

137
Bruck, J.N. 2013. Decades-long social memory in bottlenose dolphins. Proceedings of the
Royal Society of London B 280:20131726
Byers, B.E., Belinsky, K.L. and Bentley, R.A. 2010. Independent cultural evolution of
two song traditions in the chestnut-sided warbler. American Naturalist 176:476-489.
Camazine, S., Deneubourg, J.L., Franks, N.R., Sneyd, J., Theraula, G. and Bonabeau, E.
2001. Self-organization in biological systems. Princeton University Press.
Cantor, M. and Whitehead, H. 2013. The interplay between social networks and culture:
theoretically and among whales and dolphins. Philosophical Transactions of the Royal
Society of London B 368:20120340.
Cantor, M., Wedekin, L.L., Guimarães, P.R., Daura-Jorge, F.G., Rossi-Santos, M.R. and
Simões-Lopes, P.C. 2012. Disentangling social networks from spatiotemporal
dynamics: the temporal structure of a dolphin society. Animal Behaviour 84:641-651.
Castellano, C., Fortunato, S. and Loretto, V. 2009. Statistical physics of social dynamics.
Reviews of Modern Physics 81:591-646.
Cassirer, E. 1944. An essay on man. Yale University Press.
Cavalli-Sforza, L.L. and Feldman, M.W. 1981. Cultural transmission and evolution: a
quantitative approach. Princeton University Press.
Centola, D., Gonzalez-Avella, J.C., Eguiluz, V.M. and San Miguel, M. 2007. Homophily,
cultural drift and the co-evolution of cultural groups. Journal of Conflict Resolution
51:905-929.
Christal, J. and Whitehead, H. 2001. Social affiliations within sperm whale (Physeter
macrocephalus) groups. Ethology 107:323-340.

138
Christal, J., Whitehead, H. and Lettevall, E. 1998. Sperm whale social units: variation
and change. Canadian Journal of Zoology 76:1431-1440
Clutton-Brock, T.H. 1989. Review lecture: mammalian mating systems. Proceedings of
the Royal Society of London B 236:339-372.
Connor, R.C. 2000. Group living in whales and dolphins. In: Cetacean societies (Mann,
J., Connor, R.C., Tyack, P.L. and Whitehead, H., eds). University of Chicago Press,
Chicago. 199-218pp.
Connor, R.C., Mann, J., Tyack, P.L., Whitehead, H. 1998. Social evolution in toothed
whales. Trends in Ecology and Evolution 13:228-232.
Coussi-Korbel, S. and Fragaszy, D.M. 1995. On the relation between social dynamics and
social learning. Animal Behaviour 50:1441-1453.
Crossin, G.T., Phillips, R.A., Lattin, C.R., Romero, L.M. and Williams, T.D. 2013.
Corticosterone mediated costs of reproduction link current to future breeding. General
& Comparative Endocrinology 193:112-120.
Curio, E., Ernst, U. and Vieth, W.,1978. Cultural transmission of enemy recognition: one
function of mobbing. Science 202:899-901.
Daura-Jorge, F.G., Cantor, M., Ingram, S.N., Lusseau, D. & Simões-Lopes, P.C. 2012.
The structure of a bottlenose dolphin society is coupled to a unique foraging
cooperation with artisanal fishermen. Biology Letters 8:702-705.
Deecke, V.B., Ford, J.K.B., and Spong, P. 2000. Dialect change in resident killer whales:
implications for vocal learning and cultural transmission. Animal Behavious 60:629–
638.
Dunbar, R.I. and Shultz, S. 2007. Evolution in the social brain. Science 317:1344-1347.

139
Duboscq, J., Romano, V., MacIntosh, A. and Sueur, C. 2016. Social Information
Transmission in Animals: Lessons from Studies of Diffusion. Frontiers in Psychology
7:1147.
Fayet, A.L., Tobias, J.A., Hintzen, R.E. and Seddon, N. 2014. Immigration and dispersal
are key determinants of cultural diversity in a songbird population. Behavioral Ecology
25:744-753.
Filatova, O.A. and Miller, P.J. 2015. An agent-based model of dialect evolution in killer
whales. Journal of Theoretical Biology 373:82-91.
Filatova, O.A., Miller, P.J., Yurk, H., Samarra, F.I., Hoyt, E., Ford, J.K., Matkin, C.O.
and Barrett-Lennard, L.G. 2015. Killer whale call frequency is similar across the
oceans, but varies across sympatric ecotypes. Journal of the Acoustic Society of
America 138:251-257.
Ford, J.K.B. 1991. Vocal traditions among resident killer whales (Orcinus orca) in
coastal waters of British Columbia. Canadian Journal of Zoology 69:1454-1483.
Ford, J.K.B., Ellis, G.M., Barrett-Lennard, L.G., Morton, A.B., Palm, R.S. and Balcomb
III, K.C. 1998. Dietary specialization in two sympatric populations of killer whales
(Orcinus orca) in coastal British Columbia and adjacent waters. Canadian Journal of
Zoology 76:14-56-1471.
Frank, S.A. 1998. Foundations of social evolution. Princeton University Press.
Frantzis, A. and Alexiadou, P. 2008. Male sperm whale (Physeter macrocephalus) coda
production and coda-type usage depend on the presence of conspecifics and the
behavioural context. Canadian Journal of Zoology 86:62–75.

140
Franz, M. and Nunn, C.L. 2009. Rapid evolution of social learning. Journal Evolutionary
Biology 22:1914-1922.
Freeberg, T.M., Dunbar, R.I. and Ord, T.J. 2012. Social complexity as a proximate and
ultimate factor in communicative complexity. Philosophical Transactions of the Royal
Society of London B 367:1785-1801.
Garland, E.C., Goldizen, A.W., Rekdahl, M.L., Constantine, R., Garrigue, C., Hauser,
N.D., Poole, M.M., Robbins, J. and Noad, M.J. 2011. Dynamic horizontal cultural
transmission of humpback whale song at the ocean basin scale. Current Biology
21:687-691.
Gero, S. and Rendell, L. 2015. Oceanic societies: studying cetaceans with a social
network approach. In: Animal social networks (Krause, J., James, R., Franks, D.W.
and Croft, D.P., eds). Oxford University Press. 139-149pp.
Gero, S., Whitehead, H. and Rendell, L. 2016a. Individual, unit, and vocal clan level
identity cues in sperm whale codas. Royal Society Open Science 3:150372.
Gero, S., Bøttcher, A., Whitehead, H., and Madsen, P.T. 2016b. Socially segregated,
sympatric sperm whale clans in the Atlantic Ocean. Royal Society Open Science
3:160061.
Gero, S., Milligan, M., Rinaldi, C., Francis, P., Gordon, J., Carlson, C., Steffen, A.,
Tyack, P., Evans, P. and Whitehead, H. 2014. Behavior and social structure of the
sperm whales of Dominica, West Indies. Marine Mammal Science 30:905-922.
Gero, S., Gordon, J. and Whitehead, H. 2013. Calves as social hubs: dynamics of the
social network within sperm whale units. Proceedings of the Royal Society B
280:20131113.

141
Gero, S., Engelhaupt, D., Rendell L. and Whitehead, H. 2009. Who Cares? Between-
group variation in alloparental care-giving in sperm whales. Behavioral Ecology 20:
838-843.
Gowans, S., Würsig, B. and Karczmarski, L. 2007. The social structure and strategies of
delphinids: Predictions based on an ecological framework. Advances in Marine
Biology 53:195-294.
Hahn, M.W. and Bentley, R.A. 2003. Drift as a mechanism for cultural change: an
example from baby names. Proceedings of the Royal Society of London B 270:S120-
S123.
Hamilton, W.D. 1964. The genetical evolution of social behaviour II. Journal of
Theoretical Biology 7:17-52.
Hemelrijk, C. 2005. Self-organisation and evolution of biological and social systems.
Cambridge University Press.
Heyes, C.M. 1994. Social learning in animals: categories and mechanisms. Biological
Review 69:207-231.
Hinde, R.A. 1976. Interactions, relationships and social structure. Man 11:1-17.
Hoppitt, W. and Laland, K.N. 2008. Social processes influencing learning in animals: a
review of the evidence. Advances in the Study of Behavior 38:105-165.
Horn, A.G. and Leonard, M.L. 2005. Nestling begging as a communication network. In:
Animal communication networks (McGregor, P., ed). Cambridge University Press.
170-190pp.
Jablonka, E. and Lamb, M.J. 2014. Evolution in four dimensions, revised edition: genetic,
epigenetic, behavioral, and symbolic variation in the history of life. MIT press.

142
Janik, V.M. 2005. Underwater acoustic communication networks in marine mammals. In:
Animal Communication Networks (McGregor, P., ed). Cambridge University Press.
390-415pp.
Janik, V.M.,2014. Cetacean vocal learning and communication. Current Opinion in
Neurobiology 28:60-65.
Janik, V.M. and Slater, P.J. 2000. The different roles of social learning in vocal
communication. Animal Behaviour 60:1-11.
Jaquet, N. 1996. How spatial and temporal scales influence understanding of sperm
whale distribution: a review. Mammal Review 26:51-65.
Ji, L.J. and Yap, S. 2016. Culture and cognition. Current Opinion in Psychology 8:105-
111.
Kappeler, P.M., Barret, L. Blumstein, D.T. and Clutton-Brock, T.H. 2013. Constraints
and flexibility in mammalian social behaviour: introduction. Philosophical
Transactions of the Royal Society B 368:20120337.
King, S.L. and Janik, V.M. 2015. Come dine with me: food-associated social signalling
in wild bottlenose dolphins (Tursiops truncatus). Animal cognition 18:969-974.
King, S.L., Harley, H.E. and Janik, V.M. 2014. The role of signature whistle matching in
bottlenose dolphins, Tursiops truncatus. Animal Behaviour 96:79-86.
King, S.L. and Janik, V.M. 2013. Bottlenose dolphins can use learned vocal labels to
address each other. Proceedings of the National Academy of Sciences 110:13216-
13221.

143
King, S.L., Sayigh, L.S., Wells, R.S., Fellner, W. and Janik, V.M. 2013. Vocal copying
of individually distinctive signature whistles in bottlenose dolphins. Proceedings of the
Royal Society of London B 280:20130053.
Kirby, S., Tamariz, M., Cornish, H. and Smith, K. 2015. Compression and
communication in the cultural evolution of linguistic structure. Cognition 141:87-102.
Koerper, H.C. & Stickel, E.G. 1980. Cultural drift: a primary process of culture
change. Journal of Anthropological Ressearch 36:463-469.
Krause, J. and Ruxton, G.D. 2002. Living in groups. Oxford University Press.
Krause, J., James, R. and Croft, D.P. 2010. Personality in the context of social networks.
Philosophical Transactions of the Royal Society of London B 365:4099-4106.
Krebs JR, Kroodsma DE. 1980 Repertoires and geographical variation in bird song.
Advances in the Study of Behaviour 11:143-177.
Laland, K.N. 2004. Social learning strategies. Animal Learning & Behavior 32:4-14.
Laland, K.N. and O’Brien, M.J. 2012. Cultural niche construction: an introduction.
Biological Theory 6:191-202.
Laland, K.N. and Galef, B.G. 2009. The question of animal culture. Harvard University
Press.
Laland, K.N. and Janik, V.M. 2006. The animal cultures debate. Trends in Ecology &
Evolution 21:542-547.
Laland, K.N. and Hoppitt, W. 2003. Do animals have culture? Evolutionary
Anthropology 12:150-159.

144
Laland, K.N., Odling-Smee, J. and Myles, S., 2010. How culture shaped the human
genome: bringing genetics and the human sciences together. Nature Reviews Genetics
11:137-148.
Laland, K.N., Odling‐Smee, J. and Feldman, M.W. 2001. Cultural niche construction and
human evolution. Journal of Evolutionary Biology 14:22-33.
Laland, K., Uller, T., Feldman, M., Sterelny, K., Müller, G.B., Moczek, A., Jablonka, E.,
Odling-Smee, J., Wray, G.A., Hoekstra, H.E. and Futuyma, D.J. 2014. Does
evolutionary theory need a rethink? Nature 514:161-164.
Lefebvre, L., Reader, S.M. and Sol, D. 2004. Brains, innovations and evolution in birds
and primates. Brain, Behavior and Evolution 63:233-246.
Lehner, P.N. 1998. Handbook of ethological methods. Cambridge University Press.
Lopez, J.C. and Lopez, D. 1985. Killer whales (Orcinus orca) of Patagonia, and their
behavior of intentional stranding while hunting near shore. Journal of Mammalogy
66:181-183.
Lott, D. L. 1984. Intraspecific variation in the social systems of wild vertebrates.
Behaviour 88:266-325.
Lusseau, D., Wilson, B., Hammond, P.S., Grellier, K., Durban, J.W., Parsons, K.M.,
Barton, T.R. and Thompson, P.M. 2006. Quantifying the influence of sociality on
population structure in bottlenose dolphins. Journal of Animal Ecology 75:14–24.
Lyrholm, T., Leimar, O., Johanneson, B. and Gyllensten, U. 1999. Sex–biased dispersal
in sperm whales: contrasting mitochondrial and nuclear genetic structure of global
populations. Proceedings of the Royal Society of London B 266:347-354.

145
Mann, J,, Stanton, M.A., Patterson, E.M., Bienenstock, E.J. and Singh, L.O. 2012. Social
networks reveal cultural behaviour in tool-using using dolphins. Nature
Communications 3: 980.
Mann, J., Connor, R.C., Tyack, P.L. and Whitehead, H. 2000. Cetacean societies.
Chicago University Press.
Marino, L., Connor, R.C., Fordyce, R.E., Herman, L.M., Hof, P.R., Lefebvre, L.,
Lusseau, D., McCowan, B., Nimchinsky, E.A., Pack, A.A., Rendell, L., Reidenberg,
J.S., Reiss, D., Uhen, M.D., Van der Gucht, E. and Whitehead, H. 2007. Cetaceans
have complex brains for complex cognition. PLoS Biology 5:e139.
Marshall-Pescini, S. and Whiten, A. 2008. Chimpanzees (Pan troglodytes) and the
question of cumulative culture: an experimental approach. Animal Cognition 11:449-
456.
Matsuzawa, T., Tomonaga, M. and Tanaka, M. 2006. Cognitive development in
Chimpanzees. Springer.
May-Collado, L.J., Agnarsson, I. and Wartzok, D. 2007. Phylogenetic review of tonal
sound production in whales in relation to sociality. BMC Evolutionary Biology 7:136.
McGregor, P.K. 2005. Animal communication networks. Cambridge University Press.
McGregor, P.K. and Horn, A. 2015. Communication and social networks. In: Animal
social networks (Krause, J., James, R., Franks, D.W. and Croft, D.P., eds). Oxford
University Press. 84-94pp.
McPherson, M., Smith-Lovin, L. and Cook, J.M. 2001. Birds of a feather: homophily in
social networks. Annual Review of Sociology 27:415-44.

146
Mesoudi, A., Magid, K. and Hussain, D. 2016. How Do People Become WEIRD?
Migration reveals the cultural transmission mechanisms underlying variation in
psychological processes. PloS One 11: e0147162.
Mesoudi, A. 2011. Cultural evolution: how Darwinian theory can explain human culture
and synthesize the social sciences. University of Chicago Press.
Morgan, T.J.H. and Laland, K.N. 2012. The biological bases of conformity. Frontiers in
Neuroscience 6:87.
Nelson, D.A., Hallberg, K.I. and Soha, J.A. 2004. Cultural evolution of Puget sound
white-crowned sparrow song dialects. Ethology 110:879-908.
Noad, M.J., Cato, D.H., Bryden, M.M., Jenner, M.N. and Jenner, K.C.S. 2000. Cultural
revolution in whale songs. Nature 408:537-537.
Norenzayan, A. 2011. Explaining human behavioral diversity. Science 332:1041-1042.
Nunn, C.L., Thrall, P.H., Bartz, K., Dasgupta, T. and Boesch, C. 2009. Do transmission
mechanisms or social systems drive cultural dynamics in socially structured
populations? Animal Behaviour 77:1515-1524.
Oliveira, R. 2005. Hormones, social context and animal communication. In: Animal
Communication Networks (McGregor, P., ed). Cambridge University Press. 481-
519pp.
Patterson, E.M., Krzyszczyk, E. and Mann, J. 2015. Age-specific foraging performance
and reproduction in tool-using wild bottlenose dolphins. Behavioral Ecology 164. doi:
10.1093/beheco/arv164
Perreault, C. 2012. The pace of cultural evolution. Plos One 7: e45150.

147
Perreault, C., Moya, C. and Boyd, R. 2012. A bayesian approach to the evolution of
social learning. Evolution and Human Behaviour 33:449-459.
Perry, S. 2009. Are nonhuman primates likely to exhibit cultural capacities like those of
humans. In: The question of animal culture (Laland, K.N. and Galef, B.G., eds)
Harvard University Press. 247-268pp.
Pitman, R.L. and Durban, J.W. 2012. Cooperative hunting behavior, prey selectivity and
prey handling by pack ice killer whales (Orcinus orca), type B, in Antarctic Peninsula
waters. Marine Mammal Science 28:16-36.
Podos, J. and Warren, P.S. 2007. The evolution of geographic variation in birdsong.
Advances in the Study of Behavior 37:403-458.
Rendell, L. and Whitehead, H. 2003. Vocal clans in sperm whales (Physeter
macrocephalus). Proceedings of the Royal Society B 270:225-231.
Rendell, L. and Whitehead, H. 2001. Culture in whales and dolphins. Behavioral Brain
Sciences 24:309-324.
Rendell, L., Mesnick, S.L., Dalebout, M.L., Burtenshaw, J. and Whitehead, H.
2012. Can genetic differences explain vocal dialect variation in sperm whales,
Physeter macrocephalus? Behavior Genetics 42:332-343.
Rendell, L., Boyd, R., Cownden, D., Enquist, M., Eriksson, K., Feldman, M.W., Fogarty,
L., Ghirlanda, S., Lillicrap, T. and Laland, K.N. 2010. Why copy others? Insights from
the social learning strategies tournament. Science 328:208-213.
Rendell, L., Fogarty, L., Hoppitt, W.J., Morgan, T.J., Webster, M.M., Laland, K.N. 2011.
Cognitive culture: theoretical and empirical insights into social learning strategies.
Trends in cognitive sciences 15:68-76.

148
Rice, D.W. 1989. Sperm whale Physeter macrocephalus Linnaeus, 1758. In: Handbook
of Marine Mammals. 177-233 pp.
Richard, K. R., Dillon, M.C., Whitehead, H. and Wright, J.M. 1996. Patterns of kinship
in groups of free-living sperm whales (Physeter macrocephalus) revealed by multiple
molecular genetic analyses. Proceedings of the National Academy of Science USA
93:8792-8795.
Richerson, P.J. and Boyd, R. 2005. Not by genes alone: How culture transformed human
evolution. Chicago University Press.
Schradin, C. 2013. Intraspecific variation in social organization by genetic variation,
developmental plasticity, social flexibility or entirely extrinsic factors. Philosophical
Transactions of the Royal Society B 368:20120346.
Schulz, T., Whitehead, H., Gero, S. and Rendell, L. 2008. Overlapping and matching of
codas in vocal interactions between sperm whales: insights into communication
function. Animal Behaviour 76:1977-1988.
Sih, A., Cote, J., Evans, M., Fogarty, S. and Pruitt, J. 2012. Ecological implications of
behavioural syndromes. Ecology Letters 15:278–289.
Simões-Lopes, P.C., Fabián, M.E. & Menegheti, J.O. 1998. Dolphin interactions with the
mullet artisanal fishing on southern Brazil: a qualitative and quantitative approach.
Revista Brasileira de Zoologia 15:709-726.
Slabbekoorn, H. and Boer-Visser, A. 2006. Cities change the songs of birds. Current
Biology 16:2326-2331.
Slater, P.J.B. and Ince, S.A. 1979. Cultural evolution in chaffinch song. Behaviour
71:146-166.

149
Smith J.N., Goldizen, A.W., Dunlop, R.A., and Noad, M.J. 2008. Songs of male
humpback whales, Megaptera novaeangliae, are involved in intersexual interactions
Animal Behaviour 76:467–477
Smuts, B.B., Cheney, D.L., Seyfarth, R.M. and Wrangham, R.W. 2008. Primate societies.
University of Chicago Press.
Tamariz, M. and Kirby, S. 2016. The cultural evolution of language. Current Opinion in
Psychology 8:37-43.
Tanaka, T., Sugiura, H. and Masataka, N. 2006. Cross-sectional and longitudinal studies
of the development of group differences in acoustic features of coo calls in two groups
of japanese macaques. Ethology 112:7-21.
Tennie, C., Call, J. and Tomasello, M. 2009. Ratcheting up the ratchet: on the evolution
of cumulative culture. Philosophical Transactions of the Royal Society of London B
364:2405-2415.
Tinbergen, J. 1953. Social behaviour in animals: with special reference to vertebrates.
Methuen & Co.
Tobias, J.A., Aben, J., Brumfield, R.T., Derryberry, E.P., Halfwerk, W., Slabbekoorn, H.
and Seddon, N, 2010. Song divergence by sensory drive in Amazonian birds.
Evolution 64: 2820-2839.
Tyack, P.L. 1998. Acoustic communication under the sea. In: Animal acoustic
communication: Sound analysis and research methods (Hopp, S.L., Owren, M.J. and
Evans, C.S., eds.). Springer Berlin Heidelberg. 163-220pp.

150
van Schaik, C.P., Ancrenaz, M., Borgen, G., Galdikas, B., Knott, C.D., Singleton, I.,
Suzuki, A., Utami, S.S. and Merrill, M. 2003. Orangutan cultures and the evolution of
material culture. Science 299:102-105.
Voelkl, B. and Noë, R. 2010. Simulation of information propagation in real-life primate
networks: Longevity, fecundity, fidelity. Behavioral Ecology and Sociobiology
64:1449-1459.
Voelkl, B. and Noë, R. 2008 The influence of social structure on the propagation of
social information in artificial primate groups: A graph-based simulation approach.
Journal of Theoretical Biology 252:77-86.
Watkins, W.A. and Schevill, W.E. 1977. Sperm whale codas. The Journal of the
Acoustical Society of America 62:1485-1490.
Weaver, W. 1948. Science and complexity. American Scientist 36: 536-544.
Williams, H., Levin, I.I., Norris, D.R., Newman, A.E. and Wheelwright, N.T. 2013.
Three decades of cultural evolution in Savannah sparrow songs. Animal Behaviour
8:213-223.
Wilson, E.O. 1975. Sociobiology: The New Synthesis. Cambridge.
White, D.J., Gersick, A.S. and Snyder-Mackler, N. 2012. Social networks and the
development of social skills in cowbirds. Philosophical Transactions of the Royal
Society B 367:1892-1900.
Whitehead, H. 2008a. Social and cultural evolution in the ocean: Convergences and
contrasts with terrestrial systems. In: The Deep Structure of Biology (Conway-Morris,
S. ed.). Templeton Foundation Press. 143-160pp.

151
Whitehead, H. 2008b. Analyzing animal societies: Quantitative methods for vertebrate
social analysis. Chicago University Press.
Whitehead, H. 200. Sperm whales: Social evolution in the ocean. Chicago University
Press.
Whitehead, H. 1989. Foraging formations of Galápagos sperm whales. Canadian Journal
of Zoology 67:2131-2139.
Whitehead, H. and Rendell, L. 2014. The cultural lives of whales and dolphins.
University of Chicago Press.
Whitehead, H. and Lusseau, D. 2012. Animal social networks as substrate for cultural
behavioural diversity. Journal of Theoretical Biology 294:19–28.
Whitehead, H. and Richerson, P. 2009. The evolution of conformist social learning can
cause population collapse in realistically variable environments. Evolution and Human
Behaviour 30:261–273.
Whitehead, H. and Weilgart, L.S. 1991. Patterns of visually observable behaviour and
vocalizations in groups of female sperm whales. Behaviour 118:275-296.
Whitehead, H. and Arnbom, T. 1987. Social organization of sperm whales off the
Galápagos Islands, February-April 1985. Canadian Journal of Zoology 65:913-919.
Whitehead. H, Antunes, R., Gero, S., Wong, S.N.P., Engelhaupt, D. and Rendell, L.
2012. Multilevel societies of female sperm whales (Physeter macrocephalus) in the
Atlantic and Pacific: Why are they so different? International Journal of Primatology
33:1142-1164.

152
Whitehead, H., Waters, S. and Lyrholm, T. 1991. Social organization in female sperm
whales and their offspring: constant companions and casual acquaintances. Behavioral
Ecology and Sociobiology 29:385-389.
Whiten, A. and Whiten, A. 2011. The scope of culture in chimpanzees, humans and
ancestral apes. Philosophical Transactions of the Royal Society B 366:997-1007.
Whiten, A., Caldwell, C.A. and Mesoudi, A. 2016. Cultural diffusion in humans and
other animals. Current Opinion in Psychology 8:15-21.
Whiten, A., Horner, V. and de Waal, F.B.M. 2005. Conformity to cultural norms of tool
use in chimpanzees. Nature 437:737-740.
Whiten, A, Goodall, J., McGrew, W.C., Nishida, T., Reynolds, V., Sugiyama, Y., Tutin,
C.E.G. Wrangham, R.W. and Boesch, C. 1999. Cultures in Chimpanzees Nature
399:682–685.
Wolf, M. and Weissing, F.J. 2012. Animal personalities: consequences for ecology and
evolution. Trends in Ecology and Evolution 27:452-461.
CHAPTER 2
1. Kappeler, P. M., Barret, L. Blumstein, D. T. & Clutton-Brock, T. H. 2013
Introduction: Constraints and flexibility in mammalian social behaviour: introduction
and synthesis Phil. Trans. R. Soc. B, 368. 20120337. doi: 10.1098/rstb.2012.0337.

153
2. Ghalambor, C. K., McKay, J. K., Carroll, S. P. & Reznick, D. N. 2007 Adaptive
versus non-adaptive phenotypic plasticity and the potential for contemporary
adaptation in new environments. Func. Ecol. 21, 394-407. (doi: 10.1111/j.1365-
2435.2007.01283.x)
3. Laland, K. N. & O’Brien, M. J. 2012 Cultural niche construction: an introduction.
Biol. Theory. (doi: 10.1007/s13752-012-0026-6)
4. Via, S., Gomulkiewicz, R., DeJong, G., Scheiner, S. M., Schlichting, C. D. & Van
Tiendern, P. H. 1995 Adaptive phenotypic plasticity: consensus and controversy.
Trends Ecol. Evol. 10, 212-217. (doi: 10.1016/S0169-5347(00)89061-8)
5. Boyd, R. & Richerson, P. J. 1985 Culture and the Evolutionary Process. Chicago
University Press.
6. Agrawal, A. A. 2001 Phenotypic plasticity in the interactions and evolution of
species. Science. 294, 321-326. (doi: 10.1126/science.1060701)
7. Henrich, J. & McElreath, R. 2003 The evolution of cultural evolution. Evol.
Anthropol. 12, 123-135. (doi: 10.1002/evan.10110)
8. Laland, K. N. 2004 Social learning strategies. Learn. Behav. 32, 4-14. (doi:
10.3758/BF03196002)
9. Perreault, C., Moya, C. & Boyd, R. 2012 A Bayesian approach to the evolution of
social learning. Evol. Hum. Behav. 33, 449-459. (doi:
10.1016/j.evolhumbehav.2011.12.007)
10. Heyes, C. M. 1994 Social learning in animals: categories and mechanisms. Biol. Rev.
96, 207-231. (doi: 10.1111/j.1469-185X.1994.tb01506.x)

154
11. Franz, M. & Nunn, C. L. 2009 Rapid evolution of social learning. J. Evol. Biol. 22,
1914-1922. (doi: 10.1111/j.1420-9101.2009.01804.x)
12. Laland, K. N. & Hoppitt, W. 2003 Do animals have culture? Evol. Anthropol. 12,
150-159. (doi: 10.1002/evan.10111)
13. Norenzan, A. 2011 Explaining human behavioral diversity. Science 332, 1041-1042.
(doi: 10.1126/science.1207050)
14. Croft, D. P., James, R. & Krause, J. 2008 Exploring animal social networks.
Princeton, New Jersey: Princeton University Press.
15. Voelkl, B. & Nöe, R. 2010 Simulation of information propagation in real-life primate
networks: longevity, fecundity, fidelity. Behav. Ecol. Sociobiol. 64, 1449-1459. (doi:
10.1007/s00265-010-0960-x)
16. Voelkl, B. & Nöe, R. 2008 The influence of social structure on the propagation of
social information in artificial primate groups: a graph-based simulation approach. J.
Theor. Biol. 252, 77-86. (doi: 10.1016/j.jtbi.2008.02.002)
17. Whitehead, H. & Lusseau, D. 2012 Animal social networks as substrate for cultural
behavioural diversity. J. Theor. Biol. 294, 19-28. (doi: 10.1016/j.jtbi.2011.10.025)
18. Hinde, R. A. 1976 Interactions, relationships and social structure. Man 11, 1-17.
19. Boccaletti, S., Latora, V., Moreno, Y., Chavez, M. & Hwang, D. U. 2006 Complex
networks: structure and dynamics. Phys. Rep. 424, 175-308. (doi:
10.1016/j.physrep.2005.10.009)
20. Axelrod, R. 1997 The dissemination of culture: a model with local convergence and
global polarization. J. Confl. Resol. 41, 203-226. (doi:
10.1177/0022002797041002001)

155
21. McPherson, M., Smith-Lovin, L. & Cook, J. M. 2001 Birds of a feather: homophily in
social networks. Annu. Rev. Sociol. 27, 415-44.
22. Centola, D., González-Avella, J. C., Eguíluz, V. M. & San Miguel, M. 2007
Homophily, cultural drift, and the co-evolution of cultural groups. J. Conflict Resol.
51, 905-929. (doi: 10.1177/0022002707307632)
23. Morgan, T. J .H. & Laland, K. N. 2012 The biological bases of conformity. Front.
Neurosci. (doi: 10.3389/fnins.2012.00087)
24. Boyd, R. & Richerson, P. J. 1987 The evolution of ethnic markers. Cult. Anthrop. 2,
65-79. (doi: 10.1525/can.1987.2.1.02a00070)
25. Gross, T. & Blasius, B. 2008 Adaptive coevolutionary networks: a review. J. R. Soc.
Interface 5, 259-271. (doi: 10.1098/rsif.2007.1229)
26. Castellano, C., Fortunato, S. & Loretto, V. 2009 Statistical physics of social
dynamics. Rev. Mod. Phys. 81, 591-646. (doi: 10.1103/RevModPhys.81.591)
27. Zimmermamm, M. G., Eguíluz, V. M. & San Miguel, M. 2004 Coevolution of
dynamical states and interactions in dynamic networks. Phys. Rev. E 69, 065102. (doi:
10.1103/PhysRevE.69.065102)
28. Holme, P. & Newman, M. E .J. 2006 Nonequilibrium phase transition in the
coevolution of networks and opinions. Phys. Rev. E 74, 056108. (doi:
10.1103/PhysRevE.74.056108)
29. Grabowski, A. & Kosiński, R. A. 2006 Evolution of a social network: the role of
cultural diversity. Phys. Rev. E 73, 016135. (doi: 10.1103/PhysRevE.73.016135)

156
30. Bryden, J., Funk, S., Geard, N., Bullock, S. & Jansen, V. A. A. 2011 Stability in flux:
community structure in dynamic networks. J. Roy. Soc. Interface 8, 1031-1040. (doi:
10.1098/rsif.2010.0524)
31. Skyrms, B. & Pemantle, R. 2000 A dynamic model of social network formation.
Proc.Natl. Acad. Sci. USA. 97, 9340-9346. (doi: 10.1073/pnas.97.16.9340)
32. Rosvall, M. & Sneppen, K. 2006 Modeling self-organization of communication and
topology in social networks. Phys. Rev. E 74, 016108. (doi:
10.1103/PhysRevE.74.016108)
33. Rosvall, M. & Sneppen, K. 2009 Reinforced communication and social navigation
generate groups in model networks. Phys. Rev. E 79, 026111. (doi:
10.1103/PhysRevE.79.026111)
34. Deffuant, G., Neau, D., Amblard, F. & Weisbuch, G. 2000 Mixing beliefs among
interacting agents. Adv. Comp. System 3, 87-98.
35. Lusseau, D., Whitehead, H. & Gero, S. 2008 Incorporating uncertainty into the study
of animal social networks. Anim. Behav. 75, 1809-1815. (doi:
10.1016/j.anbehav.2007.10.029)
36. Connor, R. C., Mann, J., Tyack, P. L. & Whitehead, H. 1998 Social evolution in
toothed whales. Trends Ecol. Evol. 13, 228-232. (doi: 10.1016/S0169-5347(98)01326-
3)
37. Rendell, L. & Whitehead, H. 2001 Culture in whales and dolphins. Behav. Brain Sci.
24, 309-324.

157
38. Whitehead, H. 2009 How might we study culture? A perspective from the ocean. In
The question of animal culture (eds. R.N. Laland & B. Galef ), pp. 125-152.
Cambridge: Harvard University Press.
39. Pastor-Satorras, R. & Vespignani, A. 2001 Epidemic dynamics and endemic states in
complex networks. Phys. Rev. E 63, 066117. (doi: 10.1103/PhysRevE.63.066117)
40. Amblard, F. & Deffuant, G. 2004 The role of network topology on extremism
propagation with the relative agreement opinion dynamics. Physica A 343, 725-738.
(doi: 10.1016/j.physa.2004.06.102)
41. Meyers, L., Pourbohloul, B., Newman, M., Skowronski, D., Brunham, R. 2005
Network theory and SARS: predicting outbreak diversity. J. Theor. Biol. 232, 71-81.
(doi: 10.1016/j.jtbi.2004.07.026)
42. Guimarães, P. R., Argollo de Menezes, M., Baird, R. W., Lusseau, D., Guimarães, P
& Reis, S.F. 2007 Vulnerability of a killer whale social network to disease outbreaks.
Phys. Rev. E 76, 042901. (doi: 10.1103/PhysRevE.76.042901)
43. Salathé, M. & Jones, J. H. 2010 Dynamics and control of diseases in networks with
community structure. PLoS Comput. Biol. 6, e1000736.
(doi:10.1371/journal.pcbi.1000736)
44. Christensen, C., Albert, I., Grenfell, B., & Albert, R. 2010 Disease dynamics in a
dynamic social network. Phys. A 389, 2663-2674. (doi: 10.1016/j.physa.2010.02.034)
45. Griffin R. H. & Nunn, C. L. 2012 Community structure and the spread of infectious
disease in primate social networks Evol. Ecol. 26,779–800. (doi: 10.1007/s10682-011-
9526-2)

158
46. Nunn, C. L., Thrall, P. H., Bartz, K., Dasgupta, T. & Boesch, C. 2009 Do
transmission mechanisms or social systems drive cultural dynamics in socially
structured populations? Anim. Behav. 77, 1515-1524. (doi:
10.1016/j.anbehav.2009.02.023)
47. Coussi-Korbel, S. & Fragaszy, D. M. 1995 On the relation between social dynamics
and social learning. Anim. Behav. 50, 1441-1453. (doi: 10.1016/0003-3472(95)80001-
8)
48. Kendal, R. L., Custance, D. M., Kendal, J. R., Vale, G., Stoinski, T. S., Rakotomalala,
N. L. & Rasamimanana, H. 2010 Evidence for social learning in wild lemurs (Lemur
catta). Learn. Behav. 38, 220-234. (doi: 10.3758/LB.38.3.220)
49. Vital, C. & Martins, E. P. 2009 Using graph thery metrics to infer information flow
through animal social groups: a computer simulation analysis. Ethology 115, 347-355.
(doi: 10.1111/j.1439-0310.2009.01613.x)
50. Wittemyer, G., Douglas-Hamilton, I. & Getz, W. M. 2005 The socio-ecology of
elephants: analysis of the processes creating multitiered social structures. Anim.
Behav. 69, 1357-1371. (doi: 10.1016/j.anbehav.2004.08.018)
51. Krause, J., James, R. & Croft, D. P. 2010 Personality in the context of social
networks. Phil. Trans. R. Soc. B 365, 4099-4106. (doi: 10.1098/rstb.2010.0216)
52. Boogart, N. J., Reader, S. M., Hoppit, W. & Laland, K. N. 2008 The origin and spread
of innovations in starlings. Anim. Behav. 75, 1509-1518.
(doi:10.1016/j.anbehav.2007.09.033)
53. Hoppitt, W. J. E., Boogert, N. J. & Laland, K. N. 2010 Detecting social transmission
in networks. J. Theor. Biol. 263, 544-555. (doi: 10.1016/j.jtbi.2010.01.004)

159
54. Kendal, R. L., Galef, B. G. Jr. & van Schaik, C. P. 2010 Social learning research
outside the laboratory: How and why? Learn. Behav. 38, 187-194. (doi:
10.3758/LB.38.3.187)
55. Donaldson R., Finn, H., Bejder, L., Lusseau, D. & Calver, M. 2012 The social side of
human-wildlife interaction: wildlife can learn harmful behaviours from each other.
Anim. Conserv. 15,427-435. (doi: 10.1111/j.1469-1795.2012.00548.x)
56. Payne, K. 1999 The progressively changing songs of humpback whales: a window on
the creative process in a wild animal. In The origins of music (eds. N.L. Wallin, B.
Merker & S. Brown), pp. 135-150. Cambridge: MIT Press.
57. Wilson, E. O. 1975 Sociobiology: the new synthesis. Cambridge, MA: Belknap Press.
58. Laland, K. N. & Janik, V. M. 2006. The animal culture debate. Trends Ecol. Evol. 21,
542-547. (doi: 10.1016/j.tree.2006.06.005)
59. Acevedo, A. & Smultea, M. A. 1995 First records of humpback whales including
calves at Golfo Dulce and Isla del Coco, Costa Rica, suggesting geographical overlap
of northern and southern hemishere populations. Mar. Mamm. Sci. 11, 554-560. (doi:
10.1111/j.1748-7692.1995.tb00677.x)
60. Payne, R. & Guinee, L. N. 1983 Humpback whale, Megaptera novaeangliae, songs as
an indicator of "stocks". In Communication and behavior of whales (ed. R. Payne),
pp. 333-358. Colorado: Westview Press.
61. Cerchio, S., Jacobsen, J. K. & Norris, T. F. 2001 Temporal and geographical variation
in songs of humpback whales, Megaptera novaeangliae: synchronous change in
Hawaiian and Mexican breeding assemblages. Anim. Behav. 62, 313-329. (doi:
10.1006/anbe.2001.1747)

160
62. Garland, E. C., Goldizen, A. W., Rekdahl, M. L., Constantine, R., Garrigue, C.,
Hauser, N. D, Poole, M. M, Robbins, J. & Noad, M. J. 2011 Dynamic horizontal
cultural transmission of humpback whale song at the ocean basin scale. Curr. Biol.
21, 687-691. (doi: 10.1016/j.cub.2011.03.019)
63. Noad, M. J., Cato, D. H., Bryden, M. M., Jenner, M. N. & Jenner, K. C. S. 2000
Cultural revolution in whale songs. Nature 408, 537. (doi: 10.1038/35046199)
64. Payne, R.S. & McVay, S. 1971 Songs of humpback whales. Science 173, 585-597.
(doi 10.1126/science.173.3997.585)
65. Gracia-Lázaro, C., Quijandría, L., Hernández, L., Floría, L. M. & Moreno, Y. 2011
Coevolutionary network approach to cultural dynamics controlled by intolerance.
Phys. Rev. E 84, 067101. (doi: 10.1103/PhysRevE.84.067101)
66. Wolf, M. & Weissing, F. J. 2012 Animal personalities: consequences for ecology and
evolution. Trends Ecol. Evol. 27, 452-461. (doi: 10.1016/j.tree.2012.05.001)
67. Sih, A., Hanser, S. F. & McHugh, K. A. 2009 Social network theory: new insights and
issues for behavioral ecologists. Behav. Ecol. Sociobiol. 63, 975-988. (doi:
10.1007/s00265-009-0725-6)
68. Sargeant, B. L. & Mann, J. M. 2009 Developmental evidence for foraging traditions
in wild bottlenose dolphins. Anim. Behav. 78, 715-721. (doi:
10.1016/j.anbehav.2009.05.037)
69. Pike, T. W., Samanta, M., Lindström, J. & Royle, N. J. 2008 Behavioural phenotype
affects social interactions in an animal network. Proc. R. Soc. B 275, 2515-2520. (doi:
10.1098/rspb.2008.0744)

161
70. Bolnick, D. I., Svanbäck, R., Fordyce, J. A., Yang, L. H., Davis, J. M., Hulsey, C. D.
& Forister, M. L. 2003 The ecology of individuals: incidence and implications of
individual specialization. Am. Nat. 161, 1-28. (doi: 10.1086/343878)
71. Estes, J. A., Riedman, M. L., Staedler, M. M., Tinker, M. T. & Lyon, B. E. 2003
Individual variation in prey selection by sea otters: patterns, causes and implications.
J. Anim. Ecol. 72, 144-155. (doi: 10.1046/j.1365-2656.2003.00690.x)
72. Mann, J., Stanton, M. A., Patterson, E. M., Bienenstock, E. B. & Singh, L. O. 2012
Social networks reveal cultural behaviour in tool-using using dolphins. Nature (doi:
10.1038/ncomms1983)
73. Ansmann, I. C., Parra, G. J., Chilvers, B. L. & Lanyon, J. M. 2012 Dolphins
restructure social system after reduction of commercial fisheries. Anim. Behav. 84,
575-581. (doi: 10.1016/j.anbehav.2012.06.009)
74. Bacher, K., Allen, S., Lindholm, A. K., Bejder, L. & Krützen, M. 2010 Genes or
culture: are mitochondrial genes associated with tool use in bottlenose dolphins
(Tursiops sp.)? Behav. Genet. 40, 706-714 (doi: 10.1007/s10519-010-9375-8)
75. Kopps, A. M. & Sherwin W. B. 2012 Modelling the emergence and stability of a
vertically transmitted cultural trait in bottlenose dolphins. Anim. Behav. (doi:
10.1016/j.anbehav.2012.08.029)
76. Krützen, M., Mann, J., Heithaus, M. R., Connor, R. C., Bejder, L. & Sherwin, W. B.
2005 Cultural transmission of tool use in bottlenose dolphins. Proc. Natl. Acad. Sci.
USA. 102, 8939-8943. (doi: 10.1073/pnas.0500232102)
77. Chilvers, B. L. & Corkeron, P. J. 2001 Trawling and bottlenose dolphins' social
structure. Proc. R. Soc. Lond. B 268, 709-726. (doi: 10.1098/rspb.2001.1732)

162
78. Henrich, J. & Gil-White, F. 2001 The evolution of prestige: freely conferred
deference as a mechanism for enhancing the benefits of cultural transmission. Evol.
Hum. Behav. 22, 165-196. (doi: 10.1016/S1090-5138(00)00071-4)
79. Henrich, J. & Boyd, R. 1998 The evolution of conformist transmission and the
emergence of between group differences. Evol. Hum. Behav. 19, 215-242. (doi:
10.1016/S1090-5138(98)00018-X)
80. Mesnick, S. L. 2001 Genetic relatedness in sperm whales: evidence and cultural
implications. Behav. Brain Sci. 24, 346-347 (doi: 10.1017/S0140525X01463965)
81. Ford, J. K. B., Ellis, G. M. & Balcomb, K. C. 2000 Killer whales. Vancouver, British
Columbia: UBC Press.
82. Whitehead, H., Antunes, R., Gero, S., Wong, S. N. P., Engelhaupt, D. & Rendell, L.
2012 Multilevel societies of female sperm whales (Physeter macrocephalus) in the
Atlantic and Pacific: why are they so different? Int. J. Primat. (doi: 10.1007/s10764-
012-9598-z)
83. Deecke, V. B., Ford, J. K. B. & Spong, P. 2000 Dialect change in resident killer
whales: implications for vocal learning and cultural transmission. Anim. Behav. 40,
629-638.
84. Whitehead, H., Rendell, L., Osborne, R. W. & Würsig, B. 2004 Culture and
conservation of non-humans with reference to whales and dolphins: review and new
directions. Biol. Conserv. 120, 431-441. (doi: 10.1016/j.biocon.2004.03.017)
85. Perry, S. 2009 Are non-human primates likely to exhibit cultural capacities like those
of humans? In The question of animal culture (eds. K.N. Laland & B.G. Galef Jr), pp.
247-268. Cambridge, MA: Harvard University Press.

163
86. Ford, J. K. B. 1989 Acoustic behaviour of resident killer whales (Orcinus orca) off
Vancouver Island, British Columbia. Can. J. Zool. 67, 727-745.
87. Ford, J. K. B. 1991 Vocal traditions among resident killer whales (Orcinus orca) in
coastal waters of British Columbia. Can. J. Zool. 69, 1454-1483.
88. Yurk, H., Barrett-Lennard, L., Ford, J. K. B. & Matkin, C. O. 2002 Cultural
transmission within maternal lineages: vocal clans in resident killer whales in
southern Alaska. Anim. Behav. 63, 1103-1119. (doi: 10.1006/anbe.2002.3012)
89. Rendell, L. & Whitehead, H. 2003 Vocal clans in sperm whales (Physeter
macrocephalus). Proc. R. Soc. B. 270, 225-231. (doi: 10.1098/rspb.2002.2239)
90. Whitehead, H. & Rendell, L. 2004 Movements, habitat use and feeding success of
cultural clans of South Pacific sperm whales. J. Anim. Ecol. 73, 190-196. (doi:
10.1111/j.1365-2656.2004.00798.x)
91. Antunes, R. N. C. 2009 Variation in sperm whale (Physeter macrocephalus) coda
vocalizations and social structure in the North Atlantic Ocean. PhD thesis. University
of St. Andrews. (http://hdl.handle.net/10023/827).
92. Whitehead, H. 2008 Analyzing animal societies: quantitative methods for vertebrate
social analysis. Chicago: University of Chicago Press.
93. Costa, L. da F., Rodrigues, F. A., Travieso, G. & Villas Boas, P. R. 2007
Characterization of complex networks: a survey of measurements. Adv. Phys. 56, 167-
242. (doi: 10.1080/00018730601170527)
94. Newman, M. E. J. 2010 Networks: an introduction. Oxford University Press.

164
95. Croft, D. P., Madden, J. R., Franks, D. W. & James, R. 2011 Hypothesis
testing in animal social networks. Trends. Ecol. Evol. 26, 502-507. (doi:
10.1016/j.tree.2011.05.012)
96. Kendal, R. L., Kendal, J. R., Hoppitt, W. & Laland, K. N. 2009 Identifying social
learning in animal populations: A new “option-bias” method. PLoS ONE 4, e6541.
(doi: 10.1371/journal.pone.0006541)
97. Franz, M. & Nunn, C. L. 2009 Network-based diffusion analysis: a new method for
detecting social learning. Proc. R. Soc. B 276, 1829-1836. (doi:
10.1098/rspb.2008.1824)
98. Franz, M. & Nunn, C. L. 2010 Investigating the impact of observation errors on the
statistical performance of network-based diffusion analysis. Learn. Behav. 38, 235-
242. (doi: 10.3758/LB.38.3.235)
99. Dekker, D., Krackhardt, D. & Snijders, T. A. B. 2007 Sensitivity of MRQAP tests to
collinearity and autocorrelation conditions. Psychometrika 72, 563-581. (doi:
10.1007/s11336-007-9016-1)
100. Matthews, L. J. 2009 Intragroup behavioral variation in white-fronted capuchin
monkeys (Cebus albifrons): mixed evidence for social learning inferred from new and
established analytical methods. Behaviour 146, 295-324. (doi:
10.1163/156853909X410937)
101. Vazquez, A. 2006 Spreading dynamics on heterogeneous populations: multitype
network approach. Phys. Rev. E 74, 066114. (doi: 10.1103/PhysRevE.74.066114)

165
102. Wang, B., Cao, L., Suzuki, H. & Aihara, K. 2011 Epidemic spread in adaptive
networks with multitype agents. J. Phys. A: Math. Theor. 44, 035101.
(doi:10.1088/1751-8113/44/3/035101)
103. Daura-Jorge, F. G., Cantor, M., Ingram, S. N., Lusseau, D. & Simões-Lopes, P. C.
2012 The structure of a bottlenose dolphin society in coupled to a unique foraging
cooperation with artisanal fishermen. Biol. Lett. (doi: 10.1098/rsbl.2012.0174)
104. Simões-Lopes, P. C., Fabián, M. E. & Menegheti, J. O. 1998 Dolphin interactions
with the mullet artisanal fishing on southern Brazil: a qualitative and quantitative
approach. Rev. Bras. Zool. 15, 709-726. (doi: 10.1590/S0101-81751998000300016)
105. Pike, T. W. & Laland, K. N. 2010 Conformist learning in nine-spined sticklebacks'
foraging decisions. Biol. Lett. 23, 466-468. (doi: 10.1098/rsbl.2009.1014)
CHAPTER 3
1. Hinde, R. A. Interactions, relationships and social structure. Man 11, 1-17 (1976).
2. Clutton-Brock, T. H. Review lecture: mammalian mating systems. Proc. R. Soc. B.
236, 339-372 (1989).
3. Kappeler, P. M., Barrett, L., Blumstein, D. T. & Clutton-Brock, T. H. Constraints and
flexibility in mammalian social behaviour: introduction and synthesis. Phil. Trans. R.
Soc. B 368, 20120337 (2013).

166
4. Zhou, W., Sornette, D., Hill, R. & Dunbar, R. Discrete hierarchical organization of
social group sizes. Proc. R. Soc. B 272, 439-444 (2005).
5. Hamilton, M. J., Milne, B. T., Walker, R. S., Burger, O. & Brown, J. H. The complex
structure of hunter–gatherer social networks. Proc. R. Soc. B. 274, 2195–2202
(2007).
6. Grueter, C. C., Chapais, B. & Zinner, D. Evolution of multilevel social systems in
nonhuman primates and humans. Intl. J. Primatol. 33, 1002-1037 (2012).
7. Hill, R. A., Bentley, R. A. & Dunbar, R. I. M. Network scaling reveals consistent
fractal pattern in hierarchical mammalian societies. Biol. Lett. 4, 748-751 (2008).
8. Wittemeyer, G., Douglas-Hamilton, I. & Getz, W. M. The socioecology of elephants:
analysis of the processes creating multitiered social structures. An. Behav. 69, 1357–
1371 (2005).
9. Ford, J. K. B., Ellis, G. M. & Balcomb, K. C. Killer Whales (University of British
Columbia Press, 2000).
10. Krause, J. & Ruxton, G. D. Living in Groups (Oxford University Press, 2002).
11. Swedell, L. & Plummer, T. A papionin multilevel society as a model for hominin
social evolution. Intl. J. Primatol. 33, 1165-1193 (2012).
12. Dunbar, R. I. M. Neocortex size as a constraint on group size in primates. J. Hum.
Evol. 22, 469-493 (1992).
13. Sutcliffe, A., Dunbar, R., Binder, J. & Arrow, H. Relationships and the social brain:
integrating psychological and evolutionary perspectives. Brit. J. Psychol. 103, 149–
168 (2012).

167
14. Laland K. N. & Hoppitt, W. Do animals have culture? Evol. Anthropol. 12, 150-159
(2003).
15. Laland, K. N. & Janik, V. M. The animal cultures debate. Trends Ecol Evol. 21, 542–
547 (2006).
16. Cantor, M. & Whitehead, H. The interplay between social networks and culture:
theoretically and among whales and dolphins. Phil. Trans. R. Soc. B 368, 20120340
(2013).
17. McPherson, M., Smith-Lovin, L. & Cook, J. M. Birds of a feather: homophily in social
networks. Ann. Rev. Sociol. 27, 415-44 (2001).
18. Axelrod, R. The dissemination of culture: a model with local convergence and global
polarization. J. Conf. Resol. 41, 203-226 (1997).
19. Morgan, T. J .H. & Laland, K. N. The biological bases of conformity. Front.
Neurosci. 6, 1-7 (2012).
20. Boyd, R. & Richerson, P. J. The evolution of ethnic markers. Cult. Anthropol. 2, 65-
79 (1987).
21. Moffett, M. W. Human identity and the evolution of societies. Hum. Nat. 24, 219-267
(2013).
22. Nunn, C. L., Thrall, P. H., Bartz, K., Dasgupta, T. & Boesch, C. Do transmission
mechanisms or social systems drive cultural dynamics in socially structured
populations? An. Behav. 77, 1515-1524 (2009).
23. Perreault, C., Moya, C. & Boyd, R. A Bayesian approach to the evolution of social
learning. Evol. Hum. Behav. 33, 449-459 (2012).

168
24. McElreath, R., Boyd, R. & Richerson, P. J. Shared norms and the evolution of ethnic
markers. Curr. Anthropol. 44, 122-130 (2003).
25. Efferson, C., Lalive, R. & Fehr, E. The coevolution of cultural groups and ingroup
favoritism. Science 321, 1844-1849 (2008).
26. Centola, D., González-Avella, J. C., Eguíluz, V. M. & San Miguel, M. Homophily,
cultural drift, and the co-evolution of cultural groups. J. Confl. Resol. 51, 905-929
(2007).
27. Whiten, A. et al. Cultures in chimpanzees. Nature 399, 682-685 (1999).
28. Mann, J., Stanton, M. A., Patterson, E. M., Bienenstock, E. B. & Singh, L. O. Social
networks reveal cultural behaviour in tool-using using dolphins. Nat. Commun. 3, 1-
7 (2012).
29. Jenkins, P. Cultural transmission of song patterns and dialect development in a free-
living bird population. Anim. Behav. 26, 50-78 (1978).
30. Rendell, L. & Whitehead, H. Vocal clans in sperm whales (Physeter macrocephalus).
Proc. R. Soc. B 270, 225-231 (2003).
31. Krützen, M., Willems, E. P. & van Schaik, C. P. Culture and geographic variation in
orangutan behavior. Curr. Biol. 21, 1808–1812 (2011).
32. Podos, J. & Warren, P. The evolution of geographic variation in birdsong. Adv. Stud.
Behav. 37, 403-458 (2007).
33. Cavalli-Sforza, L. L. & Feldman, M. W. Cultural transmission and evolution.
(Princeton University Press, 1981).

169
34. Ellers, J. & Slabbekoorn, H. Song divergence and male dispersal among bird
populations: a spatially explicit model testing the role of vocal learning. Anim. Behav.
65, 671-681 (2003).
35. Fayet, A. L., Tobias, J. A., Hintzen, R. E. & Seddon, N. Immigration and dispersal are
key determinants of cultural diversity in a songbird population. Behav. Ecol. 25, 744-
753 (2014).
36. Boyd, R. & Richerson, P. J. Culture and the Evolutionary Process. (Chicago
University Press, 1985).
37. Mann, J., Connor, R. C., Tyack, P. L. & Whitehead, H. Cetacean societies: field
studies of dolphins and whales. (University of Chicago Press, 2000).
38. Whitehead, H. & Rendell, L. Oceans of Culture: Cultures of Whales and Dolphins.
(Chicago University Press, 2014).
39. Whitehead, H., Antunes, R., Gero, S., Wong, S. N. P., Engelhaupt, D. & Rendell, L.
Multilevel societies of female sperm whales (Physeter macrocephalus) in the
Atlantic and Pacific: Why are they so different? Intl. J. Primatol. 33, 1142-1164
(2012).
40. Weilgart, L. & Whitehead, H. Group-specific dialects and geographical variation in
coda repertoire in South Pacific sperm whales. Behav. Ecol. Sociobiol. 40, 277-285
(1997).
41. Janik, V. M. Cetacean vocal learning and communication. Curr. Opin. Neurobiol. 28,
60-65 (2014).

170
42. Whitehead, H., Dillon, M., Dufault, S., Weilgart, L. & Wright, J. Nongeographically
based population structure of South Pacific sperm whales: Dialects, fluke-markings
and genetics. J. Anim. Ecol. 67, 253-262 (1998).
43. Rendell, L., Mesnick, S. L., Dalebout, M. L., Burtenshaw, J. & Whitehead, H. Can
genetic differences explain vocal dialect variation in sperm whales, Physeter
macrocephalus? Behav. Gen. 42, 332-343 (2012).
44. Antunes, R. N. C. Variation in Sperm Whale (Physeter macrocephalus) Coda
Vocalizations and Social Structure in the North Atlantic Ocean. PhD thesis.
(University of St. Andrews, 2009).
45. Christal, J., Whitehead, H. & Lettevall, E. Sperm whale social units: variation and
change. Can. J. Zool. 76, 1431-1440 (1998).
46. Burnside, W. R., Brown, J. H., Burger, O., Hamilton, M. J., Moses, M. &
Bettencourt, L. Human macroecology: linking pattern and process in big-picture
human ecology. Biol. Rev. 87, 194-208 (2012).
47. Carr, G. M. & Macdonald, D. W. The sociality of solitary foragers: a model based on
resource dispersion. An. Behav. 34, 1540-1549 (1986).
48. Gowans, S., Würsig, B. & Karczmarski, L. The social structure and strategies of
delphinids: predictions based on an ecological framework. Adv. Mar. Biol. 53, 195-
294 (2007).
49. Daura-Jorge, F. G., Cantor, M., Ingram, S. N., Lusseau, D. & Simões-Lopes, P. C. The
structure of a bottlenose dolphin society in coupled to a unique foraging cooperation
with artisanal fishermen. Biol. Lett. 8, 702-705 (2012).

171
50. Whitehead, H. & Rendell, L. Movements, habitat use and feeding success of cultural
clans of South Pacific sperm whales. J. An. Ecol. 73, 190-196 (2004).
51. Schulz, T. M., Whitehead, H., Gero, S. & Rendell, L. Overlapping and matching of
codas in vocal interactions between sperm whales: insights into communication
function. An. Behav. 76, 1977-1988 (2008).
52. Filatova, O. A., Guzeev, M. A., Fedutin, I. D., Burdin, A. M. & Hoyt, E. Dependence
of killer whale (Orcinus orca) acoustic signals on the type of activity and social
context. Biol. Bull. 40, 790-796 (2013).
53. Quick, N. J. & Janik, V. M. Whistle rates of wild bottlenose dolphins (Tursiops
truncatus): influences of group size and behavior. J. Comp. Psychol. 122, 305-311
(2008).
54. Kopps, A. M. & Sherwin, W. B. Modelling the emergence and stability of a vertically
transmitted cultural trait in bottlenose dolphins. An. Behav. 84, 1347-1362 (2012).
55. Henrich, J. & Boyd, R. The evolution of conformist transmission and the emergence
of between group differences. Evol. Hum. Behav. 19, 215-242 (1998).
56. Boyd, R. & Richerson, P. J. Culture and the Evolutionary Process. (Chicago
University Press, 1985).
57. Aplin, L. M., Farine, D. R., Morand-Ferron, J., Cockburn, A., Thornton, A., &
Sheldon, B. C. Experimentally induced innovations lead to persistent culture via
conformity in wild birds. Nature 518, 538–541 (2014).
58. Riesch, R., Barrett-Lennard, L. G., Ellis, G. M., Ford, J. K. & Deecke, V. B. Cultural
traditions and the evolution of reproductive isolation: ecological speciation in killer
whales? Biol. J. Linn. Soc. 106, 1-17 (2012).

172
59. Deecke, V. B., Ford, J. K. B. & Spong, P. Dialect change in resident killer whales:
implications for vocal learning and cultural transmission. An. Behav. 40, 629-638
(2000).
60. Slater, P.J. The cultural transmission of bird song. Trends Ecol. Evol. 1, 94-97 (1986).
61. Filatova, O. A., Burdin, A. M., & Hoyt, E. Is killer whale dialect evolution random?
Behav. Proc. 99, 34-41 (2013).
62. Laland, K. N. & Galef, B. G. The Question of Animal Culture (Harvard University
Press, 2009).
63. Whitehead H. Sperm Whales: Social Evolution in the Ocean. (Chicago University
Press, 2003).
64. R Core Team. R: A Language and Environment for Statistical Computing. (R
Foundation for Statistical Computing, 2013).
65. Grimm, V. et al. A standard protocol for describing individual-based and agent-based
models. Ecol. Model. 198, 115-126 (2006).
66. Marcoux, M., Whitehead, H. & Rendell, L. Coda vocalizations recorded in breeding
areas are almost entirely produced by mature female sperm whales (Physeter
macrocephalus). Can. J. Zool. 84, 609-614 (2006).
67. Chiquet, R. A., Ma, B., Ackleh, A. S., Pal, N. & Sidorovskaia, N. Demographic
analysis of sperm whales using matrix population models. Ecol. Model. 248, 71-79
(2013).
68. Pons, P. & Latapy, M. Computing communities in large networks using random
walks. Comp. Inf. Sci. 284-293 (2005).

173
69. Newman, M. E. Modularity and community structure in networks. Proc. Natl. Acad.
Sci. U.S.A. 103, 8577-8582 (2006).
70. Opsahl, T. Colizza, V., Panzarasa, P. & Ramasco, J. J. Prominence and control: the
weighted rich-club effect. Phys. Rev. Lett. 101, 169702 (2008).
CHAPTER 4
Allen, J., M. Weinrich, W. Hoppitt and L. Rendell. 2013. Network-based diffusion
analysis reveals cultural transmission of lobtail feeding in humpback whales.
Science 340:485-488.
Ansmann, I. C., G. J. Parra, B. L. Chilvers and J. M. Lanyon. 2012. Dolphins restructure
social system after reduction of commercial fisheries. Animal Behaviour 84: 575-581.
Aplin, L. M., D. R. Farine, J. Morand-Ferron and B. C. Sheldon. 2012. Social networks
predict patch discovery in a wild population of songbirds. Proceedings of the Royal
Society: Biological Sciences 279: 4199-4205.
Atton N., B. J. Galef, W. Hoppitt, M. M. Webster and K. N. Laland. 2014 Familiarity
affects social network structure and discovery of prey patch locations in foraging
stickleback shoals. Proceedings of the Royal Society B 281: 20140579.
doi:10.1098/rspb.2014.0579.

174
Baird, R. W. 2000. The killer whale—foraging specializations and group hunting. Pages
127–53 in Mann, J., R. C. Connor, P. Tyack and H. Whitehead, eds. Cetacean
societies. University of Chicago Press, Chicago.
Boyd, R. and P. J. Richerson. 1985. Culture and the evolutionary process. University of
Chicago Press, Chicago.
Burnham, K.P. and D. R. Anderson. 2002. Model Selection and multimodel inference: A
practical information-theoretic approach. Springer–Verlag, New York.
Cantor, M. and H. Whitehead. 2013. The interplay between social networks and culture:
theoretically and among whales and dolphins. Philosophical Transactions of the Royal
Society: Biological Sciences 368:20120340. doi:10.1098/rstb.2012.0340
Cavalli-Sforza, L.L. and M. W. Feldman. 1981. Cultural transmission and evolution.
Princeton University Press, Princeton.
Centola, D., J. C. González-Avella, V. M. Eguíluz and M. San Miguel. 2007. Homophily,
cultural drift, and the co-evolution of cultural groups. Journal of Conflict Resolution
51:905-929.
Christal, J and H. Whitehead. 2001. Social affiliations within sperm whale (Physeter
macrocephalus) groups. Ethology.107:323-340.
Christal, J., H. Whitehead, and H. Lettevall. 1998. Sperm whale social units: variation
and change. Canadian Journal of Zoology 76:1431-1440.
Croft D. P., J. Krause, S. K. Darden, I.W. Ramnarine, J. J. Faria and R. James. 2009.
Behavioural trait assortment in a social network: patterns and implications. Behavioral
Ecology and Sociobiology 63:1495–1503.

175
Cronin, K. A., E. J. Van Leeuwen, V. Vreeman and D. Haun. 2014. Population-level
variability in the social climates of four chimpanzee societies. Evolution and Human
Behavior. doi: 10.1016/j.evolhumbehav.2014.05.004
Daura-Jorge, F.G., M. Cantor, S. N. Ingram, D. Lusseau and P. C. Simões-Lopes. 2012.
The structure of a bottlenose dolphin society in coupled to a unique foraging
cooperation with artisanal fishermen. Biology Letters 8: 702-705.
Farine, D. R. 2014. Measuring phenotypic assortment in animal social networks:
Weighted associations are more robust than binary edges. Animal Behaviour 89: 141-
153.
Gero, S., J. Gordon and H. Whitehead. 2013. Calves as social hubs: Dynamics of the
social network within sperm whale units. Proceedings of the Royal Society: Biological
Sciences 280: 20131113. doi:10.1098/rspb.2013.1113
Hahn, M, W. and R. A. Bentley. 2003. Drift as a mechanism for cultural change: An
example from baby names. Proceedings of the Royal Society: Biological Sciences
270:S120-S123.
Kappeler, P.M., L. Barret, D. T. Blumstein and T. H. Clutton-Brock. 2013. Constraints
and flexibility in mammalian social behaviour: introduction. Philosophical
Transactions of the Royal Society: Biological Sciences 368:20120337.
doi:10.1098/rstb.2012.0337
Koerper, H. C. and E. G. Stickel. 1980. Cultural drift: a primary process of culture
change. Journal of Anthropological Research 36:463-469.
Krause, J. and G. D. Ruxton. 2002. Living in groups. Oxford University Press, Oxford.

176
Laland, K. N. and B N. Galef. 2009. The question of animal culture. Harvard University
Press, Cambridge.
Laland, K. N. and W. Hoppitt. 2003. Do animals have culture? Evolutionary
Anthropology 12:150-159.
Lott, D. L. 1984. Intraspecific variation in the social systems of wild vertebrates.
Behaviour. 88:266-325.
Mace, R. 2014. Human behavioral ecology and its evil twin. Behavioral Ecology 25:
443–449.
Mann, J., M. A. Stanton, E. M. Patterson, E. B. Bienenstock, and L. O. Singh. 2012.
Social networks reveal cultural behaviour in tool-using using dolphins. Nature
Communications 3: 980. doi: 10.1038/ncomms1983.
Marcoux, M., H. Whitehead and L. Rendell. 2007a. Sperm whale feeding variation by
location, year, social group and clan: evidence from stable isotopes. Marine Ecology
Progress Series 333:309-314.
Marcoux, M., L. Rendell and H. Whitehead. 2007b. Indications of fitness differences
among vocal clans of sperm whales. Behavioral Ecology and Sociobiology 61:1093-
1098.
Morin, P. A., F. I. Archer, A. D. Foote et al. 2010. Complete mitochondrial genome
phylogeographic analysis of killer whales (Orcinus orca) indicates multiple species.
Genome Research 20:908-16.
Otis, D. L., K. P. Burnham, G. C. White and D. R. Anderson. 1978. Statistical inference
from capture data on closed animal populations. Wildlife monographs 62:3-135.

177
R Core Team. 2014. R: A language and environment for statistical computing. R
Foundation for Statistical Computing, Vienna, Austria. URL http://www.R-
project.org/.Rendell, L. and H. Whitehead. 2003. Vocal clans in sperm whales
(Physeter macrocephalus). Proceedings of the Royal Society: Biological Sciences
270:225-231.
Rendell, L., S. L. Mesnick, M. L. Dalebout, J. Burtenshaw and H. Whitehead. 2012. Can
genetic differences explain vocal dialect variation in sperm whales, Physeter
macrocephalus? Behavior Genetics 42: 332-343.
Riesch, R., L. G. Barrett-Lennard, G. M. Ellis, J. K. B. Ford, and V. B. Deecke. 2012.
Cultural traditions and the evolution of reproductive isolation: ecological speciation in
killer whales? Biological Journal of the Linnean Society 106:1–17.
Sachser, N., S. Kaiser and M. B. Hennessy. 2013. Behavioural profiles are shaped by
social experience: When, how and why. Philosophical Transactions of the Royal
Society: Biological Sciences 368:20120344. doi:10.1098/rstb.2012.0344
Schradin, C. 2013. Intraspecific variation in social organization by genetic variation,
developmental plasticity, social flexibility or entirely extrinsic factors. Philosophical
Transactions of the Royal Society: Biological Sciences 368:20120346.
doi:10.1098/rstb.2012.0346
Schulz, T. M., H. Whitehead, S. Gero and L. Rendell. 2008. Overlapping and matching of
codas in vocal interactions between sperm whales: Insights into communication
function. Animal Behaviour 76:1977-1988.

178
Voelkl, B. and Nöe, R. 2010. Simulation of information propagation in real-life primate
networks: longevity, fecundity, fidelity. Behavioral Ecology and Sociobiology 64:
1449-1459.
Whitehead, H. 2009a. SOCPROG programs: Analysing animal social structures.
Behavioral Ecology and Sociobiology 63: 765-778.
Whitehead, H. 2009b. How might we study culture? A perspective from the ocean. Pages
125-152 in Laland R. N. and B. Galef, eds. The question of animal culture. Harvard
University Press, Cambridge, MA.
Whitehead, H. 2008a. Analyzing animal societies: Quantitative methods for vertebrate
social analysis. University of Chicago Press, Chicago.
Whitehead, H. 2008b. Precision and power in the analysis of social structure using
associations. Animal Behaviour 75: 1093-1099.
Whitehead, H. 2003. Sperm whales: Social evolution in the ocean. University of Chicago
Press, Chicago.
Whitehead, H. 1999. Variation in the visually observable behavior of groups of
Galápagos sperm whales. Marine Mammal Science 15:1181-1197.
Whitehead, H. 1996. Babysitting, dive synchrony, and indications of alloparental care in
sperm whales. Behavioral Ecology and Sociobiology 38: 237-244.
Whitehead, H. 1995. Investigating structure and temporal scale in social organizations
using identified individuals. Behavioral Ecology 6:199-208.
Whitehead, H. and D. Lusseau. 2012. Animal social networks as substrate for cultural
behavioural diversity. Journal of Theoretical Biology 294:19-28.

179
Whitehead, H. and L. Rendell. 2014. The cultural lives of whales and dolphins.
University of Chicago Press, Chicago.
Whitehead, H. and L. Rendell. 2004. Movements, habitat use and feeding success of
cultural clans of South Pacific sperm whales. Journal of Animal Ecology 73:190-196.
Whitehead, H., Antunes, R., Gero, S., Wong, S.N.P., Engelhaupt, D. and Rendell, L.
2012. Multilevel societies of female sperm whales (Physeter macrocephalus) in the
Atlantic and Pacific: Why are they so different? International Journal of Primatology
33:1142-1164.
Whitehead, H., M. Dillon, S. Dufault, L. Weilgart and J. Wright. 1998.
Nongeographically based population structure of South Pacific sperm whales:
Dialects, fluke-markings and genetics. Journal Animal Ecology 67:253–262.
Whiten, A., J. Goodal, W. C. McGrew et al. 1999. Cultures in chimpanzees.
Nature. 399:682-685.doi:10.1038/21415
Wolf, M. and J. Krause. 2014. Why personality differences matter for social functioning
and social structure. Trends in Ecology & Evolution 29:306-308.
CHAPTER 5
1. Avital E, Jablonka E. 2000 Animal traditions: behavioural inheritance in evolution.
New York, NY: Cambridge University Press.

180
2. Richerson PJ, Boyd R. 2005 Not by genes alone: How culture transformed human
evolution. Chicago, IL: University of Chicago Press.
3. Cavalli-Sforza LL, Feldman MW. 1981 Cultural transmission and evolution: a
quantitative approach. Princeton, NJ: Princeton University Press.
4. Garland EC, Goldizen AW, Lilley MS, Rekdahl ML, Garrigue C, Constantine R,
Hauser ND, Poole MM, Robbins J, Noad MJ. 2015 Population structure of
humpback whales in the western and central South Pacific Ocean as determined by
vocal exchange among populations. Conserv. Biol. 29, 1198-1207. (doi:
10.1111/cobi.12492)
5. Noad MJ, Cato DH, Bryden MM, Jenner MN, Jenner KC. 2000 Cultural revolution
in whale songs. Nature 408, 537-537. (doi:10.1038/35046199)
6. Garland EC, Goldizen AW, Rekdahl ML, Constantine R, Garrigue C, Hauser ND,
Poole MM, Robbins J, Noad MJ. 2011 Dynamic horizontal cultural transmission of
humpback whale song at the ocean basin scale. Curr. Biol. 21, 687-691.
(doi:10.1016/j.cub.2011.03.019)
7. Allen J, Weinrich M, Hoppitt W, Rendell L. 2013 Network-based diffusion analysis
reveals cultural transmission of lobtail feeding in humpback whales. Science 340,
485-488. (doi: 10.1126/science.1231976)
8. Swift J. 1977 Sahelian pastoralists: underdevelopment, desertification, and famine.
Ann. Rev. Anthropol. 6, 457-478.
9. Sinclair ARE, Fryxell JM. 1985 The Sahel of Africa: Ecology of a disaster. Can. J.
Zool. 63, 987-994.

181
10. Whitehead H, Antunes R, Gero S, Wong SN, Engelhaupt D, Rendell L. 2012
Multilevel societies of female sperm whales (Physeter macrocephalus) in the
Atlantic and Pacific: why are they so different? Intl. J. Primatol. 33, 1142-1164.
(doi: 10.1007/s10764-012-9598-z)
11. Christal J, Whitehead H, Lettevall E. 1998 Sperm whale social units: variation and
change. Can. J. Zool. 76, 1431–1440.
12. Gero S, Milligan M, Rinaldi C, Francis P, Gordon J, Carlson C, Steffen A, Tyack P,
Evans P, Whitehead H. 2014 Behavior and social structure of the sperm whales of
Dominica, West Indies. Mar. Mam. Sci. 30, 905-922. (doi: 10.1111/mms.12086)
13. Watkins WA, Schevill WE. 1977 Sperm whale codas. J. Acoust. Soc. Am. 62, 1485-
1490.
14. Rendell L, Whitehead H. 2003 Vocal clans in sperm whales (Physeter
macrocephalus). Proc. R. Soc. B 270, 225-231. (doi: 10.1098/rspb.2002.2239)
15. Rendell L, Whitehead H. 2005 Spatial and temporal variation in sperm whale coda
vocalisations: Stable usage and local dialects. An. Behav. 70, 191-198.
(doi:10.1016/j.anbehav.2005.03.001)
16. Rendell L, Mesnick SL, Dalebout ML, Burtenshaw J, Whitehead H. 2012 Can
genetic differences explain vocal dialect variation in sperm whales, Physeter
macrocephalus? Behav. Gen. 42, 332-43. (doi: 10.1007/s10519-011-9513-y)
17. Whitehead H, Rendell L. 2004 Movements, habitat use and feeding success of
cultural clans of South Pacific sperm whales. J. An. Ecol. 73, 190-196. (doi:
10.1111/j.1365-2656.2004.00798.x)

182
18. Marcoux M, Whitehead H, Rendell L. 2007 Sperm whale diet variation by sex,
location, year, social group and clan: evidence from stable isotopes. Mar. Ecol. Prog.
Ser. 333, 309-314. (doi: http://dx.doi.org/10.3354/meps333309)
19. Cantor M, Whitehead H. 2015 How does social behavior differ among sperm whale
clans? Mar. Mam. Sci. 31, 1275-90. (doi: 10.1111/mms.12218)
20. Whitehead H, Coakes A, Jaquet N, Lusseau S. 2008 Movements of sperm whales in
the tropical Pacific. Mar. Ecol. Prog. Ser. 361, 291-300.
21. Clarke R, Paliza O, Aguayo A. 1988 Sperm whales of the southeast Pacific. Part IV:
fatness, food and feeding. Invest. Cetacea 21, 53-195.
22. Whitehead H, Christal J, Dufault S. 1997 Past and distant whaling and the rapid
decline of sperm whales off the Galápagos Islands. Conserv. Biol. 11, 1387-1396.
(doi: 10.1046/j.1523-1739.1997.96246.x)
23. Whitehead H. 1990 Computer assisted individual identification of sperm whale
flukes. Rep. Intl. Whal. Comm. 12, 71–77.
24. Whitehead H. 2003 Sperm whale societies: Social evolution in the ocean. Chicago,
IL: University of Chicago Press.
25. Gillespie D. 1997 An acoustic survey for sperm whales in the Southern Ocean
Sanctuary conducted from the R/V Aurora Australis. Rep. Intl. Whal. Comm. 47,
897-908.
26. Weilgart L, Whitehead H. 1997 Group-specific dialects and geographical variation in
coda repertoire in South Pacific sperm whales. Behav. Ecol. Sociobiol. 40, 277-285.

183
27. Gero S, Whitehead H, Rendell L. 2016 Individual, unit, and vocal clan level identity
cues in sperm whale codas. R. Soc. Open Sci. 3, 150372. (doi:
http://dx.doi.org/10.1098/rsos.150372)
28. Antunes R, Schulz T, Gero S, Whitehead H, Gordon J, Rendell L. 2011 Individually
distinctive acoustic features in sperm whale codas. An. Behav. 81, 723-730.
(doi:10.1016/j.anbehav.2010.12.019)
29. Ankerst M, Breunig MM, Kriegel H-P, Sander J. 1999 OPTICS: ordering points to
identify the clustering structure. Proc. SIGMOD’99. Intl. Conf. Manag. Data 28, 49–
60. (doi:10.1145/304181.304187)
30. Cantor M, Shoemaker LG, Cabral RB, Flores CO, Varga M, Whitehead H. 2015
Multilevel animal societies can emerge from cultural transmission. Nat. Comm. 6,
8091. (doi:10.1038/ncomms9091)
31. Jaquet N, Gendron D, Coakes A. 2003 Sperm whales in the Gulf of California:
residency, movements, behavior, and the possible influence of variation in food
supply. Mar. Mamm. Sci. 19, 545-62. (doi: 10.1111/j.1748-7692.2003.tb01320.x)
32. Dufault S, Whitehead, H. 1995 An assessment of changes with time in the marking
patterns used for photo-identification of individual sperm whales, Physeter
macrocephalus. Mar. Mamm. Sci. 11, 335-343. (doi: 10.1111/j.1748-
7692.1995.tb00289.x)
33. Álvarez-Torres AM, Rendell L, Jaquet N, Gendron D. 2006. Rango de distribución
de clanes de cachalote: el Golfo de California y el Pacífico Sur. In Reunión
Internacional sobre el Estudio de los Mamíferos Acuáticos (eds Gendron D,
Siciliano S), pp. 4. Mérida, Mexico: SOLAMAC.

184
34. Smith TD, Reeves RR, Josephson EA, Lund JN. 2012 Spatial and seasonal
distribution of American whaling and whales in the age of sail. PloS One 7, 4905.
(doi: http://dx.doi.org/10.1371/journal.pone.0034905)
35. Whitehead H. 1996 Variation in the feeding success of sperm whales: temporal scale,
spatial scale and relationship to migrations. J. An. Ecol. 65, 429-438.
36. Cai W et al. 2014 Increasing frequency of extreme El Niño events due to greenhouse
warming. Nature Clim. Change 4, 111-116. (doi:10.1038/nclimate2100)
37. Strutton PG, Chavez FP. 2000 Primary productivity in the equatorial Pacific during
the 1997–1998 El Niño. J. Geophys. Res. 105, 26089-26101. (doi:
10.1029/1999JC000056)
38. Barber RT, Chavez FP. 1983 Biological consequences of El Niño. Science 222,
1203-1210. (doi: 10.1126/science.222.4629.1203)
39. Merlen G. 1984 The 1982–1983 El Niño: Some of its consequences for Galápagos
wildlife. Oryx 18, 210-214.
40. Smith SC, Whitehead H. 1993 Variations in the feeding success and behaviour of
Galápagos sperm whales (Physeter macrocephalus) as they relate to oceanographic
conditions. Can. J. Zool. 71, 1991-1996.
41. Lee T, McPhaden MJ. 2010 Increasing intensity of El Niño in the central-equatorial
Pacific. Geophys. Res. Lett. 37, L14603 (doi:10.1029/2010GL044007)
42. Ramirez P, Urquizo W. 1985 Los cetáceos mayores y el fenómeno El Niño 1982-
1983. In El Niño, su impacto en la fauna marina (eds Arntz WE, Landa A, Tarazona
J), pp 201-206. Callao, Perú: Boletin Instituto del Mar de Perú.

185
43. Ford JK, Ellis GM, Barrett-Lennard LG, Morton AB, Palm RS, Balcomb III KC.
1998 Dietary specialization in two sympatric populations of killer whales (Orcinus
orca) in coastal British Columbia and adjacent waters. Can. J. Zool. 76, 1456-71.
44. Estes JA, Riedman ML, Staedler MM, Tinker MT, Lyon BE. 2003 Individual
variation in prey selection by sea otters: patterns, causes and implications. J. An.
Ecol. 72, 144–155. (doi: 10.1046/j.1365-2656.2003.00690.x)
45. Ramirez P. 1989 Captura de cachalote en Paita, 1976-1981. Bol. Lima 63, 81-88.
46. Whitehead H. 2002 Estimates of the current global population size and historical
trajectory for sperm whales. Mar. Ecol. Prog. Ser. 242, 295-304.
47. Whitehead H. 2000 Density-dependent habitat selection and the modeling of sperm
whale (Physeter macrocephalus) exploitation. Can. J. Fish. Aqu. Sci. 57, 223-230.
(doi: 10.1139/f99-227)
48. Strandburg-Peshkin A, Farine DR, Couzin ID, Crofoot MC. 2015 Shared decision-
making drives collective movement in wild baboons. Science 348, 1358-1361. (doi:
10.1126/science.aaa5099)
49. Pinter-Wollman N, Isbell LA, Hart LA. 2009 The relationship between social
behaviour and habitat familiarity in African elephants (Loxodonta africana). Proc. R.
Soc. B 276, 1009-1014. (doi:10.1098/rspb.2008.1538)
50. Whitehead H. In press. Consensus movements by groups of sperm whales. Mar.
Mam. Sci.
51. Deecke VB, Ford JKB, Spong P. 2000 Dialect change in resident killer whales:
Implications for vocal learning and cultural transmission. An. Behav. 60, 629–638.
(doi:10.1006/anbe.2000.1454)

186
52. Nelson DA, Hallberg KI, Soha JA. 2004 Cultural evolution of Puget sound white-
crowned sparrow song dialects. Ethology 110, 879-908. (doi: 10.1111/j.1439-
0310.2004.01025.x)
53. Williams H, Levin II, Norris DR, Newman AE, Wheelwright NT. 2013 Three
decades of cultural evolution in Savannah sparrow songs. An. Behav. 85, 213-223.
(doi:10.1016/j.anbehav.2012.10.028)
CHAPTER 6
Allen, J., Weinrich, M., Hoppitt, W. and Rendell, L. 2013. Network-based diffusion
analysis reveals cultural transmission of lobtail feeding in humpback whales. Science
340:485-488.
Aplin, L.M., Farine, D.R., Morand-Ferron, J., Cockburn, A., Thornton, A. and Sheldon,
B.C. 2015. Experimentally induced innovations lead to persistent culture via
conformity in wild birds. Nature 518:538-541.
Ansmann, I.C., Parra, G.J., Chilvers, B.L. and Lanyon, J.M. 2012. Dolphins restructure
social system after reduction of commercial fisheries. Animal Behaviour 84:575-581.
Box, H.O. and Gibson, K.R. 1999. Mammalian social learning: comparative and
ecological perspectives. Cambridge University Press.

187
Boyd, R. and Richerson, P.J. 1996. Why culture is common, but cultural evolution is rare.
Proceedings of the British Academy 88:77–93.
Boyd, R., Richerson, P. and Henrich, J. 2011. The cultural niche: Why social learning is
essential for human adaptation. Proceedings of the National Academic of Sciences
USA 108:10918–10925.
Calambokidis, J., Schorr, G.S., Steiger, G.H., Francis, J., Bakhtiari, M., Marshall, G.,
Oleson, E.M., Gendron, D. and Robertson, K. 2007. Insights into the underwater
diving, feeding, and calling behavior of blue whales from a suction-cup-attached
video-imaging tag (CRITTERCAM). Marine Technology Society Journal 41:19-29.
Cai, W., Borlace, S., Lengaigne, M., Van Rensch, P., Collins, M., Vecchi, G.,
Timmermann, A., Santoso, A., McPhaden, M.J., Wu, L. and England, M.H. 2014.
Increasing frequency of extreme El Niño events due to greenhouse warming. Nature
Climate Change 4:111-116.
Castles, M., Heinsohn, R., Marshall, H.H., Lee, A.E., Cowlishaw, G. and Carter, A.J.
2014. Social networks created with different techniques are not comparable. Animal
Behaviour, 96:59-67.
Corbey, R. and Lanjouw, A. 2013. The politics of species: Reshaping our relationships
with other animals. Cambridge University Press.
Diamond, J. 2012. The world until yesterday: What can we learn from traditional
societies? Penguin.
Diamond, J. 2005. Collapse: How societies choose to fail or succeed. Penguin.
Estes, J.A. 2006. Whales, whaling, and ocean ecosystems. University of California Press.

188
Estes, J.A., Terborgh, J., Brashares, J.S., Power, M.E., Berger, J., Bond, W.J., Carpenter,
S.R., Essington, T.E., Holt, R.D., Jackson, J.B. and Marquis, R.J. 2011. Trophic
downgrading of planet Earth. Science 333:301-306.
Farine, D.R. 2015. Proximity as a proxy for interactions: issues of scale in social network
analysis. Animal Behaviour 104:1–5.
Farine, D.R. and H. Whitehead. 2015. Constructing, conducting and interpreting animal
social network analysis. Journal of Animal Ecology 84:1144–1163.
Ford, J.K.B., Ellis, G.M. and Balcomb, K.C. 2000. Killer Whales. University of British
Columbia Press.
Garland, E.C., Goldizen, A.W., Rekdahl, M.L., Constantine, R., Garrigue, C., Hauser,
N.D., Poole, M.M., Robbins, J. and Noad, M.J. 2011. Dynamic horizontal cultural
transmission of humpback whale song at the ocean basin scale. Current Biology
21:687-691.
Gero, S., Whitehead, H. and Rendell L. 2016 Individual, unit, and vocal clan level
identity cues in sperm whale codas. Royal Society Open Science 3:150372.
Gero, S., Gordon, J. and Whitehead, H. 2013. Calves as social hubs: Dynamics of the
social network within sperm whale units. Proceedings of the Royal Society B
280:20131113.
Gould, S.J. 1998. Leonardo's mountain of clams and the diet of worms. Harmony Books.
Gross, T. and Blasius, B. 2008. Adaptive coevolutionary networks: a review. Journal of
the Royal Society Interface 5:259-271.
Hinde, R.A. 1976. Interactions, relationships and social structure. Man 11:1-17.

189
Hoppitt, W. and Laland, K.N. 2013. Social learning: an introduction to mechanisms,
methods, and models. Princeton University Press.
Jambeck, J.R., Geyer, R., Wilcox, C., Siegler, T.R., Perryman, M., Andrady, A.,
Narayan, R. and Law, K.L.,2015. Plastic waste inputs from land into the ocean.
Science 347:768-771.
Johnson, M.P. and Tyack, P.L. 2003. A digital acoustic recording tag for measuring the
response of wild marine mammals to sound. IEEE Journal of Oceanic Engineering
28:3-12.
Koch, P.L. and Barnosky, A.D. 2006. Late Quaternary extinctions: state of the debate.
Annual Review of Ecology, Evolution, and Systematics 37:215-250.
Laland, K.N. and Galef, B.G. 2009. The question of animal culture. Harvard University
Press.
Laland, K.N. and Hoppitt, W. 2003. Do animals have culture? Evolutionary
Anthropology 12:150-159.
Mann, J., Stanton, M.A., Patterson, E.M., Bienenstock, E.J. and Singh, L.O. 2012. Social
networks reveal cultural behaviour in tool-using using dolphins. Nature
Communications 3:980.
Marcoux, M., Whitehead, H. and Rendell, L. 2007. Sperm whale feeding variation by
location, year, social group and clan: evidence from stable isotopes. Marine Ecology
Progress Series 333:309-314.
Marean C.W. 2015. The most invasive species of all. Scientific American 313.
McPherson, M., Smith-Lovin, L. and Cook, J.M. 2001. Birds of a feather: homophily in
social networks. Annual Review of Sociology 27:415-44.

190
Myers, R.A. and Worm, B., 2003. Rapid worldwide depletion of predatory fish
communities. Nature 423:280-283.
Nowak, M.A. 2006. Evolutionary dynamics: exploring the equations of life. Harvard
University Press.
Palumbi, S.R. 2002. The evolution explosion: how humans cause rapid evolutionary
change. WW Norton & Company.
Pinter-Wollman, N., Hobson, E.A., Smith, J.E., Edelman, A.J., Shizuka, D., De Silva, S.,
Waters, J.S., Prager, S.D., Sasaki, T., Wittemyer, G. and Fewell, J. 2013. The
dynamics of animal social networks: analytical, conceptual, and theoretical advances.
Behavioral Ecology 25:242-255.
Railsback, S.F. and Grimm, V. 2013. Agent-based and individual-based modeling: a
practical introduction. Princeton University Press.
Rendell, L.E. and Whitehead, H. 2003. Vocal clans in sperm whales (Physeter
macrocephalus). Proceedings of the Royal Society of London B 270:225-231.
Rendell, L. and Whitehead, H. 2001. Culture in whales and dolphins. Behavioral Brain
Sciences 24:309-324.
Safina, C. 2015. Beyond words: what animals think and feel. Macmillan.
Sakakibara, C., 2009. ‘No whale, no music’: Inupiaq drumming and global warming.
Polar Record 45:289-303.
Sayigh, L.S., Tyack, P.L., Wells, R.S., Solow, A.R., Scott, M.D. and Irvine, A.B. 1998.
Individual recognition in wild bottlenose dolphins: a field test using playback
experiments. Animal Behaviour 57:41-50.

191
Springmann, M., Godfray, H.C.J., Rayner, M. and Scarborough, P. 2016. Analysis and
valuation of the health and climate change cobenefits of dietary change. Proceedings
of the National Academy of Sciences of the USA. doi: 10.1073/pnas.1523119113.
Tarnita, C.E., Antal, T., Ohtsuki, H. and Nowak, M.A. 2009. Evolutionary dynamics in
set structured populations. Proceedings of the National Academy of Sciences of USA
106:8601-8604.
Tennie, C., Call, J. and Tomasello, M. 2009. Ratcheting up the ratchet: on the evolution
of cumulative culture. Philosophical Transactions of the Royal Society of London B
364:2405-2415.
Tinbergen, J. 1953. Social behaviour in animals: with special reference to vertebrates.
Methuen & Co. Press.
Tomasello, M. 1999. The Human Adaptation for Culture. Annual Review of
Anthropology 28: 509-529.
van Schaik, C.P., Ancrenaz, M., Borgen, G., Galdikas, B., Knott, C.D., Singleton, I.,
Suzuki, A., Utami, S.S. and Merrill, M. 2003. Orangutan cultures and the evolution of
material culture. Science 299:102-105.
Wake, D.B. and Vredenburg, V.T. 2008. Are we in the midst of the sixth mass
extinction? A view from the world of amphibians. Proceedings of the National
Academy of Sciences of the USA 105:11466-11473.
Weilgart, L.S. 2007. The impacts of anthropogenic ocean noise on cetaceans and
implications for management. Canadian Journal of Zoology 85:1091-1116.

192
Whitehead, H. 2009. How might we study culture? A perspective from the ocean. In: The
question of animal culture. (R.N. Laland and B. Galef, eds). Harvard University Press
125-152pp.
Whitehead, H. and James, R. 2015. Generalized affiliation indices extract affiliations
from social network data. Methods in Ecology and Evolution 6:836-844.
Whitehead, H. and Rendell, L. 2014. The cultural lives of whales and dolphins.
University of Chicago Press.
Whitehead, H. and Rendell, L. 2004. Movements, habitat use and feeding success of
cultural clans of South Pacific sperm whales. Journal of Animal Ecology 73:190-196.
Whitehead, H. and Dufault, S. 1999. Techniques for analyzing vertebrate social structure
using identified individuals: review and recommendations. Advances in the Study of
Behavior 28:33-74.
Whitehead, H., McGill, B. and Worm, B. 2008. Diversity of deep‐water cetaceans in
relation to temperature: implications for ocean warming. Ecology Letters 11:1198-
1207.
Whitehead, H., Christal, J. and Dufault, S. 1997, Past and distant whaling and the rapid
decline of sperm whales off the Galápagos Islands. Conservation Biology 11:1387-
1396.
Whiten, A., Goodall, J., McGrew, W.C., Nishida, T., Reynolds, V., Sugiyama, Y., Tutin,
C.E., Wrangham, R.W. and Boesch, C. 1999. Cultures in chimpanzees. Nature
399:682-685.
Whiten, A., Caldwell, C.A. and Mesoudi, A. 2016. Cultural diffusion in humans and
other animals. Current Opinion in Psychology 8:15-21.

193
Whiten, A., Horner, V. and de Waal, F.B.M. 2005. Conformity to cultural norms of tool
use in chimpanzees. Nature 437:737-740.
Worm, B., Barbier, E.B., Beaumont, N., Duffy, J.E., Folke, C., Halpern, B.S., Jackson,
J.B., Lotze, H.K., Micheli, F., Palumbi, S.R. and Sala, E. 2006. Impacts of biodiversity
loss on ocean ecosystem services. Science 314:787-790.
Yeakel, J.D., Pires, M.M., Rudolf, L., Dominy, N.J., Koch, P.L., Guimarães, P.R. and
Gross, T. 2014. Collapse of an ecological network in Ancient Egypt. Proceedings of
the National Academy of Sciences of the USA 111:14472-14477.

194
APPENDIX A: SUPPLEMENTARY MATERIAL FOR CHAPTER 213
A2.1 TABLE S2.1. Glossary of network terminology and its interpretation in the context
of animal societies, based on refs. 1-7.
Definition Meaning in the animal social context Network, graph
Collection of points (see “nodes”) joined in pairs by lines (see “edges”) according to a defined relationship.
Population of individuals represented by nodes and connected by their social relationships represented by edges.
Nodes, vertices
Points in the network diagram, representing the elements of the studied system. Nodes can have different states.
Usually represent identified individuals, but can represent higher levels of social structure. States of nodes include sex, age, behaviour types.
Edges, links, ties
Connecting lines between two nodes in the network, representing a relationship between the elements of the system.
Represents the social relationship between two individuals.
Binary edges
Edges can be present or absent and represent the presence of a qualitative relationship between two nodes in a network.
Presence or absence of a social relationship (or social interactions) between two identified individuals.
Weighted edges
Quantitative relationships between two nodes in a network, whose weights are proportional to the relationship intensity.
Quantitative measure of social relationships. Commonly, weighted edges represent the proportion of time two individuals spend associated, estimated by association indices [7], or the rate at which they interact per unit time.
One-mode network
Networks in which all nodes have the possibility of being connected.
Animal social networks themselves are examples of one-mode networks: all pairs of individuals may have a relationship.
Two-mode network
Networks whose nodes are divided into two distinct sets, with edges only occurring
Figure 2.4 is a two-mode network, illustrating individuals connected to the behaviour types that they perform.
13This appendix available online at http://rstb.royalsocietypublishing.org/content/royptb/suppl/2013/03/28/rstb.2012.0340.DC1/rstb20120340supp1.pdf as supplementary material for the manuscript: Cantor M. & Whitehead H. 2013. The interplay between social networks and culture: theoretically and among whales and dolphins. Philosophical Transactions of the Royal Society B. 368. 1618, 20120340. doi: 10.1098/rstb.2012.0340

195
between different sets of nodes.
Coevolutionary (or adaptive) network
Network exhibiting a feedback loop between the local and topological dynamics, i.e. the state of the nodes and the evolution of the network structure.
We suggest that this feedback loop can represent the interplay between changes in individual behaviour and the social structure, mediated by social learning occurring during social relationships (see Figure 2.1b).
Topology of the network
The arrangement of the nodes and the pattern of relationships between them; the structure of a network.
The topology of a social network is an illustration of the social structure of a population.
Modular structure
Network composed of weakly interlinked groups of nodes, which are strongly internally connected.
A modular social network depicts sets of individuals that interact or associate at high frequency with each other, and at lower frequency with individuals of other modules.
Nested structure
In a nested two-mode network, some nodes have more interactions than others and there is a tendency for interactions of nodes with few interactions to be a proper subset of the interactions of nodes with more interactions
Figure 2.4 contains a nested individual-strategy network in which individuals that perform few strategies tend to perform a proper subset of the behavioural strategies performed by the individuals that perform several strategies.
Small-world properties
Networks in which two nodes that are both linked to a third node tend to be themselves linked and in which there is a small average shortest path length between individuals.
In a small-world network, most individuals are not directly related to each other, but almost everyone can be reached from every other by a small number of relationship steps.
Shortest path length
The least number of steps between two connected individuals that separate two nodes in a network.
Measures the shortest distance between two individuals in a social network, in terms of number of intermediate relationships. It is a measure of the efficiency of information transmission.
Connectance The proportion of realized edges in relation to possible edges.
Total number of dyadic relationships given the total number of possible dyadic relationships.
Strength The sum of the weights of all edges connected to a node.
Sum of intensity of all social relationships of a given individual, sometimes called gregariousness.
Closeness centrality
Total distance of a given node to all other nodes in the network, defined by the inverse sum of its
A measure of how related an individual is to all others in the social network.

196
shortest distances to all other nodes.
Betweenness centrality
Measures the degree to which a node lies on the shortest path between two other nodes.
Measures the number of shortest paths that passes through an individual; thus individuals with high betweenness may funnel and control the flow of information through the social network.
A2.2 SUPPLEMENTARY REFERENCES
1. Boccaletti, S., Latora, V., Moreno, Y., Chavez, M. & Hwang, D. U. 2006 Complex
networks: structure and dynamics. Phys. Rep. 424, 175-308. (doi:
10.1016/j.physrep.2005.10.009)
2. Costa, L. da F., Rodrigues, F. A., Travieso, G. & Villas Boas, P. R. 2007
Characterization of complex networks: a survey of measurements. Adv. Phys. 56, 167-
242. (doi: 10.1080/00018730601170527)
3. Croft, D. P., James, R. & Krause, J. 2008 Exploring animal social networks. Princeton,
New Jersey: Princeton University Press.
4. Gross, T. & Blasius, B. 2008 Adaptive coevolutionary networks: a review. J. R. Soc.
Interface 5, 259-271. (doi: 10.1098/rsif.2007.1229)
5. Newman, M. E. J. 2010 Networks: an introduction. Oxford University Press.
6. Vital, C. & Martins, E. P. 2009 Using graph theory metrics to infer information flow
through animal social groups: a computer simulation analysis. Ethology 115, 347-355.
(doi: 10.1111/j.1439-0310.2009.01613.x)
7. Whitehead, H. 2008 Analyzing animal societies: quantitative methods for vertebrate
social analysis. Chicago: University of Chicago Press.

197
A2.3 COPYRIGHT RELEASE: PERMISSION TO REPRODUCE PUBLISHED ARTICLE
Published article: Cantor M. & Whitehead H. 2013. The interplay between social networks and culture: theoretically and among whales and dolphins. Philosophical Transactions of the Royal Society B. 368. 1618, 20120340. doi: 10.1098/rstb.2012.0340 Ph.D. Thesis: On the interplay between society and culture: causes, consequences and stability of sperm whale clans 1355 Oxford Street, Department of Biology, Dalhousie University, Halifax NS, B3H 4J1, Canada According to the Royal Society (6-9 Carlton House Terrace, London SW1Y 5AG, United Kingdom) there are no restrictions for me as an author to reproduce my own work as a chapter of my thesis given that I will cite it properly and provide the full reference. This was confirmed by the editorial board of the journal (correspondence copied below).
From: Permissions <[email protected]> Date: January 26, 2016 at 6:54 AM Dear Mauricio, You are allowed to publish your paper in your thesis but not our typeset version, it has to be your own version. Unfortunately, it’s our policy not to sign any forms so I hope this email is sufficient. Jennifer
Therefore, permission is granted for:
a) the inclusion of the material described above in your thesis b) for the material described above to be included in the copy of your thesis that is
sent to the Library and Archives of Canada (formerly National Library of Canada) for reproduction and distribution.

198
APPENDIX B: SUPPLEMENTARY MATERIAL FOR CHAPTER 314
B3.1 SUPPLEMENTARY FIGURE S3.1
14 This appendix is available online at http://www.nature.com/ncomms/2015/150908/ncomms9091/extref/ncomms9091-s1.pdf as supplementary material for the manuscript: Cantor M, Shoemaker LG, Cabral RB, Flores CO, Varga M, Whitehead H. 2015. Multilevel animal societies can emerge from cultural transmission. Nature Communications 6: 8091. doi:10.1038/ncomms9091

199
Supplementary Figure S3.1. Sensitivity analysis of parameterization and initial
conditions in the emergence of clans in the 20 simulated scenarios. Clan emergence is
evaluated by the weighted modularity Q-value (y-axis) in each of the acoustic networks
simulated by the 20 agent-based models (x-axis). Color code denotes similar transmission
mechanisms of coda types among agents operating at different social levels (see Figure
3.3A, main text); shapes represent the social level at which the transmission operated
(circle: population, square: social unit, circle: predefined geographical clan); whiskers
represent the 95% confidence intervals (CI) estimated by an appropriate theoretical
model, based on 1000 iterations and 10 replicates for each model. Significant Q-values,
those falling outside of the 95% CI of the benchmark distribution (P < 0.001), indicate a
reliable partition in the acoustic networks, i.e. a modular topology with subsets of social
units (nodes) more strongly connected with each other than with the rest of the network
(see Figure 3.4, main text). The top plot illustrates our main results (Figure 3.3C, main
text), followed by their initial parameters values. In each of the 16 new scenarios below
(a-h), a single parameter was changed at a time for all 20 models with values representing
the extremes of a biologically meaningful range (the parameter value is indicated in the
top left of the plot). Note that each small plot resembles very much the main pattern
shown in the top plot, indicating that the clan emergence presented in the main text is
robust to variation in the parameters and initial conditions.

200
B3.2 SUPPLEMENTARY FIGURE S3.2
Supplementary Figure S3.2. Sensitivity analysis of the weighted modularity metric
along a gradient of increasing sampling of the link weights in the acoustic networks. The
modularity metric defines a reliable partition in the acoustic networks (i.e. emergent
clans) simulated by each of the 20 agent-based models (ABMs). Whiskers represent the
95% confidence intervals (CI) given by 1000 replicates in the bootstrap procedure (link
weight resampling with replacement). Color code denotes similar transmission
mechanisms of coda types among agents operating at different social levels (following
Figure 3.3A, main text). Note the strikingly similar pattern in all scenarios, conferring

201
robustness to our chosen metric for clan partition across the range of possible weights for
a link (coda repertoire similarity) between nodes (social units) in the simulated networks.
B3.3 SUPPLEMENTARY FIGURE S3.3
Supplementary Figure S3.3. Typical simulated dataset. Output of a representative
simulated dataset, with social learning of coda types within social units (ABM04), after
700 simulated years: (A) Social unit size distribution (number of agents); (B) Age
distribution (in simulated years, i.e. time steps in the simulation); (C) Population size

202
over time (number of agents); (D) Coda frequency of all repertoires of all agents within
each social unit. Each boxplot represents the frequency distribution of a social unit; boxes
represent 1st and 3rd quantiles; black horizontal bars represent median; dashed whiskers
represent minimum and maximum frequencies; circles indicate outliers.

B3.4 SUPPLEMENTARY TABLE S3.1. Modularity results and averaged acoustic similarity in all 20 agent-based models.
ABM
Transmission process and level of operation Modularity Average acoustic similarity ± SD
Q 95% CI Emergent social units Emergent clans within between # within between
01 Individual learning (IL) 0 0 – 0.6*10-8 0.3301±0.0122 0.3297±0.0079 1 0.3301 - 02 Genetic inheritance (GI) 0.1*10-8 0 – 0.8*10-8 0.4405±0.0533 0.3902±0.0312 1 0.3913 - 03 Social learning (SL) at population level 0 0 – 1.7*10-8 0.5026±0.0196 0.5017±0.0127 1 0.5026 - 04 Social learning (SL) at unit level 0 0 – 0.2*10-8 0.4958±0.0170 0.4956±0.0120 1 0.4958 - 05 Social learning (SL) at clan level 0 0 – 0.4*10-8 0.4874±0.0138 0.4875±0.0106 1 0.4872 - 06 SL+Homophily (H) at population level 0 0 – 0.9*10-8 0.9592±0.0139 0.9545±0.0106 1 0.9592 - 07 SL+Homophily (H) at unit level 0 0 – 0.2*10-8 0.9546±0.0196 0.9494±0.0142 1 0.9546 - 08 SL+Homophily (H) at clan level 0 0 – 0.5*10-8 0.9613±0.0103 0.9570±0.0077 1 0.9575 - 09 SL+Conformism (C) at population level 0.2*10-8 0 – 0.9*10-8 0.7477±0.0122 0.7470±0.0101 1 0.7495 - 10 SL+Conformism (C) at unit level 0 0 – 0.9*10-8 0.7538±0.0171 0.7536±0.0123 1 0.7538 - 11 SL+Conformism (C) at clan level 0.6*10-8 0 – 0.7*10-8 0.7094±0.0119 0.7086±0.0082 1 0.7086 - 12 SL+Symbolic Marking (SM) at population 0 0 – 0.3*10-8 0.4246±0.0100 0.4253±0.0068 1 0.4246 - 13 SL+Symbolic Marking (SM) at unit level 0 0 – 1.0*10-8 0.4821±0.0171 0.4813±0.0103 1 0.4821 - 14 SL+Symbolic Marking (SM) at clan level 1.0*10-8 0 – 0.5*10-8 0.4794±0.0199 0.4801±0.0127 1 0.4808 - 15 SL+H+C at population level 0.020 0 – 0.003 0.7625±0.0540 0.7494±0.0491 3 0.7343±0.0684 0.7302±0.0054 16 SL+H+C at unit level 0.036 0 – 0.006 0.7582±0.0639 0.7437±0.0498 2 0.7183±0.0852 0.7115±0.0046 17 SL+H+C at clan level 0.029 0 – 0.003 0.8210±0.0730 0.8089±0.0581 2 0.8191±0.0112 0.8189±0.0056 18 SL+H+SM at population level 0.9*10-8 0 – 1.7*10-8 0.9581±0.0152 0.9531±0.0110 1 0.9538 - 19 SL+H+SM at unit level 0 0 – 0.7*10-8 0.9546±0.0179 0.9479±0.0148 1 0.9546 - 20 SL+H+SM at clan level 0.5*10-8 0 – 1.5*10-8 0.9567±0.0142 0.9509±0.0103 1 0.9524 -
For each agent-based models (ABM01-20), modularity Q ± 95% confidence intervals (CI) calculated with theoretical models,
and averaged coda repertoire similarity ± standard deviation (s.d.) within and between social units and emergent clans are
presented. ABMs are composed by a transmission process (individual learning, genetic inheritance, social learning (SL)),
with/without a transmission bias (homophily (H), conformism (C), symbolic marking (SM)), occurring at three different social
levels (population, social unit, predefined geographically-segregated clan).
203

204
B3.5 SUPPLEMENTARY TABLE S3.2. Parameters tested in sensitivity analysis of the agent-
based model parameterization and initial conditions.
Parameter or starting
condition Lower estimate Chosen condition Upper estimate
a) Starting population size and
carrying capacity (agents) N0 = 500 N0 = 1000 N0 = 5000
b) Reproductive age (years) 6 to 20 9 to 40 18 to 70
c) Migration rate among social
units (agents year-1) c = 0.01 c = 0.05 c = 0.10
d) Mortality probability
(year-1)
Uniform (equal to all
agents)
Age-dependent [1]
(Mcalves = 0.093, Madults
= 0.055)
Age-dependent [2]
(Mcalves = 0.1679,
Madults = 0.0505)
e) Initial age distribution
(years)
Normal distribution
(all ages are equally
probable)
Exponential decay
(more younger, less
older agents)
Exponential
increase (more
older, less younger
agents)
f) Initial average social unit
size (agents) tvu = 8 tvu = 12 tvu = 15
h) Individual learning rate
(year-1) ilearn = 0 ilearn = 0.02 ilearn = 0.10
g) Repertoire length (coda
types) nCodas = 31 nCodas = 62 nCodas = 93
Tested parameters were common to all of the 20 agent-based models. Three conditions
for each parameter were tested: a lower extreme estimate, the chosen condition, and an
upper extreme estimate.

205
B3.6 SUPPLEMENTARY NOTE 3.1
Collectively, the sensitivity analysis evaluated the robustness of the clan partition
across various demographic, learning, and coda-specific parameterizations (see
Sensitivity analysis of parameterization and initial conditions in the agent-based models,
Supplementary Methods). The different effects considered were the proportion of
potential tutors (adult agents) as source of cultural traits (coda types) [3], their dispersal
rates [4,5] as seeding of copying errors and innovations [6,7] between social units on the
transmission of coda types among learners (calves), the diversity of cultural traits in the
population and hence the emergence distinct cultural groups [8], here the clans of sperm
whales. The results were very robust to changes in the initial conditions and
parameterization (Supplementary Figure S3.1). This is clear in two key ways. First, in all
of the 16 cases with different initial conditions, there was no reliable clan partition in the
models in which they originally have not emerged (ABMs 1-11, 13-14, 18-20). In these
cases, modularity was zero or non-significant and 2 to 3 orders of magnitude smaller than
in the cases where clans emerged (Supplementary Figure S3.1). Second, clans emerged
only in the very same three models with biased social learning of coda types (ABMs 15-
17) in which we originally observed partition of the acoustic networks into modules
(Figure 3.4, main text).
Although the overall pattern is robust to the initial conditions, there were a few
deviant situations (10%: 5 situations/(3 models*16 cases)) in which these three models
that originally yielded clans did not produce them when the parameters were set to
extreme estimates (Supplementary Figure 3.1). These were when: a) individual learning
rate was excessively high in ABMs 15 and 16; and c) coda repertoire length was

206
excessively small in ABMs 15, 16 and 17. We interpret these findings as follow. First,
with very high rate of individual learning, the social learning efficiency decreases. Such
rates (10% per year) would represent very low fidelity in copying coda types and/or very
high rate of innovation by calves. Either way, the overall diversity increases, dismantling
possible homogeneity in coda repertoires within potential clans. Second, with very small
coda repertoires (c), there are few coda types and consequently little room for variation.
When averaging the repertoires of all individuals of social units, the overall diversity
decreases, leading to the convergence of all units’ repertoires and consequently to no
partition into clans.
B3.7 SUPPLEMENTARY NOTE 3.2
Our sensitivity analysis of our metric for the clan partition (see Sensitivity analysis of
clan partition, Supplementary Methods) suggests that the clan emergence is robust to the
variation in the averaged acoustic similarity among social units (acoustic network links)
(Supplementary Figure 3.2). In all the 20 agent-based models, the pattern was strikingly
similar: modularity values were high, stable (with small 95% confidence intervals) and
consistent from 5 to 100% of the sampled links (despite an overall decrease around 30%).
This confers robustness to our chosen metric for clan partition across the range of
possible weights for a link (coda repertoire similarity) between nodes (social units) in the
simulated networks.

207
B3.8 SUPPLEMENTARY METHODS 3.1. The balabm R package.
Agent-based models are available in the R package balabm v.1.1, which is deposited
open-sourced at the Bitbucket repository https://bitbucket.org/maucantor/balabm. The
package also makes available the empirical data used in this work.
1. Installation: The package can be installed from the repository:
a. Launch R. Install and/or load the package ‘devtools’ with the command:
if(!require(devtools)){install.packages('devtools'); library(devtools)}
b. Install and load ‘balabm’ with the command:
install_bitbucket(“maucantor/balabm”); library(balabm)
2. Running the models.
a. Browse your local machine for the folder where R was installed and find the folder
/library/balabm.
b. The folder /abm/ contains the scripts for each of the ABM (Check README.txt).
Copy the content of this folder to your working directory.
c. Open the R scripts for the agent-based models in R (or RStudio) to run the models.
When using these models or data, please cite the R package along with the original paper:
citation("balabm")
B3.9 SUPPLEMENTARY METHODS 3.2. Empirical support for the agent-based models.
We built agent-based models based on the following empirical socioecological findings:
a. Social structure parameters

208
i. Female and immature sperm whales are found in nearly-permanent social units that
include related, as well as unrelated, animals [9]. Mature males lead quasi-solitary lives
and spend a great part of their lives near the poles, associate only briefly with female
social units for mating [9], and rarely perform coda vocalizations [10]. Therefore, males
would not play any important role in the behavioural learning mechanisms we addressed
here, and thus the simulated social units contained only female agents.
ii. Calves experience high natal group philopatry, i.e. they remain in the natal social unit
since they are highly dependent on their mothers [9,11]. Thus, agents with 0, 1 and 2
years old do not change social unit membership, i.e., the probability of remaining with
the mothers in their natal social unit (i.e. retaining the social unit membership label) was
rem = 1.
iii. Changes in social unit membership are very rare. Social units are long-term entities
that are composed of females and immatures that live and move together for many years
and likely their entire lives [9,12]. Thus, adult females have very low probability of
migrating to other social units [13]. There is a rough estimate of 6.3% probability of
individuals to be involved in social unit merging, splitting or transferring of individuals
within a given year [13]. Thus, in our models there was a very low probability, c = 0.05,
of adult agents migrating to another social unit (i.e., of randomly changing their social
unit label) through their lives. In the abovementioned study [13], the individuals who
changed social units were relatively young females. Thus, in our models the migration
probability was age-dependent, inversely proportional to the agents’ age, with youngster
agents more prone to change their social unit.

209
iv. Therefore, with i, ii, and iii, the social units emerge in the simulations as nearly-
permanent and nearly-matrilineal, as in the empirical data. Although four other short-
term aggregative levels have been described for sperm whales, none of them are
considered a social level per se [9] either because they are temporary (small temporal
scale: clusters, groups) or because they do not involve social interaction among
individuals (large spatial scale: aggregations, concentrations). Clusters are ephemeral sets
of individuals swimming closely at the water surface for periods of minutes, and groups
are sets of units moving together in a coordinate manner for periods of few hours to few
days [9]. Concentrations are patches of whales spanning a few hundred kilometers, within
which aggregations of individuals within 10-20 kilometers may occur [9]. Therefore,
these short-term aggregative levels were not represented in the models.
b. Population parameters
v. Empirical social units were delineated using individuals re-sighted at least three times,
with at least two other individuals during at least two 12h-identification periods spaced
out by at least 30 days [13]. Off the Galápagos Islands, there were 174 photo-identified
individual sperm whales that meet the above criteria and were assigned to 18 known
social units [13]. To account for undersampling, the simulated initial population size was
more than 5 times larger (N0 = 1000 individuals) than the empirical number of photo-
identified individuals, but still a reasonable number of sperm whales (excluding mature
males) to be using the waters off the Galápagos Islands [14].
vi. The mean social unit size off the Galápagos Islands is about 12 members (including
sometimes juvenile males) [14,15]. The maximum initial number of simulated social

210
units was a function of the initial population size: TVU = N0 / SU where TVU is the total
number of social units at time step t=1, N0 is the initial population size, and SU is a
random integer from the uniform distribution ϵ[8,14].
vii. Social units rarely split, merge, or experience abrupt membership changes [9,13]. With
stochastic demographic processes in the simulations, social units may increase or
decrease in size over the simulated time (see Appendix B3.3, Supplementary Figure
3.3A). To prevent the simulated social units from growing indefinitely, they split in half
when their size doubled the maximum initial social unit size at time step t=1. All agents
of a splitting social unit had the same probability of remaining in their original unit or
being part of a new social unit. That is, half of the agents of that social unit were
randomly selected with equal probabilities to keep their social unit membership labels,
while the other half had their social unit membership replaced by the new label Tvu_t +1,
where Tvu_t is the maximum number of social units existent at the time step t.
viii. Although precise ages are hard to estimate empirically, female sperm whales are
thought to become sexually mature after at about the age of 9, stop reproducing after
about 40 years old, and live 70 years on average [9]. In the simulations, agents followed
these characteristics. The simulation were started with agents’ age being randomly
assigned from an exponential distribution ( ∙ ∙ , age ≥ 0, λ = 0.08),
so the initial population was mostly young, with ages typically varying from 0 to 70 years
old. Agents reproduced from 9 to 40 years old (i.e. newborn calf agents are added to their
simulated social units), and demographic rates were chosen such that most whales lived
70 years (although some could die earlier and a few live longer) (Appendix B3.3,
Supplementary Figure S3.3B).

211
ix. The empirical female sperm whale reproduction rate is age-specific and estimated [16]
to be bemp_i = 0.257 – (0.0038 × agei), where bemp_i is the empirical birth rate and agei is
the age in years of the individual i. Because we were interested only in female agents, we
simulated female offspring only, so the simulated birth rate was half of the empirical one
(bi = bemp_i / 2), assuming a 1:1 sex ratio in birth events. At each time step t, a birth
probability bi_t was calculated for all agents of the population who reached sexual
maturity, which have the same probability of giving birth. In the social unit of the
selected reproductive agents there will be an addition of one agent with age 0 and an
empty coda repertoire vector.
x. Population was modeled as density-dependent. We assumed that all social unit
members compete for the same foraged resources, and thus the population fluctuated
around the carrying capacity (i.e., the initial population size, N0 = 1000 individuals) over
time (see Appendix B3.3, Supplementary Figure 3.3C).
xi. Mortality rates (mt) were defined as mt = [(Bt + Nt) – N0] / (Bt + Nt), where Bt is the
number of births in year t, Nt is the population size in year t, and N0 is the initial
population size. Calves usually have higher mortality than adults, and classic and recent
empirical estimates corroborate this pattern [9,10]. In our models, to account for age-
dependence in mortality we calculated the number of agents that would die in each time
step, mt, and removed agents from the simulation according to empirical estimates of
mortality rates [9] (calf = 0.093 year-1; adult and juveniles = 0.055 year-1). Therefore, all
agents in the population at the time step t had a probability of dying according to their
age class. The death of selected agents was represented by the removal of their coda
repertoires, social unit membership, and age labels from the model.

212
xii. The simulations lasted for t = 700 years, a period 10 times longer than the empirical
life expectancy [9] and long enough to achieve a steady state in the simulations.
c. Learning parameters
xiii. While sperm whales mainly produce echolocation sounds (continuous series of clicks),
they also produce codas, stereotypical patterns of 3-40 broadband clicks lasting less than
3 seconds in total [17]. Codas are performed in a social context [9,18,19] almost
exclusively by females [10] and their major function seems to be labelling and
reinforcing social bonds [20].
xiv. Sperm whale social units have vocal repertoires of about 31 coda types (usually 3-4
commonly used plus about 25 to 28 uncommonly used coda types) [19,21]. In our
simulations, agent calves started with coda repertoires of 31 random codas (frequencies
of which were drawn from the uniform distribution ϵ[0,100]). Along the simulation, they
could change their repertoires and add frequencies of up to 62 coda types, which is twice
as long as the empirical coda repertoires to correct for undersampling of empirical data.
xv. Individuals gradually develop their codas in early ages [22,23] and rarely change coda
repertoire as adults. The precise age for learning the acoustic repertoire is genuinely
difficult to estimate given the impossibilities of experimental intervention with sperm
whales in the wild. While the empirical evidence is inherently scarce, it suggests that
individuals mainly compose their vocal repertoires at early ages, rather than over the
course of their lives. Based on the best available empirical data, we defined a calf as an
agent up to 3 years old—since after this age sperm whales are usually larger and begin to

213
wean and perform deeper dives [12]. Learning was modelled such that calf agents change
their coda repertoires between the ages of 0 and 3 years old (see Figure 3.2, main text).
xvi. To account for copying errors and innovations [6,24], in all models calf agents were
subjected to a low probability (0.02) of replacing the frequency of one randomly chosen
coda type (62 codas * 0.02 ≈ 1) by a value drawn from the uniform distribution ϵ[0,100]
each year (at ages 0, 1 and 2 year old). This effect represented individual learning, i.e. the
chance of deliberately creating new coda types (innovation), or randomly creating a new
type by copying an existent one with low fidelity (copying error). Therefore, with xii and
xiii, changes in the coda repertoire occurred three times for each calf agent and after the
age of 3, their repertoires were fixed.
xvii. Individuals within social units have very similar (but not identical) coda repertoires
[21,23,25,26]; and social units of the same clans have similar (but not identical) coda
repertoires [21,23]. Therefore, just as with the empirical data [21], we evaluated possible
clan segregation based on the coda repertoire of the social units. In our simulations, we
used the averaged coda repertoires of the social units to examine whether they cluster in
the simulated acoustic networks (i.e., by testing for modularity).
xviii. Social units from different clans in the same area have very distinct coda repertoires
[21], which justifies clustering of social units with high coda repertoire similarity as
emergent clans in the simulations.
xix. Demographic effects and individual movements—such as migration, immigration and
dispersal—can be important drivers of cultural diversity [27]. Our models were explicitly
temporally-structured and implicitly spatially-structured. To account for the potential
demographic and movement effects in coda transmission, while respecting the structure

214
of the sperm whale societies with nearly-permanent social units, we simulated different
levels of population mixing. We replicated all the models with social learning and
transmission biases in the three social levels that are relevant for sperm whales: social
unit, predefined geographical clans and population. In doing so, it is reasonable to assume
that the mean distance between an individual and other members of its unit is less than
that between the individual and other members of its clan, which in turn is less than the
distance between two members of the whole population. We represented the case in
which social units are fairly closed structures by allowing the calf agents to learn only
within their own social units. We represented learning between social units that are
spatially segregated by starting the simulations with predefined clans mimicking the
geographically-segregated clans found in the Atlantic [28], and allowing calf agents to
copy from agents of other units, but only from those within their clans. Finally, we
represented the case of a completely mixed population by allowing the calf agents learn
from any agent in the population.
B3.10 SUPPLEMENTARY METHODS 3.3. Sensitivity analysis of parameterization and
initial conditions in the agent-based models.
Agent-based models usually rely on assumed parameters to modulate the agents’
behaviour. In some cases, their empirical values are unknown. We have grounded the
parameter estimates of our models using the best empirical evidence available (see
Empirical support for the agent-based models, Appendix B3.9, Supplementary Methods
3.2). In our main analysis (Figures 3.3 and 3.4, main text), the parameters and initial
conditions were fixed across scenarios, so we can directly compare differences in

215
learning strategies—the overarching goal of this study—without having the confounding
influence of changing parameter values or starting conditions.
Possibly, different starting points in the simulated scenarios could cascade into
different model outputs. To evaluate the robustness of our findings on the partition of
simulated social units of sperm whales into clans with distinct acoustic behaviour, we
performed a sensitivity analysis of the parameters that were common to all of the 20
agent-based models. We assessed the impact of 6 initial demographic parameters in
addition to 2 key parameters of coda transmission (Appendix B3.5, Supplementary Table
S3.2). Some demographic parameters could affect the number of learners (calf agents)
and tutors (adult agents) in the population: population size (carrying capacity) controls
number of agents; reproductive age controls addition of agents; mortality controls
removal of agents; initial age distribution controls number of calves in the starting
populations. Others tested demographic parameters could affect the probabilities of
interaction between agents: migration rates among social units affect population mixing;
average social unit size affect number of associates of an agent. Finally, the coda
transmission parameters could affect learning fidelity and cultural trait diversity:
individual learning controls the rate of innovations and leaning errors in producing new
coda types; while coda repertoire length controls number of coda types to be learned.
To evaluate the clan partition, we ran the models changing a single parameter value at
a time and calculated the modularity Q-metric for weighted one-mode networks, our
measure of clan partition. Significantly high Q-values indicated a reliable partition in the
acoustic network into modules, i.e., the emergent clans. The significance of Q-values was
checked using an appropriate theoretical model reshuffling the link weights among social

216
units, using 1000 iterations. Modularity was considered high and significant when the
observed Q-value was higher than the expected by chance, falling outside of the 95%
confidence intervals (CI) of the benchmark distribution generated by the theoretical
model (for more details, see details in the main methods section).
Our models are computationally demanding; therefore, for each of the 8 parameters
and initial conditions we tested two values (the extremes of a biologically-meaningful
range) and replicated it 10 times for each model, amassing 3200 Q-values from
independent runs of the agent-based models. Supplementary Table 3.2 (Appendix B3.5)
displays all parameters and their tested ranges. We compared our modularity findings
(Figures 3.3C and 3.4, main text) with 16 other situations, changing a single parameter at
a time. This allowed us to parse out the effect of each parameter on our modularity
results, rather than having confounding influences of multiple parameter changes as a
time. While, ideally, we would examine interactions of parameters as well, due to
computational limitations with agent-based models, it is common to examine changing a
single parameter at a time [32,33]. The results are available in the Supplementary Figure
3.1 (Appendix B3.1) and Supplementary Note 3.1 (Appendix B3.6).
B3.11 SUPPLEMENTARY METHODS 3.4. Sensitivity analysis of clan partition.
We defined a clan, both in the empirical and simulated datasets, using a weighted
modularity metric to evaluate the partition of the acoustic networks (i.e., nodes
representing social units connected by weighted links representing similarity among their
coda repertoires). Although the agent-based models simulated coda repertoires for each
agent, the empirical data is not resolved at the individual level since it is logistically very

217
difficult to assign coda production to individual whales in the wild (this has been
achieved in just one case [26]). To make the simulated data comparable to the empirical
data, we averaged the coda repertoires of all agents of the social units to build the
acoustic networks (see Figure 3.4, main text). However, the simulation of coda
repertoires with agent-based models represents a “complete sampling”, in the sense that
we are able to record all codas of all agents of all social units. Clearly, this is not the case
for the empirical data, for the same logistical challenges.
We have used the weighted counterpart of the modularity metric to account for
fine-scale variation in the similarities among simulated social units. To evaluate if the
metric is robust to variation in the levels of sampling in the individual coda repertoires—
and make simulated and real-world acoustic networks even more comparable—we
performed a sensitivity analysis to the resultant weighted modularity Q-values in the
simulations. We resampled (with replacement, 1000 iterations) the simulated network
links of all 20 ABMs and evaluated the modularity values with increasing sampling
gradient, from 5% to 100% with increment of 5% of the links at a time (bootstrap
procedure). The results are available in the Supplementary Figure 3.2 (Appendix B3.2)
and Supplementary Note 3.2 (Appendix B3.7).
B3.12 SUPPLEMENTARY METHODS 3.5. Differences between empirical and simulated
coda types.
Codas are stereotypical patterns of 3-40 broadband clicks lasting less than 3
seconds in total [17]. The empirical codas types are classified according to inter-click
intervals, i.e., the proportion of time between the clicks [19,21]. For instance, a coda type

218
labelled as 5R contains 5 regularly-spaced clicks (so 4 equal inter-click intervals), while a
4+1 coda also contains 5 clicks but with an extended period between the 4th and 5th clicks
(so 3 equal and one extended inter-click interval). Sperm whales can produce several
coda types [19,21]. Here, we simulated the absolute frequency of the different coda types
each whale can make, not inter-click intervals that define coda types. In our agent-based
models, each agent has a coda repertoire represented by a vector with maximum of 62
elements denoting absolute continuous frequencies of different coda types from 0
(absent) to 100 (always performed coda type). For instance, consider a whale A that
always performs 5 codas types 3R, 4R, 5R, 4+1, 5+1; and a whale B that mostly performs
the codas 3R, 4R, 7R but sometimes also performs the codas 6R, 2+1, 3+4, 2+4. The
repertoire of a simulated agent representing A is given by a vector of 62 elements, 5 of
which have frequency 100% and the rest is zeroed. Likewise, the repertoire of the agent B
is also a 62-element vector but with 3 elements with 100%, 4 elements with intermediate
frequency (say 30, 40, 60, 50%) and the rest is zeroed. Therefore, the two vectors differ
both in number of zeroed elements and in the frequencies of the non-zeroed ones. Note
that we simulated and compared frequencies of use of labelled codas, not the codas
themselves, because we are interested in evaluating the diversity of codas individuals end
up producing under different coda transmission scenarios (to further quantify and
compare the similarity of their coda repertoires).
B3.13 SUPPLEMENTARY METHODS 3.6. Differences between empirical and simulated
coda transmission.

219
The principal mechanism for the acquisition of coda repertoire is hypothesized to
be social learning, in which individuals reproduce the coda types they are exposed to
[19,21,23,29,30]. The main goal of our agent-based models is to test which transmission
mechanisms, if any, can reproduce the empirical patterns (distinct vocal clans of sperm
whales with highly similar coda repertoires), presumably generated by social learning of
coda types among whales. Therefore, we modeled changes in the agents’ coda repertoires
(i.e. changes in the frequency of codas used) occurring due to varieties of social learning
and other alternative transmission processes, to observe under which combination of
transmission processes vocal clans (clusters of social units with similar coda repertoire)
emerged. Briefly, the transmission processes modelled were: genetic inheritance or
vertical transmission (agents copy the exact mother’s repertoire), individual learning
(agents are assigned to random coda types and frequencies), and oblique social learning
(see main text and Figure 3.2).
Oblique social learning was simulated as agents copying different proportions of
other older agents’ repertoires (i.e. coda types and their frequencies of usage). For an
example of a typical social learning simulated event, consider the two abovementioned
fictional whales A and B. When the agent A “learns” from B, it randomly selects a coda
type i from B’s repertoire (62-element coda vector) and copies their frequency of use so
the ith element in A’s repertoire will contain the same value as the ith element in B’s
repertoire. The proportion of coda types copied is predefined, as well as from whom the
codas were copied (only from individuals of the same social unit; or from individuals of
different social units of the same vocal clan; or from any individuals of the population)
(see main text and Figure 3.2A, iii). This “pure” social learning could also be biased by

220
homophily, conformism, and/or symbolic marking. In the models with homophily, agents
copied coda types from agents of social units with high coda repertoire similarity to the
social unit they belong to, but not their own (Figure 3.2A, iv). In the models with
conformism, agents disproportionately copied the most common coda types (within their
social unit, within their clan, or within the entire population) (Figure 3.2A, v). Finally, in
the models with symbolic marking, agent calves copied a specific subset (~10%) of the
coda repertoire of their social unit to mark the social unit they belong to. This subset is
represented by 6 coda types that individuals from a given social unit will always perform
(i.e., all agents will have 6 specific elements with 100% frequencies in the coda vector)
(Figure 3.2A, vi). In our 20 sub-models, these transmission processes could be combined
and occur within the social unit (Figure 3.2B, vii), the pre-defined vocal clan (Figure
3.2B, viii), or entire population (Figure 3.2B, xi) (see also the main text and Figure 3.3A
for full description).
B3.14 SUPPLEMENTARY METHODS 3.7. Differences between empirical and simulated
coda repertoire comparison.
Empirical coda repertoires were assigned to the social units whose members were
photo-identified within 2h of the recording at the field and had at least 25 codas recorded.
The empirical repertoires of the social units were compared using two methods, one
based on continuous and other on categorical measures [21,31]. The first method used an
averaged multivariate similarity method to compare codas with the same number of
clicks, based on the infinity-norm distance between the absolute and standardized
intervals between adjacent clicks (inter-click intervals):

221
∑ ∑ .
.
∙ (1)
where sAB is the coda similarity between the repertoires A and B, each with nA and nB
codas respectively; li is the number of clicks in coda i of set A, lj is the number of clicks
in coda j of set B, and dij is the maximum distance (given by the infinity-norm) between
the inter-click interval vectors of the codas i and j. The basal similarity was 0.001 to give
a very fine scale comparison of codas on the order of 1 millisecond (although results are
robust to variation) [31]. The multivariate similarity (s) was used to build the links among
social units in the empirical acoustic networks, which we then used to analyze the clan
partition. The second method categorized codas into nearly discrete types based on the
number of clicks using a k-means clustering algorithm and a variance ratio criterion to
choose the number of clusters [19,21]. Each coda type was given a representative label
(e.g. 3R for codas with three regularly spaced clicks; 4+1 for 5-click codas with an
extended interval before the last click). Two categorical coda types were considered
similar if they were assigned to the same type (categorical similarity = 1) and dissimilar if
assigned to different types (categorical similarity = 0) [19,21].
In our agent-based models, we simulated frequencies of usage of coda types
(categories), and not the inter-click intervals of each coda, therefore the coda repertoire
comparison resembles the second method. We chose the asymmetric weighted Bray-
Curtis index as a feasible metric to compare the simulated data—the averaged frequency
of usage of codas within members of a social unit—to calculate the similarity between
the repertoires of the social units and further evaluate the emergence of clans. For each
two coda repertoires, the similarity of the frequencies of use of coda types was given by:
1 (2)

222
where BCAB is the sum of the lowest frequency of the coda types that are common to both
repertoires of the social unit A and B; SA is the total frequency of the codas in the
repertoire of the social unit A, while SB is the total frequency of codas in the repertoire of
the social unit B. The original Bray-Curtis index measures dissimilarity, so here 1- BCAB
gives the similarity between repertoires: from 0 (completely different) to 1 (exactly equal
repertoires). Note that this metric did not consider coda types that were simultaneously
absent (double zeroes) in both repertoire vectors. Finally, the Bray-Curtis similarities
between simulated social units were used to build the simulated acoustic networks from
which we analyzed the potential partition into clans.
B3.15 SUPPLEMENTARY REFERENCES
1. Chiquet, R. A., Ma, B., Ackleh, A. S., Pal, N. & Sidorovskaia, N. Demographic
analysis of sperm whales using matrix population models. Ecol. Model. 248, 71-79
(2013).
2. Whitehead, H. & Gero, S. Positive observed rates of increase do not reflect a healthy
population: conflicting rates of increase in the sperm whale population of the eastern
Caribbean. Endanger. Species Res. 27, 207-218 (2015).
3. Williams, J. & Slater, P. Modeling bird song dialects—the influence of repertoire size
and numbers of neighbours. J. Theor. Biol. 145, 487–496 (1990).
4. Ellers, J. & Slabbekoorn, H. Song divergence and male dispersal among bird
populations: a spatially explicit model testing the role of vocal learning. Anim.
Behav. 65, 671–681 (2003).

223
5. Nunn, C., Thrall, P., Bartz, K., Dasgupta, T. & Boesch, C. Do transmission
mechanisms or social systems drive cultural dynamics in socially structured
populations? Anim. Behav. 77, 1515–1524 (2009).
6. Slater, P. J. The cultural transmission of bird song. Trends Ecol Evol. 1, 94–97 (1986).
7. Whiten, A., Goodall, J., McGrew, W., Nishida, T. & Reynolds V. Charting cultural
variation in chimpanzees. Behaviour 138, 1481–1516 (2001).
8. Cantor, M. & Whitehead, H. The interplay between social networks and culture:
theoretically and among whales and dolphins. Phil. Trans. R. Soc. B 368, 20120340
(2013).
9. Whitehead, H. Sperm Whales: Social Evolution in the Ocean. (Chicago University
Press, 2003).
10. Marcoux, M., Whitehead, H. & Rendell, L. Coda vocalizations recorded in breeding
areas are almost entirely produced by mature female sperm whales (Physeter
macrocephalus). Can. J. Zool. 84, 609-614 (2006).
11. Gero, S., Gordon, J. & Whitehead, H. Calves as social hubs: dynamics of the social
network within sperm whale units. Proc. R. Soc. B. 280, 20131113 (2013).
12. Gero, S. et al. Behavior and social structure of the sperm whales of Dominica, West
Indies. Mar. Mamm. Sci. 30, 905-922 (2014).
13. Christal, J., Whitehead, H. & Lettevall, E. Sperm whale social units: variation and
change. Can. J. Zool. 76, 1431-1440 (1998).
14. Whitehead, H., Christal, J. & Dufault S. Past and distant whaling and the rapid
decline of sperm whales off the Galápagos Islands. Conserv. Biol. 11, 1387-1396
(1997).

224
15. Whitehead, H., Antunes, R., Gero, S., Wong, S. N. P., Engelhaupt, D., & Rendell, L.
Multilevel societies of female sperm whales (Physeter macrocephalus) in the
Atlantic and Pacific: Why are they so different? Intl. J. Primatol. 33, 1142-1164
(2012).
16. Whitehead, H. Estimates of the current global population size and historical trajectory
for sperm whales. Mar. Ecol. Prog. Ser. 242, 295-304 (2002).
17. Watkins, W. A. & Schevill, W. E. Sperm whale codas. J. Acoust. Soc. Am. 62,1486-
1490 (1977).
18. Whitehead, H. & Weilgart, L. Patterns of visually observable behavior and
vocalizations in groups of female sperm whales. Behaviour 118, 271-296 (1991).
19. Weilgart, L. & Whitehead, H. Group-specific dialects and geographical variation in
coda repertoire in South Pacific sperm whales. Behav. Ecol. Sociobiol. 40, 277-285
(1997).
20. Schulz, T. M., Whitehead, H., Gero, S. & Rendell, L. Overlapping and matching of
codas in vocal interactions between sperm whales: insights into communication
function. An. Behav. 76, 1977-1988 (2008).
21. Rendell, L. & Whitehead, H. Vocal clans in sperm whales (Physeter macrocephalus).
Proc. R. Soc. B 270, 225-231 (2003).
22. Watkins, W. A., Moore, K. E., Clark, C. W. & Dahlheim, M. E. in Animal Sonar (eds
Nachtigall, P.E. & Moore, P.W.B.) 99-107 (Plenum, 1988).
23. Gero, S. On the Dynamics of Social Relationships and Vocal Communication between
Individuals and Social Units of Sperm Whales. Ph.D. Thesis (Dalhousie University,
2012).

225
24. Filatova, O. A., Burdin, A. M. & Hoyt, E. Is killer whale dialect evolution random?
Behav. Proc. 99, 34–41 (2013).
25. Rendell, L. & Whitehead, H. Do sperm whales share coda vocalizations? Insights into
coda usage from acoustic size measurement. An. Behav. 67, 865-874 (2004).
26. Schulz, T. M., Whitehead, H., Gero, S. & Rendell, L. Individual vocal production in a
sperm whale (Physeter macrocephalus) social unit. Mar. Mam. Sci. 27, 149-166
(2010).
27. Fayet, A. L., Tobias, J. A., Hintzen, R. E., & Seddon, N. Immigration and dispersal
are key determinants of cultural diversity in a songbird population. Behav. Ecol. 25,
744-753 (2014).
28. Antunes, R. N. C. Variation in Sperm Whale (Physeter macrocephalus) Coda
Vocalizations and Social Structure in the North Atlantic Ocean. PhD thesis.
(University of St. Andrews, 2009).
29. Rendell, L., Mesnick, S. L., Dalebout, M. L., Burtenshaw, J. & Whitehead, H. Can
genetic differences explain vocal dialect variation in sperm whales, Physeter
macrocephalus? Behav. Gen. 42, 332-343 (2012).
30. Whitehead, H. & Rendell, L. Oceans of Culture: Cultures of Whales and Dolphins.
(Chicago University Press, 2014).
31. Rendell, L. & Whitehead, H. Comparing repertoires of sperm whale codas: a multiple
methods approach. Bioacoustics 14, 61-81 (2003).
32. Czaczkes, T. J. How to not get stuck—Negative feedback due to crowding maintains
flexibility in ant foraging. J. Theor. Biol. 360, 172-180 (2014).

226
33. Kanagaraj, R., Wiegand, T., Kramer-Schadt, S. & Goyal, S. P. Using individual-
based movement models to assess inter-patch connectivity for large carnivores in
fragmented landscapes. Biol. Conserv. 167, 298-309 (2013).

227
B3.17 COPYRIGHT RELEASE: PERMISSION TO REPRODUCE PUBLISHED ARTICLE
Published article: Cantor, M., Shoemaker, L.G., Cabral, R., Flores, C.O., Varga, M., Whitehead, H. 2015. Multilevel animal societies can emerge from cultural transmission. Nature Communications. 6: 8091. doi:10.1038/ncomms9091 Ph.D. Thesis: On the interplay between society and culture: causes, consequences and stability of sperm whale clans 1355 Oxford Street, Department of Biology, Dalhousie University, Halifax NS, B3H 4J1, Canada According to the Nature Publishing Group there are no restrictions for me to reproduce my own work as a chapter of my thesis given that I will cite it properly and provide the full reference. This was confirmed by the editorial board of the journal (correspondence copied below).
From: NPG Open Access <[email protected]> Date: January 25, 2016 at 1:54 PM Dear Mauricio, 1. As you have published your paper under an open access CC BY licence you and all other readers are free to reuse and re-mix this content as you wish, provided that you attribute the original article – see the CC BY reuse terms here: http://creativecommons.org/licenses/by/4.0/ 2. Authors publishing via the open access route retain copyright of their manuscripts. As such you are the copyright holder, so we are not able to sign a copyright release form. Jess Monaghan, PhD Research and Development Officer, Open Research Nature Publishing Group / Palgrave Macmillan E: [email protected] / [email protected]
Therefore, permission is granted for:
a) the inclusion of the material described above in your thesis b) for the material described above to be included in the copy of your thesis that is
sent to the Library and Archives of Canada (formerly National Library of Canada) for reproduction and distribution.

228
APPENDIX C: SUPPLEMENTARY MATERIAL FOR CHAPTER 415
C4.1 TABLE S4.1. Summary of the social metrics among social units of two vocal clans of
sperm whales off the Galápagos Islands (Plus-One and Regular). Unit size (number of
photo-identified individuals), mean cluster size while foraging (number of individuals),
dive synchrony (residuals of no-dive gap in minutes, from the dive synchrony regression
model), social differentiation (S), association indices (HWI).
Clan Social Unit
Social unit size
Cluster size ± SDa
Dive synchrony ± SDa
S ± SEb HWI ± SD
Plus-One D 14 1.42 ± 0.06 -0.17 ± 3.36 0.00 ± 0.37 0.16± 0.21 Plus-One F 12 2.01 ± 0.45 -1.08 ± 2.21 0.00 ± 0.25 0.17± 0.17 Plus-One G 11 - - 0.60 ± 0.20 0.22± 0.34 Plus-One N 6 1.34 - 0.00 ± 0.09 0.41± 0.16 Plus-One Q 6 1.85 3.21 0.00 ± 0.40 0.27± 0.27 Regular A 24 1.68 ± 0.34 3.68 ± 5.06 0.67 ± 0.10 0.10± 0.14 Regular B 22 1.45 ± 0.08 2.28 ± 1.45 0.33 ± 0.16 0.21± 0.17 Regular E 18 1.30 6.46 0.79 ± 0.07 0.15± 0.20 Regular J 9 1.79 ± 0.38 8.31 0.74 ± 0.34 0.15± 0.22 Regular I 6 1.50 ± 0.18 13.05 0.00 0.11 ± 0.13 Regular K 13 1.89 ± 0.49 8.30 0.22 ± 0.36 0.14± 0.22 Regular L 11 1.63 ± 0.31 3.92 ± 2.78 0.00 ± 0.29 0.27± 0.17 Regular O 8 1.20 - 0.33 ±0.30 0.07± 0.13 Regular P 9 1.56 ± 0.34 - 0.52 ± 0.34 0.09± 0.16 Regular S 6 1.49 ± 0.22 4.51 ± 7.65 0.00 0.07 ± 0.15
a SD: standard deviation; b SE: standard error; Dashes indicate unavailable data.
15 This appendix is available at http://onlinelibrary.wiley.com/doi/10.1111/mms.12218/suppinfo as supplementary material for the article: Cantor, M., Whitehead, H. 2015. How does social behavior vary among sperm whale clans? Marine Mammal Science. doi: 10.1111/mms.12218

229
C4.2 COPYRIGHT RELEASE: PERMISSION TO REPRODUCE PUBLISHED ARTICLE
Published article: Cantor, M., Whitehead, H. 2015. How does social behavior vary among sperm whale clans? Marine Mammal Science. 31(4): 1275–1290; doi: 10.1111/mms.12218 Ph.D. Thesis: On the interplay between society and culture: causes, consequences and stability of sperm whale clans 1355 Oxford Street, Department of Biology, Dalhousie University, Halifax NS, B3H 4J1, Canada I provide below the permission granted by the publisher John Wiley and Sons for:
a) the inclusion of the material described above in your thesis b) for the material described above to be included in the copy of your thesis that is
sent to the Library and Archives of Canada (formerly National Library of Canada) for reproduction and distribution.
This Agreement between Mauricio Cantor ("You") and John Wiley and Sons ("John Wiley and Sons") consists of your license details and the terms and conditions provided by John Wiley and Sons and Copyright Clearance Center. License Number 3794340738843
License date Jan 22, 2016
Licensed Content Publisher John Wiley and Sons
Licensed Content Publication Marine Mammal Science
Licensed Content Title How does social behavior differ among sperm whale
clans?
Licensed Content Author Maurício Cantor, Hal Whitehead
Licensed Content Date Apr 2, 2015
Pages 16
Type of use Dissertation/Thesis
Requestor type Author of this Wiley article
Format Print and electronic
Portion Full article
Will you be translating? No

230
Title of your thesis / dissertation ON THE INTERPLAY BETWEEN SOCIETY AND
CULTURE: CAUSES, CONSEQUENCES AND
STABILITY OF SPERM WHALE CLANS
Expected completion date Jul 2016
Expected size (number of pages) 250
Requestor Location Mauricio Cantor
1355 Oxford Street
Department of Biology
Dalhousie University
Halifax, NS B3H4J1
Canada
Attn: Mauricio Cantor
Billing Type Invoice
Billing Address Mauricio Cantor
1355 Oxford Street
Department of Biology
Dalhousie University
Halifax, NS B3H4J1
Canada
Attn: Mauricio Cantor
Total 0.00 CAD
Terms and Conditions

231
APPENDIX D: SUPPLEMENTARY MATERIAL FOR CHAPTER 516
D5.1 TABLE S5.1. Sampling effort summary of dedicated visual and acoustic surveys for
sperm whales in the Eastern Tropical Pacific (ETP). Study areas: Galápagos Islands (1),
Panamá, Ecuador, and northern Peru (2), southern Peru and Chile (3), Gulf of California
(4) and Western Pacific (5). Days following whales: total days tracking and in visual
contact with sperm whale groups; Photographic records: total number of pictures taken of
tail flukes for photo-identification (see also [1]); Codas analyzed: total number of coda
samples manually identified and included in the continuous analyses (see also [2]).
Year Study areas Days following whales
Photographic records
Codas analyzed
1985 1,2 32 973 1,511 1987 1 55 1,615 2,342 1988 1 15 442 0 1989 1 56 1,708 113 1991 1,2 25 962 413 1992 2,4,5 13 273 1,234 1993 2,3,4,5 26 514 1,553 1994 1 3 108 0 1995 1,2,4 23 583 660 1996 1 8 144 0 1997 1,4 20 310 0 1998 1,4 27 179 0 1999 1,2,4,5 46 811 879 2000 2,3 79 2,082 5,360 2002 1,4 35 897 0 2003 4,5 17 383 0 2004 4 6 173 0 2013 1 27 996 1,986 2014 1 41 1,113 994 Total ETP 554 14,286 17,045
16 Supplementary material for the manuscript: Cantor M, Whitehead H, Gero S, Rendell L. Cultural
turnover among Galápagos sperm whales. Royal Society Open Science.

232
In 2013 and 2014, we revisited the Galápagos waters, totaling 165 sampling days and 1,670 hours
with visual and/or acoustic contact with 15 groups of distinctive whales photo-identified together.
D5.2 TABLE S5.2. Number of photo-identified (quality rating Q 3) individual adult
female sperm whales and immatures of both sexes (males in parentheses) in the Tropical
Pacific by study area and year. Only individuals with a recorded position are presented.
Calves were not quantified. Data from 1985-2004 (3,947 individuals) came from [1].
Year Galápagos
Panamá, Ecuador, Northern Perú
Chile, Southern Perú
Gulf of California
Western Pacific
Total
1985 344 (8) 6 (0) 0 (0) 0 (0) 0 (0) 358 1987 440 (8) 0 (0) 0 (0) 0 (0) 0 (0) 448 1988 95 (0) 0 (0) 0 (0) 0 (0) 0 (0) 95 1989 337 (4) 0 (0) 0 (0) 0 (0) 0 (0) 337 1991 94 (2) 278 (4) 0 (0) 0 (0) 0 (0) 378 1992 0 (0) 5 (0) 0 (0) 1 (0) 109 (5) 120 1993 0 (0) 116 (1) 114 (0) 2 (0) 5 (0) 238 1994 23 (0) 0 (0) 0 (0) 0 (0) 0 (0) 23 1995 91 (8) 21 (0) 0 (0) 4 (0) 0 (0) 124 1996 29 (4) 0 (0) 0 (0) 0 (0) 0 (0) 31 1997 0 (0) 0 (0) 0 (0) 5 (0) 0 (0) 5 1998 27 (6) 0 (0) 0 (0) 64 (4) 0 (0) 101 1999 9 (3) 3 (0) 0 (0) 102 (3) 1 (0) 120 2000 0 (0) 15 (0) 863 (32) 0 (0) 0 (0) 910 2002 0 (37) 0 (0) 0 (0) 280 (3) 0 (0) 420 2003 1 (0) 0 (0) 0 (0) 139 (4) 1 (0) 141 2004 0 (0) 0 (0) 0 (0) 68 (0) 0 (0) 68 2013 210 (25) 0 (0) 0 (0) 0 (0) 0 (0) 235 2014 253 (33) 0 (0) 0 (0) 0 (0) 0 (0) 286 Total 1,953 (138) 444 (5) 997 (32) 665 (16) 116 (5) 4,468

233
D5.3 TABLE S5.3. Number of codas analyzed from groups of female and immature sperm
whales photo-identified together in the Eastern Tropical Pacific by study area and year.
Year correspond to the photo-identification effort in Table S5.1. Data from 1985-1999
(14,065 codas) came from [2].
Year Galápagos
Panamá, Ecuador, Northern Perú
Chile, Southern Perú
Gulf of California
Western Pacific
Total
1985 1,511 0 0 0 0 1,511 1987 2,342 0 0 0 0 2,342 1988 0 0 0 0 0 0 1989 113 0 0 0 0 113 1991 0 413 0 0 0 413 1992 0 293 0 941 0 1,234 1993 0 429 616 134 374 1,553 1994 0 0 0 0 0 0 1995 660 0 0 0 0 660 1996 0 0 0 0 0 0 1997 0 0 0 0 0 0 1998 0 0 0 0 0 0 1999 879 0 0 0 0 879 2000 0 0 5,360 0 0 5,360 2002 0 0 0 0 0 0 2003 0 0 0 0 0 0 2004 0 0 0 0 0 0 2013 1,986 0 0 0 0 1,986 2014 994 0 0 0 0 994 Total 8,485 1,135 5,976 1,075 374 17,045

234
D5.4 SUPPLEMENTARY FIGURE S5.1.
Supplementary Figure S5.1. Schematic of the analyses of acoustic recordings and coda
repertoires to define vocal clans of sperm whales. In the processing phase, raw acoustic
recordings were listened at ¼ speed and codas were marked in the Rainbow Click
software. Coda repertoires were composed of coda recordings assigned to groups of
whales photo-identified together. In the analysis phase, we used the absolute inter-click
intervals (ICI, the actual time between the onset of one click to another in a coda
sequence) to characterize the temporal structure of the codas. We then used two
complementary analyses, continuous and categorical. With the continuous measure, we

235
compared coda repertoires similarity among groups of whales, using customized
MATLAB routines to calculate the multivariate Euclidean distance between repertoires
and hierarchical clustering algorithm (supported by a bootstrap procedure) to define the
partition of groups into clans of whales (Figure 5.3a). With the categorical measure, we
qualitatively described the differences between clan repertoires. We used the OPTICS
algorithm to identify clusters of very similar coda samples, with stereotyped rhythm and
tempo (Figure S5.2), which we called coda types. We performed a sensitivity analysis to
define the most parsimonious initial parameters for the OPTICS algorithm (Figure S5.4).
Many coda samples were disregarded as ‘noise’ and not included in a coda type cluster;
however nearly asymptotic discovery curves suggested that nearly all coda types made by
the sampled groups were represented (Figure S5.3). We then used contingency tables
(Figure 5.3B) to illustrate the principal differences between the repertoires of the
different clans (Figure 5.3A), and Principal Component Analysis (Figures S5.6, S5.7) to
visualize with more details these differences in coda type usage by different clans. This
schematic was adapted from [3].

236
D5.5 SUPPLEMENTARY FIGURE S5.2.
Supplementary Figure S5.2. Codas up to 12 clicks produced by sperm whales across the
Eastern Tropical Pacific and classified into discrete types. Coda types (y-axis) were
defined by the OPTICS algorithm (fixed ξ=0.025 and minpts ~4% of the sample size)
based on absolute time (x-axis) between inter-click intervals (ICIs). Dots represent mean
time of each click in the coda, and whiskers represent 95% Confidence Intervals around
the mean time. Coda type labels were based on the rhythm, where the first number
indicates the number of clicks; “R” indicates regularly spaced clicks; “I” indicates
increasing click intervals along the coda; “+” indicates extended interval between clicks;
and the sequential number distinguishes between codas with the same number of clicks
and rhythm but of increasing duration (e.g. 9R1, 9R2, 9R3).

237
D5.6 SUPPLEMENTARY FIGURE S5.3.
Supplementary Figure S5.3. Discovery curves for coda types per photo-identified group
of sperm whales across the Eastern Tropical Pacific. Coda types were identified using the
OPTICSxi algorithm, under three initial values for the key parameters ξ (drop in sample
density) and minpts (number of minimum points): a) low ξ = 0.005, high minpts = 8%
sample size; b) intermediate ξ = 0.025, intermediate minpts = 4% sample size; and c) high
ξ = 0.050, low minpts = 2%. Black lines represent a repertoire of a photo-identified group
of whales, red lines represent the mean discovery curve and red shades represent the
standard errors for the mean curve.

238
D5.7 SUPPLEMENTARY FIGURE S5.4.

239
Supplementary Figure S5.4. Codas classified into discrete types according to rhythm,
produced by photo-identified groups of sperm whales across the Eastern Tropical Pacific.
Coda types up to 12 clicks (y-axis) were based on absolute time (x-axis) between inter-
click intervals (ICIs). Dots represent mean time of each click in the coda, and whiskers
represent 95% Confidence Intervals around the mean time. Coda types were defined by
the OPTICSxi algorithm, under three alternative initial parameterization, varying contrast
parameter ξ (threshold in reachability distance drop, establishing the relative decrease in
density within clusters) and minpts (defines the minimum number of samples that can be
considered a cluster) but fixing ξ (maximum reachability distance within which clusters
will be searched for): (a) ξ = 0.025, minpts ~ 4% of sample size; (b) ξ = 0.005, minpts =
about 8% of sample size; (c) ξ = 0.05, minpts ~ 2% of sample size. Coda type labels (y-
axis) were based on the rhythm, where the first number indicates number of clicks, “R”
indicates regularly spaced clicks; “I” indicates increasing click intervals along the coda;
“+” indicates extended interval between clicks; and the sequential number or letters
distinguishes between coda with same length and rhythm but of increasing duration (e.g.
9R1, 9R2; 2+1A, 2+1B). “N” indicate the coda samples regarded as ‘noise’ by the
OPTICS algorithm (note low accuracy, i.e. large 95% confidence intervals) and so
discarded from the categorical analyses. The matrices illustrate coda types (rows) for
each photo-identified group (columns). Shades of grey indicate the frequency of
occurrence of coda types in a given group repertoire (x>10%: black; 5%<x<=10%: dark
grey; 1%<x <=5%: grey; 0<x<=1%: light grey; 0: white). Color code for photo-identified
groups follow original clan partition in [2] and in the Figure 5.3 (main text). Numbers on
the right indicate the total codas per type used in the categorical analysis. Note the high

240
number of coda samples discarded as noise (“N”). Overall, there were some variations
across the three parameterization schemes. For instance, the number of coda types would
be 25 for the restrictive (a) or 29 for the permissive (c) parameterization schemes, mainly
because some 3- and 6-click codas were merged into the same or split into more types.
The intermediate parameterization (b) described more clearly the clan segregation based
on the continuous analysis data.
D5.8 SUPPLEMENTARY FIGURE S5.5.
Supplementary Figure S5.5. Coda repertoire similarity among only the groups of sperm
whales recorded off the Galápagos Islands in 2013 and 2014. The hierarchical clustering
dendrogram (average linkage, CCC=0.89) depicts the multivariate similarity (Euclidean
distances on absolute inter-click intervals) among coda repertoires of groups of whales
(branches), colored by clans (as in [2]; see also Figure 5.3A). Numbers besides the
clustering branches indicated the number of times (out of 100) they were replicated by in
bootstrap analyses; numbers underneath are the year of recording.

241
D5.9 SUPPLEMENTARY FIGURE S5.6.
Supplementary Figure S5.6. Coda types used by vocal clans of the sperm whales.
Principal component analysis was used to reduce the dimensionality of the raw absolute
inter-click intervals (ICI) for each coda length (number of clicks) for better visualization
of the clusters of codas classified by OPTICSxi into categorical types (Figure S5.2,
represented by icon shape) using the intermediate parameterization scheme (Figures
5.3B, S5.2, S5.4B). Coda samples are colored by clans, a categorical variable defined by

242
hierarchical clustering analysis (Figure 5.3A; as in [2]). Loading plots indicate the
direction of variation according to each ICI. The amount of variance explained by the
first two principal components (PC) is given at the axes. The new data set recorded off
Galápagos in 2013 and 2014 is marked in black. For clarity, all coda samples regarded as
‘noise’ by the OPTICSxi algorithm (Figure S5.4) were not plotted. Overall, coda types
(here, defined by distinct clusters) were usually defined by the presence/absence of
extended pauses (‘+’), as suggested by the direction of loadings of the longer ICIs. Note
that clans shared some coda types (e.g. 5R, 11R, 12R) but also produced coda types
which were nearly exclusive of their own clan. For instance, the Regular clan mainly
produced regularly-spaced codas from 6 to 12 clicks (e.g. 6-12R); the Short clan mainly
produced codas with 3 to 5 clicks; Plus-One groups produced mainly short codas with an
extended pause before the final click (e.g. 3+1, 1+3+1, 5+1, 4+1+1); Four-Plus groups
produced codas with four regular clicks (e.g. 4R, 4+1+1, 2+4). These characteristic codas
used more frequently by specific clans (Figure 5.3B) appears to have driven the clan
partitions in the dendrogram presented in the main text (Figure 5.3A).

243
D5.10 SUPPLEMENTARY FIGURE S5.7.

244
Supplementary Figure S5.7. All codas sampled from sperm whales in the Eastern
Tropical Pacific as categorized by OPTICSxi including unclassified samples (‘noise’).
Principal component analysis on the inter-click intervals (ICI) for each coda length
(number of clicks) was used here to reduce the dimensionality of the data for better
visualization and interpretation. The amount of variance explained by the first two
principal components (PC) is given at the axes. Codas are colored by type, as defined by
the OPTICSxi algorithm using the intermediate parameterization scheme (Figure S5.4B).
Samples sizes by type and proportion of unclassified samples (‘noise’) by coda length are
presented. Note our classification analysis was conservative and discarded a large portion

245
of the samples regarded as ‘noise’ by the OPTICSxi algorithm. This creates a scenario in
which we only define new coda types when there exists many, highly similar codas.
D5.11 SUPPLEMENTARY METHODS 5.1: Acoustic recordings
Recordings of sperm whale acoustic repertoires were made when whales were
socializing or resting at the surface, and at the beginning of foraging dives [4], using a
variety of hydrophone arrays (frequency responses: 6 Hz–10 kHz, ±3 dB; 1–10 kHz, ±3
dB) connected to different recorders and amplifiers (details in Rendell & Whitehead
2003a). In 2013 and 2014, we switched to a custom-built 100m long towed hydrophone
array consisting of two Benthos AQ-4 elements (frequency response of 0.1-30kHz)
spaced by 3m connected via Magrec HP02 preamplifiers to a Magrec HP27ST
amplifying and conditioning box which imposed an analogue high-pass filter at 1kHz or
less, and recorded using a laptop PC running PAMGUARD software [5], sampling at
96kHz. To analyze codas, we only use the temporal patterning of their clicks; thus the
variation in the sampling or frequency responses of the recording systems used does not
impact our analysis.
D5.12 SUPPLEMENTARY METHODS 5.2: Permutation tests for differences between group
repertoires
All coda recordings on a given day from a given group represented a single
repertoire, and repertoires from different days were treated as replicates of a group’s

246
repertoire [3]. To test for differences in repertoire between groups, we tested the null
hypothesis that the coda repertoire similarity between recordings of the same group on
two different days (same group, different days: SGDD) is the same as that between
recordings of different groups on different days (different groups, different days: DGDD)
[3]. We performed Mantel tests (1,000 permutations, Spearman correlation) [6] to test
correlations between matrices of multivariate similarity (see below) between sets of
codas recorded on pairs of days and a binary matrix in which SGDD=1 and DGDD=0. If
different groups have different repertoires, then we would expect greater similarity within
a group than between different groups, and so significantly positive correlation between
these matrices.
D5.13 SUPPLEMENTARY METHODS 5.3: Details on continuous similarity of coda
repertoires
To quantify the similarity between coda repertoires of groups of whales, we used
two complementary approaches: continuous and categorical. The continuous approach is
classification-free (disregards coda types) and based on the multivariate similarity of two
codas with the same number of clicks using the Euclidean distances between their inter-
click interval vectors [7]. We quantified the similarity between entire coda repertoires as
[2,7]:
∑ ∑
∙ (1)
where SAB is the similarity between repertoires A with nA codas and repertoire B with nB
codas; li and lj are the number of clicks in coda i from repertoire A and the number of

247
clicks in coda j in repertoire B; b is the basal similarity (b=0.001) representing a very fine
comparison at the order of 1 ms (repertoire similarities are in any case generally robust to
variation in b) [7]; and dij is the Euclidean distance between the inter-click interval
vectors of codas i and j [2,7]. Codas with different numbers of clicks were assigned a
zero multivariate similarity [2,7,8].
D5.14 SUPPLEMENTARY METHODS 5.4: Details on categorical analysis of coda repertoires
With the categorical approach to analyze coda repertoires, we classified codas into
discrete types to illustrate thematic patterning differences in the repertoires among clans
of whales. We assigned categorical types based on the distribution of the absolute ICIs
using the OPTICSxi hierarchical clustering [9] in the ELKI framework [10]. We ran
OPTICSxi on the absolute inter-click intervals independently for all coda samples of
same number of clicks. Long codas (>12 clicks) were rare (0.9% of 17,045 codas
recorded, Table S5.1) and were not considered for the categorical analysis, but used only
in the continuous analysis. We then named discrete codas types based on their rhythm
and tempo—following previous nomenclature [2,11]: first number indicates number of
clicks, “R” indicates regularly spaced clicks; “I” indicates increasing click intervals; “+”
indicates extended interval; and the last number distinguishes between two similar coda
types.
OPTICS is a density-based algorithm that orders samples linearly according to
their distances apart in the multivariate space; distances are used to calculate
“reachability” between samples and then define clusters. OPTICS defines clusters based

248
on the following parameters: the contrast parameter ξ defines the threshold in reachability
distance drop, establishing the relative decrease in density between versus within clusters;
minpts defines the minimum number of samples that can be considered a cluster (details
in [9]). The key advantage of OPTICSxi relative to other clustering algorithms is the
ability to distinguish clustered samples in multivariate space (i.e. codas with low
reachability, or distance in the ordered list) from sparser, outlier samples (i.e. codas with
high reachability, located far away from dense clusters). The latter are regarded as ‘noise’
instead of being forced into a cluster, as in other clustering algorithms (e.g. k-means)
[2,7]. Therefore, the clusters defined by OPTICSxi (here, coda types) are conservative in
membership, since only coda samples with high similarity are considered and any
uncertain sample (i.e. the ‘noise’, with low similarity, between clusters) is discarded.
OPTICS density-based algorithm is more successful and accurate in identifying natural
clusters in large datasets [12], and so is superior to the k-means algorithm previously
used to define coda types [2,7,11] that attempted to classify every sample into a coda
type, among other clear limitations [7]. We emphasize that here we used coda
classification for descriptive purposes: to illustrate the thematic patterning of codas
driving clan segregation given by the continuous analysis that includes all codas.
There are no rules of thumb to define the OPTICSxi initial parameterization.
Therefore, we then ran a sensitivity analysis to find parsimonious parameter values. We
first ran the classification algorithm with two extreme conditions: with low drop in
sample density and high number of minimum points (low ξ = 0.005, high minpts = 8%
sample size); and high drop in sample density and low minimum points (ξ = 0.050,
minpts = 2%). The two extreme conditions yielded slightly different coda type

249
classifications (Figure S5.3). The former produced many coda types (larger clusters were
typically split into many small ones) and the latter produced only a few (visually discrete
clusters were not split). Therefore, for our final analyses we used intermediate values for
ξ and minpts.
For the final classification of codas, we fixed the ξ parameter across all
independent analyses of codas of different lengths (i.e. number of clicks), but we adjusted
the minpts parameter to the corresponding sample sizes. We used ξ = 0.025 (i.e. 2.5%
drop in sample density defined a new cluster), so considered that the differences between
coda types of different lengths are the same [3]. We adjusted minpts according to the
sample size of each coda length to be around 4% because shorter codas are usually more
numerous than longer ones. In all cases, we were very conservative and considered a
coda type only the terminal branches in the hierarchical classification discarding all
sample that was not in the core of the clusters.
D5.15 SUPPLEMENTARY METHODS 5.5: Social level definitions
Sperm whale societies contain multiple social levels [4,13]. The fundamental one
is the nearly-permanent social unit, defined as sets of individuals that live and move
together for long periods, from several months to several years [14]. Social units form
temporary groups among themselves, defining sets of animals that move together in a
coordinated manner for periods of few hours to few days [4]. These groups are formed
among social units of the same vocal clan [2], defined by sets of social units with high
similarity in their coda repertoires [2]. To delineate a social unit, long-term photo-

250
identification data is therefore required (see methodological details in [14]). While this
was possible for previous years off the Galápagos [14], there were not enough data
available to reliably delineate social units across the Eastern Pacific (see [2]), neither off
Galápagos in 2013 and 2014. Therefore, our analyses focused on acoustic repertoires of
groups of sperm whales photo-identified together [2]. Social units are known to form
these briefer groupings with one another [4], thus in our analysis we may have recorded
the acoustic repertoire of more than one social unit. However, this would not affect our
analysis because social units are known to group only with other units of the same clan
[2].
D5.16 SUPPLEMENTARY REFERENCES
1. Whitehead H, Coakes A, Jaquet N, Lusseau S. 2008 Movements of sperm whales in
the tropical Pacific. Mar. Ecol. Prog. Ser. 361, 291-300.
2. Rendell L, Whitehead H. 2003 Vocal clans in sperm whales (Physeter
macrocephalus). Proc. R. Soc. B 270, 225-231. (doi: 10.1098/rspb.2002.2239)
3. Gero S, Whitehead H, Rendell L. 2016 Individual, unit, and vocal clan level identity
cues in sperm whale codas. R. Soc. Open Sci. 3, 150372. (doi:
http://dx.doi.org/10.1098/rsos.150372)
4. Whitehead H. 2003 Sperm whale societies: Social evolution in the ocean. Chicago,
IL: University of Chicago Press.
5. Gillespie D, Mellinger DK, Gordon J, Mclaren D, Redmond P, McHugh R, Trinder
PW, Deng XY, Thode A. 2009 PAMGUARD: Semiautomated, open source software

251
for real-time acoustic detection and localisation of cetaceans. J. Acoust. Soc. Am.
125, 2547 (doi: http://dx.doi.org/10.1121/1.4808713)
6. Schnell GD, Watt DJ, Douglas ME. 1985 Statistical comparison of proximity
matrices: applications in animal behaviour. An. Behav. 33, 239–253.
7. Rendell L, Whitehead H. 2003 Comparing repertoires of sperm whale codas: A
multiple methods approach. Bioacoustics 14, 61–81.
8. Antunes R, Schulz T, Gero S, Whitehead H, Gordon J, Rendell L. 2011 Individually
distinctive acoustic features in sperm whale codas. An. Behav. 81, 723-730.
(doi:10.1016/j.anbehav.2010.12.019)
9. Ankerst M, Breunig MM, Kriegel H-P, Sander J. 1999 OPTICS: ordering points to
identify the clustering structure. Proc. SIGMOD’99. Intl. Conf. Manag. Data 28, 49–
60. (doi:10.1145/304181.304187)
10. Achtert E, Kriegel HP, Schubert E, Zimek A. 2013 Interactive data mining with 3D-
parallel-coordinate-trees. Proc. 2013 ACM SIGMOD Int. Conf. Manag. Data 1009–
1012. (doi:10.1145/2463676.2463696)
11. Weilgart L, Whitehead H. 1997 Group-specific dialects and geographical variation in
coda repertoire in South Pacific sperm whales. Behav. Ecol. Sociobiol. 40, 277-285.
12. Nanni M, Pedreschi D. 2006 Time-focused clustering of trajectories of moving
objects. J. Intell. Inf. Syst. 27, 267–289. (doi:10.1007/s10844-006-9953-7)
13. Whitehead H, Antunes R, Gero S, Wong SN, Engelhaupt D, Rendell L. 2012
Multilevel societies of female sperm whales (Physeter macrocephalus) in the
Atlantic and Pacific: why are they so different? Intl. J. Primatol. 33, 1142-1164.
(doi: 10.1007/s10764-012-9598-z)

252
14. Christal J, Whitehead H, Lettevall E. 1998 Sperm whale social units: variation and
change. Can. J. Zool. 76, 1431-1440.


