Embed Size (px)
Citation preview
Published Ahead of Print 14 June 2013. 2013, 12(8):1120. DOI: 10.1128/EC.00112-13. Eukaryotic Cell
Srikantha and David R. SollYang-Nim Park, Karla J. Daniels, Claude Pujol, Thyagarajan ''Sexual'' as Well as ''Pathogenic'' BiofilmCandida albicans Forms a Specialized
http://ec.asm.org/content/12/8/1120Updated information and services can be found at:
These include:
SUPPLEMENTAL MATERIAL Supplemental material
REFERENCEShttp://ec.asm.org/content/12/8/1120#ref-list-1at:
This article cites 48 articles, 26 of which can be accessed free
CONTENT ALERTS more»articles cite this article),
Receive: RSS Feeds, eTOCs, free email alerts (when new
http://journals.asm.org/site/misc/reprints.xhtmlInformation about commercial reprint orders: http://journals.asm.org/site/subscriptions/To subscribe to to another ASM Journal go to:
on June 10, 2014 by guesthttp://ec.asm
.org/D
ownloaded from
on June 10, 2014 by guest
http://ec.asm.org/
Dow
nloaded from

Candida albicans Forms a Specialized “Sexual” as Well as“Pathogenic” Biofilm
Yang-Nim Park, Karla J. Daniels, Claude Pujol, Thyagarajan Srikantha, David R. Soll
Developmental Studies Hybridoma Bank, Department of Biology, University of Iowa, Iowa City, Iowa, USA
Candida albicans forms two types of biofilm in RPMI 1640 medium, depending upon the configuration of the mating type locus.
In the prevalent a/� configuration, cells form a biofilm that is impermeable, impenetrable by leukocytes, and fluconazole resis-
tant. It is regulated by the Ras1/cyclic AMP (cAMP) pathway. In the a/a or �/� configuration, white cells form a biofilm that is
architecturally similar to an a/� biofilm but, in contrast, is permeable, penetrable, and fluconazole susceptible. It is regulated by
the mitogen-activated protein (MAP) kinase pathway. The MTL-homozygous biofilm has been shown to facilitate chemotro-
pism, a step in the mating process. This has led to the hypothesis that specialized MTL-homozygous biofilms facilitate mating. If
true, then MTL-homozygous biofilms should have an advantage over MTL-heterozygous biofilms in supporting mating. We
have tested this prediction using a complementation strategy and show that minority opaque a/a and �/� cells seeded in MTL-
homozygous biofilms mate at frequencies 1 to 2 orders of magnitude higher than in MTL-heterozygous biofilms. No difference
in mating frequencies was observed between seeded patches of MTL-heterozygous and MTL-homozygous cells grown on agar at
28°C in air or 20% CO2 and at 37°C. Mating frequencies are negligible in seeded patches of both a/� and a/a cells, in contrast to
seeded biofilms. Together, these results support the hypothesis that MTL-homozygous (a/a or �/�) white cells form a specialized
“sexual biofilm.”
Candida albicans is the most pervasive fungal pathogen coloniz-ing humans (1). As is the case with bacterial pathogens (2–4),
it can colonize host tissues, catheters, and prosthetics by formingmulticellular biofilms. However, unlike bacterial pathogens, C.albicans forms two types of biofilms, depending upon the geneticconfiguration of its mating type locus (MTL) (5). In nature, C.albicans is primarily heterozygous at the MTL locus (a/�) (6–9).To mate, it must first undergo homozygosis to a/a or �/� (10, 11)and then switch from the white to the opaque phenotype (12).This transition also appears to be required for mating of rare hap-loid cells (13). When in the predominant a/� configuration, cellsform robust biofilms on silicone elastomers in RPMI medium (5,14, 15). Development of these a/� biofilms includes the formationof a basal yeast cell polylayer at the substratum, which forms germtubes at the distal (top) edge. These germ tubes elongate to form athick upper layer of vertically oriented hyphae embedded in anextracellular, polymolecular matrix (16, 17). MTL-heterozygousa/� biofilms formed under these conditions have been shown tobe impermeable to low- and high-molecular-weight molecules,impenetrable by human polymorphonuclear leukocytes (PMNs),and resistant to fluconazole (5, 18). These traits are consistentwith those exhibited by commensal and pathogenic bacterial bio-films (3, 4, 19).
In the predominant a/� configuration, C. albicans cells expressthe a1-�2 corepressor, which blocks white-opaque switching (7,12) and mating (10, 11). Upon homozygosis, however, a/a and�/� cells express only a1 or �2, respectively. White-opaqueswitching and mating are then derepressed because of the absenceof the a1-�2 corepressor (7, 12). In the derepressed state, whiteMTL-homozygous cells must switch to opaque to mate (7, 12, 20).In this derepressed state, white cells, but not opaque cells, formrobust biofilms on silicone elastomers in RPMI 1640 medium,which are architecturally similar to a/� biofilms (21–25). They tooare composed of a basal yeast cell polylayer and a larger upperregion consisting of vertically oriented hyphae embedded in a
dense extracellular polymolecular matrix. However, in contrast to
a/� biofilms, these MTL-homozygous white cell biofilms do not
exhibit the several traits deemed relevant to commensalism and
pathogenesis. They are permeable to low- and high-molecular-
weight molecules, readily penetrated by phagocytic human white
blood cells, and drug susceptible (5, 18, 26). Although they do not
exhibit pathogenic traits of a/� biofilms, they have been shown to
facilitate chemotropism between the conjugation tubes formed by
seeded minority opaque cells, a major step in the mating process
(21). The facilitation of mating is consistent with the signal trans-
duction pathway that regulates MTL-homozygous white cell bio-
film formation. Whereas MTL-heterozygous biofilm formation is
regulated by the Ras1/cyclic AMP (cAMP) pathway (5, 27, 28),
MTL-homozygous biofilm formation is regulated by the same
pheromones, pheromone receptors, trimeric G protein complex,
and mitogen-activated protein (MAP) kinase pathway that regu-
late the mating response in opaque cells (5, 24–26). The same
MAP kinase pathway, however, targets different transcription fac-
tors in pheromone-activated white and opaque cells for different
phenotypic outcomes, namely, the formation of a white cell bio-
film in the former case and the mating response in the latter case.
The formation of a white cell biofilm, therefore, is coordinately
regulated with the opaque cell mating response by the same signal.
This would allow mating-competent opaque cells to signal mat-
Received 8 May 2013 Accepted 10 June 2013
Published ahead of print 14 June 2013
Address correspondence to David R. Soll, [email protected].
Supplemental material for this article may be found at http://dx.doi.org/10.1128
/EC.00112-13.
Copyright © 2013, American Society for Microbiology. All Rights Reserved.
doi:10.1128/EC.00112-13
1120 ec.asm.org Eukaryotic Cell p. 1120–1131 August 2013 Volume 12 Number 8
on June 10, 2014 by guesthttp://ec.asm
.org/D
ownloaded from

ing-incompetent white cells to form a sexual biofilm that facili-tates mating.
If our general hypothesis is correct, MTL-homozygous bio-films should be far more effective in supporting mating betweenminority opaque cells than MTL-heterozygous biofilms. Here, us-ing a complementation strategy, we have tested this prediction byperforming a comparison of the frequency of mating betweenminority opaque cells seeded in MTL-heterozygous biofilms andthose in MTL-homozygous biofilms. We show that the frequencyof complementation in MTL-homozygous biofilms is approxi-mately 10 to �100 times higher than in MTL-heterozygous bio-films, supporting the proposed hypothesis. We further show thatthere is very little difference in mating frequency between seededMTL-heterozygous and MTL-homozygous cells grown as patcheson nutrient agar under the same conditions as biofilms. Thesepatches consist almost entirely of budding yeast cells. The latterresults support the conclusion that the sexual MTL-homozygousbiofilm indeed provides a specialized environment that facilitatesthe mating process.
MATERIALS AND METHODS
Strains. The a/� strain CAI4 was auxotrophic for URA3 (�ura3/�ura3)(29), the a/a strain GH11 was auxotrophic for URA3 (�ura3/�ura3), andthe �/� strain Red3/6 (30) was auxotrophic for ADE2 (�ade2/�ade2). Theorigins and genetic descriptions of all strains can be found in Table S1 inthe supplemental material.
Analysis of mating in biofilms. All strains used here were auxotrophicand therefore were grown to stationary phase at 28°C in suspension inmodified Lee’s medium (31) supplemented with adenine (30 �g/ml) anduridine (100 �g/ml). Cells were collected, washed, and resuspended inRPMI 1640 medium (Gibco, Grand Island, NY) supplemented with ade-nine and uridine. Cells were then mixed in various combinations for atotal of 2 � 107 cells in 1 ml of RPMI 1640 medium supplemented withadenine and uridine, and 2 ml of cell suspension was dispersed on siliconelastomer discs (0.1 cm thick, 1 cm in diameter) (Cardiovascular Instru-ment Corp., Wakefield, MA). The discs were inserted into the wells of aCostar 24-well cluster plate. The elastomer-supported cultures were incu-bated for 1.5 h at 28°C. The elastomer preparations were then gentlyrinsed with phosphate buffer solution (PBS) and transferred into wells ofa Costar 12-well cluster plate. Each well was filled with 2.5 ml of RPMImedium supplemented with adenine and uridine and placed onto rockerswhich swayed back and forth gently at a low angle. Incubation was per-formed under four sets of conditions: 28°C in air, 28°C in 20% CO2, 37°Cin air, and 37°C in 20% CO2. After 48 h, cells were removed from theelastomer disc by sonicating the preparations three times for 5 s at 70%amplitude (Vibra Cell Sonic and Materials, Inc.) in 1 ml of Hanks’ bal-anced salt solution (HBSS; Grand Island, NY) without cations and sup-plemented with 20 mM EDTA. Aliquots were then plated onto agar selec-tion plates that were 10 cm in diameter. Selection agar contained modifiedLee’s medium lacking adenine and uridine, which allowed assessment ofthe frequency of complementation (i.e., viable colonies). In select exper-iments, diluted aliquots were plated onto agar plates 10 cm in diametercontaining modified Lee’s medium supplemented with adenine and uri-dine (nonselection plates), to assess the total CFU, and with phloxine B, toscore the number of opaque CFU (32). Each experiment included 3 bio-films under each set of conditions. Each biofilm was analyzed on threeselection plates containing Lee’s medium lacking adenine and uridine,resulting in nine measurements for each condition per experiment. Thecombined number of plates for four independent experiments was 12.Frequency was computed as the number of complemented CFU per bio-film or, in select experiments, per opaque CFU.
PCR analysis of the MTL configuration. PCR was used to analyze theheterozygosity of the MTL locus of complemented colonies. PCR forMTLa1 was performed with primer pair MTLa1F (5=-TTGAAGCGTGA
GAGGCAGGAG-3=) and MTLa1R (5=-GATTAGGCTGTTTGTTCTTCTCG-3=), and PCR for MTL�2 was performed with primer pair MTL�2F(5=-CATGAATTCACGTCTGGAGGCAC-3=) and MTL�2R (5=-AAGCAGCCAACTCAGGTCAC-3=).
FACS analysis of DNA content. The DNA content of cells from indi-vidual complemented colonies was measured by fluorescence-activatedcell sorting (FACS), as described by Paulovich and Hartwell (33), withminor modifications. Cells were harvested from colonies grown for 15days (i.e., to stationary phase) on selection medium and washed twice inwater. The size of colonies analyzed ranged between 5 and 6 mm. Cellswere fixed in 1 ml of 95% ethanol overnight at 4°C, washed twice with 50mM sodium citrate (pH 7.4), and incubated in 50 mM sodium citratecontaining 0.25 mg/ml RNase A for 1 h at 50°C. Cells were then treatedwith proteinase K (20 mg/ml) for 1 h and then stained with propidiumiodide (10 �g/ml) in 2 ml of 50 mM sodium citrate. As a control fordiploid (2N) and tetraploid (4N) DNA content, strain SC5314 (a/�) wasgrown to mid-log phase (optical density at 600 nm [OD600] � 0.6) in 10ml of yeast extract-peptone-dextrose (YPD) medium. An aliquot of 100 �lof stained cells was diluted in 2 ml of 50 mM sodium citrate. FACS wasperformed on 50,000 cells by using a BD FACSCalibur instrument. TheFACScan fluorescence of propidium iodide was excited with a 488-nmargon laser and emitted at 585 nm.
Microscopic analysis of conjugation tubes and fusions. To imageconjugation tubes and shmoos, cells were stained with calcofluor (20). Toimage fusions in biofilms, we first generated MTL-homozygous a/a and�/� strains that expressed either mCherry or green fluorescent protein(GFP) in the opaque state so that fusants expressed both fluorescent mol-ecules. To accomplish this, the mCherry and GFP genes were individuallyplaced under the regulation of the promoter of the opaque-specific geneOP4 in plasmids pGFP-SAT and pmCherry-SAT, respectively. PlasmidpGFP-SAT was generated by exchanging the SalI-PstI-digested GFP-URA3 fragment in plasmid pGFP70 (34) with the SalI-PstI-digested GFP-caSAT1 fragment from plasmid pNIM1 (35). Plasmid pmCherry-SAT wasconstructed by substituting mCherry for GFP in plasmid pGFP-SAT.mCherry was obtained by PCR amplification of plasmid pEpGAP-Cherry(36) with primer pair mCherry-1 (5=-GGTTTCAAAAGGTGAAGAAG-3=) and mCherry-2 (5=-ATATGGATCCTTATTTATATAATTCATCCATACC-3=). All sequences were verified. The XbaI-SacI-restricted DNA frag-ment of each plasmid was then inserted into one of the OP4 alleles of strainGH11 or Red3/6.
MTL-heterozygous or MTL-homozygous biofilms were cast by adding5% mCherry-expressing �/� opaque cells plus 5% GFP-expressing a/aopaque cells. Biofilms were either fixed in 2% paraformaldehyde andstained with calcofluor (Fluorescent Brightener 28; Sigma) or disrupted in100 �l of HBSS and stained with calcofluor. Biofilms were imaged byusing a Bio-Rad Radiance 2100 MP multiphoton laser scanning confocalmicroscope equipped with a 20� Plan Fluor water immersion objectiveand a Nikon TE 2000 microscope. Simultaneous GFP (488-nm excitation/515-nm emission), mCherry (587-nm excitation/610-nm emission), andcalcofluor (800-nm excitation/420-nm emission) fluorescent images wereacquired as a z-series at 3-�m intervals through areas where fusions oc-curred in biofilms. Separation of the emissions of the three fluors wasachieved by using LASERSHARP 2000 software (Bio-Rad, Hercules, CA)with lambda strobbing to minimize bleedthrough in simultaneous imagescan acquisitions. The MicroFire digital camera and software were usedfor epifluorescence imaging.
Patch analysis. A total of 2 � 107 cells grown to stationary phase inmodified Lee’s medium (31) supplemented with uridine and adenine,either unseeded or seeded with opaque cells as in the case of biofilmformation, were suspended in 20 �l of PBS and spotted onto agar con-taining modified Lee’s medium supplemented with adenine and uridine.After 48 h of incubation at 28°C or 37°C in air or 20% CO2, cells from eachpatch were resuspended in 1 ml of PBS. To assess complementation, 100�l of undiluted cells was plated onto nutrient agar lacking uridine andadenine. To measure total CFU and opaque CFU, 100 �l of a serial dilu-
Sexual Biofilms in Candida albicans
August 2013 Volume 12 Number 8 ec.asm.org 1121
on June 10, 2014 by guesthttp://ec.asm
.org/D
ownloaded from
tion of 10�3, 10�4, and 10�5 cells was spread onto agar containing Lee’smedium supplemented with adenine and uridine.
RESULTS
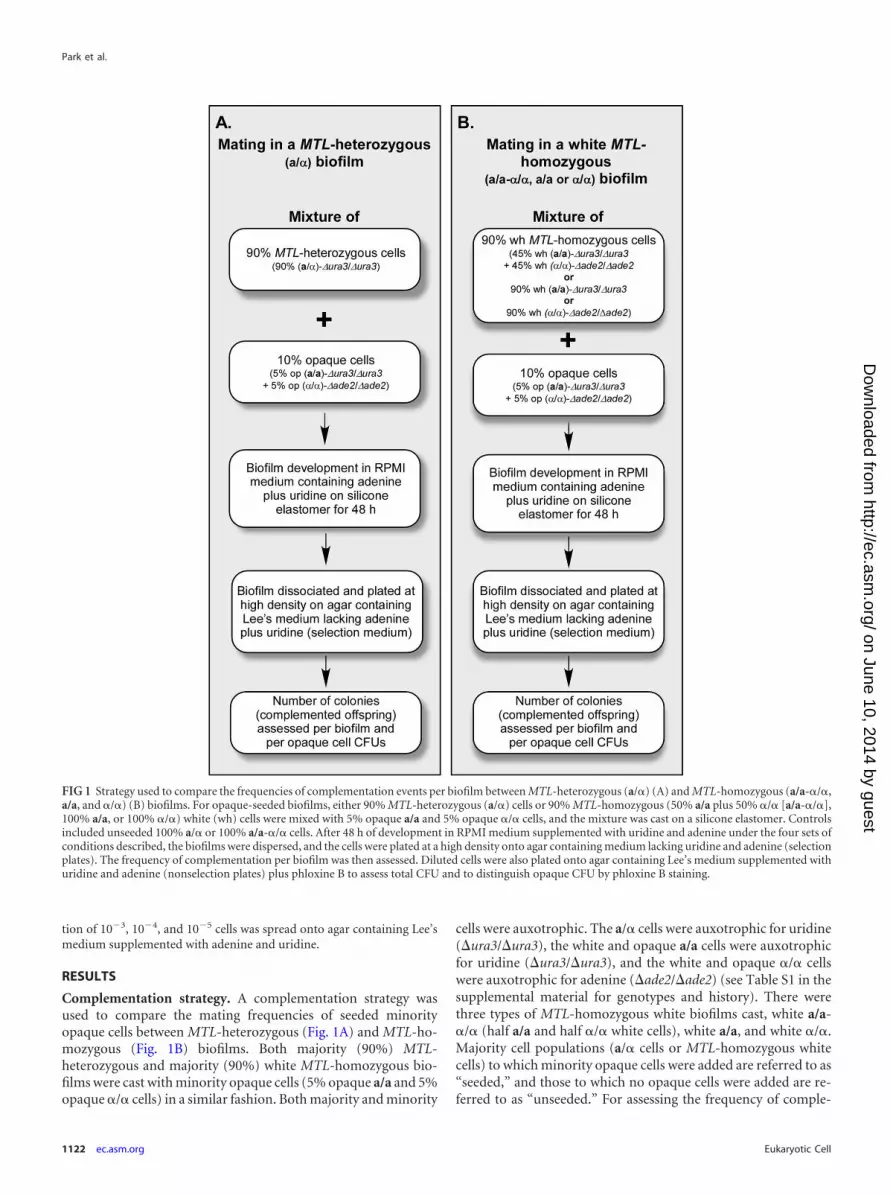
Complementation strategy. A complementation strategy wasused to compare the mating frequencies of seeded minorityopaque cells between MTL-heterozygous (Fig. 1A) and MTL-ho-mozygous (Fig. 1B) biofilms. Both majority (90%) MTL-heterozygous and majority (90%) white MTL-homozygous bio-films were cast with minority opaque cells (5% opaque a/a and 5%opaque �/� cells) in a similar fashion. Both majority and minority
cells were auxotrophic. The a/� cells were auxotrophic for uridine(�ura3/�ura3), the white and opaque a/a cells were auxotrophicfor uridine (�ura3/�ura3), and the white and opaque �/� cellswere auxotrophic for adenine (�ade2/�ade2) (see Table S1 in thesupplemental material for genotypes and history). There werethree types of MTL-homozygous white biofilms cast, white a/a-�/� (half a/a and half �/� white cells), white a/a, and white �/�.Majority cell populations (a/� cells or MTL-homozygous whitecells) to which minority opaque cells were added are referred to as“seeded,” and those to which no opaque cells were added are re-ferred to as “unseeded.” For assessing the frequency of comple-
FIG 1 Strategy used to compare the frequencies of complementation events per biofilm between MTL-heterozygous (a/�) (A) and MTL-homozygous (a/a-�/�,a/a, and �/�) (B) biofilms. For opaque-seeded biofilms, either 90% MTL-heterozygous (a/�) cells or 90% MTL-homozygous (50% a/a plus 50% �/� [a/a-�/�],100% a/a, or 100% �/�) white (wh) cells were mixed with 5% opaque a/a and 5% opaque �/� cells, and the mixture was cast on a silicone elastomer. Controlsincluded unseeded 100% a/� or 100% a/a-�/� cells. After 48 h of development in RPMI medium supplemented with uridine and adenine under the four sets ofconditions described, the biofilms were dispersed, and the cells were plated at a high density onto agar containing medium lacking uridine and adenine (selectionplates). The frequency of complementation per biofilm was then assessed. Diluted cells were also plated onto agar containing Lee’s medium supplemented withuridine and adenine (nonselection plates) plus phloxine B to assess total CFU and to distinguish opaque CFU by phloxine B staining.
Park et al.
1122 ec.asm.org Eukaryotic Cell
on June 10, 2014 by guesthttp://ec.asm
.org/D
ownloaded from

mentation (i.e., fusion), biofilms were first developed in RPMImedium (37) supplemented with uridine and adenine (nonselec-tion medium) on silicone elastomer discs for 48 h and then me-chanically dissociated, and the same volume of cell suspension wasplated at a high density on agar containing modified Lee’s medium(31, 38), a defined medium, lacking uridine and adenine (selec-tion medium). On selection plates, only cells that have becomeprototrophic for both uridine and adenine (i.e., putative fusionproducts [a/�] of opaque a/a cells [�ura3/�ura3] and opaque �/�cells [�ade2/�ade2]) can form colonies. Cell suspensions werealso diluted and plated onto nonselection plates containing phlox-ine B. The latter platings provided us with the total concentrationof CFU per biofilm and the concentration of phloxine B-stainedopaque CFU per biofilm. Complementation was tested under foursets of conditions: 28°C in air, 28°C in 20% CO2, 37°C in air, and37°C in 20% CO2. Under each test condition in each individualexperiment, three biofilms were cast, and after 48 h under each setof conditions, biofilms were disrupted, an aliquot of each biofilmsuspension was plated onto selection plates, and the plates werescored for the number of complementation events. This resultedin nine measures of complementation per condition per experi-ment. Four experiments were performed, three of which were per-formed under all four conditions and one of which was analyzedin air and in 20% CO2 only at 37°C.
Cell composition and architecture of biofilms. The basic ar-chitectures were similar for MTL-heterozygous and MTL-ho-mozygous biofilms seeded or unseeded with minority a/a and �/�opaque cells. After 48 h, all biofilms contained a basal yeast cellpolylayer, from which extended vertically oriented hyphae, whichhave been shown to be embedded in a uniform extracellular ma-trix (5, 14–16, 39). MTL-heterozygous biofilms, both seeded andunseeded, were on average slightly thicker (10 to 20%) than MTL-homozygous biofilms (see Table S2 in the supplemental material).Seeding caused a 10% increase in the thickness of MTL-homozy-gous biofilms but not MTL-heterozygous biofilms (see Table S2 inthe supplemental material). Because the cells in the upper regionsof biofilms were composed of hyphae embedded in a dense ma-trix, mechanical disruption resulted in multicompartmented hy-phal fragments plus matrix, which behaved as single CFU whenplated. Opaque cells, however, were individually released whenbiofilms were disrupted (data not shown). The density of opaque
cells in mature biofilms was consistently only slightly higher inMTL-homozygous than in MTL-heterozygous biofilms under thefour tested sets of conditions (see Table S4 in the supplementalmaterial). Based on these observations, we have computed thefrequencies of complementation as the number of complementa-tion events not only per biofilm but also per opaque CFU. Becausethe majority of cells in the upper biofilm layers are hyphal, totalCFU do not represent total cell compartments and provide incon-sistent values. We therefore did not use total CFU to calculatecomplementation frequencies.
Complementation in unseeded control biofilms. As was ex-pected, no prototrophic colonies were observed when preparationof disrupted unseeded a/� biofilms were plated onto selectionplates (Tables 1 and 2). This was true for all four experimentsunder all four conditions. However, when preparations of dis-rupted unseeded a/a-�/� biofilms were plated similarly, low com-plementation frequencies were observed, ranging on average from0 to 0.8 per biofilm under the four test conditions (Table 1). Thiswas expected given that opaque cells are formed in white cell pop-ulations through spontaneous white-to-opaque switching (32,40–42). The concentration of spontaneously appearing opaquecells in unseeded a/a-�/� biofilms ranged from 3 � 104 to 1 � 105
per biofilm (see Table S4 in the supplemental material). This sug-gested that after 48 h of development, no more than 4% of opaquecells in seeded MTL-homozygous biofilms were due to spontane-ous switching of majority white cells.
Complementation in seeded biofilms. The mean numbers ofcomplementation events per a/� biofilm seeded with a/a and �/�opaque cells under the four sets of conditions were 2.4 � 1.4,1.3 � 1.4, 0, and 0.5 � 0.6, respectively (Table 1). In contrast, themean numbers of complementation events per seeded a/a-�/�biofilms were 22.6 � 9.5, 30.2 � 12.2, 34.9 � 27.3, and 43.2 �29.1, respectively (Table 1). The numbers of complementationevents per seeded a/a-�/� biofilm were therefore 9, 23, �35, and86 times those of similarly seeded a/� biofilms for the four sets oftest conditions (Table 2). The mean number of complementationevents per seeded a/a biofilm was similar to that per seeded a/a-�/� biofilm, whereas the mean number of complementationevents per seeded �/� biofilm was higher for each tested condition(Table 1). The differences between the complementation frequen-cies in MTL-heterozygous biofilms and those in MTL-homozy-gous biofilms are clearly demonstrated by bar graphs in which theaverage number of complementation events per biofilm was nor-malized to the highest value attained (100%) under the four sets of
TABLE 1 Mean frequencies of complementation events per MTL-heterozygous and MTL-homozygous biofilmsa
Genotype ofmajoritycells
Additionof 5% opa/a 5% op�/�
Mean no. of complementation events per biofilm � SD
28°C 37°C
Air 20% CO2 Air 20% CO2
a/� � 0 0 0 0 2.4 � 1.4 1.3 � 1.4 0 0.5 � 0.6
a/a-�/� � 0 0.7 � 1.2 0.8 � 1.1 0.6 � 1.2 22.6 � 9.5 30.2 � 12.2 34.9 � 27.3 43.2 � 29.1
a/a 20.4 � 12.2 21.0 � 4.7 25.4 � 25.7 33.1 � 23.9
�/� 56.7 � 68.8 102.5 � 63.6 104.7 � 88.8 163.6 � 139.9
a The mean frequencies were computed from the average frequencies from four
separate experiments. The average frequencies per experiment were then used to
compute the mean and standard deviation for each cell mixture and condition. In each
experiment, three samples were analyzed from each of three independent biofilms. In
one of the four experiments, biofilms were analyzed only at 37°C. op, opaque.
TABLE 2 Comparison of MTL-heterozygous and MTL-homozygouscomplementation frequencies computed per biofilm
Comparison
Ratio of complementation frequencies
28°C 37°C
Air 20% CO2 Air 20% CO2
a⁄a��⁄��op
a⁄��op9� 23� �35� 86�
a⁄a�op
a⁄��op9� 16� �25� 66�
�⁄��op
a⁄��op24� 79� �105� 328�
Sexual Biofilms in Candida albicans
August 2013 Volume 12 Number 8 ec.asm.org 1123
on June 10, 2014 by guesthttp://ec.asm
.org/D
ownloaded from

conditions (Fig. 2). In Fig. 2A, this has been done for the com-bined data from experiments 1 to 4, and in Fig. 2B, this has beendone for the data for each of the four experiments. In lieu of errorbars, one can assess the standard deviations of the data that werenormalized in Table 1, and the P values were computed by theStudent t test for the combined data from the four experimentsbetween seeded a/a-�/� and a/� biofilms (see Table S3 in thesupplemental material). These P values were highly significant forthe four sets of test conditions (P values of 0.0001, 0.0001,0.0003, and 0.0001) (see Table S3 in the supplemental material).
MTL-heterozygous and MTL-homozygous biofilms containedsimilar concentrations of opaque CFU (see Table S4 in the sup-plemental material), allowing us to compute and compare the
frequencies of complementation events as a function of opaqueCFU. Although the differences between a/� and a/a-�/� biofilmswere highly significant, the error bars for the bar graphs wererelatively high (see standard deviations in Table 1). Thus, addi-tions of error bars to the three-dimensional (3D) plots in Fig. 2distracted from the main point of the plots, the differences inmean frequencies. The complementation frequencies in MTL-ho-mozygous biofilms, computed as a function of opaque CFU, wereagain far higher than those in MTL-heterozygous biofilms. At28°C, the differences between MTL-homozygous (a/a-�/�, a/a,and �/�) and MTL-heterozygous (a/�) biofilms ranged between50- and 140-fold in air and between 22- and 32-fold in 20% CO2
(see Table S5 in the supplemental material). At 37°C, the differ-
FIG 2 Histogram comparing complementation frequencies between a/� and a/a-�/� biofilms under the four tested conditions. The pooled data from fourexperiments (A) and the data for each experiment (B) have been normalized to the highest complementation value (100%) under each test condition. Thestandard deviations of the mean values of frequencies for the four experiments can be found in Table 1. A table of the P values demonstrating that the differencesbetween the normalized mean frequencies of complementation per a/� biofilm and a/a-�/� biofilm (A) are significant is presented in Table S3 in the supple-mental material. This table is in lieu of error bars. A key defining the different MTL genotypes of the biofilms is presented in the box in panel A.
Park et al.
1124 ec.asm.org Eukaryotic Cell
on June 10, 2014 by guesthttp://ec.asm
.org/D
ownloaded from

ences ranged between 4- and 8-fold in air and 5- and 16-fold in20% CO2 (see Table S5 in the supplemental material). The differ-ences were again found to be significant by using the Student t test(data not shown). Together, the results demonstrate that eventhough a/� and MTL-homozygous biofilms are architecturallysimilar and retain similar numbers of seeded opaque cells at ma-turity, the frequencies of complementation under all four condi-tions were far higher in MTL-homozygous biofilms.
Complementation occurs in biofilms and not on selectionplates. We have assumed in the analysis described above thatcomplementation occurs in biofilms, but to assess complementa-tion, cells were plated at a high density onto selection plates (Fig.1). To verify that the complementation events occurred in bio-films and not in the high-density cell preparations after they werespread onto selection plates, we plated fresh high-density mixturesof a/� cells containing 10% opaque cells (50:50 ratio of a/a and�/�) and a/a-�/� cells containing 10% opaque cells (50:50 ratio ofa/a and �/�) directly onto selection plates, at the same high den-sity used to test complementation in biofilms. No complementa-tion occurred on multiple plates in three separate experiments ineither seeded a/� or seeded a/a-�/� plates, even after 8 days, dem-onstrating that in the experimental protocol that we used (Fig. 1),complementation occurred in biofilms.
Complemented strains are a/� and vary in DNA content. Ifthe complementation of auxotrophic markers in biofilms indeedrepresents mating fusions, the immediate MTL configuration ofthe complementation products of opaque a/a (�ura3/�ura3) and�/� (�ade2/�ade2) cells should be a/�. As cells lose chromosomesin the transition to the diploid state (43), they would diversify toa/�, a/a, and �/�. The mating type locus resides on chromosome5, while the genes for ADE2 and URA3 reside on chromosome 3(http://www.candidagenome.org/). To test whether the matingtype configurations of complemented strains (�ade2/ADE2 and�ura3/URA3) were in fact a/�, we tested cells from colonies thatgrew on selection plates for the presence of the genes MTLa1,which resides in the a copy of the MTL locus, and MTL�2, whichresides in the � copy of the MTL locus (44), by PCR. Of 86 ran-domly selected complemented clones formed by opaque a/a and�/� cells in mixed white a/a-�/� biofilms, 83 were a/�, 1 was a/a,and 2 were �/�. In Fig. 3A, the MTL genotypes of 27 strains ran-domly selected from the 86 complemented strains are shown. Oneof these clones (clone 4) lacked the MTLa1 gene. Of 9 comple-mented isolates formed by opaque a/a and �/� cells in a/� bio-films, all were MTL heterozygous (Fig. 3B). These results demon-strate that the great majority of complemented strains obtained ineither a/� or a/a-�/� biofilms were indeed the result of fusionbetween opaque a/a and �/� cells.
Since C. albicans is a diploid, fusions should result in tetrap-loids, which must then undergo chromosome reduction to returnto the diploid state (43). To test this prediction, 17 random com-plemented clones from the set shown in Fig. 3A were grown for 15days on selection plates to stationary phase so that they wouldaccumulate in G1 (45). They were then analyzed by fluorescence-activated cell sorting (FACS) for DNA content. Strain SC5314(a/�) collected in the mid-log phase of growth provided measuresof cells with DNA contents of 2N and 4N (Fig. 3C, top left), whichallowed us to assess the DNA contents of complemented clonesthrough comparisons. The DNA contents of the 17 fusants instationary phase ranged from 4N to 2N (Fig. 3C), suggesting pro-gressive loss of chromosomes. Surprisingly, even strains which
appeared diploid or near diploid by FACS were a/� (clones 1, 8,12, and 14). This suggests that during chromosome loss, there maybe a selective advantage for maintaining the a/� genotype (i.e.,heterozygosity of chromosome 5).
Cell biology of complementation. Given that complementa-tion between opaque a/a and opaque �/� cells occurs in MTL-homozygous biofilms at frequencies approximately 1 to 2 ordersof magnitude higher than in MTL-heterozygous biofilms, onewould expect to observe a higher frequency of conjugation tubesand fusions in the former. Staining of cell preparations with cal-cofluor can be used to distinguish conjugation tubes from hyphae,given that the latter, but not the former, are compartmentalized byseptae that stain intensely with calcofluor (20). In seeded a/� bio-films stained with calcofluor, large oblong opaque cells (Op) werereadily identified. A minority of them formed wide evaginations,suggestive of shmoo formation (20) (Fig. 4A to D). Hyphae (H),the predominant phenotype, contained calcofluor-stained septae(Fig. 4A to D). However, long septum-free conjugation tubes wererarely observed in seeded a/� biofilms. In marked contrast, longseptum-free conjugation tubes were readily distinguished inseeded white a/a-�/� biofilms (Fig. 4E to H). To visualize fusionin a/a-�/� biofilms, we generated an �/� strain with the fluores-cent protein mCherry under the regulation of the OP4 promoter(�ade2/�ade2 OP4/op4::OP4p-mCherry) and an a/a strain withthe fluorescent protein GFP also under the regulation of the OP4promoter (�ura3/�ura3 OP4/op4::OP4p-GFP) (see Table S1 inthe supplemental material). In the opaque state, �/� cells wouldexpress mCherry, and a/a cells would express GFP, since the OP4promoter is selectively upregulated in the opaque phase (46). Fu-sants of opaque mCherry-expressing �/� cells and opaque GFP-expressing a/a cells would be both red (mCherry) and green(GFP), colors which can be separated by using laser scanning con-focal microscopy (LSCM) and LASERSHARP 2000 software (Bio-Rad). Superimposing the two colored images would result in yel-low when red and green are superimposed. Fusions exhibitinguniform red and green fluorescence were readily observed inwhite a/a-�/� biofilms seeded with 5% opaque �/� mCherrycells and 5% opaque a/a GFP cells. An example of two opaquecells connected by a conjugation bridge is presented in Fig. 4Ito L. By simultaneously staining with calcofluor (Fig. 4K), weconfirmed that a bridge existed between two cell bodies andthat it contained no septae. In Fig. 4L, calcofluor staining issubtracted, and the fusant outlined is blue. Similar red andgreen fusants with long conjugation bridges could not be foundin seeded a/� biofilms.
Complementation in patches. If the difference in the facilita-tion of mating between MTL-heterozygous and MTL-homozy-gous biofilms was specifically a result of the formation of a con-figuration of the mating type locus and had nothing to do withdifferences in the specialized biofilm formed by MTL-homozy-gous cells, the same difference in mating frequencies betweenseeded MTL-heterozygous and MTL-homozygous biofilmsshould be observed in seeded patches of cells grown on agar. Al-ternatively, if differences in complementation frequencies werethe result of differences in the alternative biofilms per se, the fre-quencies should be similar in seeded MTL-heterozygous andMTL-homozygous patches. To distinguish between these alterna-tive possibilities, we seeded majority a/� cells, white a/a-�/� cells,white a/a cells, and white �/� cells with 5% opaque a/a and 5%opaque �/� cells, using the same auxotrophic strains described for
Sexual Biofilms in Candida albicans
August 2013 Volume 12 Number 8 ec.asm.org 1125
on June 10, 2014 by guesthttp://ec.asm
.org/D
ownloaded from

biofilms in Fig. 1. The cell mixtures were then spotted onto agarcontaining Lee’s medium supplemented with uridine and adenine(nonselection medium). These agar cultures were then incubatedfor 48 h under the same four conditions used to analyze biofilms.Cells in patches grown on agar had none of the architecture ex-hibited by biofilms in RPMI 1640 medium. They consisted almostexclusively of budding cells or disorganized mixtures of yeast cellsand hyphae. Cells from patches were then suspended and plated at
a high density onto selective medium to assess the frequency ofcomplementation. Cells were also diluted and plated onto nonse-lection medium containing phloxine B to assess total CFU andopaque CFU. In the case of patches, the frequency of complemen-tation events was computed as a function of CFU, since cells dis-sociated freely and even hyphae fragmented, probably as a resultof the absence of matrix, although they still represented multi-compartmented fragments when plated.
FIG 3 The MTL genotype of the complemented strains was predominantly a/� (97%). The DNA contents varied between 2N and �4N. (A) PCR analyses of theMTL genotypes (MTLa1 and MTL�2) of 27 of the 86 complemented offspring tested from seeded MTL-homozygous (a/a-�/�) biofilms. Of the 86 comple-mented strains, 83 were a/�, 2 were �, and 1 was a. In the limited set shown, all but clone 4 were a/�. (B) PCR analysis of 9 complemented offspring fromMTL-heterozygous biofilms. All proved to be a/�. (C) DNA content of complemented strains from MTL-homozygous biofilms analyzed by fluorescence-activated cell sorting (FACS). Cells of complemented strains were grown to stationary phase. As a control, the DNA content of a log-phase culture of strainSC5314 (a/�) was analyzed (top left) to obtain the relative positions of 2N and 4N DNA. The scans are ordered from diploid to tetraploid or greater. The strainsanalyzed in panel A for MTL configuration are presented in parentheses in panel C.
Park et al.
1126 ec.asm.org Eukaryotic Cell
on June 10, 2014 by guesthttp://ec.asm
.org/D
ownloaded from

For control patches of unseeded a/� cells grown at 28°C in airor 20% CO2, no prototrophic colonies were obtained on selectionplates, as expected (Fig. 5A). For seeded a/� patches, however, themean frequencies of complementation events per total CFU at28°C in air and in 20% CO2 were (6.1 � 8.6) � 10�4 and (1.5 �2.0) � 10�4, respectively. In control patches of unseeded a/a-�/�cells, the mean frequency of complementation events per CFU wasnegligible (Fig. 5A). The mean frequencies of complementation inseeded MTL-homozygous patches (a/a-�/�, a/a, and �/�) grownat 28°C in air or in 20% CO2, however, were similar to those inseeded a/� patches (Fig. 5A). This is evident in bar graphs of nor-malized data (Fig. 5B). The ratios of complementation frequenciesin patches grown at 28°C for seeded a/� versus seeded a/a-�/�,a/a, or �/� patches were 0.8, 1.0, and 0.8, respectively, in air and0.6, 0.3, and 1.3, respectively, in 20% CO2 (Fig. 5C). In all cases,the differences in mean complementation frequencies between
seeded a/� and MTL-homozygous patches proved to be nonsig-nificant (P value of �0.05) by using the Student t test.
Surprisingly, there was negligible complementation at 37°C ineither air or 20% CO2 in both seeded a/� and seeded MTL-ho-mozygous (a/a-�/�, a/a, and �/�) patches (Fig. 5A). This was indirect contrast to seeded biofilms, in which complementation oc-curred on average at similar frequencies at 28°C and 37°C (Tables1 and 2). Lack of complementation at 37°C in both a/� and MTL-homozygous patches was not due to a decrease in the concentra-tion of opaque cells (Fig. 5D). There was, however, a difference inthe levels of hypha formation between patches that formed at 28°Cand patches that formed at 37°C, particularly in a/� patches (seeTable S6 in the supplemental material). Cells in unseeded andseeded a/� patches were almost exclusively (�99%) in the yeastform at 28°C but primarily (90%) in the hyphal form at 37°C (seeTable S6 in the supplemental material). Thus, one might conclude
FIG 4 Conjugation tubes and fusions between opaque a/a and opaque �/� cells are readily observed in MTL-homozygous (a/a-�/�) biofilms but notMTL-heterozygous (a/�) biofilms. (A to D) Representative epifluorescence images of calcofluor-stained cells in a/� biofilms that had been seeded with a 10%mixture of opaque a/a and opaque �/� cells. Hyphae (H), which make up the majority of cells, exhibited intensely stained septae, which are absent fromconjugation tubes. Opaque cells (Op), which are larger than white cells, stained intensely with calcofluor. Evaginations (Evag) of opaque cells are suggestive ofshmoo formation. However, conjugation tubes could be found only rarely in a/� biofilms. (E to H) Conjugation tubes (Conj tube) were readily observedemanating from opaque cells in MTL-homozygous (a/a-�/�) biofilms. These long conjugation tubes could be discriminated from hyphae by the lack ofcalcofluor-stained septae. (I to L) Example of a fusion between a GFP-expressing opaque a/a cell and mCherry-expressing opaque �/� cells in a white a/a-�/�biofilm. (I) Confocal z-series projection of mCherry staining of a fusant (f). Two individual opaque red �/� cells are in close contact with the fusant. (J) Confocalz-series projection of GFP of the same fusant. One opaque green a/a cell (star) is in close contact with the fusant. (K) Confocal z-series projection of mCherry andthat of GFP for a fusant, embedded in calcofluor-stained cells, are imaged simultaneously in a preparation. Merging of red and green produces yellow. (L) Thecalcofluor-stained nonfusant cells in panels I and J have been subtracted from the images. A drawn-in dark blue outline delimits the edge of the entire fusionprofile obtained by calcofluor staining of the same preparation shown in panel K. A z-series of six images was taken at 3-�m intervals for projections. Scale bars,5 �m.
Sexual Biofilms in Candida albicans
August 2013 Volume 12 Number 8 ec.asm.org 1127
on June 10, 2014 by guesthttp://ec.asm
.org/D
ownloaded from

that hyphae formed in patches inhibited mating, but the results ofMTL-homozygous patches did not support that conclusion. Cellsin MTL-homozygous patches grown in air at 37°C were primarily(90 to 99%) in the yeast form (see Table S6 in the supplementalmaterial), yet they still did not undergo complementation. Inter-estingly, at 37°C in air, seeded a/a-�/� and a/a patches contained
low levels of shmoos and short conjugation tubes but did notcontain fusants (see Table S6 in the supplemental material). To-gether, the results obtained at 28°C for patches indicate that thedifference in mating frequencies between MTL-heterozygous andMTL-homozygous biofilms is not due simply to differences in theMTL configuration but rather to differences in the biofilms
FIG 5 Frequencies of mating in patches of cells grown on agar containing the same mixtures as biofilms do not exhibit differences between seeded MTL-homozygous and seeded MTL-heterozygous patches. Patches were grown on agar containing nutrient medium supplemented with uridine and adenine for 48 hunder the same four sets of conditions as those used for biofilms. (A) Mean frequency of complementation events per patch. The data are averaged from fourseparate experiments, as was performed for biofilms as described in Fig. 1. Complementation frequencies were computed per CFU. (B) Histogram comparingcomplementation frequencies in patches for normalized data, as was done in Fig. 2 for biofilms. The key for MTL genotypes is presented in a box. (C) Comparisonof complementation frequencies per CFU. (D) Proportion of opaque CFU per patch after 48 h. The data for 37°C and 20% CO2 in panel D were derived from asingle CFU obtained in one of four experiments. All data in panels A and D, except for data for 37°C and 20% CO2 in panel D, are presented as means � standarddeviations.
Park et al.
1128 ec.asm.org Eukaryotic Cell
on June 10, 2014 by guesthttp://ec.asm
.org/D
ownloaded from
formed by cells of the alternative MTL configurations. Moreover,these results demonstrate that MTL-homozygous biofilms pro-vide a specialized environment that facilitates mating at 37°C.
DISCUSSION
We previously demonstrated (5, 15) that when distributed on asilicone elastomer in RPMI 1640 medium, both stationary-phaseMTL-heterozygous and stationary-phase white MTL-homozy-gous yeast cells become adhesive and cohesive, forming a basalpolylayer of cells in the budding yeast form. This polylayer thengives rise to an upper layer of vertically oriented hyphae engulfedin an extracellular polymolecular matrix, as originally describedby Hawser and Douglas (37). The upper layer accounts for over80% of the depth of the biofilm. However, we found that eventhough the architecture appears similar, traits associated withpathogenic bacterial biofilms (2–4) are exhibited by MTL-heterozygous biofilms but not by MTL-homozygous biofilms (5,15). Whereas a/� biofilms are impermeable to low- and high-molecular-weight molecules, impenetrable by human PMNs, andresistant to fluconazole, a/a and �/� biofilms are permeable, pen-etrable, and fluconazole susceptible (5, 15). So what role does aMTL-homozygous biofilm play? White a/a and �/� biofilms havebeen shown to facilitate chemotropism between seeded minoritya/a and �/� opaque cells (21). Moreover, in RPMI 1640 medium,formation of an a/� biofilm is regulated by the Ras1/cAMP path-way, whereas a/a and �/� biofilms are regulated by the MAP ki-nase pathway, the same pathway, including the same pheromonesignals, pheromone receptors, trimeric G protein complex, andMAP kinase pathway, that facilitates opaque cell mating (5, 26).Hence, the MTL-homozygous biofilm not only facilitates chemot-ropism between opaque cells and is regulated by the same signaltransduction pathway that regulates the opaque cell mating re-sponse but also is coordinated with that response by sharing thepheromone signal released by opaque cells. This has led to thehypothesis that a/� biofilms facilitate commensalism and patho-genesis (i.e., they represent “pathogenic biofilms”) and that pher-omone-induced a/a and �/� biofilms facilitate mating (i.e., theyrepresent “sexual biofilms”). If correct, the latter but not the for-mer should facilitate mating when seeded with minority opaquea/a and �/� cells. Here, using a straightforward complementationassay, we present evidence that this is indeed the case. In addition,we show that there is no similar discrimination in mating fre-quency between seeded patches of MTL-heterozygous and MTL-homozygous cells grown on agar under the same conditions asthose for biofilms, demonstrating that the differences in matingfrequency are due to differences in the alternative biofilms per seand not simply to the configuration of MTL. It should be notedthat this difference holds not only for biofilms formed in RPMImedium at 28°C but also for biofilms formed in Spider medium at37°C in 20% CO2, even though the cell architecture and deposi-tion of matrix differ dramatically between biofilms formed in thetwo media, and the frequencies of mating in biofilms formed inSpider medium are lower than the frequencies in biofilms formedin RPMI 1640 medium (K. Daniels, Y.-N. Park, T. Srikantha, andD. R. Soll, submitted for publication).
Biofilm architecture and opaque cell content. We have foundthat the general architectures of MTL-heterozygous and MTL-homozygous biofilms were similar under the four sets of condi-tions. More importantly, there were no major differences betweenMTL-heterozygous and MTL-homozygous biofilms in the density
of seeded opaque cells after 48 h of development under any of thefour conditions that would account for the dramatic differencesbetween them in the frequencies of complementation events. Inaddition, spontaneous switching to the opaque phenotype by ma-jority white cells in MTL-homozygous biofilms accounted for4% of the opaque cells in seeded MTL-homozygous biofilmsafter 48 h of development.
Complementation frequencies. The frequencies of comple-mentation events per biofilm in MTL-homozygous biofilmsformed at 28°C, in either air or 20% CO2, were 9- to 79-fold higherthan those in MTL-heterozygous biofilms. The frequencies ofcomplementation events per biofilm in MTL-homozygous bio-films at 28°C were consistently higher in 20% CO2 than in air. Thefrequencies of complementation events per biofilm in MTL-ho-mozygous biofilms were also higher than those in MTL-heterozy-gous biofilms at 37°C, and again, the frequency in MTL-homozy-gous biofilms was consistently higher in 20% CO2 than in air.When we computed frequency as a function of opaque cell con-centration per biofilm, the frequency in MTL-homozygous bio-films at 28°C was 50- to 140-fold higher than that in MTL-heterozygous biofilms in air and 22- to 32-fold higher in 20% CO2.At 37°C in air and 20% CO2, the frequency of complementationcomputed as a function of opaque CFU was again far higher inMTL-homozygous biofilms than in MTL-heterozygous biofilms.As we have argued, because the majority of cell compartments inbiofilms formed in RPMI 1640 medium are hyphal and embeddedin a dense matrix, multicompartmented hyphal fragments of var-ious sizes embedded in matrix gave rise to variable total CFUmeasured after biofilm disruption. We therefore computed com-plementation frequencies per biofilm and as a function of totalopaque CFU rather than as a function of total CFU. Although thefrequencies obtained in biofilms are far lower than those obtainedin dense opaque a/a and �/� suspension cultures (47), the latter isthe result of collisions resulting from mixing and may be less phys-iological than a biofilm. Together, our results support the hypoth-esis that MTL-heterozygous biofilms play a specialized role inpathogenesis (5, 15), whereas MTL-homozygous biofilms play aspecialized role in facilitating mating.
Patches are not discriminatory. If it is the formation of anMTL-homozygous biofilm with a specialized matrix that facili-tates mating, then we would not expect to observe differences inmating frequencies in patches of a/� versus a/a-�/�, a/a, or �/�cells grown on agar under the same four sets of conditions inwhich we tested biofilms, since patches lack matrix and biofilmarchitecture. Both seeded MTL-heterozygous and seeded MTL-homozygous biofilms formed in RPMI 1640 medium were highlyorganized, containing a basal yeast cell polylayer and an upperregion of vertically oriented hyphae embedded in an extracellularmatrix. In the case of MTL-heterozygous biofilms, it is the special-ized matrix formed by genes regulated by the transcription factorBcrl that confers the specialized attributes of impermeability, im-penetrability, and drug resistance (15). It has been hypothesizedthat a factor other than Bcrl regulates the genes that form thespecialized matrix in MTL-homozygous biofilms that facilitatemating. In marked contrast, patches formed by MTL-heterozy-gous and MTL-homozygous cells at 28°C on agar are not architec-turally complex. At 28°C, they consist almost entirely of tightlypacked, noncohesive yeast cells with little space between them fora complex matrix. At 28°C, seeded minority opaque cells under-went complementation in MTL-heterozygous and MTL-homozy-
Sexual Biofilms in Candida albicans
August 2013 Volume 12 Number 8 ec.asm.org 1129
on June 10, 2014 by guesthttp://ec.asm
.org/D
ownloaded from
gous patches at similar frequencies in both air and 20% CO2.Therefore, while the frequency of mating was far higher in MTL-homozygous biofilms than in MTL-heterozygous biofilms, therewas no such discrimination in patches, supporting the conclusionthat it is the architecture and composition of the matrix of MTL-homozygous biofilms per se and not simply the configuration ofthe mating type locus that facilitate mating.
Surprisingly, at 37°C, we observed virtually no conjugationbetween seeded opaque cells in either MTL-heterozygous or MTL-homozygous patches. In four independent experiments, each inair and in 20% CO2, only one complementation event was ob-served in a single patch of seeded �/� cells in 20% CO2. SeededMTL-homozygous patches contained concentrations of opaquecells at 37°C that were similar to those at 28°C, so it was not a lackof opaque cells that was responsible for this result. In markedcontrast, there was little difference in the low frequencies of com-plementation events between 28°C and 37°C for seeded a/� bio-films and little difference in the elevated frequencies for seededMTL-homozygous (a/a-��, a/a, or �/�) biofilms between 28°Cand 37°C. Because seeded a/� patches consisted of over 90% hy-phae, one might argue that it was this characteristic (i.e., hyphaformation in patches) that inhibited complementation. However,this explanation is insufficient given that seeded a/a-�/�, a/a, and�/� patches at 37°C contained on average only 10% hyphae in airand 50% hyphae in 20% CO2 but still did not support comple-mentation. The dramatic reduction in complementation at 37°Cin patches but not in biofilms supports the hypothesis that MTL-homozygous biofilms create a specialized environment that facil-itates mating at physiological temperatures.
Conclusion. The results presented here demonstrate thatMTL-homozygous but not MTL-heterozygous biofilms, formedon silicone elastomers in RPMI 1640 medium, facilitate mating inair or in 20% CO2 and at 28°C or 37°C. These results in turnsupport the hypothesis that C. albicans can form two types ofbiofilms, depending in the configuration of the MTL locus. In thea/� configuration, C. albicans cells form a biofilm that is imper-meable, impenetrable by leukocytes, and drug resistant, charac-teristics that facilitate commensalism and pathogenesis (a “patho-genic” biofilm) but not mating. In the a/a or �/� configuration, C.albicans cells expressing the white phenotype form a biofilm thatfacilitates mating (a “sexual” biofilm), which does not exhibit thecharacteristics that facilitate commensalism and pathogenesis.The basis for discrimination appears to be in the formation ofalternative matrices, the matrix of a/� biofilms regulated by thetranscription factor Bcr1 (15, 17, 48), and the matrix of a/a and�/� biofilms by an as-yet-unidentified transcription factor (15).Given that this appears to be the first identified case in a microbialpathogen of alternative biofilms, one pathogenic and the othersexual, one wonders if such separation of function has evolved inother microbial pathogens but has gone unnoticed.
ACKNOWLEDGMENTS
This research was funded by the Developmental Studies Hybridoma Bank(DSHB), a NIH National Resource.
We are indebted to Sandy Beck for assembling the manuscript.
REFERENCES
1. Odds FC. 1998. Should resistance to azole antifungals in vitro be inter-preted as predicting clinical non-response? Drug Resist. Updat. 1:11–15.
2. Hoiby N, Bjarnsholt T, Givskov M, Molin S, Ciofu O. 2010. Antibioticresistance of bacterial biofilms. Int. J. Antimicrob. Agents 35:322–332.
3. Costerton JW, Stewart PS, Greenberg EP. 1999. Bacterial biofilms: acommon cause of persistent infections. Science 284:1318 –1322.
4. Hall-Stoodley L, Costerton JW, Stoodley P. 2004. Bacterial biofilms:from the natural environment to infectious diseases. Nat. Rev. Microbiol.2:95–108.
5. Yi S, Sahni N, Daniels KJ, Lu KL, Srikantha T, Huang G, Garnaas AM,Soll DR. 2011. Alternative mating type configurations (a/alpha versus a/aor alpha/alpha) of Candida albicans result in alternative biofilms regulatedby different pathways. PLoS Biol. 9:e1001117. doi:10.1371/journal.pbio.1001117.
6. Legrand M, Lephart P, Forche A, Mueller FM, Walsh T, Magee PT,Magee BB. 2004. Homozygosity at the MTL locus in clinical strains ofCandida albicans: karyotypic rearrangements and tetraploid formation.Mol. Microbiol. 52:1451–1462.
7. Lockhart SR, Pujol C, Daniels KJ, Miller MG, Johnson AD, Pfaller MA,Soll DR. 2002. In Candida albicans, white-opaque switchers are homozy-gous for mating type. Genetics 162:737–745.
8. Odds FC, Hanson MF, Davidson AD, Jacobsen MD, Wright P, WhyteJA, Gow NA, Jones BL. 2007. One year prospective survey of Candidabloodstream infections in Scotland. J. Med. Microbiol. 56:1066 –1075.
9. Tavanti A, Davidson AD, Johnson EM, Maiden MC, Shaw DJ, Gow NA,Odds FC. 2005. Multilocus sequence typing for differentiation of strainsof Candida tropicalis. J. Clin. Microbiol. 43:5593–5600.
10. Hull CM, Raisner RM, Johnson AD. 2000. Evidence for mating of the“asexual” yeast Candida albicans in a mammalian host. Science 289:307–310.
11. Magee BB, Magee PT. 2000. Induction of mating in Candida albicans byconstruction of MTLa and MTLalpha strains. Science 289:310 –313.
12. Miller MG, Johnson AD. 2002. White-opaque switching in Candidaalbicans is controlled by mating-type locus homeodomain proteins andallows efficient mating. Cell 110:293–302.
13. Hickman MA, Zeng G, Forche A, Hirakawa MP, Abbey D, HarrisonBD, Wang YM, Su CH, Bennett RJ, Wang Y, Berman J. 2013. The‘obligate diploid’ Candida albicans forms mating-competent haploids.Nature 494:55–59.
14. Baillie GS, Douglas LJ. 1998. Effect of growth rate on resistance of Can-dida albicans biofilms to antifungal agents. Antimicrob. Agents Che-mother. 42:1900 –1905.
15. Srikantha T, Daniels KJ, Pujol C, Kim E, Soll DR. 2013. Identificationof genes upregulated by the transcription factor Bcr1 that are involved inimpermeability, impenetrability, and drug resistance of Candida albicansa/alpha biofilms. Eukaryot. Cell 12:875– 888.
16. Douglas LJ. 2003. Candida biofilms and their role in infection. TrendsMicrobiol. 11:30 –36.
17. Finkel JS, Mitchell AP. 2011. Genetic control of Candida albicans biofilmdevelopment. Nat. Rev. Microbiol. 9:109 –118.
18. Srikantha T, Daniels KJ, Pujol C, Sahni N, Yi S, Soll DR. 2012. Nonsexgenes in the mating type locus of Candida albicans play roles in a/alphabiofilm formation, including impermeability and fluconazole resistance.PLoS Pathog. 8:e1002476. doi:10.1371/journal.ppat.1002476.
19. Mittelman MW. 1998. Structure and functional characteristics of bacte-rial biofilms in fluid processing operations. J. Dairy Sci. 81:2760 –2764.
20. Lockhart SR, Zhao R, Daniels KJ, Soll DR. 2003. Alpha-pheromone-induced “shmooing” and gene regulation require white-opaque switchingduring Candida albicans mating. Eukaryot. Cell 2:847– 855.
21. Daniels KJ, Srikantha T, Lockhart SR, Pujol C, Soll DR. 2006. Opaquecells signal white cells to form biofilms in Candida albicans. EMBO J.25:2240 –2252.
22. Sahni N, Yi S, Daniels KJ, Huang G, Srikantha T, Soll DR. 2010. Tec1mediates the pheromone response of the white phenotype of Candidaalbicans: insights into the evolution of new signal transduction pathways.PLoS Biol. 8:e1000363. doi:10.1371/journal.pbio.1000363.
23. Sahni N, Yi S, Pujol C, Soll DR. 2009. The white cell response topheromone is a general characteristic of Candida albicans strains. Eu-karyot. Cell 8:251–256.
24. Yi S, Sahni N, Daniels KJ, Pujol C, Srikantha T, Soll DR. 2008. The samereceptor, G protein, and mitogen-activated protein kinase pathway acti-vate different downstream regulators in the alternative white and opaquepheromone responses of Candida albicans. Mol. Biol. Cell 19:957–970.
25. Yi S, Sahni N, Pujol C, Daniels KJ, Srikantha T, Ma N, Soll DR. 2009.A Candida albicans-specific region of the alpha-pheromone receptor playsa selective role in the white cell pheromone response. Mol. Microbiol.71:925–947.
Park et al.
1130 ec.asm.org Eukaryotic Cell
on June 10, 2014 by guesthttp://ec.asm
.org/D
ownloaded from

26. Yi S, Sahni N, Daniels KJ, Lu KL, Huang G, Srikantha T, Soll DR. 2011.Self-induction of a/a or alpha/alpha biofilms in Candida albicans is a pher-omone-based paracrine system requiring switching. Eukaryot. Cell 10:753–760.
27. Nobile CJ, Mitchell AP. 2005. Regulation of cell-surface genes and bio-film formation by the C. albicans transcription factor Bcr1p. Curr. Biol.15:1150 –1155.
28. Nobile CJ, Nett JE, Hernday AD, Homann OR, Deneault JS, Nantel A,Andes DR, Johnson AD, Mitchell AP. 2009. Biofilm matrix regulation byCandida albicans Zap1. PLoS Biol. 7:e1000133. doi:10.1371/journal.pbio.1000133.
29. Fonzi WA, Irwin MY. 1993. Isogenic strain construction and gene map-ping in Candida albicans. Genetics 134:717–728.
30. Srikantha T, Morrow B, Schroppel K, Soll DR. 1995. The frequency ofintegrative transformation at phase-specific genes of Candida albicanscorrelates with their transcriptional state. Mol. Gen. Genet. 246:342–352.
31. Bedell GW, Soll DR. 1979. Effects of low concentrations of zinc on thegrowth and dimorphism of Candida albicans: evidence for zinc-resistantand -sensitive pathways for mycelium formation. Infect. Immun. 26:348 –354.
32. Anderson JM, Soll DR. 1987. Unique phenotype of opaque cells in thewhite-opaque transition of Candida albicans. J. Bacteriol. 169:5579 –5588.
33. Paulovich AG, Hartwell LH. 1995. A checkpoint regulates the rate ofprogression through S phase in S. cerevisiae in response to DNA damage.Cell 82:841– 847.
34. Park YN, Strauss A, Morschhauser J. 2004. The white-phase-specificgene WH11 is not required for white-opaque switching in Candida albi-cans. Mol. Genet. Genomics 272:88 –97.
35. Park YN, Morschhauser J. 2005. Tetracycline-inducible gene expressionand gene deletion in Candida albicans. Eukaryot. Cell 4:1328 –1342.
36. Keppler-Ross S, Noffz C, Dean N. 2008. A new purple fluorescent colormarker for genetic studies in Saccharomyces cerevisiae and Candida albi-cans. Genetics 179:705–710.
37. Hawser SP, Douglas LJ. 1995. Resistance of Candida albicans biofilms toantifungal agents in vitro. Antimicrob. Agents Chemother. 39:2128 –2131.
38. Lee KL, Buckley HR, Campbell CC. 1975. An amino acid liquid syntheticmedium for the development of mycelial and yeast forms of Candidaalbicans. Sabouraudia 13:148 –153.
39. Hawser SP, Douglas LJ. 1994. Biofilm formation by Candida species onthe surface of catheter materials in vitro. Infect. Immun. 62:915–921.
40. Bergen MS, Voss E, Soll DR. 1990. Switching at the cellular level in thewhite-opaque transition of Candida albicans. J. Gen. Microbiol. 136:1925–1936.
41. Rikkerink EH, Magee BB, Magee PT. 1988. Opaque-white phenotypetransition: a programmed morphological transition in Candida albicans.J. Bacteriol. 170:895– 899.
42. Slutsky B, Staebell M, Anderson J, Risen L, Pfaller M, Soll DR. 1987.“White-opaque transition”: a second high-frequency switching system inCandida albicans. J. Bacteriol. 169:189 –197.
43. Bennett RJ, Johnson AD. 2003. Completion of a parasexual cycle inCandida albicans by induced chromosome loss in tetraploid strains.EMBO J. 22:2505–2515.
44. Hull CM, Johnson AD. 1999. Identification of a mating type-like locus inthe asexual pathogenic yeast Candida albicans. Science 285:1271–1275.
45. Reed SI. 1980. The selection of S. cerevisiae mutants defective in the startevent of cell division. Genetics 95:561–577.
46. Morrow B, Srikantha T, Anderson J, Soll DR. 1993. Coordinate regu-lation of two opaque-phase-specific genes during white-opaque switchingin Candida albicans. Infect. Immun. 61:1823–1828.
47. Lachke SA, Lockhart SR, Daniels KJ, Soll DR. 2003. Skin facilitatesCandida albicans mating. Infect. Immun. 71:4970 – 4976.
48. Taff HT, Nett JE, Zarnowski R, Ross KM, Sanchez H, Cain MT,Hamaker J, Mitchell AP, Andes DR. 2012. A Candida biofilm-inducedpathway for matrix glucan delivery: implications for drug resistance. PLoSPathog. 8:e1002848. doi:10.1371/journal.ppat.1002848.
Sexual Biofilms in Candida albicans
August 2013 Volume 12 Number 8 ec.asm.org 1131
on June 10, 2014 by guesthttp://ec.asm
.org/D
ownloaded from


