Embed Size (px)
Citation preview
The Science of the Total Environment 306(2003) 133–158
0048-9697/03/$ - see front matter� 2002 Elsevier Science B.V. All rights reserved.PII: S0048-9697Ž02.00489-8
Cadmium, zinc, copper, arsenic, selenium and mercury in seabirdsfrom the Barents Sea: levels, inter-specific and geographical
differences
Vladimir M. Savinov *, Geir W. Gabrielsen , Tatiana N. Savinovaa,c, b a,c
Murmansk Marine Biological Institute of the Russian Academy of Science, 17, Vladimirskaya St., 183010, Murmansk, Russiaa
Norwegian Polar Institute, Polar Environmental Centre, 9296, Tromsø, Norwayb
Akvaplan-niva AS, Polar Environmental Centre, 9296, Tromsø, Norwayc
Received 12 April 2002; accepted 22 May 2002
Abstract
Trace elements Cd, Zn, Cu, As, Se and Hg were analysed in muscle and liver of Brunnich’s guillemot, Common¨guillemot, Puffin, Black guillemot, Little auk, Razorbill, Common eider, King eider, Glaucous gull, Herring gull,Black-legged kittiwake, Northern fulmar and Arctic tern collected in 1991–1992 at the main breeding colonies in theBarents Sea. The highest levels of the most toxic elements Cd and Hg were found in birds nesting north ofSpitsbergen. Extremely high levels of As were detected in tissues of all seabird species collected at colonies inChernaya Guba(Novaya Zemlya), where nuclear tests were carried out in the 1960s. In general, levels of all of thetrace elements in the Barents Sea seabirds were similar or lower in comparison with those reported for the sameseabird species from the other Arctic areas. Data on metallothionein concentrations in different seabird species needto be collected in order to understand the mechanism of bioaccumulation and possible toxic effects of trace elementsin Arctic seabirds.� 2002 Elsevier Science B.V. All rights reserved.
Keywords: Cd; Zn; Cu; As; Se; Hg; Seabirds; Tissue levels; The Barents Sea
1. Introduction
Seabirds are widely used to monitor trace ele-ment levels due to their wide distribution and highposition in the food chain. The detailed knowledgeof general seabird ecology, numbers and productiv-ity of many populations make them particularly
*Corresponding author. Tel.:q47-777-50347; fax:q47-777-50301.
E-mail address:[email protected](V.M. Savinov).
appropriate as a choice of biomonitors or bioindi-cators(Furness and Camphuysen, 1997). Gilbert-son et al. (1987) provide some evidencesuggesting that contaminant levels in seabirds havelower coefficients of variation than in fish ormarine mammals, and that the confidence intervalobtained from the analysis of seabirds is as smallas that obtained from a larger sample of fish ormammals.The Barents Sea is very productive and is
inhabited by one of the largest concentrations of
134 V.M. Savinov et al. / The Science of the Total Environment 306 (2003) 133–158
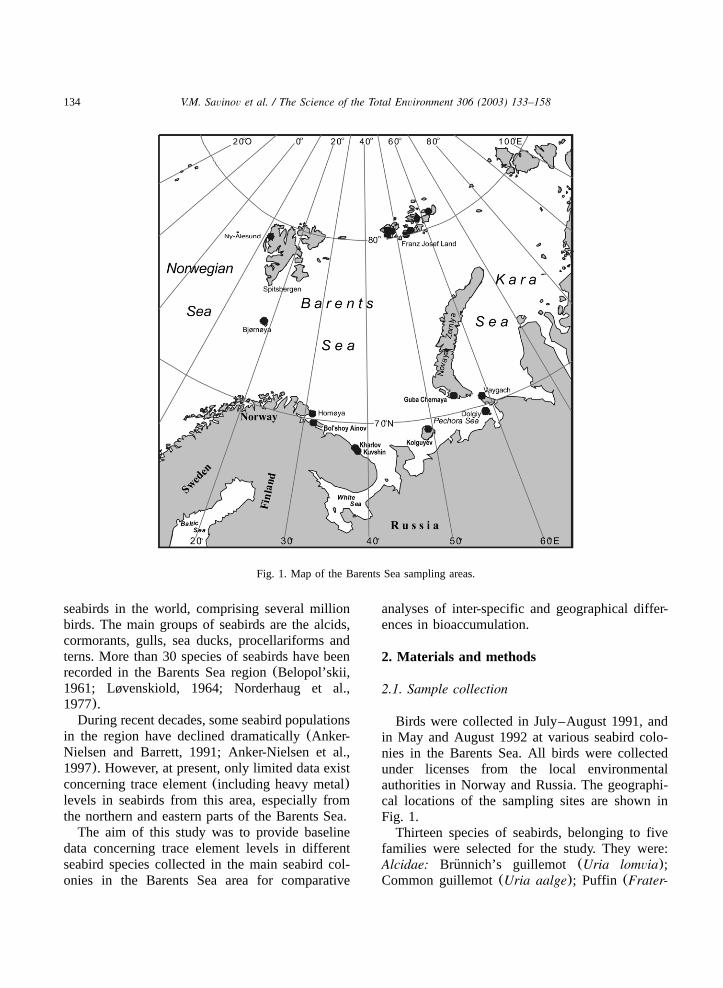
Fig. 1. Map of the Barents Sea sampling areas.
seabirds in the world, comprising several millionbirds. The main groups of seabirds are the alcids,cormorants, gulls, sea ducks, procellariforms andterns. More than 30 species of seabirds have beenrecorded in the Barents Sea region(Belopol’skii,1961; Løvenskiold, 1964; Norderhaug et al.,1977).During recent decades, some seabird populations
in the region have declined dramatically(Anker-Nielsen and Barrett, 1991; Anker-Nielsen et al.,1997). However, at present, only limited data existconcerning trace element(including heavy metal)levels in seabirds from this area, especially fromthe northern and eastern parts of the Barents Sea.The aim of this study was to provide baseline
data concerning trace element levels in differentseabird species collected in the main seabird col-onies in the Barents Sea area for comparative
analyses of inter-specific and geographical differ-ences in bioaccumulation.
2. Materials and methods
2.1. Sample collection
Birds were collected in July–August 1991, andin May and August 1992 at various seabird colo-nies in the Barents Sea. All birds were collectedunder licenses from the local environmentalauthorities in Norway and Russia. The geographi-cal locations of the sampling sites are shown inFig. 1.Thirteen species of seabirds, belonging to five
families were selected for the study. They were:Alcidae: Brunnich’s guillemot (Uria lomvia);¨Common guillemot(Uria aalge); Puffin (Frater-
135V.M. Savinov et al. / The Science of the Total Environment 306 (2003) 133–158
cula arctica); Black guillemot (Cepphus grylle);Little auk (Alle alle); Razorbill (Alca torda);Anatidae: Common eider(Somateria mollissima);King eider(Somateria spectabilis); Laridae: Glau-cous gull (Larus hyperboreus); Herring gull(Larus argentatus); Black-legged kittiwake(Rissatridactyla); Procellariidae: Northern fulmar(Ful-marus glacialis); andSternidae: Arctic tern (Ster-na paradisaea).The birds were caught with nets or noose poles
in the nesting colonies. Those, which were impos-sible to catch, were shot with a shotgun. All birdswere weighed using a Pesola spring balance andtheir sex was determined at dissection. For tracemetals determination, samples of liver and muscleswere collected. Only titanium tools were usedwhen dissecting the birds. The dissection was donein the laboratory onboard of the research vessel orin the field. All samples were frozen in plasticbags and stored in a deep-freezer(y20 8C) untilanalysis.
2.2. Analytical method
Samples of muscle and liver of birds werefreeze-dried for approximately 24 h to a finalpressure of 0.05 mbar aty53 8C, using a CHRISTLDC-1 freeze dryer. Each sample was digested inScan pure concentrated nitric acid in a microwaveoven (Milestone MLS 1200). The elements weredetermined by atomic absorption spectroscopy(Perkin Elmer Model 1100B). A graphite furnace(HGA 700) with an automatic sampler(AS 70)was used for As and Se, and a hydride system(FIAS 200) with an automatic sampler(AS 90)for Hg. The other elements(Cd, Cu and Zn) wereanalysed by flame AAS.The accuracy of the analytical procedures was
checked against the National Bureau of Standards(NBS) for bovine liver 1577A(Cd, Cu, Hg, Seand Zn) and dogfish muscle DOLM-1(As, Cd,Cu, Hg, Se and Zn). The accuracy of the analyticalprocedures was good for most of the metals.However, only approximately 50 and 70% of theconcentrations given for Cr in the two dogfishstandards could be detected.Trace metal determination was done at the
Norwegian Institute for Nature Research(NINA,
Trondheim). The laboratory has accreditation fortrace element analyses(P072).All element concentrations are presented in this
report as mgykg dw (dw).
2.3. Data analysis
Outliers were checked with box-and-whiskersplot procedure. A box-and-whiskers plot shows thedistribution of a quantitative variable. For a plotof a quantitative variable grouped by a qualitativevariable, the distribution within each category isdisplayed. The vertical line inside the box repre-sents the median(the 50th percentile) and thevertical ends of the box represent the lower andupper hinges(the 25th and 75th percentiles).Outliers are data outside the inner fences. WhereHspread is the absolute value of the differencebetween the two hinges, inner fences are definedas:
Lower fenceslower hingey1.5 (Hspread)
Upper fencesupper hingeq1.5 (Hspread)
Outliers values were removed from the wholedata set(for each species separately) before thetesting of significant differences in trace elementlevels between various seabird species.Kruskal–Wallis ANOVA statistics were used to
estimate the significance of differences betweenthe means and to identify homogeneous groups. Ahomogeneous group is a group with no significantdifferences between means. The word ‘significant’has only been used in the statistical context(P-0.05).Brunnich’s guillemot and Black-legged kitti-¨
wake were most widely represented in our dataand collected in the same areas. Therefore, thesetwo species were used for a general evaluation ofgeographical differences between trace elementcontaminant levels in the Barents Sea areas inves-tigated. Before statistical analysis, the trace ele-ment concentrations in Brunnich’s guillemot and¨kittiwake tissues were standardised for each spe-cies separately and pooled. Outliers values wereremoved from the new data set.All statistical procedures were performed with
SYSTAT Ver. 5.0(Systat Inc.).
136 V.M. Savinov et al. / The Science of the Total Environment 306 (2003) 133–158
For the interspecies comparisons, all samplingareas were pooled together, so there is the possi-bility of influence of ‘noise’ connected with geo-graphic differences. Therefore, seabird speciescollected at only one or neighbouring colonieswere marked on the figures.
3. Results and discussion
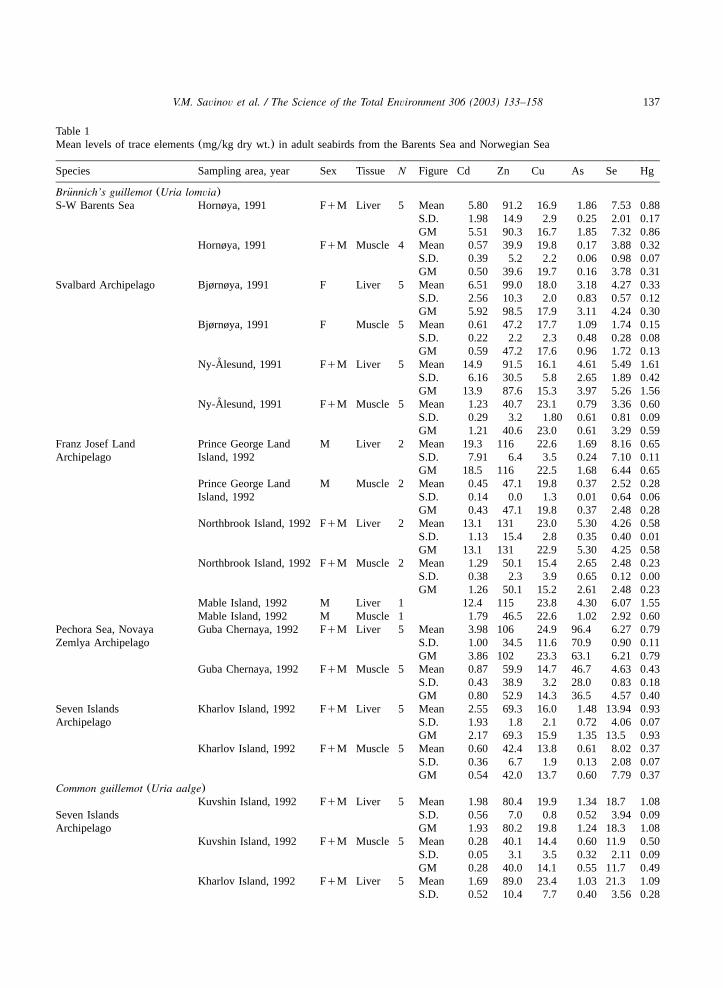
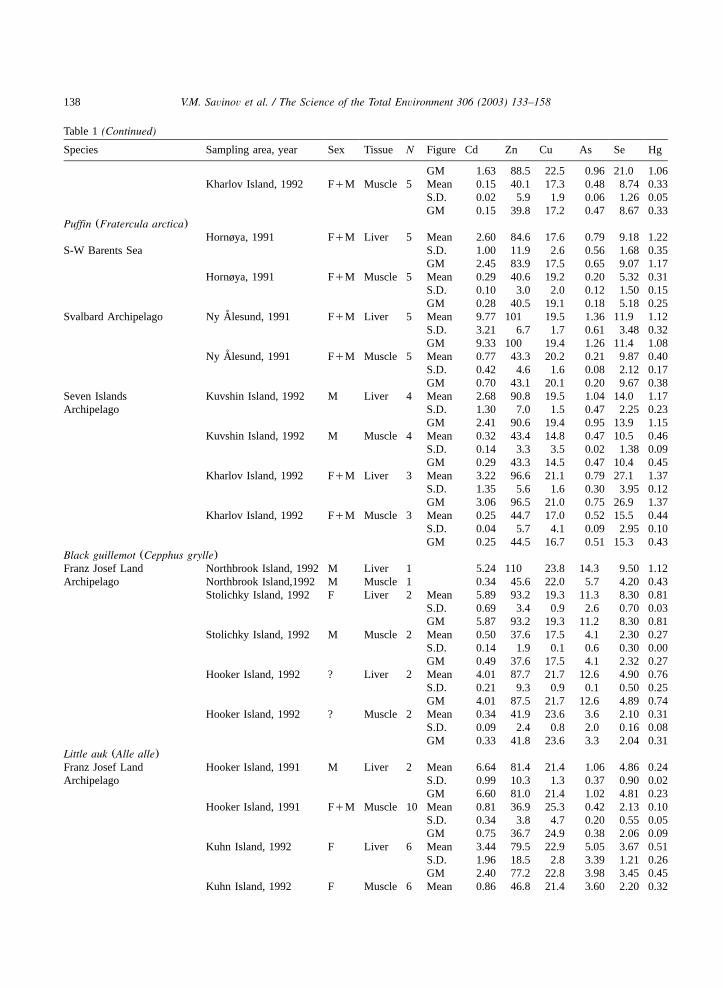
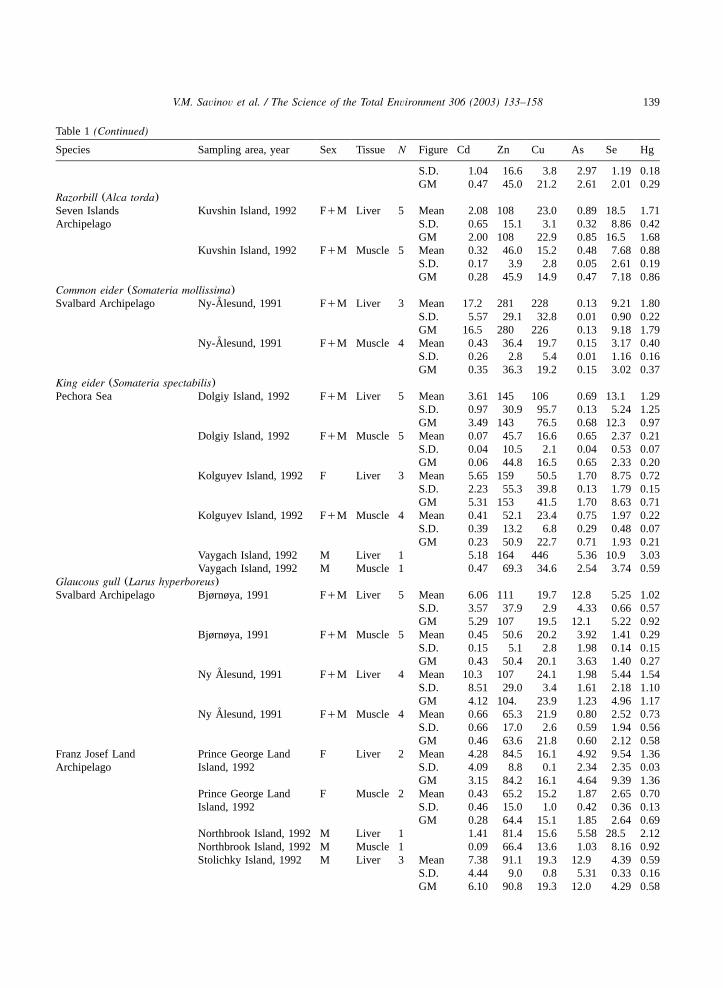
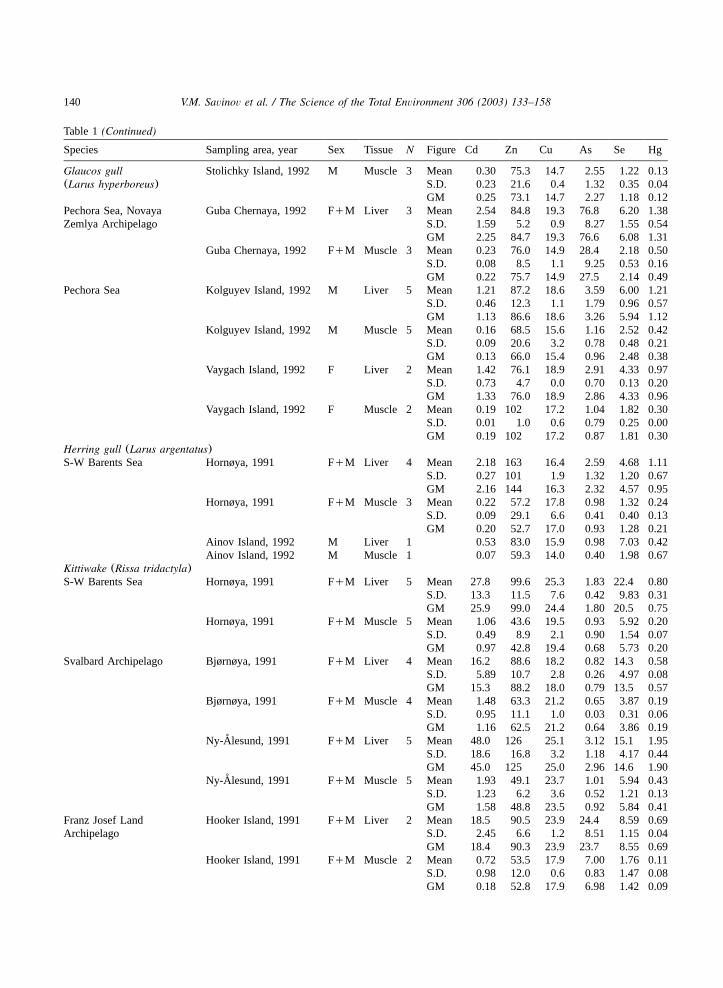
The results of metal and trace element determi-nations in bird tissues are presented in Table 1.
3.1. Cadmium
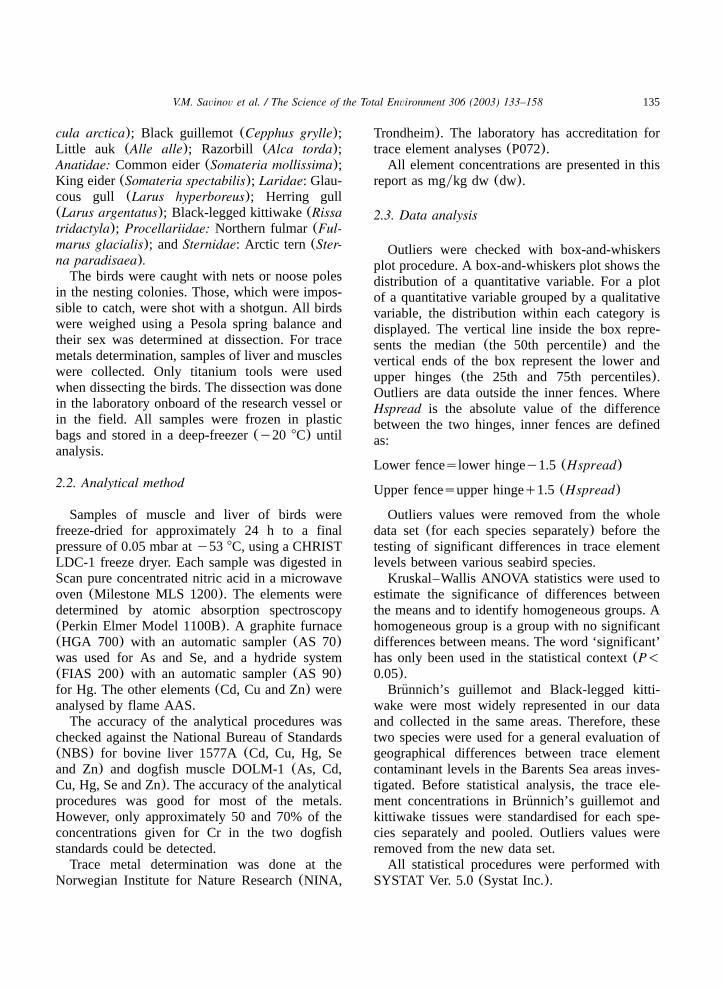
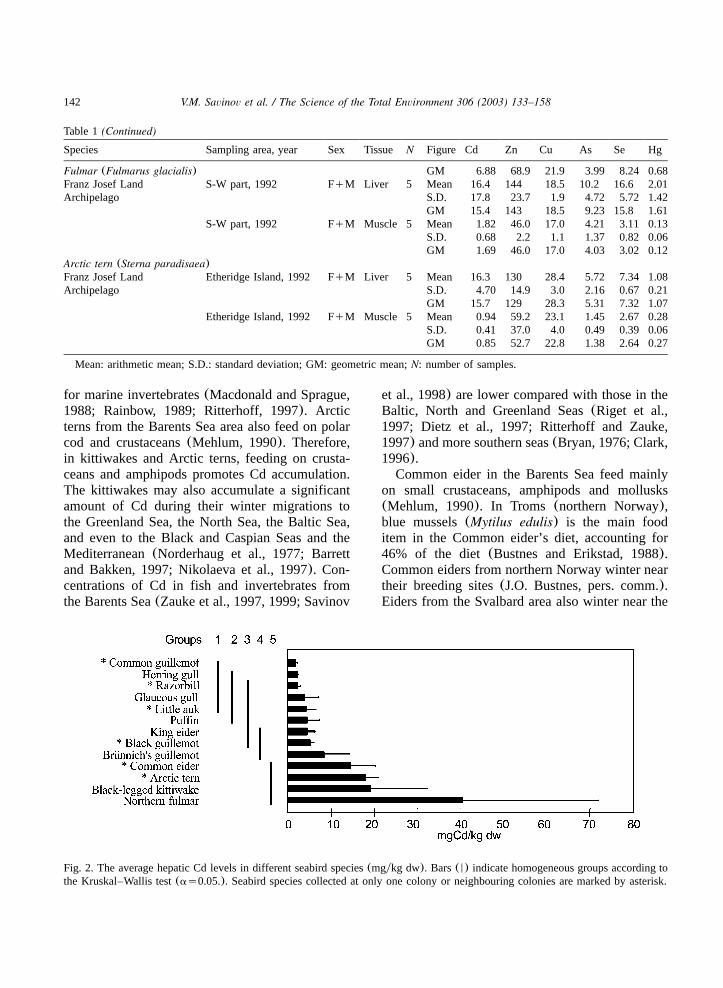
Average Cd concentrations in liver of bird spe-cies varied from 1.72(Common guillemot) to 40.4mgykg (fulmar). The statistical analysis enabledus to combine the species into five homogeneousgroups(Fig. 2) The first group was characterisedby the lowest Cd concentrations(from 1.72 to4.24 mgykg) and included the Common guillemot,Herring gull, Razorbill, Glaucous gull and Littleauk. The average Cd concentrations in liver ofbirds included in this group were significantlylower than those found in the liver of birds of theother species except for the Puffin, King eider andBlack guillemot.The levels of trace elements may vary widely
among different seabird species(Fimreite, 1979;Hutton, 1981; Rainbow, 1989; Nielsen and Dietz,1989; Wenzel and Gabrielsen, 1995) depending onthe bird’s feeding ecology, intensity and timing ofexposure in foraging areas, as well as their physi-ological and biochemical characteristics. Levels oftrace elements also varied widely for the speciesfrom the present study.Significantly higher Cd levels were found in
fulmar, kittiwake, Arctic tern and Common eider.All these seabird species have relatively variablefeeding habits. Svalbard fulmars feed mainly onsquid, polychaetes, crustaceans and small fish(Mehlum, 1990). Invertebrates(squid and crusta-ceans) may accumulate considerable quantities ofcadmium(Hamanaka and Ogi, 1984; Macdonaldand Sprague, 1988; Rainbow, 1989; Ritterhoff,1997). Pelagic polychaetes and polar cod are alsothe main food items for fulmar in the Franz JosefLand area(Weslawski and Skakuij, 1992). In the
Barents Sea, fulmars are observed feeding onfisheries offal near fishing vessels(del Hoyo etal., 1992). It is also known that the intake offisheries offal may result in increased Cd concen-trations in seabirds(Zunk, 1984). Fish entrails,such as liver and kidney, may contain high levelsof Cd (Macdonald and Sprague, 1988). Feedingon fisheries offal may thus be partly responsiblefor the high levels of Cd in fulmar. However, Cdlevels detected in seabirds are the result of twomain processes: bioaccumulation mainly via food;and biodegradation processes in the bird’s organs.Cadmium is bound within the liver to a lowmolecular weight protein called metallothionein.Cd bound in this way has a long biological half-life and a tendency to accumulate with age(Scheu-hammer, 1987). The fulmar is one of the mostlong-lived species among seabirds(Ollason andDunnet, 1988). Bioaccumulation of Cd with agemay also be one of the possible explanations ofhigh levels detected in this species. Nielsen andDietz (1989) found significantly higher levels ofCd in older birds. Apparently, a combination ofdifferent biochemical, biological and ecologicalfeatures of this species promote a high Cd bioac-cumulation in this species. Further investigationsare needed to study features of Cd bioaccumulationin fulmars.Kittiwakes and Arctic terns from the Barents
Sea area also have elevated Cd levels comparedto the other species examined. Feeding on inver-tebrates may be one explanation of high Cd levelsin these species. Kittiwakes from the Barents Seaarea feed mainly on small fish(cod, polar cod,herring and capelin) and invertebrates: euphausiidsand amphipodsParathemisto spp. (Belopol’skii,1961; Mehlum, 1990; Mehlum and Gabrielsen,1993, 1995). During the chick-rearing period,which was the sampling period for the birdsanalysed in the present study, euphausiids andamphipods were even more frequent in the kitti-wake’s diet. In kittiwakes sampled on Franz JosefLand,Parathemisto libellula accounted for almost90% of the stomach contents. Among the marineamphipods, adult hyperiid amphipods of the genusParathemisto had typically high concentrations ofCd (reaching up to 70 mgykg dry wt.). These areamong the highest values reported in the literature
137V.M. Savinov et al. / The Science of the Total Environment 306 (2003) 133–158
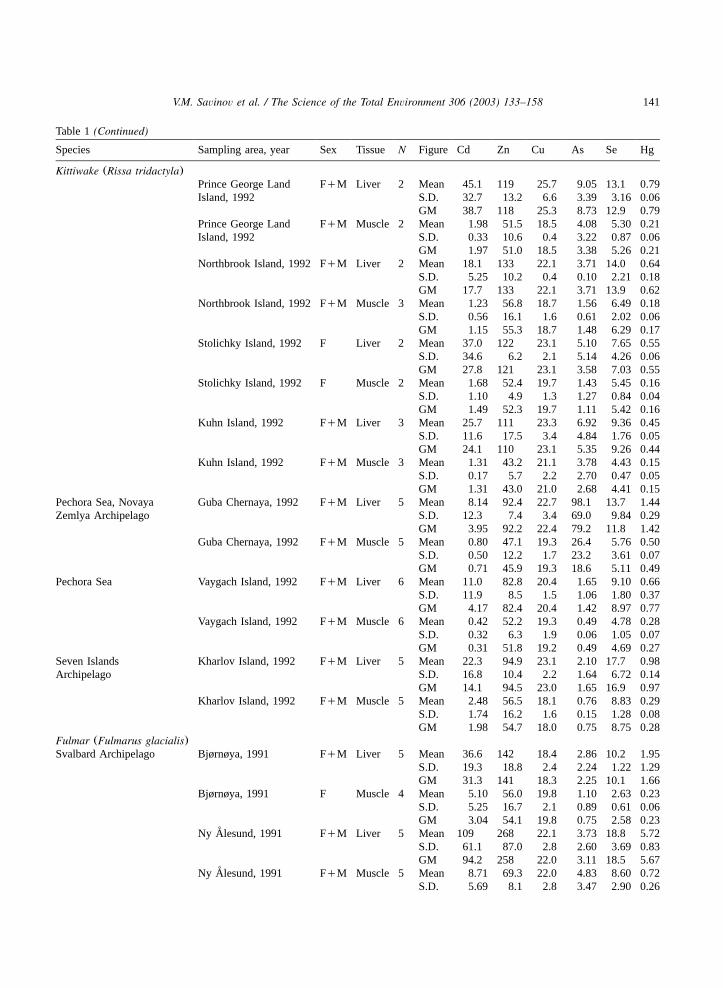
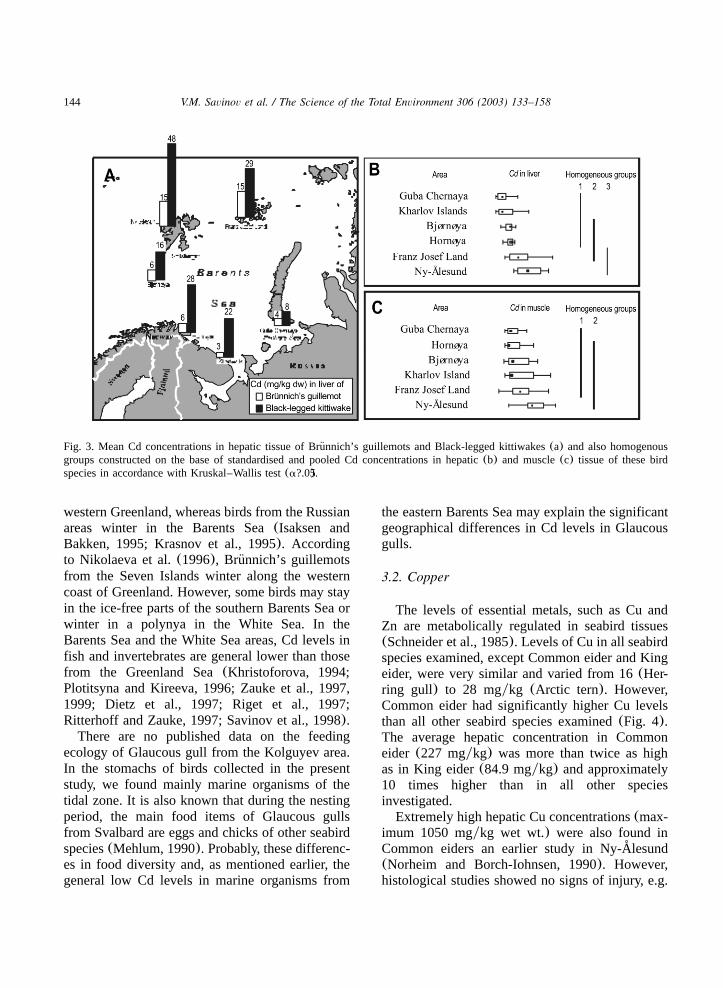
Table 1Mean levels of trace elements(mgykg dry wt.) in adult seabirds from the Barents Sea and Norwegian Sea
Species Sampling area, year Sex Tissue N Figure Cd Zn Cu As Se Hg
Brunnich’s guillemot (Uria lomvia)¨S-W Barents Sea Hornøya, 1991 FqM Liver 5 Mean 5.80 91.2 16.9 1.86 7.53 0.88
S.D. 1.98 14.9 2.9 0.25 2.01 0.17GM 5.51 90.3 16.7 1.85 7.32 0.86
Hornøya, 1991 FqM Muscle 4 Mean 0.57 39.9 19.8 0.17 3.88 0.32S.D. 0.39 5.2 2.2 0.06 0.98 0.07GM 0.50 39.6 19.7 0.16 3.78 0.31
Svalbard Archipelago Bjørnøya, 1991 F Liver 5 Mean 6.51 99.0 18.0 3.18 4.27 0.33S.D. 2.56 10.3 2.0 0.83 0.57 0.12GM 5.92 98.5 17.9 3.11 4.24 0.30
Bjørnøya, 1991 F Muscle 5 Mean 0.61 47.2 17.7 1.09 1.74 0.15S.D. 0.22 2.2 2.3 0.48 0.28 0.08GM 0.59 47.2 17.6 0.96 1.72 0.13
Ny-Alesund, 1991˚ FqM Liver 5 Mean 14.9 91.5 16.1 4.61 5.49 1.61S.D. 6.16 30.5 5.8 2.65 1.89 0.42GM 13.9 87.6 15.3 3.97 5.26 1.56
Ny-Alesund, 1991˚ FqM Muscle 5 Mean 1.23 40.7 23.1 0.79 3.36 0.60S.D. 0.29 3.2 1.80 0.61 0.81 0.09GM 1.21 40.6 23.0 0.61 3.29 0.59
Franz Josef Land Prince George Land M Liver 2 Mean 19.3 116 22.6 1.69 8.16 0.65Archipelago Island, 1992 S.D. 7.91 6.4 3.5 0.24 7.10 0.11
GM 18.5 116 22.5 1.68 6.44 0.65Prince George Land M Muscle 2 Mean 0.45 47.1 19.8 0.37 2.52 0.28Island, 1992 S.D. 0.14 0.0 1.3 0.01 0.64 0.06
GM 0.43 47.1 19.8 0.37 2.48 0.28Northbrook Island, 1992 FqM Liver 2 Mean 13.1 131 23.0 5.30 4.26 0.58
S.D. 1.13 15.4 2.8 0.35 0.40 0.01GM 13.1 131 22.9 5.30 4.25 0.58
Northbrook Island, 1992 FqM Muscle 2 Mean 1.29 50.1 15.4 2.65 2.48 0.23S.D. 0.38 2.3 3.9 0.65 0.12 0.00GM 1.26 50.1 15.2 2.61 2.48 0.23
Mable Island, 1992 M Liver 1 12.4 115 23.8 4.30 6.07 1.55Mable Island, 1992 M Muscle 1 1.79 46.5 22.6 1.02 2.92 0.60
Pechora Sea, Novaya Guba Chernaya, 1992 FqM Liver 5 Mean 3.98 106 24.9 96.4 6.27 0.79Zemlya Archipelago S.D. 1.00 34.5 11.6 70.9 0.90 0.11
GM 3.86 102 23.3 63.1 6.21 0.79Guba Chernaya, 1992 FqM Muscle 5 Mean 0.87 59.9 14.7 46.7 4.63 0.43
S.D. 0.43 38.9 3.2 28.0 0.83 0.18GM 0.80 52.9 14.3 36.5 4.57 0.40
Seven Islands Kharlov Island, 1992 FqM Liver 5 Mean 2.55 69.3 16.0 1.48 13.94 0.93Archipelago S.D. 1.93 1.8 2.1 0.72 4.06 0.07
GM 2.17 69.3 15.9 1.35 13.5 0.93Kharlov Island, 1992 FqM Muscle 5 Mean 0.60 42.4 13.8 0.61 8.02 0.37
S.D. 0.36 6.7 1.9 0.13 2.08 0.07GM 0.54 42.0 13.7 0.60 7.79 0.37
Common guillemot (Uria aalge)Kuvshin Island, 1992 FqM Liver 5 Mean 1.98 80.4 19.9 1.34 18.7 1.08
Seven Islands S.D. 0.56 7.0 0.8 0.52 3.94 0.09Archipelago GM 1.93 80.2 19.8 1.24 18.3 1.08
Kuvshin Island, 1992 FqM Muscle 5 Mean 0.28 40.1 14.4 0.60 11.9 0.50S.D. 0.05 3.1 3.5 0.32 2.11 0.09GM 0.28 40.0 14.1 0.55 11.7 0.49
Kharlov Island, 1992 FqM Liver 5 Mean 1.69 89.0 23.4 1.03 21.3 1.09S.D. 0.52 10.4 7.7 0.40 3.56 0.28
138 V.M. Savinov et al. / The Science of the Total Environment 306 (2003) 133–158
Table 1(Continued)
Species Sampling area, year Sex Tissue N Figure Cd Zn Cu As Se Hg
GM 1.63 88.5 22.5 0.96 21.0 1.06Kharlov Island, 1992 FqM Muscle 5 Mean 0.15 40.1 17.3 0.48 8.74 0.33
S.D. 0.02 5.9 1.9 0.06 1.26 0.05GM 0.15 39.8 17.2 0.47 8.67 0.33
Puffin (Fratercula arctica)Hornøya, 1991 FqM Liver 5 Mean 2.60 84.6 17.6 0.79 9.18 1.22
S-W Barents Sea S.D. 1.00 11.9 2.6 0.56 1.68 0.35GM 2.45 83.9 17.5 0.65 9.07 1.17
Hornøya, 1991 FqM Muscle 5 Mean 0.29 40.6 19.2 0.20 5.32 0.31S.D. 0.10 3.0 2.0 0.12 1.50 0.15GM 0.28 40.5 19.1 0.18 5.18 0.25
Svalbard Archipelago Ny Alesund, 1991˚ FqM Liver 5 Mean 9.77 101 19.5 1.36 11.9 1.12S.D. 3.21 6.7 1.7 0.61 3.48 0.32GM 9.33 100 19.4 1.26 11.4 1.08
Ny Alesund, 1991˚ FqM Muscle 5 Mean 0.77 43.3 20.2 0.21 9.87 0.40S.D. 0.42 4.6 1.6 0.08 2.12 0.17GM 0.70 43.1 20.1 0.20 9.67 0.38
Seven Islands Kuvshin Island, 1992 M Liver 4 Mean 2.68 90.8 19.5 1.04 14.0 1.17Archipelago S.D. 1.30 7.0 1.5 0.47 2.25 0.23
GM 2.41 90.6 19.4 0.95 13.9 1.15Kuvshin Island, 1992 M Muscle 4 Mean 0.32 43.4 14.8 0.47 10.5 0.46
S.D. 0.14 3.3 3.5 0.02 1.38 0.09GM 0.29 43.3 14.5 0.47 10.4 0.45
Kharlov Island, 1992 FqM Liver 3 Mean 3.22 96.6 21.1 0.79 27.1 1.37S.D. 1.35 5.6 1.6 0.30 3.95 0.12GM 3.06 96.5 21.0 0.75 26.9 1.37
Kharlov Island, 1992 FqM Muscle 3 Mean 0.25 44.7 17.0 0.52 15.5 0.44S.D. 0.04 5.7 4.1 0.09 2.95 0.10GM 0.25 44.5 16.7 0.51 15.3 0.43
Black guillemot (Cepphus grylle)Franz Josef Land Northbrook Island, 1992 M Liver 1 5.24 110 23.8 14.3 9.50 1.12Archipelago Northbrook Island,1992 M Muscle 1 0.34 45.6 22.0 5.7 4.20 0.43
Stolichky Island, 1992 F Liver 2 Mean 5.89 93.2 19.3 11.3 8.30 0.81S.D. 0.69 3.4 0.9 2.6 0.70 0.03GM 5.87 93.2 19.3 11.2 8.30 0.81
Stolichky Island, 1992 M Muscle 2 Mean 0.50 37.6 17.5 4.1 2.30 0.27S.D. 0.14 1.9 0.1 0.6 0.30 0.00GM 0.49 37.6 17.5 4.1 2.32 0.27
Hooker Island, 1992 ? Liver 2 Mean 4.01 87.7 21.7 12.6 4.90 0.76S.D. 0.21 9.3 0.9 0.1 0.50 0.25GM 4.01 87.5 21.7 12.6 4.89 0.74
Hooker Island, 1992 ? Muscle 2 Mean 0.34 41.9 23.6 3.6 2.10 0.31S.D. 0.09 2.4 0.8 2.0 0.16 0.08GM 0.33 41.8 23.6 3.3 2.04 0.31
Little auk (Alle alle)Franz Josef Land Hooker Island, 1991 M Liver 2 Mean 6.64 81.4 21.4 1.06 4.86 0.24Archipelago S.D. 0.99 10.3 1.3 0.37 0.90 0.02
GM 6.60 81.0 21.4 1.02 4.81 0.23Hooker Island, 1991 FqM Muscle 10 Mean 0.81 36.9 25.3 0.42 2.13 0.10
S.D. 0.34 3.8 4.7 0.20 0.55 0.05GM 0.75 36.7 24.9 0.38 2.06 0.09
Kuhn Island, 1992 F Liver 6 Mean 3.44 79.5 22.9 5.05 3.67 0.51S.D. 1.96 18.5 2.8 3.39 1.21 0.26GM 2.40 77.2 22.8 3.98 3.45 0.45
Kuhn Island, 1992 F Muscle 6 Mean 0.86 46.8 21.4 3.60 2.20 0.32
139V.M. Savinov et al. / The Science of the Total Environment 306 (2003) 133–158
Table 1(Continued)
Species Sampling area, year Sex Tissue N Figure Cd Zn Cu As Se Hg
S.D. 1.04 16.6 3.8 2.97 1.19 0.18GM 0.47 45.0 21.2 2.61 2.01 0.29
Razorbill (Alca torda)Seven Islands Kuvshin Island, 1992 FqM Liver 5 Mean 2.08 108 23.0 0.89 18.5 1.71Archipelago S.D. 0.65 15.1 3.1 0.32 8.86 0.42
GM 2.00 108 22.9 0.85 16.5 1.68Kuvshin Island, 1992 FqM Muscle 5 Mean 0.32 46.0 15.2 0.48 7.68 0.88
S.D. 0.17 3.9 2.8 0.05 2.61 0.19GM 0.28 45.9 14.9 0.47 7.18 0.86
Common eider (Somateria mollissima)Svalbard Archipelago Ny-Alesund, 1991˚ FqM Liver 3 Mean 17.2 281 228 0.13 9.21 1.80
S.D. 5.57 29.1 32.8 0.01 0.90 0.22GM 16.5 280 226 0.13 9.18 1.79
Ny-Alesund, 1991˚ FqM Muscle 4 Mean 0.43 36.4 19.7 0.15 3.17 0.40S.D. 0.26 2.8 5.4 0.01 1.16 0.16GM 0.35 36.3 19.2 0.15 3.02 0.37
King eider (Somateria spectabilis)Pechora Sea Dolgiy Island, 1992 FqM Liver 5 Mean 3.61 145 106 0.69 13.1 1.29
S.D. 0.97 30.9 95.7 0.13 5.24 1.25GM 3.49 143 76.5 0.68 12.3 0.97
Dolgiy Island, 1992 FqM Muscle 5 Mean 0.07 45.7 16.6 0.65 2.37 0.21S.D. 0.04 10.5 2.1 0.04 0.53 0.07GM 0.06 44.8 16.5 0.65 2.33 0.20
Kolguyev Island, 1992 F Liver 3 Mean 5.65 159 50.5 1.70 8.75 0.72S.D. 2.23 55.3 39.8 0.13 1.79 0.15GM 5.31 153 41.5 1.70 8.63 0.71
Kolguyev Island, 1992 FqM Muscle 4 Mean 0.41 52.1 23.4 0.75 1.97 0.22S.D. 0.39 13.2 6.8 0.29 0.48 0.07GM 0.23 50.9 22.7 0.71 1.93 0.21
Vaygach Island, 1992 M Liver 1 5.18 164 446 5.36 10.9 3.03Vaygach Island, 1992 M Muscle 1 0.47 69.3 34.6 2.54 3.74 0.59
Glaucous gull (Larus hyperboreus)Svalbard Archipelago Bjørnøya, 1991 FqM Liver 5 Mean 6.06 111 19.7 12.8 5.25 1.02
S.D. 3.57 37.9 2.9 4.33 0.66 0.57GM 5.29 107 19.5 12.1 5.22 0.92
Bjørnøya, 1991 FqM Muscle 5 Mean 0.45 50.6 20.2 3.92 1.41 0.29S.D. 0.15 5.1 2.8 1.98 0.14 0.15GM 0.43 50.4 20.1 3.63 1.40 0.27
Ny Alesund, 1991˚ FqM Liver 4 Mean 10.3 107 24.1 1.98 5.44 1.54S.D. 8.51 29.0 3.4 1.61 2.18 1.10GM 4.12 104. 23.9 1.23 4.96 1.17
Ny Alesund, 1991˚ FqM Muscle 4 Mean 0.66 65.3 21.9 0.80 2.52 0.73S.D. 0.66 17.0 2.6 0.59 1.94 0.56GM 0.46 63.6 21.8 0.60 2.12 0.58
Franz Josef Land Prince George Land F Liver 2 Mean 4.28 84.5 16.1 4.92 9.54 1.36Archipelago Island, 1992 S.D. 4.09 8.8 0.1 2.34 2.35 0.03
GM 3.15 84.2 16.1 4.64 9.39 1.36Prince George Land F Muscle 2 Mean 0.43 65.2 15.2 1.87 2.65 0.70Island, 1992 S.D. 0.46 15.0 1.0 0.42 0.36 0.13
GM 0.28 64.4 15.1 1.85 2.64 0.69Northbrook Island, 1992 M Liver 1 1.41 81.4 15.6 5.58 28.5 2.12Northbrook Island, 1992 M Muscle 1 0.09 66.4 13.6 1.03 8.16 0.92Stolichky Island, 1992 M Liver 3 Mean 7.38 91.1 19.3 12.9 4.39 0.59
S.D. 4.44 9.0 0.8 5.31 0.33 0.16GM 6.10 90.8 19.3 12.0 4.29 0.58
140 V.M. Savinov et al. / The Science of the Total Environment 306 (2003) 133–158
Table 1(Continued)
Species Sampling area, year Sex Tissue N Figure Cd Zn Cu As Se Hg
Glaucos gull Stolichky Island, 1992 M Muscle 3 Mean 0.30 75.3 14.7 2.55 1.22 0.13(Larus hyperboreus) S.D. 0.23 21.6 0.4 1.32 0.35 0.04
GM 0.25 73.1 14.7 2.27 1.18 0.12Pechora Sea, Novaya Guba Chernaya, 1992 FqM Liver 3 Mean 2.54 84.8 19.3 76.8 6.20 1.38Zemlya Archipelago S.D. 1.59 5.2 0.9 8.27 1.55 0.54
GM 2.25 84.7 19.3 76.6 6.08 1.31Guba Chernaya, 1992 FqM Muscle 3 Mean 0.23 76.0 14.9 28.4 2.18 0.50
S.D. 0.08 8.5 1.1 9.25 0.53 0.16GM 0.22 75.7 14.9 27.5 2.14 0.49
Pechora Sea Kolguyev Island, 1992 M Liver 5 Mean 1.21 87.2 18.6 3.59 6.00 1.21S.D. 0.46 12.3 1.1 1.79 0.96 0.57GM 1.13 86.6 18.6 3.26 5.94 1.12
Kolguyev Island, 1992 M Muscle 5 Mean 0.16 68.5 15.6 1.16 2.52 0.42S.D. 0.09 20.6 3.2 0.78 0.48 0.21GM 0.13 66.0 15.4 0.96 2.48 0.38
Vaygach Island, 1992 F Liver 2 Mean 1.42 76.1 18.9 2.91 4.33 0.97S.D. 0.73 4.7 0.0 0.70 0.13 0.20GM 1.33 76.0 18.9 2.86 4.33 0.96
Vaygach Island, 1992 F Muscle 2 Mean 0.19 102 17.2 1.04 1.82 0.30S.D. 0.01 1.0 0.6 0.79 0.25 0.00GM 0.19 102 17.2 0.87 1.81 0.30
Herring gull (Larus argentatus)S-W Barents Sea Hornøya, 1991 FqM Liver 4 Mean 2.18 163 16.4 2.59 4.68 1.11
S.D. 0.27 101 1.9 1.32 1.20 0.67GM 2.16 144 16.3 2.32 4.57 0.95
Hornøya, 1991 FqM Muscle 3 Mean 0.22 57.2 17.8 0.98 1.32 0.24S.D. 0.09 29.1 6.6 0.41 0.40 0.13GM 0.20 52.7 17.0 0.93 1.28 0.21
Ainov Island, 1992 M Liver 1 0.53 83.0 15.9 0.98 7.03 0.42Ainov Island, 1992 M Muscle 1 0.07 59.3 14.0 0.40 1.98 0.67
Kittiwake (Rissa tridactyla)S-W Barents Sea Hornøya, 1991 FqM Liver 5 Mean 27.8 99.6 25.3 1.83 22.4 0.80
S.D. 13.3 11.5 7.6 0.42 9.83 0.31GM 25.9 99.0 24.4 1.80 20.5 0.75
Hornøya, 1991 FqM Muscle 5 Mean 1.06 43.6 19.5 0.93 5.92 0.20S.D. 0.49 8.9 2.1 0.90 1.54 0.07GM 0.97 42.8 19.4 0.68 5.73 0.20
Svalbard Archipelago Bjørnøya, 1991 FqM Liver 4 Mean 16.2 88.6 18.2 0.82 14.3 0.58S.D. 5.89 10.7 2.8 0.26 4.97 0.08GM 15.3 88.2 18.0 0.79 13.5 0.57
Bjørnøya, 1991 FqM Muscle 4 Mean 1.48 63.3 21.2 0.65 3.87 0.19S.D. 0.95 11.1 1.0 0.03 0.31 0.06GM 1.16 62.5 21.2 0.64 3.86 0.19
Ny-Alesund, 1991˚ FqM Liver 5 Mean 48.0 126 25.1 3.12 15.1 1.95S.D. 18.6 16.8 3.2 1.18 4.17 0.44GM 45.0 125 25.0 2.96 14.6 1.90
Ny-Alesund, 1991˚ FqM Muscle 5 Mean 1.93 49.1 23.7 1.01 5.94 0.43S.D. 1.23 6.2 3.6 0.52 1.21 0.13GM 1.58 48.8 23.5 0.92 5.84 0.41
Franz Josef Land Hooker Island, 1991 FqM Liver 2 Mean 18.5 90.5 23.9 24.4 8.59 0.69Archipelago S.D. 2.45 6.6 1.2 8.51 1.15 0.04
GM 18.4 90.3 23.9 23.7 8.55 0.69Hooker Island, 1991 FqM Muscle 2 Mean 0.72 53.5 17.9 7.00 1.76 0.11
S.D. 0.98 12.0 0.6 0.83 1.47 0.08GM 0.18 52.8 17.9 6.98 1.42 0.09
141V.M. Savinov et al. / The Science of the Total Environment 306 (2003) 133–158
Table 1(Continued)
Species Sampling area, year Sex Tissue N Figure Cd Zn Cu As Se Hg
Kittiwake (Rissa tridactyla)Prince George Land FqM Liver 2 Mean 45.1 119 25.7 9.05 13.1 0.79Island, 1992 S.D. 32.7 13.2 6.6 3.39 3.16 0.06
GM 38.7 118 25.3 8.73 12.9 0.79Prince George Land FqM Muscle 2 Mean 1.98 51.5 18.5 4.08 5.30 0.21Island, 1992 S.D. 0.33 10.6 0.4 3.22 0.87 0.06
GM 1.97 51.0 18.5 3.38 5.26 0.21Northbrook Island, 1992 FqM Liver 2 Mean 18.1 133 22.1 3.71 14.0 0.64
S.D. 5.25 10.2 0.4 0.10 2.21 0.18GM 17.7 133 22.1 3.71 13.9 0.62
Northbrook Island, 1992 FqM Muscle 3 Mean 1.23 56.8 18.7 1.56 6.49 0.18S.D. 0.56 16.1 1.6 0.61 2.02 0.06GM 1.15 55.3 18.7 1.48 6.29 0.17
Stolichky Island, 1992 F Liver 2 Mean 37.0 122 23.1 5.10 7.65 0.55S.D. 34.6 6.2 2.1 5.14 4.26 0.06GM 27.8 121 23.1 3.58 7.03 0.55
Stolichky Island, 1992 F Muscle 2 Mean 1.68 52.4 19.7 1.43 5.45 0.16S.D. 1.10 4.9 1.3 1.27 0.84 0.04GM 1.49 52.3 19.7 1.11 5.42 0.16
Kuhn Island, 1992 FqM Liver 3 Mean 25.7 111 23.3 6.92 9.36 0.45S.D. 11.6 17.5 3.4 4.84 1.76 0.05GM 24.1 110 23.1 5.35 9.26 0.44
Kuhn Island, 1992 FqM Muscle 3 Mean 1.31 43.2 21.1 3.78 4.43 0.15S.D. 0.17 5.7 2.2 2.70 0.47 0.05GM 1.31 43.0 21.0 2.68 4.41 0.15
Pechora Sea, Novaya Guba Chernaya, 1992 FqM Liver 5 Mean 8.14 92.4 22.7 98.1 13.7 1.44Zemlya Archipelago S.D. 12.3 7.4 3.4 69.0 9.84 0.29
GM 3.95 92.2 22.4 79.2 11.8 1.42Guba Chernaya, 1992 FqM Muscle 5 Mean 0.80 47.1 19.3 26.4 5.76 0.50
S.D. 0.50 12.2 1.7 23.2 3.61 0.07GM 0.71 45.9 19.3 18.6 5.11 0.49
Pechora Sea Vaygach Island, 1992 FqM Liver 6 Mean 11.0 82.8 20.4 1.65 9.10 0.66S.D. 11.9 8.5 1.5 1.06 1.80 0.37GM 4.17 82.4 20.4 1.42 8.97 0.77
Vaygach Island, 1992 FqM Muscle 6 Mean 0.42 52.2 19.3 0.49 4.78 0.28S.D. 0.32 6.3 1.9 0.06 1.05 0.07GM 0.31 51.8 19.2 0.49 4.69 0.27
Seven Islands Kharlov Island, 1992 FqM Liver 5 Mean 22.3 94.9 23.1 2.10 17.7 0.98Archipelago S.D. 16.8 10.4 2.2 1.64 6.72 0.14
GM 14.1 94.5 23.0 1.65 16.9 0.97Kharlov Island, 1992 FqM Muscle 5 Mean 2.48 56.5 18.1 0.76 8.83 0.29
S.D. 1.74 16.2 1.6 0.15 1.28 0.08GM 1.98 54.7 18.0 0.75 8.75 0.28
Fulmar (Fulmarus glacialis)Svalbard Archipelago Bjørnøya, 1991 FqM Liver 5 Mean 36.6 142 18.4 2.86 10.2 1.95
S.D. 19.3 18.8 2.4 2.24 1.22 1.29GM 31.3 141 18.3 2.25 10.1 1.66
Bjørnøya, 1991 F Muscle 4 Mean 5.10 56.0 19.8 1.10 2.63 0.23S.D. 5.25 16.7 2.1 0.89 0.61 0.06GM 3.04 54.1 19.8 0.75 2.58 0.23
Ny Alesund, 1991˚ FqM Liver 5 Mean 109 268 22.1 3.73 18.8 5.72S.D. 61.1 87.0 2.8 2.60 3.69 0.83GM 94.2 258 22.0 3.11 18.5 5.67
Ny Alesund, 1991˚ FqM Muscle 5 Mean 8.71 69.3 22.0 4.83 8.60 0.72S.D. 5.69 8.1 2.8 3.47 2.90 0.26
142 V.M. Savinov et al. / The Science of the Total Environment 306 (2003) 133–158
Table 1(Continued)
Species Sampling area, year Sex Tissue N Figure Cd Zn Cu As Se Hg
Fulmar (Fulmarus glacialis) GM 6.88 68.9 21.9 3.99 8.24 0.68Franz Josef Land S-W part, 1992 FqM Liver 5 Mean 16.4 144 18.5 10.2 16.6 2.01Archipelago S.D. 17.8 23.7 1.9 4.72 5.72 1.42
GM 15.4 143 18.5 9.23 15.8 1.61S-W part, 1992 FqM Muscle 5 Mean 1.82 46.0 17.0 4.21 3.11 0.13
S.D. 0.68 2.2 1.1 1.37 0.82 0.06GM 1.69 46.0 17.0 4.03 3.02 0.12
Arctic tern (Sterna paradisaea)Franz Josef Land Etheridge Island, 1992 FqM Liver 5 Mean 16.3 130 28.4 5.72 7.34 1.08Archipelago S.D. 4.70 14.9 3.0 2.16 0.67 0.21
GM 15.7 129 28.3 5.31 7.32 1.07Etheridge Island, 1992 FqM Muscle 5 Mean 0.94 59.2 23.1 1.45 2.67 0.28
S.D. 0.41 37.0 4.0 0.49 0.39 0.06GM 0.85 52.7 22.8 1.38 2.64 0.27
Mean: arithmetic mean; S.D.: standard deviation; GM: geometric mean;N: number of samples.
Fig. 2. The average hepatic Cd levels in different seabird species(mgykg dw). Bars(N) indicate homogeneous groups according tothe Kruskal–Wallis test(as0.05.). Seabird species collected at only one colony or neighbouring colonies are marked by asterisk.
for marine invertebrates(Macdonald and Sprague,1988; Rainbow, 1989; Ritterhoff, 1997). Arcticterns from the Barents Sea area also feed on polarcod and crustaceans(Mehlum, 1990). Therefore,in kittiwakes and Arctic terns, feeding on crusta-ceans and amphipods promotes Cd accumulation.The kittiwakes may also accumulate a significantamount of Cd during their winter migrations tothe Greenland Sea, the North Sea, the Baltic Sea,and even to the Black and Caspian Seas and theMediterranean(Norderhaug et al., 1977; Barrettand Bakken, 1997; Nikolaeva et al., 1997). Con-centrations of Cd in fish and invertebrates fromthe Barents Sea(Zauke et al., 1997, 1999; Savinov
et al., 1998) are lower compared with those in theBaltic, North and Greenland Seas(Riget et al.,1997; Dietz et al., 1997; Ritterhoff and Zauke,1997) and more southern seas(Bryan, 1976; Clark,1996).Common eider in the Barents Sea feed mainly
on small crustaceans, amphipods and mollusks(Mehlum, 1990). In Troms (northern Norway),blue mussels(Mytilus edulis) is the main fooditem in the Common eider’s diet, accounting for46% of the diet(Bustnes and Erikstad, 1988).Common eiders from northern Norway winter neartheir breeding sites(J.O. Bustnes, pers. comm.).Eiders from the Svalbard area also winter near the
143V.M. Savinov et al. / The Science of the Total Environment 306 (2003) 133–158
northern Norwegian coast, but also near Iceland(Mehlum, 1990). Elevated Cd levels in tissues ofeiders may be the result of feeding on contaminat-ed food in the coastal areas. Cd levels in bluemussels from the Norwegian coast varied from 0.7mgyg in mussels from Troms(Killie, 1997) to76.1 mgyg in those from the western coast ofNorway (Sørfjorden) (Knutzen and Skei, 1991).Differences in Cd levels found in Common eiderand King eider from the Barents Sea may alsosupport this hypothesis. Both Common eider andKing eider have a similar diet in the Barents Seaarea. They have, however, different wintering are-as. King eiders that breed in the eastern part ofthe Barents Sea winter in the White Sea(Nygard˚et al., 1988). Cd levels found in mussels from theWhite Sea(Khristoforova, 1994) are similar tothose from the Pechora Sea(Savinov et al., 1998)and much lower than levels along the Norwegiancoast(Knutzen and Skei, 1991).The lowest Cd level was found in the Common
guillemot. Fish is the predominant food item forthis species in the Barents Sea area(Belopol’skii,1961; Erikstad and Vader, 1989; Barrett and Fur-ness, 1990). Apparently, the more homogeneousdiet promotes low Cd levels in the Commonguillemot. Cd levels in fish from the southern partof the Barents Sea and coastal areas of northernNorway are also low(Zauke et al., 1997, 1999;Solberg et al., 1997; Green, 1997). Investigationshave shown seasonal fluctuations in Cd concentra-tions in the Common guillemot from north-westScotland, indicating that in this species cadmiumturnover may be faster than previously thought(Stewart et al., 1994). Further studies on seasonalvariation in Cd levels in Common guillemots fromthe Barents Sea are recommended.Levels of Cd in the muscle of the investigated
species varied from 0.16 mgykg (Herring gull) to5.22 mgykg (fulmar). The level of Cd in themuscle of the fulmar was significantly highercompared to the other species investigated. Theaverage Cd level in the muscle of the Herring gullwas similar to that in the Common guillemot, Kingeider, Glaucous gull, Razorbill and Puffin(Table1).Geographical differences in hepatic Cd levels
were found in Puffins, fulmars, Glaucous gulls,
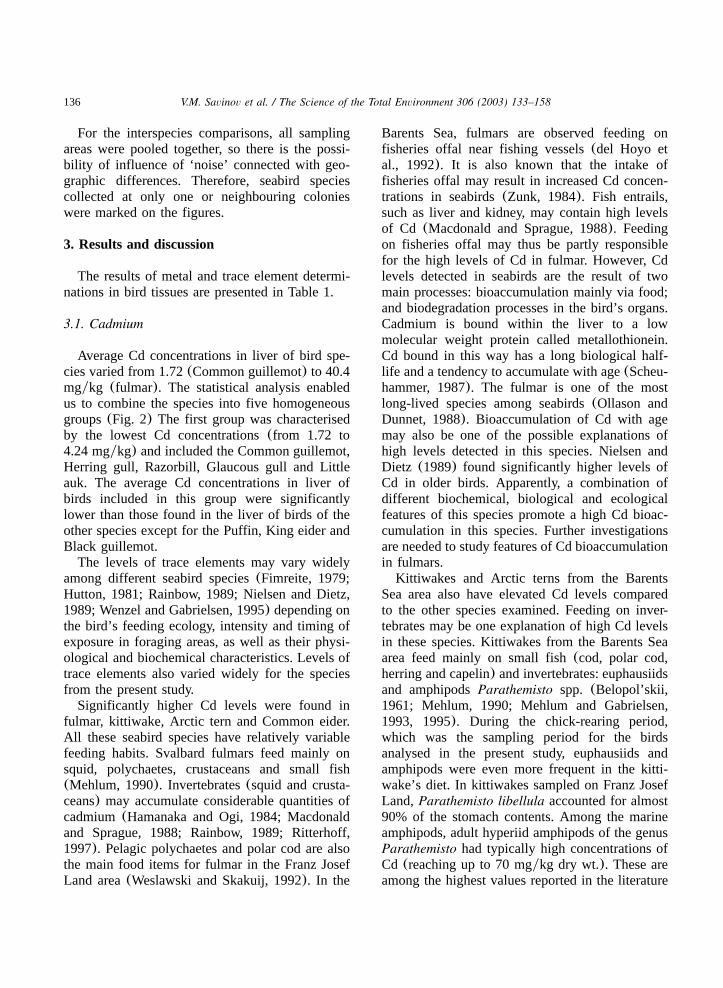
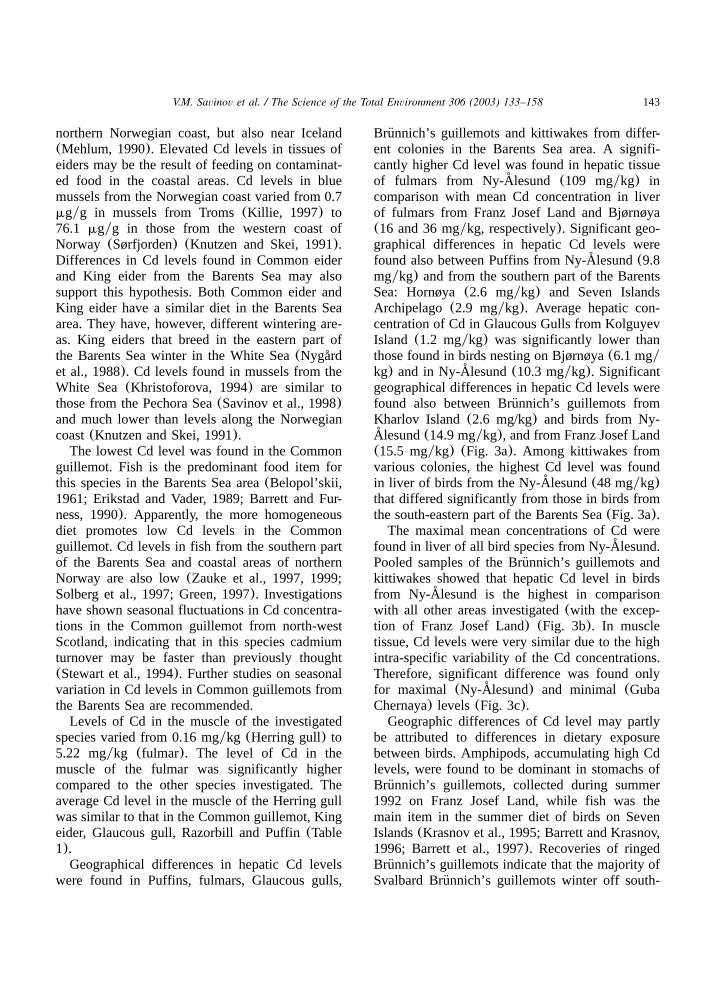
Brunnich’s guillemots and kittiwakes from differ-¨ent colonies in the Barents Sea area. A signifi-cantly higher Cd level was found in hepatic tissueof fulmars from Ny-Alesund(109 mgykg) in˚comparison with mean Cd concentration in liverof fulmars from Franz Josef Land and Bjørnøya(16 and 36 mgykg, respectively). Significant geo-graphical differences in hepatic Cd levels werefound also between Puffins from Ny-Alesund(9.8˚mgykg) and from the southern part of the BarentsSea: Hornøya(2.6 mgykg) and Seven IslandsArchipelago (2.9 mgykg). Average hepatic con-centration of Cd in Glaucous Gulls from KolguyevIsland (1.2 mgykg) was significantly lower thanthose found in birds nesting on Bjørnøya(6.1 mgykg) and in Ny-Alesund(10.3 mgykg). Significant˚geographical differences in hepatic Cd levels werefound also between Brunnich’s guillemots from¨Kharlov Island (2.6 mg/kg) and birds from Ny-Alesund(14.9 mgykg), and from Franz Josef Land˚(15.5 mgykg) (Fig. 3a). Among kittiwakes fromvarious colonies, the highest Cd level was foundin liver of birds from the Ny-Alesund(48 mgykg)˚that differed significantly from those in birds fromthe south-eastern part of the Barents Sea(Fig. 3a).The maximal mean concentrations of Cd were
found in liver of all bird species from Ny-Alesund.˚Pooled samples of the Brunnich’s guillemots and¨kittiwakes showed that hepatic Cd level in birdsfrom Ny-Alesund is the highest in comparison˚with all other areas investigated(with the excep-tion of Franz Josef Land) (Fig. 3b). In muscletissue, Cd levels were very similar due to the highintra-specific variability of the Cd concentrations.Therefore, significant difference was found onlyfor maximal (Ny-Alesund) and minimal (Guba˚Chernaya) levels(Fig. 3c).Geographic differences of Cd level may partly
be attributed to differences in dietary exposurebetween birds. Amphipods, accumulating high Cdlevels, were found to be dominant in stomachs ofBrunnich’s guillemots, collected during summer¨1992 on Franz Josef Land, while fish was themain item in the summer diet of birds on SevenIslands(Krasnov et al., 1995; Barrett and Krasnov,1996; Barrett et al., 1997). Recoveries of ringedBrunnich’s guillemots indicate that the majority of¨Svalbard Brunnich’s guillemots winter off south-¨
144 V.M. Savinov et al. / The Science of the Total Environment 306 (2003) 133–158
Fig. 3. Mean Cd concentrations in hepatic tissue of Brunnich’s guillemots and Black-legged kittiwakes(a) and also homogenous¨groups constructed on the base of standardised and pooled Cd concentrations in hepatic(b) and muscle(c) tissue of these birdspecies in accordance with Kruskal–Wallis test(a?.05).
western Greenland, whereas birds from the Russianareas winter in the Barents Sea(Isaksen andBakken, 1995; Krasnov et al., 1995). Accordingto Nikolaeva et al.(1996), Brunnich’s guillemots¨from the Seven Islands winter along the westerncoast of Greenland. However, some birds may stayin the ice-free parts of the southern Barents Sea orwinter in a polynya in the White Sea. In theBarents Sea and the White Sea areas, Cd levels infish and invertebrates are general lower than thosefrom the Greenland Sea(Khristoforova, 1994;Plotitsyna and Kireeva, 1996; Zauke et al., 1997,1999; Dietz et al., 1997; Riget et al., 1997;Ritterhoff and Zauke, 1997; Savinov et al., 1998).There are no published data on the feeding
ecology of Glaucous gull from the Kolguyev area.In the stomachs of birds collected in the presentstudy, we found mainly marine organisms of thetidal zone. It is also known that during the nestingperiod, the main food items of Glaucous gullsfrom Svalbard are eggs and chicks of other seabirdspecies(Mehlum, 1990). Probably, these differenc-es in food diversity and, as mentioned earlier, thegeneral low Cd levels in marine organisms from
the eastern Barents Sea may explain the significantgeographical differences in Cd levels in Glaucousgulls.
3.2. Copper
The levels of essential metals, such as Cu andZn are metabolically regulated in seabird tissues(Schneider et al., 1985). Levels of Cu in all seabirdspecies examined, except Common eider and Kingeider, were very similar and varied from 16(Her-ring gull) to 28 mgykg (Arctic tern). However,Common eider had significantly higher Cu levelsthan all other seabird species examined(Fig. 4).The average hepatic concentration in Commoneider (227 mgykg) was more than twice as highas in King eider(84.9 mgykg) and approximately10 times higher than in all other speciesinvestigated.Extremely high hepatic Cu concentrations(max-
imum 1050 mgykg wet wt.) were also found inCommon eiders an earlier study in Ny-Alesund˚(Norheim and Borch-Iohnsen, 1990). However,histological studies showed no signs of injury, e.g.
145V.M. Savinov et al. / The Science of the Total Environment 306 (2003) 133–158
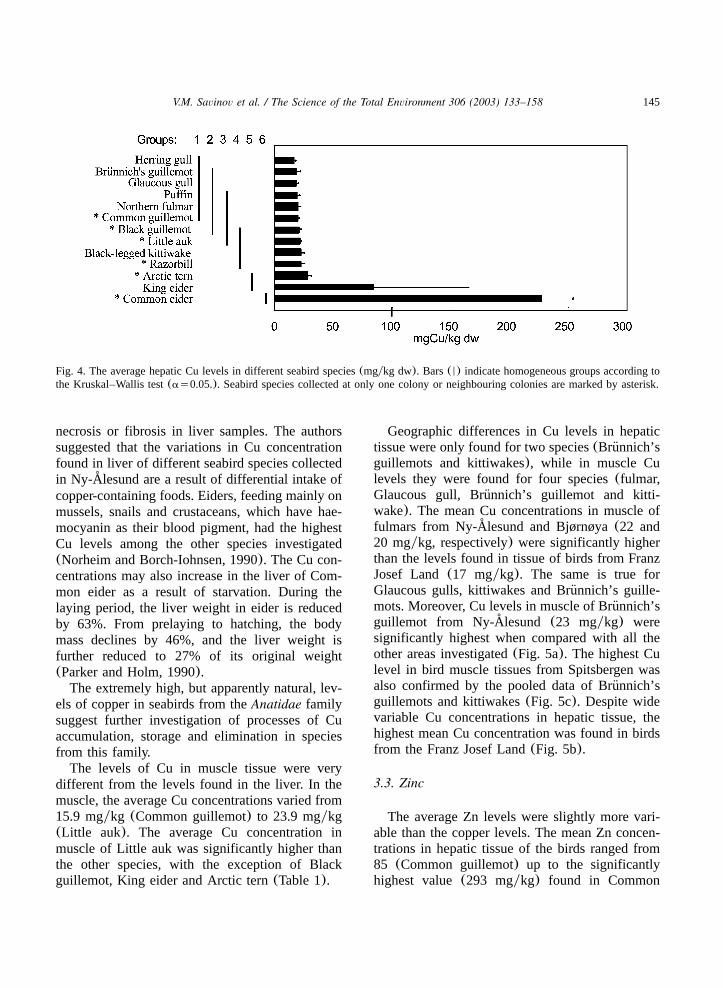
Fig. 4. The average hepatic Cu levels in different seabird species(mgykg dw). Bars(N) indicate homogeneous groups according tothe Kruskal–Wallis test(as0.05.). Seabird species collected at only one colony or neighbouring colonies are marked by asterisk.
necrosis or fibrosis in liver samples. The authorssuggested that the variations in Cu concentrationfound in liver of different seabird species collectedin Ny-Alesund are a result of differential intake of˚copper-containing foods. Eiders, feeding mainly onmussels, snails and crustaceans, which have hae-mocyanin as their blood pigment, had the highestCu levels among the other species investigated(Norheim and Borch-Iohnsen, 1990). The Cu con-centrations may also increase in the liver of Com-mon eider as a result of starvation. During thelaying period, the liver weight in eider is reducedby 63%. From prelaying to hatching, the bodymass declines by 46%, and the liver weight isfurther reduced to 27% of its original weight(Parker and Holm, 1990).The extremely high, but apparently natural, lev-
els of copper in seabirds from theAnatidae familysuggest further investigation of processes of Cuaccumulation, storage and elimination in speciesfrom this family.The levels of Cu in muscle tissue were very
different from the levels found in the liver. In themuscle, the average Cu concentrations varied from15.9 mgykg (Common guillemot) to 23.9 mgykg(Little auk). The average Cu concentration inmuscle of Little auk was significantly higher thanthe other species, with the exception of Blackguillemot, King eider and Arctic tern(Table 1).
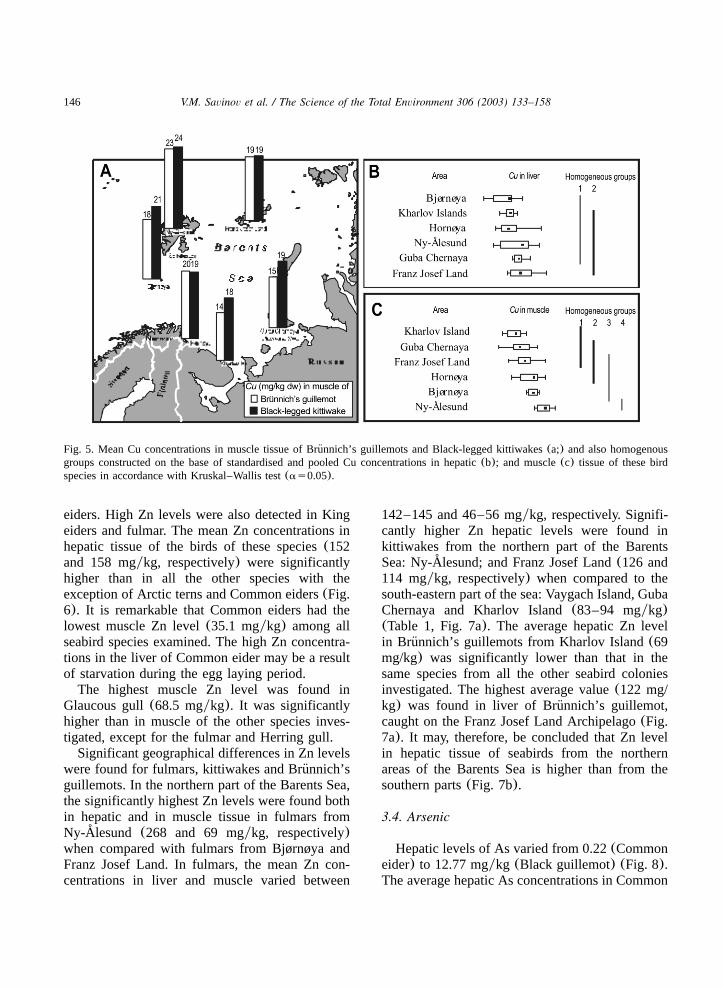
Geographic differences in Cu levels in hepatictissue were only found for two species(Brunnich’s¨guillemots and kittiwakes), while in muscle Culevels they were found for four species(fulmar,Glaucous gull, Brunnich’s guillemot and kitti-¨wake). The mean Cu concentrations in muscle offulmars from Ny-Alesund and Bjørnøya(22 and˚20 mgykg, respectively) were significantly higherthan the levels found in tissue of birds from FranzJosef Land(17 mgykg). The same is true forGlaucous gulls, kittiwakes and Brunnich’s guille-¨mots. Moreover, Cu levels in muscle of Brunnich’s¨guillemot from Ny-Alesund (23 mgykg) were˚significantly highest when compared with all theother areas investigated(Fig. 5a). The highest Culevel in bird muscle tissues from Spitsbergen wasalso confirmed by the pooled data of Brunnich’s¨guillemots and kittiwakes(Fig. 5c). Despite widevariable Cu concentrations in hepatic tissue, thehighest mean Cu concentration was found in birdsfrom the Franz Josef Land(Fig. 5b).
3.3. Zinc
The average Zn levels were slightly more vari-able than the copper levels. The mean Zn concen-trations in hepatic tissue of the birds ranged from85 (Common guillemot) up to the significantlyhighest value(293 mgykg) found in Common
146 V.M. Savinov et al. / The Science of the Total Environment 306 (2003) 133–158
Fig. 5. Mean Cu concentrations in muscle tissue of Brunnich’s guillemots and Black-legged kittiwakes(a;) and also homogenous¨groups constructed on the base of standardised and pooled Cu concentrations in hepatic(b); and muscle(c) tissue of these birdspecies in accordance with Kruskal–Wallis test(as0.05).
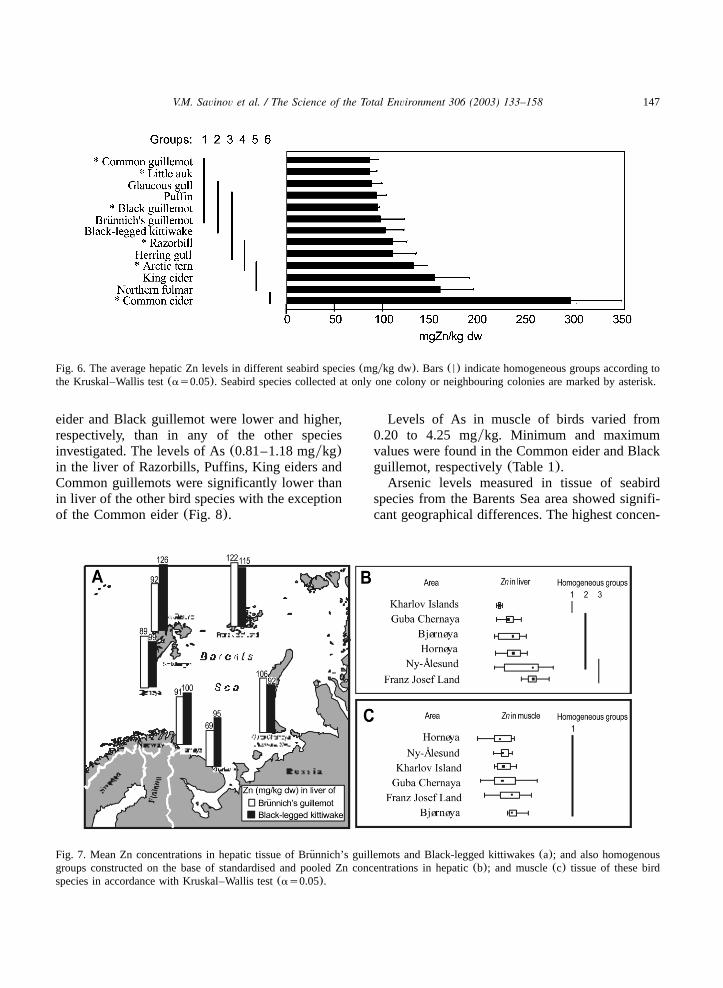
eiders. High Zn levels were also detected in Kingeiders and fulmar. The mean Zn concentrations inhepatic tissue of the birds of these species(152and 158 mgykg, respectively) were significantlyhigher than in all the other species with theexception of Arctic terns and Common eiders(Fig.6). It is remarkable that Common eiders had thelowest muscle Zn level(35.1 mgykg) among allseabird species examined. The high Zn concentra-tions in the liver of Common eider may be a resultof starvation during the egg laying period.The highest muscle Zn level was found in
Glaucous gull(68.5 mgykg). It was significantlyhigher than in muscle of the other species inves-tigated, except for the fulmar and Herring gull.Significant geographical differences in Zn levels
were found for fulmars, kittiwakes and Brunnich’s¨guillemots. In the northern part of the Barents Sea,the significantly highest Zn levels were found bothin hepatic and in muscle tissue in fulmars fromNy-Alesund (268 and 69 mgykg, respectively)˚when compared with fulmars from Bjørnøya andFranz Josef Land. In fulmars, the mean Zn con-centrations in liver and muscle varied between
142–145 and 46–56 mgykg, respectively. Signifi-cantly higher Zn hepatic levels were found inkittiwakes from the northern part of the BarentsSea: Ny-Alesund; and Franz Josef Land(126 and˚114 mgykg, respectively) when compared to thesouth-eastern part of the sea: Vaygach Island, GubaChernaya and Kharlov Island(83–94 mgykg)(Table 1, Fig. 7a). The average hepatic Zn levelin Brunnich’s guillemots from Kharlov Island(69¨mg/kg) was significantly lower than that in thesame species from all the other seabird coloniesinvestigated. The highest average value(122 mg/kg) was found in liver of Brunnich’s guillemot,¨caught on the Franz Josef Land Archipelago(Fig.7a). It may, therefore, be concluded that Zn levelin hepatic tissue of seabirds from the northernareas of the Barents Sea is higher than from thesouthern parts(Fig. 7b).
3.4. Arsenic
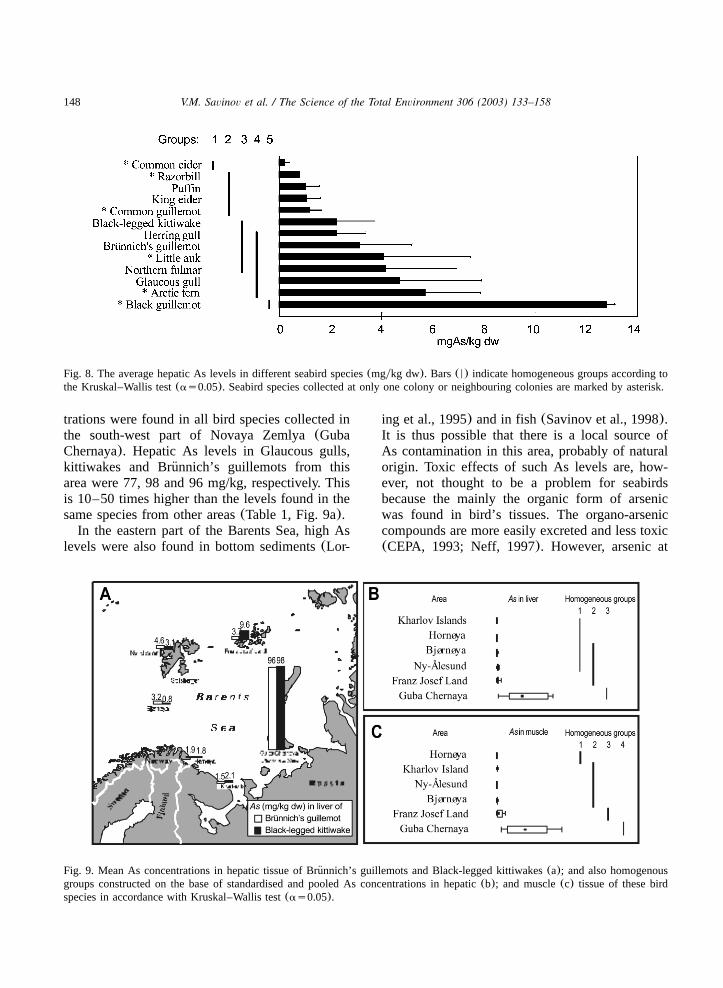
Hepatic levels of As varied from 0.22(Commoneider) to 12.77 mgykg (Black guillemot) (Fig. 8).The average hepatic As concentrations in Common
147V.M. Savinov et al. / The Science of the Total Environment 306 (2003) 133–158
Fig. 6. The average hepatic Zn levels in different seabird species(mgykg dw). Bars(N) indicate homogeneous groups according tothe Kruskal–Wallis test(as0.05). Seabird species collected at only one colony or neighbouring colonies are marked by asterisk.
Fig. 7. Mean Zn concentrations in hepatic tissue of Brunnich’s guillemots and Black-legged kittiwakes(a); and also homogenous¨groups constructed on the base of standardised and pooled Zn concentrations in hepatic(b); and muscle(c) tissue of these birdspecies in accordance with Kruskal–Wallis test(as0.05).
eider and Black guillemot were lower and higher,respectively, than in any of the other speciesinvestigated. The levels of As(0.81–1.18 mgykg)in the liver of Razorbills, Puffins, King eiders andCommon guillemots were significantly lower thanin liver of the other bird species with the exceptionof the Common eider(Fig. 8).
Levels of As in muscle of birds varied from0.20 to 4.25 mgykg. Minimum and maximumvalues were found in the Common eider and Blackguillemot, respectively(Table 1).Arsenic levels measured in tissue of seabird
species from the Barents Sea area showed signifi-cant geographical differences. The highest concen-
148 V.M. Savinov et al. / The Science of the Total Environment 306 (2003) 133–158
Fig. 8. The average hepatic As levels in different seabird species(mgykg dw). Bars(N) indicate homogeneous groups according tothe Kruskal–Wallis test(as0.05). Seabird species collected at only one colony or neighbouring colonies are marked by asterisk.
Fig. 9. Mean As concentrations in hepatic tissue of Brunnich’s guillemots and Black-legged kittiwakes(a); and also homogenous¨groups constructed on the base of standardised and pooled As concentrations in hepatic(b); and muscle(c) tissue of these birdspecies in accordance with Kruskal–Wallis test(as0.05).
trations were found in all bird species collected inthe south-west part of Novaya Zemlya(GubaChernaya). Hepatic As levels in Glaucous gulls,kittiwakes and Brunnich’s guillemots from this¨area were 77, 98 and 96 mg/kg, respectively. Thisis 10–50 times higher than the levels found in thesame species from other areas(Table 1, Fig. 9a).In the eastern part of the Barents Sea, high As
levels were also found in bottom sediments(Lor-
ing et al., 1995) and in fish(Savinov et al., 1998).It is thus possible that there is a local source ofAs contamination in this area, probably of naturalorigin. Toxic effects of such As levels are, how-ever, not thought to be a problem for seabirdsbecause the mainly the organic form of arsenicwas found in bird’s tissues. The organo-arseniccompounds are more easily excreted and less toxic(CEPA, 1993; Neff, 1997). However, arsenic at
149V.M. Savinov et al. / The Science of the Total Environment 306 (2003) 133–158
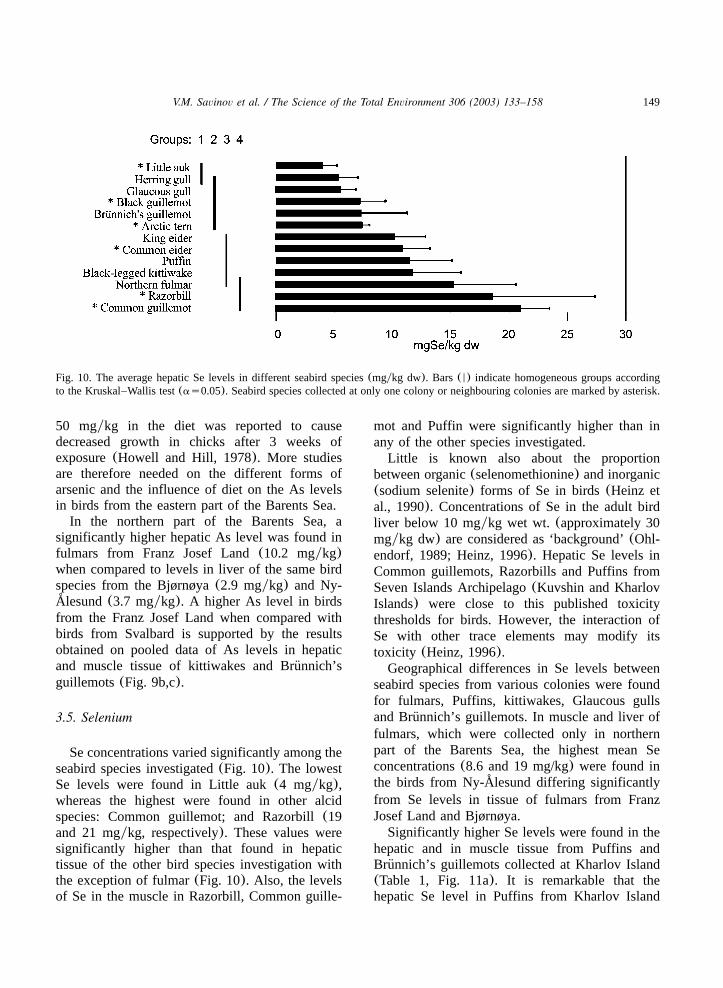
Fig. 10. The average hepatic Se levels in different seabird species(mgykg dw). Bars(N) indicate homogeneous groups accordingto the Kruskal–Wallis test(as0.05). Seabird species collected at only one colony or neighbouring colonies are marked by asterisk.
50 mgykg in the diet was reported to causedecreased growth in chicks after 3 weeks ofexposure(Howell and Hill, 1978). More studiesare therefore needed on the different forms ofarsenic and the influence of diet on the As levelsin birds from the eastern part of the Barents Sea.In the northern part of the Barents Sea, a
significantly higher hepatic As level was found infulmars from Franz Josef Land(10.2 mgykg)when compared to levels in liver of the same birdspecies from the Bjørnøya(2.9 mgykg) and Ny-Alesund(3.7 mgykg). A higher As level in birds˚from the Franz Josef Land when compared withbirds from Svalbard is supported by the resultsobtained on pooled data of As levels in hepaticand muscle tissue of kittiwakes and Brunnich’s¨guillemots(Fig. 9b,c).
3.5. Selenium
Se concentrations varied significantly among theseabird species investigated(Fig. 10). The lowestSe levels were found in Little auk(4 mgykg),whereas the highest were found in other alcidspecies: Common guillemot; and Razorbill(19and 21 mgykg, respectively). These values weresignificantly higher than that found in hepatictissue of the other bird species investigation withthe exception of fulmar(Fig. 10). Also, the levelsof Se in the muscle in Razorbill, Common guille-
mot and Puffin were significantly higher than inany of the other species investigated.Little is known also about the proportion
between organic(selenomethionine) and inorganic(sodium selenite) forms of Se in birds(Heinz etal., 1990). Concentrations of Se in the adult birdliver below 10 mgykg wet wt. (approximately 30mgykg dw) are considered as ‘background’(Ohl-endorf, 1989; Heinz, 1996). Hepatic Se levels inCommon guillemots, Razorbills and Puffins fromSeven Islands Archipelago(Kuvshin and KharlovIslands) were close to this published toxicitythresholds for birds. However, the interaction ofSe with other trace elements may modify itstoxicity (Heinz, 1996).Geographical differences in Se levels between
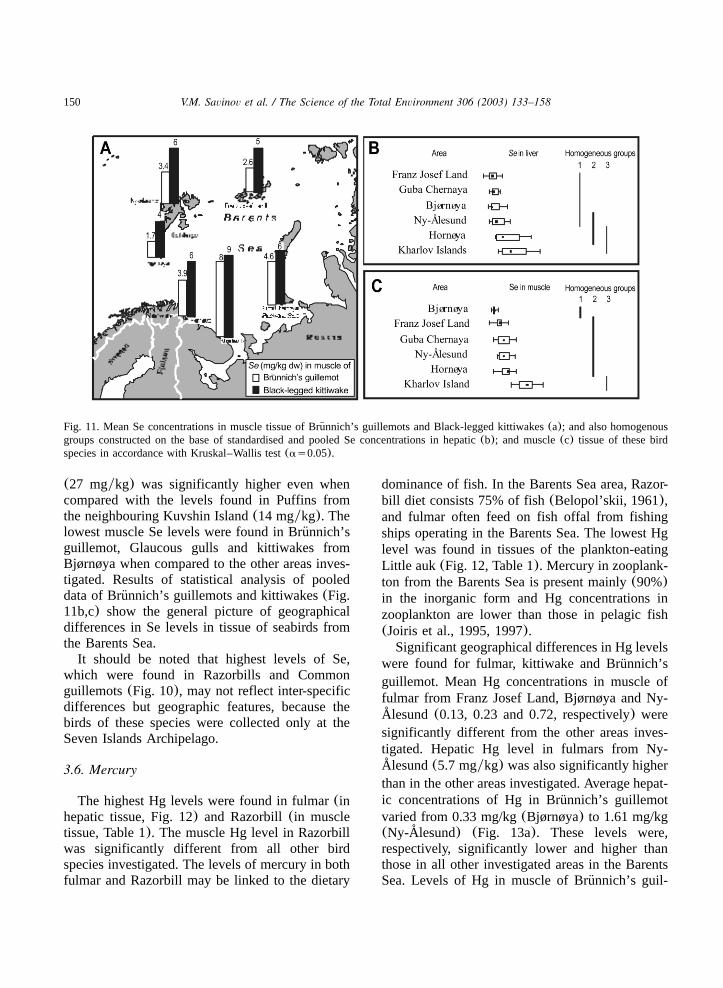
seabird species from various colonies were foundfor fulmars, Puffins, kittiwakes, Glaucous gullsand Brunnich’s guillemots. In muscle and liver of¨fulmars, which were collected only in northernpart of the Barents Sea, the highest mean Seconcentrations(8.6 and 19 mg/kg) were found inthe birds from Ny-Alesund differing significantly˚
from Se levels in tissue of fulmars from FranzJosef Land and Bjørnøya.Significantly higher Se levels were found in the
hepatic and in muscle tissue from Puffins andBrunnich’s guillemots collected at Kharlov Island¨(Table 1, Fig. 11a). It is remarkable that thehepatic Se level in Puffins from Kharlov Island
150 V.M. Savinov et al. / The Science of the Total Environment 306 (2003) 133–158
Fig. 11. Mean Se concentrations in muscle tissue of Brunnich’s guillemots and Black-legged kittiwakes(a); and also homogenous¨groups constructed on the base of standardised and pooled Se concentrations in hepatic(b); and muscle(c) tissue of these birdspecies in accordance with Kruskal–Wallis test(as0.05).
(27 mgykg) was significantly higher even whencompared with the levels found in Puffins fromthe neighbouring Kuvshin Island(14 mgykg). Thelowest muscle Se levels were found in Brunnich’s¨guillemot, Glaucous gulls and kittiwakes fromBjørnøya when compared to the other areas inves-tigated. Results of statistical analysis of pooleddata of Brunnich’s guillemots and kittiwakes(Fig.¨11b,c) show the general picture of geographicaldifferences in Se levels in tissue of seabirds fromthe Barents Sea.It should be noted that highest levels of Se,
which were found in Razorbills and Commonguillemots(Fig. 10), may not reflect inter-specificdifferences but geographic features, because thebirds of these species were collected only at theSeven Islands Archipelago.
3.6. Mercury
The highest Hg levels were found in fulmar(inhepatic tissue, Fig. 12) and Razorbill(in muscletissue, Table 1). The muscle Hg level in Razorbillwas significantly different from all other birdspecies investigated. The levels of mercury in bothfulmar and Razorbill may be linked to the dietary
dominance of fish. In the Barents Sea area, Razor-bill diet consists 75% of fish(Belopol’skii, 1961),and fulmar often feed on fish offal from fishingships operating in the Barents Sea. The lowest Hglevel was found in tissues of the plankton-eatingLittle auk (Fig. 12, Table 1). Mercury in zooplank-ton from the Barents Sea is present mainly(90%)in the inorganic form and Hg concentrations inzooplankton are lower than those in pelagic fish(Joiris et al., 1995, 1997).Significant geographical differences in Hg levels
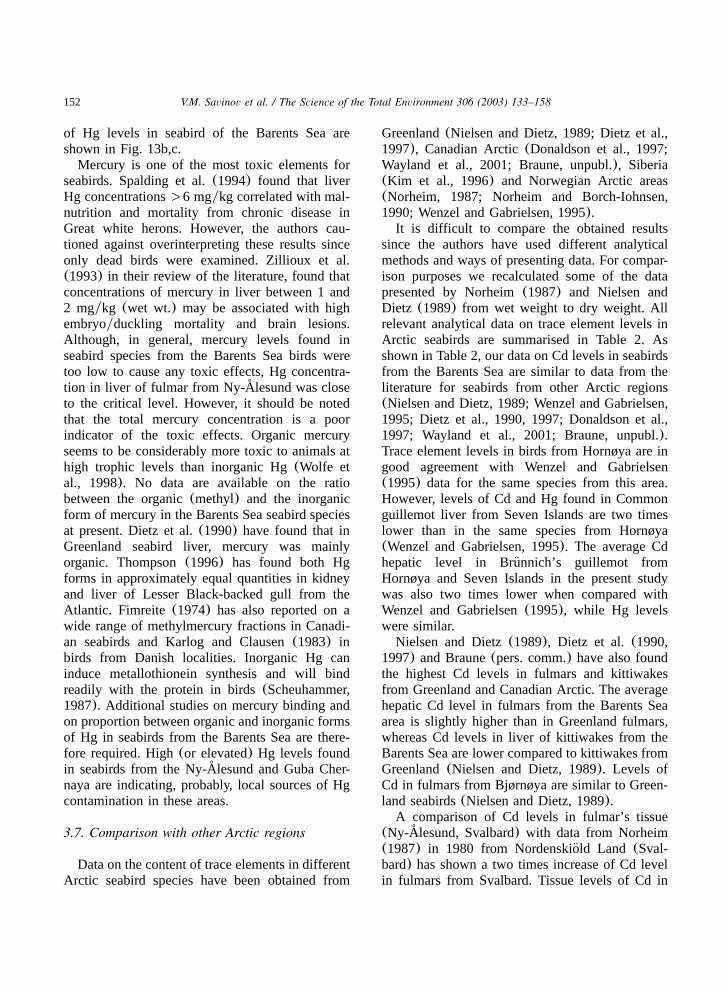
were found for fulmar, kittiwake and Brunnich’s¨guillemot. Mean Hg concentrations in muscle offulmar from Franz Josef Land, Bjørnøya and Ny-Alesund (0.13, 0.23 and 0.72, respectively) were˚
significantly different from the other areas inves-tigated. Hepatic Hg level in fulmars from Ny-Alesund(5.7 mgykg) was also significantly higher˚
than in the other areas investigated. Average hepat-ic concentrations of Hg in Brunnich’s guillemot¨varied from 0.33 mg/kg(Bjørnøya) to 1.61 mg/kg(Ny-Alesund) (Fig. 13a). These levels were,˚respectively, significantly lower and higher thanthose in all other investigated areas in the BarentsSea. Levels of Hg in muscle of Brunnich’s guil-¨
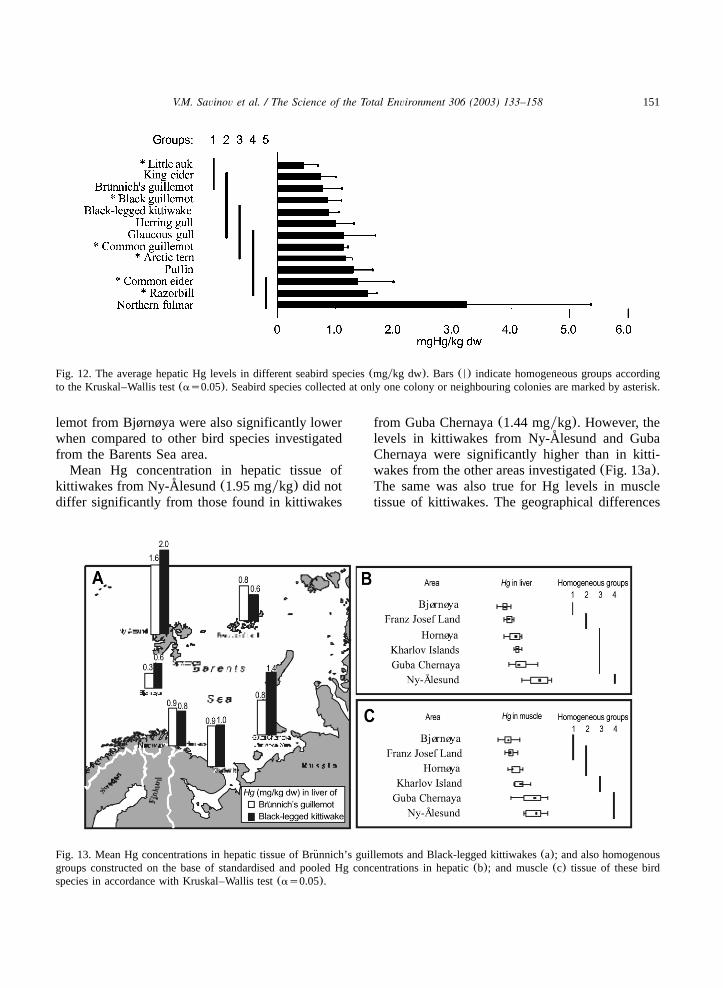
151V.M. Savinov et al. / The Science of the Total Environment 306 (2003) 133–158
Fig. 12. The average hepatic Hg levels in different seabird species(mgykg dw). Bars(N) indicate homogeneous groups accordingto the Kruskal–Wallis test(as0.05). Seabird species collected at only one colony or neighbouring colonies are marked by asterisk.
Fig. 13. Mean Hg concentrations in hepatic tissue of Brunnich’s guillemots and Black-legged kittiwakes(a); and also homogenous¨groups constructed on the base of standardised and pooled Hg concentrations in hepatic(b); and muscle(c) tissue of these birdspecies in accordance with Kruskal–Wallis test(as0.05).
lemot from Bjørnøya were also significantly lowerwhen compared to other bird species investigatedfrom the Barents Sea area.Mean Hg concentration in hepatic tissue of
kittiwakes from Ny-Alesund(1.95 mgykg) did not˚differ significantly from those found in kittiwakes
from Guba Chernaya(1.44 mgykg). However, thelevels in kittiwakes from Ny-Alesund and Guba˚Chernaya were significantly higher than in kitti-wakes from the other areas investigated(Fig. 13a).The same was also true for Hg levels in muscletissue of kittiwakes. The geographical differences
152 V.M. Savinov et al. / The Science of the Total Environment 306 (2003) 133–158
of Hg levels in seabird of the Barents Sea areshown in Fig. 13b,c.Mercury is one of the most toxic elements for
seabirds. Spalding et al.(1994) found that liverHg concentrations)6 mgykg correlated with mal-nutrition and mortality from chronic disease inGreat white herons. However, the authors cau-tioned against overinterpreting these results sinceonly dead birds were examined. Zillioux et al.(1993) in their review of the literature, found thatconcentrations of mercury in liver between 1 and2 mgykg (wet wt.) may be associated with highembryoyduckling mortality and brain lesions.Although, in general, mercury levels found inseabird species from the Barents Sea birds weretoo low to cause any toxic effects, Hg concentra-tion in liver of fulmar from Ny-Alesund was close˚to the critical level. However, it should be notedthat the total mercury concentration is a poorindicator of the toxic effects. Organic mercuryseems to be considerably more toxic to animals athigh trophic levels than inorganic Hg(Wolfe etal., 1998). No data are available on the ratiobetween the organic(methyl) and the inorganicform of mercury in the Barents Sea seabird speciesat present. Dietz et al.(1990) have found that inGreenland seabird liver, mercury was mainlyorganic. Thompson(1996) has found both Hgforms in approximately equal quantities in kidneyand liver of Lesser Black-backed gull from theAtlantic. Fimreite (1974) has also reported on awide range of methylmercury fractions in Canadi-an seabirds and Karlog and Clausen(1983) inbirds from Danish localities. Inorganic Hg caninduce metallothionein synthesis and will bindreadily with the protein in birds(Scheuhammer,1987). Additional studies on mercury binding andon proportion between organic and inorganic formsof Hg in seabirds from the Barents Sea are there-fore required. High(or elevated) Hg levels foundin seabirds from the Ny-Alesund and Guba Cher-˚naya are indicating, probably, local sources of Hgcontamination in these areas.
3.7. Comparison with other Arctic regions
Data on the content of trace elements in differentArctic seabird species have been obtained from
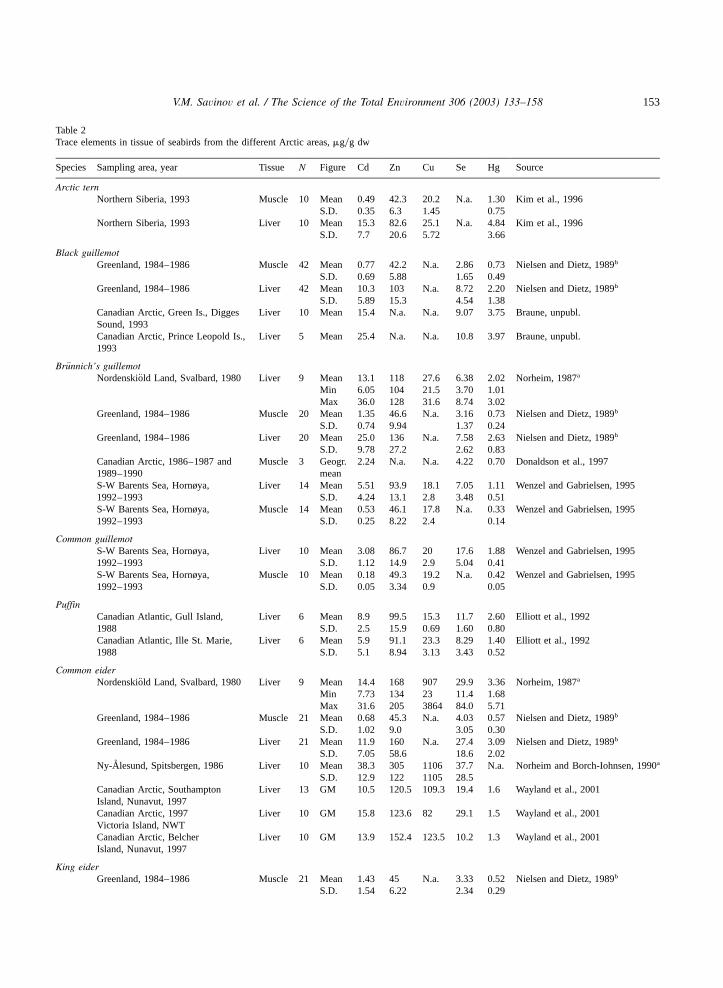
Greenland(Nielsen and Dietz, 1989; Dietz et al.,1997), Canadian Arctic(Donaldson et al., 1997;Wayland et al., 2001; Braune, unpubl.), Siberia(Kim et al., 1996) and Norwegian Arctic areas(Norheim, 1987; Norheim and Borch-Iohnsen,1990; Wenzel and Gabrielsen, 1995).It is difficult to compare the obtained results
since the authors have used different analyticalmethods and ways of presenting data. For compar-ison purposes we recalculated some of the datapresented by Norheim(1987) and Nielsen andDietz (1989) from wet weight to dry weight. Allrelevant analytical data on trace element levels inArctic seabirds are summarised in Table 2. Asshown in Table 2, our data on Cd levels in seabirdsfrom the Barents Sea are similar to data from theliterature for seabirds from other Arctic regions(Nielsen and Dietz, 1989; Wenzel and Gabrielsen,1995; Dietz et al., 1990, 1997; Donaldson et al.,1997; Wayland et al., 2001; Braune, unpubl.).Trace element levels in birds from Hornøya are ingood agreement with Wenzel and Gabrielsen(1995) data for the same species from this area.However, levels of Cd and Hg found in Commonguillemot liver from Seven Islands are two timeslower than in the same species from Hornøya(Wenzel and Gabrielsen, 1995). The average Cdhepatic level in Brunnich’s guillemot from¨Hornøya and Seven Islands in the present studywas also two times lower when compared withWenzel and Gabrielsen(1995), while Hg levelswere similar.Nielsen and Dietz(1989), Dietz et al. (1990,
1997) and Braune(pers. comm.) have also foundthe highest Cd levels in fulmars and kittiwakesfrom Greenland and Canadian Arctic. The averagehepatic Cd level in fulmars from the Barents Seaarea is slightly higher than in Greenland fulmars,whereas Cd levels in liver of kittiwakes from theBarents Sea are lower compared to kittiwakes fromGreenland(Nielsen and Dietz, 1989). Levels ofCd in fulmars from Bjørnøya are similar to Green-land seabirds(Nielsen and Dietz, 1989).A comparison of Cd levels in fulmar’s tissue
(Ny-Alesund, Svalbard) with data from Norheim˚(1987) in 1980 from Nordenskiold Land(Sval-¨bard) has shown a two times increase of Cd levelin fulmars from Svalbard. Tissue levels of Cd in
153V.M. Savinov et al. / The Science of the Total Environment 306 (2003) 133–158
Table 2Trace elements in tissue of seabirds from the different Arctic areas,mgyg dw
Species Sampling area, year Tissue N Figure Cd Zn Cu Se Hg Source
Arctic ternNorthern Siberia, 1993 Muscle 10 Mean 0.49 42.3 20.2 N.a. 1.30 Kim et al., 1996
S.D. 0.35 6.3 1.45 0.75Northern Siberia, 1993 Liver 10 Mean 15.3 82.6 25.1 N.a. 4.84 Kim et al., 1996
S.D. 7.7 20.6 5.72 3.66
Black guillemotGreenland, 1984–1986 Muscle 42 Mean 0.77 42.2 N.a. 2.86 0.73 Nielsen and Dietz, 1989b
S.D. 0.69 5.88 1.65 0.49Greenland, 1984–1986 Liver 42 Mean 10.3 103 N.a. 8.72 2.20 Nielsen and Dietz, 1989b
S.D. 5.89 15.3 4.54 1.38Canadian Arctic, Green Is., Digges Liver 10 Mean 15.4 N.a. N.a. 9.07 3.75 Braune, unpubl.Sound, 1993Canadian Arctic, Prince Leopold Is., Liver 5 Mean 25.4 N.a. N.a. 10.8 3.97 Braune, unpubl.1993
Brunnich’s guillemot¨Nordenskiold Land, Svalbard, 1980¨ Liver 9 Mean 13.1 118 27.6 6.38 2.02 Norheim, 1987a
Min 6.05 104 21.5 3.70 1.01Max 36.0 128 31.6 8.74 3.02
Greenland, 1984–1986 Muscle 20 Mean 1.35 46.6 N.a. 3.16 0.73 Nielsen and Dietz, 1989b
S.D. 0.74 9.94 1.37 0.24Greenland, 1984–1986 Liver 20 Mean 25.0 136 N.a. 7.58 2.63 Nielsen and Dietz, 1989b
S.D. 9.78 27.2 2.62 0.83Canadian Arctic, 1986–1987 and Muscle 3 Geogr. 2.24 N.a. N.a. 4.22 0.70 Donaldson et al., 19971989–1990 meanS-W Barents Sea, Hornøya, Liver 14 Mean 5.51 93.9 18.1 7.05 1.11 Wenzel and Gabrielsen, 19951992–1993 S.D. 4.24 13.1 2.8 3.48 0.51S-W Barents Sea, Hornøya, Muscle 14 Mean 0.53 46.1 17.8 N.a. 0.33 Wenzel and Gabrielsen, 19951992–1993 S.D. 0.25 8.22 2.4 0.14
Common guillemotS-W Barents Sea, Hornøya, Liver 10 Mean 3.08 86.7 20 17.6 1.88 Wenzel and Gabrielsen, 19951992–1993 S.D. 1.12 14.9 2.9 5.04 0.41S-W Barents Sea, Hornøya, Muscle 10 Mean 0.18 49.3 19.2 N.a. 0.42 Wenzel and Gabrielsen, 19951992–1993 S.D. 0.05 3.34 0.9 0.05
PuffinCanadian Atlantic, Gull Island, Liver 6 Mean 8.9 99.5 15.3 11.7 2.60 Elliott et al., 19921988 S.D. 2.5 15.9 0.69 1.60 0.80Canadian Atlantic, Ille St. Marie, Liver 6 Mean 5.9 91.1 23.3 8.29 1.40 Elliott et al., 19921988 S.D. 5.1 8.94 3.13 3.43 0.52
Common eiderNordenskiold Land, Svalbard, 1980¨ Liver 9 Mean 14.4 168 907 29.9 3.36 Norheim, 1987a
Min 7.73 134 23 11.4 1.68Max 31.6 205 3864 84.0 5.71
Greenland, 1984–1986 Muscle 21 Mean 0.68 45.3 N.a. 4.03 0.57 Nielsen and Dietz, 1989b
S.D. 1.02 9.0 3.05 0.30Greenland, 1984–1986 Liver 21 Mean 11.9 160 N.a. 27.4 3.09 Nielsen and Dietz, 1989b
S.D. 7.05 58.6 18.6 2.02Ny-Alesund, Spitsbergen, 1986˚ Liver 10 Mean 38.3 305 1106 37.7 N.a. Norheim and Borch-Iohnsen, 1990a
S.D. 12.9 122 1105 28.5Canadian Arctic, Southampton Liver 13 GM 10.5 120.5 109.3 19.4 1.6 Wayland et al., 2001Island, Nunavut, 1997Canadian Arctic, 1997 Liver 10 GM 15.8 123.6 82 29.1 1.5 Wayland et al., 2001Victoria Island, NWTCanadian Arctic, Belcher Liver 10 GM 13.9 152.4 123.5 10.2 1.3 Wayland et al., 2001Island, Nunavut, 1997
King eiderGreenland, 1984–1986 Muscle 21 Mean 1.43 45 N.a. 3.33 0.52 Nielsen and Dietz, 1989b
S.D. 1.54 6.22 2.34 0.29
154 V.M. Savinov et al. / The Science of the Total Environment 306 (2003) 133–158
Table 2(Continued)
Species Sampling area, year Tissue N Figure Cd Zn Cu Se Hg Source
Greenland, 1984–1986 Liver 21 Mean 20.4 167 N.a. 27.1 2.07 Nielsen and Dietz, 1989b
S.D. 14.5 50.7 21.2 1.39Northern Siberia, 1993 Muscle 1 0.66 32 19 N.a. 0.29 Kim et al., 1996Northern Siberia, 1993 Liver 1 25.5 201 696 N.a. 5.75 Kim et al., 1996Canadian Arctic, Southampton Liver 13 GM 27.1 135.3 86.7 18.7 2.1 Wayland et al., 2001Island, Nunavut, 1997
Canadian Arctic, 1997, Victoria LoverN 10 GM 23.3 168.8 176.4 35.6 1.7 Wayland et al., 2001Island, NWT
FulmarNordenskiold Land, Svalbard, 1980¨ Liver 10 Mean 57.1 245 20.8 10.1 7.06 Norheim, 1987a
Min 20.5 168 18.8 4.70 2.02Max 108 319 22.5 21.5 14.1
Greenland, 1984–1986 Muscle 17 Mean 4.74 62.2 N.a. 8.36 0.92 Nielsen and Dietz, 1989b
S.D. 5.46 22.4 2.98 0.39Greenland, 1984–1986 Liver 17 Mean 34.8 173 N.a. 28.7 7.38 Nielsen and Dietz, 1989b
S.D. 20.5 65.7 7.66 4.44Canadian Arctic, Prince Leopold Is., Liver 10 Mean 39.4 N.a. N.a. 34.4 8.12 Braune, unpubl.1993
Glaucous gullNordenskiold Land, Svalbard, 1980¨ Liver 11 Mean 12.1 108 24.5 7.39 5.38 Norheim, 1987a
Min 1.34 87.4 18.5 4.37 2.69Max 31.6 158 33.6 12.1 7.73
Greenland, 1984–1986 Muscle 15 Mean 1.36 83.3 N.a. 5.26 2.50 Nielsen and Dietz, 1989b
S.D. 1.29 15.0 4.21 1.39Greenland, 1984–1986 Liver 15 Mean 37.6 144 N.a. 16.4 8.72 Nielsen and Dietz, 1989b
S.D. 37.7 46.7 12.7 4.74Canadian Arctic, Coats Is., 1992 Liver 2 Mean 8.54 N.a. N.a. 9.20 6.78 Braune, unpubl.
Northern Siberia, 1993 Muscle 1 0.13 78.1 13.0 N.a. 0.5 Kim et al., 1996Northern Siberia, 1993 Liver 1 3.90 86.5 12.8 N.a. 3.28 Kim et al., 1996
Herring gullCanadian Atlantic, Gull Island, 1988 Liver 6 Mean 3.6 90.1 16.8 3.21 1.70 Elliott et al., 1992
S.D. 1.8 16.2 2.12 0.84 0.67Canadian Atlantic, Kent Island, 1988 Liver 6 Mean 5.4 129 12.2 3.36 1.50 Elliott et al., 1992
S.D. 5.0 26.2 2.05 0.62 0.53Canadian Atlantic, Manawagonish Liver 6 Mean 1.7 84.7 30.6 3.20 0.69 Elliott et al., 1992Island S.D. 0.4 8.56 20.6 0.67 0.18Northern Siberia, 1993 Muscle 6 Mean 0.91 62.1 14.2 N.a. 0.72 Kim et al., 1996
S.D. 0.22 7.9 1.72 0.30Northern Siberia, 1993 Liver 6 Mean 26.3 141 19.9 N.a. 4.01 Kim et al., 1996
S.D. 16.1 68 3.48 2.14
KittiwakeGreenland, 1984–1986 Muscle 15 Mean 1.52 50.4 N.a. 9.34 0.54 Nielsen and Dietz, 1989b
S.D. 1.20 9.07 5.67 0.37Greenland, 1984–1986 Liver 15 Mean 25.7 119 N.a. 32.0 2.10 Nielsen and Dietz, 1989b
S.D. 13.3 25.8 20.5 1.43S-W Barents Sea, Hornøya, Liver 22 Mean 14.4 112 19.6 16.9 2.85 Wenzel and Gabrielsen, 19951992–1993 S.D. 11.3 52.3 5.7 9.5 1.02S-W Barents Sea, Hornøya, Muscle 27 Mean 1.24 53.5 18.1 N.a. 0.58 Wenzel and Gabrielsen, 19951992–1993 S.D. 0.64 7.05 1.25 0.22Canadian Arctic, Prince Leopold Is., Liver 10 Mean 24.2 N.a. N.a. 36.2 3.05 Braune, unpubl.1993
Little aukNordenskiold Land, Svalbard, 1980¨ Liver 9 Mean 14.4 124 28.2 8.74 1.68 Norheim, 1987a
155V.M. Savinov et al. / The Science of the Total Environment 306 (2003) 133–158
Table 2(Continued)
Species Sampling area, year Tissue N Figure Cd Zn Cu Se Hg Source
Min 8.06 104 22.8 5.04 1.34Max 19.5 144 31.6 15.1 2.35
Greenland, 1984–1986 Muscle 13 Mean 1.30 54.4 N.a. 8.81 0.49 Nielsen and Dietz, 1989b
S.D. 0.60 26.7 5.46 0.28Greenland, 1984–1986 Liver 13 Mean 17.4 122 N.a. 19.7 1.61 Nielsen and Dietz, 1989b
S.D. 8.57 13.6 8.77 0.92
Recalculated from wet wt. with factor 3.36(see Dietz et al., 1997).a
Recalculated from wet wt. with the factors obtained for each bird group(see Nielsen and Dietz, 1989); N.a.: not analysed.b
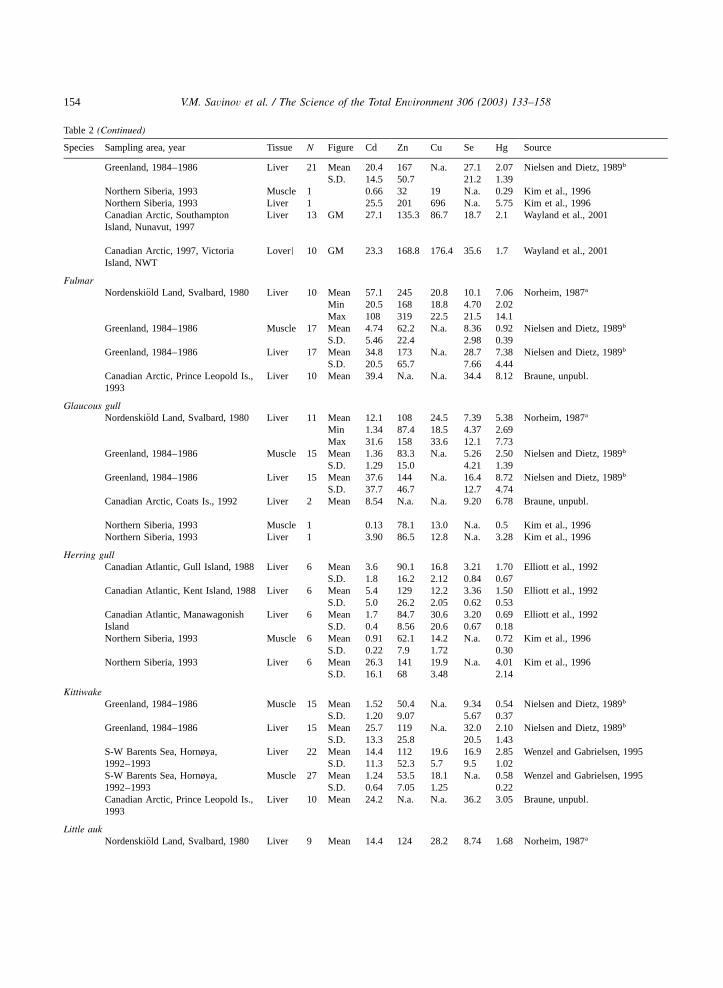
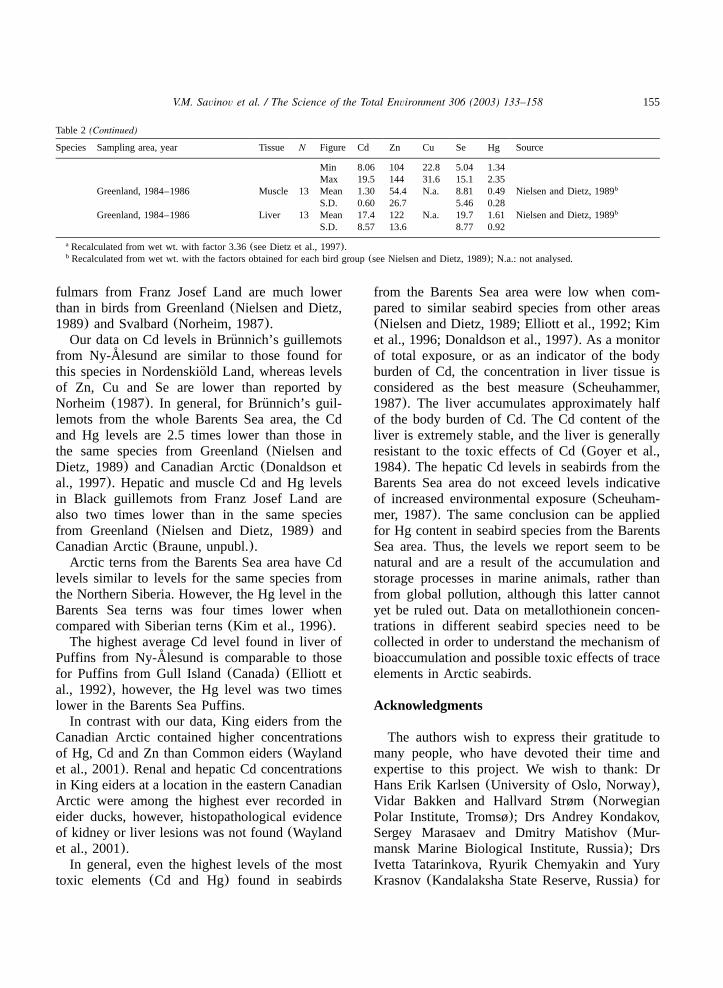
fulmars from Franz Josef Land are much lowerthan in birds from Greenland(Nielsen and Dietz,1989) and Svalbard(Norheim, 1987).Our data on Cd levels in Brunnich’s guillemots¨
from Ny-Alesund are similar to those found for˚this species in Nordenskiold Land, whereas levels¨of Zn, Cu and Se are lower than reported byNorheim (1987). In general, for Brunnich’s guil-¨lemots from the whole Barents Sea area, the Cdand Hg levels are 2.5 times lower than those inthe same species from Greenland(Nielsen andDietz, 1989) and Canadian Arctic(Donaldson etal., 1997). Hepatic and muscle Cd and Hg levelsin Black guillemots from Franz Josef Land arealso two times lower than in the same speciesfrom Greenland(Nielsen and Dietz, 1989) andCanadian Arctic(Braune, unpubl.).Arctic terns from the Barents Sea area have Cd
levels similar to levels for the same species fromthe Northern Siberia. However, the Hg level in theBarents Sea terns was four times lower whencompared with Siberian terns(Kim et al., 1996).The highest average Cd level found in liver of
Puffins from Ny-Alesund is comparable to those˚for Puffins from Gull Island(Canada) (Elliott etal., 1992), however, the Hg level was two timeslower in the Barents Sea Puffins.In contrast with our data, King eiders from the
Canadian Arctic contained higher concentrationsof Hg, Cd and Zn than Common eiders(Waylandet al., 2001). Renal and hepatic Cd concentrationsin King eiders at a location in the eastern CanadianArctic were among the highest ever recorded ineider ducks, however, histopathological evidenceof kidney or liver lesions was not found(Waylandet al., 2001).In general, even the highest levels of the most
toxic elements(Cd and Hg) found in seabirds
from the Barents Sea area were low when com-pared to similar seabird species from other areas(Nielsen and Dietz, 1989; Elliott et al., 1992; Kimet al., 1996; Donaldson et al., 1997). As a monitorof total exposure, or as an indicator of the bodyburden of Cd, the concentration in liver tissue isconsidered as the best measure(Scheuhammer,1987). The liver accumulates approximately halfof the body burden of Cd. The Cd content of theliver is extremely stable, and the liver is generallyresistant to the toxic effects of Cd(Goyer et al.,1984). The hepatic Cd levels in seabirds from theBarents Sea area do not exceed levels indicativeof increased environmental exposure(Scheuham-mer, 1987). The same conclusion can be appliedfor Hg content in seabird species from the BarentsSea area. Thus, the levels we report seem to benatural and are a result of the accumulation andstorage processes in marine animals, rather thanfrom global pollution, although this latter cannotyet be ruled out. Data on metallothionein concen-trations in different seabird species need to becollected in order to understand the mechanism ofbioaccumulation and possible toxic effects of traceelements in Arctic seabirds.
Acknowledgments
The authors wish to express their gratitude tomany people, who have devoted their time andexpertise to this project. We wish to thank: DrHans Erik Karlsen(University of Oslo, Norway),Vidar Bakken and Hallvard Strøm(NorwegianPolar Institute, Tromsø); Drs Andrey Kondakov,Sergey Marasaev and Dmitry Matishov(Mur-mansk Marine Biological Institute, Russia); DrsIvetta Tatarinkova, Ryurik Chemyakin and YuryKrasnov(Kandalaksha State Reserve, Russia) for
156 V.M. Savinov et al. / The Science of the Total Environment 306 (2003) 133–158
their help in collection of samples from Ny-Alesund, Bjørnøya, Hornøya, West and East Mur-˚man coasts and Franz Josef Land. Especially, wewould like to thank Halvar Ludvigsen for his greathelp during the expedition to the eastern BarentsSea in 1992. We also want to thank SyverinLierhagen for analysis of heavy metals at theNorwegian Institute for Nature Research analyticallaboratory in Trondheim. Comments from RobBarrett, Rune Dietz and Birgit Braune on earlierdrafts of this manuscript were greatly appreciated,as were subsequent comments on the final draftby anonymous reviewers. The study was financedby: the Norwegian Directorate for Nature Manage-ment (Trondheim); the Norwegian Ministry ofForeign Affairs (Oslo); the Norwegian ResearchCouncil (the Nordic Scholarship Scheme for theBaltic Countries and Northwest Russia); and theRussian Academy of Sciences.
References
Anker-Nielsen T, Barrett RT. Status of seabirds in northernNorway. Br Birds 1991;84:329–341.
Anker-Nielsen T, Barrett RT, Krasnov YuV. Long- and short-term responses of seabirds in the Norwegian and BarentsSeas to changes in stocks of prey fish. Proceedings. ForageFishes in Marine Ecosystems. Alaska Sea Grant CollegeProgram, AK-SG-97-01 1997. p. 683–698.
Barrett RT, Furness RW. The prey and diving depths ofseabirds on Hornøya, North Norway after a decrease in theBarents Sea capelin stocks. Ornis Scand 1990;21(3):179–186.
Barrett RT, Bakken V. Movements of kittiwakesRissa tridac-tyla ringed in Norway. Ringing Migration 1997;18:25–32.
Barrett RT, Krasnov YuV. Recent responses to changes instocks of prey species by seabirds breeding in the southernBarents Sea. ICES J Mar Sci 1996;53:713–722.
Barrett RT, Bakken V, Krasnov YuV. The diet of Commonand Brunnich’s guillemotsUria aalge andU. lomvia in the¨Barents region. Polar Res 1997;16(2):73–84.
Belopol’skii LO. Ecology of Colonial Seabirds of the BarentsSea. Jerusalem: Israel Program for Scientific Translations,1961. p. 458. Translated from Ecologia morskikh colonial-nykh ptits Barentseva morya, 1957.
Bryan GW. Heavy metal contamination in the sea. In: JohnstonR, editor. Marine Pollution. London: Academic press, 1976.p. 185–302.
Bustnes JO, Erikstad KE. The diet of sympatric winteringpopulations of Common eiderSomateria mollissima andKing eiderS. spectabilis in Northern Norway. Ornis Fennica1988;65:163–168.
CEPA (Canadian Environmental Protection Act). Arsenic andits Compounds. pp, 1993.
Clark RB. Marine Pollution. 3rd edition. Oxford: ClarendonPress, 1996. (172 pp.)
del Hoyo J, Elliott A, Sargatal J, editors. Handbook of theBirds of the World, vol. 1. Barcelona: Lynx Editions, 1992.(696 pp).
Dietz R, Johansen P, Riget F, Asmund G. Data on heavymetals from Greenland before 1994: contaminants in theGreenland Marine environment. In: Aarkrog A, Aastrup P,Asmund G, Bjerregaard P, Boertmann D, Carlsen L, Chris-tensen J, Johansen M, Larsen H, Paulsen GB, Petersen H,Pilegaard K, Poulsen ME, Pritzl G, Riget F, Skov H, SpliidH, Weihe P, Wahlin P, editors. AMAP Greenland 1994-˚1996. Environmental Project No. 356. Copenhagen: Ministryof Environment and Energy, Danish Environmental Protec-tion Agency, 1997. p. 247–350.
Dietz R, Nielsen CO, Hansen MM, Hansen CT. Organicmercury in Greenland birds and mammals. Sci Total Environ1990;95:41–51.
Donaldson GM, Braune BM, Gaston AJ, Noble DC. Organo-chlorine and heavy metal residues in breast muscle ofknown-age thick-milled Murres(Uria lomvia) from theCanadian Arctic. Arch Environ Contam Toxicol1997;33:430–435.
Elliott JE, Scheuhammer AM, Leighton FA, Pearce PA. Heavymetal and metallothionein concentrations in Atlantic Cana-dian seabirds. Arch Environ Contam Toxicol 1992;22:63–73.
Erikstad KE, Vader W. Capelin selection by Common andBrunnich’s guillemots during the prelaying season. Ornis¨Scand 1989;20(2):151–155.
Fimreite N. Mercury contamination of aquatic birds in North-western Ontario. J Wildl Manage 1974;38(1):120–131.
Fimreite N. Accumulation and effects of mercury in 79 birds.In: Nriagu JO, editor. The Biogeochemistry of Mercury inthe Environment. Amsterdam: Elsevier, 1979. p. 601–627.
Furness RW, Camphuysen CJ. Seabirds as monitors of themarine environment. ICES J Marine Sci 1997;54:726–737.
Gilbertson M, Eliott JE, Peakall DB. Seabirds as indicators ofmarine pollution. In: Diamond AW, Filion F, editors. TheValue of Birds. ICBP Tech. Publ. 6. Cambridge: Internation-al Council for Bird Preservation, 1987. p. 231–248.
Goyer RA, Cherian MG, Delaquerriere-Richardson L. Corre-lation of parameters of cadmium exposure with onset ofcadmium-induced nephropathy in rats. JEPTO 1984;5:89–100.
Green NW. Joint Assessment and Monitoring Programme(JAMP). National Comments to the Norwegian Data for1995. Norwegian State Pollution Monitoring ProgrammeReport no. 685y97. TA-no. 1405y1997. 1997. (125 pp).
Hamanaka T, Ogi H. Cadmium and zinc concentrations in thehyperiid amphipodParathemisto libellula from the BeringSea. Bull Fac Fish Hokkaido Univ 1984;35:171–178.
Heinz GH, Pendleton GW, Krynitsky AJ, Gold LG. Seleniumaccumulation and elimination in Mallards. Arch EnvironContam Toxicol 1990;19:374–379.
157V.M. Savinov et al. / The Science of the Total Environment 306 (2003) 133–158
Heinz GH. Selenium in birds. In: Beyer WN, Heinz GH,Redmon-Norwood AW, editors. Environmental Contami-nants in Wildlife: Interpreting Tissue Concentrations,SETAC Spec Publ SerCRC Press, Inc, 1996. p. 447–458.
Howell GO, Hill CH. Biological interaction of selenium andother trace elements in chicks. Env Health Perspect1978;25:147–150.
Hutton M. Accumulation of heavy metals and selenium inthree seabird species from the United Kingdom. EnvironPollut (Series A) 1981;26:129–145.
Isaksen K, Bakken V. Breeding populations of seabirds inSvalbard. In: Isaksen K, Bakken V, editors. Seabird Popu-lations in the Northern Barents Sea. Source Data for theImpact Assessment of the Effect of Oil Drilling Activity.Norsk Polarinstitutte Meddelelser, 135, 1995, pp. 11–35.
Joiris CR, Ali IB, Holsbeek L, Bossicart M, Tapia G. Totaland organic mercury in Barents Sea Pelagic fish. BullEnviron Contam Toxicol 1995;55:674–681.
Joiris CR, Moatemri Loroussi N, Holsbeek L. Mercury andpolychlorinated biphenyls in zooplankton and shrimp fromthe Barents Sea and the Spitsbergen area. Bull EnvironContam Toxicol 1997;59:472–478.
Karlog O, Clausen B. Mercury and methylmercury in livertissue from ringed herring gulls collected in three Danishlocalities. Nord Veterinaermed 1983;35:245–250.
Khristoforova NK. Chemico-ecological characteristic of theKandalaksha Bay of the White Sea on heavy metal contentsin molluscs and algaes. Khimiko-ecologicheskaya kharak-teristika Kandalakshskogo zaliva Belogo morya po soder-zhaniyu tyazhelyh metallov v mollyuskah i vodoroslyah.Biologiya Morya 1994;20:154–162. In Russian with Englishabstract.
Killie B. Miljøundersøkelse TromS.D.alsfyllingen Juli 1997.(Environmental survey in TromS.D.alsfyllingen), Akvaplan-niva Rapport 412.97.1231. 15 pp, 1997. In Norwegian.
Kim E-Y, Ichihashi H, Saeki K, Atrashkevich G, Tanabe S,Tatsukava R. Metal accumulation in tissues of seabirds fromChaun, Northeast Siberia, Russia. Environ Poll1996;92(3):247–252.
Knutzen J, Skei J. Tiltaksorienterte miljøundersøkelser iSørfjorden og Hardangerfjorden 1990. Statlig program forforurensningsovervakning rapport 467y91 (Environmental˚contaminants in Sør fjord and Hardanger fjord, 1990 TAnr.784y1991, State Environmental Monitoring ProgramReport 461y91), SFTyNIVA 1991. (63 pp). In Norwegian.
Krasnov YuV, Matishov GG, Galaktionov KV, Savinova TN.Murman’s Colonial Seabirds. Morskiye kolonialniye ptitsyMurmana, Nauka, St. Petersburg 1995. (222 pp). In Russianwith English abstract.
Loring DH, Næs K, Dahle S, Matishov GG, Illin G. Arsenic,trace metals and organic micro contaminants in sedimentsfrom the Pechora Sea, Russia. Mar Geol 1995;128:153–167.
Løvenskiold HL. Avifauna Svalbardensis(Svalbard ornithofau-na). Norsk Polarinst. Skrifter nr 1964;129: (460 pp). InNorwegian.
Macdonald CR, Sprague JB. Cadmium in marine in marineinvertebrates and arctic cod in the Canadian Arctic. Distri-bution and ecological implications. Mar Ecol Prog Ser1988;47:17–30.
Mehlum F. The birds and mammals of Svalbard. PolarhandbokNo. 5, Norsk Polarinstitutt, Oslo. 1990. (140 pp).
Mehlum F, Gabrielsen GW. The diet of high-arctic seabirds incoastal and ice-covered pelagic areas near the Svalbardarchipelago. Polar Biol 1993;12(1):1–20.
Mehlum F, Gabrielsen GW. Energy expenditure and foodcomposition by seabird populations in the Barents Searegion. In: Skjoldal HR, Hopkins C, Erikstad KE, LeinaasHP, editors. Ecology of Fjords and Coastal Waters. Amster-dam: Elsevier, 1995. p. 457–470.
Neff JM. Ecotoxicology of arsenic in the marine environment.Environ Toxicol Chem 1997;16:917–927.
Nielsen CO, Dietz R. Heavy metals in Greenland seabirds.Meddelelser om Greenland. Bioscience 1989;29:3–26.
Nikolaeva N, Krasnov Yu, Barrett RT. Movements of CommonUria aalge and Brunnich’s guillemotsU. lomvia breeding¨in the southern Barents Sea. Fauna Norv Ser C Cinclus1996;19:9–20.
Nikolaeva N, Krasnov Yu, Barrett RT. Movements of kitti-wakesRissa tridactyla breeding in the southern Barents Sea.Fauna Norv Ser C Cinclus 1997;20:9–16.
Norderhaug M, Brun E, Mollen GU. Barentshavetssjøfugleressurser. Norsk Polarinst. Meddel No 104 1977.(119 pp). In Norwegian.
Norheim G. Levels and interactions of heavy metals in seabirds from Svalbard and the Antarctic. Environ Pollut1987;47:83–94.
Norheim G, Borch-Iohnsen B. Svalbard: trace elements inliver from eider. In: Lag J, editor. Excess and Deficiency of˚Trace Elements in Relation to Human and Animal Healthin Arctic and Subarctic RegionsThe Norwegian Academyof Sciences and Letters, 1990. p. 217–219.
Nygard T, Larsen BH, Follestad A, Strann K-B. Numbers and˚distribution of wintering waterfowl in Norway. Wildfowl1988;39:164–176.
Ohlendorf HM. Bioaccumulation and effects of selenium inwildlife. In: Jacobs LW, editor. Selenium in Agriculture andthe Environment. SSSA Special Publ. No. 23. Madison, WI:Amer. Soc. Agronomy and Soil Sci. Amer, 1989. p. 133–177.
Ollason JC, Dunnet GM. Variation in breeding success infulmars. In: Clutton-Brock TH, editor. Reproductive Suc-cess. Studies of Individual Variation in Contrasting BreedingSystem. Chicago and London: The University of ChicagoPress, 1988. p. 263–278.
Parker H, Holm H. Patterns of nutrient and energy expenditurein female Common eiders nesting in the High Arctic. TheAuk 1990;107:660–668.
Plotitsyna NF, Kireeva LI. Contaminants in marine organismsfrom the Barents Sea. Zagryaznyayuschiye veschestva vmorskih organizmah Barentseva morya. Materials on PINROResearches in 1995. Murmansk: PINRO, 1996. p. 168–191.In Russian.
158 V.M. Savinov et al. / The Science of the Total Environment 306 (2003) 133–158
Rainbow PS. Copper, cadmium and zinc concentrations inoceanic amphipod and euphausiid crustaceans, as a sourceof heavy metals to pelagic seabirds. Mar Biol1989;103:513–518.
Riget F, Dietz R, Johansen P. Zinc, cadmium, mercury andselenium in Greenland fish. Meddelelser om Grønland.Bioscience 1997;48:5–29.
Ritterhoff J. Assessment of trace metals in zooplankton fromthe Fram Strait and the Greenland Sea. Ph.D Thesis, Olden-burg University, 1997, 101 pp.
Ritterhoff J, Zauke G-P. Trace metals in field samples ofzooplankton from the Fram Strait and the Greenland Sea.Sci Total Environ 1997;199:255–270.
Savinov V., Dahle S., Savinova T., Killie B., Hummel H.,Matishov G. Contaminants in the Pechora Sea biota. Akva-plan-niva rapport N 430.1252, 1998 37 pp.
Schneider R, Steinhagen-Schneider G, Drescher HE. Organo-chlorines and heavy metals in seals and birds from theWeddell Sea. In: Seigfried WR, Condy PR, Laws RM,editors. Antarctic Nutrient Cycles and Food Webs. Berlin:Springer-Verlag, 1985. p. 652–655.
Scheuhammer AM. The chronic toxicity of aluminium, cad-mium, mercury and lead in birds: a review. Environ Pollut1987;46:263–295.
Solberg T, Becher G, Berg V, Eriksen GS. Kartlegging avmiljøgifter i fisk og skalldyr fra nord-omrade.(Environmen-˚tal contaminants in fish and SNT-rapport 4). 1997. InNorwegian.
Spalding MC, Bjork RD, Powell GVN, Sundlof SF. Mercuryand cause of death in great white herons. J Wildl Manage1994;58:735–739.
Stewart FM, Thompson DR, Furness RW, Harrison N. Seasonalvariation in heavy metal levels in tissue of CommonguillemotsUria aalge, from northwestern Scotland. ArchEnviron Contam Toxicol 1994;27:168–175.
Thompson DR. Mercury in birds and terrestrial mammals. In:Beyer WN, Heinz GH, Redmon-Norwjjd AW, editors. Envi-ronmental Contaminants in Wildlife: Interpreting TissueConcentrations. Boca Raton, FL, USA: Lewis, 1996. p.341–356.
Wayland M, Gilchrist HG, Dickson DL, Bollinger T, James C,Carreno RA, Keating J. Trace elements in King eiders andCommon eiders in the Canadian Arctic. Arch EnvironContam Toxicol 2001;41:491–500.
Wenzel C, Gabrielsen GW. Trace element accumulation inthree seabird species from Hornøya, Norway. Arch EnvironContam Toxicol 1995;29:198–206.
Weslawski M, Skakuij M. Summer feeding of seabirds inTikhaya Bay, Franz Josef Land. Environmental studies fromFranz Josef Land, with emphasis on Tikhaya Bay, HookerIsland. Norsk Polarinstitutt Meddelelser 120 1992. p. 55–62.
Wolfe MF, Achwarzbach S, Sulamian RA. Effect of mercuryon wildlife: a comprehensive review. Env Toxicol Chem1998;17(2):146–160.
Zauke G-P, Savinov VM, Ritterhoff J, Savinova TN. Heavymetals in fishes from the Barents Sea(Summer 1994).Proceedings of AMAP International Symposium on Envi-ronmental Pollution of the Arctic, 1–5 June 1997, Tromsø,Norway 1997. p. 221–223.
Zauke G-P, Savinov VM, Ritterhoff J, Savinova TN. Heavymetals in fish from the Barents Sea(summer 1994). SciTotal Environ 1999;227:161–173.
Zillioux EJ, Porcella DB, Benoit JM. Mercury cycling andeffects in freshwater wetland ecosystems. Environ ToxicolChem 1993;12:2245–2264.
Zunk B. In: Welz B, editor. Fortschritte in der atomspektro-metrischen. Spurenanalytik 1. Weinmeim: Verlag Chemie,1984. p. 597–607. In German.


