Embed Size (px)
Citation preview
arX
iv:1
011.
2704
v1 [
phys
ics.
soc-
ph]
11
Nov
201
0
BUILT-UP STRUCTURE CRITICALITY
DANIEL VASATA1,2, PAVEL EXNER2,3 AND PETR SEBA2,4,5
1 Department of Physics, Faculty of Nuclear Sciences and Physical Engineering
Czech Technical University in Prague, Brehova 7, CZ-115 19, Prague, Czech Republic2 Doppler Institute for Mathematical Physics and Applied Mathematics
Faculty of Nuclear Sciences and Physical Engineering
Czech Technical University in Prague, Brehova 7, CZ-115 19, Prague, Czech Republic3 Nuclear Physics Institute, Academy of Sciences of the Czech Republic
CZ-25068, Rez near Prague, Czech Republic4 University of Hradec Kralove, Vıta Nejedleho 573, CZ-50002, Hradec Kralove, Czech
Republic5 Institute of Physics, Czech Academy of Sciences, Cukrovarnicka 10, CZ-18000 Prague
8, Czech Republic
Abstract. The built-up land represents an important type of overall land-scape. In this paper the built-up land structure in largest cities in the CzechRepublic and selected cities in the U.S.A. is analysed using the frameworkof statistical physics. We calculate the variance of the built-up area and thenumber variance of built-up landed plots in discs. In both cases the variance asa function of a disc radius follows a power law. The obtained values of powerlaw exponents are comparable through different cities. The study is based oncadastral data from the Czech Republic and building footprints from GIS datain the U.S.A.
1. Introduction
Urban land represents one of the most significant fingerprints of human activityon the Earth. The creation and development of its structure is influenced by cul-tural, sociological, economic, political and other conditions. Despite the apparentcomplexity, some simple universal properties and rules can be found. Classic ex-ample is the rank size distribution of cities firstly mentioned by Auerbach (in [1])and later discussed by Zipf [2]. They claimed that if the cities are ranked by theirnumber of inhabitants, then the rank-size distribution follows a power law.
From physical point of view it is interesting to study the spatial properties ofurban pattern. In this way, the fractal properties of urban systems are often men-tioned [1, 3, 4, 5]. This gives a motivation to simulate the growth of urban clustersby applying physical growth models that generate fractal structures. As an im-portant example, models based on diffusion limited aggregation [3, 6] should bementioned. Those models generally produce large connected fractal clusters cen-tred in the CBD (central business district). Real urban aggregates however consistof individually growing separated clusters in a hierarchy of cities. Alternative modelreflecting such a separation was introduced by Makse et al. [5, 7]. The model corre-sponds to the correlated percolation in the presence of a density gradient. RecentlyF. Schweitzer [1] proposed agent-based model that is again able to reproduce theobserved morphology of cities.
1
2 DANIEL VASATA1,2, PAVEL EXNER2,3 AND PETR SEBA2,4,5
Almost all the previously mentioned works deal with the structure and develop-ment of large urban areas represented by coarse-grained maps. Our aim is to studythe urban structure represented by the built-up land on much smaller scales. Inthe following we show the connection of built-up land in the centre of cities to theso called critical systems from thermodynamics. To do this we focus on correlationand fluctuation properties.
The connection to critical systems (phase transitions) can be motivated by thefact that from the economic point of view, the change of land to built-up typerepresents the change of phase for type of land. The place is equipped with anadditional property - a building. Another motivation arise from above mentionedfractal (self-similar) properties of urban systems. Critical behaviour in connectionto urban systems is actually not new. The concept of self-organized criticality [8]in this area was introduced by Batty and Xie [9]. The fingerprint of criticality usedin their paper is a fractal dimension.
2. Critical phenomena
To make the paper self-contained, let us recall briefly some specific features of theso called critical systems [10, 11, 12]. Properties of different thermodynamic systemsnear the continuous (second-order) phase transition show specific universalities forwhich the term critical phenomena is used.
If one is interested in the static spacial structure, then certainly the most im-portant property is the scaling invariance. In simple terms, if a part of a system ismagnified to the same size as the original system, it is not possible to distinguishbetween the magnified part and the original system. Near the critical point, thereexists only one characteristic length of the system, the correlation length ξ, whichis solely responsible for singular contributions to thermodynamic quantities anddiverges at the critical point.
In order to describe these features explicitly one needs to define an order param-eter 〈M〉 as a thermodynamic quantity that distinguishes between the two phases.Notation 〈...〉 stands for ensemble average. It is also useful to define a local orderparameter value m(r) by the relation
(1) M =
∫
V
m(r)dr, V ⊂ R2.
If the system is homogeneous and isotropic in the volume V , then
(2) 〈m(r)〉 = 〈m(0)〉 = m =〈M〉
V, ∀r ∈ V.
The spatial properties of order parameter distribution can be described by thetwo-point correlation function defined as
(3) G(r1, r2) =
⟨(m(r1)− 〈m(r1)〉
)(m(r2)− 〈m(r2)〉
)⟩.
This can be under homogeneity and isotropy assumptions simplified to
(4) G(r1, r2) = G(r2 − r1) = G(r) = 〈m(r)m(0)〉 −m2,
where r = r2 − r1 and r = |r|. Therefore the correlation function depends only onthe relative distance |r| = |r2 − r1| of two points r1 and r2. The scaling assumption
BUILT-UP STRUCTURE CRITICALITY 3
for correlation function can be written in the following form:
(5) G(r) =Ψ(r/ξ)
rη, 0 < η < 2,
where Ψ is some bounded function and ξ is correlation length. Index η appearing inthe exponent of power law part of G(r) is called the anomalous dimension. As westated before, the correlation length diverge when approaching the critical point.Correlation function then follows a power law decay G(r) ∝ r−η .
Local order parameter represents for every realization a scalar field m : V → R.The system as a whole ensemble of different realizations is therefore described bystochastic scalar field. This definition can be extended to systems composed ofpoint particles. Here, the empirical density function ρ is taken as the local orderparameter. For particles located at points r1, r2, r3, r4, ... ∈ R2 it is given by
(6) ρ(r) =
∞∑
i=1
δ(r − ri).
It is well known [12] that the correlation function for such density can be decom-posed to
(7) G(r2 − r1) = ρ0δ(r2 − r1) + G(r2 − r1),
where G(r2 − r1) is the non-diagonal part of the form (5) meaningful only forr = |r2 − r1| > 0. The difference to ordinary scalar field parameter is thus onlyin the diagonal δ therm which of course doesn’t influence the character of thedivergence in the vicinity of the critical point.
2.1. Parameter variance in discs. The useful tool to analyse experimental datais the variance of the parameter value in discs. For the parameter m(r) withhomogeneous and isotropic distribution 〈m(r)〉 = m the cumulative value of theparameter in the disc of radius R is given by
(8) M(R) =
∫
S(R)
m(r)dr,
where the disc is the set S(R) ≡ {r ∈ Rd| |r| < R} with a volume |S(R)|. Thecentre of the disc is not important because of the homogeneity of the parameterdistribution. The parameter variance is defined [13] as
(9) σ2(R) = 〈M(R)2〉 − 〈M(R)〉2,
where
(10) 〈M(R)〉 =
∫
S(R)
〈m(r)〉dr = m |S(R)| ,
and
(11) 〈M(R)2〉 =
∫
S(R)
∫
S(R)
〈m(r1)m(r2)〉dr1dr2.
Using the definition (3) of the two-point correlation function, σ2(R) can be rewrittenas
(12) σ2(R) = |S(R)|
∫
S(2R)
G(r)dr.
4 DANIEL VASATA1,2, PAVEL EXNER2,3 AND PETR SEBA2,4,5
In the thermodynamic limit V → +∞ and R → +∞ the integral on the right siderepresents the susceptibility of the system according to the fluctuation-dissipationtheorem [11]:
(13) χ =1
kBT
∫
V
G(r, T )dr.
Because the susceptibility is finite outside of the critical point, the followingasymptotic behaviour holds:
(14) σ2(R) ∝ R2 ∼ 〈M(R)〉, R ≫ 1.
Different situation arises when the system is approaching the critical point. Spa-tial correlations in this region are long-ranged and the correlation function is dom-inated by the power-law decay (5). This together with (12) in the region R ≫ 1and R ≪ ξ gives
(15) σ2(R) ∝ R4−η ∼ 〈M(R)〉2−η
2 .
Thus, in order to determine the criticality of thermodynamic system, one canstudy the fluctuations. If the dependence of σ2(R) on 〈M(R)〉 follows a power lawwith exponent larger than 1, than the system is close to critical point.
3. Data analysis
In this section we show that built-up land pattern has the same fluctuation andcorrelation properties as critical systems. The analysis of the structure is basedon cadastral records in the Czech Republic and building footprints in the U.S.A.Cadastral records contain information about fractalization of the overall landscapeinto smallest unique pieces of land - land parcels (plots). Every landed plot i in theCzech Republic is characterised by its definition point ri, size (acreage) λi, typeof land and the ownership data. Since our interest is in the built-up structure, werestrict our attention only to built-up landed plots. The second part of our data,building footprints, are part of GIS data in the ESRI Shapefile format available forfew U.S.A. cities on the Internet. Footprints are represented by polygons reflectingthe true shape, and therefore size, of overlying buildings.
Because the exact parcel shape for our cadastral data is unknown1, the moststraightforward analysis is to represent the built-up landed plots as points givenby their definition points ri. For this representation the order parameter is givenby the singular point density (6). Parameter variance σ2(R) is then the numbervariance in discs. In the case of building footprints, centroids of the parcels areused as definition points.
Another possibility is to approximate unknown parcel shapes by circles withthe same acreage. The built-up land is then represented as a subset Z of twodimensional surface R2. The order parameter in this case is just the indicator ofsuch a subset:
(16) m(r) =
{1 building at r0 othervise
This approximation leads to errors. Fortunately, the approach of estimating pa-rameter variance in discs is much less sensitive to them than the direct estimation
1The exact geodetic information about the shape are of course stored in the Czech cadastre.Unfortunately we have no access to this part of the data.
BUILT-UP STRUCTURE CRITICALITY 5
of correlation function. During the calculation of built-up area contained inside oneconcrete disc S(R) according to (10), the intersection area of the disc with everyparcel represented by the circle is added to cumulative result:
(17) M(R) =∑
i∈I
λ(Si
⋂S(R)
),
where λ(A) denotes the acreage of subset A ⊂ R2 (Lebesgue measure on R2), I isthe set of all built-up parcels, and Si is the circle positioned at the definition pointof the i-th parcel having the same size λ(Si) = λi. For R much larger than typicalparcel radius this approach produce errors only in the vicinity of the disc boundary.The effective error will therefore decrease as
(18)M(R)− M(R)
M(R)∼ R−1.
In the case of polygon representation for building footprints we take Si as polygonsand (17) gives exact value of built-up area inside the disc.
All estimations are based on the assumption of self-averaging property [14, 15]. Itmeans that sufficiently large sample is a good representative of the whole ensemble.In our case however, the size of sample is limited to the area around the citycentre where we can expected uniform density. Nevertheless, we expect that thecorrelation length is shorter than the typical city centre size, so the self-averaging(in the weak sense) can be valid. By the city centre we mean the area around thecity core (central ’plateau’), where the built-up density is virtually constant [16].For typical large Czech city the diameter of such area is about 4 km. This size putslimitation on the radius of discs in order to obtain reasonable statistics. Togetherwith the fact that the power law dependence, if presented, is valid for R >> 1, oneis usually restricted to work in the region 400 m . R . 1000 m.
Related to this, mean values in formula (9) for fixed radius R are estimated in thefollowing way. Inside the studied part of the city A ⊂ R2 we uniformly randomlychoose centres oj of N , N >> 1 (usually N = 2000) discs, so that every disc isinherited in A, S(oj , R) ≡ oj + S(R) ⊂ A. For every disc S(oj , R) the cumulativeparameter value Mj(R) inside is calculated. This means either number of pointsinside the disc or built-up area given by (17). The mean value is estimated by
(19) 〈M(R)〉 =1
N
∑
j
Mj(R)
and the variance by
(20) σ2(R) =1
N − 1
∑
j
(Mj(R)− 〈M(R)〉
)2
.
Note that we use the same notation for the definition (9) and for the estimator(20).
4. Results
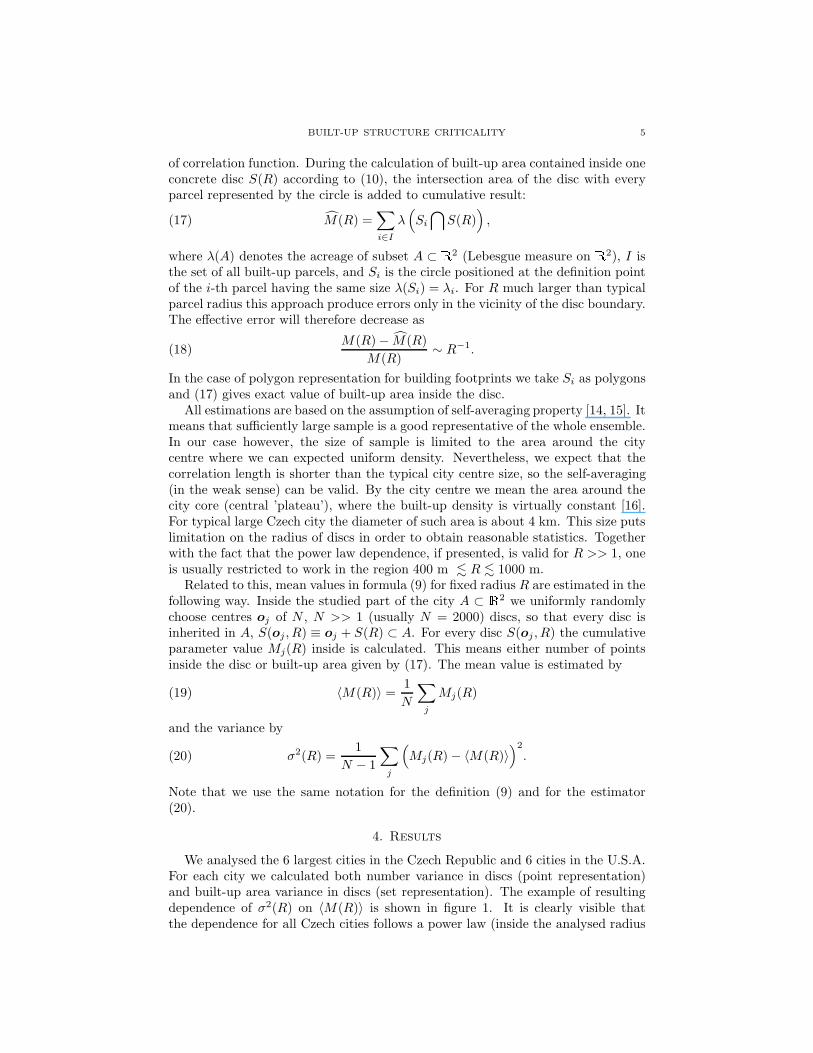
We analysed the 6 largest cities in the Czech Republic and 6 cities in the U.S.A.For each city we calculated both number variance in discs (point representation)and built-up area variance in discs (set representation). The example of resultingdependence of σ2(R) on 〈M(R)〉 is shown in figure 1. It is clearly visible thatthe dependence for all Czech cities follows a power law (inside the analysed radius
6 DANIEL VASATA1,2, PAVEL EXNER2,3 AND PETR SEBA2,4,5
104
105
106
109
1010
1011
〈M (R)〉
σ2(R
)
PrahaPlzenLiberecBrnoCeske BudejoviceOstrava
Figure 1. Dependencies of σ2(R) on 〈M(R)〉 in log-log scale fordifferent cities in the Czech republic.
range). The same behaviour is actually valid for all cities in both representations.Power law dependence can be in log-log plot fitted by a straight line. From this fitone can easily determine the exponent of the respective power law. The summaryof resulting exponents α for studied cities according to the relation
(21) σ2(R) ∝ 〈M(R)〉α, α = 2−η
2
is given in the table 1. As follows from (14), α = 1 stands for the system that is
Table 1. Exponents α according to power law dependence (21)of σ2(R) on 〈M(R)〉. In the 2-nd and 5-th column are valuesof exponent for point representation. The 3-rd and 5-th columnscontain values for set representation with circular approximationof built-up units (for building footprints - circles with the originin the centroid and the same size as actual polygon). The 6-thcolumn contains values for set representation using actual knownpolygonal shape of built-up footprints.
City Points Area City Points Areacircle circle polygon
Praha 1.47 1.64 Raleigh 1.73 1.58 1.58Plzen 1.61 1.69 Boston 1.62 1.62 1.62Liberec 1.54 1.65 Pittsburgh 1.69 1.68 1.69Brno 1.40 1.65 Spokane 1.69 1.57 1.59
Ceske Budejovice 1.50 1.58 Tompkins 1.75 1.57 1.59Ostrava 1.54 1.62 Springfield 1.52 1.3 1.3
BUILT-UP STRUCTURE CRITICALITY 7
outside of the critical region, e.g. randomly positioned particles. One can see thatthis is not the case of built-up land pattern.
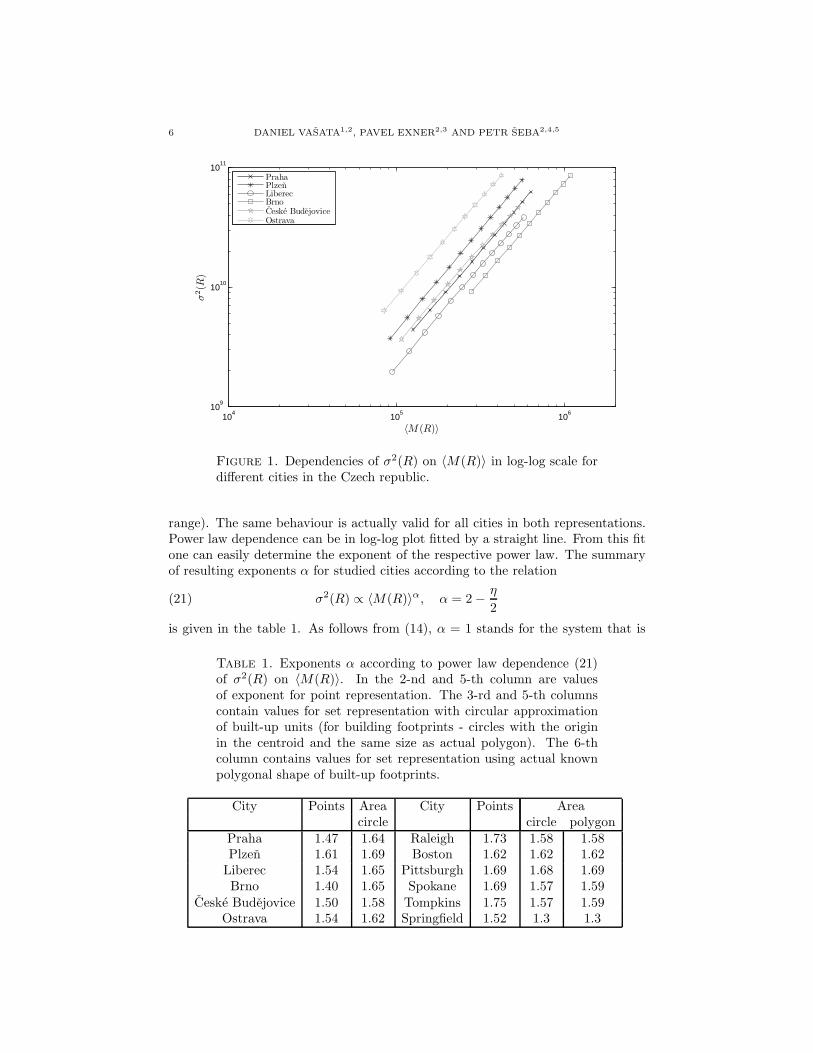
The values of exponent for built-up land pattern are for both representationsmuch larger than 1. In the case of point pattern the average value of exponentis αp = 1.60. We can see the systematic distinction between Czech cities (lowervalues) and American cities (larger values). Better results arise from the analysisof built-up area fluctuations. There is no clear systematic difference in this casebetween the Czech republic and the U.S.A. The average value of the exponent isαa = 1.62 with much lower fluctuations around this value. The only significantdeviation in the power law coefficient is represented by the City of Springfield.Such a result can be explained by its strongly constrained lattice-like structure (seefigure 2). The structure is therefore much more homogeneous than in the othercities. This fact implies lower fluctuations.
Figure 2. Constrained structure of Springfield.
Comparing the values of exponent in the 6-th and 7-th column of the table 1 wecan conclude that the approximation of unknown parcel shape by circles does notproduce significant errors.
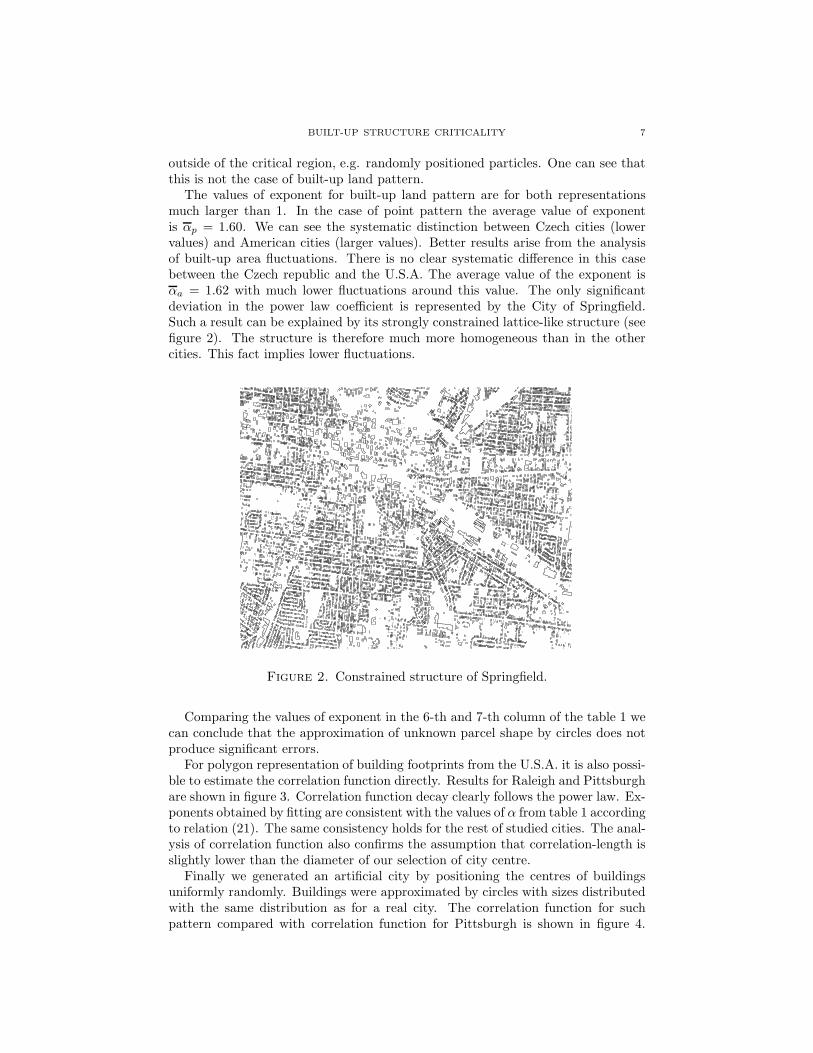
For polygon representation of building footprints from the U.S.A. it is also possi-ble to estimate the correlation function directly. Results for Raleigh and Pittsburghare shown in figure 3. Correlation function decay clearly follows the power law. Ex-ponents obtained by fitting are consistent with the values of α from table 1 accordingto relation (21). The same consistency holds for the rest of studied cities. The anal-ysis of correlation function also confirms the assumption that correlation-length isslightly lower than the diameter of our selection of city centre.
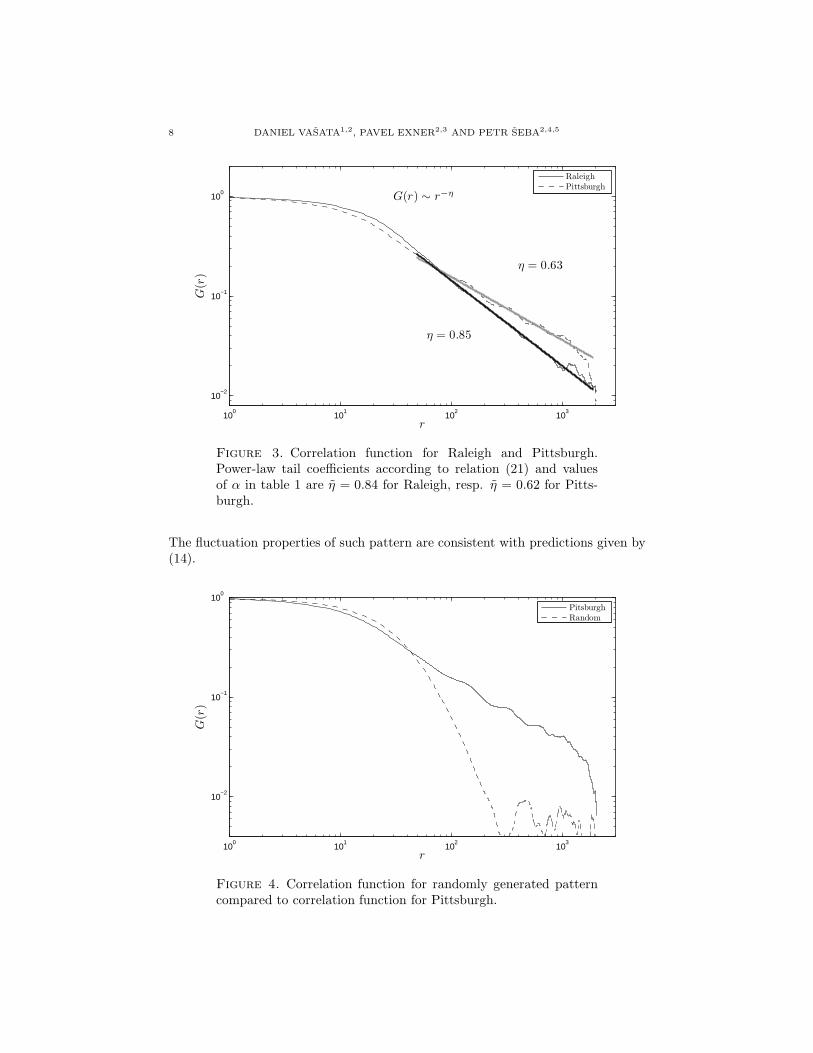
Finally we generated an artificial city by positioning the centres of buildingsuniformly randomly. Buildings were approximated by circles with sizes distributedwith the same distribution as for a real city. The correlation function for suchpattern compared with correlation function for Pittsburgh is shown in figure 4.
8 DANIEL VASATA1,2, PAVEL EXNER2,3 AND PETR SEBA2,4,5
100
101
102
103
10−2
10−1
100
r
G(r
)
G(r) ∼ r−η
η = 0.85
η = 0.63
RaleighPittsburgh
Figure 3. Correlation function for Raleigh and Pittsburgh.Power-law tail coefficients according to relation (21) and valuesof α in table 1 are η = 0.84 for Raleigh, resp. η = 0.62 for Pitts-burgh.
The fluctuation properties of such pattern are consistent with predictions given by(14).
100
101
102
103
10−2
10−1
100
r
G(r
)
PitsburghRandom
Figure 4. Correlation function for randomly generated patterncompared to correlation function for Pittsburgh.
BUILT-UP STRUCTURE CRITICALITY 9
5. Conclusion
The computations show that for both representations the dependence of fluc-tuations on the mean value of the parameter follows a power law. Moreover theset representation, as can be expected, seems to be more universal. The valuesof the exponent α in the relation σ2(R) ∼ 〈M(R)〉α, for different cities except ofSpringfield are very close to the value α = 1.62. Different results for Springfieldcan be explained by strongly constrained lattice-like structure of that city.
We can conclude that the inner urban area structure is correlated with a long-ranged power-law dependence. This shows the connection between critical systemsand the urban system. The power-law exponent seems to be independent of theparticular city, being therefore determined only by the fact that it represents aninner urban structure. Such an observation is very interesting and the connectionbetween urban area and critical systems may be useful to development and veri-fication of further urban models. It also confirms the hypothesis of self-organizedcriticality in urban systems in a new way different from that established previously[9].
Obtaining this result, one can further ask about the origin of the critical be-haviour. The most natural explanation comes from the way cities growth incorpo-rating the connection of built-up land to all sorts of networks, such as transporta-tion, water supply, sewerage, electricity, etc.
Acknowledgments
The research was supported by the Czech Ministry of Education, Youth andSports within the project LC06002, by the Grant Agency of the Czech Republicwithin the project No. 202/08/H072 and by the project No. SGS10/211/OHK4/2T/14of the Czech Technical University in Prague. We are indebted to Helena Sandovaand Petr Soucek from the Czech Office for Surveying, Mapping and Cadastre forthe help with acquiring the data.
References
[1] Frank Schweitzer. Brownian Agents and Active Particles. Springer, first edition, 2003.[2] George Kingsley Zipf. Human Behavior and the Principle of Least Effort. Addison-Wesley,
1949.[3] Michael Batty and Paul Longley. Fractal Cities: A Geometry of Form and Function. Aca-
demic Press, first edition, 1994.[4] P. Frankhauser and R. Sadler. Fractal analysis of urban structures. Natural Structures -
Principles, Strategies and Models in Architecture and Nature. Proc. Int. Symp. SFB 230,4:57–65, 1992.
[5] Hernan A. Makse, Jose S. Andrade, Michael Batty, Shlomo Havlin, and H. Eugene Stanley.Modeling urban growth patterns with correlated percolation. Phys. Rev. E, 58(6):7054–7062,Dec 1998.
[6] Tamas Viscek. Fractal Growth Phenomena. World Scientific, Singapore, 1989.[7] Hernan A. Makse, Shlomo Havlin, and H. Eugene Stanley. Modelling urban growth patterns.
Nature, 377:608–612, oct 1995.[8] Per Bak, Chao Tang, and Kurt Wiesenfeld. Self-organized criticality. Phys. Rev. A, 38(1):364–
374, Jul 1988.[9] Michael Batty and Yichun Xie. Self-organized criticality and urban development. Discrete
Dynamics in Nature and Society, 3:109–124, 1999.[10] Igor Herbut. A Modern Approach to Critical Phenomena. Cambridge University Press, Cam-
bridge, U.K., 2007.[11] Kerson Huang. Statistical Mechanics. John Wiley & Sons, 2nd edition, 1987.

10 DANIEL VASATA1,2, PAVEL EXNER2,3 AND PETR SEBA2,4,5
[12] L. D. Landau and E. M. Lifschitz. Statistical Physics. Pergamon Press, 3rd edition, 1980.[13] Andrea Gabrielli, Michael Joyce, and Francesco Sylos Labini. Glass-like universe: Real-space
correlation properties of standard cosmological models. Phys. Rev. D, 65(8):083523, Apr 2002.[14] Didier Sornette. Critical Phenomena in Natural Sciences. Springer, 2000.[15] Amnon Aharony and A. Brooks Harris. Absence of self-averaging and universal fluctuations
in random systems near critical points. Phys. Rev. Lett., 77(18):3700–3703, Oct 1996.[16] Marianne Guerois and Denise Pumain. Built-up encroachment and the urban field: a com-
parison of forty european cities. Environment and Planning A, 40:2186–2203, 2008.


