Embed Size (px)
Citation preview
Copyright © 2010 by Monitor Company Group, L.P.
No part of this publication may be reproduced, stored in a retrieval system, or transmitted in any form or by any means — electronic, mechanical, photocopying,
recording, or otherwise — without the permission of Monitor Company Group, L.P.
This document provides an outline of a presentation and is incomplete without the accompanying oral commentary and discussion.
SAN FRANCISCO SÃO PAULO SEOUL SINGAPORE TOKYO TORONTO ZURICHSHANGHAI
BEIJING CHICAGO HONG KONGCAMBRIDGE DELHI DUBAI JOHANNESBURG
PARISLOS ANGELES MADRID MUMBAI MUNICH NEW YORKMOSCOWLONDON
Commissioned by NHB, funded by FIRST Initiative with active support from World Bank
July 2010
Building Houses, Financing Homes
A Study Report of India’s Rapidly Growing Housing and Housing FinanceMarkets for the Low-Income Customer
2Copyright © 2010 Monitor Company Group, L.P.
Contents
Summary of Findings
Market Overview
LIH Developers: Operations, Commercial Viability and Marketability
Housing Finance Companies: Operations and Commercial Viability
Appendix
3Copyright © 2010 Monitor Company Group, L.P.
Summary of Findings
Improved Supply in the Low Income Housing Market
This study has found more than 25 developers in urban areas across India building (or about tobuild) multi-family units in the Rs. 3 lakh to Rs. 7 lakh price range1
Additionally, the market is changing in three significant ways:
– New Cities
Projects are spread across 7 states indicating that the cities that saw the initial low income housing projects, such asAhmedabad and Mumbai, are seeing copycat projects in these cities,
These successful examples are also leading to the proliferation of low income housing projects in other cities
– New Mix of Developers
New mix of developers contains not only traditional developers but also larger, more established developers as well assome corporate players.
The latter two see the low income housing market as a scale “manufacturing” opportunity, and are in the process of doingsizable initial projects to confirm feasibility and refine their models, as a key step to building successful businesses at highvolumes
– E.g., VBHC has already announced plans to build a million homes (priced below Rs. 10 lakhs) in 10 years
– Neptune Group (an erstwhile premium builder) has declared intentions to expand from Mumbai to other cities inMaharashtra with its ‘Swarajya’ brand, before ultimately expanding nationally.
– New Ideas
To successfully do this, these developers are constantly innovating in their projects – testing new constructiontechnologies, creating new architectural designs, incorporating sustainability elements, etc.
The low-income housing market (LIH) in urban India is improving, with the beginnings of arobust supply equation in place for affordable, high-quality housing…
Note: 1The study was conducted by Monitor Inclusive Markets for the NHB, funded by FIRST Initiative and supported by the World Bank. For project details, please see the Project Overviewsection in the Appendix
4Copyright © 2010 Monitor Company Group, L.P.
Summary of Findings
Increased Access to Loans in the Housing Finance Market
The housing finance market today contains a wide variety of players:
– Pioneers of the housing finance space for low income customers, e.g. Gruh and DHFL
Also includes two new kinds of players:
– Dedicated start-ups like MHFC that have identified this very segment as a large business opportunity
– Established companies with excellent track records in allied businesses (e.g. MAS in Microfinanceand Vehicle Loans, SEWA in livelihood and credit, and Muthoot Pappachan Group in Gold Loans) thatare seeing opportunities or cross-over efficiencies in the space
Other expected entrants into the space include:
– SUMEL Housing Finance Limited, Home First Finance Ltd, Aptus Value Housing Finance India Ltd., andAadhar Housing Finance Pvt. Ltd., all of which already have, or have applied to NHB for, a Certificate ofRegistration (CoR);
To serve a segment which comes with challenges, each of these companies are constantlyinnovating, e.g. with regard to customer risk assessment mechanisms, distribution models, collectionmechanisms, and back-office procedures
… and an upswing in the availability of housing finance for poorer customers, with a marketthat now includes more players than ever before serving, or aspiring to serve, the lowincome customer
5Copyright © 2010 Monitor Company Group, L.P.
Summary of Findings
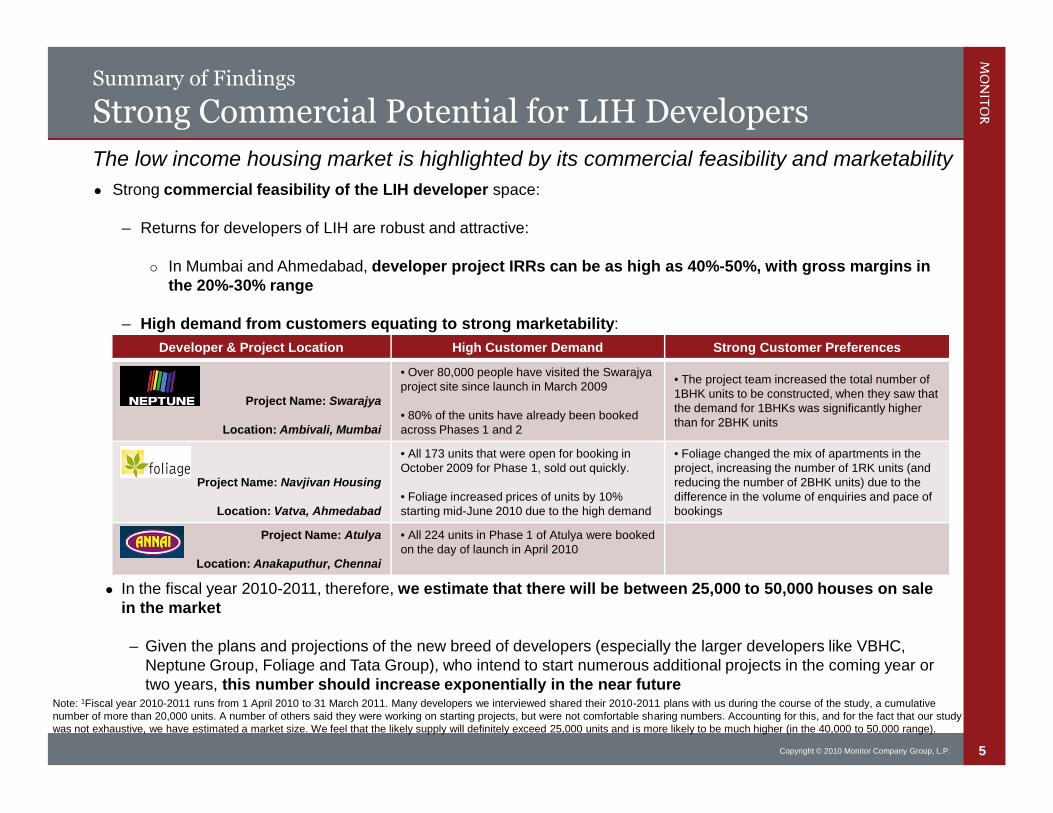
Strong Commercial Potential for LIH Developers
Strong commercial feasibility of the LIH developer space:
– Returns for developers of LIH are robust and attractive:
In Mumbai and Ahmedabad, developer project IRRs can be as high as 40%-50%, with gross margins inthe 20%-30% range
– High demand from customers equating to strong marketability:
The low income housing market is highlighted by its commercial feasibility and marketability
Developer & Project Location High Customer Demand Strong Customer Preferences
Project Name: Swarajya
Location: Ambivali, Mumbai
• Over 80,000 people have visited the Swarajyaproject site since launch in March 2009
• 80% of the units have already been bookedacross Phases 1 and 2
• The project team increased the total number of1BHK units to be constructed, when they saw thatthe demand for 1BHKs was significantly higherthan for 2BHK units
Project Name: Navjivan Housing
Location: Vatva, Ahmedabad
• All 173 units that were open for booking inOctober 2009 for Phase 1, sold out quickly.
• Foliage increased prices of units by 10%starting mid-June 2010 due to the high demand
• Foliage changed the mix of apartments in theproject, increasing the number of 1RK units (andreducing the number of 2BHK units) due to thedifference in the volume of enquiries and pace ofbookings
Project Name: Atulya
Location: Anakaputhur, Chennai
• All 224 units in Phase 1 of Atulya were bookedon the day of launch in April 2010
In the fiscal year 2010-2011, therefore, we estimate that there will be between 25,000 to 50,000 houses on salein the market
– Given the plans and projections of the new breed of developers (especially the larger developers like VBHC,Neptune Group, Foliage and Tata Group), who intend to start numerous additional projects in the coming year ortwo years, this number should increase exponentially in the near future
Note: 1Fiscal year 2010-2011 runs from 1 April 2010 to 31 March 2011. Many developers we interviewed shared their 2010-2011 plans with us during the course of the study, a cumulativenumber of more than 20,000 units. A number of others said they were working on starting projects, but were not comfortable sharing numbers. Accounting for this, and for the fact that our studywas not exhaustive, we have estimated a market size. We feel that the likely supply will definitely exceed 25,000 units and is more likely to be much higher (in the 40,000 to 50,000 range).
6Copyright © 2010 Monitor Company Group, L.P.
Summary of Findings
Strong Commercial Potential for HFCs
Strong economic potential in the HFC space:
– Established HFCs have robust returns on assets and equity, and the new entrants areexpecting similar returns
E.g. HDFC has a RoA of 2.7%, DHFL of 1.7% and MAS of between 2% - 2.5% (expected)
ROEs for these companies range from 17.5% to ~22%
– There is a strong commercial opportunity in targeting the low income, informal sector urbancustomer, which is a large and un-served population
Monitor’s illustrative model of a pure-play HFC targeting the low-income, informal sector customer, assumes a“hub and spoke” model
– HFC would operate in Metros and Tier I – III cities, with “hub” retail branches and “spoke” project sitekiosks to follow up on new low income construction projects1
The model “hub and spoke” HFC would disburse close to 260,000 loans of an average ticket size of Rs. 4lakhs (and an interest rate of 14%) in ten years
– Such an HFC can turn profitable within 3 years, with a RoA of over 2.5% to 2.9% by year 5 and aRoE of ~17% by year 7
The housing finance companies that are serving the low income urban customers, are seeingstrong commercial performance
Note: 1Metros are cities with population of greater than 40 lakhs, Tier I cities have a population of between 10-40 lakhs, Tier II cities have a population of between 5-10 lakhs, Tier IIIcities have a population of between 1-5 lakhs.
7Copyright © 2010 Monitor Company Group, L.P.
Contents
Summary of Findings
Market Overview
– The Low Income Housing Market in India 2010
LIH Developers: Operations, Commercial Viability and Marketability
Housing Finance Companies: Operations and Commercial Viability
Appendix
8Copyright © 2010 Monitor Company Group, L.P.
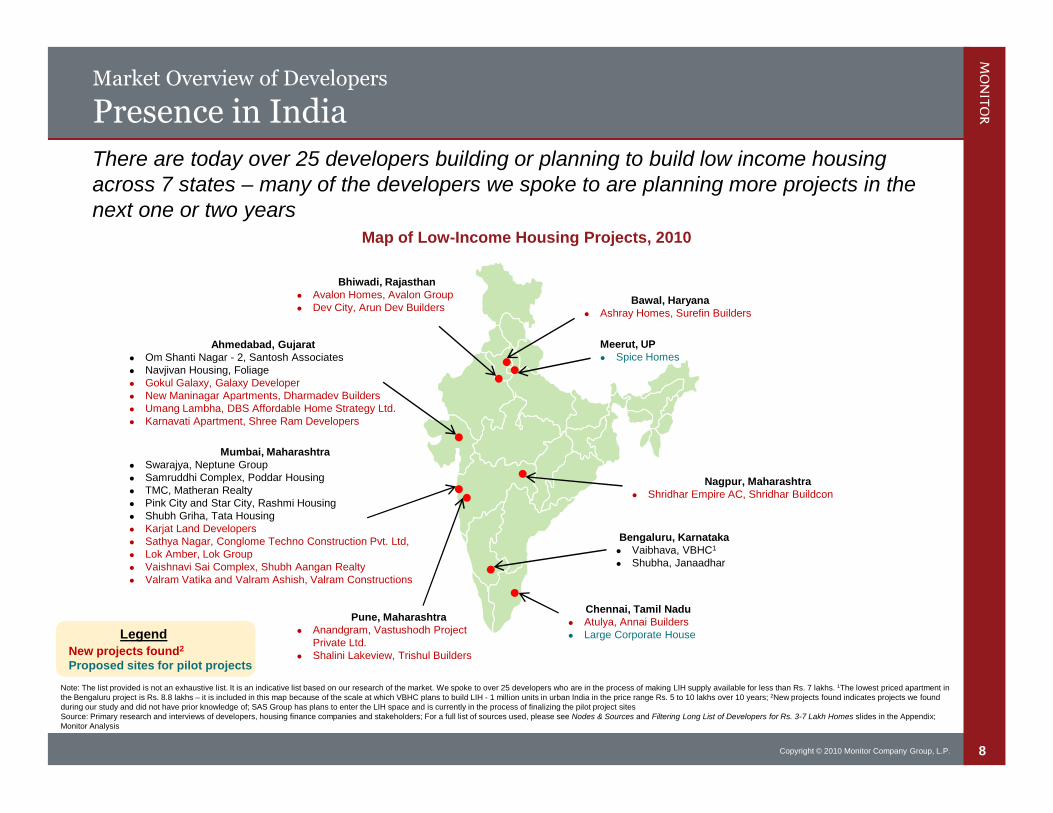
There are today over 25 developers building or planning to build low income housingacross 7 states – many of the developers we spoke to are planning more projects in thenext one or two years
Market Overview of Developers
Presence in India
Map of Low-Income Housing Projects, 2010
LegendNew projects found2
Proposed sites for pilot projects
Note: The list provided is not an exhaustive list. It is an indicative list based on our research of the market. We spoke to over 25 developers who are in the process of making LIH supply available for less than Rs. 7 lakhs. 1The lowest priced apartment inthe Bengaluru project is Rs. 8.8 lakhs – it is included in this map because of the scale at which VBHC plans to build LIH - 1 million units in urban India in the price range Rs. 5 to 10 lakhs over 10 years; 2New projects found indicates projects we foundduring our study and did not have prior knowledge of; SAS Group has plans to enter the LIH space and is currently in the process of finalizing the pilot project sitesSource: Primary research and interviews of developers, housing finance companies and stakeholders; For a full list of sources used, please see Nodes & Sources and Filtering Long List of Developers for Rs. 3-7 Lakh Homes slides in the Appendix;Monitor Analysis
Chennai, Tamil Nadu Atulya, Annai Builders Large Corporate House
Bengaluru, Karnataka Vaibhava, VBHC1
Shubha, Janaadhar
Nagpur, Maharashtra Shridhar Empire AC, Shridhar Buildcon
Meerut, UP Spice Homes
Bawal, Haryana Ashray Homes, Surefin Builders
Bhiwadi, Rajasthan Avalon Homes, Avalon Group Dev City, Arun Dev Builders
Ahmedabad, Gujarat Om Shanti Nagar - 2, Santosh Associates Navjivan Housing, Foliage Gokul Galaxy, Galaxy Developer New Maninagar Apartments, Dharmadev Builders Umang Lambha, DBS Affordable Home Strategy Ltd. Karnavati Apartment, Shree Ram Developers
Mumbai, Maharashtra Swarajya, Neptune Group Samruddhi Complex, Poddar Housing TMC, Matheran Realty Pink City and Star City, Rashmi Housing Shubh Griha, Tata Housing Karjat Land Developers Sathya Nagar, Conglome Techno Construction Pvt. Ltd, Lok Amber, Lok Group Vaishnavi Sai Complex, Shubh Aangan Realty Valram Vatika and Valram Ashish, Valram Constructions
Pune, Maharashtra Anandgram, Vastushodh Project
Private Ltd. Shalini Lakeview, Trishul Builders
9Copyright © 2010 Monitor Company Group, L.P.
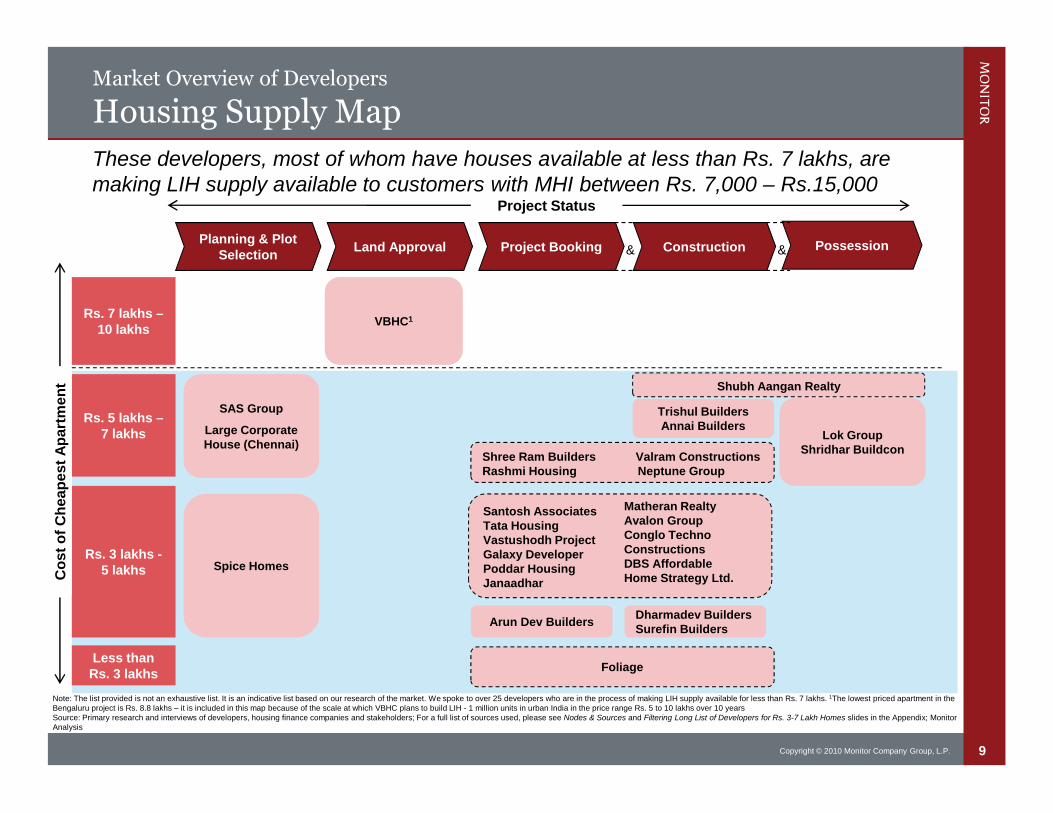
Market Overview of Developers
Housing Supply Map
Note: The list provided is not an exhaustive list. It is an indicative list based on our research of the market. We spoke to over 25 developers who are in the process of making LIH supply available for less than Rs. 7 lakhs. 1The lowest priced apartment in theBengaluru project is Rs. 8.8 lakhs – it is included in this map because of the scale at which VBHC plans to build LIH - 1 million units in urban India in the price range Rs. 5 to 10 lakhs over 10 yearsSource: Primary research and interviews of developers, housing finance companies and stakeholders; For a full list of sources used, please see Nodes & Sources and Filtering Long List of Developers for Rs. 3-7 Lakh Homes slides in the Appendix; MonitorAnalysis
Planning & PlotSelection
Land Approval ConstructionProject Booking Possession
Rs. 7 lakhs –10 lakhs
Rs. 5 lakhs –7 lakhs
Rs. 3 lakhs -5 lakhs
Less thanRs. 3 lakhs
Project Status
Co
st
of
Ch
eap
est
Ap
art
men
t
These developers, most of whom have houses available at less than Rs. 7 lakhs, aremaking LIH supply available to customers with MHI between Rs. 7,000 – Rs.15,000
Shubh Aangan Realty
Trishul BuildersAnnai Builders
Lok GroupShridhar Buildcon
Santosh AssociatesTata HousingVastushodh ProjectGalaxy DeveloperPoddar HousingJanaadhar
Foliage
SAS Group
Large CorporateHouse (Chennai)
VBHC1
Matheran RealtyAvalon GroupConglo TechnoConstructionsDBS AffordableHome Strategy Ltd.
Shree Ram Builders Valram ConstructionsRashmi Housing Neptune Group
Dharmadev BuildersSurefin Builders
Spice Homes
Arun Dev Builders
& &
10Copyright © 2010 Monitor Company Group, L.P.
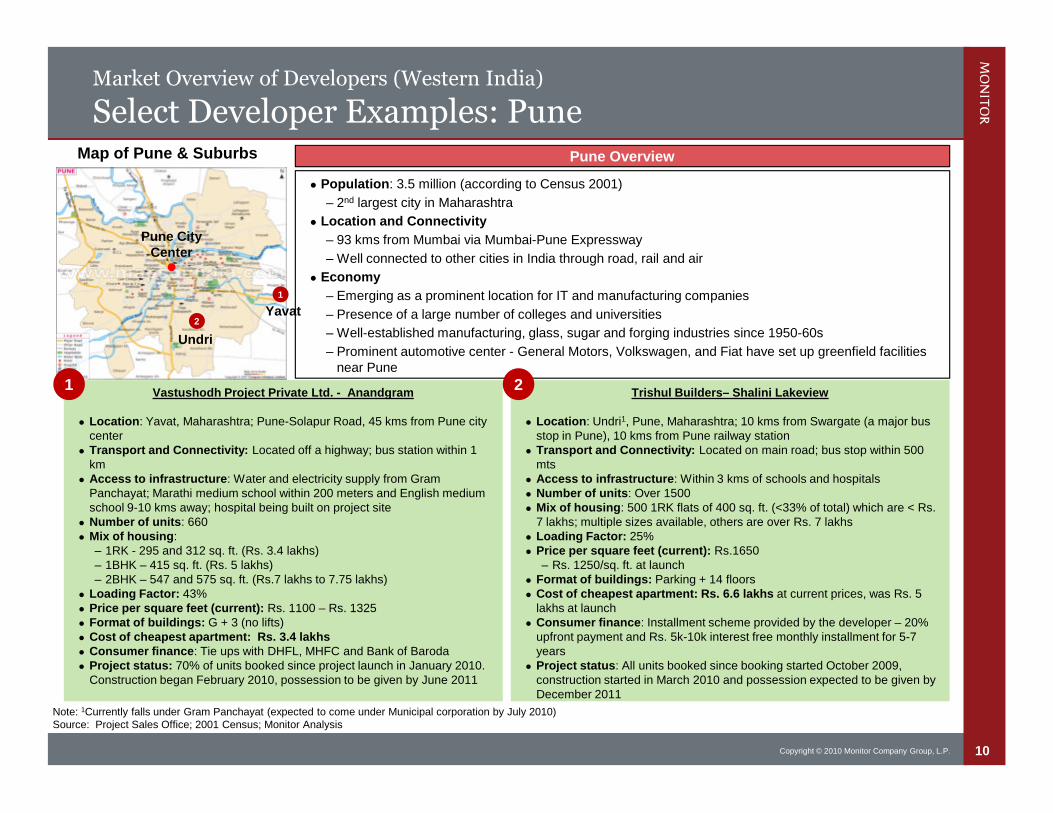
Market Overview of Developers (Western India)
Select Developer Examples: Pune
Note: 1Currently falls under Gram Panchayat (expected to come under Municipal corporation by July 2010)Source: Project Sales Office; 2001 Census; Monitor Analysis
Vastushodh Project Private Ltd. - Anandgram
Location: Yavat, Maharashtra; Pune-Solapur Road, 45 kms from Pune citycenter
Transport and Connectivity: Located off a highway; bus station within 1km
Access to infrastructure: Water and electricity supply from GramPanchayat; Marathi medium school within 200 meters and English mediumschool 9-10 kms away; hospital being built on project site
Number of units: 660 Mix of housing:
– 1RK - 295 and 312 sq. ft. (Rs. 3.4 lakhs)– 1BHK – 415 sq. ft. (Rs. 5 lakhs)– 2BHK – 547 and 575 sq. ft. (Rs.7 lakhs to 7.75 lakhs)
Loading Factor: 43% Price per square feet (current): Rs. 1100 – Rs. 1325 Format of buildings: G + 3 (no lifts) Cost of cheapest apartment: Rs. 3.4 lakhs Consumer finance: Tie ups with DHFL, MHFC and Bank of Baroda Project status: 70% of units booked since project launch in January 2010.
Construction began February 2010, possession to be given by June 2011
1Trishul Builders– Shalini Lakeview
Location: Undri1, Pune, Maharashtra; 10 kms from Swargate (a major busstop in Pune), 10 kms from Pune railway station
Transport and Connectivity: Located on main road; bus stop within 500mts
Access to infrastructure: Within 3 kms of schools and hospitals Number of units: Over 1500 Mix of housing: 500 1RK flats of 400 sq. ft. (<33% of total) which are < Rs.
7 lakhs; multiple sizes available, others are over Rs. 7 lakhs Loading Factor: 25% Price per square feet (current): Rs.1650
– Rs. 1250/sq. ft. at launch Format of buildings: Parking + 14 floors Cost of cheapest apartment: Rs. 6.6 lakhs at current prices, was Rs. 5
lakhs at launch Consumer finance: Installment scheme provided by the developer – 20%
upfront payment and Rs. 5k-10k interest free monthly installment for 5-7years
Project status: All units booked since booking started October 2009,construction started in March 2010 and possession expected to be given byDecember 2011
Pune CityCenter
Undri
Map of Pune & Suburbs
Yavat
Population: 3.5 million (according to Census 2001)
– 2nd largest city in Maharashtra
Location and Connectivity
– 93 kms from Mumbai via Mumbai-Pune Expressway
– Well connected to other cities in India through road, rail and air
Economy
– Emerging as a prominent location for IT and manufacturing companies
– Presence of a large number of colleges and universities
– Well-established manufacturing, glass, sugar and forging industries since 1950-60s
– Prominent automotive center - General Motors, Volkswagen, and Fiat have set up greenfield facilitiesnear Pune
Pune Overview
1
2
2
11Copyright © 2010 Monitor Company Group, L.P.
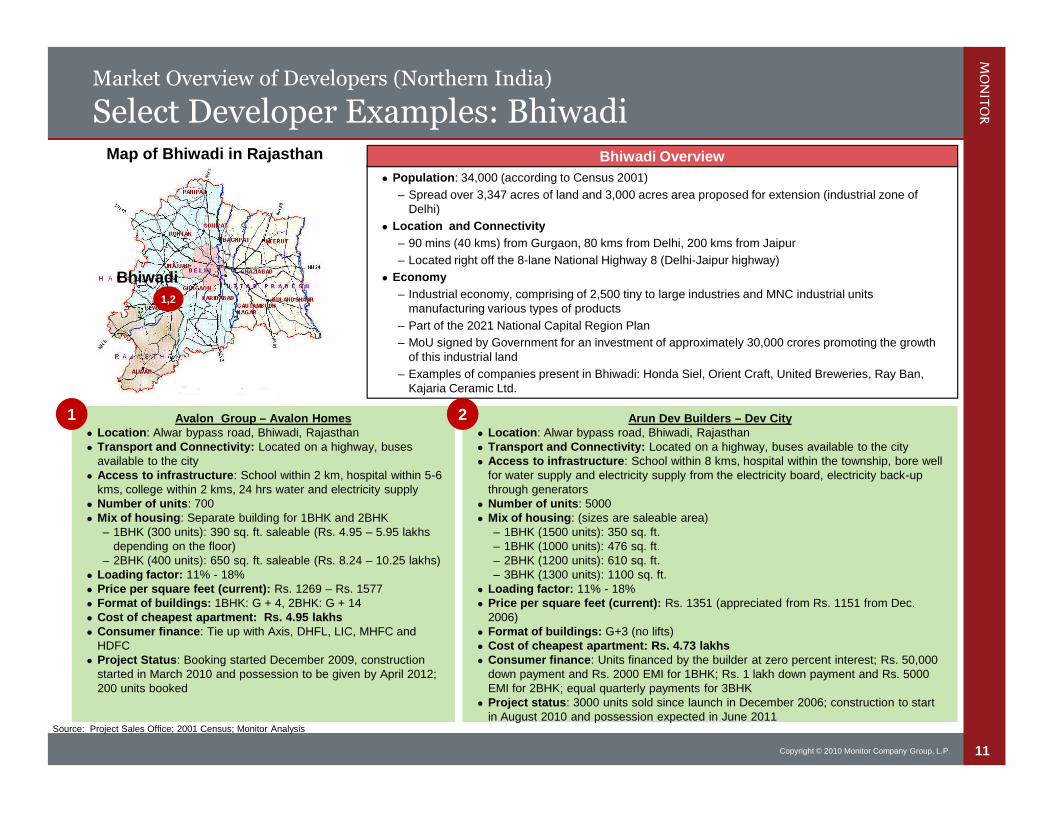
Arun Dev Builders – Dev City Location: Alwar bypass road, Bhiwadi, Rajasthan Transport and Connectivity: Located on a highway, buses available to the city Access to infrastructure: School within 8 kms, hospital within the township, bore well
for water supply and electricity supply from the electricity board, electricity back-upthrough generators
Number of units: 5000 Mix of housing: (sizes are saleable area)
– 1BHK (1500 units): 350 sq. ft.– 1BHK (1000 units): 476 sq. ft.– 2BHK (1200 units): 610 sq. ft.– 3BHK (1300 units): 1100 sq. ft.
Loading factor: 11% - 18% Price per square feet (current): Rs. 1351 (appreciated from Rs. 1151 from Dec.
2006) Format of buildings: G+3 (no lifts) Cost of cheapest apartment: Rs. 4.73 lakhs Consumer finance: Units financed by the builder at zero percent interest; Rs. 50,000
down payment and Rs. 2000 EMI for 1BHK; Rs. 1 lakh down payment and Rs. 5000EMI for 2BHK; equal quarterly payments for 3BHK
Project status: 3000 units sold since launch in December 2006; construction to startin August 2010 and possession expected in June 2011
Market Overview of Developers (Northern India)
Select Developer Examples: Bhiwadi
Source: Project Sales Office; 2001 Census; Monitor Analysis
Population: 34,000 (according to Census 2001)
– Spread over 3,347 acres of land and 3,000 acres area proposed for extension (industrial zone ofDelhi)
Location and Connectivity
– 90 mins (40 kms) from Gurgaon, 80 kms from Delhi, 200 kms from Jaipur
– Located right off the 8-lane National Highway 8 (Delhi-Jaipur highway)
Economy
– Industrial economy, comprising of 2,500 tiny to large industries and MNC industrial unitsmanufacturing various types of products
– Part of the 2021 National Capital Region Plan
– MoU signed by Government for an investment of approximately 30,000 crores promoting the growthof this industrial land
– Examples of companies present in Bhiwadi: Honda Siel, Orient Craft, United Breweries, Ray Ban,Kajaria Ceramic Ltd.
Bhiwadi OverviewMap of Bhiwadi in Rajasthan
Avalon Group – Avalon Homes Location: Alwar bypass road, Bhiwadi, Rajasthan Transport and Connectivity: Located on a highway, buses
available to the city Access to infrastructure: School within 2 km, hospital within 5-6
kms, college within 2 kms, 24 hrs water and electricity supply Number of units: 700 Mix of housing: Separate building for 1BHK and 2BHK
– 1BHK (300 units): 390 sq. ft. saleable (Rs. 4.95 – 5.95 lakhsdepending on the floor)
– 2BHK (400 units): 650 sq. ft. saleable (Rs. 8.24 – 10.25 lakhs) Loading factor: 11% - 18% Price per square feet (current): Rs. 1269 – Rs. 1577 Format of buildings: 1BHK: G + 4, 2BHK: G + 14 Cost of cheapest apartment: Rs. 4.95 lakhs Consumer finance: Tie up with Axis, DHFL, LIC, MHFC and
HDFC Project Status: Booking started December 2009, construction
started in March 2010 and possession to be given by April 2012;200 units booked
1
Bhiwadi
1,2
2
12Copyright © 2010 Monitor Company Group, L.P.
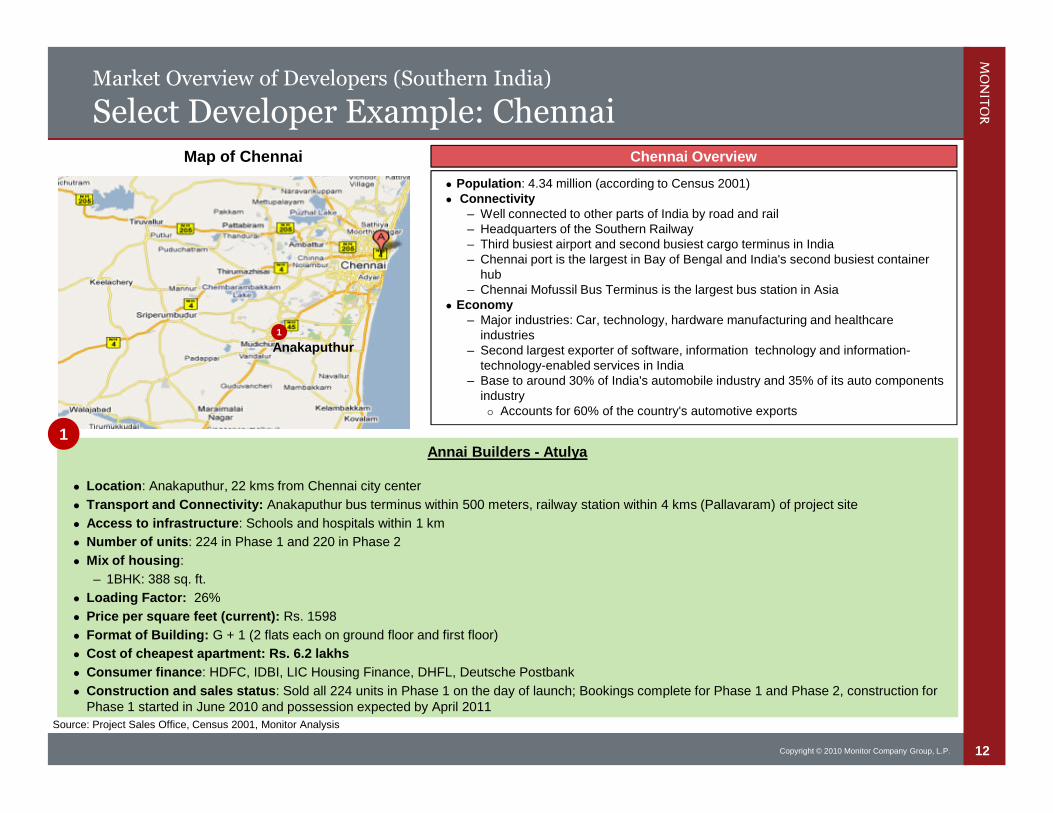
Market Overview of Developers (Southern India)
Select Developer Example: Chennai
Source: Project Sales Office, Census 2001, Monitor Analysis
Annai Builders - Atulya
Location: Anakaputhur, 22 kms from Chennai city center
Transport and Connectivity: Anakaputhur bus terminus within 500 meters, railway station within 4 kms (Pallavaram) of project site
Access to infrastructure: Schools and hospitals within 1 km
Number of units: 224 in Phase 1 and 220 in Phase 2
Mix of housing:
– 1BHK: 388 sq. ft.
Loading Factor: 26%
Price per square feet (current): Rs. 1598
Format of Building: G + 1 (2 flats each on ground floor and first floor)
Cost of cheapest apartment: Rs. 6.2 lakhs
Consumer finance: HDFC, IDBI, LIC Housing Finance, DHFL, Deutsche Postbank
Construction and sales status: Sold all 224 units in Phase 1 on the day of launch; Bookings complete for Phase 1 and Phase 2, construction forPhase 1 started in June 2010 and possession expected by April 2011
Map of Chennai
Delhi
Gurgaon
Bawal
Population: 4.34 million (according to Census 2001) Connectivity
– Well connected to other parts of India by road and rail– Headquarters of the Southern Railway– Third busiest airport and second busiest cargo terminus in India– Chennai port is the largest in Bay of Bengal and India's second busiest container
hub– Chennai Mofussil Bus Terminus is the largest bus station in Asia
Economy– Major industries: Car, technology, hardware manufacturing and healthcare
industries– Second largest exporter of software, information technology and information-
technology-enabled services in India– Base to around 30% of India's automobile industry and 35% of its auto components
industry Accounts for 60% of the country's automotive exports
Chennai Overview
1
1
1
Anakaputhur
13Copyright © 2010 Monitor Company Group, L.P.
Contents
Summary of Findings
Market Overview
– Housing Finance Companies serving Low Income Customers
LIH Developers: Operations, Commercial Viability and Marketability
Housing Finance Companies: Operations and Commercial Viability
Appendix
14Copyright © 2010 Monitor Company Group, L.P.
Market Overview of HFCs
State of the Market
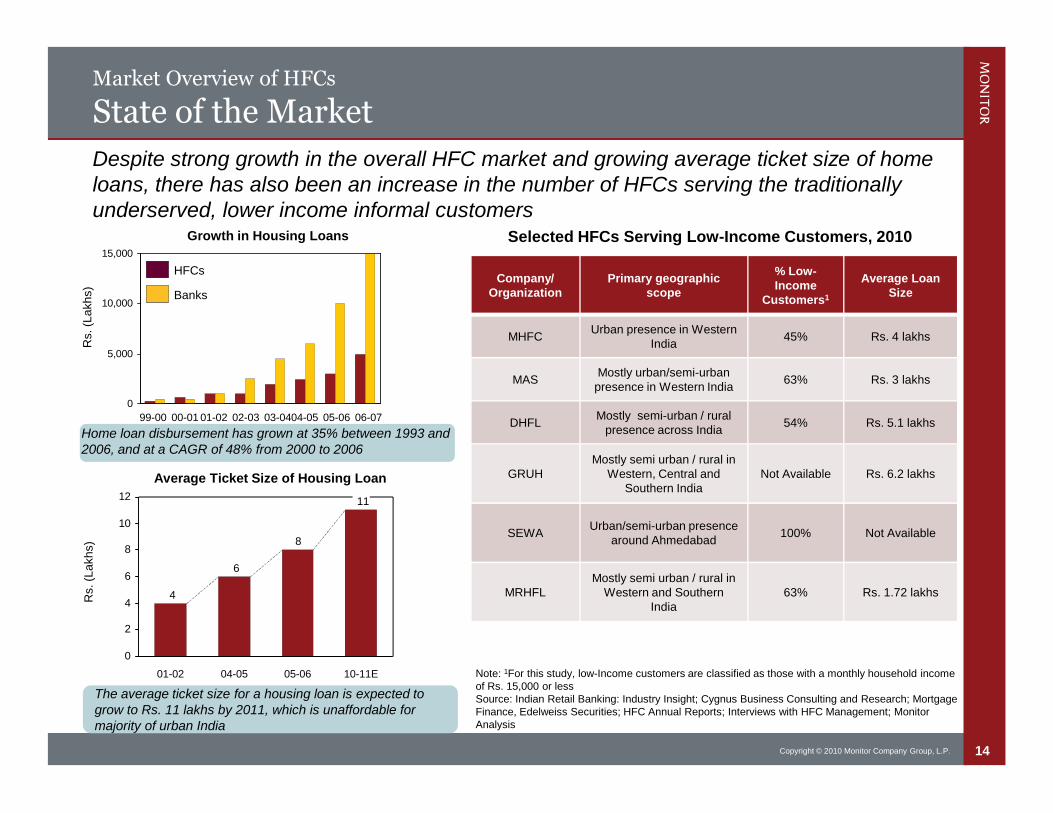
Despite strong growth in the overall HFC market and growing average ticket size of homeloans, there has also been an increase in the number of HFCs serving the traditionallyunderserved, lower income informal customers
Growth in Housing Loans
Rs.(L
akh
s)
06-0705-0604-0503-0402-0301-0200-0199-00
8
6
4
11
0
2
4
6
8
10
12
04-0501-02 10-11E05-06
Rs.(L
akh
s)
Average Ticket Size of Housing Loan
Note: 1For this study, low-Income customers are classified as those with a monthly household incomeof Rs. 15,000 or lessSource: Indian Retail Banking: Industry Insight; Cygnus Business Consulting and Research; MortgageFinance, Edelweiss Securities; HFC Annual Reports; Interviews with HFC Management; MonitorAnalysis
The average ticket size for a housing loan is expected togrow to Rs. 11 lakhs by 2011, which is unaffordable formajority of urban India
Company/Organization
Primary geographicscope
% Low-Income
Customers1
Average LoanSize
MHFCUrban presence in Western
India45% Rs. 4 lakhs
MASMostly urban/semi-urban
presence in Western India63% Rs. 3 lakhs
DHFLMostly semi-urban / rural
presence across India54% Rs. 5.1 lakhs
GRUHMostly semi urban / rural in
Western, Central andSouthern India
Not Available Rs. 6.2 lakhs
SEWAUrban/semi-urban presence
around Ahmedabad100% Not Available
MRHFLMostly semi urban / rural in
Western and SouthernIndia
63% Rs. 1.72 lakhs
Selected HFCs Serving Low-Income Customers, 2010
0
5,000
10,000
15,000
Banks
HFCs
Home loan disbursement has grown at 35% between 1993 and2006, and at a CAGR of 48% from 2000 to 2006
15Copyright © 2010 Monitor Company Group, L.P.
Market Overview of HFCs
Representative HFC Map
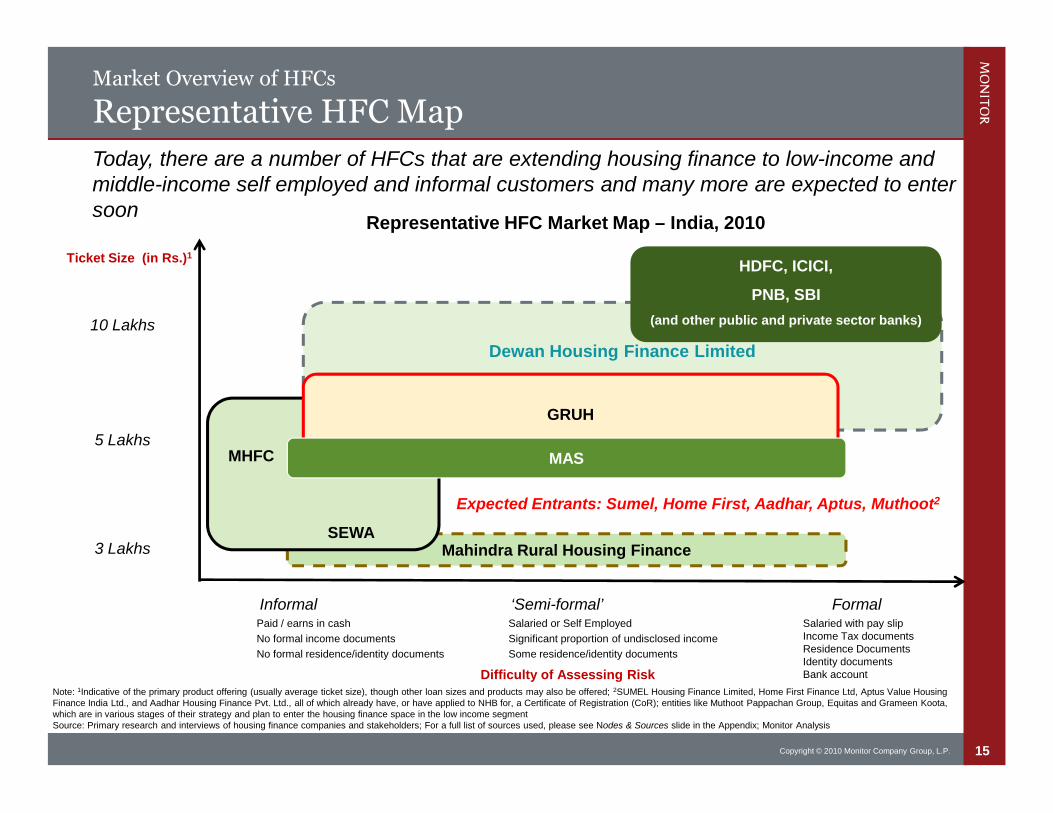
Note: 1Indicative of the primary product offering (usually average ticket size), though other loan sizes and products may also be offered; 2SUMEL Housing Finance Limited, Home First Finance Ltd, Aptus Value HousingFinance India Ltd., and Aadhar Housing Finance Pvt. Ltd., all of which already have, or have applied to NHB for, a Certificate of Registration (CoR); entities like Muthoot Pappachan Group, Equitas and Grameen Koota,which are in various stages of their strategy and plan to enter the housing finance space in the low income segmentSource: Primary research and interviews of housing finance companies and stakeholders; For a full list of sources used, please see Nodes & Sources slide in the Appendix; Monitor Analysis
Today, there are a number of HFCs that are extending housing finance to low-income andmiddle-income self employed and informal customers and many more are expected to entersoon
Mahindra Rural Housing Finance
Dewan Housing Finance Limited
Formal‘Semi-formal’InformalPaid / earns in cash
No formal income documents
No formal residence/identity documents
Salaried with pay slipIncome Tax documentsResidence DocumentsIdentity documentsBank account
Salaried or Self Employed
Significant proportion of undisclosed income
Some residence/identity documents
Difficulty of Assessing Risk
Ticket Size (in Rs.)1
10 Lakhs
5 Lakhs
3 Lakhs
GRUH
HDFC, ICICI,
PNB, SBI
(and other public and private sector banks)
MAS
Expected Entrants: Sumel, Home First, Aadhar, Aptus, Muthoot2
Representative HFC Market Map – India, 2010
MHFC
SEWA
16Copyright © 2010 Monitor Company Group, L.P.
Market Overview of HFCs
Select HFC Example: GRUH Finance Limited
Note: Data is for entire GRUH portfolio, not just for purchase of new homes; 1NCD: Non-Convertible DebentureSource: Interview with Sudhin Choksey (Managing Director of GRUH), GRUH Annual Report 2009-2010, ICRA credit rating, Monitor Analysis
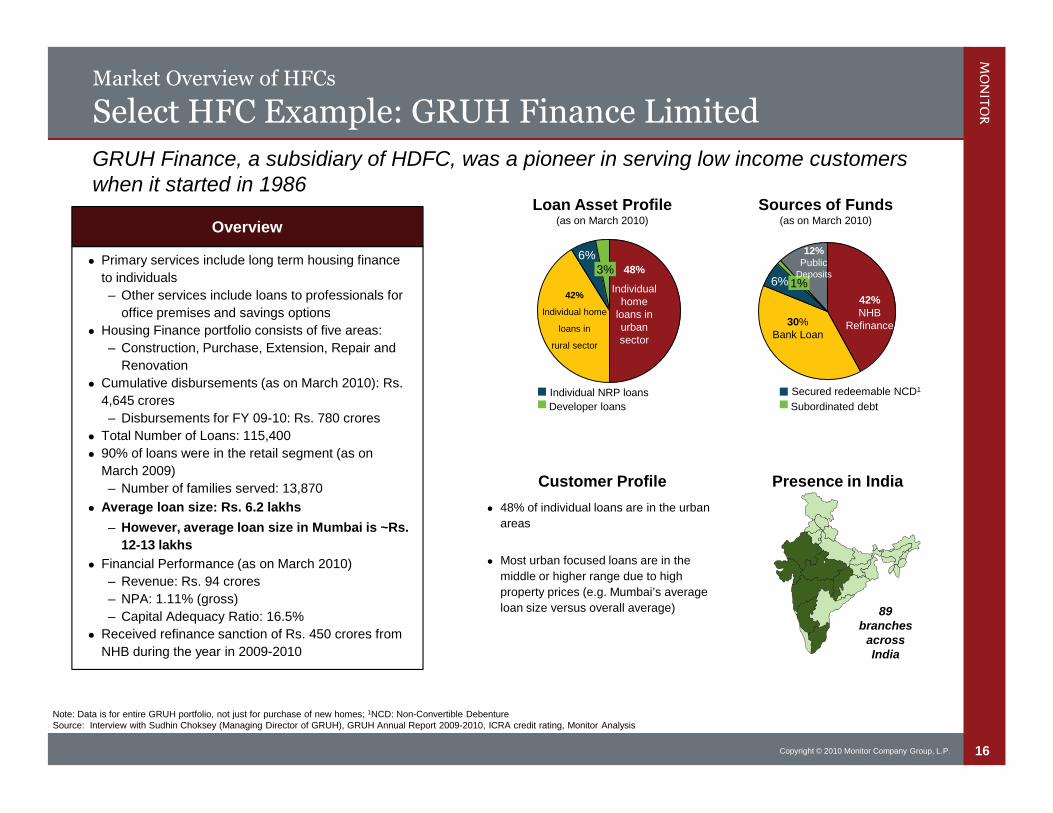
GRUH Finance, a subsidiary of HDFC, was a pioneer in serving low income customerswhen it started in 1986
Overview
Primary services include long term housing finance
to individuals
– Other services include loans to professionals for
office premises and savings options
Housing Finance portfolio consists of five areas:
– Construction, Purchase, Extension, Repair and
Renovation
Cumulative disbursements (as on March 2010): Rs.
4,645 crores
– Disbursements for FY 09-10: Rs. 780 crores
Total Number of Loans: 115,400
90% of loans were in the retail segment (as on
March 2009)
– Number of families served: 13,870
Average loan size: Rs. 6.2 lakhs
– However, average loan size in Mumbai is ~Rs.
12-13 lakhs
Financial Performance (as on March 2010)
– Revenue: Rs. 94 crores
– NPA: 1.11% (gross)
– Capital Adequacy Ratio: 16.5%
Received refinance sanction of Rs. 450 crores from
NHB during the year in 2009-2010
6%3%
Loan Asset Profile(as on March 2010)
Individual NRP loans
Developer loans
Presence in India
48% of individual loans are in the urban
areas
Most urban focused loans are in the
middle or higher range due to high
property prices (e.g. Mumbai’s average
loan size versus overall average)
Customer Profile
Sources of Funds(as on March 2010)
1%6%42%
Individual home
loans in
rural sector
48%
Individualhome
loans inurbansector
30%Bank Loan
42%NHB
Refinance
12%Public
Deposits
Secured redeemable NCD1
Subordinated debt
89branches
acrossIndia
17Copyright © 2010 Monitor Company Group, L.P.
Market Overview of HFCs
Select HFC Example: MHFC
Overview
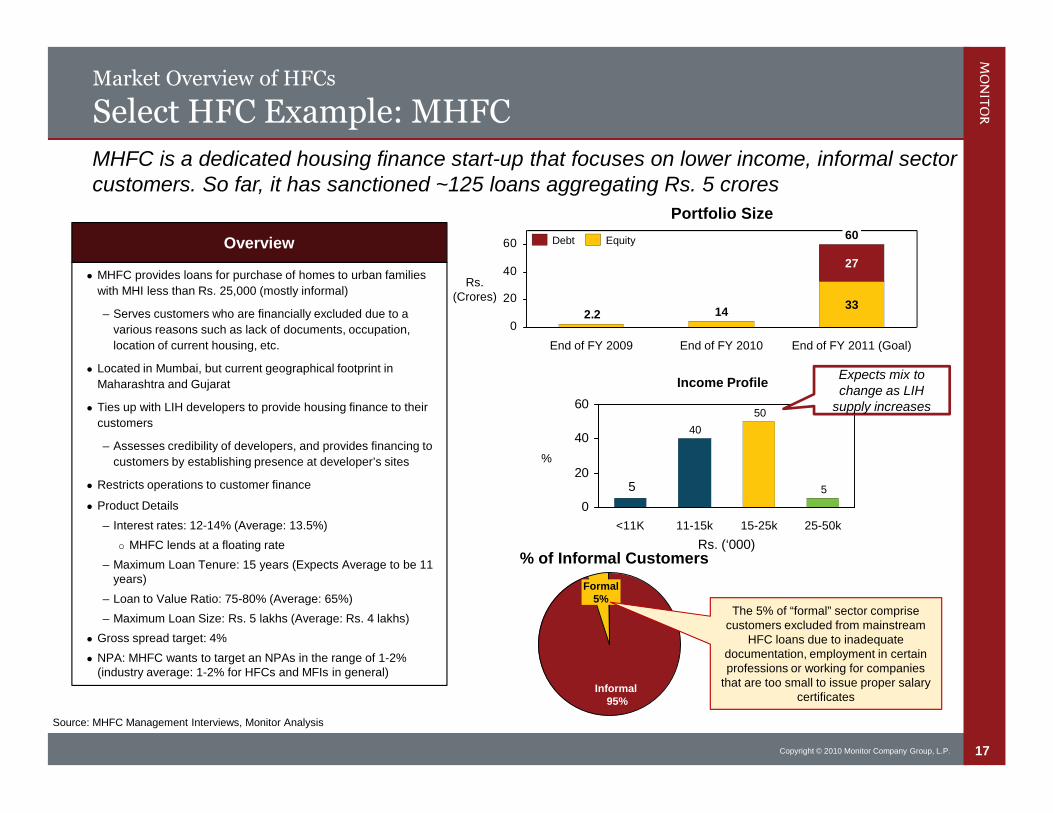
MHFC provides loans for purchase of homes to urban families
with MHI less than Rs. 25,000 (mostly informal)
– Serves customers who are financially excluded due to a
various reasons such as lack of documents, occupation,
location of current housing, etc.
Located in Mumbai, but current geographical footprint in
Maharashtra and Gujarat
Ties up with LIH developers to provide housing finance to their
customers
– Assesses credibility of developers, and provides financing to
customers by establishing presence at developer’s sites
Restricts operations to customer finance
Product Details
– Interest rates: 12-14% (Average: 13.5%)
MHFC lends at a floating rate
– Maximum Loan Tenure: 15 years (Expects Average to be 11years)
– Loan to Value Ratio: 75-80% (Average: 65%)
– Maximum Loan Size: Rs. 5 lakhs (Average: Rs. 4 lakhs)
Gross spread target: 4%
NPA: MHFC wants to target an NPAs in the range of 1-2%(industry average: 1-2% for HFCs and MFIs in general)
MHFC is a dedicated housing finance start-up that focuses on lower income, informal sectorcustomers. So far, it has sanctioned ~125 loans aggregating Rs. 5 crores
5
50
40
5
0
20
40
60
25-50k15-25k11-15k<11K
Income Profile
Rs. (‘000)
Informal95%
Formal5%
% of Informal Customers
The 5% of “formal” sector comprisecustomers excluded from mainstream
HFC loans due to inadequatedocumentation, employment in certainprofessions or working for companies
that are too small to issue proper salarycertificates
Source: MHFC Management Interviews, Monitor Analysis
Rs.(Crores)
2.20
20
40
60
End of FY 2011 (Goal)
60
33
27
End of FY 2010
14
End of FY 2009
EquityDebt
Portfolio Size
%
Expects mix tochange as LIH
supply increases
18Copyright © 2010 Monitor Company Group, L.P.
Contents
Summary of Findings
Market Overview
LIH Developers: Operations, Commercial Viability and Marketability
– Mumbai
– Ahmedabad
Housing Finance Companies: Operations and Commercial Viability
Appendix
19Copyright © 2010 Monitor Company Group, L.P.
Mumbai: Developers
Overview of Projects - Mumbai
Note: TMC, Matheran Realty’s project has not been included in the map above; 1All prices are in current prices
Source: Developer interviews; Project Sales Office; Indian Railways website; Monitor Analysis
Map of Mumbai(with Railway Map)
ChurchgateMumbai CST
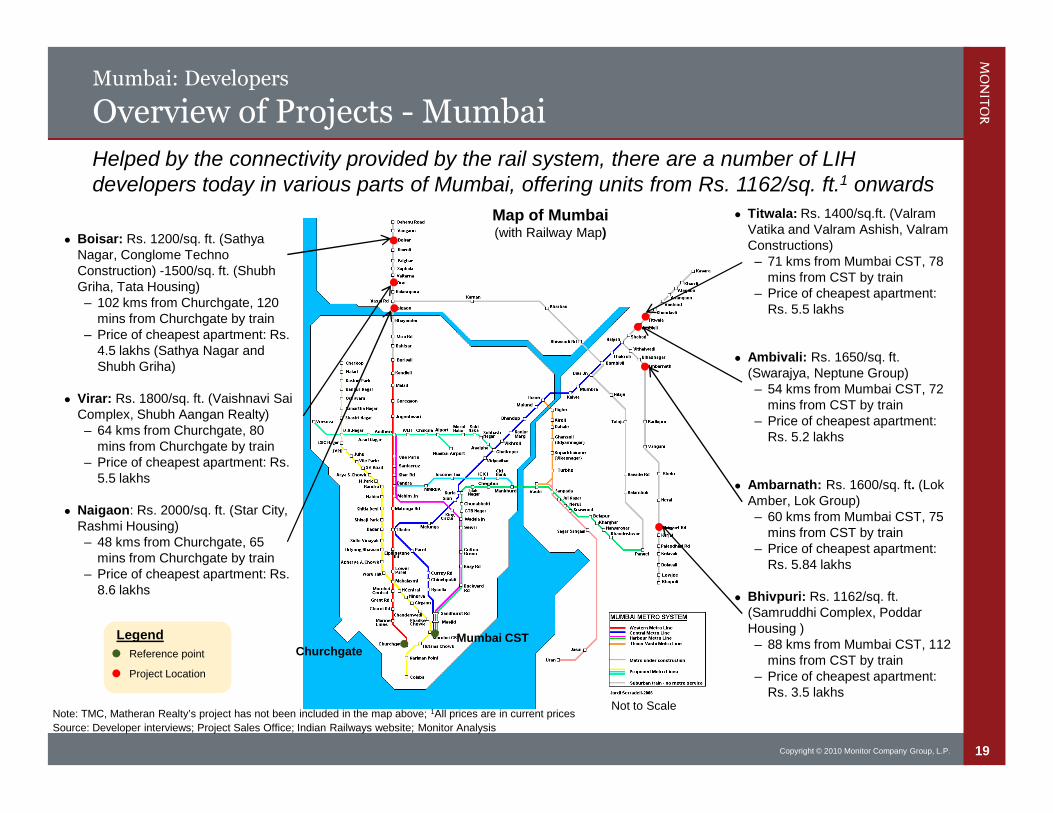
Boisar: Rs. 1200/sq. ft. (SathyaNagar, Conglome TechnoConstruction) -1500/sq. ft. (ShubhGriha, Tata Housing)– 102 kms from Churchgate, 120
mins from Churchgate by train– Price of cheapest apartment: Rs.
4.5 lakhs (Sathya Nagar andShubh Griha)
Virar: Rs. 1800/sq. ft. (Vaishnavi SaiComplex, Shubh Aangan Realty)– 64 kms from Churchgate, 80
mins from Churchgate by train– Price of cheapest apartment: Rs.
5.5 lakhs
Naigaon: Rs. 2000/sq. ft. (Star City,Rashmi Housing)– 48 kms from Churchgate, 65
mins from Churchgate by train– Price of cheapest apartment: Rs.
8.6 lakhs
Legend
Reference point
Project Location
Titwala: Rs. 1400/sq.ft. (ValramVatika and Valram Ashish, ValramConstructions)– 71 kms from Mumbai CST, 78
mins from CST by train– Price of cheapest apartment:
Rs. 5.5 lakhs
Ambivali: Rs. 1650/sq. ft.(Swarajya, Neptune Group)– 54 kms from Mumbai CST, 72
mins from CST by train– Price of cheapest apartment:
Rs. 5.2 lakhs
Ambarnath: Rs. 1600/sq. ft. (LokAmber, Lok Group)– 60 kms from Mumbai CST, 75
mins from CST by train– Price of cheapest apartment:
Rs. 5.84 lakhs
Bhivpuri: Rs. 1162/sq. ft.(Samruddhi Complex, PoddarHousing )– 88 kms from Mumbai CST, 112
mins from CST by train– Price of cheapest apartment:
Rs. 3.5 lakhs
Helped by the connectivity provided by the rail system, there are a number of LIHdevelopers today in various parts of Mumbai, offering units from Rs. 1162/sq. ft.1 onwards
Not to Scale
20Copyright © 2010 Monitor Company Group, L.P.
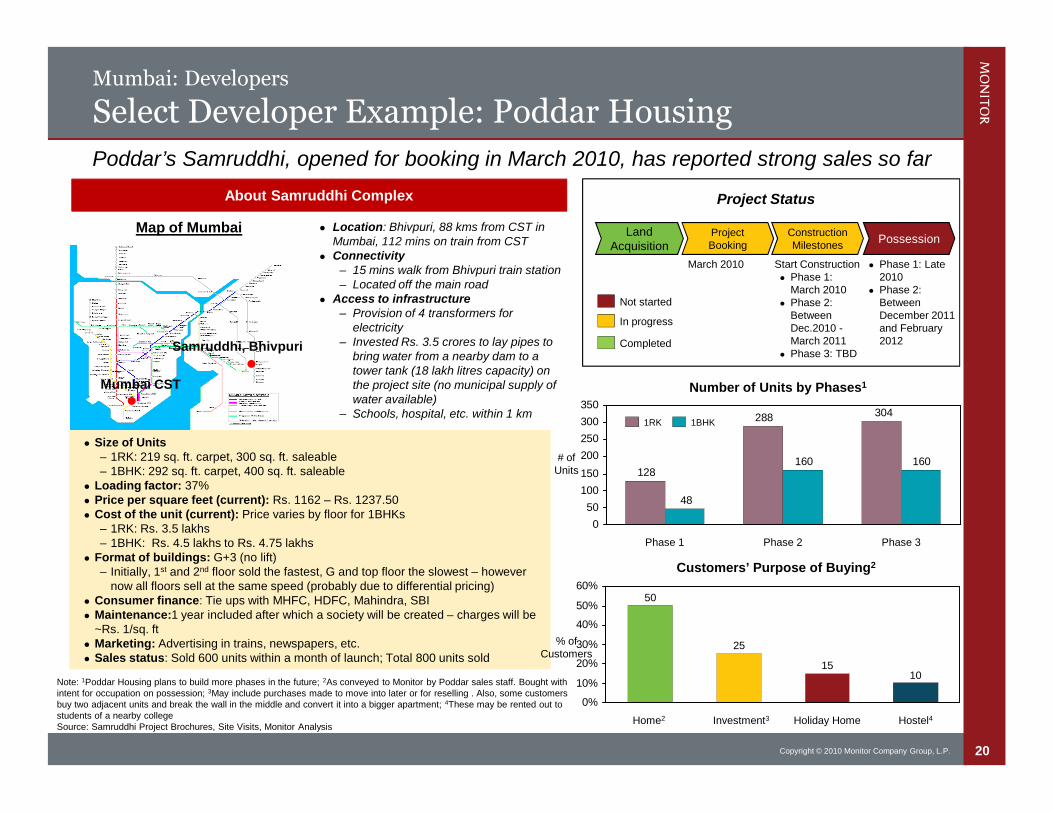
Size of Units– 1RK: 219 sq. ft. carpet, 300 sq. ft. saleable– 1BHK: 292 sq. ft. carpet, 400 sq. ft. saleable
Loading factor: 37% Price per square feet (current): Rs. 1162 – Rs. 1237.50 Cost of the unit (current): Price varies by floor for 1BHKs
– 1RK: Rs. 3.5 lakhs– 1BHK: Rs. 4.5 lakhs to Rs. 4.75 lakhs
Format of buildings: G+3 (no lift)– Initially, 1st and 2nd floor sold the fastest, G and top floor the slowest – however
now all floors sell at the same speed (probably due to differential pricing) Consumer finance: Tie ups with MHFC, HDFC, Mahindra, SBI Maintenance:1 year included after which a society will be created – charges will be
~Rs. 1/sq. ft Marketing: Advertising in trains, newspapers, etc. Sales status: Sold 600 units within a month of launch; Total 800 units sold
Poddar’s Samruddhi, opened for booking in March 2010, has reported strong sales so far
About Samruddhi Complex
0%
10%
20%
30%
40%
50%
60%
Hostel4
10
Holiday Home
15
Investment3
25
Home2
50
Customers’ Purpose of Buying2
304288
128160160
48
0
50
100
150
200
250
300
350
Phase 3Phase 2Phase 1
1BHK1RK
Number of Units by Phases1
LandAcquisition
ProjectBooking
ConstructionMilestones
Possession
Project Status
Phase 1: Late2010
Phase 2:BetweenDecember 2011and February2012
Start Construction Phase 1:
March 2010 Phase 2:
BetweenDec.2010 -March 2011
Phase 3: TBD
Note: 1Poddar Housing plans to build more phases in the future; 2As conveyed to Monitor by Poddar sales staff. Bought withintent for occupation on possession; 3May include purchases made to move into later or for reselling . Also, some customersbuy two adjacent units and break the wall in the middle and convert it into a bigger apartment; 4These may be rented out tostudents of a nearby collegeSource: Samruddhi Project Brochures, Site Visits, Monitor Analysis
Samruddhi, Bhivpuri
Map of Mumbai
Mumbai CST
Location: Bhivpuri, 88 kms from CST inMumbai, 112 mins on train from CST
Connectivity– 15 mins walk from Bhivpuri train station– Located off the main road
Access to infrastructure– Provision of 4 transformers for
electricity– Invested Rs. 3.5 crores to lay pipes to
bring water from a nearby dam to atower tank (18 lakh litres capacity) onthe project site (no municipal supply ofwater available)
– Schools, hospital, etc. within 1 km
Not started
In progress
Completed
Mumbai: Developers
Select Developer Example: Poddar Housing
March 2010
# ofUnits
% ofCustomers
21Copyright © 2010 Monitor Company Group, L.P.
Mumbai: Developers
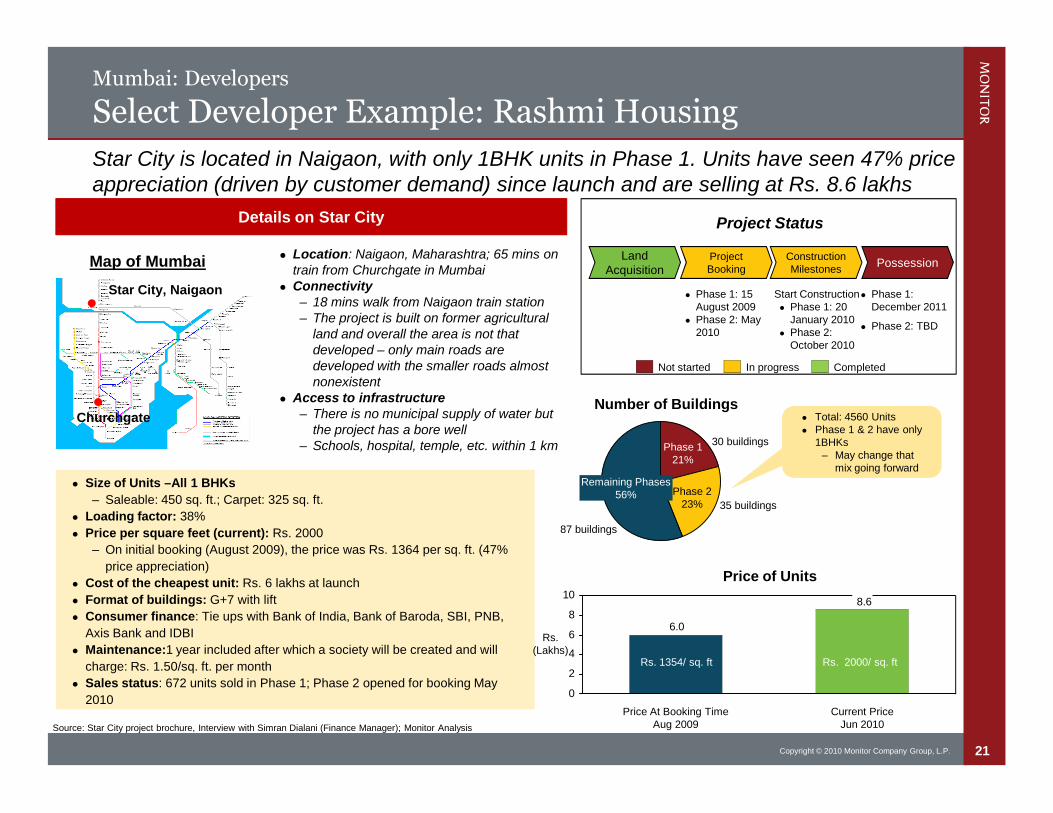
Select Developer Example: Rashmi Housing
Size of Units –All 1 BHKs
– Saleable: 450 sq. ft.; Carpet: 325 sq. ft.
Loading factor: 38%
Price per square feet (current): Rs. 2000
– On initial booking (August 2009), the price was Rs. 1364 per sq. ft. (47%
price appreciation)
Cost of the cheapest unit: Rs. 6 lakhs at launch
Format of buildings: G+7 with lift
Consumer finance: Tie ups with Bank of India, Bank of Baroda, SBI, PNB,
Axis Bank and IDBI
Maintenance:1 year included after which a society will be created and will
charge: Rs. 1.50/sq. ft. per month
Sales status: 672 units sold in Phase 1; Phase 2 opened for booking May
2010
Star City is located in Naigaon, with only 1BHK units in Phase 1. Units have seen 47% priceappreciation (driven by customer demand) since launch and are selling at Rs. 8.6 lakhs
Details on Star City
Price of Units
Number of Buildings
LandAcquisition
ProjectBooking
ConstructionMilestones
Possession
Project Status
Phase 1:December 2011
Phase 2: TBD
Start Construction Phase 1: 20
January 2010 Phase 2:
October 2010
Source: Star City project brochure, Interview with Simran Dialani (Finance Manager); Monitor Analysis
Phase 1: 15August 2009
Phase 2: May2010
Phase 223%
Phase 121%
Remaining Phases56%
30 buildings
87 buildings
8.6
6.0
0
2
4
6
8
10
Current PriceJun 2010
Price At Booking TimeAug 2009
Rs. 1354/ sq. ft Rs. 2000/ sq. ft
Not started In progress Completed
Map of Mumbai
Star City, Naigaon
Churchgate Total: 4560 Units Phase 1 & 2 have only
1BHKs– May change that
mix going forward
Location: Naigaon, Maharashtra; 65 mins ontrain from Churchgate in Mumbai
Connectivity– 18 mins walk from Naigaon train station– The project is built on former agricultural
land and overall the area is not thatdeveloped – only main roads aredeveloped with the smaller roads almostnonexistent
Access to infrastructure– There is no municipal supply of water but
the project has a bore well– Schools, hospital, temple, etc. within 1 km
35 buildings
Rs.(Lakhs)
22Copyright © 2010 Monitor Company Group, L.P.
Contents
Summary of Findings
Market Overview
LIH Developers: Operations, Commercial Viability and Marketability
– Mumbai
Neptune Group Case Study
Commercial Viability & Marketability
– Ahmedabad
Housing Finance Companies: Operations and Commercial Viability
Appendix
23Copyright © 2010 Monitor Company Group, L.P.
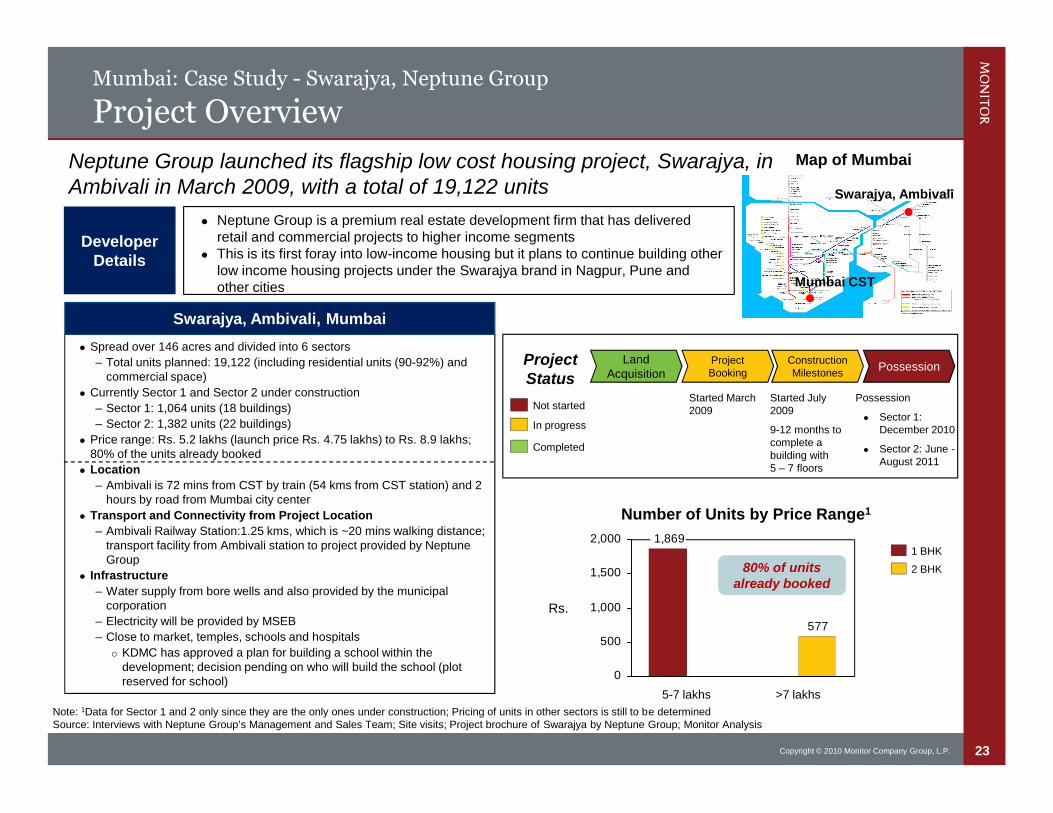
Spread over 146 acres and divided into 6 sectors
– Total units planned: 19,122 (including residential units (90-92%) andcommercial space)
Currently Sector 1 and Sector 2 under construction
– Sector 1: 1,064 units (18 buildings)
– Sector 2: 1,382 units (22 buildings)
Price range: Rs. 5.2 lakhs (launch price Rs. 4.75 lakhs) to Rs. 8.9 lakhs;80% of the units already booked
Location
– Ambivali is 72 mins from CST by train (54 kms from CST station) and 2hours by road from Mumbai city center
Transport and Connectivity from Project Location
– Ambivali Railway Station:1.25 kms, which is ~20 mins walking distance;transport facility from Ambivali station to project provided by NeptuneGroup
Infrastructure
– Water supply from bore wells and also provided by the municipalcorporation
– Electricity will be provided by MSEB
– Close to market, temples, schools and hospitals
KDMC has approved a plan for building a school within thedevelopment; decision pending on who will build the school (plotreserved for school)
Mumbai: Case Study - Swarajya, Neptune Group
Project Overview
Neptune Group launched its flagship low cost housing project, Swarajya, inAmbivali in March 2009, with a total of 19,122 units
Neptune Group is a premium real estate development firm that has deliveredretail and commercial projects to higher income segments
This is its first foray into low-income housing but it plans to continue building otherlow income housing projects under the Swarajya brand in Nagpur, Pune andother cities
DeveloperDetails
Swarajya, Ambivali
1,869
577
0
500
1,000
1,500
2,000
>7 lakhs5-7 lakhs
Number of Units by Price Range1
Map of Mumbai
LandAcquisition
ProjectBooking
ConstructionMilestones
PossessionProjectStatus
Not started
In progress
Completed
Possession
Sector 1:December 2010
Sector 2: June -August 2011
Note: 1Data for Sector 1 and 2 only since they are the only ones under construction; Pricing of units in other sectors is still to be determinedSource: Interviews with Neptune Group’s Management and Sales Team; Site visits; Project brochure of Swarajya by Neptune Group; Monitor Analysis
Started March2009
Started July2009
9-12 months tocomplete abuilding with5 – 7 floors
2 BHK
1 BHK
Swarajya, Ambivali, Mumbai
Mumbai CST
80% of unitsalready booked
Rs.
24Copyright © 2010 Monitor Company Group, L.P.
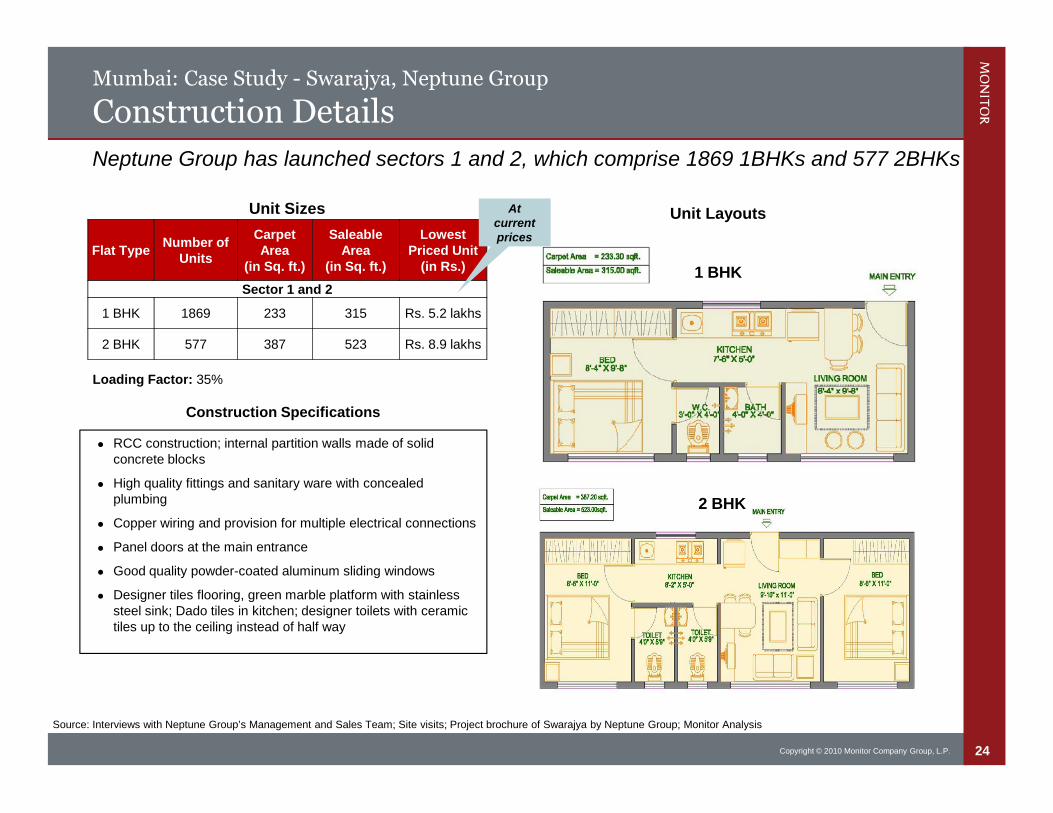
Mumbai: Case Study - Swarajya, Neptune Group
Construction Details
Flat TypeNumber of
Units
CarpetArea
(in Sq. ft.)
SaleableArea
(in Sq. ft.)
LowestPriced Unit
(in Rs.)
Sector 1 and 2
1 BHK 1869 233 315 Rs. 5.2 lakhs
2 BHK 577 387 523 Rs. 8.9 lakhs
Unit Sizes
1 BHK
Construction Specifications
RCC construction; internal partition walls made of solidconcrete blocks
High quality fittings and sanitary ware with concealedplumbing
Copper wiring and provision for multiple electrical connections
Panel doors at the main entrance
Good quality powder-coated aluminum sliding windows
Designer tiles flooring, green marble platform with stainlesssteel sink; Dado tiles in kitchen; designer toilets with ceramictiles up to the ceiling instead of half way
Source: Interviews with Neptune Group’s Management and Sales Team; Site visits; Project brochure of Swarajya by Neptune Group; Monitor Analysis
Neptune Group has launched sectors 1 and 2, which comprise 1869 1BHKs and 577 2BHKs
Unit Layouts
2 BHK
Atcurrentprices
Loading Factor: 35%
25Copyright © 2010 Monitor Company Group, L.P.
Mumbai: Case Study - Swarajya, Neptune Group
Typical Floor Plan and Site Layout
Source: Project brochure of Swarajya by Neptune Group; Monitor Analysis
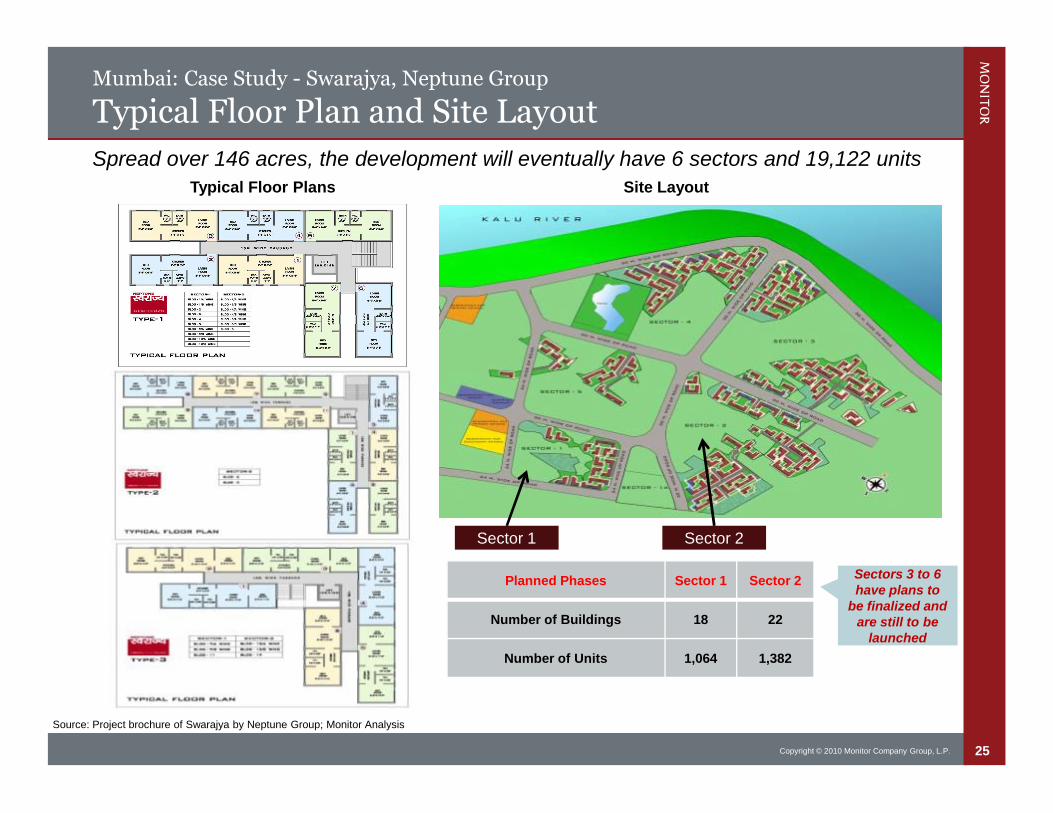
Spread over 146 acres, the development will eventually have 6 sectors and 19,122 units
Typical Floor Plans Site Layout
Planned Phases Sector 1 Sector 2
Number of Buildings 18 22
Number of Units 1,064 1,382
Sector 1 Sector 2
Sectors 3 to 6have plans to
be finalized andare still to be
launched
26Copyright © 2010 Monitor Company Group, L.P.
Mumbai: Case Study - Swarajya, Neptune Group
Pricing & Format Details
Price of Units by Floor(Current Prices)
1,7601,6901,8101,740
0
500
1,000
1,500
2,000
2 BHK1 BHK
3rd to 7th floor
Ground to 2nd floor
Pricing Details
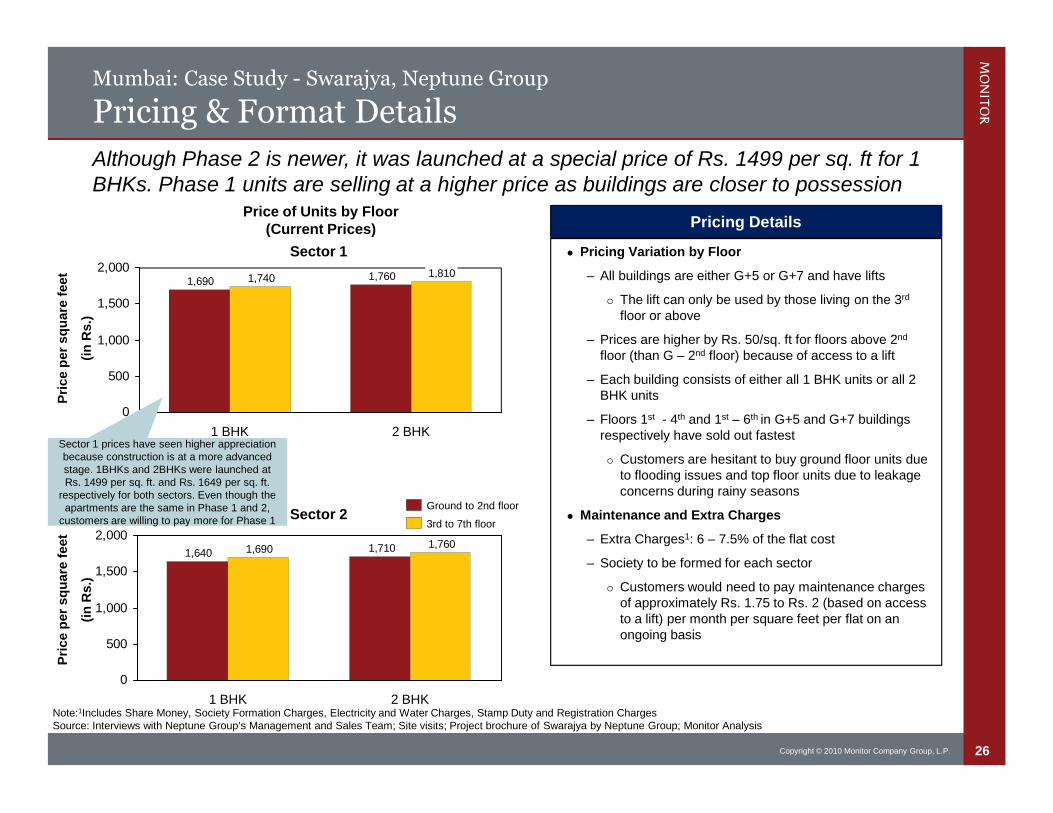
Pricing Variation by Floor
– All buildings are either G+5 or G+7 and have lifts
The lift can only be used by those living on the 3rd
floor or above
– Prices are higher by Rs. 50/sq. ft for floors above 2nd
floor (than G – 2nd floor) because of access to a lift
– Each building consists of either all 1 BHK units or all 2BHK units
– Floors 1st - 4th and 1st – 6th in G+5 and G+7 buildingsrespectively have sold out fastest
Customers are hesitant to buy ground floor units dueto flooding issues and top floor units due to leakageconcerns during rainy seasons
Maintenance and Extra Charges
– Extra Charges1: 6 – 7.5% of the flat cost
– Society to be formed for each sector
Customers would need to pay maintenance chargesof approximately Rs. 1.75 to Rs. 2 (based on accessto a lift) per month per square feet per flat on anongoing basis
Pri
ce
per
sq
uare
feet
(in
Rs.)
Note:1Includes Share Money, Society Formation Charges, Electricity and Water Charges, Stamp Duty and Registration ChargesSource: Interviews with Neptune Group’s Management and Sales Team; Site visits; Project brochure of Swarajya by Neptune Group; Monitor Analysis
Sector 1
1,7101,6401,7601,690
0
500
1,000
1,500
2,000
2 BHK1 BHK
Pri
ce
per
sq
uare
feet
(in
Rs.)
Sector 2
Although Phase 2 is newer, it was launched at a special price of Rs. 1499 per sq. ft for 1BHKs. Phase 1 units are selling at a higher price as buildings are closer to possession
Sector 1 prices have seen higher appreciationbecause construction is at a more advancedstage. 1BHKs and 2BHKs were launched atRs. 1499 per sq. ft. and Rs. 1649 per sq. ft.
respectively for both sectors. Even though theapartments are the same in Phase 1 and 2,
customers are willing to pay more for Phase 1
27Copyright © 2010 Monitor Company Group, L.P.
Mumbai: Case Study - Swarajya, Neptune Group
Customer Finance
Note: 1Rates as communicated to the MIM team by Sales Team; 2Includes Share Money, Society Formation Charges, Electricity and Water Charges, Stamp Duty and Registration Charges.Additional costs are paid upfront along with the down payment and hence are not included in the loan amount or EMIsSource: Brochures and handouts for the project, Interviews with Neptune Group’s Management and Sales Team; Monitor Analysis
Availability andaccess to consumer
finance (List ofpreapproved banks)
Some capacity to serve informalsector customers
Largely formalsector customers
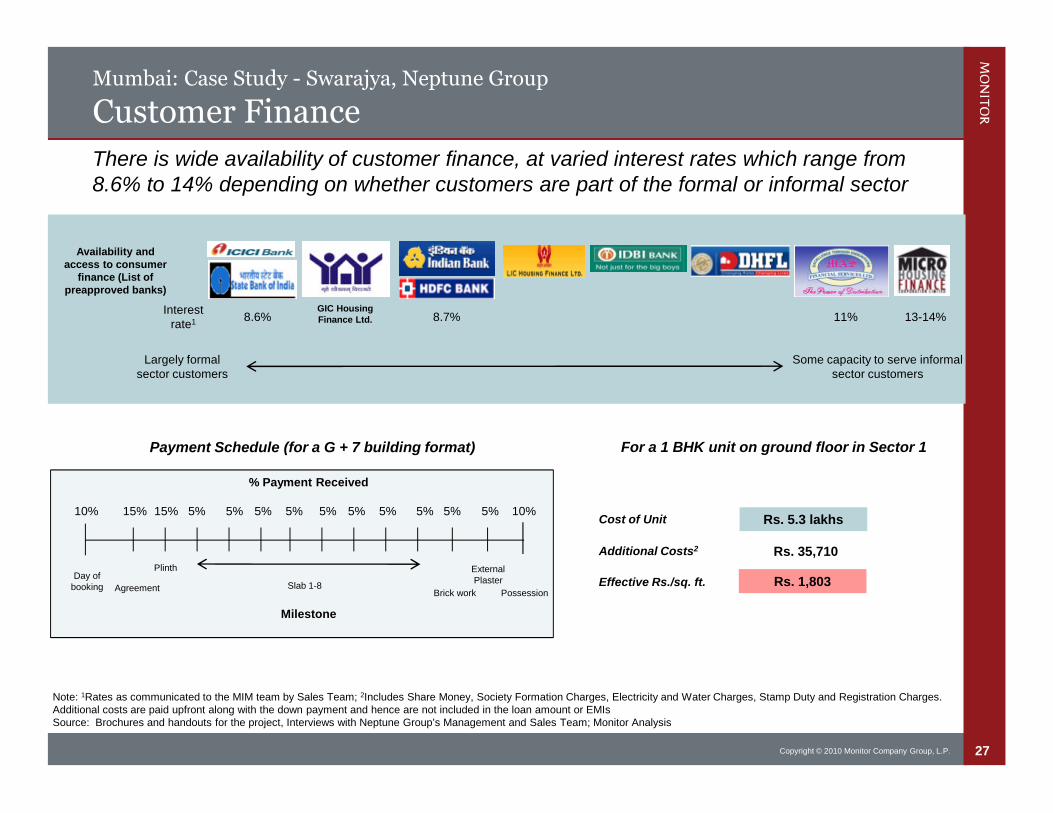
There is wide availability of customer finance, at varied interest rates which range from8.6% to 14% depending on whether customers are part of the formal or informal sector
13-14%11%8.7%8.6%
Payment Schedule (for a G + 7 building format)
% Payment Received
10%
Day ofbooking
15% 15% 5% 5% 5% 5% 5% 5% 5% 5% 5%
Agreement
Plinth
Slab 1-8Brick work
ExternalPlaster
Possession
Milestone
5% 10%
Interestrate1
For a 1 BHK unit on ground floor in Sector 1
Rs. 5.3 lakhsCost of Unit
Additional Costs2 Rs. 35,710
Effective Rs./sq. ft. Rs. 1,803
GIC HousingFinance Ltd.
28Copyright © 2010 Monitor Company Group, L.P.
Mumbai: Case Study - Swarajya, Neptune Group
Marketing and Sales
Marketing Channels
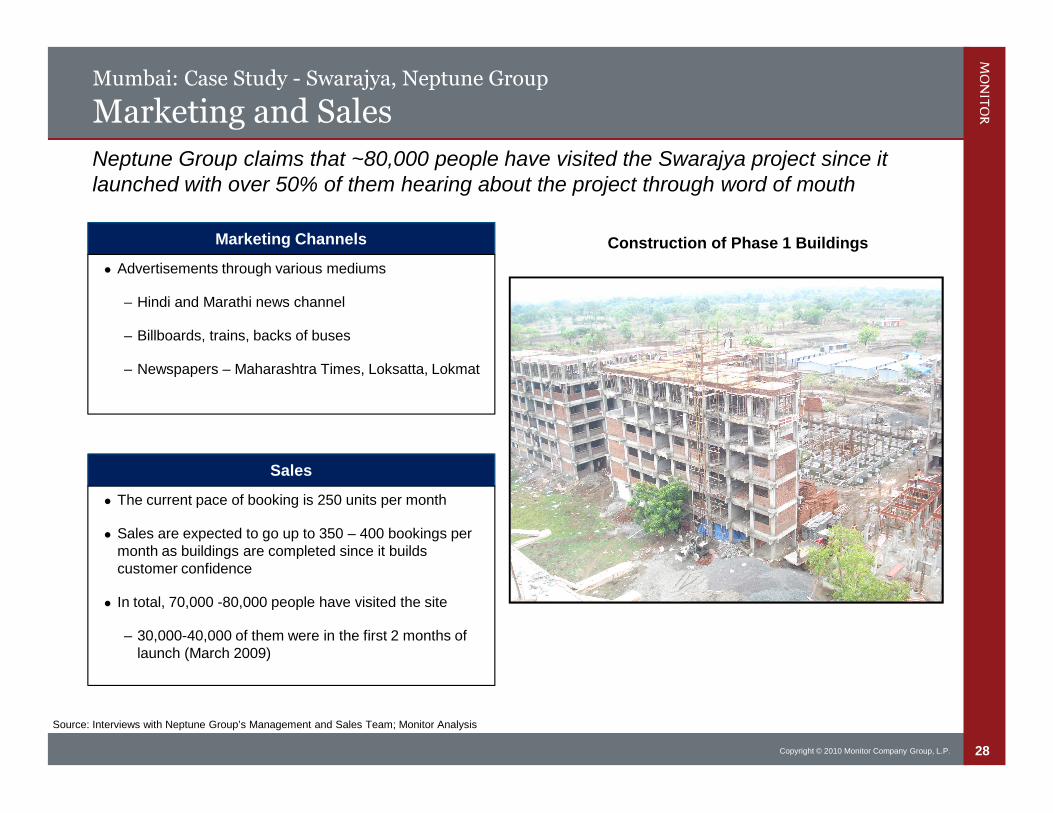
Advertisements through various mediums
– Hindi and Marathi news channel
– Billboards, trains, backs of buses
– Newspapers – Maharashtra Times, Loksatta, Lokmat
Sales
The current pace of booking is 250 units per month
Sales are expected to go up to 350 – 400 bookings permonth as buildings are completed since it buildscustomer confidence
In total, 70,000 -80,000 people have visited the site
– 30,000-40,000 of them were in the first 2 months oflaunch (March 2009)
Source: Interviews with Neptune Group’s Management and Sales Team; Monitor Analysis
Neptune Group claims that ~80,000 people have visited the Swarajya project since itlaunched with over 50% of them hearing about the project through word of mouth
Construction of Phase 1 Buildings
29Copyright © 2010 Monitor Company Group, L.P.
Mumbai: Case Study - Swarajya, Neptune Group
Customer Profile
Note: 1MIDC = Maharashtra Industrial Development Corporation; 2BMC = Brihanmumbai Municipal Corporation; 3Self Employed includes owners of hotels, shops, transport, etc. 4Otherincludes owners of businesses (6%), Labors/workers used for loading & unloading from truck, ship, etc. (4%), Civil Supervisors & Engineers (2%), Auto & Taxi Drivers (2%) and MTNL & BSNLworkers (2%)Source: Interviews with Neptune Group’s Management and Sales Team; Monitor Analysis
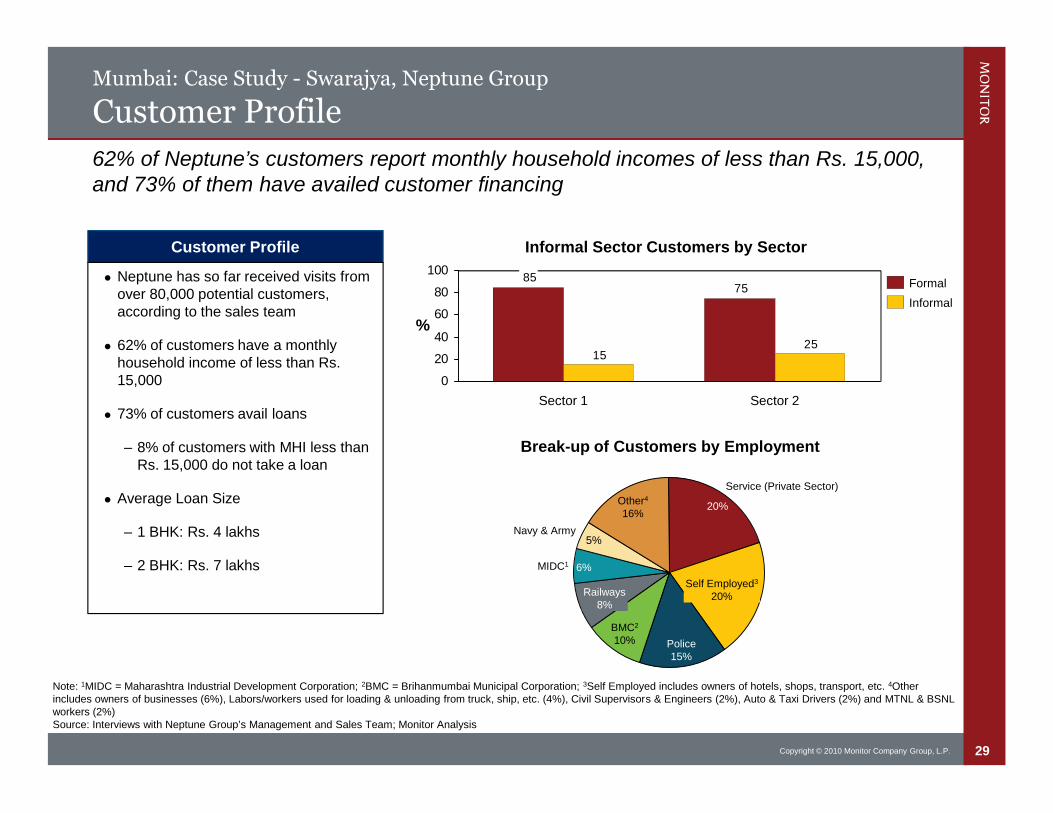
62% of Neptune’s customers report monthly household incomes of less than Rs. 15,000,and 73% of them have availed customer financing
Informal Sector Customers by Sector
7585
2515
0
20
40
60
80
100
Sector 2Sector 1
Informal
Formal
%
Customer Profile
Neptune has so far received visits fromover 80,000 potential customers,according to the sales team
62% of customers have a monthlyhousehold income of less than Rs.15,000
73% of customers avail loans
– 8% of customers with MHI less thanRs. 15,000 do not take a loan
Average Loan Size
– 1 BHK: Rs. 4 lakhs
– 2 BHK: Rs. 7 lakhs
5%Navy & Army
MIDC1 6%
Railways8%
BMC2
10% Police15%
Self Employed3
20%
Service (Private Sector)
20%Other4
16%
Break-up of Customers by Employment
30Copyright © 2010 Monitor Company Group, L.P.
Contents
Summary of Findings
Market Overview
LIH Developers: Operations, Commercial Viability and Marketability
– Mumbai
Neptune Group Case Study
Commercial Viability & Marketability
– Ahmedabad
Housing Finance Companies: Operations and Commercial Viability
Appendix

31Copyright © 2010 Monitor Company Group, L.P.
Mumbai: Commercial Viability & Marketability
Objectives and Approach
Objective
Our Approach
To assess the marketability and commercial viability of low-income housing projects from a developer’spoint of view for two selected and representative geographies
– Mumbai, Maharashtra
– Ahmedabad, Gujarat
For an effective, accurate and reliable set of results, we included in our analysis:
– Data and assumptions driven by field-based experiences of both short-listed developers(showcased in the case studies) as well as long-list developers
– Triangulated findings with expert advisors
32Copyright © 2010 Monitor Company Group, L.P.
Mumbai LIH Project: Commercial Viability & Marketability Representation
Assumptions & Inputs
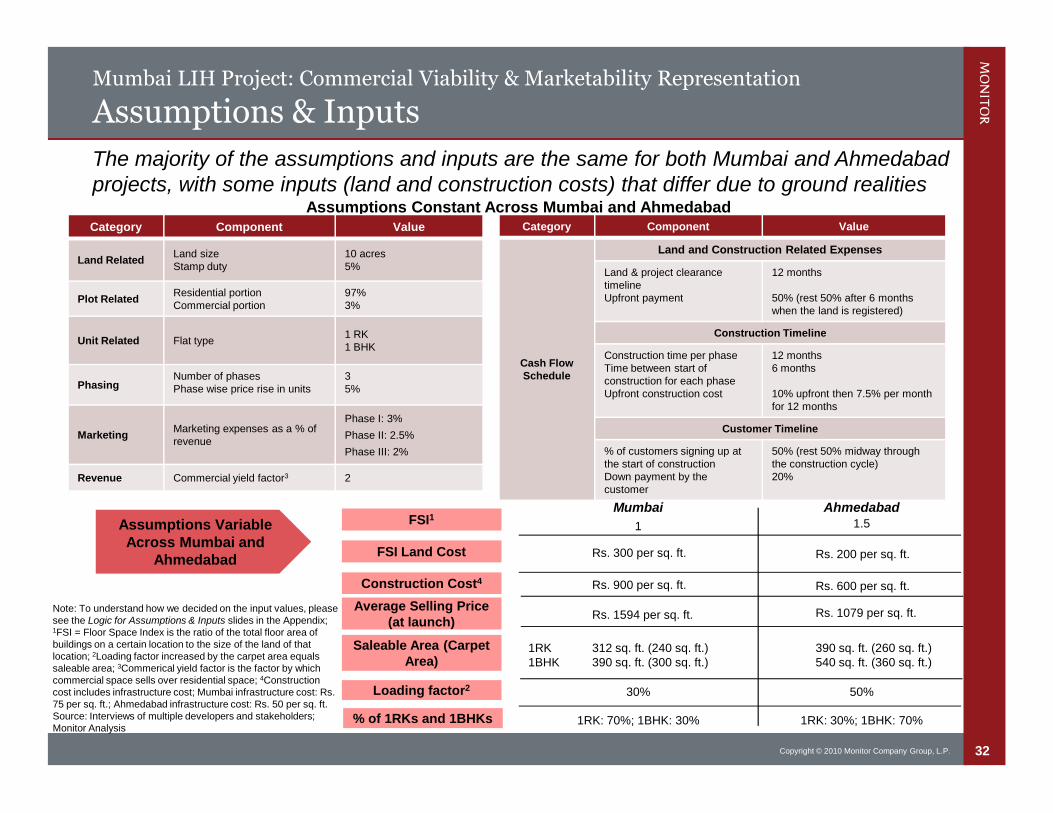
Note: To understand how we decided on the input values, pleasesee the Logic for Assumptions & Inputs slides in the Appendix;1FSI = Floor Space Index is the ratio of the total floor area ofbuildings on a certain location to the size of the land of thatlocation; 2Loading factor increased by the carpet area equalssaleable area; 3Commerical yield factor is the factor by whichcommercial space sells over residential space; 4Constructioncost includes infrastructure cost; Mumbai infrastructure cost: Rs.75 per sq. ft.; Ahmedabad infrastructure cost: Rs. 50 per sq. ft.Source: Interviews of multiple developers and stakeholders;Monitor Analysis
Assumptions Constant Across Mumbai and AhmedabadCategory Component Value
Land RelatedLand sizeStamp duty
10 acres5%
Plot RelatedResidential portionCommercial portion
97%3%
Unit Related Flat type1 RK1 BHK
PhasingNumber of phasesPhase wise price rise in units
35%
MarketingMarketing expenses as a % ofrevenue
Phase I: 3%
Phase II: 2.5%
Phase III: 2%
Revenue Commercial yield factor3 2
Category Component Value
Cash FlowSchedule
Land and Construction Related Expenses
Land & project clearancetimelineUpfront payment
12 months
50% (rest 50% after 6 monthswhen the land is registered)
Construction Timeline
Construction time per phaseTime between start ofconstruction for each phaseUpfront construction cost
12 months6 months
10% upfront then 7.5% per monthfor 12 months
Customer Timeline
% of customers signing up atthe start of constructionDown payment by thecustomer
50% (rest 50% midway throughthe construction cycle)20%
FSI Land Cost
Construction Cost4
Average Selling Price(at launch)
Mumbai Ahmedabad
Rs. 300 per sq. ft.
Rs. 900 per sq. ft.
Rs. 200 per sq. ft.
Rs. 600 per sq. ft.
Assumptions VariableAcross Mumbai and
Ahmedabad
The majority of the assumptions and inputs are the same for both Mumbai and Ahmedabadprojects, with some inputs (land and construction costs) that differ due to ground realities
Saleable Area (CarpetArea)
312 sq. ft. (240 sq. ft.)390 sq. ft. (300 sq. ft.)
390 sq. ft. (260 sq. ft.)540 sq. ft. (360 sq. ft.)
1RK1BHK
Rs. 1594 per sq. ft. Rs. 1079 per sq. ft.
FSI1 1 1.5
Loading factor2 50%30%
% of 1RKs and 1BHKs 1RK: 30%; 1BHK: 70%1RK: 70%; 1BHK: 30%
33Copyright © 2010 Monitor Company Group, L.P.
Mumbai LIH Project: Commercial Viability & Marketability Representation
Output & Results
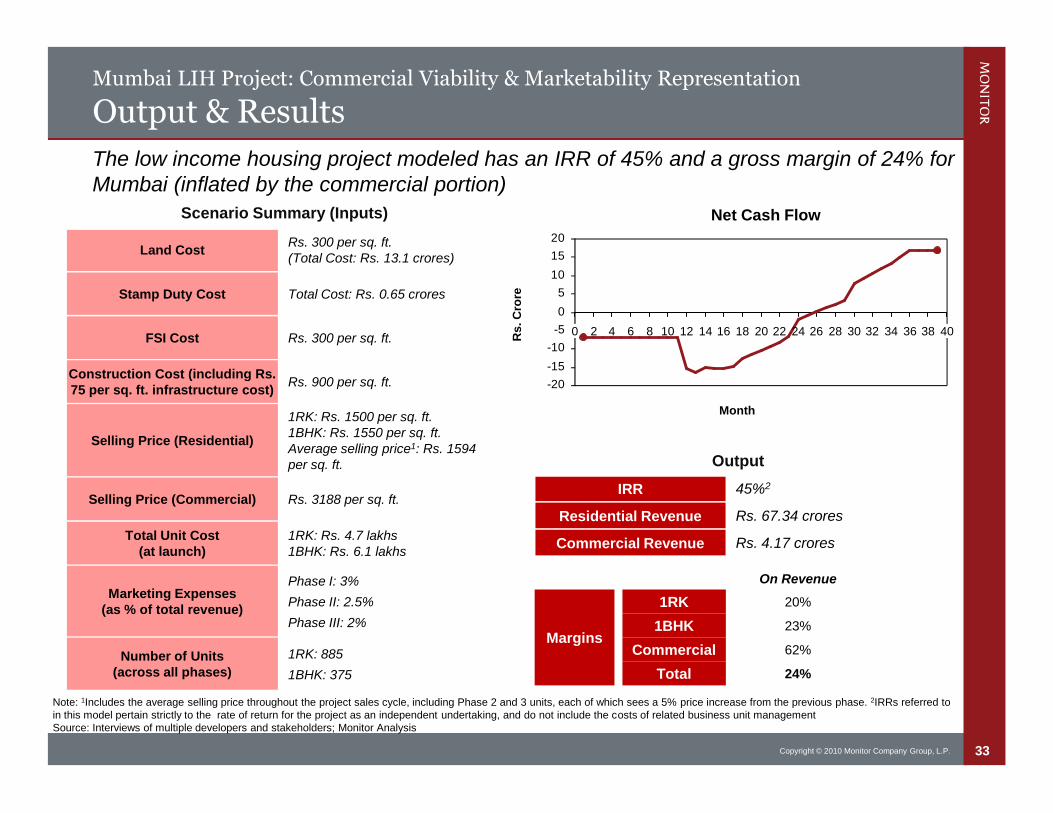
Note: 1Includes the average selling price throughout the project sales cycle, including Phase 2 and 3 units, each of which sees a 5% price increase from the previous phase. 2IRRs referred toin this model pertain strictly to the rate of return for the project as an independent undertaking, and do not include the costs of related business unit managementSource: Interviews of multiple developers and stakeholders; Monitor Analysis
The low income housing project modeled has an IRR of 45% and a gross margin of 24% forMumbai (inflated by the commercial portion)
Scenario Summary (Inputs)
Land CostRs. 300 per sq. ft.(Total Cost: Rs. 13.1 crores)
Stamp Duty Cost Total Cost: Rs. 0.65 crores
FSI Cost Rs. 300 per sq. ft.
Construction Cost (including Rs.75 per sq. ft. infrastructure cost)
Rs. 900 per sq. ft.
Selling Price (Residential)
1RK: Rs. 1500 per sq. ft.1BHK: Rs. 1550 per sq. ft.Average selling price1: Rs. 1594per sq. ft.
Selling Price (Commercial) Rs. 3188 per sq. ft.
Total Unit Cost(at launch)
1RK: Rs. 4.7 lakhs1BHK: Rs. 6.1 lakhs
Marketing Expenses(as % of total revenue)
Phase I: 3%
Phase II: 2.5%
Phase III: 2%
Number of Units(across all phases)
1RK: 885
1BHK: 375
Net Cash Flow
Output
IRR 45%2
Residential Revenue Rs. 67.34 crores
Commercial Revenue Rs. 4.17 crores
On Revenue
1RK
1BHK
Commercial
Total
20%
23%
62%
24%
Margins
Month
Rs
.C
rore
-20
-15
-10
-5
0
5
10
15
20
2010 30 404 60 2 8 12 14 16 18 22 24 26 28 32 34 36 38
34Copyright © 2010 Monitor Company Group, L.P.
Mumbai: Commercial Viability & Marketability
Marketability Examples
Note: 1Nayan Shah is the Head of Finance, BD and Investor Relationship Manager at Neptune GroupSource: Management Interviews, Site Visits, Monitor Analysis
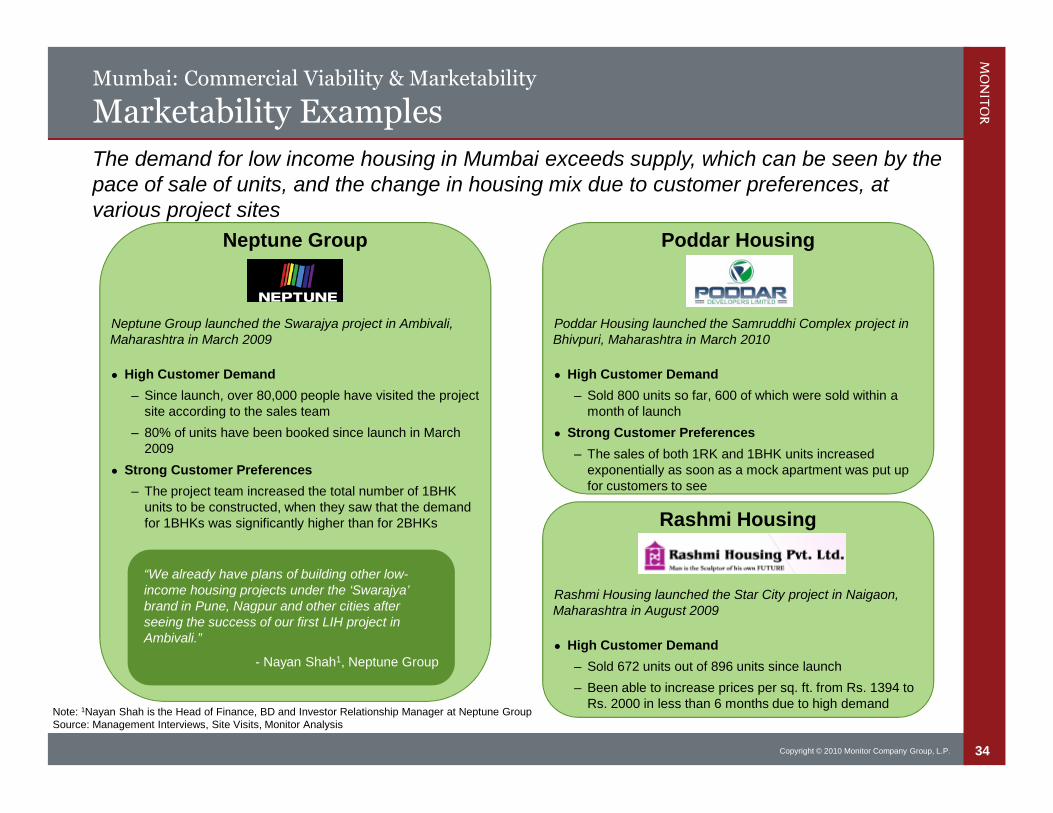
The demand for low income housing in Mumbai exceeds supply, which can be seen by thepace of sale of units, and the change in housing mix due to customer preferences, atvarious project sites
Neptune Group
Neptune Group launched the Swarajya project in Ambivali,Maharashtra in March 2009
High Customer Demand
– Since launch, over 80,000 people have visited the projectsite according to the sales team
– 80% of units have been booked since launch in March2009
Strong Customer Preferences
– The project team increased the total number of 1BHKunits to be constructed, when they saw that the demandfor 1BHKs was significantly higher than for 2BHKs
Poddar Housing
Poddar Housing launched the Samruddhi Complex project inBhivpuri, Maharashtra in March 2010
High Customer Demand
– Sold 800 units so far, 600 of which were sold within amonth of launch
Strong Customer Preferences
– The sales of both 1RK and 1BHK units increasedexponentially as soon as a mock apartment was put upfor customers to see
“We already have plans of building other low-income housing projects under the ‘Swarajya’brand in Pune, Nagpur and other cities afterseeing the success of our first LIH project inAmbivali.”
- Nayan Shah1, Neptune Group
Rashmi Housing
Rashmi Housing launched the Star City project in Naigaon,Maharashtra in August 2009
High Customer Demand
– Sold 672 units out of 896 units since launch
– Been able to increase prices per sq. ft. from Rs. 1394 toRs. 2000 in less than 6 months due to high demand
35Copyright © 2010 Monitor Company Group, L.P.
Contents
Summary of Findings
Market Overview
LIH Developers: Operations, Commercial Viability and Marketability
– Mumbai
– Ahmedabad
Housing Finance Companies: Operations and Commercial Viability
Appendix
36Copyright © 2010 Monitor Company Group, L.P.
Ahmedabad: Developers
Introduction - Ahmedabad
Note: 1All prices are in current pricesSource: Interviews with developers including Galaxy Developer, Santosh Associates, Foliage, Shree Ram Developers, DBS Affordable Home Strategy Ltd. and Dharmadev Builders; 2001Census; Monitor Analysis
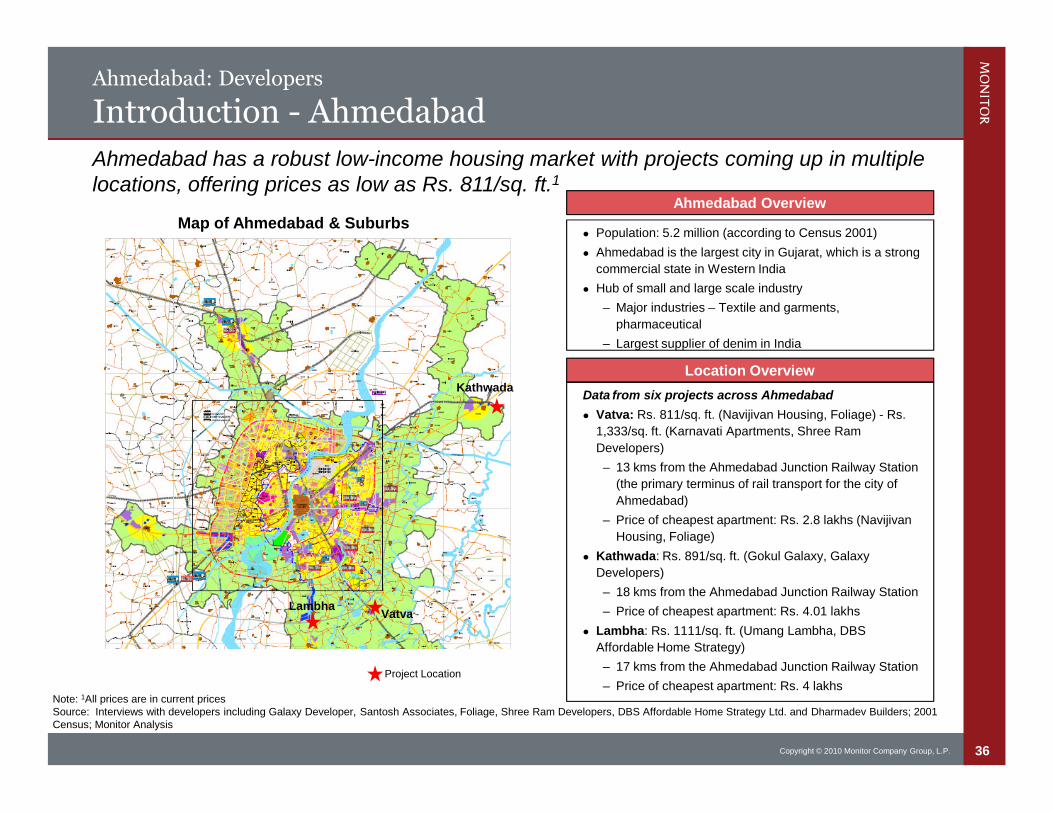
Ahmedabad has a robust low-income housing market with projects coming up in multiplelocations, offering prices as low as Rs. 811/sq. ft.1
Map of Ahmedabad & Suburbs
Location Overview
Data from six projects across Ahmedabad
Vatva: Rs. 811/sq. ft. (Navijivan Housing, Foliage) - Rs.
1,333/sq. ft. (Karnavati Apartments, Shree Ram
Developers)
– 13 kms from the Ahmedabad Junction Railway Station
(the primary terminus of rail transport for the city of
Ahmedabad)
– Price of cheapest apartment: Rs. 2.8 lakhs (Navijivan
Housing, Foliage)
Kathwada: Rs. 891/sq. ft. (Gokul Galaxy, Galaxy
Developers)
– 18 kms from the Ahmedabad Junction Railway Station
– Price of cheapest apartment: Rs. 4.01 lakhs
Lambha: Rs. 1111/sq. ft. (Umang Lambha, DBS
Affordable Home Strategy)
– 17 kms from the Ahmedabad Junction Railway Station
– Price of cheapest apartment: Rs. 4 lakhs
Ahmedabad Overview
Population: 5.2 million (according to Census 2001)
Ahmedabad is the largest city in Gujarat, which is a strong
commercial state in Western India
Hub of small and large scale industry
– Major industries – Textile and garments,
pharmaceutical
– Largest supplier of denim in India
Project Location
Kathwada
VatvaLambha
37Copyright © 2010 Monitor Company Group, L.P.
Ahmedabad: Developers
Select Developer Example: Foliage
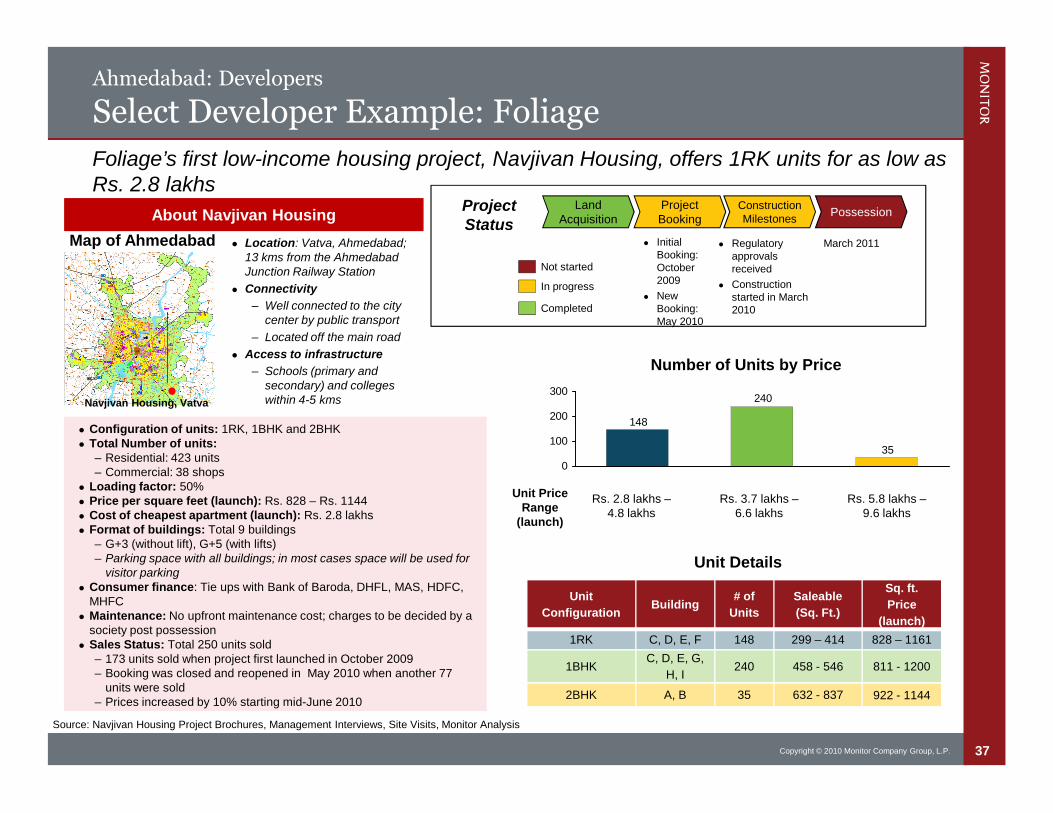
Location: Vatva, Ahmedabad;13 kms from the AhmedabadJunction Railway Station
Connectivity
– Well connected to the citycenter by public transport
– Located off the main road
Access to infrastructure
– Schools (primary andsecondary) and collegeswithin 4-5 kms
Configuration of units: 1RK, 1BHK and 2BHK Total Number of units:
– Residential: 423 units– Commercial: 38 shops
Loading factor: 50% Price per square feet (launch): Rs. 828 – Rs. 1144 Cost of cheapest apartment (launch): Rs. 2.8 lakhs Format of buildings: Total 9 buildings
– G+3 (without lift), G+5 (with lifts)– Parking space with all buildings; in most cases space will be used for
visitor parking Consumer finance: Tie ups with Bank of Baroda, DHFL, MAS, HDFC,
MHFC Maintenance: No upfront maintenance cost; charges to be decided by a
society post possession Sales Status: Total 250 units sold
– 173 units sold when project first launched in October 2009– Booking was closed and reopened in May 2010 when another 77
units were sold– Prices increased by 10% starting mid-June 2010
Foliage’s first low-income housing project, Navjivan Housing, offers 1RK units for as low asRs. 2.8 lakhs
About Navjivan HousingLand
AcquisitionProjectBooking
ConstructionMilestones
Possession
March 2011 Regulatoryapprovalsreceived
Constructionstarted in March2010
Source: Navjivan Housing Project Brochures, Management Interviews, Site Visits, Monitor Analysis
Unit
ConfigurationBuilding
# of
Units
Saleable
(Sq. Ft.)
Sq. ft.
Price
(launch)
1RK C, D, E, F 148 299 – 414 828 – 1161
1BHKC, D, E, G,
H, I240 458 - 546 811 - 1200
2BHK A, B 35 632 - 837 922 - 1144
Unit Details
Number of Units by Price
Rs. 2.8 lakhs –4.8 lakhs
Rs. 3.7 lakhs –6.6 lakhs
Rs. 5.8 lakhs –9.6 lakhs
Unit PriceRange
(launch)
Not started
In progress
Completed
ProjectStatus
Map of Ahmedabad InitialBooking:October2009
NewBooking:May 2010
Navjivan Housing, Vatva
35
240
148
0
100
200
300
38Copyright © 2010 Monitor Company Group, L.P.
Ahmedabad: Developers
Select Developer Example: Galaxy Developer
Note: 1Price range depends on the floor – certain floors have higher priceSource: Project Sales Office, Monitor Analysis
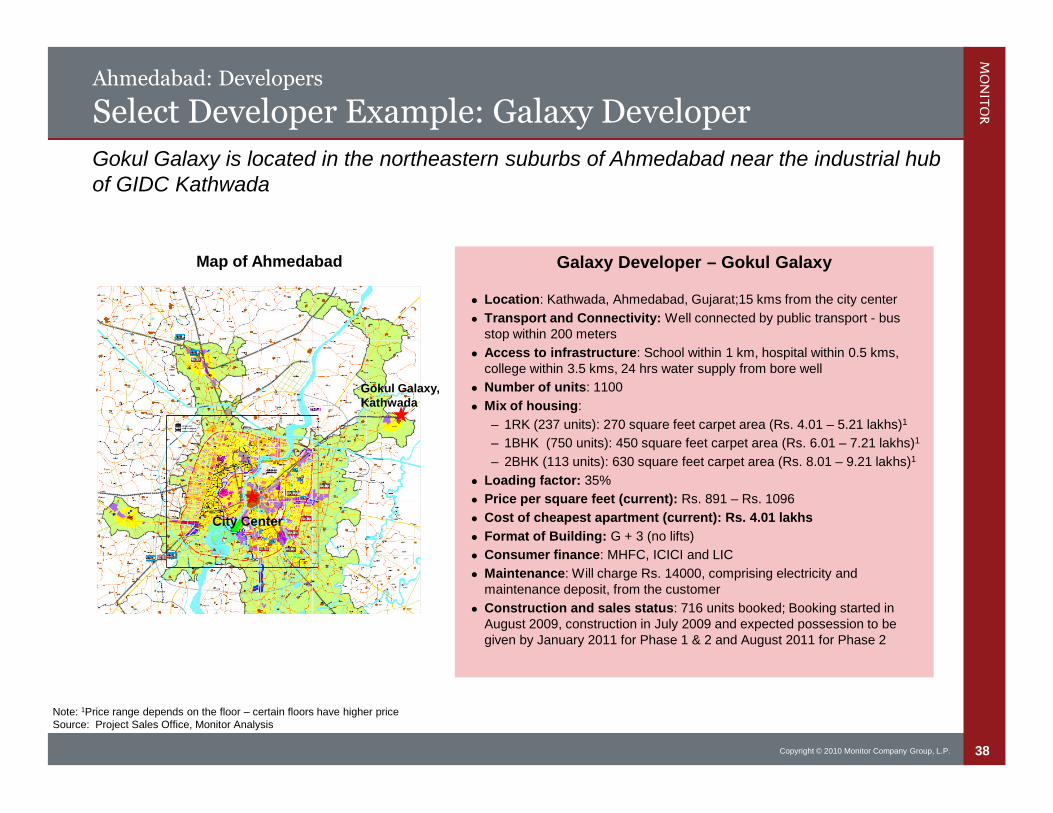
Gokul Galaxy is located in the northeastern suburbs of Ahmedabad near the industrial hubof GIDC Kathwada
Map of Ahmedabad Galaxy Developer – Gokul Galaxy
Location: Kathwada, Ahmedabad, Gujarat;15 kms from the city center
Transport and Connectivity: Well connected by public transport - busstop within 200 meters
Access to infrastructure: School within 1 km, hospital within 0.5 kms,college within 3.5 kms, 24 hrs water supply from bore well
Number of units: 1100
Mix of housing:
– 1RK (237 units): 270 square feet carpet area (Rs. 4.01 – 5.21 lakhs)1
– 1BHK (750 units): 450 square feet carpet area (Rs. 6.01 – 7.21 lakhs)1
– 2BHK (113 units): 630 square feet carpet area (Rs. 8.01 – 9.21 lakhs)1
Loading factor: 35%
Price per square feet (current): Rs. 891 – Rs. 1096
Cost of cheapest apartment (current): Rs. 4.01 lakhs
Format of Building: G + 3 (no lifts)
Consumer finance: MHFC, ICICI and LIC
Maintenance: Will charge Rs. 14000, comprising electricity andmaintenance deposit, from the customer
Construction and sales status: 716 units booked; Booking started inAugust 2009, construction in July 2009 and expected possession to begiven by January 2011 for Phase 1 & 2 and August 2011 for Phase 2
Gokul Galaxy,Kathwada
City Center

39Copyright © 2010 Monitor Company Group, L.P.
Contents
Summary of Findings
Market Overview
LIH Developers: Operations, Commercial Viability and Marketability
– Mumbai
– Ahmedabad
Case Study: Santosh Associates
Commercial Viability & Marketability
Housing Finance Companies: Operations and Commercial Viability
Appendix
40Copyright © 2010 Monitor Company Group, L.P.
Ahmedabad: Case Study - Om Shanti Nagar 2, Santosh Associates
Project Overview
Om Shanti Nagar 2
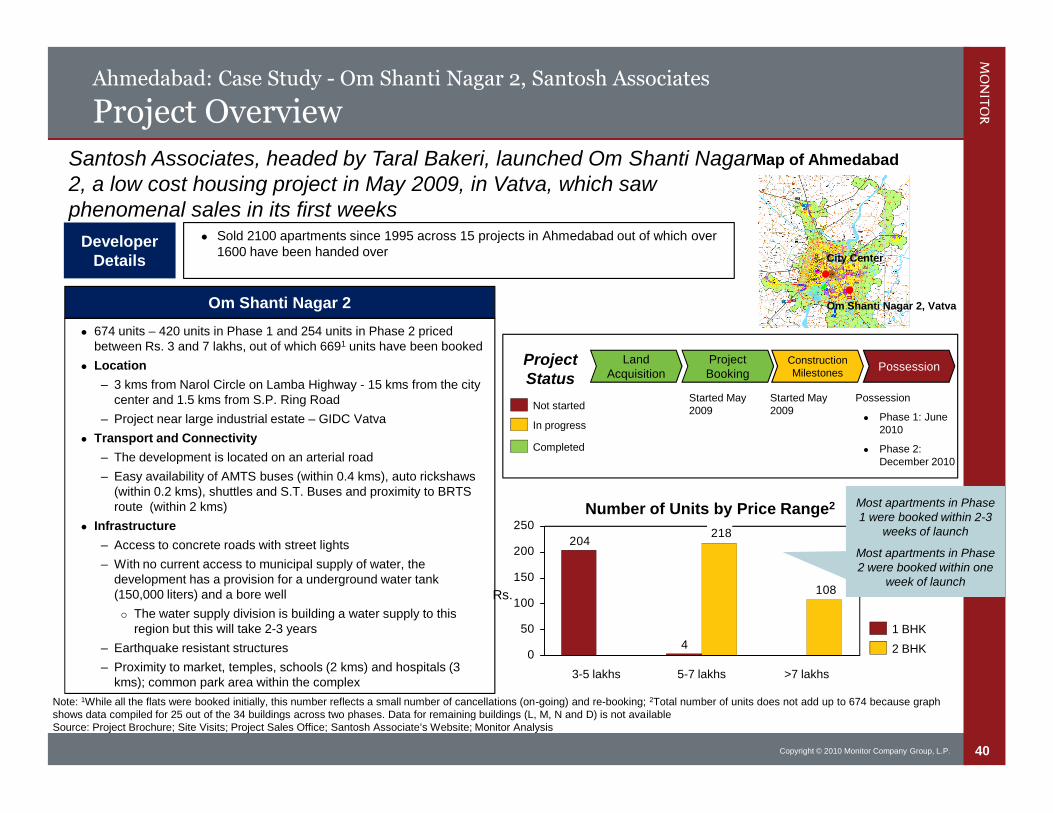
674 units – 420 units in Phase 1 and 254 units in Phase 2 pricedbetween Rs. 3 and 7 lakhs, out of which 6691 units have been booked
Location
– 3 kms from Narol Circle on Lamba Highway - 15 kms from the citycenter and 1.5 kms from S.P. Ring Road
– Project near large industrial estate – GIDC Vatva
Transport and Connectivity
– The development is located on an arterial road
– Easy availability of AMTS buses (within 0.4 kms), auto rickshaws(within 0.2 kms), shuttles and S.T. Buses and proximity to BRTSroute (within 2 kms)
Infrastructure
– Access to concrete roads with street lights
– With no current access to municipal supply of water, thedevelopment has a provision for a underground water tank(150,000 liters) and a bore well
The water supply division is building a water supply to thisregion but this will take 2-3 years
– Earthquake resistant structures
– Proximity to market, temples, schools (2 kms) and hospitals (3kms); common park area within the complex
Santosh Associates, headed by Taral Bakeri, launched Om Shanti Nagar2, a low cost housing project in May 2009, in Vatva, which sawphenomenal sales in its first weeks
Sold 2100 apartments since 1995 across 15 projects in Ahmedabad out of which over1600 have been handed over
DeveloperDetails
4
204
108
218
0
50
100
150
200
250
>7 lakhs5-7 lakhs3-5 lakhs
Number of Units by Price Range2
Map of Ahmedabad
LandAcquisition
ProjectBooking
ConstructionMilestones
PossessionProjectStatus
1 BHK
2 BHK
Not started
In progress
Completed
Possession
Phase 1: June2010
Phase 2:December 2010
Note: 1While all the flats were booked initially, this number reflects a small number of cancellations (on-going) and re-booking; 2Total number of units does not add up to 674 because graphshows data compiled for 25 out of the 34 buildings across two phases. Data for remaining buildings (L, M, N and D) is not availableSource: Project Brochure; Site Visits; Project Sales Office; Santosh Associate’s Website; Monitor Analysis
Most apartments in Phase1 were booked within 2-3
weeks of launch
Most apartments in Phase2 were booked within one
week of launch
Started May2009
Started May2009
Om Shanti Nagar 2, Vatva
City Center
Rs.
41Copyright © 2010 Monitor Company Group, L.P.
Ahmedabad: Case Study - Om Shanti Nagar 2, Santosh Associates
Construction Details
Flat TypeNumber of
UnitsCarpet Area(in Sq. ft.)
Saleable Area(in Sq. ft.)
Lowest pricedUnit (in Rs.)
Phase 1
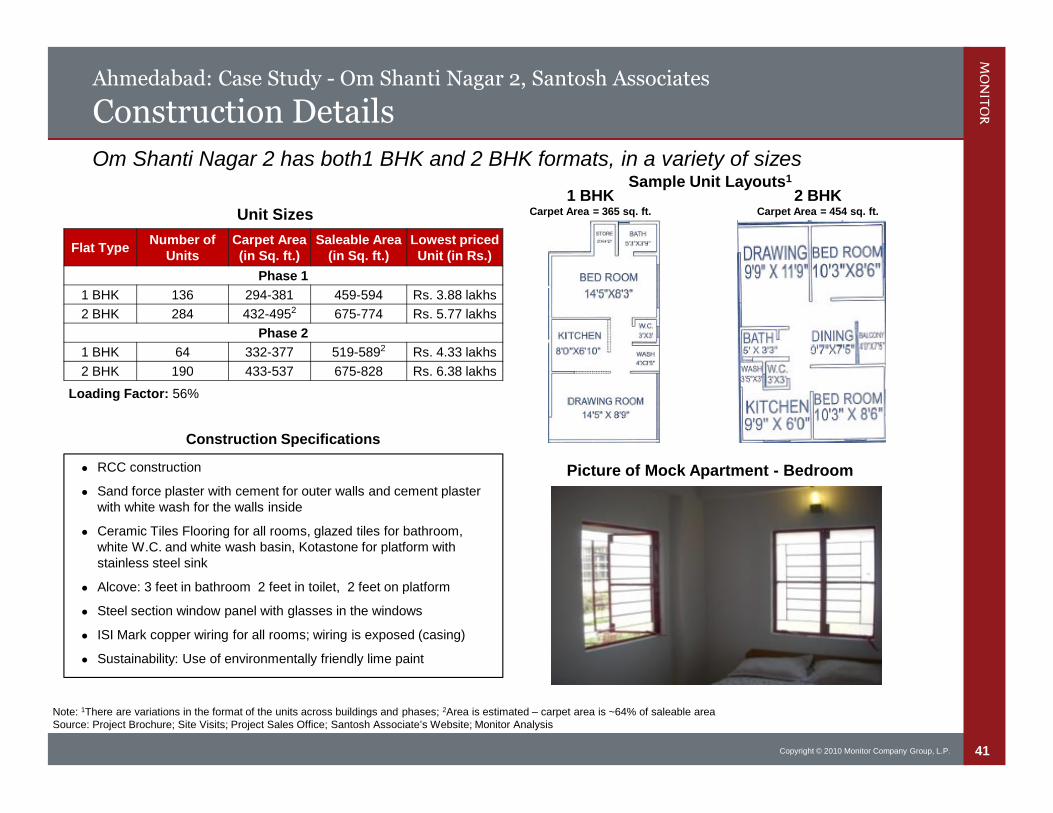
1 BHK 136 294-381 459-594 Rs. 3.88 lakhs
2 BHK 284 432-4952 675-774 Rs. 5.77 lakhs
Phase 2
1 BHK 64 332-377 519-5892 Rs. 4.33 lakhs
2 BHK 190 433-537 675-828 Rs. 6.38 lakhs
Unit Sizes1 BHK
Carpet Area = 365 sq. ft.
2 BHKCarpet Area = 454 sq. ft.
Construction Specifications
RCC construction
Sand force plaster with cement for outer walls and cement plasterwith white wash for the walls inside
Ceramic Tiles Flooring for all rooms, glazed tiles for bathroom,white W.C. and white wash basin, Kotastone for platform withstainless steel sink
Alcove: 3 feet in bathroom 2 feet in toilet, 2 feet on platform
Steel section window panel with glasses in the windows
ISI Mark copper wiring for all rooms; wiring is exposed (casing)
Sustainability: Use of environmentally friendly lime paint
Note: 1There are variations in the format of the units across buildings and phases; 2Area is estimated – carpet area is ~64% of saleable areaSource: Project Brochure; Site Visits; Project Sales Office; Santosh Associate’s Website; Monitor Analysis
Om Shanti Nagar 2 has both1 BHK and 2 BHK formats, in a variety of sizesSample Unit Layouts1
Picture of Mock Apartment - Bedroom
Loading Factor: 56%
42Copyright © 2010 Monitor Company Group, L.P.
Ahmedabad: Case Study - Om Shanti Nagar 2, Santosh Associates
Site Layout
Source: Project Brochure; Site Visits; Project Sales Office; Santosh Associate’s Website; Monitor Analysis
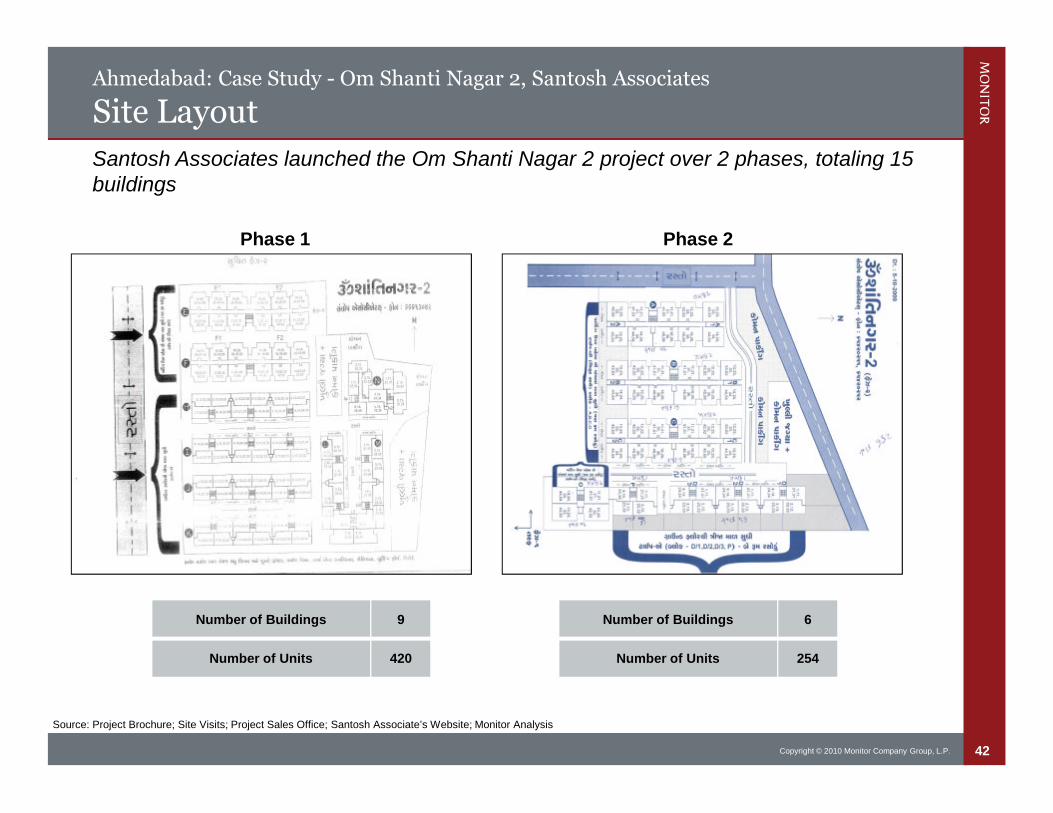
Santosh Associates launched the Om Shanti Nagar 2 project over 2 phases, totaling 15buildings
Phase 1 Phase 2
Number of Buildings 9
Number of Units 420
Number of Buildings 6
Number of Units 254
43Copyright © 2010 Monitor Company Group, L.P.
Ahmedabad: Case Study - Om Shanti Nagar 2, Santosh Associates
Pricing and Format Layouts
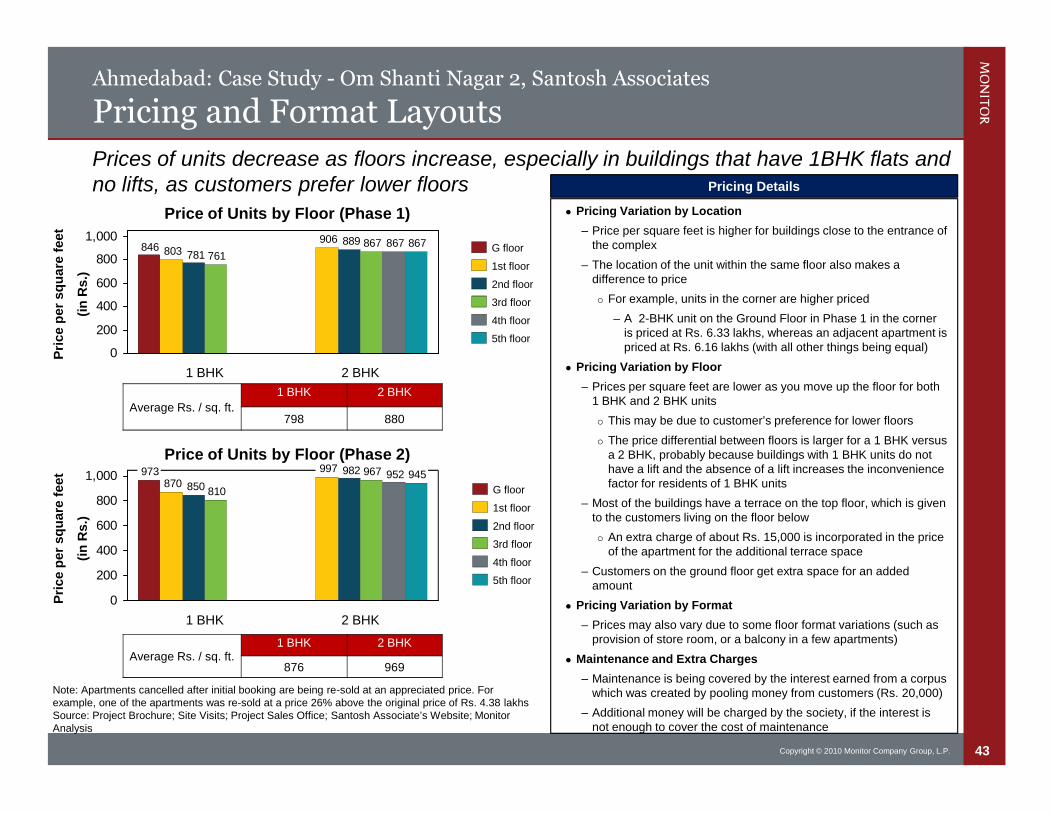
Price of Units by Floor (Phase 1)
846906
803889
781867
761867 867
0
200
400
600
800
1,000
2 BHK1 BHK
G floor
5th floor
4th floor
3rd floor
2nd floor
1st floor
Pricing Details
Pricing Variation by Location
– Price per square feet is higher for buildings close to the entrance ofthe complex
– The location of the unit within the same floor also makes adifference to price
For example, units in the corner are higher priced
– A 2-BHK unit on the Ground Floor in Phase 1 in the corneris priced at Rs. 6.33 lakhs, whereas an adjacent apartment ispriced at Rs. 6.16 lakhs (with all other things being equal)
Pricing Variation by Floor
– Prices per square feet are lower as you move up the floor for both1 BHK and 2 BHK units
This may be due to customer’s preference for lower floors
The price differential between floors is larger for a 1 BHK versusa 2 BHK, probably because buildings with 1 BHK units do nothave a lift and the absence of a lift increases the inconveniencefactor for residents of 1 BHK units
– Most of the buildings have a terrace on the top floor, which is givento the customers living on the floor below
An extra charge of about Rs. 15,000 is incorporated in the priceof the apartment for the additional terrace space
– Customers on the ground floor get extra space for an addedamount
Pricing Variation by Format
– Prices may also vary due to some floor format variations (such asprovision of store room, or a balcony in a few apartments)
Maintenance and Extra Charges
– Maintenance is being covered by the interest earned from a corpuswhich was created by pooling money from customers (Rs. 20,000)
– Additional money will be charged by the society, if the interest isnot enough to cover the cost of maintenance
Average Rs. / sq. ft.
1 BHK 2 BHK
798 880
Pri
ce
per
sq
uare
feet
(in
Rs.)
Note: Apartments cancelled after initial booking are being re-sold at an appreciated price. Forexample, one of the apartments was re-sold at a price 26% above the original price of Rs. 4.38 lakhsSource: Project Brochure; Site Visits; Project Sales Office; Santosh Associate’s Website; MonitorAnalysis
Prices of units decrease as floors increase, especially in buildings that have 1BHK flats andno lifts, as customers prefer lower floors
973 997
870982
850
967
810
952 945
0
200
400
600
800
1,000
1 BHK 2 BHK
Pri
ce
per
sq
uare
feet
(in
Rs.)
Average Rs. / sq. ft.1 BHK 2 BHK
876 969
Price of Units by Floor (Phase 2)
G floor
5th floor
4th floor
3rd floor
2nd floor
1st floor
44Copyright © 2010 Monitor Company Group, L.P.
Ahmedabad: Case Study - Om Shanti Nagar 2, Santosh Associates
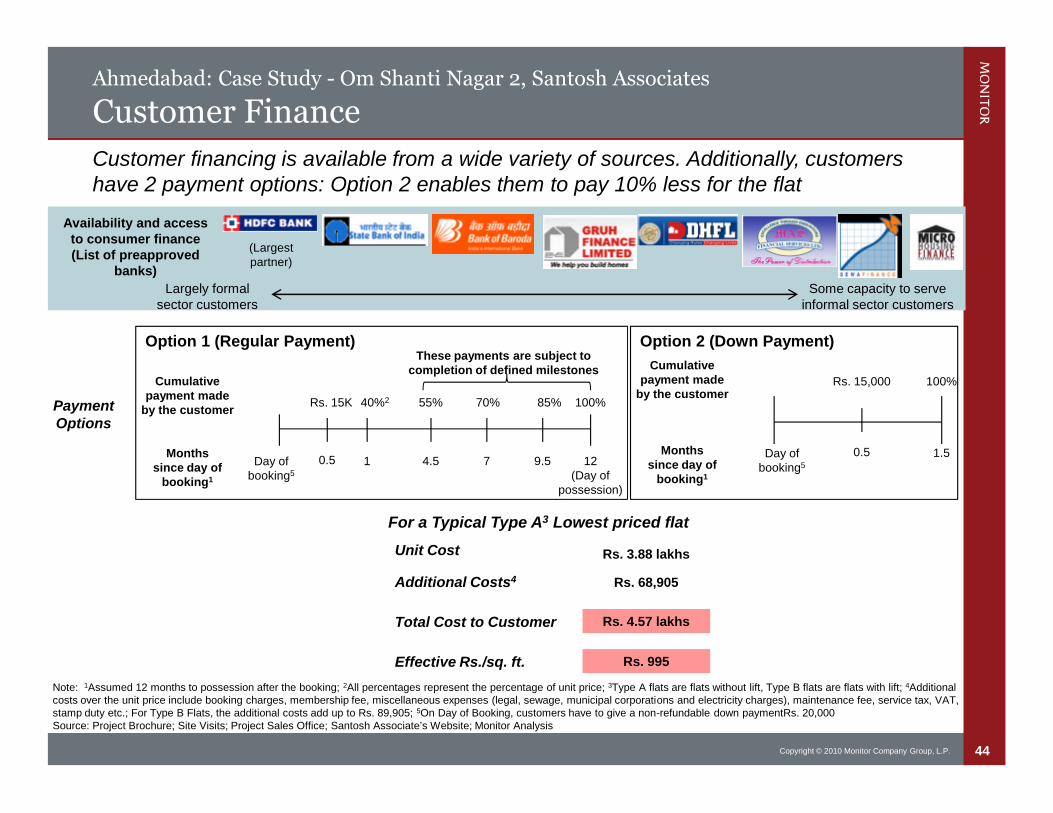
Customer Finance
12(Day of
possession)
1Day ofbooking5
Monthssince day of
booking1
Cumulativepayment made
by the customer
4.5 9.57
40%2 55% 70% 85% 100%
These payments are subject tocompletion of defined milestones
Option 1 (Regular Payment) Option 2 (Down Payment)
1.5Day ofbooking5
100%
Monthssince day of
booking1
Note: 1Assumed 12 months to possession after the booking; 2All percentages represent the percentage of unit price; 3Type A flats are flats without lift, Type B flats are flats with lift; 4Additionalcosts over the unit price include booking charges, membership fee, miscellaneous expenses (legal, sewage, municipal corporations and electricity charges), maintenance fee, service tax, VAT,stamp duty etc.; For Type B Flats, the additional costs add up to Rs. 89,905; 5On Day of Booking, customers have to give a non-refundable down paymentRs. 20,000Source: Project Brochure; Site Visits; Project Sales Office; Santosh Associate’s Website; Monitor Analysis
Customer financing is available from a wide variety of sources. Additionally, customershave 2 payment options: Option 2 enables them to pay 10% less for the flat
Availability and accessto consumer finance(List of preapproved
banks)
(Largestpartner)
Some capacity to serveinformal sector customers
Largely formalsector customers
0.5
Rs. 15K
0.5
Rs. 15,000
Cumulativepayment made
by the customerPaymentOptions
For a Typical Type A3 Lowest priced flat
Additional Costs4 Rs. 68,905
Total Cost to Customer Rs. 4.57 lakhs
Effective Rs./sq. ft. Rs. 995
Unit Cost Rs. 3.88 lakhs
45Copyright © 2010 Monitor Company Group, L.P.
Contents
Summary of Findings
Market Overview
LIH Developers: Operations, Commercial Viability and Marketability
– Mumbai
– Ahmedabad
Case Study: Santosh Associates
Commercial Viability & Marketability
Housing Finance Companies: Operations and Commercial Viability
Appendix
46Copyright © 2010 Monitor Company Group, L.P.
Ahmedabad: Commercial Viability & Marketability
Objectives and Approach
Objective
Our Approach
To assess the marketability and commercial viability of low-income housing projects from a developer’spoint of view for two selected and representative geographies
– Mumbai, Maharashtra
– Ahmedabad, Gujarat
For an effective, accurate and reliable set of results, we included in our analysis:
– Data and assumptions driven by field based experiences of both short-listed developers(showcased in the case studies) as well as long-list developers
– Triangulated findings with expert advisors
47Copyright © 2010 Monitor Company Group, L.P.
Ahmedabad LIH Project: Commercial Viability & Marketability Representation
Assumptions & Inputs
Note: To understand how we decided on the input values,please see the Logic for Assumptions & Inputs slides in theAppendix; 1FSI = Floor Space Index is the ratio of the totalfloor area of buildings on a certain location to the size of theland of that location; 2Loading factor increased by the carpetarea equals saleable area; 3Commerical yield factor is thefactor by which commercial space sells over residentialspace; 4Construction cost includes infrastructure cost;Mumbai infrastructure cost: Rs. 75 per sq. ft.; Ahmedabadinfrastructure cost: Rs. 50 per sq. ft.Source: Interviews of multiple developers and stakeholders;Monitor Analysis
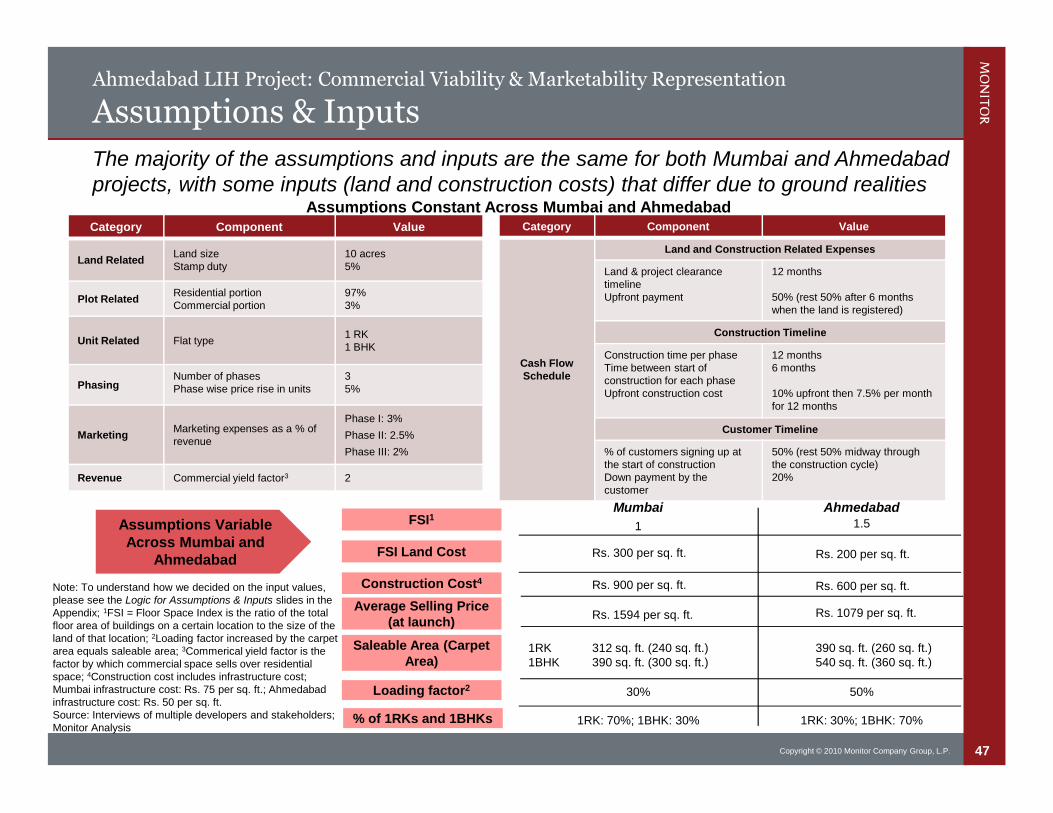
Assumptions Constant Across Mumbai and AhmedabadCategory Component Value
Land RelatedLand sizeStamp duty
10 acres5%
Plot RelatedResidential portionCommercial portion
97%3%
Unit Related Flat type1 RK1 BHK
PhasingNumber of phasesPhase wise price rise in units
35%
MarketingMarketing expenses as a % ofrevenue
Phase I: 3%
Phase II: 2.5%
Phase III: 2%
Revenue Commercial yield factor3 2
Category Component Value
Cash FlowSchedule
Land and Construction Related Expenses
Land & project clearancetimelineUpfront payment
12 months
50% (rest 50% after 6 monthswhen the land is registered)
Construction Timeline
Construction time per phaseTime between start ofconstruction for each phaseUpfront construction cost
12 months6 months
10% upfront then 7.5% per monthfor 12 months
Customer Timeline
% of customers signing up atthe start of constructionDown payment by thecustomer
50% (rest 50% midway throughthe construction cycle)20%
FSI Land Cost
Construction Cost4
Average Selling Price(at launch)
Mumbai Ahmedabad
Rs. 300 per sq. ft.
Rs. 900 per sq. ft.
Rs. 200 per sq. ft.
Rs. 600 per sq. ft.
Assumptions VariableAcross Mumbai and
Ahmedabad
The majority of the assumptions and inputs are the same for both Mumbai and Ahmedabadprojects, with some inputs (land and construction costs) that differ due to ground realities
Saleable Area (CarpetArea)
312 sq. ft. (240 sq. ft.)390 sq. ft. (300 sq. ft.)
390 sq. ft. (260 sq. ft.)540 sq. ft. (360 sq. ft.)
1RK1BHK
Rs. 1594 per sq. ft. Rs. 1079 per sq. ft.
FSI1 1 1.5
Loading factor2 50%30%
% of 1RKs and 1BHKs 1RK: 30%; 1BHK: 70%1RK: 70%; 1BHK: 30%
48Copyright © 2010 Monitor Company Group, L.P.
Ahmedabad LIH Project: Commercial Viability & Marketability Representation
Output & Results
Note: 1Includes the average selling price throughout the project sales cycle, including Phase 2 and 3 units, which see a 5% price increase from the previous phase 2IRRs referred to in thismodel pertain strictly to the rate of return for the project as an independent undertaking, and do not include the costs of related business unit management.Source Interviews of multiple developers and stakeholders; Monitor Analysis
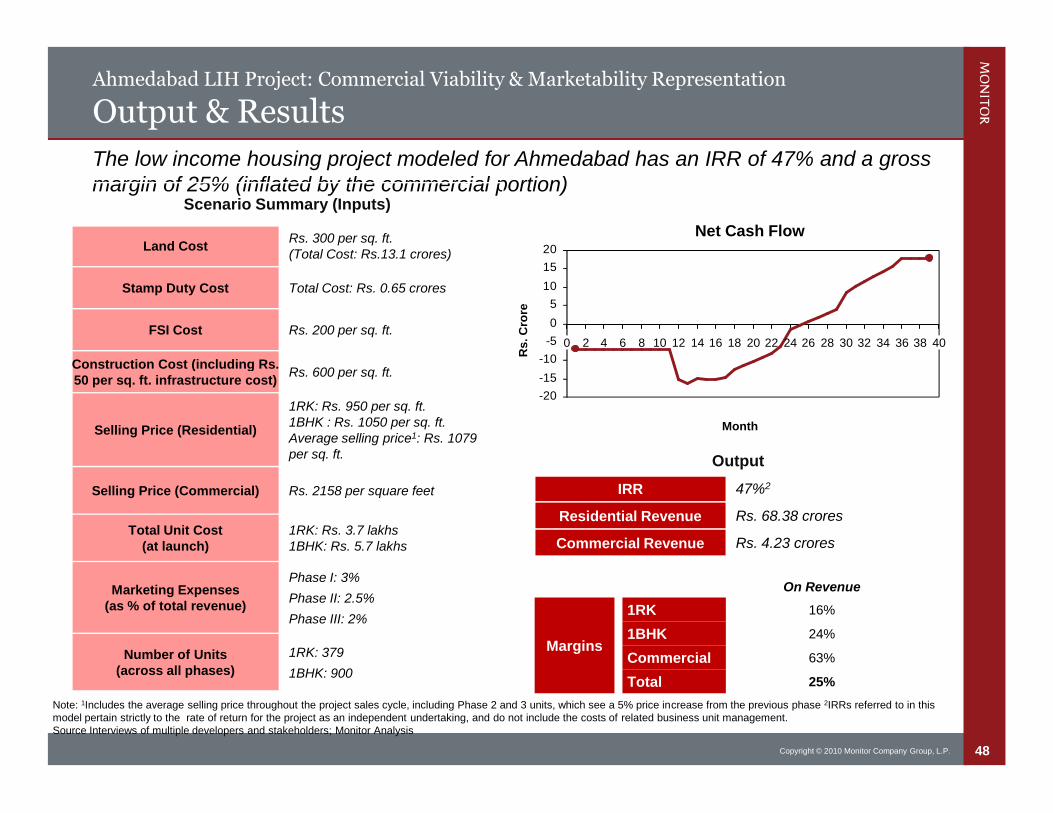
The low income housing project modeled for Ahmedabad has an IRR of 47% and a grossmargin of 25% (inflated by the commercial portion)
Net Cash Flow
Scenario Summary (Inputs)
Land CostRs. 300 per sq. ft.(Total Cost: Rs.13.1 crores)
Stamp Duty Cost Total Cost: Rs. 0.65 crores
FSI Cost Rs. 200 per sq. ft.
Construction Cost (including Rs.50 per sq. ft. infrastructure cost)
Rs. 600 per sq. ft.
Selling Price (Residential)
1RK: Rs. 950 per sq. ft.1BHK : Rs. 1050 per sq. ft.Average selling price1: Rs. 1079per sq. ft.
Selling Price (Commercial) Rs. 2158 per square feet
Total Unit Cost(at launch)
1RK: Rs. 3.7 lakhs1BHK: Rs. 5.7 lakhs
Marketing Expenses(as % of total revenue)
Phase I: 3%
Phase II: 2.5%
Phase III: 2%
Number of Units(across all phases)
1RK: 379
1BHK: 900
On Revenue
1RK
1BHK
Commercial
Total
16%
24%
63%
25%
Margins
Output
IRR 47%2
Residential Revenue Rs. 68.38 crores
Commercial Revenue Rs. 4.23 crores
Month
Rs
.C
rore
-20
-15
-10
-5
0
5
10
15
20
6 404 38323028262422202 18161412100 34 368
49Copyright © 2010 Monitor Company Group, L.P.
Ahmedabad: Commercial Viability & Marketability
Marketability Examples
Source: Management Interviews, Site Visits, Press Articles, Monitor Analysis
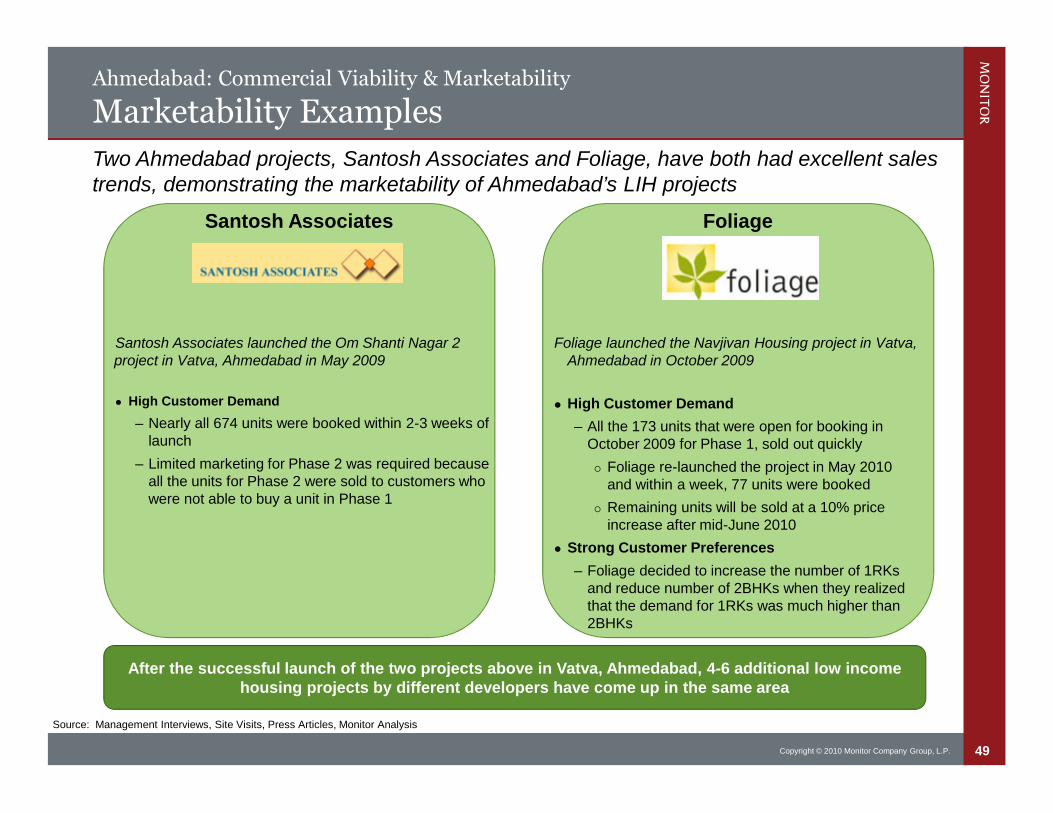
Two Ahmedabad projects, Santosh Associates and Foliage, have both had excellent salestrends, demonstrating the marketability of Ahmedabad’s LIH projects
Santosh Associates
Santosh Associates launched the Om Shanti Nagar 2project in Vatva, Ahmedabad in May 2009
High Customer Demand
– Nearly all 674 units were booked within 2-3 weeks oflaunch
– Limited marketing for Phase 2 was required becauseall the units for Phase 2 were sold to customers whowere not able to buy a unit in Phase 1
Foliage
Foliage launched the Navjivan Housing project in Vatva,Ahmedabad in October 2009
High Customer Demand
– All the 173 units that were open for booking inOctober 2009 for Phase 1, sold out quickly
Foliage re-launched the project in May 2010and within a week, 77 units were booked
Remaining units will be sold at a 10% priceincrease after mid-June 2010
Strong Customer Preferences
– Foliage decided to increase the number of 1RKsand reduce number of 2BHKs when they realizedthat the demand for 1RKs was much higher than2BHKs
After the successful launch of the two projects above in Vatva, Ahmedabad, 4-6 additional low incomehousing projects by different developers have come up in the same area
50Copyright © 2010 Monitor Company Group, L.P.
Contents
Summary of Findings
Market Overview
Low Income Developers: Operations, Commercial Viability and Marketability
Housing Finance Companies: Operations and Commercial Viability
– Case Study: MAS
– Case Study: DHFL
– Commercial Viability
Appendix
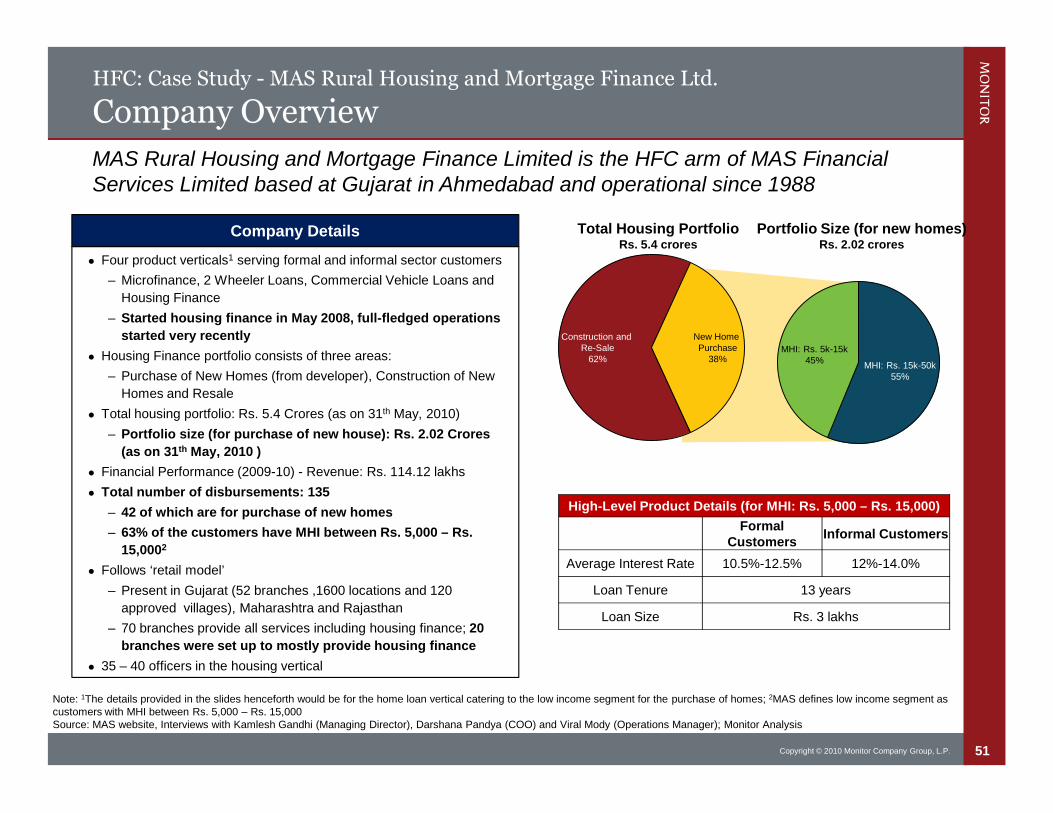
51Copyright © 2010 Monitor Company Group, L.P.
HFC: Case Study - MAS Rural Housing and Mortgage Finance Ltd.
Company Overview
Company Details
Four product verticals1 serving formal and informal sector customers
– Microfinance, 2 Wheeler Loans, Commercial Vehicle Loans and
Housing Finance
– Started housing finance in May 2008, full-fledged operations
started very recently
Housing Finance portfolio consists of three areas:
– Purchase of New Homes (from developer), Construction of New
Homes and Resale
Total housing portfolio: Rs. 5.4 Crores (as on 31th May, 2010)
– Portfolio size (for purchase of new house): Rs. 2.02 Crores
(as on 31th May, 2010 )
Financial Performance (2009-10) - Revenue: Rs. 114.12 lakhs
Total number of disbursements: 135
– 42 of which are for purchase of new homes
– 63% of the customers have MHI between Rs. 5,000 – Rs.
15,0002
Follows ‘retail model’
– Present in Gujarat (52 branches ,1600 locations and 120
approved villages), Maharashtra and Rajasthan
– 70 branches provide all services including housing finance; 20
branches were set up to mostly provide housing finance
35 – 40 officers in the housing vertical
Portfolio Size (for new homes)Rs. 2.02 crores
Note: 1The details provided in the slides henceforth would be for the home loan vertical catering to the low income segment for the purchase of homes; 2MAS defines low income segment ascustomers with MHI between Rs. 5,000 – Rs. 15,000Source: MAS website, Interviews with Kamlesh Gandhi (Managing Director), Darshana Pandya (COO) and Viral Mody (Operations Manager); Monitor Analysis
MAS Rural Housing and Mortgage Finance Limited is the HFC arm of MAS FinancialServices Limited based at Gujarat in Ahmedabad and operational since 1988
High-Level Product Details (for MHI: Rs. 5,000 – Rs. 15,000)
FormalCustomers
Informal Customers
Average Interest Rate 10.5%-12.5% 12%-14.0%
Loan Tenure 13 years
Loan Size Rs. 3 lakhs
Total Housing PortfolioRs. 5.4 crores
Construction andRe-Sale
62%
New HomePurchase
38%MHI: Rs. 15k-50k
55%
MHI: Rs. 5k-15k45%
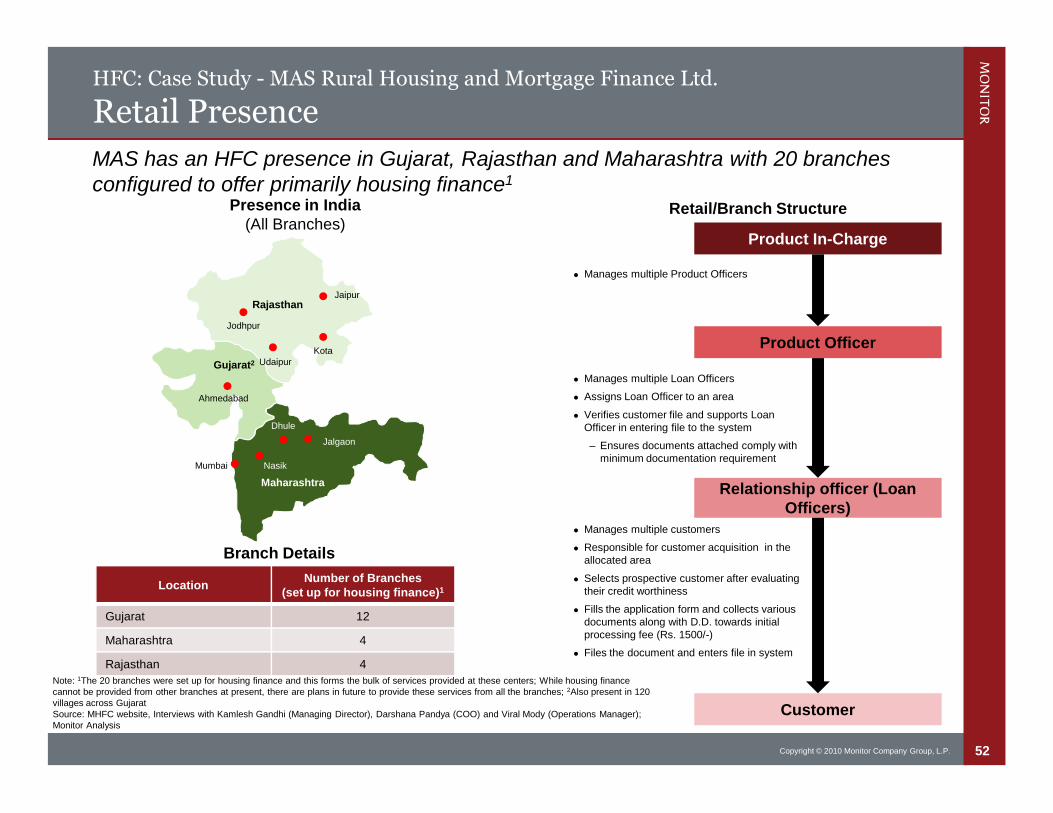
52Copyright © 2010 Monitor Company Group, L.P.
HFC: Case Study - MAS Rural Housing and Mortgage Finance Ltd.
Retail Presence
Presence in India(All Branches)
Note: 1The 20 branches were set up for housing finance and this forms the bulk of services provided at these centers; While housing financecannot be provided from other branches at present, there are plans in future to provide these services from all the branches; 2Also present in 120villages across GujaratSource: MHFC website, Interviews with Kamlesh Gandhi (Managing Director), Darshana Pandya (COO) and Viral Mody (Operations Manager);Monitor Analysis
MAS has an HFC presence in Gujarat, Rajasthan and Maharashtra with 20 branchesconfigured to offer primarily housing finance1
Gujarat2
Maharashtra
RajasthanJaipur
KotaUdaipur
Jodhpur
Mumbai Nasik
Dhule
Jalgaon
Branch Details
LocationNumber of Branches
(set up for housing finance)1
Gujarat 12
Maharashtra 4
Rajasthan 4
Product In-Charge
Retail/Branch Structure
Product Officer
Relationship officer (LoanOfficers)
Customer
Manages multiple Loan Officers
Assigns Loan Officer to an area
Verifies customer file and supports LoanOfficer in entering file to the system
– Ensures documents attached comply withminimum documentation requirement
Manages multiple customers
Responsible for customer acquisition in theallocated area
Selects prospective customer after evaluatingtheir credit worthiness
Fills the application form and collects variousdocuments along with D.D. towards initialprocessing fee (Rs. 1500/-)
Files the document and enters file in system
Manages multiple Product Officers
Ahmedabad
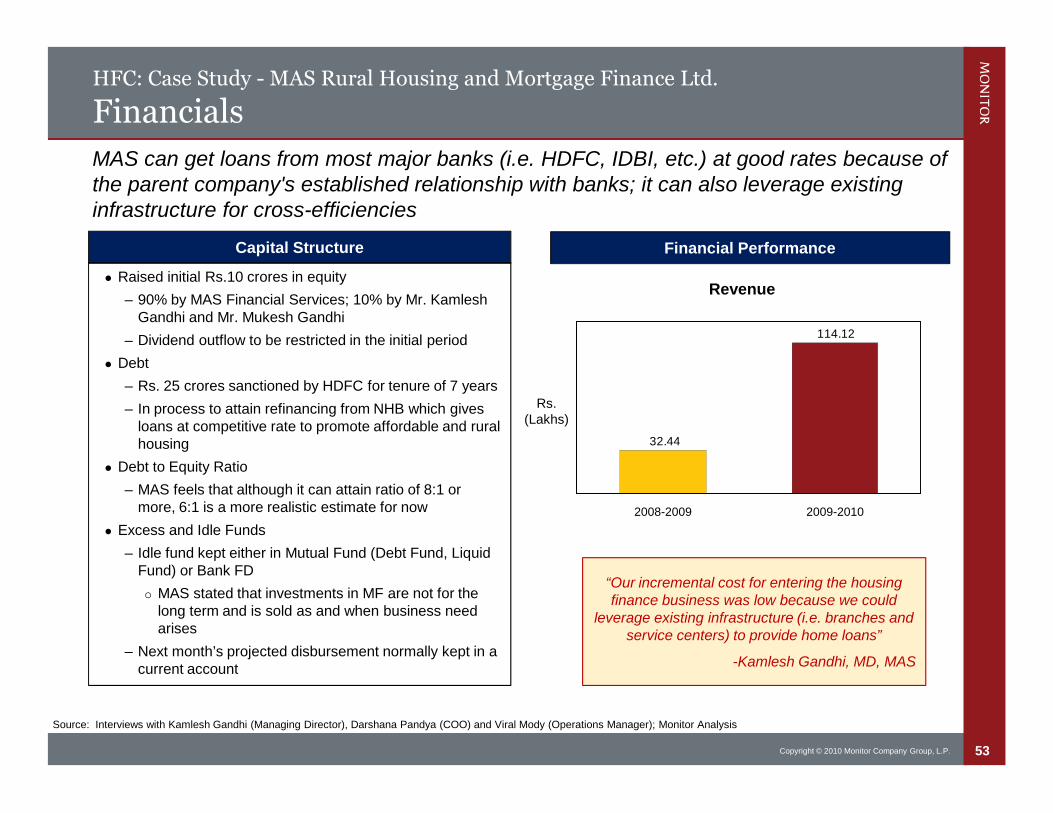
53Copyright © 2010 Monitor Company Group, L.P.
HFC: Case Study - MAS Rural Housing and Mortgage Finance Ltd.
Financials
Capital Structure
Raised initial Rs.10 crores in equity
– 90% by MAS Financial Services; 10% by Mr. KamleshGandhi and Mr. Mukesh Gandhi
– Dividend outflow to be restricted in the initial period
Debt
– Rs. 25 crores sanctioned by HDFC for tenure of 7 years
– In process to attain refinancing from NHB which givesloans at competitive rate to promote affordable and ruralhousing
Debt to Equity Ratio
– MAS feels that although it can attain ratio of 8:1 ormore, 6:1 is a more realistic estimate for now
Excess and Idle Funds
– Idle fund kept either in Mutual Fund (Debt Fund, LiquidFund) or Bank FD
MAS stated that investments in MF are not for thelong term and is sold as and when business needarises
– Next month’s projected disbursement normally kept in acurrent account
Source: Interviews with Kamlesh Gandhi (Managing Director), Darshana Pandya (COO) and Viral Mody (Operations Manager); Monitor Analysis
“Our incremental cost for entering the housingfinance business was low because we could
leverage existing infrastructure (i.e. branches andservice centers) to provide home loans”
-Kamlesh Gandhi, MD, MAS
114.12
32.44
2009-20102008-2009
Revenue
Financial Performance
MAS can get loans from most major banks (i.e. HDFC, IDBI, etc.) at good rates because ofthe parent company's established relationship with banks; it can also leverage existinginfrastructure for cross-efficiencies
Rs.(Lakhs)
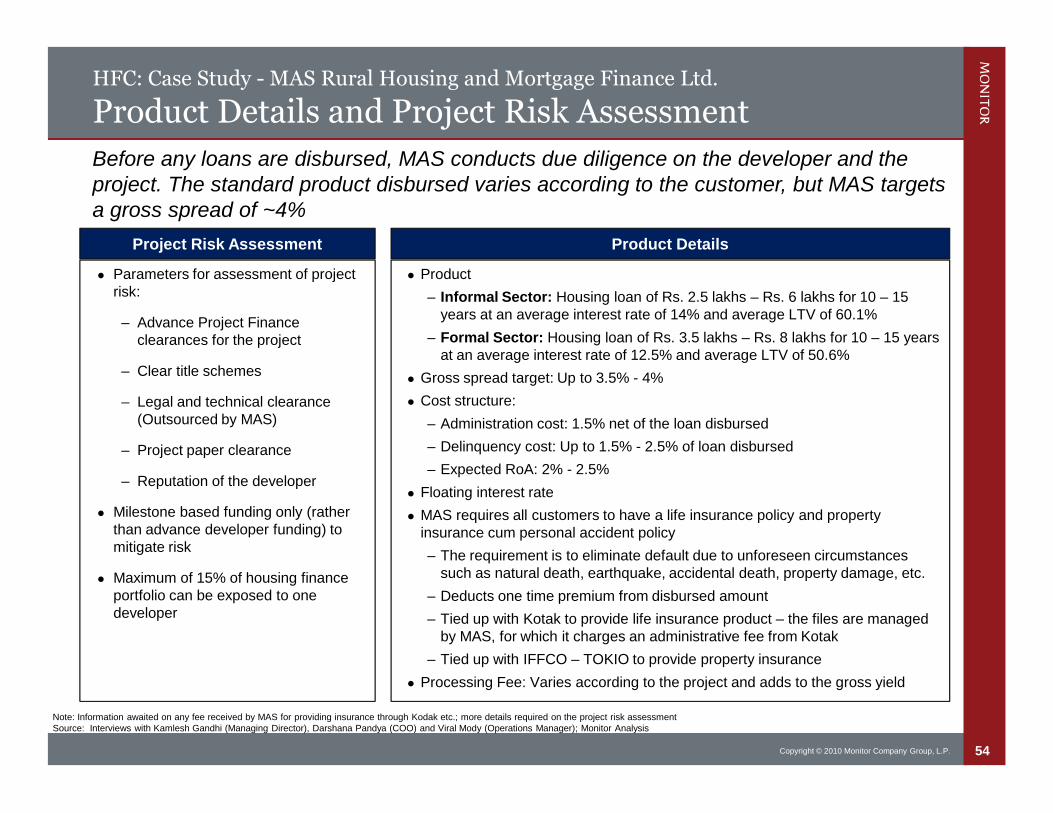
54Copyright © 2010 Monitor Company Group, L.P.
HFC: Case Study - MAS Rural Housing and Mortgage Finance Ltd.
Product Details and Project Risk Assessment
Product Details
Product
– Informal Sector: Housing loan of Rs. 2.5 lakhs – Rs. 6 lakhs for 10 – 15years at an average interest rate of 14% and average LTV of 60.1%
– Formal Sector: Housing loan of Rs. 3.5 lakhs – Rs. 8 lakhs for 10 – 15 yearsat an average interest rate of 12.5% and average LTV of 50.6%
Gross spread target: Up to 3.5% - 4%
Cost structure:
– Administration cost: 1.5% net of the loan disbursed
– Delinquency cost: Up to 1.5% - 2.5% of loan disbursed
– Expected RoA: 2% - 2.5%
Floating interest rate
MAS requires all customers to have a life insurance policy and propertyinsurance cum personal accident policy
– The requirement is to eliminate default due to unforeseen circumstancessuch as natural death, earthquake, accidental death, property damage, etc.
– Deducts one time premium from disbursed amount
– Tied up with Kotak to provide life insurance product – the files are managedby MAS, for which it charges an administrative fee from Kotak
– Tied up with IFFCO – TOKIO to provide property insurance
Processing Fee: Varies according to the project and adds to the gross yield
Note: Information awaited on any fee received by MAS for providing insurance through Kodak etc.; more details required on the project risk assessmentSource: Interviews with Kamlesh Gandhi (Managing Director), Darshana Pandya (COO) and Viral Mody (Operations Manager); Monitor Analysis
Before any loans are disbursed, MAS conducts due diligence on the developer and theproject. The standard product disbursed varies according to the customer, but MAS targetsa gross spread of ~4%
Parameters for assessment of projectrisk:
– Advance Project Financeclearances for the project
– Clear title schemes
– Legal and technical clearance(Outsourced by MAS)
– Project paper clearance
– Reputation of the developer
Milestone based funding only (ratherthan advance developer funding) tomitigate risk
Maximum of 15% of housing financeportfolio can be exposed to onedeveloper
Project Risk Assessment
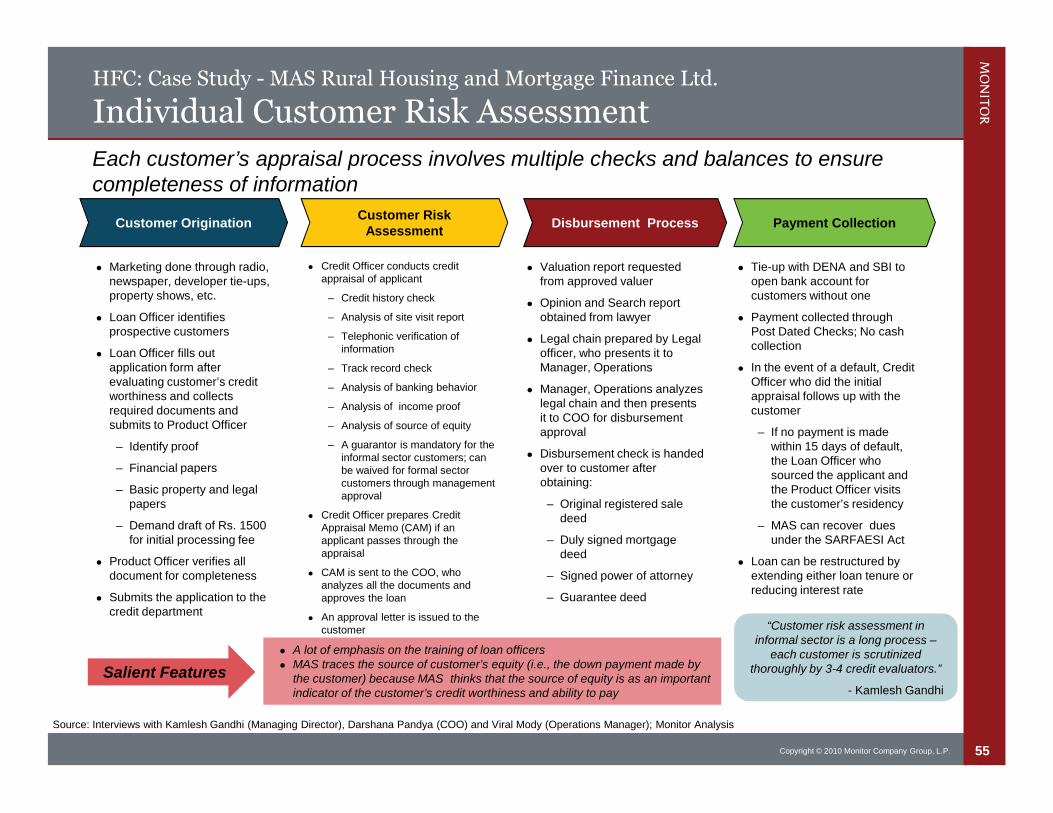
55Copyright © 2010 Monitor Company Group, L.P.
HFC: Case Study - MAS Rural Housing and Mortgage Finance Ltd.
Individual Customer Risk Assessment
Each customer’s appraisal process involves multiple checks and balances to ensurecompleteness of information
Marketing done through radio,newspaper, developer tie-ups,property shows, etc.
Loan Officer identifiesprospective customers
Loan Officer fills outapplication form afterevaluating customer’s creditworthiness and collectsrequired documents andsubmits to Product Officer
– Identify proof
– Financial papers
– Basic property and legalpapers
– Demand draft of Rs. 1500for initial processing fee
Product Officer verifies alldocument for completeness
Submits the application to thecredit department
Customer OriginationCustomer Risk
AssessmentDisbursement Process
Credit Officer conducts creditappraisal of applicant
– Credit history check
– Analysis of site visit report
– Telephonic verification ofinformation
– Track record check
– Analysis of banking behavior
– Analysis of income proof
– Analysis of source of equity
– A guarantor is mandatory for theinformal sector customers; canbe waived for formal sectorcustomers through managementapproval
Credit Officer prepares CreditAppraisal Memo (CAM) if anapplicant passes through theappraisal
CAM is sent to the COO, whoanalyzes all the documents andapproves the loan
An approval letter is issued to thecustomer
Valuation report requestedfrom approved valuer
Opinion and Search reportobtained from lawyer
Legal chain prepared by Legalofficer, who presents it toManager, Operations
Manager, Operations analyzeslegal chain and then presentsit to COO for disbursementapproval
Disbursement check is handedover to customer afterobtaining:
– Original registered saledeed
– Duly signed mortgagedeed
– Signed power of attorney
– Guarantee deed
Payment Collection
Tie-up with DENA and SBI toopen bank account forcustomers without one
Payment collected throughPost Dated Checks; No cashcollection
In the event of a default, CreditOfficer who did the initialappraisal follows up with thecustomer
– If no payment is madewithin 15 days of default,the Loan Officer whosourced the applicant andthe Product Officer visitsthe customer’s residency
– MAS can recover duesunder the SARFAESI Act
Loan can be restructured byextending either loan tenure orreducing interest rate
Source: Interviews with Kamlesh Gandhi (Managing Director), Darshana Pandya (COO) and Viral Mody (Operations Manager); Monitor Analysis
“Customer risk assessment ininformal sector is a long process –
each customer is scrutinizedthoroughly by 3-4 credit evaluators.”
- Kamlesh Gandhi
A lot of emphasis on the training of loan officers MAS traces the source of customer’s equity (i.e., the down payment made by
the customer) because MAS thinks that the source of equity is as an importantindicator of the customer’s credit worthiness and ability to pay
Salient Features
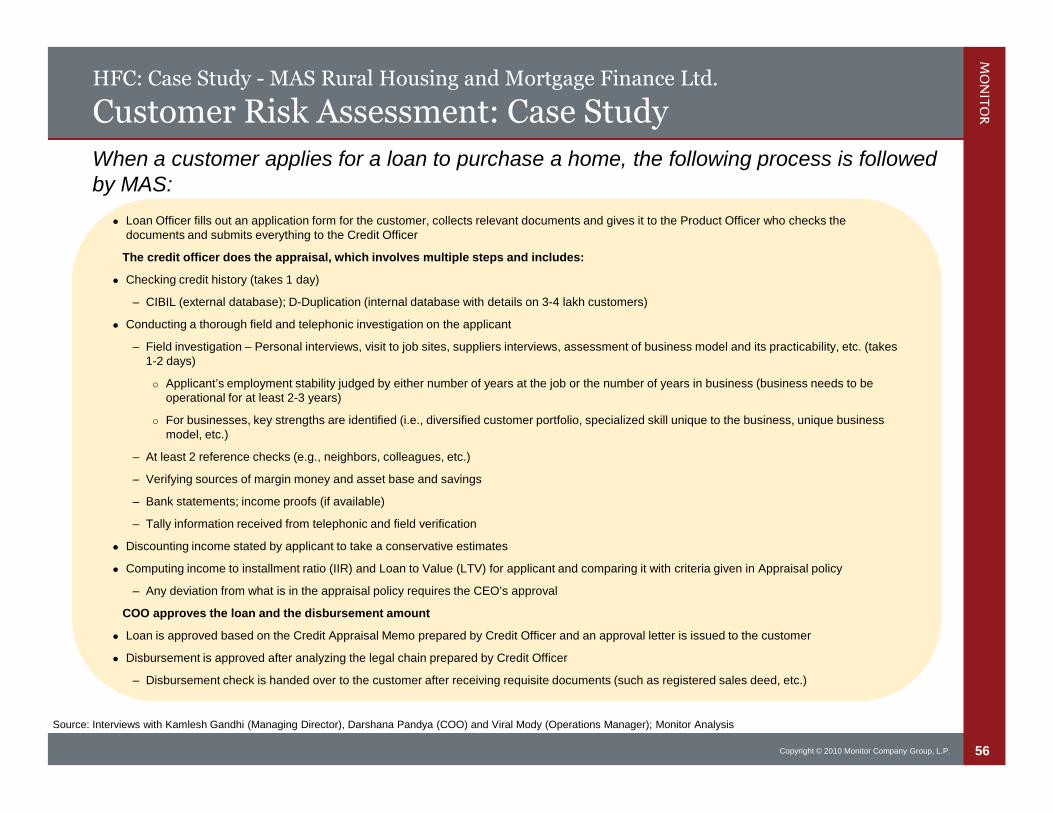
56Copyright © 2010 Monitor Company Group, L.P.
HFC: Case Study - MAS Rural Housing and Mortgage Finance Ltd.
Customer Risk Assessment: Case Study
Source: Interviews with Kamlesh Gandhi (Managing Director), Darshana Pandya (COO) and Viral Mody (Operations Manager); Monitor Analysis
When a customer applies for a loan to purchase a home, the following process is followedby MAS:
Loan Officer fills out an application form for the customer, collects relevant documents and gives it to the Product Officer who checks thedocuments and submits everything to the Credit Officer
The credit officer does the appraisal, which involves multiple steps and includes:
Checking credit history (takes 1 day)
– CIBIL (external database); D-Duplication (internal database with details on 3-4 lakh customers)
Conducting a thorough field and telephonic investigation on the applicant
– Field investigation – Personal interviews, visit to job sites, suppliers interviews, assessment of business model and its practicability, etc. (takes1-2 days)
Applicant’s employment stability judged by either number of years at the job or the number of years in business (business needs to beoperational for at least 2-3 years)
For businesses, key strengths are identified (i.e., diversified customer portfolio, specialized skill unique to the business, unique businessmodel, etc.)
– At least 2 reference checks (e.g., neighbors, colleagues, etc.)
– Verifying sources of margin money and asset base and savings
– Bank statements; income proofs (if available)
– Tally information received from telephonic and field verification
Discounting income stated by applicant to take a conservative estimates
Computing income to installment ratio (IIR) and Loan to Value (LTV) for applicant and comparing it with criteria given in Appraisal policy
– Any deviation from what is in the appraisal policy requires the CEO’s approval
COO approves the loan and the disbursement amount
Loan is approved based on the Credit Appraisal Memo prepared by Credit Officer and an approval letter is issued to the customer
Disbursement is approved after analyzing the legal chain prepared by Credit Officer
– Disbursement check is handed over to the customer after receiving requisite documents (such as registered sales deed, etc.)
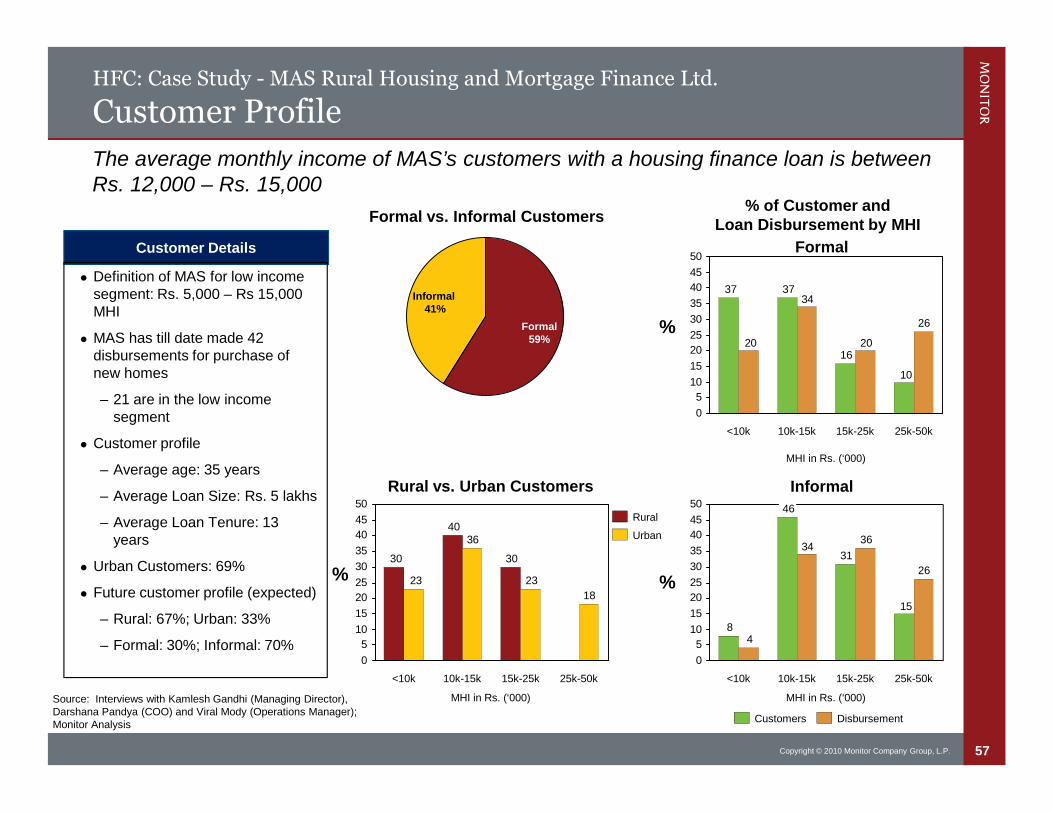
57Copyright © 2010 Monitor Company Group, L.P.
HFC: Case Study - MAS Rural Housing and Mortgage Finance Ltd.
Customer Profile
Customer Details
Definition of MAS for low incomesegment: Rs. 5,000 – Rs 15,000MHI
MAS has till date made 42disbursements for purchase ofnew homes
– 21 are in the low incomesegment
Customer profile
– Average age: 35 years
– Average Loan Size: Rs. 5 lakhs
– Average Loan Tenure: 13years
Urban Customers: 69%
Future customer profile (expected)
– Rural: 67%; Urban: 33%
– Formal: 30%; Informal: 70%
MHI in Rs. (‘000)
Informal41%
Formal59%
Formal vs. Informal Customers
Source: Interviews with Kamlesh Gandhi (Managing Director),Darshana Pandya (COO) and Viral Mody (Operations Manager);Monitor Analysis
The average monthly income of MAS’s customers with a housing finance loan is betweenRs. 12,000 – Rs. 15,000
% of Customer andLoan Disbursement by MHI
MHI in Rs. (‘000)
15
31
46
8
26
3634
4
0
5
10
15
20
25
30
35
40
45
50
25k-50k15k-25k10k-15k<10k
10
16
3737
26
20
34
20
0
5
10
15
20
25
30
35
40
45
50
25k-50k15k-25k10k-15k<10k
30
40
30
18
23
36
23
0
5
10
15
20
25
30
35
40
45
50
25k-50k15k-25k10k-15k<10k
Rural vs. Urban Customers
MHI in Rs. (‘000)
DisbursementCustomers
Formal
Informal
Urban
Rural
%
%%
58Copyright © 2010 Monitor Company Group, L.P.
Contents
Summary of Findings
Market Overview
Low Income Developers: Operations, Commercial Viability and Marketability
Housing Finance Companies: Operations and Commercial Viability
– Case Study: MAS
– Case Study: DHFL
– Commercial Viability
Appendix
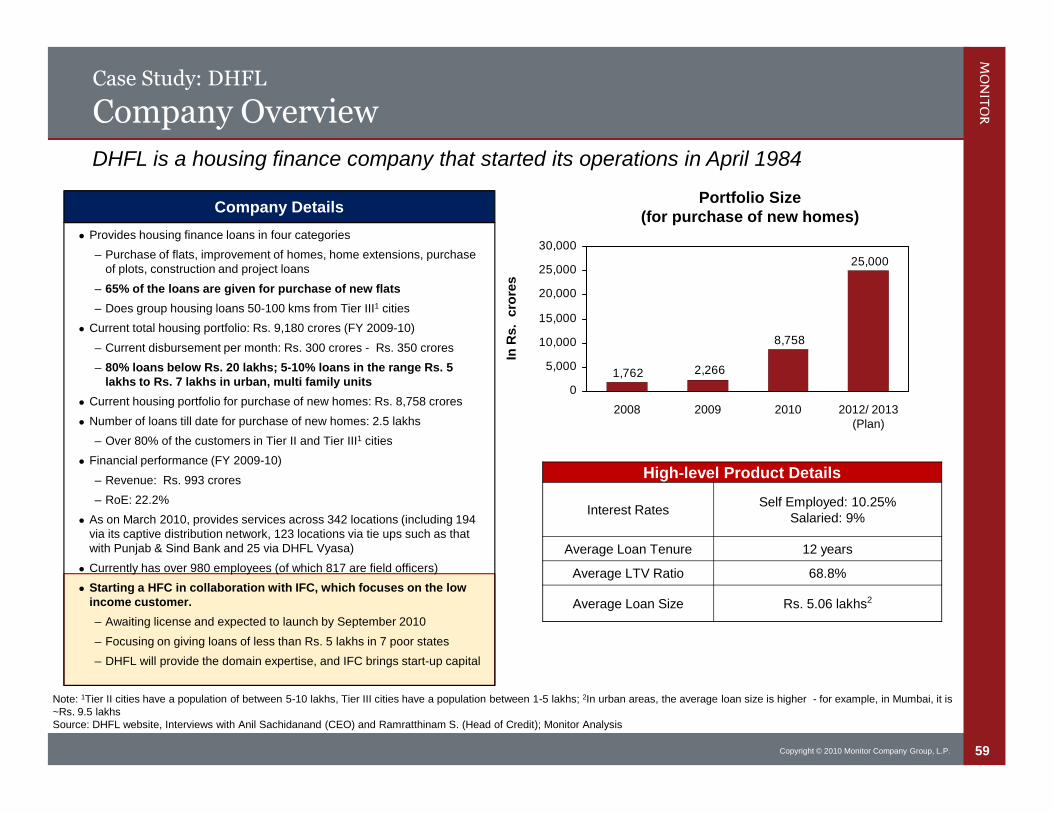
59Copyright © 2010 Monitor Company Group, L.P.
Case Study: DHFL
Company Overview
Company Details
Provides housing finance loans in four categories
– Purchase of flats, improvement of homes, home extensions, purchaseof plots, construction and project loans
– 65% of the loans are given for purchase of new flats
– Does group housing loans 50-100 kms from Tier III1 cities
Current total housing portfolio: Rs. 9,180 crores (FY 2009-10)
– Current disbursement per month: Rs. 300 crores - Rs. 350 crores
– 80% loans below Rs. 20 lakhs; 5-10% loans in the range Rs. 5lakhs to Rs. 7 lakhs in urban, multi family units
Current housing portfolio for purchase of new homes: Rs. 8,758 crores
Number of loans till date for purchase of new homes: 2.5 lakhs
– Over 80% of the customers in Tier II and Tier III1 cities
Financial performance (FY 2009-10)
– Revenue: Rs. 993 crores
– RoE: 22.2%
As on March 2010, provides services across 342 locations (including 194via its captive distribution network, 123 locations via tie ups such as thatwith Punjab & Sind Bank and 25 via DHFL Vyasa)
Currently has over 980 employees (of which 817 are field officers)
Starting a HFC in collaboration with IFC, which focuses on the lowincome customer.
– Awaiting license and expected to launch by September 2010
– Focusing on giving loans of less than Rs. 5 lakhs in 7 poor states
– DHFL will provide the domain expertise, and IFC brings start-up capital
Note: 1Tier II cities have a population of between 5-10 lakhs, Tier III cities have a population between 1-5 lakhs; 2In urban areas, the average loan size is higher - for example, in Mumbai, it is~Rs. 9.5 lakhsSource: DHFL website, Interviews with Anil Sachidanand (CEO) and Ramratthinam S. (Head of Credit); Monitor Analysis
DHFL is a housing finance company that started its operations in April 1984
High-level Product Details
Interest RatesSelf Employed: 10.25%
Salaried: 9%
Average Loan Tenure 12 years
Average LTV Ratio 68.8%
Average Loan Size Rs. 5.06 lakhs2
Portfolio Size(for purchase of new homes)
InR
s.
cro
res
25,000
2,266
8,758
1,762
0
5,000
10,000
15,000
20,000
25,000
30,000
2012/ 2013(Plan)
201020092008
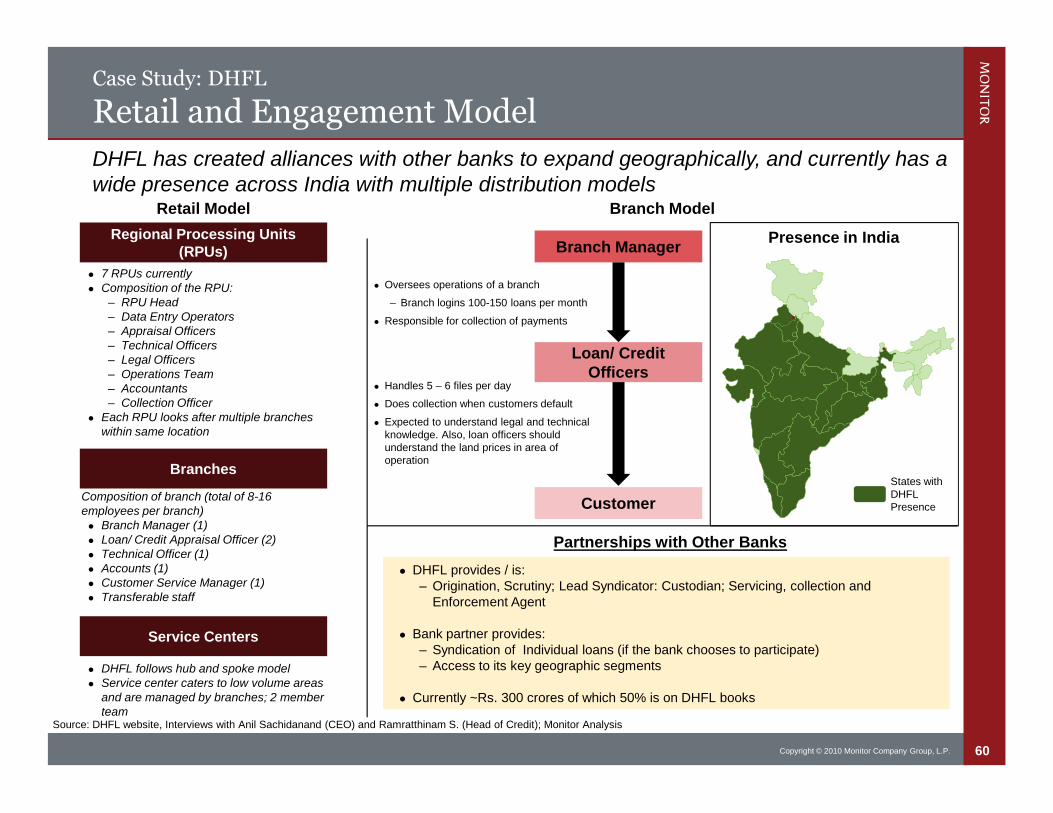
60Copyright © 2010 Monitor Company Group, L.P.
Case Study: DHFL
Retail and Engagement Model
DHFL has created alliances with other banks to expand geographically, and currently has awide presence across India with multiple distribution models
Retail Model
Branch Manager
Loan/ CreditOfficers
Customer
Oversees operations of a branch
– Branch logins 100-150 loans per month
Responsible for collection of payments
Handles 5 – 6 files per day
Does collection when customers default
Expected to understand legal and technicalknowledge. Also, loan officers shouldunderstand the land prices in area ofoperation
Composition of branch (total of 8-16employees per branch) Branch Manager (1) Loan/ Credit Appraisal Officer (2) Technical Officer (1) Accounts (1) Customer Service Manager (1) Transferable staff
Source: DHFL website, Interviews with Anil Sachidanand (CEO) and Ramratthinam S. (Head of Credit); Monitor Analysis
Presence in IndiaRegional Processing Units(RPUs)
7 RPUs currently Composition of the RPU:
– RPU Head– Data Entry Operators– Appraisal Officers– Technical Officers– Legal Officers– Operations Team– Accountants– Collection Officer
Each RPU looks after multiple brancheswithin same location
Branches
Service Centers
DHFL follows hub and spoke model Service center caters to low volume areas
and are managed by branches; 2 memberteam
Branch Model
Partnerships with Other Banks
States withDHFLPresence
DHFL provides / is:– Origination, Scrutiny; Lead Syndicator: Custodian; Servicing, collection and
Enforcement Agent
Bank partner provides:– Syndication of Individual loans (if the bank chooses to participate)– Access to its key geographic segments
Currently ~Rs. 300 crores of which 50% is on DHFL books
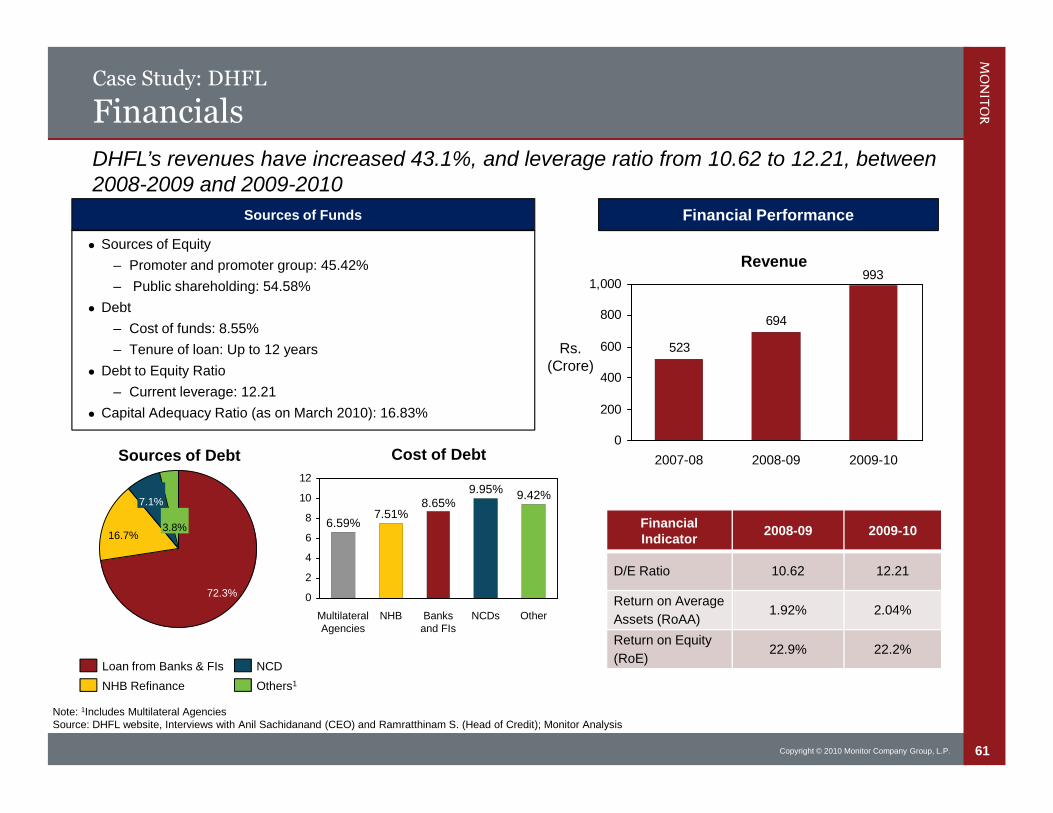
61Copyright © 2010 Monitor Company Group, L.P.
Case Study: DHFL
Financials
Sources of Funds
Sources of Equity
– Promoter and promoter group: 45.42%
– Public shareholding: 54.58%
Debt
– Cost of funds: 8.55%
– Tenure of loan: Up to 12 years
Debt to Equity Ratio
– Current leverage: 12.21
Capital Adequacy Ratio (as on March 2010): 16.83%
DHFL’s revenues have increased 43.1%, and leverage ratio from 10.62 to 12.21, between2008-2009 and 2009-2010
Note: 1Includes Multilateral AgenciesSource: DHFL website, Interviews with Anil Sachidanand (CEO) and Ramratthinam S. (Head of Credit); Monitor Analysis
FinancialIndicator
2008-09 2009-10
D/E Ratio 10.62 12.21
Return on Average
Assets (RoAA)1.92% 2.04%
Return on Equity
(RoE)22.9% 22.2%
Revenue
Financial Performance
993
694
523
0
200
400
600
800
1,000
2009-102008-092007-08
3.8%
7.1%
16.7%
72.3%
Sources of Debt
Others1
NCD
NHB Refinance
Loan from Banks & FIs
Cost of Debt
0
2
4
6
8
10
12
Other
9.42%
NCDs
9.95%
Banksand FIs
NHB
7.51%
MultilateralAgencies
6.59%
8.65%
Rs.(Crore)
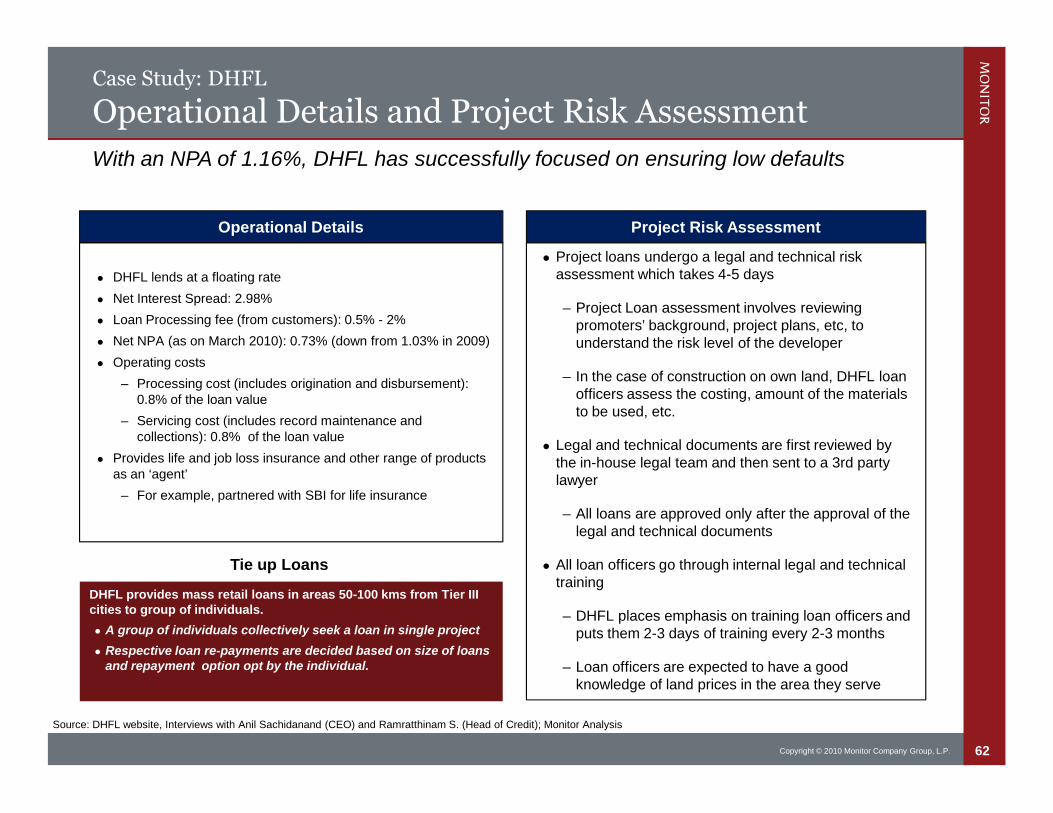
62Copyright © 2010 Monitor Company Group, L.P.
Case Study: DHFL
Operational Details and Project Risk Assessment
Project loans undergo a legal and technical riskassessment which takes 4-5 days
– Project Loan assessment involves reviewingpromoters’ background, project plans, etc, tounderstand the risk level of the developer
– In the case of construction on own land, DHFL loanofficers assess the costing, amount of the materialsto be used, etc.
Legal and technical documents are first reviewed bythe in-house legal team and then sent to a 3rd partylawyer
– All loans are approved only after the approval of thelegal and technical documents
All loan officers go through internal legal and technicaltraining
– DHFL places emphasis on training loan officers andputs them 2-3 days of training every 2-3 months
– Loan officers are expected to have a goodknowledge of land prices in the area they serve
Project Risk AssessmentOperational Details
DHFL lends at a floating rate
Net Interest Spread: 2.98%
Loan Processing fee (from customers): 0.5% - 2%
Net NPA (as on March 2010): 0.73% (down from 1.03% in 2009)
Operating costs
– Processing cost (includes origination and disbursement):0.8% of the loan value
– Servicing cost (includes record maintenance andcollections): 0.8% of the loan value
Provides life and job loss insurance and other range of productsas an ‘agent’
– For example, partnered with SBI for life insurance
With an NPA of 1.16%, DHFL has successfully focused on ensuring low defaults
Source: DHFL website, Interviews with Anil Sachidanand (CEO) and Ramratthinam S. (Head of Credit); Monitor Analysis
Tie up Loans
DHFL provides mass retail loans in areas 50-100 kms from Tier IIIcities to group of individuals.
A group of individuals collectively seek a loan in single project
Respective loan re-payments are decided based on size of loansand repayment option opt by the individual.
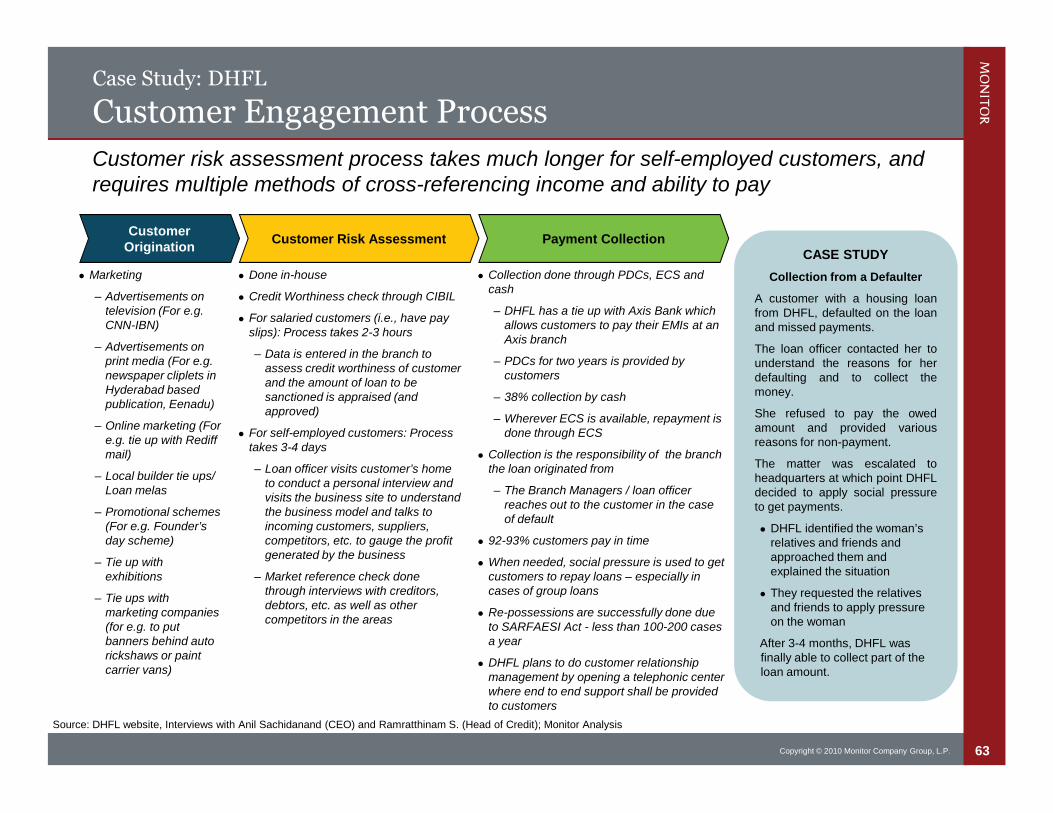
63Copyright © 2010 Monitor Company Group, L.P.
Case Study: DHFL
Customer Engagement Process
CustomerOrigination
Customer Risk Assessment Payment Collection
Customer risk assessment process takes much longer for self-employed customers, andrequires multiple methods of cross-referencing income and ability to pay
Source: DHFL website, Interviews with Anil Sachidanand (CEO) and Ramratthinam S. (Head of Credit); Monitor Analysis
Done in-house
Credit Worthiness check through CIBIL
For salaried customers (i.e., have payslips): Process takes 2-3 hours
– Data is entered in the branch toassess credit worthiness of customerand the amount of loan to besanctioned is appraised (andapproved)
For self-employed customers: Processtakes 3-4 days
– Loan officer visits customer’s hometo conduct a personal interview andvisits the business site to understandthe business model and talks toincoming customers, suppliers,competitors, etc. to gauge the profitgenerated by the business
– Market reference check donethrough interviews with creditors,debtors, etc. as well as othercompetitors in the areas
Collection done through PDCs, ECS andcash
– DHFL has a tie up with Axis Bank whichallows customers to pay their EMIs at anAxis branch
– PDCs for two years is provided bycustomers
– 38% collection by cash
– Wherever ECS is available, repayment isdone through ECS
Collection is the responsibility of the branchthe loan originated from
– The Branch Managers / loan officerreaches out to the customer in the caseof default
92-93% customers pay in time
When needed, social pressure is used to getcustomers to repay loans – especially incases of group loans
Re-possessions are successfully done dueto SARFAESI Act - less than 100-200 casesa year
DHFL plans to do customer relationshipmanagement by opening a telephonic centerwhere end to end support shall be providedto customers
CASE STUDY
Collection from a Defaulter
A customer with a housing loanfrom DHFL, defaulted on the loanand missed payments.
The loan officer contacted her tounderstand the reasons for herdefaulting and to collect themoney.
She refused to pay the owedamount and provided variousreasons for non-payment.
The matter was escalated toheadquarters at which point DHFLdecided to apply social pressureto get payments.
DHFL identified the woman’srelatives and friends andapproached them andexplained the situation
They requested the relativesand friends to apply pressureon the woman
After 3-4 months, DHFL wasfinally able to collect part of theloan amount.
Marketing
– Advertisements ontelevision (For e.g.CNN-IBN)
– Advertisements onprint media (For e.g.newspaper cliplets inHyderabad basedpublication, Eenadu)
– Online marketing (Fore.g. tie up with Rediffmail)
– Local builder tie ups/Loan melas
– Promotional schemes(For e.g. Founder’sday scheme)
– Tie up withexhibitions
– Tie ups withmarketing companies(for e.g. to putbanners behind autorickshaws or paintcarrier vans)
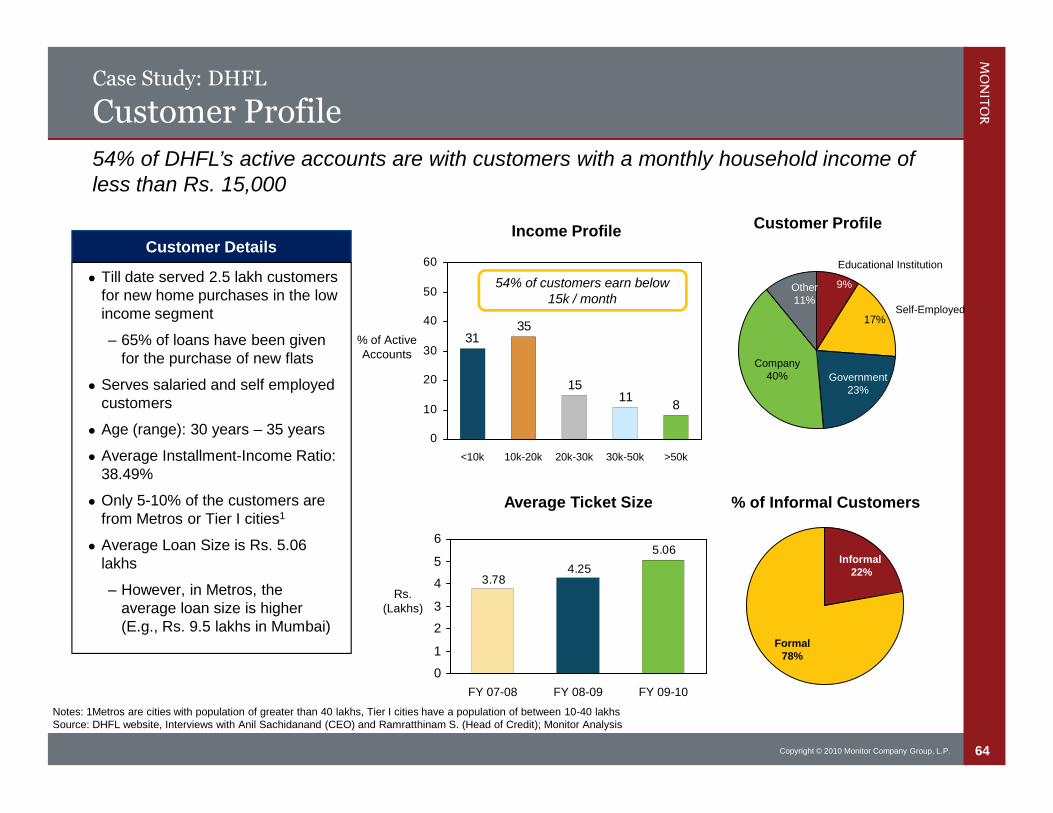
64Copyright © 2010 Monitor Company Group, L.P.
Case Study: DHFL
Customer Profile
Customer Details
Till date served 2.5 lakh customersfor new home purchases in the lowincome segment
– 65% of loans have been givenfor the purchase of new flats
Serves salaried and self employedcustomers
Age (range): 30 years – 35 years
Average Installment-Income Ratio:38.49%
Only 5-10% of the customers arefrom Metros or Tier I cities1
Average Loan Size is Rs. 5.06lakhs
– However, in Metros, theaverage loan size is higher(E.g., Rs. 9.5 lakhs in Mumbai)
811
15
3531
0
10
20
30
40
50
60
>50k30k-50k20k-30k10k-20k<10k
Income Profile
Formal78%
Informal22%
% of Informal Customers
54% of DHFL’s active accounts are with customers with a monthly household income ofless than Rs. 15,000
Notes: 1Metros are cities with population of greater than 40 lakhs, Tier I cities have a population of between 10-40 lakhsSource: DHFL website, Interviews with Anil Sachidanand (CEO) and Ramratthinam S. (Head of Credit); Monitor Analysis
5.06
4.253.78
0
1
2
3
4
5
6
FY 09-10FY 08-09FY 07-08
Average Ticket Size
17%
9%Other11%
Company40% Government
23%
Customer Profile
Self-Employed
Educational Institution
Rs.(Lakhs)
% of ActiveAccounts
54% of customers earn below15k / month
65Copyright © 2010 Monitor Company Group, L.P.
Contents
Summary of Findings
Market Overview
LIH Developers: Operations, Commercial Viability and Marketability
Housing Finance Companies: Operations and Commercial Viability
– Case Study: MAS
– Case Study: DHFL
– Commercial Viability
Appendix
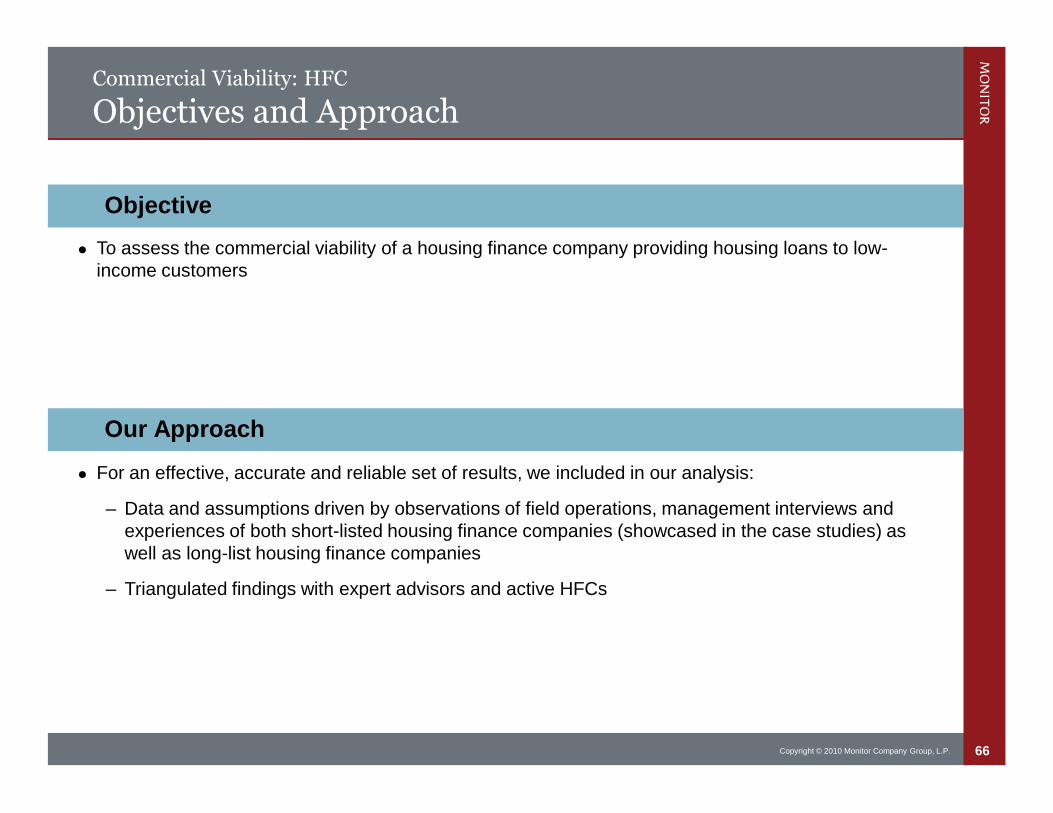
66Copyright © 2010 Monitor Company Group, L.P.
Commercial Viability: HFC
Objectives and Approach
Objective
Our Approach
To assess the commercial viability of a housing finance company providing housing loans to low-income customers
For an effective, accurate and reliable set of results, we included in our analysis:
– Data and assumptions driven by observations of field operations, management interviews andexperiences of both short-listed housing finance companies (showcased in the case studies) aswell as long-list housing finance companies
– Triangulated findings with expert advisors and active HFCs
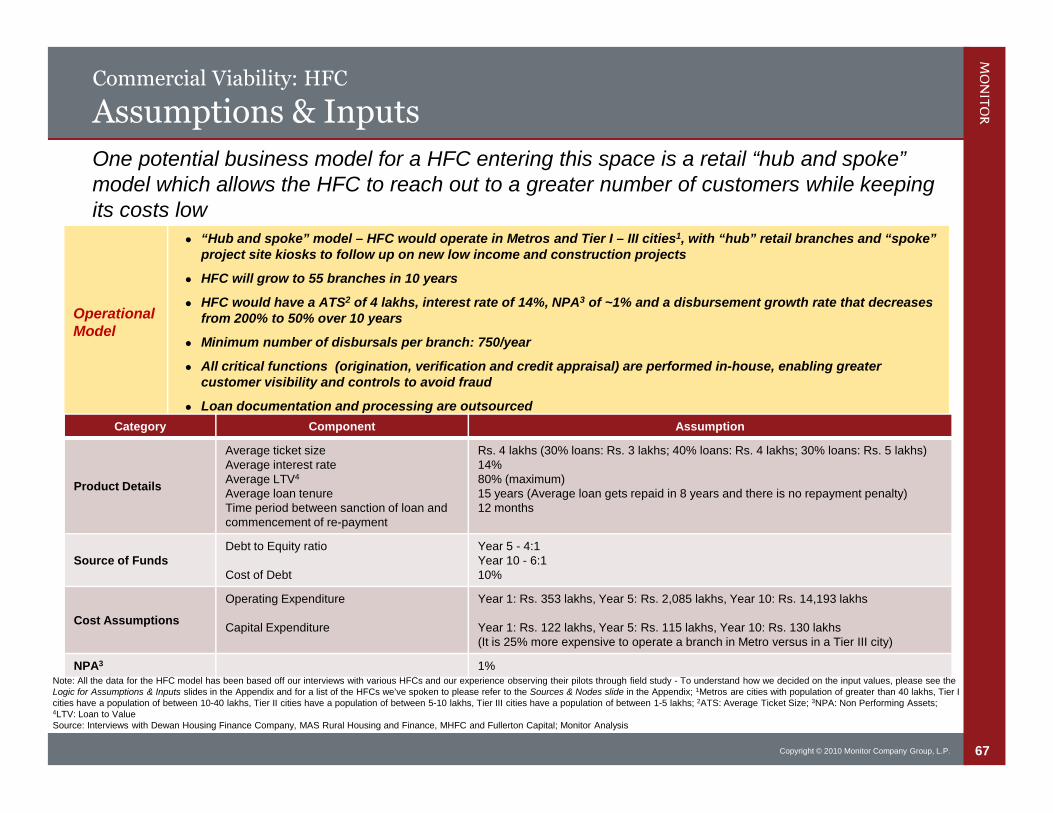
67Copyright © 2010 Monitor Company Group, L.P.
Commercial Viability: HFC
Assumptions & Inputs
OperationalModel
“Hub and spoke” model – HFC would operate in Metros and Tier I – III cities1, with “hub” retail branches and “spoke”project site kiosks to follow up on new low income and construction projects
HFC will grow to 55 branches in 10 years
HFC would have a ATS2 of 4 lakhs, interest rate of 14%, NPA3 of ~1% and a disbursement growth rate that decreasesfrom 200% to 50% over 10 years
Minimum number of disbursals per branch: 750/year
All critical functions (origination, verification and credit appraisal) are performed in-house, enabling greatercustomer visibility and controls to avoid fraud
Loan documentation and processing are outsourced
One potential business model for a HFC entering this space is a retail “hub and spoke”model which allows the HFC to reach out to a greater number of customers while keepingits costs low
Category Component Assumption
Product Details
Average ticket sizeAverage interest rateAverage LTV4
Average loan tenureTime period between sanction of loan andcommencement of re-payment
Rs. 4 lakhs (30% loans: Rs. 3 lakhs; 40% loans: Rs. 4 lakhs; 30% loans: Rs. 5 lakhs)14%80% (maximum)15 years (Average loan gets repaid in 8 years and there is no repayment penalty)12 months
Source of FundsDebt to Equity ratio
Cost of Debt
Year 5 - 4:1Year 10 - 6:110%
Cost Assumptions
Operating Expenditure
Capital Expenditure
Year 1: Rs. 353 lakhs, Year 5: Rs. 2,085 lakhs, Year 10: Rs. 14,193 lakhs
Year 1: Rs. 122 lakhs, Year 5: Rs. 115 lakhs, Year 10: Rs. 130 lakhs(It is 25% more expensive to operate a branch in Metro versus in a Tier III city)
NPA3 1%Note: All the data for the HFC model has been based off our interviews with various HFCs and our experience observing their pilots through field study - To understand how we decided on the input values, please see theLogic for Assumptions & Inputs slides in the Appendix and for a list of the HFCs we’ve spoken to please refer to the Sources & Nodes slide in the Appendix; 1Metros are cities with population of greater than 40 lakhs, Tier Icities have a population of between 10-40 lakhs, Tier II cities have a population of between 5-10 lakhs, Tier III cities have a population of between 1-5 lakhs; 2ATS: Average Ticket Size; 3NPA: Non Performing Assets;4LTV: Loan to ValueSource: Interviews with Dewan Housing Finance Company, MAS Rural Housing and Finance, MHFC and Fullerton Capital; Monitor Analysis
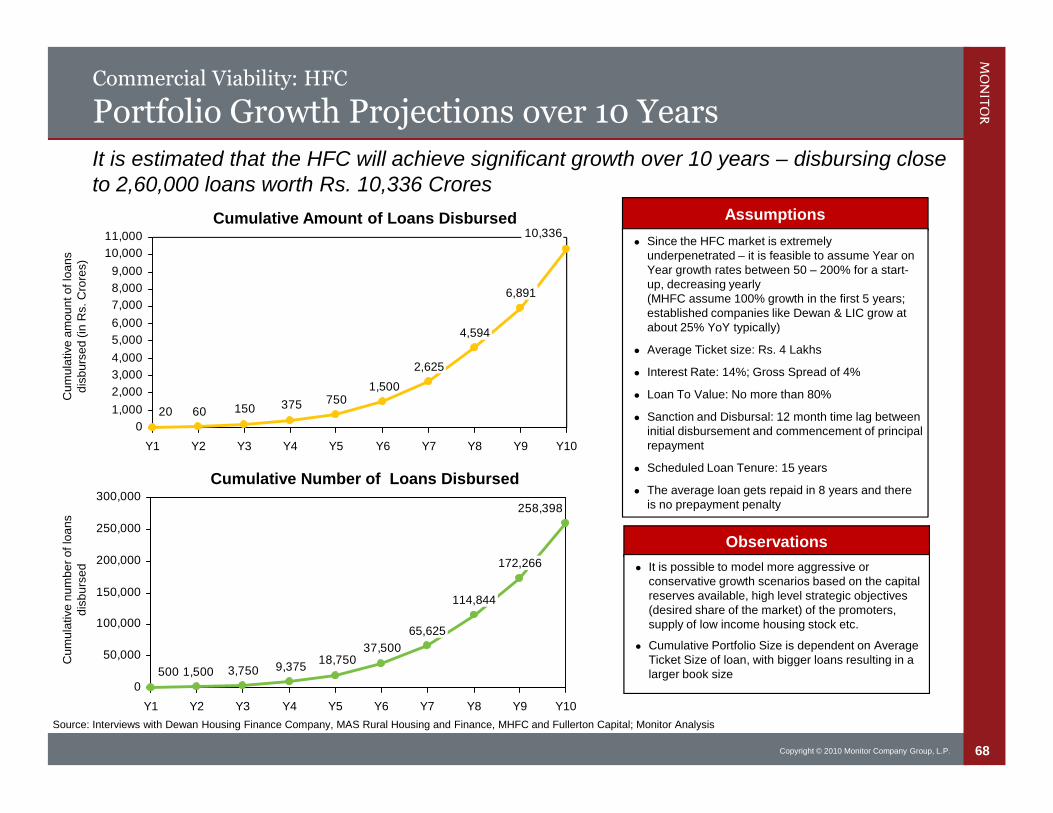
68Copyright © 2010 Monitor Company Group, L.P.
Commercial Viability: HFC
Portfolio Growth Projections over 10 Years
10,336
1,5007503751506020
0
1,000
2,000
3,000
4,000
5,000
6,000
7,000
8,000
9,000
10,000
11,000
Y10Y9
6,891
Y8
4,594
Y7
2,625
Y6Y5Y4Y3Y2Y1
Cu
mu
lative
am
ou
nto
flo
an
sd
isb
urs
ed
(in
Rs.C
rore
s)
It is estimated that the HFC will achieve significant growth over 10 years – disbursing closeto 2,60,000 loans worth Rs. 10,336 Crores
258,398
37,50018,750
9,3753,7501,5005000
50,000
100,000
150,000
200,000
250,000
300,000
Y10Y9
172,266
Y8
114,844
Y7
65,625
Y6Y5Y4Y3Y2Y1
Cumulative Amount of Loans Disbursed
Cu
mu
lative
nu
mb
er
oflo
an
sd
isb
urs
ed
Source: Interviews with Dewan Housing Finance Company, MAS Rural Housing and Finance, MHFC and Fullerton Capital; Monitor Analysis
Cumulative Number of Loans Disbursed
Assumptions
Since the HFC market is extremelyunderpenetrated – it is feasible to assume Year onYear growth rates between 50 – 200% for a start-up, decreasing yearly(MHFC assume 100% growth in the first 5 years;established companies like Dewan & LIC grow atabout 25% YoY typically)
Average Ticket size: Rs. 4 Lakhs
Interest Rate: 14%; Gross Spread of 4%
Loan To Value: No more than 80%
Sanction and Disbursal: 12 month time lag betweeninitial disbursement and commencement of principalrepayment
Scheduled Loan Tenure: 15 years
The average loan gets repaid in 8 years and thereis no prepayment penalty
Observations
It is possible to model more aggressive orconservative growth scenarios based on the capitalreserves available, high level strategic objectives(desired share of the market) of the promoters,supply of low income housing stock etc.
Cumulative Portfolio Size is dependent on AverageTicket Size of loan, with bigger loans resulting in alarger book size
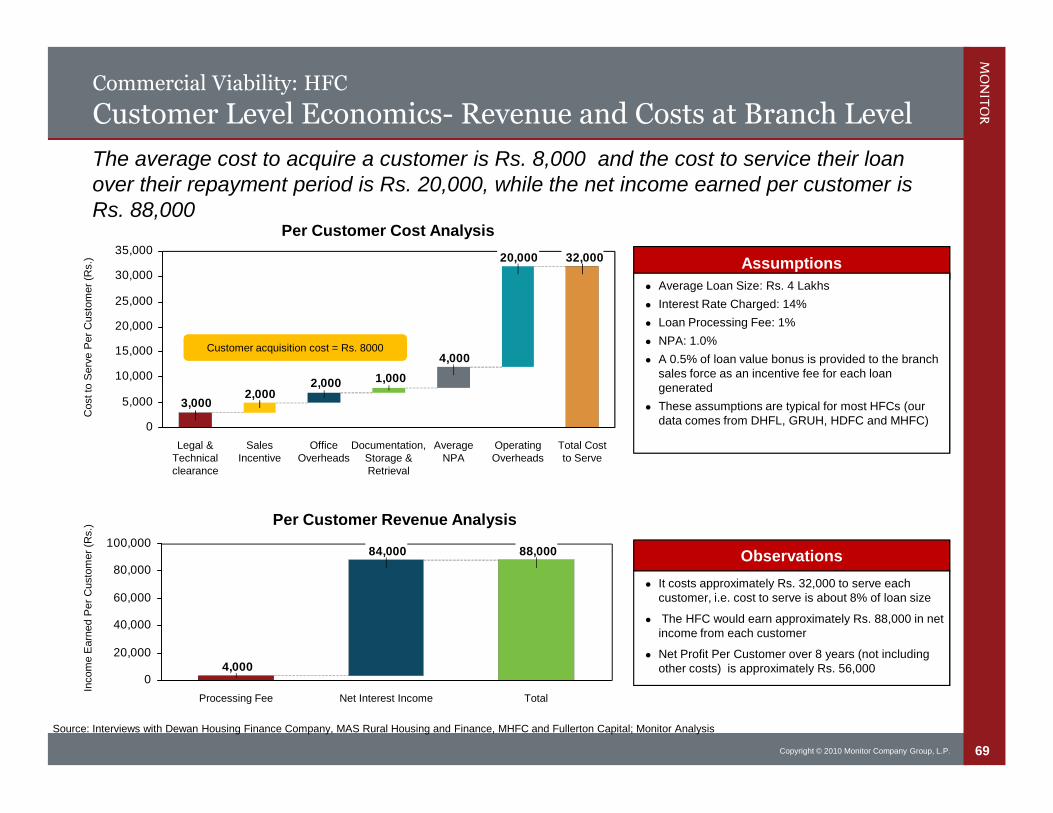
69Copyright © 2010 Monitor Company Group, L.P.
Commercial Viability: HFC
Customer Level Economics- Revenue and Costs at Branch Level
The average cost to acquire a customer is Rs. 8,000 and the cost to service their loanover their repayment period is Rs. 20,000, while the net income earned per customer isRs. 88,000
Source: Interviews with Dewan Housing Finance Company, MAS Rural Housing and Finance, MHFC and Fullerton Capital; Monitor Analysis
Per Customer Cost Analysis
Costto
Serv
eP
er
Custo
mer
(Rs.)
Incom
eE
arn
ed
Per
Custo
mer
(Rs.)
88,00084,000
4,0000
20,000
40,000
60,000
80,000
100,000
TotalNet Interest IncomeProcessing Fee
Per Customer Revenue Analysis
32,00020,000
4,000
1,0002,0002,000
3,000
0
5,000
10,000
15,000
20,000
25,000
30,000
35,000
OfficeOverheads
Documentation,Storage &Retrieval
SalesIncentive
Legal &Technicalclearance
Total Costto Serve
OperatingOverheads
AverageNPA
Assumptions
Average Loan Size: Rs. 4 Lakhs
Interest Rate Charged: 14%
Loan Processing Fee: 1%
NPA: 1.0%
A 0.5% of loan value bonus is provided to the branchsales force as an incentive fee for each loangenerated
These assumptions are typical for most HFCs (ourdata comes from DHFL, GRUH, HDFC and MHFC)
Observations
It costs approximately Rs. 32,000 to serve eachcustomer, i.e. cost to serve is about 8% of loan size
The HFC would earn approximately Rs. 88,000 in netincome from each customer
Net Profit Per Customer over 8 years (not includingother costs) is approximately Rs. 56,000
Customer acquisition cost = Rs. 8000
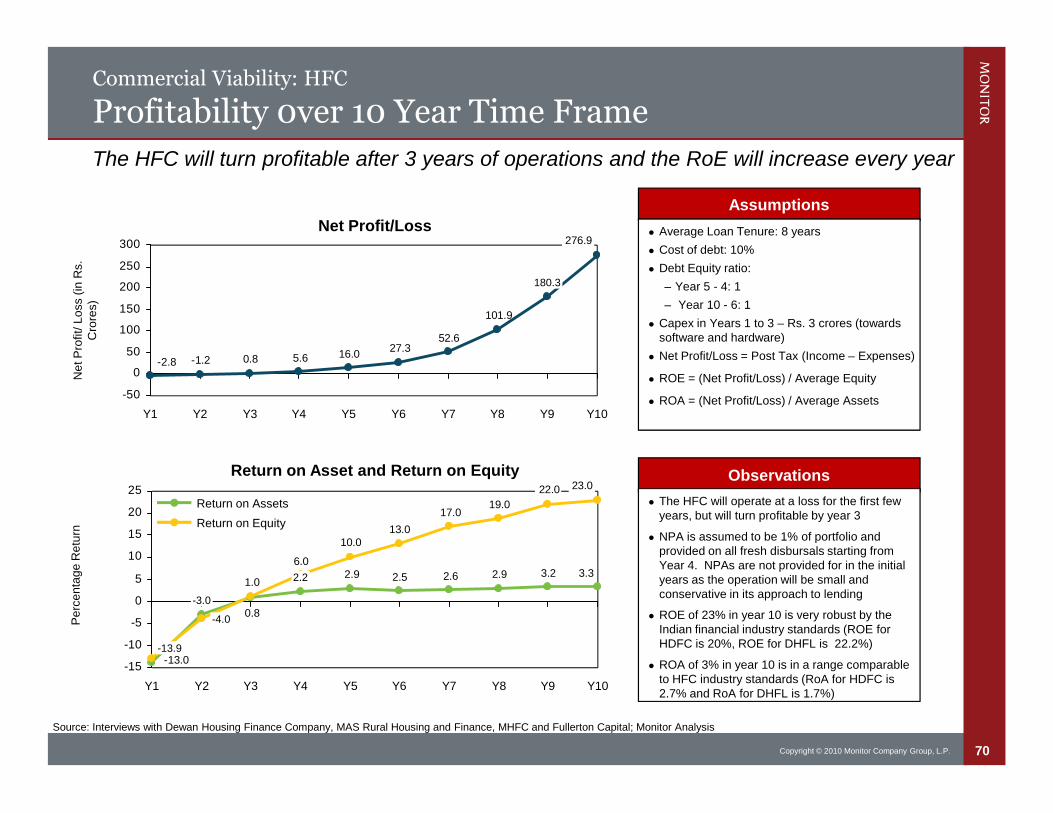
70Copyright © 2010 Monitor Company Group, L.P.
Commercial Viability: HFC
Profitability 0ver 10 Year Time Frame
101.9
52.627.3
16.05.60.8-1.2-2.8
276.9
-50
0
50
100
150
200
250
300
Y10Y9
180.3
Y8Y7Y6Y5Y4Y3Y2Y1
Ne
tP
rofit/
Lo
ss
(in
Rs.
Cro
res)
The HFC will turn profitable after 3 years of operations and the RoE will increase every year
3.33.22.92.62.52.9
0.8
23.022.0
19.017.0
13.010.0
6.0
1.0
-13.0-15
-10
-5
0
5
10
15
20
25
Y10Y9Y8Y7Y6Y5
-13.9
-3.0
Y4
2.2
Y3Y2Y1
-4.0
Net Profit/Loss
Return on Asset and Return on Equity
Pe
rce
nta
ge
Re
turn
Return on Equity
Return on Assets
Source: Interviews with Dewan Housing Finance Company, MAS Rural Housing and Finance, MHFC and Fullerton Capital; Monitor Analysis
Assumptions
Average Loan Tenure: 8 years
Cost of debt: 10%
Debt Equity ratio:
– Year 5 - 4: 1
– Year 10 - 6: 1
Capex in Years 1 to 3 – Rs. 3 crores (towardssoftware and hardware)
Net Profit/Loss = Post Tax (Income – Expenses)
ROE = (Net Profit/Loss) / Average Equity
ROA = (Net Profit/Loss) / Average Assets
Observations
The HFC will operate at a loss for the first fewyears, but will turn profitable by year 3
NPA is assumed to be 1% of portfolio andprovided on all fresh disbursals starting fromYear 4. NPAs are not provided for in the initialyears as the operation will be small andconservative in its approach to lending
ROE of 23% in year 10 is very robust by theIndian financial industry standards (ROE forHDFC is 20%, ROE for DHFL is 22.2%)
ROA of 3% in year 10 is in a range comparableto HFC industry standards (RoA for HDFC is2.7% and RoA for DHFL is 1.7%)
71Copyright © 2010 Monitor Company Group, L.P.
Contents
Summary of Findings
Market Overview
Low Income Developers: Operations, Commercial Viability and Marketability
Housing Finance Companies: Operations and Commercial Viability
Appendix
– Project Overview
– Nodes & Sources
– Logic for Assumptions & Inputs
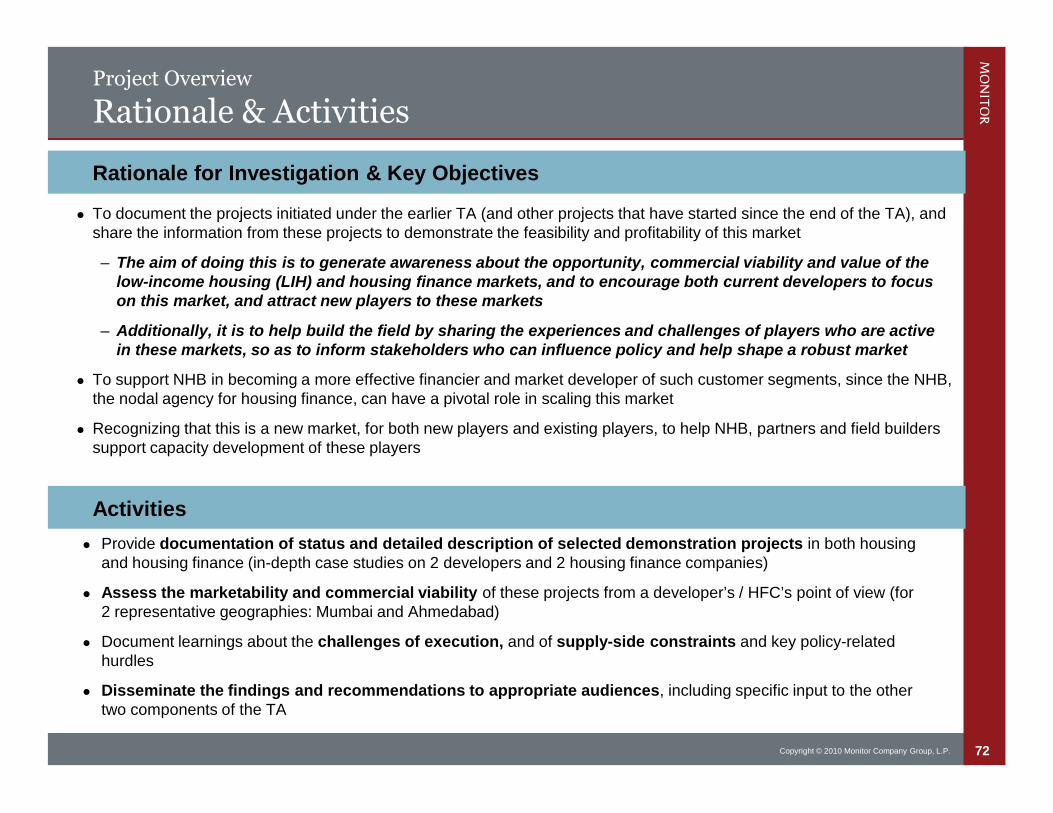
72Copyright © 2010 Monitor Company Group, L.P.
Project Overview
Rationale & Activities
To document the projects initiated under the earlier TA (and other projects that have started since the end of the TA), andshare the information from these projects to demonstrate the feasibility and profitability of this market
– The aim of doing this is to generate awareness about the opportunity, commercial viability and value of thelow-income housing (LIH) and housing finance markets, and to encourage both current developers to focuson this market, and attract new players to these markets
– Additionally, it is to help build the field by sharing the experiences and challenges of players who are activein these markets, so as to inform stakeholders who can influence policy and help shape a robust market
To support NHB in becoming a more effective financier and market developer of such customer segments, since the NHB,the nodal agency for housing finance, can have a pivotal role in scaling this market
Recognizing that this is a new market, for both new players and existing players, to help NHB, partners and field builderssupport capacity development of these players
Rationale for Investigation & Key Objectives
Activities
Provide documentation of status and detailed description of selected demonstration projects in both housingand housing finance (in-depth case studies on 2 developers and 2 housing finance companies)
Assess the marketability and commercial viability of these projects from a developer’s / HFC’s point of view (for2 representative geographies: Mumbai and Ahmedabad)
Document learnings about the challenges of execution, and of supply-side constraints and key policy-relatedhurdles
Disseminate the findings and recommendations to appropriate audiences, including specific input to the othertwo components of the TA
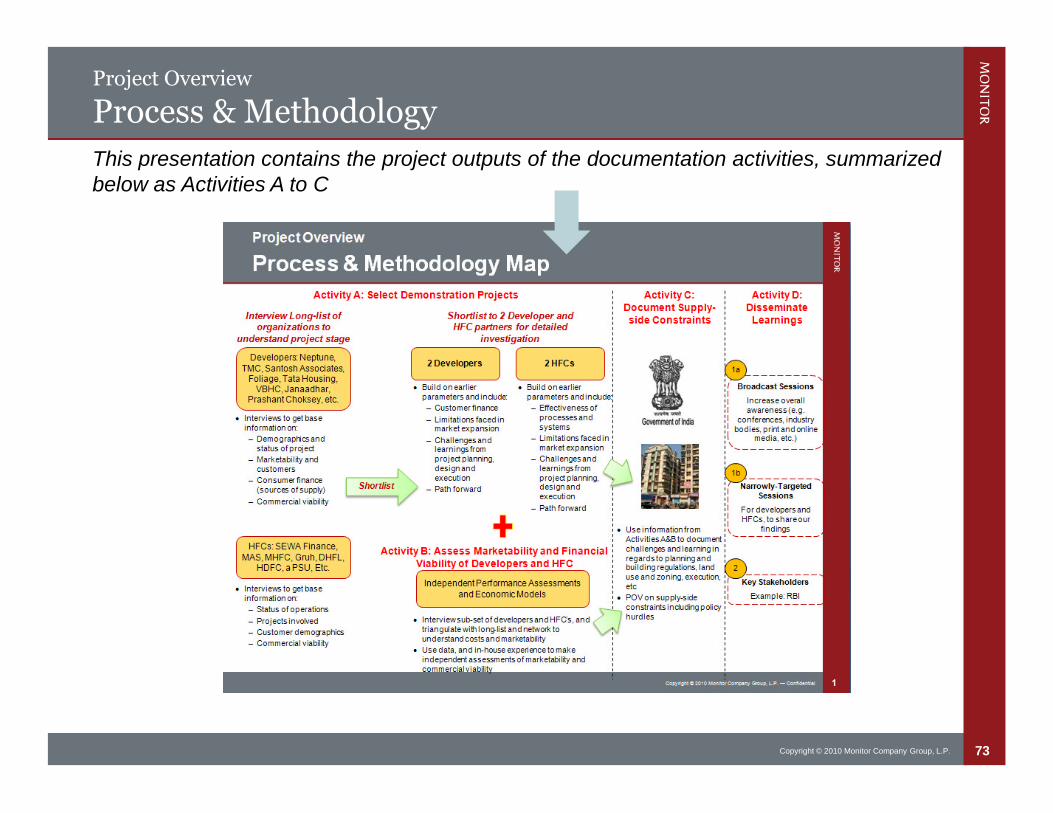
73Copyright © 2010 Monitor Company Group, L.P.
Project Overview
Process & Methodology
This presentation contains the project outputs of the documentation activities, summarizedbelow as Activities A to C

74Copyright © 2010 Monitor Company Group, L.P.
Contents
Summary of Findings
Market Overview
Low Income Developers: Operations, Commercial Viability and Marketability
Housing Finance Companies: Operations and Commercial Viability
Appendix
– Project Overview
– Nodes & Sources
– Logic for Assumptions & Inputs
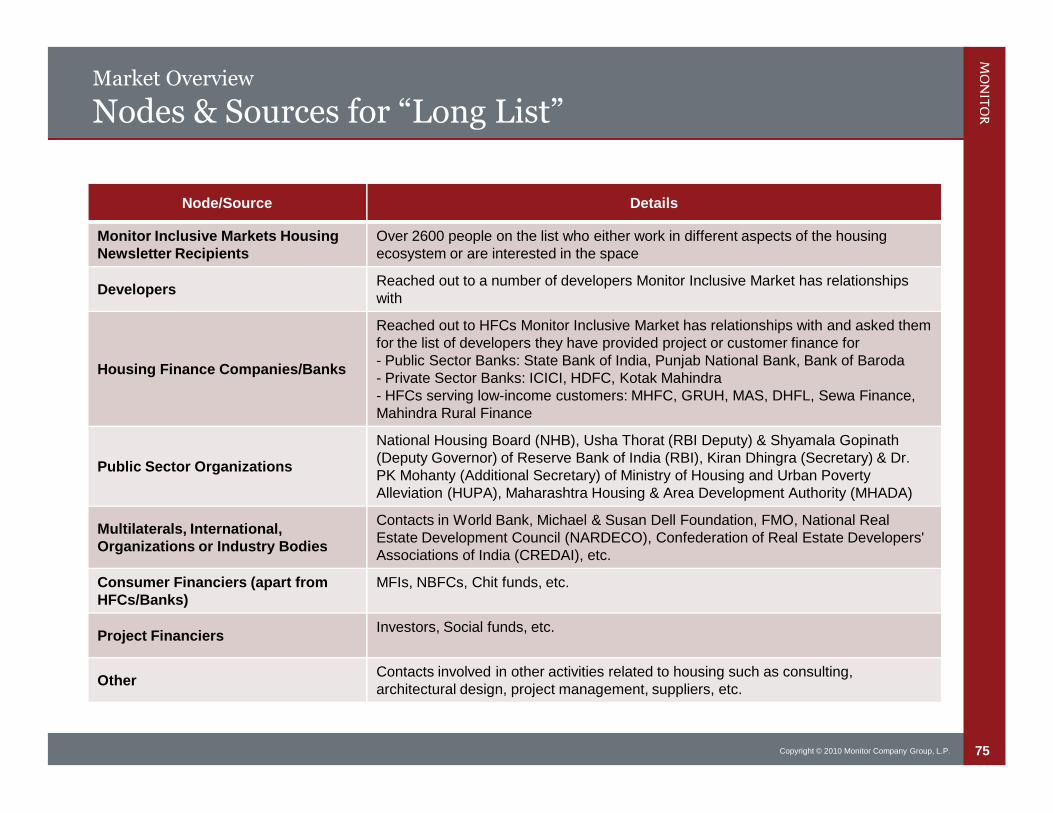
75Copyright © 2010 Monitor Company Group, L.P.
Market Overview
Nodes & Sources for “Long List”
Node/Source Details
Monitor Inclusive Markets HousingNewsletter Recipients
Over 2600 people on the list who either work in different aspects of the housingecosystem or are interested in the space
DevelopersReached out to a number of developers Monitor Inclusive Market has relationshipswith
Housing Finance Companies/Banks
Reached out to HFCs Monitor Inclusive Market has relationships with and asked themfor the list of developers they have provided project or customer finance for- Public Sector Banks: State Bank of India, Punjab National Bank, Bank of Baroda- Private Sector Banks: ICICI, HDFC, Kotak Mahindra- HFCs serving low-income customers: MHFC, GRUH, MAS, DHFL, Sewa Finance,Mahindra Rural Finance
Public Sector Organizations
National Housing Board (NHB), Usha Thorat (RBI Deputy) & Shyamala Gopinath(Deputy Governor) of Reserve Bank of India (RBI), Kiran Dhingra (Secretary) & Dr.PK Mohanty (Additional Secretary) of Ministry of Housing and Urban PovertyAlleviation (HUPA), Maharashtra Housing & Area Development Authority (MHADA)
Multilaterals, International,Organizations or Industry Bodies
Contacts in World Bank, Michael & Susan Dell Foundation, FMO, National RealEstate Development Council (NARDECO), Confederation of Real Estate Developers'Associations of India (CREDAI), etc.
Consumer Financiers (apart fromHFCs/Banks)
MFIs, NBFCs, Chit funds, etc.
Project FinanciersInvestors, Social funds, etc.
OtherContacts involved in other activities related to housing such as consulting,architectural design, project management, suppliers, etc.
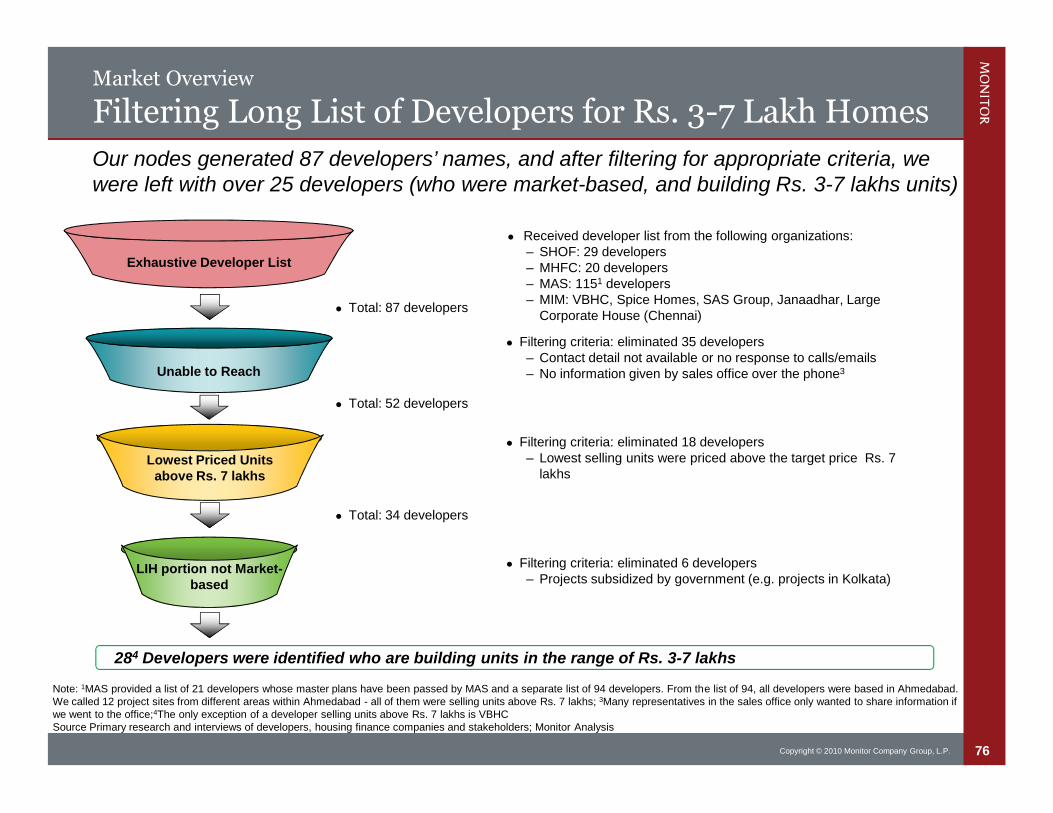
76Copyright © 2010 Monitor Company Group, L.P.
Market Overview
Filtering Long List of Developers for Rs. 3-7 Lakh Homes
Unable to Reach
Total: 52 developers
Lowest Priced Unitsabove Rs. 7 lakhs
LIH portion not Market-based
Exhaustive Developer List
Received developer list from the following organizations:– SHOF: 29 developers– MHFC: 20 developers– MAS: 1151 developers– MIM: VBHC, Spice Homes, SAS Group, Janaadhar, Large
Corporate House (Chennai)
Filtering criteria: eliminated 35 developers– Contact detail not available or no response to calls/emails– No information given by sales office over the phone3
Filtering criteria: eliminated 18 developers– Lowest selling units were priced above the target price Rs. 7
lakhs
Filtering criteria: eliminated 6 developers– Projects subsidized by government (e.g. projects in Kolkata)
Our nodes generated 87 developers’ names, and after filtering for appropriate criteria, wewere left with over 25 developers (who were market-based, and building Rs. 3-7 lakhs units)
Note: 1MAS provided a list of 21 developers whose master plans have been passed by MAS and a separate list of 94 developers. From the list of 94, all developers were based in Ahmedabad.We called 12 project sites from different areas within Ahmedabad - all of them were selling units above Rs. 7 lakhs; 3Many representatives in the sales office only wanted to share information ifwe went to the office;4The only exception of a developer selling units above Rs. 7 lakhs is VBHCSource Primary research and interviews of developers, housing finance companies and stakeholders; Monitor Analysis
Total: 34 developers
284 Developers were identified who are building units in the range of Rs. 3-7 lakhs
Total: 87 developers

77Copyright © 2010 Monitor Company Group, L.P.
Contents
Summary of Findings
Market Overview
Low Income Developers: Operations, Commercial Viability and Marketability
Housing Finance Companies: Operations and Commercial Viability
Appendix
– Project Overview
– Nodes & Sources
– Logic for Assumptions & Inputs
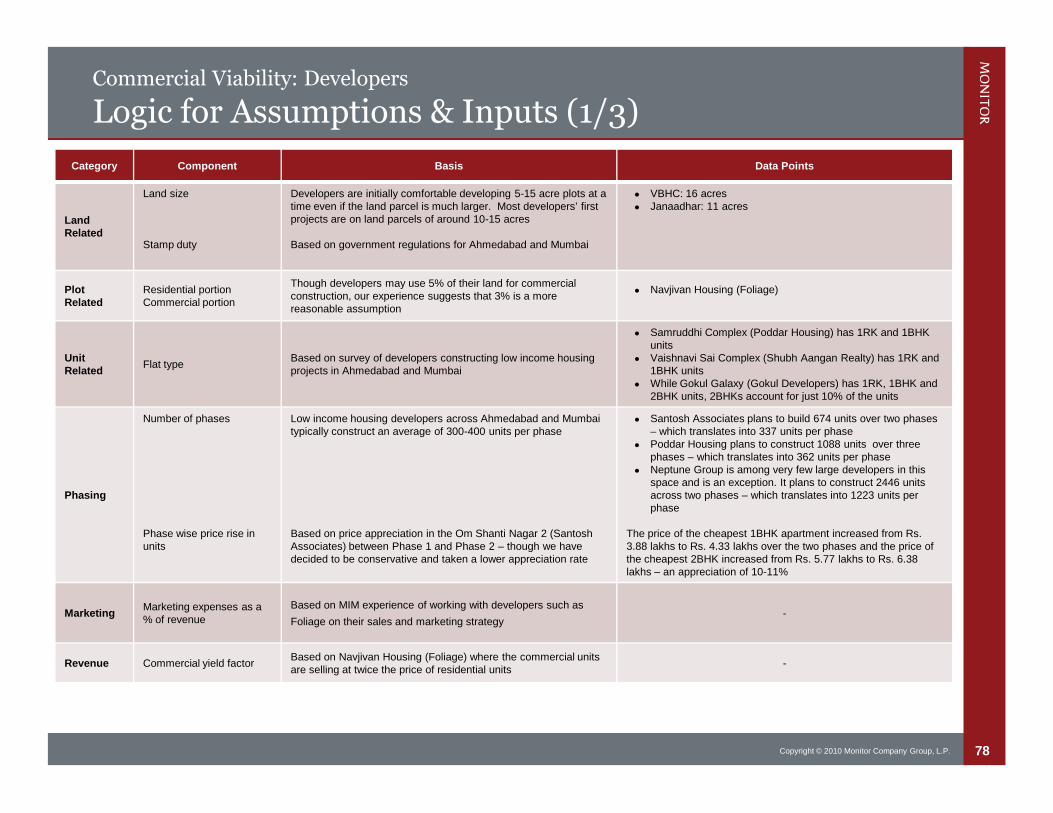
78Copyright © 2010 Monitor Company Group, L.P.
Commercial Viability: Developers
Logic for Assumptions & Inputs (1/3)
Category Component Basis Data Points
LandRelated
Land size
Stamp duty
Developers are initially comfortable developing 5-15 acre plots at atime even if the land parcel is much larger. Most developers’ firstprojects are on land parcels of around 10-15 acres
Based on government regulations for Ahmedabad and Mumbai
VBHC: 16 acres Janaadhar: 11 acres
PlotRelated
Residential portionCommercial portion
Though developers may use 5% of their land for commercialconstruction, our experience suggests that 3% is a morereasonable assumption
Navjivan Housing (Foliage)
UnitRelated
Flat typeBased on survey of developers constructing low income housingprojects in Ahmedabad and Mumbai
Samruddhi Complex (Poddar Housing) has 1RK and 1BHKunits
Vaishnavi Sai Complex (Shubh Aangan Realty) has 1RK and1BHK units
While Gokul Galaxy (Gokul Developers) has 1RK, 1BHK and2BHK units, 2BHKs account for just 10% of the units
Phasing
Number of phases
Phase wise price rise inunits
Low income housing developers across Ahmedabad and Mumbaitypically construct an average of 300-400 units per phase
Based on price appreciation in the Om Shanti Nagar 2 (SantoshAssociates) between Phase 1 and Phase 2 – though we havedecided to be conservative and taken a lower appreciation rate
Santosh Associates plans to build 674 units over two phases– which translates into 337 units per phase
Poddar Housing plans to construct 1088 units over threephases – which translates into 362 units per phase
Neptune Group is among very few large developers in thisspace and is an exception. It plans to construct 2446 unitsacross two phases – which translates into 1223 units perphase
The price of the cheapest 1BHK apartment increased from Rs.3.88 lakhs to Rs. 4.33 lakhs over the two phases and the price ofthe cheapest 2BHK increased from Rs. 5.77 lakhs to Rs. 6.38lakhs – an appreciation of 10-11%
MarketingMarketing expenses as a% of revenue
Based on MIM experience of working with developers such as
Foliage on their sales and marketing strategy-
Revenue Commercial yield factorBased on Navjivan Housing (Foliage) where the commercial unitsare selling at twice the price of residential units
-
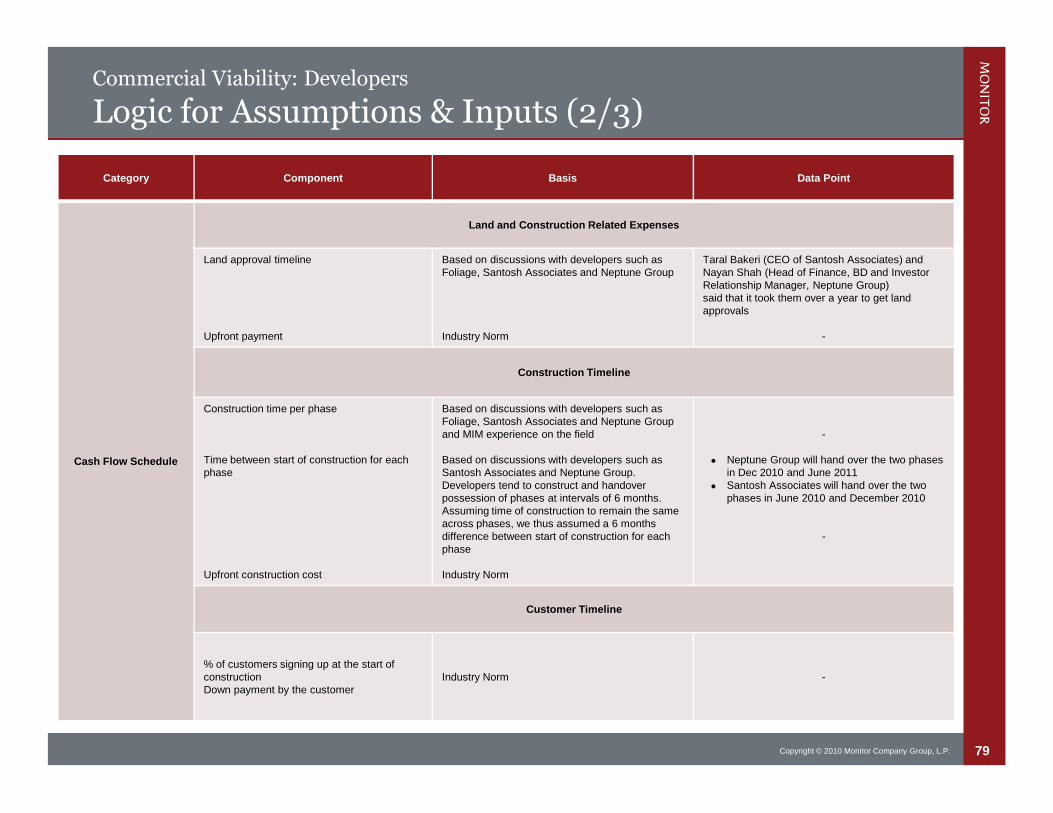
79Copyright © 2010 Monitor Company Group, L.P.
Commercial Viability: Developers
Logic for Assumptions & Inputs (2/3)
Category Component Basis Data Point
Cash Flow Schedule
Land and Construction Related Expenses
Land approval timeline
Upfront payment
Based on discussions with developers such asFoliage, Santosh Associates and Neptune Group
Industry Norm
Taral Bakeri (CEO of Santosh Associates) andNayan Shah (Head of Finance, BD and InvestorRelationship Manager, Neptune Group)said that it took them over a year to get landapprovals
-
Construction Timeline
Construction time per phase
Time between start of construction for eachphase
Upfront construction cost
Based on discussions with developers such asFoliage, Santosh Associates and Neptune Groupand MIM experience on the field
Based on discussions with developers such asSantosh Associates and Neptune Group.Developers tend to construct and handoverpossession of phases at intervals of 6 months.Assuming time of construction to remain the sameacross phases, we thus assumed a 6 monthsdifference between start of construction for eachphase
Industry Norm
-
Neptune Group will hand over the two phasesin Dec 2010 and June 2011
Santosh Associates will hand over the twophases in June 2010 and December 2010
-
Customer Timeline
% of customers signing up at the start ofconstructionDown payment by the customer
Industry Norm -
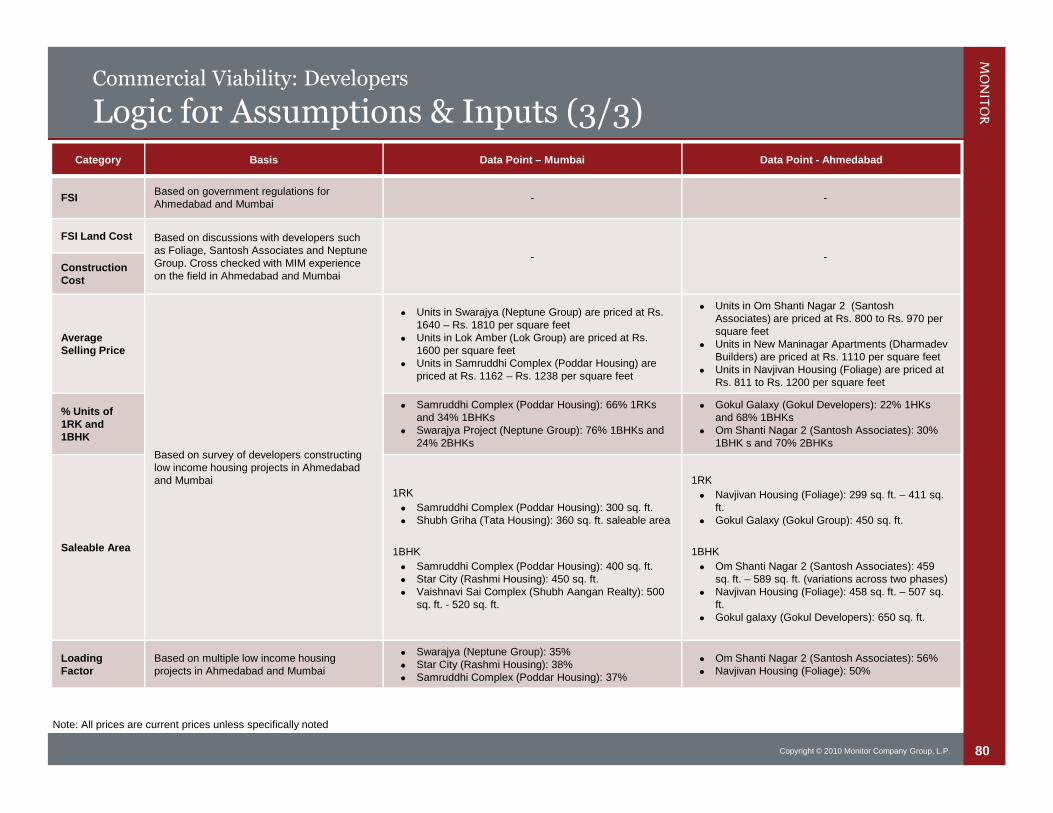
80Copyright © 2010 Monitor Company Group, L.P.
Commercial Viability: Developers
Logic for Assumptions & Inputs (3/3)Category Basis Data Point – Mumbai Data Point - Ahmedabad
FSIBased on government regulations forAhmedabad and Mumbai
- -
FSI Land Cost Based on discussions with developers suchas Foliage, Santosh Associates and NeptuneGroup. Cross checked with MIM experienceon the field in Ahmedabad and Mumbai
- -ConstructionCost
AverageSelling Price
Based on survey of developers constructinglow income housing projects in Ahmedabadand Mumbai
Units in Swarajya (Neptune Group) are priced at Rs.1640 – Rs. 1810 per square feet
Units in Lok Amber (Lok Group) are priced at Rs.1600 per square feet
Units in Samruddhi Complex (Poddar Housing) arepriced at Rs. 1162 – Rs. 1238 per square feet
Units in Om Shanti Nagar 2 (SantoshAssociates) are priced at Rs. 800 to Rs. 970 persquare feet
Units in New Maninagar Apartments (DharmadevBuilders) are priced at Rs. 1110 per square feet
Units in Navjivan Housing (Foliage) are priced atRs. 811 to Rs. 1200 per square feet
% Units of1RK and1BHK
Samruddhi Complex (Poddar Housing): 66% 1RKsand 34% 1BHKs
Swarajya Project (Neptune Group): 76% 1BHKs and24% 2BHKs
Gokul Galaxy (Gokul Developers): 22% 1HKsand 68% 1BHKs
Om Shanti Nagar 2 (Santosh Associates): 30%1BHK s and 70% 2BHKs
Saleable Area
1RK
Samruddhi Complex (Poddar Housing): 300 sq. ft. Shubh Griha (Tata Housing): 360 sq. ft. saleable area
1BHK
Samruddhi Complex (Poddar Housing): 400 sq. ft. Star City (Rashmi Housing): 450 sq. ft. Vaishnavi Sai Complex (Shubh Aangan Realty): 500
sq. ft. - 520 sq. ft.
1RK
Navjivan Housing (Foliage): 299 sq. ft. – 411 sq.ft.
Gokul Galaxy (Gokul Group): 450 sq. ft.
1BHK
Om Shanti Nagar 2 (Santosh Associates): 459sq. ft. – 589 sq. ft. (variations across two phases)
Navjivan Housing (Foliage): 458 sq. ft. – 507 sq.ft.
Gokul galaxy (Gokul Developers): 650 sq. ft.
LoadingFactor
Based on multiple low income housingprojects in Ahmedabad and Mumbai
Swarajya (Neptune Group): 35% Star City (Rashmi Housing): 38% Samruddhi Complex (Poddar Housing): 37%
Om Shanti Nagar 2 (Santosh Associates): 56% Navjivan Housing (Foliage): 50%
Note: All prices are current prices unless specifically noted
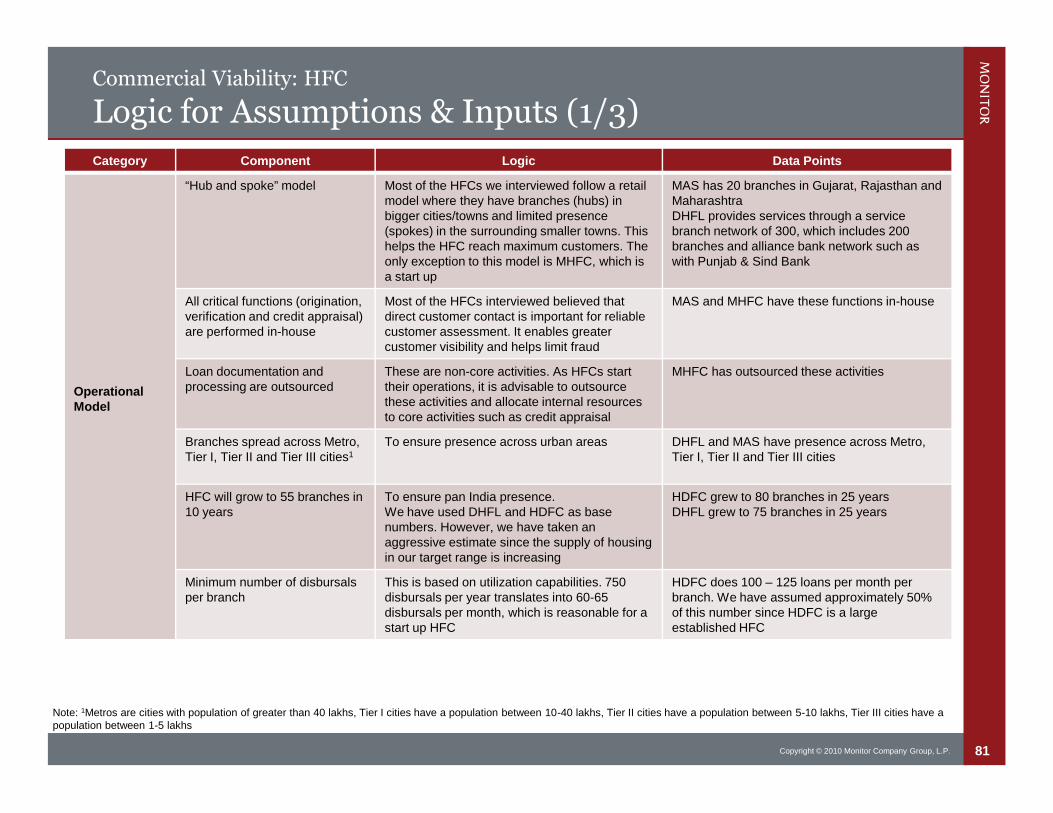
81Copyright © 2010 Monitor Company Group, L.P.
Commercial Viability: HFC
Logic for Assumptions & Inputs (1/3)
Category Component Logic Data Points
OperationalModel
“Hub and spoke” model Most of the HFCs we interviewed follow a retailmodel where they have branches (hubs) inbigger cities/towns and limited presence(spokes) in the surrounding smaller towns. Thishelps the HFC reach maximum customers. Theonly exception to this model is MHFC, which isa start up
MAS has 20 branches in Gujarat, Rajasthan andMaharashtraDHFL provides services through a servicebranch network of 300, which includes 200branches and alliance bank network such aswith Punjab & Sind Bank
All critical functions (origination,verification and credit appraisal)are performed in-house
Most of the HFCs interviewed believed thatdirect customer contact is important for reliablecustomer assessment. It enables greatercustomer visibility and helps limit fraud
MAS and MHFC have these functions in-house
Loan documentation andprocessing are outsourced
These are non-core activities. As HFCs starttheir operations, it is advisable to outsourcethese activities and allocate internal resourcesto core activities such as credit appraisal
MHFC has outsourced these activities
Branches spread across Metro,Tier I, Tier II and Tier III cities1
To ensure presence across urban areas DHFL and MAS have presence across Metro,Tier I, Tier II and Tier III cities
HFC will grow to 55 branches in10 years
To ensure pan India presence.We have used DHFL and HDFC as basenumbers. However, we have taken anaggressive estimate since the supply of housingin our target range is increasing
HDFC grew to 80 branches in 25 yearsDHFL grew to 75 branches in 25 years
Minimum number of disbursalsper branch
This is based on utilization capabilities. 750disbursals per year translates into 60-65disbursals per month, which is reasonable for astart up HFC
HDFC does 100 – 125 loans per month perbranch. We have assumed approximately 50%of this number since HDFC is a largeestablished HFC
Note: 1Metros are cities with population of greater than 40 lakhs, Tier I cities have a population between 10-40 lakhs, Tier II cities have a population between 5-10 lakhs, Tier III cities have apopulation between 1-5 lakhs
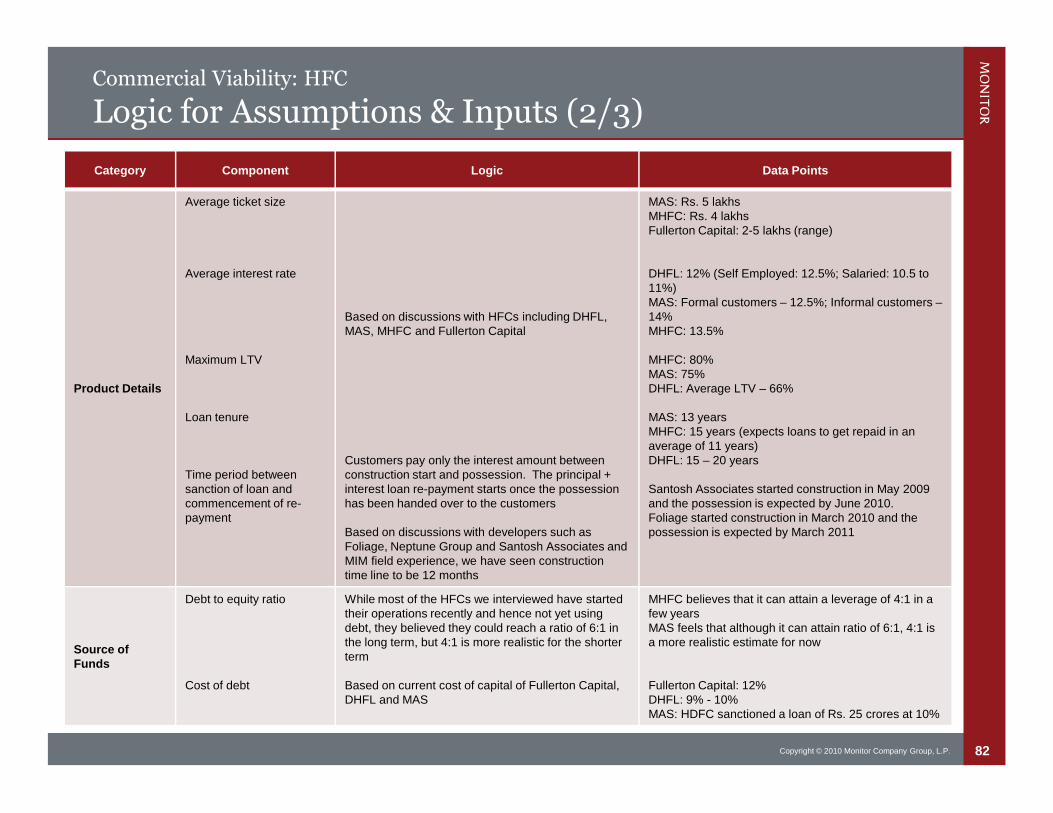
82Copyright © 2010 Monitor Company Group, L.P.
Commercial Viability: HFC
Logic for Assumptions & Inputs (2/3)
Category Component Logic Data Points
Product Details
Average ticket size
Average interest rate
Maximum LTV
Loan tenure
Time period betweensanction of loan andcommencement of re-payment
Based on discussions with HFCs including DHFL,MAS, MHFC and Fullerton Capital
Customers pay only the interest amount betweenconstruction start and possession. The principal +interest loan re-payment starts once the possessionhas been handed over to the customers
Based on discussions with developers such asFoliage, Neptune Group and Santosh Associates andMIM field experience, we have seen constructiontime line to be 12 months
MAS: Rs. 5 lakhsMHFC: Rs. 4 lakhsFullerton Capital: 2-5 lakhs (range)
DHFL: 12% (Self Employed: 12.5%; Salaried: 10.5 to11%)MAS: Formal customers – 12.5%; Informal customers –14%MHFC: 13.5%
MHFC: 80%MAS: 75%DHFL: Average LTV – 66%
MAS: 13 yearsMHFC: 15 years (expects loans to get repaid in anaverage of 11 years)DHFL: 15 – 20 years
Santosh Associates started construction in May 2009and the possession is expected by June 2010.Foliage started construction in March 2010 and thepossession is expected by March 2011
Source ofFunds
Debt to equity ratio
Cost of debt
While most of the HFCs we interviewed have startedtheir operations recently and hence not yet usingdebt, they believed they could reach a ratio of 6:1 inthe long term, but 4:1 is more realistic for the shorterterm
Based on current cost of capital of Fullerton Capital,DHFL and MAS
MHFC believes that it can attain a leverage of 4:1 in afew yearsMAS feels that although it can attain ratio of 6:1, 4:1 isa more realistic estimate for now
Fullerton Capital: 12%DHFL: 9% - 10%MAS: HDFC sanctioned a loan of Rs. 25 crores at 10%
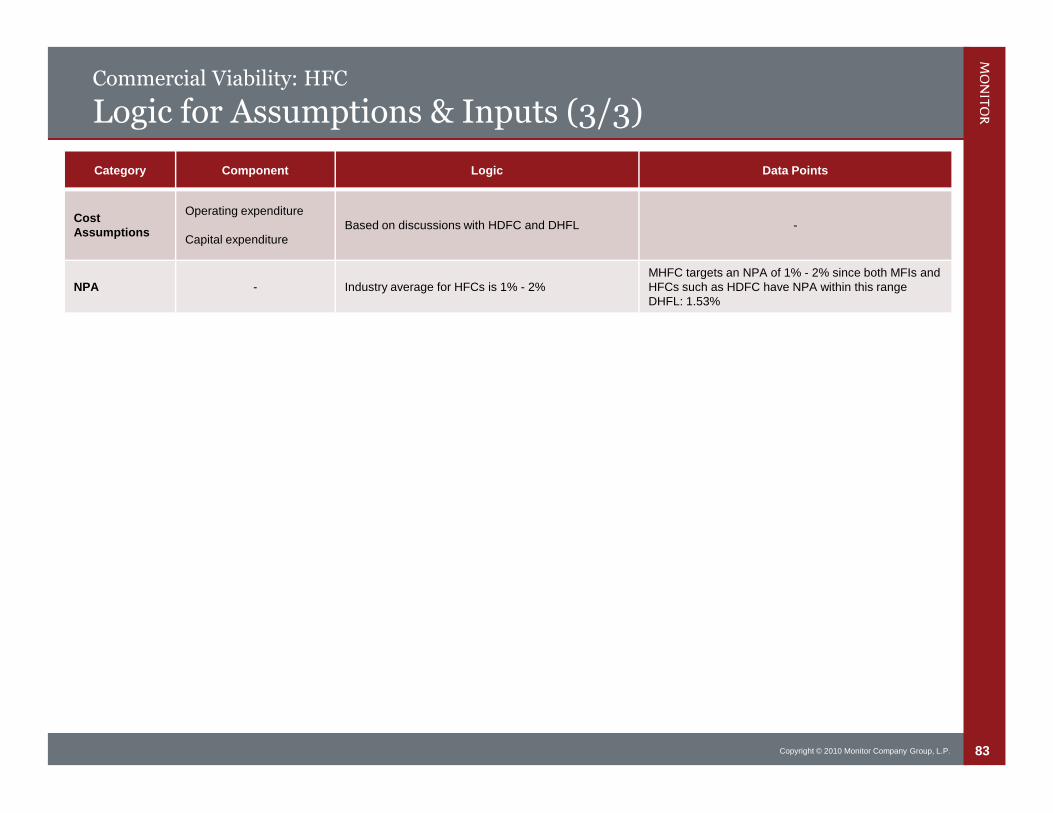
83Copyright © 2010 Monitor Company Group, L.P.
Commercial Viability: HFC
Logic for Assumptions & Inputs (3/3)
Category Component Logic Data Points
CostAssumptions
Operating expenditure
Capital expenditureBased on discussions with HDFC and DHFL -
NPA - Industry average for HFCs is 1% - 2%MHFC targets an NPA of 1% - 2% since both MFIs andHFCs such as HDFC have NPA within this rangeDHFL: 1.53%


