Embed Size (px)
Citation preview
Building a Generic Platform for Big Sensor Data Application
Chun-Hsiang Lee, David Birch, Chao Wu, Dilshan Silva, Orestis Tsinalis, Yang Li, Shulin Yan, Moustafa Ghanem, Yike Guo*
Dept. of Computing Imperial College London
London SW7 2AZ, United Kingdom *Corresponding Author
{c.lee08, david.birch, c.wu09, d.silva10, orestis.tsinalis10, yang.li09, sly09, m.ghanem, y.guo}@imperial.ac.uk
Abstract—The drive toward smart cities alongside the rising adoption of personal sensors is leading to a torrent of sensor data. While systems exist for storing and managing sensor data, the real value of such data is the insight which can be generated from it. However there is currently no platform which enables sensor data to be taken from collection, through use in models to produce useful data products. The architecture of such a platform is a current research question in the field of Big Data and Smart Cities. In this paper we explore five key challenges in this field and provide a response through a sensor data platform “Concinnity” which can take sensor data from collection to final product via a data repository and workflow system. This will enable rapid development of applications built on sensor data using data fusion and the integration and composition of models to form novel workflows. We summarize the key features of our approach, exploring how it enables value to be derived from sensor data efficiently.
Keywords: sensor data management, sensor application, sensor platform, Digital City, Smart City.
I. INTRODUCTION AND MOTIVATION The pervasive use of mobile and sensing devices enables
everyone to collect data at any time, at any place. Sensor data is certainly valuable to sensor owners for their own specific purposes, but could also be valuable to a wider audience. The bottleneck now is not how to collect, store and manage the resulting Big Data itself, as various technologies exist to address these elements. Rather the challenge is how to build systems that enable us to effectively use such data. This, in turn, requires us to revisit the key challenges in designing such systems. We note that in this paper we focus exclusively on the informatics challenges of big sensor data, upstream of the lower-level hardware or networking considerations.
A. Crowdsourcing and Collaboration The first challenge relates to how we can create an eco-
system where users get mutual benefit from data contribution, sharing and usage. The current open data imperative and big data wave force us to think beyond the ‘owner-is-the-user’ model. Conversely, openness is not just a goal in itself; there should be significant benefits for multiple actors from opening up data. Similarly, there is an important distinction to be made between single and multi-provider big
data. Single-provider big data is usually curated and consistent, whereas multi-provider big data suffers from lack of structure and consistency. The sensor data that we consider in this paper is open, multi-provider and big. An effective sensor informatics platform for managing it must support and enable a collaborative framework that supports operations for sharing, annotating, reusing and analysing the data itself. It must also enable sharing and documenting the results and outputs of analysing such data with their provenance, i.e. tracking how they were developed in terms of data sources and analysis operations.
B. Heterogeneity and Disparity A second challenge relates to the disparity and
heterogeneity of sensor data. Sensor-generated big data is typically never under centralized control at a single location and is stored at distributed locations. Assuming that all data will be eventually all uploaded in a central location is not realistic. A more realistic assumption is that users can access and integrate parts of the data they need into their own data storage, when they need it. The main challenge is that data collected by different people under different regimes, and stored in different databases, is rarely stored in any standard formats. With such heterogeneous data, there is no universal way to retrieve and transform the data automatically and universally into a unified data source for useful analysis. Moreover, due to the heterogeneity in the ownership of sensor infrastructures, the data sets collected from sensors are not structured and documented in a way that would make their combined use possible. An effective sensor informatics system for managing and using such data must support tools that enable developers to query and integrate heterogeneous data in disparate locations whilst lowering the complexity of dealing with its diversity.
C. Multi-Resolution and Multi-Scale The third challenge relates to the fact that organizations,
or individuals, deploying sensors to collect data typically have different assumptions and intentions for what type of data needs to be collected. They may use different types of sensors measuring different (but related) phenomena at different, and irregularly distributed, geographical places. The measurements are also typically collected at different rates and time intervals. When data from such devices is aggregated and/or integrated for use in a new application the user is very quickly faced with its multi-resolution nature.
2013 IEEE International Conference on Big Data
978-1-4799-1293-3/13/$31.00 ©2013 IEEE 94
Moreover, users of the data will have their own conceptual multi-scale levels of abstraction in their models. Taking an urban city as an example, city models often work at higher levels of abstraction – such as a city wide, neighbourhood level or transportation model level. Further, such different layers of abstraction frequently interact; building upon the results of higher or lower levels to create further insight. An effective sensor informatics platform must provide features that allow successfully supporting such multi-resolution and multi-scale integrative analysis of the data.
D. Data Uncertainty and Trustworthiness The fourth challenge relates to the inherent levels of
uncertainty of the data itself. Sensor data collected by third parties is supplied without centralized control. This data could have been generated by sensors that are faulty, wrongly calibrated or beyond their life time. There may even be measurements that have been maliciously tampered with or intentionally supplied with erroneous information. The challenge also extends to the outputs of analysing existing data and reporting the results of the analysis back for use by other users. The resulting data may also have multiple levels of uncertainty/trust associated with it. An effective sensor informatics system must support users in assessing, managing and reasoning about the trustworthiness of the data, results and their owners and how such trustworthiness (or lack thereof) affects our usage of such data.
E. Model and Decision Making The fifth challenge relates to using the data itself in a
collaborative way to guide decision making processes. Ultimately, the collected data needs to be subjected to different forms analysis; whether to find patterns or to develop new models to guide decisions. The quality of the analysis, models and decisions all depend on the quality of the input data itself. This includes uncertainty in measurements, the resolution of the data and whether it contains missing values. The analysis and modelling of the data must be resilient to such factors. Moreover, the processing and analysis of large sensor data collections inevitably translates into computational costs. If real-time decisions are needed and available resources are limited, users are typically willing to compromise the quality of their models, e.g. by using less data or less computation. An effective sensor informatics platform must support an adaptive framework that fits the properties of the available data and resources.
The five challenges discussed above motivate the work presented in this paper. In Section II we review existing sensor data management systems and approaches. In Section III and IV, we provide an overview of our new platform design and its key components. In Section V we present a number of application scenarios. In Section VI, we present our summary, discussion and future work.
II. RELATED WORK / BACKGROUND Sensor networks [1, 2] provide infrastructure through
which we obtain data about the physical, engineered, and social systems by using sensing devices. They have wide
application in the areas of environmental monitoring, security surveillance, mental training, city planning and health care. In a sensor network, individual sensors nodes can be deployed in fixed locations or as mobile devices, or as ad-hoc nodes that connect and disconnect from the network infrequently. Each sensor collects measurements and sensors exchange information through wired or wireless communication channels using various network topologies and communication protocols. In such a network the nodes of the network can be connected together or alternatively all nodes can communicate directly only with a base station.
In this paper, we make no assumptions about the networking protocols used to connect the sensor nodes. We also make no distinction between who owns or operates the individual sensor nodes. Our main focus is on the data collected by the different sensors and made available for sharing and collaboration. Such data needs to be stored and managed in a system that enables users to collaborate. We categorize different sensor data management platforms by their support for such collaboration into three generations as described below. We then describe briefly the WikiSensing system used as the backend for our own current research.
A. First Generation Although many sensor network systems are designed for
use by many users in different applications, the first generation data management systems focused simply on storing and querying the sensor data. Examples include Aurora and Cougar [3] [4] which process incoming data streams for applications. Such systems provide query algebra containing several primitive operations for expressing queries over the streams and/or querying the sensor nodes in a distributed way. Such systems had no clear notion of enabling or supporting collaboration between users of the same set of sensors.
B. Second Generation The second generation data management systems
provided different primitives to support collaboration between users of sensor networks. Such systems enabled either configuring the collection and/or the processing of data in a collaborative way between different users. For example, the Discovery Net system [6] provides an example where different users could develop their own data collection workflows specifying how sensor data can be processed before storing in a centralized data warehouse. It also enabled them to develop analysis workflows for integrating the data with data collected from other data sources. Users of the system could thus share the same data and also derive new views and analysis results that were also shared. Another example is the CitiSense [5, 7] project which deployed a system allowing users to provide feedback on pollutants by the general public using mobile devices. By enabling this, the system supports enriching the information by the users and also allows them to comment on the operation and trustworthiness of the sensors. Each of the systems in this category supports a limited form of collaboration while operating on a fixed set of sensors.
95
C. Third Generation The third generation data management systems for is
based on open systems where users can collaboratively submit data from any sensor and where other users can use such data. One example of this generation is Xively [8] (formally known as both Pachube and then Cosm) which enables users to share their sensor data and allows them to collaboratively build applications based on such data. The system follows a passive approach to the control of sensors by the collaborators. However, it simplifies online collaboration between them by allowing them to submit diverse data sets ranging from individual energy and environment data to data collected from transport services. Moreover, it allows developers to embed real-time graphs & widgets in websites; analyse and process historical data, and send real-time alerts to control devices.
Another example of the third generation systems is the WikiSensing System (wikisensing.org) [9] which is used in our research presented in this paper. It provides a web-accessible online database services allowing sensor owners to register and connect their devices to feed data into the system for storage. It also allows developers to connect to the database and build their own applications based on that data and perform different forms of analysis. Moreover, it provides support for adding and annotating information about the sensors and their data through a wiki approach.
D. Other systems Various other research efforts have been conducted on
sensor data fusion [10-13]. However, most efforts do not address the design of a public and generic platform to fuse the sensor data, especially for large scale, multisource data. Similarly, although there are significant research efforts on building analysis models for sensor applications [14] [15-18], most work builds on certain assumptions on the data distributions and few of these work are organized in a framework or toolkit for sensor data analyses or application developers to use. Similarly, work has been done on model composition [19], which becomes a critical component of our platform, and some workflow systems for model combination were created [6, 20, 21], but none of these efforts addresses designing a generic analysis platform for sensor data and modelling. It is worth noting that there are several sensor data marketplaces [22-24] where users and developers can query and purchase the data from these data marketplaces and then build their application by themselves. However, there is no platform to support users in turning such data into applications.
III. CONCINNITY PLATFORM OVERVIEW While WikiSensing provides many collaboration features
that support addressing the crowdsourcing and collaboration challenges of sensor informatics, it does not address the other challenges identified in Section 1. In order to fully leverage the value of data collected by sensor network systems, more work needs to be done in improving how we can manage data collected from various sources in a collaborative way, especially in terms of data collection, fusion and analysis.
Our motivation here is to investigate how we can build on top of WikiSensing a novel WikiModelling platform so as to provide a comprehensive solution “Concinnity” that can address the other challenges.
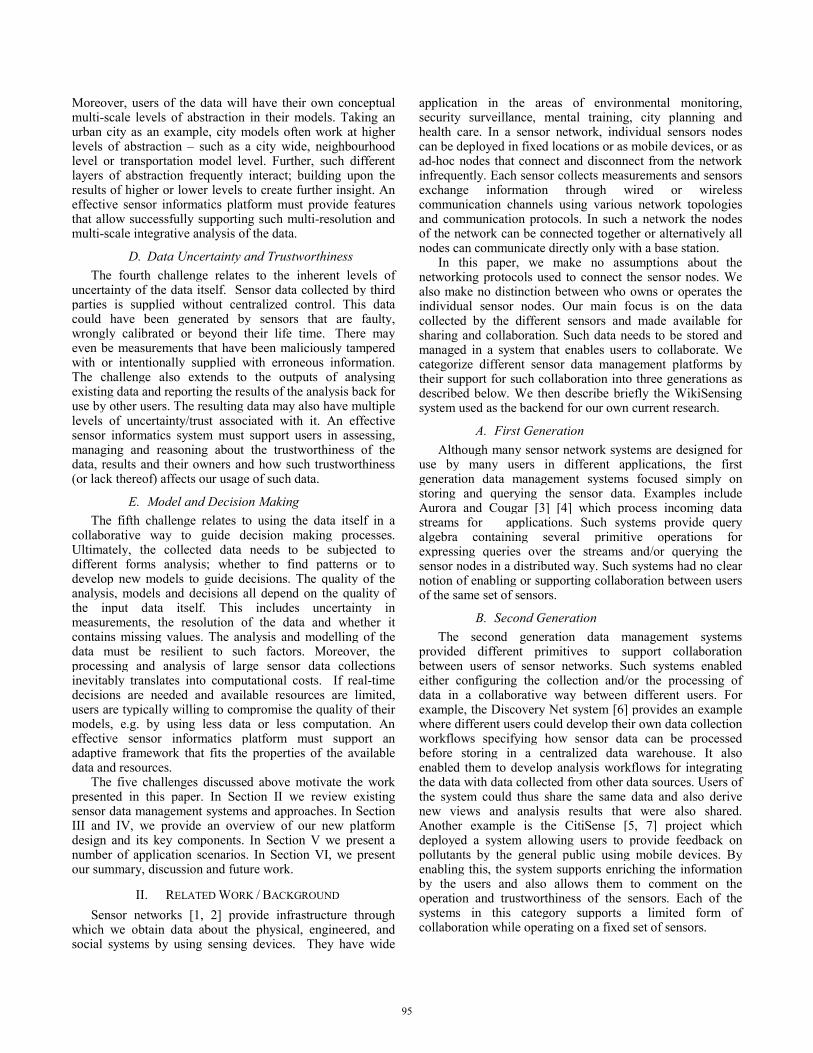
Fig. 1 illustrates the Concinnity architecture for addressing the challenges. In the remainder of this section we describe the components and how their interaction provides a solution for building a generic Platform-as-a-Service (PaaS) for sensor data management.
A. WikiModelling - AppEditor
The application development environment, “AppEditor”, supports developers in constructing sensor data applications. It allows them to retrieve sensor data from various sources using a declarative query language, and to review the sensor data at multi-scale and multi-resolution levels using a range of visualisation tools, including category-based hierarchical structure and location-based exploration. Users can apply filters to such data and then composite it with analytical models using idea similar to the mashup editor [25] as workflows and finally publish their sensor data application. The AppEditor also provides a collaborative environment to access hierarchical catalogue of existing data sets, models and analysis workflows that have been contributed by different developers. Such workflows will be executed using the workflow engine.
B. WikiModelling – Workflow Engine Workflow definitions from the AppEditor are passed to a
workflow engine workflow engine to retrieve data from different sources and to filter it or fuse it as required and to transform the data into formats suitable for input to analytic models. , We base our implementation on an extension of the “HierSynth” [19] engine enables the creation of a hierarchical representation of the conceptual multi-scale or
Figure 1. Concinnity Platform overview, next generation systems will require collaborative sensor data storage together with a space to analyse data and a collaborative interface for creating workflows for this purpose.
96
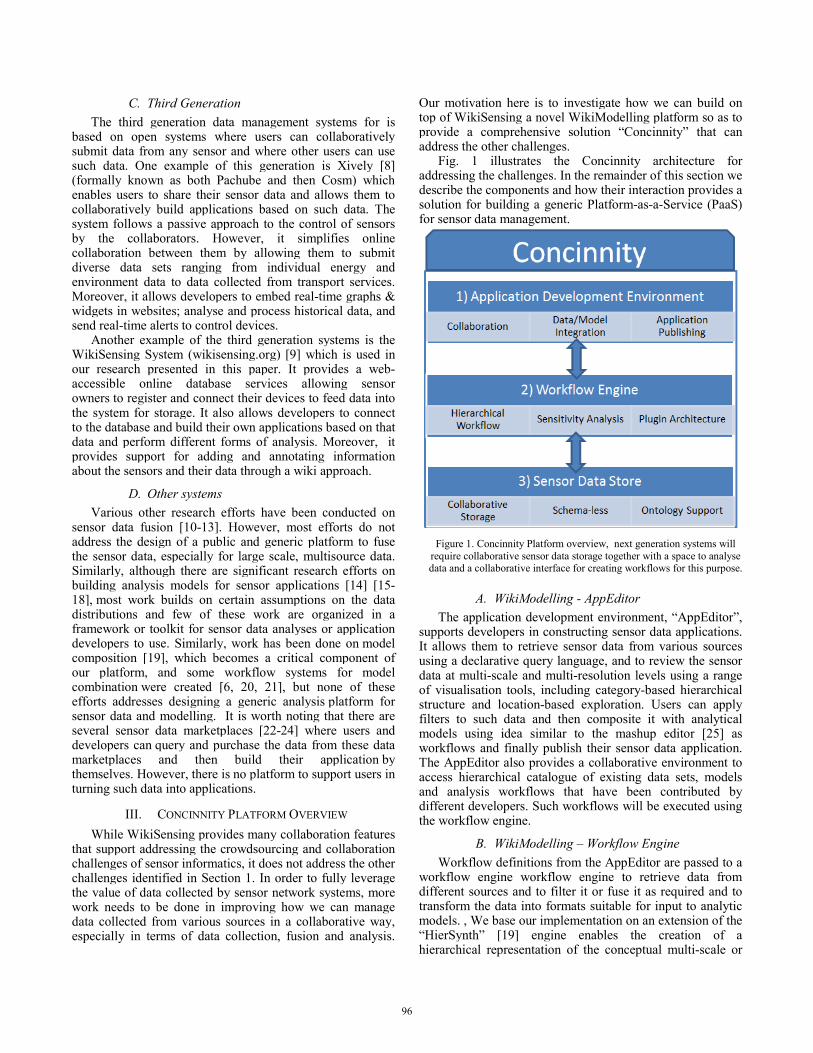
Figure 2. Concinnity Platform architecture, combinding the WikiModelling and WikiSensing Systems
multi-resolution environment under study within the workflow graph itself. For example, a geographical decomposition of the city into suburbs and districts, e.g. based on standard urban ontologies by the Open Geospatial Consortium, enables the composition of data and models to be achieved at each level of the city and provides an effective communication paradigm for cross-scale modelling. The workflow engine also provides the context of how model integration can be achieved. It supports a wide variety of input and output data sources including wikisensing.org and requires that every model or data fusion module to register its list of inputs and outputs to the engine. These requirements can then be used to verify all data required for integration are available when the workflow is created. A plug-in architecture supports multiple methods for achieving data fusion and resolving concerns with uncertainty. The engine supports multiple users and scenarios by default, each with their own library of configured data sources models, and workflows. To support collaboration the engine enables the publication of workflows as new public API’s upon the platform. This provides a concept of “workflows of workflows” supporting the creation of an ecosystem of useful techniques to be composed in a collaborative fashion.
C. WikiSensing The WikiModelling system builds upon the WikiSensing
repository as a sensor data storage solution. WikiSensing’s original design simplifies addressing the heterogeneity and disparity challenge in two ways. Firstly, its schema-less storage architecture based on mongoDB decouples the storage layer from the data schema, enabling storage layer flexibility. Secondly, it offers data stream aggregation abstraction via the concept of ‘virtual sensors’. By using this functionality users can create their virtual sensors using
custom aggregation functions. To address the multi-resolution and multi-scale challenge, WikiSensing is extended in this work to support ontology definitions, thus offering the capability of ontology-based querying over the data using user-defined ontologies suitable to the level of detail that each application demands by this over time, geography or a conceptual resolution. Moreover, to address the data trustworthiness challenge, we extend it by incorporating various anomaly detection tools within the system and also by extending the sensor metadata model to capture trustworthiness information explicitly.
IV. DETAILED DESIGN AND IMPLEMENTATION Fig. 2 shows our detailed design of the Concinnity
platform. This consists of the WikiSensing data store and the WikiModelling workflow engine and application editor. WikiSensing provides capabilities for data storage and management, while the WikiModelling system support application design and execution environment. In the following section, we will discuss each component of our platform in detail.
A. WikiModelling - AppEditor The AppEditor is an online development environment,
which provides a graphical user interface to integrate data from different sensors, apply analytic models, construct workflows, publishing the final service as a sensor application. As shown in Fig. 2, it comprises several modules as described below.
Data/Models Explorer: Developers can visually discover and browse available sensor data as well as analytic models in our platform before constructing their applications. In this module the AppEditor integrates available sensor data on the map as shown in Fig. 3. It also retrieves lists of models provided by the WikiModelling system. When there are no
97
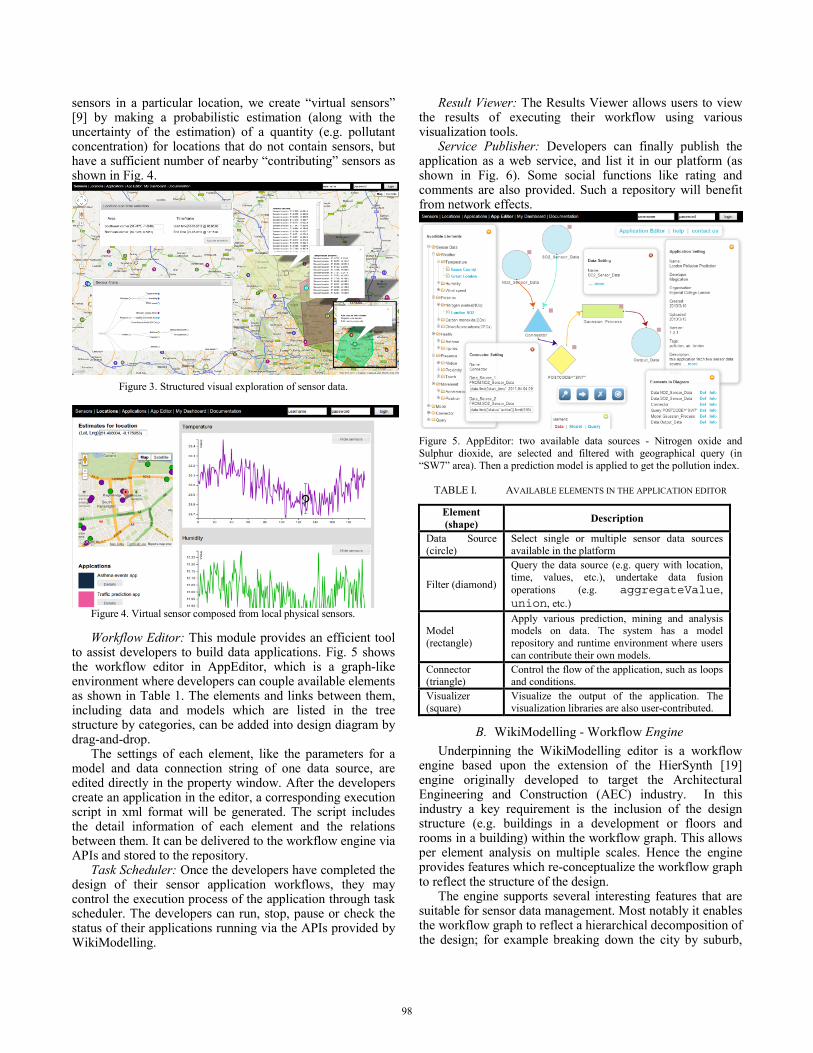
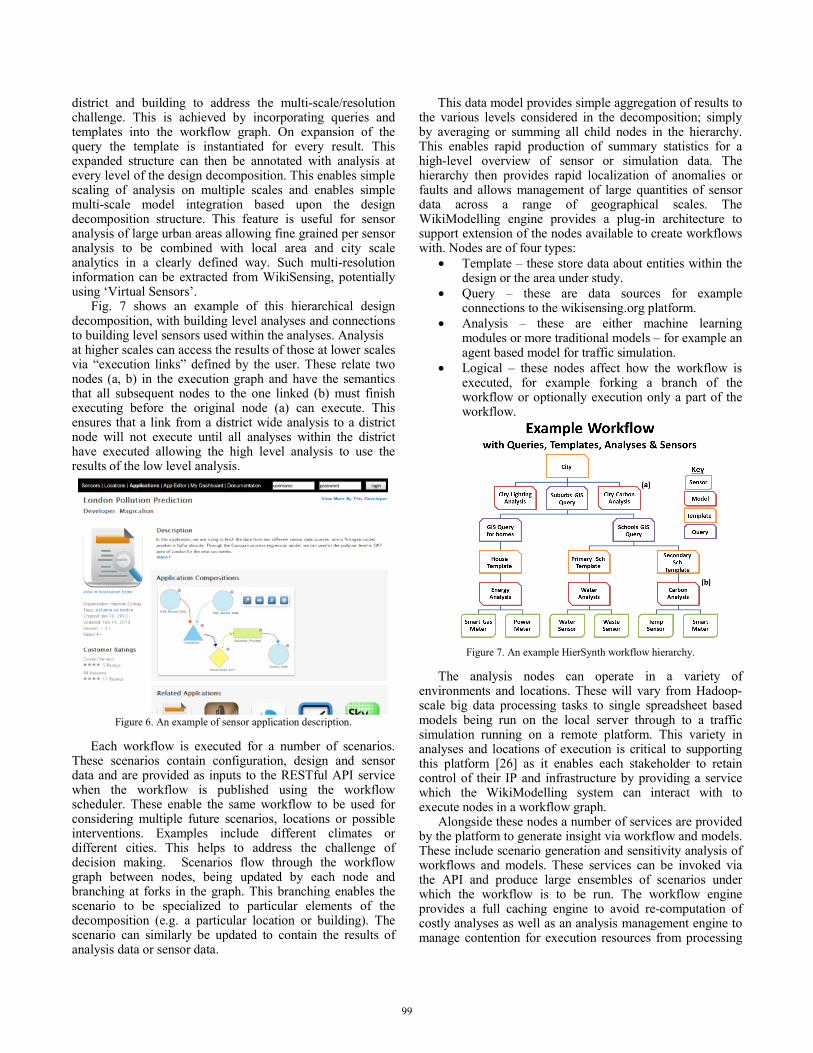
sensors in a particular location, we create “virtual sensors” [9] by making a probabilistic estimation (along with the uncertainty of the estimation) of a quantity (e.g. pollutant concentration) for locations that do not contain sensors, but have a sufficient number of nearby “contributing” sensors as shown in Fig. 4.
Figure 3. Structured visual exploration of sensor data.
Figure 4. Virtual sensor composed from local physical sensors.
Workflow Editor: This module provides an efficient tool to assist developers to build data applications. Fig. 5 shows the workflow editor in AppEditor, which is a graph-like environment where developers can couple available elements as shown in Table 1. The elements and links between them, including data and models which are listed in the tree structure by categories, can be added into design diagram by drag-and-drop.
The settings of each element, like the parameters for a model and data connection string of one data source, are edited directly in the property window. After the developers create an application in the editor, a corresponding execution script in xml format will be generated. The script includes the detail information of each element and the relations between them. It can be delivered to the workflow engine via APIs and stored to the repository.
Task Scheduler: Once the developers have completed the design of their sensor application workflows, they may control the execution process of the application through task scheduler. The developers can run, stop, pause or check the status of their applications running via the APIs provided by WikiModelling.
Result Viewer: The Results Viewer allows users to view the results of executing their workflow using various visualization tools.
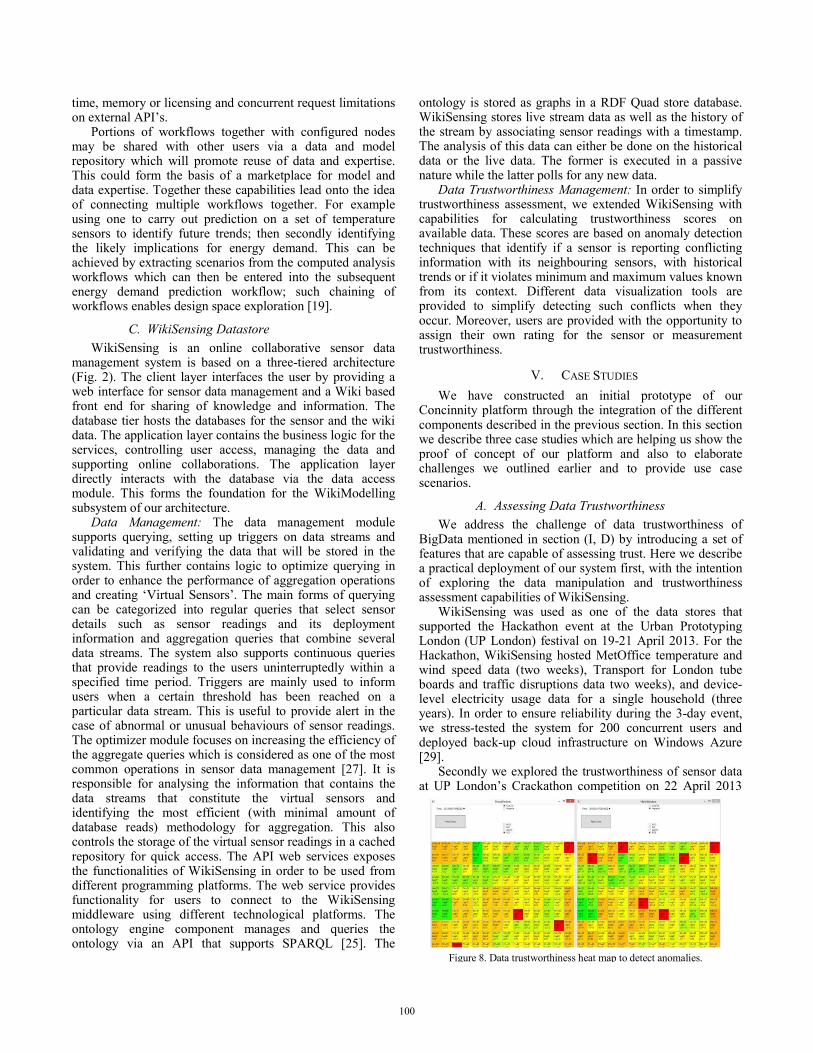
Service Publisher: Developers can finally publish the application as a web service, and list it in our platform (as shown in Fig. 6). Some social functions like rating and comments are also provided. Such a repository will benefit from network effects.
Figure 5. AppEditor: two available data sources - Nitrogen oxide and Sulphur dioxide, are selected and filtered with geographical query (in “SW7” area). Then a prediction model is applied to get the pollution index.
TABLE I. AVAILABLE ELEMENTS IN THE APPLICATION EDITOR
Element (shape) Description
Data Source (circle)
Select single or multiple sensor data sources available in the platform
Filter (diamond)
Query the data source (e.g. query with location, time, values, etc.), undertake data fusion operations (e.g. aggregateValue, union, etc.)
Model (rectangle)
Apply various prediction, mining and analysis models on data. The system has a model repository and runtime environment where users can contribute their own models.
Connector (triangle)
Control the flow of the application, such as loops and conditions.
Visualizer (square)
Visualize the output of the application. The visualization libraries are also user-contributed.
B. WikiModelling - Workflow Engine Underpinning the WikiModelling editor is a workflow
engine based upon the extension of the HierSynth [19] engine originally developed to target the Architectural Engineering and Construction (AEC) industry. In this industry a key requirement is the inclusion of the design structure (e.g. buildings in a development or floors and rooms in a building) within the workflow graph. This allows per element analysis on multiple scales. Hence the engine provides features which re-conceptualize the workflow graph to reflect the structure of the design.
The engine supports several interesting features that are suitable for sensor data management. Most notably it enables the workflow graph to reflect a hierarchical decomposition of the design; for example breaking down the city by suburb,
98
district and building to address the multi-scale/resolution challenge. This is achieved by incorporating queries and templates into the workflow graph. On expansion of the query the template is instantiated for every result. This expanded structure can then be annotated with analysis at every level of the design decomposition. This enables simple scaling of analysis on multiple scales and enables simple multi-scale model integration based upon the design decomposition structure. This feature is useful for sensor analysis of large urban areas allowing fine grained per sensor analysis to be combined with local area and city scale analytics in a clearly defined way. Such multi-resolution information can be extracted from WikiSensing, potentially using ‘Virtual Sensors’.
Fig. 7 shows an example of this hierarchical design decomposition, with building level analyses and connections to building level sensors used within the analyses. Analysis at higher scales can access the results of those at lower scales via “execution links” defined by the user. These relate two nodes (a, b) in the execution graph and have the semantics that all subsequent nodes to the one linked (b) must finish executing before the original node (a) can execute. This ensures that a link from a district wide analysis to a district node will not execute until all analyses within the district have executed allowing the high level analysis to use the results of the low level analysis.
Figure 6. An example of sensor application description.
Each workflow is executed for a number of scenarios. These scenarios contain configuration, design and sensor data and are provided as inputs to the RESTful API service when the workflow is published using the workflow scheduler. These enable the same workflow to be used for considering multiple future scenarios, locations or possible interventions. Examples include different climates or different cities. This helps to address the challenge of decision making. Scenarios flow through the workflow graph between nodes, being updated by each node and branching at forks in the graph. This branching enables the scenario to be specialized to particular elements of the decomposition (e.g. a particular location or building). The scenario can similarly be updated to contain the results of analysis data or sensor data.
This data model provides simple aggregation of results to the various levels considered in the decomposition; simply by averaging or summing all child nodes in the hierarchy. This enables rapid production of summary statistics for a high-level overview of sensor or simulation data. The hierarchy then provides rapid localization of anomalies or faults and allows management of large quantities of sensor data across a range of geographical scales. The WikiModelling engine provides a plug-in architecture to support extension of the nodes available to create workflows with. Nodes are of four types:
• Template – these store data about entities within the design or the area under study.
• Query – these are data sources for example connections to the wikisensing.org platform.
• Analysis – these are either machine learning modules or more traditional models – for example an agent based model for traffic simulation.
• Logical – these nodes affect how the workflow is executed, for example forking a branch of the workflow or optionally execution only a part of the workflow.
Figure 7. An example HierSynth workflow hierarchy.
The analysis nodes can operate in a variety of environments and locations. These will vary from Hadoop-scale big data processing tasks to single spreadsheet based models being run on the local server through to a traffic simulation running on a remote platform. This variety in analyses and locations of execution is critical to supporting this platform [26] as it enables each stakeholder to retain control of their IP and infrastructure by providing a service which the WikiModelling system can interact with to execute nodes in a workflow graph.
Alongside these nodes a number of services are provided by the platform to generate insight via workflow and models. These include scenario generation and sensitivity analysis of workflows and models. These services can be invoked via the API and produce large ensembles of scenarios under which the workflow is to be run. The workflow engine provides a full caching engine to avoid re-computation of costly analyses as well as an analysis management engine to manage contention for execution resources from processing
99
time, memory or licensing and concurrent request limitations on external API’s.
Portions of workflows together with configured nodes may be shared with other users via a data and model repository which will promote reuse of data and expertise. This could form the basis of a marketplace for model and data expertise. Together these capabilities lead onto the idea of connecting multiple workflows together. For example using one to carry out prediction on a set of temperature sensors to identify future trends; then secondly identifying the likely implications for energy demand. This can be achieved by extracting scenarios from the computed analysis workflows which can then be entered into the subsequent energy demand prediction workflow; such chaining of workflows enables design space exploration [19].
C. WikiSensing Datastore WikiSensing is an online collaborative sensor data
management system is based on a three-tiered architecture (Fig. 2). The client layer interfaces the user by providing a web interface for sensor data management and a Wiki based front end for sharing of knowledge and information. The database tier hosts the databases for the sensor and the wiki data. The application layer contains the business logic for the services, controlling user access, managing the data and supporting online collaborations. The application layer directly interacts with the database via the data access module. This forms the foundation for the WikiModelling subsystem of our architecture.
Data Management: The data management module supports querying, setting up triggers on data streams and validating and verifying the data that will be stored in the system. This further contains logic to optimize querying in order to enhance the performance of aggregation operations and creating ‘Virtual Sensors’. The main forms of querying can be categorized into regular queries that select sensor details such as sensor readings and its deployment information and aggregation queries that combine several data streams. The system also supports continuous queries that provide readings to the users uninterruptedly within a specified time period. Triggers are mainly used to inform users when a certain threshold has been reached on a particular data stream. This is useful to provide alert in the case of abnormal or unusual behaviours of sensor readings. The optimizer module focuses on increasing the efficiency of the aggregate queries which is considered as one of the most common operations in sensor data management [27]. It is responsible for analysing the information that contains the data streams that constitute the virtual sensors and identifying the most efficient (with minimal amount of database reads) methodology for aggregation. This also controls the storage of the virtual sensor readings in a cached repository for quick access. The API web services exposes the functionalities of WikiSensing in order to be used from different programming platforms. The web service provides functionality for users to connect to the WikiSensing middleware using different technological platforms. The ontology engine component manages and queries the ontology via an API that supports SPARQL [25]. The
ontology is stored as graphs in a RDF Quad store database. WikiSensing stores live stream data as well as the history of the stream by associating sensor readings with a timestamp. The analysis of this data can either be done on the historical data or the live data. The former is executed in a passive nature while the latter polls for any new data.
Data Trustworthiness Management: In order to simplify trustworthiness assessment, we extended WikiSensing with capabilities for calculating trustworthiness scores on available data. These scores are based on anomaly detection techniques that identify if a sensor is reporting conflicting information with its neighbouring sensors, with historical trends or if it violates minimum and maximum values known from its context. Different data visualization tools are provided to simplify detecting such conflicts when they occur. Moreover, users are provided with the opportunity to assign their own rating for the sensor or measurement trustworthiness.
V. CASE STUDIES We have constructed an initial prototype of our
Concinnity platform through the integration of the different components described in the previous section. In this section we describe three case studies which are helping us show the proof of concept of our platform and also to elaborate challenges we outlined earlier and to provide use case scenarios.
A. Assessing Data Trustworthiness We address the challenge of data trustworthiness of
BigData mentioned in section (I, D) by introducing a set of features that are capable of assessing trust. Here we describe a practical deployment of our system first, with the intention of exploring the data manipulation and trustworthiness assessment capabilities of WikiSensing.
WikiSensing was used as one of the data stores that supported the Hackathon event at the Urban Prototyping London (UP London) festival on 19-21 April 2013. For the Hackathon, WikiSensing hosted MetOffice temperature and wind speed data (two weeks), Transport for London tube boards and traffic disruptions data two weeks), and device-level electricity usage data for a single household (three years). In order to ensure reliability during the 3-day event, we stress-tested the system for 200 concurrent users and deployed back-up cloud infrastructure on Windows Azure [29].
Secondly we explored the trustworthiness of sensor data at UP London’s Crackathon competition on 22 April 2013
Figure 8. Data trustworthiness heat map to detect anomalies.
100
where WikiSensing’s data trustworthiness API was first tested with external users. For the Crackathon, contestants were given air pollution data of four types from 140 sensors at an area in East London, which had been selectively altered to simulate different potential attacks on the data. The task was to assign a trustworthiness score to measurements of different sensors at different times, with the aid of WikiSensing’s trustworthiness API which offered history-based and neighbour-based abnormal reading detection. Fig. 8 shows one visual anomaly detection tool used.
B. Electric Car Vehicles In the context of the city understanding the future impact
of electric vehicles upon the electrical grid is key to the resilience of the city’s infrastructure. To address this researchers in London’s Digital City Exchange have proposed a collaborative approach [26] to modelling the impact of electric vehicle charging upon the electricity grid. This approach brings together experts in transportation studies with those studying the electrical grid. In a nutshell an agent based transportation model will be used to simulate expected journeys within the cities. This journey information will then be translated into the state of charge of a collection of electric vehicles together with their locations through the day (the opportunities to charge them). Finally these charging profiles will be translated into load in the electricity grid based upon a variety of charging and pricing strategies.
Concinnity will support this analysis by enabling the collaboration on a single platform by aiding the integration of models and data together using the WikiModelling system. This workflow will be driven using data from a range of sources including National Statistics and maps and electricity grid statistics. These must each be aggregated to the correct level of the multi-scale representation at which the workflow is being run, using a hierarchical workflow similar to Fig. 7. This will enable running the simulation at different scales, perhaps with a city-wide transpiration simulation being used by district and substation level electricity grid simulations. There is the potential to extend this case study to deal with sensor data collected from current electric vehicle owners as to their typical journeys, state of charge and charging times. However this will necessitate complex data fusion from crowd-sourced data which will have inherent uncertainty. Addressing these challenges remains an integral goal of our system to enable this case-study on our platform.
C. Health and Medical Applications Current smart phones have many embedded sensors
ranging from microphones to gyroscopes and proximity sensors. Similarly, new generations of professional wearable medical sensors can now connect to smart phones and transfer sensing results directly about person’s health; including blood pressure, oxygen saturation, blood glucose level, Electrocardiogram (ECG), Electroencephalogram (EEG) and electro-cardiography (EKG).
However, there is currently no standardized format of storing and exchanging this data. This has created heterogeneity and disparity challenges, making it difficult for users to reclaim back their data, manage or remix it in their
preferred ways. From the provider’s point of view, such massive growth of these big health sensor data creates both data manageability and collaboration challenges.
Concinnity also has applications beyond traditional digital cities and can provide a basis for applications in healthcare as well as in medical research. The platform allows individuals to contribute data about their lifestyles and well-being via smartphones, tablets and wearable devices. The platform made the collected data available for sharing and collaboration. It also enables such crowd-sourced data to be analysed in various ways by composing different models and workflows in AppEditor.
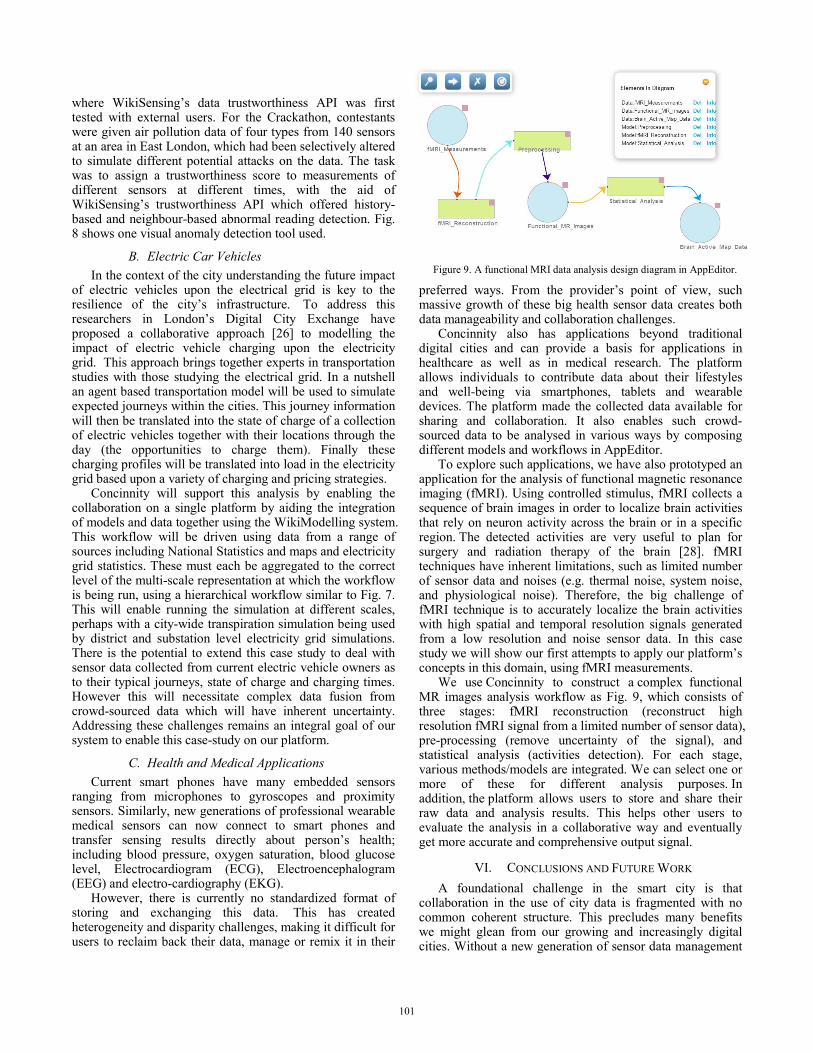
To explore such applications, we have also prototyped an application for the analysis of functional magnetic resonance imaging (fMRI). Using controlled stimulus, fMRI collects a sequence of brain images in order to localize brain activities that rely on neuron activity across the brain or in a specific region. The detected activities are very useful to plan for surgery and radiation therapy of the brain [28]. fMRI techniques have inherent limitations, such as limited number of sensor data and noises (e.g. thermal noise, system noise, and physiological noise). Therefore, the big challenge of fMRI technique is to accurately localize the brain activities with high spatial and temporal resolution signals generated from a low resolution and noise sensor data. In this case study we will show our first attempts to apply our platform’s concepts in this domain, using fMRI measurements.
We use Concinnity to construct a complex functional MR images analysis workflow as Fig. 9, which consists of three stages: fMRI reconstruction (reconstruct high resolution fMRI signal from a limited number of sensor data), pre-processing (remove uncertainty of the signal), and statistical analysis (activities detection). For each stage, various methods/models are integrated. We can select one or more of these for different analysis purposes. In addition, the platform allows users to store and share their raw data and analysis results. This helps other users to evaluate the analysis in a collaborative way and eventually get more accurate and comprehensive output signal.
VI. CONCLUSIONS AND FUTURE WORK A foundational challenge in the smart city is that
collaboration in the use of city data is fragmented with no common coherent structure. This precludes many benefits we might glean from our growing and increasingly digital cities. Without a new generation of sensor data management
Figure 9. A functional MRI data analysis design diagram in AppEditor.
101
platforms as explored in this paper the adoption and benefits of the smart city will be substantially reduced. Particularly as challenges in collaboration and data heterogeneity breed an increasingly fragmented patchwork of systems and data unable to exploit the benefits of multi-resolution and multi-scale data analysis compounded by the inherent disparity of data, its uncertainty and potential untrustworthiness.
Creating this new generation of sensor data management platforms has many benefits, most notably in network effects enabled by collaboration. Citizens will gain new real-time services allowing more informed decision making, this leads to optimisation and greater efficiency in the use of city services; a key goal of city authorities. This is enabled by developers utilising the platform to combine data and models in novel ways; providing value to data providers via new monetisation streams.
The Concinnity system addresses the five identified challenges via its sub-systems. For example the wikisensing.org data platform aids crowdsourcing of data whilst collating metadata to deal with its disparity and providing tools to assess its trustworthiness. Similarly the workflow system is designed to address the multi-scale challenges whilst allowing integrated consumption of data to aid model based decision making. This is supported by a collaborative workflow editing system.
To validate the Concinnity platform we have proposed three case studies utilising different aspects of the system to respond to the challenges facing the next generation of sensor data management platforms. At present this architecture is being implemented by integrating and resting the components described in Figure 1. Once completed the authors look forward to reporting the lessons learned from these case studies. This will provide a platform for further research for supporting wider multidisciplinary studies in the context of the realization of the smart city concept and serve as a digital exchange framework.
ACKNOWLEDGMENT We would like to acknowledge research funding received
from the EPSRC through Research Grant EP/H042512/1, “Elastic Sensor Networks: Towards Attention-Based Information Management in Large-Scale Sensor Networks”, and Research Grant EP/I038837/1, “Digital City Exchange”.
REFERENCES [1] Akyildiz, Ian F., Weilian Su, Yogesh Sankarasubramaniam, and Erdal
Cayirci. "A survey on sensor networks." Communications magazine, IEEE 40, no. 8 (2002): 102-114.
[2] Yick, Jennifer, Biswanath Mukherjee, and Dipak Ghosal. "Wireless sensor network survey." Computer networks 52, no.12 (2008): 2292-2330.
[3] Abadi, Daniel J., Don Carney, Ugur Çetintemel, Mitch Cherniack, Christian Convey, Sangdon Lee, Michael Stonebraker, Nesime Tatbul, and Stan Zdonik. "Aurora: a new model and architecture for data stream management." The VLDB Journal—The International Journal on Very Large Data Bases 12, no. 2 (2003): 120-139.
[4] Bonnet, Philippe, Johannes Gehrke, and Praveen Seshadri. "Towards sensor database systems." Lecture Notes in Computer Science (2001): 3-14.
[5] Murty, Rohan Narayana, Geoffrey Mainland, Ian Rose, Atanu Roy Chowdhury, Abhimanyu Gosain, Josh Bers, and Matt Welsh. "Citysense: An urban-scale wireless sensor network and testbed." In
Technologies for Homeland Security, 2008 IEEE Conference on, pp. 583-588. IEEE, 2008.
[6] Richards, M., M. Ghanem, M. Osmond, Y. Guo, and J. Hassard. "Grid-based analysis of air pollution data." Ecological modelling 194, no. 1 (2006): 274-286.
[7] Nikzad, Nima, Celal Ziftci, Piero Zappi, Nichole Quick, Priti Aghera, Nakul Verma, Barry Demchak et al. CitiSense: Adaptive Services for Community-driven Behavioral and Environmental Monitoring to Induce Change. Department of Computer Science and Engineering, University of California, San Diego, 2011.
[8] Folea, S., Ghercioiu, M., & Ursutiu, D. (2010). Cloud instrument powered by solar cell sends data to pachube. International Journal of Online Engineering (iJOE), 6(4), pp-20.
[9] Silva, Dilshan, Moustafa Ghanem, and Yike Guo. "WikiSensing: An Online Collaborative Approach for Sensor Data Management." Sensors 12, no. 10 (2012): 13295-13332.
[10] Crowley, James L., and Yves Demazeau. "Principles and techniques for sensor data fusion." Signal processing 32, no. 1 (1993): 5-27.
[11] Luo, Ren C., M-H. Lin, and Ralph S. Scherp. "Dynamic multi-sensor data fusion system for intelligent robots." Robotics and Automation, IEEE Journal of 4, no. 4 (1988): 386-396.
[12] Klein, Lawrence A. Sensor and data fusion: a tool for information assessment and decision making. Vol. 324. Bellingham eWA WA: SPIE press, 2004.
[13] Llinas, James, and David L. Hall. "An introduction to multi-sensor data fusion." In Circuits and Systems, 1998. ISCAS'98. Proceedings of IEEE International Symposium, vol. 6, pp. 537-540. IEEE, 1998.
[14] Cantoni, Virginio, Luca Lombardi, and Paolo Lombardi. "Challenges for data mining in distributed sensor networks." In Pattern Recognition,. ICPR 18th International Conference on, vol. 1, pp. 1000-1007. IEEE, 2006.
[15] Deshpande, Amol, Minos Garofalakis, and Rajeev Rastogi. "Independence is good: dependency-based histogram synopses for high-dimensional data." ACM SIGMOD Record 30, no.2 (2001): 199-210.
[16] Getoor, Lise, Benjamin Taskar, and Daphne Koller. "Selectivity estimation using probabilistic models." In ACM SIGMOD Record, vol. 30, no. 2, pp. 461-472. ACM, 2001.
[17] Deshpande, Amol, Carlos Guestrin, Samuel R. Madden, Joseph M. Hellerstein, and Wei Hong. "Model-driven data acquisition in sensor networks." Proceedings of the 13th international conference on Very large data bases-Volume 30, pp. 588-599. VLDB Endowment, 2004.
[18] Chu, David, Amol Deshpande, Joseph M. Hellerstein, and Wei Hong. "Approximate data collection in sensor networks using probabilistic models." In Data Engineering, 2006. ICDE'06. Proceedings of the 22nd International Conference on, pp. 48-48. IEEE, 2006.
[19] Birch, David, Paul HJ Kelly, Anthony J. Field, and Alvise Simondetti. "Computationally unifying urban masterplanning." Proceedings of the ACM International Conference on Computing Frontiers, p. 32. 2013.
[20] MyExperiment: http://www.myexperiment.org/ [21] Taverna: http://www.taverna.org.uk/ [22] Windows Azure Data Marketplace: https://datamarket.azure.com/ [23] Data Market: http://datamarket.com/ [24] Factual:http://factual.com/ [25] Di Lorenzo, Giusy, Hakim Hacid, Hye-young Paik, and Boualem
Benatallah. "Data integration in mashups." ACM Sigmod Record 38, no. 1 (2009): 59-66.
[26] K. H. van Dam, O. Tsinalis, A. Sivakumar, N. Shah, Y. Guo, and J. W. Polak. "Introducing a model composition platform for urban energy and transport systems". In Proceedings of the Agent Technologies in Energy Systems workshop (ATES2012) at AAMAS2012, pages 103-104, Valencia, Spain, 5 June 2012.
[27] MongoDb: http://www.mongodb.org [28] Huettel, Scott A., Allen W. Song, and Gregory McCarthy.
"Functional magnetic resonance imaging." (2004). [29] Windows Azure: http://www.windowsazure.com/
102


