Embed Size (px)
Citation preview
Ž .Journal of Volcanology and Geothermal Research 75 1997 137–157
Bubble coalescence in basaltic lava: Its impact on the evolution ofbubble populations
Richard A. Herd ), Harry PinkertonEnÕironmental Science DiÕision, Lancaster UniÕersity, Lancaster LA1 4YQ, UK
Received 8 November 1995; accepted 9 May 1996
Abstract
Ž .Morphological properties bubble number density, porosity, mean radius, specific surface area of vesicular rocks providequantitative information on the rates of bubble nucleation, growth and coalescence in magmas when measured as a functionof time. Such data are useful in constraining the timing and style of gas release during volcanic eruptions. Volcanic rockscommonly show strong zonation with respect to bubble size and porosity, indicating a variation in the amount of bubble
Ž .growth and coalescence preserved within a single sample. Morphological properties and bubble size distributions BSD’swere measured in a suite of zoned alkali basalts using image analysis and the data were compared to theoretical predictions.Our data indicate that at porosities greater than 35%, extensive coalescence occurred during the growth of bubbles withrestricted nucleation; at lower porosities, vesiculation is dominated by nucleation and diffusion with no coalescence. Theinteriors of many of our samples have undergone 4–7 binary coalescence events after eruption in a time of around 15 min.The Ostwald ripening effect has not significantly modified the BSD’s.
Keywords: bubble coalescence; bubble population; morphological properties; basaltaic lava; magma degassing
1. Introduction
Degassing of a magma strongly influences itsŽrheological properties and eruptive style Sparks and
.Pinkerton, 1978 . However, an outstanding problemin degassing studies is explaining how and when gasphysically separates from magma. Commonly-en-countered, low-viscosity liquids usually degas by abubble ascentrbursting mechanism which allows ef-
) Corresponding author. Now at: British Geological Survey,Kingsley Dunham Centre, Keyworth, Nottingham NG12 5GG,UK.
ficient gas separation if the host liquid is not ascend-ing quickly, whilst causing limited disruption of theliquid. In rapidly-ascending, low-viscosity melts andmost high-viscosity ones, bubbles may be effectively
Žimmobile on the timescale of their growth Parfitt.and Wilson, 1995 . In this case, each bubble moves
with the magma from which it grew, having limitedinteractions with other bubbles until high vesiculari-ties are achieved. Degassing then takes place eitherby the formation of interconnections between bub-
Ž .bles permeable foam or by violent disruption of theliquid into a spray of droplets which then undergofurther degassing. The dominant degassing mecha-
0377-0273r97r$17.00 Copyright q 1997 Elsevier Science B.V. All rights reserved.Ž .PII S0377-0273 96 00039-X
( )R.A. Herd, H. PinkertonrJournal of Volcanology and Geothermal Research 75 1997 137–157138
nism therefore depends on three timescales: the bub-ble growth rate, ascent velocity of the bubble relativeto the liquid, and the coalescence rate. The first twotimescales are reasonably well constrained for mag-
Ž .mas Sparks, 1978; Bottinga and Javoy, 1990 . Thecoalescence rate is, however, poorly known. In spe-cial circumstances, degassing can also take place
Ž .from a highly-expanded foam reticulite by bubble-to-bubble transfer of gas through thin bubble wallswithout extensive, physical connectivity between ad-jacent bubbles.
The evolution of a bubble population in a melt isa complex process involving nucleation, diffusionalgrowth, decompressional growth, coalescence, ripen-
Ž .ing bubble-to-bubble gas transfer and the effects ofŽfloatation loss of bubbles from the systemraddition
.of bubbles from below . Interpreting the resultantBSD and the rates of processes in a rock is difficultwithout tight spatial and temporal constraints on the
Ž .samples. Mangan et al. 1993 and Cashman et al.Ž .1994 achieved this control, allowing them to un-ravel many of the complexities in the evolution ofbubble populations during the eruption and flow oflavas, and bulk loss of gas from the system. Theirresults are, however, only applicable in part to the
Ž .static post-emplacement inflation and vesiculationof lavas and bombs. The approach described in thiswork uses zoned samples where the control isachieved through the position at which a measure-
Ž .ment is made related to the cooling time and thefact that the initial state of vesiculation is believed tobe preserved in the outer portions of the sample.
Coarsening of bubbles in magmas tends to beoverlooked because large bubbles are lost more eas-ily than small ones during eruption and their pres-ence is less likely to be recorded in the rocks. Foamstend to fragment through the largest bubblesŽ .Blackburn et al., 1976; Walker, 1980 , and so theydefine the margins of pyroclasts and are seen lessoften in the resulting deposits. Surficial transport oflava provides ample opportunity for loss of the coarse
Ž .bubble fraction Cashman et al., 1994 . It has beenobserved that Strombolian activity at Heimaey wascontrolled by the bursting of large, individual bub-
Žbles which caused discrete explosions Blackburn et.al., 1976 , but such bubbles are not preserved in
Ž . Ž .scoria. Sahagian et al. 1989 and Walker 1989show that coalescence in basalt flows plays an im-
portant part in controlling the final sizes and posi-tions of bubbles.
Foams and emulsions are thermodynamically un-stable and, given time, will separate in order tominimise their free energy. Coalescence is a majormechanism for reducing the surface energy of foamand can lead ultimately to the formation of a singlegas pocket. Properties of magmas such as viscosityand tensile strength are sensitive to the vesicularity
Žand sizes of bubbles Murase and McBirney, 1973;.Stein and Spera, 1992 . Consequently, a period of
bubble coarsening affects a magma’s behaviour dur-ing ascent and eruption.
Theoretical coalescence models involving bubblesascending through magma have used collection ker-nels to obtain the probability that a bubble pair will
Žmeet and coalesce Wilson and Head, 1981;Vergniolle and Jaupart, 1986; Giberti et al., 1992;
. Ž .Parfitt and Wilson, 1995 . Manga and Stone 1994have demonstrated that this concept should be ex-tended to accommodate the effect of bubble defor-mation which allows more distant bubbles to interactand coalesce. The approach used in the present studyexamines the vesiculation of a closed parcel of
Ž .magma no loss or gain of bubbles from outside inwhich there is relatively little vertical movement ofbubbles. It provides direct measurements of theamount of coalescence in a natural magma and someconstraint on the timescales involved. The rates ofcoalescence implied have direct relevance to mag-matic foams in shallow magma chambers, vesicularzones in lava flows, and the morphological evolutionof pyroclasts.
Image analysis has been used in this study tomeasure morphological properties of vesicular rocks.Many volcanic rocks show an increase in vesicular-ity and bubble size towards their centres. The lowercooling rate of the interiors allows a greater time forvesiculation and interaction of bubbles and so pro-vides a natural range in the amount of growth andcoalescence. Unambiguous evidence of coalescencecan be seen in samples where the common wallbetween two bubbles has failed and partially coa-lesced bubbles are observed. However, the commonwall tends to retract after coalescence due to surfacetension, leaving a single, larger bubble with no im-mediate evidence of the event. Consequently, visualinspection only gives an indication of the most re-
( )R.A. Herd, H. PinkertonrJournal of Volcanology and Geothermal Research 75 1997 137–157 139
cently coalesced bubbles. Morphological propertiesof samples have been used in this study to investi-gate more fully the relative importance of coales-cence by comparing measured properties with theo-retical predictions.
2. Methods
2.1. Data collection
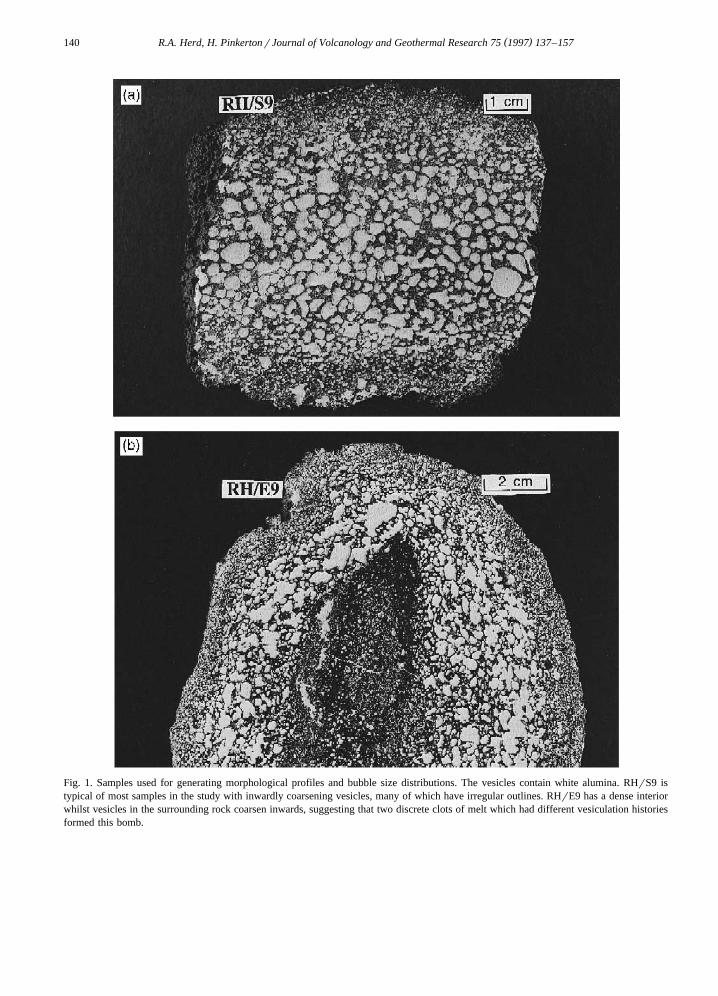
The rocks described in this study are a suite ofalkali basalts from recent eruptions on Mt. Etna andStromboli. Slabby lava crusts were collected frompahoehoe flows within 100 m of the source vents,XaXa blocks from a single, thin flow, and bombs fromvarious localities. The samples were sawn perpendic-ular to their outer margins and the vesicles exposedon cut surfaces filled with a white matrix of aluminato produce a strong colour contrast with the rockŽ .Fig. 1 . The surfaces were scanned using an HewlettPackard ScanJet Plus at a resolution of 85 mmrpixeland the 8-bit images processed on a Macintosh com-puter. Image analysis software 1 was used to mea-sure areas, perimeters, numbers and orientations ofvesicles on the images, after binary thresholding andsegmentation. The thresholding procedure used toisolate vesicles from rock is somewhat subjective,but the vesicle margins are sharp and the brightnesshistograms of the images all showed two separatepeaks so they could be segmented confidently. Thebrightness difference of the threshold between all theimages was only 3 DN values, allowing valid com-parison of data from each image to be made. Thecharacteristics of the samples are summarised inTable 1.
ŽStereological theory Cruz Orive, 1976; Russ,.1986, 1990 was used to convert the raw properties
measured on 2D images to the relevant properties of3D samples. These are the full size distribution ofvesicles and morphological properties. The 2D to 3D
Žconversion the deconvolution or unfolding proce-.dure is required for a full size analysis due to the
1 NIH Image is Public Domain and is available via anonymousFTP from zippy.nimh.nih.gov in the directory rpubrimage.
problems associated with sampling a particle popula-tion by planar methods. These result from the possi-
Ž .bility of a generating an intersect size smaller thanŽ .the true particle diameter, and b the probability of
intersecting any given particle. The unfolding proce-dure is based on the assumption of randomly-disper-sed, spherical particles and considers the combinedprobabilities of intersecting a given particle which isproportional to its radius, and the relative proportionsof intersect sizes that could be generated by each
Ž Ž . Ž . .particle size i.e. a and b above . A matrix ofcoefficients is calculated, which is inverted and thenmultiplied by the measured 2D distribution and by a
Ž .scaling factor reflecting the size of the sample toŽ .give the original 3D distribution. Russ 1986 gives
full details of the unfolding procedure. Routineswere written to automate the processing of the sizedistribution data from images. Some populations ofpetrographic importance are shown in Fig. 2 todemonstrate the difference in appearance of a 3Ddistribution when examined in a 2D section.
As the samples used show strong zonation withŽ .respect to vesicle size and vesicularity Fig. 1 , it
was sometimes impossible to measure sufficientvesicles in a homogeneous area for a reliable size
Žanalysis. Morphological properties i.e. number den-sity, N , porosity, f, mean radius, r and specificv
surface area, S – the surface area per unit volume ofv.foam can be measured with fewer vesicles and were
collected as profiles through each sample byanalysing a series of strips on each image parallel tothe sample’s outer surface. The properties are mea-sured as follows:
Ž .1 Porosity, f. The area fraction of a phase in aŽ2D section is equal to the volume fraction Chayes,
.1956 and can be measured very accurately by imageanalysis.
Ž .2 Specific surface area, S . The specific surfacevŽarea is measured from a 2D section using Cruz
.Orive, 1976; Russ, 1986 :
4Ý PS s , 1Ž .v
p A
where ÝP is the sum of the vesicle perimeters in theŽimage corrected for the extra perimeter produced by
.those vesicles which cut the image margins and Ais the image area. Although this equation was de-
( )R.A. Herd, H. PinkertonrJournal of Volcanology and Geothermal Research 75 1997 137–157140
Fig. 1. Samples used for generating morphological profiles and bubble size distributions. The vesicles contain white alumina. RHrS9 istypical of most samples in the study with inwardly coarsening vesicles, many of which have irregular outlines. RHrE9 has a dense interiorwhilst vesicles in the surrounding rock coarsen inwards, suggesting that two discrete clots of melt which had different vesiculation historiesformed this bomb.
( )R.A. Herd, H. PinkertonrJournal of Volcanology and Geothermal Research 75 1997 137–157 141
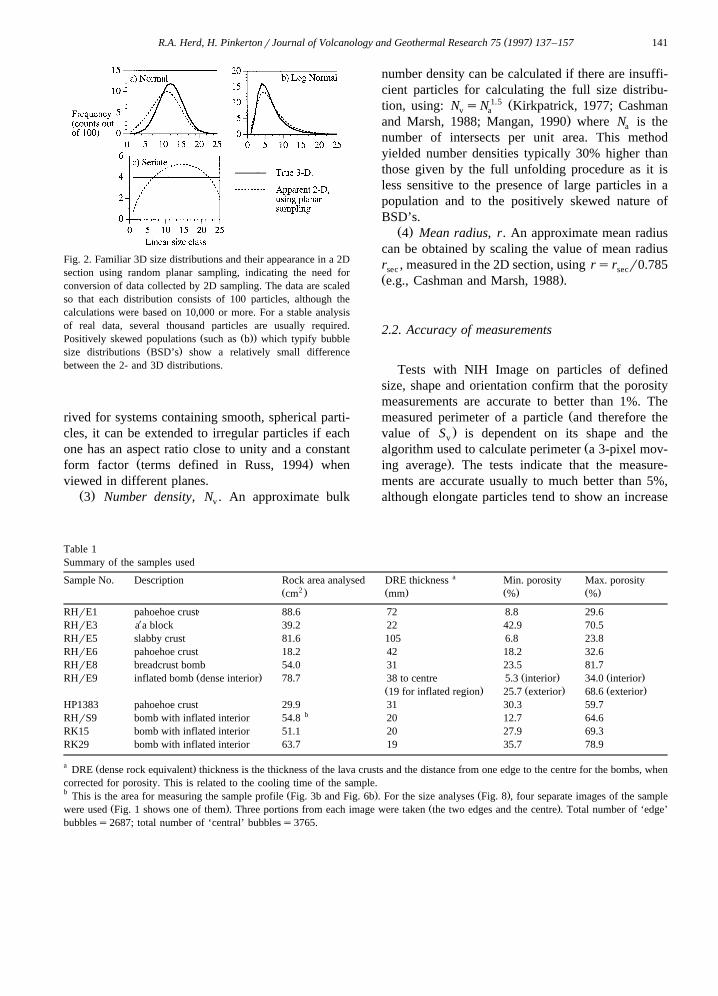
Fig. 2. Familiar 3D size distributions and their appearance in a 2Dsection using random planar sampling, indicating the need forconversion of data collected by 2D sampling. The data are scaledso that each distribution consists of 100 particles, although thecalculations were based on 10,000 or more. For a stable analysisof real data, several thousand particles are usually required.
Ž Ž ..Positively skewed populations such as b which typify bubbleŽ .size distributions BSD’s show a relatively small difference
between the 2- and 3D distributions.
rived for systems containing smooth, spherical parti-cles, it can be extended to irregular particles if eachone has an aspect ratio close to unity and a constant
Ž .form factor terms defined in Russ, 1994 whenviewed in different planes.
Ž .3 Number density, N . An approximate bulkv
number density can be calculated if there are insuffi-cient particles for calculating the full size distribu-
1.5 Žtion, using: N sN Kirkpatrick, 1977; Cashmanv a.and Marsh, 1988; Mangan, 1990 where N is thea
number of intersects per unit area. This methodyielded number densities typically 30% higher thanthose given by the full unfolding procedure as it isless sensitive to the presence of large particles in apopulation and to the positively skewed nature ofBSD’s.
Ž .4 Mean radius, r. An approximate mean radiuscan be obtained by scaling the value of mean radiusr , measured in the 2D section, using rsr r0.785sec secŽ .e.g., Cashman and Marsh, 1988 .
2.2. Accuracy of measurements
Tests with NIH Image on particles of definedsize, shape and orientation confirm that the porositymeasurements are accurate to better than 1%. The
Žmeasured perimeter of a particle and therefore the.value of S is dependent on its shape and thev
Žalgorithm used to calculate perimeter a 3-pixel mov-.ing average . The tests indicate that the measure-
ments are accurate usually to much better than 5%,although elongate particles tend to show an increase
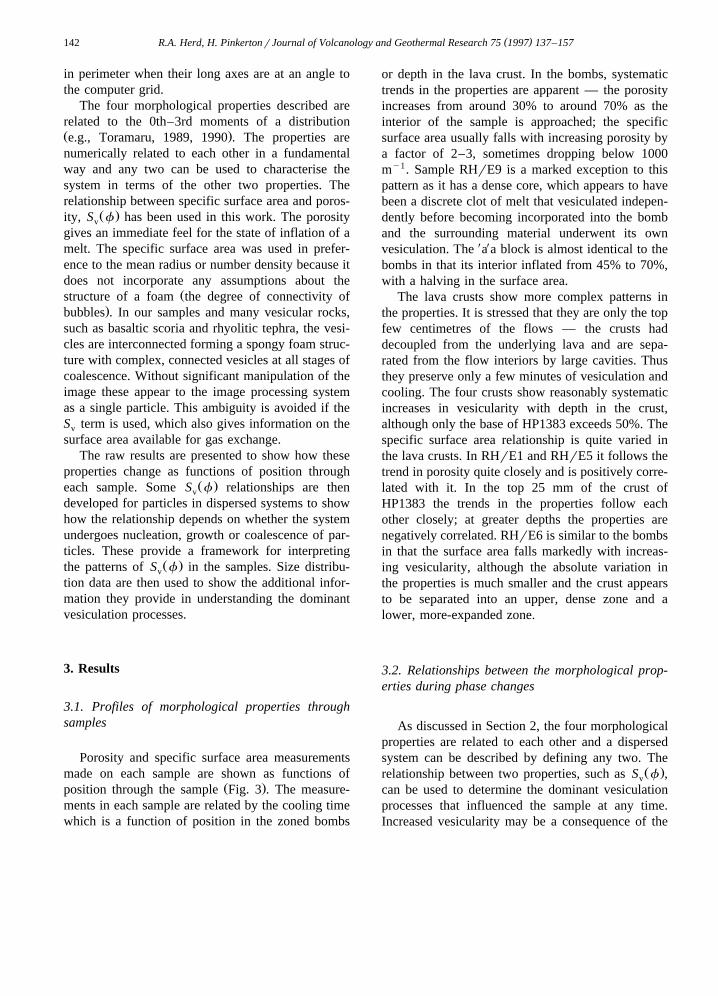
Table 1Summary of the samples used
aSample No. Description Rock area analysed DRE thickness Min. porosity Max. porosity2Ž . Ž . Ž . Ž .cm mm % %
XRHrE1 pahoehoe crust 88.6 72 8.8 29.6XRHrE3 a a block 39.2 22 42.9 70.5
RHrE5 slabby crust 81.6 105 6.8 23.8RHrE6 pahoehoe crust 18.2 42 18.2 32.6RHrE8 breadcrust bomb 54.0 31 23.5 81.7
Ž . Ž . Ž .RHrE9 inflated bomb dense interior 78.7 38 to centre 5.3 interior 34.0 interiorŽ . Ž . Ž .19 for inflated region 25.7 exterior 68.6 exterior
HP1383 pahoehoe crust 29.9 31 30.3 59.7bRHrS9 bomb with inflated interior 54.8 20 12.7 64.6
RK15 bomb with inflated interior 51.1 20 27.9 69.3RK29 bomb with inflated interior 63.7 19 35.7 78.9
a Ž .DRE dense rock equivalent thickness is the thickness of the lava crusts and the distance from one edge to the centre for the bombs, whencorrected for porosity. This is related to the cooling time of the sample.b Ž . Ž .This is the area for measuring the sample profile Fig. 3b and Fig. 6b . For the size analyses Fig. 8 , four separate images of the sample
Ž . Ž .were used Fig. 1 shows one of them . Three portions from each image were taken the two edges and the centre . Total number of ‘edge’bubbless2687; total number of ‘central’ bubbless3765.
( )R.A. Herd, H. PinkertonrJournal of Volcanology and Geothermal Research 75 1997 137–157142
in perimeter when their long axes are at an angle tothe computer grid.
The four morphological properties described arerelated to the 0th–3rd moments of a distributionŽ .e.g., Toramaru, 1989, 1990 . The properties arenumerically related to each other in a fundamentalway and any two can be used to characterise thesystem in terms of the other two properties. Therelationship between specific surface area and poros-
Ž .ity, S f has been used in this work. The porosityv
gives an immediate feel for the state of inflation of amelt. The specific surface area was used in prefer-ence to the mean radius or number density because itdoes not incorporate any assumptions about the
Žstructure of a foam the degree of connectivity of.bubbles . In our samples and many vesicular rocks,
such as basaltic scoria and rhyolitic tephra, the vesi-cles are interconnected forming a spongy foam struc-ture with complex, connected vesicles at all stages ofcoalescence. Without significant manipulation of theimage these appear to the image processing systemas a single particle. This ambiguity is avoided if theS term is used, which also gives information on thev
surface area available for gas exchange.The raw results are presented to show how these
properties change as functions of position throughŽ .each sample. Some S f relationships are thenv
developed for particles in dispersed systems to showhow the relationship depends on whether the systemundergoes nucleation, growth or coalescence of par-ticles. These provide a framework for interpreting
Ž .the patterns of S f in the samples. Size distribu-v
tion data are then used to show the additional infor-mation they provide in understanding the dominantvesiculation processes.
3. Results
3.1. Profiles of morphological properties throughsamples
Porosity and specific surface area measurementsmade on each sample are shown as functions of
Ž .position through the sample Fig. 3 . The measure-ments in each sample are related by the cooling timewhich is a function of position in the zoned bombs
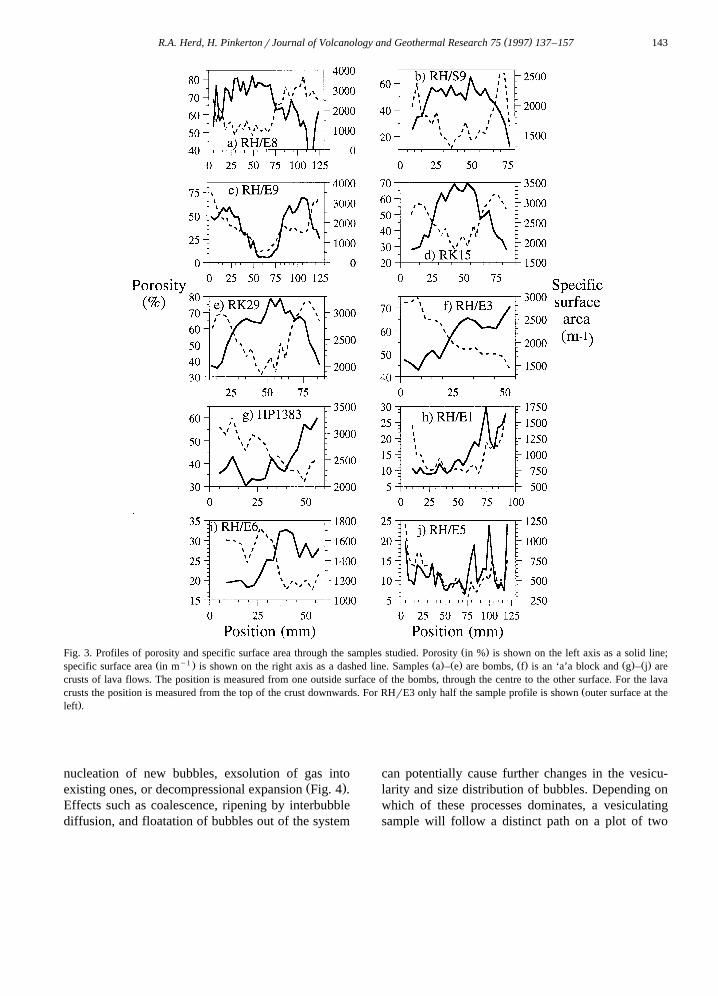
or depth in the lava crust. In the bombs, systematictrends in the properties are apparent — the porosityincreases from around 30% to around 70% as theinterior of the sample is approached; the specificsurface area usually falls with increasing porosity bya factor of 2–3, sometimes dropping below 1000my1. Sample RHrE9 is a marked exception to thispattern as it has a dense core, which appears to havebeen a discrete clot of melt that vesiculated indepen-dently before becoming incorporated into the bomband the surrounding material underwent its ownvesiculation. The XaXa block is almost identical to thebombs in that its interior inflated from 45% to 70%,with a halving in the surface area.
The lava crusts show more complex patterns inthe properties. It is stressed that they are only the topfew centimetres of the flows — the crusts haddecoupled from the underlying lava and are sepa-rated from the flow interiors by large cavities. Thusthey preserve only a few minutes of vesiculation andcooling. The four crusts show reasonably systematicincreases in vesicularity with depth in the crust,although only the base of HP1383 exceeds 50%. Thespecific surface area relationship is quite varied inthe lava crusts. In RHrE1 and RHrE5 it follows thetrend in porosity quite closely and is positively corre-lated with it. In the top 25 mm of the crust ofHP1383 the trends in the properties follow eachother closely; at greater depths the properties arenegatively correlated. RHrE6 is similar to the bombsin that the surface area falls markedly with increas-ing vesicularity, although the absolute variation inthe properties is much smaller and the crust appearsto be separated into an upper, dense zone and alower, more-expanded zone.
3.2. Relationships between the morphological prop-erties during phase changes
As discussed in Section 2, the four morphologicalproperties are related to each other and a dispersedsystem can be described by defining any two. The
Ž .relationship between two properties, such as S f ,v
can be used to determine the dominant vesiculationprocesses that influenced the sample at any time.Increased vesicularity may be a consequence of the
( )R.A. Herd, H. PinkertonrJournal of Volcanology and Geothermal Research 75 1997 137–157 143
Ž .Fig. 3. Profiles of porosity and specific surface area through the samples studied. Porosity in % is shown on the left axis as a solid line;Ž y1 . Ž . Ž . Ž . Ž . Ž .specific surface area in m is shown on the right axis as a dashed line. Samples a – e are bombs, f is an ‘a’a block and g – j are
crusts of lava flows. The position is measured from one outside surface of the bombs, through the centre to the other surface. For the lavaŽcrusts the position is measured from the top of the crust downwards. For RHrE3 only half the sample profile is shown outer surface at the
.left .
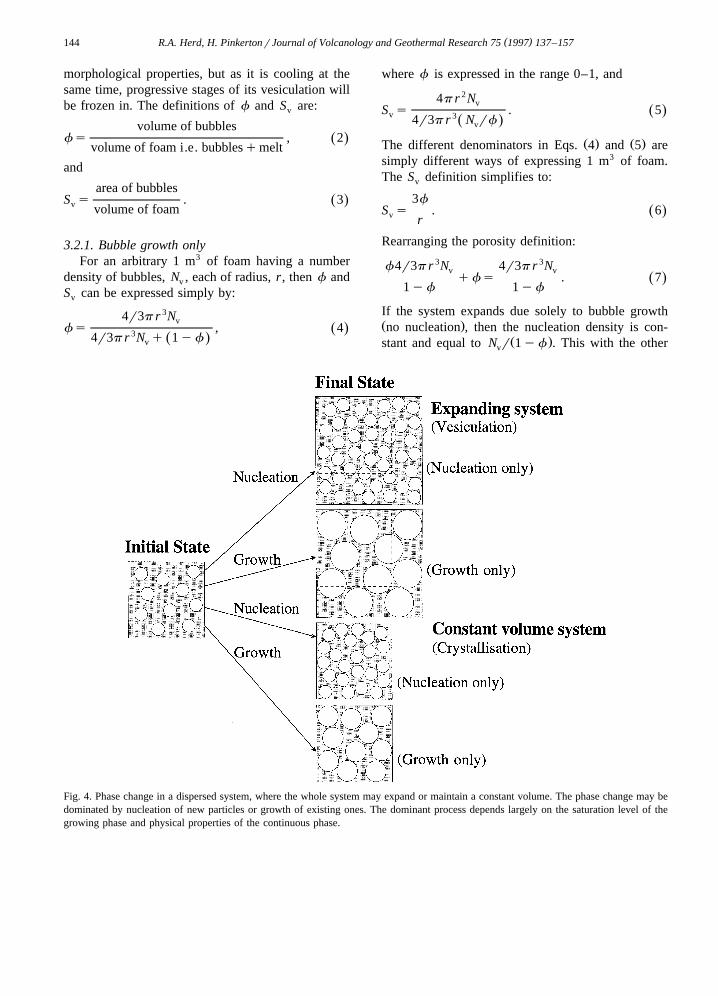
nucleation of new bubbles, exsolution of gas intoŽ .existing ones, or decompressional expansion Fig. 4 .
Effects such as coalescence, ripening by interbubblediffusion, and floatation of bubbles out of the system
can potentially cause further changes in the vesicu-larity and size distribution of bubbles. Depending onwhich of these processes dominates, a vesiculatingsample will follow a distinct path on a plot of two
( )R.A. Herd, H. PinkertonrJournal of Volcanology and Geothermal Research 75 1997 137–157144
morphological properties, but as it is cooling at thesame time, progressive stages of its vesiculation willbe frozen in. The definitions of f and S are:v
volume of bubblesfs , 2Ž .
volume of foam i.e. bubblesqmelt
and
area of bubblesS s . 3Ž .v volume of foam
3.2.1. Bubble growth onlyFor an arbitrary 1 m3 of foam having a number
density of bubbles, N , each of radius, r, then f andv
S can be expressed simply by:v
4r3p r 3Nvfs , 4Ž .34r3p r N q 1yfŽ .v
where f is expressed in the range 0–1, and
4p r 2NvS s . 5Ž .v 34r3p r N rfŽ .v
Ž . Ž .The different denominators in Eqs. 4 and 5 aresimply different ways of expressing 1 m3 of foam.The S definition simplifies to:v
3fS s . 6Ž .v r
Rearranging the porosity definition:
f4r3p r 3N 4r3p r 3Nv vqfs . 7Ž .
1yf 1yf
If the system expands due solely to bubble growthŽ .no nucleation , then the nucleation density is con-
Ž .stant and equal to N r 1yf . This with the otherv
Fig. 4. Phase change in a dispersed system, where the whole system may expand or maintain a constant volume. The phase change may bedominated by nucleation of new particles or growth of existing ones. The dominant process depends largely on the saturation level of thegrowing phase and physical properties of the continuous phase.
( )R.A. Herd, H. PinkertonrJournal of Volcanology and Geothermal Research 75 1997 137–157 145
constants is taken into a term, a, which after simpli-fying leaves:
fsar 3 1yf , 8Ž . Ž .Ž . Ž Ž .. Ž .where as 4p N r 3 1yf . Substituting Eq. 8v
Ž .into Eq. 6 :
S s3ar 2 1yf , 9Ž . Ž .v
Ž .and then removing r using Eq. 6 , leaves:1r32r3S s3f ayaf . 10Ž . Ž .v
Ž .The noticeable feature of Eq. 10 is that S is av
maximum when fs66.7%. Thus, bubble growth athigh gas fractions would be expected to generate aprogressive fall in S , as bubbles are displaced fromv
a reference volume quicker than surface area isŽ .generated by their growth Fig. 4 . It can be shown
Žthat the nature of the bubble growth decompression.or diffusion and the initial size distribution of bub-
bles do not influence this relationship, but for theŽ .purposes of clarity Eq. 10 is derived using a uni-
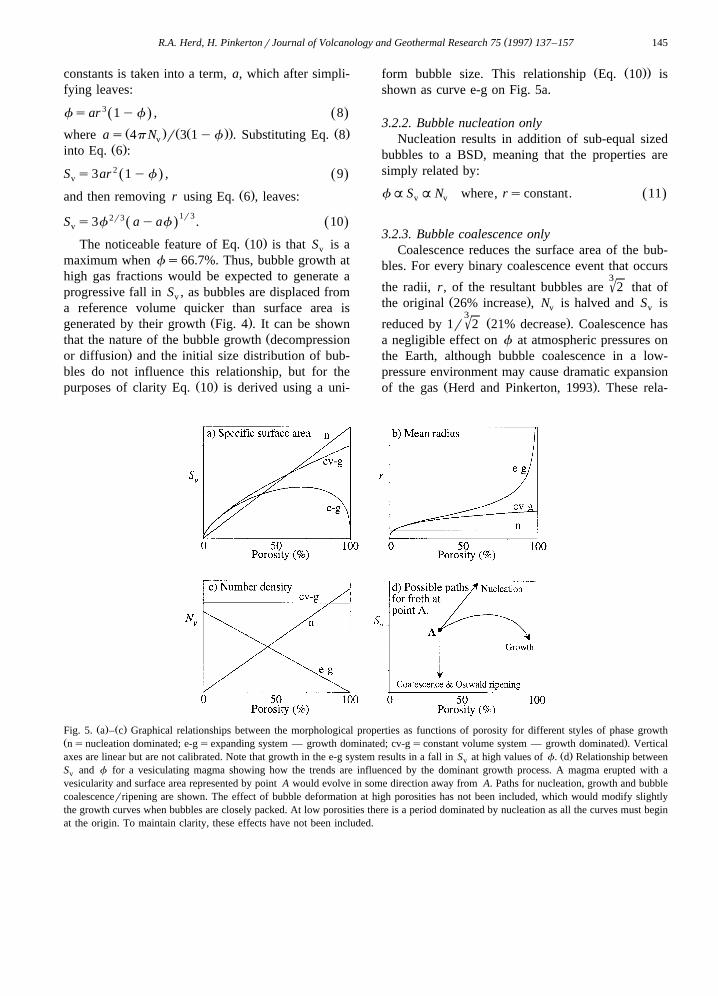
Ž Ž ..form bubble size. This relationship Eq. 10 isshown as curve e-g on Fig. 5a.
3.2.2. Bubble nucleation onlyNucleation results in addition of sub-equal sized
bubbles to a BSD, meaning that the properties aresimply related by:
fAS AN where, rsconstant. 11Ž .v v
3.2.3. Bubble coalescence onlyCoalescence reduces the surface area of the bub-
bles. For every binary coalescence event that occurs3'the radii, r, of the resultant bubbles are 2 that of
Ž .the original 26% increase , N is halved and S isv v3' Ž .reduced by 1r 2 21% decrease . Coalescence has
a negligible effect on f at atmospheric pressures onthe Earth, although bubble coalescence in a low-pressure environment may cause dramatic expansion
Ž .of the gas Herd and Pinkerton, 1993 . These rela-
Ž . Ž .Fig. 5. a – c Graphical relationships between the morphological properties as functions of porosity for different styles of phase growthŽ .nsnucleation dominated; e-gsexpanding system — growth dominated; cv-gsconstant volume system — growth dominated . Vertical
Ž .axes are linear but are not calibrated. Note that growth in the e-g system results in a fall in S at high values of f. d Relationship betweenv
S and f for a vesiculating magma showing how the trends are influenced by the dominant growth process. A magma erupted with av
vesicularity and surface area represented by point A would evolve in some direction away from A. Paths for nucleation, growth and bubblecoalescencerripening are shown. The effect of bubble deformation at high porosities has not been included, which would modify slightlythe growth curves when bubbles are closely packed. At low porosities there is a period dominated by nucleation as all the curves must beginat the origin. To maintain clarity, these effects have not been included.
( )R.A. Herd, H. PinkertonrJournal of Volcanology and Geothermal Research 75 1997 137–157146
tionships are shown as graphs of S , r, N asv v
functions of f in Fig. 5a–c.
( )3.2.4. Particles in a constant Õolume crystallisationŽ .By way of comparison the S f relations forv
Ž .particles in a constant volume crystallising systemare included. The relationships for nucleation andcoalescence are unchanged. In the case of particlegrowth, it can be shown that:
S sf 2r3a1r3 , 12Ž .v
where a is a constant for this style of growth givenby as36p N and is also shown on Fig. 5a–c asv
curve cv-g.For a real sample, more than one vesiculation
process-nucleation, growth, coalescence etc. may oc-cur at any time, producing a superimposition of
Ž .effects on an S f plot. The relative importance ofv
each process can then be evaluated by comparing theŽ .trend in the measured S f data with that predictedv
for each process operating in isolation. Point A onFig. 5d represents the vesicularity of a clot of melterupted with a given f and S . If the melt werev
sufficiently mobile, further bubble nucleation mayoccur, or the existing bubbles may expand due todecompression or diffusional growth, or they may
Ž .interact and coalesce. The final trend of the S fv
data may be some combination of all these pro-cesses. The margins of the samples we studied aredense relative to their interiors. It is reasonable,therefore, to take the vesicularity of the margins asrepresentative of the state of the magma on eruption,and to assume that the interiors vesiculated from that
Ž .state i.e. point A on Fig. 5d .
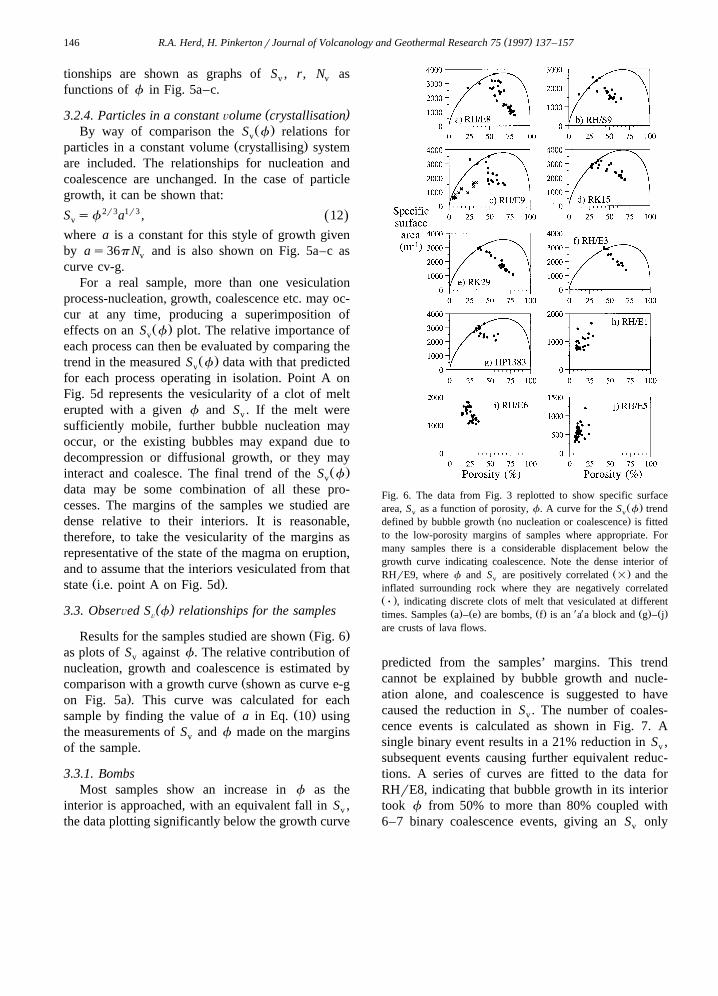
( )3.3. ObserÕed S f relationships for the samplesÕ
Ž .Results for the samples studied are shown Fig. 6as plots of S against f. The relative contribution ofv
nucleation, growth and coalescence is estimated byŽcomparison with a growth curve shown as curve e-g
.on Fig. 5a . This curve was calculated for eachŽ .sample by finding the value of a in Eq. 10 using
the measurements of S and f made on the marginsv
of the sample.
3.3.1. BombsMost samples show an increase in f as the
interior is approached, with an equivalent fall in S ,v
the data plotting significantly below the growth curve
Fig. 6. The data from Fig. 3 replotted to show specific surfaceŽ .area, S as a function of porosity, f. A curve for the S f trendv v
Ž .defined by bubble growth no nucleation or coalescence is fittedto the low-porosity margins of samples where appropriate. Formany samples there is a considerable displacement below thegrowth curve indicating coalescence. Note the dense interior of
Ž .RHrE9, where f and S are positively correlated = and thev
inflated surrounding rock where they are negatively correlatedŽ .Ø , indicating discrete clots of melt that vesiculated at different
Ž . Ž . Ž . X X Ž . Ž .times. Samples a – e are bombs, f is an a a block and g – jare crusts of lava flows.
predicted from the samples’ margins. This trendcannot be explained by bubble growth and nucle-ation alone, and coalescence is suggested to havecaused the reduction in S . The number of coales-v
cence events is calculated as shown in Fig. 7. Asingle binary event results in a 21% reduction in S ,v
subsequent events causing further equivalent reduc-tions. A series of curves are fitted to the data forRHrE8, indicating that bubble growth in its interiortook f from 50% to more than 80% coupled with6–7 binary coalescence events, giving an S onlyv
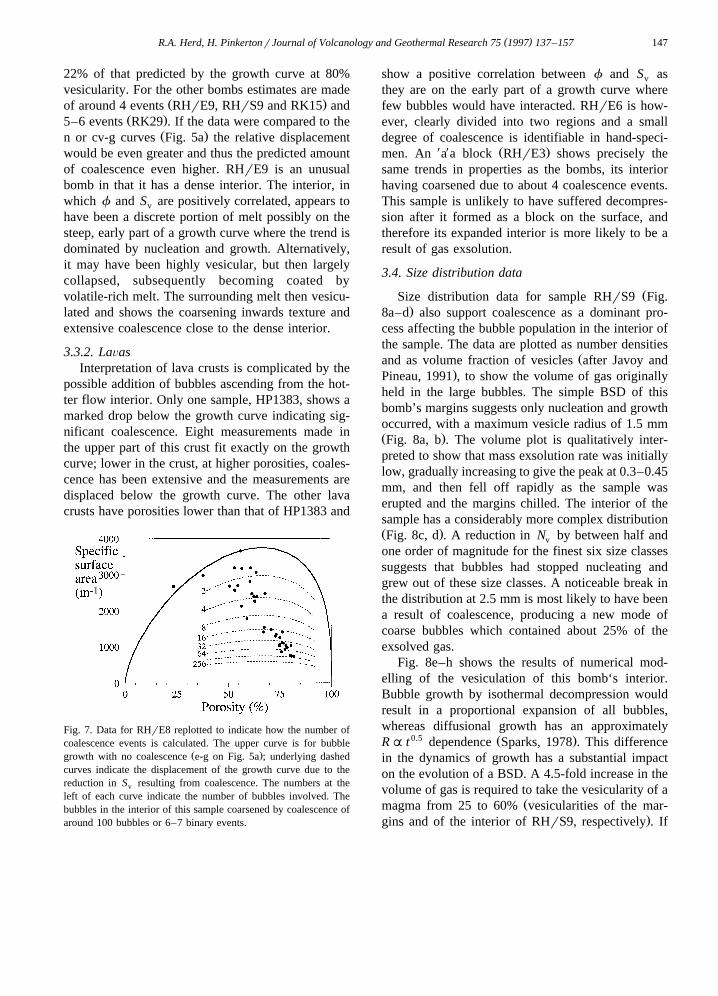
( )R.A. Herd, H. PinkertonrJournal of Volcanology and Geothermal Research 75 1997 137–157 147
22% of that predicted by the growth curve at 80%vesicularity. For the other bombs estimates are made
Ž .of around 4 events RHrE9, RHrS9 and RK15 andŽ .5–6 events RK29 . If the data were compared to the
Ž .n or cv-g curves Fig. 5a the relative displacementwould be even greater and thus the predicted amountof coalescence even higher. RHrE9 is an unusualbomb in that it has a dense interior. The interior, inwhich f and S are positively correlated, appears tov
have been a discrete portion of melt possibly on thesteep, early part of a growth curve where the trend isdominated by nucleation and growth. Alternatively,it may have been highly vesicular, but then largelycollapsed, subsequently becoming coated byvolatile-rich melt. The surrounding melt then vesicu-lated and shows the coarsening inwards texture andextensive coalescence close to the dense interior.
3.3.2. LaÕasInterpretation of lava crusts is complicated by the
possible addition of bubbles ascending from the hot-ter flow interior. Only one sample, HP1383, shows amarked drop below the growth curve indicating sig-nificant coalescence. Eight measurements made inthe upper part of this crust fit exactly on the growthcurve; lower in the crust, at higher porosities, coales-cence has been extensive and the measurements aredisplaced below the growth curve. The other lavacrusts have porosities lower than that of HP1383 and
Fig. 7. Data for RHrE8 replotted to indicate how the number ofcoalescence events is calculated. The upper curve is for bubble
Ž .growth with no coalescence e-g on Fig. 5a ; underlying dashedcurves indicate the displacement of the growth curve due to thereduction in S resulting from coalescence. The numbers at thev
left of each curve indicate the number of bubbles involved. Thebubbles in the interior of this sample coarsened by coalescence ofaround 100 bubbles or 6–7 binary events.
show a positive correlation between f and S asv
they are on the early part of a growth curve wherefew bubbles would have interacted. RHrE6 is how-ever, clearly divided into two regions and a smalldegree of coalescence is identifiable in hand-speci-
X X Ž .men. An a a block RHrE3 shows precisely thesame trends in properties as the bombs, its interiorhaving coarsened due to about 4 coalescence events.This sample is unlikely to have suffered decompres-sion after it formed as a block on the surface, andtherefore its expanded interior is more likely to be aresult of gas exsolution.
3.4. Size distribution data
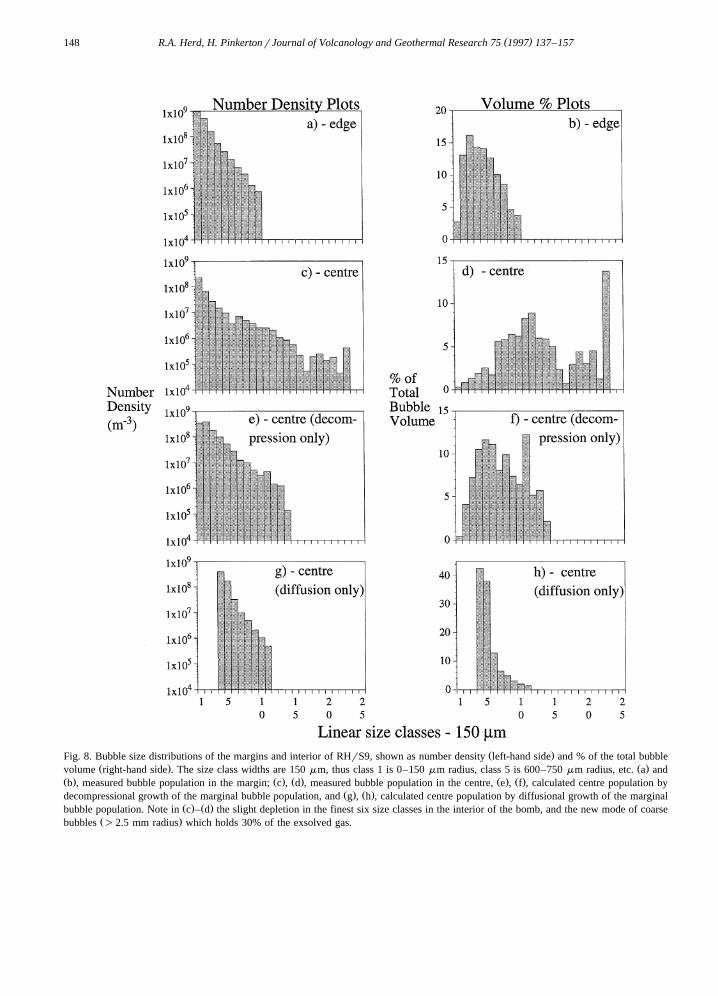
ŽSize distribution data for sample RHrS9 Fig..8a–d also support coalescence as a dominant pro-
cess affecting the bubble population in the interior ofthe sample. The data are plotted as number densities
Žand as volume fraction of vesicles after Javoy and.Pineau, 1991 , to show the volume of gas originally
held in the large bubbles. The simple BSD of thisbomb’s margins suggests only nucleation and growthoccurred, with a maximum vesicle radius of 1.5 mmŽ .Fig. 8a, b . The volume plot is qualitatively inter-preted to show that mass exsolution rate was initiallylow, gradually increasing to give the peak at 0.3–0.45mm, and then fell off rapidly as the sample waserupted and the margins chilled. The interior of thesample has a considerably more complex distributionŽ .Fig. 8c, d . A reduction in N by between half andv
one order of magnitude for the finest six size classessuggests that bubbles had stopped nucleating andgrew out of these size classes. A noticeable break inthe distribution at 2.5 mm is most likely to have beena result of coalescence, producing a new mode ofcoarse bubbles which contained about 25% of theexsolved gas.
Fig. 8e–h shows the results of numerical mod-elling of the vesiculation of this bomb‘s interior.Bubble growth by isothermal decompression wouldresult in a proportional expansion of all bubbles,whereas diffusional growth has an approximately
0.5 Ž .RA t dependence Sparks, 1978 . This differencein the dynamics of growth has a substantial impacton the evolution of a BSD. A 4.5-fold increase in thevolume of gas is required to take the vesicularity of a
Žmagma from 25 to 60% vesicularities of the mar-.gins and of the interior of RHrS9, respectively . If
( )R.A. Herd, H. PinkertonrJournal of Volcanology and Geothermal Research 75 1997 137–157148
Ž .Fig. 8. Bubble size distributions of the margins and interior of RHrS9, shown as number density left-hand side and % of the total bubbleŽ . Ž .volume right-hand side . The size class widths are 150 mm, thus class 1 is 0–150 mm radius, class 5 is 600–750 mm radius, etc. a and
Ž . Ž . Ž . Ž . Ž .b , measured bubble population in the margin; c , d , measured bubble population in the centre, e , f , calculated centre population byŽ . Ž .decompressional growth of the marginal bubble population, and g , h , calculated centre population by diffusional growth of the marginal
Ž . Ž .bubble population. Note in c – d the slight depletion in the finest six size classes in the interior of the bomb, and the new mode of coarseŽ .bubbles )2.5 mm radius which holds 30% of the exsolved gas.
( )R.A. Herd, H. PinkertonrJournal of Volcanology and Geothermal Research 75 1997 137–157 149
this were achieved solely by decompression then3'each bubbles’ radius would increase by 4.5 . De-
compression preserves the form of the original BSD,but as the largest bubbles show the greatest increasein radius, the BSD is spread towards higher values.ŽIt also emphasises irregularities in the original BSD
.measurement . In Fig. 8e, f, it is seen that four newsize classes would be occupied by coarse bubbles,whilst some bubbles would remain in the finest sizeclasses. In contrast, diffusional growth gives thesmallest bubbles in a population the highest radialgrowth rates. The age of each bubble in the marginof the bomb is proportional to the square of its radiusŽ .assuming minimal interaction . If all bubbles in thecentre of the bomb stopped growing at the same
2(time, then the relation R s R qk gives the ra-2 1
dius R of each bubble at 60% vesicularity derived2
from each bubble of radius R at 25% vesicularity1
and k is a constant proportional to the time betweencooling of the exterior and interior. Results of mod-elled diffusional growth of the bubbles in the mar-
Ž .gins of RHrS9 are shown Fig. 8g, h . Only onenew size class is encountered but the finest threehave been vacated. Diffusional growth narrows aBSD, whilst shifting it towards larger sizes, and
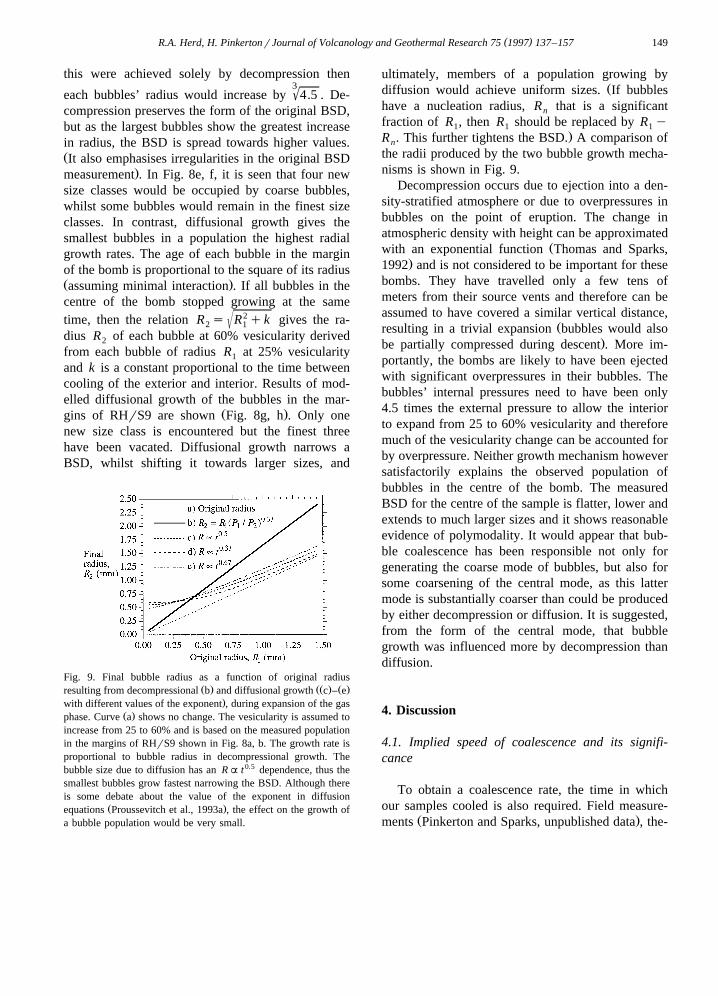
Fig. 9. Final bubble radius as a function of original radiusŽ . ŽŽ . Ž .resulting from decompressional b and diffusional growth c – e
.with different values of the exponent , during expansion of the gasŽ .phase. Curve a shows no change. The vesicularity is assumed to
increase from 25 to 60% and is based on the measured populationin the margins of RHrS9 shown in Fig. 8a, b. The growth rate isproportional to bubble radius in decompressional growth. Thebubble size due to diffusion has an RA t 0.5 dependence, thus thesmallest bubbles grow fastest narrowing the BSD. Although thereis some debate about the value of the exponent in diffusion
Ž .equations Proussevitch et al., 1993a , the effect on the growth ofa bubble population would be very small.
ultimately, members of a population growing byŽdiffusion would achieve uniform sizes. If bubbles
have a nucleation radius, R that is a significantn
fraction of R , then R should be replaced by R y1 1 1.R . This further tightens the BSD. A comparison ofn
the radii produced by the two bubble growth mecha-nisms is shown in Fig. 9.
Decompression occurs due to ejection into a den-sity-stratified atmosphere or due to overpressures inbubbles on the point of eruption. The change inatmospheric density with height can be approximated
Žwith an exponential function Thomas and Sparks,.1992 and is not considered to be important for these
bombs. They have travelled only a few tens ofmeters from their source vents and therefore can beassumed to have covered a similar vertical distance,
Žresulting in a trivial expansion bubbles would also.be partially compressed during descent . More im-
portantly, the bombs are likely to have been ejectedwith significant overpressures in their bubbles. Thebubbles’ internal pressures need to have been only4.5 times the external pressure to allow the interiorto expand from 25 to 60% vesicularity and thereforemuch of the vesicularity change can be accounted forby overpressure. Neither growth mechanism howeversatisfactorily explains the observed population ofbubbles in the centre of the bomb. The measuredBSD for the centre of the sample is flatter, lower andextends to much larger sizes and it shows reasonableevidence of polymodality. It would appear that bub-ble coalescence has been responsible not only forgenerating the coarse mode of bubbles, but also forsome coarsening of the central mode, as this lattermode is substantially coarser than could be producedby either decompression or diffusion. It is suggested,from the form of the central mode, that bubblegrowth was influenced more by decompression thandiffusion.
4. Discussion
4.1. Implied speed of coalescence and its signifi-cance
To obtain a coalescence rate, the time in whichour samples cooled is also required. Field measure-
Ž .ments Pinkerton and Sparks, unpublished data , the-
( )R.A. Herd, H. PinkertonrJournal of Volcanology and Geothermal Research 75 1997 137–157150
Ž .oretical studies Kent, 1995 and cooling experi-ments with liquid basalt at Lancaster indicate that a5-cm-thick crust forms on the top surface of a basalt
Ž .flow in 15–30 min Herd, 1994 . This has beentaken as the maximum time available for the growthand interaction of bubbles after eruption as the denserock distances to the centres of the inflated regions
Žof these samples are less than 5 cm with the excep-.tions of RHrE1 and RHrE5 . This indicates the
occurrence of binary coalescence events every fewminutes. In active Hawaiian lava flows, Cashman et
Ž . Žal. 1994 suggest even higher coalescence rates forexample 2–3 binary events in 10 s for a Wahaulatuberbreakout pair; 4–5 binary events in 3–15 min
.for a Kamoamoa tuberbreakout pair . These oc-curred in hotter, more mobile basalts and were prob-
Žably dominated by dynamic coalescence ascending.bubbles . The lava crusts RHrE6 and HP1383 un-
derwent a similar number of binary coalescenceevents-around 3, although the bombs studied hereunderwent up to 7 binary events in around 15 min.
The terms ‘magmatic foams’ and ‘vesicular caps’are often used to describe the upper regions of
Žshallow magma chambers Jaupart and Vergniolle,.1989; Parfitt et al., 1992 . If they do form at the roof
of such chambers, their lifetimes should be carefullyevaluated, as the speed of coalescence suggestedhere would indicate collapse to relatively dense meltand free gas in a few hours. Thus the magmargasstructure at the top of a chamber would involve freegas at the very top, overlying a zone of frothy meltundergoing coalescence and film drainage above meltwhose vesicularity decreases with depth. The argu-ment about the relative amounts of foam or free gasthen revolves on the rate of gas release from thechamber and the timescales of foam collapse andreplenishment via ascending bubbles.
4.2. Theoretical speed of coalescence
In all foam and emulsion studies, it is desirable toknow the speed of coalescence and its contributiontowards coarsening of the dispersed phase. Consider-able theoretical and experimental effort has beenfocused on predicting coalescence rates based on theproperties of the phases and on particle size. Theextent of coalescence in a system depends on threetimescales:
Ž .1 t . The total residence time of bubbles in ares
system during which interaction and coalescence maytake place. In our samples t is taken to be the timeres
Žtaken to cool to the solidus or strictly when the meltbecomes too viscous for bubble growth and interac-
.tion after eruption as this is the ‘extra’ time avail-able for vesiculation of the interior of samples.
Ž .2 t . The time required to allow film drainagerup
and rupture after a bubble pair meet. A definitiveequation, based purely on physical properties of theliquid and bubble sizes, is lacking due to the com-plex interaction of hydrodynamic, gravitational andVan der Waals forces which produce film drainage,dimpling and, ultimately, the generation of a surface
Ž .instability which leads to failure Palermo, 1991 .ŽAttempts to apply published equations e.g., Tora-
.maru, 1988 to bubbles in magmas yield extremelyŽlong drainage and rupture times hours for basalts
.and weeks for rhyolites , which are clearly at vari-ance with the coalescence rates suggested here. Onelimitation in the use of the Toramaru equation isuncertainty about the dimensions of the interbubbledisc of melt that fails during coalescence. Move-ment, turbulence and shock in magmatic systemsmay disrupt bubble films well before they havethinned to their spontaneous rupture thickness. Dear
Ž .and Field 1988 recognised that the application of asudden shock induces bubble collapse. In foams thiscould initiate rapid and pervasive collapse of bubblewalls, thus promoting coalescence. The effect ofcrystals on foam stability, breakdown and coales-cence is also poorly understood. Whilst they tend to
Žstabilise the foam by slowing drainage Hudales and. ŽStein, 1990 they may promote film disruption Pro-
.ussevitch et al., 1993b, their fig. 5 and coalescencewould be expected to occur more rapidly. However,
Ž .Klug and Cashman 1994 suggested that the pres-ence of microlites in silicic pumices retarded bubbleexpansion and coalescence during eruption. The ef-fect of surface active chemicals and charged specieson bubble stability in magmas is essentially un-
Ž .known Sparks, 1978 . In experimental studies greatpains are taken to ensure cleanliness of materials and
Ž .surfaces Lawson, 1967 and the absence of chargeand movement in order to eliminate these factorswhich encourage earlier film rupture. Clearly thenthe presence of these variables in natural magmas,which are difficult to quantify, renders the use of
( )R.A. Herd, H. PinkertonrJournal of Volcanology and Geothermal Research 75 1997 137–157 151
classical drainage and rupture equations question-able.
Ž .3 t . The recovery time for a coalesced pair torec
return to a spherical shape can be predicted from therheological properties of the liquid. Retraction of thecommon wall once two bubbles are interconnected ispromoted by surface tension s , and resisted by the
Ž .effective viscosity of the liquid h . Frenkel 1945e
first derived the following:
rhet f 13Ž .rec
s
to predict the recovery time from rheological proper-ties. Using an intermediate viscosity value of 500
Ž .Pa s for Etna lavas Pinkerton and Norton, 1995 andy1 Žsurface tension of 0.3 N m Walker and Mullins,
.1981 t is in the order of 10 s for 1-cm diameterrec
bubbles. Many coalesced bubbles in our samples, incontrast to those in photographs in Sarda and Gra-
Ž . Ž .ham 1990 and Mangan et al. 1993 , have not fullyrecovered to a spherical shape. This may be due tothe higher viscosity of Etna basalt, the smaller sam-
Žple size effectively earlier quenching relative to the.coalescence event or the presence of a yield strength
Ž .which is not accommodated in Eq. 13 .The rate of expansion of an overpressured gas
bubble in basalt should also be evaluated. For abubble of radius R, in an infinite, incompressible,Newtonian liquid this is calculated using an abbrevi-
Žated form of the Rayleigh–Plesset equation e.g.,.Sparks, 1978 :
2s 1˙P shr gqP q q4hRb m atm R R
32¨ ˙qr RRq R 14Ž .m ž /2
where P is the instantaneous internal bubble pres-b
sure, h the depth of overlying liquid, r the liquidm
density, g the acceleration due to gravity, P theatm˙atmospheric pressure, s the surface tension, R the
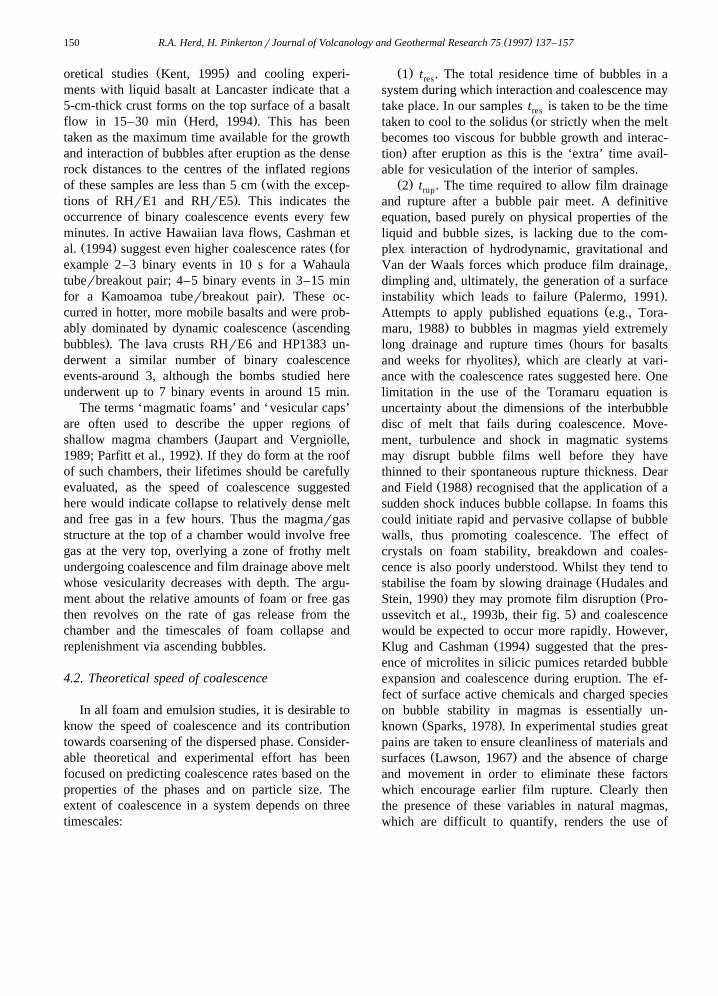
¨radial bubble growth rate and R the radial accelera-Ž .tion. Numerical solutions are shown Fig. 10 for the
expansion of bubbles which have suffered an instan-taneous, 27-fold decompression in liquids of viscos-
6 2 Žity 10 and 10 Pa s 3-fold increase in radius under.ideal, isothermal conditions . In a very viscous liq-
uid, a bubble approaches its equilibrium size in an
asymptotic manner; for large bubbles in low-viscos-ity liquids the gas expansion is so rapid as to gener-ate sufficient momentum in the surrounding liquid tocarry the bubble beyond its equilibrium size initiat-ing damped oscillations around that size. For the
ŽEtna samples hs500 Pa s, Rs0.6 mm, 4.5-fold.decompression the gas expansion would be ex-
pected to occur in less than 1 s with very smallsubsequent oscillations.
4.3. Significance for the Õertical zonation of bubblesin solidified laÕas
Ž .Aubele et al. 1988 explain vertical variations inthe vesicularity of lavas, by diffusional growth andascent of bubbles. If their model was applicable toall our lava samples, f and S would both increasev
with depth in the crust at all values of f. This isŽseen in the two low-porosity samples RHrE1 and
.RHrE5 . At higher porosities the effect of coales-cence becomes significant, lowering the measure-
Ž .ments of S . Walker 1989 and Sahagian et al.vŽ .1989 observed significant bubble coalescence insolidified, basaltic flows, whilst Cashman et al.Ž .1994 demonstrated both coalescence textures and amassive depletion in the bubble number densitycaused in part by coalescence. At porosities greater
Ž .than 30–35%, the Aubele et al. 1988 model couldbe extended to include this effect.
Some other significant problems exist in theŽ .Aubele et al. 1988 model. Their observation re-
Ž .garding the field data p. 358 ‘‘...the net result is noŽsystematic change in density with depth...’’ refer-
ring to the density of rock in the upper vesicular.zone of flows is curious and inconsistent with their
computer model. The first comment regarding theirfield data is the measured values of rock densitythemselves. Densities in excess of 2900 kg my3 areremarkable even for olivine-rich basalts. The pres-
y3 Žence of densities reaching 3400 kg m their fig..11 indicates a probable error in their measurements.
They describe a downward decrease in bubble num-ber density, increase in bubble radius at constant
Ž .porosity and therefore decreasing S for the upperv
crust. This observation, if correct, is difficult toexplain by their computer model which invokesmovement by buoyancy and diffusional growth of
( )R.A. Herd, H. PinkertonrJournal of Volcanology and Geothermal Research 75 1997 137–157152
Ž Ž .. Ž . 6Fig. 10. Expansion of overpressured bubbles as predicted by the Rayleigh–Plesset equation Eq. 14 . a 10 -Pa s liquid containing aŽ .bubble initially 1 mm in radius, b 100-Pa s liquid containing a bubble initially 5 cm in radius. In both examples the liquid density was
y3 Ž l l2500 kg m and the initial and final pressures were 27 and 1 atmospheres, respectively. An adiabatic solution P V sP V , using1 1 2 2. Ž .ls1.3 for the gas expansion is also shown in b . The bubble undergoes a 12.6-fold increase in volume for a 27-fold decrease in pressure
Ž . Ž .under adiabatic conditions. Step times in the programme were a 0.25 s and b 0.001 s.
bubbles, because constant rock density implies that aconstant volume of gas was held at each level in thevesicular zone. It would take a fortuitous balance
Žbetween bubble loss through ascent to higher re-.gions and sometimes out of the flow and bubble
Žgain addition of those from the flow interior which.have grown extensively by volatile exsolution to
generate a constant porosity throughout the flowcrust. Although this is concerned primarily with
vesiculation and growth of bubbles following em-placement, passive gas loss is also likely to haveoccurred during transport of the lava prior to the
Ž .formation of a crust Cashman et al., 1994 .Ž .The pattern Aubele et al. 1988 observed is more
simply explained by invoking the existence of ayield strength in the basaltic lava and coalescence of
Ž .bubbles Walker, 1989 . The lava crusts could thendevelop by diffusional growth of bubbles, an in-
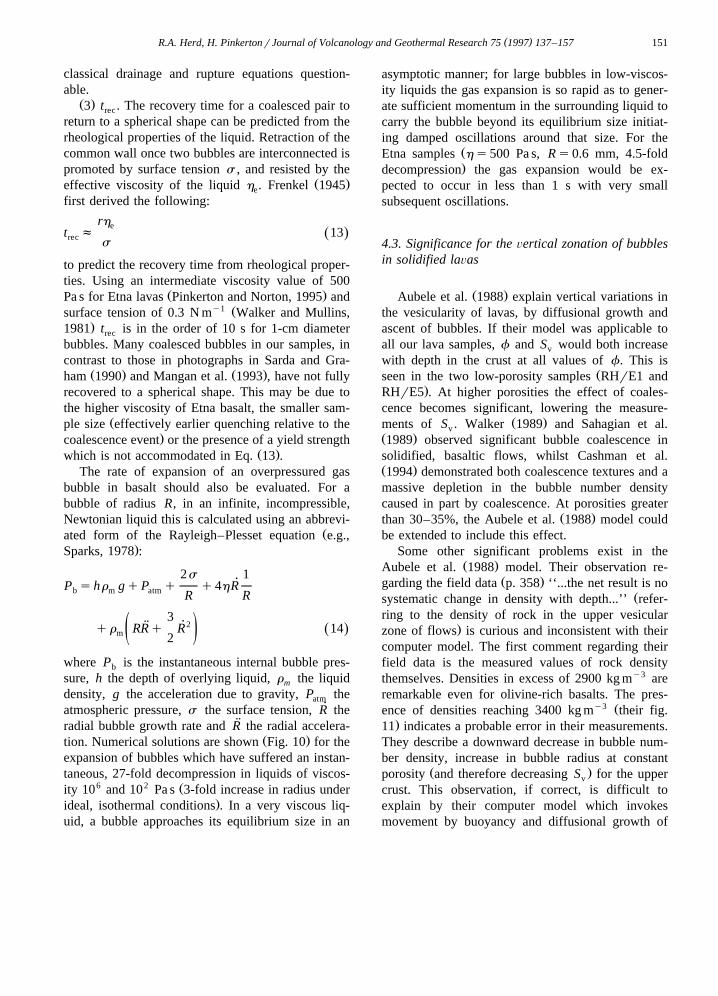
Fig. 11. Effect of image cleaning operations on properties measured by NIH Image. Note the severe reduction in S and N with each passv v
due to the removal of individual pixels and small clusters. There is no significant difference between the two operations on the values of Sv
and N . Although f is much less sensitive to the effects of either cleaning process, the smoothing filter causes a reduction with every pass,v
whilst the effects of the erode–dilate are limited to the first two passes.
( )R.A. Herd, H. PinkertonrJournal of Volcanology and Geothermal Research 75 1997 137–157 153
crease in coalescence frequency with depth, but lim-ited bubble ascent. It is stressed that the use of abubble ascent model incorporating a Newtonian vis-cosity is quite wrong if the liquid had a yield strengthand certain particles not able to overcome it. Etnean
Ž .lavas have significant yield strengths up to 400 Paat subliquidus temperatures largely due to the pres-
Žence of microcrysts Sparks et al., 1978; Sparks and. Ž .Pinkerton, 1978 . Fig. 1 of Sparks et al. 1978 with
a density contrast of 2650 kg my3, indicates that theascent of bubbles up to 7 cm in diameter might beretarded by such a yield strength. Laboratory experi-
Žments with Etnean lavas Pinkerton and Norton,. Ž .1995 gave lower yield strengths up to 78 Pa ,
which would impede the ascent of bubbles up to 1.5cm in diameter. This suggests that most bubbles inthe lava crusts we examined did not ascend signifi-cant distances, but grew and coalesced close to thepositions at which they originally nucleated. Thisdoes not however preclude passive gas loss from the
Ž .emplacing flow Cashman et al., 1994 as the rheo-logical properties of Etnean lavas change dramati-
Žcally with only a few degrees of cooling Pinkerton.and Sparks, 1978; Pinkerton and Norton, 1995 and
the development of a yield strength is abrupt.
4.4. Other explanations of the trends
4.4.1. Ostwald ripeningIt has been assumed so far that coalescence is the
principal mechanism causing coarsening of the BSD’sof the rocks examined. Ostwald ripening is an alter-native mechanism for depleting the fine fractionfrom a bubble population, leading to a gradual coars-
Ž .ening of the BSD Toramaru, 1989 . Ripening isdriven by surface energy requirements and results ingas transfer from the smallest to the largest bubbles.In this respect it differs from coalescence, whichoccurs due to mechanical and molecular interactionsresulting in a more favourable thermodynamic situa-tion, but is not actually driven by surface energy.The result of ripening is similar to coalescence inthat S is reduced at constant f, and in size distribu-v
tion data appears as a progressive increase in themean bubble size with time coupled with a depletion
Žof the fine fraction Kabalnov et al., 1987, 1990 for.diagrams of this change . Coalescence, however is
likely to produce polymodality in a BSD and irregu-lar bubble outlines.
Ž .The Lifshitz and Slyozov 1961 theory for ripen-ing rate was derived for negligible volume fractionof the dispersed phase. An adjustment is made for
Ž .finite volume dispersed phase Voorhees, 1985which is necessary for practical applicationsŽ .Kabalnov et al., 1987, 1990 :
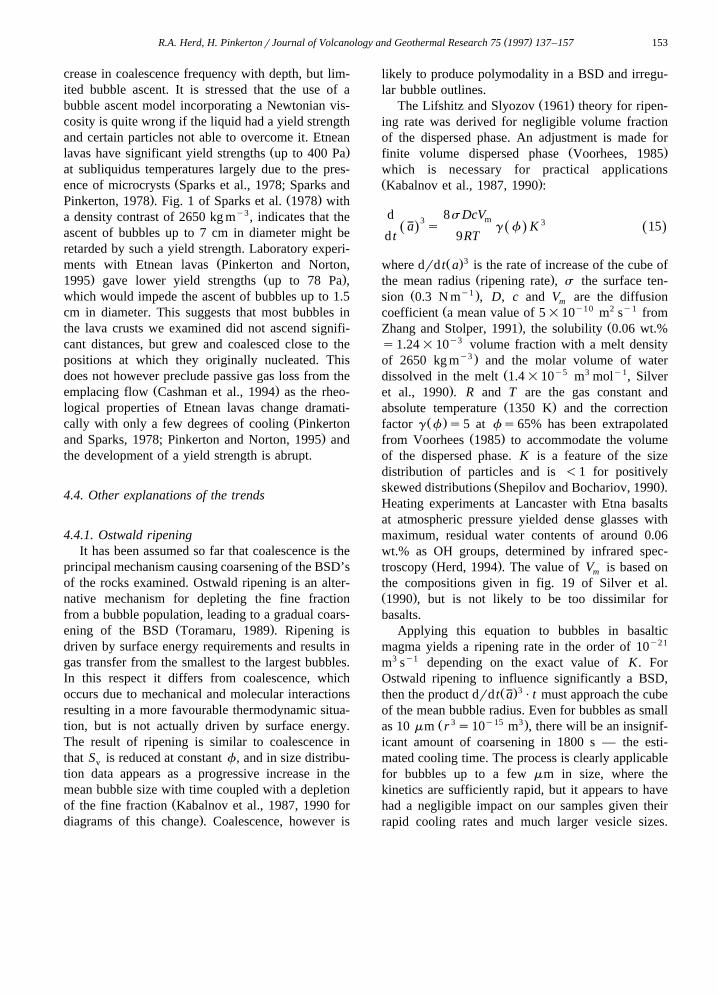
d 8s DcVm3 3a s g f K 15Ž . Ž . Ž .d t 9RT
3Ž .where drd t a is the rate of increase of the cube ofŽ .the mean radius ripening rate , s the surface ten-
Ž y1 .sion 0.3 N m , D, c and V are the diffusionmŽ y10 2 y1coefficient a mean value of 5=10 m s from
. ŽZhang and Stolper, 1991 , the solubility 0.06 wt.%s1.24=10y3 volume fraction with a melt density
y3 .of 2650 kg m and the molar volume of waterŽ y5 3 y1dissolved in the melt 1.4=10 m mol , Silver
.et al., 1990 . R and T are the gas constant andŽ .absolute temperature 1350 K and the correction
Ž .factor g f s5 at fs65% has been extrapolatedŽ .from Voorhees 1985 to accommodate the volume
of the dispersed phase. K is a feature of the sizedistribution of particles and is -1 for positively
Ž .skewed distributions Shepilov and Bochariov, 1990 .Heating experiments at Lancaster with Etna basaltsat atmospheric pressure yielded dense glasses withmaximum, residual water contents of around 0.06wt.% as OH groups, determined by infrared spec-
Ž .troscopy Herd, 1994 . The value of V is based onm
the compositions given in fig. 19 of Silver et al.Ž .1990 , but is not likely to be too dissimilar forbasalts.
Applying this equation to bubbles in basalticmagma yields a ripening rate in the order of 10y21
m3 sy1 depending on the exact value of K. ForOstwald ripening to influence significantly a BSD,
3Ž .then the product drd t a P t must approach the cubeof the mean bubble radius. Even for bubbles as small
Ž 3 y15 3.as 10 mm r s10 m , there will be an insignif-icant amount of coarsening in 1800 s — the esti-mated cooling time. The process is clearly applicablefor bubbles up to a few mm in size, where thekinetics are sufficiently rapid, but it appears to havehad a negligible impact on our samples given theirrapid cooling rates and much larger vesicle sizes.
( )R.A. Herd, H. PinkertonrJournal of Volcanology and Geothermal Research 75 1997 137–157154
Whilst Ostwald ripening should not be ignored as aprocess which may influence a BSD, it does notappear to have substantially affected the samplesdescribed here and timescales in the order of 105–108
seconds are probably required for the onset of signif-icant coarsening of bubbles in basalt by ripening.Furthermore, it would not be expected that ripeningof bubbles would occur at the same time as majorvolatile exsolution since ripening is a late-stage ef-fect involving gas transfer from the smallest to largestbubbles through the intervening melt.
The calculation above disagrees with the result ofŽ .Proussevitch et al. 1993b . They used a value of
4=10y9 m2 sy1 for D, the diffusion coefficient ofŽwater. The data of Zhang and Stolper 1991, their
.fig. 2 , indicate that this is probably a factor ofaround twenty too high at the water content Prousse-
Ž . Ž .vitch et al. 1993b were proposing 0.1 wt.% , andconsequently they derived a substantially higher
Ž .ripening rate. Sparks 1978 indicates that a value inthe range 10y10–10y9 m2 sy1 is appropriate forbasalts depending on the water content. Cashman et
Ž .al. 1994 describe Ostwald ripening as ‘a potentmechanism’ but the basis for this comment is notclear as they do not actually give a ripening rateŽonly a relative bubble growth rate as a function of
.bubble size . If the bubbles in our samples under-went ripening on the 10 s timescale proposed by
Ž .Mangan and Cashman 1995 then in the 15 minavailable for cooling one would expect a markeddepletion in the finest size classes and overall tight-ening of the BSD. We measured a half-to-one orderof magnitude reduction in the frequency of bubblesin the six smallest size classes in sample RHrS9Ž .Fig. 8a, c , which is very slightly more than thatpredicted were decompression the only growth
Ž . Ž .mechanism Fig. 8c, e . Cashman et al. 1994 how-ever record much more dramatic depletion in the
Žfinest size classes of a tube-breakout pair e.g., )2orders of magnitude depletion in the finest size class
.in their Fig. 10a . They suggest that the ripening ratemay have been enhanced due to the development ofa thin plastic skins on the breakout which wouldallow a small overpressure to develop.
4.4.2. Data artifactA major concern revolves on the nature of size
distribution data measured by image analysis. The
presence of large vesicles in high-porosity materialmeans that there is little space available for finevesicles which enhance the S value. At moderatev
values of f, S may be elevated due to considerablev
numbers of small vesicles and irregularities on theirmargins. It is conceivable that this effect may itselfgenerate an inverse relationship between f and Sv
at a certain range of f. We have performed exten-sive tests with NIH Image to look at this possibility,
Ž .using the interior of sample RHrS9 Fig. 11 andŽ .show that it is not a major problem Herd, 1994 .
Images can be cleaned of odd pixels and irregular-ities by a variety of methods. Common cleanupoperations include eroderdilate operations on binaryimages and smoothing filters applied to greytoneimages prior to binary segmentation. The resultsindicate significant reductions in S and N due tov v
the removal of small bubbles and individual pixels,with no significant difference between the cleanupoperations. On a BSD plot this results in a reductiononly in the frequency of the smallest size class.Porosity is less sensitive to the cleanup operations,but indicates a difference in their usefulness. Theeroderdilate function results in a total fall in f of1%, whereas the smoothing filter produces a continu-ous fall with each pass of the filter. This is a result ofthe convex nature of particles causing the filter togain a greater part of its average from outside whentouching one edge and therefore they are reduced insize. Whilst the use of a single erode–dilate opera-tion is appropriate to clean an image, the smoothingfilter is not. Although these effects are most pro-nounced in moderate vesicularity rock due to thegreater amount of odd pixels, the effect also appliesto high-porosity material, so the trends in data on anS versus f plot are unaffected. When applied to thev
whole image of a zoned sample, the amount ofcoalescence is reduced, typically by about half anevent. Thus we conclude that the reduction in S atv
high f due to coalescence is real but recognise thatsome ‘tightening’ of data at high f is probablyrelated to this effect.
4.5. Bubble coalescence in other magma types
Rhyolite bombs frequently show similar featuresto the basaltic ones described above. They often have
Ž .dense, glassy or very slightly vesicular margins
( )R.A. Herd, H. PinkertonrJournal of Volcanology and Geothermal Research 75 1997 137–157 155
grading inwards into more highly vesiculated mate-rial, comprised of larger bubbles. Although thetimescale for bubble coalescence in rhyolites islonger, due to the higher melt viscosity retardingfilm-drainage and retraction of the common wall,theory suggests that coalescence would be extensive
Žin the lifetime of a silicic magma chamber Jaupart.and Vergniolle, 1989 and for coarsely vesicular
pumice on rhyolite flows. Unequivocal evidence forthe presence of free gas in a magma chamber is still
Ž .lacking, but the studies of Newman et al. 1988strongly suggest the coexistence of gas with a small,
Ž .shallow rhyolite body and Tait et al. 1989 providecompelling arguments for the coexistence of gas andmagma. Bubble interactions, and in particular coales-cence, appear to be an important, but relativelyneglected, aspect of degassing models.
5. Conclusions
Image analysis and stereological theory were usedto measure the bubble size distribution and morpho-logical properties of vesicular rocks. For sampleswhich are temporally well-constrained, these proper-ties allow the relative importance and rate of nucle-ation, growth and coalescence of bubbles to be esti-mated. The technique has been applied to a series ofalkali basalts from which we conclude that:
Ø Bubble coalescence is detectable in basalticbombs, lava crusts and XaXa blocks at porosities aslow as 35%. Above this porosity, coalescence ap-pears to have been extensive and the porosity isinversely correlated with the surface area of the rock.
Ø Coarsening of the measured bubble populationscannot be satisfactorily modelled using diffusionaland decompressional growth models. The size distri-butions have a different form and extend to muchcoarser sizes at a given vesicularity than predicted bythese mechanisms.
Ø The theory for the Ostwald ripening effect doesnot predict significant coarsening of the bubbles inthese melts in timescales of a few tens of minutes.The calculated ripening rate for water vapour bub-bles in Etnean basalt is of the order 10y21 m3 sy1
which is only likely to be significant in timescales of5 Ž .10 s or more even for fine 10 mm radius bubbles.
The observed slight depletion of the finest bubbles ismost likely to have been a result of bubbles growing
out of these size classes, which were not then re-placed by nucleation of new ones, rather than aproduct of Ostwald ripening.
Ø Binary coalescence events are suggested tooccur in Etnean basalt on timescales of a few min-
Ž .utes up to 7 events in 15 min . This indicates thatbasaltic foams will collapse and separate to melt plusfree gas in a few hours. Foams of more viscousmagma will be longer-lived but still undergo steadycoalescence, which aids degassing. Coalescence is ageneral process that should be considered in the latestages of magmatic evolution when gas may coexistwith magma in a shallow chamber, and during thesurface vesiculation of lavas and pyroclasts.
Acknowledgements
We thank Russell Kent and Alun Jones for theprovision of samples and discussions about coolingrates. We are grateful to Steve Sparks, Heidi Maderand Lionel Wilson for informal discussions aboutvesiculation, degassing and the use of bubbles topetrographers. The manuscript was improved thanksto exhaustive and critical reviews by Margaret Man-gan and Elizabeth Parfitt. RAH was supported byNERC studentship GT4r90rGSr53.
References
Aubele, J.C., Crumpler, L.S. and Elston, W.G., 1988. Vesiclezonation and vertical structure of basalt flows. J. Volcanol.Geotherm. Res., 35: 349–374.
Blackburn, E.A., Wilson, L. and Sparks, R.S.J., 1976. Mecha-nisms and dynamics of strombolian activity. J. Geol. Soc.London, 132: 429–440.
Bottinga, Y. and Javoy, M., 1990. MORB degassing: Bubblegrowth and ascent. Chem. Geol., 81: 255–270.
Cashman, K.V. and Marsh, B.D., 1988. Crystal size distributionŽ .CSD in rocks and the kinetics and dynamics of crystalliza-tion. II Makaopuhi lava lake. Contrib. Mineral. Petrol., 99:292–305.
Cashman, K.V., Mangan, M.T. and Newman, S., 1994. Surfacedegassing and modifications to vesicle size distributions inactive basalt flows. J. Volcanol. Geotherm. Res., 61: 45–68.
Chayes, F., 1956. Petrographic Modal Analysis. Wiley, NewYork.
Cruz Orive, L-M., 1976. Quantifying ‘pattern’: A stereologicalapproach. J. Microsc., 107: 1–18.
Dear, J.P. and Field, J.E., 1988. A study of the collapse of arraysof cavities. J. Fluid Mech., 190: 409–425.
( )R.A. Herd, H. PinkertonrJournal of Volcanology and Geothermal Research 75 1997 137–157156
Frenkel, J., 1945. Viscous flow of crystalline bodies under theŽ .action of surface tension. J. Phys., 9 5 : 385–391.
Giberti, G., Jaupart, C. and Sartoris, G., 1992. Steady-state opera-tion of Stromboli volcano, Italy: Constraints on the feedingsystem. Bull. Volcanol., 54: 535–541.
Herd, R.A., 1994. Degassing mechanisms during explosive vol-canic eruptions. Ph.D. thesis, University of Lancaster, UK,unpublished.
Herd, R.A. and Pinkerton, H., 1993. Bubble coalescence in mag-Ž .mas. Lunar Planet. Sci. Conf., Vol. XXIV 2 , pp. 641–642.
Hudales, J.B.M. and Stein, H.N., 1990. The influence of solidparticles on foam and film drainage. J. Coll. Interface Sci.,140: 307–313.
Jaupart, C. and Vergniolle, S., 1989. The generation and collapseof a foam layer at the roof of a basaltic magma chamber. J.Fluid Mech., 203: 347–380.
Javoy, M. and Pineau, F., 1991. The volatiles record of a ‘pop-ping’ rock from the Mid-Atlantic Ridge at 14 8N: Chemicaland isotopic composition of gas trapped in the vesicles. EarthPlanet. Sci. Lett., 107: 598–611.
Kabalnov, A.S., Pertzov, A.V. and Shchukin, E.D., 1987. Ostwaldripening in emulsions I. Direct observations of ostwald ripen-ing in emulsions. J. Coll. Interface Sci., 118: 590–597.
Kabalnov, A.S., Makarov, K.N., Pertzov, A.V. and Shchukin,E.D., 1990. Ostwald ripening in emulsions II. Ostwald ripen-ing in hydocarbon emulsions: Experimental verification of
Ž .equation for absolute rates. J. Coll. Interface Sci., 138 1 :98–104.
Kent, R.M., 1995. Numerical modelling of the fluid flow and heattransfer in some volcanic systems. Ph.D. thesis, University ofLancaster, UK, unpublished.
Kirkpatrick, R.J., 1977. Nucleation and growth of plagioclase,Makaopuhi and Alae lava lakes, Kilauea Volcano, Hawaii.Bull. Geol. Soc. Am., 88: 78–84.
Klug, C. and Cashman, K.V., 1994. Vesiculation of May 18,1980, Mount St. Helens magma. Geology, 22: 468–472.
Lawson, G.B., 1967. Coalescence processes. Chem. Proc. Eng.,May: 45–60.
Lifshitz, I.M. and Slyozov, V.V., 1961. The kinetics of precipita-tion from supersaturated solid solutions. J. Phys. Chem. Solids,19: 35–50.
Manga, M. and Stone, H.A., 1994. Interactions between bubblesin magmas and lavas: Effects of bubble deformation. J. Vol-canol. Geotherm. Res., 63: 267–279.
Mangan, M.T., 1990. Crystal size distribution systematics and thedetermination of magma storage times: The 1959 eruption ofKilauea volcano, Hawaii. J. Volcanol. Geotherm. Res., 44:295–302.
Mangan, M.T. and Cashman, K.V., 1995. Vesiculation in basalticŽ .lava fountains. Am. Geophys. Union Fall meeting , V22C–7.
Mangan, M.T., Cashman, K.V. and Newman, S., 1993. Vesicula-tion of basaltic magma during eruption. Geology, 21: 157–160.
Murase, T. and McBirney, A.R., 1973. Properties of some com-mon igneous rocks and their melts at high temperatures. Bull.Geol. Soc. Am., 84: 3563–3592.
Newman, S., Epstein, S. and Stolper, E., 1988. Water, carbondioxide, and hydrogen isotopes in glasses from the ca. 1340
A.D. eruption of the Mono Craters, California: Constraints ondegassing phenomena and initial volatile content. J. Volcanol.Geotherm. Res., 35: 75–96.
´Palermo, T., 1991. Le phenomene de coalescence: Etude bibli-´ `Ž . Žographique. Rev. Inst. Fr. Pet., 46 3 : 325–360, in French
.with English abstract .Parfitt, E.A. and Wilson, L., 1995. Explosive volcanic eruptions-
IX. The transition between Hawaiian-style lava fountainingand Strombolian explosive activity. Geophys. J. Int., 121:226–232.
Parfitt, E.A., Wilson, L. and Head, J.W.III., 1992. Basaltic magmareservoirs: Factors controlling their rupture characteristics and
Ž .evolution. J. Volcanol. Geotherm. Res., 55 1–2 : 1–14.Pinkerton, H. and Norton, G.E., 1995. Rheological properties of
basaltic lavas at sub-liquidus temperatures: Laboratory andfield measurements on lavas from Mount Etna. J. Volcanol.Geotherm. Res., 68: 307–323.
Pinkerton, H. and Sparks, R.S.J., 1978. Field measurements of therheology of lava. Nature, 276: 383–385.
Proussevitch, A.A., Sahagian, D.L. and Anderson, A.T., 1993a.Dynamics of diffusive bubble growth in magmas: Isothermal
Ž .case. J. Geophys. Res., 98 B12 : 22,283–22,307.Proussevitch, A.A., Sahagian, D.L. and Kutolin, V.A., 1993b.
Stability of foams in silicate melts. J. Volcanol. Geotherm.Res., 59: 161–178.
Russ, J.C., 1986. Practical Stereology. Plenum Press, New York.Russ, J.C., 1990. Computer-assisted microscopy: The Measure-
ment and Analysis of Images. Plenum Press, New York.Russ, J.C., 1994. The Image Processing Handbook, 2nd Ed. CRC
Press.Sahagian, D.L., Anderson, A.T. and Ward, B., 1989. Bubble
coalescence in basalt flows: Comparison of a numerical modelwith natural examples. Bull. Volcanol., 52: 49–56.
Sarda, P. and Graham, D., 1990. Mid-ocean ridge popping rocks:Implications for degassing at ridge crests. Earth Planet. Sci.Lett., 97: 268–289.
Shepilov, M.P. and Bochariov, V.B., 1990. Computer simulationof the crystal volume distribution in a fully crystallized glass.Application to the estimation of the precipitate size distribu-tion after the completion of the stage of diffusion-limitedgrowth from supersaturated solid solution. J. Non-Cryst. Solid.,125: 161–167.
Silver, L.A., Ihinger, P.D. and Stolper, E., 1990. The influence ofbulk composition on the speciation of water in silicate glasses.Contrib. Mineral. Petrol., 104: 142–162.
Sparks, R.S.J., 1978. The dynamics of bubble formation andgrowth in magmas: A review and analysis. J. Volcanol.Geotherm. Res., 3: 1–37.
Sparks, R.S.J. and Pinkerton, H., 1978. Effect of degassing on therheology of basaltic lava. Nature, 276: 385–386.
Sparks, R.S.J., Pinkerton, H. and Macdonald, R., 1978. Thetransport of xenoliths in magmas. Earth Planet. Sci. Lett., 35:234–238.
Stein, D.J. and Spera, F.J., 1992. Rheology and microstructure ofmagmatic emulsions: Theory and experiments. J. Volcanol.Geotherm. Res., 49: 157–174.
Tait, S., Jaupart, C. and Vergniolle, S., 1989. Pressure, gas
( )R.A. Herd, H. PinkertonrJournal of Volcanology and Geothermal Research 75 1997 137–157 157
content and eruption periodicity of a shallow, crystallisingmagma chamber. Earth Planet. Sci. Lett., 92: 107–123.
Thomas, R.M.E. and Sparks, R.S.J., 1992. Cooling of tephraduring fallout from eruption columns. Bull. Volcanol., 54:542–553.
Toramaru, A., 1988. Formation of propagation pattern in two-phaseflow systems with application to volcanic eruptions. Geophys.J. Int., 95: 613–623.
Toramaru, A., 1989. Vesiculation process and bubble size distri-bution in ascending magmas with constant velocities. J. Geo-
Ž .phys. Res., 94 B12 : 17,523–17,542.Toramaru, A., 1990. Measurement of bubble size distribution in
vesiculated rocks with implications for quantitative estimationof eruption processes. J. Volcanol. Geotherm. Res., 43: 71–90.
Vergniolle, S. and Jaupart, C., 1986. Separated two-phase flowŽ .and basaltic eruptions. J. Geophys. Res., 91 B12 : 12,842–
12,860.
Voorhees, P.W., 1985. The theory of Ostwald Ripening. J. Stat.Ž .Phys., 38 1–2 : 231–252.
Walker, D. and Mullins Jr., O., 1981. Surface tension of naturalsilicate melts from 1200–15008C and implications for meltstructure. Contrib. Mineral. Petrol., 76: 455–462.
Walker, G.P.L., 1980. The Taupo pumice, product of the mostŽ .powerful known ultraplinian eruption? J. Volcanol.
Geotherm. Res., 8: 69–94.Walker, G.P.L., 1989. Spongy pahoehoe in Hawaii: A study of
vesicle-distribution patterns in basalt and their significance.Bull. Volcanol., 51: 199–209.
Wilson, L. and Head, J.W., 1981. Ascent and eruption of basalticŽ .magma on the earth and moon. J. Geophys. Res., 86 B4 :
2971–3001.Zhang, Y. and Stolper, E.M., 1991. Water diffusion in a basaltic
melt. Nature, 351: 306–309.