Embed Size (px)
Citation preview
1 IntroductionAn assessment of spatial planning practice at the end of the 20th century suggestedthat the adoption and use of geoinformation tools (geographic information and spatialmodeling systems) are far from widespread and far from being effectively integratedinto the planning process (Stillwell et al, 1999). From the assessment it may be con-cluded that many planners now have access to the geodata and meta-geoinformationfacilities of their organizations, and many are proficient in using their geoinformationtools to perform spatial queries and to generate thematic maps. Progress towards theuse of these tools beyond these basic activities to help solve key planning problems throughmore sophisticated analysis, however, remains very limited (Stillwell et al, 1999). Geo-information tools appear to be seldom used for those tasks that are unique to planning,such as visioning, storytelling, forecasting, analysis, sketching, and evaluation (Couclelis,2003; Klosterman, 1997).
Studies to explain the shortfall in the adoption of geoinformation tools have oftentaken a broad, systems-analytical perspective, suggesting not only reasons of a techni-cal nature, but also human, organizational, and institutional factors. Alleged reasonsare that most current tools are far too generic, complex, and inflexible, incompatiblewith most planning tasks, oriented towards technology rather than problems, andtoo focused on strict rationality (Batty, 2003; Bishop, 1998; Couclelis, 1989; Geertman
Bottlenecks blocking widespread usage of planning supportsystems
Guido VonkCopernicus Institute for Sustainable Development and Innovation, Utrecht University,PO Box 80115, 3508 TC Utrecht, The Netherlands; e-mail: [email protected]
Stan GeertmanôUrban and Regional Research Center Utrecht, Utrecht University, PO Box 80115, 3508 TCUretcht, The Netherlands; e-mail: [email protected]
Paul SchotCopernicus Institute for Sustainable Development and Innovation, Utrecht University,PO Box 80115, 3508 TC Utrecht, The Netherlands; e-mail: [email protected] 15 January 2004; in revised form 25 May 2004
Environment and Planning A 2005, volume 37, pages 909 ^ 924
Abstract. Research on planning support systems (PSS) is characterized by a strong emphasis on thesupply side, whereas little research has been undertaken on the successes and failures in the adoption ofPSS within the planning community (demand side).What becomes clear from the existing research is thatusage is not widespread. In this paper we aim to find the main bottlenecks blocking the widespread use ofPSS in spatial planning. To achieve this, a global online survey was conducted in which almost 100 PSSexperts participated and for which a theoretical framework from the field of business studies served as abasis. The results show that a multitude of factors cause the underutilization of PSS, their characteristicsbeing human, organizational and institutional, as well as technical. In particular, the lack of awareness ofand experience with PSS, alongside the relative lack of recognition of the value of PSS within the spatialplanning community, tend to block widespread usage and adoption of PSS in planning practice. On thisbasis, we offer recommendations for the enhancement of PSS adoption, namely to disseminate moreprofoundly information and knowledge about the existence and benefits of PSS within the spatial planningcommunity. Real-world example projects and in-depth research on potential benefits of PSS applicationin planning practice will be crucial in this.
DOI:10.1068/a3712
ôAlso Nexpri, Utrecht University.
and Stillwell, 2003a; Harris and Batty, 1993; Innes and Simpson, 1993; Klosterman andLandis, 1988; Nedovic-Budic, 1998; Scholten and Stillwell, 1990; Sheppard et al, 1999;Sieber, 2000; Uran and Janssen, 2003).
Quite recently, a new generation of geoinformation tools has entered the scene thatis focusing directly on support of spatial planning tasks, the so-called planning supportsystems (PSS). As a precursor, Harris (1989) defined PSS as appropriate models forcombining a range of computer-based methods and models into an integrated systemthat can support the spatial planning function. PSS bring together the functionalitiesof geographic information systems (GIS), models, and visualization, to gather, struc-ture, analyze, and communicate information in planning. Or, as recently defined byGeertman and Stillwell (2003b), PSS can be considered a subset of geoinformation-based instruments that incorporate a suite of components (theories, data, information,knowledge, methods, tools, etc) that collectively support all of, or some part of, a uniqueplanning task. In this way, PSS take the form of `information frameworks' that integratethe full range of information technologies useful for supporting the specific planningcontext for which they are designed (Geertman and Stillwell, 2003c; Klosterman, 1997).Tools like GIS and spatial decision support systems (SDSS) are related to PSS and someoverlap exists. In general, however, PSS aim to focus purely on planning support,whereas many SDSS and GIS technologies can be used for planning support if required,but are not particularly dedicated to that use [for more information on generaldifferences between PSS, GIS, and SDSS see Geertman and Stillwell (2003b)].
Over the last few years, individuals or groups based at scientific, research, orplanning institutions around the world have been involved in the development, testing,and implementation of a range of PSS (Batty and Densham, 1996; Bishop, 1998; Dijstet al, 2003; Edamura and Tsuchida, 1999; EPA, 2000; Guhathakurta, 2002; Hopkins,1999; Klosterman, 2001; Landis, 2001; Omer, 2003; Snyder, 2004; TCDDM-V, 2003;URISA, 2003; Voss et al, 2003; Waddell, 2002; Wegener, 2001). Several authors haveattempted to create a comprehensive picture of the extent of planning support toolsthat constitute PSS. This effort resulted in two books, among others: one that concen-trates on the different aspects related to PSS (Brail and Klosterman, 2001); the othershowing the immense diversity of PSS by presenting the outcomes of a worldwidesurvey of PSS in planning practice (Geertman and Stillwell, 2003b).
Besides these two more or less supply-side-oriented contributions, there remainslittle insight into the demand for PSS in planning practice. This absence of insightis remarkable because one can conclude that the widespread adoption and imple-mentation of PSS in planning practice are dragging far behind the supply of PSStools. This underusage is problematic at a time when spatial planning is increasinglycomplex and planners are showing an increasing demand for support (Bishop,1998; Geertman and Stillwell, 2003d; Voss et al, 2003).
A review of the scarce literature on the application of PSS in planning practicereveals some hints as to the reasons for the shortfall. First, the literature confirms theaforementioned reasons for underusage of geoinformation tools in general. However,hardly any studies provide general insights into bottlenecks for the specific field of PSS.A decade ago, Harris and Batty (1993) concluded that the lack of existing PSS leadsplanners to be ignorant of their potential, causing a lack of demand. A few years later,Bishop (1998) concluded that existing tools are too loosely coupled for them to con-stitute a PSS. Recently, Geertman and Stillwell (2003c) stated that a great diversity ofPSS has been developed, but that there is a serious need for a more explicit focus on theplanning and support aspects of PSS instead oföas is often the caseöon their systemaspect. They provide a series of recommendations, based on interpreted bottlenecksfrom a series of cases.
910 G Vonk, S Geertman, P Schot
A more thorough overview of empirical bottlenecks does not yet exist. The deficit indemand for PSS therefore cannot be fully explained with reference to existing knowledge.Our primary aim in this paper is to shed more light on the reasons for thisunderutilization.We do this by explicitly questioning developers and users about whichbottlenecks may be preventing widespread usage of PSS in planning practice. Insightsfrom this investigation may help developers of PSS to attune their tools better to thedemands of planning practice, and at the same time it may help potential users ofPSSöthe plannersöto formulate their requirements more explicitly. By advancing ourknowledge in this way, we hope to stimulate the application of PSS in planningpractice and improve the handling of practical planning problems.
2 Theoretical frameworkWe regard the adoption and implementation of PSS as a special case of adoption andimplementation of any information and communication technology (ICT) system. Inthis way, we can make use of extensive lines of research on adoption and implementa-tion of ICT from the theoretical domains of innovation science, management science, andbusiness studies (Davis, 1986; Dishaw and Strong, 1999; Frambach and Schillewaert, 2002;Mathieson, 1991; Rogers, 1962; 2003; Thompson et al, 1991; Venkatesh and Davis, 2000;Wilson et al, 2002). Innovation-science research on technology adoption and imple-mentation has evolved largely around Rogers's famous work Diffusion of Innovations(Rogers, 1962; 2003), in which technology adoption and implementation are consid-ered at both an organizational and an individual level. The core of this researchline is a model consisting of five sequential stages in innovation adoption and imple-mentation: (1) generation of awareness of existence of an innovation; (2) persuasionand the formation of an attitude towards the innovation; (3) an adoption decision;(4) implementation; and (5) confirmation.
In management science, research on technology adoption and implementationoriginates from a basic theory in social psychology: the theory of reasoned action(Fishbein and Ajzen, 1975). This became a landmark research line when the paper` Technology acceptance model'' by Davis was published in 1986. This model hasbeen verified over a hundred times since and was updated and extended by Venkateshand Davis in 2000. Technology acceptance is considered here only at an individuallevel. Its main components are the attitude towards an innovation, leading to accep-tance of the innovation, and continued usage of the innovation. This attitude is formedby two central factors, `perceived usefulness' and `perceived ease of use', which areinfluenced by a number of external factors such as the `output quality' and `jobrelevance' of the innovation.
As both lines of research can to some extent be considered two sides of the same coin,quite recently Frambach and Schillewaert (2002) integrated the two in a comprehensivemultilevel framework. This integrated framework, which was published in the field ofbusiness studies, has been used as a basis for the study presented in this paper. A version,showing only influence factors at an aggregated level, is shown in figure 1 (see over).
Figure 1 shows that an organization-level decision to adopt an innovation that maylead to continued use is preceded first of all by generation of awareness, after whichpotential users may start to consider using an innovation and from this they form anintention to use it. These factors are directly influenced by the `adopter characteristics'for example, organization size), organizational environmental influences' (for example,competitiveness) and the `perceived innovation characteristics' (for example, perceivedcomplexity); and are indirectly influenced by social network' characteristics (for exam-ple, network participation), `provider marketing efforts', and also the organizationalenvironmental influences'. Following the organizational-level adoption decision, the
Bottlenecks blocking widespread usage of planning support systems 911
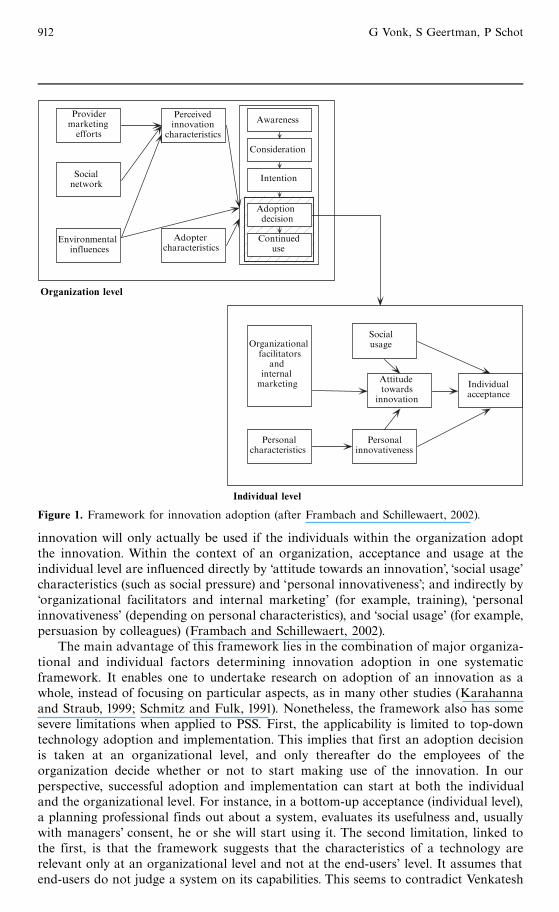
innovation will only actually be used if the individuals within the organization adoptthe innovation. Within the context of an organization, acceptance and usage at theindividual level are influenced directly by `attitude towards an innovation', `social usage'characteristics (such as social pressure) and `personal innovativeness'; and indirectly by`organizational facilitators and internal marketing' (for example, training), `personalinnovativeness' (depending on personal characteristics), and `social usage' (for example,persuasion by colleagues) (Frambach and Schillewaert, 2002).
The main advantage of this framework lies in the combination of major organiza-tional and individual factors determining innovation adoption in one systematicframework. It enables one to undertake research on adoption of an innovation as awhole, instead of focusing on particular aspects, as in many other studies (Karahannaand Straub, 1999; Schmitz and Fulk, 1991). Nonetheless, the framework also has somesevere limitations when applied to PSS. First, the applicability is limited to top-downtechnology adoption and implementation. This implies that first an adoption decisionis taken at an organizational level, and only thereafter do the employees of theorganization decide whether or not to start making use of the innovation. In ourperspective, successful adoption and implementation can start at both the individualand the organizational level. For instance, in a bottom-up acceptance (individual level),a planning professional finds out about a system, evaluates its usefulness and, usuallywith managers' consent, he or she will start using it. The second limitation, linked tothe first, is that the framework suggests that the characteristics of a technology arerelevant only at an organizational level and not at the end-users' level. It assumes thatend-users do not judge a system on its capabilities. This seems to contradict Venkatesh
Providermarketingefforts
Socialnetwork
Environmentalinfluences
Perceivedinnovation
characteristics
Awareness
Consideration
Intention
Adoptiondecision
Continueduse
Organization level
SocialusageOrganizational
facilitatorsand
internalmarketing
Personalcharacteristics
Attitudetowards
innovation
Individualacceptance
Personalinnovativeness
Individual level
Adoptercharacteristics
Figure 1. Framework for innovation adoption (after Frambach and Schillewaert, 2002).
912 G Vonk, S Geertman, P Schot
and Davis's (2000) model, in which they consider `output quality' and `job fit' asimportant determinants of individual technology acceptance. Moreover, it contradictsour experience with end-users. Third, the framework presented focuses on informationtechnology in general and not on PSS in particular. Some refinement is requiredbecause, after all, PSS are not the same as word processors or spreadsheet programs.
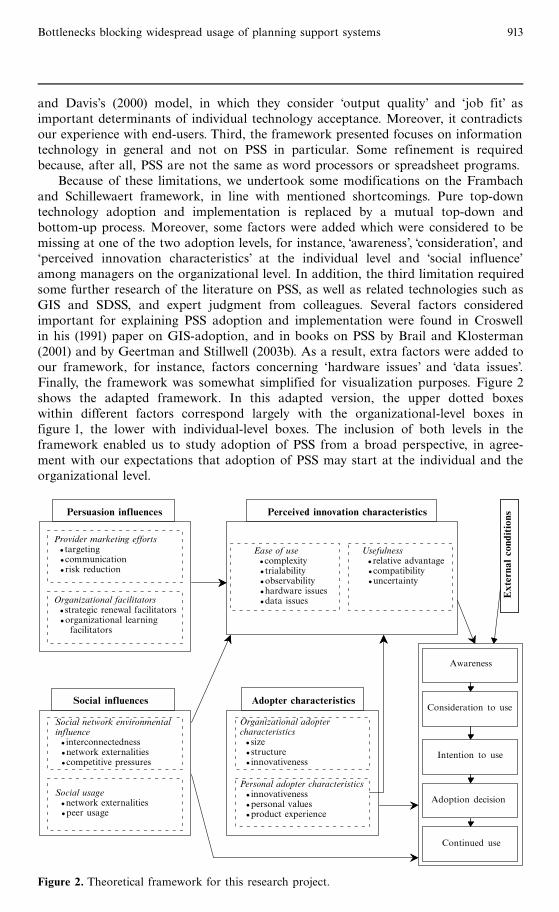
Because of these limitations, we undertook some modifications on the Frambachand Schillewaert framework, in line with mentioned shortcomings. Pure top-downtechnology adoption and implementation is replaced by a mutual top-down andbottom-up process. Moreover, some factors were added which were considered to bemissing at one of the two adoption levels, for instance, `awareness', consideration', and`perceived innovation characteristics' at the individual level and `social influence'among managers on the organizational level. In addition, the third limitation requiredsome further research of the literature on PSS, as well as related technologies such asGIS and SDSS, and expert judgment from colleagues. Several factors consideredimportant for explaining PSS adoption and implementation were found in Croswellin his (1991) paper on GIS-adoption, and in books on PSS by Brail and Klosterman(2001) and by Geertman and Stillwell (2003b). As a result, extra factors were added toour framework, for instance, factors concerning `hardware issues' and `data issues'.Finally, the framework was somewhat simplified for visualization purposes. Figure 2shows the adapted framework. In this adapted version, the upper dotted boxeswithin different factors correspond largely with the organizational-level boxes infigure 1, the lower with individual-level boxes. The inclusion of both levels in theframework enabled us to study adoption of PSS from a broad perspective, in agree-ment with our expectations that adoption of PSS may start at the individual and theorganizational level.
Persuasion influences
Provider marketing efforts� targeting�communication� risk reduction
Organizational facilitators� strategic renewal facilitators�organizational learning
facilitators
Perceived innovation characteristicsExterna
lcond
itions
Social influences
Social network environmentalinfluence� interconnectedness�network externalities�competitive pressures
Social usage�network externalities�peer usage
Adopter characteristics
Organizational adoptercharacteristics� size� structure� innovativeness
Personal adopter characteristics� innovativeness�personal values�product experience
Ease of use�complexity� trialability�observability�hardware issues�data issues
Usefulness� relative advantage�compatibility�uncertainty
Awareness
Consideration to use
Intention to use
Adoption decision
Continued use
Figure 2. Theoretical framework for this research project.
Bottlenecks blocking widespread usage of planning support systems 913
We conducted a survey to determine the importance of the influence factors in explainingwhy the use of PSS for spatial planning is not widespread; influence factors were convertedto bottleneck indicators, the importance of which was measured with bottleneck statements.
3 MethodUsing the theoretical framework, we constructed a web survey to discover empiricallythe main bottlenecks preventing the more widespread use of PSS in spatial planningpractice. In March 2003, via several electronic and regular mailing lists, approximately800 people involved in PSS around the world were asked to participate in the survey byfilling out our online form.
The main part of the questionnaire consisted of sixty-seven statements, referring topotential bottlenecks, of which the importance had to be judged. These statementswere based on technology adoption studies in information systems literature and ingeoinformation literature (Brail and Klosterman, 2001; Croswell, 1991; Davis, 1989;Dishaw and Strong, 1999; Geertman and Stillwell, 2003b; Karahanna and Straub, 1999;Masser and Onsrud, 1993; Rogers, 2003; Uran and Janssen, 2003; Venkatesh andDavis, 2000). For each statement, respondents could distinguish between one of fourcategories: `unimportant', `important', `very important', and `don't know'. For evalu-ation of the received enquiries, questions were added to determine the characteristicsof the survey population, such as their origin, working position, affiliation to PSS, andexperience with PSS. In particular, the experience of the respondents was consideredcrucial to the value of their replies; their experience was determined by asking respon-dents to select from a list of thirty-four well-known and less well-known PSS, thosethey had worked with or heard about. The list consisted of a selection of planning toolsdescribed in an Environmental Protection Agency (EPA) study and two PSS overviews(Brail and Klosterman, 2001; EPA, 2000; Geertman and Stillwell, 2003b). In addition tothe closed statements and questions, open questions were provided to suggest additionalbottlenecks that were not on our list and to add comments about bottlenecks.
First, during the analysis, PSS experts were distinguished from nonexperts, accord-ing to the criterion that experts should have at least heard of, or worked with, two outof the thirty-four listed PSS.
Second, the indicated importance of each of the bottleneck statements was calcu-lated by combining the frequency scores of the answer categories `important' and `veryimportant'. For interpretation, these combined scores were compared with frequencyscores for the answer categories `unimportant' and `don't know' to determine howunanimous respondents were in their judgments on the importance of the statements.
Third, the sixty-seven bottleneck statements were classified into twenty-four bottle-neck indicators, to increase transparency and consistency. Consistency was particularlyimportant because many statements were close in meaning or even partially overlap-ping. The average frequency score of contributing statements reflects the importance of abottleneck indicator. Consistency of the indicators was evaluated by using distributionsof frequency scores of contributing statements.
Fourth, results were validated, by analyzing and comparing the results from sub-groups of respondents with the results from all respondents. Small differences in resultsindicate unanimity among respondents, which contributes to the general validity of theresults, whereas larger differences indicate the opposite. Subgroups were distinguishedon the basis of geographical origin and expertise. With regards to geographical origin,subgroups were made consisting of Europeans and North Americans, as these were theonly subgroups large enough for analysis. With regard to expertise, subgroups weremade consisting of `moderate experts'öthose knowing more than one but fewer thanten PSSöand `greater experts'öthose knowing more than ten PSS.
914 G Vonk, S Geertman, P Schot
Fifth, the bottleneck indicators were interpreted in relation to the theoreticalframework, thus providing insight into how the important bottleneck indicators areinterrelated and how they affect adoption and implementation. To this end, the bottle-neck indicators were grouped, as far as possible, into the different factors distinguishedin the theoretical framework. The average frequency score per group of bottleneckswas calculated and represents the factor score. From this measure it is possible toderive the relative importance of the different factors in the theoretical framework.
Finally, the rankings of important bottleneck indicators, and their interrelations andeffects on adoption and implementation, were used to develop an overall interpretationof bottlenecks that prevent more widespread usage of PSS.
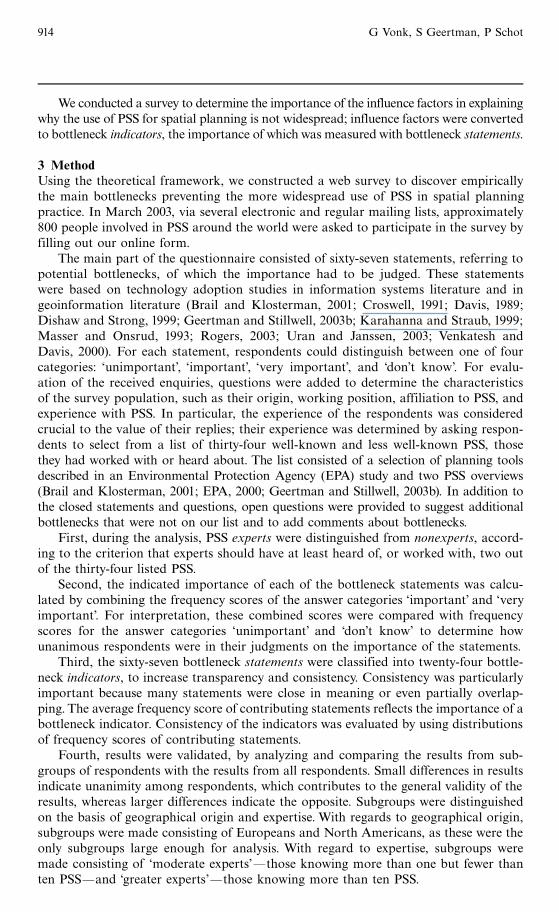
4 Results4.1 Bottleneck indicators4.1.1 Exploration of responsesIn total ninety-six respondents filled out the form, which is estimated as approximatelya 12% response ratio. Figure 3 indicates the level of PSS knowledge of the ninety-sixrespondents. It shows that 90% of respondents (eighty-six) had heard of or worked withat least two of the systems, and this group was therefore included in the categoryexperts in further analysis. The other 10% (ten respondents) were excluded. In general,respondents' knowledge of PSS seems to be quite high, as 50% of respondents hadheard of or worked with more than six systems. One respondent claimed to know all ofthe thirty-four listed PSS. Moreover, the analysis of respondents' PSS knowledge alsorevealed that `UrbanSim' (56%) was the best-known system, followed by `What If ?'(44%) and `CommunityViz'2 (41%) (Klosterman, 2001; Kwartler and Bernard, 2001;Waddell, 2002).
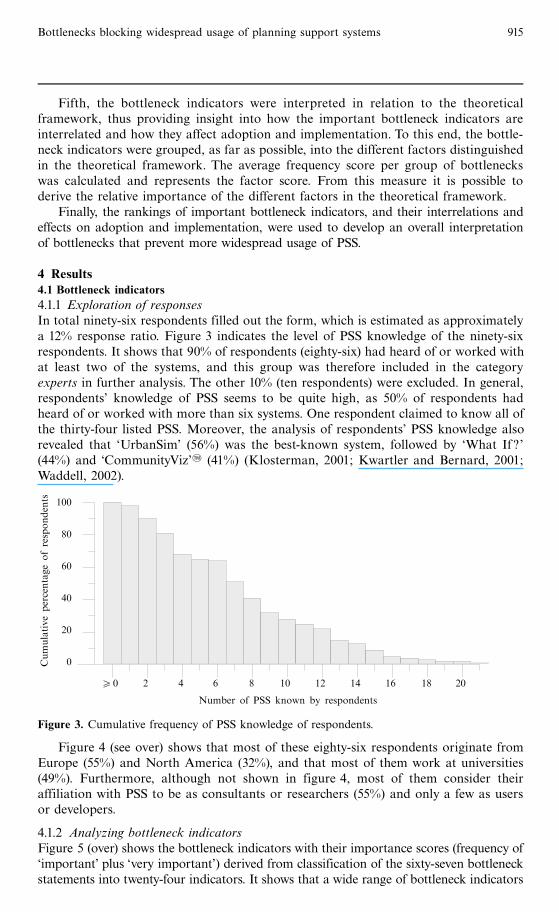
Figure 4 (see over) shows that most of these eighty-six respondents originate fromEurope (55%) and North America (32%), and that most of them work at universities(49%). Furthermore, although not shown in figure 4, most of them consider theiraffiliation with PSS to be as consultants or researchers (55%) and only a few as usersor developers.
4.1.2 Analyzing bottleneck indicatorsFigure 5 (over) shows the bottleneck indicators with their importance scores (frequency of`important' plus `very important') derived from classification of the sixty-seven bottleneckstatements into twenty-four indicators. It shows that a wide range of bottleneck indicators
100
80
60
40
20
0
50 2 4 6 8 10 12 14 16 18 20
Cumulativepercentageofrespondents
Number of PSS known by respondents
Figure 3. Cumulative frequency of PSS knowledge of respondents.
Bottlenecks blocking widespread usage of planning support systems 915
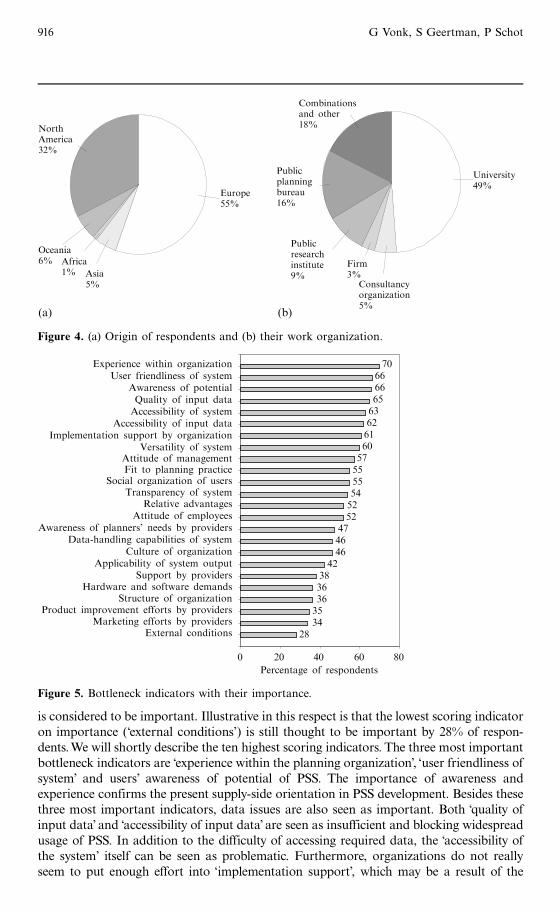
is considered to be important. Illustrative in this respect is that the lowest scoring indicatoron importance ( external conditions') is still thought to be important by 28% of respon-dents.We will shortly describe the ten highest scoring indicators. The three most importantbottleneck indicators are experience within the planning organization', `user friendliness ofsystem' and users' awareness of potential of PSS. The importance of awareness andexperience confirms the present supply-side orientation in PSS development. Besides thesethree most important indicators, data issues are also seen as important. Both quality ofinput data' and accessibility of input data' are seen as insufficient and blocking widespreadusage of PSS. In addition to the difficulty of accessing required data, the accessibility ofthe system' itself can be seen as problematic. Furthermore, organizations do not reallyseem to put enough effort into `implementation support', which may be a result of the
NorthAmerica32%
Europe55%
Oceania6% Africa
1% Asia5%
Combinationsand other18%
Publicplanningbureau16%
University49%
Publicresearchinstitute9%
Firm3%
Consultancyorganization5%
(a) (b)
Figure 4. (a) Origin of respondents and (b) their work organization.
Experience within organizationUser friendliness of system
Awareness of potentialQuality of input dataAccessibility of system
Accessibility of input dataImplementation support by organization
Versatility of systemAttitude of managementFit to planning practice
Social organization of usersTransparency of system
Relative advantagesAttitude of employees
Awareness of planners' needs by providersData-handling capabilities of system
Culture of organizationApplicability of system output
Support by providersHardware and software demands
Structure of organizationProduct improvement efforts by providers
Marketing efforts by providersExternal conditions
7066666563626160
575555545252
474646
423836363534
28
0 20 40 60 80
Percentage of respondents
Figure 5. Bottleneck indicators with their importance.
916 G Vonk, S Geertman, P Schot
attitude of the management'. The PSS are also seen as neither having sufficient versatilitynor sufficient `fit to planning practice'.
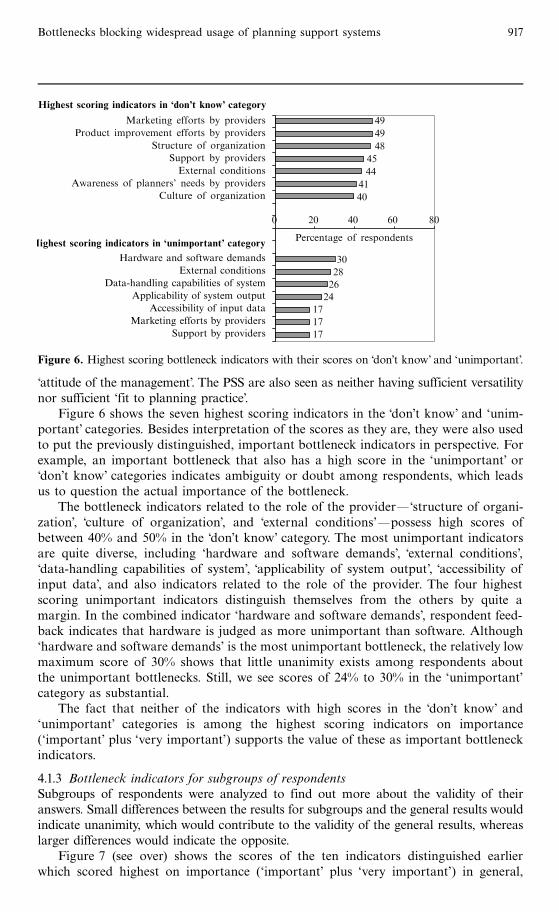
Figure 6 shows the seven highest scoring indicators in the `don't know' and `unim-portant' categories. Besides interpretation of the scores as they are, they were also usedto put the previously distinguished, important bottleneck indicators in perspective. Forexample, an important bottleneck that also has a high score in the `unimportant' or`don't know' categories indicates ambiguity or doubt among respondents, which leadsus to question the actual importance of the bottleneck.
The bottleneck indicators related to the role of the providerö`structure of organi-zation', culture of organization', and `external conditions'öpossess high scores ofbetween 40% and 50% in the `don't know' category. The most unimportant indicatorsare quite diverse, including `hardware and software demands', `external conditions',`data-handling capabilities of system', `applicability of system output', `accessibility ofinput data', and also indicators related to the role of the provider. The four highestscoring unimportant indicators distinguish themselves from the others by quite amargin. In the combined indicator `hardware and software demands', respondent feed-back indicates that hardware is judged as more unimportant than software. Although`hardware and software demands' is the most unimportant bottleneck, the relatively lowmaximum score of 30% shows that little unanimity exists among respondents aboutthe unimportant bottlenecks. Still, we see scores of 24% to 30% in the `unimportant'category as substantial.
The fact that neither of the indicators with high scores in the `don't know' and`unimportant' categories is among the highest scoring indicators on importance(`important' plus `very important') supports the value of these as important bottleneckindicators.
4.1.3 Bottleneck indicators for subgroups of respondentsSubgroups of respondents were analyzed to find out more about the validity of theiranswers. Small differences between the results for subgroups and the general results wouldindicate unanimity, which would contribute to the validity of the general results, whereaslarger differences would indicate the opposite.
Figure 7 (see over) shows the scores of the ten indicators distinguished earlierwhich scored highest on importance (`important' plus `very important') in general,
Highest scoring indicators in `don't know' category
Marketing efforts by providers
Product improvement efforts by providers
Structure of organization
Support by providers
External conditions
Awareness of planners' needs by providers
Culture of organization
Highest scoring indicators in `unimportant' categoryHardware and software demands
External conditionsData-handling capabilities of system
Applicability of system outputAccessibility of input data
Marketing efforts by providersSupport by providers
0 20 40 60 80
Percentage of respondents
30
28
26
24
17
17
17
49
49
48
45
44
41
40
Figure 6. Highest scoring bottleneck indicators with their scores on don't know' and `unimportant'.
Bottlenecks blocking widespread usage of planning support systems 917
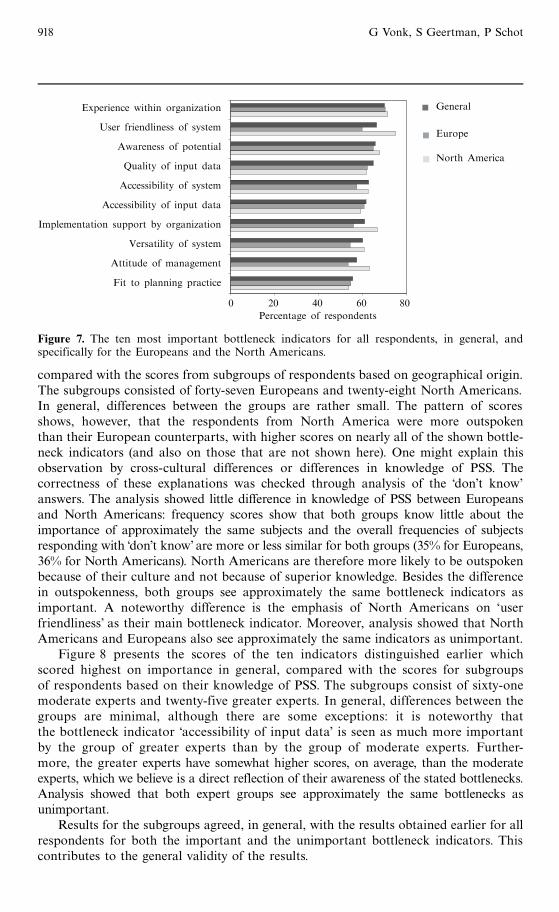
compared with the scores from subgroups of respondents based on geographical origin.The subgroups consisted of forty-seven Europeans and twenty-eight North Americans.In general, differences between the groups are rather small. The pattern of scoresshows, however, that the respondents from North America were more outspokenthan their European counterparts, with higher scores on nearly all of the shown bottle-neck indicators (and also on those that are not shown here). One might explain thisobservation by cross-cultural differences or differences in knowledge of PSS. Thecorrectness of these explanations was checked through analysis of the `don't know'answers. The analysis showed little difference in knowledge of PSS between Europeansand North Americans: frequency scores show that both groups know little about theimportance of approximately the same subjects and the overall frequencies of subjectsresponding with don't know' are more or less similar for both groups (35% for Europeans,36% for North Americans). North Americans are therefore more likely to be outspokenbecause of their culture and not because of superior knowledge. Besides the differencein outspokenness, both groups see approximately the same bottleneck indicators asimportant. A noteworthy difference is the emphasis of North Americans on `userfriendliness' as their main bottleneck indicator. Moreover, analysis showed that NorthAmericans and Europeans also see approximately the same indicators as unimportant.
Figure 8 presents the scores of the ten indicators distinguished earlier whichscored highest on importance in general, compared with the scores for subgroupsof respondents based on their knowledge of PSS. The subgroups consist of sixty-onemoderate experts and twenty-five greater experts. In general, differences between thegroups are minimal, although there are some exceptions: it is noteworthy thatthe bottleneck indicator `accessibility of input data' is seen as much more importantby the group of greater experts than by the group of moderate experts. Further-more, the greater experts have somewhat higher scores, on average, than the moderateexperts, which we believe is a direct reflection of their awareness of the stated bottlenecks.Analysis showed that both expert groups see approximately the same bottlenecks asunimportant.
Results for the subgroups agreed, in general, with the results obtained earlier for allrespondents for both the important and the unimportant bottleneck indicators. Thiscontributes to the general validity of the results.
Experience within organization
User friendliness of system
Awareness of potential
Quality of input data
Accessibility of system
Accessibility of input data
Implementation support by organization
Versatility of system
Attitude of management
Fit to planning practice
0 20 40 60 80
Percentage of respondents
General
Europe
North America
Figure 7. The ten most important bottleneck indicators for all respondents, in general, andspecifically for the Europeans and the North Americans.
918 G Vonk, S Geertman, P Schot

4.2 Interpretation of results4.2.1 Interpretation in terms of the theoretical frameworkJust by reading the list of indicators shown in figure 5, one can see that someindicators are related. From such a list, however, these relations are not very clear.Our theoretical framework on innovation adoption helps to interpret these relationsand therefore helps to add value to the results. Figure 9 (see over) shows the theoreticalframework, with the bottleneck indicators and their importance scores incorporatedwithin the suitable factors. The percentages were calculated from average frequencyscores of the indicators contained within each factor and indicate the importance ofthe factors.
The earlier notion that there is not a single bottleneck blocking widespread usageand acceptance of PSS, but quite a diversity, is clearly conveyed by figure 9. Almost allof the factors of the theoretical framework seem to be bottlenecks. Only externalconditions' and `provider marketing efforts' score quite low (540%). The higherscoring factors range from those related to the `organizational adopter characteristics',`social influences', `persuasion influences', `perceived innovation characteristics', andconsideration to use', which score about 40 ^ 60%, to `awareness', `personal adoptercharacteristics', and `organizational facilitators', which score significantly higher(60 ^ 70%). All of these factors directly or indirectly influence the highest scoringfactor, which is the `intention to use' (470%). As a result of the structure of thetheoretical framework, aggregation effects may well have caused the high scores ofsome of these factors. Because of its influential position, if `intention to use' is abottleneck, this more or less confirms that adoption decisions will be blocked, thereforepreventing the use of PSS becoming widespread.
4.2.2 Overall interpretation of bottlenecks preventing adoption of PSSThe rankings of important bottleneck indicators, as shown in figure 5, and their inter-relations and effects on adoption, as shown in figure 9, were used to develop an overallinterpretation of bottlenecks which prevent more widespread usage of PSS. It appearsthat a wide diversity of bottlenecks is considered to be important. Also, there seems tobe little experience with PSS among planners (indicator: experience within organiza-tion'). In addition to having little experience, respondents indicate that many plannersare not even aware of the existence and potential of PSS (indicator: `awareness ofpotential'), suggesting that the activity going on within the PSS developer community
Experience within organization
User friendliness of system
Awareness of potential
Quality of input data
Accessibility of system
Accessibility of input data
Implementation support by organization
Versatility of system
Attitude of management
Fit to planning practice
0 20 40 60 80
Percentage of respondents
Experts
Moderate experts
Greater experts
Figure 8. The ten most important bottleneck indicators for PSS experts, moderate experts, andgreater experts.
Bottlenecks blocking widespread usage of planning support systems 919
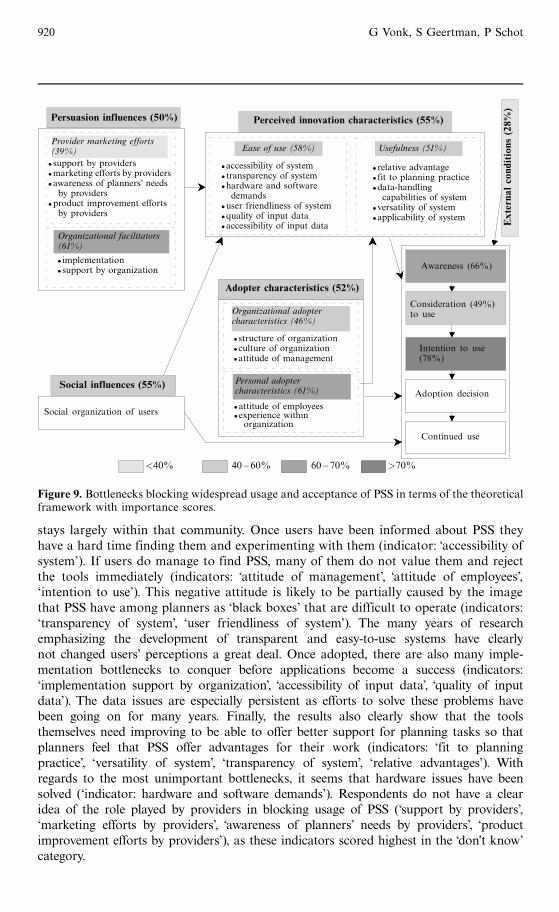
stays largely within that community. Once users have been informed about PSS theyhave a hard time finding them and experimenting with them (indicator: `accessibility ofsystem'). If users do manage to find PSS, many of them do not value them and rejectthe tools immediately (indicators: `attitude of management', `attitude of employees',`intention to use'). This negative attitude is likely to be partially caused by the imagethat PSS have among planners as `black boxes' that are difficult to operate (indicators:`transparency of system', `user friendliness of system'). The many years of researchemphasizing the development of transparent and easy-to-use systems have clearlynot changed users' perceptions a great deal. Once adopted, there are also many imple-mentation bottlenecks to conquer before applications become a success (indicators:`implementation support by organization', accessibility of input data', quality of inputdata'). The data issues are especially persistent as efforts to solve these problems havebeen going on for many years. Finally, the results also clearly show that the toolsthemselves need improving to be able to offer better support for planning tasks so thatplanners feel that PSS offer advantages for their work (indicators: `fit to planningpractice', `versatility of system', `transparency of system', `relative advantages'). Withregards to the most unimportant bottlenecks, it seems that hardware issues have beensolved (`indicator: hardware and software demands'). Respondents do not have a clearidea of the role played by providers in blocking usage of PSS ( support by providers',`marketing efforts by providers', awareness of planners' needs by providers', `productimprovement efforts by providers'), as these indicators scored highest in the don't know'category.
Persuasion influences (50%) Perceived innovation characteristics (55%)
Externa
lcond
itions
(28%
)
Provider marketing efforts(39%)� support by providers�marketing efforts by providers�awareness of planners' needs
by providers�product improvement efforts
by providers
Organizational facilitators(61%)
Ease of use (58%) Usefulness (51%)
�accessibility of system� transparency of system�hardware and software
demands�user friendliness of system�quality of input data�accessibility of input data
� relative advantage� fit to planning practice�data-handling
capabilities of system�versatility of system�applicability of system
Adopter characteristics (52%)
Social influences (55%)
Social organization of users
Organizational adoptercharacteristics (46%)
Personal adoptercharacteristics (61%)
� structure of organization�culture of organization�attitude of management
<40% 40 ± 60% 60 ± 70% >70%
Awareness (66%)
Consideration (49%)to use
Intention to use(78%)
Adoption decision
Continued use
� implementation� support by organization
�attitude of employees�experience within
organization
Figure 9. Bottlenecks blocking widespread usage and acceptance of PSS in terms of the theoreticalframework with importance scores.
920 G Vonk, S Geertman, P Schot
5 Methodological reflectionSeveral assumptions, practices, and outcomes may have affected the results. First, noempirical verification of the theoretical framework of Frambach and Schillewaert wasfound in the literature.We did not consider this absence to be detrimental to the value ofthe results obtained, because its constituents have been verified separately in extensivelines of research dedicated to innovation adoption. As the only apparent application ofthe framework, this study may be also valuable for the field of business studies fromwhich the framework was derived.
Second, because of our selection procedure based on the number of known PSS,respondents with many years of practical experience would have been excluded, if theyhad experience of only one system and had not heard of any other. However, we do notexpect this to decrease the validity of results, because the enquiry was not establishedto find out the value of one particular system, but to gain insight into the broader fieldof PSS and its application in spatial planning practice.
Third, with respect to the respondents, there is an emphasis on the geographicalhotspots of Europe and North America, on universities, and also on researchers andconsultants. Although it is likely that the mailing lists are partly to blame for thisemphasis, it is not expected to result in a large decrease in the broader validity of theresults, because European and North American universities remain prime breedinggrounds for new developments in geoinformation. Still, it must be recognized thatthe emphasis on university workers and researchers is important considering our aimto find out why spatial planners tend not to use PSS. The low response of plannersthemselves may be explained by the fact that nonusage makes it, by definition, difficultto answer the questionnaire; this is particularly indicated by the fact that a substantialmailing to planners resulted in little response. We therefore had to assume universityworkers and researchers are well qualified to replace the planners themselves. Ingeneral, we believe that the number of responses and the expressed knowledge onPSS form a solid basis for providing a sufficient quality of data and, thus, reliableoutcomes for the further analysis of the expressed bottlenecks.
Fourth, some assumptions were made in the development of the list of statementsand in classifying the statements into indicators and factors. It was assumed that:(1) the list of statements reflected the existing bottlenecks appropriately; (2) the indi-cators reflected the meaning of grouped statements sufficiently; and (3) the statementsand indicators had weightings in the classification equal to those of the indicators andfactors. Considering the absence of respondents who commented on this, and consider-ing the sound theoretical framework used to distinguish indicators and factors, webelieve that, in general, these assumptions are valid and do not decrease the valueof our results.
Our findings suggest that the aim has been achieved, because we now have an overviewof the main bottlenecks blocking widespread use of PSS in spatial planning. However, forparticular PSS there can be numerous reasons why they would fail under particularcircumstances or succeed in other settings. The bottlenecks found in this study refer tothe technology as a whole, instead of referring to particular systems. The validity of theresults is expected to reach beyond PSS for spatial planning only. Based on similaritiesbetween the tools themselves, processes in which the tools are applied, and currentresearch topics in relation to these tools, we expect our results to be at least partiallyvalid for PSS in general (Geertman and Stillwell, 2003a); GIS (Allen and Goers, 2002;Carver, 2003; De Man, 2003); SDSS (Crossland et al, 1995; Uran, 2002; Uran and Janssen,2003); Integrated Assessment models (Hisschemo« ller et al, 2001; Rotmans, 1998); DSSin general (Shim et al, 2002); and Information Systems in general (Frambach andSchillewaert, 2002; Rogers, 2003; Windrum and De Berranger, 2003).
Bottlenecks blocking widespread usage of planning support systems 921
6 Conclusions and recommendationsLiterature suggests that the widespread adoption and implementation of PSS inplanning practice is lagging behind the supply of PSS tools. The primary aim of thisstudy has been to shed more light on the reasons for the shortfall by asking explicitquestions about bottlenecks which prevent widespread usage of PSS in spatial planningpractice.
The main conclusion is that there is a multitude of bottlenecks blocking widespreadusage and acceptance of PSS in spatial planning practice; these can be summarizedinto three main categories. First, the PSS experts questioned see little awareness amongplanners of the existence of PSS and of the purposes for which PSS can be used.Second, they feel there is a lack of experience with PSS, which means that potentialusers are unaware of the benefits of using PSS and of the conditions under which PSScould best be applied. Third, they feel there is a low intention to start using PSS amongpossible users. These categories are probably interrelated. It is clear that, althoughsystem development is continuing at a rapid pace, this development has remainedlargely unnoticed by the intended users. If the planning community remains unaware,it will not acquire experience of PSS and so demand will not develop, which will resultin insufficient payoff for investors in PSS development. Furthermore, the process ofimproving existing tools by practice will remain slow. This means that in termsof product life cycle, the product will not get a chance to mature and to reach thepoint where its development and proliferation become self-enforcing. Therefore, if nomarketing action is taken, it is likely that PSS will not get a good chance to prove theirworth as a means for improving spatial planning practice. These conclusions areexpected to be at least partially valid for a broader set of computer-based tools, suchas PSS in general, GIS, SDSS, integrated assessment models, DSS, and informationsystems in general.
For anyone who believes in PSS technology and wants to further it, in both acommercial and a noncommercial sense, it is of great importance to start spreadingthe news about the existence of PSS and their benefits. If planners become aware of theexistence of PSS, they might consider undertaking real-world example projects, whichwill give them experience. Positive experiences could increase users' intentions to startusing a PSS structurally in their planning practice. It may be very difficult to convinceplanners because many have negative attitudes towards computer-based planning toolsin general. To have clear arguments to convince potential users, besides the positiveresults of real-world example projects, thorough research into the potential benefits ofPSS for spatial planning is recommended. Such a study could be the next step in anattempt to discern the successes and failures of PSS for spatial planning.
Acknowledgements. The authors kindly thank all respondents for their participation.We also offerour thanks to Kor de Jong and Arie-Pieter van Duijn for their work on the survey, Dick Klostermanand Richard Kingston for opening up their mailing lists, and many othersötoo numerous tomention hereöfor their comments and suggestions.
ReferencesAllen E, Goers R, 2002, ` Beyond maps: the next generation of GIS tools'', Planning Magazine
http://www.crit.com/documents/beyond maps.pdfBatty M, 2003, ` Planning support systems: technologies that are driving planning'', in Planning
Support Systems in Practice Eds S Geertman, J Stillwell (Springer, Berlin) pp v ^ viiiBattyM,Densham, PJ,1996,` Decision support, GIS, andurban planning'', http://www.geog.ucl.ac.uk/�pdensham/SDSS/s t paper.html
Bishop I, 1998, ` Planning Support: hardware and software in search of a system'' ComputersEnvironment and Urban Systems 22 189 ^ 202
Brail R, Klosterman R (Eds), 2001Planning Support Systems: Integrating Geographic InformationSystems, Models and Visualization Tools (ESRI Press, Redlands, CA)
922 G Vonk, S Geertman, P Schot
Carver S, 2003, ` The future of participatory approaches using geographic information: developinga research agenda for the 21st century''URISAJournal (Access and Participatory Approaches I)15 61 ^ 71
Couclelis H, 1989, ` Geographically informed planning: requirements for planning relevant GIS'',in Proceedings of 36th North American Meeting of Regional Science Association Santa Barbara
Couclelis H, 2003, ` Where has the future gone? Rethinking the role of integrated land use models inspatial planning'', inFramingLandUseDynamics: ReviewedAbstracts International Conference,16 ^ 18 April 2003 Faculty of Geographical Sciences, Utrecht University, Utrecht, pp 27 ^ 28
Crossland M,Wynne B, Perkins W, 1995, ` Spatial decision support systems: an overview oftechnology and a test of efficacy''Decision Support Systems 14 219 ^ 235
Croswell P, 1991, ` Obstacles to GIS implementation and guidelines to increase the opportunitiesfor success'' URISA Journal 3 43 ^ 56
Davis F, 1986 ATechnology Acceptance Model for Empirically Testing New End-user InformationSystems: Theory and Results PhD Dissertation, Massachusetts Institute of Technology,Cambridge, MA
Davis F, 1989, ` Perceived usefulness, perceived ease-of-use, and user acceptance of informationtechnology''MIS Quarterly 13 319 ^ 339
De Man E, 2003, ``Cultural and institutional conditions for using geographic information; accessand participation'' URISA Journal (Access and Participatory Approaches I) 15 29 ^ 33
Dijst M, Schot P, De Jong K (Eds), 2003, ` Framing land use dynamics, reviewed abstracts'', Facultyof Geographical Sciences, University of Utrecht, Utrecht
Dishaw M, Strong D, 1999, ` Extending the technology acceptance model with task-technology fitconstructs'' Information and Management 36 9 ^ 21
Edamura T, Tsuchida T, 1999, ` Planning support system for an urban environment improvementproject'' Environment and Planning B: Planning and Design 26 381 ^ 391
EPA, 2000, ` Projecting land-use change: a summary of models for assessing the effects of communitygrowth and change on land-use patterns'', EPA/600/R-00/098, US Environmental ProtectionAgency, Office of Research and Development, Cincinnati, OH
Fishbein M, Ajzen I, 1975 Belief, Attitude, Intention, and Behavior: An Introduction to Theory andResearch (Addison-Wesley, Reading, MA)
Frambach R, Schillewaert N, 2002, ` Organizational innovation adoption, a multilevel frameworkof determinants and opportunities for future research''Journal of Business Research 55163 ^ 176
Geertman S, Stillwell J, 2003a, ` Planning support systems: an inventory of current practice''Computers Environment and Urban Systems 28 291 ^ 310
Geertman S, Stillwell J (Eds), 2003b Planning Support Systems in Practice (Springer, Berlin)Geertman S, Stillwell J, 2003c, ` Planning support systems: an introduction'', in Planning Support
Systems in Practice Eds S Geertman, J Stillwell (Springer, Berlin) pp 3 ^ 23Geertman S, Stillwell J, 2003d, ` Interactive support systems for participatory planning'', inPlanning
Support Systems in Practice Eds S Geertman, J Stillwell (Springer, Berlin) pp 25 ^ 44Guhathakurta S, 2002, ` Urban modeling as storytelling: using simulation models as a narrative''
Environment and Planning B: Planning and Design 29 895 ^ 911Harris B, 1989, ` Beyond geographic information-systemsöcomputers and the planning professional''
Journal of the American Planning Association 55 85 ^ 90Harris B, Batty M, 1993, ` Locational models, geographical information and planning support
systems'' Journal of Planning Education and Research 12 84 ^ 98Hisschemo« ller M, Tol R S J,Vellinga P, 2001, ``The relevance of participatory approaches in
integrated environmental assessment'' Integrated Assessment 2 57 ^ 72Hopkins L D, 1999, ` Structure of a planning support system for urban development'' Environment
and Planning B: Planning and Design 26 333 ^ 343Innes J, Simpson D, 1993, ``Implementing GIS for planning'' Journal of the American Planning
Association 59 230 ^ 236Karahanna E, Straub D, 1999, ` The psychological origins of perceived usefulness and ease-of-use''
Information and Management 35 237 ^ 250Klosterman R, 1997, ` Planning support systems: a new perspective on computer-aided planning''
Journal of Planning Education and Research 17 45 ^ 54Klosterman R, 2001, ` The what if ? Planning Support System'', in Planning Support Systems,
Integrating Geographic Information Systems, Models and Visualization Tools Eds R Brail,R Klosterman (ESRI Press, Redlands, CA) pp 263 ^ 284
Klosterman R, Landis J, 1988, ` Microcomputers in US planning: past, present and future''Environment and Planning B: Planning and Design 15 355 ^ 368
Bottlenecks blocking widespread usage of planning support systems 923
KwartlerM, Bernard R, 2001, ` CommunityViz: an integrated planning support system'', in PlanningSupport Systems, Integrating Geographical Information Systems, Models and VisualizationToolsEds R Brail, R Klosterman (ESRI Press, Redlands, CA) pp 285 ^ 308
Landis J, 2001, ` CUF, CUFII, and CURBA: a family of spatially explicit urban growth and land-usepolicy simulation models'', in Planning Support Systems, Integrating Geographic InformationSystems, Models and Visualization Tools Eds R Brail, R Klosterman (ESRI Press, Redlands,CA) pp 157 ^ 200
Masser I, Onsrud H (Eds), 1993 Diffusion and Use of Geographic InformationTechnologies (Kluwer,Dordrecht)
Mathieson K, 1991, ` Predicting user intentions: comparing the technology acceptance model withthe theory of planned behaviour'' Information Systems Research 2 173 ^ 191
Nedovic-Budic Z, 1998, ` The impact of GIS technology'' Environment and Planning B: Planningand Design 25 681 ^ 692
Omer I, 2003, ` Web-based planning support system for public participation: an individualperspective'', in Proceedings of the 6th AGILE Conference on Geographic Information Science(Presses Polytechniques et Universitaires Romandes, Lausanne) pp 607 ^ 612
Rogers E, 1962 Diffusion of Innovations 1st edition (Collier Macmillan, NewYork)Rogers E, 2003 Diffusion of Innovations 5th edition (Free Press, NewYork)Rotmans J,1998,` Methods for IA: the challenges and opportunities ahead''EnvironmentalModeling
and Assessment 3 155 ^ 179Schmitz J, Fulk J, 1991, ` Organizational colleagues, media richness, and electronic mailöa test
of the social-influence model of technology use'' Communication Research 18 487 ^ 523Scholten H, Stillwell J (Eds), 1990 Geographical Information Systems for Urban and Regional Planning
(Kluwer, Dordrecht)Sheppard E, Couclelis H, Graham S, Harrington J, Onsrud H, 1999, ` Geographies of the
information society'' International Journal of Geographical Information Science 13 797 ^ 823Shim J P,Warkentin M, Courtney J F, Power D J, Sharda R, Carlsson C, 2002, ` Past, present,
and future of decision support technology'' Decision Support Systems 33 111 ^ 126Sieber R, 2000, ` GIS implementation in the grassroots'' URISA Journal 12 15 ^ 29Snyder K, 2004, Placematters.com website, http://www.placematters.us/index2.htmlStillwell J, Geertman S, Openshaw S (Eds), 1999, ` Developments in geographical information and
planning'', in Geographical Information and Planning (Springer, Berlin) pp 3 ^ 22TCDDM-V, 2003, ` Tools for community design and decision making, working session V'',
http://www.placematters.us/TCDDMV/Thompson R, Higgins C, Howell J, 1991, ``Personal computingötoward a conceptual-model
of utilization''MIS Quarterly 15 125 ^ 143Uran O, 2002 Spatial Decision Support Systems for Coastal Zone and Water Management PhD
thesis, Faculty of Economics and Business Studies, Free University, AmsterdamUran O, Janssen R, 2003, ``Why are spatial decision support systems not used? Some experiences
from the Netherlands'' Computers, Environment and Urban Systems 27 511 ^ 526URISA 2003, ` Public participation GIS conference, final program and abstracts'', Urban and
Regional Information Systems Association, http://www.urisa.org/PPGIS/2003/papers/Final.pdfVenkatesh V, Davis F, 2000, `A theoretical extension of the technology acceptance model: four
longitudinal field studies''Management Science 46 186 ^ 204Voss A,Voss H, Gatalsky P, Oppor L, 2003, ``Prototype and further requirements of a real
participatory GIS'', in Proceedings of the 6th AGILE Conference on Geographic InformationScience (Presses Polytechniques et Universitaires Romandes, Lausanne) pp 613 ^ 622
Waddell P, 2002, ` UrbanSim: modeling urban development for land use transportation andenvironmental planning'' Journal of the American Planning Association 68 297 ^ 314
Wegener M, 2001, ` New spatial planning models'' Journal of Applied Geography 3 224 ^ 237Wilson B, Sherry L, Dobrovolny J, Batty M, Ryder M, 2002, `Adoption of learning technologies
in schools and universities'', inHandbook on Information Technologies for Education and TrainingEds H Adelsberger, B Collis, J Pawlowski (Springer, New York) pp 293 ^ 308
Windrum P, De Berranger P, 2003, ``Factors affecting the adoption of intranets and extranets bySMEs: a UK study'', http://eaepe.infonomics.nl/index.htm
ß 2005 a Pion publication printed in Great Britain
924 G Vonk, S Geertman, P Schot


