Embed Size (px)
Citation preview
April 2017
BMW GROUPINVESTOR FACTBOOK

BMW Group Investor Factbook, April 2017
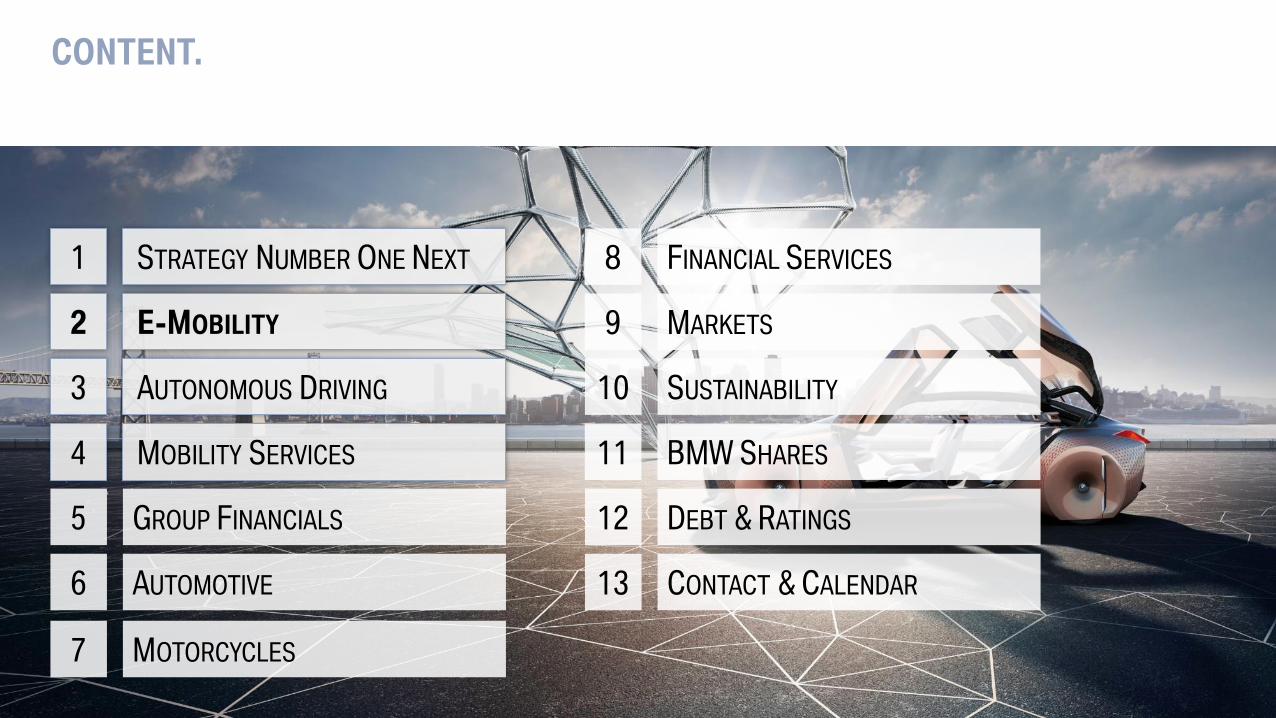
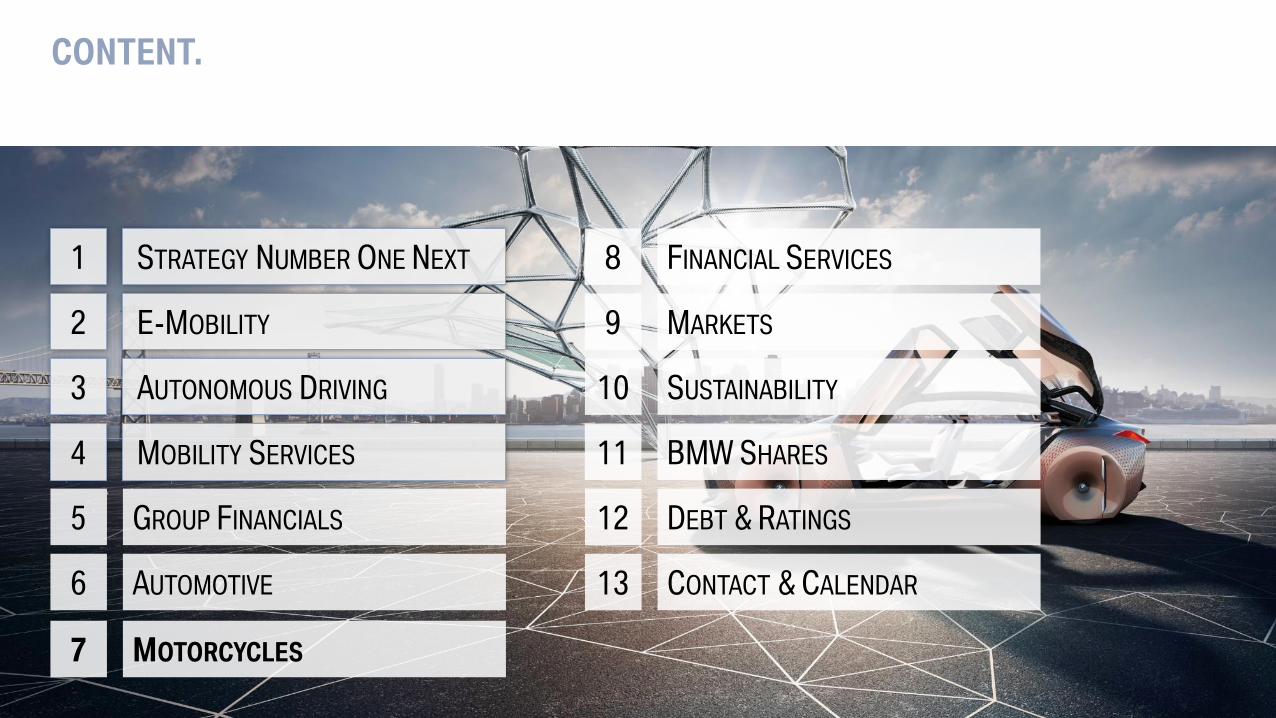
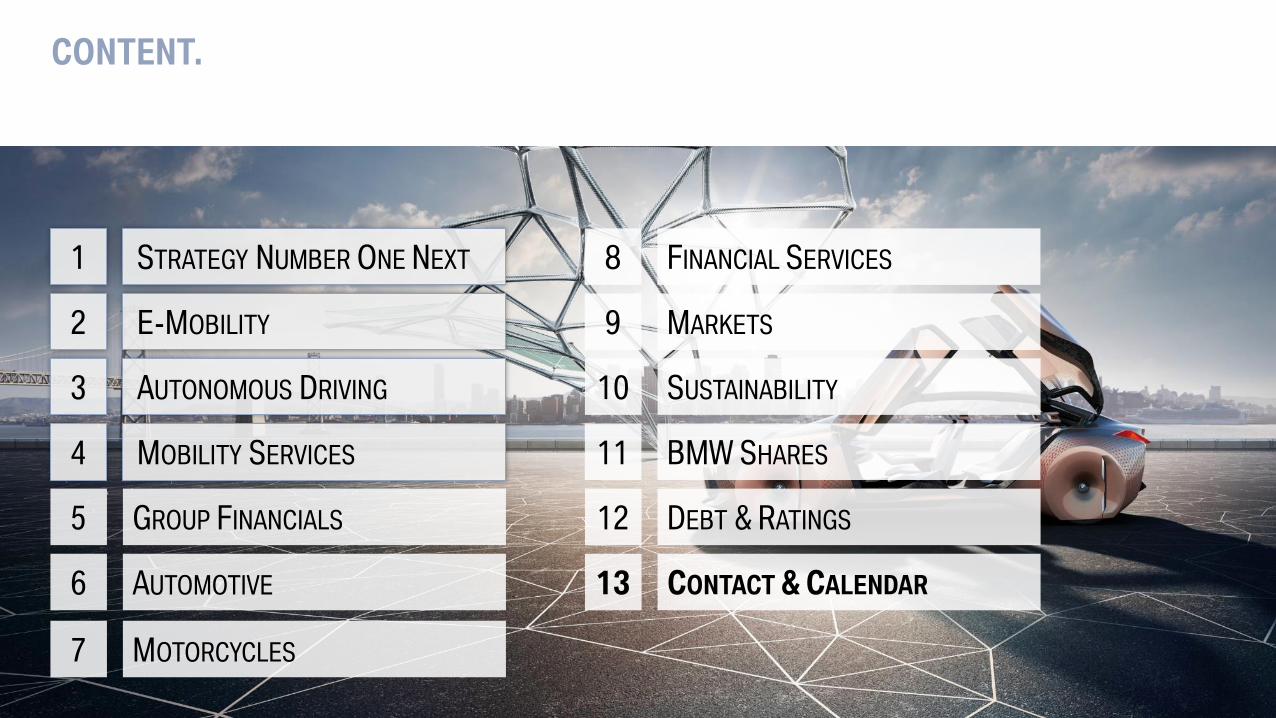
CONTENT.
Page 2
5 GROUP FINANCIALS
7 MOTORCYCLES
8 FINANCIAL SERVICES
9 MARKETS
12 DEBT & RATINGS
13 CONTACT & CALENDAR6 AUTOMOTIVE
11 BMW SHARES
1 STRATEGY NUMBER ONE NEXT
2 E-MOBILITY
3 AUTONOMOUS DRIVING
4 MOBILITY SERVICES
10 SUSTAINABILITY
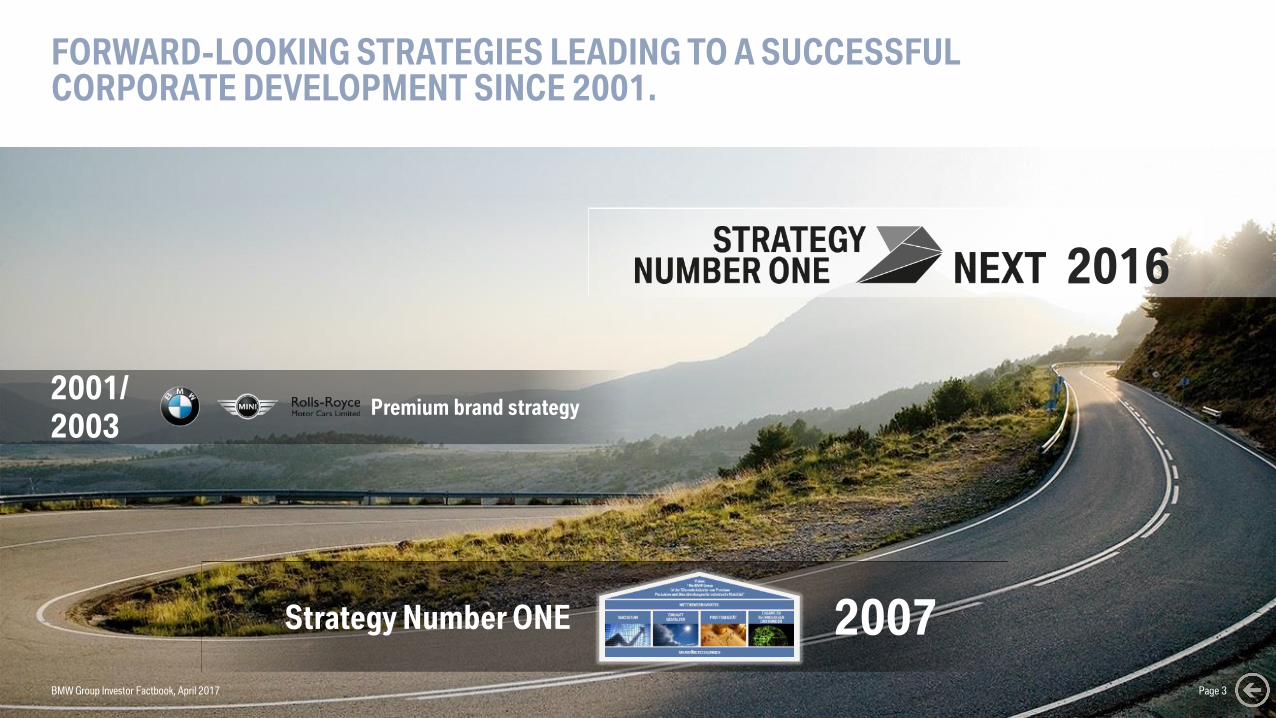
Premium brand strategy2001/
2003
Strategy Number ONE 2007
FORWARD-LOOKING STRATEGIES LEADING TO A SUCCESSFUL CORPORATE DEVELOPMENT SINCE 2001.
2016
BMW Group Investor Factbook, April 2017 Page 3
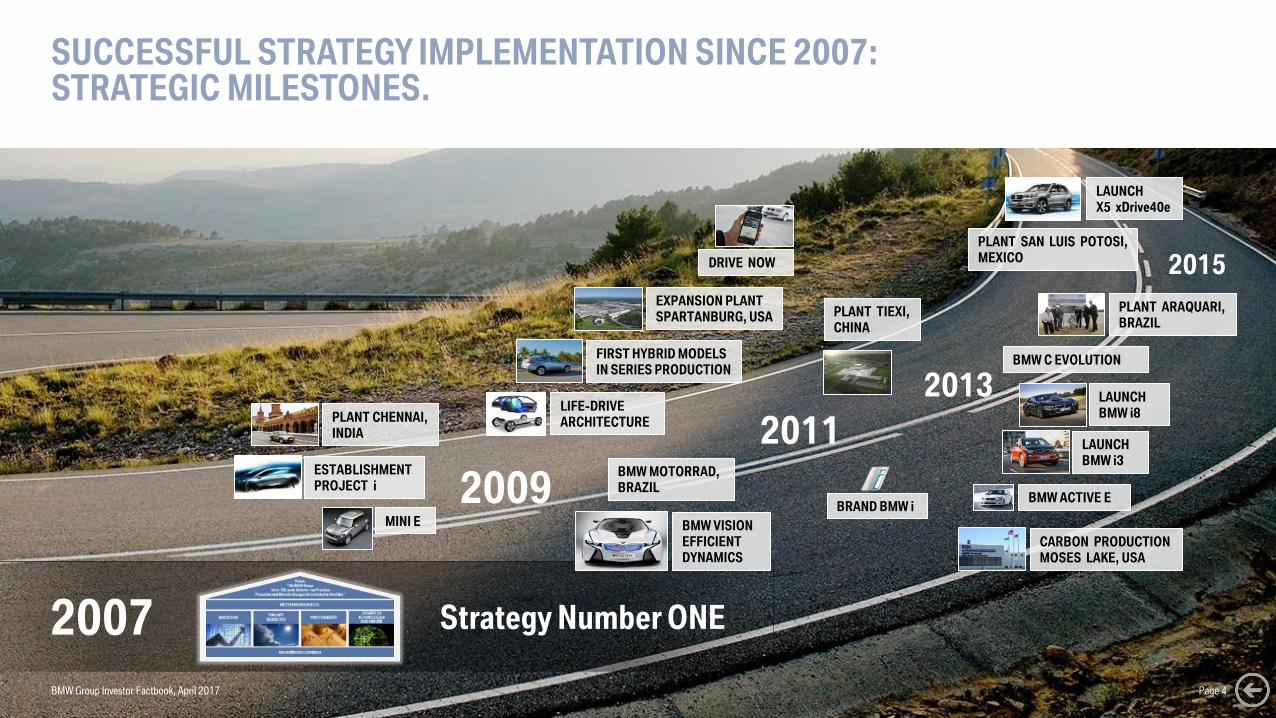
SUCCESSFUL STRATEGY IMPLEMENTATION SINCE 2007: STRATEGIC MILESTONES.
BMW Group Investor Factbook, April 2017 Page 4
Strategy Number ONE2007
2009
2011
2013
ESTABLISHMENT
PROJECT i
PLANT CHENNAI,
INDIA
BMW VISION
EFFICIENT
DYNAMICS
MINI E
BMW MOTORRAD,
BRAZIL
FIRST HYBRID MODELS
IN SERIES PRODUCTION
LIFE-DRIVE
ARCHITECTURE
EXPANSION PLANT
SPARTANBURG, USA
BMW ACTIVE E
CARBON PRODUCTION
MOSES LAKE, USA
DRIVE NOW
PLANT TIEXI,
CHINA
BRAND BMW i
LAUNCH
BMW i8
PLANT SAN LUIS POTOSI,
MEXICO
BMW C EVOLUTION
PLANT ARAQUARI,
BRAZIL
LAUNCH
X5 xDrive40e
LAUNCH
BMW i3
2015
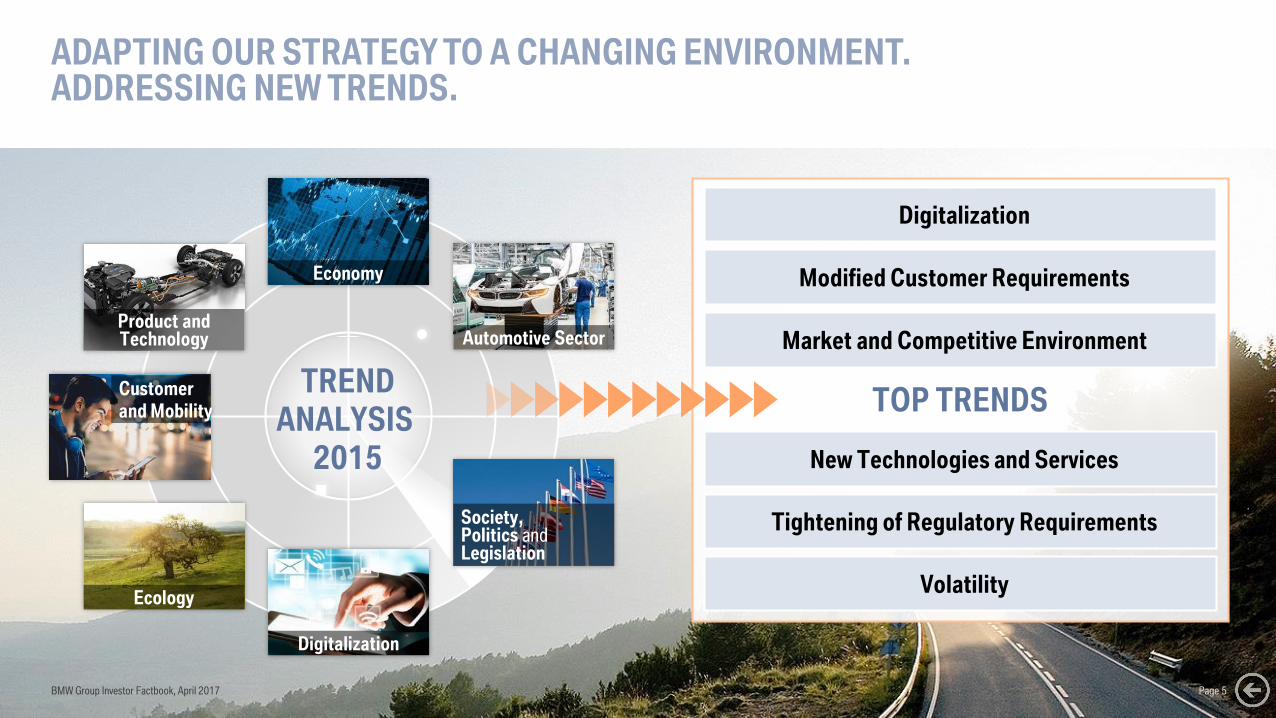
ADAPTING OUR STRATEGY TO A CHANGING ENVIRONMENT.ADDRESSING NEW TRENDS.
TREND
ANALYSIS
2015
Digitalization
Modified Customer Requirements
Tightening of Regulatory Requirements
Volatility
New Technologies and Services
Market and Competitive Environment
TOP TRENDS
Automotive Sector
Digitalization
Society,Politics andLegislation
Ecology
Economy
Customer
and Mobility
Product andTechnology
BMW Group Investor Factbook, April 2017 Page 5
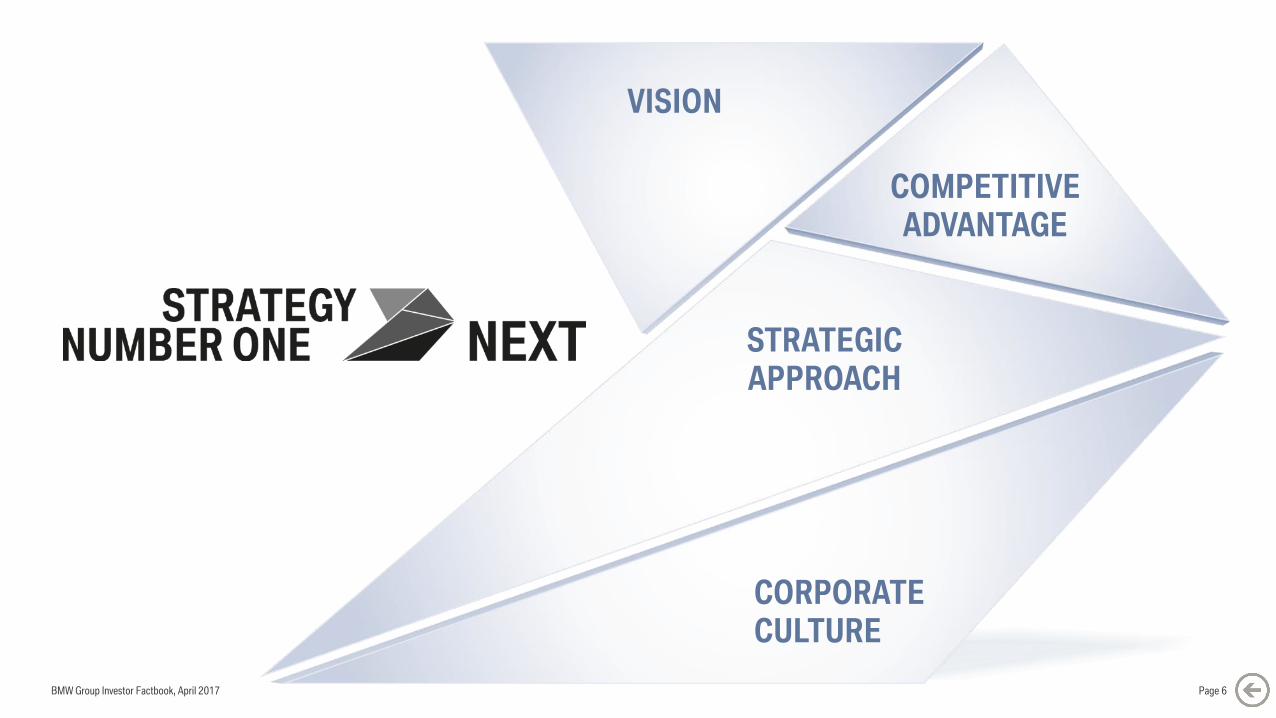
CORPORATE
CULTURE
STRATEGIC
APPROACH
COMPETITIVE
ADVANTAGE
VISION
BMW Group Investor Factbook, April 2017 Page 6
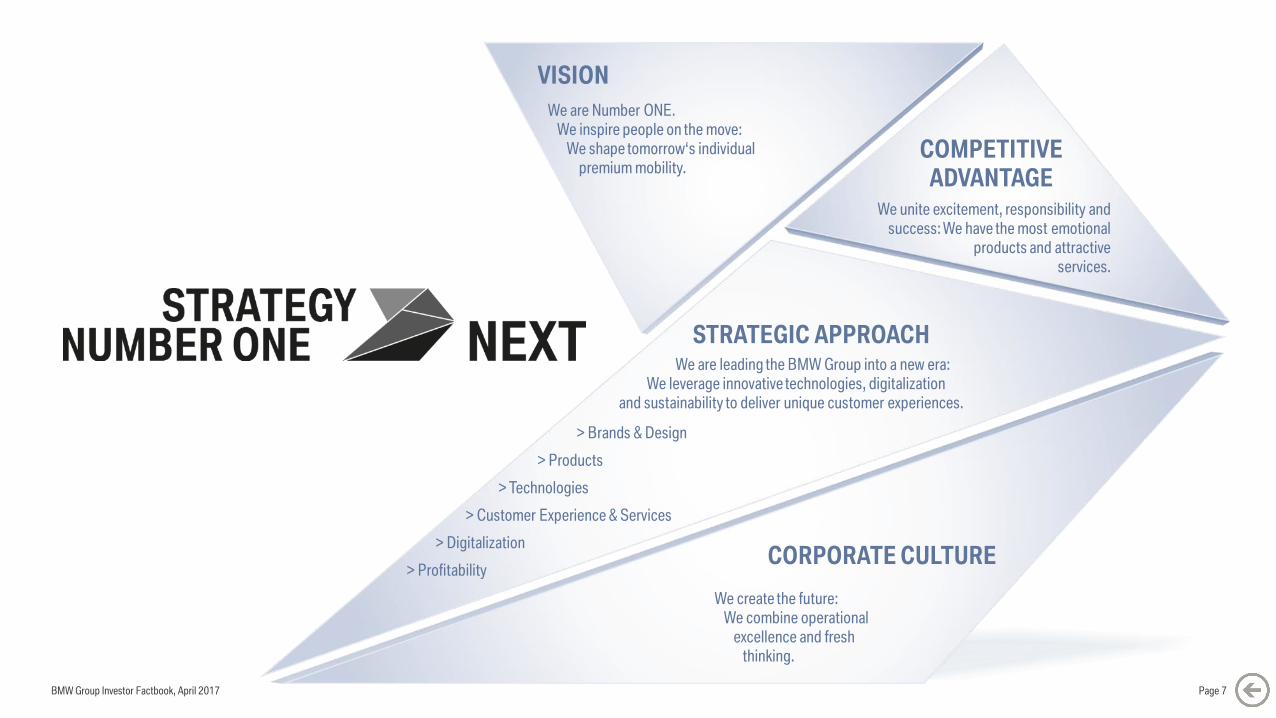
STRATEGIC APPROACH
> Brands & Design
We are leading the BMW Group into a new era:
We leverage innovative technologies, digitalization
and sustainability to deliver unique customer experiences.
> Products
> Technologies
> Customer Experience & Services
> Digitalization
> Profitability
VISION
We are Number ONE.
We inspire people on the move:
We shape tomorrow‘s individual
premium mobility.COMPETITIVE
ADVANTAGE
We unite excitement, responsibility and
success: We have the most emotional
products and attractive
services.
CORPORATE CULTURE
We create the future:
We combine operational
excellence and fresh
thinking.
BMW Group Investor Factbook, April 2017 Page 7
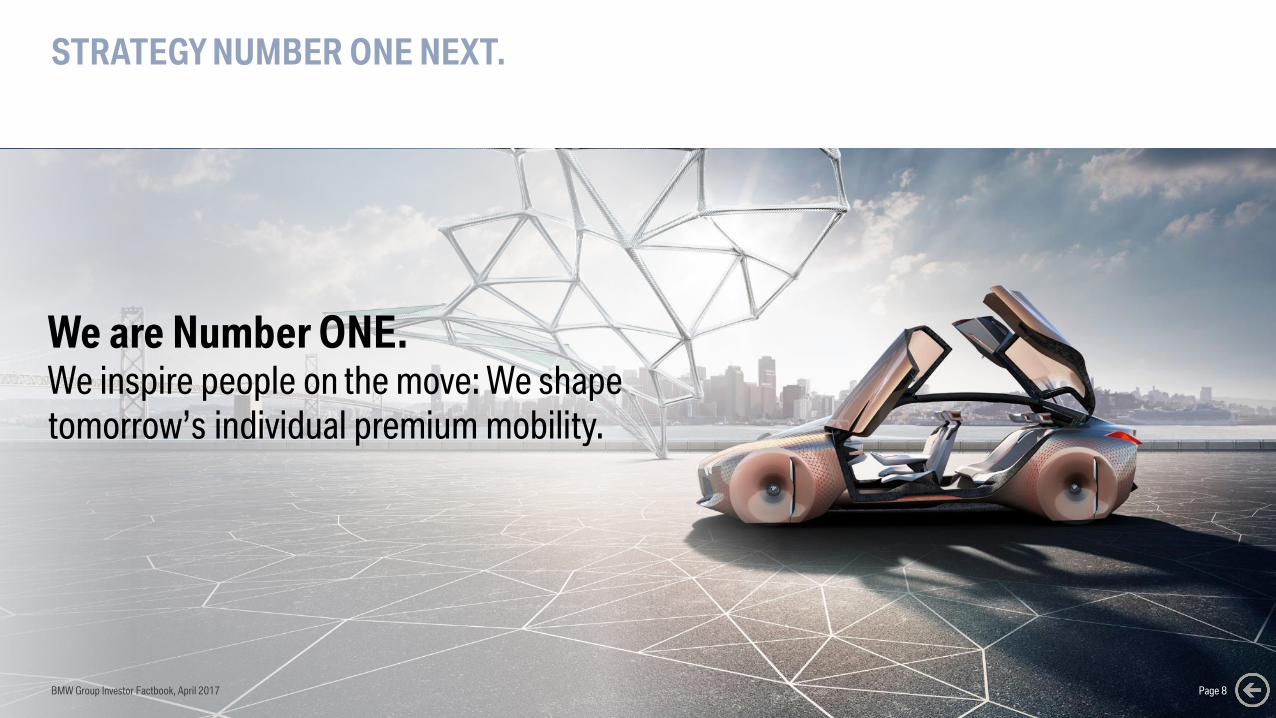
STRATEGY NUMBER ONE NEXT.
Page 8
We are Number ONE. We inspire people on the move: We shape
tomorrow’s individual premium mobility.
BMW Group Investor Factbook, April 2017
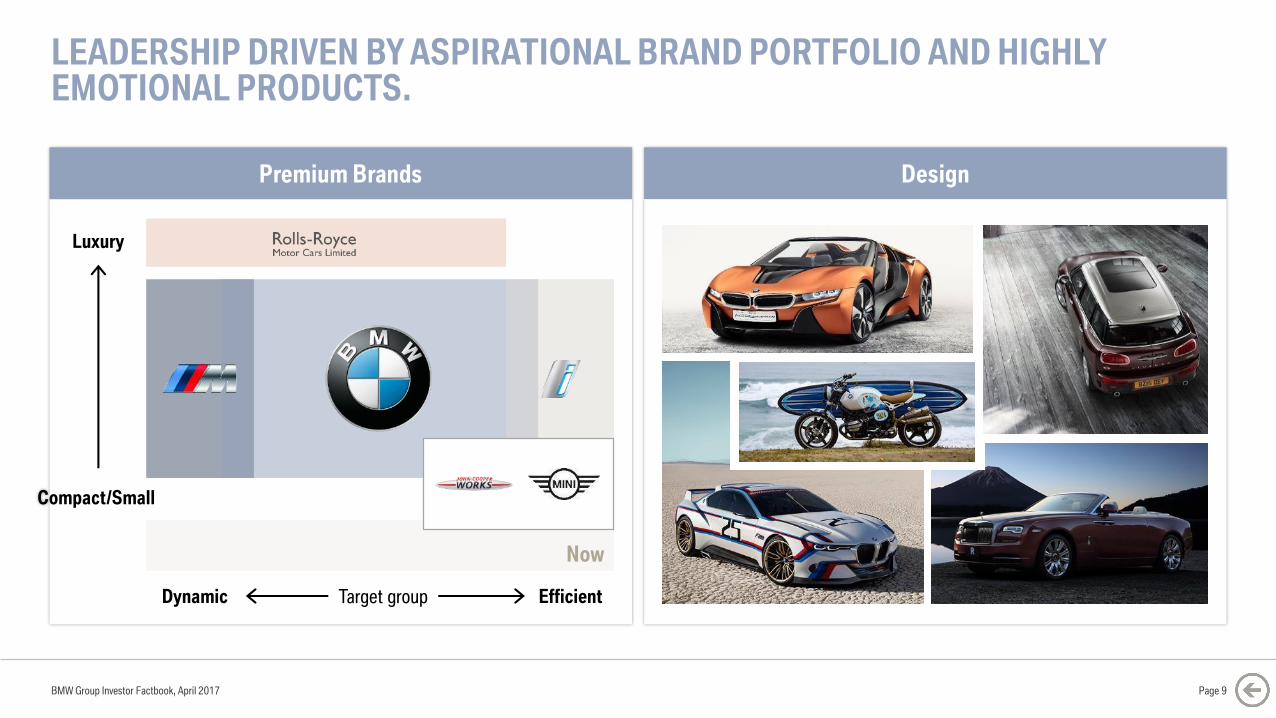
LEADERSHIP DRIVEN BY ASPIRATIONAL BRAND PORTFOLIO AND HIGHLY EMOTIONAL PRODUCTS.
Design
BMW Group Investor Factbook, April 2017
Premium Brands
Luxury
Dynamic Efficient
Compact/Small
Now
Target group
Page 9
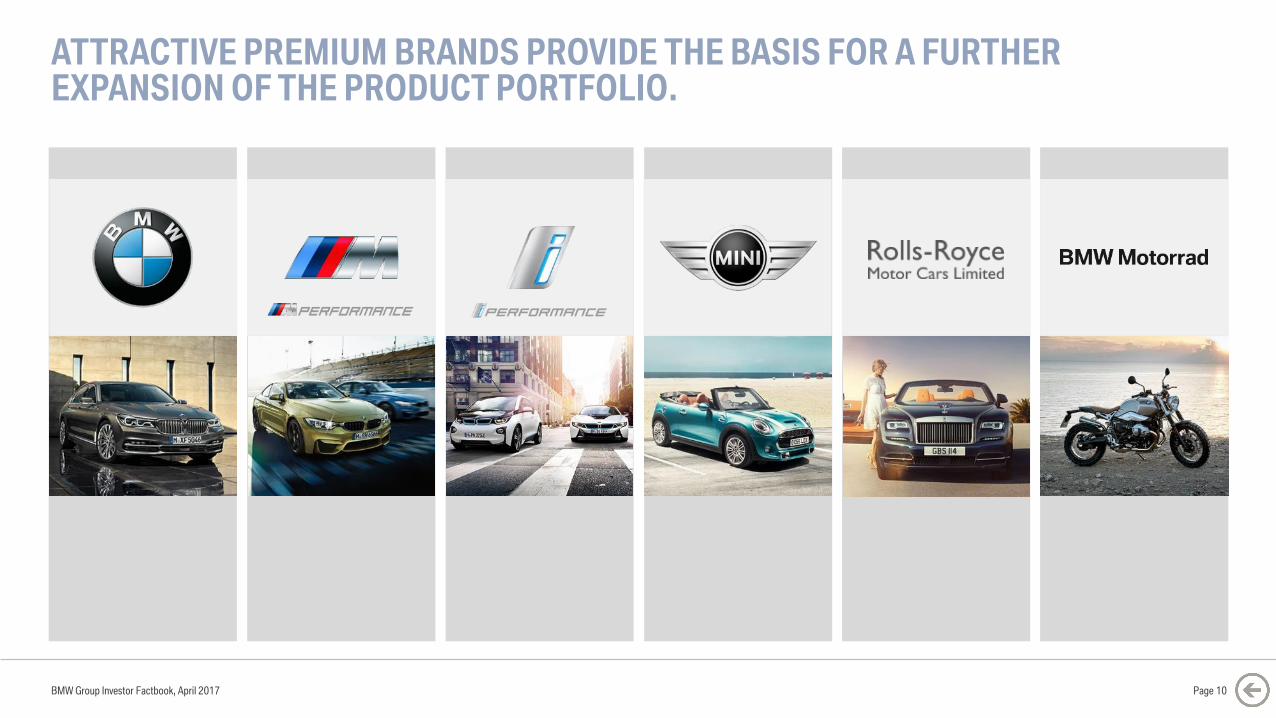
ATTRACTIVE PREMIUM BRANDS PROVIDE THE BASIS FOR A FURTHER EXPANSION OF THE PRODUCT PORTFOLIO.
BMW Group Investor Factbook, April 2017 Page 10
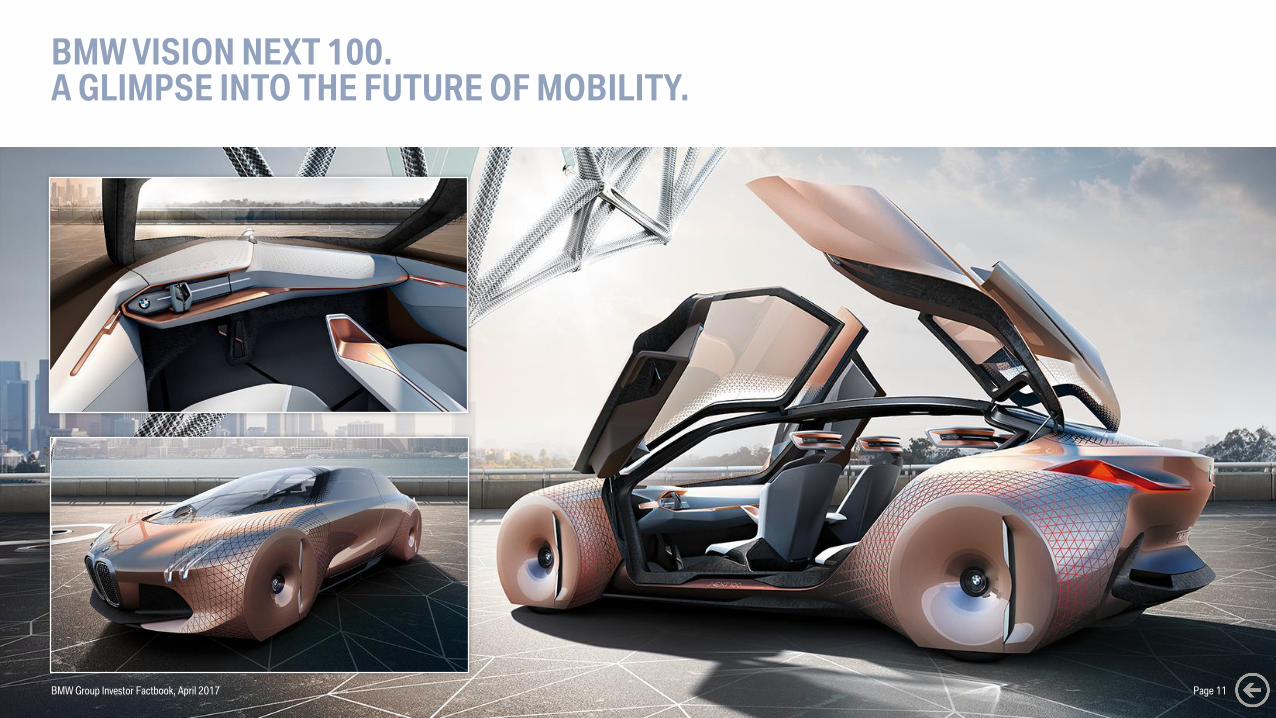
BMW VISION NEXT 100.A GLIMPSE INTO THE FUTURE OF MOBILITY.
BMW Group Investor Factbook, April 2017 Page 11
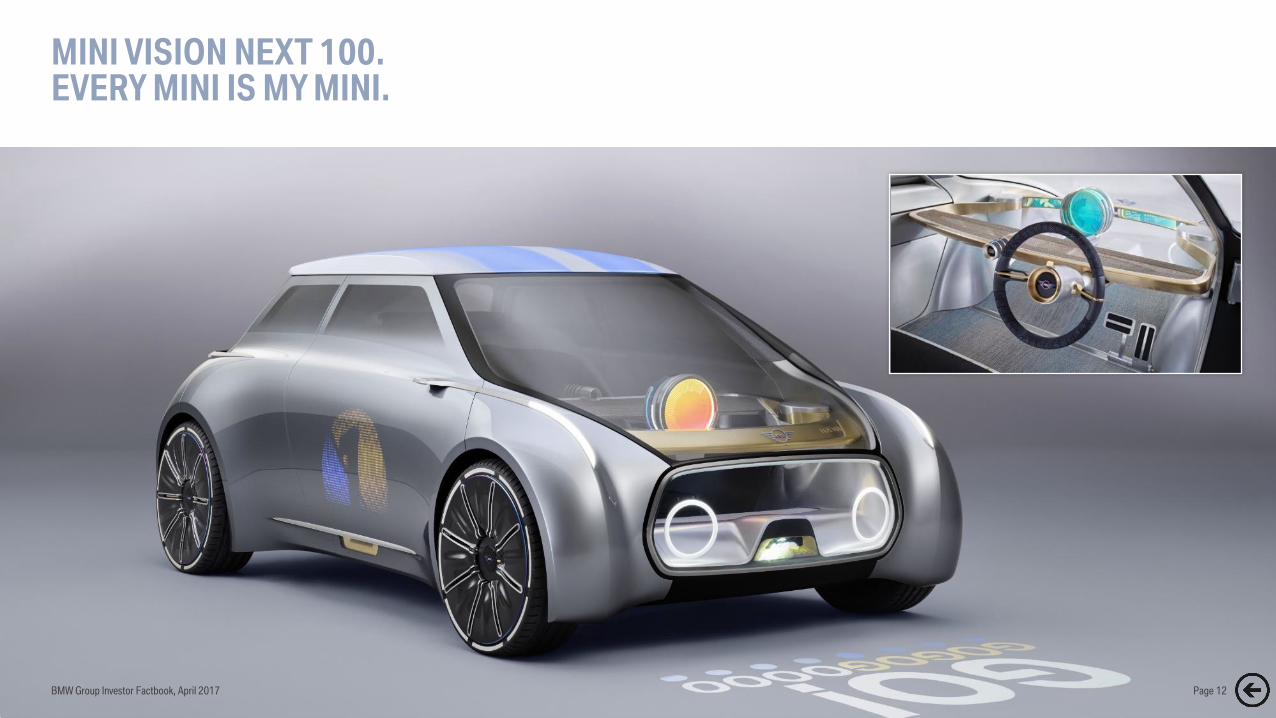
MINI VISION NEXT 100.EVERY MINI IS MY MINI.
BMW Group Investor Factbook, April 2017 Page 12
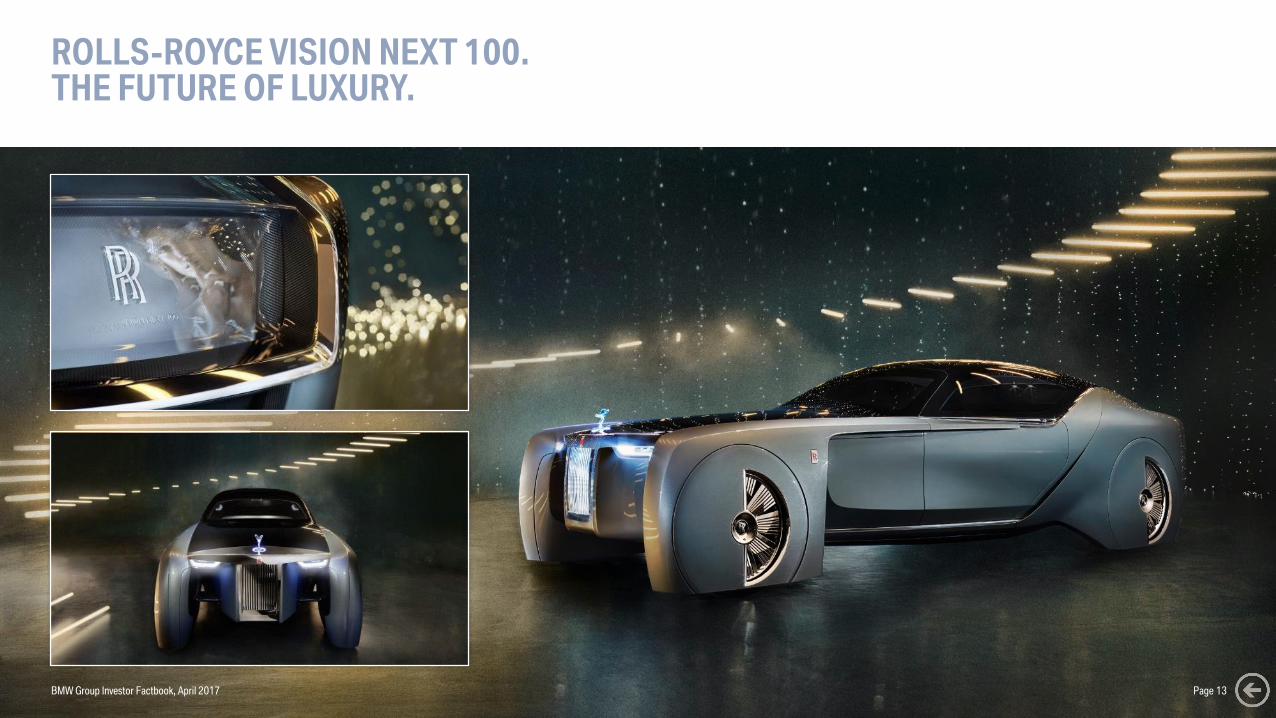
ROLLS-ROYCE VISION NEXT 100.THE FUTURE OF LUXURY.
BMW Group Investor Factbook, April 2017 Page 13
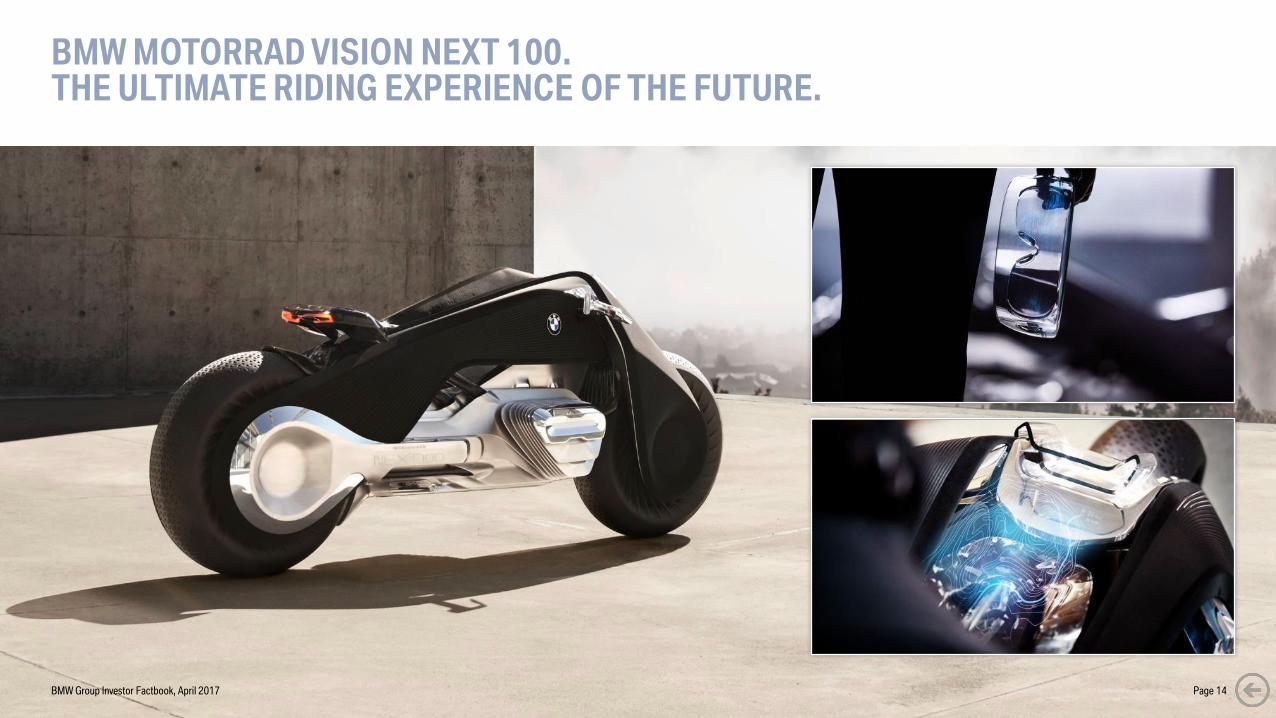
BMW MOTORRAD VISION NEXT 100.THE ULTIMATE RIDING EXPERIENCE OF THE FUTURE.
BMW Group Investor Factbook, April 2017 Page 14

CULTUREWe create the future:
We combine operational excellence and
fresh thinking.
RESPONSIBILITY
APPRECIATION
TRANSPARENCY
TRUST
OPENNESS
BMW Group Investor Factbook, April 2017 Page 15

AUTONOMOUS CONNECTED
ELECTRIFIED CUSTOMER FOCUS
ACES ARE A CORE ELEMENT OF STRATEGY NUMBER ONE > NEXT.
SHARED / SERVICES
BMW Group Investor Factbook, April 2017 Page 16
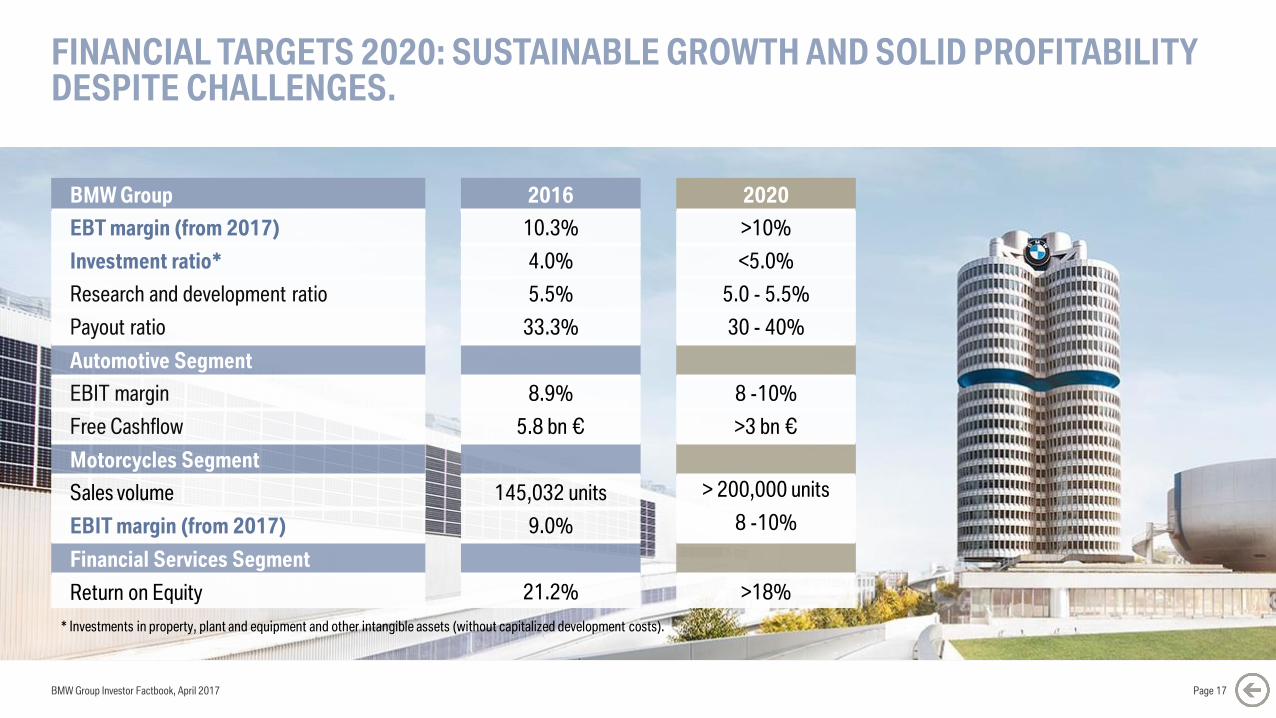
FINANCIAL TARGETS 2020: SUSTAINABLE GROWTH AND SOLID PROFITABILITY DESPITE CHALLENGES.
BMW Group Investor Factbook, April 2017
BMW Group
EBT margin (from 2017)
Investment ratio*
Research and development ratio
Payout ratio
Automotive Segment
EBIT margin
Free Cashflow
Motorcycles Segment
Sales volume
EBIT margin (from 2017)
Financial Services Segment
Return on Equity
* Investments in property, plant and equipment and other intangible assets (without capitalized development costs).
Page 17
2016
10.3%
4.0%
5.5%
33.3%
8.9%
5.8 bn €
145,032 units
9.0%
21.2%
2020
>10%
<5.0%
5.0 - 5.5%
30 - 40%
8 -10%
>3 bn €
> 200,000 units
8 -10%
>18%
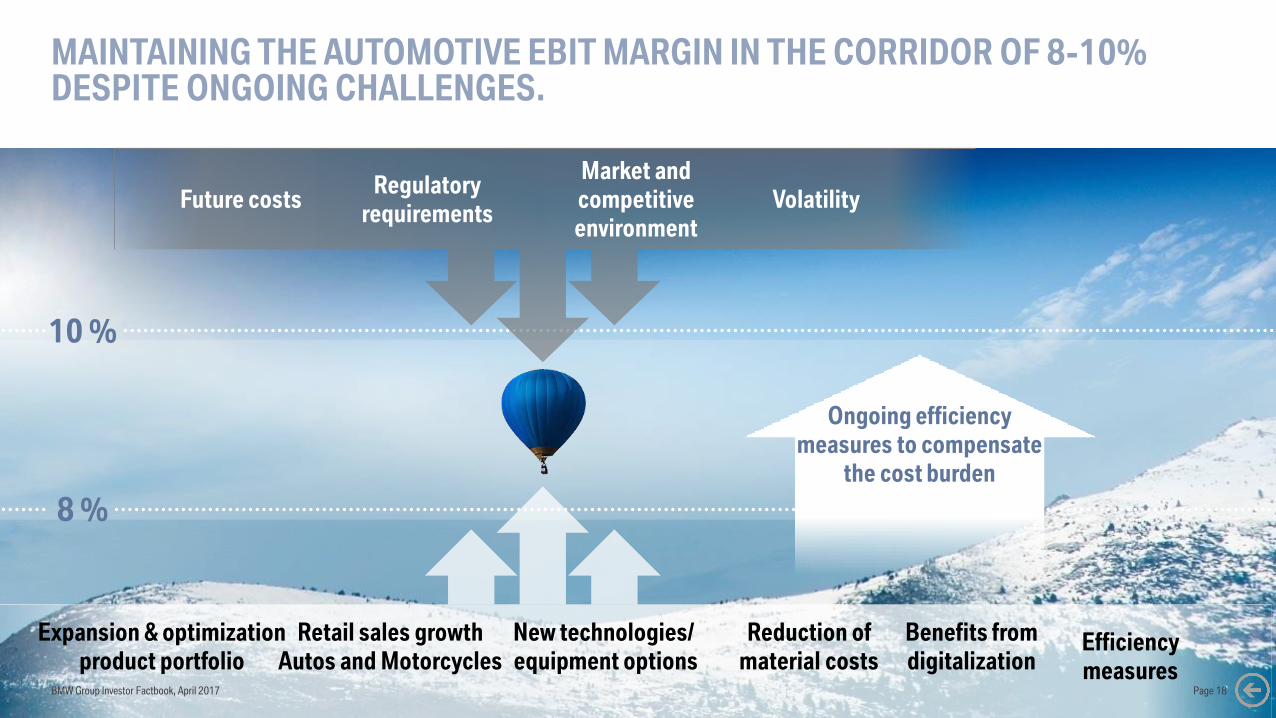
MAINTAINING THE AUTOMOTIVE EBIT MARGIN IN THE CORRIDOR OF 8-10% DESPITE ONGOING CHALLENGES.
8 %
10 %
Ongoing efficiency
measures to compensate
the cost burden
Future costs Volatility
Market and
competitive
environment
Regulatory
requirements
Expansion & optimization
product portfolio
Reduction of
material costs
New technologies/
equipment options
Retail sales growth
Autos and Motorcycles
Benefits from
digitalizationEfficiency
measuresBMW Group Investor Factbook, April 2017 Page 18
BMW Group Investor Factbook, April 2017
CONTENT.
Page 19
5 GROUP FINANCIALS
7 MOTORCYCLES
8 FINANCIAL SERVICES
9 MARKETS
12 DEBT & RATINGS
13 CONTACT & CALENDAR6 AUTOMOTIVE
11 BMW SHARES
1 STRATEGY NUMBER ONE NEXT
2 E-MOBILITY
3 AUTONOMOUS DRIVING
4 MOBILITY SERVICES
10 SUSTAINABILITY
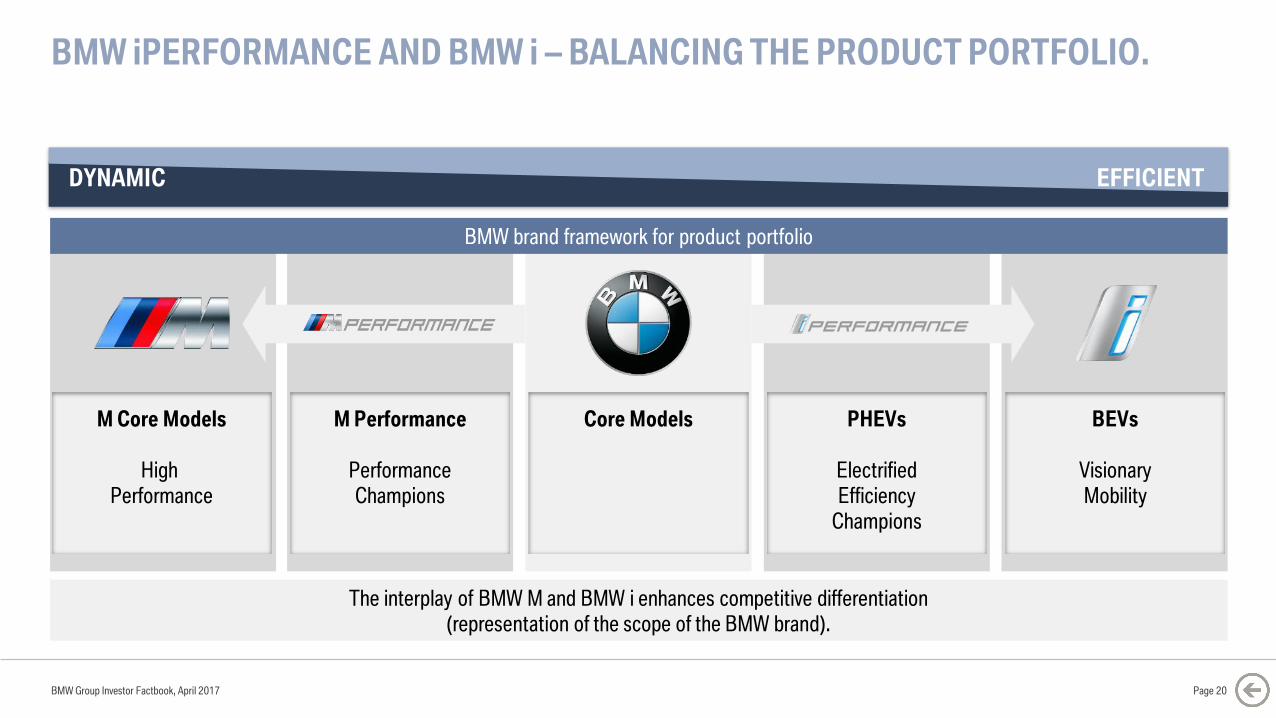
BMW iPERFORMANCE AND BMW i – BALANCING THE PRODUCT PORTFOLIO.
BMW Group Investor Factbook, April 2017
DYNAMIC EFFICIENT
M Core Models
High
Performance
M Performance
Performance
Champions
Core Models PHEVs
Electrified
Efficiency
Champions
BEVs
Visionary
Mobility
The interplay of BMW M and BMW i enhances competitive differentiation
(representation of the scope of the BMW brand).
BMW brand framework for product portfolio
Page 20
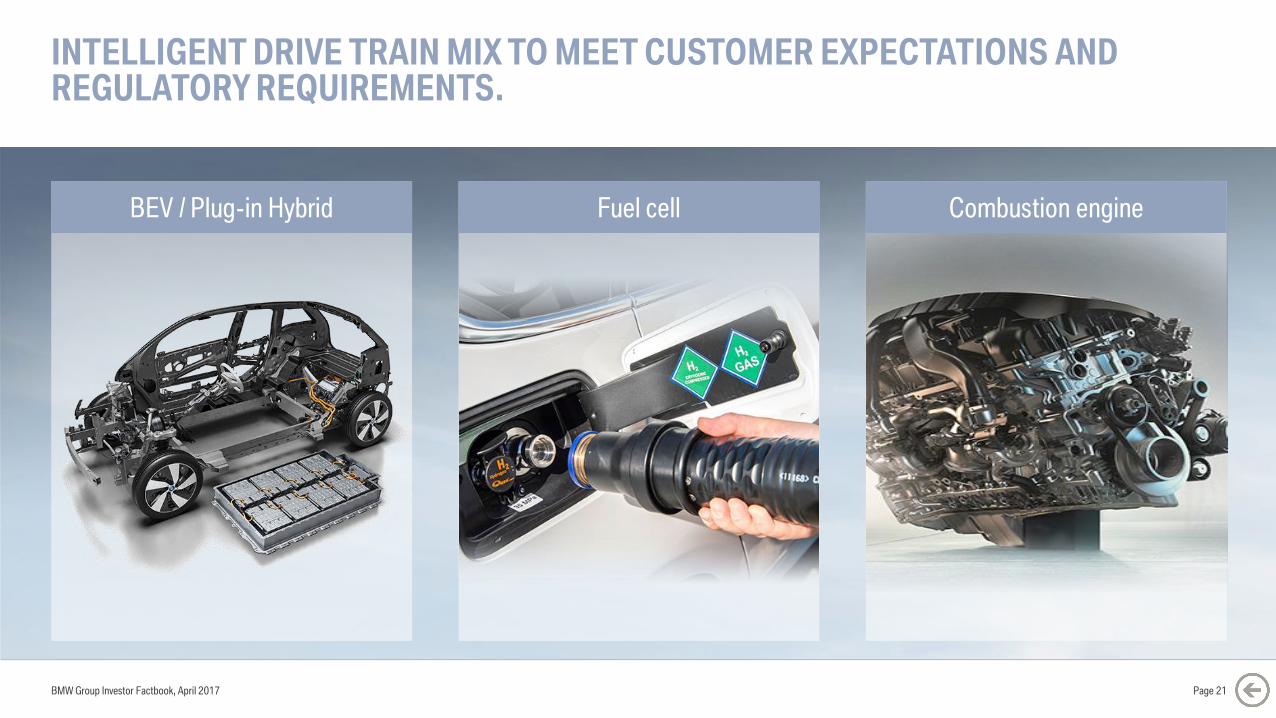
INTELLIGENT DRIVE TRAIN MIX TO MEET CUSTOMER EXPECTATIONS AND REGULATORY REQUIREMENTS.
BEV / Plug-in Hybrid Fuel cell
BMW Group Investor Factbook, April 2017 Page 21
Combustion engine
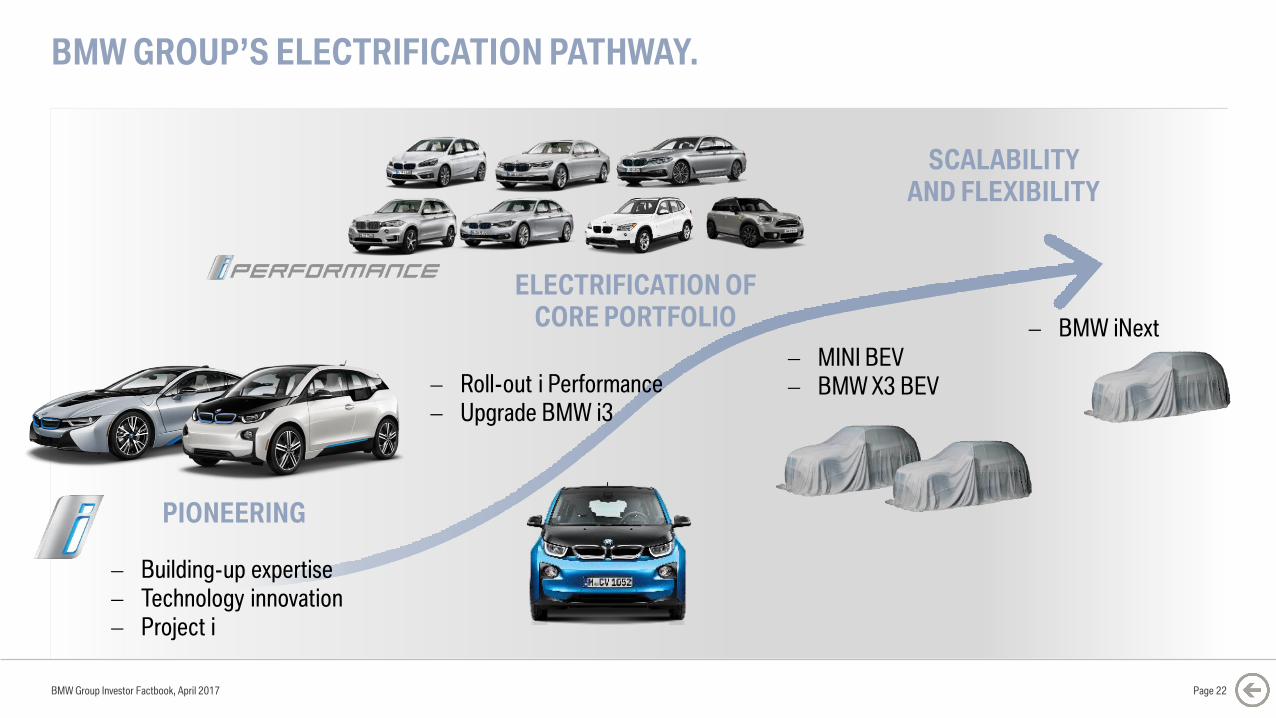
BMW GROUP’S ELECTRIFICATION PATHWAY.
PIONEERING
ELECTRIFICATION OF
CORE PORTFOLIO
SCALABILITY
AND FLEXIBILITY
Building-up expertise
Technology innovation
Project i
Roll-out i Performance
Upgrade BMW i3
MINI BEV
BMW X3 BEV
BMW iNext
BMW Group Investor Factbook, April 2017 Page 22
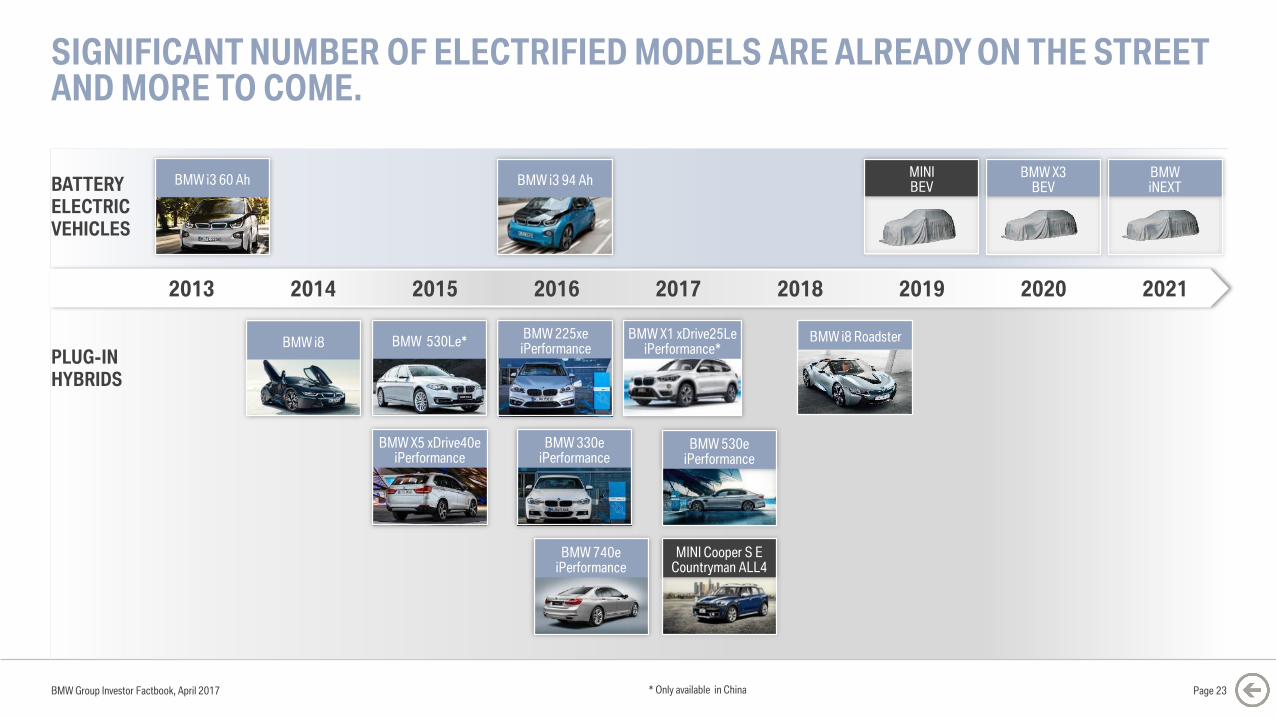
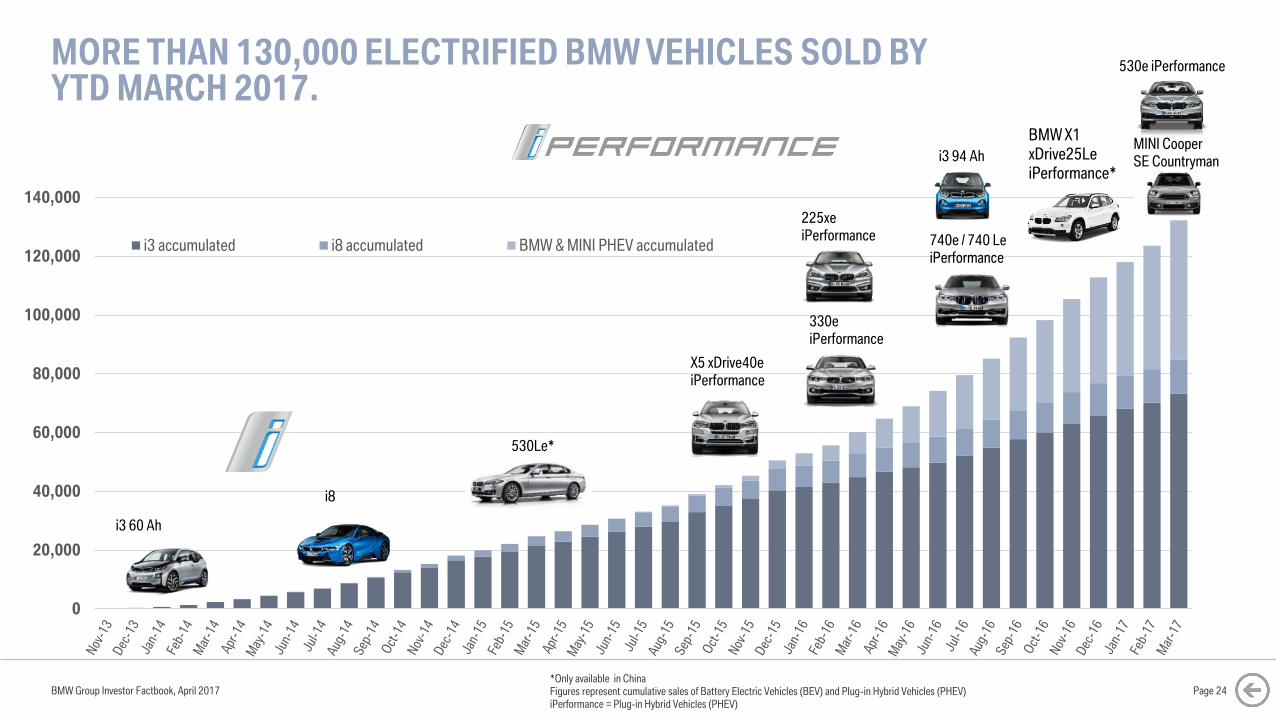
SIGNIFICANT NUMBER OF ELECTRIFIED MODELS ARE ALREADY ON THE STREET AND MORE TO COME.
BMW Group Investor Factbook, April 2017 Page 23
BATTERY
ELECTRIC
VEHICLES
PLUG-IN
HYBRIDS
BMW 225xeiPerformanceBMW i8 BMW 530Le*
BMW 740eiPerformance
BMW X1 xDrive25LeiPerformance*
BMW X5 xDrive40eiPerformance
BMW i3 60 Ah BMW i3 94 Ah
* Only available in China
BMW 530e iPerformance
BMW X3BEV
MINI BEV
MINI Cooper S E Countryman ALL4
BMWiNEXT
BMW i8 Roadster
2013 2014 2015 2016 2017 2018 2019 2020 2021
BMW 330eiPerformance
0
20,000
40,000
60,000
80,000
100,000
120,000
140,000
i3 accumulated i8 accumulated BMW & MINI PHEV accumulated
MORE THAN 130,000 ELECTRIFIED BMW VEHICLES SOLD BY YTD MARCH 2017.
BMW Group Investor Factbook, April 2017 Page 24
i3 60 Ah
i8
X5 xDrive40e
iPerformance
530Le*
330e
iPerformance
225xe
iPerformance 740e / 740 Le
iPerformance
i3 94 Ah
*Only available in ChinaFigures represent cumulative sales of Battery Electric Vehicles (BEV) and Plug-in Hybrid Vehicles (PHEV)iPerformance = Plug-in Hybrid Vehicles (PHEV)
530e iPerformance
MINI Cooper
SE Countryman
BMW X1
xDrive25Le
iPerformance*
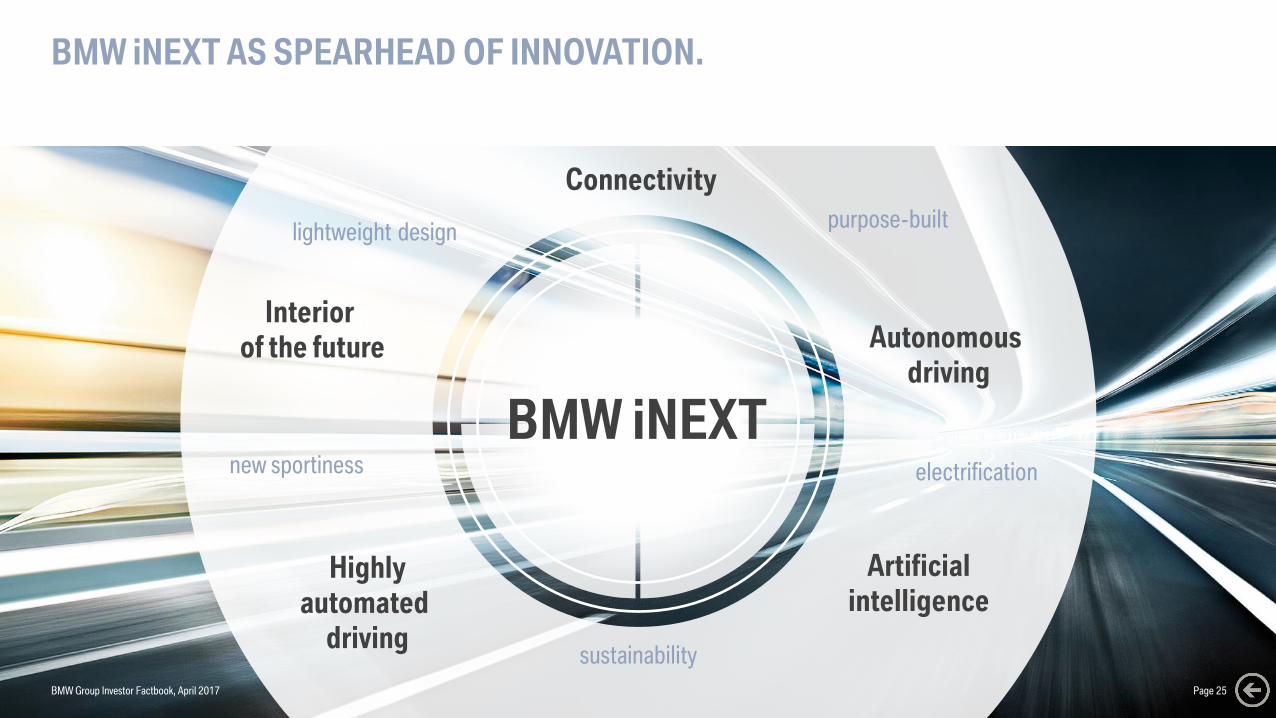
BMW iNEXT AS SPEARHEAD OF INNOVATION.
Artificial
intelligence
Interior
of the future
Highly
automated
driving
Autonomous
driving
electrification
lightweight designpurpose-built
sustainability
BMW iNEXTnew sportiness
Connectivity
BMW Group Investor Factbook, April 2017 Page 25

BMW Group Investor Factbook, April 2017
CONTENT.
Page 26
5 GROUP FINANCIALS
7 MOTORCYCLES
8 FINANCIAL SERVICES
9 MARKETS
12 DEBT & RATINGS
13 CONTACT & CALENDAR6 AUTOMOTIVE
11 BMW SHARES
1 STRATEGY NUMBER ONE NEXT
2 E-MOBILITY
3 AUTONOMOUS DRIVING
4 MOBILITY SERVICES
10 SUSTAINABILITY
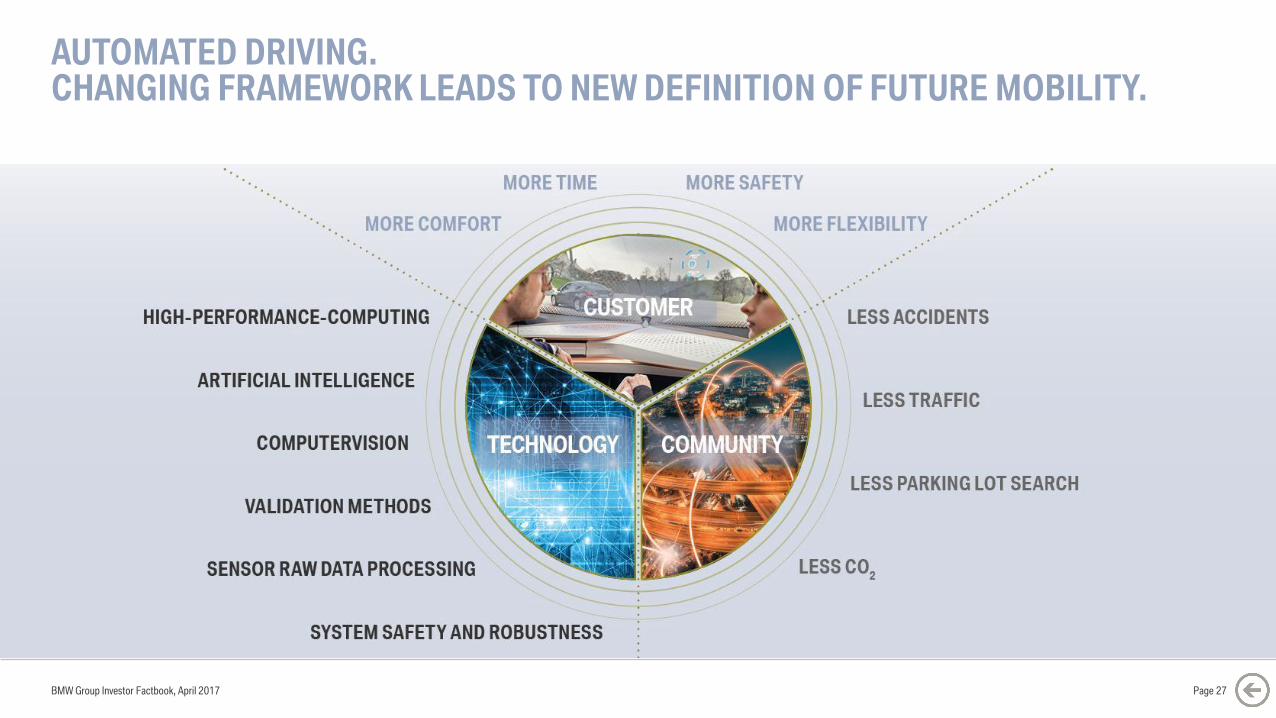
AUTOMATED DRIVING.CHANGING FRAMEWORK LEADS TO NEW DEFINITION OF FUTURE MOBILITY.
BMW Group Investor Factbook, April 2017 Page 27
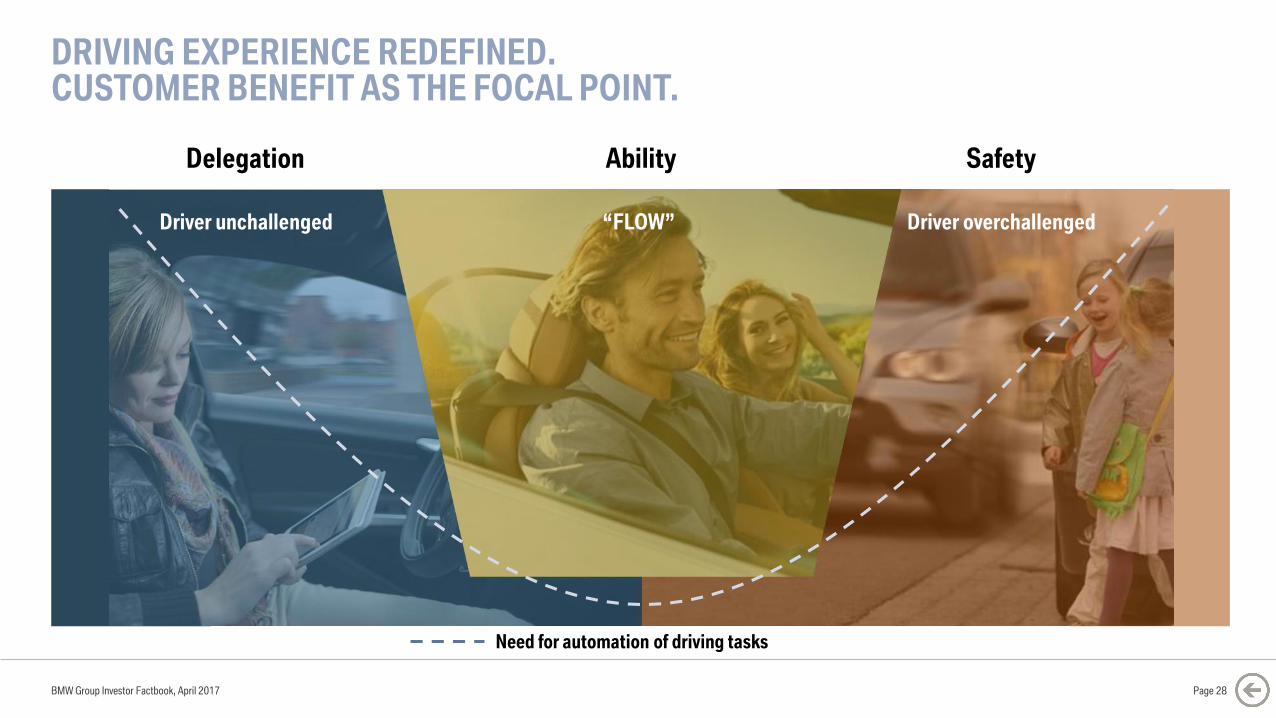
DRIVING EXPERIENCE REDEFINED.CUSTOMER BENEFIT AS THE FOCAL POINT.
BMW Group Investor Factbook, April 2017
Need for automation of driving tasks
Delegation Ability Safety
“FLOW” Driver overchallengedDriver unchallenged
Page 28
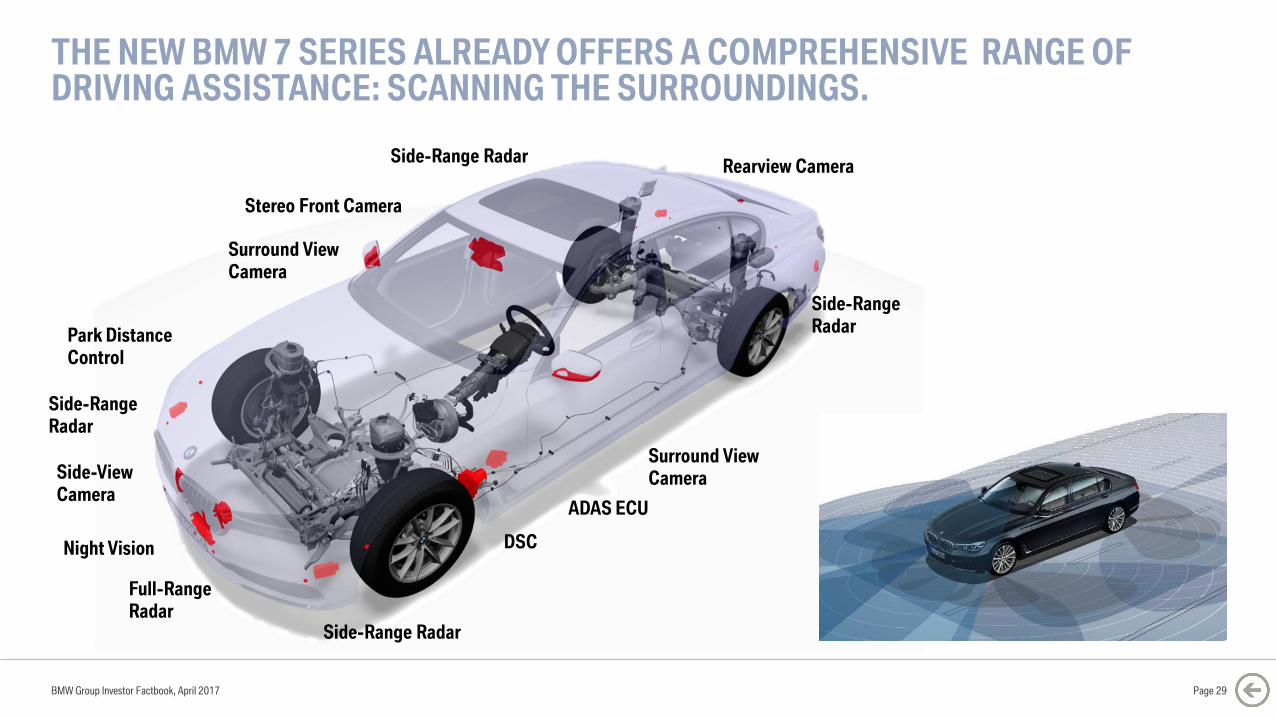
THE NEW BMW 7 SERIES ALREADY OFFERS A COMPREHENSIVE RANGE OF DRIVING ASSISTANCE: SCANNING THE SURROUNDINGS.
BMW Group Investor Factbook, April 2017
Stereo Front Camera
DSC
ADAS ECU
Full-Range
Radar
Park Distance
Control
Surround View
Camera
Night Vision
Side-Range
Radar
Side-Range Radar
Side-Range
Radar
Side-Range RadarRearview Camera
Side-View
Camera
Surround View
Camera
Page 29
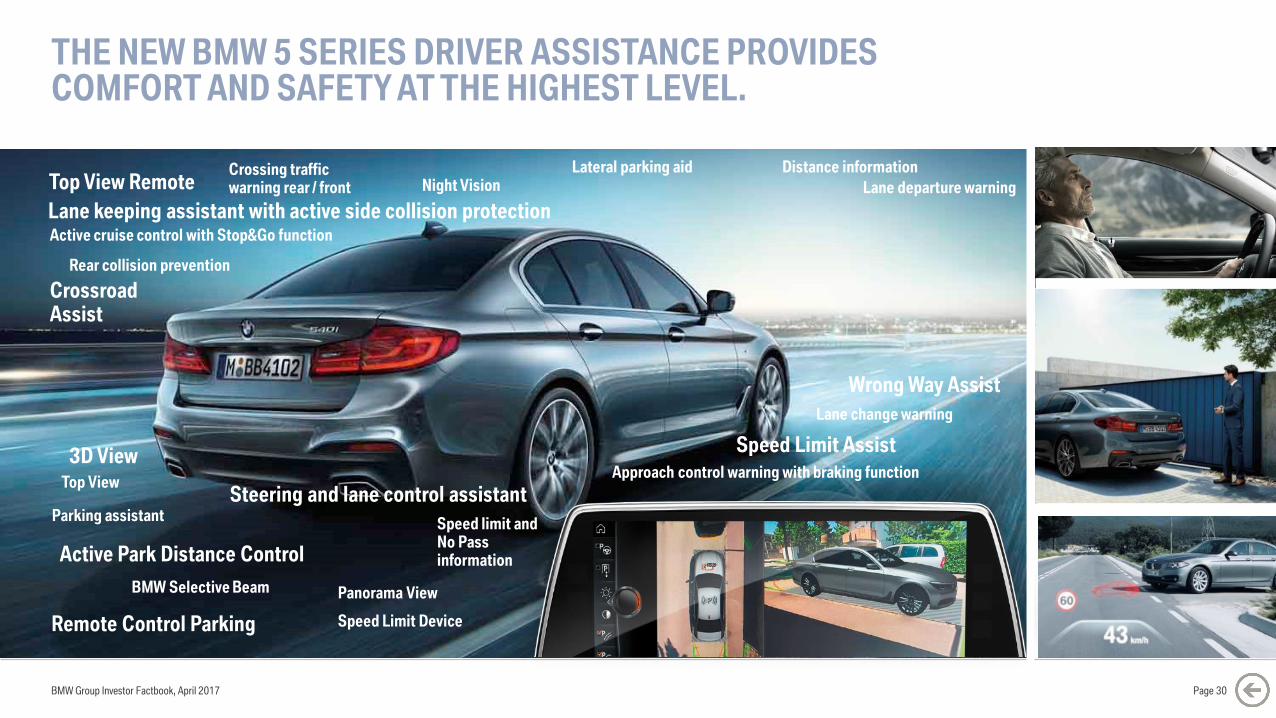
THE NEW BMW 5 SERIES DRIVER ASSISTANCE PROVIDES COMFORT AND SAFETY AT THE HIGHEST LEVEL.
BMW Group Investor Factbook, April 2017 Page 30
Crossing traffic warning rear / front
Active cruise control with Stop&Go function
Lane keeping assistant with active side collision protection
Steering and lane control assistant
Speed Limit Assist
Panorama View
Active Park Distance Control
Parking assistant
Top View
3D View
Lateral parking aidNight Vision
BMW Selective Beam
Remote Control Parking
Distance information
Rear collision prevention
Lane change warning
Lane departure warning
Speed limit and No Pass information
Approach control warning with braking function
Speed Limit Device
Wrong Way Assist
Crossroad Assist
Top View Remote
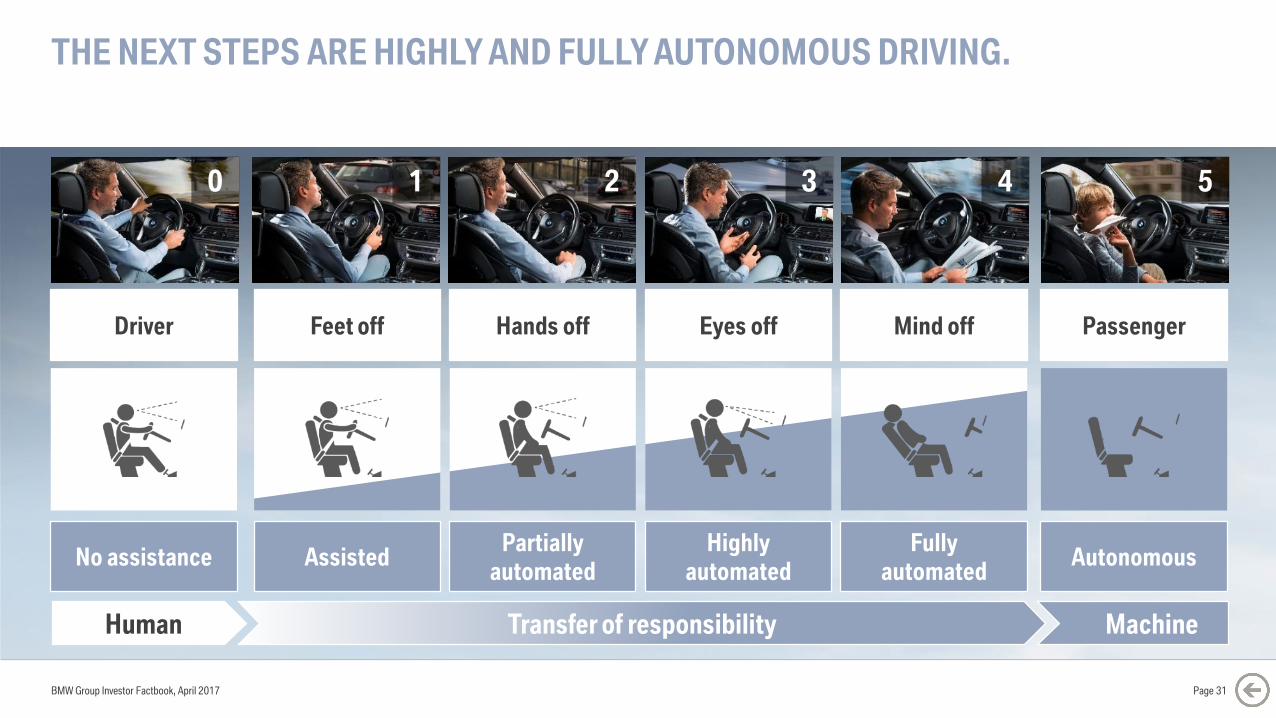
THE NEXT STEPS ARE HIGHLY AND FULLY AUTONOMOUS DRIVING.
Driver
No assistance
Feet off
Assisted
Hands off
Partially
automated
Eyes off
Highly
automated
Mind off
Fully
automated
Transfer of responsibilityHuman Machine
Passenger
Autonomous
0 1 2 3 4 5
BMW Group Investor Factbook, April 2017 Page 31
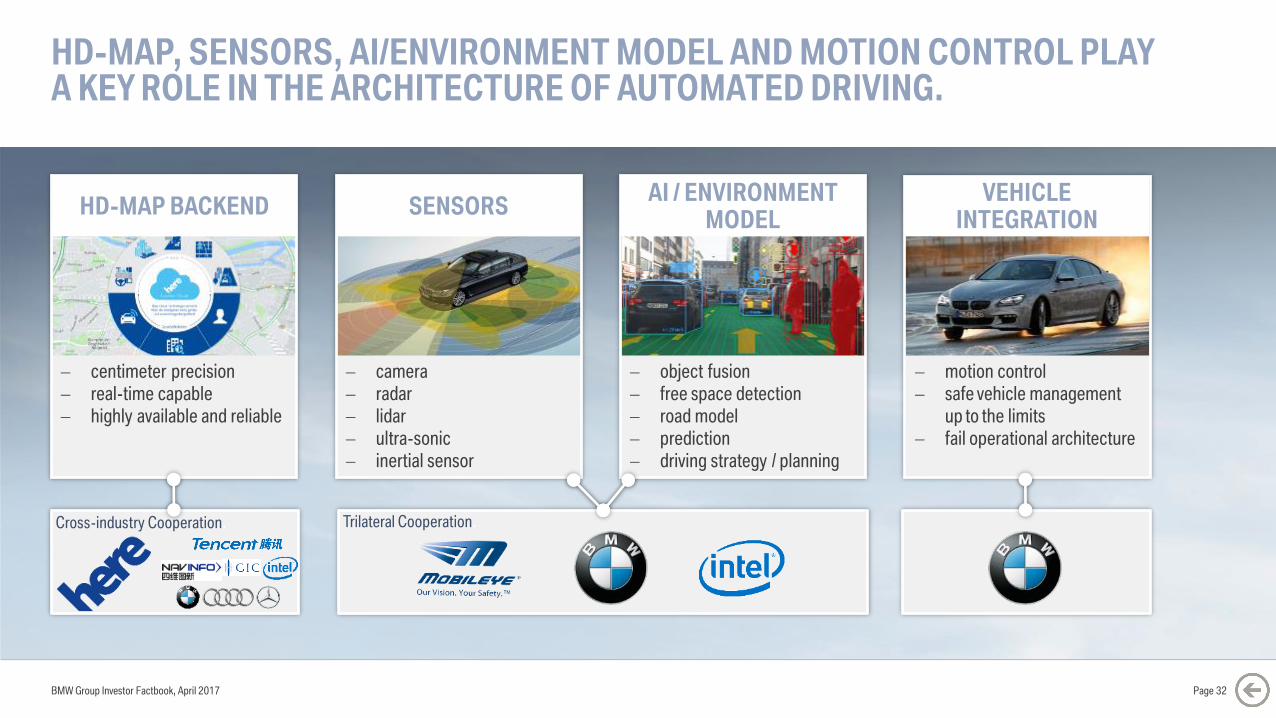
HD-MAP, SENSORS, AI/ENVIRONMENT MODEL AND MOTION CONTROL PLAYA KEY ROLE IN THE ARCHITECTURE OF AUTOMATED DRIVING.
BMW Group Investor Factbook, April 2017 Page 32
motion control
safe vehicle management
up to the limits
fail operational architecture
object fusion
free space detection
road model
prediction
driving strategy / planning
camera
radar
lidar
ultra-sonic
inertial sensor
centimeter precision
real-time capable
highly available and reliable
Cross-industry Cooperation. Trilateral Cooperation.
VEHICLE INTEGRATION
AI / ENVIRONMENT MODEL
SENSORSHD-MAP BACKEND
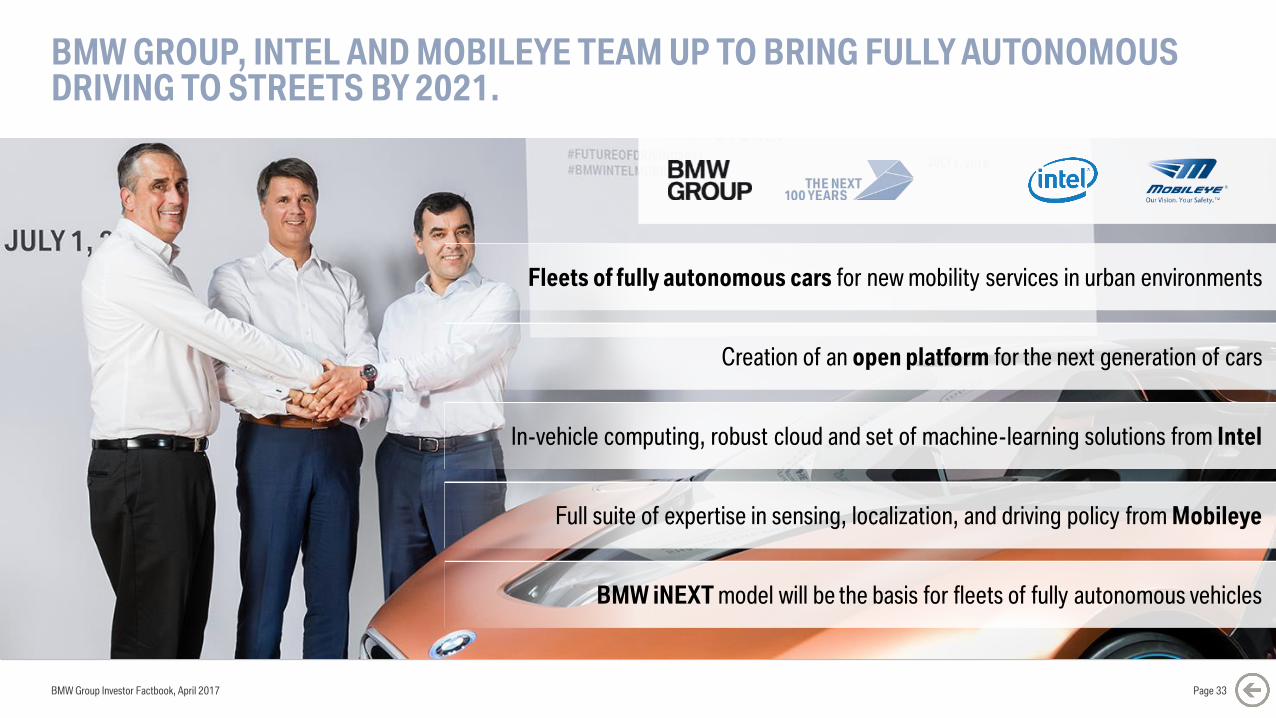
BMW GROUP, INTEL AND MOBILEYE TEAM UP TO BRING FULLY AUTONOMOUS DRIVING TO STREETS BY 2021.
BMW Group Investor Factbook, April 2017 Page 33
Fleets of fully autonomous cars for new mobility services in urban environments
In-vehicle computing, robust cloud and set of machine-learning solutions from Intel
BMW iNEXT model will be the basis for fleets of fully autonomous vehicles
Creation of an open platform for the next generation of cars
Full suite of expertise in sensing, localization, and driving policy from Mobileye
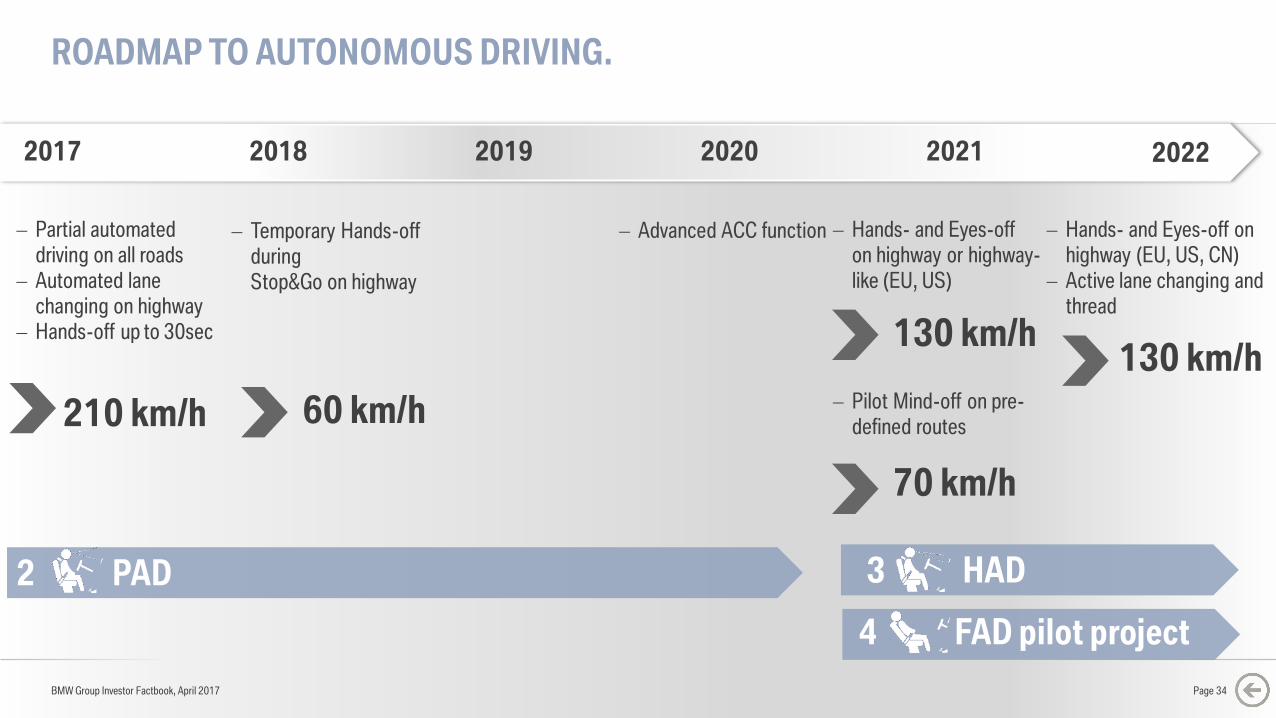
ROADMAP TO AUTONOMOUS DRIVING.
2 PAD 3 HAD
4 FAD pilot project
210 km/h 60 km/h
130 km/h
70 km/h
130 km/h
2017 2018 2019 2020 2021 2022
Partial automated
driving on all roads
Automated lane
changing on highway
Hands-off up to 30sec
Temporary Hands-off
during
Stop&Go on highway
Advanced ACC function Hands- and Eyes-off
on highway or highway-
like (EU, US)
Pilot Mind-off on pre-
defined routes
Hands- and Eyes-off on
highway (EU, US, CN)
Active lane changing and
thread
BMW Group Investor Factbook, April 2017 Page 34

BMW Group Investor Factbook, April 2017
CONTENT.
Page 35
5 GROUP FINANCIALS
7 MOTORCYCLES
8 FINANCIAL SERVICES
9 MARKETS
12 DEBT & RATINGS
13 CONTACT & CALENDAR6 AUTOMOTIVE
11 BMW SHARES
1 STRATEGY NUMBER ONE NEXT
2 E-MOBILITY
3 AUTONOMOUS DRIVING
4 MOBILITY SERVICES
10 SUSTAINABILITY
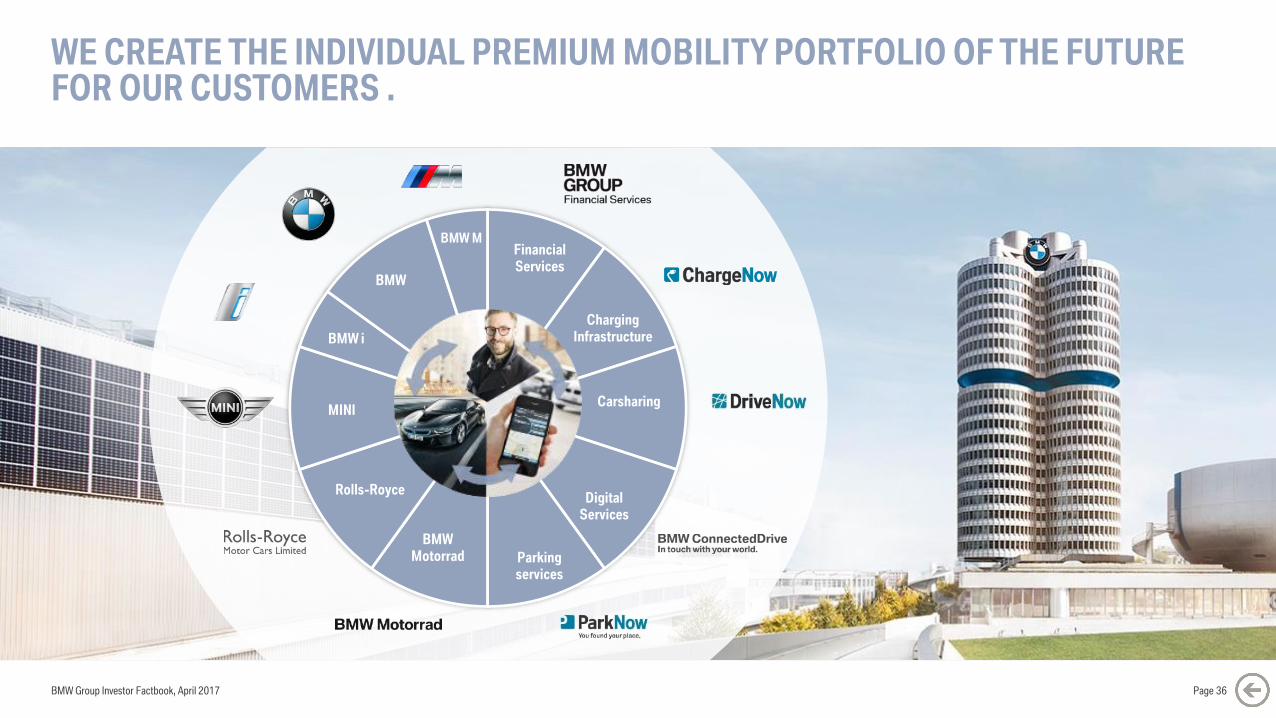
WE CREATE THE INDIVIDUAL PREMIUM MOBILITY PORTFOLIO OF THE FUTURE FOR OUR CUSTOMERS .
BMW Group Investor Factbook, April 2017
BMW
MINI
Rolls-Royce
BMW
Motorrad
Carsharing
Parking
services
Financial
Services
Digital
Services
Charging
InfrastructureBMW i
BMW M
Page 36
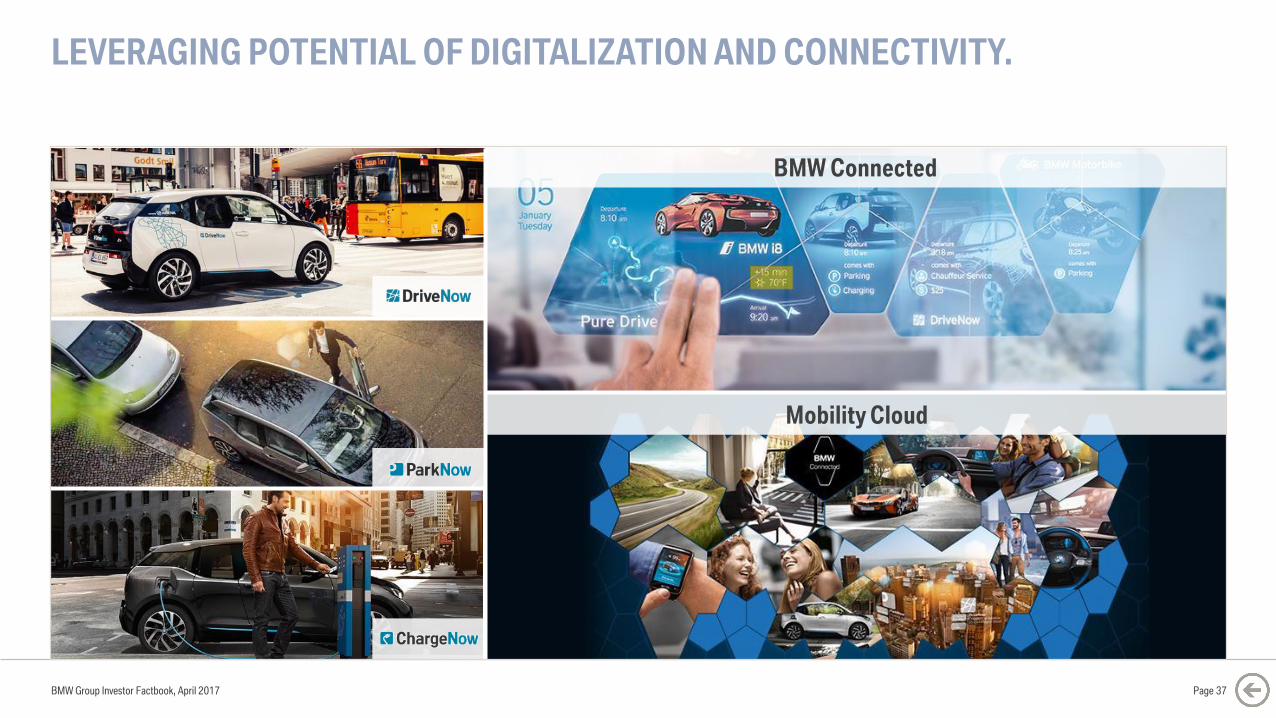
LEVERAGING POTENTIAL OF DIGITALIZATION AND CONNECTIVITY.
BMW Connected
Mobility Cloud
BMW Group Investor Factbook, April 2017 Page 37
Page 38
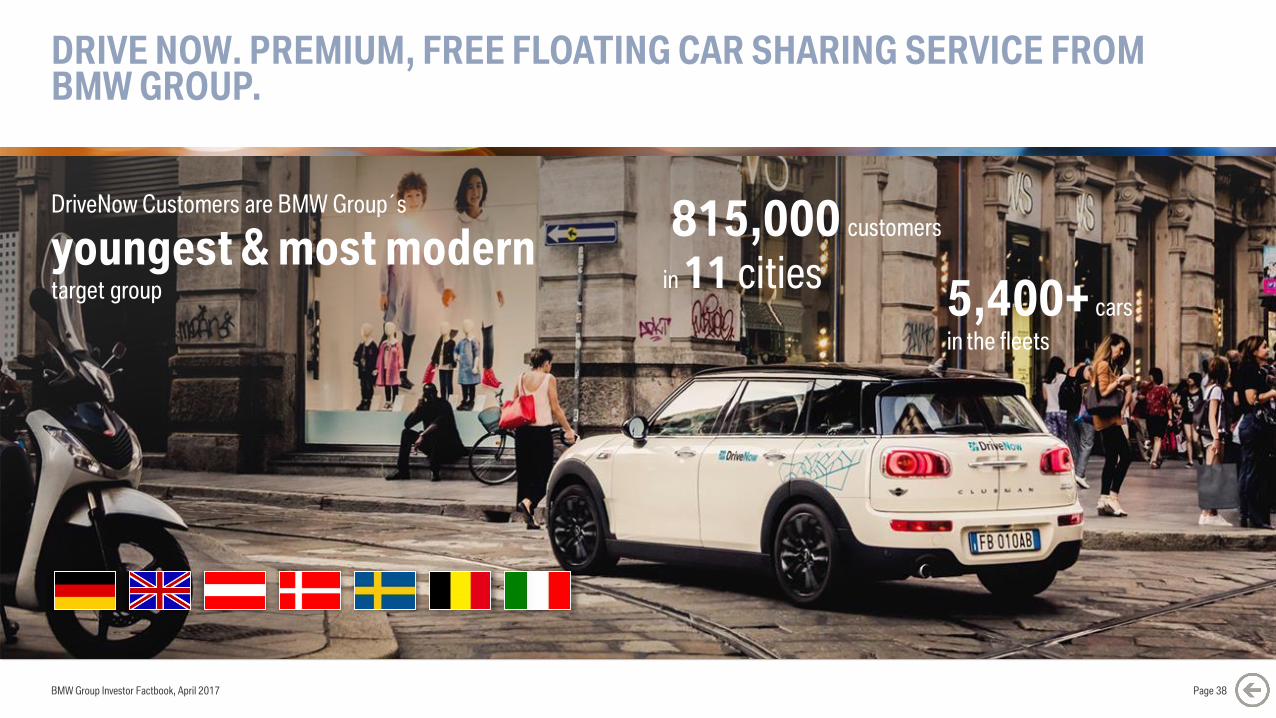
DRIVE NOW. PREMIUM, FREE FLOATING CAR SHARING SERVICE FROM BMW GROUP.
815,000 customers
in 11 cities
DriveNow Customers are BMW Group´s
youngest & most modern target group 5,400+ cars
in the fleets
BMW Group Investor Factbook, April 2017
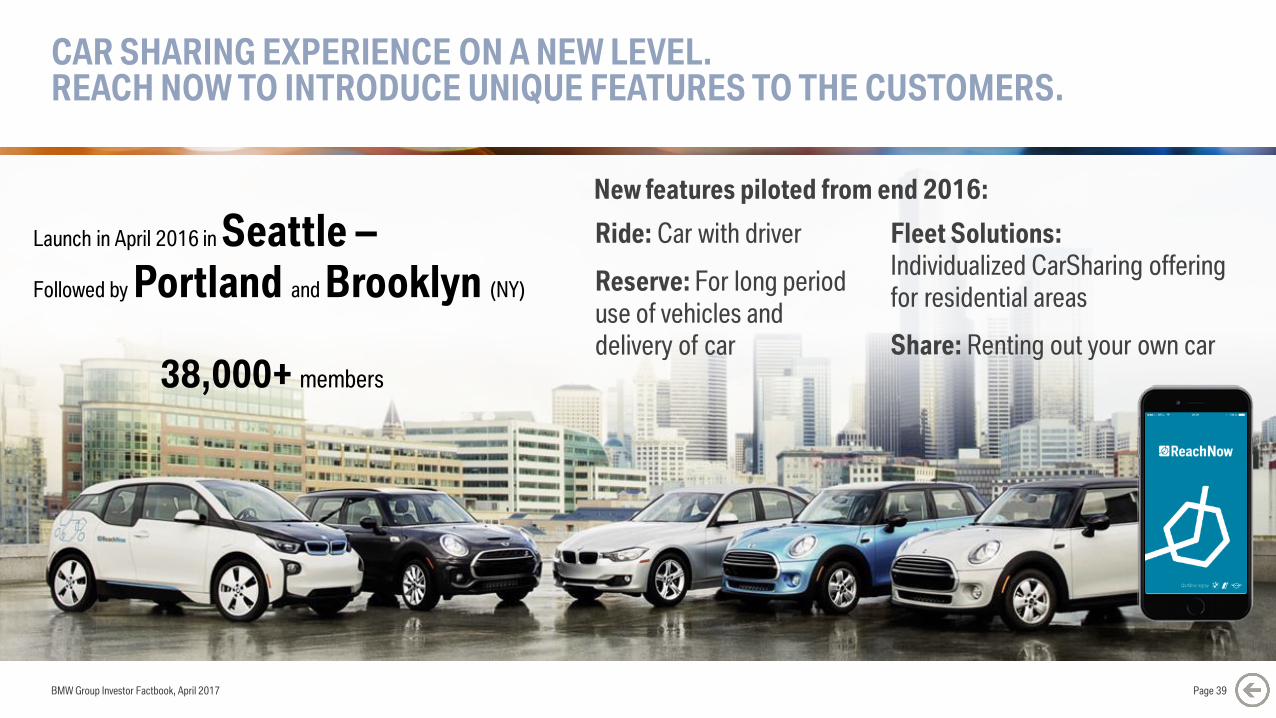
CAR SHARING EXPERIENCE ON A NEW LEVEL. REACH NOW TO INTRODUCE UNIQUE FEATURES TO THE CUSTOMERS.
BMW Group Investor Factbook, April 2017 Page 39
Fleet Solutions:
Individualized CarSharing offering
for residential areas
Share: Renting out your own car
New features piloted from end 2016:
Ride: Car with driver
Reserve: For long period
use of vehicles and
delivery of car
38,000+ members
Launch in April 2016 in Seattle –
Followed by Portland and Brooklyn (NY)
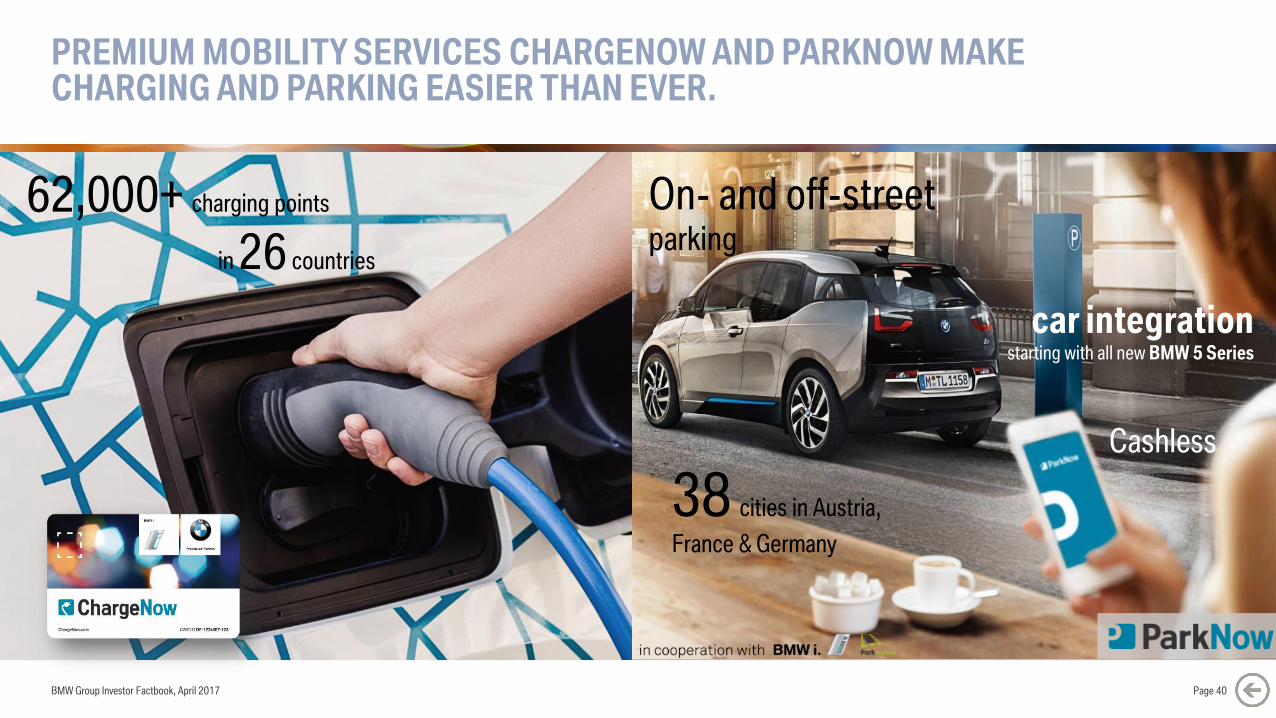
PREMIUM MOBILITY SERVICES CHARGENOW AND PARKNOW MAKE CHARGING AND PARKING EASIER THAN EVER.
BMW Group Investor Factbook, April 2017 Page 40
62,000+ charging points
in 26 countries
On- and off-street parking
Cashless
car integration starting with all new BMW 5 Series
38 cities in Austria,
France & Germany
BMW Group Investor Factbook, April 2017
CONTENT.
Page 41
5 GROUP FINANCIALS
7 MOTORCYCLES
8 FINANCIAL SERVICES
9 MARKETS
12 DEBT & RATINGS
13 CONTACT & CALENDAR6 AUTOMOTIVE
11 BMW SHARES
1 STRATEGY NUMBER ONE NEXT
2 E-MOBILITY
3 AUTONOMOUS DRIVING
4 MOBILITY SERVICES
10 SUSTAINABILITY
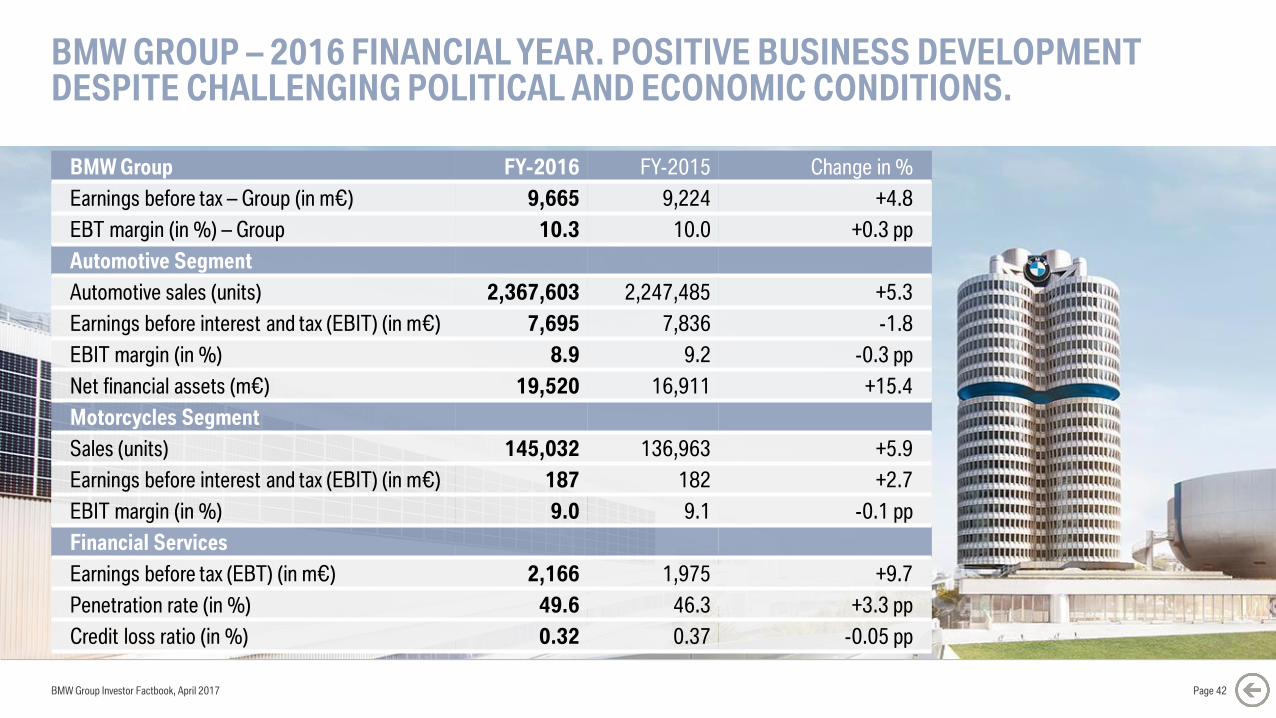
BMW GROUP – 2016 FINANCIAL YEAR. POSITIVE BUSINESS DEVELOPMENT DESPITE CHALLENGING POLITICAL AND ECONOMIC CONDITIONS.
BMW Group Investor Factbook, April 2017 Page 42
BMW Group FY-2016 FY-2015 Change in %
Earnings before tax – Group (in m€) 9,665 9,224 +4.8
EBT margin (in %) – Group 10.3 10.0 +0.3 pp
Automotive Segment
Automotive sales (units) 2,367,603 2,247,485 +5.3
Earnings before interest and tax (EBIT) (in m€) 7,695 7,836 -1.8
EBIT margin (in %) 8.9 9.2 -0.3 pp
Net financial assets (m€) 19,520 16,911 +15.4
Motorcycles Segment
Sales (units) 145,032 136,963 +5.9
Earnings before interest and tax (EBIT) (in m€) 187 182 +2.7
EBIT margin (in %) 9.0 9.1 -0.1 pp
Financial Services
Earnings before tax (EBT) (in m€) 2,166 1,975 +9.7
Penetration rate (in %) 49.6 46.3 +3.3 pp
Credit loss ratio (in %) 0.32 0.37 -0.05 pp
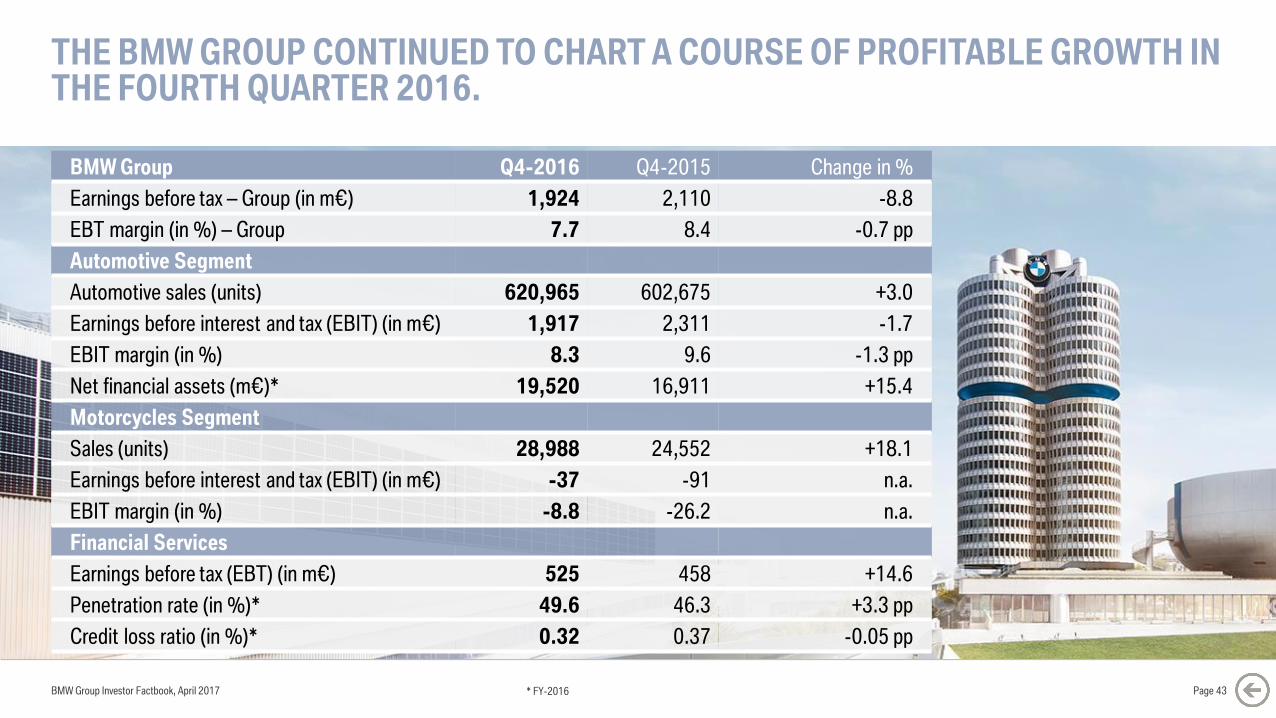
THE BMW GROUP CONTINUED TO CHART A COURSE OF PROFITABLE GROWTH IN THE FOURTH QUARTER 2016.
BMW Group Investor Factbook, April 2017 Page 43
BMW Group Q4-2016 Q4-2015 Change in %
Earnings before tax – Group (in m€) 1,924 2,110 -8.8
EBT margin (in %) – Group 7.7 8.4 -0.7 pp
Automotive Segment
Automotive sales (units) 620,965 602,675 +3.0
Earnings before interest and tax (EBIT) (in m€) 1,917 2,311 -1.7
EBIT margin (in %) 8.3 9.6 -1.3 pp
Net financial assets (m€)* 19,520 16,911 +15.4
Motorcycles Segment
Sales (units) 28,988 24,552 +18.1
Earnings before interest and tax (EBIT) (in m€) -37 -91 n.a.
EBIT margin (in %) -8.8 -26.2 n.a.
Financial Services
Earnings before tax (EBT) (in m€) 525 458 +14.6
Penetration rate (in %)* 49.6 46.3 +3.3 pp
Credit loss ratio (in %)* 0.32 0.37 -0.05 pp
* FY-2016
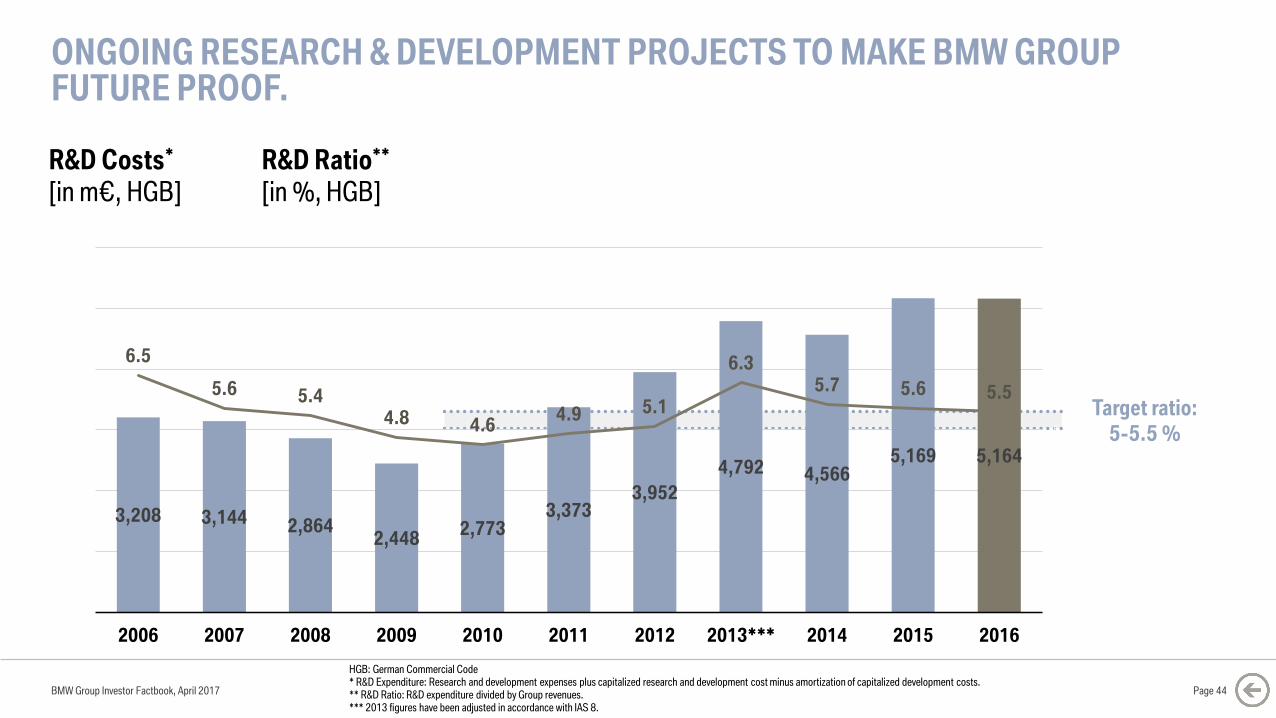
ONGOING RESEARCH & DEVELOPMENT PROJECTS TO MAKE BMW GROUP FUTURE PROOF.
BMW Group Investor Factbook, April 2017
R&D Costs*
[in m€, HGB]
R&D Ratio**
[in %, HGB]
Page 44
HGB: German Commercial Code* R&D Expenditure: Research and development expenses plus capitalized research and development cost minus amortization of capitalized development costs.** R&D Ratio: R&D expenditure divided by Group revenues.*** 2013 figures have been adjusted in accordance with IAS 8.
Target ratio:
5-5.5 %
3,208 3,144 2,8642,448
2,7733,373
3,952
4,792 4,5665,169 5,164
6.5
5.6 5.44.8 4.6
4.9 5.1
6.35.7 5.6 5.5
0
1
2
3
4
5
6
7
8
9
10
0
1,000
2,000
3,000
4,000
5,000
6,000
2006 2007 2008 2009 2010 2011 2012 2013*** 2014 2015 2016
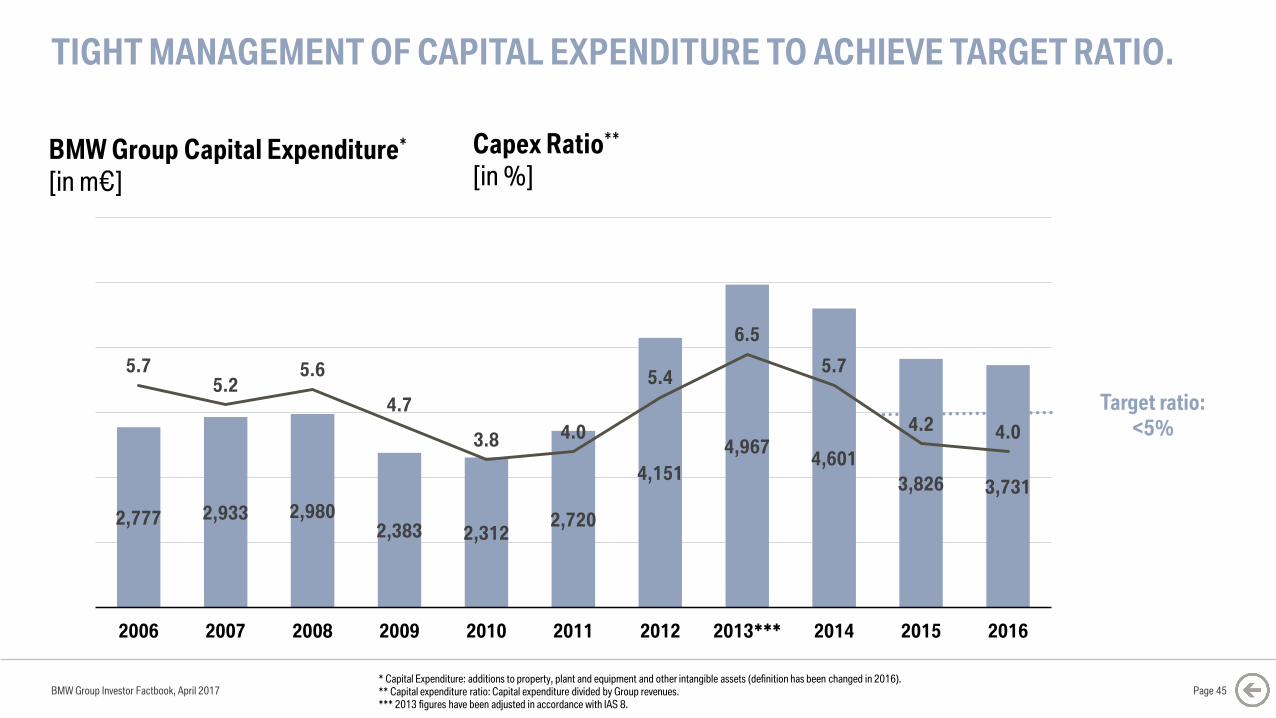
TIGHT MANAGEMENT OF CAPITAL EXPENDITURE TO ACHIEVE TARGET RATIO.
BMW Group Investor Factbook, April 2017
BMW Group Capital Expenditure*
[in m€]
Capex Ratio**
[in %]
* Capital Expenditure: additions to property, plant and equipment and other intangible assets (definition has been changed in 2016).** Capital expenditure ratio: Capital expenditure divided by Group revenues.*** 2013 figures have been adjusted in accordance with IAS 8.
Page 45
Target ratio:
<5%
2,777 2,933 2,9802,383 2,312
2,720
4,151
4,9674,601
3,826 3,731
5.75.2
5.6
4.7
3.8 4.0
5.4
6.5
5.7
4.2 4.0
0
1
2
3
4
5
6
7
8
9
10
0
1,000
2,000
3,000
4,000
5,000
6,000
2006 2007 2008 2009 2010 2011 2012 2013*** 2014 2015 2016
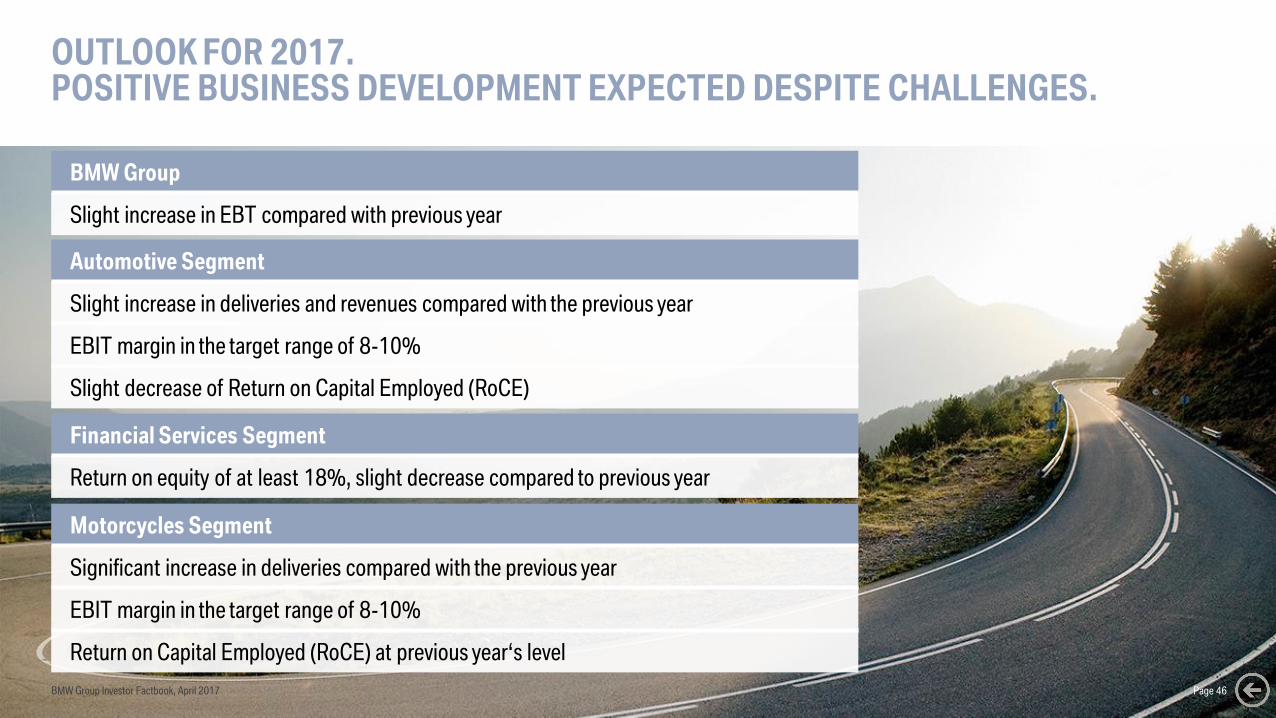
OUTLOOK FOR 2017.POSITIVE BUSINESS DEVELOPMENT EXPECTED DESPITE CHALLENGES.
BMW Group
Slight increase in EBT compared with previous year
Automotive Segment
Slight increase in deliveries and revenues compared with the previous year
EBIT margin in the target range of 8-10%
Slight decrease of Return on Capital Employed (RoCE)
Financial Services Segment
Return on equity of at least 18%, slight decrease compared to previous year
Motorcycles Segment
Significant increase in deliveries compared with the previous year
EBIT margin in the target range of 8-10%
Return on Capital Employed (RoCE) at previous year‘s level
BMW Group Investor Factbook, April 2017 Page 46
BMW Group Investor Factbook, April 2017
CONTENT.
Page 47
5 GROUP FINANCIALS
7 MOTORCYCLES
8 FINANCIAL SERVICES
9 MARKETS
12 DEBT & RATINGS
13 CONTACT & CALENDAR6 AUTOMOTIVE
11 BMW SHARES
1 STRATEGY NUMBER ONE NEXT
2 E-MOBILITY
3 AUTONOMOUS DRIVING
4 MOBILITY SERVICES
10 SUSTAINABILITY
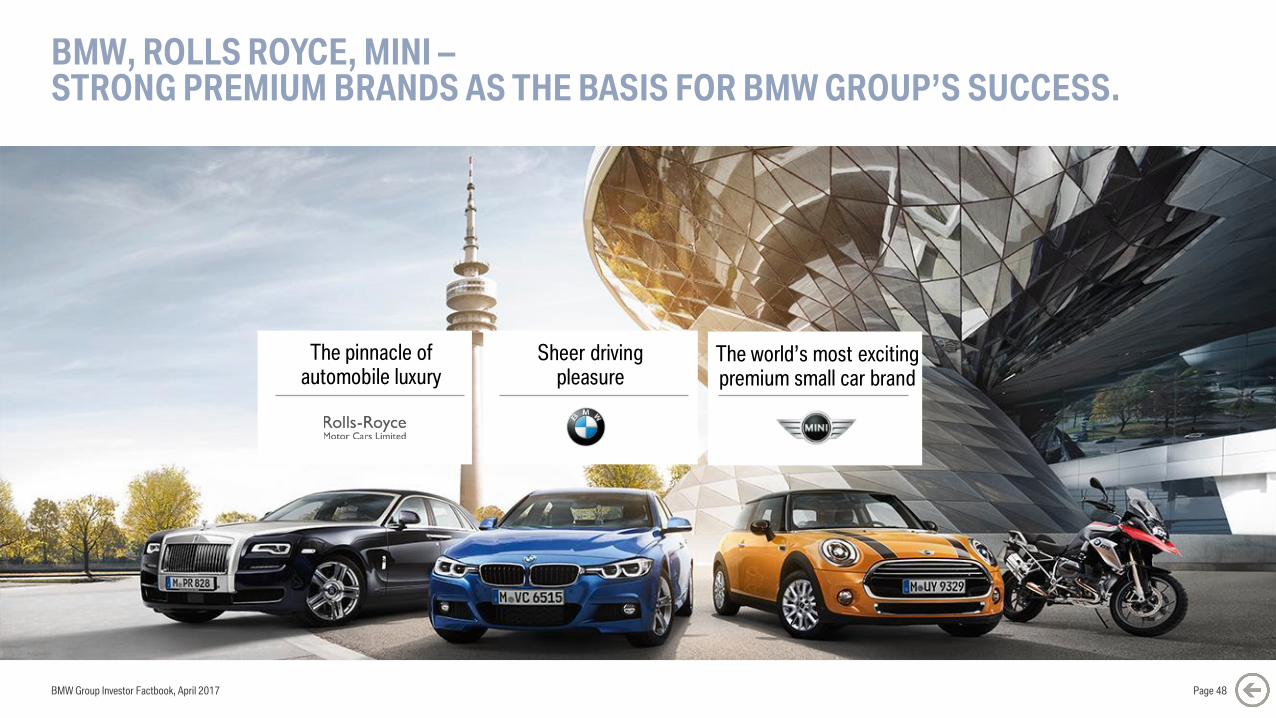
BMW, ROLLS ROYCE, MINI –STRONG PREMIUM BRANDS AS THE BASIS FOR BMW GROUP’S SUCCESS.
The world’s most exciting premium small car brand
Sheer driving pleasure
The pinnacle ofautomobile luxury
BMW Group Investor Factbook, April 2017 Page 48
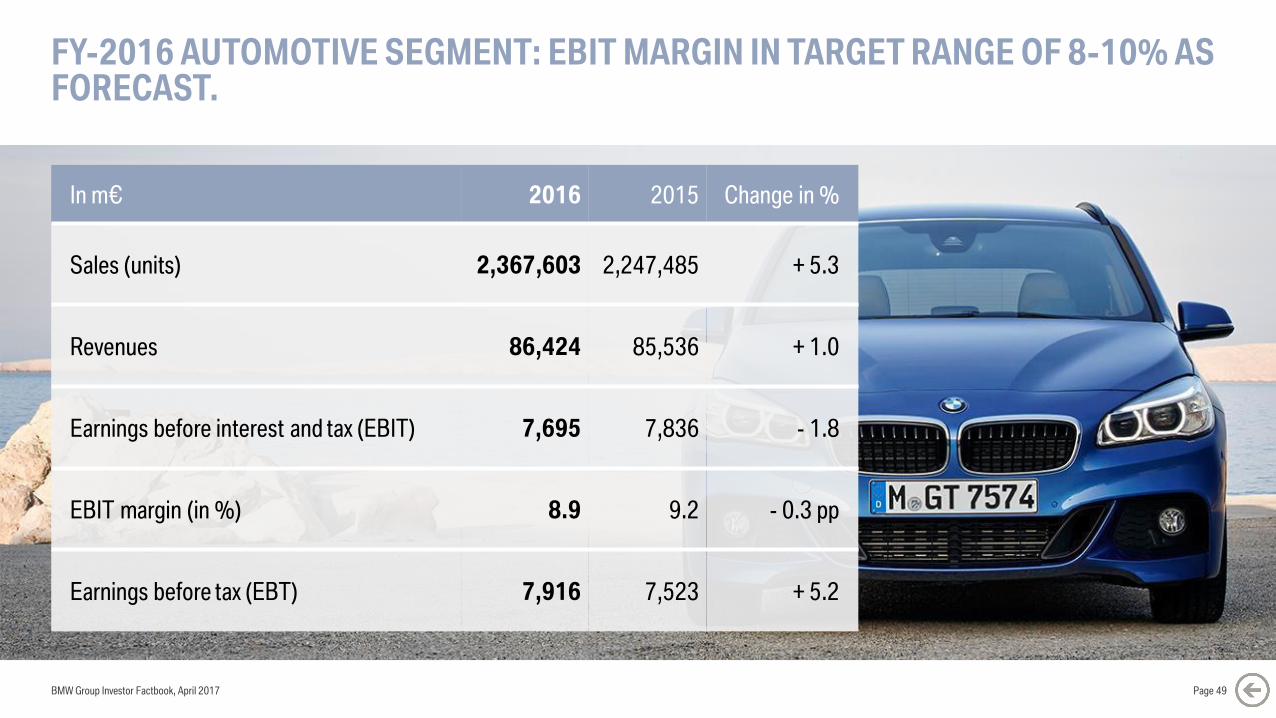
In m€ 2016 2015 Change in %
Sales (units) 2,367,603 2,247,485 + 5.3
Revenues 86,424 85,536 + 1.0
Earnings before interest and tax (EBIT) 7,695 7,836 - 1.8
EBIT margin (in %) 8.9 9.2 - 0.3 pp
Earnings before tax (EBT) 7,916 7,523 + 5.2
FY-2016 AUTOMOTIVE SEGMENT: EBIT MARGIN IN TARGET RANGE OF 8-10% AS FORECAST.
BMW Group Investor Factbook, April 2017 Page 49
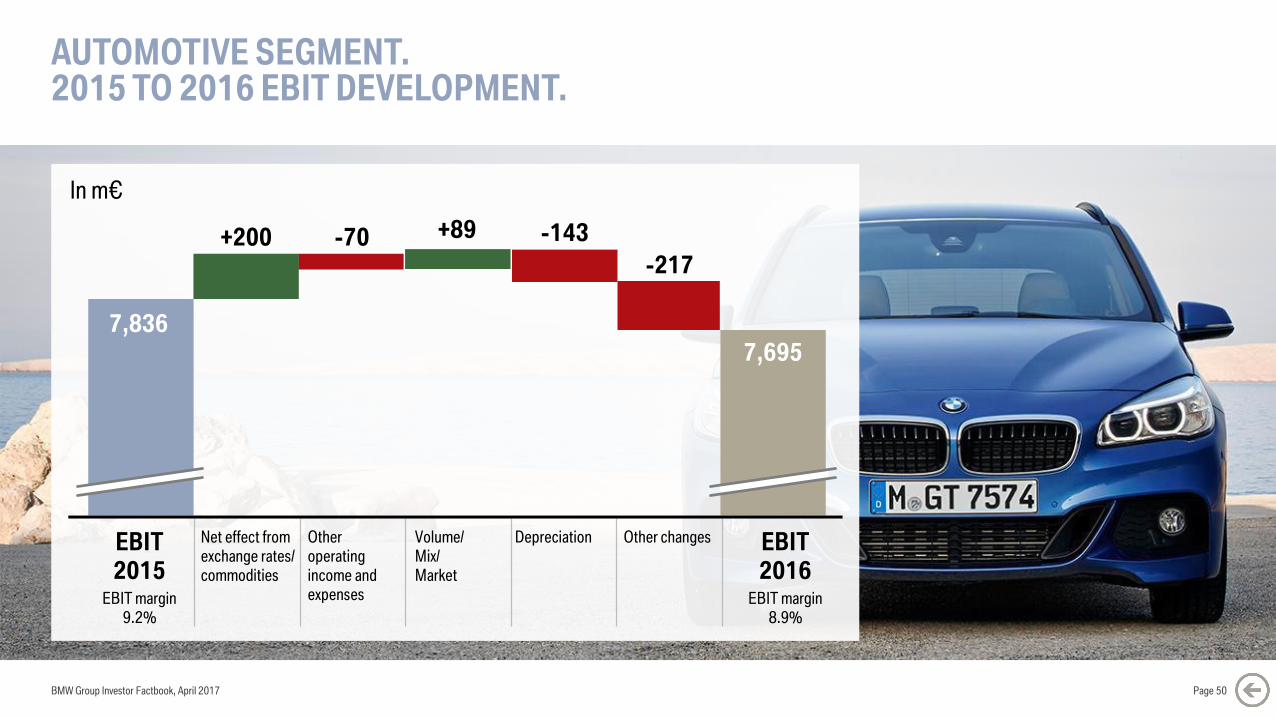
AUTOMOTIVE SEGMENT.2015 TO 2016 EBIT DEVELOPMENT.
In m€
EBIT
2015
EBIT
2016
7,836
7,695
+200 -70 +89 -143
-217
EBIT margin
9.2%
EBIT margin
8.9%
Net effect from
exchange rates/
commodities
Other
operating
income and
expenses
Volume/
Mix/
Market
Depreciation Other changes
BMW Group Investor Factbook, April 2017 Page 50
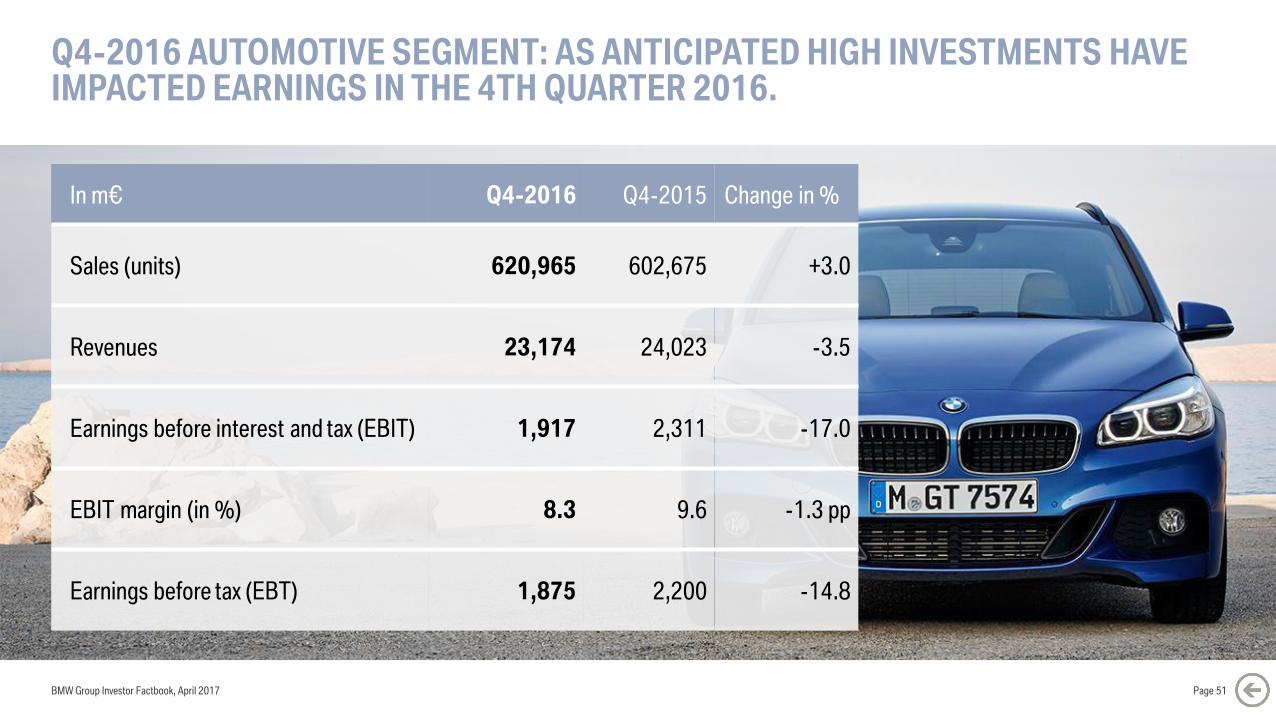
Q4-2016 AUTOMOTIVE SEGMENT: AS ANTICIPATED HIGH INVESTMENTS HAVE IMPACTED EARNINGS IN THE 4TH QUARTER 2016.
BMW Group Investor Factbook, April 2017 Page 51
In m€ Q4-2016 Q4-2015 Change in %
Sales (units) 620,965 602,675 +3.0
Revenues 23,174 24,023 -3.5
Earnings before interest and tax (EBIT) 1,917 2,311 -17.0
EBIT margin (in %) 8.3 9.6 -1.3 pp
Earnings before tax (EBT) 1,875 2,200 -14.8

BMW GROUP ACHIEVES SIXTH CONSECUTIVE ALL-TIME SALES HIGH AND REMAINS WORLD’S LEADING PREMIUM CAR COMPANY IN FY 2016.
2,367,603 +5.3%
2,003,359 +5.2%
360,233 +6.4%
4,011 +6.0%
145,032 +5.9%
BMW Group Investor Factbook, April 2017 Page 52Sales figures FY-2016
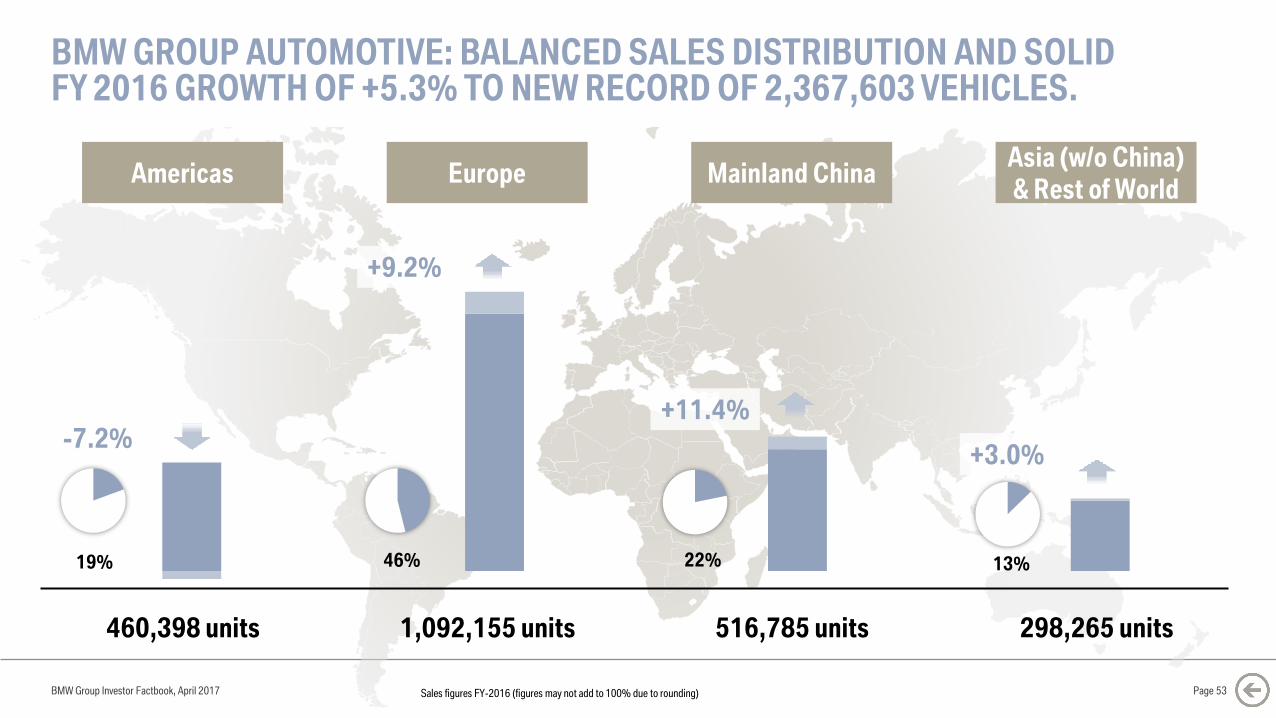
Americas
460,398 units
Europe
1,092,155 units
+9.2%
Mainland China
516,785 units
Asia (w/o China)
& Rest of World
298,265 units
-7.2%
19% 46%
+11.4%
22% 13%
+3.0%
BMW GROUP AUTOMOTIVE: BALANCED SALES DISTRIBUTION AND SOLID FY 2016 GROWTH OF +5.3% TO NEW RECORD OF 2,367,603 VEHICLES.
Sales figures FY-2016 (figures may not add to 100% due to rounding) Page 53BMW Group Investor Factbook, April 2017
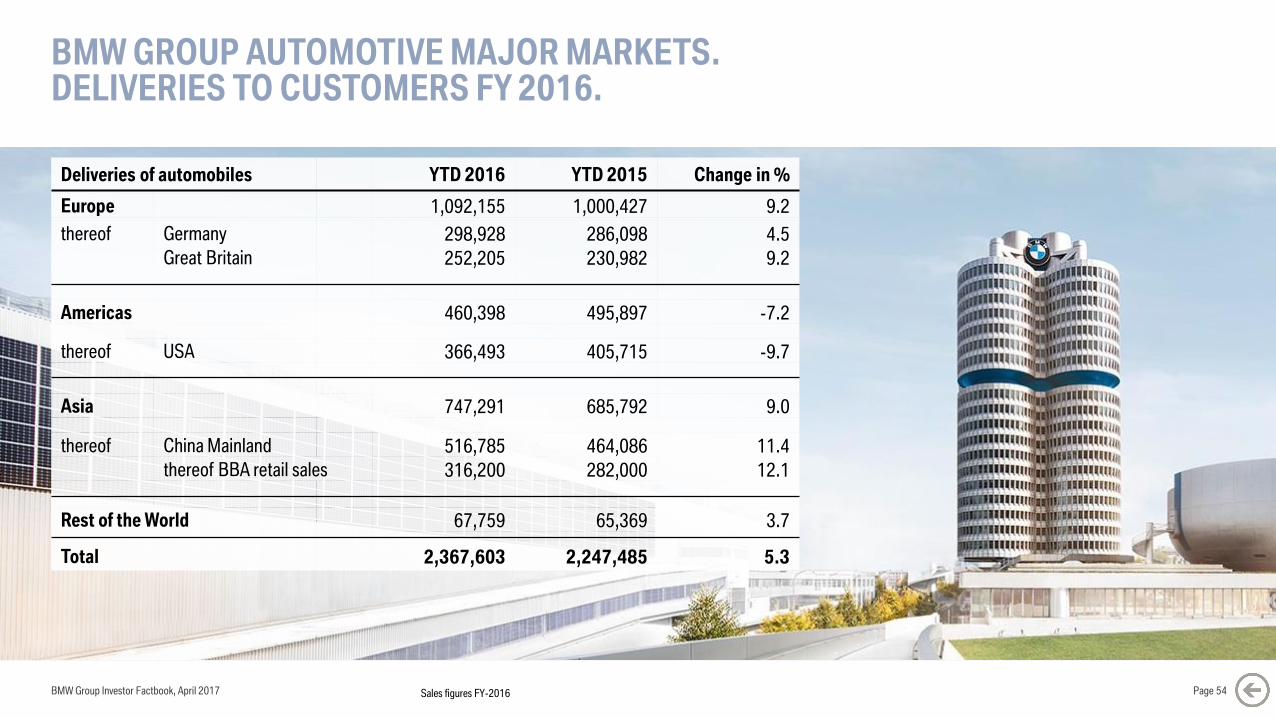
BMW GROUP AUTOMOTIVE MAJOR MARKETS. DELIVERIES TO CUSTOMERS FY 2016.
Page 54
Deliveries of automobiles YTD 2016 YTD 2015 Change in %
Europe 1,092,155 1,000,427 9.2
thereof Germany 298,928 286,098 4.5
Great Britain 252,205 230,982 9.2
Americas 460,398 495,897 -7.2
thereof USA 366,493 405,715 -9.7
Asia 747,291 685,792 9.0
thereof China Mainland 516,785 464,086 11.4
thereof BBA retail sales 316,200 282,000 12.1
Rest of the World 67,759 65,369 3.7
Total 2,367,603 2,247,485 5.3
BMW Group Investor Factbook, April 2017 Sales figures FY-2016

DELIVERIES TO CUSTOMERS BY SERIES OR BRAND FY 2016.
Page 55
Deliveries of automobiles YTD 2016 YTD 2015 Change in %
1 Series 176,032 182,158 -3.4
2 Series 196,183 157,144 24.8
3 Series 411,844 444,338 -7.3
4 Series 133,272 152,390 12.5
5 Series 331,410 347,096 -4.5
6 Series 13,400 20,962 36.1
7 Series 61,514 36,364 69.2
X1 220,378 120,011 83.6
X3 157,017 137,810 13.9
X4 58,055 55,050 5.5
X5 166,219 168,143 -1.1
X6 43,323 46,305 -6.4
Z4 5,432 7,950 31.7
BMW i 29,280 29,513 -0.8
BMW Total 2,003,359 1,905,234 5.2
MINI 360,233 338,466 6.4
Rolls Royce 4,011 3,785 6
BMW Group Total 2,367,603 2,247,485 5.3
BMW Group Investor Factbook, April 2017 Sales figures FY-2016
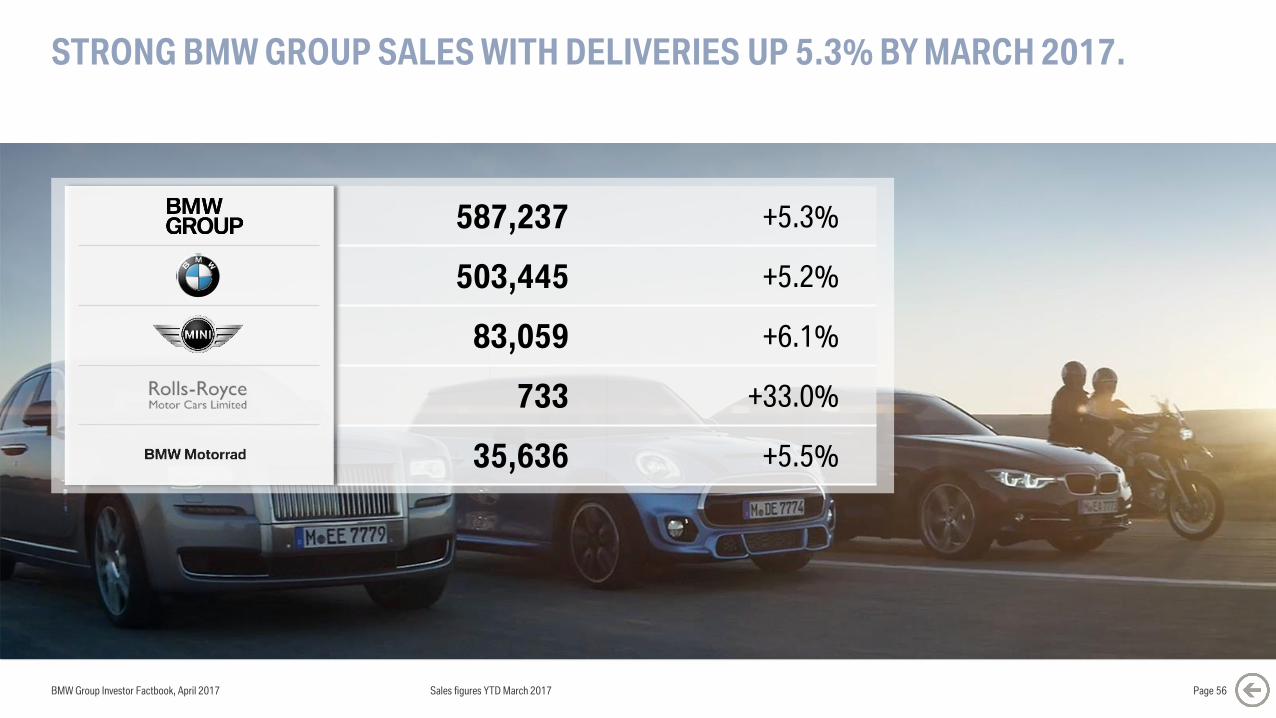
STRONG BMW GROUP SALES WITH DELIVERIES UP 5.3% BY MARCH 2017.
587,237 +5.3%
503,445 +5.2%
83,059 +6.1%
733 +33.0%
35,636 +5.5%
BMW Group Investor Factbook, April 2017 Page 56Sales figures YTD March 2017
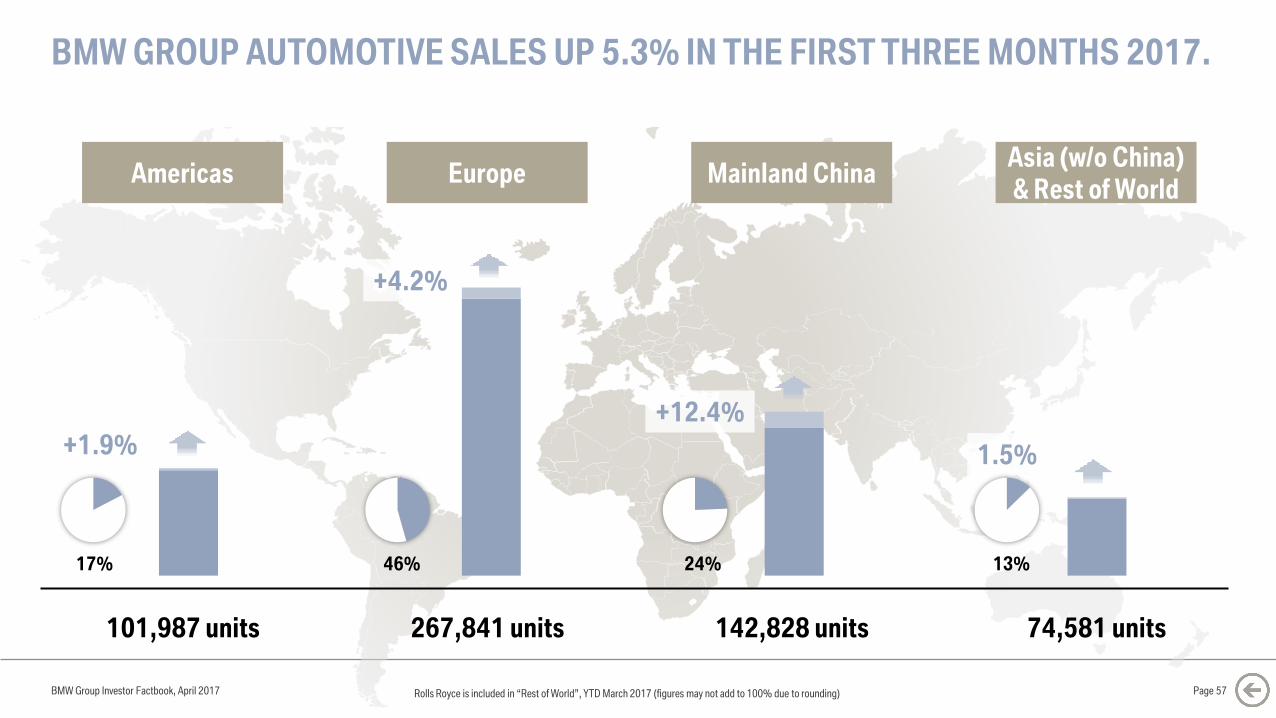
Americas
101,987 units
Europe
267,841 units
+4.2%
Mainland China
142,828 units
Asia (w/o China)
& Rest of World
74,581 units
+1.9%
17% 46%
+12.4%
24% 13%
1.5%
BMW GROUP AUTOMOTIVE SALES UP 5.3% IN THE FIRST THREE MONTHS 2017.
BMW Group Investor Factbook, April 2017 Rolls Royce is included in “Rest of World”, YTD March 2017 (figures may not add to 100% due to rounding) Page 57
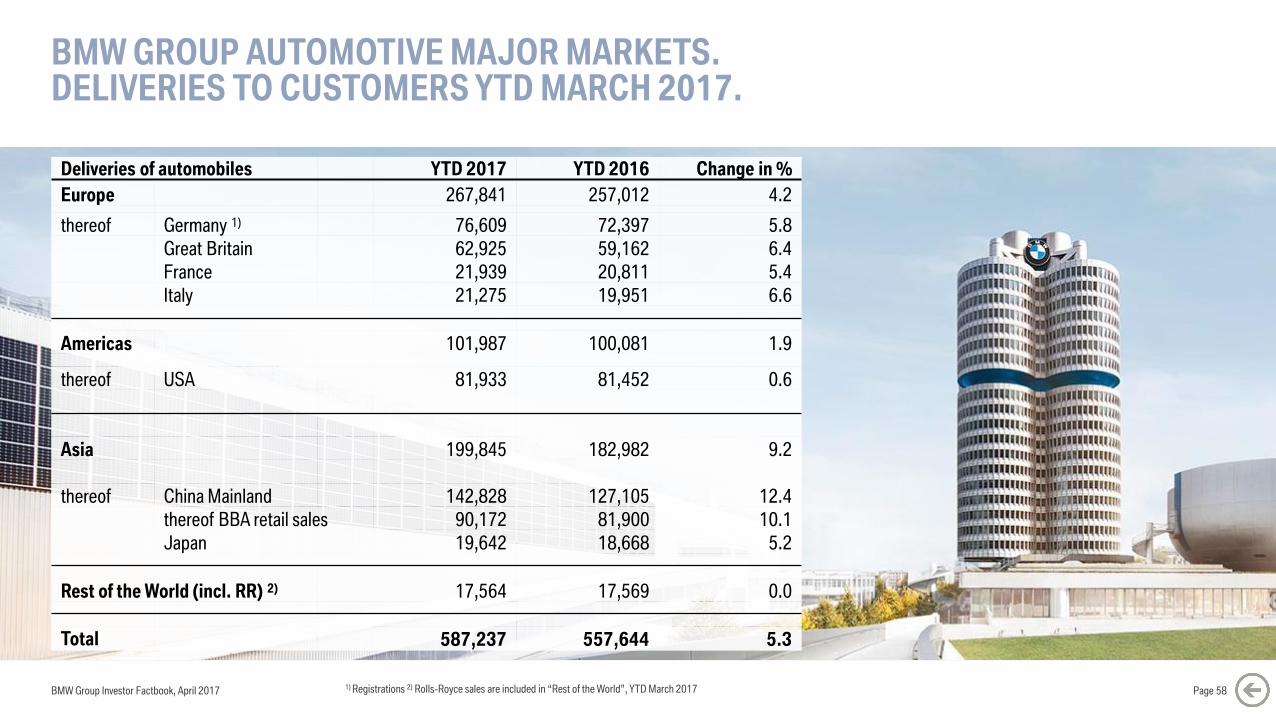
BMW GROUP AUTOMOTIVE MAJOR MARKETS. DELIVERIES TO CUSTOMERS YTD MARCH 2017.
BMW Group Investor Factbook, April 2017 Page 58
Deliveries of automobiles YTD 2017 YTD 2016 Change in %
Europe 267,841 257,012 4.2
thereof Germany 1) 76,609 72,397 5.8
Great Britain 62,925 59,162 6.4
France 21,939 20,811 5.4
Italy 21,275 19,951 6.6
Americas 101,987 100,081 1.9
thereof USA 81,933 81,452 0.6
Asia 199,845 182,982 9.2
thereof China Mainland 142,828 127,105 12.4
thereof BBA retail sales 90,172 81,900 10.1
Japan 19,642 18,668 5.2
Rest of the World (incl. RR) 2) 17,564 17,569 0.0
Total 587,237 557,644 5.3
1) Registrations 2) Rolls-Royce sales are included in “Rest of the World”, YTD March 2017
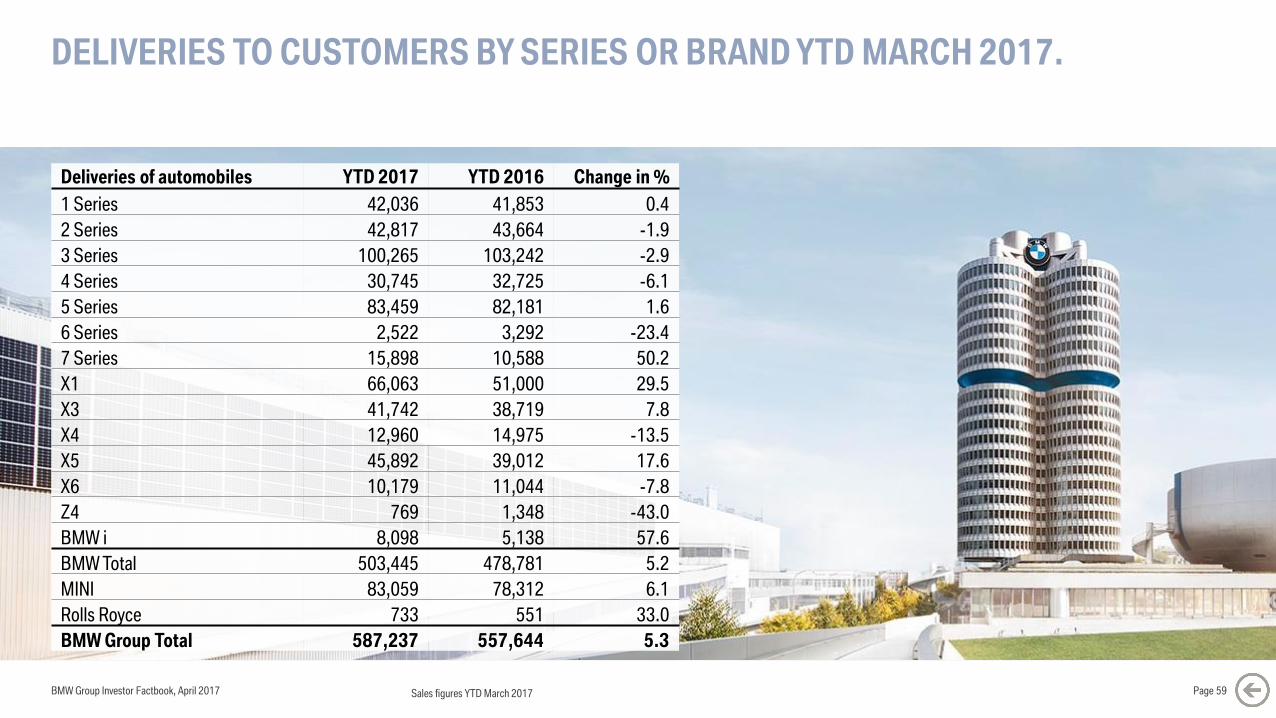
DELIVERIES TO CUSTOMERS BY SERIES OR BRAND YTD MARCH 2017.
BMW Group Investor Factbook, April 2017 Page 59
Deliveries of automobiles YTD 2017 YTD 2016 Change in %
1 Series 42,036 41,853 0.4
2 Series 42,817 43,664 -1.9
3 Series 100,265 103,242 -2.9
4 Series 30,745 32,725 -6.1
5 Series 83,459 82,181 1.6
6 Series 2,522 3,292 -23.4
7 Series 15,898 10,588 50.2
X1 66,063 51,000 29.5
X3 41,742 38,719 7.8
X4 12,960 14,975 -13.5
X5 45,892 39,012 17.6
X6 10,179 11,044 -7.8
Z4 769 1,348 -43.0
BMW i 8,098 5,138 57.6
BMW Total 503,445 478,781 5.2
MINI 83,059 78,312 6.1
Rolls Royce 733 551 33.0
BMW Group Total 587,237 557,644 5.3
Sales figures YTD March 2017
0
500
1,000
1,500
2,000
2007 2008 2009 2010 2011 2012 2013 2014 2015 2016
BMW MINI Rolls-Royce
BMW Group Investor Factbook, April 2017 Page 60
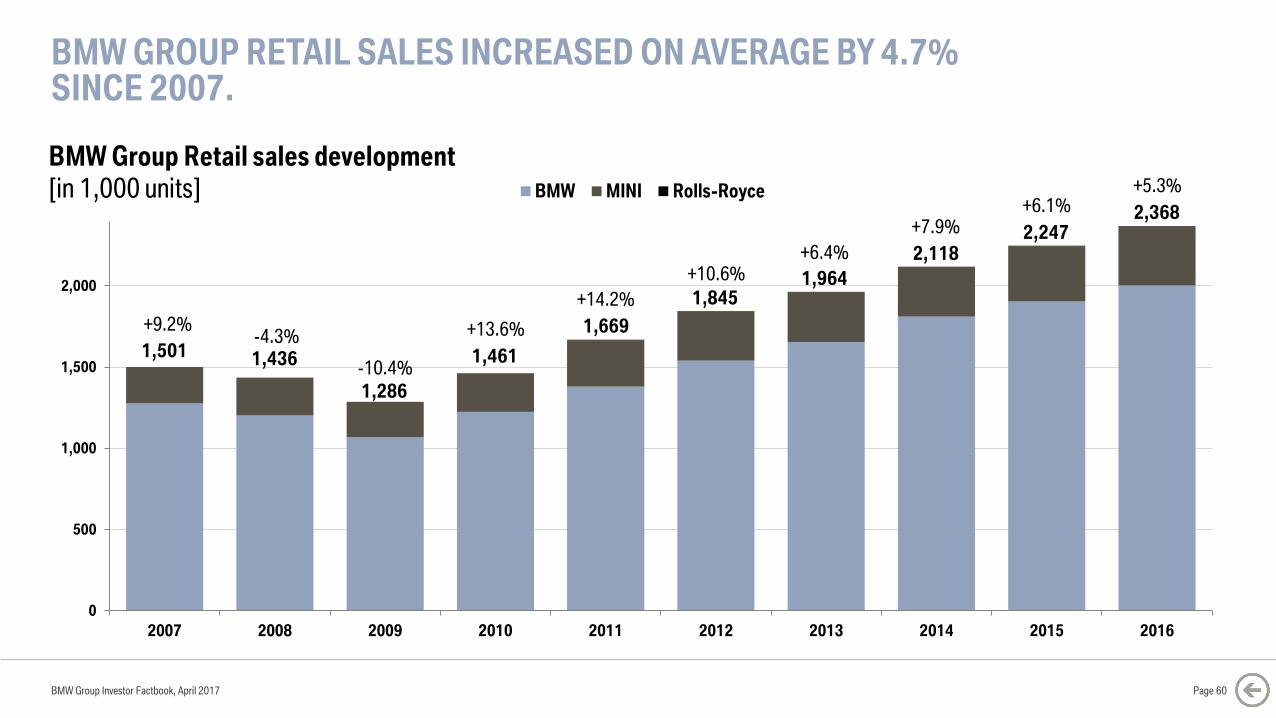
BMW Group Retail sales development
[in 1,000 units]
BMW GROUP RETAIL SALES INCREASED ON AVERAGE BY 4.7% SINCE 2007.
1,436
1,286
1,461
+9.2%-4.3%
-10.4%
+13.6%
1,845+14.2%
+10.6%
1,669
1,964
+6.4%
1,501
2,118
+7.9%+6.1%
2,247
+5.3%
2,368
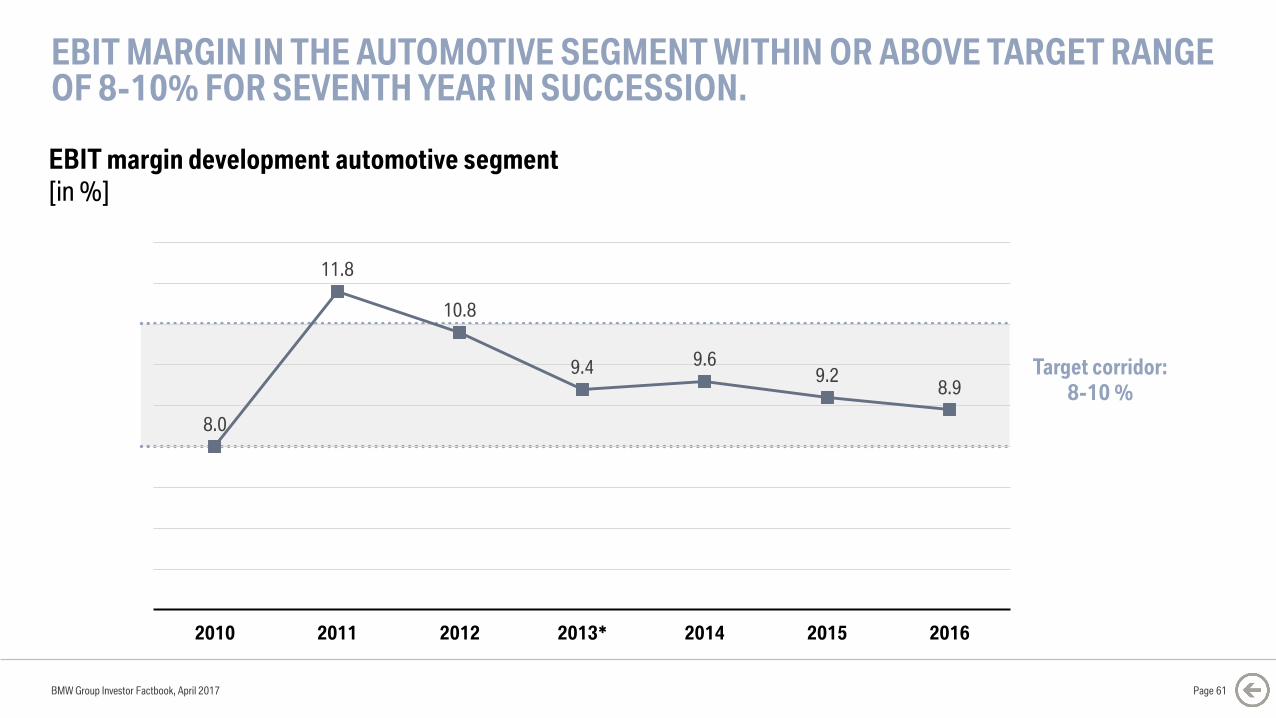
EBIT MARGIN IN THE AUTOMOTIVE SEGMENT WITHIN OR ABOVE TARGET RANGE OF 8-10% FOR SEVENTH YEAR IN SUCCESSION.
BMW Group Investor Factbook, April 2017
EBIT margin development automotive segment
[in %]
Page 61
Target corridor:
8-10 %
8.0
11.8
10.8
9.4 9.69.2
8.9
2010 2011 2012 2013* 2014 2015 2016
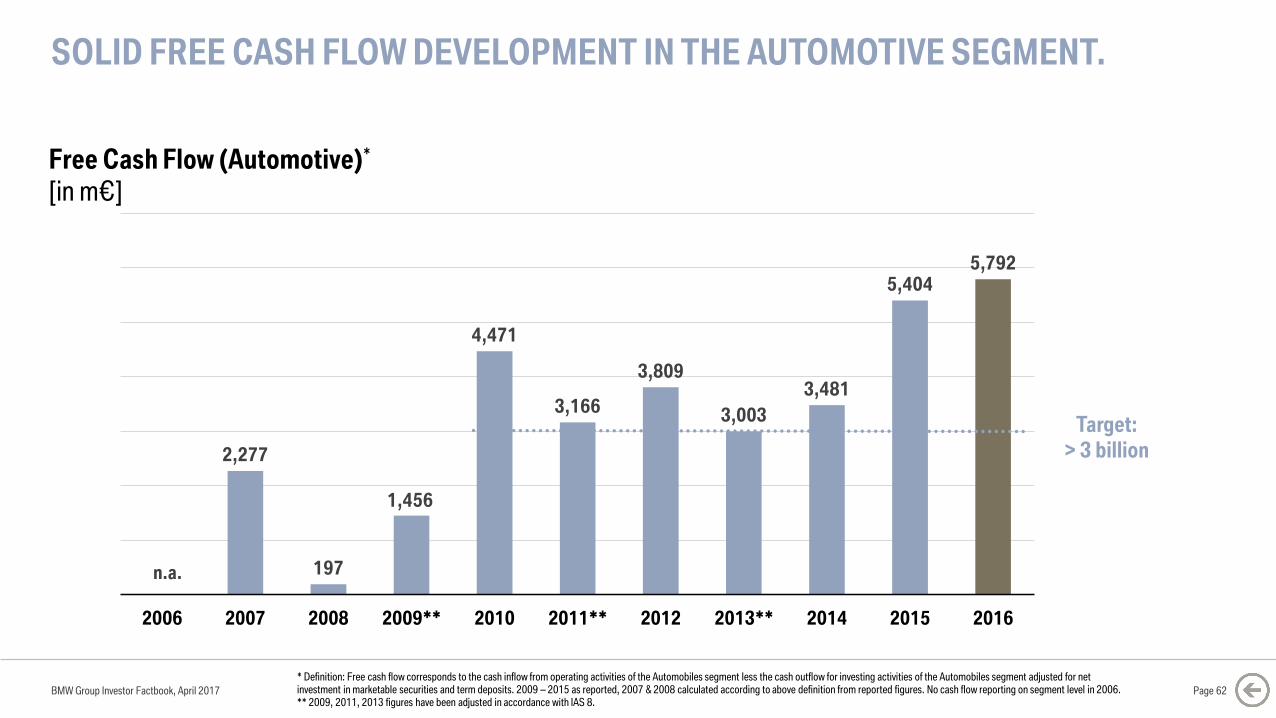
SOLID FREE CASH FLOW DEVELOPMENT IN THE AUTOMOTIVE SEGMENT.
BMW Group Investor Factbook, April 2017 Page 62
* Definition: Free cash flow corresponds to the cash inflow from operating activities of the Automobiles segment less the cash outflow for investing activities of the Automobiles segment adjusted for net investment in marketable securities and term deposits. 2009 – 2015 as reported, 2007 & 2008 calculated according to above definition from reported figures. No cash flow reporting on segment level in 2006.** 2009, 2011, 2013 figures have been adjusted in accordance with IAS 8.
2,277
197
1,456
4,471
3,166
3,809
3,003
3,481
5,4045,792
2006 2007 2008 2009** 2010 2011** 2012 2013** 2014 2015 2016
Target:
> 3 billion
n.a.
Free Cash Flow (Automotive)*
[in m€]
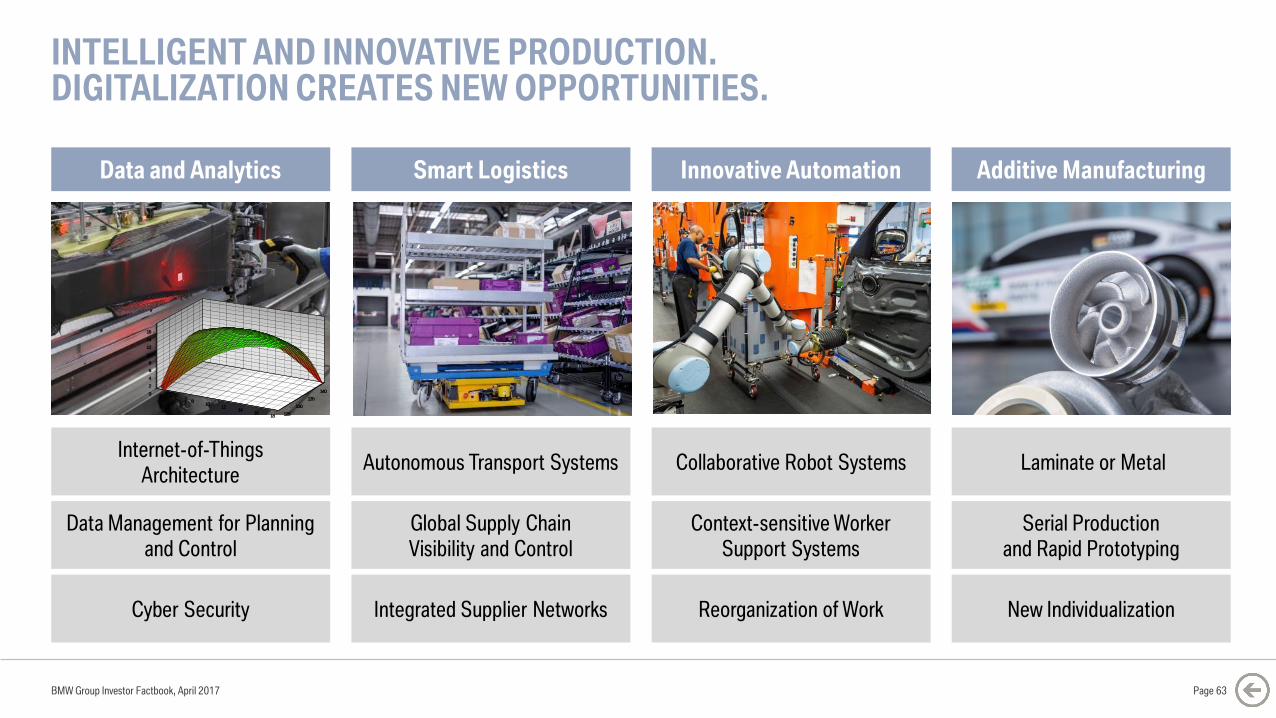
INTELLIGENT AND INNOVATIVE PRODUCTION.DIGITALIZATION CREATES NEW OPPORTUNITIES.
BMW Group Investor Factbook, April 2017
Laminate or Metal
Serial Production
and Rapid Prototyping
New Individualization
Internet-of-Things
Architecture
Data Management for Planning
and Control
Cyber Security
Autonomous Transport Systems
Global Supply Chain
Visibility and Control
Integrated Supplier Networks
Collaborative Robot Systems
Context-sensitive Worker
Support Systems
Reorganization of Work
46
810
1214
1618
0
2
4
6
8
10
12
14
16
125
130
135
1404
68
1012
1416
18
0
2
4
6
8
10
12
14
16
125
130
135
140
Data and Analytics Smart Logistics Innovative Automation Additive Manufacturing
Page 63
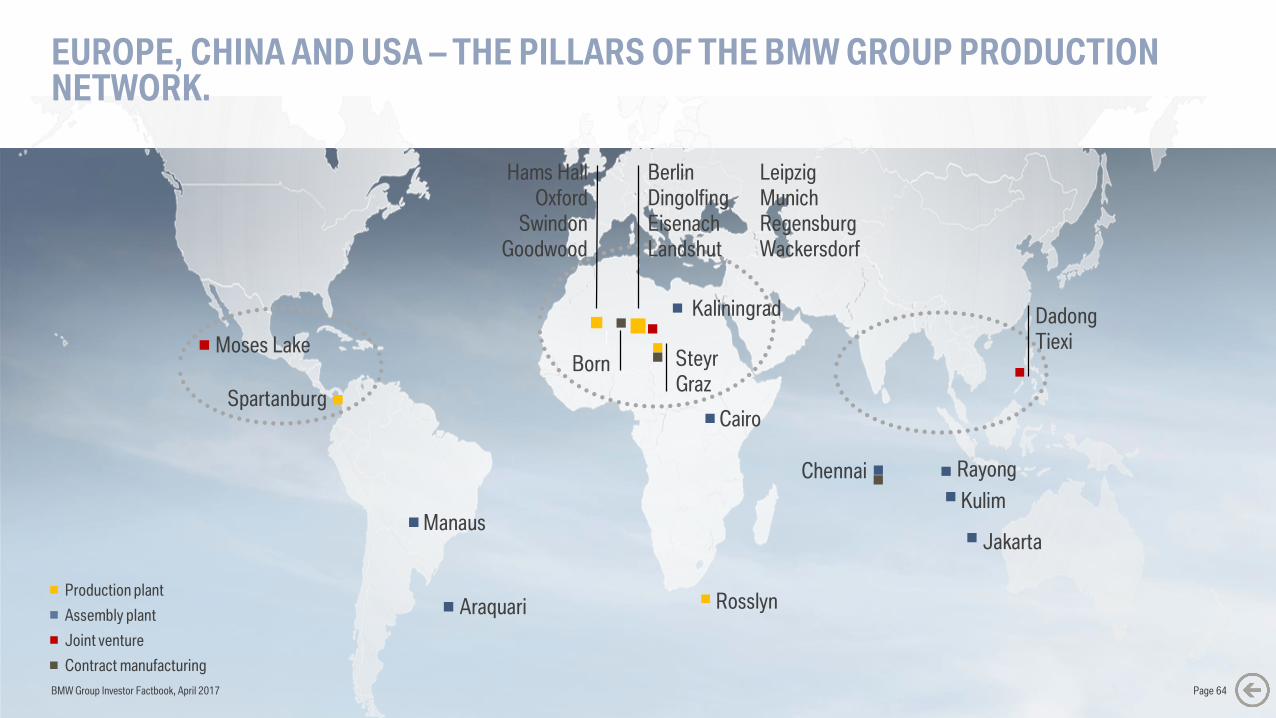
EUROPE, CHINA AND USA – THE PILLARS OF THE BMW GROUP PRODUCTION NETWORK.
Assembly plant
Joint venture
Contract manufacturing
Production plant
Moses Lake
Spartanburg
Dadong
Tiexi
RayongChennai
Kulim
Jakarta
Rosslyn
Manaus
Cairo
Araquari
Hams Hall
Oxford
Swindon
Goodwood
Leipzig
Munich
Regensburg
Wackersdorf
Kaliningrad
Berlin
Dingolfing
Eisenach
Landshut
Steyr
GrazBorn
BMW Group Investor Factbook, April 2017 Page 64
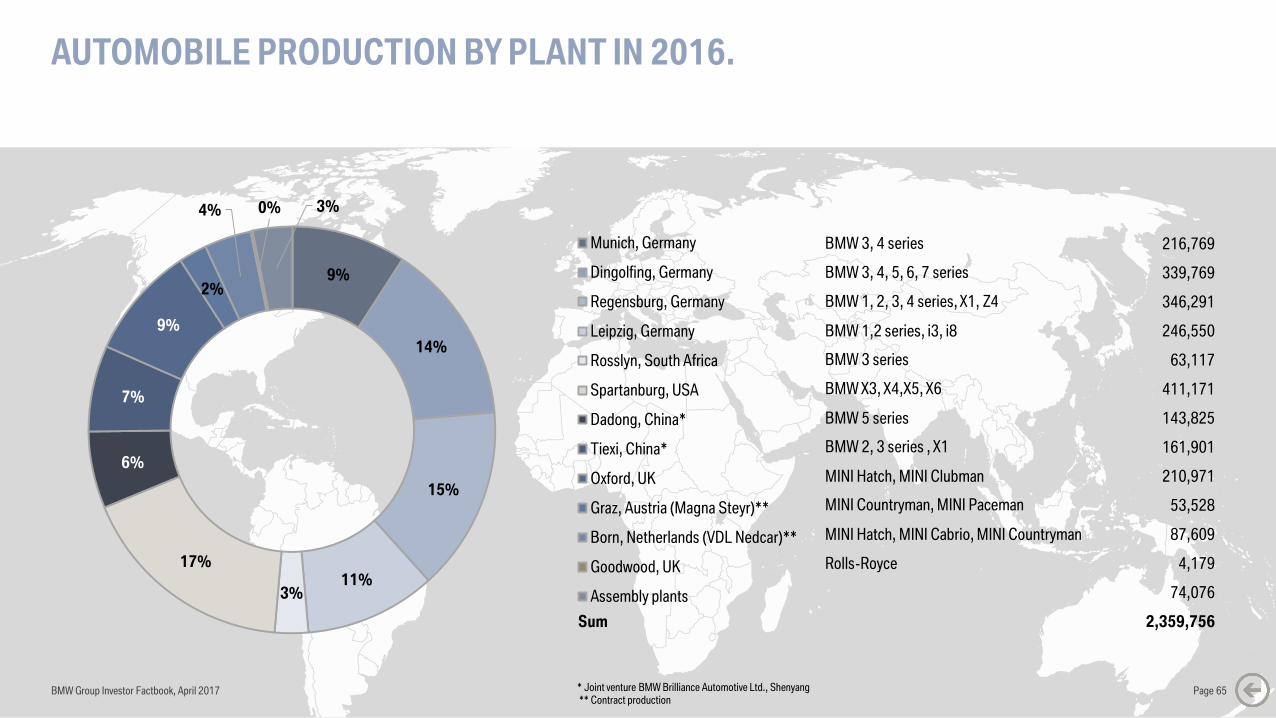
AUTOMOBILE PRODUCTION BY PLANT IN 2016.
BMW Group Investor Factbook, April 2017 Page 65* Joint venture BMW Brilliance Automotive Ltd., Shenyang** Contract production
9%
14%
15%
11%3%
17%
6%
7%
9%
2%
4% 0% 3%
Munich, Germany
Dingolfing, Germany
Regensburg, Germany
Leipzig, Germany
Rosslyn, South Africa
Spartanburg, USA
Dadong, China*
Tiexi, China*
Oxford, UK
Graz, Austria (Magna Steyr)**
Born, Netherlands (VDL Nedcar)**
Goodwood, UK
Assembly plants
BMW 3, 4 series 216,769
BMW 3, 4, 5, 6, 7 series 339,769
BMW 1, 2, 3, 4 series, X1, Z4 346,291
BMW 1,2 series, i3, i8 246,550
BMW 3 series 63,117
BMW X3, X4,X5, X6 411,171
BMW 5 series 143,825
BMW 2, 3 series , X1 161,901
MINI Hatch, MINI Clubman 210,971
MINI Countryman, MINI Paceman 53,528
MINI Hatch, MINI Cabrio, MINI Countryman 87,609
Rolls-Royce 4,179
74,076
Sum 2,359,756
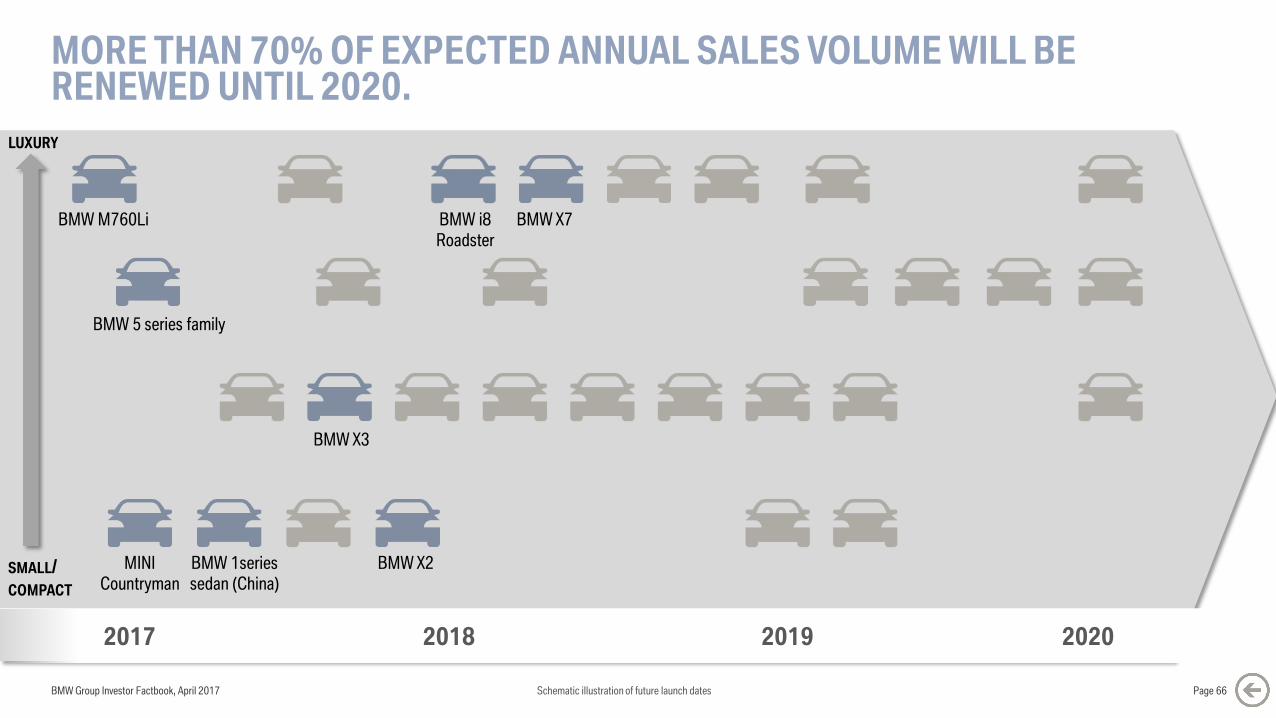
MORE THAN 70% OF EXPECTED ANNUAL SALES VOLUME WILL BE RENEWED UNTIL 2020.
BMW Group Investor Factbook, April 2017 Page 66
BMW 5 series family
MINI
Countryman
BMW X3
BMW M760Li
BMW X2BMW 1series
sedan (China)
BMW X7BMW i8
Roadster
LUXURY
SMALL/
COMPACT
2017 2018 2019 2020
Schematic illustration of future launch dates
BMW Group Investor Factbook, April 2017 Page 67
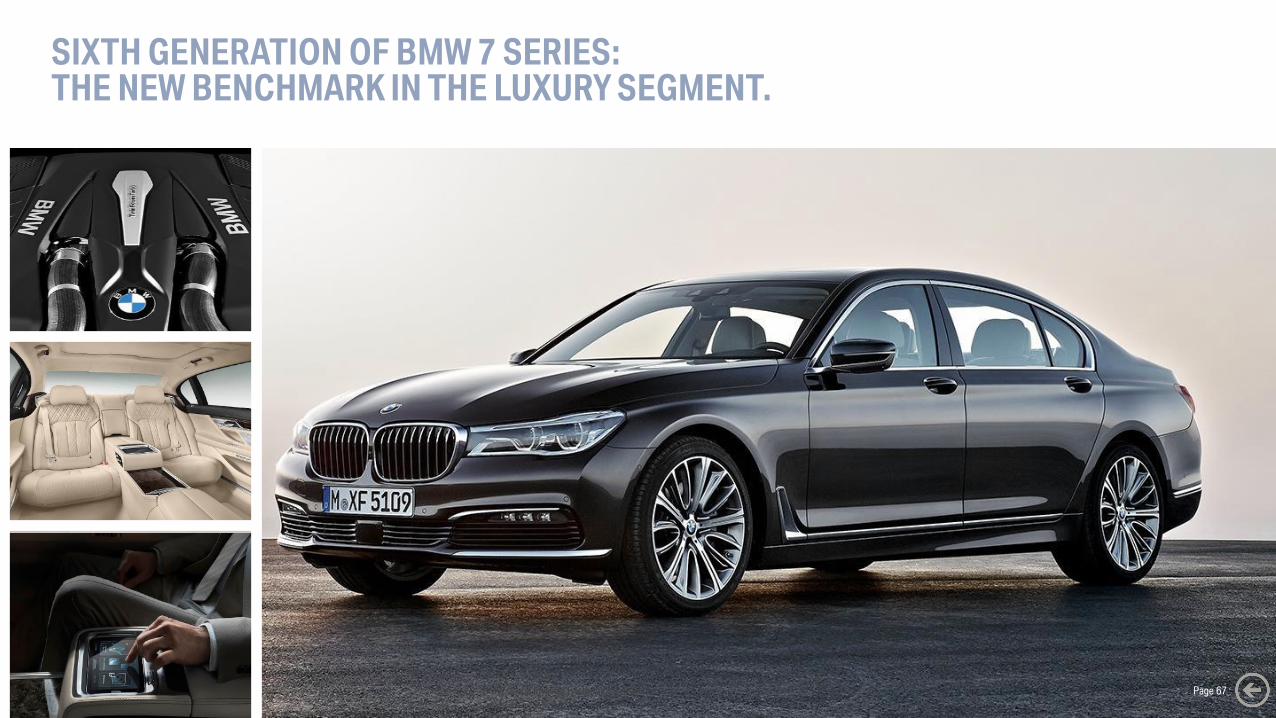
SIXTH GENERATION OF BMW 7 SERIES:THE NEW BENCHMARK IN THE LUXURY SEGMENT.
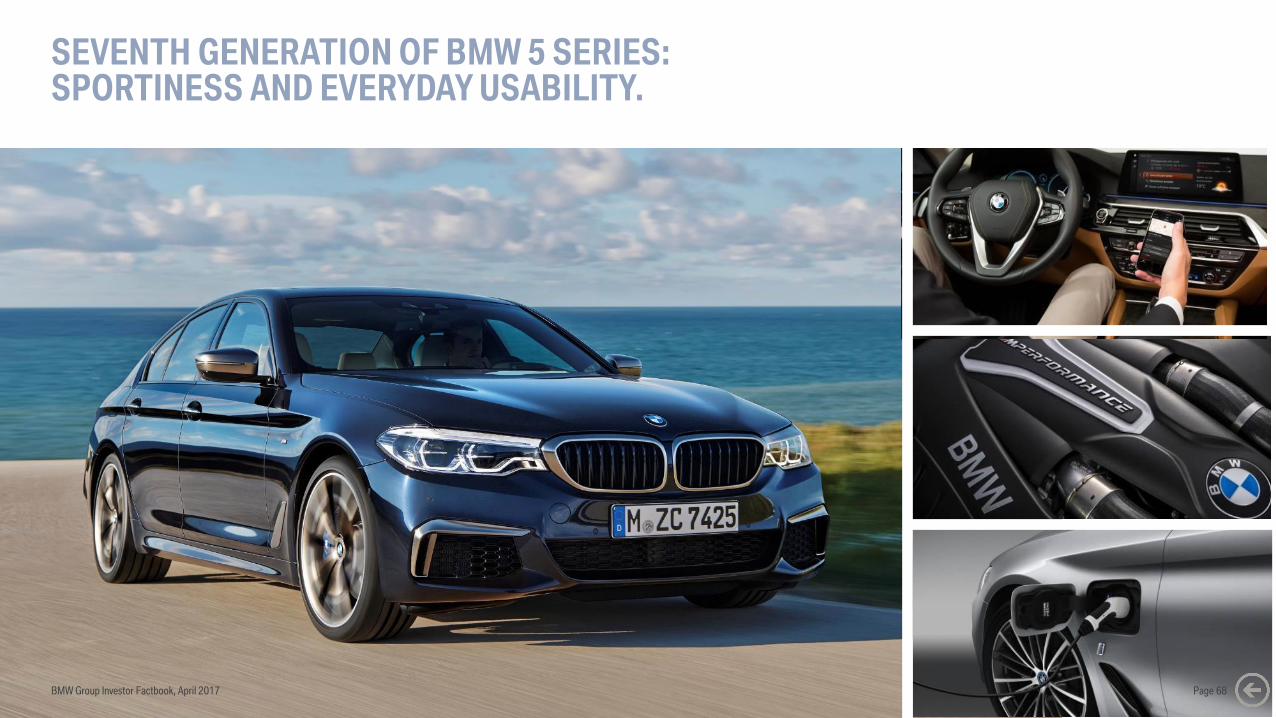
SEVENTH GENERATION OF BMW 5 SERIES:SPORTINESS AND EVERYDAY USABILITY.
BMW Group Investor Factbook, April 2017 Page 68
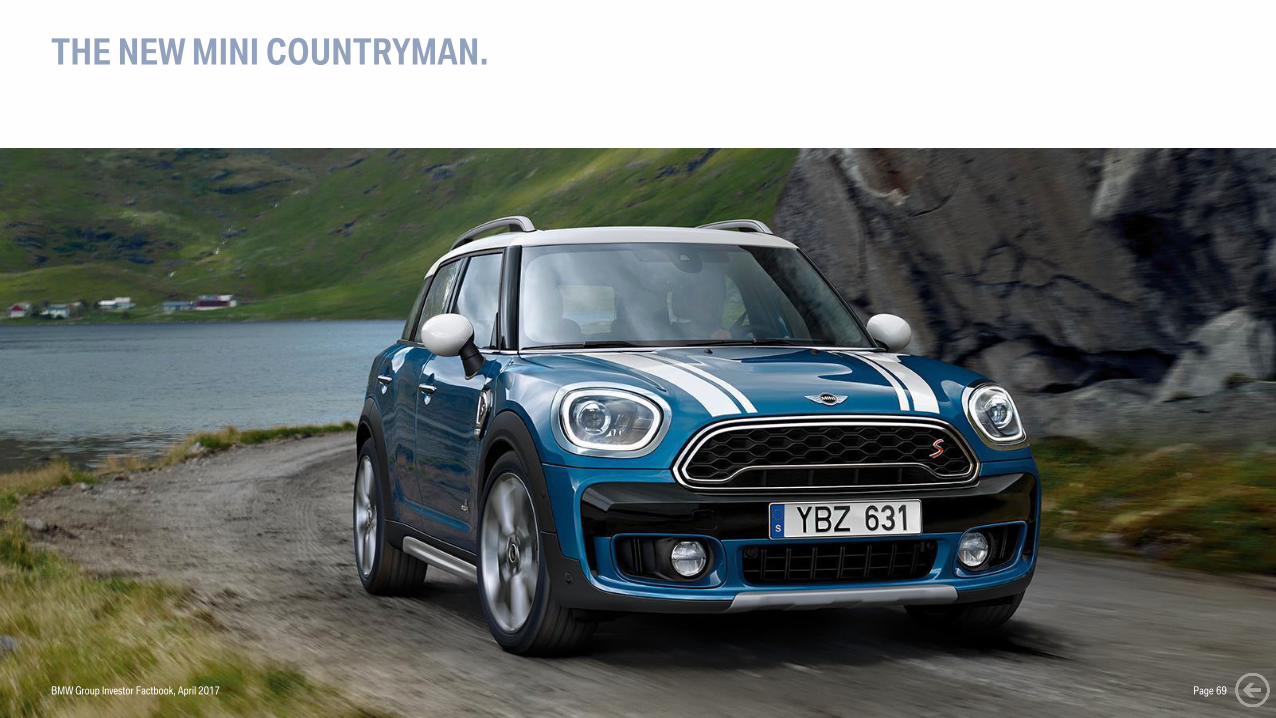
THE NEW MINI COUNTRYMAN.
BMW Group Investor Factbook, April 2017 Page 69
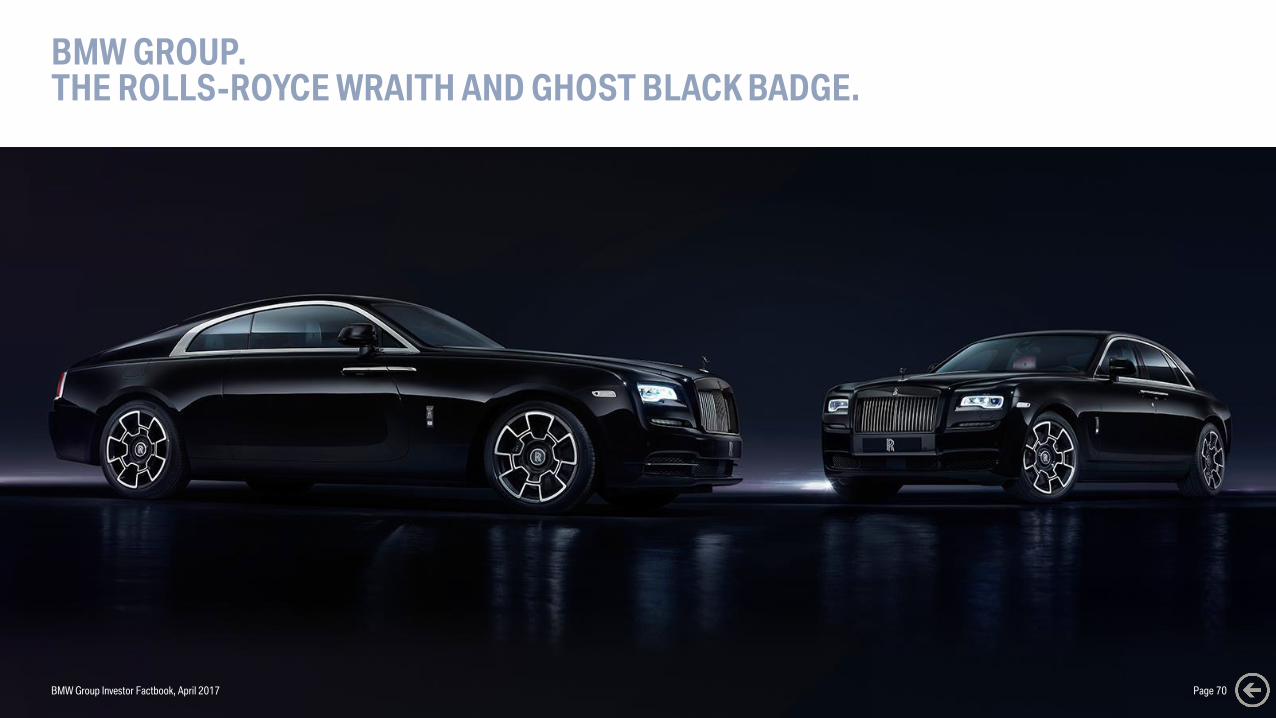
BMW GROUP.THE ROLLS-ROYCE WRAITH AND GHOST BLACK BADGE.
BMW Group Investor Factbook, April 2017 Page 70
BMW Group Investor Factbook, April 2017 Page 71
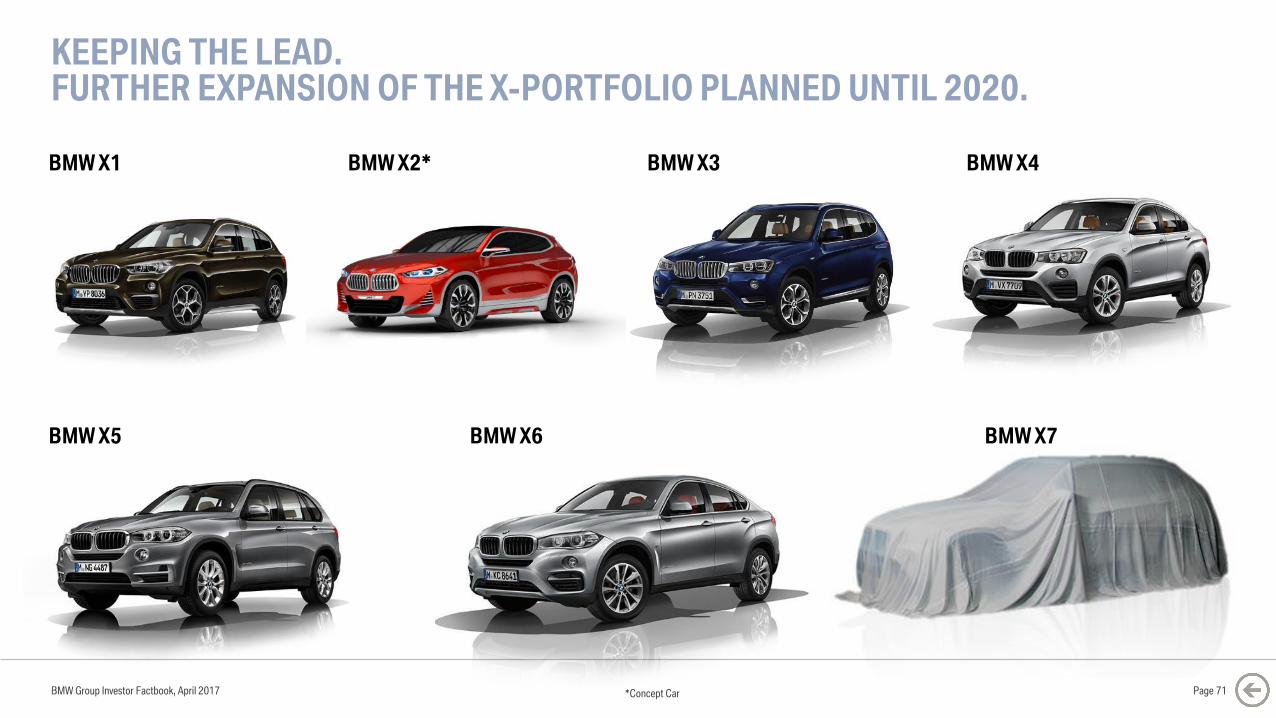
KEEPING THE LEAD.FURTHER EXPANSION OF THE X-PORTFOLIO PLANNED UNTIL 2020.
BMW X1
BMW X5
BMW X3
BMW X6
BMW X4
BMW X7
BMW X2*
*Concept Car
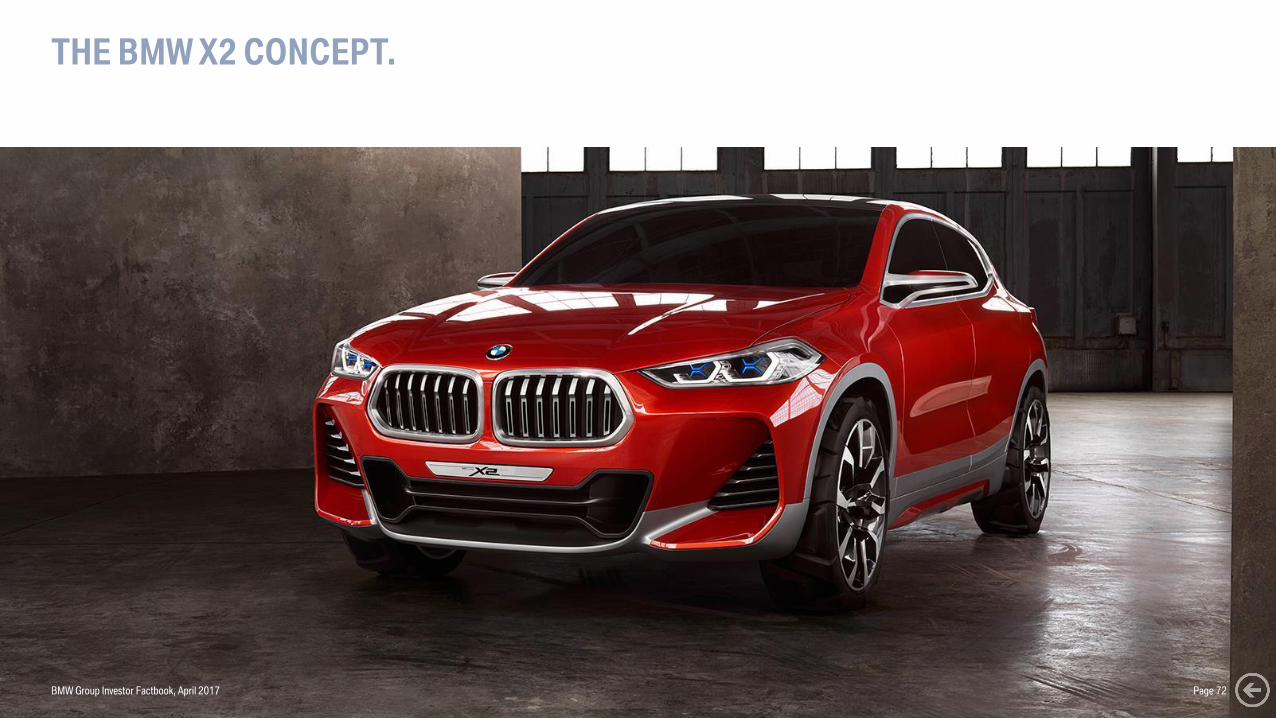
THE BMW X2 CONCEPT.
BMW Group Investor Factbook, April 2017 Page 72
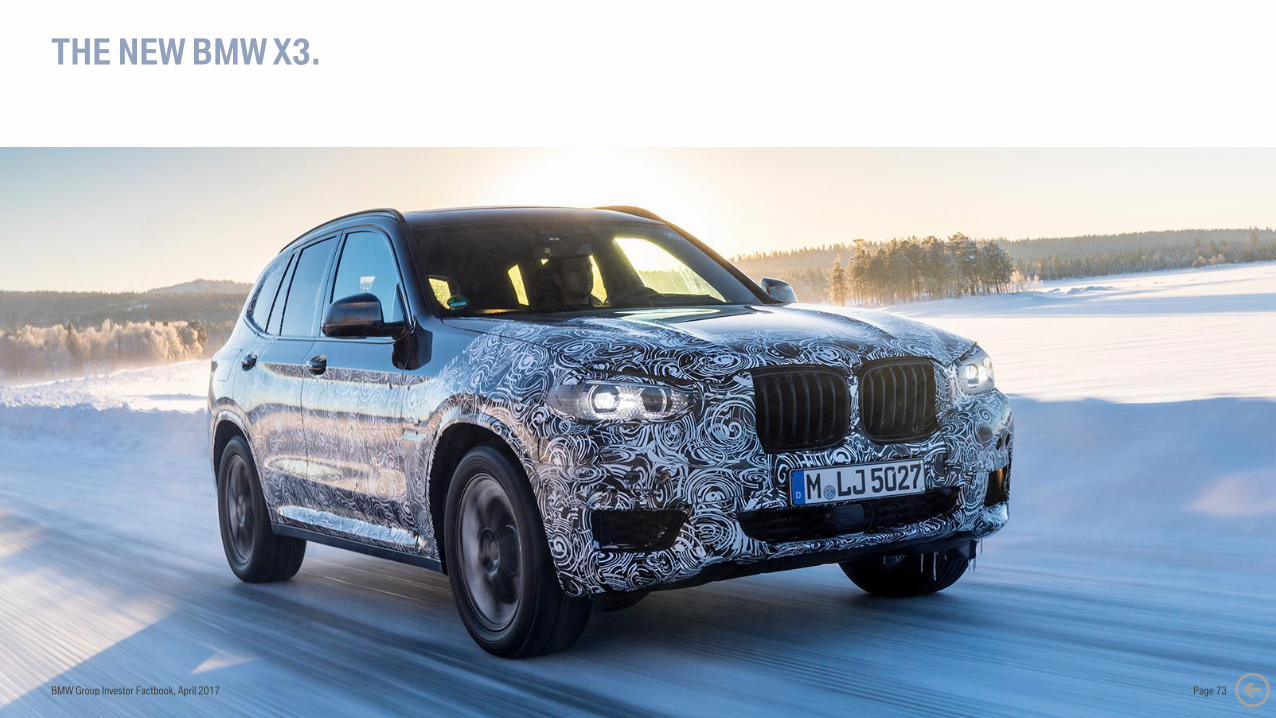
THE NEW BMW X3.
BMW Group Investor Factbook, April 2017 Page 73
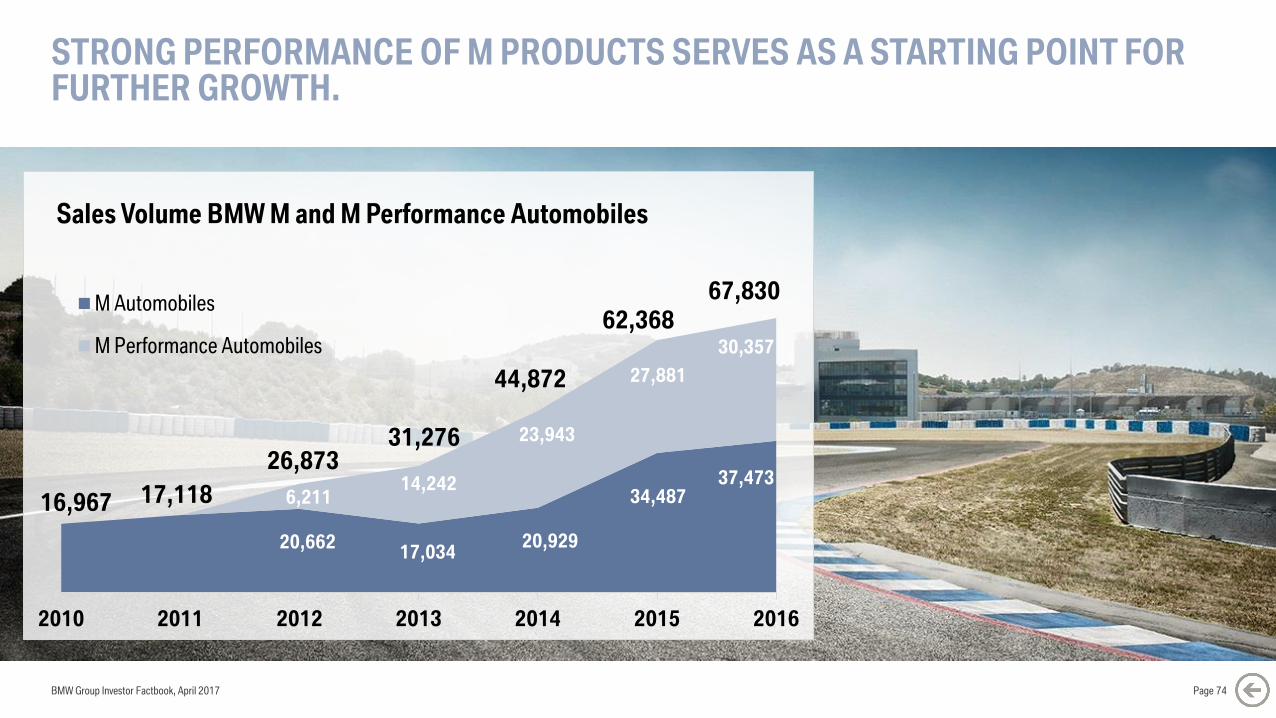
STRONG PERFORMANCE OF M PRODUCTS SERVES AS A STARTING POINT FOR FURTHER GROWTH.
BMW Group Investor Factbook, April 2017 Page 74
16,967 17,118
26,87331,276
44,872
62,368
67,830
2010 2011 2012 2013 2014 2015 2016
Sales Volume BMW M and M Performance Automobiles
M Automobiles
M Performance Automobiles
20,662
6,211
17,034
14,242
20,929
23,943
34,487
27,881
37,473
30,357
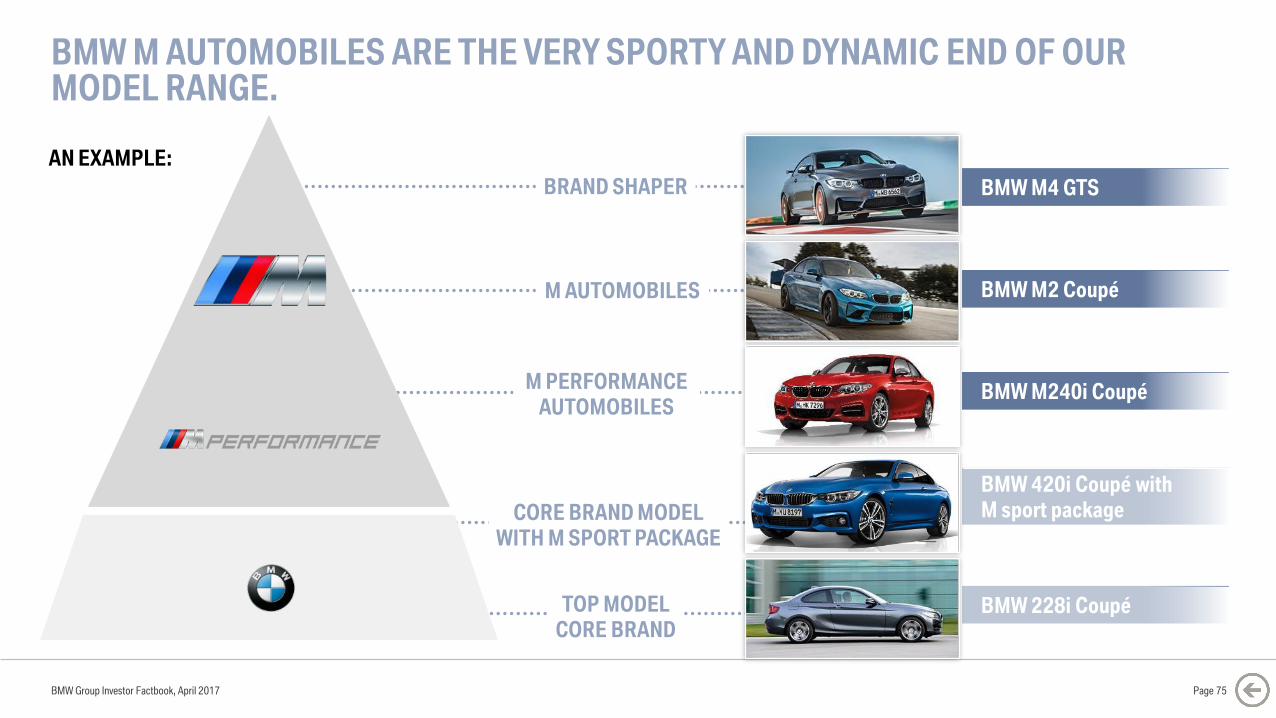
BMW M AUTOMOBILES ARE THE VERY SPORTY AND DYNAMIC END OF OUR MODEL RANGE.
BMW Group Investor Factbook, April 2017
BRAND SHAPER BMW M4 GTS
BMW M240i Coupé
BMW M2 Coupé
BMW 228i Coupé
AN EXAMPLE:
M AUTOMOBILES
M PERFORMANCE
AUTOMOBILES
TOP MODEL
CORE BRAND
Page 75
CORE BRAND MODEL
WITH M SPORT PACKAGE
BMW 420i Coupé with
M sport package
THE NEW BMW 4 SERIES MODELS.
BMW Group Investor Factbook, April 2017 Page 76
BMW Group Investor Factbook, April 2017
CONTENT.
Page 77
5 GROUP FINANCIALS
7 MOTORCYCLES
8 FINANCIAL SERVICES
9 MARKETS
12 DEBT & RATINGS
13 CONTACT & CALENDAR6 AUTOMOTIVE
11 BMW SHARES
1 STRATEGY NUMBER ONE NEXT
2 E-MOBILITY
3 AUTONOMOUS DRIVING
4 MOBILITY SERVICES
10 SUSTAINABILITY
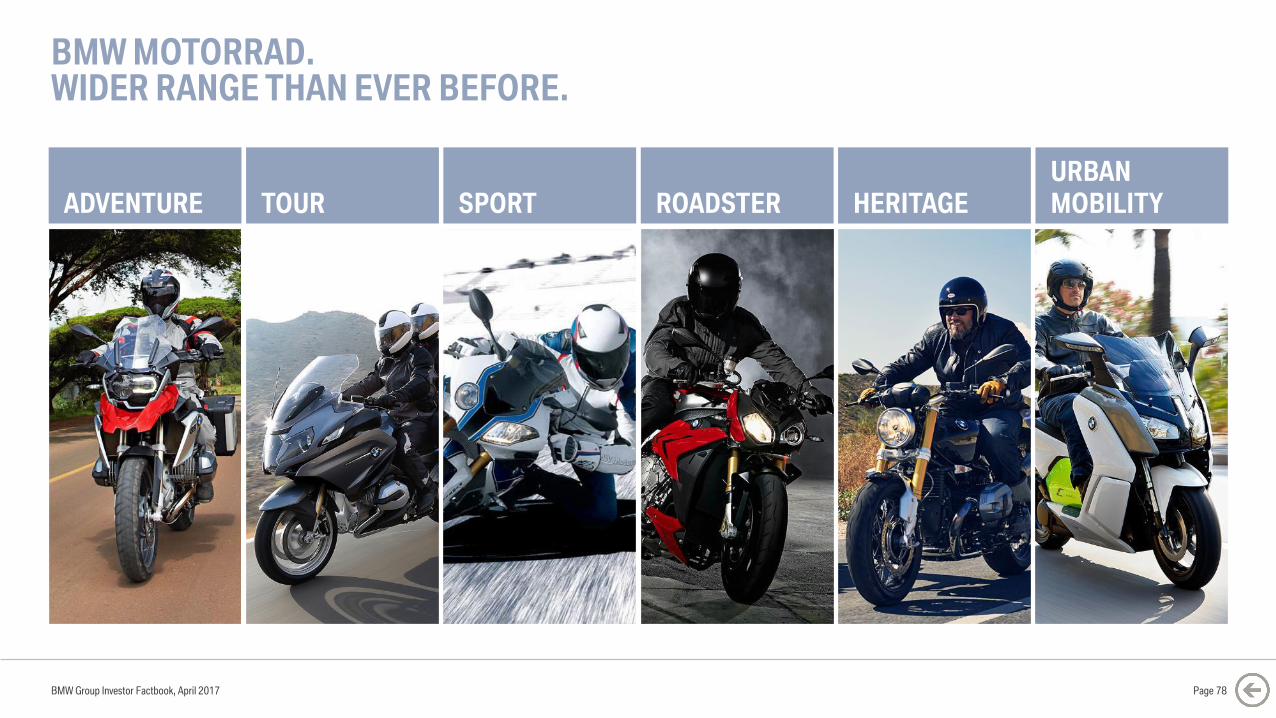
BMW MOTORRAD.WIDER RANGE THAN EVER BEFORE.
BMW Group Investor Factbook, April 2017
ADVENTURE TOUR SPORT ROADSTER HERITAGE
URBAN
MOBILITY
Page 78
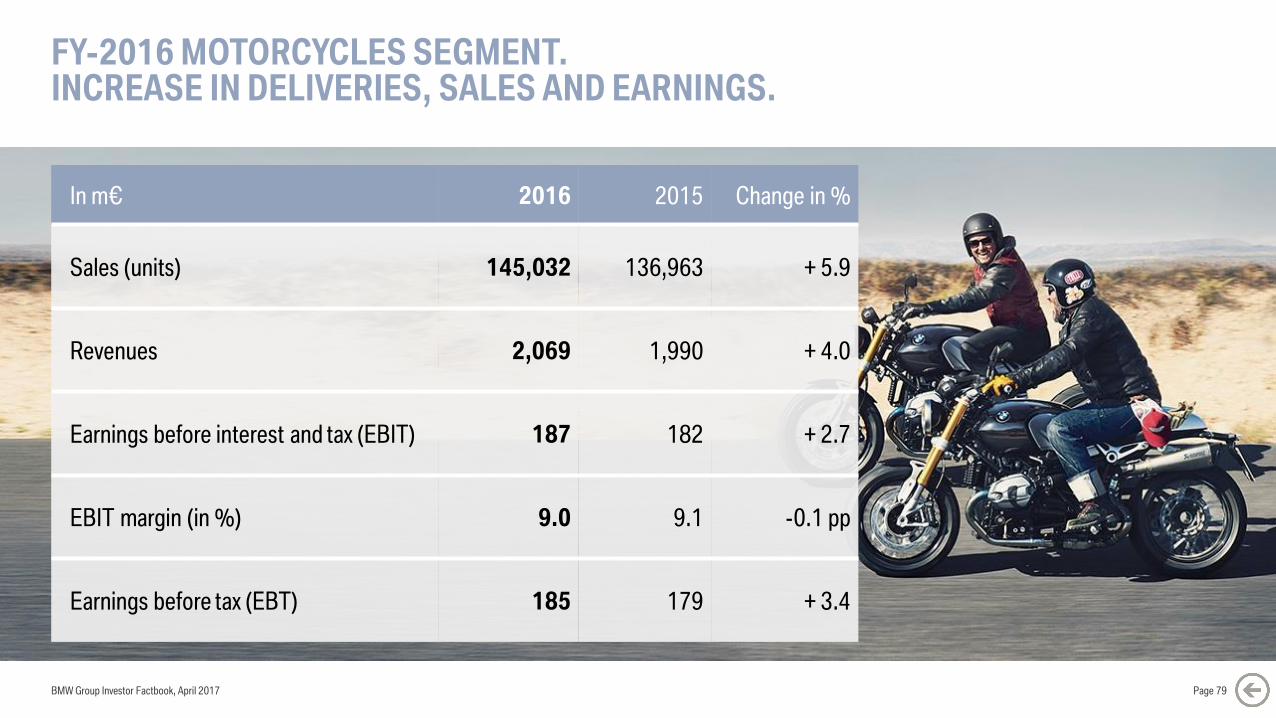
FY-2016 MOTORCYCLES SEGMENT.INCREASE IN DELIVERIES, SALES AND EARNINGS.
In m€ 2016 2015 Change in %
Sales (units) 145,032 136,963 + 5.9
Revenues 2,069 1,990 + 4.0
Earnings before interest and tax (EBIT) 187 182 + 2.7
EBIT margin (in %) 9.0 9.1 -0.1 pp
Earnings before tax (EBT) 185 179 + 3.4
BMW Group Investor Factbook, April 2017 Page 79
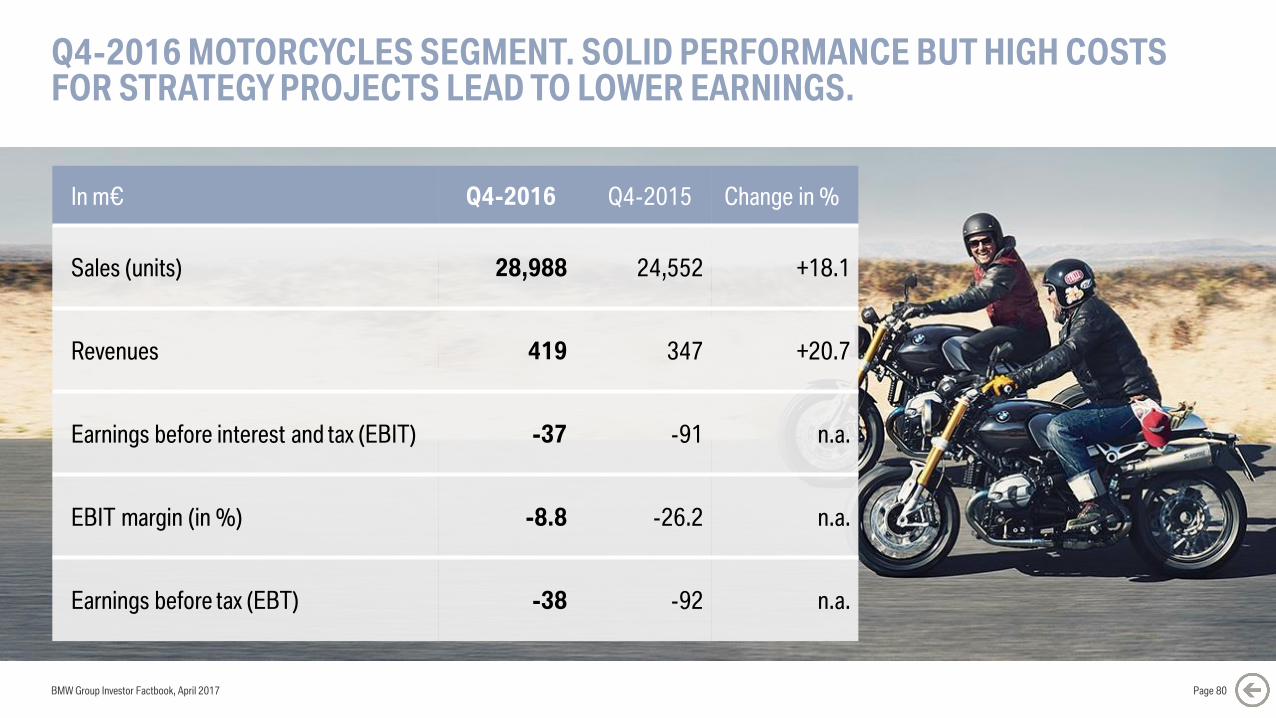
Q4-2016 MOTORCYCLES SEGMENT. SOLID PERFORMANCE BUT HIGH COSTS FOR STRATEGY PROJECTS LEAD TO LOWER EARNINGS.
BMW Group Investor Factbook, April 2017 Page 80
In m€ Q4-2016 Q4-2015 Change in %
Sales (units) 28,988 24,552 +18.1
Revenues 419 347 +20.7
Earnings before interest and tax (EBIT) -37 -91 n.a.
EBIT margin (in %) -8.8 -26.2 n.a.
Earnings before tax (EBT) -38 -92 n.a.
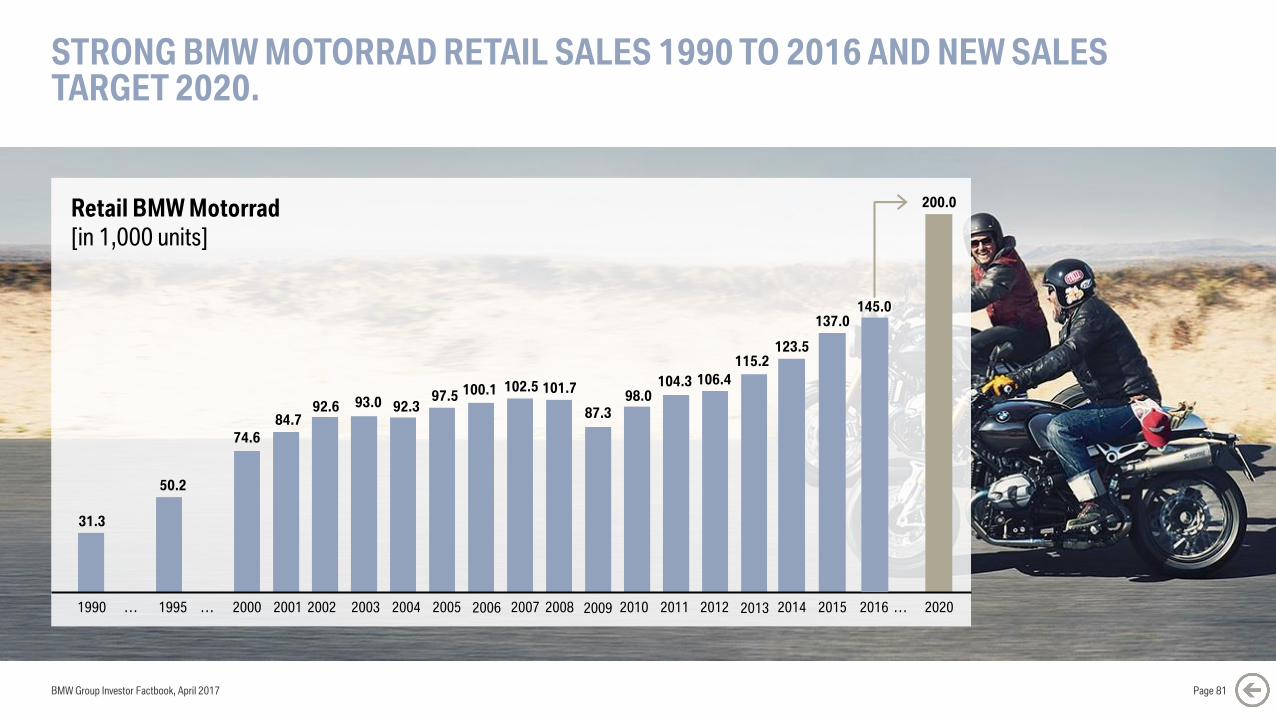
STRONG BMW MOTORRAD RETAIL SALES 1990 TO 2016 AND NEW SALES TARGET 2020.
BMW Group Investor Factbook, April 2017
Retail BMW Motorrad
[in 1,000 units]
Page 81
1990 1995 2000 2001 2002 2003 2004 2005 2006 2007 2008 2009 2010 2011 2012 2013 2014 2015… …
31.3
50.2
74.6
84.792.6 93.0 92.3
97.5 100.1 102.5 101.7
87.3
98.0104.3 106.4
115.2123.5
137.0
200.0
2020…2016
145.0
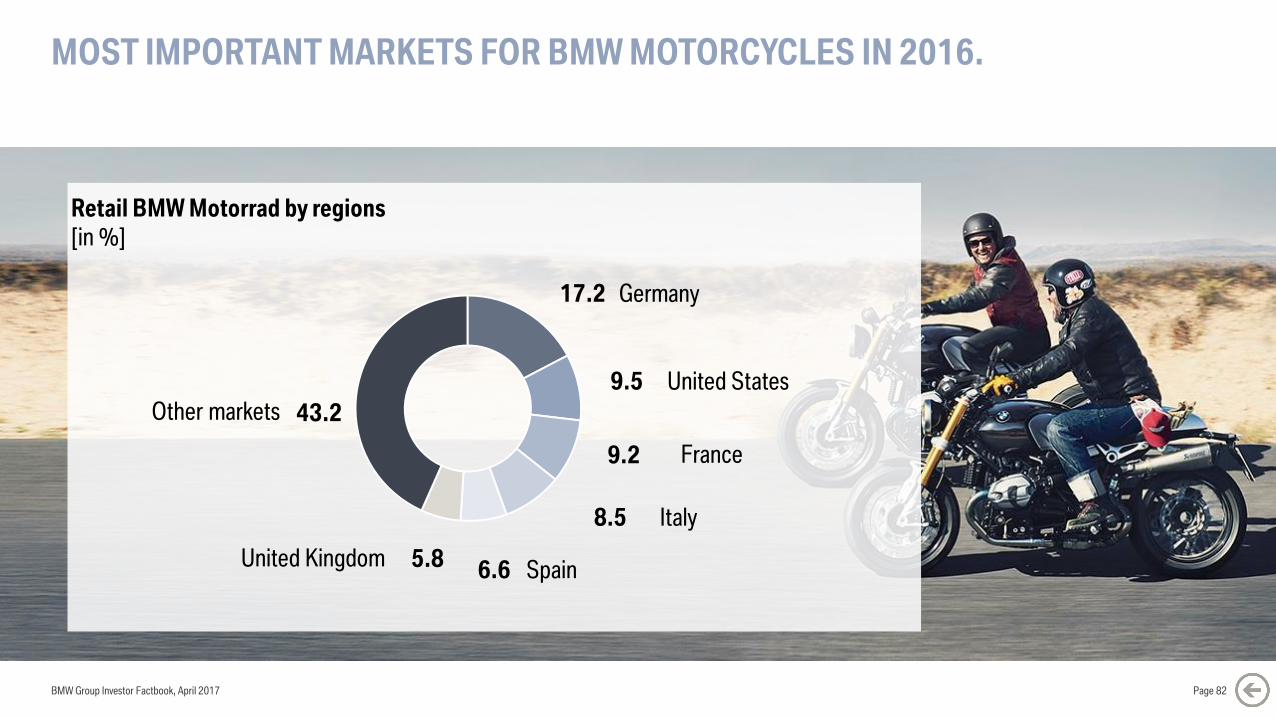
MOST IMPORTANT MARKETS FOR BMW MOTORCYCLES IN 2016.
BMW Group Investor Factbook, April 2017
Retail BMW Motorrad by regions
[in %]
43.2
17.2
9.5
9.2
8.5
6.65.8
Germany
United States
France
Italy
Other markets
SpainUnited Kingdom
Page 82
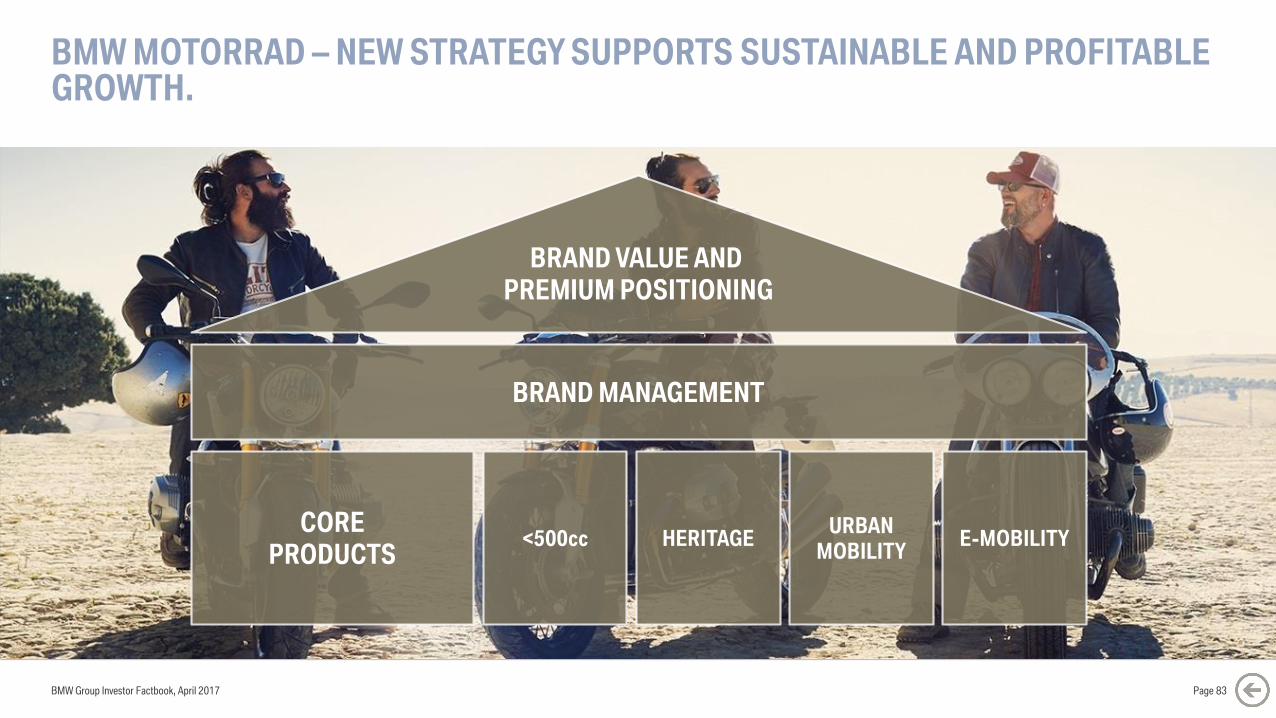
BMW MOTORRAD – NEW STRATEGY SUPPORTS SUSTAINABLE AND PROFITABLE GROWTH.
BMW Group Investor Factbook, April 2017
BRAND VALUE AND
PREMIUM POSITIONING
BRAND MANAGEMENT
CORE
PRODUCTS<500cc HERITAGE
URBAN
MOBILITYE-MOBILITY
Page 83
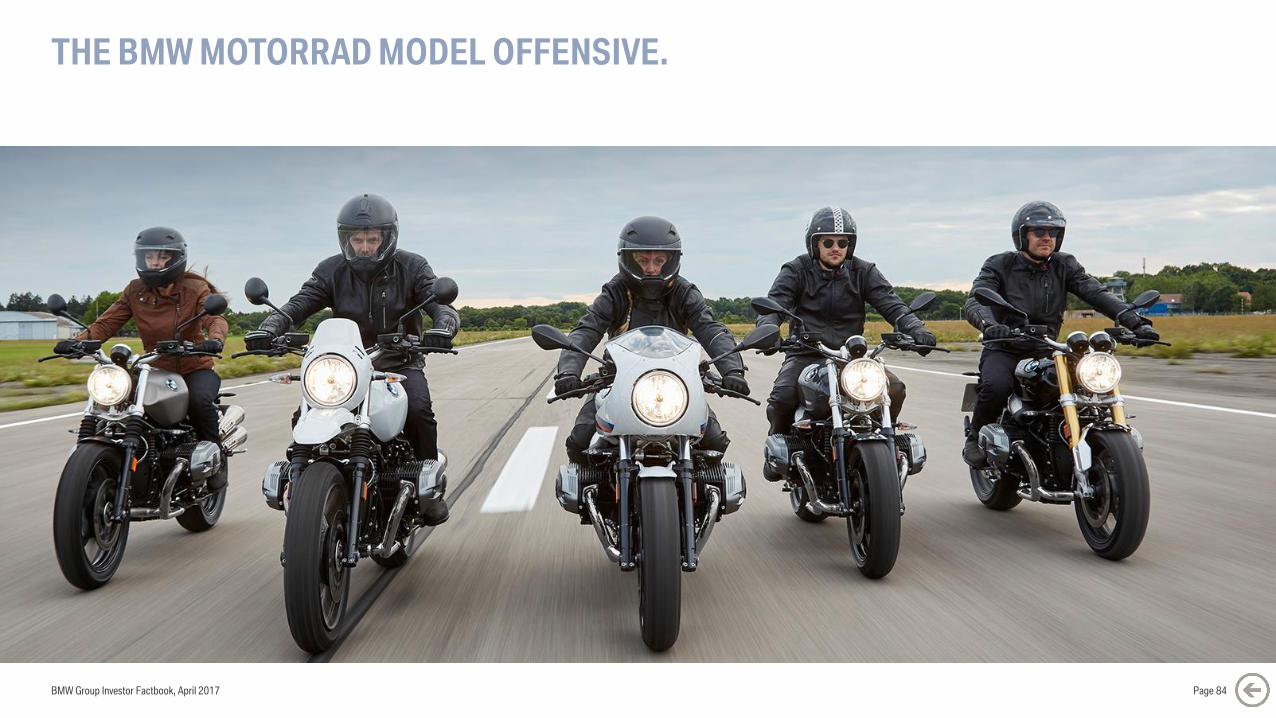
THE BMW MOTORRAD MODEL OFFENSIVE.
BMW Group Investor Factbook, April 2017 Page 84
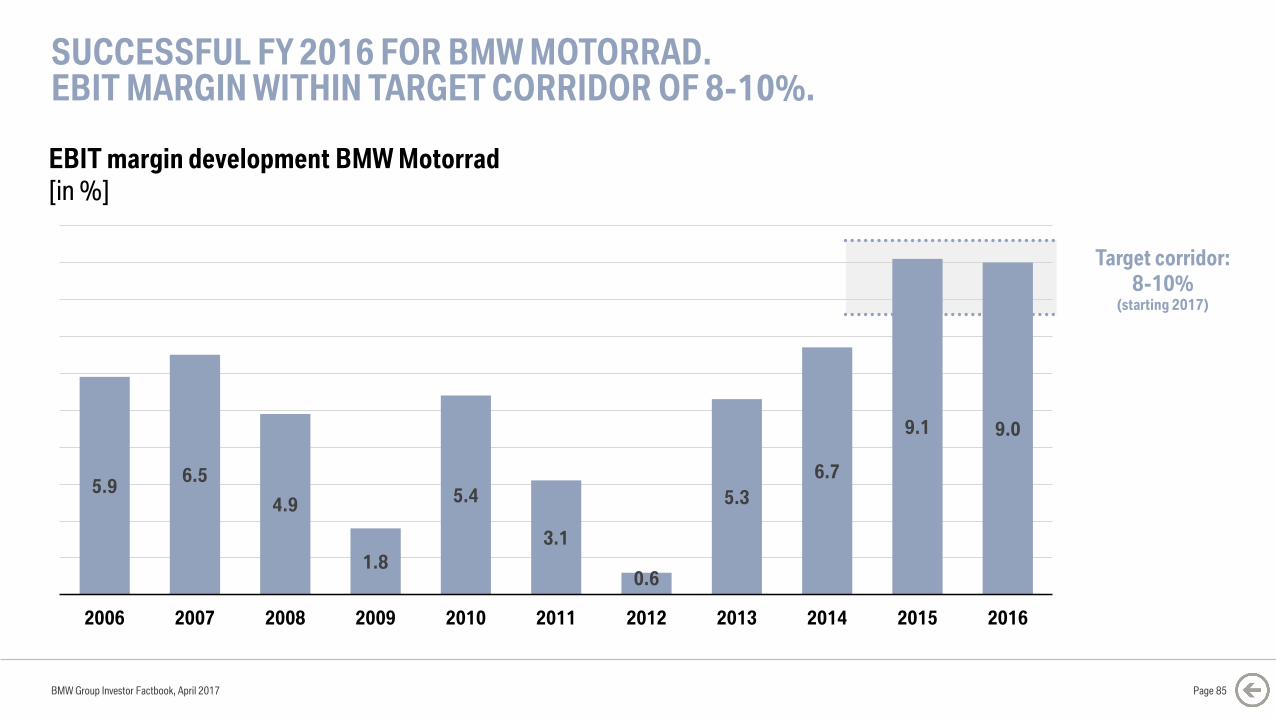
Target corridor:
8-10%(starting 2017)
5.96.5
4.9
1.8
5.4
3.1
0.6
5.3
6.7
9.1 9.0
2006 2007 2008 2009 2010 2011 2012 2013 2014 2015 2016
BMW Group Investor Factbook, April 2017
SUCCESSFUL FY 2016 FOR BMW MOTORRAD.EBIT MARGIN WITHIN TARGET CORRIDOR OF 8-10%.
Page 85
EBIT margin development BMW Motorrad
[in %]

BMW Group Investor Factbook, April 2017
CONTENT.
Page 86
5 GROUP FINANCIALS
7 MOTORCYCLES
8 FINANCIAL SERVICES
9 MARKETS
12 DEBT & RATINGS
13 CONTACT & CALENDAR6 AUTOMOTIVE
11 BMW SHARES
1 STRATEGY NUMBER ONE NEXT
2 E-MOBILITY
3 AUTONOMOUS DRIVING
4 MOBILITY SERVICES
10 SUSTAINABILITY
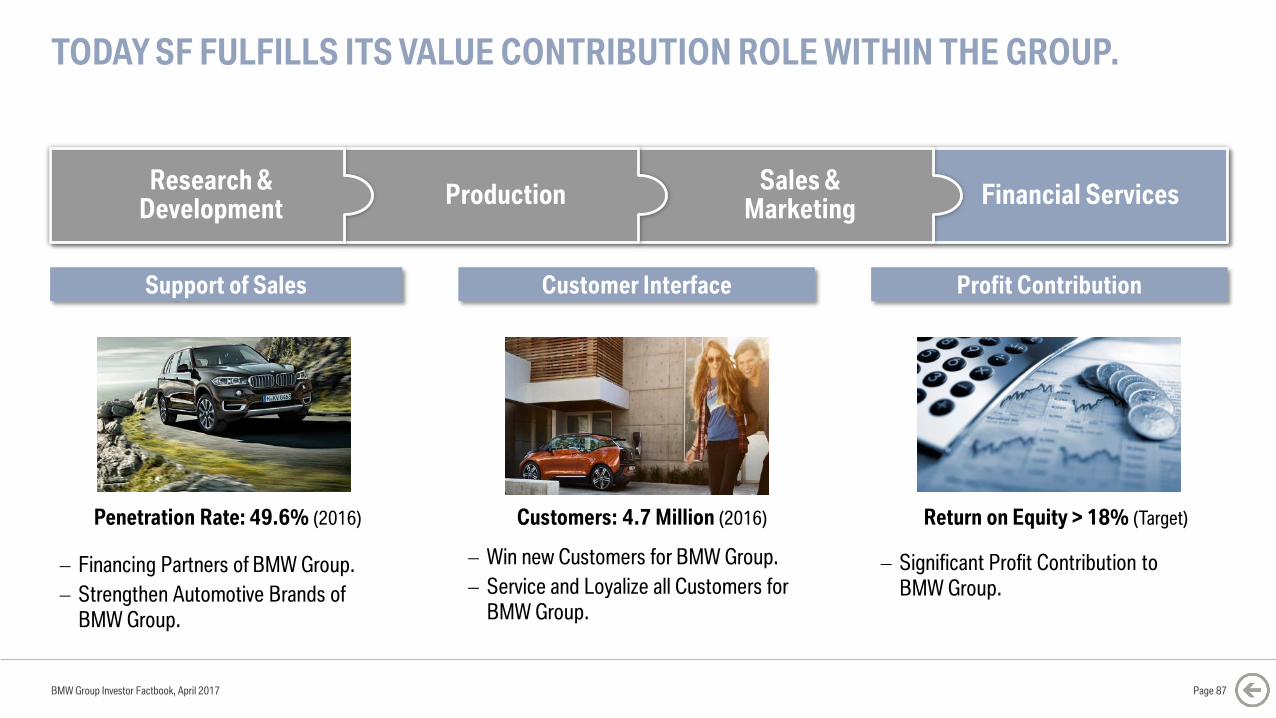
TODAY SF FULFILLS ITS VALUE CONTRIBUTION ROLE WITHIN THE GROUP.
Support of Sales Profit ContributionCustomer Interface
Financial ServicesSales &
MarketingProduction
Research & Development
Significant Profit Contribution to
BMW Group. Financing Partners of BMW Group.
Strengthen Automotive Brands of
BMW Group.
Win new Customers for BMW Group.
Service and Loyalize all Customers for
BMW Group.
Return on Equity > 18% (Target)Penetration Rate: 49.6% (2016) Customers: 4.7 Million (2016)
BMW Group Investor Factbook, April 2017 Page 87
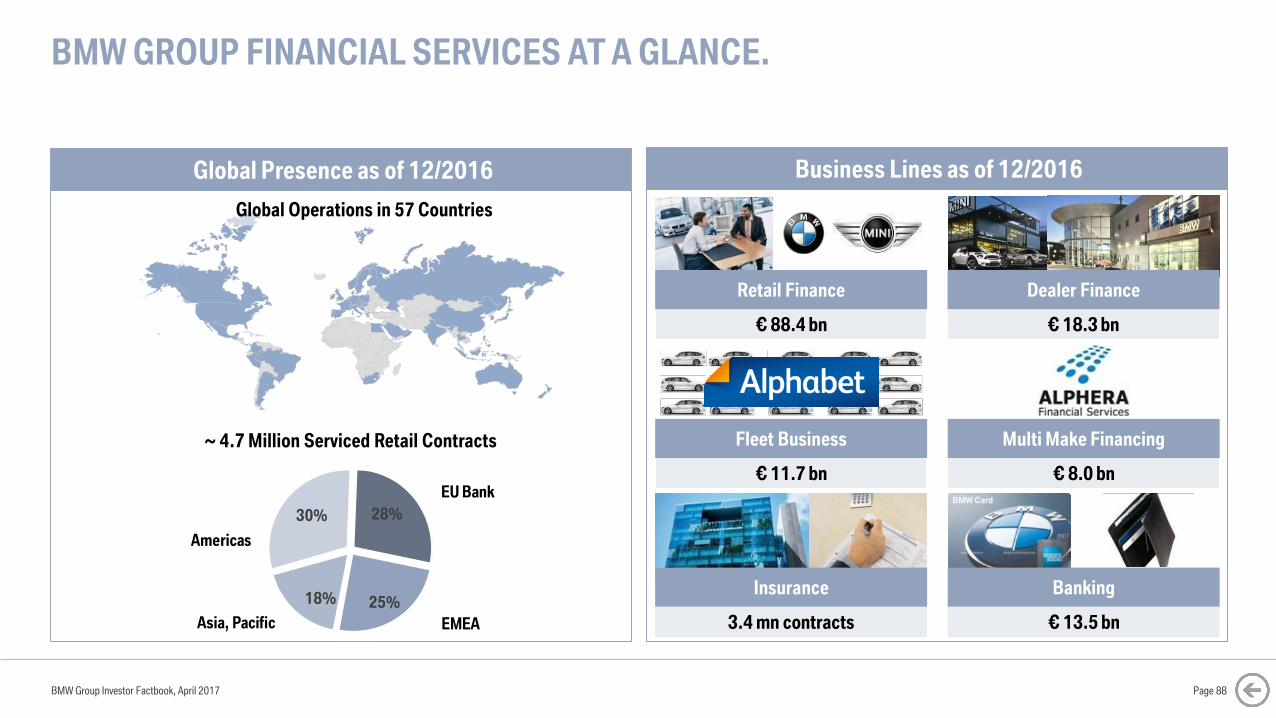
BMW GROUP FINANCIAL SERVICES AT A GLANCE.
Business Lines as of 12/2016Global Presence as of 12/2016
Global Operations in 57 Countries
€ 88.4 bn
Retail Finance
€ 18.3 bn
Dealer Finance
3.4 mn contracts
Insurance
€ 8.0 bn
Multi Make Financing
€ 13.5 bn
Banking
€ 11.7 bn
Fleet Business
BMW Group Investor Factbook, April 2017 Page 88
EU Bank
EMEA
Americas
Asia, Pacific
28%
25%18%
30%
~ 4.7 Million Serviced Retail Contracts
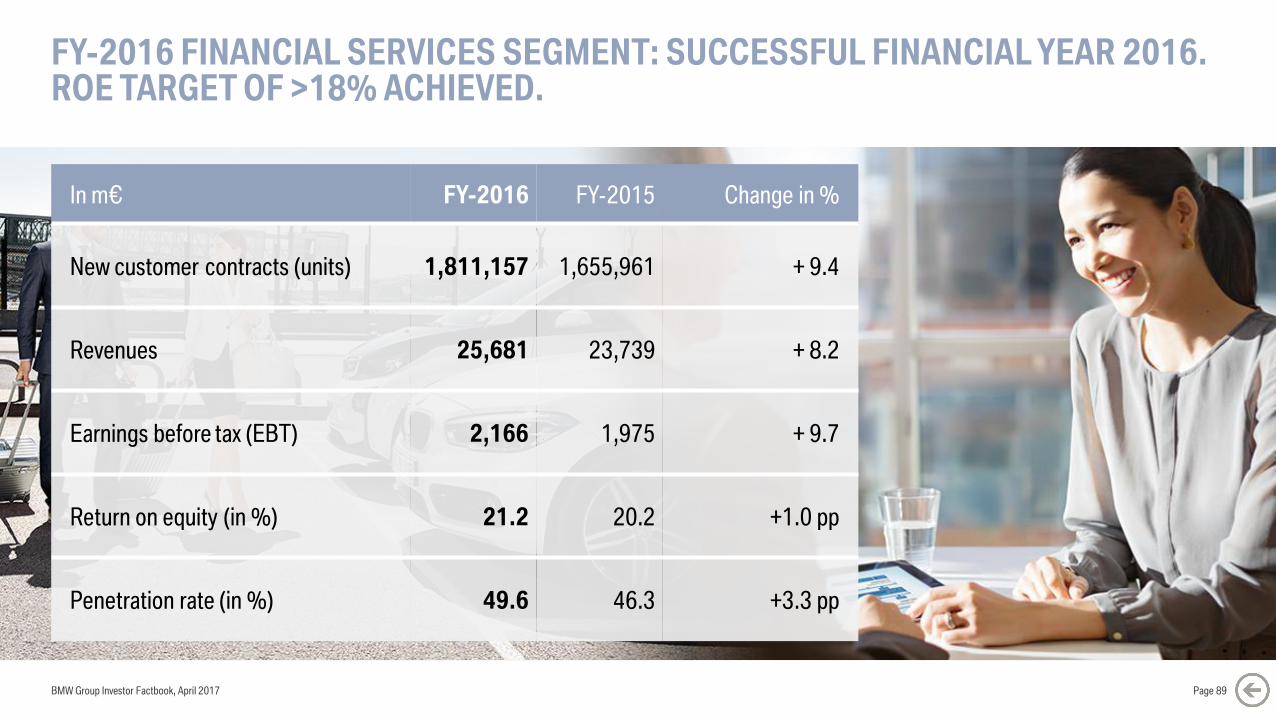
FY-2016 FINANCIAL SERVICES SEGMENT: SUCCESSFUL FINANCIAL YEAR 2016.ROE TARGET OF >18% ACHIEVED.
In m€ FY-2016 FY-2015 Change in %
New customer contracts (units) 1,811,157 1,655,961 + 9.4
Revenues 25,681 23,739 + 8.2
Earnings before tax (EBT) 2,166 1,975 + 9.7
Return on equity (in %) 21.2 20.2 +1.0 pp
Penetration rate (in %) 49.6 46.3 +3.3 pp
BMW Group Investor Factbook, April 2017 Page 89
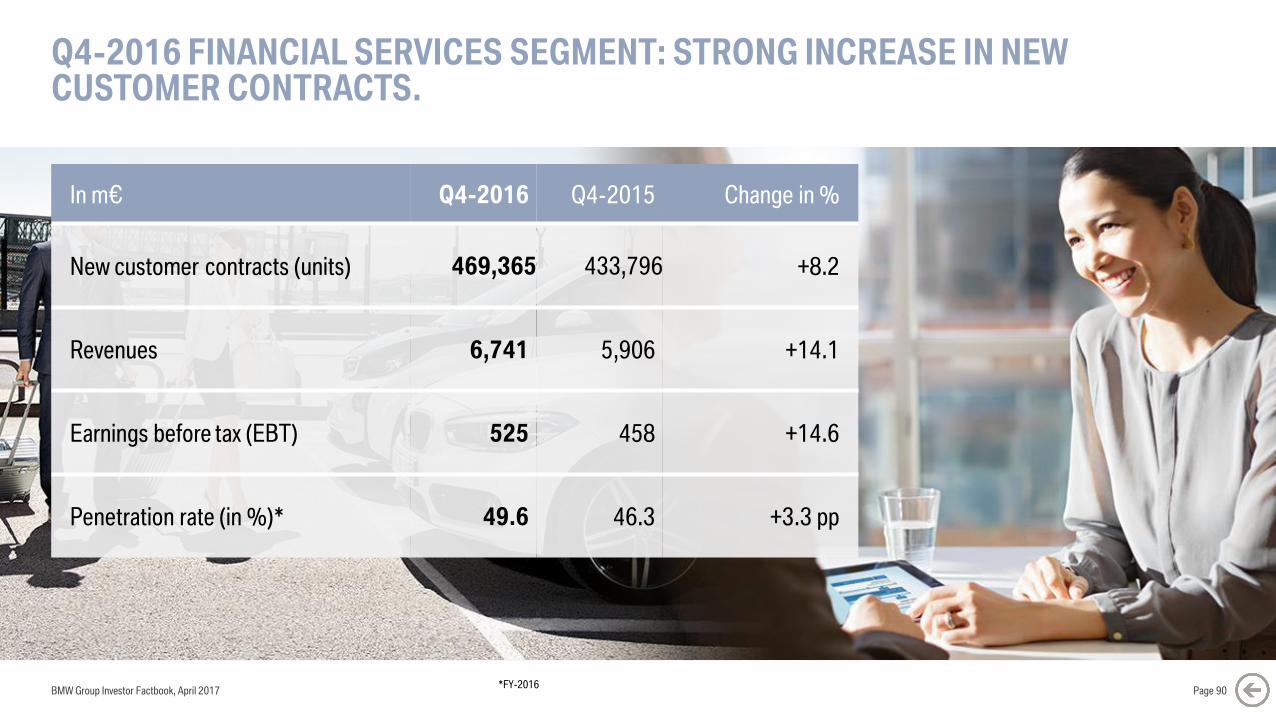
Q4-2016 FINANCIAL SERVICES SEGMENT: STRONG INCREASE IN NEW CUSTOMER CONTRACTS.
In m€ Q4-2016 Q4-2015 Change in %
New customer contracts (units) 469,365 433,796 +8.2
Revenues 6,741 5,906 +14.1
Earnings before tax (EBT) 525 458 +14.6
Penetration rate (in %)* 49.6 46.3 +3.3 pp
BMW Group Investor Factbook, April 2017 Page 90*FY-2016
SF
19%
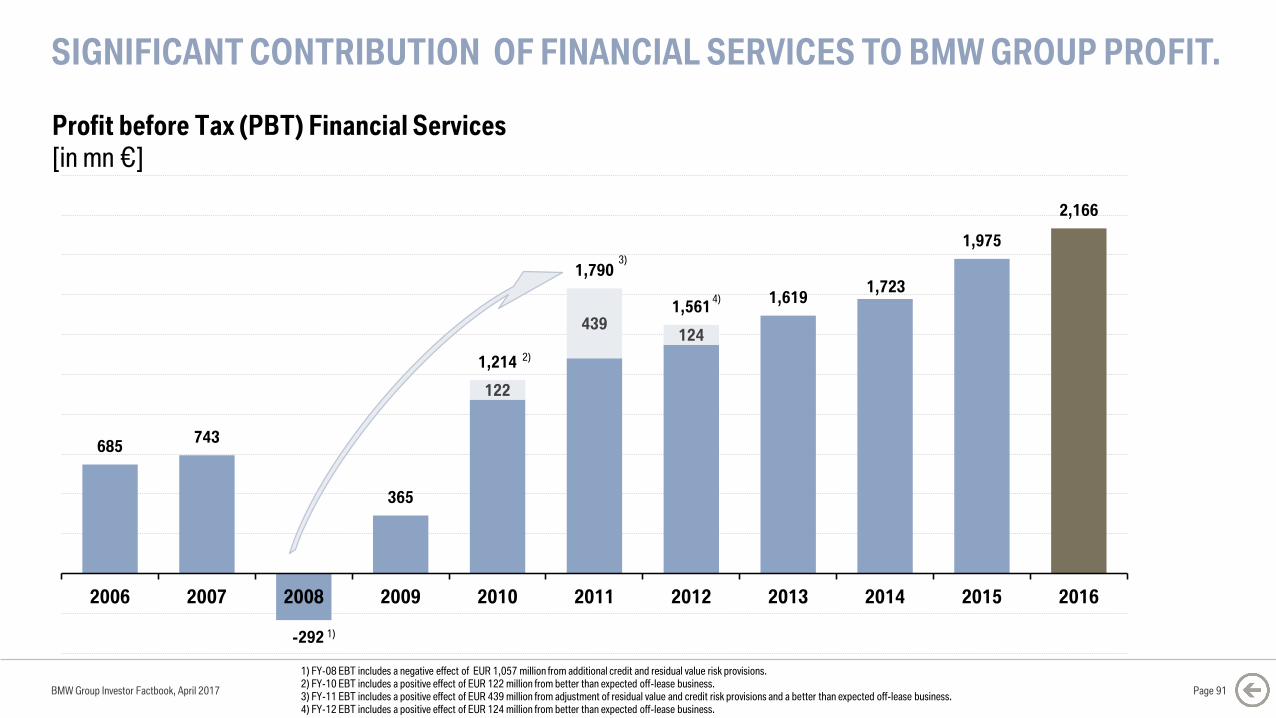
SIGNIFICANT CONTRIBUTION OF FINANCIAL SERVICES TO BMW GROUP PROFIT.
BMW Group Investor Factbook, April 2017 Page 91
122
439124
685743
-292
365
1,214
1,790
1,5611,619
1,723
1,975
2,166
2006 2007 2008 2009 2010 2011 2012 2013 2014 2015 2016
1) FY-08 EBT includes a negative effect of EUR 1,057 million from additional credit and residual value risk provisions.2) FY-10 EBT includes a positive effect of EUR 122 million from better than expected off-lease business.3) FY-11 EBT includes a positive effect of EUR 439 million from adjustment of residual value and credit risk provisions and a better than expected off-lease business.
4) FY-12 EBT includes a positive effect of EUR 124 million from better than expected off-lease business.
2)
3)
4)
1)
Profit before Tax (PBT) Financial Services
[in mn €]
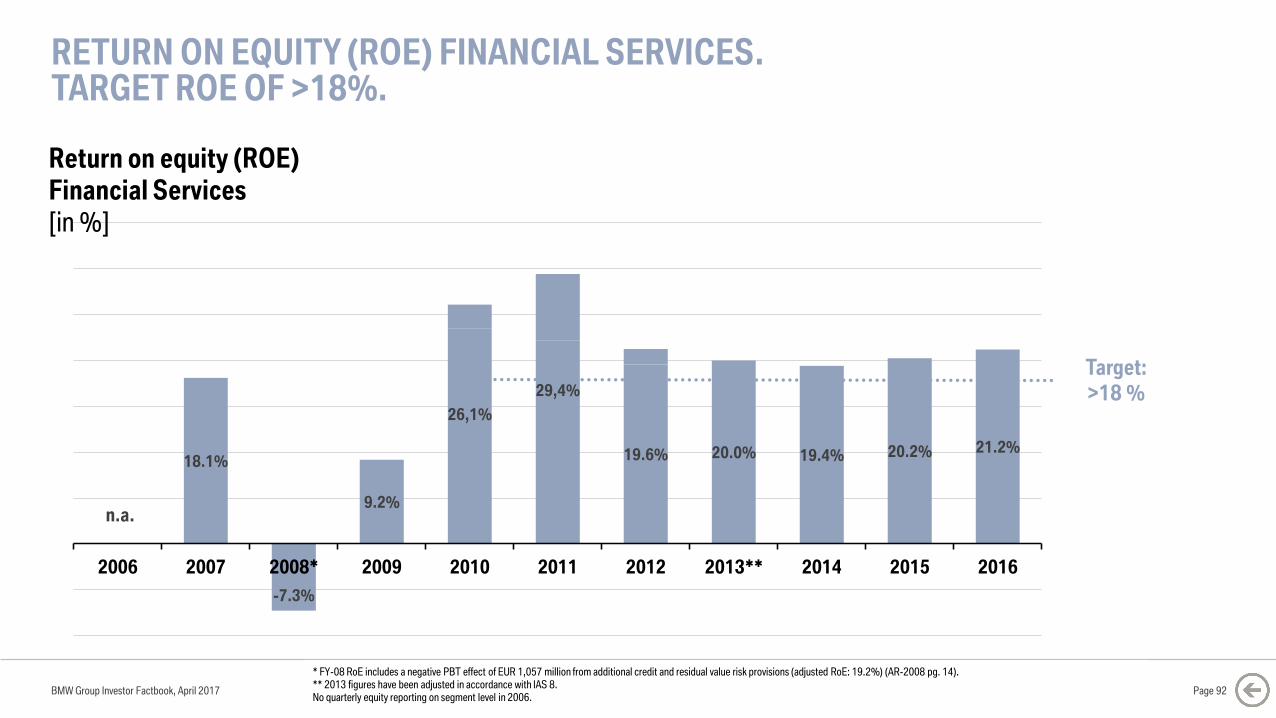
18.1%
-7.3%
9.2%
26,1%
29,4%
19.6% 20.0% 19.4% 20.2% 21.2%
2006 2007 2008* 2009 2010 2011 2012 2013** 2014 2015 2016
RETURN ON EQUITY (ROE) FINANCIAL SERVICES.TARGET ROE OF >18%.
BMW Group Investor Factbook, April 2017
Return on equity (ROE)
Financial Services
[in %]
Page 92
* FY-08 RoE includes a negative PBT effect of EUR 1,057 million from additional credit and residual value risk provisions (adjusted RoE: 19.2%) (AR-2008 pg. 14).** 2013 figures have been adjusted in accordance with IAS 8. No quarterly equity reporting on segment level in 2006.
Target:
>18 %
n.a.
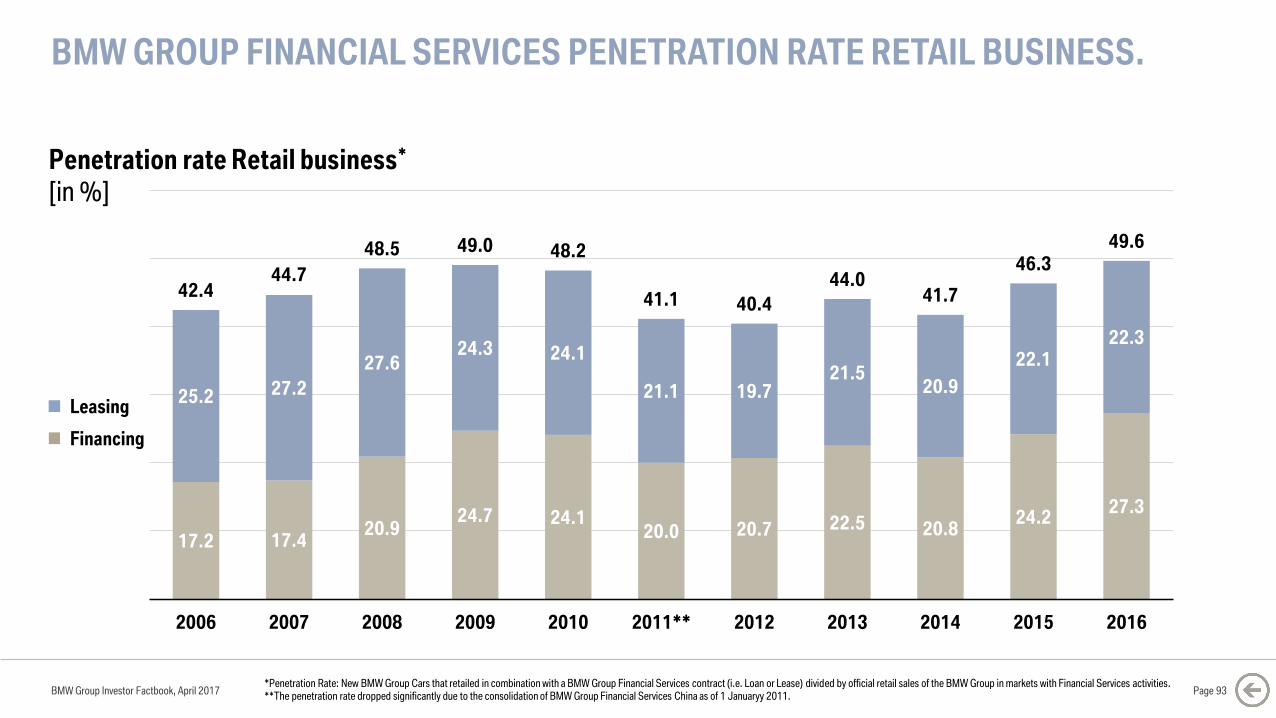
BMW GROUP FINANCIAL SERVICES PENETRATION RATE RETAIL BUSINESS.
BMW Group Investor Factbook, April 2017
Penetration rate Retail business*
[in %]
Page 93*Penetration Rate: New BMW Group Cars that retailed in combination with a BMW Group Financial Services contract (i.e. Loan or Lease) divided by official retail sales of the BMW Group in markets with Financial Services activities.**The penetration rate dropped significantly due to the consolidation of BMW Group Financial Services China as of 1 Januaryy 2011.
17.2 17.420.9
24.7 24.120.0 20.7 22.5 20.8
24.227.3
25.2 27.2
27.624.3 24.1
21.1 19.721.5
20.9
22.122.3
42.444.7
48.5 49.0 48.2
41.1 40.4
44.041.7
46.3
49.6
0.0
10.0
20.0
30.0
40.0
50.0
60.0
2006 2007 2008 2009 2010 2011** 2012 2013 2014 2015 2016
Financing
Leasing
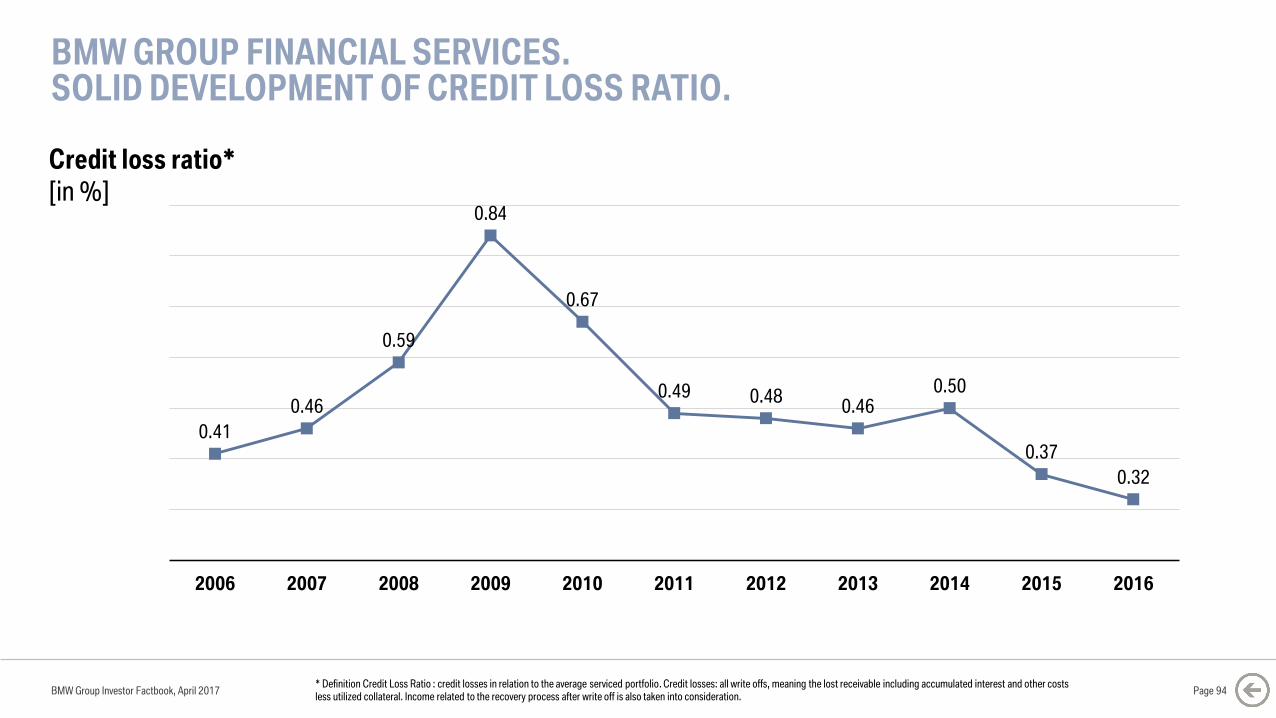
BMW GROUP FINANCIAL SERVICES. SOLID DEVELOPMENT OF CREDIT LOSS RATIO.
BMW Group Investor Factbook, April 2017
Credit loss ratio*
[in %]
Page 94* Definition Credit Loss Ratio : credit losses in relation to the average serviced portfolio. Credit losses: all write offs, meaning the lost receivable including accumulated interest and other costs less utilized collateral. Income related to the recovery process after write off is also taken into consideration.
0.41
0.46
0.59
0.84
0.67
0.49 0.480.46
0.50
0.37
0.32
2006 2007 2008 2009 2010 2011 2012 2013 2014 2015 2016
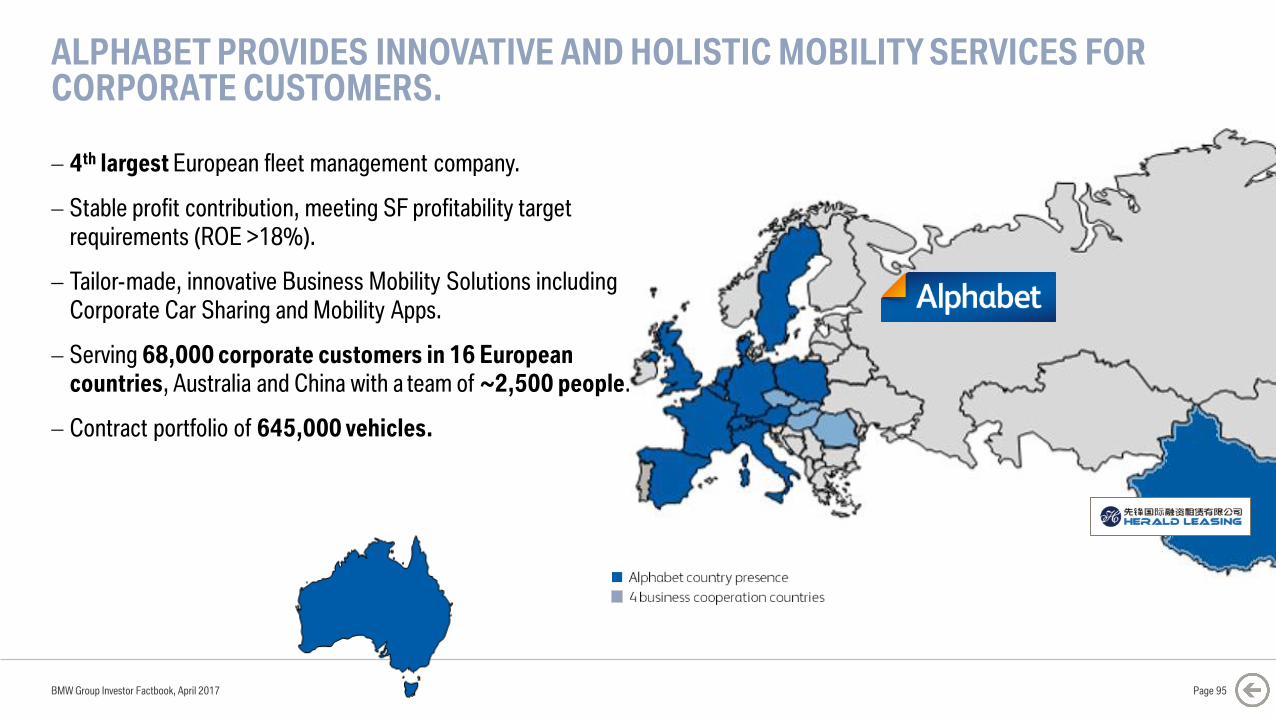
ALPHABET PROVIDES INNOVATIVE AND HOLISTIC MOBILITY SERVICES FOR CORPORATE CUSTOMERS.
BMW Group Investor Factbook, April 2017 Page 95
4th largest European fleet management company.
Stable profit contribution, meeting SF profitability target
requirements (ROE >18%).
Tailor-made, innovative Business Mobility Solutions including
Corporate Car Sharing and Mobility Apps.
Serving 68,000 corporate customers in 16 European
countries, Australia and China with a team of ~2,500 people.
Contract portfolio of 645,000 vehicles.

BMW Group Investor Factbook, April 2017
CONTENT.
Page 96
5 GROUP FINANCIALS
7 MOTORCYCLES
8 FINANCIAL SERVICES
9 MARKETS
12 DEBT & RATINGS
13 CONTACT & CALENDAR6 AUTOMOTIVE
11 BMW SHARES
1 STRATEGY NUMBER ONE NEXT
2 E-MOBILITY
3 AUTONOMOUS DRIVING
4 MOBILITY SERVICES
10 SUSTAINABILITY
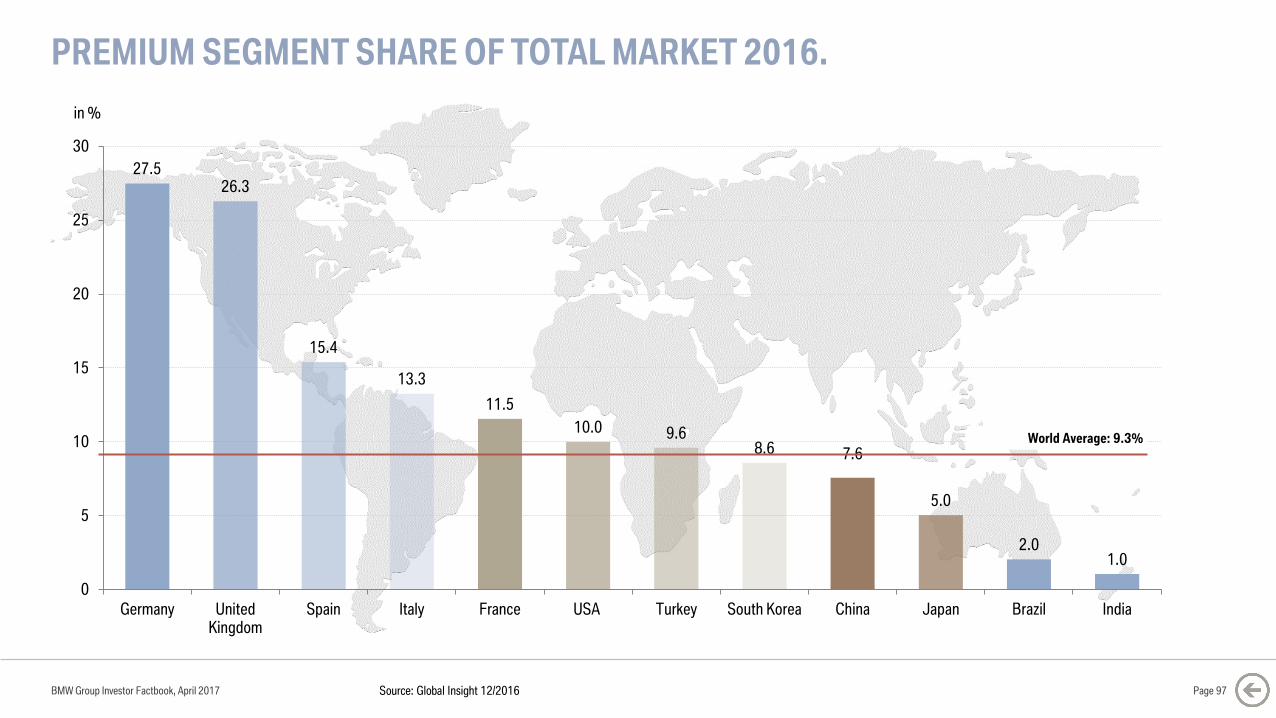
27.526.3
15.4
13.3
11.5
10.0 9.68.6 7.6
5.0
2.01.0
0
5
10
15
20
25
30
Germany UnitedKingdom
Spain Italy France USA Turkey South Korea China Japan Brazil India
PREMIUM SEGMENT SHARE OF TOTAL MARKET 2016.
BMW Group Investor Factbook, April 2017 Page 97
in %
World Average: 9.3%
Source: Global Insight 12/2016
0
1,000
2,000
3,000
4,000
5,000
6,000
7,000
8,000
9,000
10,000
2016 2017 2018 2019 2020 2021
*BRIKT refers to Brazil, Russia, India, South Korea and Turkey Source: Global Insight 12/2016
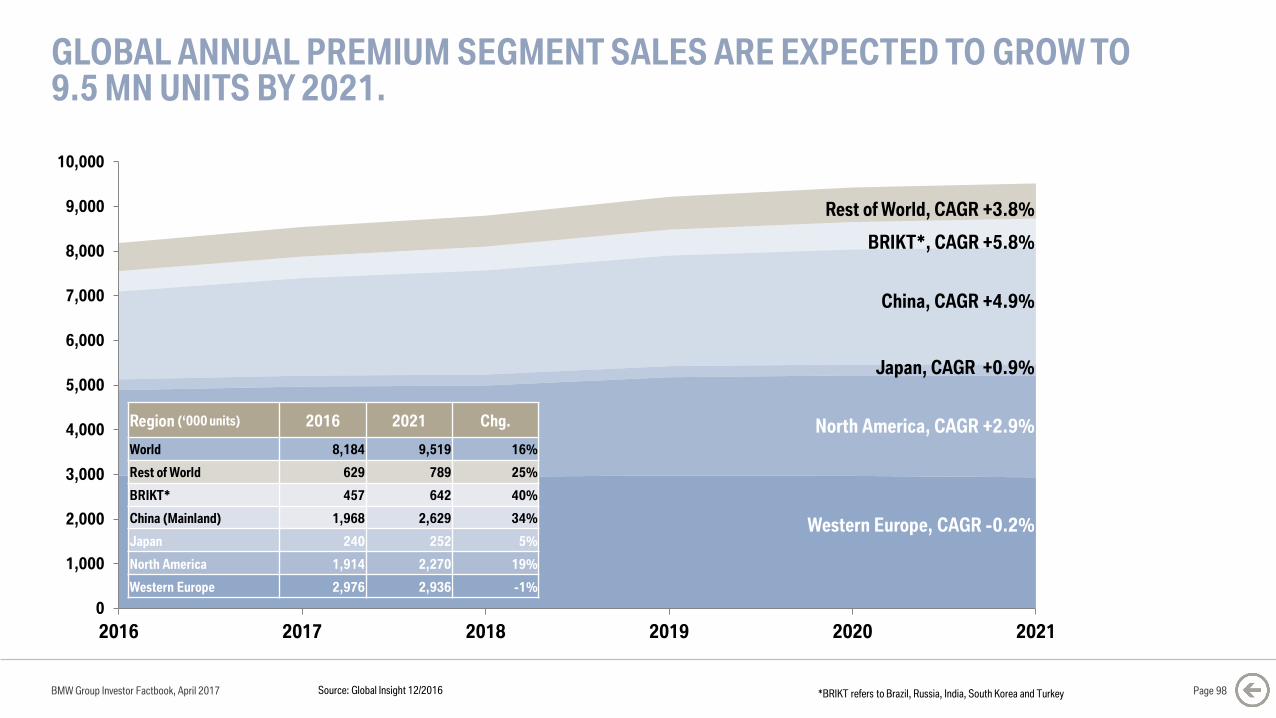
GLOBAL ANNUAL PREMIUM SEGMENT SALES ARE EXPECTED TO GROW TO 9.5 MN UNITS BY 2021.
BMW Group Investor Factbook, April 2017 Page 98
China, CAGR +4.9%
Japan, CAGR +0.9%
North America, CAGR +2.9%
Western Europe, CAGR -0.2%
Rest of World, CAGR +3.8%
BRIKT*, CAGR +5.8%
Region (‘000 units) 2016 2021 Chg.
World 8,184 9,519 16%
Rest of World 629 789 25%
BRIKT* 457 642 40%
China (Mainland) 1,968 2,629 34%
Japan 240 252 5%
North America 1,914 2,270 19%
Western Europe 2,976 2,936 -1%
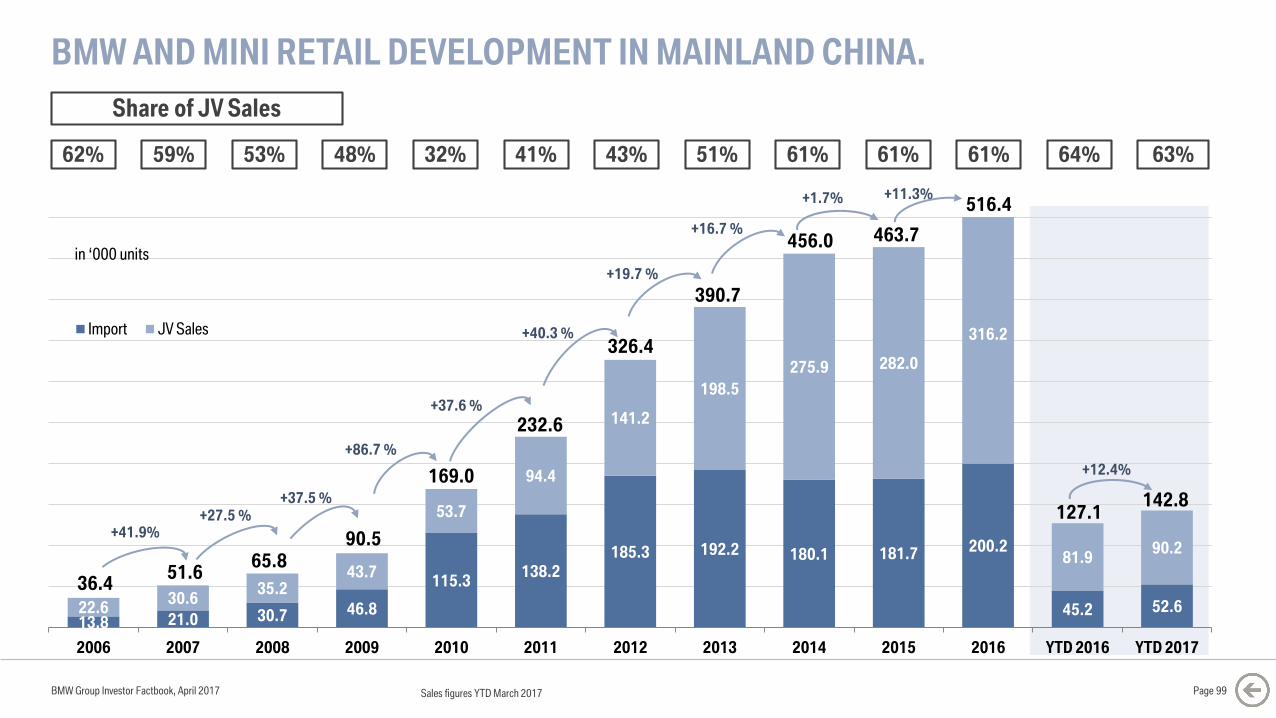
BMW AND MINI RETAIL DEVELOPMENT IN MAINLAND CHINA.
BMW Group Investor Factbook, April 2017 Page 99
59% 53% 48% 32% 61%41% 43%
Share of JV Sales
51% 61%
13.8 21.0 30.7 46.8
115.3138.2
185.3 192.2 180.1 181.7 200.2
45.2 52.622.630.6
35.243.7
53.7
94.4
141.2
198.5
275.9 282.0
316.2
81.990.2
2006 2007 2008 2009 2010 2011 2012 2013 2014 2015 2016 YTD 2016 YTD 2017
Import JV Sales
51.665.8
90.5
169.0
232.6
326.4
in ‘000 units
390.7
456.0
+27.5 %
+37.5 %
+86.7 %
+37.6 %
+40.3 %
+19.7 %
+16.7 %
+1.7% 516.4
61% 64%
463.7
+11.3%
+12.4%
63%
127.1142.8
62%
36.4
+41.9%
Sales figures YTD March 2017
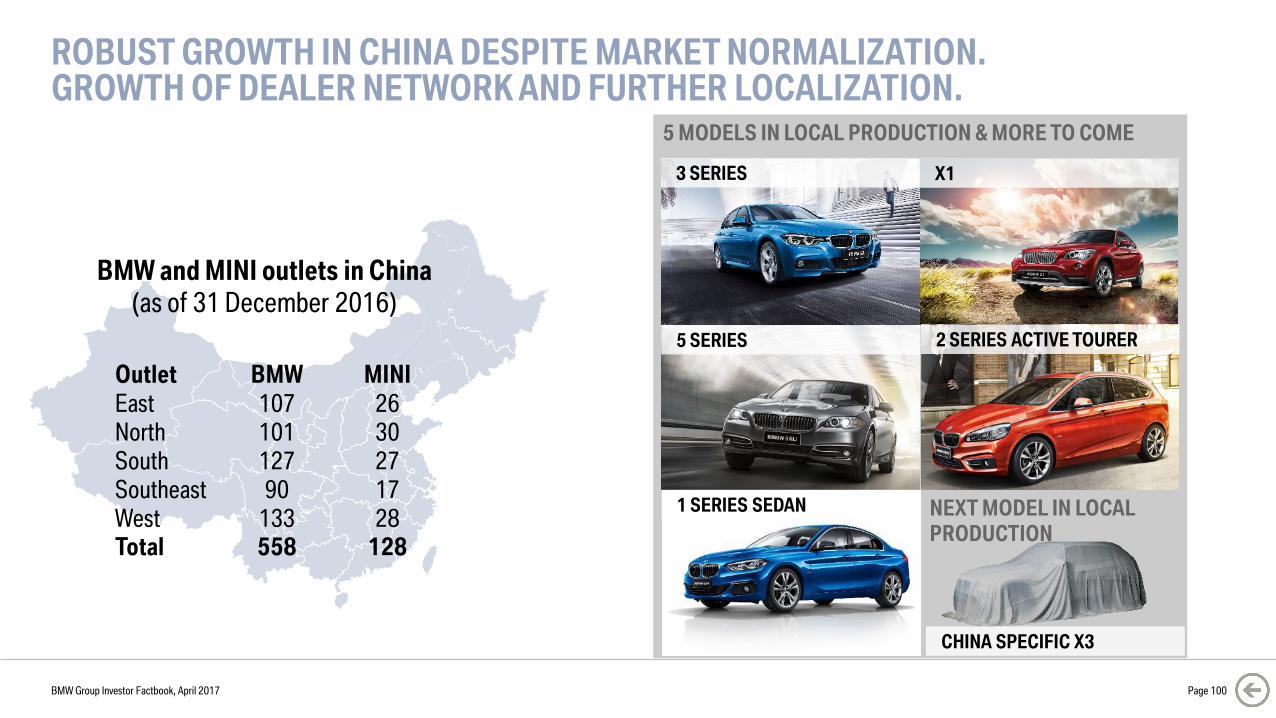
5 MODELS IN LOCAL PRODUCTION & MORE TO COME
ROBUST GROWTH IN CHINA DESPITE MARKET NORMALIZATION.GROWTH OF DEALER NETWORK AND FURTHER LOCALIZATION.
BMW Group Investor Factbook, April 2017 Page 100
BMW and MINI outlets in China
(as of 31 December 2016)
Outlet BMW MINI
East 107 26
North 101 30
South 127 27
Southeast 90 17
West 133 28Total 558 128
3 SERIES
5 SERIES
X1
CHINA SPECIFIC X3
2 SERIES ACTIVE TOURER
NEXT MODEL IN LOCAL
PRODUCTION
1 SERIES SEDAN
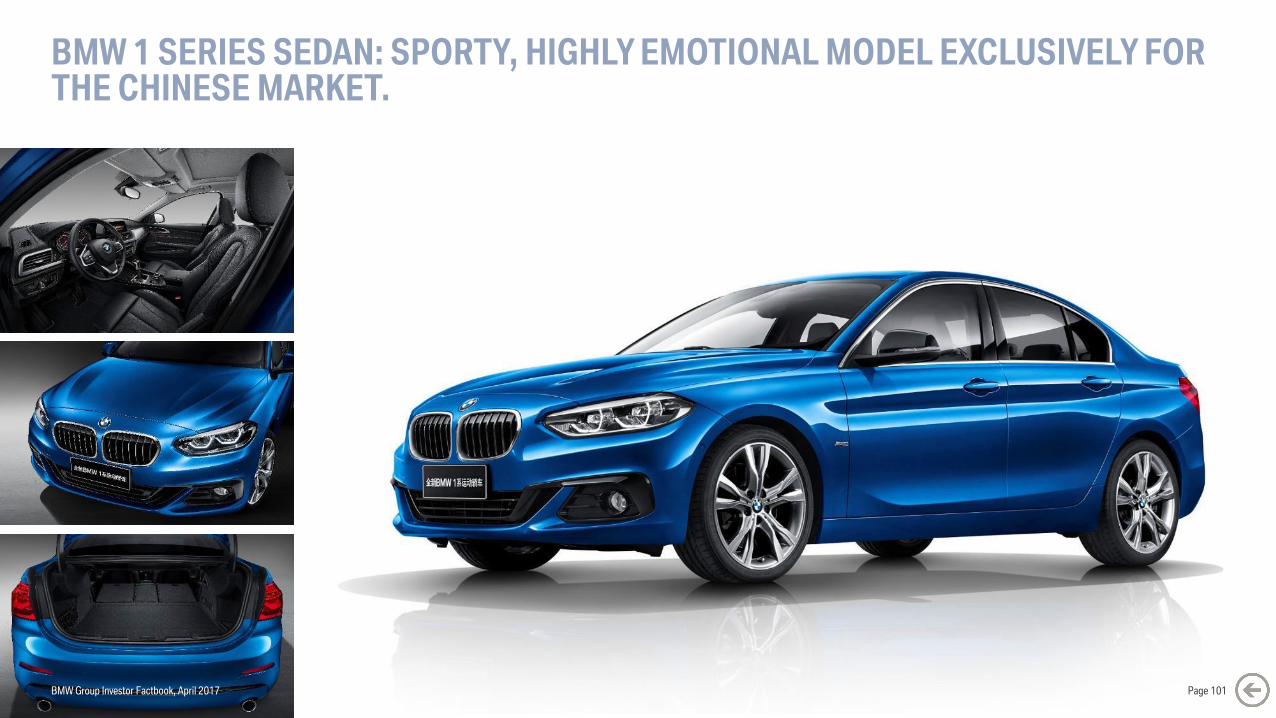
BMW 1 SERIES SEDAN: SPORTY, HIGHLY EMOTIONAL MODEL EXCLUSIVELY FOR THE CHINESE MARKET.
BMW Group Investor Factbook, April 2017 Page 101
Source: BMW & MINI Retail data, FY-2016
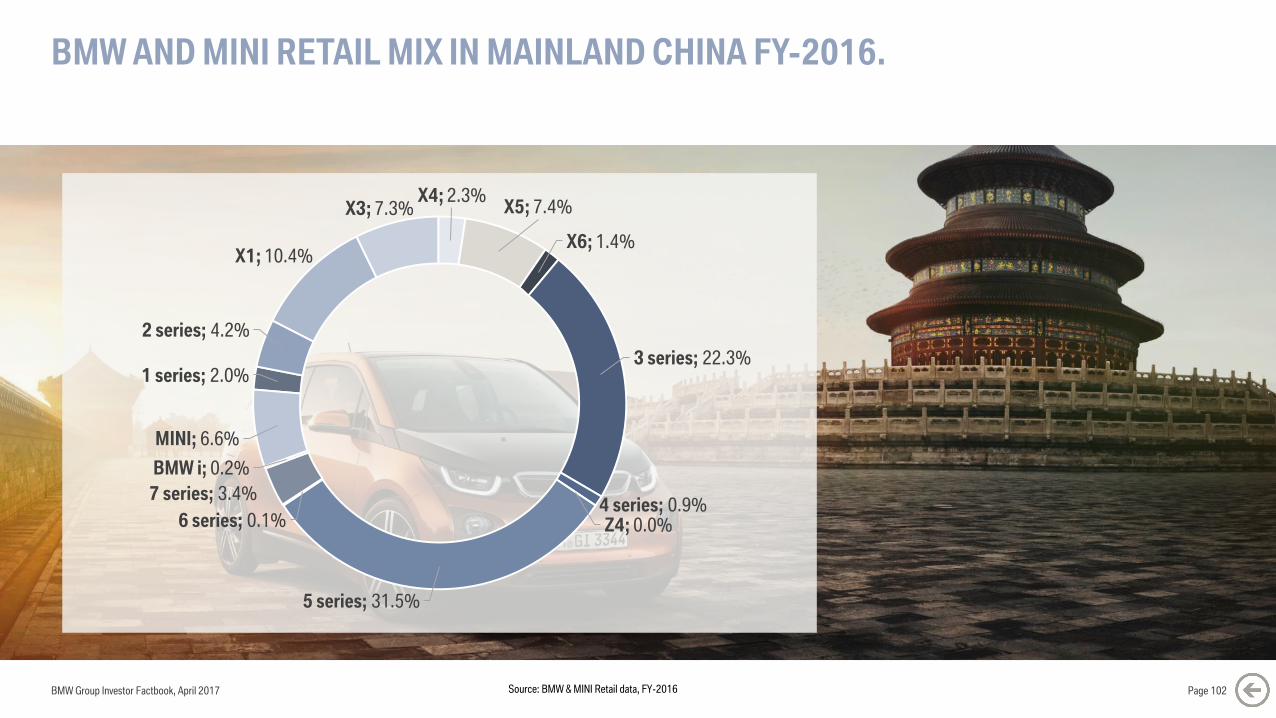
BMW AND MINI RETAIL MIX IN MAINLAND CHINA FY-2016.
BMW Group Investor Factbook, April 2017 Page 102
1 series; 2.0%
2 series; 4.2%
X1; 10.4%
X3; 7.3%X4; 2.3%
X5; 7.4%
X6; 1.4%
3 series; 22.3%
4 series; 0.9%Z4; 0.0%
5 series; 31.5%
6 series; 0.1%
7 series; 3.4%
BMW i; 0.2%
MINI; 6.6%
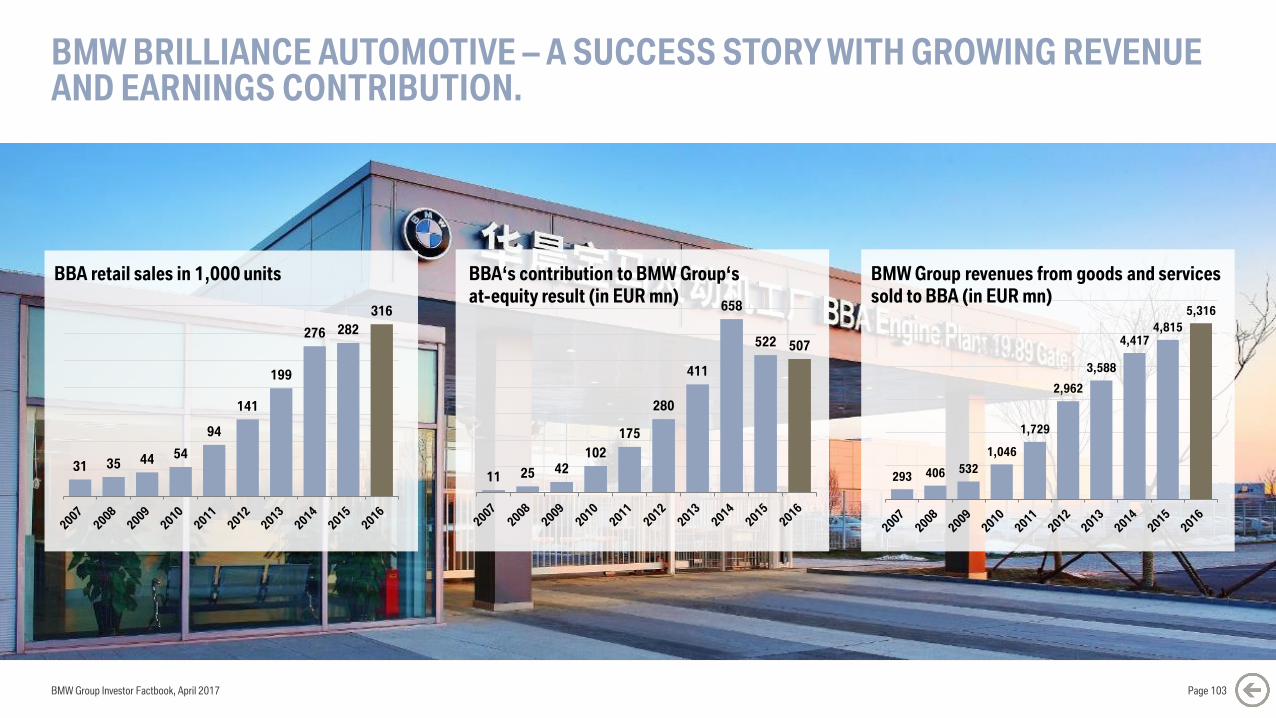
BMW BRILLIANCE AUTOMOTIVE – A SUCCESS STORY WITH GROWING REVENUE AND EARNINGS CONTRIBUTION.
BMW Group Investor Factbook, April 2017 Page 103
31 35 44 54
94
141
199
276 282
316
BBA retail sales in 1,000 units
11 25 42
102
175
280
411
658
522 507
293 406 532
1,046
1,729
2,962
3,588
4,4174,815
5,316
BMW Group revenues from goods and services
sold to BBA (in EUR mn)
BBA‘s contribution to BMW Group‘s
at-equity result (in EUR mn)
BMW Group Investor Factbook, April 2017
CONTENT.
Page 104
5 GROUP FINANCIALS
7 MOTORCYCLES
8 FINANCIAL SERVICES
9 MARKETS
12 DEBT & RATINGS
13 CONTACT & CALENDAR6 AUTOMOTIVE
11 BMW SHARES
1 STRATEGY NUMBER ONE NEXT
2 E-MOBILITY
3 AUTONOMOUS DRIVING
4 MOBILITY SERVICES
10 SUSTAINABILITY
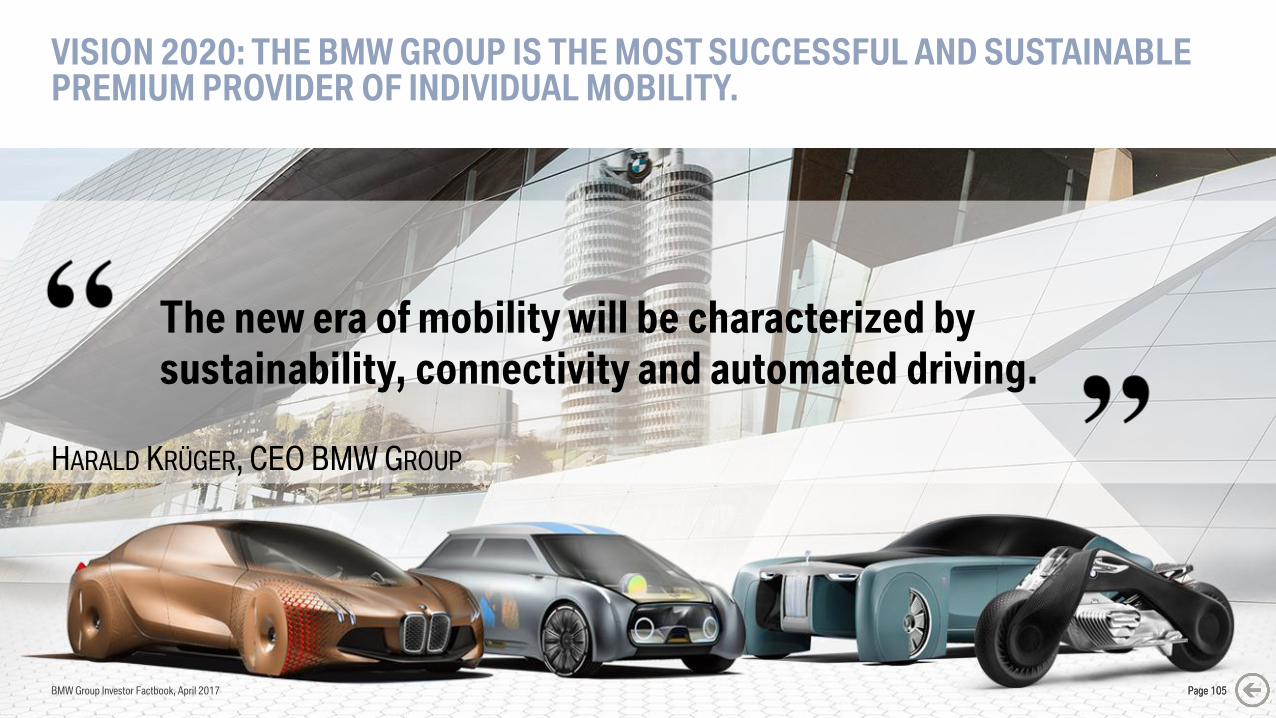
VISION 2020: THE BMW GROUP IS THE MOST SUCCESSFUL AND SUSTAINABLEPREMIUM PROVIDER OF INDIVIDUAL MOBILITY.
The new era of mobility will be characterized by
sustainability, connectivity and automated driving.
HARALD KRÜGER, CEO BMW GROUP
Page 105BMW Group Investor Factbook, April 2017 Page 105
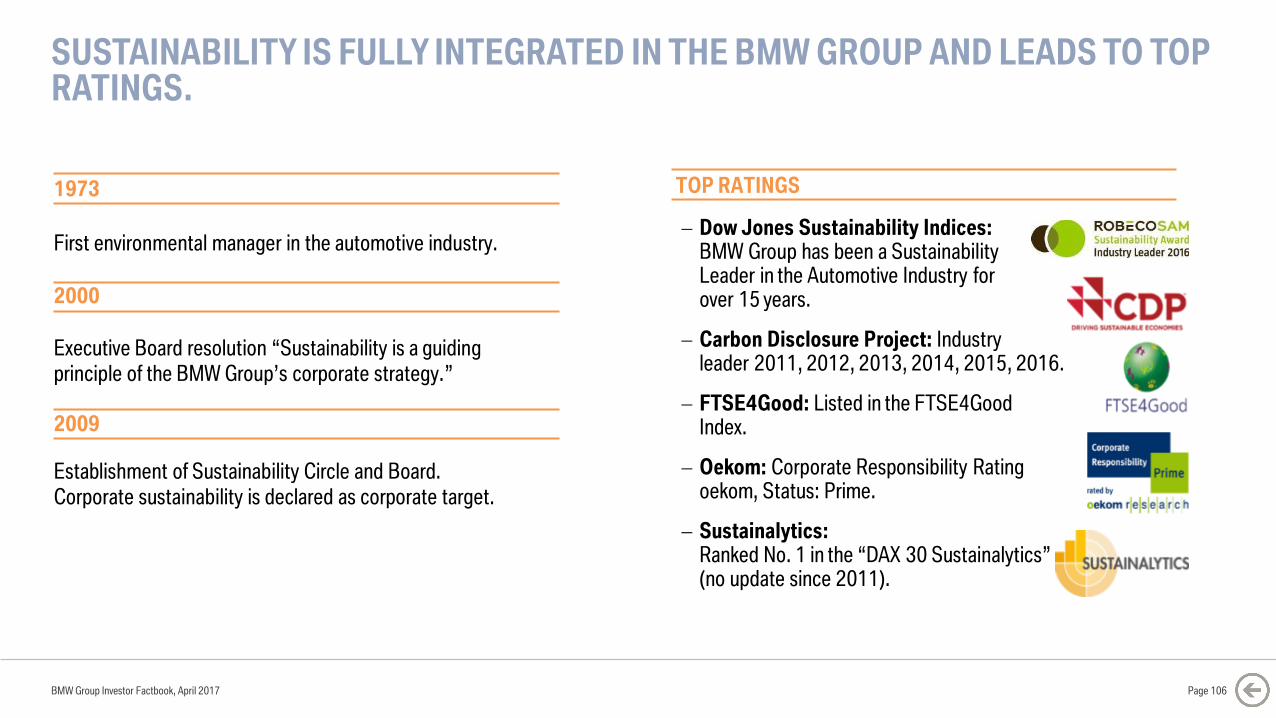
SUSTAINABILITY IS FULLY INTEGRATED IN THE BMW GROUP AND LEADS TO TOP RATINGS.
BMW Group Investor Factbook, April 2017
First environmental manager in the automotive industry.
Establishment of Sustainability Circle and Board.
Corporate sustainability is declared as corporate target.
Executive Board resolution “Sustainability is a guiding
principle of the BMW Group’s corporate strategy.”
1973
2000
2009
TOP RATINGS
Dow Jones Sustainability Indices: BMW Group has been a SustainabilityLeader in the Automotive Industry for over 15 years.
Carbon Disclosure Project: Industryleader 2011, 2012, 2013, 2014, 2015, 2016.
FTSE4Good: Listed in the FTSE4Good Index.
Oekom: Corporate Responsibility Rating oekom, Status: Prime.
Sustainalytics:Ranked No. 1 in the “DAX 30 Sustainalytics” (no update since 2011).
Page 106
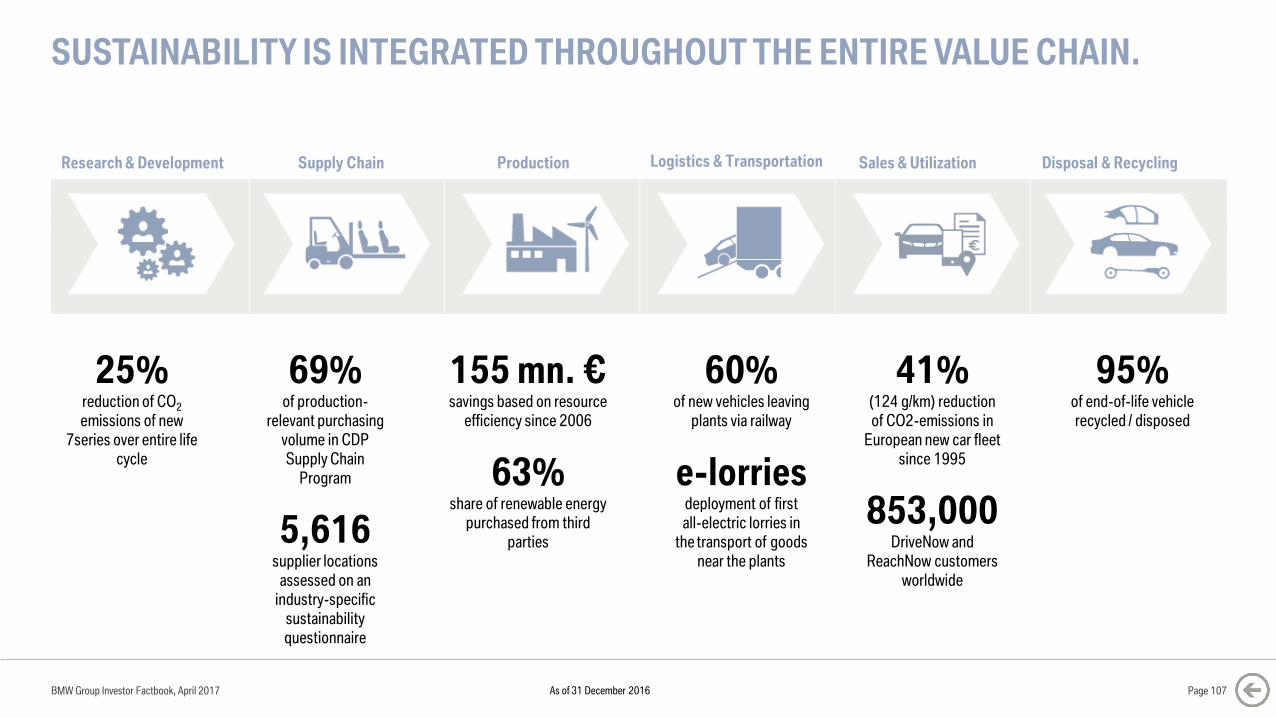
SUSTAINABILITY IS INTEGRATED THROUGHOUT THE ENTIRE VALUE CHAIN.
BMW Group Investor Factbook, April 2017 Page 107
25% reduction of CO2
emissions of new
7series over entire life
cycle
69% of production-
relevant purchasing
volume in CDP
Supply Chain
Program
5,616supplier locations
assessed on an
industry-specific
sustainability
questionnaire
155 mn. €savings based on resource
efficiency since 2006
63%share of renewable energy
purchased from third
parties
60% of new vehicles leaving
plants via railway
e-lorriesdeployment of first
all-electric lorries in
the transport of goods
near the plants
41%(124 g/km) reduction
of CO2-emissions in
European new car fleet
since 1995
853,000DriveNow and
ReachNow customers
worldwide
95% of end-of-life vehicle
recycled / disposed
Research & Development Supply Chain Production Logistics & Transportation Sales & Utilization Disposal & Recycling
As of 31 December 2016
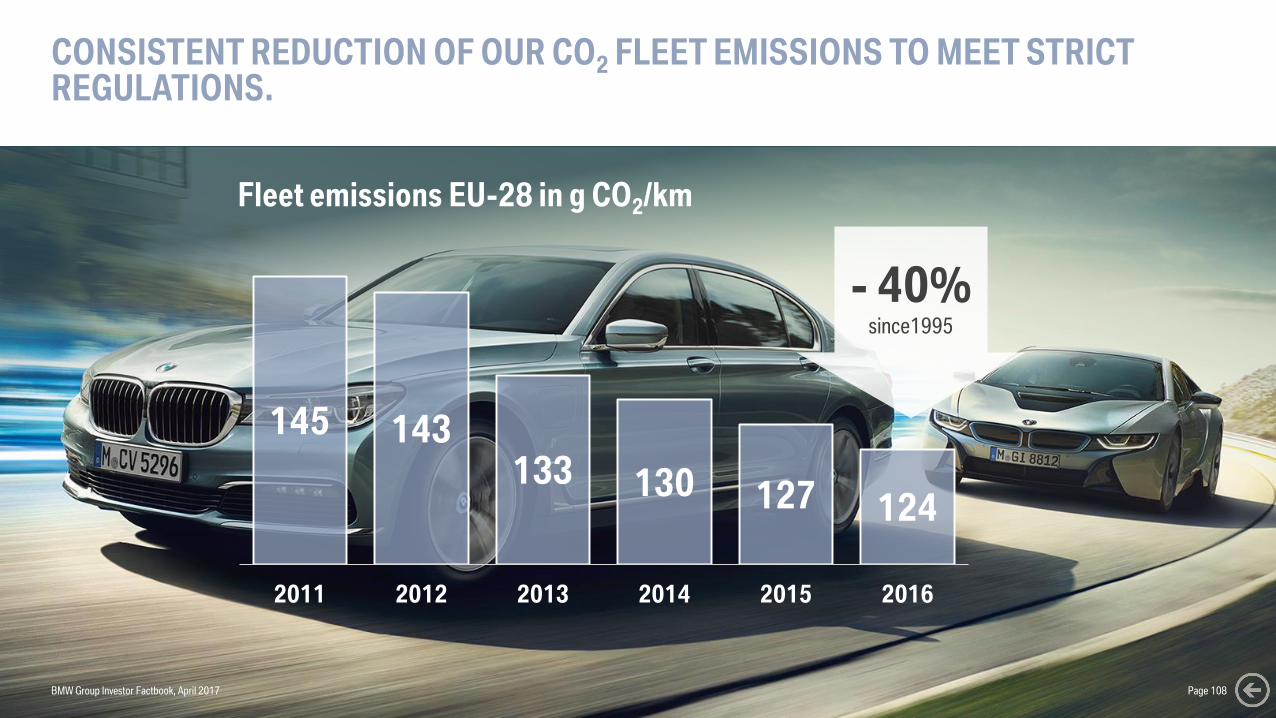
CONSISTENT REDUCTION OF OUR CO2 FLEET EMISSIONS TO MEET STRICT REGULATIONS.
145 143133 130 127 124
2011 2012 2013 2014 2015 2016
Fleet emissions EU-28 in g CO2/km
- 40%since1995
BMW Group Investor Factbook, April 2017 Page 108
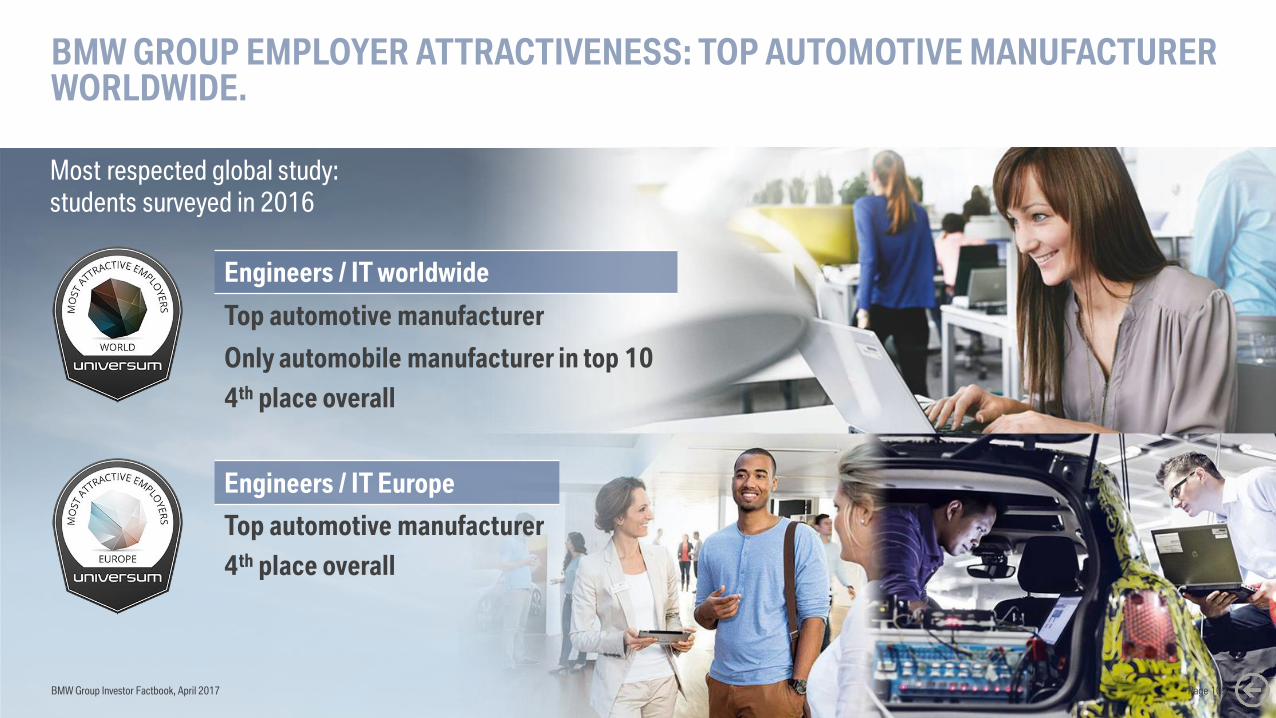
BMW GROUP EMPLOYER ATTRACTIVENESS: TOP AUTOMOTIVE MANUFACTURER WORLDWIDE.
Engineers / IT worldwide
Top automotive manufacturer
Only automobile manufacturer in top 10
4th place overall
Engineers / IT Europe
Top automotive manufacturer
4th place overall
Most respected global study:
students surveyed in 2016
BMW Group Investor Factbook, April 2017 Page 109
BMW Group Investor Factbook, April 2017
CONTENT.
Page 110
5 GROUP FINANCIALS
7 MOTORCYCLES
8 FINANCIAL SERVICES
9 MARKETS
12 DEBT & RATINGS
13 CONTACT & CALENDAR6 AUTOMOTIVE
11 BMW SHARES
1 STRATEGY NUMBER ONE NEXT
2 E-MOBILITY
3 AUTONOMOUS DRIVING
4 MOBILITY SERVICES
10 SUSTAINABILITY
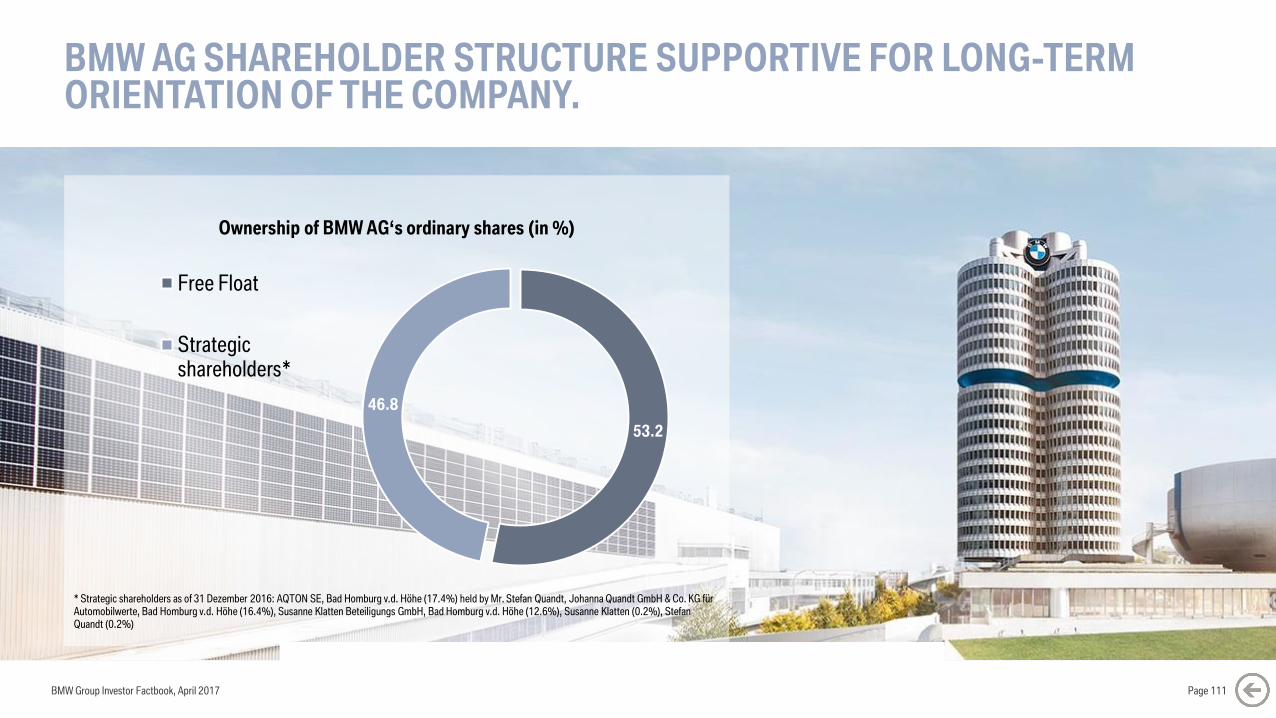
BMW AG SHAREHOLDER STRUCTURE SUPPORTIVE FOR LONG-TERM ORIENTATION OF THE COMPANY.
53.2
46.8
Free Float
Strategicshareholders*
Ownership of BMW AG‘s ordinary shares (in %)
* Strategic shareholders as of 31 Dezember 2016: AQTON SE, Bad Homburg v.d. Höhe (17.4%) held by Mr. Stefan Quandt, Johanna Quandt GmbH & Co. KG für Automobilwerte, Bad Homburg v.d. Höhe (16.4%), Susanne Klatten Beteiligungs GmbH, Bad Homburg v.d. Höhe (12.6%), Susanne Klatten (0.2%), Stefan Quandt (0.2%)
Page 111BMW Group Investor Factbook, April 2017
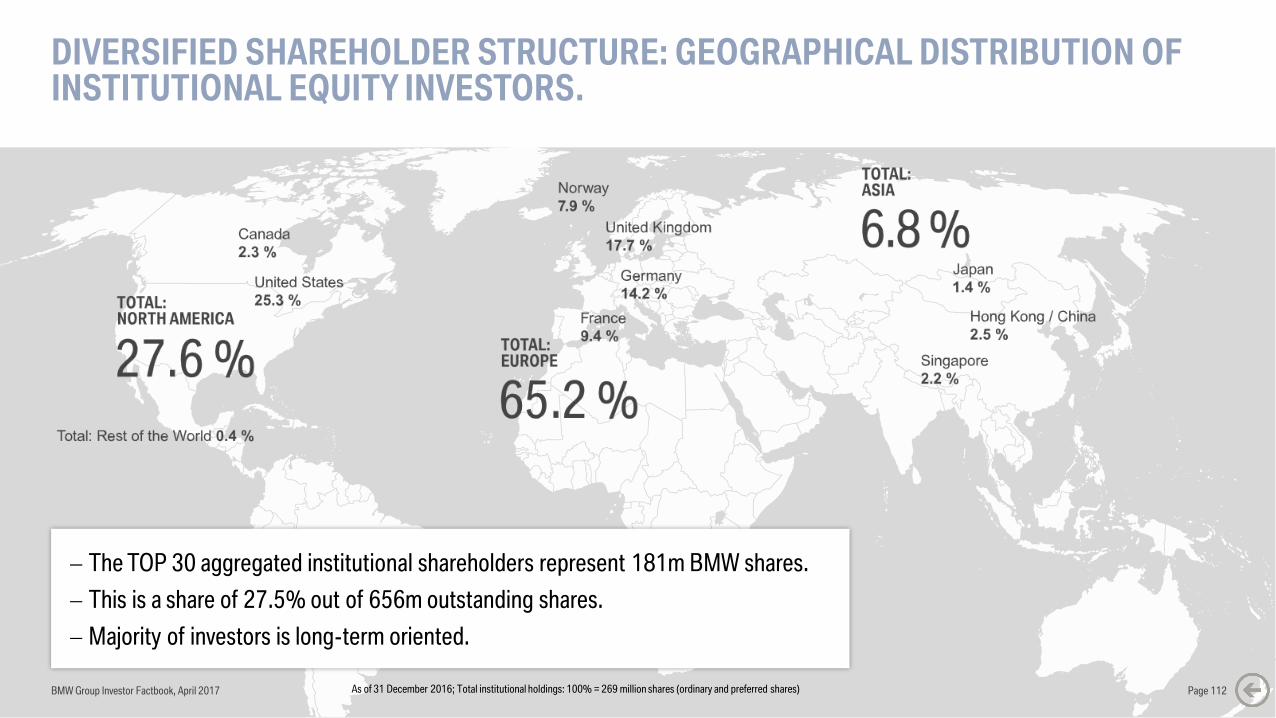
DIVERSIFIED SHAREHOLDER STRUCTURE: GEOGRAPHICAL DISTRIBUTION OF INSTITUTIONAL EQUITY INVESTORS.
BMW Group Investor Factbook, April 2017 Page 112As of 31 December 2016; Total institutional holdings: 100% = 269 million shares (ordinary and preferred shares)
The TOP 30 aggregated institutional shareholders represent 181m BMW shares.
This is a share of 27.5% out of 656m outstanding shares.
Majority of investors is long-term oriented.
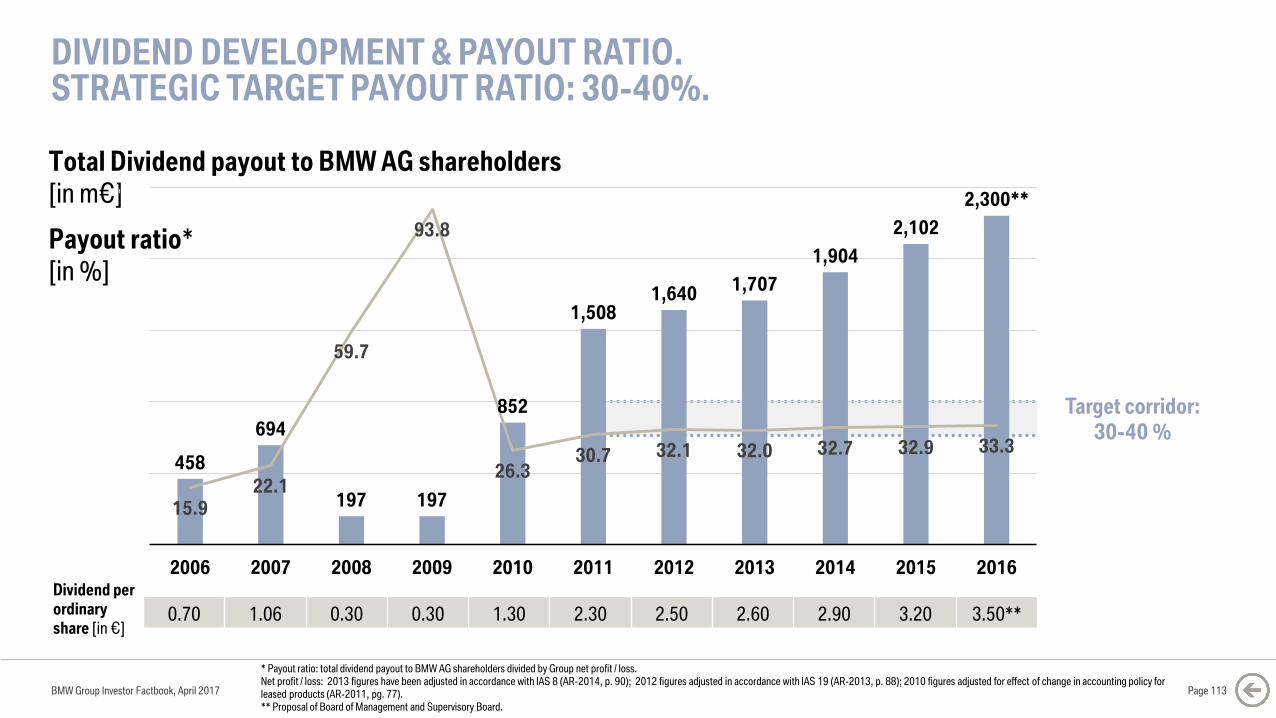
DIVIDEND DEVELOPMENT & PAYOUT RATIO.STRATEGIC TARGET PAYOUT RATIO: 30-40%.
BMW Group Investor Factbook, April 2017 Page 113
* Payout ratio: total dividend payout to BMW AG shareholders divided by Group net profit / loss.Net profit / loss: 2013 figures have been adjusted in accordance with IAS 8 (AR-2014, p. 90); 2012 figures adjusted in accordance with IAS 19 (AR-2013, p. 88); 2010 figures adjusted for effect of change in accounting policy for leased products (AR-2011, pg. 77).** Proposal of Board of Management and Supervisory Board.
0.70 1.06 0.30 0.30 1.30 2.30 2.50 2.60 2.90 3.20 3.50**
Dividend per
ordinary
share [in €]
Target corridor:
30-40 %
Total Dividend payout to BMW AG shareholders
[in m€]
Payout ratio*
[in %]
458
694
197 197
852
1,5081,640
1,707
1,904
2,102
2,300**
15.9
22.1
59.7
93.8
26.330.7 32.1 32.0 32.7 32.9 33.3
0
10
20
30
40
50
60
70
80
90
100
0
500
1,000
1,500
2,000
2,500
2006 2007 2008 2009 2010 2011 2012 2013 2014 2015 2016
BMW Group Investor Factbook, April 2017
CONTENT.
Page 114
5 GROUP FINANCIALS
7 MOTORCYCLES
8 FINANCIAL SERVICES
9 MARKETS
12 DEBT & RATINGS
13 CONTACT & CALENDAR6 AUTOMOTIVE
11 BMW SHARES
1 STRATEGY NUMBER ONE NEXT
2 E-MOBILITY
3 AUTONOMOUS DRIVING
4 MOBILITY SERVICES
10 SUSTAINABILITY
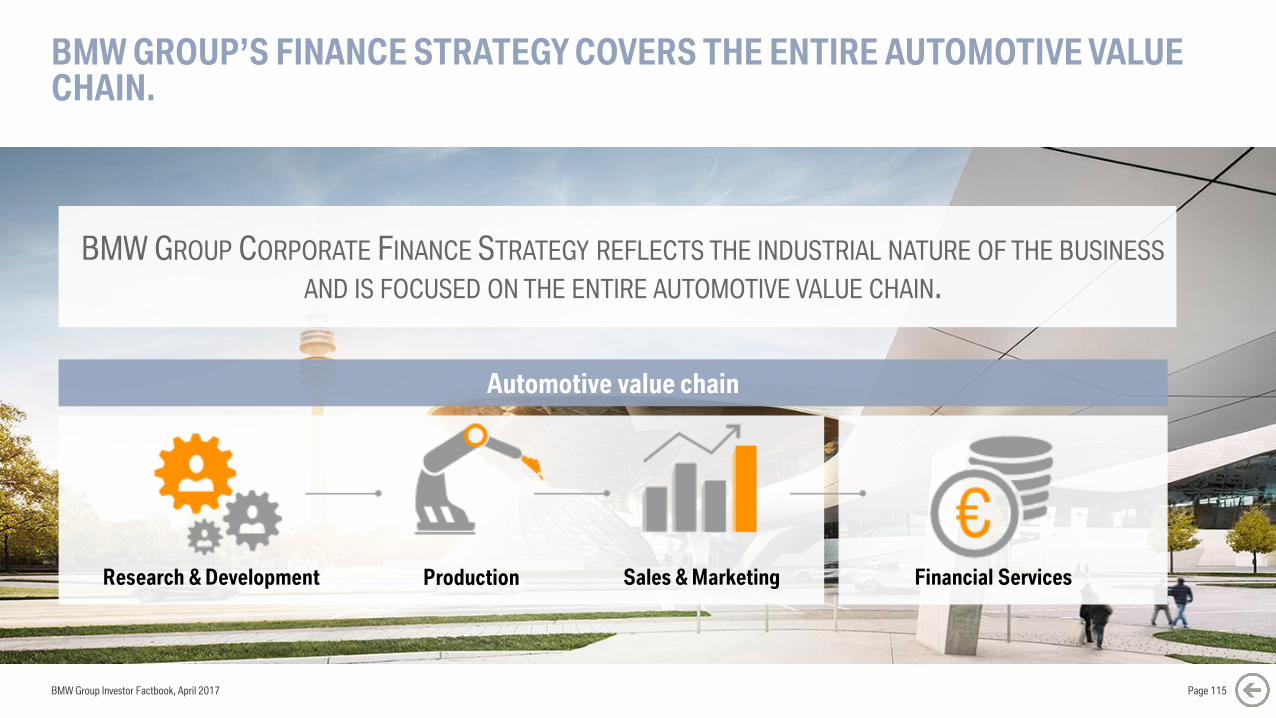
BMW GROUP’S FINANCE STRATEGY COVERS THE ENTIRE AUTOMOTIVE VALUE CHAIN.
Page 115BMW Group Investor Factbook, April 2017
Research & Development Production Financial ServicesSales & Marketing
BMW GROUP CORPORATE FINANCE STRATEGY REFLECTS THE INDUSTRIAL NATURE OF THE BUSINESS
AND IS FOCUSED ON THE ENTIRE AUTOMOTIVE VALUE CHAIN.
Automotive value chain
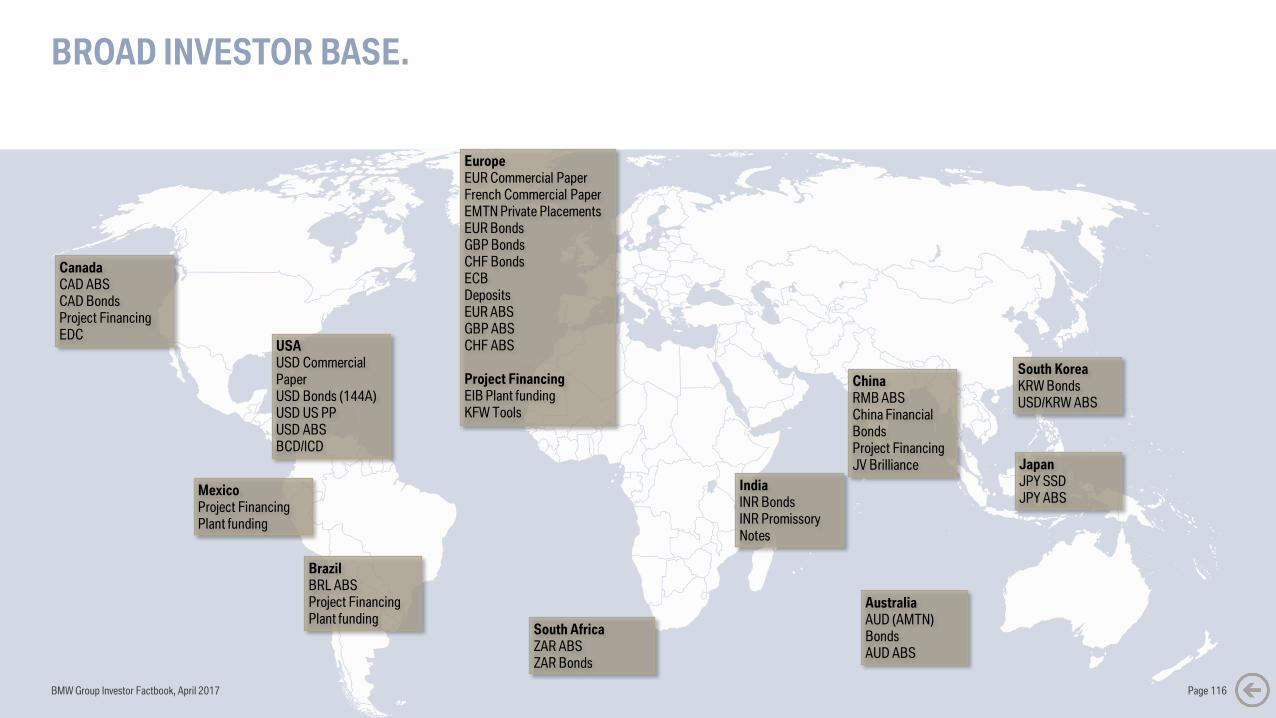
BROAD INVESTOR BASE.
USA
USD Commercial
PaperUSD Bonds (144A)USD US PPUSD ABSBCD/ICD
Canada
CAD ABSCAD BondsProject FinancingEDC
Brazil
BRL ABSProject FinancingPlant funding
Mexico
Project FinancingPlant funding
Europe
EUR Commercial PaperFrench Commercial PaperEMTN Private PlacementsEUR BondsGBP BondsCHF BondsECB Deposits
EUR ABSGBP ABSCHF ABS
Project Financing
EIB Plant funding KFW Tools
Japan
JPY SSDJPY ABS
Australia
AUD (AMTN) BondsAUD ABS
South Africa
ZAR ABSZAR Bonds
India
INR BondsINR Promissory Notes
South Korea
KRW BondsUSD/KRW ABS
China
RMB ABSChina Financial BondsProject FinancingJV Brilliance
BMW Group Investor Factbook, April 2017 Page 116
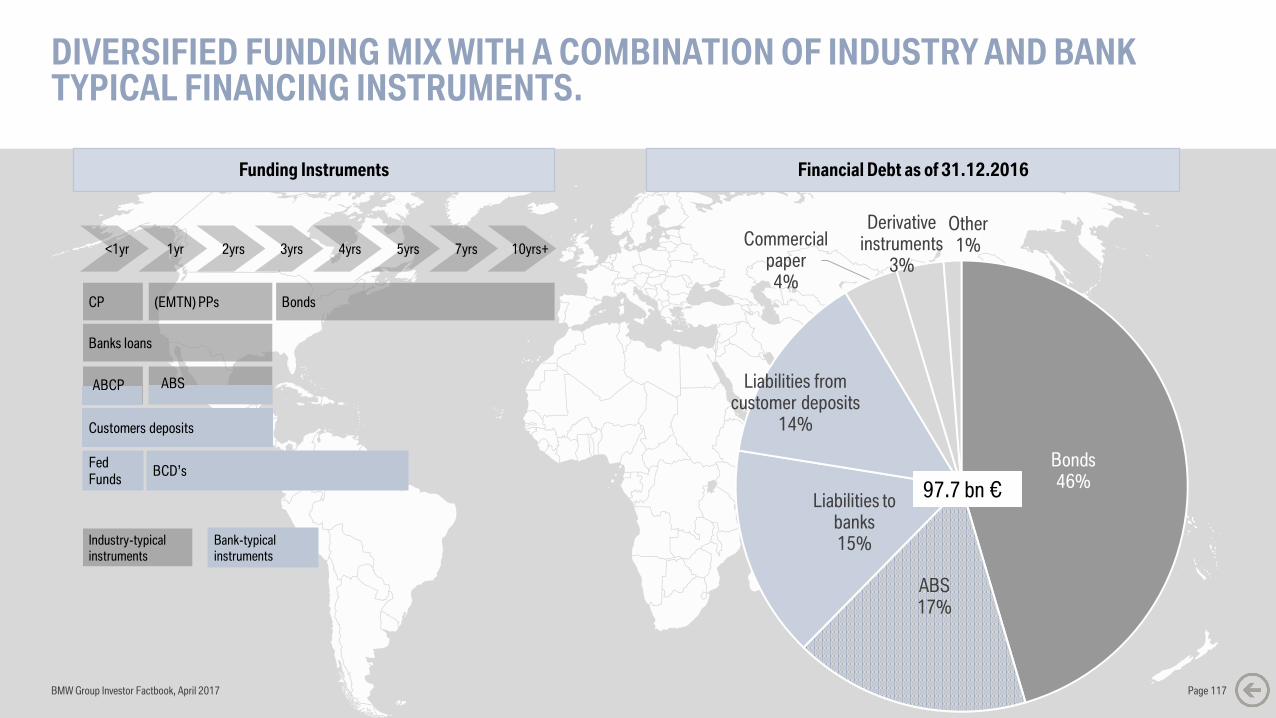
DIVERSIFIED FUNDING MIX WITH A COMBINATION OF INDUSTRY AND BANK TYPICAL FINANCING INSTRUMENTS.
BMW Group Investor Factbook, April 2017 Page 117
CP
<1yr 1yr 2yrs 3yrs 4yrs 5yrs 7yrs 10yrs+
(EMTN) PPs Bonds
Customers deposits
Banks loans
FedFunds
BCD’s
Bank-typical
instruments
Industry-typical
instruments
ABS ABCP
Funding Instruments Financial Debt as of 31.12.2016
Bonds46%
ABS17%
Liabilities to banks15%
Liabilities from customer deposits
14%
Commercial paper
4%
Derivative instruments
3%
Other1%
97.7 bn €
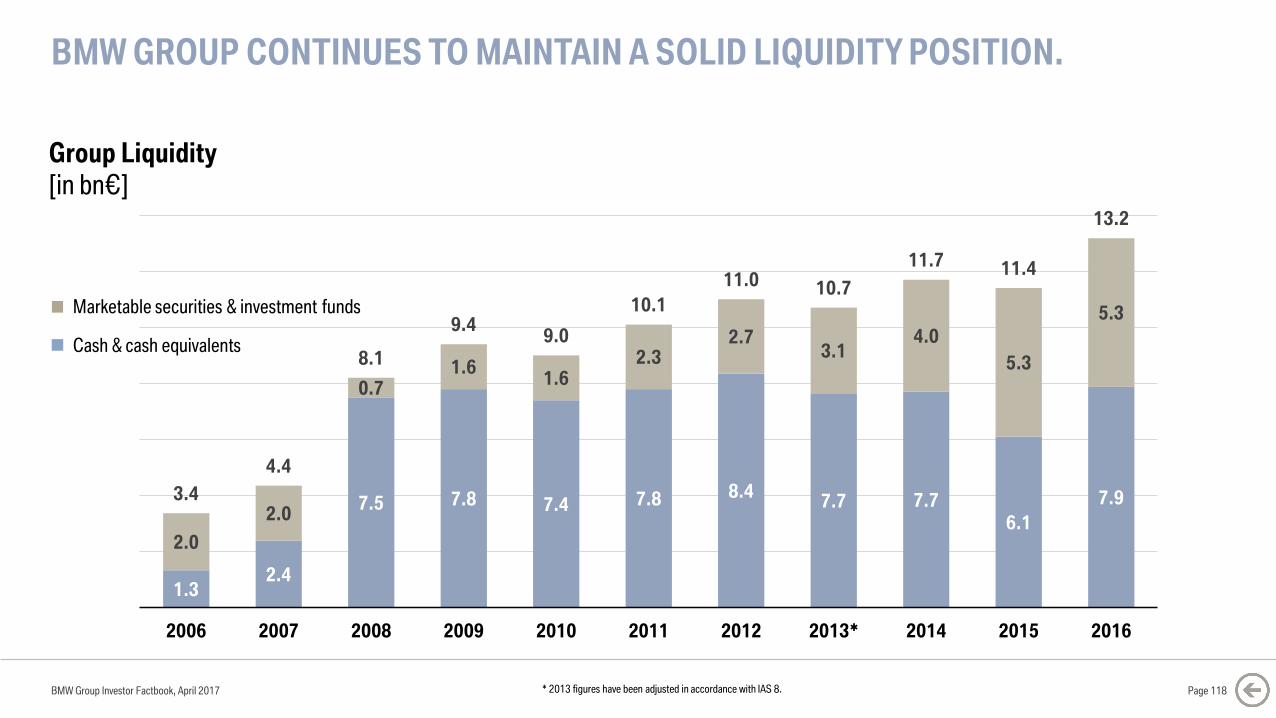
BMW GROUP CONTINUES TO MAINTAIN A SOLID LIQUIDITY POSITION.
Page 118
1.32.4
7.5 7.8 7.4 7.8 8.47.7 7.7
6.1
7.9
2.0
2.0
0.71.6
1.62.3
2.73.1
4.0
5.3
5.3
3.4
4.4
8.1
9.49.0
10.1
11.0 10.7
11.7 11.4
13.2
0.0
2.0
4.0
6.0
8.0
10.0
12.0
14.0
2006 2007 2008 2009 2010 2011 2012 2013* 2014 2015 2016
Group Liquidity
[in bn€]
Marketable securities & investment funds
Cash & cash equivalents
* 2013 figures have been adjusted in accordance with IAS 8.BMW Group Investor Factbook, April 2017
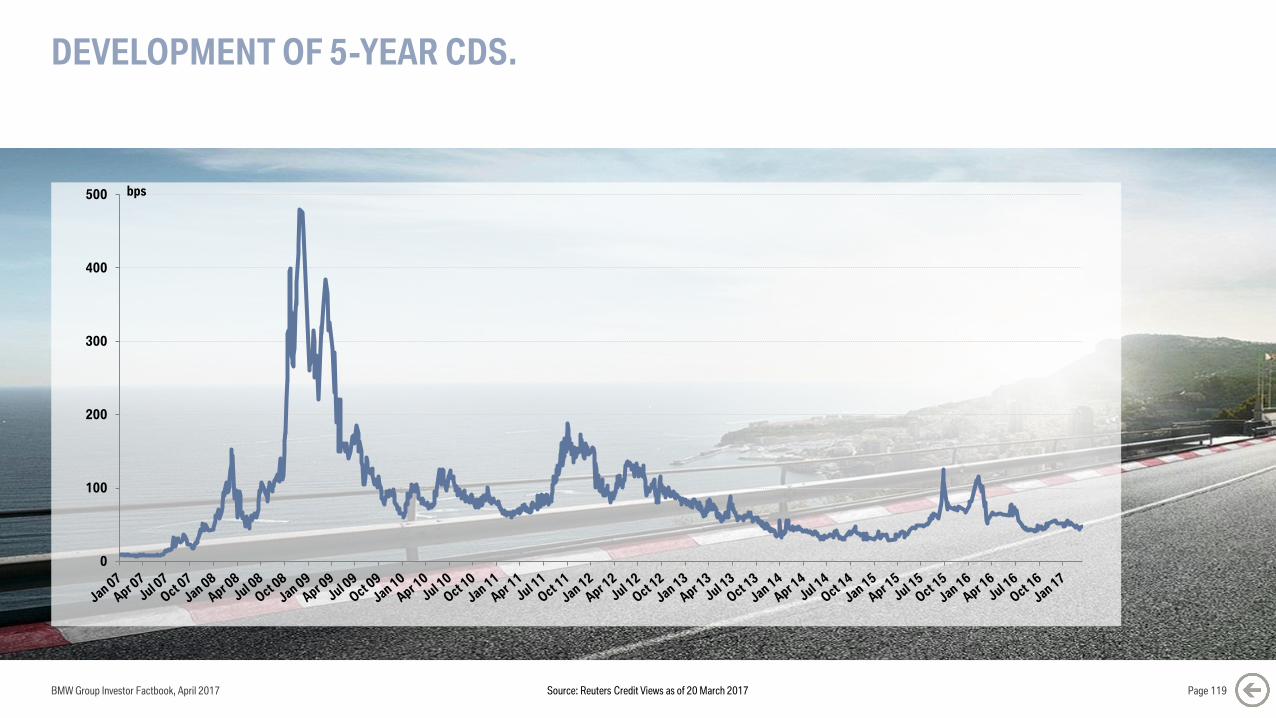
DEVELOPMENT OF 5-YEAR CDS.
BMW Group Investor Factbook, April 2017 Page 119
0
100
200
300
400
500
Source: Reuters Credit Views as of 20 March 2017
bps
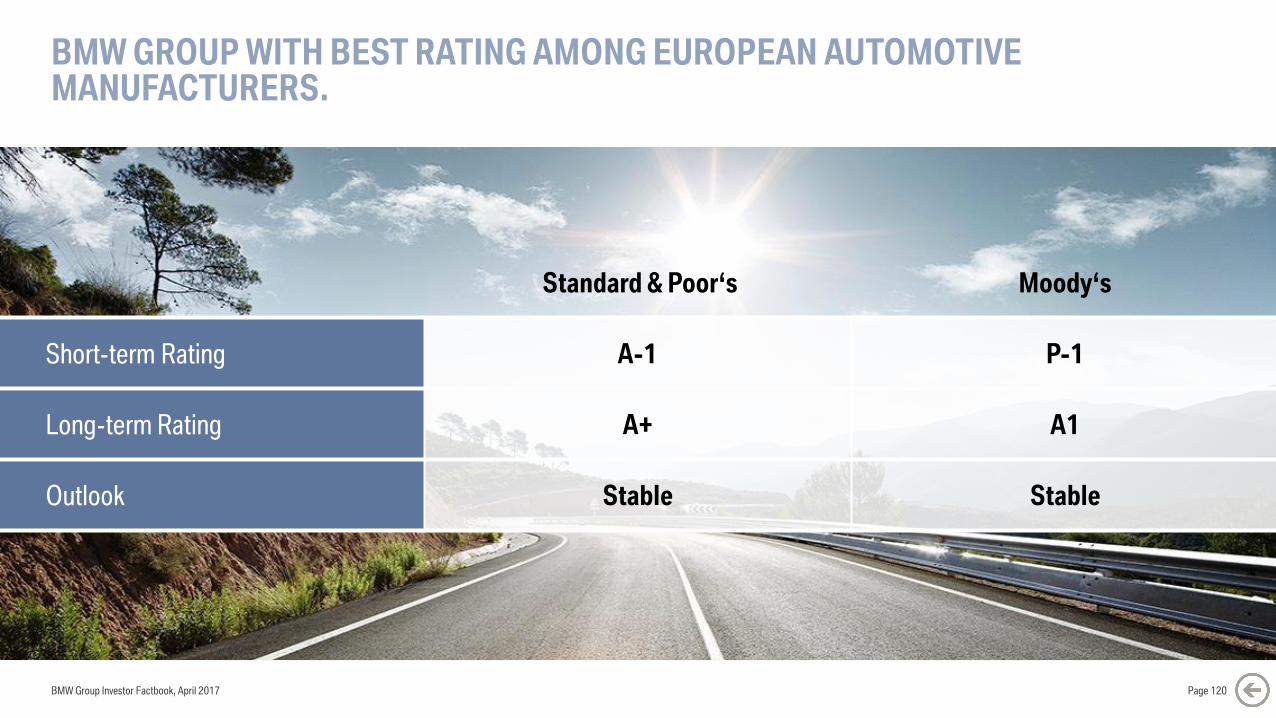
BMW GROUP WITH BEST RATING AMONG EUROPEAN AUTOMOTIVE MANUFACTURERS.
Page 120
Standard & Poor‘s Moody‘s
Short-term Rating A-1 P-1
Long-term Rating A+ A1
Outlook Stable Stable
Page 9
BMW Group Investor Factbook, April 2017
BMW Group Investor Factbook, April 2017
CONTENT.
Page 121
5 GROUP FINANCIALS
7 MOTORCYCLES
8 FINANCIAL SERVICES
9 MARKETS
10 SUSTAINABILITY
12 DEBT & RATINGS
13 CONTACT & CALENDAR6 AUTOMOTIVE
11 BMW SHARES
1 STRATEGY NUMBER ONE NEXT
2 E-MOBILITY
3 AUTONOMOUS DRIVING
4 MOBILITY SERVICES
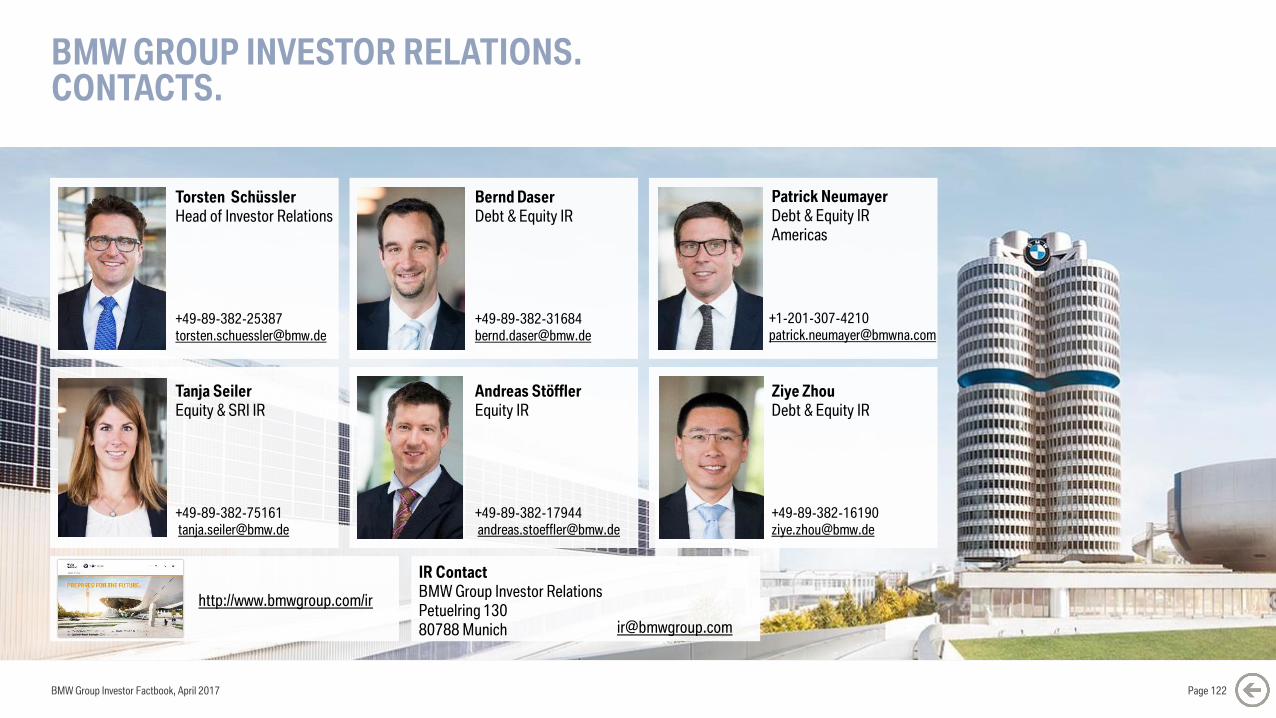
BMW GROUP INVESTOR RELATIONS. CONTACTS.
BMW Group Investor Factbook, April 2017
Torsten Schüssler
Head of Investor Relations
Andreas Stöffler
Equity IR
Bernd Daser
Debt & Equity IR
Ziye Zhou
Debt & Equity IR
Patrick Neumayer
Debt & Equity IR
Americas
Tanja Seiler
Equity & SRI IR
http://www.bmwgroup.com/ir
IR Contact
BMW Group Investor Relations
Petuelring 130
80788 Munich
Page 122
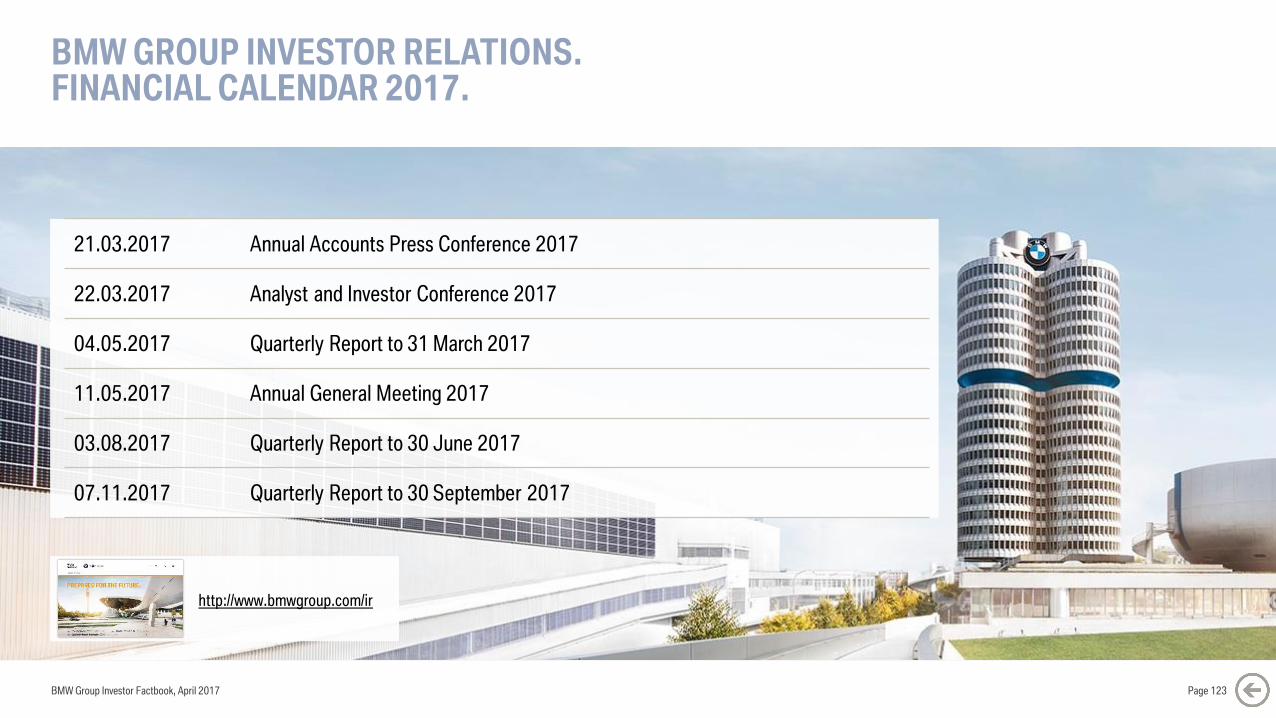
BMW GROUP INVESTOR RELATIONS.FINANCIAL CALENDAR 2017.
BMW Group Investor Factbook, April 2017
21.03.2017 Annual Accounts Press Conference 2017
22.03.2017 Analyst and Investor Conference 2017
04.05.2017 Quarterly Report to 31 March 2017
11.05.2017 Annual General Meeting 2017
03.08.2017 Quarterly Report to 30 June 2017
07.11.2017 Quarterly Report to 30 September 2017
http://www.bmwgroup.com/ir
Page 123
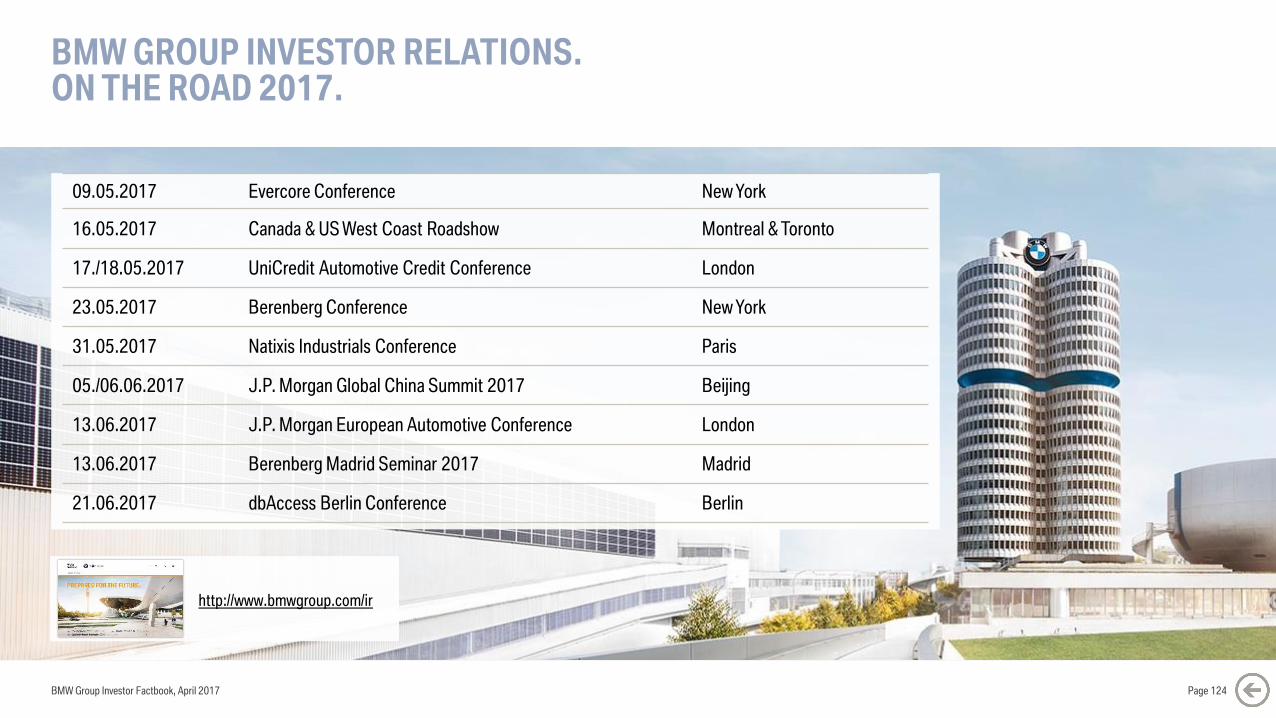
BMW GROUP INVESTOR RELATIONS.ON THE ROAD 2017.
BMW Group Investor Factbook, April 2017
09.05.2017 Evercore Conference New York
16.05.2017 Canada & US West Coast Roadshow Montreal & Toronto
17./18.05.2017 UniCredit Automotive Credit Conference London
23.05.2017 Berenberg Conference New York
31.05.2017 Natixis Industrials Conference Paris
05./06.06.2017 J.P. Morgan Global China Summit 2017 Beijing
13.06.2017 J.P. Morgan European Automotive Conference London
13.06.2017 Berenberg Madrid Seminar 2017 Madrid
21.06.2017 dbAccess Berlin Conference Berlin
http://www.bmwgroup.com/ir
Page 124
DISCLAIMER.
BMW Group Investor Factbook, April 2017 Page 125
This document contains forward-looking statements that reflect BMW Group’s current views about future events. The words
“anticipate,” “assume,” “believe,” “estimate,” “expect,” “intend,” “may,” ”can,” “could,” “plan,” “project,” “should” and
similar expressions are used to identify forward-looking statements.
These statements are subject to many risks and uncertainties or may be affected by factors outside BMW Group’s control,
including adverse developments in global economic conditions resulting in a decline in demand in BMW Group’s key
markets, including China, North America and Europe; a deterioration in credit and financial markets; a shift in consumer
preferences affecting demand for BMW Group’s products; changes in the prices of fuel or raw materials; disruption of
production due to shortages of materials, labor strikes or supplier insolvencies; the effective implementation of BMW
Group’s strategic goals and targets; changes in laws, regulations and government policies, particularly those relating to
vehicle emissions, fuel economy and safety; and other risks and uncertainties, including those described under the heading
“Report on Risks and Opportunities” in BMW Group’s most recent Annual Report.
If any of these risks and uncertainties materializes or if the assumptions underlying any of BMW Group’s forward-looking
statements prove to be incorrect, actual results may be materially different from those BMW Group expresses or implies by
such statements. BMW Group does not intend or assume any obligation to update these forward-looking statements.


