Embed Size (px)
Citation preview

Br
JDa
b
c
d
e
f
a
ARRAA
KMSBAPH
1
eMtbduclo(li
0h
Agriculture, Ecosystems and Environment 178 (2013) 71– 77
Contents lists available at ScienceDirect
Agriculture, Ecosystems and Environment
jo ur nal ho me page: www.elsev ier .com/ locate /agee
iodiversity responses to land use in traditional fruit orchards of aural agricultural landscape
akub Horaka,∗, Alena Peltanovab, Andrea Podavkovac, Lenka Safarovad,e, Petr Boguschf,usan Romportlb, Petr Zasadil c
Czech University of Life Sciences Prague, Faculty of Forestry and Wood Sciences, Kamycka 1176, CZ-165 21 Prague, Czech RepublicCharles University in Prague, Faculty of Science, Vinicna 7, CZ-128 44 Prague, Czech RepublicCzech University of Life Sciences Prague, Faculty of Environmental Sciences, Kamycka 1176, CZ-165 21 Prague 6, Czech RepublicEast Bohemian Museum in Pardubice, Zamek 2, CZ-530 02 Pardubice, Czech RepublicLesak (lesak.eu), Arnosta z Pardubic 2597, CZ-530 02 Pardubice, Czech RepublicUniversity of Hradec Kralove, Faculty of Science, Rokitanskeho 62, CZ-500 03 Hradec Kralove, Czech Republic
r t i c l e i n f o
rticle history:eceived 17 November 2012eceived in revised form 12 June 2013ccepted 24 June 2013vailable online 31 July 2013
eywords:ulti-taxa approach
patial partitioningirds
a b s t r a c t
Ecologists and land managers are becoming increasingly aware that the landscape context within whicha habitat fragment exists could be as important as the habitat fragment itself. Our aims were to find how,and at which spatial scale of the landscape, the biodiversity of a rural agricultural landscape of a centralEuropean country (Czech Republic) is affected by land use. We used a multi-taxa approach based on sixtaxa, namely (i) birds, (ii) bees and wasps, (iii) beetles, (iv) butterflies, (v) land snails, and (vi) plants,in 25 traditional fruit orchards. We carried out spatial partitioning of three different types of land use(orchards, deciduous woodlands and grasslands) with radii ranging from 200 m to 3200 m. With respectto land use, the spatial partitioning showed that land snails, and bees and wasps were influenced tothe lowest area of surrounding land use types, followed by beetles, butterflies and plants, and finally
rthropodslantsabitat fragments
birds. Species richness in most of the taxa studied was enhanced by an increase in the area covered byorchards in the surrounding landscape. Our findings support the idea that multi-taxa responses to landuse in landscape studies should be measured at different scales, for example, by making use of spatialpartitioning. Our study showed that although they are an artificial patches, traditional orchards helpmaintain biodiversity in rural agricultural landscapes, and that an increase in the area covered by similarpatches in the surroundings also increases the species richness of the studied taxa.
. Introduction
The loss of biodiversity in agricultural landscapes is consid-red to be a challenge for nature conservation (Ouin et al., 2004).ost of the central European landscape consists of artificial habi-
ats, which are often poor in their heterogeneity and have ofteneen intensively exploited (Schmidt et al., 2008). Modern human-ominated landscapes are typically characterized by intensive landse and high levels of habitat destruction, often resulting in sharplyontrasting habitat mosaics (Tscharntke et al., 2002a). Biodiversityoss even in artificial habitats may have additional negative effectsn ecosystem services throughout regional agricultural landscapes
Tscharntke et al., 2005) and the loss at lower trophic levels ofteneads to a decrease in predator densities, which furthermore resultsn the loss of natural pest control (Kruess and Tscharntke, 1994).∗ Corresponding author. Tel.: +420 777838284.E-mail address: [email protected] (J. Horak).
167-8809/$ – see front matter © 2013 Elsevier B.V. All rights reserved.ttp://dx.doi.org/10.1016/j.agee.2013.06.020
© 2013 Elsevier B.V. All rights reserved.
The importance of spatial context for understanding ecologicalsystems is increasingly being recognized by ecologists of differentdisciplines (Steffan-Dewenter, 2003). Spatial landscape-based pro-cesses play an important role in community and population ecology(Hanski, 1999; Schmidt et al., 2008).
It is likely that the relevance of the different matrix habitats inthe surrounding landscape depends on the degree of specializationof the study organisms. Understanding the extent to which speciesdistributions at different scales are determined by their dispersalability or ecological requirements is a crucial task in communityecology (Krauss et al., 2003).
Land use types are one of the basic elements in landscapeecology at the regional scale (Forman, 1995). Recently, biologistshave become increasingly aware that the landscape context withinwhich habitat fragments exist could be as important as the habitat
fragments themselves (Tscharntke et al., 2002a). A greater under-standing of this aspect could have major implications for how westudy and conserve biotic assemblages within agricultural land-scapes.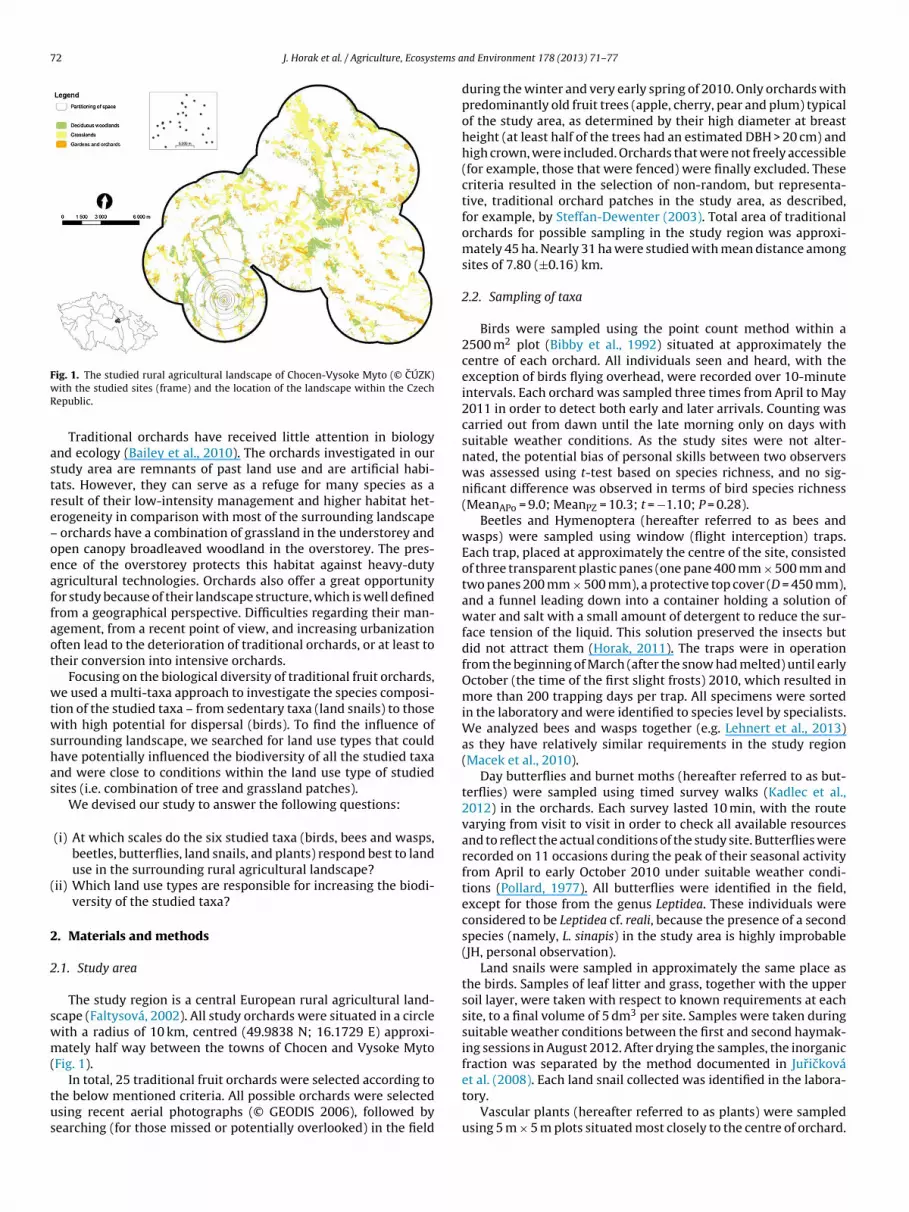
72 J. Horak et al. / Agriculture, Ecosystems a
FwR
astre–oeaffaot
wtwshas
(
2
2
swm(
tus
ig. 1. The studied rural agricultural landscape of Chocen-Vysoke Myto (© CÚZK)ith the studied sites (frame) and the location of the landscape within the Czechepublic.
Traditional orchards have received little attention in biologynd ecology (Bailey et al., 2010). The orchards investigated in ourtudy area are remnants of past land use and are artificial habi-ats. However, they can serve as a refuge for many species as aesult of their low-intensity management and higher habitat het-rogeneity in comparison with most of the surrounding landscape
orchards have a combination of grassland in the understorey andpen canopy broadleaved woodland in the overstorey. The pres-nce of the overstorey protects this habitat against heavy-dutygricultural technologies. Orchards also offer a great opportunityor study because of their landscape structure, which is well definedrom a geographical perspective. Difficulties regarding their man-gement, from a recent point of view, and increasing urbanizationften lead to the deterioration of traditional orchards, or at least toheir conversion into intensive orchards.
Focusing on the biological diversity of traditional fruit orchards,e used a multi-taxa approach to investigate the species composi-
ion of the studied taxa – from sedentary taxa (land snails) to thoseith high potential for dispersal (birds). To find the influence of
urrounding landscape, we searched for land use types that couldave potentially influenced the biodiversity of all the studied taxand were close to conditions within the land use type of studiedites (i.e. combination of tree and grassland patches).
We devised our study to answer the following questions:
(i) At which scales do the six studied taxa (birds, bees and wasps,beetles, butterflies, land snails, and plants) respond best to landuse in the surrounding rural agricultural landscape?
ii) Which land use types are responsible for increasing the biodi-versity of the studied taxa?
. Materials and methods
.1. Study area
The study region is a central European rural agricultural land-cape (Faltysová, 2002). All study orchards were situated in a circleith a radius of 10 km, centred (49.9838 N; 16.1729 E) approxi-ately half way between the towns of Chocen and Vysoke Myto
Fig. 1).
In total, 25 traditional fruit orchards were selected according tohe below mentioned criteria. All possible orchards were selectedsing recent aerial photographs (© GEODIS 2006), followed byearching (for those missed or potentially overlooked) in the field
nd Environment 178 (2013) 71– 77
during the winter and very early spring of 2010. Only orchards withpredominantly old fruit trees (apple, cherry, pear and plum) typicalof the study area, as determined by their high diameter at breastheight (at least half of the trees had an estimated DBH > 20 cm) andhigh crown, were included. Orchards that were not freely accessible(for example, those that were fenced) were finally excluded. Thesecriteria resulted in the selection of non-random, but representa-tive, traditional orchard patches in the study area, as described,for example, by Steffan-Dewenter (2003). Total area of traditionalorchards for possible sampling in the study region was approxi-mately 45 ha. Nearly 31 ha were studied with mean distance amongsites of 7.80 (±0.16) km.
2.2. Sampling of taxa
Birds were sampled using the point count method within a2500 m2 plot (Bibby et al., 1992) situated at approximately thecentre of each orchard. All individuals seen and heard, with theexception of birds flying overhead, were recorded over 10-minuteintervals. Each orchard was sampled three times from April to May2011 in order to detect both early and later arrivals. Counting wascarried out from dawn until the late morning only on days withsuitable weather conditions. As the study sites were not alter-nated, the potential bias of personal skills between two observerswas assessed using t-test based on species richness, and no sig-nificant difference was observed in terms of bird species richness(MeanAPo = 9.0; MeanPZ = 10.3; t = −1.10; P = 0.28).
Beetles and Hymenoptera (hereafter referred to as bees andwasps) were sampled using window (flight interception) traps.Each trap, placed at approximately the centre of the site, consistedof three transparent plastic panes (one pane 400 mm × 500 mm andtwo panes 200 mm × 500 mm), a protective top cover (D = 450 mm),and a funnel leading down into a container holding a solution ofwater and salt with a small amount of detergent to reduce the sur-face tension of the liquid. This solution preserved the insects butdid not attract them (Horak, 2011). The traps were in operationfrom the beginning of March (after the snow had melted) until earlyOctober (the time of the first slight frosts) 2010, which resulted inmore than 200 trapping days per trap. All specimens were sortedin the laboratory and were identified to species level by specialists.We analyzed bees and wasps together (e.g. Lehnert et al., 2013)as they have relatively similar requirements in the study region(Macek et al., 2010).
Day butterflies and burnet moths (hereafter referred to as but-terflies) were sampled using timed survey walks (Kadlec et al.,2012) in the orchards. Each survey lasted 10 min, with the routevarying from visit to visit in order to check all available resourcesand to reflect the actual conditions of the study site. Butterflies wererecorded on 11 occasions during the peak of their seasonal activityfrom April to early October 2010 under suitable weather condi-tions (Pollard, 1977). All butterflies were identified in the field,except for those from the genus Leptidea. These individuals wereconsidered to be Leptidea cf. reali, because the presence of a secondspecies (namely, L. sinapis) in the study area is highly improbable(JH, personal observation).
Land snails were sampled in approximately the same place asthe birds. Samples of leaf litter and grass, together with the uppersoil layer, were taken with respect to known requirements at eachsite, to a final volume of 5 dm3 per site. Samples were taken duringsuitable weather conditions between the first and second haymak-ing sessions in August 2012. After drying the samples, the inorganicfraction was separated by the method documented in Juricková
et al. (2008). Each land snail collected was identified in the labora-tory.Vascular plants (hereafter referred to as plants) were sampledusing 5 m × 5 m plots situated most closely to the centre of orchard.
J. Horak et al. / Agriculture, Ecosystems and Environment 178 (2013) 71– 77 73
Table 1Percentage cover of the three studied land use predictors in partitioned space sur-rounding traditional fruit orchards in a rural agricultural landscape. Note that thetype of transformation is indexed in the upper index of radius column.
Predictor Radius (m) Mean ± S.E. Minimum–maximum
Deciduous 2003√
1.02 ± 0.22 0.00–3.072833
√1.26 ± 0.21 0.00–3.28
4003√
1.45 ± 0.20 0.00–3.335653
√1.58 ± 0.20 0.00–3.32
8003√
1.71 ± 0.18 0.00–3.0511313
√1.72 ± 0.15 0.37–2.80
16003√
1.70 ± 0.13 0.55–2.622263 6.02 ± 0.76 0.55–12.613200 5.89 ± 0.51 0.94–10.03
Orchard 200 17.00 ± 1.85 0.00–39.69283 12.94 ± 1.63 0.00–34.59400
√2.98 ± 0.23 0.00–5.58
565√
2.68 ± 0.19 0.00–4.54800 6.25 ± 0.62 0.87–13.78
1131 5.12 ± 0.37 2.63–9.491600 4.53 ± 0.31 2.15–8.9622633
√1.62 ± 0.04 1.35–2.18
3200 4.69 ± 0.27 2.62–8.18
Grassland 200√
3.79 ± 0.54 0.00–7.70283
√3.71 ± 0.46 0.00–7.14
400 17.20 ± 2.67 0.39–52.215653
√2.36 ± 0.12 1.18–3.53
8003√
2.22 ± 0.10 1.35–3.3411313
√3.33 ± 0.22 1.54–6.35
16003√
2.31 ± 0.08 1.58–3.41
Pcd
2
tcidFf
doseblwgr(attr
2
tpm
Table 2Relationship between species richness and abundance (coverage in the case ofplants) of all studied taxa and their statistical significance.
Taxon R2 R P
Birds 0.89 0.94 <0.0001Bees and wasps 0.63 0.79 <0.0001Beetles 0.97 0.99 <0.0001Butterflies 0.68 0.82 <0.0001Land snails 0.30 0.54 0.0050
d.f. = 1.5 created in CanoDraw 4.14 (ter Braak and Smilauer, 2002).
3. Results
2263 13.98 ± 1.19 3.59–31.103200 13.24 ± 0.86 5.72–21.72
lants were sampled before the time of haymaking (i.e. when grassyover was harvested for hay) in the study area during the last 10ays of May.
.3. Study predictors
We searched for land use predictors that could have poten-ially affected the biodiversity of all the studied taxa and werelose to conditions within the land use type of studied sites. Wedentified the three most suitable predictors using the Topographicigital base map of the Czech Republic 1:10,000 (ZABAGED) and theorest Cover Map (http://forest.jrc.ec.europa.eu/forest-mapping/orest-cover-map/2006-forest-cover-map) in GIS.
The three predictors were garden and orchard environments,eciduous woodlands, and grasslands. Domestic garden andrchard environments (hereafter referred to as orchard) wereelected due to resemblance to the studied habitat type. Gardennvironments in the study area were combined with orchards,ecause they had similar landscape structure in terms of grass-
and in the understorey and fruit trees in the overstorey. Deciduousoodlands (hereafter referred to as deciduous) and permanent
rasslands (hereafter referred to as grassland) best reflected theemnants of the former natural vegetation of the study areaNeuhäuselová, 2001) to which the organisms had been able todapt for a long period of time. A combination of these two predic-ors best reflected the structure of the study habitat type, namelyhe fruit orchard. Predictors with a non-normal distribution wereoot transformed to achieve normality (Table 1).
.4. Spatial partitioning
We used spatial partitioning for analyses of the best response ofhe studied taxa to land use. The landscape composition of the threeredictors around the orchards was characterized on nine logarith-ic spatial scales, with radii ranging from 200 m (with respect to
Plants 0.88 0.94 <0.0001
the highest length of the studied sites) to 3200 m (each circle wastwice the size, in terms of area, of the previous one), via land-usemapping and subsequent GIS analysis (Schmidt et al., 2008). Thus,each study orchard had a defined landscape with a 3200 m radius(Fig. 1).
2.5. Multivariate analysis
Species richness and abundance (coverage in the case of plants)showed, a mostly highly, positive relationship for all studied taxa(Table 2). The presence of a species in each orchard, rather thanthe number of individuals, was thus taken as the basis for analyses,which seemed to be more suitable for multi-taxa comparisons.
Correlation between species richness of the studied taxa (in par-ticular radius) was evaluated using multi-correlation matrix in R.Linear regression in R was used to assess the trends for relationshipbetween species richness of all studied taxa and radius.
Due to the use of presence and absence matrices (see Legendreand Legendre, 1998), we used canonical correspondence anal-ysis (CCA), a constrained method of multivariate statistics. Weused inter-species distances and biplot scaling with significanceof canonical axes together under the full model with 9999 permu-tations (Leps and Smilauer, 2003) in CANOCO 4.5. The potentialbiased effect of spatial autocorrelation was solved using the spatialco-predictors, namely the geographical coordinates of the samplingpoints (x, y) and their squares and cross-product terms (x2, y2, xy;Wartenberg, 1985). The cubic terms (x2y, xy2, x3, y3; Borcard et al.,1992) were not included, thus maintaining a comparable numberof factors for the three explanatory data sets.
We used the method of variance partitioning in CCA with allpredictors included, followed by analyses with land use as the pre-dictor and space as the co-predictor. These analyses were thencarried out in the reverse order (Legendre, 1993). The explainedvariance and significance of land use were employed using testof predictor as implemented in CANOCO with a Monte Carlo per-mutation test (9999 permutations) under the full model (Leps andSmilauer, 2003).
2.6. Generalized additive model and visualization
For the resulting ordination diagrams, we used CCA dataattribute plots with number of species as dependent variable andtheir response to the study predictors using generalized additivemodel (GAM) with a Gaussian distribution and smoothness with
ˇ
In total, 38 species of birds (231 occurrences), 408 species of beetles (1284 occur-rences), 50 species of butterflies (349 occurrences), 18 species of land snails (83occurrences), 84 species of bees and wasps (241 occurrences) and 140 species ofplants (669 occurrences) were recorded.
74 J. Horak et al. / Agriculture, Ecosystems and Environment 178 (2013) 71– 77
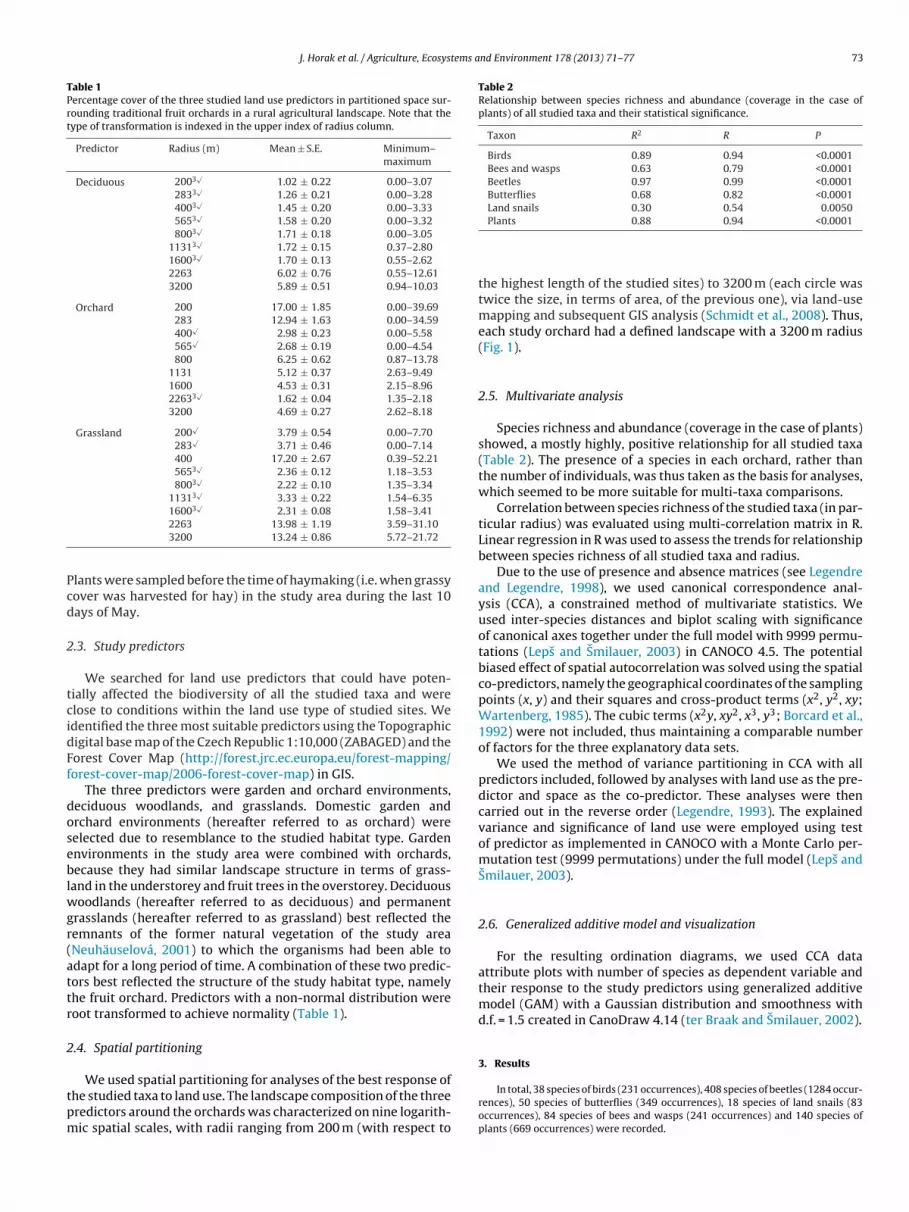
Fig. 2. Diagrams showing the results of land use spatial partitioning using explained variance of predictors derived from Canonical correspondence analysis (CCA) with spacea d linep e landa
3
tpltbm
ma
san
r
3
asot
t
Faor
s co-predictor. Groups consisted of (a) bees and wasps (dashed line), beetles (dottelants (dotted line). Note that significant responses of each of the studied taxa to thnd that the radii used for the final analyses are labeled.
.1. Spatial partitioning
Spatial partitioning showed that land snails, and bees and wasps responded tohe surrounding landscape at the lowest radius, followed by beetles, butterflies andlants at the medium-sized radii, whereas birds showed the best response to the
argest radius (Fig. 2). The analysis also showed that butterflies and land snails werehe most responsive to land use, as demonstrated by the explained variance. Beetles,ees and wasps showed no significant response to land use, and birds showed theost fluctuating pattern.
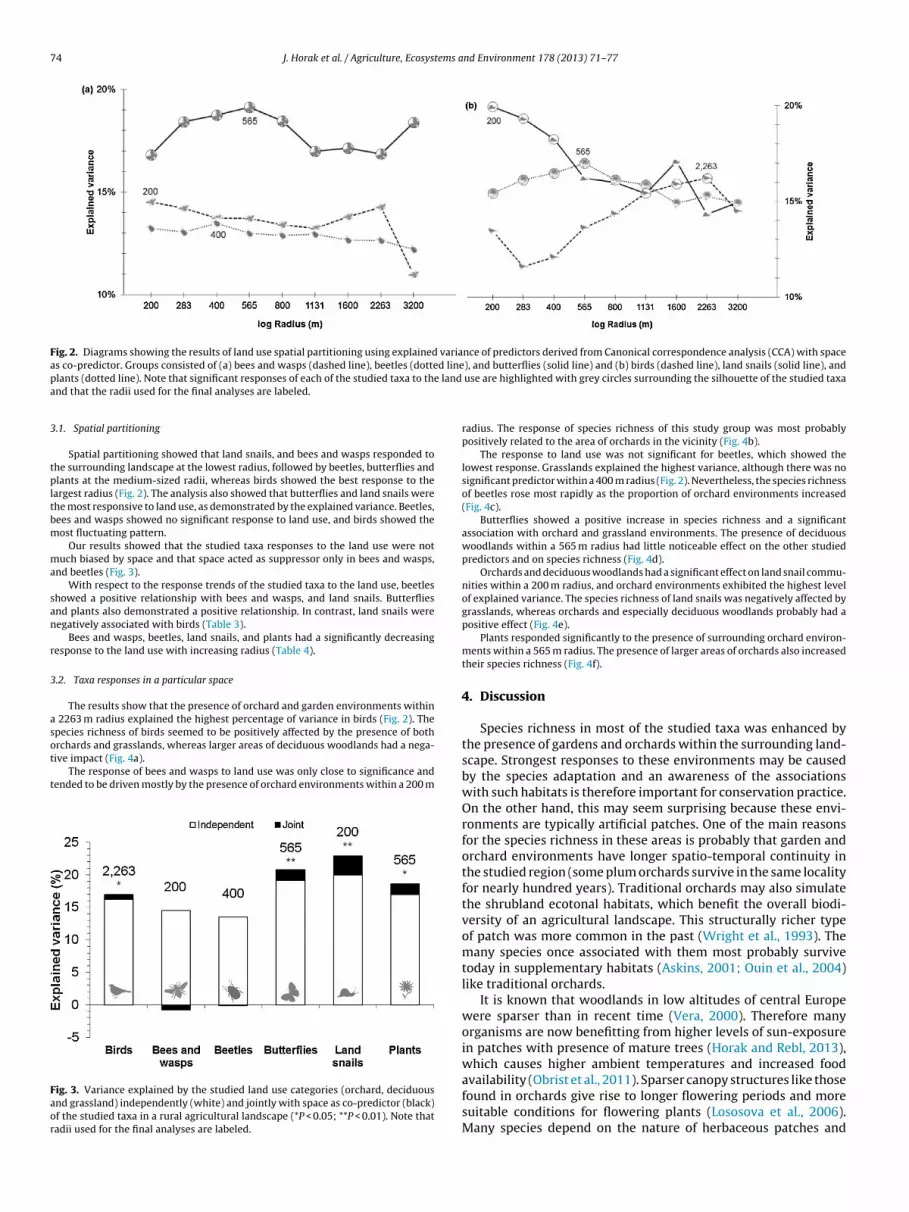
Our results showed that the studied taxa responses to the land use were notuch biased by space and that space acted as suppressor only in bees and wasps,
nd beetles (Fig. 3).With respect to the response trends of the studied taxa to the land use, beetles
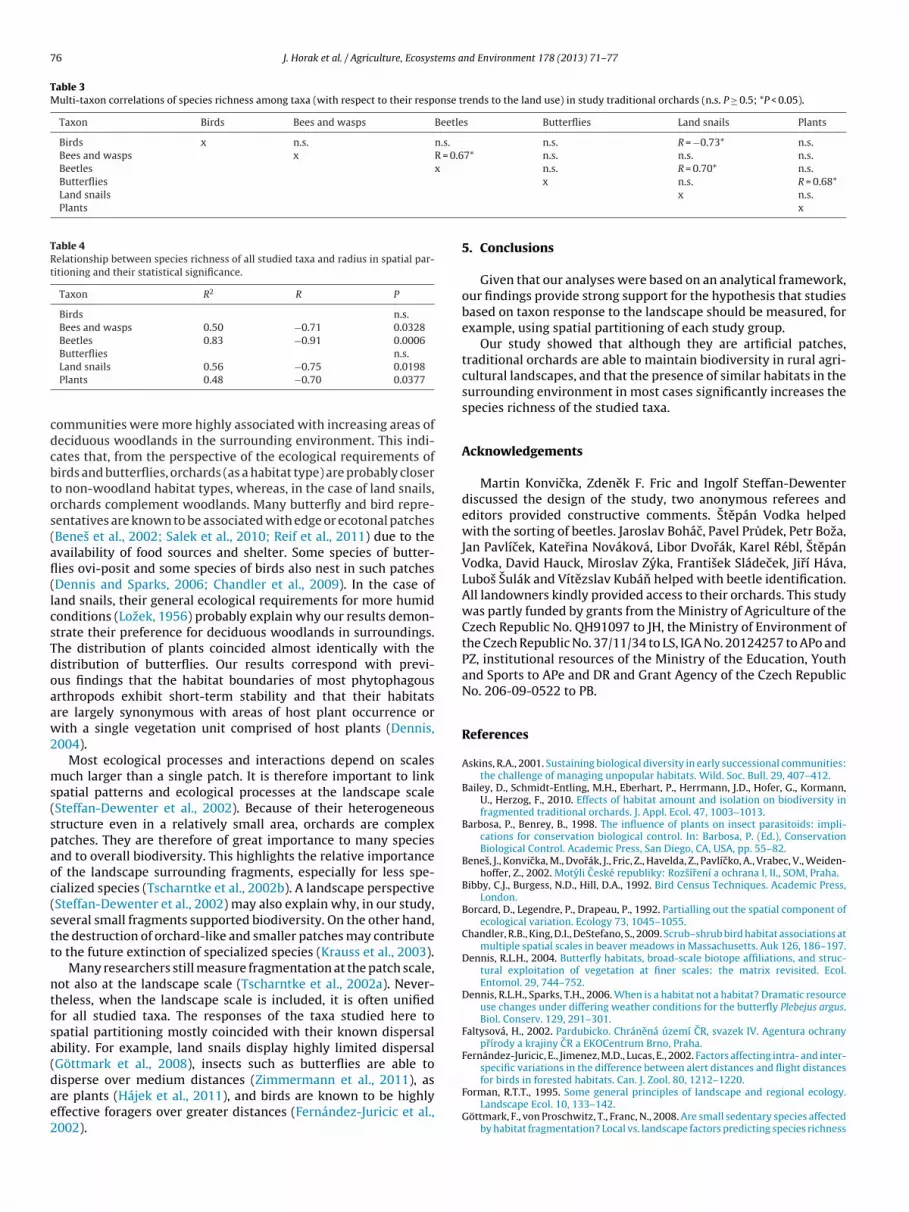
howed a positive relationship with bees and wasps, and land snails. Butterfliesnd plants also demonstrated a positive relationship. In contrast, land snails wereegatively associated with birds (Table 3).
Bees and wasps, beetles, land snails, and plants had a significantly decreasingesponse to the land use with increasing radius (Table 4).
.2. Taxa responses in a particular space
The results show that the presence of orchard and garden environments within 2263 m radius explained the highest percentage of variance in birds (Fig. 2). Thepecies richness of birds seemed to be positively affected by the presence of both
rchards and grasslands, whereas larger areas of deciduous woodlands had a nega-ive impact (Fig. 4a).The response of bees and wasps to land use was only close to significance andended to be driven mostly by the presence of orchard environments within a 200 m
ig. 3. Variance explained by the studied land use categories (orchard, deciduousnd grassland) independently (white) and jointly with space as co-predictor (black)f the studied taxa in a rural agricultural landscape (*P < 0.05; **P < 0.01). Note thatadii used for the final analyses are labeled.
), and butterflies (solid line) and (b) birds (dashed line), land snails (solid line), and use are highlighted with grey circles surrounding the silhouette of the studied taxa
radius. The response of species richness of this study group was most probablypositively related to the area of orchards in the vicinity (Fig. 4b).
The response to land use was not significant for beetles, which showed thelowest response. Grasslands explained the highest variance, although there was nosignificant predictor within a 400 m radius (Fig. 2). Nevertheless, the species richnessof beetles rose most rapidly as the proportion of orchard environments increased(Fig. 4c).
Butterflies showed a positive increase in species richness and a significantassociation with orchard and grassland environments. The presence of deciduouswoodlands within a 565 m radius had little noticeable effect on the other studiedpredictors and on species richness (Fig. 4d).
Orchards and deciduous woodlands had a significant effect on land snail commu-nities within a 200 m radius, and orchard environments exhibited the highest levelof explained variance. The species richness of land snails was negatively affected bygrasslands, whereas orchards and especially deciduous woodlands probably had apositive effect (Fig. 4e).
Plants responded significantly to the presence of surrounding orchard environ-ments within a 565 m radius. The presence of larger areas of orchards also increasedtheir species richness (Fig. 4f).
4. Discussion
Species richness in most of the studied taxa was enhanced bythe presence of gardens and orchards within the surrounding land-scape. Strongest responses to these environments may be causedby the species adaptation and an awareness of the associationswith such habitats is therefore important for conservation practice.On the other hand, this may seem surprising because these envi-ronments are typically artificial patches. One of the main reasonsfor the species richness in these areas is probably that garden andorchard environments have longer spatio-temporal continuity inthe studied region (some plum orchards survive in the same localityfor nearly hundred years). Traditional orchards may also simulatethe shrubland ecotonal habitats, which benefit the overall biodi-versity of an agricultural landscape. This structurally richer typeof patch was more common in the past (Wright et al., 1993). Themany species once associated with them most probably survivetoday in supplementary habitats (Askins, 2001; Ouin et al., 2004)like traditional orchards.
It is known that woodlands in low altitudes of central Europewere sparser than in recent time (Vera, 2000). Therefore manyorganisms are now benefitting from higher levels of sun-exposurein patches with presence of mature trees (Horak and Rebl, 2013),which causes higher ambient temperatures and increased food
availability (Obrist et al., 2011). Sparser canopy structures like thosefound in orchards give rise to longer flowering periods and moresuitable conditions for flowering plants (Lososova et al., 2006).Many species depend on the nature of herbaceous patches and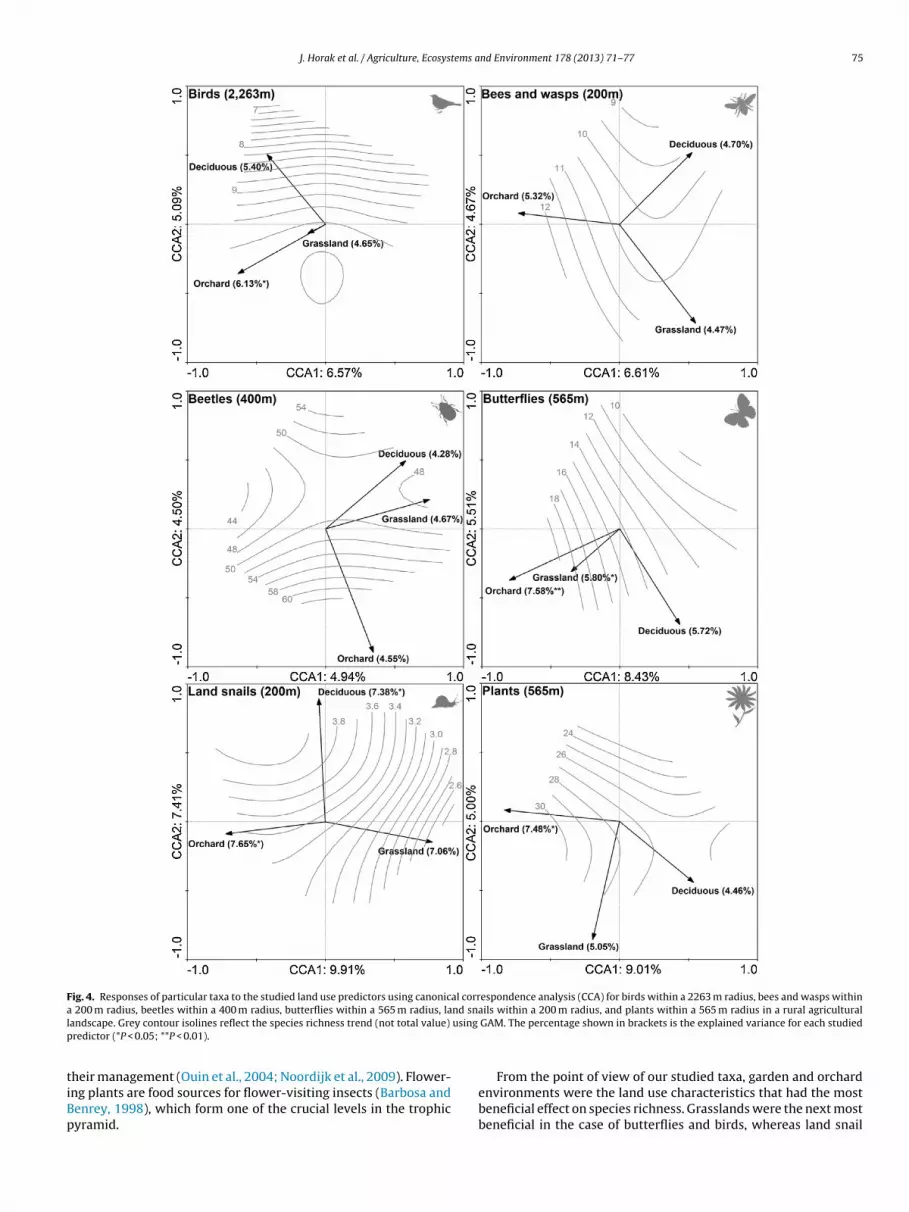
J. Horak et al. / Agriculture, Ecosystems and Environment 178 (2013) 71– 77 75
Fig. 4. Responses of particular taxa to the studied land use predictors using canonical correspondence analysis (CCA) for birds within a 2263 m radius, bees and wasps withina nd snal using
p
tiBp
200 m radius, beetles within a 400 m radius, butterflies within a 565 m radius, laandscape. Grey contour isolines reflect the species richness trend (not total value)
redictor (*P < 0.05; **P < 0.01).
heir management (Ouin et al., 2004; Noordijk et al., 2009). Flower-ng plants are food sources for flower-visiting insects (Barbosa andenrey, 1998), which form one of the crucial levels in the trophicyramid.
ils within a 200 m radius, and plants within a 565 m radius in a rural agriculturalGAM. The percentage shown in brackets is the explained variance for each studied
From the point of view of our studied taxa, garden and orchardenvironments were the land use characteristics that had the mostbeneficial effect on species richness. Grasslands were the next mostbeneficial in the case of butterflies and birds, whereas land snail
76 J. Horak et al. / Agriculture, Ecosystems and Environment 178 (2013) 71– 77
Table 3Multi-taxon correlations of species richness among taxa (with respect to their response trends to the land use) in study traditional orchards (n.s. P ≥ 0.5; *P < 0.05).
Taxon Birds Bees and wasps Beetles Butterflies Land snails Plants
Birds x n.s. n.s. n.s. R = −0.73* n.s.Bees and wasps x R = 0.67* n.s. n.s. n.s.Beetles x n.s. R = 0.70* n.s.Butterflies
Land snails
Plants
Table 4Relationship between species richness of all studied taxa and radius in spatial par-titioning and their statistical significance.
Taxon R2 R P
Birds n.s.Bees and wasps 0.50 −0.71 0.0328Beetles 0.83 −0.91 0.0006Butterflies n.s.
cdcbtos(afl(lcsTdoaaw2
ms(spaoc(stt
ntfsa(dae2
Land snails 0.56 −0.75 0.0198Plants 0.48 −0.70 0.0377
ommunities were more highly associated with increasing areas ofeciduous woodlands in the surrounding environment. This indi-ates that, from the perspective of the ecological requirements ofirds and butterflies, orchards (as a habitat type) are probably closero non-woodland habitat types, whereas, in the case of land snails,rchards complement woodlands. Many butterfly and bird repre-entatives are known to be associated with edge or ecotonal patchesBenes et al., 2002; Salek et al., 2010; Reif et al., 2011) due to thevailability of food sources and shelter. Some species of butter-ies ovi-posit and some species of birds also nest in such patchesDennis and Sparks, 2006; Chandler et al., 2009). In the case ofand snails, their general ecological requirements for more humidonditions (Lozek, 1956) probably explain why our results demon-trate their preference for deciduous woodlands in surroundings.he distribution of plants coincided almost identically with theistribution of butterflies. Our results correspond with previ-us findings that the habitat boundaries of most phytophagousrthropods exhibit short-term stability and that their habitatsre largely synonymous with areas of host plant occurrence orith a single vegetation unit comprised of host plants (Dennis,
004).Most ecological processes and interactions depend on scales
uch larger than a single patch. It is therefore important to linkpatial patterns and ecological processes at the landscape scaleSteffan-Dewenter et al., 2002). Because of their heterogeneoustructure even in a relatively small area, orchards are complexatches. They are therefore of great importance to many speciesnd to overall biodiversity. This highlights the relative importancef the landscape surrounding fragments, especially for less spe-ialized species (Tscharntke et al., 2002b). A landscape perspectiveSteffan-Dewenter et al., 2002) may also explain why, in our study,everal small fragments supported biodiversity. On the other hand,he destruction of orchard-like and smaller patches may contributeo the future extinction of specialized species (Krauss et al., 2003).
Many researchers still measure fragmentation at the patch scale,ot also at the landscape scale (Tscharntke et al., 2002a). Never-heless, when the landscape scale is included, it is often unifiedor all studied taxa. The responses of the taxa studied here topatial partitioning mostly coincided with their known dispersalbility. For example, land snails display highly limited dispersalGöttmark et al., 2008), insects such as butterflies are able to
isperse over medium distances (Zimmermann et al., 2011), asre plants (Hájek et al., 2011), and birds are known to be highlyffective foragers over greater distances (Fernández-Juricic et al.,002).x n.s. R = 0.68*x n.s.
x
5. Conclusions
Given that our analyses were based on an analytical framework,our findings provide strong support for the hypothesis that studiesbased on taxon response to the landscape should be measured, forexample, using spatial partitioning of each study group.
Our study showed that although they are artificial patches,traditional orchards are able to maintain biodiversity in rural agri-cultural landscapes, and that the presence of similar habitats in thesurrounding environment in most cases significantly increases thespecies richness of the studied taxa.
Acknowledgements
Martin Konvicka, Zdenek F. Fric and Ingolf Steffan-Dewenterdiscussed the design of the study, two anonymous referees andeditors provided constructive comments. Stepán Vodka helpedwith the sorting of beetles. Jaroslav Bohác, Pavel Prudek, Petr Boza,Jan Pavlícek, Katerina Nováková, Libor Dvorák, Karel Rébl, StepánVodka, David Hauck, Miroslav Zyka, Frantisek Sládecek, Jirí Háva,Lubos Sulák and Vítezslav Kubán helped with beetle identification.All landowners kindly provided access to their orchards. This studywas partly funded by grants from the Ministry of Agriculture of theCzech Republic No. QH91097 to JH, the Ministry of Environment ofthe Czech Republic No. 37/11/34 to LS, IGA No. 20124257 to APo andPZ, institutional resources of the Ministry of the Education, Youthand Sports to APe and DR and Grant Agency of the Czech RepublicNo. 206-09-0522 to PB.
References
Askins, R.A., 2001. Sustaining biological diversity in early successional communities:the challenge of managing unpopular habitats. Wild. Soc. Bull. 29, 407–412.
Bailey, D., Schmidt-Entling, M.H., Eberhart, P., Herrmann, J.D., Hofer, G., Kormann,U., Herzog, F., 2010. Effects of habitat amount and isolation on biodiversity infragmented traditional orchards. J. Appl. Ecol. 47, 1003–1013.
Barbosa, P., Benrey, B., 1998. The influence of plants on insect parasitoids: impli-cations for conservation biological control. In: Barbosa, P. (Ed.), ConservationBiological Control. Academic Press, San Diego, CA, USA, pp. 55–82.
Benes, J., Konvicka, M., Dvorák, J., Fric, Z., Havelda, Z., Pavlícko, A., Vrabec, V., Weiden-hoffer, Z., 2002. Motyli Ceské republiky: Rozsírení a ochrana I, II., SOM, Praha.
Bibby, C.J., Burgess, N.D., Hill, D.A., 1992. Bird Census Techniques. Academic Press,London.
Borcard, D., Legendre, P., Drapeau, P., 1992. Partialling out the spatial component ofecological variation. Ecology 73, 1045–1055.
Chandler, R.B., King, D.I., DeStefano, S., 2009. Scrub–shrub bird habitat associations atmultiple spatial scales in beaver meadows in Massachusetts. Auk 126, 186–197.
Dennis, R.L.H., 2004. Butterfly habitats, broad-scale biotope affiliations, and struc-tural exploitation of vegetation at finer scales: the matrix revisited. Ecol.Entomol. 29, 744–752.
Dennis, R.L.H., Sparks, T.H., 2006. When is a habitat not a habitat? Dramatic resourceuse changes under differing weather conditions for the butterfly Plebejus argus.Biol. Conserv. 129, 291–301.
Faltysová, H., 2002. Pardubicko. Chránená území CR, svazek IV. Agentura ochranyprírody a krajiny CR a EKOCentrum Brno, Praha.
Fernández-Juricic, E., Jimenez, M.D., Lucas, E., 2002. Factors affecting intra- and inter-specific variations in the difference between alert distances and flight distances
for birds in forested habitats. Can. J. Zool. 80, 1212–1220.Forman, R.T.T., 1995. Some general principles of landscape and regional ecology.Landscape Ecol. 10, 133–142.
Göttmark, F., von Proschwitz, T., Franc, N., 2008. Are small sedentary species affectedby habitat fragmentation? Local vs. landscape factors predicting species richness
tems a
H
HH
H
J
K
K
K
L
L
L
L
L
LM
N
N
P.J., 1993. Global Climates Since the Last Glacial Maximum. University of Min-
J. Horak et al. / Agriculture, Ecosys
and composition of land molluscs in Swedish conservation forests. J. Biogeogr.35, 1062–1076.
ájek, M., Rolecek, J., Cottenie, K., Kintrová, K., Horsák, M., Poulícková, A., Hájková,P., Fránková, M., Díte, D., 2011. Environmental and spatial controls of bioticassemblages in a discrete semi-terrestrial habitat: comparison of organismswith different dispersal abilities sampled in the same plots. J. Biogeogr. 38,1683–1693.
anski, I., 1999. Metapopulation Ecology. Oxford University Press, Oxford.orak, J., 2011. Response of saproxylic beetles to tree species composition in a
secondary urban forest area. Urban For. Urban Gree. 10, 213–222.orak, J., Rebl, K., 2013. The species richness of click beetles in ancient pasture
woodland benefits from a high level of sun exposure. J. Insect Conserv. 17,307–318.
uricková, L., Horsák, M., Cameron, R., Hylander, K., Míkovcová, A., Hlavac, J.C.,Rohovec, J., 2008. Land snail distribution patterns within a site: the role ofdifferent calcium sources. Eur. J. Soil Biol. 44, 172–179.
adlec, T., Tropek, R., Konvicka, M., 2012. Timed surveys and transect walks as com-parable methods for monitoring butterflies in small plots. J. Insect Conserv. 16,275–280.
rauss, J., Steffan-Dewenter, I., Tscharntke, T., 2003. Local species immigration,extinction, and turnover of butterflies in relation to habitat area and habitatisolation. Oecologia 137, 591–602.
ruess, A., Tscharntke, T., 1994. Habitat fragmentation, species loss, and biologicalcontrol. Science 264, 1581–1584.
egendre, P., 1993. Spatial autocorrelation: trouble or new paradigm? Ecology 74,1659–1673.
egendre, P., Legendre, L., 1998. Numerical Ecology, second English ed. ElsevierScience BV, Amsterdam.
ehnert, L.W., Bassler, C., Brandl, R., Burton, P.J., Muller, J., 2013. Conservation valueof forests attacked by bark beetles: highest number of indicator species in foundin early successional stages. J. Nat. Conserv. 21, 97–104.
eps, J., Smilauer, P., 2003. Multivariate Analysis of Ecological Data using CANOCO.Cambridge University Press, UK.
ososova, Z., Chytry, M., Kuhn, I., Hajek, O., Horakova, V., Pysek, P., Tichy, L., 2006.Patterns of plant traits in annual vegetation of man-made habitats in centralEurope. Perspect. Plant. Ecol. 8, 69–81.
ozek, V., 1956. Klíc ceskoslovenskych mekkysu. Vydavatelstvo SAV, Bratislava.acek, J., Straka, J., Bogusch, P., Dvorák, L., Bezdecka, P., Tyrner, P., 2010. Blanokrídlí
Ceské Republiky: Zahadloví. Academia.
euhäuselová, Z., 2001. Map of Potential Natural Vegetation of the Czech Republic.Academia, Praha.oordijk, J., Delille, K., Schaffers, A.P., Sykora, K.V., 2009. Optimizing grassland
management for flower-visiting insects in roadside verges. Biol. Conserv. 142,2097–2103.
nd Environment 178 (2013) 71– 77 77
Obrist, M.K., Rathey, E., Bontadina, F., Martinoli, A., Conedera, M., Christe, P., Moretti,M., 2011. Response of bat species to sylvo-pastoral abandonment. Forest Ecol.Manage. 261, 789–798.
Ouin, A., Aviron, S., Dover, J., Burel, F., 2004. Complementation/supplementation ofresources for butterflies in agricultural landscapes. Agric. Ecosyst. Environ. 103,473–479.
Pollard, E., 1977. A method for assessing changes in the abundance of butterflies.Biol. Conserv. 12, 115–134.
Reif, J., Marhoul, P., Cızek, O., Konvicka, M., 2011. Abandoned military training sitesare an overlooked refuge for at-risk open habitat bird species. Biodivers. Conserv.20, 3645–3662.
Salek, M., Svobodova, J., Zasadil, P., 2010. Edge effect of low-traffic forest roads onbird communities in secondary production forests in central Europe. LandscapeEcol. 25, 1113–1124.
Schmidt, M.H., Thies, C., Nentwig, W., Tscharntke, T., 2008. Contrasting responses ofarable spiders to the landscape matrix at different spatial scales. J. Biogeogr. 35,157–166.
Steffan-Dewenter, I., 2003. Importance of habitat area and landscape context forspecies richness of bees and wasps in fragmented orchard meadows. Conserv.Biol. 17, 1036–1044.
Steffan-Dewenter, I., Munzenberg, U., Burger, C., Thies, C., Tscharntke, T., 2002. Scale-dependent effects of landscape structure on three pollinator guilds. Ecology 83,1421–1432.
ter Braak, C.J.F., Smilauer, P., 2002. CANOCO Reference Manual and CanoDraw forWindows User’s Guide: Software for Canonical Community Ordination (version4.5). Microcomputer Power, USA.
Tscharntke, T., Steffan-Dewenter, I., Kruess, A., Thies, C., 2002a. Contribution of smallhabitat fragments to conservation of insect communities of grassland-croplandlandscapes. Ecol. Appl. 12, 354–363.
Tscharntke, T., Steffan-Dewenter, I., Kruess, A., Thies, C., 2002b. Characteristics ofinsect populations on habitat fragments—a mini review. Ecol. Res. 17, 229–239.
Tscharntke, T., Klein, A.M., Kruess, A., Steffan-Dewenter, I., Thies, C., 2005. Landscapeperspectives on agricultural intensification and biodiversity—ecosystem servicemanagement. Ecol. Lett. 8, 857–874.
Vera, F.W.M., 2000. Grazing Ecology and Forest History. CABI Publishing, UK.Wartenberg, D., 1985. Canonical trend surface analysis: a method for describing
geographic patterns. Syst. Zool. 34, 259–279.Wright, H.E., Kutzbach, J.E., Webb, T., Ruddiman, W.F., Street-Perrott, F.A., Bartlein,
nesota Press, USA.Zimmermann, K., Fric, Z., Jiskra, P., Kopeckova, M., Vlasanek, P., Zapletal, M., Kon-
vicka, M., 2011. Mark-recapture on large spatial scale reveals long distancedispersal in the Marsh Fritillary, Euphydryas aurinia. Ecol. Entomol. 36, 499–510.