Embed Size (px)
Citation preview
Biodiversity Author:
Steven Cork, Land & Water Australia and CSIRO
Paul Sattler, Paul Sattler Eco-consulting Pty Ltd
Jason Alexandra, Alexandra and Associates Pty Ltd
Peer reviewers: Dr D Lindenmayer, Centre for Resource and Environmental Studies, ANU
Dr D Lunney, Department of Environment and Conservation, NSW
Professor H Possingham, University of Queensland
Dr John Woinarski, NT Department of Infrastructure Planning and Environment
Citation:
Cork S, Sattler P and Alexandra J 2006, ‘Biodiversity’ theme commentary prepared for the 2006 Australian State of the Environment Committee, Department of the Environment and Heritage, Canberra, <http://www.deh.gov.au/soe/2006/commentaries/biodiversity/index.html>.
Acknowledgements
The authors would like to thank Dr David Lindenmayer, Professor Hugh Possingham, members of the ‘Reimagining the Suburb’ group at RMIT University (Sarah Bekessy, Ascelin Gordon, William Langford, and Georgia Garrard), Dr Denis Saunders, Dr John Woinarski and Dr Dan Lunney for their critical reviews, comments and suggestions made on earlier drafts of this commentary.
Executive summary Despite large investments and some promising responses, biodiversity in Australia continues to decline. Because of ongoing pressures and the legacy of past pressures, we cannot expect to see major reversals in this decline in the near future.
This is the third national state of the environment report that raises concerns about the lack of long-term, systematic biodiversity information that would allow firm conclusions to be drawn about the details and mechanisms of this decline and, especially, whether responses are being effective or are likely to be effective.
Australia’s biodiversity is of incalculable value to this and future generations. As well as underpinning the culture of Australian society, it provides raw materials (for example, water, fibre, food products, chemicals) and services (for example, water filtration, pest control, waste disposal, stabilisation of waterways and coasts, regulation of air quality) that support industries as diverse as tourism, forestry, agriculture, fishing, boat building, manufacturing, human life and wellbeing in general.
Data on the relative strength of pressures on biodiversity, changes in the number and status of species, and the effectiveness of responses are too patchy in geographic spread and too narrowly focused on a few pressures, species or responses. Data are also not systematic enough to allow firm conclusions to be drawn about changes from one state of the environment reporting period (1997, 2001, 2006) to the next at a national scale. A greater commitment to long-term ecological research and strategic monitoring of key biodiversity indicators is required to allow assessments of change over these time scales.
Some broad conclusions can, however, be made about trends operating over a longer time frame. It is clear that the major pressures on biodiversity that have been operating for decades are still strong and will continue to drive decline in biodiversity across large areas of the continent, together with new and emerging pressures. Some responses to biodiversity decline are beginning to have effect and promise to provide substantial future benefits. Involvement of people from across Australian society in actions to conserve biodiversity is providing important human and financial resources.
A wide range of experts across Australia identify some of the major pressures that threaten biodiversity on a national scale (not in order of significance) to be: total grazing pressure, weeds, invasive organisms, changed fire regimes, and habitat fragmentation. For example, grazing and the conversion of pastures to support it have reduced the extent of native grasslands in a range of temperate Australian ecosystems to less than two per cent of that present in 1750 and have simplified the structure and quality of habitat for animals in these systems. As of 2004, a total of 95 species of animals and 68 plants were listed under the Environmental Protection and Biodiversity Conservation Act 1999 (EPBC Act) as threatened by at least one invasive organism and it is estimated that Australia gains around 20 new pests
or diseases each year; and major habitat changes have occurred in both northern and southern Australia due to changed fire regimes, especially with widespread drought conditions in recent years.
Other pressures are of particular significance in some regions. These include vegetation clearing, pollution of waterways by nutrient enrichment, changed hydrology, and salinity, which are of concern both because of their direct effects and their interaction with other pressures.
These major pressures are interrelated and operate over a range of scales, from local to regional to national. They have been operating over long periods of time, resulting from patterns of economic development, population growth in Australia, and global processes like increased movement of species within and between countries. The pressures have a legacy (often called an ‘extinction debt’) that will continue for decades to come, even as Australia takes remedial action. Notably, vegetation clearing may become a less significant direct threat in the future. Most states and territories have now introduced legislation aimed at regulating broadacre vegetation clearing, but the legacies of past vegetation clearing—including changed hydrology, habitat loss and fragmentation, and impacts on seed supplies and regeneration of native vegetation—remain strong drivers of biodiversity decline.
Climate change will further compound and intensify pressures on biodiversity, especially by affecting rainfall patterns, and hence fire frequency, affecting regeneration of vegetation, and changing where plants and animals can live. Different pressures are more or less important in different parts of Australia. Minimising their impacts will require improved knowledge and strategic action tailored to each part of the continent.
Notable recent responses to pressures on biodiversity include: major policy reforms intended to phase out broadscale vegetation clearing, and commitments to providing environmental flows for some rivers and wetlands. These reforms should make significant contributions to protecting Australia’s biodiversity in the future.
Significant investment has been made through the Natural Heritage Trust (NHT) and the National Action Plan for Salinity and Water Quality (NAP). Funding of regional projects through these programmes resulted in increased awareness, interest, and community involvement in biodiversity conservation. Detailed evaluations of the effectiveness of these ambitious programmes are not yet available. Because responses are dispersed between all tiers of government, regional organisations, communities and industries, coordination, measuring of biodiversity outcomes, and identifying which actions were or were not successful remain major challenges.
National objectives and targets for biodiversity conservation have been agreed by all states and territories other than Queensland, Tasmania and the Northern Territory. The only major review available on progress towards these targets (Griffin NRM Pty 2004) concluded that
progress was encouraging on only 38 per cent of the 29 targets which were mostly policy, regulatory or planning process targets rather than biodiversity outcome targets.
Effective management of biodiversity in Australia requires an improved capacity to collect, synthesise and interpret key information and to consider biodiversity in the context of broader environmental change. Planning effective management responses requires a commitment to significant increases in research on understanding and measuring biodiversity and its roles in ecosystem function, mapping of vegetation and ecosystems at appropriate scales, and development and implementation of monitoring frameworks at a range of scales (regional, state and national). Monitoring should directly lead to adaptive management and be incorporated into an experimental learning framework that tells us how different strategies perform.
The National Land and Water Resources Audit’s Australian Terrestrial Biodiversity Assessment (NLWRA 2002) provided an important review of information and trends related to various elements of biodiversity at a bioregional scale across the continent. There is a need for ongoing collection and dissemination of this type of information to allow assessment of progress in biodiversity conservation and to support strategic interventions to protect biodiversity.
Many responses to biodiversity decline have been reactive. In some bioregions—particularly those subjected to intense development for urbanisation or agriculture—major programmes of ecosystem restoration are required. Restoration programmes need to be planned carefully and based on best available science, to deliver multiple biodiversity and other natural resource benefits. Prevention is more cost effective than restoration, and proactive and anticipatory policies are required that focus on preventing ecosystem and species decline.
Australia’s terrestrial protected area system is a central strategy in protecting biodiversity and, while it has increased to cover about 10.5 per cent of the continent, it is not representative across bioregions. Specific effort is needed to meet commitments to develop a fully representative system across all bioregions where the opportunity remains.
As knowledge of Australia’s ecosystems improves so does the understanding of the scale of the pressures and the challenges for responding to those challenges. The authors believe that implementation of programmes across the broader landscape has not been sufficiently proactive, strategic or adequately resourced to address the accumulating impacts that are driving biodiversity decline.
Stemming biodiversity decline will require biodiversity initiatives in which detailed responses are tailored to each bioregion of Australia and are sufficiently understood to focus the current investment in regional delivery processes. A basic platform of knowledge and community commitment now exists to develop such initiatives.
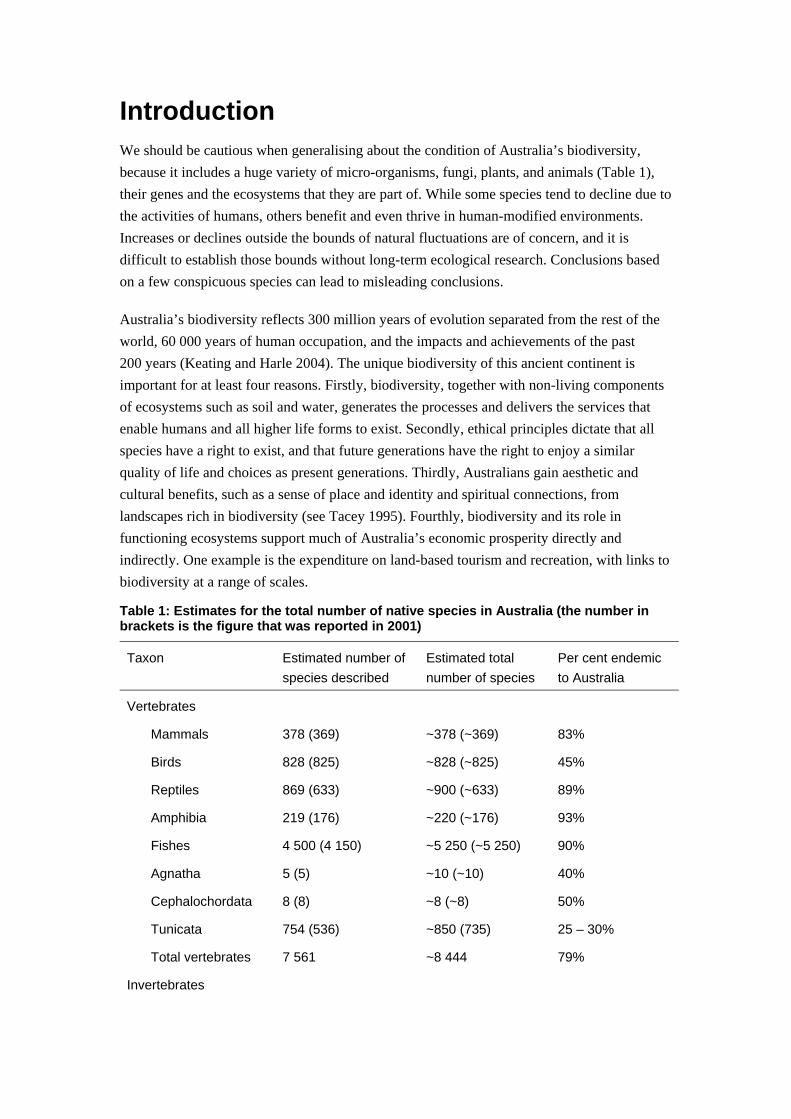
Introduction We should be cautious when generalising about the condition of Australia’s biodiversity, because it includes a huge variety of micro-organisms, fungi, plants, and animals (Table 1), their genes and the ecosystems that they are part of. While some species tend to decline due to the activities of humans, others benefit and even thrive in human-modified environments. Increases or declines outside the bounds of natural fluctuations are of concern, and it is difficult to establish those bounds without long-term ecological research. Conclusions based on a few conspicuous species can lead to misleading conclusions.
Australia’s biodiversity reflects 300 million years of evolution separated from the rest of the world, 60 000 years of human occupation, and the impacts and achievements of the past 200 years (Keating and Harle 2004). The unique biodiversity of this ancient continent is important for at least four reasons. Firstly, biodiversity, together with non-living components of ecosystems such as soil and water, generates the processes and delivers the services that enable humans and all higher life forms to exist. Secondly, ethical principles dictate that all species have a right to exist, and that future generations have the right to enjoy a similar quality of life and choices as present generations. Thirdly, Australians gain aesthetic and cultural benefits, such as a sense of place and identity and spiritual connections, from landscapes rich in biodiversity (see Tacey 1995). Fourthly, biodiversity and its role in functioning ecosystems support much of Australia’s economic prosperity directly and indirectly. One example is the expenditure on land-based tourism and recreation, with links to biodiversity at a range of scales.
Table 1: Estimates for the total number of native species in Australia (the number in brackets is the figure that was reported in 2001)
Taxon Estimated number of species described
Estimated total number of species
Per cent endemic to Australia
Vertebrates
Mammals 378 (369) ~378 (~369) 83%
Birds 828 (825) ~828 (~825) 45%
Reptiles 869 (633) ~900 (~633) 89%
Amphibia 219 (176) ~220 (~176) 93%
Fishes 4 500 (4 150) ~5 250 (~5 250) 90%
Agnatha 5 (5) ~10 (~10) 40%
Cephalochordata 8 (8) ~8 (~8) 50%
Tunicata 754 (536) ~850 (735) 25 – 30%
Total vertebrates 7 561 ~8 444 79%
Invertebrates

Taxon Estimated number of species described
Estimated total number of species
Per cent endemic to Australia
Hemichordata 17 22 25 – 30%
Echinodermata 1 165 (1 206) ~1 406 (~1 400) 31%
Insecta ~80 000 (58 532)
~95 000 – 204 743 (~83 860)
unknown
Arachnida 5 711 (5 666) ~27 960 (~27 960) unknown
Myriapoda 405 ~2 800 unknown
Crustacea 7 130 (6 426) ~9 500 (~9 500) unknown
Onychophora 71 (56) ~80 (~56) unknown
Mollusca ~8 700 (9 336) ~12 250 (~12 250) 38%
Annelida 2 300 (2 125) ~4 230 (~4 230) 67%
Nematoda ~2 060 (2 060) ~30 000 (30 000) unknown
Acanthocephala 56 (57) ~160 (~160) unknown
Platyhelminthes 1 593 (1 506) ~10 000 (~10 800) unknown
Cnidaria 1 705 (1 270) ~2 200 (~1 760) unknown
Porifera 1 416 (1 416) ~3 500 (~3 500) 56%
Others 2 213 (2 929) ~5 015 (~7 230) unknown
Total invertebrates (rounded)
114 600 ~250 000 unknown
Plants
Bryophyta 1 852 (1 500) ~2 200 (~2 500) 25%
Vascular Plants
18 140 (15 638) ~20 500 (20 000 to 25 000)
90%
Ferns and allies (446) (~500) (40%)
Gymnosperms (113) (unknown) (96%)
Magnoliophyta (17 580) (19 000 to 21 000) (91%)
Total plants ~20 000 23 000 84%
Others
Lichens 3 227 (2 877) ~5 000 (~5 000) 34%
Fungi
5 672 (12 500) 160 000 to 250 000 (250 000)
90%
Bacteria ~40 (unknown) 40 000 (unknown) unknown
Cyanophyta ~40 12 000 – 40 000 unknown
Taxon Estimated number of species described
Estimated total number of species
Per cent endemic to Australia
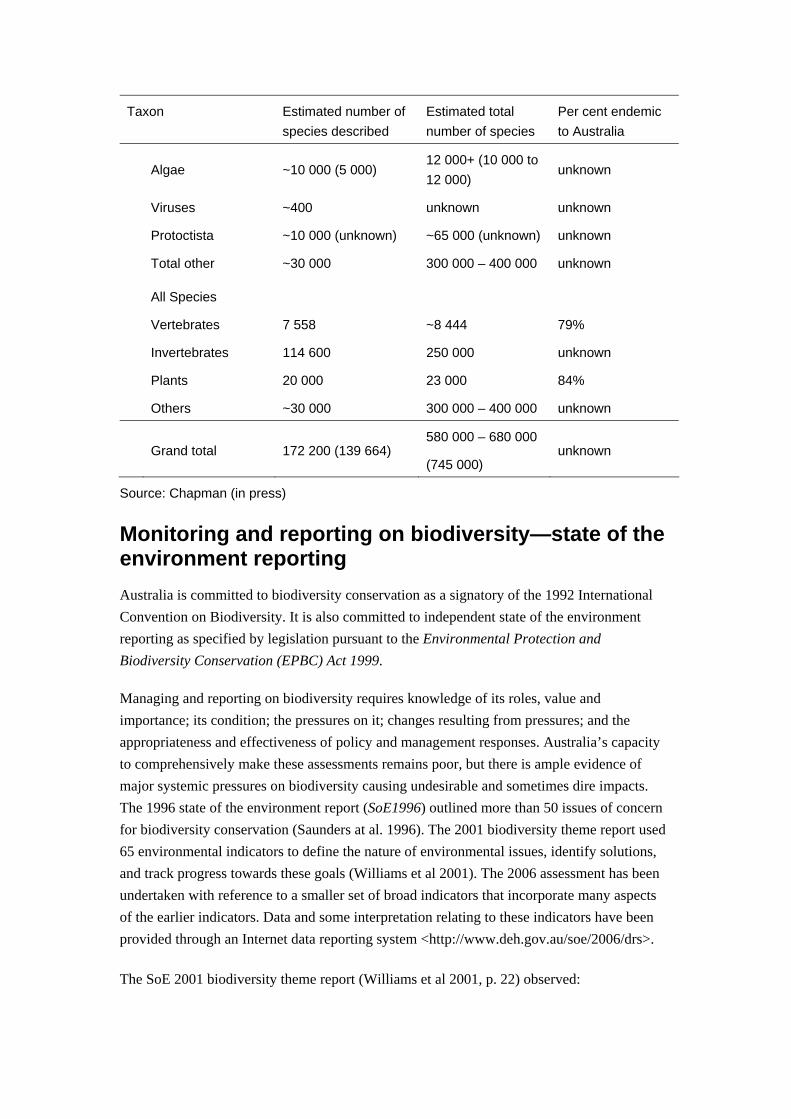
Algae ~10 000 (5 000)
12 000+ (10 000 to 12 000)
unknown
Viruses ~400 unknown unknown
Protoctista ~10 000 (unknown) ~65 000 (unknown) unknown
Total other ~30 000 300 000 – 400 000 unknown
All Species
Vertebrates 7 558 ~8 444 79%
Invertebrates 114 600 250 000 unknown
Plants 20 000 23 000 84%
Others ~30 000 300 000 – 400 000 unknown
Grand total 172 200 (139 664)
580 000 – 680 000
(745 000) unknown
Source: Chapman (in press)
Monitoring and reporting on biodiversity—state of the environment reporting Australia is committed to biodiversity conservation as a signatory of the 1992 International Convention on Biodiversity. It is also committed to independent state of the environment reporting as specified by legislation pursuant to the Environmental Protection and Biodiversity Conservation (EPBC) Act 1999.
Managing and reporting on biodiversity requires knowledge of its roles, value and importance; its condition; the pressures on it; changes resulting from pressures; and the appropriateness and effectiveness of policy and management responses. Australia’s capacity to comprehensively make these assessments remains poor, but there is ample evidence of major systemic pressures on biodiversity causing undesirable and sometimes dire impacts. The 1996 state of the environment report (SoE1996) outlined more than 50 issues of concern for biodiversity conservation (Saunders at al. 1996). The 2001 biodiversity theme report used 65 environmental indicators to define the nature of environmental issues, identify solutions, and track progress towards these goals (Williams et al 2001). The 2006 assessment has been undertaken with reference to a smaller set of broad indicators that incorporate many aspects of the earlier indicators. Data and some interpretation relating to these indicators have been provided through an Internet data reporting system <http://www.deh.gov.au/soe/2006/drs>. The SoE 2001 biodiversity theme report (Williams et al 2001, p. 22) observed:
In order to track these changes, a monitoring program is essential where repeated sets of measurements are compared with a benchmark set or condition. For SoE reporting, these benchmarks must enable the effects of current programmes and policies and of land/resource management activities to be assessed in relation to their biodiversity outcomes.
Such an ecological monitoring programme still does not exist. In its absence, and with indicators changing from one state of the environment report to the next, it is not possible to draw firm conclusions about changes in the state of biodiversity from one reporting period to the next. Monitoring should not, however, be considered an end in itself. Its role is in achieving goals such as better management decisions, early warning, progress against targets and milestones, learning, and community education. Ideally, monitoring of biodiversity should be incorporated into an experimental learning framework that tells us how different strategies perform and leads to better solutions (Possingham 2000; Possingham at al. 2001).
The pressure, state, response model This report is structured around the three elements of state of the environment reporting: pressures on biodiversity, the impacts of those pressures on the state of biodiversity, and responses to the pressures. For clarity, and in response to reviewer’s comments, most discussion of responses is in a separate section but pressure-specific responses are also referred to in the relevant subsection of ‘Pressures’.
Information used in this report In this report, a range of information relating to condition and trends in Australian biodiversity is considered, especially information that has become available since the 1996 SoE report and the 2001 SoE biodiversity theme report (Saunders at al. 1996; Williams at al. 2001). Most of that information is summarised in the data reporting system <http://www.deh.gov.au/soe/2006/drs> and only selected highlights are reported in detail in this commentary. One of the sources of information in the period since SoE2001 has been the Australian Terrestrial Biodiversity Assessment (NLWRA 2002), which is the most comprehensive national collation and interpretation of information undertaken to date. Its conclusions were drawn after SoE2001 was completed. Most of the other information that has become available since SoE2001 is of limited geographic spread or focuses on a limited range of issues.
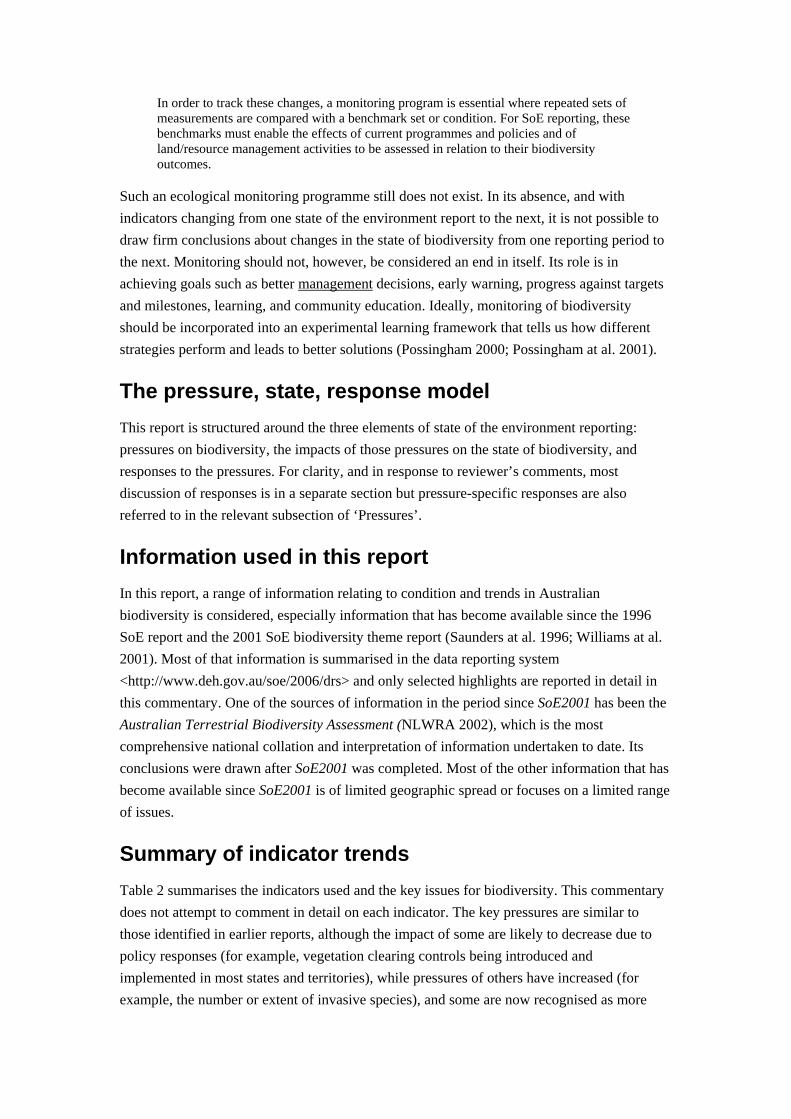
Summary of indicator trends Table 2 summarises the indicators used and the key issues for biodiversity. This commentary does not attempt to comment in detail on each indicator. The key pressures are similar to those identified in earlier reports, although the impact of some are likely to decrease due to policy responses (for example, vegetation clearing controls being introduced and implemented in most states and territories), while pressures of others have increased (for example, the number or extent of invasive species), and some are now recognised as more
important than previously thought (for example, climate change). As explained above, detailed conclusions about changes in most indicators between state of the environment reporting periods are not possible. Similarly, conclusions about the relative importance of individual pressures (apart from identifying the major group of pressures discussed above) are not warranted because their importance can vary between locations and because the pressures are interrelated and need to be addressed together rather than separately.
Table 2: Summary of this commentary on biodiversity indicators
Issue (and indicators) Comments
Utilisation and value of biodiversity
It has been well established that Australian biodiversity has major economic and broader values to Australians and the world, although there is debate about how to measure these values precisely.
Benefits such as carbon sequestration, water filtration, pest control, and maintenance of air quality are not currently quantified in economic or other terms and yet they are among the most valuable aspects of utilising biodiversity.
Harvesting and trade in wildlife
• Australian fisheries production - National Tonnage and Value of Retained Catch Average tonnage and value of other (non-food) agricultural products per hectare of land under production
• Ecologically sustainable harvesting of some selected nationally significant native species
Research and monitoring of some commercially harvested species suggest that, with appropriate science-based management, direct use of native species can be managed sustainably. Cases of sustainable use supported by sufficient research and monitoring are rare.
Medicines and other potentially useful biological compounds
• Number of compounds from terrestrial sources at some stage of commercial development
• Number of compounds from coastal and marine sources at some stage of commercial development
No data are available.
Incentives for biodiversity management
• Government investments to protect biodiversity for public good purposes
Many catchment management authorities and local and state governments are beginning to deliver an increasingly wide range of incentives that are intended to conserve biodiversity through improved management of habitats. These schemes are small relative to the extent of degradation and the level required to reward biodiversity stewardship.
Tourism
• Tourism activities based in areas of high biodiversity significance
• Value of and numbers participating in landscape based tourism and recreation
• Value of an numbers participating in coastal and marine based tourism and recreation
• Number of international and domestic tourists
Nature-based tourism continues to be a significant component of Australia’s economy, but this is often not reflected in the level of management resources provided to conservation agencies to protect biodiversity values in parks. Apart from a few examples like the Great Barrier Reef, the tourism industry makes little direct contribution to management of, and research into, the biodiversity infrastructure on which it fundamentally relies. This is an opportunity to improve both funding for biodiversity assessment and recognition of the economic value of biodiversity

Pressures on biodiversity
Land clearing
• Change in area and proportion of woody native vegetation
Rates of broadscale land clearing are expected to decline nationally (at different rates in different states and territories) due to new regulations on land clearing. However, loss of remnants, fragmentation and clearing of regrowth in key areas is a major ongoing issue. Effective implementation of recent legislative reforms is important.
Invasive organisms
• Current research into pressures and contributions of naturalised introduced species
• The change in extent of selected nationally significant introduced invasive organisms
• Examples of native species whose populations have declined where various invasive organisms have established resident populations
• Land use and land use change
• Examples of significant wetland weeds
• Examples of carp pressures and measures for removal and/or commercial catch
• Correlation between various human activities and introduction of coastal and marine species
There has been increased attention in the literature to impacts of invasive organisms since 2001. Invasive organisms are, or are likely to become, a major threat for many species and ecosystems. Developments include an increased focus on controlling the entry of new species. A number of legislative and policy gaps have been identified and addressed. Nevertheless, the spread of introduced pasture species (including invasive pasture grasses) is still a major concern with few solutions in sight. With respect to aquatic systems, there is a rise in naturalised freshwater fish nationally.
Fire
• Area burnt by frequency, intensity and season of burning
• Examples of the impact of fires on biodiversity
• Temporal and spatial correlation between changing fire regimes and species change
• Severe drought and wildfire correlation
While increased attention has been given to fire as a pressure on biodiversity since SoE1996 and SoE2001, the data still do not allow conclusions to be reached about changes in fire regimes nationally. In parts of Australia, including the northern savannas, the scale, frequency and intensity of fires remains a key issue for biodiversity. Fires in southern Australia tend to be more episodic, with large-scale fires like the 2003 alpine fires favoured by periods of below average dryness. There is still no serious system of fire mapping and fire regime mapping in Australia. This is needed for such a fire-prone continent (Cary et al 2003)
Grazing pressure
• Examples of the impact of grazing on biodiversity
• Total grazing pressure relative to net primary productivity
Total grazing pressure is one of the most significant issues for biodiversity conservation. Grazing not only leads to removal of vegetation and, often, soil degradation, but also on the quality of habitat as overgrazing simplifies the structure and complexity of vegetation. Impacts are likely to increase as average climate and climate variability change. Ongoing expansion of watering facilities in some areas is a major driver of total grazing pressure. The extent of water remote lands in rangelands could be a useful indicator.
Changed hydrology
• Examples of the impact of changed hydrology on biodiversity
• Area and proportion of land affected by or at risk of dryland salinity and acidity
• Average annual groundwater depth
• Groundwater management plans that consider groundwater dependent ecosystems
Changed hydrology remains a major pressure, especially since the full effects of salinity from historical vegetation clearing have yet to be realised. Increasing direct effects on wetlands and aquatic dependent biodiversity are likely to be made worse with climate change. Inadequate attention has been paid to groundwater-dependent biodiversity. Considerable planning is required to address restoration at broad landscape scales.
Climate variability
• Examples of impacts of climate variability on selected terrestrial species, habitats or ecosystems
• Examples of the impact of climate variability on selected coastal and marine species, habitats or ecosystems
Climate change, including associated change in the variability of climate, ranks with habitat modification as the biggest global threat to biodiversity (Thomas et al 2004; Millennium Ecosystem Assessment 2005a, b). In Australia, changes in average climate and climate variability are being recognised as among the most significant emerging threats. There are few long-term datasets to test impacts and develop predictions. Discerning the effects of climate variability from other pressures in the past is an issue. Efforts to reduce climatic pressures are long-term, expensive and multi-national. Mitigation of impacts will need a new focus on ecosystem management and must consider the capacity of genes, species and ecosystems to adapt to change. Future mitigation plans should consider the possibility that extreme measures, such as active translocation of species to new habitat, might be needed.
Species, habitats and ecological communities
Species diversity
• The number of fauna and flora species described in Australia compared with previous years and estimated total number of species
ABRS estimates that around 172 200 species have been described (this figure was 139 664 in SoE2001) of an estimated total of 580 000 to 680 000 (was 745 000 in SoE2001). Because this is only 25 per cent (compared with 19 per cent in 2001), this indicator does not currently say much about the diversity or state of Australian biodiversity. It does, however, provide important information on taxonomic effort.
Conservation status of species and ecological communities
• Conservation status of nationally significant species and ecological communities, compared with previous years
Since the commencement of the EPBC Act in 2000, there have been 134 species and ten ecological communities added to the original lists of threatened species and threatened ecological communities. This does not include transfers to other categories on the list or species that have been delisted. Changes to these lists are essentially in response to public nominations from parties with an interest in a particular species or ecological community. It is not a systematic assessment of species most at risk. Therefore these lists cannot be used as an accurate indicator of biodiversity change. Using similar criteria, but using available data for all ecosystems across Australia, the NLWRA identified over 2800 threatened ecosystems.
Condition of wetlands and riparian vegetation
• Extent of significant wetlands
• Examples of deterioration of condition of wetland vegetation
• Ramsar wetlands with implemented management plans
The good condition of many rivers in northern Australia is an asset worthy of note and protection.
Government action on species and ecological communities conservation or management
• Summary of measures being implemented to respond to threats to biodiversity from invasive species
While the date reporting system shows increases in funding for some aspects of threat abatement for invasive organisms, the effectiveness of funded projects is unknown. The few data available on trends in species targeted by recovery plans suggests mixed success.
• Listed threatened species or ecological communities for which recovery action is showing stable or increasing populations
There has been an increase in the number of species listed under Australian government legislation as vulnerable, endangered or critically endangered for all groups, but this mainly reflects listing activity and cannot be linked to changes in the status of biodiversity. Conservation effort should also focus on non-threatened species and ecosystems such as the conservation of endemic species.
• Alignment of state, territory and Australian government listing processes
Progress has been made recently on aligning listing between the Australian Government and the states and territories (see <http://www.deh.gov.au/soe/2006/emerging/species-listing/index.html>).
Community action on species and ecological communities conservation or management
• Measures taken to conserve species or ecological communities on land that is not part of the national reserve system
There is a trend towards greater community involvement in biodiversity planning and management, with assistance from governments, but the effectiveness of this involvement has not been evaluated in most cases. It is important to avoid the establishment of a system of ‘paper’ protected areas on private lands without effective monitoring tied to adaptive management.
• Indigenous knowledge of species and ecological communities and their utilisation for management by Indigenous and non-Indigenous managers and for other purposes by Indigenous and non-Indigenous people
Case studies reviewed in the data reporting system suggest that the use of Indigenous knowledge can have benefit to the whole community, but there are no data on trends in efforts to capture and use indigenous knowledge. The 2006 Australian State of the Environment Committee commissioned four case studies on Indigenous involvement in environmental management (see <http://www.deh.gov.au/soe/2006/integrative/indigenous/index.html>).
Landscapes
Ecosystem diversity
• The proportion and area of native woody and non-woody vegetation and changes over time
• Change in extent and proportion of woody vegetation, clearing and regrowth
• Fragmentation of remnant vegetation
• Estimated loss of biodiversity resulting from land clearing
• Conservation status of nationally significant species and ecological communities, compared with previous years
• Trends in selected groups of coastal and marine species and habitats
Most available data relate to broad vegetation types. The proportion of 1750 extent remaining varies from 63 to 100 per cent. This masks major declines in particular species and assemblages within these major types, declines in condition of the vegetation as habitat, decline in connectivity of habitat and much higher than average rates of clearance in some regions and bioregions, all of which have major implications for biodiversity. One of the major concerns is lack of replacement of old with young plants in largely cleared landscapes.
More than 17 million hectares of forest have been cleared nationally since 1973. Taking account of revegetation and regrowth, the net loss was about 7.5 million hectares. There are major limitations to drawing conclusions about the impacts of vegetation clearance on biodiversity because there are few nationwide data on vegetation extent and condition, and there is no comprehensive mapping of vegetation ecosystems at an acceptable planning scale of 1:100 000 to 1:250 000 across Australia.
Land clearing in Australia is expected to decline in the future due to new regulations in all states and territories, but this is not apparent in the data available for this assessment. Clearing in Queensland continues at a high level as part of phase-out arrangements.
Revegetation programmes need to be carefully targeted to achieve defined biodiversity objectives in each locality. The total nett loss of forest in Australia due to land clearing between 1973 and 2004 was about 7.5 million hectares. Data on forest regrowth presented in the data reporting system are difficult to interpret and potentially misleading. It is not clear what the nature of much of the regrowth is—a large proportion is likely to be non-native and of low value for biodiversity.
Revegetated and regrowth areas do not necessarily have the same habitat qualities as the previous vegetation. Revegetation strategies should include strategies to reward protection of natural regrowth in key areas. There is declining condition in vegetation and lack of recruitment in many extensively cleared landscapes.
Government action on landscape protection
Significant vegetation management reforms have occurred and are being implemented in Queensland, New South Wales and Tasmania since SoE2001.
• Extent and comprehensiveness of terrestrial protected areas
• Number and extent of marine protected areas
A comprehensive protected area system across all bioregions has not been met. Approximately, 67 per cent of regional ecosystems are represented in national parks and similar reserves. Opportunities for a representative system of protected areas are non-existent in some bioregions and diminishing in others.
• Institutional response to loss of native vegetation
The effectiveness and efficiency of major national initiatives through the Natural Heritage Trust (NHT) and the National Action Plan for Salinity and Water Quality (NAP) for the protection of biodiversity at the scale required is uncertain. Limited monitoring of real biodiversity gains (as distinct from auditing process) is a major problem. The lack of integrated regional biodiversity strategies for input into a wide range of planning and delivery processes is of concern.
Utilisation and value of biodiversity Biodiversity is enormously valuable in its own right, in economic and cultural terms, and in the provision of market and non-market ecosystem goods and services (see Williams et al 2001; PMSEIC 2002; Millennium Ecosystem Assessment 2003; CSIRO 2005; BDAC 2005). Biodiversity underpins the life support systems that we depend upon. When it is lost, ecosystems break down and essential ecosystem services falter, causing economical and cultural impoverishment of societies. This can be seen today in some of the worn-out pastoral areas or salinity-affected agricultural regions of Australia.
Biodiversity supplies a pool of biological and genetic resources that contribute to resilience in ecological, social and economic systems. In ecological systems, biodiversity provides ‘insurance’ against change by maintaining a range of species that perform the same or similar functions but that could adapt differently to changing conditions (Folke et al 2002). Biodiversity’s contribution to social and economic resilience is exemplified by disease resistant crops and new crop plants, such as wattle seeds for protein, plantation eucalypts, new medicines, insecticides and other products (Folke et al 2002; Elmqvist 2003; Simpson and Chudleigh 2003; Resilience Alliance 2006).
The SoE 2001 biodiversity theme report mentioned efforts to estimate the economic value of biodiversity and ecosystem services (Williams et al 2001). Such approaches are rarely integrated into decision-making processes. This is a major deficiency in current investment in biodiversity management, especially because the size of this investment is partly determined by the balance between poorly defined (and typically longer-term) benefits from conservation and well-defined (but typically shorter-term) benefits from land conversion.
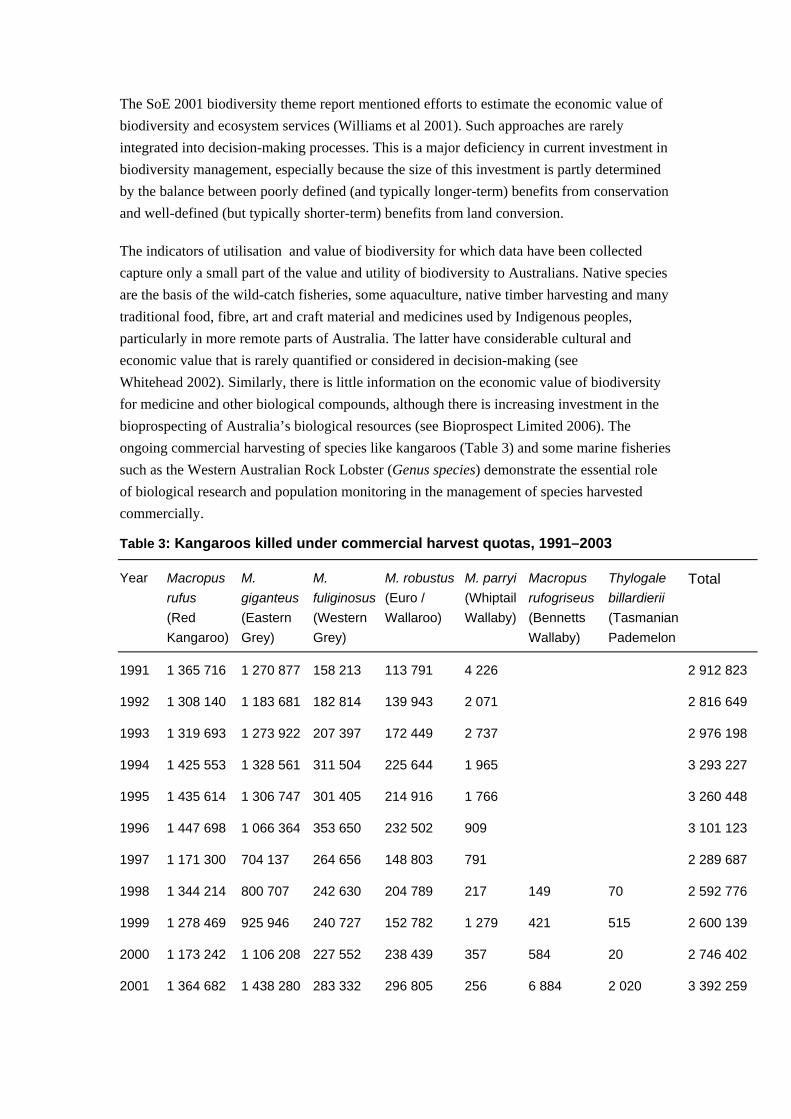
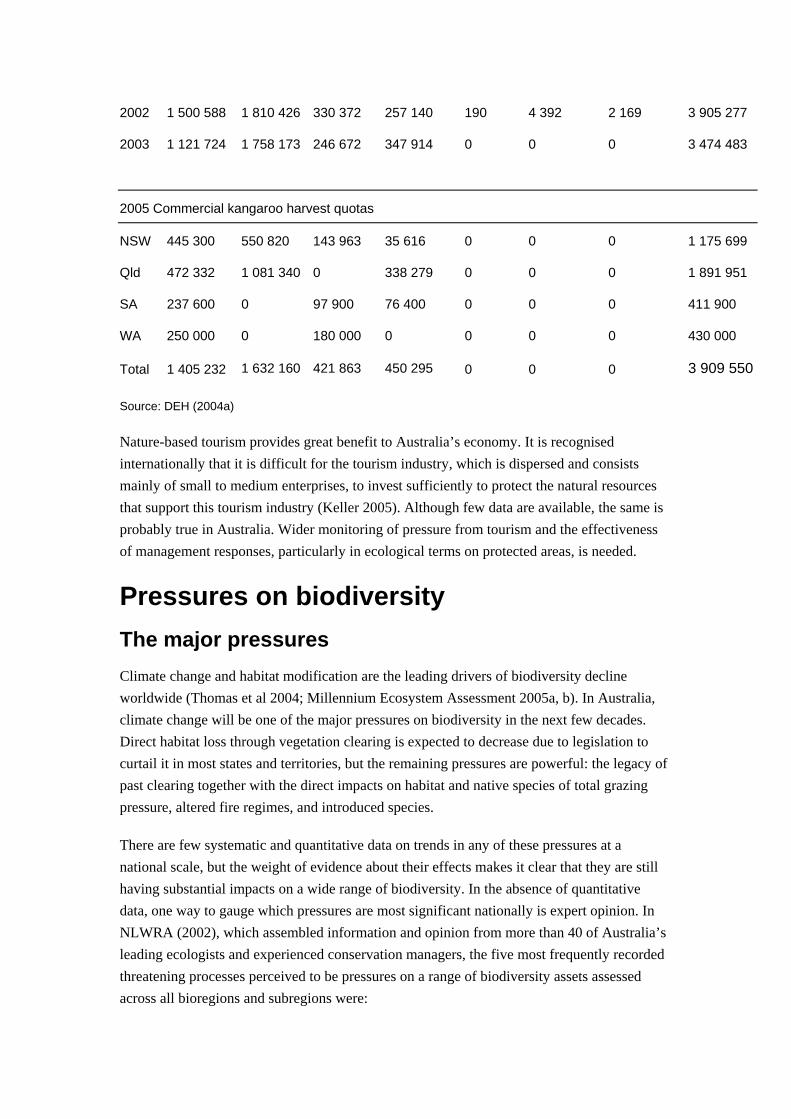
The indicators of utilisation and value of biodiversity for which data have been collected capture only a small part of the value and utility of biodiversity to Australians. Native species are the basis of the wild-catch fisheries, some aquaculture, native timber harvesting and many traditional food, fibre, art and craft material and medicines used by Indigenous peoples, particularly in more remote parts of Australia. The latter have considerable cultural and economic value that is rarely quantified or considered in decision-making (see Whitehead 2002). Similarly, there is little information on the economic value of biodiversity for medicine and other biological compounds, although there is increasing investment in the bioprospecting of Australia’s biological resources (see Bioprospect Limited 2006). The ongoing commercial harvesting of species like kangaroos (Table 3) and some marine fisheries such as the Western Australian Rock Lobster (Genus species) demonstrate the essential role of biological research and population monitoring in the management of species harvested commercially.
Table 3: Kangaroos killed under commercial harvest quotas, 1991–2003
Year Macropus rufus (Red Kangaroo)
M. giganteus (Eastern Grey)
M. fuliginosus(Western Grey)
M. robustus(Euro / Wallaroo)
M. parryi(Whiptail Wallaby)
Macropus rufogriseus (Bennetts Wallaby)
Thylogale billardierii (Tasmanian Pademelon
Total
1991 1 365 716 1 270 877 158 213 113 791 4 226 2 912 823
1992 1 308 140 1 183 681 182 814 139 943 2 071 2 816 649
1993 1 319 693 1 273 922 207 397 172 449 2 737 2 976 198
1994 1 425 553 1 328 561 311 504 225 644 1 965 3 293 227
1995 1 435 614 1 306 747 301 405 214 916 1 766 3 260 448
1996 1 447 698 1 066 364 353 650 232 502 909 3 101 123
1997 1 171 300 704 137 264 656 148 803 791 2 289 687
1998 1 344 214 800 707 242 630 204 789 217 149 70 2 592 776
1999 1 278 469 925 946 240 727 152 782 1 279 421 515 2 600 139
2000 1 173 242 1 106 208 227 552 238 439 357 584 20 2 746 402
2001 1 364 682 1 438 280 283 332 296 805 256 6 884 2 020 3 392 259
2002 1 500 588 1 810 426 330 372 257 140 190 4 392 2 169 3 905 277
2003 1 121 724 1 758 173 246 672 347 914 0 0 0 3 474 483
2005 Commercial kangaroo harvest quotas
NSW 445 300 550 820 143 963 35 616 0 0 0 1 175 699
Qld 472 332 1 081 340 0 338 279 0 0 0 1 891 951
SA 237 600 0 97 900 76 400 0 0 0 411 900
WA 250 000 0 180 000 0 0 0 0 430 000
Total 1 405 232 1 632 160 421 863 450 295 0 0 0 3 909 550
Source: DEH (2004a)
Nature-based tourism provides great benefit to Australia’s economy. It is recognised internationally that it is difficult for the tourism industry, which is dispersed and consists mainly of small to medium enterprises, to invest sufficiently to protect the natural resources that support this tourism industry (Keller 2005). Although few data are available, the same is probably true in Australia. Wider monitoring of pressure from tourism and the effectiveness of management responses, particularly in ecological terms on protected areas, is needed.
Pressures on biodiversity The major pressures Climate change and habitat modification are the leading drivers of biodiversity decline worldwide (Thomas et al 2004; Millennium Ecosystem Assessment 2005a, b). In Australia, climate change will be one of the major pressures on biodiversity in the next few decades. Direct habitat loss through vegetation clearing is expected to decrease due to legislation to curtail it in most states and territories, but the remaining pressures are powerful: the legacy of past clearing together with the direct impacts on habitat and native species of total grazing pressure, altered fire regimes, and introduced species.
There are few systematic and quantitative data on trends in any of these pressures at a national scale, but the weight of evidence about their effects makes it clear that they are still having substantial impacts on a wide range of biodiversity. In the absence of quantitative data, one way to gauge which pressures are most significant nationally is expert opinion. In NLWRA (2002), which assembled information and opinion from more than 40 of Australia’s leading ecologists and experienced conservation managers, the five most frequently recorded threatening processes perceived to be pressures on a range of biodiversity assets assessed across all bioregions and subregions were:
• total grazing pressure
• weeds
• feral animals
• changed fire regime
• habitat fragmentation.
Other less frequently reported pressures include:
• vegetation clearing (particularly eastern Australia)
• changed hydrology and salinity (changed flows, increases or decreases in ground water)
• pollution (including sediment and nutrient pollution of rivers, wetlands, estuaries and coastal waters).
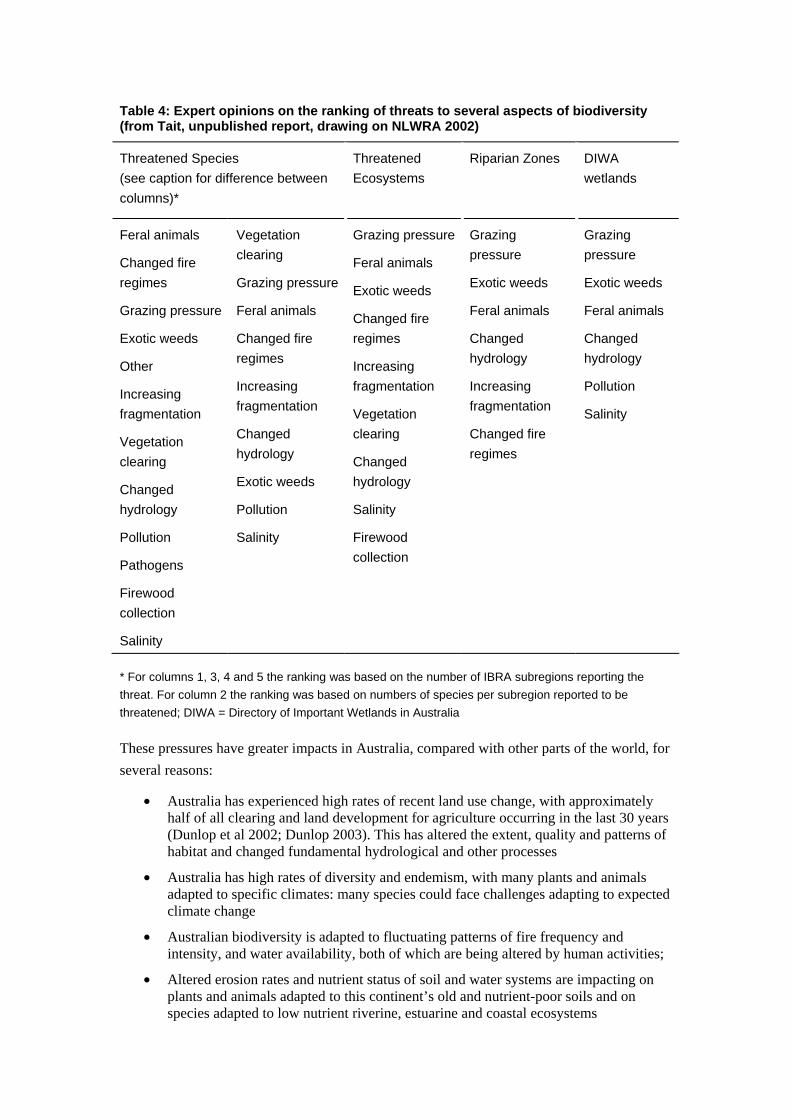
Table 4: Expert opinions on the ranking of threats to several aspects of biodiversity (from Tait, unpublished report, drawing on NLWRA 2002)
Threatened Species (see caption for difference between columns)*
Threatened Ecosystems
Riparian Zones DIWA wetlands
Feral animals
Changed fire regimes
Grazing pressure
Exotic weeds
Other
Increasing fragmentation
Vegetation clearing
Changed hydrology
Pollution
Pathogens
Firewood collection
Salinity
Vegetation clearing
Grazing pressure
Feral animals
Changed fire regimes
Increasing fragmentation
Changed hydrology
Exotic weeds
Pollution
Salinity
Grazing pressure
Feral animals
Exotic weeds
Changed fire regimes
Increasing fragmentation
Vegetation clearing
Changed hydrology
Salinity
Firewood collection
Grazing pressure
Exotic weeds
Feral animals
Changed hydrology
Increasing fragmentation
Changed fire regimes
Grazing pressure
Exotic weeds
Feral animals
Changed hydrology
Pollution
Salinity
* For columns 1, 3, 4 and 5 the ranking was based on the number of IBRA subregions reporting the threat. For column 2 the ranking was based on numbers of species per subregion reported to be threatened; DIWA = Directory of Important Wetlands in Australia
These pressures have greater impacts in Australia, compared with other parts of the world, for several reasons:
• Australia has experienced high rates of recent land use change, with approximately half of all clearing and land development for agriculture occurring in the last 30 years (Dunlop et al 2002; Dunlop 2003). This has altered the extent, quality and patterns of habitat and changed fundamental hydrological and other processes
• Australia has high rates of diversity and endemism, with many plants and animals adapted to specific climates: many species could face challenges adapting to expected climate change
• Australian biodiversity is adapted to fluctuating patterns of fire frequency and intensity, and water availability, both of which are being altered by human activities;
• Altered erosion rates and nutrient status of soil and water systems are impacting on plants and animals adapted to this continent’s old and nutrient-poor soils and on species adapted to low nutrient riverine, estuarine and coastal ecosystems
• Australia, with its 300 million years of geographic isolation and separate evolution, has been protected from biotic invasions. It is increasingly being exposed to exotic species due to increased globalisation of trade and movement of people.
In the following section, comment is made on these major pressures individually, but it should be born in mind that they are not independent. They often interact to increase one another’s impact, and they should not be dealt with individually. This is why landscape-scale responses to biodiversity decline, discussed later, are extremely important.
Land clearing
Recognition of the impact of clearing Australia's native vegetation is not new. As long ago as 1892, Samuel Dixon expressed concern to the Royal Society of South Australia (Dixon 1892) about the destruction of the forests, balding of hills, increased flooding and loss of indigenous flora.
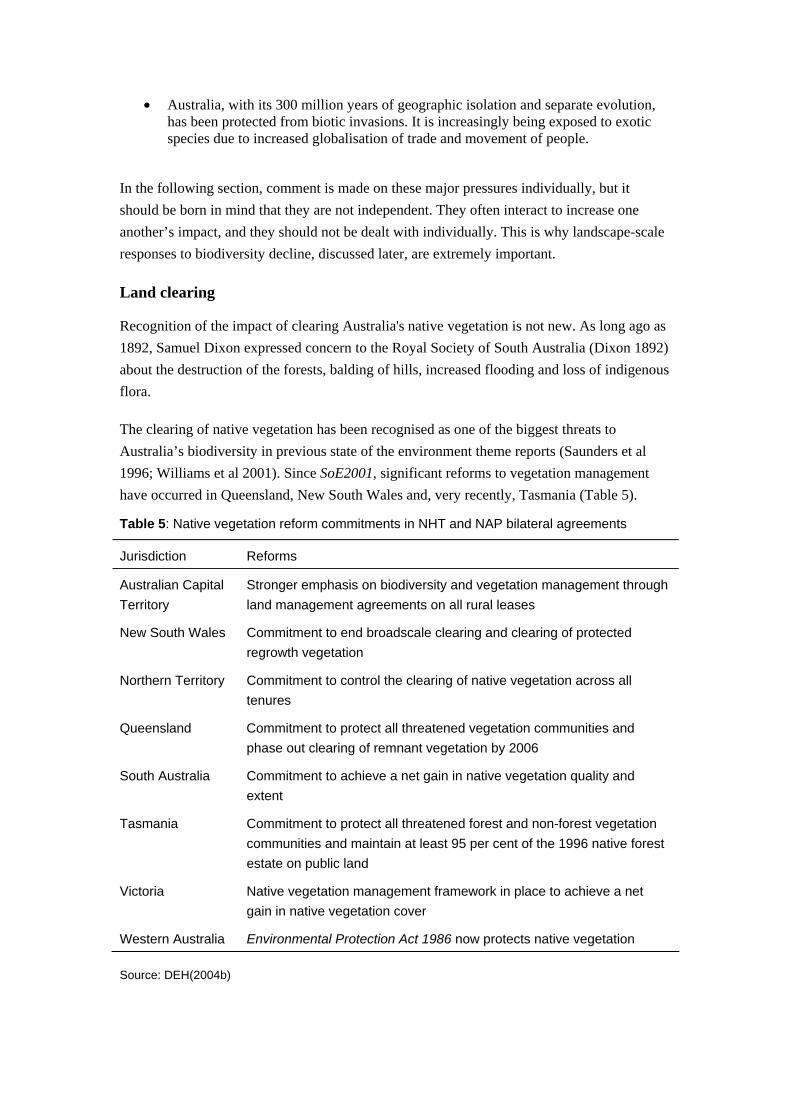
The clearing of native vegetation has been recognised as one of the biggest threats to Australia’s biodiversity in previous state of the environment theme reports (Saunders et al 1996; Williams et al 2001). Since SoE2001, significant reforms to vegetation management have occurred in Queensland, New South Wales and, very recently, Tasmania (Table 5).
Table 5: Native vegetation reform commitments in NHT and NAP bilateral agreements
Jurisdiction Reforms
Australian Capital Territory
Stronger emphasis on biodiversity and vegetation management through land management agreements on all rural leases
New South Wales Commitment to end broadscale clearing and clearing of protected regrowth vegetation
Northern Territory Commitment to control the clearing of native vegetation across all tenures
Queensland Commitment to protect all threatened vegetation communities and phase out clearing of remnant vegetation by 2006
South Australia Commitment to achieve a net gain in native vegetation quality and extent
Tasmania Commitment to protect all threatened forest and non-forest vegetation communities and maintain at least 95 per cent of the 1996 native forest estate on public land
Victoria Native vegetation management framework in place to achieve a net gain in native vegetation cover
Western Australia Environmental Protection Act 1986 now protects native vegetation
Source: DEH(2004b)
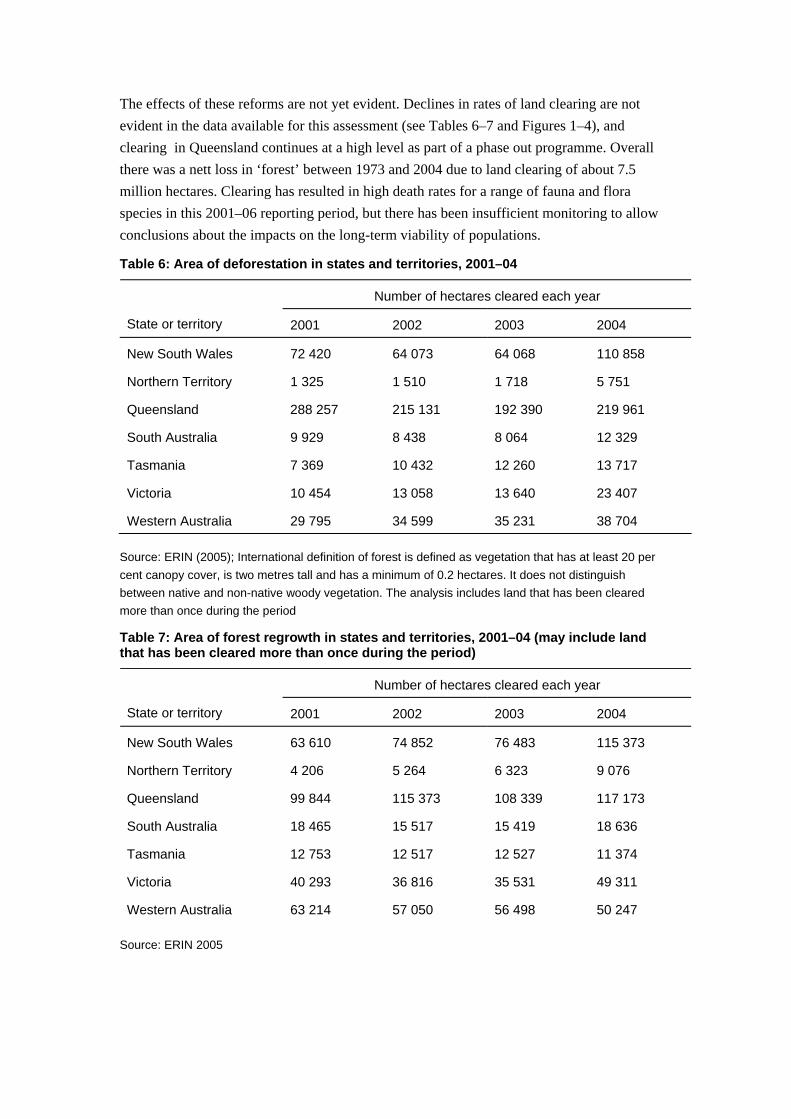
The effects of these reforms are not yet evident. Declines in rates of land clearing are not evident in the data available for this assessment (see Tables 6–7 and Figures 1–4), and clearing in Queensland continues at a high level as part of a phase out programme. Overall there was a nett loss in ‘forest’ between 1973 and 2004 due to land clearing of about 7.5 million hectares. Clearing has resulted in high death rates for a range of fauna and flora species in this 2001–06 reporting period, but there has been insufficient monitoring to allow conclusions about the impacts on the long-term viability of populations.
Table 6: Area of deforestation in states and territories, 2001–04
Number of hectares cleared each year
State or territory 2001 2002 2003 2004
New South Wales 72 420 64 073 64 068 110 858
Northern Territory 1 325 1 510 1 718 5 751
Queensland 288 257 215 131 192 390 219 961
South Australia 9 929 8 438 8 064 12 329
Tasmania 7 369 10 432 12 260 13 717
Victoria 10 454 13 058 13 640 23 407
Western Australia 29 795 34 599 35 231 38 704
Source: ERIN (2005); International definition of forest is defined as vegetation that has at least 20 per cent canopy cover, is two metres tall and has a minimum of 0.2 hectares. It does not distinguish between native and non-native woody vegetation. The analysis includes land that has been cleared more than once during the period
Table 7: Area of forest regrowth in states and territories, 2001–04 (may include land that has been cleared more than once during the period)
Number of hectares cleared each year
State or territory 2001 2002 2003 2004
New South Wales 63 610 74 852 76 483 115 373
Northern Territory 4 206 5 264 6 323 9 076
Queensland 99 844 115 373 108 339 117 173
South Australia 18 465 15 517 15 419 18 636
Tasmania 12 753 12 517 12 527 11 374
Victoria 40 293 36 816 35 531 49 311
Western Australia 63 214 57 050 56 498 50 247
Source: ERIN 2005
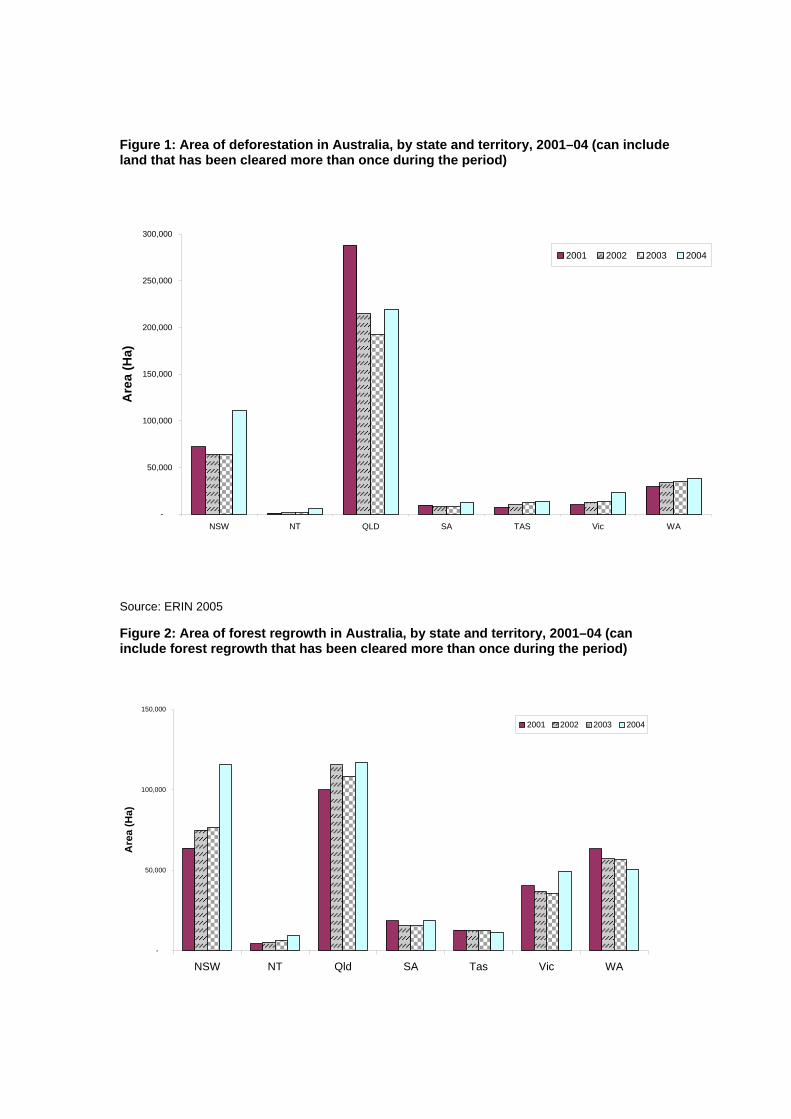
Figure 1: Area of deforestation in Australia, by state and territory, 2001–04 (can include land that has been cleared more than once during the period)
Source: ERIN 2005
Figure 2: Area of forest regrowth in Australia, by state and territory, 2001–04 (can include forest regrowth that has been cleared more than once during the period)
-
50,000
100,000
150,000
200,000
250,000
300,000
NSW NT QLD SA TAS Vic WA
Are
a (H
a)
2001 2002 2003 2004
-
50,000
100,000
150,000
NSW NT Qld SA Tas Vic WA
Are
a (H
a)
2001 2002 2003 2004
Source: ERIN 2005
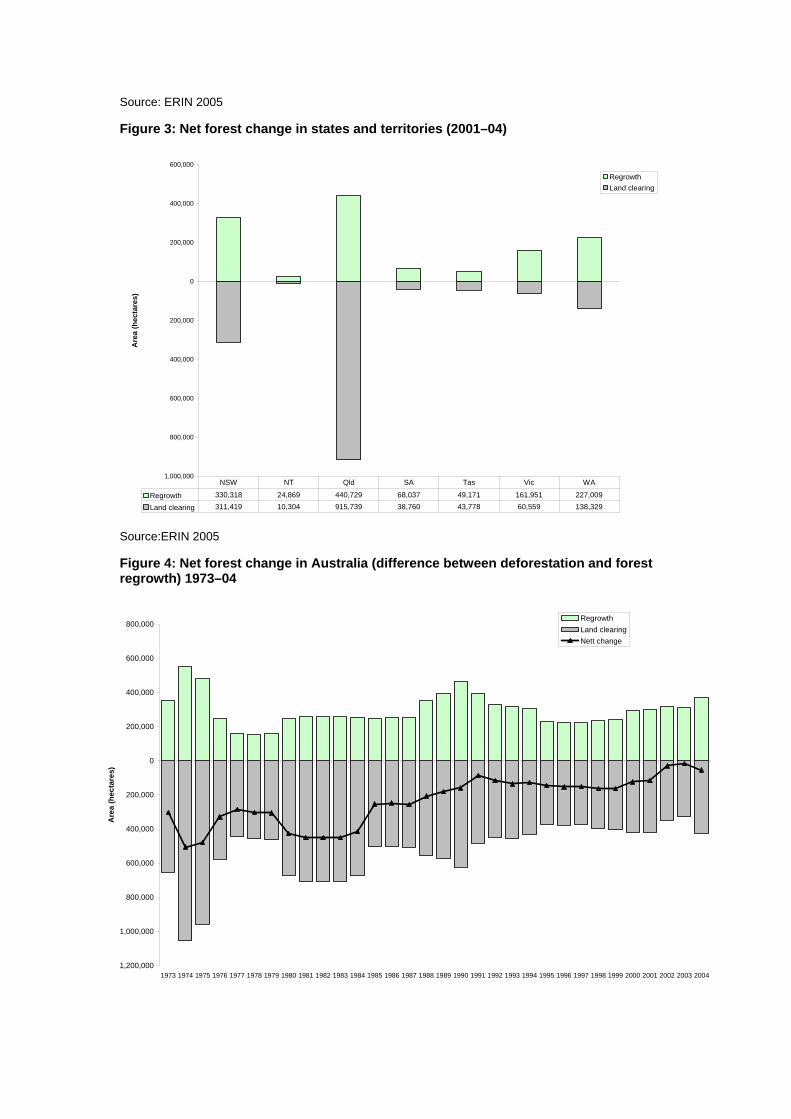
Figure 3: Net forest change in states and territories (2001–04)
Source:ERIN 2005
Figure 4: Net forest change in Australia (difference between deforestation and forest regrowth) 1973–04
1,200,000
1,000,000
800,000
600,000
400,000
200,000
0
200,000
400,000
600,000
800,000
1973 1974 1975 1976 1977 1978 1979 1980 1981 1982 1983 1984 1985 1986 1987 1988 1989 1990 1991 1992 1993 1994 1995 1996 1997 1998 1999 2000 2001 2002 2003 2004
Are
a (h
ecta
res)
RegrowthLand clearingNett change
1,000,000
800,000
600,000
400,000
200,000
0
200,000
400,000
600,000
Are
a (h
ecta
res)
RegrowthLand clearing
Regrowth 330,318 24,869 440,729 68,037 49,171 161,951 227,009
Land clearing 311,419 10,304 915,739 38,760 43,778 60,559 138,329
NSW NT Qld SA Tas Vic WA
Source: ERIN 2005
While recent developments may make broadacre vegetation clearing itself of less concern as a direct pressure nationally than it was at SoE2001 (although it remains a significant pressure in some parts of Australia), the legacy of past clearing is a major ongoing pressure. Once vegetation communities and their associated animals and other organisms have been fragmented and disturbed by clearing they become susceptible to other pressures such as insects, weeds, overgrazing, compaction, salinisation, and changed fire regimes (Saunders et al 1996; Williams et al 2001). In particular, changed hydrology may underlie increasing salinisation for many decades (see Murray–Darling Basin Commission 2003b).
For vegetation communities, these pressures can result in a decline in health, increased susceptibility to diseases, failure of regeneration, and even plant death. As many vegetation communities on fertile soils have been preferentially and extensively cleared, these communities are generally under-represented in protected areas, and remnants outside reserves are under particular threat. Recent work in South Australia and Western Australia raises fears that direct removal of paddock trees, coupled with a lack of regeneration, will lead to a near-complete loss of paddock trees from many rural landscapes in the future (Saunders et al 2003; Carruthers and Hodder 2005).
For both plants and animals, fragmentation of large areas of habitat into smaller pieces means that fewer species can be accommodated in the new ‘islands’. In addition, fragmentation can slow or prevent the mixing of genes among individuals in populations, which can result in inbreeding that reduces the reproductive fitness and long-term health of populations. It is estimated, for example, that even after cessation of clearing in the Mount Lofty Ranges of South Australia, 16 species are likely to go extinct within 200 years due to past impacts (Westphal et al 2003). Available data also report declines in a range of bird species in other parts of Australia (Olsen et al 2006) At present there are few studies of genetic fitness and health of Australia’s biodiversity, although with the increasing capacity through high-speed genetic profiling, research into genetic impacts for some species will be more feasible in coming years.
Clearing in the past has been much higher in some vegetation types than others (NLWRA 2002; and also Table 8; Figure 5). In general, policy frameworks have not been in place to determine the environmental risks and costs, such as of loss of ecosystem services, of clearing in each area (for example, the loss of carbon sequestration and artesian aquifer recharge associated with clearing of marginal rangelands in the Desert Uplands of Queensland). In terms of both planning and state of the environment reporting, there is a need for better assessment processes that assess the trade-offs between development, biodiversity impacts, and implications for ecosystem services at scales relevant to the processes involved; those tradeoffs should also be made much clearer than they are now.
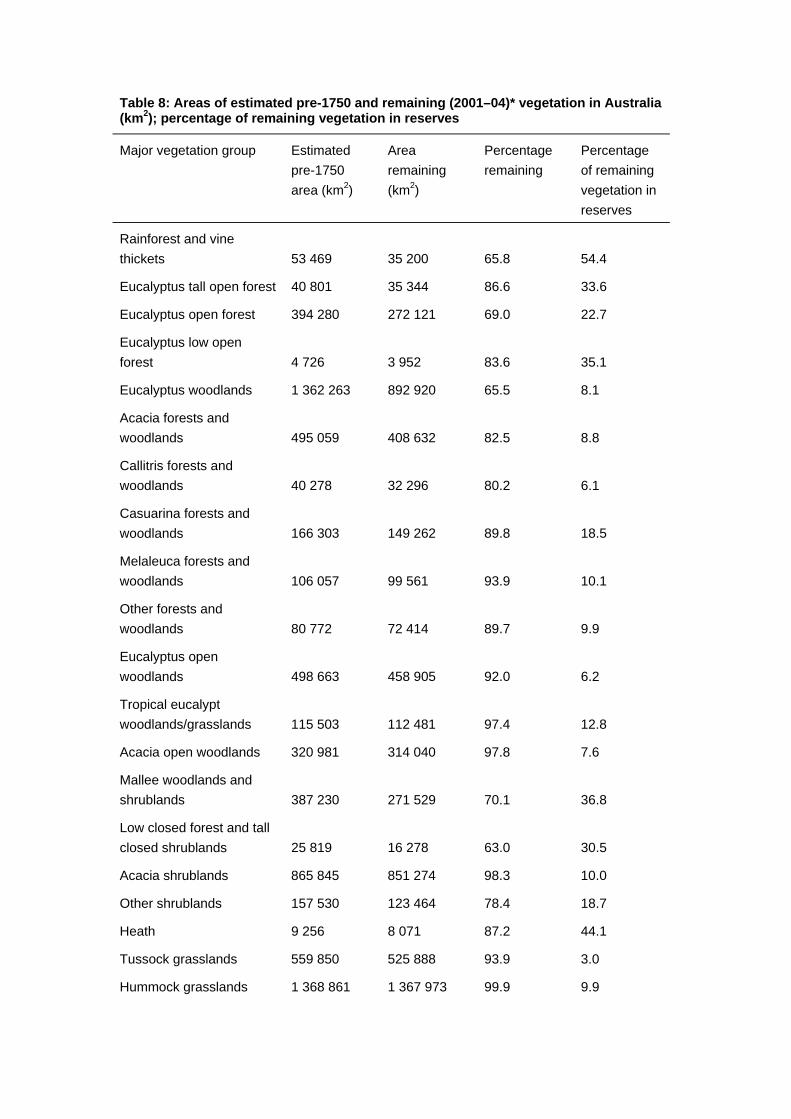
Table 8: Areas of estimated pre-1750 and remaining (2001–04)* vegetation in Australia (km2); percentage of remaining vegetation in reserves
Major vegetation group Estimated pre-1750 area (km2)
Area remaining (km2)
Percentage remaining
Percentage of remaining vegetation in reserves
Rainforest and vine thickets 53 469 35 200 65.8 54.4
Eucalyptus tall open forest 40 801 35 344 86.6 33.6
Eucalyptus open forest 394 280 272 121 69.0 22.7
Eucalyptus low open forest 4 726 3 952 83.6 35.1
Eucalyptus woodlands 1 362 263 892 920 65.5 8.1
Acacia forests and woodlands 495 059 408 632 82.5 8.8
Callitris forests and woodlands 40 278 32 296 80.2 6.1
Casuarina forests and woodlands 166 303 149 262 89.8 18.5
Melaleuca forests and woodlands 106 057 99 561 93.9 10.1
Other forests and woodlands 80 772 72 414 89.7 9.9
Eucalyptus open woodlands 498 663 458 905 92.0 6.2
Tropical eucalypt woodlands/grasslands 115 503 112 481 97.4 12.8
Acacia open woodlands 320 981 314 040 97.8 7.6
Mallee woodlands and shrublands 387 230 271 529 70.1 36.8
Low closed forest and tall closed shrublands 25 819 16 278 63.0 30.5
Acacia shrublands 865 845 851 274 98.3 10.0
Other shrublands 157 530 123 464 78.4 18.7
Heath 9 256 8 071 87.2 44.1
Tussock grasslands 559 850 525 888 93.9 3.0
Hummock grasslands 1 368 861 1 367 973 99.9 9.9
Other grasslands, herblands, sedgelands and rushlands 67 977 64 810 95.3 17.2
Chenopod shrublands, samphire shrubs and forblands 447 239 436 801 97.7 12.6
Mangroves 9 664 9 325 96.5 33.1
7 578 427 6 562 541 86.6 11.5
* except for the NSW component, where most data are from 1997; Sources: National Vegetation Information System (NVIS) Stage 1, Version 3.0 Major Vegetation Groups, DEH, Canberra. URL: http://www.deh.gov.au/erin/nvis/mvg/index.html; and DEH (2006) Australia’s Native Vegetation 2006, Australian Government, Canberra.
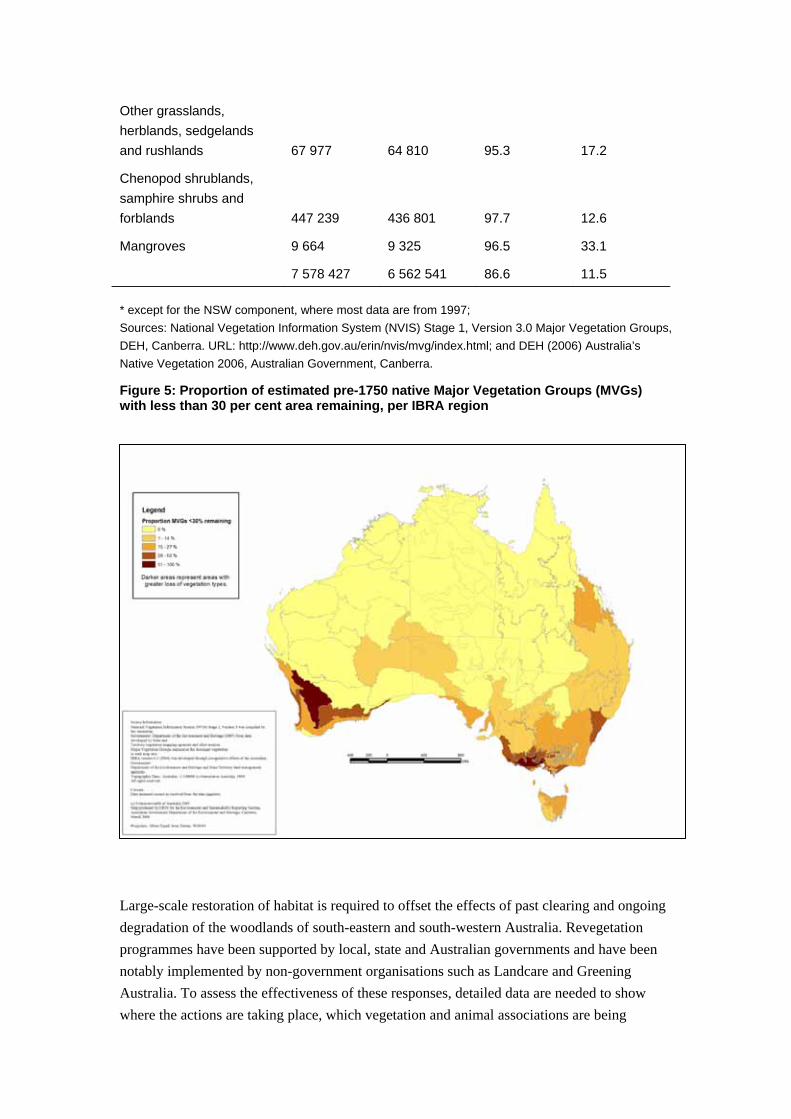
Figure 5: Proportion of estimated pre-1750 native Major Vegetation Groups (MVGs) with less than 30 per cent area remaining, per IBRA region
Large-scale restoration of habitat is required to offset the effects of past clearing and ongoing degradation of the woodlands of south-eastern and south-western Australia. Revegetation programmes have been supported by local, state and Australian governments and have been notably implemented by non-government organisations such as Landcare and Greening Australia. To assess the effectiveness of these responses, detailed data are needed to show where the actions are taking place, which vegetation and animal associations are being

targeted, how the actions affect the connectivity of habitat, how populations are responding, and how changed hydrological regimes may be restored in some locations. As emphasised elsewhere in this commentary, plans are required that identify the specific priorities for different places and different elements of biodiversity around Australia.
At present, the only data available on replacement of vegetation at a national scale are very broad. These data do not distinguish between native and introduced plants; they also include plantations, with variable value for biodiversity, and woody weeds. Revegetated areas take many decades to develop structure and other elements of habitat quality required to sustain plant and animal populations. Thus, numbers of individual plants and animals do not increase as quickly in replaced vegetation as they declined during clearing.
Nevertheless, recent research indicates that in landscapes that have been predominantly cleared and grazed, revegetation can have a significant impact on fauna (Lindenmayer et al 2003). Programmes to encourage the protection of regrowth in key areas remain viable opportunities to secure some threatened ecological communities and the return of vegetation to overcleared landscapes. This can be a much more cost-effective approach than replanting in some landscapes where natural regenerative capacity remains. Other effective responses involve the fencing and special management of remnants.
Invasive organisms Invasive organisms are animals, plants or diseases that have entered Australia from elsewhere, either as deliberate or accidental introductions, and many cause economic, social or environmental harm (Australian Biosecurity Group 2005).
These species have diverse modes of action, routes of introduction and spread, and geographic range among invasive organisms (Reddiex et al 2004; Australian Biosecurity Group 2005;. There are more than 2800 exotic weeds, 25 mammals, 20 birds, four reptiles, 34 fish, 100–400 invasive marine species, and unknown numbers of other invertebrate species and diseases. The CSIRO estimates that Australia gains 20 new pests or diseases each year (CSIRO 2004).
In Australia, exotic pests like feral cats, foxes and rabbits are considered a primary cause of past extinctions of animal species and a potent source of ongoing pressure (see Table 10). Examples include the recent arrival of the Cane Toad (Bufus marinus) in relatively undisturbed parts of the Top End, and the devastating reduction in Quoll (Dasyurus spp) numbers.
The impacts of habitat alteration can be magnified by invasive organisms. The two Australia Bird Atlas surveys reviewed by Garnett et al (2002) show increases in habitat modification and the relative abundance of introduced bird species correlated with decreases in native bird abundance and distribution. The highest abundance of introduced bird species, principally
exotic species, occur in the extensively modified parts of south-east Australia and eastern Tasmania where they now make up 15 per cent of all species (NLWRA 2002).
Diseases have posed threats, and will pose new threats, to both plants and animals, especially in an increasingly globalised world (Millennium Ecosystem Assessment 2005b). A prime example is the devastating impacts of Phytophthera cinnamomi on native vegetation (Australian Biosecurity Group 2005).
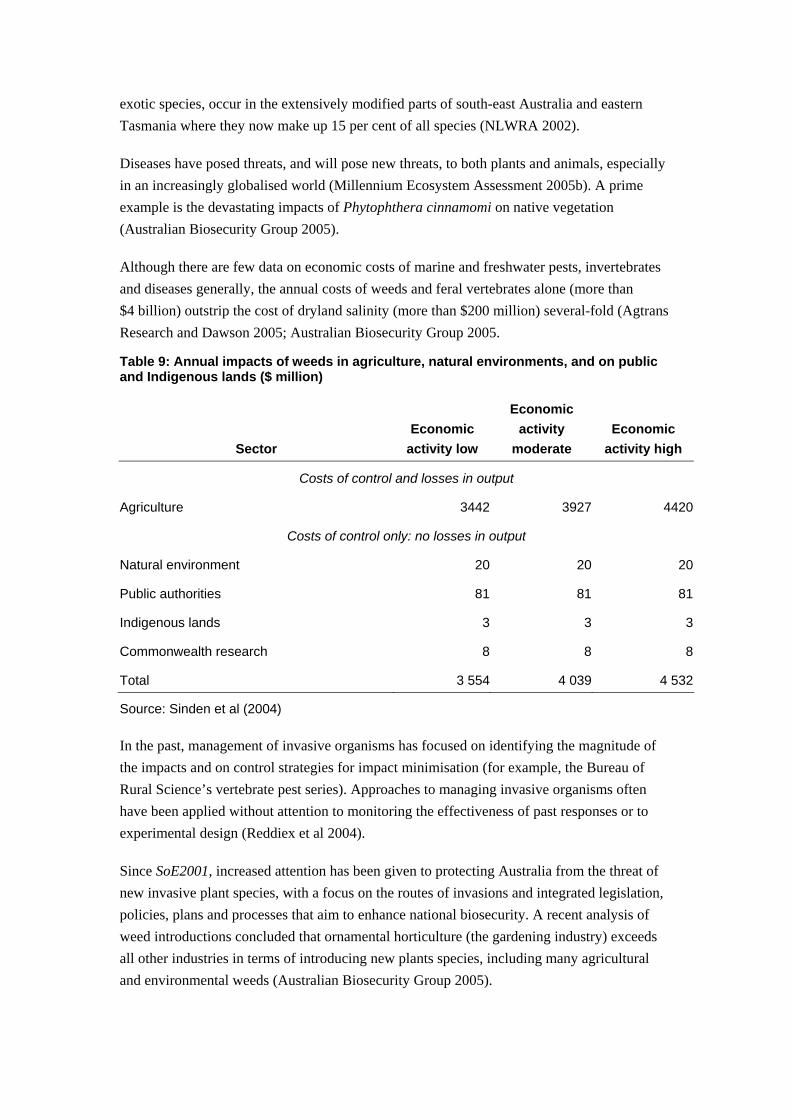
Although there are few data on economic costs of marine and freshwater pests, invertebrates and diseases generally, the annual costs of weeds and feral vertebrates alone (more than $4 billion) outstrip the cost of dryland salinity (more than $200 million) several-fold (Agtrans Research and Dawson 2005; Australian Biosecurity Group 2005.
Table 9: Annual impacts of weeds in agriculture, natural environments, and on public and Indigenous lands ($ million)
Sector Economic
activity low
Economic activity
moderate Economic
activity high
Costs of control and losses in output
Agriculture 3442 3927 4420
Costs of control only: no losses in output
Natural environment 20 20 20
Public authorities 81 81 81
Indigenous lands 3 3 3
Commonwealth research 8 8 8
Total 3 554 4 039 4 532
Source: Sinden et al (2004)
In the past, management of invasive organisms has focused on identifying the magnitude of the impacts and on control strategies for impact minimisation (for example, the Bureau of Rural Science’s vertebrate pest series). Approaches to managing invasive organisms often have been applied without attention to monitoring the effectiveness of past responses or to experimental design (Reddiex et al 2004).
Since SoE2001, increased attention has been given to protecting Australia from the threat of new invasive plant species, with a focus on the routes of invasions and integrated legislation, policies, plans and processes that aim to enhance national biosecurity. A recent analysis of weed introductions concluded that ornamental horticulture (the gardening industry) exceeds all other industries in terms of introducing new plants species, including many agricultural and environmental weeds (Australian Biosecurity Group 2005).
A number of gaps in Australia’s suite of responses to invasive organisms have been identified, including: gaps in quarantine laws; inadequate early warning surveillance; mismatches between laws in different states; inadequate contingency plans for environmental weeds, pests and diseases; inadequate approaches to integrated control of agricultural and environmental pests; inadequate funding for controlling environmental invasive species; inadequate protocols to decide priorities and who pays; poor sharing of information; and lack of community awareness (Australian Biosecurity Group 2005). The deliberate spread of some aggressive introduced pasture species and the lack of protocols for their use as part of pastoral development remains a key biodiversity issue.
It has been noted that public resources committed to invasive organisms appear to be small, particularly compared with expenditure on other natural resource management issues, the economic and environmental impacts of invasives compared with other issues, and the relatively high benefit-cost ratios reported from analyses of research and development on invasive organisms (Agtrans Research and Dawson 2005).
The Australian, state and territory governments have commenced a major review to identify and correct strategic gaps in Australia’s response to invasive organisms. This includes development of a National Framework to Prevent and Control Invasive Species, a National Biosecurity Strategy, a revision of the National Weeds Strategy, development of a new National Pest Animal Strategy, and progress to implement the National System for the Prevention and Management of Introduced Marine Pests. In early 2005, the Australian Government agreed to remove 4000 known weeds not yet present in Australia from the permitted list under the Quarantine Proclamation 1998. Because of the costs of invasive organisms and the risks they could pose to Australia’s diversity of ecosystems, it would be prudent to go further and place the burden of proof on proponents of any new introductions, with new species planned for introduction being considered potentially invasive until proven benign.
Fire See also: Living in a land of fire <http://www.deh.gov.au/soe/2006/integrative/fire/index.html>
‘Burn grass’ is as ancient as time itself. The burning of country was handed down to our people from the Dreamtime. ‘Burn grass’ takes place after the wet season when the grass starts drying off. The country tells you when and where to burn. To carry out this task you must know your country (Yinirrakun—April Bright 1995).
To grow flowers in Blackheath, Australia, set fire to your fields. Let flame singe the delicate dust-seeds of native shrubs. Soon they sprout, on ground bare, as if hoed. Bright petals follow,… but not one has a name that Shakespeare knew… (O’Connor 1990)
Both quotes, from widely different backgrounds, tell of fire as a natural phenomenon and its importance in the evolutionary history of Australia. Recent research confirms the conventional wisdom that different types of country and different species of plants and animals require different fire regimes. This approach is reflected in the Ecological Society of Australia’s call for informed use of fire as a management tool and in approaches adopted by the various state agencies responsible for fire.
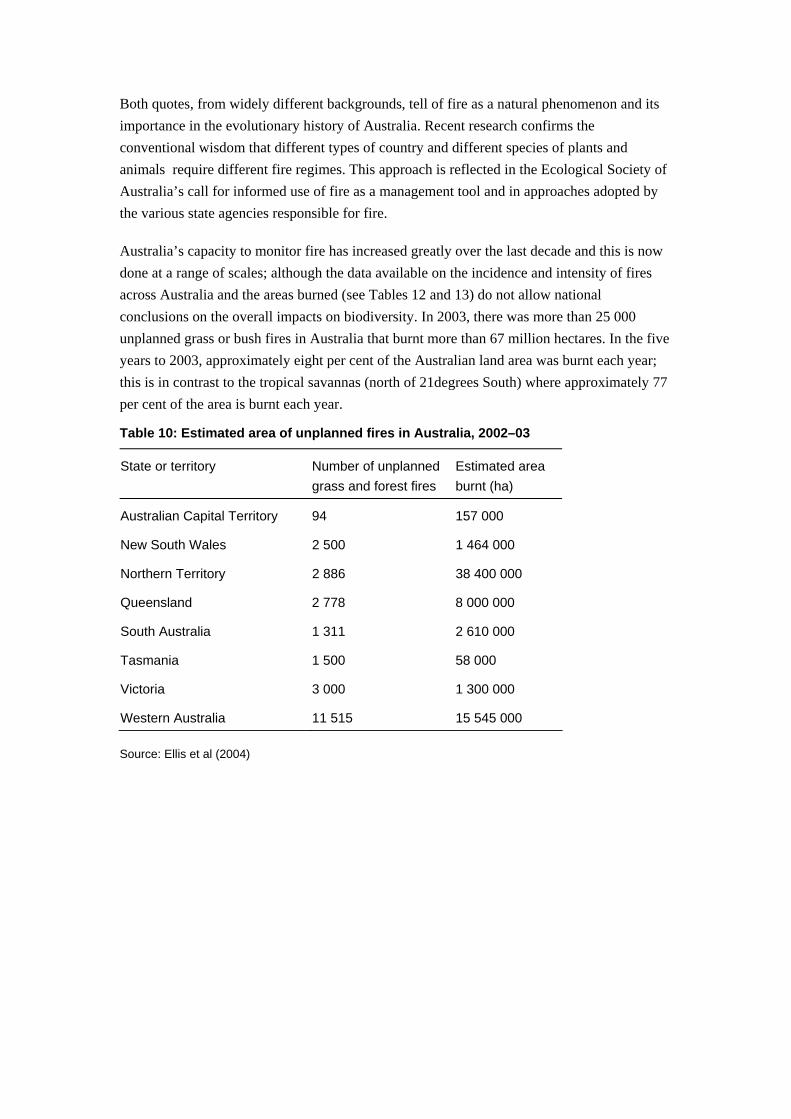
Australia’s capacity to monitor fire has increased greatly over the last decade and this is now done at a range of scales; although the data available on the incidence and intensity of fires across Australia and the areas burned (see Tables 12 and 13) do not allow national conclusions on the overall impacts on biodiversity. In 2003, there was more than 25 000 unplanned grass or bush fires in Australia that burnt more than 67 million hectares. In the five years to 2003, approximately eight per cent of the Australian land area was burnt each year; this is in contrast to the tropical savannas (north of 21degrees South) where approximately 77 per cent of the area is burnt each year.
Table 10: Estimated area of unplanned fires in Australia, 2002–03
State or territory Number of unplanned grass and forest fires
Estimated area burnt (ha)
Australian Capital Territory 94 157 000
New South Wales 2 500 1 464 000
Northern Territory 2 886 38 400 000
Queensland 2 778 8 000 000
South Australia 1 311 2 610 000
Tasmania 1 500 58 000
Victoria 3 000 1 300 000
Western Australia 11 515 15 545 000
Source: Ellis et al (2004)
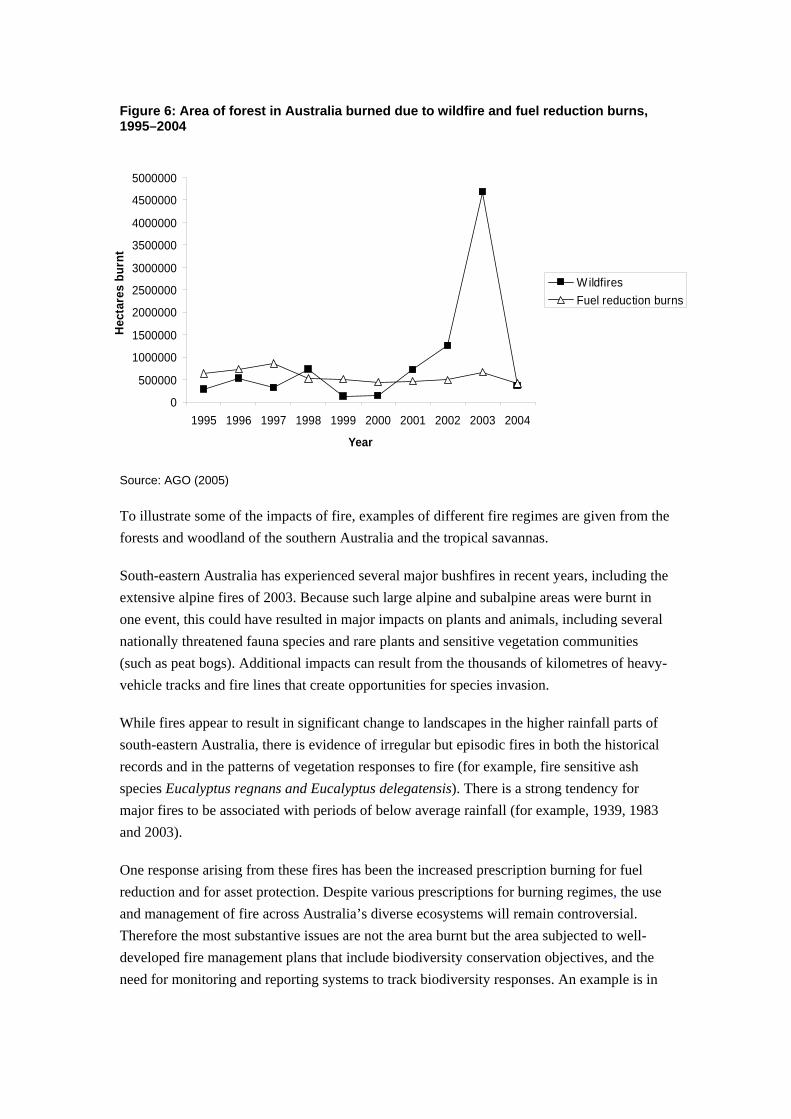
Figure 6: Area of forest in Australia burned due to wildfire and fuel reduction burns, 1995–2004
Source: AGO (2005)
To illustrate some of the impacts of fire, examples of different fire regimes are given from the forests and woodland of the southern Australia and the tropical savannas.
South-eastern Australia has experienced several major bushfires in recent years, including the extensive alpine fires of 2003. Because such large alpine and subalpine areas were burnt in one event, this could have resulted in major impacts on plants and animals, including several nationally threatened fauna species and rare plants and sensitive vegetation communities (such as peat bogs). Additional impacts can result from the thousands of kilometres of heavy-vehicle tracks and fire lines that create opportunities for species invasion.
While fires appear to result in significant change to landscapes in the higher rainfall parts of south-eastern Australia, there is evidence of irregular but episodic fires in both the historical records and in the patterns of vegetation responses to fire (for example, fire sensitive ash species Eucalyptus regnans and Eucalyptus delegatensis). There is a strong tendency for major fires to be associated with periods of below average rainfall (for example, 1939, 1983 and 2003).
One response arising from these fires has been the increased prescription burning for fuel reduction and for asset protection. Despite various prescriptions for burning regimes, the use and management of fire across Australia’s diverse ecosystems will remain controversial. Therefore the most substantive issues are not the area burnt but the area subjected to well-developed fire management plans that include biodiversity conservation objectives, and the need for monitoring and reporting systems to track biodiversity responses. An example is in
0
500000
1000000
1500000
2000000
2500000
3000000
3500000
4000000
4500000
5000000
1995 1996 1997 1998 1999 2000 2001 2002 2003 2004
Year
Hec
tare
s bu
rnt
WildfiresFuel reduction burns
parks in the Northern Territory, which have fire monitoring programmes that are designed to measure biodiversity trends (Edwards et al 2003).
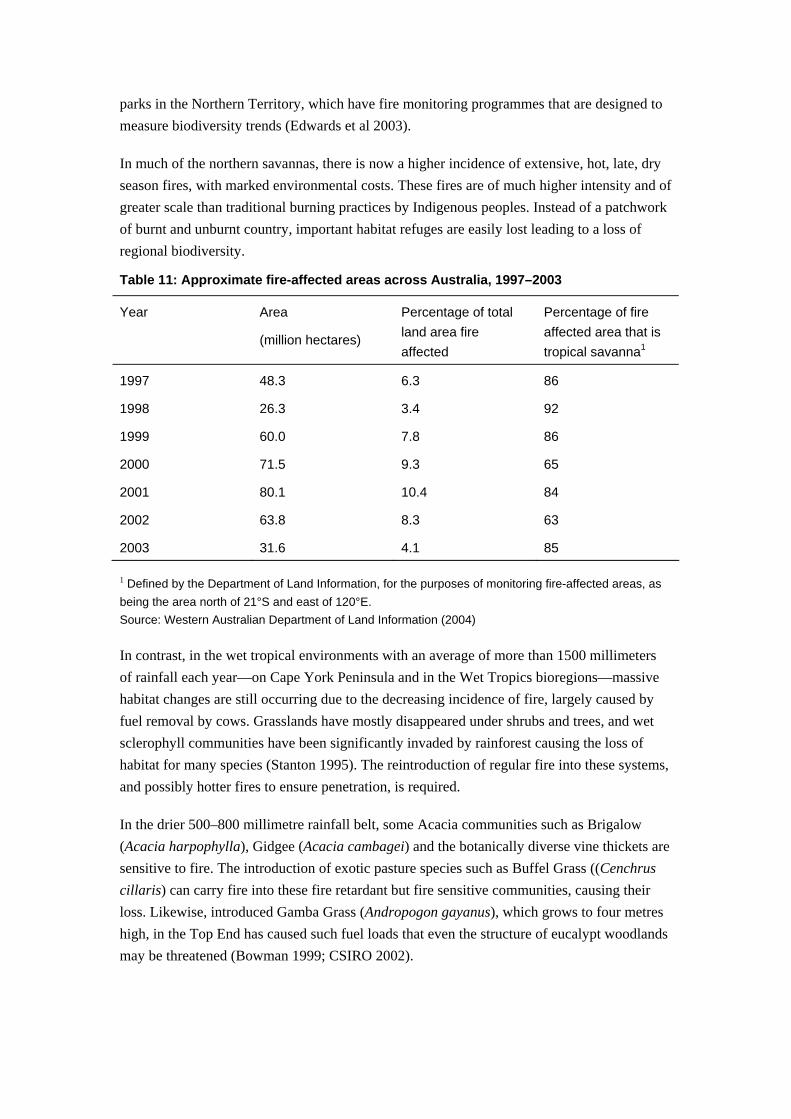
In much of the northern savannas, there is now a higher incidence of extensive, hot, late, dry season fires, with marked environmental costs. These fires are of much higher intensity and of greater scale than traditional burning practices by Indigenous peoples. Instead of a patchwork of burnt and unburnt country, important habitat refuges are easily lost leading to a loss of regional biodiversity.
Table 11: Approximate fire-affected areas across Australia, 1997–2003
Year Area
(million hectares)
Percentage of total land area fire affected
Percentage of fire affected area that is tropical savanna1
1997 48.3 6.3 86
1998 26.3 3.4 92
1999 60.0 7.8 86
2000 71.5 9.3 65
2001 80.1 10.4 84
2002 63.8 8.3 63
2003 31.6 4.1 85
1 Defined by the Department of Land Information, for the purposes of monitoring fire-affected areas, as being the area north of 21°S and east of 120°E. Source: Western Australian Department of Land Information (2004)
In contrast, in the wet tropical environments with an average of more than 1500 millimeters of rainfall each year—on Cape York Peninsula and in the Wet Tropics bioregions—massive habitat changes are still occurring due to the decreasing incidence of fire, largely caused by fuel removal by cows. Grasslands have mostly disappeared under shrubs and trees, and wet sclerophyll communities have been significantly invaded by rainforest causing the loss of habitat for many species (Stanton 1995). The reintroduction of regular fire into these systems, and possibly hotter fires to ensure penetration, is required.
In the drier 500–800 millimetre rainfall belt, some Acacia communities such as Brigalow (Acacia harpophylla), Gidgee (Acacia cambagei) and the botanically diverse vine thickets are sensitive to fire. The introduction of exotic pasture species such as Buffel Grass ((Cenchrus cillaris) can carry fire into these fire retardant but fire sensitive communities, causing their loss. Likewise, introduced Gamba Grass (Andropogon gayanus), which grows to four metres high, in the Top End has caused such fuel loads that even the structure of eucalypt woodlands may be threatened (Bowman 1999; CSIRO 2002).
In some agricultural and pastoral regions, fire has been excluded for social and economic reasons. There often is a reticence by the community to allow the use of fire because of threats to safety and property, and because the short-term loss of pasture is considered economically undesirable. In places this has led to invasion by woody shrubs, which causes the loss of ground cover and sometimes creates conditions where controlled use of fire as a management tool to control woody shrubs cannot be used due to the lack of grassy biomass (fuel) in the ground layer (Noble et al 1990).
Fire was recognised in 1999 as a main threatening process for many rare, vulnerable and endangered Australian birds (Woinarski 1999) and this situation has not improved.
The long history of the withdrawal of traditional burning practices has allowed radical changes to occur to the structure and floristics of many habitats. In some places, the return to traditional burning is not possible. In contrast, in large parts of northern Australia and across our rangelands, the adoption of burning practices based on the combined experience of traditional ‘grass burn’ and scientific knowledge is essential to achieve sustainable management for biodiversity (Latz 1995).
The adoption of appropriate fire regimes could be one of the most cost-effective tools for biodiversity management across large parts of Australia Williams et al (2001) identified a tension between management of fire for biodiversity protection versus other management objectives in much of Australia. Some progress has been made since SoE2001 towards resolving this dilemma, with the publication of several guidelines based on research on the fire ecology of a range of species. The application of a technical understanding of fire regimes and their impacts on different ecosystems to protect biodiversity as part of ongoing land management remains a key challenge. This will involve much greater investment in research and in community understanding of appropriate fire regimes than currently exists. Finally, fire frequency and intensity, and the probability of uncontrollable fires, are likely to change significantly with climate change (see below).
Grazing Grazing affects biodiversity in a range of ways, including direct removal of some species, changes in the relative proportions and mixtures of species in ecosystems such as grasslands, shrublands and woodlands, alteration to habitat in mid-and lower storeys of forests and grasslands, altered fire regimes, and impacts on soil structure and water infiltration. Total grazing pressure is considered to be the most significant threat to a range of biodiversity elements, including threatened ecosystems across Australia (Table 4). Very large reductions in extent of all native grasslands have occurred since 1750 (Table 4).
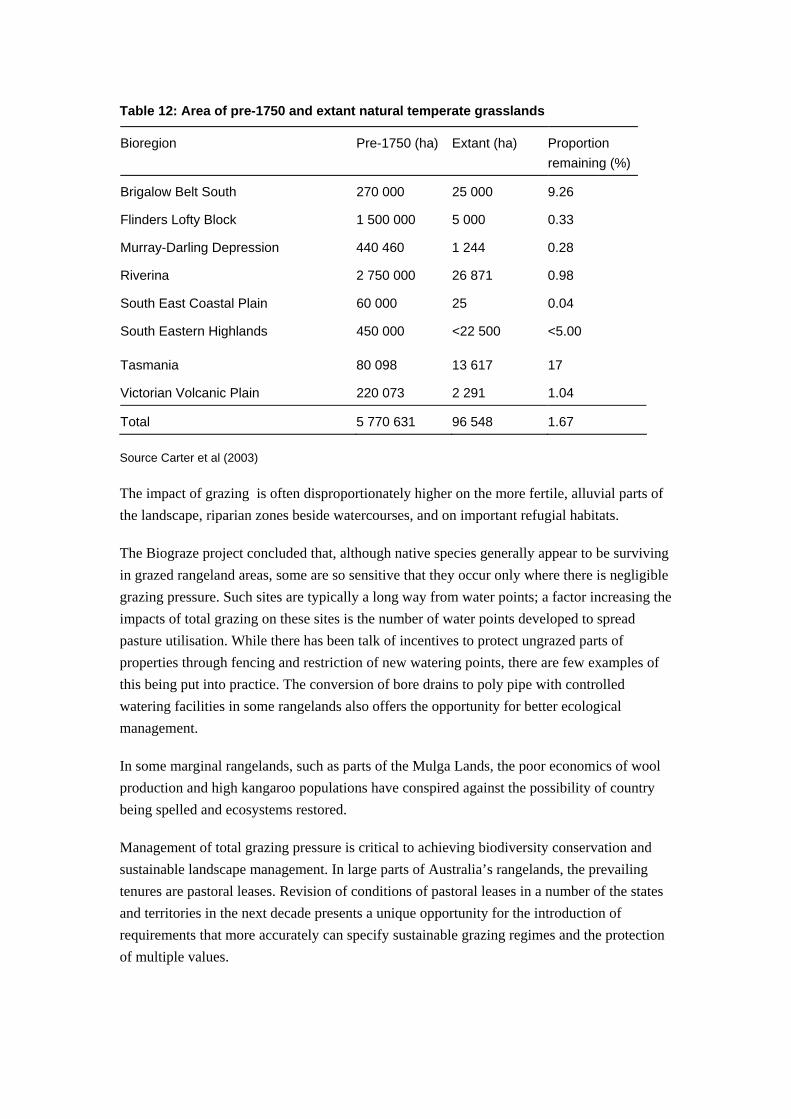
Table 12: Area of pre-1750 and extant natural temperate grasslands
Bioregion Pre-1750 (ha) Extant (ha) Proportion remaining (%)
Brigalow Belt South 270 000 25 000 9.26
Flinders Lofty Block 1 500 000 5 000 0.33
Murray-Darling Depression 440 460 1 244 0.28
Riverina 2 750 000 26 871 0.98
South East Coastal Plain 60 000 25 0.04
South Eastern Highlands 450 000 <22 500 <5.00
Tasmania 80 098 13 617 17
Victorian Volcanic Plain 220 073 2 291 1.04
Total 5 770 631 96 548 1.67
Source Carter et al (2003)
The impact of grazing is often disproportionately higher on the more fertile, alluvial parts of the landscape, riparian zones beside watercourses, and on important refugial habitats.
The Biograze project concluded that, although native species generally appear to be surviving in grazed rangeland areas, some are so sensitive that they occur only where there is negligible grazing pressure. Such sites are typically a long way from water points; a factor increasing the impacts of total grazing on these sites is the number of water points developed to spread pasture utilisation. While there has been talk of incentives to protect ungrazed parts of properties through fencing and restriction of new watering points, there are few examples of this being put into practice. The conversion of bore drains to poly pipe with controlled watering facilities in some rangelands also offers the opportunity for better ecological management.
In some marginal rangelands, such as parts of the Mulga Lands, the poor economics of wool production and high kangaroo populations have conspired against the possibility of country being spelled and ecosystems restored.
Management of total grazing pressure is critical to achieving biodiversity conservation and sustainable landscape management. In large parts of Australia’s rangelands, the prevailing tenures are pastoral leases. Revision of conditions of pastoral leases in a number of the states and territories in the next decade presents a unique opportunity for the introduction of requirements that more accurately can specify sustainable grazing regimes and the protection of multiple values.
No coordinated Australia-wide monitoring programme exists for the rangelands, despite their enormous social, environmental and economic contribution; efforts to establish a comprehensive monitoring system have been slow. A number of major reports have recommended the comprehensive monitoring of the rangelands, including the impacts of grazing on biodiversity and landscape function. These reports include: National Principles and Guidelines for Rangeland Management (Commonwealth of Australia 1999); Rangelands – Tracking Changes (NLWRA 2001b); and Biodiversity Monitoring in the Rangelands: A Way Forward (Smyth et al 2003). Progress on monitoring in the rangelands is reported in Watson 2006 <http://www.deh.gov.au/soe/2006/emerging/rangelands/index.html>.
Changed hydrology Hydrology is the study of the properties, distribution, and effects of water on the earth's surface, in the soil and underlying rocks, and in the atmosphere. Impacts of changed hydrology on biodiversity include deteriorating water quality, reduced water availability, altered flow regimes in waterways, and the rising of watertables due to clearing of native vegetation and the movement of salts to surface layers of soil and waterways (Williams et al 2001).
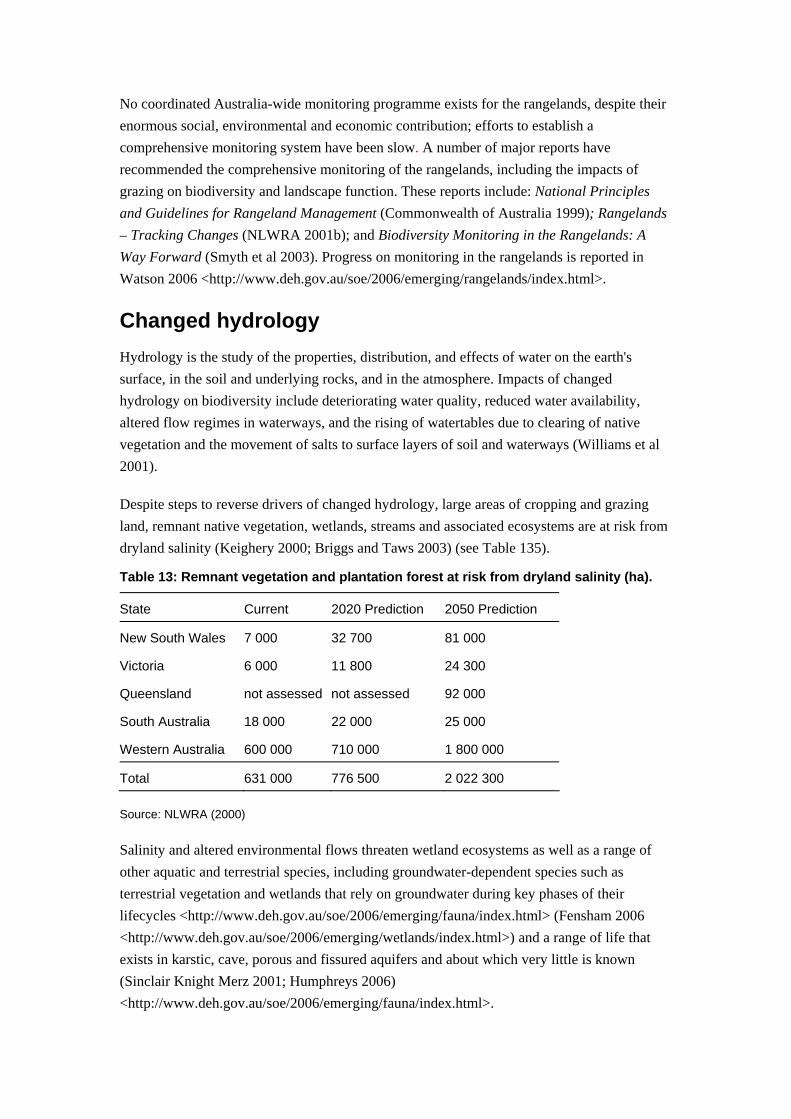
Despite steps to reverse drivers of changed hydrology, large areas of cropping and grazing land, remnant native vegetation, wetlands, streams and associated ecosystems are at risk from dryland salinity (Keighery 2000; Briggs and Taws 2003) (see Table 135).
Table 13: Remnant vegetation and plantation forest at risk from dryland salinity (ha).
State Current 2020 Prediction 2050 Prediction
New South Wales 7 000 32 700 81 000
Victoria 6 000 11 800 24 300
Queensland not assessed not assessed 92 000
South Australia 18 000 22 000 25 000
Western Australia 600 000 710 000 1 800 000
Total 631 000 776 500 2 022 300
Source: NLWRA (2000)
Salinity and altered environmental flows threaten wetland ecosystems as well as a range of other aquatic and terrestrial species, including groundwater-dependent species such as terrestrial vegetation and wetlands that rely on groundwater during key phases of their lifecycles <http://www.deh.gov.au/soe/2006/emerging/fauna/index.html> (Fensham 2006 <http://www.deh.gov.au/soe/2006/emerging/wetlands/index.html>) and a range of life that exists in karstic, cave, porous and fissured aquifers and about which very little is known (Sinclair Knight Merz 2001; Humphreys 2006) <http://www.deh.gov.au/soe/2006/emerging/fauna/index.html>.
In October 2000, A National Action Plan for Salinity and Water Quality in Australia was released by the Australian Government. More recently, the National Water Commission was established to improve water management across Australia, including its use for environmental outcomes.
Modelling of the future impact of vegetation clearing in the Queensland part of the Murray-Darling Basin shows that, for some groundwater flow systems, there could be a tenfold increase in salinity during the next 50 years (Murray-Darling Basin Commission 2003a). This finding establishes the finite timeline—or window—for catchment-wide management strategies to be put in place to keep the salt down in the soil profile. Once the salt reaches the surface or appears in the streams of the Brigalow Belt it will be too late to address the issue effectively and prevent substantial impacts (John Williams pers. comm. 2005).
Climate change and climate variability Variability in climate is a characteristic of many Australian environments, to which native species have adapted in their evolution. There is now scientific consensus of profound changes in both average climate and the extremes and timing of the components of climate in coming decades.
In SoE2001, climate change was identified as a serious emerging threat to biodiversity that needed to be adequately documented, better understood and managed (Williams et al 2001). More recent Australian (Howden et al 2003, Krockenberger et al 2003) and international (Thomas et al 2004) aassessments suggest that climate change is among the most significant emerging pressures on biodiversity.
Although the capacity to attribute changes in biodiversity in the recent past specifically to climate change is limited, a few convincing examples are emerging. These include the encroachment by snow gum (Eucalyptus pauciflora) into subalpine grasslands and higher elevations, and shifts in ranges of vertebrates in the Alps over the thirty-year period to 1999.
Changes in climate are likely to induce rapid change in the conditions that determine the numbers and distribution of Australian native species, as well as weeds and other invasive organisms, in coming decades. While the ability to predict impacts of climate change in the future is still developing, the predicted changes strongly underline the need for adequate institutional responses to deal with a range of direct and indirect impacts on biodiversity.
Direct and indirect impacts of climate changes on biodiversity include physiological effects on species (such as a failure of alpine species to cope with increased summer temperatures, a failure of native plants to cope with changed water availability), altered interactions within communities and ecosystems (such as increased or decreased competitive ability of native versus introduced plants as increased temperatures and elevated carbon dioxide levels encourage increased growth rates, changes in food availability and predator-prey relationships, changes in the structure of habitat and cover, and the movement of species to

new areas), altered stream flows, and changes in the severity and frequency of natural events such as bushfires (Pittock 2003).
Credible analyses suggest that there will be major changes in biodiversity due to changes in climate in coming decades. For example, predicted increases in temperatures could result in serious population declines in half of Australia’s butterfly species, loss of all suitable bioclimates for more than a third of vertebrates in southeastern Australia, and major changes in the Australian tree flora, depending on how closely current ranges reflect climatic limits (Hughes 2003). Climate change is likely to result in significant shrinking or total loss of habitat for those Australian species dependent on cool, high-altitude climatic zones such as those in Victoria’s alpine regions or in high altitudes in the Wet Tropics. Alterations to rainfall patterns and hydrological cycles—affecting wetlands, river ecosystems and estuaries—will have repercussions for aquatic biodiversity, including fish, and for migratory birds that depend on wetlands for breeding (Pittock 2003).
Adapting to climate change will require integrated policy, in which biodiversity issues are not addressed in isolation from other policy issues. For example, biodiversity responses will need to be developed and applied along with other natural resource management and industry policies, such as those addressing drought impacts and the need for more public investment in water resource infrastructure.
A decade ago, the impacts on biodiversity of climate change were seen as a distant threat that did not warrant urgent policy attention; this was partly due to sparse evidence. Conservation planning today needs to take account of climate change. Since 1996, climate change has been listed by some jurisdictions as a ‘key threatening process’ (for example, New South Wales in 2000 and the Australian Government in 2001). Despite these listings and a growing body of global scientific evidence about both climate change and its impacts on biodiversity, only limited attention has been given in Australian biodiversity conservation policy and practice to the impacts of climate change (Howden et al 2003). A National Biodiversity and Climate Change Action Plan (Natural Resource Management Ministers Council 2005) was released in 2005 with the aim of addressing many of the policy, research and development issues identified above, but responsibilities and funding for implementation are as yet unclear.
Pressures rarely act alone It is worth reiterating that these pressures are all interrelated. The information that is currently available indicates that regions with the most intense agricultural and urban development tend to have the most species, habitats and ecological communities in decline. For example, more than 40 per cent of nationally listed threatened ecological communities and more than 50 per cent of threatened species occur in urban fringe areas (Yencken and Wilkinson 2000). Considerable biodiversity impacts also have occurred in Australia’s arid lands where species such as small mammals, often persisting in extreme conditions, have succumbed to pervasive threats from changed fire regimes and grazing pressure across large areas.
State of biodiversity Species, habitats and ecological communities Australia has one of the highest levels of biological diversity in the world. That diversity exists at a range of scales—landscapes, ecosystems, species and genes—that should all be considered in a state of biodiversity assessment.
Unfortunately, we have imperfect knowledge of the condition and trend of biodiversity at any scale and the ecological implications of this for sustaining Australia’s natural systems and heritage.
Since the commencement of the EPBC Act, there have been 134 species and 10 ecological communities added to the original lists of threatened species and threatened ecological communities. This includes neither transfers to other categories on the list nor species that have been delisted. Changes to these lists are essentially in response to public nominations from parties with an interest in a particular species or ecological community. It is not a systematic assessment of species or ecological communities most at risk. Therefore, these lists cannot be used as an accurate indicator of biodiversity change. New approaches to assessing changes in biodiversity from information in listing processes are worth looking at for future state of the environment reports (Butchart et al 2006). The alignment of listing processes between the Commonwealth and the states and territories is reported in DEH (2006) <http://www.deh.gov.au/soe/2006/emerging/species-listing/index.html>.
A large proportion of Australia’s threatened species occurs within the Murray-Darling Basin, south-west Western Australia, populated coastal parts and in the Tasmanian Midlands: these are regions where intensive development has occurred. Threatened vascular plants and threatened birds are declining across much of the continent. Threatened mammal species are rapidly declining, particularly in arid parts of Western Australia. Threatened reptiles are declining across Australia and threatened amphibians are declining in southeastern Australia South-East Queensland, Brigalow Belt South, and the Wet Tropics bioregions (NLWRA 2002).
An analysis of the two Bird Atlas surveys, 1977–1981 and 1998–2001, showed that 29 species (out of 497 species) had significantly decreased reporting rates over this one 20-year period. Grassland, woodland and ground-nesting guilds were particularly affected (Garnett, Crowley and Barrett 2002; NLWRA 2002, Olsen et al 2006 <http://www.deh.gov.au/soe/2006/emerging/birds/index.html>).
Twenty-two species of mammals are extinct in Australia; a further eight species are found only on islands. A further two, possibly three, have become extinct on Christmas Island. Arid and semi-arid parts of Australia have generally lost a high proportion of their mammals (NLWRA 2002).
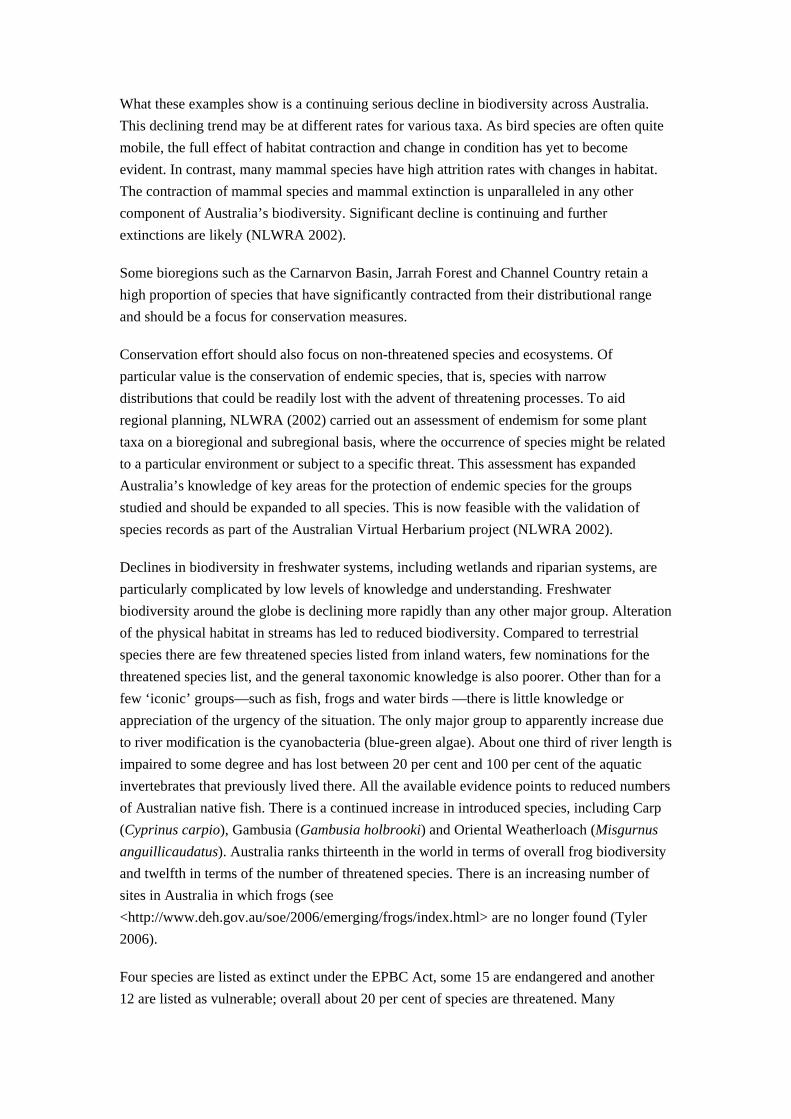
What these examples show is a continuing serious decline in biodiversity across Australia. This declining trend may be at different rates for various taxa. As bird species are often quite mobile, the full effect of habitat contraction and change in condition has yet to become evident. In contrast, many mammal species have high attrition rates with changes in habitat. The contraction of mammal species and mammal extinction is unparalleled in any other component of Australia’s biodiversity. Significant decline is continuing and further extinctions are likely (NLWRA 2002).
Some bioregions such as the Carnarvon Basin, Jarrah Forest and Channel Country retain a high proportion of species that have significantly contracted from their distributional range and should be a focus for conservation measures.
Conservation effort should also focus on non-threatened species and ecosystems. Of particular value is the conservation of endemic species, that is, species with narrow distributions that could be readily lost with the advent of threatening processes. To aid regional planning, NLWRA (2002) carried out an assessment of endemism for some plant taxa on a bioregional and subregional basis, where the occurrence of species might be related to a particular environment or subject to a specific threat. This assessment has expanded Australia’s knowledge of key areas for the protection of endemic species for the groups studied and should be expanded to all species. This is now feasible with the validation of species records as part of the Australian Virtual Herbarium project (NLWRA 2002).
Declines in biodiversity in freshwater systems, including wetlands and riparian systems, are particularly complicated by low levels of knowledge and understanding. Freshwater biodiversity around the globe is declining more rapidly than any other major group. Alteration of the physical habitat in streams has led to reduced biodiversity. Compared to terrestrial species there are few threatened species listed from inland waters, few nominations for the threatened species list, and the general taxonomic knowledge is also poorer. Other than for a few ‘iconic’ groups—such as fish, frogs and water birds —there is little knowledge or appreciation of the urgency of the situation. The only major group to apparently increase due to river modification is the cyanobacteria (blue-green algae). About one third of river length is impaired to some degree and has lost between 20 per cent and 100 per cent of the aquatic invertebrates that previously lived there. All the available evidence points to reduced numbers of Australian native fish. There is a continued increase in introduced species, including Carp (Cyprinus carpio), Gambusia (Gambusia holbrooki) and Oriental Weatherloach (Misgurnus anguillicaudatus). Australia ranks thirteenth in the world in terms of overall frog biodiversity and twelfth in terms of the number of threatened species. There is an increasing number of sites in Australia in which frogs (see <http://www.deh.gov.au/soe/2006/emerging/frogs/index.html> are no longer found (Tyler 2006).
Four species are listed as extinct under the EPBC Act, some 15 are endangered and another 12 are listed as vulnerable; overall about 20 per cent of species are threatened. Many
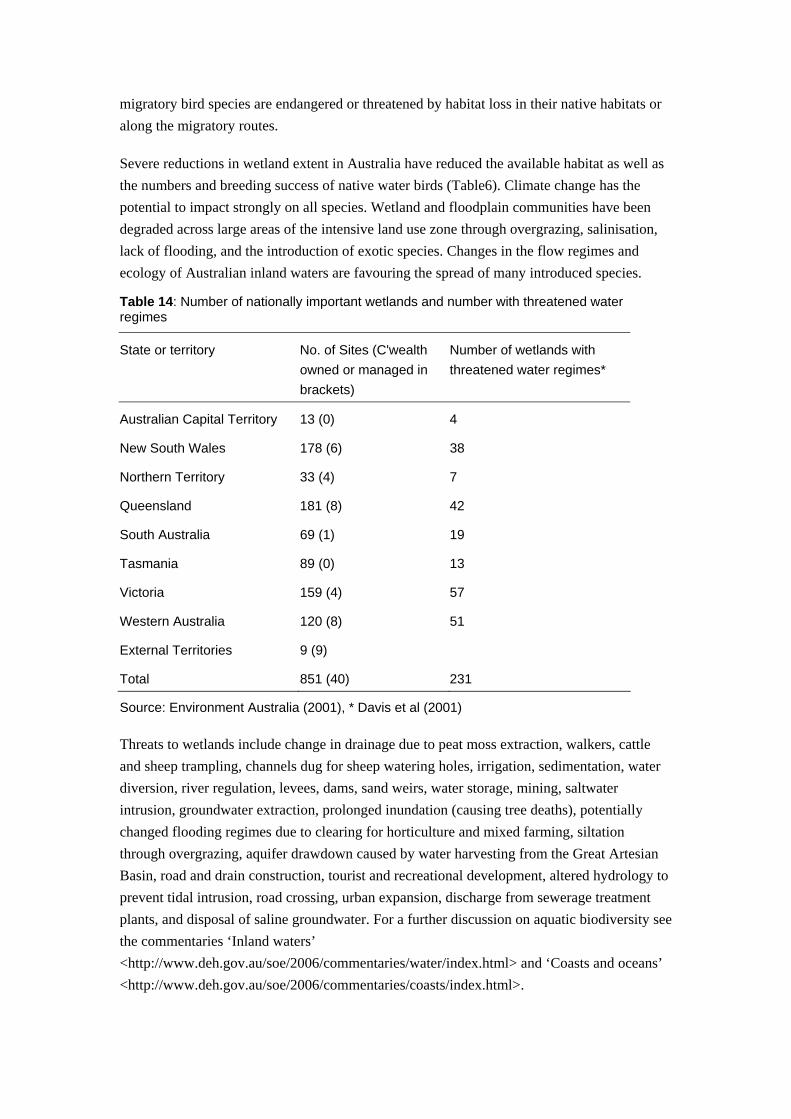
migratory bird species are endangered or threatened by habitat loss in their native habitats or along the migratory routes.
Severe reductions in wetland extent in Australia have reduced the available habitat as well as the numbers and breeding success of native water birds (Table6). Climate change has the potential to impact strongly on all species. Wetland and floodplain communities have been degraded across large areas of the intensive land use zone through overgrazing, salinisation, lack of flooding, and the introduction of exotic species. Changes in the flow regimes and ecology of Australian inland waters are favouring the spread of many introduced species.
Table 14: Number of nationally important wetlands and number with threatened water regimes
State or territory No. of Sites (C'wealth owned or managed in brackets)
Number of wetlands with threatened water regimes*
Australian Capital Territory 13 (0) 4
New South Wales 178 (6) 38
Northern Territory 33 (4) 7
Queensland 181 (8) 42
South Australia 69 (1) 19
Tasmania 89 (0) 13
Victoria 159 (4) 57
Western Australia 120 (8) 51
External Territories 9 (9)
Total 851 (40) 231
Source: Environment Australia (2001), * Davis et al (2001)
Threats to wetlands include change in drainage due to peat moss extraction, walkers, cattle and sheep trampling, channels dug for sheep watering holes, irrigation, sedimentation, water diversion, river regulation, levees, dams, sand weirs, water storage, mining, saltwater intrusion, groundwater extraction, prolonged inundation (causing tree deaths), potentially changed flooding regimes due to clearing for horticulture and mixed farming, siltation through overgrazing, aquifer drawdown caused by water harvesting from the Great Artesian Basin, road and drain construction, tourist and recreational development, altered hydrology to prevent tidal intrusion, road crossing, urban expansion, discharge from sewerage treatment plants, and disposal of saline groundwater. For a further discussion on aquatic biodiversity see the commentaries ‘Inland waters’ <http://www.deh.gov.au/soe/2006/commentaries/water/index.html> and ‘Coasts and oceans’ <http://www.deh.gov.au/soe/2006/commentaries/coasts/index.html>.
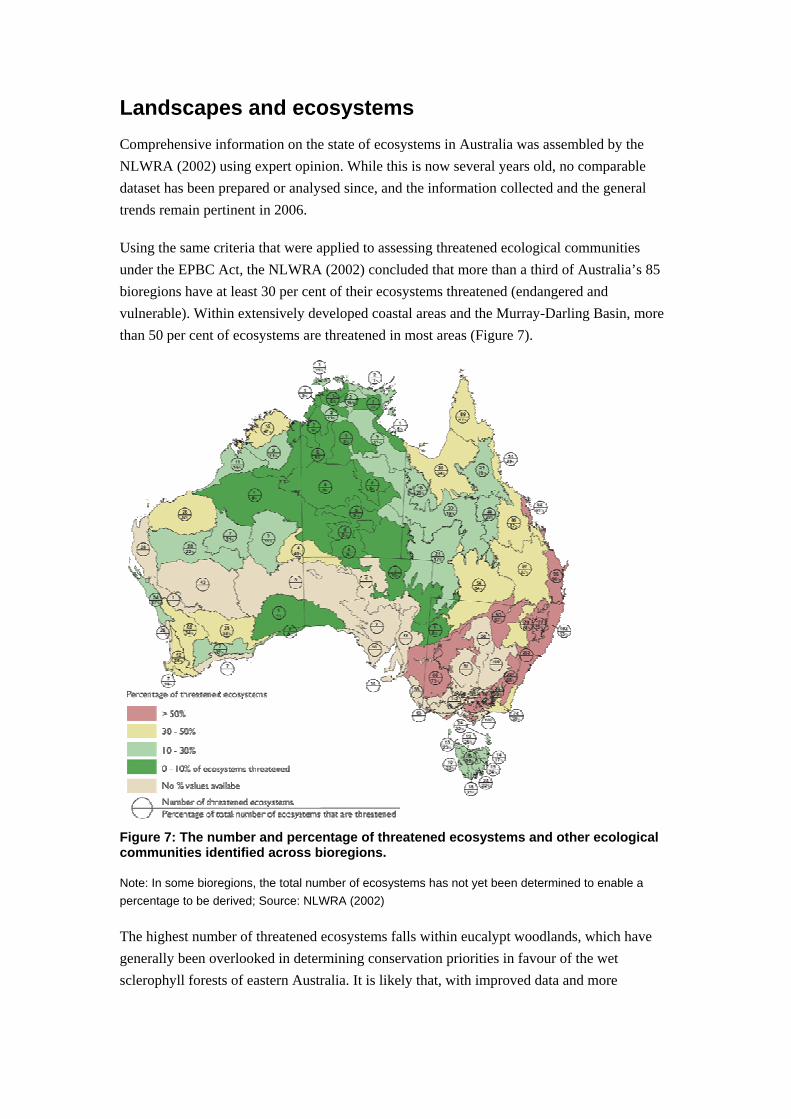
Landscapes and ecosystems Comprehensive information on the state of ecosystems in Australia was assembled by the NLWRA (2002) using expert opinion. While this is now several years old, no comparable dataset has been prepared or analysed since, and the information collected and the general trends remain pertinent in 2006.
Using the same criteria that were applied to assessing threatened ecological communities under the EPBC Act, the NLWRA (2002) concluded that more than a third of Australia’s 85 bioregions have at least 30 per cent of their ecosystems threatened (endangered and vulnerable). Within extensively developed coastal areas and the Murray-Darling Basin, more than 50 per cent of ecosystems are threatened in most areas (Figure 7).
Figure 7: The number and percentage of threatened ecosystems and other ecological communities identified across bioregions.
Note: In some bioregions, the total number of ecosystems has not yet been determined to enable a percentage to be derived; Source: NLWRA (2002)
The highest number of threatened ecosystems falls within eucalypt woodlands, which have generally been overlooked in determining conservation priorities in favour of the wet sclerophyll forests of eastern Australia. It is likely that, with improved data and more
comprehensive mapping, the number of ecosystems that are considered to be threatened will increase.
Thirty-two threatened ‘ecological communities’ were listed (at 21 July 2005) under the EPBC Act. Some of these ecological communities incorporate a number of component threatened ecosystems identified at a bioregional level. Some of the states and the Australian Capital Territory have separate legislation for the listing of threatened ecosystems or for specific recognition of threatened ecosystems in vegetation management legislation (see DEH 2006).
Key issues remain: they include the development of recovery plans for listed threatened ecological communities and ecosystems, and the implementation of cooperative management arrangements between levels of government. Definition of ecological communities will continue to be debated because the scientific underpinning is still developing, but a more systematic process of identification, listing and development of cooperative recovery programmes is needed.
Strategic planning of restoration efforts is vitally important to achieve multiple environmental benefits, but some objectives carry formidable challenges. The scale of past deforestation in Australia means that, if a hypothetical target of 30 per cent vegetation was to be re-established, the replanting and safeguarding of regrowth over nine million hectares would be required (NLWRA 2002). In parts of the landscape, much higher levels of revegetation could be required to reduce salinity, and even then amelioration will only occur over long timeframes.
Assessing the changing state of biodiversity at landscape scales requires not only information on the extent of vegetation but also data on its condition as habitat. Approaches to assessing condition are still at experimental stages. An expert opinion assessment of Landscape Heath in Australia (NLWRA 2001) indicated that nearly a third of the intensive land use zone (non-rangelands) has less than 30 per cent remnant vegetation, and the connectivity of remnant vegetation across the landscape has been lost in nearly half of this zone.
In northern Australia, the condition of nationally important wetlands is generally good, but in southern Australia, more than a third of nationally important wetlands continue to decline (NLWRA 2002). The management actions that are required to effect recovery in southern wetlands relate to abating the principal threats of overgrazing, introduced species, pollution, salinity and other changed hydrology. The condition and trend of regionally important wetlands is poorly known. This is significant because these wetlands are often more vulnerable to incremental loss but essential for the protection of regional biodiversity. In some regions, altered flow regimes have resulted in the loss of ninety per cent of floodplain wetlands in the Murray-Darling Basin, 50 per cent of coastal wetlands in New South Wales and 75 per cent of wetlands on the Swan Coastal Plain in south-west Western Australia (Arthington 2002).
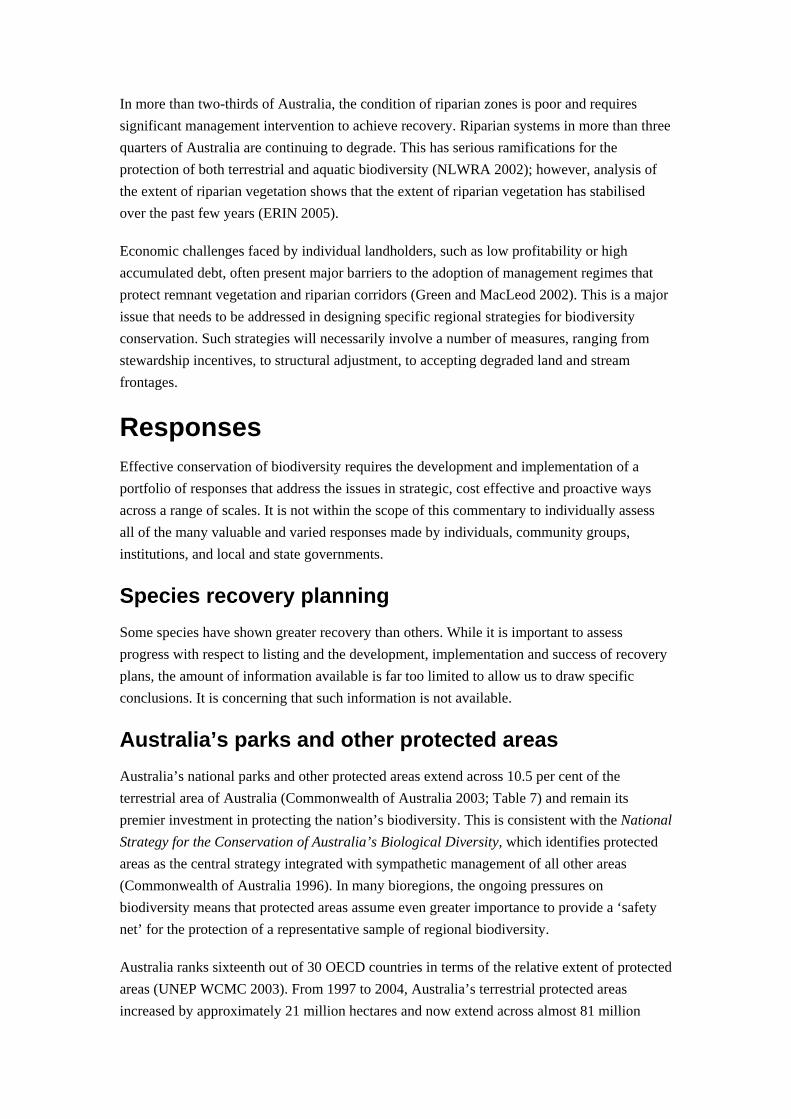
In more than two-thirds of Australia, the condition of riparian zones is poor and requires significant management intervention to achieve recovery. Riparian systems in more than three quarters of Australia are continuing to degrade. This has serious ramifications for the protection of both terrestrial and aquatic biodiversity (NLWRA 2002); however, analysis of the extent of riparian vegetation shows that the extent of riparian vegetation has stabilised over the past few years (ERIN 2005).
Economic challenges faced by individual landholders, such as low profitability or high accumulated debt, often present major barriers to the adoption of management regimes that protect remnant vegetation and riparian corridors (Green and MacLeod 2002). This is a major issue that needs to be addressed in designing specific regional strategies for biodiversity conservation. Such strategies will necessarily involve a number of measures, ranging from stewardship incentives, to structural adjustment, to accepting degraded land and stream frontages.
Responses Effective conservation of biodiversity requires the development and implementation of a portfolio of responses that address the issues in strategic, cost effective and proactive ways across a range of scales. It is not within the scope of this commentary to individually assess all of the many valuable and varied responses made by individuals, community groups, institutions, and local and state governments.
Species recovery planning Some species have shown greater recovery than others. While it is important to assess progress with respect to listing and the development, implementation and success of recovery plans, the amount of information available is far too limited to allow us to draw specific conclusions. It is concerning that such information is not available.
Australia’s parks and other protected areas Australia’s national parks and other protected areas extend across 10.5 per cent of the terrestrial area of Australia (Commonwealth of Australia 2003; Table 7) and remain its premier investment in protecting the nation’s biodiversity. This is consistent with the National Strategy for the Conservation of Australia’s Biological Diversity, which identifies protected areas as the central strategy integrated with sympathetic management of all other areas (Commonwealth of Australia 1996). In many bioregions, the ongoing pressures on biodiversity means that protected areas assume even greater importance to provide a ‘safety net’ for the protection of a representative sample of regional biodiversity.
Australia ranks sixteenth out of 30 OECD countries in terms of the relative extent of protected areas (UNEP WCMC 2003). From 1997 to 2004, Australia’s terrestrial protected areas increased by approximately 21 million hectares and now extend across almost 81 million
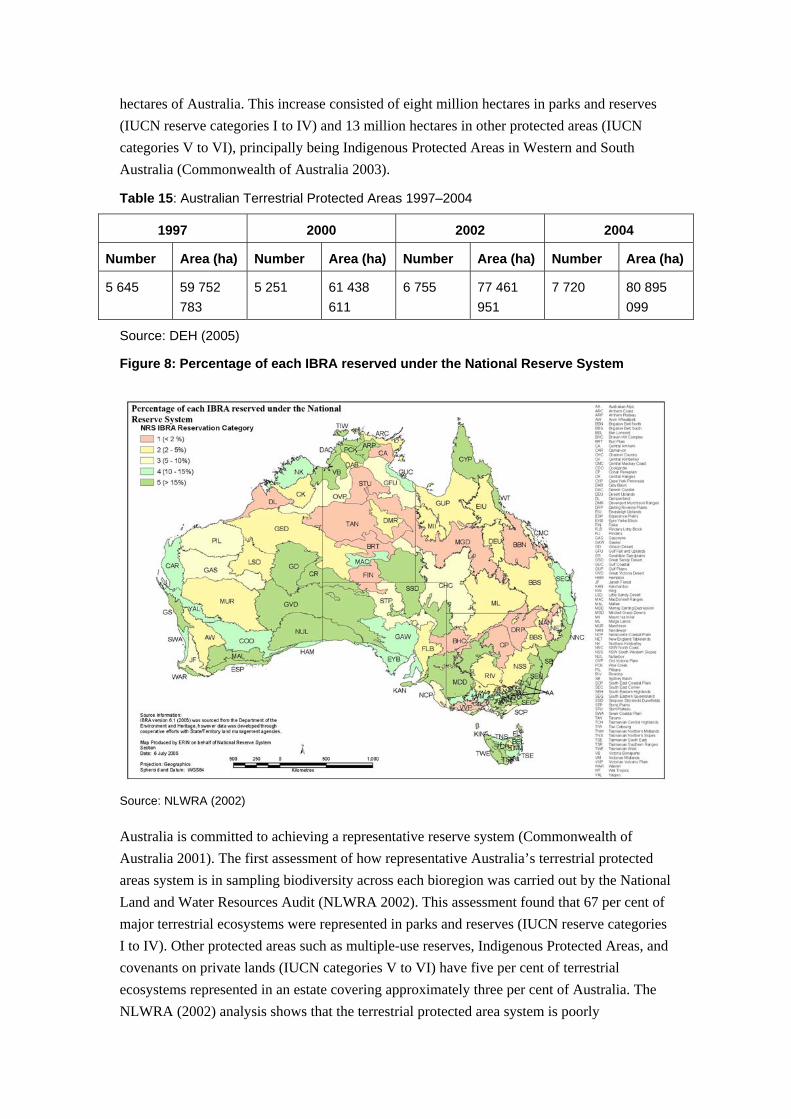
hectares of Australia. This increase consisted of eight million hectares in parks and reserves (IUCN reserve categories I to IV) and 13 million hectares in other protected areas (IUCN categories V to VI), principally being Indigenous Protected Areas in Western and South Australia (Commonwealth of Australia 2003).
Table 15: Australian Terrestrial Protected Areas 1997–2004
1997 2000 2002 2004
Number Area (ha) Number Area (ha) Number Area (ha) Number Area (ha)
5 645 59 752 783
5 251 61 438 611
6 755 77 461 951
7 720 80 895 099
Source: DEH (2005)
Figure 8: Percentage of each IBRA reserved under the National Reserve System
Source: NLWRA (2002)
Australia is committed to achieving a representative reserve system (Commonwealth of Australia 2001). The first assessment of how representative Australia’s terrestrial protected areas system is in sampling biodiversity across each bioregion was carried out by the National Land and Water Resources Audit (NLWRA 2002). This assessment found that 67 per cent of major terrestrial ecosystems were represented in parks and reserves (IUCN reserve categories I to IV). Other protected areas such as multiple-use reserves, Indigenous Protected Areas, and covenants on private lands (IUCN categories V to VI) have five per cent of terrestrial ecosystems represented in an estate covering approximately three per cent of Australia. The NLWRA (2002) analysis shows that the terrestrial protected area system is poorly
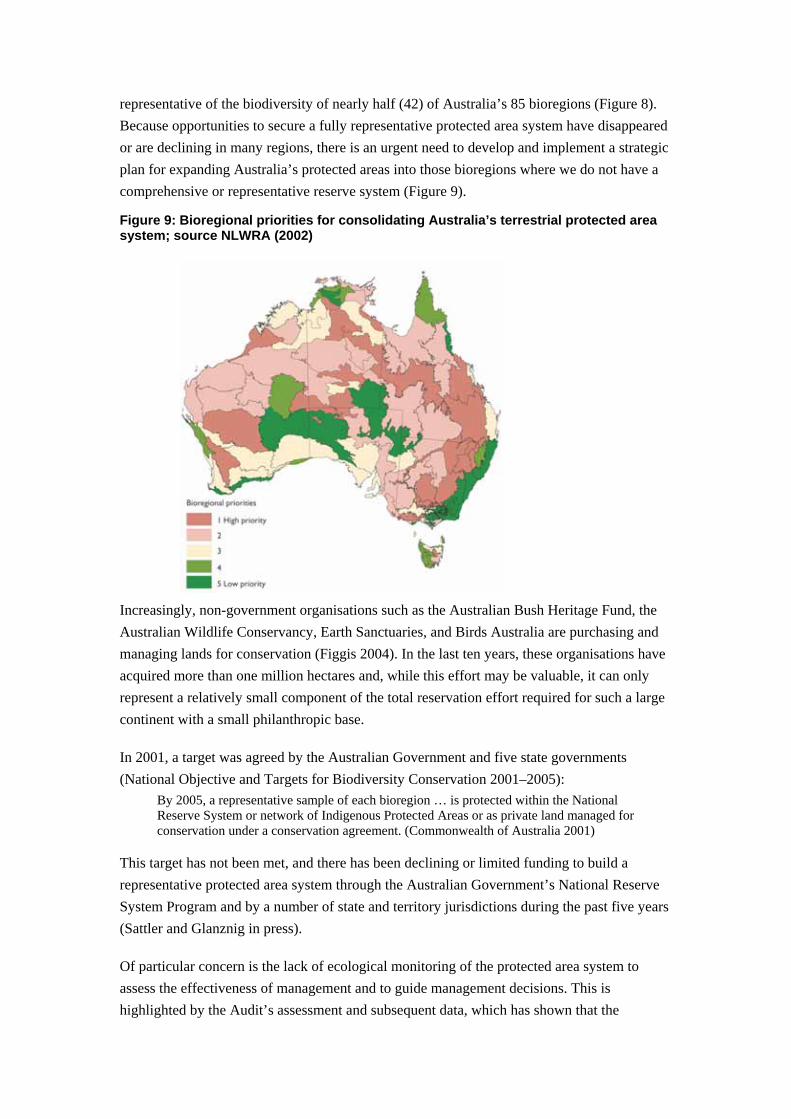
representative of the biodiversity of nearly half (42) of Australia’s 85 bioregions (Figure 8). Because opportunities to secure a fully representative protected area system have disappeared or are declining in many regions, there is an urgent need to develop and implement a strategic plan for expanding Australia’s protected areas into those bioregions where we do not have a comprehensive or representative reserve system (Figure 9).
Figure 9: Bioregional priorities for consolidating Australia’s terrestrial protected area system; source NLWRA (2002)
Increasingly, non-government organisations such as the Australian Bush Heritage Fund, the Australian Wildlife Conservancy, Earth Sanctuaries, and Birds Australia are purchasing and managing lands for conservation (Figgis 2004). In the last ten years, these organisations have acquired more than one million hectares and, while this effort may be valuable, it can only represent a relatively small component of the total reservation effort required for such a large continent with a small philanthropic base.
In 2001, a target was agreed by the Australian Government and five state governments (National Objective and Targets for Biodiversity Conservation 2001–2005):
By 2005, a representative sample of each bioregion … is protected within the National Reserve System or network of Indigenous Protected Areas or as private land managed for conservation under a conservation agreement. (Commonwealth of Australia 2001)
This target has not been met, and there has been declining or limited funding to build a representative protected area system through the Australian Government’s National Reserve System Program and by a number of state and territory jurisdictions during the past five years (Sattler and Glanznig in press).
Of particular concern is the lack of ecological monitoring of the protected area system to assess the effectiveness of management and to guide management decisions. This is highlighted by the Audit’s assessment and subsequent data, which has shown that the

majority (57 per cent) of protected areas are managed only to a fair standard across Australia with permanent resource degradation possibly occurring in 19 per cent (Sattler 2005 and Table 8). Some emerging data suggest that, especially for habitat that requires fire regimes that are difficult to manage in reserves, conservation might require more integrated off- and on-reserve management (Andersen et al 2005).
Table 16: An assessment of the standard of management in terrestrial protected areas within Australia’s bioregions
Management standard* Number (and per cent) of bioregions
Very good 7 (9%)
Good 12 (15%)
Fair 47 (57%)
Poor 16 (19%)
* Protected Area Management Classes: Very good (for example, a high proportion of protected areas has management plans; ecological monitoring programmes in place and key biodiversity issues are being addressed); Good (for example, major biodiversity issues effectively managed); Fair (for example, biodiversity values and or management issues are poorly identified; resource degradation is occurring through retrievable); Poor (for example, high visitor impacts or other threatening processes that are not managed and are leading to permanent resource degradation in a number of parks) Source: Sattler (2005)
Major initiatives across landscapes Since SoE2001, a major initiative for the protection of Australia’s biodiversity at a national scale has been the NHT, phases one and two. NAP, launched in 2001, also is intended to address the protection of biodiversity within an integrated approach to natural resource management, with Australian Government funding matched by the states and territories. Other major achievements, discussed previously, are the actions taken by most jurisdictions during recent years to limit vegetation clearing.
In 2003, the Council of Australian Governments (COAG) agreed to a National Water Initiative that aims to implement environmental flow regimes at a whole-of-basin, aquifer or catchment scale. For the Murray River there was a historic commitment of significant funding of $500 million to return 500 gigalitres of environmental flow for iconic sites along the river including the Barmah forest and the Coroong. Of particular note has been the recent and growing acceptance by governments and the community of the need for water reform in Australia.
Measuring progress The new NHT and NAP initiatives have seen the largest investment ever made in integrating biodiversity conservation within natural resource management processes. New arrangements have been put in place with regional natural resource management bodies to develop and
implement management plans that incorporate biodiversity targets and objectives. The Australian, state and territory governments have established bilateral agreements that seek land and water reforms through better regional planning and investment strategies.
All stakeholders in biodiversity conservation want to see these investments made in the most effective and efficient ways possible. A mid-term review of the first phase of NHT concluded that good progress was being made on involving people in, and improving institutional arrangements for, biodiversity conservation (Centre for International Economics, CSIRO, and Resource Policy and Management 1999). It raised concerns, however, about progress on environmental protection (projects at too small a scale to have much impact) and sustainable production (few projects addressing this issue). The framework for extension of the NHT proposed to address these issues through various measures, including: a specific focus on broadscale land clearing; development and application of appropriate economic and market-based measures to support the conservation of terrestrial native biodiversity; and improved measures to conserve and enhance remnant native vegetation, encourage more sustainable management of rangeland ecosystems, and integrate multiple objectives including biodiversity conservation, salinity mitigation, greenhouse gas abatement, improved land stability and enhanced water quality (Environment Australia and Agriculture, Forestry and Fisheries Australia 2002).
A further assessment of the efficiency and effectiveness of the NHT is currently underway but the results were not available at the time that this commentary was written. In 2002, a major independent report to the Prime Minister’s Science, Engineering and Innovation Council stressed the need for rigorous methods for determining conservation priorities and for assessment of the cost effectiveness of conservation investments (PMSEIC 2002). This report suggested that in the past programmes like the NHT, the National Reserve System, the NAP, and the National Water Reform Framework have sometimes struggled to achieve enough focus on the underlying causes of biodiversity decline. It recommended investment in four areas in particular that are likely to return greatest impact:
– Redressing the absence of economic signals, to urban and rural Australians alike, that connect the ecological condition of natural systems to our use of them for products and services.
– Reducing land clearance.
– Limiting over-extraction of water from our rivers.
Limiting the spread of pests, weeds and imported diseases.
As discussed previously in this commentary, action has been taken by Australian and state governments to address each of these areas. Concerns have been raised about whether enough is being invested, particularly in excluding invasive species (Australian Biosecurity Group 2005) and reversing the impacts of past land clearing. These concerns underline the importance of assessing the past and likely future effectiveness of the approaches taken and strategic investment where there is the feasibility of positive outcomes for defined biodiversity priorities.
NLWRA (2002) concluded that, in nearly half of Australia, there were significant impediments to achieving biodiversity outcomes, in terms of extent of landscape degradation, socio-economic factors, and regional and community capacity. Conservation measures are well integrated into production systems in only 1.5 per cent of Australia, with natural resource management actions achieving some biodiversity conservation outcomes in only a further 21 per cent of the country. Addressing many issues requiring structural adjustment or the establishment of new market mechanisms may exceed the capacity of local or regional bodies because these issues require whole-of-government and often industry-wide solutions (NLWRA 2002).
A set of national objectives and targets for biodiversity have been agreed to by the Australian, state and territory governments (with the exception of Queensland, Tasmania and the Northern Territory) and form a basis for implementing the goals of the National Strategy for the Conservation of Australia’s Biological Diversity (Commonwealth of Australia 1996). A recent assessment concluded that 52 per cent of the 29 targets reviewed will not be met in the designated timeframe and that progress on a further ten per cent could not be determined (Griffin NRM 2004). Mostly, the targets met have been those related to policy, regulations or plans rather than the achievement of biodiversity objectives.
Investment in review and improvement Best practice in environmental policy and management requires that adequate investment be made in reviewing the adequacy of legislation, policy, planning and progress, and taking action to improve processes where necessary. This is especially important with respect to biodiversity conservation in Australia given the large amount being invested, the ambitious objectives being pursued, and the concerning state of the resource. In this context, monitoring needs to be more than just measuring trends; it needs to be incorporated into an experimental learning framework where it is telling us how different strategies perform (Possingham 2000; Possingham et al 2001). Adoption of adaptive management approaches that systematically monitor and learn about the environment (Holling 1978) is increasingly being recognised as a critically important component of Australian natural resource management (for example, ALGA 1997a,b; Dore and Woodhill 1998; VCMC 2002; EHMP 2004).
A key requirement to monitor changes in resource condition is the establishment of targets and identification of suitable indicators. Accordingly, the Australian Government has made a considerable investment in the development of various natural resource indicators and the establishment of monitoring, evaluation and reporting processes for regional natural resource management groups. However, the adoption of indicators by regional bodies to report natural resource condition trends has proved problematic, with trials identifying the lack of data and suitable methodology for their practical application, the inappropriateness of indicators and their relevance to the level of reporting required.
There exists concern over the lack of technical capacity at a regional level for monitoring and making informed assessment of resource condition changes, and the lack of a framework to synthesise the results of monitoring (ALGA 2005). The development of a robust monitoring and evaluation systems will require greater cooperative state and territory arrangements, with regional bodies and the linking to existing biodiversity monitoring programmes being conducted by conservation agencies.
A major concern is the limited long-term ecological research and monitoring in Australia (see <http://www.ilternet.edu/>), which could be used to benchmark condition and monitor change over decades. This is especially significant in the context of the pervasive pressures and their insidious impacts on biodiversity discussed above.
National Land and Water Resources Audit A $30 million, five-year programme establishing the National Land and Water Resources Audit was concluded in 2002, with the completion of a series of studies on the nation’s land, water and biodiversity. One of the studies, Australian Terrestrial Biodiversity Assessment (NLWRA 2002), established a successful partnership with all states and territories and, for the first time, collated information on biodiversity at a range of levels from species to landscapes for each bioregion and subregion. This enabled a comprehensive picture to be developed at a national level drawing upon information collated for Australia’s 85 bioregions and 384 subregions. This assessment model also has assisted a number of jurisdictions in taking a broader approach to regional biodiversity management.
The authors of this commentary believe that it is highly desirable that the systematic work carried out in the first biodiversity assessment be built upon and extended to further quantify the assessment of the condition and trend of biodiversity and the effectiveness of policy initiatives. This is important, because there is no comparable process in place that can report on a range of biodiversity assets at a scale useful for regional planning and that can then be collated for the whole continent.
Cost-effective approaches for biodiversity conservation Targeted strategies are required that focus on maximising conservation return. In some instances, this could warrant a shift away from iconic issues to more threatened parts of the landscape (for example eucalypt woodlands), or where more significant biodiversity gains might be made from tailoring investment to address specific bioregional priorities such as preventative strategies. Considerable conservation effort will continue to be needed in degraded landscapes, and this will mean planning investment for multiple natural resource management returns that include the recovery of biodiversity.

Figure 10: Recovery opportunities for threatened species and ecosystems)
Source: NLWRA (2002)
The Australian Terrestrial Biodiversity Assessment ( Figure 10) found that modest investment could lead to significant recovery of threatened species and ecosystems in northern Australia and across central Australia. In nearly half of Australia, however, significant constraints to recovery were identified owing to the level of landscape and habitat degradation, resource constraints and limited regional and community capacity. Cost-effectiveness analysis should be a key consideration in designing major investment strategies (NLWRA 2002, p. 138).
A more tailored approach to (bio)regional planning Since 2001, Australia has made a large investment in a regional delivery model for conservation and integrated natural resource management. While this model has the potential to address biodiversity and other environmental issues at appropriate scales of time and space, there are several challenges to its effective implementation. Many people living in regions are focused on local issues, and there is often a lack of understanding of regional or national biodiversity issues. There is little assessment made of the cost effectiveness of proposed responses. Political, social, administrative and ecological boundaries do not overlap and this often confounds conservation actions (Saunders and Briggs 2002, Wild River 2006 <http://www.deh.gov.au/soe/2006/integrative/local-government/index.html>).
There is a need, therefore, for conservation strategies that consider the particular biodiversity issues of different bioregions integrated with other natural resource management considerations as part of a regional delivery framework. Such planning requires sufficient technical capacity to clearly identify biodiversity priorities, assess opportunities for cost-
effective and preventative actions, and define clear outcomes for investment. This capacity seems to be in short supply. Comprehensive bioregional conservation strategies should develop an integrated mix of major conservation measures such as protected area consolidation, species and ecosystem recovery and natural resource management actions that include threat abatement measures.
Bioregional conservation planning is an explicit provision within the EPBC Act, which could be used to facilitate a cooperative planning process with the involvement of state and regional bodies.
This approach of building on the current regional investment initiatives with tailored responses for all of Australia’s 85 bioregions aligns with the proposed National Biodiversity Initiative (National Biodiversity Alliance 2004).
Incentives for protecting biodiversity The period since SoE2001 has seen substantial activity by the Australian, state and territory governments, as well as some industry and community groups, in exploring new incentive schemes and market-based mechanisms to achieve biodiversity outcomes (Cutbush 2006 <http://www.deh.gov.au/soe/2006/emerging/incentives/index.html>). Examples include:
• auction and tender schemes—Land Management Tenders in NSW; BushTender in Victoria, Vegetation Incentive Program in Queensland
• New South Wales Environmental Services Scheme
• auctioning habitat links and carbon sinks
In October 2003, the Australian Government announced 15 national biodiversity hotspots: areas that are rich in plant and animal species and under immediate threat from impacts such as land clearing, development pressures or, salinity. It also announced funding of $36 million for enhancing active conservation management in these areas. This is a welcome programme that will include incentives in one form or another, but should be integrated with other state biodiversity conservation initiatives.
In the past, Australia has explored a range of ways to achieve better land management—ranging from reliance on voluntary measures or altruism to achieve conservation on private land, to legislative measures to establish a duty-of-care that matches community expectations. Two notable approaches that have emerged in this state of the environment reporting period are: the Vegetation Incentive Program in Queensland, which provides additional incentives for protecting regrowth outside the standard established by legislation, and provision for financial incentives for better management of native vegetation associated with legislative reforms in New South Wales, supported by a decision-support tool (Property Vegetation Plan Developer) that considers salinity, water quality, soil degradation, biodiversity, threatened species and invasive native plant species.
Most of the incentive schemes are at early stages of development and, given the growing emphasis on market-based and stewardship approaches to managing biodiversity, rigorous assessments of their performance in meeting biodiversity objectives along with evaluation of other options is required.
Conclusions As knowledge of Australia’s ecosystems improves so does the understanding of the scale of the management challenges. Proactive and anticipatory responses that address biodiversity conservation priorities in advance of serious decline are needed if national and regional goals are to be met.
This reporting period (2001 to 2006) has seen the emergence of several major initiatives by governments, as well as greatly increased involvement of communities in biodiversity conservation. While these initiatives address many of the issues raised as concerns in the past, their effectiveness has yet to be assessed. Early signs suggest that progress is good with respect to processes, but slower than planned with respect to outcomes for biodiversity that could take decades, if not centuries, to manifest themselves.
These initiatives provide a base on which to build, but more is needed to stem the decline in biodiversity and bring about recovery. The authors of this commentary suggest that a substantially funded national approach to biodiversity conservation is needed, which takes a range of approaches tailored to meet the different needs of different bioregions and includes the following important components:
• long-term commitment to sufficient and sustained funding of national conservation programmes commensurate with the nature of the threats and the scale of environmental degradation
• effective policy and institutional arrangements that deliver the community, scientific, professional and institutional capacity that is required to effectively conserve biodiversity; this should involve greater cooperation between levels of government
• systematic and long-term ecological monitoring and research, strategically targeted at key biodiversity groups and biomes and done in a way that enables Australia to learn through experimentation about how to address key challenges such as management of threatening processes, the development of sustainable production systems and ecological restoration
• specific collection and analysis of information on a regular basis to allow robust conclusions to be drawn about national trends (for example in state of the environment reporting)
• strategic analyses of biodiversity priorities at a bioregional scale to inform natural resource managers, industry and local government and ensure that biodiversity impacts and trade-offs are explicit
• ongoing cooperation between the private and public sectors to achieve the scale of landscape management required to stem biodiversity loss and protect ecosystems
• building on current promising efforts to achieve effective motivation and incentives for biodiversity conservation beyond a defined a duty of care
• urgent implementation of a representative protected area system across all bioregions
• development of threat abatement programmes to address widespread threats such as grazing pressure, inappropriate fire regimes and invasive organisms, especially where modest investment could achieve substantial returns across the northern savannas and other rangeland areas
• ongoing community education and awareness programmes.
References AGO [Australian Greenhouse Office] 2005, National Greenhouse Gas Inventory 2003, Part B, Appendix table 4, ‘Land use change and forestry’, Department of the Environment and Heritage, Canberra, <http://www.greenhouse.gov.au/inventory/2003/index.html>, viewed 1 May 2006.
Agtrans Research and Dawson N 2005, ‘Review of progress on invasive species’, Final report to Department of the Environment and Heritage, Department of the Environment and Heritage, <http://www.deh.gov.au/biodiversity/invasive/publications/review/index.html>, viewed 31 July, 2006.
ALGA [Australian Local Government Association] 1997a, Choosing and Using Environmental Indicators, ALGA, Canberra.
ALGA [Australian Local Government Association] 1997b, Regional Environmental Strategies— How to Prepare and Implement Them, ALGA, Canberra.
ALGA [Australian Local Government Association] 2005, Increasing Coastal Councils’ Capacity to Manage the Natural Resource Base, Natural Heritage Trust, Canberra.
Andersen AN, Cook GD, Corbett LK, Douglas MM, Eager RW, Russell-Smith J, Setterfield SA, Williams RJ, and Woinarski JCZ, 2005, Fire frequency and biodiversity conservation in Australian tropical savannas: implications from the Kapalga fire experiment, Australian Ecology 30(2):155, Blackwell Publishing, Melbourne.
Arthington A 2002, Environmental flows: ecological importance, methods and lessons from Australia, paper presented at: Mekong Dialogue Workshop ‘International transfer of river basin development experience: Australia and the Mekong Region’, 2 September 2002. <http://www.mekong.es.usyd.edu.au/events/past/Conference2002/angela_arthington.pdf>, viewed 4 August 2006.
Australian Biosecurity Group 2005, Invasive Weeds, Pests and Diseases: Solutions to Secure Australia. CRC for Pest Animal Control, CRC for Australian Weed Management and WWF – Australia, Canberra, <http://www.wwf.org.au/News_and_information/Publications/PDF/Policies_position/ABGInvasiveSolutions.pdf>, viewed 4 August 2006.
BDAC [Biological Diversity Advisory Committee] 2005, Making Economics Work for Biodiversity Conservation, Land & Water Australia, Canberra. <http://www.deh.gov.au/biodiversity/publications/economic-valuation/pubs/conservation1-4.pdf>, viewed 4 August 2006.
Bioprospect Limited 2006, website, <http://www.bioprospect.com>, viewed 28 July 2006.
Bowman D 1999, Introduced grasses: triumph or Trojan horse? Savanna Links 10, Tropical Savannas CRC, Darwin, <http://savanna.ntu.edu.au/publications/savanna_links10/introduced_grasses.html>, viewed 4 August 2006.
Briggs SV and Taws N 2003, Impacts of salinity on biodiversity – clear understanding or muddy confusion? Australian Journal of Botany 51:609–617, CSIRO Publishing, Melbourne.
Butchart SHM, Resit Akcakaya H, Kennedy E and Hilton-Taylor C 2006, Biodiversity Indicators Based on Trends in Conservation Status: Strengths of the IUCN Red List Index, Conservation Biology Volume 20, No. 2, 579–581
Carruthers S and Hodder M 2005, A Landscape Approach to Determine the Ecological Value of Paddock Trees. Land and Water Australia Project Reference DEP11, Final Report. Prepared for Land and Water Australia and the South Australian Native Vegetation Council. Land and Water Australia, Canberra.
Carter O, Murphy A, and Cheal D 2003, Natural Temperate Grassland, Department of Natural Resources & Environment (Victoria), Flora Ecology Research Section, Arthur Rylah Institute for Environmental Research, Department of Natural Resources and Environment, Victoria.
Cary G, Lindenmayer D and Dovers S (eds) 2003, Australia Burning: Fire Ecology, Policy and Management Issues, Melbourne: CSIRO Publishing.
Centre for International Economics, CSIRO, and Resource Policy and Management, 1999, Midterm review of the Natural Heritage Trust. Bushcare Program, Natural Heritage Trust, <http://www.nht.gov.au/review/mtrfinrpt/pubs/bushcare.pdf>, Canberra, viewed 4 August 2006.
Chapman AD (in press) Numbers of Living Species in Australia and the World, Report for the Department of the Environment and Heritage, Canberra.
Commonwealth of Australia 1999, Australian Guidelines for Establishing the National Reserve System, Environment Australia, Canberra.
Commonwealth of Australia 2001, National Objectives and Targets for Biodiversity Conservation, 2001–2005, Environment Australia, Canberra.
Commonwealth of Australia 2003, Collaborative Australian Protected Areas Database 2002, Department of the Environment and Heritage, Canberra, <http://www.deh.gov.au/parks/nrs/capad/2002/index.html>, viewed 4 August 2006.
Commonwealth of Australia 1996, National Strategy for the Conservation of Australia’s Biological Diversity, Department of the Environment, Sport and Territories, Canberra.
CSIRO 2002, Fire risk as African grass invades top end, Media release, Ref 2002/196 – Oct 17 , 2002, CSIRO, Canberra <http://www.csiro.au/files/mediaRelease/mr2002/Prgamba.htm>, viewed 4 August 2006.
CSIRO 2004, Submission to the Federal senate inquiry on invasive species. CSIRO, Canberra, <http://www.aph.gov.au/senate/committee/ecita_ctte/invasive_species/submissions/sub34.doc>, viewed 4 August 2006
CSIRO 2005, Ecosystem Services Project website, various publications available at <http://www.ecosystemservicesproject.org/html/publications/index.htm>, viewed 18 August 2005.
Cutbush G 2006, ‘Incentives for natural and cultural heritage conservation’ paper prepared for the 2006 Australian State of the Environment Committee, Department of the Environment and Heritage, Canberra, <http://www.deh.gov.au/soe/2006/emerging/incentives/index.html>.
Davis JA, Froend RH, Hamilton DP, Horwitz P, McComb AJ, Oldham CE 2001, Environmental Water Requirements to Maintain Wetlands of National and International Importance, Environmental Flows Initiative Technical Report Number 1, Commonwealth of Australia, Canberra, <http://www.deh.gov.au/water/rivers/nrhp/wetlands/index.html>, viewed 6 October 2005.
DEH [Department of the Environment and Heritage] 2004a, Kangaroo Harvesting Statistics, <http://www.deh.gov.au/biodiversity/trade-use/wild-harvest/kangaroo/stats.html>, last updated 16 Dec 2004, viewed 26 September 2005.
DEH [Department of the Environment and Heritage] 2004b, Annual Report, 2003–2004, <http://www.deh.gov.au/about/annual-report/03-04/pubs/outcome-1.pdf>, viewed 13 October 2005.
DEH [Department of the Environment and Heritage] 2005, The Collaborative Australian Protected Areas Database (CAPAD), <http://www.deh.gov.au/parks/nrs/capad/index.html>, viewed 4 August 2006.
DEH [Department of the Environment and Heritage] 2006, Species Information Partnerships: Sharing Knowledge on Threatened Species, Prepared by the Australian Government Department of Environment and Heritage for the 2006 State of the Environment Committee, <http://www.deh.gov.au/soe/2006/emerging/species-listing/index.html>.
Dixon S 1892, ‘The effects of settlement and pastoral occupation in Australia upon the indigenous vegetation’, Transactions and Proceedings of the Royal Society of South Australia 15: 195–206. Royal Society of South Australia, Adelaide.
Dore J and Woodhill J 1998, Essential Characteristic of Regional Natural Resources Management Strategies, Greening Australia, Canberra.
Dunlop M 2003, Taking a long view of land use in Australia, in Search of Sustainability, February – November 2003 [Internet Conference]. Australia 21 Ltd, Nature and Society Forum inc, Sustainable Population Australia Inc, in association with The Australian Collaboration, Canberra, viewed 4 August 2006.
Dunlop M, Turner G, Foran B and Poldy F 2002, Decision Points for Land and Water Futures, Resource Futures Program Working Document 2002/08, CSIRO Sustainable Ecosystems, Canberra, Australia. Final Report to Land & Water Australia.
Edwards A, Kennett R, Price O, Russell-Smith J, Spiers G and Woinarski J 2003, ‘Monitoring the impacts of fire regimes on vegetation in northern Australia: an example from Kakadu National Park’, International Journal of Wildland Fire 12:427–40, CSIRO, Melbourne.
EHMP 2004, Ecosystem Health Monitoring Program 2002–2003, Annual technical report, Moreton Bay Waterways and Catchments Partnership, Brisbane.
Ellis S, Kanowski P and Whelan R 2004, National Inquiry on Bushfire Mitigation and Management, Commonwealth of Australia, Canberra, <http://www.coagbushfireenquiry.gov.au/findings.htm#response>, viewed 4 August 2006.
Elmqvist T, Folke C, Nyström M, Peterson G, Bengtsson J, Walker B, and Norberg J 2003, ‘Response diversity, ecosystem change, and resilience’, Frontiers in Ecology and the Environment 1(9):488–494, Ecological Society of America, Washington, DC.
Environment Australia and Agriculture, Forestry and Fisheries Australia, 2002, Framework for the Extension of the Natural Heritage Trust, Attachment A, Bushcare, Environment Australia, Canberra, <http://www.nht.gov.au/publications/framework/bushcare.html>, viewed 4 August 2006.
Environment Australia 2001, A Directory of Important Wetlands in Australia, third edition Environment Australia, Canberra, <http://www.deh.gov.au/water/wetlands/database/directory/index.html>, viewed 6 October 2005>.
ERIN 2005, ‘Analysis of forest in the intensive landuse zone’, unpublished data from the Environmental Resource Information Network, Department of the Environment and Heritage, source of data AGO Version 1, July 2005, NCAS, DEH/AGO, Canberra.
Fensham R 2006, ‘Spring wetlands of the Great Artesian Basin – unique environments’, paper for the 2006 Australian State of the Environment Committee, Department of Environment and Heritage, Canberra, <http://www.deh.gov.au/soe/2006/emerging/wetlands/index.html>.
Figgis P 2004, Conservation on Private Lands: the Australian Experience, IUCN, Gland, Switzerland and Cambridge, UK.
Folke C, Carpenter S, Elmqvist T, Gunderson L, Holling CS, Walker B 2002, ‘Resilience and sustainable development: building adaptive capacity in a world of transformations’, Ambio 31:437–40, Royal Swedish Academy of Sciences, Stockholm.
Garnett ST, Crowley GM and Barrett GB 2002, ‘Birds’, in Australian Terrestrial Biodiversity Assessment, National Land and Water Resources Audit, Commonwealth of Australia, Canberra.
Green JL and MacLeod ND 2002, ‘Barriers and opportunities for adoption’, in McIntyre S, McIvor JG and Heard KM (eds) Managing and Conserving Grassy Woodlands, CSIRO Publishing, Collingwood, Victoria.
Griffin NRM Pty Ltd, 2004, Small Steps for Nature: A review of progress towards the National Objectives and Targets for Biological Diversity Conservation 2001–2005, Humane Society International and WWF-Australia, <http://www.wwf.org.au/News_and_information/Publications/PDF/Report/NOTS_Review.pdf>, viewed 4 August 2006.
Hollings CS (ed), 1978, Adaptive Environmental Assessment and Management, John Wiley and Sons, London.
Howden M, Hughes L, Dunlop M , Zethoven I, Hilbert D and Chilcott C 2003, Climate Change Impacts On Biodiversity In Australia, Outcomes of a workshop sponsored by the Biological Diversity Advisory Committee, 1–2 October 2002, Commonwealth of Australia, Canberra.
Hughes L 2003, ‘Indicators of Climate Change’ in Howden M, Hughes L, Dunlop M, Zethoven I, Hilbert D and Chilcott C (eds), Climate Change Impacts on Biodiversity in Australia: Outcomes of a workshop sponsored by the Biological Diversity Committee, 1–2 October 2002, Commonwealth of Australia, Canberra, pp. 58–62.
Humphreys W 2006, ‘Groundwater fauna’, paper prepared for the 2006 Australian State of the Environment Committee, Department of the Environment and Heritage, Canberra, <http://www.deh.gov.au/soe/2006/emerging/fauna/index.html>.
Keating BA and Harle K 2004, Farming in an ancient land—Australia's journey towards sustainable agriculture. In Conserving Soil and Water for Society : Sharing Solutions : ISCO 2004—13th International Soil Conservation Organisation Conference, Brisbane, July 2004, Paper no. 102, reprint no. 4966, Australian Society of Soil Science and International Erosion Control Association (Australasia), Brisbane.
Keighery G 2000, Wheatbelt wonders under threat, Landscope, Summer 2000–2001, Department of the Environment and Conservation Western Australia, Perth.
Keller P 2005, Global Tourism Growth: a Challenge for SMES, Conference on Global Tourism Growth: A Challenge for SMEs, 6–7 September 2005, Gwangju, Korea, Organisation for Economic Co-operation and Development, <http://www.oecd.org/dataoecd/28/21/36884961.pdf>, viewed 4 August, 2006.
Krockenburger AK, Kitching RL and Turton SM 2003, Environmental Crisis: Climate Change and Terrestrial Biodiversity in Queensland, Cooperative Research Centre for Tropical Rainforest Ecology and Management, Rainforest CRC, Cairns.
Latz P 1995, ‘Fire in the desert’, in Rose DB (Ed) Country in Flames. Proceedings of the 1994 symposium on biodiversity and fire in North Australia, Department of the Environment, Sport and Territories and the North Australia Research Unit (ANU), Canberra.
Lindenmayer DB, McIntyre S and Fischer J 2003, ‘Birds in eucalypt and pine forests: landscape alteration and its implications for research models of faunal habitat use’, Biological Conservation 110(1):45–53, Elsevier, UK.
Long K and Robley A (2004), Arthur Rylah Institute for Environmental Research DEH, Canberra, <http://www.deh.gov.au/biodiversity/invasive/publications/fencing/index.html>, viewed August 2006.
McLeod R 2004, Impact of Invasive Animals in Australia 2004, Cooperative Research, Centre for Pest Animal Control, Canberra, <http://www.pestanimal.crc.org.au/info/publications.htm>, viewed 4 August 2006.
Millennium Ecosystem Assessment 2003, Ecosystems and Human Well-Being, Island Press, Washington DC.
Millennium Ecosystem Assessment 2005a, Ecosystems & Human Well-being: Biodiversity Synthesis, Island Press, Washington DC.
Millennium Ecosystem Assessment 2005b, Ecosystems and Human Well-being: Synthesis, Island Press, Washington, DC.
Murray-Darling Basin Commission 2003a, Salinity Update 2003, <http://www.mdbc.gov.au/__data/page/306/salinityUpdate2003.pdf>, viewed 4 August 2006.
Murray-Darling Basin Commission 2003b, ‘Rapid assessment of the impact of recent vegetation clearing on salinity in the Queensland part of the MDB and projected scenarios’, unpublished report, Canberra.
National Biodiversity Alliance 2004, Proposal for a new National Biodiversity Initiative, National Biodiversity Alliance, GPO Box 528, Sydney, 2000. <http://www.wwf.org.au/News_and_information/Publications/PDF/Policies_position/NBANationalBiodiversityInitiative.pdf>, viewed 4 August 2006.
NLWRA [National Land and Water Resources Audit] 2000, Australian Dryland Salinity Assessment - Extent, Impacts, Processes, Monitoring and Management Options, Commonwealth of Australia, Canberra.
NLWRA [National Land and Water Resources Audit] 2001a, Landscape Health in Australia, Commonwealth of Australia, Canberra.
NLWRA [National Land and Water Resources Audit] 2001b, Rangelands – Tracking Changes, Commonwealth of Australia, Canberra.
NLWRA [National Land and Water Resources Audit] 2002, Australian Terrestrial Biodiversity Assessment, Commonwealth of Australia, Canberra, <http://audit.ea.gov.au/ANRA/vegetation/docs/biodiversity/bio_assess_contents.cfm>, viewed 4 August 2006.
Noble JC, Joss PJ and GK Jones GK (eds), 1990, The Mallee Lands: a Conservation Perspective, CSIRO Publications, Melbourne.
O’Connor M 1990, Fire-stick Farming: Selected Poems 1972–90, Hale and Iremonger, Sydney, p. 32.
Olsen P, Silcocks A, Weston M and Tzaros C 2006, ‘Birds of woodlands and grasslands’ Paper for the 2006 Australian State of the Environment Committee, Department of Environment and Heritage, Canberra, <http://www.deh.gov.au/soe/2006/emerging/birds/index.html>.
Pittock B (ed) 2003, Climate Change – An Australian Guide to the Science and Potential Impacts, Australian Greenhouse Office, Canberra.
PMSEIC [Prime Minister’s Science, Engineering and Innovation Council] 2002, ‘Sustaining our natural systems and biodiversity’ Paper prepared by an independent working group for the 8th meeting of PMSEIC, 31 May 2002, <http://www.dest.gov.au/NR/rdonlyres/EE0F827A-94BB-4E0C-80F5-A058293F190C/2014/Sustaining_our_Natural_Systems_and_Biodiversity_Wo.pdf>, viewed 4 August 2006.
Possingham HP 2000, ‘Is environmental research a waste of time?’ Ecological Management and Restoration, 1(2):81–82, Blackwell Publishing, Melbourne.
Possingham HP, Andelman SJ, Noon BR, Trombulak S and Pulliam HR 2001, ‘Making smart conservation decisions’, chapter 10 in Orians G and Soule M, Research Priorities for Conservation Biology, Island Press, Washington DC.
Reddiex B, Forsyth DM, McDonald-Madden E, Einoder LD, Griffioen PA, Chick RR, and Robley AJ 2004, Review of Existing Red Fox, Wild Dog, Feral Cat, Feral Rabbit, Feral Pig, and Feral Goat Control in Australia. I. Audit, Arthur Rylah Institute for Environmental Research, Department of Sustainability and Environment, Melbourne.
Resilience Alliance, website, <http://www.resalliance.org>, viewed July 28 2006.
Sattler PS 2005, ‘An evaluation of Queensland’s Protected Area System in a national context for comprehensiveness, adequacy and standard of management’ in Growing Pains: Managing a Larger Protected Estate, National Parks Association of Queensland, Brisbane.
Sattler PS and Glanznig A in press, Building Nature's Safety Net: an Evaluation of Australia's Terrestrial Protected Area System (1991–2004), World Wildlife Fund, Sydney.
Saunders D, Beattie A, Eliott S, Fox M, Hill B, Pressey B, Veal D, Venning J, Maliel M and Zammit C 1996, ‘Biodiversity’ in Australia: State of the Environment 1996, State of the Environment Advisory Council, CSIRO Publishing, Melbourne.
Saunders DA and Briggs SV 2002, ‘Nature grows in straight lines – or does she? What are the consequences of the mismatch between human-imposed linear boundaries and ecosystem boundaries? An Australian example’, Landscape and Urban Planning 61:71–82, Elsevier, UK.
Saunders DA, Smith GT, Ingram JA and Forrester RI 2003, ‘Changes in a remnant of salmon gum Eucalyptus salmonophloia and York gum E. loxophleba woodland, 1978 to 1997. Implications for woodland conservation in the wheat-sheep regions of Australia’, Biological Conservation 110: 245–56, Elsevier, UK.
Simpson S and Chudleigh P (eds), 2003, Wattle Seed Workshop. Proceedings of a Workshop to Assess Prospects and Develop R&D Priorities for a Wattle Seed Industry, Rural Industries Research and Development Corporation, Canberra.
Sinclair Knight Merz Pty Ltd 2001, Environmental Water Requirements of Groundwater Dependent Ecosystems, Technical report number 2, Environment Australia, Canberra, <http://www.deh.gov.au/water/rivers/nrhp/groundwater/>, viewed dd month yyyy.
Sinden S, Jones R, Hester S, Odom D, Kalisch C, James R and Cacho O 2004, The Economic Impact of Weeds in Australia, CRC for Australian Weed Management, Adelaide, <http://www.weeds.crc.org.au/documents/tech_series_8.pdf> viewed 4 August 2006.
Smyth A, James C and Whiteman G 2003, ‘Biodiversity monitoring in the rangelands: a way forward’ in Final Report to the Environment Australia on an Expert Technical Workshop, Alice Springs, CSIRO Sustainable Ecosystems, 29 October – 1 November 2002, Alice Springs NT, Environment Australia and CSIRO, Canberra.
Stanton P 1995, ‘A tropical Queensland perspective’ in Rose DB (Ed.) Country in Flames. Proceedings of the 1994 Symposium on Biodiversity and Fire in North Australia, Department of the Environment, Sport and Territories and the North Australia Research Unit (ANU), Canberra.
Tacey DJ 1995, Edge of the Sacred-Transformation in Australia, Harper Collins Publishers, Melbourne.
Thomas CD, Cameron A, Green RE, Bakkenes M, Beaumont LJ, Collingham YC, Erasmus, BFN, De Siquiera MF, Grainger A, Hannah L, Hughes L, Huntley B, Van Jaarsveld AS, Midgley GF, Miles L, Ortega-Huerta MA, Peterson AT, Phillips O and Williams SE 2004, Extinction risk from climate change, Nature 427: 145–148.
Tyler M 2006, ‘The disappearing frogs’, paper prepared for the 2006 Australian State of the Environment Committee, Department of the Environment and Heritage, Canberra, <http://www.deh.gov.au/soe/2006/emerging/frogs/index.html>.
UNEP-WCMC, 2003, United Nations Environment Programme – World Conservation Monitoring Centre. World Database on Protected Areas Version 6. Compiled by the World Database on Protected Areas Consortium. Cambridge, UK <http://earthtrends.wri.org>, viewed 4 August 2006.
VCMC [Victorian Catchment Management Council] 2002, The Health of Our Catchments - A Victorian Report Card, The State of Victoria, Melbourne.
Watson I 2006, ‘Monitoring in the rangelands’, paper prepared for the 2006 Australian State of the Environment Committee, Department of the Environment and Heritage, Canberra, <http://www.deh.gov.au/soe/2006/emerging/rangelands/index.html>.
Western Australian Department of Land Information, 2004, referred to in Ellis S, Kanowski P and Whelan R, National Inquiry on Bushfire Mitigation and Management, Commonwealth of Australia, Canberra, <http://www.coagbushfireenquiry.gov.au/findings.htm#response>, viewed 4 August 2006.
Westphal MI, Field SA, Tyre AJ, Paton D and Possingham HP, 2003, ‘Effects of landscape pattern on bird species distribution in the Mt. Lofty Ranges, South Australia’, Landscape Ecology 18: 413–26, Kluwer Academic Publishers, USA.
Whitehead PJ 2002, ‘Land management: The next frontier’, paper presented to the workshop ‘Preparing for the ANAO’s performance audit of Northern Territory land councils and the Aboriginals Benefit Account’, 12–13 February, University House, Canberra.
Wild River S 2006, ‘The role of local government in environmental and heritage management’, paper prepared for the 2006 Australia State of the Environment Committee, Department of Environment and Heritage, Canberra, <http://www.deh.gov.au/soe/2006/integrative/local-government/index.html>.
Williams J, Read C, Norton A, Dovers S, Burgman M, Proctor W and Anderson H 2001, Biodiversity, Australia State of the Environment Report 2001 (Theme Report), CSIRO Publishing on behalf of the Department of the Environment and Heritage, Canberra.
Yencken D and Wilkinson D 2000, Resetting the Compass, Australia’s Journey Towards Sustainability, CSIRO Publishing, Collingwood, Victoria .
Woinarski J 1999, ‘Fire and Australian birds: a review’, in Gill AM, Woinarski, JCZ and York A (Eds) Australia's Biodiversity – Responses to Fire. Plants, Birds and Invertebrates Biodiversity, Technical paper no. 1, Commonwealth of Australia, Canberra.
Yinirrakun – April Bright, 1995, ‘Burn grass’ in Rose DB (ed.) Country in Flames. Proceedings of the 1994 Symposium on Biodiversity and Fire in North Australia, Department of the Environment, Sport and Territories and the North Australia Research Unit (ANU), Canberra.


