Embed Size (px)
Citation preview

BIOCHEMICALENGINEERING ANDBIOTECHNOLOGY
SECOND EDITIONGHASEM D. NAJAFPOUR
Biotechnology Research Lab., Faculty of Chemical Engineering,Noshirvani University of Technology, Babol, Iran
AMSTERDAM BOSTON HEIDELBERG LONDON NEW YORK OXFORDPARIS SAN DIEGO SAN FRANCISCO SINGAPORE SYDNEY TOKYO
ElsevierRadarweg 29, PO Box 211, 1000 AE Amsterdam, NetherlandsThe Boulevard, Langford Lane, Kidlington, Oxford OX5 1GB, UK225 Wyman Street, Waltham, MA 02451, USA
Copyright © 2015, 2007 Elsevier B.V. All rights reserved.
No part of this publication may be reproduced or transmitted in any form or by any means,electronic or mechanical, including photocopying, recording, or any information storage and retrievalsystem, without permission in writing from the publisher. Details on how to seek permission, furtherinformation about the Publisher’s permissions policies and our arrangements with organizationssuch as the Copyright Clearance Center and the Copyright Licensing Agency, can be found at ourwebsite: www.elsevier.com/permissions.
This book and the individual contributions contained in it are protected under copyright by thePublisher (other than as may be noted herein).
NoticesKnowledge and best practice in this field are constantly changing. As new research and experiencebroaden our understanding, changes in research methods, professional practices, or medicaltreatment may become necessary.
Practitioners and researchers must always rely on their own experience and knowledge in evaluatingand using any information, methods, compounds, or experiments described herein. In using suchinformation or methods they should be mindful of their own safety and the safety of others,including parties for whom they have a professional responsibility.
To the fullest extent of the law, neither the Publisher nor the authors, contributors, or editors,assume any liability for any injury and/or damage to persons or property as a matter of productsliability, negligence or otherwise, or from any use or operation of any methods, products,instructions, or ideas contained in the material herein.
ISBN: 978-0-444-63357-6
British Library Cataloguing in Publication DataA catalogue record for this book is available from the British Library
Library of Congress Cataloging-in-Publication DataA catalog record for this book is available from the Library of Congress
For Information on all Elsevier publicationsvisit our website at http://store.elsevier.com/
Author Biography
Author of Biochemical Engineering & Biotechnology is a distin-guished professor in chemical engineering and the chairman ofBiotechnology Research Center, Babol Noshirvani Universityof Technology, Iran. He is an educated scholar from Universityof Arkansas, United States with strong background in bio-logical processes. He is deeply involved in research andteaching in biochemical engineering subjects and has con-ducted many practical researches in the fields of biofuel andbiochemical engineering.
He has served as academic member of University ofMazandaran, visiting professor at University of Waterloo,Canada and University of Arkansas, United States, UniversityScience Malaysia (USM, Penang), and Babol Noshirvani University of Technology. He alsospent his sabbatical leave at University of Arkansas, United States (1992e1993). He hasexpanded his scientific research activities on single cell protein, microbial fuel cells, renew-able energy, and synthetic fuels. Since 2005, he was qualified and appointed as professor inthe faculty of chemical engineering at Babol Noshirvani University of Technology, Iran.
Currently, Prof. Najafpour is serving as editor-in chief in some international journalsincluding: International Journal of Engineering, World Applied Sciences Journal, Middle EastJournal of Scientific Research, and Iranica Journal of Energy and Environment since 2006. Inaddition, he is the editor of Journal of Environmental Chemistry and Ecotoxicology, academicjournals, since 2007. He is an active member of numerous international institutes, editor andreviewer of number of international journals, and many scientific societies. He is often invitedto many international conferences as keynote speaker. In the past decades, he has supervisedmore than 145 post graduate and 28 Ph.D. students. He has published more than 350 researchpapers in international journals and has written eight books in the field of Chemical Engi-neering and Biotechnology. In year 2006, he has published the first edition of his book withElsevier entitled Biochemical Engineering & Biotechnology. He has won number of awards forresearch achievements and was the winner of gold medal for the Invention/InnovationExhibition sponsored by Ministry of Science, Technology Malaysia (2004). His researches forformulation of transparent soap and natural biodegradable liquid detergent from palm oil’sfatty acids, was patented with SIRIM Berhad, Malaysia (2003). Currently, he is supervisingnumber of Ph.D. scholars and conducting top research projects on microbial fuel cells, bio-diesel, biohydrogen, biofuel from algae, bioethanol from agro-wastes, enzyme technology,renewable energy, heterogeneous catalytic processes, wastewater engineering, and biologicaltreatment processes.
xi
Book Audience and Overview
WHO SHOULD READTHIS BOOK?
The intersection between biology and en-gineering has resulted in a number of fields,two of which are biochemical engineeringand biomedical engineering. Thus, onewould like to use this book to broaden his orher knowledge in interdisciplinary area ofengineering/technology and biology/medi-cine. The field biochemical engineering isrelatively new; in past two decades moreresearch activities have been developed.I believe more and more research activitieswill be focused in this area in near future.The extended material exactly deals withapplication of biotechnology, as the relatedbioprocess may lead to commercialization.
This book is focused on practical knowl-edge and research outcome, which is used tojustify the theoretical concepts. Bioseparationand environmental issues are incorporated ascase studies related to bioprocesses. Besidecase studies, the book contains many exam-ples and solved problems, which help readersto understand all industrial aspects and ap-plications in biotechnology. The second edi-tion broadens the knowledge of researchscientists on “Biochemical Engineering andBiotechnology” to learn fundamentals ofbiotechnology and apply research outcome incommercial scale. The knowledge in this bookis not limited to any geographic region.
Most of currently available books in thisfield are very complicated or may notexplain the detail of processes. In myopinion, detail information in this book
offers the greatest advantage over otheravailable sources. Students and those whoare getting familiar with biological andbiotechnological processes need to knowabout biosciences, some examples, and casestudies to improve their information andknowledge. This book illustrates severalsuccessful research and case studies con-ducted in this area, which would be veryhelpful to give an insight to readers.
The present book is more attractive tochemical engineers academics, professionals,and postgraduate students, while it is rec-ommended for senior undergraduates. Allchapters give more understanding of therelated knowledge to specific field ofbiotechnology. The related case studies areincorporated with original research data thatwould help to develop advance researchtechnology and innovation.
This book is a useful guide for all scien-tists to apply theoretical bases and also toconduct research in bioprocesses. The bookexplains many concepts and presents highlyqualitative and quantitative results in bio-logical processes. It concentrates on applica-tion of biology and biochemistry inengineering aspects. The details of bioengi-neering concepts would be the following:enzyme and microbial growth kinetics;bioreactor design and actual applications inprocess scale-up; downstream productrecovery; biological products separationand purification; and production of value-added products such as enzymes fromwastes, antibiotics, and other fermentativeproducts.
xiii
The target audience (mainly undergradu-ate and graduate students of biochemicalengineering) needs to understand the basicconcepts and theoretical and practicalknowledge with appropriate depth andbreadth about this topic. This book combinesthe theoretical basis of biochemical engi-neering with original research data. This is agreat beneficial to the reader.
The second edition of the present bookshould serve as a useful reference for researchscientists currently conducting research in thearea of chemical, physical, and biologicaltreatment of industrial wastewater.
This book contains important and inter-esting topics in the field of bioprocess.Extensive applications of biotechnology inbiochemical engineering are included. Thesecond edition has been certainly improved,which may attract special attention of many
scientists around the world. The revisedbook emphasizes on practical aspects andcase studies. It contains useful guidelines foryoung research scientists to develop theirresearch activities. I believe this book candeliver practical knowledge and contributeto special fields of bioprocesses.
The new chapters added to the secondedition are novel and related to recent topicsin biotechnology. Additional case studiesfrom recent researches are useful and cangive insight to the readers to broaden theirfuture work. Addition of new chapters mayenhance the quality of the work. More dis-cussion on pathway of microorganisms isalso incorporated. Identifying the pathwayof organisms may assist engineers to knowthe growth factors and enzymes related toenhance series of biological reactions toachieve high yield of end products.
BOOK AUDIENCE AND OVERVIEWxiv
Preface
PREFACE TO THE SECONDEDITION
First and foremost, I want to thank theAlmighty for mercy who blessed me andgave me the strength to accomplish thiswork. I would like to thank my colleaguesDr H. Younesi, Dr M. Mohammadi, andDr H. Zare, who have assisted me in drawingsome of the figures. I am also very thankful tomy colleagues who have contributed to someparts of the chapters: Dr A.A. Ghoreyshi,Dr M. Rahimnejad, and Dr M. Jahanshahifrom Babol Noshirvani University ofTechnology and Dr M. Tabatabaei fromAgricultural Biotechnology Research Insti-tute of Iran. Also special thanks go toDr H. Younesi, Dr W.S. Long, Dr M. Esfaha-nian, Mr M.H. Shahavi, Professor A.H.Kamaruddin, Professor S. Bhatia, ProfessorA.R. Mohamed, and Professor A.L. Ahmadfor their valuable contribution to case studies.
I would like to acknowledge my friends inMalaysia: Dr W.S. Long, Professor A.H.Kamaruddin, School of Chemical Engineer-ing, Universiti Sains Malaysia, for thefeedbacks and editing parts of this book.I also wish to acknowledge the followingindividuals who have positively influencedmy professional and educational endeavorsover the years: Professor J.L. Gaddy,Professor Mark Townsend, Professor K.E.Starling, Professor C.M. Sliepcevich,Professor S. Ellaison, and Professor Ed.Clausen. Nor should I forget the person whohas accelerated this work and given lots of
encouragement: Dr. Kostas Marinakis andMs Christine McElvenny at Elsevier.
PREFACE TO THE FIRSTEDITION
In the new millennium, extensive appli-cation of bioprocesses has created an envi-ronment for many engineers to expandtheir knowledge and interest in biotech-nology. Microorganisms produce alcoholsand acetone, which are used in industrialprocesses. Knowledge related to industrialmicrobiology has been revolutionized bythe ability of genetically engineered cellsto make many new products. Genetic engi-neering and gene mounting have beendeveloped for the enhancement of industrialfermentation. Finally, application of bio-chemical engineering in biotechnology hasbecome a new way of making commercialproducts.
This book demonstrates the applicationof biological sciences in engineering withtheoretical and practical aspects. These 20chapters give more understanding of theknowledge related to the specified field, withmore practical approaches and related casestudies with original research data. It is abook for students to follow the sequentiallectures with detailed explanations, and solvethe actual problems in the related chapters.
There are many graphs that present actualexperimental data, and figures and tables,along with sufficient explanations. It is a
xv
good book for those who are interested inmore advanced research in the field ofbiotechnology, and a true guide for begin-ners to practice and establish advancedresearch in this field. The book is specificallytargeted to serve as a useful text for collegeand university students; it is mostly recom-mended for undergraduate courses in one ortwo semesters. It will also prove very usefulfor research institutes and postgraduatesinvolved in practical research in biochemicalengineering and biotechnology.
This book has suitable biological scienceapplications in biochemical engineering andthe knowledge related to those biologicalprocesses. The book is unique, with practicalapproaches in the industrial field. I havetried to prepare a suitable textbook using adirect approach that should be very usefulfor students in following the many casestudies. It is unique in having solved prob-lems, examples and demonstrations ofdetailed experiments, with simple design
equations and required calculations. Severalauthors have contributed to enrich the casestudies.
During the years of my graduate studiesin the United States at the University ofOklahoma and the University of Arkansas,several lectureres and professors from Schoolof Chemical Engineering gave me muchknowledge and assisted me in my academicachievements. I have also had the opportunityto learn many things from different people,in different schools at the University ofOklahoma. I am very thankful for theircourage and guidance. My vision in researchand my success are due to these two greatscholars at the University of Arkansas;supervised my research projects; they arealways remembered.
Ghasem D. NajafpourBiotechnology Research Lab., Faculty of
Chemical Engineering, NoshirvaniUniversity of Technology, Babol, Iran.
PREFACExvi
C H A P T E R
1
Industrial Microbiology
O U T L I N E
1.1 Introduction 1
1.2 Role of Biotechnology 2
1.3 Role of Biosciences 5
1.4 Microbe Functions 5
1.5 Process Fermentation 7
1.6 Application of FermentationProcesses 9
1.7 Bioprocess Products 101.7.1 Biomass 101.7.2 Cell Products 111.7.3 Modified Compounds
(Biotransformation) 11
1.8 Production of Lactic Acid 11
1.9 Production of Vinegar 13
1.10 Production of Amino Acids(Lysine and Glutamic Acid)and Insulin 141.10.1 Stepwise Amino Acid
Production 141.10.2 Insulin 15
1.11 Antibiotics, Production ofPenicillin 15
1.12 Production of Enzymes 16
1.13 Production of Baker’s Yeast 16
References 18
1.1 INTRODUCTION
Microorganisms have been identified and exploited for more than a century. The Babylo-nians and Sumerians used yeast to prepare alcohol. There is a great history beyond fermen-tation processes that explains the applications of microbial processes that resulted in theproduction of food and beverages. In the mid-19th century, Louis Pasteur understood the
1Biochemical Engineering and Biotechnologyhttp://dx.doi.org/10.1016/B978-0-444-63357-6.00001-8 Copyright © 2015 Elsevier B.V. All rights reserved.
role of microorganisms in fermented food, wine, alcohols, beverages, cheese, milk, yogurtand other dairy products, fuels, and fine chemical industries. He identified many microbialprocesses and discovered the first principal role of fermentation, which was that microbesrequire substrate to produce primary and secondary metabolites and end products.
In the new millennium, extensive application of bioprocesses has created an environmentfor many engineers to expand the field of biotechnology. One of the useful applications ofbiotechnology is the use of microorganisms to produce alcohols and acetone, which areused in industrial processes. The knowledge related to industrial microbiology has been revo-lutionized by the ability of genetically engineered cells to make many new products. Geneticengineering and gene mounting have been developed in the enhancement of industrialfermentation. Consequently, biotechnology is a new approach for making commercial prod-ucts using living organisms. Furthermore, knowledge of bioprocesses has been developed todeliver fine-quality products.
The application of biological sciences in industrial processes is known as bioprocess.Today, most biological and pharmaceutical products are produced in well-defined industrialbioprocesses. For instance, bacteria are able to produce most amino acids that can be used infood and medicine. There are hundreds of microbial and fungal products purely available inthe biotechnology market. The microbial production of amino acids can be used to produceL-isomers; chemical production results in both D- and L-isomers. Lysine and glutamic acidare produced by Corynebacterium glutamicum. Another food additive is citric acid, which isproduced by Aspergillus niger. Table 1.1 summarizes several widespread applications of in-dustrial microbiology to deliver a variety of products in applied industries.
The growth of cells on a large scale is called industrial fermentation. Industrial fermenta-tion is normally performed in a bioreactor, which controls aeration, pH, and temperature. Mi-croorganisms use an organic source and produce primary metabolites such as ethanol, whichare formed during the cells’ exponential growth phase. In some bioprocesses, yeast or fungiare used to produce advanced valuable products. Those products are considered as second-ary metabolites, such as penicillin, which is produced during the stationary phase. Yeasts aregrown for wine- and bread-making. There are other microbes such as Rhizobium, Bradyrhi-zobium, and Bacillus thuringiensis that are able to grow and use carbohydrates and organicsources originating from agricultural wastes. Vaccines, antibiotics, and steroids are also prod-ucts of microbial growth.
1.2 ROLE OF BIOTECHNOLOGY
Biotechnology is an interdisciplinary area that governs the application of biology andchemistry in engineering sciences. In fact, it is the knowledge of the exploitation of living mi-croorganisms and their by-products, such as enzymes, secondary metabolites, and any prod-uct from the pathway of living organisms. These biobased products are expanding as safefood additives, medicines, and cosmetics.
In the past decades, the application of biotechnology focused only on animal biotechnologyor plant cell technology and horticulture. But today, the development of biotechnology hasenhanced and moved beyond the borders. The knowledge has expanded in many fields ofengineering as well as in advance biomaterial and nano-biotechnology products.
1. INDUSTRIAL MICROBIOLOGY2
In the mid-19th century, Louis Pasteur well understood the industrial application of micro-organisms to deliver useful products while implementing various bioprocesses. The raw ma-terials were used as substrates and nutrients for microorganisms to draw suitable products.The products were used by humans, and the even rate of productions was at commercialscale. Microorganisms under normal condition produce large number of chemicals, pharma-ceuticals, and food-grade products. Other applications of microorganisms are clearly stated in
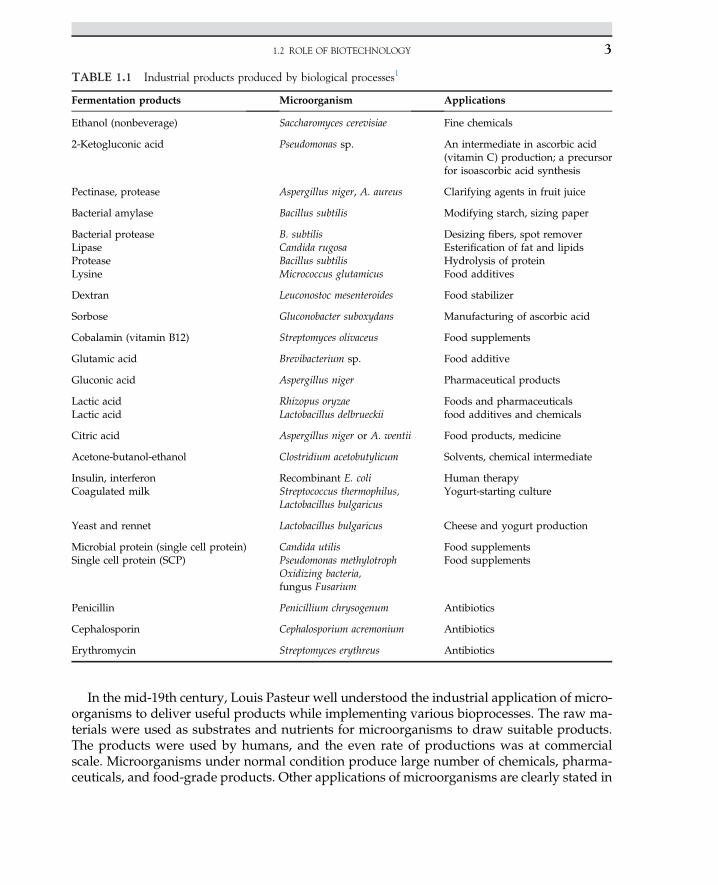
TABLE 1.1 Industrial products produced by biological processes1
Fermentation products Microorganism Applications
Ethanol (nonbeverage) Saccharomyces cerevisiae Fine chemicals
2-Ketogluconic acid Pseudomonas sp. An intermediate in ascorbic acid(vitamin C) production; a precursorfor isoascorbic acid synthesis
Pectinase, protease Aspergillus niger, A. aureus Clarifying agents in fruit juice
Bacterial amylase Bacillus subtilis Modifying starch, sizing paper
Bacterial proteaseLipaseProteaseLysine
B. subtilisCandida rugosaBacillus subtilisMicrococcus glutamicus
Desizing fibers, spot removerEsterification of fat and lipidsHydrolysis of proteinFood additives
Dextran Leuconostoc mesenteroides Food stabilizer
Sorbose Gluconobacter suboxydans Manufacturing of ascorbic acid
Cobalamin (vitamin B12) Streptomyces olivaceus Food supplements
Glutamic acid Brevibacterium sp. Food additive
Gluconic acid Aspergillus niger Pharmaceutical products
Lactic acidLactic acid
Rhizopus oryzaeLactobacillus delbrueckii
Foods and pharmaceuticalsfood additives and chemicals
Citric acid Aspergillus niger or A. wentii Food products, medicine
Acetone-butanol-ethanol Clostridium acetobutylicum Solvents, chemical intermediate
Insulin, interferonCoagulated milk
Recombinant E. coliStreptococcus thermophilus,Lactobacillus bulgaricus
Human therapyYogurt-starting culture
Yeast and rennet Lactobacillus bulgaricus Cheese and yogurt production
Microbial protein (single cell protein)Single cell protein (SCP)
Candida utilisPseudomonas methylotrophOxidizing bacteria,fungus Fusarium
Food supplementsFood supplements
Penicillin Penicillium chrysogenum Antibiotics
Cephalosporin Cephalosporium acremonium Antibiotics
Erythromycin Streptomyces erythreus Antibiotics
1.2 ROLE OF BIOTECHNOLOGY 3
mining and bioleaching. The metals are leached out from low grade ores. In the removal oforganic pollutants, microorganisms are safely used for many treatment processes and biore-mediation. They are able to remove obnoxious pollutants from an aqueous phase. In bio-filters, pollutants are removed from air steams through filter media. Biodegradation ofvolatile organic compounds in a biofilter easily takes place by the consortia of living micro-organisms in the filter bed. Applications of microorganisms are expended in many biologicalprocesses for economical and environmental reasons. In general, the industrial application ofmicrobes can be summarized in a simple reaction:
Raw material;Organic pollutants as substratesþMicrobes
/Biodegraded fine products and byproducts
In most cases, microorganisms are used to convert waste organic material to useful andstable products. The organisms used in the treatment processes are non-pathogens with noside effect on human health. For instance, dairy waste (whey), pulp, and paper wastes areoften used for the propagation of microorganisms.
Industrial fermentations are used in large-scale tanks, often with a capacity of 15e50 m3.From the metabolism of the microorganisms in growth media, the heterogeneous phase ofcell mass exists in a broth of culture, while targeted products are liberated. The desired cellproducts must be recovered in downstream processing via separation and purification ofproducts in aqueous or solid phases for recovery of the product in crystallized or precipi-tated matter, as solid products are easily recovered and removed from downstream. Thecommercial products are cell mass with intercellular products. Enzymes are categorizedas intracellular and extracellular products. The cell products and secondary metabolitescan be used as essential compounds for cell growth. Intermediate metabolites may not beessential as nutrients for cell growth. The biobased products originated from microorgan-isms are used as chemicals and pharmaceutical compounds, such as antibiotics, interferon,hormones, insulin, and steroid drugs. The genetically engineered bacteria or gene-mountedcells are able to produce strictly the targeted product for the treatment and drug purposes.Mass production of food supplements is performed via bacteria, yeast, fungi, and algae. Thecheap raw materials are used for the production of food supplements that are commerciallyviable in large-scale production. The production of amino acids is a practical example;among amino acids, glutamic and folic acids are fermented from dairy waste. Beverage in-dustries are the oldest large-scale production plants to produce nonalcoholic and alcoholicdrinks. Also, bacteria are used for the production of vaccines and antigens. The annotatedcell bodies are used as an antigen for the generation of the antibody for the immunizationof patients and to protect them from diseases. One of the commercial applications of indus-trial microorganisms is for oil spillage clean up and removal of coastal pollutants. The or-ganisms having high tolerance to hydrocarbons and aromatics can degrade and usehydrocarbon sources, while inorganic nitrogen sources are balanced for maximum cellgrowth. Industrial applications of microorganisms with the designated product are summa-rized in Table 1.1. The most biobased products are lactic acid and amino acids such as lysineand glutamic acids. The detailed descriptions of each product are discussed in differentchapters and in related bioprocesses.
1. INDUSTRIAL MICROBIOLOGY4
Various types of carbon sources, such as corn syrup, potato starch, molasses, and whey,are often used for the production of lactic acid. If starch is used, then the natural polymermust be hydrolyzed to monomeric sugar via enzymatic hydrolysis. The monosaccharidesliberated from hydrolysis are used for the fermentation process.
1.3 ROLE OF BIOSCIENCES
In past centuries, the boundary of the knowledge of applied sciences was expanded,whichresulted in an evolution of interdisciplinary areas like biobased majors that have assisted en-gineering sciences to develop the more extended field of applied sciences. In the 1960s, engi-neers never thought of getting involved in microorganisms in processes. Expansion of processdeals with biological knowledge and fundamental biological sciences; in most treatment pro-cesses, microbes and bacteria are involved. The use of enzymes in biobased refineries for theproduction of biofuels and pharmaceutical products created an advance technology for lifeimprovements. The idea of the replacement of fossil fuel with clean fuel such as biohydrogenhas been discussed in recently published articles. The combustion of hydrogen never gener-ates any air pollution. Even for desulfurization of natural gas, the process does not requirechemical solvents for sorption processes because sulfur gases are used by microbes and sulfuris removed from the natural gas stream. In traditional chemical engineering, even simple unitoperation and mass transfer were sufficient to derive the process, while modern process en-gineers cannot live without the biological knowledge and application of microorganisms intheir daily routine life. Therefore, the identification, isolation, propagation, and mass cultiva-tion of potent organisms are required for many processes. Living organisms most often act asbiocatalysts in many biochemical and biological processes. In fact, microorganisms play a ma-jor role. Today, the expansion of biological research developed molecular biology. In thisfield, metabolic engineering and genetic engineering serve to broaden engineers’ knowledgefor a breakthrough in production level and process yield enhancement. For instance, applica-tions of recombinant organisms in the fields of medicine and pharmaceutical sciences are suc-cessful cases of biosciences. In addition, knowledge of microbiology for degradation of toxicorganic compounds and pesticides by microbial strains in an anaerobic process has created anenvironment for bioconversion of organic chemicals to methane and carbon dioxide to beused as energy sources. If microbiology is divided into basic and application sciences, thenone can directly use applied microbiology in the field of bioprocesses. On the other hand, en-zymes and hormones or intermediate cell metabolites as products of living organisms areused in many bioprocesses.
1.4 MICROBE FUNCTIONS
Microbes are defined as creatures that cannot be observed by naked eyes. Theirmorphology is easily seen under microscopes. Microorganisms are categorized as bacteria,fungi, algae, and protozoa. Also, a virus is identified as a living organism that may causeinfection. Microorganisms are classified based on their morphology, physiology, structure
1.4 MICROBE FUNCTIONS 5
of cell wall, cell divisions, and propagation of cells. The impact of microorganisms on humanlife may be categorized as useful, nonpathogens, and pathogens. The nonpathogens class oforganisms may live in a friendly environment without causing any disease, while pathogenscause infection. The nonpathogen class of organisms is used in human food and beverages.This class of organisms is used for the production of hormones, interferon, enzymes, andmany pharmaceutical products. These organisms are often used in many industrial processesfor the production of food, fuels, and fine chemicals. A single organism is able to live inde-pendently and perform in a network; the organisms may act in an organ for a specific func-tion. The manifestation of life may come through evolution, as each organ carries out specifictasks to function and operate in a living system.
Microorganisms based on morphology and structure for the beginners are quite similar, allhaving cell walls to protect the cell materials. The cytoplasm of a cell is enclosed by the cellwall; even cell components inside the cell may be identified or unidentified. All cells are ableto function perfectly as life is expected from a living organism.
The term cell was introduced in past centuries. Cells are surrounded by boundaries thatare known as the cell wall. The wall protects the cell content, also known as cytoplasm,and the cell organs inside the cell. The organ may be formed by the unification of numberof cells; most often this looks like honey bees’ cell structure with defined cell walls, as amass of cells are unanimously gathered to act for specific function.
Cells are living organisms; they are unique, and all cell components are identified. Thecolloidal material inside the cell is known as cytoplasm encapsulated by the cell wall. Thecell components inside the cell can be clearly observed by electronic microscope. Cells arereplicated in a suitable environment, and nutrients are essential for cell growth. The cellwall is permeable to nutrients inside the media; the cell duplicates in a defined time, whichis an indicator of growth known as doubling time.
Microorganisms having biological activities require nutrient sources such as carbon, nitro-gen, and phosphate. Most of the organisms must obtain energy from carbon sources. Some ofthe organisms are able to use nitrogen from air and fix nitrogen as nitrate or generate aminoacids for the synthesis of protein. They are able to produce complex nitrogenous compounds.Some other organisms use inorganic and organic nitrogen for protein synthesis.
Microorganisms are able to use a number of carbon sources with a wide metabolic reac-tion. They are adapt to many sources of nutrients. The use of inexpensive nutrients maycreate an opportunity for microbes to convert waste to useful products. Especially in indus-trial waste, organic sources are available that easily can be converted to the desired productin the presence or absence of oxygen via fermentation.
An organism can have commercial products listed in four categories:
1. Single cells2. Large molecules, such as enzymes3. Primary metabolites4. Secondary metabolites.
The primary and secondary metabolites in a bioprocess can be estimated based on pro-jected pathways for the production of intracellular and extracellular by-products.
Four classes of organisms are used in industrial processes. They are yeasts, molds, singlebacteria, and actinomycetes (fungi). Yeast and molds are well developed in industrial
1. INDUSTRIAL MICROBIOLOGY6
processes. Mold and actinomycetes have a filamentous shape growing in a branched system.They are not like individual cells. Yeasts compared with single cells are much bigger, whilethey are observed in single individual cells. Fungi show up in a filamentous shape known ashyphae. For instance, Candida utilis is a type of fungus having industrial applications, such assingle cell protein. Molds are certainly known for their antibacterial activities. This group,including Aspergillus oryzae and A. niger and genera of Penicillum, are well known. The strictanaerobes and prokaryote cell, Streptomycetes, are the most filamentous fungi-producing an-tibiotics. The organisms are eukaryote like fungi and plant cells. The distinct point ofeukaryote cells is the nucleus, the cell surrounded by the membrane. All organs in the cellare identified under electronic microscope. They have more than one chromosome withdefined mitochondria. The mitochondria of the cell are responsible for cell energy, and allchemical reactions are carried out in this center. In contrast, organisms without a distinct nu-cleus are known as prokaryote cells. Bacteria and microbes are prokaryote; the cells are singleisolated units, much smaller than a eukaryote cell. The sizes of eukaryote cells are most prob-ably 10 times bigger than prokaryotes. In a prokaryotic cell, the nucleus materials are spreadout inside the cell, and cell organs are not identified. Among anaerobic prokaryote cells, theClostridium species may produce toxin like botulism synthesized by C. botulinum and C. buter-icum; they are notorious living organisms that cause serious health problems for human be-ings. In the fermentation of an organic substrate, the pathways of organisms are alwaysquestionable. Organisms in terms of product delivery are known as homofermentative andheterofermentative. The homofermentative organism delivers one significant or principalproduct, while heterofermentative organisms may generate two or more products throughthe pathway of organisms. For example, yeasts are able to ferment 6-carbon sugar, eitherglucose or fructose, to 2 mol of ethanol and 2 mol of carbon dioxide. The pathway of the or-ganism can be influenced by the composition of the media. If yeast refused to produce alcoholdue to the acidic pH of the media, then the microbial pathway will shift to lactic acid produc-tion. If the fermentation media is contaminated with any Lactobacillus species, then glucose isconverted to lactic acid. In fact, the heterofermentative culture is able to convert glucose toseveral products, such as lactic acid, ethanol, and carbon dioxide, through an alternative mi-crobial pathway. Clostridium acetobutylicum is a heterofermentative that can produce two ma-jor products. This organism is able to use glucose and produce a mixture of acetone, ethanol,isopropanol, and butanol. The culture is aerobic; a certain fraction of substrate is used andconverted to a metabolite, then the remaining fraction is converted to a beneficial cell biomassor protein. However, in full oxidation with an excess amount of oxygen, all substrates areoxidized to carbon dioxide and water through a pathway known as glucolysis. The fact isthe aerobic process not only ends in carbon dioxide and water, but also delivers significantmolecules as an energy carrier that are used for synthesis of biomolecules.
1.5 PROCESS FERMENTATION
The term “fermentation” was obtained from the Latin verb fervere, which describes theaction of yeast or malt on sugar or fruit extracts and grains. The “boiling” observed duringfermentation is due to the production of carbon dioxide bubbles from the aqueous phaseunder the anaerobic catabolism of carbohydrates in the fermentation medium. The art of
1.5 PROCESS FERMENTATION 7
fermentation is defined as the chemical transformation of organic compounds with the aidof enzymes. The ability of yeast to make alcohol was known to the Babylonians and Sume-rians before 6000 BC. The Egyptians discovered the generation of carbon dioxide bybrewer’s yeast in the preparation of bread. The degradation of carbohydrates by microor-ganisms is followed by the glycolytic or EmbdeneMeyerhofeParnas pathway.2,3 Therefore,the overall biochemical reaction mechanisms to extract energy and form products underanaerobic conditions are called fermentation processes. In the process of ethanol produc-tion, carbohydrates are reduced to pyruvate with the aid of nicotinamide adenine dinucle-otide; ethanol is the end product. Other fermentation processes include the cultivation ofacetic acid bacteria for the production of vinegar. Lactic acid bacteria preserve milk; theproducts are yogurt and cheese. Various bacteria and molds are involved in the productionof cheese. Louis Pasteur, who is known as the father of the fermentation process, in theearly 19th century defined fermentation as life without air. He proved that existing micro-bial life came from preexisting life. There was a strong belief that fermentation was strictlya biochemical reaction. Pasteur disproved the chemical hypothesis. In 1876, he had beencalled by the distillers of Lille in Great Britain to investigate why the content of theirfermentation product turned sour.4 Pasteur found microbial contamination of the yeastbroth under his microscope. He discovered organic acid formation, such as lactic acidbefore ethanol fermentation. His greatest contribution was to establish different types offermentation by specific microorganisms, enabling work on pure cultures to obtain pureproduct. In other words, fermentation is known as a process with the existence of strictlyanaerobic life; that is, life in the absence of oxygen. The process is summarized in thefollowing steps:
• Action of yeast on extracts of fruit juice or malted grain: The biochemical reactions arerelated to generation of energy by catabolism of organic compounds.
• Biomass or mass of living matter (living cells) in a liquid solution with essential nutri-ents at suitable temperature and pH grows up: As a result, the content of biomassincreases with time.
In World War I, Germany was desperate to manufacture explosives and needed glycerolfor this. They had identified glycerol in alcohol fermentation. Carl Neuberg discovered thatthe addition of sodium bisulphate to the fermentation broth favored glycerol production atthe expense of ethanol. Germany quickly developed industrial-scale fermentation, with aproduction capacity of about 35 tons per day.4 In Great Britain, acetone was in great de-mand; it was obtained by anaerobic fermentation of acetoneebutanol-ethanol usingC. acetobutylicum.
In large-scale fermentation production, contamination of pure culture with other organ-isms and bacteriophage or virus is the major problem. Microorganisms are capable of per-forming a wide range of metabolic reactions using various sources of nutrients. Thatmakes the fermentation processes suitable for industrial applications with inexpensive nutri-ents. Molasses, corn syrup, waste products from the crystallization of sugar industries, andthe wet milling of corn are valuable broths for the production of antibiotics and fine chemi-cals. We will discuss many industrial fermentation processes in the coming Chapter. First, wewill focus on the fundamental concepts of biochemical engineering rather than theapplications.
1. INDUSTRIAL MICROBIOLOGY8
There are various industries using biological processes to produce new products, such asantibiotics, chemicals, alcohols, lipid, fatty acids, and proteins. Deep understanding of thebioprocess may require actual knowledge of biology and microbiology in the applicationsof the above processes. It is very interesting to demonstrate bench-scale experiments andmake use of large-scale advanced technology. However, the application of the bioprocessin a large-scale and the control of microorganisms in 100,000 l of media may not be quiteso simple to manage. Therefore, trained engineers are essential and in high demand; thiscan be achieved by knowledge enhancement in the sheathe bioprocesses. To achieve such ob-jectives, we may need to explain the whole process to the skilled labor and trained staff toimplement bioprocess knowhow in biotechnology.
1.6 APPLICATION OF FERMENTATION PROCESSES
Man has been using the fermentative abilities of microorganisms in various forms formany centuries. Yeasts were first used to make bread; later, their use expanded to thefermentation of dairy products to make cheese and yogurt. Today, more than 200 typesof fermented food products are available in the market. There are several active biologicalprocesses in the industry producing high-quality products, such as various antibiotics, glu-tamic acid, citric acid, acetic acid, and butyric and propionic acids. Synthesis of proteins andamino acids, lipids and fatty acids, simple sugar and polysaccharides such as xanthan gumand glycerol, and many more fine chemicals and alcohols is carried out through bio-processes with suitable industrial applications. The knowledge of bioprocess is an integra-tion of biochemistry, microbiology, and engineering science applied in industrialtechnology. Application of viable microorganisms and cultured tissue cells in an industrialprocess to produce specific products is known as bioprocess. Thus, fermentation productsand the ability to cultivate large amounts of organisms are the focus of bioprocess, andsuch achievements may be obtained using vessels known as fermenters or bioreactors.The cultivation of large amounts of organisms in fermenters and bioreactors with relatedfermentation products is the major focus of bioprocess.
A bioreactor is a vessel in which an organism is cultivated and grown in a controlledmanner to form the by-product. In some cases, special organisms are cultivated to producevery specific products such as antibiotics. The laboratory scale of a bioreactor is in the rangeof 2e100 l, but in commercial processes or in a large-scale operation, this might be up to100 m3.5,6 Initially, the term “fermenter” was used to describe these vessels, but in strictterms, fermentation is an anaerobic process, whereas the major proportion of fermentersuse aerobic conditions. The term “bioreactor” has been introduced to describe a fermentationvessel for growing the microorganisms under aerobic or anaerobic conditions.
Bioprocess plants are an essential part of the food, fine chemical, and pharmaceutical in-dustries. Use of microorganisms to transform biological materials to fermented foods, cheese,and chemicals has its antiquity. Bioprocesses have been developed for an enormous range ofcommercial products, as listed in Table 1.1. Most of the products originate from relativelycheap raw materials. The production of industrial alcohols and organic solvents mostly orig-inates from cheap feed stocks. The more expensive and special bioprocesses are in the pro-duction of antibiotics, monoclonal antibodies, and vaccines. Industrial enzymes and living
1.6 APPLICATION OF FERMENTATION PROCESSES 9
cells such as baker’s yeast and brewer’s yeast are also commercial products obtained frombioprocess plants.
1.7 BIOPROCESS PRODUCTS
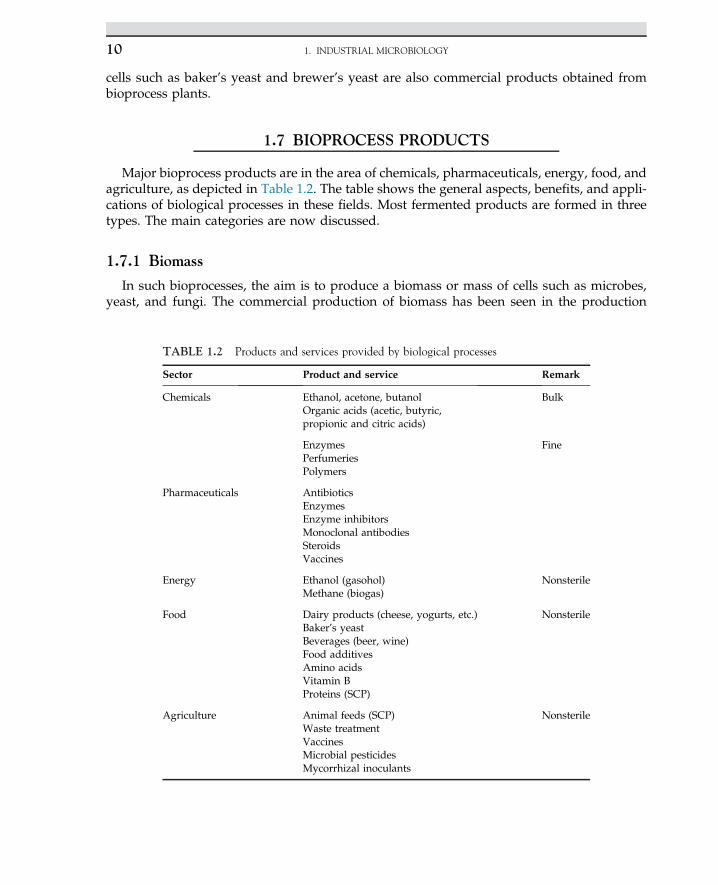
Major bioprocess products are in the area of chemicals, pharmaceuticals, energy, food, andagriculture, as depicted in Table 1.2. The table shows the general aspects, benefits, and appli-cations of biological processes in these fields. Most fermented products are formed in threetypes. The main categories are now discussed.
1.7.1 Biomass
In such bioprocesses, the aim is to produce a biomass or mass of cells such as microbes,yeast, and fungi. The commercial production of biomass has been seen in the production
TABLE 1.2 Products and services provided by biological processes
Sector Product and service Remark
Chemicals Ethanol, acetone, butanolOrganic acids (acetic, butyric,propionic and citric acids)
Bulk
EnzymesPerfumeriesPolymers
Fine
Pharmaceuticals AntibioticsEnzymesEnzyme inhibitorsMonoclonal antibodiesSteroidsVaccines
Energy Ethanol (gasohol)Methane (biogas)
Nonsterile
Food Dairy products (cheese, yogurts, etc.)Baker’s yeastBeverages (beer, wine)Food additivesAmino acidsVitamin BProteins (SCP)
Nonsterile
Agriculture Animal feeds (SCP)Waste treatmentVaccinesMicrobial pesticidesMycorrhizal inoculants
Nonsterile
1. INDUSTRIAL MICROBIOLOGY10
of baker’s yeast, which is used in the baking industry. Single cell protein (SCP) is produced asa biomass enriched in protein.7 An algae called Spirulina has been used for animal food insome countries. SCP is used as a food source produced from renewable resources such aswhey, cellulose, starch, molasses, and a wide range of plant waste.
1.7.2 Cell Products
Products are produced by cells with the aid of enzymes and metabolites known as cellproducts. These products are categorized as either extracellular or intracellular. Enzymesare one of the major cell products used in industry. Enzymes are extracted from plantsand animals. Microbial enzymes can be also produced in large quantities by conventionaltechniques. Enzyme productivity can be improved by mutation, selection, and perhaps ge-netic manipulation. The use of enzymes in industry is very extensive, especially in baking,cereal-making, coffee, candy, chocolate, corn syrup, and dairy products as well as the fruitjuice and beverage industry. The most common enzymes used in the food industries areamylase in baking; protease and amylase in beef products; pectinase and hemicellulase inthe coffee industry; catalase, lactase, and protease in dairy products; and glucose oxidasein the fruit juice industry.
1.7.3 Modified Compounds (Biotransformation)
Almost all types of cells can be used to convert an added compound into another com-pound, involving many forms of enzymatic reaction including dehydration, oxidation, hy-droxylation, amination, isomerization, etc. These types of conversion have advantages overchemical processes in that the reaction can be very specific and performed at moderate tem-peratures. Examples of transformations using enzymes include the production of steroids, theconversion of antibiotics, and prostaglandins. Industrial transformation requires the produc-tion of large quantities of an enzyme; the half-life of enzymes can be improved by immobi-lization, and extraction can be simplified by the use of whole cells. In any bioprocess, thebioreactor is not an isolated unit, but is a part of an integrated process with upstream anddownstream components. The upstream consists of storage tanks, growth, and media prep-aration followed by sterilization. Also, seed culture for inoculation requires upstream pro-cessing, with sterilized raw material, mainly sugar and nutrients, required for thebioreactor to operate. Sterilization of the bioreactor can be done by steam at 15 pounds persquare inch gauge at 121 �C or using any disinfectant chemical reagent such as ethylene ox-ide. The downstream processing involves extraction of the product and purification asnormal chemical units of operation.8 The solids are separated from the liquid, and the solu-tion and supernatant from the separation unit may go for further purification after the prod-uct has been concentrated.
1.8 PRODUCTION OF LACTIC ACID
Lactic acid was produced from sour milk. It is believed that Louis Pasteur was the firstscientist who identified fermentation of sour milk to lactic acid. The bioconversion was
1.8 PRODUCTION OF LACTIC ACID 11
found through homolactic fermentation; as a result, maltose is converted to lactate. Lacticacid is known as an acidulent, a flavoring agent for food preservation, and in the dairy in-dustry it is used as feedstock for production of polylactatic acid, which is known as a biode-gradable polymer. Lactic acid is also used for the preservation of vegetables such as carrotsand radishes. The world annual demand for lactic acid is approximated to be 150,000(metric) tons. The lactic acid production via fermentation is mostly carried out by the Lacto-bacillus species, which is a stereoisomer of L(þ) and D(�), or a mixture of racemic DL lacticacid. The separation process for a specific isomer is expensive and tedious. More than 100species of Lactobacillus are identified as potential organisms for the production of lactic acid.The most popular species of lactic acid producers are Lactobacillus bulgaricus, Lactobacillusplantarum, Lactobacillus brevis, Lactobacillus helveticus, Lactobacillus delbrueckii, Lactobacilluscasei, Lactobacillus paracasei, and Lactobacillus manihotivorans. Generally, Lactobacillus arehomofermentative and can produce a high concentration of lactic acid, while heterofermen-tatives may convert 50% of substrate to lactic acid. Several carbohydrates, such as corn andpotato starch, molasses, and whey, can be used to produce lactic acid. Starch must first behydrolyzed to glucose by enzymatic hydrolysis; then fermentation is performed in the sec-ond stage. The choice of carbohydrate material depends on its availability, and pretreat-ment is required before fermentation. We shall describe the bioprocess for the productionof lactic acid from whey. Inexpensive raw material for the production of lactic acid is rec-ommended. It is customary to convert a significant proportion of cheese whey to lacticacid. Fermentation of lactic acid in suspended growth is more favorable than solid statefermentation (SSF). It is believed that fungi are more suitable for SSF, while the use of Lacto-bacillus species in suspended growth and submerged culture is more favorable for thefermentation process.
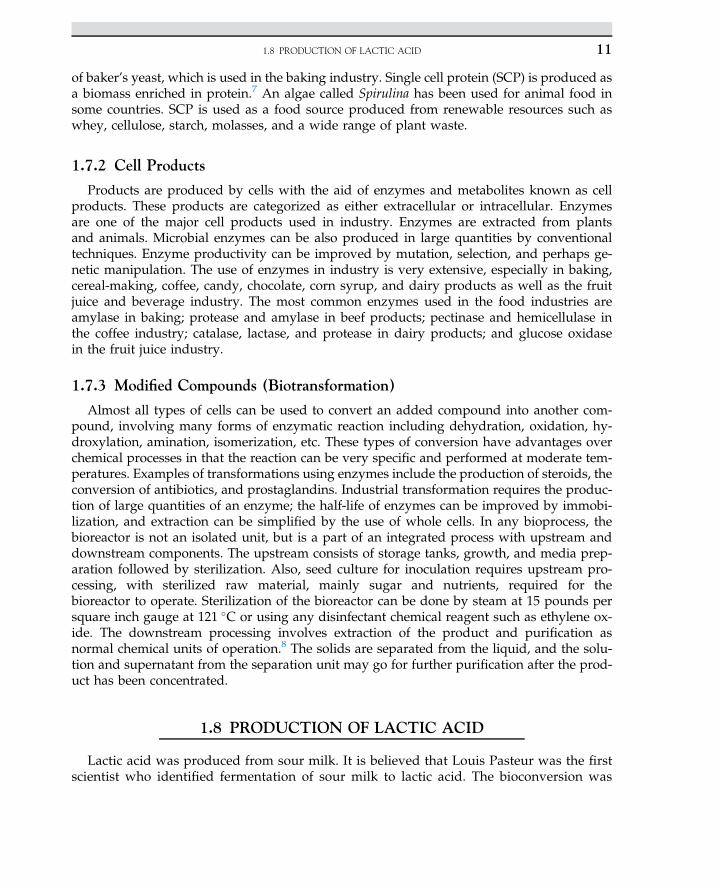
Large quantities of whey constitute a waste product in the manufacturing process of dairyproducts such as cheese. From the standpoint of environmental pollution, it is considered amajor problem, and the disposal of untreated wastes may create environmental disasters. It isdesirable to use whey to make some useful product. Whey can be converted from being awaste product to something more desirable that can be used for the growth of certain bacteriabecause it contains lactose, nitrogenous substances, vitamins, and salts. Organisms can uselactose and grow on cheese wastes; the most suitable of them are Lactobacillus species suchas L. bulgaricus, which is the most suitable species for whey. This organism grows rapidly,is homofermentative, and thus is capable of converting lactose to the single end-product oflactic acid. Stock cultures of the organism are maintained in a skimmed milk medium. A threeto five volume% of inoculum is prepared and transferred to the main bioreactor, and the cul-ture is stored in pasteurized, skimmed milk at an incubation temperature of 43 �C. Duringfermentation, pH is controlled by the addition of a slurry of lime to neutralize the productto prevent any product inhibition. The accumulation of lactic acid would retard the fermen-tation process because of the formation of calcium lactate. After two days of complete incu-bation, the material is boiled to coagulate the protein and then filtered. The solid filter cake isa useful, enriched protein product that may be used as an animal feed supplement. Thefiltrate containing calcium lactate is then concentrated by removing water under vacuum, fol-lowed by purification of the final product. The flow diagram for this process is shown inFigure 1.1.
1. INDUSTRIAL MICROBIOLOGY12
1.9 PRODUCTION OF VINEGAR
The sugars in fruits such as grapes are fermentedbyyeasts to producewines. Inwine-making,lactic acid bacteria convert malic acid into lactic acid in malolactic fermentation in fruits withhigh acidity. Acetobacter and Gluconobacter oxidize ethanol in wine to acetic acid (vinegar).
The word “wine” is derived from the French term vinaigre meaning “sour wine.” It is pre-pared by allowing a wine to get sour under controlled conditions. The production of vinegarinvolves two steps of biochemical changes:
1. Alcoholic fermentation in fermentation of a carbohydrate2. Oxidation of the alcohol to acetic acid.
There are several kinds of vinegar. The differences between them are primarily associatedwith the kind of material used in the alcoholic fermentation, e.g., fruit juices, sugar, and hy-drolyzed starchy materials. Based on US Department of Agriculture definitions, there are afew types of vinegar, namely vinegar, cider vinegar, and apple vinegar. The products aremade by the alcoholic and subsequent acetous fermentations of the apple juice. The aceticacid content is about 5%. Yeast fermentation is used for the production of alcohol. The alcoholis adjusted to 10e13%, then it is exposed to acetic acid bacteria (Acetobacter species), by meansof which oxygen is required for the oxidation of alcohol to acetic acid. The desired tempera-ture for Acetobacter is 15e34 �C. The reaction is:
C6H12O6 ��������!Zymomonas mobilis2CH3CH2OHþ 2CO2 (1.9.1)
2CH3CH2OHþ 2O2 �������!Acetobacter sp:2CH3COOHþ 2H2O (1.9.2)
The oxidation of ethanol to acetic acid for the production of vinegar is not a fully oxidativeprocess, but the aerobic organism is able to convert glucose to gluconic acid via incompleteoxidation. The derived adenosine triphosphate from limited oxidation is growth associated;finally, with the aid of supplementary nutrients in the media, the organisms are able to com-plete the biochemical reaction to acetic acid production.
FIGURE 1.1 Production of lactic acid from whey.
1.9 PRODUCTION OF VINEGAR 13
1.10 PRODUCTION OF AMINO ACIDS(LYSINE AND GLUTAMIC ACID) AND INSULIN
Many microorganisms can synthesize amino acids from inorganic nitrogen compounds.The rate and amount of some amino acid production may exceed the cells’ need for proteinsynthesis, in which the excess amino acids are excreted into the media. Some microorganismsare capable of producing certain amino acids such as lysine, glutamic acid, and tryptophan.The primary metabolites are used by specific organism to synthesize next components. Someaerobic organism like C. glutamicum can produce lysine. The mutants of C. glutamicum areable to produce a high concentration of lysine; the appreciable concentration may reach to50 gl�1. Lysine is one of the 20 essential amino acids for synthesis of protein molecule. Thelow molecular weights of cell products as primary metabolites are essential for the cellgrowth. Another group of microbial products known as secondary metabolites are notdirectly involved in the synthesis of biomolecules like antibiotics. Secondary metabolitesare also produced by certain microorganisms; they are not fast-growing organisms, as theprecious byproducts appear at a late stage of the growth cycle. The primary metabolitesare involved in biosynthesis of the cell, while the secondary metabolites are mostly consid-ered useful biological products that are easily marketable and have numerous applications.The secondary metabolites may contribute certain action as anti-survival of organisms. Thedetailed action of secondary metabolites can be inhibitory competitors in the growth system.The organisms go through rapid growth in the initial stage; when further growth is halted bythe depletion of essential nutrients in the medium, then organisms enter the next phase. Thesecondary metabolites are often used for control and survival; therefore, they are more bene-ficially used for drug and pharmaceutical products.
1.10.1 Stepwise Amino Acid Production
Lysine is an essential amino acid for the nutrition of humans that is used as a supplemen-tary food with bread and other foodstuffs. This amino acid is a biological product that is alsoused as a food additive and cereal protein. One of the commercial methods for production oflysine consists of a two-stage process using two species of bacteria as follows:
• Step 1: Formation of diaminopimelic acid (DAP) by E. coli• Step 2: Decarboxylation of DAP by Enterobacter aerogenes.
The carbon sources for production of amino acids are corn, potato starch, molasses, andwhey. If starch is used, it must be hydrolyzed to glucose to achieve higher yield. Escherichiacoli is grown in a medium consisting of glycerol, corn steep liquor, and diammonium phos-phate under aerobic conditions with controlled temperature and pH for an incubation periodof three days.
Many species of microorganisms, especially bacteria and fungi are capable of producinglarge amounts of glutamic acid. Glutamic acid is produced by microbial metabolites ofMicrococcus, Arthrobacter, and Brevibacterium through the Krebs cycle. Monosodium gluta-mate is known as a flavor-enhancing amino acid in food industries. The medium generallyused for its production consists of a carbohydrate, peptone, inorganic salts, and biotin.
1. INDUSTRIAL MICROBIOLOGY14
The concentration of biotin has a significant influence on the yield of glutamic acid. The a-ketoglutaric acid is an intermediate in the tricarboxylic acid cycle or the Krebs cycle and isthe precursor of glutamic acid. The conversion of a-ketoglutaric acid to glutamic acid isaccomplished in the presence of glutamic acid dehydrogenase (GDH), ammonia, and nico-tinamide adenine dinucleotide phosphate (NADPH) as follows2,9:
a� ketoglutaric acidþNADPH�!GDH
L�GlutamateþNADPþ þH2O (1.10.1.1)
The living cells assimilate nitrogen by incorporating it into a-ketoglutaric acid, then to glu-tamic acid and glutamine.
1.10.2 Insulin
In the human body, one-third of glucose from dietary sources is converted to glycogen inthe liver. About half the carbohydrates from dietary sources are converted to glycogen inmuscle tissues. The remaining carbohydrates are immediately oxidized for body energy re-quirements. Both glucose uptake and glycogen synthesis are stimulated by a peptide hor-mone produced in the pancreas known as insulin, which is the most important hormoneto regulate carbohydrate and fat metabolism in the human body. The hormone stimulatesglycogen breakdown and release of glucose from the liver. In fact, insulin acts reciprocallywhen blood sugar is high to respond and regulate blood glucose, ensuring that blood sugarconcentration is at a relatively constant and safe level (110 mg dl�1). The extra glucose is poly-merized may be stored in the liver and muscles as glycogen.
Insulin is one of the important pharmaceutical products produced commercially by genet-ically engineered bacteria. Before this development, commercial insulin was isolated from an-imal pancreatic tissue. Microbial insulin has been available since 1982. The human insulingene is introduced into a bacterium like E. coli. Two major advantages of insulin productionby microorganisms are that the resultant insulin is chemically identical to human insulin andit can be produced in unlimited quantities.
1.11 ANTIBIOTICS, PRODUCTION OF PENICILLIN
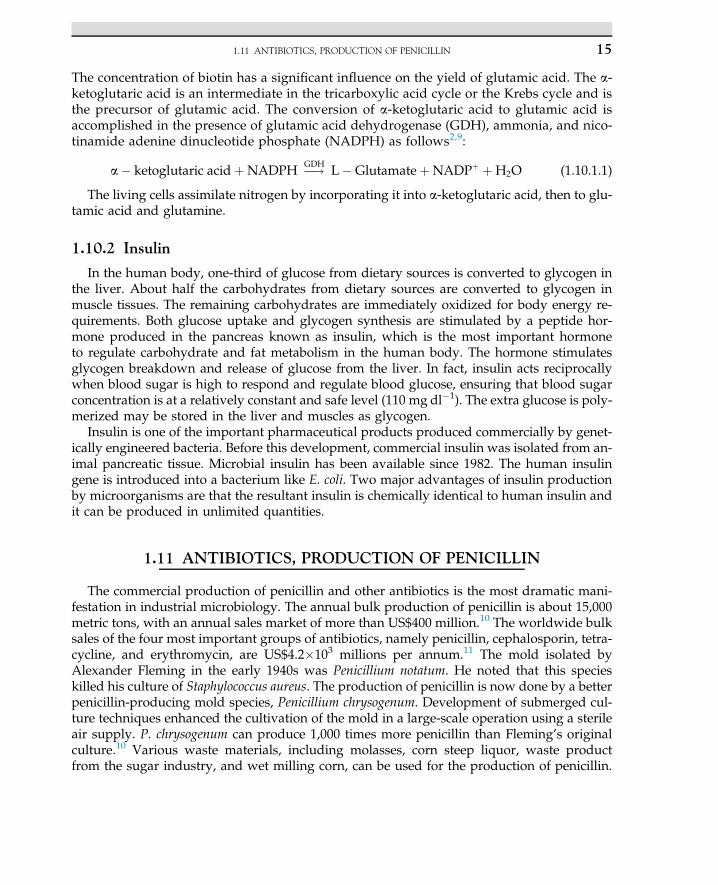
The commercial production of penicillin and other antibiotics is the most dramatic mani-festation in industrial microbiology. The annual bulk production of penicillin is about 15,000metric tons, with an annual sales market of more than US$400 million.10 The worldwide bulksales of the four most important groups of antibiotics, namely penicillin, cephalosporin, tetra-cycline, and erythromycin, are US$4.2�103 millions per annum.11 The mold isolated byAlexander Fleming in the early 1940s was Penicillium notatum. He noted that this specieskilled his culture of Staphylococcus aureus. The production of penicillin is now done by a betterpenicillin-producing mold species, Penicillium chrysogenum. Development of submerged cul-ture techniques enhanced the cultivation of the mold in a large-scale operation using a sterileair supply. P. chrysogenum can produce 1,000 times more penicillin than Fleming’s originalculture.10 Various waste materials, including molasses, corn steep liquor, waste productfrom the sugar industry, and wet milling corn, can be used for the production of penicillin.
1.11 ANTIBIOTICS, PRODUCTION OF PENICILLIN 15
Streptomycin is commonly produced by Actinomycetes. The major steps in the commercialproduction of penicillin are:
1. Preparation of inoculum2. Preparation and sterilization of the medium3. Inoculation of the medium in the fermenter4. Forced aeration with sterile air during incubation5. Removal of mold mycelium after fermentation6. Extraction and purification of the penicillin.
1.12 PRODUCTION OF ENZYMES
Many molds synthesize and excrete large quantities of enzymes into the surrounding me-dium. Enzymes are proteins; they are denatured by heat and extracted or precipitated bychemical solvents like ethanol and by inorganic salts like ammonium sulfate.12 Coenzymesare also proteins combined with low molecular mass organics like vitamin B. It is industriallyapplicable and economically feasible to produce, concentrate, extract, and purify enzymesfrom cultures of molds such as Aspergillus, Penicillium, Mucor, and Rhizopus. Mold enzymessuch as amylase, invertase, protease, and pectinase are useful in the processing or refiningof a variety of materials. Amylases hydrolyze starch to dextrin and sugars. They are usedin preparing sizes and adhesives, desizing textiles, clarifying fruit juices, manufacturing phar-maceuticals, and other purposes. Invertase hydrolyzes sucrose to form glucose and fructose(invert sugars). It is widely used in candy-making and the production of noncrystallizablesyrup from sucrose, which is partly hydrolyzed by this enzyme. The proteolytic enzymessuch as protease are used for bating in leather processing to obtain a fine texture. Proteaseis also used in the manufacturing of liquid glue, degumming of silks, and clarification ofbeer protein. It is used in laundry detergents and as an adjunct to soaps. Pectinase is usedin the clarification of fruit juice and to hydrolyze pectins in the retting of flax for themanufacturing of linen. Apoenzyme is the protein portion of enzyme that is inactive. The re-action between low molecular mass coenzymes and apoenzyme gives active holoenzyme:
Apoenzymeþ Coenzyme/Holoenzyme ðactiveÞ (1.12.1)
1.13 PRODUCTION OF BAKER’S YEAST
The use of yeast as a leavening agent in baking dates back to the early histories of theEgyptians, Greeks, and Romans. In those days, leavened bread was made by mixing someleftover dough from the previous batch of bread with fresh dough. In modern baking,pure cultures of selected strains of Saccharomyces cerevisiae are mixed with bread dough tobring about desired changes in the texture and flavor of bread. Characteristics of S. cerevisiaestrains are selected for commercial production of baker’s yeast. These strains have the abilityto ferment sugar in the dough vigorously and rapidly. The selected strains must be stable and
1. INDUSTRIAL MICROBIOLOGY16
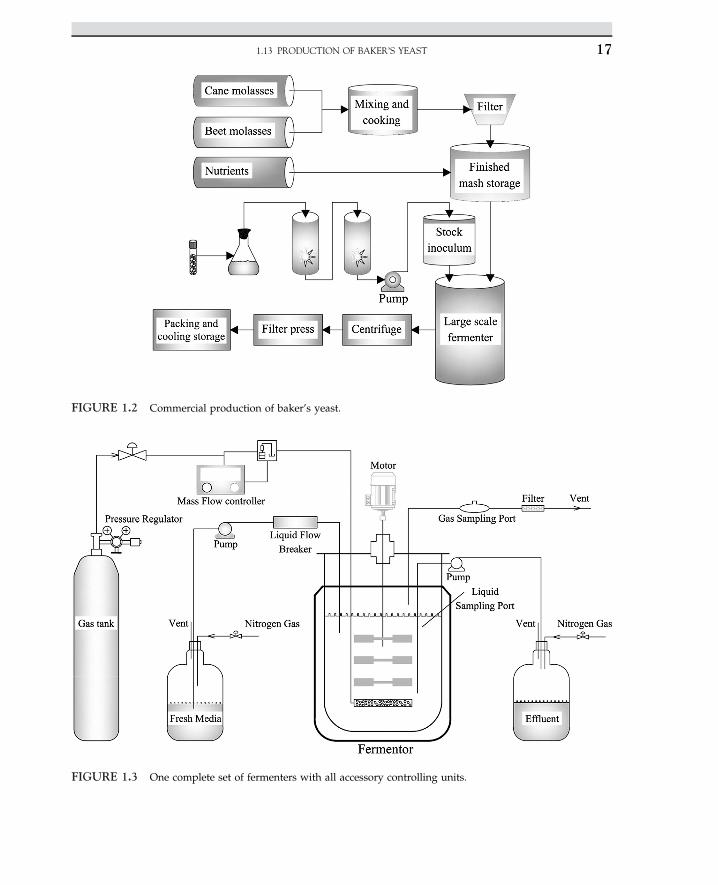
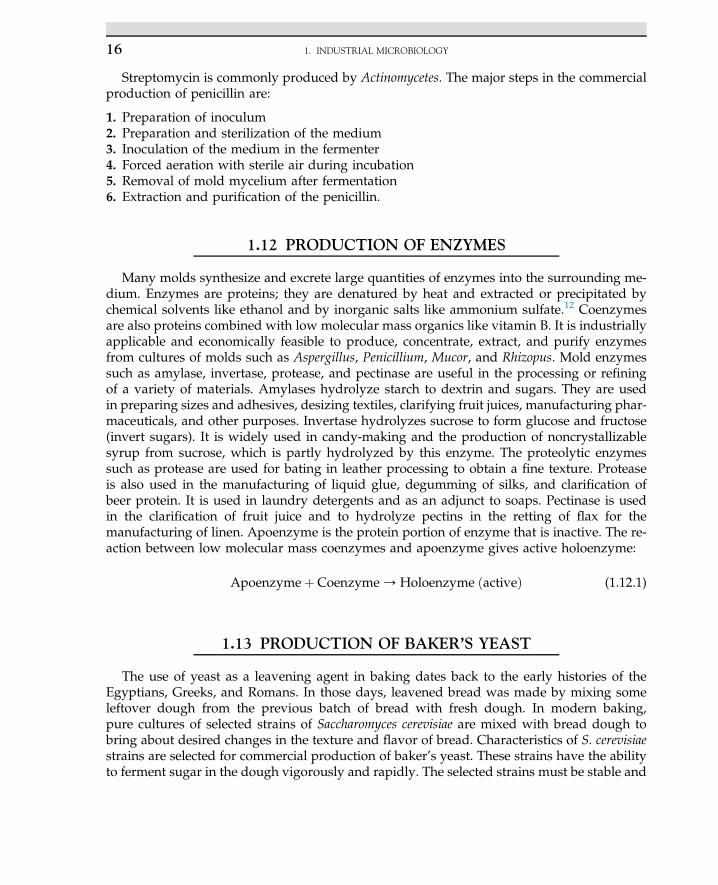
FIGURE 1.2 Commercial production of baker’s yeast.
FIGURE 1.3 One complete set of fermenters with all accessory controlling units.
1.13 PRODUCTION OF BAKER’S YEAST 17
produce carbon dioxide, which results from the fermentation process for leavening or risingthe dough. The quality of bread depends on the selected strain of yeast, the incubation period,and the choice of raw materials. Sugars in bread dough are fermented by yeast to ethanol andCO2, and the CO2 causes the bread to rise.
In the manufacturing of baker’s yeast, the stock strain is inoculated into a medium contain-ing molasses and corn steep liquor. The pH of the medium is adjusted to be slightly acidic atpH 4e5. The acidic pH may retard the bacterial growth. The inoculated medium is aeratedduring the incubation period. At the end, the cells are harvested by centrifuging out thefermentation broth and recovered by filter press. A small amount of vegetable oil is addedto act as a plasticizer, and then the cell mass is molded into blocks. The process is shownin Figure 1.2.
A full set of bioreactor with pH and temperature controllers are shown in Figure 1.3. Thecomplete set of fermenters with all accessory controlling units creates a good opportunity toprovide suitable production of biochemical products with variation of process parameters.Pumping fresh nutrients and operating in batch, fed batch, and continuous mode are easyand suitable for producing fine chemicals, amino acids, and even antibiotics.
References1. Phaff HJ. Sci Am 1981;245:77.2. Baily JE, Ollis DF. Biochemical engineering fundamentals. 2nd ed. New York: McGraw-Hill; 1986.3. Aiba S, Humphrey AE, Millis NF. Biochemical engineering. 2nd ed. New York: Academic Press; 1973.4. Demain AL, Solomon AN. Sci Am 1981;245:67.5. Ghose TK. Bioprocess computation in biotechnology. Ellis Horwood Limited Series in biochemistry and biotechnology,vol. 1. New York: Ellis Horwood Limited; 1990.
6. Scragg AH. Bioreactors in biotechnology:a practical approach. Ellis Horwood Limited Series in biochemistry and biotech-nology. New York: Ellis Horwood Limited; 1991.
7. Bradford MM. J Anal Biochem 1976;72:248.8. Doran PM. Bioprocess engineering principles. New York: Academic Press; 1995.9. Shuler ML, Kargi F. Bioprocess engineering: basic concepts. New Jersey: Prentice-Hall; 1992.10. Pelczar MJ, Chan ECS, Krieg NR. Microbiology. New York: McGraw-Hill; 1986.11. Aharonowitz Y, Cohen G. Sci Am 1981;245:141.12. Thomas LC, Chamberlin GJ. Colorimetric chemical analytical methods. Salisbury (United Kingdom): Tintometer Ltd;
1980.
1. INDUSTRIAL MICROBIOLOGY18
C H A P T E R
2
Enzyme Technology
O U T L I N E
2.1 Introduction 20
2.2 Enzyme Elementary ReactionRate 21
2.3 Enzyme Classifications 28
2.4 Enzymes Specific Function 30
2.5 Enzymes Act as Catalysts 30
2.6 Inhibitors of Enzyme-CatalyzedReactions 31
2.7 Industrial Application ofEnzymes 33
2.8 Coenzymes 35
2.9 Effect of pH on EnzymeActivities 37
2.10 Enzyme Unit Activities 37
2.11 Enzyme Deactivation 37
Nomenclature 38
2.12 Solve Problems 39
References 40
2.13 Case Study: Solid-StateFermentation of SugarcaneBagasse in a Tray Bioreactorfor Production of Lipase UsingRhizopus oryzae 41
2.13.1 Introduction 41
2.13.2 Material and Methods 422.13.2.1 Bioreactor Setup 432.14.2.2 Solid-State Fermentation
and Sample Preparation 43
2.13.3 Results and Discussion 44
References 49
19Biochemical Engineering and Biotechnologyhttp://dx.doi.org/10.1016/B978-0-444-63357-6.00002-X Copyright © 2015 Elsevier B.V. All rights reserved.
S U B C H A P T E R
2.1Introduction
An enzyme is a protein or an organic compound that is similar to a protein and has cat-alytic activities. An enzyme acts very specifically with a specified functional group thatacts as an active site. An enzyme [E] interacts with substrate [S] and as a result, an enzymeesubstrate complex [ES] as an intermediate compound is formed. The initiation reactions arereversible, and equilibrium is reached. Then, the intermediate compound goes through irre-versible reaction to yield a product and a free enzyme. The liberated enzyme searches for asubstrate to form an [ES]. The defined reaction mechanism proceeds until substrates are con-verted to products. In fact, presence of the enzyme in the reaction media is to accelerate thereaction rate. The concept of reaction as energy involved is similar to the mechanism of cat-alytic reaction.1
Most enzymes are named according to the reaction involved. Generally, all enzymescarry the name of the reaction with a suffix as “ase,” for instance, an amylolytic enzymethat reacts with amylose is named amylase; that means the enzyme that hydrolyzesamylose is named amylase. Also, the organic configuration is similar to carbohydratesthat are specified for the enzyme as well. Another example is the enzyme that catalyzesthe decomposition of urea is named as urease. The enzyme that reacts with tyrosine isknown as tyrosinase. The name of enzyme interacting with a substrate like uric acid isuricase.
The enzymatic reactions may take place in homogeneous or heterogeneous phases. It de-pends on the enzyme and substrate phases or conditions. In general, three cases may occur. Ifenzyme is soluble and the substrate is in the liquid phase, which is called the homogeneousphase, the enzyme and substrate interact in a single liquid phase. In this case, both enzymeand substrate are soluble in an aqueous phase. In the case of solid-state fermentation (SSF), asolid substrate like rice bran or soya beans uses a specific culture, say Aspergillus niger, live inliquefied nutrients. The solid substrate should contain desired moisture, and the SSF processsuccessfully delivers the enzyme. This process is known as heterogeneous, as more than onephase exists.
For the production of enzymes, a number of bioreactors are involved. Tray bioreactorsare often employed for SSF. The leachates from solid media are collected for recovery ofan enzyme. In this case, enzymes are available in an aqueous phase while substratesremain in the solid phase. In the heterogeneous case, either enzyme or substrates are insolid or liquid phases. In the case of SSF, the organisms utilize a substrate to generatebiomass and an enzyme. The enzyme may be involved in further enzymatic reaction.The enzyme or organisms must penetrate into a solid substrate for the liquefaction of
2. ENZYME TECHNOLOGY20
the solid, and as a result of washing, solid products are isolated. In SSF, the liberated en-zymes are washed off the solid bed, while cell biomass is washed off along with the liber-ated enzyme.
Whereas, the third case may be the inverse of the second case, as substrate is available inthe liquid phase while an enzyme is insoluble or in solid phase (insoluble enzyme plus sol-uble substrate). An example of a type II reaction is the use of amylase, lipase, and protease inlaundry detergents. The soluble enzymes interact with the insoluble substrate attached to thesurface of cloth, and as a result, the product is soluble. For the type III enzymatic reaction, theenzyme is insoluble; the enzyme is immobilized on a solid support and then packed in a col-umn. The soluble substrate has to pass through the bed of enzymes. Most often, the secondtype of soluble substrates are preferred. For the simple case, both enzyme and substrate are inan aqueous phase.
2.2 ENZYME ELEMENTARY REACTION RATE
Let us define the substrate [S] to be urea, (NH2)2CO, and the suitable enzyme [E] for hy-drolysis of urea would be urease. The product is defined as [P], CO2 and NH3. The mecha-nism of the reaction for the enzyme-substrate complex is written as follows:
½E� þ ½S�#k1k�1
½ES� (2.2.1)
Urease þ ðNH2Þ2CO#k1
k�1
Urease� ðNH2Þ2CO (2.2.2)
In the next step, as the intermediate compound is hydrolyzed, urease is released; theproduct would be ammonia and carbon dioxide. The reaction is irreversible, expressedas follows:
½ES� þH2O/ks ½E� þ ½P� (2.2.3)
Urease � ðNH2Þ2COþH2O/UreaseþNH3 þ CO2 (2.2.4)
The rate of utilization of substrate �rS is stated as follows:
�rS ¼ k1½E�½S� � k�1½ES� (2.2.5)
At equilibrium for constant intermediate concentration, the rate of change of intermediatewith respect to time reached to zero is stated as:
rE$S ¼ 0 ¼ k1½E�½S� � k�1½ES� � ks½H2O�½ES� (2.2.6)
The rate of hydrolysis of the intermediate complex is:
rp ¼ ks�ES
��H2O
�(2.2.7)
2.2 ENZYME ELEMENTARY REACTION RATE 21
Based on equilibrium, one can calculate the intermediate [ES] according to followingrelation:
½ES� ¼ k1½E�½S�k�1 þ ks½H2O� (2.2.8)
Where part of the initial enzyme concentration is active and the remaining is attached tothe substrate as an intermediate complex [Eo] ¼ [E] þ [ES], one can define the free enzymepart as [E] ¼ [Eo] � [ES]; now we can substitute the free enzyme [E] in the above equation,which results in the following relation:
k1ð½Eo� � ½ES�Þ½S� ¼ ½ES�ðk�1 þ ks½H2O�Þ (2.2.9)
Rearrange Eqn (2.2.6), then solve for [ES]:
½ES� ¼ k1½Eo�½S�k�1 þ ks½H2O� þ k1½S� (2.2.10)
In the course of hydrolysis, the concentration of water compared to enzyme and substrateis in excess; therefore, once can assume a new constant k0 ¼ ks[H2O]. Then, substitute the con-stant into Eqn 2.2.10, which yields:
�rs ¼ k0k1½Eo�½S�k�1 þ k0 þ k1½S� (2.2.11)
Let us define a constant known as MichaeliseMenten constant KM ¼ k1 þ k0 and k0k1[Eo] asmaximum specific rate:
Vmax ¼ k0k1½Eo� (2.2.12)
Finally, Eqn 2.2.11 simplifies and reduces to a well-known equation called the MichaeliseMenten rate equation, stated as follows:
V ¼ VmaxSKM þ S
(2.2.13)
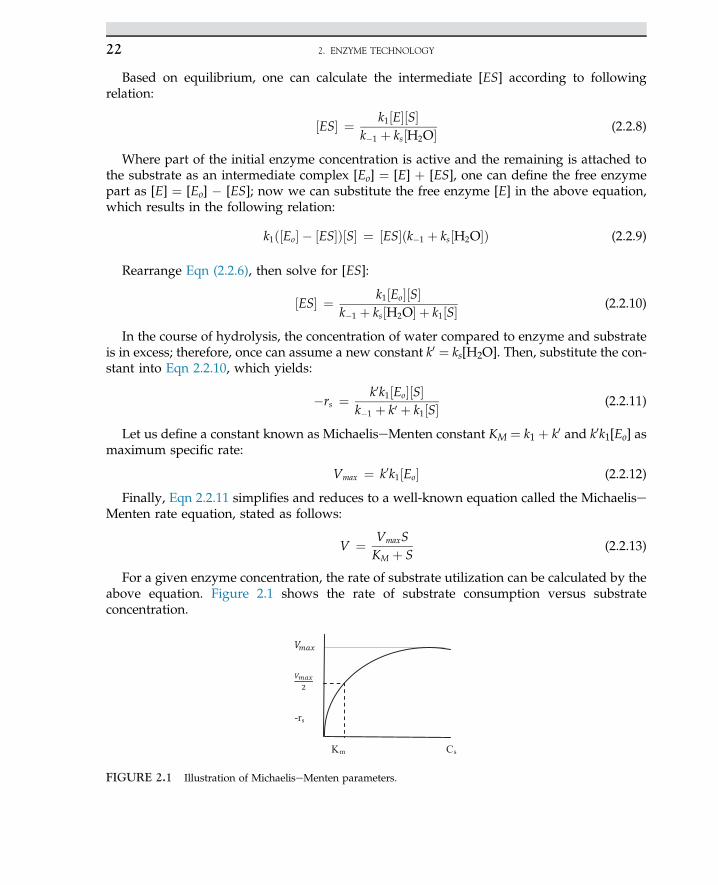
For a given enzyme concentration, the rate of substrate utilization can be calculated by theabove equation. Figure 2.1 shows the rate of substrate consumption versus substrateconcentration.
-rs
Km Cs
FIGURE 2.1 Illustration of MichaeliseMenten parameters.
2. ENZYME TECHNOLOGY22
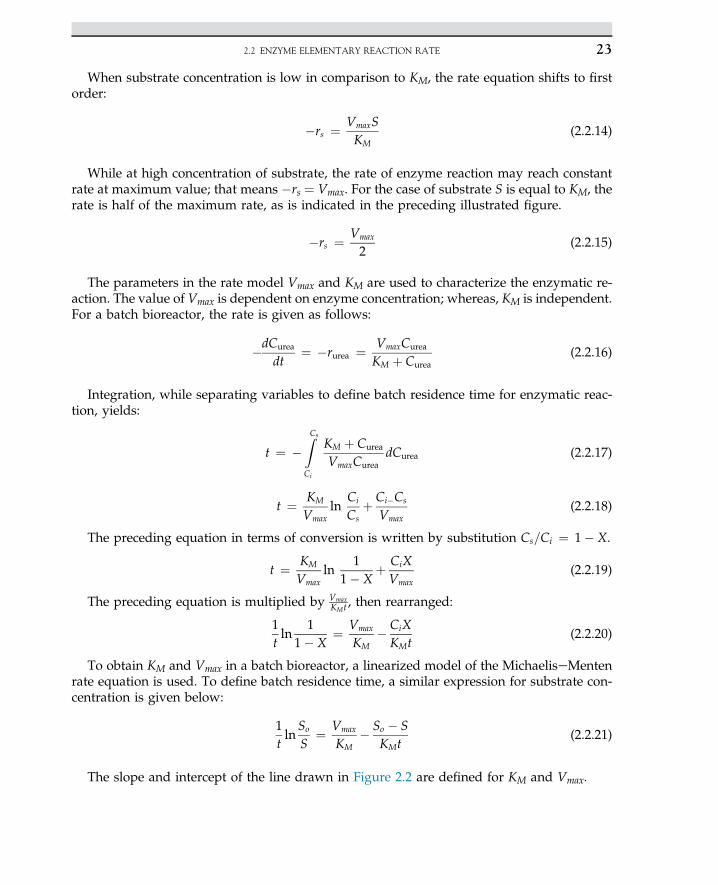
When substrate concentration is low in comparison to KM, the rate equation shifts to firstorder:
�rs ¼ VmaxSKM
(2.2.14)
While at high concentration of substrate, the rate of enzyme reaction may reach constantrate at maximum value; that means �rs ¼ Vmax. For the case of substrate S is equal to KM, therate is half of the maximum rate, as is indicated in the preceding illustrated figure.
�rs ¼ Vmax
2(2.2.15)
The parameters in the rate model Vmax and KM are used to characterize the enzymatic re-action. The value of Vmax is dependent on enzyme concentration; whereas, KM is independent.For a batch bioreactor, the rate is given as follows:
�dCurea
dt¼ �rurea ¼ VmaxCurea
KM þ Curea(2.2.16)
Integration, while separating variables to define batch residence time for enzymatic reac-tion, yields:
t ¼ �ZCs
Ci
KM þ Curea
VmaxCureadCurea (2.2.17)
t ¼ KM
Vmaxln
Ci
Csþ Ci�Cs
Vmax(2.2.18)
The preceding equation in terms of conversion is written by substitution Cs=Ci ¼ 1� X.
t ¼ KM
Vmaxln
11� X
þ CiXVmax
(2.2.19)
The preceding equation is multiplied by VmaxKMt , then rearranged:
1tln
11� X
¼ Vmax
KM� CiXKMt
(2.2.20)
To obtain KM and Vmax in a batch bioreactor, a linearized model of the MichaeliseMentenrate equation is used. To define batch residence time, a similar expression for substrate con-centration is given below:
1tln
So
S¼ Vmax
KM� So � S
KMt(2.2.21)
The slope and intercept of the line drawn in Figure 2.2 are defined for KM and Vmax.
2.2 ENZYME ELEMENTARY REACTION RATE 23
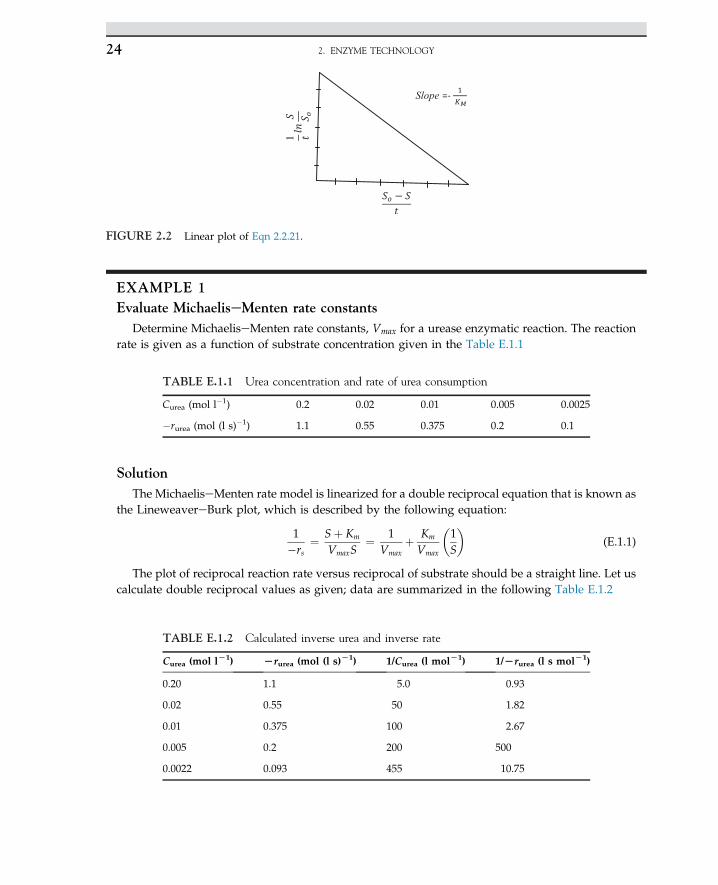
EXAMPLE 1Evaluate MichaeliseMenten rate constants
Determine MichaeliseMenten rate constants, Vmax for a urease enzymatic reaction. The reactionrate is given as a function of substrate concentration given in the Table E.1.1
SolutionThe MichaeliseMenten rate model is linearized for a double reciprocal equation that is known as
the LineweavereBurk plot, which is described by the following equation:
1�rs
¼ Sþ Km
VmaxS¼ 1
Vmaxþ Km
Vmax
�1S
�(E.1.1)
The plot of reciprocal reaction rate versus reciprocal of substrate should be a straight line. Let uscalculate double reciprocal values as given; data are summarized in the following Table E.1.2
Slope =-
1
FIGURE 2.2 Linear plot of Eqn 2.2.21.
TABLE E.1.1 Urea concentration and rate of urea consumption
Curea (mol l�1) 0.2 0.02 0.01 0.005 0.0025
�rurea (mol (l s)�1) 1.1 0.55 0.375 0.2 0.1
TABLE E.1.2 Calculated inverse urea and inverse rate
Curea (mol lL1) Lrurea (mol (l s)L1) 1/Curea (l molL1) 1/Lrurea (l s molL1)
0.20 1.1 5.0 0.93
0.02 0.55 50 1.82
0.01 0.375 100 2.67
0.005 0.2 200 500
0.0022 0.093 455 10.75
2. ENZYME TECHNOLOGY24
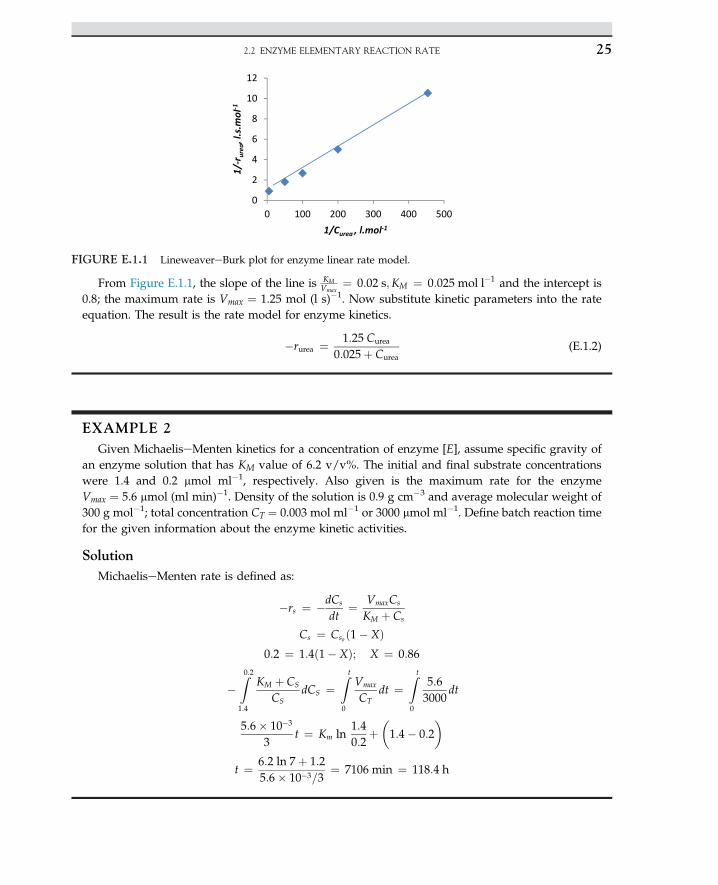
From Figure E.1.1, the slope of the line is KMVmax
¼ 0:02 s;KM ¼ 0:025 mol l�1 and the intercept is0.8; the maximum rate is Vmax ¼ 1.25 mol (l s)�1. Now substitute kinetic parameters into the rateequation. The result is the rate model for enzyme kinetics.
�rurea ¼ 1:25 Curea
0:025þ Curea(E.1.2)
EXAMPLE 2Given MichaeliseMenten kinetics for a concentration of enzyme [E], assume specific gravity of
an enzyme solution that has KM value of 6.2 v/v%. The initial and final substrate concentrationswere 1.4 and 0.2 mmol ml�1, respectively. Also given is the maximum rate for the enzymeVmax ¼ 5.6 mmol (ml min)�1. Density of the solution is 0.9 g cm�3 and average molecular weight of300 g mol�1; total concentration CT ¼ 0.003 mol ml�1 or 3000 mmol ml�1. Define batch reaction timefor the given information about the enzyme kinetic activities.
SolutionMichaeliseMenten rate is defined as:
�rs ¼ �dCs
dt¼ VmaxCs
KM þ Cs
Cs ¼ Cso ð1� XÞ0:2 ¼ 1:4ð1� XÞ; X ¼ 0:86
�Z0:2
1:4
KM þ CS
CSdCS ¼
Z t
0
Vmax
CTdt ¼
Z t
0
5:63000
dt
5:6� 10�3
3t ¼ Km ln
1:40:2
þ�1:4� 0:2
�
t ¼ 6:2 ln 7þ 1:25:6� 10�3=3
¼ 7106 min ¼ 118:4 h
0
2
4
6
8
10
12
0 100 200 300 400 500
1/-r
urea
, l.s
.mol
-11/Curea , l.mol-1
FIGURE E.1.1 LineweavereBurk plot for enzyme linear rate model.
2.2 ENZYME ELEMENTARY REACTION RATE 25
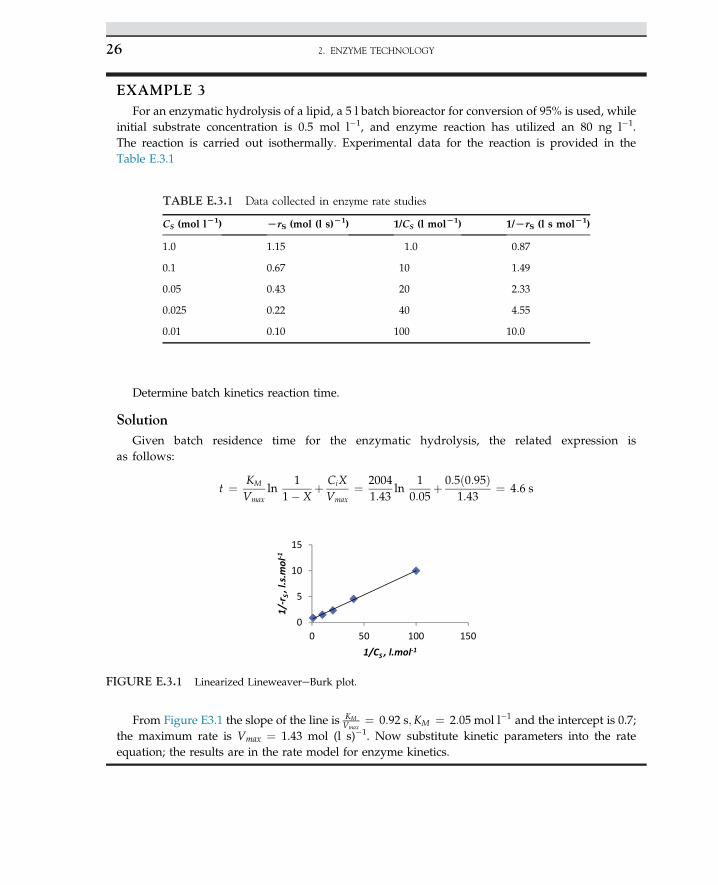
EXAMPLE 3For an enzymatic hydrolysis of a lipid, a 5 l batch bioreactor for conversion of 95% is used, while
initial substrate concentration is 0.5 mol l�1, and enzyme reaction has utilized an 80 ng l�1.The reaction is carried out isothermally. Experimental data for the reaction is provided in theTable E.3.1
Determine batch kinetics reaction time.
SolutionGiven batch residence time for the enzymatic hydrolysis, the related expression is
as follows:
t ¼ KM
Vmaxln
11� X
þ CiXVmax
¼ 20041:43
ln1
0:05þ 0:5ð0:95Þ
1:43¼ 4:6 s
From Figure E3.1 the slope of the line is KMVmax
¼ 0:92 s;KM ¼ 2:05 mol l�1 and the intercept is 0.7;the maximum rate is Vmax ¼ 1.43 mol (l s)�1. Now substitute kinetic parameters into the rateequation; the results are in the rate model for enzyme kinetics.
TABLE E.3.1 Data collected in enzyme rate studies
CS (mol lL1) LrS (mol (l s)L1) 1/CS (l molL1) 1/LrS (l s molL1)
1.0 1.15 1.0 0.87
0.1 0.67 10 1.49
0.05 0.43 20 2.33
0.025 0.22 40 4.55
0.01 0.10 100 10.0
0
5
10
15
0 50 100 150
1/-r
S , l
.s.m
ol-1
1/CS , l.mol-1
FIGURE E.3.1 Linearized LineweavereBurk plot.
2. ENZYME TECHNOLOGY26
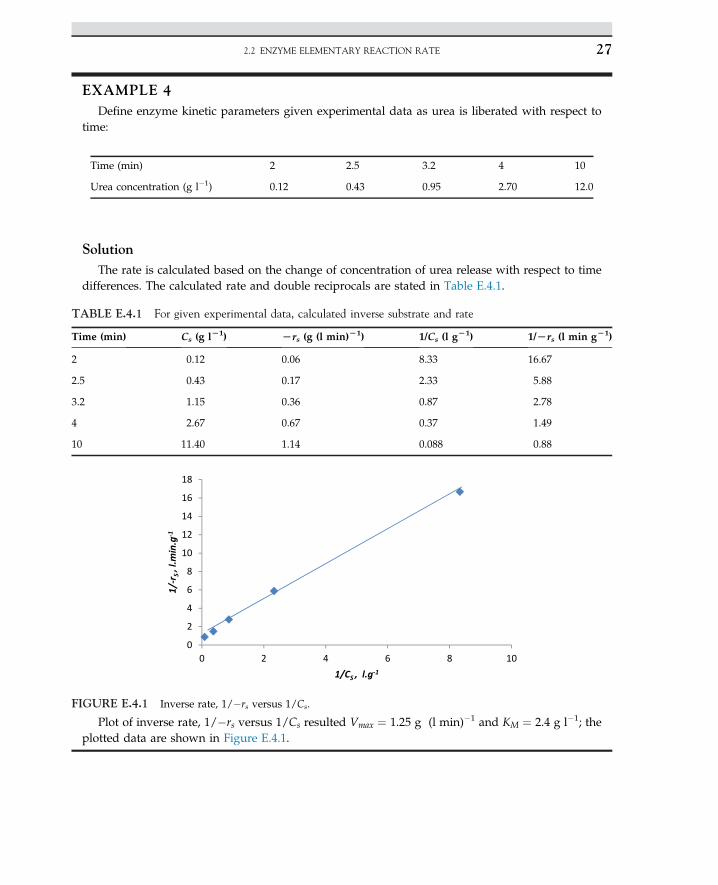
EXAMPLE 4Define enzyme kinetic parameters given experimental data as urea is liberated with respect to
time:
SolutionThe rate is calculated based on the change of concentration of urea release with respect to time
differences. The calculated rate and double reciprocals are stated in Table E.4.1.
Plot of inverse rate, 1/�rs versus 1/Cs resulted Vmax ¼ 1.25 g (l min)�1 and KM ¼ 2.4 g l�1; theplotted data are shown in Figure E.4.1.
Time (min) 2 2.5 3.2 4 10
Urea concentration (g l�1) 0.12 0.43 0.95 2.70 12.0
TABLE E.4.1 For given experimental data, calculated inverse substrate and rate
Time (min) Cs (g lL1) Lrs (g (l min)L1) 1/Cs (l gL1) 1/Lrs (l min gL1)
2 0.12 0.06 8.33 16.67
2.5 0.43 0.17 2.33 5.88
3.2 1.15 0.36 0.87 2.78
4 2.67 0.67 0.37 1.49
10 11.40 1.14 0.088 0.88
0
2
4
6
8
10
12
14
16
18
0 2 4 6 8 10
1/-r
S , l
.min
.g-1
1/CS , l.g-1
FIGURE E.4.1 Inverse rate, 1/�rs versus 1/Cs.
2.2 ENZYME ELEMENTARY REACTION RATE 27
The energy stored in the protein as biomolecules is known as the activation energy; it mayassist as the biochemical reaction proceeds. In a living system, an enzyme functions in a spe-cific temperature and pH. Enzymes have remarkable properties; as enzyme are catalyzed andspeed up the reaction rate, the rate may increase by a magnitude of one million. Enzymes, incontrast to inorganic catalyst, act in a very specific manner and often function for a very se-lective, exact reaction. In pharmaceutical applications, enzymes are used to activate a specificmedicine by shifting a functional group of a medicine. Because the actions of enzymes arehighly selective, side reactions or side products are rarely produced. Enzymes are knownas very precise catalysts that conserve energy in biochemical reactions. The free energyinvolved for enzymatic reaction is much lower than noncatalytic reaction.
Enzymes are known for being very unique, and they have active sites for interacting withan exact functional group coupled with a substrate. That is why enzymes work like a lockand key model. Several amino acids are involved in participation of the active site and cata-lytic activities. As a result, energy is transferred to the enzymeesubstrate complex; that en-ergy can lower the energy formation of the product, and then products are released. Thatmeans the energy required for the reaction transferred by the enzyme enhances the productto be released. The catalytic activity of an enzyme depends on an interaction between theactive site amino acids and the substrate. It may be possible in some other enzyme nonproteincomponents to be responsible for their catalytic activities. For instance, enzyme cofactors areacting ions in enzymes; these ions are like Fe2þ, Zn2þ, Mg2þ, Mn2þ or a complex of organicsknown as coenzymes. If a protein component of the enzyme is lacking an essential cofactor, itis known as “apoenzyme.” Once an enzyme is bounded to cofactors, it is called holoenzyme.2
The rate of an enzyme acting as a catalyst can be regulated in a desired environment. Theenzyme activities may be enhanced by activators or promoters, and also, the activities can bereduced by enzyme inhibitors. This means the activity of an enzyme can be regulated by co-factors and bonds to any ions for extra charges. For example, hexokinase is an enzyme thatcan catalyze the adenine triphosphate in the phosphorylation of carbohydrates known as hex-ose, a six-carbon sugar. The enzyme will bind to D-glucose, not to L-hexose. This is a specificaction of the enzyme on a specified carbohydrate. The prefixes D- and L- for carbohydrates arerelated to shifting polarized sugar isomers. In fact, photons of light can move the isomerstructure of D-glucose carbohydrates as the molecule can shift the polarized light to the rightand L-hexose shifts the light to the left, like a-L-fucose (6-deoxy-L-galactose).1
2.3 ENZYME CLASSIFICATIONS
Enzymes are classified based on their specific function. In biological processes and livingsystems, certainly a huge number of biochemical reactions occur under enzymatic activities.3
These enzymes are categorized based on the reaction and specific function, product forma-tion, or substrate consumption. There are six groups of enzymes identified based on enzymeactivities and enzyme-specific special function:
1. Oxidation and reduction enzymes: These enzymes are involved in oxidation and reduc-tion and are often called oxidoreductase. The common conversion of oxidases, reductases,and hydrogenases is ketones/keto-acids to chiral alcohols. For instance, in the oxidationof ethanol, the alcohol is converted to aldehydes, while nicotinamide adenine
2. ENZYME TECHNOLOGY28
dinucleotide (NADþ) is reduced to nicotinamide adenine dinucleotide hydrogenase(NADH). The reaction in living systems requires an enzyme to oxidize ethanol whileNADþ is reduced.
CH3CH2OHþNADþ#CH3CHO þNADHþHþ (2.3.1)
The enzymatic reaction catalyzed by lactate dehydrogenase can be stated as follows:
PyruvateþNADHþHþ/lactate þNADþ (2.3.2)
Aspartate ammonia lyase (aspartase) can convert aspartic acid to fumaric acid; the re-action is stated as follows:
Aspartate/Fumarate þNH3 (2.3.3)
2. Enzymes involved in transfer reactions: The second group of enzymes is known as“transferase.” This group of enzymes transfers a functional group from one molecule toanother one. For example, in an enzyme known as “phosphatase,” the phosphate groupis moved from adenosine triphosphate (ATP) to an other compound.
3. Hydrolase enzymes: These enzymes are able to hydrolyze a polysaccharide to a monomericsugar. In fact, the purpose of a hydrolase enzyme is to catalyze the reaction of a watermolecule with a polymer. For example, amylose is reacted with amylase in the presence ofwater, and as a result, glucose is liberated. Another example is a reaction of phosphatasebreaking a phosphate group to liberate phosphoric acid while alcohol is formed.
ReOeH2PO3 þH2O/ReOHþH3PO4 (2.3.4)
The enzymes act as digestive function while breaking the peptide bond in proteins.The most common hydrolytic enzyme, for instance reaction, of water with cellulose fi-ber, monomeric sugar is formed.
4. Enzymes for the removal or formation of a double bond: The formation or removal of adouble bond with a group transfer occurres by an enzyme having the suffix of “lyase,”which includes the amino group, water, and ammonia. For example, an enzyme knowas decarboxylase is able to remove CO2 from alpha- or beta-ketoacids:
�CO2eCH]CHeCO�2 þ2OH�4CO�
2 eCHOHeCHOHeCO�2 2.3.5
Such a type of enzyme is able to remove double bonds to deliver a saturated organicstructure. Another example is the removal of the ammonia group from an amino acid.In this case, serine is converted to pyruvate:
CH2OHeCHNHþ3 eCO2/CH3eCOeCO�
2 þNH3 (2.3.6)
5. Isomerization of functional groups: This group of enzymes is able to catalyze chemicalstructure as the position of functional group is shifting, while the molecule contains thesame number of atoms; the only changes occur on the configuration of the molecule assome functional groups are displaced. Such changes are called isomerization. Forexample, the enzyme known as phosphate isomerase is able to shift the aldehyde group
2.3 ENZYME CLASSIFICATIONS 29
(eCHO) to ketone from (eCOe). The reaction of isomerization in glyceraldehyde-3-phosphate is shown next:
CHOeCHOHeCH2eOePO2�3 4CH2OHeCOeCH2eOePO2�
3 (2.3.7)
In addition, the following reactions demonstrate how the isomerase enzyme can cata-lyze reactions. For instance, triose phosphate isomerase can convert dihydroxyacetoneto glyceraldehyde-3-phosphate.
dihydroxyacetone phosphate/glyceraldehyde-3-phosphate (2.3.8)
Also, an especial enzyme is able to convert optical isomers; for example, alanine race-mase may convert L-alanine to D-alanine.
L-alanine/D-alanine (2.3.9)
6. Single bond formation by eliminating the elements of water: Enzymes known as hydro-lases act in breaking down bonds by adding water molecules. However, ligases respondin a converse reaction by removing a water molecule from two functional groups toform a single bond. Synthetases are a subclass of ligases used for hydrolysis of ATP todrive this formation. For example, aminoacyl-transfer RNA synthetases join amino acidsto transfer RNAs for protein synthesis.
2.4 ENZYMES SPECIFIC FUNCTION
Enzymes that are able to function outside of living cells are known as biological catalystsacting in vitro. The enzymatic activities of enzymes are associated with a protein structurebecause enzymes have active sites with which bind to substrate. Generally, digestive en-zymes are pure protein structures. For example, urease is a pure protein. Pepsin, trypsin,and chymotrypsin are known as digestive enzymes. Lysozymes are active enzymes foundin tears, saliva, and egg whites that digest the cell wall of some bacteria. The structure of alysozyme is in crystalline form, which was defined by X-ray crystallography. That was thebeginning of the field of structure biology. Enzymes are globular proteins arranged fromamino acid residues. The activities of enzymes are determined by their three-dimensionalstructure of proteins.
2.5 ENZYMES ACT AS CATALYSTS
Most enzymes are known as active catalysts, acting fast, and the rate of reactions ismillions of times faster than uncatalyzed reactions. In fact, enzymes function similar to metaloxide catalysts. The enzymes-like catalysts are not consumed by the catalytic reaction, whilethe catalyst can lower the required activation energy to perform the reaction.
Besides the catalytic activities of enzymes, in comparison to metal oxide catalysts, they actvery specifically on a substrate. Enzymes are highly selective for interaction with their spe-cific substrate. The activities of enzymes are affected by other molecules. If any molecules
2. ENZYME TECHNOLOGY30
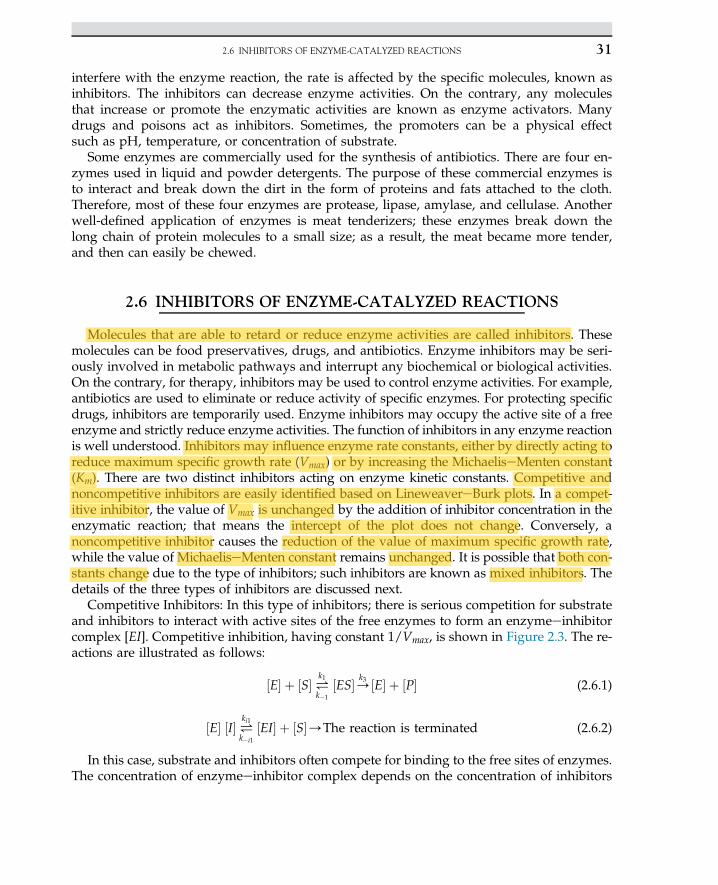
interfere with the enzyme reaction, the rate is affected by the specific molecules, known asinhibitors. The inhibitors can decrease enzyme activities. On the contrary, any moleculesthat increase or promote the enzymatic activities are known as enzyme activators. Manydrugs and poisons act as inhibitors. Sometimes, the promoters can be a physical effectsuch as pH, temperature, or concentration of substrate.
Some enzymes are commercially used for the synthesis of antibiotics. There are four en-zymes used in liquid and powder detergents. The purpose of these commercial enzymes isto interact and break down the dirt in the form of proteins and fats attached to the cloth.Therefore, most of these four enzymes are protease, lipase, amylase, and cellulase. Anotherwell-defined application of enzymes is meat tenderizers; these enzymes break down thelong chain of protein molecules to a small size; as a result, the meat became more tender,and then can easily be chewed.
2.6 INHIBITORS OF ENZYME-CATALYZED REACTIONS
Molecules that are able to retard or reduce enzyme activities are called inhibitors. Thesemolecules can be food preservatives, drugs, and antibiotics. Enzyme inhibitors may be seri-ously involved in metabolic pathways and interrupt any biochemical or biological activities.On the contrary, for therapy, inhibitors may be used to control enzyme activities. For example,antibiotics are used to eliminate or reduce activity of specific enzymes. For protecting specificdrugs, inhibitors are temporarily used. Enzyme inhibitors may occupy the active site of a freeenzyme and strictly reduce enzyme activities. The function of inhibitors in any enzyme reactionis well understood. Inhibitors may influence enzyme rate constants, either by directly acting toreduce maximum specific growth rate (Vmax) or by increasing the MichaeliseMenten constant(Km). There are two distinct inhibitors acting on enzyme kinetic constants. Competitive andnoncompetitive inhibitors are easily identified based on LineweavereBurk plots. In a compet-itive inhibitor, the value of Vmax is unchanged by the addition of inhibitor concentration in theenzymatic reaction; that means the intercept of the plot does not change. Conversely, anoncompetitive inhibitor causes the reduction of the value of maximum specific growth rate,while the value of MichaeliseMenten constant remains unchanged. It is possible that both con-stants change due to the type of inhibitors; such inhibitors are known as mixed inhibitors. Thedetails of the three types of inhibitors are discussed next.
Competitive Inhibitors: In this type of inhibitors; there is serious competition for substrateand inhibitors to interact with active sites of the free enzymes to form an enzymeeinhibitorcomplex [EI]. Competitive inhibition, having constant 1/Vmax, is shown in Figure 2.3. The re-actions are illustrated as follows:
½E� þ ½S�#k1k�1
½ES�/k3 ½E� þ ½P� (2.6.1)
½E� ½I�#ki1k�i1
½EI� þ ½S�/The reaction is terminated (2.6.2)
In this case, substrate and inhibitors often compete for binding to the free sites of enzymes.The concentration of enzymeeinhibitor complex depends on the concentration of inhibitors
2.6 INHIBITORS OF ENZYME-CATALYZED REACTIONS 31
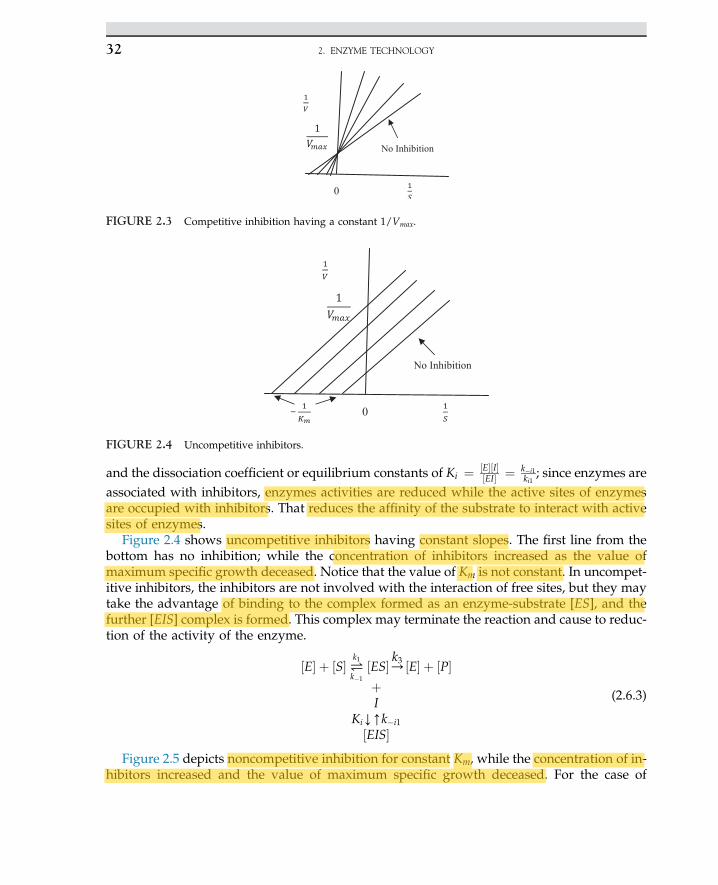
and the dissociation coefficient or equilibrium constants of Ki ¼ ½E�½I�½EI� ¼ k�i1
ki1; since enzymes are
associated with inhibitors, enzymes activities are reduced while the active sites of enzymesare occupied with inhibitors. That reduces the affinity of the substrate to interact with activesites of enzymes.
Figure 2.4 shows uncompetitive inhibitors having constant slopes. The first line from thebottom has no inhibition; while the concentration of inhibitors increased as the value ofmaximum specific growth deceased. Notice that the value of Km is not constant. In uncompet-itive inhibitors, the inhibitors are not involved with the interaction of free sites, but they maytake the advantage of binding to the complex formed as an enzyme-substrate [ES], and thefurther [EIS] complex is formed. This complex may terminate the reaction and cause to reduc-tion of the activity of the enzyme.
½E� þ ½S�#k1k�1
½ES�/k3 ½E� þ ½P�þI
KiY[k�i1
½EIS�
(2.6.3)
Figure 2.5 depicts noncompetitive inhibition for constant Km, while the concentration of in-hibitors increased and the value of maximum specific growth deceased. For the case of
No Inhibition
0
FIGURE 2.3 Competitive inhibition having a constant 1/Vmax.
No Inhibition
0
FIGURE 2.4 Uncompetitive inhibitors.
2. ENZYME TECHNOLOGY32
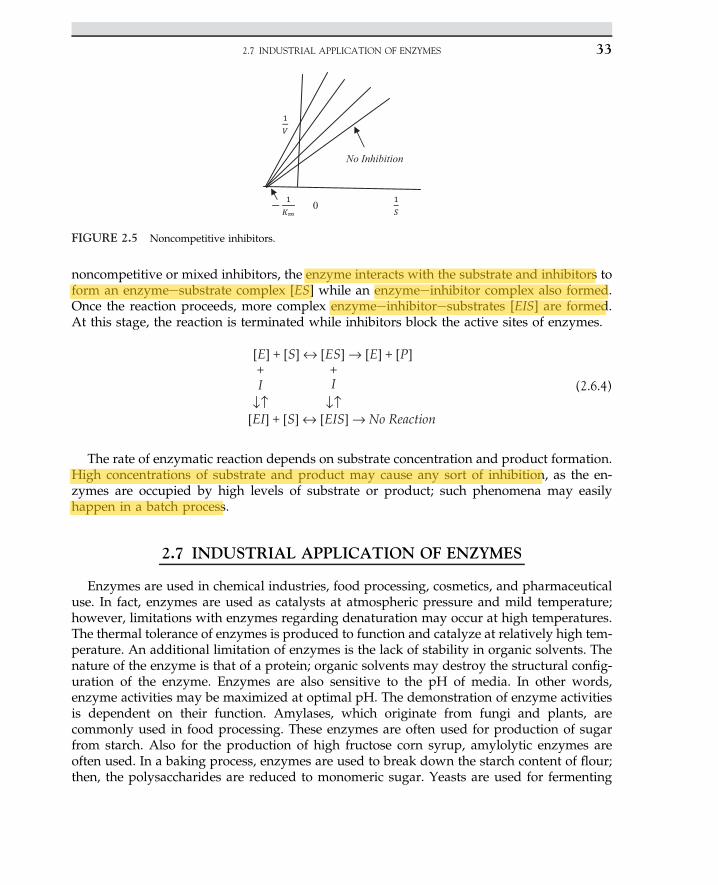
noncompetitive or mixed inhibitors, the enzyme interacts with the substrate and inhibitors toform an enzymeesubstrate complex [ES] while an enzymeeinhibitor complex also formed.Once the reaction proceeds, more complex enzymeeinhibitoresubstrates [EIS] are formed.At this stage, the reaction is terminated while inhibitors block the active sites of enzymes.
+ +
↓↑ ↓↑[EI] + [S] ↔ [EIS] → No Reaction
[E] + [S] ↔ [ES] → [E] + [P]
II (2.6.4)
The rate of enzymatic reaction depends on substrate concentration and product formation.High concentrations of substrate and product may cause any sort of inhibition, as the en-zymes are occupied by high levels of substrate or product; such phenomena may easilyhappen in a batch process.
2.7 INDUSTRIAL APPLICATION OF ENZYMES
Enzymes are used in chemical industries, food processing, cosmetics, and pharmaceuticaluse. In fact, enzymes are used as catalysts at atmospheric pressure and mild temperature;however, limitations with enzymes regarding denaturation may occur at high temperatures.The thermal tolerance of enzymes is produced to function and catalyze at relatively high tem-perature. An additional limitation of enzymes is the lack of stability in organic solvents. Thenature of the enzyme is that of a protein; organic solvents may destroy the structural config-uration of the enzyme. Enzymes are also sensitive to the pH of media. In other words,enzyme activities may be maximized at optimal pH. The demonstration of enzyme activitiesis dependent on their function. Amylases, which originate from fungi and plants, arecommonly used in food processing. These enzymes are often used for production of sugarfrom starch. Also for the production of high fructose corn syrup, amylolytic enzymes areoften used. In a baking process, enzymes are used to break down the starch content of flour;then, the polysaccharides are reduced to monomeric sugar. Yeasts are used for fermenting
No Inhibition
0
FIGURE 2.5 Noncompetitive inhibitors.
2.7 INDUSTRIAL APPLICATION OF ENZYMES 33
carbohydrates to generate intermediate metabolites and carbon dioxide. The fermented prod-uct may be enriched with protein, and even proteases are used to liberate folic acid or otheruseful amino acids for the production of biscuits. The enriched flour is used for production ofamino acids and other intermediate metabolites. In fermentation, carbon dioxide is generated;therefore, instead of baking soda, yeasts are used in bakeries and the food industry.
In preparation of predigested baby foods, use of trypsin is common. In the brewing indus-try, enzymes from barely are released in the course of the mashing stage of beer production.The enzyme breaks down starch and proteins to produce monosaccharides, peptides, andamino acids. The process is enriched via fermentation of yeasts. The industrial enzymes pre-pared from barley are widely used in the brewing process. These enzymes are perfectlysubstituted for the enzyme naturally found in barley.
Enzymes such as amylase, glucanase, and proteases are used for the saccharification ofpolysaccharides and proteolysis of proteins in malt. An enzyme, such as b-glucanase or ara-binoxylanase, is used for the improvement of wort and beer filtration. Also, amyloglucosi-dases and pullulanases are implied in low-caloric beer to adjust the fermentation. Use ofprotease in clarification and removal of the cloudiness of stored beer is absolutely effective.The fermentation efficiency may be enhanced by the reduction of diacetyl, which is conduct-ed in the enzymatic process by acetolactate decarboxylase . Normally, fruit juices are clarifiedby addition of enzymes known as cellulase and pectinase.
Enzymes are directly involved in cheese manufacturing, which are used to hydrolyze pro-tein. In fact, the rennin, which is derived from the stomachs of young ruminant calves andlambs, is rich in proteolytic enzymes. The extracted enzymes from ruminants are used indairy industries. There are many enzymes generated from Lactobacillus species used in dairyproducts. For instance, lipase is used for production of cheese to enhance ripening of the bluemold cheese.
The enzymes involved in most starch industries are amylase, amyloglucosidase, and glu-coamylase. All of these enzymes are used for the hydrolysis of starch, which break downcarbonecarbon bonds and liberate monomeric sugars like glucose and fructose in the formof various syrups that are products of starch industries.
The enzyme known as glucose isomerase is used to convert glucose to fructose. Thisenzyme is often used for production of highly enriched fructose syrups from starchy mate-rials. These syrups are enhanced with sweetening properties and lower calorific valuesthan sucrose for the same level of sweetness.
Applications of several enzymes in pulp and paper industries are well known. These en-zymes are amylases, xylanases, cellulases, and ligninases. All of the amylolytic enzymes areused to degrade starch in order to reduce viscosity, sizing, and also used for paper coating.Xylanases may reduce the consumption of bleaches used for decolorizing; cellulose is alsoused for smoothening fibers. The lignin-degrading enzymes are used to remove ligninfrom softened paper. Use of cellulase in the biofuel industry is clearly demonstrated forthe bioconversion of cellulose to reduced sugars. The monomeric carbohydrates are fer-mented to ethanol.
One of the main uses of enzymes is for the cleaning purposes as biological detergents.These enzymes are primarily proteases produced in an extra cellular cell synthesis, usingfor washing and presoaking conditions. The enzyme directly acts on protein stains on clothes.For liquid detergent, a combination of four enzymes is used, such as primary proteases,
2. ENZYME TECHNOLOGY34
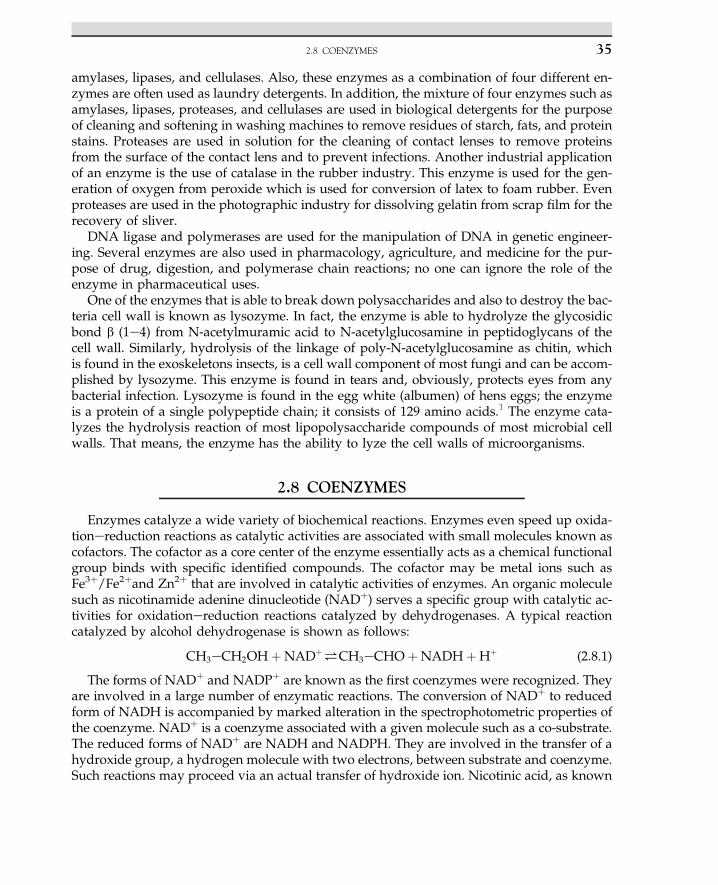
amylases, lipases, and cellulases. Also, these enzymes as a combination of four different en-zymes are often used as laundry detergents. In addition, the mixture of four enzymes such asamylases, lipases, proteases, and cellulases are used in biological detergents for the purposeof cleaning and softening in washing machines to remove residues of starch, fats, and proteinstains. Proteases are used in solution for the cleaning of contact lenses to remove proteinsfrom the surface of the contact lens and to prevent infections. Another industrial applicationof an enzyme is the use of catalase in the rubber industry. This enzyme is used for the gen-eration of oxygen from peroxide which is used for conversion of latex to foam rubber. Evenproteases are used in the photographic industry for dissolving gelatin from scrap film for therecovery of sliver.
DNA ligase and polymerases are used for the manipulation of DNA in genetic engineer-ing. Several enzymes are also used in pharmacology, agriculture, and medicine for the pur-pose of drug, digestion, and polymerase chain reactions; no one can ignore the role of theenzyme in pharmaceutical uses.
One of the enzymes that is able to break down polysaccharides and also to destroy the bac-teria cell wall is known as lysozyme. In fact, the enzyme is able to hydrolyze the glycosidicbond b (1e4) from N-acetylmuramic acid to N-acetylglucosamine in peptidoglycans of thecell wall. Similarly, hydrolysis of the linkage of poly-N-acetylglucosamine as chitin, whichis found in the exoskeletons insects, is a cell wall component of most fungi and can be accom-plished by lysozyme. This enzyme is found in tears and, obviously, protects eyes from anybacterial infection. Lysozyme is found in the egg white (albumen) of hens eggs; the enzymeis a protein of a single polypeptide chain; it consists of 129 amino acids.1 The enzyme cata-lyzes the hydrolysis reaction of most lipopolysaccharide compounds of most microbial cellwalls. That means, the enzyme has the ability to lyze the cell walls of microorganisms.
2.8 COENZYMES
Enzymes catalyze a wide variety of biochemical reactions. Enzymes even speed up oxida-tionereduction reactions as catalytic activities are associated with small molecules known ascofactors. The cofactor as a core center of the enzyme essentially acts as a chemical functionalgroup binds with specific identified compounds. The cofactor may be metal ions such asFe3þ/Fe2þand Zn2þ that are involved in catalytic activities of enzymes. An organic moleculesuch as nicotinamide adenine dinucleotide (NADþ) serves a specific group with catalytic ac-tivities for oxidationereduction reactions catalyzed by dehydrogenases. A typical reactioncatalyzed by alcohol dehydrogenase is shown as follows:
CH3eCH2OHþNADþ#CH3eCHO þNADHþHþ (2.8.1)
The forms of NADþ and NADPþ are known as the first coenzymes were recognized. Theyare involved in a large number of enzymatic reactions. The conversion of NADþ to reducedform of NADH is accompanied by marked alteration in the spectrophotometric properties ofthe coenzyme. NADþ is a coenzyme associated with a given molecule such as a co-substrate.The reduced forms of NADþ are NADH and NADPH. They are involved in the transfer of ahydroxide group, a hydrogen molecule with two electrons, between substrate and coenzyme.Such reactions may proceed via an actual transfer of hydroxide ion. Nicotinic acid, as known
2.8 COENZYMES 35
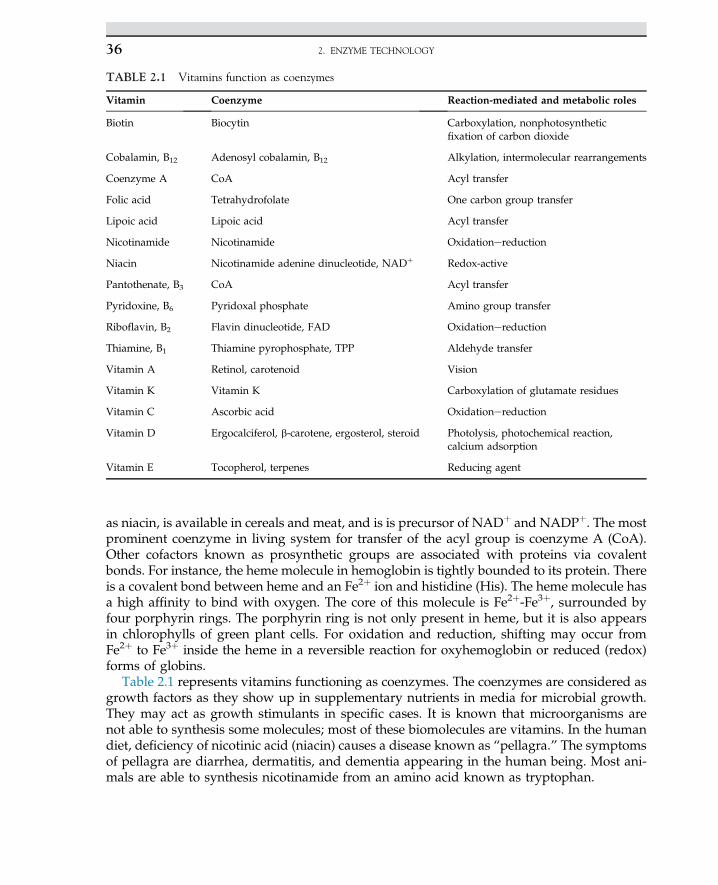
as niacin, is available in cereals and meat, and is is precursor of NADþ and NADPþ. The mostprominent coenzyme in living system for transfer of the acyl group is coenzyme A (CoA).Other cofactors known as prosynthetic groups are associated with proteins via covalentbonds. For instance, the heme molecule in hemoglobin is tightly bounded to its protein. Thereis a covalent bond between heme and an Fe2þ ion and histidine (His). The heme molecule hasa high affinity to bind with oxygen. The core of this molecule is Fe2þ-Fe3þ, surrounded byfour porphyrin rings. The porphyrin ring is not only present in heme, but it is also appearsin chlorophylls of green plant cells. For oxidation and reduction, shifting may occur fromFe2þ to Fe3þ inside the heme in a reversible reaction for oxyhemoglobin or reduced (redox)forms of globins.
Table 2.1 represents vitamins functioning as coenzymes. The coenzymes are considered asgrowth factors as they show up in supplementary nutrients in media for microbial growth.They may act as growth stimulants in specific cases. It is known that microorganisms arenot able to synthesis some molecules; most of these biomolecules are vitamins. In the humandiet, deficiency of nicotinic acid (niacin) causes a disease known as “pellagra.” The symptomsof pellagra are diarrhea, dermatitis, and dementia appearing in the human being. Most ani-mals are able to synthesis nicotinamide from an amino acid known as tryptophan.
TABLE 2.1 Vitamins function as coenzymes
Vitamin Coenzyme Reaction-mediated and metabolic roles
Biotin Biocytin Carboxylation, nonphotosyntheticfixation of carbon dioxide
Cobalamin, B12 Adenosyl cobalamin, B12 Alkylation, intermolecular rearrangements
Coenzyme A CoA Acyl transfer
Folic acid Tetrahydrofolate One carbon group transfer
Lipoic acid Lipoic acid Acyl transfer
Nicotinamide Nicotinamide Oxidationereduction
Niacin Nicotinamide adenine dinucleotide, NADþ Redox-active
Pantothenate, B3 CoA Acyl transfer
Pyridoxine, B6 Pyridoxal phosphate Amino group transfer
Riboflavin, B2 Flavin dinucleotide, FAD Oxidationereduction
Thiamine, B1 Thiamine pyrophosphate, TPP Aldehyde transfer
Vitamin A Retinol, carotenoid Vision
Vitamin K Vitamin K Carboxylation of glutamate residues
Vitamin C Ascorbic acid Oxidationereduction
Vitamin D Ergocalciferol, b-carotene, ergosterol, steroid Photolysis, photochemical reaction,calcium adsorption
Vitamin E Tocopherol, terpenes Reducing agent
2. ENZYME TECHNOLOGY36
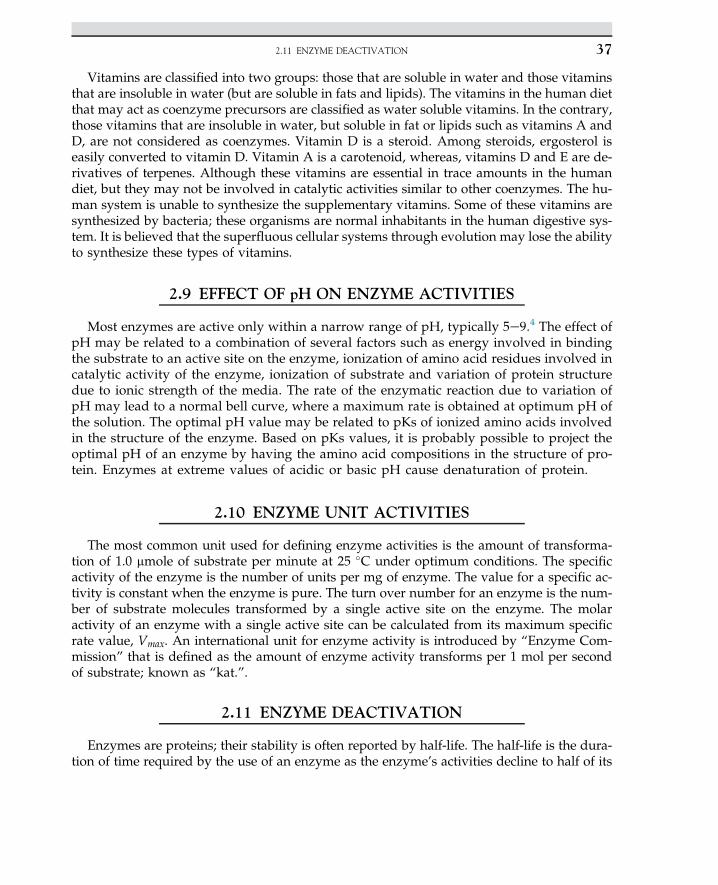
Vitamins are classified into two groups: those that are soluble in water and those vitaminsthat are insoluble in water (but are soluble in fats and lipids). The vitamins in the human dietthat may act as coenzyme precursors are classified as water soluble vitamins. In the contrary,those vitamins that are insoluble in water, but soluble in fat or lipids such as vitamins A andD, are not considered as coenzymes. Vitamin D is a steroid. Among steroids, ergosterol iseasily converted to vitamin D. Vitamin A is a carotenoid, whereas, vitamins D and E are de-rivatives of terpenes. Although these vitamins are essential in trace amounts in the humandiet, but they may not be involved in catalytic activities similar to other coenzymes. The hu-man system is unable to synthesize the supplementary vitamins. Some of these vitamins aresynthesized by bacteria; these organisms are normal inhabitants in the human digestive sys-tem. It is believed that the superfluous cellular systems through evolution may lose the abilityto synthesize these types of vitamins.
2.9 EFFECT OF pH ON ENZYME ACTIVITIES
Most enzymes are active only within a narrow range of pH, typically 5e9.4 The effect ofpH may be related to a combination of several factors such as energy involved in bindingthe substrate to an active site on the enzyme, ionization of amino acid residues involved incatalytic activity of the enzyme, ionization of substrate and variation of protein structuredue to ionic strength of the media. The rate of the enzymatic reaction due to variation ofpH may lead to a normal bell curve, where a maximum rate is obtained at optimum pH ofthe solution. The optimal pH value may be related to pKs of ionized amino acids involvedin the structure of the enzyme. Based on pKs values, it is probably possible to project theoptimal pH of an enzyme by having the amino acid compositions in the structure of pro-tein. Enzymes at extreme values of acidic or basic pH cause denaturation of protein.
2.10 ENZYME UNIT ACTIVITIES
The most common unit used for defining enzyme activities is the amount of transforma-tion of 1.0 mmole of substrate per minute at 25 �C under optimum conditions. The specificactivity of the enzyme is the number of units per mg of enzyme. The value for a specific ac-tivity is constant when the enzyme is pure. The turn over number for an enzyme is the num-ber of substrate molecules transformed by a single active site on the enzyme. The molaractivity of an enzyme with a single active site can be calculated from its maximum specificrate value, Vmax. An international unit for enzyme activity is introduced by “Enzyme Com-mission” that is defined as the amount of enzyme activity transforms per 1 mol per secondof substrate; known as “kat.”.
2.11 ENZYME DEACTIVATION
Enzymes are proteins; their stability is often reported by half-life. The half-life is the dura-tion of time required by the use of an enzyme as the enzyme’s activities decline to half of its
2.11 ENZYME DEACTIVATION 37
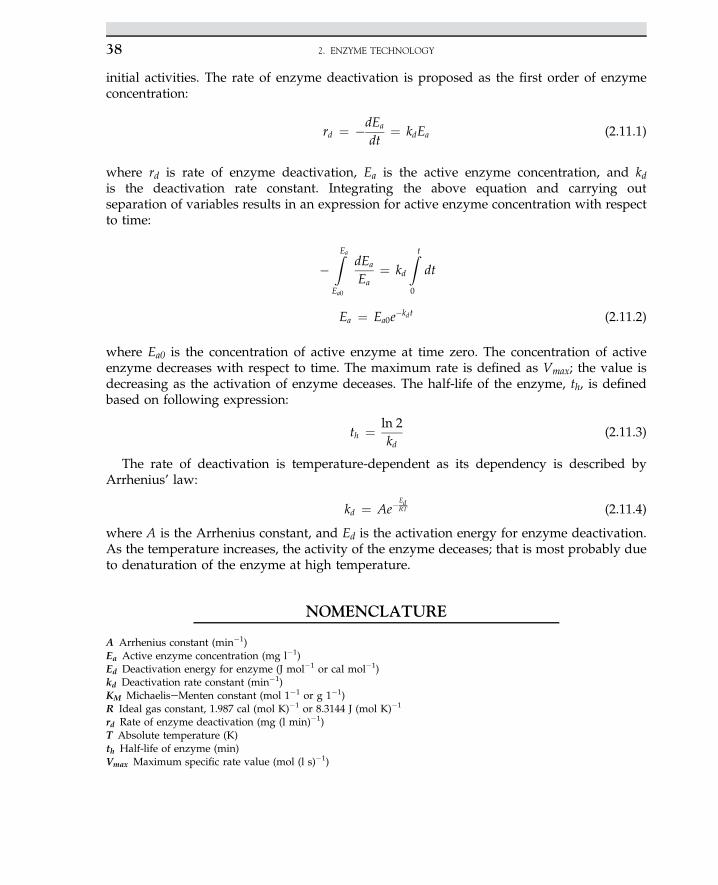
initial activities. The rate of enzyme deactivation is proposed as the first order of enzymeconcentration:
rd ¼ �dEa
dt¼ kdEa (2.11.1)
where rd is rate of enzyme deactivation, Ea is the active enzyme concentration, and kdis the deactivation rate constant. Integrating the above equation and carrying outseparation of variables results in an expression for active enzyme concentration with respectto time:
�ZEaEa0
dEa
Ea¼ kd
Z t
0
dt
Ea ¼ Ea0e�kdt (2.11.2)
where Ea0 is the concentration of active enzyme at time zero. The concentration of activeenzyme decreases with respect to time. The maximum rate is defined as Vmax; the value isdecreasing as the activation of enzyme deceases. The half-life of the enzyme, th, is definedbased on following expression:
th ¼ ln 2kd
(2.11.3)
The rate of deactivation is temperature-dependent as its dependency is described byArrhenius’ law:
kd ¼ Ae�EdRT (2.11.4)
where A is the Arrhenius constant, and Ed is the activation energy for enzyme deactivation.As the temperature increases, the activity of the enzyme deceases; that is most probably dueto denaturation of the enzyme at high temperature.
NOMENCLATURE
A Arrhenius constant (min�1)Ea Active enzyme concentration (mg l�1)Ed Deactivation energy for enzyme (J mol�1 or cal mol�1)kd Deactivation rate constant (min�1)KM MichaeliseMenten constant (mol 1�1 or g 1�1)R Ideal gas constant, 1.987 cal (mol K)�1 or 8.3144 J (mol K)�1
rd Rate of enzyme deactivation (mg (l min)�1)T Absolute temperature (K)th Half-life of enzyme (min)Vmax Maximum specific rate value (mol (l s)�1)
2. ENZYME TECHNOLOGY38
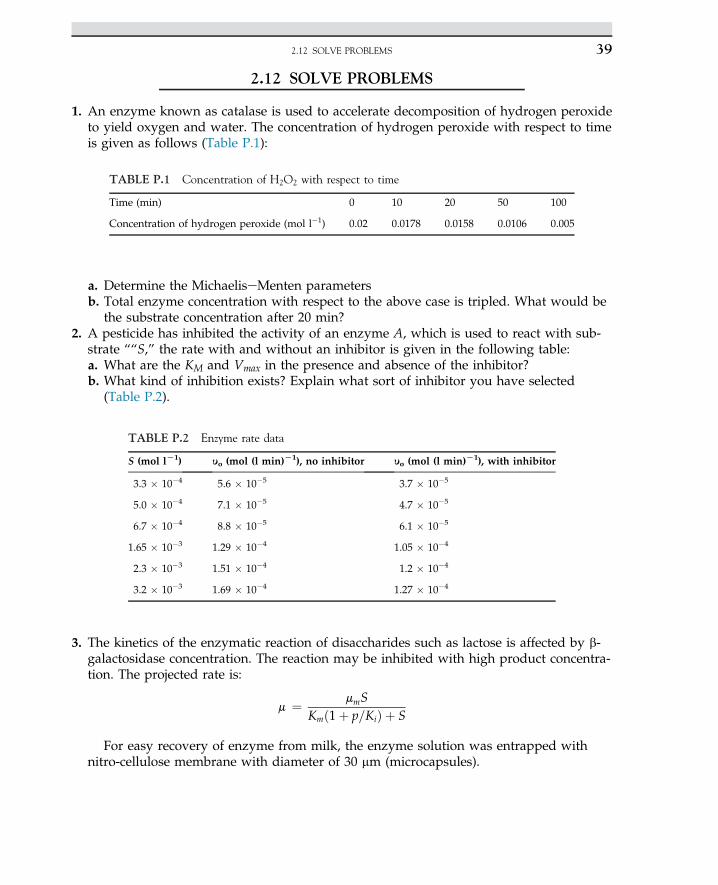
2.12 SOLVE PROBLEMS
1. An enzyme known as catalase is used to accelerate decomposition of hydrogen peroxideto yield oxygen and water. The concentration of hydrogen peroxide with respect to timeis given as follows (Table P.1):
a. Determine the MichaeliseMenten parametersb. Total enzyme concentration with respect to the above case is tripled. What would be
the substrate concentration after 20 min?2. A pesticide has inhibited the activity of an enzyme A, which is used to react with sub-
strate ““S,” the rate with and without an inhibitor is given in the following table:a. What are the KM and Vmax in the presence and absence of the inhibitor?b. What kind of inhibition exists? Explain what sort of inhibitor you have selected
(Table P.2).
3. The kinetics of the enzymatic reaction of disaccharides such as lactose is affected by b-galactosidase concentration. The reaction may be inhibited with high product concentra-tion. The projected rate is:
m ¼ mmSKmð1þ p=KiÞ þ S
For easy recovery of enzyme from milk, the enzyme solution was entrapped withnitro-cellulose membrane with diameter of 30 mm (microcapsules).
TABLE P.1 Concentration of H2O2 with respect to time
Time (min) 0 10 20 50 100
Concentration of hydrogen peroxide (mol l�1) 0.02 0.0178 0.0158 0.0106 0.005
TABLE P.2 Enzyme rate data
S (mol lL1) yo (mol (l min)L1), no inhibitor yo (mol (l min)L1), with inhibitor
3.3 � 10�4 5.6 � 10�5 3.7 � 10�5
5.0 � 10�4 7.1 � 10�5 4.7 � 10�5
6.7 � 10�4 8.8 � 10�5 6.1 � 10�5
1.65 � 10�3 1.29 � 10�4 1.05 � 10�4
2.3 � 10�3 1.51 � 10�4 1.2 � 10�4
3.2 � 10�3 1.69 � 10�4 1.27 � 10�4
2.12 SOLVE PROBLEMS 39
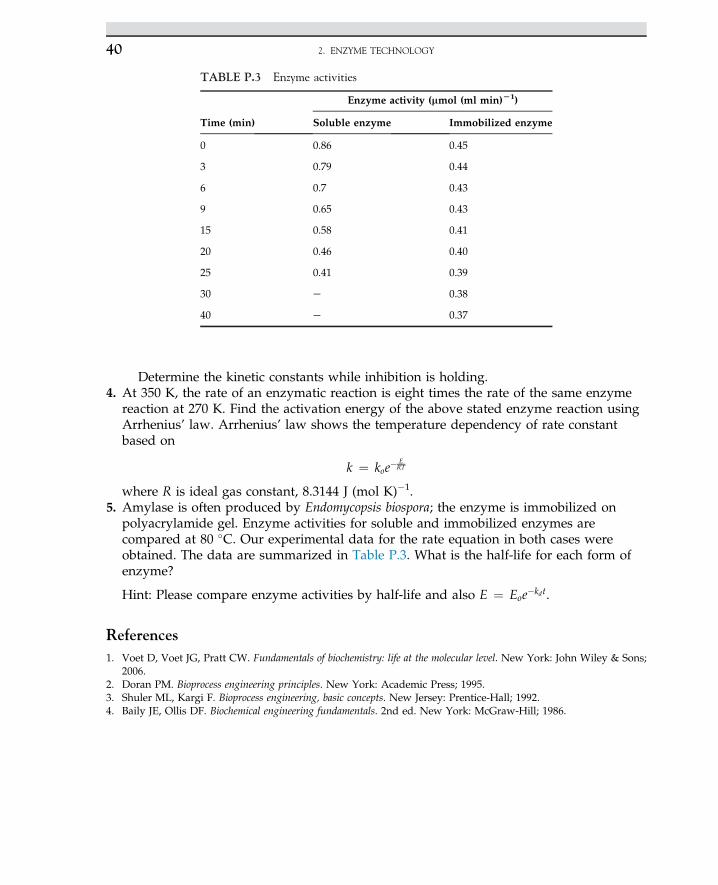
Determine the kinetic constants while inhibition is holding.4. At 350 K, the rate of an enzymatic reaction is eight times the rate of the same enzyme
reaction at 270 K. Find the activation energy of the above stated enzyme reaction usingArrhenius’ law. Arrhenius’ law shows the temperature dependency of rate constantbased on
k ¼ koe�ERT
where R is ideal gas constant, 8.3144 J (mol K)�1.5. Amylase is often produced by Endomycopsis biospora; the enzyme is immobilized on
polyacrylamide gel. Enzyme activities for soluble and immobilized enzymes arecompared at 80 �C. Our experimental data for the rate equation in both cases wereobtained. The data are summarized in Table P.3. What is the half-life for each form ofenzyme?
Hint: Please compare enzyme activities by half-life and also E ¼ Eoe�kdt.
References1. Voet D, Voet JG, Pratt CW. Fundamentals of biochemistry: life at the molecular level. New York: John Wiley & Sons;
2006.2. Doran PM. Bioprocess engineering principles. New York: Academic Press; 1995.3. Shuler ML, Kargi F. Bioprocess engineering, basic concepts. New Jersey: Prentice-Hall; 1992.4. Baily JE, Ollis DF. Biochemical engineering fundamentals. 2nd ed. New York: McGraw-Hill; 1986.
TABLE P.3 Enzyme activities
Time (min)
Enzyme activity (mmol (ml min)L1)
Soluble enzyme Immobilized enzyme
0 0.86 0.45
3 0.79 0.44
6 0.7 0.43
9 0.65 0.43
15 0.58 0.41
20 0.46 0.40
25 0.41 0.39
30 e 0.38
40 e 0.37
2. ENZYME TECHNOLOGY40
S U B C H A P T E R
2.13Case Study: Solid-State Fermentation of Sugarcane Bagasse
in a Tray Bioreactor for Production of Lipase UsingRhizopus oryzae*
2.13.1 INTRODUCTION
Lipases (glycerol ester hydrolases EC 3.1.1.3) are well-known biocatalysts participating inthe hydrolysis reaction to produce fatty acids and monoacylglycerols from triacylglycerols.The reaction occurs in the watereoil interface. Numerous industrial applications of lipasesuch as the food industry, pharmaceuticals, cosmetics, wastewater treatment, and the leatherindustry have been reported in literature.1-5 Yield of lipase production is associated withseveral parameters including type of fermentation, substrate varieties, the strain of microor-ganism, as well as fermentation environment, i.e., the bioreactor.6-8
Cellulosic and lignocellulosic agricultural wastes such as sugarcane bagasse can be used aspotential substrates for lipase production.9 Their usage offers two advantages: first, it helps toomit or reduce environmental pollution caused by their disposal into open spaces. Second, itresults in the production of value-added products (such as enzymes) from invaluable sources.
Solid-state fermentation (SSF) and submerged fermentation (SmF) are regarded as twosuitable fermentation techniques for the production of enzymes, including lipases. Theformer is defined as the cultivation of microorganisms in the absence of free-flowing water,while in the latter, fermentation occurs in the liquid media. In the last two decades, variousstudies have considered lipase production in solid-state fermentation, most probably due tosome superiorities of this technique compared to submerged fermentation. By using agro-industrial residues, high yields of product formation and simple technology have madeSSF economically feasible.
Bacteria, fungi, and yeasts are three main microorganisms which yield lipase. However,due to low water activity in SSF, fungi and yeasts are well adapted to fermentation condi-tions. Thus, the studies concerning lipase synthesis in SSF are mainly focused on fungi andyeasts as potential microorganisms. Several strains of potential lipase-producing fungi,such as Aspergillus, Rhizopus, Penicillium, Rhizomucor and Geotrichum, are reported in thestudies.10
*This case study was partially written with contributions from:Zahra Vaseghi, Biotechnology Research Lab., School of Chemical Engineering, Noshirvani University ofTechnology, Babol, Iran.
2.13.1 INTRODUCTION 41
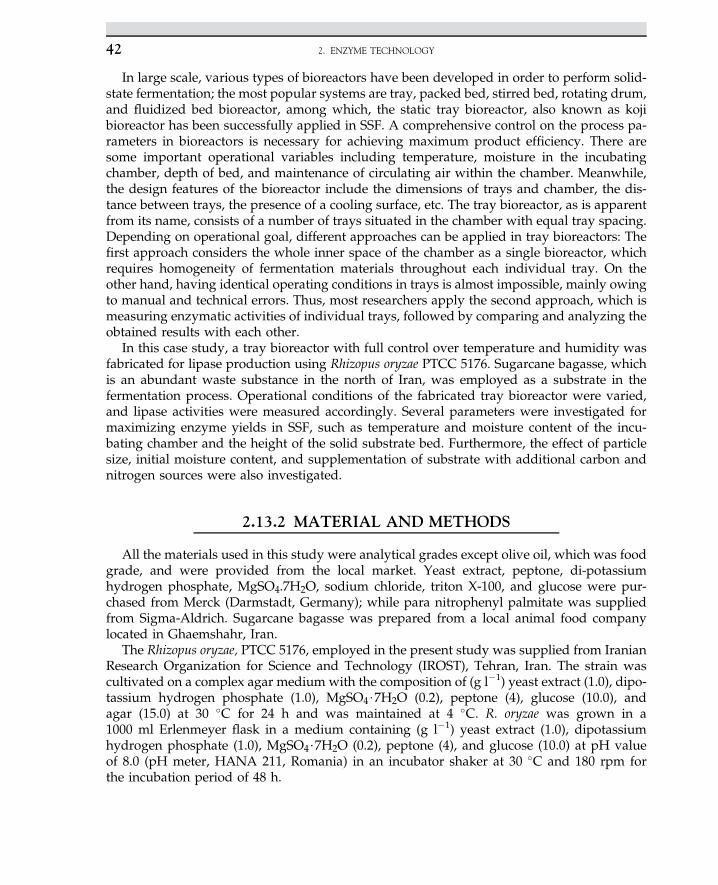
In large scale, various types of bioreactors have been developed in order to perform solid-state fermentation; the most popular systems are tray, packed bed, stirred bed, rotating drum,and fluidized bed bioreactor, among which, the static tray bioreactor, also known as kojibioreactor has been successfully applied in SSF. A comprehensive control on the process pa-rameters in bioreactors is necessary for achieving maximum product efficiency. There aresome important operational variables including temperature, moisture in the incubatingchamber, depth of bed, and maintenance of circulating air within the chamber. Meanwhile,the design features of the bioreactor include the dimensions of trays and chamber, the dis-tance between trays, the presence of a cooling surface, etc. The tray bioreactor, as is apparentfrom its name, consists of a number of trays situated in the chamber with equal tray spacing.Depending on operational goal, different approaches can be applied in tray bioreactors: Thefirst approach considers the whole inner space of the chamber as a single bioreactor, whichrequires homogeneity of fermentation materials throughout each individual tray. On theother hand, having identical operating conditions in trays is almost impossible, mainly owingto manual and technical errors. Thus, most researchers apply the second approach, which ismeasuring enzymatic activities of individual trays, followed by comparing and analyzing theobtained results with each other.
In this case study, a tray bioreactor with full control over temperature and humidity wasfabricated for lipase production using Rhizopus oryzae PTCC 5176. Sugarcane bagasse, whichis an abundant waste substance in the north of Iran, was employed as a substrate in thefermentation process. Operational conditions of the fabricated tray bioreactor were varied,and lipase activities were measured accordingly. Several parameters were investigated formaximizing enzyme yields in SSF, such as temperature and moisture content of the incu-bating chamber and the height of the solid substrate bed. Furthermore, the effect of particlesize, initial moisture content, and supplementation of substrate with additional carbon andnitrogen sources were also investigated.
2.13.2 MATERIAL AND METHODS
All the materials used in this study were analytical grades except olive oil, which was foodgrade, and were provided from the local market. Yeast extract, peptone, di-potassiumhydrogen phosphate, MgSO4.7H2O, sodium chloride, triton X-100, and glucose were pur-chased from Merck (Darmstadt, Germany); while para nitrophenyl palmitate was suppliedfrom Sigma-Aldrich. Sugarcane bagasse was prepared from a local animal food companylocated in Ghaemshahr, Iran.
The Rhizopus oryzae, PTCC 5176, employed in the present study was supplied from IranianResearch Organization for Science and Technology (IROST), Tehran, Iran. The strain wascultivated on a complex agar medium with the composition of (g l�1) yeast extract (1.0), dipo-tassium hydrogen phosphate (1.0), MgSO4$7H2O (0.2), peptone (4), glucose (10.0), andagar (15.0) at 30 �C for 24 h and was maintained at 4 �C. R. oryzae was grown in a1000 ml Erlenmeyer flask in a medium containing (g l�1) yeast extract (1.0), dipotassiumhydrogen phosphate (1.0), MgSO4$7H2O (0.2), peptone (4), and glucose (10.0) at pH valueof 8.0 (pH meter, HANA 211, Romania) in an incubator shaker at 30 �C and 180 rpm forthe incubation period of 48 h.
2. ENZYME TECHNOLOGY42
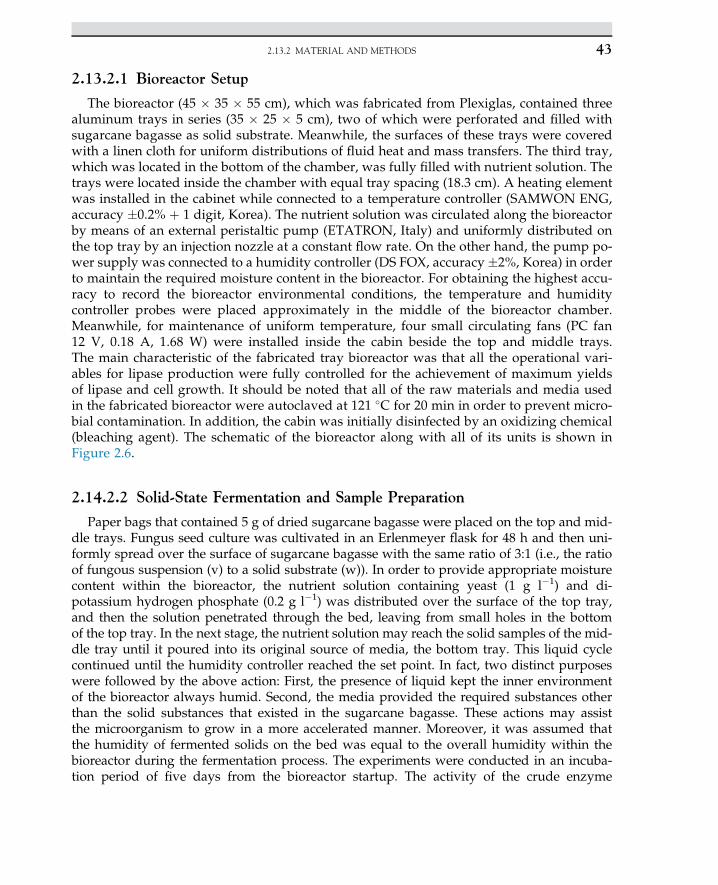
2.13.2.1 Bioreactor Setup
The bioreactor (45 � 35 � 55 cm), which was fabricated from Plexiglas, contained threealuminum trays in series (35 � 25 � 5 cm), two of which were perforated and filled withsugarcane bagasse as solid substrate. Meanwhile, the surfaces of these trays were coveredwith a linen cloth for uniform distributions of fluid heat and mass transfers. The third tray,which was located in the bottom of the chamber, was fully filled with nutrient solution. Thetrays were located inside the chamber with equal tray spacing (18.3 cm). A heating elementwas installed in the cabinet while connected to a temperature controller (SAMWON ENG,accuracy �0.2% þ 1 digit, Korea). The nutrient solution was circulated along the bioreactorby means of an external peristaltic pump (ETATRON, Italy) and uniformly distributed onthe top tray by an injection nozzle at a constant flow rate. On the other hand, the pump po-wer supply was connected to a humidity controller (DS FOX, accuracy �2%, Korea) in orderto maintain the required moisture content in the bioreactor. For obtaining the highest accu-racy to record the bioreactor environmental conditions, the temperature and humiditycontroller probes were placed approximately in the middle of the bioreactor chamber.Meanwhile, for maintenance of uniform temperature, four small circulating fans (PC fan12 V, 0.18 A, 1.68 W) were installed inside the cabin beside the top and middle trays.The main characteristic of the fabricated tray bioreactor was that all the operational vari-ables for lipase production were fully controlled for the achievement of maximum yieldsof lipase and cell growth. It should be noted that all of the raw materials and media usedin the fabricated bioreactor were autoclaved at 121 �C for 20 min in order to prevent micro-bial contamination. In addition, the cabin was initially disinfected by an oxidizing chemical(bleaching agent). The schematic of the bioreactor along with all of its units is shown inFigure 2.6.
2.14.2.2 Solid-State Fermentation and Sample Preparation
Paper bags that contained 5 g of dried sugarcane bagasse were placed on the top and mid-dle trays. Fungus seed culture was cultivated in an Erlenmeyer flask for 48 h and then uni-formly spread over the surface of sugarcane bagasse with the same ratio of 3:1 (i.e., the ratioof fungous suspension (v) to a solid substrate (w)). In order to provide appropriate moisturecontent within the bioreactor, the nutrient solution containing yeast (1 g l�1) and di-potassium hydrogen phosphate (0.2 g l�1) was distributed over the surface of the top tray,and then the solution penetrated through the bed, leaving from small holes in the bottomof the top tray. In the next stage, the nutrient solution may reach the solid samples of the mid-dle tray until it poured into its original source of media, the bottom tray. This liquid cyclecontinued until the humidity controller reached the set point. In fact, two distinct purposeswere followed by the above action: First, the presence of liquid kept the inner environmentof the bioreactor always humid. Second, the media provided the required substances otherthan the solid substances that existed in the sugarcane bagasse. These actions may assistthe microorganism to grow in a more accelerated manner. Moreover, it was assumed thatthe humidity of fermented solids on the bed was equal to the overall humidity within thebioreactor during the fermentation process. The experiments were conducted in an incuba-tion period of five days from the bioreactor startup. The activity of the crude enzyme
2.13.2 MATERIAL AND METHODS 43
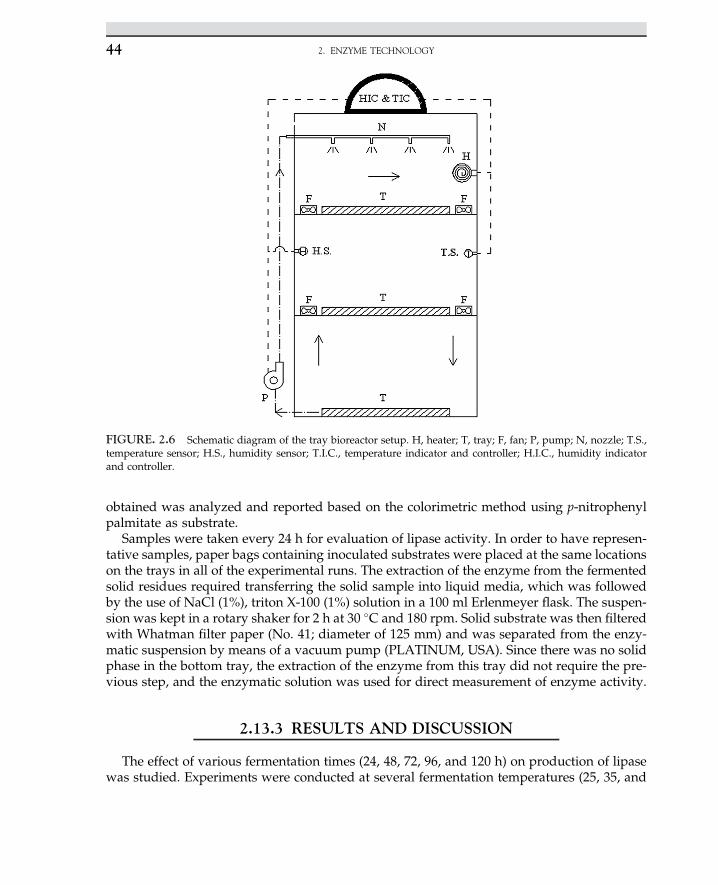
obtained was analyzed and reported based on the colorimetric method using p-nitrophenylpalmitate as substrate.
Samples were taken every 24 h for evaluation of lipase activity. In order to have represen-tative samples, paper bags containing inoculated substrates were placed at the same locationson the trays in all of the experimental runs. The extraction of the enzyme from the fermentedsolid residues required transferring the solid sample into liquid media, which was followedby the use of NaCl (1%), triton X-100 (1%) solution in a 100 ml Erlenmeyer flask. The suspen-sion was kept in a rotary shaker for 2 h at 30 �C and 180 rpm. Solid substrate was then filteredwith Whatman filter paper (No. 41; diameter of 125 mm) and was separated from the enzy-matic suspension by means of a vacuum pump (PLATINUM, USA). Since there was no solidphase in the bottom tray, the extraction of the enzyme from this tray did not require the pre-vious step, and the enzymatic solution was used for direct measurement of enzyme activity.
2.13.3 RESULTS AND DISCUSSION
The effect of various fermentation times (24, 48, 72, 96, and 120 h) on production of lipasewas studied. Experiments were conducted at several fermentation temperatures (25, 35, and
FIGURE. 2.6 Schematic diagram of the tray bioreactor setup. H, heater; T, tray; F, fan; P, pump; N, nozzle; T.S.,temperature sensor; H.S., humidity sensor; T.I.C., temperature indicator and controller; H.I.C., humidity indicatorand controller.
2. ENZYME TECHNOLOGY44
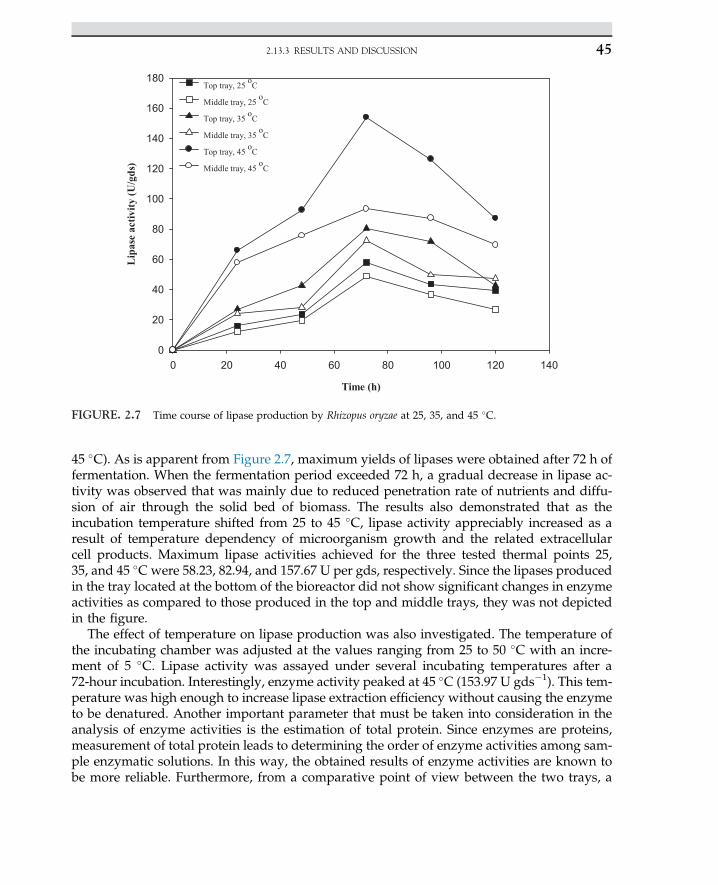
45 �C). As is apparent from Figure 2.7, maximum yields of lipases were obtained after 72 h offermentation. When the fermentation period exceeded 72 h, a gradual decrease in lipase ac-tivity was observed that was mainly due to reduced penetration rate of nutrients and diffu-sion of air through the solid bed of biomass. The results also demonstrated that as theincubation temperature shifted from 25 to 45 �C, lipase activity appreciably increased as aresult of temperature dependency of microorganism growth and the related extracellularcell products. Maximum lipase activities achieved for the three tested thermal points 25,35, and 45 �C were 58.23, 82.94, and 157.67 U per gds, respectively. Since the lipases producedin the tray located at the bottom of the bioreactor did not show significant changes in enzymeactivities as compared to those produced in the top and middle trays, they was not depictedin the figure.
The effect of temperature on lipase production was also investigated. The temperature ofthe incubating chamber was adjusted at the values ranging from 25 to 50 �C with an incre-ment of 5 �C. Lipase activity was assayed under several incubating temperatures after a72-hour incubation. Interestingly, enzyme activity peaked at 45 �C (153.97 U gds�1). This tem-perature was high enough to increase lipase extraction efficiency without causing the enzymeto be denatured. Another important parameter that must be taken into consideration in theanalysis of enzyme activities is the estimation of total protein. Since enzymes are proteins,measurement of total protein leads to determining the order of enzyme activities among sam-ple enzymatic solutions. In this way, the obtained results of enzyme activities are known tobe more reliable. Furthermore, from a comparative point of view between the two trays, a
Time (h)
0 20 40 60 80 100 120 140
Lip
ase
activ
ity (U
/gds
)
0
20
40
60
80
100
120
140
160
180Top tray, 25 oC
Middle tray, 25 oC
Top tray, 35 oC
Middle tray, 35 oC
Top tray, 45 oC
Middle tray, 45 oC
FIGURE. 2.7 Time course of lipase production by Rhizopus oryzae at 25, 35, and 45 �C.
2.13.3 RESULTS AND DISCUSSION 45
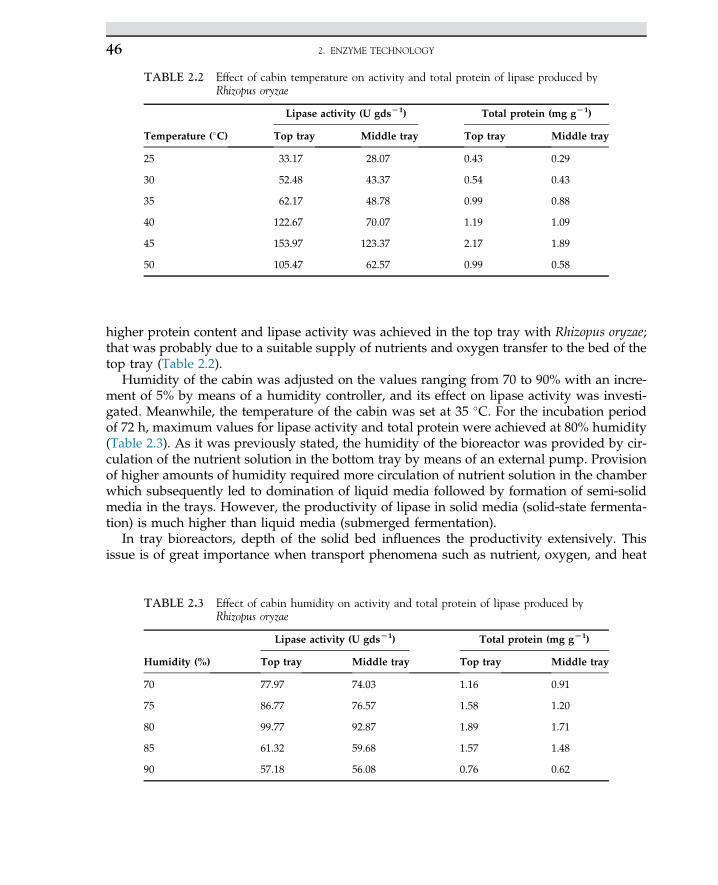
higher protein content and lipase activity was achieved in the top tray with Rhizopus oryzae;that was probably due to a suitable supply of nutrients and oxygen transfer to the bed of thetop tray (Table 2.2).
Humidity of the cabin was adjusted on the values ranging from 70 to 90% with an incre-ment of 5% by means of a humidity controller, and its effect on lipase activity was investi-gated. Meanwhile, the temperature of the cabin was set at 35 �C. For the incubation periodof 72 h, maximum values for lipase activity and total protein were achieved at 80% humidity(Table 2.3). As it was previously stated, the humidity of the bioreactor was provided by cir-culation of the nutrient solution in the bottom tray by means of an external pump. Provisionof higher amounts of humidity required more circulation of nutrient solution in the chamberwhich subsequently led to domination of liquid media followed by formation of semi-solidmedia in the trays. However, the productivity of lipase in solid media (solid-state fermenta-tion) is much higher than liquid media (submerged fermentation).
In tray bioreactors, depth of the solid bed influences the productivity extensively. Thisissue is of great importance when transport phenomena such as nutrient, oxygen, and heat
TABLE 2.2 Effect of cabin temperature on activity and total protein of lipase produced byRhizopus oryzae
Temperature (�C)
Lipase activity (U gdsL1) Total protein (mg gL1)
Top tray Middle tray Top tray Middle tray
25 33.17 28.07 0.43 0.29
30 52.48 43.37 0.54 0.43
35 62.17 48.78 0.99 0.88
40 122.67 70.07 1.19 1.09
45 153.97 123.37 2.17 1.89
50 105.47 62.57 0.99 0.58
TABLE 2.3 Effect of cabin humidity on activity and total protein of lipase produced byRhizopus oryzae
Humidity (%)
Lipase activity (U gdsL1) Total protein (mg gL1)
Top tray Middle tray Top tray Middle tray
70 77.97 74.03 1.16 0.91
75 86.77 76.57 1.58 1.20
80 99.77 92.87 1.89 1.71
85 61.32 59.68 1.57 1.48
90 57.18 56.08 0.76 0.62
2. ENZYME TECHNOLOGY46
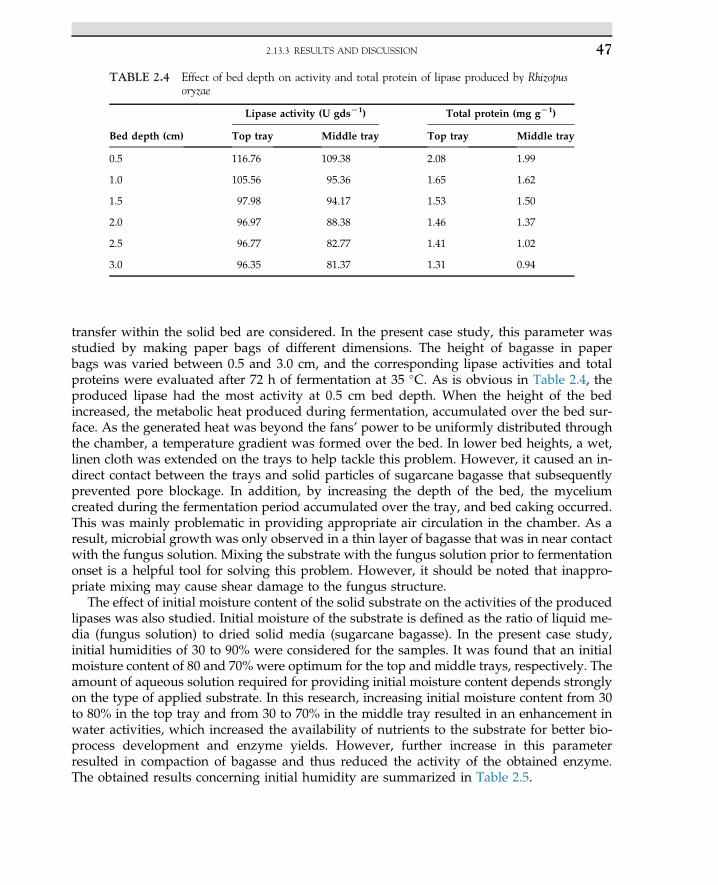
transfer within the solid bed are considered. In the present case study, this parameter wasstudied by making paper bags of different dimensions. The height of bagasse in paperbags was varied between 0.5 and 3.0 cm, and the corresponding lipase activities and totalproteins were evaluated after 72 h of fermentation at 35 �C. As is obvious in Table 2.4, theproduced lipase had the most activity at 0.5 cm bed depth. When the height of the bedincreased, the metabolic heat produced during fermentation, accumulated over the bed sur-face. As the generated heat was beyond the fans’ power to be uniformly distributed throughthe chamber, a temperature gradient was formed over the bed. In lower bed heights, a wet,linen cloth was extended on the trays to help tackle this problem. However, it caused an in-direct contact between the trays and solid particles of sugarcane bagasse that subsequentlyprevented pore blockage. In addition, by increasing the depth of the bed, the myceliumcreated during the fermentation period accumulated over the tray, and bed caking occurred.This was mainly problematic in providing appropriate air circulation in the chamber. As aresult, microbial growth was only observed in a thin layer of bagasse that was in near contactwith the fungus solution. Mixing the substrate with the fungus solution prior to fermentationonset is a helpful tool for solving this problem. However, it should be noted that inappro-priate mixing may cause shear damage to the fungus structure.
The effect of initial moisture content of the solid substrate on the activities of the producedlipases was also studied. Initial moisture of the substrate is defined as the ratio of liquid me-dia (fungus solution) to dried solid media (sugarcane bagasse). In the present case study,initial humidities of 30 to 90% were considered for the samples. It was found that an initialmoisture content of 80 and 70% were optimum for the top and middle trays, respectively. Theamount of aqueous solution required for providing initial moisture content depends stronglyon the type of applied substrate. In this research, increasing initial moisture content from 30to 80% in the top tray and from 30 to 70% in the middle tray resulted in an enhancement inwater activities, which increased the availability of nutrients to the substrate for better bio-process development and enzyme yields. However, further increase in this parameterresulted in compaction of bagasse and thus reduced the activity of the obtained enzyme.The obtained results concerning initial humidity are summarized in Table 2.5.
TABLE 2.4 Effect of bed depth on activity and total protein of lipase produced by Rhizopusoryzae
Bed depth (cm)
Lipase activity (U gdsL1) Total protein (mg gL1)
Top tray Middle tray Top tray Middle tray
0.5 116.76 109.38 2.08 1.99
1.0 105.56 95.36 1.65 1.62
1.5 97.98 94.17 1.53 1.50
2.0 96.97 88.38 1.46 1.37
2.5 96.77 82.77 1.41 1.02
3.0 96.35 81.37 1.31 0.94
2.13.3 RESULTS AND DISCUSSION 47
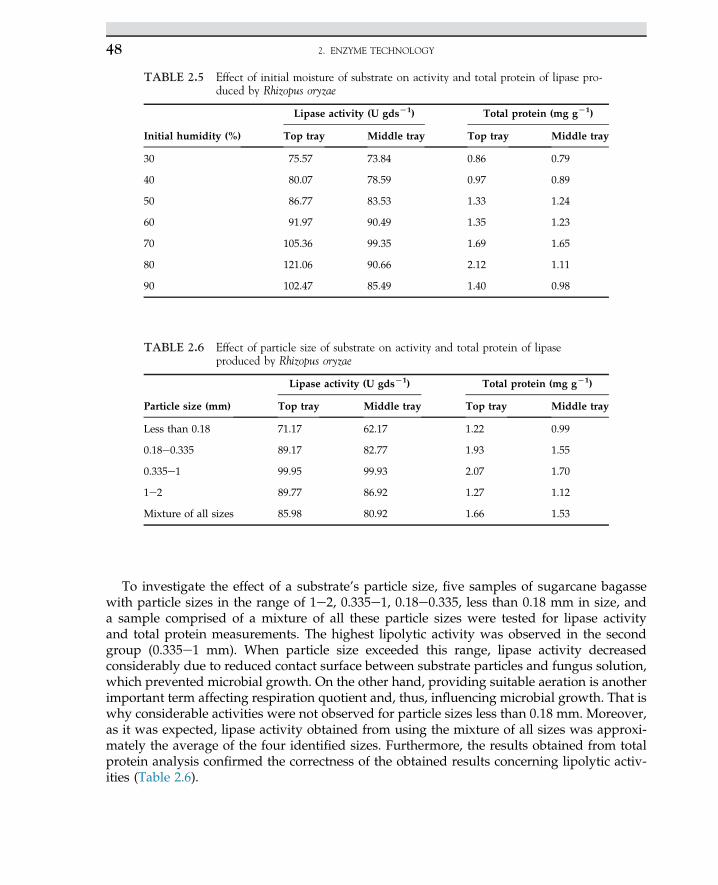
To investigate the effect of a substrate’s particle size, five samples of sugarcane bagassewith particle sizes in the range of 1e2, 0.335e1, 0.18e0.335, less than 0.18 mm in size, anda sample comprised of a mixture of all these particle sizes were tested for lipase activityand total protein measurements. The highest lipolytic activity was observed in the secondgroup (0.335e1 mm). When particle size exceeded this range, lipase activity decreasedconsiderably due to reduced contact surface between substrate particles and fungus solution,which prevented microbial growth. On the other hand, providing suitable aeration is anotherimportant term affecting respiration quotient and, thus, influencing microbial growth. That iswhy considerable activities were not observed for particle sizes less than 0.18 mm. Moreover,as it was expected, lipase activity obtained from using the mixture of all sizes was approxi-mately the average of the four identified sizes. Furthermore, the results obtained from totalprotein analysis confirmed the correctness of the obtained results concerning lipolytic activ-ities (Table 2.6).
TABLE 2.5 Effect of initial moisture of substrate on activity and total protein of lipase pro-duced by Rhizopus oryzae
Initial humidity (%)
Lipase activity (U gdsL1) Total protein (mg gL1)
Top tray Middle tray Top tray Middle tray
30 75.57 73.84 0.86 0.79
40 80.07 78.59 0.97 0.89
50 86.77 83.53 1.33 1.24
60 91.97 90.49 1.35 1.23
70 105.36 99.35 1.69 1.65
80 121.06 90.66 2.12 1.11
90 102.47 85.49 1.40 0.98
TABLE 2.6 Effect of particle size of substrate on activity and total protein of lipaseproduced by Rhizopus oryzae
Particle size (mm)
Lipase activity (U gdsL1) Total protein (mg gL1)
Top tray Middle tray Top tray Middle tray
Less than 0.18 71.17 62.17 1.22 0.99
0.18e0.335 89.17 82.77 1.93 1.55
0.335e1 99.95 99.93 2.07 1.70
1e2 89.77 86.92 1.27 1.12
Mixture of all sizes 85.98 80.92 1.66 1.53
2. ENZYME TECHNOLOGY48
Supplementation of the substrate with carbon and nitrogen sources is another importantfactor that significantly affected lipase production. In order to enhance lipolytic enzyme pro-duction, olive oil and urea were used as the pure carbon and nitrogen sources. In the case ofthe carbon source, the concentration of oil was varied, and lipase production was monitoredafter a 72-hour incubation period. Maximum activities of lipase were achieved when sugar-cane bagasse was supplemented with 8% (v/w) olive oil, while other parameters remained atthe desired or optimum conditions. Activity of the enzymes located at the top and middletrays in this case was found to be 215.16, 199.36 U gds�1. Furthermore, lipolytic activity ob-tained using urea (2% w/w) as the supplementary nitrogen source was 253.55 and205.16 U gds�1 for the top and middle trays. As is apparent from the obtained results, nitro-gen source plays a more important role in enhancing lipolytic activities than a carbon sourcesuch as olive oil. This may be due to the fact that bagasse is rich in carbon sources on its own.Thus, its supplementation with nitrogen sources is a greater help for increasing the activity ofthe produced enzyme under solid-state fermentation.
References1. Damaso MCT, Passianoto MA, Freitas SC, Freire DMG, Lago RCA, Couri S. Utilization of agroindustrial residuesfor lipase production by solid-state fermentation. Braz J Microbiol 2008;39:676e81.
2. Vaseghi Z, Najafpour GD, Mohseni S, Mahjoub S, Hosseinpour MN. Lipase production in tray bioreactor via solidstate fermentation under desired growth conditions. Iranica J Energy Environ 2012;3:76e82.
3. Singhara RR, Patel AK, Soccol CR, Pandey A. Recent advances in solid-state fermentation. Biochem Eng J2009;44:13e8.
4. Rigo E, Ninow JL, Di Luccio M, Oliveira JV, Polloni AE, Remonatto D, et al. Lipase production by solidfermentation of soybean meal with different supplements. LWT Food Sci Technol 2010;43:1132e7.
5. Adinarayana K, Raju K, Zargar MI, Devi RB, Lakshmi PJ, Ellaiah P. Optimization of process parameters forproduction of lipase in solid-state fermentation by newly isolated Aspergillus species. Indian J Biotechnol2004;3:65e9.
6. Colen G, Junqueira RG, Moraes-Santos T. Isolation and screening of alkaline lipase-producing fungi fromBrazilian savanna soil. J Microbiol Biotechnol 2006;22:881e5.
7. Hosseinpour MN, Najafpour GD, Younesi H, Khorrami M, Vaseghi Z. Lipase production in solid state fermen-tation using Aspergillus niger: response surface methodology. Int J Eng 2012;25:151e9.
8. Ali HKQ, Zulkali M. Design aspects of bioreactors for solid-state fermentation: a review. Chem Biochem. Eng Q2011;25:255e66.
9. Rodriguez Couto S, Sanroman MA. Application of solid-state fermentation to ligninolytic enzyme production.Biochem. Eng J 2005;22:211e9.
10. Guatarra MLE, Godoy MG, Castilho LR, Freire DMG. Inoculum strategies for Penicillin simplicissimum lipaseproduction by solid state fermentation using a residue from the babassu oil industry. J Chem Technol Biotechnol2007;82:313e8.
REFERENCES 49
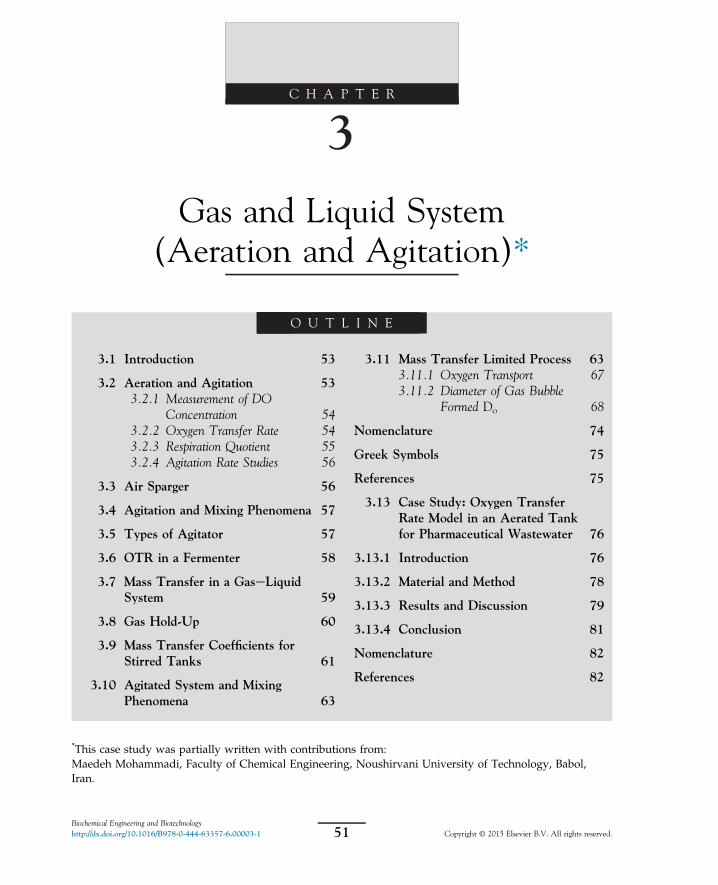
C H A P T E R
3
Gas and Liquid System(Aeration and Agitation)*
O U T L I N E
3.1 Introduction 53
3.2 Aeration and Agitation 533.2.1 Measurement of DO
Concentration 543.2.2 Oxygen Transfer Rate 543.2.3 Respiration Quotient 553.2.4 Agitation Rate Studies 56
3.3 Air Sparger 56
3.4 Agitation and Mixing Phenomena 57
3.5 Types of Agitator 57
3.6 OTR in a Fermenter 58
3.7 Mass Transfer in a GaseLiquidSystem 59
3.8 Gas Hold-Up 60
3.9 Mass Transfer Coefficients forStirred Tanks 61
3.10 Agitated System and MixingPhenomena 63
3.11 Mass Transfer Limited Process 633.11.1 Oxygen Transport 673.11.2 Diameter of Gas Bubble
Formed Do 68
Nomenclature 74
Greek Symbols 75
References 75
3.13 Case Study: Oxygen TransferRate Model in an Aerated Tankfor Pharmaceutical Wastewater 76
3.13.1 Introduction 76
3.13.2 Material and Method 78
3.13.3 Results and Discussion 79
3.13.4 Conclusion 81
Nomenclature 82
References 82
*This case study was partially written with contributions from:Maedeh Mohammadi, Faculty of Chemical Engineering, Noushirvani University of Technology, Babol,Iran.
51Biochemical Engineering and Biotechnologyhttp://dx.doi.org/10.1016/B978-0-444-63357-6.00003-1 Copyright © 2015 Elsevier B.V. All rights reserved.
3.14 Case Study: Fuel and ChemicalProduction from the WatereGasShift Reaction by FermentationProcesses 83
3.14.1 Introduction 83
3.14.2 Kinetics of Growth in a BatchBioreactor 84
3.14.3 Effect of SubstrateConcentration on MicrobialGrowth 88
3.14.4 Mass Transfer Phenomena 91
3.13.5 Kinetic of Water Gas ShiftReaction 93
3.14.6 Growth Kinetics of COSubstrate on C. ljungdahlii 96
Nomenclature 98
Acknowledgments 99
References 99
3. GAS AND LIQUID SYSTEM (AERATION AND AGITATION)52
S U B C H A P T E R
3.1Introduction
In the biochemical engineering profession, there are various bioprocesses actively involvedin the synthesis and production of biological products. Understanding all the processes mayrequire basic knowledge of biology, biochemistry, biotechnology, and real knowledge of en-gineering processes. Transfer of oxygen is a major concern in many bioprocesses in which airis required for microbial growth, such as production of single-cell protein and antibiotics.Agitation in a fermentation unit is directly related to oxygen transported from the gas phaseto the liquid phase followed by oxygen uptake by the individual microbial cell. The activitiesof microorganisms are monitored by the use of oxygen from the supplied air and the respi-ration quotient (RQ). In this chapter, mechanisms of oxygen transport are discussed. The de-tails of process operation are also discussed in this chapter.
3.2 AERATION AND AGITATION
Aeration and agitation as the most vital parameters are implemented in most fermentationprocesses. The word “aerobe” refers to the kind of microorganism that needs molecular ox-ygen for growth and metabolism. “Aerobic” is the condition of living organisms that surviveonly in the presence of molecular oxygen. Aerobic bacteria require oxygen for growth andcan be incubated to be grown in atmospheric air. Oxygen is a strong oxidizing agent thathas the ability to accept electrons for yielding energy, a process known as respiration.
A bioreactor is a reaction vessel in which an organism is cultivated in a controlled mannerto produce cell bodies and/or product. Initially the term “fermenter” was used to describethese vessels, but in strict terms, fermentation is an anaerobic process, whereas most fermen-ters use aerobic processes. Thus, in general terms, “bioreactor” means a vessel in which or-ganisms are grown under either aerobic or anaerobic conditions. In this book, the term“bioreactor” will be used because of its global applications. If a bioreactor or a reaction vesseloperates under aerating conditions, the system is called an aerobic bioreactor. In this situa-tion, sterile air is supplied to the bioreactor as a source of intake for respiration of microor-ganisms. The supplied oxygen is dissolved in the liquid phase. The microorganismsconsume the oxygen that is dissolved in the liquid media for respiration and growth. Thegrowth of aerobic bacteria in the fermenter is controlled by the availability of substrate,oxygen, energy sources, and enzymes. Microbial cultures are always known as heteroge-neous systems, because cells are solid and nutrients are in the liquid phase. The supplied
3.2 AERATION AND AGITATION 53
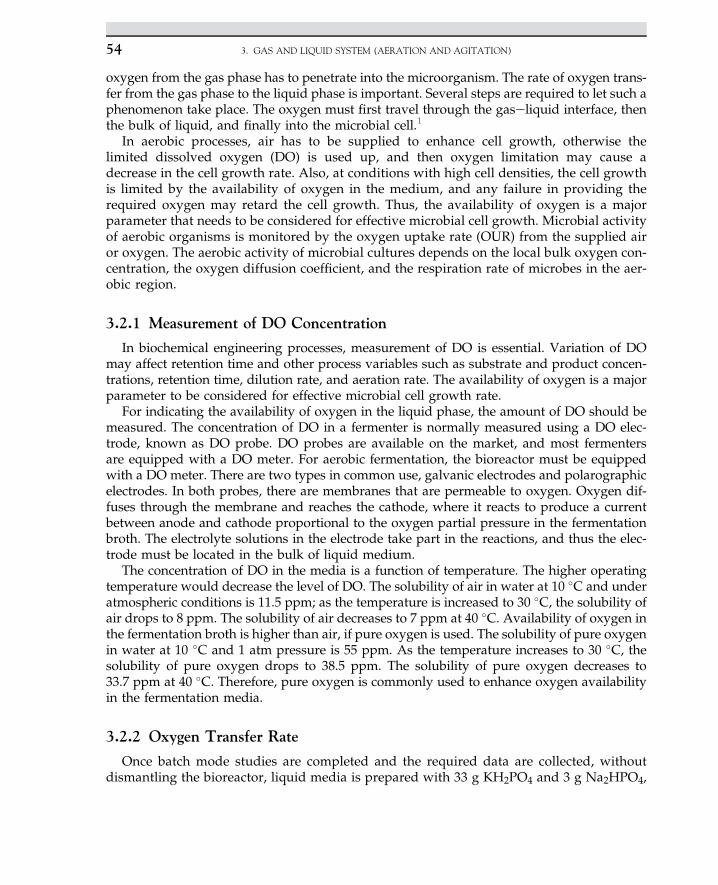
oxygen from the gas phase has to penetrate into the microorganism. The rate of oxygen trans-fer from the gas phase to the liquid phase is important. Several steps are required to let such aphenomenon take place. The oxygen must first travel through the gaseliquid interface, thenthe bulk of liquid, and finally into the microbial cell.1
In aerobic processes, air has to be supplied to enhance cell growth, otherwise thelimited dissolved oxygen (DO) is used up, and then oxygen limitation may cause adecrease in the cell growth rate. Also, at conditions with high cell densities, the cell growthis limited by the availability of oxygen in the medium, and any failure in providing therequired oxygen may retard the cell growth. Thus, the availability of oxygen is a majorparameter that needs to be considered for effective microbial cell growth. Microbial activityof aerobic organisms is monitored by the oxygen uptake rate (OUR) from the supplied airor oxygen. The aerobic activity of microbial cultures depends on the local bulk oxygen con-centration, the oxygen diffusion coefficient, and the respiration rate of microbes in the aer-obic region.
3.2.1 Measurement of DO Concentration
In biochemical engineering processes, measurement of DO is essential. Variation of DOmay affect retention time and other process variables such as substrate and product concen-trations, retention time, dilution rate, and aeration rate. The availability of oxygen is a majorparameter to be considered for effective microbial cell growth rate.
For indicating the availability of oxygen in the liquid phase, the amount of DO should bemeasured. The concentration of DO in a fermenter is normally measured using a DO elec-trode, known as DO probe. DO probes are available on the market, and most fermentersare equipped with a DO meter. For aerobic fermentation, the bioreactor must be equippedwith a DO meter. There are two types in common use, galvanic electrodes and polarographicelectrodes. In both probes, there are membranes that are permeable to oxygen. Oxygen dif-fuses through the membrane and reaches the cathode, where it reacts to produce a currentbetween anode and cathode proportional to the oxygen partial pressure in the fermentationbroth. The electrolyte solutions in the electrode take part in the reactions, and thus the elec-trode must be located in the bulk of liquid medium.
The concentration of DO in the media is a function of temperature. The higher operatingtemperature would decrease the level of DO. The solubility of air in water at 10 �C and underatmospheric conditions is 11.5 ppm; as the temperature is increased to 30 �C, the solubility ofair drops to 8 ppm. The solubility of air decreases to 7 ppm at 40 �C. Availability of oxygen inthe fermentation broth is higher than air, if pure oxygen is used. The solubility of pure oxygenin water at 10 �C and 1 atm pressure is 55 ppm. As the temperature increases to 30 �C, thesolubility of pure oxygen drops to 38.5 ppm. The solubility of pure oxygen decreases to33.7 ppm at 40 �C. Therefore, pure oxygen is commonly used to enhance oxygen availabilityin the fermentation media.
3.2.2 Oxygen Transfer Rate
Once batch mode studies are completed and the required data are collected, withoutdismantling the bioreactor, liquid media is prepared with 33 g KH2PO4 and 3 g Na2HPO4,
3. GAS AND LIQUID SYSTEM (AERATION AND AGITATION)54
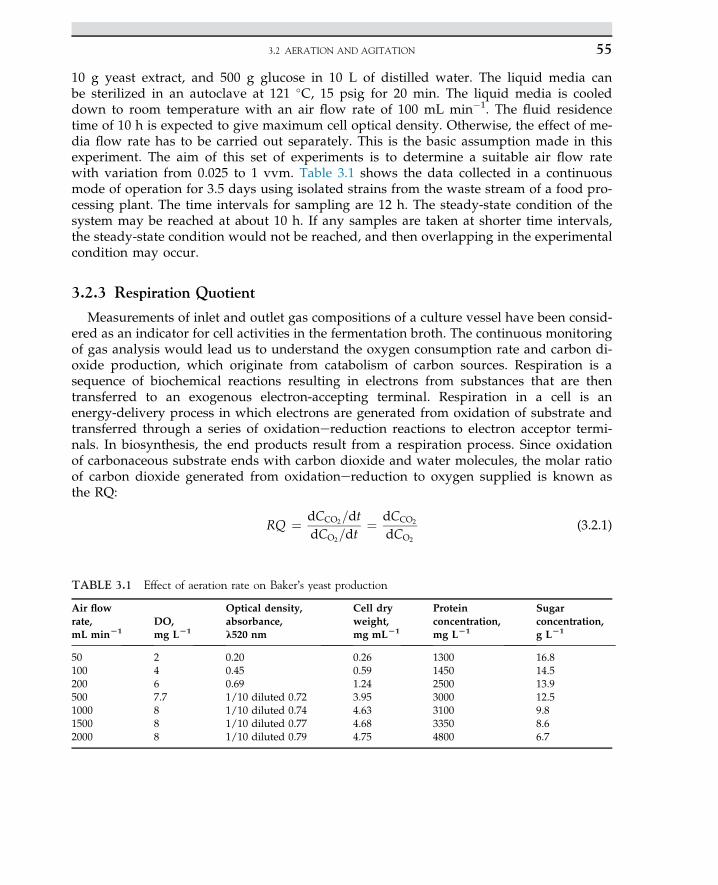
10 g yeast extract, and 500 g glucose in 10 L of distilled water. The liquid media canbe sterilized in an autoclave at 121 �C, 15 psig for 20 min. The liquid media is cooleddown to room temperature with an air flow rate of 100 mL min�1. The fluid residencetime of 10 h is expected to give maximum cell optical density. Otherwise, the effect of me-dia flow rate has to be carried out separately. This is the basic assumption made in thisexperiment. The aim of this set of experiments is to determine a suitable air flow ratewith variation from 0.025 to 1 vvm. Table 3.1 shows the data collected in a continuousmode of operation for 3.5 days using isolated strains from the waste stream of a food pro-cessing plant. The time intervals for sampling are 12 h. The steady-state condition of thesystem may be reached at about 10 h. If any samples are taken at shorter time intervals,the steady-state condition would not be reached, and then overlapping in the experimentalcondition may occur.
3.2.3 Respiration Quotient
Measurements of inlet and outlet gas compositions of a culture vessel have been consid-ered as an indicator for cell activities in the fermentation broth. The continuous monitoringof gas analysis would lead us to understand the oxygen consumption rate and carbon di-oxide production, which originate from catabolism of carbon sources. Respiration is asequence of biochemical reactions resulting in electrons from substances that are thentransferred to an exogenous electron-accepting terminal. Respiration in a cell is anenergy-delivery process in which electrons are generated from oxidation of substrate andtransferred through a series of oxidationereduction reactions to electron acceptor termi-nals. In biosynthesis, the end products result from a respiration process. Since oxidationof carbonaceous substrate ends with carbon dioxide and water molecules, the molar ratioof carbon dioxide generated from oxidationereduction to oxygen supplied is known asthe RQ:
RQ ¼ dCCO2=dtdCO2=dt
¼ dCCO2
dCO2
(3.2.1)
TABLE 3.1 Effect of aeration rate on Baker’s yeast production
Air flowrate,mL minL1
DO,mg LL1
Optical density,absorbance,l520 nm
Cell dryweight,mg mLL1
Proteinconcentration,mg LL1
Sugarconcentration,g LL1
50100200500100015002000
2467.7888
0.200.450.691/10 diluted 0.721/10 diluted 0.741/10 diluted 0.771/10 diluted 0.79
0.260.591.243.954.634.684.75
1300145025003000310033504800
16.814.513.912.59.88.66.7
3.2 AERATION AND AGITATION 55
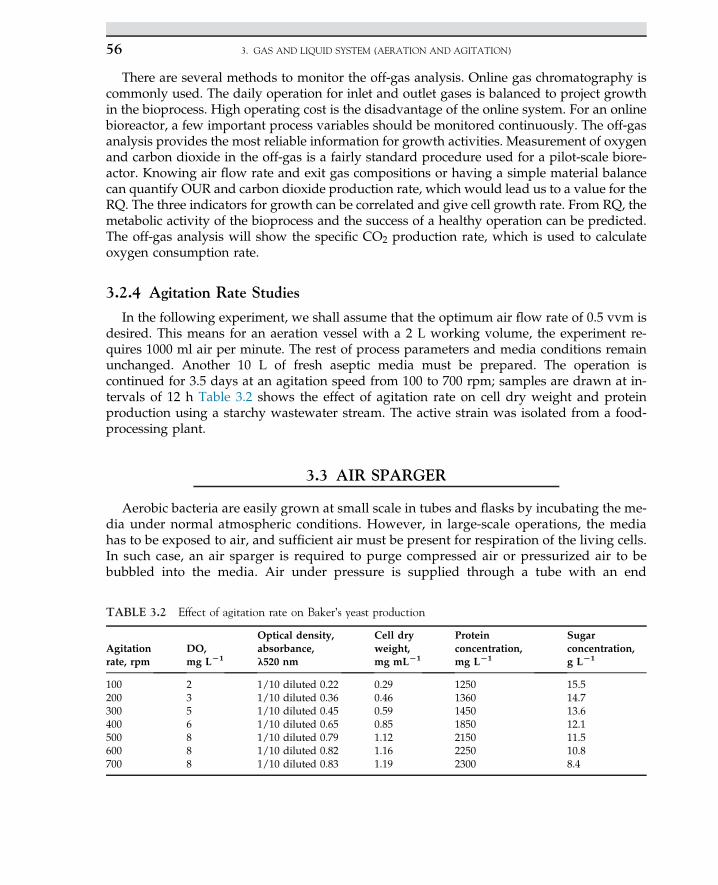
There are several methods to monitor the off-gas analysis. Online gas chromatography iscommonly used. The daily operation for inlet and outlet gases is balanced to project growthin the bioprocess. High operating cost is the disadvantage of the online system. For an onlinebioreactor, a few important process variables should be monitored continuously. The off-gasanalysis provides the most reliable information for growth activities. Measurement of oxygenand carbon dioxide in the off-gas is a fairly standard procedure used for a pilot-scale biore-actor. Knowing air flow rate and exit gas compositions or having a simple material balancecan quantify OUR and carbon dioxide production rate, which would lead us to a value for theRQ. The three indicators for growth can be correlated and give cell growth rate. From RQ, themetabolic activity of the bioprocess and the success of a healthy operation can be predicted.The off-gas analysis will show the specific CO2 production rate, which is used to calculateoxygen consumption rate.
3.2.4 Agitation Rate Studies
In the following experiment, we shall assume that the optimum air flow rate of 0.5 vvm isdesired. This means for an aeration vessel with a 2 L working volume, the experiment re-quires 1000 ml air per minute. The rest of process parameters and media conditions remainunchanged. Another 10 L of fresh aseptic media must be prepared. The operation iscontinued for 3.5 days at an agitation speed from 100 to 700 rpm; samples are drawn at in-tervals of 12 h Table 3.2 shows the effect of agitation rate on cell dry weight and proteinproduction using a starchy wastewater stream. The active strain was isolated from a food-processing plant.
3.3 AIR SPARGER
Aerobic bacteria are easily grown at small scale in tubes and flasks by incubating the me-dia under normal atmospheric conditions. However, in large-scale operations, the mediahas to be exposed to air, and sufficient air must be present for respiration of the living cells.In such case, an air sparger is required to purge compressed air or pressurized air to bebubbled into the media. Air under pressure is supplied through a tube with an end
TABLE 3.2 Effect of agitation rate on Baker’s yeast production
Agitationrate, rpm
DO,mg LL1
Optical density,absorbance,l520 nm
Cell dryweight,mg mLL1
Proteinconcentration,mg LL1
Sugarconcentration,g LL1
100200300400500600700
2356888
1/10 diluted 0.221/10 diluted 0.361/10 diluted 0.451/10 diluted 0.651/10 diluted 0.791/10 diluted 0.821/10 diluted 0.83
0.290.460.590.851.121.161.19
1250136014501850215022502300
15.514.713.612.111.510.88.4
3. GAS AND LIQUID SYSTEM (AERATION AND AGITATION)56
consisting of a perforated plate or “O” ring with very fine holes or orifices. The size of bub-bles depends on the size of hole and type of sparger. For very fine bubbles with effective gasdispersion, a microsparger is used in the fermenter. A microsparger is, in fact, a highlyporous material and is used instead of a gas sparger. The size of bubbles affects the masstransfer process. Smaller bubble size provides more surface area for gas exposure, so a bet-ter oxygen transfer rate (OTR) is obtained. The size of gas bubbles and their dispersionthroughout the reactor vessel are critical for bioreactor performance. Although a spargingunit will provide small size bubble and good gas distribution with sufficient agitation,microspargers are often used because the porous media provides an extensive number offine and uniform bubbles. They are also resistant to plugging of biomass on the outer sur-face of the sparger.
3.4 AGITATION AND MIXING PHENOMENA
Mixing is a physical operation that creates uniformities in fluids and eliminates anyconcentration and temperature gradients. If a system is perfectly mixed, there is homoge-neous distribution of system properties. Mixing is one of the most important operations inbioprocessing. Efficient liquid mixing is essential in a bioreactor to maintain not only auniform DO concentration, but also a uniform liquid concentration. To createan optimum environment in the bioreactor, agitation is required for cells to have accessto all substrates, including oxygen in aerobic cultures. Another aspect of an agitated systemis uniform heat transfer. Most bioreactors must be able to operate at a constant uniformtemperature. A jacketed system for cooling, or a cooling coil, is provided for sufficientheat transfer. The objectives of agitation and effective mixing are to circulate the fluidfor sufficient time, to disperse the gas bubbles in the liquid, to have small bubbles withhigh interfacial area, and to maintain uniform conditions for mass and heat transferoperations.
Agitation creates uniformity of gas bubbles in the entire media by placing the agitator inthe appropriate position. A few sets of impellers are used to ensure the even distribution ofthe gas in the fermentation broth. Very high agitation may cause high shear forces that maydamage the cell wall and cause cell rupture. If the propagating cells, such as animal cells andplant tissue cultures, are shear-sensitive, special configurations of impellers are required.A wide variety of impellers are available; other shapes of impellers related to mixing andagitation of bioreactors are discussed in the literature.2
3.5 TYPES OF AGITATOR
Gas dispersion is not mainly related to the sparger, but rather is dependent on the type ofimpeller used for agitation. There are four types of agitator commonly used in bioreactors:
• Disk turbine (Rushton turbine)• Inclined blade turbine
3.5 TYPES OF AGITATOR 57
• Propeller, marine type• Intermig.
These types of agitators are used in low-viscosity systems (m < 50 kg m�1 s�1) with highrotational speed. The typical tip speed velocity for turbine and intermig is in the region of3 m s�1, a propeller rotates faster. These impellers are classified as remote clearance type, hav-ing diameters in the range of 25e67% of the tank diameter.
The most common type of agitator is disk turbine. It consists of several short bladesmounted on a central shaft. The diameter of a turbine is normally 35e45% of the tankdiameter. There are four to six blades for perfect mixing. Turbines with flat bladesgive radial flow. This is good for gas dispersion in the media where the gas is introducedjust below the impeller; it is drawn up to the blades and broken up into uniform finebubbles.
The propeller agitator with three blades rotates at relatively high speeds of 60e300 rpm;high efficient mixing is obtained. The generated flow pattern is axial flow since the fluidmoves axially down to the center and up the side of the tank.
The intermig agitator is the most recently developed agitator. This is an axial pumpingimpeller in which the blades are mounted at an angle opposite each other. Comparingthe mixing properties of disk turbine agitator with an intermig agitator, the intermigagitator has more uniform energy transferred to the fluid in the vessel. Therefore, thistype of agitator requires less power and less air input to obtain the same degree of mixingand mass transfer coefficient.
3.6 OTR IN A FERMENTER
The molar flux of oxygen is generalized in a simple equation, with the concentrationgradient as the major driving force in the transfer of oxygen from gas and liquid interfaceto the bulk of liquid. The rate of oxygen transfer in a fermenter broth is influenced by severalphysical and chemical parameters that change either kL, the value of interfacial area of bub-bles (a), or the concentration gradient known as the driving force for the mass transfer. At lowconcentrations of the soluble gas, the molar flux of oxygen transported to the fermentationmedia is3:
NA ¼ kLa�C�
AL � CAL�
(3.6.1)
where NA is the oxygen flux in kmol m�2 s�1, kL is the liquid side mass transfer coefficient inm2 s�1, C�
AL is the oxygen concentration in equilibrium with the liquid phase at the interface inkmol m�3, CAL is the oxygen concentration in the bulk of liquid in kmol m�3, and a is theinterfacial area in surface area of bubbles per unit volume of broth (m2 m�3). The DO canbe measured at one or several points in the vessel, depending on vessel size, using a DOprobe. In the large bioreactor, the partial pressure of oxygen in the gas will fall as it passesthrough the fermentation broth.
Plog mean ¼ Pin � Pout
lnðPin=PoutÞ (3.6.2)
3. GAS AND LIQUID SYSTEM (AERATION AND AGITATION)58
The equilibrium concentration is evaluated from Henry’s law.3,4 The equilibrium concen-tration of oxygen is calculated by the ratio of mean value of pressure over Henry’s law con-stant, H.
C� ¼ Plog mean
H(3.6.3)
This is the most accurate method of measuring the mass transfer coefficient, and it canbe used in the actual fermentation system. It depends on accurate oxygen analyses and accu-rate measurement of temperature and pressure. For bubble sizes of 2e3 mm diameter in thefermentation broth, the mass transfer coefficient is about 3 � 10�4 to 4 � 10�4 m s�1.
3.7 MASS TRANSFER IN A GASeLIQUID SYSTEM
The molar flux of oxygen is generalized in a simple equation, with the concentrationgradient as the major driving force in the transfer of oxygen from gas and liquid interfaceto the bulk of liquid. Oxygen transfer at low concentrations is proportional to the oxygen con-centration gradient existing on the interface of the gas and liquid bulk phases. The molar fluxof oxygen from the gas phase to the liquid phase is stated as:
JO2 ¼ kg�PO2 � PO2;i
�(3.7.1)
where JO2 is the molar flux of oxygen in (mol m�2 s�1), kg is the mass transfer coefficient in thegas side in (mol m�2 atm�1 s�1), PO2 is the oxygen partial pressure in the bulk of gas phase in(atm), and PO2;i is the oxygen partial pressure at the interface in (atm). The molar flux ofoxygen from the gaseliquid interface to the bulk of liquid is expressed as:
JO2 ¼ kl�Ci � Cl
�(3.7.2)
where NA is oxygen flux in kmol m�2 s�1, kL is the mass transfer coefficient in liquidside in (m s�1), Ci is oxygen concentration at the interface in (mol m�3), and CL is oxygen con-centration in the bulk of liquid in (mol m�3). Based on film theory and considering the steady-state condition, the oxygen flux in the gas film is equal to the flux in the liquid film:
JO2 ¼ kg�PO2 � PO2;i
� ¼ kl�Ci � Cl
�(3.7.3)
Since it is impossible to measure the interface concentration by knowing the molar flux andmass transfer coefficient, the bulk driving force and equilibrium concentrations should beconsidered:
JO2 ¼ Kg�PO2 � P�� ¼ Kl
�C� � Cl
�(3.7.4)
where Kg and Kl are the overall mass transfer coefficients in the gas and liquid phase,respectively, P* is the partial pressure of oxygen in equilibrium with liquid phase, and C*
is the saturation concentration of oxygen in liquid bulk in equilibrium with gas phase. Theequilibrium partial pressure of oxygen can be related to the equilibrium concentration ofthe gas in the liquid using Henry’s law as follows:
P� ¼ HC� (3.7.5)
3.7 MASS TRANSFER IN A GASeLIQUID SYSTEM 59
where H is the Henry’s constant in (atm m3 mol�1). Combing Eqns (3.7.3) and (3.7.4) andconsidering the Henry’s law, the resistances in series are written as:
1Kl
¼ 1klþ 1Hkg
(3.7.6)
For slightly soluble gases, H is defined as a large value (769.23 L atm mol�1). In such case,the resistance to mass transfer lies on the liquid film side, and the gas phase resistance can beneglected. Thus, the overall mass transfer coefficient for sparingly soluble gases equals to thelocal mass transfer coefficient: KL ¼ kL. Thus, the molar flux of oxygen from the gas phase toliquid phase can be expressed as:
JO2 ¼ kl�C� � Cl
�(3.7.7)
The molar flux of oxygen in the gas phase to liquid phase is also stated as:
Na ¼ kg�PO2 � PO2;i
�(3.7.8)
where kg is the mass transfer coefficient at the gas side in kmol m�2 atm�1 s�1, PO2 is the ox-ygen partial pressure at the bulk of gas phase in atmospheres, and PO2;i oxygen partial pres-sure at interface. It is impossible to measure the interface concentration by the molar fluxwithout knowing the mass transfer coefficient.
NA ¼ KLðC� � CLÞ (3.7.9)
where KL is the overall mass transfer coefficient, then, Henry’s law is
P ¼ HC� (3.7.10)
1KL
¼ 1kL
þ 1Hkg
(3.7.11)
For the OTR, the interface area is important. For oxygen bubbles, the surface area of bub-bles is defined as:
a ¼ Surface areaVolume
¼ m2
m3(3.7.12)
By multiplying both sides of Eqns (3.7.9) with (3.7.12), the following equation results:
�rA ¼ KLaðC� � CLÞ (3.7.12)
where, �rA is the consumption rate of substrate A in mol L�1 s�1.
3.8 GAS HOLD-UP
The fraction of the fluid volume occupied by gas is called gas hold-up: that is, the volumefraction of gas phase to total gaseliquid volume. Small bubbles lead to higher gas hold-up,which is defined by the following equation4,5:
ε ¼ Vg
Vl þ Vg(3.8.1)
3. GAS AND LIQUID SYSTEM (AERATION AND AGITATION)60
where ε is the gas hold-up, Vg is the volume of gas bubbles in the reactor in (m3), and Vl is thevolume of liquid in the fermenter in (m3). The interfacial surface area of bubbles, assumingspherical bubbles, can be calculated as:
a ¼ 6εdb
(3.8.2)
where db is the average bubble diameter in (m).
3.9 MASS TRANSFER COEFFICIENTS FOR STIRRED TANKS
Agitation of fermentation broth creates a uniform distribution of air in the media. Once asolution is mixed, some energy is exerted into the system. Increasing the input power reducesthe bubble size, and this in turn increases the interfacial area. Therefore, the mass transfer co-efficient would be a function of power input per unit volume of fermentation broth, whichis also affected by the gas superficial velocity.2,3 The general correlation is expected to beas follows:
kla ¼ a
�PVl
�y
vzs (3.9.1)
where kla is the volumetric mass transfer coefficient in (s�1), a is proportionality factor as aconstant, P is the agitator power under gassing condition in (W), Vl is the liquid volumewithout gassing in (m3); vs is the gas superficial velocity in (m s�1), and y and z are empiricalconstants. Most laboratory fermenters operate with a stirrer power between 10 and20 kW m�3, whereas large bioreactors operate at 0.5e5 kW m�3. The mass transfer coefficientfor coalescing airewater dispersion is:
kla ¼ 2:6� 10�2
�PVl
�0:4
v0:5s (3.9.2)
The above correlation is valid for a bioreactor size of less than 3000 L and a gassed powerper unit volume of 0.5e10 kW. For noncoalescing (nonsticky) aireelectrolyte dispersion, theexponents of the gassed power per unit volume and gas superficial velocity in the correlationof mass transfer coefficient change slightly. The empirical correlation with defined coeffi-cients may come from the experimental data with a well-defined bioreactor with a workingvolume of less than 5000 L and a gassed power per unit volume of 0.5e10 kW. The definedcorrelation is:
kla ¼ 2� 10�3
�PVl
�0:7
v0:2s (3.9.3)
This empirical correlation was obtained from the experimental data with a well-definedbioreactor with a working volume of less than 5000 L and a gassed power per unit volumeof 0.5e10 kW.
In general, coalescing systems are those in which the water is relatively pure; noncoalesc-ing systems are those in which a small amount of electrolytes presents in the system.
3.9 MASS TRANSFER COEFFICIENTS FOR STIRRED TANKS 61
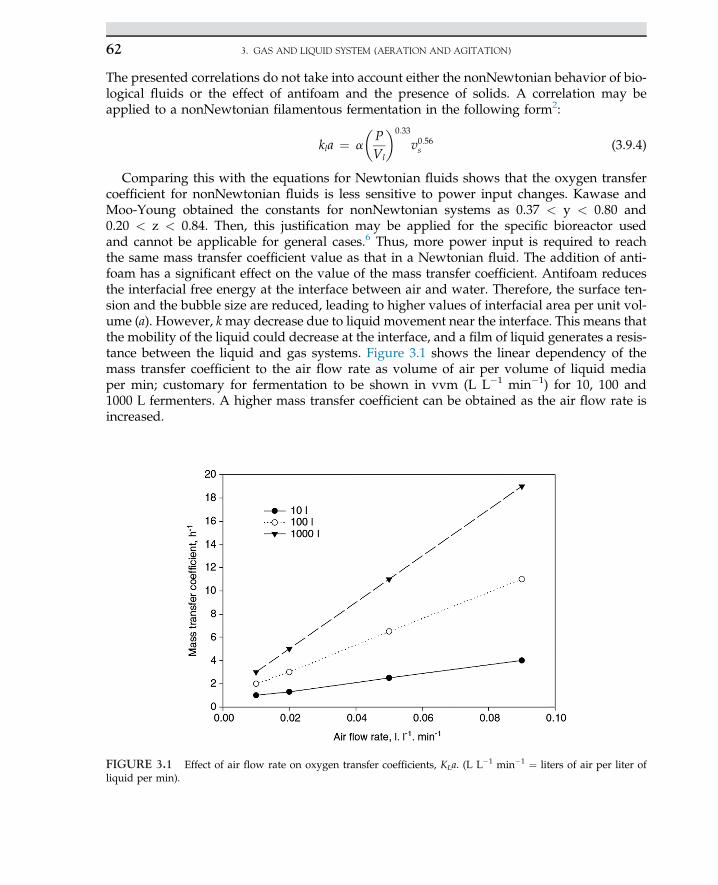
The presented correlations do not take into account either the nonNewtonian behavior of bio-logical fluids or the effect of antifoam and the presence of solids. A correlation may beapplied to a nonNewtonian filamentous fermentation in the following form2:
kla ¼ a
�PVl
�0:33
v0:56s (3.9.4)
Comparing this with the equations for Newtonian fluids shows that the oxygen transfercoefficient for nonNewtonian fluids is less sensitive to power input changes. Kawase andMoo-Young obtained the constants for nonNewtonian systems as 0.37 < y < 0.80 and0.20 < z < 0.84. Then, this justification may be applied for the specific bioreactor usedand cannot be applicable for general cases.6 Thus, more power input is required to reachthe same mass transfer coefficient value as that in a Newtonian fluid. The addition of anti-foam has a significant effect on the value of the mass transfer coefficient. Antifoam reducesthe interfacial free energy at the interface between air and water. Therefore, the surface ten-sion and the bubble size are reduced, leading to higher values of interfacial area per unit vol-ume (a). However, kmay decrease due to liquid movement near the interface. This means thatthe mobility of the liquid could decrease at the interface, and a film of liquid generates a resis-tance between the liquid and gas systems. Figure 3.1 shows the linear dependency of themass transfer coefficient to the air flow rate as volume of air per volume of liquid mediaper min; customary for fermentation to be shown in vvm (L L�1 min�1) for 10, 100 and1000 L fermenters. A higher mass transfer coefficient can be obtained as the air flow rate isincreased.
FIGURE 3.1 Effect of air flow rate on oxygen transfer coefficients, KLa. (L L�1 min�1 ¼ liters of air per liter ofliquid per min).
3. GAS AND LIQUID SYSTEM (AERATION AND AGITATION)62
3.10 AGITATED SYSTEM AND MIXING PHENOMENA
The following treatment of agitation is restricted to fluids that approximate to Newtonianfluids. Because mixing is a complex process, the variables involved are considered together ina dimensionless group known as the Reynolds number (Re). Re is used to characterize thebehavior of flow:
Re ¼ Inertia forcesViscous forces
¼ rD2i Nm
(3.10.1)
where Di is the impeller diameter in m, N is the rotational speed of impellers in round persecond (rps), r is the fluid density in kg m�3, and m is the viscosity of the fluid inkg m�1 s�1. Fully turbulent flow exists above a Reynolds number of 104, whereas fullylaminar flow exists below 100; in between is the transitional region. Another group of dimen-sionless variables that are used to characterize mixing in a vessel is the Froude number (Fr),which takes gravitational forces into account:
Fr ¼ Inertia forcesGravity forces
¼ N2Di
g(3.10.2)
where g is gravitational acceleration in m s�2. A third group, which is related to energyrequired by the agitator, is the power number. This shows the power consumption for stir-ring. The power consumption is related to fluid properties, the density and viscosity of thefluid, the stirrer rotation rate, and the impeller diameter. Several well-known studies haveshown the relation between power number and Reynolds number; the laminar region is astraight line, but it depends on the shape of the impellers.2,4,5 Marine propellers requireless energy compared with flat blade turbine disks. The power in the turbulent region is pro-portional to N3
i D5i ; therefore the power number is the ratio of power for the aerated fluid and
the nonaerated powered system, which is:
NPo ¼ P$gcN3D5
i r(3.10.3)
where P is agitator power in W. The power number for laminar flow is proportional to theinverse of the Reynolds number, Npo z k1/Rei; for turbulent flow, the agitation power is pro-portional to K2N3D5
i r, where units for agitation power are in W, kW, or hp.
3.11 MASS TRANSFER LIMITED PROCESS
The transfer of oxygen from the gas phase to the liquid phase becomes “mass transferlimited” when sufficient oxygen is not supplied to the fermentation broth, especially in cul-tures with high cell density. Some actual cases are.
• In a large-scale fermenter for penicillin production.• In production of extracellular biopolymers such as xanthan gum.• In wastewater treatment with an activated sludge system.
3.11 MASS TRANSFER LIMITED PROCESS 63
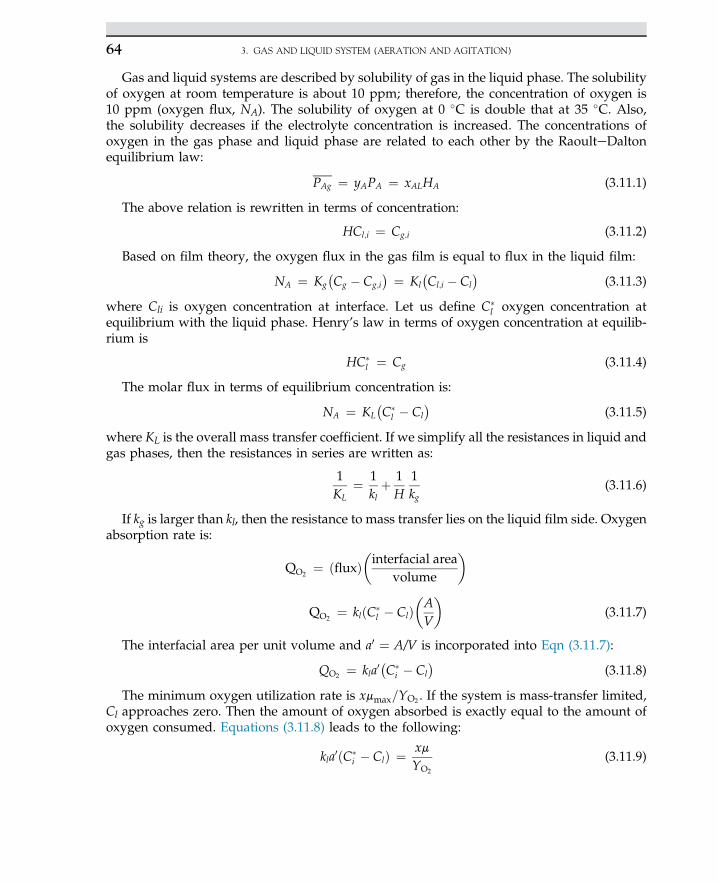
Gas and liquid systems are described by solubility of gas in the liquid phase. The solubilityof oxygen at room temperature is about 10 ppm; therefore, the concentration of oxygen is10 ppm (oxygen flux, NA). The solubility of oxygen at 0 �C is double that at 35 �C. Also,the solubility decreases if the electrolyte concentration is increased. The concentrations ofoxygen in the gas phase and liquid phase are related to each other by the RaoulteDaltonequilibrium law:
PAg ¼ yAPA ¼ xALHA (3.11.1)
The above relation is rewritten in terms of concentration:
HCl;i ¼ Cg;i (3.11.2)
Based on film theory, the oxygen flux in the gas film is equal to flux in the liquid film:
NA ¼ Kg�Cg � Cg;i
� ¼ Kl�Cl;i � Cl
�(3.11.3)
where Cli is oxygen concentration at interface. Let us define C�l oxygen concentration at
equilibrium with the liquid phase. Henry’s law in terms of oxygen concentration at equilib-rium is
HC�l ¼ Cg (3.11.4)
The molar flux in terms of equilibrium concentration is:
NA ¼ KL�C�
l � Cl�
(3.11.5)
where KL is the overall mass transfer coefficient. If we simplify all the resistances in liquid andgas phases, then the resistances in series are written as:
1KL
¼ 1klþ 1H
1kg
(3.11.6)
If kg is larger than kl, then the resistance to mass transfer lies on the liquid film side. Oxygenabsorption rate is:
QO2¼ ðfluxÞ
�interfacial area
volume
�
QO2¼ klðC�
l � Cl�AV
�(3.11.7)
The interfacial area per unit volume and a0 ¼ A/V is incorporated into Eqn (3.11.7):
QO2 ¼ kla0�C�
i � Cl�
(3.11.8)
The minimum oxygen utilization rate is xmmax=YO2 . If the system is mass-transfer limited,Cl approaches zero. Then the amount of oxygen absorbed is exactly equal to the amount ofoxygen consumed. Equations (3.11.8) leads to the following:
kla0ðC�i � ClÞ ¼ xm
YO2
(3.11.9)
3. GAS AND LIQUID SYSTEM (AERATION AND AGITATION)64
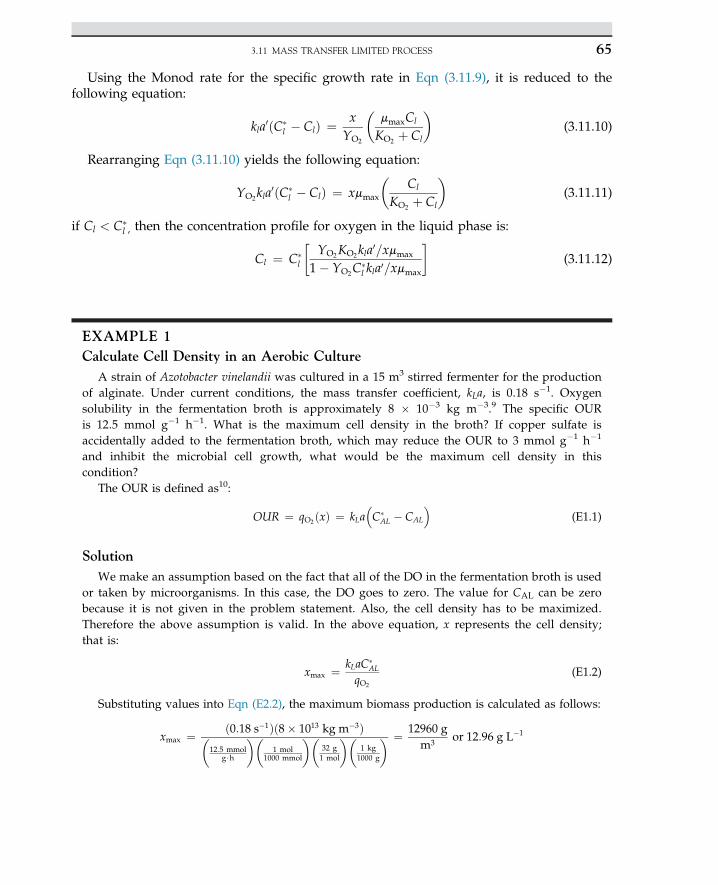
Using the Monod rate for the specific growth rate in Eqn (3.11.9), it is reduced to thefollowing equation:
kla0ðC�l � ClÞ ¼ x
YO2
�mmaxCl
KO2 þ Cl
�(3.11.10)
Rearranging Eqn (3.11.10) yields the following equation:
YO2kla0ðC�
l � ClÞ ¼ xmmax
�Cl
KO2 þ Cl
�(3.11.11)
if Cl < C�l , then the concentration profile for oxygen in the liquid phase is:
Cl ¼ C�l
�YO2KO2kla
0=xmmax
1� YO2C�l kla0=xmmax
�(3.11.12)
EXAMPLE 1Calculate Cell Density in an Aerobic Culture
A strain of Azotobacter vinelandii was cultured in a 15 m3 stirred fermenter for the productionof alginate. Under current conditions, the mass transfer coefficient, kLa, is 0.18 s�1. Oxygensolubility in the fermentation broth is approximately 8 � 10�3 kg m�3.9 The specific OURis 12.5 mmol g�1 h�1. What is the maximum cell density in the broth? If copper sulfate isaccidentally added to the fermentation broth, which may reduce the OUR to 3 mmol g�1 h�1
and inhibit the microbial cell growth, what would be the maximum cell density in thiscondition?
The OUR is defined as10:
OUR ¼ qO2ðxÞ ¼ kLa�C�
AL � CAL
(E1.1)
SolutionWe make an assumption based on the fact that all of the DO in the fermentation broth is used
or taken by microorganisms. In this case, the DO goes to zero. The value for CAL can be zerobecause it is not given in the problem statement. Also, the cell density has to be maximized.Therefore the above assumption is valid. In the above equation, x represents the cell density;that is:
xmax ¼ kLaC�AL
qO2
(E1.2)
Substituting values into Eqn (E2.2), the maximum biomass production is calculated as follows:
xmax ¼ ð0:18 s�1Þð8� 1013 kg m�3Þ�12:5 mmol
g$h
��1 mol
1000 mmol
��32 g1 mol
��1 kg1000 g
� ¼ 12960 gm3
or 12:96 g L�1
3.11 MASS TRANSFER LIMITED PROCESS 65
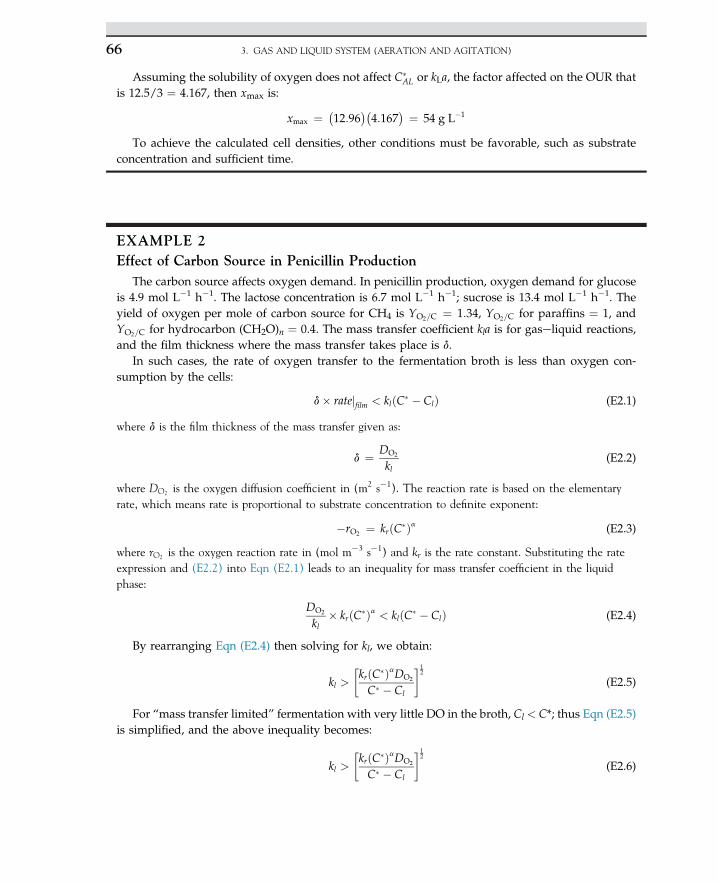
Assuming the solubility of oxygen does not affect C�AL or kLa, the factor affected on the OUR that
is 12.5/3 ¼ 4.167, then xmax is:
xmax ¼ �12:96
��4:167
� ¼ 54 g L�1
To achieve the calculated cell densities, other conditions must be favorable, such as substrateconcentration and sufficient time.
EXAMPLE 2Effect of Carbon Source in Penicillin Production
The carbon source affects oxygen demand. In penicillin production, oxygen demand for glucoseis 4.9 mol L�1 h�1. The lactose concentration is 6.7 mol L�1 h�1; sucrose is 13.4 mol L�1 h�1. Theyield of oxygen per mole of carbon source for CH4 is YO2=C ¼ 1:34, YO2=C for paraffins ¼ 1, andYO2=C for hydrocarbon (CH2O)n ¼ 0.4. The mass transfer coefficient kla is for gaseliquid reactions,and the film thickness where the mass transfer takes place is d.
In such cases, the rate of oxygen transfer to the fermentation broth is less than oxygen con-sumption by the cells:
d� ratejfilm < klðC� � ClÞ (E2.1)
where d is the film thickness of the mass transfer given as:
d ¼ DO2
kl(E2.2)
where DO2 is the oxygen diffusion coefficient in (m2 s�1). The reaction rate is based on the elementaryrate, which means rate is proportional to substrate concentration to definite exponent:
�rO2 ¼ krðC�Þa (E2.3)
where rO2 is the oxygen reaction rate in (mol m�3 s�1) and kr is the rate constant. Substituting the rateexpression and (E2.2) into Eqn (E2.1) leads to an inequality for mass transfer coefficient in the liquidphase:
DO2
kl� krðC�Þa < klðC� � ClÞ (E2.4)
By rearranging Eqn (E2.4) then solving for kl, we obtain:
kl >�krðC�ÞaDO2
C� � Cl
�12
(E2.5)
For “mass transfer limited” fermentation with very little DO in the broth, Cl < C*; thus Eqn (E2.5)is simplified, and the above inequality becomes:
kl >�krðC�ÞaDO2
C� � Cl
�12
(E2.6)
3. GAS AND LIQUID SYSTEM (AERATION AND AGITATION)66
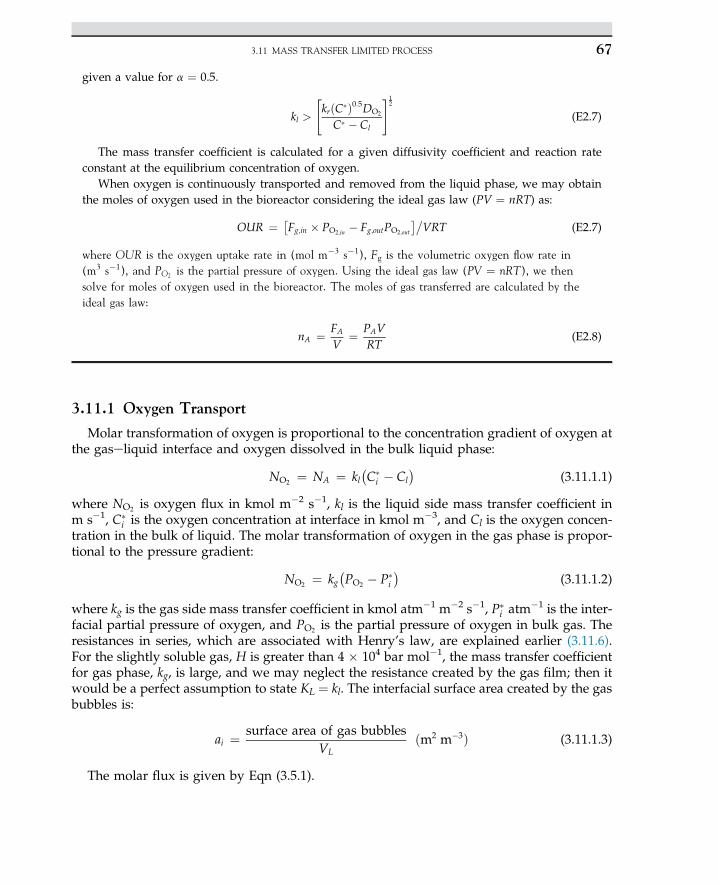
given a value for a ¼ 0.5.
kl >
"krðC�Þ0:5DO2
C� � Cl
#12
(E2.7)
The mass transfer coefficient is calculated for a given diffusivity coefficient and reaction rateconstant at the equilibrium concentration of oxygen.
When oxygen is continuously transported and removed from the liquid phase, we may obtainthe moles of oxygen used in the bioreactor considering the ideal gas law (PV ¼ nRT) as:
OUR ¼ Fg;in � PO2;in � Fg;outPO2;out
��VRT (E2.7)
where OUR is the oxygen uptake rate in (mol m�3 s�1), Fg is the volumetric oxygen flow rate in(m3 s�1), and PO2 is the partial pressure of oxygen. Using the ideal gas law (PV ¼ nRT), we thensolve for moles of oxygen used in the bioreactor. The moles of gas transferred are calculated by theideal gas law:
nA ¼ FA
V¼ PAV
RT(E2.8)
3.11.1 Oxygen Transport
Molar transformation of oxygen is proportional to the concentration gradient of oxygen atthe gaseliquid interface and oxygen dissolved in the bulk liquid phase:
NO2 ¼ NA ¼ kl�C�
i � Cl�
(3.11.1.1)
where NO2 is oxygen flux in kmol m�2 s�1, kl is the liquid side mass transfer coefficient inm s�1, C�
i is the oxygen concentration at interface in kmol m�3, and Cl is the oxygen concen-tration in the bulk of liquid. The molar transformation of oxygen in the gas phase is propor-tional to the pressure gradient:
NO2 ¼ kg�PO2 � P�
i
�(3.11.1.2)
where kg is the gas side mass transfer coefficient in kmol atm�1 m�2 s�1, P�i atm
�1 is the inter-facial partial pressure of oxygen, and PO2 is the partial pressure of oxygen in bulk gas. Theresistances in series, which are associated with Henry’s law, are explained earlier (3.11.6).For the slightly soluble gas, H is greater than 4 � 104 bar mol�1, the mass transfer coefficientfor gas phase, kg, is large, and we may neglect the resistance created by the gas film; then itwould be a perfect assumption to state KL ¼ kl. The interfacial surface area created by the gasbubbles is:
ai ¼ surface area of gas bubbles
VLðm2 m�3Þ (3.11.1.3)
The molar flux is given by Eqn (3.5.1).
3.11 MASS TRANSFER LIMITED PROCESS 67
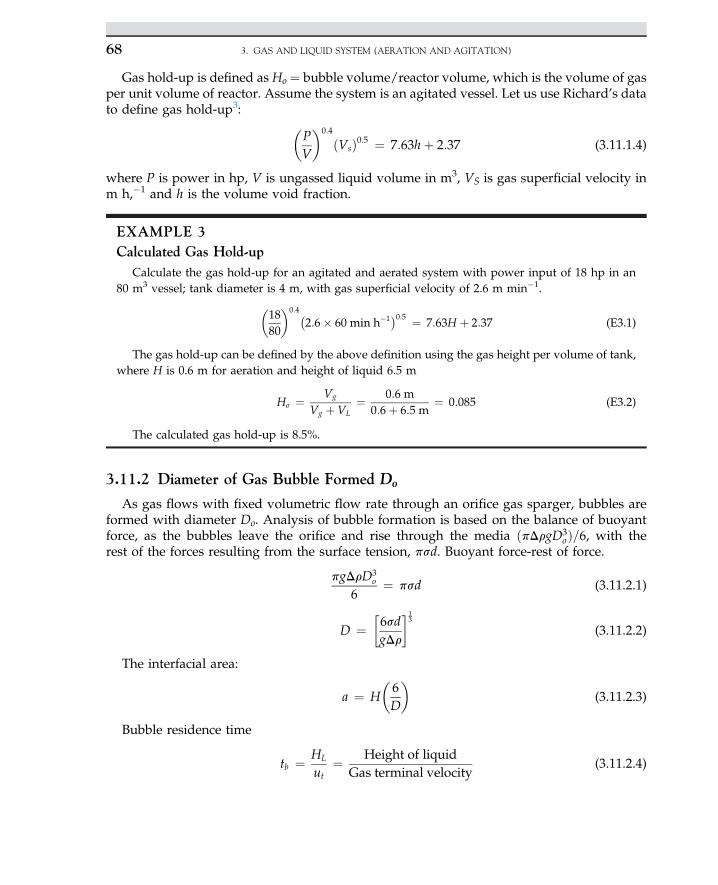
Gas hold-up is defined as Ho ¼ bubble volume/reactor volume, which is the volume of gasper unit volume of reactor. Assume the system is an agitated vessel. Let us use Richard’s datato define gas hold-up3: �
PV
�0:4
ðVsÞ0:5 ¼ 7:63hþ 2:37 (3.11.1.4)
where P is power in hp, V is ungassed liquid volume in m3, VS is gas superficial velocity inm h,�1 and h is the volume void fraction.
EXAMPLE 3Calculated Gas Hold-up
Calculate the gas hold-up for an agitated and aerated system with power input of 18 hp in an80 m3 vessel; tank diameter is 4 m, with gas superficial velocity of 2.6 m min�1.�
1880
�0:4�2:6� 60min h�1�0:5 ¼ 7:63H þ 2:37 (E3.1)
The gas hold-up can be defined by the above definition using the gas height per volume of tank,where H is 0.6 m for aeration and height of liquid 6.5 m
Ho ¼ Vg
Vg þ VL¼ 0:6 m
0:6þ 6:5 m¼ 0:085 (E3.2)
The calculated gas hold-up is 8.5%.
3.11.2 Diameter of Gas Bubble Formed Do
As gas flows with fixed volumetric flow rate through an orifice gas sparger, bubbles areformed with diameter Do. Analysis of bubble formation is based on the balance of buoyantforce, as the bubbles leave the orifice and rise through the media ðpDrgD3
oÞ=6, with therest of the forces resulting from the surface tension, psd. Buoyant force-rest of force.
pgDrD3o
6¼ psd (3.11.2.1)
D ¼�6sdgDr
�13
(3.11.2.2)
The interfacial area:
a ¼ H�6D
�(3.11.2.3)
Bubble residence time
tb ¼ HL
ut¼ Height of liquid
Gas terminal velocity(3.11.2.4)
3. GAS AND LIQUID SYSTEM (AERATION AND AGITATION)68
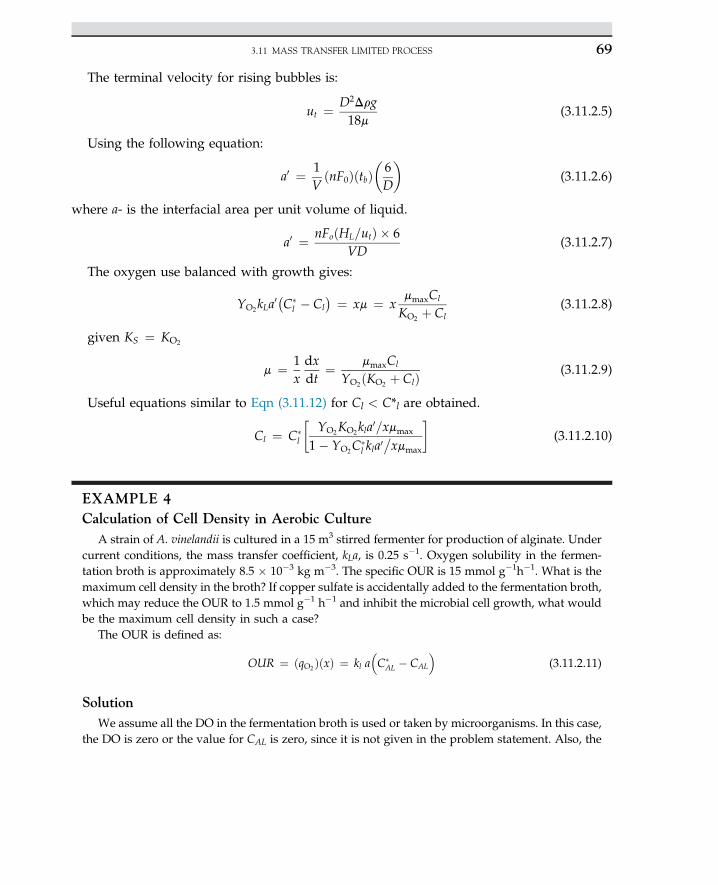
The terminal velocity for rising bubbles is:
ut ¼ D2Drg18m
(3.11.2.5)
Using the following equation:
a0 ¼ 1VðnF0ÞðtbÞ
�6D
�(3.11.2.6)
where a- is the interfacial area per unit volume of liquid.
a0 ¼ nFoðHL=utÞ � 6VD
(3.11.2.7)
The oxygen use balanced with growth gives:
YO2kLa0�C�
l � Cl� ¼ xm ¼ x
mmaxCl
KO2 þ Cl(3.11.2.8)
given KS ¼ KO2
m ¼ 1xdxdt
¼ mmaxCl
YO2ðKO2 þ ClÞ (3.11.2.9)
Useful equations similar to Eqn (3.11.12) for Cl < C*l are obtained.
Cl ¼ C�l
�YO2KO2kla
0=xmmax
1� YO2C�l kla0
�xmmax
�(3.11.2.10)
EXAMPLE 4Calculation of Cell Density in Aerobic Culture
A strain of A. vinelandii is cultured in a 15 m3 stirred fermenter for production of alginate. Undercurrent conditions, the mass transfer coefficient, kLa, is 0.25 s�1. Oxygen solubility in the fermen-tation broth is approximately 8.5 � 10�3 kg m�3. The specific OUR is 15 mmol g�1h�1. What is themaximum cell density in the broth? If copper sulfate is accidentally added to the fermentation broth,which may reduce the OUR to 1.5 mmol g�1 h�1 and inhibit the microbial cell growth, what wouldbe the maximum cell density in such a case?
The OUR is defined as:
OUR ¼ ðqO2ÞðxÞ ¼ kl a�C�
AL � CAL
(3.11.2.11)
SolutionWe assume all the DO in the fermentation broth is used or taken by microorganisms. In this case,
the DO is zero or the value for CAL is zero, since it is not given in the problem statement. Also, the
3.11 MASS TRANSFER LIMITED PROCESS 69
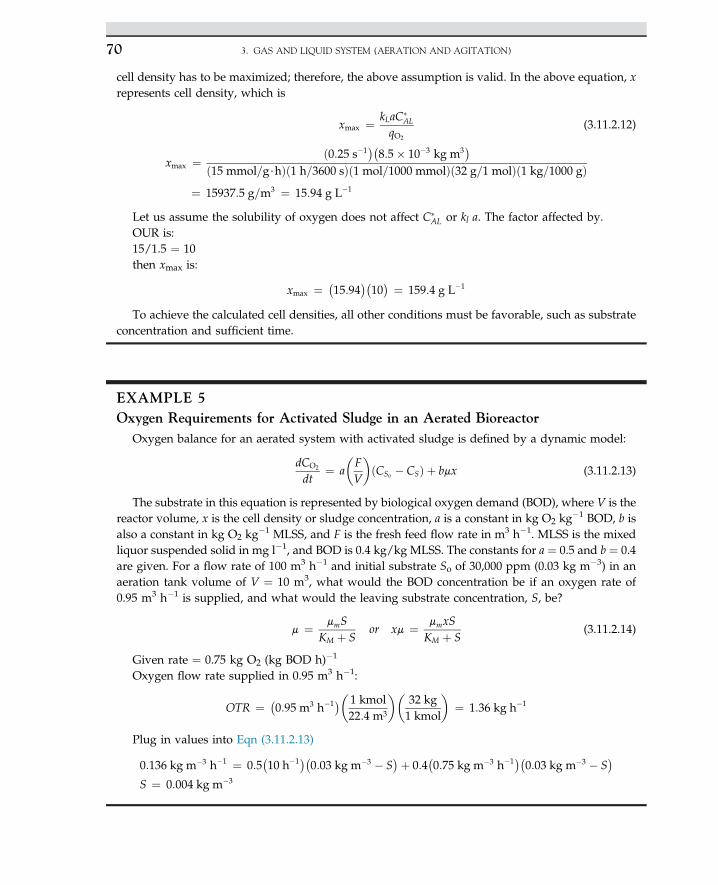
cell density has to be maximized; therefore, the above assumption is valid. In the above equation, xrepresents cell density, which is
xmax ¼ kLaC�AL
qO2
(3.11.2.12)
xmax ¼ ð0:25 s�1��8:5� 10�3 kg m3
�ð15 mmol=g$hÞð1 h=3600 sÞð1 mol=1000 mmolÞð32 g=1 molÞð1 kg=1000 gÞ
¼ 15937:5 g=m3 ¼ 15:94 g L�1
Let us assume the solubility of oxygen does not affect C�AL or kl a. The factor affected by.
OUR is:15/1.5 ¼ 10then xmax is:
xmax ¼ �15:94
��10� ¼ 159:4 g L�1
To achieve the calculated cell densities, all other conditions must be favorable, such as substrateconcentration and sufficient time.
EXAMPLE 5Oxygen Requirements for Activated Sludge in an Aerated Bioreactor
Oxygen balance for an aerated system with activated sludge is defined by a dynamic model:
dCO2
dt¼ a
�FV
�ðCSo � CSÞ þ bmx (3.11.2.13)
The substrate in this equation is represented by biological oxygen demand (BOD), where V is thereactor volume, x is the cell density or sludge concentration, a is a constant in kg O2 kg
�1 BOD, b isalso a constant in kg O2 kg
�1 MLSS, and F is the fresh feed flow rate in m3 h�1. MLSS is the mixedliquor suspended solid in mg l�1, and BOD is 0.4 kg/kg MLSS. The constants for a ¼ 0.5 and b ¼ 0.4are given. For a flow rate of 100 m3 h�1 and initial substrate So of 30,000 ppm (0.03 kg m�3) in anaeration tank volume of V ¼ 10 m3, what would the BOD concentration be if an oxygen rate of0.95 m3 h�1 is supplied, and what would the leaving substrate concentration, S, be?
m ¼ mmSKM þ S
or xm ¼ mmxSKM þ S
(3.11.2.14)
Given rate ¼ 0.75 kg O2 (kg BOD h)�1
Oxygen flow rate supplied in 0.95 m3 h�1:
OTR ¼ �0:95 m3 h�1��1 kmol
22:4 m3
��32 kg1 kmol
�¼ 1:36 kg h�1
Plug in values into Eqn (3.11.2.13)
0:136 kg m�3 h�1 ¼ 0:5�10 h�1��0:03 kg m�3 � S
�þ 0:4�0:75 kg m�3 h�1��0:03 kg m�3 � S
�S ¼ 0:004 kg m�3
3. GAS AND LIQUID SYSTEM (AERATION AND AGITATION)70
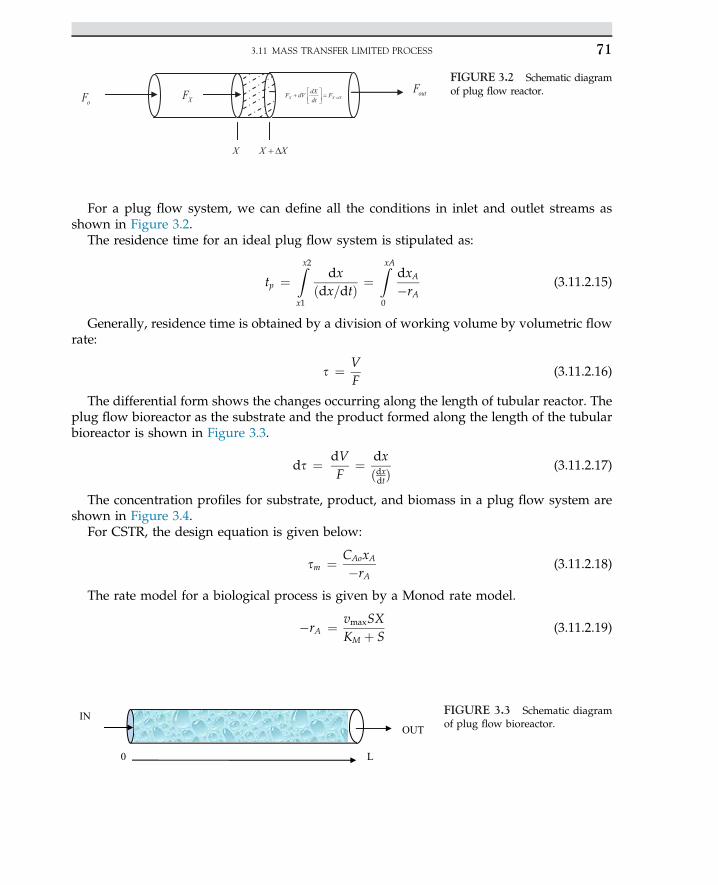
For a plug flow system, we can define all the conditions in inlet and outlet streams asshown in Figure 3.2.
The residence time for an ideal plug flow system is stipulated as:
tp ¼Zx2x1
dxðdx=dtÞ ¼
ZxA0
dxA�rA
(3.11.2.15)
Generally, residence time is obtained by a division of working volume by volumetric flowrate:
s ¼ VF
(3.11.2.16)
The differential form shows the changes occurring along the length of tubular reactor. Theplug flow bioreactor as the substrate and the product formed along the length of the tubularbioreactor is shown in Figure 3.3.
ds ¼ dVF
¼ dxðdxdtÞ
(3.11.2.17)
The concentration profiles for substrate, product, and biomass in a plug flow system areshown in Figure 3.4.
For CSTR, the design equation is given below:
sm ¼ CAoxA�rA
(3.11.2.18)
The rate model for a biological process is given by a Monod rate model.
�rA ¼ vmaxSXKM þ S
(3.11.2.19)
FIGURE 3.2 Schematic diagramof plug flow reactor.
……………………………………………………INOUT
0 L
……………………………………………………………………… ……………………………………………………………………………………………………………………………………………………………………………………………… ……………………………………………………………………………………………………………………………………………………………………… …………………………………………………………………………………………………………………………………………………………FIGURE 3.3 Schematic diagramof plug flow bioreactor.
3.11 MASS TRANSFER LIMITED PROCESS 71
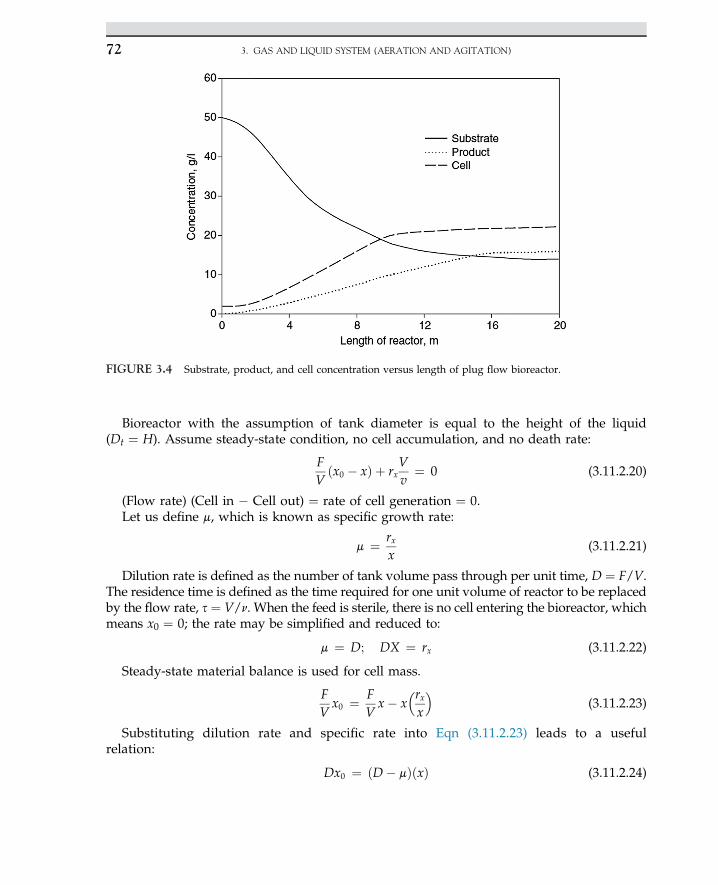
Bioreactor with the assumption of tank diameter is equal to the height of the liquid(Dt ¼ H). Assume steady-state condition, no cell accumulation, and no death rate:
FVðx0 � xÞ þ rx
Vv
¼ 0 (3.11.2.20)
(Flow rate) (Cell in � Cell out) ¼ rate of cell generation ¼ 0.Let us define m, which is known as specific growth rate:
m ¼ rxx
(3.11.2.21)
Dilution rate is defined as the number of tank volume pass through per unit time, D ¼ F/V.The residence time is defined as the time required for one unit volume of reactor to be replacedby the flow rate, s ¼ V/n. When the feed is sterile, there is no cell entering the bioreactor, whichmeans x0 ¼ 0; the rate may be simplified and reduced to:
m ¼ D; DX ¼ rx (3.11.2.22)
Steady-state material balance is used for cell mass.
FVx0 ¼ F
Vx� x
�rxx
(3.11.2.23)
Substituting dilution rate and specific rate into Eqn (3.11.2.23) leads to a usefulrelation:
Dx0 ¼ ðD� mÞðxÞ (3.11.2.24)
FIGURE 3.4 Substrate, product, and cell concentration versus length of plug flow bioreactor.
3. GAS AND LIQUID SYSTEM (AERATION AND AGITATION)72
For the case of sterile feed, Eqn (3.11.2.24) reduces to:
ðD� mÞ ¼ 0 or D ¼ m (3.11.2.25)
The general balance equation is given below:
VRdCi
dt¼ FðtÞ½Cif � Ci� þ rfi (3.11.2.26)
At unsteady-state conditions, the change of concentration with respect to time is detect-able, dS/dt s 0, but for steady-state conditions the leaving substrate may be constant. Fora plug flow bioreactor, we can treat it like a batch system.
The cell balance is:
�dCA
dt¼ �rA (3.11.2.27)
The change of cell density with respect to time is given as follows:
dxdt
¼ rxxx ¼ mx (3.11.2.28)
Substituting the specific growth rate into Eqn (3.11.2.28) leads to the following differentialequation:
dxdt
¼�mmaxSKS þ S
�X (3.11.2.29)
When dilution rate reaches the maximum specific rate (D ¼ mmax), wash out phenomenamay take place.
Balance for substrate S:
�dsdt
¼ XY
�mmaxSKS þ S
�(3.11.2.30)
For sterile media in a chemostat:
Din ¼ mmaxS0
KS þ S0(3.11.2.31)
The substrate concentration is defined as:
S ¼ DKS
mmax �Dand Y ¼ X
S0 � S(3.11.2.32)
The biomass is calculated using Eqn (3.11.2.32):
X ¼ YðS0 � SÞ ¼ Y�S0 � DKS
mmax �D
�(3.11.2.33)
Yield of biomass is defined as:
Y ¼ mass of cells formed
mass of substrate consumed
3.11 MASS TRANSFER LIMITED PROCESS 73
The Monod rate equation, m ¼ mmaxSKSþS, is used to substitute into mass balance. Substituting
S into X, the following equation is obtained:
Dx0 þ�mmaxSKS þ S
�D�X ¼ 0 (3.11.2.34)
At steady state condition, the mass balance for substrate S is dSdt ¼ 0, results in the
following equation:
DðS0 � SÞ ¼�mmaxSKS þ S
�XY
(3.11.2.35)
The rate equation is incorporated:
DðS0 � SÞ ¼ rxY
(3.11.2.36)
NOMENCLATURE
a Gaseliquid interfacial area per unit volume of broth, m�1
C* Saturation concentration of oxygen in liquid bulk in equilibrium with gas phase, mol m�3
Ci Oxygen concentration at the interface, mol m�3
Cl Oxygen concentration in the bulk of liquid, mol m�3
Do Orifice diameter, mdb Average bubble diameter, mDO2 Oxygen diffusion coefficient, m2 s�1
Fg Volumetric oxygen flow rate, m3 s�1
H Henry’s constant, atm m3 mol�1
Hl Height of liquid, mJO2 Molar flux of oxygen, mol m�2 s�1
kg Mass transfer coefficient in the gas side, mol m�2 atm�1 s�1
Kg Overall mass transfer coefficient in the gas phase, mol m�2 atm�1 s�1
kl Mass transfer coefficient in liquid side, m s�1
Kl Overall mass transfer coefficient in the liquid phase, m s�1
kr Rate constantkla Volumetric mass transfer coefficient, s�1
NO2 Oxygen transfer rate, mol m3 s�1
OUR Oxygen uptake rate, mol m�3 s�1
P Agitator power under gassing condition, WP* Partial pressure of oxygen in equilibrium with liquid phase, atmPO2 Oxygen partial pressure in the bulk of gas phase, atmPO2 ;i Oxygen partial pressure at the interface, atmrO2 Oxygen reaction rate, mol m�3 s�1
tb Bubble residence time in liquid, svvm Volume of air per volume of liquid media per min, L L�1 min�1
Vg Volume of gas bubbles in the reactor, m3
Vl Volume of liquid in the fermenter, m3
vs Gas superficial velocity, m s�1
vt Gas terminal velocity, m s�1
y, z Empirical constants
3. GAS AND LIQUID SYSTEM (AERATION AND AGITATION)74
GREEK SYMBOLS
a proportionality factor as a constantd film thickness of the mass transfer, mε gas hold-upm viscosity, kg m�1 s�1
rl density of liquid, kg m�3
rg density of gas, kg m�3
s interfacial tension of the gaseliquid film, kg s�2
References1. Baily JE, Ollis DF. Biochemical engineering fundamentals. 2nd ed. New York: McGraw-Hill; 1986.2. Scragg AH. Bioreactors in biotechnology: a practical approach. New York: Ellis Horwood Series in Biochemistry and
Biotechnology; 1991.3. Wang DIC, Cooney CL, Deman AL, Dunnill P, Humphrey AE, Lilly MD. Fermentation and enzyme technology.
New York: John Wiley & Sons; 1979.4. Doran PM. Bioprocess engineering principles. New York: Academic Press; 1995.5. Shuler ML, Kargi F. Bioprocess engineering, basic concepts. New Jersey: Prentice Hall; 1992.6. Kawase Y, Moo-Young M. Correlations for liquid phase mass transfer coefficients in bubble column reactors with
newtonian and non-newtonian fluids. Can J Chem Eng 1992;70(1):48e54.
REFERENCES 75
S U B C H A P T E R
3.13Case Study: Oxygen Transfer Rate Model in an Aerated
Tank for Pharmaceutical Wastewater
3.13.1 INTRODUCTION
Aerobic wastewater treatment processes remove dissolved and colloidal organic matterfrom industrial wastewater. The growth and propagation of the microorganisms consumeoxygen in the liquid phase. This causes the dissolved oxygen (DO) to be depleted whenthe microorganisms are in the exponential growth phase. However, the specific oxygen up-take of bacteria increases only slightly with increasing oxygen concentration above a certaincritical concentration. To achieve the optimum oxygen transfer rate (OTR), several parame-ters, such as airflow rate, bubble size, nature of the wastewater, agitation rate, temperature,reaction rate, and propagation of the microorganisms, which influence the mass transfer rate,have to be considered. The activated sludge process for domestic wastewater treatment wasfirst introduced to the world in 1914.1 Since then, many studies have been conducted toimprove the oxygen transfer efficiency. Among the aeration devices introduced are porousdiffuser, filter type diffuser, mechanical aeration device, orifice type diffuser, and fine-poreair diffuser. In the United States today, the aerated treatment process has a substantial mar-ket. There is a great emphasis on the enhancement of an efficient process, which may lead tointensive research programs. The process aim is to evaluate the design, operation, and con-trol processes while improving overall system performance. The transfer of oxygen from thegas phase to the microorganism takes place in several steps. First, the oxygen must travelthrough the gas to the gaseliquid interface, then through the bulk liquid, and finally intothe microorganism. Some researchers believe that oxygen transfer occurs significantly duringbubble formation when the interfacial area exposed to the liquid is constantly renewed. Onthe other hand, there are other researchers who believe that significant oxygen transfer oc-curs during the bubble’s ascent. However, it is well understood that regardless of wherethe transfer occurs, the rate of transfer is proportional to the contact time and area of contactbetween the liquid and the gas. It is found that the overall gas transfer coefficient, KL$a, in-creases while bubble size decreases down to a diameter of 2.2 mm; further reduction in bub-ble size results in a decrease of KL$a, although smaller bubbles may increase oxygen transferefficiency.2
3. GAS AND LIQUID SYSTEM (AERATION AND AGITATION)76
Modeling oxygen transport in the aeration system is important because it can be used as areference for overall process performance improvement as well as process design and simu-lation. The oxygen transfer process mentioned above is based on the concentration gradientbetween the oxygen concentration in the gas phase and in the organism. The basic model foroxygen transfer in a dispersed gaseliquid system is given by Eqn (3.7.3).3 For the gas side,mass transfer can be similarly defined in terms of the gas partial pressure, as explained inthe related section.
Since it is usually impossible to measure the local and interface concentrations everywherein a bioreactor, average values of concentrations or dominant bulk concentrations and overallmass transfer coefficients are used. To know the total OTR in a vessel, the total surface areaavailable for the oxygen transfer has to be determined. Thus, an overall mass transfer coeffi-cient incorporating the surface area of the bubble is used, namely NA ¼ KL$a (C* � C). Thevalue of KL$a is dependent on the physicochemical properties of the bioreactor media, thephysical properties of the bioreactor, and the operating conditions of the vessel. The magni-tude of KL$a can be controlled by the agitation rate and the airflow rate. Oxygen is the sub-strate that enhances microbial growth; however, above a certain concentration, the microbialgrowth becomes independent of the oxygen concentration.
In a short period, at a quasisteady-state condition, OTR to microbial cells would be equalto oxygen molar flow transfer to the liquid phase4:
dCdt
¼ KL$aðC� � CÞ �QO2x (3.13.1.1)
At steady-state condition the oxygen concentration profile would be an exponential model:
C� C�
Co � C� ¼ e�KL$a t (3.13.1.2)
In reality, oxygen concentration never reaches the concentration defined in the proposedmodel, because the microbial activities at optimal and maximum cell density would reachthe point where oxygen depletion takes place.5
The volumetric mass transfer coefficient, KL$a, for a continuous stirred tank bioreactor canbe correlated by power input per unit volume, bubble size, which reflects the interfacial area,and superficial gas velocity.3,6 The general form of the correlations for evaluating KL$a isdefined as a polynomial equation given by Eqn (3.9.1).
The mass transfer coefficient is expected to relate gas power per unit volume and gas ter-minal velocity. Measurement of gas bubble velocity is troublesome in the experimental stageof aeration. Extensive research has been conducted for an explanation of the above correla-tion. Gaseliquid mass transfer in low-viscosity fluids and in agitated vessels has beenreviewed and summarized as stated in Secion 3.93:
1. For coalescing airewater dispersion, when liquid is relatively pure, the mass transfer co-efficient was estimated from Eqn (3.9.2) for the defined range of liquid volume and po-wer per unit volume:
Vl � 2:6 m3; 500 < Pg�Vl < 10; 000 (3.13.1.3)
3.13.1 INTRODUCTION 77
2. For noncoalescing aireelectrolyte dispersion, when there is a small amount of electrolytein the system, the mass transfer coefficient may be correlated using Eqn (3.9.3), with thefollowing condition for liquid volume and power per unit volume:
Vl � 4 m3; 500 < Pg�Vl < 10; 000 (3.13.1.4)
The above correlations may not be valid for nonNewtonian behavior of biological fluids,nor for the effect of antifoam or in the presence of solids. A correlation proposed in the liter-ature as stated in Eqn (3.9.4)3 may be true for aerobic nonNewtonian fluid filamentous mediaof fermentation broth.
The industrial wastewater used in the current experiment is considered as noncoalescingaireelectrolyte dispersion. Thus, the equations discussed above would be used as a theoret-ical model for the estimation of oxygen transfer rate in the liquid phase.
3.13.2 MATERIAL AND METHOD
The nonpenicillin wastewater from a pharmaceutical company was collected and used in thebatch aerationwastewater treatment experiment. The pharmaceuticalwastewater had a clear or-ange color and a strong odor, contained toxic chemicals, and had a COD value in the range of3000e30,000 mg L�1. The pH of the wastewater was neutralized and monitored for each exper-imental run, because the bacteria would have a higher rate of propagation at neutral pH.
Two different sizes of aerated tanks with working volumes of three and 15 L were used.An aeration pump (model 8500, 6 W) with low, medium, and high rates of oxygenation wasused for the small tank. A gas-flow meter (Cole Parmer, model 6G08 R4) with a flow range of0e70 mL min�1 was used for setting the desired airflow rate. Air bubbles entered the bottomof the tank through a gas sparger and maintained the wastewater highly aerated. A stirrer(Cafamo digitalm model RZR2000) in the range of 100e600 rpm was used for complete aera-tion in the small aeration tank. Also, a 15 L aeration unit (model TR01, with a stirrer modelRW20DZM.n, 72W, KIKA from Labortechnik, Malaysia) was used for the large aeration tank.A high-shear dispersing impeller with a diameter of 82 mm was used in the large system.A DO meter (model HI9145 microprocessor, Hanna Instrument, Portugal) was used to detectand measure the amount of DO in the large aeration tank.
The organism was isolated from the wastewater that was used as the seed culture. The me-dium for seed culture as a starter of each experimental run was prepared by dissolving 1.0 gof glucose and 1.0 g of peptone in 100 mL of distilled water. The nutrients and minerals wereobtained from Merck. The medium was sterilized in an autoclave at 121 �C, 15 psig steampressure for 20 min.
Periodic samples were taken at the starting point after introducing the inocula on the first,second, and third day of each experimental run. The optical cell density, COD, carbohydrateconcentration, and DO were monitored for various airflow rates. The COD was measured bythe closed reflux colorimetric method at 600 nm with a spectrophotometer, using potassiumdichromate as a reducing reagent.7 All organic chemicals that were present in the waste-water could be detected as equivalent to carbohydrates by a chemical reducing agent,3,5-dinitrosalycilic acid, which was detected by the spectrophotometer at 540 nmwavelength.8,9
3. GAS AND LIQUID SYSTEM (AERATION AND AGITATION)78
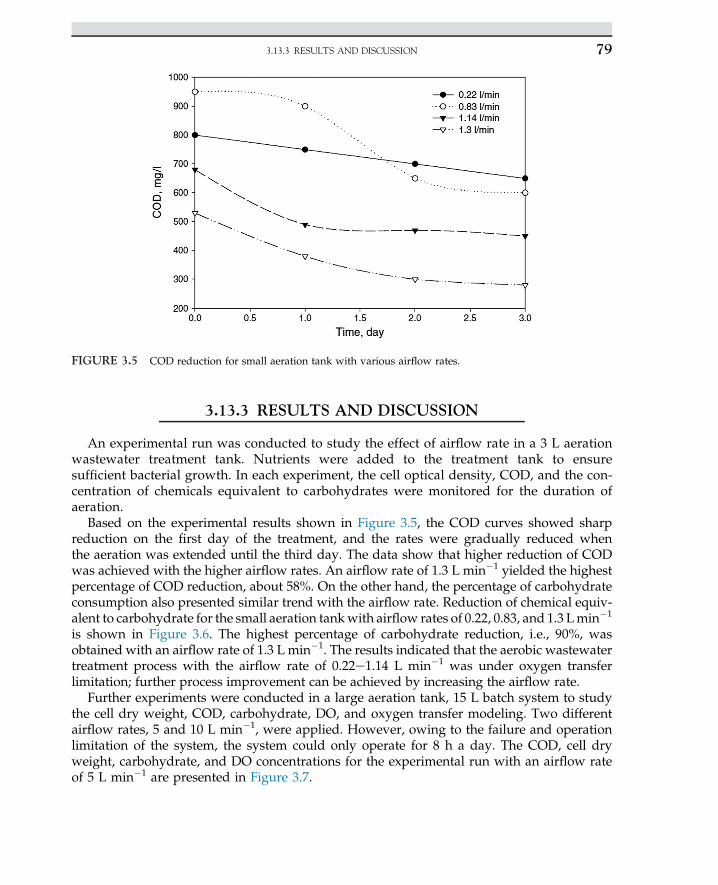
3.13.3 RESULTS AND DISCUSSION
An experimental run was conducted to study the effect of airflow rate in a 3 L aerationwastewater treatment tank. Nutrients were added to the treatment tank to ensuresufficient bacterial growth. In each experiment, the cell optical density, COD, and the con-centration of chemicals equivalent to carbohydrates were monitored for the duration ofaeration.
Based on the experimental results shown in Figure 3.5, the COD curves showed sharpreduction on the first day of the treatment, and the rates were gradually reduced whenthe aeration was extended until the third day. The data show that higher reduction of CODwas achieved with the higher airflow rates. An airflow rate of 1.3 L min�1 yielded the highestpercentage of COD reduction, about 58%. On the other hand, the percentage of carbohydrateconsumption also presented similar trend with the airflow rate. Reduction of chemical equiv-alent to carbohydrate for the small aeration tankwith airflow rates of 0.22, 0.83, and 1.3 Lmin�1
is shown in Figure 3.6. The highest percentage of carbohydrate reduction, i.e., 90%, wasobtained with an airflow rate of 1.3 L min�1. The results indicated that the aerobic wastewatertreatment process with the airflow rate of 0.22e1.14 L min�1 was under oxygen transferlimitation; further process improvement can be achieved by increasing the airflow rate.
Further experiments were conducted in a large aeration tank, 15 L batch system to studythe cell dry weight, COD, carbohydrate, DO, and oxygen transfer modeling. Two differentairflow rates, 5 and 10 L min�1, were applied. However, owing to the failure and operationlimitation of the system, the system could only operate for 8 h a day. The COD, cell dryweight, carbohydrate, and DO concentrations for the experimental run with an airflow rateof 5 L min�1 are presented in Figure 3.7.
FIGURE 3.5 COD reduction for small aeration tank with various airflow rates.
3.13.3 RESULTS AND DISCUSSION 79
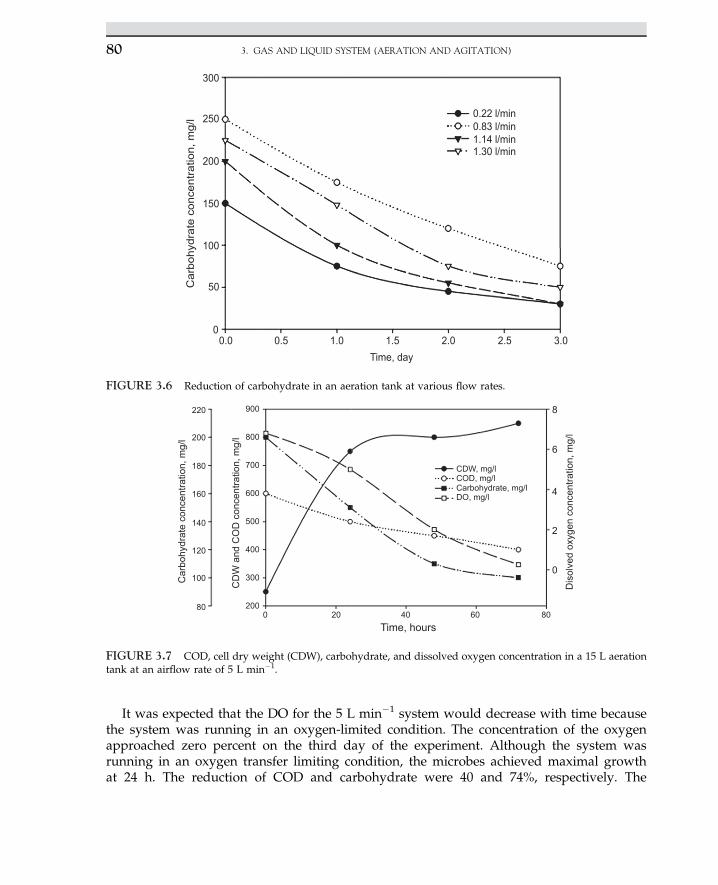
It was expected that the DO for the 5 L min�1 system would decrease with time becausethe system was running in an oxygen-limited condition. The concentration of the oxygenapproached zero percent on the third day of the experiment. Although the system wasrunning in an oxygen transfer limiting condition, the microbes achieved maximal growthat 24 h. The reduction of COD and carbohydrate were 40 and 74%, respectively. The
220
200
180
160
140
120
100
200
300
400
500
600
700
800
900
800
2
4
6
8
0
20 40 60 80
Car
bohy
drat
e co
ncen
tratio
n, m
g/l
CD
W a
nd C
OD
con
cent
ratio
n, m
g/l
Time, hours
CDW, mg/lCOD, mg/lCarbohydrate, mg/lDO, mg/l
Dis
olve
d ox
ygen
con
cent
ratio
n, m
g/l
FIGURE 3.7 COD, cell dry weight (CDW), carbohydrate, and dissolved oxygen concentration in a 15 L aerationtank at an airflow rate of 5 L min�1.
300
250
200
150
100
50
00.0 0.5 1.0 1.5 2.0 2.5 3.0
Time, day
0.22 l/min0.83 l/min1.14 l/min1.30 l/min
Car
bohy
drat
e co
ncen
tratio
n, m
g/l
FIGURE 3.6 Reduction of carbohydrate in an aeration tank at various flow rates.
3. GAS AND LIQUID SYSTEM (AERATION AND AGITATION)80
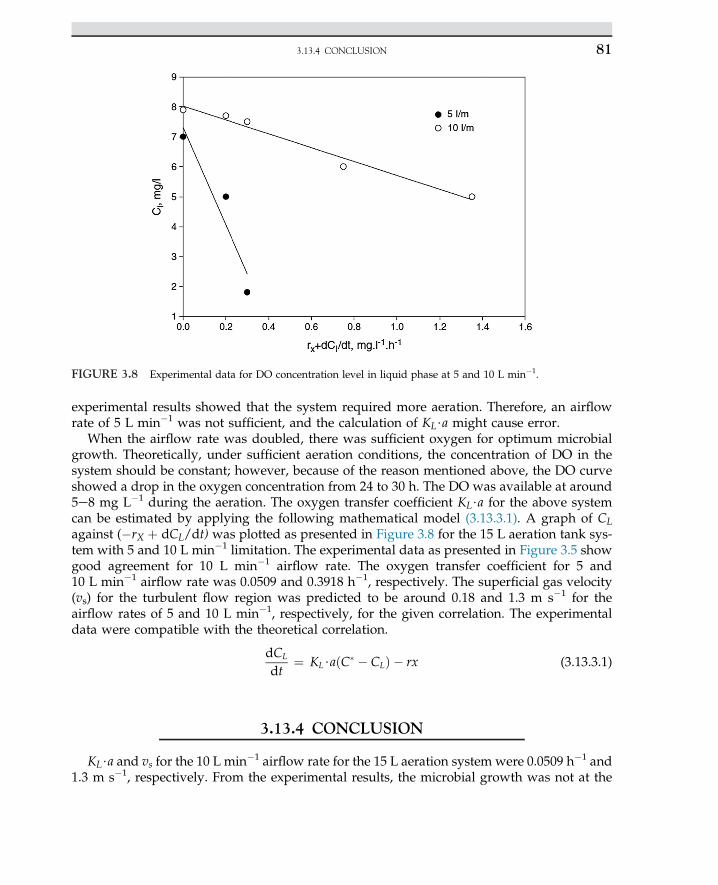
experimental results showed that the system required more aeration. Therefore, an airflowrate of 5 L min�1 was not sufficient, and the calculation of KL$a might cause error.
When the airflow rate was doubled, there was sufficient oxygen for optimum microbialgrowth. Theoretically, under sufficient aeration conditions, the concentration of DO in thesystem should be constant; however, because of the reason mentioned above, the DO curveshowed a drop in the oxygen concentration from 24 to 30 h. The DO was available at around5e8 mg L�1 during the aeration. The oxygen transfer coefficient KL$a for the above systemcan be estimated by applying the following mathematical model (3.13.3.1). A graph of CLagainst (�rX þ dCL/dt) was plotted as presented in Figure 3.8 for the 15 L aeration tank sys-tem with 5 and 10 L min�1 limitation. The experimental data as presented in Figure 3.5 showgood agreement for 10 L min�1 airflow rate. The oxygen transfer coefficient for 5 and10 L min�1 airflow rate was 0.0509 and 0.3918 h�1, respectively. The superficial gas velocity(vs) for the turbulent flow region was predicted to be around 0.18 and 1.3 m s�1 for theairflow rates of 5 and 10 L min�1, respectively, for the given correlation. The experimentaldata were compatible with the theoretical correlation.
dCL
dt¼ KL$aðC� � CLÞ � rx (3.13.3.1)
3.13.4 CONCLUSION
KL$a and vs for the 10 L min�1 airflow rate for the 15 L aeration system were 0.0509 h�1 and1.3 m s�1, respectively. From the experimental results, the microbial growth was not at the
FIGURE 3.8 Experimental data for DO concentration level in liquid phase at 5 and 10 L min�1.
3.13.4 CONCLUSION 81
optimum stage for the reasons mentioned earlier. Nevertheless, a reduction of around 95%can be achieved for carbohydrate reduction. However, further studies should be carriedout for optimization of the treatment and to improve COD reduction for pharmaceuticalwastewater treatment.
NOMENCLATURE
Co Initial concentration, mg L�1
C Concentration, mol m�3
CL Concentration in the bulk of liquid, mol m�3
x Biomass concentration, g L�1
NA Molar rate, mol m�3 h�1
KL$a Mass transfer coefficient in liquid phase, h�1
C* Oxygen concentration in equilibrium with liquid phase at the interface, mol m�3
QO2 Oxygen absorption rate, mol L�1 h�1
Pg Gassed power, WVl Volume of liquid in the fermenter, m3
Lr Consumption rate of substrate, mol L�1 s�1
t Time, h
References1. Eckenfelder WW. Industrial water pollution control. 3rd ed. New York: McGraw-Hill; 2000. p. 341.2. Scragg AH. Bioreactors in biotechnology. New York: Ellis Horwood; 1997.3. Deronzier G, Duchene Ph, Heduit A. Wat Sci Technol 1998;38(3):35.4. Badino Jr CA, Facciotti MCR, Schmidell WJ. Chem Technol Biotechnol 2000;75:469.5. Chern J-M, Yu C-F. Indust Eng Chem Res 1997;36:5447.6. Bailey J, Ollis DF. Biochemical engineering fundamentals. New York: McGraw-Hill; 1986.7. Greenberg AE, Clesceri LS, Eaton AD. Standard methods for the examination of water and wastewater. 18th ed.
Washington, DC: American Public Health Association, American Water and Wastewater Association, WaterEnvironment Federation; 1992.
8. Summers JB. J Biol Chem 1924;62:248.9. Thomas LC, Chamberlin GJ. Colorimetric chemical analytical methods. Salisbury, United Kingdom: Tintometer Ltd;
1980.
3. GAS AND LIQUID SYSTEM (AERATION AND AGITATION)82
S U B C H A P T E R
3.14Case Study: Fuel and Chemical Production from the
WatereGas Shift Reaction by Fermentation Processes*
3.14.1 INTRODUCTION
Synthesis gas (syngas), a mixture of primarily CO, H2, and CO2 is a major building block inthe production of fuels and chemicals.1,2 Syngas is produced from several sources, includingcoal, oil shale, tar sands, heavy residual oil, or low-grade natural gas.3,4 Catalytic processesare used to convert syngas components into a variety of fuels and chemicals, such ashydrogen, methane, methanol, ethanol, acetic acid, etc.5 Microorganisms are used as suitablebiocatalysts to convert syngas into chemicals and fuels. Biological processes, although gener-ally slower than chemical reaction, have several advantages over catalytic processes, such ashigher specificity, higher yields, lower energy cost, and generally greater resistance to catalystpoisoning. Furthermore, the irreversible character of biological reactions allows completeconversion and avoids thermodynamic equilibrium.5,6
Anaerobic bacteria are able to grow autotrophically on syngas components. They followspecific pathways to produce fuels and chemicals from inorganic waste gases.7 The reactionoccurs under mild conditions, ambient temperature, and pressure with the formation of spe-cific products.8 However, direct production of fuels and chemicals by gasification technologyis economically unfavorable and requires a very large plant.9,10 Suitable microorganisms maybe used for production of fuels and chemicals from bioconversion of syngas. Fermentationneeds substrates such as CO or CO2 to provide energy for bacterial growth, maintenance,and by-products such as organic acid, alcohols, and hydrogen that result from microbialmetabolism.11,12 A recent investigation was conducted using suitable microorganisms to pro-duce acetic acid and ethanol from H2, CO, and CO2. The organism must be anaerobic andgrow either chemolithotrophically on CO and H2/CO2 or chemoorganotrophically withcarbon sources such as fructose, malate, glutamate, or pyruvate. It has been reported that
*This case study was partially written with contributions from:Habibollah Younesi, Department of Environmental Science, Faculty of Natural Resources, Tarbiat ModaresUniversity, Noor, Iran;Abdul Rahman Mohamed, School of Chemical Engineering, Engineering Campus, Universiti SainsMalaysia, 14300 Nibong Tebal, Pulau Pinang, Malaysia.
3.14.1 INTRODUCTION 83
CO, H2, and CO2 can be converted to acetate by several bacteria such as Clostridium aceticum,Acetobacterium woodii, Clostridium ljungdahlii, and Clostridium thermoaceticum.13e15
Generally, bacteria in the fermentation process require substrates like glucose, sucrose, ma-late, or acetate as carbon sources to obtain energy for growth and maintenance for synthesisof organic acids, alcohols, and hydrogen, which are liberated in the course of microbial meta-bolism.3,16 It is believed that for oxidation of CO, acetyl coenzyme A is required to enter COinto the citric acid cycle. Rhodospirillum rubrum is capable of producing carbon monoxide de-hydrogenase (CODH) to facilitate the oxidation process.17 It was stated that synthetic gaseswere converted to molecular hydrogen with the aid of several photosynthetic bacteria, forinstance C. aceticum, A. woodii, C. ljungdahlii, and C. thermoaceticum, which are able to producefuels and chemicals.12,13
Purple nonsulfur phototrophic anaerobic bacteria use light (photons) to produce hydrogenby a biological route. The metabolites of photosynthetic bacteria are organic acids or carbonmonoxide as the energy source. Bacteria grown on carbon monoxide produce molecularhydrogen and carbon dioxide and generate no by-product. The CODH from methanogenicbacteria is the key enzyme in CO metabolism.18 It has been reported that light and acetateare present during hydrogen formation, in which light is required for hydrogen evolutionand acetate is not consumed during hydrogen production.19 Reports in the literature statethat R. rubrum can be grown on organic components. Photoheterotrophic growth is basedon most intermediate metabolites in the tricarboxylic acid (TCA) cycle. The major precoursein this pathway is an acetylating agent for the synthesis of other components and coenzymeA (CoA). Acetyl CoA is the key component for entering the TCA cycle. In this cycle, molec-ular hydrogen and carbon dioxide are continuously evolved.20
In the past decade, an increasing interest in biological utilization of gaseous substrates hasdeveloped in several bioprocesses for fuel synthesis.18,21 Production of chemicals and fuelsfrom gaseous substrates was demonstrated in biocatalytic processes. It has also been reportedthat biological processes are used to convert gaseous substrates such as CO/H2 or CO2/H2 toethanol and acetate at ambient temperature and atmospheric pressure.22 The reactions aregenerally carried out in the aqueous phase, where microorganisms are suspended as free cellsor in flocs. The advantages of microbial processes are stated as the product specificity,yielding few by-products and high process yield. Also, the resistance of biocatalysts hasbeen found to be higher than chemical catalysts. In industrial gas streams, chemical catalystsare easily inhibited by trace contaminants such as H2S and COS. Therefore, the economicattraction of biological processes in the development of suitable biocatalysts to fermentgaseous substrates to valuable products has been considered.23e25
In the present study, a strictly anaerobic bacterium, C. ljungdahlii, was used to investigateethanol and acetate production by bioconversion of syngas at various total pressures of syngasin a series of batch bioreactors. The significant aspect of this fermentation was to investigate thebioconversion of syngas to commercial fuels. The effects of initial total pressure of syngas onmicrobial cell population, substrate and product inhibition in the culture were also studied.
3.14.2 KINETICS OF GROWTH IN A BATCH BIOREACTOR
When microbial cells are inoculated into a batch bioreactor containing fresh media, theirincrease in concentration can be monitored.26 It is common to use the cell dry weight as a
3. GAS AND LIQUID SYSTEM (AERATION AND AGITATION)84
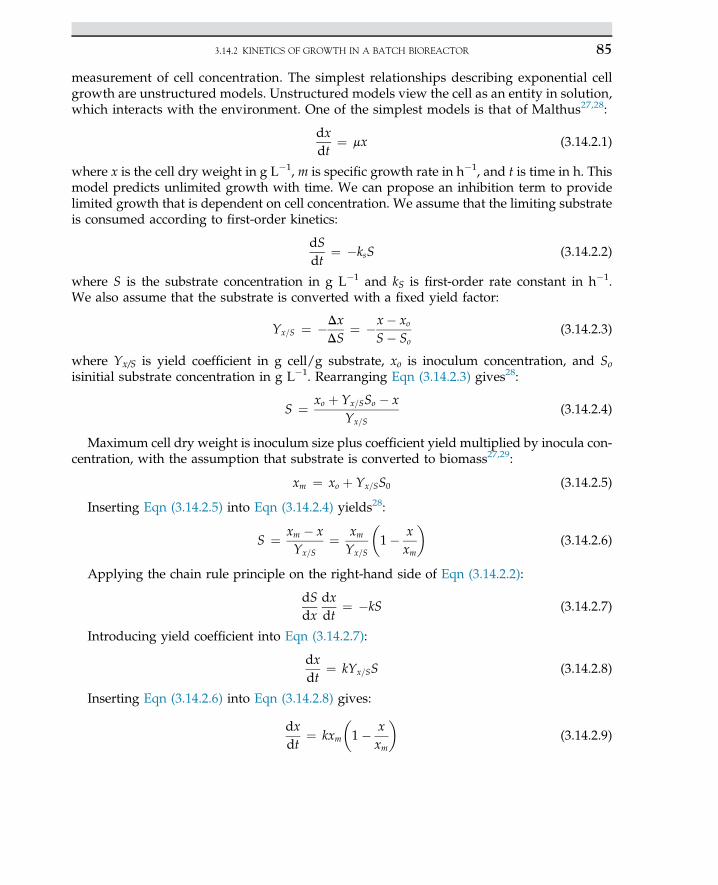
measurement of cell concentration. The simplest relationships describing exponential cellgrowth are unstructured models. Unstructured models view the cell as an entity in solution,which interacts with the environment. One of the simplest models is that of Malthus27,28:
dxdt
¼ mx (3.14.2.1)
where x is the cell dry weight in g L�1, m is specific growth rate in h�1, and t is time in h. Thismodel predicts unlimited growth with time. We can propose an inhibition term to providelimited growth that is dependent on cell concentration. We assume that the limiting substrateis consumed according to first-order kinetics:
dSdt
¼ �ksS (3.14.2.2)
where S is the substrate concentration in g L�1 and kS is first-order rate constant in h�1.We also assume that the substrate is converted with a fixed yield factor:
Yx=S ¼ �DxDS
¼ �x� xoS� So
(3.14.2.3)
where Yx/S is yield coefficient in g cell/g substrate, xo is inoculum concentration, and Soisinitial substrate concentration in g L�1. Rearranging Eqn (3.14.2.3) gives28:
S ¼ xo þ Yx=SSo � xYx=S
(3.14.2.4)
Maximum cell dry weight is inoculum size plus coefficient yield multiplied by inocula con-centration, with the assumption that substrate is converted to biomass27,29:
xm ¼ xo þ Yx=SS0 (3.14.2.5)
Inserting Eqn (3.14.2.5) into Eqn (3.14.2.4) yields28:
S ¼ xm � xYx=S
¼ xmYx=S
�1� x
xm
�(3.14.2.6)
Applying the chain rule principle on the right-hand side of Eqn (3.14.2.2):
dSdx
dxdt
¼ �kS (3.14.2.7)
Introducing yield coefficient into Eqn (3.14.2.7):
dxdt
¼ kYx=SS (3.14.2.8)
Inserting Eqn (3.14.2.6) into Eqn (3.14.2.8) gives:
dxdt
¼ kxm
�1� x
xm
�(3.14.2.9)
3.14.2 KINETICS OF GROWTH IN A BATCH BIOREACTOR 85
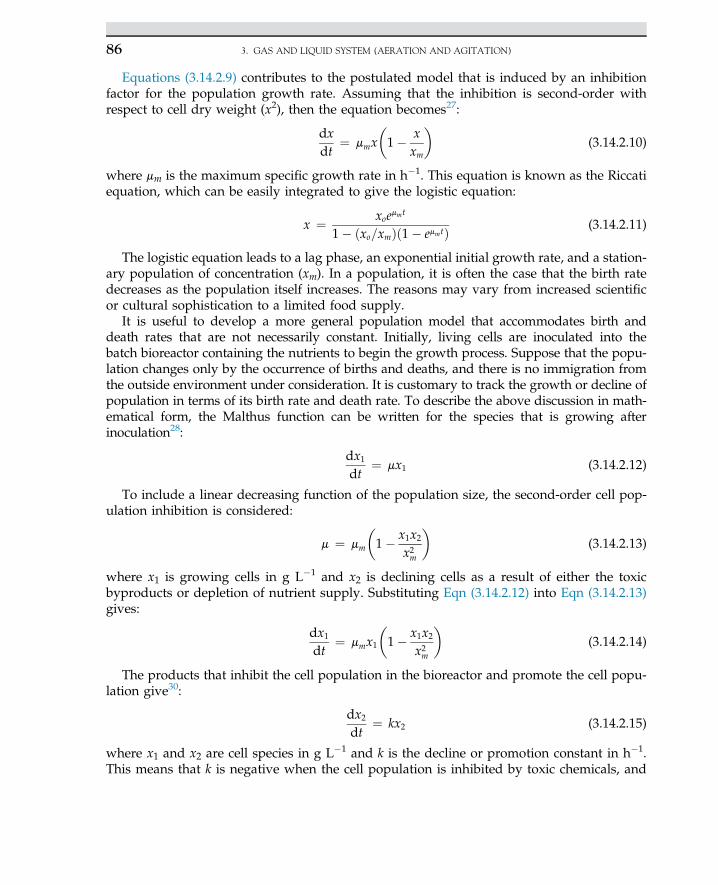
Equations (3.14.2.9) contributes to the postulated model that is induced by an inhibitionfactor for the population growth rate. Assuming that the inhibition is second-order withrespect to cell dry weight (x2), then the equation becomes27:
dxdt
¼ mmx�1� x
xm
�(3.14.2.10)
where mm is the maximum specific growth rate in h�1. This equation is known as the Riccatiequation, which can be easily integrated to give the logistic equation:
x ¼ xoemmt
1� ðxo=xmÞð1� emmtÞ (3.14.2.11)
The logistic equation leads to a lag phase, an exponential initial growth rate, and a station-ary population of concentration (xm). In a population, it is often the case that the birth ratedecreases as the population itself increases. The reasons may vary from increased scientificor cultural sophistication to a limited food supply.
It is useful to develop a more general population model that accommodates birth anddeath rates that are not necessarily constant. Initially, living cells are inoculated into thebatch bioreactor containing the nutrients to begin the growth process. Suppose that the popu-lation changes only by the occurrence of births and deaths, and there is no immigration fromthe outside environment under consideration. It is customary to track the growth or decline ofpopulation in terms of its birth rate and death rate. To describe the above discussion in math-ematical form, the Malthus function can be written for the species that is growing afterinoculation28:
dx1dt
¼ mx1 (3.14.2.12)
To include a linear decreasing function of the population size, the second-order cell pop-ulation inhibition is considered:
m ¼ mm
�1� x1x2
x2m
�(3.14.2.13)
where x1 is growing cells in g L�1 and x2 is declining cells as a result of either the toxicbyproducts or depletion of nutrient supply. Substituting Eqn (3.14.2.12) into Eqn (3.14.2.13)gives:
dx1dt
¼ mmx1
�1� x1x2
x2m
�(3.14.2.14)
The products that inhibit the cell population in the bioreactor and promote the cell popu-lation give30:
dx2dt
¼ kx2 (3.14.2.15)
where x1 and x2 are cell species in g L�1 and k is the decline or promotion constant in h�1.This means that k is negative when the cell population is inhibited by toxic chemicals, and
3. GAS AND LIQUID SYSTEM (AERATION AND AGITATION)86
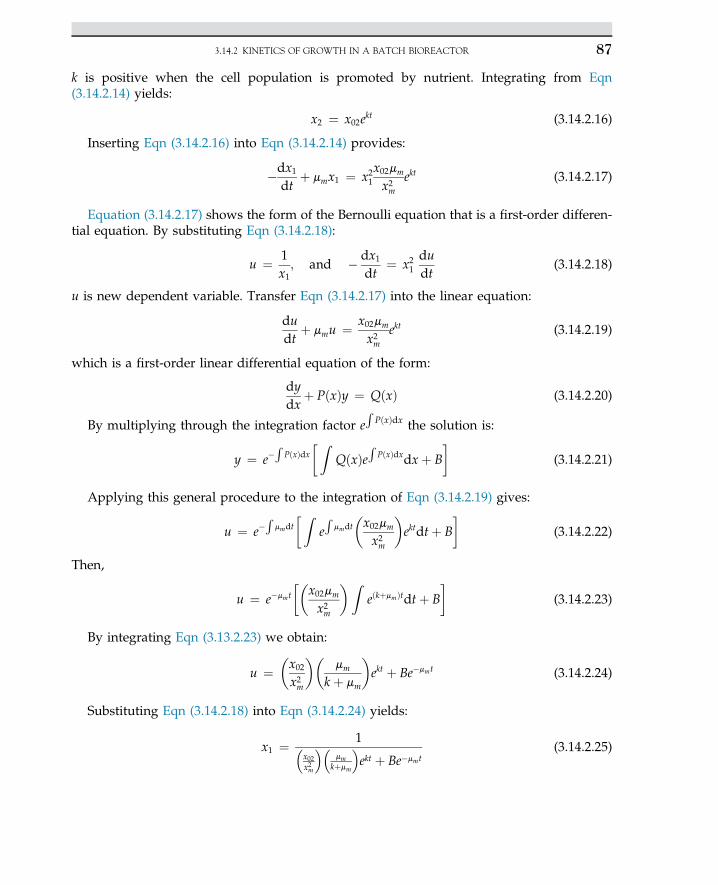
k is positive when the cell population is promoted by nutrient. Integrating from Eqn(3.14.2.14) yields:
x2 ¼ x02ekt (3.14.2.16)
Inserting Eqn (3.14.2.16) into Eqn (3.14.2.14) provides:
�dx1dt
þ mmx1 ¼ x21x02mm
x2mekt (3.14.2.17)
Equation (3.14.2.17) shows the form of the Bernoulli equation that is a first-order differen-tial equation. By substituting Eqn (3.14.2.18):
u ¼ 1x1; and � dx1
dt¼ x21
dudt
(3.14.2.18)
u is new dependent variable. Transfer Eqn (3.14.2.17) into the linear equation:
dudt
þ mmu ¼ x02mm
x2mekt (3.14.2.19)
which is a first-order linear differential equation of the form:
dydx
þ PðxÞy ¼ QðxÞ (3.14.2.20)
By multiplying through the integration factor eR
PðxÞdx the solution is:
y ¼ e�R
PðxÞdx� Z
QðxÞeR
PðxÞdxdxþ B�
(3.14.2.21)
Applying this general procedure to the integration of Eqn (3.14.2.19) gives:
u ¼ e�R
mmdt� Z
eR
mmdt�x02mm
x2m
�ektdtþ B
�(3.14.2.22)
Then,
u ¼ e�mmt
��x02mm
x2m
�ZeðkþmmÞtdtþ B
�(3.14.2.23)
By integrating Eqn (3.13.2.23) we obtain:
u ¼�x02x2m
��mm
k þ mm
�ekt þ Be�mmt (3.14.2.24)
Substituting Eqn (3.14.2.18) into Eqn (3.14.2.24) yields:
x1 ¼ 1�x02x2m
�mm
kþmm
ekt þ Be�mmt
(3.14.2.25)
3.14.2 KINETICS OF GROWTH IN A BATCH BIOREACTOR 87
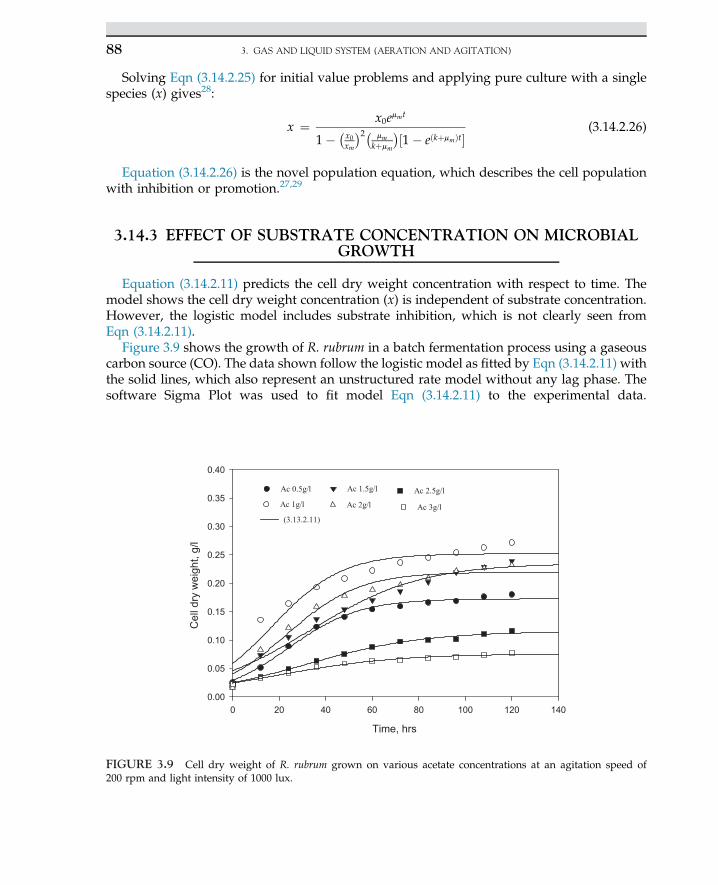
Solving Eqn (3.14.2.25) for initial value problems and applying pure culture with a singlespecies (x) gives28:
x ¼ x0emmt
1� �x0xm
�2� mmkþmm
�½1� eðkþmmÞt�(3.14.2.26)
Equation (3.14.2.26) is the novel population equation, which describes the cell populationwith inhibition or promotion.27,29
3.14.3 EFFECT OF SUBSTRATE CONCENTRATION ON MICROBIALGROWTH
Equation (3.14.2.11) predicts the cell dry weight concentration with respect to time. Themodel shows the cell dry weight concentration (x) is independent of substrate concentration.However, the logistic model includes substrate inhibition, which is not clearly seen fromEqn (3.14.2.11).
Figure 3.9 shows the growth of R. rubrum in a batch fermentation process using a gaseouscarbon source (CO). The data shown follow the logistic model as fitted by Eqn (3.14.2.11) withthe solid lines, which also represent an unstructured rate model without any lag phase. Thesoftware Sigma Plot was used to fit model Eqn (3.14.2.11) to the experimental data.
Time, hrs
0 20 40 60 80 100 120 140
Cel
l dry
wei
ght,
g/l
0.00
0.05
0.10
0.15
0.20
0.25
0.30
0.35
0.40
Ac 0.5g/l
Ac 1g/l
Ac 1.5g/l
Ac 2g/l
Ac 2.5g/l
Ac 3g/l(3.13.2.11)
FIGURE 3.9 Cell dry weight of R. rubrum grown on various acetate concentrations at an agitation speed of200 rpm and light intensity of 1000 lux.
3. GAS AND LIQUID SYSTEM (AERATION AND AGITATION)88
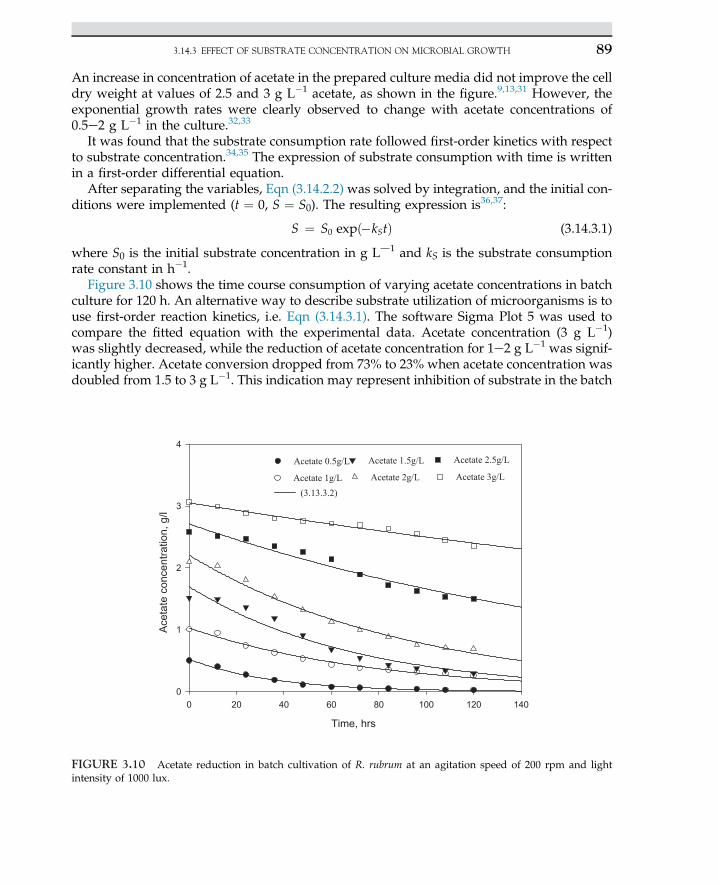
An increase in concentration of acetate in the prepared culture media did not improve the celldry weight at values of 2.5 and 3 g L�1 acetate, as shown in the figure.9,13,31 However, theexponential growth rates were clearly observed to change with acetate concentrations of0.5e2 g L�1 in the culture.32,33
It was found that the substrate consumption rate followed first-order kinetics with respectto substrate concentration.34,35 The expression of substrate consumption with time is writtenin a first-order differential equation.
After separating the variables, Eqn (3.14.2.2) was solved by integration, and the initial con-ditions were implemented (t ¼ 0, S ¼ S0). The resulting expression is36,37:
S ¼ S0 expð�kStÞ (3.14.3.1)
where S0 is the initial substrate concentration in g Ld1 and kS is the substrate consumptionrate constant in h�1.
Figure 3.10 shows the time course consumption of varying acetate concentrations in batchculture for 120 h. An alternative way to describe substrate utilization of microorganisms is touse first-order reaction kinetics, i.e. Eqn (3.14.3.1). The software Sigma Plot 5 was used tocompare the fitted equation with the experimental data. Acetate concentration (3 g L�1)was slightly decreased, while the reduction of acetate concentration for 1e2 g L�1 was signif-icantly higher. Acetate conversion dropped from 73% to 23% when acetate concentration wasdoubled from 1.5 to 3 g L�1. This indication may represent inhibition of substrate in the batch
Time, hrs
0 20 40 60 80 100 120 140
Ace
tate
con
cent
ratio
n, g
/l
0
1
2
3
4
Acetate 0.5g/L
Acetate 1g/L
Acetate 1.5g/L
Acetate 2g/L
Acetate 2.5g/L
Acetate 3g/L
(3.13.3.2)
FIGURE 3.10 Acetate reduction in batch cultivation of R. rubrum at an agitation speed of 200 rpm and lightintensity of 1000 lux.
3.14.3 EFFECT OF SUBSTRATE CONCENTRATION ON MICROBIAL GROWTH 89
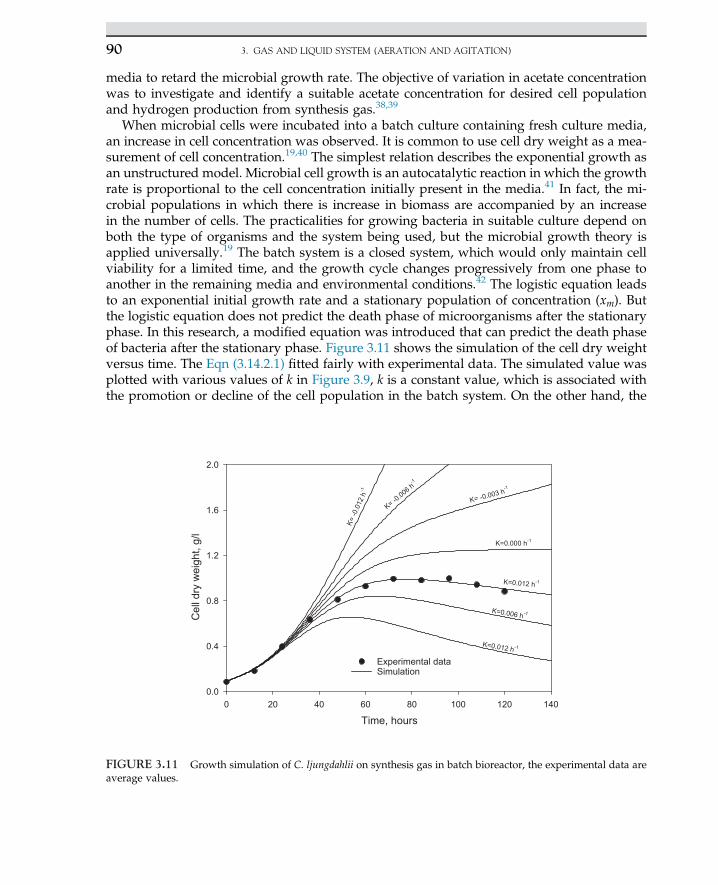
media to retard the microbial growth rate. The objective of variation in acetate concentrationwas to investigate and identify a suitable acetate concentration for desired cell populationand hydrogen production from synthesis gas.38,39
When microbial cells were incubated into a batch culture containing fresh culture media,an increase in cell concentration was observed. It is common to use cell dry weight as a mea-surement of cell concentration.19,40 The simplest relation describes the exponential growth asan unstructured model. Microbial cell growth is an autocatalytic reaction in which the growthrate is proportional to the cell concentration initially present in the media.41 In fact, the mi-crobial populations in which there is increase in biomass are accompanied by an increasein the number of cells. The practicalities for growing bacteria in suitable culture depend onboth the type of organisms and the system being used, but the microbial growth theory isapplied universally.19 The batch system is a closed system, which would only maintain cellviability for a limited time, and the growth cycle changes progressively from one phase toanother in the remaining media and environmental conditions.42 The logistic equation leadsto an exponential initial growth rate and a stationary population of concentration (xm). Butthe logistic equation does not predict the death phase of microorganisms after the stationaryphase. In this research, a modified equation was introduced that can predict the death phaseof bacteria after the stationary phase. Figure 3.11 shows the simulation of the cell dry weightversus time. The Eqn (3.14.2.1) fitted fairly with experimental data. The simulated value wasplotted with various values of k in Figure 3.9, k is a constant value, which is associated withthe promotion or decline of the cell population in the batch system. On the other hand, the
Time, hours0 20 40 60 80 100 120 140
Cel
l dry
wei
ght,
g/l
0.0
0.4
0.8
1.2
1.6
2.0
Experimental dataSimulation
K=0.012 h
K=0.006 h
K=0.012 h
K=0.000 h
K= -0.003 h
K= -0.006 h
K=-0
.012
h
FIGURE 3.11 Growth simulation of C. ljungdahlii on synthesis gas in batch bioreactor, the experimental data areaverage values.
3. GAS AND LIQUID SYSTEM (AERATION AND AGITATION)90
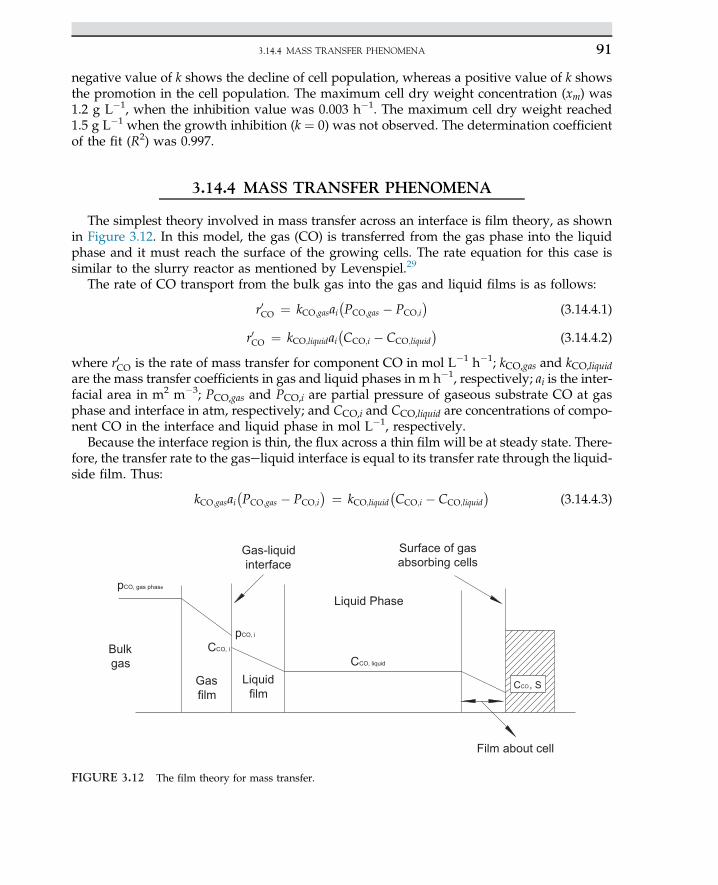
negative value of k shows the decline of cell population, whereas a positive value of k showsthe promotion in the cell population. The maximum cell dry weight concentration (xm) was1.2 g L�1, when the inhibition value was 0.003 h�1. The maximum cell dry weight reached1.5 g L�1 when the growth inhibition (k ¼ 0) was not observed. The determination coefficientof the fit (R2) was 0.997.
3.14.4 MASS TRANSFER PHENOMENA
The simplest theory involved in mass transfer across an interface is film theory, as shownin Figure 3.12. In this model, the gas (CO) is transferred from the gas phase into the liquidphase and it must reach the surface of the growing cells. The rate equation for this case issimilar to the slurry reactor as mentioned by Levenspiel.29
The rate of CO transport from the bulk gas into the gas and liquid films is as follows:
r0CO ¼ kCO;gasai�PCO;gas � PCO;i
�(3.14.4.1)
r0CO ¼ kCO;liquidai�CCO;i � CCO;liquid
�(3.14.4.2)
where r0CO is the rate of mass transfer for component CO in mol L�1 h�1; kCO,gas and kCO,liquidare the mass transfer coefficients in gas and liquid phases in m h�1, respectively; ai is the inter-facial area in m2 m�3; PCO,gas and PCO,i are partial pressure of gaseous substrate CO at gasphase and interface in atm, respectively; and CCO,i and CCO,liquid are concentrations of compo-nent CO in the interface and liquid phase in mol L�1, respectively.
Because the interface region is thin, the flux across a thin film will be at steady state. There-fore, the transfer rate to the gaseliquid interface is equal to its transfer rate through the liquid-side film. Thus:
kCO;gasai�PCO;gas � PCO;i
� ¼ kCO;liquid�CCO;i � CCO;liquid
�(3.14.4.3)
Liquid Phase
pCO, i
Gas film
Bulk gas
Liquid film
CCO, i
pCO, gas phas
Gas-liquidinterface
Film about cell
CCO, liquid
C , S
Surface of gasabsorbing cells
FIGURE 3.12 The film theory for mass transfer.
3.14.4 MASS TRANSFER PHENOMENA 91
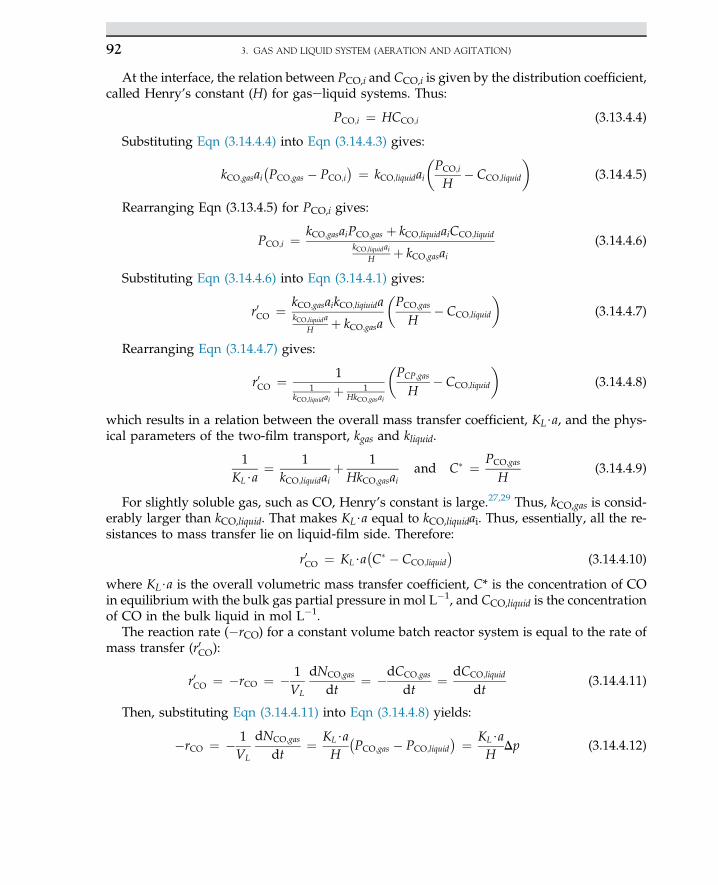
At the interface, the relation between PCO,i and CCO,i is given by the distribution coefficient,called Henry’s constant (H) for gaseliquid systems. Thus:
PCO;i ¼ HCCO;i (3.13.4.4)
Substituting Eqn (3.14.4.4) into Eqn (3.14.4.3) gives:
kCO;gasai�PCO;gas � PCO;i
� ¼ kCO;liquidai
�PCO;i
H� CCO;liquid
�(3.14.4.5)
Rearranging Eqn (3.13.4.5) for PCO,i gives:
PCO;i ¼kCO;gasaiPCO;gas þ kCO;liquidaiCCO;liquid
kCO;liquidaiH þ kCO;gasai
(3.14.4.6)
Substituting Eqn (3.14.4.6) into Eqn (3.14.4.1) gives:
r0CO ¼ kCO;gasaikCO;liqiuidakCO;liquida
H þ kCO;gasa
�PCO;gas
H� CCO;liquid
�(3.14.4.7)
Rearranging Eqn (3.14.4.7) gives:
r0CO ¼ 11
kCO;liquidaiþ 1
HkCO;gasai
�PCP;gas
H� CCO;liquid
�(3.14.4.8)
which results in a relation between the overall mass transfer coefficient, KL$a, and the phys-ical parameters of the two-film transport, kgas and kliquid.
1KL$a
¼ 1kCO;liquidai
þ 1HkCO;gasai
and C� ¼ PCO;gas
H(3.14.4.9)
For slightly soluble gas, such as CO, Henry’s constant is large.27,29 Thus, kCO,gas is consid-erably larger than kCO,liquid. That makes KL$a equal to kCO,liquidai. Thus, essentially, all the re-sistances to mass transfer lie on liquid-film side. Therefore:
r0CO ¼ KL$a�C� � CCO;liquid
�(3.14.4.10)
where KL$a is the overall volumetric mass transfer coefficient, C* is the concentration of COin equilibrium with the bulk gas partial pressure in mol L�1, and CCO,liquid is the concentrationof CO in the bulk liquid in mol L�1.
The reaction rate (�rCO) for a constant volume batch reactor system is equal to the rate ofmass transfer (r0CO):
r0CO ¼ �rCO ¼ � 1VL
dNCO;gas
dt¼ �dCCO;gas
dt¼ dCCO;liquid
dt(3.14.4.11)
Then, substituting Eqn (3.14.4.11) into Eqn (3.14.4.8) yields:
�rCO ¼ � 1VL
dNCO;gas
dt¼ KL$a
H
�PCO;gas � PCO;liquid
� ¼ KL$aH
Dp (3.14.4.12)
3. GAS AND LIQUID SYSTEM (AERATION AND AGITATION)92
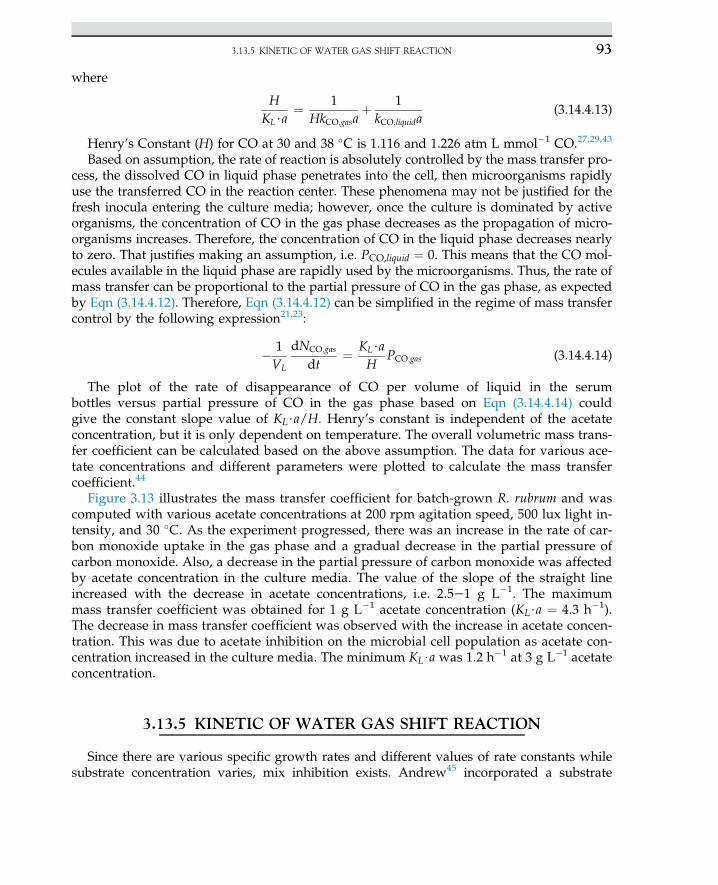
where
HKL$a
¼ 1HkCO;gasa
þ 1kCO;liquida
(3.14.4.13)
Henry’s Constant (H) for CO at 30 and 38 �C is 1.116 and 1.226 atm L mmol�1 CO.27,29,43
Based on assumption, the rate of reaction is absolutely controlled by the mass transfer pro-cess, the dissolved CO in liquid phase penetrates into the cell, then microorganisms rapidlyuse the transferred CO in the reaction center. These phenomena may not be justified for thefresh inocula entering the culture media; however, once the culture is dominated by activeorganisms, the concentration of CO in the gas phase decreases as the propagation of micro-organisms increases. Therefore, the concentration of CO in the liquid phase decreases nearlyto zero. That justifies making an assumption, i.e. PCO,liquid ¼ 0. This means that the CO mol-ecules available in the liquid phase are rapidly used by the microorganisms. Thus, the rate ofmass transfer can be proportional to the partial pressure of CO in the gas phase, as expectedby Eqn (3.14.4.12). Therefore, Eqn (3.14.4.12) can be simplified in the regime of mass transfercontrol by the following expression21,23:
� 1VL
dNCO;gas
dt¼ KL$a
HPCO;gas (3.14.4.14)
The plot of the rate of disappearance of CO per volume of liquid in the serumbottles versus partial pressure of CO in the gas phase based on Eqn (3.14.4.14) couldgive the constant slope value of KL$a/H. Henry’s constant is independent of the acetateconcentration, but it is only dependent on temperature. The overall volumetric mass trans-fer coefficient can be calculated based on the above assumption. The data for various ace-tate concentrations and different parameters were plotted to calculate the mass transfercoefficient.44
Figure 3.13 illustrates the mass transfer coefficient for batch-grown R. rubrum and wascomputed with various acetate concentrations at 200 rpm agitation speed, 500 lux light in-tensity, and 30 �C. As the experiment progressed, there was an increase in the rate of car-bon monoxide uptake in the gas phase and a gradual decrease in the partial pressure ofcarbon monoxide. Also, a decrease in the partial pressure of carbon monoxide was affectedby acetate concentration in the culture media. The value of the slope of the straight lineincreased with the decrease in acetate concentrations, i.e. 2.5e1 g L�1. The maximummass transfer coefficient was obtained for 1 g L�1 acetate concentration (KL$a ¼ 4.3 h�1).The decrease in mass transfer coefficient was observed with the increase in acetate concen-tration. This was due to acetate inhibition on the microbial cell population as acetate con-centration increased in the culture media. The minimum KL$a was 1.2 h�1 at 3 g L�1 acetateconcentration.
3.13.5 KINETIC OF WATER GAS SHIFT REACTION
Since there are various specific growth rates and different values of rate constants whilesubstrate concentration varies, mix inhibition exists. Andrew45 incorporated a substrate
3.13.5 KINETIC OF WATER GAS SHIFT REACTION 93
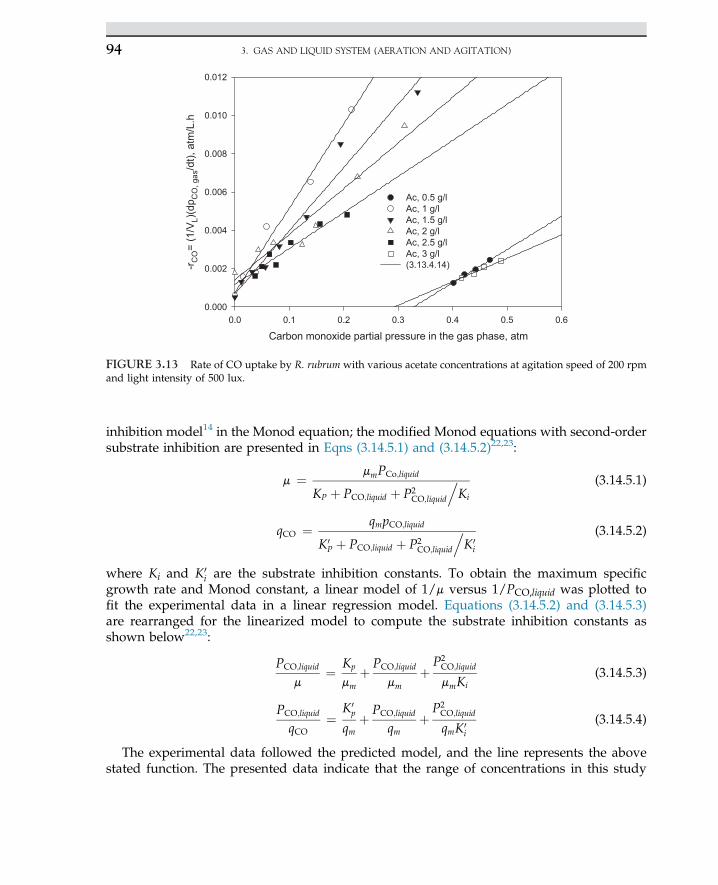
inhibition model14 in the Monod equation; the modified Monod equations with second-ordersubstrate inhibition are presented in Eqns (3.14.5.1) and (3.14.5.2)22,23:
m ¼ mmPCo;liquid
KP þ PCO;liquid þ P2CO;liquid
.Ki
(3.14.5.1)
qCO ¼ qmpCO;liquid
K0P þ PCO;liquid þ P2
CO;liquid
.K0
i
(3.14.5.2)
where Ki and K0i are the substrate inhibition constants. To obtain the maximum specific
growth rate and Monod constant, a linear model of 1/m versus 1/PCO,liquid was plotted tofit the experimental data in a linear regression model. Equations (3.14.5.2) and (3.14.5.3)are rearranged for the linearized model to compute the substrate inhibition constants asshown below22,23:
PCO;liquid
m¼ Kp
mmþ PCO;liquid
mmþ P2
CO;liquid
mmKi(3.14.5.3)
PCO;liquid
qCO¼ K0
p
qmþ PCO;liquid
qmþ P2
CO;liquid
qmK0i
(3.14.5.4)
The experimental data followed the predicted model, and the line represents the abovestated function. The presented data indicate that the range of concentrations in this study
Carbon monoxide partial pressure in the gas phase, atm0.0 0.1 0.2 0.3 0.4 0.5 0.6
-r CO
= (1
/VL)
(dp C
O, g
as/d
t), a
tm/L
.h
0.000
0.002
0.004
0.006
0.008
0.010
0.012
Ac, 0.5 g/lAc, 1 g/lAc, 1.5 g/lAc, 2 g/lAc, 2.5 g/lAc, 3 g/l(3.13.4.14)
FIGURE 3.13 Rate of CO uptake by R. rubrum with various acetate concentrations at agitation speed of 200 rpmand light intensity of 500 lux.
3. GAS AND LIQUID SYSTEM (AERATION AND AGITATION)94
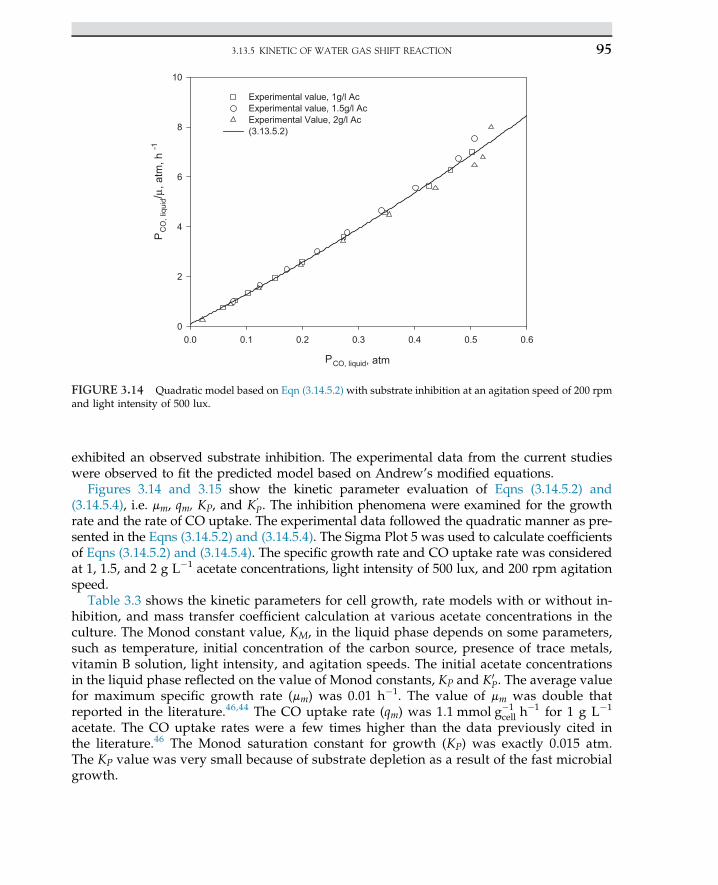
exhibited an observed substrate inhibition. The experimental data from the current studieswere observed to fit the predicted model based on Andrew’s modified equations.
Figures 3.14 and 3.15 show the kinetic parameter evaluation of Eqns (3.14.5.2) and(3.14.5.4), i.e. mm, qm, KP, and K’
P. The inhibition phenomena were examined for the growthrate and the rate of CO uptake. The experimental data followed the quadratic manner as pre-sented in the Eqns (3.14.5.2) and (3.14.5.4). The Sigma Plot 5 was used to calculate coefficientsof Eqns (3.14.5.2) and (3.14.5.4). The specific growth rate and CO uptake rate was consideredat 1, 1.5, and 2 g L�1 acetate concentrations, light intensity of 500 lux, and 200 rpm agitationspeed.
Table 3.3 shows the kinetic parameters for cell growth, rate models with or without in-hibition, and mass transfer coefficient calculation at various acetate concentrations in theculture. The Monod constant value, KM, in the liquid phase depends on some parameters,such as temperature, initial concentration of the carbon source, presence of trace metals,vitamin B solution, light intensity, and agitation speeds. The initial acetate concentrationsin the liquid phase reflected on the value of Monod constants, KP and K0
P. The average valuefor maximum specific growth rate (mm) was 0.01 h�1. The value of mm was double thatreported in the literature.46,44 The CO uptake rate (qm) was 1:1 mmol g�1
cell h�1 for 1 g L�1
acetate. The CO uptake rates were a few times higher than the data previously cited inthe literature.46 The Monod saturation constant for growth (KP) was exactly 0.015 atm.The KP value was very small because of substrate depletion as a result of the fast microbialgrowth.
PCO, liquid, atm
0.0 0.1 0.2 0.3 0.4 0.5 0.6
PC
O, l
iqui
d/µ, a
tm, h
-1
0
2
4
6
8
10
Experimental value, 1g/l AcExperimental value, 1.5g/l AcExperimental Value, 2g/l Ac(3.13.5.2)
FIGURE 3.14 Quadratic model based on Eqn (3.14.5.2) with substrate inhibition at an agitation speed of 200 rpmand light intensity of 500 lux.
3.13.5 KINETIC OF WATER GAS SHIFT REACTION 95
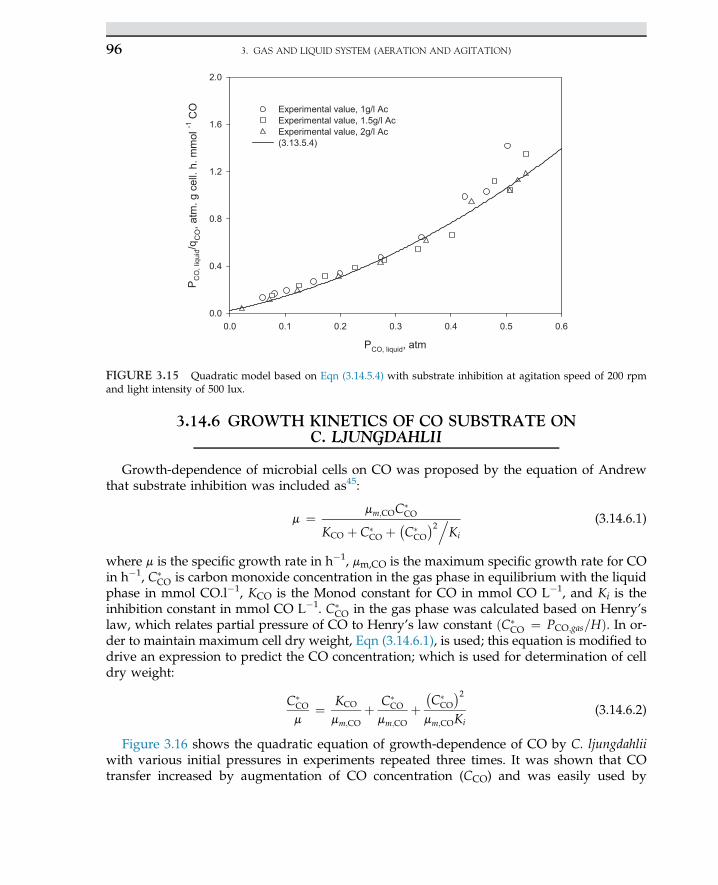
3.14.6 GROWTH KINETICS OF CO SUBSTRATE ONC. LJUNGDAHLII
Growth-dependence of microbial cells on CO was proposed by the equation of Andrewthat substrate inhibition was included as45:
m ¼ mm;COC�CO
KCO þ C�CO þ �
C�CO
�2.Ki
(3.14.6.1)
where m is the specific growth rate in h�1, mm,CO is the maximum specific growth rate for COin h�1, C�
CO is carbon monoxide concentration in the gas phase in equilibrium with the liquidphase in mmol CO.l�1, KCO is the Monod constant for CO in mmol CO L�1, and Ki is theinhibition constant in mmol CO L�1. C�
CO in the gas phase was calculated based on Henry’slaw, which relates partial pressure of CO to Henry’s law constant ðC�
CO ¼ PCO;gas=HÞ. In or-der to maintain maximum cell dry weight, Eqn (3.14.6.1), is used; this equation is modified todrive an expression to predict the CO concentration; which is used for determination of celldry weight:
C�CO
m¼ KCO
mm;COþ C�
CO
mm;COþ
�C�
CO
�2mm;COKi
(3.14.6.2)
Figure 3.16 shows the quadratic equation of growth-dependence of CO by C. ljungdahliiwith various initial pressures in experiments repeated three times. It was shown that COtransfer increased by augmentation of CO concentration (CCO) and was easily used by
PCO, liquid, atm
0.0 0.1 0.2 0.3 0.4 0.5 0.6
PC
O, l
iqui
d/qC
O, a
tm. g
cel
l. h.
mm
ol-1
CO
0.0
0.4
0.8
1.2
1.6
2.0
Experimental value, 1g/l AcExperimental value, 1.5g/l AcExperimental value, 2g/l Ac(3.13.5.4)
FIGURE 3.15 Quadratic model based on Eqn (3.14.5.4) with substrate inhibition at agitation speed of 200 rpmand light intensity of 500 lux.
3. GAS AND LIQUID SYSTEM (AERATION AND AGITATION)96
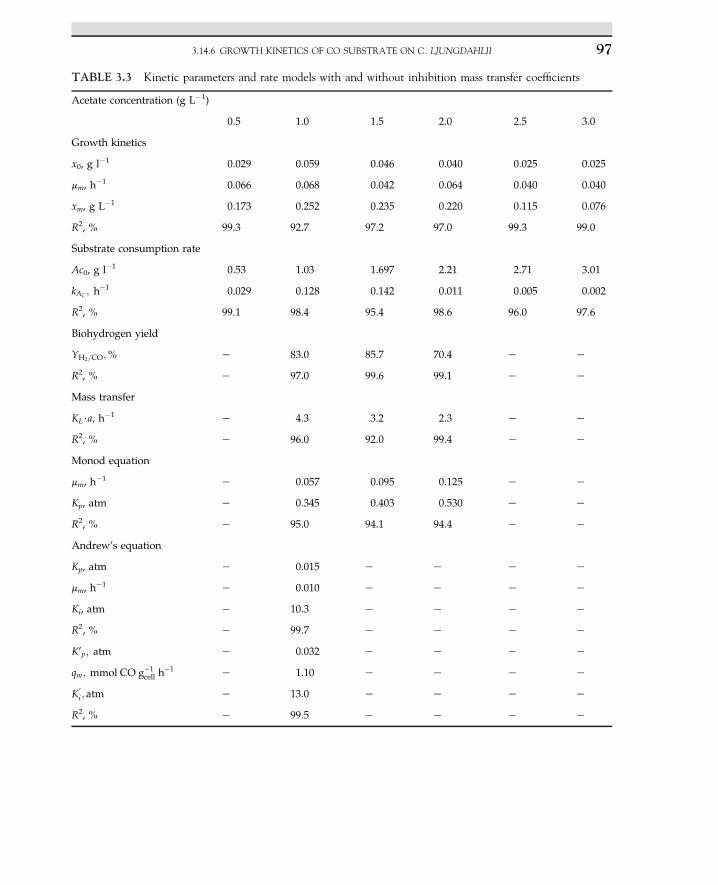
TABLE 3.3 Kinetic parameters and rate models with and without inhibition mass transfer coefficients
Acetate concentration (g L�1)
0.5 1.0 1.5 2.0 2.5 3.0
Growth kinetics
x0, g l�1 0.029 0.059 0.046 0.040 0.025 0.025
mm, h�1 0.066 0.068 0.042 0.064 0.040 0.040
xm, g L�1 0.173 0.252 0.235 0.220 0.115 0.076
R2, % 99.3 92.7 97.2 97.0 99.3 99.0
Substrate consumption rate
Ac0, g l�1 0.53 1.03 1.697 2.21 2.71 3.01
kAC ; h�1 0.029 0.128 0.142 0.011 0.005 0.002
R2, % 99.1 98.4 95.4 98.6 96.0 97.6
Biohydrogen yield
YH2=CO;% e 83.0 85.7 70.4 e e
R2, % e 97.0 99.6 99.1 e e
Mass transfer
KL$a, h�1 e 4.3 3.2 2.3 e e
R2, % e 96.0 92.0 99.4 e e
Monod equation
mm, h�1 e 0.057 0.095 0.125 e e
Kp, atm e 0.345 0.403 0.530 e e
R2, % e 95.0 94.1 94.4 e e
Andrew’s equation
Kp, atm e 0.015 e e e e
mm, h�1 e 0.010 e e e e
Ki, atm e 10.3 e e e e
R2, % e 99.7 e e e e
K0p; atm e 0.032 e e e e
qm; mmol CO g�1cell h
�1 e 1.10 e e e e
K’i ; atm e 13.0 e e e e
R2, % e 99.5 e e e e
3.14.6 GROWTH KINETICS OF CO SUBSTRATE ON C. LJUNGDAHLII 97
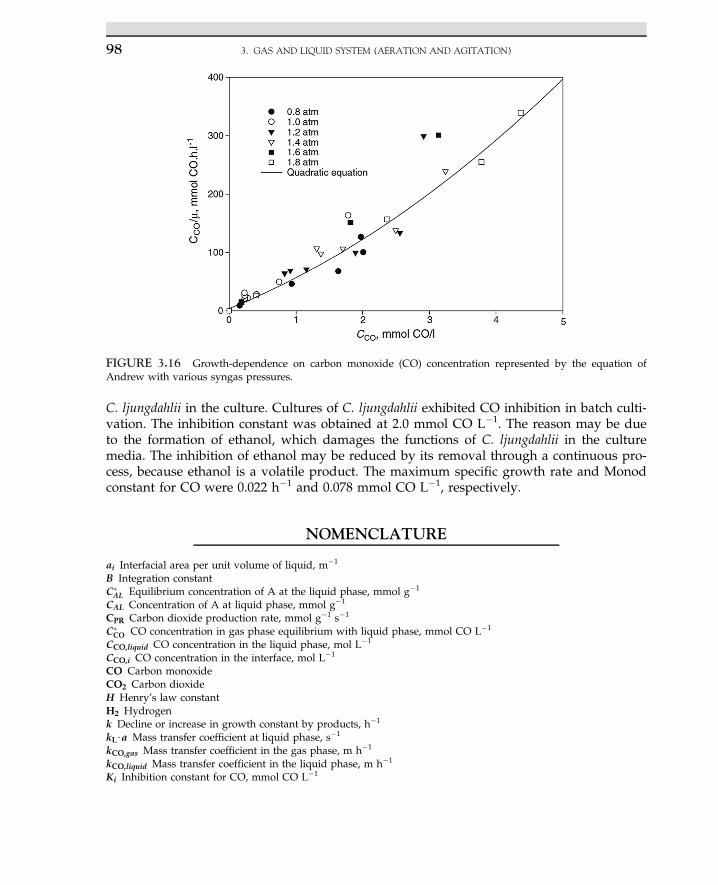
C. ljungdahlii in the culture. Cultures of C. ljungdahlii exhibited CO inhibition in batch culti-vation. The inhibition constant was obtained at 2.0 mmol CO L�1. The reason may be dueto the formation of ethanol, which damages the functions of C. ljungdahlii in the culturemedia. The inhibition of ethanol may be reduced by its removal through a continuous pro-cess, because ethanol is a volatile product. The maximum specific growth rate and Monodconstant for CO were 0.022 h�1 and 0.078 mmol CO L�1, respectively.
NOMENCLATURE
ai Interfacial area per unit volume of liquid, m�1
B Integration constantC�AL Equilibrium concentration of A at the liquid phase, mmol g�1
CAL Concentration of A at liquid phase, mmol g�1
CPR Carbon dioxide production rate, mmol g�1 s�1
C�CO CO concentration in gas phase equilibrium with liquid phase, mmol CO L�1
CCO,liquid CO concentration in the liquid phase, mol L�1
CCO,i CO concentration in the interface, mol L�1
CO Carbon monoxideCO2 Carbon dioxideH Henry’s law constantH2 Hydrogenk Decline or increase in growth constant by products, h�1
kL$a Mass transfer coefficient at liquid phase, s�1
kCO,gas Mass transfer coefficient in the gas phase, m h�1
kCO,liquid Mass transfer coefficient in the liquid phase, m h�1
Ki Inhibition constant for CO, mmol CO L�1
FIGURE 3.16 Growth-dependence on carbon monoxide (CO) concentration represented by the equation ofAndrew with various syngas pressures.
3. GAS AND LIQUID SYSTEM (AERATION AND AGITATION)98
K0i Substrate inhibition constant for uptake rate, atm
KCO Monod constant for CO, mmol CO L�1
kS First-order rate constant, h�1
NCO,gas Number of moles of CO component in the gas phase, atmKL$a Overall gaseliquid mass transfer coefficient, h�1
KP Monod saturation constant for growth, atmK0
P Monod saturation constant for substrate uptake, atmPCO,i Partial pressure of CO in interface, atmPCO,gas Partial pressure of CO in the gas phase, atmPCO,liquid Partial pressure of CO in the liquid phase, atmqCO Substrate uptake rate per unit of cell weight, mmol g�1
cell h�1
qm Maximum specific substrate uptake rate, mmol g�1cell h
�1
S0 Initial substrate concentration, g L�1
S Substrate concentration, g L�1
t Time, hVl Volume of liquid phase, Lx0 Initial cell concentration, g L�1
x Cell dry weight concentration, g L�1
xm Maximum cell dry weight concentration, g L�1
Yx/S Yield coefficient of cell substrate, gcell g�1substrate
m Specific growth rate, h�1
mm Maximum specific growth rate, h�1
mm,CO Maximum specific growth rate for CO, h�1
OUR Oxygen uptake rate, mmol g�1 s�1
RQ Respiration quotient, mmol CO2 per mmol O2x Biomass concentration, mg L�1
xmax The maximum specific biomass production, s�1
qO2 Specific oxygen uptake rate, s�1
AcknowledgmentsThe present research was made possible through a long-term IRPA grant No.01-02-05-3223EA011, sponsored by theMinistry of Science, Technology and Innovations (MOSTI), Malaysia, and Universiti Sains Malaysia (USM). The authorsare thankful to the RCMO and MOSTI scientific panels, Universiti Sains Malaysia and MOSTI for their financialsupport.
References1. Younesi H, Najafpour G, Mohamed AR. Iran J Biotechnol 2006;4(1):45.2. Mohammadi M, Najafpour GD, Younesi H, Lahijani P, Uzir MH, Mohamed AR. Renew Sust Energ Rev2011;15(9):4255.
3. Najafpour G, Ku Ismail KS, Younesi H, Mohamed A, Harun A. Int J Eng 2004;17:105.4. Najafpour G, Younesi H, Syahidah Ku Ismail K. Bioresour Technol 2004;92(3):251.5. Klasson KT, Ackerson MD, Clausen EC, Gaddy JL. Enzyme Microb Technol 1992;14(8):602.6. Younesi H, Najafpour G, Ku Ismail KS, Mohamed AR, Kamaruddin AH. Bioresour Technol 2008;99(7):2612.7. Braun M, Mayer F, Gottschalk G. Arch Microbiol 1981;128(3):288.8. Najafpour G, Younesi H, Mohamed A. Malays J Microbiol 2005;1(1):12.9. Tjatjopoulos GJ, Vasalos IA. Ind Eng Chem Res 1998;37(4):1410.10. Najafpour G, Ismail KSK, Younesi H, Mohamed AR, Kamaruddin AH. Afr J Biotechnol 2004;3(10):503.11. Asada Y, Miyake J. J Biosci Bioeng 1999;88(1):1.12. Jung GY, Kim JR, Park J-Y, Park S. Int J Hydrog Energy 2002;27(6):601.13. Kellum R, Drake HL. J Bacteriol 1984;160(1):466.
REFERENCES 99
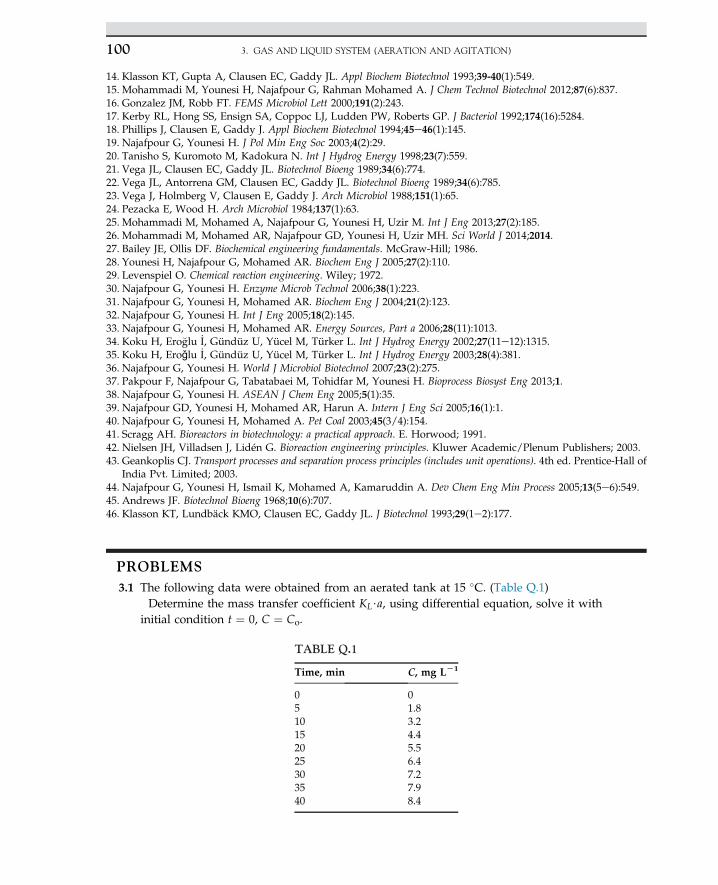
14. Klasson KT, Gupta A, Clausen EC, Gaddy JL. Appl Biochem Biotechnol 1993;39-40(1):549.15. Mohammadi M, Younesi H, Najafpour G, Rahman Mohamed A. J Chem Technol Biotechnol 2012;87(6):837.16. Gonzalez JM, Robb FT. FEMS Microbiol Lett 2000;191(2):243.17. Kerby RL, Hong SS, Ensign SA, Coppoc LJ, Ludden PW, Roberts GP. J Bacteriol 1992;174(16):5284.18. Phillips J, Clausen E, Gaddy J. Appl Biochem Biotechnol 1994;45e46(1):145.19. Najafpour G, Younesi H. J Pol Min Eng Soc 2003;4(2):29.20. Tanisho S, Kuromoto M, Kadokura N. Int J Hydrog Energy 1998;23(7):559.21. Vega JL, Clausen EC, Gaddy JL. Biotechnol Bioeng 1989;34(6):774.22. Vega JL, Antorrena GM, Clausen EC, Gaddy JL. Biotechnol Bioeng 1989;34(6):785.23. Vega J, Holmberg V, Clausen E, Gaddy J. Arch Microbiol 1988;151(1):65.24. Pezacka E, Wood H. Arch Microbiol 1984;137(1):63.25. Mohammadi M, Mohamed A, Najafpour G, Younesi H, Uzir M. Int J Eng 2013;27(2):185.26. Mohammadi M, Mohamed AR, Najafpour GD, Younesi H, Uzir MH. Sci World J 2014;2014.27. Bailey JE, Ollis DF. Biochemical engineering fundamentals. McGraw-Hill; 1986.28. Younesi H, Najafpour G, Mohamed AR. Biochem Eng J 2005;27(2):110.29. Levenspiel O. Chemical reaction engineering. Wiley; 1972.30. Najafpour G, Younesi H. Enzyme Microb Technol 2006;38(1):223.31. Najafpour G, Younesi H, Mohamed AR. Biochem Eng J 2004;21(2):123.32. Najafpour G, Younesi H. Int J Eng 2005;18(2):145.33. Najafpour G, Younesi H, Mohamed AR. Energy Sources, Part a 2006;28(11):1013.34. Koku H, Ero�glu _I, Gündüz U, Yücel M, Türker L. Int J Hydrog Energy 2002;27(11e12):1315.35. Koku H, Eroǧlu _I, Gündüz U, Yücel M, Türker L. Int J Hydrog Energy 2003;28(4):381.36. Najafpour G, Younesi H. World J Microbiol Biotechnol 2007;23(2):275.37. Pakpour F, Najafpour G, Tabatabaei M, Tohidfar M, Younesi H. Bioprocess Biosyst Eng 2013;1.38. Najafpour G, Younesi H. ASEAN J Chem Eng 2005;5(1):35.39. Najafpour GD, Younesi H, Mohamed AR, Harun A. Intern J Eng Sci 2005;16(1):1.40. Najafpour G, Younesi H, Mohamed A. Pet Coal 2003;45(3/4):154.41. Scragg AH. Bioreactors in biotechnology: a practical approach. E. Horwood; 1991.42. Nielsen JH, Villadsen J, Lidén G. Bioreaction engineering principles. Kluwer Academic/Plenum Publishers; 2003.43. Geankoplis CJ. Transport processes and separation process principles (includes unit operations). 4th ed. Prentice-Hall of
India Pvt. Limited; 2003.44. Najafpour G, Younesi H, Ismail K, Mohamed A, Kamaruddin A. Dev Chem Eng Min Process 2005;13(5e6):549.45. Andrews JF. Biotechnol Bioeng 1968;10(6):707.46. Klasson KT, Lundbäck KMO, Clausen EC, Gaddy JL. J Biotechnol 1993;29(1e2):177.
PROBLEMS3.1 The following data were obtained from an aerated tank at 15 �C. (Table Q.1)
Determine the mass transfer coefficient KL$a, using differential equation, solve it withinitial condition t ¼ 0, C ¼ Co.
TABLE Q.1
Time, min C, mg LL1
0510152025303540
01.83.24.45.56.47.27.98.4
3. GAS AND LIQUID SYSTEM (AERATION AND AGITATION)100
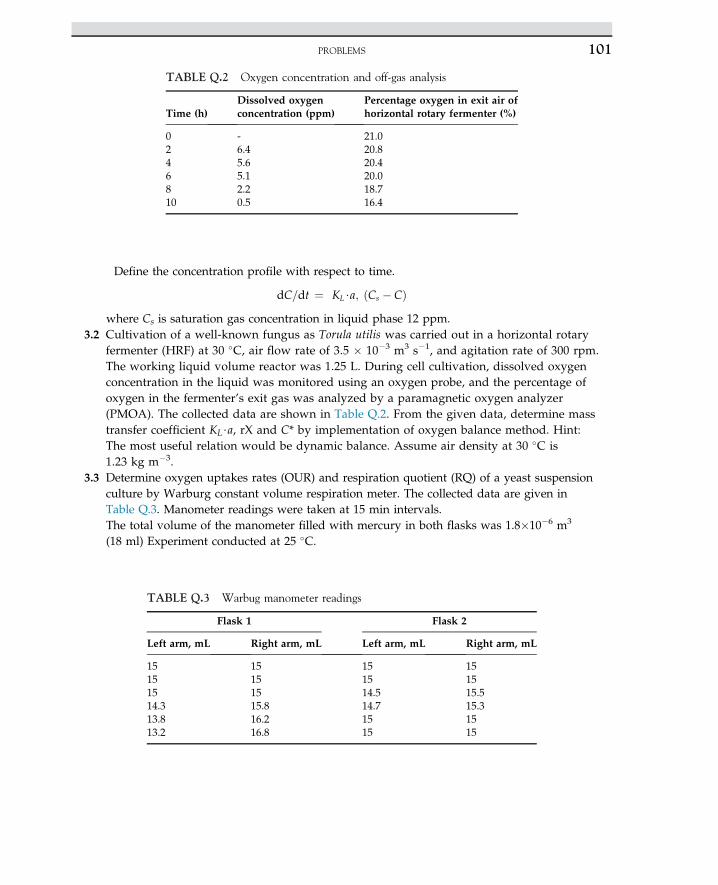
Define the concentration profile with respect to time.
dC=dt ¼ KL$a; ðCs � CÞwhere Cs is saturation gas concentration in liquid phase 12 ppm.
3.2 Cultivation of a well-known fungus as Torula utilis was carried out in a horizontal rotaryfermenter (HRF) at 30 �C, air flow rate of 3.5 � 10�3 m3 s�1, and agitation rate of 300 rpm.The working liquid volume reactor was 1.25 L. During cell cultivation, dissolved oxygenconcentration in the liquid was monitored using an oxygen probe, and the percentage ofoxygen in the fermenter’s exit gas was analyzed by a paramagnetic oxygen analyzer(PMOA). The collected data are shown in Table Q.2. From the given data, determine masstransfer coefficient KL$a, rX and C* by implementation of oxygen balance method. Hint:The most useful relation would be dynamic balance. Assume air density at 30 �C is1.23 kg m�3.
3.3 Determine oxygen uptakes rates (OUR) and respiration quotient (RQ) of a yeast suspensionculture by Warburg constant volume respiration meter. The collected data are given inTable Q.3. Manometer readings were taken at 15 min intervals.The total volume of the manometer filled with mercury in both flasks was 1.8�10�6 m3
(18 ml) Experiment conducted at 25 �C.
TABLE Q.3 Warbug manometer readings
Flask 1 Flask 2
Left arm, mL Right arm, mL Left arm, mL Right arm, mL
15151514.313.813.2
15151515.816.216.8
151514.514.71515
151515.515.31515
TABLE Q.2 Oxygen concentration and off-gas analysis
Time (h)Dissolved oxygenconcentration (ppm)
Percentage oxygen in exit air ofhorizontal rotary fermenter (%)
0246810
-6.45.65.12.20.5
21.020.820.420.018.716.4
PROBLEMS 101
Contents of the flasks were:Flask 1: A 3-mL suspension of yeast with alkali in the central cup.Flask 2: A 3-mL suspension of yeast (washed cells)*Flask 3: Blank, distilled water þ0.3 mL KOH in the cup.From the above given data, calculate:
1. The OUR for the yeast suspension2. RQ of yeast cell
3. GAS AND LIQUID SYSTEM (AERATION AND AGITATION)102
C H A P T E R
4
Fermentation Process Control
O U T L I N E
4.1 Introduction 104
4.2 Bioreactor Controlling Probes 105
4.3 Characteristics of Bioreactor Sensors 106
4.4 Temperature Measurement andControl 108
4.5 Dissolved Oxygen Measurement andControl 109
4.6 pH/Redox Measurement and Control 110
4.7 Detection and Prevention of Foam 112
4.8 Biosensors 1134.8.1 Biological Element 1144.8.2 Immobilization of Biomaterials 115
4.8.2.1 Adsorption 1154.8.2.2 Entrapment 1154.8.2.3 Encapsulation 115
4.8.2.4 Cross-Linking 1164.8.2.5 Covalent Binding 116
4.8.3 Transducer 1174.8.3.1 Thermal Biosensor 1174.8.3.2 Optical Biosensor 1174.8.3.3 Piezoelectric Biosensor 1174.8.3.4 Electrochemical
Biosensor 1174.8.4 Amperometric Biosensors 118
4.8.4.1 Response Time 1224.8.4.2 Recovery Time 1224.8.4.3 Linear Detection Range 1224.8.4.4 Limit of Detection 1224.8.4.5 Sensitivity 123
Nomenclature 124
References 124
103Biochemical Engineering and Biotechnologyhttp://dx.doi.org/10.1016/B978-0-444-63357-6.00004-3 Copyright © 2015 Elsevier B.V. All rights reserved.
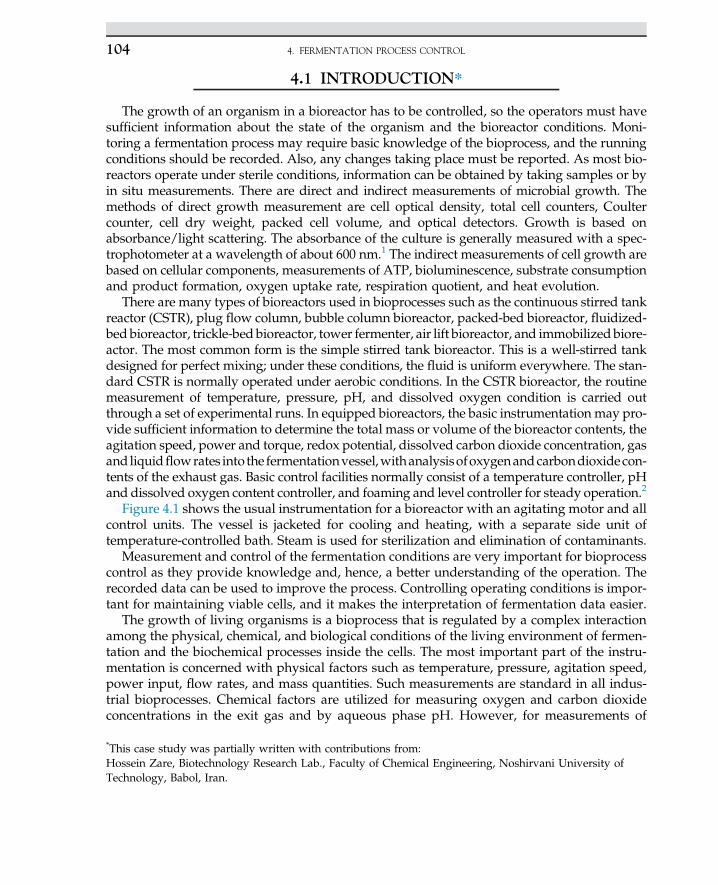
4.1 INTRODUCTION*
The growth of an organism in a bioreactor has to be controlled, so the operators must havesufficient information about the state of the organism and the bioreactor conditions. Moni-toring a fermentation process may require basic knowledge of the bioprocess, and the runningconditions should be recorded. Also, any changes taking place must be reported. As most bio-reactors operate under sterile conditions, information can be obtained by taking samples or byin situ measurements. There are direct and indirect measurements of microbial growth. Themethods of direct growth measurement are cell optical density, total cell counters, Coultercounter, cell dry weight, packed cell volume, and optical detectors. Growth is based onabsorbance/light scattering. The absorbance of the culture is generally measured with a spec-trophotometer at a wavelength of about 600 nm.1 The indirect measurements of cell growth arebased on cellular components, measurements of ATP, bioluminescence, substrate consumptionand product formation, oxygen uptake rate, respiration quotient, and heat evolution.
There are many types of bioreactors used in bioprocesses such as the continuous stirred tankreactor (CSTR), plug flow column, bubble column bioreactor, packed-bed bioreactor, fluidized-bed bioreactor, trickle-bed bioreactor, tower fermenter, air lift bioreactor, and immobilized biore-actor. The most common form is the simple stirred tank bioreactor. This is a well-stirred tankdesigned for perfect mixing; under these conditions, the fluid is uniform everywhere. The stan-dard CSTR is normally operated under aerobic conditions. In the CSTR bioreactor, the routinemeasurement of temperature, pressure, pH, and dissolved oxygen condition is carried outthrough a set of experimental runs. In equipped bioreactors, the basic instrumentation may pro-vide sufficient information to determine the total mass or volume of the bioreactor contents, theagitation speed, power and torque, redox potential, dissolved carbon dioxide concentration, gasand liquidflowrates into the fermentationvessel,withanalysisofoxygenandcarbondioxidecon-tents of the exhaust gas. Basic control facilities normally consist of a temperature controller, pHand dissolved oxygen content controller, and foaming and level controller for steady operation.2
Figure 4.1 shows the usual instrumentation for a bioreactor with an agitating motor and allcontrol units. The vessel is jacketed for cooling and heating, with a separate side unit oftemperature-controlled bath. Steam is used for sterilization and elimination of contaminants.
Measurement and control of the fermentation conditions are very important for bioprocesscontrol as they provide knowledge and, hence, a better understanding of the operation. Therecorded data can be used to improve the process. Controlling operating conditions is impor-tant for maintaining viable cells, and it makes the interpretation of fermentation data easier.
The growth of living organisms is a bioprocess that is regulated by a complex interactionamong the physical, chemical, and biological conditions of the living environment of fermen-tation and the biochemical processes inside the cells. The most important part of the instru-mentation is concerned with physical factors such as temperature, pressure, agitation speed,power input, flow rates, and mass quantities. Such measurements are standard in all indus-trial bioprocesses. Chemical factors are utilized for measuring oxygen and carbon dioxideconcentrations in the exit gas and by aqueous phase pH. However, for measurements of
*This case study was partially written with contributions from:Hossein Zare, Biotechnology Research Lab., Faculty of Chemical Engineering, Noshirvani University ofTechnology, Babol, Iran.
4. FERMENTATION PROCESS CONTROL104
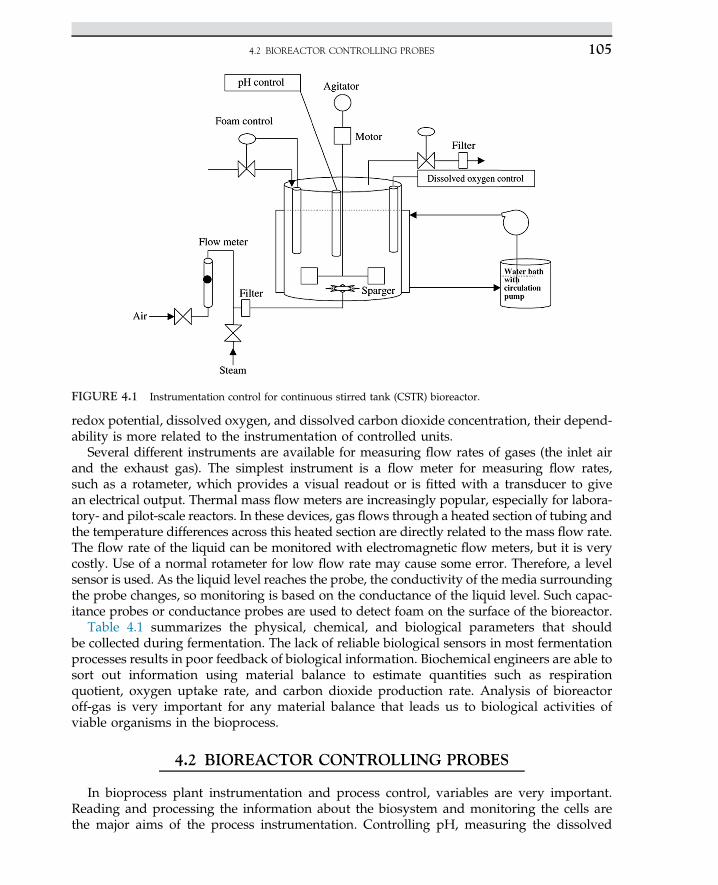
redox potential, dissolved oxygen, and dissolved carbon dioxide concentration, their depend-ability is more related to the instrumentation of controlled units.
Several different instruments are available for measuring flow rates of gases (the inlet airand the exhaust gas). The simplest instrument is a flow meter for measuring flow rates,such as a rotameter, which provides a visual readout or is fitted with a transducer to givean electrical output. Thermal mass flow meters are increasingly popular, especially for labora-tory- and pilot-scale reactors. In these devices, gas flows through a heated section of tubing andthe temperature differences across this heated section are directly related to the mass flow rate.The flow rate of the liquid can be monitored with electromagnetic flow meters, but it is verycostly. Use of a normal rotameter for low flow rate may cause some error. Therefore, a levelsensor is used. As the liquid level reaches the probe, the conductivity of the media surroundingthe probe changes, so monitoring is based on the conductance of the liquid level. Such capac-itance probes or conductance probes are used to detect foam on the surface of the bioreactor.
Table 4.1 summarizes the physical, chemical, and biological parameters that shouldbe collected during fermentation. The lack of reliable biological sensors in most fermentationprocesses results in poor feedback of biological information. Biochemical engineers are able tosort out information using material balance to estimate quantities such as respirationquotient, oxygen uptake rate, and carbon dioxide production rate. Analysis of bioreactoroff-gas is very important for any material balance that leads us to biological activities ofviable organisms in the bioprocess.
4.2 BIOREACTOR CONTROLLING PROBES
In bioprocess plant instrumentation and process control, variables are very important.Reading and processing the information about the biosystem and monitoring the cells arethe major aims of the process instrumentation. Controlling pH, measuring the dissolved
FIGURE 4.1 Instrumentation control for continuous stirred tank (CSTR) bioreactor.
4.2 BIOREACTOR CONTROLLING PROBES 105
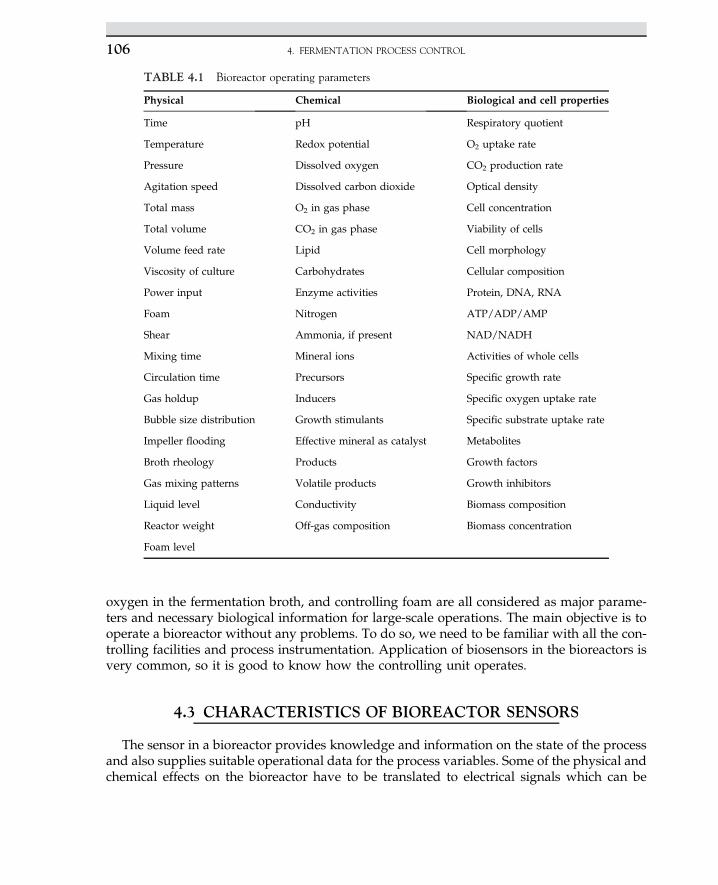
oxygen in the fermentation broth, and controlling foam are all considered as major parame-ters and necessary biological information for large-scale operations. The main objective is tooperate a bioreactor without any problems. To do so, we need to be familiar with all the con-trolling facilities and process instrumentation. Application of biosensors in the bioreactors isvery common, so it is good to know how the controlling unit operates.
4.3 CHARACTERISTICS OF BIOREACTOR SENSORS
The sensor in a bioreactor provides knowledge and information on the state of the processand also supplies suitable operational data for the process variables. Some of the physical andchemical effects on the bioreactor have to be translated to electrical signals which can be
TABLE 4.1 Bioreactor operating parameters
Physical Chemical Biological and cell properties
Time pH Respiratory quotient
Temperature Redox potential O2 uptake rate
Pressure Dissolved oxygen CO2 production rate
Agitation speed Dissolved carbon dioxide Optical density
Total mass O2 in gas phase Cell concentration
Total volume CO2 in gas phase Viability of cells
Volume feed rate Lipid Cell morphology
Viscosity of culture Carbohydrates Cellular composition
Power input Enzyme activities Protein, DNA, RNA
Foam Nitrogen ATP/ADP/AMP
Shear Ammonia, if present NAD/NADH
Mixing time Mineral ions Activities of whole cells
Circulation time Precursors Specific growth rate
Gas holdup Inducers Specific oxygen uptake rate
Bubble size distribution Growth stimulants Specific substrate uptake rate
Impeller flooding Effective mineral as catalyst Metabolites
Broth rheology Products Growth factors
Gas mixing patterns Volatile products Growth inhibitors
Liquid level Conductivity Biomass composition
Reactor weight Off-gas composition Biomass concentration
Foam level
4. FERMENTATION PROCESS CONTROL106
amplified and then displayed on a monitor or recorder and used as an input signal for a con-trolling unit. In practice, the response of most of the processes follows a sigmoidal S-shapedcurve. A similar response would be obtained if a dissolved oxygen probe was suddenlyremoved from a vessel with depleted oxygen levels, the probe transferred to a vessel withwater maintained with supplied air passed through the aqueous phase, and the systemagitated for sufficient oxygen transfer so that it is saturated in the liquid phase.3 Air bubblesmay interfere with sensor signals, and false readings can mislead the bioreactor operation.
The dynamics given by the instrument response signal comprise several processes takingplace in series. Thus, the transfer of oxygen from the air into the liquid causes reduction in therate of mass transfer due to the reduction in the concentration gradient as the existing drivingforces. The rate of change of the oxygen concentration in the gas phase is determined by themagnitude of the time constant which depends on the gas volume and the mass transfercoefficient KLa. The rate of change in the dissolved oxygen with time is determined by themagnitude of the time constant for the liquid phase which depends on the volume of theliquid and the mass transfer coefficient. Finally, the time-varying liquid-phase concentrationis registered by the dissolved oxygen electrode and is transmitted as an output signal. Againthe signal is affected by the electrode time constant. Thus, the process dynamics are deter-mined by a combination of the time constants for gas phase, liquid phase, and the electrodedynamics. Figure 4.2 shows the computer simulation results of such a dynamic aerationexperiment. The y-axis shows the response fraction with respect to time. The gas-phaseresponse is typically first-order, and the liquid phase shows some lag or delay on the signal.The electrode response is much more delayed for a slow-acting electrode.4
FIGURE 4.2 Computer simulation of adynamic aeration experiment with a slowdissolved oxygen (DO) electrode.
4.3 CHARACTERISTICS OF BIOREACTOR SENSORS 107
4.4 TEMPERATURE MEASUREMENT AND CONTROL
Control of temperature for fermentation vessels is required because of the narrow range ofoptimal temperature. Most fermenters operate around 30e36 �C, but certain fermentationsmay require control of the temperature in a range of 0.5 �C; this can easily be obtained inlarge bioreactors.4,5 To maintain bioreactor temperature within the limited range, the systemmay require regulation of heating and cooling by the control system. Heat is generated in thefermenter by dissipation of power, resulting in an agitated system; heat is also generated bythe exothermic biochemical reactions. In exothermic reactions, the fermentation vesselrequires cooling. At the start and end of the fermentation, the heat generation rate is verylow, although the systems are normally heated to achieve the desired temperature. Thereare many alternatives for measuring and controlling the bioreactor temperature. Theseinclude glass thermometers, thermocouples, thermostats, resistance thermometers, and mini-ature integrated circuit devices. Thermal units capable of giving direct electrical outputsignals are favored for control purposes. Thermocouples are cheap and simple to use, butthey are rather low in resolution and require a cold junction. Thermistors are semiconductorsthat exhibit a change in electrical conductivity with temperature. They are very sensitive andinexpensive; they give a highly nonlinear output. Modern transistorized, integrated circuitscombine the features, but they often display a more linear output. Platinum resistance ther-mometers are usually preferred as standard. To avoid contamination of the bioreactor, thethermometers are usually fitted into thin-walled stainless-steel pockets which project intothe bioreactor. The pockets are filled with a heat-conducting liquid to provide good contactand to speed the instrument response. The resistance thermometer works on a principle thatelectrical resistance changes with temperature. It requires the passage of a current to developa measurable voltage which is proportional to the temperature. However, the current shouldnot be so large that it causes heating effects.
The changes in the electrical resistance of the electrical wires to the thermometer can bequite large, with their resistance being affected by changes in the ambient temperature. Theseeffects can be eliminated by using separate wires to supply and sense the current. The advan-tages of platinum resistance detectors are their high accuracy, high stability, and that thelinear output signal can be obtained in normal temperature ranges. The high temperaturesteam for sterilization may require separate instrumentation within a temperature range of50e150 �C.5
The energy balance for the bioreactor is shown by the following equation. As the fermenteris used batchwise, the heat balance is mathematically expressed as stated in (4.4.1):
d�MCPTdt
�¼ mXð�DHXÞV � UA
�T � Tj
�(4.4.1)
where M is the total mass of the reactor for the batch system in kg, CP is the specific heat inkJ kg�1 K�1, T is the temperature of the fermentation in K and t is time in s. Also, the term mXis the rate of cell growth in kg m�3 s�1, V is the working volume of the bioreactor in m,3 andDHx is the exothermic heat generated inside the fermenter in kJ kg�1 cell. Under steady-stateconditions of controlled temperature, dT/dt ¼ 0, the rate of heat accumulation is zero, and therate of heat production is equal to the heat transfer by the jacketed system. The rate of heat
4. FERMENTATION PROCESS CONTROL108
production is related to the rate of cell growth. The rate of heat transfer is the mean temper-ature gradient, [T�Tj], multiplied by overall heat transfer coefficient (U) in kJ m�2 s�1 K�1. Tjis the temperature of the coolant in the jacket in K.
4.5 DISSOLVED OXYGEN MEASUREMENT AND CONTROL
The dissolved oxygen (DO) content of the fermentation broth is also an important fermen-tation parameter, affecting cell growth and product formation. The rate of oxygen supply tothe cell is often limited because the solubility of oxygen in fermentation is low. Unfortunately,measurement and control of dissolved oxygen under bioreactor conditions is a challengingproblem. The low solubility of oxygen makes the measurements very difficult. There areseveral methods to determine the concentration of dissolved oxygen. Most DO probes usea membrane to separate the point of measurement from the broth; all probes require calibra-tion before use. Three main methods are used: (1) the tubing method; (2) use of mass spec-trometer probes; and (3) electrochemical detectors. In the tubing method, an inert gasflows through a coil of permeable silicon rubber tubing that is immersed in the bioreactor.Oxygen diffuses from the broth, through the wall of the tubing, and into a flow of inertgas passing through the tube. The concentration gradient exists because of the diffusion ofoxygen into the inert gas. Then, the concentration of oxygen gas in the inert gas is measuredat the outlet of the coil by an oxygen gas analyzer. This method has a relatively slow rate ofresponse on the order of several minutes. The advantages of this method are its simplicity,and in situ sterilization is easily carried out. In the second method, the membrane of amass spectrometer probe is used to separate the fermenter contents from the high vacuumof the mass spectrometer. Measurement of oxygen in the mass spectrometer probe and thetubings are based on the ability of the gas to diffuse across the surface of membrane.
The most common method of measuring dissolved oxygen is based on electrochemicaldetector. Two types of detectos are commercially available: galvanic and polarographicdetectors. Both use membranes to separate electrochemical cell components from the broth.The membrane must be permeable only to oxygen and not to any other chemicals that mightinterfere with the measurement. Oxygen diffuses from the broth across the permeable mem-brane to the electrochemical cell of the detector, where it is reduced at the cathode to producea measurable current or voltage which is proportional to the rate of arrival of oxygen at thecathode. It is important to note that the measurement rate of oxygen arrival at the cathodedepends on the rate of arrival at the outer membrane surface, the rate of transfer acrossthe membrane, and the rate of transport from the inner surface of the membrane to the cath-ode. The rate of arrival at the cathode is proportional to the rate of diffusion of oxygen acrossthe membrane. The rate of diffusion is also proportional to the overall concentration drivingforce for oxygen mass transfer. We assume the oxygen concentration at the inner surface ofthe membrane is efficiently reduced to zero. The rate of diffusion is thus proportional to theoxygen concentration in the liquid only. The electrical signal produced by the probe isdirectly proportional to the dissolved oxygen concentration of the liquid. The probe has tobe calibrated for accurate measurements.
In the galvanic detector, the electrochemical detector consists of a noble metal, like silver(Ag) or platinum (Pt), and a base metal, such as lead (Pb) or tin (Sn), which acts as the anode.
4.5 DISSOLVED OXYGEN MEASUREMENT AND CONTROL 109
The well-defined galvanic detector is immersed in the electrolyte solution. Various electrolytesolutions can be used, but commonly they may be a buffered lead acetate, sodium acetate,and acetic acid mixture. The chemical reaction in the cathode with electrons generated inthe anode may generate a measurable electrical voltage, which is a detectable signal for mea-surements of DO. The lead is the anode in the electrolyte solution that is oxidized. Therefore,the probe life is dependent on the surface area of the anode. The series of chemical reactionsoccurring in the cathode and anode are stated as follows:
Cathode : O2 þ 2H2Oþ 4e�/4OH�
Anode : Pb/Pbþþ þ 2e�
Overall : O2 þ 2Pbþ 2H2O/2PbðOHÞ(4.5.1)
Polarographic electrodes are different from the galvanic type. In this type of electrode, theexternal negative base voltage is applied between the cathode (Au or Pt) and the anode (Ag/AgCl) so that oxygen is reduced at the cathode according to the sequential reactions statedbelow. The following reactions take place at cathode and anode, respectively:
Cathode : O2 þ 2H2Oþ 2e�/H2O2 þ 2OH�
H2O2 þ 2e�/2OH�
Anode : Agþ Cl�/4AgClþ e�(4.5.2a)
Overall reaction : 4AgþO2 þ 2H2Oþ 4Cl�/4AgClþ 4OH� (4.5.2b)
An electrical output for a polarographic detector is produced according to the above reac-tions. Again, various electrolytes can be used for this type of detector, but they are usuallybased on KCl or AgCl with additional high molecular mass compounds that are added toprevent the loss of electrolyte during sterilization.
4.6 pH/REDOX MEASUREMENT AND CONTROL
Fermenters are generally operated most efficiently. The fermentation process is normallycarried out at a constant pH. The pH of a culture medium will change with the metabolicproduct of microorganisms that are developed in the fermentation media. Therefore, pHcontrol is required during the course of fermentation. The pH has a major effect on cellgrowth and product formation by influencing the breakdown of substrates and transportof both substrate and product through the cell wall. It is, therefore, a very important factorin fermentation. In fine chemicals, organic acids, amino acids, and antibiotic fermentations,even a small change in the pH can cause a large fall in the productivity. Also, in animal-cell fermentations, the pH is strictly affected by the cell density.
Measurement of pH is based on the absolute standard of the electrochemical properties ofthe standard hydrogen electrode. The basic part of the electrode is a very thin, glassmembrane (0.2e0.5 mm) that reacts with water to form a hydrated gel layer of only50e500 Å thicknesses. This layer exists on both sides of the membrane and is essential forthe correct operation and maintenance of the electrode. Hydrogen ions that exist withinthe layer are mobile, and any difference between the ionic activities on each side of the
4. FERMENTATION PROCESS CONTROL110
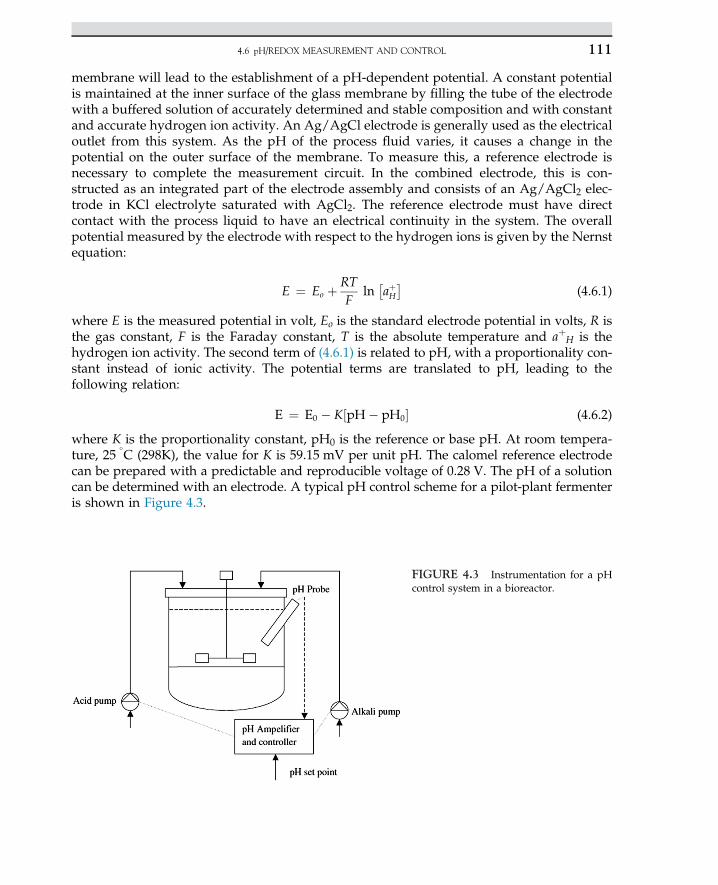
membrane will lead to the establishment of a pH-dependent potential. A constant potentialis maintained at the inner surface of the glass membrane by filling the tube of the electrodewith a buffered solution of accurately determined and stable composition and with constantand accurate hydrogen ion activity. An Ag/AgCl electrode is generally used as the electricaloutlet from this system. As the pH of the process fluid varies, it causes a change in thepotential on the outer surface of the membrane. To measure this, a reference electrode isnecessary to complete the measurement circuit. In the combined electrode, this is con-structed as an integrated part of the electrode assembly and consists of an Ag/AgCl2 elec-trode in KCl electrolyte saturated with AgCl2. The reference electrode must have directcontact with the process liquid to have an electrical continuity in the system. The overallpotential measured by the electrode with respect to the hydrogen ions is given by the Nernstequation:
E ¼ Eo þ RTF
ln�aþH
�(4.6.1)
where E is the measured potential in volt, Eo is the standard electrode potential in volts, R isthe gas constant, F is the Faraday constant, T is the absolute temperature and aþH is thehydrogen ion activity. The second term of (4.6.1) is related to pH, with a proportionality con-stant instead of ionic activity. The potential terms are translated to pH, leading to thefollowing relation:
E ¼ E0 � K½pH� pH0� (4.6.2)
where K is the proportionality constant, pH0 is the reference or base pH. At room tempera-ture, 25
�C (298K), the value for K is 59.15 mV per unit pH. The calomel reference electrode
can be prepared with a predictable and reproducible voltage of 0.28 V. The pH of a solutioncan be determined with an electrode. A typical pH control scheme for a pilot-plant fermenteris shown in Figure 4.3.
FIGURE 4.3 Instrumentation for a pHcontrol system in a bioreactor.
4.6 pH/REDOX MEASUREMENT AND CONTROL 111
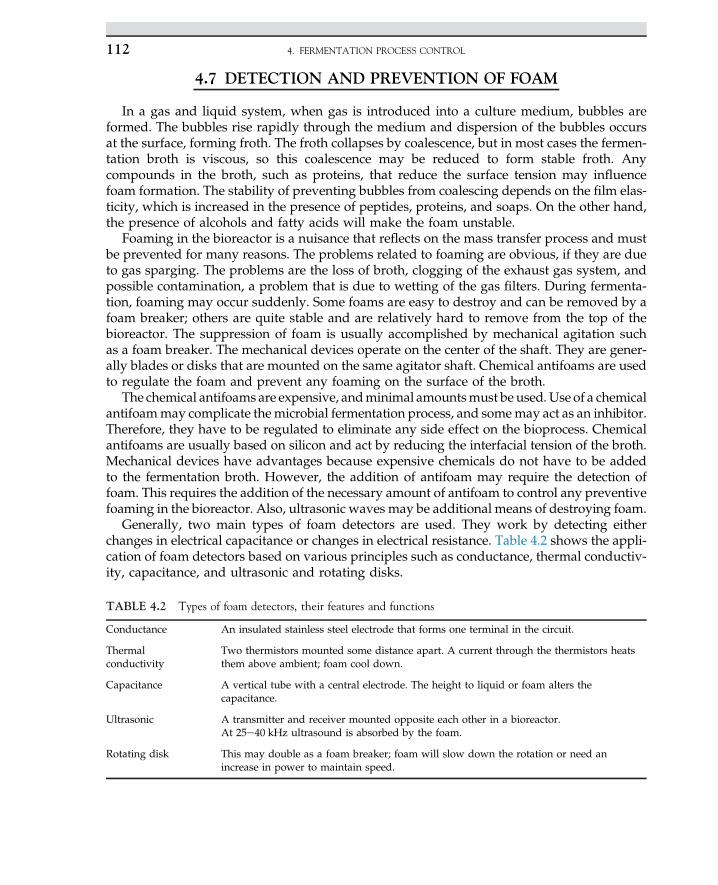
4.7 DETECTION AND PREVENTION OF FOAM
In a gas and liquid system, when gas is introduced into a culture medium, bubbles areformed. The bubbles rise rapidly through the medium and dispersion of the bubbles occursat the surface, forming froth. The froth collapses by coalescence, but in most cases the fermen-tation broth is viscous, so this coalescence may be reduced to form stable froth. Anycompounds in the broth, such as proteins, that reduce the surface tension may influencefoam formation. The stability of preventing bubbles from coalescing depends on the film elas-ticity, which is increased in the presence of peptides, proteins, and soaps. On the other hand,the presence of alcohols and fatty acids will make the foam unstable.
Foaming in the bioreactor is a nuisance that reflects on the mass transfer process and mustbe prevented for many reasons. The problems related to foaming are obvious, if they are dueto gas sparging. The problems are the loss of broth, clogging of the exhaust gas system, andpossible contamination, a problem that is due to wetting of the gas filters. During fermenta-tion, foaming may occur suddenly. Some foams are easy to destroy and can be removed by afoam breaker; others are quite stable and are relatively hard to remove from the top of thebioreactor. The suppression of foam is usually accomplished by mechanical agitation suchas a foam breaker. The mechanical devices operate on the center of the shaft. They are gener-ally blades or disks that are mounted on the same agitator shaft. Chemical antifoams are usedto regulate the foam and prevent any foaming on the surface of the broth.
The chemical antifoams are expensive, andminimal amountsmust be used. Use of a chemicalantifoammay complicate themicrobial fermentation process, and somemay act as an inhibitor.Therefore, they have to be regulated to eliminate any side effect on the bioprocess. Chemicalantifoams are usually based on silicon and act by reducing the interfacial tension of the broth.Mechanical devices have advantages because expensive chemicals do not have to be addedto the fermentation broth. However, the addition of antifoam may require the detection offoam. This requires the addition of the necessary amount of antifoam to control any preventivefoaming in the bioreactor. Also, ultrasonic waves may be additional means of destroying foam.
Generally, two main types of foam detectors are used. They work by detecting eitherchanges in electrical capacitance or changes in electrical resistance. Table 4.2 shows the appli-cation of foam detectors based on various principles such as conductance, thermal conductiv-ity, capacitance, and ultrasonic and rotating disks.
TABLE 4.2 Types of foam detectors, their features and functions
Conductance An insulated stainless steel electrode that forms one terminal in the circuit.
Thermalconductivity
Two thermistors mounted some distance apart. A current through the thermistors heatsthem above ambient; foam cool down.
Capacitance A vertical tube with a central electrode. The height to liquid or foam alters thecapacitance.
Ultrasonic A transmitter and receiver mounted opposite each other in a bioreactor.At 25e40 kHz ultrasound is absorbed by the foam.
Rotating disk This may double as a foam breaker; foam will slow down the rotation or need anincrease in power to maintain speed.
4. FERMENTATION PROCESS CONTROL112
The capacitance foam detector is made of two electrodes which are installed in the biore-actor. They measure the capacitance of the air space above the normal working liquid level inthe bioreactor. If foaming occurs, the air-space capacitance is reduced. Detection is by achange in the magnitude of a small alternating electrical current that is applied betweenthe two electrodes. This method is applicable in large-scale bioreactors. The change in electri-cal current is converted to an output signal from the detectors; the change in current isdirectly proportional to the amount of foam formed. From evaporation of the liquid media,fouling problems may occur on the electrode by the broth. This may cause some error in foamdetection, so regular cleaning is needed to maintain the electrode.
The foam detector based on the resistance method acts on the conductivity of the probe.The length of the probe is coated with some electrically insulating material, leaving the tipof the probe exposed to the media. As the foam builds up, it contacts the tip of the probe,thus completing an electrical circuit and producing an output signal. In the fermentationmedium, as the tip of the probe contacts the generated foam, an electrical circuit is generated,and an output signal is produced for foam detection.
Another type of probe is based on the principle of the sudden cooling of the heatedelement. When foam comes in contact with a heated electrical element, the hot surface detectssudden cooling, which is translated to an output signal. The major problem with the use of aheated element is fouling of the media; the sensitivity decreases while it is used, so suchdetectors may not be reliable in practice.
The two other foam sensors mentioned above are ultrasound and rotating disks. The ultra-sound sensor is composed of a transmitter and a receiver mounted opposite to each other andoperates at 25e40 kHz. In the bioreactor, the waves are absorbed by the foam, and the signalis generated. The rotational disk foam sensor is a mechanical foam breaker which is used byincreasing the rotational resistance.
The use of a chemical agent as an antifoam is affected by an oneoff algorithm with vari-able dosing time and time delay. If the presence of foam is detected, then the controller firstactivates a delay timer. This type of foam controller works with some delay and variabledosing time. If at the end of the delay period the foam still presents, then the dosingpump is activated, and chemical agent is added to the bioreactor. If the foam is still detectedat the end of this period, the combined system of delay and dosing is reactivated. With thismethod of control, addition of any unnecessary antifoam is prevented.
4.8 BIOSENSORS
Sensors are essential tools for determination of different chemical and physical quantitiessuch as temperature, pressure, humidity, concentration, etc. In recent years, industrial growthhas required rapid measurements of substances, which are conceivable by applying sensors.6
Sensors convert the changes in physical and chemical properties into detectable signalswhich can be recorded by an instrument. For instance, a glass thermometer is a simple andelementary sensor. In a glass thermometer, an increase or decrease in temperature causesexpansion or contraction of a liquid volume that can be measured in a calibrated glass tube.Another example of a sensor is the human body. The nose and the tongue are sensors whichnaturally detect smell and flavors. In the nose, when the chemicals reach olfactory bulbs (which
4.8 BIOSENSORS 113
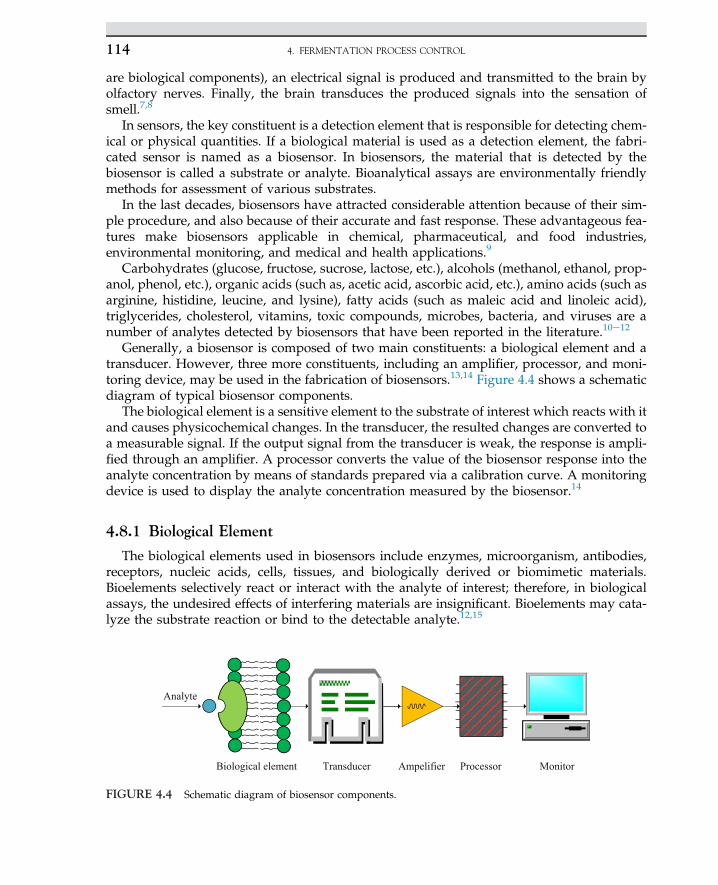
are biological components), an electrical signal is produced and transmitted to the brain byolfactory nerves. Finally, the brain transduces the produced signals into the sensation ofsmell.7,8
In sensors, the key constituent is a detection element that is responsible for detecting chem-ical or physical quantities. If a biological material is used as a detection element, the fabri-cated sensor is named as a biosensor. In biosensors, the material that is detected by thebiosensor is called a substrate or analyte. Bioanalytical assays are environmentally friendlymethods for assessment of various substrates.
In the last decades, biosensors have attracted considerable attention because of their sim-ple procedure, and also because of their accurate and fast response. These advantageous fea-tures make biosensors applicable in chemical, pharmaceutical, and food industries,environmental monitoring, and medical and health applications.9
Carbohydrates (glucose, fructose, sucrose, lactose, etc.), alcohols (methanol, ethanol, prop-anol, phenol, etc.), organic acids (such as, acetic acid, ascorbic acid, etc.), amino acids (such asarginine, histidine, leucine, and lysine), fatty acids (such as maleic acid and linoleic acid),triglycerides, cholesterol, vitamins, toxic compounds, microbes, bacteria, and viruses are anumber of analytes detected by biosensors that have been reported in the literature.10e12
Generally, a biosensor is composed of two main constituents: a biological element and atransducer. However, three more constituents, including an amplifier, processor, and moni-toring device, may be used in the fabrication of biosensors.13,14 Figure 4.4 shows a schematicdiagram of typical biosensor components.
The biological element is a sensitive element to the substrate of interest which reacts with itand causes physicochemical changes. In the transducer, the resulted changes are converted toa measurable signal. If the output signal from the transducer is weak, the response is ampli-fied through an amplifier. A processor converts the value of the biosensor response into theanalyte concentration by means of standards prepared via a calibration curve. A monitoringdevice is used to display the analyte concentration measured by the biosensor.14
4.8.1 Biological Element
The biological elements used in biosensors include enzymes, microorganism, antibodies,receptors, nucleic acids, cells, tissues, and biologically derived or biomimetic materials.Bioelements selectively react or interact with the analyte of interest; therefore, in biologicalassays, the undesired effects of interfering materials are insignificant. Bioelements may cata-lyze the substrate reaction or bind to the detectable analyte.12,15
Biological element Transducer Ampelifier Processor Monitor
Analyte
FIGURE 4.4 Schematic diagram of biosensor components.
4. FERMENTATION PROCESS CONTROL114
Enzymes are the most desired biological elements used in the fabrication of biosensors. Anenzyme is a complicated and large macromolecule that consists of chains of amino acidslinked together. In fact, an enzyme is a highly selective biocatalyst that accelerates the rateand specificity of biochemical reactions. The advantages of enzymatic biosensors are thatthey possess high selectivity, rapid detection, and high sensitivity.16
4.8.2 Immobilization of Biomaterials
The immobilization of bioelements plays an important role in the performance of biosen-sors. The various techniques based on physical (adsorption, entrapment, and encapsulation)and chemical (cross-linking and covalent binding) methods are commonly used for biomate-rial immobilization.17e19
4.8.2.1 Adsorption
Adsorption of enzymes and biomaterials by insoluble supports is the simplest method forbioelement immobilization. This technique is based on physical interactions (Van der Waal’sforces, hydrogen bonds, and multiple salt linkages) between the enzyme and the surface ofsolid support.20 In the adsorption method, the enzyme is dropped on the support surfaceor support is immersed into the enzyme solution. After a certain time, the support is allowedto dry and then is washed with a buffer solution or distillated water to remove the unboundenzymes from the surface. In the adsorption technique, no extra chemicals are used; therefore,this method has low cost and also does not have undesired effects on enzyme activities.Enzyme leakage is the main disadvantage of adsorption method, which is caused by fluctu-ation of temperature, pH, and ionic strength or induction of analyte.20,21 The biosensors basedon adsorption method have sufficient repeatability and are useful for disposable diagnosticenzyme kits.
4.8.2.2 Entrapment
Entrapment of enzymes within polymeric matrices is a common method for immobili-zation. In this method, first, enzyme is added to the monomeric solution, and then themonomer is polymerized. Thermal, solegel, and electropolymerization are typical methodsused in entrapment technique.22 The pore size of the gel or fiber is such that the matrixprevents leakage of enzyme macromolecules; whereas, the analyte or reaction productscan freely diffuse into the matrix and reach enzyme active sites. However, high molecularweight analytes cannot easily penetrate into the matrix.23 The conditions applied in chem-ical polymerization and generated free radicals may have damaging effects on enzymeactivity. Therefore, the conditions of polymerization need to be carefully controlled.Polypyrrole, polythionine, polyethylene dioxythiophene, natural polymer (chitosan, agar)and calcium alginate are some common materials that are widely used for enzymeentrapment.22,24
4.8.2.3 Encapsulation
Encapsulation of enzyme and biomaterials within the membrane is another method ofimmobilization. In microencapsulation, the enzyme is surrounded by a continuous film ofmembrane or polymeric gel to produce spherical beads that contain an enzyme, known as
4.8 BIOSENSORS 115
microcapsuls.20 Encapsulation of enzyme between the coating material and support surface isthe most applicable method used in biosensors. In this method, first, the enzyme is placed onthe surface of the support, and then a film of membrane is coated on the surface of the depos-ited enzyme.
The most important membrane and coating materials used for encapsulation are carra-geenan, chitosan, sodium alginate, carboxy methyl cellulose (CMC), methylcellulose,cellulose acetate, polycarbonate, polysulfone, polyacrylate, collagen, Teflon, and phospho-lipids.22,25 Applying membranes that selectively allow analytes and products to permeateis a useful and precise technique; however, the biosensors based on this method usuallyhave long response times. Membrane disruption caused by accumulation of side productsis another disadvantage of this method.
4.8.2.4 Cross-Linking
This type of immobilization is based on the intermolecular cross-linking of an enzyme,either to other enzyme molecules or to functional groups available on the support. Aggrega-tion of enzymes leads to a bulky mass of enzyme molecules that is insoluble in the supportingelectrolyte; therefore, the enzyme leakage resulting from enzyme solubility is significantlyreduced.26
The most common reagents used for cross-linking are glutaraldehyde and toluene diiso-cyanate. The disruptive nature of cross-linking reactions and also the toxicity of cross-linkers adversely affect the conformation of enzyme active cites and cause a decrease inenzyme activity. Hence, the amount of reagent used in cross-linking and the ratio of enzymeto reagent must be precisely controlled. The cross-linking technique is usually used in asso-ciation with another immobilization method to ensure high performance of immobilizationand, consequently, to enhance biosensor stability.27
4.8.2.5 Covalent Binding
The covalent binding method is based on the strong covalent bonds between amino acidside chains of the enzyme and a protein with functional groups available on the support.Since covalent bonds are the strongest chemical bonds, the covalent binding method ismore stable than other immobilization methods. The most common functional groups usedin covalent bonding are the hydroxyl group (�OH) of the serine, threonine, and tyrosine,the amino group (�NH2) of lysine, arginine, and histidine, the carboxyl group (�COOH)of glutamic acid and aspartic acid, and the thiol group (�SH) of cysteine.28
In this technique, first, the support is functionalized with specific reagents to create therequired functional groups. Then, the enzyme is added to the support for coupling with func-tional groups. For example, (3-Aminopropyl) triethoxysilane, carbodiimide conjugation, andcyanogen bromide are widely used for producing �NH2, �COOH, and �OH functionalgroups, respectively. Alkylation, peptide binding, diazo linkage, and isourea linkage arethe main reaction processes used in the covalent binding method.7,22
The main disadvantage of covalent binding is that some of the enzyme active sites partic-ipate in the coupling reaction, which causes the deactivation of the enzyme. However, addi-tion of enzyme inhibitors at the moment of the coupling reaction moderately preventsenzyme active sites from taking part in the reaction.
4. FERMENTATION PROCESS CONTROL116
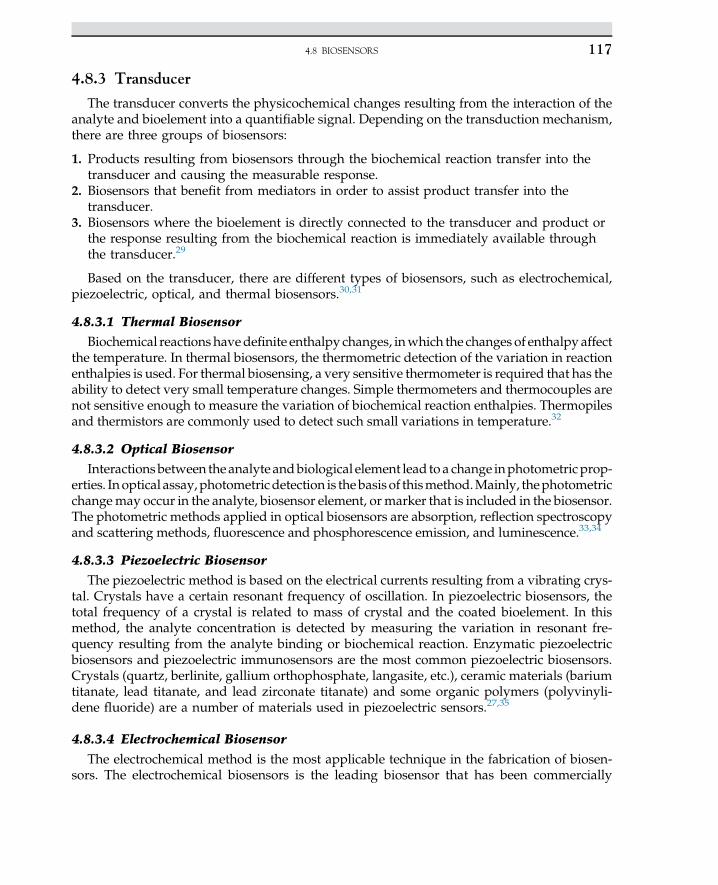
4.8.3 Transducer
The transducer converts the physicochemical changes resulting from the interaction of theanalyte and bioelement into a quantifiable signal. Depending on the transduction mechanism,there are three groups of biosensors:
1. Products resulting from biosensors through the biochemical reaction transfer into thetransducer and causing the measurable response.
2. Biosensors that benefit from mediators in order to assist product transfer into thetransducer.
3. Biosensors where the bioelement is directly connected to the transducer and product orthe response resulting from the biochemical reaction is immediately available throughthe transducer.29
Based on the transducer, there are different types of biosensors, such as electrochemical,piezoelectric, optical, and thermal biosensors.30,31
4.8.3.1 Thermal Biosensor
Biochemical reactions havedefinite enthalpy changes, inwhich the changes of enthalpy affectthe temperature. In thermal biosensors, the thermometric detection of the variation in reactionenthalpies is used. For thermal biosensing, a very sensitive thermometer is required that has theability to detect very small temperature changes. Simple thermometers and thermocouples arenot sensitive enough to measure the variation of biochemical reaction enthalpies. Thermopilesand thermistors are commonly used to detect such small variations in temperature.32
4.8.3.2 Optical Biosensor
Interactions between the analyte andbiological element lead to a change inphotometric prop-erties. In optical assay,photometricdetection is thebasisof thismethod.Mainly, thephotometricchangemay occur in the analyte, biosensor element, or marker that is included in the biosensor.The photometric methods applied in optical biosensors are absorption, reflection spectroscopyand scattering methods, fluorescence and phosphorescence emission, and luminescence.33,34
4.8.3.3 Piezoelectric Biosensor
The piezoelectric method is based on the electrical currents resulting from a vibrating crys-tal. Crystals have a certain resonant frequency of oscillation. In piezoelectric biosensors, thetotal frequency of a crystal is related to mass of crystal and the coated bioelement. In thismethod, the analyte concentration is detected by measuring the variation in resonant fre-quency resulting from the analyte binding or biochemical reaction. Enzymatic piezoelectricbiosensors and piezoelectric immunosensors are the most common piezoelectric biosensors.Crystals (quartz, berlinite, gallium orthophosphate, langasite, etc.), ceramic materials (bariumtitanate, lead titanate, and lead zirconate titanate) and some organic polymers (polyvinyli-dene fluoride) are a number of materials used in piezoelectric sensors.27,35
4.8.3.4 Electrochemical Biosensor
The electrochemical method is the most applicable technique in the fabrication of biosen-sors. The electrochemical biosensors is the leading biosensor that has been commercially
4.8 BIOSENSORS 117
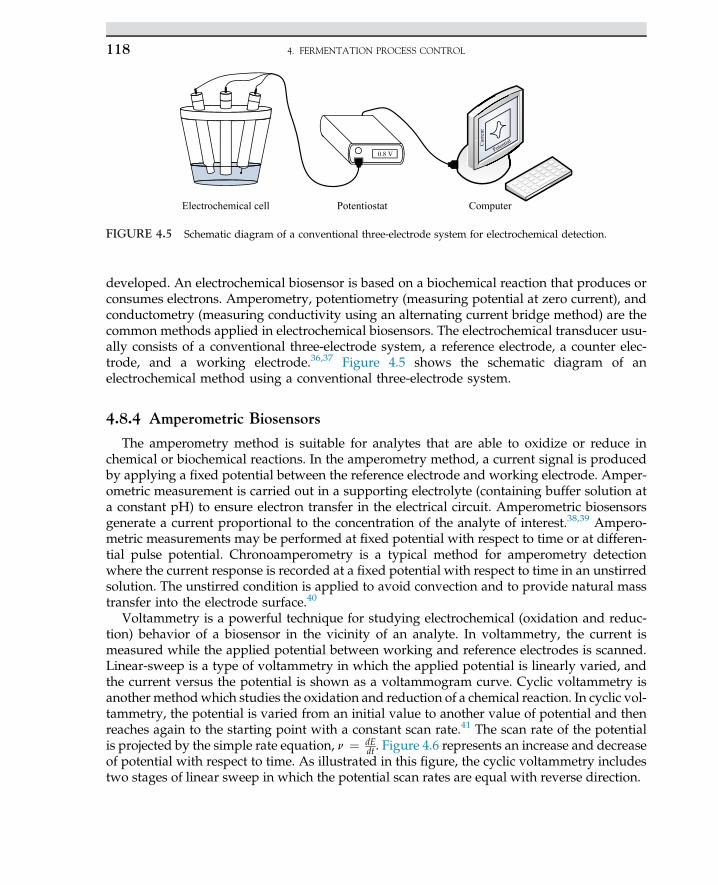
developed. An electrochemical biosensor is based on a biochemical reaction that produces orconsumes electrons. Amperometry, potentiometry (measuring potential at zero current), andconductometry (measuring conductivity using an alternating current bridge method) are thecommon methods applied in electrochemical biosensors. The electrochemical transducer usu-ally consists of a conventional three-electrode system, a reference electrode, a counter elec-trode, and a working electrode.36,37 Figure 4.5 shows the schematic diagram of anelectrochemical method using a conventional three-electrode system.
4.8.4 Amperometric Biosensors
The amperometry method is suitable for analytes that are able to oxidize or reduce inchemical or biochemical reactions. In the amperometry method, a current signal is producedby applying a fixed potential between the reference electrode and working electrode. Amper-ometric measurement is carried out in a supporting electrolyte (containing buffer solution ata constant pH) to ensure electron transfer in the electrical circuit. Amperometric biosensorsgenerate a current proportional to the concentration of the analyte of interest.38,39 Ampero-metric measurements may be performed at fixed potential with respect to time or at differen-tial pulse potential. Chronoamperometry is a typical method for amperometry detectionwhere the current response is recorded at a fixed potential with respect to time in an unstirredsolution. The unstirred condition is applied to avoid convection and to provide natural masstransfer into the electrode surface.40
Voltammetry is a powerful technique for studying electrochemical (oxidation and reduc-tion) behavior of a biosensor in the vicinity of an analyte. In voltammetry, the current ismeasured while the applied potential between working and reference electrodes is scanned.Linear-sweep is a type of voltammetry in which the applied potential is linearly varied, andthe current versus the potential is shown as a voltammogram curve. Cyclic voltammetry isanother methodwhich studies the oxidation and reduction of a chemical reaction. In cyclic vol-tammetry, the potential is varied from an initial value to another value of potential and thenreaches again to the starting point with a constant scan rate.41 The scan rate of the potentialis projected by the simple rate equation, n ¼ dE
dt . Figure 4.6 represents an increase and decreaseof potential with respect to time. As illustrated in this figure, the cyclic voltammetry includestwo stages of linear sweep in which the potential scan rates are equal with reverse direction.
Cur
rent
Potential
0.8 V
Electrochemical cell Potentiostat Computer
FIGURE 4.5 Schematic diagram of a conventional three-electrode system for electrochemical detection.
4. FERMENTATION PROCESS CONTROL118
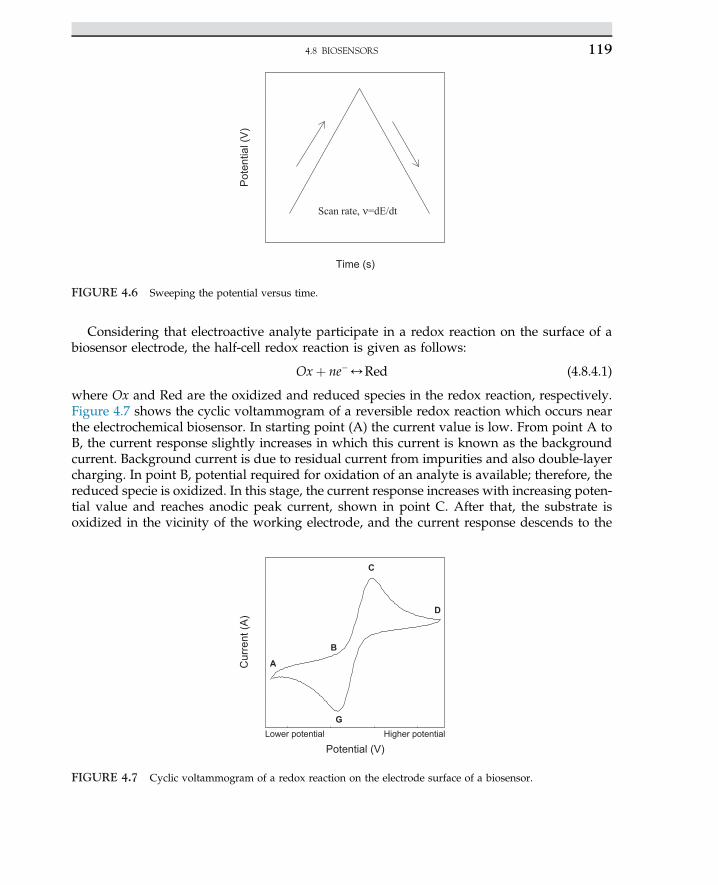
Considering that electroactive analyte participate in a redox reaction on the surface of abiosensor electrode, the half-cell redox reaction is given as follows:
Oxþ ne�4Red (4.8.4.1)
where Ox and Red are the oxidized and reduced species in the redox reaction, respectively.Figure 4.7 shows the cyclic voltammogram of a reversible redox reaction which occurs nearthe electrochemical biosensor. In starting point (A) the current value is low. From point A toB, the current response slightly increases in which this current is known as the backgroundcurrent. Background current is due to residual current from impurities and also double-layercharging. In point B, potential required for oxidation of an analyte is available; therefore, thereduced specie is oxidized. In this stage, the current response increases with increasing poten-tial value and reaches anodic peak current, shown in point C. After that, the substrate isoxidized in the vicinity of the working electrode, and the current response descends to the
Time (s)
Pot
entia
l (V
)
Scan rate, ν=dE/dt
FIGURE 4.6 Sweeping the potential versus time.
Potential (V)
Cur
rent
(A)
A
B
C
D
GLower potential Higher potential
FIGURE 4.7 Cyclic voltammogram of a redox reaction on the electrode surface of a biosensor.
4.8 BIOSENSORS 119
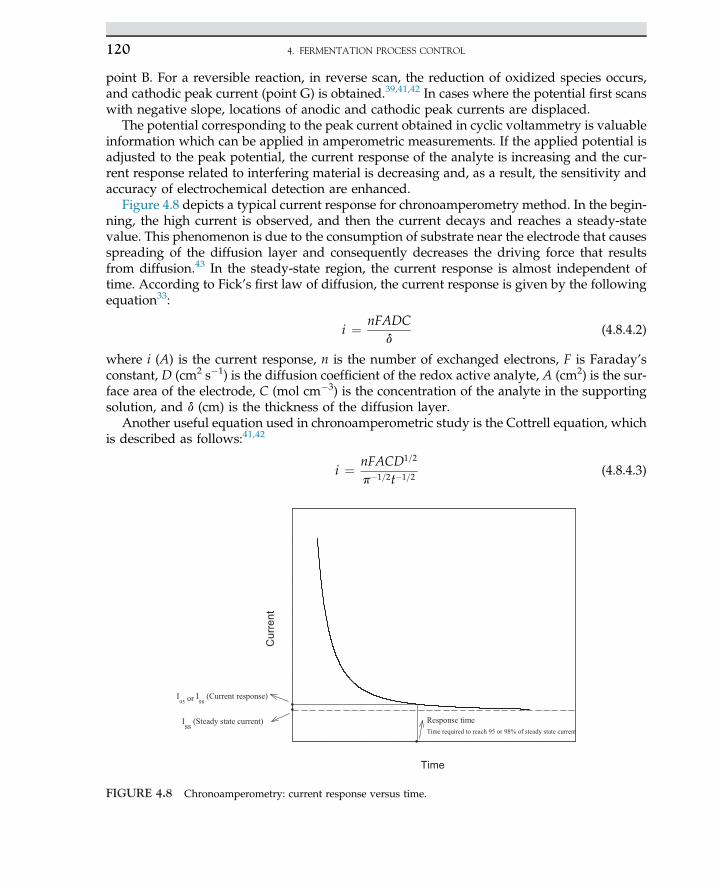
point B. For a reversible reaction, in reverse scan, the reduction of oxidized species occurs,and cathodic peak current (point G) is obtained.39,41,42 In cases where the potential first scanswith negative slope, locations of anodic and cathodic peak currents are displaced.
The potential corresponding to the peak current obtained in cyclic voltammetry is valuableinformation which can be applied in amperometric measurements. If the applied potential isadjusted to the peak potential, the current response of the analyte is increasing and the cur-rent response related to interfering material is decreasing and, as a result, the sensitivity andaccuracy of electrochemical detection are enhanced.
Figure 4.8 depicts a typical current response for chronoamperometry method. In the begin-ning, the high current is observed, and then the current decays and reaches a steady-statevalue. This phenomenon is due to the consumption of substrate near the electrode that causesspreading of the diffusion layer and consequently decreases the driving force that resultsfrom diffusion.43 In the steady-state region, the current response is almost independent oftime. According to Fick’s first law of diffusion, the current response is given by the followingequation33:
i ¼ nFADCd
(4.8.4.2)
where i (A) is the current response, n is the number of exchanged electrons, F is Faraday’sconstant, D (cm2 s�1) is the diffusion coefficient of the redox active analyte, A (cm2) is the sur-face area of the electrode, C (mol cm�3) is the concentration of the analyte in the supportingsolution, and d (cm) is the thickness of the diffusion layer.
Another useful equation used in chronoamperometric study is the Cottrell equation, whichis described as follows:41,42
i ¼ nFACD1=2
p�1=2t�1=2(4.8.4.3)
Time
Cur
rent
Iss (Steady state current)
I or I (Current response)
Response timeTime required to reach 95 or 98% of steady state current
FIGURE 4.8 Chronoamperometry: current response versus time.
4. FERMENTATION PROCESS CONTROL120
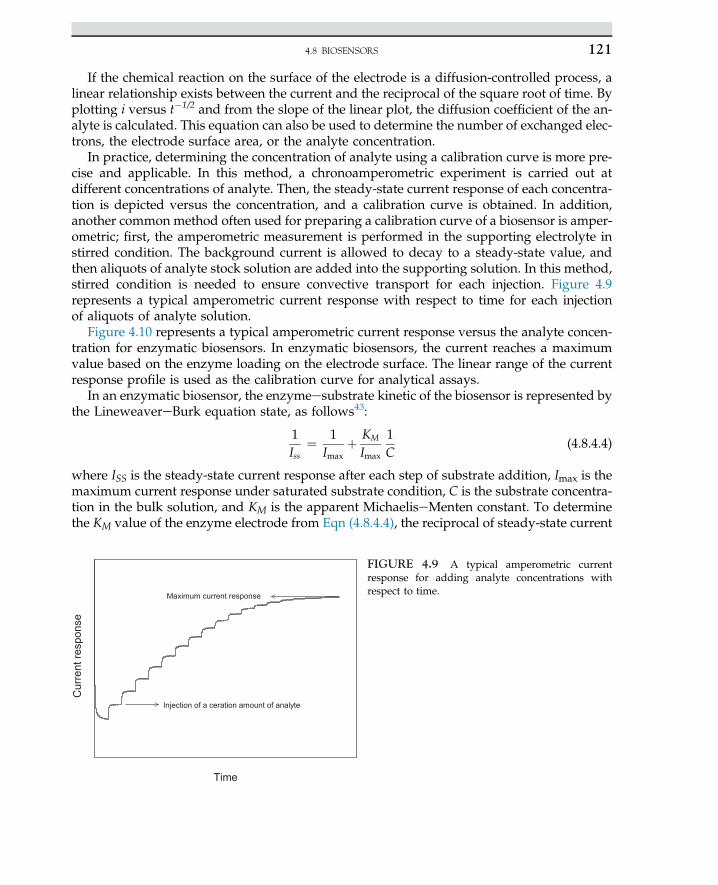
If the chemical reaction on the surface of the electrode is a diffusion-controlled process, alinear relationship exists between the current and the reciprocal of the square root of time. Byplotting i versus t�1/2 and from the slope of the linear plot, the diffusion coefficient of the an-alyte is calculated. This equation can also be used to determine the number of exchanged elec-trons, the electrode surface area, or the analyte concentration.
In practice, determining the concentration of analyte using a calibration curve is more pre-cise and applicable. In this method, a chronoamperometric experiment is carried out atdifferent concentrations of analyte. Then, the steady-state current response of each concentra-tion is depicted versus the concentration, and a calibration curve is obtained. In addition,another common method often used for preparing a calibration curve of a biosensor is amper-ometric; first, the amperometric measurement is performed in the supporting electrolyte instirred condition. The background current is allowed to decay to a steady-state value, andthen aliquots of analyte stock solution are added into the supporting solution. In this method,stirred condition is needed to ensure convective transport for each injection. Figure 4.9represents a typical amperometric current response with respect to time for each injectionof aliquots of analyte solution.
Figure 4.10 represents a typical amperometric current response versus the analyte concen-tration for enzymatic biosensors. In enzymatic biosensors, the current reaches a maximumvalue based on the enzyme loading on the electrode surface. The linear range of the currentresponse profile is used as the calibration curve for analytical assays.
In an enzymatic biosensor, the enzymeesubstrate kinetic of the biosensor is represented bythe LineweavereBurk equation state, as follows43:
1Iss
¼ 1Imax
þ KM
Imax
1C
(4.8.4.4)
where ISS is the steady-state current response after each step of substrate addition, Imax is themaximum current response under saturated substrate condition, C is the substrate concentra-tion in the bulk solution, and KM is the apparent MichaeliseMenten constant. To determinethe KM value of the enzyme electrode from Eqn (4.8.4.4), the reciprocal of steady-state current
Time
Cur
rent
resp
onse
Injection of a ceration amount of analyte
Maximum current response
FIGURE 4.9 A typical amperometric currentresponse for adding analyte concentrations withrespect to time.
4.8 BIOSENSORS 121
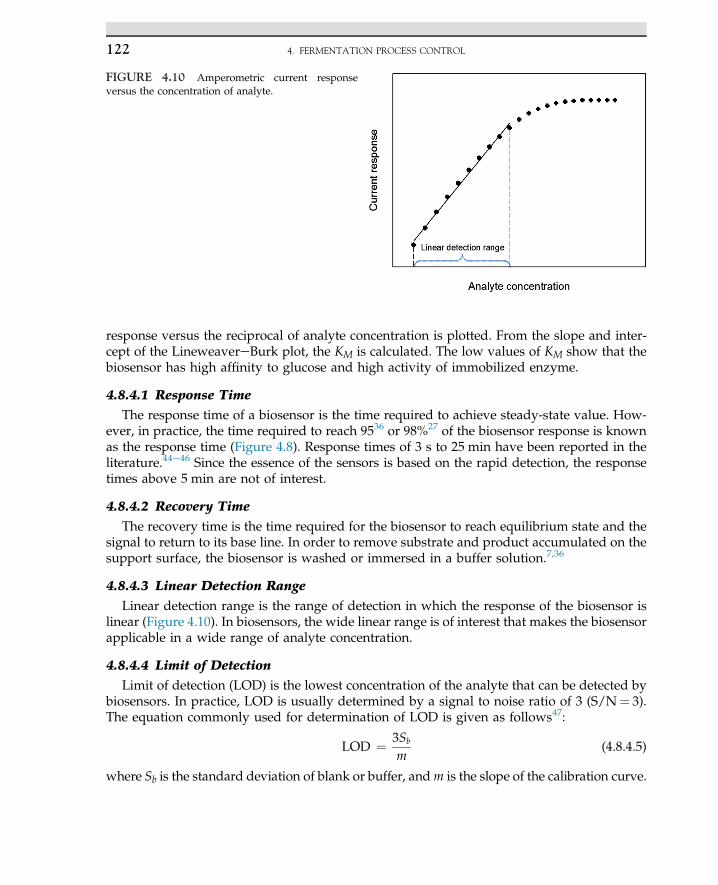
response versus the reciprocal of analyte concentration is plotted. From the slope and inter-cept of the LineweavereBurk plot, the KM is calculated. The low values of KM show that thebiosensor has high affinity to glucose and high activity of immobilized enzyme.
4.8.4.1 Response Time
The response time of a biosensor is the time required to achieve steady-state value. How-ever, in practice, the time required to reach 9536 or 98%27 of the biosensor response is knownas the response time (Figure 4.8). Response times of 3 s to 25 min have been reported in theliterature.44e46 Since the essence of the sensors is based on the rapid detection, the responsetimes above 5 min are not of interest.
4.8.4.2 Recovery Time
The recovery time is the time required for the biosensor to reach equilibrium state and thesignal to return to its base line. In order to remove substrate and product accumulated on thesupport surface, the biosensor is washed or immersed in a buffer solution.7,36
4.8.4.3 Linear Detection Range
Linear detection range is the range of detection in which the response of the biosensor islinear (Figure 4.10). In biosensors, the wide linear range is of interest that makes the biosensorapplicable in a wide range of analyte concentration.
4.8.4.4 Limit of Detection
Limit of detection (LOD) is the lowest concentration of the analyte that can be detected bybiosensors. In practice, LOD is usually determined by a signal to noise ratio of 3 (S/N¼ 3).The equation commonly used for determination of LOD is given as follows47:
LOD ¼ 3Sb
m(4.8.4.5)
where Sb is the standard deviation of blank or buffer, andm is the slope of the calibration curve.
FIGURE 4.10 Amperometric current responseversus the concentration of analyte.
4. FERMENTATION PROCESS CONTROL122
4.8.4.5 Sensitivity
Sensitivity is defined as the current response per unit of analyte concentration and elec-trode surface. From the definition, it is found that for a certain current response, the biosensorsensitivity is higher for the electrode that has a smaller surface than others.
The biochemical constituents of fermentation broth such as liberated biochemical com-pounds, oxidation, and reductions have been developed by a wide range of biosensors. Abiosensor consists of twomain elements. These two elements, the biocatalyst and a transducer,are combined as a single detecting probe in which the transducer and biocatalyst are heldtogether in a very close contact. The biosensor acts as a device as flowpasses. It can detect pene-tration of flow through biocatalysts and measures the biochemical transformation of a givensubstance, for example, a change in pH. The function of the transducer is to detect such changeand to produce an output signal, which is related to the concentration of the measured sub-stance. In fact, a biosensor is a combination of a biological sensor attached to a transducer,which is a simple device that acts specifically with a high sensitivity in measurements.
The application of biosensors in an operating bioreactor is usually based on whole cells orenzyme activities. The perfect function of a biosensor is very dependent on the biological activ-ities of a system. The biocatalytic reaction produces some detectable change that must be con-verted to an output signal by the transducer. The transducers are usually amperometric andpotentiometric devices. Such transducers are included in dissolved oxygen probes and pH elec-trodes, ion-selective electrodes, and gas-sensing devices. Amperometric detectors operate bymeasuring the flux of some electrochemical redox activities of the produced biosensor reaction.For example, a dissolved oxygen probe can be used to measure the rate of oxygen flux pro-duced in a catalyzed oxidation reaction. DOprobes are a popular form of biosensor transducer.They are used for microbial and enzymatic oxidoreductase reactions. Many enzymatic reac-tions are associated with the uptake or production of protons. The rate of proton flux can bemeasured by using a potentiometric detector, which is normally done in a pH probe.
Several biosensors are commercially available. One of the most useful ones is the glucosesensor. The standard sensor determines glucose concentration based on the glucose oxidaseenzyme. The chemical reaction for the oxidation of glucose is as follows:
GlucoseþO2 þH2O/Gluconic acid�Hþ�þH2O2 (4.8.1)
A suitable biosensor can measure the amount of oxygen consumed in the above reaction.The biosensor is constructed by the surrounding tip of the DO probe, which is a glucosepermeable membrane and retains glucose oxidase/electrolyte solution in direct contactwith the membrane of the DO probe. Normally, the DO probe can measure the rate of oxygenflux in the bulk liquid. The flux across the DO probe membrane to the cathode, where oxygenis reduced, is equal to the rate of oxygen flux reaching and reducing the electrode. Thereduced amount of oxygen is equivalent to the rate of glucose that is consumed in the glucoseoxidase enzymatic conversion of glucose to gluconic acid.
The use of a catalyst with an oxidase enzyme is an example of the application of a com-bined enzyme system, which illustrates the wide potential offered by multienzyme electrodesystems. Various enzymes can be arranged to work sequentially to transform quite complexsubstances and eventually to produce a measurable concentration-dependent change that isdetected by the output signal and recorded for analysis.
4.8 BIOSENSORS 123
NOMENCLATURE
E Potential, VEo Standard electrode potential, VR The gas constantK Proportionality constant, mV per unit pHT Absolute temperature, Kn Potential scan rate, V/sI Current, AF Faraday’s constantA Surface area, cm2
D Diffusion coefficient, cm2 s�1
C Analyte concentration, mol cm�3
d Diffusion layer thickness, cm2
t Time, sISS Steady-state current, AImax Maximum current response, AKM Apparent MichaeliseMenten constantSb Standard deviationm Slope of the calibration curve
References1. Baily JE, Ollis DF. Biochemical engineering fundamentals. 2nd ed. New York: McGraw-Hill; 1986.2. Scragg AH. Bioreactors in biotechnology, a practical approach. Ellis Horwood series in biochemistry and biotechnology;New York: Ellis Horwood Limited; 1991.
3. Wang DIC, Cooney CL, Deman AL, Dunnill P, Humphrey AE, Lilly MD. Fermentation and enzyme technology. NewYork: John Wiley & Sons; 1979.
4. Doran PM. Bioprocess engineering principles. New York: Academic Press; 1995.5. Stanbury PF, Whitaker A. Principles of fermentation technology. New York: Pergamon Press; 1987.6. Ho CK, Robinson A, Miller DR, Davis MJ. Overview of sensors and needs for environmental monitoring. Sensors2005;5(1):4e37.
7. Eggins BR. Biosensors: an introduction. Chichester (UK): Wiley; 1996.8. Nicholas J, White D. Liquid-in-glass thermometry. Traceable temperatures: an introduction to temperature measurementand calibration. 2nd ed., Wiley: 1999. 255e293.
9. Wang J. Glucose biosensors: 40 years of advances and challenges. Electroanalysis 2001;13(12):983e8.10. Mello LD, Kubota LT. Review of the use of biosensors as analytical tools in the food and drink industries. Food
Chem 2002;77(2):237e56.11. Rodriguez-Mozaz S, de Alda MJL, Barceló D. Biosensors as useful tools for environmental analysis and moni-
toring. Anal Bioanal Chem 2006;386(4):1025e41.12. Vo-Dinh T, Cullum B. Biosensors and biochips: advances in biological and medical diagnostics. Fresenius’ J Anal
Chem 2000;366(6e7):540e51.13. Berggren C, Bjarnason B, Johansson G. Instrumentation for direct capacitive biosensors. Instrum Sci Technol
1999;27(2):131e9.14. Davis J, Huw Vaughan D, Cardosi MF. Elements of biosensor construction. Enzyme Microb Technol 1995;
17(12):1030e5.15. Mohanty SP, Kougianos E. Biosensors: a tutorial review. Potentials IEEE 2006;25(2):35e40.16. Newman JD, Setford SJ. Enzymatic biosensors. Mol Biotechnol 2006;32(3):249e68.17. Bourdillon C, Laval JM, Thomas D. Enzymatic electrocatalysis: controlled potential electrolysis and cosubstrate
regeneration with immobilized enzyme modified electrode. J Electrochem Soc 1986;133(4):706e11.18. Krajewska B. Application of chitin-and chitosan-based materials for enzyme immobilizations: a review. Enzyme
Microb Technol 2004;35(2):126e39.
4. FERMENTATION PROCESS CONTROL124
19. Olea D, Viratelle O, Faure C. Polypyrrole-glucose oxidase biosensor: effect of enzyme encapsulation in multi-lamellar vesicles on analytical properties. Biosens Bioelectron 2008;23(6):788e94.
20. Guisan JM. Immobilization of enzymes and cells, Vol. 22. Springer; 2006.21. Mathewson PR, Finley JW. Biosens Design Application, Vol. 511. 1992.22. Bickerstaff Jr GF. Immobilization of enzymes and cells. Springer; 1997.23. Guisán JM, Penzol G, Armisen P, Bastida A, Blanco RM, Fernandez-Lafuente R, et al. Immobilization of enzymes
acting on macromolecular substrates. In: Immobilization of enzymes and cells. Springer; 1997. p. 261e75.24. Dempsey E, Diamond D, Collier A. Development of a biosensor for endocrine disrupting compounds based on
tyrosinase entrapped within a poly (thionine) film. Biosens Bioelectron 2004;20(2):367e77.25. Wijffels RH, Buitelaar R, Bucke C, Tramper J. Immobilized cells: basics and applications, Elsevier Science; 1996.26. Cooper J, Cass T. Biosensors, Vol. 268. Oxford University Press; 2004.27. Canh TM. Biosensors. US: Springer; 1994.28. Williams R, Blanch H. Covalent immobilization of protein monolayers for biosensor applications. Biosens
Bioelectron 1994;9(2):159e67.29. Mulchandani A, Bassi AS. Principles and applications of biosensors for bioprocess monitoring and control. Critical
Rev Biotechnol 1995;15(2):105e24.30. Patel P. (Bio) sensors for measurement of analytes implicated in food safety: a review. Trac Trends Anal Chem
2002;21(2):96e115.31. Si W, Han Z, Lei W, Wu Q, Zhang Y, Xia M, et al. Fast electrochemical determination of imidacloprid at an
activated glassy carbon electrode. J Electrochem Soc 2014;161(1):B9e13.32. Ramanathan K, Danielsson B. Principles and applications of thermal biosensors. Biosens Bioelectron 2001;
16(6):417e23.33. Bilitewski U, Turner A. Biosensors in environmental monitoring. CRC Press; 2003.34. Riboh JC, Haes AJ, McFarland AD, Ranjit Yonzon C, Van Duyne RP. A nanoscale optical biosensor: real-time
immunoassay in physiological buffer enabled by improved nanoparticle adhesion. J Phys Chem B 2003;107(8):1772e80.
35. Pramanik S, Pingguan-Murphy B, Osman NAA. Developments of immobilized surface modified piezoelectriccrystal biosensors for advanced applications. Int J Electrochem Sci 2013;8:8863e92.
36. Ronkainen NJ, Halsall HB, Heineman WR. Electrochemical biosensors. Chem Soc Rev 2010;39(5):1747e63.37. Thevenot DR, Toth K, Durst RA, Wilson GS. Electrochemical biosensors: recommended definitions and classifi-
cation. Pure Appl Chem 1999;71(12):2333e48.38. Frew JE, Hill HAO. Electrochemical biosensors. Anal Chem 1987;59(15):933Ae44A.39. Grieshaber D, MacKenzie R, Vörös J, Reimhult E. Electrochemical biosensors-Sensor principles and architectures.
Sensors 2008;8(3):1400e58.40. Scheller F, Schubert F. Biosensors. Elsevier; 1991.41. Allen JB, Larry RF. Electrochemical methods: fundamentals and applications. Department of chemistry and
biochemistry university of Texas at Austin. John Wiley & Sons, Inc; 2001.42. Greef R, Peat R, Peter L, Pletcher D, Robinson J. Instrumental methods in electrochemistry. Chichester (England): Ellis
Horwood Ltd; 1985.43. Wang Y, Ma X, Wen Y, Zheng Y, Duan G, Zhang Z, et al. Phytic acid-based layer-by-layer assembly for fabrication
of mesoporous gold film and its biosensor application. J Electrochem Soc 2010;157(1):K5e9.44. Yang VC-M, Ngo TT. Biosensors and their applications. Springer; 2000.45. Gomathi P, Kim MK, Park JJ, Ragupathy D, Rajendran A, Lee SC, et al. Multiwalled carbon nanotubes grafted
chitosan nanobiocomposite: a prosperous functional nanomaterials for glucose biosensor application. SensorsActuators B Chem 2011;155(2):897e902.
46. Rogers KR, Mulchandani A, Zhou W. Biosensor and chemical sensor technology: process monitoring and control[]. In: ACS symposium series (USA); 1995.
47. Reddaiah K, Madhusudana Reddy T. Electrochemical biosensor based on silica solegel entrapment of horseradishperoxidase onto the carbon paste electrode toward the determination of 2-aminophenol in non-aqueous solvents:a voltammetric study. J Mol Liq 2014;196:77e85.
REFERENCES 125
C H A P T E R
5
Growth Kinetics
O U T L I N E
5.1 Introduction 129
5.2 Indirect Measurements of CellGrowth 129
5.2.1 Fluorescence Spectroscopy 1295.2.2 Specific Growth Rate 130
5.3 Cell Growth in Batch Culture 131
5.4 Growth Phases 131
5.5 Kinetics of Batch Culture 132
5.6 Growth Kinetics for ContinuousCulture 133
5.7 Material Balance for ContinuousStirred Tank Reactor (CSTR) 137
5.7.1 Rate of ProductFormation 139
5.7.2 Continuous Culture 1405.7.3 Disadvantages of Batch
Culture 1405.7.4 Advantages of Continuous
Culture 1405.7.5 Growth Kinetics,
Biomass, and ProductYields, YX/S and YP/S 140
5.7.6 Biomass Balances (Cells)in a Bioreactor 141
5.7.7 Material Balance inTerms of Substrate in aChemostat 142
5.7.8 Modified Chemostat 1435.7.9 Fed Batch Culture 144
5.8 Enzyme Reaction Kinetics 1455.8.1 Mechanisms of Single
Enzyme with DualSubstrates 147
5.8.2 Kinetics of ReversibleReactions with DualSubstrate Reaction 151
5.8.3 Reaction Mechanismwith CompetitiveInhibition 152
5.8.4 NoncompetitiveInhibition Rate Model 153
5.9 Unstructured Kinetic Model 173
Nomenclature 179
References 180
127Biochemical Engineering and Biotechnologyhttp://dx.doi.org/10.1016/B978-0-444-63357-6.00005-5 Copyright © 2015 Elsevier B.V. All rights reserved.
5.11 Case Study: Enzyme KineticModels for Resolution ofRacemic Ibuprofen Esters in aMembrane Reactor 181
5.11.1 Introduction 181
5.11.2 Enzyme Kinetics 1825.11.2.1 Substrate and Product
Inhibitions Analyses 1825.11.2.2 Substrate Inhibition Study 1835.11.2.3 Product Inhibition Study 185
5.11.3 Enzyme Kinetics for RapidEquilibrium System (Quasi-Equilibrium) 187
5.11.4 Derivation of Enzymatic RateEquation from RapidEquilibrium Assumption 187
5.11.5 Verification of KineticMechanism 189
References 191
5. GROWTH KINETICS128
S U B C H A P T E R
5.1Introduction
Microbial growth is considered for the observation of the living cell activities. It is impor-tant to monitor cell growth and biological and biocatalytic activities in cell metabolism.Several methods are available to predict cell growth by direct or indirect measurements.Cell dry weight, cell optical density (OD), cell turbidity, cell respiration, metabolic rate,and metabolites are quite suitable for analyzing cell growth, substrate utilization, and prod-uct formation. The rate of cell growth is described in this chapter. Various bioprocesses aremodeled for substrate utilization and product formation. Growth kinetics in batch andcontinuous culture is examined in detail.
5.2 INDIRECT MEASUREMENTS OF CELL GROWTH
Biological fluorophores including proteins, pigments, and many metabolites such as nico-tinamide adenine dinucleotide hydrogenase (NADH) represents cell activities. Biologicalcompounds including nucleotides, riboflavin, NADH, nicotinamide adenine dinucleotidephosphate-oxidase, and flavin adenine dinucleotide are fluorophores at specific wavelengthsof 310e520 nm are fluorescence with properties that can be detected and measured as countsfor cell growth activities. The cell population can be determined by fluorescence spectros-copy. The method has advantages as it is relatively specific, sensitive, and accurate for onlinemeasurements.
5.2.1 Fluorescence Spectroscopy
Certain cellular components exhibit fluorescence property, which is defined as the abilityto absorb light with spectral longer fluorescence wavelength. The fluorescence light intensitydepends on concentration of fluorophase, which is described by the LamberteBeer law:
Fl ¼ f$If$�1� e�a$C$d
�(5.2.1.1)
Where Fl is intensity of fluorescence light (W cm�2), f is the fluorescence yield and If is theexcitation light intensity (W cm�2), a is molar absorption coefficient (mol�1 cm�1), C is fluo-rophore concentration (mol l�1), and d is path length (cm). Because nonlinear relation exist forfluorescence with respect to concentration of fluorophore, one can use the linearized segmentof the above relation for small concentration of fluorophore over a small path. The relationcan be simplified as:
Fl ¼ f=If$a$C$d (5.2.1.2)
5.2 INDIRECT MEASUREMENTS OF CELL GROWTH 129
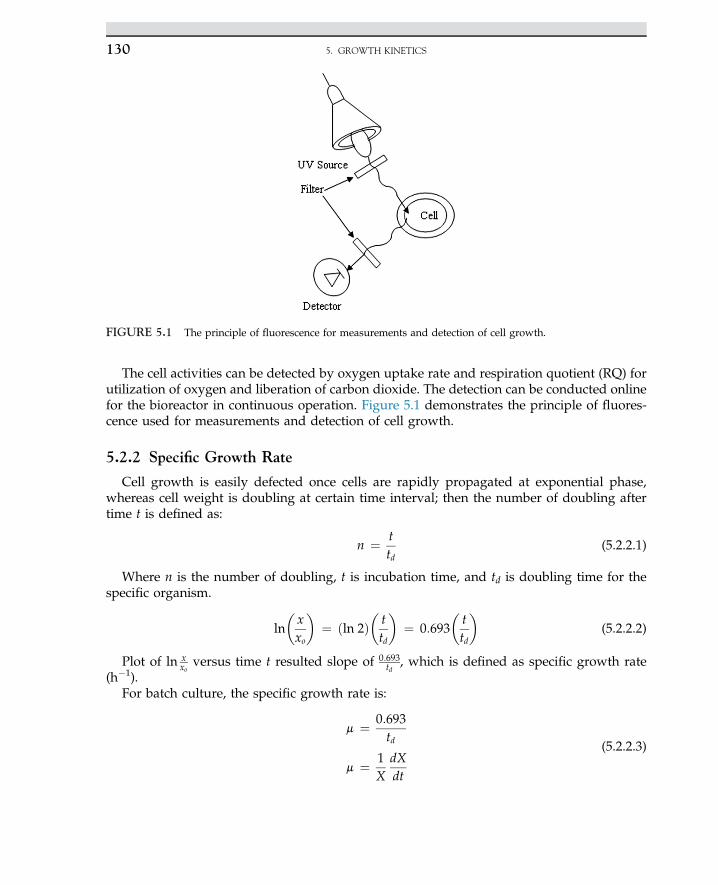
The cell activities can be detected by oxygen uptake rate and respiration quotient (RQ) forutilization of oxygen and liberation of carbon dioxide. The detection can be conducted onlinefor the bioreactor in continuous operation. Figure 5.1 demonstrates the principle of fluores-cence used for measurements and detection of cell growth.
5.2.2 Specific Growth Rate
Cell growth is easily defected once cells are rapidly propagated at exponential phase,whereas cell weight is doubling at certain time interval; then the number of doubling aftertime t is defined as:
n ¼ ttd
(5.2.2.1)
Where n is the number of doubling, t is incubation time, and td is doubling time for thespecific organism.
ln
�xxo
�¼ ðln 2Þ
�ttd
�¼ 0:693
�ttd
�(5.2.2.2)
Plot of ln xxoversus time t resulted slope of 0:693
td, which is defined as specific growth rate
(h�1).For batch culture, the specific growth rate is:
m ¼ 0:693td
m ¼ 1X
dXdt
(5.2.2.3)
FIGURE 5.1 The principle of fluorescence for measurements and detection of cell growth.
5. GROWTH KINETICS130
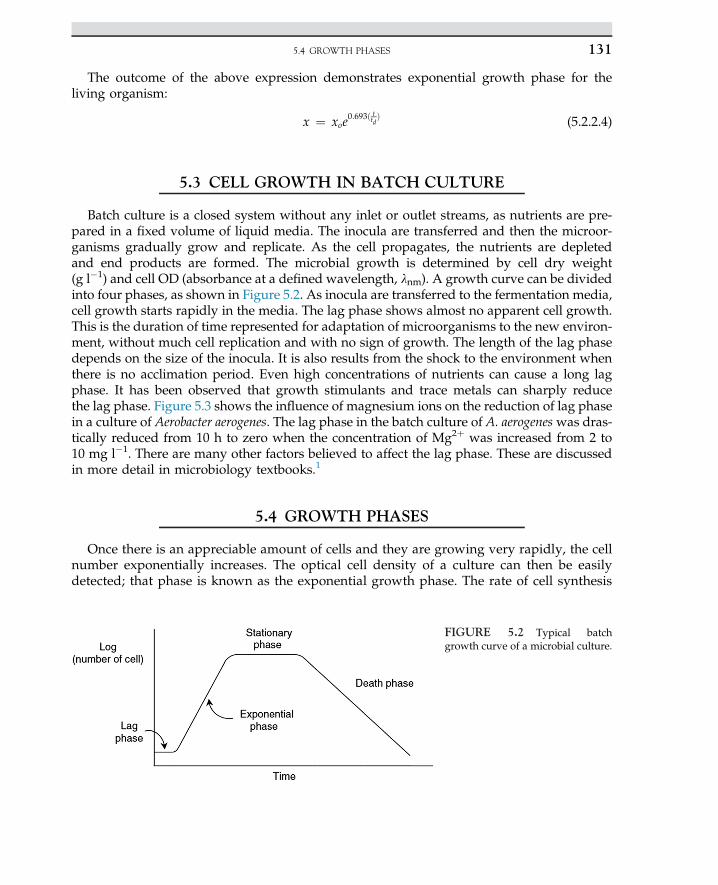
The outcome of the above expression demonstrates exponential growth phase for theliving organism:
x ¼ xoe0:693ð t
tdÞ (5.2.2.4)
5.3 CELL GROWTH IN BATCH CULTURE
Batch culture is a closed system without any inlet or outlet streams, as nutrients are pre-pared in a fixed volume of liquid media. The inocula are transferred and then the microor-ganisms gradually grow and replicate. As the cell propagates, the nutrients are depletedand end products are formed. The microbial growth is determined by cell dry weight(g l�1) and cell OD (absorbance at a defined wavelength, lnm). A growth curve can be dividedinto four phases, as shown in Figure 5.2. As inocula are transferred to the fermentation media,cell growth starts rapidly in the media. The lag phase shows almost no apparent cell growth.This is the duration of time represented for adaptation of microorganisms to the new environ-ment, without much cell replication and with no sign of growth. The length of the lag phasedepends on the size of the inocula. It is also results from the shock to the environment whenthere is no acclimation period. Even high concentrations of nutrients can cause a long lagphase. It has been observed that growth stimulants and trace metals can sharply reducethe lag phase. Figure 5.3 shows the influence of magnesium ions on the reduction of lag phasein a culture of Aerobacter aerogenes. The lag phase in the batch culture of A. aerogenes was dras-tically reduced from 10 h to zero when the concentration of Mg2þ was increased from 2 to10 mg l�1. There are many other factors believed to affect the lag phase. These are discussedin more detail in microbiology textbooks.1
5.4 GROWTH PHASES
Once there is an appreciable amount of cells and they are growing very rapidly, the cellnumber exponentially increases. The optical cell density of a culture can then be easilydetected; that phase is known as the exponential growth phase. The rate of cell synthesis
FIGURE 5.2 Typical batchgrowth curve of a microbial culture.
5.4 GROWTH PHASES 131
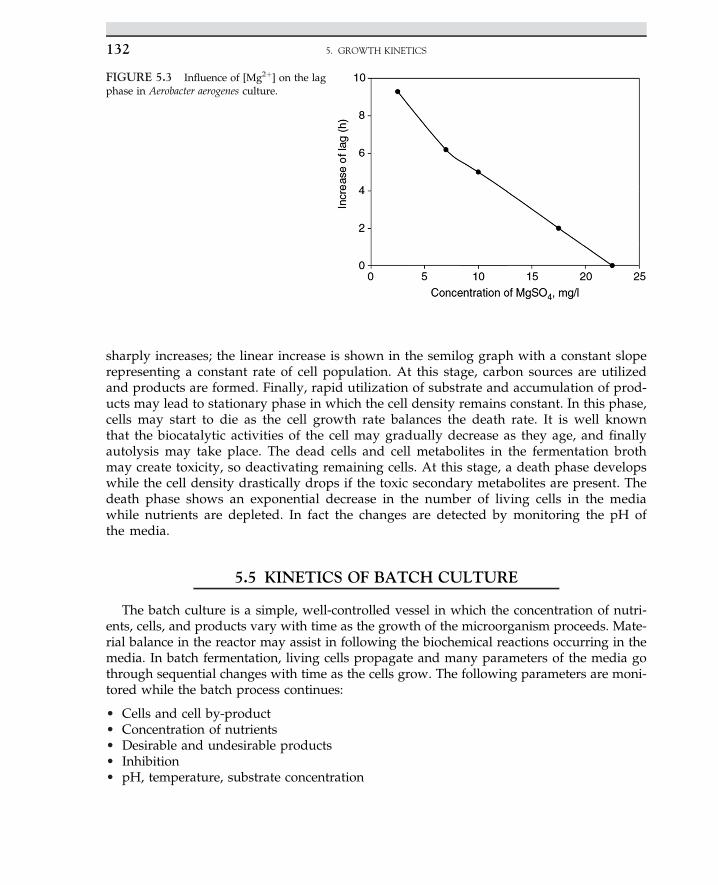
sharply increases; the linear increase is shown in the semilog graph with a constant sloperepresenting a constant rate of cell population. At this stage, carbon sources are utilizedand products are formed. Finally, rapid utilization of substrate and accumulation of prod-ucts may lead to stationary phase in which the cell density remains constant. In this phase,cells may start to die as the cell growth rate balances the death rate. It is well knownthat the biocatalytic activities of the cell may gradually decrease as they age, and finallyautolysis may take place. The dead cells and cell metabolites in the fermentation brothmay create toxicity, so deactivating remaining cells. At this stage, a death phase developswhile the cell density drastically drops if the toxic secondary metabolites are present. Thedeath phase shows an exponential decrease in the number of living cells in the mediawhile nutrients are depleted. In fact the changes are detected by monitoring the pH ofthe media.
5.5 KINETICS OF BATCH CULTURE
The batch culture is a simple, well-controlled vessel in which the concentration of nutri-ents, cells, and products vary with time as the growth of the microorganism proceeds. Mate-rial balance in the reactor may assist in following the biochemical reactions occurring in themedia. In batch fermentation, living cells propagate and many parameters of the media gothrough sequential changes with time as the cells grow. The following parameters are moni-tored while the batch process continues:
• Cells and cell by-product• Concentration of nutrients• Desirable and undesirable products• Inhibition• pH, temperature, substrate concentration
FIGURE 5.3 Influence of [Mg2þ] on the lagphase in Aerobacter aerogenes culture.
5. GROWTH KINETICS132
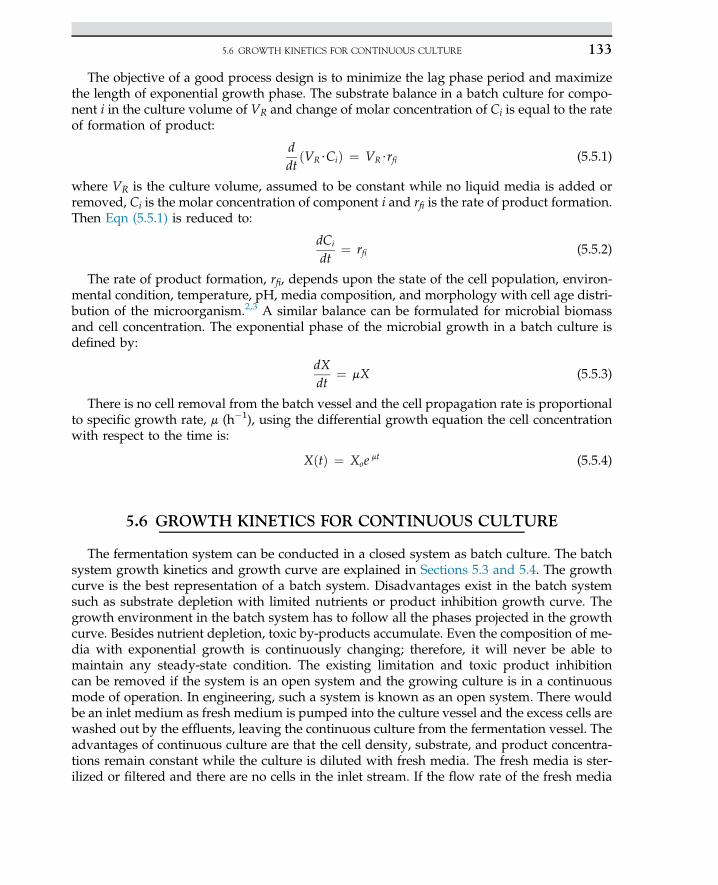
The objective of a good process design is to minimize the lag phase period and maximizethe length of exponential growth phase. The substrate balance in a batch culture for compo-nent i in the culture volume of VR and change of molar concentration of Ci is equal to the rateof formation of product:
ddtðVR$CiÞ ¼ VR$rfi (5.5.1)
where VR is the culture volume, assumed to be constant while no liquid media is added orremoved, Ci is the molar concentration of component i and rfi is the rate of product formation.Then Eqn (5.5.1) is reduced to:
dCi
dt¼ rfi (5.5.2)
The rate of product formation, rfi, depends upon the state of the cell population, environ-mental condition, temperature, pH, media composition, and morphology with cell age distri-bution of the microorganism.2,3 A similar balance can be formulated for microbial biomassand cell concentration. The exponential phase of the microbial growth in a batch culture isdefined by:
dXdt
¼ mX (5.5.3)
There is no cell removal from the batch vessel and the cell propagation rate is proportionalto specific growth rate, m (h�1), using the differential growth equation the cell concentrationwith respect to the time is:
XðtÞ ¼ Xoe mt (5.5.4)
5.6 GROWTH KINETICS FOR CONTINUOUS CULTURE
The fermentation system can be conducted in a closed system as batch culture. The batchsystem growth kinetics and growth curve are explained in Sections 5.3 and 5.4. The growthcurve is the best representation of a batch system. Disadvantages exist in the batch systemsuch as substrate depletion with limited nutrients or product inhibition growth curve. Thegrowth environment in the batch system has to follow all the phases projected in the growthcurve. Besides nutrient depletion, toxic by-products accumulate. Even the composition of me-dia with exponential growth is continuously changing; therefore, it will never be able tomaintain any steady-state condition. The existing limitation and toxic product inhibitioncan be removed if the system is an open system and the growing culture is in a continuousmode of operation. In engineering, such a system is known as an open system. There wouldbe an inlet medium as fresh medium is pumped into the culture vessel and the excess cells arewashed out by the effluents, leaving the continuous culture from the fermentation vessel. Theadvantages of continuous culture are that the cell density, substrate, and product concentra-tions remain constant while the culture is diluted with fresh media. The fresh media is ster-ilized or filtered and there are no cells in the inlet stream. If the flow rate of the fresh media
5.6 GROWTH KINETICS FOR CONTINUOUS CULTURE 133
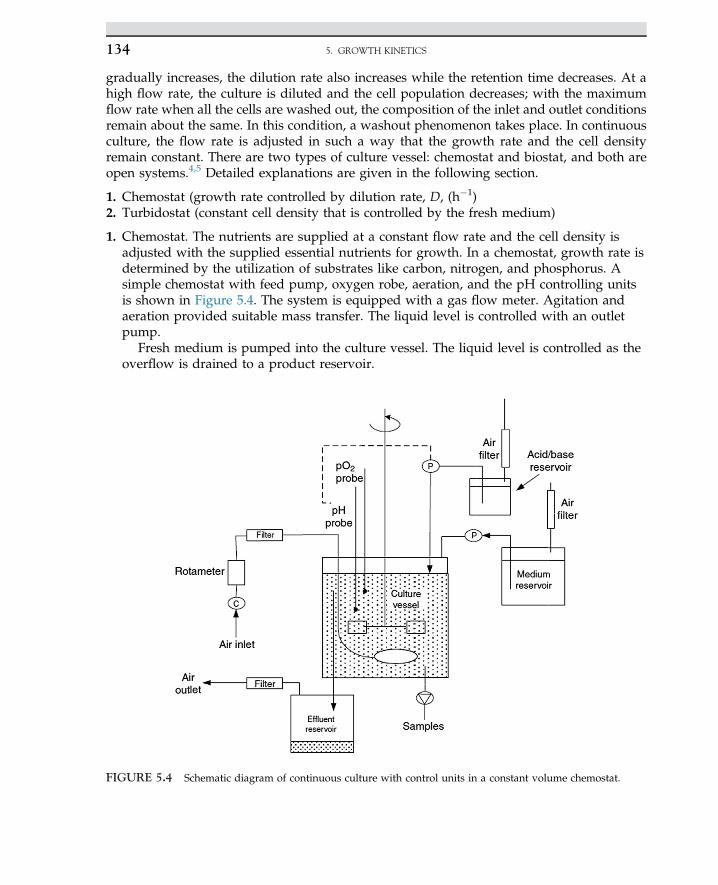
gradually increases, the dilution rate also increases while the retention time decreases. At ahigh flow rate, the culture is diluted and the cell population decreases; with the maximumflow rate when all the cells are washed out, the composition of the inlet and outlet conditionsremain about the same. In this condition, a washout phenomenon takes place. In continuousculture, the flow rate is adjusted in such a way that the growth rate and the cell densityremain constant. There are two types of culture vessel: chemostat and biostat, and both areopen systems.4,5 Detailed explanations are given in the following section.
1. Chemostat (growth rate controlled by dilution rate, D, (h�1)2. Turbidostat (constant cell density that is controlled by the fresh medium)
1. Chemostat. The nutrients are supplied at a constant flow rate and the cell density isadjusted with the supplied essential nutrients for growth. In a chemostat, growth rate isdetermined by the utilization of substrates like carbon, nitrogen, and phosphorus. Asimple chemostat with feed pump, oxygen robe, aeration, and the pH controlling unitsis shown in Figure 5.4. The system is equipped with a gas flow meter. Agitation andaeration provided suitable mass transfer. The liquid level is controlled with an outletpump.
Fresh medium is pumped into the culture vessel. The liquid level is controlled as theoverflow is drained to a product reservoir.
FIGURE 5.4 Schematic diagram of continuous culture with control units in a constant volume chemostat.
5. GROWTH KINETICS134
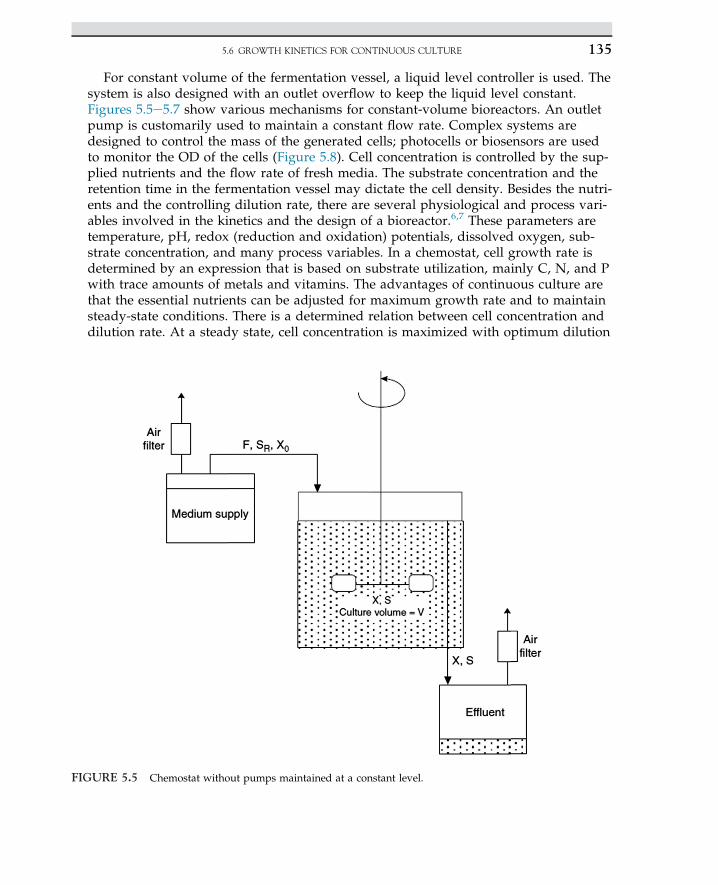
For constant volume of the fermentation vessel, a liquid level controller is used. Thesystem is also designed with an outlet overflow to keep the liquid level constant.Figures 5.5e5.7 show various mechanisms for constant-volume bioreactors. An outletpump is customarily used to maintain a constant flow rate. Complex systems aredesigned to control the mass of the generated cells; photocells or biosensors are usedto monitor the OD of the cells (Figure 5.8). Cell concentration is controlled by the sup-plied nutrients and the flow rate of fresh media. The substrate concentration and theretention time in the fermentation vessel may dictate the cell density. Besides the nutri-ents and the controlling dilution rate, there are several physiological and process vari-ables involved in the kinetics and the design of a bioreactor.6,7 These parameters aretemperature, pH, redox (reduction and oxidation) potentials, dissolved oxygen, sub-strate concentration, and many process variables. In a chemostat, cell growth rate isdetermined by an expression that is based on substrate utilization, mainly C, N, and Pwith trace amounts of metals and vitamins. The advantages of continuous culture arethat the essential nutrients can be adjusted for maximum growth rate and to maintainsteady-state conditions. There is a determined relation between cell concentration anddilution rate. At a steady state, cell concentration is maximized with optimum dilution
FIGURE 5.5 Chemostat without pumps maintained at a constant level.
5.6 GROWTH KINETICS FOR CONTINUOUS CULTURE 135
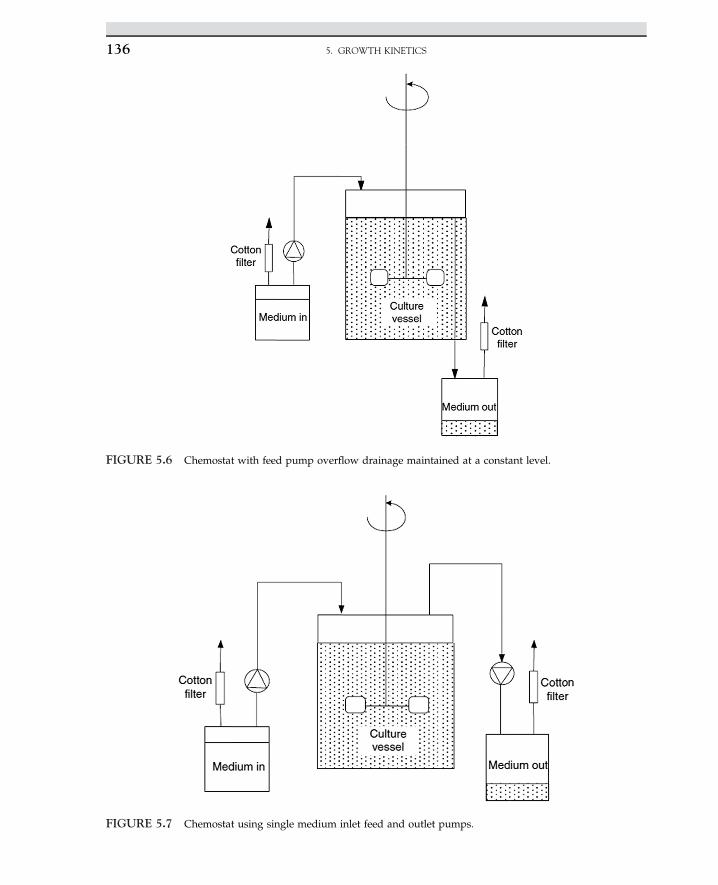
FIGURE 5.6 Chemostat with feed pump overflow drainage maintained at a constant level.
FIGURE 5.7 Chemostat using single medium inlet feed and outlet pumps.
5. GROWTH KINETICS136
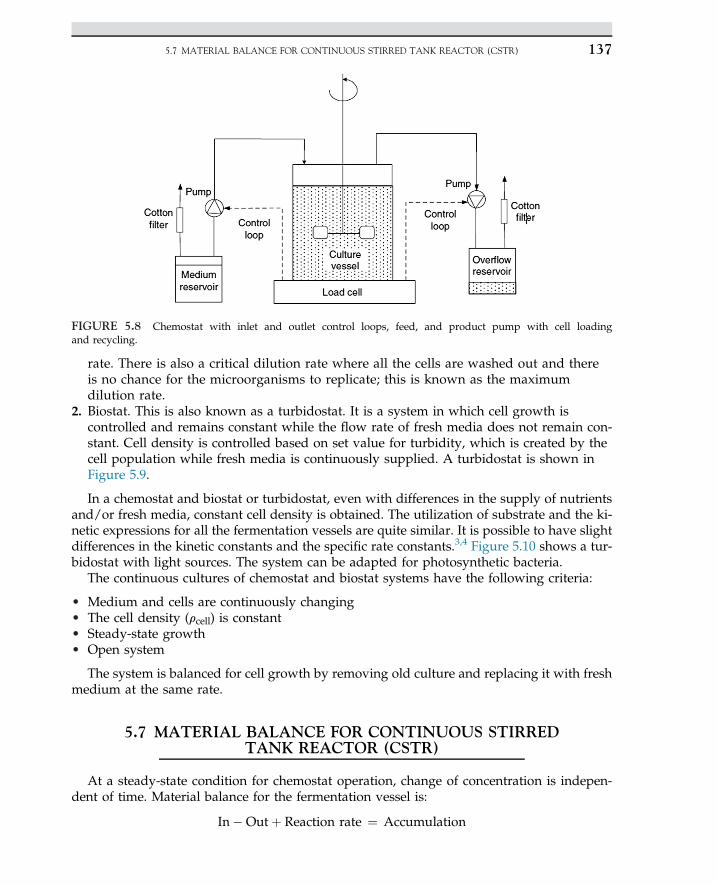
rate. There is also a critical dilution rate where all the cells are washed out and thereis no chance for the microorganisms to replicate; this is known as the maximumdilution rate.
2. Biostat. This is also known as a turbidostat. It is a system in which cell growth iscontrolled and remains constant while the flow rate of fresh media does not remain con-stant. Cell density is controlled based on set value for turbidity, which is created by thecell population while fresh media is continuously supplied. A turbidostat is shown inFigure 5.9.
In a chemostat and biostat or turbidostat, even with differences in the supply of nutrientsand/or fresh media, constant cell density is obtained. The utilization of substrate and the ki-netic expressions for all the fermentation vessels are quite similar. It is possible to have slightdifferences in the kinetic constants and the specific rate constants.3,4 Figure 5.10 shows a tur-bidostat with light sources. The system can be adapted for photosynthetic bacteria.
The continuous cultures of chemostat and biostat systems have the following criteria:
• Medium and cells are continuously changing• The cell density (rcell) is constant• Steady-state growth• Open system
The system is balanced for cell growth by removing old culture and replacing it with freshmedium at the same rate.
5.7 MATERIAL BALANCE FOR CONTINUOUS STIRREDTANK REACTOR (CSTR)
At a steady-state condition for chemostat operation, change of concentration is indepen-dent of time. Material balance for the fermentation vessel is:
In�Outþ Reaction rate ¼ Accumulation
FIGURE 5.8 Chemostat with inlet and outlet control loops, feed, and product pump with cell loadingand recycling.
5.7 MATERIAL BALANCE FOR CONTINUOUS STIRRED TANK REACTOR (CSTR) 137
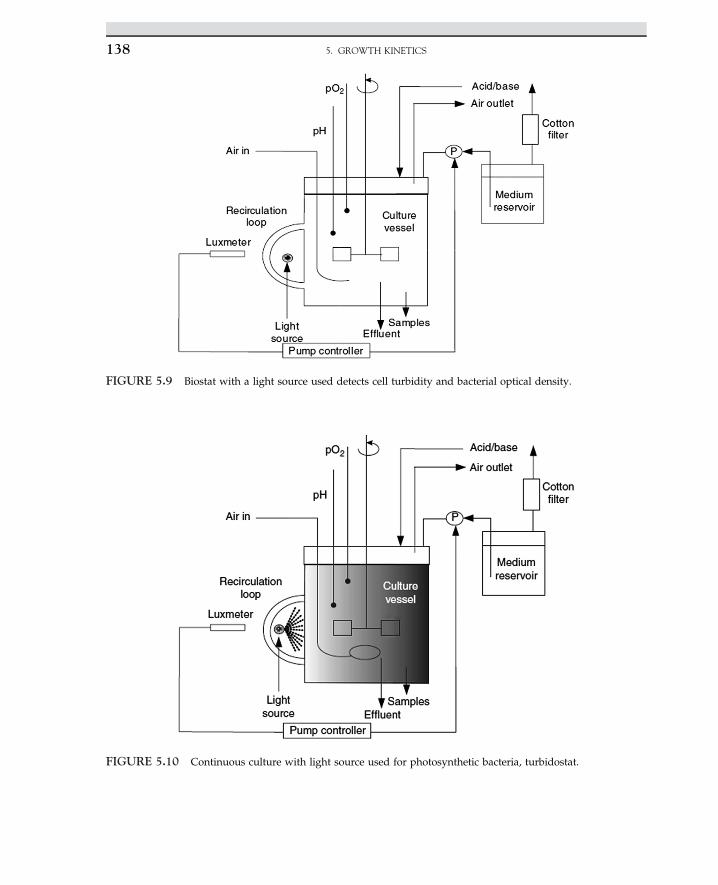
FIGURE 5.9 Biostat with a light source used detects cell turbidity and bacterial optical density.
FIGURE 5.10 Continuous culture with light source used for photosynthetic bacteria, turbidostat.
5. GROWTH KINETICS138
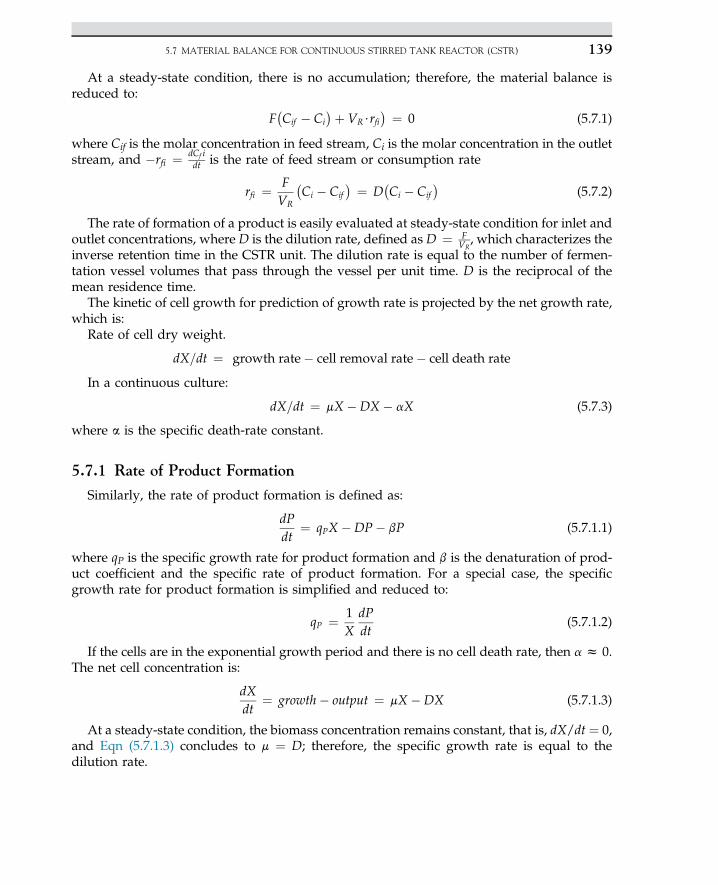
At a steady-state condition, there is no accumulation; therefore, the material balance isreduced to:
F�Cif � Ci
�þ VR$rfi� ¼ 0 (5.7.1)
where Cif is the molar concentration in feed stream, Ci is the molar concentration in the outletstream, and �rfi ¼ dCf i
dt is the rate of feed stream or consumption rate
rfi ¼ FVR
�Ci � Cif
� ¼ D�Ci � Cif
�(5.7.2)
The rate of formation of a product is easily evaluated at steady-state condition for inlet andoutlet concentrations, where D is the dilution rate, defined as D ¼ F
VR, which characterizes the
inverse retention time in the CSTR unit. The dilution rate is equal to the number of fermen-tation vessel volumes that pass through the vessel per unit time. D is the reciprocal of themean residence time.
The kinetic of cell growth for prediction of growth rate is projected by the net growth rate,which is:
Rate of cell dry weight.
dX=dt ¼ growth rate� cell removal rate� cell death rate
In a continuous culture:
dX=dt ¼ mX �DX � aX (5.7.3)
where a is the specific death-rate constant.
5.7.1 Rate of Product Formation
Similarly, the rate of product formation is defined as:
dPdt
¼ qPX �DP� bP (5.7.1.1)
where qP is the specific growth rate for product formation and b is the denaturation of prod-uct coefficient and the specific rate of product formation. For a special case, the specificgrowth rate for product formation is simplified and reduced to:
qP ¼ 1X
dPdt
(5.7.1.2)
If the cells are in the exponential growth period and there is no cell death rate, then a z 0.The net cell concentration is:
dXdt
¼ growth� output ¼ mX �DX (5.7.1.3)
At a steady-state condition, the biomass concentration remains constant, that is, dX/dt ¼ 0,and Eqn (5.7.1.3) concludes to m ¼ D; therefore, the specific growth rate is equal to thedilution rate.
5.7 MATERIAL BALANCE FOR CONTINUOUS STIRRED TANK REACTOR (CSTR) 139
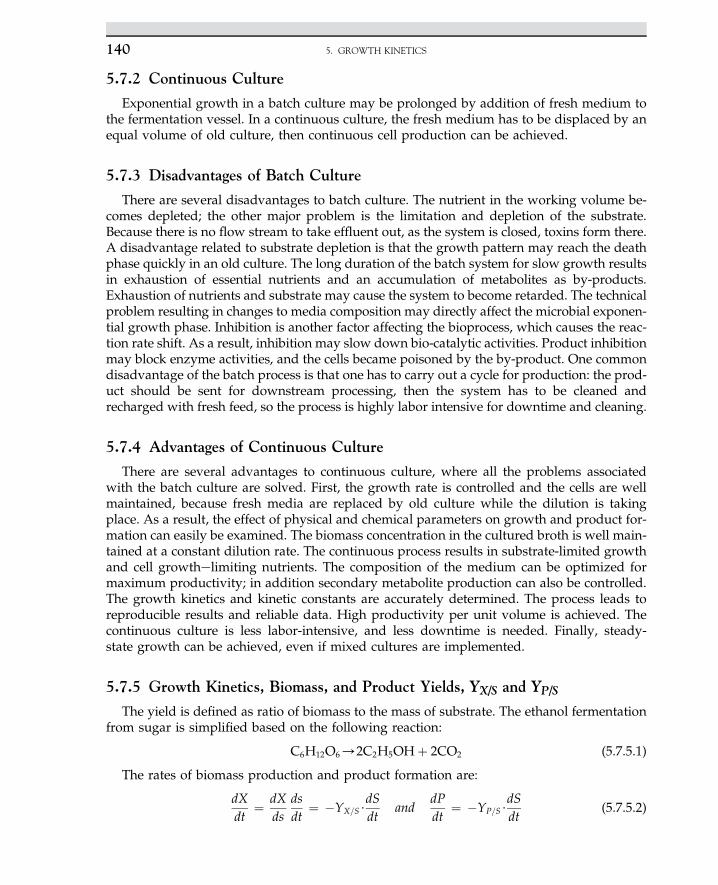
5.7.2 Continuous Culture
Exponential growth in a batch culture may be prolonged by addition of fresh medium tothe fermentation vessel. In a continuous culture, the fresh medium has to be displaced by anequal volume of old culture, then continuous cell production can be achieved.
5.7.3 Disadvantages of Batch Culture
There are several disadvantages to batch culture. The nutrient in the working volume be-comes depleted; the other major problem is the limitation and depletion of the substrate.Because there is no flow stream to take effluent out, as the system is closed, toxins form there.A disadvantage related to substrate depletion is that the growth pattern may reach the deathphase quickly in an old culture. The long duration of the batch system for slow growth resultsin exhaustion of essential nutrients and an accumulation of metabolites as by-products.Exhaustion of nutrients and substrate may cause the system to become retarded. The technicalproblem resulting in changes to media composition may directly affect the microbial exponen-tial growth phase. Inhibition is another factor affecting the bioprocess, which causes the reac-tion rate shift. As a result, inhibition may slow down bio-catalytic activities. Product inhibitionmay block enzyme activities, and the cells became poisoned by the by-product. One commondisadvantage of the batch process is that one has to carry out a cycle for production: the prod-uct should be sent for downstream processing, then the system has to be cleaned andrecharged with fresh feed, so the process is highly labor intensive for downtime and cleaning.
5.7.4 Advantages of Continuous Culture
There are several advantages to continuous culture, where all the problems associatedwith the batch culture are solved. First, the growth rate is controlled and the cells are wellmaintained, because fresh media are replaced by old culture while the dilution is takingplace. As a result, the effect of physical and chemical parameters on growth and product for-mation can easily be examined. The biomass concentration in the cultured broth is well main-tained at a constant dilution rate. The continuous process results in substrate-limited growthand cell growthelimiting nutrients. The composition of the medium can be optimized formaximum productivity; in addition secondary metabolite production can also be controlled.The growth kinetics and kinetic constants are accurately determined. The process leads toreproducible results and reliable data. High productivity per unit volume is achieved. Thecontinuous culture is less labor-intensive, and less downtime is needed. Finally, steady-state growth can be achieved, even if mixed cultures are implemented.
5.7.5 Growth Kinetics, Biomass, and Product Yields, YX/S and YP/S
The yield is defined as ratio of biomass to the mass of substrate. The ethanol fermentationfrom sugar is simplified based on the following reaction:
C6H12O6/2C2H5OHþ 2CO2 (5.7.5.1)
The rates of biomass production and product formation are:
dXdt
¼ dXds
dsdt
¼ �YX=S$dSdt
anddPdt
¼ �YP=S$dSdt
(5.7.5.2)
5. GROWTH KINETICS140
where the yields of biomass and product are:
YX=S ¼ �DXDS
and YP=S ¼ �DPDS
(5.7.5.3)
For instance, the theoretical yield of ethanol fermentation based on fermentation of glucoseresults in 2 mol of ethanol:
2 mol EtOHmol C6H12O6
¼ 2� 46180
¼ 0:511g EtOH
g C6H12O6
The effect of substrate concentration on specific growth rate (m) in a batch culture is relatedto the time and mmax; the relation is known as the Monod rate equation. The cell density (rcell)increases linearly in the exponential phase. When substrate (S) is depleted, the specificgrowth rate (m) decreases. The Monod equation is described in the following equation:
m ¼ mmS
KS þ S(5.7.5.4)
where m is the specific growth rate, mm is the maximum specific growth rate in h�1, KS is satu-ration or Monod constant and S is substrate in g l�1. The linearized form of the Monod equa-tion is:
1m
¼�KS
mm
�1Sþ 1mm
(5.7.5.5)
The average biomass concentration is defined as the product of yield of biomass andchange of substrate concentrations in inlet and outlet streams. The biomass balance is:
X ¼ YX=S
�� DS� ¼ YX=S
�Si � So
�(5.7.5.6)
where Si and So are inlet and outlet concentrations in mol l�1. Rate expression is based on theMonod equation for substrate utilization, given by the rate Eqn (5.7.5.4):
mKS þ mS ¼ mmaxS or mKS ¼ ðmmax � mÞS (5.7.5.7)
The rate equation was solved for substrate concentration in the product stream. Rearrange-ment of Eqn (5.7.5.7) results in an equation for substrate in terms of specific rate:
S ¼ KSm
mmax � m(5.7.5.8)
Finally, at a steady-state condition, as has been statedpreviously Eqn (5.7.1.3), the rate of sub-strate consumption is equal to the biomass generation, with the assumption of zero death rate:
m ¼ D0So ¼ KSDmmax �D
(5.7.5.9)
5.7.6 Biomass Balances (Cells) in a Bioreactor
The material balance for cells in a continuous culture chemostat is defined as:
cell accumulation ¼ cell in� cell outþ cell growth � cell death (5.7.6.1)
5.7 MATERIAL BALANCE FOR CONTINUOUS STIRRED TANK REACTOR (CSTR) 141
dXdt
¼�FV
�ðXo � XÞ þ mX � aX (5.7.6.2)
where F is the flow rate in h�1, V is the working volume of the bioreactor in l, X is the cellconcentration in g l�1, m is the specific growth rate in h�1, Ke or Kd equal a, known as the spe-cific death rate in h�1, and D or F/V is the dilution rate in h�1. Because in the exponentialphase, steady-state growth has been achieved and the specific growth rate is much greaterthan the specific death rate, then Eqn (5.7.6.2) is simplified and reduced to a point wherethe specific growth rate is equal to the dilution rate:
dXdt
¼ �DX þ mX (5.7.6.3)
At a steady-state condition, biomass concentration is constant or cell density is stable atfixed dilution rate:
dXdt
¼ 0
0 ¼ Xðm�DÞ (5.7.6.4)
Then, m ¼ D. Such condition is valid only at steady condition. As the fresh medium flowrate increases, cell concentration may gradually decreases because of high dilution rate.There is a specific dilution rate known as critical dilution rate where a washout phenome-non takes place. At the critical dilution rate there is not enough time for the microorganismsto replicate.
5.7.7 Material Balance in Terms of Substrate in a Chemostat
The substrate balance is given based on following equation:
�dSdt
¼�FV
�ðSin � SoutÞ �
�m
YX=S
�cell growth
X ��
qPYP=S
�product formed
X � mXmaintenance may negligible
(5.7.7.1)
In general, m >> m, so we can therefore neglect the last term. For steady-state conditions,no additional product is formed, which means there are no changes in substrate and productconcentrations:
�dSdt
¼ 0 and�
qPYP=S
�¼ 0 (5.7.7.2)
Simplify Eqn (5.6.7.1) substituting F/V ¼ D and then m ¼ D resulted in:
0 ¼ DðSin � SoutÞ ��
mXYX=S
�(5.7.7.3)
Rearranging this equation yield:
X ¼ YX=S�Sin � Sout
�(5.7.7.4)
5. GROWTH KINETICS142
For a steady-state condition, dilution rate and outlet substrate concentration are defined:
D ¼ mmS
KS þ S0Sout ¼ KSD
mm �D(5.7.7.5)
Substituting Eqn (5.7.7.5) into Eqn (5.7.7.4):
X ¼ YX=S
�Sin � KSD
mm �D
�(5.7.7.6)
For unsteady state when msD:
dXdt
¼ Xðm�DÞ (5.7.7.7)
The equation with respect to substrate is:
dXdt
¼ X�mm
SKS þ S
�D�
(5.7.7.8)
5.7.8 Modified Chemostat
With cell recycling, chemostat efficiency is improved. To maintain a high cell density, thecells in the outlet stream are recycled back to the fermentation vessel. Figure 5.11 represents achemostat unit with a cell harvesting system. The separation unit is used for harvesting thecells and recycling then to the culture vessel to increase the cell concentration. The materialbalance in a constant volume chemostat is derived based on cell balance as shown in thefollowing equations. Material balance in a chemostat with recycle, rcell:
dXdt
¼�FV
�½Xo � Xð1þ sÞ� þ mX þ
�FV
�$cx (5.7.8.1)
where s ¼ recycle ratio.c ¼ the factor by which the outlet stream is concentrated before return.For steady-state, dX
dt ¼ 0
m ¼ Dð1þ s� cÞ (5.7.8.2)
Multiple stages of continuous culture are designed to use the outlet of the first vessel as theinoculum for the next stage. If intermediate metabolites are used as feed for another micro-organism, sequential continuous culture is useful. The dilution rate for each vessel may bedifferent to the other vessel. It is also possible to supply different nutrients for each stageof fermentation vessel. It is common to operate earlier stages as aerobic and subsequentstages in an anaerobic condition. In addition, if unused substrate leaves the product stream,it can be used in the next stage even at low substrate concentration. The kinetic representationmay show a slower rate and even drop to zero order. Figure 5.12 shows two stages of a che-mostat in operation.
5.7 MATERIAL BALANCE FOR CONTINUOUS STIRRED TANK REACTOR (CSTR) 143
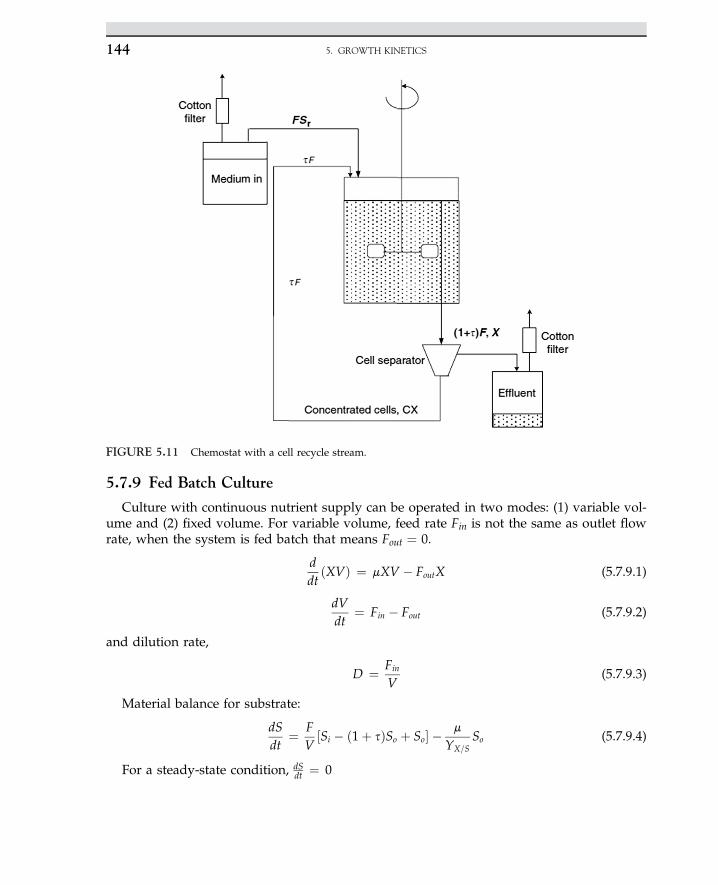
5.7.9 Fed Batch Culture
Culture with continuous nutrient supply can be operated in two modes: (1) variable vol-ume and (2) fixed volume. For variable volume, feed rate Fin is not the same as outlet flowrate, when the system is fed batch that means Fout ¼ 0.
ddtðXVÞ ¼ mXV � FoutX (5.7.9.1)
dVdt
¼ Fin � Fout (5.7.9.2)
and dilution rate,
D ¼ Fin
V(5.7.9.3)
Material balance for substrate:
dSdt
¼ FV½Si � ð1þ sÞSo þ So� � m
YX=SSo (5.7.9.4)
For a steady-state condition, dSdt ¼ 0
FIGURE 5.11 Chemostat with a cell recycle stream.
5. GROWTH KINETICS144
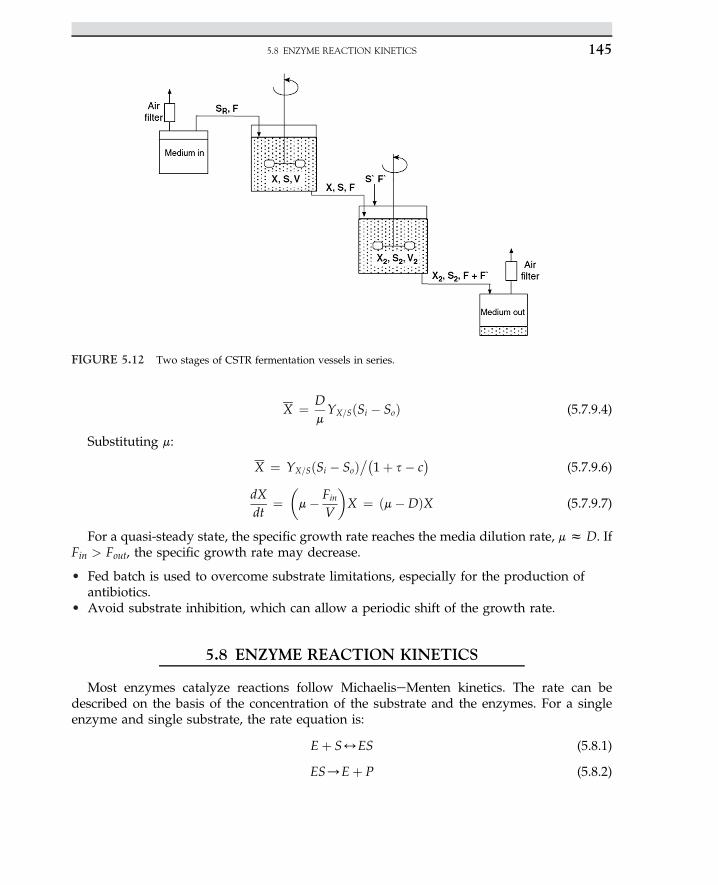
X ¼ DmYX=SðSi � SoÞ (5.7.9.4)
Substituting m:
X ¼ YX=SðSi � SoÞ��
1þ s� c�
(5.7.9.6)
dXdt
¼�m� Fin
V
�X ¼ ðm�DÞX (5.7.9.7)
For a quasi-steady state, the specific growth rate reaches the media dilution rate, m z D. IfFin > Fout, the specific growth rate may decrease.
• Fed batch is used to overcome substrate limitations, especially for the production ofantibiotics.
• Avoid substrate inhibition, which can allow a periodic shift of the growth rate.
5.8 ENZYME REACTION KINETICS
Most enzymes catalyze reactions follow MichaeliseMenten kinetics. The rate can bedescribed on the basis of the concentration of the substrate and the enzymes. For a singleenzyme and single substrate, the rate equation is:
Eþ S4ES (5.8.1)
ES/Eþ P (5.8.2)
FIGURE 5.12 Two stages of CSTR fermentation vessels in series.
5.8 ENZYME REACTION KINETICS 145
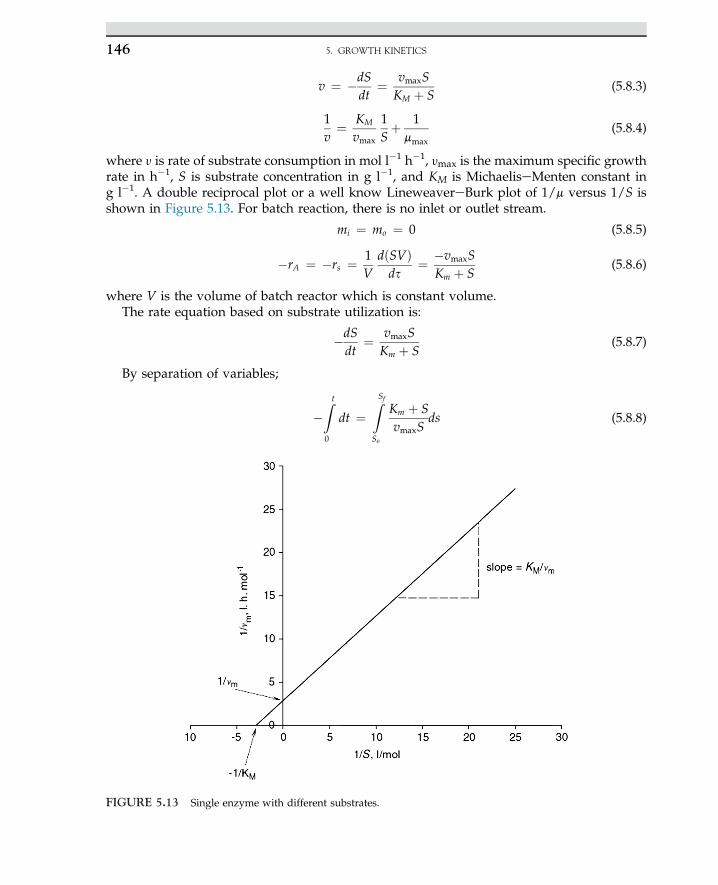
v ¼ �dSdt
¼ vmaxSKM þ S
(5.8.3)
1v¼ KM
vmax
1Sþ 1mmax
(5.8.4)
where y is rate of substrate consumption in mol l�1 h�1, ymax is the maximum specific growthrate in h�1, S is substrate concentration in g l�1, and KM is MichaeliseMenten constant ing l�1. A double reciprocal plot or a well know LineweavereBurk plot of 1/m versus 1/S isshown in Figure 5.13. For batch reaction, there is no inlet or outlet stream.
mi ¼ mo ¼ 0 (5.8.5)
�rA ¼ �rs ¼ 1V
dðSVÞds
¼ �vmaxSKm þ S
(5.8.6)
where V is the volume of batch reactor which is constant volume.The rate equation based on substrate utilization is:
�dSdt
¼ vmaxSKm þ S
(5.8.7)
By separation of variables;
�Z t
0
dt ¼ZSfSo
Km þ SvmaxS
ds (5.8.8)
FIGURE 5.13 Single enzyme with different substrates.
5. GROWTH KINETICS146
then, fractionation and integration resulted in:
�t ¼ Km
vmax
lnSf
Soþ 1vmax
�Sf � So
�(5.8.9)
Batch reaction time is calculated based on following relation:
tbatch ¼ Km
vmax
lnS0
Sfþ�Sf � S0
�vmax
(5.8.10)
where S0 is the initial substrate concentration in g l�1 and Sf is the final substrate concentra-tion in g l�1.
5.8.1 Mechanisms of Single Enzyme with Dual Substrates
The kinetics of double substrates with defined dissociation constants are given as:
Eþ S1 %k
k�1
ES1; K1 ¼ k�1
k(5.8.1.1)
where K1 is the equilibrium constant or dissociation constant.
ES1/k01 Eþ P1 (5.8.1.2)
Similarly, for a second substrate, the reaction is carried out and the second product isformed.
Eþ S2 %k2
k�2
ES2; K2 ¼ k�2
k2(5.8.1.3)
where K2 is the equilibrium or dissociation constant.
ES2/k02 Eþ P2 (5.8.1.4)
Overall enzyme balance and equilibrium constants are defined for the intermediate sub-strate and enzyme complex. The total enzyme concentration is the sum of free and conju-gated enzymes with the substrates.
eo ¼ Eþ ES1 þ ES2 (5.8.1.5)
The intermediates, complexes of ES1 and ES2, are defined based on equilibrium constants.
K1 ¼ ½E�½S1�ES1
0ES1 ¼ ½E�½S1�K1
(5.8.1.6)
K2 ¼ ½E�½S2�½ES2� 0ES2 ¼ ½E�½S2�
K2(5.8.1.7)
The initial and total enzyme concentrations are defined based on measurable componentsgiven as:
eo ¼ E�1þ S1
K1þ S2
K2
�(5.8.1.8)
5.8 ENZYME REACTION KINETICS 147
The free enzyme can also be defined based on the following equation:
E ¼ eo�1þ S1
K1þ S2
K2
� (5.8.1.9)
The rate equation for first substrate:
�ds1dt
¼ v1 ¼ k01½ES1� ¼ k01½E�½S1�K1
(5.8.1.10)
The rate is defined with respect to dual substrates:
v1 ¼ k01eo½S1�K1
�1þ S1
K1þ S2
K2
�(5.8.1.11)
The rate equation for the second substrate is:
�ds2dt
¼ v2 ¼ k’2½ES2� ¼ k’2½E�½S2�K2
(5.8.1.12)
The second rate is also defined as follows:
v2 ¼ k’2eo½S2�K2
,�1þ S1
K1þ S2
K2
�(5.8.1.13)
Overall reaction rates for dual substrates are the sum of the rates of dissociation of twosubstrates.
vT ¼ �dST
dt¼ �
�dS1
dtþ dS2
dt
�¼ eo
k’1S1
K1þ k’2S2
K2
!,�1þ S1
K1þ S2
K2
�(5.8.1.14)
If one substrate vanishes, then the rate is based on the concentration of the total substratepresent in the reaction vessel; so, if S2 is zero, then the total substrate concentration STo is theconcentration of substrate involved in the reaction.
vT ¼ eok1STo
K1 þ STo(5.8.1.15)
Otherwise, if one of the substrate increases, the other substrate decreases. If S2 increases,then S1 has to decrease. The simplified rate, which is very similar to that for a single substrate,is given as follows:
vT ¼ eok2STo
K2 þ STo(5.8.1.16)
In general, enzymes are proteins and carry charges; the perfect assumption for enzyme re-actions would be multiple active sites for binding substrates with a strong affinity to hold onto substrate. In an enzyme mechanism, the second substrate molecule can bind to the enzymeas well, which is based on the free sites available in the dimensional structure of the enzyme.Sometimes, large amounts of substrate cause the enzyme-catalyzed reaction to diminish; such
5. GROWTH KINETICS148
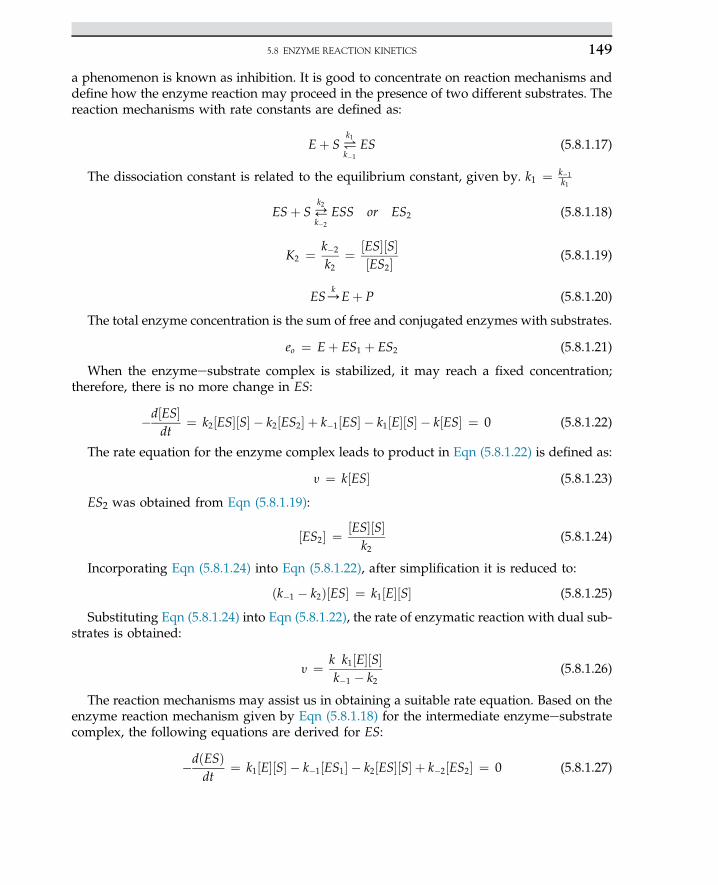
a phenomenon is known as inhibition. It is good to concentrate on reaction mechanisms anddefine how the enzyme reaction may proceed in the presence of two different substrates. Thereaction mechanisms with rate constants are defined as:
Eþ S#k1
k�1
ES (5.8.1.17)
The dissociation constant is related to the equilibrium constant, given by. k1 ¼ k�1k1
ESþ S%k2
k�2
ESS or ES2 (5.8.1.18)
K2 ¼ k�2
k2¼ ½ES�½S�
½ES2� (5.8.1.19)
ES/kEþ P (5.8.1.20)
The total enzyme concentration is the sum of free and conjugated enzymes with substrates.
eo ¼ Eþ ES1 þ ES2 (5.8.1.21)
When the enzymeesubstrate complex is stabilized, it may reach a fixed concentration;therefore, there is no more change in ES:
�d½ES�dt
¼ k2½ES�½S� � k2½ES2� þ k�1½ES� � k1½E�½S� � k½ES� ¼ 0 (5.8.1.22)
The rate equation for the enzyme complex leads to product in Eqn (5.8.1.22) is defined as:
y ¼ k½ES� (5.8.1.23)
ES2 was obtained from Eqn (5.8.1.19):
½ES2� ¼ ½ES�½S�k2
(5.8.1.24)
Incorporating Eqn (5.8.1.24) into Eqn (5.8.1.22), after simplification it is reduced to:
ðk�1 � k2Þ½ES� ¼ k1½E�½S� (5.8.1.25)
Substituting Eqn (5.8.1.24) into Eqn (5.8.1.22), the rate of enzymatic reaction with dual sub-strates is obtained:
y ¼ k k1½E�½S�k�1 � k2
(5.8.1.26)
The reaction mechanisms may assist us in obtaining a suitable rate equation. Based on theenzyme reaction mechanism given by Eqn (5.8.1.18) for the intermediate enzymeesubstratecomplex, the following equations are derived for ES:
�dðESÞdt
¼ k1½E�½S� � k�1½ES1� � k2½ES�½S� þ k�2½ES2� ¼ 0 (5.8.1.27)
5.8 ENZYME REACTION KINETICS 149
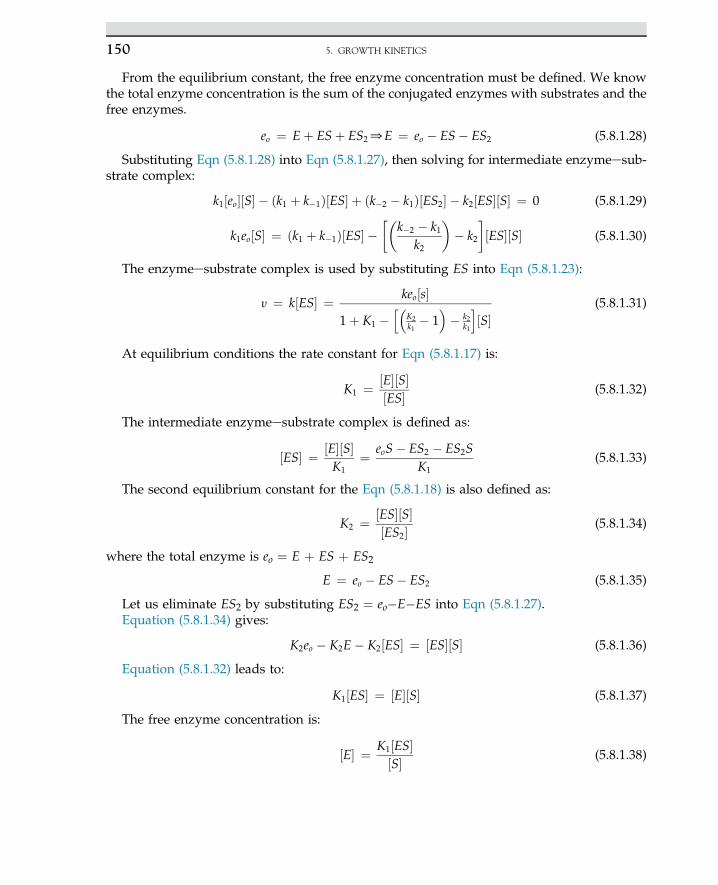
From the equilibrium constant, the free enzyme concentration must be defined. We knowthe total enzyme concentration is the sum of the conjugated enzymes with substrates and thefree enzymes.
eo ¼ Eþ ESþ ES20E ¼ eo � ES� ES2 (5.8.1.28)
Substituting Eqn (5.8.1.28) into Eqn (5.8.1.27), then solving for intermediate enzymeesub-strate complex:
k1½eo�½S� � ðk1 þ k�1Þ½ES� þ ðk�2 � k1Þ½ES2� � k2½ES�½S� ¼ 0 (5.8.1.29)
k1eo½S� ¼ ðk1 þ k�1Þ½ES� ��
k�2 � k1k2
�� k2
�½ES�½S� (5.8.1.30)
The enzymeesubstrate complex is used by substituting ES into Eqn (5.8.1.23):
y ¼ k½ES� ¼ keo½s�1þ K1 �
h�K2k1� 1�� k2
k1
i½S�
(5.8.1.31)
At equilibrium conditions the rate constant for Eqn (5.8.1.17) is:
K1 ¼ ½E�½S�½ES� (5.8.1.32)
The intermediate enzymeesubstrate complex is defined as:
½ES� ¼ ½E�½S�K1
¼ eoS� ES2 � ES2SK1
(5.8.1.33)
The second equilibrium constant for the Eqn (5.8.1.18) is also defined as:
K2 ¼ ½ES�½S�½ES2� (5.8.1.34)
where the total enzyme is eo ¼ E þ ES þ ES2
E ¼ eo � ES� ES2 (5.8.1.35)
Let us eliminate ES2 by substituting ES2 ¼ eo�E�ES into Eqn (5.8.1.27).Equation (5.8.1.34) gives:
K2eo � K2E� K2½ES� ¼ ½ES�½S� (5.8.1.36)
Equation (5.8.1.32) leads to:
K1½ES� ¼ ½E�½S� (5.8.1.37)
The free enzyme concentration is:
½E� ¼ K1½ES�½S� (5.8.1.38)
5. GROWTH KINETICS150
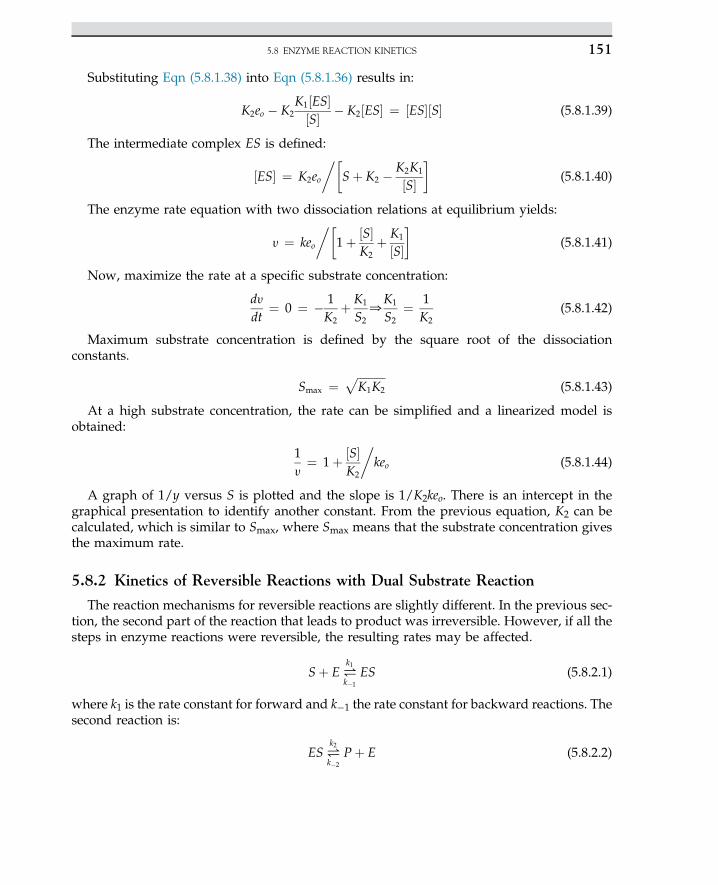
Substituting Eqn (5.8.1.38) into Eqn (5.8.1.36) results in:
K2eo � K2K1½ES�½S� � K2½ES� ¼ ½ES�½S� (5.8.1.39)
The intermediate complex ES is defined:
½ES� ¼ K2eo
Sþ K2 � K2K1
½S��
(5.8.1.40)
The enzyme rate equation with two dissociation relations at equilibrium yields:
y ¼ keo
1þ ½S�
K2þ K1
½S��
(5.8.1.41)
Now, maximize the rate at a specific substrate concentration:
dydt
¼ 0 ¼ � 1K2
þ K1
S20
K1
S2¼ 1
K2(5.8.1.42)
Maximum substrate concentration is defined by the square root of the dissociationconstants.
Smax ¼ffiffiffiffiffiffiffiffiffiffiK1K2
p(5.8.1.43)
At a high substrate concentration, the rate can be simplified and a linearized model isobtained:
1y¼ 1þ ½S�
K2
keo (5.8.1.44)
A graph of 1/y versus S is plotted and the slope is 1/K2keo. There is an intercept in thegraphical presentation to identify another constant. From the previous equation, K2 can becalculated, which is similar to Smax, where Smax means that the substrate concentration givesthe maximum rate.
5.8.2 Kinetics of Reversible Reactions with Dual Substrate Reaction
The reaction mechanisms for reversible reactions are slightly different. In the previous sec-tion, the second part of the reaction that leads to product was irreversible. However, if all thesteps in enzyme reactions were reversible, the resulting rates may be affected.
Sþ E#k1
k�1
ES (5.8.2.1)
where k1 is the rate constant for forward and k�1 the rate constant for backward reactions. Thesecond reaction is:
ES#k2
k�2
Pþ E (5.8.2.2)
5.8 ENZYME REACTION KINETICS 151
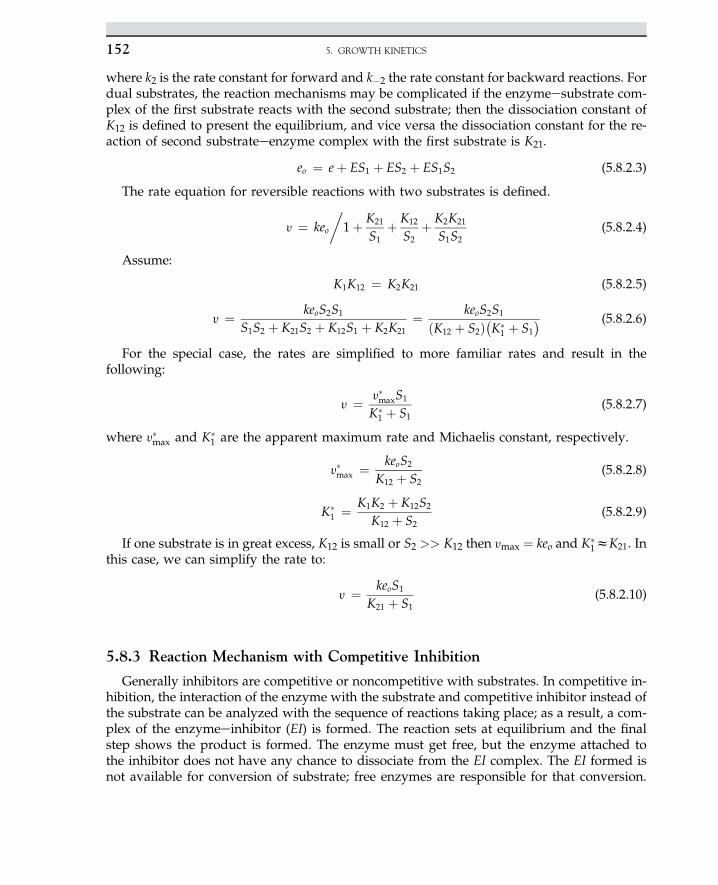
where k2 is the rate constant for forward and k�2 the rate constant for backward reactions. Fordual substrates, the reaction mechanisms may be complicated if the enzymeesubstrate com-plex of the first substrate reacts with the second substrate; then the dissociation constant ofK12 is defined to present the equilibrium, and vice versa the dissociation constant for the re-action of second substrateeenzyme complex with the first substrate is K21.
eo ¼ eþ ES1 þ ES2 þ ES1S2 (5.8.2.3)
The rate equation for reversible reactions with two substrates is defined.
y ¼ keo
1þ K21
S1þ K12
S2þ K2K21
S1S2(5.8.2.4)
Assume:
K1K12 ¼ K2K21 (5.8.2.5)
y ¼ keoS2S1
S1S2 þ K21S2 þ K12S1 þ K2K21¼ keoS2S1
ðK12 þ S2Þ�K�
1 þ S1� (5.8.2.6)
For the special case, the rates are simplified to more familiar rates and result in thefollowing:
y ¼ y�maxS1
K�1 þ S1
(5.8.2.7)
where y�max and K�1 are the apparent maximum rate and Michaelis constant, respectively.
y�max ¼ keoS2
K12 þ S2(5.8.2.8)
K�1 ¼ K1K2 þ K12S2
K12 þ S2(5.8.2.9)
If one substrate is in great excess, K12 is small or S2 >> K12 then ymax ¼ keo and K�1zK21. In
this case, we can simplify the rate to:
y ¼ keoS1
K21 þ S1(5.8.2.10)
5.8.3 Reaction Mechanism with Competitive Inhibition
Generally inhibitors are competitive or noncompetitive with substrates. In competitive in-hibition, the interaction of the enzyme with the substrate and competitive inhibitor instead ofthe substrate can be analyzed with the sequence of reactions taking place; as a result, a com-plex of the enzymeeinhibitor (EI) is formed. The reaction sets at equilibrium and the finalstep shows the product is formed. The enzyme must get free, but the enzyme attached tothe inhibitor does not have any chance to dissociate from the EI complex. The EI formed isnot available for conversion of substrate; free enzymes are responsible for that conversion.
5. GROWTH KINETICS152
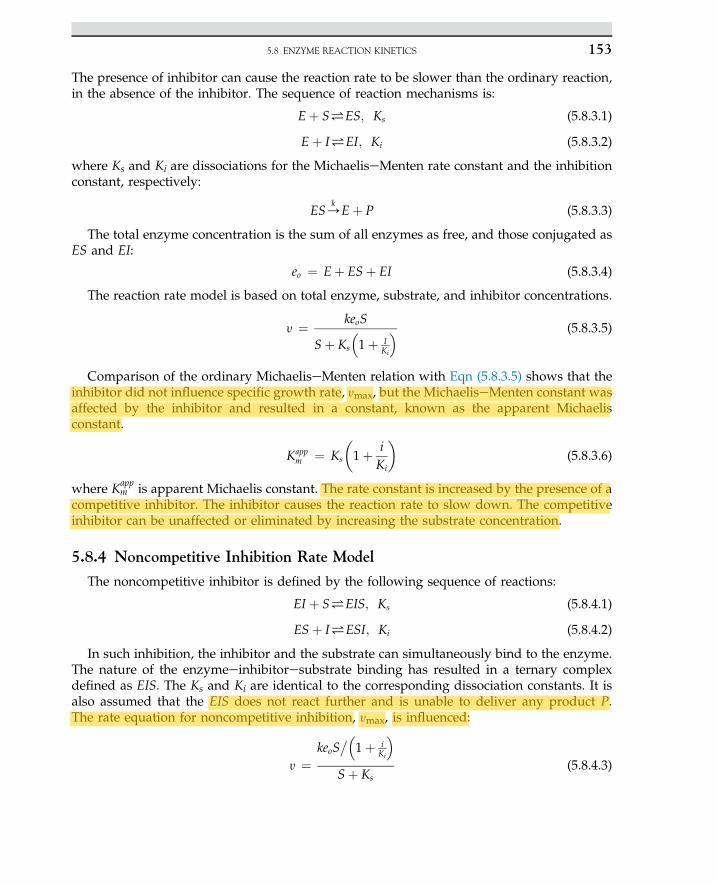
The presence of inhibitor can cause the reaction rate to be slower than the ordinary reaction,in the absence of the inhibitor. The sequence of reaction mechanisms is:
Eþ S#ES; Ks (5.8.3.1)
Eþ I#EI; Ki (5.8.3.2)
where Ks and Ki are dissociations for the MichaeliseMenten rate constant and the inhibitionconstant, respectively:
ES/kEþ P (5.8.3.3)
The total enzyme concentration is the sum of all enzymes as free, and those conjugated asES and EI:
eo ¼ Eþ ESþ EI (5.8.3.4)
The reaction rate model is based on total enzyme, substrate, and inhibitor concentrations.
y ¼ keoS
Sþ Ks
�1þ I
Ki
� (5.8.3.5)
Comparison of the ordinary MichaeliseMenten relation with Eqn (5.8.3.5) shows that theinhibitor did not influence specific growth rate, ymax, but the MichaeliseMenten constant wasaffected by the inhibitor and resulted in a constant, known as the apparent Michaelisconstant.
Kappm ¼ Ks
�1þ i
Ki
�(5.8.3.6)
where Kappm is apparent Michaelis constant. The rate constant is increased by the presence of a
competitive inhibitor. The inhibitor causes the reaction rate to slow down. The competitiveinhibitor can be unaffected or eliminated by increasing the substrate concentration.
5.8.4 Noncompetitive Inhibition Rate Model
The noncompetitive inhibitor is defined by the following sequence of reactions:
EI þ S#EIS; Ks (5.8.4.1)
ESþ I#ESI; Ki (5.8.4.2)
In such inhibition, the inhibitor and the substrate can simultaneously bind to the enzyme.The nature of the enzymeeinhibitoresubstrate binding has resulted in a ternary complexdefined as EIS. The Ks and Ki are identical to the corresponding dissociation constants. It isalso assumed that the EIS does not react further and is unable to deliver any product P.The rate equation for noncompetitive inhibition, ymax, is influenced:
y ¼keoS
��1þ i
Ki
�Sþ Ks
(5.8.4.3)
5.8 ENZYME REACTION KINETICS 153
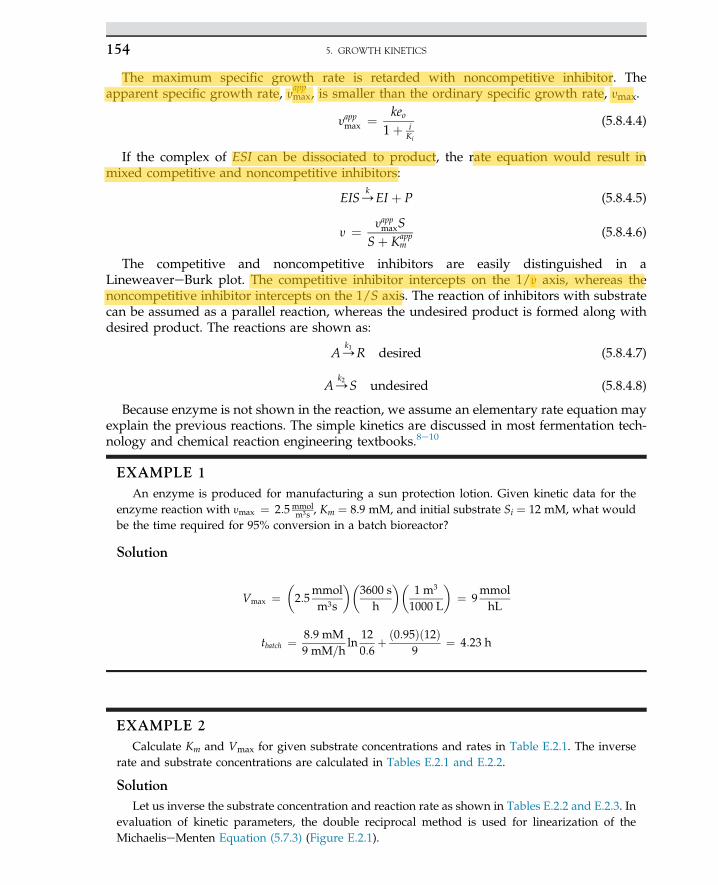
The maximum specific growth rate is retarded with noncompetitive inhibitor. Theapparent specific growth rate, yappmax, is smaller than the ordinary specific growth rate, ymax.
yappmax ¼ keo1þ i
Ki
(5.8.4.4)
If the complex of ESI can be dissociated to product, the rate equation would result inmixed competitive and noncompetitive inhibitors:
EIS/kEI þ P (5.8.4.5)
y ¼ yappmaxSSþ Kapp
m(5.8.4.6)
The competitive and noncompetitive inhibitors are easily distinguished in aLineweavereBurk plot. The competitive inhibitor intercepts on the 1/y axis, whereas thenoncompetitive inhibitor intercepts on the 1/S axis. The reaction of inhibitors with substratecan be assumed as a parallel reaction, whereas the undesired product is formed along withdesired product. The reactions are shown as:
A/k1 R desired (5.8.4.7)
A/k2 S undesired (5.8.4.8)
Because enzyme is not shown in the reaction, we assume an elementary rate equation mayexplain the previous reactions. The simple kinetics are discussed in most fermentation tech-nology and chemical reaction engineering textbooks.8e10
EXAMPLE 1An enzyme is produced for manufacturing a sun protection lotion. Given kinetic data for the
enzyme reaction with ymax ¼ 2:5 mmolm3s , Km ¼ 8.9 mM, and initial substrate Si ¼ 12 mM, what would
be the time required for 95% conversion in a batch bioreactor?
Solution
Vmax ¼�2:5
mmolm3s
��3600 s
h
��1 m3
1000 L
�¼ 9
mmolhL
tbatch ¼ 8:9 mM9 mM=h
ln120:6
þ ð0:95Þð12Þ9
¼ 4:23 h
EXAMPLE 2Calculate Km and Vmax for given substrate concentrations and rates in Table E.2.1. The inverse
rate and substrate concentrations are calculated in Tables E.2.1 and E.2.2.
SolutionLet us inverse the substrate concentration and reaction rate as shown in Tables E.2.2 and E.2.3. In
evaluation of kinetic parameters, the double reciprocal method is used for linearization of theMichaeliseMenten Equation (5.7.3) (Figure E.2.1).
5. GROWTH KINETICS154
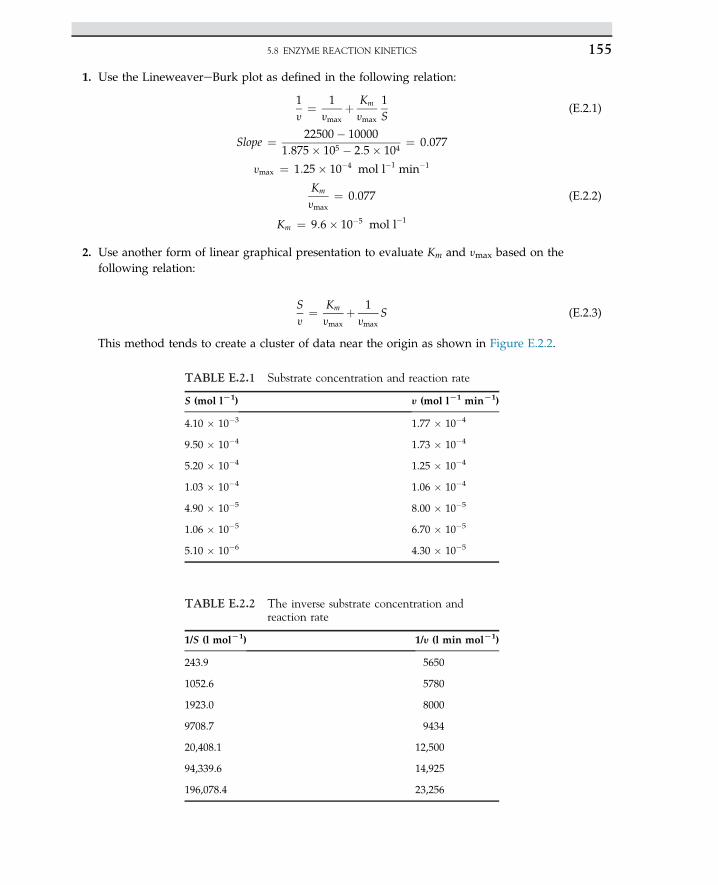
1. Use the LineweavereBurk plot as defined in the following relation:
1y¼ 1
ymax
þ Km
ymax
1S
(E.2.1)
Slope ¼ 22500� 100001:875� 105 � 2:5� 104
¼ 0:077
ymax ¼ 1:25� 10�4 mol l�1 min�1
Km
ymax
¼ 0:077 (E.2.2)
Km ¼ 9:6� 10�5 mol l�1
2. Use another form of linear graphical presentation to evaluate Km and ymax based on thefollowing relation:
Sy¼ Km
ymax
þ 1ymax
S (E.2.3)
This method tends to create a cluster of data near the origin as shown in Figure E.2.2.
TABLE E.2.1 Substrate concentration and reaction rate
S (mol lL1) y (mol lL1 minL1)
4.10 � 10�3 1.77 � 10�4
9.50 � 10�4 1.73 � 10�4
5.20 � 10�4 1.25 � 10�4
1.03 � 10�4 1.06 � 10�4
4.90 � 10�5 8.00 � 10�5
1.06 � 10�5 6.70 � 10�5
5.10 � 10�6 4.30 � 10�5
TABLE E.2.2 The inverse substrate concentration andreaction rate
1/S (l molL1) 1/y (l min molL1)
243.9 5650
1052.6 5780
1923.0 8000
9708.7 9434
20,408.1 12,500
94,339.6 14,925
196,078.4 23,256
5.8 ENZYME REACTION KINETICS 155
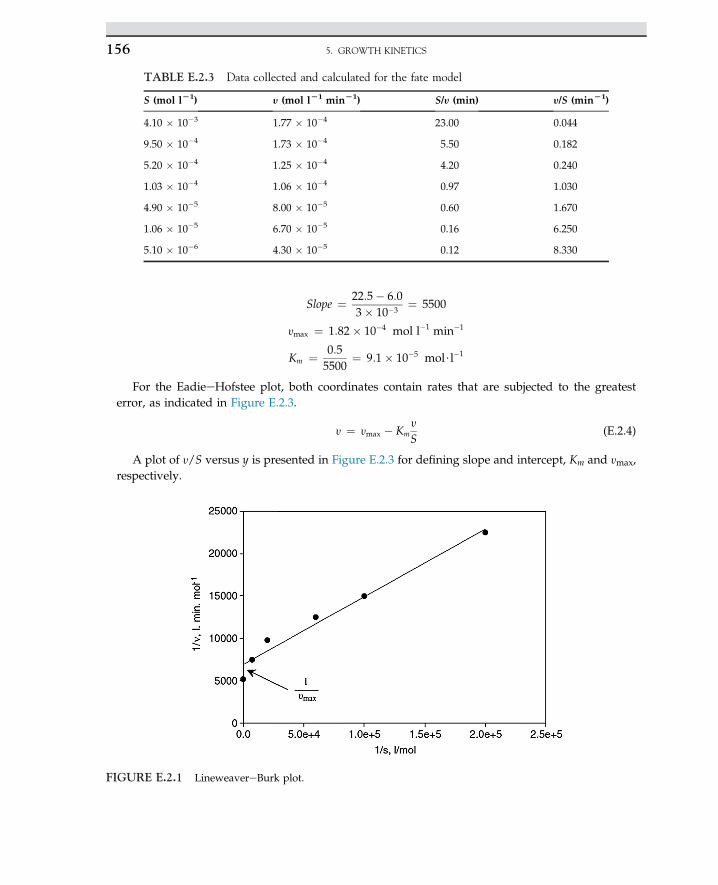
Slope ¼ 22:5� 6:03� 10�3
¼ 5500
ymax ¼ 1:82� 10�4 mol l�1 min�1
Km ¼ 0:55500
¼ 9:1� 10�5 mol$l�1
For the EadieeHofstee plot, both coordinates contain rates that are subjected to the greatesterror, as indicated in Figure E.2.3.
y ¼ ymax � Kmy
S(E.2.4)
A plot of y/S versus y is presented in Figure E.2.3 for defining slope and intercept, Km and ymax,respectively.
TABLE E.2.3 Data collected and calculated for the fate model
S (mol lL1) y (mol lL1 minL1) S/y (min) y/S (minL1)
4.10 � 10�3 1.77 � 10�4 23.00 0.044
9.50 � 10�4 1.73 � 10�4 5.50 0.182
5.20 � 10�4 1.25 � 10�4 4.20 0.240
1.03 � 10�4 1.06 � 10�4 0.97 1.030
4.90 � 10�5 8.00 � 10�5 0.60 1.670
1.06 � 10�5 6.70 � 10�5 0.16 6.250
5.10 � 10�6 4.30 � 10�5 0.12 8.330
FIGURE E.2.1 LineweavereBurk plot.
5. GROWTH KINETICS156
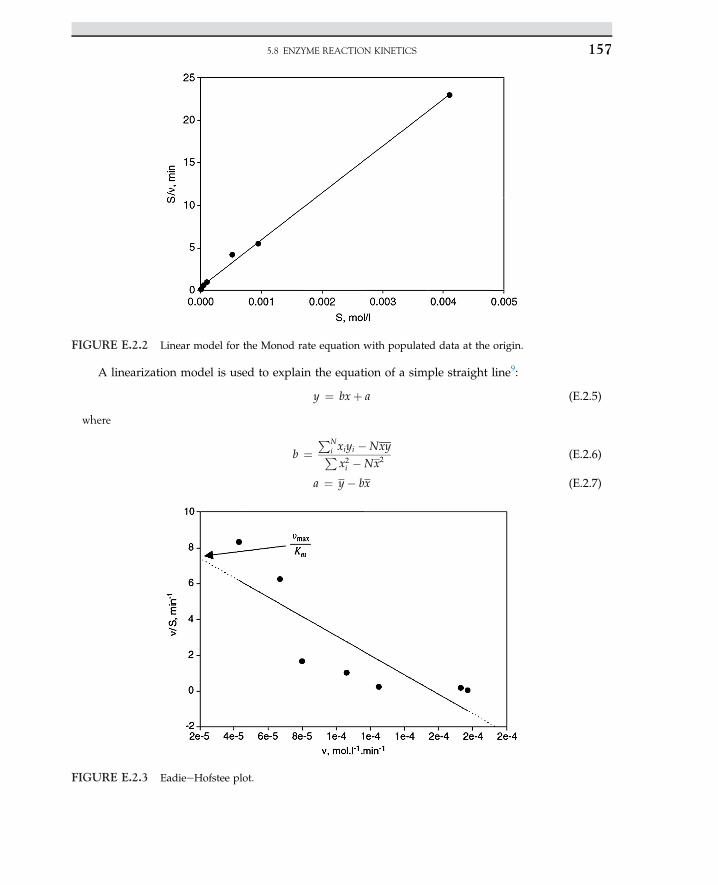
A linearization model is used to explain the equation of a simple straight line9:
y ¼ bxþ a (E.2.5)
where
b ¼PN
i xiyi �NxyPx2i �Nx2
(E.2.6)
a ¼ y� bx (E.2.7)
FIGURE E.2.2 Linear model for the Monod rate equation with populated data at the origin.
FIGURE E.2.3 EadieeHofstee plot.
5.8 ENZYME REACTION KINETICS 157
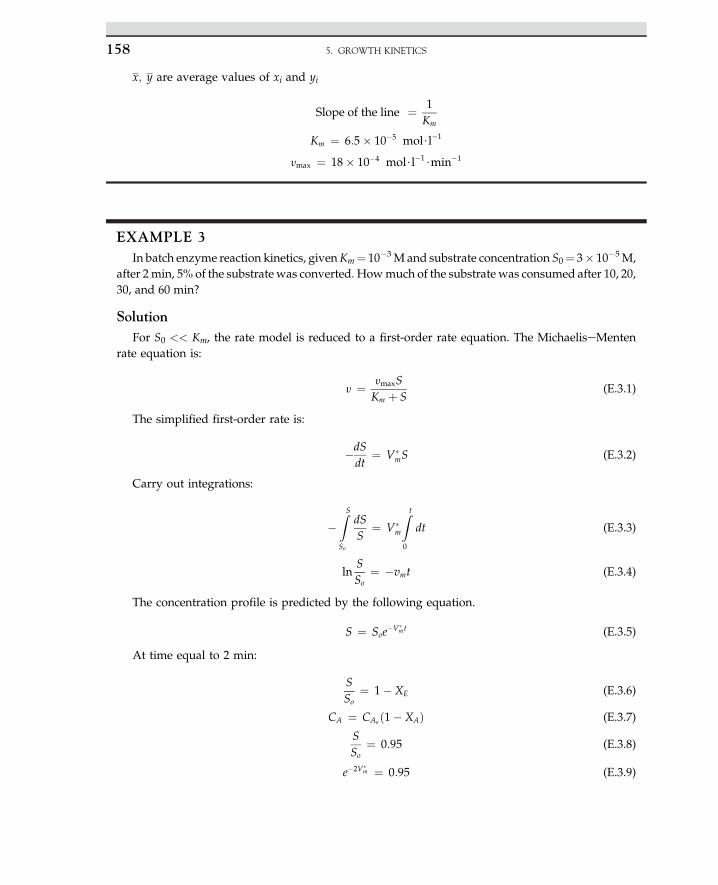
x; y are average values of xi and yi
Slope of the line ¼ 1Km
Km ¼ 6:5� 10�5 mol$l�1
ymax ¼ 18� 10�4 mol$l�1$min�1
EXAMPLE 3In batch enzyme reaction kinetics, givenKm¼ 10�3M and substrate concentration S0¼ 3� 10�5M,
after 2min, 5% of the substrate was converted. Howmuch of the substrate was consumed after 10, 20,30, and 60 min?
SolutionFor S0 << Km, the rate model is reduced to a first-order rate equation. The MichaeliseMenten
rate equation is:
y ¼ ymaxSKm þ S
(E.3.1)
The simplified first-order rate is:
�dSdt
¼ V�mS (E.3.2)
Carry out integrations:
�ZSSo
dSS
¼ V�m
Z t
0
dt (E.3.3)
lnSSo
¼ �vmt (E.3.4)
The concentration profile is predicted by the following equation.
S ¼ Soe�V�mt (E.3.5)
At time equal to 2 min:
SSo
¼ 1� XE (E.3.6)
CA ¼ CAoð1� XAÞ (E.3.7)
SSo
¼ 0:95 (E.3.8)
e�2V�m ¼ 0:95 (E.3.9)
5. GROWTH KINETICS158
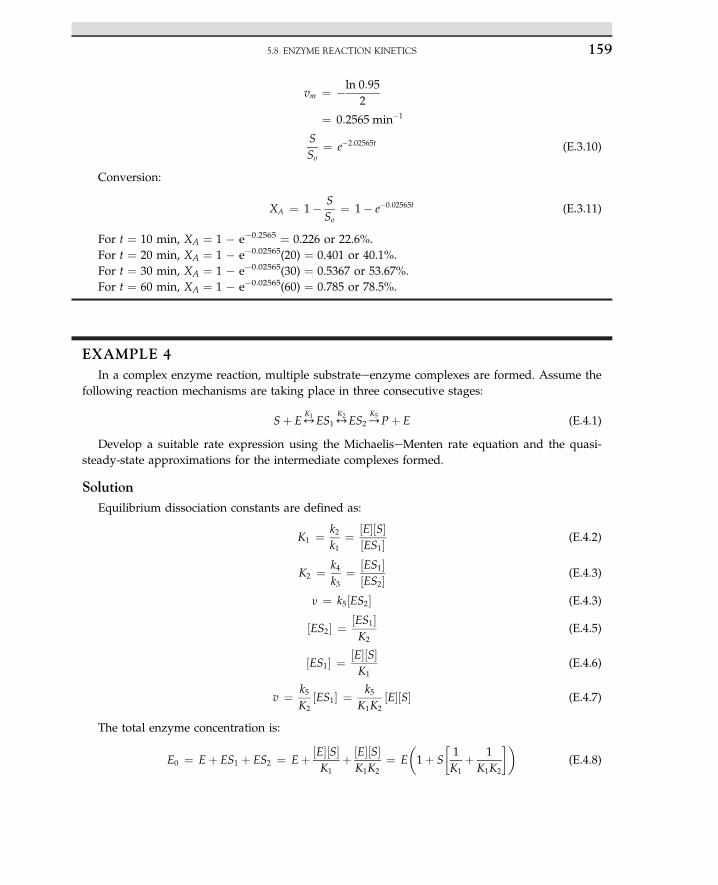
vm ¼ �ln 0:952
¼ 0:2565 min�1
SSo
¼ e�2:02565t (E.3.10)
Conversion:
XA ¼ 1� SSo
¼ 1� e�0:02565t (E.3.11)
For t ¼ 10 min, XA ¼ 1 � e�0.2565 ¼ 0.226 or 22.6%.For t ¼ 20 min, XA ¼ 1 � e�0.02565(20) ¼ 0.401 or 40.1%.For t ¼ 30 min, XA ¼ 1 � e�0.02565(30) ¼ 0.5367 or 53.67%.For t ¼ 60 min, XA ¼ 1 � e�0.02565(60) ¼ 0.785 or 78.5%.
EXAMPLE 4In a complex enzyme reaction, multiple substrateeenzyme complexes are formed. Assume the
following reaction mechanisms are taking place in three consecutive stages:
Sþ E4K1 ES14
K2 ES2/K5 Pþ E (E.4.1)
Develop a suitable rate expression using the MichaeliseMenten rate equation and the quasi-steady-state approximations for the intermediate complexes formed.
SolutionEquilibrium dissociation constants are defined as:
K1 ¼ k2k1
¼ ½E�½S�½ES1� (E.4.2)
K2 ¼ k4k3
¼ ½ES1�½ES2� (E.4.3)
y ¼ k5½ES2� (E.4.3)
½ES2� ¼ ½ES1�K2
(E.4.5)
½ES1� ¼ ½E�½S�K1
(E.4.6)
v ¼ k5K2
½ES1� ¼ k5K1K2
½E�½S� (E.4.7)
The total enzyme concentration is:
E0 ¼ Eþ ES1 þ ES2 ¼ Eþ ½E�½S�K1
þ ½E�½S�K1K2
¼ E�1þ S
1K1
þ 1K1K2
��(E.4.8)
5.8 ENZYME REACTION KINETICS 159
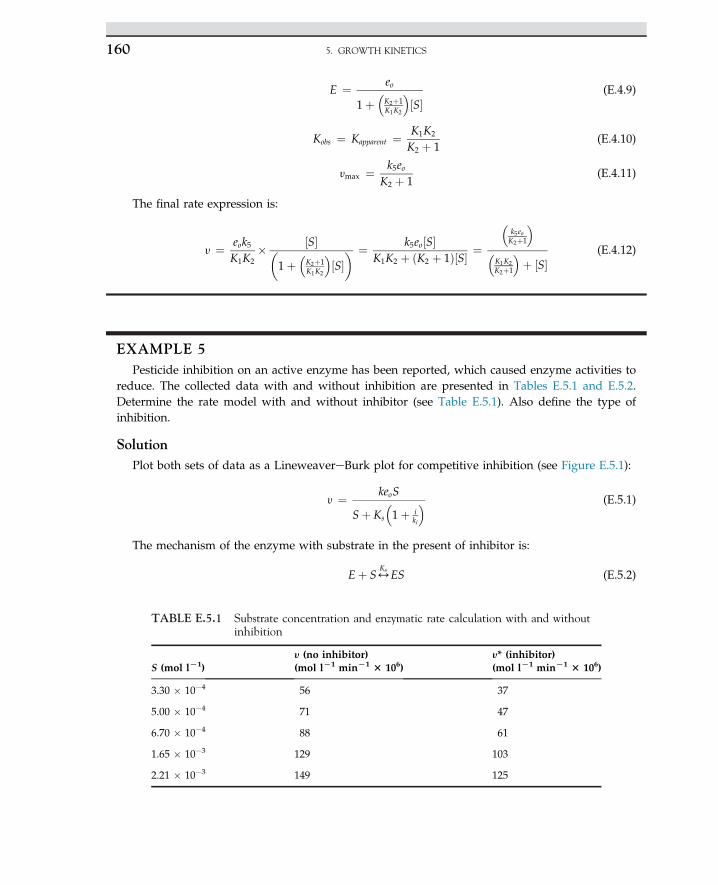
E ¼ eo
1þ�K2þ1K1K2
�½S�
(E.4.9)
Kobs ¼ Kapparent ¼ K1K2
K2 þ 1(E.4.10)
ymax ¼ k5eoK2 þ 1
(E.4.11)
The final rate expression is:
y ¼ eok5K1K2
� ½S��1þ
�K2þ1K1K2
�½S�� ¼ k5eo½S�
K1K2 þ ðK2 þ 1Þ½S� ¼
�k5eoK2þ1
��K1K2K2þ1
�þ ½S�
(E.4.12)
EXAMPLE 5Pesticide inhibition on an active enzyme has been reported, which caused enzyme activities to
reduce. The collected data with and without inhibition are presented in Tables E.5.1 and E.5.2.Determine the rate model with and without inhibitor (see Table E.5.1). Also define the type ofinhibition.
SolutionPlot both sets of data as a LineweavereBurk plot for competitive inhibition (see Figure E.5.1):
y ¼ keoS
Sþ Ks
�1þ i
ki
� (E.5.1)
The mechanism of the enzyme with substrate in the present of inhibitor is:
Eþ S4Ks ES (E.5.2)
TABLE E.5.1 Substrate concentration and enzymatic rate calculation with and withoutinhibition
S (mol lL1)y (no inhibitor)(mol lL1 minL1 3 106)
y* (inhibitor)(mol lL1 minL1 3 106)
3.30 � 10�4 56 37
5.00 � 10�4 71 47
6.70 � 10�4 88 61
1.65 � 10�3 129 103
2.21 � 10�3 149 125
5. GROWTH KINETICS160
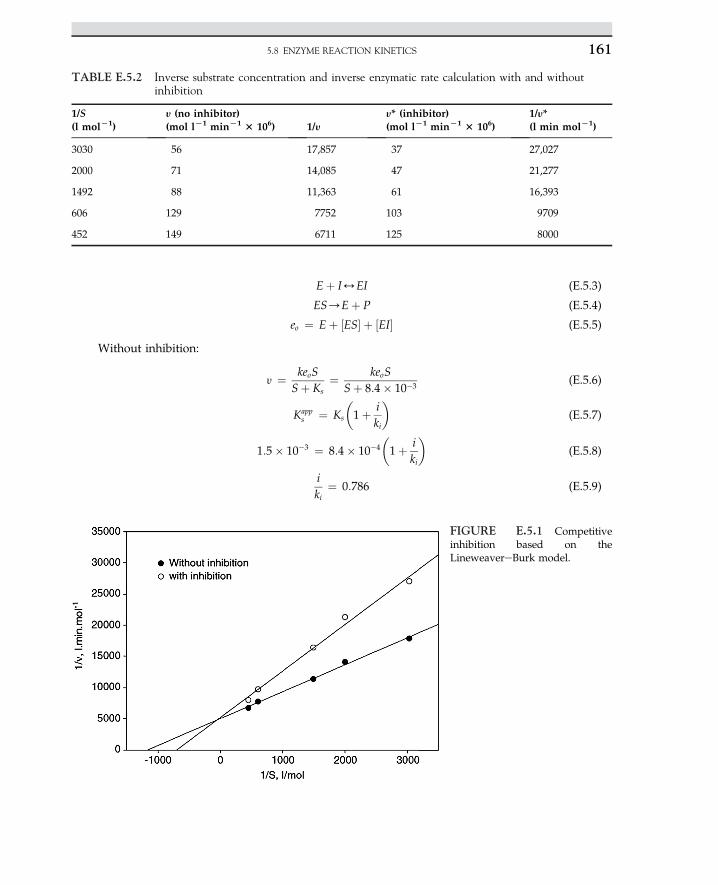
Eþ I4EI (E.5.3)
ES/Eþ P (E.5.4)
eo ¼ Eþ ½ES� þ ½EI� (E.5.5)
Without inhibition:
y ¼ keoSSþ Ks
¼ keoSSþ 8:4� 10�3
(E.5.6)
Kapps ¼ Ks
�1þ i
ki
�(E.5.7)
1:5� 10�3 ¼ 8:4� 10�4
�1þ i
ki
�(E.5.8)
iki
¼ 0:786 (E.5.9)
FIGURE E.5.1 Competitiveinhibition based on theLineweavereBurk model.
TABLE E.5.2 Inverse substrate concentration and inverse enzymatic rate calculation with and withoutinhibition
1/S(l molL1)
y (no inhibitor)(mol lL1 minL1 3 106) 1/y
y* (inhibitor)(mol lL1 minL1 3 106)
1/y*(l min molL1)
3030 56 17,857 37 27,027
2000 71 14,085 47 21,277
1492 88 11,363 61 16,393
606 129 7752 103 9709
452 149 6711 125 8000
5.8 ENZYME REACTION KINETICS 161
kii
0:786¼ 10�5
0:786¼ 1:73� 10�3m (E.510)
Plug in a number:
88� 10�6 ¼ keo � 6:7� 10�4
6:7� 10�4 þ 8:4� 10�3(E.5.11)
keo ¼ 1:2� 10�3 min�1
61� 10�6 ¼ 1:2� 10�3 � 6:7� 10�4
6:7� 10�4 þ 8:4� 10�3�1þ i
ki
� (E.5.12)
iki
¼ 0:49 (E.5.13)
The reading from the plot for the rate without inhibition:
Slope :ð18� 5Þ � 103
3100¼ 4:2
kapp ¼ 1:5� 10�3
For the data plotted with inhibition:
Slope :ð27� 5Þ � 103
3000¼ 7:3
K2
ymax
¼ 4:2
Ks ¼ 8:4� 10�4 mol l�1
ymax ¼ 2� 10�4 mol min�1
Based on the graphical presentation, this is a competitive inhibition.
EXAMPLE 6The RQ is often used to estimate metabolic stoichiometry. Using quasi-steady-state and by defi-
nition of RQ, develop a system of two linear equations with two unknowns by solving a matrix underthe following conditions: the coefficient of the matrix with yeast growth (g ¼ 4.14), ammonia(gN ¼ 0), and glucose (gS ¼ 4.0), where the evolution of CO2 and biosynthesis are very small(s ¼ 0.095). Calculate the stoichiometric coefficient for RQ ¼ 1.0 for the previous biological processes.
SolutionAt a quasi-steady-state condition:
d½NADHþHþ�dt
¼ ys
2� a� 2b� 1
2
ys � ysð1þ sÞ � d
n� yN
�¼ 0 (E.6.1)
5. GROWTH KINETICS162
RQ ¼ moles of CO2
moles of O2¼ aþ s
b(E.6.2)
8<:
ysa2
� 2b ¼ 12
yB � ySð1þ dÞ � d
nyN
�
a� bðRQÞ ¼ �s
(E.6.3)
The mathematical solution for this system is set as given by the following matrix:
24 vs2
�2
1 �ðRQÞ
35 a
b
�¼24 1
2vB � vS
�1þ s
�� s
nvN
�s
35 (E.6.4)
At a singular point, let:
24 vs2
�2
1 �ðRQÞ
35 ¼ 0 (E.6.5)
�ðRQÞ�yS2
�� ð� 2Þð1Þ ¼ 0 (E.6.6)
RQ ¼ 4yS
(E.6.7)
For anaerobic fermentation, yS ¼ 4 then RQ ¼ 1.0.
2 �2
1 �1:05
� ab
�¼
26412
h4:14� 4ð1þ 0:095Þ � 0
i
�0:095
375 ¼
"�0:12
�0:095
#
a ¼ 0:64; b ¼ 0:7 (E.6.8)2 �2
1 �1:05
� ab
�¼"�0:12
�0:095
#(E.6.9)
a ¼ 0:52; b ¼ 0:58
Increasing RQ with very small changes causes, the constants a and b to change in the reaction.
EXAMPLE 7For single- and multiple-substrate kinetics, single-substrate glucose, 30 g l�1 and dual substrates
glucose and lactose with each carbohydrate at a concentration of 15 g l�1 or total.A carbohydrate concentration of 30 g l�1 was used in sterilized media (Table E.7.1). The cell OD
was measured at wavelength 420 nm. The following data for single and double substrates wereobtained. If OD is linear in cell density with a value of 0.175 equal to 0.1 mg cell dry weight permilliliter, evaluate the specific growth rate, lag phase, and yield of biomass.
5.8 ENZYME REACTION KINETICS 163
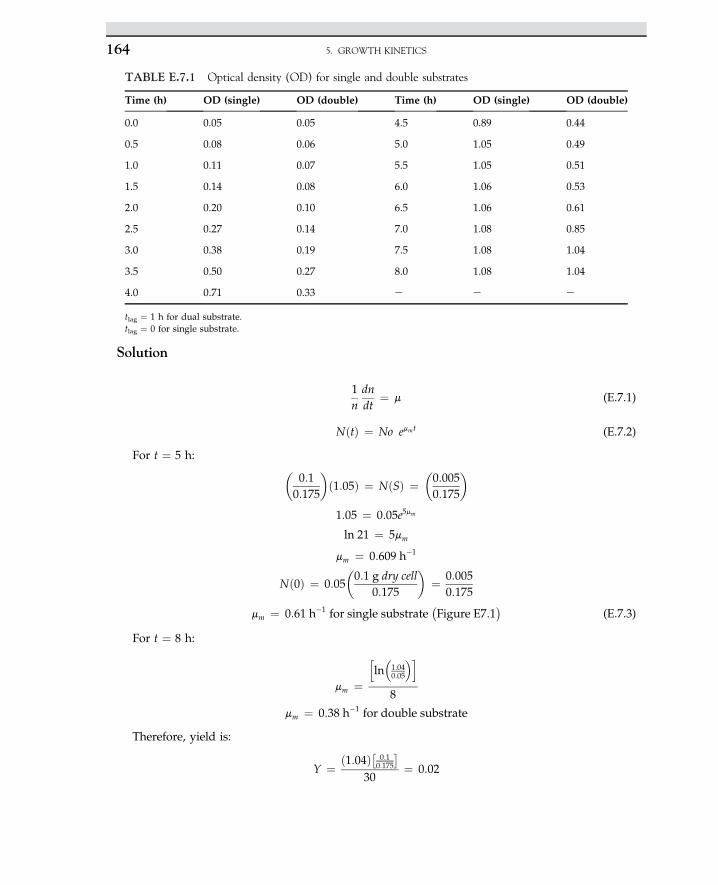
Solution
1ndndt
¼ m (E.7.1)
NðtÞ ¼ No emmt (E.7.2)
For t ¼ 5 h: �0:10:175
�ð1:05Þ ¼ NðSÞ ¼
�0:0050:175
�
1:05 ¼ 0:05e5mm
ln 21 ¼ 5mm
mm ¼ 0:609 h�1
Nð0Þ ¼ 0:05�0:1 g dry cell
0:175
�¼ 0:005
0:175
mm ¼ 0:61 h�1 for single substrate�Figure E7:1
�(E.7.3)
For t ¼ 8 h:
mm ¼
hln�1:040:05
�i8
mm ¼ 0:38 h�1 for double substrate
Therefore, yield is:
Y ¼ ð1:04Þ 0:10:175
�30
¼ 0:02
TABLE E.7.1 Optical density (OD) for single and double substrates
Time (h) OD (single) OD (double) Time (h) OD (single) OD (double)
0.0 0.05 0.05 4.5 0.89 0.44
0.5 0.08 0.06 5.0 1.05 0.49
1.0 0.11 0.07 5.5 1.05 0.51
1.5 0.14 0.08 6.0 1.06 0.53
2.0 0.20 0.10 6.5 1.06 0.61
2.5 0.27 0.14 7.0 1.08 0.85
3.0 0.38 0.19 7.5 1.08 1.04
3.5 0.50 0.27 8.0 1.08 1.04
4.0 0.71 0.33 e e e
tlag ¼ 1 h for dual substrate.tlag ¼ 0 for single substrate.
5. GROWTH KINETICS164
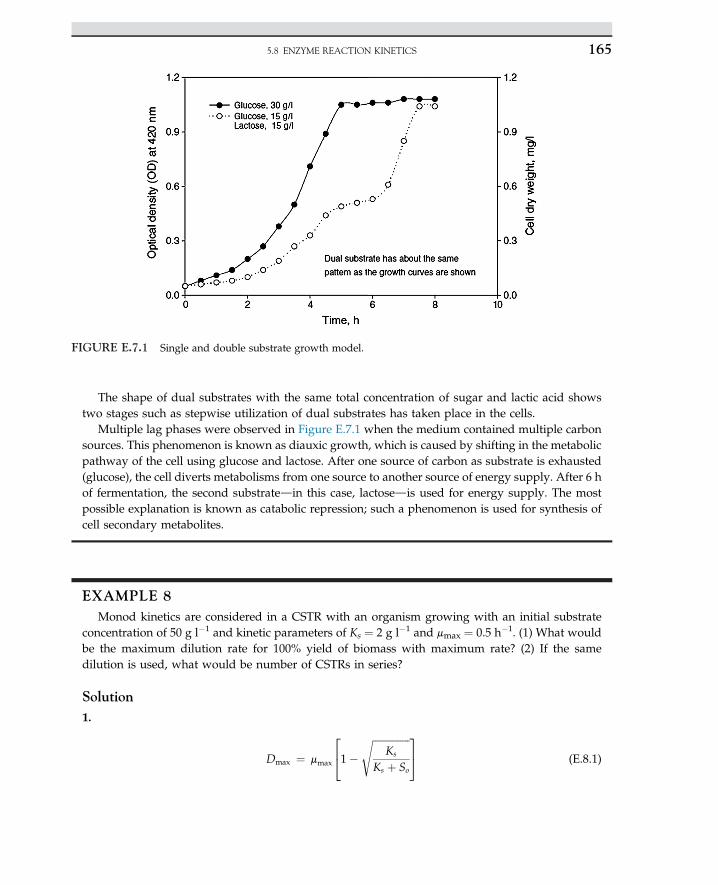
The shape of dual substrates with the same total concentration of sugar and lactic acid showstwo stages such as stepwise utilization of dual substrates has taken place in the cells.
Multiple lag phases were observed in Figure E.7.1 when the medium contained multiple carbonsources. This phenomenon is known as diauxic growth, which is caused by shifting in the metabolicpathway of the cell using glucose and lactose. After one source of carbon as substrate is exhausted(glucose), the cell diverts metabolisms from one source to another source of energy supply. After 6 hof fermentation, the second substratedin this case, lactosedis used for energy supply. The mostpossible explanation is known as catabolic repression; such a phenomenon is used for synthesis ofcell secondary metabolites.
EXAMPLE 8Monod kinetics are considered in a CSTR with an organism growing with an initial substrate
concentration of 50 g l�1 and kinetic parameters of Ks ¼ 2 g l�1 and mmax ¼ 0.5 h�1. (1) What wouldbe the maximum dilution rate for 100% yield of biomass with maximum rate? (2) If the samedilution is used, what would be number of CSTRs in series?
Solution1.
Dmax ¼ mmax
241�
ffiffiffiffiffiffiffiffiffiffiffiffiffiffiffiKs
Ks þ So
s 35 (E.8.1)
FIGURE E.7.1 Single and double substrate growth model.
5.8 ENZYME REACTION KINETICS 165
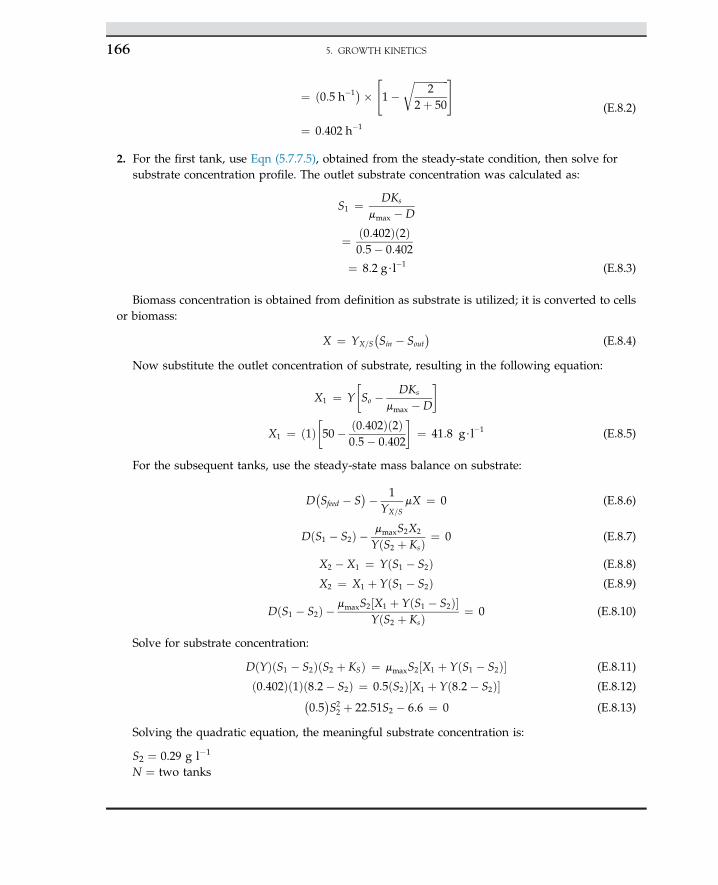
¼ ð0:5 h�1��"1�
ffiffiffiffiffiffiffiffiffiffiffiffiffiffi2
2þ 50
r #
¼ 0:402 h�1
(E.8.2)
2. For the first tank, use Eqn (5.7.7.5), obtained from the steady-state condition, then solve forsubstrate concentration profile. The outlet substrate concentration was calculated as:
S1 ¼ DKs
mmax �D
¼ ð0:402Þð2Þ0:5� 0:402
¼ 8:2 g$l�1 (E.8.3)
Biomass concentration is obtained from definition as substrate is utilized; it is converted to cellsor biomass:
X ¼ YX=S�Sin � Sout
�(E.8.4)
Now substitute the outlet concentration of substrate, resulting in the following equation:
X1 ¼ YSo � DKs
mmax �D
�
X1 ¼ ð1Þ50� ð0:402Þð2Þ
0:5� 0:402
�¼ 41:8 g$l�1 (E.8.5)
For the subsequent tanks, use the steady-state mass balance on substrate:
D�Sfeed � S
�� 1YX=S
mX ¼ 0 (E.8.6)
DðS1 � S2Þ � mmaxS2X2
YðS2 þ KsÞ ¼ 0 (E.8.7)
X2 � X1 ¼ YðS1 � S2Þ (E.8.8)
X2 ¼ X1 þ YðS1 � S2Þ (E.8.9)
DðS1 � S2Þ � mmaxS2½X1 þ YðS1 � S2Þ�YðS2 þ KsÞ ¼ 0 (E.8.10)
Solve for substrate concentration:
DðYÞðS1 � S2ÞðS2 þ KSÞ ¼ mmaxS2½X1 þ YðS1 � S2Þ� (E.8.11)
ð0:402Þð1Þð8:2� S2Þ ¼ 0:5ðS2Þ½X1 þ Yð8:2� S2Þ� (E.8.12)�0:5�S22 þ 22:51S2 � 6:6 ¼ 0 (E.8.13)
Solving the quadratic equation, the meaningful substrate concentration is:
S2 ¼ 0.29 g l�1
N ¼ two tanks
5. GROWTH KINETICS166
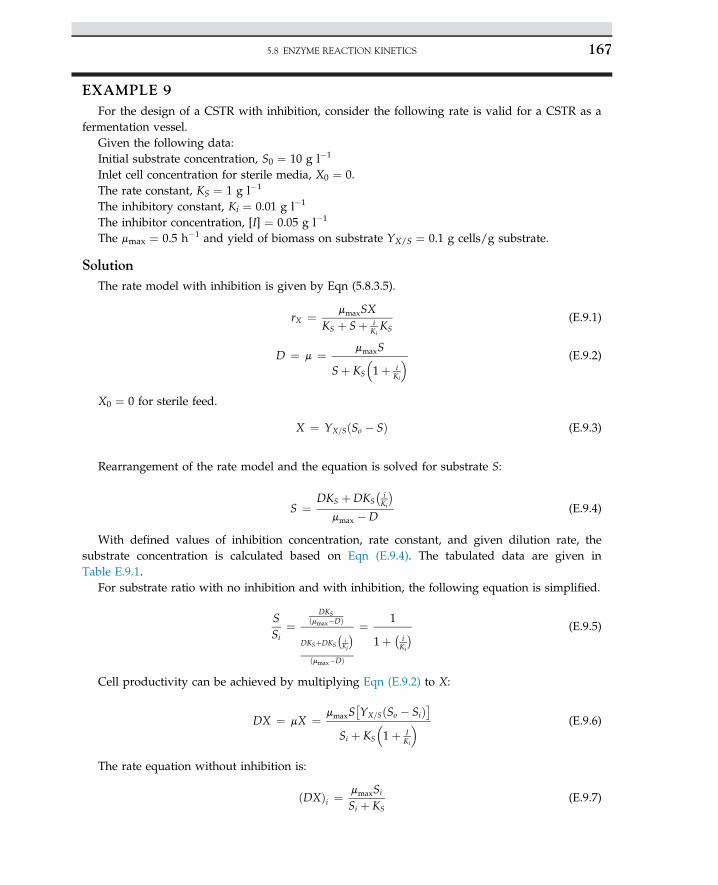
EXAMPLE 9For the design of a CSTR with inhibition, consider the following rate is valid for a CSTR as a
fermentation vessel.Given the following data:Initial substrate concentration, S0 ¼ 10 g l�1
Inlet cell concentration for sterile media, X0 ¼ 0.The rate constant, KS ¼ 1 g l�1
The inhibitory constant, Ki ¼ 0.01 g l�1
The inhibitor concentration, [I] ¼ 0.05 g l�1
The mmax ¼ 0.5 h�1 and yield of biomass on substrate YX/S ¼ 0.1 g cells/g substrate.
SolutionThe rate model with inhibition is given by Eqn (5.8.3.5).
rX ¼ mmaxSXKS þ Sþ i
KiKS
(E.9.1)
D ¼ m ¼ mmaxS
Sþ KS
�1þ i
Ki
� (E.9.2)
X0 ¼ 0 for sterile feed.
X ¼ YX=SðSo � SÞ (E.9.3)
Rearrangement of the rate model and the equation is solved for substrate S:
S ¼ DKS þDKS�
iKi
�mmax �D
(E.9.4)
With defined values of inhibition concentration, rate constant, and given dilution rate, thesubstrate concentration is calculated based on Eqn (E.9.4). The tabulated data are given inTable E.9.1.
For substrate ratio with no inhibition and with inhibition, the following equation is simplified.
SSi
¼DKS
ðmmax�DÞ
DKSþDKS
�iKi
�ðmmax�DÞ
¼ 1
1þ � iKi
� (E.9.5)
Cell productivity can be achieved by multiplying Eqn (E.9.2) to X:
DX ¼ mX ¼ mmaxS YX=SðSo � SiÞ
�Si þ KS
�1þ I
Ki
� (E.9.6)
The rate equation without inhibition is:
ðDXÞi ¼mmaxSi
Si þ KS(E.9.7)
5.8 ENZYME REACTION KINETICS 167
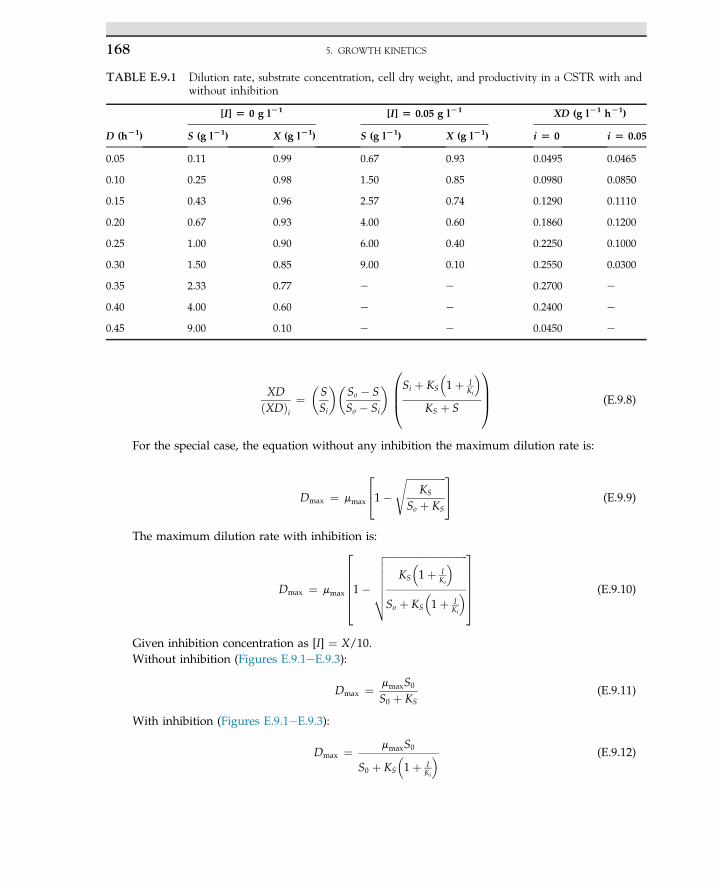
XDðXDÞi
¼�SSi
��So � SSo � Si
� 0BB@Si þ KS
�1þ I
Ki
�KS þ S
1CCA (E.9.8)
For the special case, the equation without any inhibition the maximum dilution rate is:
Dmax ¼ mmax
241�
ffiffiffiffiffiffiffiffiffiffiffiffiffiffiffiffiKS
So þ KS
s 35 (E.9.9)
The maximum dilution rate with inhibition is:
Dmax ¼ mmax
2666641�
ffiffiffiffiffiffiffiffiffiffiffiffiffiffiffiffiffiffiffiffiffiffiffiffiffiffiffiffiffiffiffiffiffiKS
�1þ I
Ki
�So þ KS
�1þ I
Ki
�vuuuuut
377775 (E.9.10)
Given inhibition concentration as [I] ¼ X/10.Without inhibition (Figures E.9.1eE.9.3):
Dmax ¼ mmaxS0
S0 þ KS(E.9.11)
With inhibition (Figures E.9.1eE.9.3):
Dmax ¼ mmaxS0
S0 þ KS
�1þ I
Ki
� (E.9.12)
TABLE E.9.1 Dilution rate, substrate concentration, cell dry weight, and productivity in a CSTR with andwithout inhibition
D (hL1)
[I] [ 0 g lL1 [I] [ 0.05 g lL1 XD (g lL1 hL1)
S (g lL1) X (g lL1) S (g lL1) X (g lL1) i [ 0 i [ 0.05
0.05 0.11 0.99 0.67 0.93 0.0495 0.0465
0.10 0.25 0.98 1.50 0.85 0.0980 0.0850
0.15 0.43 0.96 2.57 0.74 0.1290 0.1110
0.20 0.67 0.93 4.00 0.60 0.1860 0.1200
0.25 1.00 0.90 6.00 0.40 0.2250 0.1000
0.30 1.50 0.85 9.00 0.10 0.2550 0.0300
0.35 2.33 0.77 e e 0.2700 e
0.40 4.00 0.60 e e 0.2400 e
0.45 9.00 0.10 e e 0.0450 e
5. GROWTH KINETICS168
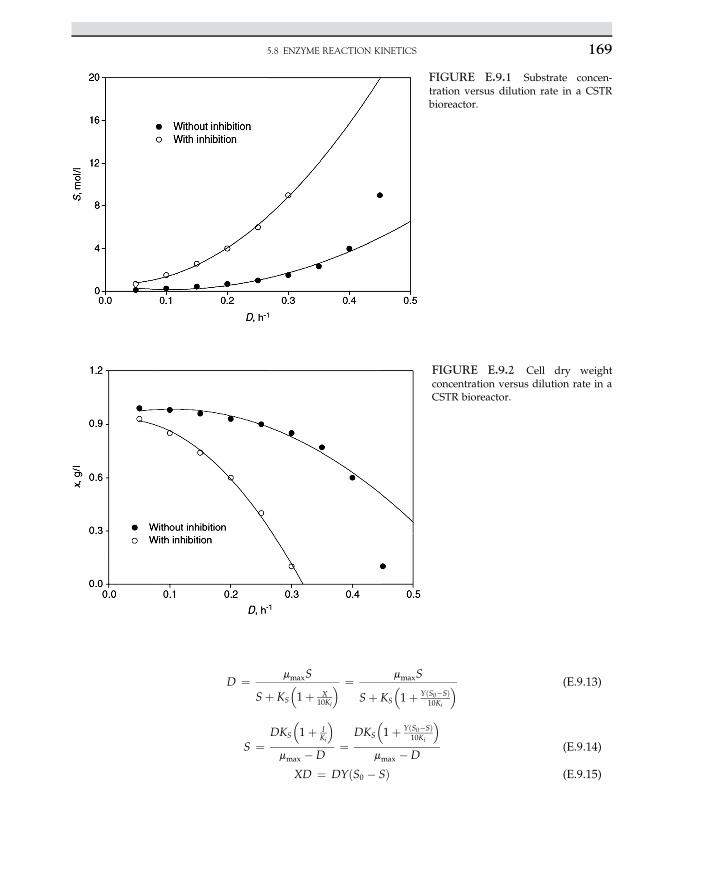
D ¼ mmaxS
Sþ KS
�1þ X
10Ki
� ¼ mmaxS
Sþ KS
�1þ YðS0�SÞ
10Ki
� (E.9.13)
S ¼DKS
�1þ I
Ki
�mmax �D
¼DKS
�1þ YðS0�SÞ
10Ki
�mmax �D
(E.9.14)
XD ¼ DYðS0 � SÞ (E.9.15)
FIGURE E.9.1 Substrate concen-tration versus dilution rate in a CSTRbioreactor.
FIGURE E.9.2 Cell dry weightconcentration versus dilution rate in aCSTR bioreactor.
5.8 ENZYME REACTION KINETICS 169
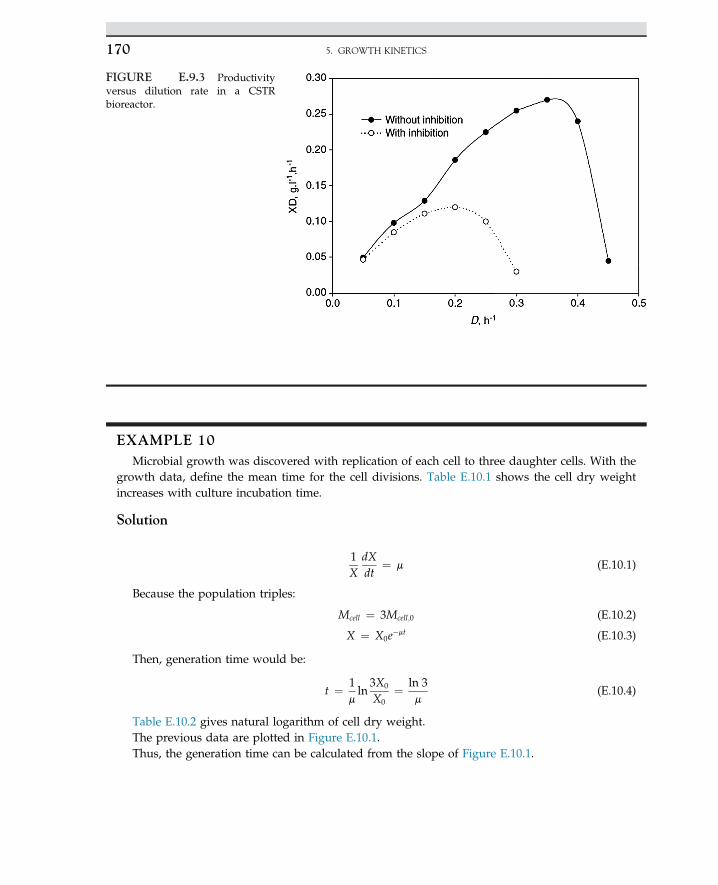
EXAMPLE 10Microbial growth was discovered with replication of each cell to three daughter cells. With the
growth data, define the mean time for the cell divisions. Table E.10.1 shows the cell dry weightincreases with culture incubation time.
Solution
1X
dXdt
¼ m (E.10.1)
Because the population triples:
Mcell ¼ 3Mcell;0 (E.10.2)
X ¼ X0e�mt (E.10.3)
Then, generation time would be:
t ¼ 1mln
3X0
X0¼ ln 3
m(E.10.4)
Table E.10.2 gives natural logarithm of cell dry weight.The previous data are plotted in Figure E.10.1.Thus, the generation time can be calculated from the slope of Figure E.10.1.
FIGURE E.9.3 Productivityversus dilution rate in a CSTRbioreactor.
5. GROWTH KINETICS170
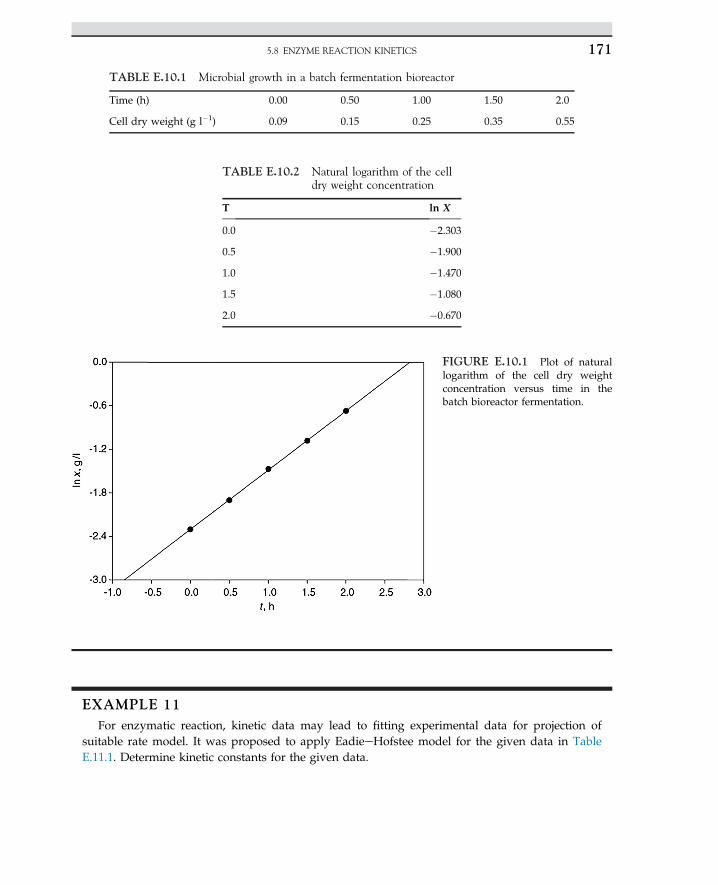
EXAMPLE 11For enzymatic reaction, kinetic data may lead to fitting experimental data for projection of
suitable rate model. It was proposed to apply EadieeHofstee model for the given data in TableE.11.1. Determine kinetic constants for the given data.
TABLE E.10.1 Microbial growth in a batch fermentation bioreactor
Time (h) 0.00 0.50 1.00 1.50 2.0
Cell dry weight (g l�1) 0.09 0.15 0.25 0.35 0.55
TABLE E.10.2 Natural logarithm of the celldry weight concentration
T ln X
0.0 �2.303
0.5 �1.900
1.0 �1.470
1.5 �1.080
2.0 �0.670
FIGURE E.10.1 Plot of naturallogarithm of the cell dry weightconcentration versus time in thebatch bioreactor fermentation.
5.8 ENZYME REACTION KINETICS 171
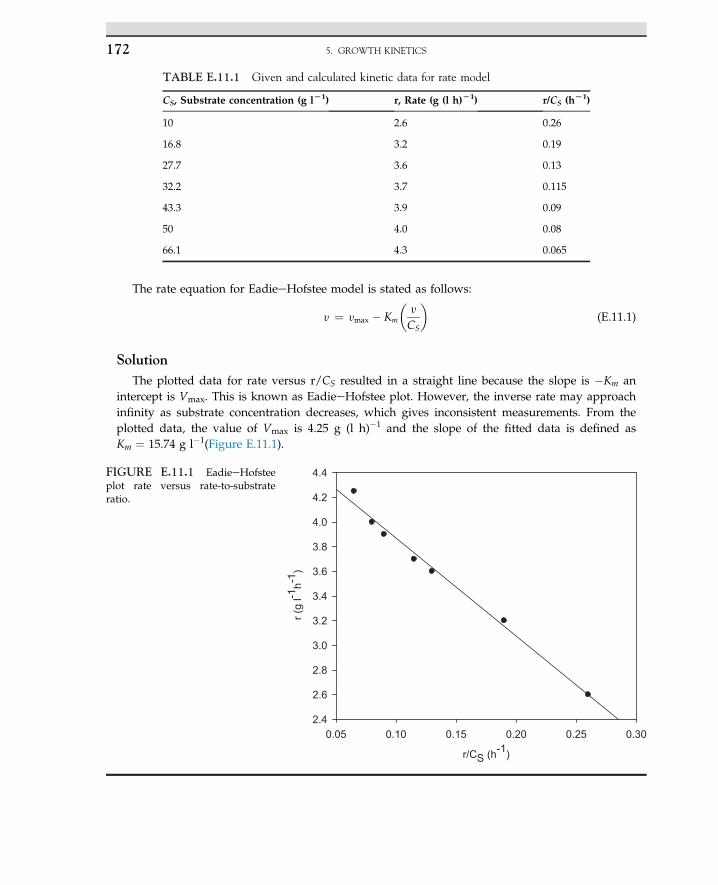
The rate equation for EadieeHofstee model is stated as follows:
y ¼ ymax � Km
�y
CS
�(E.11.1)
SolutionThe plotted data for rate versus r/CS resulted in a straight line because the slope is �Km an
intercept is Vmax. This is known as EadieeHofstee plot. However, the inverse rate may approachinfinity as substrate concentration decreases, which gives inconsistent measurements. From theplotted data, the value of Vmax is 4.25 g (l h)�1 and the slope of the fitted data is defined asKm ¼ 15.74 g l�1(Figure E.11.1).
TABLE E.11.1 Given and calculated kinetic data for rate model
CS, Substrate concentration (g lL1) r, Rate (g (l h)L1) r/CS (hL1)
10 2.6 0.26
16.8 3.2 0.19
27.7 3.6 0.13
32.2 3.7 0.115
43.3 3.9 0.09
50 4.0 0.08
66.1 4.3 0.065
r/CS (h-1)
0.05 0.10 0.15 0.20 0.25 0.30
r (g
l-1h-1
)
2.4
2.6
2.8
3.0
3.2
3.4
3.6
3.8
4.0
4.2
4.4FIGURE E.11.1 EadieeHofsteeplot rate versus rate-to-substrateratio.
5. GROWTH KINETICS172
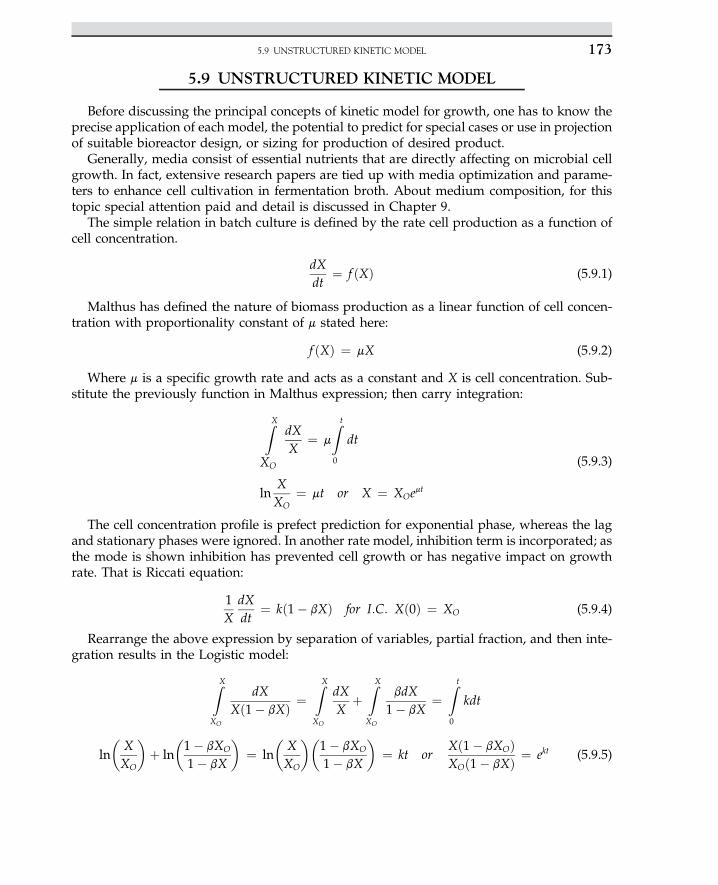
5.9 UNSTRUCTURED KINETIC MODEL
Before discussing the principal concepts of kinetic model for growth, one has to know theprecise application of each model, the potential to predict for special cases or use in projectionof suitable bioreactor design, or sizing for production of desired product.
Generally, media consist of essential nutrients that are directly affecting on microbial cellgrowth. In fact, extensive research papers are tied up with media optimization and parame-ters to enhance cell cultivation in fermentation broth. About medium composition, for thistopic special attention paid and detail is discussed in Chapter 9.
The simple relation in batch culture is defined by the rate cell production as a function ofcell concentration.
dXdt
¼ f ðXÞ (5.9.1)
Malthus has defined the nature of biomass production as a linear function of cell concen-tration with proportionality constant of m stated here:
f ðXÞ ¼ mX (5.9.2)
Where m is a specific growth rate and acts as a constant and X is cell concentration. Sub-stitute the previously function in Malthus expression; then carry integration:
ZXXO
dXX
¼ m
Z t
0
dt
lnXXO
¼ mt or X ¼ XOemt
(5.9.3)
The cell concentration profile is prefect prediction for exponential phase, whereas the lagand stationary phases were ignored. In another rate model, inhibition term is incorporated; asthe mode is shown inhibition has prevented cell growth or has negative impact on growthrate. That is Riccati equation:
1X
dXdt
¼ kð1� bXÞ for I:C: Xð0Þ ¼ XO (5.9.4)
Rearrange the above expression by separation of variables, partial fraction, and then inte-gration results in the Logistic model:
ZXXO
dXXð1� bXÞ ¼
ZXXO
dXX
þZXXO
bdX1� bX
¼Z t
0
kdt
ln
�XXO
�þ ln
�1� bXO
1� bX
�¼ ln
�XXO
��1� bXO
1� bX
�¼ kt or
Xð1� bXOÞXOð1� bXÞ ¼ ekt (5.9.5)
5.9 UNSTRUCTURED KINETIC MODEL 173
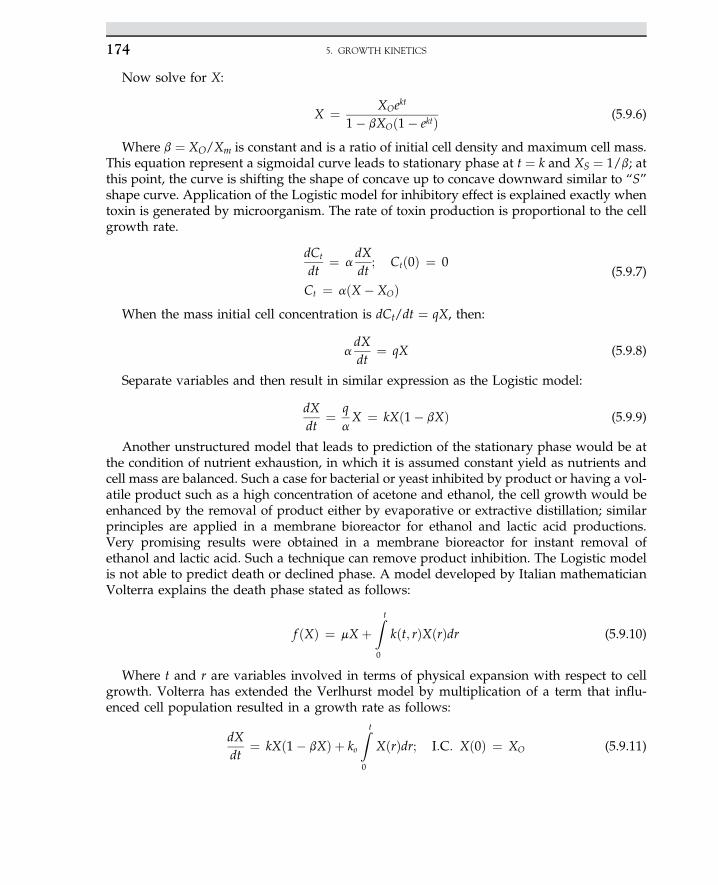
Now solve for X:
X ¼ XOekt
1� bXOð1� ektÞ (5.9.6)
Where b ¼ XO/Xm is constant and is a ratio of initial cell density and maximum cell mass.This equation represent a sigmoidal curve leads to stationary phase at t ¼ k and XS ¼ 1/b; atthis point, the curve is shifting the shape of concave up to concave downward similar to “S”shape curve. Application of the Logistic model for inhibitory effect is explained exactly whentoxin is generated by microorganism. The rate of toxin production is proportional to the cellgrowth rate.
dCt
dt¼ a
dXdt
; Ctð0Þ ¼ 0
Ct ¼ aðX � XOÞ(5.9.7)
When the mass initial cell concentration is dCt/dt ¼ qX, then:
adXdt
¼ qX (5.9.8)
Separate variables and then result in similar expression as the Logistic model:
dXdt
¼ qaX ¼ kXð1� bXÞ (5.9.9)
Another unstructured model that leads to prediction of the stationary phase would be atthe condition of nutrient exhaustion, in which it is assumed constant yield as nutrients andcell mass are balanced. Such a case for bacterial or yeast inhibited by product or having a vol-atile product such as a high concentration of acetone and ethanol, the cell growth would beenhanced by the removal of product either by evaporative or extractive distillation; similarprinciples are applied in a membrane bioreactor for ethanol and lactic acid productions.Very promising results were obtained in a membrane bioreactor for instant removal ofethanol and lactic acid. Such a technique can remove product inhibition. The Logistic modelis not able to predict death or declined phase. A model developed by Italian mathematicianVolterra explains the death phase stated as follows:
f ðXÞ ¼ mX þZ t
0
kðt; rÞXðrÞdr (5.9.10)
Where t and r are variables involved in terms of physical expansion with respect to cellgrowth. Volterra has extended the Verlhurst model by multiplication of a term that influ-enced cell population resulted in a growth rate as follows:
dXdt
¼ kXð1� bXÞ þ ko
Z t
0
XðrÞdr; I:C: Xð0Þ ¼ XO (5.9.11)
5. GROWTH KINETICS174
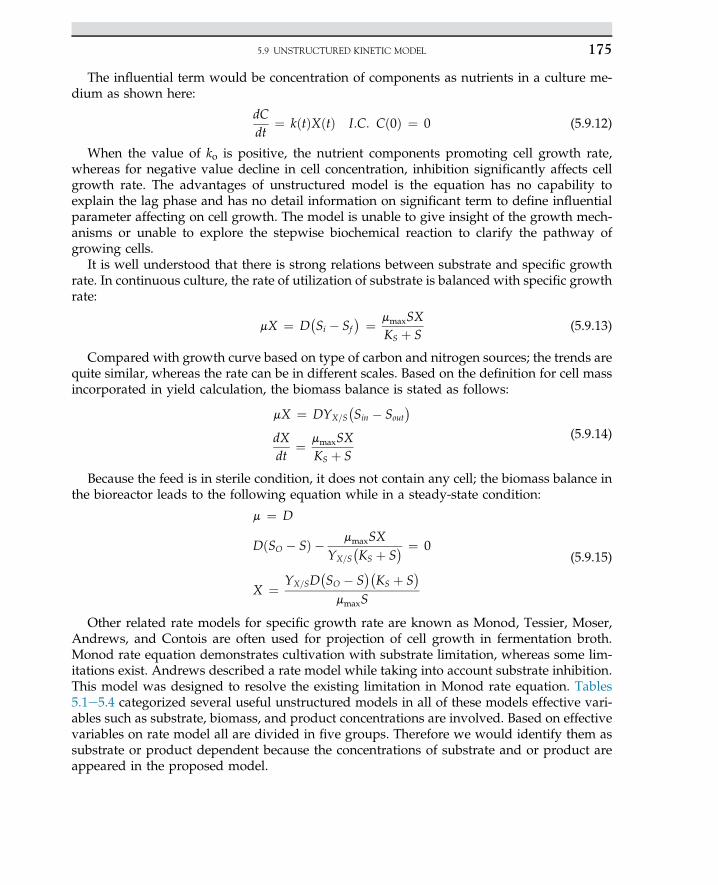
The influential term would be concentration of components as nutrients in a culture me-dium as shown here:
dCdt
¼ kðtÞXðtÞ I:C: Cð0Þ ¼ 0 (5.9.12)
When the value of ko is positive, the nutrient components promoting cell growth rate,whereas for negative value decline in cell concentration, inhibition significantly affects cellgrowth rate. The advantages of unstructured model is the equation has no capability toexplain the lag phase and has no detail information on significant term to define influentialparameter affecting on cell growth. The model is unable to give insight of the growth mech-anisms or unable to explore the stepwise biochemical reaction to clarify the pathway ofgrowing cells.
It is well understood that there is strong relations between substrate and specific growthrate. In continuous culture, the rate of utilization of substrate is balanced with specific growthrate:
mX ¼ D�Si � Sf
� ¼ mmaxSXKS þ S
(5.9.13)
Compared with growth curve based on type of carbon and nitrogen sources; the trends arequite similar, whereas the rate can be in different scales. Based on the definition for cell massincorporated in yield calculation, the biomass balance is stated as follows:
mX ¼ DYX=S�Sin � Sout
�dXdt
¼ mmaxSXKS þ S
(5.9.14)
Because the feed is in sterile condition, it does not contain any cell; the biomass balance inthe bioreactor leads to the following equation while in a steady-state condition:
m ¼ D
DðSO � SÞ � mmaxSXYX=S
�KS þ S
� ¼ 0
X ¼ YX=SD�SO � S
��KS þ S
�mmaxS
(5.9.15)
Other related rate models for specific growth rate are known as Monod, Tessier, Moser,Andrews, and Contois are often used for projection of cell growth in fermentation broth.Monod rate equation demonstrates cultivation with substrate limitation, whereas some lim-itations exist. Andrews described a rate model while taking into account substrate inhibition.This model was designed to resolve the existing limitation in Monod rate equation. Tables5.1e5.4 categorized several useful unstructured models in all of these models effective vari-ables such as substrate, biomass, and product concentrations are involved. Based on effectivevariables on rate model all are divided in five groups. Therefore we would identify them assubstrate or product dependent because the concentrations of substrate and or product areappeared in the proposed model.
5.9 UNSTRUCTURED KINETIC MODEL 175
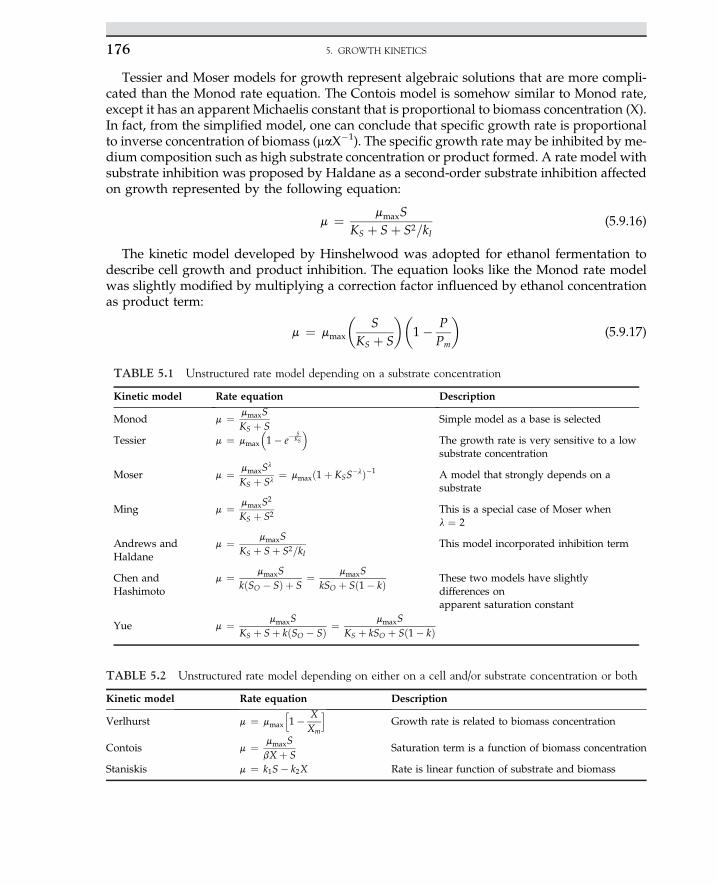
Tessier and Moser models for growth represent algebraic solutions that are more compli-cated than the Monod rate equation. The Contois model is somehow similar to Monod rate,except it has an apparent Michaelis constant that is proportional to biomass concentration (X).In fact, from the simplified model, one can conclude that specific growth rate is proportionalto inverse concentration of biomass (maX�1). The specific growth rate may be inhibited by me-dium composition such as high substrate concentration or product formed. A rate model withsubstrate inhibition was proposed by Haldane as a second-order substrate inhibition affectedon growth represented by the following equation:
m ¼ mmaxSKS þ Sþ S2=kI
(5.9.16)
The kinetic model developed by Hinshelwood was adopted for ethanol fermentation todescribe cell growth and product inhibition. The equation looks like the Monod rate modelwas slightly modified by multiplying a correction factor influenced by ethanol concentrationas product term:
m ¼ mmax
�S
KS þ S
��1� P
Pm
�(5.9.17)
TABLE 5.1 Unstructured rate model depending on a substrate concentration
Kinetic model Rate equation Description
Monod m ¼ mmaxSKS þ S
Simple model as a base is selected
Tessier m ¼ mmax
�1� e�
SKS
�The growth rate is very sensitive to a lowsubstrate concentration
Moser m ¼ mmaxSl
KS þ Sl¼ mmaxð1þ KSS�lÞ�1 A model that strongly depends on a
substrate
Ming m ¼ mmaxS2
KS þ S2This is a special case of Moser whenl ¼ 2
Andrews andHaldane
m ¼ mmaxSKS þ Sþ S2=kI
This model incorporated inhibition term
Chen andHashimoto
m ¼ mmaxSkðSO � SÞ þ S
¼ mmaxSkSO þ Sð1� kÞ These two models have slightly
differences onapparent saturation constant
Yue m ¼ mmaxSKS þ Sþ kðSO � SÞ ¼ mmaxS
KS þ kSO þ Sð1� kÞ
TABLE 5.2 Unstructured rate model depending on either on a cell and/or substrate concentration or both
Kinetic model Rate equation Description
Verlhurst m ¼ mmax
h1� X
Xm
iGrowth rate is related to biomass concentration
Contois m ¼ mmaxSbX þ S
Saturation term is a function of biomass concentration
Staniskis m ¼ k1S� k2X Rate is linear function of substrate and biomass
5. GROWTH KINETICS176
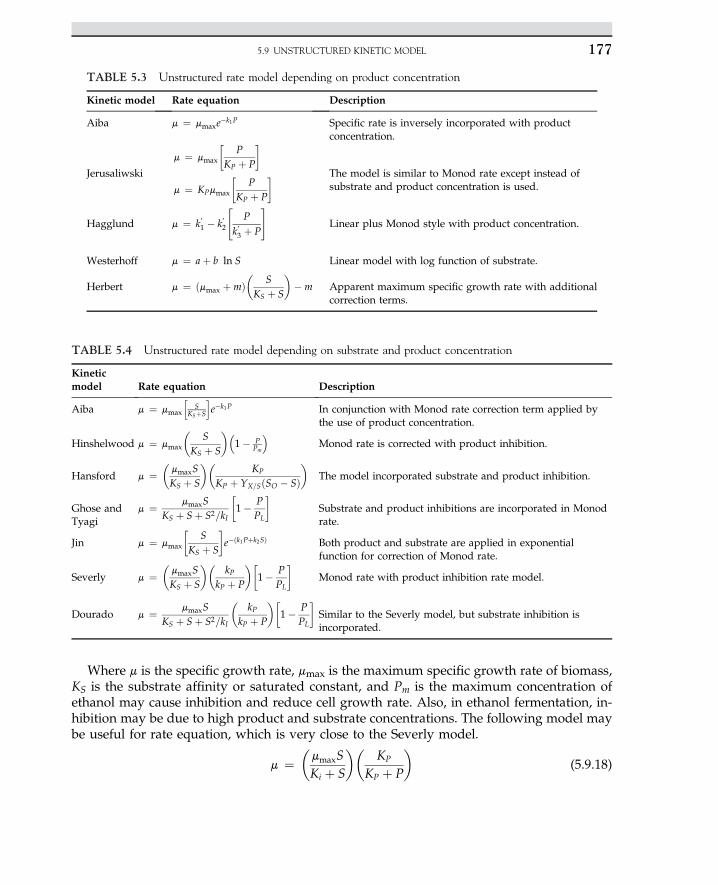
Where m is the specific growth rate, mmax is the maximum specific growth rate of biomass,KS is the substrate affinity or saturated constant, and Pm is the maximum concentration ofethanol may cause inhibition and reduce cell growth rate. Also, in ethanol fermentation, in-hibition may be due to high product and substrate concentrations. The following model maybe useful for rate equation, which is very close to the Severly model.
m ¼�mmaxSKi þ S
��KP
KP þ P
�(5.9.18)
TABLE 5.3 Unstructured rate model depending on product concentration
Kinetic model Rate equation Description
Aiba m ¼ mmaxe�k1P Specific rate is inversely incorporated with productconcentration.
Jerusaliwski
m ¼ mmax
P
KP þ P
�
m ¼ KPmmax
P
KP þ P
� The model is similar to Monod rate except instead ofsubstrate and product concentration is used.
Hagglund m ¼ k’1 � k’2
"P
k’3 þ P
#Linear plus Monod style with product concentration.
Westerhoff m ¼ aþ b ln S Linear model with log function of substrate.
Herbert m ¼ ðmmax þmÞ�
SKS þ S
��m Apparent maximum specific growth rate with additional
correction terms.
TABLE 5.4 Unstructured rate model depending on substrate and product concentration
Kineticmodel Rate equation Description
Aiba m ¼ mmax
hS
KSþS
ie�k1P In conjunction with Monod rate correction term applied by
the use of product concentration.
Hinshelwood m ¼ mmax
�S
KS þ S
��1� P
Pm
�Monod rate is corrected with product inhibition.
Hansford m ¼�mmaxSKS þ S
��KP
KP þ YX=SðSO � SÞ�
The model incorporated substrate and product inhibition.
Ghose andTyagi
m ¼ mmaxSKS þ Sþ S2=kI
1� P
PL
�Substrate and product inhibitions are incorporated in Monodrate.
Jin m ¼ mmax
S
KS þ S
�e�ðk1Pþk2SÞ Both product and substrate are applied in exponential
function for correction of Monod rate.
Severly m ¼�mmaxSKS þ S
��kP
kP þ P
�1� P
PL
�Monod rate with product inhibition rate model.
Dourado m ¼ mmaxSKS þ Sþ S2=kI
�kP
kP þ P
�1� P
PL
�Similar to the Severly model, but substrate inhibition isincorporated.
5.9 UNSTRUCTURED KINETIC MODEL 177
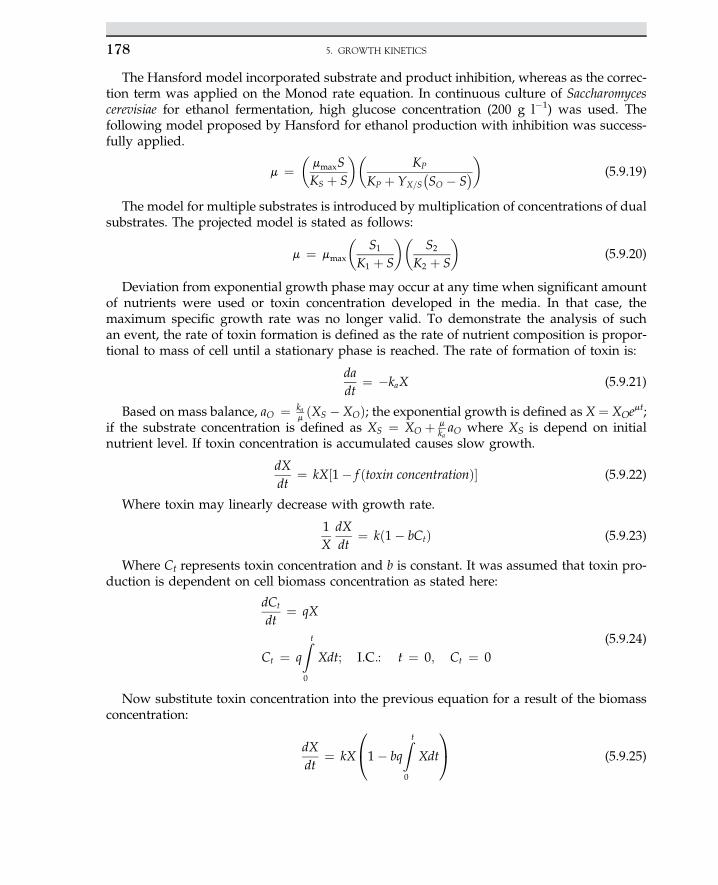
The Hansford model incorporated substrate and product inhibition, whereas as the correc-tion term was applied on the Monod rate equation. In continuous culture of Saccharomycescerevisiae for ethanol fermentation, high glucose concentration (200 g l�1) was used. Thefollowing model proposed by Hansford for ethanol production with inhibition was success-fully applied.
m ¼�mmaxSKS þ S
��KP
KP þ YX=S�SO � S
�� (5.9.19)
The model for multiple substrates is introduced by multiplication of concentrations of dualsubstrates. The projected model is stated as follows:
m ¼ mmax
�S1
K1 þ S
��S2
K2 þ S
�(5.9.20)
Deviation from exponential growth phase may occur at any time when significant amountof nutrients were used or toxin concentration developed in the media. In that case, themaximum specific growth rate was no longer valid. To demonstrate the analysis of suchan event, the rate of toxin formation is defined as the rate of nutrient composition is propor-tional to mass of cell until a stationary phase is reached. The rate of formation of toxin is:
dadt
¼ �kaX (5.9.21)
Based on mass balance, aO ¼ kamðXS � XOÞ; the exponential growth is defined as X ¼ XOe
mt;if the substrate concentration is defined as XS ¼ XO þ m
kaaO where XS is depend on initial
nutrient level. If toxin concentration is accumulated causes slow growth.
dXdt
¼ kX½1� f ðtoxin concentrationÞ� (5.9.22)
Where toxin may linearly decrease with growth rate.
1X
dXdt
¼ kð1� bCtÞ (5.9.23)
Where Ct represents toxin concentration and b is constant. It was assumed that toxin pro-duction is dependent on cell biomass concentration as stated here:
dCt
dt¼ qX
Ct ¼ qZ t
0
Xdt; I:C:: t ¼ 0; Ct ¼ 0(5.9.24)
Now substitute toxin concentration into the previous equation for a result of the biomassconcentration:
dXdt
¼ kX
0@1� bq
Z t
0
Xdt
1A (5.9.25)
5. GROWTH KINETICS178
The effective specific growth rate is
meff ¼ 1X
dXdt
¼ k
0@1� bq
Z t
0
Xdt
1A (5.9.26)
When cell growth is halted, that means meff ¼ 0; then:
0@1� bq
Z t
0
Xdt
1A ¼ 0;
1bq
¼Z t
0
Xdt
When Ct ¼ 1/b, then dX/dt ¼ 0; this means constant biomass. Also, it means that the toxi-cated medium has to be diluted with nontoxicated nutrients. If the growth is halted due todecrease or exhaustion of nutrients; then dilution with a non-nutrient does not improvethe growth. For the death phase projection is defined as follows:
X ¼ XOe�kdt (5.9.27)
NOMENCLATURE
m Specific growth rate, h�1
mmax Maximum specific growth rate, h�1
rcell Cell density, g l�1
y Specific growth rate constant, g l�1 h�1
Ci Molar concentration of component i, g l�1
Cif Molar concentration in feed, g l�1
D or F/V Dilution rate, h�1
F Flow rate, h�1
i Inhibition concentration, g l�1
k2 Rate constant for forward, h�1
kL2 Rate constant for backward, h�1
Kappm Apparent Michaelis constant, g l�1
Kd Specific death rate, h�1
Ki Inhibition constant, g l�1
KS Saturation or Monod constant g l�1
rfi Rate of product formation, g l�1 h�1
S Substrate concentration, g l�1
VR Culture volume, m3
V Working volume of the bioreactor, lX Cell concentration, g l�1
X0 Initial biomass concentration, g l�1
yappmax Apparent maximum specific growth rate constant, h�1
YP/S Yield of productYX/S Yield of biomass
NOMENCLATURE 179
References1. Pelczar MJ, Chan ECS, Krieg NR. Microbiology. New York: McGraw-Hill; 1986.2. Baily JE, Ollis DF. Biochemical engineering fundamentals. 2nd ed. New York: McGraw-Hill; 1986.3. Wang DIC, Cooney CL, Deman AL, Dunnill P, Humphrey AE, Lilly MD. Fermentation and enzyme technology. NewYork: John Wiley & Sons; 1979.
4. Scragg AH. Bioreactor in biotechnology, a practical approach. New York: Ellis Horwood Series in Biochemistry andBiotechnology; 1991.
5. Doran PM. Bioprocess engineering principles. New York: Academic Press; 1995.6. Ghose TK. Bioprocess computation in biotechnology, vol. 1. New York: Ellis Horwood Series in Biochemistry andBiotechnology; 1990.
7. Shuler ML, Kargi F. Bioprocess engineering, basic concepts. New Jersey: Prentice Hall; 1992.8. Stanbury PF, Whitaker A. Principles of fermentation technology. Oxford: Pergamon Press; 1984.9. Levenspiel O. Chemical reaction engineering. 3rd ed. New York: John Wiley & Sons; 1999.10. James ML, Smith GM, Wolford JC. Applied numerical methods for digital computation. New York: Harper & Row;
1977.
5. GROWTH KINETICS180
S U B C H A P T E R
5.11Case Study: Enzyme Kinetic Models for Resolution ofRacemic Ibuprofen Esters in a Membrane Reactor*
5.11.1 INTRODUCTION
In this case study, an enzymatic hydrolysis reaction, the racemic ibuprofen ester,i.e., (R)- and (S)-ibuprofen esters in equimolar mixture, undergoes a kinetic resolutionin a biphasic enzymatic membrane reactor (EMR). In kinetic resolution, the two enantio-mers react at different rates; lipase originated from Candida rugosa shows a greater stereo-preference toward the (S)-enantiomer. The membrane module consisted of multiplebundles of polymeric hydrophilic hollow fiber. The membrane separated the two immis-cible phases (i.e., organic in the shell side and aqueous in the lumen). Racemic substrate inthe organic phase enacted with immobilized enzyme on the membrane where the hydro-lysis reaction took place, and the product (S)-ibuprofen acid was extracted into theaqueous phase.
In this case study, the kinetic behavior of the immobilized system was analyzed while thefollowing parameters were taken into account:
1. the rate equations for native enzymes and immobilized enzymes are not necessarily thesame because of microenvironment and shear stress effects;
2. within the reaction layer, the substrate should diffuse, then mass transfer and enzymaticreaction occur simultaneously, giving rise to substrate concentration profiles at levelslower than the feed concentration; and
3. external mass transfer resistances have to be taken into account, depending on the oper-ating conditions and the reactor configuration.
The values of the MichaeliseMenten kinetic parameters, Vappmax and Kapp
m characterize the ki-netic expression for the microenvironment within the porous structure. Kinetic analyses ofthe immobilized lipase in the membrane reactor were performed because the kinetic param-eters cannot be assumed to be the same values as for the native enzymes.
*This chapter was written with contributions from:Wei Sing Long, Institute of Thermodynamics, Helmut-Schmidt University, Hamburg, Germany;Azlina Harun Kamaruddin, Subash Bhatia, School of Chemical Engineering, Engineering Campus,Universiti Sains Malaysia, 14300 Nibong Tebal, Pulau Pinang, Malaysia.
5.11.1 INTRODUCTION 181
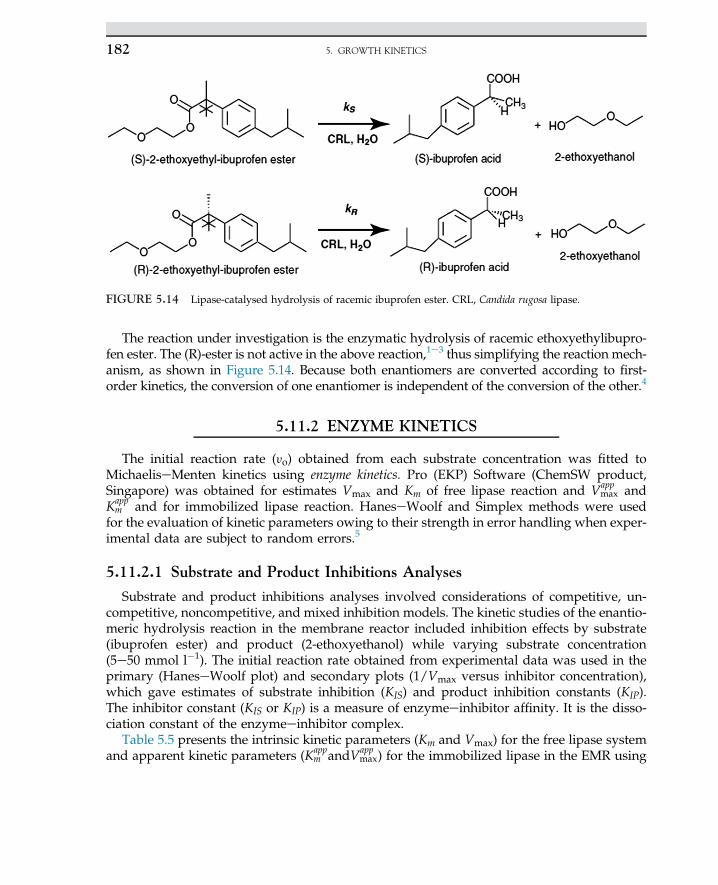
The reaction under investigation is the enzymatic hydrolysis of racemic ethoxyethylibupro-fen ester. The (R)-ester is not active in the above reaction,1e3 thus simplifying the reaction mech-anism, as shown in Figure 5.14. Because both enantiomers are converted according to first-order kinetics, the conversion of one enantiomer is independent of the conversion of the other.4
5.11.2 ENZYME KINETICS
The initial reaction rate (yo) obtained from each substrate concentration was fitted toMichaeliseMenten kinetics using enzyme kinetics. Pro (EKP) Software (ChemSW product,Singapore) was obtained for estimates Vmax and Km of free lipase reaction and Vapp
max andKappm and for immobilized lipase reaction. HaneseWoolf and Simplex methods were used
for the evaluation of kinetic parameters owing to their strength in error handling when exper-imental data are subject to random errors.5
5.11.2.1 Substrate and Product Inhibitions Analyses
Substrate and product inhibitions analyses involved considerations of competitive, un-competitive, noncompetitive, and mixed inhibition models. The kinetic studies of the enantio-meric hydrolysis reaction in the membrane reactor included inhibition effects by substrate(ibuprofen ester) and product (2-ethoxyethanol) while varying substrate concentration(5e50 mmol l�1). The initial reaction rate obtained from experimental data was used in theprimary (HaneseWoolf plot) and secondary plots (1/Vmax versus inhibitor concentration),which gave estimates of substrate inhibition (KIS) and product inhibition constants (KIP).The inhibitor constant (KIS or KIP) is a measure of enzymeeinhibitor affinity. It is the disso-ciation constant of the enzymeeinhibitor complex.
Table 5.5 presents the intrinsic kinetic parameters (Km and Vmax) for the free lipase systemand apparent kinetic parameters (Kapp
m andVappmax) for the immobilized lipase in the EMR using
FIGURE 5.14 Lipase-catalysed hydrolysis of racemic ibuprofen ester. CRL, Candida rugosa lipase.
5. GROWTH KINETICS182
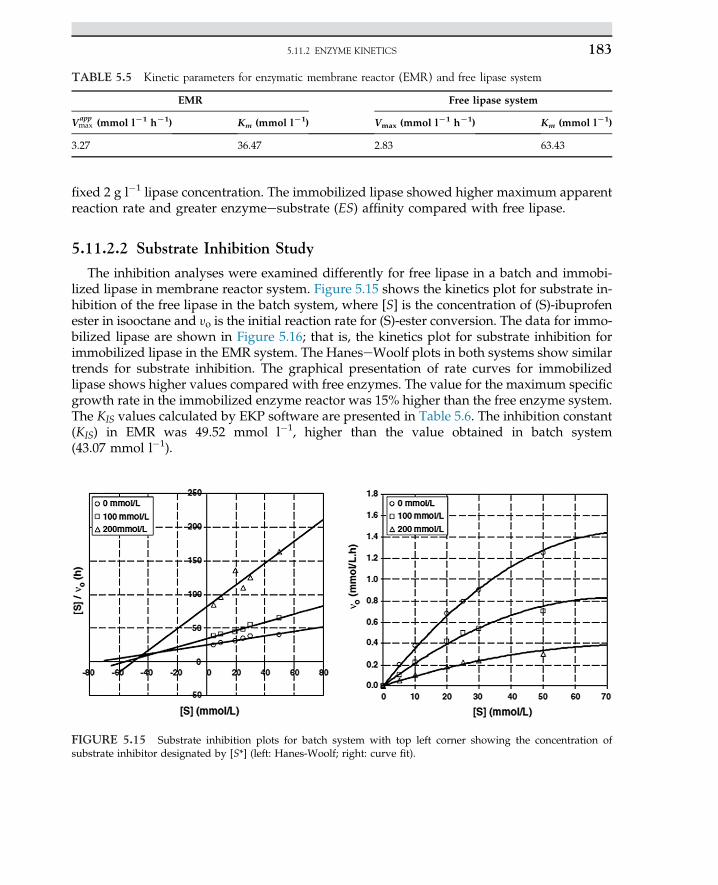
fixed 2 g l�1 lipase concentration. The immobilized lipase showed higher maximum apparentreaction rate and greater enzymeesubstrate (ES) affinity compared with free lipase.
5.11.2.2 Substrate Inhibition Study
The inhibition analyses were examined differently for free lipase in a batch and immobi-lized lipase in membrane reactor system. Figure 5.15 shows the kinetics plot for substrate in-hibition of the free lipase in the batch system, where [S] is the concentration of (S)-ibuprofenester in isooctane and yo is the initial reaction rate for (S)-ester conversion. The data for immo-bilized lipase are shown in Figure 5.16; that is, the kinetics plot for substrate inhibition forimmobilized lipase in the EMR system. The HaneseWoolf plots in both systems show similartrends for substrate inhibition. The graphical presentation of rate curves for immobilizedlipase shows higher values compared with free enzymes. The value for the maximum specificgrowth rate in the immobilized enzyme reactor was 15% higher than the free enzyme system.The KIS values calculated by EKP software are presented in Table 5.6. The inhibition constant(KIS) in EMR was 49.52 mmol l�1, higher than the value obtained in batch system(43.07 mmol l�1).
TABLE 5.5 Kinetic parameters for enzymatic membrane reactor (EMR) and free lipase system
EMR Free lipase system
Vappmax (mmol lL1 hL1) Km (mmol lL1) Vmax (mmol lL1 hL1) Km (mmol lL1)
3.27 36.47 2.83 63.43
FIGURE 5.15 Substrate inhibition plots for batch system with top left corner showing the concentration ofsubstrate inhibitor designated by [S*] (left: Hanes-Woolf; right: curve fit).
5.11.2 ENZYME KINETICS 183
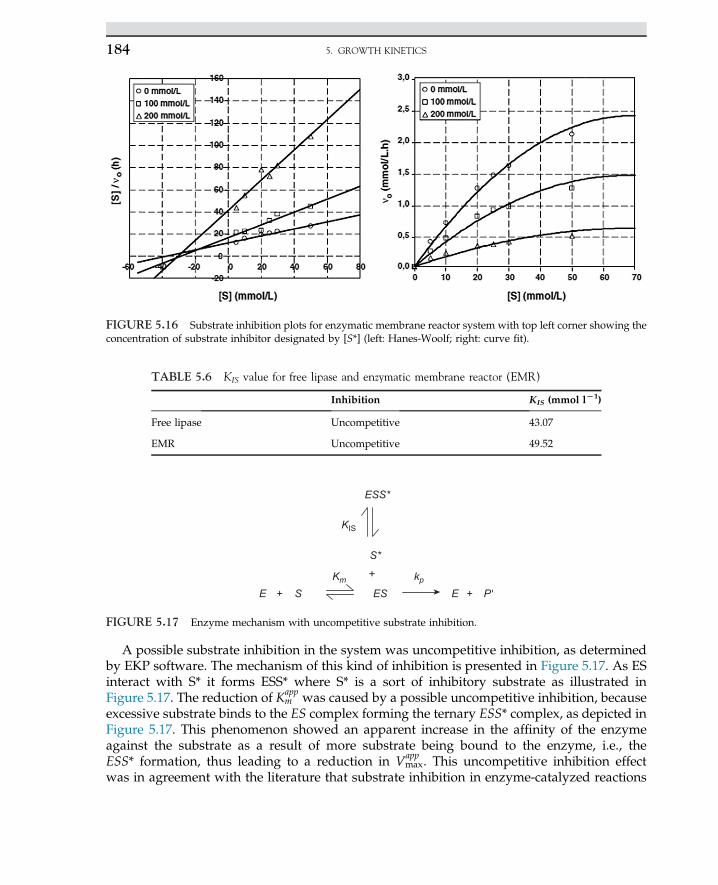
A possible substrate inhibition in the system was uncompetitive inhibition, as determinedby EKP software. The mechanism of this kind of inhibition is presented in Figure 5.17. As ESinteract with S* it forms ESS* where S* is a sort of inhibitory substrate as illustrated inFigure 5.17. The reduction of Kapp
m was caused by a possible uncompetitive inhibition, becauseexcessive substrate binds to the ES complex forming the ternary ESS* complex, as depicted inFigure 5.17. This phenomenon showed an apparent increase in the affinity of the enzymeagainst the substrate as a result of more substrate being bound to the enzyme, i.e., theESS* formation, thus leading to a reduction in Vapp
max. This uncompetitive inhibition effectwas in agreement with the literature that substrate inhibition in enzyme-catalyzed reactions
FIGURE 5.16 Substrate inhibition plots for enzymatic membrane reactor system with top left corner showing theconcentration of substrate inhibitor designated by [S*] (left: Hanes-Woolf; right: curve fit).
TABLE 5.6 KIS value for free lipase and enzymatic membrane reactor (EMR)
Inhibition KIS (mmol lL1)
Free lipase Uncompetitive 43.07
EMR Uncompetitive 49.52
E ES
ESS*
S*
KIS
Km kpS+ E P'+
+
FIGURE 5.17 Enzyme mechanism with uncompetitive substrate inhibition.
5. GROWTH KINETICS184
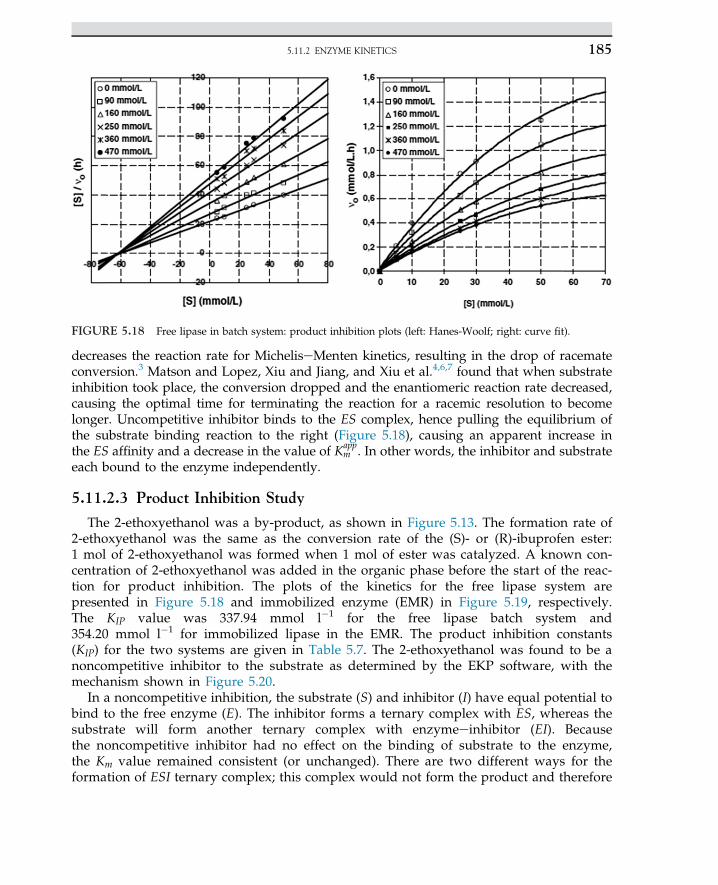
decreases the reaction rate for MicheliseMenten kinetics, resulting in the drop of racemateconversion.3 Matson and Lopez, Xiu and Jiang, and Xiu et al.4,6,7 found that when substrateinhibition took place, the conversion dropped and the enantiomeric reaction rate decreased,causing the optimal time for terminating the reaction for a racemic resolution to becomelonger. Uncompetitive inhibitor binds to the ES complex, hence pulling the equilibrium ofthe substrate binding reaction to the right (Figure 5.18), causing an apparent increase inthe ES affinity and a decrease in the value of Kapp
m . In other words, the inhibitor and substrateeach bound to the enzyme independently.
5.11.2.3 Product Inhibition Study
The 2-ethoxyethanol was a by-product, as shown in Figure 5.13. The formation rate of2-ethoxyethanol was the same as the conversion rate of the (S)- or (R)-ibuprofen ester:1 mol of 2-ethoxyethanol was formed when 1 mol of ester was catalyzed. A known con-centration of 2-ethoxyethanol was added in the organic phase before the start of the reac-tion for product inhibition. The plots of the kinetics for the free lipase system arepresented in Figure 5.18 and immobilized enzyme (EMR) in Figure 5.19, respectively.The KIP value was 337.94 mmol l�1 for the free lipase batch system and354.20 mmol l�1 for immobilized lipase in the EMR. The product inhibition constants(KIP) for the two systems are given in Table 5.7. The 2-ethoxyethanol was found to be anoncompetitive inhibitor to the substrate as determined by the EKP software, with themechanism shown in Figure 5.20.
In a noncompetitive inhibition, the substrate (S) and inhibitor (I) have equal potential tobind to the free enzyme (E). The inhibitor forms a ternary complex with ES, whereas thesubstrate will form another ternary complex with enzymeeinhibitor (EI). Becausethe noncompetitive inhibitor had no effect on the binding of substrate to the enzyme,the Km value remained consistent (or unchanged). There are two different ways for theformation of ESI ternary complex; this complex would not form the product and therefore
FIGURE 5.18 Free lipase in batch system: product inhibition plots (left: Hanes-Woolf; right: curve fit).
5.11.2 ENZYME KINETICS 185
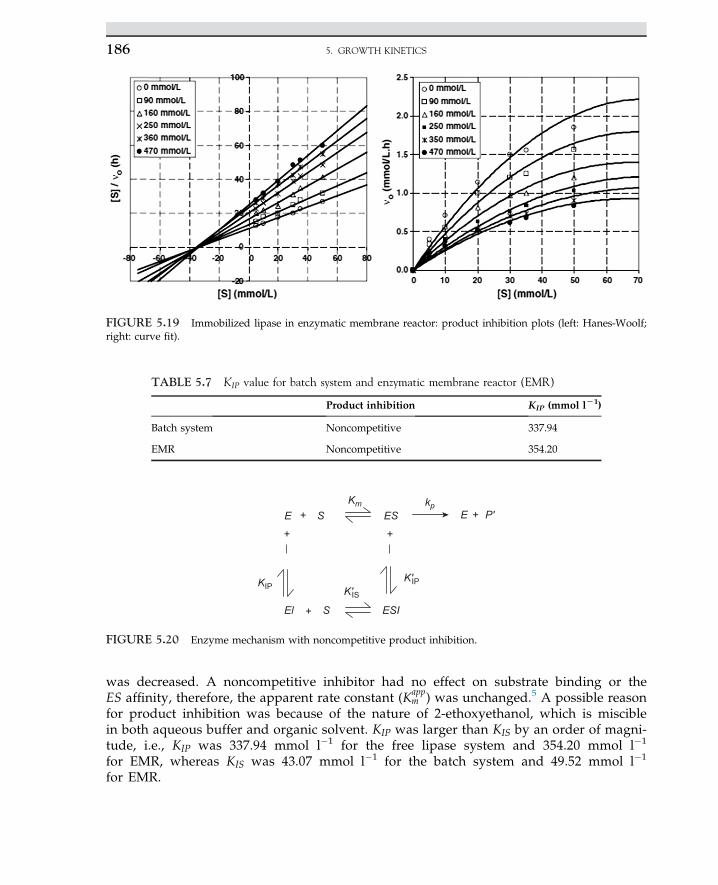
was decreased. A noncompetitive inhibitor had no effect on substrate binding or theES affinity, therefore, the apparent rate constant (Kapp
m ) was unchanged.5 A possible reasonfor product inhibition was because of the nature of 2-ethoxyethanol, which is misciblein both aqueous buffer and organic solvent. KIP was larger than KIS by an order of magni-tude, i.e., KIP was 337.94 mmol l�1 for the free lipase system and 354.20 mmol l�1
for EMR, whereas KIS was 43.07 mmol l�1 for the batch system and 49.52 mmol l�1
for EMR.
FIGURE 5.19 Immobilized lipase in enzymatic membrane reactor: product inhibition plots (left: Hanes-Woolf;right: curve fit).
TABLE 5.7 KIP value for batch system and enzymatic membrane reactor (EMR)
Product inhibition KIP (mmol lL1)
Batch system Noncompetitive 337.94
EMR Noncompetitive 354.20
KIP K'ISK'IP
El S ESI
E ESSKm kp
+
+
+ E P'+
+
FIGURE 5.20 Enzyme mechanism with noncompetitive product inhibition.
5. GROWTH KINETICS186
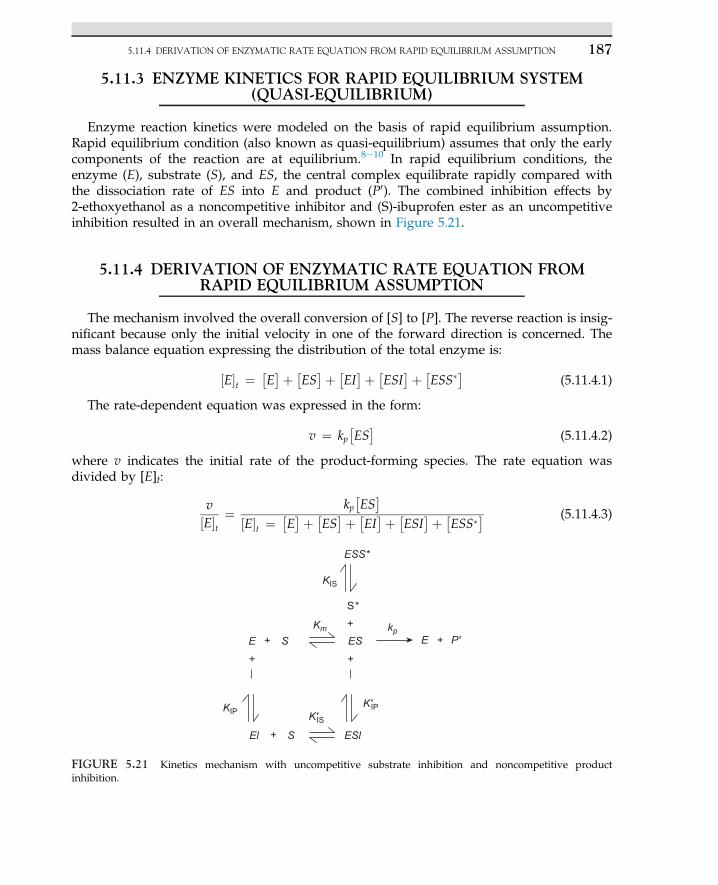
5.11.3 ENZYME KINETICS FOR RAPID EQUILIBRIUM SYSTEM(QUASI-EQUILIBRIUM)
Enzyme reaction kinetics were modeled on the basis of rapid equilibrium assumption.Rapid equilibrium condition (also known as quasi-equilibrium) assumes that only the earlycomponents of the reaction are at equilibrium.8e10 In rapid equilibrium conditions, theenzyme (E), substrate (S), and ES, the central complex equilibrate rapidly compared withthe dissociation rate of ES into E and product (P0). The combined inhibition effects by2-ethoxyethanol as a noncompetitive inhibitor and (S)-ibuprofen ester as an uncompetitiveinhibition resulted in an overall mechanism, shown in Figure 5.21.
5.11.4 DERIVATION OF ENZYMATIC RATE EQUATION FROMRAPID EQUILIBRIUM ASSUMPTION
The mechanism involved the overall conversion of [S] to [P]. The reverse reaction is insig-nificant because only the initial velocity in one of the forward direction is concerned. Themass balance equation expressing the distribution of the total enzyme is:
½E�t ¼ E�þ ES�þ EI�þ ESI�þ ESS�� (5.11.4.1)
The rate-dependent equation was expressed in the form:
v ¼ kp ES�
(5.11.4.2)
where v indicates the initial rate of the product-forming species. The rate equation wasdivided by [E]t:
v½E�t
¼ kp ES�
½E�t ¼ E�þ ES�þ EI�þ ESI�þ ESS�� (5.11.4.3)
K'IS
KIS
K'IP
ESS*
S*
KIP
El
+
ESl
+
E ESSKm kp
+
S+
E P'++
FIGURE 5.21 Kinetics mechanism with uncompetitive substrate inhibition and noncompetitive productinhibition.
5.11.4 DERIVATION OF ENZYMATIC RATE EQUATION FROM RAPID EQUILIBRIUM ASSUMPTION 187
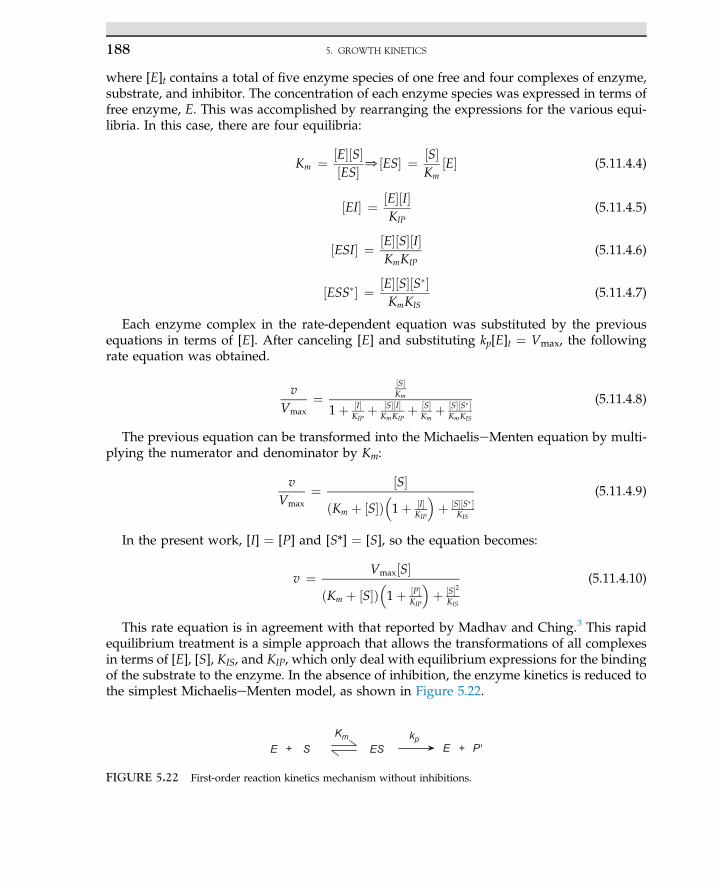
where [E]t contains a total of five enzyme species of one free and four complexes of enzyme,substrate, and inhibitor. The concentration of each enzyme species was expressed in terms offree enzyme, E. This was accomplished by rearranging the expressions for the various equi-libria. In this case, there are four equilibria:
Km ¼ ½E�½S�½ES� 0½ES� ¼ ½S�
Km½E� (5.11.4.4)
½EI� ¼ ½E�½I�KIP
(5.11.4.5)
½ESI� ¼ ½E�½S�½I�KmKIP
(5.11.4.6)
½ESS�� ¼ ½E�½S�½S��KmKIS
(5.11.4.7)
Each enzyme complex in the rate-dependent equation was substituted by the previousequations in terms of [E]. After canceling [E] and substituting kp[E]t ¼ Vmax, the followingrate equation was obtained.
vVmax
¼½S�Km
1þ ½I�KIP
þ ½S�½I�KmKIP
þ ½S�Km
þ ½S�½S��KmKIS
(5.11.4.8)
The previous equation can be transformed into the MichaeliseMenten equation by multi-plying the numerator and denominator by Km:
vVmax
¼ ½S�ðKm þ ½S�Þ
�1þ ½I�
KIP
�þ ½S�½S��
KIS
(5.11.4.9)
In the present work, [I] ¼ [P] and [S*] ¼ [S], so the equation becomes:
v ¼ Vmax½S�ðKm þ ½S�Þ
�1þ ½P�
KIP
�þ ½S�2
KIS
(5.11.4.10)
This rate equation is in agreement with that reported by Madhav and Ching.3 This rapidequilibrium treatment is a simple approach that allows the transformations of all complexesin terms of [E], [S], KIS, and KIP, which only deal with equilibrium expressions for the bindingof the substrate to the enzyme. In the absence of inhibition, the enzyme kinetics is reduced tothe simplest MichaeliseMenten model, as shown in Figure 5.22.
E ESSKm kp
+ E P'+
FIGURE 5.22 First-order reaction kinetics mechanism without inhibitions.
5. GROWTH KINETICS188
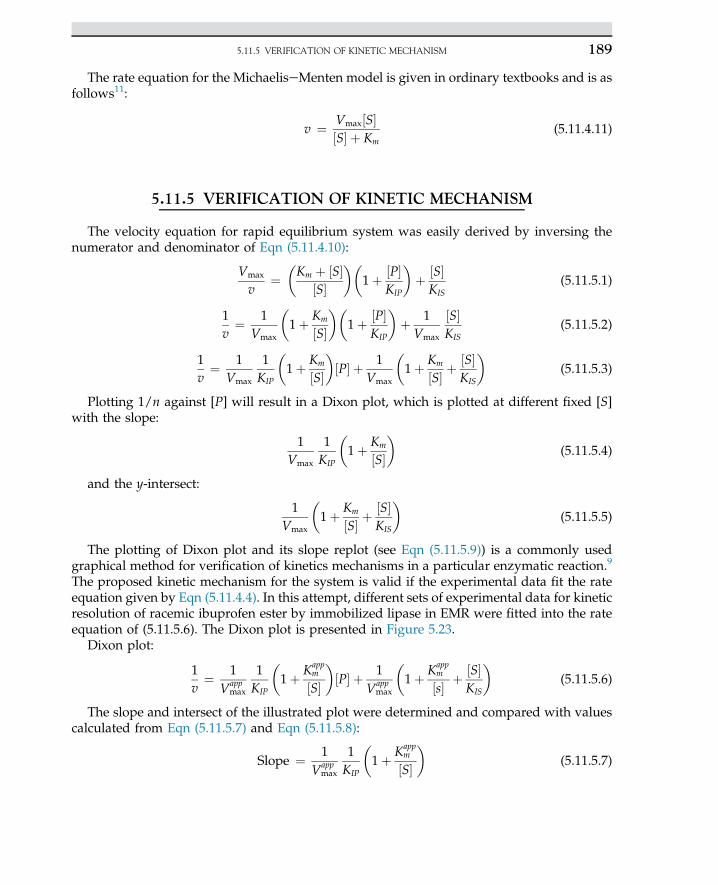
The rate equation for the MichaeliseMenten model is given in ordinary textbooks and is asfollows11:
v ¼ Vmax½S�½S� þ Km
(5.11.4.11)
5.11.5 VERIFICATION OF KINETIC MECHANISM
The velocity equation for rapid equilibrium system was easily derived by inversing thenumerator and denominator of Eqn (5.11.4.10):
Vmax
v¼�Km þ ½S�
½S���
1þ ½P�KIP
�þ ½S�KIS
(5.11.5.1)
1v¼ 1
Vmax
�1þ Km
½S���
1þ ½P�KIP
�þ 1Vmax
½S�KIS
(5.11.5.2)
1v¼ 1
Vmax
1KIP
�1þ Km
½S��½P� þ 1
Vmax
�1þ Km
½S� þ½S�KIS
�(5.11.5.3)
Plotting 1/n against [P] will result in a Dixon plot, which is plotted at different fixed [S]with the slope:
1Vmax
1KIP
�1þ Km
½S��
(5.11.5.4)
and the y-intersect:
1Vmax
�1þ Km
½S� þ½S�KIS
�(5.11.5.5)
The plotting of Dixon plot and its slope replot (see Eqn (5.11.5.9)) is a commonly usedgraphical method for verification of kinetics mechanisms in a particular enzymatic reaction.9
The proposed kinetic mechanism for the system is valid if the experimental data fit the rateequation given by Eqn (5.11.4.4). In this attempt, different sets of experimental data for kineticresolution of racemic ibuprofen ester by immobilized lipase in EMR were fitted into the rateequation of (5.11.5.6). The Dixon plot is presented in Figure 5.23.
Dixon plot:
1v¼ 1
Vappmax
1KIP
�1þ Kapp
m
½S��½P� þ 1
Vappmax
�1þ Kapp
m
½s� þ ½S�KIS
�(5.11.5.6)
The slope and intersect of the illustrated plot were determined and compared with valuescalculated from Eqn (5.11.5.7) and Eqn (5.11.5.8):
Slope ¼ 1Vapp
max
1KIP
�1þ Kapp
m
½S��
(5.11.5.7)
5.11.5 VERIFICATION OF KINETIC MECHANISM 189
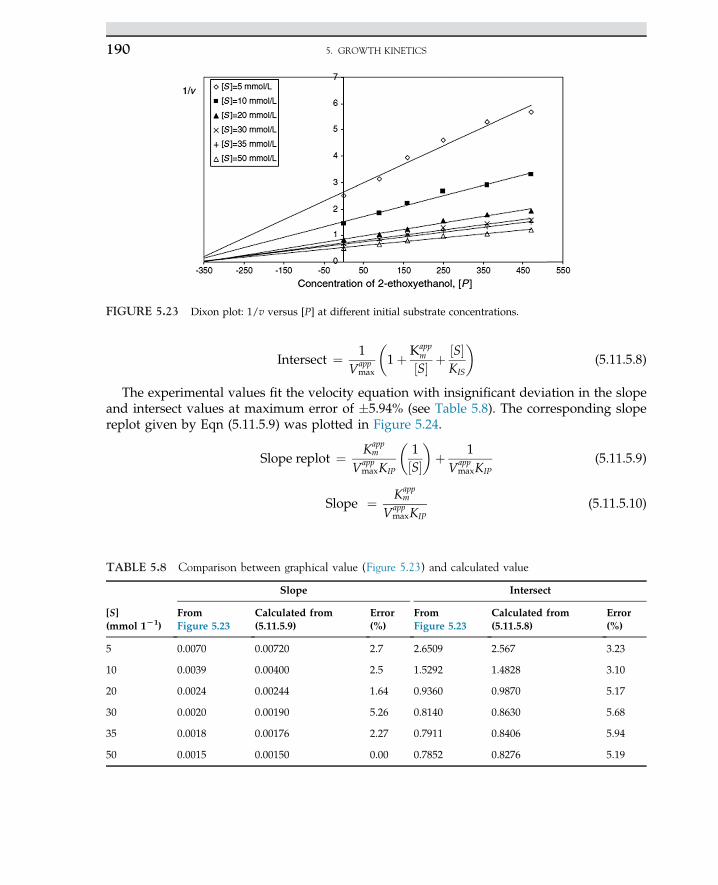
Intersect ¼ 1Vapp
max
�1þ Kapp
m
½S� þ ½S�KIS
�(5.11.5.8)
The experimental values fit the velocity equation with insignificant deviation in the slopeand intersect values at maximum error of �5.94% (see Table 5.8). The corresponding slopereplot given by Eqn (5.11.5.9) was plotted in Figure 5.24.
Slope replot ¼ Kappm
VappmaxKIP
�1½S��þ 1Vapp
maxKIP(5.11.5.9)
Slope ¼ Kappm
VappmaxKIP
(5.11.5.10)
FIGURE 5.23 Dixon plot: 1/v versus [P] at different initial substrate concentrations.
TABLE 5.8 Comparison between graphical value (Figure 5.23) and calculated value
[S](mmol 1L1)
Slope Intersect
FromFigure 5.23
Calculated from(5.11.5.9)
Error(%)
FromFigure 5.23
Calculated from(5.11.5.8)
Error(%)
5 0.0070 0.00720 2.7 2.6509 2.567 3.23
10 0.0039 0.00400 2.5 1.5292 1.4828 3.10
20 0.0024 0.00244 1.64 0.9360 0.9870 5.17
30 0.0020 0.00190 5.26 0.8140 0.8630 5.68
35 0.0018 0.00176 2.27 0.7911 0.8406 5.94
50 0.0015 0.00150 0.00 0.7852 0.8276 5.19
5. GROWTH KINETICS190
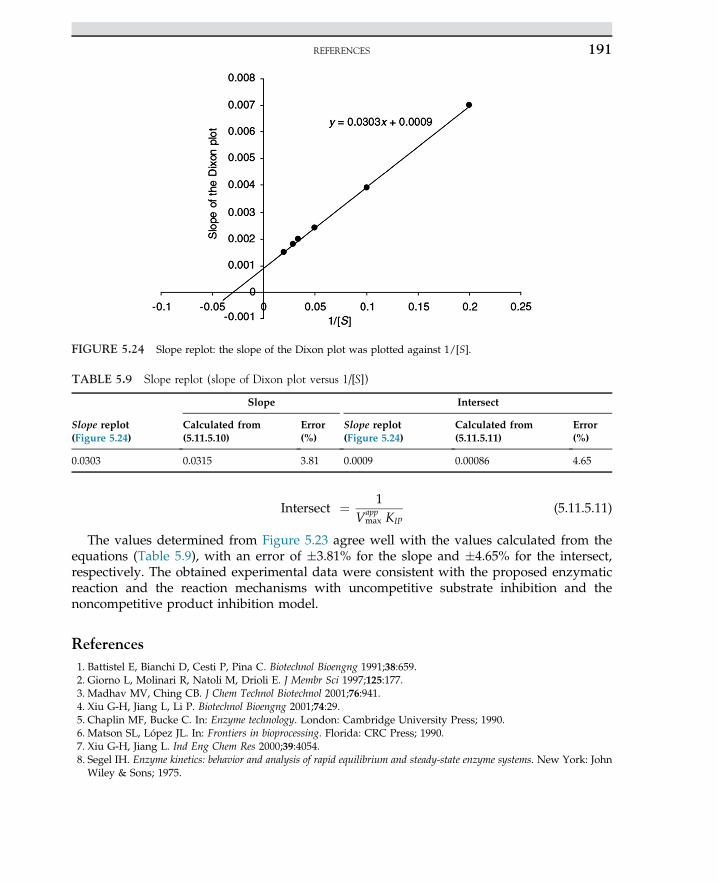
Intersect ¼ 1Vapp
max KIP(5.11.5.11)
The values determined from Figure 5.23 agree well with the values calculated from theequations (Table 5.9), with an error of �3.81% for the slope and �4.65% for the intersect,respectively. The obtained experimental data were consistent with the proposed enzymaticreaction and the reaction mechanisms with uncompetitive substrate inhibition and thenoncompetitive product inhibition model.
References1. Battistel E, Bianchi D, Cesti P, Pina C. Biotechnol Bioengng 1991;38:659.2. Giorno L, Molinari R, Natoli M, Drioli E. J Membr Sci 1997;125:177.3. Madhav MV, Ching CB. J Chem Technol Biotechnol 2001;76:941.4. Xiu G-H, Jiang L, Li P. Biotechnol Bioengng 2001;74:29.5. Chaplin MF, Bucke C. In: Enzyme technology. London: Cambridge University Press; 1990.6. Matson SL, López JL. In: Frontiers in bioprocessing. Florida: CRC Press; 1990.7. Xiu G-H, Jiang L. Ind Eng Chem Res 2000;39:4054.8. Segel IH. Enzyme kinetics: behavior and analysis of rapid equilibrium and steady-state enzyme systems. New York: JohnWiley & Sons; 1975.
FIGURE 5.24 Slope replot: the slope of the Dixon plot was plotted against 1/[S].
TABLE 5.9 Slope replot (slope of Dixon plot versus 1/[S])
Slope Intersect
Slope replot(Figure 5.24)
Calculated from(5.11.5.10)
Error(%)
Slope replot(Figure 5.24)
Calculated from(5.11.5.11)
Error(%)
0.0303 0.0315 3.81 0.0009 0.00086 4.65
REFERENCES 191
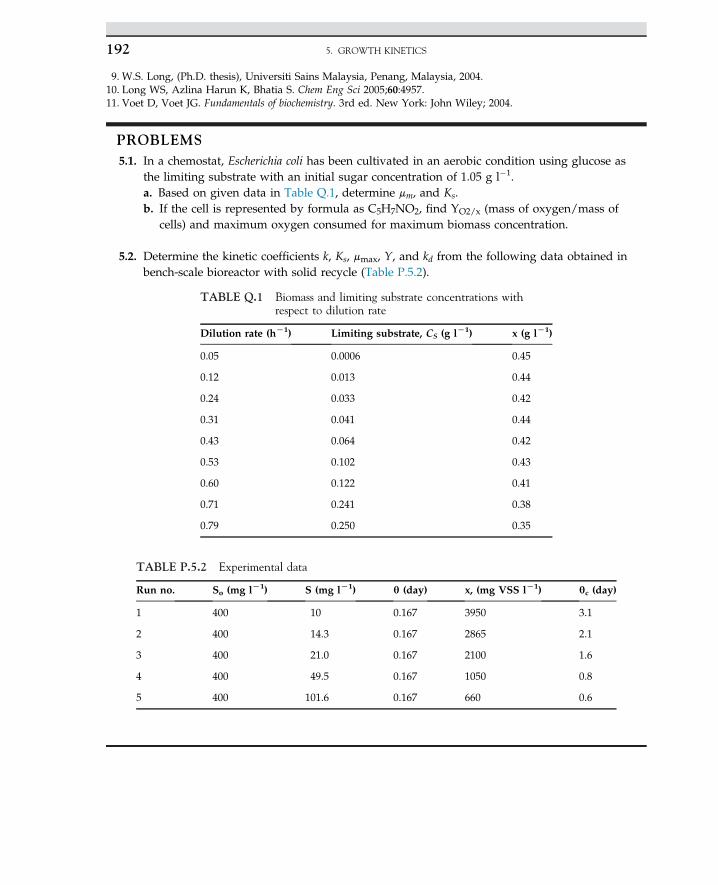
9. W.S. Long, (Ph.D. thesis), Universiti Sains Malaysia, Penang, Malaysia, 2004.10. Long WS, Azlina Harun K, Bhatia S. Chem Eng Sci 2005;60:4957.11. Voet D, Voet JG. Fundamentals of biochemistry. 3rd ed. New York: John Wiley; 2004.
PROBLEMS5.1. In a chemostat, Escherichia coli has been cultivated in an aerobic condition using glucose as
the limiting substrate with an initial sugar concentration of 1.05 g l�1.a. Based on given data in Table Q.1, determine mm, and Ks.b. If the cell is represented by formula as C5H7NO2, find YO2/x (mass of oxygen/mass of
cells) and maximum oxygen consumed for maximum biomass concentration.
5.2. Determine the kinetic coefficients k, Ks, mmax, Y, and kd from the following data obtained inbench-scale bioreactor with solid recycle (Table P.5.2).
TABLE Q.1 Biomass and limiting substrate concentrations withrespect to dilution rate
Dilution rate (hL1) Limiting substrate, CS (g lL1) x (g lL1)
0.05 0.0006 0.45
0.12 0.013 0.44
0.24 0.033 0.42
0.31 0.041 0.44
0.43 0.064 0.42
0.53 0.102 0.43
0.60 0.122 0.41
0.71 0.241 0.38
0.79 0.250 0.35
TABLE P.5.2 Experimental data
Run no. So (mg lL1) S (mg lL1) q (day) x, (mg VSS lL1) qc (day)
1 400 10 0.167 3950 3.1
2 400 14.3 0.167 2865 2.1
3 400 21.0 0.167 2100 1.6
4 400 49.5 0.167 1050 0.8
5 400 101.6 0.167 660 0.6
5. GROWTH KINETICS192
C H A P T E R
6
Bioreactor Design
O U T L I N E
6.1 Introduction 193
6.2 Bioreactors: Background 194
6.3 Type of Bioreactor 1956.3.1 Airlift Bioreactors 1966.3.2 Airlift Pressure Cycle
Bioreactors 1976.3.3 Loop Bioreactor 197
6.4 Stirred Tank Bioreactor 198
6.5 Bubble Column Fermenter 201
6.6 Airlift Bioreactors 202
6.7 Heat Transfer 203
6.8 Design Equations for CSTRFermenter 205
6.8.1 Monod Model for aChemostat 205
6.9 Temperature Effect on RateConstant 209
6.10 Scale-Up of Stirred-TankBioreactor 210
6.11 Biological Transport of Oxygenthrough Cells 2176.11.1 Estimation of Mass Transfer
Coefficient 2186.11.2 Mass Transfer in Aerated
and Agitated Vessels 221
Nomenclature 223
References 223
6.1 INTRODUCTION
To design a bioreactor, some objectives must be defined. The decisions made in design ofthe bioreactor could have a significant impact on overall process performance. Knowledge ofreaction kinetics is essential for understanding how a biological reactor works. Knowledge
193Biochemical Engineering and Biotechnologyhttp://dx.doi.org/10.1016/B978-0-444-63357-6.00006-7 Copyright © 2015 Elsevier B.V. All rights reserved.
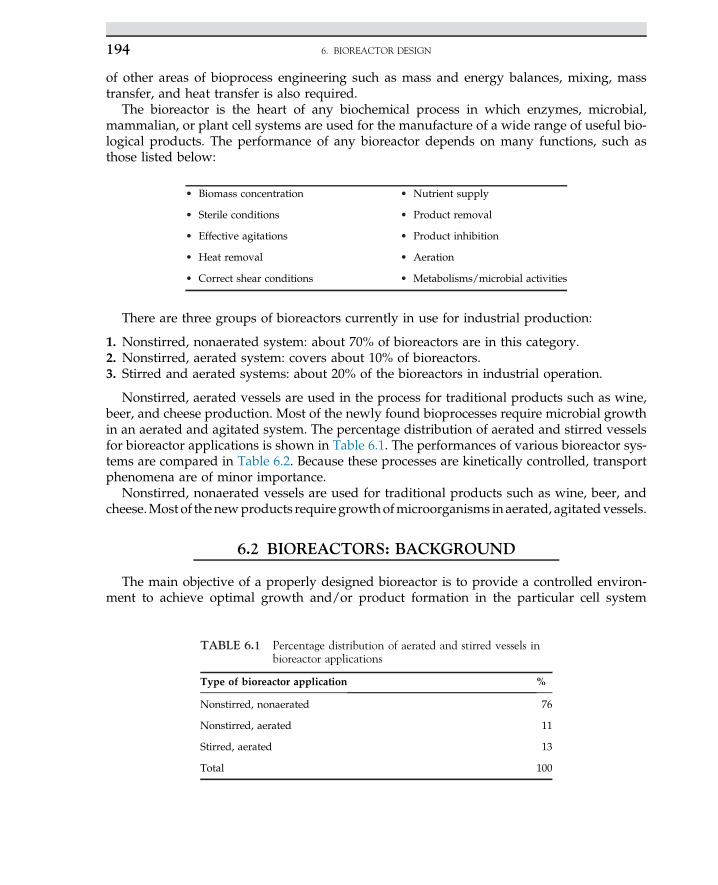
of other areas of bioprocess engineering such as mass and energy balances, mixing, masstransfer, and heat transfer is also required.
The bioreactor is the heart of any biochemical process in which enzymes, microbial,mammalian, or plant cell systems are used for the manufacture of a wide range of useful bio-logical products. The performance of any bioreactor depends on many functions, such asthose listed below:
• Biomass concentration • Nutrient supply
• Sterile conditions • Product removal
• Effective agitations • Product inhibition
• Heat removal • Aeration
• Correct shear conditions • Metabolisms/microbial activities
There are three groups of bioreactors currently in use for industrial production:
1. Nonstirred, nonaerated system: about 70% of bioreactors are in this category.2. Nonstirred, aerated system: covers about 10% of bioreactors.3. Stirred and aerated systems: about 20% of the bioreactors in industrial operation.
Nonstirred, aerated vessels are used in the process for traditional products such as wine,beer, and cheese production. Most of the newly found bioprocesses require microbial growthin an aerated and agitated system. The percentage distribution of aerated and stirred vesselsfor bioreactor applications is shown in Table 6.1. The performances of various bioreactor sys-tems are compared in Table 6.2. Because these processes are kinetically controlled, transportphenomena are of minor importance.
Nonstirred, nonaerated vessels are used for traditional products such as wine, beer, andcheese.Most of the newproducts require growthofmicroorganisms in aerated, agitatedvessels.
6.2 BIOREACTORS: BACKGROUND
The main objective of a properly designed bioreactor is to provide a controlled environ-ment to achieve optimal growth and/or product formation in the particular cell system
TABLE 6.1 Percentage distribution of aerated and stirred vessels inbioreactor applications
Type of bioreactor application %
Nonstirred, nonaerated 76
Nonstirred, aerated 11
Stirred, aerated 13
Total 100
6. BIOREACTOR DESIGN194
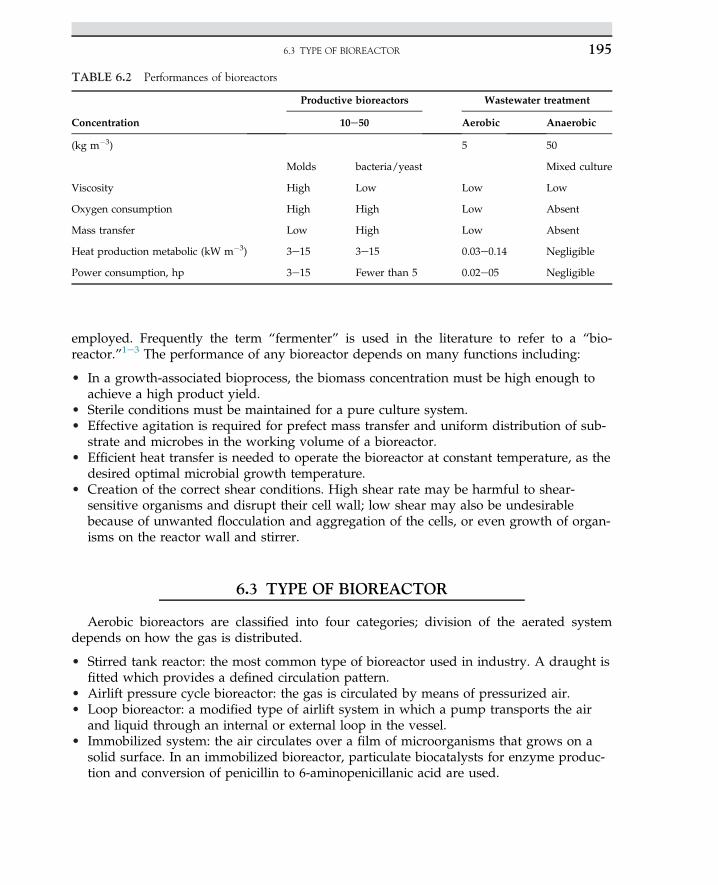
employed. Frequently the term “fermenter” is used in the literature to refer to a “bio-reactor.”1e3 The performance of any bioreactor depends on many functions including:
• In a growth-associated bioprocess, the biomass concentration must be high enough toachieve a high product yield.
• Sterile conditions must be maintained for a pure culture system.• Effective agitation is required for prefect mass transfer and uniform distribution of sub-
strate and microbes in the working volume of a bioreactor.• Efficient heat transfer is needed to operate the bioreactor at constant temperature, as the
desired optimal microbial growth temperature.• Creation of the correct shear conditions. High shear rate may be harmful to shear-
sensitive organisms and disrupt their cell wall; low shear may also be undesirablebecause of unwanted flocculation and aggregation of the cells, or even growth of organ-isms on the reactor wall and stirrer.
6.3 TYPE OF BIOREACTOR
Aerobic bioreactors are classified into four categories; division of the aerated systemdepends on how the gas is distributed.
• Stirred tank reactor: the most common type of bioreactor used in industry. A draught isfitted which provides a defined circulation pattern.
• Airlift pressure cycle bioreactor: the gas is circulated by means of pressurized air.• Loop bioreactor: a modified type of airlift system in which a pump transports the air
and liquid through an internal or external loop in the vessel.• Immobilized system: the air circulates over a film of microorganisms that grows on a
solid surface. In an immobilized bioreactor, particulate biocatalysts for enzyme produc-tion and conversion of penicillin to 6-aminopenicillanic acid are used.
TABLE 6.2 Performances of bioreactors
Concentration
Productive bioreactors Wastewater treatment
10e50 Aerobic Anaerobic
(kg m�3) 5 50
Molds bacteria/yeast Mixed culture
Viscosity High Low Low Low
Oxygen consumption High High Low Absent
Mass transfer Low High Low Absent
Heat production metabolic (kW m�3) 3e15 3e15 0.03e0.14 Negligible
Power consumption, hp 3e15 Fewer than 5 0.02e05 Negligible
6.3 TYPE OF BIOREACTOR 195
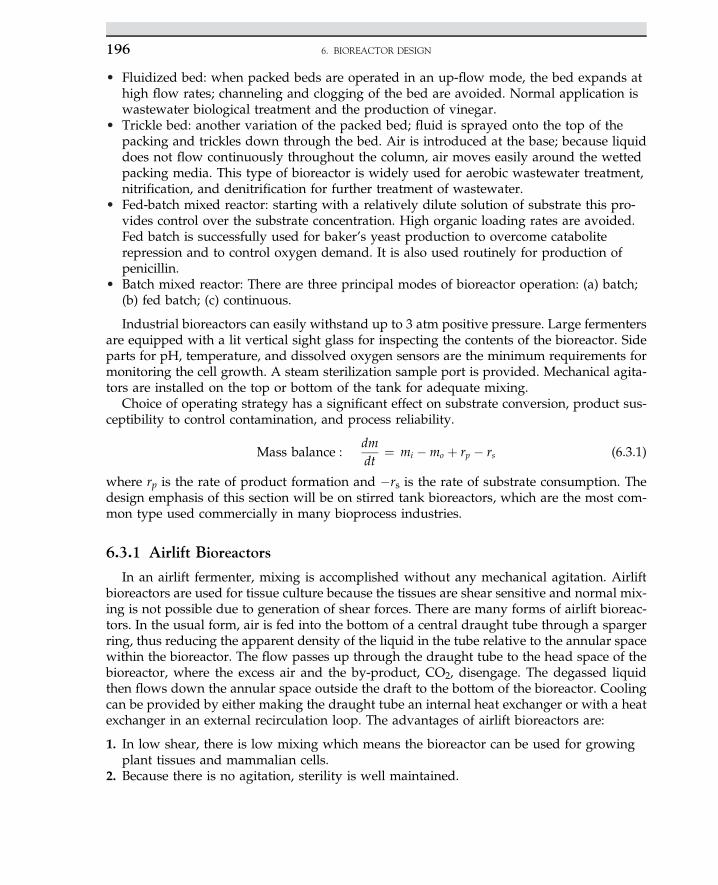
• Fluidized bed: when packed beds are operated in an up-flow mode, the bed expands athigh flow rates; channeling and clogging of the bed are avoided. Normal application iswastewater biological treatment and the production of vinegar.
• Trickle bed: another variation of the packed bed; fluid is sprayed onto the top of thepacking and trickles down through the bed. Air is introduced at the base; because liquiddoes not flow continuously throughout the column, air moves easily around the wettedpacking media. This type of bioreactor is widely used for aerobic wastewater treatment,nitrification, and denitrification for further treatment of wastewater.
• Fed-batch mixed reactor: starting with a relatively dilute solution of substrate this pro-vides control over the substrate concentration. High organic loading rates are avoided.Fed batch is successfully used for baker’s yeast production to overcome cataboliterepression and to control oxygen demand. It is also used routinely for production ofpenicillin.
• Batch mixed reactor: There are three principal modes of bioreactor operation: (a) batch;(b) fed batch; (c) continuous.
Industrial bioreactors can easily withstand up to 3 atm positive pressure. Large fermentersare equipped with a lit vertical sight glass for inspecting the contents of the bioreactor. Sideparts for pH, temperature, and dissolved oxygen sensors are the minimum requirements formonitoring the cell growth. A steam sterilization sample port is provided. Mechanical agita-tors are installed on the top or bottom of the tank for adequate mixing.
Choice of operating strategy has a significant effect on substrate conversion, product sus-ceptibility to control contamination, and process reliability.
Mass balance :dmdt
¼ mi �mo þ rp � rs (6.3.1)
where rp is the rate of product formation and �rs is the rate of substrate consumption. Thedesign emphasis of this section will be on stirred tank bioreactors, which are the most com-mon type used commercially in many bioprocess industries.
6.3.1 Airlift Bioreactors
In an airlift fermenter, mixing is accomplished without any mechanical agitation. Airliftbioreactors are used for tissue culture because the tissues are shear sensitive and normal mix-ing is not possible due to generation of shear forces. There are many forms of airlift bioreac-tors. In the usual form, air is fed into the bottom of a central draught tube through a spargerring, thus reducing the apparent density of the liquid in the tube relative to the annular spacewithin the bioreactor. The flow passes up through the draught tube to the head space of thebioreactor, where the excess air and the by-product, CO2, disengage. The degassed liquidthen flows down the annular space outside the draft to the bottom of the bioreactor. Coolingcan be provided by either making the draught tube an internal heat exchanger or with a heatexchanger in an external recirculation loop. The advantages of airlift bioreactors are:
1. In low shear, there is low mixing which means the bioreactor can be used for growingplant tissues and mammalian cells.
2. Because there is no agitation, sterility is well maintained.
6. BIOREACTOR DESIGN196
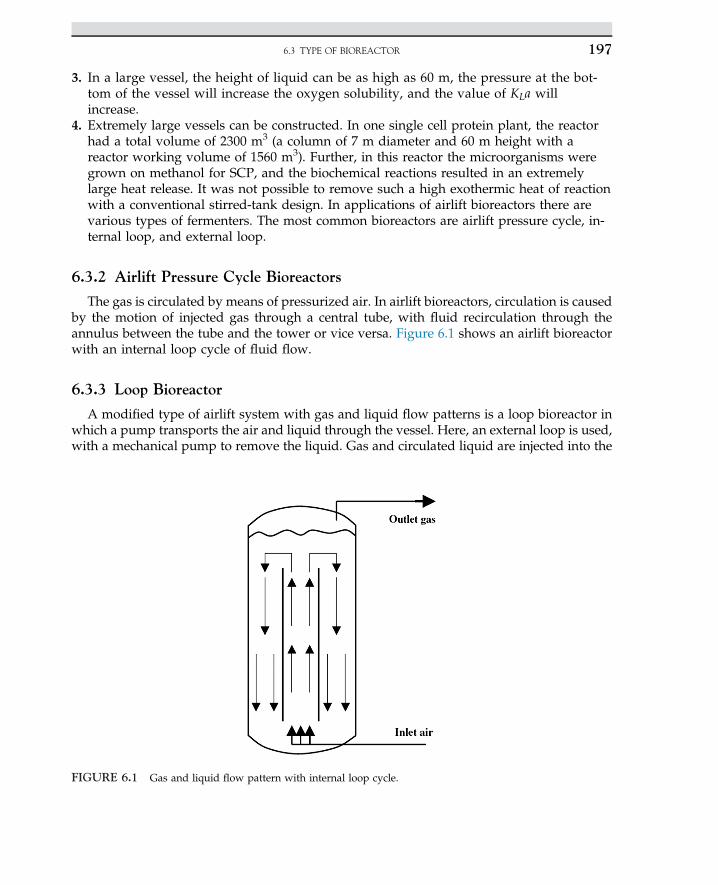
3. In a large vessel, the height of liquid can be as high as 60 m, the pressure at the bot-tom of the vessel will increase the oxygen solubility, and the value of KLa willincrease.
4. Extremely large vessels can be constructed. In one single cell protein plant, the reactorhad a total volume of 2300 m3 (a column of 7 m diameter and 60 m height with areactor working volume of 1560 m3). Further, in this reactor the microorganisms weregrown on methanol for SCP, and the biochemical reactions resulted in an extremelylarge heat release. It was not possible to remove such a high exothermic heat of reactionwith a conventional stirred-tank design. In applications of airlift bioreactors there arevarious types of fermenters. The most common bioreactors are airlift pressure cycle, in-ternal loop, and external loop.
6.3.2 Airlift Pressure Cycle Bioreactors
The gas is circulated by means of pressurized air. In airlift bioreactors, circulation is causedby the motion of injected gas through a central tube, with fluid recirculation through theannulus between the tube and the tower or vice versa. Figure 6.1 shows an airlift bioreactorwith an internal loop cycle of fluid flow.
6.3.3 Loop Bioreactor
A modified type of airlift system with gas and liquid flow patterns is a loop bioreactor inwhich a pump transports the air and liquid through the vessel. Here, an external loop is used,with a mechanical pump to remove the liquid. Gas and circulated liquid are injected into the
FIGURE 6.1 Gas and liquid flow pattern with internal loop cycle.
6.3 TYPE OF BIOREACTOR 197
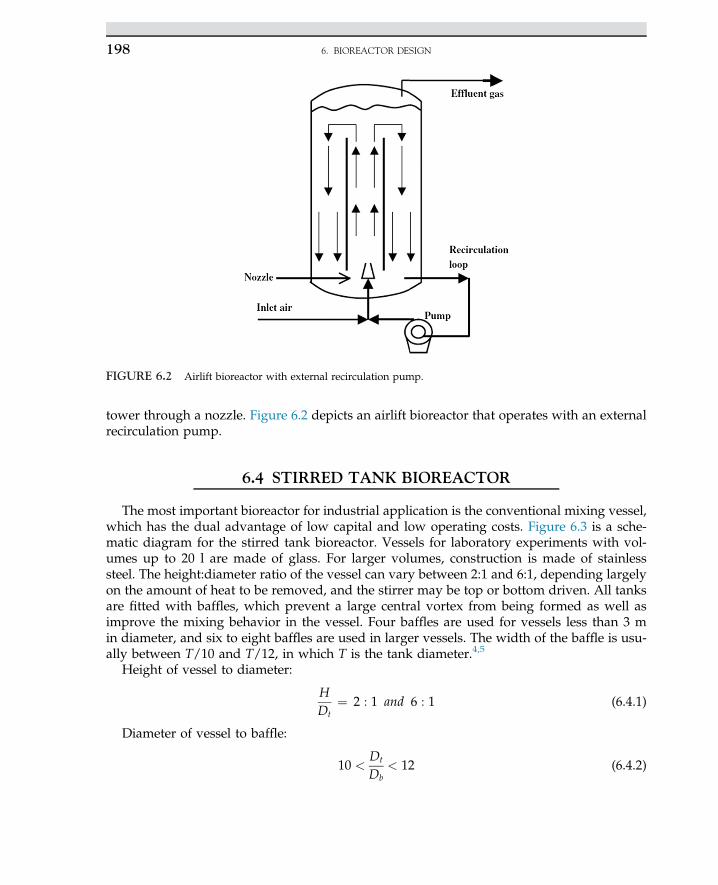
tower through a nozzle. Figure 6.2 depicts an airlift bioreactor that operates with an externalrecirculation pump.
6.4 STIRRED TANK BIOREACTOR
The most important bioreactor for industrial application is the conventional mixing vessel,which has the dual advantage of low capital and low operating costs. Figure 6.3 is a sche-matic diagram for the stirred tank bioreactor. Vessels for laboratory experiments with vol-umes up to 20 l are made of glass. For larger volumes, construction is made of stainlesssteel. The height:diameter ratio of the vessel can vary between 2:1 and 6:1, depending largelyon the amount of heat to be removed, and the stirrer may be top or bottom driven. All tanksare fitted with baffles, which prevent a large central vortex from being formed as well asimprove the mixing behavior in the vessel. Four baffles are used for vessels less than 3 min diameter, and six to eight baffles are used in larger vessels. The width of the baffle is usu-ally between T/10 and T/12, in which T is the tank diameter.4,5
Height of vessel to diameter:
HDt
¼ 2 : 1 and 6 : 1 (6.4.1)
Diameter of vessel to baffle:
10 <Dt
Db< 12 (6.4.2)
FIGURE 6.2 Airlift bioreactor with external recirculation pump.
6. BIOREACTOR DESIGN198
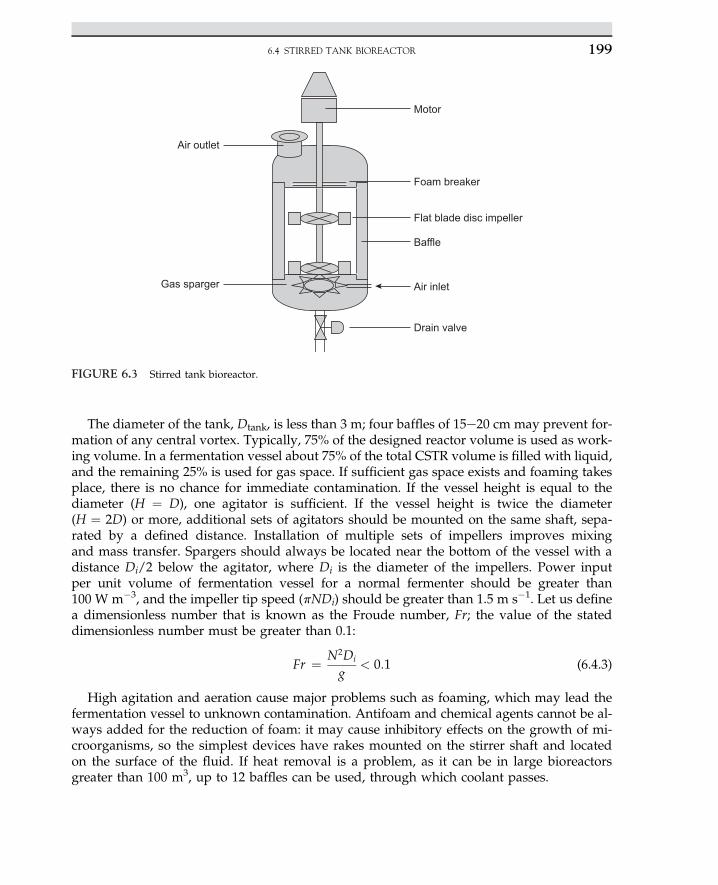
The diameter of the tank, Dtank, is less than 3 m; four baffles of 15e20 cm may prevent for-mation of any central vortex. Typically, 75% of the designed reactor volume is used as work-ing volume. In a fermentation vessel about 75% of the total CSTR volume is filled with liquid,and the remaining 25% is used for gas space. If sufficient gas space exists and foaming takesplace, there is no chance for immediate contamination. If the vessel height is equal to thediameter (H ¼ D), one agitator is sufficient. If the vessel height is twice the diameter(H ¼ 2D) or more, additional sets of agitators should be mounted on the same shaft, sepa-rated by a defined distance. Installation of multiple sets of impellers improves mixingand mass transfer. Spargers should always be located near the bottom of the vessel with adistance Di/2 below the agitator, where Di is the diameter of the impellers. Power inputper unit volume of fermentation vessel for a normal fermenter should be greater than100 W m�3, and the impeller tip speed (pNDi) should be greater than 1.5 m s�1. Let us definea dimensionless number that is known as the Froude number, Fr; the value of the stateddimensionless number must be greater than 0.1:
Fr ¼ N2Di
g< 0:1 (6.4.3)
High agitation and aeration cause major problems such as foaming, which may lead thefermentation vessel to unknown contamination. Antifoam and chemical agents cannot be al-ways added for the reduction of foam: it may cause inhibitory effects on the growth of mi-croorganisms, so the simplest devices have rakes mounted on the stirrer shaft and locatedon the surface of the fluid. If heat removal is a problem, as it can be in large bioreactorsgreater than 100 m3, up to 12 baffles can be used, through which coolant passes.
Motor
Foam breaker
Flat blade disc impeller
Baffle
Air inlet
Drain valve
Air outlet
Gas sparger
FIGURE 6.3 Stirred tank bioreactor.
6.4 STIRRED TANK BIOREACTOR 199
Careful consideration must be given to agitator design within a bioreactor because it con-trols the operation of the bioreactor.
The most common type of agitator used is the four-bladed disk turbine. However, researchon the hydrodynamics of the system has shown that other disk turbine agitators with 12, 18,or concave blades have advantages.
Considerable research has been undertaken in gas/liquid systems with no solids presentand where shear is not a problem. In systems that are shear sensitive and where solids arepresent, there are advantages in using an inclined bladed turbine. The number of agitatorsmounted on the shaft will be dependent on the height of liquid in the vessel. For specificationof the correct number of agitators on the shaft, the height of liquid in the vessel should beequal to liquid height. Desired mixing with one set of agitators may occur. If the height ofliquid is two or three times that of the tank diameter (H ¼ 2T or 3T), additional agitatorsshould be mounted on the same shaft. The sets of impellers are separated by a distance 4;then 4 ¼ T, where T represents tank diameter. Installation of multisets of impellers improvesmixing and enhances mass transfer.
High turbulence is required for efficient mixing; this is created by the vortex field whichforms behind the blades. For all the gas to flow through this region it must enter the vesselclose to and preferably underneath the disk; hence it is recommended that spargers shouldalways be placed near the impellers. The location is about a distance of Di/2 below theagitator, where Di is the impeller diameter.
The centrifugal force will draw the gas into the system, which ensures that sufficient tur-bulence is created. For this, a power input greater than 100 W m�3 is required from theagitator.6 Alternatively, a tip speed (pNDi) greater than 1.5 m s�1 or a Froude number(N2Di/g) greater than 0.1 is often used, where N is the agitator speed in Hz, and g is gravi-tational acceleration in m s�2.
The design of a gas inlet device is of only secondary importance for the capture anddispersal of the gas by the agitator. For efficient mass transfer, a multiple-orifice ring spargeris generally used with a gas outflow diameter of 3Di/4. However, it is only slightly betterthan a single open-pipe sparging located centrally beneath the disk.
Foaming is often a problem in large-scale aerated systems. Antifoam cannot always beadded for the disappearance of foam because it may interfere with the living system andinhibit the growth of microorganisms. However, there are several mechanical methods bywhich the foam can be broken up. The simplest devices have rakes mounted on the stirrershaft located on the surface of the liquid. A more sophisticated device is the “Funda-foam sys-tem,” in which the foam is destroyed by centrifugal forces. The nutrient solution held in thefoam flows back into the bioreactor, and the air released from the foam leaves the vessel.
There should be a minimum number of openings in the bioreactor so that sterility can bemaintained. Small openings must be made leak proof with an O-ring, and larger openingsfitted with gaskets. One of the most difficult areas to seal effectively is the point where theagitator shaft passes into the vessel; here a double mechanical shaft seal should be fitted. Ifpossible the joints of all the parts connected within the sterile vessel as well as all of the pipesboth inside and outside the bioreactor should be welded. There should not be any directconnection between the nonsterile and the sterile area; that is, sampling devices and injectionports must be accommodated in steam-sterilization closures. Most often, steam is applied toensure the sterilized condition in sampling points.
6. BIOREACTOR DESIGN200
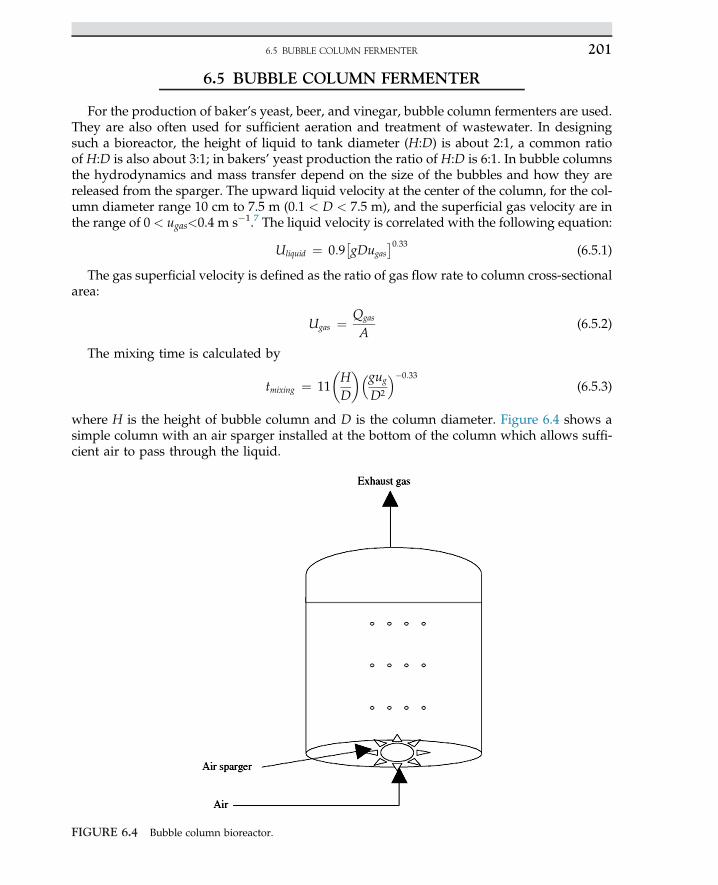
6.5 BUBBLE COLUMN FERMENTER
For the production of baker’s yeast, beer, and vinegar, bubble column fermenters are used.They are also often used for sufficient aeration and treatment of wastewater. In designingsuch a bioreactor, the height of liquid to tank diameter (H:D) is about 2:1, a common ratioof H:D is also about 3:1; in bakers’ yeast production the ratio of H:D is 6:1. In bubble columnsthe hydrodynamics and mass transfer depend on the size of the bubbles and how they arereleased from the sparger. The upward liquid velocity at the center of the column, for the col-umn diameter range 10 cm to 7.5 m (0.1 < D < 7.5 m), and the superficial gas velocity are inthe range of 0 < ugas<0.4 m s�1.7 The liquid velocity is correlated with the following equation:
Uliquid ¼ 0:9�gDugas
�0:33 (6.5.1)
The gas superficial velocity is defined as the ratio of gas flow rate to column cross-sectionalarea:
Ugas ¼ Qgas
A(6.5.2)
The mixing time is calculated by
tmixing ¼ 11�HD
��gug
D2
��0:33(6.5.3)
where H is the height of bubble column and D is the column diameter. Figure 6.4 shows asimple column with an air sparger installed at the bottom of the column which allows suffi-cient air to pass through the liquid.
FIGURE 6.4 Bubble column bioreactor.
6.5 BUBBLE COLUMN FERMENTER 201
6.6 AIRLIFT BIOREACTORS
In an airlift fermenter, mixing is accomplished without any mechanical agitation. An airliftfermenter is used for tissue culture, because the tissues are shear sensitive and normal mixingis not possible. With the airlift, because the shear levels are significantly lower than the stirredvessels, it is suitable for tissue culture. The gas is sparged only up to the part of the vesselcross-section called the riser. Gas is held up; fluid density decreases causing liquid in the riserto move upward and the bubble-free liquid to circulate through the down-comer. The liquidcirculates in airlift reactors as a result of the density difference between riser and down-comer.
There are many forms of airlift bioreactors. In the usual form, air is fed into the bottom of acentral draught tube through a sparger ring, so reducing the apparent density of the liquid inthe tube relative to the annular space within the bioreactor. The flow passes up through thedraught tube to the head space of the bioreactor, where the excess air and the by-product,CO2, disengage. The degassed liquid then flows down the annular space outside the draftto the bottom of the bioreactor. In general, airlift bioreactors have the following features:
• Internal-loop vessels• Draft tubes• External loop or outer loop.
The cooling duty can be provided either by making the draught tube an internal heatexchanger or with a heat exchanger in an external circulation loop. The mass transfer coeffi-cient for an external loop airlift fermenter is estimated by the following correlations8:
KLa < 0:32u0:7g (6.6.1)
The height of airlift reactors is typically about 10 times the diameter of the column (H¼ 10D).For deep-shaft systems the ratio of H:D is about 100. For large fermenters (500 m3), abubble column is an attractive choice, because it is simple and cheap to operate. The maindisadvantages of airlift reactors are:
1. High capital cost for large-scale vessels.2. High energy costs. Although an agitator is not required, a greater air throughput is
necessary, and the air must be at a higher pressure, particularly on a large scale. Inaddition, the efficiency of gas compression is low.
3. As the microorganisms circulate through the bioreactor, the conditions change, and it isimpossible to maintain consistent levels of carbon source, nutrients, and oxygenthroughout the vessel.
4. The separation of gas from the liquid is not very efficient when foam is present. In thedesign of an airlift bioreactor, these disadvantages must be minimized. If the feed comesin at only one location, the organism would experience continuous cycles of highgrowth, followed by starvation. This would result in the production of undesirable by-products, low yields, and high death rates. Therefore, particularly on a large scale, mul-tiple feed points should be used. Similarly, air should be admitted at various points upthe column. However, the air must mainly enter from the bottom to circulate the fluidthrough the reactor.
6. BIOREACTOR DESIGN202
6.7 HEAT TRANSFER
The temperature in a vessel can be controlled by removing heat by means of water circu-lating through a jacket on the outside of the vessel and/or by passing the water through hol-low baffles situated in the vessel. With an airlift bioreactor the heat can be removed throughthe hollow draught tube. The rate at which heat is transferred is given by
Q ¼ UADT (6.7.1)
where Q is heat transferred in W, U is the overall heat transfer coefficient in W m�2 K�1, A isthe surface area for heat transfer in m2, and DT is the log mean temperature; in approximationthat is the temperature difference between media and cooling water in K. The coefficient Umay represent the conductivity of the system, which depends on the system geometry, fluidproperties, flow velocity, wall material, and thickness. The overall resistance to heat transferis the reciprocal of the overall heat transfer coefficient. It is defined as the sum of the individ-ual resistances to heat transfer as heat passes from one fluid to another, and can be written as
1U
¼ 1ho
þ 1hiþ 1hof
þ 1hif
þ 1hw
(6.7.2)
where, ho is the outside film coefficient, hi is the inside film coefficient, hof is the outsidefouling film coefficient, hif is the inside fouling film coefficient, hw is the wall heat transfer co-efficient (which is k/x), k is the thermal conductivity of the wall, and x is the wall thickness inm. The units for all film coefficients are W m�2 K�1. This equation is applicable for all casesexcept a thick-walled tube where a correction factor must be used. The outside and insidefilm coefficients can be evaluated from semiempirical correlations of the form
Nu ¼ kðReÞaðPrÞb (6.7.3)
where Nu is Nusselt number, the ratio of convective to conductive heat transfer coefficients.The terms k, a, and b are constants. Re is Reynolds number, which is the ratio of inertialover viscous forces, and Pr is Prandtl number, which is the ratio of kinematic viscosityover the thermal diffusivity. The dimensionless numbers involved in the above correlationare stated as
Nu ¼ hDt
k(6.7.4)
Re ¼ DiVr
mor
D2i Nr
m(6.7.5)
Pr ¼ Cpm
k¼ y
a(6.7.6)
where Dt is the vessel diameter, Di is the impeller diameter, all in m; r is the density inkg m�3, m is the viscosity in kg m�1 s�1, g the kinematic viscosity in m2 s�1, k is the thermalconductivity in W m�1 K�1, h is the convective heat transfer coefficient in W m�2 K�1, Cp isthe specific heat in J kg�1 K�1, a is the thermal diffusivity in m2 s�1, V is the velocity inm s�1, and N is the impeller speed in Hz. The above equation applies to turbulent
6.7 HEAT TRANSFER 203
conditions for Newtonian fluids. In stirred-tank bioreactors, normally turbulent conditionsare attained. However, non-Newtonian behavior can occur, especially if polysaccharidespass into the broth. An extensive literature survey of heat transfer correlations for bothNewtonian and non-Newtonian single-phase systems has been introduced by many re-searchers. They have shown that for holdups of less than 15%, the rates of heat transferwith gas addition are very close to the values obtained without gas addition.8,9 Gas holdupis defined as the volume of gas in the vessel per vessel volume, and can be calculated withthe equation
ε ¼ K�Pg
VL
�0:48
ðvsÞ0:4 (6.7.7)
where Pg is power consumed by gassed liquid in W, VL is liquid volume without gassing, ns isthe superficial gas velocity in m s�1, and K is a constant. Other correlations for gas holdup aredefined in the literature.10,11
The calculation of heat transfer film coefficients in an airlift bioreactor is more complex, assmall reactors may operate under laminar flow conditions whereas large-scale vessels operateunder turbulent flow conditions. It has been found that under laminar flow conditions, thefermentation broths show non-Newtonian behavior, so the heat transfer coefficient can beevaluated with a modified form of the equation known as the GraetzeLeveque equation,9
Nu ¼ 1:75d0:33Gz0:33 (6.7.8)
where d is correction for non-Newtonian behavior equal to (3nþ1)/4n, where n is the flowbehavior index of power-law fluid. Gz is the Graetz number, a dimensionless number relatedto mass flow rate, heat capacity, and conductive heat transfer coefficient.
Gz ¼ m,Cp
kL(6.7.9)
where m, is the mass flow rate of fluid in the tube in kg se1, and Cp is specific heat inJ kg�1 K�1, k is thermal conductivity in W m�1 K�1, and L is the length along the tube inm. This equation is most accurately applied in the initial stages of the bioreactor. In laterstages growing Xanthmonas campestris, the value of the film coefficients were up to 45% lowerthan predicted by the GraetzeLeveque equation, because of fouling of the heat transfer sur-face. However, with Aspergillus niger, values of up to four times those predicted by the non-Newtonian form of GraetzeLeveque equation were observed. The enhancement was foundto be dependent on cell concentration and morphology of the microorganisms. That wasprobably due to the increased turbulence of the boundary layer caused by the aggregatedmycelial. The overall heat transfer coefficient is dependent on the agitation rate in the vessel,throughput of the liquid and gas in an airlift bioreactor, and the rate of circulation of coolingwater in the jacket. The expected value of the overall heat transfer coefficient including allresistance for a nonfouling system should be in the range of 500e1500 W m�2 K�1. In caseof any problems, for instance, mammal and plant cells, which are shear sensitive the vesselside turbulence must be reduced; consequently, the heat transfer coefficient will be lowered.In such cases, the heat transfer will increase only by providing more heat transfer area. Addi-tional effective surface area can be obtained by having a vessel with a large height:diameter
6. BIOREACTOR DESIGN204
ratio, because the volume of a vessel is proportional to the height multiplied by the cross-sectional area, whereas the surface area is the external area of the vessel that is aHD, wherea is the proportionality factor. Where the total heat transferred must be calculated, the powerof the agitator should be included, because a considerable amount of energy is converted toheat in the vessel.
Small temperature differences, DT, in a bioreactor are usually easily stabilized, unlessrefrigerated cooling water is used; which means that the product of overall heat transfer co-efficient and the heat transfer area, “UA,” must be large. Therefore, the heat transfer areacan be maximized by having cooling water in the baffles as well as in the jacket of thebioreactor.
6.8 DESIGN EQUATIONS FOR CSTR FERMENTER
In designing a bioreactor, material balance is used for all the streams associated with thefermentation vessel. The biomass at inlet and outlet and the generated biomass must bebalanced while the fermentation proceeds. The cell balance without any cell accumulationis shown in the equation
FðX0 � XÞ þ Vrx ¼ 0 (6.8.1)
where X is viable cell in the effluent stream and X0 is viable cell in the feed stream, F is thevolumetric flow rate, V is the reactor working volume, and rx is the rate of cell formation perunit volume. The rate equation is explained in detail by a Monod rate model. The Monod rateequation is well known in microbial growth kinetics.
m ¼ mmaxSKs þ S
(6.8.2)
where m is the specific growth rate, mmax is the maximum specific growth rate, and KS is theMonod constant.
6.8.1 Monod Model for a Chemostat
AMonod rate model is used to demonstrate the rate of biomass generation. We neglect thecell death rate. Let us denote the ratio of biomass rate of generation to biomass concentration,rx/X, that is, the specific growth rate; m also denotes the dilution rate; D is defined as numberof tank volumes passed through per unit time, F/V. After substitution of D and m into Eqn(6.8.1), the following equation is obtained:
DXo ¼ ðD� mÞX (6.8.1.1)
Substituting specific growth rate based on the Monod rate equation into Eqn (6.8.2), therearranging results in �
mmaxSKs þ S
�D�X þDX0 ¼ 0 (6.8.1.2)
6.8 DESIGN EQUATIONS FOR CSTR FERMENTER 205
For sterile media with suitable nutrients in the absence of any organisms.
Xo ¼ 0; 0 ¼ ðD� mÞXBiomass generated is considered as Xs0; therefore Dem ¼ 0.
D ¼ m (6.8.1.3)
At steady state, substrate utilization is balanced with a rate equation:
FðSi � SÞ ¼�mmaxSKS þ S
�V (6.8.1.4)
When the volume of the vessel is divided by the flow rate, retention time and dilution rateare defined in the following equation:
VF
¼ s ¼ 1D
(6.8.1.5)
Plug in Eqn (6.8.1.5) to Eqn (6.8.1.4):
DðSi � SÞ ¼�mmaxSKS þ S
�(6.8.1.6)
Solve Eqn (6.8.1.6) for dilution rate or substrate concentration, as follows:�mmaxSKs þ S
�¼ D or S ¼ DKs
mmax �D(6.8.1.7)
Material balance in terms of cell density is written as
drcelldt
¼ FVðri � roÞ þ ðm� aÞrcell (6.8.1.8)
Under steady-state conditions, dr=dt ¼ 0 for a sterile fermenter, inlet cell mass is zero(ri ¼ 0), Eqn (6.8.1.8) is simplified and reduced to dilution rate, which is similar to Eqn(6.8.1.3) above. Substrate balance may also lead to the same results as the followingrelations:
dSdt
¼ FVðSi � SÞ � mrcell
Yield of cell�mrcell �
qPrcellYP=s
(6.8.1.9)
Under steady-state conditions, where dS=dt ¼ 0 and mrcell << mrcell/Y, Eqn (6.8.1.9) canbe simplified and leads to substrate balance with growth rate:
DðSo � SÞ ¼ mrcell
Y(6.8.1.10)
For the special case when m ¼ D, the substrate balance equation reduces to yield of sub-strate to cell biomass:
rcell ¼ YðSi � SÞ (6.8.1.11)
6. BIOREACTOR DESIGN206
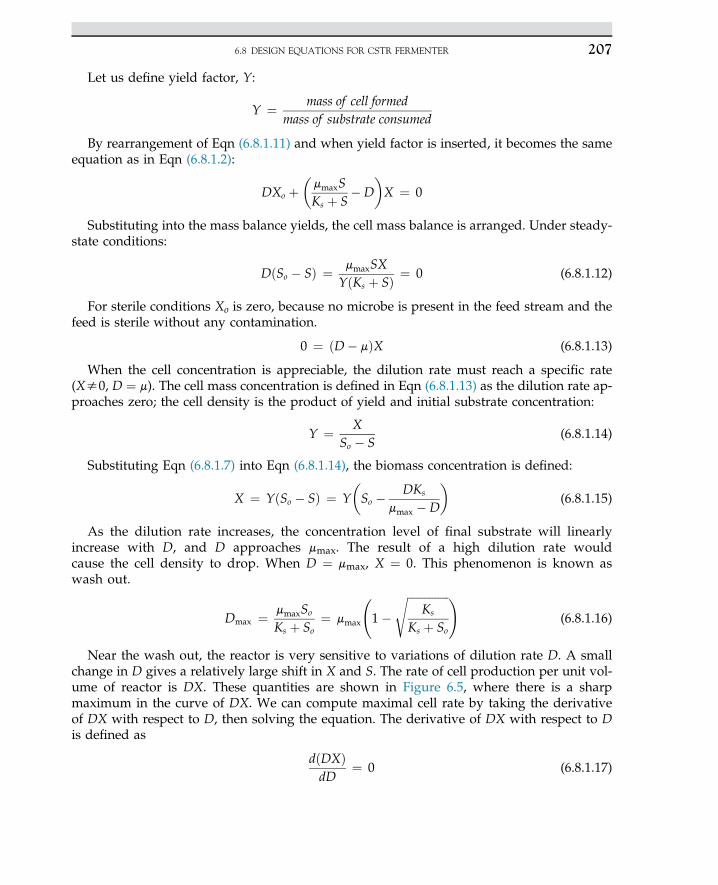
Let us define yield factor, Y:
Y ¼ mass of cell formedmass of substrate consumed
By rearrangement of Eqn (6.8.1.11) and when yield factor is inserted, it becomes the sameequation as in Eqn (6.8.1.2):
DXo þ�mmaxSKs þ S
�D�X ¼ 0
Substituting into the mass balance yields, the cell mass balance is arranged. Under steady-state conditions:
DðSo � SÞ ¼ mmaxSXYðKs þ SÞ ¼ 0 (6.8.1.12)
For sterile conditions Xo is zero, because no microbe is present in the feed stream and thefeed is sterile without any contamination.
0 ¼ ðD� mÞX (6.8.1.13)
When the cell concentration is appreciable, the dilution rate must reach a specific rate(Xs0, D ¼ m). The cell mass concentration is defined in Eqn (6.8.1.13) as the dilution rate ap-proaches zero; the cell density is the product of yield and initial substrate concentration:
Y ¼ XSo � S
(6.8.1.14)
Substituting Eqn (6.8.1.7) into Eqn (6.8.1.14), the biomass concentration is defined:
X ¼ YðSo � SÞ ¼ Y�So � DKs
mmax �D
�(6.8.1.15)
As the dilution rate increases, the concentration level of final substrate will linearlyincrease with D, and D approaches mmax. The result of a high dilution rate wouldcause the cell density to drop. When D ¼ mmax, X ¼ 0. This phenomenon is known aswash out.
Dmax ¼ mmaxSo
Ks þ So¼ mmax
1�
ffiffiffiffiffiffiffiffiffiffiffiffiffiffiffiKs
Ks þ So
s !(6.8.1.16)
Near the wash out, the reactor is very sensitive to variations of dilution rate D. A smallchange in D gives a relatively large shift in X and S. The rate of cell production per unit vol-ume of reactor is DX. These quantities are shown in Figure 6.5, where there is a sharpmaximum in the curve of DX. We can compute maximal cell rate by taking the derivativeof DX with respect to D, then solving the equation. The derivative of DX with respect to Dis defined as
dðDXÞdD
¼ 0 (6.8.1.17)
6.8 DESIGN EQUATIONS FOR CSTR FERMENTER 207
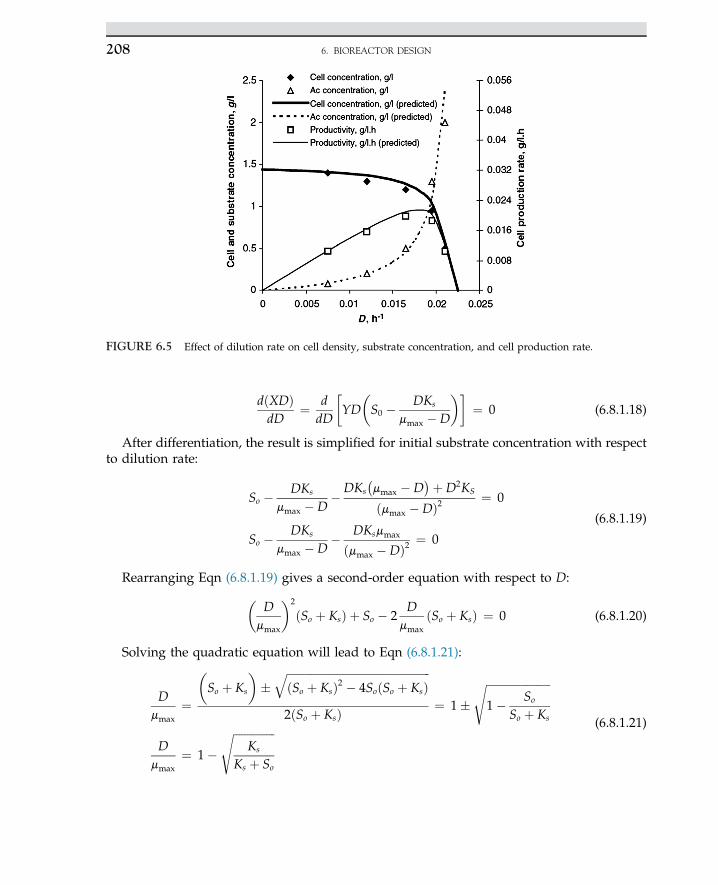
dðXDÞdD
¼ ddD
YD�S0 � DKs
mmax �D
�¼ 0 (6.8.1.18)
After differentiation, the result is simplified for initial substrate concentration with respectto dilution rate:
So � DKs
mmax �D�DKs
�mmax �D
�þD2KS
ðmmax �DÞ2 ¼ 0
So � DKs
mmax �D� DKsmmax
ðmmax �DÞ2 ¼ 0
(6.8.1.19)
Rearranging Eqn (6.8.1.19) gives a second-order equation with respect to D:�D
mmax
�2
ðSo þ KsÞ þ So � 2D
mmax
ðSo þ KsÞ ¼ 0 (6.8.1.20)
Solving the quadratic equation will lead to Eqn (6.8.1.21):
Dmmax
¼
�So þ Ks
��
ffiffiffiffiffiffiffiffiffiffiffiffiffiffiffiffiffiffiffiffiffiffiffiffiffiffiffiffiffiffiffiffiffiffiffiffiffiffiffiffiffiffiffiffiffiffiffiffiffiffiffiffiðSo þ KsÞ2 � 4SoðSo þ KsÞ
q2ðSo þ KsÞ ¼ 1�
ffiffiffiffiffiffiffiffiffiffiffiffiffiffiffiffiffiffiffiffiffiffiffi1� So
So þ Ks
s
Dmmax
¼ 1�ffiffiffiffiffiffiffiffiffiffiffiffiffiffiffi
Ks
Ks þ So
s (6.8.1.21)
FIGURE 6.5 Effect of dilution rate on cell density, substrate concentration, and cell production rate.
6. BIOREACTOR DESIGN208
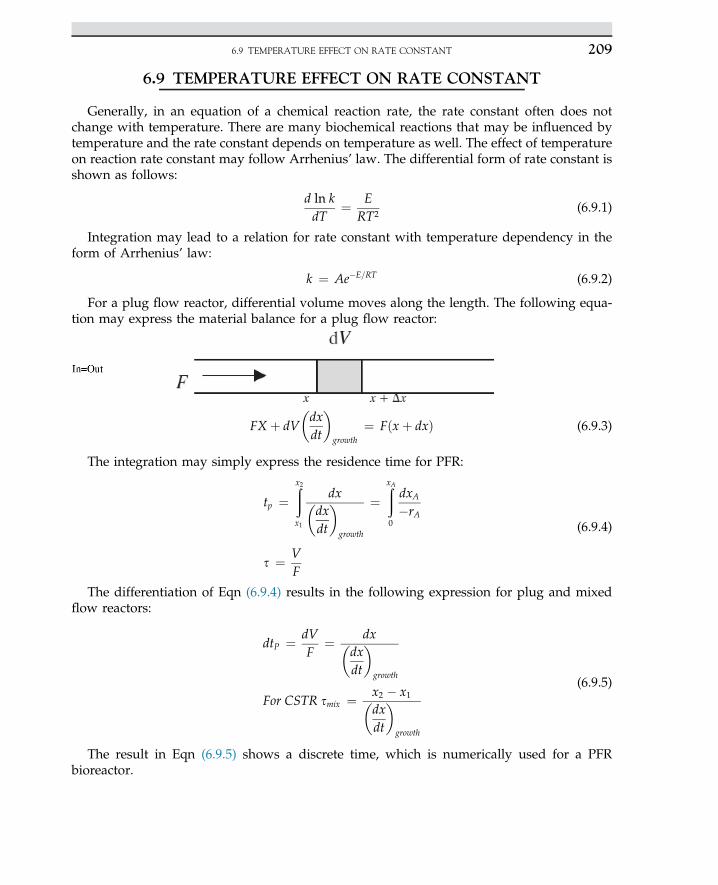
6.9 TEMPERATURE EFFECT ON RATE CONSTANT
Generally, in an equation of a chemical reaction rate, the rate constant often does notchange with temperature. There are many biochemical reactions that may be influenced bytemperature and the rate constant depends on temperature as well. The effect of temperatureon reaction rate constant may follow Arrhenius’ law. The differential form of rate constant isshown as follows:
d ln kdT
¼ ERT2
(6.9.1)
Integration may lead to a relation for rate constant with temperature dependency in theform of Arrhenius’ law:
k ¼ Ae�E=RT (6.9.2)
For a plug flow reactor, differential volume moves along the length. The following equa-tion may express the material balance for a plug flow reactor:
FX þ dV�dxdt
�growth
¼ Fðxþ dxÞ (6.9.3)
The integration may simply express the residence time for PFR:
tp ¼ðx2x1
dx�dxdt
�growth
¼ðxA0
dxA�rA
s ¼ VF
(6.9.4)
The differentiation of Eqn (6.9.4) results in the following expression for plug and mixedflow reactors:
dtP ¼ dVF
¼ dx�dxdt
�growth
For CSTR smix ¼ x2 � x1�dxdt
�growth
(6.9.5)
The result in Eqn (6.9.5) shows a discrete time, which is numerically used for a PFRbioreactor.
6.9 TEMPERATURE EFFECT ON RATE CONSTANT 209
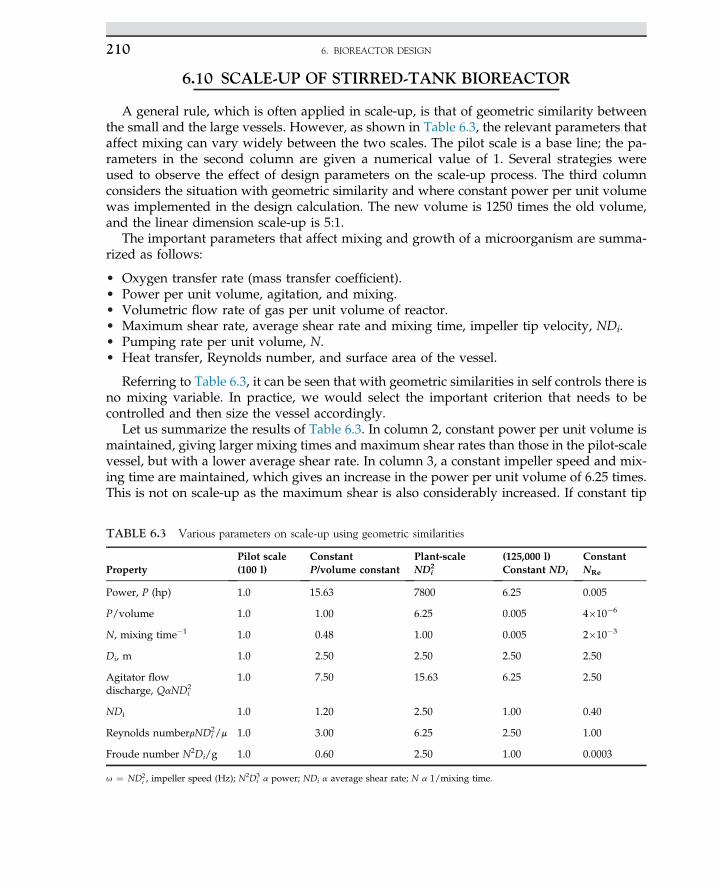
6.10 SCALE-UP OF STIRRED-TANK BIOREACTOR
A general rule, which is often applied in scale-up, is that of geometric similarity betweenthe small and the large vessels. However, as shown in Table 6.3, the relevant parameters thataffect mixing can vary widely between the two scales. The pilot scale is a base line; the pa-rameters in the second column are given a numerical value of 1. Several strategies wereused to observe the effect of design parameters on the scale-up process. The third columnconsiders the situation with geometric similarity and where constant power per unit volumewas implemented in the design calculation. The new volume is 1250 times the old volume,and the linear dimension scale-up is 5:1.
The important parameters that affect mixing and growth of a microorganism are summa-rized as follows:
• Oxygen transfer rate (mass transfer coefficient).• Power per unit volume, agitation, and mixing.• Volumetric flow rate of gas per unit volume of reactor.• Maximum shear rate, average shear rate and mixing time, impeller tip velocity, NDi.• Pumping rate per unit volume, N.• Heat transfer, Reynolds number, and surface area of the vessel.
Referring to Table 6.3, it can be seen that with geometric similarities in self controls there isno mixing variable. In practice, we would select the important criterion that needs to becontrolled and then size the vessel accordingly.
Let us summarize the results of Table 6.3. In column 2, constant power per unit volume ismaintained, giving larger mixing times and maximum shear rates than those in the pilot-scalevessel, but with a lower average shear rate. In column 3, a constant impeller speed and mix-ing time are maintained, which gives an increase in the power per unit volume of 6.25 times.This is not on scale-up as the maximum shear is also considerably increased. If constant tip
TABLE 6.3 Various parameters on scale-up using geometric similarities
PropertyPilot scale(100 l)
ConstantP/volume constant
Plant-scaleNDi
2(125,000 l)Constant NDi
ConstantNRe
Power, P (hp) 1.0 15.63 7800 6.25 0.005
P/volume 1.0 1.00 6.25 0.005 4�10�6
N, mixing time�1 1.0 0.48 1.00 0.005 2�10�3
Di, m 1.0 2.50 2.50 2.50 2.50
Agitator flowdischarge, QaNDi
21.0 7.50 15.63 6.25 2.50
NDi 1.0 1.20 2.50 1.00 0.40
Reynolds numberrNDi2/m 1.0 3.00 6.25 2.50 1.00
Froude number N2Di/g 1.0 0.60 2.50 1.00 0.0003
u ¼ ND2i , impeller speed (Hz); N2Di
3 a power; NDi a average shear rate; N a 1/mixing time.
6. BIOREACTOR DESIGN210
velocity is maintained, as shown in column 4, the power per unit volume is drasticallydecreased and consequently the mass transfer rate of oxygen to microorganisms. In all ofthese scale-up calculations, the Reynolds number is increased. In column 5, an attemptwas made to maintain a constant Reynolds number, which resulted in a dramatic fall inthe power requirement and an increase in mixing time. The extremely low Reynolds numbercaused very low agitation and low power input. This is usually not a practical situation, andgenerally the Reynolds number always increases in the scale-up process. The special criteriachosen for the scale-up process are based on three concepts:
• Constant power/unit volume.• Constant gas flow rate/unit volume.• Geometric similarity of the vessel.
These criteria have been found to give comparable growth and product rates comparedwith the pilot-scale operation. If we need to control maximum shear, the value of NDi shouldbe the same in both the pilot- and the large-scale vessels.
EXAMPLE 1A bacterial fermentation was carried out in a reactor containing broth with average
density r ¼ 1200 kgm�3 and viscosity 0.02 N s m�2. The broth was agitated at 90 rpm and airwas introduced through the sparger at a flow rate of 0.4 vvm. The fermenter was equippedwith two sets of flat blade turbine impellers and four baffles. The dimensions of vessel,impellers, and baffle width were as follows:
Tank diameter, Dt ¼ 4 m;Impeller diameter, Di ¼ 2 m;Baffle width, Wb ¼ 0.4 m;Also, the liquid depth was H ¼ 6.5 m.Determine: (a) ungassed power, P; (b) gassed power, Pg; (c) KLa; (d) gas holdup.
SolutionLet us define the ratio of tank diameter to impeller diameter:
Dt
Di¼ 4
2¼ 2 (E.1.1)
Also, the ratio of the height of the liquid level to impeller diameter is:
HL
Di¼ 6:5
2¼ 3:25 (E.1.2)
n ¼ 90 rpm60
¼ 1:5 rps (E.1.3)
Now define the Reynolds number:
NRe ¼ ND2i r
m¼ ð1:5Þð2Þ2ð1200Þ
0:02¼ 3:6� 105 (E.1.4)
6.10 SCALE-UP OF STIRRED-TANK BIOREACTOR 211
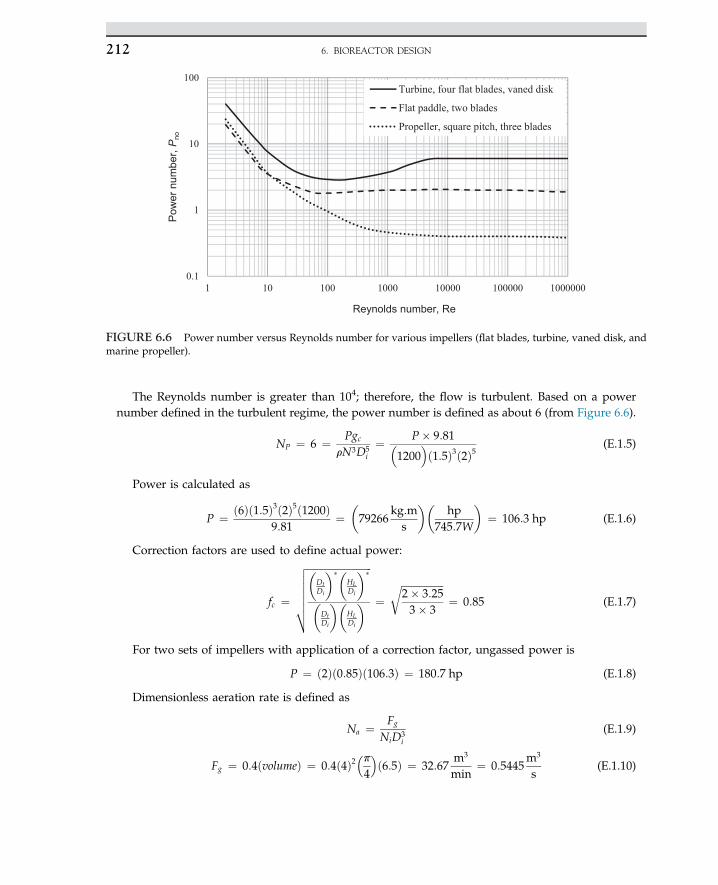
The Reynolds number is greater than 104; therefore, the flow is turbulent. Based on a powernumber defined in the turbulent regime, the power number is defined as about 6 (from Figure 6.6).
NP ¼ 6 ¼ PgcrN3D5
i¼ P� 9:81�
1200�ð1:5Þ3ð2Þ5
(E.1.5)
Power is calculated as
P ¼ ð6Þð1:5Þ3ð2Þ5ð1200Þ9:81
¼�79266
kg:ms
��hp
745:7W
�¼ 106:3 hp (E.1.6)
Correction factors are used to define actual power:
fc ¼
ffiffiffiffiffiffiffiffiffiffiffiffiffiffiffiffiffiffiffiffiffiffiffiffiffiffi�DtDi
���HLDi
��
�DtDi
��HLDi
�vuuuuut ¼
ffiffiffiffiffiffiffiffiffiffiffiffiffiffiffiffiffi2� 3:253� 3
r¼ 0:85 (E.1.7)
For two sets of impellers with application of a correction factor, ungassed power is
P ¼ ð2Þð0:85Þð106:3Þ ¼ 180:7 hp (E.1.8)
Dimensionless aeration rate is defined as
Na ¼ Fg
NiD3i
(E.1.9)
Fg ¼ 0:4ðvolumeÞ ¼ 0:4ð4Þ2�p4
�ð6:5Þ ¼ 32:67
m3
min¼ 0:5445
m3
s(E.1.10)
0.1
1
10
100
1 10 100 1000 10000 100000 1000000
Pow
er n
umbe
r, P
no
Reynolds number, Re
Turbine, four flat blades, vaned disk
Flat paddle, two blades
Propeller, square pitch, three blades
FIGURE 6.6 Power number versus Reynolds number for various impellers (flat blades, turbine, vaned disk, andmarine propeller).
6. BIOREACTOR DESIGN212
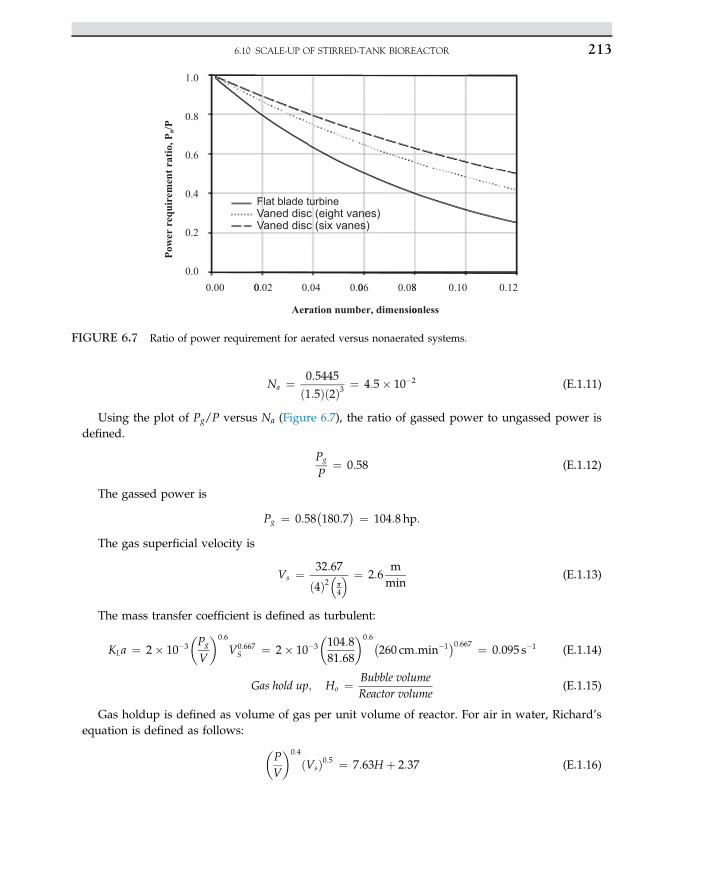
Na ¼ 0:5445
ð1:5Þð2Þ3 ¼ 4:5� 10�2 (E.1.11)
Using the plot of Pg/P versus Na (Figure 6.7), the ratio of gassed power to ungassed power isdefined.
Pg
P¼ 0:58 (E.1.12)
The gassed power is
Pg ¼ 0:58�180:7
� ¼ 104:8 hp:
The gas superficial velocity is
Vs ¼ 32:67
ð4Þ2�p4
� ¼ 2:6mmin
(E.1.13)
The mass transfer coefficient is defined as turbulent:
KLa ¼ 2� 10�3
�Pg
V
�0:6
V0:667S ¼ 2� 10�3
�104:881:68
�0:6�260 cm:min�1�0:667 ¼ 0:095 s�1 (E.1.14)
Gas hold up; Ho ¼ Bubble volumeReactor volume
(E.1.15)
Gas holdup is defined as volume of gas per unit volume of reactor. For air in water, Richard’sequation is defined as follows: �
PV
�0:4
ðVsÞ0:5 ¼ 7:63H þ 2:37 (E.1.16)
Pow
er r
equi
rem
ent r
atio
, Pa/P
1.0
0.8
0.6
0.4
0.2
0.0 0.00 00.02 0.
Aer
.04 0.0
ration numb
06 0.08
er, dimensio
8 0.10
onless
0.12
Flat blade turbineVaned disc (eight vanes)Vaned disc (six vanes)
FIGURE 6.7 Ratio of power requirement for aerated versus nonaerated systems.
6.10 SCALE-UP OF STIRRED-TANK BIOREACTOR 213
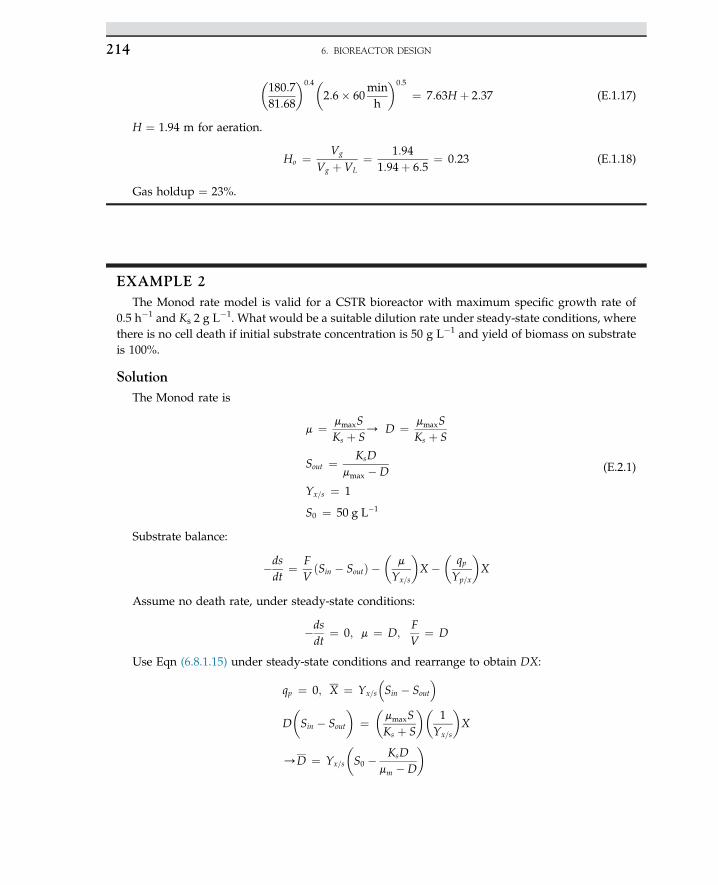
�180:781:68
�0:4�2:6� 60
min
h
�0:5
¼ 7:63H þ 2:37 (E.1.17)
H ¼ 1.94 m for aeration.
Ho ¼ Vg
Vg þ VL¼ 1:94
1:94þ 6:5¼ 0:23 (E.1.18)
Gas holdup ¼ 23%.
EXAMPLE 2The Monod rate model is valid for a CSTR bioreactor with maximum specific growth rate of
0.5 h�1 and Ks 2 g L�1. What would be a suitable dilution rate under steady-state conditions, wherethere is no cell death if initial substrate concentration is 50 g L�1 and yield of biomass on substrateis 100%.
SolutionThe Monod rate is
m ¼ mmaxSKs þ S
/ D ¼ mmaxSKs þ S
Sout ¼ KsDmmax �D
Yx=s ¼ 1
S0 ¼ 50 g L�1
(E.2.1)
Substrate balance:
�dsdt
¼ FVðSin � SoutÞ �
�m
Yx=s
�X �
�qpYp=x
�X
Assume no death rate, under steady-state conditions:
�dsdt
¼ 0; m ¼ D;FV
¼ D
Use Eqn (6.8.1.15) under steady-state conditions and rearrange to obtain DX:
qp ¼ 0; X ¼ Yx=s
�Sin � Sout
�
D�Sin � Sout
�¼�mmaxSKs þ S
��1
Yx=s
�X
/D ¼ Yx=s
�S0 � KsD
mm �D
�
6. BIOREACTOR DESIGN214
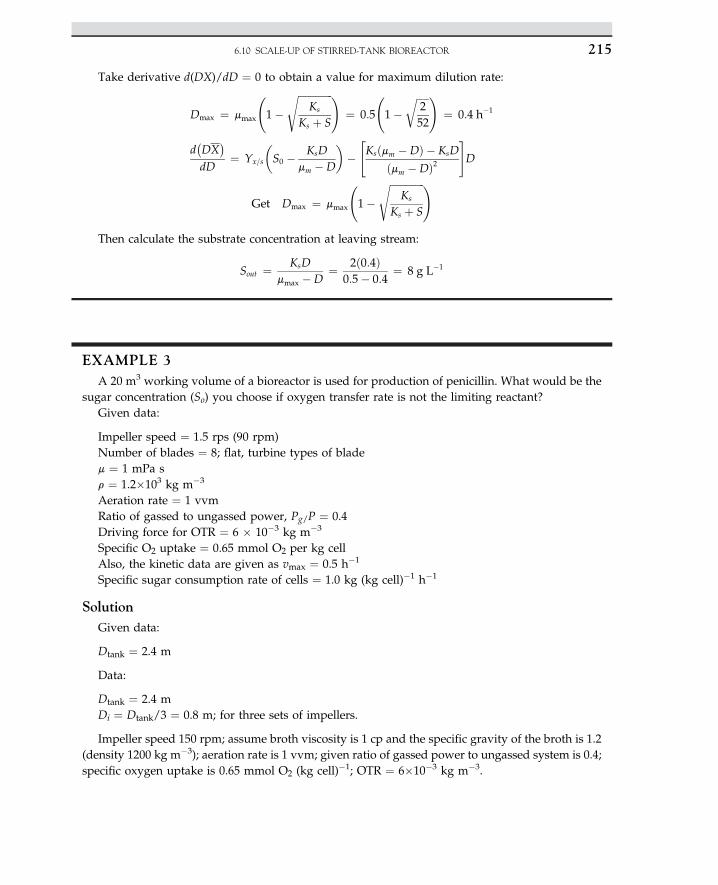
Take derivative d(DX)/dD ¼ 0 to obtain a value for maximum dilution rate:
Dmax ¼ mmax
1�
ffiffiffiffiffiffiffiffiffiffiffiffiffiffiKs
Ks þ S
s !¼ 0:5
1�
ffiffiffiffiffi252
r !¼ 0:4 h�1
d�DX�
dD¼ Yx=s
�S0 � KsD
mm �D
��"Ksðmm �DÞ � KsD
ðmm �DÞ2#D
Get Dmax ¼ mmax
1�
ffiffiffiffiffiffiffiffiffiffiffiffiffiffiKs
Ks þ S
s !
Then calculate the substrate concentration at leaving stream:
Sout ¼ KsDmmax �D
¼ 2ð0:4Þ0:5� 0:4
¼ 8 g L�1
EXAMPLE 3A 20 m3 working volume of a bioreactor is used for production of penicillin. What would be the
sugar concentration (So) you choose if oxygen transfer rate is not the limiting reactant?Given data:
Impeller speed ¼ 1.5 rps (90 rpm)Number of blades ¼ 8; flat, turbine types of bladem ¼ 1 mPa sr ¼ 1.2�103 kg m�3
Aeration rate ¼ 1 vvmRatio of gassed to ungassed power, Pg/P ¼ 0.4Driving force for OTR ¼ 6 � 10�3 kg m�3
Specific O2 uptake ¼ 0.65 mmol O2 per kg cellAlso, the kinetic data are given as vmax ¼ 0.5 h�1
Specific sugar consumption rate of cells ¼ 1.0 kg (kg cell)�1 h�1
SolutionGiven data:
Dtank ¼ 2.4 m
Data:
Dtank ¼ 2.4 mDi ¼ Dtank/3 ¼ 0.8 m; for three sets of impellers.
Impeller speed 150 rpm; assume broth viscosity is 1 cp and the specific gravity of the broth is 1.2(density 1200 kg m�3); aeration rate is 1 vvm; given ratio of gassed power to ungassed system is 0.4;specific oxygen uptake is 0.65 mmol O2 (kg cell)�1; OTR ¼ 6�10�3 kg m�3.
6.10 SCALE-UP OF STIRRED-TANK BIOREACTOR 215
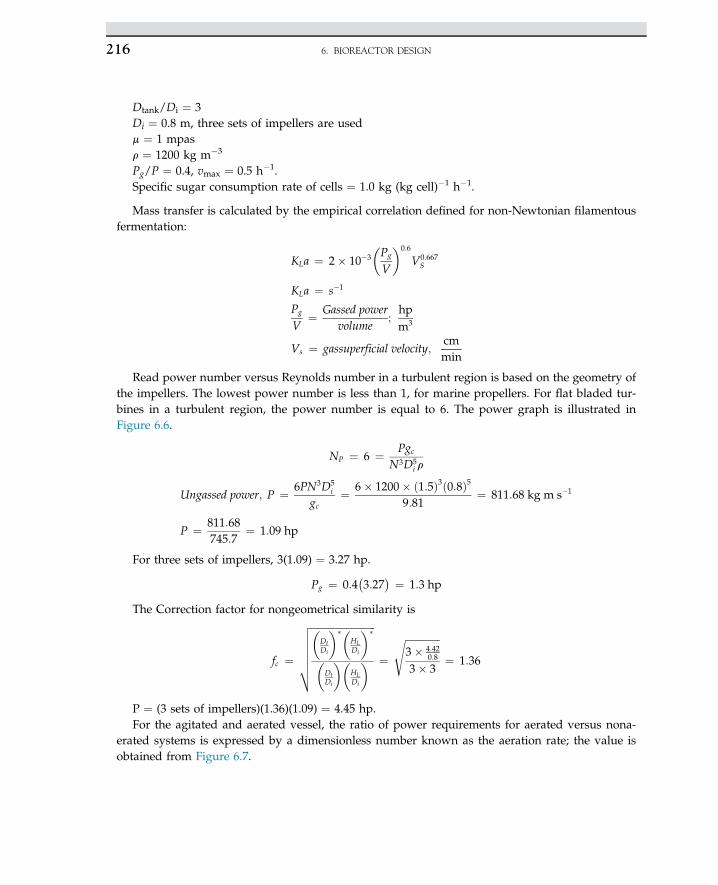
Dtank/Di ¼ 3Di ¼ 0.8 m, three sets of impellers are usedm ¼ 1 mpasr ¼ 1200 kg m�3
Pg/P ¼ 0.4, vmax ¼ 0.5 h�1.Specific sugar consumption rate of cells ¼ 1.0 kg (kg cell)�1 h�1.
Mass transfer is calculated by the empirical correlation defined for non-Newtonian filamentousfermentation:
KLa ¼ 2� 10�3
�Pg
V
�0:6
V0:667S
KLa ¼ s�1
Pg
V¼ Gassed power
volume;hpm3
Vs ¼ gassuperficial velocity;cmmin
Read power number versus Reynolds number in a turbulent region is based on the geometry ofthe impellers. The lowest power number is less than 1, for marine propellers. For flat bladed tur-bines in a turbulent region, the power number is equal to 6. The power graph is illustrated inFigure 6.6.
NP ¼ 6 ¼ PgcN3D5
i r
Ungassed power; P ¼ 6PN3D5i
gc¼ 6� 1200� ð1:5Þ3ð0:8Þ5
9:81¼ 811:68 kg m s�1
P ¼ 811:68745:7
¼ 1:09 hp
For three sets of impellers, 3(1.09) ¼ 3.27 hp.
Pg ¼ 0:4�3:27
� ¼ 1:3 hp
The Correction factor for nongeometrical similarity is
fc ¼
ffiffiffiffiffiffiffiffiffiffiffiffiffiffiffiffiffiffiffiffiffiffiffiffiffiffi�DtDi
���HLDi
��
�DtDi
��HLDi
�vuuuuut ¼
ffiffiffiffiffiffiffiffiffiffiffiffiffiffi3� 4:42
0:8
3� 3
s¼ 1:36
P ¼ (3 sets of impellers)(1.36)(1.09) ¼ 4.45 hp.For the agitated and aerated vessel, the ratio of power requirements for aerated versus nona-
erated systems is expressed by a dimensionless number known as the aeration rate; the value isobtained from Figure 6.7.
6. BIOREACTOR DESIGN216
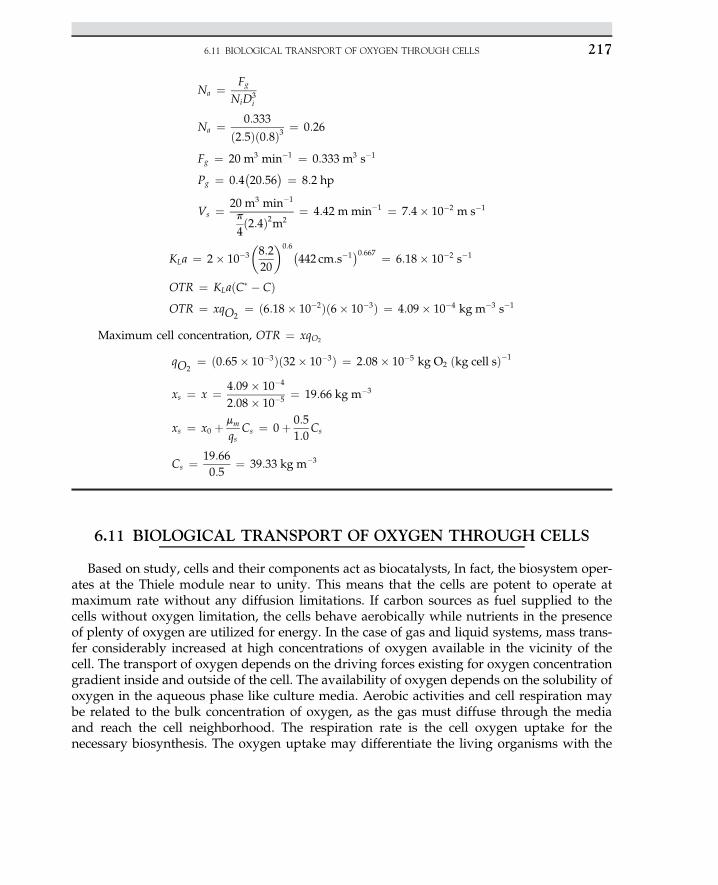
Na ¼ Fg
NiD3i
Na ¼ 0:333
ð2:5Þð0:8Þ3 ¼ 0:26
Fg ¼ 20 m3 min�1 ¼ 0:333 m3 s�1
Pg ¼ 0:4�20:56
� ¼ 8:2 hp
Vs ¼ 20 m3 min�1
p
4ð2:4Þ2m2
¼ 4:42 mmin�1 ¼ 7:4� 10�2 m s�1
KLa ¼ 2� 10�3
�8:220
�0:6�442 cm:s�1
�0:667 ¼ 6:18� 10�2 s�1
OTR ¼ KLaðC� � CÞOTR ¼ xqO2
¼ ð6:18� 10�2Þð6� 10�3Þ ¼ 4:09� 10�4 kg m�3 s�1
Maximum cell concentration, OTR ¼ xqO2
qO2¼ ð0:65� 10�3Þð32� 10�3Þ ¼ 2:08� 10�5 kg O2 ðkg cell sÞ�1
xs ¼ x ¼ 4:09� 10�4
2:08� 10�5 ¼ 19:66 kg m�3
xs ¼ x0 þ mm
qsCs ¼ 0þ 0:5
1:0Cs
Cs ¼ 19:660:5
¼ 39:33 kg m�3
6.11 BIOLOGICAL TRANSPORT OF OXYGEN THROUGH CELLS
Based on study, cells and their components act as biocatalysts, In fact, the biosystem oper-ates at the Thiele module near to unity. This means that the cells are potent to operate atmaximum rate without any diffusion limitations. If carbon sources as fuel supplied to thecells without oxygen limitation, the cells behave aerobically while nutrients in the presenceof plenty of oxygen are utilized for energy. In the case of gas and liquid systems, mass trans-fer considerably increased at high concentrations of oxygen available in the vicinity of thecell. The transport of oxygen depends on the driving forces existing for oxygen concentrationgradient inside and outside of the cell. The availability of oxygen depends on the solubility ofoxygen in the aqueous phase like culture media. Aerobic activities and cell respiration maybe related to the bulk concentration of oxygen, as the gas must diffuse through the mediaand reach the cell neighborhood. The respiration rate is the cell oxygen uptake for thenecessary biosynthesis. The oxygen uptake may differentiate the living organisms with the
6.11 BIOLOGICAL TRANSPORT OF OXYGEN THROUGH CELLS 217
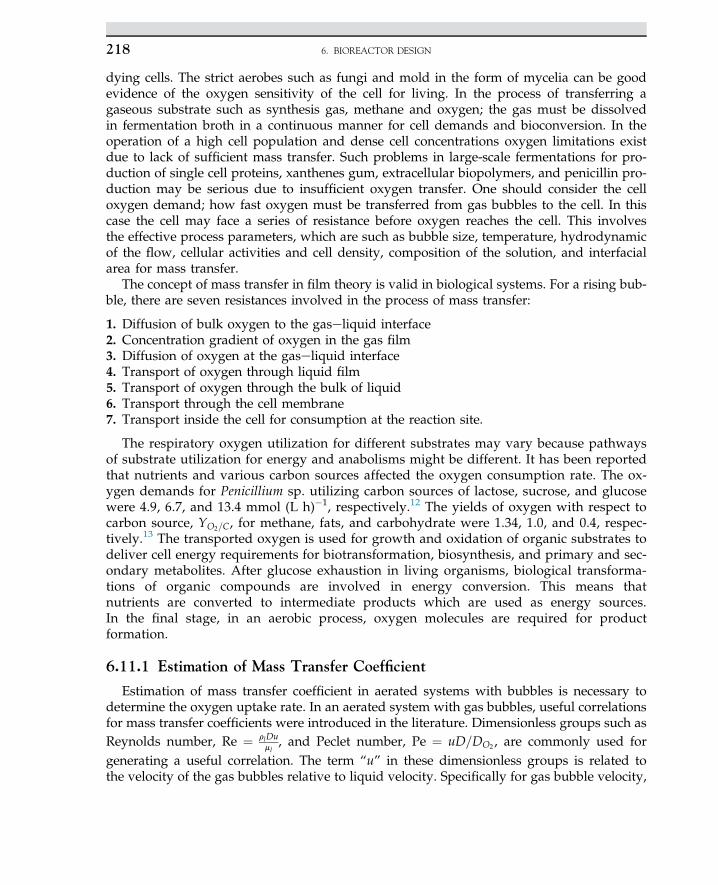
dying cells. The strict aerobes such as fungi and mold in the form of mycelia can be goodevidence of the oxygen sensitivity of the cell for living. In the process of transferring agaseous substrate such as synthesis gas, methane and oxygen; the gas must be dissolvedin fermentation broth in a continuous manner for cell demands and bioconversion. In theoperation of a high cell population and dense cell concentrations oxygen limitations existdue to lack of sufficient mass transfer. Such problems in large-scale fermentations for pro-duction of single cell proteins, xanthenes gum, extracellular biopolymers, and penicillin pro-duction may be serious due to insufficient oxygen transfer. One should consider the celloxygen demand; how fast oxygen must be transferred from gas bubbles to the cell. In thiscase the cell may face a series of resistance before oxygen reaches the cell. This involvesthe effective process parameters, which are such as bubble size, temperature, hydrodynamicof the flow, cellular activities and cell density, composition of the solution, and interfacialarea for mass transfer.
The concept of mass transfer in film theory is valid in biological systems. For a rising bub-ble, there are seven resistances involved in the process of mass transfer:
1. Diffusion of bulk oxygen to the gaseliquid interface2. Concentration gradient of oxygen in the gas film3. Diffusion of oxygen at the gaseliquid interface4. Transport of oxygen through liquid film5. Transport of oxygen through the bulk of liquid6. Transport through the cell membrane7. Transport inside the cell for consumption at the reaction site.
The respiratory oxygen utilization for different substrates may vary because pathwaysof substrate utilization for energy and anabolisms might be different. It has been reportedthat nutrients and various carbon sources affected the oxygen consumption rate. The ox-ygen demands for Penicillium sp. utilizing carbon sources of lactose, sucrose, and glucosewere 4.9, 6.7, and 13.4 mmol (L h)�1, respectively.12 The yields of oxygen with respect tocarbon source, YO2=C, for methane, fats, and carbohydrate were 1.34, 1.0, and 0.4, respec-tively.13 The transported oxygen is used for growth and oxidation of organic substrates todeliver cell energy requirements for biotransformation, biosynthesis, and primary and sec-ondary metabolites. After glucose exhaustion in living organisms, biological transforma-tions of organic compounds are involved in energy conversion. This means thatnutrients are converted to intermediate products which are used as energy sources.In the final stage, in an aerobic process, oxygen molecules are required for productformation.
6.11.1 Estimation of Mass Transfer Coefficient
Estimation of mass transfer coefficient in aerated systems with bubbles is necessary todetermine the oxygen uptake rate. In an aerated system with gas bubbles, useful correlationsfor mass transfer coefficients were introduced in the literature. Dimensionless groups such asReynolds number, Re ¼ rlDu
ml, and Peclet number, Pe ¼ uD=DO2 , are commonly used for
generating a useful correlation. The term “u” in these dimensionless groups is related tothe velocity of the gas bubbles relative to liquid velocity. Specifically for gas bubble velocity,
6. BIOREACTOR DESIGN218
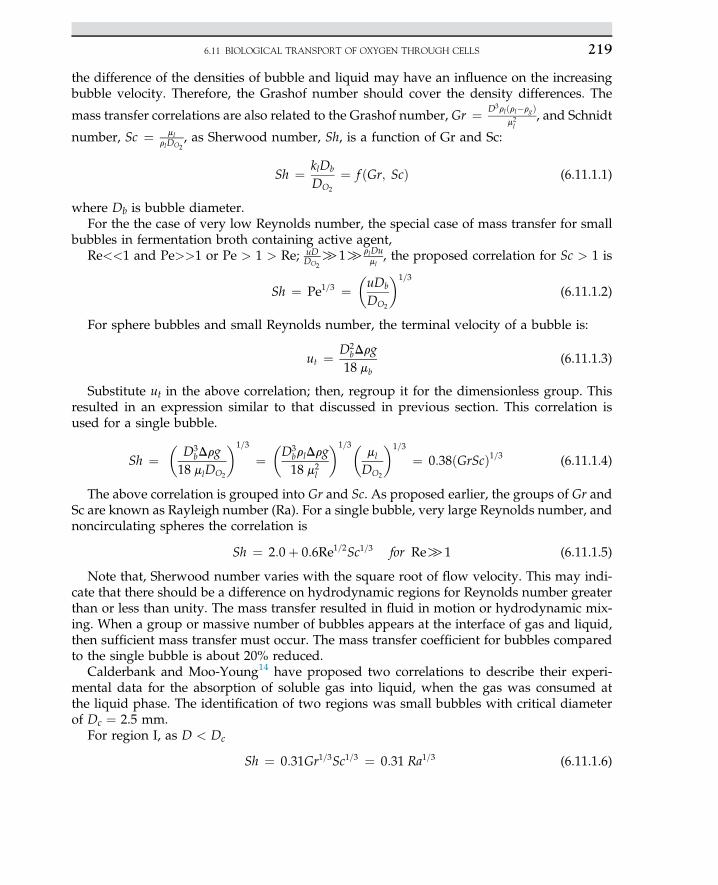
the difference of the densities of bubble and liquid may have an influence on the increasingbubble velocity. Therefore, the Grashof number should cover the density differences. The
mass transfer correlations are also related to the Grashof number, Gr ¼ D3rlðrl�rgÞm2l
, and Schnidt
number, Sc ¼ mlrlDO2
, as Sherwood number, Sh, is a function of Gr and Sc:
Sh ¼ klDb
DO2
¼ f ðGr; ScÞ (6.11.1.1)
where Db is bubble diameter.For the the case of very low Reynolds number, the special case of mass transfer for small
bubbles in fermentation broth containing active agent,Re<<1 and Pe>>1 or Pe > 1 > Re; uD
DO2[1[rlDu
ml, the proposed correlation for Sc > 1 is
Sh ¼ Pe1=3 ¼�uDb
DO2
�1=3
(6.11.1.2)
For sphere bubbles and small Reynolds number, the terminal velocity of a bubble is:
ut ¼ D2bDrg18 mb
(6.11.1.3)
Substitute ut in the above correlation; then, regroup it for the dimensionless group. Thisresulted in an expression similar to that discussed in previous section. This correlation isused for a single bubble.
Sh ¼�
D3bDrg
18 mlDO2
�1=3
¼�D3
brlDrg18 m2
l
�1=3�ml
DO2
�1=3
¼ 0:38ðGrScÞ1=3 (6.11.1.4)
The above correlation is grouped into Gr and Sc. As proposed earlier, the groups of Gr andSc are known as Rayleigh number (Ra). For a single bubble, very large Reynolds number, andnoncirculating spheres the correlation is
Sh ¼ 2:0þ 0:6Re1=2Sc1=3 for Re[1 (6.11.1.5)
Note that, Sherwood number varies with the square root of flow velocity. This may indi-cate that there should be a difference on hydrodynamic regions for Reynolds number greaterthan or less than unity. The mass transfer resulted in fluid in motion or hydrodynamic mix-ing. When a group or massive number of bubbles appears at the interface of gas and liquid,then sufficient mass transfer must occur. The mass transfer coefficient for bubbles comparedto the single bubble is about 20% reduced.
Calderbank and Moo-Young14 have proposed two correlations to describe their experi-mental data for the absorption of soluble gas into liquid, when the gas was consumed atthe liquid phase. The identification of two regions was small bubbles with critical diameterof Dc ¼ 2.5 mm.
For region I, as D < Dc
Sh ¼ 0:31Gr1=3Sc1=3 ¼ 0:31 Ra1=3 (6.11.1.6)
6.11 BIOLOGICAL TRANSPORT OF OXYGEN THROUGH CELLS 219
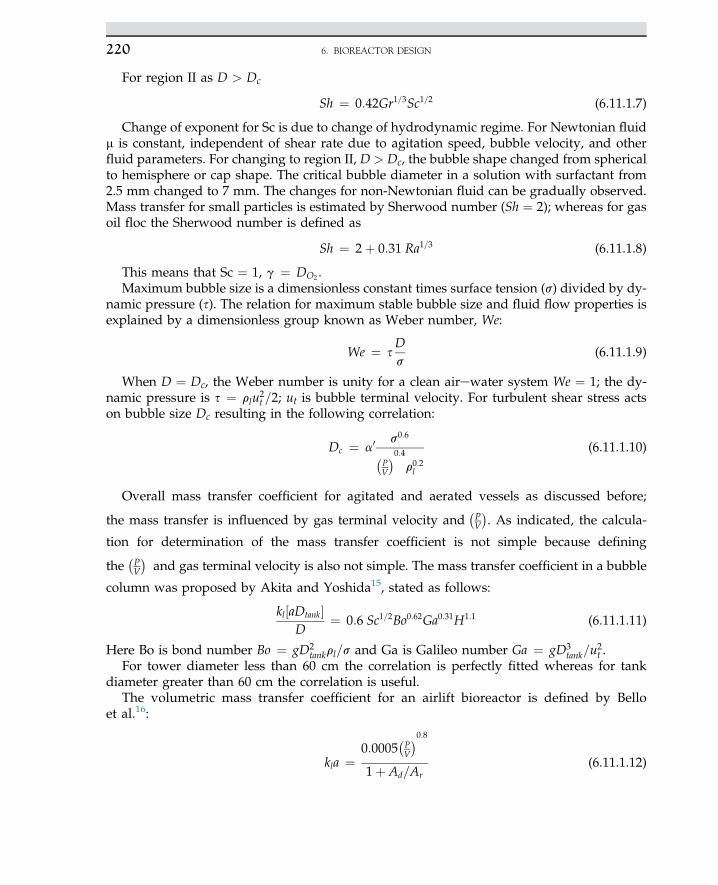
For region II as D > Dc
Sh ¼ 0:42Gr1=3Sc1=2 (6.11.1.7)
Change of exponent for Sc is due to change of hydrodynamic regime. For Newtonian fluidm is constant, independent of shear rate due to agitation speed, bubble velocity, and otherfluid parameters. For changing to region II, D > Dc, the bubble shape changed from sphericalto hemisphere or cap shape. The critical bubble diameter in a solution with surfactant from2.5 mm changed to 7 mm. The changes for non-Newtonian fluid can be gradually observed.Mass transfer for small particles is estimated by Sherwood number (Sh ¼ 2); whereas for gasoil floc the Sherwood number is defined as
Sh ¼ 2þ 0:31 Ra1=3 (6.11.1.8)
This means that Sc ¼ 1, g ¼ DO2 .Maximum bubble size is a dimensionless constant times surface tension (s) divided by dy-
namic pressure (s). The relation for maximum stable bubble size and fluid flow properties isexplained by a dimensionless group known as Weber number, We:
We ¼ sDs
(6.11.1.9)
When D ¼ Dc, the Weber number is unity for a clean airewater system We ¼ 1; the dy-namic pressure is s ¼ rlu2t =2; ut is bubble terminal velocity. For turbulent shear stress actson bubble size Dc resulting in the following correlation:
Dc ¼ a0 s0:6
�PV
�0:4r0:2l
(6.11.1.10)
Overall mass transfer coefficient for agitated and aerated vessels as discussed before;
the mass transfer is influenced by gas terminal velocity and�PV
�. As indicated, the calcula-
tion for determination of the mass transfer coefficient is not simple because defining
the�PV
�and gas terminal velocity is also not simple. The mass transfer coefficient in a bubble
column was proposed by Akita and Yoshida15, stated as follows:
kl½aDtank�D
¼ 0:6 Sc1=2Bo0:62Ga0:31H1:1 (6.11.1.11)
Here Bo is bond number Bo ¼ gD2tankrl=s and Ga is Galileo number Ga ¼ gD3
tank=u2t .
For tower diameter less than 60 cm the correlation is perfectly fitted whereas for tankdiameter greater than 60 cm the correlation is useful.
The volumetric mass transfer coefficient for an airlift bioreactor is defined by Belloet al.16:
kla ¼0:0005
�PV
�0:81þ Ad=Ar
(6.11.1.12)
6. BIOREACTOR DESIGN220
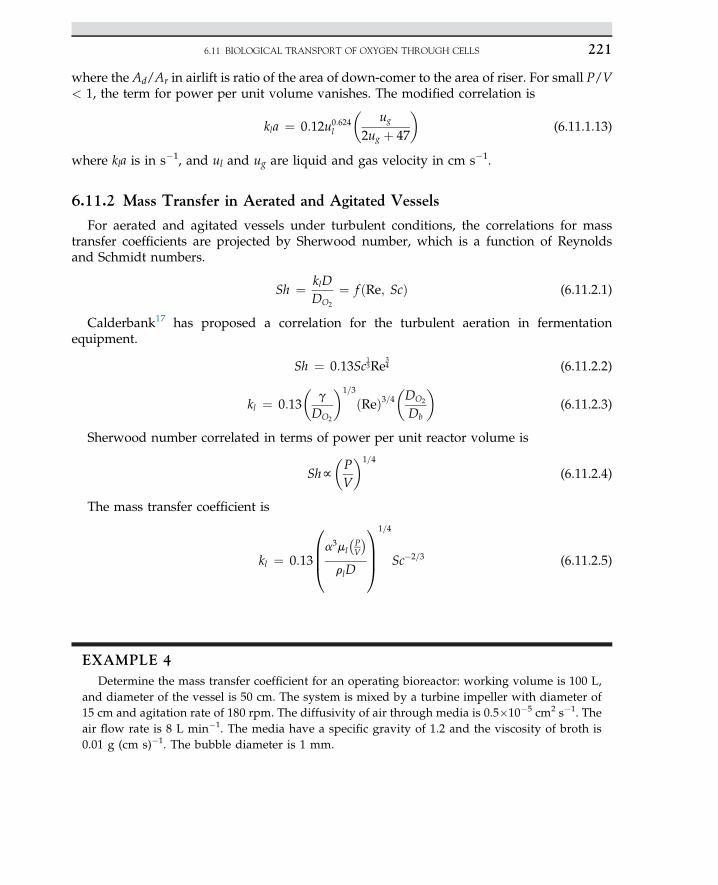
where the Ad/Ar in airlift is ratio of the area of down-comer to the area of riser. For small P/V< 1, the term for power per unit volume vanishes. The modified correlation is
kla ¼ 0:12u0:624l
�ug
2ug þ 47
�(6.11.1.13)
where kla is in s�1, and ul and ug are liquid and gas velocity in cm s�1.
6.11.2 Mass Transfer in Aerated and Agitated Vessels
For aerated and agitated vessels under turbulent conditions, the correlations for masstransfer coefficients are projected by Sherwood number, which is a function of Reynoldsand Schmidt numbers.
Sh ¼ klDDO2
¼ f ðRe; ScÞ (6.11.2.1)
Calderbank17 has proposed a correlation for the turbulent aeration in fermentationequipment.
Sh ¼ 0:13Sc13Re
34 (6.11.2.2)
kl ¼ 0:13�
g
DO2
�1=3
ðReÞ3=4�DO2
Db
�(6.11.2.3)
Sherwood number correlated in terms of power per unit reactor volume is
Shf�PV
�1=4
(6.11.2.4)
The mass transfer coefficient is
kl ¼ 0:13
0BB@a3ml
�PV
�rlD
1CCA
1=4
Sc�2=3 (6.11.2.5)
EXAMPLE 4Determine the mass transfer coefficient for an operating bioreactor: working volume is 100 L,
and diameter of the vessel is 50 cm. The system is mixed by a turbine impeller with diameter of15 cm and agitation rate of 180 rpm. The diffusivity of air through media is 0.5�10�5 cm2 s�1. Theair flow rate is 8 L min�1. The media have a specific gravity of 1.2 and the viscosity of broth is0.01 g (cm s)�1. The bubble diameter is 1 mm.
6.11 BIOLOGICAL TRANSPORT OF OXYGEN THROUGH CELLS 221
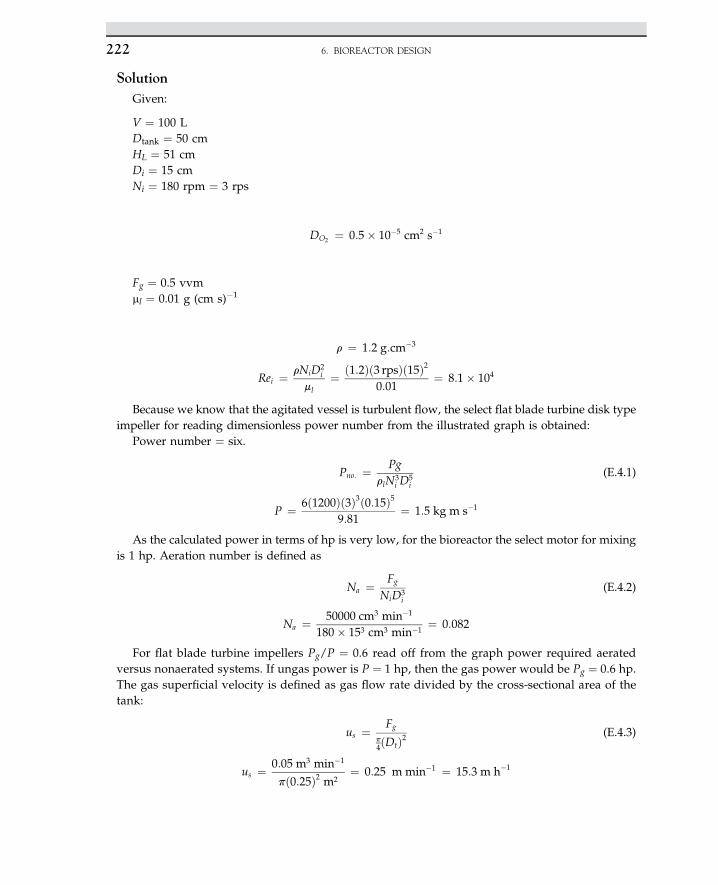
SolutionGiven:
V ¼ 100 LDtank ¼ 50 cmHL ¼ 51 cmDi ¼ 15 cmNi ¼ 180 rpm ¼ 3 rps
DO2 ¼ 0:5� 10�5 cm2 s�1
Fg ¼ 0.5 vvmml ¼ 0.01 g (cm s)�1
r ¼ 1:2 g:cm�3
Rei ¼ rNiD2i
ml¼ ð1:2Þð3 rpsÞð15Þ2
0:01¼ 8:1� 104
Because we know that the agitated vessel is turbulent flow, the select flat blade turbine disk typeimpeller for reading dimensionless power number from the illustrated graph is obtained:
Power number ¼ six.
Pno: ¼ PgrlN3
i D5i
(E.4.1)
P ¼ 6ð1200Þð3Þ3ð0:15Þ59:81
¼ 1:5 kg m s�1
As the calculated power in terms of hp is very low, for the bioreactor the select motor for mixingis 1 hp. Aeration number is defined as
Na ¼ Fg
NiD3i
(E.4.2)
Na ¼ 50000 cm3 min�1
180� 153 cm3 min�1¼ 0:082
For flat blade turbine impellers Pg/P ¼ 0.6 read off from the graph power required aeratedversus nonaerated systems. If ungas power is P ¼ 1 hp, then the gas power would be Pg ¼ 0.6 hp.The gas superficial velocity is defined as gas flow rate divided by the cross-sectional area of thetank:
us ¼ Fg
p4ðDtÞ2
(E.4.3)
us ¼ 0:05 m3 min�1
pð0:25Þ2 m2¼ 0:25 mmin�1 ¼ 15:3m h�1
6. BIOREACTOR DESIGN222
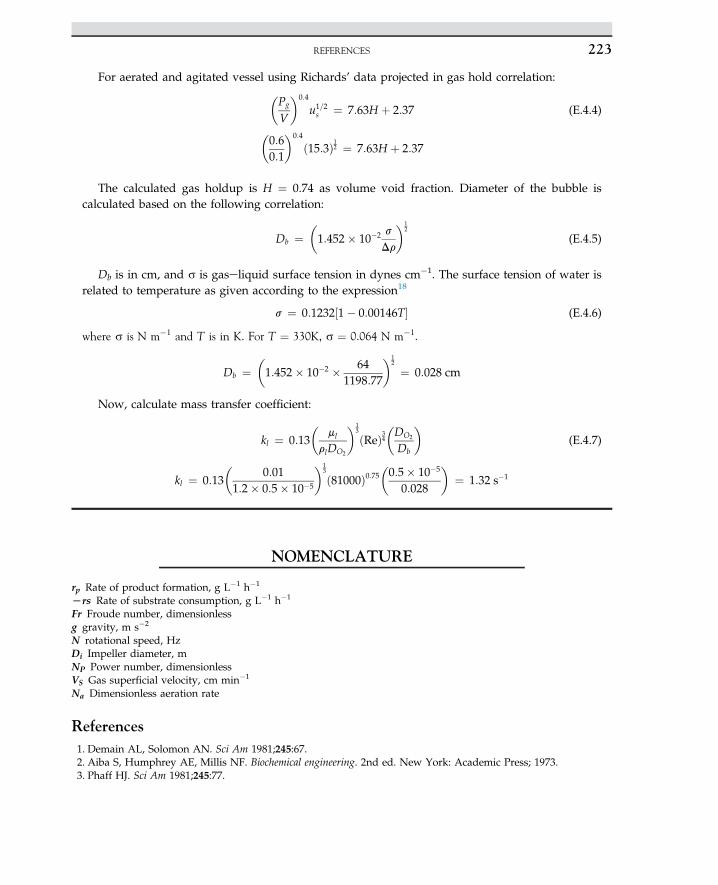
For aerated and agitated vessel using Richards’ data projected in gas hold correlation:�Pg
V
�0:4
u1=2s ¼ 7:63H þ 2:37 (E.4.4)
�0:60:1
�0:4
ð15:3Þ12 ¼ 7:63H þ 2:37
The calculated gas holdup is H ¼ 0.74 as volume void fraction. Diameter of the bubble iscalculated based on the following correlation:
Db ¼�1:452� 10�2 s
Dr
�12
(E.4.5)
Db is in cm, and s is gaseliquid surface tension in dynes cm�1. The surface tension of water isrelated to temperature as given according to the expression18
s ¼ 0:1232½1� 0:00146T� (E.4.6)
where s is N m�1 and T is in K. For T ¼ 330K, s ¼ 0.064 N m�1.
Db ¼�1:452� 10�2 � 64
1198:77
�12
¼ 0:028 cm
Now, calculate mass transfer coefficient:
kl ¼ 0:13�
ml
rlDO2
�13
ðReÞ34�DO2
Db
�(E.4.7)
kl ¼ 0:13�
0:011:2� 0:5� 10�5
�13
ð81000Þ0:75�0:5� 10�5
0:028
�¼ 1:32 s�1
NOMENCLATURE
rp Rate of product formation, g L�1 h�1
Lrs Rate of substrate consumption, g L�1 h�1
Fr Froude number, dimensionlessg gravity, m s�2
N rotational speed, HzDi Impeller diameter, mNP Power number, dimensionlessVS Gas superficial velocity, cm min�1
Na Dimensionless aeration rate
References1. Demain AL, Solomon AN. Sci Am 1981;245:67.2. Aiba S, Humphrey AE, Millis NF. Biochemical engineering. 2nd ed. New York: Academic Press; 1973.3. Phaff HJ. Sci Am 1981;245:77.
REFERENCES 223
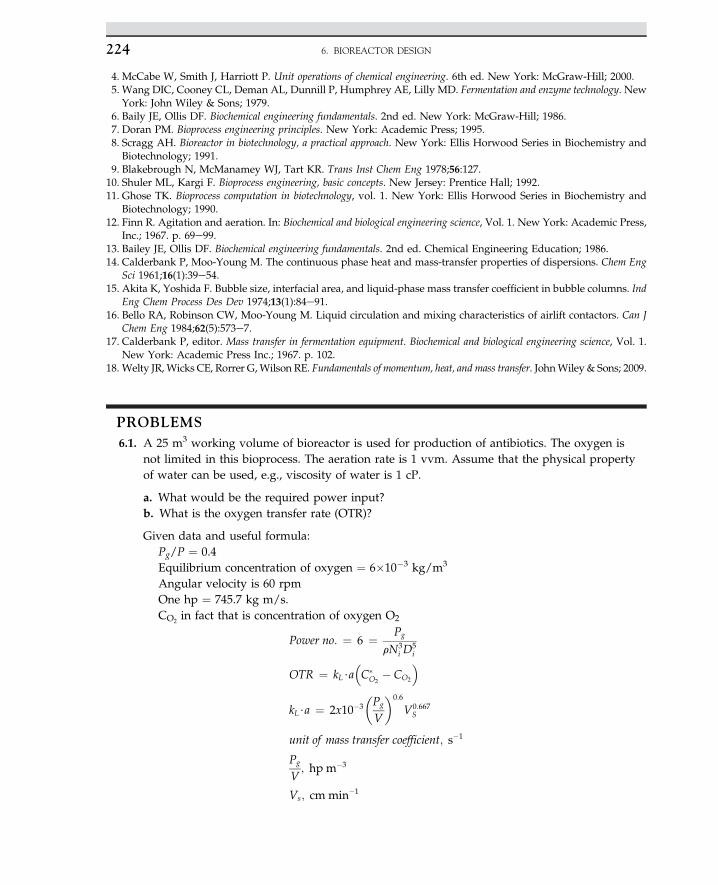
4. McCabe W, Smith J, Harriott P. Unit operations of chemical engineering. 6th ed. New York: McGraw-Hill; 2000.5. Wang DIC, Cooney CL, Deman AL, Dunnill P, Humphrey AE, Lilly MD. Fermentation and enzyme technology. NewYork: John Wiley & Sons; 1979.
6. Baily JE, Ollis DF. Biochemical engineering fundamentals. 2nd ed. New York: McGraw-Hill; 1986.7. Doran PM. Bioprocess engineering principles. New York: Academic Press; 1995.8. Scragg AH. Bioreactor in biotechnology, a practical approach. New York: Ellis Horwood Series in Biochemistry andBiotechnology; 1991.
9. Blakebrough N, McManamey WJ, Tart KR. Trans Inst Chem Eng 1978;56:127.10. Shuler ML, Kargi F. Bioprocess engineering, basic concepts. New Jersey: Prentice Hall; 1992.11. Ghose TK. Bioprocess computation in biotechnology, vol. 1. New York: Ellis Horwood Series in Biochemistry and
Biotechnology; 1990.12. Finn R. Agitation and aeration. In: Biochemical and biological engineering science, Vol. 1. New York: Academic Press,
Inc.; 1967. p. 69e99.13. Bailey JE, Ollis DF. Biochemical engineering fundamentals. 2nd ed. Chemical Engineering Education; 1986.14. Calderbank P, Moo-Young M. The continuous phase heat and mass-transfer properties of dispersions. Chem Eng
Sci 1961;16(1):39e54.15. Akita K, Yoshida F. Bubble size, interfacial area, and liquid-phase mass transfer coefficient in bubble columns. Ind
Eng Chem Process Des Dev 1974;13(1):84e91.16. Bello RA, Robinson CW, Moo-Young M. Liquid circulation and mixing characteristics of airlift contactors. Can J
Chem Eng 1984;62(5):573e7.17. Calderbank P, editor. Mass transfer in fermentation equipment. Biochemical and biological engineering science, Vol. 1.
New York: Academic Press Inc.; 1967. p. 102.18. Welty JR, Wicks CE, Rorrer G,Wilson RE. Fundamentals of momentum, heat, and mass transfer. JohnWiley & Sons; 2009.
PROBLEMS6.1. A 25 m3 working volume of bioreactor is used for production of antibiotics. The oxygen is
not limited in this bioprocess. The aeration rate is 1 vvm. Assume that the physical propertyof water can be used, e.g., viscosity of water is 1 cP.
a. What would be the required power input?b. What is the oxygen transfer rate (OTR)?
Given data and useful formula:Pg/P ¼ 0.4Equilibrium concentration of oxygen ¼ 6�10�3 kg/m3
Angular velocity is 60 rpmOne hp ¼ 745.7 kg m/s.CO2
in fact that is concentration of oxygen O2
Power no: ¼ 6 ¼ Pg
rN3i D
5i
OTR ¼ kL$a�C�
O2� CO2
�
kL$a ¼ 2x10�3
�Pg
V
�0:6
V0:667S
unit of mass transfer coefficient; s�1
Pg
V; hp m�3
Vs; cm min�1
6. BIOREACTOR DESIGN224
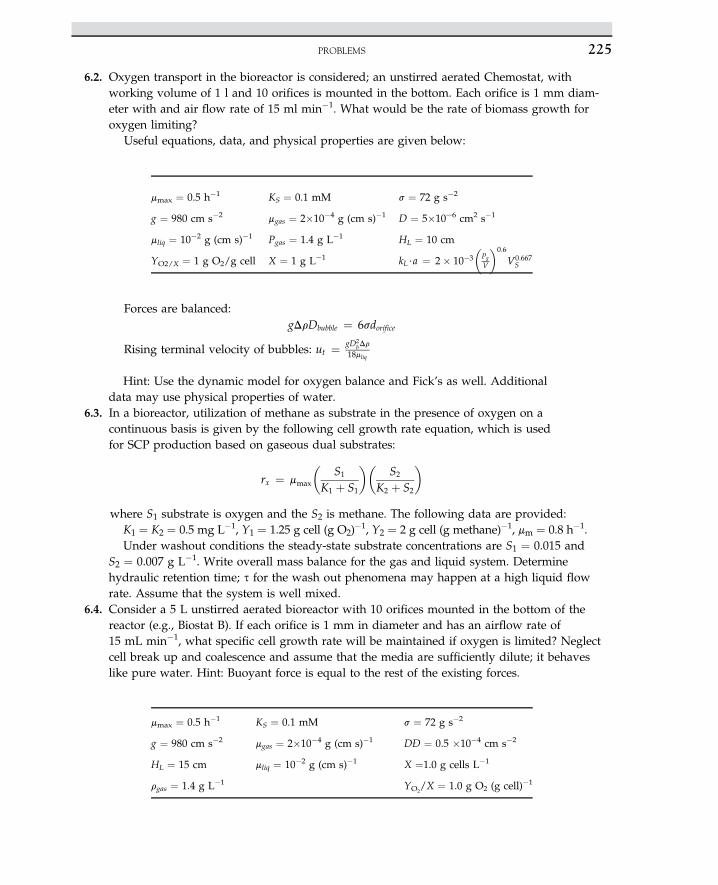
6.2. Oxygen transport in the bioreactor is considered; an unstirred aerated Chemostat, withworking volume of 1 l and 10 orifices is mounted in the bottom. Each orifice is 1 mm diam-eter with and air flow rate of 15 ml min�1. What would be the rate of biomass growth foroxygen limiting?
Useful equations, data, and physical properties are given below:
Forces are balanced:gDrDbubble ¼ 6sdorifice
Rising terminal velocity of bubbles: ut ¼ gD2bDr
18mliq
Hint: Use the dynamic model for oxygen balance and Fick’s as well. Additionaldata may use physical properties of water.
6.3. In a bioreactor, utilization of methane as substrate in the presence of oxygen on acontinuous basis is given by the following cell growth rate equation, which is usedfor SCP production based on gaseous dual substrates:
rx ¼ mmax
�S1
K1 þ S1
��S2
K2 þ S2
�
where S1 substrate is oxygen and the S2 is methane. The following data are provided:K1 ¼ K2 ¼ 0.5 mg L�1, Y1 ¼ 1.25 g cell (g O2)
�1, Y2 ¼ 2 g cell (g methane)�1, mm ¼ 0.8 h�1.Under washout conditions the steady-state substrate concentrations are S1 ¼ 0.015 and
S2 ¼ 0.007 g L�1. Write overall mass balance for the gas and liquid system. Determinehydraulic retention time; s for the wash out phenomena may happen at a high liquid flowrate. Assume that the system is well mixed.
6.4. Consider a 5 L unstirred aerated bioreactor with 10 orifices mounted in the bottom of thereactor (e.g., Biostat B). If each orifice is 1 mm in diameter and has an airflow rate of15 mL min�1, what specific cell growth rate will be maintained if oxygen is limited? Neglectcell break up and coalescence and assume that the media are sufficiently dilute; it behaveslike pure water. Hint: Buoyant force is equal to the rest of the existing forces.
mmax ¼ 0.5 h�1 KS ¼ 0.1 mM s ¼ 72 g s�2
g ¼ 980 cm s�2 mgas ¼ 2�10�4 g (cm s)�1 DÐ ¼ 0.5 �10�4 cm s�2
HL ¼ 15 cm mliq ¼ 10�2 g (cm s)�1 X ¼1.0 g cells L�1
rgas ¼ 1.4 g L�1 YO2/X ¼ 1.0 g O2 (g cell)�1
mmax ¼ 0.5 h�1 KS ¼ 0.1 mM s ¼ 72 g s�2
g ¼ 980 cm s�2 mgas ¼ 2�10�4 g (cm s)�1 D ¼ 5�10e6 cm2 s�1
mliq ¼ 10�2 g (cm s)�1 Pgas ¼ 1.4 g L�1 HL ¼ 10 cm
YO2/X ¼ 1 g O2/g cell X ¼ 1 g L�1 kL$a ¼ 2� 10�3�
Pg
V
�0:6
V0:667S
PROBLEMS 225
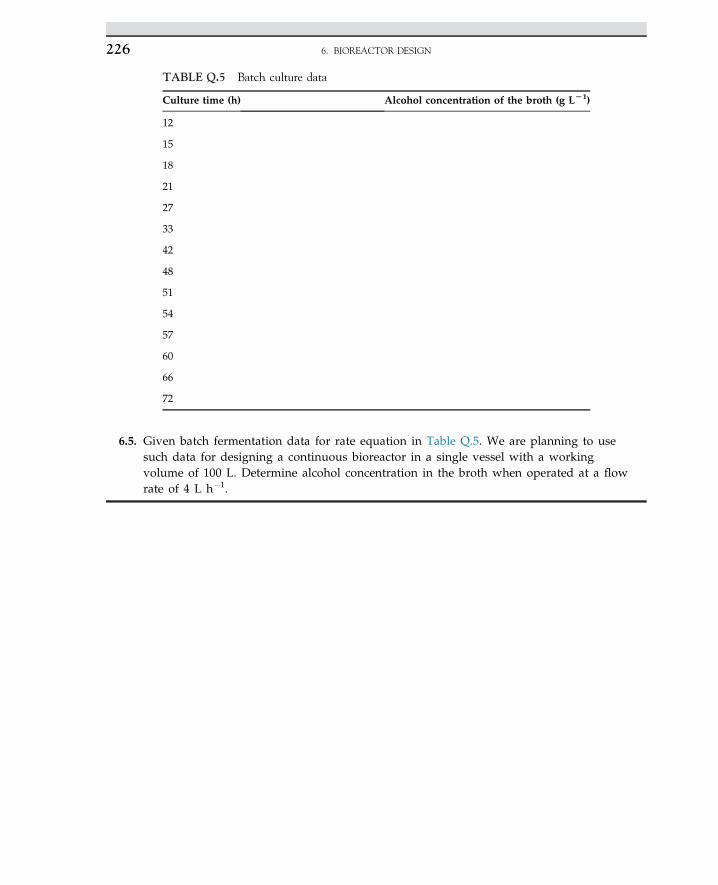
6.5. Given batch fermentation data for rate equation in Table Q.5. We are planning to usesuch data for designing a continuous bioreactor in a single vessel with a workingvolume of 100 L. Determine alcohol concentration in the broth when operated at a flowrate of 4 L h�1.
TABLE Q.5 Batch culture data
Culture time (h) Alcohol concentration of the broth (g LL1)
12
15
18
21
27
33
42
48
51
54
57
60
66
72
6. BIOREACTOR DESIGN226
C H A P T E R
7
Downstream Processing
O U T L I N E
7.1 Introduction 228
7.2 Downstream Processing 228
7.3 Filtration 2317.3.1 Theory of Filtration 231
7.4 Centrifugation 2337.4.1 Theory of Centrifugation 233
7.5 Sedimentation 235
7.6 Flotation 237
7.7 Emerging Technology for CellRecovery 238
7.8 Cell Disruption 238
7.9 Solvent Extraction 2397.9.1 Product Recovery by Liquid
eLiquid Extraction 240
7.9.2 Continuous ExtractionColumn Process, RotatingDisk Contactors 240
7.10 Adsorption 2427.10.1 Ion-Exchange Adsorption 2427.10.2 Langmuir Isotherm
Adsorption 2437.10.3 Freundlich Isotherm
Adsorption 2437.10.4 Fixed-Bed Adsorption 243
7.11 Chromatography 2447.11.1 Principles of Chromatography 246
7.12 Crystallization Process 253
7.13 Freeze-Drying 255
Nomenclature 255
References 256
227Biochemical Engineering and Biotechnologyhttp://dx.doi.org/10.1016/B978-0-444-63357-6.00007-9 Copyright © 2015 Elsevier B.V. All rights reserved.
7.1 INTRODUCTION
Bioprocess engineering treats raw materials and generates useful products. Mostbioprocesses involve one or more of the following processes: centrifugation, chromatography,cooling, crystallization, dialysis, distillation, drying, evaporation, filtration, heating,humidification, membrane separation, milling, mixing, precipitation, centrifugation, solidhandling, and solvent extraction. A particular sequence of unit operations and bioprocessesis used for the manufacture of an extra pure pharmaceutical product.
Fermentation broths are complex, aqueous mixtures of cells, comprising soluble extracel-lular and intracellular products and any unconverted substrate or unconvertible components.Recovery, separation, purification, and extraction of products are important in bioprocessengineering. In particular, separation is a useful technique; it depends on product, its solubi-lity, size of the process, and product value. Purification of high-value pharmaceuticalproducts using chromatography such as hormones, antibodies, and enzymes is expensiveand difficult to scale up for commercialization.1 The necessary steps to follow a specificprocess depend on the nature of the product and the characteristics of the fermentation broth.There are a few steps for product recovery; the following processes are discussed, which areconsidered as an alternative for the product recovery from fermentation broth.
Initially, fermentation broth has to be characterized based on the viscosity of the fluid. Ifthe presence of biomass or cells causes trouble, the biomass and cells have to be removed.If the product is stored inside the cells, the cells must be ruptured and the product mustbe freed. Intracellular protein can easily be precipitated, settled or filtered. In fact, the productin diluted broth may not be economical enough for efficient recovery. Enrichment of theproduct from the bioreactor effluents for increasing the product concentration may reducethe cost of product recovery. There are several economical methods for pure product recov-ery, such as crystallization of the product from the concentrated broth or liquid phase. Evensmall amounts of cellular proteins can be lyophilized or dried from crude solution of biolog-ical products such as hormone or enzymes.2,3 Advanced technology has to be implemented toreduce downstream processing costs.
7.2 DOWNSTREAM PROCESSING
In downstream processing of a fermentation unit for enzyme production with a feed streamof sugar at a concentration of 35 g l�1, the expected product to be recovered is a-amylase. Theconcentration of enzyme is very low, about several 100 milligrams per liter in the fermentationbroth. Solvent extraction is a suitable process to recover a small amount of enzyme. The chanceof some enzyme being intracellular is high; therefore, cells are ruptured to liberate intracellularenzyme, which can then interact with organic solvents. Figure 7.1 shows a simple diagram for ajacketed fermentation vessel for operation at constant temperature.
Bioprocess includes the bioreactor and a subsequent section for product recovery. Theparticular separation techniques are useful for any given bioprocess, which depends notonly on the size, charge, and solubility of the product but also on the size of the process andproduct value. For example, various forms of gel filtration, gel chromatography, and ionexchangers are used to purify highly valuable pharmaceutical biological compounds such as
7. DOWNSTREAM PROCESSING228
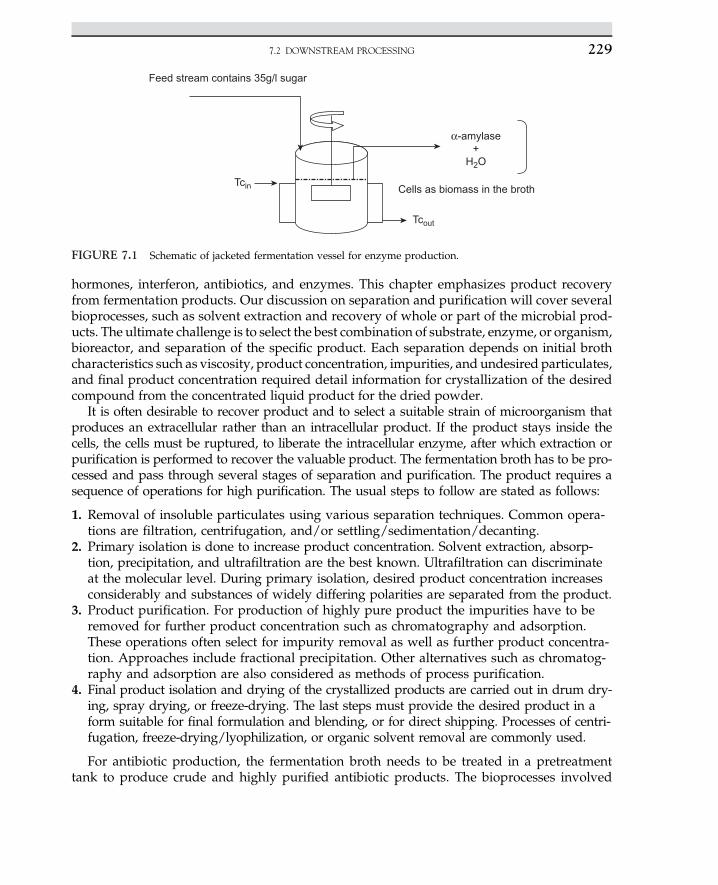
hormones, interferon, antibiotics, and enzymes. This chapter emphasizes product recoveryfrom fermentation products. Our discussion on separation and purification will cover severalbioprocesses, such as solvent extraction and recovery of whole or part of the microbial prod-ucts. The ultimate challenge is to select the best combination of substrate, enzyme, or organism,bioreactor, and separation of the specific product. Each separation depends on initial brothcharacteristics such as viscosity, product concentration, impurities, and undesired particulates,and final product concentration required detail information for crystallization of the desiredcompound from the concentrated liquid product for the dried powder.
It is often desirable to recover product and to select a suitable strain of microorganism thatproduces an extracellular rather than an intracellular product. If the product stays inside thecells, the cells must be ruptured, to liberate the intracellular enzyme, after which extraction orpurification is performed to recover the valuable product. The fermentation broth has to be pro-cessed and pass through several stages of separation and purification. The product requires asequence of operations for high purification. The usual steps to follow are stated as follows:
1. Removal of insoluble particulates using various separation techniques. Common opera-tions are filtration, centrifugation, and/or settling/sedimentation/decanting.
2. Primary isolation is done to increase product concentration. Solvent extraction, absorp-tion, precipitation, and ultrafiltration are the best known. Ultrafiltration can discriminateat the molecular level. During primary isolation, desired product concentration increasesconsiderably and substances of widely differing polarities are separated from the product.
3. Product purification. For production of highly pure product the impurities have to beremoved for further product concentration such as chromatography and adsorption.These operations often select for impurity removal as well as further product concentra-tion. Approaches include fractional precipitation. Other alternatives such as chromatog-raphy and adsorption are also considered as methods of process purification.
4. Final product isolation and drying of the crystallized products are carried out in drum dry-ing, spray drying, or freeze-drying. The last steps must provide the desired product in aform suitable for final formulation and blending, or for direct shipping. Processes of centri-fugation, freeze-drying/lyophilization, or organic solvent removal are commonly used.
For antibiotic production, the fermentation broth needs to be treated in a pretreatmenttank to produce crude and highly purified antibiotic products. The bioprocesses involved
Cells as biomass in the broth
Tcout
Tcin
Feed stream contains 35g/l sugar
α-amylase
+
H2O
FIGURE 7.1 Schematic of jacketed fermentation vessel for enzyme production.
7.2 DOWNSTREAM PROCESSING 229
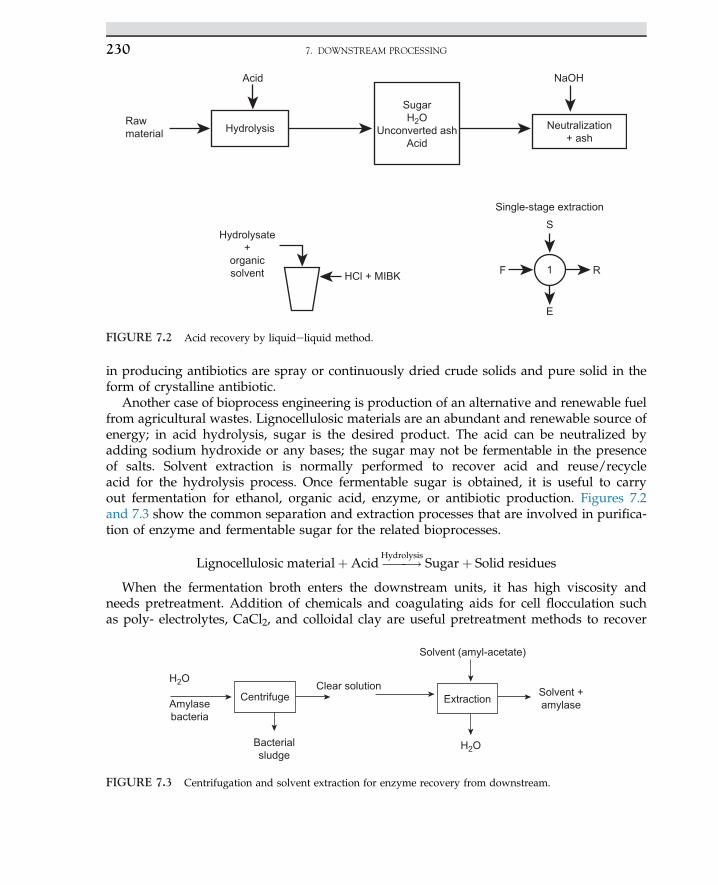
in producing antibiotics are spray or continuously dried crude solids and pure solid in theform of crystalline antibiotic.
Another case of bioprocess engineering is production of an alternative and renewable fuelfrom agricultural wastes. Lignocellulosic materials are an abundant and renewable source ofenergy; in acid hydrolysis, sugar is the desired product. The acid can be neutralized byadding sodium hydroxide or any bases; the sugar may not be fermentable in the presenceof salts. Solvent extraction is normally performed to recover acid and reuse/recycleacid for the hydrolysis process. Once fermentable sugar is obtained, it is useful to carryout fermentation for ethanol, organic acid, enzyme, or antibiotic production. Figures 7.2and 7.3 show the common separation and extraction processes that are involved in purifica-tion of enzyme and fermentable sugar for the related bioprocesses.
Lignocellulosic materialþAcid ����!HydrolysisSugarþ Solid residues
When the fermentation broth enters the downstream units, it has high viscosity andneeds pretreatment. Addition of chemicals and coagulating aids for cell flocculation suchas poly- electrolytes, CaCl2, and colloidal clay are useful pretreatment methods to recover
Hydrolysate
+
organic
solvent
Raw
material
Acid
Hydrolysis
Sugar
H2O
Unconverted ash
Acid
Single-stage extraction
S
1F R
E
Neutralization
+ ash
NaOH
HCl + MIBK
FIGURE 7.2 Acid recovery by liquideliquid method.
Amylase
bacteria
H2O
H2OBacterial
sludge
Centrifuge Extraction
Clear solution
Solvent (amyl-acetate)
Solvent +
amylase
FIGURE 7.3 Centrifugation and solvent extraction for enzyme recovery from downstream.
7. DOWNSTREAM PROCESSING230
product from downstream. Settling solids are often used in large-scale wastewater treatmentprocesses as well as traditional fermentation industries. Generally, simple centrifugationproduces a cell-concentrated stream of 15% w/v. Also, filtration produces more concentratedcell sludge of up to 20e35% w/v.4
7.3 FILTRATION
In filtration, solid particles are separated from a fluidesolid mixture by forcing the fluidthrough a filter medium or filter cloth, which retains the solid particles. As a result, solids areretained by filter media and the filtrate is obtained, which is a clear solution without any solidparticles. The solid particles deposited on the filter form a layer, which is known as filter cake.The deposited solids create resistance, which reduces filter flux. The depth of the filter cakegradually increases as more solids are retained. The filter cake may create more resistance tofurther filtration. Filtration can be performed using either vacuum or positive-pressure equip-ment. The exerting differential pressure across the filter separates fluid from solid and is calledthe filtration pressure drop. Ease of filtration depends on particle properties and fluid filtrates.The compactions of particles are soft or hard, compressible or non-compressible, and the viscos-ity of the fluid may create different resistances. Fermentation broths are troublesome and hardto filter, because of the non-Newtonian behavior of the broth. Most microbial filter cakes arecompressible. When the filter pores are clogged by cell bodies, then the high pressure drop re-sults inmajor problems in thefiltration of fermentationbroth. Thenmorepressure is createdandgradually the filtration rate drops.
Filter aids are widely used in the fermentation industry to improve the efficiency of filtra-tion. A filter aid is a precoated filter medium to prevent blockage or blinding of the filter bysolids, which would otherwise wedge themselves into the pores of the cloth. Filter aid can beadded to the fermentation broth to increase the porosity of the cake as it forms. This is onlyrecommended when the fermentation product is extracellular. Filter aids add to the cost offiltration. The minimum quantity needed to achieve the desired condition must be experi-mentally established. Fermentation broths can be pretreated to improve filtration character-istics. Heating may denature proteins while enhancing the filterability of mycelial brothssuch as in penicillin production. Alternatively, electrolytes may be added to promote coag-ulation of colloids into larger, denser particles, which are easier to filter. Finally, the filtrationprocess is affected by the viscosity and composition of the broth, and the cell cake.5
Plate filters are suitable for filtration of batch fermentation broth; accumulated biomassmust be cleaned periodically. A rotary-drum vacuum filter is used for a continuous system.This type of filter can be used for the removal of Penicillium and Streptomyces mycelia in theproduction of penicillin and streptomycin, respectively.5 In these processes, the rotary-drumfilter is used with a pre-coated cloth filter with filter aid; the filter cake is removed by a knifeblade that scrapes the cake from the rotating drum.
7.3.1 Theory of Filtration
Assume laminar flow of filtrate of liquid through the filter cake. The rate of filtration isusually measured as the rate at which liquid filtrate is collected. The filtration rate dependson the area of the filter cloth, the viscosity of the liquid, the pressure drop across the filter, and
7.3 FILTRATION 231
filter cake resistance. At any instant during filtration, the rate of filtration is given by thefollowing equation:
1A
dVf
dt¼ Dp
mc
ha�WA
�þ rmi (7.3.1.1)
where A is the filter area, Vf is the volume of filtrate, t is the filtration time, DP is the pressuredrop across the filter, mc is the fluid viscosity, and W is the mass of solids in the filter cake.Where W is defined as:
W ¼ mass of solids in the cake ¼h ru
1�mu
iVf ¼ mu
1�mu(7.3.1.2)
where m is the ratio of mass of wet cake over mass of dry cake and u is the solid massfraction.
Also from (7.3.1.1), rm is the filter media resistance and a is the average specific cake resis-tance. If the filter cake is incompressible, a is constant; for compressible cake a is defined as:
a ¼ a’ðDPÞS (7.3.1.3)
where S is cake compressibility, and a0 is constant, depending on the size of particles in thecake. For incompressible solids, S is about zero; for highly compressible solids, S is about 1.For convenient integration, rewrite (7.3.1.1) in its reciprocal form:
AdtdVf
¼ mfa
�ru
1�mu
�Vf
ADpþ mf rDP
(7.3.1.4)
The separation of variables is used for suitable integrations, which result in the followingequations:
AZ
dt ¼�mfaru
1�mu
��1
ADP
�ZVfdVf þ
mf rDP
ZdVf (7.3.1.5)
ðAÞðtÞ ¼ mfa
2ADP
�ru
1�mu
�V2
f þ�mf rDP
�Vf (7.3.1.6)
Use of an initial condition for calculation for defining integration constant at t ¼ 0, Vf ¼ 0,gives the integration constant as zero. By division of the above equation with Vf we canobtain a linear model, which we can plot and obtain the slope and intercepts. The modifiedequation after division of (7.3.1.6) is:
tVf
�A
¼ mfaru
2DPð1�muÞ$Vf
Aþ mf rDP
(7.3.1.7)
Now (7.3.1.7) is linear, as tVf =A
versus Vf
A , the linearized model is (y¼k1x þ k2):
tVf
�A
¼ ki
�Vf
A
�þ k2 (7.3.1.8)
where k1 ¼ mcaru
2DPð1�muÞ and k2 ¼ mcrmDP .
7. DOWNSTREAM PROCESSING232
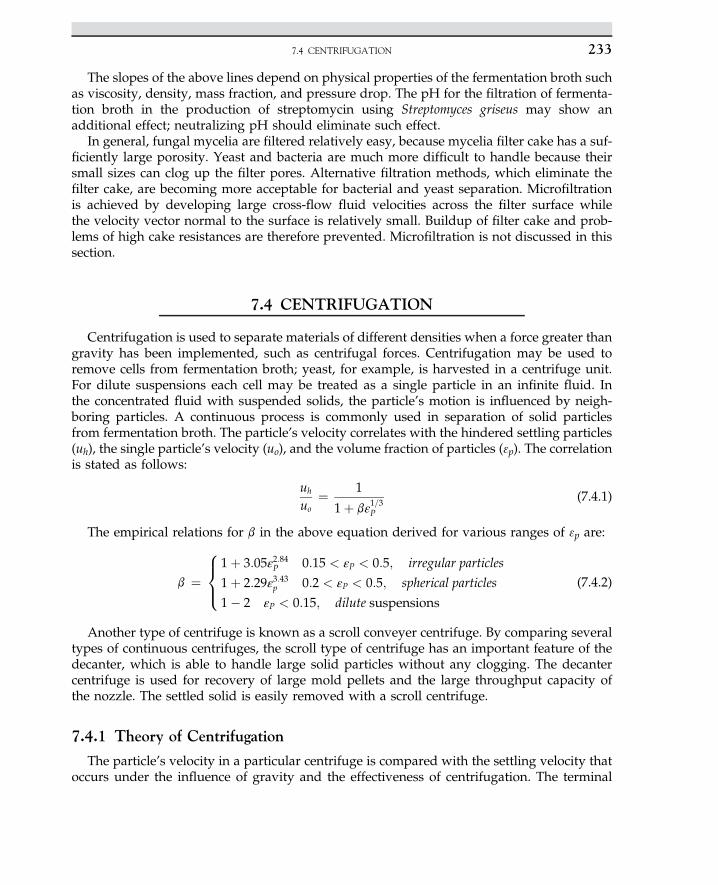
The slopes of the above lines depend on physical properties of the fermentation broth suchas viscosity, density, mass fraction, and pressure drop. The pH for the filtration of fermenta-tion broth in the production of streptomycin using Streptomyces griseus may show anadditional effect; neutralizing pH should eliminate such effect.
In general, fungal mycelia are filtered relatively easy, because mycelia filter cake has a suf-ficiently large porosity. Yeast and bacteria are much more difficult to handle because theirsmall sizes can clog up the filter pores. Alternative filtration methods, which eliminate thefilter cake, are becoming more acceptable for bacterial and yeast separation. Microfiltrationis achieved by developing large cross-flow fluid velocities across the filter surface whilethe velocity vector normal to the surface is relatively small. Buildup of filter cake and prob-lems of high cake resistances are therefore prevented. Microfiltration is not discussed in thissection.
7.4 CENTRIFUGATION
Centrifugation is used to separate materials of different densities when a force greater thangravity has been implemented, such as centrifugal forces. Centrifugation may be used toremove cells from fermentation broth; yeast, for example, is harvested in a centrifuge unit.For dilute suspensions each cell may be treated as a single particle in an infinite fluid. Inthe concentrated fluid with suspended solids, the particle’s motion is influenced by neigh-boring particles. A continuous process is commonly used in separation of solid particlesfrom fermentation broth. The particle’s velocity correlates with the hindered settling particles(uh), the single particle’s velocity (uo), and the volume fraction of particles (3p). The correlationis stated as follows:
uh
uo¼ 1
1þ bε1=3P
(7.4.1)
The empirical relations for b in the above equation derived for various ranges of 3p are:
b ¼1þ 3:05ε2:84P 0:15 < εP < 0:5; irregular particles
1þ 2:29ε3:43p 0:2 < εP < 0:5; spherical particles
1� 2 εP < 0:15; dilute suspensions
8><>: (7.4.2)
Another type of centrifuge is known as a scroll conveyer centrifuge. By comparing severaltypes of continuous centrifuges, the scroll type of centrifuge has an important feature of thedecanter, which is able to handle large solid particles without any clogging. The decantercentrifuge is used for recovery of large mold pellets and the large throughput capacity ofthe nozzle. The settled solid is easily removed with a scroll centrifuge.
7.4.1 Theory of Centrifugation
The particle’s velocity in a particular centrifuge is compared with the settling velocity thatoccurs under the influence of gravity and the effectiveness of centrifugation. The terminal
7.4 CENTRIFUGATION 233
velocity during gravity settling of a small particle in dilute suspension is given by Stoke’slaw:
ug ¼�rP � rf
18m
�D2
Pg (7.4.1.1)
where ug is the sedimentation velocity under gravity, rp is the density of the particle, rf is thedensity of the fluid, m is the viscosity of the fluid, Dp is the diameter of the solid particle, and gis gravitational acceleration. In (7.4.1.1) the centrifugal force is implemented to obtain termi-nal velocity in the centrifuge:
uc ¼�rP � rf
18m
�D2
Pu2r (7.4.1.2)
where uc is the particle velocity in the centrifuge, u is the angular velocity of the bowl in rads�1, and r is the radius of the bowl or centrifuge drum. The ratio of velocity in the centrifugeto velocity under gravity (uc/ug) is called the centrifuge effect or g-number, and is denoted asZ; therefore:
Z ¼ u2rg
(7.4.1.3)
The force developed in a centrifuge is Z times the force of gravity and is often expressed asso many g-forces. Industrial centrifuges have Z factors from 300 to 16,000. In a small labora-tory centrifuge, Z may be up to 500,000. The particle velocity in a given centrifuge can beincreased by increasing the centrifuge angular velocity (u); by increasing the particle diam-eter (Dp); by increasing the density differences between particle and liquid ðDr ¼ rP � rf Þ;and by decreasing suspension viscosity (m).
However, where the particles reach the walls of the bowl, the separation is also affected bythe time of exposure to the centrifugal forces. In continuous flow and devices such as the discstack centrifuge, the residence time increases by decreasing the feed flow rate. Performance ofcentrifuges of different size can be compared by using a parameter known as the sigma factor(P
). For a continuous centrifuge, the sigma factor is related to the feed flow rate:
S ¼ Q2ug
(7.4.1.4)
where Q is the volumetric flow rate and ug is the terminal velocity of the particles in a grav-itational field. The sigma factor physically represents the cross-sectional area of a gravitysettler with the same sedimentation characteristics as the centrifuge. For two centrifugeswith equal particle velocities, the performance of their effectiveness is related by theirflow rate:
Q1
S1¼ Q2
S2(7.4.1.5)
where subscripts 1 and 2 denote the two centrifuges. Equation (7.4.1.5) can be used toscale-up centrifuge equipment. The sigma factor depends on centrifuge design. Figure 7.4
7. DOWNSTREAM PROCESSING234
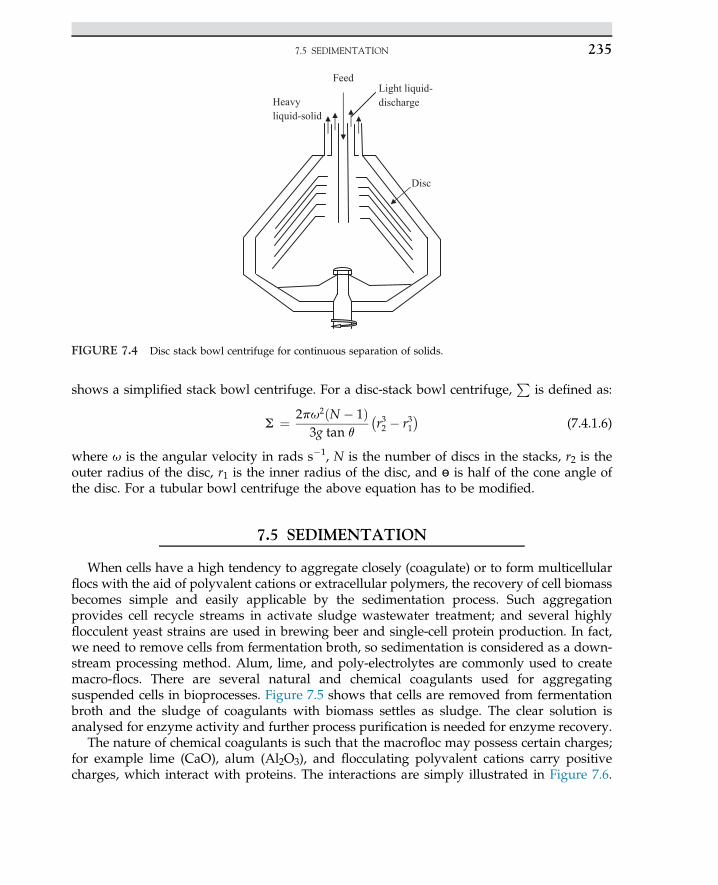
shows a simplified stack bowl centrifuge. For a disc-stack bowl centrifuge,P
is defined as:
S ¼ 2pu2ðN � 1Þ3g tan q
�r32 � r31
�(7.4.1.6)
where u is the angular velocity in rads s�1, N is the number of discs in the stacks, r2 is theouter radius of the disc, r1 is the inner radius of the disc, and ɵ is half of the cone angle ofthe disc. For a tubular bowl centrifuge the above equation has to be modified.
7.5 SEDIMENTATION
When cells have a high tendency to aggregate closely (coagulate) or to form multicellularflocs with the aid of polyvalent cations or extracellular polymers, the recovery of cell biomassbecomes simple and easily applicable by the sedimentation process. Such aggregationprovides cell recycle streams in activate sludge wastewater treatment; and several highlyflocculent yeast strains are used in brewing beer and single-cell protein production. In fact,we need to remove cells from fermentation broth, so sedimentation is considered as a down-stream processing method. Alum, lime, and poly-electrolytes are commonly used to createmacro-flocs. There are several natural and chemical coagulants used for aggregatingsuspended cells in bioprocesses. Figure 7.5 shows that cells are removed from fermentationbroth and the sludge of coagulants with biomass settles as sludge. The clear solution isanalysed for enzyme activity and further process purification is needed for enzyme recovery.
The nature of chemical coagulants is such that the macrofloc may possess certain charges;for example lime (CaO), alum (Al2O3), and flocculating polyvalent cations carry positivecharges, which interact with proteins. The interactions are simply illustrated in Figure 7.6.
Heavy liquid-solid
Feed Light liquid-discharge
Disc
FIGURE 7.4 Disc stack bowl centrifuge for continuous separation of solids.
7.5 SEDIMENTATION 235
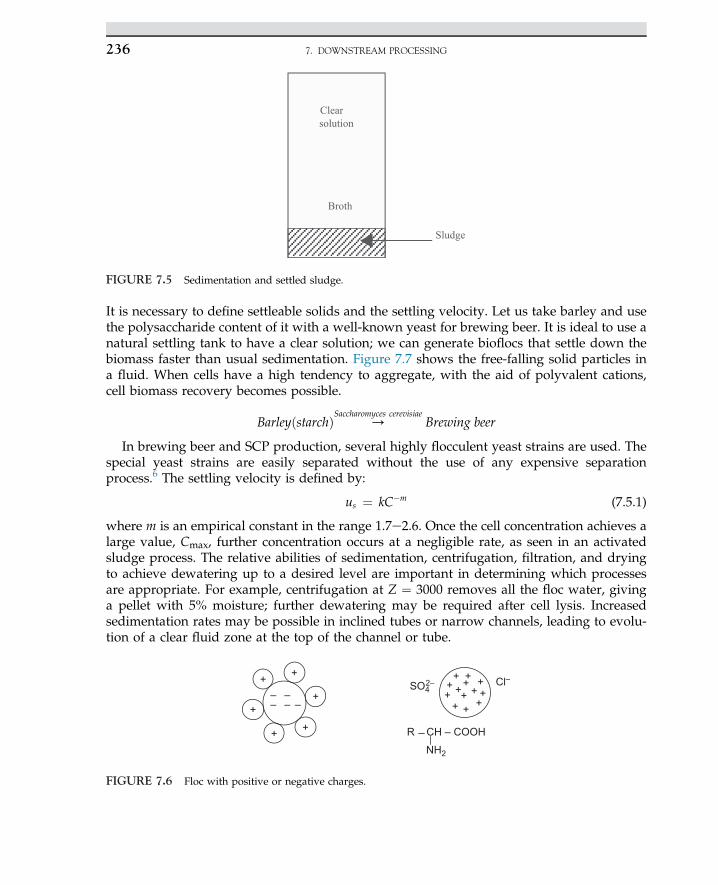
It is necessary to define settleable solids and the settling velocity. Let us take barley and usethe polysaccharide content of it with a well-known yeast for brewing beer. It is ideal to use anatural settling tank to have a clear solution; we can generate bioflocs that settle down thebiomass faster than usual sedimentation. Figure 7.7 shows the free-falling solid particles ina fluid. When cells have a high tendency to aggregate, with the aid of polyvalent cations,cell biomass recovery becomes possible.
BarleyðstarchÞ /Saccharomyces cerevisiae
Brewing beer
In brewing beer and SCP production, several highly flocculent yeast strains are used. Thespecial yeast strains are easily separated without the use of any expensive separationprocess.6 The settling velocity is defined by:
us ¼ kC�m (7.5.1)
where m is an empirical constant in the range 1.7e2.6. Once the cell concentration achieves alarge value, Cmax, further concentration occurs at a negligible rate, as seen in an activatedsludge process. The relative abilities of sedimentation, centrifugation, filtration, and dryingto achieve dewatering up to a desired level are important in determining which processesare appropriate. For example, centrifugation at Z ¼ 3000 removes all the floc water, givinga pellet with 5% moisture; further dewatering may be required after cell lysis. Increasedsedimentation rates may be possible in inclined tubes or narrow channels, leading to evolu-tion of a clear fluid zone at the top of the channel or tube.
Clearsolution
Broth
Sludge
FIGURE 7.5 Sedimentation and settled sludge.
+––
–– –
++
+
+ +
+ ++ + +
+++++ + +
+
CH – COOHR
Cl–SO42–
NH2
FIGURE 7.6 Floc with positive or negative charges.
7. DOWNSTREAM PROCESSING236
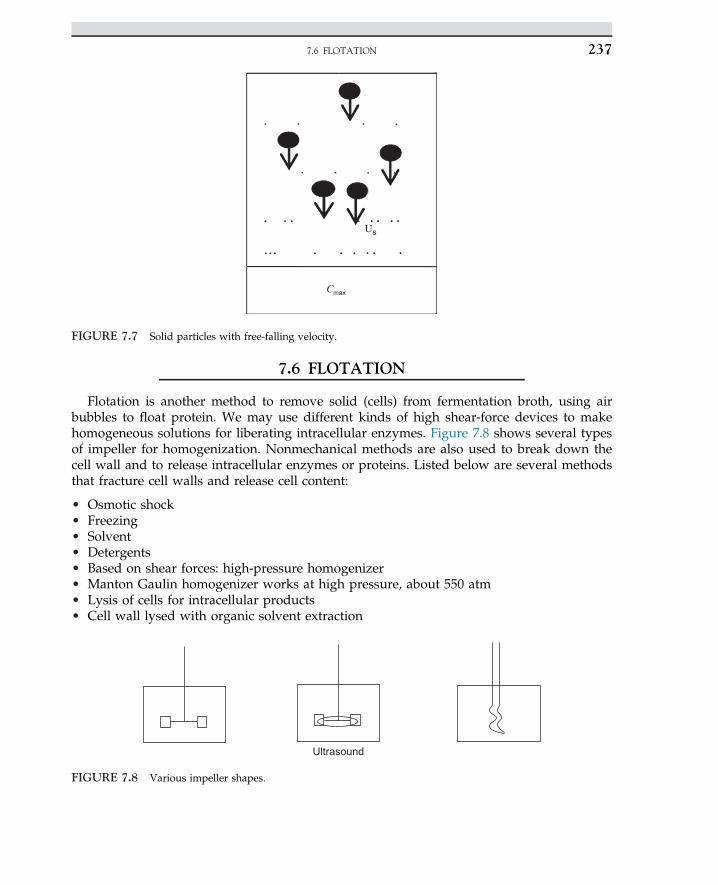
7.6 FLOTATION
Flotation is another method to remove solid (cells) from fermentation broth, using airbubbles to float protein. We may use different kinds of high shear-force devices to makehomogeneous solutions for liberating intracellular enzymes. Figure 7.8 shows several typesof impeller for homogenization. Nonmechanical methods are also used to break down thecell wall and to release intracellular enzymes or proteins. Listed below are several methodsthat fracture cell walls and release cell content:
• Osmotic shock• Freezing• Solvent• Detergents• Based on shear forces: high-pressure homogenizer• Manton Gaulin homogenizer works at high pressure, about 550 atm• Lysis of cells for intracellular products• Cell wall lysed with organic solvent extraction
Us
Cmax
FIGURE 7.7 Solid particles with free-falling velocity.
Ultrasound
FIGURE 7.8 Various impeller shapes.
7.6 FLOTATION 237
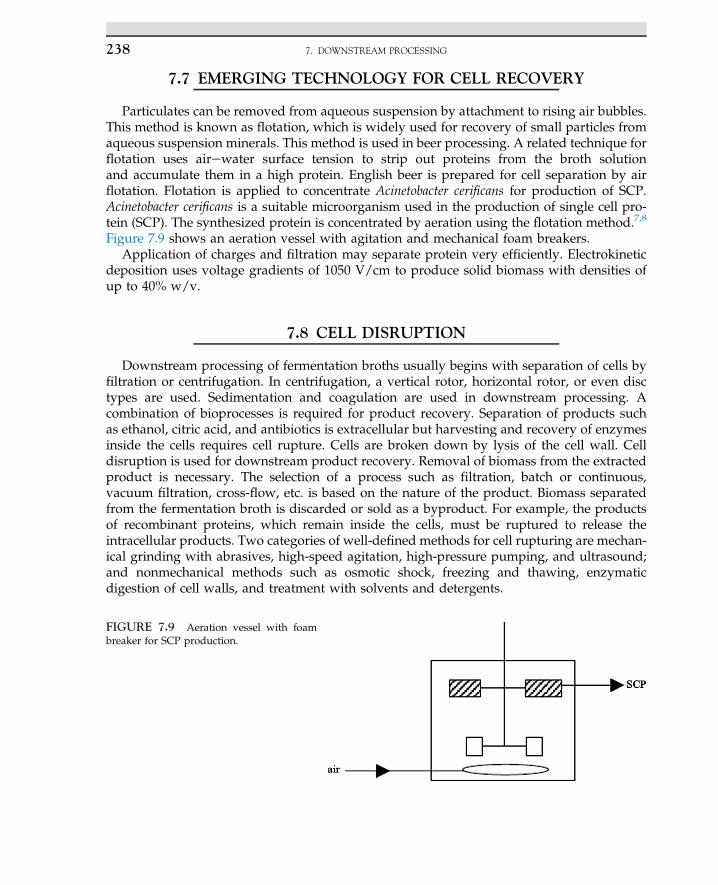
7.7 EMERGING TECHNOLOGY FOR CELL RECOVERY
Particulates can be removed from aqueous suspension by attachment to rising air bubbles.This method is known as flotation, which is widely used for recovery of small particles fromaqueous suspension minerals. This method is used in beer processing. A related technique forflotation uses airewater surface tension to strip out proteins from the broth solutionand accumulate them in a high protein. English beer is prepared for cell separation by airflotation. Flotation is applied to concentrate Acinetobacter cerificans for production of SCP.Acinetobacter cerificans is a suitable microorganism used in the production of single cell pro-tein (SCP). The synthesized protein is concentrated by aeration using the flotation method.7,8
Figure 7.9 shows an aeration vessel with agitation and mechanical foam breakers.Application of charges and filtration may separate protein very efficiently. Electrokinetic
deposition uses voltage gradients of 1050 V/cm to produce solid biomass with densities ofup to 40% w/v.
7.8 CELL DISRUPTION
Downstream processing of fermentation broths usually begins with separation of cells byfiltration or centrifugation. In centrifugation, a vertical rotor, horizontal rotor, or even disctypes are used. Sedimentation and coagulation are used in downstream processing. Acombination of bioprocesses is required for product recovery. Separation of products suchas ethanol, citric acid, and antibiotics is extracellular but harvesting and recovery of enzymesinside the cells requires cell rupture. Cells are broken down by lysis of the cell wall. Celldisruption is used for downstream product recovery. Removal of biomass from the extractedproduct is necessary. The selection of a process such as filtration, batch or continuous,vacuum filtration, cross-flow, etc. is based on the nature of the product. Biomass separatedfrom the fermentation broth is discarded or sold as a byproduct. For example, the productsof recombinant proteins, which remain inside the cells, must be ruptured to release theintracellular products. Two categories of well-defined methods for cell rupturing are mechan-ical grinding with abrasives, high-speed agitation, high-pressure pumping, and ultrasound;and nonmechanical methods such as osmotic shock, freezing and thawing, enzymaticdigestion of cell walls, and treatment with solvents and detergents.
FIGURE 7.9 Aeration vessel with foambreaker for SCP production.
7. DOWNSTREAM PROCESSING238
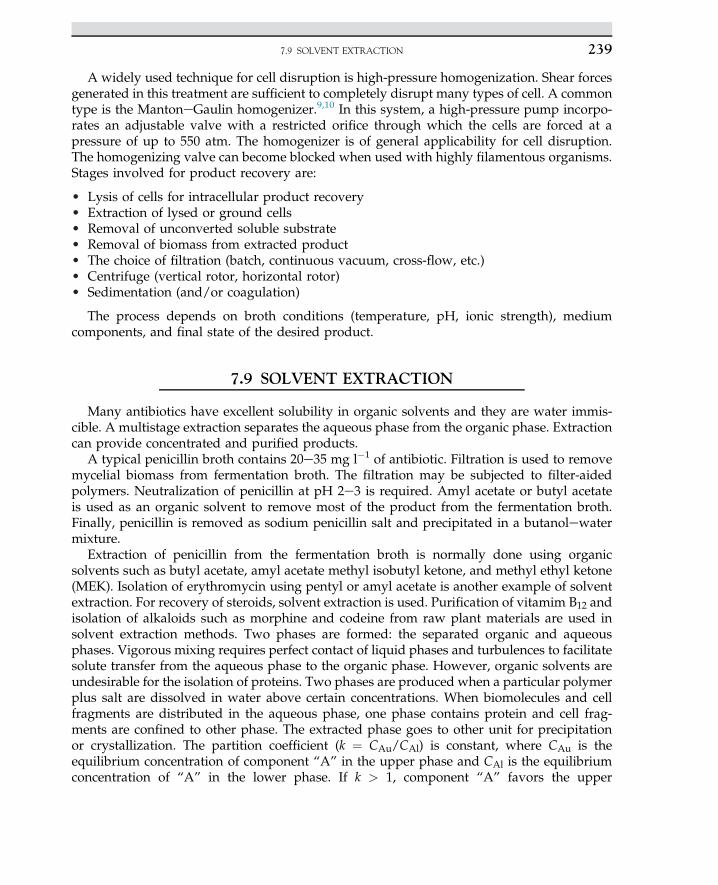
A widely used technique for cell disruption is high-pressure homogenization. Shear forcesgenerated in this treatment are sufficient to completely disrupt many types of cell. A commontype is the MantoneGaulin homogenizer.9,10 In this system, a high-pressure pump incorpo-rates an adjustable valve with a restricted orifice through which the cells are forced at apressure of up to 550 atm. The homogenizer is of general applicability for cell disruption.The homogenizing valve can become blocked when used with highly filamentous organisms.Stages involved for product recovery are:
• Lysis of cells for intracellular product recovery• Extraction of lysed or ground cells• Removal of unconverted soluble substrate• Removal of biomass from extracted product• The choice of filtration (batch, continuous vacuum, cross-flow, etc.)• Centrifuge (vertical rotor, horizontal rotor)• Sedimentation (and/or coagulation)
The process depends on broth conditions (temperature, pH, ionic strength), mediumcomponents, and final state of the desired product.
7.9 SOLVENT EXTRACTION
Many antibiotics have excellent solubility in organic solvents and they are water immis-cible. A multistage extraction separates the aqueous phase from the organic phase. Extractioncan provide concentrated and purified products.
A typical penicillin broth contains 20e35 mg l�1 of antibiotic. Filtration is used to removemycelial biomass from fermentation broth. The filtration may be subjected to filter-aidedpolymers. Neutralization of penicillin at pH 2e3 is required. Amyl acetate or butyl acetateis used as an organic solvent to remove most of the product from the fermentation broth.Finally, penicillin is removed as sodium penicillin salt and precipitated in a butanolewatermixture.
Extraction of penicillin from the fermentation broth is normally done using organicsolvents such as butyl acetate, amyl acetate methyl isobutyl ketone, and methyl ethyl ketone(MEK). Isolation of erythromycin using pentyl or amyl acetate is another example of solventextraction. For recovery of steroids, solvent extraction is used. Purification of vitamim B12 andisolation of alkaloids such as morphine and codeine from raw plant materials are used insolvent extraction methods. Two phases are formed: the separated organic and aqueousphases. Vigorous mixing requires perfect contact of liquid phases and turbulences to facilitatesolute transfer from the aqueous phase to the organic phase. However, organic solvents areundesirable for the isolation of proteins. Two phases are produced when a particular polymerplus salt are dissolved in water above certain concentrations. When biomolecules and cellfragments are distributed in the aqueous phase, one phase contains protein and cell frag-ments are confined to other phase. The extracted phase goes to other unit for precipitationor crystallization. The partition coefficient (k ¼ CAu/CAl) is constant, where CAu is theequilibrium concentration of component “A” in the upper phase and CAl is the equilibriumconcentration of “A” in the lower phase. If k > 1, component “A” favors the upper
7.9 SOLVENT EXTRACTION 239
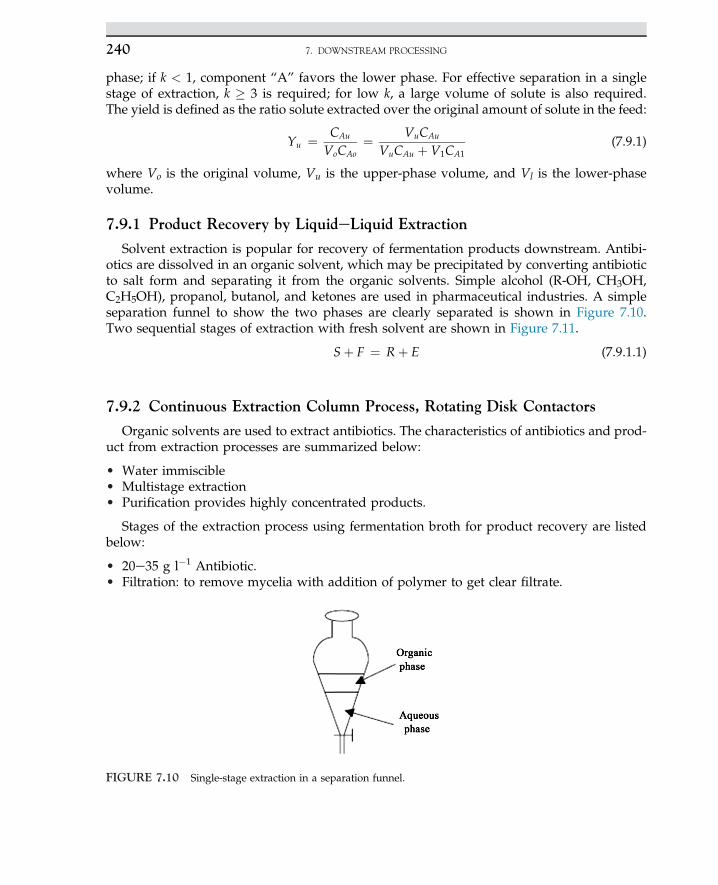
phase; if k < 1, component “A” favors the lower phase. For effective separation in a singlestage of extraction, k � 3 is required; for low k, a large volume of solute is also required.The yield is defined as the ratio solute extracted over the original amount of solute in the feed:
Yu ¼ CAu
VoCAo¼ VuCAu
VuCAu þ V1CA1(7.9.1)
where Vo is the original volume, Vu is the upper-phase volume, and Vl is the lower-phasevolume.
7.9.1 Product Recovery by LiquideLiquid Extraction
Solvent extraction is popular for recovery of fermentation products downstream. Antibi-otics are dissolved in an organic solvent, which may be precipitated by converting antibioticto salt form and separating it from the organic solvents. Simple alcohol (R-OH, CH3OH,C2H5OH), propanol, butanol, and ketones are used in pharmaceutical industries. A simpleseparation funnel to show the two phases are clearly separated is shown in Figure 7.10.Two sequential stages of extraction with fresh solvent are shown in Figure 7.11.
Sþ F ¼ Rþ E (7.9.1.1)
7.9.2 Continuous Extraction Column Process, Rotating Disk Contactors
Organic solvents are used to extract antibiotics. The characteristics of antibiotics and prod-uct from extraction processes are summarized below:
• Water immiscible• Multistage extraction• Purification provides highly concentrated products.
Stages of the extraction process using fermentation broth for product recovery are listedbelow:
• 20e35 g l�1 Antibiotic.• Filtration: to remove mycelia with addition of polymer to get clear filtrate.
FIGURE 7.10 Single-stage extraction in a separation funnel.
7. DOWNSTREAM PROCESSING240
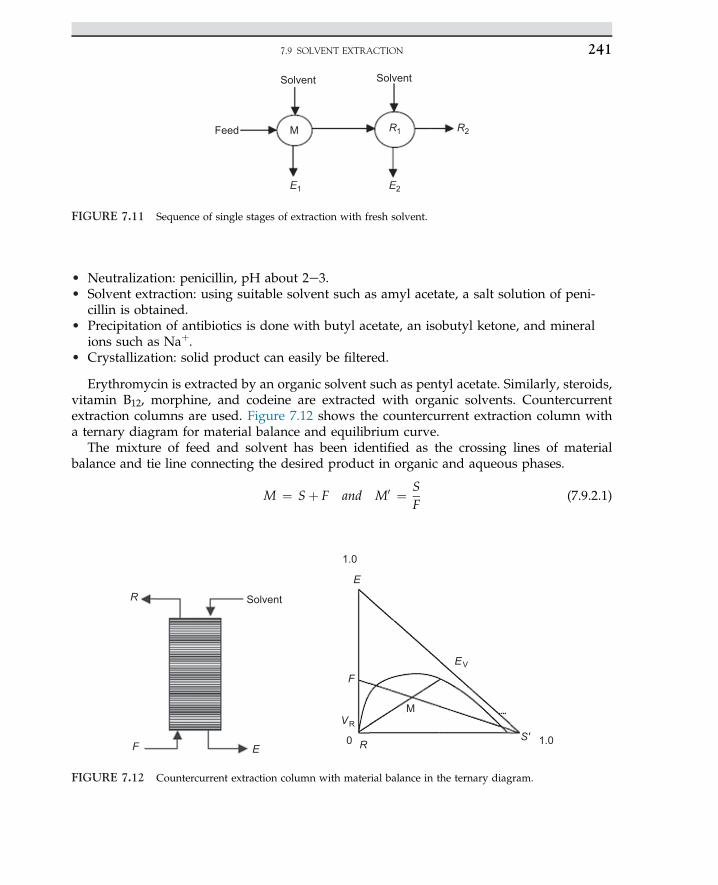
• Neutralization: penicillin, pH about 2e3.• Solvent extraction: using suitable solvent such as amyl acetate, a salt solution of peni-
cillin is obtained.• Precipitation of antibiotics is done with butyl acetate, an isobutyl ketone, and mineral
ions such as Naþ.• Crystallization: solid product can easily be filtered.
Erythromycin is extracted by an organic solvent such as pentyl acetate. Similarly, steroids,vitamin B12, morphine, and codeine are extracted with organic solvents. Countercurrentextraction columns are used. Figure 7.12 shows the countercurrent extraction column witha ternary diagram for material balance and equilibrium curve.
The mixture of feed and solvent has been identified as the crossing lines of materialbalance and tie line connecting the desired product in organic and aqueous phases.
M ¼ Sþ F and M0 ¼ SF
(7.9.2.1)
Feed
Solvent Solvent
M R1 R2
E2E1
FIGURE 7.11 Sequence of single stages of extraction with fresh solvent.
R Solvent
F
F
E
E
MVR
R0
EV
S 1.0
1.0
'
FIGURE 7.12 Countercurrent extraction column with material balance in the ternary diagram.
7.9 SOLVENT EXTRACTION 241
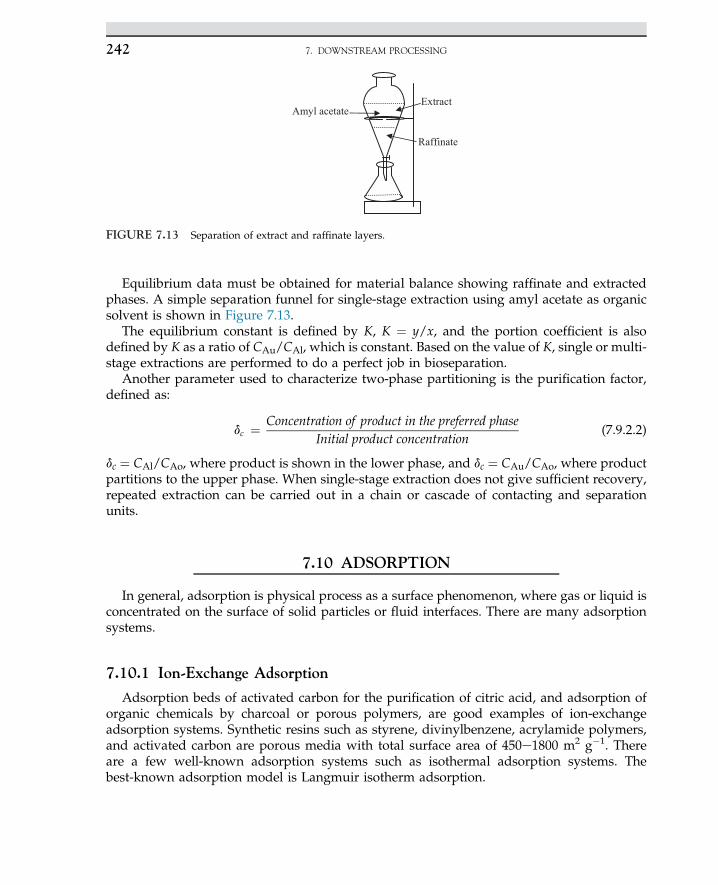
Equilibrium data must be obtained for material balance showing raffinate and extractedphases. A simple separation funnel for single-stage extraction using amyl acetate as organicsolvent is shown in Figure 7.13.
The equilibrium constant is defined by K, K ¼ y/x, and the portion coefficient is alsodefined by K as a ratio of CAu/CAl, which is constant. Based on the value of K, single or multi-stage extractions are performed to do a perfect job in bioseparation.
Another parameter used to characterize two-phase partitioning is the purification factor,defined as:
dc ¼ Concentration of product in the preferred phaseInitial product concentration
(7.9.2.2)
dc ¼ CAl/CAo, where product is shown in the lower phase, and dc ¼ CAu/CAo, where productpartitions to the upper phase. When single-stage extraction does not give sufficient recovery,repeated extraction can be carried out in a chain or cascade of contacting and separationunits.
7.10 ADSORPTION
In general, adsorption is physical process as a surface phenomenon, where gas or liquid isconcentrated on the surface of solid particles or fluid interfaces. There are many adsorptionsystems.
7.10.1 Ion-Exchange Adsorption
Adsorption beds of activated carbon for the purification of citric acid, and adsorption oforganic chemicals by charcoal or porous polymers, are good examples of ion-exchangeadsorption systems. Synthetic resins such as styrene, divinylbenzene, acrylamide polymers,and activated carbon are porous media with total surface area of 450e1800 m2 g�1. Thereare a few well-known adsorption systems such as isothermal adsorption systems. Thebest-known adsorption model is Langmuir isotherm adsorption.
Amyl acetate
Raffinate
Extract
FIGURE 7.13 Separation of extract and raffinate layers.
7. DOWNSTREAM PROCESSING242
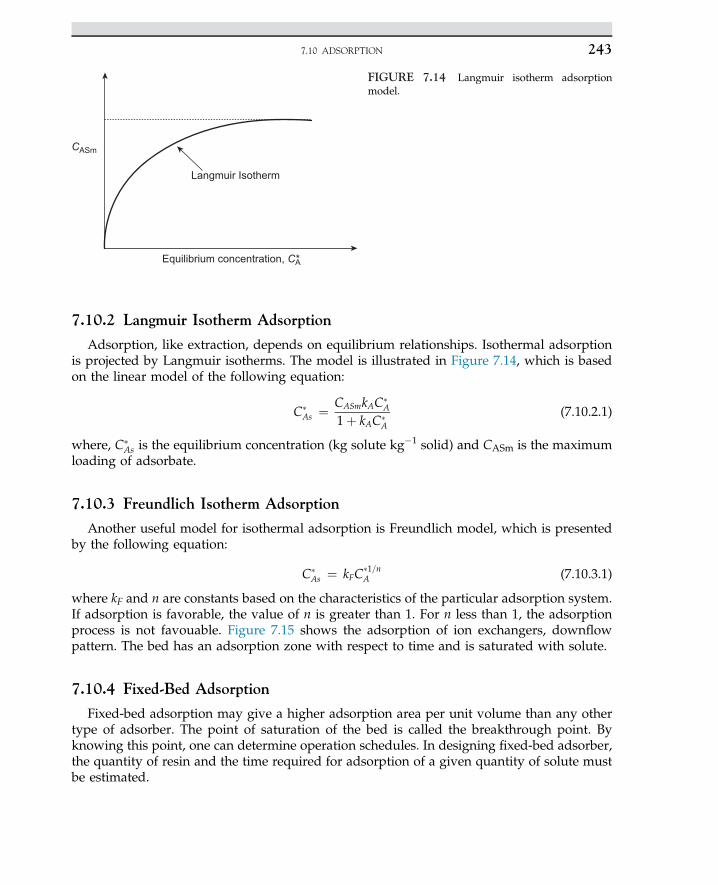
7.10.2 Langmuir Isotherm Adsorption
Adsorption, like extraction, depends on equilibrium relationships. Isothermal adsorptionis projected by Langmuir isotherms. The model is illustrated in Figure 7.14, which is basedon the linear model of the following equation:
C�As ¼ CASmkAC�
A
1þ kAC�A
(7.10.2.1)
where, C�As is the equilibrium concentration (kg solute kg�1 solid) and CASm is the maximum
loading of adsorbate.
7.10.3 Freundlich Isotherm Adsorption
Another useful model for isothermal adsorption is Freundlich model, which is presentedby the following equation:
C�As ¼ kFC
�1=nA (7.10.3.1)
where kF and n are constants based on the characteristics of the particular adsorption system.If adsorption is favorable, the value of n is greater than 1. For n less than 1, the adsorptionprocess is not favouable. Figure 7.15 shows the adsorption of ion exchangers, downflowpattern. The bed has an adsorption zone with respect to time and is saturated with solute.
7.10.4 Fixed-Bed Adsorption
Fixed-bed adsorption may give a higher adsorption area per unit volume than any othertype of adsorber. The point of saturation of the bed is called the breakthrough point. Byknowing this point, one can determine operation schedules. In designing fixed-bed adsorber,the quantity of resin and the time required for adsorption of a given quantity of solute mustbe estimated.
Langmuir Isotherm
Equilibrium concentration, CA*
CASm
FIGURE 7.14 Langmuir isotherm adsorptionmodel.
7.10 ADSORPTION 243
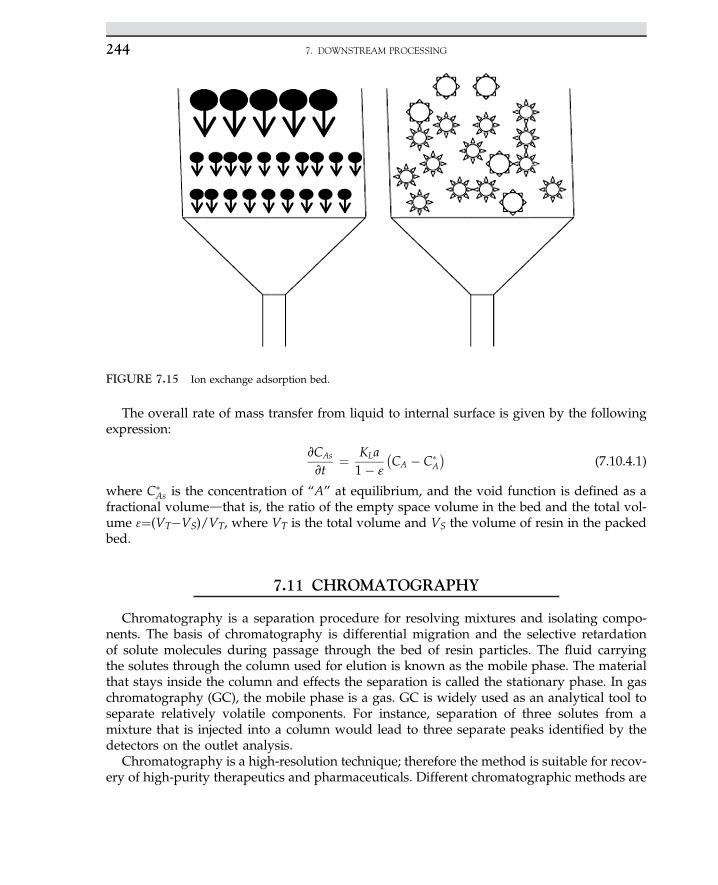
The overall rate of mass transfer from liquid to internal surface is given by the followingexpression:
vCAs
vt¼ KLa
1� ε
�CA � C�
A
�(7.10.4.1)
where C�As is the concentration of “A” at equilibrium, and the void function is defined as a
fractional volumedthat is, the ratio of the empty space volume in the bed and the total vol-ume 3¼(VT�VS)/VT, where VT is the total volume and VS the volume of resin in the packedbed.
7.11 CHROMATOGRAPHY
Chromatography is a separation procedure for resolving mixtures and isolating compo-nents. The basis of chromatography is differential migration and the selective retardationof solute molecules during passage through the bed of resin particles. The fluid carryingthe solutes through the column used for elution is known as the mobile phase. The materialthat stays inside the column and effects the separation is called the stationary phase. In gaschromatography (GC), the mobile phase is a gas. GC is widely used as an analytical tool toseparate relatively volatile components. For instance, separation of three solutes from amixture that is injected into a column would lead to three separate peaks identified by thedetectors on the outlet analysis.
Chromatography is a high-resolution technique; therefore the method is suitable for recov-ery of high-purity therapeutics and pharmaceuticals. Different chromatographic methods are
FIGURE 7.15 Ion exchange adsorption bed.
7. DOWNSTREAM PROCESSING244
available for purification of proteins, amino acids, nucleic acids, alkaloids, vitamins, steroids,and many other biological materials. These methods are adsorption chromatography, parti-tion chromatography, ion-exchange chromatography, gel chromatography, and affinity chro-matography. These methods differ in the principal mechanism by which the molecules areretarded in the chromatography column. There are several distinct methods ofchromatography:
• Adsorption chromatography.• Partition chromatography.• Ion-exchange chromatography, such as carboxy methyl cellulose (CMC), agarose, and/
or dextrin.• Gel chromatography or molecular sieve chromatography, such as polyacrylamide gels.• Affinity chromatography, which is the binding of biomolecules with the matrix bed,
often used for antibodies and antigens.
In adsorption chromatography, the bed has special characteristics to adsorb solutes.The recommended beds for adsorption chromatography are silica gel, alumina, and charcoal.
In ion-exchange chromatography, agarose, dextrose, and carboxy methyl cellulose (CMC)are used as the media beds for separation. In gel chromatography the bed is mainly molecularsieves such as polyacrylamide gels. In affinity chromatography, the separating bed is a bind-ing biomolecular matrix that is able to attract antibodies or antigen, so there is good affinityfor separating the product. The gel is defined as porous material that is cross-linked, such asdextrin agarose and polyacryamide gel. As flow passes through the bed, differentiation andseparation based on molecular size occur. The large molecules are completely trapped whilesmall molecules move through the gel matrix. The small molecules are able to penetrate intothe pore of the packed bed. The intermediate-sized molecules are separated from large andsmall molecules. At the end of the process, three zones are eluted with buffers for backwashto separate original samples to three proportions with molecular cut-off. The capacity of thecolumn is given by the following equation:
k ¼ Ve � Vo
Vo(7.11.1)
where k is known as the capacity of the column, and the solvent volume for eluting the bedis defined with Ve; also Vo is the void volume, the free volume, outside of the bed particles;Vi is known as internal volume of liquid in the pores of the particles; and Vs is the volumeof the gel itself. These equations are normally applied for partition coefficient, ion ex-change, and affinity chromatography. In gel filtration, the separation is a function of effec-tive molecular size, elution volume, and total gel volume. The total volume of the gelcolumn is:
Vtotal ¼ Vo þ Vi þ Vs
Ve ¼ Vo þ kPVi
where Ve is the volume of eluting solvent, Vo is the void volume outside the particles, Vi is theinternal volume of liquid in the pores of the particles, and Vs is the volume of the gel itself.For two solutes k1 and k2 are capacity factors for solutes 1 and 2, respectively. The relative
7.11 CHROMATOGRAPHY 245
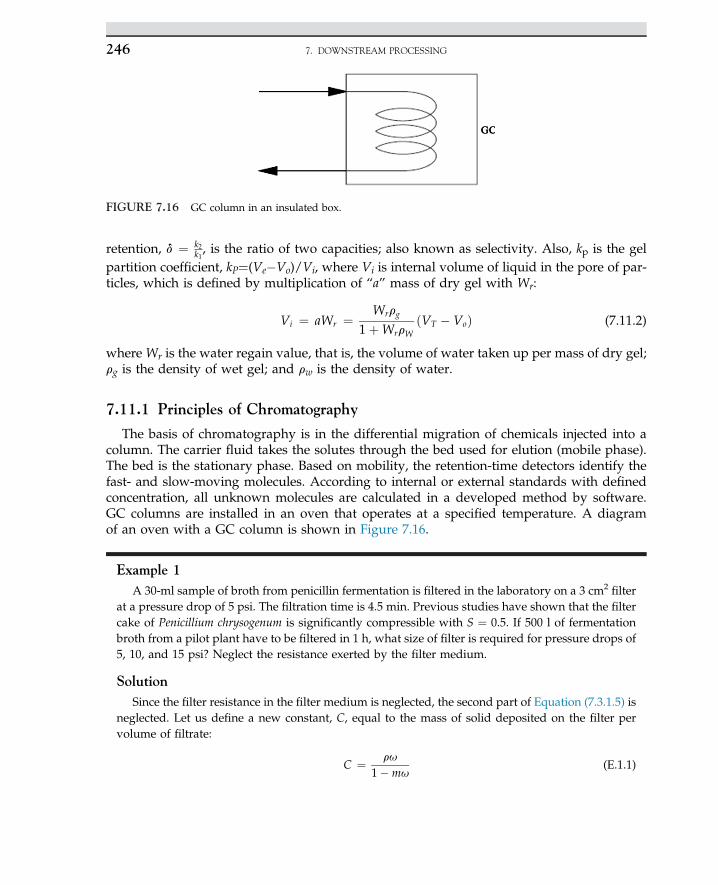
retention, d ¼ k2k1, is the ratio of two capacities; also known as selectivity. Also, kp is the gel
partition coefficient, kP¼(Ve�Vo)/Vi, where Vi is internal volume of liquid in the pore of par-ticles, which is defined by multiplication of “a” mass of dry gel with Wr:
Vi ¼ aWr ¼ Wrrg
1þWrrWðVT � VoÞ (7.11.2)
where Wr is the water regain value, that is, the volume of water taken up per mass of dry gel;rg is the density of wet gel; and rw is the density of water.
7.11.1 Principles of Chromatography
The basis of chromatography is in the differential migration of chemicals injected into acolumn. The carrier fluid takes the solutes through the bed used for elution (mobile phase).The bed is the stationary phase. Based on mobility, the retention-time detectors identify thefast- and slow-moving molecules. According to internal or external standards with definedconcentration, all unknown molecules are calculated in a developed method by software.GC columns are installed in an oven that operates at a specified temperature. A diagramof an oven with a GC column is shown in Figure 7.16.
Example 1A 30-ml sample of broth from penicillin fermentation is filtered in the laboratory on a 3 cm2
filterat a pressure drop of 5 psi. The filtration time is 4.5 min. Previous studies have shown that the filtercake of Penicillium chrysogenum is significantly compressible with S ¼ 0.5. If 500 l of fermentationbroth from a pilot plant have to be filtered in 1 h, what size of filter is required for pressure drops of5, 10, and 15 psi? Neglect the resistance exerted by the filter medium.
SolutionSince the filter resistance in the filter medium is neglected, the second part of Equation (7.3.1.5) is
neglected. Let us define a new constant, C, equal to the mass of solid deposited on the filter pervolume of filtrate:
C ¼ ru
1�mu(E.1.1)
FIGURE 7.16 GC column in an insulated box.
7. DOWNSTREAM PROCESSING246
Equations (7.3.1.5) was modified as the second part is neglected, so the filtration time per unitvolume is:
tVf
¼ mcaru
2DPð1�muÞVf
A2(E.1.2)
The obtained equation is written with respect to pressure drop:
tVf
¼ mea0DPS�1C2A2
(E.1.3)
The area for a laboratory-scale filter is calculated by:
mea0c ¼ 2A2t
ðDPÞS�1V2f
mea0c ¼ 2
�3cm2
�2ð4:5minÞð5psiÞ0:5�1�30cm3
�2mea
0c ¼ 0:201ðpsiÞ0:5min
cm2
The area for a pilot-scale filter is obtained according to defined pressure drop.For a pressure drop of 5 psi, the filter area is:
A2 ¼ mea0cðDPÞS�1V2
f
2t
A2 ¼ ð0:201Þð5Þ0:5�1�500; 000cm3�2
120min
A ¼ 1:37� 104cm2 or 1:37m2
For pressure drop of 10 psi, the filter area is:
A2 ¼ mea0cðDPÞS�1V2
f
2t
¼ ð0:20125Þð10Þ0:5�1�500; 000cm3�2
120min
A ¼ 1:15� 104cm2 or 1:15m2
The value for area A for a pressure drop of 15 psi is reduced: A.
ð0:20125Þð15Þ0:5�1�500; 000cm3�2
120min
¼ 1:04m2
Having a differential pressure in the above filtration process, and increasing the pressure dropfrom 5 to 10 and then 15 psi, the filter area was reduced by 19 and 11%, respectively. One of themain reasons why an increase in the pressure drop results in less filter area may be due tocompression of the filter cake and the porosity of the filter.
7.11 CHROMATOGRAPHY 247
Example 2Filtration of 300 ml of fermentation broth was carried out in a laboratory-sized filter with a
pressure drop of 10 psi. The filtration took 20 min. Based on previous studies, the filter cakeobtained from Penicillium chrysogenum was compressible with the exponent “s” in the equation forcalculation of filter area equal to 0.5.
1. What size of filter is required to carry out filtration of 1 m3 broth from a pilot plant in 20 hand at a pressure drop of 20 psi?
2. What is the percentage increase in filter area if the pressure drop is reduced to 10 psi?
Solution
tVf
¼ mac2A2DP
$Vf ¼ ma0cDPs�1
2A2$Vf
a ¼ a0DPs
ma0c ¼ 2A2t
ðDPÞS�1V2f
¼ 2ð10Þ2ð20Þð10Þ0:5�1ð300Þ2 ¼ 0:1405
A ¼"ðma0cÞDP�0:5V2
f
2t
#1=2
¼�ðma0cÞDP�0:5
2t
Vf
¼"0:1405ð20Þ�0:5
2� 2� 60
#1=2�106cm3
� ¼ 1:14� 104cm2 ¼ 1:14m2
A1
A2¼
"�DP1
DP2
��0:5#1=2
¼�12
��0:25
¼ 1:189 (E.2.1)
An 18.9% increase in the area of the filter was obtained.
A1
A2¼
ðma0c=2tÞ0:51
hð20Þ�0:5
i1=2ðma0c=2tÞ0:52
hð20Þ�0:5
i1=2 ¼ 0:4730:56
¼ 0:84
A2 ¼ A1
0:84¼ 1:14
0:84¼ 1:356m2 (E.2.2)
The ratio of A2A1
¼ 1:3561:14 ¼ 1:189, which is approximately an increase in filter surface area of 19%.
7. DOWNSTREAM PROCESSING248
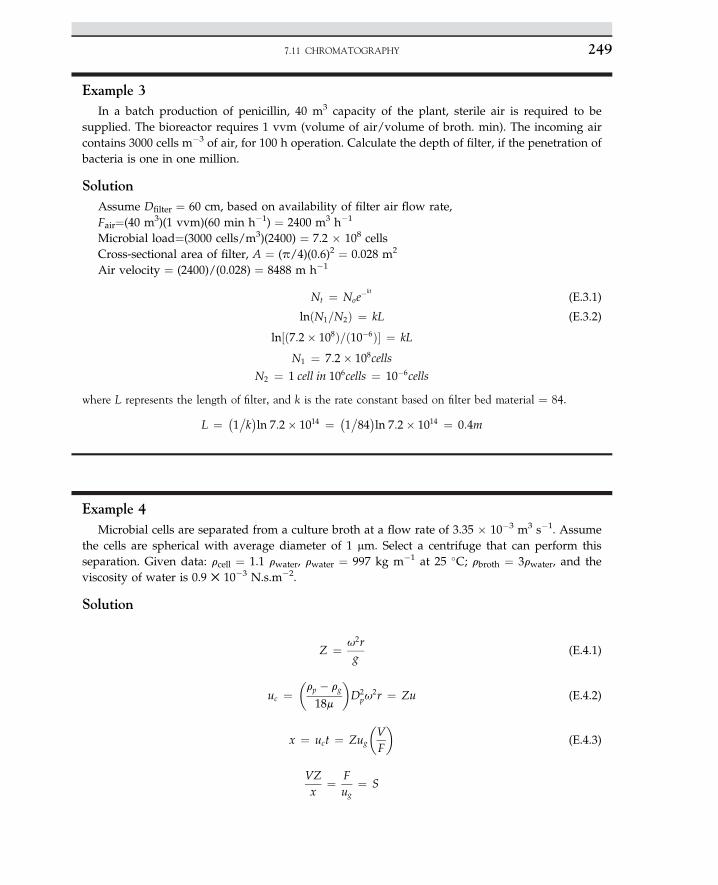
Example 3In a batch production of penicillin, 40 m3 capacity of the plant, sterile air is required to be
supplied. The bioreactor requires 1 vvm (volume of air/volume of broth. min). The incoming aircontains 3000 cells m�3 of air, for 100 h operation. Calculate the depth of filter, if the penetration ofbacteria is one in one million.
SolutionAssume Dfilter ¼ 60 cm, based on availability of filter air flow rate,Fair¼(40 m3)(1 vvm)(60 min h�1) ¼ 2400 m3 h�1
Microbial load¼(3000 cells/m3)(2400) ¼ 7.2 � 108 cellsCross-sectional area of filter, A ¼ (p/4)(0.6)2 ¼ 0.028 m2
Air velocity ¼ (2400)/(0.028) ¼ 8488 m h�1
Nt ¼ Noe�kt
(E.3.1)
lnðN1=N2Þ ¼ kL (E.3.2)
ln½ð7:2� 108Þ=ð10�6Þ� ¼ kL
N1 ¼ 7:2� 108cells
N2 ¼ 1 cell in 106cells ¼ 10�6cells
where L represents the length of filter, and k is the rate constant based on filter bed material ¼ 84.
L ¼ �1�k�ln 7:2� 1014 ¼ �
1�84�ln 7:2� 1014 ¼ 0:4m
Example 4Microbial cells are separated from a culture broth at a flow rate of 3.35 � 10�3 m3 s�1. Assume
the cells are spherical with average diameter of 1 mm. Select a centrifuge that can perform thisseparation. Given data: rcell ¼ 1.1 rwater, rwater ¼ 997 kg m�1 at 25 �C; rbroth ¼ 3rwater, and theviscosity of water is 0.9 ✕ 10�3 N.s.m�2.
Solution
Z ¼ u2rg
(E.4.1)
uc ¼�rp � rg
18m
�D2
pu2r ¼ Zu (E.4.2)
x ¼ uct ¼ Zug
�VF
�(E.4.3)
VZx
¼ Fug
¼ S
7.11 CHROMATOGRAPHY 249
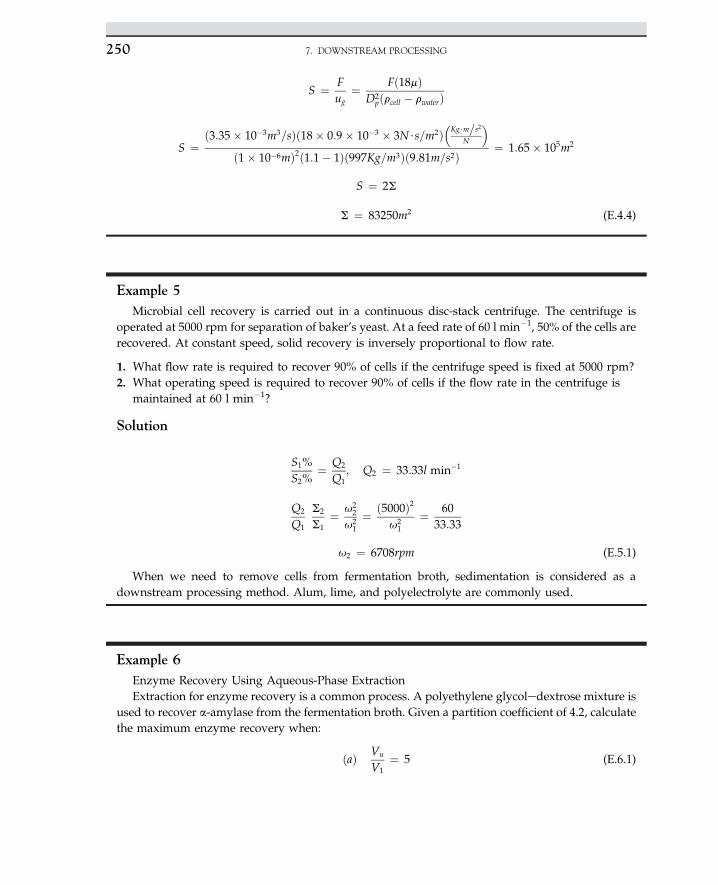
S ¼ Fug
¼ Fð18mÞD2
pðrcell � rwaterÞ
S ¼ð3:35� 10�3m3=sÞð18� 0:9� 10�3 � 3N$s=m2Þ
Kg$m=s2
N
�ð1� 10�6mÞ2ð1:1� 1Þð997Kg=m3Þð9:81m=s2Þ ¼ 1:65� 105m2
S ¼ 2S
S ¼ 83250m2 (E.4.4)
Example 5Microbial cell recovery is carried out in a continuous disc-stack centrifuge. The centrifuge is
operated at 5000 rpm for separation of baker’s yeast. At a feed rate of 60 l min�1, 50% of the cells arerecovered. At constant speed, solid recovery is inversely proportional to flow rate.
1. What flow rate is required to recover 90% of cells if the centrifuge speed is fixed at 5000 rpm?2. What operating speed is required to recover 90% of cells if the flow rate in the centrifuge is
maintained at 60 l min�1?
Solution
S1%S2%
¼ Q2
Q1; Q2 ¼ 33:33l min�1
Q2
Q1
S2
S1¼ u2
2
u21¼ ð5000Þ2
u21
¼ 6033:33
u2 ¼ 6708rpm (E.5.1)
When we need to remove cells from fermentation broth, sedimentation is considered as adownstream processing method. Alum, lime, and polyelectrolyte are commonly used.
Example 6Enzyme Recovery Using Aqueous-Phase ExtractionExtraction for enzyme recovery is a common process. A polyethylene glycoledextrose mixture is
used to recover a-amylase from the fermentation broth. Given a partition coefficient of 4.2, calculatethe maximum enzyme recovery when:
ðaÞ Vu
V1¼ 5 (E.6.1)
7. DOWNSTREAM PROCESSING250
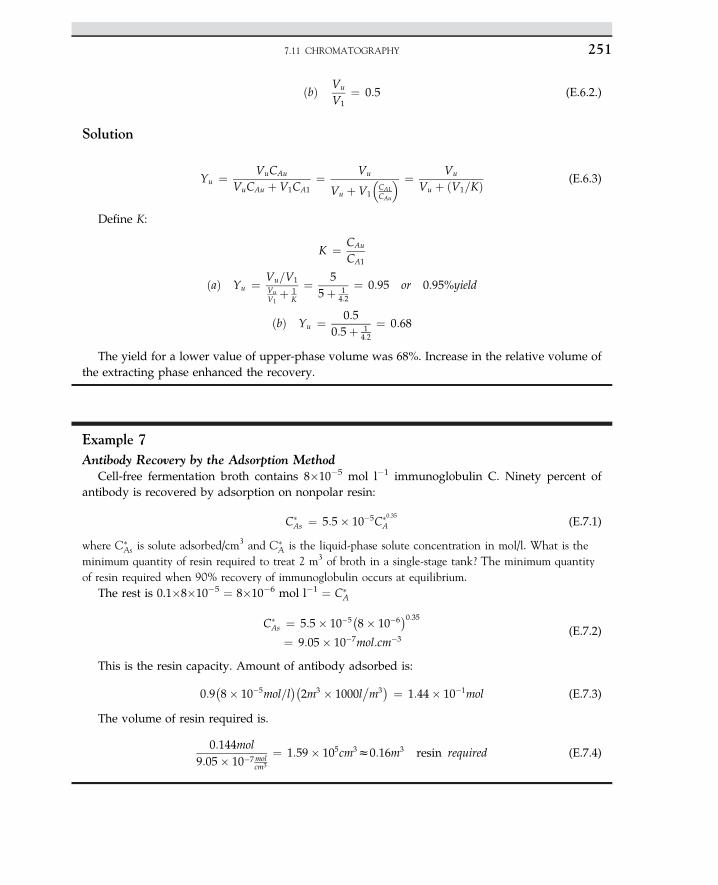
ðbÞ Vu
V1¼ 0:5 (E.6.2.)
Solution
Yu ¼ VuCAu
VuCAu þ V1CA1¼ Vu
Vu þ V1
CA1CAu
� ¼ Vu
Vu þ ðV1=KÞ (E.6.3)
Define K:
K ¼ CAu
CA1
ðaÞ Yu ¼ Vu=V1VuV1
þ 1K
¼ 55þ 1
4:2
¼ 0:95 or 0:95%yield
ðbÞ Yu ¼ 0:50:5þ 1
4:2
¼ 0:68
The yield for a lower value of upper-phase volume was 68%. Increase in the relative volume ofthe extracting phase enhanced the recovery.
Example 7Antibody Recovery by the Adsorption Method
Cell-free fermentation broth contains 8�10�5 mol l�1 immunoglobulin C. Ninety percent ofantibody is recovered by adsorption on nonpolar resin:
C�As ¼ 5:5� 10�5C�0:35
A (E.7.1)
where C�As is solute adsorbed/cm3 and C�
A is the liquid-phase solute concentration in mol/l. What is theminimum quantity of resin required to treat 2 m3 of broth in a single-stage tank? The minimum quantityof resin required when 90% recovery of immunoglobulin occurs at equilibrium.
The rest is 0.1�8�10�5 ¼ 8�10�6 mol l�1 ¼ C�A
C�As ¼ 5:5� 10�5
�8� 10�6
�0:35¼ 9:05� 10�7mol:cm�3
(E.7.2)
This is the resin capacity. Amount of antibody adsorbed is:
0:9�8� 10�5mol=l
��2m3 � 1000l
�m3
� ¼ 1:44� 10�1mol (E.7.3)
The volume of resin required is.
0:144mol9:05� 10�7mol
cm3
¼ 1:59� 105cm3z0:16m3 resin required (E.7.4)
7.11 CHROMATOGRAPHY 251
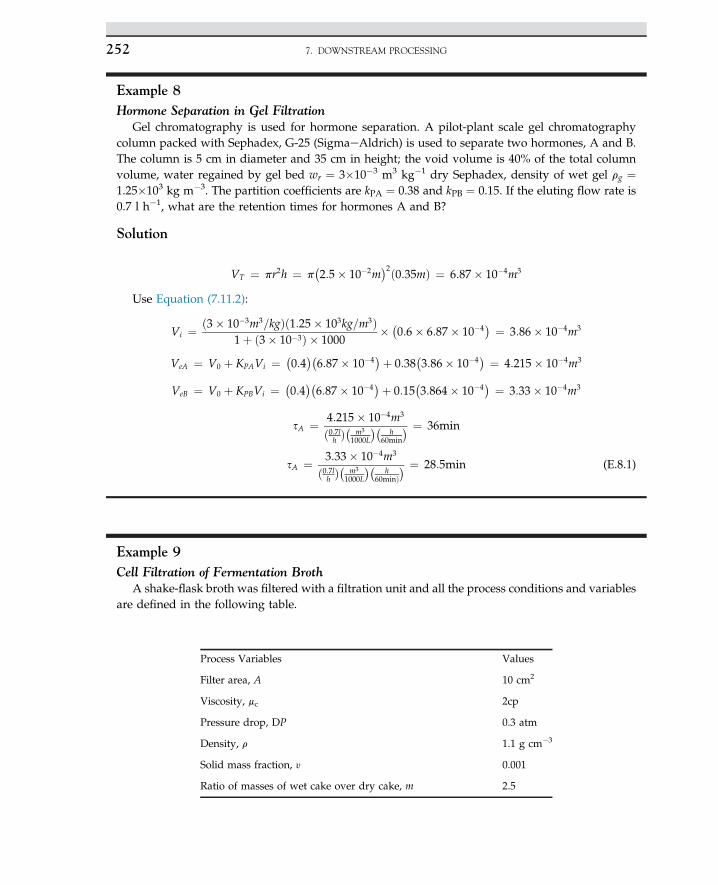
Example 8Hormone Separation in Gel Filtration
Gel chromatography is used for hormone separation. A pilot-plant scale gel chromatographycolumn packed with Sephadex, G-25 (SigmaeAldrich) is used to separate two hormones, A and B.The column is 5 cm in diameter and 35 cm in height; the void volume is 40% of the total columnvolume, water regained by gel bed wr ¼ 3�10�3 m3 kg�1 dry Sephadex, density of wet gel rg ¼1.25�103 kg m�3. The partition coefficients are kPA ¼ 0.38 and kPB ¼ 0.15. If the eluting flow rate is0.7 l h�1, what are the retention times for hormones A and B?
Solution
VT ¼ pr2h ¼ p�2:5� 10�2m
�2ð0:35mÞ ¼ 6:87� 10�4m3
Use Equation (7.11.2):
Vi ¼ ð3� 10�3m3=kgÞð1:25� 103kg=m3Þ1þ ð3� 10�3Þ � 1000
� �0:6� 6:87� 10�4
� ¼ 3:86� 10�4m3
VeA ¼ V0 þ KPAVi ¼�0:4
��6:87� 10�4
�þ 0:38�3:86� 10�4
� ¼ 4:215� 10�4m3
VeB ¼ V0 þ KPBVi ¼�0:4
��6:87� 10�4
�þ 0:15�3:864� 10�4
� ¼ 3:33� 10�4m3
sA ¼ 4:215� 10�4m3
ð0:7lh Þ�
m3
1000L
��h
60min
� ¼ 36min
sA ¼ 3:33� 10�4m3
ð0:7lh Þ�
m3
1000L
��h
60minÞ� ¼ 28:5min (E.8.1)
Example 9Cell Filtration of Fermentation Broth
A shake-flask broth was filtered with a filtration unit and all the process conditions and variablesare defined in the following table.
Process Variables Values
Filter area, A 10 cm2
Viscosity, mc 2cp
Pressure drop, DP 0.3 atm
Density, r 1.1 g cm�3
Solid mass fraction, y 0.001
Ratio of masses of wet cake over dry cake, m 2.5
7. DOWNSTREAM PROCESSING252
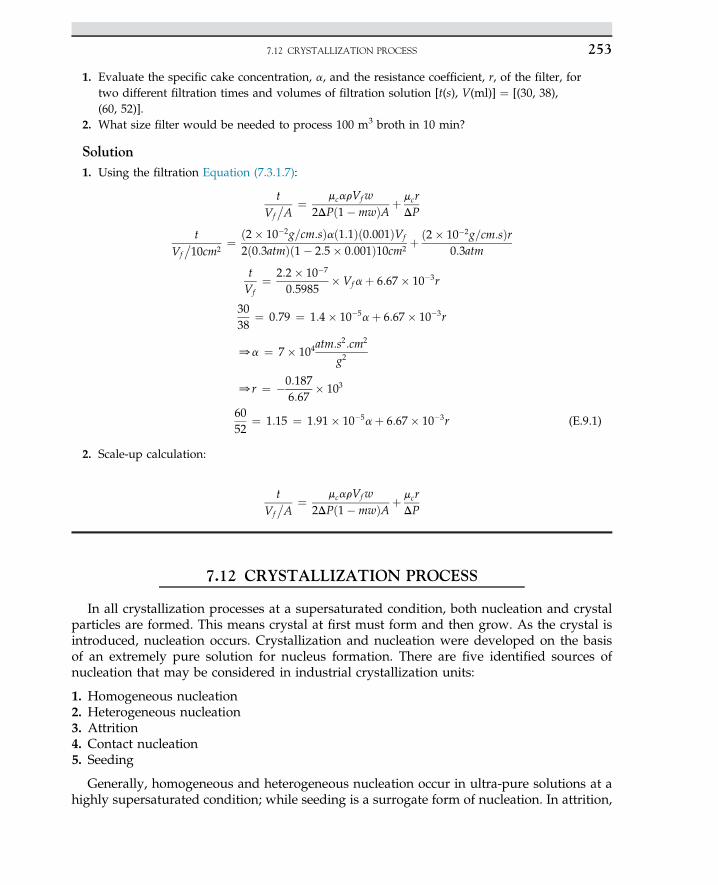
1. Evaluate the specific cake concentration, a, and the resistance coefficient, r, of the filter, fortwo different filtration times and volumes of filtration solution [t(s), V(ml)] ¼ [(30, 38),(60, 52)].
2. What size filter would be needed to process 100 m3 broth in 10 min?
Solution1. Using the filtration Equation (7.3.1.7):
tVf
�A
¼ mcarVfw2DPð1�mwÞAþ mcr
DP
tVf
�10cm2
¼ ð2� 10�2g=cm:sÞað1:1Þð0:001ÞVf
2ð0:3atmÞð1� 2:5� 0:001Þ10cm2þ ð2� 10�2g=cm:sÞr
0:3atm
tVf
¼ 2:2� 10�7
0:5985� Vfaþ 6:67� 10�3r
3038
¼ 0:79 ¼ 1:4� 10�5aþ 6:67� 10�3r
0a ¼ 7� 104atm:s2:cm2
g2
0r ¼ �0:1876:67
� 103
6052
¼ 1:15 ¼ 1:91� 10�5aþ 6:67� 10�3r (E.9.1)
2. Scale-up calculation:
tVf
�A
¼ mcarVfw2DPð1�mwÞAþ mcr
DP
7.12 CRYSTALLIZATION PROCESS
In all crystallization processes at a supersaturated condition, both nucleation and crystalparticles are formed. This means crystal at first must form and then grow. As the crystal isintroduced, nucleation occurs. Crystallization and nucleation were developed on the basisof an extremely pure solution for nucleus formation. There are five identified sources ofnucleation that may be considered in industrial crystallization units:
1. Homogeneous nucleation2. Heterogeneous nucleation3. Attrition4. Contact nucleation5. Seeding
Generally, homogeneous and heterogeneous nucleation occur in ultra-pure solutions at ahighly supersaturated condition; while seeding is a surrogate form of nucleation. In attrition,
7.12 CRYSTALLIZATION PROCESS 253
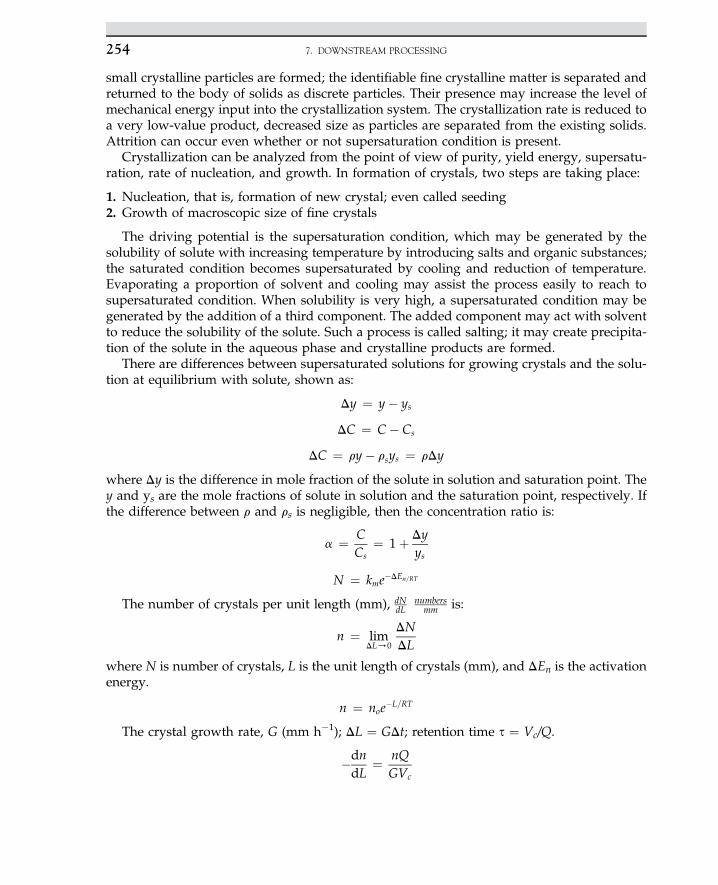
small crystalline particles are formed; the identifiable fine crystalline matter is separated andreturned to the body of solids as discrete particles. Their presence may increase the level ofmechanical energy input into the crystallization system. The crystallization rate is reduced toa very low-value product, decreased size as particles are separated from the existing solids.Attrition can occur even whether or not supersaturation condition is present.
Crystallization can be analyzed from the point of view of purity, yield energy, supersatu-ration, rate of nucleation, and growth. In formation of crystals, two steps are taking place:
1. Nucleation, that is, formation of new crystal; even called seeding2. Growth of macroscopic size of fine crystals
The driving potential is the supersaturation condition, which may be generated by thesolubility of solute with increasing temperature by introducing salts and organic substances;the saturated condition becomes supersaturated by cooling and reduction of temperature.Evaporating a proportion of solvent and cooling may assist the process easily to reach tosupersaturated condition. When solubility is very high, a supersaturated condition may begenerated by the addition of a third component. The added component may act with solventto reduce the solubility of the solute. Such a process is called salting; it may create precipita-tion of the solute in the aqueous phase and crystalline products are formed.
There are differences between supersaturated solutions for growing crystals and the solu-tion at equilibrium with solute, shown as:
Dy ¼ y� ys
DC ¼ C� Cs
DC ¼ ry� rsys ¼ rDy
where Dy is the difference in mole fraction of the solute in solution and saturation point. They and ys are the mole fractions of solute in solution and the saturation point, respectively. Ifthe difference between r and rs is negligible, then the concentration ratio is:
a ¼ CCs
¼ 1þ Dyys
N ¼ kme�DEn=RT
The number of crystals per unit length (mm), dNdL
numbersmm is:
n ¼ limDL/0
DNDL
where N is number of crystals, L is the unit length of crystals (mm), and DEn is the activationenergy.
n ¼ noe�L=RT
The crystal growth rate, G (mm h�1); DL ¼ GDt; retention time s ¼ Vc/Q.
�dndL
¼ nQGVc
7. DOWNSTREAM PROCESSING254
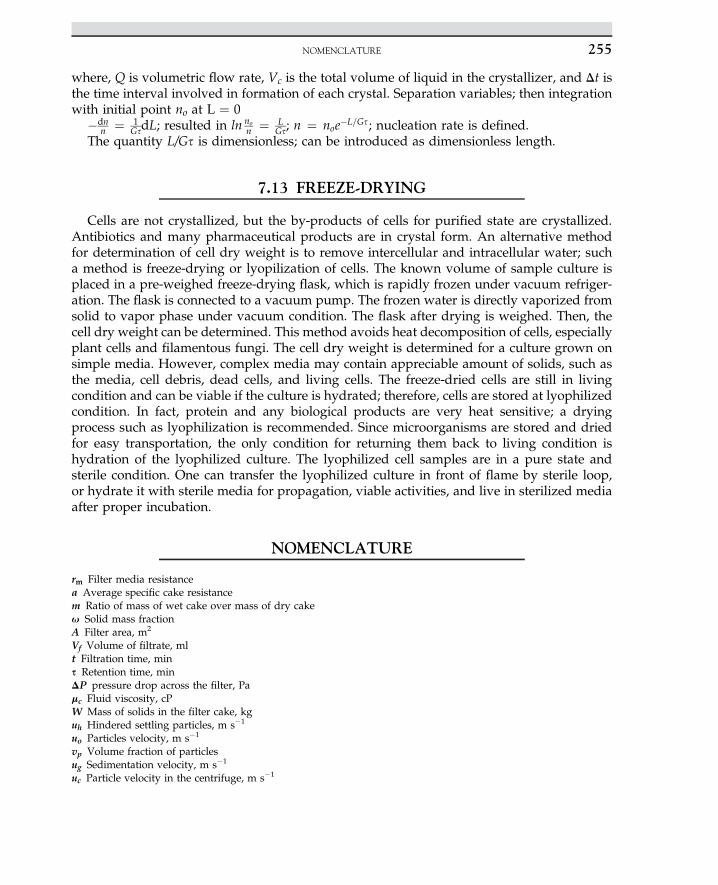
where, Q is volumetric flow rate, Vc is the total volume of liquid in the crystallizer, and Dt isthe time interval involved in formation of each crystal. Separation variables; then integrationwith initial point no at L ¼ 0
�dnn ¼ 1
GsdL; resulted in ln non ¼ L
Gs; n ¼ noe�L=Gs; nucleation rate is defined.The quantity L/Gs is dimensionless; can be introduced as dimensionless length.
7.13 FREEZE-DRYING
Cells are not crystallized, but the by-products of cells for purified state are crystallized.Antibiotics and many pharmaceutical products are in crystal form. An alternative methodfor determination of cell dry weight is to remove intercellular and intracellular water; sucha method is freeze-drying or lyopilization of cells. The known volume of sample culture isplaced in a pre-weighed freeze-drying flask, which is rapidly frozen under vacuum refriger-ation. The flask is connected to a vacuum pump. The frozen water is directly vaporized fromsolid to vapor phase under vacuum condition. The flask after drying is weighed. Then, thecell dry weight can be determined. This method avoids heat decomposition of cells, especiallyplant cells and filamentous fungi. The cell dry weight is determined for a culture grown onsimple media. However, complex media may contain appreciable amount of solids, such asthe media, cell debris, dead cells, and living cells. The freeze-dried cells are still in livingcondition and can be viable if the culture is hydrated; therefore, cells are stored at lyophilizedcondition. In fact, protein and any biological products are very heat sensitive; a dryingprocess such as lyophilization is recommended. Since microorganisms are stored and driedfor easy transportation, the only condition for returning them back to living condition ishydration of the lyophilized culture. The lyophilized cell samples are in a pure state andsterile condition. One can transfer the lyophilized culture in front of flame by sterile loop,or hydrate it with sterile media for propagation, viable activities, and live in sterilized mediaafter proper incubation.
NOMENCLATURE
rm Filter media resistancea Average specific cake resistancem Ratio of mass of wet cake over mass of dry cakeu Solid mass fractionA Filter area, m2
Vf Volume of filtrate, mlt Filtration time, mins Retention time, minDP pressure drop across the filter, Pamc Fluid viscosity, cPW Mass of solids in the filter cake, kguh Hindered settling particles, m s�1
uo Particles velocity, m s�1
vp Volume fraction of particlesug Sedimentation velocity, m s�1
uc Particle velocity in the centrifuge, m s�1
NOMENCLATURE 255
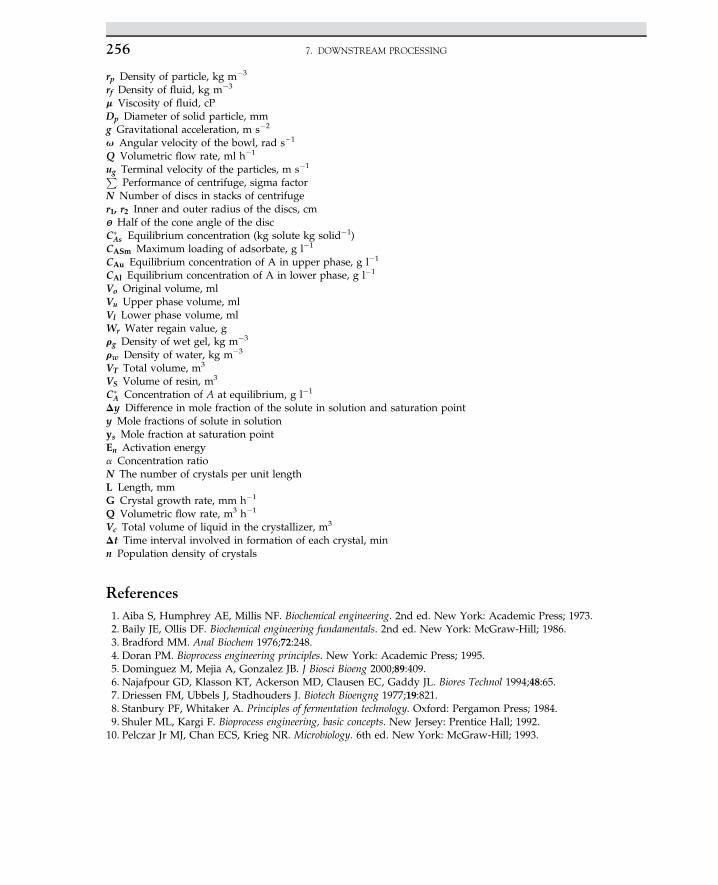
rp Density of particle, kg m�3
rf Density of fluid, kg m�3
m Viscosity of fluid, cPDp Diameter of solid particle, mmg Gravitational acceleration, m s�2
u Angular velocity of the bowl, rad s�1
Q Volumetric flow rate, ml h�1
ug Terminal velocity of the particles, m s�1PPerformance of centrifuge, sigma factor
N Number of discs in stacks of centrifuger1, r2 Inner and outer radius of the discs, cmɵ Half of the cone angle of the discC�As Equilibrium concentration (kg solute kg solid�1)
CASm Maximum loading of adsorbate, g l�1
CAu Equilibrium concentration of A in upper phase, g l�1
CAl Equilibrium concentration of A in lower phase, g l�1
Vo Original volume, mlVu Upper phase volume, mlVl Lower phase volume, mlWr Water regain value, grg Density of wet gel, kg m�3
rw Density of water, kg m�3
VT Total volume, m3
VS Volume of resin, m3
C�A Concentration of A at equilibrium, g l�1
Dy Difference in mole fraction of the solute in solution and saturation pointy Mole fractions of solute in solutionys Mole fraction at saturation pointEn Activation energya Concentration ratioN The number of crystals per unit lengthL Length, mmG Crystal growth rate, mm h�1
Q Volumetric flow rate, m3 h�1
Vc Total volume of liquid in the crystallizer, m3
Dt Time interval involved in formation of each crystal, minn Population density of crystals
References1. Aiba S, Humphrey AE, Millis NF. Biochemical engineering. 2nd ed. New York: Academic Press; 1973.2. Baily JE, Ollis DF. Biochemical engineering fundamentals. 2nd ed. New York: McGraw-Hill; 1986.3. Bradford MM. Anal Biochem 1976;72:248.4. Doran PM. Bioprocess engineering principles. New York: Academic Press; 1995.5. Dominguez M, Mejia A, Gonzalez JB. J Biosci Bioeng 2000;89:409.6. Najafpour GD, Klasson KT, Ackerson MD, Clausen EC, Gaddy JL. Biores Technol 1994;48:65.7. Driessen FM, Ubbels J, Stadhouders J. Biotech Bioengng 1977;19:821.8. Stanbury PF, Whitaker A. Principles of fermentation technology. Oxford: Pergamon Press; 1984.9. Shuler ML, Kargi F. Bioprocess engineering, basic concepts. New Jersey: Prentice Hall; 1992.10. Pelczar Jr MJ, Chan ECS, Krieg NR. Microbiology. 6th ed. New York: McGraw-Hill; 1993.
7. DOWNSTREAM PROCESSING256
C H A P T E R
8
Immobilization of MicrobialCells for the Production
of Organic Acid and Ethanol
O U T L I N E
8.1 Introduction 259
8.2 Immobilized Microbial Cells 2608.2.1 Carrier Binding 2618.2.2 Entrapment 2618.2.3 Cross-Linking 2628.2.4 Advantages and
Disadvantages of ImmobilizedCells 262
8.3 ICR Experiments 263
8.4 ICR Rate Model 263
Nomenclature 266
References 266
8.6 Case Study: Ethanol Fermentationin an Immobilized Cell ReactorUsing Saccharomyces cerevisiae 267
8.6.1 Introduction 267
8.6.2 Materials and Methods 2688.6.2.1 Experimental Reactor
System 2688.6.2.2 Determination of Glucose
Concentration 2708.6.2.3 Detection of Ethanol 2718.6.2.4 Yeast Cell Dry Weight and
Optical Density 2718.6.2.5 Electronic Microscopic
Scanning of ImmobilizedCells 271
8.6.2.6 Statistical Analysis 271
8.6.3 Results and Discussion 2728.6.3.1 Evaluation of Immobilized
Cells 2728.6.3.2 Batch Fermentation 278
257Biochemical Engineering and Biotechnologyhttp://dx.doi.org/10.1016/B978-0-444-63357-6.00008-0 Copyright © 2015 Elsevier B.V. All rights reserved.
8.6.3.3 Relative Activity 2788.6.3.4 Reactor Setup 2798.6.3.5 Effect of High Concentration
of Substrate on ImmobilizedCells 279
8.6.4 Conclusion 281
Nomenclature 282
Acknowledgment 282
References 282
8.7 Fundamentals of ImmobilizationTechnology, and MathematicalModel for ICR Performance 284
8.7.1 Immobilization ofMicroorganisms by CovalentBonds 284
8.7.2 Oxygen Transfer to ImmobilizedMicroorganisms 284
8.7.3 Substrate Transfer toImmobilized Microorganisms 285
8.7.4 Growth and Colony Formation ofImmobilized Microorganisms 286
8.7.5 Immobilized Systems for EthanolProduction 288
Reference 289
8. IMMOBILIZATION OF MICROBIAL CELLS FOR THE PRODUCTION OF ORGANIC ACID AND ETHANOL258
S U B C H A P T E R
8.1Introduction
Microorganisms are biocatalysts actively used in the fermentation process where productand biomass are obtained from fermentable sugars. The cells are harvested and reused. Theimmobilization of cells has been practiced in the production of vinegar. Enzymes and wholecells can be bound to solid support, fixed in the form of an active layer. When substratepasses over the surface, enzymatic reactions change the substrate to the desired product. En-zymes and suitable microorganisms are used in manufacturing food flavors, additives, med-icines, and other goods and produced by variety of microbial metabolites. Immobilized cellsmay perform different from an equivalent mass of freely suspended cells.1 They may produceextracellular polymers, which are usually lumped together with cells in dry biomass mea-surements, resulting in overestimation of the activity of immobilized biomass.2 In addition,cell location in the form of biofilm can affect its quality and activity, because profiles of envi-ronmental conditions such as substrate concentration often exit. However, in many studiesresults for freely suspended cultures have been used to model immobilized cell bioreactors,usually without a lot of attention to assessing the quality of the biomass in the system. Typi-cally these models allow for the effect of difficult limitations in and around the biofilm andassume that the immobilized cells have the same quality and activity as the suspended cellculture, regardless of the position in the biofilm.
In fact, significant substrate concentration gradients may exist for cells immobilized in bio-film. Cells located close to the nutrient supply are likely to maintain higher quality and activ-ity compared to cells located relatively further away, leading to differentiation in the qualityor activity of the immobilized cell population. This difference is more pronounced if there arestarvation regions. In practice, zero substrate concentration may exist inside the biofilm,because in these regions the cell physiology may be markedly different from that of the freelysuspended cells.
The cells’ activities have been described based on a multispecies biofilm model and the mi-crobial kinetics by a mathematical model. Using this model predicts that the biomass on theexternal surface of the biofilm has higher activity than the biomass near the solid support sur-face and that condition may occur, after the biofilm has reached a critical depth or formed athick multilayer of the biofilm. The model was based on microbial growth kinetics deter-mined by Wang et al.2 However, no experimental results were presented in either of thesestudies to verify the model predictions, nor was the predicted immobilized biomass activitycompared with that of freely suspended cells in a comprehensive way.
Wang et al.2 and Najafpour et al.3,4 worked with immobilized microbial cells of Nitrobacteragilis, Saccharomyces cerevisiae, and Pseudomonas aeruginosa in gel beads, respectively. They
8. IMMOBILIZATION OF MICROBIAL CELLS FOR THE PRODUCTION OF ORGANIC ACID AND ETHANOL 259
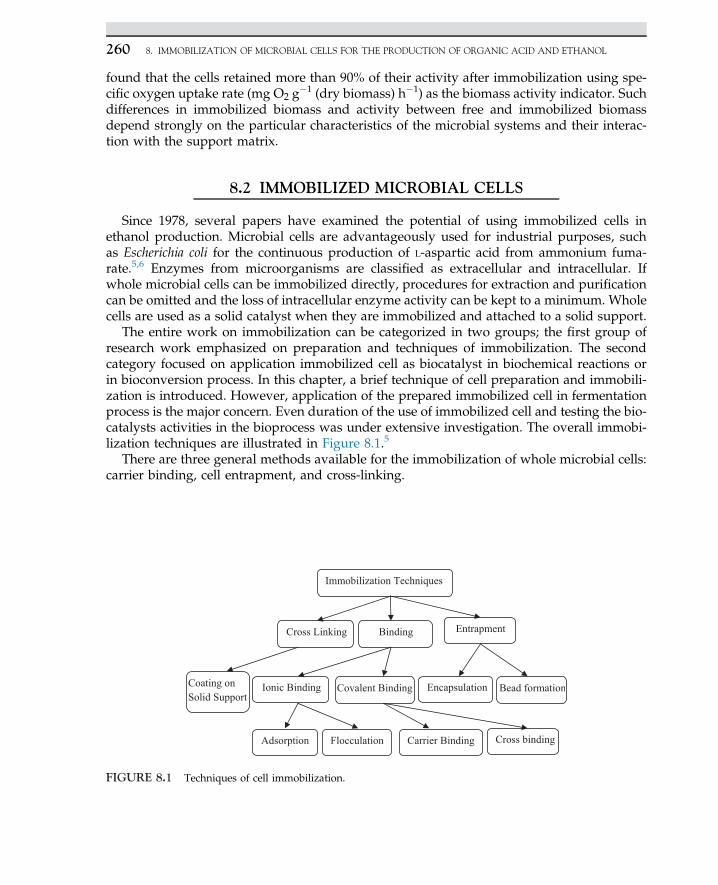
found that the cells retained more than 90% of their activity after immobilization using spe-cific oxygen uptake rate (mg O2 g
�1 (dry biomass) h�1) as the biomass activity indicator. Suchdifferences in immobilized biomass and activity between free and immobilized biomassdepend strongly on the particular characteristics of the microbial systems and their interac-tion with the support matrix.
8.2 IMMOBILIZED MICROBIAL CELLS
Since 1978, several papers have examined the potential of using immobilized cells inethanol production. Microbial cells are advantageously used for industrial purposes, suchas Escherichia coli for the continuous production of L-aspartic acid from ammonium fuma-rate.5,6 Enzymes from microorganisms are classified as extracellular and intracellular. Ifwhole microbial cells can be immobilized directly, procedures for extraction and purificationcan be omitted and the loss of intracellular enzyme activity can be kept to a minimum. Wholecells are used as a solid catalyst when they are immobilized and attached to a solid support.
The entire work on immobilization can be categorized in two groups; the first group ofresearch work emphasized on preparation and techniques of immobilization. The secondcategory focused on application immobilized cell as biocatalyst in biochemical reactions orin bioconversion process. In this chapter, a brief technique of cell preparation and immobili-zation is introduced. However, application of the prepared immobilized cell in fermentationprocess is the major concern. Even duration of the use of immobilized cell and testing the bio-catalysts activities in the bioprocess was under extensive investigation. The overall immobi-lization techniques are illustrated in Figure 8.1.5
There are three general methods available for the immobilization of whole microbial cells:carrier binding, cell entrapment, and cross-linking.
Immobilization Techniques
Cross Linking Binding Entrapment
Ionic Binding Covalent Binding
Carrier Binding Flocculation Adsorption Cross binding
Bead formationEncapsulationCoating on Solid Support
FIGURE 8.1 Techniques of cell immobilization.
8. IMMOBILIZATION OF MICROBIAL CELLS FOR THE PRODUCTION OF ORGANIC ACID AND ETHANOL260
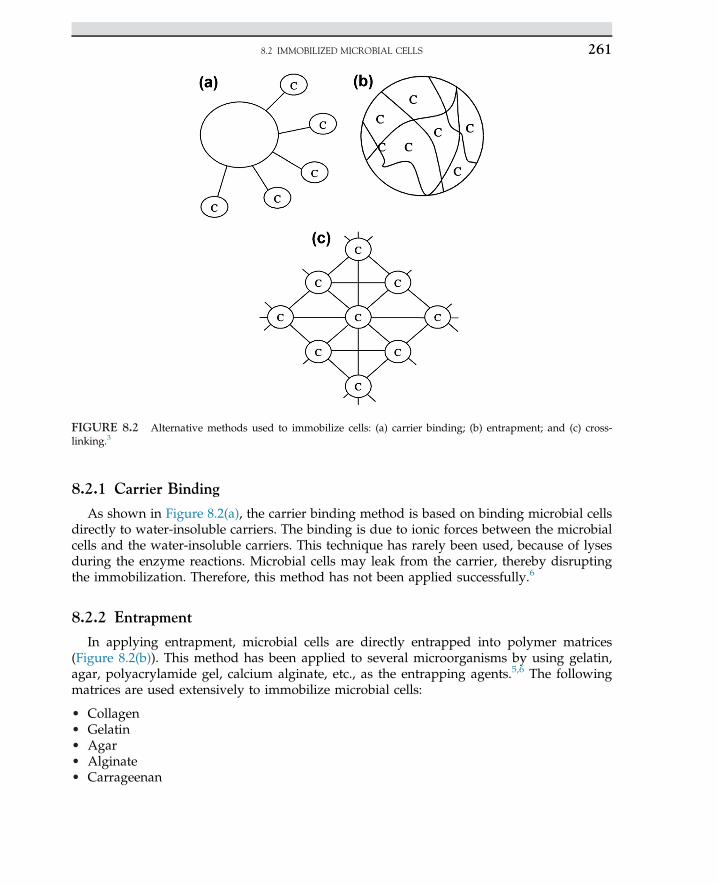
8.2.1 Carrier Binding
As shown in Figure 8.2(a), the carrier binding method is based on binding microbial cellsdirectly to water-insoluble carriers. The binding is due to ionic forces between the microbialcells and the water-insoluble carriers. This technique has rarely been used, because of lysesduring the enzyme reactions. Microbial cells may leak from the carrier, thereby disruptingthe immobilization. Therefore, this method has not been applied successfully.6
8.2.2 Entrapment
In applying entrapment, microbial cells are directly entrapped into polymer matrices(Figure 8.2(b)). This method has been applied to several microorganisms by using gelatin,agar, polyacrylamide gel, calcium alginate, etc., as the entrapping agents.5,6 The followingmatrices are used extensively to immobilize microbial cells:
• Collagen• Gelatin• Agar• Alginate• Carrageenan
FIGURE 8.2 Alternative methods used to immobilize cells: (a) carrier binding; (b) entrapment; and (c) cross-linking.3
8.2 IMMOBILIZED MICROBIAL CELLS 261
• Cellulose triacetate• Polyacrylamide• Polystyrene
In this method, microbial cells are apparently lysed within the entrapping agent, but theyretain the desired enzymatic activity. To perform an efficient immobilization, the type andconcentration of a bifunctional reagent for entrapment should be optimized. The advantageof this method is that cell leakage may act as a diffusion barrier, thus causing difficulty intransferring substrate and product through the matrix.4,7,8
8.2.3 Cross-Linking
Microbial cells immobilized by cross-linking with bi- or multifunctional reagents such asglutaraldehyde have been reported to be successful, but active immobilizationshave not been obtained with other reagents such as toluenediisocyanate.7 The microbialcell wall is composed of lipoproteins, with lipopolysaccharide extending from the cell mem-brane. Glutaraldehyde reacts with lysine within the protein in the lipid bilayer of the cellmembrane.
Furthermore, gelatin is physically absorbed on a solid support, which provides a covalentlink between the microbial cells and the gelatin layer which is tightly bound to a solid sup-port by absorption (Figure 8.2(c)).
Glutaraldehyde has been used as cross-linking reagent for ethanol production. Maximumachieving rate was reported as high as 7.4 g l�1 h�1 ethanol produced from glucose.9 The ma-jor advantage of the cross-linking method is that the immobilization reagent does not act asdiffusion barrier. Actually, a thin film of cells is provided in this system, making it ideal formany applications.10,11
8.2.4 Advantages and Disadvantages of Immobilized Cells
There are several advantages for an immobilized cell system over a batch or CSTR system.The first and most obvious benefit is the capability of recycling or reusing the microorgan-isms because they are retained in the reactor as the product leaves the reactor. Second, immo-bilization can be easily used for a continuous process maintaining high cell density, thusproviding a high productivity.12
Third, nutrient depletion and inhibitory compounds do not, in general, have a large effecton the immobilized cells because the cells are fixed by immobilization. In batch and CSTRfermentation, nutrient depletion, inhibition and accumulation of toxic by-products are majorproblems, but immobilized cells are usually unaffected by toxic by-products.
However, there are disadvantages for using immobilized cells. The cell may containnumerous catalytically active enzymes, which may catalyze unwanted side reactions. Also,the cell membrane itself may serve as a diffusion barrier and may reduce productivity. Thematrix may sharply reduce productivity if the microorganism is sensitive to product inhibi-tion. One of the disadvantages of immobilized cell reactors (ICRs) is that the physiologicalstate of the microorganism cannot be controlled.
8. IMMOBILIZATION OF MICROBIAL CELLS FOR THE PRODUCTION OF ORGANIC ACID AND ETHANOL262
8.3 ICR EXPERIMENTS
The ICR experiments were undertaken to determine the performance of immobilized Pro-pionibacterium acidipropionici in a plug-flow tubular reactor. The productivity of the ICR wasevaluated by measuring glucose and xylose consumption, and propionic and acetic acid pro-duction, along the length of the reactor.3
The Raschig rings were sterilized and dip-coated in sterile 20% gelatin and 1.5% agar so-lution. The coated rings were dried; the dried coated rings were randomly packed in the col-umn. The packing was sprayed with a 2.5% glutaraldehyde solution. An alternativeprocedure to prepare the packing was also tested and proved to be satisfactory. In the lattermethod, the reactor column was filled with clean Raschig rings. A hot gelatin-agar solutionwas passed through the column and allowed to wet the entire packing surface. When thecoating was dried, the glutaraldehyde solution was passed through the column in a similarfashion. The column was allowed to stand for 24 h and then washed with sterile, distilled wa-ter. The reactor was sterilized by passing ethylene oxide through the column. The ethyleneoxide was allowed to stand in the column for 8 h before the system was purged with sterilenitrogen. The feed and product tubing were autoclaved using steam at 15 psig.
After sterilization, a 24-h incubated seed culture was pumped through the column. Anadaptation time of about 48 h was allowed for the establishment of a film of microorganismscross-linked to the surface Raschig rings. The Raschig rings served as solid support. Feed me-dia were then pumped into the reactor. An accurate calculation of the retention time in thereactor was difficult, because growth and carbon dioxide evolution may take a significantfraction of avoid volume of the ICR, resulting in a false retention time. The microbial filmthickness could be controlled by periodically passing sterile nitrogen or carbon dioxidethrough the column, to stop cell overgrowth.
A feed concentration of 15 g glucose and 15 g xylose per liter was used over a feed rate of20e200 ml h�1. Samples were taken at successive points along the reactor length, and theusual analysis for glucose and xylose consumption, organic acid production, and cell densitywere done. A kinetic model for the growth and fermentation of P. acidipropioniciwas obtainedfrom these data.
Analytical procedures were set up to measure cell density, sugar concentration, andorganic acid concentration. The turbidity of the culture (optical density) was determinedby reading the absorbance with spectrophotometer and cell counts. Sugar concentration asa single substrate was measured by an industrial digital analyzer. Total sugar was evaluatedby a reducing agent such as dinitrosalicylic acid in alkaline solution. An orange color wasproduced which was read on a spectrophotometer at 540 nm. Organic acids were determinedby a gas chromatograph, with a flame ionization detector.
8.4 ICR RATE MODEL
Table 8.1 presents the results of the ICR retention time studies, sugar concentration (dualsubstrate) studies, and cell density. The kinetic model for ICR was derived on the basis of afirst order reaction, plug flow, and steady-state behavior.
8.4 ICR RATE MODEL 263
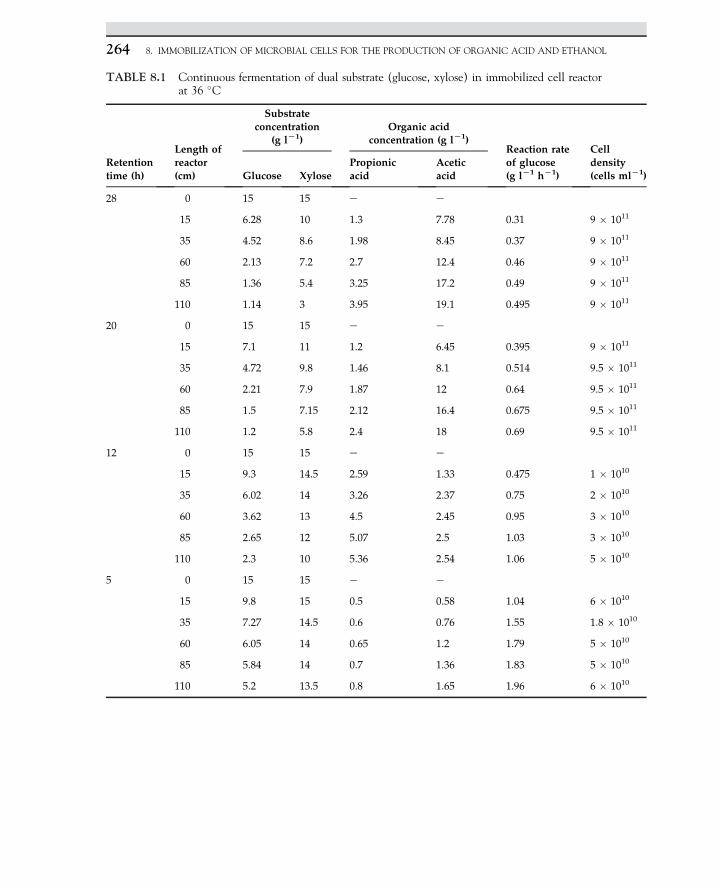
TABLE 8.1 Continuous fermentation of dual substrate (glucose, xylose) in immobilized cell reactorat 36 �C
Retentiontime (h)
Length ofreactor(cm)
Substrateconcentration
(g lL1)Organic acid
concentration (g lL1)Reaction rateof glucose(g lL1 hL1)
Celldensity(cells mlL1)Glucose Xylose
Propionicacid
Aceticacid
28 0 15 15 e e
15 6.28 10 1.3 7.78 0.31 9 � 1011
35 4.52 8.6 1.98 8.45 0.37 9 � 1011
60 2.13 7.2 2.7 12.4 0.46 9 � 1011
85 1.36 5.4 3.25 17.2 0.49 9 � 1011
110 1.14 3 3.95 19.1 0.495 9 � 1011
20 0 15 15 e e
15 7.1 11 1.2 6.45 0.395 9 � 1011
35 4.72 9.8 1.46 8.1 0.514 9.5 � 1011
60 2.21 7.9 1.87 12 0.64 9.5 � 1011
85 1.5 7.15 2.12 16.4 0.675 9.5 � 1011
110 1.2 5.8 2.4 18 0.69 9.5 � 1011
12 0 15 15 e e
15 9.3 14.5 2.59 1.33 0.475 1 � 1010
35 6.02 14 3.26 2.37 0.75 2 � 1010
60 3.62 13 4.5 2.45 0.95 3 � 1010
85 2.65 12 5.07 2.5 1.03 3 � 1010
110 2.3 10 5.36 2.54 1.06 5 � 1010
5 0 15 15 e e
15 9.8 15 0.5 0.58 1.04 6 � 1010
35 7.27 14.5 0.6 0.76 1.55 1.8 � 1010
60 6.05 14 0.65 1.2 1.79 5 � 1010
85 5.84 14 0.7 1.36 1.83 5 � 1010
110 5.2 13.5 0.8 1.65 1.96 6 � 1010
8. IMMOBILIZATION OF MICROBIAL CELLS FOR THE PRODUCTION OF ORGANIC ACID AND ETHANOL264
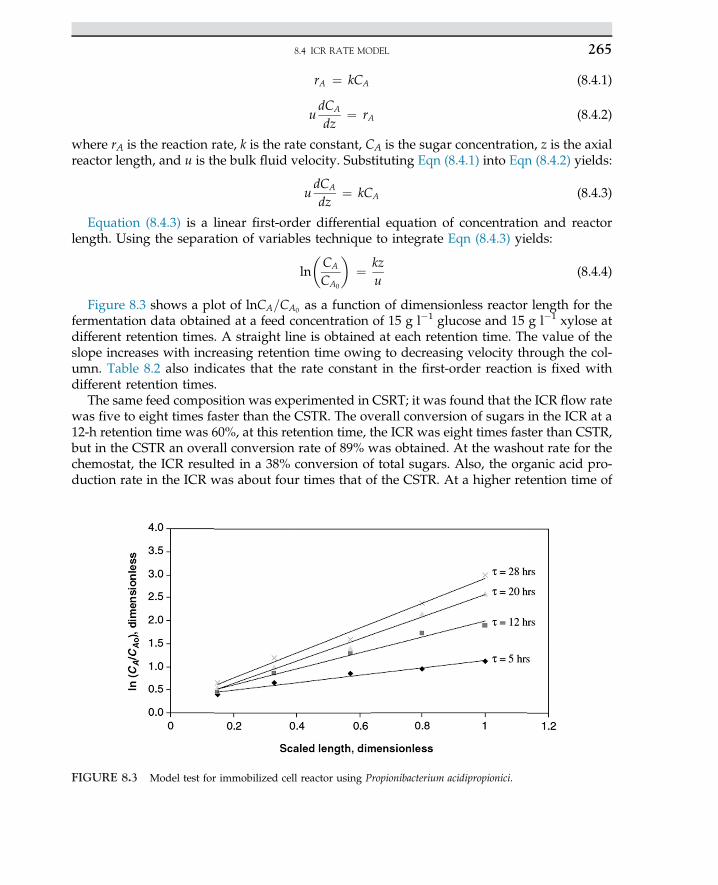
rA ¼ kCA (8.4.1)
udCA
dz¼ rA (8.4.2)
where rA is the reaction rate, k is the rate constant, CA is the sugar concentration, z is the axialreactor length, and u is the bulk fluid velocity. Substituting Eqn (8.4.1) into Eqn (8.4.2) yields:
udCA
dz¼ kCA (8.4.3)
Equation (8.4.3) is a linear first-order differential equation of concentration and reactorlength. Using the separation of variables technique to integrate Eqn (8.4.3) yields:
ln
�CA
CA0
�¼ kz
u(8.4.4)
Figure 8.3 shows a plot of lnCA=CA0 as a function of dimensionless reactor length for thefermentation data obtained at a feed concentration of 15 g l�1 glucose and 15 g l�1 xylose atdifferent retention times. A straight line is obtained at each retention time. The value of theslope increases with increasing retention time owing to decreasing velocity through the col-umn. Table 8.2 also indicates that the rate constant in the first-order reaction is fixed withdifferent retention times.
The same feed composition was experimented in CSRT; it was found that the ICR flow ratewas five to eight times faster than the CSTR. The overall conversion of sugars in the ICR at a12-h retention time was 60%, at this retention time, the ICR was eight times faster than CSTR,but in the CSTR an overall conversion rate of 89% was obtained. At the washout rate for thechemostat, the ICR resulted in a 38% conversion of total sugars. Also, the organic acid pro-duction rate in the ICR was about four times that of the CSTR. At a higher retention time of
FIGURE 8.3 Model test for immobilized cell reactor using Propionibacterium acidipropionici.
8.4 ICR RATE MODEL 265
28 h, the conversion of glucose in the ICR and CSTR were about the same, but the conversionof xylose reached 75% in the ICR and 86% in the CSTR.
NOMENCLATURE
CA Sugar concentration (g l�1)k Rate constant (l h�1)rA Reaction rate (g l�1 h�1)u Bulk fluid velocity (cm h�1)z Axial reactor length (cm)
References1. Gikas P, Livingston AG. Biotechnol Bioeng 1997;55:660.2. Wang DIC, Cooney CL, Demain ADL, Dunnill P, Humphrey AE, Lilly MD. Fermentation and enzyme technology.New York: John Wiley & Sons; 1979.
3. Najafpour GD. J Sci I R Iran 1990;1:172.4. Najafpour GD, Younesi H. Bioresour Technol 2004;92:251.5. Chibata I. Immobilized microbial cells with polyacrylamide gel, carrageenan and their industrial applications. In:Immobilized microbial cells. Washington (DC): American Chemical Society; 1979 [chapter 3].
6. Chibata I. Microb Technol 1979;II:361.7. Brodelius P, Mesback K. Adv Appl Microbiol 1982;28:1.8. Mark RR, Muzzio FJ, Buettner HM, Sebastian CR. Biotechnol Bioeng 1996;49:223.9. Sitton OC, Gaddy JL. Biotechnol Bioeng 1980;22:1735.10. Najfpour GD. Propionic and acetic acid fermentation using propionibacterium acidipropionici in batch and continuous
culture [Ph.D. thesis]. Fayetteville (AR): University of Arkansas; 1983.11. Najafpour GD. Resour Conserv 1987;13:187.12. Senthuran A, Senthuran V, Mattiasson B, Kaul R. Biotechnol Bioeng 1997;55:841.
TABLE 8.2 Immobilized cell reactor kinetic model for immobilizedPropionibacterium acidipropionici10
Retention time s (h) Flow rate (ml hL1) Rate constant (hL1)
5 214 0.70
8 135 0.69
12 90 0.68
20 55 0.68
28 38 0.51
8. IMMOBILIZATION OF MICROBIAL CELLS FOR THE PRODUCTION OF ORGANIC ACID AND ETHANOL266
S U B C H A P T E R
8.6Case Study: Ethanol Fermentation in an Immobilized Cell
Reactor Using Saccharomyces cerevisiae*
8.6.1 INTRODUCTION
Owing to diminishing fossil fuel reserves, alternative energy sources need to be renewable,sustainable, efficient, cost-effective, convenient, and safe.1 In recent decades, microbial pro-duction of ethanol has been considered as an alternative fuel for the future because fossil fuelsare depleting. Several microorganisms, including Clostridium sp. and yeast, the well-knownethanol producers Saccharomyces cerevisiae and Zymomonas mobilis, are suitable candidatesto produce ethanol.2,3
Microorganisms under anaerobic growth conditions have the ability to use glucose by theEmbdeneMeyerhofeParnas pathway.4 Carbohydrates are phosphorylated through the meta-bolic pathway; the end products are 2 mol of ethanol and carbon dioxide.5
During batch fermentation of S. cerevisiae, other influential parameters can adversely influ-ence the specific rate of growth, and inhibition can be caused either by product or substrateconcentration. The viability of the S. cerevisiae population, its specific rate of fermentation,and the sugar uptake rate are directly related to the desired medium condition.6 It hasbeen reported by Nagodawithana and Steinkraus,7 that the addition of ethanol to thecultured media was less toxic for S. cerevisiae than ethanol produced by cell bodies. This in-dicates that there are other metabolic by-products that can cause inhibition and may showimpurity of ethanol produced in the fermentation system. Also, the death rates were lowerwith addition of pure ethanol than the similar condition with the endogenously producedethanol concentration.7
Use of biofilm reactors for ethanol production has been investigated to improve the eco-nomics and performance of fermentation processes.8 Immobilization of microbial cells forfermentation has been developed to eliminate inhibition caused by high concentrations ofsubstrate and product, also to enhance productivity and yield of ethanol. Recent work onethanol production in an immobilized cell reactor (ICR) showed that production of ethanol
*This case study was partially written with contributions from:Habibollah Younesi, Department of Environmental Science, Faculty of Natural Resources, Tarbiat ModaresUniversity, Noor, Iran.
8.6.1 INTRODUCTION 267
using Z. mobilis was doubled.9 The immobilized recombinant Z. mobilis was also successfullyused with high concentrations of sugar (12e15%).10
The potential use of immobilized cells in fermentation processes for fuel production hasbeen described previously. If intact microbial cells are directly immobilized, the removal ofmicroorganisms from downstream product can be omitted and the loss of intracellularenzyme activity can be kept to a minimum level.11
Recently, immobilized biomass activity has been given more attention, because it has beenacknowledged to play a significant role in bioreactor performance.12 Frequently, immobilizedcells are subjected to limitations in the supply of nutrients. Thus, because of the presence ofheterogeneous materials such as immobilized cells, there is no convective flow inside thebeads and the cells can receive nutrients only by diffusion.13 Immobilization of cells to a solidmatrix is an alternative means of high biomass retention. The cells divide within and on thecore of the matrix.14 Alginate is widely used in food, pharmaceutical, textile, and paper prod-ucts. Alginate is used in these products for thickening, stabilizing, gel, and film forming. So-dium alginate is a linear polysaccharide, normally isolated from many strains of marinebrown seaweed and algae, named “alginate.” The copolymer consists of two uronic acidsor polyuronic acids. It comprises primarily D-mannuronic acid (M) and L-glucuronic acid(G). Alginic acid can be either water-soluble or nonwater-soluble depending on the type ofthe associated salt. Interchange of sodium ions with calcium ions in the solution may followsolidification of sodium alginate in calcium chloride solution. The sodium salt, other alkalinemetals, and ammonia are soluble in water, whereas the polyvalent cations salts (e.g., calcium)are not water-soluble, except for magnesium ions.
The purpose of this research was to obtain high ethanol production with high yields ofproductivity and to lower the high operating costs. The ICR column fermenter was usedwith S. cerevisiae by an entrapment technique using alginate as a porous wall to retain theyeast cells. The effect of initial glucose concentration on the production of ethanol by S. cer-evisiae was evaluated. The yield for large-scale ethanol production was compared with theethanol produced in batch fermentation using the same microorganism.
8.6.2 MATERIALS AND METHODS
8.6.2.1 Experimental Reactor System
The ICR was a plug flow tubular column, constructed with a nominal diameter of 5 cm,internal diameter of 4.6 cm, Plexiglas of 3 mm wall thickness, and 85 cm length. The mediumwas fed to the ICR column from a feed tank located above the column. A variable-speed Mas-terflex pump, model L/S Easyload (Cole-Parmer, Vernon Hills, IL, USA) was used to transferfeed medium from a 20 l polypropylene autoclavable Nalgene carboy (Cole-Parmer), thecarboy was serving as reservoir. The effluent from the column was collected in a 20-l poly-propylene autoclavable carboy serving as product reservoir. A flow breaker was installed be-tween the column and feed pump, which prevented growth of microorganisms andcontamination of feed line and feed tank. Samples from the ICR column were taken fromthe inlet and outlet compartments of the column. A 16-h culture was harvested at exponentialgrowth phase and mixed with 2% sodium alginate. The slurry of yeast culture was converted
8. IMMOBILIZATION OF MICROBIAL CELLS FOR THE PRODUCTION OF ORGANIC ACID AND ETHANOL268
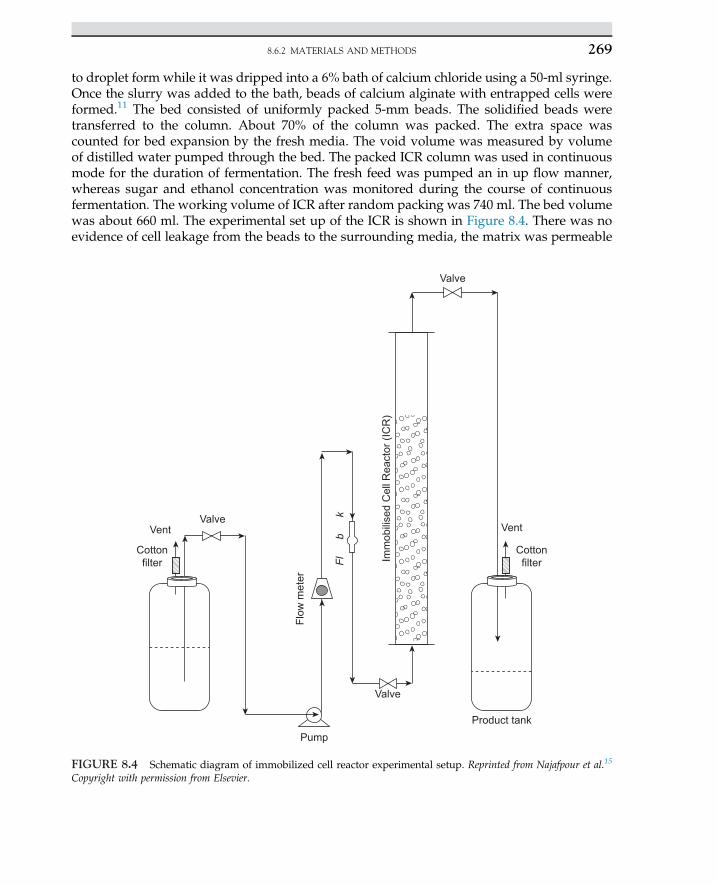
to droplet form while it was dripped into a 6% bath of calcium chloride using a 50-ml syringe.Once the slurry was added to the bath, beads of calcium alginate with entrapped cells wereformed.11 The bed consisted of uniformly packed 5-mm beads. The solidified beads weretransferred to the column. About 70% of the column was packed. The extra space wascounted for bed expansion by the fresh media. The void volume was measured by volumeof distilled water pumped through the bed. The packed ICR column was used in continuousmode for the duration of fermentation. The fresh feed was pumped an in up flow manner,whereas sugar and ethanol concentration was monitored during the course of continuousfermentation. The working volume of ICR after random packing was 740 ml. The bed volumewas about 660 ml. The experimental set up of the ICR is shown in Figure 8.4. There was noevidence of cell leakage from the beads to the surrounding media, the matrix was permeable
Cotton
filter
Vent
Cotton
filter
VentValve
Flo
w m
ete
r
Imm
obili
sed C
ell
Reacto
r (I
CR
)
Valve
Valve
Pump
Product tank
bFl
k
FIGURE 8.4 Schematic diagram of immobilized cell reactor experimental setup. Reprinted from Najafpour et al.15
Copyright with permission from Elsevier.
8.6.2 MATERIALS AND METHODS 269
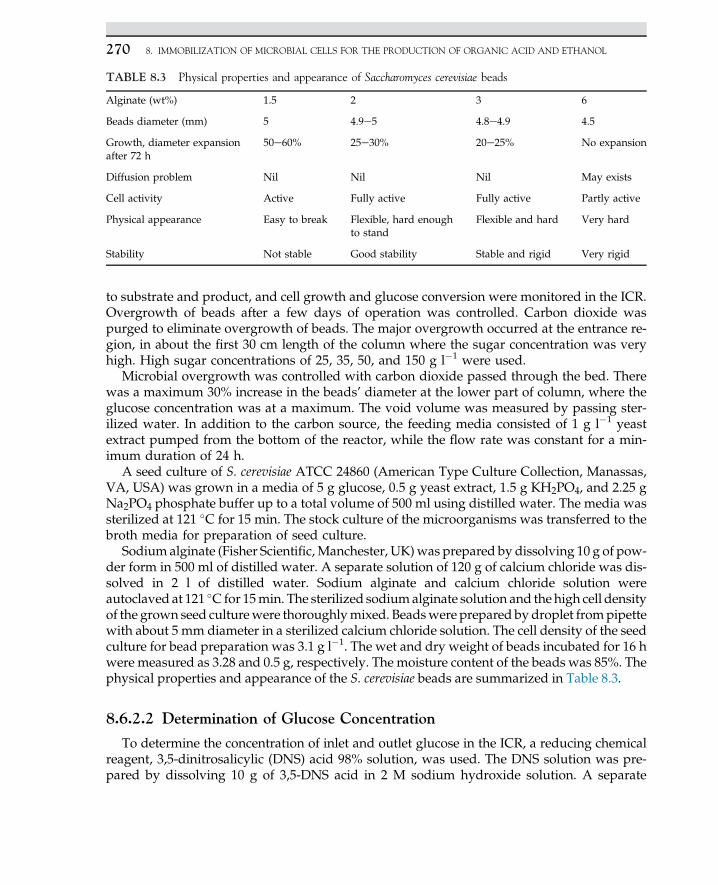
to substrate and product, and cell growth and glucose conversion were monitored in the ICR.Overgrowth of beads after a few days of operation was controlled. Carbon dioxide waspurged to eliminate overgrowth of beads. The major overgrowth occurred at the entrance re-gion, in about the first 30 cm length of the column where the sugar concentration was veryhigh. High sugar concentrations of 25, 35, 50, and 150 g l�1 were used.
Microbial overgrowth was controlled with carbon dioxide passed through the bed. Therewas a maximum 30% increase in the beads’ diameter at the lower part of column, where theglucose concentration was at a maximum. The void volume was measured by passing ster-ilized water. In addition to the carbon source, the feeding media consisted of 1 g l�1 yeastextract pumped from the bottom of the reactor, while the flow rate was constant for a min-imum duration of 24 h.
A seed culture of S. cerevisiae ATCC 24860 (American Type Culture Collection, Manassas,VA, USA) was grown in a media of 5 g glucose, 0.5 g yeast extract, 1.5 g KH2PO4, and 2.25 gNa2PO4 phosphate buffer up to a total volume of 500 ml using distilled water. The media wassterilized at 121 �C for 15 min. The stock culture of the microorganisms was transferred to thebroth media for preparation of seed culture.
Sodiumalginate (Fisher Scientific,Manchester, UK)was prepared by dissolving 10 g of pow-der form in 500 ml of distilled water. A separate solution of 120 g of calcium chloride was dis-solved in 2 l of distilled water. Sodium alginate and calcium chloride solution wereautoclaved at 121 �C for 15min. The sterilized sodiumalginate solution and the high cell densityof the grown seed culturewere thoroughlymixed. Beadswere prepared by droplet frompipettewith about 5 mm diameter in a sterilized calcium chloride solution. The cell density of the seedculture for bead preparation was 3.1 g l�1. The wet and dry weight of beads incubated for 16 hwere measured as 3.28 and 0.5 g, respectively. The moisture content of the beads was 85%. Thephysical properties and appearance of the S. cerevisiae beads are summarized in Table 8.3.
8.6.2.2 Determination of Glucose Concentration
To determine the concentration of inlet and outlet glucose in the ICR, a reducing chemicalreagent, 3,5-dinitrosalicylic (DNS) acid 98% solution, was used. The DNS solution was pre-pared by dissolving 10 g of 3,5-DNS acid in 2 M sodium hydroxide solution. A separate
TABLE 8.3 Physical properties and appearance of Saccharomyces cerevisiae beads
Alginate (wt%) 1.5 2 3 6
Beads diameter (mm) 5 4.9e5 4.8e4.9 4.5
Growth, diameter expansionafter 72 h
50e60% 25e30% 20e25% No expansion
Diffusion problem Nil Nil Nil May exists
Cell activity Active Fully active Fully active Partly active
Physical appearance Easy to break Flexible, hard enoughto stand
Flexible and hard Very hard
Stability Not stable Good stability Stable and rigid Very rigid
8. IMMOBILIZATION OF MICROBIAL CELLS FOR THE PRODUCTION OF ORGANIC ACID AND ETHANOL270
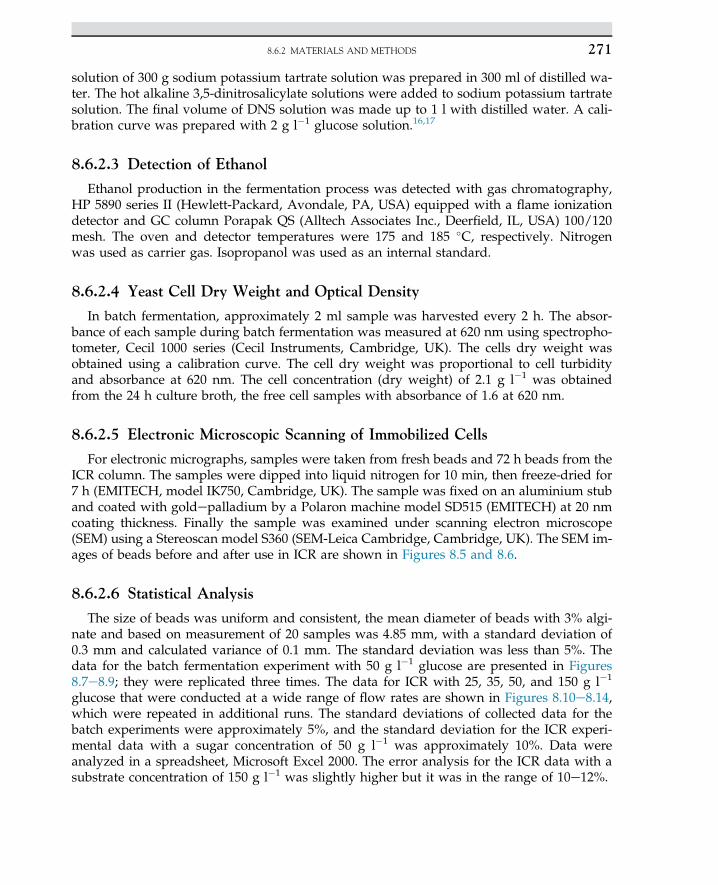
solution of 300 g sodium potassium tartrate solution was prepared in 300 ml of distilled wa-ter. The hot alkaline 3,5-dinitrosalicylate solutions were added to sodium potassium tartratesolution. The final volume of DNS solution was made up to 1 l with distilled water. A cali-bration curve was prepared with 2 g l�1 glucose solution.16,17
8.6.2.3 Detection of Ethanol
Ethanol production in the fermentation process was detected with gas chromatography,HP 5890 series II (Hewlett-Packard, Avondale, PA, USA) equipped with a flame ionizationdetector and GC column Porapak QS (Alltech Associates Inc., Deerfield, IL, USA) 100/120mesh. The oven and detector temperatures were 175 and 185 �C, respectively. Nitrogenwas used as carrier gas. Isopropanol was used as an internal standard.
8.6.2.4 Yeast Cell Dry Weight and Optical Density
In batch fermentation, approximately 2 ml sample was harvested every 2 h. The absor-bance of each sample during batch fermentation was measured at 620 nm using spectropho-tometer, Cecil 1000 series (Cecil Instruments, Cambridge, UK). The cells dry weight wasobtained using a calibration curve. The cell dry weight was proportional to cell turbidityand absorbance at 620 nm. The cell concentration (dry weight) of 2.1 g l�1 was obtainedfrom the 24 h culture broth, the free cell samples with absorbance of 1.6 at 620 nm.
8.6.2.5 Electronic Microscopic Scanning of Immobilized Cells
For electronic micrographs, samples were taken from fresh beads and 72 h beads from theICR column. The samples were dipped into liquid nitrogen for 10 min, then freeze-dried for7 h (EMITECH, model IK750, Cambridge, UK). The sample was fixed on an aluminium stuband coated with goldepalladium by a Polaron machine model SD515 (EMITECH) at 20 nmcoating thickness. Finally the sample was examined under scanning electron microscope(SEM) using a Stereoscan model S360 (SEM-Leica Cambridge, Cambridge, UK). The SEM im-ages of beads before and after use in ICR are shown in Figures 8.5 and 8.6.
8.6.2.6 Statistical Analysis
The size of beads was uniform and consistent, the mean diameter of beads with 3% algi-nate and based on measurement of 20 samples was 4.85 mm, with a standard deviation of0.3 mm and calculated variance of 0.1 mm. The standard deviation was less than 5%. Thedata for the batch fermentation experiment with 50 g l�1 glucose are presented in Figures8.7e8.9; they were replicated three times. The data for ICR with 25, 35, 50, and 150 g l�1
glucose that were conducted at a wide range of flow rates are shown in Figures 8.10e8.14,which were repeated in additional runs. The standard deviations of collected data for thebatch experiments were approximately 5%, and the standard deviation for the ICR experi-mental data with a sugar concentration of 50 g l�1 was approximately 10%. Data wereanalyzed in a spreadsheet, Microsoft Excel 2000. The error analysis for the ICR data with asubstrate concentration of 150 g l�1 was slightly higher but it was in the range of 10e12%.
8.6.2 MATERIALS AND METHODS 271
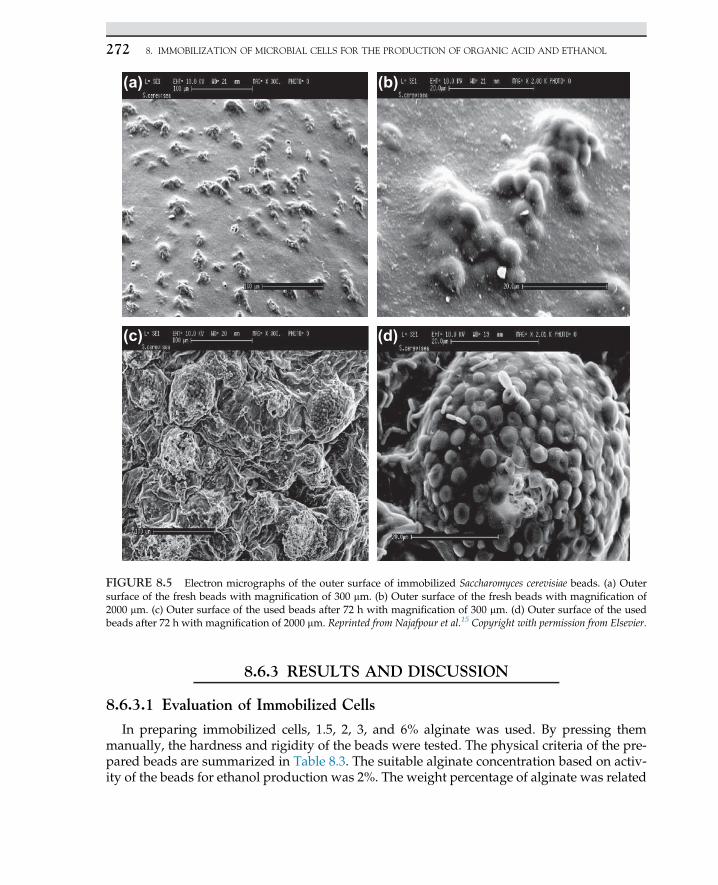
8.6.3 RESULTS AND DISCUSSION
8.6.3.1 Evaluation of Immobilized Cells
In preparing immobilized cells, 1.5, 2, 3, and 6% alginate was used. By pressing themmanually, the hardness and rigidity of the beads were tested. The physical criteria of the pre-pared beads are summarized in Table 8.3. The suitable alginate concentration based on activ-ity of the beads for ethanol production was 2%. The weight percentage of alginate was related
(a) (b)
(c) (d)
FIGURE 8.5 Electron micrographs of the outer surface of immobilized Saccharomyces cerevisiae beads. (a) Outersurface of the fresh beads with magnification of 300 mm. (b) Outer surface of the fresh beads with magnification of2000 mm. (c) Outer surface of the used beads after 72 h with magnification of 300 mm. (d) Outer surface of the usedbeads after 72 h with magnification of 2000 mm. Reprinted from Najafpour et al.15 Copyright with permission from Elsevier.
8. IMMOBILIZATION OF MICROBIAL CELLS FOR THE PRODUCTION OF ORGANIC ACID AND ETHANOL272
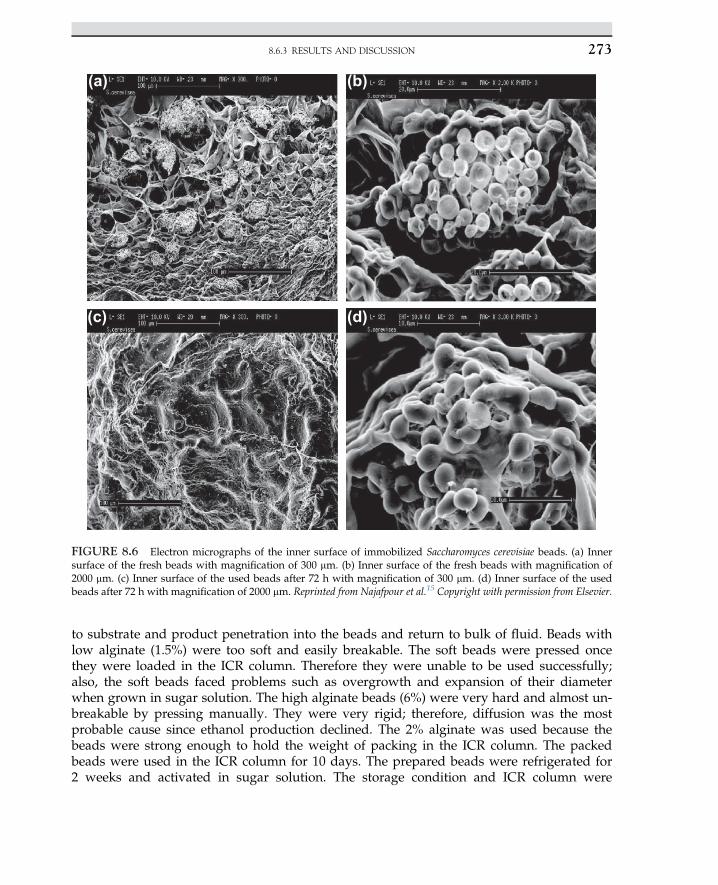
to substrate and product penetration into the beads and return to bulk of fluid. Beads withlow alginate (1.5%) were too soft and easily breakable. The soft beads were pressed oncethey were loaded in the ICR column. Therefore they were unable to be used successfully;also, the soft beads faced problems such as overgrowth and expansion of their diameterwhen grown in sugar solution. The high alginate beads (6%) were very hard and almost un-breakable by pressing manually. They were very rigid; therefore, diffusion was the mostprobable cause since ethanol production declined. The 2% alginate was used because thebeads were strong enough to hold the weight of packing in the ICR column. The packedbeads were used in the ICR column for 10 days. The prepared beads were refrigerated for2 weeks and activated in sugar solution. The storage condition and ICR column were
(a) (b)
(c) (d)
FIGURE 8.6 Electron micrographs of the inner surface of immobilized Saccharomyces cerevisiae beads. (a) Innersurface of the fresh beads with magnification of 300 mm. (b) Inner surface of the fresh beads with magnification of2000 mm. (c) Inner surface of the used beads after 72 h with magnification of 300 mm. (d) Inner surface of the usedbeads after 72 h with magnification of 2000 mm. Reprinted from Najafpour et al.15 Copyright with permission from Elsevier.
8.6.3 RESULTS AND DISCUSSION 273
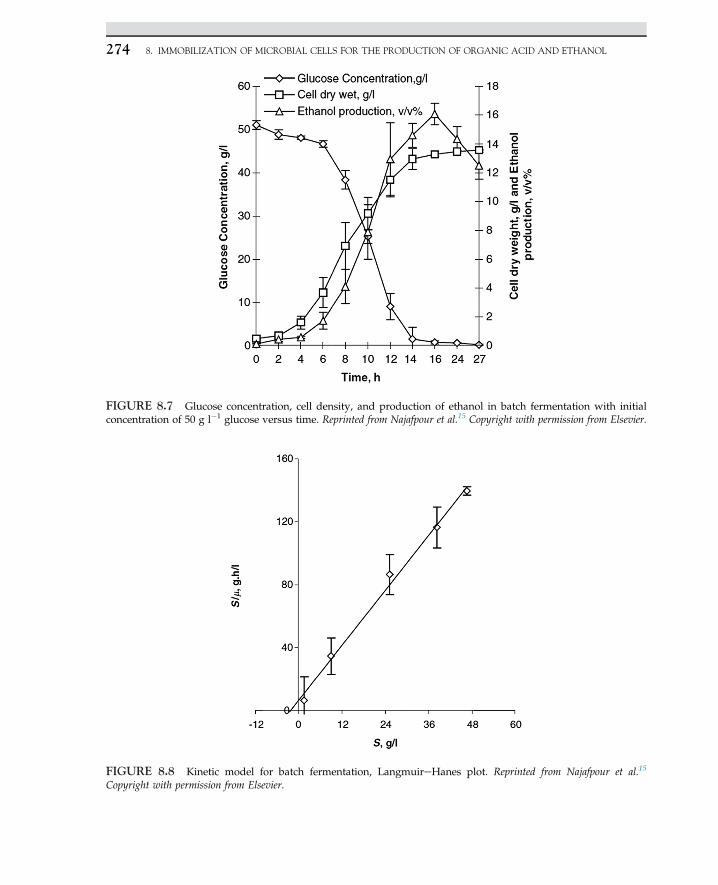
FIGURE 8.7 Glucose concentration, cell density, and production of ethanol in batch fermentation with initialconcentration of 50 g l�1 glucose versus time. Reprinted from Najafpour et al.15 Copyright with permission from Elsevier.
FIGURE 8.8 Kinetic model for batch fermentation, LangmuireHanes plot. Reprinted from Najafpour et al.15
Copyright with permission from Elsevier.
8. IMMOBILIZATION OF MICROBIAL CELLS FOR THE PRODUCTION OF ORGANIC ACID AND ETHANOL274
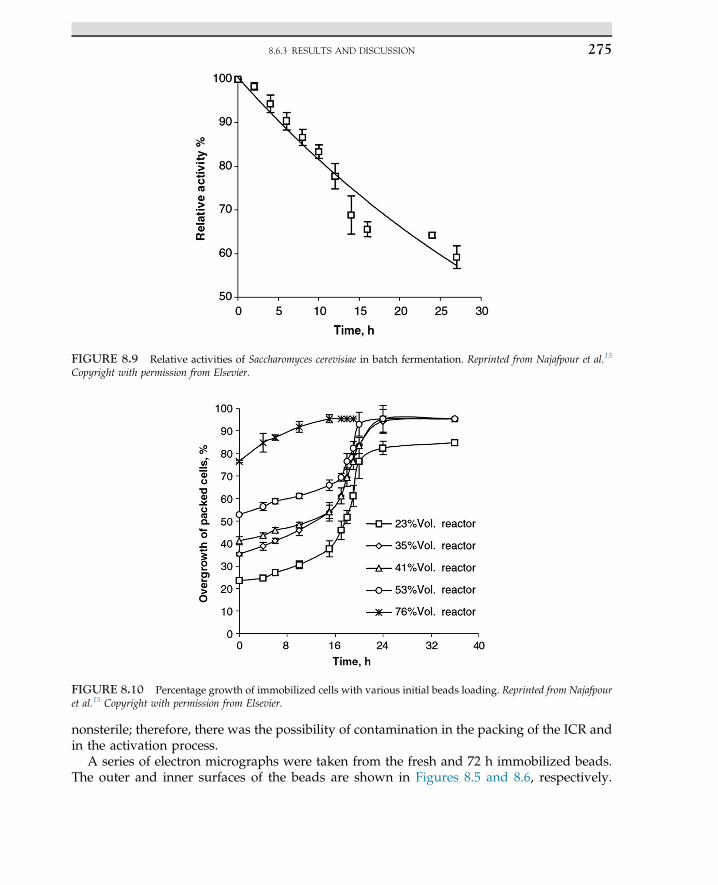
nonsterile; therefore, there was the possibility of contamination in the packing of the ICR andin the activation process.
A series of electron micrographs were taken from the fresh and 72 h immobilized beads.The outer and inner surfaces of the beads are shown in Figures 8.5 and 8.6, respectively.
FIGURE 8.9 Relative activities of Saccharomyces cerevisiae in batch fermentation. Reprinted from Najafpour et al.15
Copyright with permission from Elsevier.
FIGURE 8.10 Percentage growth of immobilized cells with various initial beads loading. Reprinted from Najafpouret al.15 Copyright with permission from Elsevier.
8.6.3 RESULTS AND DISCUSSION 275
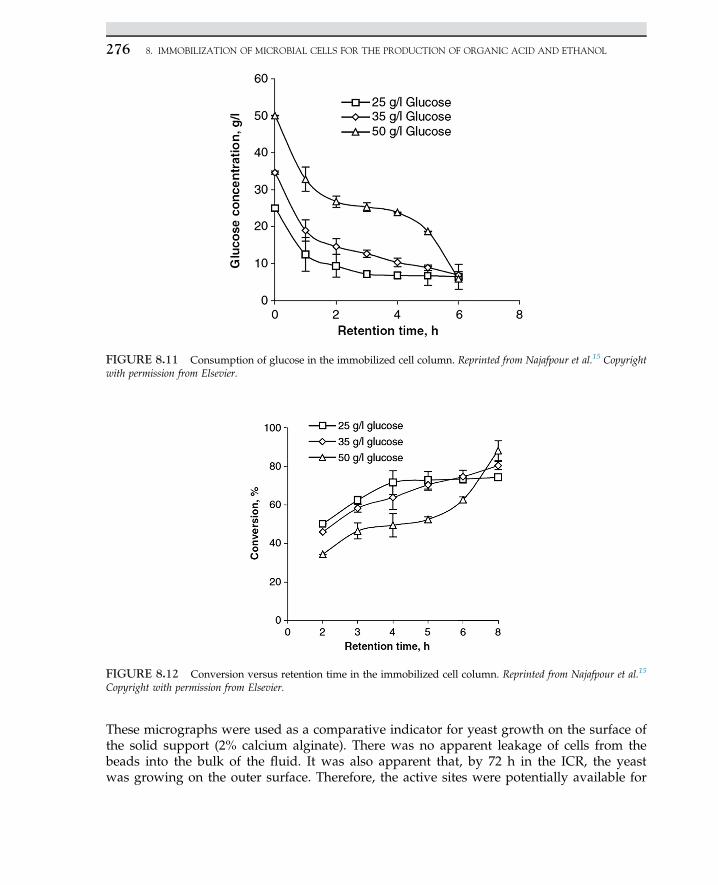
These micrographs were used as a comparative indicator for yeast growth on the surface ofthe solid support (2% calcium alginate). There was no apparent leakage of cells from thebeads into the bulk of the fluid. It was also apparent that, by 72 h in the ICR, the yeastwas growing on the outer surface. Therefore, the active sites were potentially available for
FIGURE 8.11 Consumption of glucose in the immobilized cell column. Reprinted from Najafpour et al.15 Copyrightwith permission from Elsevier.
FIGURE 8.12 Conversion versus retention time in the immobilized cell column. Reprinted from Najafpour et al.15
Copyright with permission from Elsevier.
8. IMMOBILIZATION OF MICROBIAL CELLS FOR THE PRODUCTION OF ORGANIC ACID AND ETHANOL276
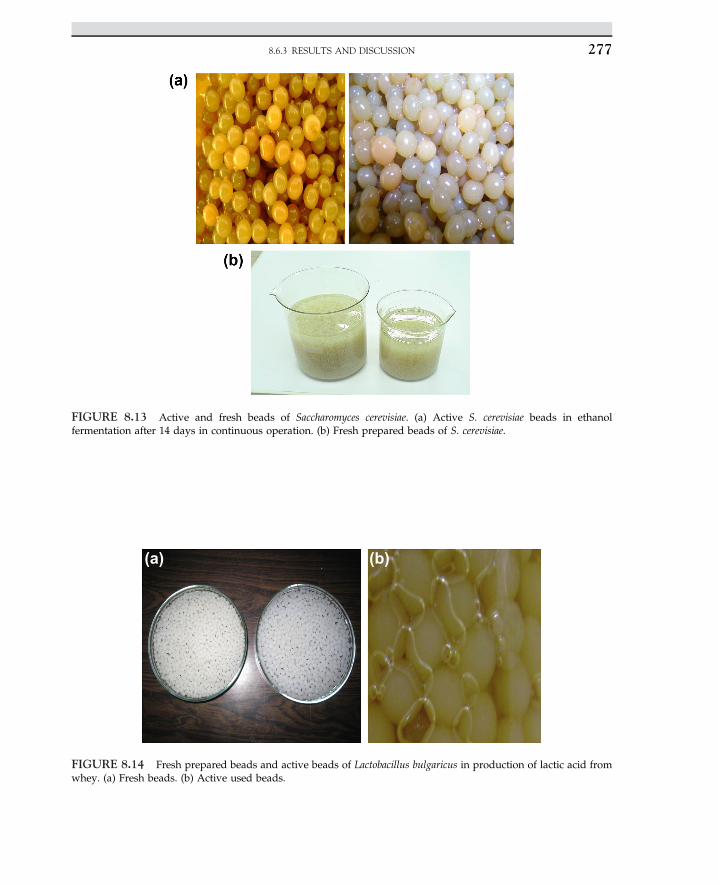
FIGURE 8.13 Active and fresh beads of Saccharomyces cerevisiae. (a) Active S. cerevisiae beads in ethanolfermentation after 14 days in continuous operation. (b) Fresh prepared beads of S. cerevisiae.
(a) (b)
FIGURE 8.14 Fresh prepared beads and active beads of Lactobacillus bulgaricus in production of lactic acid fromwhey. (a) Fresh beads. (b) Active used beads.
8.6.3 RESULTS AND DISCUSSION 277
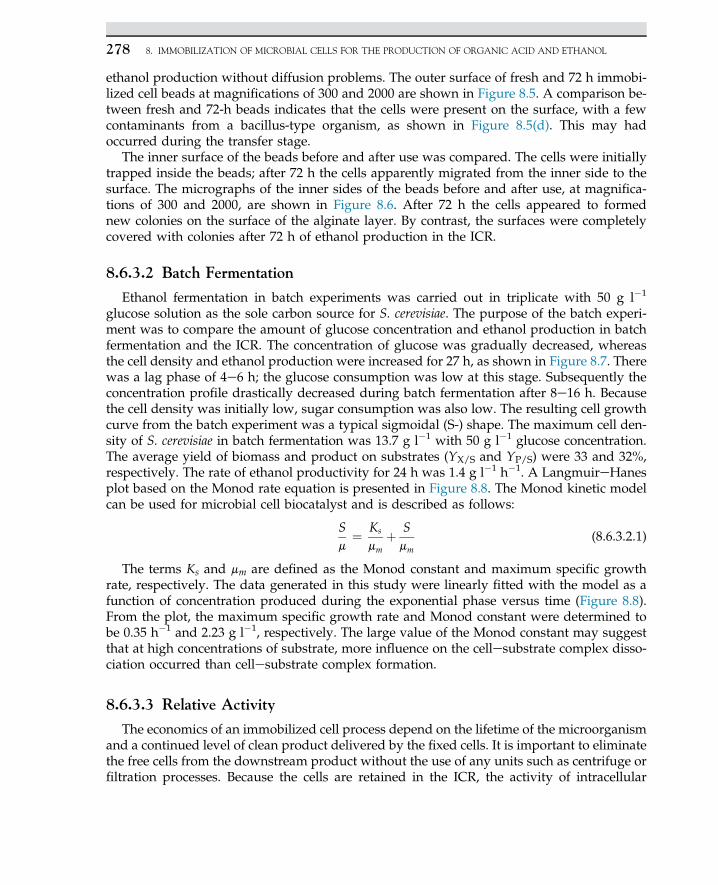
ethanol production without diffusion problems. The outer surface of fresh and 72 h immobi-lized cell beads at magnifications of 300 and 2000 are shown in Figure 8.5. A comparison be-tween fresh and 72-h beads indicates that the cells were present on the surface, with a fewcontaminants from a bacillus-type organism, as shown in Figure 8.5(d). This may hadoccurred during the transfer stage.
The inner surface of the beads before and after use was compared. The cells were initiallytrapped inside the beads; after 72 h the cells apparently migrated from the inner side to thesurface. The micrographs of the inner sides of the beads before and after use, at magnifica-tions of 300 and 2000, are shown in Figure 8.6. After 72 h the cells appeared to formednew colonies on the surface of the alginate layer. By contrast, the surfaces were completelycovered with colonies after 72 h of ethanol production in the ICR.
8.6.3.2 Batch Fermentation
Ethanol fermentation in batch experiments was carried out in triplicate with 50 g l�1
glucose solution as the sole carbon source for S. cerevisiae. The purpose of the batch experi-ment was to compare the amount of glucose concentration and ethanol production in batchfermentation and the ICR. The concentration of glucose was gradually decreased, whereasthe cell density and ethanol production were increased for 27 h, as shown in Figure 8.7. Therewas a lag phase of 4e6 h; the glucose consumption was low at this stage. Subsequently theconcentration profile drastically decreased during batch fermentation after 8e16 h. Becausethe cell density was initially low, sugar consumption was also low. The resulting cell growthcurve from the batch experiment was a typical sigmoidal (S-) shape. The maximum cell den-sity of S. cerevisiae in batch fermentation was 13.7 g l�1 with 50 g l�1 glucose concentration.The average yield of biomass and product on substrates (YX/S and YP/S) were 33 and 32%,respectively. The rate of ethanol productivity for 24 h was 1.4 g l�1 h�1. A LangmuireHanesplot based on the Monod rate equation is presented in Figure 8.8. The Monod kinetic modelcan be used for microbial cell biocatalyst and is described as follows:
Sm
¼ Ks
mmþ Smm
(8.6.3.2.1)
The terms Ks and mm are defined as the Monod constant and maximum specific growthrate, respectively. The data generated in this study were linearly fitted with the model as afunction of concentration produced during the exponential phase versus time (Figure 8.8).From the plot, the maximum specific growth rate and Monod constant were determined tobe 0.35 h�1 and 2.23 g l�1, respectively. The large value of the Monod constant may suggestthat at high concentrations of substrate, more influence on the cellesubstrate complex disso-ciation occurred than cellesubstrate complex formation.
8.6.3.3 Relative Activity
The economics of an immobilized cell process depend on the lifetime of the microorganismand a continued level of clean product delivered by the fixed cells. It is important to eliminatethe free cells from the downstream product without the use of any units such as centrifuge orfiltration processes. Because the cells are retained in the ICR, the activity of intracellular
8. IMMOBILIZATION OF MICROBIAL CELLS FOR THE PRODUCTION OF ORGANIC ACID AND ETHANOL278
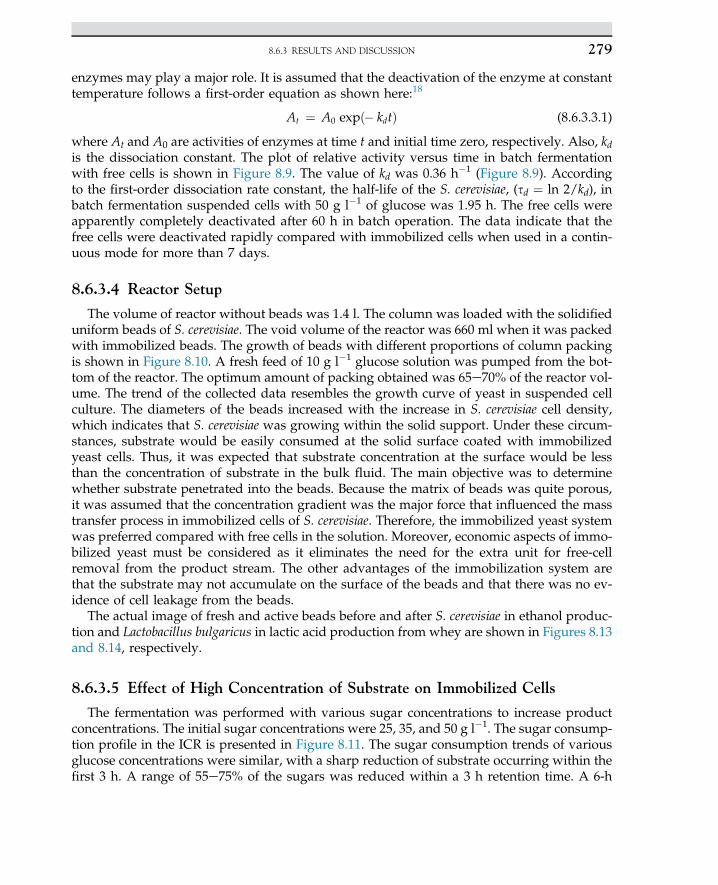
enzymes may play a major role. It is assumed that the deactivation of the enzyme at constanttemperature follows a first-order equation as shown here:18
At ¼ A0 expð� kdtÞ (8.6.3.3.1)
where At and A0 are activities of enzymes at time t and initial time zero, respectively. Also, kdis the dissociation constant. The plot of relative activity versus time in batch fermentationwith free cells is shown in Figure 8.9. The value of kd was 0.36 h�1 (Figure 8.9). Accordingto the first-order dissociation rate constant, the half-life of the S. cerevisiae, (sd ¼ ln 2/kd), inbatch fermentation suspended cells with 50 g l�1 of glucose was 1.95 h. The free cells wereapparently completely deactivated after 60 h in batch operation. The data indicate that thefree cells were deactivated rapidly compared with immobilized cells when used in a contin-uous mode for more than 7 days.
8.6.3.4 Reactor Setup
The volume of reactor without beads was 1.4 l. The column was loaded with the solidifieduniform beads of S. cerevisiae. The void volume of the reactor was 660 ml when it was packedwith immobilized beads. The growth of beads with different proportions of column packingis shown in Figure 8.10. A fresh feed of 10 g l�1 glucose solution was pumped from the bot-tom of the reactor. The optimum amount of packing obtained was 65e70% of the reactor vol-ume. The trend of the collected data resembles the growth curve of yeast in suspended cellculture. The diameters of the beads increased with the increase in S. cerevisiae cell density,which indicates that S. cerevisiae was growing within the solid support. Under these circum-stances, substrate would be easily consumed at the solid surface coated with immobilizedyeast cells. Thus, it was expected that substrate concentration at the surface would be lessthan the concentration of substrate in the bulk fluid. The main objective was to determinewhether substrate penetrated into the beads. Because the matrix of beads was quite porous,it was assumed that the concentration gradient was the major force that influenced the masstransfer process in immobilized cells of S. cerevisiae. Therefore, the immobilized yeast systemwas preferred compared with free cells in the solution. Moreover, economic aspects of immo-bilized yeast must be considered as it eliminates the need for the extra unit for free-cellremoval from the product stream. The other advantages of the immobilization system arethat the substrate may not accumulate on the surface of the beads and that there was no ev-idence of cell leakage from the beads.
The actual image of fresh and active beads before and after S. cerevisiae in ethanol produc-tion and Lactobacillus bulgaricus in lactic acid production from whey are shown in Figures 8.13and 8.14, respectively.
8.6.3.5 Effect of High Concentration of Substrate on Immobilized Cells
The fermentation was performed with various sugar concentrations to increase productconcentrations. The initial sugar concentrations were 25, 35, and 50 g l�1. The sugar consump-tion profile in the ICR is presented in Figure 8.11. The sugar consumption trends of variousglucose concentrations were similar, with a sharp reduction of substrate occurring within thefirst 3 h. A range of 55e75% of the sugars was reduced within a 3 h retention time. A 6-h
8.6.3 RESULTS AND DISCUSSION 279
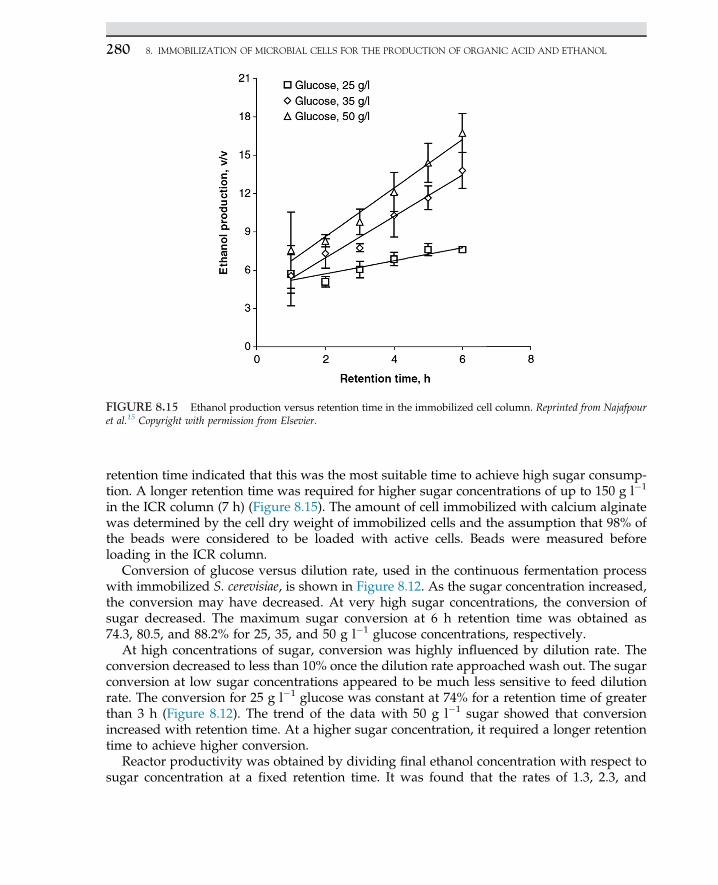
retention time indicated that this was the most suitable time to achieve high sugar consump-tion. A longer retention time was required for higher sugar concentrations of up to 150 g l�1
in the ICR column (7 h) (Figure 8.15). The amount of cell immobilized with calcium alginatewas determined by the cell dry weight of immobilized cells and the assumption that 98% ofthe beads were considered to be loaded with active cells. Beads were measured beforeloading in the ICR column.
Conversion of glucose versus dilution rate, used in the continuous fermentation processwith immobilized S. cerevisiae, is shown in Figure 8.12. As the sugar concentration increased,the conversion may have decreased. At very high sugar concentrations, the conversion ofsugar decreased. The maximum sugar conversion at 6 h retention time was obtained as74.3, 80.5, and 88.2% for 25, 35, and 50 g l�1 glucose concentrations, respectively.
At high concentrations of sugar, conversion was highly influenced by dilution rate. Theconversion decreased to less than 10% once the dilution rate approached wash out. The sugarconversion at low sugar concentrations appeared to be much less sensitive to feed dilutionrate. The conversion for 25 g l�1 glucose was constant at 74% for a retention time of greaterthan 3 h (Figure 8.12). The trend of the data with 50 g l�1 sugar showed that conversionincreased with retention time. At a higher sugar concentration, it required a longer retentiontime to achieve higher conversion.
Reactor productivity was obtained by dividing final ethanol concentration with respect tosugar concentration at a fixed retention time. It was found that the rates of 1.3, 2.3, and
FIGURE 8.15 Ethanol production versus retention time in the immobilized cell column. Reprinted from Najafpouret al.15 Copyright with permission from Elsevier.
8. IMMOBILIZATION OF MICROBIAL CELLS FOR THE PRODUCTION OF ORGANIC ACID AND ETHANOL280
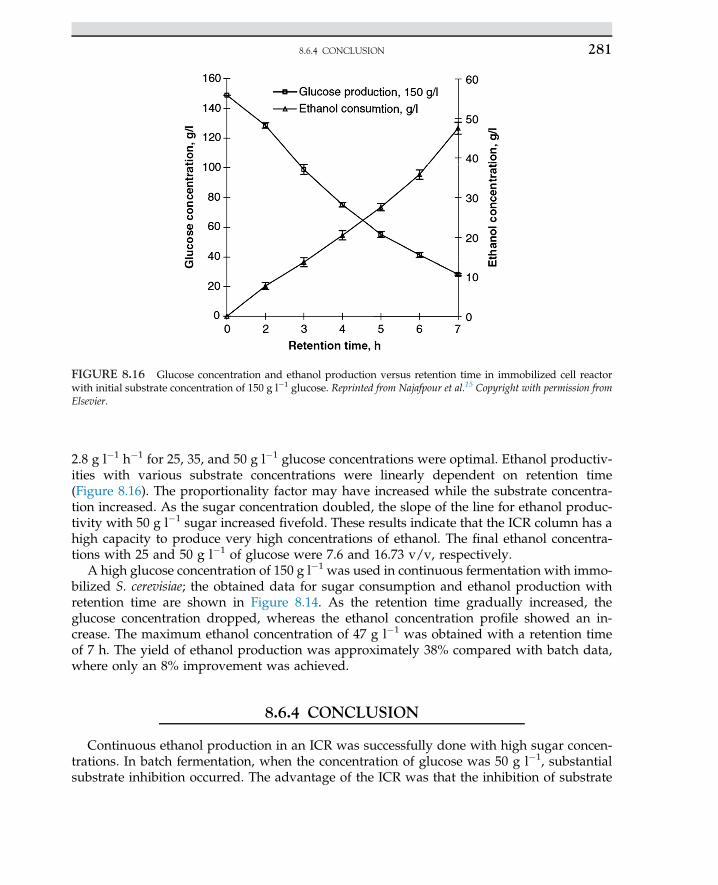
2.8 g l�1 h�1 for 25, 35, and 50 g l�1 glucose concentrations were optimal. Ethanol productiv-ities with various substrate concentrations were linearly dependent on retention time(Figure 8.16). The proportionality factor may have increased while the substrate concentra-tion increased. As the sugar concentration doubled, the slope of the line for ethanol produc-tivity with 50 g l�1 sugar increased fivefold. These results indicate that the ICR column has ahigh capacity to produce very high concentrations of ethanol. The final ethanol concentra-tions with 25 and 50 g l�1 of glucose were 7.6 and 16.73 v/v, respectively.
A high glucose concentration of 150 g l�1 was used in continuous fermentation with immo-bilized S. cerevisiae; the obtained data for sugar consumption and ethanol production withretention time are shown in Figure 8.14. As the retention time gradually increased, theglucose concentration dropped, whereas the ethanol concentration profile showed an in-crease. The maximum ethanol concentration of 47 g l�1 was obtained with a retention timeof 7 h. The yield of ethanol production was approximately 38% compared with batch data,where only an 8% improvement was achieved.
8.6.4 CONCLUSION
Continuous ethanol production in an ICR was successfully done with high sugar concen-trations. In batch fermentation, when the concentration of glucose was 50 g l�1, substantialsubstrate inhibition occurred. The advantage of the ICR was that the inhibition of substrate
FIGURE 8.16 Glucose concentration and ethanol production versus retention time in immobilized cell reactorwith initial substrate concentration of 150 g l�1 glucose. Reprinted from Najafpour et al.15 Copyright with permission fromElsevier.
8.6.4 CONCLUSION 281
and product were not apparent even with a 150 g l�1 glucose solution in the fresh feed (datanot shown). The ICR system exhibited a higher yield of ethanol production (38%) than thebatch system. The ICR column gave a high performance to processing feed with concentratedsugar. Most of ICR experimental runs resulted in a glucose consumption of 82e85%. The re-sults indicate that the immobilization of S. cerevisiae possesses the capacity not only to usehigh concentrations of sugar, but also to yield higher ethanol productivities during the courseof continuous fermentation. Ethanol production in the ICR column increased fivefold, as theglucose concentration was doubled from 25 to 50 g l�1. The new findings in the present inves-tigation confirmed the application of concentrated feed with a higher rate of ethanol produc-tion, because the cell loaded into the gel matrices of sodium alginate shown in the SEMmicrographs eliminated the free cells from the ethanol product stream.
NOMENCLATURE
Ao Initial activity of bacterium (U g�1 cell)At Activity of bacterium at time t (U g�1 cell)C Microorganisms cell concentration (g l�1)kd Dissociation constant (h�1)Ks Monod constant (g l�1)S Substrate concentration (g l�1)T Time (h)m Specific growth rate (g l�1 h�1)mm Maximum specific growth rate (h�1)
AcknowledgmentThe present research was made possible through an Intensive Research Priority Area (IRPA) grant No. 03-02-05-9016,sponsored by the Universiti Sains Malaysia. We thank the Research Creativity & Management Office, Universiti SainsMalaysia, Penang, Malaysia. Special thanks go to the Ministry of Science Technology and Environment (MOSTE),Kuala Lumpur, Malaysian government, for their financial support for IRPA.
References1. Chum LH, Overend RP. Fuel Bioprocess Technol 2001;17:187.2. Flickinger MC, Drew SW. In: Encyclopedia of bioprocess technology: fermentation, biocatalysis, and bioseparation, vol. 2;1999. p. 939.
3. Gunasekaran P, Raj KC. Ethanol fermentation technology e Zymomonas mobilis; 2001. http://ces.iisc.ernet.in/curscinew/july10/articles14.htm.
4. Baily JE, Ollis DF. Biochemical engineering fundamentals. New York: McGraw-Hill; 1986 [chapter 3].5. Ingram LO, Gomez PF, Lai X, Moniruzzaman M, Wood BE. Biotechnol Bioeng 1998;58:204.6. Holzberg I, Finn RK, Steinkraus KH. Biotechnol Bioeng 1967;9:413.7. Nagodawithana TW, Steinkraus KH. J Appl Env Microbiol 1976;31:158.8. Vega JL, Clausen EC, Gaddy JL. J Enzyme Microb Technol 1988;10:390.9. Takamitsu I, Izumida H, Akagi Y, Sakamoto M. J Ferment Bioeng 1993;75:32.10. Yamada T, Fatigati MA, Zhang M. Appl Biochem Biotechnol 2002;98:899.11. Najafpour G. Organic acids for biomass by continuous fermentation. Resour Consern 1987;17:187.12. Gikas P, Livingston AG. Biotechnol Bioeng 1997;55:660.13. Riley MR, Muzzio FJ, Buettner HM, Reyes SC. Biotechnol Bioeng 1996;49:223.
8. IMMOBILIZATION OF MICROBIAL CELLS FOR THE PRODUCTION OF ORGANIC ACID AND ETHANOL282

14. Senthuran A, Senthuran V, Mattiasson B, Kaul R. Biotechnol Bioeng 1997;55:841.15. Najafpour GD, Younesi H, Ku Ismail KS. Ethanol fermentation in immobilized cell reactor (ICR) using Saccha-
romyces cerevisiae. Bioresour Technol 2004;92(3):251.16. Summers JB. J Biol Chem 1924;62:248.17. Miller GL. Anal Chem 1959;31:426.18. Yuan YJ, Wang SH, Song ZX, Gao RC. J Chem Technol Biotechnol 2002;77:602.
REFERENCES 283
S U B C H A P T E R
8.7Fundamentals of Immobilization Technology,and Mathematical Model for ICR Performance
It is well-known that pure enzymes change their behavior and stability when they areimmobilized. In the past two decades, the immobilization of microorganisms, cells, and partsof cells has gradually been introduced into microbiology and biotechnology. The cell immo-bilization techniques are modifications of the techniques developed for enzymes. However,the larger size of microbes has influenced the techniques. As for immobilized enzymes,two broad types of method have been used to immobilize microorganisms: attachment toa support and entrapment.
8.7.1 IMMOBILIZATION OF MICROORGANISMSBY COVALENT BONDS
By these methods microorganisms are cross-linked by chemical substances, e.g., by glutar-aldehyde. The surfaces (especially the proteins) of microorganisms are linked with the surfacesof other microorganisms by aldehyde groups of glutaraldehyde. Yeast cells, for instance, reactwith free ε-amino group or N-terminal amino groups to form imines. Another reaction mech-anism was proposed for a conjugated addition of amino groups to double linkages of a- andb-unsaturated oligomers, which are present in commercial aqueous solutions of glutaralde-hyde. This mechanism may explain the stability of the linkages. By this chemical linking,growth inhibition and toxic influences on the microorganisms are very intensive. These reac-tions are only partly understood and can lead to decay or death of the microorganisms.
8.7.2 OXYGEN TRANSFER TO IMMOBILIZED MICROORGANISMS
Availability of oxygen is one of the most important parameters that are different for immo-bilized and free microorganisms. Free organisms can get oxygen directly from the surround-ing air or, in most technical processes, from the liquid, especially water, which containsdissolved oxygen. The molar transfer of oxygen with respect to time, dO2/dt, can bedescribed by the following equation:
dO2
dt¼ KLa
�Cg � CL
�(8.7.2.1)
8. IMMOBILIZATION OF MICROBIAL CELLS FOR THE PRODUCTION OF ORGANIC ACID AND ETHANOL284
KLa is the volumetric oxygen mass transfer coefficient, owing to the oxygen transfer fromthe gas phase or air, Cg, to the surface of the cells, Cx or to the transfer of oxygen dissolvedin water to the surface of the cells. In principle, the same formula can be applied to immo-bilized microorganisms, but here the conditions are quite different. The adsorbed cells formmicrobial films or varying thickness during a short incubation time. Oxygen has to be trans-ferred into these microfilms, and because of this, zones of different oxygen concentrationsexist in the films, in which the growth of the microorganisms varies in direct relation tothe oxygen concentration. Using the unsteady-state model, the maximum oxygen penetra-tion depth for highly packed immobilized cells has been reported to be in the range of50e200 mm.
8.7.3 SUBSTRATE TRANSFER TO IMMOBILIZEDMICROORGANISMS
In an immobilized cell bioreactor, significant substrate concentration gradients may exist.Cells are located close to the nutrient supply, which are likely to maintain higher qualityand activity than cells located relatively further away, leading to differentiation in the qual-ity or activity of the immobilized cell population. This differentiation is more pronounced ifthere are starvation regions (practically zero substrate concentration) inside the reactor.Typical approaches for measuring diffusivities in immobilized cell systems include beadmethods, diffusion chambers, and holographic laser interferometry. These methods can beapplied to various support materials, but they are time-consuming, making it onerous tomeasure effective diffusivity (Deff) over a wide range of cell fractions. Owing to the math-ematical models involved, the deconvolution of diffusivities can be very sensitive to errorsin concentration measurements. There are mathematical correlations developed to predictDeff as a function of diffusivities in broth and inside the cells (D0, Dc). The relation canalso be used to extrapolate Deff measurements from one cell fraction to any other cell frac-tion. Various values of D0/Dc have been compiled in Table 8.4 for a variety of immobilizedcell systems. These diffusivity ratios for specific systems (i.e., diffusing species, cell type,and gel material) facilitate the prediction of Deff values for a wide range of operating con-ditions. For a few systems, the diffusivity ratios are very large ðNÞ. The infinite diffusivity
TABLE 8.4 Methods of immobilization
AttachmentWithout support cross-linkingWith support
Aggregation of floc for formation of cross-linkingCovalent bindingAdsorption to ion-exchangers or inorganic sorbentBiofilm formation
Entrapment Organic polymerInorganic polymerSemipermeable membrane
8.7.3 SUBSTRATE TRANSFER TO IMMOBILIZED MICROORGANISMS 285
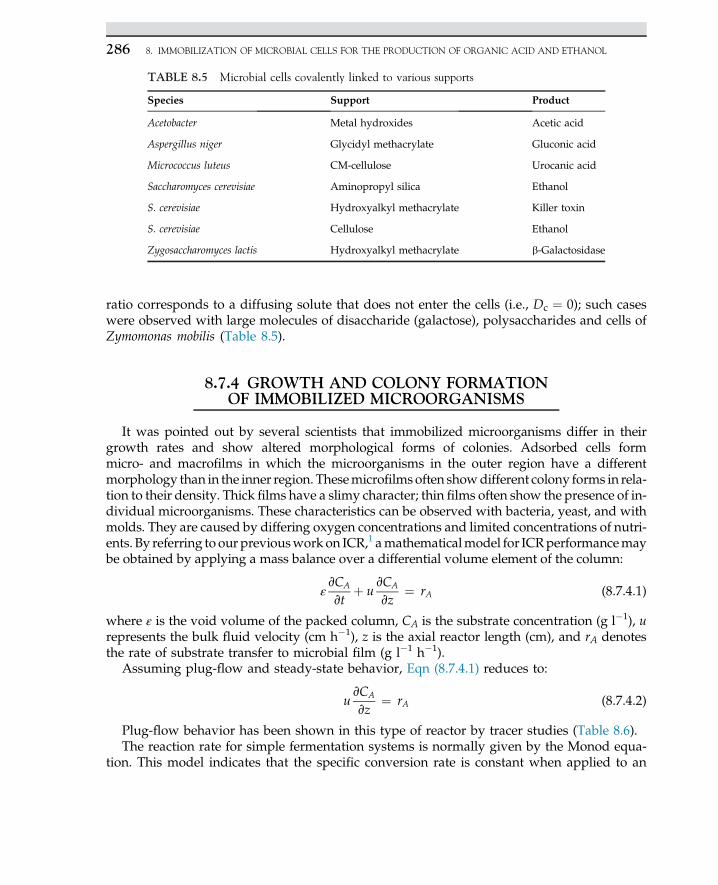
ratio corresponds to a diffusing solute that does not enter the cells (i.e., Dc ¼ 0); such caseswere observed with large molecules of disaccharide (galactose), polysaccharides and cells ofZymomonas mobilis (Table 8.5).
8.7.4 GROWTH AND COLONY FORMATIONOF IMMOBILIZED MICROORGANISMS
It was pointed out by several scientists that immobilized microorganisms differ in theirgrowth rates and show altered morphological forms of colonies. Adsorbed cells formmicro- and macrofilms in which the microorganisms in the outer region have a differentmorphology than in the inner region. Thesemicrofilms often showdifferent colony forms in rela-tion to their density. Thick films have a slimy character; thin films often show the presence of in-dividual microorganisms. These characteristics can be observed with bacteria, yeast, and withmolds. They are caused by differing oxygen concentrations and limited concentrations of nutri-ents. By referring to our previouswork on ICR,1 amathematicalmodel for ICRperformancemaybe obtained by applying a mass balance over a differential volume element of the column:
ε
vCA
vtþ u
vCA
vz¼ rA (8.7.4.1)
where ε is the void volume of the packed column, CA is the substrate concentration (g l�1), urepresents the bulk fluid velocity (cm h�1), z is the axial reactor length (cm), and rA denotesthe rate of substrate transfer to microbial film (g l�1 h�1).
Assuming plug-flow and steady-state behavior, Eqn (8.7.4.1) reduces to:
uvCA
vz¼ rA (8.7.4.2)
Plug-flow behavior has been shown in this type of reactor by tracer studies (Table 8.6).The reaction rate for simple fermentation systems is normally given by the Monod equa-
tion. This model indicates that the specific conversion rate is constant when applied to an
TABLE 8.5 Microbial cells covalently linked to various supports
Species Support Product
Acetobacter Metal hydroxides Acetic acid
Aspergillus niger Glycidyl methacrylate Gluconic acid
Micrococcus luteus CM-cellulose Urocanic acid
Saccharomyces cerevisiae Aminopropyl silica Ethanol
S. cerevisiae Hydroxyalkyl methacrylate Killer toxin
S. cerevisiae Cellulose Ethanol
Zygosaccharomyces lactis Hydroxyalkyl methacrylate b-Galactosidase
8. IMMOBILIZATION OF MICROBIAL CELLS FOR THE PRODUCTION OF ORGANIC ACID AND ETHANOL286
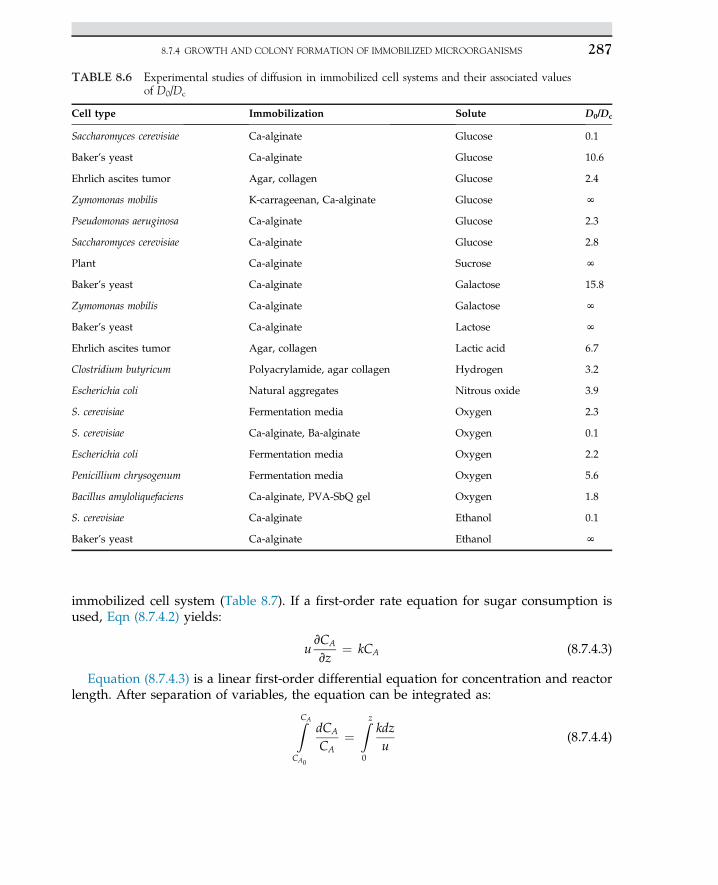
immobilized cell system (Table 8.7). If a first-order rate equation for sugar consumption isused, Eqn (8.7.4.2) yields:
uvCA
vz¼ kCA (8.7.4.3)
Equation (8.7.4.3) is a linear first-order differential equation for concentration and reactorlength. After separation of variables, the equation can be integrated as:
ZCA
CA0
dCA
CA¼
Zz
0
kdzu
(8.7.4.4)
TABLE 8.6 Experimental studies of diffusion in immobilized cell systems and their associated valuesof D0/Dc
Cell type Immobilization Solute D0/Dc
Saccharomyces cerevisiae Ca-alginate Glucose 0.1
Baker’s yeast Ca-alginate Glucose 10.6
Ehrlich ascites tumor Agar, collagen Glucose 2.4
Zymomonas mobilis K-carrageenan, Ca-alginate Glucose N
Pseudomonas aeruginosa Ca-alginate Glucose 2.3
Saccharomyces cerevisiae Ca-alginate Glucose 2.8
Plant Ca-alginate Sucrose N
Baker’s yeast Ca-alginate Galactose 15.8
Zymomonas mobilis Ca-alginate Galactose N
Baker’s yeast Ca-alginate Lactose N
Ehrlich ascites tumor Agar, collagen Lactic acid 6.7
Clostridium butyricum Polyacrylamide, agar collagen Hydrogen 3.2
Escherichia coli Natural aggregates Nitrous oxide 3.9
S. cerevisiae Fermentation media Oxygen 2.3
S. cerevisiae Ca-alginate, Ba-alginate Oxygen 0.1
Escherichia coli Fermentation media Oxygen 2.2
Penicillium chrysogenum Fermentation media Oxygen 5.6
Bacillus amyloliquefaciens Ca-alginate, PVA-SbQ gel Oxygen 1.8
S. cerevisiae Ca-alginate Ethanol 0.1
Baker’s yeast Ca-alginate Ethanol N
8.7.4 GROWTH AND COLONY FORMATION OF IMMOBILIZED MICROORGANISMS 287
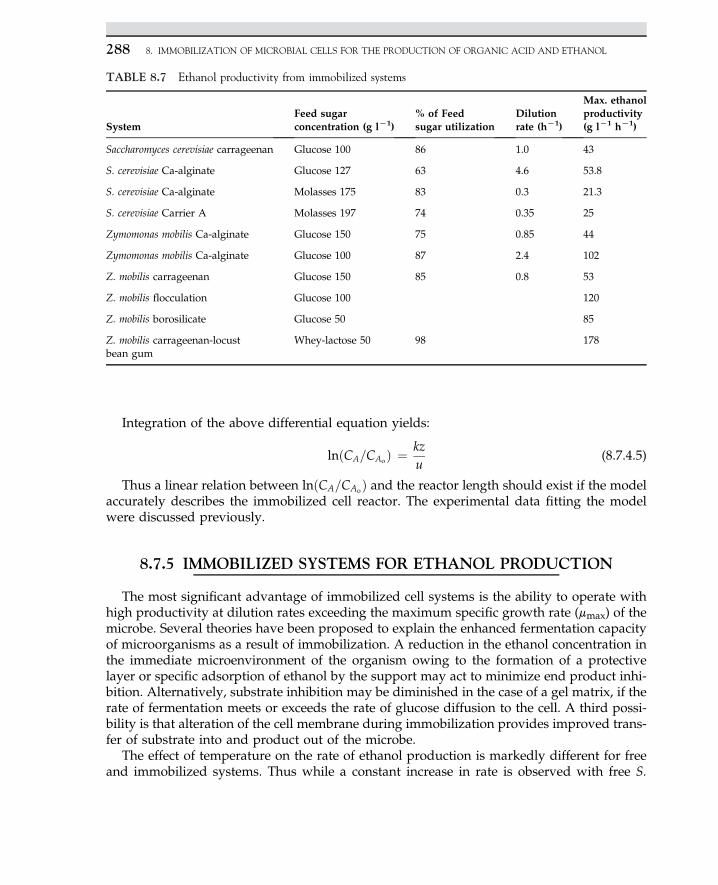
Integration of the above differential equation yields:
lnðCA=CAoÞ ¼ kzu
(8.7.4.5)
Thus a linear relation between lnðCA=CAoÞ and the reactor length should exist if the model
accurately describes the immobilized cell reactor. The experimental data fitting the modelwere discussed previously.
8.7.5 IMMOBILIZED SYSTEMS FOR ETHANOL PRODUCTION
The most significant advantage of immobilized cell systems is the ability to operate withhigh productivity at dilution rates exceeding the maximum specific growth rate (mmax) of themicrobe. Several theories have been proposed to explain the enhanced fermentation capacityof microorganisms as a result of immobilization. A reduction in the ethanol concentration inthe immediate microenvironment of the organism owing to the formation of a protectivelayer or specific adsorption of ethanol by the support may act to minimize end product inhi-bition. Alternatively, substrate inhibition may be diminished in the case of a gel matrix, if therate of fermentation meets or exceeds the rate of glucose diffusion to the cell. A third possi-bility is that alteration of the cell membrane during immobilization provides improved trans-fer of substrate into and product out of the microbe.
The effect of temperature on the rate of ethanol production is markedly different for freeand immobilized systems. Thus while a constant increase in rate is observed with free S.
TABLE 8.7 Ethanol productivity from immobilized systems
SystemFeed sugarconcentration (g lL1)
% of Feedsugar utilization
Dilutionrate (hL1)
Max. ethanolproductivity(g lL1 hL1)
Saccharomyces cerevisiae carrageenan Glucose 100 86 1.0 43
S. cerevisiae Ca-alginate Glucose 127 63 4.6 53.8
S. cerevisiae Ca-alginate Molasses 175 83 0.3 21.3
S. cerevisiae Carrier A Molasses 197 74 0.35 25
Zymomonas mobilis Ca-alginate Glucose 150 75 0.85 44
Zymomonas mobilis Ca-alginate Glucose 100 87 2.4 102
Z. mobilis carrageenan Glucose 150 85 0.8 53
Z. mobilis flocculation Glucose 100 120
Z. mobilis borosilicate Glucose 50 85
Z. mobilis carrageenan-locustbean gum
Whey-lactose 50 98 178
8. IMMOBILIZATION OF MICROBIAL CELLS FOR THE PRODUCTION OF ORGANIC ACID AND ETHANOL288

cerevisiae as temperature is increased from 25 to 42 �C, a maximum occurs at 30 �C with cellsimmobilized in sodium alginate. The lower temperature optimum for immobilized systemsmay result from diffusional limitations of ethanol within the support matrix. At higher tem-peratures, ethanol production exceeds its rate of diffusion so that accumulation occurs withinthe beads. The achievement of inhibitory levels then causes the declines observed in theethanol production rate.
Significant differences are also apparent for the effect of pH on the fermentation rate. Thenarrow pH optimum characteristic of a free cell system is replaced by an extremely broadrange upon immobilization. This effect stems from the gradient pH that exists within thebead.
Reference1. Najafpour GD. Resour Conserv 1987;13:187.
REFERENCE 289
C H A P T E R
9
Material and Elemental Balance
O U T L I N E
9.1 Introduction 291
9.2 Media Preparation for Fermentation 2929.2.1 Medium Formulation 2939.2.2 Preparation of Anaerobic Media 2959.2.3 Preparation of Minimal Media
and Standard Media 301
9.3 Growth of Stoichiometry andElemental Balances 303
9.4 Energy Balance for ContinuousEthanol Fermentation 305
9.5 Mass Balance for BiologicalProcesses 306
9.6 Conservation of Mass Principle 3099.6.1 Acetic Acid Fermentation
Process 3129.6.2 Xanthan Gum Production 3149.6.3 Stoichiometric Coefficient for
Cell Growth 317
9.7 EmbdeneMeyerhofeParnasPathway 3189.7.1 Description of Glycolysis 319
References 326
9.1 INTRODUCTION
All microorganisms require nutrients for propagation and to produce metabolites as usefulbyproducts. Medium is supplied to the reaction vessel while the products leave througheffluent for downstream processing. Balancing individual elements assists us in understand-ing biocatalytic activities and monitoring the downstream process. Nutrients are supplied inaqueous media with carbon, nitrogen, and phosphorus sources. Mineral elements, vitamins,and oxygen are also provided to enhance microbial growth. Once a system is selected, we
291Biochemical Engineering and Biotechnologyhttp://dx.doi.org/10.1016/B978-0-444-63357-6.00009-2 Copyright © 2015 Elsevier B.V. All rights reserved.
balance the inlet and outlet compositions. Knowledge of microbial elemental compositionssuch as C, H, N, S, P, Mg, Na, and K is required to solve the elemental balance equation. Nor-mally trace metals and minerals such as Fe, Cu, Zn, Co, Mn, and Mo are required in smallquantities, which act as growth stimulants with sufficient energy sources to provide adeno-sine triphosphate (ATP) as needed, for biochemical reactions to precede and progress.1
Carbohydrates as substrates are used in the cells to generate energy and carry out biosyn-thesis. An adequate carbon source is essential to ensure cell growth. Nutrients are frequentlyadded into the media in substantially excessive amounts than are required by the cell, but theamount of trace metals and minerals supplied is limited.2e4
For any viable microorganism in a fermentation process, we should be able to respond tothe following questions:
• What would the respiration quotient be related to the concentration of CO2 generated inthe fermentation process, known as off gas?
• What fraction of substrate is consumed and how much substrate is converted tobiomass and end products?
• If the process is aerobic, how much O2 is required?• What would the oxygen transfer rate be?
To answer these questions, the media used to propagate and culture organisms are dis-cussed; then, mass balance is required for microorganisms to determine conversion andhow much air has to be supplied into the fermentation broth. The substrate consumptionor production rates must be set as a starting point. To provide suitable answers to these state-ments, we may approach the questions by reviewing a few biological processes and illus-trating the assumptions and process conditions.
9.2 MEDIA PREPARATION FOR FERMENTATION
A recent survey showed that many research papers are published for the purpose of iden-tifying suitable a media composition for maximum growth and productivity. Various soft-ware packages have been developed to optimize the chemical composition of media.Appropriate media for cultivating microorganisms are necessary to contain carbon, nitrogen,and phosphorous sources. The media have to be prepared in advance before inoculum istransferred to them. Media have to meet certain requirements to provide a suitable environ-ment for an organism to have safe and sustainable growth. All organisms are required to livein water while necessary nutrients are available for the organism in the aqueous phase. Wateracts as the desired environment for keeping all nutrients in the soluble phase. Based on theconcentration of gradients, nutrients diffuse through the cell wall. In addition, the energysource for all viable cells is supplied by a carbon source and nitrogen and phosphorous com-pounds are required for the biosynthesis of essential compounds such as amino acids andnucleic acids. Enzymes have an important role as biocatalysts and energize biochemical re-actions to be formed. Most enzymes for an active state require a center core of metal ions(e.g., Co, Cu, Mn, Mo, Zn, Fe, and B). For certain organisms, vitamins and supplementarynutrients are essential to secure cell growth. Some organisms are unable to synthesize nucleicacids, amino acids, and vitamins. Therefore, specific growth factors are identified and
9. MATERIAL AND ELEMENTAL BALANCE292
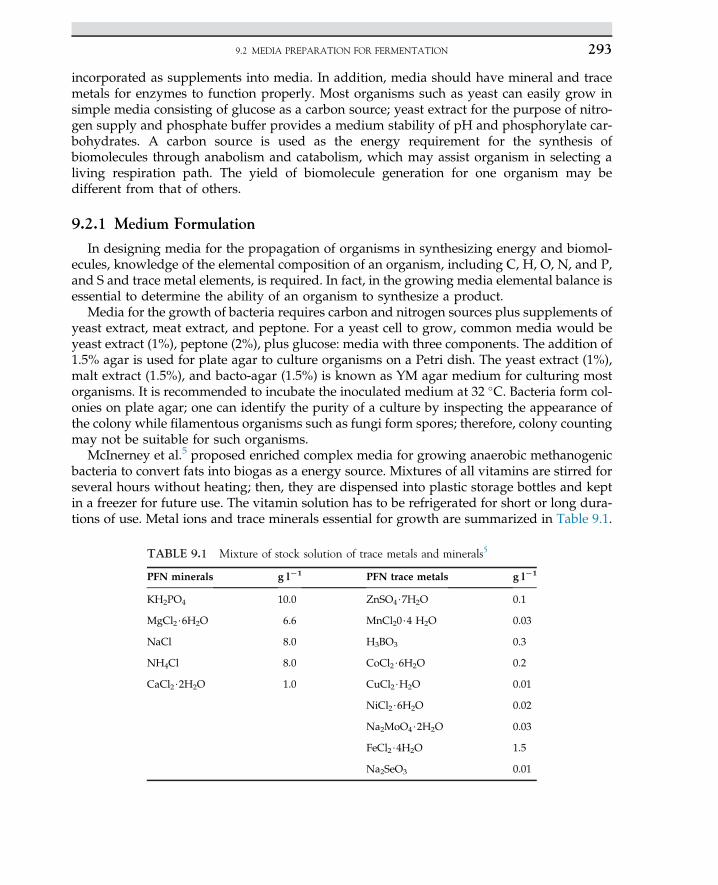
incorporated as supplements into media. In addition, media should have mineral and tracemetals for enzymes to function properly. Most organisms such as yeast can easily grow insimple media consisting of glucose as a carbon source; yeast extract for the purpose of nitro-gen supply and phosphate buffer provides a medium stability of pH and phosphorylate car-bohydrates. A carbon source is used as the energy requirement for the synthesis ofbiomolecules through anabolism and catabolism, which may assist organism in selecting aliving respiration path. The yield of biomolecule generation for one organism may bedifferent from that of others.
9.2.1 Medium Formulation
In designing media for the propagation of organisms in synthesizing energy and biomol-ecules, knowledge of the elemental composition of an organism, including C, H, O, N, and P,and S and trace metal elements, is required. In fact, in the growing media elemental balance isessential to determine the ability of an organism to synthesize a product.
Media for the growth of bacteria requires carbon and nitrogen sources plus supplements ofyeast extract, meat extract, and peptone. For a yeast cell to grow, common media would beyeast extract (1%), peptone (2%), plus glucose: media with three components. The addition of1.5% agar is used for plate agar to culture organisms on a Petri dish. The yeast extract (1%),malt extract (1.5%), and bacto-agar (1.5%) is known as YM agar medium for culturing mostorganisms. It is recommended to incubate the inoculated medium at 32 �C. Bacteria form col-onies on plate agar; one can identify the purity of a culture by inspecting the appearance ofthe colony while filamentous organisms such as fungi form spores; therefore, colony countingmay not be suitable for such organisms.
McInerney et al.5 proposed enriched complex media for growing anaerobic methanogenicbacteria to convert fats into biogas as a energy source. Mixtures of all vitamins are stirred forseveral hours without heating; then, they are dispensed into plastic storage bottles and keptin a freezer for future use. The vitamin solution has to be refrigerated for short or long dura-tions of use. Metal ions and trace minerals essential for growth are summarized in Table 9.1.
TABLE 9.1 Mixture of stock solution of trace metals and minerals5
PFN minerals g lL1 PFN trace metals g lL1
KH2PO4 10.0 ZnSO4$7H2O 0.1
MgCl2$6H2O 6.6 MnCl20$4 H2O 0.03
NaCl 8.0 H3BO3 0.3
NH4Cl 8.0 CoCl2$6H2O 0.2
CaCl2$2H2O 1.0 CuCl2$H2O 0.01
NiCl2$6H2O 0.02
Na2MoO4$2H2O 0.03
FeCl2$4H2O 1.5
Na2SeO3 0.01
9.2 MEDIA PREPARATION FOR FERMENTATION 293
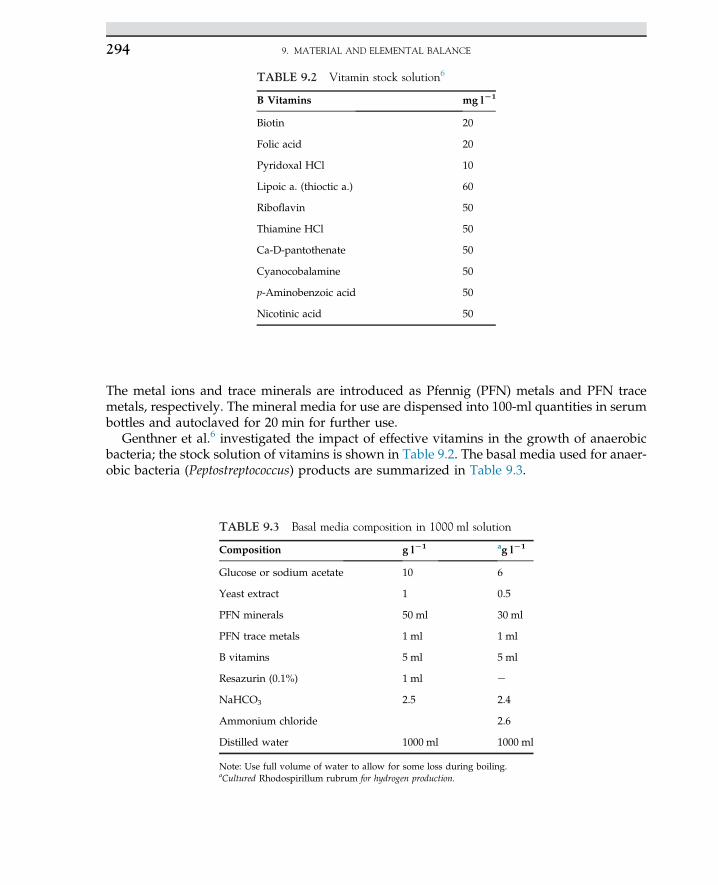
The metal ions and trace minerals are introduced as Pfennig (PFN) metals and PFN tracemetals, respectively. The mineral media for use are dispensed into 100-ml quantities in serumbottles and autoclaved for 20 min for further use.
Genthner et al.6 investigated the impact of effective vitamins in the growth of anaerobicbacteria; the stock solution of vitamins is shown in Table 9.2. The basal media used for anaer-obic bacteria (Peptostreptococcus) products are summarized in Table 9.3.
TABLE 9.2 Vitamin stock solution6
B Vitamins mg lL1
Biotin 20
Folic acid 20
Pyridoxal HCl 10
Lipoic a. (thioctic a.) 60
Riboflavin 50
Thiamine HCl 50
Ca-D-pantothenate 50
Cyanocobalamine 50
p-Aminobenzoic acid 50
Nicotinic acid 50
TABLE 9.3 Basal media composition in 1000 ml solution
Composition g lL1 ag lL1
Glucose or sodium acetate 10 6
Yeast extract 1 0.5
PFN minerals 50 ml 30 ml
PFN trace metals 1 ml 1 ml
B vitamins 5 ml 5 ml
Resazurin (0.1%) 1 ml e
NaHCO3 2.5 2.4
Ammonium chloride 2.6
Distilled water 1000 ml 1000 ml
Note: Use full volume of water to allow for some loss during boiling.aCultured Rhodospirillum rubrum for hydrogen production.
9. MATERIAL AND ELEMENTAL BALANCE294
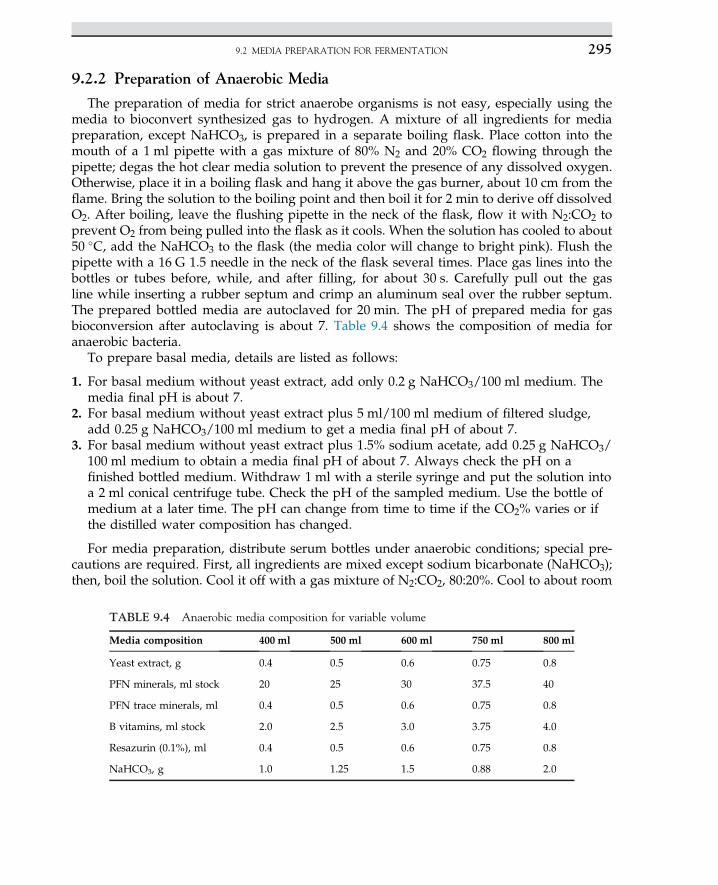
9.2.2 Preparation of Anaerobic Media
The preparation of media for strict anaerobe organisms is not easy, especially using themedia to bioconvert synthesized gas to hydrogen. A mixture of all ingredients for mediapreparation, except NaHCO3, is prepared in a separate boiling flask. Place cotton into themouth of a 1 ml pipette with a gas mixture of 80% N2 and 20% CO2 flowing through thepipette; degas the hot clear media solution to prevent the presence of any dissolved oxygen.Otherwise, place it in a boiling flask and hang it above the gas burner, about 10 cm from theflame. Bring the solution to the boiling point and then boil it for 2 min to derive off dissolvedO2. After boiling, leave the flushing pipette in the neck of the flask, flow it with N2:CO2 toprevent O2 from being pulled into the flask as it cools. When the solution has cooled to about50 �C, add the NaHCO3 to the flask (the media color will change to bright pink). Flush thepipette with a 16 G 1.5 needle in the neck of the flask several times. Place gas lines into thebottles or tubes before, while, and after filling, for about 30 s. Carefully pull out the gasline while inserting a rubber septum and crimp an aluminum seal over the rubber septum.The prepared bottled media are autoclaved for 20 min. The pH of prepared media for gasbioconversion after autoclaving is about 7. Table 9.4 shows the composition of media foranaerobic bacteria.
To prepare basal media, details are listed as follows:
1. For basal medium without yeast extract, add only 0.2 g NaHCO3/100 ml medium. Themedia final pH is about 7.
2. For basal medium without yeast extract plus 5 ml/100 ml medium of filtered sludge,add 0.25 g NaHCO3/100 ml medium to get a media final pH of about 7.
3. For basal medium without yeast extract plus 1.5% sodium acetate, add 0.25 g NaHCO3/100 ml medium to obtain a media final pH of about 7. Always check the pH on afinished bottled medium. Withdraw 1 ml with a sterile syringe and put the solution intoa 2 ml conical centrifuge tube. Check the pH of the sampled medium. Use the bottle ofmedium at a later time. The pH can change from time to time if the CO2% varies or ifthe distilled water composition has changed.
For media preparation, distribute serum bottles under anaerobic conditions; special pre-cautions are required. First, all ingredients are mixed except sodium bicarbonate (NaHCO3);then, boil the solution. Cool it off with a gas mixture of N2:CO2, 80:20%. Cool to about room
TABLE 9.4 Anaerobic media composition for variable volume
Media composition 400 ml 500 ml 600 ml 750 ml 800 ml
Yeast extract, g 0.4 0.5 0.6 0.75 0.8
PFN minerals, ml stock 20 25 30 37.5 40
PFN trace minerals, ml 0.4 0.5 0.6 0.75 0.8
B vitamins, ml stock 2.0 2.5 3.0 3.75 4.0
Resazurin (0.1%), ml 0.4 0.5 0.6 0.75 0.8
NaHCO3, g 1.0 1.25 1.5 0.88 2.0
9.2 MEDIA PREPARATION FOR FERMENTATION 295
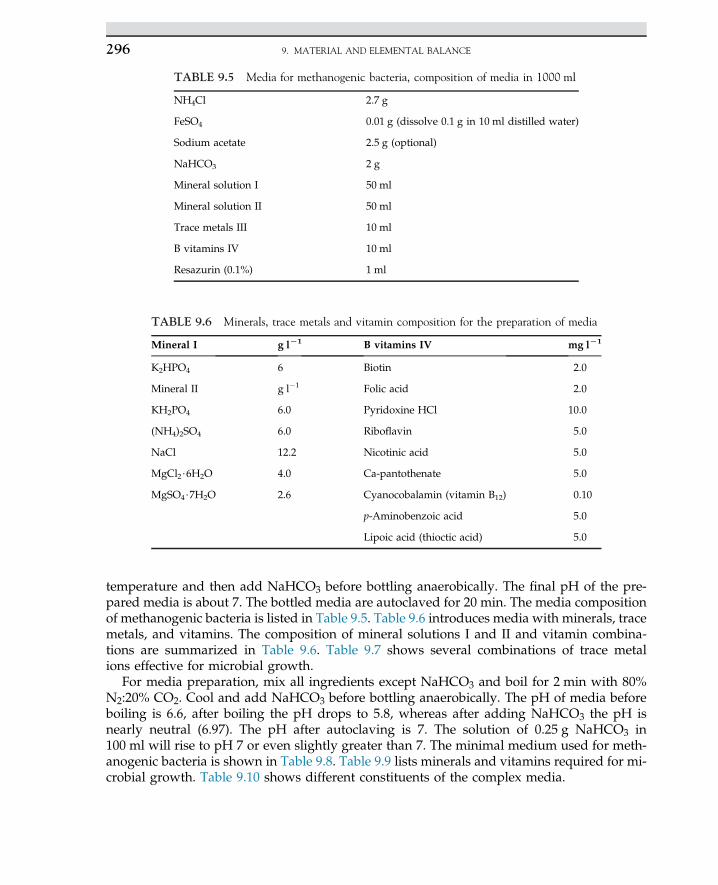
temperature and then add NaHCO3 before bottling anaerobically. The final pH of the pre-pared media is about 7. The bottled media are autoclaved for 20 min. The media compositionof methanogenic bacteria is listed in Table 9.5. Table 9.6 introduces media with minerals, tracemetals, and vitamins. The composition of mineral solutions I and II and vitamin combina-tions are summarized in Table 9.6. Table 9.7 shows several combinations of trace metalions effective for microbial growth.
For media preparation, mix all ingredients except NaHCO3 and boil for 2 min with 80%N2:20% CO2. Cool and add NaHCO3 before bottling anaerobically. The pH of media beforeboiling is 6.6, after boiling the pH drops to 5.8, whereas after adding NaHCO3 the pH isnearly neutral (6.97). The pH after autoclaving is 7. The solution of 0.25 g NaHCO3 in100 ml will rise to pH 7 or even slightly greater than 7. The minimal medium used for meth-anogenic bacteria is shown in Table 9.8. Table 9.9 lists minerals and vitamins required for mi-crobial growth. Table 9.10 shows different constituents of the complex media.
TABLE 9.5 Media for methanogenic bacteria, composition of media in 1000 ml
NH4Cl 2.7 g
FeSO4 0.01 g (dissolve 0.1 g in 10 ml distilled water)
Sodium acetate 2.5 g (optional)
NaHCO3 2 g
Mineral solution I 50 ml
Mineral solution II 50 ml
Trace metals III 10 ml
B vitamins IV 10 ml
Resazurin (0.1%) 1 ml
TABLE 9.6 Minerals, trace metals and vitamin composition for the preparation of media
Mineral I g lL1 B vitamins IV mg lL1
K2HPO4 6 Biotin 2.0
Mineral II g l�1 Folic acid 2.0
KH2PO4 6.0 Pyridoxine HCl 10.0
(NH4)2SO4 6.0 Riboflavin 5.0
NaCl 12.2 Nicotinic acid 5.0
MgCl2$6H2O 4.0 Ca-pantothenate 5.0
MgSO4$7H2O 2.6 Cyanocobalamin (vitamin B12) 0.10
p-Aminobenzoic acid 5.0
Lipoic acid (thioctic acid) 5.0
9. MATERIAL AND ELEMENTAL BALANCE296
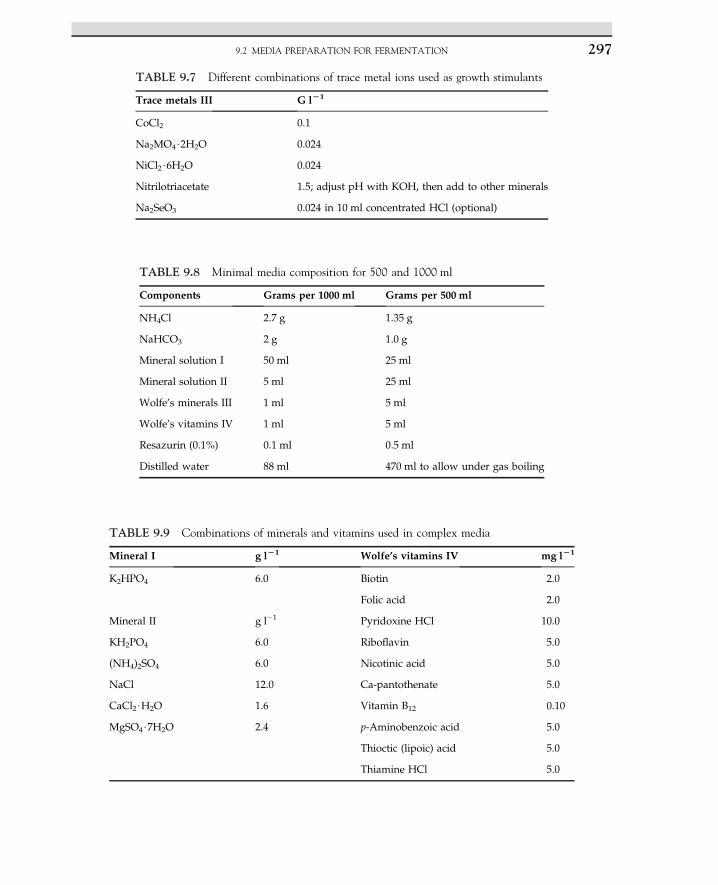
TABLE 9.7 Different combinations of trace metal ions used as growth stimulants
Trace metals III G lL1
CoCl2 0.1
Na2MO4$2H2O 0.024
NiCl2$6H2O 0.024
Nitrilotriacetate 1.5; adjust pH with KOH, then add to other minerals
Na2SeO3 0.024 in 10 ml concentrated HCl (optional)
TABLE 9.8 Minimal media composition for 500 and 1000 ml
Components Grams per 1000 ml Grams per 500 ml
NH4Cl 2.7 g 1.35 g
NaHCO3 2 g 1.0 g
Mineral solution I 50 ml 25 ml
Mineral solution II 5 ml 25 ml
Wolfe’s minerals III 1 ml 5 ml
Wolfe’s vitamins IV 1 ml 5 ml
Resazurin (0.1%) 0.1 ml 0.5 ml
Distilled water 88 ml 470 ml to allow under gas boiling
TABLE 9.9 Combinations of minerals and vitamins used in complex media
Mineral I g lL1 Wolfe’s vitamins IV mg lL1
K2HPO4 6.0 Biotin 2.0
Folic acid 2.0
Mineral II g l�1 Pyridoxine HCl 10.0
KH2PO4 6.0 Riboflavin 5.0
(NH4)2SO4 6.0 Nicotinic acid 5.0
NaCl 12.0 Ca-pantothenate 5.0
CaCl2$H2O 1.6 Vitamin B12 0.10
MgSO4$7H2O 2.4 p-Aminobenzoic acid 5.0
Thioctic (lipoic) acid 5.0
Thiamine HCl 5.0
9.2 MEDIA PREPARATION FOR FERMENTATION 297
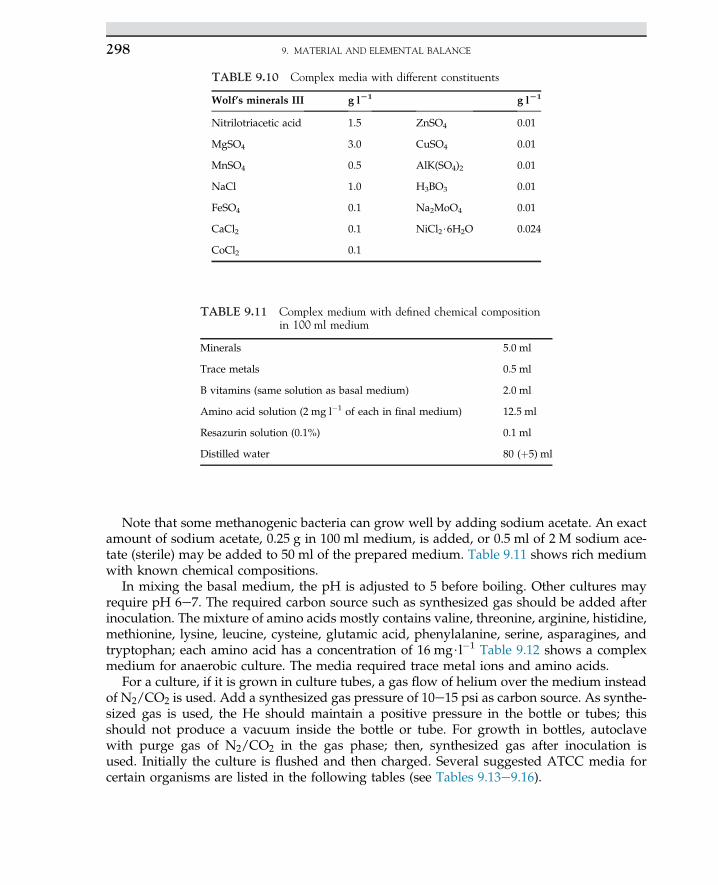
Note that some methanogenic bacteria can grow well by adding sodium acetate. An exactamount of sodium acetate, 0.25 g in 100 ml medium, is added, or 0.5 ml of 2 M sodium ace-tate (sterile) may be added to 50 ml of the prepared medium. Table 9.11 shows rich mediumwith known chemical compositions.
In mixing the basal medium, the pH is adjusted to 5 before boiling. Other cultures mayrequire pH 6e7. The required carbon source such as synthesized gas should be added afterinoculation. The mixture of amino acids mostly contains valine, threonine, arginine, histidine,methionine, lysine, leucine, cysteine, glutamic acid, phenylalanine, serine, asparagines, andtryptophan; each amino acid has a concentration of 16 mg$l�1 Table 9.12 shows a complexmedium for anaerobic culture. The media required trace metal ions and amino acids.
For a culture, if it is grown in culture tubes, a gas flow of helium over the medium insteadof N2/CO2 is used. Add a synthesized gas pressure of 10e15 psi as carbon source. As synthe-sized gas is used, the He should maintain a positive pressure in the bottle or tubes; thisshould not produce a vacuum inside the bottle or tube. For growth in bottles, autoclavewith purge gas of N2/CO2 in the gas phase; then, synthesized gas after inoculation isused. Initially the culture is flushed and then charged. Several suggested ATCC media forcertain organisms are listed in the following tables (see Tables 9.13e9.16).
TABLE 9.10 Complex media with different constituents
Wolf’s minerals III g lL1 g lL1
Nitrilotriacetic acid 1.5 ZnSO4 0.01
MgSO4 3.0 CuSO4 0.01
MnSO4 0.5 AlK(SO4)2 0.01
NaCl 1.0 H3BO3 0.01
FeSO4 0.1 Na2MoO4 0.01
CaCl2 0.1 NiCl2$6H2O 0.024
CoCl2 0.1
TABLE 9.11 Complex medium with defined chemical compositionin 100 ml medium
Minerals 5.0 ml
Trace metals 0.5 ml
B vitamins (same solution as basal medium) 2.0 ml
Amino acid solution (2 mg l�1 of each in final medium) 12.5 ml
Resazurin solution (0.1%) 0.1 ml
Distilled water 80 (þ5) ml
9. MATERIAL AND ELEMENTAL BALANCE298
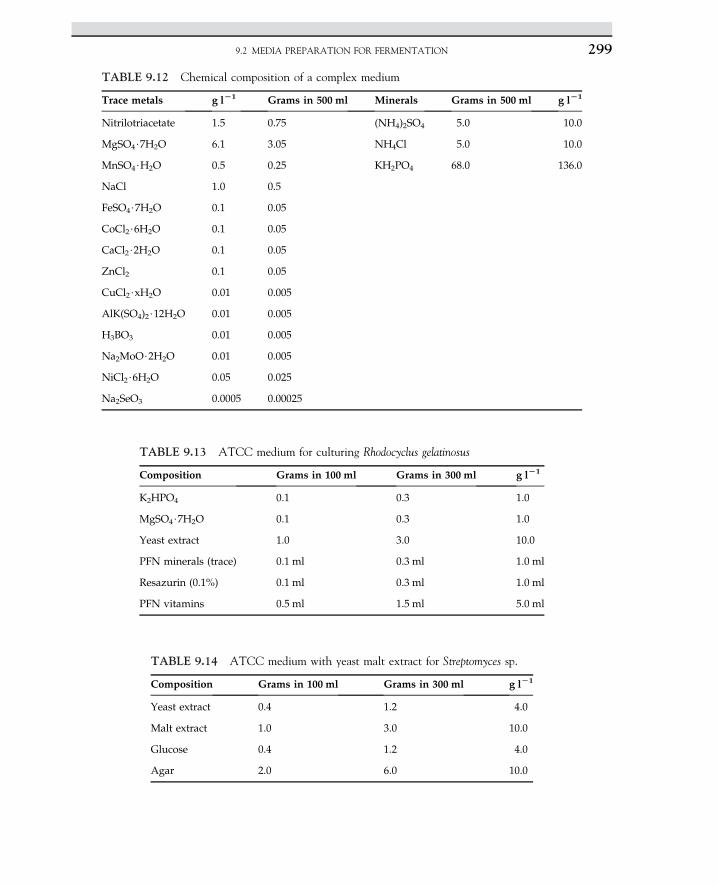
TABLE 9.12 Chemical composition of a complex medium
Trace metals g lL1 Grams in 500 ml Minerals Grams in 500 ml g lL1
Nitrilotriacetate 1.5 0.75 (NH4)2SO4 5.0 10.0
MgSO4$7H2O 6.1 3.05 NH4Cl 5.0 10.0
MnSO4$H2O 0.5 0.25 KH2PO4 68.0 136.0
NaCl 1.0 0.5
FeSO4$7H2O 0.1 0.05
CoCl2$6H2O 0.1 0.05
CaCl2$2H2O 0.1 0.05
ZnCl2 0.1 0.05
CuCl2$xH2O 0.01 0.005
AlK(SO4)2$12H2O 0.01 0.005
H3BO3 0.01 0.005
Na2MoO$2H2O 0.01 0.005
NiCl2$6H2O 0.05 0.025
Na2SeO3 0.0005 0.00025
TABLE 9.13 ATCC medium for culturing Rhodocyclus gelatinosus
Composition Grams in 100 ml Grams in 300 ml g lL1
K2HPO4 0.1 0.3 1.0
MgSO4$7H2O 0.1 0.3 1.0
Yeast extract 1.0 3.0 10.0
PFN minerals (trace) 0.1 ml 0.3 ml 1.0 ml
Resazurin (0.1%) 0.1 ml 0.3 ml 1.0 ml
PFN vitamins 0.5 ml 1.5 ml 5.0 ml
TABLE 9.14 ATCC medium with yeast malt extract for Streptomyces sp.
Composition Grams in 100 ml Grams in 300 ml g lL1
Yeast extract 0.4 1.2 4.0
Malt extract 1.0 3.0 10.0
Glucose 0.4 1.2 4.0
Agar 2.0 6.0 10.0
9.2 MEDIA PREPARATION FOR FERMENTATION 299
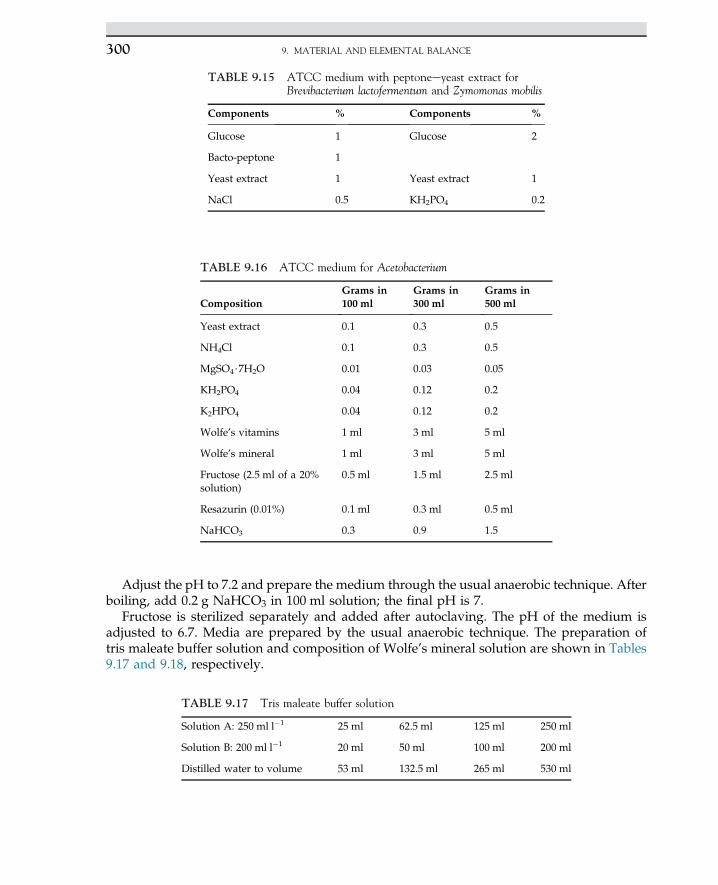
Adjust the pH to 7.2 and prepare the medium through the usual anaerobic technique. Afterboiling, add 0.2 g NaHCO3 in 100 ml solution; the final pH is 7.
Fructose is sterilized separately and added after autoclaving. The pH of the medium isadjusted to 6.7. Media are prepared by the usual anaerobic technique. The preparation oftris maleate buffer solution and composition of Wolfe’s mineral solution are shown in Tables9.17 and 9.18, respectively.
TABLE 9.15 ATCC medium with peptoneeyeast extract forBrevibacterium lactofermentum and Zymomonas mobilis
Components % Components %
Glucose 1 Glucose 2
Bacto-peptone 1
Yeast extract 1 Yeast extract 1
NaCl 0.5 KH2PO4 0.2
TABLE 9.16 ATCC medium for Acetobacterium
CompositionGrams in100 ml
Grams in300 ml
Grams in500 ml
Yeast extract 0.1 0.3 0.5
NH4Cl 0.1 0.3 0.5
MgSO4$7H2O 0.01 0.03 0.05
KH2PO4 0.04 0.12 0.2
K2HPO4 0.04 0.12 0.2
Wolfe’s vitamins 1 ml 3 ml 5 ml
Wolfe’s mineral 1 ml 3 ml 5 ml
Fructose (2.5 ml of a 20%solution)
0.5 ml 1.5 ml 2.5 ml
Resazurin (0.01%) 0.1 ml 0.3 ml 0.5 ml
NaHCO3 0.3 0.9 1.5
TABLE 9.17 Tris maleate buffer solution
Solution A: 250 ml l�1 25 ml 62.5 ml 125 ml 250 ml
Solution B: 200 ml l�1 20 ml 50 ml 100 ml 200 ml
Distilled water to volume 53 ml 132.5 ml 265 ml 530 ml
9. MATERIAL AND ELEMENTAL BALANCE300
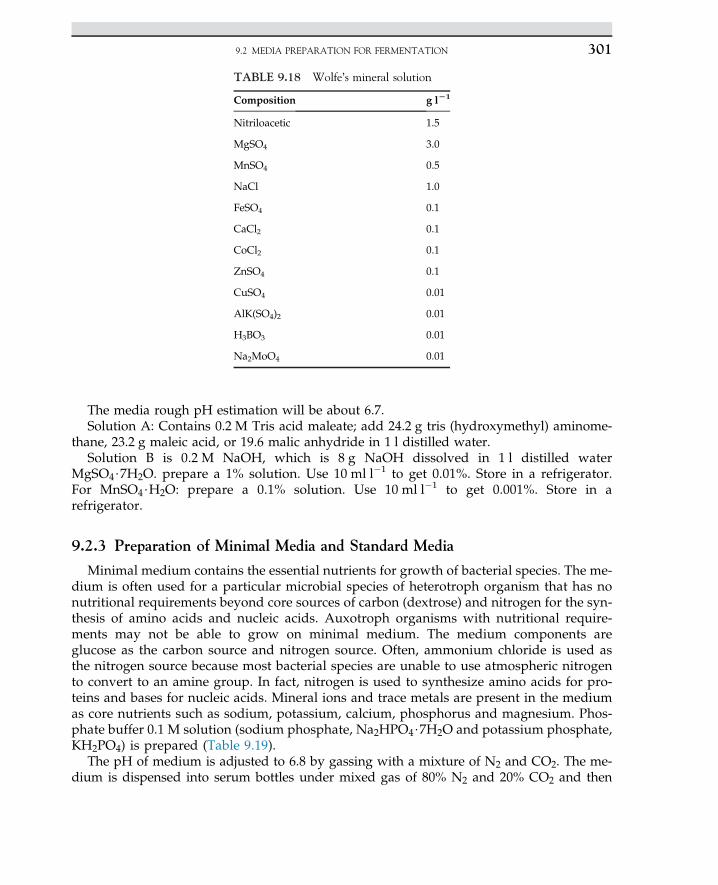
The media rough pH estimation will be about 6.7.Solution A: Contains 0.2 M Tris acid maleate; add 24.2 g tris (hydroxymethyl) aminome-
thane, 23.2 g maleic acid, or 19.6 malic anhydride in 1 l distilled water.Solution B is 0.2 M NaOH, which is 8 g NaOH dissolved in 1 l distilled water
MgSO4$7H2O. prepare a 1% solution. Use 10 ml l�1 to get 0.01%. Store in a refrigerator.For MnSO4$H2O: prepare a 0.1% solution. Use 10 ml l�1 to get 0.001%. Store in arefrigerator.
9.2.3 Preparation of Minimal Media and Standard Media
Minimal medium contains the essential nutrients for growth of bacterial species. The me-dium is often used for a particular microbial species of heterotroph organism that has nonutritional requirements beyond core sources of carbon (dextrose) and nitrogen for the syn-thesis of amino acids and nucleic acids. Auxotroph organisms with nutritional require-ments may not be able to grow on minimal medium. The medium components areglucose as the carbon source and nitrogen source. Often, ammonium chloride is used asthe nitrogen source because most bacterial species are unable to use atmospheric nitrogento convert to an amine group. In fact, nitrogen is used to synthesize amino acids for pro-teins and bases for nucleic acids. Mineral ions and trace metals are present in the mediumas core nutrients such as sodium, potassium, calcium, phosphorus and magnesium. Phos-phate buffer 0.1 M solution (sodium phosphate, Na2HPO4$7H2O and potassium phosphate,KH2PO4) is prepared (Table 9.19).
The pH of medium is adjusted to 6.8 by gassing with a mixture of N2 and CO2. The me-dium is dispensed into serum bottles under mixed gas of 80% N2 and 20% CO2 and then
TABLE 9.18 Wolfe’s mineral solution
Composition g lL1
Nitriloacetic 1.5
MgSO4 3.0
MnSO4 0.5
NaCl 1.0
FeSO4 0.1
CaCl2 0.1
CoCl2 0.1
ZnSO4 0.1
CuSO4 0.01
AlK(SO4)2 0.01
H3BO3 0.01
Na2MoO4 0.01
9.2 MEDIA PREPARATION FOR FERMENTATION 301
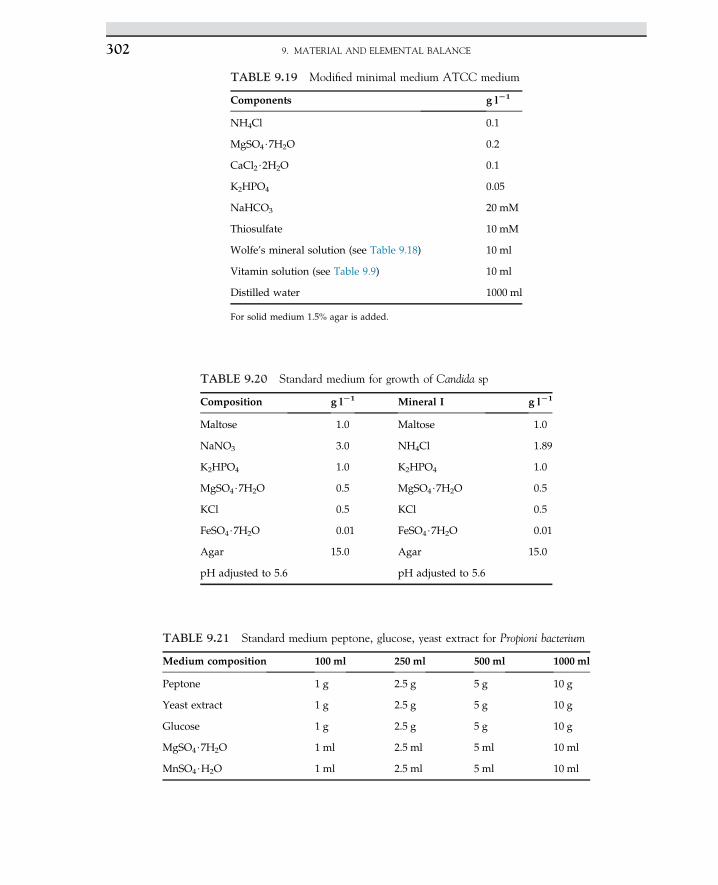
TABLE 9.20 Standard medium for growth of Candida sp
Composition g lL1 Mineral I g lL1
Maltose 1.0 Maltose 1.0
NaNO3 3.0 NH4Cl 1.89
K2HPO4 1.0 K2HPO4 1.0
MgSO4$7H2O 0.5 MgSO4$7H2O 0.5
KCl 0.5 KCl 0.5
FeSO4$7H2O 0.01 FeSO4$7H2O 0.01
Agar 15.0 Agar 15.0
pH adjusted to 5.6 pH adjusted to 5.6
TABLE 9.19 Modified minimal medium ATCC medium
Components g lL1
NH4Cl 0.1
MgSO4$7H2O 0.2
CaCl2$2H2O 0.1
K2HPO4 0.05
NaHCO3 20 mM
Thiosulfate 10 mM
Wolfe’s mineral solution (see Table 9.18) 10 ml
Vitamin solution (see Table 9.9) 10 ml
Distilled water 1000 ml
For solid medium 1.5% agar is added.
TABLE 9.21 Standard medium peptone, glucose, yeast extract for Propioni bacterium
Medium composition 100 ml 250 ml 500 ml 1000 ml
Peptone 1 g 2.5 g 5 g 10 g
Yeast extract 1 g 2.5 g 5 g 10 g
Glucose 1 g 2.5 g 5 g 10 g
MgSO4$7H2O 1 ml 2.5 ml 5 ml 10 ml
MnSO4$H2O 1 ml 2.5 ml 5 ml 10 ml
9. MATERIAL AND ELEMENTAL BALANCE302
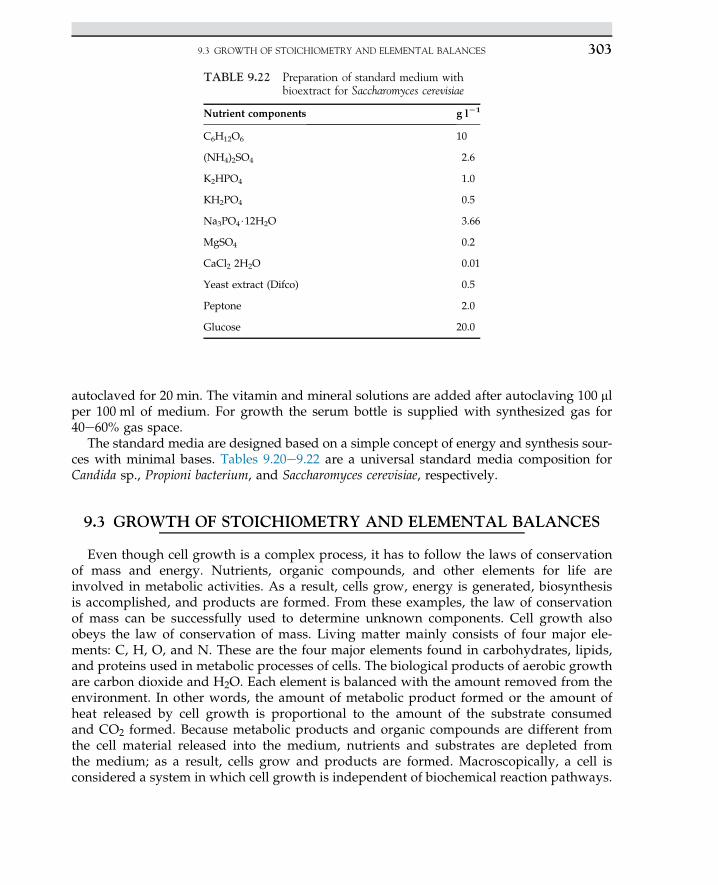
autoclaved for 20 min. The vitamin and mineral solutions are added after autoclaving 100 mlper 100 ml of medium. For growth the serum bottle is supplied with synthesized gas for40e60% gas space.
The standard media are designed based on a simple concept of energy and synthesis sour-ces with minimal bases. Tables 9.20e9.22 are a universal standard media composition forCandida sp., Propioni bacterium, and Saccharomyces cerevisiae, respectively.
9.3 GROWTH OF STOICHIOMETRY AND ELEMENTAL BALANCES
Even though cell growth is a complex process, it has to follow the laws of conservationof mass and energy. Nutrients, organic compounds, and other elements for life areinvolved in metabolic activities. As a result, cells grow, energy is generated, biosynthesisis accomplished, and products are formed. From these examples, the law of conservationof mass can be successfully used to determine unknown components. Cell growth alsoobeys the law of conservation of mass. Living matter mainly consists of four major ele-ments: C, H, O, and N. These are the four major elements found in carbohydrates, lipids,and proteins used in metabolic processes of cells. The biological products of aerobic growthare carbon dioxide and H2O. Each element is balanced with the amount removed from theenvironment. In other words, the amount of metabolic product formed or the amount ofheat released by cell growth is proportional to the amount of the substrate consumedand CO2 formed. Because metabolic products and organic compounds are different fromthe cell material released into the medium, nutrients and substrates are depleted fromthe medium; as a result, cells grow and products are formed. Macroscopically, a cell isconsidered a system in which cell growth is independent of biochemical reaction pathways.
TABLE 9.22 Preparation of standard medium withbioextract for Saccharomyces cerevisiae
Nutrient components g lL1
C6H12O6 10
(NH4)2SO4 2.6
K2HPO4 1.0
KH2PO4 0.5
Na3PO4$12H2O 3.66
MgSO4 0.2
CaCl2 2H2O 0.01
Yeast extract (Difco) 0.5
Peptone 2.0
Glucose 20.0
9.3 GROWTH OF STOICHIOMETRY AND ELEMENTAL BALANCES 303
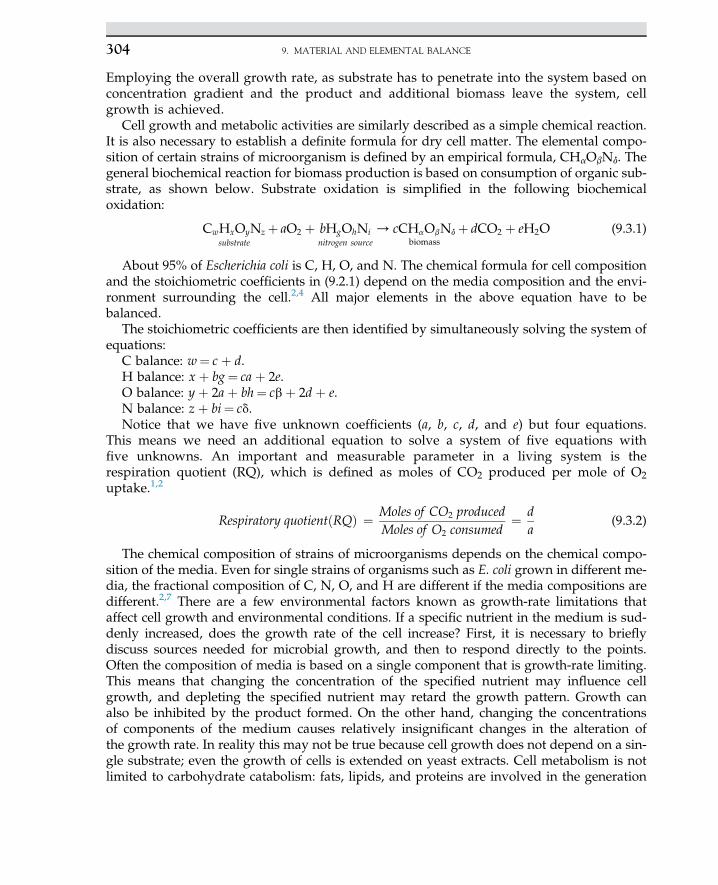
Employing the overall growth rate, as substrate has to penetrate into the system based onconcentration gradient and the product and additional biomass leave the system, cellgrowth is achieved.
Cell growth and metabolic activities are similarly described as a simple chemical reaction.It is also necessary to establish a definite formula for dry cell matter. The elemental compo-sition of certain strains of microorganism is defined by an empirical formula, CHaObNd. Thegeneral biochemical reaction for biomass production is based on consumption of organic sub-strate, as shown below. Substrate oxidation is simplified in the following biochemicaloxidation:
CwHxOyNzsubstrate
þ aO2 þ bHgOhNinitrogen source
/ cCHaObNd
biomassþ dCO2 þ eH2O (9.3.1)
About 95% of Escherichia coli is C, H, O, and N. The chemical formula for cell compositionand the stoichiometric coefficients in (9.2.1) depend on the media composition and the envi-ronment surrounding the cell.2,4 All major elements in the above equation have to bebalanced.
The stoichiometric coefficients are then identified by simultaneously solving the system ofequations:
C balance: w¼ c þ d.H balance: x þ bg¼ ca þ 2e.O balance: y þ 2a þ bh¼ cb þ 2d þ e.N balance: z þ bi¼ cd.Notice that we have five unknown coefficients (a, b, c, d, and e) but four equations.
This means we need an additional equation to solve a system of five equations withfive unknowns. An important and measurable parameter in a living system is therespiration quotient (RQ), which is defined as moles of CO2 produced per mole of O2uptake.1,2
Respiratory quotientðRQÞ ¼ Moles of CO2 producedMoles of O2 consumed
¼ da
(9.3.2)
The chemical composition of strains of microorganisms depends on the chemical compo-sition of the media. Even for single strains of organisms such as E. coli grown in different me-dia, the fractional composition of C, N, O, and H are different if the media compositions aredifferent.2,7 There are a few environmental factors known as growth-rate limitations thataffect cell growth and environmental conditions. If a specific nutrient in the medium is sud-denly increased, does the growth rate of the cell increase? First, it is necessary to brieflydiscuss sources needed for microbial growth, and then to respond directly to the points.Often the composition of media is based on a single component that is growth-rate limiting.This means that changing the concentration of the specified nutrient may influence cellgrowth, and depleting the specified nutrient may retard the growth pattern. Growth canalso be inhibited by the product formed. On the other hand, changing the concentrationsof components of the medium causes relatively insignificant changes in the alteration ofthe growth rate. In reality this may not be true because cell growth does not depend on a sin-gle substrate; even the growth of cells is extended on yeast extracts. Cell metabolism is notlimited to carbohydrate catabolism: fats, lipids, and proteins are involved in the generation
9. MATERIAL AND ELEMENTAL BALANCE304
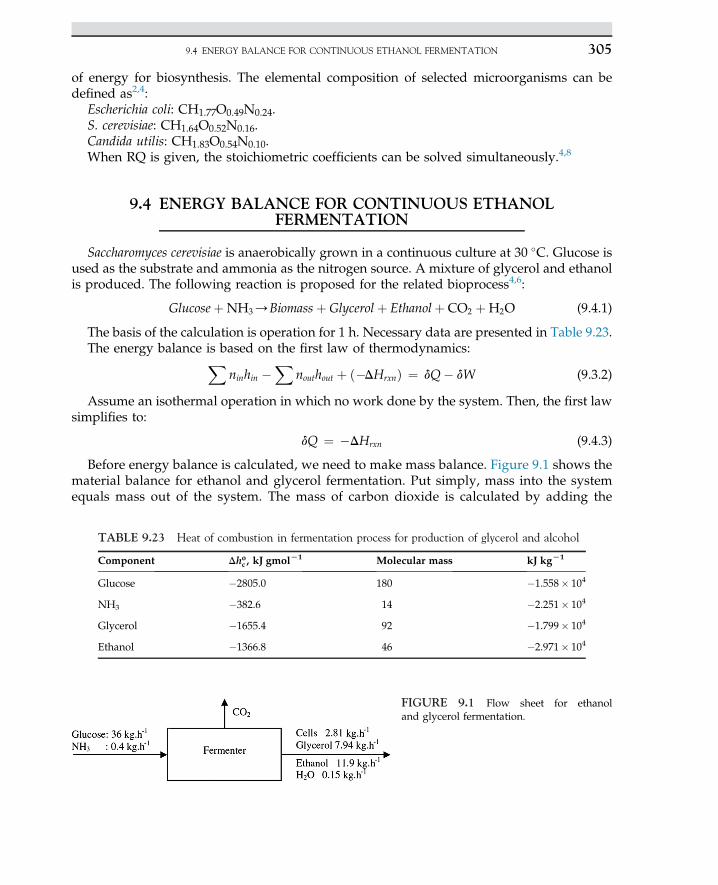
of energy for biosynthesis. The elemental composition of selected microorganisms can bedefined as2,4:
Escherichia coli: CH1.77O0.49N0.24.S. cerevisiae: CH1.64O0.52N0.16.Candida utilis: CH1.83O0.54N0.10.When RQ is given, the stoichiometric coefficients can be solved simultaneously.4,8
9.4 ENERGY BALANCE FOR CONTINUOUS ETHANOLFERMENTATION
Saccharomyces cerevisiae is anaerobically grown in a continuous culture at 30 �C. Glucose isused as the substrate and ammonia as the nitrogen source. A mixture of glycerol and ethanolis produced. The following reaction is proposed for the related bioprocess4,6:
GlucoseþNH3/Biomassþ Glycerolþ Ethanolþ CO2 þH2O (9.4.1)
The basis of the calculation is operation for 1 h. Necessary data are presented in Table 9.23.The energy balance is based on the first law of thermodynamics:X
ninhin �X
nouthout þ ð�DHrxnÞ ¼ dQ� dW (9.3.2)
Assume an isothermal operation in which no work done by the system. Then, the first lawsimplifies to:
dQ ¼ �DHrxn (9.4.3)
Before energy balance is calculated, we need to make mass balance. Figure 9.1 shows thematerial balance for ethanol and glycerol fermentation. Put simply, mass into the systemequals mass out of the system. The mass of carbon dioxide is calculated by adding the
TABLE 9.23 Heat of combustion in fermentation process for production of glycerol and alcohol
Component Dhoc , kJ gmolL1 Molecular mass kJ kgL1
Glucose �2805.0 180 �1.558� 104
NH3 �382.6 14 �2.251� 104
Glycerol �1655.4 92 �1.799� 104
Ethanol �1366.8 46 �2.971� 104
FIGURE 9.1 Flow sheet for ethanoland glycerol fermentation.
9.4 ENERGY BALANCE FOR CONTINUOUS ETHANOL FERMENTATION 305
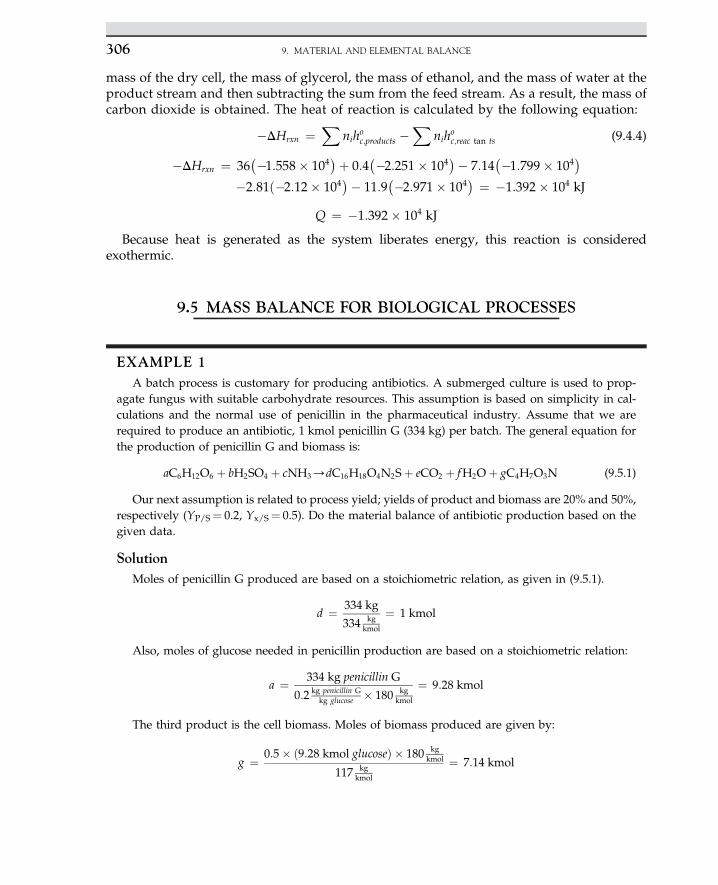
mass of the dry cell, the mass of glycerol, the mass of ethanol, and the mass of water at theproduct stream and then subtracting the sum from the feed stream. As a result, the mass ofcarbon dioxide is obtained. The heat of reaction is calculated by the following equation:
�DHrxn ¼X
nihoc;products �X
nihoc;reac tan ts (9.4.4)
�DHrxn ¼ 36��1:558� 104
�þ 0:4��2:251� 104
�� 7:14��1:799� 104
��2:81ð�2:12� 104
�� 11:9��2:971� 104
� ¼ �1:392� 104 kJ
Q ¼ �1:392� 104 kJ
Because heat is generated as the system liberates energy, this reaction is consideredexothermic.
9.5 MASS BALANCE FOR BIOLOGICAL PROCESSES
EXAMPLE 1A batch process is customary for producing antibiotics. A submerged culture is used to prop-
agate fungus with suitable carbohydrate resources. This assumption is based on simplicity in cal-culations and the normal use of penicillin in the pharmaceutical industry. Assume that we arerequired to produce an antibiotic, 1 kmol penicillin G (334 kg) per batch. The general equation forthe production of penicillin G and biomass is:
aC6H12O6 þ bH2SO4 þ cNH3/dC16H18O4N2Sþ eCO2 þ fH2Oþ gC4H7O3N (9.5.1)
Our next assumption is related to process yield; yields of product and biomass are 20% and 50%,respectively (YP/S¼ 0.2, Yx/S¼ 0.5). Do the material balance of antibiotic production based on thegiven data.
SolutionMoles of penicillin G produced are based on a stoichiometric relation, as given in (9.5.1).
d ¼ 334 kg
334 kgkmol
¼ 1 kmol
Also, moles of glucose needed in penicillin production are based on a stoichiometric relation:
a ¼ 334 kg penicillin G
0:2 kg penicillin Gkg glucose � 180 kg
kmol
¼ 9:28 kmol
The third product is the cell biomass. Moles of biomass produced are given by:
g ¼ 0:5� ð9:28 kmol glucoseÞ � 180 kgkmol
117 kgkmol
¼ 7:14 kmol
9. MATERIAL AND ELEMENTAL BALANCE306
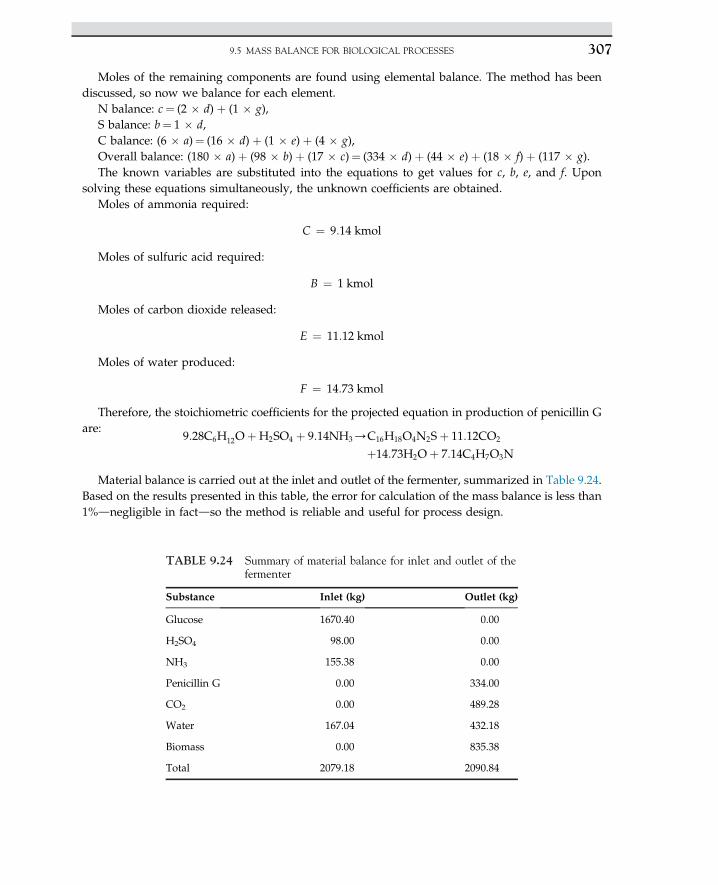
Moles of the remaining components are found using elemental balance. The method has beendiscussed, so now we balance for each element.
N balance: c¼ (2 � d) þ (1 � g),S balance: b¼ 1 � d,C balance: (6 � a)¼ (16 � d) þ (1 � e) þ (4 � g),Overall balance: (180 � a) þ (98 � b) þ (17 � c)¼ (334 � d) þ (44 � e) þ (18 � f) þ (117 � g).The known variables are substituted into the equations to get values for c, b, e, and f. Upon
solving these equations simultaneously, the unknown coefficients are obtained.Moles of ammonia required:
C ¼ 9:14 kmol
Moles of sulfuric acid required:
B ¼ 1 kmol
Moles of carbon dioxide released:
E ¼ 11:12 kmol
Moles of water produced:
F ¼ 14:73 kmol
Therefore, the stoichiometric coefficients for the projected equation in production of penicillin Gare:
9:28C6H12OþH2SO4 þ 9:14NH3/C16H18O4N2Sþ 11:12CO2
þ14:73H2Oþ 7:14C4H7O3N
Material balance is carried out at the inlet and outlet of the fermenter, summarized in Table 9.24.Based on the results presented in this table, the error for calculation of the mass balance is less than1%dnegligible in factdso the method is reliable and useful for process design.
TABLE 9.24 Summary of material balance for inlet and outlet of thefermenter
Substance Inlet (kg) Outlet (kg)
Glucose 1670.40 0.00
H2SO4 98.00 0.00
NH3 155.38 0.00
Penicillin G 0.00 334.00
CO2 0.00 489.28
Water 167.04 432.18
Biomass 0.00 835.38
Total 2079.18 2090.84
9.5 MASS BALANCE FOR BIOLOGICAL PROCESSES 307
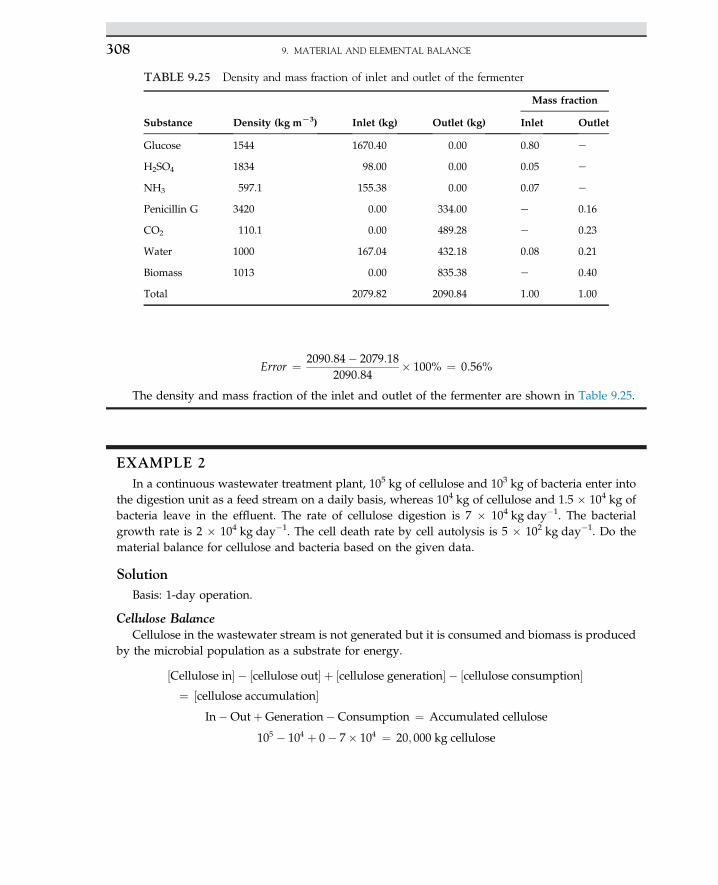
Error ¼ 2090:84� 2079:182090:84
� 100% ¼ 0:56%
The density and mass fraction of the inlet and outlet of the fermenter are shown in Table 9.25.
EXAMPLE 2In a continuous wastewater treatment plant, 105 kg of cellulose and 103 kg of bacteria enter into
the digestion unit as a feed stream on a daily basis, whereas 104 kg of cellulose and 1.5 � 104 kg ofbacteria leave in the effluent. The rate of cellulose digestion is 7 � 104 kg day�1. The bacterialgrowth rate is 2 � 104 kg day�1. The cell death rate by cell autolysis is 5 � 102 kg day�1. Do thematerial balance for cellulose and bacteria based on the given data.
SolutionBasis: 1-day operation.
Cellulose BalanceCellulose in the wastewater stream is not generated but it is consumed and biomass is produced
by the microbial population as a substrate for energy.
½Cellulose in� � ½cellulose out� þ ½cellulose generation� � ½cellulose consumption�¼ ½cellulose accumulation�
In�OutþGeneration� Consumption ¼ Accumulated cellulose
105 � 104 þ 0� 7� 104 ¼ 20; 000 kg cellulose
TABLE 9.25 Density and mass fraction of inlet and outlet of the fermenter
Substance Density (kg mL3) Inlet (kg) Outlet (kg)
Mass fraction
Inlet Outlet
Glucose 1544 1670.40 0.00 0.80 e
H2SO4 1834 98.00 0.00 0.05 e
NH3 597.1 155.38 0.00 0.07 e
Penicillin G 3420 0.00 334.00 e 0.16
CO2 110.1 0.00 489.28 e 0.23
Water 1000 167.04 432.18 0.08 0.21
Biomass 1013 0.00 835.38 e 0.40
Total 2079.82 2090.84 1.00 1.00
9. MATERIAL AND ELEMENTAL BALANCE308
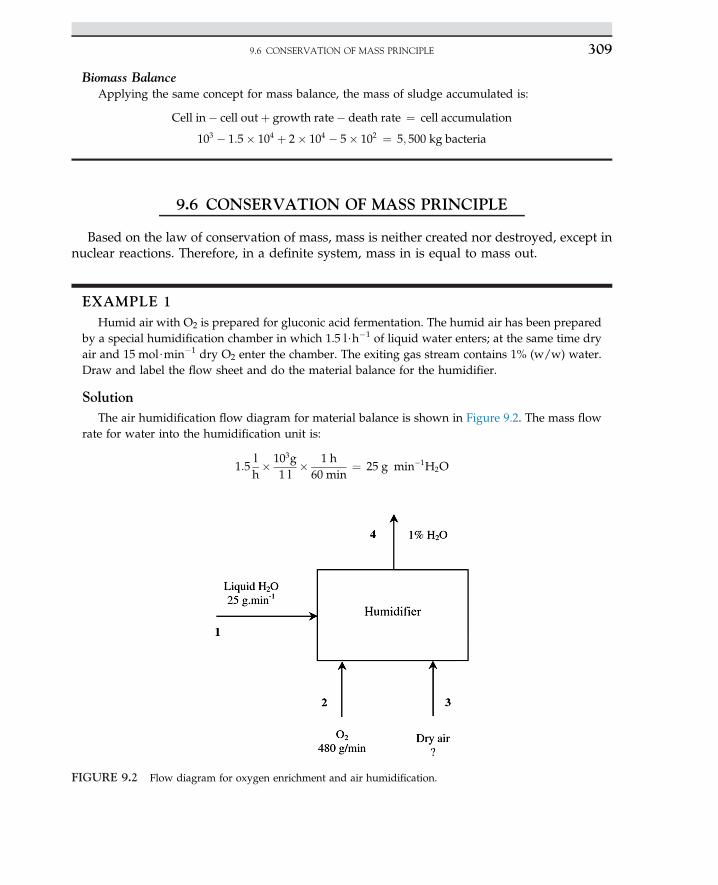
Biomass BalanceApplying the same concept for mass balance, the mass of sludge accumulated is:
Cell in� cell outþ growth rate� death rate ¼ cell accumulation
103 � 1:5� 104 þ 2� 104 � 5� 102 ¼ 5; 500 kg bacteria
9.6 CONSERVATION OF MASS PRINCIPLE
Based on the law of conservation of mass, mass is neither created nor destroyed, except innuclear reactions. Therefore, in a definite system, mass in is equal to mass out.
EXAMPLE 1Humid air with O2 is prepared for gluconic acid fermentation. The humid air has been prepared
by a special humidification chamber in which 1.5 l$h�1 of liquid water enters; at the same time dryair and 15 mol$min�1 dry O2 enter the chamber. The exiting gas stream contains 1% (w/w) water.Draw and label the flow sheet and do the material balance for the humidifier.
SolutionThe air humidification flow diagram for material balance is shown in Figure 9.2. The mass flow
rate for water into the humidification unit is:
1:5lh� 103g
1 l� 1 h60min
¼ 25 g min�1H2O
FIGURE 9.2 Flow diagram for oxygen enrichment and air humidification.
9.6 CONSERVATION OF MASS PRINCIPLE 309
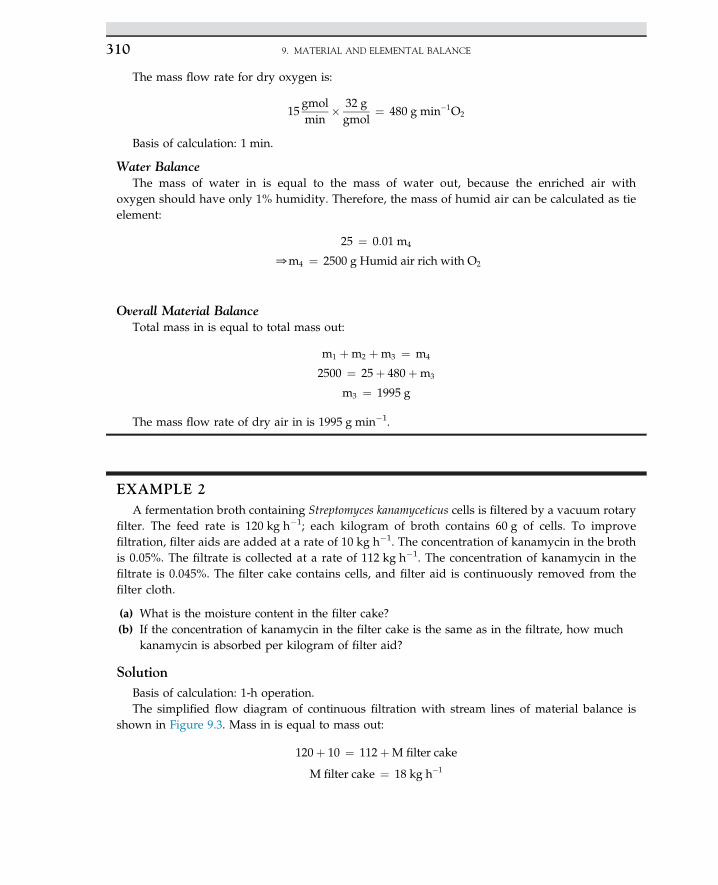
The mass flow rate for dry oxygen is:
15gmolmin
� 32 ggmol
¼ 480 g min�1O2
Basis of calculation: 1 min.
Water BalanceThe mass of water in is equal to the mass of water out, because the enriched air with
oxygen should have only 1% humidity. Therefore, the mass of humid air can be calculated as tieelement:
25 ¼ 0:01 m4
0m4 ¼ 2500 g Humid air rich with O2
Overall Material BalanceTotal mass in is equal to total mass out:
m1 þm2 þm3 ¼ m4
2500 ¼ 25þ 480þm3
m3 ¼ 1995 g
The mass flow rate of dry air in is 1995 g min�1.
EXAMPLE 2A fermentation broth containing Streptomyces kanamyceticus cells is filtered by a vacuum rotary
filter. The feed rate is 120 kg h�1; each kilogram of broth contains 60 g of cells. To improvefiltration, filter aids are added at a rate of 10 kg h�1. The concentration of kanamycin in the brothis 0.05%. The filtrate is collected at a rate of 112 kg h�1. The concentration of kanamycin in thefiltrate is 0.045%. The filter cake contains cells, and filter aid is continuously removed from thefilter cloth.
(a) What is the moisture content in the filter cake?(b) If the concentration of kanamycin in the filter cake is the same as in the filtrate, how much
kanamycin is absorbed per kilogram of filter aid?
SolutionBasis of calculation: 1-h operation.The simplified flow diagram of continuous filtration with stream lines of material balance is
shown in Figure 9.3. Mass in is equal to mass out:
120þ 10 ¼ 112þM filter cake
M filter cake ¼ 18 kg h�1
9. MATERIAL AND ELEMENTAL BALANCE310
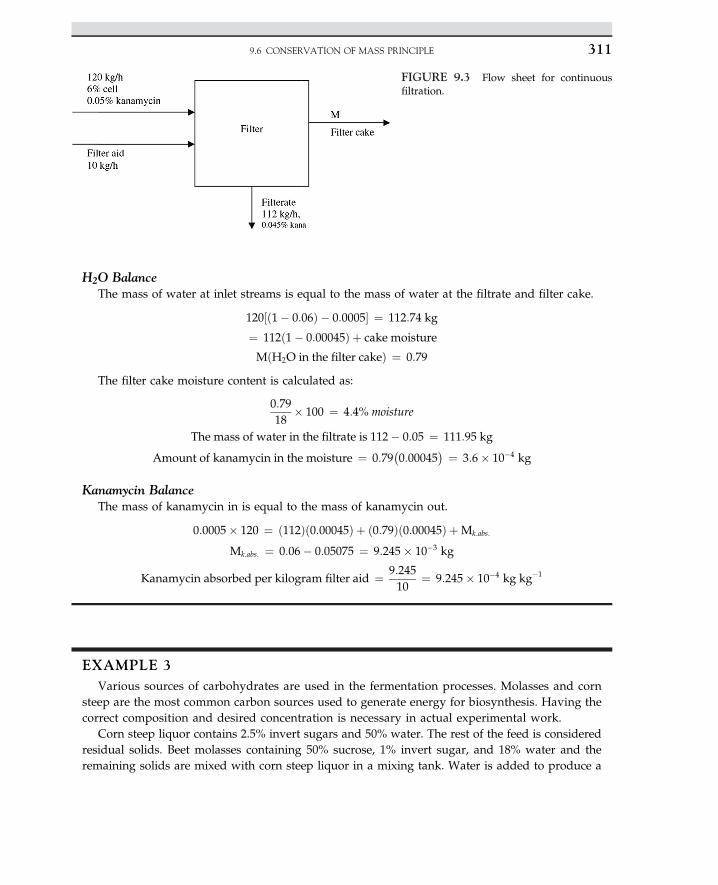
H2O BalanceThe mass of water at inlet streams is equal to the mass of water at the filtrate and filter cake.
120½ð1� 0:06Þ � 0:0005� ¼ 112:74 kg
¼ 112ð1� 0:00045Þ þ cake moisture
MðH2O in the filter cakeÞ ¼ 0:79
The filter cake moisture content is calculated as:
0:7918
� 100 ¼ 4:4% moisture
The mass of water in the filtrate is 112� 0:05 ¼ 111:95 kg
Amount of kanamycin in the moisture ¼ 0:79�0:00045
� ¼ 3:6� 10�4 kg
Kanamycin BalanceThe mass of kanamycin in is equal to the mass of kanamycin out.
0:0005� 120 ¼ ð112Þð0:00045Þ þ ð0:79Þð0:00045Þ þMk:abs:
Mk:abs: ¼ 0:06� 0:05075 ¼ 9:245� 10�3 kg
Kanamycin absorbed per kilogram filter aid ¼ 9:24510
¼ 9:245� 10�4 kg kg�1
EXAMPLE 3Various sources of carbohydrates are used in the fermentation processes. Molasses and corn
steep are the most common carbon sources used to generate energy for biosynthesis. Having thecorrect composition and desired concentration is necessary in actual experimental work.
Corn steep liquor contains 2.5% invert sugars and 50% water. The rest of the feed is consideredresidual solids. Beet molasses containing 50% sucrose, 1% invert sugar, and 18% water and theremaining solids are mixed with corn steep liquor in a mixing tank. Water is added to produce a
FIGURE 9.3 Flow sheet for continuousfiltration.
9.6 CONSERVATION OF MASS PRINCIPLE 311
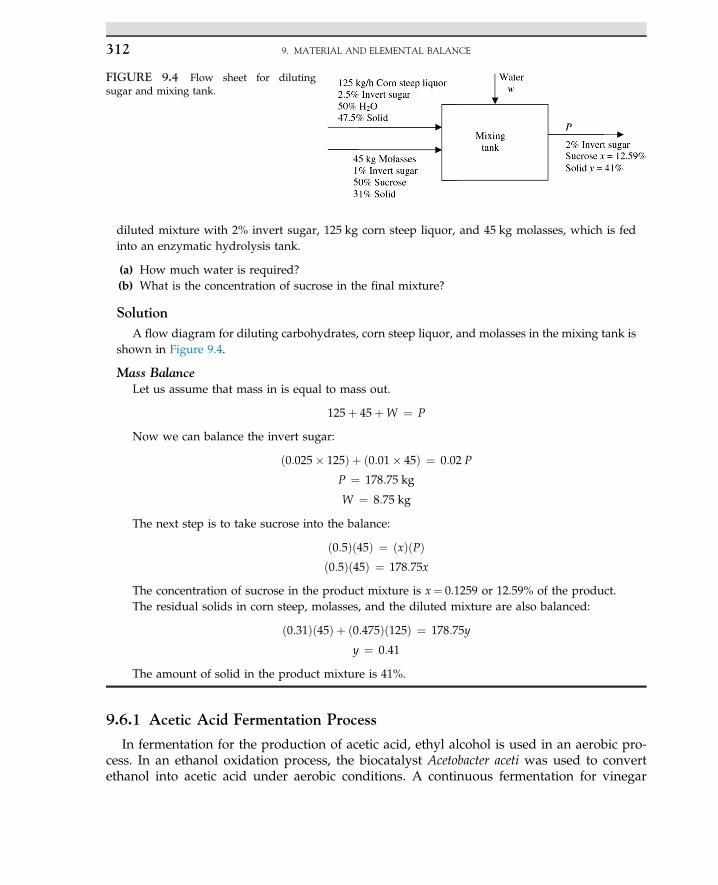
diluted mixture with 2% invert sugar, 125 kg corn steep liquor, and 45 kg molasses, which is fedinto an enzymatic hydrolysis tank.
(a) How much water is required?(b) What is the concentration of sucrose in the final mixture?
SolutionA flow diagram for diluting carbohydrates, corn steep liquor, and molasses in the mixing tank is
shown in Figure 9.4.
Mass BalanceLet us assume that mass in is equal to mass out.
125þ 45þW ¼ P
Now we can balance the invert sugar:
ð0:025� 125Þ þ ð0:01� 45Þ ¼ 0:02 P
P ¼ 178:75 kg
W ¼ 8:75 kg
The next step is to take sucrose into the balance:
ð0:5Þð45Þ ¼ ðxÞðPÞð0:5Þð45Þ ¼ 178:75x
The concentration of sucrose in the product mixture is x¼ 0.1259 or 12.59% of the product.The residual solids in corn steep, molasses, and the diluted mixture are also balanced:
ð0:31Þð45Þ þ ð0:475Þð125Þ ¼ 178:75y
y ¼ 0:41
The amount of solid in the product mixture is 41%.
9.6.1 Acetic Acid Fermentation Process
In fermentation for the production of acetic acid, ethyl alcohol is used in an aerobic pro-cess. In an ethanol oxidation process, the biocatalyst Acetobacter aceti was used to convertethanol into acetic acid under aerobic conditions. A continuous fermentation for vinegar
FIGURE 9.4 Flow sheet for dilutingsugar and mixing tank.
9. MATERIAL AND ELEMENTAL BALANCE312
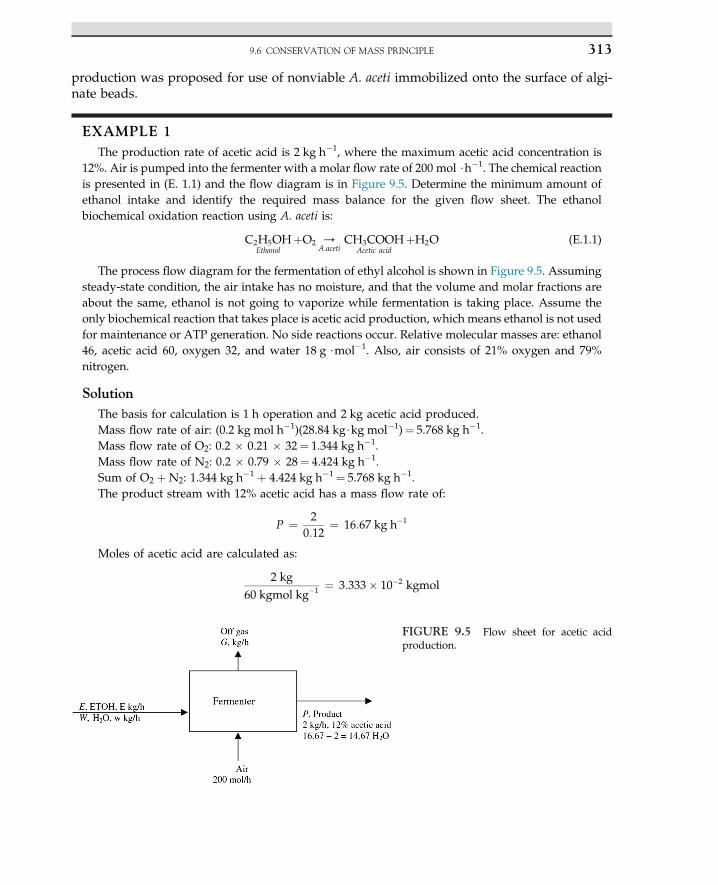
production was proposed for use of nonviable A. aceti immobilized onto the surface of algi-nate beads.
EXAMPLE 1The production rate of acetic acid is 2 kg h�1, where the maximum acetic acid concentration is
12%. Air is pumped into the fermenter with a molar flow rate of 200 mol $h�1. The chemical reactionis presented in (E. 1.1) and the flow diagram is in Figure 9.5. Determine the minimum amount ofethanol intake and identify the required mass balance for the given flow sheet. The ethanolbiochemical oxidation reaction using A. aceti is:
C2H5OHEthanol
þO2 /A:aceti
CH3COOHAcetic acid
þH2O (E.1.1)
The process flow diagram for the fermentation of ethyl alcohol is shown in Figure 9.5. Assumingsteady-state condition, the air intake has no moisture, and that the volume and molar fractions areabout the same, ethanol is not going to vaporize while fermentation is taking place. Assume theonly biochemical reaction that takes place is acetic acid production, which means ethanol is not usedfor maintenance or ATP generation. No side reactions occur. Relative molecular masses are: ethanol46, acetic acid 60, oxygen 32, and water 18 g $mol�1. Also, air consists of 21% oxygen and 79%nitrogen.
SolutionThe basis for calculation is 1 h operation and 2 kg acetic acid produced.Mass flow rate of air: (0.2 kg mol h�1)(28.84 kg$kg mol�1)¼ 5.768 kg h�1.Mass flow rate of O2: 0.2 � 0.21 � 32¼ 1.344 kg h�1.Mass flow rate of N2: 0.2 � 0.79 � 28¼ 4.424 kg h�1.Sum of O2 þ N2: 1.344 kg h�1 þ 4.424 kg h�1¼ 5.768 kg h�1.The product stream with 12% acetic acid has a mass flow rate of:
P ¼ 20:12
¼ 16:67 kg h�1
Moles of acetic acid are calculated as:
2 kg60 kgmol kg�1 ¼ 3:333� 10�2 kgmol
FIGURE 9.5 Flow sheet for acetic acidproduction.
9.6 CONSERVATION OF MASS PRINCIPLE 313
From the reaction stoichiometry, for each mole of acetic acid, 1 mol of oxygen is used.So the equal molar oxygen consumption is:
�3:333� 10�2
��32� ¼ 1:067 kg O2 consumed
Excess amount of O2 ¼ 1:344� 1:067 ¼ 0:277 kg h�1
The off gas stream consists of all inlet nitrogen plus excess oxygen.Off gas, G, is the sum of excess oxygen plus inert nitrogen.
G ¼ N2 þ excess O2 ¼ 4:424þ 0:277 ¼ 4:701 kg
Off gas composition is 0:277=4:701 ¼ 0:059; 5:9% O2 and 94:1% N2
Water BalanceThe sum of water at the inlet stream and water generated by the chemical reaction is equal to
water at the outlet stream.
H2O inþH2O generated ¼ H2O out
Mass of H2O generated: (3.333 � 10�2)(18 kg$kg mol�1)¼ 0.6 kg.Water at inlet stream: 14.67 kg e (0.6 kg, H2O generated)¼ 14.07 kg.
Ethanol BalanceEthanol concentration at the inlet plus ethanol generated is equal to ethanol in the outlet stream
as unreacted reactant plus ethanol consumed. For each mole of acetic acid, 1 mol ethanol is used.The mass of ethanol used is:
Mass of ETOH consumed ¼ �3:333� 10�2
��46 kg$kgmol�1� ¼ 1:533 kg Ethanol
Assume all of the ethanol (100%) is taken by the bacteria and that there is no ethanolgeneration or evaporation. This means that ethanol in is equal to ethanol consumed in the oxidationprocess.
Ethanol in ¼ ethanol consumed ¼ 1:533 kg ETOH
9.6.2 Xanthan Gum Production
EXAMPLE 1Xanthan gum is produced using Xanthomonas campestris in a batch culture. Laboratory experi-
ments have shown that for each gram of glucose used by the bacteria, 0.23 g oxygen and 0.01 gammonia are consumed whereas 0.75 g gum, 0.09 g cells, 0.27 g gaseous CO2, and 0.13 g H2O areformed. Other components such as phosphate can be neglected. A medium containing glucose andammonia dissolved in 20,000 l of water is pumped into a CSTR fermenter and inoculated with X.campestris. Air is pumped; the off gas recovered during the entire batch is 1250 kg. The final gumconcentration is 3.5 wt%. What is the percentage of excess air and how much glucose and ammoniaare required?
9. MATERIAL AND ELEMENTAL BALANCE314
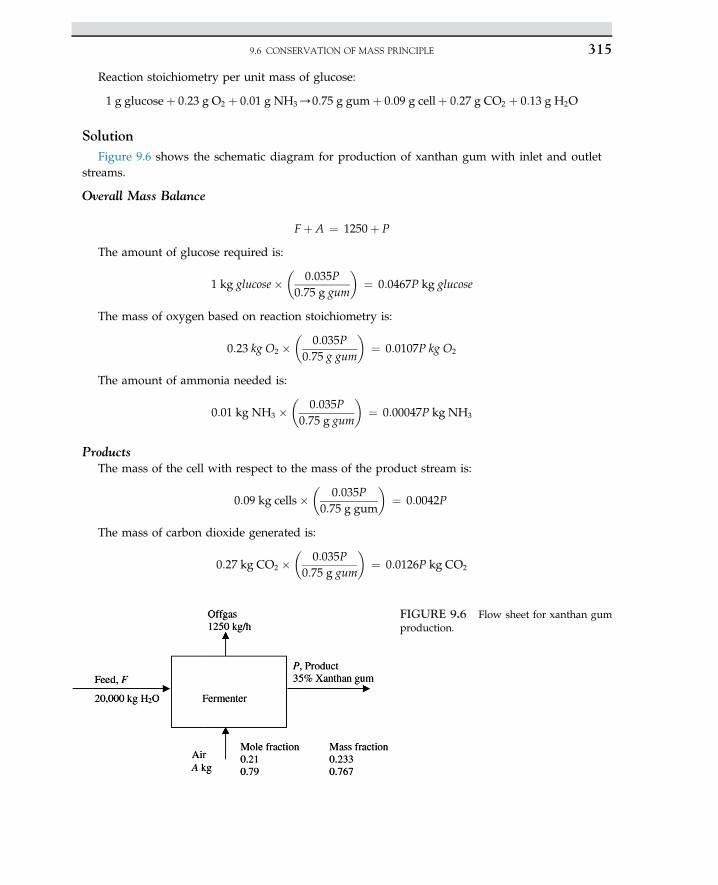
Reaction stoichiometry per unit mass of glucose:
1 g glucoseþ 0:23 g O2 þ 0:01 g NH3/0:75 g gumþ 0:09 g cellþ 0:27 g CO2 þ 0:13 g H2O
SolutionFigure 9.6 shows the schematic diagram for production of xanthan gum with inlet and outlet
streams.
Overall Mass Balance
Fþ A ¼ 1250þ P
The amount of glucose required is:
1 kg glucose��
0:035P0:75 g gum
�¼ 0:0467P kg glucose
The mass of oxygen based on reaction stoichiometry is:
0:23 kg O2 ��
0:035P0:75 g gum
�¼ 0:0107P kg O2
The amount of ammonia needed is:
0:01 kg NH3 ��
0:035P0:75 g gum
�¼ 0:00047P kg NH3
ProductsThe mass of the cell with respect to the mass of the product stream is:
0:09 kg cells��
0:035P0:75 g gum
�¼ 0:0042P
The mass of carbon dioxide generated is:
0:27 kg CO2 ��
0:035P0:75 g gum
�¼ 0:0126P kg CO2
FIGURE 9.6 Flow sheet for xanthan gumproduction.
9.6 CONSERVATION OF MASS PRINCIPLE 315
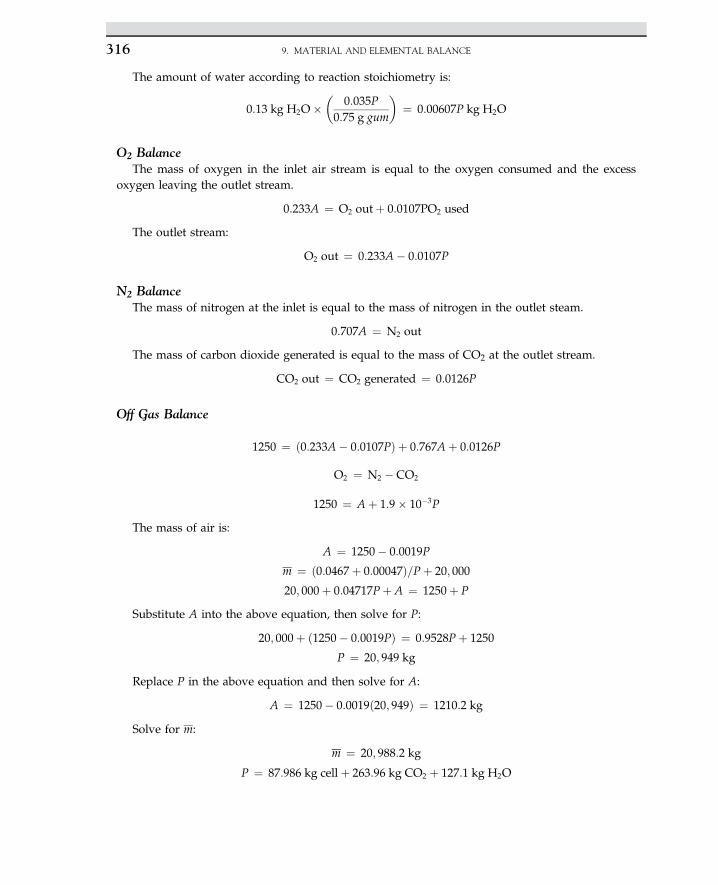
The amount of water according to reaction stoichiometry is:
0:13 kg H2O��
0:035P0:75 g gum
�¼ 0:00607P kg H2O
O2 BalanceThe mass of oxygen in the inlet air stream is equal to the oxygen consumed and the excess
oxygen leaving the outlet stream.
0:233A ¼ O2 outþ 0:0107PO2 used
The outlet stream:
O2 out ¼ 0:233A� 0:0107P
N2 BalanceThe mass of nitrogen at the inlet is equal to the mass of nitrogen in the outlet steam.
0:707A ¼ N2 out
The mass of carbon dioxide generated is equal to the mass of CO2 at the outlet stream.
CO2 out ¼ CO2 generated ¼ 0:0126P
Off Gas Balance
1250 ¼ ð0:233A� 0:0107PÞ þ 0:767Aþ 0:0126P
O2 ¼ N2 � CO2
1250 ¼ Aþ 1:9� 10�3P
The mass of air is:
A ¼ 1250� 0:0019P
m ¼ ð0:0467þ 0:00047Þ=Pþ 20; 000
20; 000þ 0:04717Pþ A ¼ 1250þ P
Substitute A into the above equation, then solve for P:
20; 000þ ð1250� 0:0019PÞ ¼ 0:9528Pþ 1250
P ¼ 20; 949 kg
Replace P in the above equation and then solve for A:
A ¼ 1250� 0:0019ð20; 949Þ ¼ 1210:2 kg
Solve for m:
m ¼ 20; 988:2 kg
P ¼ 87:986 kg cellþ 263:96 kg CO2 þ 127:1 kg H2O
9. MATERIAL AND ELEMENTAL BALANCE316
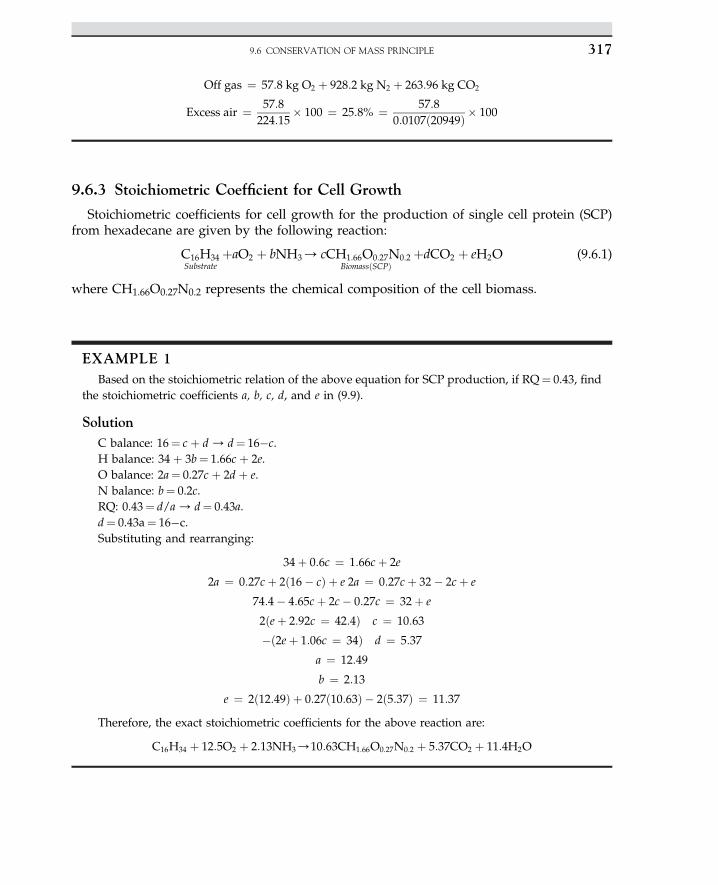
Off gas ¼ 57:8 kg O2 þ 928:2 kg N2 þ 263:96 kg CO2
Excess air ¼ 57:8224:15
� 100 ¼ 25:8% ¼ 57:80:0107ð20949Þ � 100
9.6.3 Stoichiometric Coefficient for Cell Growth
Stoichiometric coefficients for cell growth for the production of single cell protein (SCP)from hexadecane are given by the following reaction:
C16H34Substrate
þaO2 þ bNH3/ cCH1:66O0:27N0:2BiomassðSCPÞ
þdCO2 þ eH2O (9.6.1)
where CH1.66O0.27N0.2 represents the chemical composition of the cell biomass.
EXAMPLE 1Based on the stoichiometric relation of the above equation for SCP production, if RQ¼ 0.43, find
the stoichiometric coefficients a, b, c, d, and e in (9.9).
SolutionC balance: 16¼ c þ d/ d¼ 16�c.H balance: 34 þ 3b¼ 1.66c þ 2e.O balance: 2a¼ 0.27c þ 2d þ e.N balance: b¼ 0.2c.RQ: 0.43¼ d/a/ d¼ 0.43a.d¼ 0.43a¼ 16�c.Substituting and rearranging:
34þ 0:6c ¼ 1:66cþ 2e
2a ¼ 0:27cþ 2ð16� cÞ þ e 2a ¼ 0:27cþ 32� 2cþ e
74:4� 4:65cþ 2c� 0:27c ¼ 32þ e
2ðeþ 2:92c ¼ 42:4Þ c ¼ 10:63
�ð2eþ 1:06c ¼ 34Þ d ¼ 5:37
a ¼ 12:49
b ¼ 2:13
e ¼ 2ð12:49Þ þ 0:27ð10:63Þ � 2ð5:37Þ ¼ 11:37
Therefore, the exact stoichiometric coefficients for the above reaction are:
C16H34 þ 12:5O2 þ 2:13NH3/10:63CH1:66O0:27N0:2 þ 5:37CO2 þ 11:4H2O
9.6 CONSERVATION OF MASS PRINCIPLE 317
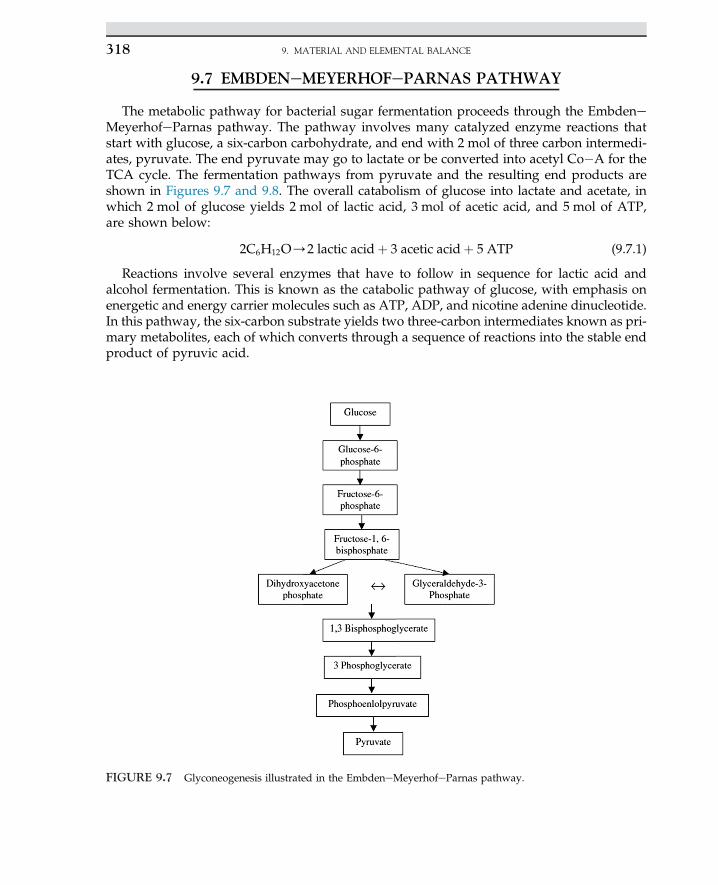
9.7 EMBDENeMEYERHOFePARNAS PATHWAY
The metabolic pathway for bacterial sugar fermentation proceeds through the EmbdeneMeyerhofeParnas pathway. The pathway involves many catalyzed enzyme reactions thatstart with glucose, a six-carbon carbohydrate, and end with 2 mol of three carbon intermedi-ates, pyruvate. The end pyruvate may go to lactate or be converted into acetyl Co�A for theTCA cycle. The fermentation pathways from pyruvate and the resulting end products areshown in Figures 9.7 and 9.8. The overall catabolism of glucose into lactate and acetate, inwhich 2 mol of glucose yields 2 mol of lactic acid, 3 mol of acetic acid, and 5 mol of ATP,are shown below:
2C6H12O/2 lactic acidþ 3 acetic acidþ 5 ATP (9.7.1)
Reactions involve several enzymes that have to follow in sequence for lactic acid andalcohol fermentation. This is known as the catabolic pathway of glucose, with emphasis onenergetic and energy carrier molecules such as ATP, ADP, and nicotine adenine dinucleotide.In this pathway, the six-carbon substrate yields two three-carbon intermediates known as pri-mary metabolites, each of which converts through a sequence of reactions into the stable endproduct of pyruvic acid.
FIGURE 9.7 Glyconeogenesis illustrated in the EmbdeneMeyerhofeParnas pathway.
9. MATERIAL AND ELEMENTAL BALANCE318
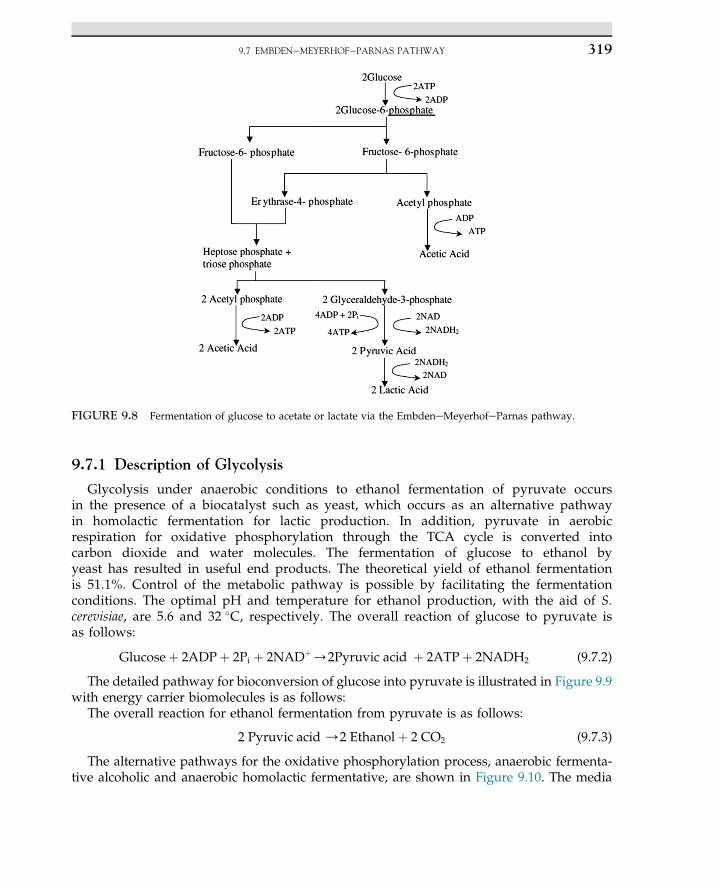
9.7.1 Description of Glycolysis
Glycolysis under anaerobic conditions to ethanol fermentation of pyruvate occursin the presence of a biocatalyst such as yeast, which occurs as an alternative pathwayin homolactic fermentation for lactic production. In addition, pyruvate in aerobicrespiration for oxidative phosphorylation through the TCA cycle is converted intocarbon dioxide and water molecules. The fermentation of glucose to ethanol byyeast has resulted in useful end products. The theoretical yield of ethanol fermentationis 51.1%. Control of the metabolic pathway is possible by facilitating the fermentationconditions. The optimal pH and temperature for ethanol production, with the aid of S.cerevisiae, are 5.6 and 32 �C, respectively. The overall reaction of glucose to pyruvate isas follows:
Glucoseþ 2ADPþ 2Pi þ 2NADþ/2Pyruvic acid þ 2ATPþ 2NADH2 (9.7.2)
The detailed pathway for bioconversion of glucose into pyruvate is illustrated in Figure 9.9with energy carrier biomolecules is as follows:
The overall reaction for ethanol fermentation from pyruvate is as follows:
2 Pyruvic acid /2 Ethanolþ 2 CO2 (9.7.3)
The alternative pathways for the oxidative phosphorylation process, anaerobic fermenta-tive alcoholic and anaerobic homolactic fermentative, are shown in Figure 9.10. The media
FIGURE 9.8 Fermentation of glucose to acetate or lactate via the EmbdeneMeyerhofeParnas pathway.
9.7 EMBDENeMEYERHOFePARNAS PATHWAY 319
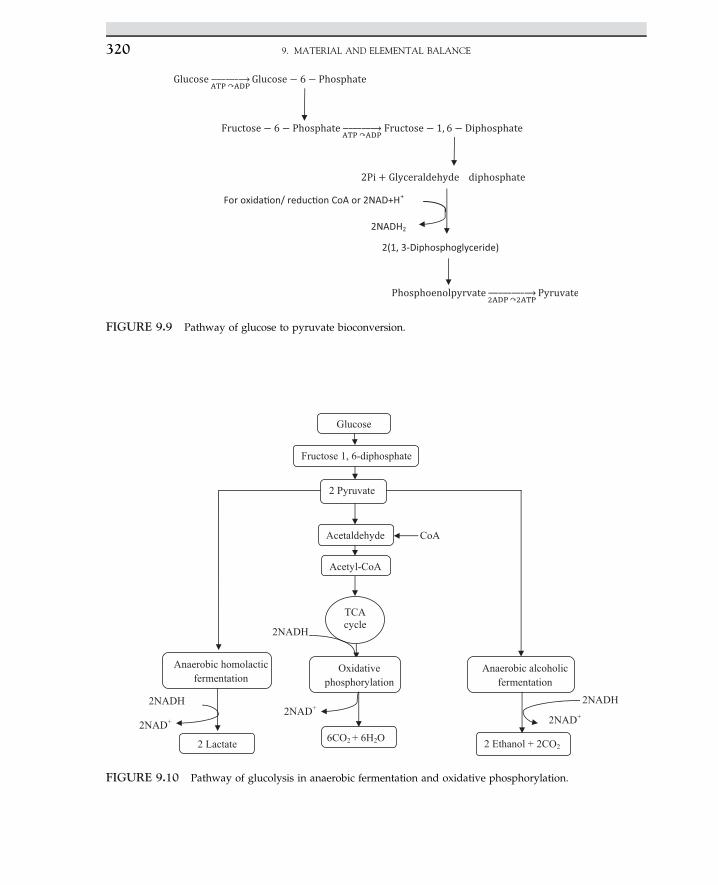
FIGURE 9.9 Pathway of glucose to pyruvate bioconversion.
Glucose
Fructose 1, 6-diphosphate
2 Pyruvate
Acetaldehyde
TCA cycle
Acetyl-CoA
Oxidative phosphorylation
6CO2 + 6H2O
2NADH
2NAD+
CoA
Anaerobic alcoholic fermentation
Anaerobic homolactic fermentation
2 Lactate 2 Ethanol + 2CO2
2NAD+
2NADH
2NAD+
2NADH
FIGURE 9.10 Pathway of glucolysis in anaerobic fermentation and oxidative phosphorylation.
9. MATERIAL AND ELEMENTAL BALANCE320
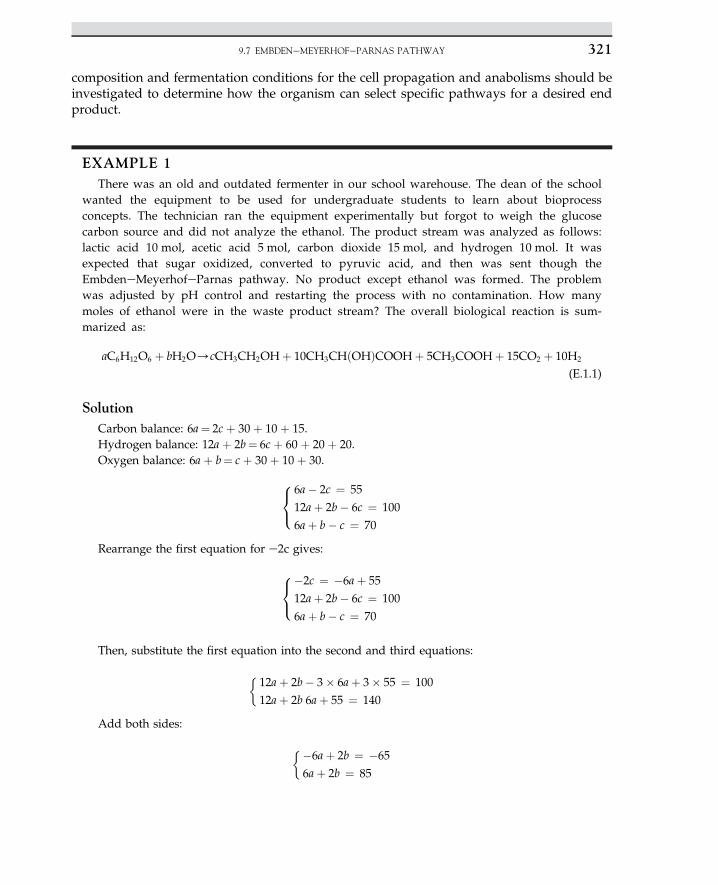
composition and fermentation conditions for the cell propagation and anabolisms should beinvestigated to determine how the organism can select specific pathways for a desired endproduct.
EXAMPLE 1There was an old and outdated fermenter in our school warehouse. The dean of the school
wanted the equipment to be used for undergraduate students to learn about bioprocessconcepts. The technician ran the equipment experimentally but forgot to weigh the glucosecarbon source and did not analyze the ethanol. The product stream was analyzed as follows:lactic acid 10 mol, acetic acid 5 mol, carbon dioxide 15 mol, and hydrogen 10 mol. It wasexpected that sugar oxidized, converted to pyruvic acid, and then was sent though theEmbdeneMeyerhofeParnas pathway. No product except ethanol was formed. The problemwas adjusted by pH control and restarting the process with no contamination. How manymoles of ethanol were in the waste product stream? The overall biological reaction is sum-marized as:
aC6H12O6 þ bH2O/cCH3CH2OHþ 10CH3CHðOHÞCOOHþ 5CH3COOHþ 15CO2 þ 10H2
(E.1.1)
SolutionCarbon balance: 6a¼ 2c þ 30 þ 10 þ 15.Hydrogen balance: 12a þ 2b¼ 6c þ 60 þ 20 þ 20.Oxygen balance: 6a þ b¼ c þ 30 þ 10 þ 30.
8<:
6a� 2c ¼ 55
12aþ 2b� 6c ¼ 100
6aþ b� c ¼ 70
Rearrange the first equation for e2c gives:
8<:
�2c ¼ �6aþ 55
12aþ 2b� 6c ¼ 100
6aþ b� c ¼ 70
Then, substitute the first equation into the second and third equations:
�12aþ 2b� 3� 6aþ 3� 55 ¼ 100
12aþ 2b 6aþ 55 ¼ 140
Add both sides:
��6aþ 2b ¼ �65
6aþ 2b ¼ 85
9.7 EMBDENeMEYERHOFePARNAS PATHWAY 321
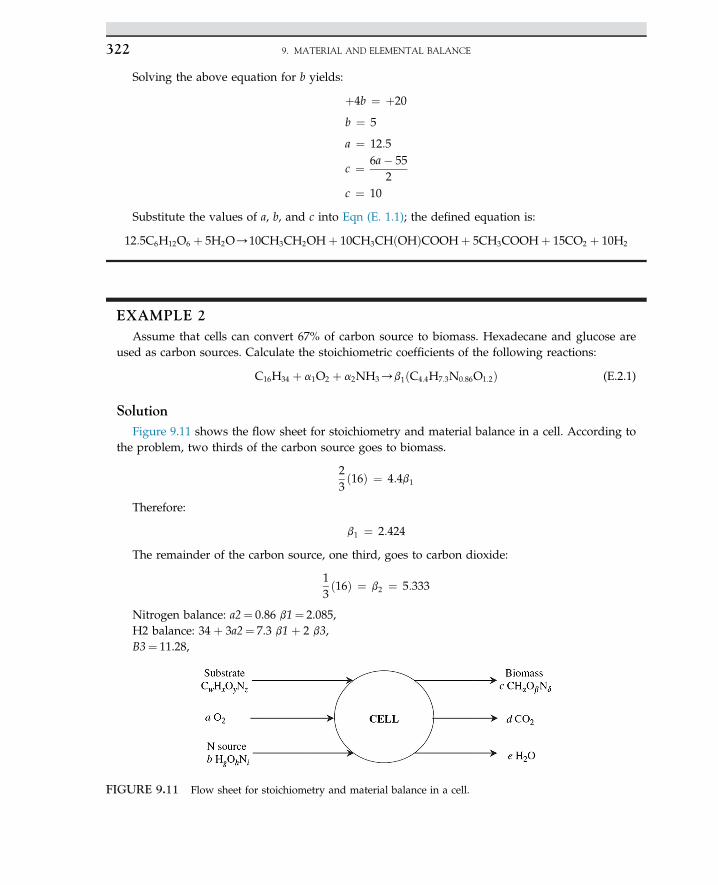
Solving the above equation for b yields:
þ4b ¼ þ20
b ¼ 5
a ¼ 12:5
c ¼ 6a� 552
c ¼ 10
Substitute the values of a, b, and c into Eqn (E. 1.1); the defined equation is:
12:5C6H12O6 þ 5H2O/10CH3CH2OHþ 10CH3CHðOHÞCOOHþ 5CH3COOHþ 15CO2 þ 10H2
EXAMPLE 2Assume that cells can convert 67% of carbon source to biomass. Hexadecane and glucose are
used as carbon sources. Calculate the stoichiometric coefficients of the following reactions:
C16H34 þ a1O2 þ a2NH3/b1ðC4:4H7:3N0:86O1:2Þ (E.2.1)
SolutionFigure 9.11 shows the flow sheet for stoichiometry and material balance in a cell. According to
the problem, two thirds of the carbon source goes to biomass.
23ð16Þ ¼ 4:4b1
Therefore:
b1 ¼ 2:424
The remainder of the carbon source, one third, goes to carbon dioxide:
13ð16Þ ¼ b2 ¼ 5:333
Nitrogen balance: a2¼ 0.86 b1¼ 2.085,H2 balance: 34 þ 3a2¼ 7.3 b1 þ 2 b3,B3¼ 11.28,
FIGURE 9.11 Flow sheet for stoichiometry and material balance in a cell.
9. MATERIAL AND ELEMENTAL BALANCE322
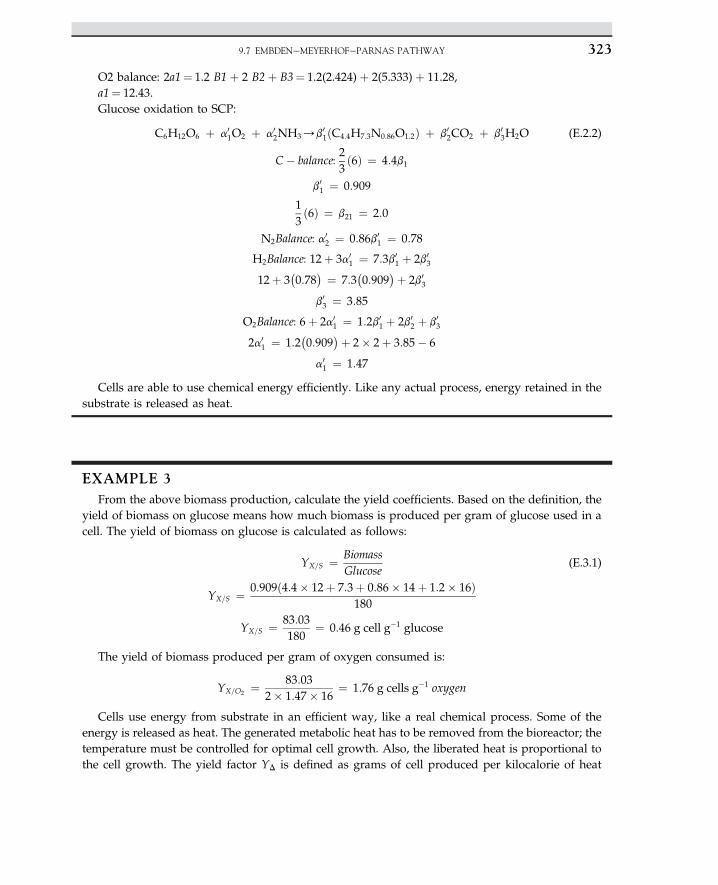
O2 balance: 2a1¼ 1.2 B1 þ 2 B2 þ B3¼ 1.2(2.424) þ 2(5.333) þ 11.28,a1¼ 12.43.Glucose oxidation to SCP:
C6H12O6 þ a01O2 þ a0
2NH3/b01ðC4:4H7:3N0:86O1:2Þ þ b0
2CO2 þ b03H2O (E.2.2)
C� balance:23ð6Þ ¼ 4:4b1
b01 ¼ 0:909
13ð6Þ ¼ b21 ¼ 2:0
N2Balance: a02 ¼ 0:86b0
1 ¼ 0:78
H2Balance: 12þ 3a01 ¼ 7:3b0
1 þ 2b03
12þ 3�0:78
� ¼ 7:3�0:909
�þ 2b03
b03 ¼ 3:85
O2Balance: 6þ 2a01 ¼ 1:2b0
1 þ 2b02 þ b0
3
2a01 ¼ 1:2
�0:909
�þ 2� 2þ 3:85� 6
a01 ¼ 1:47
Cells are able to use chemical energy efficiently. Like any actual process, energy retained in thesubstrate is released as heat.
EXAMPLE 3From the above biomass production, calculate the yield coefficients. Based on the definition, the
yield of biomass on glucose means how much biomass is produced per gram of glucose used in acell. The yield of biomass on glucose is calculated as follows:
YX=S ¼ BiomassGlucose
(E.3.1)
YX=S ¼ 0:909ð4:4� 12þ 7:3þ 0:86� 14þ 1:2� 16Þ180
YX=S ¼ 83:03180
¼ 0:46 g cell g�1 glucose
The yield of biomass produced per gram of oxygen consumed is:
YX=O2 ¼ 83:032� 1:47� 16
¼ 1:76 g cells g�1 oxygen
Cells use energy from substrate in an efficient way, like a real chemical process. Some of theenergy is released as heat. The generated metabolic heat has to be removed from the bioreactor; thetemperature must be controlled for optimal cell growth. Also, the liberated heat is proportional tothe cell growth. The yield factor YD is defined as grams of cell produced per kilocalorie of heat
9.7 EMBDENeMEYERHOFePARNAS PATHWAY 323
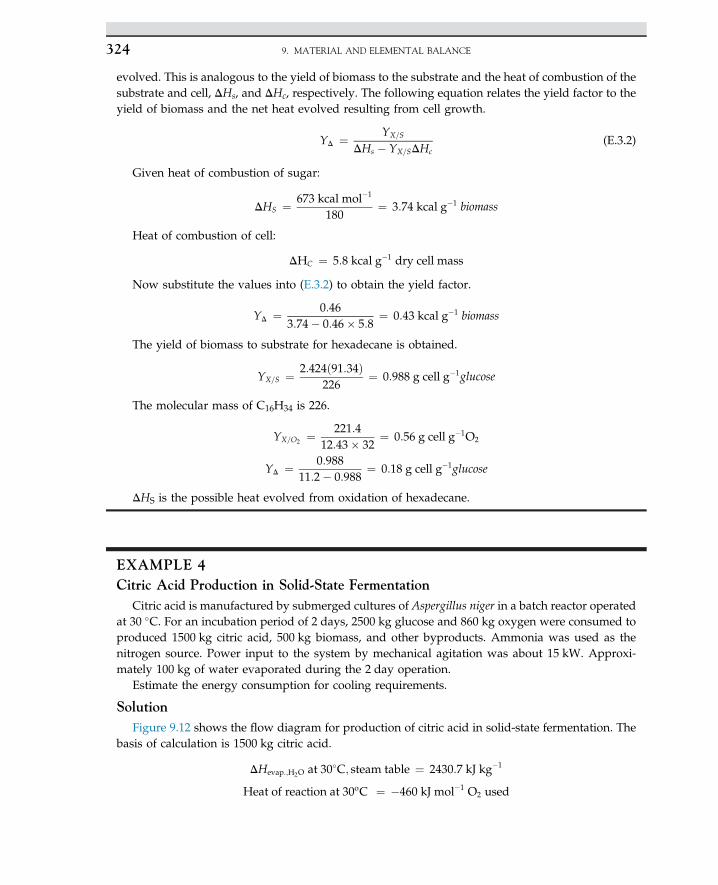
evolved. This is analogous to the yield of biomass to the substrate and the heat of combustion of thesubstrate and cell, DHs, and DHc, respectively. The following equation relates the yield factor to theyield of biomass and the net heat evolved resulting from cell growth.
YD ¼ YX=S
DHs � YX=SDHc(E.3.2)
Given heat of combustion of sugar:
DHS ¼ 673 kcal mol�1
180¼ 3:74 kcal g�1 biomass
Heat of combustion of cell:
DHC ¼ 5:8 kcal g�1 dry cell mass
Now substitute the values into (E.3.2) to obtain the yield factor.
YD ¼ 0:463:74� 0:46� 5:8
¼ 0:43 kcal g�1 biomass
The yield of biomass to substrate for hexadecane is obtained.
YX=S ¼ 2:424ð91:34Þ226
¼ 0:988 g cell g�1glucose
The molecular mass of C16H34 is 226.
YX=O2 ¼ 221:412:43� 32
¼ 0:56 g cell g�1O2
YD ¼ 0:98811:2� 0:988
¼ 0:18 g cell g�1glucose
DHS is the possible heat evolved from oxidation of hexadecane.
EXAMPLE 4Citric Acid Production in Solid-State Fermentation
Citric acid is manufactured by submerged cultures of Aspergillus niger in a batch reactor operatedat 30 �C. For an incubation period of 2 days, 2500 kg glucose and 860 kg oxygen were consumed toproduced 1500 kg citric acid, 500 kg biomass, and other byproducts. Ammonia was used as thenitrogen source. Power input to the system by mechanical agitation was about 15 kW. Approxi-mately 100 kg of water evaporated during the 2 day operation.
Estimate the energy consumption for cooling requirements.
SolutionFigure 9.12 shows the flow diagram for production of citric acid in solid-state fermentation. The
basis of calculation is 1500 kg citric acid.
DHevap:;H2O at 30�C; steam table ¼ 2430:7 kJ kg�1
Heat of reaction at 30oC ¼ �460 kJ mol�1 O2 used
9. MATERIAL AND ELEMENTAL BALANCE324
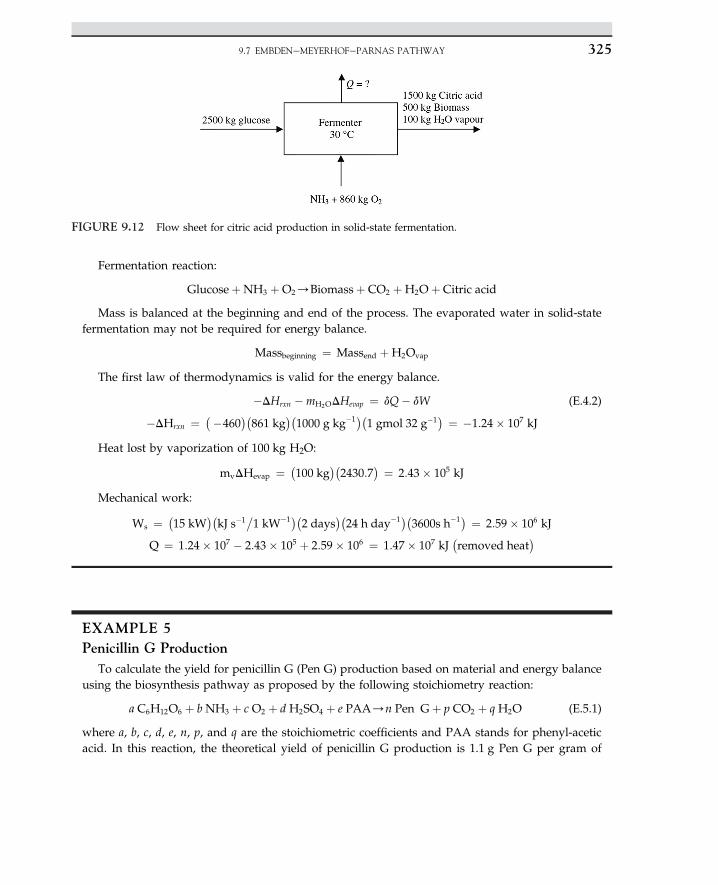
Fermentation reaction:
GlucoseþNH3 þO2/Biomassþ CO2 þH2Oþ Citric acid
Mass is balanced at the beginning and end of the process. The evaporated water in solid-statefermentation may not be required for energy balance.
Massbeginning ¼ Massend þH2Ovap
The first law of thermodynamics is valid for the energy balance.
�DHrxn �mH2ODHevap ¼ dQ� dW (E.4.2)
�DHrxn ¼ ��460��861 kg
��1000 g kg�1��1 gmol 32 g�1
� ¼ �1:24� 107 kJ
Heat lost by vaporization of 100 kg H2O:
mvDHevap ¼ �100 kg
��2430:7
� ¼ 2:43� 105 kJ
Mechanical work:
Ws ¼ �15 kW
��kJ s�1
�1 kW�1��2 days
��24 h day�1��3600s h�1� ¼ 2:59� 106 kJ
Q ¼ 1:24� 107 � 2:43� 105 þ 2:59� 106 ¼ 1:47� 107 kJ�removed heat
�
EXAMPLE 5Penicillin G Production
To calculate the yield for penicillin G (Pen G) production based on material and energy balanceusing the biosynthesis pathway as proposed by the following stoichiometry reaction:
a C6H12O6 þ b NH3 þ c O2 þ d H2SO4 þ e PAA/n Pen Gþ p CO2 þ q H2O (E.5.1)
where a, b, c, d, e, n, p, and q are the stoichiometric coefficients and PAA stands for phenyl-aceticacid. In this reaction, the theoretical yield of penicillin G production is 1.1 g Pen G per gram of
FIGURE 9.12 Flow sheet for citric acid production in solid-state fermentation.
9.7 EMBDENeMEYERHOFePARNAS PATHWAY 325
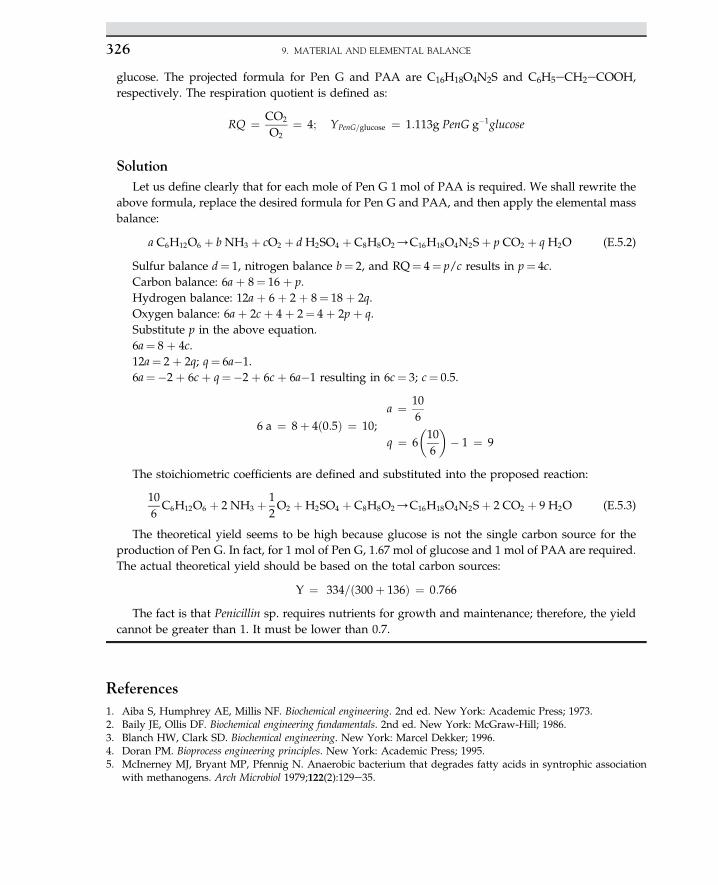
glucose. The projected formula for Pen G and PAA are C16H18O4N2S and C6H5eCH2eCOOH,respectively. The respiration quotient is defined as:
RQ ¼ CO2
O2¼ 4; YPenG=glucose ¼ 1:113g PenG g�1glucose
SolutionLet us define clearly that for each mole of Pen G 1 mol of PAA is required. We shall rewrite the
above formula, replace the desired formula for Pen G and PAA, and then apply the elemental massbalance:
a C6H12O6 þ b NH3 þ cO2 þ dH2SO4 þ C8H8O2/C16H18O4N2Sþ p CO2 þ q H2O (E.5.2)
Sulfur balance d¼ 1, nitrogen balance b¼ 2, and RQ¼ 4¼ p/c results in p¼ 4c.Carbon balance: 6a þ 8¼ 16 þ p.Hydrogen balance: 12a þ 6 þ 2 þ 8¼ 18 þ 2q.Oxygen balance: 6a þ 2c þ 4 þ 2¼ 4 þ 2p þ q.Substitute p in the above equation.6a¼ 8 þ 4c.12a¼ 2 þ 2q; q¼ 6a�1.6a¼�2 þ 6c þ q¼�2 þ 6c þ 6a�1 resulting in 6c¼ 3; c¼ 0.5.
6 a ¼ 8þ 4ð0:5Þ ¼ 10;a ¼ 10
6
q ¼ 6�106
�� 1 ¼ 9
The stoichiometric coefficients are defined and substituted into the proposed reaction:
106C6H12O6 þ 2 NH3 þ 1
2O2 þH2SO4 þ C8H8O2/C16H18O4N2Sþ 2 CO2 þ 9 H2O (E.5.3)
The theoretical yield seems to be high because glucose is not the single carbon source for theproduction of Pen G. In fact, for 1 mol of Pen G, 1.67 mol of glucose and 1 mol of PAA are required.The actual theoretical yield should be based on the total carbon sources:
Y ¼ 334=ð300þ 136Þ ¼ 0:766
The fact is that Penicillin sp. requires nutrients for growth and maintenance; therefore, the yieldcannot be greater than 1. It must be lower than 0.7.
References1. Aiba S, Humphrey AE, Millis NF. Biochemical engineering. 2nd ed. New York: Academic Press; 1973.2. Baily JE, Ollis DF. Biochemical engineering fundamentals. 2nd ed. New York: McGraw-Hill; 1986.3. Blanch HW, Clark SD. Biochemical engineering. New York: Marcel Dekker; 1996.4. Doran PM. Bioprocess engineering principles. New York: Academic Press; 1995.5. McInerney MJ, Bryant MP, Pfennig N. Anaerobic bacterium that degrades fatty acids in syntrophic association
with methanogens. Arch Microbiol 1979;122(2):129e35.
9. MATERIAL AND ELEMENTAL BALANCE326
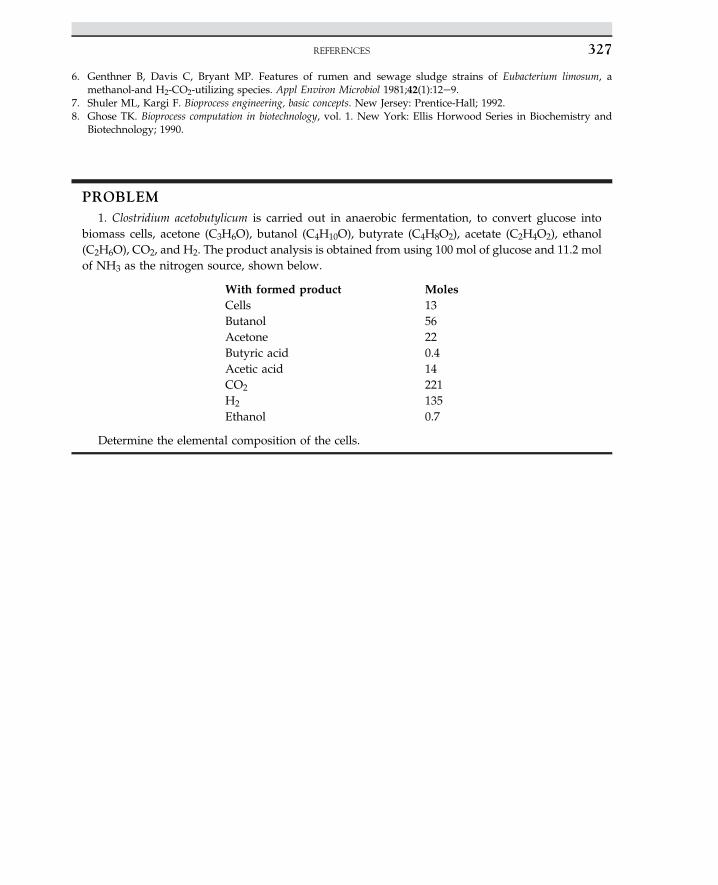
6. Genthner B, Davis C, Bryant MP. Features of rumen and sewage sludge strains of Eubacterium limosum, amethanol-and H2-CO2-utilizing species. Appl Environ Microbiol 1981;42(1):12e9.
7. Shuler ML, Kargi F. Bioprocess engineering, basic concepts. New Jersey: Prentice-Hall; 1992.8. Ghose TK. Bioprocess computation in biotechnology, vol. 1. New York: Ellis Horwood Series in Biochemistry and
Biotechnology; 1990.
PROBLEM1. Clostridium acetobutylicum is carried out in anaerobic fermentation, to convert glucose into
biomass cells, acetone (C3H6O), butanol (C4H10O), butyrate (C4H8O2), acetate (C2H4O2), ethanol(C2H6O), CO2, and H2. The product analysis is obtained from using 100 mol of glucose and 11.2 molof NH3 as the nitrogen source, shown below.
With formed product MolesCells 13Butanol 56Acetone 22Butyric acid 0.4Acetic acid 14CO2 221H2 135Ethanol 0.7
Determine the elemental composition of the cells.
REFERENCES 327
C H A P T E R
10
Application of FermentationProcesses
O U T L I N E
10.1 Introduction 330
10.2 Production of Ethanol byFermentation 330
10.3 Benefits from Bioethanol Fuel 331
10.4 Stoichiometry of BiochemicalReaction 331
10.5 Optical Cell Density 332
10.6 Kinetics of Growth and ProductFormation 333
10.7 Preparation of Stock Culture 334
10.8 Inoculum Preparation 335
10.9 Inoculation of Seed Culture 336
10.10 Analytical Method for SugarAnalysis 33710.10.1 Quantitative Analysis 33710.10.2 Analysis of Mixed Sugar by
Ultraviolet 337Sample Preparation 338
10.11 Analytical Method for EthanolAnalysis 338
10.12 Refractive Index Determination 338
10.13 Cell Dry Weight Measurements 339
10.14 Yield Calculation 339
10.15 Batch Fermentation Experiment 340
10.16 Continuous FermentationExperiment 341
10.17 Media Sterilization 342
10.18 Batch Experiment 34210.18.1 Optical Cell Density,
Ethanol, andCarbohydrateConcentration 342
10.18.2 Continuous EthanolFermentation Experiment 343
10.19 Expected Results 343
References 344
329Biochemical Engineering and Biotechnologyhttp://dx.doi.org/10.1016/B978-0-444-63357-6.00010-9 Copyright © 2015 Elsevier B.V. All rights reserved.
10.1 INTRODUCTION
In World War I, Germany needed to synthesize glycerol to manufacture explosives. It wasfound that glycerol was generated in alcoholic fermentation. Nearburg discovered that theaddition of sodium bisulfite to the fermentation broth was favored and enhanced the produc-tion of glycerol at the expense of ethanol. German scientists quickly developed industrial-scale fermentation with a yield capacity of 1000 tons of glycerol per month.1,2
Ethanol is an essential chemical used as a raw material for a vast range of applicationsincluding chemicals, fuel (bioethanol), beverages, pharmaceuticals, and cosmetics. The feed-stock for ethanol generally comes from renewable sources such as starch (from wheat, barley,maize, potato, cassava, sweet potato, etc.) and molasses or syrups originating from sugar beetor sugar cane, and so forth. The second generation of bioethanol uses raw material feedstocknot related to human food sources: nonfood base raw material such as cellulose and organicwastes. Cellulose is natural polymer of glucose, which is the major constituent of almost allplants and is a renewable source by plantations. For instance, wood is made of cellulose,hemicellulose, and lignin. Hemicellulose is a hetero-polymer of glucose and xylose (hexoseand pentose). Cellulosic material should be hydrolyzed and converted to a monomer offermentable sugar for ethanol fermentation. The strategy for producing renewable and inex-pensive raw material involves ethanol fermentation in a single or two-step process. In a singlestep, pure or mixed cultures of organisms are used to break down cellulose and then fermentthe resulting sugar solely into ethanol. Organisms that have such a capability are apparentlyrare; therefore, a two-step process has to be implemented. In this process, one organismbreaks polymeric sugar into monomers. The alternative approach is a single operation unitto break down cellulose and ferment the resulting sugar into ethanol. An organism isrequired to deliver enzymes for enzymatic hydrolysis while ethanol fermentation is takingplace. Such a phenomenon in a single organism may not be possible unless investigators pre-sent species of organisms genetically engineered with induction and incorporation enzyme-producing genes into ethanol producers to take two different metabolic pathways forsaccharification while an anaerobic pathway for ethanol production is in progress. Then, inthe fermentation of sugar, a second organism is used to produce bioethanol. The six-carbon sugar is easily fermented by bacteria or yeast into ethanol. It is believed that thereare more efficient bacteria such as Zymomonas mobilis and Thermoanaerobacter ethanolicus forthe bioconversion of carbohydrates to ethanol. Bioethanol is produced via fermentation tech-nology. The fermentation product downstream is processed with subsequent enrichment bydistillation/rectification and dehydration.
Bioethanol is becoming a viable solution as a source of renewable energy because it isconsidered a non-fossil fuel. It may originate from renewable agricultural sources, resultingin clean combustion without emissions into the atmosphere.
10.2 PRODUCTION OF ETHANOL BY FERMENTATION
Carbohydrates obtained from grain, potato, or molasses are fermented by yeasts to pro-duce ethanol in the production of beer, alcohols, and distilled spirits. Fermentation of sugarusing Saccharomyces cerevisiae produces ethanol under anaerobic conditions. The batch
10. APPLICATION OF FERMENTATION PROCESSES330
fermentation system is affected by high substrate and product inhibition. Glucose concentra-tion has a major role in increasing the concentration of ethanol and the cell growth rate in thefermentation broth. Cell density, ethanol concentration, and glucose concentration aremeasured. Industrial-grade sugars and molasses are used to produce bioethanol. Today,alcohol technologies are well developed. Many integrated extractive distillation, evaporativevacuum distillation, membrane separation, and purification techniques have enhancedethanol production plants, and the process is considered economically feasible for competingwith fossil fuel prices.
In the process of integration in bioethanol production, a membrane bioreactor (MBR) isdesigned to reduce ethanol distillation and purification costs. This means that while ethanolis produced in a bioreactor, the synthesized bioethanol is vaporized and extracted in a lique-fied nitrogen gas trap. This process is developed to eliminate substrate and production inhi-bitions resulting from the use of high sugar concentrations in fresh feed and high ethanolproduced in a fermentation broth. A breakthrough invention may occur in the next stageof technology development while we can demonstrate a commercial plant working withMBRs. For knowledge-based research, an MBR is developed and necessary data are collectedfor the fabricated MBR; details of the design process and experimental data are further dis-cussed in a case study in Chapter 16.
10.3 BENEFITS FROM BIOETHANOL FUEL
Alcoholic fermentation and ethanol production by S. cerevisiae have been well known for afew decades. Many obligate aerobic fungi, such as common molds of the genera Aspergillus,Fusarium species and Mucor, are also well known for their ability to produce ethanol.2 Ben-efits are:
• Use of renewable resources• Cleaner environment owing to cleaner combustion• No net carbon dioxide emissions• Expanded market opportunities in agriculture• Less dependence on crude oil
10.4 STOICHIOMETRY OF BIOCHEMICAL REACTION
The following biochemical reaction represents sugar fermentation. Ethanol is the end prod-uct, which may be used as a useful bioprocess chemical.
C6H12O6 Yeast fermentation���������! 2C2H5OHþ 2CO2
Glucose Ethanol Carbondioxide
180 g mol�1 46 g mol�1 44 g mol�1 (10.4.1)
Two popular microorganisms can produce a high concentration of alcohol: one is bacteriaand the other is yeast. Their tolerance to high concentrations of ethanol and substrates isstated in the literature.3e5 The most common ones are Z. mobilis and S. cerevisiae. Ethanol
10.4 STOICHIOMETRY OF BIOCHEMICAL REACTION 331
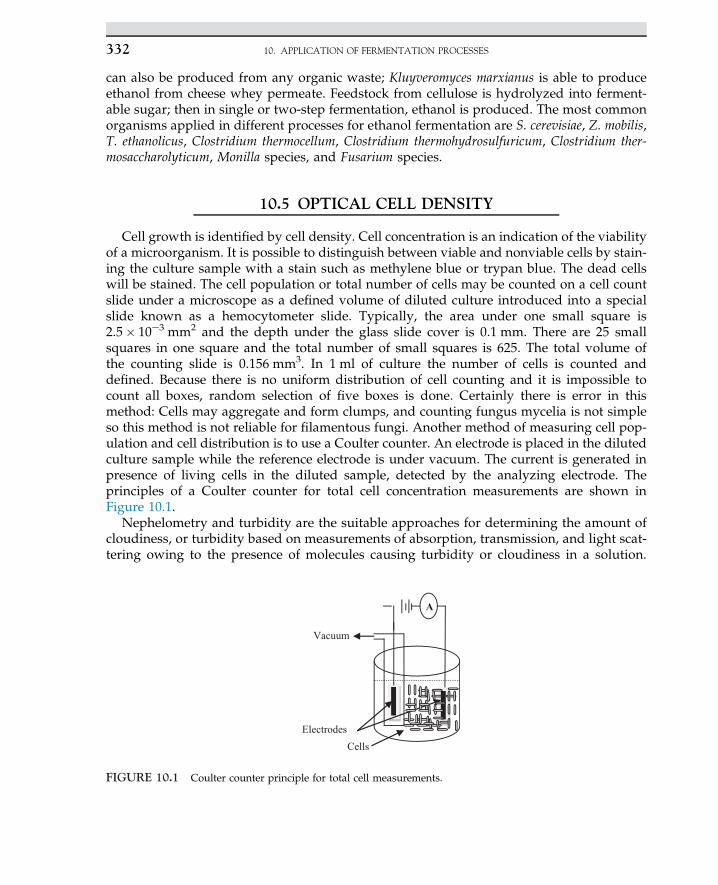
can also be produced from any organic waste; Kluyveromyces marxianus is able to produceethanol from cheese whey permeate. Feedstock from cellulose is hydrolyzed into ferment-able sugar; then in single or two-step fermentation, ethanol is produced. The most commonorganisms applied in different processes for ethanol fermentation are S. cerevisiae, Z. mobilis,T. ethanolicus, Clostridium thermocellum, Clostridium thermohydrosulfuricum, Clostridium ther-mosaccharolyticum, Monilla species, and Fusarium species.
10.5 OPTICAL CELL DENSITY
Cell growth is identified by cell density. Cell concentration is an indication of the viabilityof a microorganism. It is possible to distinguish between viable and nonviable cells by stain-ing the culture sample with a stain such as methylene blue or trypan blue. The dead cellswill be stained. The cell population or total number of cells may be counted on a cell countslide under a microscope as a defined volume of diluted culture introduced into a specialslide known as a hemocytometer slide. Typically, the area under one small square is2.5� 10e3 mm2 and the depth under the glass slide cover is 0.1 mm. There are 25 smallsquares in one square and the total number of small squares is 625. The total volume ofthe counting slide is 0.156 mm3. In 1 ml of culture the number of cells is counted anddefined. Because there is no uniform distribution of cell counting and it is impossible tocount all boxes, random selection of five boxes is done. Certainly there is error in thismethod: Cells may aggregate and form clumps, and counting fungus mycelia is not simpleso this method is not reliable for filamentous fungi. Another method of measuring cell pop-ulation and cell distribution is to use a Coulter counter. An electrode is placed in the dilutedculture sample while the reference electrode is under vacuum. The current is generated inpresence of living cells in the diluted sample, detected by the analyzing electrode. Theprinciples of a Coulter counter for total cell concentration measurements are shown inFigure 10.1.
Nephelometry and turbidity are the suitable approaches for determining the amount ofcloudiness, or turbidity based on measurements of absorption, transmission, and light scat-tering owing to the presence of molecules causing turbidity or cloudiness in a solution.
Vacuum
ElectrodesCells
A
FIGURE 10.1 Coulter counter principle for total cell measurements.
10. APPLICATION OF FERMENTATION PROCESSES332
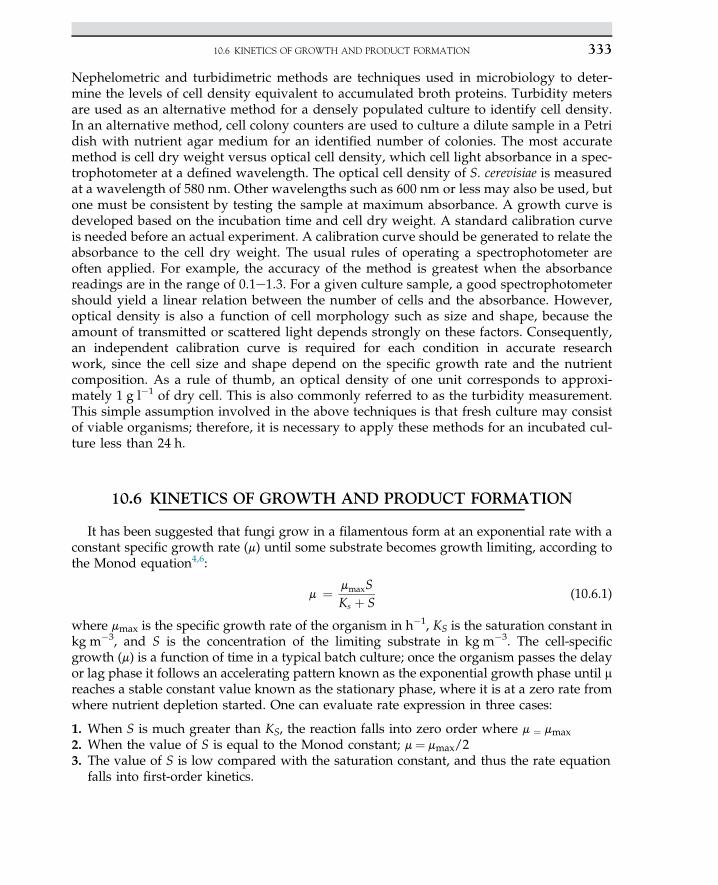
Nephelometric and turbidimetric methods are techniques used in microbiology to deter-mine the levels of cell density equivalent to accumulated broth proteins. Turbidity metersare used as an alternative method for a densely populated culture to identify cell density.In an alternative method, cell colony counters are used to culture a dilute sample in a Petridish with nutrient agar medium for an identified number of colonies. The most accuratemethod is cell dry weight versus optical cell density, which cell light absorbance in a spec-trophotometer at a defined wavelength. The optical cell density of S. cerevisiae is measuredat a wavelength of 580 nm. Other wavelengths such as 600 nm or less may also be used, butone must be consistent by testing the sample at maximum absorbance. A growth curve isdeveloped based on the incubation time and cell dry weight. A standard calibration curveis needed before an actual experiment. A calibration curve should be generated to relate theabsorbance to the cell dry weight. The usual rules of operating a spectrophotometer areoften applied. For example, the accuracy of the method is greatest when the absorbancereadings are in the range of 0.1e1.3. For a given culture sample, a good spectrophotometershould yield a linear relation between the number of cells and the absorbance. However,optical density is also a function of cell morphology such as size and shape, because theamount of transmitted or scattered light depends strongly on these factors. Consequently,an independent calibration curve is required for each condition in accurate researchwork, since the cell size and shape depend on the specific growth rate and the nutrientcomposition. As a rule of thumb, an optical density of one unit corresponds to approxi-mately 1 g l�1 of dry cell. This is also commonly referred to as the turbidity measurement.This simple assumption involved in the above techniques is that fresh culture may consistof viable organisms; therefore, it is necessary to apply these methods for an incubated cul-ture less than 24 h.
10.6 KINETICS OF GROWTH AND PRODUCT FORMATION
It has been suggested that fungi grow in a filamentous form at an exponential rate with aconstant specific growth rate (m) until some substrate becomes growth limiting, according tothe Monod equation4,6:
m ¼ mmaxSKs þ S
(10.6.1)
where mmax is the specific growth rate of the organism in h�1, KS is the saturation constant inkg m�3, and S is the concentration of the limiting substrate in kg m�3. The cell-specificgrowth (m) is a function of time in a typical batch culture; once the organism passes the delayor lag phase it follows an accelerating pattern known as the exponential growth phase until mreaches a stable constant value known as the stationary phase, where it is at a zero rate fromwhere nutrient depletion started. One can evaluate rate expression in three cases:
1. When S is much greater than KS, the reaction falls into zero order where m ¼ mmax2. When the value of S is equal to the Monod constant; m¼ mmax/23. The value of S is low compared with the saturation constant, and thus the rate equation
falls into first-order kinetics.
10.6 KINETICS OF GROWTH AND PRODUCT FORMATION 333
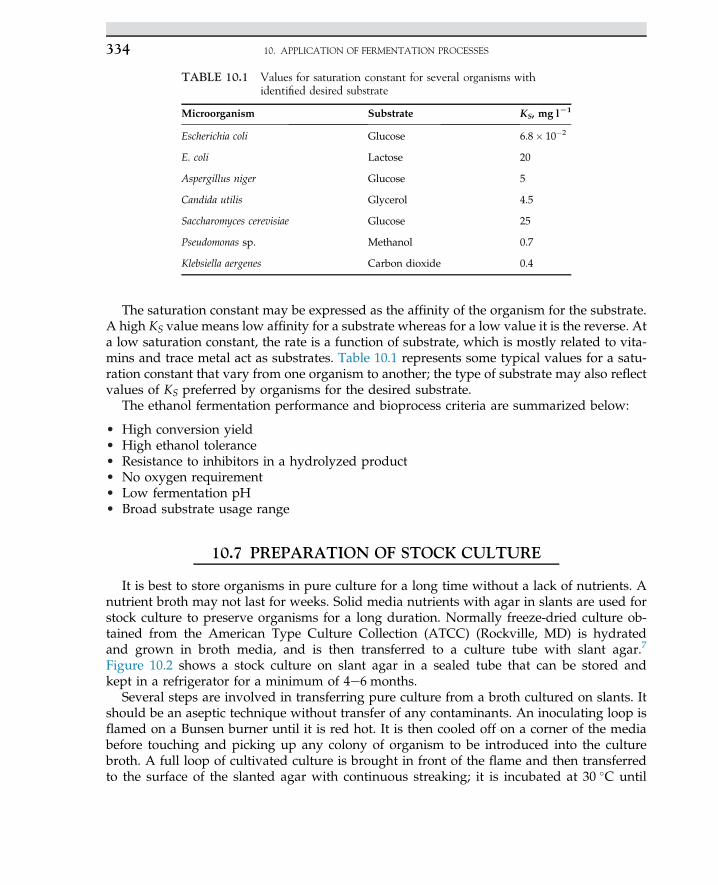
The saturation constant may be expressed as the affinity of the organism for the substrate.A high KS value means low affinity for a substrate whereas for a low value it is the reverse. Ata low saturation constant, the rate is a function of substrate, which is mostly related to vita-mins and trace metal act as substrates. Table 10.1 represents some typical values for a satu-ration constant that vary from one organism to another; the type of substrate may also reflectvalues of KS preferred by organisms for the desired substrate.
The ethanol fermentation performance and bioprocess criteria are summarized below:
• High conversion yield• High ethanol tolerance• Resistance to inhibitors in a hydrolyzed product• No oxygen requirement• Low fermentation pH• Broad substrate usage range
10.7 PREPARATION OF STOCK CULTURE
It is best to store organisms in pure culture for a long time without a lack of nutrients. Anutrient broth may not last for weeks. Solid media nutrients with agar in slants are used forstock culture to preserve organisms for a long duration. Normally freeze-dried culture ob-tained from the American Type Culture Collection (ATCC) (Rockville, MD) is hydratedand grown in broth media, and is then transferred to a culture tube with slant agar.7
Figure 10.2 shows a stock culture on slant agar in a sealed tube that can be stored andkept in a refrigerator for a minimum of 4e6 months.
Several steps are involved in transferring pure culture from a broth cultured on slants. Itshould be an aseptic technique without transfer of any contaminants. An inoculating loop isflamed on a Bunsen burner until it is red hot. It is then cooled off on a corner of the mediabefore touching and picking up any colony of organism to be introduced into the culturebroth. A full loop of cultivated culture is brought in front of the flame and then transferredto the surface of the slanted agar with continuous streaking; it is incubated at 30 �C until
TABLE 10.1 Values for saturation constant for several organisms withidentified desired substrate
Microorganism Substrate KS, mg lL1
Escherichia coli Glucose 6.8� 10�2
E. coli Lactose 20
Aspergillus niger Glucose 5
Candida utilis Glycerol 4.5
Saccharomyces cerevisiae Glucose 25
Pseudomonas sp. Methanol 0.7
Klebsiella aergenes Carbon dioxide 0.4
10. APPLICATION OF FERMENTATION PROCESSES334
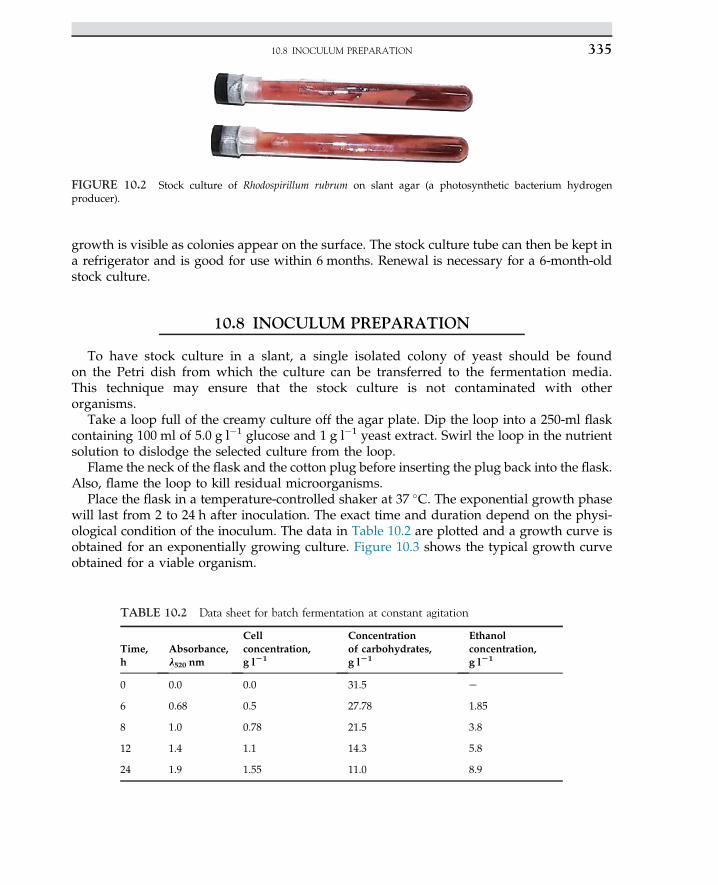
growth is visible as colonies appear on the surface. The stock culture tube can then be kept ina refrigerator and is good for use within 6 months. Renewal is necessary for a 6-month-oldstock culture.
10.8 INOCULUM PREPARATION
To have stock culture in a slant, a single isolated colony of yeast should be foundon the Petri dish from which the culture can be transferred to the fermentation media.This technique may ensure that the stock culture is not contaminated with otherorganisms.
Take a loop full of the creamy culture off the agar plate. Dip the loop into a 250-ml flaskcontaining 100 ml of 5.0 g l�1 glucose and 1 g l�1 yeast extract. Swirl the loop in the nutrientsolution to dislodge the selected culture from the loop.
Flame the neck of the flask and the cotton plug before inserting the plug back into the flask.Also, flame the loop to kill residual microorganisms.
Place the flask in a temperature-controlled shaker at 37 �C. The exponential growth phasewill last from 2 to 24 h after inoculation. The exact time and duration depend on the physi-ological condition of the inoculum. The data in Table 10.2 are plotted and a growth curve isobtained for an exponentially growing culture. Figure 10.3 shows the typical growth curveobtained for a viable organism.
TABLE 10.2 Data sheet for batch fermentation at constant agitation
Time,h
Absorbance,l520 nm
Cellconcentration,g lL1
Concentrationof carbohydrates,g lL1
Ethanolconcentration,g lL1
0 0.0 0.0 31.5 e
6 0.68 0.5 27.78 1.85
8 1.0 0.78 21.5 3.8
12 1.4 1.1 14.3 5.8
24 1.9 1.55 11.0 8.9
FIGURE 10.2 Stock culture of Rhodospirillum rubrum on slant agar (a photosynthetic bacterium hydrogenproducer).
10.8 INOCULUM PREPARATION 335
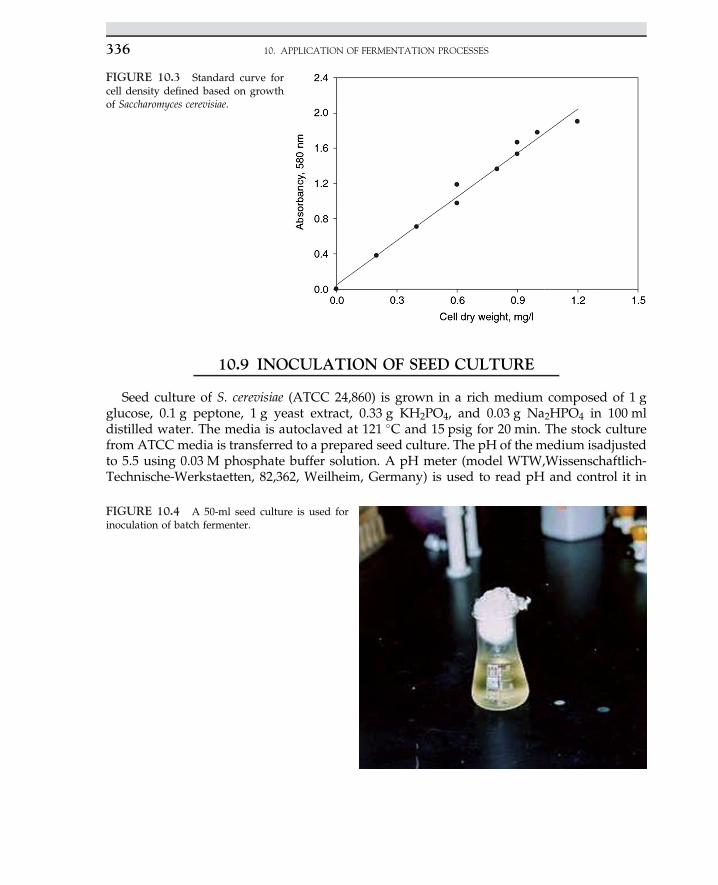
10.9 INOCULATION OF SEED CULTURE
Seed culture of S. cerevisiae (ATCC 24,860) is grown in a rich medium composed of 1 gglucose, 0.1 g peptone, 1 g yeast extract, 0.33 g KH2PO4, and 0.03 g Na2HPO4 in 100 mldistilled water. The media is autoclaved at 121 �C and 15 psig for 20 min. The stock culturefrom ATCC media is transferred to a prepared seed culture. The pH of the medium isadjustedto 5.5 using 0.03 M phosphate buffer solution. A pH meter (model WTW,Wissenschaftlich-Technische-Werkstaetten, 82,362, Weilheim, Germany) is used to read pH and control it in
FIGURE 10.3 Standard curve forcell density defined based on growthof Saccharomyces cerevisiae.
FIGURE 10.4 A 50-ml seed culture is used forinoculation of batch fermenter.
10. APPLICATION OF FERMENTATION PROCESSES336
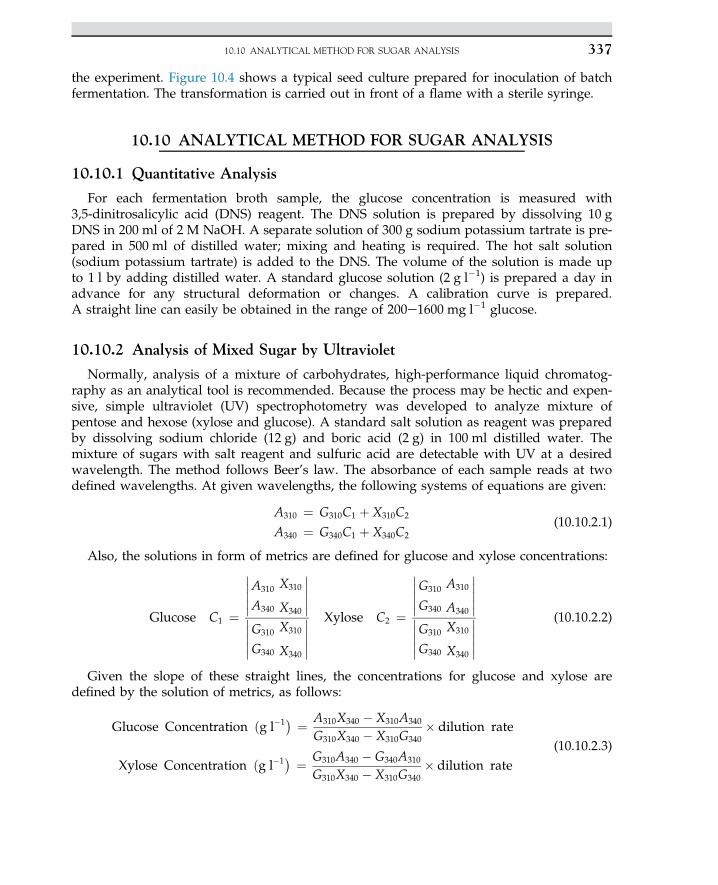
the experiment. Figure 10.4 shows a typical seed culture prepared for inoculation of batchfermentation. The transformation is carried out in front of a flame with a sterile syringe.
10.10 ANALYTICAL METHOD FOR SUGAR ANALYSIS
10.10.1 Quantitative Analysis
For each fermentation broth sample, the glucose concentration is measured with3,5-dinitrosalicylic acid (DNS) reagent. The DNS solution is prepared by dissolving 10 gDNS in 200 ml of 2 M NaOH. A separate solution of 300 g sodium potassium tartrate is pre-pared in 500 ml of distilled water; mixing and heating is required. The hot salt solution(sodium potassium tartrate) is added to the DNS. The volume of the solution is made upto 1 l by adding distilled water. A standard glucose solution (2 g l�1) is prepared a day inadvance for any structural deformation or changes. A calibration curve is prepared.A straight line can easily be obtained in the range of 200e1600 mg l�1 glucose.
10.10.2 Analysis of Mixed Sugar by Ultraviolet
Normally, analysis of a mixture of carbohydrates, high-performance liquid chromatog-raphy as an analytical tool is recommended. Because the process may be hectic and expen-sive, simple ultraviolet (UV) spectrophotometry was developed to analyze mixture ofpentose and hexose (xylose and glucose). A standard salt solution as reagent was preparedby dissolving sodium chloride (12 g) and boric acid (2 g) in 100 ml distilled water. Themixture of sugars with salt reagent and sulfuric acid are detectable with UV at a desiredwavelength. The method follows Beer’s law. The absorbance of each sample reads at twodefined wavelengths. At given wavelengths, the following systems of equations are given:
A310 ¼ G310C1 þ X310C2
A340 ¼ G340C1 þ X340C2(10.10.2.1)
Also, the solutions in form of metrics are defined for glucose and xylose concentrations:
Glucose C1 ¼
�����A310
A340
X310
X340
����������G310
G340
X310
X340
�����
Xylose C2 ¼
�����G310
G340
A310
A340
����������G310
G340
X310
X340
�����
(10.10.2.2)
Given the slope of these straight lines, the concentrations for glucose and xylose aredefined by the solution of metrics, as follows:
Glucose Concentration ðg l�1� ¼ A310X340 � X310A340
G310X340 � X310G340� dilution rate
Xylose Concentration ðg l�1� ¼ G310A340 � G340A310
G310X340 � X310G340� dilution rate
(10.10.2.3)
10.10 ANALYTICAL METHOD FOR SUGAR ANALYSIS 337
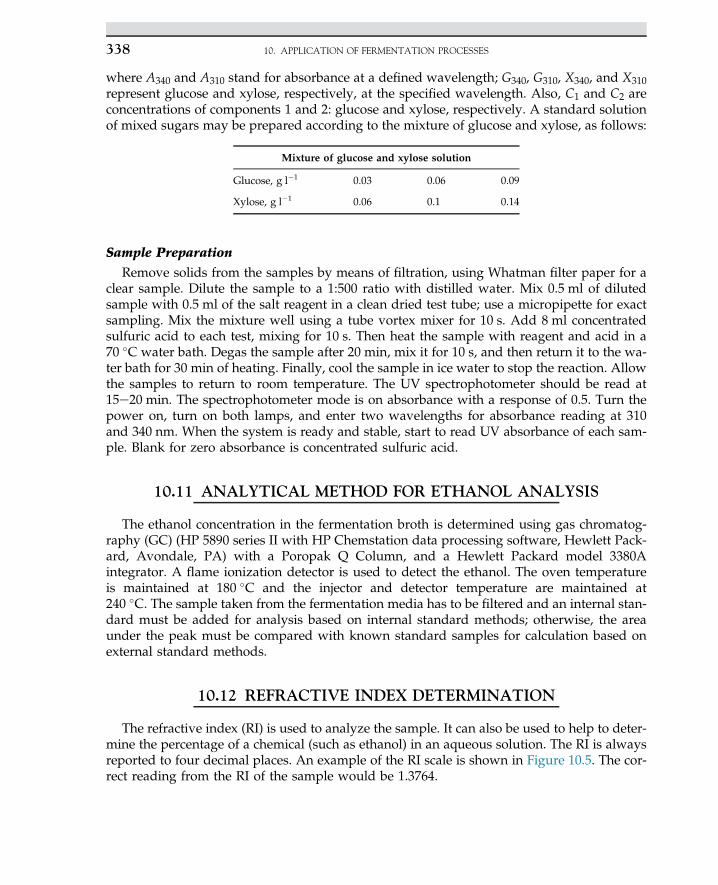
where A340 and A310 stand for absorbance at a defined wavelength; G340, G310, X340, and X310represent glucose and xylose, respectively, at the specified wavelength. Also, C1 and C2 areconcentrations of components 1 and 2: glucose and xylose, respectively. A standard solutionof mixed sugars may be prepared according to the mixture of glucose and xylose, as follows:
Mixture of glucose and xylose solution
Glucose, g l�1 0.03 0.06 0.09
Xylose, g l�1 0.06 0.1 0.14
Sample Preparation
Remove solids from the samples by means of filtration, using Whatman filter paper for aclear sample. Dilute the sample to a 1:500 ratio with distilled water. Mix 0.5 ml of dilutedsample with 0.5 ml of the salt reagent in a clean dried test tube; use a micropipette for exactsampling. Mix the mixture well using a tube vortex mixer for 10 s. Add 8 ml concentratedsulfuric acid to each test, mixing for 10 s. Then heat the sample with reagent and acid in a70 �C water bath. Degas the sample after 20 min, mix it for 10 s, and then return it to the wa-ter bath for 30 min of heating. Finally, cool the sample in ice water to stop the reaction. Allowthe samples to return to room temperature. The UV spectrophotometer should be read at15e20 min. The spectrophotometer mode is on absorbance with a response of 0.5. Turn thepower on, turn on both lamps, and enter two wavelengths for absorbance reading at 310and 340 nm. When the system is ready and stable, start to read UV absorbance of each sam-ple. Blank for zero absorbance is concentrated sulfuric acid.
10.11 ANALYTICAL METHOD FOR ETHANOL ANALYSIS
The ethanol concentration in the fermentation broth is determined using gas chromatog-raphy (GC) (HP 5890 series II with HP Chemstation data processing software, Hewlett Pack-ard, Avondale, PA) with a Poropak Q Column, and a Hewlett Packard model 3380Aintegrator. A flame ionization detector is used to detect the ethanol. The oven temperatureis maintained at 180 �C and the injector and detector temperature are maintained at240 �C. The sample taken from the fermentation media has to be filtered and an internal stan-dard must be added for analysis based on internal standard methods; otherwise, the areaunder the peak must be compared with known standard samples for calculation based onexternal standard methods.
10.12 REFRACTIVE INDEX DETERMINATION
The refractive index (RI) is used to analyze the sample. It can also be used to help to deter-mine the percentage of a chemical (such as ethanol) in an aqueous solution. The RI is alwaysreported to four decimal places. An example of the RI scale is shown in Figure 10.5. The cor-rect reading from the RI of the sample would be 1.3764.
10. APPLICATION OF FERMENTATION PROCESSES338
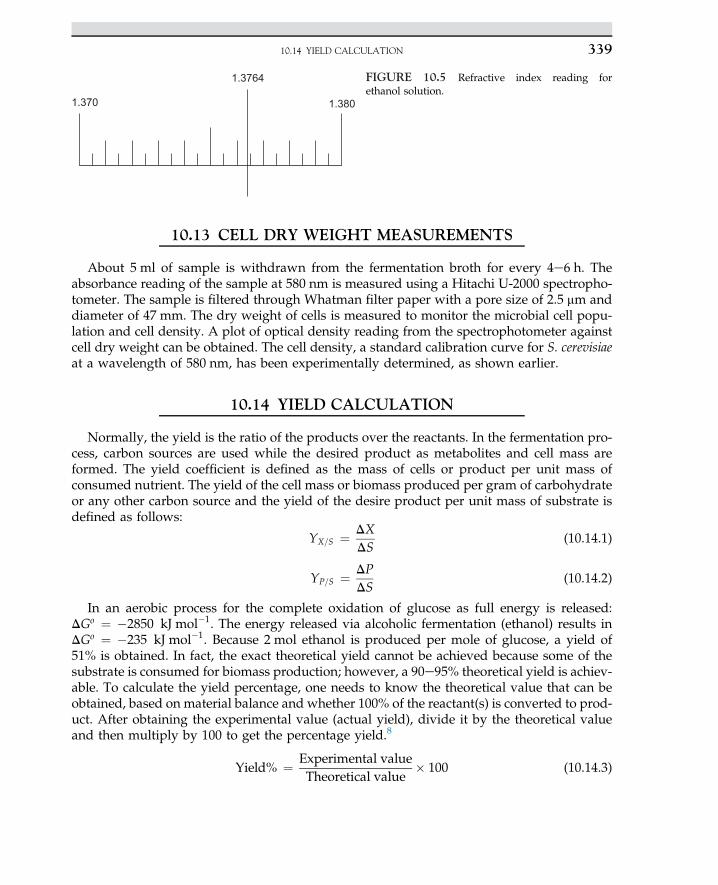
10.13 CELL DRY WEIGHT MEASUREMENTS
About 5 ml of sample is withdrawn from the fermentation broth for every 4e6 h. Theabsorbance reading of the sample at 580 nm is measured using a Hitachi U-2000 spectropho-tometer. The sample is filtered through Whatman filter paper with a pore size of 2.5 mm anddiameter of 47 mm. The dry weight of cells is measured to monitor the microbial cell popu-lation and cell density. A plot of optical density reading from the spectrophotometer againstcell dry weight can be obtained. The cell density, a standard calibration curve for S. cerevisiaeat a wavelength of 580 nm, has been experimentally determined, as shown earlier.
10.14 YIELD CALCULATION
Normally, the yield is the ratio of the products over the reactants. In the fermentation pro-cess, carbon sources are used while the desired product as metabolites and cell mass areformed. The yield coefficient is defined as the mass of cells or product per unit mass ofconsumed nutrient. The yield of the cell mass or biomass produced per gram of carbohydrateor any other carbon source and the yield of the desire product per unit mass of substrate isdefined as follows:
YX=S ¼ DXDS
(10.14.1)
YP=S ¼ DPDS
(10.14.2)
In an aerobic process for the complete oxidation of glucose as full energy is released:DGo ¼ �2850 kJ mol�1. The energy released via alcoholic fermentation (ethanol) results inDGo ¼ �235 kJ mol�1. Because 2 mol ethanol is produced per mole of glucose, a yield of51% is obtained. In fact, the exact theoretical yield cannot be achieved because some of thesubstrate is consumed for biomass production; however, a 90e95% theoretical yield is achiev-able. To calculate the yield percentage, one needs to know the theoretical value that can beobtained, based on material balance and whether 100% of the reactant(s) is converted to prod-uct. After obtaining the experimental value (actual yield), divide it by the theoretical valueand then multiply by 100 to get the percentage yield.8
Yield% ¼ Experimental value
Theoretical value� 100 (10.14.3)
1.370
1.3764
1.380
FIGURE 10.5 Refractive index reading forethanol solution.
10.14 YIELD CALCULATION 339
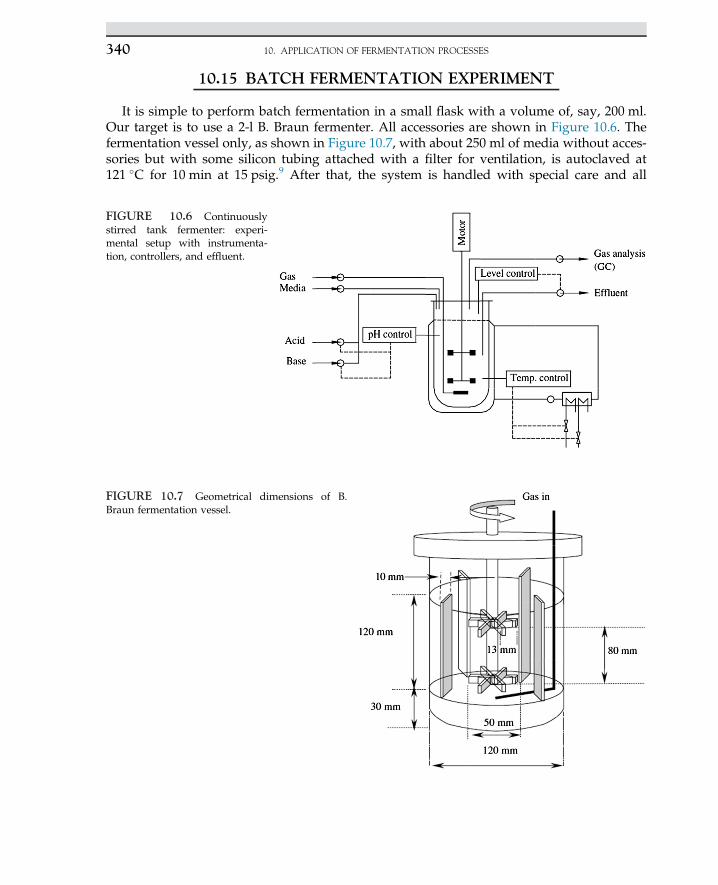
10.15 BATCH FERMENTATION EXPERIMENT
It is simple to perform batch fermentation in a small flask with a volume of, say, 200 ml.Our target is to use a 2-l B. Braun fermenter. All accessories are shown in Figure 10.6. Thefermentation vessel only, as shown in Figure 10.7, with about 250 ml of media without acces-sories but with some silicon tubing attached with a filter for ventilation, is autoclaved at121 �C for 10 min at 15 psig.9 After that, the system is handled with special care and all
FIGURE 10.6 Continuouslystirred tank fermenter: experi-mental setup with instrumenta-tion, controllers, and effluent.
FIGURE 10.7 Geometrical dimensions of B.Braun fermentation vessel.
10. APPLICATION OF FERMENTATION PROCESSES340
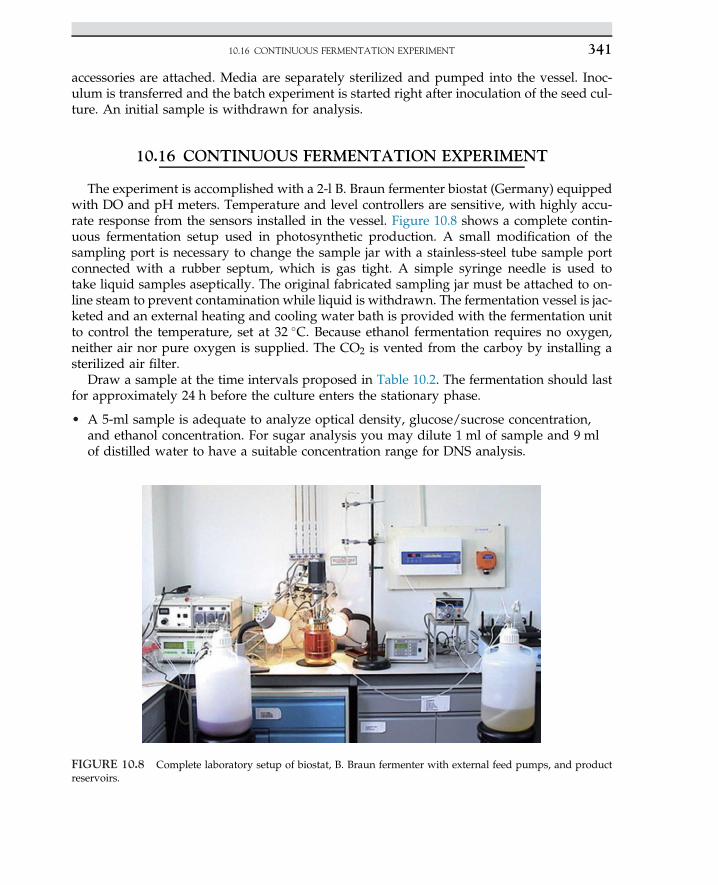
accessories are attached. Media are separately sterilized and pumped into the vessel. Inoc-ulum is transferred and the batch experiment is started right after inoculation of the seed cul-ture. An initial sample is withdrawn for analysis.
10.16 CONTINUOUS FERMENTATION EXPERIMENT
The experiment is accomplished with a 2-l B. Braun fermenter biostat (Germany) equippedwith DO and pH meters. Temperature and level controllers are sensitive, with highly accu-rate response from the sensors installed in the vessel. Figure 10.8 shows a complete contin-uous fermentation setup used in photosynthetic production. A small modification of thesampling port is necessary to change the sample jar with a stainless-steel tube sample portconnected with a rubber septum, which is gas tight. A simple syringe needle is used totake liquid samples aseptically. The original fabricated sampling jar must be attached to on-line steam to prevent contamination while liquid is withdrawn. The fermentation vessel is jac-keted and an external heating and cooling water bath is provided with the fermentation unitto control the temperature, set at 32 �C. Because ethanol fermentation requires no oxygen,neither air nor pure oxygen is supplied. The CO2 is vented from the carboy by installing asterilized air filter.
Draw a sample at the time intervals proposed in Table 10.2. The fermentation should lastfor approximately 24 h before the culture enters the stationary phase.
• A 5-ml sample is adequate to analyze optical density, glucose/sucrose concentration,and ethanol concentration. For sugar analysis you may dilute 1 ml of sample and 9 mlof distilled water to have a suitable concentration range for DNS analysis.
FIGURE 10.8 Complete laboratory setup of biostat, B. Braun fermenter with external feed pumps, and productreservoirs.
10.16 CONTINUOUS FERMENTATION EXPERIMENT 341
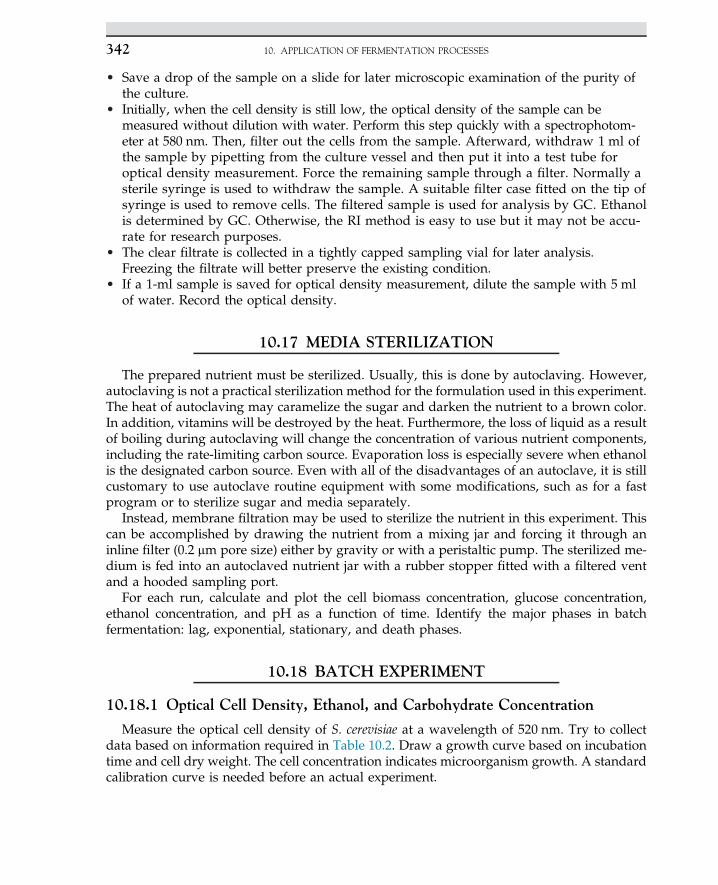
• Save a drop of the sample on a slide for later microscopic examination of the purity ofthe culture.
• Initially, when the cell density is still low, the optical density of the sample can bemeasured without dilution with water. Perform this step quickly with a spectrophotom-eter at 580 nm. Then, filter out the cells from the sample. Afterward, withdraw 1 ml ofthe sample by pipetting from the culture vessel and then put it into a test tube foroptical density measurement. Force the remaining sample through a filter. Normally asterile syringe is used to withdraw the sample. A suitable filter case fitted on the tip ofsyringe is used to remove cells. The filtered sample is used for analysis by GC. Ethanolis determined by GC. Otherwise, the RI method is easy to use but it may not be accu-rate for research purposes.
• The clear filtrate is collected in a tightly capped sampling vial for later analysis.Freezing the filtrate will better preserve the existing condition.
• If a 1-ml sample is saved for optical density measurement, dilute the sample with 5 mlof water. Record the optical density.
10.17 MEDIA STERILIZATION
The prepared nutrient must be sterilized. Usually, this is done by autoclaving. However,autoclaving is not a practical sterilization method for the formulation used in this experiment.The heat of autoclaving may caramelize the sugar and darken the nutrient to a brown color.In addition, vitamins will be destroyed by the heat. Furthermore, the loss of liquid as a resultof boiling during autoclaving will change the concentration of various nutrient components,including the rate-limiting carbon source. Evaporation loss is especially severe when ethanolis the designated carbon source. Even with all of the disadvantages of an autoclave, it is stillcustomary to use autoclave routine equipment with some modifications, such as for a fastprogram or to sterilize sugar and media separately.
Instead, membrane filtration may be used to sterilize the nutrient in this experiment. Thiscan be accomplished by drawing the nutrient from a mixing jar and forcing it through aninline filter (0.2 mm pore size) either by gravity or with a peristaltic pump. The sterilized me-dium is fed into an autoclaved nutrient jar with a rubber stopper fitted with a filtered ventand a hooded sampling port.
For each run, calculate and plot the cell biomass concentration, glucose concentration,ethanol concentration, and pH as a function of time. Identify the major phases in batchfermentation: lag, exponential, stationary, and death phases.
10.18 BATCH EXPERIMENT
10.18.1 Optical Cell Density, Ethanol, and Carbohydrate Concentration
Measure the optical cell density of S. cerevisiae at a wavelength of 520 nm. Try to collectdata based on information required in Table 10.2. Draw a growth curve based on incubationtime and cell dry weight. The cell concentration indicates microorganism growth. A standardcalibration curve is needed before an actual experiment.
10. APPLICATION OF FERMENTATION PROCESSES342
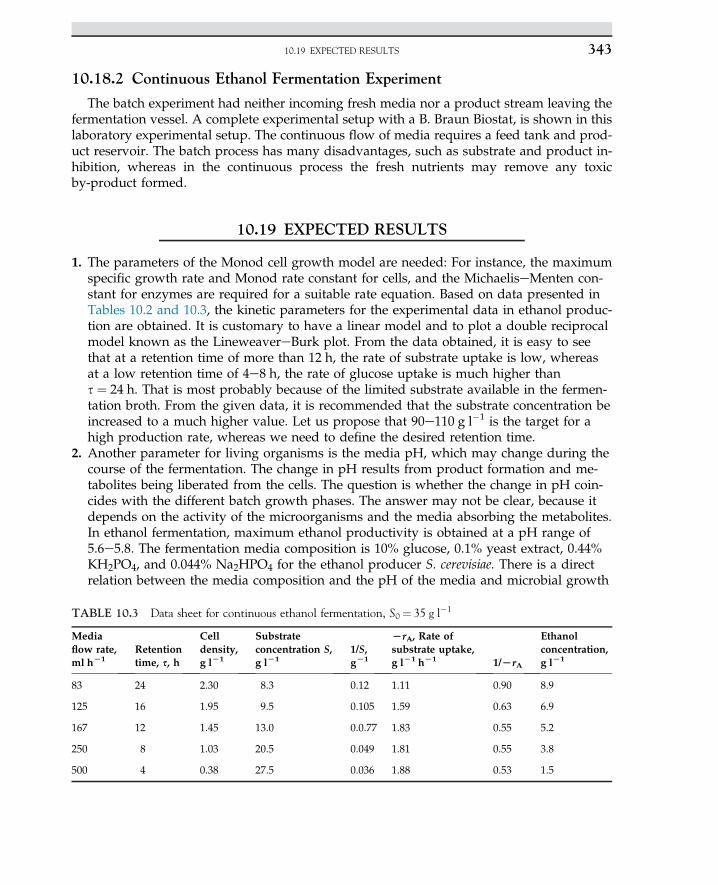
10.18.2 Continuous Ethanol Fermentation Experiment
The batch experiment had neither incoming fresh media nor a product stream leaving thefermentation vessel. A complete experimental setup with a B. Braun Biostat, is shown in thislaboratory experimental setup. The continuous flow of media requires a feed tank and prod-uct reservoir. The batch process has many disadvantages, such as substrate and product in-hibition, whereas in the continuous process the fresh nutrients may remove any toxicby-product formed.
10.19 EXPECTED RESULTS
1. The parameters of the Monod cell growth model are needed: For instance, the maximumspecific growth rate and Monod rate constant for cells, and the MichaeliseMenten con-stant for enzymes are required for a suitable rate equation. Based on data presented inTables 10.2 and 10.3, the kinetic parameters for the experimental data in ethanol produc-tion are obtained. It is customary to have a linear model and to plot a double reciprocalmodel known as the LineweavereBurk plot. From the data obtained, it is easy to seethat at a retention time of more than 12 h, the rate of substrate uptake is low, whereasat a low retention time of 4e8 h, the rate of glucose uptake is much higher thans ¼ 24 h. That is most probably because of the limited substrate available in the fermen-tation broth. From the given data, it is recommended that the substrate concentration beincreased to a much higher value. Let us propose that 90e110 g l�1 is the target for ahigh production rate, whereas we need to define the desired retention time.
2. Another parameter for living organisms is the media pH, which may change during thecourse of the fermentation. The change in pH results from product formation and me-tabolites being liberated from the cells. The question is whether the change in pH coin-cides with the different batch growth phases. The answer may not be clear, because itdepends on the activity of the microorganisms and the media absorbing the metabolites.In ethanol fermentation, maximum ethanol productivity is obtained at a pH range of5.6e5.8. The fermentation media composition is 10% glucose, 0.1% yeast extract, 0.44%KH2PO4, and 0.044% Na2HPO4 for the ethanol producer S. cerevisiae. There is a directrelation between the media composition and the pH of the media and microbial growth
TABLE 10.3 Data sheet for continuous ethanol fermentation, S0¼ 35 g l�1
Mediaflow rate,ml hL1
Retentiontime, s, h
Celldensity,g lL1
Substrateconcentration S,g lL1
1/S,gL1
LrA, Rate ofsubstrate uptake,g lL1 hL1 1/LrA
Ethanolconcentration,g lL1
83 24 2.30 8.3 0.12 1.11 0.90 8.9
125 16 1.95 9.5 0.105 1.59 0.63 6.9
167 12 1.45 13.0 0.0.77 1.83 0.55 5.2
250 8 1.03 20.5 0.049 1.81 0.55 3.8
500 4 0.38 27.5 0.036 1.88 0.53 1.5
10.19 EXPECTED RESULTS 343
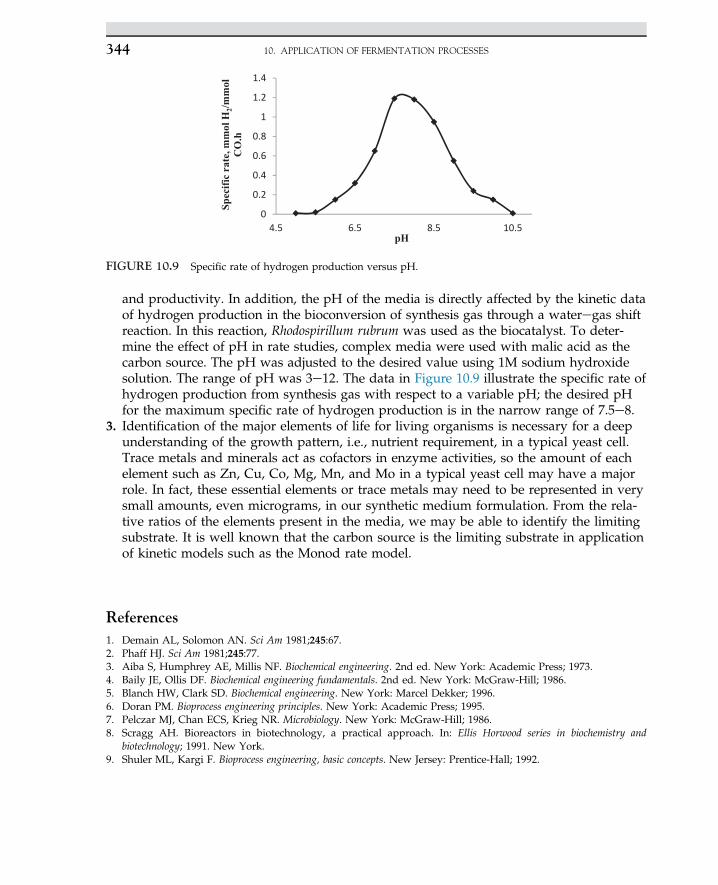
and productivity. In addition, the pH of the media is directly affected by the kinetic dataof hydrogen production in the bioconversion of synthesis gas through a wateregas shiftreaction. In this reaction, Rhodospirillum rubrum was used as the biocatalyst. To deter-mine the effect of pH in rate studies, complex media were used with malic acid as thecarbon source. The pH was adjusted to the desired value using 1M sodium hydroxidesolution. The range of pH was 3e12. The data in Figure 10.9 illustrate the specific rate ofhydrogen production from synthesis gas with respect to a variable pH; the desired pHfor the maximum specific rate of hydrogen production is in the narrow range of 7.5e8.
3. Identification of the major elements of life for living organisms is necessary for a deepunderstanding of the growth pattern, i.e., nutrient requirement, in a typical yeast cell.Trace metals and minerals act as cofactors in enzyme activities, so the amount of eachelement such as Zn, Cu, Co, Mg, Mn, and Mo in a typical yeast cell may have a majorrole. In fact, these essential elements or trace metals may need to be represented in verysmall amounts, even micrograms, in our synthetic medium formulation. From the rela-tive ratios of the elements present in the media, we may be able to identify the limitingsubstrate. It is well known that the carbon source is the limiting substrate in applicationof kinetic models such as the Monod rate model.
References1. Demain AL, Solomon AN. Sci Am 1981;245:67.2. Phaff HJ. Sci Am 1981;245:77.3. Aiba S, Humphrey AE, Millis NF. Biochemical engineering. 2nd ed. New York: Academic Press; 1973.4. Baily JE, Ollis DF. Biochemical engineering fundamentals. 2nd ed. New York: McGraw-Hill; 1986.5. Blanch HW, Clark SD. Biochemical engineering. New York: Marcel Dekker; 1996.6. Doran PM. Bioprocess engineering principles. New York: Academic Press; 1995.7. Pelczar MJ, Chan ECS, Krieg NR. Microbiology. New York: McGraw-Hill; 1986.8. Scragg AH. Bioreactors in biotechnology, a practical approach. In: Ellis Horwood series in biochemistry and
biotechnology; 1991. New York.9. Shuler ML, Kargi F. Bioprocess engineering, basic concepts. New Jersey: Prentice-Hall; 1992.
0
0.2
0.4
0.6
0.8
1
1.2
1.4
4.5 6.5 8.5 10.5Sp
ecifi
c ra
te, m
mol
H2/m
mol
C
O.h
pH
FIGURE 10.9 Specific rate of hydrogen production versus pH.
10. APPLICATION OF FERMENTATION PROCESSES344
C H A P T E R
11
Production of Antibiotics
O U T L I N E
11.1 Introduction 346
11.2 Herbal Medicines and ChemicalAgents 347
11.3 The History of Penicillin 348
11.4 Production of Penicillin 349
11.5 Microorganisms and Media 349
11.6 Inoculum Preparation 349
11.7 Filtration and Extraction ofPenicillin 352
11.8 Experimental Procedure 352
11.9 Fermenter Description 352
11.10 Analytical Method for Bioassayand Detection of Antibiotic 352
11.11 Antibiogram and Biological Assay 353
11.12 Submerged Culture 35411.12.1 Growth Kinetics in
Submerged Culture 354
11.13 Bioreactor Design and Control 355
11.14 Estimation of Dimension ofFermenter 356
11.15 Determination of the ReynoldsNumber 358
11.16 Determination of Power Input 358
11.17 Determination of OxygenTransfer Rate 359
11.18 Design Specification Sheet forthe Bioreactor 361
References 361
345Biochemical Engineering and Biotechnologyhttp://dx.doi.org/10.1016/B978-0-444-63357-6.00011-0 Copyright © 2015 Elsevier B.V. All rights reserved.
11.1 INTRODUCTION
Antibiotics are classified based on their mechanism of action or their function in a host.Some antibiotics are bactericides (an agent that destroys bacteria) whereas others are bacte-riostatic, meaning they may inhibit the growth of organisms and multiplication of bacteriabut do not kill them. In fact, they act by interfering with the synthesis of folic acid insidethe cell anabolism. Another method of classifying antibiotics is based on mode of action asantibiotic interact with an antigen. There are four modes of actions: (1) inhibition of cellwall synthesis, (2) damage of the membrane of the cell surrounded by cytoplasm, (3) inhibi-tion of nucleic acid protein synthesis, and (4) inhibition of specific enzyme systems.
Penicillin, cephalosporin, cytoserine, vancomycin, and bacitracin are among the antibioticsthat act as inhibitors of cell wall synthesis or biosynthesis of the peptidoglycan structure ofthe cell wall. These antibiotics hinder the formation of the peptidoglycan polymer, thus for-mation of the cell wall for cell synthesis is inhibited.
All prokaryote cells have a common peptidoglycan structure in their cell walls. The bio-polymers are responsible for cell shape and wall strength. The peptidoglycan polymeralternatively builds subunits of N-acetylmurmic acid, which is similar toN-acetylglucosamine. Pyruvic acid in between units serves as chain reaction for cross-linking of the cell wall with the biopolymer. There are four side chain units that act ascross-linking agents of the cell wall structure: L-alanine, D-glutamic acid, diaminopimelicacid (a compound like an amino acid), and D-alanine. The peptidoglycan content of thecell wall of different strains of bacteria may vary. The contents of cell walls of more than50% of Gram-positive bacteria and less than 10% of Gram-negative bacteria are thebiopolymer of peptidoglycan.
There are a number of bacteria not susceptible to penicillin or inhibition of the cell wall; thebiosynthesis of peptidoglycan is not working in the antibiotic mechanisms; that is due toabsence of these biopolymers in the cell wall structure. For instance, in Mycoplasma, the cellwall is completely lacking peptidoglycan structures. Therefore, penicillin is not able to func-tion as an inhibitor in such organisms. The rigidity of the cell wall and the shape of the celldepend on the content of the peptidoglycan polymer. If an organism is unable to synthesizesuch a biopolymer for its cell wall, then its replication is hindered. Such mechanisms of actioncertainly work for Gram-positive bacteria.
Penicillins are known as b-lactam antibiotics and have a related structure with differentproperties and activities. The antibiotic, with various side chains of chemicals attached tomain core of the antibiotic, makes different generations of penicillin. Some strains of bacteriaare resistant to penicillin as a result of enzymes produced that break down and inactivateantibiotics. One such enzyme is penicillinase, which deactivates penicillin. The enzyme issynthesized by group of Gram-negative bacteria. In addition, penicillin is deactivated byheat, sodium hydroxide, and strong acid solutions. Among the penicillins, which aremuch more resistant to acid, may act more efficient would be penicillin V. It is now knownthat a new generation of a synthesized penicillin with active side chains may be a bacteri-cide; it kills the bacteria rather than inhibits their growth. The bacteria may be destroyedfrom osmotic damage of the unprotected outer wall, which means that penicillin may notbe a suitable antibiotic for the treatment of Gram-negative bacteria because of its cell wallcomposition, which is completely different than others. However, a high biopolymer contentof peptidoglycan of Gram-positive bacteria is a suitable target for penicillin to act as an in-hibitor of biosynthesis of the cell wall.
11. PRODUCTION OF ANTIBIOTICS346
Antibiotics are produced by fermentation. The process may take a few days to obtain anextractable amount of product. Antibiotic production is done in a batch process. Oxygentransport is the major concern; therefore, sufficient polymeric sugar and protein with a traceamount of elemental growth factors are used to enhance production yield. An antibiogramtest is used to observe the amount of antimicrobial agent in the fermentation broth. Abioassay determines the activity unit of the bactericides.
11.2 HERBAL MEDICINES AND CHEMICAL AGENTS
Herbal medicine was used in ancient treatments. Natural chemicals extracted from herbswere used. For 17 centuries, natural quinine extracted from the bark of a particular tree knownas cinchona was used to treat malaria. Native Americans and southern Asians were able tofight malaria by chewing the bark of cinchona trees. Over time, chemical agents were identi-fied and used for treating patients. Toxic compounds such as mercury were used to treatsyphilis for 18 centuries. Even arsenic compounds were used to cure many diseases withoutgreat danger to the patient. Arsphenamine and neoarsphenamine were also used to treat pa-tients with syphilis. Investigation of chemotherapy expanded into a wide range of com-pounds. Chemotherapy is known as the treatment of disease with chemicals calledchemotherapy agents. Treatment with chemicals had been practiced for many centuries. Duringthe mid 1950s, the first generation of sulfonamide was used successfully against certain bac-teria, which was a great victory in the field of medicine. Antibiotics as chemotherapy agentswere discovered. The action of drugs or chemical agents was to destroy germs, to control thegrowth of microorganisms, or to prevent microbial growth, with the aim of treating a patient.The chemical substances had selective toxicity, and overdosing created complications for thehost. The side effects of chemicals were monitored based on observed symptoms during andafter treatment. The drug targeted specific germs and parasites. In general, germicides are notselective in their mechanisms and often interfere with the immune system. Inactivation ofgerms and parasites with antigens and antibody mechanisms played a major role in the devel-opment of germicides and antiseptic agents. The action was similar to the inactivation ofprotein antigensdby destroying, killing, or deactivating any unknown bodies penetratingthe host. The action of chemotherapeutic agents in a host can be summarized as follows:
• The antibiotic agents may destroy or prevent the germs or parasites, without creatingany injury to the host cell or with only minimal toxicity to the host.
• The chemical agents should contact the parasite by prevention or by diffusion throughthe cells and tissues of the host at suitable doses and effective concentrations.
• The action should not disturb the immune system, such as cell defense actions (knownas phagocytosis) production of antibodies, which takes place naturally in the presence ofparasites.
• These agents profoundly prevent production of bacterial nucleic acids and inhibit ge-netic replication.
Sulfonamides are very useful in treating bacterial infections, especially the infectiousagents of known microorganisms such as meningococci and Shigella, respiratory infectionscaused by streptococci and staphylococci, and urinary tract infections resulting fromGram-negative microorganisms. Sulfonamide drugs are strongly recommended for rheu-matic fever, endocarditis, and urinary tract infections after any surgery.1
11.2 HERBAL MEDICINES AND CHEMICAL AGENTS 347
11.3 THE HISTORY OF PENICILLIN
The original organism for producing penicillin, Penicillium notatum, was isolated by Alex-ander Fleming in 1926 as a chance contaminant while culturing other organisms. However,all the penicillin-producing strains were isolated and purified from an infected cantaloupe ob-tained from a market in Peoria, Illinois.1 The infecting organism was Penicillium chrysogenum.The original wild strain of Penicillium produces a yellow pigment devoid of antibiotic prop-erties that colors the final product. Production of antibiotics by mutants does not produce anypigment and yields a colorless end product.
The chemotherapeutic agent extractedorobtained fromsecondarymetabolites of living cells isknown as an antibiotic. The terms antibiotic and antibiosiswere introducedduring the 20th centurywhen Alexander Fleming, during the 1930s, accidentally found mold contaminating a culturewhile hewas cultivatingmicroorganisms.At the time, Flemingwas culturing Staphyloccus aureuson a platewith a thin agar layer. His cultured plate was contaminatedwith amold. The amazingpart of his work was that he found nomicrobial growth within a radius of 3e5 cm of the mold.2
Normally, any contaminated culture is taken out of the investigation cycle, but Fleming wascurious and decided to continue his investigation.Hewanted to knowwhy therewas no growthin presence of the mold. He needed to knowwhat the toxic metabolite was that killed the organ-isms in the neighborhood of the mold. He found that the cell metabolites were able to lyse anddissolve the cell walls of the microorganisms. He identified the contaminants as mold. Later,the mold was identified as Penicillium sp. Fleming named the drug penicillin, which was isolatedfrom P. notatum. Fleming had discovered a new antibiotic, and for his great contribution he wasawarded the Nobel Prize, in the field of medicine and physiology in 1945. His discoveryansweredhis questionofwhy the colonyofStaphylococcusdidnot grow inpresence ofP. notatum.
The commercial production of penicillin and other antibiotics is the most dramaticexample of industrial microbiology. The annual production of bulk penicillin is about 33million lb, with an annual sales market of more than US$344 million.1
Production of penicillin has been superseded by a better antibiotic-producing mold spe-cies: P. chrysogenum. The development of submerged culture techniques has enhanced thecultivation of the mold in large-scale operations using a sterile air supply. The developmentof advanced fermentation technologies lead in to utilize suitable nutrient resources, potentialstrain of microorganisms and the biosynthesis of organic compounds stated as follows:
• Streptomycin is produced by Actinomycetes.• Molasses, corn steep liquor, waste product from the sugar industry, and wet milling
corn are used for the production of penicillin.• P. chrysogenum can produce 1000 times more penicillin than Fleming’s original
culture.1,3,4
The major steps in the commercial production of penicillin are as follows:1. Preparation of inoculum.2. Preparation and sterilization of medium.3. Inoculation of the medium in the fermenter.4. Forced aeration with sterile air during incubation.5. Removal of mold mycelium after fermentation.6. Extraction and purification of the penicillin.
11. PRODUCTION OF ANTIBIOTICS348
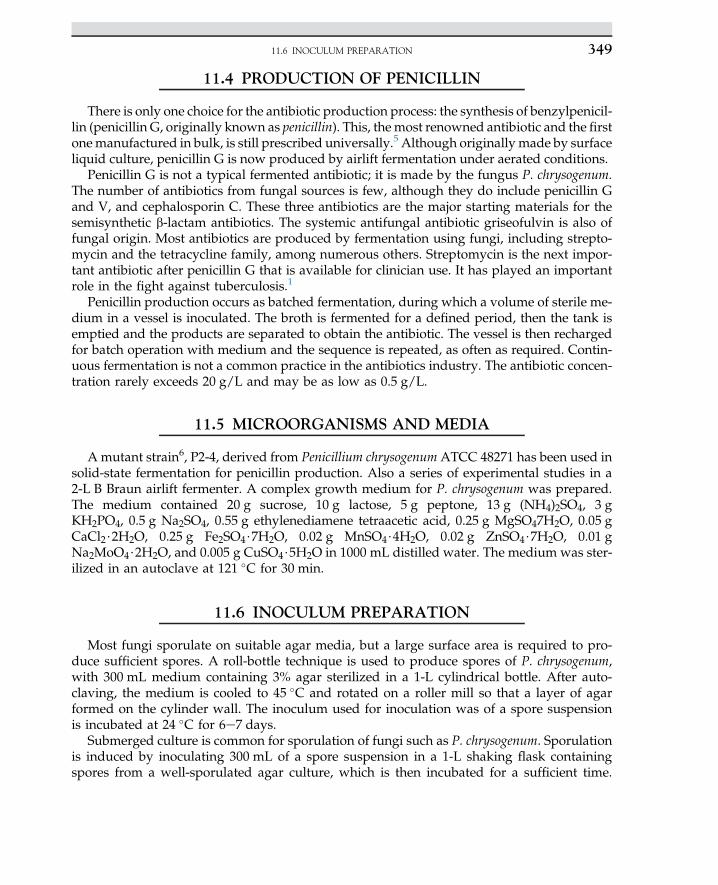
11.4 PRODUCTION OF PENICILLIN
There is only one choice for the antibiotic production process: the synthesis of benzylpenicil-lin (penicillin G, originally known as penicillin). This, themost renowned antibiotic and the firstonemanufactured in bulk, is still prescribed universally.5 Although originally made by surfaceliquid culture, penicillin G is now produced by airlift fermentation under aerated conditions.
Penicillin G is not a typical fermented antibiotic; it is made by the fungus P. chrysogenum.The number of antibiotics from fungal sources is few, although they do include penicillin Gand V, and cephalosporin C. These three antibiotics are the major starting materials for thesemisynthetic b-lactam antibiotics. The systemic antifungal antibiotic griseofulvin is also offungal origin. Most antibiotics are produced by fermentation using fungi, including strepto-mycin and the tetracycline family, among numerous others. Streptomycin is the next impor-tant antibiotic after penicillin G that is available for clinician use. It has played an importantrole in the fight against tuberculosis.1
Penicillin production occurs as batched fermentation, during which a volume of sterile me-dium in a vessel is inoculated. The broth is fermented for a defined period, then the tank isemptied and the products are separated to obtain the antibiotic. The vessel is then rechargedfor batch operation with medium and the sequence is repeated, as often as required. Contin-uous fermentation is not a common practice in the antibiotics industry. The antibiotic concen-tration rarely exceeds 20 g/L and may be as low as 0.5 g/L.
11.5 MICROORGANISMS AND MEDIA
Amutant strain6, P2-4, derived from Penicillium chrysogenum ATCC 48271 has been used insolid-state fermentation for penicillin production. Also a series of experimental studies in a2-L B Braun airlift fermenter. A complex growth medium for P. chrysogenum was prepared.The medium contained 20 g sucrose, 10 g lactose, 5 g peptone, 13 g (NH4)2SO4, 3 gKH2PO4, 0.5 g Na2SO4, 0.55 g ethylenediamene tetraacetic acid, 0.25 g MgSO47H2O, 0.05 gCaCl2$2H2O, 0.25 g Fe2SO4$7H2O, 0.02 g MnSO4$4H2O, 0.02 g ZnSO4$7H2O, 0.01 gNa2MoO4$2H2O, and 0.005 g CuSO4$5H2O in 1000 mL distilled water. The medium was ster-ilized in an autoclave at 121 �C for 30 min.
11.6 INOCULUM PREPARATION
Most fungi sporulate on suitable agar media, but a large surface area is required to pro-duce sufficient spores. A roll-bottle technique is used to produce spores of P. chrysogenum,with 300 mL medium containing 3% agar sterilized in a 1-L cylindrical bottle. After auto-claving, the medium is cooled to 45 �C and rotated on a roller mill so that a layer of agarformed on the cylinder wall. The inoculum used for inoculation was of a spore suspensionis incubated at 24 �C for 6e7 days.
Submerged culture is common for sporulation of fungi such as P. chrysogenum. Sporulationis induced by inoculating 300 mL of a spore suspension in a 1-L shaking flask containingspores from a well-sporulated agar culture, which is then incubated for a sufficient time.
11.6 INOCULUM PREPARATION 349
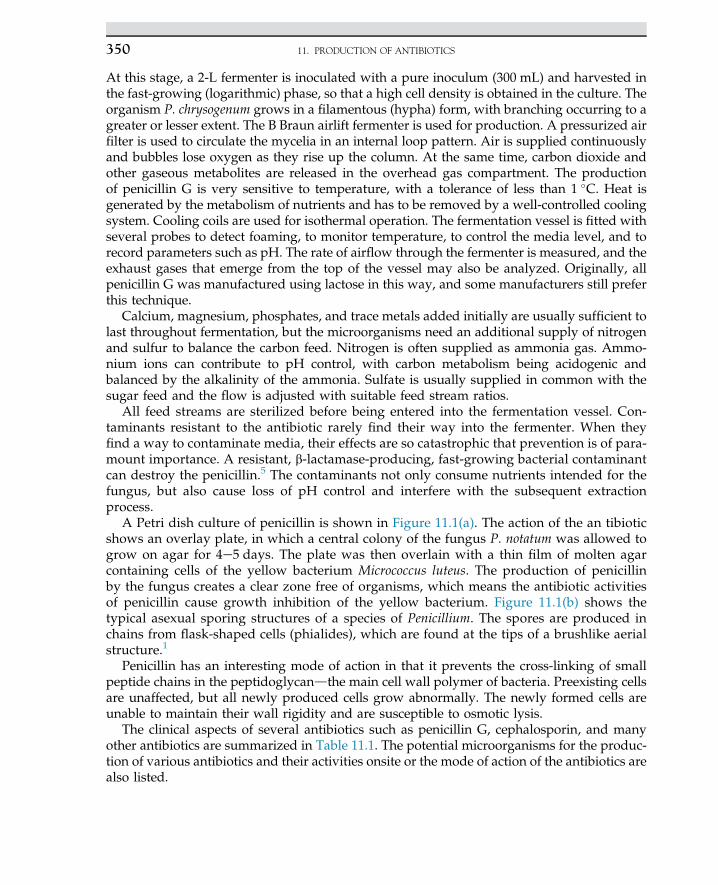
At this stage, a 2-L fermenter is inoculated with a pure inoculum (300 mL) and harvested inthe fast-growing (logarithmic) phase, so that a high cell density is obtained in the culture. Theorganism P. chrysogenum grows in a filamentous (hypha) form, with branching occurring to agreater or lesser extent. The B Braun airlift fermenter is used for production. A pressurized airfilter is used to circulate the mycelia in an internal loop pattern. Air is supplied continuouslyand bubbles lose oxygen as they rise up the column. At the same time, carbon dioxide andother gaseous metabolites are released in the overhead gas compartment. The productionof penicillin G is very sensitive to temperature, with a tolerance of less than 1 �C. Heat isgenerated by the metabolism of nutrients and has to be removed by a well-controlled coolingsystem. Cooling coils are used for isothermal operation. The fermentation vessel is fitted withseveral probes to detect foaming, to monitor temperature, to control the media level, and torecord parameters such as pH. The rate of airflow through the fermenter is measured, and theexhaust gases that emerge from the top of the vessel may also be analyzed. Originally, allpenicillin G was manufactured using lactose in this way, and some manufacturers still preferthis technique.
Calcium, magnesium, phosphates, and trace metals added initially are usually sufficient tolast throughout fermentation, but the microorganisms need an additional supply of nitrogenand sulfur to balance the carbon feed. Nitrogen is often supplied as ammonia gas. Ammo-nium ions can contribute to pH control, with carbon metabolism being acidogenic andbalanced by the alkalinity of the ammonia. Sulfate is usually supplied in common with thesugar feed and the flow is adjusted with suitable feed stream ratios.
All feed streams are sterilized before being entered into the fermentation vessel. Con-taminants resistant to the antibiotic rarely find their way into the fermenter. When theyfind a way to contaminate media, their effects are so catastrophic that prevention is of para-mount importance. A resistant, b-lactamase-producing, fast-growing bacterial contaminantcan destroy the penicillin.5 The contaminants not only consume nutrients intended for thefungus, but also cause loss of pH control and interfere with the subsequent extractionprocess.
A Petri dish culture of penicillin is shown in Figure 11.1(a). The action of the an tibioticshows an overlay plate, in which a central colony of the fungus P. notatum was allowed togrow on agar for 4e5 days. The plate was then overlain with a thin film of molten agarcontaining cells of the yellow bacterium Micrococcus luteus. The production of penicillinby the fungus creates a clear zone free of organisms, which means the antibiotic activitiesof penicillin cause growth inhibition of the yellow bacterium. Figure 11.1(b) shows thetypical asexual sporing structures of a species of Penicillium. The spores are produced inchains from flask-shaped cells (phialides), which are found at the tips of a brushlike aerialstructure.1
Penicillin has an interesting mode of action in that it prevents the cross-linking of smallpeptide chains in the peptidoglycandthe main cell wall polymer of bacteria. Preexisting cellsare unaffected, but all newly produced cells grow abnormally. The newly formed cells areunable to maintain their wall rigidity and are susceptible to osmotic lysis.
The clinical aspects of several antibiotics such as penicillin G, cephalosporin, and manyother antibiotics are summarized in Table 11.1. The potential microorganisms for the produc-tion of various antibiotics and their activities onsite or the mode of action of the antibiotics arealso listed.
11. PRODUCTION OF ANTIBIOTICS350
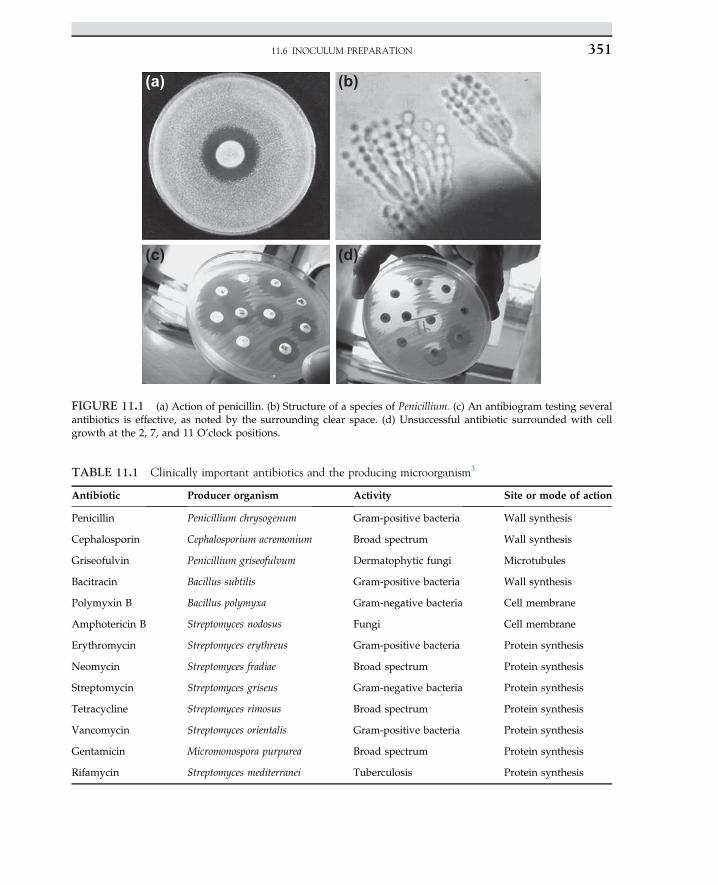
(a) (b)
(c) (d)
FIGURE 11.1 (a) Action of penicillin. (b) Structure of a species of Penicillium. (c) An antibiogram testing severalantibiotics is effective, as noted by the surrounding clear space. (d) Unsuccessful antibiotic surrounded with cellgrowth at the 2, 7, and 11 O’clock positions.
TABLE 11.1 Clinically important antibiotics and the producing microorganism3
Antibiotic Producer organism Activity Site or mode of action
Penicillin Penicillium chrysogenum Gram-positive bacteria Wall synthesis
Cephalosporin Cephalosporium acremonium Broad spectrum Wall synthesis
Griseofulvin Penicillium griseofulvum Dermatophytic fungi Microtubules
Bacitracin Bacillus subtilis Gram-positive bacteria Wall synthesis
Polymyxin B Bacillus polymyxa Gram-negative bacteria Cell membrane
Amphotericin B Streptomyces nodosus Fungi Cell membrane
Erythromycin Streptomyces erythreus Gram-positive bacteria Protein synthesis
Neomycin Streptomyces fradiae Broad spectrum Protein synthesis
Streptomycin Streptomyces griseus Gram-negative bacteria Protein synthesis
Tetracycline Streptomyces rimosus Broad spectrum Protein synthesis
Vancomycin Streptomyces orientalis Gram-positive bacteria Protein synthesis
Gentamicin Micromonospora purpurea Broad spectrum Protein synthesis
Rifamycin Streptomyces mediterranei Tuberculosis Protein synthesis
11.6 INOCULUM PREPARATION 351
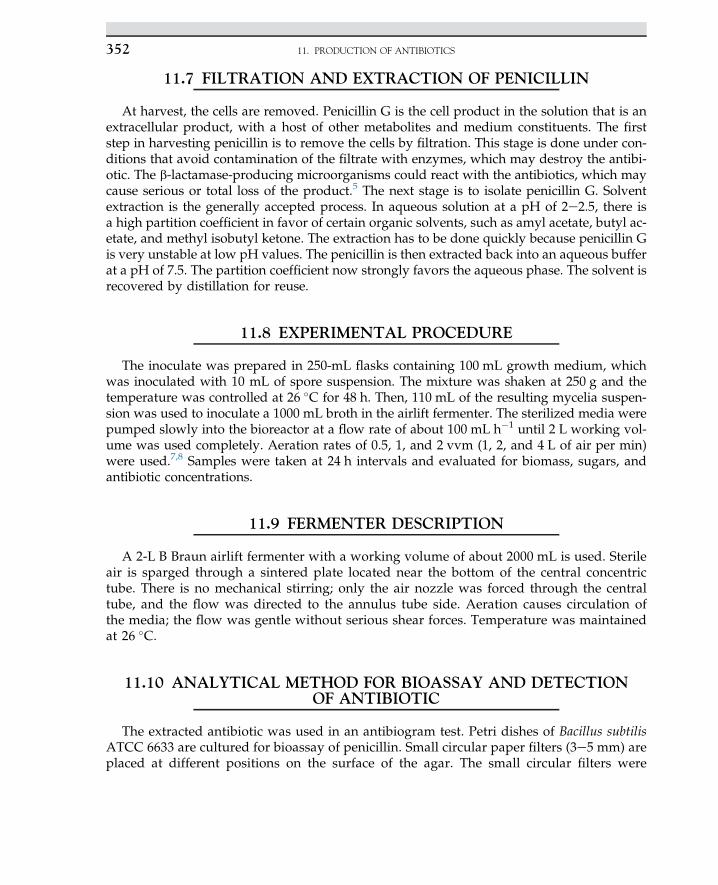
11.7 FILTRATION AND EXTRACTION OF PENICILLIN
At harvest, the cells are removed. Penicillin G is the cell product in the solution that is anextracellular product, with a host of other metabolites and medium constituents. The firststep in harvesting penicillin is to remove the cells by filtration. This stage is done under con-ditions that avoid contamination of the filtrate with enzymes, which may destroy the antibi-otic. The b-lactamase-producing microorganisms could react with the antibiotics, which maycause serious or total loss of the product.5 The next stage is to isolate penicillin G. Solventextraction is the generally accepted process. In aqueous solution at a pH of 2e2.5, there isa high partition coefficient in favor of certain organic solvents, such as amyl acetate, butyl ac-etate, and methyl isobutyl ketone. The extraction has to be done quickly because penicillin Gis very unstable at low pH values. The penicillin is then extracted back into an aqueous bufferat a pH of 7.5. The partition coefficient now strongly favors the aqueous phase. The solvent isrecovered by distillation for reuse.
11.8 EXPERIMENTAL PROCEDURE
The inoculate was prepared in 250-mL flasks containing 100 mL growth medium, whichwas inoculated with 10 mL of spore suspension. The mixture was shaken at 250 g and thetemperature was controlled at 26 �C for 48 h. Then, 110 mL of the resulting mycelia suspen-sion was used to inoculate a 1000 mL broth in the airlift fermenter. The sterilized media werepumped slowly into the bioreactor at a flow rate of about 100 mL h�1 until 2 L working vol-ume was used completely. Aeration rates of 0.5, 1, and 2 vvm (1, 2, and 4 L of air per min)were used.7,8 Samples were taken at 24 h intervals and evaluated for biomass, sugars, andantibiotic concentrations.
11.9 FERMENTER DESCRIPTION
A 2-L B Braun airlift fermenter with a working volume of about 2000 mL is used. Sterileair is sparged through a sintered plate located near the bottom of the central concentrictube. There is no mechanical stirring; only the air nozzle was forced through the centraltube, and the flow was directed to the annulus tube side. Aeration causes circulation ofthe media; the flow was gentle without serious shear forces. Temperature was maintainedat 26 �C.
11.10 ANALYTICAL METHOD FOR BIOASSAY AND DETECTIONOF ANTIBIOTIC
The extracted antibiotic was used in an antibiogram test. Petri dishes of Bacillus subtilisATCC 6633 are cultured for bioassay of penicillin. Small circular paper filters (3e5 mm) areplaced at different positions on the surface of the agar. The small circular filters were
11. PRODUCTION OF ANTIBIOTICS352
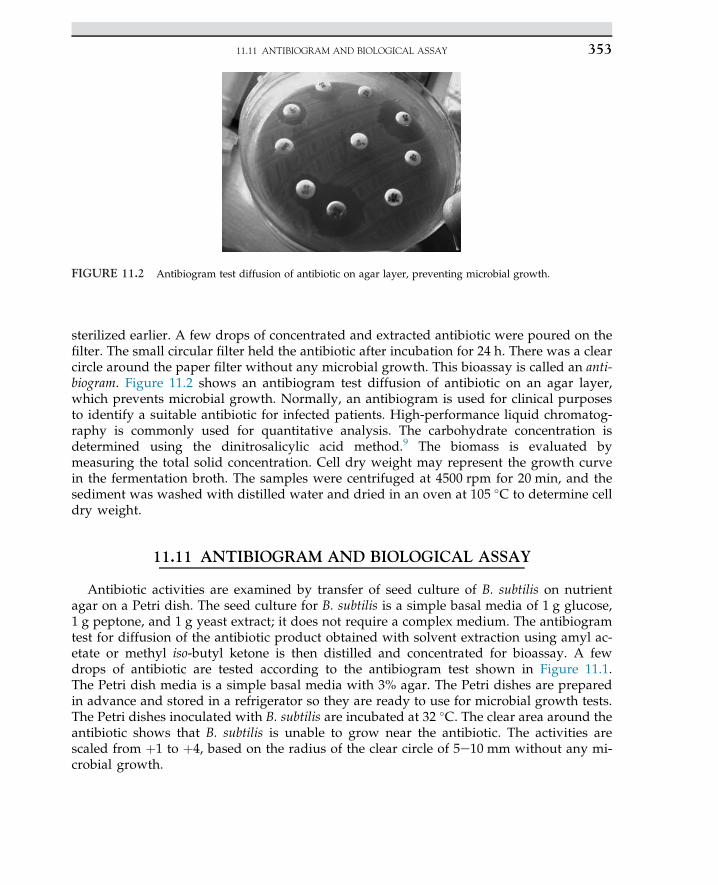
sterilized earlier. A few drops of concentrated and extracted antibiotic were poured on thefilter. The small circular filter held the antibiotic after incubation for 24 h. There was a clearcircle around the paper filter without any microbial growth. This bioassay is called an anti-biogram. Figure 11.2 shows an antibiogram test diffusion of antibiotic on an agar layer,which prevents microbial growth. Normally, an antibiogram is used for clinical purposesto identify a suitable antibiotic for infected patients. High-performance liquid chromatog-raphy is commonly used for quantitative analysis. The carbohydrate concentration isdetermined using the dinitrosalicylic acid method.9 The biomass is evaluated bymeasuring the total solid concentration. Cell dry weight may represent the growth curvein the fermentation broth. The samples were centrifuged at 4500 rpm for 20 min, and thesediment was washed with distilled water and dried in an oven at 105 �C to determine celldry weight.
11.11 ANTIBIOGRAM AND BIOLOGICAL ASSAY
Antibiotic activities are examined by transfer of seed culture of B. subtilis on nutrientagar on a Petri dish. The seed culture for B. subtilis is a simple basal media of 1 g glucose,1 g peptone, and 1 g yeast extract; it does not require a complex medium. The antibiogramtest for diffusion of the antibiotic product obtained with solvent extraction using amyl ac-etate or methyl iso-butyl ketone is then distilled and concentrated for bioassay. A fewdrops of antibiotic are tested according to the antibiogram test shown in Figure 11.1.The Petri dish media is a simple basal media with 3% agar. The Petri dishes are preparedin advance and stored in a refrigerator so they are ready to use for microbial growth tests.The Petri dishes inoculated with B. subtilis are incubated at 32 �C. The clear area around theantibiotic shows that B. subtilis is unable to grow near the antibiotic. The activities arescaled from þ1 to þ4, based on the radius of the clear circle of 5e10 mm without any mi-crobial growth.
FIGURE 11.2 Antibiogram test diffusion of antibiotic on agar layer, preventing microbial growth.
11.11 ANTIBIOGRAM AND BIOLOGICAL ASSAY 353
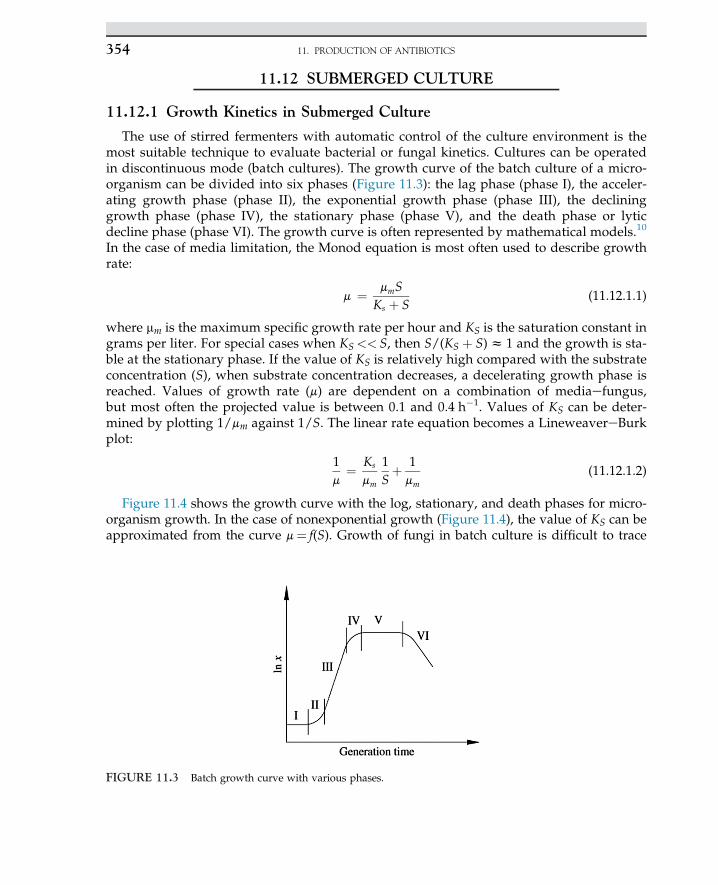
11.12 SUBMERGED CULTURE
11.12.1 Growth Kinetics in Submerged Culture
The use of stirred fermenters with automatic control of the culture environment is themost suitable technique to evaluate bacterial or fungal kinetics. Cultures can be operatedin discontinuous mode (batch cultures). The growth curve of the batch culture of a micro-organism can be divided into six phases (Figure 11.3): the lag phase (phase I), the acceler-ating growth phase (phase II), the exponential growth phase (phase III), the declininggrowth phase (phase IV), the stationary phase (phase V), and the death phase or lyticdecline phase (phase VI). The growth curve is often represented by mathematical models.10
In the case of media limitation, the Monod equation is most often used to describe growthrate:
m ¼ mmSKs þ S
(11.12.1.1)
where mm is the maximum specific growth rate per hour and KS is the saturation constant ingrams per liter. For special cases when KS<< S, then S/(KS þ S)z 1 and the growth is sta-ble at the stationary phase. If the value of KS is relatively high compared with the substrateconcentration (S), when substrate concentration decreases, a decelerating growth phase isreached. Values of growth rate (m) are dependent on a combination of mediaefungus,but most often the projected value is between 0.1 and 0.4 h�1. Values of KS can be deter-mined by plotting 1/mm against 1/S. The linear rate equation becomes a LineweavereBurkplot:
1m
¼ Ks
mm
1Sþ 1mm
(11.12.1.2)
Figure 11.4 shows the growth curve with the log, stationary, and death phases for micro-organism growth. In the case of nonexponential growth (Figure 11.4), the value of KS can beapproximated from the curve m¼ f(S). Growth of fungi in batch culture is difficult to trace
FIGURE 11.3 Batch growth curve with various phases.
11. PRODUCTION OF ANTIBIOTICS354
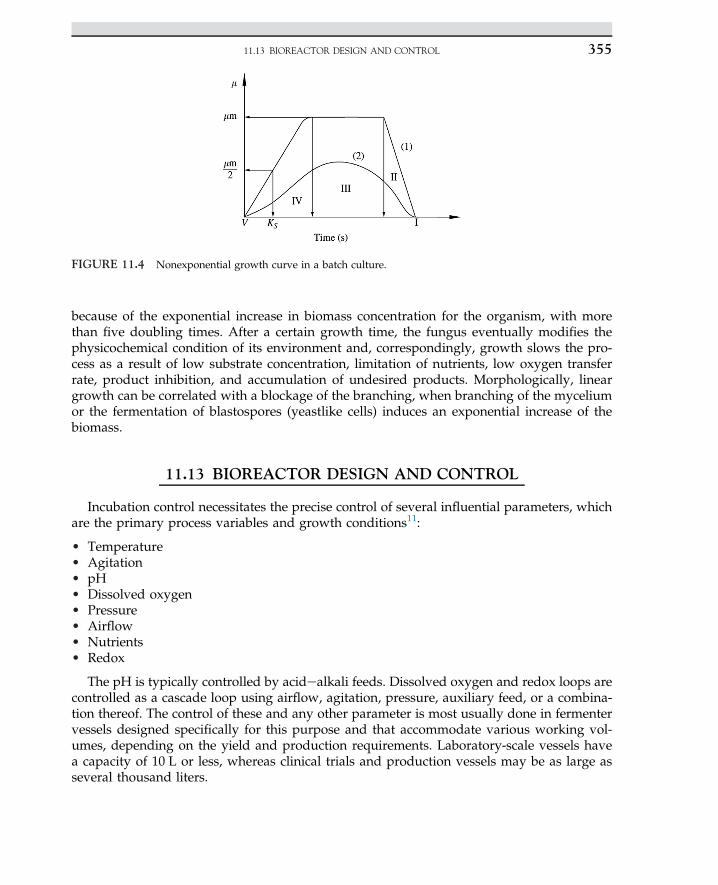
because of the exponential increase in biomass concentration for the organism, with morethan five doubling times. After a certain growth time, the fungus eventually modifies thephysicochemical condition of its environment and, correspondingly, growth slows the pro-cess as a result of low substrate concentration, limitation of nutrients, low oxygen transferrate, product inhibition, and accumulation of undesired products. Morphologically, lineargrowth can be correlated with a blockage of the branching, when branching of the myceliumor the fermentation of blastospores (yeastlike cells) induces an exponential increase of thebiomass.
11.13 BIOREACTOR DESIGN AND CONTROL
Incubation control necessitates the precise control of several influential parameters, whichare the primary process variables and growth conditions11:
• Temperature• Agitation• pH• Dissolved oxygen• Pressure• Airflow• Nutrients• Redox
The pH is typically controlled by acidealkali feeds. Dissolved oxygen and redox loops arecontrolled as a cascade loop using airflow, agitation, pressure, auxiliary feed, or a combina-tion thereof. The control of these and any other parameter is most usually done in fermentervessels designed specifically for this purpose and that accommodate various working vol-umes, depending on the yield and production requirements. Laboratory-scale vessels havea capacity of 10 L or less, whereas clinical trials and production vessels may be as large asseveral thousand liters.
FIGURE 11.4 Nonexponential growth curve in a batch culture.
11.13 BIOREACTOR DESIGN AND CONTROL 355
The actual incubation of the culture is known as the fermentation process, which is part ofthe batch cycle. A complete fermentation cycle typically includes the following steps, depend-ing predominantly on bioreactor design:
• Sterilization of empty vessel and piping using direct steam injection• Medium charging• Indirect sterilization by steam injected into the vessel jacket• Cooling and jacket drain• Preinoculation of vessel environment under control• Inoculation (injection of a small sample of the monoculture)• Incubation of the fermentation process• Harvest of the product (extraction process)
A control system must, therefore, provide flexibility in such a way that the results are ac-curate and repeatable. Also, precise control of the fermentation environment is necessary andincludes the following:
• Precise loop control with set point profile programming• Recipe management system for easy parameterization• Sequential control for vessel sterilization and more complex control strategies• Secure collection of online data from the bioreactor for analysis and evidence• Local operator display with clear graphics and controlled access to parameters
A conventional batch fermenter and the important parts of the fermentation vessel areshown in Figure 11.5.
11.14 ESTIMATION OF DIMENSION OF FERMENTER
Suppose a fermenter has a working volume of 10 m3 (Vworking¼ 10 m3); let us add 20%overdesign as a safety factor. The total volume (V) is
V ¼ Vworking
0:8¼ 10 m3
0:8¼ 12:5 m3
The volume of a fermenter for a cylindrical system is defined as
V ¼ p
4�D2
t �HL (11.14.1)
where Dt is the diameter of the tank in meters and HL is the height of the fermentation vessel.Let us take the ratio of the liquid level to the tank diameter to be HL:Dt, 2:1; therefore,
V ¼ p
4�D2
t � 2Dt (11.14.2)
V ¼ 0:5p�D3t ¼ 12:5 m3
Solving for tank diameter, Dt, and liquid height,
Dt ¼ 2:0 m
11. PRODUCTION OF ANTIBIOTICS356
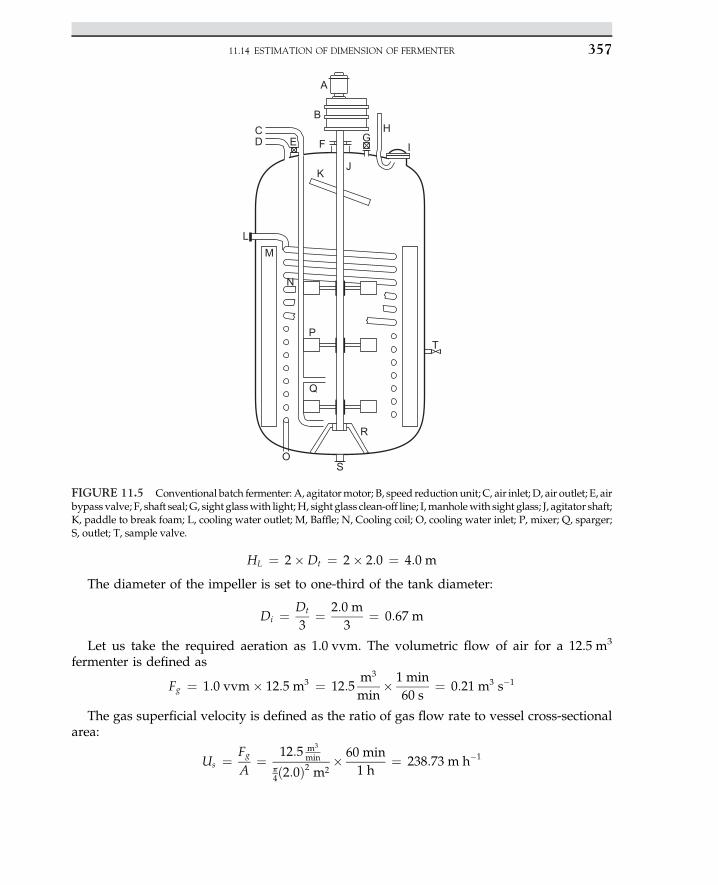
HL ¼ 2�Dt ¼ 2� 2:0 ¼ 4:0 m
The diameter of the impeller is set to one-third of the tank diameter:
Di ¼ Dt
3¼ 2:0 m
3¼ 0:67 m
Let us take the required aeration as 1.0 vvm. The volumetric flow of air for a 12.5 m3
fermenter is defined as
Fg ¼ 1:0 vvm� 12:5 m3 ¼ 12:5m3
min� 1 min
60 s¼ 0:21 m3 s�1
The gas superficial velocity is defined as the ratio of gas flow rate to vessel cross-sectionalarea:
Us ¼ Fg
A¼ 12:5 m3
min
p4ð2:0Þ2 m2
� 60 min
1 h¼ 238:73 m h�1
R
S
TP
Q
O
CD E
A
B
F
K
ML
N
J
H
IG
FIGURE 11.5 Conventional batch fermenter: A, agitatormotor; B, speed reduction unit; C, air inlet; D, air outlet; E, airbypass valve; F, shaft seal; G, sight glasswith light;H, sight glass clean-off line; I,manholewith sight glass; J, agitator shaft;K, paddle to break foam; L, cooling water outlet; M, Baffle; N, Cooling coil; O, cooling water inlet; P, mixer; Q, sparger;S, outlet; T, sample valve.
11.14 ESTIMATION OF DIMENSION OF FERMENTER 357
11.15 DETERMINATION OF THE REYNOLDS NUMBER
To calculate the Reynolds number, let us define an average density at the inlet usingweight fractions:
rave:in ¼ ð0:80� 1544Þ þ ð0:05� 1834Þ þ ð0:07� 597:1Þ þ ð0:08� 1000Þrave:in ¼ 1448:70 kg m�3
Also, the average density of the outlet stream is
rave:in ¼ ð0:16� 3420Þ þ ð0:23� 110:1Þ þ ð0:21� 1000Þ þ ð0:40� 1013Þrave:in ¼ 1187:72 kg m�3
The highest density of the solution is used to determine the Reynolds number. The broth isviscous and viscosity is assumed to be m¼ 0.1 Pa s�1. The rotational speed of the impeller isset at N¼ 150 rpm¼ 2.5 rps.
The Reynolds number is calculated based on provided data:
Re ¼ rND2i
m¼
�1448:70 kg
m3
�� ð2:5 rpsÞ � ð0:67 mÞ2
ð0:1 Pa s�1ÞRe ¼ 16; 258
The high Reynolds number represents the turbulent flow regime.
11.16 DETERMINATION OF POWER INPUT
First it is necessary, using knowledge of the flow regime, to read the power numberdirectly from a power graph (as discussed in Chapter 6 and illustrated in Figure 6.6). Thereading for Reynolds numbers greater than 16,000 is Pno¼ 6. The equation for the powernumber is
Pno ¼ Pg
rN3i D
5i¼ 6 (11.16.1)
Therefore, ungassed power is calculated as
P ¼6�
�1448:70 kg
m3
�� ð2:5 rpsÞ3 � ð0:67 mÞ5
9:81 ms2
¼ 1869:2 kg m s�1
P ¼ 1557:66kg ms
� 1 hp
745:7 kg ms
¼ 2:5 hp
That is the input power required for one set of impellers. Correction factors (fc) for nongeo-metric similarity are required to include the effect of known factors in precise calculations.
11. PRODUCTION OF ANTIBIOTICS358
fc ¼
ffiffiffiffiffiffiffiffiffiffiffiffiffiffiffiffiffiffiffiffiffiffiffi�DtDi
���HLDi
��
�DtDi
��HLDi
�
vuuuuut (11.16.2)
where the parameter in designing the bioreactor is set at Dt/Di¼ 3 and HL/Di¼ 3. On substi-tution, for the previous cases the correction factor is calculated as
fc ¼
ffiffiffiffiffiffiffiffiffiffiffiffiffiffiffiffiffiffiffiffiffiffiffi�2:00:67
��4:00:67
�3� 3
vuut¼
ffiffiffiffiffiffiffiffiffiffiffi3� 63� 3
r¼ 1:414
Therefore, the actual power with the correction factor is
P� ¼ 1:414� P ¼ 1:414� 2:09 hp ¼ 3:54 hp
The dimensionless aeration rate is defined by the following equation:
Na ¼ Fg
NiD3i¼ 0:21 m3
s
ð2:5 rpsÞ � ð2:0 mÞ3 ¼ 0:0105 (11.16.3)
Read the ratio of gassed power to ungassed power from Figure 6.7. The reading from thegraph is Pg/P¼ 0.9. The gassed power for the motor to rotate is
Pg ¼ 0:9� 3:54 hp ¼ 3:2 hp
11.17 DETERMINATION OF OXYGEN TRANSFER RATE
The mass transfer coefficient for noncoalescing air bubbled in the fermentation broth in aturbulent regime is discussed frequently in the literature.6 The volumetric mass transfer co-efficient is defined by the following correlation:
KLa ¼ 2� 10�3
�Pg
VL
�0:6
ðVSÞ0:667 (11.17.1)
where the gas superficial for the previous case is calculated as VS¼ 0.21 m3 s�1 per p (2 m)2,and the vessel working volume is
VL ¼ 4p m2 � 4 m ¼ 16p m3
Substituting VS and VL into the previous equation allows one to determine the volumetricmass transfer coefficient. The volumetric mass transfer coefficient is calculated as
KLa ¼ 2� 10�3
�2:664 hp16p m3
�0:6
��0:21 m4p s
�0:667
¼ 2:24� 10�5s�1
11.17 DETERMINATION OF OXYGEN TRANSFER RATE 359
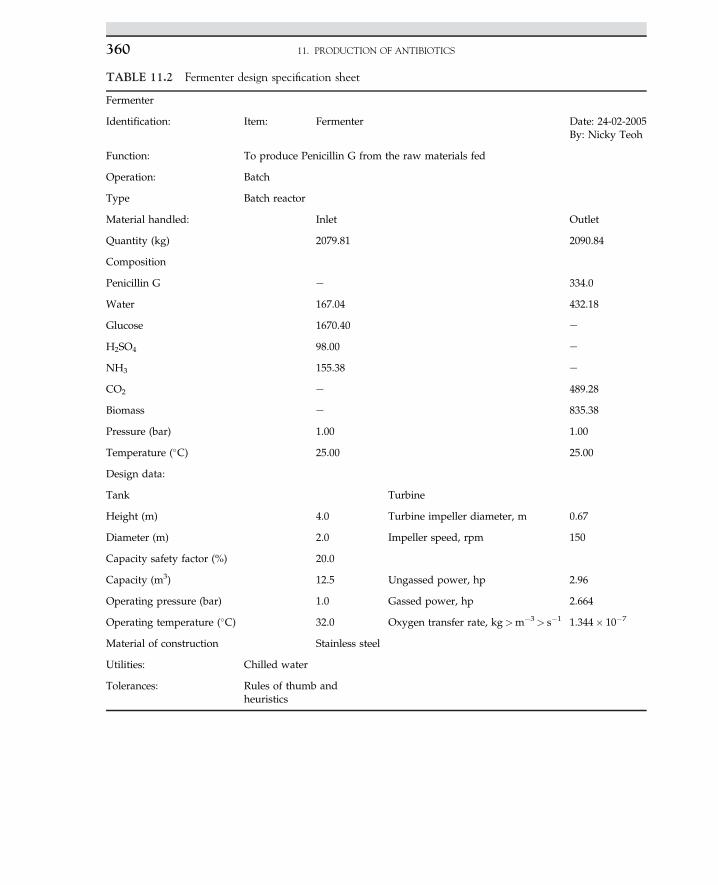
TABLE 11.2 Fermenter design specification sheet
Fermenter
Identification: Item: Fermenter Date: 24-02-2005By: Nicky Teoh
Function: To produce Penicillin G from the raw materials fed
Operation: Batch
Type Batch reactor
Material handled: Inlet Outlet
Quantity (kg) 2079.81 2090.84
Composition
Penicillin G e 334.0
Water 167.04 432.18
Glucose 1670.40 e
H2SO4 98.00 e
NH3 155.38 e
CO2 e 489.28
Biomass e 835.38
Pressure (bar) 1.00 1.00
Temperature (�C) 25.00 25.00
Design data:
Tank Turbine
Height (m) 4.0 Turbine impeller diameter, m 0.67
Diameter (m) 2.0 Impeller speed, rpm 150
Capacity safety factor (%) 20.0
Capacity (m3) 12.5 Ungassed power, hp 2.96
Operating pressure (bar) 1.0 Gassed power, hp 2.664
Operating temperature (�C) 32.0 Oxygen transfer rate, kg>m�3> s�1 1.344� 10�7
Material of construction Stainless steel
Utilities: Chilled water
Tolerances: Rules of thumb andheuristics
11. PRODUCTION OF ANTIBIOTICS360
The simple equation for the oxygen transfer rate is based on the driving forces existing forthe equilibrium value for oxygen concentration and the dissolved oxygen available in theliquid phase:
OTR ¼ KLa�C�
1 � C1�
(11.17.2)
The assumption was made that the equilibrium value for oxygen was C�1 ¼ 6 ppm and all
oxygen available in the liquid phase was used by microorganisms (C1¼ 0), which means thegrowth was mass transfer limited, the organisms were growing fast, and the limited oxygentransfer can retard the biological process. The oxygen transfer rate is calculated as
OTR ¼ 2:24� 10�5�6� 10�3 � 0
� ¼ 1:344� 10�7 kg O2 m�3 s�1
11.18 DESIGN SPECIFICATION SHEET FOR THE BIOREACTOR
The characteristics and design specification sheet for the bioreactor are summarized inTable 11.2.
References1. Pelczar MJ, Chan ECS, Krieg NR. Microbiology. 6th ed. New York: McGraw-Hill; 1993.2. Baily JE, Ollis DF. Biochemical engineering fundamentals. 2nd ed. New York: McGraw-Hill; 1986.3. Stanbury PF, Whitaker A. Principles of fermentation technology. New York: Pergamon Press; 1987.4. Demain AL, Solomon NA. Sci Am 1981;245:67.5. Voet D, Voet JG. Biochemistry. 3rd ed. New York: John Wiley; 2004.6. Dominguez M, Mejia A, Revah S, Barrios-Gonzalez J, World J. Microbiol Biotechnol 2001;17(7):751e756.7. Scragg AH. Bioreactors in biotechnology, a practical approach. Ellis Horwood series in biochemistry and biotechnology;1991. New York.
8. Ghose TK. Bioprocess computation in biotechnology. Ellis Horwood series in biochemistry and biotechnology, vol. 1; 1990.New York.
9. Miller GL. Anal Chem 1959;31:426.10. Doran PM. Bioprocess engineering principles. New York: Academic Press; 1995.11. Shuler ML, Kargi F. Bioprocess engineering, basic concepts. New Jersey: Prentice-Hall; 1992.
REFERENCES 361
C H A P T E R
12
Production of Citric Acid
O U T L I N E
12.1 Introduction 363
12.2 Production of Citric Acid inBatch Bioreactors 36412.2.1 Microorganism 365
12.3 Factors Affecting Mold Growthand the Fermentation Process 365
12.4 Starter or Seeding an Inoculum 367
12.5 Seed Culture 367
12.6 Citric Acid Production 367
12.7 Analytical Method 368
12.7.1 Cell Dry Weight 36812.7.2 Carbohydrates 36912.7.3 Citric Acid 369
12.8 Processes for Recovery andPurification of Citric Acid 369
12.9 Experimental Run 369
12.10 Kinetic Model in Batch CitricAcid Fermentation 371
Nomenclature 373
References 373
12.1 INTRODUCTION
Citric acid is an intermediate organic compound in the tricarboxylic acid (TCA) cycle and isfound naturally in citrus fruits, pineapples, and pears and crystallized as calcium citrate. Itis an important chemical used in medicines, flavoring extracts, food, candies, and the manu-facture of ink and dyes. It also is used in detergents as a surfactant in the form of trisodiumcitrate. Citric acid is a six-carbon TCA that was first isolated from lemon juice. It is used forvarious purposes in the food and beverage industry, as pharmaceuticals, and for other
363Biochemical Engineering and Biotechnologyhttp://dx.doi.org/10.1016/B978-0-444-63357-6.00012-2 Copyright © 2015 Elsevier B.V. All rights reserved.
industrial uses. It is an organic carboxylic acid and can be extracted from the juice of citrusfruits by adding calcium oxide (lime) to form calcium citrate, which is an insoluble precipitatethat can be collected by filtration; the citric acid can be recovered from its calcium salt by add-ing sulfuric acid. Citric acid is mainly produced by fermentation. There are many potent mi-croorganisms including fungi, yeast, and bacteria that are able to produce citric acid byfermentation. It also is obtained by fermentation of glucose with the aid of the moldAspergillus niger. Citric acid is used in soft drinks and also used as food additives. Its salts,the citrates, have many uses; for example, ferric ammonium citrate is used in making blue printpaper. Sour salt, used in cooking, is citric acid. Most citric acid is produced by fungal (A. niger)fermentation. For production of enzymes from fungi, nitrogen and phosphate sourcesare specifically involved in synthesis and liberation of enzymes. A. niger is a potential organismfor the synthesis of oxalate and citrate as members of TCA cycle while limitation of nitrogenand phosphate sources may influence on concentration of organic acid production. In addition,metal ions such as copper, iron, and manganese may be influential in the high productivityof citric acid. Aspergillus niger may propagate in the form of mycelia, which may causeclogging problems in a continuous system. Yeast such as Saccharomycopsis lipolytica, however,does not form mycelia; the organism is very stable with a high citric acid yield on glucose. Thedisadvantage of yeast in the production of citric acid is the by-product of isocitric acid, whichis also synthesized in parallel as a side reaction. Candida lipolytica grown on normal paraffinmixture continuously produced citric acid. The process yield by weight is significantly higherthan other carbon sources. Other species such as Candida guilliermondii use molasses forthe production of citric acid. The rate of productivity of organic acid is estimated to be0.35 g (L h)�1.1 In fact, citric acid is considered a secondary metabolite, which is synthesizedvia the TCA cycle. The production rate may be enhanced if the organisms are under catalyticrepression by limiting nitrogen sources such as ammonia. Chemical synthesis of citric acidis possible, but it is not cheaper than fungal fermentation. However, a small amount of citricacid is still produced from citrus fruits in Mexico and South America, where they are availableeconomically. There are basically three different types of batch fermentation process usedin industry. Two very common and practical fermentation processes are the liquid surface cul-ture and the submerged fermentation process. The second process, submerged culture fermen-tation, is more popular. Continuous fermentation has been studied at the laboratory scale.1,2
12.2 PRODUCTION OF CITRIC ACID IN BATCH BIOREACTORS
Citric acid fermentation of cane molasses is created through submerged fermentation in a2 L biostat stirred fermenter (B. Braun). A strain of A. niger is the most widely used for com-mercial production. A. niger is also highly recommended in this study, and can be obtainedfrom American Type Culture Collection (ATCC; Rockville, Maryland, USA). Molasses fromcane sugar is used with the addition of trace metals at the desired concentration.
The sources of sugar and initial pH of the media play a major role in citric acid production.Submerged and surface cultures are customarily used with cheap but purified and high-concentration sources of sugars. A variety of sugars may serve as the substrate for the produc-tion of citric acid; however, molasses and cane sugar are generally used in fermentation pro-cesses. Carbohydrates, along with nutrients, are incorporated into a medium with necessary
12. PRODUCTION OF CITRIC ACID364
trace metals and minerals. The medium is sterilized and then inoculated with the mold spores.The process is aerobic; adequate mixing and aeration for supply of oxygen is required. Airpasses trough a suitable filter in a sterile condition then is supplied to a large-scale fermentationtank. The strain of mold used, the composition of the medium, the necessary amount of oxygensupply, the incubation temperature, and pH affect the yield of citric acid produced.
12.2.1 Microorganism
Aspergillus niger (ATCC 11414) can be used for citric acid fermentation. It should be orderedfrom the ATCC. The culture wasmaintained on 10.0% sterilizedmolasses obtained fromCentralSugar SDNBHD (pH 5.8). The slant stock cultures ofA. niger are stored at 5 �C in the refrigerator.All the culturemedia,unlessotherwise stated,are sterilizedat121 �C(15 psigpressure) for15 min.
Aspergillus nigerutilizes beetmolasses, fructose, glucose, and starchhydrolysates as substratesfor fermentation. Inoculation proceeds by introducing the active inoculum at its optimum stage.The substrate is used at a concentration of 10e15%. The production stage usually lasts for 5 daysand takes place in stirred, aerated fermenters at 30 �C. Agitation is in the middle range, about200 rpm. Regulation of the dissolved oxygen concentration in the medium is done by the airsupply,pressurizedair, and impeller speed; regulationof thepHvalue; and regulationof the levelof free potassiumhexocyano ferrate in themedium. The tracemetal potassiumhexacyano ferrateis used for surface fermentation in citric acid production.3 The media used for fermentation inbatch culture consists of 30e150 g glucose, 0.1 g yeast extract, 0.3e1.3 g ammonium chloride,0.3 gmonopotassium phosphate, 0.2 gmagnesium sulfate, and 0.0001 g thiamine hydrochloridein one liter. The medium pH is adjusted to 5.5 then autoclaved to create a sterile medium.
Although A. niger has mainly been used in citric acid production, other strains of fungi,various kinds of yeast, and some bacteria are known to accumulate citric acid in the medium.The reasons for choosing A. niger over other potential citrate-producing organisms are thatcheap raw materials (molasses) can be used as substrate and a high product yield can beobtained. There is general agreement in the literature that the pelleted form is desirable foracid production. An ideal 1.2- to 2.5-mm-diameter pellet configuration is formed after 5days. The pellet form is a favorable spore. Pellet cultures have low viscosity, causingimproved bulk mixing and aeration conditions and lower oxygen consumption than culturescomposed mainly of filamentous forms. Furthermore, problems of wall growth and pipeblockage are reduced and the separation of biomass from culture liquid by filtration is consid-erably enhanced by the pellet form.
12.3 FACTORS AFFECTING MOLD GROWTH AND THEFERMENTATION PROCESS
Trace element nutrition is one of the most important factors affecting the yields (grams ofcitric acid per gram of sugar) from citric acid fermentation. In particular, the levels of manga-nese, iron, copper, and zinc are critical. If the levels of these trace elements are correct, otherfactors have less pronounced effects. Conversely, the medium will not allow high productionunless the trace element content is controlled carefully. Manganese (Mn2þ ions) in the nutrientmedium plays a key role in the accumulation of large amounts of citrate by A. niger. When the
12.3 FACTORS AFFECTING MOLD GROWTH AND THE FERMENTATION PROCESS 365
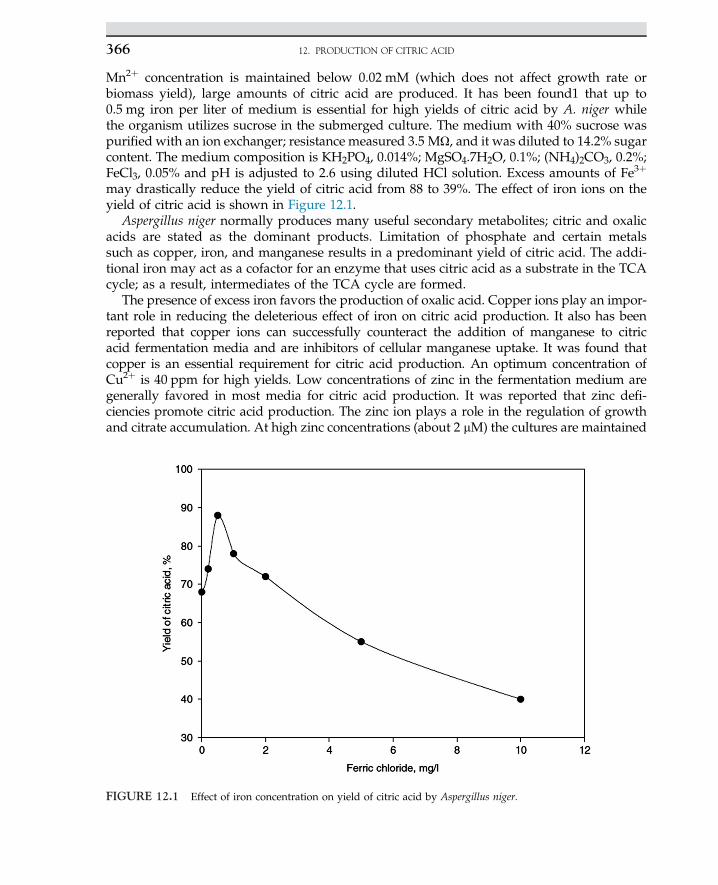
Mn2þ concentration is maintained below 0.02 mM (which does not affect growth rate orbiomass yield), large amounts of citric acid are produced. It has been found1 that up to0.5 mg iron per liter of medium is essential for high yields of citric acid by A. niger whilethe organism utilizes sucrose in the submerged culture. The medium with 40% sucrose waspurified with an ion exchanger; resistance measured 3.5 MU, and it was diluted to 14.2% sugarcontent. The medium composition is KH2PO4, 0.014%; MgSO4.7H2O, 0.1%; (NH4)2CO3, 0.2%;FeCl3, 0.05% and pH is adjusted to 2.6 using diluted HCl solution. Excess amounts of Fe3þ
may drastically reduce the yield of citric acid from 88 to 39%. The effect of iron ions on theyield of citric acid is shown in Figure 12.1.
Aspergillus niger normally produces many useful secondary metabolites; citric and oxalicacids are stated as the dominant products. Limitation of phosphate and certain metalssuch as copper, iron, and manganese results in a predominant yield of citric acid. The addi-tional iron may act as a cofactor for an enzyme that uses citric acid as a substrate in the TCAcycle; as a result, intermediates of the TCA cycle are formed.
The presence of excess iron favors the production of oxalic acid. Copper ions play an impor-tant role in reducing the deleterious effect of iron on citric acid production. It also has beenreported that copper ions can successfully counteract the addition of manganese to citricacid fermentation media and are inhibitors of cellular manganese uptake. It was found thatcopper is an essential requirement for citric acid production. An optimum concentration ofCu2þ is 40 ppm for high yields. Low concentrations of zinc in the fermentation medium aregenerally favored in most media for citric acid production. It was reported that zinc defi-ciencies promote citric acid production. The zinc ion plays a role in the regulation of growthand citrate accumulation. At high zinc concentrations (about 2 mM) the cultures are maintained
FIGURE 12.1 Effect of iron concentration on yield of citric acid by Aspergillus niger.
12. PRODUCTION OF CITRIC ACID366
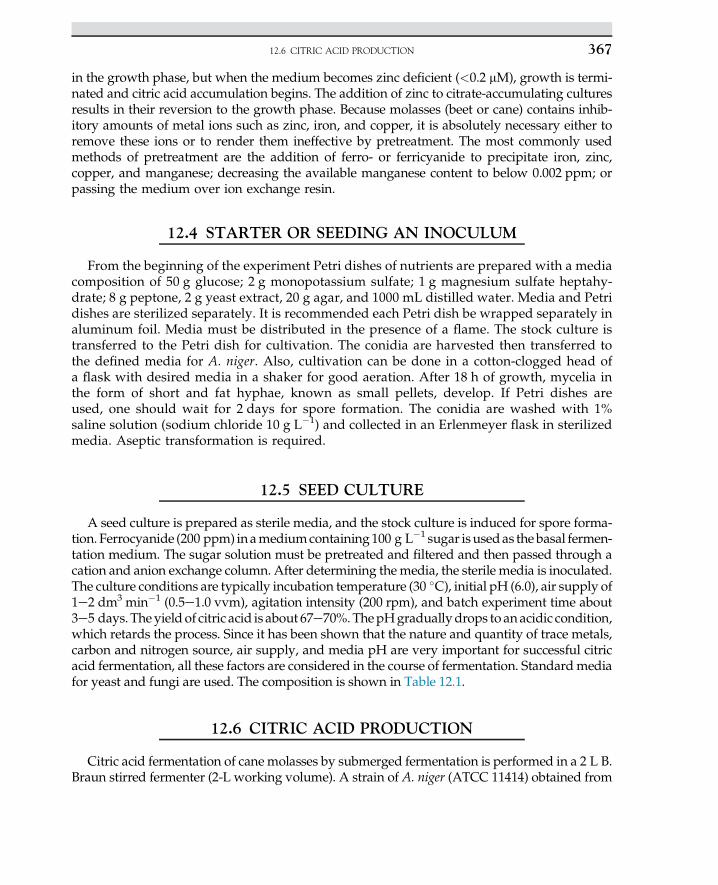
in the growth phase, but when the medium becomes zinc deficient (<0.2 mM), growth is termi-nated and citric acid accumulation begins. The addition of zinc to citrate-accumulating culturesresults in their reversion to the growth phase. Because molasses (beet or cane) contains inhib-itory amounts of metal ions such as zinc, iron, and copper, it is absolutely necessary either toremove these ions or to render them ineffective by pretreatment. The most commonly usedmethods of pretreatment are the addition of ferro- or ferricyanide to precipitate iron, zinc,copper, and manganese; decreasing the available manganese content to below 0.002 ppm; orpassing the medium over ion exchange resin.
12.4 STARTER OR SEEDING AN INOCULUM
From the beginning of the experiment Petri dishes of nutrients are prepared with a mediacomposition of 50 g glucose; 2 g monopotassium sulfate; 1 g magnesium sulfate heptahy-drate; 8 g peptone, 2 g yeast extract, 20 g agar, and 1000 mL distilled water. Media and Petridishes are sterilized separately. It is recommended each Petri dish be wrapped separately inaluminum foil. Media must be distributed in the presence of a flame. The stock culture istransferred to the Petri dish for cultivation. The conidia are harvested then transferred tothe defined media for A. niger. Also, cultivation can be done in a cotton-clogged head ofa flask with desired media in a shaker for good aeration. After 18 h of growth, mycelia inthe form of short and fat hyphae, known as small pellets, develop. If Petri dishes areused, one should wait for 2 days for spore formation. The conidia are washed with 1%saline solution (sodium chloride 10 g L�1) and collected in an Erlenmeyer flask in sterilizedmedia. Aseptic transformation is required.
12.5 SEED CULTURE
A seed culture is prepared as sterile media, and the stock culture is induced for spore forma-tion. Ferrocyanide (200 ppm) inamediumcontaining100 g L�1 sugar isusedas the basal fermen-tation medium. The sugar solution must be pretreated and filtered and then passed through acation and anion exchange column. After determining themedia, the sterile media is inoculated.The culture conditions are typically incubation temperature (30 �C), initial pH (6.0), air supply of1e2 dm3 min�1 (0.5e1.0 vvm), agitation intensity (200 rpm), and batch experiment time about3e5 days. The yield of citric acid is about 67e70%.ThepHgraduallydrops to anacidic condition,which retards the process. Since it has been shown that the nature and quantity of trace metals,carbon and nitrogen source, air supply, and media pH are very important for successful citricacid fermentation, all these factors are considered in the course of fermentation. Standardmediafor yeast and fungi are used. The composition is shown in Table 12.1.
12.6 CITRIC ACID PRODUCTION
Citric acid fermentation of cane molasses by submerged fermentation is performed in a 2 L B.Braun stirred fermenter (2-L working volume). A strain of A. niger (ATCC 11414) obtained from
12.6 CITRIC ACID PRODUCTION 367
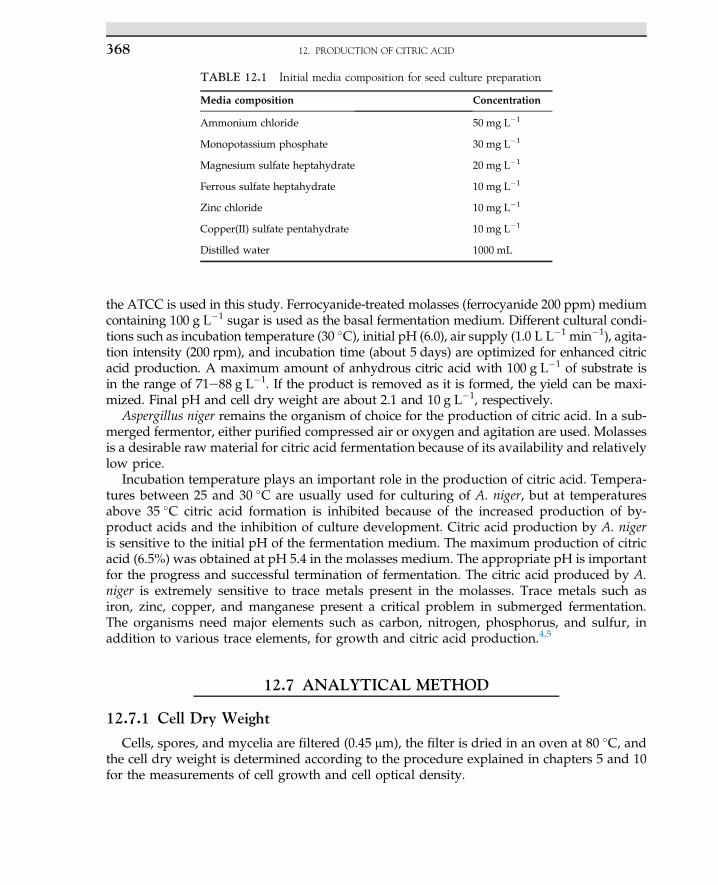
the ATCC is used in this study. Ferrocyanide-treated molasses (ferrocyanide 200 ppm) mediumcontaining 100 g L�1 sugar is used as the basal fermentation medium. Different cultural condi-tions such as incubation temperature (30 �C), initial pH (6.0), air supply (1.0 L L�1 min�1), agita-tion intensity (200 rpm), and incubation time (about 5 days) are optimized for enhanced citricacid production. A maximum amount of anhydrous citric acid with 100 g L�1 of substrate isin the range of 71e88 g L�1. If the product is removed as it is formed, the yield can be maxi-mized. Final pH and cell dry weight are about 2.1 and 10 g L�1, respectively.
Aspergillus niger remains the organism of choice for the production of citric acid. In a sub-merged fermentor, either purified compressed air or oxygen and agitation are used. Molassesis a desirable raw material for citric acid fermentation because of its availability and relativelylow price.
Incubation temperature plays an important role in the production of citric acid. Tempera-tures between 25 and 30 �C are usually used for culturing of A. niger, but at temperaturesabove 35 �C citric acid formation is inhibited because of the increased production of by-product acids and the inhibition of culture development. Citric acid production by A. nigeris sensitive to the initial pH of the fermentation medium. The maximum production of citricacid (6.5%) was obtained at pH 5.4 in the molasses medium. The appropriate pH is importantfor the progress and successful termination of fermentation. The citric acid produced by A.niger is extremely sensitive to trace metals present in the molasses. Trace metals such asiron, zinc, copper, and manganese present a critical problem in submerged fermentation.The organisms need major elements such as carbon, nitrogen, phosphorus, and sulfur, inaddition to various trace elements, for growth and citric acid production.4,5
12.7 ANALYTICAL METHOD
12.7.1 Cell Dry Weight
Cells, spores, and mycelia are filtered (0.45 mm), the filter is dried in an oven at 80 �C, andthe cell dry weight is determined according to the procedure explained in chapters 5 and 10for the measurements of cell growth and cell optical density.
TABLE 12.1 Initial media composition for seed culture preparation
Media composition Concentration
Ammonium chloride 50 mg L�1
Monopotassium phosphate 30 mg L�1
Magnesium sulfate heptahydrate 20 mg L�1
Ferrous sulfate heptahydrate 10 mg L�1
Zinc chloride 10 mg L�1
Copper(II) sulfate pentahydrate 10 mg L�1
Distilled water 1000 mL
12. PRODUCTION OF CITRIC ACID368
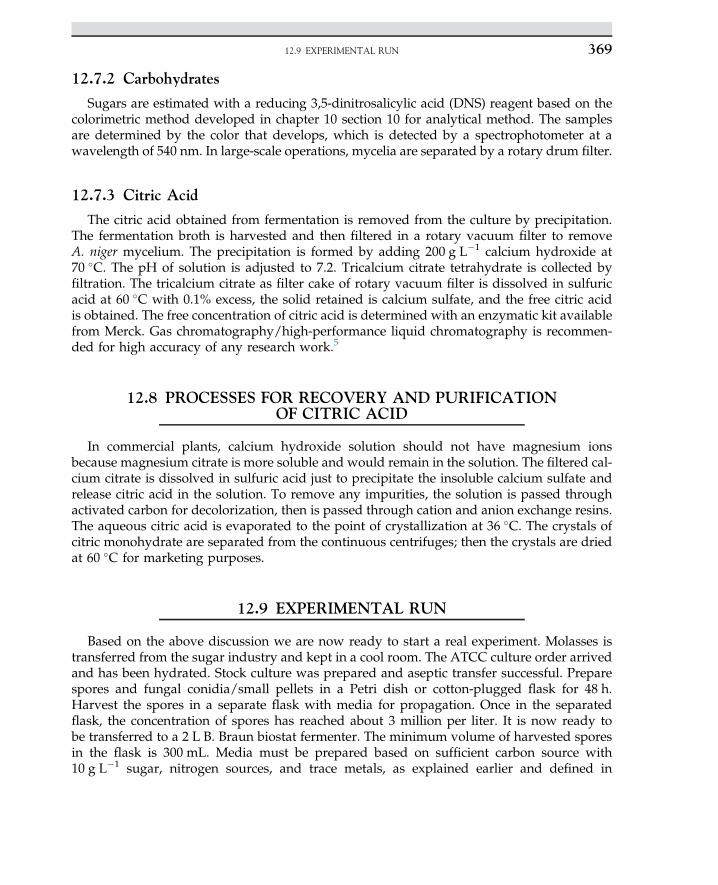
12.7.2 Carbohydrates
Sugars are estimated with a reducing 3,5-dinitrosalicylic acid (DNS) reagent based on thecolorimetric method developed in chapter 10 section 10 for analytical method. The samplesare determined by the color that develops, which is detected by a spectrophotometer at awavelength of 540 nm. In large-scale operations, mycelia are separated by a rotary drum filter.
12.7.3 Citric Acid
The citric acid obtained from fermentation is removed from the culture by precipitation.The fermentation broth is harvested and then filtered in a rotary vacuum filter to removeA. niger mycelium. The precipitation is formed by adding 200 g L�1 calcium hydroxide at70 �C. The pH of solution is adjusted to 7.2. Tricalcium citrate tetrahydrate is collected byfiltration. The tricalcium citrate as filter cake of rotary vacuum filter is dissolved in sulfuricacid at 60 �C with 0.1% excess, the solid retained is calcium sulfate, and the free citric acidis obtained. The free concentration of citric acid is determined with an enzymatic kit availablefrom Merck. Gas chromatography/high-performance liquid chromatography is recommen-ded for high accuracy of any research work.5
12.8 PROCESSES FOR RECOVERY AND PURIFICATIONOF CITRIC ACID
In commercial plants, calcium hydroxide solution should not have magnesium ionsbecause magnesium citrate is more soluble and would remain in the solution. The filtered cal-cium citrate is dissolved in sulfuric acid just to precipitate the insoluble calcium sulfate andrelease citric acid in the solution. To remove any impurities, the solution is passed throughactivated carbon for decolorization, then is passed through cation and anion exchange resins.The aqueous citric acid is evaporated to the point of crystallization at 36 �C. The crystals ofcitric monohydrate are separated from the continuous centrifuges; then the crystals are driedat 60 �C for marketing purposes.
12.9 EXPERIMENTAL RUN
Based on the above discussion we are now ready to start a real experiment. Molasses istransferred from the sugar industry and kept in a cool room. The ATCC culture order arrivedand has been hydrated. Stock culture was prepared and aseptic transfer successful. Preparespores and fungal conidia/small pellets in a Petri dish or cotton-plugged flask for 48 h.Harvest the spores in a separate flask with media for propagation. Once in the separatedflask, the concentration of spores has reached about 3 million per liter. It is now ready tobe transferred to a 2 L B. Braun biostat fermenter. The minimum volume of harvested sporesin the flask is 300 mL. Media must be prepared based on sufficient carbon source with10 g L�1 sugar, nitrogen sources, and trace metals, as explained earlier and defined in
12.9 EXPERIMENTAL RUN 369
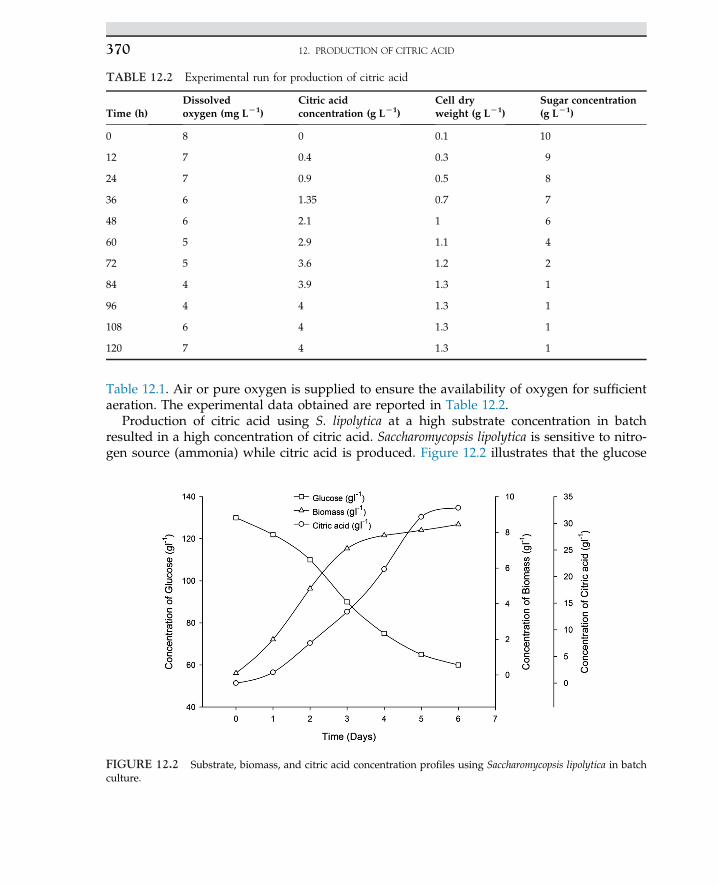
Table 12.1. Air or pure oxygen is supplied to ensure the availability of oxygen for sufficientaeration. The experimental data obtained are reported in Table 12.2.
Production of citric acid using S. lipolytica at a high substrate concentration in batchresulted in a high concentration of citric acid. Saccharomycopsis lipolytica is sensitive to nitro-gen source (ammonia) while citric acid is produced. Figure 12.2 illustrates that the glucose
TABLE 12.2 Experimental run for production of citric acid
Time (h)Dissolvedoxygen (mg LL1)
Citric acidconcentration (g LL1)
Cell dryweight (g LL1)
Sugar concentration(g LL1)
0 8 0 0.1 10
12 7 0.4 0.3 9
24 7 0.9 0.5 8
36 6 1.35 0.7 7
48 6 2.1 1 6
60 5 2.9 1.1 4
72 5 3.6 1.2 2
84 4 3.9 1.3 1
96 4 4 1.3 1
108 6 4 1.3 1
120 7 4 1.3 1
FIGURE 12.2 Substrate, biomass, and citric acid concentration profiles using Saccharomycopsis lipolytica in batchculture.
12. PRODUCTION OF CITRIC ACID370
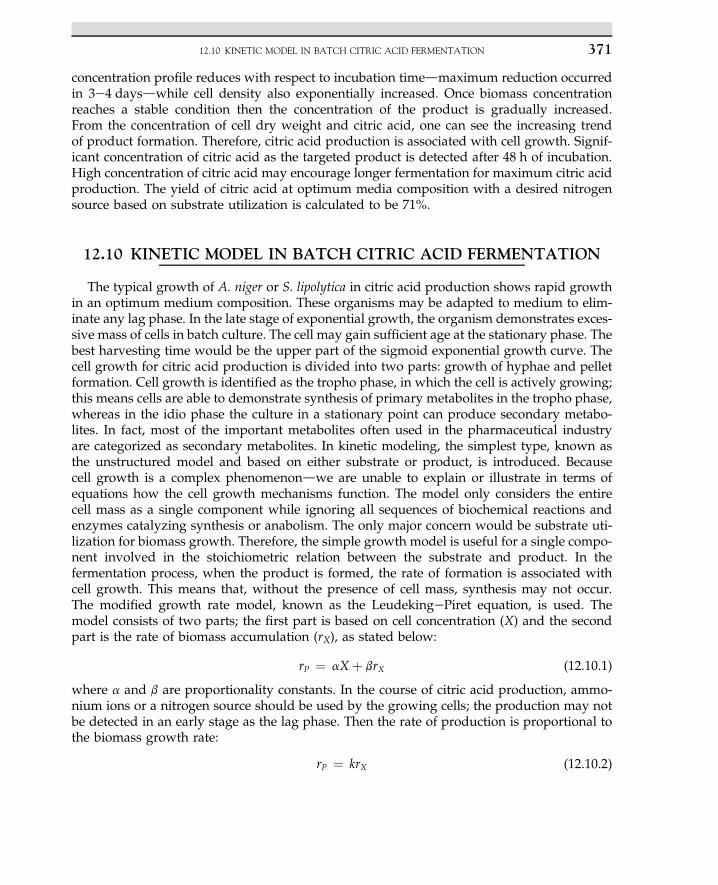
concentration profile reduces with respect to incubation timedmaximum reduction occurredin 3e4 daysdwhile cell density also exponentially increased. Once biomass concentrationreaches a stable condition then the concentration of the product is gradually increased.From the concentration of cell dry weight and citric acid, one can see the increasing trendof product formation. Therefore, citric acid production is associated with cell growth. Signif-icant concentration of citric acid as the targeted product is detected after 48 h of incubation.High concentration of citric acid may encourage longer fermentation for maximum citric acidproduction. The yield of citric acid at optimum media composition with a desired nitrogensource based on substrate utilization is calculated to be 71%.
12.10 KINETIC MODEL IN BATCH CITRIC ACID FERMENTATION
The typical growth of A. niger or S. lipolytica in citric acid production shows rapid growthin an optimum medium composition. These organisms may be adapted to medium to elim-inate any lag phase. In the late stage of exponential growth, the organism demonstrates exces-sive mass of cells in batch culture. The cell may gain sufficient age at the stationary phase. Thebest harvesting time would be the upper part of the sigmoid exponential growth curve. Thecell growth for citric acid production is divided into two parts: growth of hyphae and pelletformation. Cell growth is identified as the tropho phase, in which the cell is actively growing;this means cells are able to demonstrate synthesis of primary metabolites in the tropho phase,whereas in the idio phase the culture in a stationary point can produce secondary metabo-lites. In fact, most of the important metabolites often used in the pharmaceutical industryare categorized as secondary metabolites. In kinetic modeling, the simplest type, known asthe unstructured model and based on either substrate or product, is introduced. Becausecell growth is a complex phenomenondwe are unable to explain or illustrate in terms ofequations how the cell growth mechanisms function. The model only considers the entirecell mass as a single component while ignoring all sequences of biochemical reactions andenzymes catalyzing synthesis or anabolism. The only major concern would be substrate uti-lization for biomass growth. Therefore, the simple growth model is useful for a single compo-nent involved in the stoichiometric relation between the substrate and product. In thefermentation process, when the product is formed, the rate of formation is associated withcell growth. This means that, without the presence of cell mass, synthesis may not occur.The modified growth rate model, known as the LeudekingePiret equation, is used. Themodel consists of two parts; the first part is based on cell concentration (X) and the secondpart is the rate of biomass accumulation (rX), as stated below:
rP ¼ aX þ brX (12.10.1)
where a and b are proportionality constants. In the course of citric acid production, ammo-nium ions or a nitrogen source should be used by the growing cells; the production may notbe detected in an early stage as the lag phase. Then the rate of production is proportional tothe biomass growth rate:
rP ¼ krX (12.10.2)
12.10 KINETIC MODEL IN BATCH CITRIC ACID FERMENTATION 371
where rX is the biomass growth rate. The model predicts different types of cells exist infermentation broth, such as mycelium in hyphae and the pellet. Each type of cell havedifferent rate of productivity. Based on the above concepts discussed for Leudeking-Piretmodel, an equation similar to equation (12.10.1) is written:
rP ¼ k1rX þ k2X (12.10.3)
where k1 and k2 represent growth- and nongrowth-associated constants. The expanded formof the LeudekingePiret model can be rewritten incorporating yield based on biomass andproduct:
1YP=s
dPdt
¼ k1rXYX=s
dXdt
þ k2X (12.10.4)
The rate for substrate utilization is stated as follows:
�dSdt
¼ 1YX=s
dXdt
þ 1YP=s
dPdt
þ k2X
dSdt
¼ �gdXdt
� hX
where g ¼ 1YX=s
þ a
YP=s; h ¼ b
YP=sþ k2
(12.10.5)
A simplified model representing cell metabolite has been developed using the mainreaction inside of the cell. In this regard, biomass and product yields are the main concern;the actual biomass and product yields should not exceed one as stated as follows:
YP=s þ YX=s � 1 (12.10.6)
Rearrangements and integration resulted, as follows:
ln
�XðtÞ
XS � XðtÞ�¼ k t� ln
�XS � Xo
Xo
�
ln
�XðtÞ
XS � XðtÞ �XS � Xo
Xo
�¼ k t
(12.10.7)
where X(t) is the biomass concentration with respect to time, XS is the biomass at the station-ary phase, and Xo is the initial biomass at inoculation or the starting point. The aboveequation resembles exponential growth while we consider biomass concentration withrespect to time.
The logistic model describes the growth kinetic of S. lipolytica. The logistic equation leadsto an explanation of the lag phase, an exponential phase, and stationary phases. The specificgrowth rate predicted by the model is explained by the following equation:
dxdt
¼ mmaxx�1� x
xmax
�(12.10.8)
12. PRODUCTION OF CITRIC ACID372
where mmax is the maximum specific growth rate (h�1) and xmax is the maximum cell dryweight concentration (g L�1). The above expression is known as the Riccati equation, whichis integrated to give the following logistic equation:
x ¼ x0expðmmax tÞ1� � x0
xmax
��1� expðmmax tÞ
� (12.10.9)
The logistic growth kinetic model successfully predicted the batch culture for citric acidproduction. The maximum specific growth rate and maximum cell concentration as thekinetic parameters with an initial substrate (glucose) concentration of 50 g L�1 were0.25 h�1 and 4.71 g L�1, respectively. The model can project a rate constant of 1.6 g (L h)�1
for an initial cell concentration of 100 mg L�1 and an incubation period of 10 h.
NOMENCLATURE
X Cell concentration, g L�1
X(t) Biomass concentration with respect to time, g L�1
XS Biomass at stationary phase, g L�1
Xo Initial biomass at inoculation, g L�1
rX Rate of biomass accumulation, g (L h)�1
YP/s Product yield, that is mass of product per unit substrate, g g�1
YX/s Biomass yield, mass of cell produced per unit mass of substrate, g g�1
k1 and k2 Growth- and nongrowth-associated constants; depends on unit used
References1. Baily JE, Ollis DF. Biochemical engineering fundamentals. 2nd ed. New York: McGraw-Hill; 1986.2. Doran PM. Bioprocess engineering principles. New York: Academic Press; 1995.3. Schmauder HP, editor. Methods in biotechnology. UK: Taylor & Francis; 1997.4. Stanbury PF, Whitaker A. Principles of fermentation technology. Oxford: Pergamon Press; 1984.5. Matthews RF, Braddock RJ. Food Technol 1987;41:57.
REFERENCES 373
C H A P T E R
13
Bioprocess Scale-up
O U T L I N E
13.1 Introduction 375
13.2 Scale-up Procedure fromLaboratory Scaleto Plant Scale 37613.2.1 Scale-up for Constant KLa 37713.2.2 Scale-up Based on Shear
Forces 37813.2.3 Scale-up for Constant Mixing
Time 37913.2.4 Scale-up Based on Physical
Concepts 381
13.3 Bioreactor Design Criteria 38413.3.1 General Cases 38413.3.2 Bubble Column 384
13.4 Continuous Stirred Tank ReactorChemostat versus Tubular PlugFlow 388
13.5 Dynamic Model and OxygenTransfer Ratein Activated Sludge 399
13.6 Aerobic Wastewater Treatment 41013.6.1 Substrate Balance in a
Continuous System 41213.6.2 Material Balance in Fed
Batch 413
Nomenclature 415
References 416
13.1 INTRODUCTION
Microbial processes are developed and implemented in many ways. These processes areoperated at different scales, such as bench, pilot, and plant scales. For economic reasons,large-scale bioprocesses should not be disturbed, and any modification to the running pro-cesses may not be considered. For research, many small-scale processes are developed to
375Biochemical Engineering and Biotechnologyhttp://dx.doi.org/10.1016/B978-0-444-63357-6.00013-4 Copyright © 2015 Elsevier B.V. All rights reserved.
screen and develop better strains, improve existing culture, use efficient media, and handlethe process more efficiently with maximum productivity. The role of biochemical engineersin microbial processes is well defined. First, they should have a clear understanding of thebioprocess and know the action of biocatalysts to stimulate biochemical reactions. Second,they should maintain optimal growth and the environmental conditions required to obtainmaximum production yield. The microbial environment involves substrate and product con-centrations, media composition, pH, and temperature. There are many physical and chemicalparameters involved in the growth environment once the organisms are propagated in a well-advanced bioreactor with instrumentation control. The process parameters are the flowdynamics and chemical dynamics of the biochemical system such as mass transfer, mixing,shear generated by agitation, power input, dilution rate, nutrients, and growth stimulants.The chemical parameters of the process are well controlled and optimized for growthkinetics; physical factors are based on process design. The process design, geometric shape,and size of the bioreactor are affected by dilution rate and substrate consumption rate. Theoperating parameters are well controlled. Changing bioreactor size must follow certain rulesto meet special criteria. Most bioprocess designers have attempted to follow only vessel geo-metric similarities and some dimensionless numbers. However, only increasing volume anddimensions by keeping some dimensionless number constant may not satisfy the needs ofbioprocess design.
13.2 SCALE-UP PROCEDURE FROM LABORATORYSCALE TO PLANT SCALE
The usual procedure for scale-up of a fermenter based on concepts is well known.The following criteria are translated between two scales of operation. They are selected asa procedure for scale-up.
1. Similar Reynolds number or momentum factors.2. Constant power consumption per unit volume of liquid, Pg/V.3. Constant impeller tip velocity, NDi.4. Equal liquid mixing and recirculation times, tm.5. Constant volumetric of mass transfer coefficient, KLa.6. Keep all environmental factors for the microorganism constant.
Based on the practical history of scale-up, most fermentation processes for alcohol andorganic acid production have followed the concepts of geometric similarity and constant po-wer per unit volume. From the above concept, and as a strong basis for translation of processcriteria, only physical properties of the process were considered in the scale-up calculation.For power consumption in an agitated vessel, there is a fixed relation between impeller speed,N, and impeller diameter, Di. The constant power per unit volume for a mechanical agitatedvessel is given by:
PV
¼ rN3D5i
D3i
for Re � 104 (13.2.1)
13. BIOPROCESS SCALE-UP376
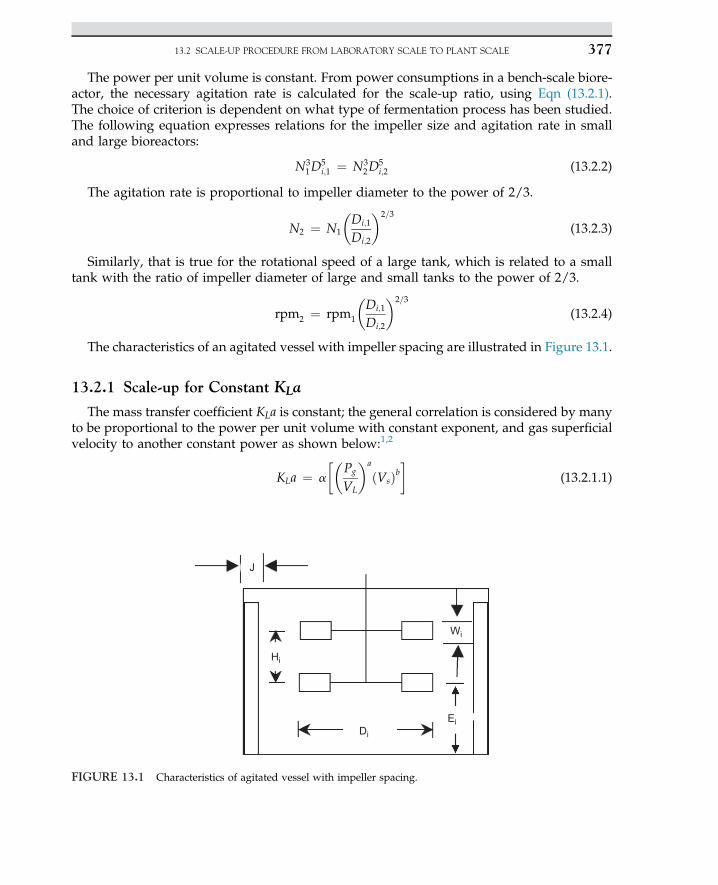
The power per unit volume is constant. From power consumptions in a bench-scale biore-actor, the necessary agitation rate is calculated for the scale-up ratio, using Eqn (13.2.1).The choice of criterion is dependent on what type of fermentation process has been studied.The following equation expresses relations for the impeller size and agitation rate in smalland large bioreactors:
N31D
5i;1 ¼ N3
2D5i;2 (13.2.2)
The agitation rate is proportional to impeller diameter to the power of 2/3.
N2 ¼ N1
�Di;1
Di;2
�2=3
(13.2.3)
Similarly, that is true for the rotational speed of a large tank, which is related to a smalltank with the ratio of impeller diameter of large and small tanks to the power of 2/3.
rpm2 ¼ rpm1
�Di;1
Di;2
�2=3
(13.2.4)
The characteristics of an agitated vessel with impeller spacing are illustrated in Figure 13.1.
13.2.1 Scale-up for Constant KLa
The mass transfer coefficient KLa is constant; the general correlation is considered by manyto be proportional to the power per unit volume with constant exponent, and gas superficialvelocity to another constant power as shown below:1,2
KLa ¼ a
��Pg
VL
�a
ðVsÞb�
(13.2.1.1)
J
Hi
Wi
DiEi
FIGURE 13.1 Characteristics of agitated vessel with impeller spacing.
13.2 SCALE-UP PROCEDURE FROM LABORATORY SCALE TO PLANT SCALE 377
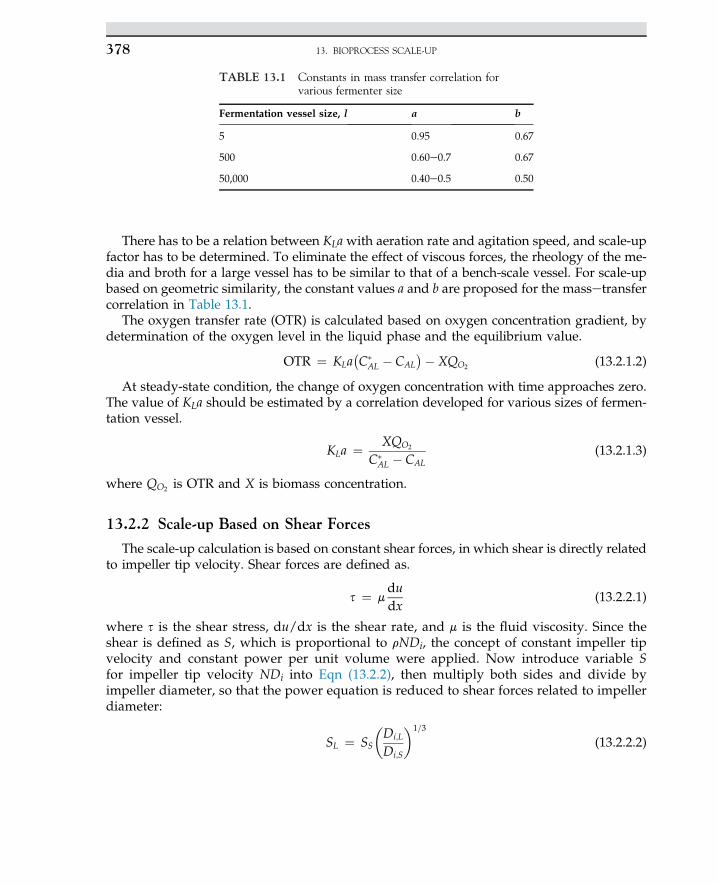
There has to be a relation between KLawith aeration rate and agitation speed, and scale-upfactor has to be determined. To eliminate the effect of viscous forces, the rheology of the me-dia and broth for a large vessel has to be similar to that of a bench-scale vessel. For scale-upbased on geometric similarity, the constant values a and b are proposed for the massetransfercorrelation in Table 13.1.
The oxygen transfer rate (OTR) is calculated based on oxygen concentration gradient, bydetermination of the oxygen level in the liquid phase and the equilibrium value.
OTR ¼ KLa�C�
AL � CAL�� XQO2 (13.2.1.2)
At steady-state condition, the change of oxygen concentration with time approaches zero.The value of KLa should be estimated by a correlation developed for various sizes of fermen-tation vessel.
KLa ¼ XQO2
C�AL � CAL
(13.2.1.3)
where QO2 is OTR and X is biomass concentration.
13.2.2 Scale-up Based on Shear Forces
The scale-up calculation is based on constant shear forces, in which shear is directly relatedto impeller tip velocity. Shear forces are defined as.
s ¼ mdudx
(13.2.2.1)
where s is the shear stress, du/dx is the shear rate, and m is the fluid viscosity. Since theshear is defined as S, which is proportional to rNDi, the concept of constant impeller tipvelocity and constant power per unit volume were applied. Now introduce variable Sfor impeller tip velocity NDi into Eqn (13.2.2), then multiply both sides and divide byimpeller diameter, so that the power equation is reduced to shear forces related to impellerdiameter:
SL ¼ SS
�Di;L
Di;S
�1=3
(13.2.2.2)
TABLE 13.1 Constants in mass transfer correlation forvarious fermenter size
Fermentation vessel size, l a b
5 0.95 0.67
500 0.60e0.7 0.67
50,000 0.40e0.5 0.50
13. BIOPROCESS SCALE-UP378
The constant shear concept has been applied for bioreactor scale-up that uses mycelia, inwhich the fermentation process is shear sensitive and the broth is affected by shear rateof impeller tip velocity. For instance, in the production of novobiocin, the yield of antibioticproduction is dependent on impeller size and impeller tip velocity.
The impeller is a device in which shear forces are transmitted to the fermentationbroth. Since the process is sensitive to a high agitation rate, it is necessary that the specialbioreactor be scaled up, based on shear forces for maximizing product yield, such asantibiotics.
This is the main reason for keeping the impeller tip speed constant; in practice, it is recom-mended that this is in the range 0.25e0.5 m s�1. If the above conditions hold, it is not neces-sary to follow the geometric similarity constraint; however, it may violate the rule of powerconsumption per unit volume. Therefore keeping the impeller at a constant speed and keep-ing KLa constant may be required for special case studies for bioreactor design in antibioticfermentation.
13.2.3 Scale-up for Constant Mixing Time
The problem associated with poor mixing in a large vessel was identified as low dissolvedoxygen in the aerated vessel. The mixing time has been correlated with turbulent flow. In alarge-scale operation, the corrected function for mixing time incorporates the actual mixingtime with impeller speed, tank diameter, and liquid height. The function of mixing, f(t) isdefined as constant mixing time:
f ðtÞ ¼ tm�ND2
i
�2=3g1=6D1=2
i Y1=2D3=2t (13.2.3.1)
where tm is the mixing time, g is gravity, Dt is the tank diameter, and Y is the depth of theliquid. Substitute Eqn (13.2.2) into Eqn (13.2.2.2) as power per unit volume is constant; theresulting equation is the mixing time:
tmL
tmS¼"�
NS
NL
�4�DiL
DiS
�#1=6(13.2.3.2)
That is proportional to impeller diameter to the power of 0.65. Then, solving for mixingtime:
tmL ¼ tmS
�DiL
DiS
�11=18
¼ tmS
�DiL
DiS
�0:65
(13.2.3.3)
Equation 13.2.3.3 is used for geometric similarity, where tmS and tmL represent the mixingtime for small and large fermentation vessels. Mixing and mixing time have been major con-cerns for several investigators, because large-scale vessels may not have uniform mixing,whereas in small vessels mixing is not a problem. The mixing time in large vessels hasbeen correlated based on dimensional analysis.
13.2 SCALE-UP PROCEDURE FROM LABORATORY SCALE TO PLANT SCALE 379
In 1953, Rushton proposed a dimensionless number that is used for scale-up calcula-tion. The dimensionless group is proportional to NRe, as shown by the followingequation:2,3
j ¼ kðNReÞa (13.2.3.4)
where the Reynolds number for an agitated vessel was defined as:
Re ¼ rND2i
m(13.2.3.5)
Since the process is more complex, the proposed method may not be valid for scale-upcalculation. The combination of power and Reynolds number was the next step for corre-lating power and fluid-flow dimensionless number, which was to define the power numberas a function of the Reynolds number. In fact, the study by Rushton summarized various geo-metrics of impellers, as his findings were plotted as dimensionless power input versusimpeller Reynolds number; the plot is known as a power graph. The plot is presentedin Figure 6.6, Chapter 6. Equation 13.2.3.6 correlates the power number as a function ofthe Reynolds number.
Np ¼ kðReÞ�m (13.2.3.6)
In fact, the power number is a dimensionless number that is the ratio of ungassed power togassed power in a normal bioreactor.3
Np ¼ PgcrN3D5
i
(13.2.3.7)
where P is ungassed power, in W or hp.In a mixed agitated vessel with a high agitation rate, a vortex often forms at the center of
the vessel. To prevent a central vortex in tanks less than 3 m in diameter, four baffles, eachwith a baffle width of 15e20 cm, are necessary. A basic assumption is to select a ratio ofliquid height to tank diameter from 2:1 to 6:1.
HL
Dt¼ 2 : 1� 6 : 1 (13.2.3.8)
It is common for an agitated vessel to have the tank diameter equal to the liquid workingvolume.
HL
Dt¼ 1 (13.2.3.9)
Also, select a ratio of tank diameter to baffle width from 10 to 12:
Dt
Db¼ 10� 12 (13.2.3.10)
A suitable impeller interspacing (Hi) is preferred for good mixing that has to be in distanceof less than 2Di:
Di < Hi < 2Di (13.2.3.11)
13. BIOPROCESS SCALE-UP380
It is well understood that mixing and mass transfer is affected by agitation andaeration rates. Typically, in an agitated vessel, the working volume is about 75% of nominalcontinuous stirred tank reactor (CSTR) volume.
13.2.4 Scale-up Based on Physical Concepts
For bioreactor scale up, an aerated and agitated vessel for a gas and liquid system, aspecific fermentation in a bench-scale fernmenter is preformed. The proposed operationfocused on large-scale fermentation while the same geometrical design is applied. Theproblem associated with a large vessel would be mass transfer limitation; proper aera-tion is required. An estimation of mass transfer coefficient for desired agitation is impor-tant for sufficient mixing. It was assumed that for either small- or large-scale bioreactoroperations there were no significant changes in physical properties of fermentation me-dia. In addition, to eliminate any side effects, both small and large systems are geomet-rically similar. The mass transfer coefficients for small and large scales are defined asfollows:
ðkLaÞSmall
ðkLaÞLarge¼ ðF=VÞ1
ðF=VÞ2
�HL1
HL2
��dB2dB1
�2=3�gB2
gB1
�1=2
(13.2.4.1)
where F/V stands for volume of gas per volume of liquid per minute (vvm) or rate ofaeration, HL is liquid level, dB is bubble diameter, and g¼ r/m is kinematic viscosity ofthe fluid. Let us denote that the subscript 1 and 2 represent small and large systems,respectively. Assume bubble size and kinematic viscosity of media in both systemsare the same while no significant changes were observed; then the above equation issimplified:
ðF=VÞ1ðF=VÞ2
¼�HL2
HL1
�(13.2.4.2)
Let us define a volumetric scale factor of 125, and aeration rate in small fermenter is 1 vvm;then what would be the aeration in large-scale fermenter? The volumetric scale-up is 125;then, the scale-up ratio of liquid height would be HL2
HL1¼ 5:
1 vvm
ðF=VÞ2¼ 5; ðF=VÞ2 ¼ 0:2 vvm
However, the effect of emerged and segregated oxygen bubbles in an aerated system maydisregard the above assumptions. For a bench-scale aerated vessel, the above correlation
should be corrected by liquid height ratio�HL1HL2
2=3; then, the corrected aeration rate for segre-
gated bubbles would be:
ðF=VÞ2 ¼ 5�2=3 ¼ 0:34
That means, instead of 0.2 vvm oxygen, 0.34 vvm oxygen is required in large-scaleaerated vessel. The concept of scale-up is based on constant physical properties of broth
13.2 SCALE-UP PROCEDURE FROM LABORATORY SCALE TO PLANT SCALE 381
during the course of fermentation, while keeping geometric similarities for aerated sys-tems. This means in a baffled bioreactor, we need to keep media composition, temper-ature, pH, and dissolved oxygen concentration constant. The proportionality factors interms of power, aeration, and many other useful terms used for scale-up are statedbelow:
PfN3D5i (13.2.4.3)
where P stands for power, N is angular velocity, and Di is diameter of the impeller. Also forgassed power (Pg) and ungassed power (P) as a function of aeration number is:
Pg
P¼ f
�Na�
13.2.4.4
Where Na is aeration number in terms of scale, proportional factors are used as statedbelow:
Na ¼ Fg
ND3i
(13.2.4.5)
FgfND3i
PVfN3D2
i
VfD3i
Fg
VfN
(13.2.4.6)
where Fg/V is the liquid circulation rate occur inside the fermenter. Also, the impeller tipvelocity represents the liquid shear rate, which is stated as:
yfNDi (13.2.4.7)
The Reynolds number, Re ¼ ND2i r=m, can be simplified for proportionality factor used for
scale up calculation shown below:
RefND2i (13.2.4.8)
Table 13.2 summarizes all physical properties for small- and large-scale fermentersusing a scale-up factor of 125. The physical properties of a large-scale bioreactor,including P, P/V, F, F/V, NDi, and Re are calculated for constant Di, while N is variedfrom 0.1 to 2.
To explain the given numbers in the above table, we had to follow up exactly the propor-tional factors given for scale-up. In the first row of the above table, the numbers are based onthe power calculation given in second row. Just multiply the numbers by a scale-up factor of125. The angular velocity, N for large-scale, reduced power to 25, then the velocity is reducedby 1/5 and the last value is 0.2/5, which is equal to 0.04. The gas volumetric flow rate (F) is
13. BIOPROCESS SCALE-UP382
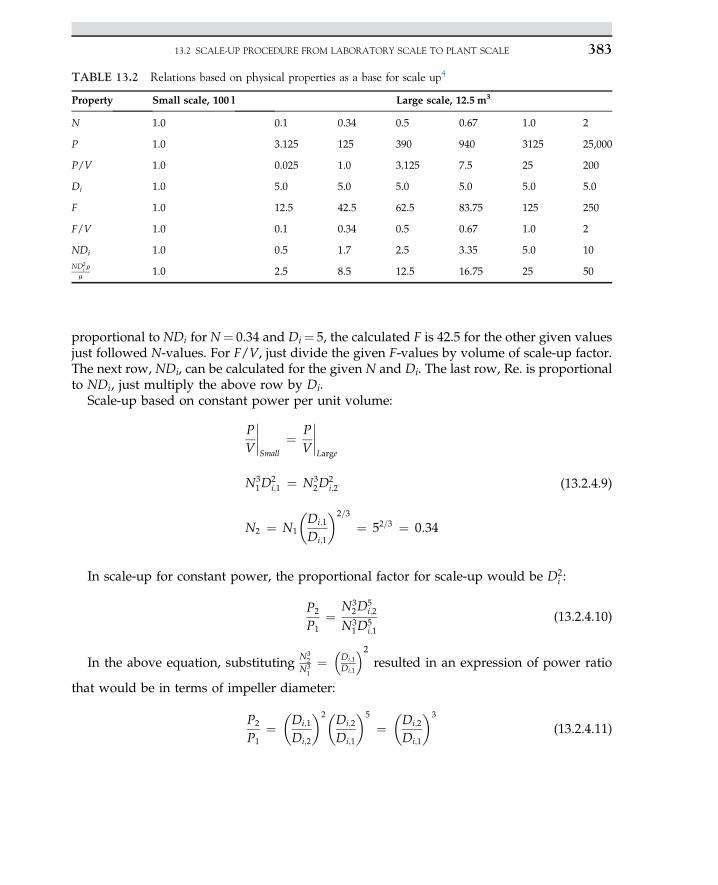
proportional to NDi for N¼ 0.34 and Di¼ 5, the calculated F is 42.5 for the other given valuesjust followed N-values. For F/V, just divide the given F-values by volume of scale-up factor.The next row, NDi, can be calculated for the given N and Di. The last row, Re. is proportionalto NDi, just multiply the above row by Di.
Scale-up based on constant power per unit volume:
PV
Small
¼ PV
Large
N31D
2i;1 ¼ N3
2D2i;2
N2 ¼ N1
�Di;1
Di;1
�2=3
¼ 52=3 ¼ 0:34
(13.2.4.9)
In scale-up for constant power, the proportional factor for scale-up would be D2i :
P2
P1¼ N3
2D5i;2
N31D
5i;1
(13.2.4.10)
In the above equation, substituting N32
N31¼�Di;1Di;1
2resulted in an expression of power ratio
that would be in terms of impeller diameter:
P2
P1¼�Di;1
Di;2
�2�Di;2
Di;1
�5
¼�Di;2
Di;1
�3
(13.2.4.11)
TABLE 13.2 Relations based on physical properties as a base for scale up4
Property Small scale, 100 l Large scale, 12.5 m3
N 1.0 0.1 0.34 0.5 0.67 1.0 2
P 1.0 3.125 125 390 940 3125 25,000
P/V 1.0 0.025 1.0 3.125 7.5 25 200
Di 1.0 5.0 5.0 5.0 5.0 5.0 5.0
F 1.0 12.5 42.5 62.5 83.75 125 250
F/V 1.0 0.1 0.34 0.5 0.67 1.0 2
NDi 1.0 0.5 1.7 2.5 3.35 5.0 10ND2
i r
m1.0 2.5 8.5 12.5 16.75 25 50
13.2 SCALE-UP PROCEDURE FROM LABORATORY SCALE TO PLANT SCALE 383
The scale-up for power ratio ends up to be the same scale-up factor for volumetricproportion that is 125 for the above case.
13.3 BIOREACTOR DESIGN CRITERIA
The bioreactor is the major piece of equipment used in biochemical processes. It differstotally from a simple chemical reaction vessel. To control physical operating parametersand microbial environmental conditions, there are several influential variables:
• Biomass concentration• Sterile condition• Effect of agitation and mass transfer• Heat removal for temperature control• pH control of the media• Correct shear conditions.
Bioreactors in terms of operation and specific criteria are well defined. The most useful andapplied types of bioreactor are:
• CSTR• Air lift: air is used for fluid circulation by pressurized air• Loop reactor: modified air lift, pump transport the air and fluid through the vessel• Immobilized system: air and fluid circulate over a film of microorganisms grown on a
solid support• Tower fermenter• Membrane bioreactor.
13.3.1 General Cases
If the height of liquid, HL, is equal to Dt, one set of agitators is enough to obtain sufficientmixing. For HL equal to 2Dt or 3Dt, additional sets of agitators separated by distance Hi arerequired, mounted on the same shaft. Spargers are placed at a distance Di/2 from the bottomof the tank. Power input is greater than 100 W m�3, and the tip impeller speed is pNDi greaterthan 1.5 m s�1. Also, the Froude number is N2Di
g greater than 1.0. Hi is impeller interspacing.Foam in the bioreactor is troublesome: it can reduce the OTR. Antifoam is use to prevent
foam formation. However, excess antifoam may cause growth inhibition in the courseof fermentation. The simplest device is known as a foam breaker, which is mounted on thestirrer shaft located on the surface of liquid. It is a flat blade.
13.3.2 Bubble Column
For production of baker’s yeast, beer, vinegar, and, in wastewater treatment, bubble col-umns are used. Generally these columns should be long enough so that bubbles are usedas they rise while passing through the column. Column diameters range from 10 cm to7.5 m. The height of the column is three to six times greater than the diameter. The common
13. BIOPROCESS SCALE-UP384
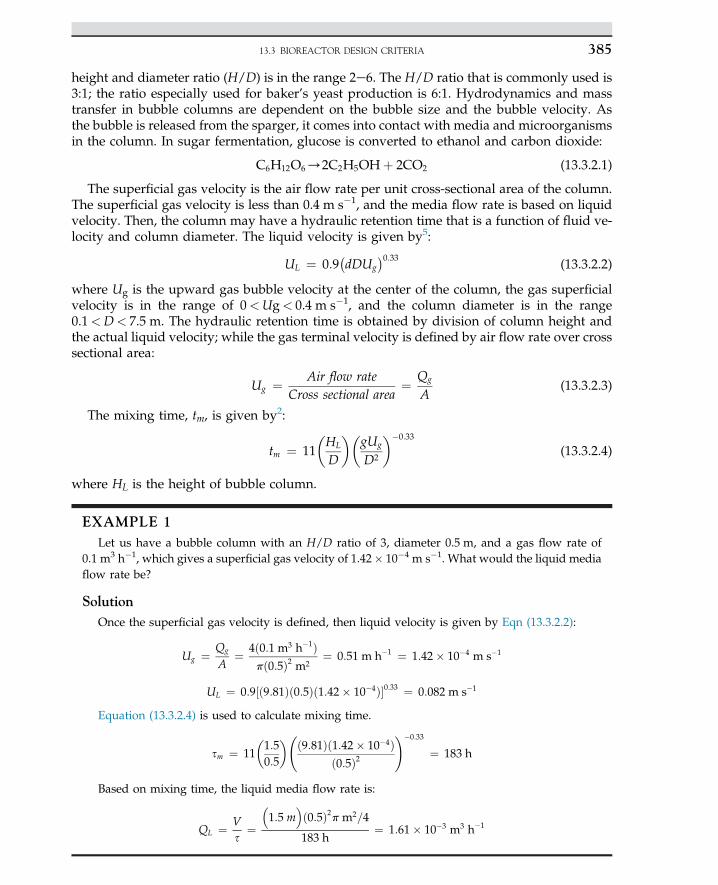
height and diameter ratio (H/D) is in the range 2e6. The H/D ratio that is commonly used is3:1; the ratio especially used for baker’s yeast production is 6:1. Hydrodynamics and masstransfer in bubble columns are dependent on the bubble size and the bubble velocity. Asthe bubble is released from the sparger, it comes into contact with media and microorganismsin the column. In sugar fermentation, glucose is converted to ethanol and carbon dioxide:
C6H12O6/2C2H5OHþ 2CO2 (13.3.2.1)
The superficial gas velocity is the air flow rate per unit cross-sectional area of the column.The superficial gas velocity is less than 0.4 m s�1, and the media flow rate is based on liquidvelocity. Then, the column may have a hydraulic retention time that is a function of fluid ve-locity and column diameter. The liquid velocity is given by5:
UL ¼ 0:9�dDUg
�0:33 (13.3.2.2)
where Ug is the upward gas bubble velocity at the center of the column, the gas superficialvelocity is in the range of 0<Ug< 0.4 m s�1, and the column diameter is in the range0.1<D< 7.5 m. The hydraulic retention time is obtained by division of column height andthe actual liquid velocity; while the gas terminal velocity is defined by air flow rate over crosssectional area:
Ug ¼ Air flow rateCross sectional area
¼ Qg
A(13.3.2.3)
The mixing time, tm, is given by2:
tm ¼ 11�HL
D
��gUg
D2
��0:33
(13.3.2.4)
where HL is the height of bubble column.
EXAMPLE 1Let us have a bubble column with an H/D ratio of 3, diameter 0.5 m, and a gas flow rate of
0.1 m3 h�1, which gives a superficial gas velocity of 1.42� 10�4 m s�1. What would the liquid mediaflow rate be?
SolutionOnce the superficial gas velocity is defined, then liquid velocity is given by Eqn (13.3.2.2):
Ug ¼ Qg
A¼ 4ð0:1 m3 h�1Þ
pð0:5Þ2 m2¼ 0:51 m h�1 ¼ 1:42� 10�4 m s�1
UL ¼ 0:9½ð9:81Þð0:5Þð1:42� 10�4Þ�0:33 ¼ 0:082 m s�1
Equation (13.3.2.4) is used to calculate mixing time.
sm ¼ 11�1:50:5
� ð9:81Þð1:42� 10�4Þð0:5Þ2
!�0:33
¼ 183 h
Based on mixing time, the liquid media flow rate is:
QL ¼ Vs
¼�1:5 m
ð0:5Þ2p m2=4
183 h¼ 1:61� 10�3 m3 h�1
13.3 BIOREACTOR DESIGN CRITERIA 385
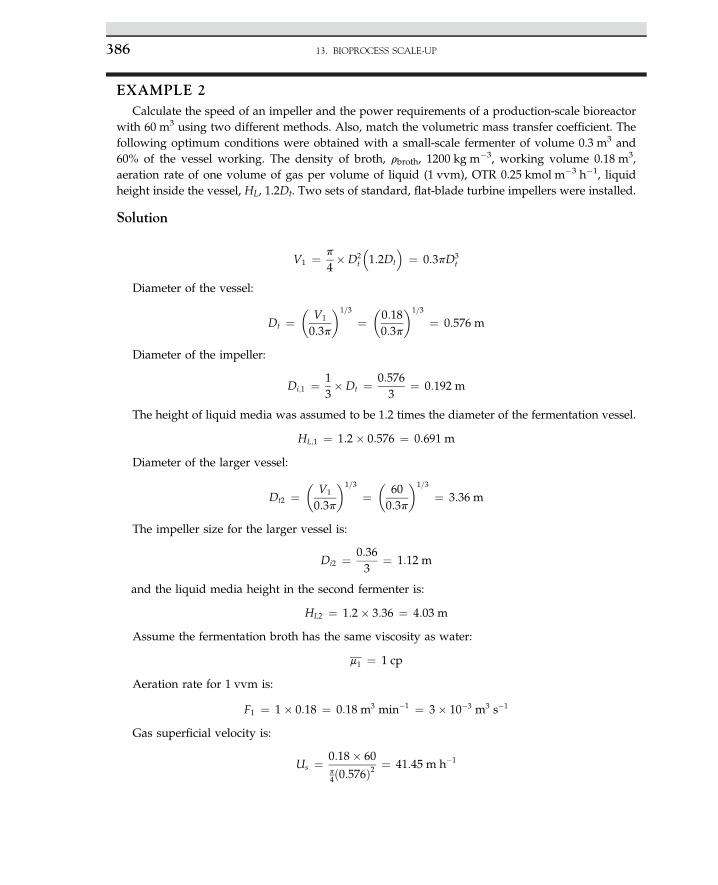
EXAMPLE 2Calculate the speed of an impeller and the power requirements of a production-scale bioreactor
with 60 m3 using two different methods. Also, match the volumetric mass transfer coefficient. Thefollowing optimum conditions were obtained with a small-scale fermenter of volume 0.3 m3 and60% of the vessel working. The density of broth, rbroth, 1200 kg m�3, working volume 0.18 m3,aeration rate of one volume of gas per volume of liquid (1 vvm), OTR 0.25 kmol m�3 h�1, liquidheight inside the vessel, HL, 1.2Dt. Two sets of standard, flat-blade turbine impellers were installed.
Solution
V1 ¼ p
4�D2
t
�1:2Dt
¼ 0:3pD3
t
Diameter of the vessel:
Dt ¼�
V1
0:3p
�1=3
¼�0:180:3p
�1=3
¼ 0:576 m
Diameter of the impeller:
Di;1 ¼ 13�Dt ¼ 0:576
3¼ 0:192 m
The height of liquid media was assumed to be 1.2 times the diameter of the fermentation vessel.
HL;1 ¼ 1:2� 0:576 ¼ 0:691 m
Diameter of the larger vessel:
Dt2 ¼�
V1
0:3p
�1=3
¼�
600:3p
�1=3
¼ 3:36 m
The impeller size for the larger vessel is:
Di2 ¼ 0:363
¼ 1:12 m
and the liquid media height in the second fermenter is:
HL2 ¼ 1:2� 3:36 ¼ 4:03 m
Assume the fermentation broth has the same viscosity as water:
m1 ¼ 1 cp
Aeration rate for 1 vvm is:
F1 ¼ 1� 0:18 ¼ 0:18 m3 min�1 ¼ 3� 10�3 m3 s�1
Gas superficial velocity is:
Us ¼ 0:18� 60p4ð0:576Þ2
¼ 41:45 m h�1
13. BIOPROCESS SCALE-UP386
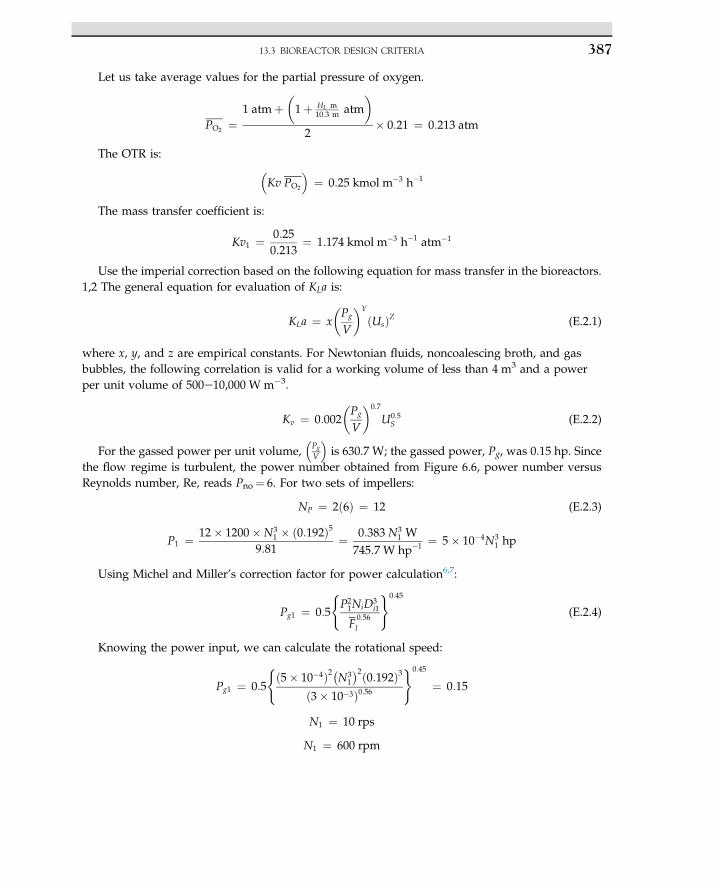
Let us take average values for the partial pressure of oxygen.
PO2 ¼1 atmþ
�1þ HL m
10:3 m atm�
2� 0:21 ¼ 0:213 atm
The OTR is: �Kv PO2
¼ 0:25 kmol m�3 h�1
The mass transfer coefficient is:
Kv1 ¼ 0:250:213
¼ 1:174 kmol m�3 h�1 atm�1
Use the imperial correction based on the following equation for mass transfer in the bioreactors.1,2 The general equation for evaluation of KLa is:
KLa ¼ x�Pg
V
�Y
ðUsÞZ (E.2.1)
where x, y, and z are empirical constants. For Newtonian fluids, noncoalescing broth, and gasbubbles, the following correlation is valid for a working volume of less than 4 m3 and a powerper unit volume of 500e10,000 W m�3.
Kv ¼ 0:002�Pg
V
�0:7
U0:5S (E.2.2)
For the gassed power per unit volume,�Pg
V
is 630.7 W; the gassed power, Pg, was 0.15 hp. Since
the flow regime is turbulent, the power number obtained from Figure 6.6, power number versusReynolds number, Re, reads Pno¼ 6. For two sets of impellers:
NP ¼ 2ð6Þ ¼ 12 (E.2.3)
P1 ¼ 12� 1200�N31 � ð0:192Þ5
9:81¼ 0:383 N3
1 W745:7 W hp�1 ¼ 5� 10�4N3
1 hp
Using Michel and Miller’s correction factor for power calculation6,7:
Pg1 ¼ 0:5
(P21NiD3
i1
F0:56l
)0:45
(E.2.4)
Knowing the power input, we can calculate the rotational speed:
Pg1 ¼ 0:5
(ð5� 10�4Þ2�N3
1
�2ð0:192Þ3ð3� 10�3Þ0:56
)0:45
¼ 0:15
N1 ¼ 10 rps
N1 ¼ 600 rpm
13.3 BIOREACTOR DESIGN CRITERIA 387
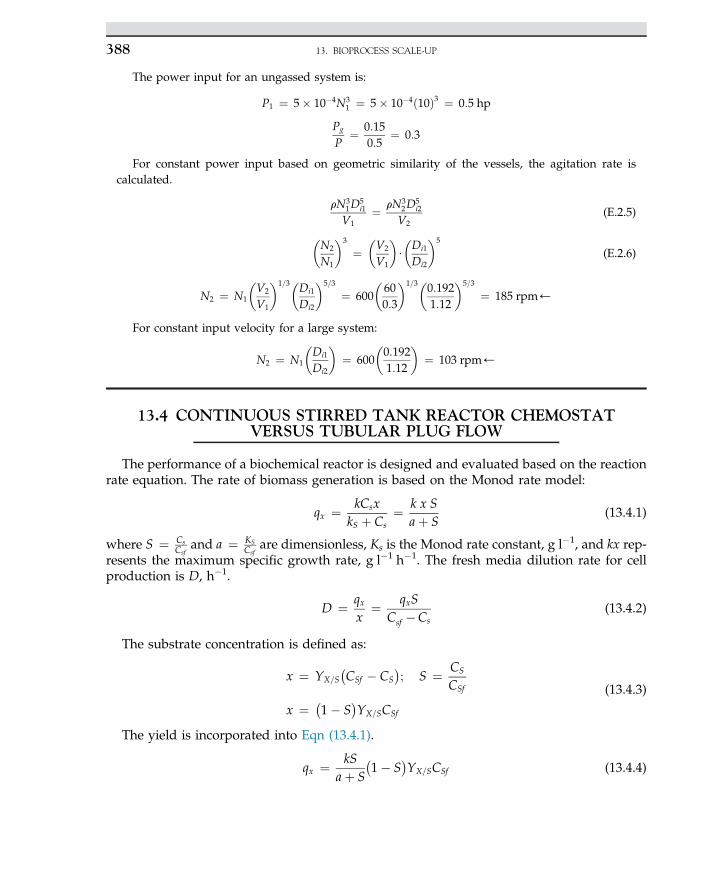
The power input for an ungassed system is:
P1 ¼ 5� 10�4N31 ¼ 5� 10�4ð10Þ3 ¼ 0:5 hp
Pg
P¼ 0:15
0:5¼ 0:3
For constant power input based on geometric similarity of the vessels, the agitation rate iscalculated.
rN31D
5i1
V1¼ rN3
2D5i2
V2(E.2.5)
�N2
N1
�3
¼�V2
V1
�$
�Di1
Di2
�5
(E.2.6)
N2 ¼ N1
�V2
V1
�1=3�Di1
Di2
�5=3
¼ 600�600:3
�1=3�0:1921:12
�5=3
¼ 185 rpm)
For constant input velocity for a large system:
N2 ¼ N1
�Di1
Di2
�¼ 600
�0:1921:12
�¼ 103 rpm)
13.4 CONTINUOUS STIRRED TANK REACTOR CHEMOSTATVERSUS TUBULAR PLUG FLOW
The performance of a biochemical reactor is designed and evaluated based on the reactionrate equation. The rate of biomass generation is based on the Monod rate model:
qx ¼ kCsxkS þ Cs
¼ k x Saþ S
(13.4.1)
where S ¼ CsCsf
and a ¼ KSCsf
are dimensionless, Ks is the Monod rate constant, g l�1, and kx rep-resents the maximum specific growth rate, g l�1 h�1. The fresh media dilution rate for cellproduction is D, h�1.
D ¼ qxx
¼ qxSCsf �Cs
(13.4.2)
The substrate concentration is defined as:
x ¼ YX=S�CSf � CS
�; S ¼ CS
CSf
x ¼ �1� S
�YX=SCSf
(13.4.3)
The yield is incorporated into Eqn (13.4.1).
qx ¼ kSaþ S
�1� S
�YX=SCSf (13.4.4)
13. BIOPROCESS SCALE-UP388
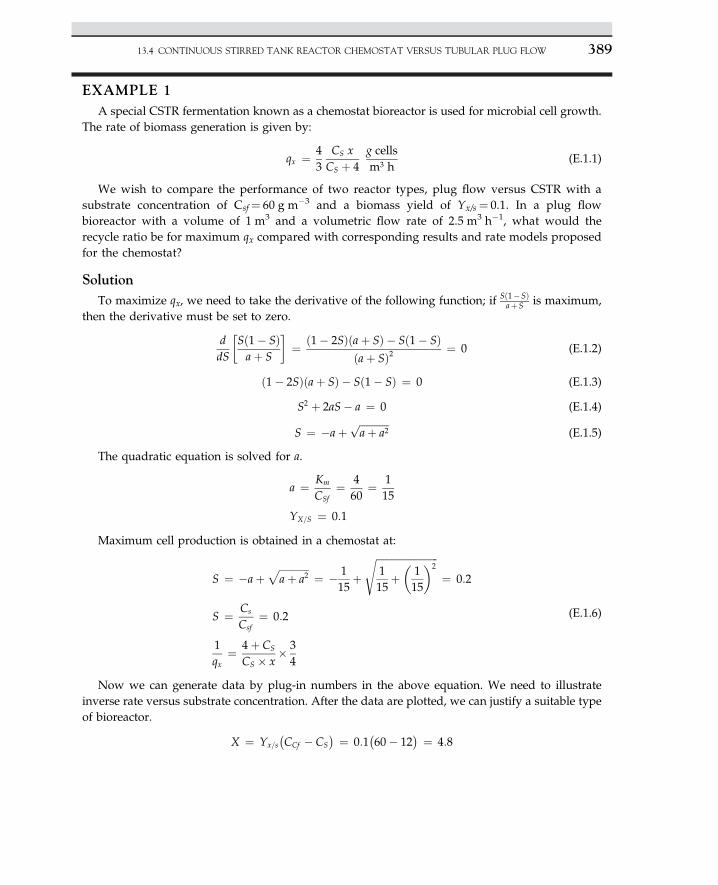
EXAMPLE 1A special CSTR fermentation known as a chemostat bioreactor is used for microbial cell growth.
The rate of biomass generation is given by:
qx ¼ 43
CS xCS þ 4
g cellsm3 h
(E.1.1)
We wish to compare the performance of two reactor types, plug flow versus CSTR with asubstrate concentration of Csf¼ 60 g m�3 and a biomass yield of Yx/s¼ 0.1. In a plug flowbioreactor with a volume of 1 m3 and a volumetric flow rate of 2.5 m3 h�1, what would therecycle ratio be for maximum qx compared with corresponding results and rate models proposedfor the chemostat?
SolutionTo maximize qx, we need to take the derivative of the following function; if Sð1�SÞ
aþS is maximum,then the derivative must be set to zero.
ddS
�Sð1� SÞaþ S
�¼ ð1� 2SÞðaþ SÞ � Sð1� SÞ
ðaþ SÞ2 ¼ 0 (E.1.2)
ð1� 2SÞðaþ SÞ � Sð1� SÞ ¼ 0 (E.1.3)
S2 þ 2aS� a ¼ 0 (E.1.4)
S ¼ �aþffiffiffiffiffiffiffiffiffiffiffiffiaþ a2
p(E.1.5)
The quadratic equation is solved for a.
a ¼ Km
CSf¼ 4
60¼ 1
15
YX=S ¼ 0:1
Maximum cell production is obtained in a chemostat at:
S ¼ �aþffiffiffiffiffiffiffiffiffiffiffiffiaþ a2
p¼ � 1
15þ
ffiffiffiffiffiffiffiffiffiffiffiffiffiffiffiffiffiffiffiffiffiffiffiffiffi115
þ�115
�2s
¼ 0:2
S ¼ Cs
Csf¼ 0:2
1qx
¼ 4þ CS
CS � x� 34
(E.1.6)
Now we can generate data by plug-in numbers in the above equation. We need to illustrateinverse rate versus substrate concentration. After the data are plotted, we can justify a suitable typeof bioreactor.
X ¼ Yx=s�CCf � CS
� ¼ 0:1�60� 12
� ¼ 4:8
13.4 CONTINUOUS STIRRED TANK REACTOR CHEMOSTAT VERSUS TUBULAR PLUG FLOW 389
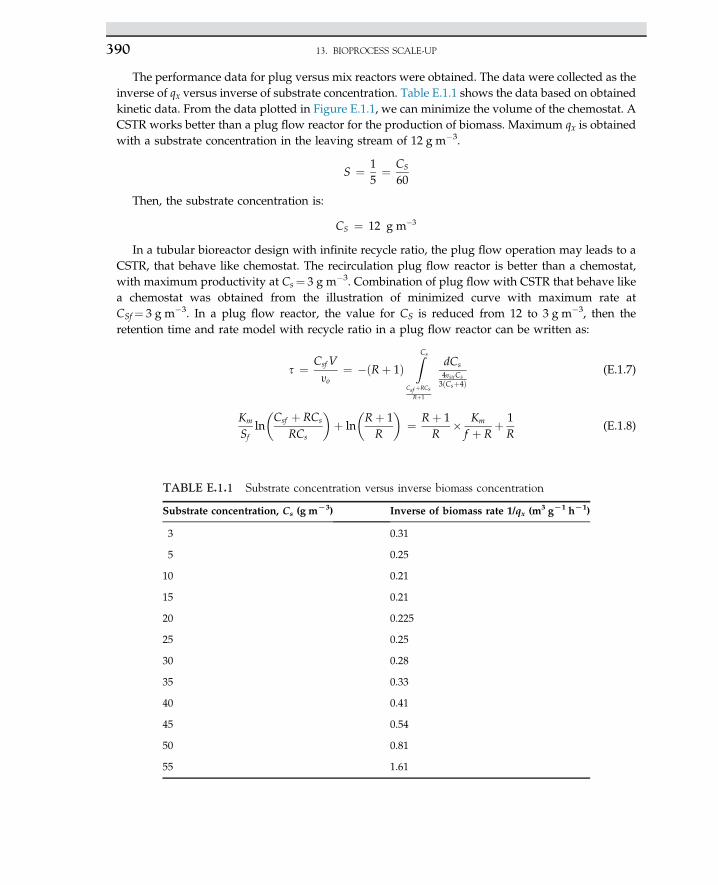
The performance data for plug versus mix reactors were obtained. The data were collected as theinverse of qx versus inverse of substrate concentration. Table E.1.1 shows the data based on obtainedkinetic data. From the data plotted in Figure E.1.1, we can minimize the volume of the chemostat. ACSTR works better than a plug flow reactor for the production of biomass. Maximum qx is obtainedwith a substrate concentration in the leaving stream of 12 g m�3.
S ¼ 15¼ CS
60
Then, the substrate concentration is:
CS ¼ 12 g m�3
In a tubular bioreactor design with infinite recycle ratio, the plug flow operation may leads to aCSTR, that behave like chemostat. The recirculation plug flow reactor is better than a chemostat,with maximum productivity at Cs¼ 3 g m�3. Combination of plug flow with CSTR that behave likea chemostat was obtained from the illustration of minimized curve with maximum rate atCSf¼ 3 g m�3. In a plug flow reactor, the value for CS is reduced from 12 to 3 g m�3, then theretention time and rate model with recycle ratio in a plug flow reactor can be written as:
s ¼ CsfVyo
¼ �ðRþ 1ÞZCs
Csf þRCsRþ1
dCs4ysxCs3ðCsþ4Þ
(E.1.7)
Km
Sfln
�Csf þ RCs
RCs
�þ ln
�Rþ 1R
�¼ Rþ 1
R� Km
f þ Rþ 1R
(E.1.8)
TABLE E.1.1 Substrate concentration versus inverse biomass concentration
Substrate concentration, Cs (g mL3) Inverse of biomass rate 1/qx (m3 gL1 hL1)
3 0.31
5 0.25
10 0.21
15 0.21
20 0.225
25 0.25
30 0.28
35 0.33
40 0.41
45 0.54
50 0.81
55 1.61
13. BIOPROCESS SCALE-UP390
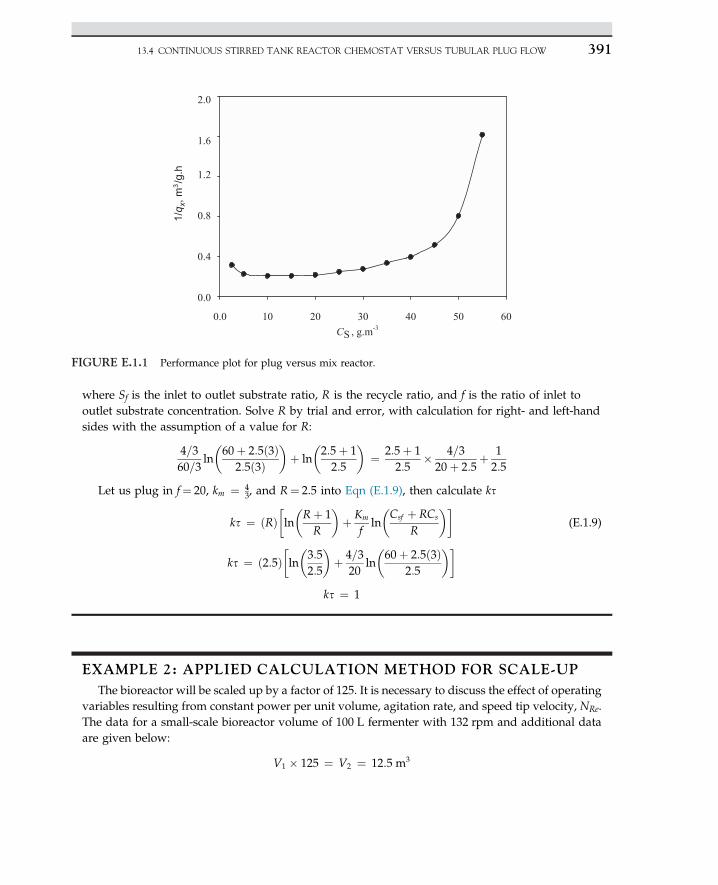
where Sf is the inlet to outlet substrate ratio, R is the recycle ratio, and f is the ratio of inlet tooutlet substrate concentration. Solve R by trial and error, with calculation for right- and left-handsides with the assumption of a value for R:
4=360=3
ln
�60þ 2:5ð3Þ
2:5ð3Þ�þ ln
�2:5þ 12:5
�¼ 2:5þ 1
2:5� 4=320þ 2:5
þ 12:5
Let us plug in f¼ 20, km ¼ 43, and R¼ 2.5 into Eqn (E.1.9), then calculate ks
ks ¼ ðRÞ�ln
�Rþ 1R
�þ Km
fln
�Csf þ RCs
R
��(E.1.9)
ks ¼ ð2:5Þ�ln
�3:52:5
�þ 4=3
20ln
�60þ 2:5ð3Þ
2:5
��ks ¼ 1
EXAMPLE 2: APPLIED CALCULATION METHOD FOR SCALE-UPThe bioreactor will be scaled up by a factor of 125. It is necessary to discuss the effect of operating
variables resulting from constant power per unit volume, agitation rate, and speed tip velocity, NRe.The data for a small-scale bioreactor volume of 100 L fermenter with 132 rpm and additional dataare given below:
V1 � 125 ¼ V2 ¼ 12:5 m3
1/q x
, m3/g
.h
2.0
1.6
1.2
0.8
0.4
0.0
0.0 10 20 30 40 50 60CS , g.m-3
FIGURE E.1.1 Performance plot for plug versus mix reactor.
13.4 CONTINUOUS STIRRED TANK REACTOR CHEMOSTAT VERSUS TUBULAR PLUG FLOW 391
pV
¼ Constant (E.2.1)
NiDi ¼ Constant (E.2.2)
Factoring for scale-up, we make some assumptions and may use a few known correlations toprogress our calculations. Let us say PfV ¼ D3
i , H/D¼ 1, and D/Di¼ 3. Also, use constant powerper unit volume for the small- and large-scale bioreactor.
PVz�N3
i D2i
�Small ¼
�N3
i D2i
�Large (E.2.3)
Since we assumed power per unit volume is constant, it is possible (NiDi)1 may not be equal with(NiDi)2. Now calculate the agitation rate for a large vessel.
Ni2 ¼ Ni1
�Di1
Di2
�2=3
¼ 132�15
�2=3
¼ 45 rpm
HVf
NiD3i
D3i
V ¼ p
4HD2 ¼ pD3
4¼ 9
4pD3
i
Now assume HzD, D¼ 3Di, and bioreactor volume is proportional to impeller diameter to thepower of VfD3
i . The Reynolds number is written as:
Rei ¼ rNDi
m(E.2.4)
The power for laminar flow is proportional to agitation rate, N2, and if the flow is turbulent,the power is proportional to wN3D2
i . Let us assume the mass transfer coefficients remain constant(KLa unchanged):
Di
Dt¼ 0:33
NDi ¼ 0:5 m s�1
Also assume the height of liquid media is 1.2 times the tank diameter.
HDt
¼ 1:2
Vs ¼ 100 l ¼ 1:2� 94
pD3i
The diameter of small tank is 68.28 cm. Since the impeller is one third of the tank diameter,Di¼ 22.76 cm.
Rei ¼ rVDi
m¼ ð1 g cm�3Þð50 cm s�1Þð22:76 cmÞ
0:01 g ðcm sÞ�1 ¼ 113800 Turbulent flow (E.2.5)
13. BIOPROCESS SCALE-UP392
Power is defined for a well-agitated vessel with a mechanical stirrer; then read power number forturbulent flow from Figure 6.6, Chapter 6:
Pno ¼ P$gcrN3D5
i
¼ 6
NDi ¼ 0:5
N ¼ 0:50:2276
¼ 2:2 rps (E.2.6)
Calculate power for a small-scale vessel:
PSmall ¼ 3:98W (E.2.7)
The power for a large vessel is based on a scale factor value of 125, which is calculated as thefollowing:
PLarge ¼ 125� 3:98 ¼ 497:5 W (E.2.8)
For mass transfer calculation:
KLa ¼ Constant
Vs ¼ 100 l Di ¼ 22:76 cm Dt ¼ 68:28 cm
NDi ¼ 0:5
Ni ¼ 0:50:2276
¼ 2:2 rps ¼ 132 rpm (E.2.9)
When Re¼ 113,800 for turbulent flow, the power number versus Re, we can read:
Pno ¼ 6
PNO ¼ P: grN3
i D5i
PSmall ¼ 6� 1000� 2:23 � 0:22765
9:81¼ 3:98 W
3:980:1
¼ 39:8Wm3
Scale-up factor¼ 125.
Ps
Pl¼�N3
i D5i
�s�
N3i D
5i
�l
¼ 1125
(E.2.10)
The power required for a large vessel is:
Pl ¼ 3:98� 125 ¼ 497:5 W or 0:67 hp (E.2.11)
The power per unit volume of small bioreactor is
P�V ¼ 3:98
�0:1 ¼ 39:8 W m�3 (E.2.12)
13.4 CONTINUOUS STIRRED TANK REACTOR CHEMOSTAT VERSUS TUBULAR PLUG FLOW 393
The volume of a large vessel is.
VL ¼ 2450�196 ¼ 12:5 m3
�DiL
DiS
�2
¼ 25
DiL ¼ ð0:84 mÞp
4D3
t ¼ p
4ð2:515Þ3 ¼ 12:5 m3 (E.2.13)
We have understood the following concepts are true; our calculations also support the fact thatpower per unit volume is constant.
NDis constant N3D2i ¼ constant
VL ¼ 125VS
Dt;L ¼ffiffiffiffiffiffiffiffiffiffiffiffiffiffiffiffiffi12:5� 4
p
3
rDt;L ¼ 2:515 m Di;L ¼ 0:84 m
Ni;L ¼ Ni;s
�Di;S
Di;L
�2=3
¼ �3:125
��0:160:8
�2=3
¼ 1 rps
Rei;L ¼ rNiD2i
m¼ ð1000Þð0:84Þ2ð1Þ
0:001 Kgm s
¼ 7:06� 105
Pno ¼ 6
Power ¼ 0:5 hp (E.2.14)
EXAMPLE 3: POWER CALCULATIONA 20-m3 working volume of bioreactor is used for production of penicillin. What is the initial
substrate concentration, so that you choose when there is a limitation in sufficient OTR and there areno limiting reactants?
If you aerate a bioreactor, power consumption is much less than a nonaerated bioreactor.Oxygen concentration: 6� 10�3 kg m�3.Oxygen uptake rate, OUR: 0.65 mmol O2 kg
�1 cell.
Bioreactor Characteristics and Given Data
Dtank¼ 2.4 m Turbine
Di¼ 0.8 m mbroth¼ 1 mPa s
Ni¼ 2.3 rps r ¼ 1:2rH2O
Number of blades¼ 8 Aeration rate¼ 1 vvm
Pg/P¼ 0.4
13. BIOPROCESS SCALE-UP394
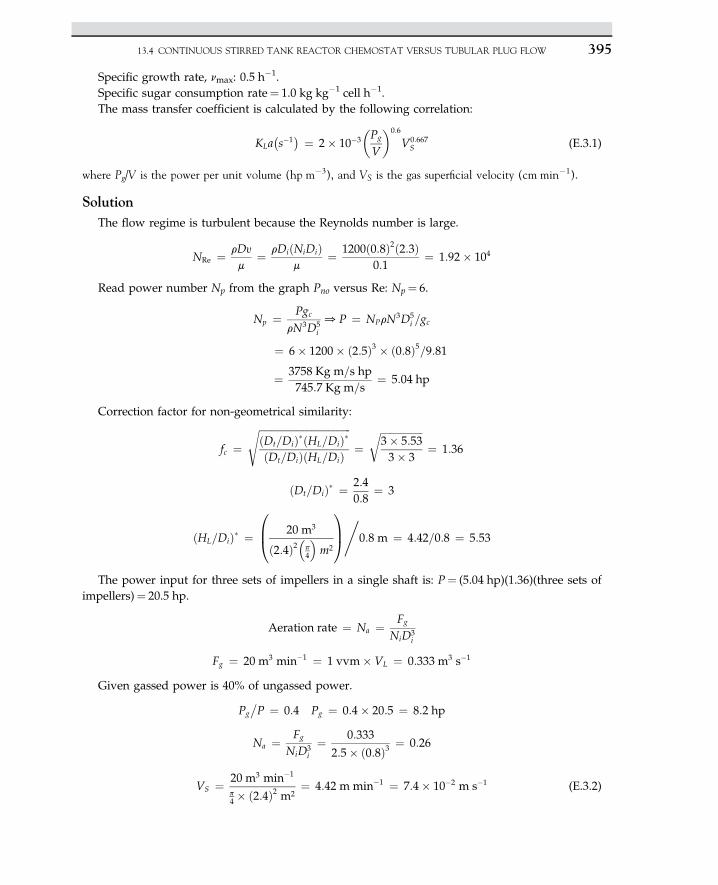
Specific growth rate, nmax: 0.5 h�1.
Specific sugar consumption rate¼ 1.0 kg kg�1 cell h�1.The mass transfer coefficient is calculated by the following correlation:
KLa�s�1� ¼ 2� 10�3
�Pg
V
�0:6
V0:667S (E.3.1)
where Pg/V is the power per unit volume (hp m�3), and VS is the gas superficial velocity (cm min�1).
SolutionThe flow regime is turbulent because the Reynolds number is large.
NRe ¼ rDy
m¼ rDiðNiDiÞ
m¼ 1200ð0:8Þ2ð2:3Þ
0:1¼ 1:92� 104
Read power number Np from the graph Pno versus Re: Np¼ 6.
Np ¼ PgcrN3D5
i
0P ¼ NPrN3D5i =gc
¼ 6� 1200� ð2:5Þ3 � ð0:8Þ5=9:81
¼ 3758 Kg m=s hp745:7 Kg m=s
¼ 5:04 hp
Correction factor for non-geometrical similarity:
fc ¼ffiffiffiffiffiffiffiffiffiffiffiffiffiffiffiffiffiffiffiffiffiffiffiffiffiffiffiffiffiffiffiffiffiffiffiffiffiðDt=DiÞ�ðHL=DiÞ�ðDt=DiÞðHL=DiÞ
s¼
ffiffiffiffiffiffiffiffiffiffiffiffiffiffiffiffiffi3� 5:533� 3
r¼ 1:36
ðDt=DiÞ� ¼ 2:40:8
¼ 3
ðHL=DiÞ� ¼
0B@ 20 m3
ð2:4Þ2�p4
m2
1CA,
0:8 m ¼ 4:42=0:8 ¼ 5:53
The power input for three sets of impellers in a single shaft is: P¼ (5.04 hp)(1.36)(three sets ofimpellers)¼ 20.5 hp.
Aeration rate ¼ Na ¼ Fg
NiD3i
Fg ¼ 20 m3 min�1 ¼ 1 vvm� VL ¼ 0:333 m3 s�1
Given gassed power is 40% of ungassed power.
Pg�P ¼ 0:4 Pg ¼ 0:4� 20:5 ¼ 8:2 hp
Na ¼ Fg
NiD3i¼ 0:333
2:5� ð0:8Þ3 ¼ 0:26
VS ¼ 20 m3 min�1
p4 � ð2:4Þ2 m2
¼ 4:42 mmin�1 ¼ 7:4� 10�2 m s�1 (E.3.2)
13.4 CONTINUOUS STIRRED TANK REACTOR CHEMOSTAT VERSUS TUBULAR PLUG FLOW 395
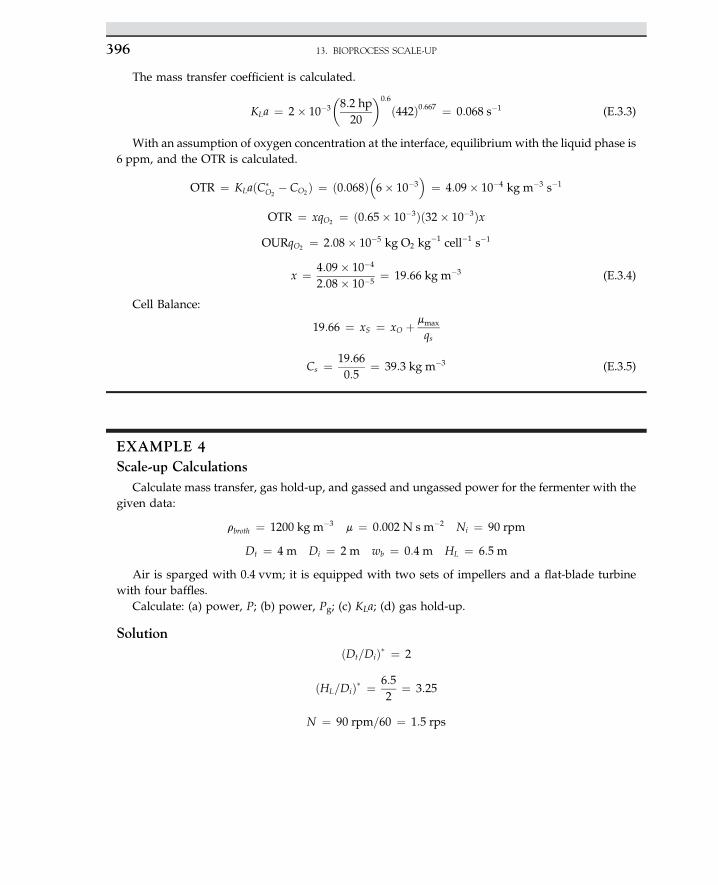
The mass transfer coefficient is calculated.
KLa ¼ 2� 10�3
�8:2 hp20
�0:6
ð442Þ0:667 ¼ 0:068 s�1 (E.3.3)
With an assumption of oxygen concentration at the interface, equilibrium with the liquid phase is6 ppm, and the OTR is calculated.
OTR ¼ KLaðC�O2
� CO2Þ ¼ ð0:068Þ�6� 10�3
¼ 4:09� 10�4 kg m�3 s�1
OTR ¼ xqO2 ¼ ð0:65� 10�3Þð32� 10�3ÞxOURqO2 ¼ 2:08� 10�5 kg O2 kg
�1 cell�1 s�1
x ¼ 4:09� 10�4
2:08� 10�5¼ 19:66 kg m�3 (E.3.4)
Cell Balance:
19:66 ¼ xS ¼ xO þ mmax
qs
Cs ¼ 19:660:5
¼ 39:3 kg m�3 (E.3.5)
EXAMPLE 4Scale-up Calculations
Calculate mass transfer, gas hold-up, and gassed and ungassed power for the fermenter with thegiven data:
rbroth ¼ 1200 kg m�3 m ¼ 0:002 N s m�2 Ni ¼ 90 rpm
Dt ¼ 4 m Di ¼ 2 m wb ¼ 0:4 m HL ¼ 6:5 m
Air is sparged with 0.4 vvm; it is equipped with two sets of impellers and a flat-blade turbinewith four baffles.
Calculate: (a) power, P; (b) power, Pg; (c) KLa; (d) gas hold-up.
SolutionðDt=DiÞ� ¼ 2
ðHL=DiÞ� ¼ 6:52
¼ 3:25
N ¼ 90 rpm=60 ¼ 1:5 rps
13. BIOPROCESS SCALE-UP396
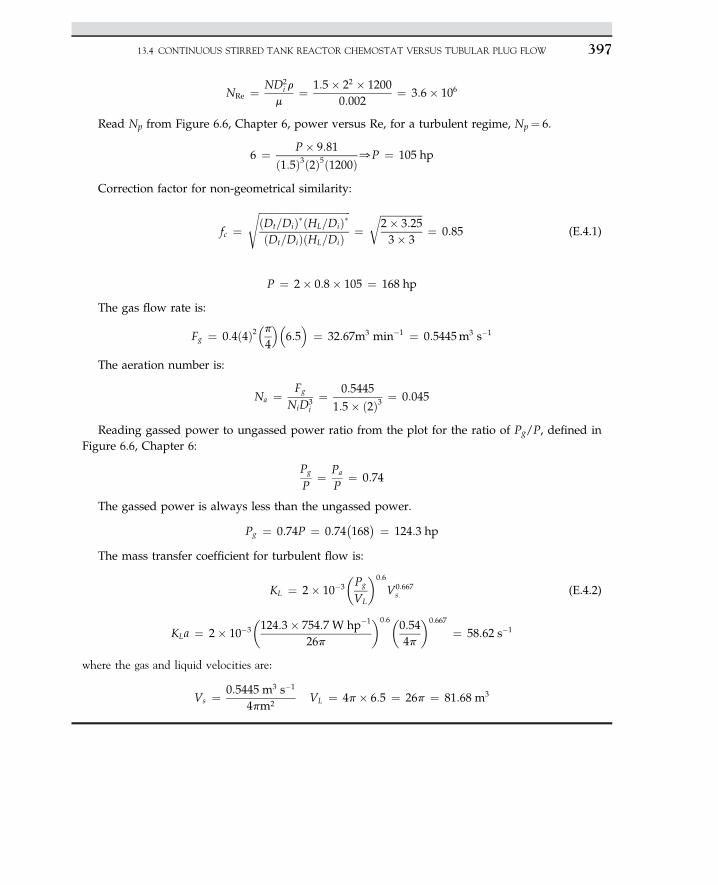
NRe ¼ ND2i r
m¼ 1:5� 22 � 1200
0:002¼ 3:6� 106
Read Np from Figure 6.6, Chapter 6, power versus Re, for a turbulent regime, Np¼ 6.
6 ¼ P� 9:81
ð1:5Þ3ð2Þ5ð1200Þ0P ¼ 105 hp
Correction factor for non-geometrical similarity:
fc ¼ffiffiffiffiffiffiffiffiffiffiffiffiffiffiffiffiffiffiffiffiffiffiffiffiffiffiffiffiffiffiffiffiffiffiffiffiffiðDt=DiÞ�ðHL=DiÞ�ðDt=DiÞðHL=DiÞ
s¼
ffiffiffiffiffiffiffiffiffiffiffiffiffiffiffiffiffi2� 3:253� 3
r¼ 0:85 (E.4.1)
P ¼ 2� 0:8� 105 ¼ 168 hp
The gas flow rate is:
Fg ¼ 0:4ð4Þ2�p4
�6:5
¼ 32:67m3 min�1 ¼ 0:5445m3 s�1
The aeration number is:
Na ¼ Fg
NiD3i¼ 0:5445
1:5� ð2Þ3 ¼ 0:045
Reading gassed power to ungassed power ratio from the plot for the ratio of Pg/P, defined inFigure 6.6, Chapter 6:
Pg
P¼ Pa
P¼ 0:74
The gassed power is always less than the ungassed power.
Pg ¼ 0:74P ¼ 0:74�168� ¼ 124:3 hp
The mass transfer coefficient for turbulent flow is:
KL ¼ 2� 10�3
�Pg
VL
�0:6
V0:667s (E.4.2)
KLa ¼ 2� 10�3
�124:3� 754:7 W hp�1
26p
�0:6�0:544p
�0:667
¼ 58:62 s�1
where the gas and liquid velocities are:
Vs ¼ 0:5445 m3 s�1
4pm2VL ¼ 4p� 6:5 ¼ 26p ¼ 81:68 m3
13.4 CONTINUOUS STIRRED TANK REACTOR CHEMOSTAT VERSUS TUBULAR PLUG FLOW 397
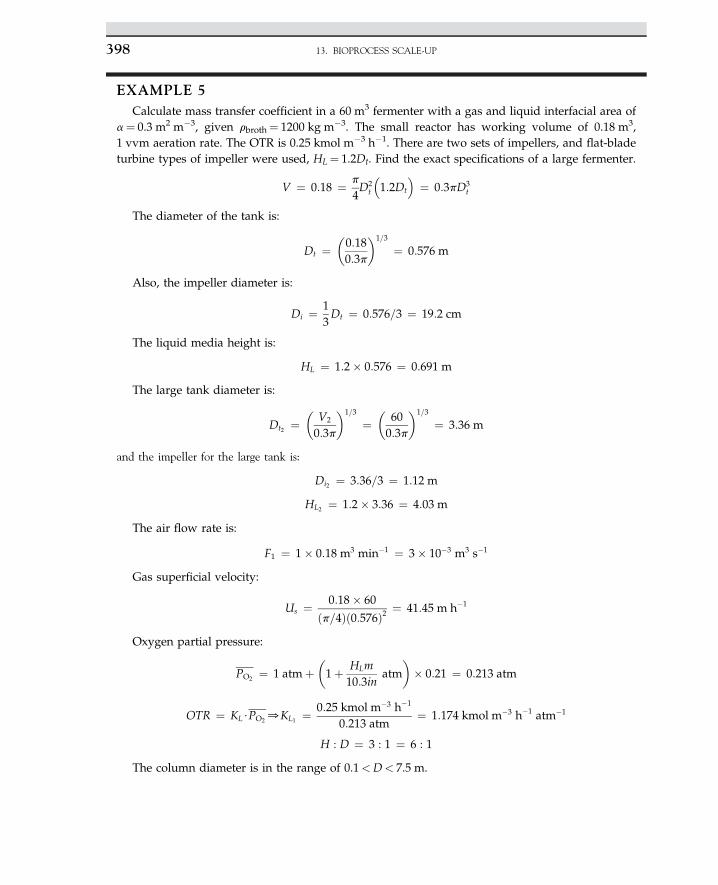
EXAMPLE 5Calculate mass transfer coefficient in a 60 m3 fermenter with a gas and liquid interfacial area of
a¼ 0.3 m2 m�3, given rbroth¼ 1200 kg m�3. The small reactor has working volume of 0.18 m3,1 vvm aeration rate. The OTR is 0.25 kmol m�3 h�1. There are two sets of impellers, and flat-bladeturbine types of impeller were used, HL¼ 1.2Dt. Find the exact specifications of a large fermenter.
V ¼ 0:18 ¼ p
4D2
t
�1:2Dt
¼ 0:3pD3
t
The diameter of the tank is:
Dt ¼�0:180:3p
�1=3
¼ 0:576 m
Also, the impeller diameter is:
Di ¼ 13Dt ¼ 0:576=3 ¼ 19:2 cm
The liquid media height is:
HL ¼ 1:2� 0:576 ¼ 0:691 m
The large tank diameter is:
Dt2 ¼�
V2
0:3p
�1=3
¼�
600:3p
�1=3
¼ 3:36 m
and the impeller for the large tank is:
Di2 ¼ 3:36=3 ¼ 1:12 m
HL2 ¼ 1:2� 3:36 ¼ 4:03 m
The air flow rate is:
F1 ¼ 1� 0:18 m3 min�1 ¼ 3� 10�3 m3 s�1
Gas superficial velocity:
Us ¼ 0:18� 60
ðp=4Þð0:576Þ2 ¼ 41:45 m h�1
Oxygen partial pressure:
PO2 ¼ 1 atmþ�1þ HLm
10:3inatm
�� 0:21 ¼ 0:213 atm
OTR ¼ KL$PO20KL1 ¼ 0:25 kmol m�3 h�1
0:213 atm¼ 1:174 kmol m�3 h�1 atm�1
H : D ¼ 3 : 1 ¼ 6 : 1
The column diameter is in the range of 0.1<D< 7.5 m.
13. BIOPROCESS SCALE-UP398
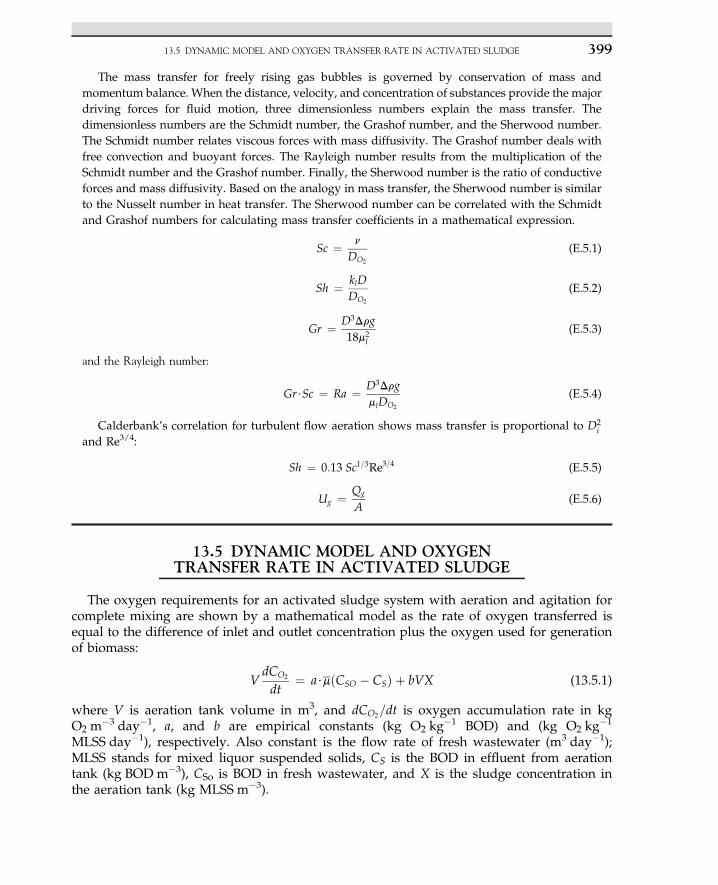
The mass transfer for freely rising gas bubbles is governed by conservation of mass andmomentum balance. When the distance, velocity, and concentration of substances provide the majordriving forces for fluid motion, three dimensionless numbers explain the mass transfer. Thedimensionless numbers are the Schmidt number, the Grashof number, and the Sherwood number.The Schmidt number relates viscous forces with mass diffusivity. The Grashof number deals withfree convection and buoyant forces. The Rayleigh number results from the multiplication of theSchmidt number and the Grashof number. Finally, the Sherwood number is the ratio of conductiveforces and mass diffusivity. Based on the analogy in mass transfer, the Sherwood number is similarto the Nusselt number in heat transfer. The Sherwood number can be correlated with the Schmidtand Grashof numbers for calculating mass transfer coefficients in a mathematical expression.
Sc ¼ n
DO2
(E.5.1)
Sh ¼ klDDO2
(E.5.2)
Gr ¼ D3Drg18m2
l
(E.5.3)
and the Rayleigh number:
Gr$Sc ¼ Ra ¼ D3DrgmlDO2
(E.5.4)
Calderbank’s correlation for turbulent flow aeration shows mass transfer is proportional to D2i
and Re3/4:
Sh ¼ 0:13 Sc1=3Re3=4 (E.5.5)
Ug ¼ Qg
A(E.5.6)
13.5 DYNAMIC MODEL AND OXYGENTRANSFER RATE IN ACTIVATED SLUDGE
The oxygen requirements for an activated sludge system with aeration and agitation forcomplete mixing are shown by a mathematical model as the rate of oxygen transferred isequal to the difference of inlet and outlet concentration plus the oxygen used for generationof biomass:
VdCO2
dt¼ a$mðCSO � CSÞ þ bVX (13.5.1)
where V is aeration tank volume in m3, and dCO2=dt is oxygen accumulation rate in kgO2 m
�3 day�1, a, and b are empirical constants (kg O2 kg�1 BOD) and (kg O2 kg
�1
MLSS day�1), respectively. Also constant is the flow rate of fresh wastewater (m3 day�1);MLSS stands for mixed liquor suspended solids, CS is the BOD in effluent from aerationtank (kg BOD m�3), CSo is BOD in fresh wastewater, and X is the sludge concentration inthe aeration tank (kg MLSS m�3).
13.5 DYNAMIC MODEL AND OXYGEN TRANSFER RATE IN ACTIVATED SLUDGE 399
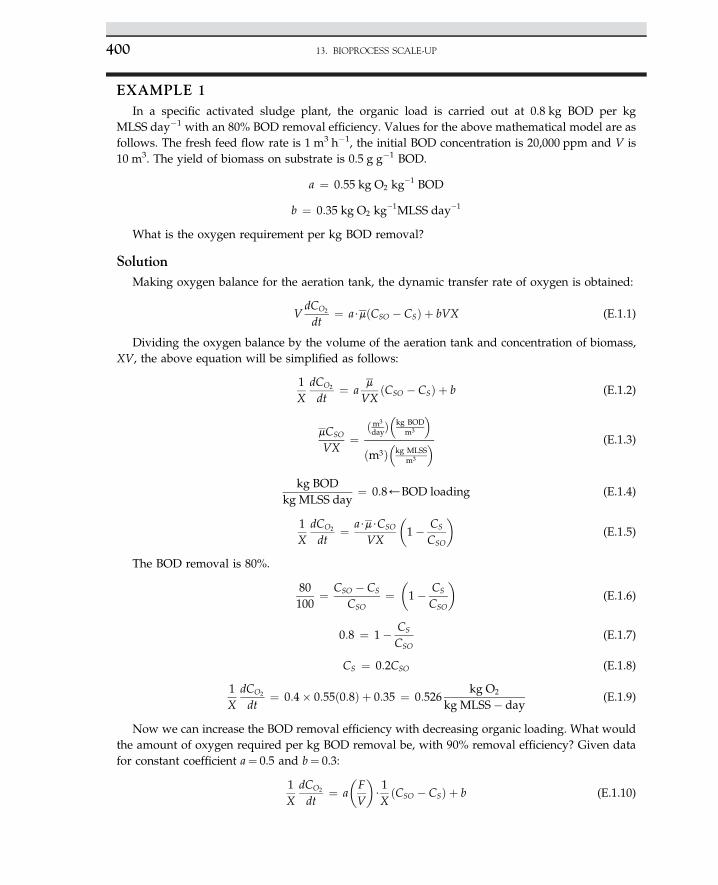
EXAMPLE 1In a specific activated sludge plant, the organic load is carried out at 0.8 kg BOD per kg
MLSS day�1 with an 80% BOD removal efficiency. Values for the above mathematical model are asfollows. The fresh feed flow rate is 1 m3 h�1, the initial BOD concentration is 20,000 ppm and V is10 m3. The yield of biomass on substrate is 0.5 g g�1 BOD.
a ¼ 0:55 kg O2 kg�1 BOD
b ¼ 0:35 kg O2 kg�1MLSS day�1
What is the oxygen requirement per kg BOD removal?
SolutionMaking oxygen balance for the aeration tank, the dynamic transfer rate of oxygen is obtained:
VdCO2
dt¼ a$mðCSO � CSÞ þ bVX (E.1.1)
Dividing the oxygen balance by the volume of the aeration tank and concentration of biomass,XV, the above equation will be simplified as follows:
1X
dCO2
dt¼ a
m
VXðCSO � CSÞ þ b (E.1.2)
mCSO
VX¼
ðm3
day�kg BOD
m3
ðm3Þ
�kg MLSS
m3
(E.1.3)
kg BODkg MLSS day
¼ 0:8)BOD loading (E.1.4)
1X
dCO2
dt¼ a$m$CSO
VX
�1� CS
CSO
�(E.1.5)
The BOD removal is 80%.
80100
¼ CSO � CS
CSO¼�1� CS
CSO
�(E.1.6)
0:8 ¼ 1� CS
CSO(E.1.7)
CS ¼ 0:2CSO (E.1.8)
1X
dCO2
dt¼ 0:4� 0:55ð0:8Þ þ 0:35 ¼ 0:526
kg O2
kg MLSS� day(E.1.9)
Now we can increase the BOD removal efficiency with decreasing organic loading. What wouldthe amount of oxygen required per kg BOD removal be, with 90% removal efficiency? Given datafor constant coefficient a¼ 0.5 and b¼ 0.3:
1X
dCO2
dt¼ a
�FV
�$1XðCSO � CSÞ þ b (E.1.10)
13. BIOPROCESS SCALE-UP400
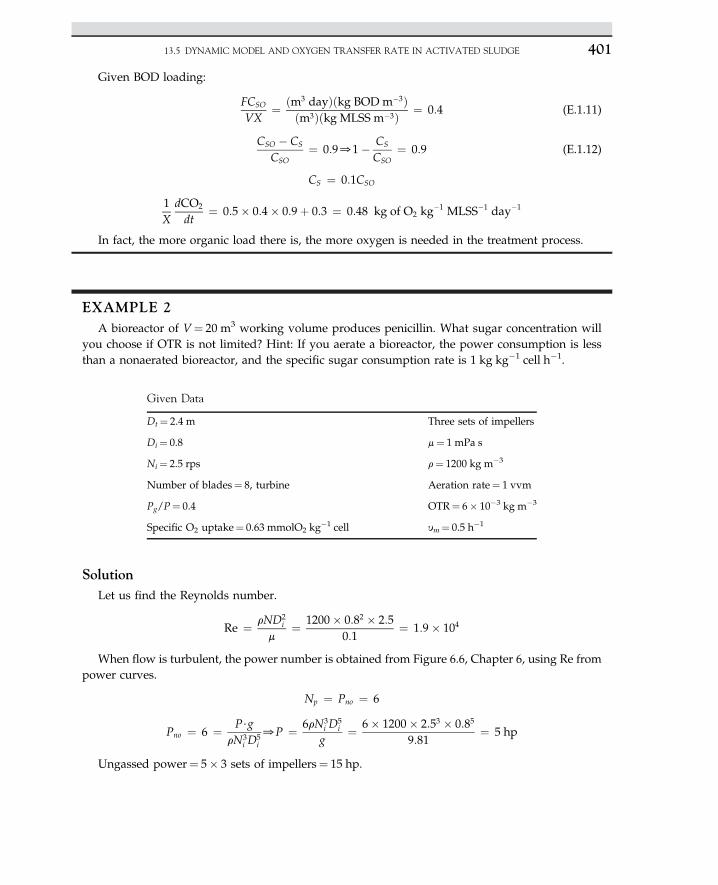
Given BOD loading:
FCSO
VX¼ ðm3 dayÞðkg BOD m�3Þ
ðm3Þðkg MLSS m�3Þ ¼ 0:4 (E.1.11)
CSO � CS
CSO¼ 0:901� CS
CSO¼ 0:9 (E.1.12)
CS ¼ 0:1CSO
1X
dCO2
dt¼ 0:5� 0:4� 0:9þ 0:3 ¼ 0:48 kg of O2 kg
�1 MLSS�1 day�1
In fact, the more organic load there is, the more oxygen is needed in the treatment process.
EXAMPLE 2A bioreactor of V¼ 20 m3 working volume produces penicillin. What sugar concentration will
you choose if OTR is not limited? Hint: If you aerate a bioreactor, the power consumption is lessthan a nonaerated bioreactor, and the specific sugar consumption rate is 1 kg kg�1 cell h�1.
SolutionLet us find the Reynolds number.
Re ¼ rND2i
m¼ 1200� 0:82 � 2:5
0:1¼ 1:9� 104
When flow is turbulent, the power number is obtained from Figure 6.6, Chapter 6, using Re frompower curves.
Np ¼ Pno ¼ 6
Pno ¼ 6 ¼ P$grN3
i D5i0P ¼ 6rN3
i D5i
g¼ 6� 1200� 2:53 � 0:85
9:81¼ 5 hp
Ungassed power¼ 5� 3 sets of impellers¼ 15 hp.
Given Data
Dt¼ 2.4 m Three sets of impellers
Di¼ 0.8 m¼ 1 mPa s
Ni¼ 2.5 rps r¼ 1200 kg m�3
Number of blades¼ 8, turbine Aeration rate¼ 1 vvm
Pg/P¼ 0.4 OTR¼ 6� 10�3 kg m�3
Specific O2 uptake¼ 0.63 mmolO2 kg�1 cell ym¼ 0.5 h�1
13.5 DYNAMIC MODEL AND OXYGEN TRANSFER RATE IN ACTIVATED SLUDGE 401
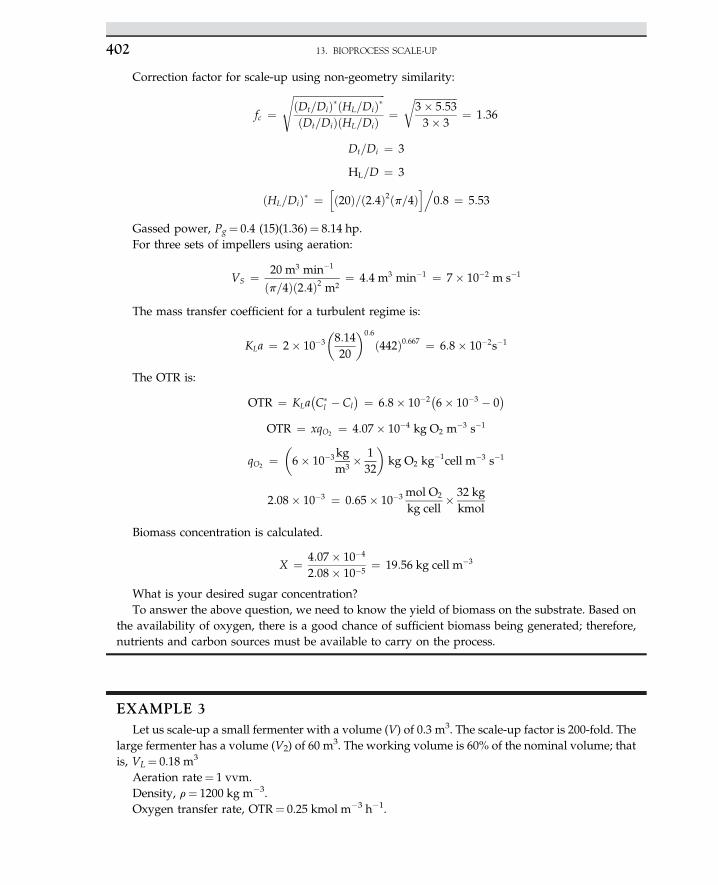
Correction factor for scale-up using non-geometry similarity:
fc ¼ffiffiffiffiffiffiffiffiffiffiffiffiffiffiffiffiffiffiffiffiffiffiffiffiffiffiffiffiffiffiffiffiffiffiffiffiffiðDt=DiÞ�ðHL=DiÞ�ðDt=DiÞðHL=DiÞ
s¼
ffiffiffiffiffiffiffiffiffiffiffiffiffiffiffiffiffi3� 5:533� 3
r¼ 1:36
Dt=Di ¼ 3
HL=D ¼ 3
ðHL=DiÞ� ¼hð20Þ=ð2:4Þ2ðp=4Þ
i.0:8 ¼ 5:53
Gassed power, Pg¼ 0.4 (15)(1.36)¼ 8.14 hp.For three sets of impellers using aeration:
VS ¼ 20 m3 min�1
ðp=4Þð2:4Þ2 m2¼ 4:4 m3 min�1 ¼ 7� 10�2 m s�1
The mass transfer coefficient for a turbulent regime is:
KLa ¼ 2� 10�3
�8:1420
�0:6
ð442Þ0:667 ¼ 6:8� 10�2s�1
The OTR is:
OTR ¼ KLa�C�
l � Cl� ¼ 6:8� 10�2
�6� 10�3 � 0
�OTR ¼ xqO2 ¼ 4:07� 10�4 kg O2 m�3 s�1
qO2 ¼�6� 10�3kg
m3� 132
�kg O2 kg
�1cell m�3 s�1
2:08� 10�3 ¼ 0:65� 10�3 mol O2
kg cell� 32 kg
kmol
Biomass concentration is calculated.
X ¼ 4:07� 10�4
2:08� 10�5¼ 19:56 kg cell m�3
What is your desired sugar concentration?To answer the above question, we need to know the yield of biomass on the substrate. Based on
the availability of oxygen, there is a good chance of sufficient biomass being generated; therefore,nutrients and carbon sources must be available to carry on the process.
EXAMPLE 3Let us scale-up a small fermenter with a volume (V) of 0.3 m3. The scale-up factor is 200-fold. The
large fermenter has a volume (V2) of 60 m3. The working volume is 60% of the nominal volume; that
is, VL¼ 0.18 m3
Aeration rate¼ 1 vvm.Density, r¼ 1200 kg m�3.Oxygen transfer rate, OTR¼ 0.25 kmol m�3 h�1.
13. BIOPROCESS SCALE-UP402
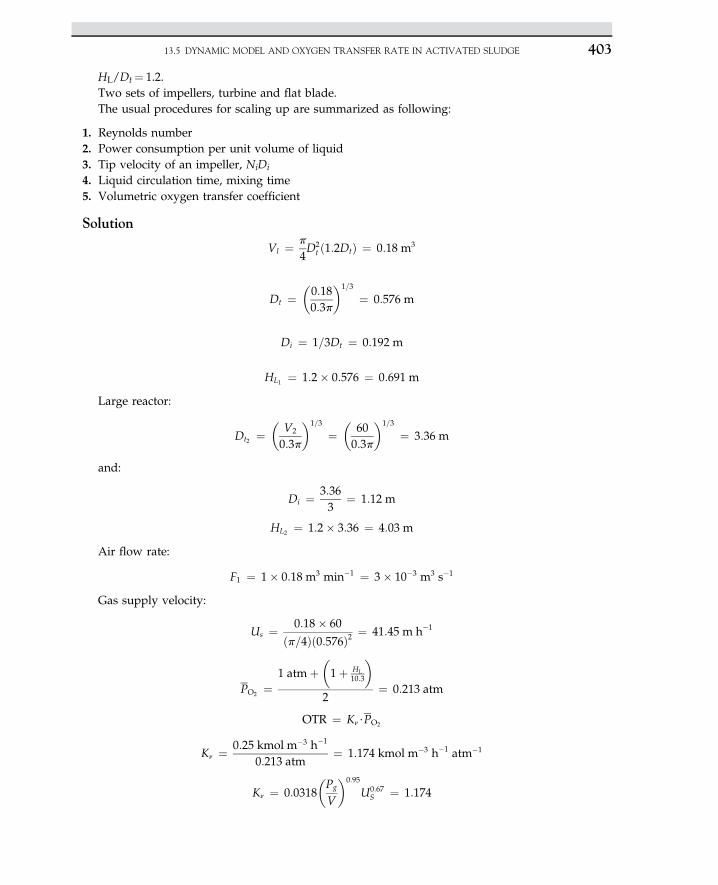
HL/Dt¼ 1.2.Two sets of impellers, turbine and flat blade.The usual procedures for scaling up are summarized as following:
1. Reynolds number2. Power consumption per unit volume of liquid3. Tip velocity of an impeller, NiDi
4. Liquid circulation time, mixing time5. Volumetric oxygen transfer coefficient
Solution
Vl ¼ p
4D2
t ð1:2DtÞ ¼ 0:18 m3
Dt ¼�0:180:3p
�1=3
¼ 0:576 m
Di ¼ 1=3Dt ¼ 0:192 m
HL1 ¼ 1:2� 0:576 ¼ 0:691 m
Large reactor:
Dt2 ¼�
V2
0:3p
�1=3
¼�
600:3p
�1=3
¼ 3:36 m
and:
Di ¼ 3:363
¼ 1:12 m
HL2 ¼ 1:2� 3:36 ¼ 4:03 m
Air flow rate:
F1 ¼ 1� 0:18 m3 min�1 ¼ 3� 10�3 m3 s�1
Gas supply velocity:
Us ¼ 0:18� 60
ðp=4Þð0:576Þ2 ¼ 41:45 m h�1
PO2 ¼1 atmþ
�1þ HL
10:3
�2
¼ 0:213 atm
OTR ¼ Kn$PO2
Kn ¼ 0:25 kmol m�3 h�1
0:213 atm¼ 1:174 kmol m�3 h�1 atm�1
Kn ¼ 0:0318�Pg
V
�0:95
U0:67S ¼ 1:174
13.5 DYNAMIC MODEL AND OXYGEN TRANSFER RATE IN ACTIVATED SLUDGE 403
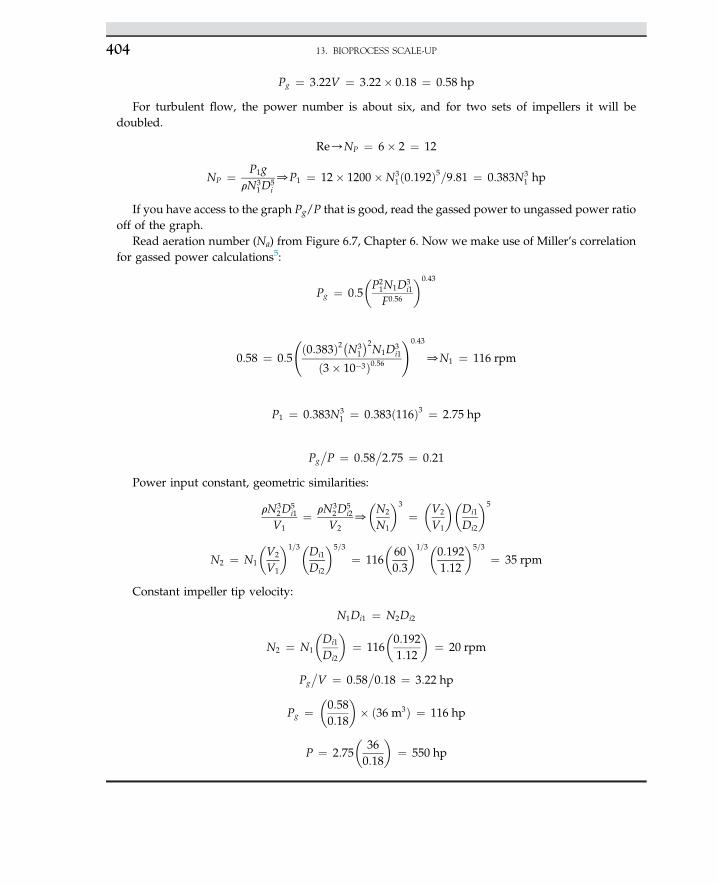
Pg ¼ 3:22V ¼ 3:22� 0:18 ¼ 0:58 hp
For turbulent flow, the power number is about six, and for two sets of impellers it will bedoubled.
Re/NP ¼ 6� 2 ¼ 12
NP ¼ P1grN3
1D5i0P1 ¼ 12� 1200�N3
1ð0:192Þ5=9:81 ¼ 0:383N31 hp
If you have access to the graph Pg/P that is good, read the gassed power to ungassed power ratiooff of the graph.
Read aeration number (Na) from Figure 6.7, Chapter 6. Now we make use of Miller’s correlationfor gassed power calculations5:
Pg ¼ 0:5�P21N1D3
i1
F0:56
�0:43
0:58 ¼ 0:5
ð0:383Þ2�N3
1
�2N1D3
i1
ð3� 10�3Þ0:56!0:43
0N1 ¼ 116 rpm
P1 ¼ 0:383N31 ¼ 0:383ð116Þ3 ¼ 2:75 hp
Pg�P ¼ 0:58
�2:75 ¼ 0:21
Power input constant, geometric similarities:
rN32D
5i1
V1¼ rN3
2D5i2
V20
�N2
N1
�3
¼�V2
V1
��Di1
Di2
�5
N2 ¼ N1
�V2
V1
�1=3�Di1
Di2
�5=3
¼ 116�600:3
�1=3�0:1921:12
�5=3
¼ 35 rpm
Constant impeller tip velocity:
N1Di1 ¼ N2Di2
N2 ¼ N1
�Di1
Di2
�¼ 116
�0:1921:12
�¼ 20 rpm
Pg�V ¼ 0:58
�0:18 ¼ 3:22 hp
Pg ¼�0:580:18
�� ð36 m3Þ ¼ 116 hp
P ¼ 2:75�
360:18
�¼ 550 hp
13. BIOPROCESS SCALE-UP404
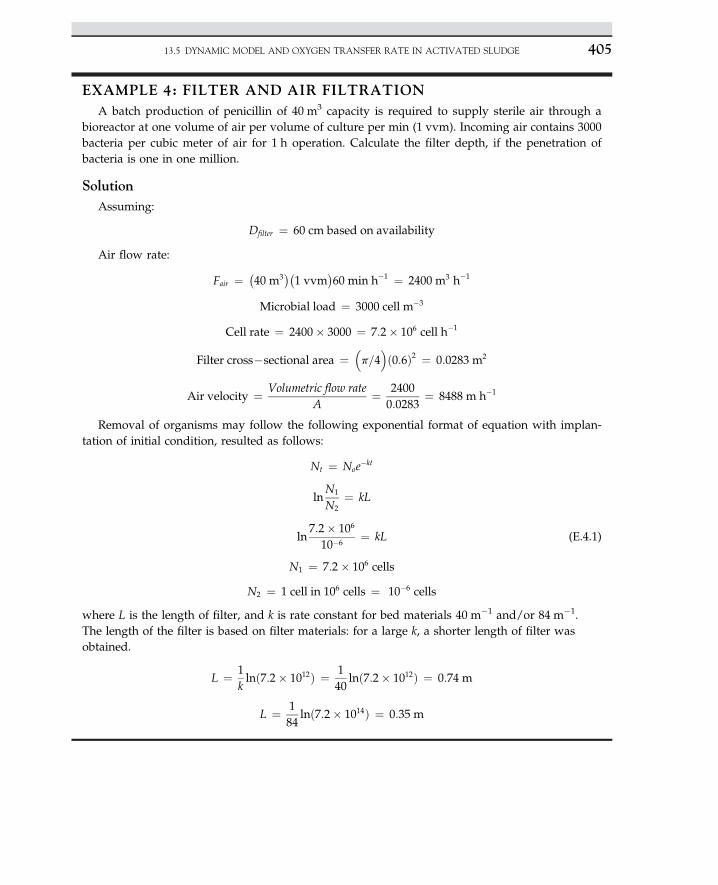
EXAMPLE 4: FILTER AND AIR FILTRATIONA batch production of penicillin of 40 m3 capacity is required to supply sterile air through a
bioreactor at one volume of air per volume of culture per min (1 vvm). Incoming air contains 3000bacteria per cubic meter of air for 1 h operation. Calculate the filter depth, if the penetration ofbacteria is one in one million.
SolutionAssuming:
Dfilter ¼ 60 cm based on availability
Air flow rate:
Fair ¼ �40 m3
��1 vvm
�60 min h�1 ¼ 2400 m3 h�1
Microbial load ¼ 3000 cell m�3
Cell rate ¼ 2400� 3000 ¼ 7:2� 106 cell h�1
Filter cross�sectional area ¼�p=4
ð0:6Þ2 ¼ 0:0283 m2
Air velocity ¼ Volumetric flow rateA
¼ 24000:0283
¼ 8488 m h�1
Removal of organisms may follow the following exponential format of equation with implan-tation of initial condition, resulted as follows:
Nt ¼ Noe�kt
lnN1
N2¼ kL
ln7:2� 106
10�6¼ kL (E.4.1)
N1 ¼ 7:2� 106 cells
N2 ¼ 1 cell in 106 cells ¼ 10�6 cells
where L is the length of filter, and k is rate constant for bed materials 40 m�1 and/or 84 m�1.The length of the filter is based on filter materials: for a large k, a shorter length of filter wasobtained.
L ¼ 1klnð7:2� 1012Þ ¼ 1
40lnð7:2� 1012Þ ¼ 0:74 m
L ¼ 184
lnð7:2� 1014Þ ¼ 0:35 m
13.5 DYNAMIC MODEL AND OXYGEN TRANSFER RATE IN ACTIVATED SLUDGE 405
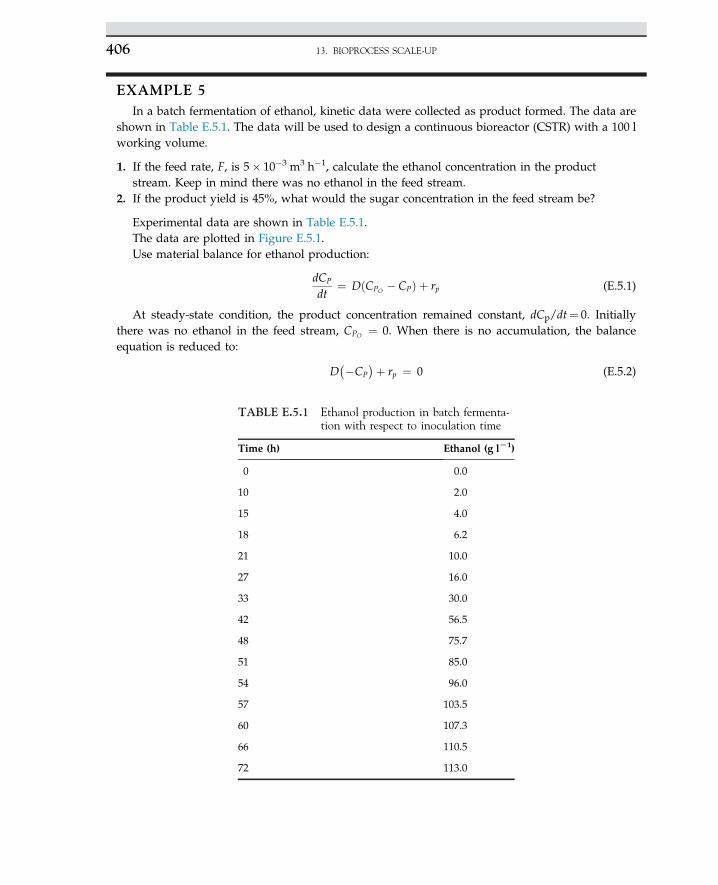
EXAMPLE 5In a batch fermentation of ethanol, kinetic data were collected as product formed. The data are
shown in Table E.5.1. The data will be used to design a continuous bioreactor (CSTR) with a 100 lworking volume.
1. If the feed rate, F, is 5� 10�3 m3 h�1, calculate the ethanol concentration in the productstream. Keep in mind there was no ethanol in the feed stream.
2. If the product yield is 45%, what would the sugar concentration in the feed stream be?
Experimental data are shown in Table E.5.1.The data are plotted in Figure E.5.1.Use material balance for ethanol production:
dCP
dt¼ DðCPO � CPÞ þ rp (E.5.1)
At steady-state condition, the product concentration remained constant, dCp/dt¼ 0. Initiallythere was no ethanol in the feed stream, CPO ¼ 0. When there is no accumulation, the balanceequation is reduced to:
D��CP
�þ rp ¼ 0 (E.5.2)
TABLE E.5.1 Ethanol production in batch fermenta-tion with respect to inoculation time
Time (h) Ethanol (g lL1)
0 0.0
10 2.0
15 4.0
18 6.2
21 10.0
27 16.0
33 30.0
42 56.5
48 75.7
51 85.0
54 96.0
57 103.5
60 107.3
66 110.5
72 113.0
13. BIOPROCESS SCALE-UP406
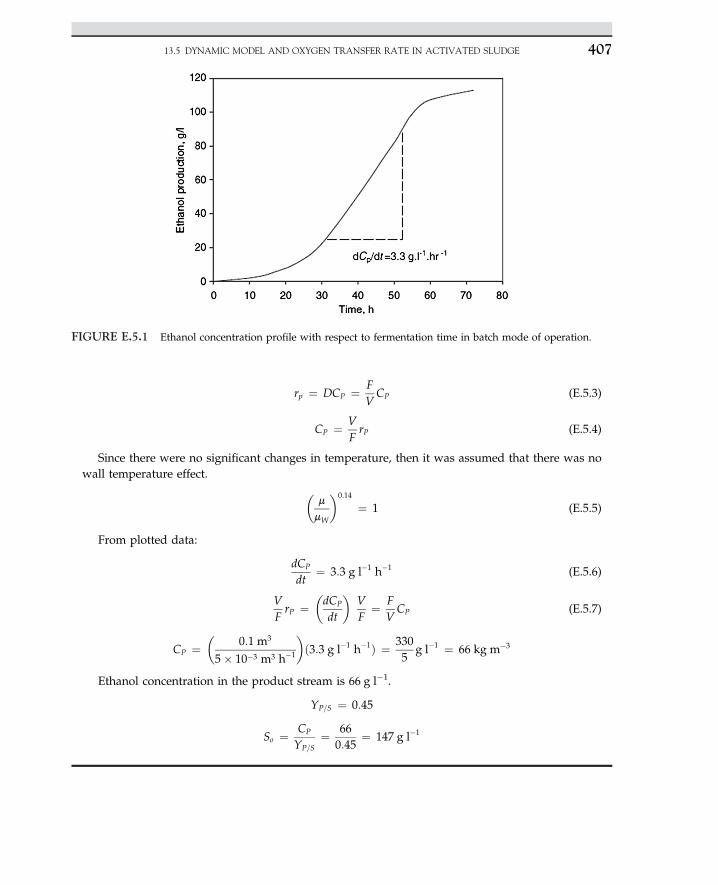
rp ¼ DCP ¼ FVCP (E.5.3)
CP ¼ VFrP (E.5.4)
Since there were no significant changes in temperature, then it was assumed that there was nowall temperature effect. �
m
mW
�0:14
¼ 1 (E.5.5)
From plotted data:
dCP
dt¼ 3:3 g l�1 h�1 (E.5.6)
VFrP ¼
�dCP
dt
�VF
¼ FVCP (E.5.7)
CP ¼�
0:1 m3
5� 10�3 m3 h�1
�ð3:3 g l�1 h�1Þ ¼ 330
5g l�1 ¼ 66 kg m�3
Ethanol concentration in the product stream is 66 g l�1.
YP=S ¼ 0:45
So ¼ CP
YP=S¼ 66
0:45¼ 147 g l�1
FIGURE E.5.1 Ethanol concentration profile with respect to fermentation time in batch mode of operation.
13.5 DYNAMIC MODEL AND OXYGEN TRANSFER RATE IN ACTIVATED SLUDGE 407
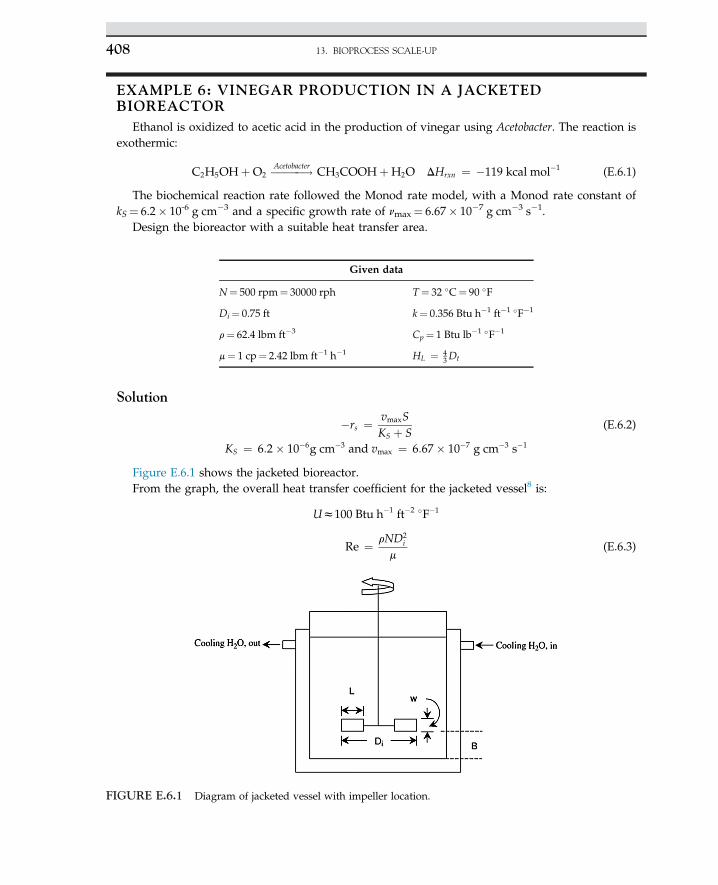
EXAMPLE 6: VINEGAR PRODUCTION IN A JACKETEDBIOREACTOR
Ethanol is oxidized to acetic acid in the production of vinegar using Acetobacter. The reaction isexothermic:
C2H5OHþO2 !AcetobacterCH3COOHþH2O DHrxn ¼ �119 kcal mol�1 (E.6.1)
The biochemical reaction rate followed the Monod rate model, with a Monod rate constant ofkS¼ 6.2� 10-6 g cm�3 and a specific growth rate of nmax¼ 6.67� 10�7 g cm�3 s�1.
Design the bioreactor with a suitable heat transfer area.
Solution
�rs ¼ vmaxSKS þ S
(E.6.2)
KS ¼ 6:2� 10�6g cm�3 and vmax ¼ 6:67� 10�7 g cm�3 s�1
Figure E.6.1 shows the jacketed bioreactor.From the graph, the overall heat transfer coefficient for the jacketed vessel8 is:
Uz100 Btu h�1 ft�2 �F�1
Re ¼ rND2i
m(E.6.3)
Given data
N¼ 500 rpm¼ 30000 rph T¼ 32 �C¼ 90 �F
Di¼ 0.75 ft k¼ 0.356 Btu h�1 ft�1 �F�1
r¼ 62.4 lbm ft�3 Cp¼ 1 Btu lb�1 �F�1
m¼ 1 cp¼ 2.42 lbm ft�1 h�1 HL ¼ 43Dt
FIGURE E.6.1 Diagram of jacketed vessel with impeller location.
13. BIOPROCESS SCALE-UP408
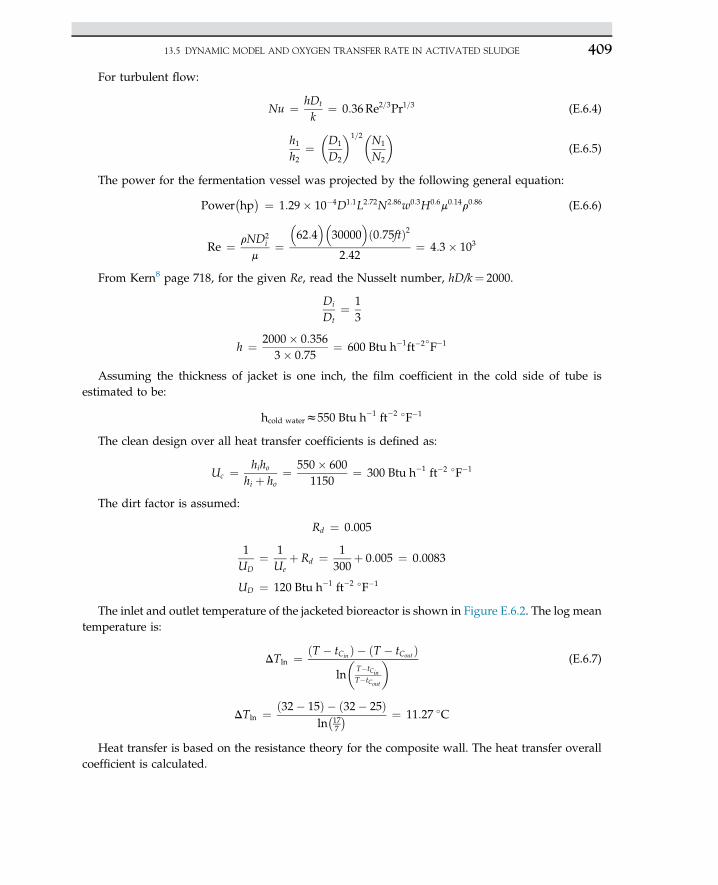
For turbulent flow:
Nu ¼ hDt
k¼ 0:36Re2=3Pr1=3 (E.6.4)
h1h2
¼�D1
D2
�1=2�N1
N2
�(E.6.5)
The power for the fermentation vessel was projected by the following general equation:
Power�hp� ¼ 1:29� 10�4D1:1L2:72N2:86w0:3H0:6m0:14r0:86 (E.6.6)
Re ¼ rND2i
m¼�62:4
�30000
ð0:75ftÞ2
2:42¼ 4:3� 103
From Kern8 page 718, for the given Re, read the Nusselt number, hD/k¼ 2000.
Di
Dt¼ 1
3
h ¼ 2000� 0:3563� 0:75
¼ 600 Btu h�1ft�2�F�1
Assuming the thickness of jacket is one inch, the film coefficient in the cold side of tube isestimated to be:
hcold waterz550 Btu h�1 ft�2 �F�1
The clean design over all heat transfer coefficients is defined as:
Uc ¼ hihohi þ ho
¼ 550� 6001150
¼ 300 Btu h�1 ft�2 �F�1
The dirt factor is assumed:
Rd ¼ 0:005
1UD
¼ 1Ue
þ Rd ¼ 1300
þ 0:005 ¼ 0:0083
UD ¼ 120 Btu h�1 ft�2 �F�1
The inlet and outlet temperature of the jacketed bioreactor is shown in Figure E.6.2. The log meantemperature is:
DTln ¼ ðT � tCinÞ � ðT � tCout Þln
�T�tCinT�tCout
� (E.6.7)
DTln ¼ ð32� 15Þ � ð32� 25Þln�177
� ¼ 11:27 �C
Heat transfer is based on the resistance theory for the composite wall. The heat transfer overallcoefficient is calculated.
13.5 DYNAMIC MODEL AND OXYGEN TRANSFER RATE IN ACTIVATED SLUDGE 409
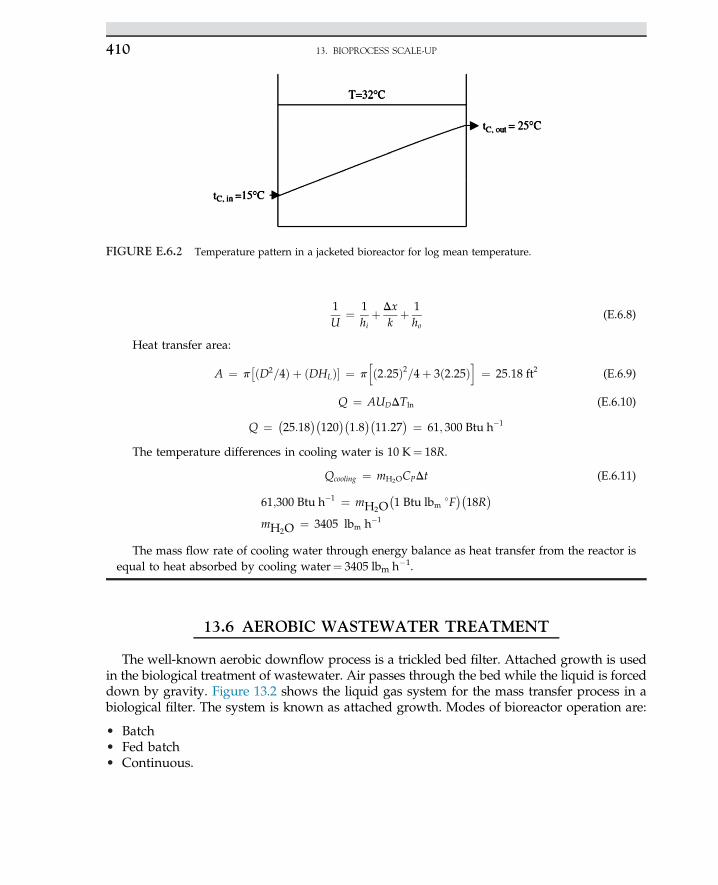
1U
¼ 1hiþ Dx
kþ 1ho
(E.6.8)
Heat transfer area:
A ¼ p�ðD2=4Þ þ ðDHLÞ� ¼ p
hð2:25Þ2=4þ 3ð2:25Þ
i¼ 25:18 ft2 (E.6.9)
Q ¼ AUDDTln (E.6.10)
Q ¼ �25:18
��120��1:8��11:27
� ¼ 61; 300 Btu h�1
The temperature differences in cooling water is 10 K¼ 18R.
Qcooling ¼ mH2OCPDt (E.6.11)
61;300 Btu h�1 ¼ mH2O�1 Btu lbm
�F��18R
�mH2O ¼ 3405 lbm h�1
The mass flow rate of cooling water through energy balance as heat transfer from the reactor isequal to heat absorbed by cooling water¼ 3405 lbm h�1.
13.6 AEROBIC WASTEWATER TREATMENT
The well-known aerobic downflow process is a trickled bed filter. Attached growth is usedin the biological treatment of wastewater. Air passes through the bed while the liquid is forceddown by gravity. Figure 13.2 shows the liquid gas system for the mass transfer process in abiological filter. The system is known as attached growth. Modes of bioreactor operation are:
• Batch• Fed batch• Continuous.
FIGURE E.6.2 Temperature pattern in a jacketed bioreactor for log mean temperature.
13. BIOPROCESS SCALE-UP410
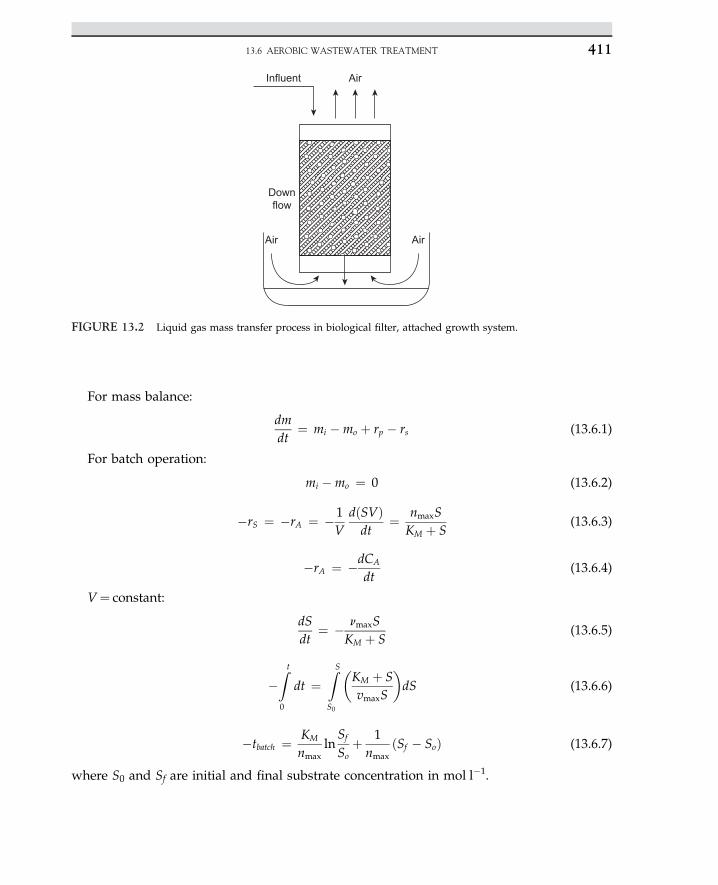
For mass balance:
dmdt
¼ mi �mo þ rp � rs (13.6.1)
For batch operation:
mi �mo ¼ 0 (13.6.2)
�rS ¼ �rA ¼ �1V
dðSVÞdt
¼ nmaxSKM þ S
(13.6.3)
�rA ¼ �dCA
dt(13.6.4)
V¼ constant:
dSdt
¼ � nmaxSKM þ S
(13.6.5)
�Z t
0
dt ¼ZSS0
�KM þ SvmaxS
�dS (13.6.6)
�tbatch ¼ KM
nmax
lnSf
Soþ 1nmax
ðSf � SoÞ (13.6.7)
where S0 and Sf are initial and final substrate concentration in mol l�1.
Air
Down
flow
Influent
Air
Air
FIGURE 13.2 Liquid gas mass transfer process in biological filter, attached growth system.
13.6 AEROBIC WASTEWATER TREATMENT 411
13.6.1 Substrate Balance in a Continuous System
Substrate balance:
dSdt
¼ FVðSI � SÞ � mrcell
Yx=s|ffl{zffl}Yieldofcell
�mrcell �qprcellYp=s|fflffl{zfflffl}
Nutrientmaintenance
(13.6.1.1)
Glucose !ATPþP1/ADPþ7:8kcal
G6P (13.6.1.2)
At steady-state condition:
dSdt
¼ 0 (13.6.1.3)
mrcell �mrcell
Ys=x(13.6.1.4)
DðSi � SÞ ¼ mrcell
Yx=sfor SCP
¼ mrcell
Yx=sþ qprcell
Yp=sfor ethanol
(13.6.1.5)
When:
m ¼ D (13.6.1.6)
rcell ¼ Yx=sðSi � SÞ (13.6.1.7)
d ln kdT
¼ ERT2
k ¼ k0e�ERT
(13.6.1.8)
EXAMPLE 1For production of an enzyme used for synthesis of a sun protection lotion, the required kinetic
data and constants are:
vmax ¼ 2:5 mmol m�3 s�1
Km ¼ 8:9 mmol l�1
So ¼ 12 mmol l�1
Find the reaction time for 95% conversion of raw materials. tbatch¼ ? for xA¼ 0.95.
13. BIOPROCESS SCALE-UP412
Solution
vmax ¼�2$5 mmol
m3 s
��3600 s
h
��1 m3
1000 l
�¼ 9 mmol
l h
tbatch ¼ Km
vmax
lnSo
Sfþ So � Sf
vmax
¼ 8$99
ln12
ð1� 0$95Þð12Þ þ0$95� 12
9
¼ 4$2 h
13.6.2 Material Balance in Fed Batch
In fact, fed batch is a batch system operating without any outlet stream. The differences insubstrate in and out are equal to the rate of product generation.
FVðSi � SÞ ¼
�vmaxSKM þ S
�VV
(13.6.2.1)
The retention time:
s ¼ 1D
¼ VF
(13.6.2.2)
DðSi � SÞ ¼ vmaxSKm þ S
(13.6.2.3)
drcelldt|ffl{zffl}
At steady state¼ 0
¼ FV
0BBB@ri � ro|{z}
sterile system
1CCCAþ
0BBB@ m|{z}
growth
� a|{z}death
1CCCArcell (13.6.2.4)
The simplified material balance would lead to growth rate:
m ¼ FV
(13.6.2.5)
13.6 AEROBIC WASTEWATER TREATMENT 413
EXAMPLE 1A 10-m3 bioreactor with H/D¼ 2.5D, 75% working volume, with two sets of standard flat blade
impellers was used for a baker’s yeast production unit. The operating dilution rate was set at 0.5 h�1.The rate equation satisfying the reactor design was a Monod model with mmax¼ 0.65 h�1andkS¼ 3 kg m�3. The initial substrate concentration was 65 g l�1 with 1 vvm aeration, a broth density of1200 kg m�3, and a viscosity m¼ 0.02 N s m�2. The yield of biomass on glucose was 0.5 g cell g�1
glucose. Calculate power consumption for a 90 rpm agitation rate and OTR of 0.05 g l�1. State thecontrolling resistance in the mass transfer process.
SolutionThe flow regime is turbulent flow. Read the value for the power number using Figure 6.6,
Chapter 6.
10 ¼ p
4ð2$5DÞD2
Dt ¼ 1$7 m
Di ¼ 0$57 m
Re ¼ ð1$5 rpsÞð0$57Þ2ð1200Þ0$02 N s
m2
¼ 2$9� 104
The flow regime is turbulent flow. Read the value for the power number using Figure 6.6 inChapter 6.
NP ¼ 6
Na ¼ Fg
ND3i
¼ 7$5 m3 min�1�90 rpm
ð0$57Þ3
¼ 0$45
where Na is known as the aeration number; then use Figure 6.7 in Chapter 6 to find the ratio ofgassed power to ungassed power.
Pg
P¼ 0$95
NP ¼ Pgcrn3D3
i
P ¼ 6� 1200ð1$5Þ3ð0$57Þ39$81
¼ 149kg ms
¼ 149745$7
¼ 0$2 hp
Conversion factor:
1 hp ¼ 745$7 kg m s�1
P ¼ 2� 0$2 ¼ 0$4 hp
13. BIOPROCESS SCALE-UP414
Pg ¼ 0$95�0$4� ¼ 0$38 hp
Pg
VL¼ 0$051 w l�1
OTR:
OTR ¼ KLaðC� CLÞ ¼ 7$9� 10�4�0$03
� ¼ 4� 10�5 kg m�3 s�1
Given:
KLa ¼ 2� 10�3V0$7s
�Pg
VL
�0,2
Vs ¼ 7$5 m3 min�1
ðp=4Þð1$72Þ2 ¼ 3$23 m min�1 ¼ 194 m h�1
KLa ¼ 2� 10�3�323 cm min�1�0$7ð0$051Þ0$2 ¼ 7$9� 10�4 s�1
Liquid film was the controlling resistance.
NOMENCLATURE
N Impeller speed, rpmDi Impeller diameter, mQO2 Oxygen transfer rate, mmol min�1
X Biomass concentration, g l�1
Pg/V Power per unit volume, hp m�3
NDi Impeller tip velocity, m s�1
tm Mixing time, minKLa Mass transfer coefficient, h�1
s Shear stress, Padudx Shear rate, s�1
m Fluid viscosity, cpN2Dig Froude Number, dimensionless
Hi Impeller interspacing, cmUg Upward gas bubble velocity, m s�1
g Gravity, m s�2
OTR Oxygen transfer rate, kmol m�3 h�1
VS US Gas superficial velocity, m s�1
Km Monod rate constant, g l�1
ymax Maximum specific growth rate, mmol m�3 s�1
kx kx Maximum specific growth rate., g l�1 h�1
D Fresh media dilution rate, h�1
F Flow rate, ml min�1
MLSS Mixed liquor suspended solids, kg m�3
V Volume, mYX/S Yield of biomass on substrateSf Inlet to outlet substrate ratioR Recycle ratiof Ratio inlet to outlet substrate concentration
NOMENCLATURE 415
References1. Scragg AH. Bioreactors in biotechnology, a practical approach. Ellis Horwood series in biochemistry and biotechnology.
1991. New York.2. Wang DIC, Cooney CL, Deman AL, Dunnill P, Humphrey AE, Lilly MD. Fermentation and enzyme technology. New
York: John Wiley & Sons; 1979.3. Baily JE, Ollis DF. Biochemical engineering fundamentals. 2nd ed. New York: McGraw-Hill; 1986.4. Aiba S, Humphrey AE, Millis NF. Biochemical engineering. 2nd ed. New York: Academic Press; 1973.5. Doran PM. Bioprocess engineering principles. New York: Academic Press; 1995.6. Michel BJ, Miller SA. AIChE J 1962;8:262.7. Stanbury PF, Whitaker A. Principles of fermentation technology. Oxford: Pergamon Press; 1984.8. Kern D. Process heat transfer. New York: McGraw Hill; 1950. p. 717.
13. BIOPROCESS SCALE-UP416
C H A P T E R
14
Single-Cell Protein
O U T L I N E
14.1 Introduction 418
14.2 Dissolved Oxygen in Single-CellProtein Production 419
14.3 Batch and ContinuousFermentation for Production ofSingle-Cell Protein 41914.3.1 Analytical Methods for
Measuring Protein Contentof Baker’s Yeast 420
14.3.2 Seed Culture 420
14.4 Batch Experiment for Productionof Baker’s Yeast 421
14.5 Separation of Microbial Biomass 421
14.6 Background 422
14.7 Production Methods 422
14.8 Media Preparation for Single-CellProtein Production 424
14.9 Analytical Methods 42414.9.1 CoomassieeProtein
Reaction Scheme 42514.9.2 Preparation of Diluted
Bovine Serum AlbuminStandards 425
14.9.3 Mixing of the CoomassiePlus Protein AssayReagent 425
14.9.4 Standard CalibrationCurve 426
14.9.5 Standard CalibrationCurve for Starch 426
14.10 Single-Cell Protein Processes 426
14.11 Nutritional Value of Single-CellProtein 428
14.12 Organisms and Substrates forSingle-Cell Protein Production 42914.12.1 Cellulose 43014.12.2 Starch 43114.12.3 Whey (Lactose) 43114.12.4 Glucose 43114.12.5 Alkanes 43114.12.6 Methane/Methanol 431
14.13 Advantages and Disadvantagesof Single-Cell Protein 432
14.14 Preparation for ExperimentalRun 433
References 433
417Biochemical Engineering and Biotechnologyhttp://dx.doi.org/10.1016/B978-0-444-63357-6.00014-6 Copyright © 2015 Elsevier B.V. All rights reserved.
14.1 INTRODUCTION
The term single-cell protein (SCP) is used to describe protein derived from cells or proteinextracted from various microorganisms such as yeast, fungi, algae, and bacteria, which aregrown for mass production from various inexpensive carbon sources such as agriculturalwastes for the synthesis of food for humans or animals. The dried cells of microorganismsor the whole organism is harvested and consumed. This is a rich protein source that can beused as a human food supplement and in animal feeds. SCP production may have great po-tential for feeding the ever-increasing world population. Massive quantities of SCP can be pro-duced in a single day. As a source of protein, it is very promising, with potential to satisfy theworld shortage of food as the population increases. SCP may be enriched with a high contentof proteins, fats and carbohydrates, nucleic acids, and vitamins. However, the disadvantage ofSCP as a human food source is the high content of nucleic acids, which may cause serious prob-lem in the human digestive track due to the limited capacity for the complete digestion ofnucleic acids. SCP may be more attractive for animal food usage due to the flexibility of animalfood and soft regulations for animal feedstock. Over the past decades, a variety of raw mate-rials have been tested for SCP production, including carbon dioxide, methane, methanol,ethanol, various sugars, and even petroleum hydrocarbons and agricultural and industrialwastes. Several carbon sources are used as energy sources for microorganisms growing andproducing SCP. In some cases, raw material requires pretreatment or hydrolysis before use.Waste sources of carbon used for SCP production are customary and cheap. SCP technologyis a suitable process for converting waste materials to useful biomass containing protein.The broth is concentrated protein that is dried with limited moisture; it is stored for use asfood or feed for humans and animals. Waste recycling has been advanced as a method for pre-venting environmental decay and increasing food supplies. It may be possible to convert wastestreams into valuable products by separation and recovery or by biological conversion.1e4
Many products are produced biologically from food process waste. The potential benefits ofsuccessful recycling of agricultural wastes are enormous. It may be the only method forlarge-scale protein production that does not require a concomitant increase in energy consump-tion. In addition, it may be the most effective method for producing animal and human foodfrom lignocellulose materials, although they have little nutritive value and are therefore usedfor fuel production. One advantage of the biological process is the flexibility of the microorgan-isms to adapt to different feedstock. Therefore, when combined with the treatment of processwaste streams, the biological conversion of these wastes to products can be both environmen-tally and economically favorable. In the production of antibiotics, sufficient growth of fungi insubmerged cultures has created potential sources of biomass as SCP and as flavor additives toreplace mushrooms; the biomass contains 50e65% protein1,5 Production of mushroom fromlignocellulosic waste seems to be a suitable and economical process because the raw materialis inexpensive and available in most countries. Petroleum-based SCP was produced based onoxidation of methane to synthesize methanol; then, methanol as a carbon source was fed to thebioreactor using bacterium known as Methylophilus methylotrophus for biomass production, an80% enriched produced protein known as Pruteen. Large scale production of SCP from petro-leum may not be economical due to the high costs of petroleum. Extensive research has beenconducted on the use of food processing wastes such as potato and orange peels for the
14. SINGLE-CELL PROTEIN418
production of SCP. One has to be very careful in using fungi species, since the synthesis of sec-ondary metabolites may cause food poising. Fungi are easily able to produce toxin and afla-toxins with the improper storage of animal feedstock; for instance, Aspergillus flavus as asecondary metabolite synthesizes toxins that are highly carcinogenic.
This chapter discusses the present status of microbial SCP production from agriculturalwastes and describes some of the technical and economical problems related to the produc-tion processes that must be overcome for large-scale application to be possible.
14.2 DISSOLVED OXYGEN IN SINGLE-CELL PROTEINPRODUCTION
In fermentation broth, the dissolved oxygen (DO) concentration is kept constant, while theproduction of SCP may reach the steady state condition, and the viable protein is continuouslyharvested. The concentration of protein is proportional to the oxygen uptake rate. Control ofDOwould achieve steady SCP production. Variation of DOmay affect retention time and otherprocess variables such as substrate and product concentrations, retention time, dilution rate,and aeration rate. Microbial activities are monitored by the oxygen uptake rate from the sup-plied air or oxygen. Microbial cells in the aerobic condition take up oxygen from the gas andthen liquid phases. The rate of oxygen transfer from the gas phase to the liquid phase is impor-tant. At high cell densities, the cell growth is limited by the availability of oxygen in the me-dium. The growth of aerobic bacteria in the fermenter is then controlled by the availabilityof oxygen, substrate, energy sources, and enzymes. Air has to be supplied for the aerobic pro-cess to enhance the cell growth. Oxygen limitation may cause a reduction in the growth rate.The supplied oxygen from the gas phase has to penetrate into the microorganism. Several stepsare required to let such a phenomenon take place. The oxygen first must travel through thegaseliquid interface, then the bulk of liquid, and finally into the microbial cell.
The above data show that in the case of high oxygen demand for SCP production, oxygenis drastically depleted after an incubation period of 12e24 h. Therefore, pure oxygen iscommonly used when the DO level drops to 2 ppm; additional oxygen may enhance oxygenavailability in the fermentation media.
Several DO probes are available. Some well-known branded fermenters, like New Bruns-wick, Bioflo series, and the B. Braun Biotstat B fermenters are equipped with a DO meter. Thisunit has a 2-l fermentation vessel equipped with a DO meter and pH probe, an antifoamsensor, and level controllers for harvesting culture. The concentration of DO in the mediais a function of temperature. A higher operating temperature would decrease the level ofDO. A microsparger is used to provide sufficient small air bubbles. The air bubbles are domi-nated in the media using a suitable gas sparger.
14.3 BATCH AND CONTINUOUS FERMENTATION FORPRODUCTION OF SINGLE-CELL PROTEIN
The fermentation vessel is a jacketed vessel with a defined working volume. The media aremade of phosphate buffer at a neutral pH with 3.3 g KH2PO4 and 0.3 g Na2HPO4, 1 g yeast
14.3 BATCH AND CONTINUOUS FERMENTATION FOR PRODUCTION OF SINGLE-CELL PROTEIN 419
extract, and 30 g glucose in 1 l of distilled water. The media should be sterilized in a 20-lcarboy. The fermentation vessel with a working volume of 2 l may have 500 ml mediainitially sterilized by stream under 15 psig and 121 �C. The seed culture is transferred tothe fermentation vessel with filtered and pressurized air; the production of SCP is monitoredby pumping fresh nutrients and supplying air. Continuous culture with constant volume andcontrolled dilution rate is conducted in SCP production, as fresh and sterilized media arepumped into the culture vessel. It is desirable to control pH, temperature, and aerationwith a constant air flow rate. The most common continuous culture system is the chemostat.The word chemostat refers to the constant chemical environment at a steady-state condition.6
Another continuous culture vessel is the turbidostat, in which the cell concentration in the cul-ture vessel is kept constant by monitoring cell optical density. The chemostat experiment iscarried out for 24 h at a constant temperature of 32 �C and by controlling pH and monitoringDO concentration. The medium consists of an excess amount of nutrients that is required tosynthesize the desired concentration of SCP. The growth limiting nutrient controls the steady-state SCP production rate. The data for optical density, DO level, cell dry weight, and mea-surements of protein and carbohydrates are carried out at 8, 12, 16, and 24 h in batch mode.The continuous operation is extended for another 24 h to monitor all parameters and measureSCP. The results should be compared with batchwise production. The expected results forreduction of sugar in real experiments were similar. The data were obtained by aeration ofpharmaceutical wastewater. A well-known reagent for determination of carbohydrates, dini-trosalicylic acid, was used to reduce the organic chemicals in the aforementioned wastewaterfor the course of three days incubation.7,8 The method of measurement will be discussed inthe following sections. If the aforementioned experiments are conducted, they may lead usto a new set of data that are totally different, and only the reduction trend would be aboutthe same. SCP production has to be determined by experimentation, and research is neededto obtain the data. Maximum carbohydrate reduction took place after 24 h of aeration. Sincethe carbon source was initially low, the rate of biomass production was not appreciable.
The role ofDOin the treatment systemis absolutelyvital. Therefore, theDOlevelmustbemain-tainedatnot less than three to four ppmin thewastewater for effective aeration. SCPproduction isvery oxygen-dependent. The results would be very satisfactory if pure oxygen was used.
14.3.1 Analytical Methods for Measuring Protein Content of Baker’s Yeast
Protein concentration can be determined using a method introduced by Bradford,9 whichuses Pierce reagent 23,200 (Piece Chemical Company, Rockford, IL, USA) in combinationwith an acidic Coomassie Brilliant Blue G-250 solution to absorb at 595 nm when the reagentbinds to the protein. A 20-mg l�1 bovine serum albumin (Piece Chemical Company, Rock-ford, IL, USA) solution will be used to prepare a standard calibration curve for determinationof protein concentration. The sample for analysis of SCP is initially homogenized or vibratedin a sonic system to break down the cell walls.
14.3.2 Seed Culture
How do we start the real experiment? A 100-ml seed culture is prepared in advance. A100-ml media consists of 0.1 g yeast extract and 1 g glucose with 0.33 g KH2PO4 and 0.03 g
14. SINGLE-CELL PROTEIN420
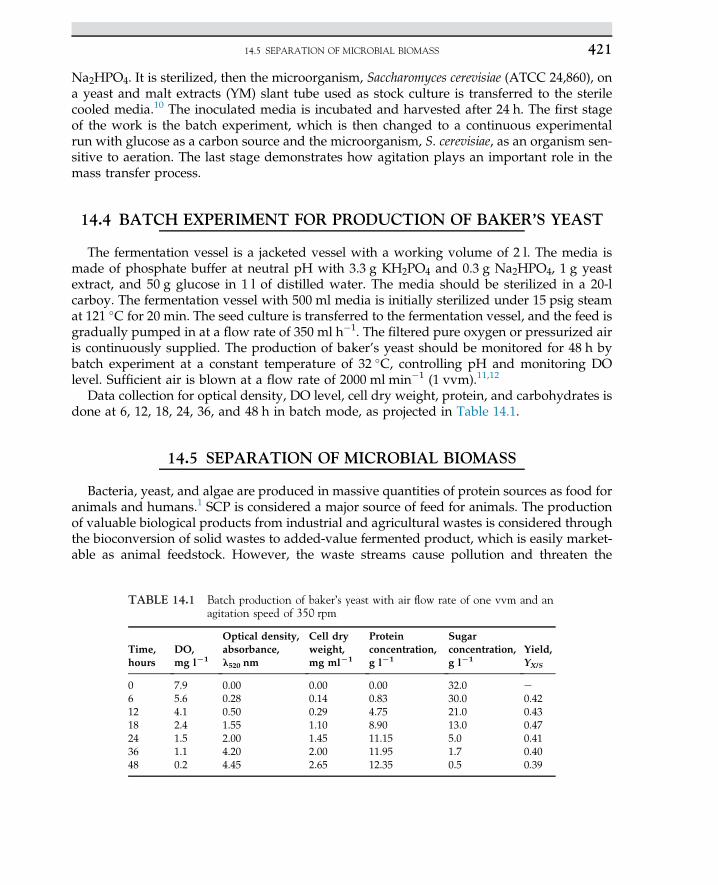
Na2HPO4. It is sterilized, then the microorganism, Saccharomyces cerevisiae (ATCC 24,860), ona yeast and malt extracts (YM) slant tube used as stock culture is transferred to the sterilecooled media.10 The inoculated media is incubated and harvested after 24 h. The first stageof the work is the batch experiment, which is then changed to a continuous experimentalrun with glucose as a carbon source and the microorganism, S. cerevisiae, as an organism sen-sitive to aeration. The last stage demonstrates how agitation plays an important role in themass transfer process.
14.4 BATCH EXPERIMENT FOR PRODUCTION OF BAKER’S YEAST
The fermentation vessel is a jacketed vessel with a working volume of 2 l. The media ismade of phosphate buffer at neutral pH with 3.3 g KH2PO4 and 0.3 g Na2HPO4, 1 g yeastextract, and 50 g glucose in 1 l of distilled water. The media should be sterilized in a 20-lcarboy. The fermentation vessel with 500 ml media is initially sterilized under 15 psig steamat 121 �C for 20 min. The seed culture is transferred to the fermentation vessel, and the feed isgradually pumped in at a flow rate of 350 ml h�1. The filtered pure oxygen or pressurized airis continuously supplied. The production of baker’s yeast should be monitored for 48 h bybatch experiment at a constant temperature of 32 �C, controlling pH and monitoring DOlevel. Sufficient air is blown at a flow rate of 2000 ml min�1 (1 vvm).11,12
Data collection for optical density, DO level, cell dry weight, protein, and carbohydrates isdone at 6, 12, 18, 24, 36, and 48 h in batch mode, as projected in Table 14.1.
14.5 SEPARATION OF MICROBIAL BIOMASS
Bacteria, yeast, and algae are produced in massive quantities of protein sources as food foranimals and humans.1 SCP is considered a major source of feed for animals. The productionof valuable biological products from industrial and agricultural wastes is considered throughthe bioconversion of solid wastes to added-value fermented product, which is easily market-able as animal feedstock. However, the waste streams cause pollution and threaten the
TABLE 14.1 Batch production of baker’s yeast with air flow rate of one vvm and anagitation speed of 350 rpm
Time,hours
DO,mg lL1
Optical density,absorbance,l520 nm
Cell dryweight,mg mlL1
Proteinconcentration,g lL1
Sugarconcentration,g lL1
Yield,YX/S
061218243648
7.95.64.12.41.51.10.2
0.000.280.501.552.004.204.45
0.000.140.291.101.452.002.65
0.000.834.758.9011.1511.9512.35
32.030.021.013.05.01.70.5
e0.420.430.470.410.400.39
14.5 SEPARATION OF MICROBIAL BIOMASS 421
environment can be considered as a raw material for SCP production using suitable strains ofmicroorganisms.
14.6 BACKGROUND
It is evident that the conversion of photosynthetically produced organic compounds intohuman and animal food is the limiting process in human food production. The worldwideannual production of organic material by photosynthesis has been estimated to be between25 and 50 tons.5,6 Any practical method capable of converting a small fraction of this yieldinto human food should find wide application and go a long way to reducing chronicfood shortages.
The growth of microorganisms, more rapid than that of the higher plants, makes themvery attractive as high-protein crops; whereas only one or two grain crops can be grownper year, a crop of yeasts or molds may be harvested weekly, and bacteria may be harvesteddaily. The use of microorganisms as a source of protein for human and animal food is not anew development. Traditional foods and feeds such as cheese, sauerkraut, miso, and silagehave a high content of microorganisms to which their nutritional properties are due inpart. The high-quality proteins synthesized during the growth of these microorganismscompare favorably with those derived from the better grains.1,3 There are many convincingreports on the availability of essential amino acids and the protein quality of SCP. Althoughthere are few data on animal feeding trials using SCP produced from lignocellulose wastes,there is a large and growing body of information about SCP from petroleum and methanol.This information should be applicable to SCP from agricultural wastes, with proper allow-ance for the undesirable contaminants in the sources. In petroleum, there has been concernabout accumulation of carcinogenic hydrocarbons. In agricultural wastes, there is concernabout accumulation of pesticides and herbicides. The guidelines for testing SCP as a majorsupplement in animal diets should be consulted for further details on feeding trials. Manymore feeding trials will be needed before SCP from lignocellulose wastes is accepted forroutine feeding.
The main carbon source for production of SCP is petroleum. It has been used by manycompanies around the world. Other potential substrates for SCP include bagasse, citruswastes, sulphite waste liquor from pulp and paper, molasses, animal manure, whey, starch,sewage, and agricultural wastes.
14.7 PRODUCTION METHODS
Some of the proposed methods for conversion of agricultural wastes into animal feed arepresented in Table 14.2. These methods will be briefly evaluated in the following. First, adistinction should be made between the production of SCP from the lignocellulose parts ofthe plant and the production of SCP from the soluble carbohydrates of many agriculturalwastes. At present, there are many plants around the world that operate for the productionof SCP. The Ceres Ecology Corporation of Chino, California, in the United States will processwaste from more than 100,000 dairy cattle for feed recycling and for control of salt in
14. SINGLE-CELL PROTEIN422
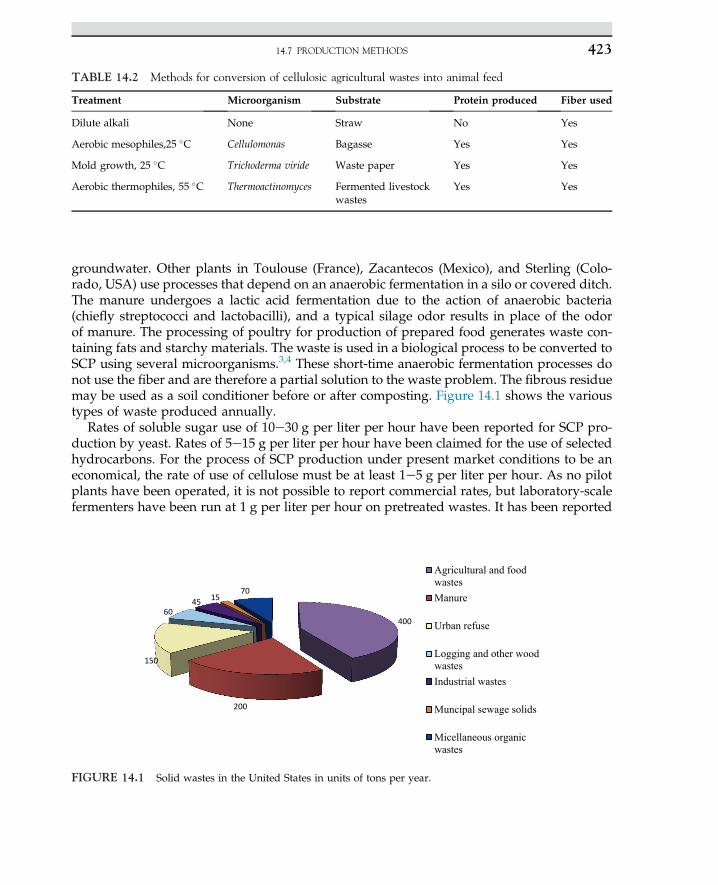
groundwater. Other plants in Toulouse (France), Zacantecos (Mexico), and Sterling (Colo-rado, USA) use processes that depend on an anaerobic fermentation in a silo or covered ditch.The manure undergoes a lactic acid fermentation due to the action of anaerobic bacteria(chiefly streptococci and lactobacilli), and a typical silage odor results in place of the odorof manure. The processing of poultry for production of prepared food generates waste con-taining fats and starchy materials. The waste is used in a biological process to be converted toSCP using several microorganisms.3,4 These short-time anaerobic fermentation processes donot use the fiber and are therefore a partial solution to the waste problem. The fibrous residuemay be used as a soil conditioner before or after composting. Figure 14.1 shows the varioustypes of waste produced annually.
Rates of soluble sugar use of 10e30 g per liter per hour have been reported for SCP pro-duction by yeast. Rates of 5e15 g per liter per hour have been claimed for the use of selectedhydrocarbons. For the process of SCP production under present market conditions to be aneconomical, the rate of use of cellulose must be at least 1e5 g per liter per hour. As no pilotplants have been operated, it is not possible to report commercial rates, but laboratory-scalefermenters have been run at 1 g per liter per hour on pretreated wastes. It has been reported
TABLE 14.2 Methods for conversion of cellulosic agricultural wastes into animal feed
Treatment Microorganism Substrate Protein produced Fiber used
Dilute alkali None Straw No Yes
Aerobic mesophiles,25 �C Cellulomonas Bagasse Yes Yes
Mold growth, 25 �C Trichoderma viride Waste paper Yes Yes
Aerobic thermophiles, 55 �C Thermoactinomyces Fermented livestockwastes
Yes Yes
400
200
150
6045 15
70
Agricultural and foodwastesManure
Urban refuse
Logging and other woodwastesIndustrial wastes
Muncipal sewage solids
Micellaneous organicwastes
FIGURE 14.1 Solid wastes in the United States in units of tons per year.
14.7 PRODUCTION METHODS 423
that gram-negative aerobic bacteria, Cellulomonas sp., grow rapidly on cellulose at 25e30 �C,but cannot use lignin or lignocellulose. Therefore, extensive pretreatment of lignocellulosicmaterial such as rice husks with hot alkali is required.7e9 The microorganism must be har-vested by centrifugation. Amino acid analysis and animal feeding trials have shown that ahigh-quality SCP can be produced. Enzymes produced by the mold Trichoderma viride areused for production of soluble sugars from waste paper cellulose. Yeasts or bacteria forSCP production can then ferment these sugars. The enzyme reaction takes place in four steps:
1. Pretreatment of waste by ball milling or hot alkali2. Enzyme production by growth of T. viride on pretreated cellulose3. Depolymerization of cellulose by T. viride enzymes4. SCP production by yeast or bacteria.
Several potential and mutant strains of T. viride have been identified in SCP production.Their capacity for amyloletic enzyme production was enhanced several fold in SCP from ling-nocellulosic resources. The process of bioconversion of agricultural wastes to SCP appearedto be too complex to find an economic application for agricultural waste.
14.8 MEDIA PREPARATION FOR SINGLE-CELL PROTEINPRODUCTION
Sago starch in Malaysia is abundant, inexpensive, and common as raw material for SCPproduction. Fifty grams of sago starch is dissolved in 1 l of 0.1 M NaOH solution. The mixtureis heat-treated until it is absolutely dissolved in deionizer water with 4 g of NaOH, then thepH is adjusted to 7. Supplementary nutrients are added: 3.3 g KH2PO4, 0.3 g Na2HPO4, andyeast extract; the media is autoclaved and used as feed for a fermenter. One hundred milli-liters of seed culture are prepared a day in advance for inoculation of fermentation. Saccha-romycopsis fibuligera ATCC9947 or ATCC9266 is grown in a media comprising 0.33 gKH2PO4, 0.03 g Na2HPO4, 0.1 g yeast extract, and 1 g glucose in 100 ml distilled water.The seed culture is harvested after 24 h of incubation at 32 �C. The microorganism is pur-chased from ATCC, and after hydration is kept in a stock culture of YM media (Difco,USA) slants. The inoculum for seed culture is the organism transferred from the preparedslant media.
The culture medium used for growth of Penicillium javanicum has been reported by Burreland his coworkers.10 The recommended medium for cultivation of the fungi without anyalteration contains the following chemical composition in 1 l solution: fumaric acid, 2.0 g,(NH4)2SO4, 2.5 g; KH2PO4.2H2O, 1.0 g; MgSO4, 0.5 g; (NH4)Fe(SO4)2.12H2O, 0.2 mg;ZnSO4.7H2O, 0.2 mg; MnSO4.H2O, 0.1 mg; thiamine hydrochloride, 0.1 mg; and a suitablecarbon source.
14.9 ANALYTICAL METHODS
Protein concentration can be determined by using the method of Bradford,9 which usesPierce reagent 23,200 (Pierce Chemical Company, Rockford, IL, USA) in combinationwith an acidic Coomassie Brilliant Blue G-20 solution to absorb at 595 nm when reagent
14. SINGLE-CELL PROTEIN424
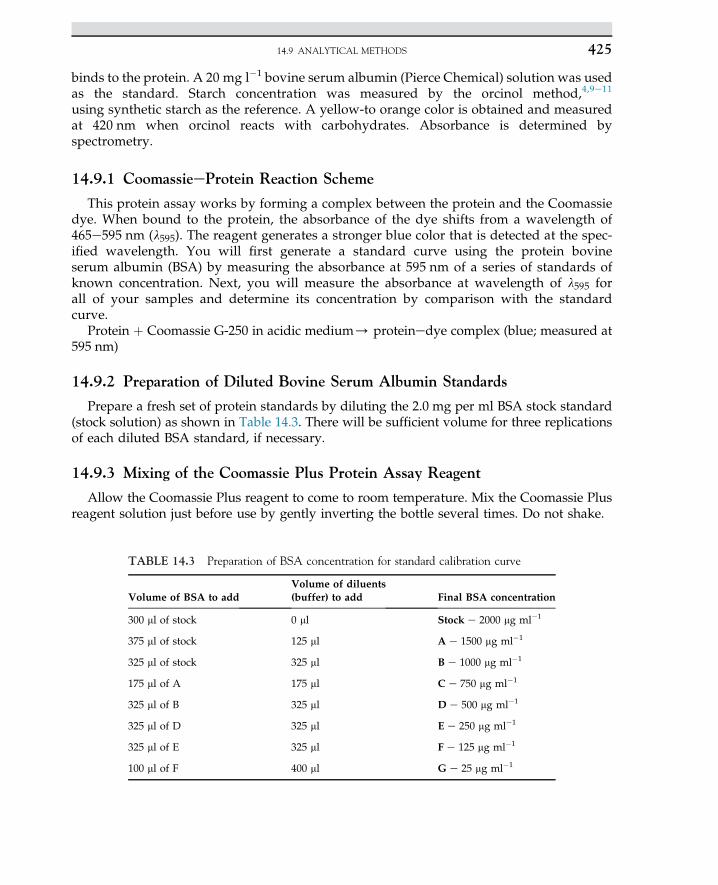
binds to the protein. A 20 mg l�1 bovine serum albumin (Pierce Chemical) solution was usedas the standard. Starch concentration was measured by the orcinol method,4,9e11
using synthetic starch as the reference. A yellow-to orange color is obtained and measuredat 420 nm when orcinol reacts with carbohydrates. Absorbance is determined byspectrometry.
14.9.1 CoomassieeProtein Reaction Scheme
This protein assay works by forming a complex between the protein and the Coomassiedye. When bound to the protein, the absorbance of the dye shifts from a wavelength of465e595 nm (l595). The reagent generates a stronger blue color that is detected at the spec-ified wavelength. You will first generate a standard curve using the protein bovineserum albumin (BSA) by measuring the absorbance at 595 nm of a series of standards ofknown concentration. Next, you will measure the absorbance at wavelength of l595 forall of your samples and determine its concentration by comparison with the standardcurve.
Protein þ Coomassie G-250 in acidic medium/ proteinedye complex (blue; measured at595 nm)
14.9.2 Preparation of Diluted Bovine Serum Albumin Standards
Prepare a fresh set of protein standards by diluting the 2.0 mg per ml BSA stock standard(stock solution) as shown in Table 14.3. There will be sufficient volume for three replicationsof each diluted BSA standard, if necessary.
14.9.3 Mixing of the Coomassie Plus Protein Assay Reagent
Allow the Coomassie Plus reagent to come to room temperature. Mix the Coomassie Plusreagent solution just before use by gently inverting the bottle several times. Do not shake.
TABLE 14.3 Preparation of BSA concentration for standard calibration curve
Volume of BSA to addVolume of diluents(buffer) to add Final BSA concentration
300 ml of stock 0 ml Stock e 2000 mg ml�1
375 ml of stock 125 ml A e 1500 mg ml�1
325 ml of stock 325 ml B e 1000 mg ml�1
175 ml of A 175 ml C e 750 mg ml�1
325 ml of B 325 ml D e 500 mg ml�1
325 ml of D 325 ml E e 250 mg ml�1
325 ml of E 325 ml F e 125 mg ml�1
100 ml of F 400 ml G e 25 mg ml�1
14.9 ANALYTICAL METHODS 425
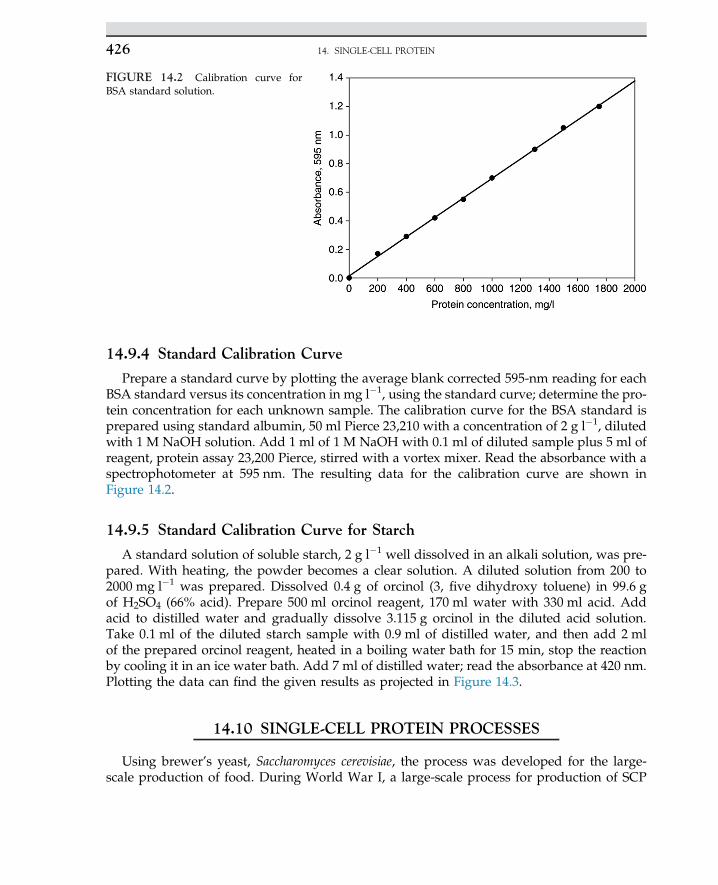
14.9.4 Standard Calibration Curve
Prepare a standard curve by plotting the average blank corrected 595-nm reading for eachBSA standard versus its concentration in mg l�1, using the standard curve; determine the pro-tein concentration for each unknown sample. The calibration curve for the BSA standard isprepared using standard albumin, 50 ml Pierce 23,210 with a concentration of 2 g l�1, dilutedwith 1 M NaOH solution. Add 1 ml of 1 M NaOH with 0.1 ml of diluted sample plus 5 ml ofreagent, protein assay 23,200 Pierce, stirred with a vortex mixer. Read the absorbance with aspectrophotometer at 595 nm. The resulting data for the calibration curve are shown inFigure 14.2.
14.9.5 Standard Calibration Curve for Starch
A standard solution of soluble starch, 2 g l�1 well dissolved in an alkali solution, was pre-pared. With heating, the powder becomes a clear solution. A diluted solution from 200 to2000 mg l�1 was prepared. Dissolved 0.4 g of orcinol (3, five dihydroxy toluene) in 99.6 gof H2SO4 (66% acid). Prepare 500 ml orcinol reagent, 170 ml water with 330 ml acid. Addacid to distilled water and gradually dissolve 3.115 g orcinol in the diluted acid solution.Take 0.1 ml of the diluted starch sample with 0.9 ml of distilled water, and then add 2 mlof the prepared orcinol reagent, heated in a boiling water bath for 15 min, stop the reactionby cooling it in an ice water bath. Add 7 ml of distilled water; read the absorbance at 420 nm.Plotting the data can find the given results as projected in Figure 14.3.
14.10 SINGLE-CELL PROTEIN PROCESSES
Using brewer’s yeast, Saccharomyces cerevisiae, the process was developed for the large-scale production of food. During World War I, a large-scale process for production of SCP
FIGURE 14.2 Calibration curve forBSA standard solution.
14. SINGLE-CELL PROTEIN426
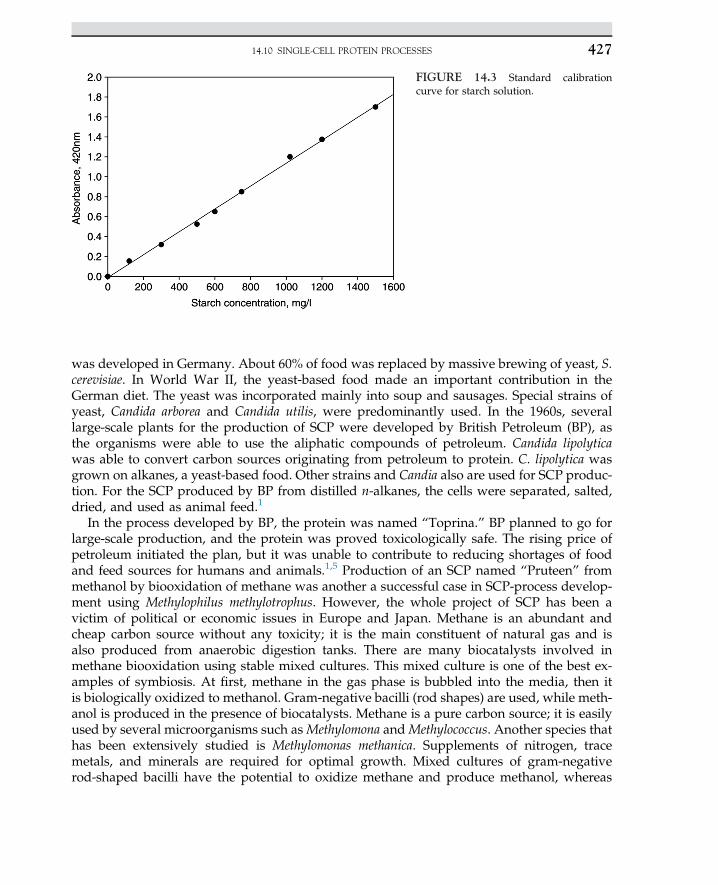
was developed in Germany. About 60% of food was replaced by massive brewing of yeast, S.cerevisiae. In World War II, the yeast-based food made an important contribution in theGerman diet. The yeast was incorporated mainly into soup and sausages. Special strains ofyeast, Candida arborea and Candida utilis, were predominantly used. In the 1960s, severallarge-scale plants for the production of SCP were developed by British Petroleum (BP), asthe organisms were able to use the aliphatic compounds of petroleum. Candida lipolyticawas able to convert carbon sources originating from petroleum to protein. C. lipolytica wasgrown on alkanes, a yeast-based food. Other strains and Candia also are used for SCP produc-tion. For the SCP produced by BP from distilled n-alkanes, the cells were separated, salted,dried, and used as animal feed.1
In the process developed by BP, the protein was named “Toprina.” BP planned to go forlarge-scale production, and the protein was proved toxicologically safe. The rising price ofpetroleum initiated the plan, but it was unable to contribute to reducing shortages of foodand feed sources for humans and animals.1,5 Production of an SCP named “Pruteen” frommethanol by biooxidation of methane was another a successful case in SCP-process develop-ment using Methylophilus methylotrophus. However, the whole project of SCP has been avictim of political or economic issues in Europe and Japan. Methane is an abundant andcheap carbon source without any toxicity; it is the main constituent of natural gas and isalso produced from anaerobic digestion tanks. There are many biocatalysts involved inmethane biooxidation using stable mixed cultures. This mixed culture is one of the best ex-amples of symbiosis. At first, methane in the gas phase is bubbled into the media, then itis biologically oxidized to methanol. Gram-negative bacilli (rod shapes) are used, while meth-anol is produced in the presence of biocatalysts. Methane is a pure carbon source; it is easilyused by several microorganisms such asMethylomona andMethylococcus. Another species thathas been extensively studied is Methylomonas methanica. Supplements of nitrogen, tracemetals, and minerals are required for optimal growth. Mixed cultures of gram-negativerod-shaped bacilli have the potential to oxidize methane and produce methanol, whereas
FIGURE 14.3 Standard calibrationcurve for starch solution.
14.10 SINGLE-CELL PROTEIN PROCESSES 427
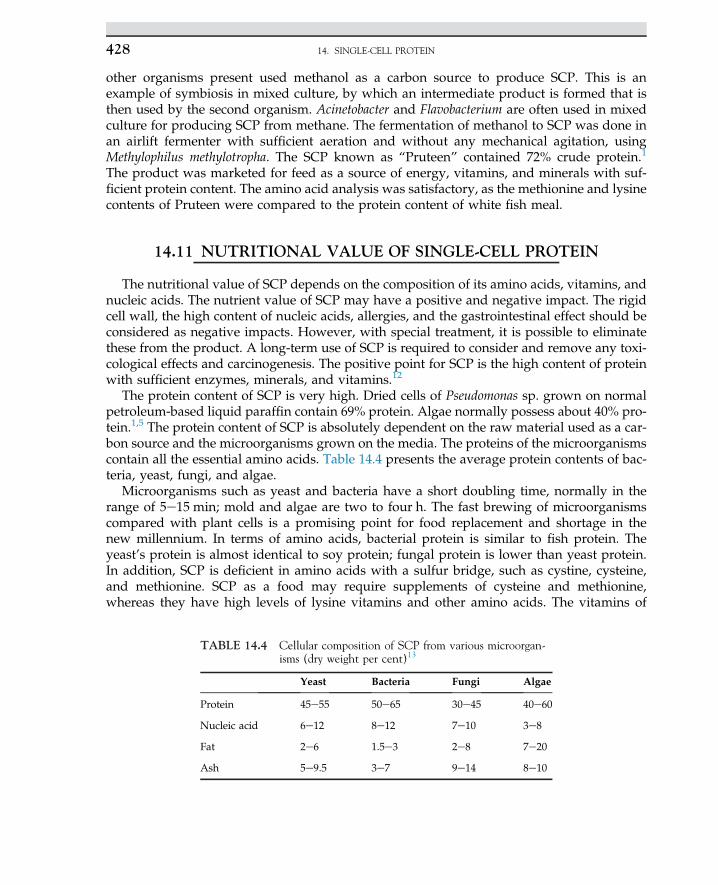
other organisms present used methanol as a carbon source to produce SCP. This is anexample of symbiosis in mixed culture, by which an intermediate product is formed that isthen used by the second organism. Acinetobacter and Flavobacterium are often used in mixedculture for producing SCP from methane. The fermentation of methanol to SCP was done inan airlift fermenter with sufficient aeration and without any mechanical agitation, usingMethylophilus methylotropha. The SCP known as “Pruteen” contained 72% crude protein.1
The product was marketed for feed as a source of energy, vitamins, and minerals with suf-ficient protein content. The amino acid analysis was satisfactory, as the methionine and lysinecontents of Pruteen were compared to the protein content of white fish meal.
14.11 NUTRITIONAL VALUE OF SINGLE-CELL PROTEIN
The nutritional value of SCP depends on the composition of its amino acids, vitamins, andnucleic acids. The nutrient value of SCP may have a positive and negative impact. The rigidcell wall, the high content of nucleic acids, allergies, and the gastrointestinal effect should beconsidered as negative impacts. However, with special treatment, it is possible to eliminatethese from the product. A long-term use of SCP is required to consider and remove any toxi-cological effects and carcinogenesis. The positive point for SCP is the high content of proteinwith sufficient enzymes, minerals, and vitamins.12
The protein content of SCP is very high. Dried cells of Pseudomonas sp. grown on normalpetroleum-based liquid paraffin contain 69% protein. Algae normally possess about 40% pro-tein.1,5 The protein content of SCP is absolutely dependent on the raw material used as a car-bon source and the microorganisms grown on the media. The proteins of the microorganismscontain all the essential amino acids. Table 14.4 presents the average protein contents of bac-teria, yeast, fungi, and algae.
Microorganisms such as yeast and bacteria have a short doubling time, normally in therange of 5e15 min; mold and algae are two to four h. The fast brewing of microorganismscompared with plant cells is a promising point for food replacement and shortage in thenew millennium. In terms of amino acids, bacterial protein is similar to fish protein. Theyeast’s protein is almost identical to soy protein; fungal protein is lower than yeast protein.In addition, SCP is deficient in amino acids with a sulfur bridge, such as cystine, cysteine,and methionine. SCP as a food may require supplements of cysteine and methionine,whereas they have high levels of lysine vitamins and other amino acids. The vitamins of
TABLE 14.4 Cellular composition of SCP from various microorgan-isms (dry weight per cent)13
Yeast Bacteria Fungi Algae
Protein 45e55 50e65 30e45 40e60
Nucleic acid 6e12 8e12 7e10 3e8
Fat 2e6 1.5e3 2e8 7e20
Ash 5e9.5 3e7 9e14 8e10
14. SINGLE-CELL PROTEIN428
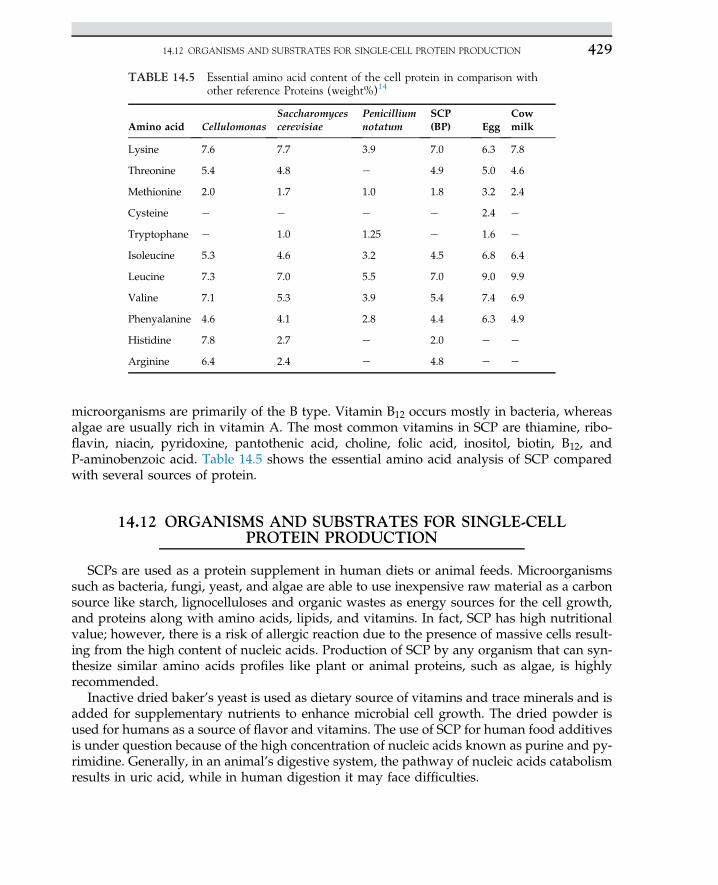
microorganisms are primarily of the B type. Vitamin B12 occurs mostly in bacteria, whereasalgae are usually rich in vitamin A. The most common vitamins in SCP are thiamine, ribo-flavin, niacin, pyridoxine, pantothenic acid, choline, folic acid, inositol, biotin, B12, andP-aminobenzoic acid. Table 14.5 shows the essential amino acid analysis of SCP comparedwith several sources of protein.
14.12 ORGANISMS AND SUBSTRATES FOR SINGLE-CELLPROTEIN PRODUCTION
SCPs are used as a protein supplement in human diets or animal feeds. Microorganismssuch as bacteria, fungi, yeast, and algae are able to use inexpensive raw material as a carbonsource like starch, lignocelluloses and organic wastes as energy sources for the cell growth,and proteins along with amino acids, lipids, and vitamins. In fact, SCP has high nutritionalvalue; however, there is a risk of allergic reaction due to the presence of massive cells result-ing from the high content of nucleic acids. Production of SCP by any organism that can syn-thesize similar amino acids profiles like plant or animal proteins, such as algae, is highlyrecommended.
Inactive dried baker’s yeast is used as dietary source of vitamins and trace minerals and isadded for supplementary nutrients to enhance microbial cell growth. The dried powder isused for humans as a source of flavor and vitamins. The use of SCP for human food additivesis under question because of the high concentration of nucleic acids known as purine and py-rimidine. Generally, in an animal’s digestive system, the pathway of nucleic acids catabolismresults in uric acid, while in human digestion it may face difficulties.
TABLE 14.5 Essential amino acid content of the cell protein in comparison withother reference Proteins (weight%)14
Amino acid CellulomonasSaccharomycescerevisiae
Penicilliumnotatum
SCP(BP) Egg
Cowmilk
Lysine 7.6 7.7 3.9 7.0 6.3 7.8
Threonine 5.4 4.8 e 4.9 5.0 4.6
Methionine 2.0 1.7 1.0 1.8 3.2 2.4
Cysteine e e e e 2.4 e
Tryptophane e 1.0 1.25 e 1.6 e
Isoleucine 5.3 4.6 3.2 4.5 6.8 6.4
Leucine 7.3 7.0 5.5 7.0 9.0 9.9
Valine 7.1 5.3 3.9 5.4 7.4 6.9
Phenyalanine 4.6 4.1 2.8 4.4 6.3 4.9
Histidine 7.8 2.7 e 2.0 e e
Arginine 6.4 2.4 e 4.8 e e
14.12 ORGANISMS AND SUBSTRATES FOR SINGLE-CELL PROTEIN PRODUCTION 429
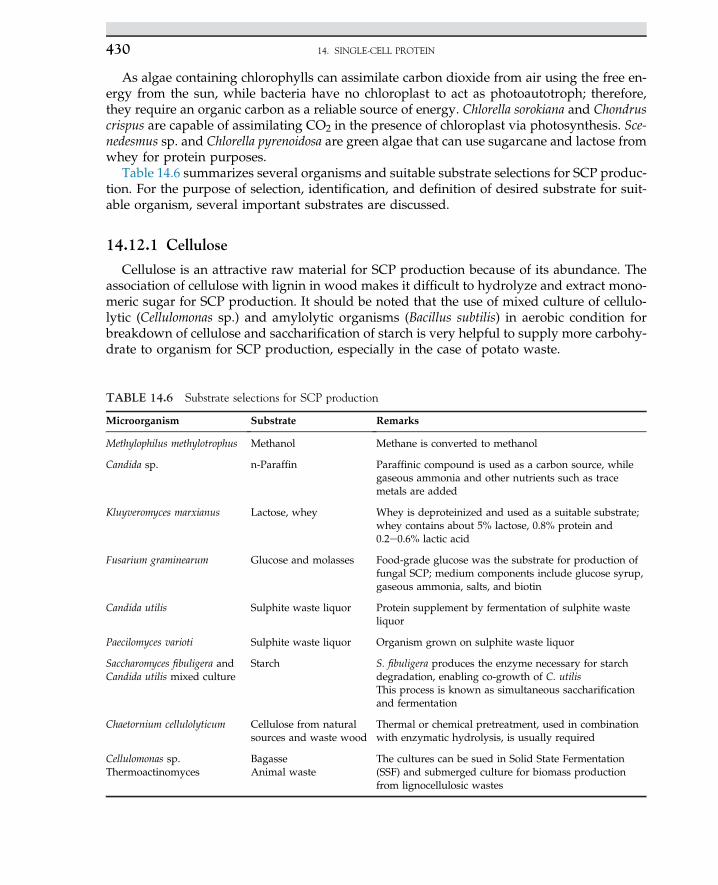
As algae containing chlorophylls can assimilate carbon dioxide from air using the free en-ergy from the sun, while bacteria have no chloroplast to act as photoautotroph; therefore,they require an organic carbon as a reliable source of energy. Chlorella sorokiana and Chondruscrispus are capable of assimilating CO2 in the presence of chloroplast via photosynthesis. Sce-nedesmus sp. and Chlorella pyrenoidosa are green algae that can use sugarcane and lactose fromwhey for protein purposes.
Table 14.6 summarizes several organisms and suitable substrate selections for SCP produc-tion. For the purpose of selection, identification, and definition of desired substrate for suit-able organism, several important substrates are discussed.
14.12.1 Cellulose
Cellulose is an attractive raw material for SCP production because of its abundance. Theassociation of cellulose with lignin in wood makes it difficult to hydrolyze and extract mono-meric sugar for SCP production. It should be noted that the use of mixed culture of cellulo-lytic (Cellulomonas sp.) and amylolytic organisms (Bacillus subtilis) in aerobic condition forbreakdown of cellulose and saccharification of starch is very helpful to supply more carbohy-drate to organism for SCP production, especially in the case of potato waste.
TABLE 14.6 Substrate selections for SCP production
Microorganism Substrate Remarks
Methylophilus methylotrophus Methanol Methane is converted to methanol
Candida sp. n-Paraffin Paraffinic compound is used as a carbon source, whilegaseous ammonia and other nutrients such as tracemetals are added
Kluyveromyces marxianus Lactose, whey Whey is deproteinized and used as a suitable substrate;whey contains about 5% lactose, 0.8% protein and0.2e0.6% lactic acid
Fusarium graminearum Glucose and molasses Food-grade glucose was the substrate for production offungal SCP; medium components include glucose syrup,gaseous ammonia, salts, and biotin
Candida utilis Sulphite waste liquor Protein supplement by fermentation of sulphite wasteliquor
Paecilomyces varioti Sulphite waste liquor Organism grown on sulphite waste liquor
Saccharomyces fibuligera andCandida utilis mixed culture
Starch S. fibuligera produces the enzyme necessary for starchdegradation, enabling co-growth of C. utilisThis process is known as simultaneous saccharificationand fermentation
Chaetornium cellulolyticum Cellulose from naturalsources and waste wood
Thermal or chemical pretreatment, used in combinationwith enzymatic hydrolysis, is usually required
Cellulomonas sp.Thermoactinomyces
BagasseAnimal waste
The cultures can be sued in Solid State Fermentation(SSF) and submerged culture for biomass productionfrom lignocellulosic wastes
14. SINGLE-CELL PROTEIN430
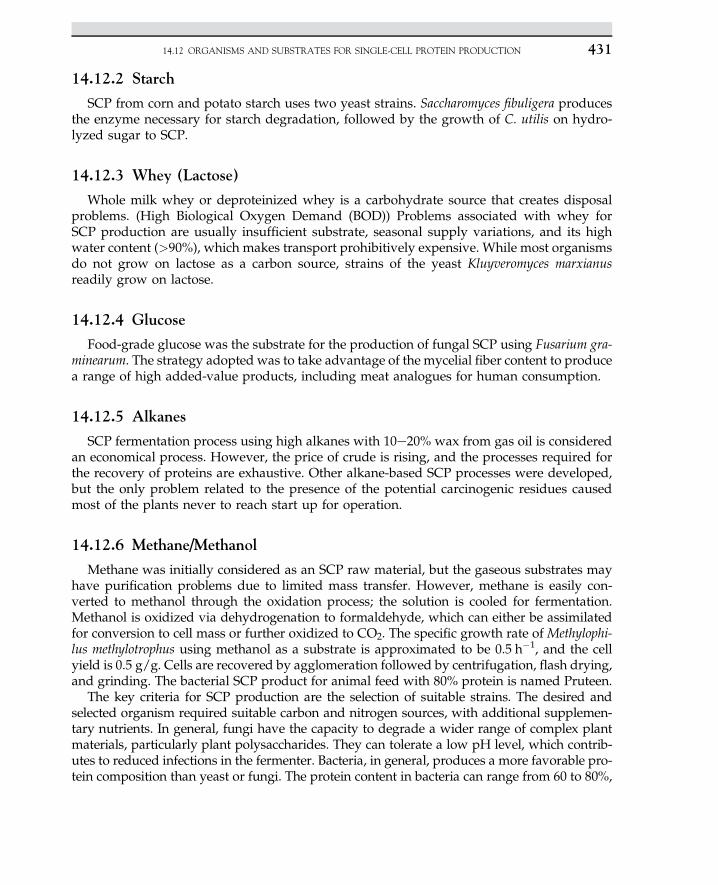
14.12.2 Starch
SCP from corn and potato starch uses two yeast strains. Saccharomyces fibuligera producesthe enzyme necessary for starch degradation, followed by the growth of C. utilis on hydro-lyzed sugar to SCP.
14.12.3 Whey (Lactose)
Whole milk whey or deproteinized whey is a carbohydrate source that creates disposalproblems. (High Biological Oxygen Demand (BOD)) Problems associated with whey forSCP production are usually insufficient substrate, seasonal supply variations, and its highwater content (>90%), which makes transport prohibitively expensive. While most organismsdo not grow on lactose as a carbon source, strains of the yeast Kluyveromyces marxianusreadily grow on lactose.
14.12.4 Glucose
Food-grade glucose was the substrate for the production of fungal SCP using Fusarium gra-minearum. The strategy adopted was to take advantage of the mycelial fiber content to producea range of high added-value products, including meat analogues for human consumption.
14.12.5 Alkanes
SCP fermentation process using high alkanes with 10e20% wax from gas oil is consideredan economical process. However, the price of crude is rising, and the processes required forthe recovery of proteins are exhaustive. Other alkane-based SCP processes were developed,but the only problem related to the presence of the potential carcinogenic residues causedmost of the plants never to reach start up for operation.
14.12.6 Methane/Methanol
Methane was initially considered as an SCP raw material, but the gaseous substrates mayhave purification problems due to limited mass transfer. However, methane is easily con-verted to methanol through the oxidation process; the solution is cooled for fermentation.Methanol is oxidized via dehydrogenation to formaldehyde, which can either be assimilatedfor conversion to cell mass or further oxidized to CO2. The specific growth rate of Methylophi-lus methylotrophus using methanol as a substrate is approximated to be 0.5 h�1, and the cellyield is 0.5 g/g. Cells are recovered by agglomeration followed by centrifugation, flash drying,and grinding. The bacterial SCP product for animal feed with 80% protein is named Pruteen.
The key criteria for SCP production are the selection of suitable strains. The desired andselected organism required suitable carbon and nitrogen sources, with additional supplemen-tary nutrients. In general, fungi have the capacity to degrade a wider range of complex plantmaterials, particularly plant polysaccharides. They can tolerate a low pH level, which contrib-utes to reduced infections in the fermenter. Bacteria, in general, produces a more favorable pro-tein composition than yeast or fungi. The protein content in bacteria can range from 60 to 80%,
14.12 ORGANISMS AND SUBSTRATES FOR SINGLE-CELL PROTEIN PRODUCTION 431
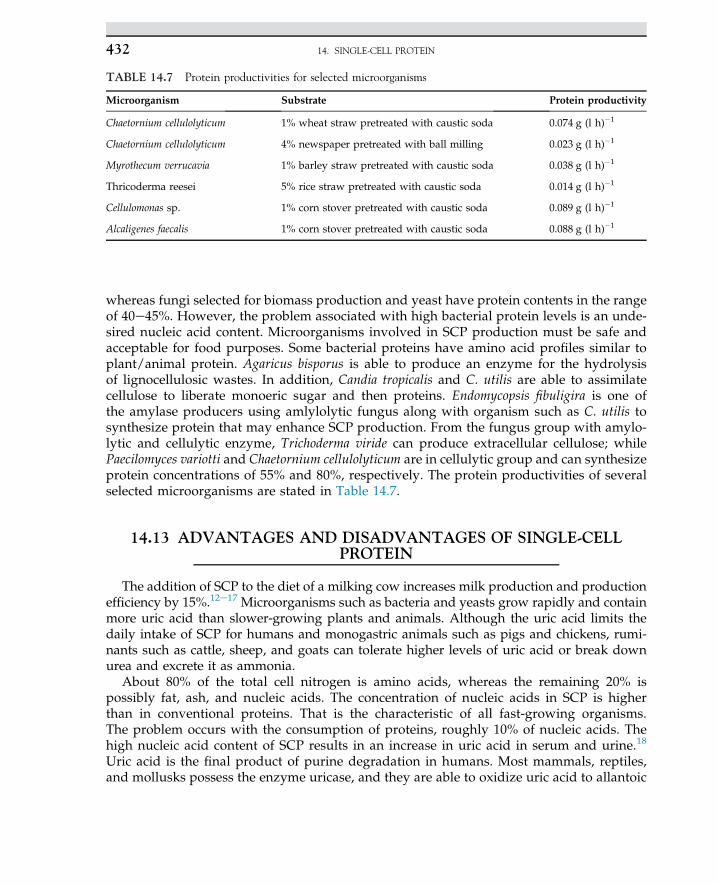
whereas fungi selected for biomass production and yeast have protein contents in the rangeof 40e45%. However, the problem associated with high bacterial protein levels is an unde-sired nucleic acid content. Microorganisms involved in SCP production must be safe andacceptable for food purposes. Some bacterial proteins have amino acid profiles similar toplant/animal protein. Agaricus bisporus is able to produce an enzyme for the hydrolysisof lignocellulosic wastes. In addition, Candia tropicalis and C. utilis are able to assimilatecellulose to liberate monoeric sugar and then proteins. Endomycopsis fibuligira is one ofthe amylase producers using amlylolytic fungus along with organism such as C. utilis tosynthesize protein that may enhance SCP production. From the fungus group with amylo-lytic and cellulytic enzyme, Trichoderma viride can produce extracellular cellulose; whilePaecilomyces variotti and Chaetornium cellulolyticum are in cellulytic group and can synthesizeprotein concentrations of 55% and 80%, respectively. The protein productivities of severalselected microorganisms are stated in Table 14.7.
14.13 ADVANTAGES AND DISADVANTAGES OF SINGLE-CELLPROTEIN
The addition of SCP to the diet of a milking cow increases milk production and productionefficiency by 15%.12e17 Microorganisms such as bacteria and yeasts grow rapidly and containmore uric acid than slower-growing plants and animals. Although the uric acid limits thedaily intake of SCP for humans and monogastric animals such as pigs and chickens, rumi-nants such as cattle, sheep, and goats can tolerate higher levels of uric acid or break downurea and excrete it as ammonia.
About 80% of the total cell nitrogen is amino acids, whereas the remaining 20% ispossibly fat, ash, and nucleic acids. The concentration of nucleic acids in SCP is higherthan in conventional proteins. That is the characteristic of all fast-growing organisms.The problem occurs with the consumption of proteins, roughly 10% of nucleic acids. Thehigh nucleic acid content of SCP results in an increase in uric acid in serum and urine.18
Uric acid is the final product of purine degradation in humans. Most mammals, reptiles,and mollusks possess the enzyme uricase, and they are able to oxidize uric acid to allantoic
TABLE 14.7 Protein productivities for selected microorganisms
Microorganism Substrate Protein productivity
Chaetornium cellulolyticum 1% wheat straw pretreated with caustic soda 0.074 g (l h)�1
Chaetornium cellulolyticum 4% newspaper pretreated with ball milling 0.023 g (l h)�1
Myrothecum verrucavia 1% barley straw pretreated with caustic soda 0.038 g (l h)�1
Thricoderma reesei 5% rice straw pretreated with caustic soda 0.014 g (l h)�1
Cellulomonas sp. 1% corn stover pretreated with caustic soda 0.089 g (l h)�1
Alcaligenes faecalis 1% corn stover pretreated with caustic soda 0.088 g (l h)�1
14. SINGLE-CELL PROTEIN432
acid. High uric acid levels in humans causes gout. That disease results from the elevation ofuric acid in body fluid. Its manifestation is painful inflammation of arthritic joints. In ani-mals with urease and allantoicase, the biodegradation of uric acid is accelerated, and theend product is ammonia. In the human body, the lack of such enzymes causes the catabo-lism of uric acid to be terminated, and uric acid has to be excreted in urine through thekidneys.19,20
The removal and reduction of the nucleic acid content of various SCPs is achieved bychemical treatment with sodium hydroxide solution or high salt solution (10%). As a result,crystals of sodium urate form and are removed from the SCP solution.21,22 The quality of SCPcan be upgraded by the destruction of cell walls. That may enhance the digestibility of SCP.With chemical treatment, the nucleic acid content of SCP is reduced.
The presence of uricase assists the uric acid to be hydrolyzed, and the end product of pu-rine degradation is completed with the addition of uricase.
14.14 PREPARATION FOR EXPERIMENTAL RUN
1. Prepare seed culture and use it for inoculation of 2 l airlift and 2 l B Braun biostat B us-ing soluble starch or glucose.
2. Perform fermentation for 24 h in a batch system.3. Monitor DO level and control pH at 6.7e7 by using 0.2 M phosphate buffer solution.4. Measure SCP based on standard methods and analysis explained above.5. Determine yield of SCP-based carbon sources.6. Take usual samples at intervals of 4e6 h.7. Measure carbon sources remaining.
References1. Rose AH. Sci Am 1981;245:127.2. Tamime AY, Deeth HC. J Food Prot 1980;43:939.3. Driessen FM, Ubbels J, Stadhouders J. Biotechnol Bioengng 1977;19:821.4. Najafpour GD, Klasson KT, Ackerson MD, Clausen EC, Gaddy JL. Biores Technol 1994;48:65.5. Pelczar Jr MJ, Chan ECS, Krieg NR. Microbiology. 6th ed. New York: McGraw-Hill; 1993.6. Stanbury PF, Whitaker A. Principles of fermentation technology. Oxford: Pergamon Press; 1984.7. Wang DIC, Cooney CL, Deman AL, Dunnill P, Humphrey AE, Lilly MD. Fermentation and enzyme technology. NewYork: John Wiley & Sons; 1979.
8. Thomas LC, Chamberlin GL. Colorimetric chemical analytical methods. Salisbury, UK: Tintometer Ltd; 1980. p. 31.9. Bradford MM. Anal Biochem 1976;72:248.10. Burrel RG, Clayton CW, Gallegly ME, Lilly VG. Phytopathol 1966;6:422.11. Miller GL. Anal Chem 1959;31:426.12. Lichtfield JH. In: Mateles, Tannenbaum, editors. The production of fungi. Single-cell protein I. Cambridge (MA):
M.I.T., Press; 1968.13. Miller MB, Litsky W. Single cell protein in industrial microbiology. New York: McGraw-Hill; 1976.14. Han YW, Duhlap CE, Callihan CD. Food Technol 1971;25:130.15. White PS, Handler, Smith EL. Principles of Biochemistry. 4th ed. New York: McGraw-Hill; 1968.16. Voet D, Voet JG. Biochemistry. 3rd ed. New York: John Wiley; 2004.17. Zee JA, Simard RE. Appl Microbiol 1974;29:59.
REFERENCES 433

18. Yakoub Khan M, Umar Dahot M, Yousuf Khan M. J Islam Acad Sci 1992;5:39.19. Scragg AH. Bioreactors in biotechnology, a practical approach. New York: Ellis Horwood Series in Biochemistry and
Biotechnology; 1991.20. Ghose TK. Bioprocess computation in biotechnology, vol. 1. New York: Ellis Horwood Series in Biochemistry and
Biotechnology; 1990.21. Doran PM. Bioprocess engineering principles. New York: Academic Press; 1995.22. Shuler ML, Kargi F. Bioprocess engineering, basic concepts. New Jersey: Prentice Hall; 1992.
14. SINGLE-CELL PROTEIN434
C H A P T E R
15
Sterilization
O U T L I N E
15.1 Introduction 435
15.2 Control of Microbial Populationby Physical Agents 436
15.3 Death Rate of Living Organisms 437
15.4 Batch Sterilization 437
15.5 Continuous Sterilization 439
15.6 Hot Plates 441
15.7 High-Temperature Sterilization 442
15.8 Sterilized Media for Microbiology 44215.8.1 Sterilization of Media for
Stock Cultures 44715.8.2 Sterilization of Bacterial
Media 44715.8.3 Sterilize Petri Dishes 448
15.8.4 Sterilization Steps in aProgrammed Autoclave 448
15.8.5 Safety Recommendation inAutoclave Operation 449
15.9 Dry Heat Sterilization 450
15.10 Sterilization with Filtration 450
15.11 Microwave Sterilization 450
15.12 Electron Beam Sterilization 451
15.13 Chemical Sterilization 451
15.14 Low-Temperature Sterilization 452
Nomenclature 452
References 452
15.1 INTRODUCTION
The control or elimination of living organisms is performed by either physical and/orchemical agents. Since most of the targeted biological products are conducted in pure culture,sterilization should be done prior to any operation. In fact, sterilization is the action of
435Biochemical Engineering and Biotechnologyhttp://dx.doi.org/10.1016/B978-0-444-63357-6.00015-8 Copyright © 2015 Elsevier B.V. All rights reserved.
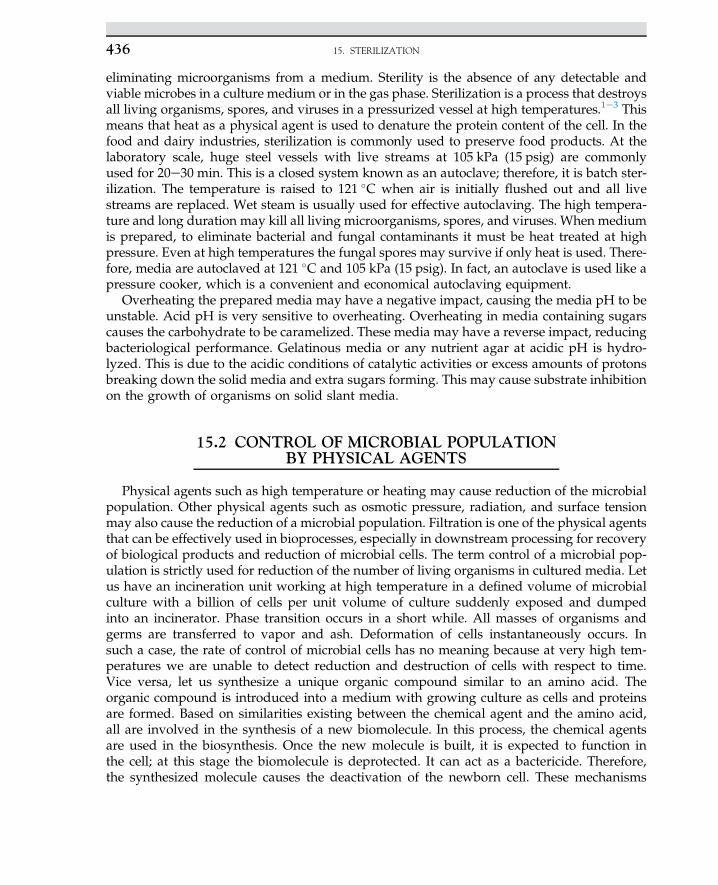
eliminating microorganisms from a medium. Sterility is the absence of any detectable andviable microbes in a culture medium or in the gas phase. Sterilization is a process that destroysall living organisms, spores, and viruses in a pressurized vessel at high temperatures.1e3 Thismeans that heat as a physical agent is used to denature the protein content of the cell. In thefood and dairy industries, sterilization is commonly used to preserve food products. At thelaboratory scale, huge steel vessels with live streams at 105 kPa (15 psig) are commonlyused for 20e30 min. This is a closed system known as an autoclave; therefore, it is batch ster-ilization. The temperature is raised to 121 �C when air is initially flushed out and all livestreams are replaced. Wet steam is usually used for effective autoclaving. The high tempera-ture and long duration may kill all living microorganisms, spores, and viruses. When mediumis prepared, to eliminate bacterial and fungal contaminants it must be heat treated at highpressure. Even at high temperatures the fungal spores may survive if only heat is used. There-fore, media are autoclaved at 121 �C and 105 kPa (15 psig). In fact, an autoclave is used like apressure cooker, which is a convenient and economical autoclaving equipment.
Overheating the prepared media may have a negative impact, causing the media pH to beunstable. Acid pH is very sensitive to overheating. Overheating in media containing sugarscauses the carbohydrate to be caramelized. These media may have a reverse impact, reducingbacteriological performance. Gelatinous media or any nutrient agar at acidic pH is hydro-lyzed. This is due to the acidic conditions of catalytic activities or excess amounts of protonsbreaking down the solid media and extra sugars forming. This may cause substrate inhibitionon the growth of organisms on solid slant media.
15.2 CONTROL OF MICROBIAL POPULATIONBY PHYSICAL AGENTS
Physical agents such as high temperature or heating may cause reduction of the microbialpopulation. Other physical agents such as osmotic pressure, radiation, and surface tensionmay also cause the reduction of a microbial population. Filtration is one of the physical agentsthat can be effectively used in bioprocesses, especially in downstream processing for recoveryof biological products and reduction of microbial cells. The term control of a microbial pop-ulation is strictly used for reduction of the number of living organisms in cultured media. Letus have an incineration unit working at high temperature in a defined volume of microbialculture with a billion of cells per unit volume of culture suddenly exposed and dumpedinto an incinerator. Phase transition occurs in a short while. All masses of organisms andgerms are transferred to vapor and ash. Deformation of cells instantaneously occurs. Insuch a case, the rate of control of microbial cells has no meaning because at very high tem-peratures we are unable to detect reduction and destruction of cells with respect to time.Vice versa, let us synthesize a unique organic compound similar to an amino acid. Theorganic compound is introduced into a medium with growing culture as cells and proteinsare formed. Based on similarities existing between the chemical agent and the amino acid,all are involved in the synthesis of a new biomolecule. In this process, the chemical agentsare used in the biosynthesis. Once the new molecule is built, it is expected to function inthe cell; at this stage the biomolecule is deprotected. It can act as a bactericide. Therefore,the synthesized molecule causes the deactivation of the newborn cell. These mechanisms
15. STERILIZATION436
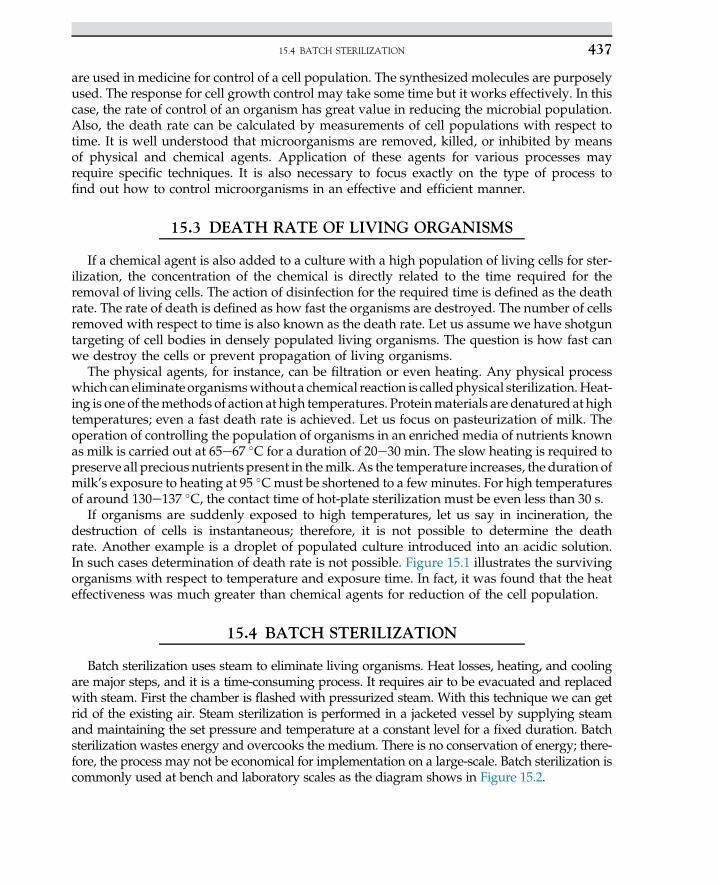
are used in medicine for control of a cell population. The synthesized molecules are purposelyused. The response for cell growth control may take some time but it works effectively. In thiscase, the rate of control of an organism has great value in reducing the microbial population.Also, the death rate can be calculated by measurements of cell populations with respect totime. It is well understood that microorganisms are removed, killed, or inhibited by meansof physical and chemical agents. Application of these agents for various processes mayrequire specific techniques. It is also necessary to focus exactly on the type of process tofind out how to control microorganisms in an effective and efficient manner.
15.3 DEATH RATE OF LIVING ORGANISMS
If a chemical agent is also added to a culture with a high population of living cells for ster-ilization, the concentration of the chemical is directly related to the time required for theremoval of living cells. The action of disinfection for the required time is defined as the deathrate. The rate of death is defined as how fast the organisms are destroyed. The number of cellsremoved with respect to time is also known as the death rate. Let us assume we have shotguntargeting of cell bodies in densely populated living organisms. The question is how fast canwe destroy the cells or prevent propagation of living organisms.
The physical agents, for instance, can be filtration or even heating. Any physical processwhich can eliminate organismswithout a chemical reaction is calledphysical sterilization.Heat-ing is one of themethods of action at high temperatures. Proteinmaterials are denatured at hightemperatures; even a fast death rate is achieved. Let us focus on pasteurization of milk. Theoperation of controlling the population of organisms in an enriched media of nutrients knownas milk is carried out at 65e67 �C for a duration of 20e30 min. The slow heating is required topreserve all precious nutrients present in themilk. As the temperature increases, the duration ofmilk’s exposure to heating at 95 �Cmust be shortened to a fewminutes. For high temperaturesof around 130e137 �C, the contact time of hot-plate sterilization must be even less than 30 s.
If organisms are suddenly exposed to high temperatures, let us say in incineration, thedestruction of cells is instantaneous; therefore, it is not possible to determine the deathrate. Another example is a droplet of populated culture introduced into an acidic solution.In such cases determination of death rate is not possible. Figure 15.1 illustrates the survivingorganisms with respect to temperature and exposure time. In fact, it was found that the heateffectiveness was much greater than chemical agents for reduction of the cell population.
15.4 BATCH STERILIZATION
Batch sterilization uses steam to eliminate living organisms. Heat losses, heating, and coolingare major steps, and it is a time-consuming process. It requires air to be evacuated and replacedwith steam. First the chamber is flashed with pressurized steam. With this technique we can getrid of the existing air. Steam sterilization is performed in a jacketed vessel by supplying steamand maintaining the set pressure and temperature at a constant level for a fixed duration. Batchsterilization wastes energy and overcooks the medium. There is no conservation of energy; there-fore, the process may not be economical for implementation on a large-scale. Batch sterilization iscommonly used at bench and laboratory scales as the diagram shows in Figure 15.2.
15.4 BATCH STERILIZATION 437
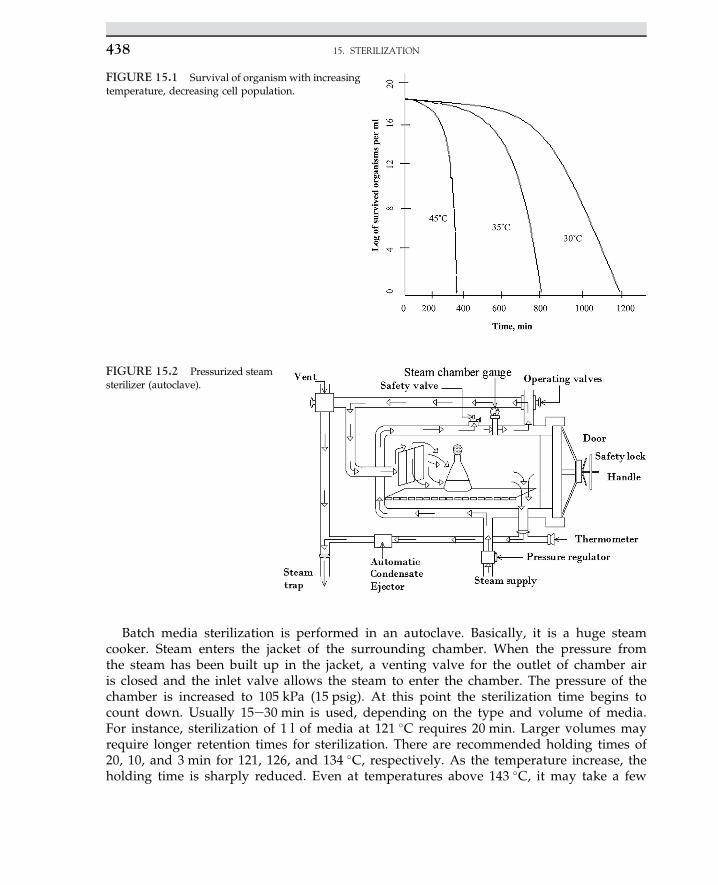
Batch media sterilization is performed in an autoclave. Basically, it is a huge steamcooker. Steam enters the jacket of the surrounding chamber. When the pressure fromthe steam has been built up in the jacket, a venting valve for the outlet of chamber airis closed and the inlet valve allows the steam to enter the chamber. The pressure of thechamber is increased to 105 kPa (15 psig). At this point the sterilization time begins tocount down. Usually 15e30 min is used, depending on the type and volume of media.For instance, sterilization of 1 l of media at 121 �C requires 20 min. Larger volumes mayrequire longer retention times for sterilization. There are recommended holding times of20, 10, and 3 min for 121, 126, and 134 �C, respectively. As the temperature increase, theholding time is sharply reduced. Even at temperatures above 143 �C, it may take a few
FIGURE 15.1 Survival of organism with increasingtemperature, decreasing cell population.
FIGURE 15.2 Pressurized steamsterilizer (autoclave).
15. STERILIZATION438
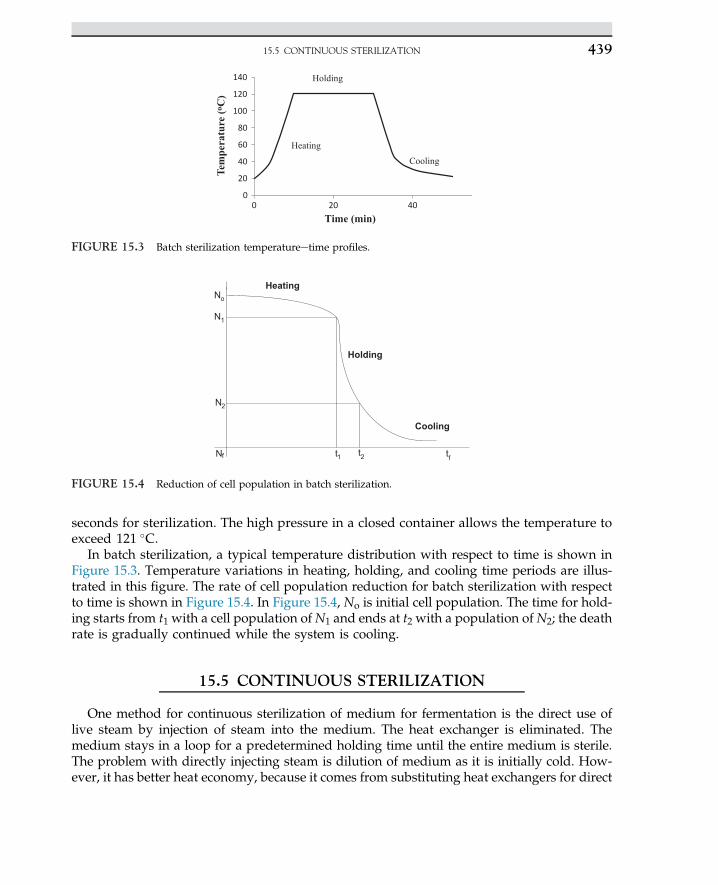
seconds for sterilization. The high pressure in a closed container allows the temperature toexceed 121 �C.
In batch sterilization, a typical temperature distribution with respect to time is shown inFigure 15.3. Temperature variations in heating, holding, and cooling time periods are illus-trated in this figure. The rate of cell population reduction for batch sterilization with respectto time is shown in Figure 15.4. In Figure 15.4, No is initial cell population. The time for hold-ing starts from t1 with a cell population of N1 and ends at t2 with a population of N2; the deathrate is gradually continued while the system is cooling.
15.5 CONTINUOUS STERILIZATION
One method for continuous sterilization of medium for fermentation is the direct use oflive steam by injection of steam into the medium. The heat exchanger is eliminated. Themedium stays in a loop for a predetermined holding time until the entire medium is sterile.The problem with directly injecting steam is dilution of medium as it is initially cold. How-ever, it has better heat economy, because it comes from substituting heat exchangers for direct
0
20
40
60
80
100
120
140
0 20 40o
Time (min)
Holding
Heating
Cooling
Tem
pera
ture
( C)
FIGURE 15.3 Batch sterilization temperatureetime profiles.
No
N1
N2
Nf t1 t2 tf
Holding
Cooling
Heating
FIGURE 15.4 Reduction of cell population in batch sterilization.
15.5 CONTINUOUS STERILIZATION 439
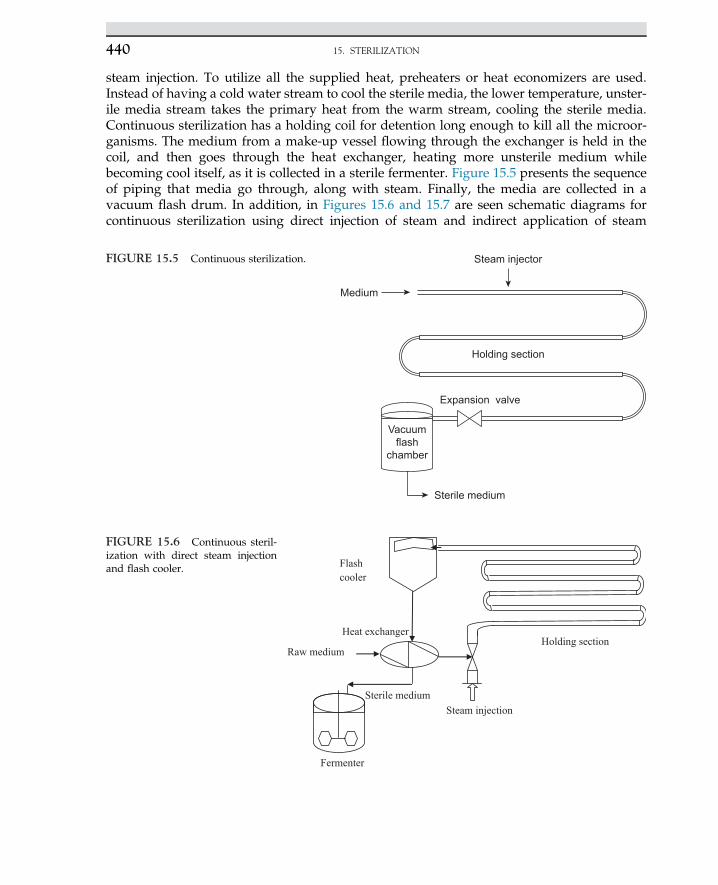
steam injection. To utilize all the supplied heat, preheaters or heat economizers are used.Instead of having a cold water stream to cool the sterile media, the lower temperature, unster-ile media stream takes the primary heat from the warm stream, cooling the sterile media.Continuous sterilization has a holding coil for detention long enough to kill all the microor-ganisms. The medium from a make-up vessel flowing through the exchanger is held in thecoil, and then goes through the heat exchanger, heating more unsterile medium whilebecoming cool itself, as it is collected in a sterile fermenter. Figure 15.5 presents the sequenceof piping that media go through, along with steam. Finally, the media are collected in avacuum flash drum. In addition, in Figures 15.6 and 15.7 are seen schematic diagrams forcontinuous sterilization using direct injection of steam and indirect application of steam
Steam injector
Holding section
Expansion valve
Sterile medium
Vacuumflash
chamber
Medium
FIGURE 15.5 Continuous sterilization.
Flash cooler
Raw medium
Heat exchanger
Steam injection
Holding section
Sterile medium
Fermenter
FIGURE 15.6 Continuous steril-ization with direct steam injectionand flash cooler.
15. STERILIZATION440
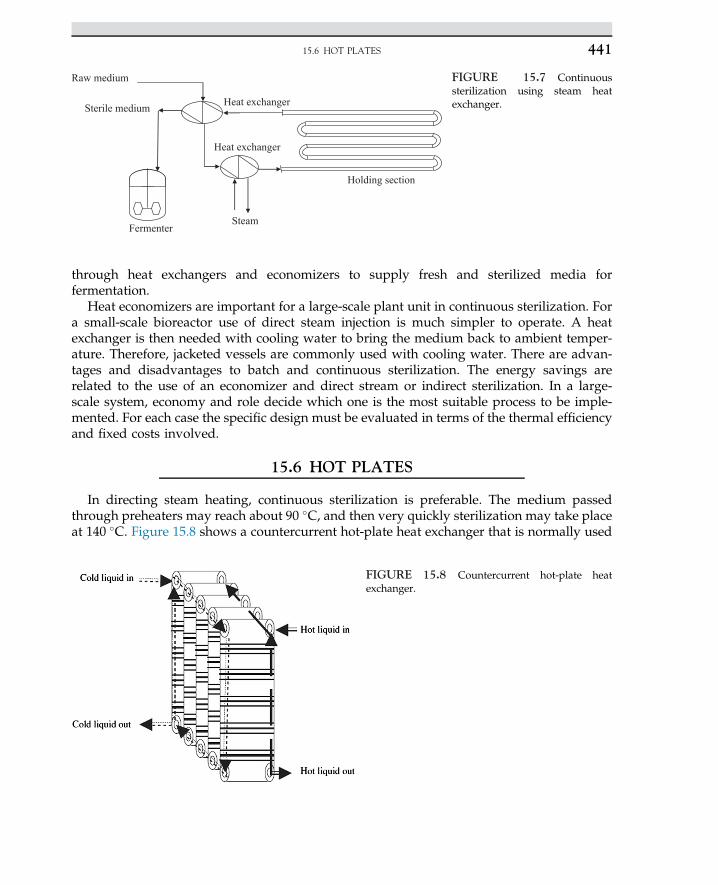
through heat exchangers and economizers to supply fresh and sterilized media forfermentation.
Heat economizers are important for a large-scale plant unit in continuous sterilization. Fora small-scale bioreactor use of direct steam injection is much simpler to operate. A heatexchanger is then needed with cooling water to bring the medium back to ambient temper-ature. Therefore, jacketed vessels are commonly used with cooling water. There are advan-tages and disadvantages to batch and continuous sterilization. The energy savings arerelated to the use of an economizer and direct stream or indirect sterilization. In a large-scale system, economy and role decide which one is the most suitable process to be imple-mented. For each case the specific design must be evaluated in terms of the thermal efficiencyand fixed costs involved.
15.6 HOT PLATES
In directing steam heating, continuous sterilization is preferable. The medium passedthrough preheaters may reach about 90 �C, and then very quickly sterilization may take placeat 140 �C. Figure 15.8 shows a countercurrent hot-plate heat exchanger that is normally used
Raw medium
Fermenter
Sterile medium Heat exchanger
Heat exchanger
Steam
Holding section
FIGURE 15.7 Continuoussterilization using steam heatexchanger.
FIGURE 15.8 Countercurrent hot-plate heatexchanger.
15.6 HOT PLATES 441
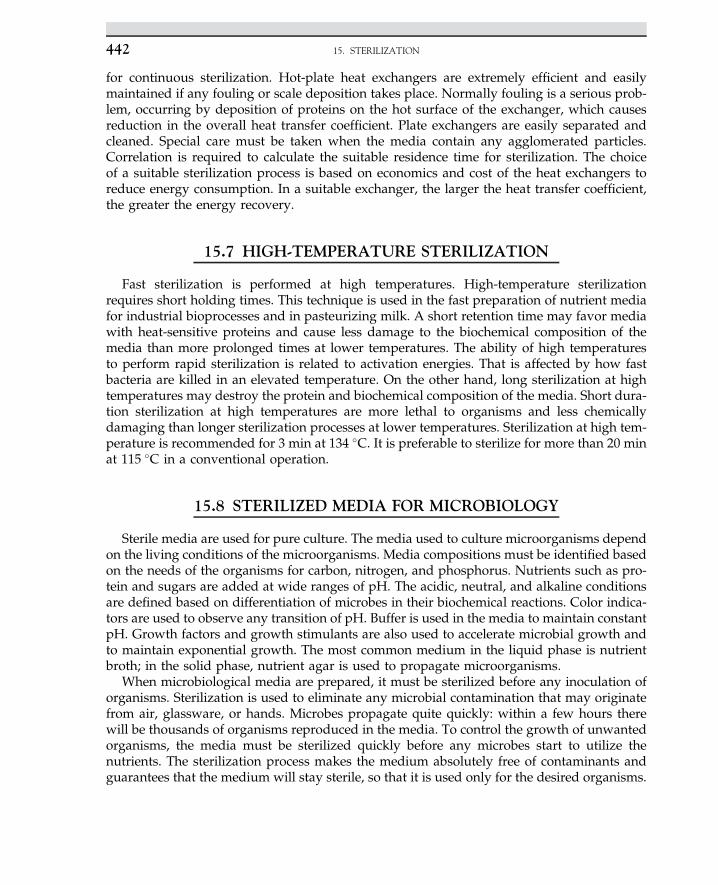
for continuous sterilization. Hot-plate heat exchangers are extremely efficient and easilymaintained if any fouling or scale deposition takes place. Normally fouling is a serious prob-lem, occurring by deposition of proteins on the hot surface of the exchanger, which causesreduction in the overall heat transfer coefficient. Plate exchangers are easily separated andcleaned. Special care must be taken when the media contain any agglomerated particles.Correlation is required to calculate the suitable residence time for sterilization. The choiceof a suitable sterilization process is based on economics and cost of the heat exchangers toreduce energy consumption. In a suitable exchanger, the larger the heat transfer coefficient,the greater the energy recovery.
15.7 HIGH-TEMPERATURE STERILIZATION
Fast sterilization is performed at high temperatures. High-temperature sterilizationrequires short holding times. This technique is used in the fast preparation of nutrient mediafor industrial bioprocesses and in pasteurizing milk. A short retention time may favor mediawith heat-sensitive proteins and cause less damage to the biochemical composition of themedia than more prolonged times at lower temperatures. The ability of high temperaturesto perform rapid sterilization is related to activation energies. That is affected by how fastbacteria are killed in an elevated temperature. On the other hand, long sterilization at hightemperatures may destroy the protein and biochemical composition of the media. Short dura-tion sterilization at high temperatures are more lethal to organisms and less chemicallydamaging than longer sterilization processes at lower temperatures. Sterilization at high tem-perature is recommended for 3 min at 134 �C. It is preferable to sterilize for more than 20 minat 115 �C in a conventional operation.
15.8 STERILIZED MEDIA FOR MICROBIOLOGY
Sterile media are used for pure culture. The media used to culture microorganisms dependon the living conditions of the microorganisms. Media compositions must be identified basedon the needs of the organisms for carbon, nitrogen, and phosphorus. Nutrients such as pro-tein and sugars are added at wide ranges of pH. The acidic, neutral, and alkaline conditionsare defined based on differentiation of microbes in their biochemical reactions. Color indica-tors are used to observe any transition of pH. Buffer is used in the media to maintain constantpH. Growth factors and growth stimulants are also used to accelerate microbial growth andto maintain exponential growth. The most common medium in the liquid phase is nutrientbroth; in the solid phase, nutrient agar is used to propagate microorganisms.
When microbiological media are prepared, it must be sterilized before any inoculation oforganisms. Sterilization is used to eliminate any microbial contamination that may originatefrom air, glassware, or hands. Microbes propagate quite quickly: within a few hours therewill be thousands of organisms reproduced in the media. To control the growth of unwantedorganisms, the media must be sterilized quickly before any microbes start to utilize thenutrients. The sterilization process makes the medium absolutely free of contaminants andguarantees that the medium will stay sterile, so that it is used only for the desired organisms.
15. STERILIZATION442
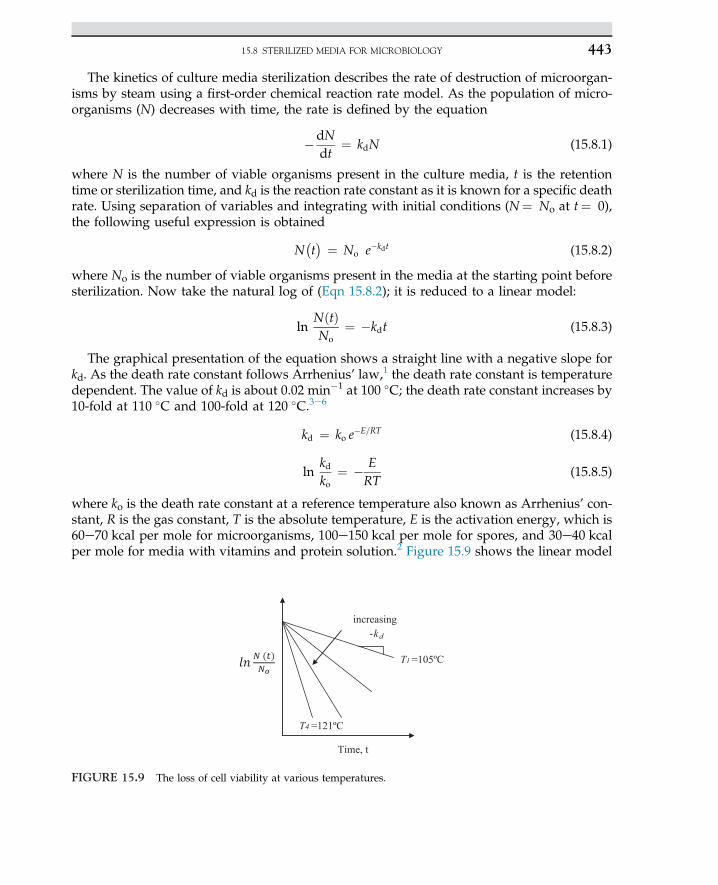
The kinetics of culture media sterilization describes the rate of destruction of microorgan-isms by steam using a first-order chemical reaction rate model. As the population of micro-organisms (N) decreases with time, the rate is defined by the equation
�dNdt
¼ kdN (15.8.1)
where N is the number of viable organisms present in the culture media, t is the retentiontime or sterilization time, and kd is the reaction rate constant as it is known for a specific deathrate. Using separation of variables and integrating with initial conditions (N¼ No at t¼ 0),the following useful expression is obtained
N�t� ¼ No e�kdt (15.8.2)
where No is the number of viable organisms present in the media at the starting point beforesterilization. Now take the natural log of (Eqn 15.8.2); it is reduced to a linear model:
lnNðtÞNo
¼ �kdt (15.8.3)
The graphical presentation of the equation shows a straight line with a negative slope forkd. As the death rate constant follows Arrhenius’ law,1 the death rate constant is temperaturedependent. The value of kd is about 0.02 min�1 at 100 �C; the death rate constant increases by10-fold at 110 �C and 100-fold at 120 �C.3e6
kd ¼ ko e�E=RT (15.8.4)
lnkdko
¼ � ERT
(15.8.5)
where ko is the death rate constant at a reference temperature also known as Arrhenius’ con-stant, R is the gas constant, T is the absolute temperature, E is the activation energy, which is60e70 kcal per mole for microorganisms, 100e150 kcal per mole for spores, and 30e40 kcalper mole for media with vitamins and protein solution.2 Figure 15.9 shows the linear model
increasing -kd
T1 =105ºC
Time, t
T4 =121ºC
FIGURE 15.9 The loss of cell viability at various temperatures.
15.8 STERILIZED MEDIA FOR MICROBIOLOGY 443
for (Eqn 15.8.3), the loss of cell viability at various temperatures. The actual data can beplotted; the slope of the line shall define the value for specific death rate, kd. As the temper-ature increases from 105 to 121 �C, the value for the slope of the line sharply increases. Thismeans that the number of viable cells at a fixed time of sterilization will drastically decreaseas the temperature increases by 16 �C.
During sterilization, for the specific death rate (kd) is not constant, the medium tempera-ture in the course of sterilization (heating, holding, and cooling), the rate constant is depen-dent on temperature. The rate constant temperature dependency according to Arrhenius lawcan be integrated stated as follows:
Vtotal ¼ lnNo
N¼ ko
Z t
0
e�E=RTdt (15.8.6)
In batch sterilization, the heating, holding, and cooling cycle all contribute towardreduction of contaminant organisms; therefore, total sterilization time is the sum of threeproportions involved in sterilization.
Vtotal ¼ Vheating þ Vholding þ Vcooling (15.8.7)
Vheating ¼ lnNo
N1¼ ko
Zt1
0
e�E=RTdt (15.8.8)
Vholding ¼ lnN1
N2¼ ko
Zt2
t1
e�E=RTdt (15.8.9)
Vcooling ¼ lnNf
N2¼ ko
Ztf
t2
e�E=RTdt (15.8.10)
Normally, heating, holding, and cooling periods may take 20%, 75%, and 5% of total ster-ilization time. In general, cell contaminants start to decrease at any temperature greater than85 �C; the rate of decreasing would be sharp at temperatures above 121 �C. In fact high tem-peratures cause faster denaturation of cell protein; as temperature increases the holding timedecreases.
EXAMPLE 1Assume that initial medium contaminants are 100 million cells per milliliter of medium, and total
volume for sterilization is 10 m3. Let us sterilize the medium with a number of viable cells, one outof 1000. That is the probability level; it means out of 1000 times of sterilization once is not sterilized.
a. Calculate sterilization time.b. If Del factors for heating and cooling are defined, also kd for the contaminants is defined
2.5 min�1, what would be the required time in holding zone?
15. STERILIZATION444
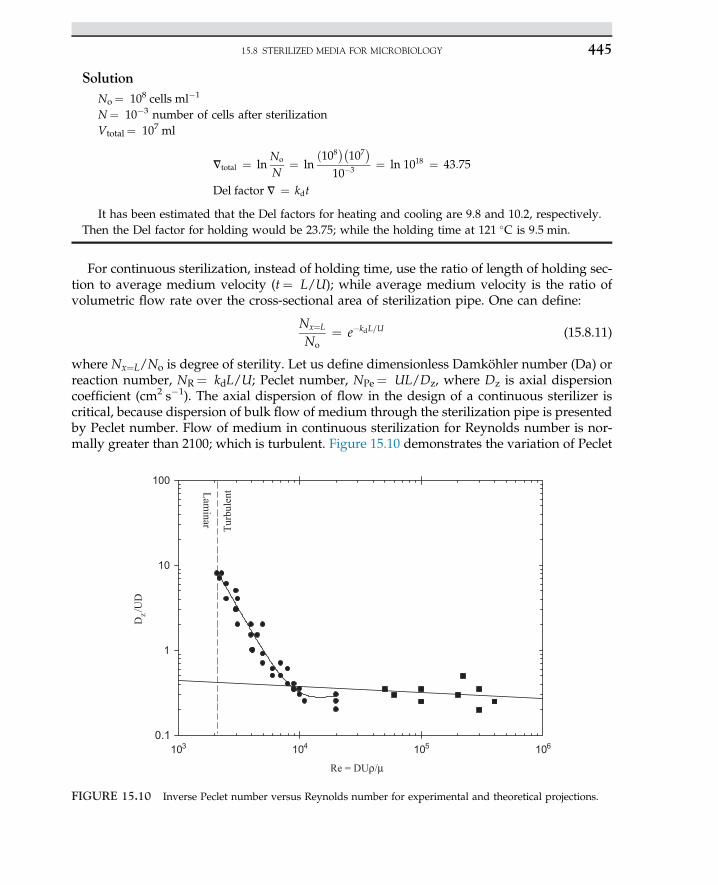
SolutionNo¼ 108 cells ml�1
N¼ 10�3 number of cells after sterilizationVtotal¼ 107 ml
Vtotal ¼ lnNo
N¼ ln
ð108��107�10�3 ¼ ln 1018 ¼ 43:75
Del factor V ¼ kdt
It has been estimated that the Del factors for heating and cooling are 9.8 and 10.2, respectively.Then the Del factor for holding would be 23.75; while the holding time at 121 �C is 9.5 min.
For continuous sterilization, instead of holding time, use the ratio of length of holding sec-tion to average medium velocity (t¼ L/U); while average medium velocity is the ratio ofvolumetric flow rate over the cross-sectional area of sterilization pipe. One can define:
Nx¼L
No¼ e�kdL=U (15.8.11)
where Nx¼L/No is degree of sterility. Let us define dimensionless Damköhler number (Da) orreaction number, NR¼ kdL/U; Peclet number, NPe¼ UL/Dz, where Dz is axial dispersioncoefficient (cm2 s�1). The axial dispersion of flow in the design of a continuous sterilizer iscritical, because dispersion of bulk flow of medium through the sterilization pipe is presentedby Peclet number. Flow of medium in continuous sterilization for Reynolds number is nor-mally greater than 2100; which is turbulent. Figure 15.10 demonstrates the variation of Peclet
Re = DUρ/μ
103 104 105 106
Dz /
UD
0.1
1
10
100
Laminar
Turb
ulen
t
FIGURE 15.10 Inverse Peclet number versus Reynolds number for experimental and theoretical projections.
15.8 STERILIZED MEDIA FOR MICROBIOLOGY 445
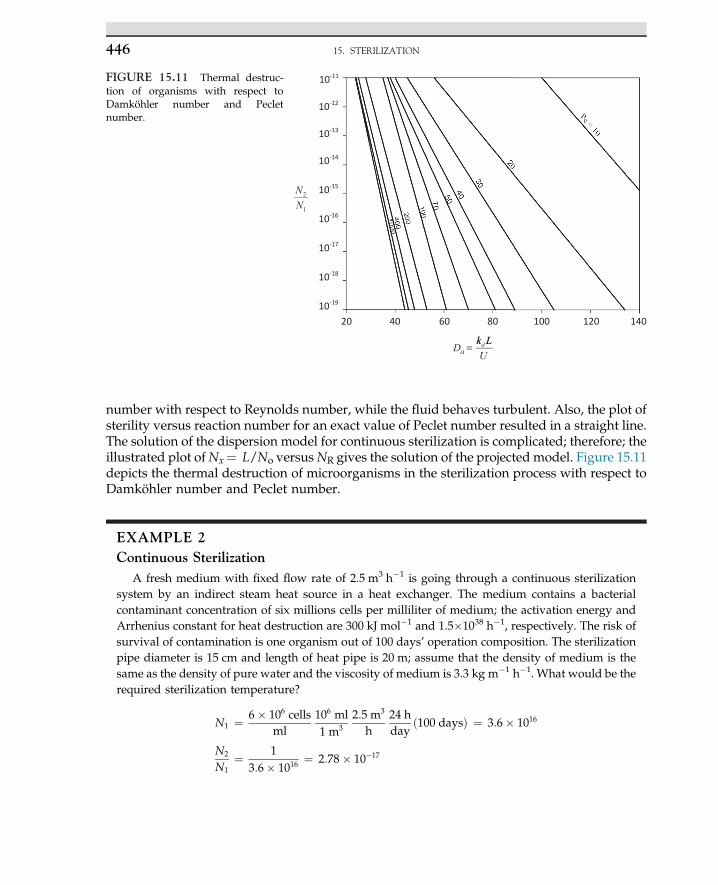
number with respect to Reynolds number, while the fluid behaves turbulent. Also, the plot ofsterility versus reaction number for an exact value of Peclet number resulted in a straight line.The solution of the dispersion model for continuous sterilization is complicated; therefore; theillustrated plot ofNx¼ L/No versusNR gives the solution of the projected model. Figure 15.11depicts the thermal destruction of microorganisms in the sterilization process with respect toDamköhler number and Peclet number.
EXAMPLE 2Continuous Sterilization
A fresh medium with fixed flow rate of 2.5 m3 h�1 is going through a continuous sterilizationsystem by an indirect steam heat source in a heat exchanger. The medium contains a bacterialcontaminant concentration of six millions cells per milliliter of medium; the activation energy andArrhenius constant for heat destruction are 300 kJ mol�1 and 1.5�1038 h�1, respectively. The risk ofsurvival of contamination is one organism out of 100 days’ operation composition. The sterilizationpipe diameter is 15 cm and length of heat pipe is 20 m; assume that the density of medium is thesame as the density of pure water and the viscosity of medium is 3.3 kg m�1 h�1. What would be therequired sterilization temperature?
N1 ¼ 6� 106 cellsml
106 ml1 m3
2:5 m3
h24 hday
ð100 daysÞ ¼ 3:6� 1016
N2
N1¼ 1
3:6� 1016¼ 2:78� 10�17
da
k Lk LD
U
10-11
10-12
10-13
10-14
10-15
10-16
10-17
10-18
10-19
2
1
NN
20 40 60 80 100 140120
=
FIGURE 15.11 Thermal destruc-tion of organisms with respect toDamköhler number and Pecletnumber.
15. STERILIZATION446
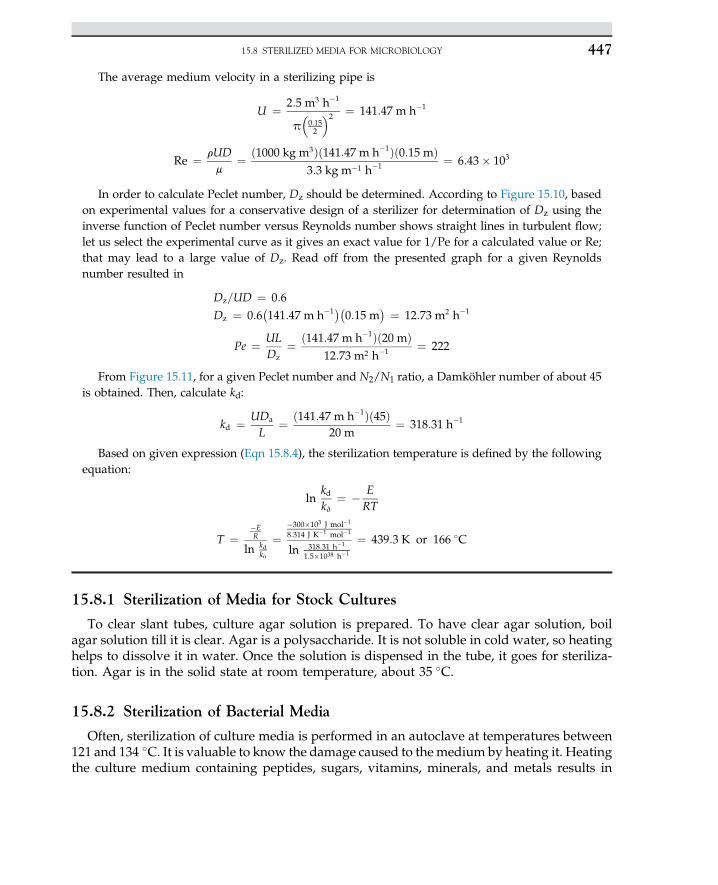
The average medium velocity in a sterilizing pipe is
U ¼ 2:5 m3 h�1
p�0:152
�2 ¼ 141:47 m h�1
Re ¼ rUDm
¼ ð1000 kg m3Þð141:47 m h�1Þð0:15 mÞ3:3 kg m�1 h�1 ¼ 6:43� 103
In order to calculate Peclet number, Dz should be determined. According to Figure 15.10, basedon experimental values for a conservative design of a sterilizer for determination of Dz using theinverse function of Peclet number versus Reynolds number shows straight lines in turbulent flow;let us select the experimental curve as it gives an exact value for 1/Pe for a calculated value or Re;that may lead to a large value of Dz. Read off from the presented graph for a given Reynoldsnumber resulted in
Dz=UD ¼ 0:6
Dz ¼ 0:6�141:47 m h�1��0:15 m� ¼ 12:73 m2 h�1
Pe ¼ ULDz
¼ ð141:47 m h�1Þð20 mÞ12:73 m2 h�1 ¼ 222
From Figure 15.11, for a given Peclet number and N2/N1 ratio, a Damköhler number of about 45is obtained. Then, calculate kd:
kd ¼ UDa
L¼ ð141:47 m h�1Þð45Þ
20 m¼ 318:31 h�1
Based on given expression (Eqn 15.8.4), the sterilization temperature is defined by the followingequation:
lnkdkv
¼ � ERT
T ¼�ER
ln kdko
¼�300�103 J mol�1
8:314 J K�1 mol�1
ln 318:31 h�1
1:5�1038 h�1
¼ 439:3 K or 166 �C
15.8.1 Sterilization of Media for Stock Cultures
To clear slant tubes, culture agar solution is prepared. To have clear agar solution, boilagar solution till it is clear. Agar is a polysaccharide. It is not soluble in cold water, so heatinghelps to dissolve it in water. Once the solution is dispensed in the tube, it goes for steriliza-tion. Agar is in the solid state at room temperature, about 35 �C.
15.8.2 Sterilization of Bacterial Media
Often, sterilization of culture media is performed in an autoclave at temperatures between121 and 134 �C. It is valuable to know the damage caused to the medium by heating it. Heatingthe culture medium containing peptides, sugars, vitamins, minerals, and metals results in
15.8 STERILIZED MEDIA FOR MICROBIOLOGY 447
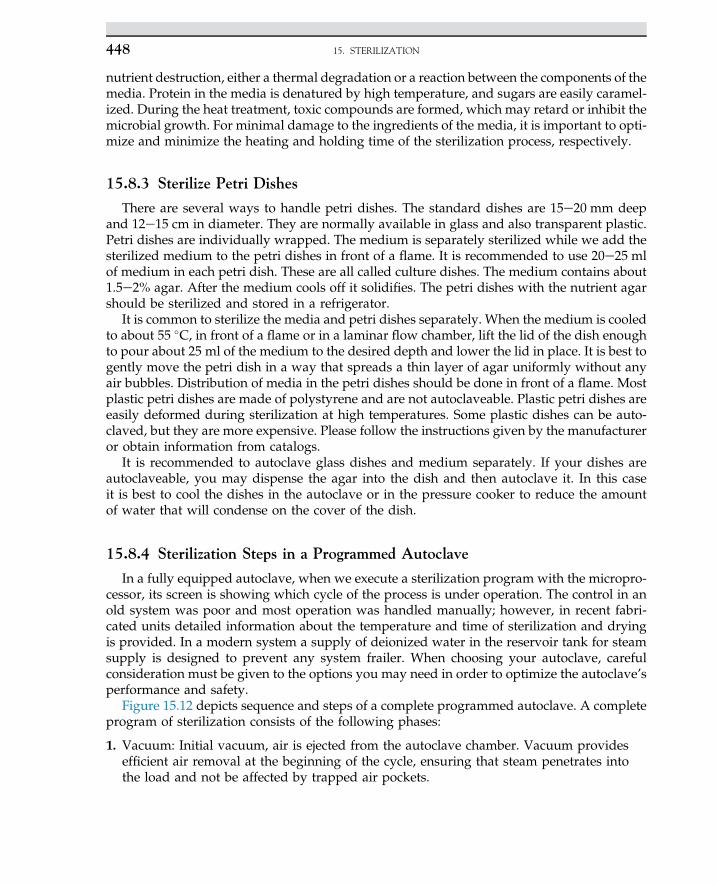
nutrient destruction, either a thermal degradation or a reaction between the components of themedia. Protein in the media is denatured by high temperature, and sugars are easily caramel-ized. During the heat treatment, toxic compounds are formed, which may retard or inhibit themicrobial growth. For minimal damage to the ingredients of the media, it is important to opti-mize and minimize the heating and holding time of the sterilization process, respectively.
15.8.3 Sterilize Petri Dishes
There are several ways to handle petri dishes. The standard dishes are 15e20 mm deepand 12e15 cm in diameter. They are normally available in glass and also transparent plastic.Petri dishes are individually wrapped. The medium is separately sterilized while we add thesterilized medium to the petri dishes in front of a flame. It is recommended to use 20e25 mlof medium in each petri dish. These are all called culture dishes. The medium contains about1.5e2% agar. After the medium cools off it solidifies. The petri dishes with the nutrient agarshould be sterilized and stored in a refrigerator.
It is common to sterilize the media and petri dishes separately. When the medium is cooledto about 55 �C, in front of a flame or in a laminar flow chamber, lift the lid of the dish enoughto pour about 25 ml of the medium to the desired depth and lower the lid in place. It is best togently move the petri dish in a way that spreads a thin layer of agar uniformly without anyair bubbles. Distribution of media in the petri dishes should be done in front of a flame. Mostplastic petri dishes are made of polystyrene and are not autoclaveable. Plastic petri dishes areeasily deformed during sterilization at high temperatures. Some plastic dishes can be auto-claved, but they are more expensive. Please follow the instructions given by the manufactureror obtain information from catalogs.
It is recommended to autoclave glass dishes and medium separately. If your dishes areautoclaveable, you may dispense the agar into the dish and then autoclave it. In this caseit is best to cool the dishes in the autoclave or in the pressure cooker to reduce the amountof water that will condense on the cover of the dish.
15.8.4 Sterilization Steps in a Programmed Autoclave
In a fully equipped autoclave, when we execute a sterilization program with the micropro-cessor, its screen is showing which cycle of the process is under operation. The control in anold system was poor and most operation was handled manually; however, in recent fabri-cated units detailed information about the temperature and time of sterilization and dryingis provided. In a modern system a supply of deionized water in the reservoir tank for steamsupply is designed to prevent any system frailer. When choosing your autoclave, carefulconsideration must be given to the options you may need in order to optimize the autoclave’sperformance and safety.
Figure 15.12 depicts sequence and steps of a complete programmed autoclave. A completeprogram of sterilization consists of the following phases:
1. Vacuum: Initial vacuum, air is ejected from the autoclave chamber. Vacuum providesefficient air removal at the beginning of the cycle, ensuring that steam penetrates intothe load and not be affected by trapped air pockets.
15. STERILIZATION448
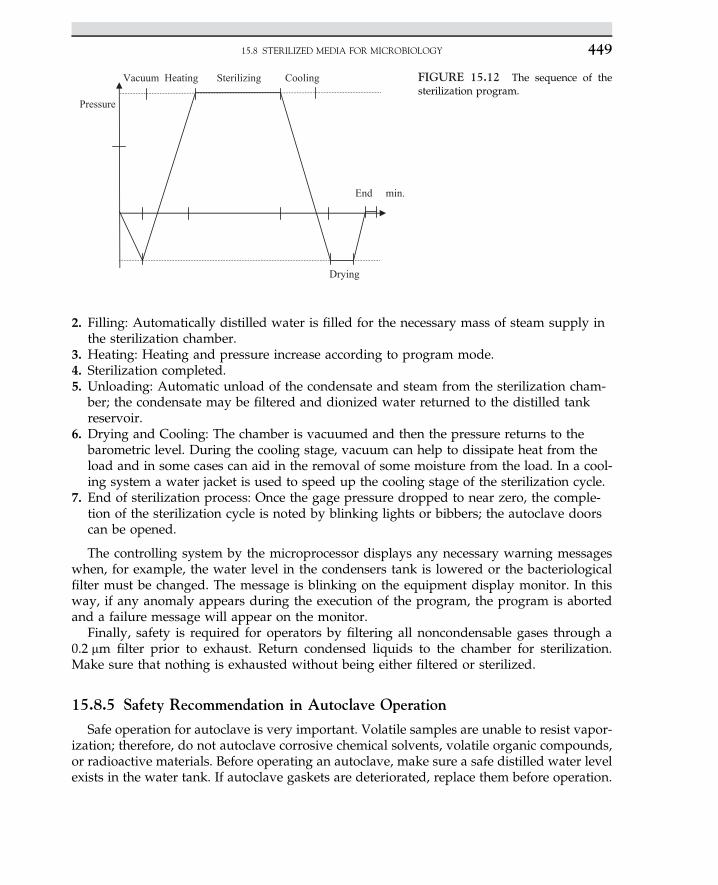
2. Filling: Automatically distilled water is filled for the necessary mass of steam supply inthe sterilization chamber.
3. Heating: Heating and pressure increase according to program mode.4. Sterilization completed.5. Unloading: Automatic unload of the condensate and steam from the sterilization cham-
ber; the condensate may be filtered and dionized water returned to the distilled tankreservoir.
6. Drying and Cooling: The chamber is vacuumed and then the pressure returns to thebarometric level. During the cooling stage, vacuum can help to dissipate heat from theload and in some cases can aid in the removal of some moisture from the load. In a cool-ing system a water jacket is used to speed up the cooling stage of the sterilization cycle.
7. End of sterilization process: Once the gage pressure dropped to near zero, the comple-tion of the sterilization cycle is noted by blinking lights or bibbers; the autoclave doorscan be opened.
The controlling system by the microprocessor displays any necessary warning messageswhen, for example, the water level in the condensers tank is lowered or the bacteriologicalfilter must be changed. The message is blinking on the equipment display monitor. In thisway, if any anomaly appears during the execution of the program, the program is abortedand a failure message will appear on the monitor.
Finally, safety is required for operators by filtering all noncondensable gases through a0.2 mm filter prior to exhaust. Return condensed liquids to the chamber for sterilization.Make sure that nothing is exhausted without being either filtered or sterilized.
15.8.5 Safety Recommendation in Autoclave Operation
Safe operation for autoclave is very important. Volatile samples are unable to resist vapor-ization; therefore, do not autoclave corrosive chemical solvents, volatile organic compounds,or radioactive materials. Before operating an autoclave, make sure a safe distilled water levelexists in the water tank. If autoclave gaskets are deteriorated, replace them before operation.
End min.
Vacuum Heating Sterilizing Cooling
Drying
Pressure
FIGURE 15.12 The sequence of thesterilization program.
15.8 STERILIZED MEDIA FOR MICROBIOLOGY 449
Do not overload autoclaving material; tubing must be wrapped in aluminum foil. If you auto-claving more than half a tank or carboys of fresh medium, check for siphoning problems; iftubings are in the medium, cotton filters are mounted for avoiding any build up pressure inthe feed tank. It is recommended to put all tubing in aluminum foil; avoid any heat damageof silicon tubing. The sterilized feed tank and tubing are connected in front of the flame understerile conditions. Put glassware in an autoclave basket. Always sterilize sugar separatelyfrom supplementary media; avoid caramelization of sugar at high temperature. Then adda carbon source to the medium in front of the flame under sterile conditions.
15.9 DRY HEAT STERILIZATION
Dry heat sterilization is used for equipment that can withstand high temperatures and dryheat but cannot withstand a wet or steam autoclave. This method is often used for glasswareas it dries and sterilizes in one operation. The pipettes must be wrapped in dustproofaluminum foil or placed in metal pipette cans. The can lids are removed during heatingand replaced after sterilization; that is, before any dust can get in the can. Disposable itemsare not recommended for dry heat sterilization. This method may only be good for perma-nent reusable glass pipettes.
Normal laboratory glassware must first be washed and cleaned. It must be rinsed withdeionized water. The clean glassware is sterilized in an oven set at 200 �C for 1e4 h. It is suit-able to cover glassware with aluminum foil to maintain aseptic conditions after removal ofthe glassware from the oven. If aluminum foil is not available, special heat-resistant wrap-ping paper can be used. The sterile glassware must be protected from the air, which hasmicroflora, or any contaminants. Avoid the use of any plastic caps and papers. Detach anylabeling tape or other flammable materials, as they are fire hazards.
15.10 STERILIZATION WITH FILTRATION
Certain media components are susceptible to heat; it will be denatured if it is heated. There-fore they must be added to the media after autoclaving. To do so, it is necessary to carry outfiltration with components using a 0.22 mm pore size filter that is appropriate to the solventused. Filters are normally available from Whatman or Fisher Scientific. It is recommendedthat you consult filter experts or suppliers about the solvent and the special application youare intending to implement for the desired filters for the process. Normally filtration of mediais used instead of sterilized media with an autoclave. To filter sterilized media, filter the waterusing a 0.45 mm pore size filter, before using a 0.22 mm pore size filter for final sterilization.
15.11 MICROWAVE STERILIZATION
Rapid sterilization of media is achieved by using microwave ovens. Most plant tissueculture media can be sterilized using a microwave, although it may not be suitable witha medium containing complex additives such as oatmeal. The high-temperature and
15. STERILIZATION450
short-time sterilization by microwave heating with a continuous microwave sterilizer wasinvestigated. Spores of Bacillus stearothermophilus were used as the biological indicator andalso spores having the ability for resistance in a conventional sterilization; whereas the ther-mal resisting spores had no significant resistance through continuous microwave sterilizer ata high temperature (135 �C).
15.12 ELECTRON BEAM STERILIZATION
Electron beam sterilization is a high-voltage potential established between a cathode andan anode in an evacuated tube. The cathode emits electrons, as a cathodic ray or electronbeam. A high intensity of electrons is produced. These electrons are accelerated to extremelyhigh velocities. These accelerated electron intensities have great potential as a bacteriocide.Most electron beams operate in a vacuum. As a result the unwanted organisms in the mediavanish and the media are sterilized.
The electron accelerator equipment producing a high-voltage beam also has variousapplications in the medical field and for surgical supplies. Electron beam sterilization is a suc-cessful technology used for sterilization of disposable medical appliances and devices with awide range of densities. The electron beam inactivates microorganisms that cause destructionof biomolecules, and results in the death of microbes by an indirect chemical reaction. Irradi-ation by gamma rays is a similar mechanism. Advanced electronics precisely control the useof electron beams in the sterilization of medical devices. Electron beam sterilization results inless material degradation than with gamma irradiation. Medical products are sterilized in theoriginal shipping containers, saving lots of time and maintaining the integrity of the originalpackage.
15.13 CHEMICAL STERILIZATION
Chemical agents are used to sterilize heat-sensitive equipment. Chemical solutions areused as a suitable method for sterilizing long pipettes and glassware. Normally at the pilotscale in the absence of life, steam and chemical agents are often used. Application of anoxidizing agent such as 10% Chlorox for 20 min or longer proves that the system operateswithout any contamination. Excess amounts of chemical agent must be removed; otherwiseorganisms are able to grow in a toxic environment. The bleach (sodium hypochlorite)then needs to be removed by rinsing with sterile water or rubbing with ethyl alcohol, 70%ethanolewater (pH 2) or an alcohol solution of 70% iso-propanol without recontaminatingthe glassware or tools. Ethanol is commonly used for cleaning surfaces. Use of bleach onmetal devices is not suitable as it corrodes metals rapidly. Ethylene oxide in the gas phaseis commonly used. This is a special chemical effectively used for column bioreactors. It is avolatile compound and strong oxidizing agent. It boils at ambient temperature; therefore,the solution of ethylene oxide (liquid phase) must be stored in a refrigerator (4 �C). An excel-lent oxidizing agent such as a 3% sodium hypochlorite is used for chemical sterilization ofequipment.
15.13 CHEMICAL STERILIZATION 451
15.14 LOW-TEMPERATURE STERILIZATION
Sterilization systems are available operating at low temperatures; such systems utilizeeffective oxidizing agents such as hydrogen peroxide or ethylene oxide in the gas phase.The application of gas technology to sterilize temperature-sensitive instruments and equip-ments was developed in past decades. Hydrogen peroxide gas technology is efficiently,effectively, and safely used to sterilize a wide range of instruments. The low-temperaturesterilization process is gentle and may take 50e70 min for high assurance of sterilization.The process by-products are oxygen and water vapor, which are nontoxic. Use of toxic gasfor sterilization may not be permissible while the generated toxic fume is harmful. Commer-cially, the hydrogen peroxide gas plasma technology is used for sterilization of devices suchas general surgery instruments, rigid and flexible endoscopes, cameras, light cables, batterypower drills, and many others. The residual H2O2 is safely eliminated while the sterilizationprocess is completed. This process in terms of energy is quite efficient; although hydrogenperoxide must be either supplied or generated in a catalytic electrodialysis process. The oper-ation temperature is normally in the range of 10e40 �C and the relative humidity is 30e75%.Sterilization is completed in short and long cycles for durations of 50 and 70 min,respectively.
NOMENCLATURE
N Number of viable organisms, ml�1
No Number of viable organisms as contaminants present in the medium, ml�1
kd Specific death rate, min�1
E Activation energy, kcal mol�1
t Sterilization time, minR Gas constant, 1.987 cal (mol K)�1
T Absolute temperature, KDz Axial dispersion coefficient, cm2 s�1
U Average medium velocity, cm min�1
L Length of holding section for sterilization, cm
References1. Pelczar MJ, Chan ECS, Krieg NR. Microbiology. New York: McGraw-Hill; 1986.2. Scragg AH. Bioreactors in biotechnology, a practical approach. New York: Ellis Horwood Series in Biochemistry and
Biotechnology; 1991.3. Doran PM. Bioprocess engineering principles. New York: Academic Press; 1995.4. Shuler ML, Kargi F. Bioprocess engineering, basic concepts. New Jersey: Prentice-Hall; 1992.5. Baily JE, Ollis DF. Biochemical engineering fundamentals. 2nd ed. New York: McGraw-Hill; 1986.6. Matthews IP, Gibson C, Samuel AH. J Biomed Mat Res 1989;23:143.
15. STERILIZATION452
C H A P T E R
16
Membrane Reactor
O U T L I N E
16.1 Introduction 455
16.2 Membrane Bioreactors 45716.2.1 MBR Configurations 45816.2.2 Membrane Materials and
Modules 45916.2.3 Different Applications of
MBR 46016.2.3.1 Landfill
Leachate 46016.2.3.2 Fermentation-
Based Products(Lactic Acid) 461
16.2.3.3 BiofuelProduction 462
16.2.3.4 Bioethanol 46216.2.3.5 Wastewater
Treatment 46316.2.4 Membrane Fouling 463
16.2.4.1 MembraneFoulingClassification 464
16.2.4.2 MembraneFouling Control 465
16.3 Membrane and MBRDevelopment 465
References 466
16.4 Case Study: Enhanced EthanolFermentation in a ContinuousMembrane Bioreactor:Pervaporation Technique 468
16.4.1 Introduction 468
16.4.2 Experimental 47016.4.2.1 Medium and
Microorganism 47016.4.2.2 Design of Membrane
Bioreactor andPervaporation System 470
16.4.2.3 Membrane 47216.4.2.4 Analysis 472
16.4.3 Results and Discussion 47216.4.3.1 Conventional
ContinuousFermentation 472
453Biochemical Engineering and Biotechnologyhttp://dx.doi.org/10.1016/B978-0-444-63357-6.00016-X Copyright © 2015 Elsevier B.V. All rights reserved.
16.4.3.2 Continuous Fermentationwith Pervaporation 473
16.4.3.3 Performance ofMembrane Bioreactor withContinuous PervaporationSystem 474
16.4.4 Conclusion 481
Acknowledgments 481
References 481
16.5 Case Study: Inorganic Zirconiag-Alumina-Coated Membrane onCeramic Support 483
16.5.1 Introduction 483
16.5.2 Materials and Methods 48516.5.2.1 Preparation of PVA
Solution 48916.5.2.2 Preparation of Zirconia-
Coated AluminaMembrane 490
16.5.2.3 Preparation of PorousCeramic Support 490
16.5.3 Results and Discussion 491
16.5.4 Conclusion 492
Acknowledgments 492
References 493
16. MEMBRANE REACTOR454
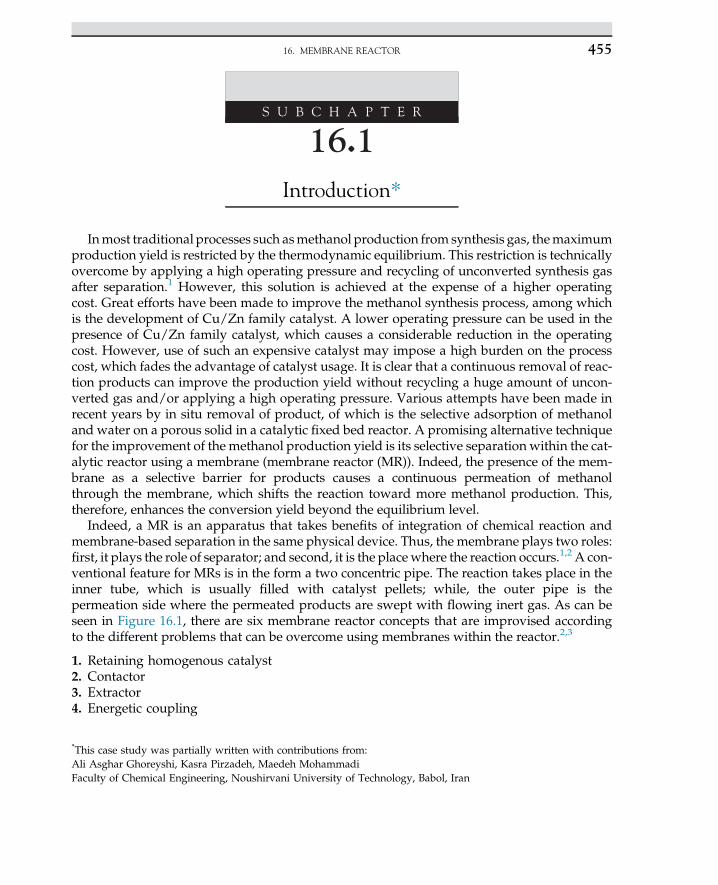
S U B C H A P T E R
16.1Introduction*
Inmost traditional processes such asmethanol production from synthesis gas, themaximumproduction yield is restricted by the thermodynamic equilibrium. This restriction is technicallyovercome by applying a high operating pressure and recycling of unconverted synthesis gasafter separation.1 However, this solution is achieved at the expense of a higher operatingcost. Great efforts have been made to improve the methanol synthesis process, among whichis the development of Cu/Zn family catalyst. A lower operating pressure can be used in thepresence of Cu/Zn family catalyst, which causes a considerable reduction in the operatingcost. However, use of such an expensive catalyst may impose a high burden on the processcost, which fades the advantage of catalyst usage. It is clear that a continuous removal of reac-tion products can improve the production yield without recycling a huge amount of uncon-verted gas and/or applying a high operating pressure. Various attempts have been made inrecent years by in situ removal of product, of which is the selective adsorption of methanoland water on a porous solid in a catalytic fixed bed reactor. A promising alternative techniquefor the improvement of the methanol production yield is its selective separation within the cat-alytic reactor using a membrane (membrane reactor (MR)). Indeed, the presence of the mem-brane as a selective barrier for products causes a continuous permeation of methanolthrough the membrane, which shifts the reaction toward more methanol production. This,therefore, enhances the conversion yield beyond the equilibrium level.
Indeed, a MR is an apparatus that takes benefits of integration of chemical reaction andmembrane-based separation in the same physical device. Thus, the membrane plays two roles:first, it plays the role of separator; and second, it is the place where the reaction occurs.1,2 A con-ventional feature for MRs is in the form a two concentric pipe. The reaction takes place in theinner tube, which is usually filled with catalyst pellets; while, the outer pipe is thepermeation side where the permeated products are swept with flowing inert gas. As can beseen in Figure 16.1, there are six membrane reactor concepts that are improvised accordingto the different problems that can be overcome using membranes within the reactor.2,3
1. Retaining homogenous catalyst2. Contactor3. Extractor4. Energetic coupling
*This case study was partially written with contributions from:Ali Asghar Ghoreyshi, Kasra Pirzadeh, Maedeh MohammadiFaculty of Chemical Engineering, Noushirvani University of Technology, Babol, Iran
16. MEMBRANE REACTOR 455
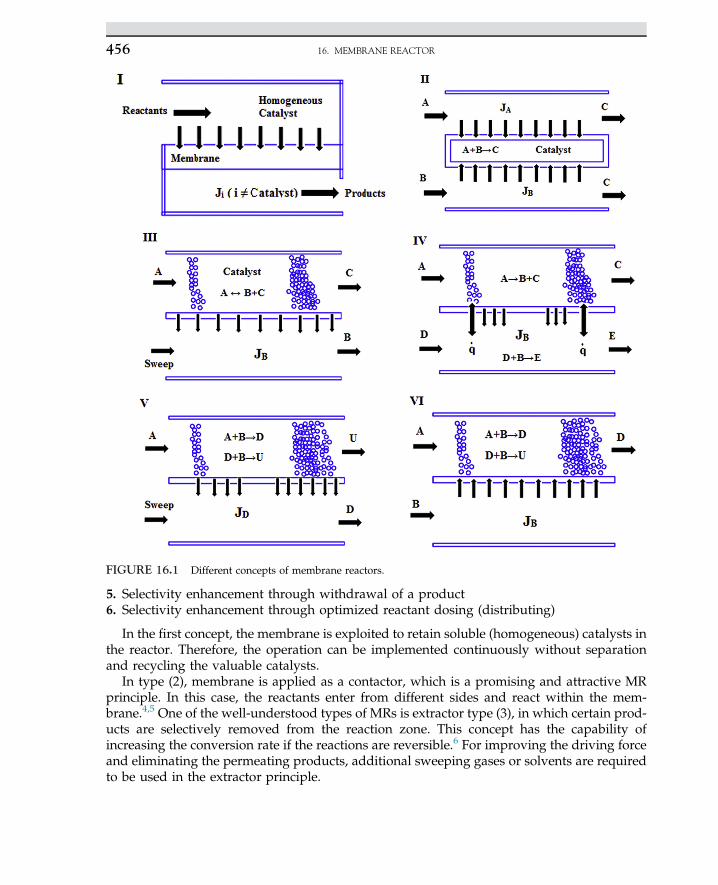
5. Selectivity enhancement through withdrawal of a product6. Selectivity enhancement through optimized reactant dosing (distributing)
In the first concept, the membrane is exploited to retain soluble (homogeneous) catalysts inthe reactor. Therefore, the operation can be implemented continuously without separationand recycling the valuable catalysts.
In type (2), membrane is applied as a contactor, which is a promising and attractive MRprinciple. In this case, the reactants enter from different sides and react within the mem-brane.4,5 One of the well-understood types of MRs is extractor type (3), in which certain prod-ucts are selectively removed from the reaction zone. This concept has the capability ofincreasing the conversion rate if the reactions are reversible.6 For improving the driving forceand eliminating the permeating products, additional sweeping gases or solvents are requiredto be used in the extractor principle.
FIGURE 16.1 Different concepts of membrane reactors.
16. MEMBRANE REACTOR456
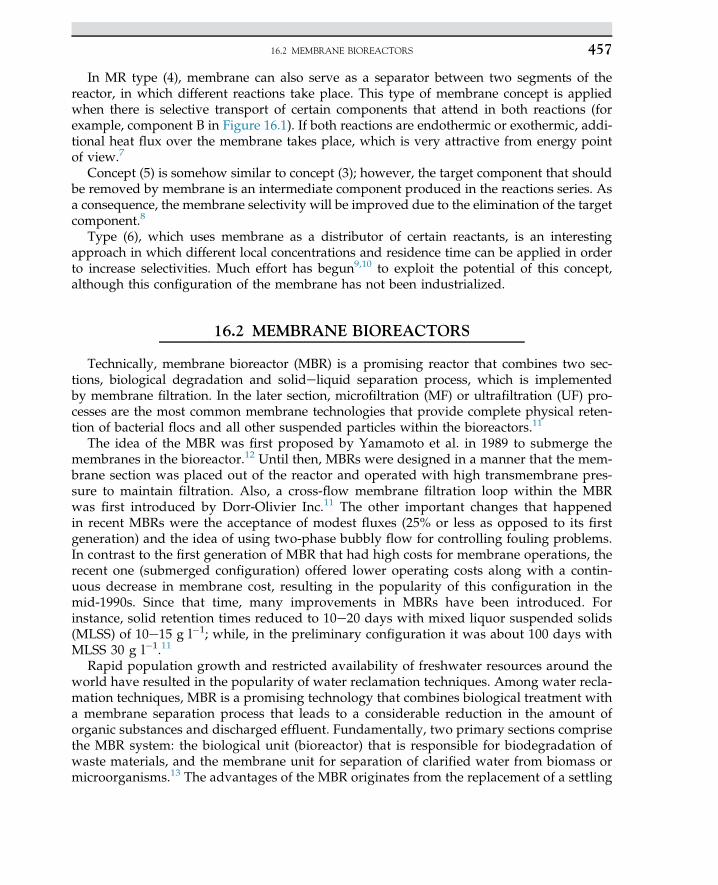
In MR type (4), membrane can also serve as a separator between two segments of thereactor, in which different reactions take place. This type of membrane concept is appliedwhen there is selective transport of certain components that attend in both reactions (forexample, component B in Figure 16.1). If both reactions are endothermic or exothermic, addi-tional heat flux over the membrane takes place, which is very attractive from energy pointof view.7
Concept (5) is somehow similar to concept (3); however, the target component that shouldbe removed by membrane is an intermediate component produced in the reactions series. Asa consequence, the membrane selectivity will be improved due to the elimination of the targetcomponent.8
Type (6), which uses membrane as a distributor of certain reactants, is an interestingapproach in which different local concentrations and residence time can be applied in orderto increase selectivities. Much effort has begun9,10 to exploit the potential of this concept,although this configuration of the membrane has not been industrialized.
16.2 MEMBRANE BIOREACTORS
Technically, membrane bioreactor (MBR) is a promising reactor that combines two sec-tions, biological degradation and solideliquid separation process, which is implementedby membrane filtration. In the later section, microfiltration (MF) or ultrafiltration (UF) pro-cesses are the most common membrane technologies that provide complete physical reten-tion of bacterial flocs and all other suspended particles within the bioreactors.11
The idea of the MBR was first proposed by Yamamoto et al. in 1989 to submerge themembranes in the bioreactor.12 Until then, MBRs were designed in a manner that the mem-brane section was placed out of the reactor and operated with high transmembrane pres-sure to maintain filtration. Also, a cross-flow membrane filtration loop within the MBRwas first introduced by Dorr-Olivier Inc.11 The other important changes that happenedin recent MBRs were the acceptance of modest fluxes (25% or less as opposed to its firstgeneration) and the idea of using two-phase bubbly flow for controlling fouling problems.In contrast to the first generation of MBR that had high costs for membrane operations, therecent one (submerged configuration) offered lower operating costs along with a contin-uous decrease in membrane cost, resulting in the popularity of this configuration in themid-1990s. Since that time, many improvements in MBRs have been introduced. Forinstance, solid retention times reduced to 10e20 days with mixed liquor suspended solids(MLSS) of 10e15 g l�1; while, in the preliminary configuration it was about 100 days withMLSS 30 g l�1.11
Rapid population growth and restricted availability of freshwater resources around theworld have resulted in the popularity of water reclamation techniques. Among water recla-mation techniques, MBR is a promising technology that combines biological treatment witha membrane separation process that leads to a considerable reduction in the amount oforganic substances and discharged effluent. Fundamentally, two primary sections comprisethe MBR system: the biological unit (bioreactor) that is responsible for biodegradation ofwaste materials, and the membrane unit for separation of clarified water from biomass ormicroorganisms.13 The advantages of the MBR originates from the replacement of a settling
16.2 MEMBRANE BIOREACTORS 457
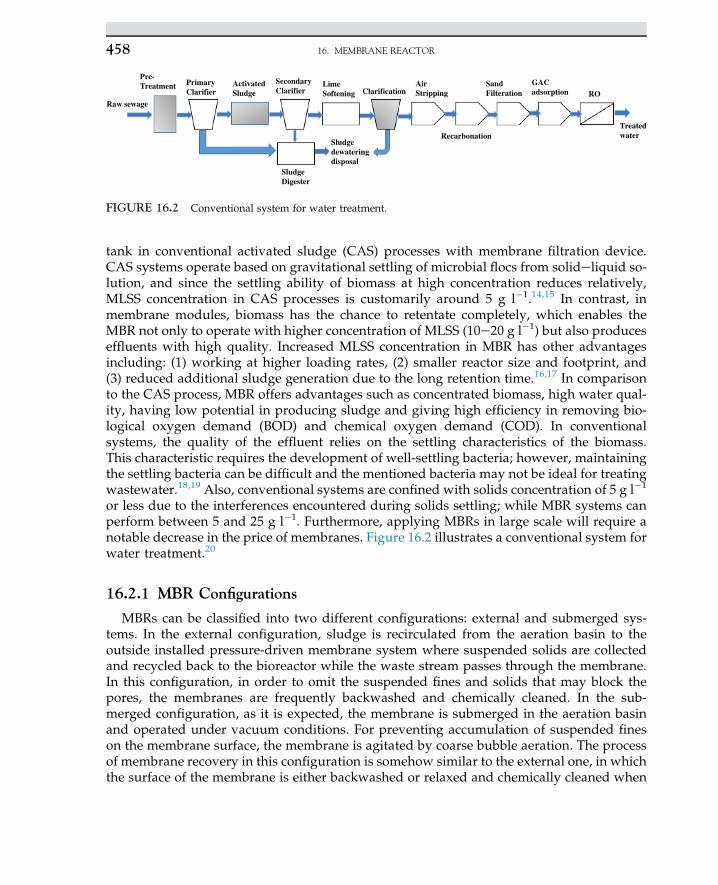
tank in conventional activated sludge (CAS) processes with membrane filtration device.CAS systems operate based on gravitational settling of microbial flocs from solideliquid so-lution, and since the settling ability of biomass at high concentration reduces relatively,MLSS concentration in CAS processes is customarily around 5 g l�1.14,15 In contrast, inmembrane modules, biomass has the chance to retentate completely, which enables theMBR not only to operate with higher concentration of MLSS (10e20 g l�1) but also produceseffluents with high quality. Increased MLSS concentration in MBR has other advantagesincluding: (1) working at higher loading rates, (2) smaller reactor size and footprint, and(3) reduced additional sludge generation due to the long retention time.16,17 In comparisonto the CAS process, MBR offers advantages such as concentrated biomass, high water qual-ity, having low potential in producing sludge and giving high efficiency in removing bio-logical oxygen demand (BOD) and chemical oxygen demand (COD). In conventionalsystems, the quality of the effluent relies on the settling characteristics of the biomass.This characteristic requires the development of well-settling bacteria; however, maintainingthe settling bacteria can be difficult and the mentioned bacteria may not be ideal for treatingwastewater.18,19 Also, conventional systems are confined with solids concentration of 5 g l�1
or less due to the interferences encountered during solids settling; while MBR systems canperform between 5 and 25 g l�1. Furthermore, applying MBRs in large scale will require anotable decrease in the price of membranes. Figure 16.2 illustrates a conventional system forwater treatment.20
16.2.1 MBR Configurations
MBRs can be classified into two different configurations: external and submerged sys-tems. In the external configuration, sludge is recirculated from the aeration basin to theoutside installed pressure-driven membrane system where suspended solids are collectedand recycled back to the bioreactor while the waste stream passes through the membrane.In this configuration, in order to omit the suspended fines and solids that may block thepores, the membranes are frequently backwashed and chemically cleaned. In the sub-merged configuration, as it is expected, the membrane is submerged in the aeration basinand operated under vacuum conditions. For preventing accumulation of suspended fineson the membrane surface, the membrane is agitated by coarse bubble aeration. The processof membrane recovery in this configuration is somehow similar to the external one, in whichthe surface of the membrane is either backwashed or relaxed and chemically cleaned when
Raw sewage
Pre-Treatment Primary
ClarifierActivatedSludge
SecondaryClarifier
LimeSoftening Clarification
AirStripping
SandFilteration
GACadsorption RO
TreatedwaterRecarbonation
Sludgedewateringdisposal
SludgeDigester
FIGURE 16.2 Conventional system for water treatment.
16. MEMBRANE REACTOR458
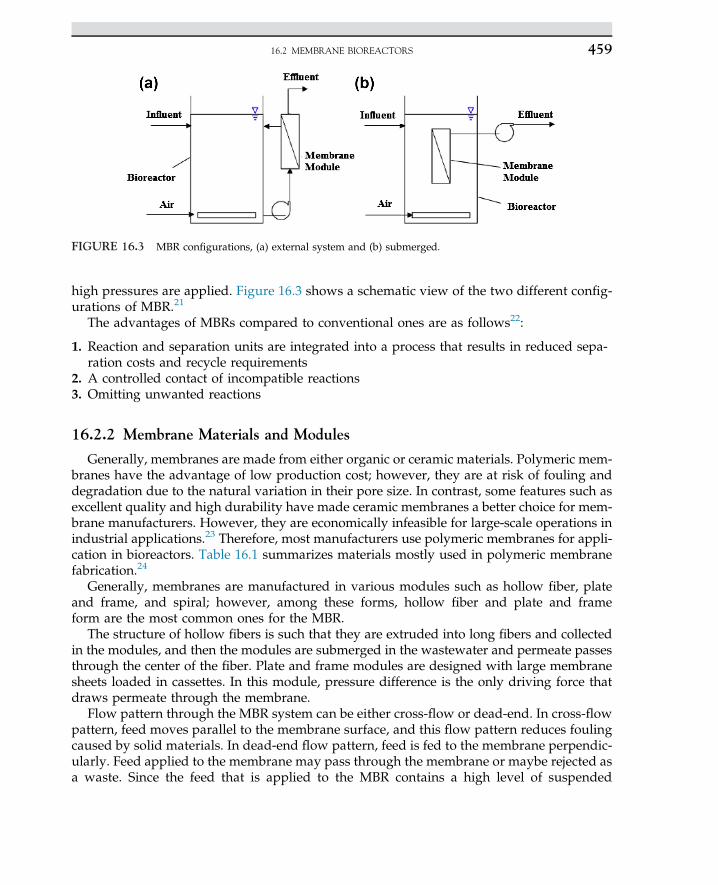
high pressures are applied. Figure 16.3 shows a schematic view of the two different config-urations of MBR.21
The advantages of MBRs compared to conventional ones are as follows22:
1. Reaction and separation units are integrated into a process that results in reduced sepa-ration costs and recycle requirements
2. A controlled contact of incompatible reactions3. Omitting unwanted reactions
16.2.2 Membrane Materials and Modules
Generally, membranes are made from either organic or ceramic materials. Polymeric mem-branes have the advantage of low production cost; however, they are at risk of fouling anddegradation due to the natural variation in their pore size. In contrast, some features such asexcellent quality and high durability have made ceramic membranes a better choice for mem-brane manufacturers. However, they are economically infeasible for large-scale operations inindustrial applications.23 Therefore, most manufacturers use polymeric membranes for appli-cation in bioreactors. Table 16.1 summarizes materials mostly used in polymeric membranefabrication.24
Generally, membranes are manufactured in various modules such as hollow fiber, plateand frame, and spiral; however, among these forms, hollow fiber and plate and frameform are the most common ones for the MBR.
The structure of hollow fibers is such that they are extruded into long fibers and collectedin the modules, and then the modules are submerged in the wastewater and permeate passesthrough the center of the fiber. Plate and frame modules are designed with large membranesheets loaded in cassettes. In this module, pressure difference is the only driving force thatdraws permeate through the membrane.
Flow pattern through the MBR system can be either cross-flow or dead-end. In cross-flowpattern, feed moves parallel to the membrane surface, and this flow pattern reduces foulingcaused by solid materials. In dead-end flow pattern, feed is fed to the membrane perpendic-ularly. Feed applied to the membrane may pass through the membrane or maybe rejected asa waste. Since the feed that is applied to the MBR contains a high level of suspended
FIGURE 16.3 MBR configurations, (a) external system and (b) submerged.
16.2 MEMBRANE BIOREACTORS 459
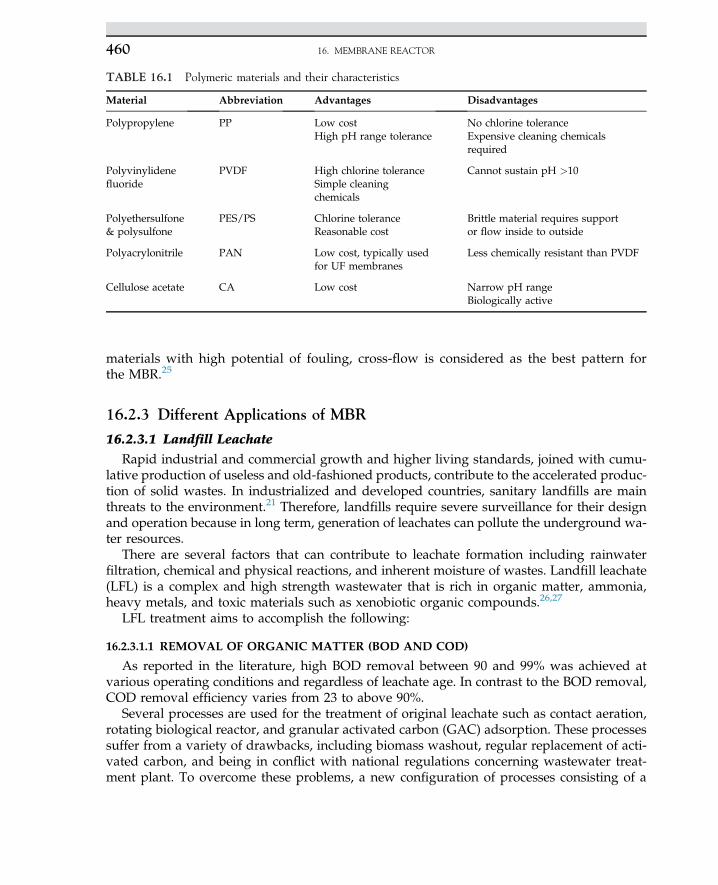
materials with high potential of fouling, cross-flow is considered as the best pattern forthe MBR.25
16.2.3 Different Applications of MBR
16.2.3.1 Landfill Leachate
Rapid industrial and commercial growth and higher living standards, joined with cumu-lative production of useless and old-fashioned products, contribute to the accelerated produc-tion of solid wastes. In industrialized and developed countries, sanitary landfills are mainthreats to the environment.21 Therefore, landfills require severe surveillance for their designand operation because in long term, generation of leachates can pollute the underground wa-ter resources.
There are several factors that can contribute to leachate formation including rainwaterfiltration, chemical and physical reactions, and inherent moisture of wastes. Landfill leachate(LFL) is a complex and high strength wastewater that is rich in organic matter, ammonia,heavy metals, and toxic materials such as xenobiotic organic compounds.26,27
LFL treatment aims to accomplish the following:
16.2.3.1.1 REMOVAL OF ORGANIC MATTER (BOD AND COD)
As reported in the literature, high BOD removal between 90 and 99% was achieved atvarious operating conditions and regardless of leachate age. In contrast to the BOD removal,COD removal efficiency varies from 23 to above 90%.
Several processes are used for the treatment of original leachate such as contact aeration,rotating biological reactor, and granular activated carbon (GAC) adsorption. These processessuffer from a variety of drawbacks, including biomass washout, regular replacement of acti-vated carbon, and being in conflict with national regulations concerning wastewater treat-ment plant. To overcome these problems, a new configuration of processes consisting of a
TABLE 16.1 Polymeric materials and their characteristics
Material Abbreviation Advantages Disadvantages
Polypropylene PP Low costHigh pH range tolerance
No chlorine toleranceExpensive cleaning chemicalsrequired
Polyvinylidenefluoride
PVDF High chlorine toleranceSimple cleaningchemicals
Cannot sustain pH >10
Polyethersulfone& polysulfone
PES/PS Chlorine toleranceReasonable cost
Brittle material requires supportor flow inside to outside
Polyacrylonitrile PAN Low cost, typically usedfor UF membranes
Less chemically resistant than PVDF
Cellulose acetate CA Low cost Narrow pH rangeBiologically active
16. MEMBRANE REACTOR460
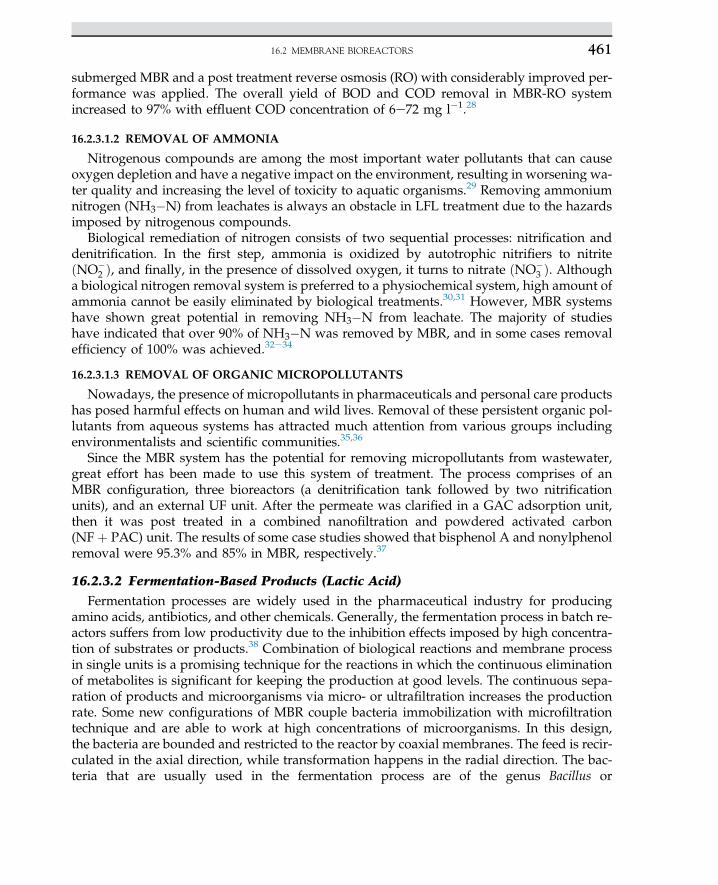
submerged MBR and a post treatment reverse osmosis (RO) with considerably improved per-formance was applied. The overall yield of BOD and COD removal in MBR-RO systemincreased to 97% with effluent COD concentration of 6e72 mg l�1.28
16.2.3.1.2 REMOVAL OF AMMONIA
Nitrogenous compounds are among the most important water pollutants that can causeoxygen depletion and have a negative impact on the environment, resulting in worsening wa-ter quality and increasing the level of toxicity to aquatic organisms.29 Removing ammoniumnitrogen (NH3�N) from leachates is always an obstacle in LFL treatment due to the hazardsimposed by nitrogenous compounds.
Biological remediation of nitrogen consists of two sequential processes: nitrification anddenitrification. In the first step, ammonia is oxidized by autotrophic nitrifiers to nitriteðNO�
2 Þ, and finally, in the presence of dissolved oxygen, it turns to nitrate ðNO�3 Þ. Although
a biological nitrogen removal system is preferred to a physiochemical system, high amount ofammonia cannot be easily eliminated by biological treatments.30,31 However, MBR systemshave shown great potential in removing NH3�N from leachate. The majority of studieshave indicated that over 90% of NH3�N was removed by MBR, and in some cases removalefficiency of 100% was achieved.32e34
16.2.3.1.3 REMOVAL OF ORGANIC MICROPOLLUTANTS
Nowadays, the presence of micropollutants in pharmaceuticals and personal care productshas posed harmful effects on human and wild lives. Removal of these persistent organic pol-lutants from aqueous systems has attracted much attention from various groups includingenvironmentalists and scientific communities.35,36
Since the MBR system has the potential for removing micropollutants from wastewater,great effort has been made to use this system of treatment. The process comprises of anMBR configuration, three bioreactors (a denitrification tank followed by two nitrificationunits), and an external UF unit. After the permeate was clarified in a GAC adsorption unit,then it was post treated in a combined nanofiltration and powdered activated carbon(NF þ PAC) unit. The results of some case studies showed that bisphenol A and nonylphenolremoval were 95.3% and 85% in MBR, respectively.37
16.2.3.2 Fermentation-Based Products (Lactic Acid)
Fermentation processes are widely used in the pharmaceutical industry for producingamino acids, antibiotics, and other chemicals. Generally, the fermentation process in batch re-actors suffers from low productivity due to the inhibition effects imposed by high concentra-tion of substrates or products.38 Combination of biological reactions and membrane processin single units is a promising technique for the reactions in which the continuous eliminationof metabolites is significant for keeping the production at good levels. The continuous sepa-ration of products and microorganisms via micro- or ultrafiltration increases the productionrate. Some new configurations of MBR couple bacteria immobilization with microfiltrationtechnique and are able to work at high concentrations of microorganisms. In this design,the bacteria are bounded and restricted to the reactor by coaxial membranes. The feed is recir-culated in the axial direction, while transformation happens in the radial direction. The bac-teria that are usually used in the fermentation process are of the genus Bacillus or
16.2 MEMBRANE BIOREACTORS 461
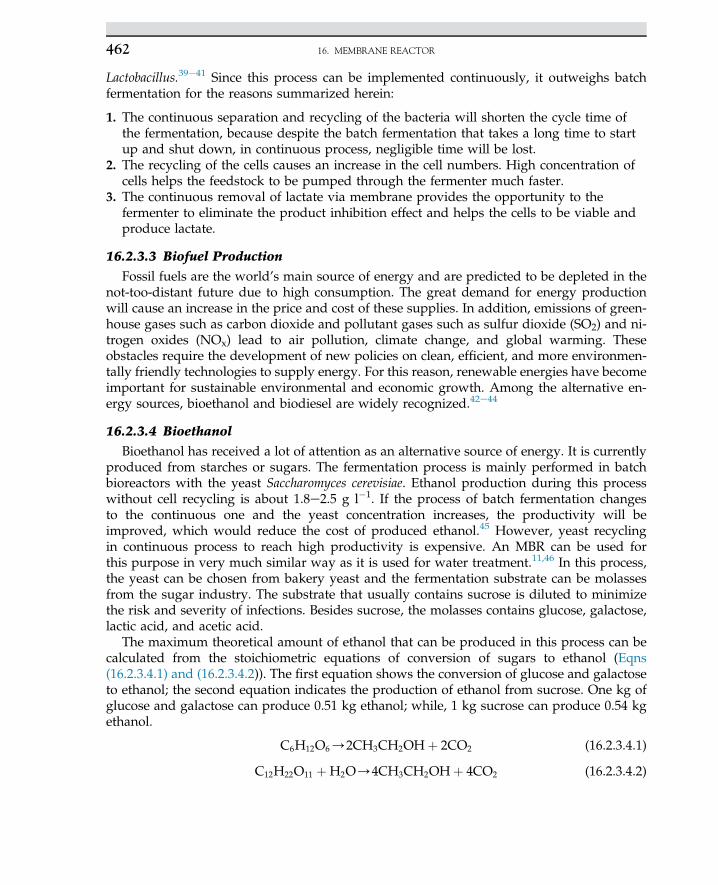
Lactobacillus.39e41 Since this process can be implemented continuously, it outweighs batchfermentation for the reasons summarized herein:
1. The continuous separation and recycling of the bacteria will shorten the cycle time ofthe fermentation, because despite the batch fermentation that takes a long time to startup and shut down, in continuous process, negligible time will be lost.
2. The recycling of the cells causes an increase in the cell numbers. High concentration ofcells helps the feedstock to be pumped through the fermenter much faster.
3. The continuous removal of lactate via membrane provides the opportunity to thefermenter to eliminate the product inhibition effect and helps the cells to be viable andproduce lactate.
16.2.3.3 Biofuel Production
Fossil fuels are the world’s main source of energy and are predicted to be depleted in thenot-too-distant future due to high consumption. The great demand for energy productionwill cause an increase in the price and cost of these supplies. In addition, emissions of green-house gases such as carbon dioxide and pollutant gases such as sulfur dioxide (SO2) and ni-trogen oxides (NOx) lead to air pollution, climate change, and global warming. Theseobstacles require the development of new policies on clean, efficient, and more environmen-tally friendly technologies to supply energy. For this reason, renewable energies have becomeimportant for sustainable environmental and economic growth. Among the alternative en-ergy sources, bioethanol and biodiesel are widely recognized.42e44
16.2.3.4 Bioethanol
Bioethanol has received a lot of attention as an alternative source of energy. It is currentlyproduced from starches or sugars. The fermentation process is mainly performed in batchbioreactors with the yeast Saccharomyces cerevisiae. Ethanol production during this processwithout cell recycling is about 1.8e2.5 g l�1. If the process of batch fermentation changesto the continuous one and the yeast concentration increases, the productivity will beimproved, which would reduce the cost of produced ethanol.45 However, yeast recyclingin continuous process to reach high productivity is expensive. An MBR can be used forthis purpose in very much similar way as it is used for water treatment.11,46 In this process,the yeast can be chosen from bakery yeast and the fermentation substrate can be molassesfrom the sugar industry. The substrate that usually contains sucrose is diluted to minimizethe risk and severity of infections. Besides sucrose, the molasses contains glucose, galactose,lactic acid, and acetic acid.
The maximum theoretical amount of ethanol that can be produced in this process can becalculated from the stoichiometric equations of conversion of sugars to ethanol (Eqns(16.2.3.4.1) and (16.2.3.4.2)). The first equation shows the conversion of glucose and galactoseto ethanol; the second equation indicates the production of ethanol from sucrose. One kg ofglucose and galactose can produce 0.51 kg ethanol; while, 1 kg sucrose can produce 0.54 kgethanol.
C6H12O6/2CH3CH2OHþ 2CO2 (16.2.3.4.1)
C12H22O11 þH2O/4CH3CH2OHþ 4CO2 (16.2.3.4.2)
16. MEMBRANE REACTOR462
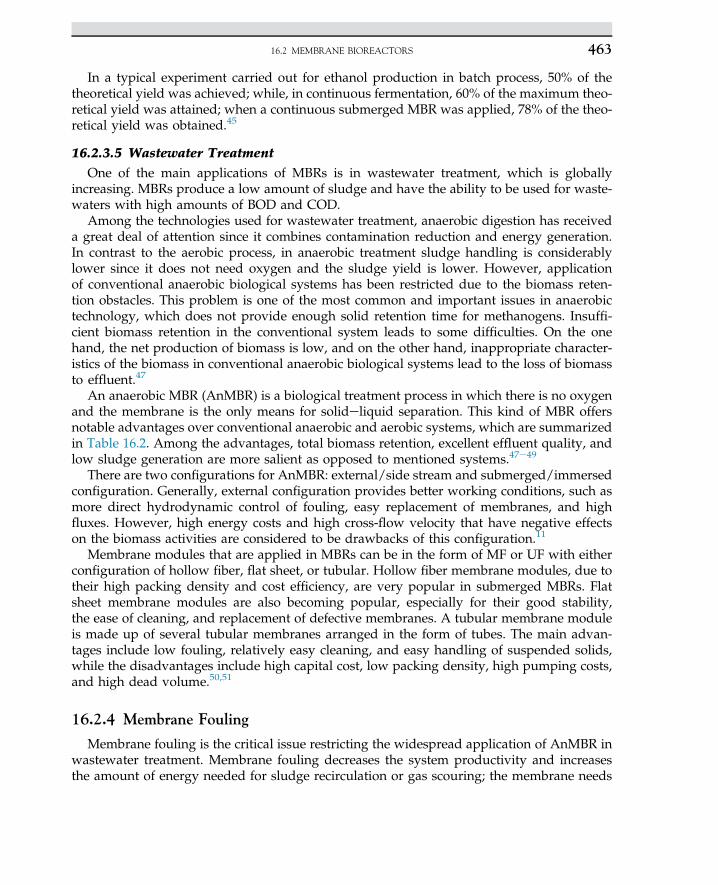
In a typical experiment carried out for ethanol production in batch process, 50% of thetheoretical yield was achieved; while, in continuous fermentation, 60% of the maximum theo-retical yield was attained; when a continuous submerged MBR was applied, 78% of the theo-retical yield was obtained.45
16.2.3.5 Wastewater Treatment
One of the main applications of MBRs is in wastewater treatment, which is globallyincreasing. MBRs produce a low amount of sludge and have the ability to be used for waste-waters with high amounts of BOD and COD.
Among the technologies used for wastewater treatment, anaerobic digestion has receiveda great deal of attention since it combines contamination reduction and energy generation.In contrast to the aerobic process, in anaerobic treatment sludge handling is considerablylower since it does not need oxygen and the sludge yield is lower. However, applicationof conventional anaerobic biological systems has been restricted due to the biomass reten-tion obstacles. This problem is one of the most common and important issues in anaerobictechnology, which does not provide enough solid retention time for methanogens. Insuffi-cient biomass retention in the conventional system leads to some difficulties. On the onehand, the net production of biomass is low, and on the other hand, inappropriate character-istics of the biomass in conventional anaerobic biological systems lead to the loss of biomassto effluent.47
An anaerobic MBR (AnMBR) is a biological treatment process in which there is no oxygenand the membrane is the only means for solideliquid separation. This kind of MBR offersnotable advantages over conventional anaerobic and aerobic systems, which are summarizedin Table 16.2. Among the advantages, total biomass retention, excellent effluent quality, andlow sludge generation are more salient as opposed to mentioned systems.47e49
There are two configurations for AnMBR: external/side stream and submerged/immersedconfiguration. Generally, external configuration provides better working conditions, such asmore direct hydrodynamic control of fouling, easy replacement of membranes, and highfluxes. However, high energy costs and high cross-flow velocity that have negative effectson the biomass activities are considered to be drawbacks of this configuration.11
Membrane modules that are applied in MBRs can be in the form of MF or UF with eitherconfiguration of hollow fiber, flat sheet, or tubular. Hollow fiber membrane modules, due totheir high packing density and cost efficiency, are very popular in submerged MBRs. Flatsheet membrane modules are also becoming popular, especially for their good stability,the ease of cleaning, and replacement of defective membranes. A tubular membrane moduleis made up of several tubular membranes arranged in the form of tubes. The main advan-tages include low fouling, relatively easy cleaning, and easy handling of suspended solids,while the disadvantages include high capital cost, low packing density, high pumping costs,and high dead volume.50,51
16.2.4 Membrane Fouling
Membrane fouling is the critical issue restricting the widespread application of AnMBR inwastewater treatment. Membrane fouling decreases the system productivity and increasesthe amount of energy needed for sludge recirculation or gas scouring; the membrane needs
16.2 MEMBRANE BIOREACTORS 463
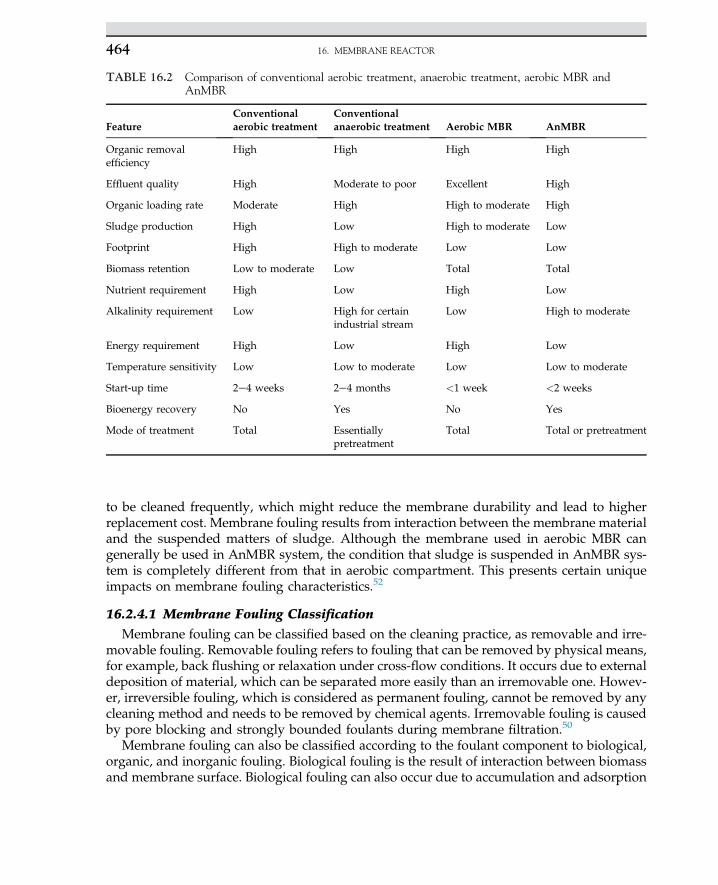
to be cleaned frequently, which might reduce the membrane durability and lead to higherreplacement cost. Membrane fouling results from interaction between the membrane materialand the suspended matters of sludge. Although the membrane used in aerobic MBR cangenerally be used in AnMBR system, the condition that sludge is suspended in AnMBR sys-tem is completely different from that in aerobic compartment. This presents certain uniqueimpacts on membrane fouling characteristics.52
16.2.4.1 Membrane Fouling Classification
Membrane fouling can be classified based on the cleaning practice, as removable and irre-movable fouling. Removable fouling refers to fouling that can be removed by physical means,for example, back flushing or relaxation under cross-flow conditions. It occurs due to externaldeposition of material, which can be separated more easily than an irremovable one. Howev-er, irreversible fouling, which is considered as permanent fouling, cannot be removed by anycleaning method and needs to be removed by chemical agents. Irremovable fouling is causedby pore blocking and strongly bounded foulants during membrane filtration.50
Membrane fouling can also be classified according to the foulant component to biological,organic, and inorganic fouling. Biological fouling is the result of interaction between biomassand membrane surface. Biological fouling can also occur due to accumulation and adsorption
TABLE 16.2 Comparison of conventional aerobic treatment, anaerobic treatment, aerobic MBR andAnMBR
FeatureConventionalaerobic treatment
Conventionalanaerobic treatment Aerobic MBR AnMBR
Organic removalefficiency
High High High High
Effluent quality High Moderate to poor Excellent High
Organic loading rate Moderate High High to moderate High
Sludge production High Low High to moderate Low
Footprint High High to moderate Low Low
Biomass retention Low to moderate Low Total Total
Nutrient requirement High Low High Low
Alkalinity requirement Low High for certainindustrial stream
Low High to moderate
Energy requirement High Low High Low
Temperature sensitivity Low Low to moderate Low Low to moderate
Start-up time 2e4 weeks 2e4 months <1 week <2 weeks
Bioenergy recovery No Yes No Yes
Mode of treatment Total Essentiallypretreatment
Total Total or pretreatment
16. MEMBRANE REACTOR464
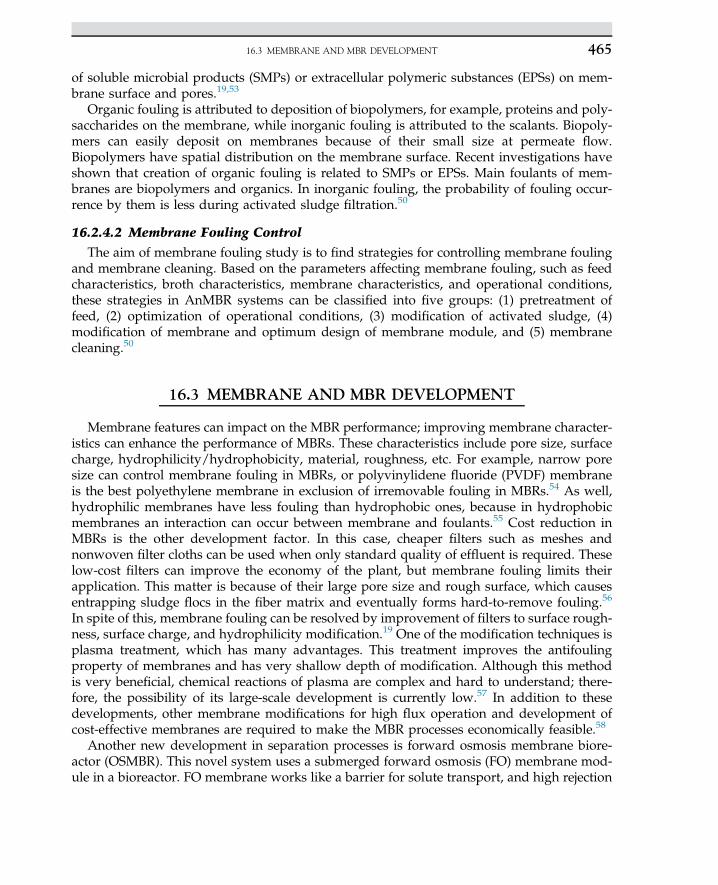
of soluble microbial products (SMPs) or extracellular polymeric substances (EPSs) on mem-brane surface and pores.19,53
Organic fouling is attributed to deposition of biopolymers, for example, proteins and poly-saccharides on the membrane, while inorganic fouling is attributed to the scalants. Biopoly-mers can easily deposit on membranes because of their small size at permeate flow.Biopolymers have spatial distribution on the membrane surface. Recent investigations haveshown that creation of organic fouling is related to SMPs or EPSs. Main foulants of mem-branes are biopolymers and organics. In inorganic fouling, the probability of fouling occur-rence by them is less during activated sludge filtration.50
16.2.4.2 Membrane Fouling Control
The aim of membrane fouling study is to find strategies for controlling membrane foulingand membrane cleaning. Based on the parameters affecting membrane fouling, such as feedcharacteristics, broth characteristics, membrane characteristics, and operational conditions,these strategies in AnMBR systems can be classified into five groups: (1) pretreatment offeed, (2) optimization of operational conditions, (3) modification of activated sludge, (4)modification of membrane and optimum design of membrane module, and (5) membranecleaning.50
16.3 MEMBRANE AND MBR DEVELOPMENT
Membrane features can impact on the MBR performance; improving membrane character-istics can enhance the performance of MBRs. These characteristics include pore size, surfacecharge, hydrophilicity/hydrophobicity, material, roughness, etc. For example, narrow poresize can control membrane fouling in MBRs, or polyvinylidene fluoride (PVDF) membraneis the best polyethylene membrane in exclusion of irremovable fouling in MBRs.54 As well,hydrophilic membranes have less fouling than hydrophobic ones, because in hydrophobicmembranes an interaction can occur between membrane and foulants.55 Cost reduction inMBRs is the other development factor. In this case, cheaper filters such as meshes andnonwoven filter cloths can be used when only standard quality of effluent is required. Theselow-cost filters can improve the economy of the plant, but membrane fouling limits theirapplication. This matter is because of their large pore size and rough surface, which causesentrapping sludge flocs in the fiber matrix and eventually forms hard-to-remove fouling.56
In spite of this, membrane fouling can be resolved by improvement of filters to surface rough-ness, surface charge, and hydrophilicity modification.19 One of the modification techniques isplasma treatment, which has many advantages. This treatment improves the antifoulingproperty of membranes and has very shallow depth of modification. Although this methodis very beneficial, chemical reactions of plasma are complex and hard to understand; there-fore, the possibility of its large-scale development is currently low.57 In addition to thesedevelopments, other membrane modifications for high flux operation and development ofcost-effective membranes are required to make the MBR processes economically feasible.58
Another new development in separation processes is forward osmosis membrane biore-actor (OSMBR). This novel system uses a submerged forward osmosis (FO) membrane mod-ule in a bioreactor. FO membrane works like a barrier for solute transport, and high rejection
16.3 MEMBRANE AND MBR DEVELOPMENT 465
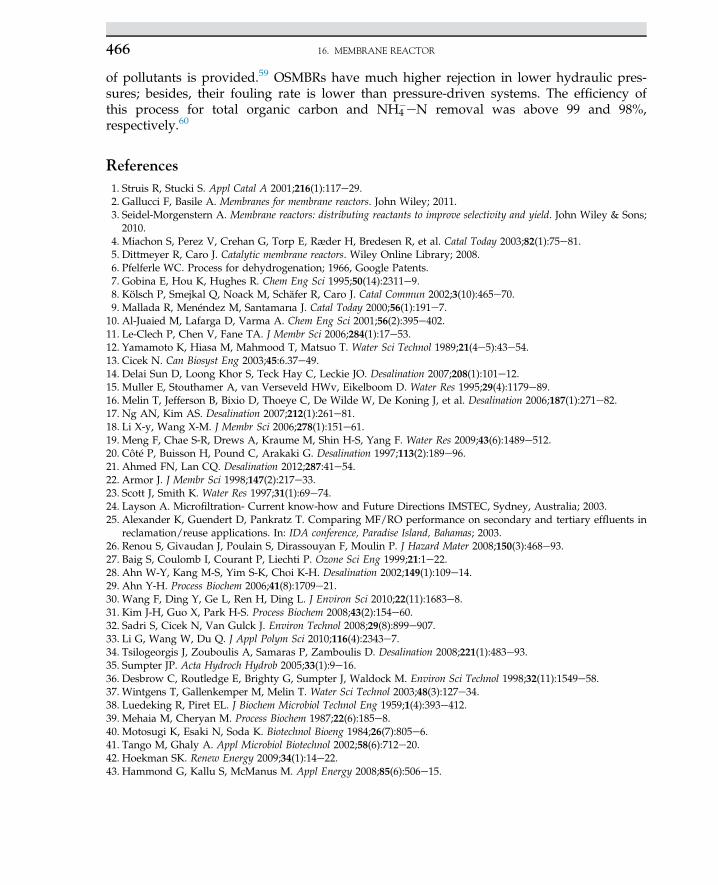
of pollutants is provided.59 OSMBRs have much higher rejection in lower hydraulic pres-sures; besides, their fouling rate is lower than pressure-driven systems. The efficiency ofthis process for total organic carbon and NH4
�eN removal was above 99 and 98%,respectively.60
References1. Struis R, Stucki S. Appl Catal A 2001;216(1):117e29.2. Gallucci F, Basile A. Membranes for membrane reactors. John Wiley; 2011.3. Seidel-Morgenstern A. Membrane reactors: distributing reactants to improve selectivity and yield. John Wiley & Sons;2010.
4. Miachon S, Perez V, Crehan G, Torp E, Ræder H, Bredesen R, et al. Catal Today 2003;82(1):75e81.5. Dittmeyer R, Caro J. Catalytic membrane reactors. Wiley Online Library; 2008.6. Pfelferle WC. Process for dehydrogenation; 1966, Google Patents.7. Gobina E, Hou K, Hughes R. Chem Eng Sci 1995;50(14):2311e9.8. Kölsch P, Smejkal Q, Noack M, Schäfer R, Caro J. Catal Commun 2002;3(10):465e70.9. Mallada R, Menéndez M, Santamarı
a J. Catal Today 2000;56(1):191e7.10. Al-Juaied M, Lafarga D, Varma A. Chem Eng Sci 2001;56(2):395e402.11. Le-Clech P, Chen V, Fane TA. J Membr Sci 2006;284(1):17e53.12. Yamamoto K, Hiasa M, Mahmood T, Matsuo T. Water Sci Technol 1989;21(4e5):43e54.13. Cicek N. Can Biosyst Eng 2003;45:6.37e49.14. Delai Sun D, Loong Khor S, Teck Hay C, Leckie JO. Desalination 2007;208(1):101e12.15. Muller E, Stouthamer A, van Verseveld HWv, Eikelboom D. Water Res 1995;29(4):1179e89.16. Melin T, Jefferson B, Bixio D, Thoeye C, De Wilde W, De Koning J, et al. Desalination 2006;187(1):271e82.17. Ng AN, Kim AS. Desalination 2007;212(1):261e81.18. Li X-y, Wang X-M. J Membr Sci 2006;278(1):151e61.19. Meng F, Chae S-R, Drews A, Kraume M, Shin H-S, Yang F. Water Res 2009;43(6):1489e512.20. Côté P, Buisson H, Pound C, Arakaki G. Desalination 1997;113(2):189e96.21. Ahmed FN, Lan CQ. Desalination 2012;287:41e54.22. Armor J. J Membr Sci 1998;147(2):217e33.23. Scott J, Smith K. Water Res 1997;31(1):69e74.24. Layson A. Microfiltration- Current know-how and Future Directions IMSTEC, Sydney, Australia; 2003.25. Alexander K, Guendert D, Pankratz T. Comparing MF/RO performance on secondary and tertiary effluents in
reclamation/reuse applications. In: IDA conference, Paradise Island, Bahamas; 2003.26. Renou S, Givaudan J, Poulain S, Dirassouyan F, Moulin P. J Hazard Mater 2008;150(3):468e93.27. Baig S, Coulomb I, Courant P, Liechti P. Ozone Sci Eng 1999;21:1e22.28. Ahn W-Y, Kang M-S, Yim S-K, Choi K-H. Desalination 2002;149(1):109e14.29. Ahn Y-H. Process Biochem 2006;41(8):1709e21.30. Wang F, Ding Y, Ge L, Ren H, Ding L. J Environ Sci 2010;22(11):1683e8.31. Kim J-H, Guo X, Park H-S. Process Biochem 2008;43(2):154e60.32. Sadri S, Cicek N, Van Gulck J. Environ Technol 2008;29(8):899e907.33. Li G, Wang W, Du Q. J Appl Polym Sci 2010;116(4):2343e7.34. Tsilogeorgis J, Zouboulis A, Samaras P, Zamboulis D. Desalination 2008;221(1):483e93.35. Sumpter JP. Acta Hydroch Hydrob 2005;33(1):9e16.36. Desbrow C, Routledge E, Brighty G, Sumpter J, Waldock M. Environ Sci Technol 1998;32(11):1549e58.37. Wintgens T, Gallenkemper M, Melin T. Water Sci Technol 2003;48(3):127e34.38. Luedeking R, Piret EL. J Biochem Microbiol Technol Eng 1959;1(4):393e412.39. Mehaia M, Cheryan M. Process Biochem 1987;22(6):185e8.40. Motosugi K, Esaki N, Soda K. Biotechnol Bioeng 1984;26(7):805e6.41. Tango M, Ghaly A. Appl Microbiol Biotechnol 2002;58(6):712e20.42. Hoekman SK. Renew Energy 2009;34(1):14e22.43. Hammond G, Kallu S, McManus M. Appl Energy 2008;85(6):506e15.
16. MEMBRANE REACTOR466
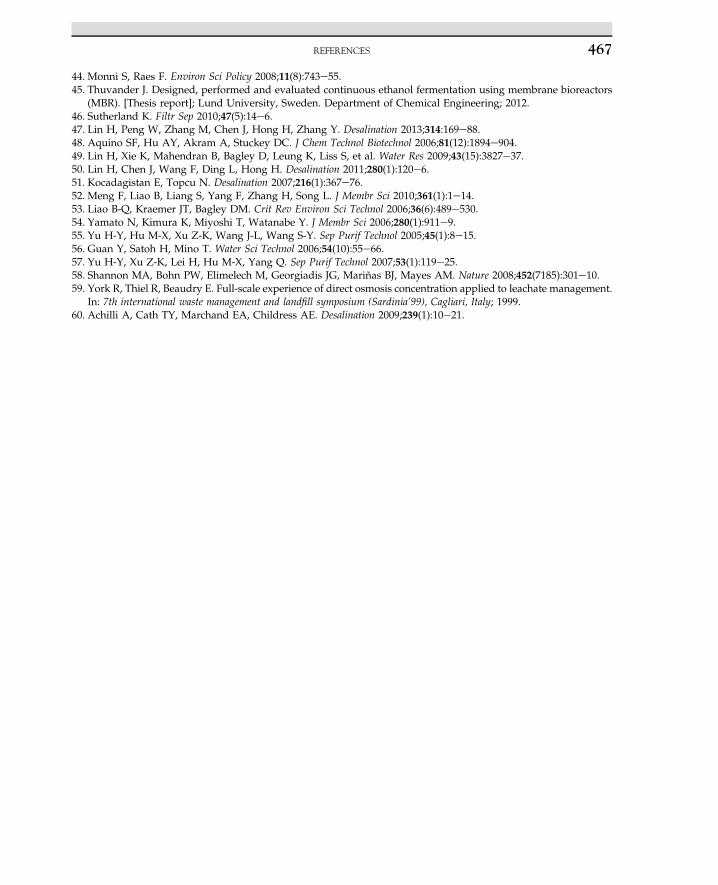
44. Monni S, Raes F. Environ Sci Policy 2008;11(8):743e55.45. Thuvander J. Designed, performed and evaluated continuous ethanol fermentation using membrane bioreactors
(MBR). [Thesis report]; Lund University, Sweden. Department of Chemical Engineering; 2012.46. Sutherland K. Filtr Sep 2010;47(5):14e6.47. Lin H, Peng W, Zhang M, Chen J, Hong H, Zhang Y. Desalination 2013;314:169e88.48. Aquino SF, Hu AY, Akram A, Stuckey DC. J Chem Technol Biotechnol 2006;81(12):1894e904.49. Lin H, Xie K, Mahendran B, Bagley D, Leung K, Liss S, et al. Water Res 2009;43(15):3827e37.50. Lin H, Chen J, Wang F, Ding L, Hong H. Desalination 2011;280(1):120e6.51. Kocadagistan E, Topcu N. Desalination 2007;216(1):367e76.52. Meng F, Liao B, Liang S, Yang F, Zhang H, Song L. J Membr Sci 2010;361(1):1e14.53. Liao B-Q, Kraemer JT, Bagley DM. Crit Rev Environ Sci Technol 2006;36(6):489e530.54. Yamato N, Kimura K, Miyoshi T, Watanabe Y. J Membr Sci 2006;280(1):911e9.55. Yu H-Y, Hu M-X, Xu Z-K, Wang J-L, Wang S-Y. Sep Purif Technol 2005;45(1):8e15.56. Guan Y, Satoh H, Mino T. Water Sci Technol 2006;54(10):55e66.57. Yu H-Y, Xu Z-K, Lei H, Hu M-X, Yang Q. Sep Purif Technol 2007;53(1):119e25.58. Shannon MA, Bohn PW, Elimelech M, Georgiadis JG, Mariñas BJ, Mayes AM. Nature 2008;452(7185):301e10.59. York R, Thiel R, Beaudry E. Full-scale experience of direct osmosis concentration applied to leachate management.
In: 7th international waste management and landfill symposium (Sardinia’99), Cagliari, Italy; 1999.60. Achilli A, Cath TY, Marchand EA, Childress AE. Desalination 2009;239(1):10e21.
REFERENCES 467
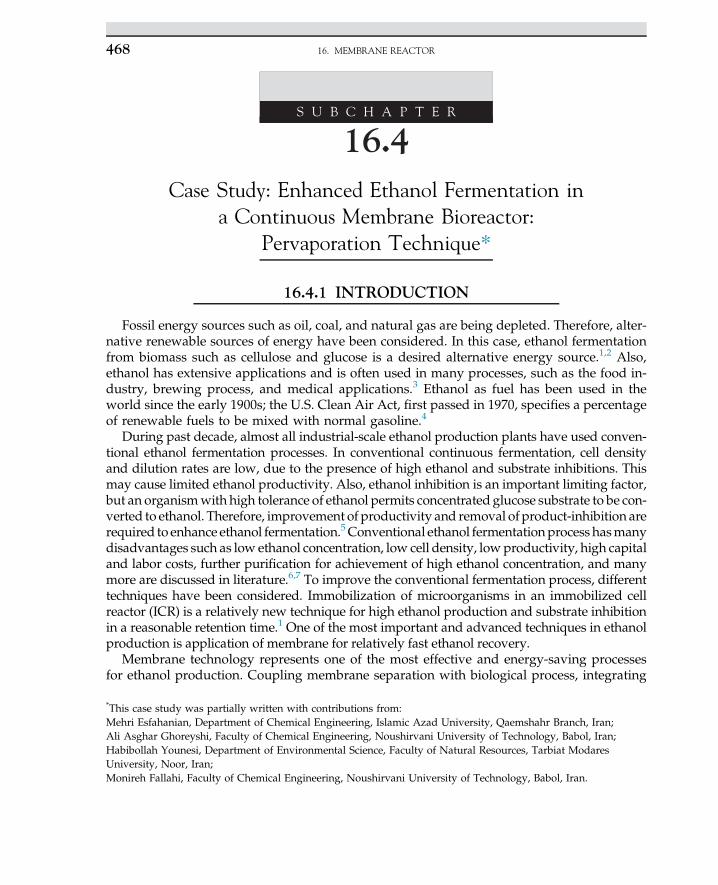
S U B C H A P T E R
16.4Case Study: Enhanced Ethanol Fermentation in
a Continuous Membrane Bioreactor:Pervaporation Technique*
16.4.1 INTRODUCTION
Fossil energy sources such as oil, coal, and natural gas are being depleted. Therefore, alter-native renewable sources of energy have been considered. In this case, ethanol fermentationfrom biomass such as cellulose and glucose is a desired alternative energy source.1,2 Also,ethanol has extensive applications and is often used in many processes, such as the food in-dustry, brewing process, and medical applications.3 Ethanol as fuel has been used in theworld since the early 1900s; the U.S. Clean Air Act, first passed in 1970, specifies a percentageof renewable fuels to be mixed with normal gasoline.4
During past decade, almost all industrial-scale ethanol production plants have used conven-tional ethanol fermentation processes. In conventional continuous fermentation, cell densityand dilution rates are low, due to the presence of high ethanol and substrate inhibitions. Thismay cause limited ethanol productivity. Also, ethanol inhibition is an important limiting factor,but an organismwith high tolerance of ethanol permits concentrated glucose substrate to be con-verted to ethanol. Therefore, improvement of productivity and removal of product-inhibition arerequired to enhance ethanol fermentation.5Conventional ethanol fermentationprocess hasmanydisadvantages such as low ethanol concentration, low cell density, lowproductivity, high capitaland labor costs, further purification for achievement of high ethanol concentration, and manymore are discussed in literature.6,7 To improve the conventional fermentation process, differenttechniques have been considered. Immobilization of microorganisms in an immobilized cellreactor (ICR) is a relatively new technique for high ethanol production and substrate inhibitionin a reasonable retention time.1 One of the most important and advanced techniques in ethanolproduction is application of membrane for relatively fast ethanol recovery.
Membrane technology represents one of the most effective and energy-saving processesfor ethanol production. Coupling membrane separation with biological process, integrating
*This case study was partially written with contributions from:Mehri Esfahanian, Department of Chemical Engineering, Islamic Azad University, Qaemshahr Branch, Iran;Ali Asghar Ghoreyshi, Faculty of Chemical Engineering, Noushirvani University of Technology, Babol, Iran;Habibollah Younesi, Department of Environmental Science, Faculty of Natural Resources, Tarbiat ModaresUniversity, Noor, Iran;Monireh Fallahi, Faculty of Chemical Engineering, Noushirvani University of Technology, Babol, Iran.
16. MEMBRANE REACTOR468
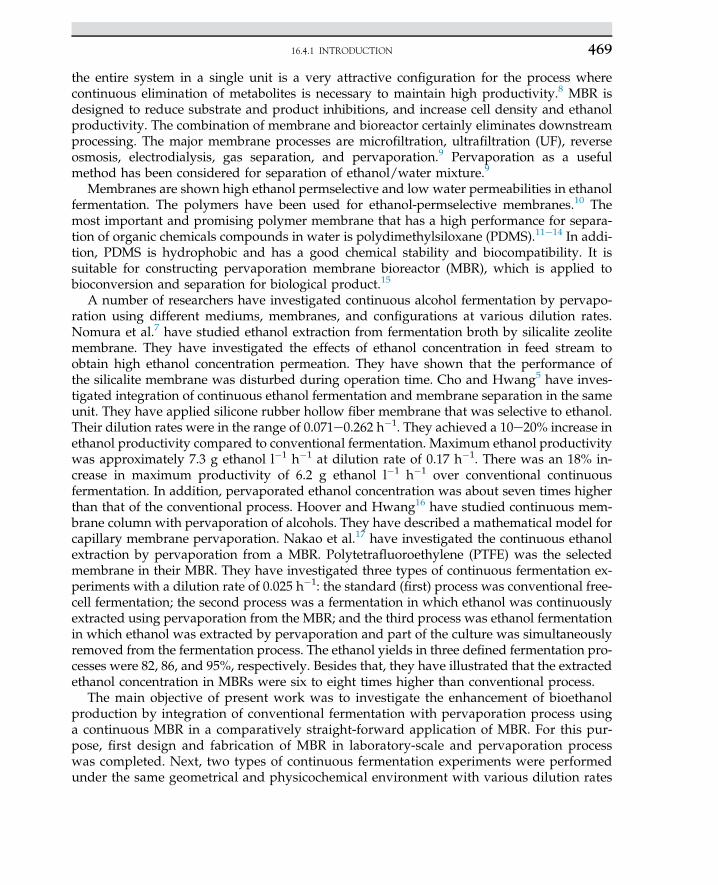
the entire system in a single unit is a very attractive configuration for the process wherecontinuous elimination of metabolites is necessary to maintain high productivity.8 MBR isdesigned to reduce substrate and product inhibitions, and increase cell density and ethanolproductivity. The combination of membrane and bioreactor certainly eliminates downstreamprocessing. The major membrane processes are microfiltration, ultrafiltration (UF), reverseosmosis, electrodialysis, gas separation, and pervaporation.9 Pervaporation as a usefulmethod has been considered for separation of ethanol/water mixture.9
Membranes are shown high ethanol permselective and low water permeabilities in ethanolfermentation. The polymers have been used for ethanol-permselective membranes.10 Themost important and promising polymer membrane that has a high performance for separa-tion of organic chemicals compounds in water is polydimethylsiloxane (PDMS).11e14 In addi-tion, PDMS is hydrophobic and has a good chemical stability and biocompatibility. It issuitable for constructing pervaporation membrane bioreactor (MBR), which is applied tobioconversion and separation for biological product.15
A number of researchers have investigated continuous alcohol fermentation by pervapo-ration using different mediums, membranes, and configurations at various dilution rates.Nomura et al.7 have studied ethanol extraction from fermentation broth by silicalite zeolitemembrane. They have investigated the effects of ethanol concentration in feed stream toobtain high ethanol concentration permeation. They have shown that the performance ofthe silicalite membrane was disturbed during operation time. Cho and Hwang5 have inves-tigated integration of continuous ethanol fermentation and membrane separation in the sameunit. They have applied silicone rubber hollow fiber membrane that was selective to ethanol.Their dilution rates were in the range of 0.071e0.262 h�1. They achieved a 10e20% increase inethanol productivity compared to conventional fermentation. Maximum ethanol productivitywas approximately 7.3 g ethanol l�1 h�1 at dilution rate of 0.17 h�1. There was an 18% in-crease in maximum productivity of 6.2 g ethanol l�1 h�1 over conventional continuousfermentation. In addition, pervaporated ethanol concentration was about seven times higherthan that of the conventional process. Hoover and Hwang16 have studied continuous mem-brane column with pervaporation of alcohols. They have described a mathematical model forcapillary membrane pervaporation. Nakao et al.17 have investigated the continuous ethanolextraction by pervaporation from a MBR. Polytetrafluoroethylene (PTFE) was the selectedmembrane in their MBR. They have investigated three types of continuous fermentation ex-periments with a dilution rate of 0.025 h�1: the standard (first) process was conventional free-cell fermentation; the second process was a fermentation in which ethanol was continuouslyextracted using pervaporation from the MBR; and the third process was ethanol fermentationin which ethanol was extracted by pervaporation and part of the culture was simultaneouslyremoved from the fermentation process. The ethanol yields in three defined fermentation pro-cesses were 82, 86, and 95%, respectively. Besides that, they have illustrated that the extractedethanol concentration in MBRs were six to eight times higher than conventional process.
The main objective of present work was to investigate the enhancement of bioethanolproduction by integration of conventional fermentation with pervaporation process usinga continuous MBR in a comparatively straight-forward application of MBR. For this pur-pose, first design and fabrication of MBR in laboratory-scale and pervaporation processwas completed. Next, two types of continuous fermentation experiments were performedunder the same geometrical and physicochemical environment with various dilution rates
16.4.1 INTRODUCTION 469
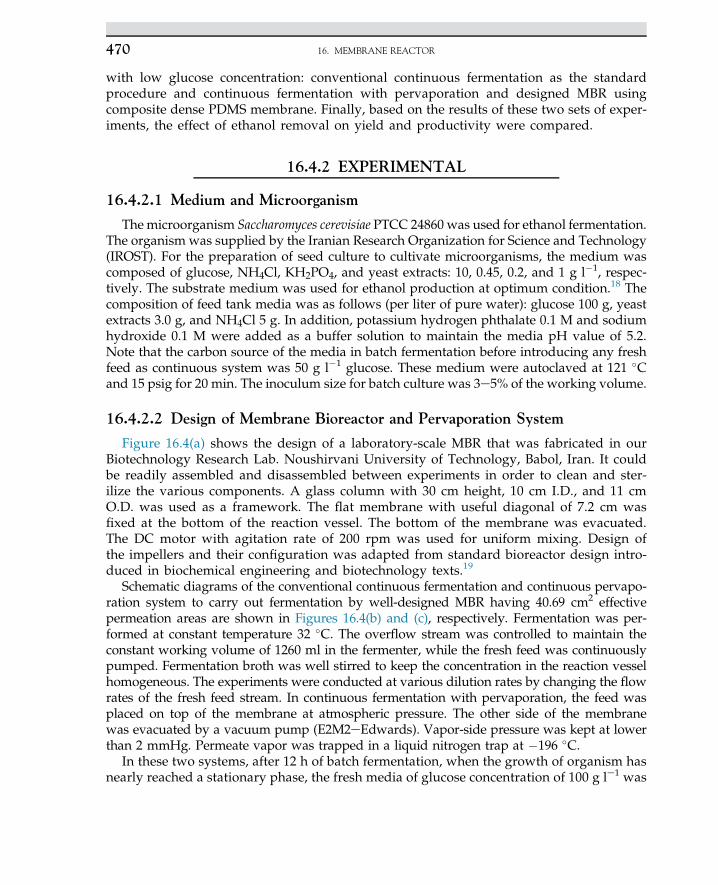
with low glucose concentration: conventional continuous fermentation as the standardprocedure and continuous fermentation with pervaporation and designed MBR usingcomposite dense PDMS membrane. Finally, based on the results of these two sets of exper-iments, the effect of ethanol removal on yield and productivity were compared.
16.4.2 EXPERIMENTAL
16.4.2.1 Medium and Microorganism
The microorganism Saccharomyces cerevisiae PTCC 24860 was used for ethanol fermentation.The organism was supplied by the Iranian Research Organization for Science and Technology(IROST). For the preparation of seed culture to cultivate microorganisms, the medium wascomposed of glucose, NH4Cl, KH2PO4, and yeast extracts: 10, 0.45, 0.2, and 1 g l�1, respec-tively. The substrate medium was used for ethanol production at optimum condition.18 Thecomposition of feed tank media was as follows (per liter of pure water): glucose 100 g, yeastextracts 3.0 g, and NH4Cl 5 g. In addition, potassium hydrogen phthalate 0.1 M and sodiumhydroxide 0.1 M were added as a buffer solution to maintain the media pH value of 5.2.Note that the carbon source of the media in batch fermentation before introducing any freshfeed as continuous system was 50 g l�1 glucose. These medium were autoclaved at 121 �Cand 15 psig for 20 min. The inoculum size for batch culture was 3e5% of the working volume.
16.4.2.2 Design of Membrane Bioreactor and Pervaporation System
Figure 16.4(a) shows the design of a laboratory-scale MBR that was fabricated in ourBiotechnology Research Lab. Noushirvani University of Technology, Babol, Iran. It couldbe readily assembled and disassembled between experiments in order to clean and ster-ilize the various components. A glass column with 30 cm height, 10 cm I.D., and 11 cmO.D. was used as a framework. The flat membrane with useful diagonal of 7.2 cm wasfixed at the bottom of the reaction vessel. The bottom of the membrane was evacuated.The DC motor with agitation rate of 200 rpm was used for uniform mixing. Design ofthe impellers and their configuration was adapted from standard bioreactor design intro-duced in biochemical engineering and biotechnology texts.19
Schematic diagrams of the conventional continuous fermentation and continuous pervapo-ration system to carry out fermentation by well-designed MBR having 40.69 cm2 effectivepermeation areas are shown in Figures 16.4(b) and (c), respectively. Fermentation was per-formed at constant temperature 32 �C. The overflow stream was controlled to maintain theconstant working volume of 1260 ml in the fermenter, while the fresh feed was continuouslypumped. Fermentation broth was well stirred to keep the concentration in the reaction vesselhomogeneous. The experiments were conducted at various dilution rates by changing the flowrates of the fresh feed stream. In continuous fermentation with pervaporation, the feed wasplaced on top of the membrane at atmospheric pressure. The other side of the membranewas evacuated by a vacuum pump (E2M2eEdwards). Vapor-side pressure was kept at lowerthan 2 mmHg. Permeate vapor was trapped in a liquid nitrogen trap at �196 �C.
In these two systems, after 12 h of batch fermentation, when the growth of organism hasnearly reached a stationary phase, the fresh media of glucose concentration of 100 g le1 was
16. MEMBRANE REACTOR470
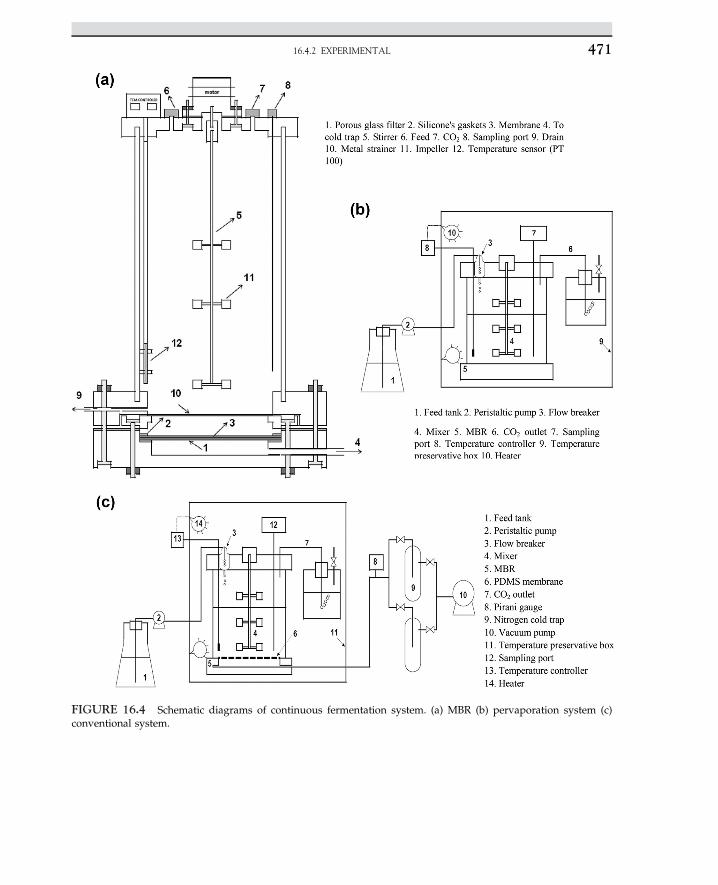
FIGURE 16.4 Schematic diagrams of continuous fermentation system. (a) MBR (b) pervaporation system (c)conventional system.
16.4.2 EXPERIMENTAL 471
fed to the bioreactor with defined flow rate. In the pervaporation system, the fresh mediumfed to the MBR and pervaporation has started. In continuous operation of MBR, the sys-tems were allowed to come to a steady state condition. Samplings of residue were per-formed every 4 h to confirm whether the steady state was achieved. When the cell,glucose, and ethanol concentrations remained constant, steady state condition was deter-mined. After sufficient data collection, then for next setting the fresh feed flow rate waschanged. The dilution rates of 0.04e0.24 h�1 were based on the ratio of the total workingvolume of the bioreactor and the calculated and recorded fresh feed flow rates in the rangeof 50.4e302.4 ml h�1.
16.4.2.3 Membrane
In this work, a dense composite PDMS and asymmetric hydrophobic/organophilic mem-brane manufactured by Pervatech Corporation (Netherlands), which is well known as beingan ethanol-permselective membrane, was used. The membrane was flat sheet form, and itwas tested for the enrichment of produced ethanol in continuous fermentation using perva-poration method. The thickness of the membrane was 3e5 mm PDMS on the top layer, sup-ported by PET with a thickness of 100 mm. The intermediate UF membrane was a type ofpolyimide (PI) with a thickness of 150 mm.
16.4.2.4 Analysis
The cell concentration was evaluated via optical density measurement based on developedcalibration curve. The optical density was measured at 620 nm using a spectrophotometer(Unico, USA). Determination of glucose concentration was performed in collected 3 ml sam-ples, and the cell from the sample was separated by micro centrifuge at 7000 g for 7 min(Hermle, model: Z 233 M-2 (Germany)). Finally, glucose concentration was determined bycolorimetric method using DNS reagent.20 Also, ethanol concentration was measured usinga gas chromatograph (Agilent, 7890A) equipped with a flame ionization detector (FID).The stainless steel packed column of 1.83 m length and 2.1 mm I.D., 80/100 mesh PorapakQ (Supelco, USA) was used. The initial oven temperature was 120 �C held for 1 min. Then,oven temperature was programmed with a rate of 40 �C min�1 until it reached 185 �C,and remained at the set temperature for 8.5 min. The detector temperature was 225 �C.Nitrogen as the carrier gas with a flow rate of 30 ml min�1 was used. Also, 2-propanol or pro-pionic acid (Merck, Germany) was prepared in 10% (v/v) as internal standard and added bya micropipette (Labnet, Germany), exactly 50 ml into 0.5 ml of each sample.
16.4.3 RESULTS AND DISCUSSION
16.4.3.1 Conventional Continuous Fermentation
At first, in order to obtain the performance of basic cultivation process, conventionalcontinuous fermentation experiments with dilution rates of 0.04e0.24 h�1 were performed.
16. MEMBRANE REACTOR472
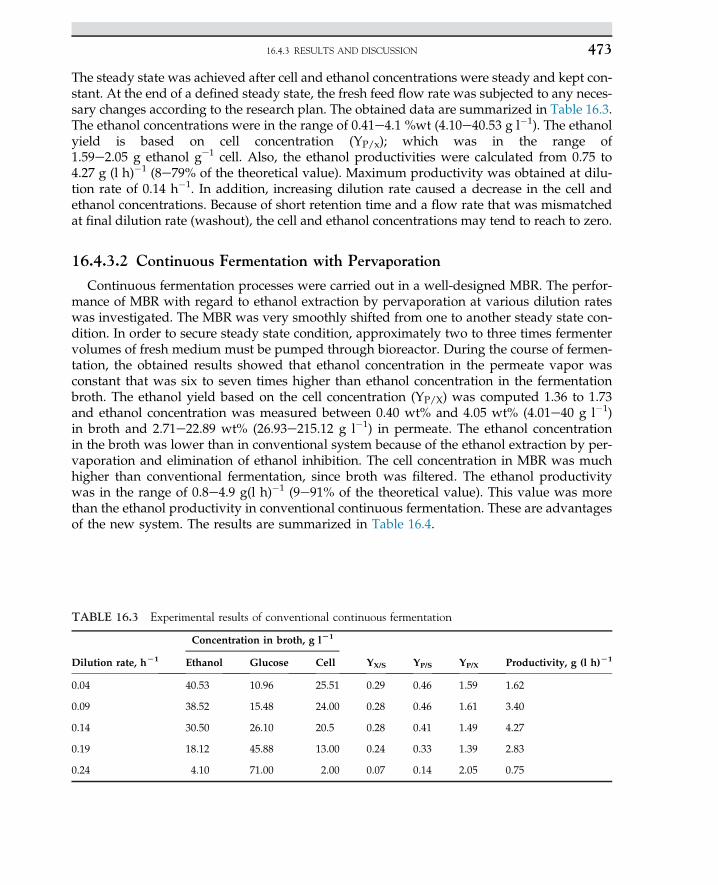
The steady state was achieved after cell and ethanol concentrations were steady and kept con-stant. At the end of a defined steady state, the fresh feed flow rate was subjected to any neces-sary changes according to the research plan. The obtained data are summarized in Table 16.3.The ethanol concentrations were in the range of 0.41e4.1 %wt (4.10e40.53 g l�1). The ethanolyield is based on cell concentration (YP/x); which was in the range of1.59e2.05 g ethanol ge1 cell. Also, the ethanol productivities were calculated from 0.75 to4.27 g (l h)�1 (8e79% of the theoretical value). Maximum productivity was obtained at dilu-tion rate of 0.14 h�1. In addition, increasing dilution rate caused a decrease in the cell andethanol concentrations. Because of short retention time and a flow rate that was mismatchedat final dilution rate (washout), the cell and ethanol concentrations may tend to reach to zero.
16.4.3.2 Continuous Fermentation with Pervaporation
Continuous fermentation processes were carried out in a well-designed MBR. The perfor-mance of MBR with regard to ethanol extraction by pervaporation at various dilution rateswas investigated. The MBR was very smoothly shifted from one to another steady state con-dition. In order to secure steady state condition, approximately two to three times fermentervolumes of fresh medium must be pumped through bioreactor. During the course of fermen-tation, the obtained results showed that ethanol concentration in the permeate vapor wasconstant that was six to seven times higher than ethanol concentration in the fermentationbroth. The ethanol yield based on the cell concentration (YP/X) was computed 1.36 to 1.73and ethanol concentration was measured between 0.40 wt% and 4.05 wt% (4.01e40 g l�1)in broth and 2.71e22.89 wt% (26.93e215.12 g l�1) in permeate. The ethanol concentrationin the broth was lower than in conventional system because of the ethanol extraction by per-vaporation and elimination of ethanol inhibition. The cell concentration in MBR was muchhigher than conventional fermentation, since broth was filtered. The ethanol productivitywas in the range of 0.8e4.9 g(l h)�1 (9e91% of the theoretical value). This value was morethan the ethanol productivity in conventional continuous fermentation. These are advantagesof the new system. The results are summarized in Table 16.4.
TABLE 16.3 Experimental results of conventional continuous fermentation
Dilution rate, hL1
Concentration in broth, g lL1
YX/S YP/S YP/X Productivity, g (l h)L1Ethanol Glucose Cell
0.04 40.53 10.96 25.51 0.29 0.46 1.59 1.62
0.09 38.52 15.48 24.00 0.28 0.46 1.61 3.40
0.14 30.50 26.10 20.5 0.28 0.41 1.49 4.27
0.19 18.12 45.88 13.00 0.24 0.33 1.39 2.83
0.24 4.10 71.00 2.00 0.07 0.14 2.05 0.75
16.4.3 RESULTS AND DISCUSSION 473
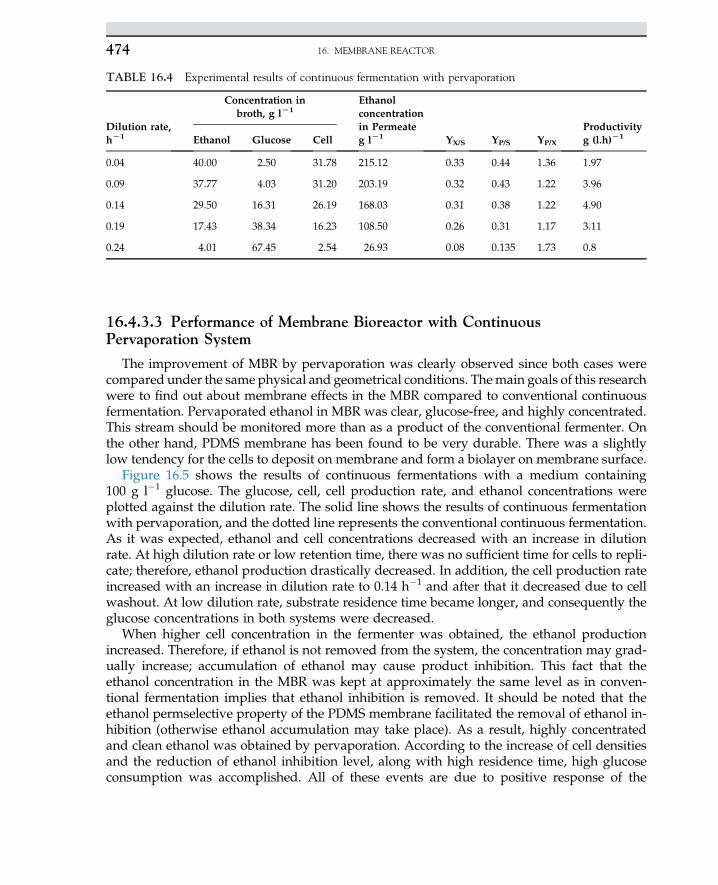
16.4.3.3 Performance of Membrane Bioreactor with ContinuousPervaporation System
The improvement of MBR by pervaporation was clearly observed since both cases werecompared under the same physical and geometrical conditions. Themain goals of this researchwere to find out about membrane effects in the MBR compared to conventional continuousfermentation. Pervaporated ethanol in MBR was clear, glucose-free, and highly concentrated.This stream should be monitored more than as a product of the conventional fermenter. Onthe other hand, PDMS membrane has been found to be very durable. There was a slightlylow tendency for the cells to deposit on membrane and form a biolayer on membrane surface.
Figure 16.5 shows the results of continuous fermentations with a medium containing100 g l�1 glucose. The glucose, cell, cell production rate, and ethanol concentrations wereplotted against the dilution rate. The solid line shows the results of continuous fermentationwith pervaporation, and the dotted line represents the conventional continuous fermentation.As it was expected, ethanol and cell concentrations decreased with an increase in dilutionrate. At high dilution rate or low retention time, there was no sufficient time for cells to repli-cate; therefore, ethanol production drastically decreased. In addition, the cell production rateincreased with an increase in dilution rate to 0.14 h�1 and after that it decreased due to cellwashout. At low dilution rate, substrate residence time became longer, and consequently theglucose concentrations in both systems were decreased.
When higher cell concentration in the fermenter was obtained, the ethanol productionincreased. Therefore, if ethanol is not removed from the system, the concentration may grad-ually increase; accumulation of ethanol may cause product inhibition. This fact that theethanol concentration in the MBR was kept at approximately the same level as in conven-tional fermentation implies that ethanol inhibition is removed. It should be noted that theethanol permselective property of the PDMS membrane facilitated the removal of ethanol in-hibition (otherwise ethanol accumulation may take place). As a result, highly concentratedand clean ethanol was obtained by pervaporation. According to the increase of cell densitiesand the reduction of ethanol inhibition level, along with high residence time, high glucoseconsumption was accomplished. All of these events are due to positive response of the
TABLE 16.4 Experimental results of continuous fermentation with pervaporation
Dilution rate,hL1
Concentration inbroth, g lL1
Ethanolconcentrationin Permeateg lL1 YX/S YP/S YP/X
Productivityg (l.h)L1Ethanol Glucose Cell
0.04 40.00 2.50 31.78 215.12 0.33 0.44 1.36 1.97
0.09 37.77 4.03 31.20 203.19 0.32 0.43 1.22 3.96
0.14 29.50 16.31 26.19 168.03 0.31 0.38 1.22 4.90
0.19 17.43 38.34 16.23 108.50 0.26 0.31 1.17 3.11
0.24 4.01 67.45 2.54 26.93 0.08 0.135 1.73 0.8
16. MEMBRANE REACTOR474
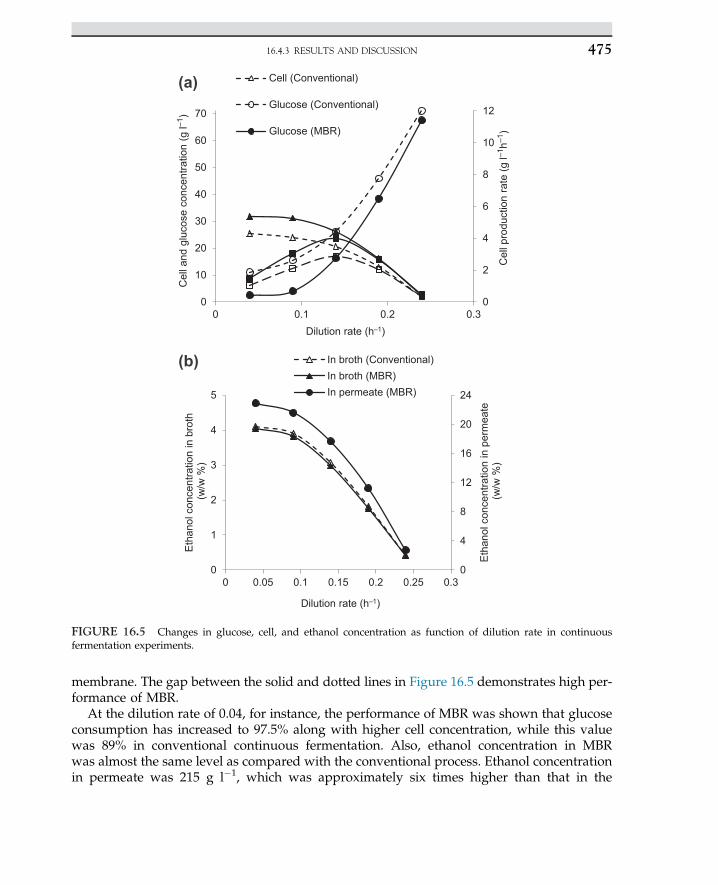
membrane. The gap between the solid and dotted lines in Figure 16.5 demonstrates high per-formance of MBR.
At the dilution rate of 0.04, for instance, the performance of MBR was shown that glucoseconsumption has increased to 97.5% along with higher cell concentration, while this valuewas 89% in conventional continuous fermentation. Also, ethanol concentration in MBRwas almost the same level as compared with the conventional process. Ethanol concentrationin permeate was 215 g l�1, which was approximately six times higher than that in the
Dilution rate (h–1)
Cell (Conventional)
Glucose (Conventional)
Cel
l and
glu
cose
con
cent
ratio
n (g
l–1)
0
2
4
6
8
10
12
0
10
20
30
40
50
60
70
0 0.1 0.2 0.3
Cel
l pro
duct
ion
rate
(g l–1
h–1)Glucose (MBR)
0
4
8
12
16
20
24
0
1
2
3
4
5
0 0.05 0.1 0.15 0.2 0.25 0.3
Eth
anol
con
cent
ratio
n in
per
mea
te(w
/w %
)
Eth
anol
con
cent
ratio
n in
bro
th(w
/w %
)
Dilution rate (h–1)
In broth (Conventional)In broth (MBR)In permeate (MBR)
(a)
(b)
FIGURE 16.5 Changes in glucose, cell, and ethanol concentration as function of dilution rate in continuousfermentation experiments.
16.4.3 RESULTS AND DISCUSSION 475
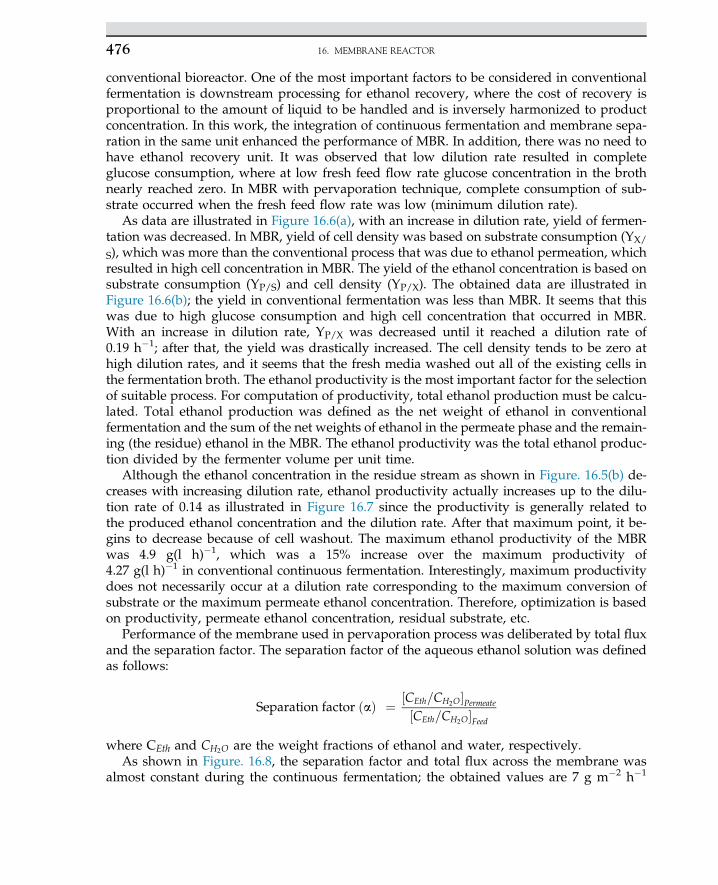
conventional bioreactor. One of the most important factors to be considered in conventionalfermentation is downstream processing for ethanol recovery, where the cost of recovery isproportional to the amount of liquid to be handled and is inversely harmonized to productconcentration. In this work, the integration of continuous fermentation and membrane sepa-ration in the same unit enhanced the performance of MBR. In addition, there was no need tohave ethanol recovery unit. It was observed that low dilution rate resulted in completeglucose consumption, where at low fresh feed flow rate glucose concentration in the brothnearly reached zero. In MBR with pervaporation technique, complete consumption of sub-strate occurred when the fresh feed flow rate was low (minimum dilution rate).
As data are illustrated in Figure 16.6(a), with an increase in dilution rate, yield of fermen-tation was decreased. In MBR, yield of cell density was based on substrate consumption (YX/
S), which was more than the conventional process that was due to ethanol permeation, whichresulted in high cell concentration in MBR. The yield of the ethanol concentration is based onsubstrate consumption (YP/S) and cell density (YP/X). The obtained data are illustrated inFigure 16.6(b); the yield in conventional fermentation was less than MBR. It seems that thiswas due to high glucose consumption and high cell concentration that occurred in MBR.With an increase in dilution rate, YP/X was decreased until it reached a dilution rate of0.19 h�1; after that, the yield was drastically increased. The cell density tends to be zero athigh dilution rates, and it seems that the fresh media washed out all of the existing cells inthe fermentation broth. The ethanol productivity is the most important factor for the selectionof suitable process. For computation of productivity, total ethanol production must be calcu-lated. Total ethanol production was defined as the net weight of ethanol in conventionalfermentation and the sum of the net weights of ethanol in the permeate phase and the remain-ing (the residue) ethanol in the MBR. The ethanol productivity was the total ethanol produc-tion divided by the fermenter volume per unit time.
Although the ethanol concentration in the residue stream as shown in Figure. 16.5(b) de-creases with increasing dilution rate, ethanol productivity actually increases up to the dilu-tion rate of 0.14 as illustrated in Figure 16.7 since the productivity is generally related tothe produced ethanol concentration and the dilution rate. After that maximum point, it be-gins to decrease because of cell washout. The maximum ethanol productivity of the MBRwas 4.9 g(l h)�1, which was a 15% increase over the maximum productivity of4.27 g(l h)�1 in conventional continuous fermentation. Interestingly, maximum productivitydoes not necessarily occur at a dilution rate corresponding to the maximum conversion ofsubstrate or the maximum permeate ethanol concentration. Therefore, optimization is basedon productivity, permeate ethanol concentration, residual substrate, etc.
Performance of the membrane used in pervaporation process was deliberated by total fluxand the separation factor. The separation factor of the aqueous ethanol solution was definedas follows:
Separation factor ðaÞ ¼ ½CEth=CH2O�Permeate
½CEth=CH2O�Feedwhere CEth and CH2O are the weight fractions of ethanol and water, respectively.
As shown in Figure. 16.8, the separation factor and total flux across the membrane wasalmost constant during the continuous fermentation; the obtained values are 7 g m�2 h�1
16. MEMBRANE REACTOR476
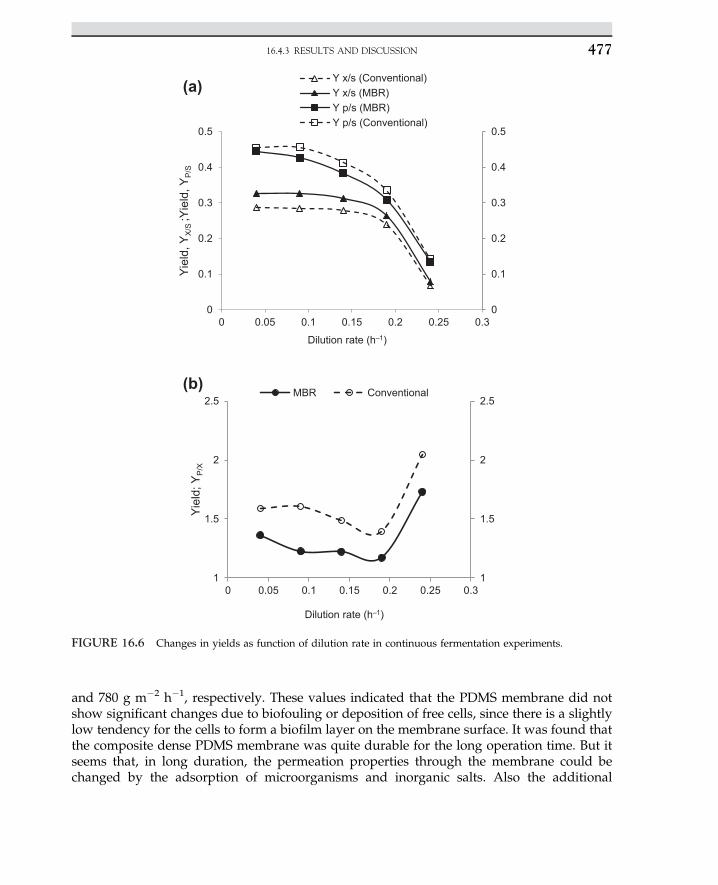
and 780 g m�2 h�1, respectively. These values indicated that the PDMS membrane did notshow significant changes due to biofouling or deposition of free cells, since there is a slightlylow tendency for the cells to form a biofilm layer on the membrane surface. It was found thatthe composite dense PDMS membrane was quite durable for the long operation time. But itseems that, in long duration, the permeation properties through the membrane could bechanged by the adsorption of microorganisms and inorganic salts. Also the additional
0
0.1
0.2
0.3
0.4
0.5
0
0.1
0.2
0.3
0.4
0.5
0 0.05 0.1 0.15 0.2 0.25 0.3
Yie
ld, Y
X/S
;Yie
ld, Y
P/S
Dilution rate (h–1)
Y x/s (Conventional)Y x/s (MBR)Y p/s (MBR)Y p/s (Conventional)
1
1.5
2
2.5
1
1.5
2
2.5
0 0.05 0.1 0.15 0.2 0.25 0.3
Yie
ld; Y
P/X
Dilution rate (h–1)
MBR Conventional
(a)
(b)
FIGURE 16.6 Changes in yields as function of dilution rate in continuous fermentation experiments.
16.4.3 RESULTS AND DISCUSSION 477
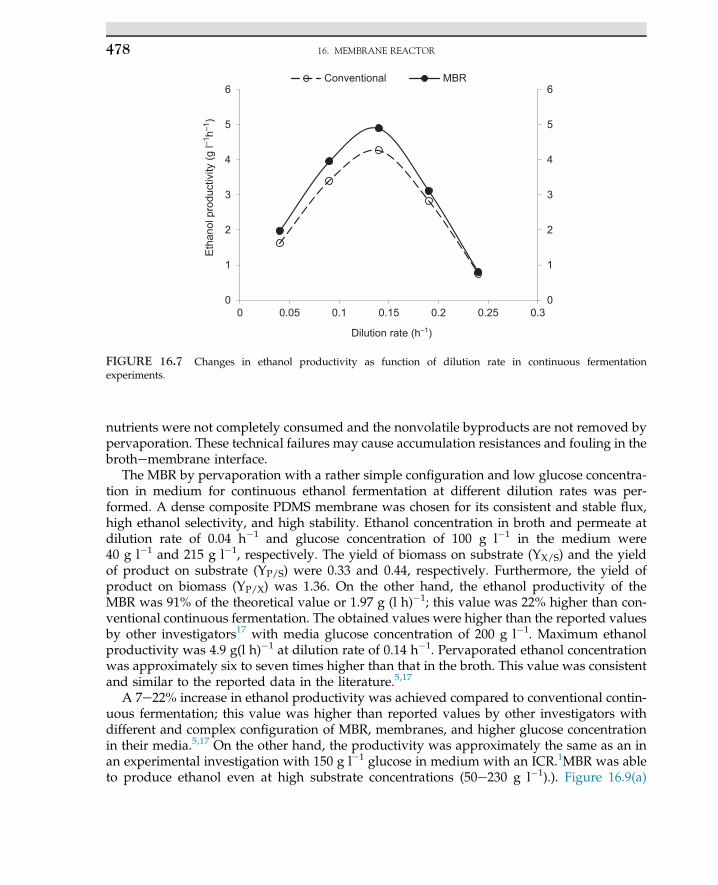
nutrients were not completely consumed and the nonvolatile byproducts are not removed bypervaporation. These technical failures may cause accumulation resistances and fouling in thebrothemembrane interface.
The MBR by pervaporation with a rather simple configuration and low glucose concentra-tion in medium for continuous ethanol fermentation at different dilution rates was per-formed. A dense composite PDMS membrane was chosen for its consistent and stable flux,high ethanol selectivity, and high stability. Ethanol concentration in broth and permeate atdilution rate of 0.04 h�1 and glucose concentration of 100 g l�1 in the medium were40 g l�1 and 215 g l�1, respectively. The yield of biomass on substrate (YX/S) and the yieldof product on substrate (YP/S) were 0.33 and 0.44, respectively. Furthermore, the yield ofproduct on biomass (YP/X) was 1.36. On the other hand, the ethanol productivity of theMBR was 91% of the theoretical value or 1.97 g (l h)�1; this value was 22% higher than con-ventional continuous fermentation. The obtained values were higher than the reported valuesby other investigators17 with media glucose concentration of 200 g l�1. Maximum ethanolproductivity was 4.9 g(l h)�1 at dilution rate of 0.14 h�1. Pervaporated ethanol concentrationwas approximately six to seven times higher than that in the broth. This value was consistentand similar to the reported data in the literature.5,17
A 7e22% increase in ethanol productivity was achieved compared to conventional contin-uous fermentation; this value was higher than reported values by other investigators withdifferent and complex configuration of MBR, membranes, and higher glucose concentrationin their media.5,17 On the other hand, the productivity was approximately the same as an inan experimental investigation with 150 g le1 glucose in medium with an ICR.1MBR was ableto produce ethanol even at high substrate concentrations (50e230 g l�1).). Figure 16.9(a)
0
1
2
3
4
5
6
0
1
2
3
4
5
6
0 0.05 0.1 0.15 0.2 0.25 0.3
Eth
anol
pro
duct
ivity
(g l–1
h–1)
Dilution rate (h–1)
Conventional MBR
FIGURE 16.7 Changes in ethanol productivity as function of dilution rate in continuous fermentationexperiments.
16. MEMBRANE REACTOR478
shows changes of cell and glucose concentration and ethanol productivity versus substrateconcentration. In addition, changes of ethanol concentration in broth and permeate phaseare illustrated in Figure 16.9(b). Experiments were performed at optimum dilution rate of0.14 h�1. Table 16.5 shows ethanol concentrations in broth and permeate with various sub-strate concentrations. As carbohydrate concentration increased, the ethanol concentrationsin permeate also increased, while productivity from 5.04 g (l h)�1 for 170 g l�1 substratedecreased to 4.56 g (l h)�1 for 235 g l�1 substrate. Decrease in ethanol productivity at veryhigh substrate concentration might be due to MBR limitation as cell densities may graduallyaccumulate in the retentive broth. In addition, biofouling may form on membrane surface forhigh dense broth. In order to enhance ethanol productivity in MBR with very high substrateconcentration, more than 200 g l�1 of either a different type of membrane with high ethanolselectivity must be used or another configuration of MBR with high flux area is required. Thisissue may require more investigation; further research has to be conducted to justify the exist-ing facts.
6
6.5
7
7.5
8
6
6.5
7
7.5
8
0 0.05 0.1 0.15 0.2 0.25 0.3
Sep
arat
ion
fact
or
Dilution rate (h–1)
600
650
700
750
800
850
900
600
650
700
750
800
850
900
0 0.05 0.1 0.15 0.2 0.25 0.3
Flux
(gm
–2h–1
)
Dilution rate (h–1)
FIGURE 16.8 Pervaporation performance through the permselective polydimethylsiloxane membrane.
16.4.3 RESULTS AND DISCUSSION 479
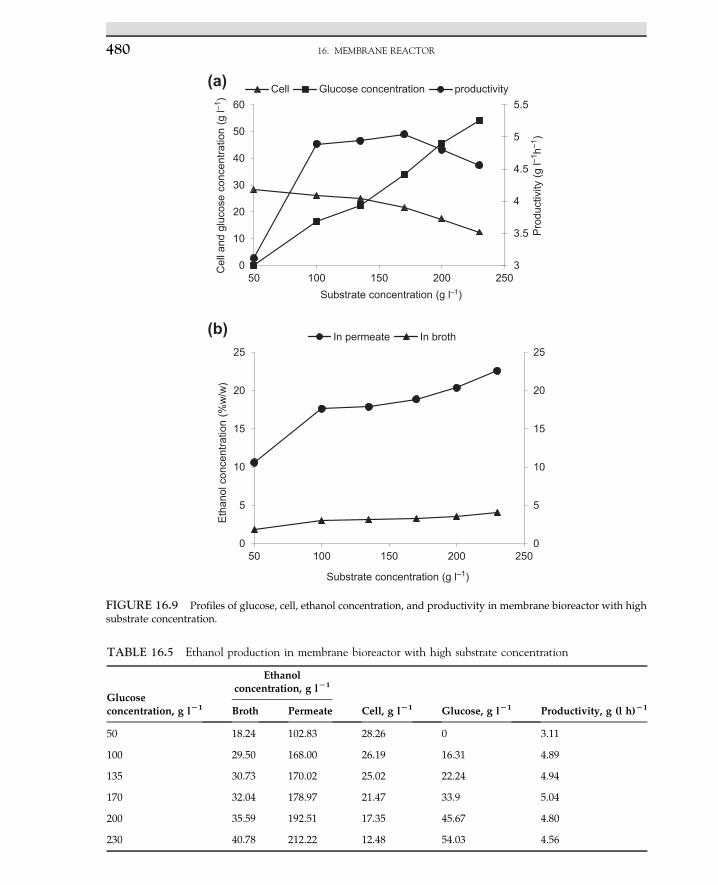
3
3.5
4
4.5
5
5.5
0
10
20
30
40
50
60
50 100 150 200 250
Pro
duct
ivity
(g l–1
h–1)
Cel
l and
glu
cose
con
cent
ratio
n (g
l–1)
Substrate concentration (g l–1)
Cell Glucose concentration productivity(a)
0
5
10
15
20
25
0
5
10
15
20
25
50 100 150 200 250
Eth
anol
con
cent
ratio
n (%
w/w
)
Substrate concentration (g l–1)
In permeate In broth(b)
FIGURE 16.9 Profiles of glucose, cell, ethanol concentration, and productivity in membrane bioreactor with highsubstrate concentration.
TABLE 16.5 Ethanol production in membrane bioreactor with high substrate concentration
Glucoseconcentration, g lL1
Ethanolconcentration, g lL1
Cell, g lL1 Glucose, g lL1 Productivity, g (l h)L1Broth Permeate
50 18.24 102.83 28.26 0 3.11
100 29.50 168.00 26.19 16.31 4.89
135 30.73 170.02 25.02 22.24 4.94
170 32.04 178.97 21.47 33.9 5.04
200 35.59 192.51 17.35 45.67 4.80
230 40.78 212.22 12.48 54.03 4.56
16. MEMBRANE REACTOR480
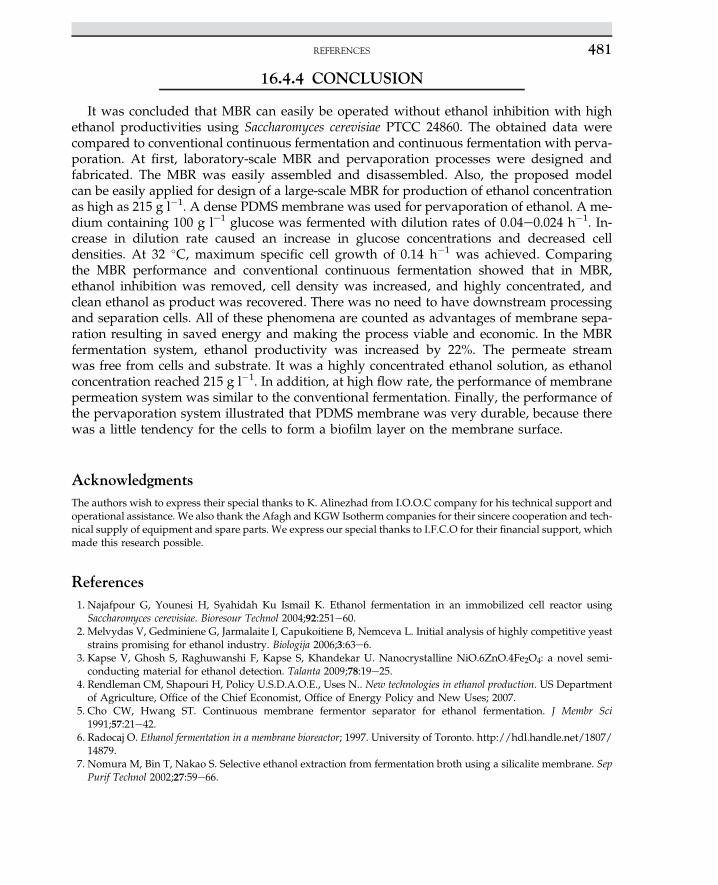
16.4.4 CONCLUSION
It was concluded that MBR can easily be operated without ethanol inhibition with highethanol productivities using Saccharomyces cerevisiae PTCC 24860. The obtained data werecompared to conventional continuous fermentation and continuous fermentation with perva-poration. At first, laboratory-scale MBR and pervaporation processes were designed andfabricated. The MBR was easily assembled and disassembled. Also, the proposed modelcan be easily applied for design of a large-scale MBR for production of ethanol concentrationas high as 215 g l�1. A dense PDMS membrane was used for pervaporation of ethanol. A me-dium containing 100 g le1 glucose was fermented with dilution rates of 0.04e0.024 h�1. In-crease in dilution rate caused an increase in glucose concentrations and decreased celldensities. At 32 �C, maximum specific cell growth of 0.14 h�1 was achieved. Comparingthe MBR performance and conventional continuous fermentation showed that in MBR,ethanol inhibition was removed, cell density was increased, and highly concentrated, andclean ethanol as product was recovered. There was no need to have downstream processingand separation cells. All of these phenomena are counted as advantages of membrane sepa-ration resulting in saved energy and making the process viable and economic. In the MBRfermentation system, ethanol productivity was increased by 22%. The permeate streamwas free from cells and substrate. It was a highly concentrated ethanol solution, as ethanolconcentration reached 215 g l�1. In addition, at high flow rate, the performance of membranepermeation system was similar to the conventional fermentation. Finally, the performance ofthe pervaporation system illustrated that PDMS membrane was very durable, because therewas a little tendency for the cells to form a biofilm layer on the membrane surface.
AcknowledgmentsThe authors wish to express their special thanks to K. Alinezhad from I.O.O.C company for his technical support andoperational assistance. We also thank the Afagh and KGW Isotherm companies for their sincere cooperation and tech-nical supply of equipment and spare parts. We express our special thanks to I.F.C.O for their financial support, whichmade this research possible.
References1. Najafpour G, Younesi H, Syahidah Ku Ismail K. Ethanol fermentation in an immobilized cell reactor usingSaccharomyces cerevisiae. Bioresour Technol 2004;92:251e60.
2. Melvydas V, Gedminiene G, Jarmalaite I, Capukoitiene B, Nemceva L. Initial analysis of highly competitive yeaststrains promising for ethanol industry. Biologija 2006;3:63e6.
3. Kapse V, Ghosh S, Raghuwanshi F, Kapse S, Khandekar U. Nanocrystalline NiO.6ZnO.4Fe2O4: a novel semi-conducting material for ethanol detection. Talanta 2009;78:19e25.
4. Rendleman CM, Shapouri H, Policy U.S.D.A.O.E., Uses N.. New technologies in ethanol production. US Departmentof Agriculture, Office of the Chief Economist, Office of Energy Policy and New Uses; 2007.
5. Cho CW, Hwang ST. Continuous membrane fermentor separator for ethanol fermentation. J Membr Sci1991;57:21e42.
6. Radocaj O. Ethanol fermentation in a membrane bioreactor; 1997. University of Toronto. http://hdl.handle.net/1807/14879.
7. Nomura M, Bin T, Nakao S. Selective ethanol extraction from fermentation broth using a silicalite membrane. SepPurif Technol 2002;27:59e66.
REFERENCES 481
8. Moueddeb H, Sanchez J, Bardot C, Fick M. Membrane bioreactor for lactic acid production. J Membr Sci1996;114:59e71.
9. González-Velasco J, González-Marcos J, López-Dehesa C. Pervaporation of ethanolewater mixtures through poly(1-trimethylsilyl-1-propyne) (PTMSP) membranes. Desalination 2002;149:61e5.
10. Vane LM. A review of pervaporation for product recovery from biomass fermentation processes. J Chem TechnolBiotechnol 2005;80:603e29.
11. Takegami S, Yamada H, Tsujii S. Pervaporation of ethanolewater mixtures using novel hydrophobic membranescontaining polydimethylsiloxane. J Membr Sci 1992;75:93e105.
12. Li L, Xiao Z, Tan S, Pu L, Zhang Z. Composite PDMSmembrane with high flux for the separation of organics fromwater by pervaporation. J Membr Sci 2004;243:177e87.
13. Xiangli F, Chen Y, Jin W, Xu N. Polydimethylsiloxane (PDMS)/ceramic composite membrane with high flux forpervaporation of ethanolewater mixtures. Ind Eng Chem Res 2007;46:2224e30.
14. Molina JM, Vatai G, Bekassy-Molnar E. Comparison of pervaporation of different alcohols from water onCMG-OM-010 and 1060-SULZER membranes. Desalination 2002;149:89e94.
15. Huang Y, Fu J, Pan Y, Huang X, Tang X. Pervaporation of ethanol aqueous solution by polyphosphazenemembranes: effect of pendant groups. Sep Purif Technol 2009;66:504e9.
16. Hoover KC, Hwang ST. Pervaporation by a continuous membrane column. J Membr Sci 1982;10:253e71.17. Nakao S, Saitoh F, Asakura T, Toda K, Kimura S. Continuous ethanol extraction by pervaporation from a
membrane bioreactor. J Membr Sci 1987;30:273e87.18. Esfahanian M, Najafpour GD, Ghoreyshi AA, Younesi H, Ahmad AL. Optimization of ethanol production by
Saccharomyces cerevisiae as function of pH and temperature: batch fermentation. In: ICENV 2010, Penang, Malaysia;2010.
19. Najafpour GD. Biochemical engineering and biotechnology. Elsevier Science; 2006.20. Thomas LC, Chamberlin GJ, Shute G, Tintometer limited S., England. Colorimetric chemical analytical methods.
England: Tintometer; 1980.
16. MEMBRANE REACTOR482
S U B C H A P T E R
16.5Case Study: Inorganic Zirconia g-Alumina-Coated
Membrane on Ceramic Support*
16.5.1 INTRODUCTION
Membrane separation represents a new type of unit operation, which, ultimately, is ex-pected to be replaced by significant use of conventional separation processes. The advan-tage of membrane separation lies in its relatively low energy requirements. The reasonfor low energy consumption is that, unlike conventional processes such as distillation,extraction, and crystallization, it generally does not feature phase transition. The rapiddevelopment of membranes in wastewater treatment encourages the development andfabrication of an inorganic membrane. The results expand knowledge and produce varioustypes of ceramic membrane.1
The ceramic membrane has a great potential and market. It represents a distinct class ofinorganic membrane. In particular, metallic-coated membranes have many industrial appli-cations. The potential of ceramic membranes in separation, filtration, and catalytic reactionshas favored research on synthesis, characterization, and property improvement of inorganicmembranes because of their unique features compared with other types of membrane. Muchattention has focused on inorganic membranes, which are superior to organic ones in ther-mal, chemical, and mechanical stability, and resistance to microbial degradation.
Alumina membranes have recently received considerable attention for their use in a widerange of applications. Alumina is the most cost-effective and widely used material in the fam-ily of engineering ceramics. The raw materials from which this high-performance technical-grade ceramic is made are readily available and reasonably priced, resulting in good valuefor the cost in fabricated alumina shapes, with an excellent combination of properties andan attractive price. For commercial membrane applications, a-Al2O3 and g-Al2O3 are themost common membranes. a-Al2O3 membranes are well known for their thermal and hydro-thermal stabilities beyond 1000 �C.
An inorganic membrane can be prepared by various methods such as solegel, phase separa-tion, and leaching.2,3 The solegel process is considered the most practical method among thoseused to prepare inorganic membrane. Solegel processing is a simple technology in principlebut requires considerable effort to become of practical use. The advantage of this technology is
*This case study was partially written with contributions from:Abdul Latif Ahmad, Membrane Technology, School of Chemical Engineering, Engineering Campus, UniversitiSains Malaysia, Nibong Tebal, Pulau Pinang, Malaysia.
16.5.1 INTRODUCTION 483
the ability to produce high-purity g-aluminamembranes at low temperatures (400e600 �C). Thepore size distribution is very narrow, and additional elements can be added.4,5 However, only g-aluminamembranes have the disadvantage of a poor chemical and thermal stability. BelowpH4,they dissolve to form Al3þ ions; above pH 12, the membrane will form Al(OH)4
�. g-Al2O3 has ahighly detective spinal structure and can be considered as an AlOxHy species, which dissolvesmore slowly, in low and high pH of the aqueous phase as strong hydroxides behave.
Meanwhile, at higher temperatures (600e900 �C), pore growth occurs. Above 850 �C, thetransformation of g-alumina upon heating is: g / q / a-alumina. The stable a-Al2O3 phaseforms above 1000 �C by nucleation and growth.6 In the transition of alumina derived fromboehmite gels, the pores are as large as the grains. These pores are unable to stop grainboundary migration when a-Al2O3 forms above 1100 �C. Hao et al.7 stated that the phasetransformation from g-Al2O3 to q-Al2O3 occurred at 900 �C for pure alumina membranes.With further heat treatment, 1200 �C and higher, a complete transformation of the q-Al2O3to the high temperature a-Al2O3 phase is observed.
Foreign additives can affect the phase transformation as well as the pore structure at hightemperatures. To inhibit dissolution of alumina species or pore growth, the particles arecoated with an inert component such as zirconia, titania, and lanthana.1 It has been reportedthat the effect of zirconia addition in alumina retarded the grain growth behavior of thealumina membrane. It was found that the ZrO2 prevents abnormal growth of Al2O3 duringheat treatment.1,3 The effect of zirconia on the phase transformation could be explained by thefact the presence of the zirconia on the g-alumina surface may reduce the possibility of thenucleation of a-alumina, thus raising the phase transformation temperature.
In this case study, a zirconia-alumina membrane has been developed using the solegeltechnique with and without support.6,7 The porous ceramic was prepared to fabricate themembrane support. A thin film of aluminum and zirconium was formed on the porousceramic support. Unsupported membrane was also prepared. The unsupported membranewas not strong enough to hold a high-pressure gradient; it was very fragile and not usefulfor independent use. The supported membrane on a highly porous ceramic was quite strong,but the coating covered the solid surface. The ceramic support was strong enough to hold anymechanical forces. Apart from the ceramic support, polyvinyl alcohol (PVA) was prepared tobe used as a binder in the preparation of zirconiaealumina membranes to avoid the forma-tion of cracks on the membrane surface. The overall process in the fabrication of membranesis shown in Figure 16.10. The uniform coating and crack-free membranes were examined byscanning electron microscopy (SEM) and light microscope (LM) photographs shown inFigures 16.11e16.14. The main part of the research activities was the preparation and devel-opment of an inorganic membrane with and without support (zirconia-coated on g-alumina).The membrane surface was characterized by SEM and LM.
In preparing the membrane, a clear sol was obtained by the addition of acid into thealuminum sec-butoxide sol to peptize the sol and obtain a stable colloid solution. Aluminummonohydroxides formed by the hydrolysis of aluminum alkoxides, which are peptizable to aclear sol. Peptization was performed by the addition of acid and heat treatment for a suffi-cient time. It was found that stable sols cannot be obtained when the concentration of the pep-tization acid is too low.
The critical range for inorganic acids such as nitric, hydrochloric, and perchloric acids is0.03e0.1 mol/mol of hydroxide. In this study, nitric acid was used as the peptizing agent.
16. MEMBRANE REACTOR484
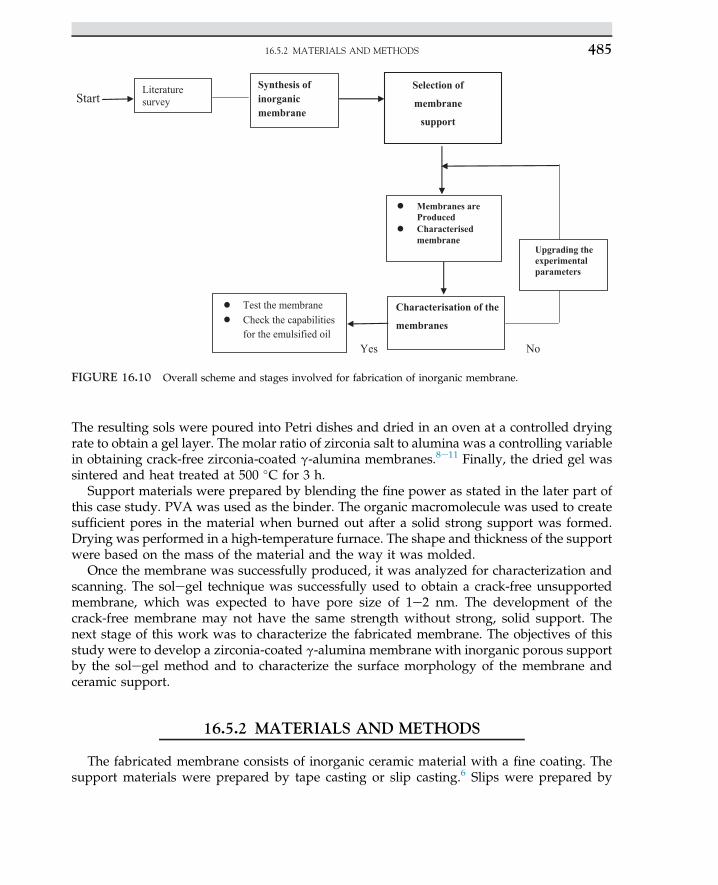
The resulting sols were poured into Petri dishes and dried in an oven at a controlled dryingrate to obtain a gel layer. The molar ratio of zirconia salt to alumina was a controlling variablein obtaining crack-free zirconia-coated g-alumina membranes.8e11 Finally, the dried gel wassintered and heat treated at 500 �C for 3 h.
Support materials were prepared by blending the fine power as stated in the later part ofthis case study. PVA was used as the binder. The organic macromolecule was used to createsufficient pores in the material when burned out after a solid strong support was formed.Drying was performed in a high-temperature furnace. The shape and thickness of the supportwere based on the mass of the material and the way it was molded.
Once the membrane was successfully produced, it was analyzed for characterization andscanning. The solegel technique was successfully used to obtain a crack-free unsupportedmembrane, which was expected to have pore size of 1e2 nm. The development of thecrack-free membrane may not have the same strength without strong, solid support. Thenext stage of this work was to characterize the fabricated membrane. The objectives of thisstudy were to develop a zirconia-coated g-alumina membrane with inorganic porous supportby the solegel method and to characterize the surface morphology of the membrane andceramic support.
16.5.2 MATERIALS AND METHODS
The fabricated membrane consists of inorganic ceramic material with a fine coating. Thesupport materials were prepared by tape casting or slip casting.6 Slips were prepared by
Literaturesurvey
Synthesis ofinorganicmembrane
Selection of
membrane
support
Membranes areProducedCharacterisedmembrane
Characterisation of the
membranes
Test the membraneCheck the capabilitiesfor the emulsified oil
Upgrading theexperimentalparameters
Yes No
Start
••
••
FIGURE 16.10 Overall scheme and stages involved for fabrication of inorganic membrane.
16.5.2 MATERIALS AND METHODS 485
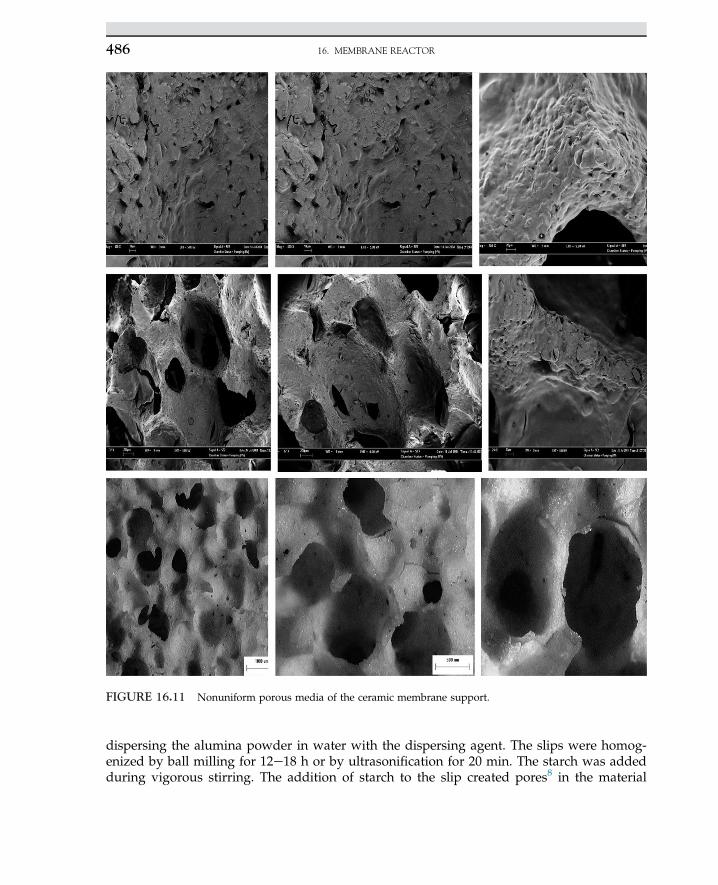
dispersing the alumina powder in water with the dispersing agent. The slips were homog-enized by ball milling for 12e18 h or by ultrasonification for 20 min. The starch was addedduring vigorous stirring. The addition of starch to the slip created pores8 in the material
FIGURE 16.11 Nonuniform porous media of the ceramic membrane support.
16. MEMBRANE REACTOR486
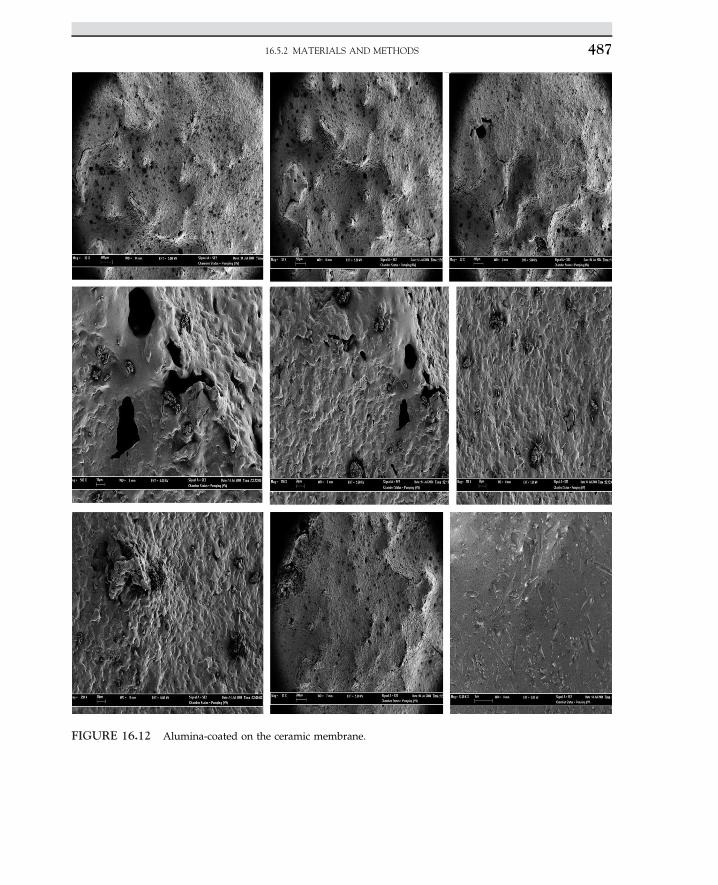
FIGURE 16.12 Alumina-coated on the ceramic membrane.
16.5.2 MATERIALS AND METHODS 487
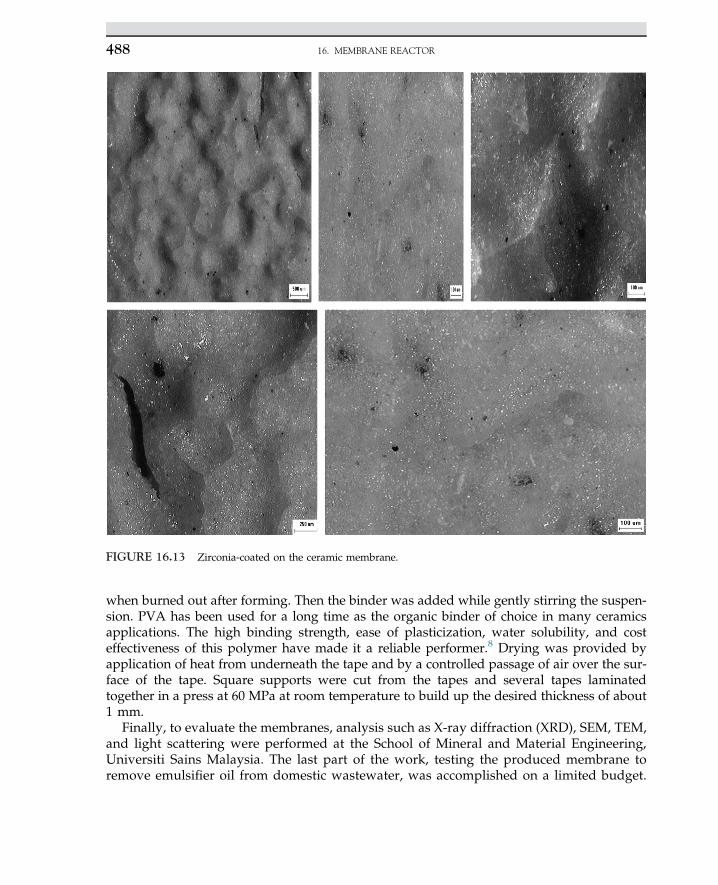
when burned out after forming. Then the binder was added while gently stirring the suspen-sion. PVA has been used for a long time as the organic binder of choice in many ceramicsapplications. The high binding strength, ease of plasticization, water solubility, and costeffectiveness of this polymer have made it a reliable performer.8 Drying was provided byapplication of heat from underneath the tape and by a controlled passage of air over the sur-face of the tape. Square supports were cut from the tapes and several tapes laminatedtogether in a press at 60 MPa at room temperature to build up the desired thickness of about1 mm.
Finally, to evaluate the membranes, analysis such as X-ray diffraction (XRD), SEM, TEM,and light scattering were performed at the School of Mineral and Material Engineering,Universiti Sains Malaysia. The last part of the work, testing the produced membrane toremove emulsifier oil from domestic wastewater, was accomplished on a limited budget.
FIGURE 16.13 Zirconia-coated on the ceramic membrane.
16. MEMBRANE REACTOR488
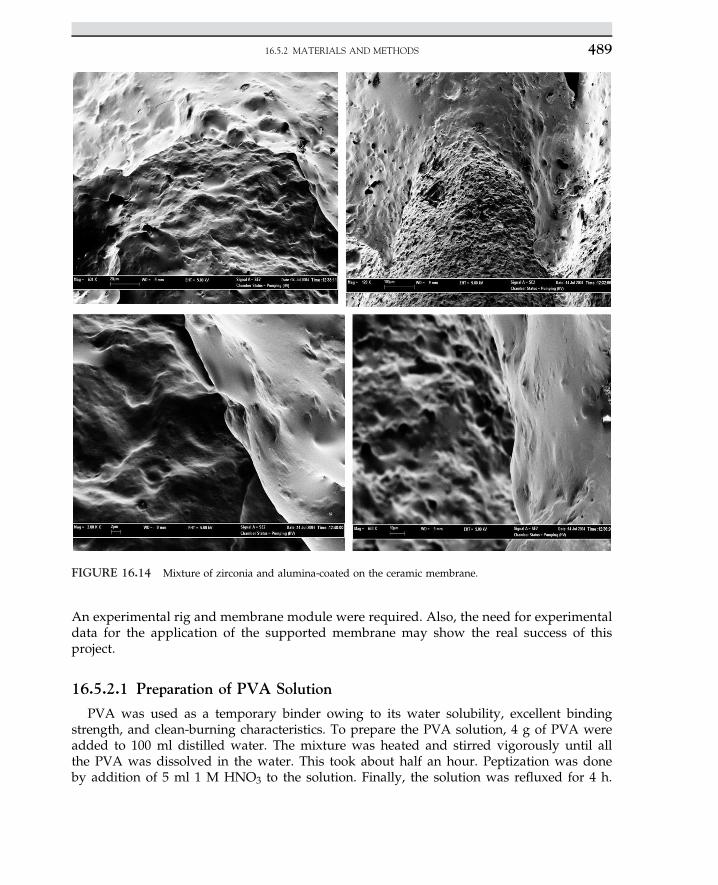
An experimental rig and membrane module were required. Also, the need for experimentaldata for the application of the supported membrane may show the real success of thisproject.
16.5.2.1 Preparation of PVA Solution
PVA was used as a temporary binder owing to its water solubility, excellent bindingstrength, and clean-burning characteristics. To prepare the PVA solution, 4 g of PVA wereadded to 100 ml distilled water. The mixture was heated and stirred vigorously until allthe PVA was dissolved in the water. This took about half an hour. Peptization was doneby addition of 5 ml 1 M HNO3 to the solution. Finally, the solution was refluxed for 4 h.
FIGURE 16.14 Mixture of zirconia and alumina-coated on the ceramic membrane.
16.5.2 MATERIALS AND METHODS 489
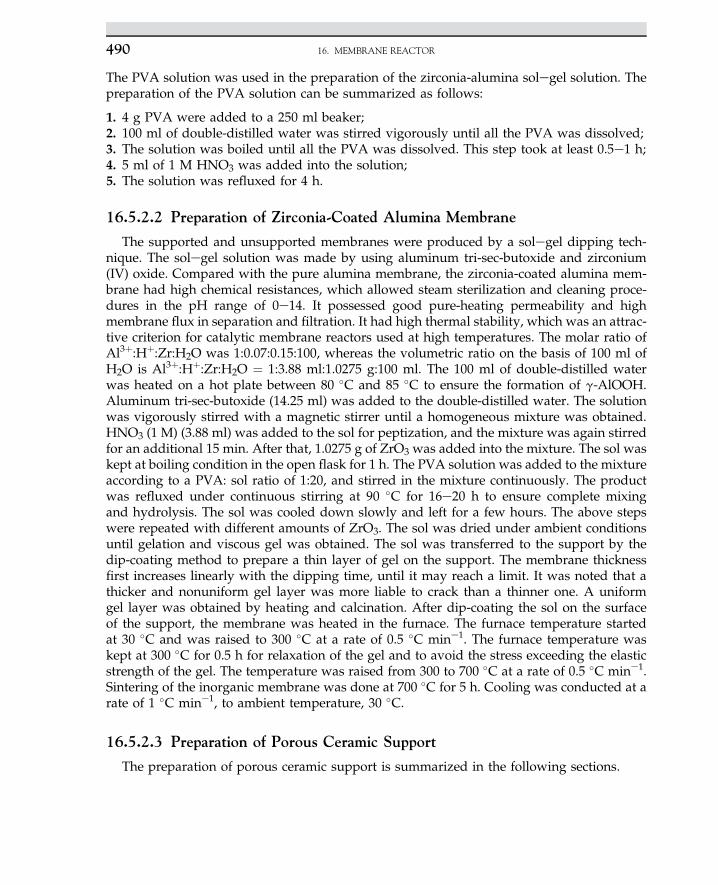
The PVA solution was used in the preparation of the zirconia-alumina solegel solution. Thepreparation of the PVA solution can be summarized as follows:
1. 4 g PVA were added to a 250 ml beaker;2. 100 ml of double-distilled water was stirred vigorously until all the PVA was dissolved;3. The solution was boiled until all the PVA was dissolved. This step took at least 0.5e1 h;4. 5 ml of 1 M HNO3 was added into the solution;5. The solution was refluxed for 4 h.
16.5.2.2 Preparation of Zirconia-Coated Alumina Membrane
The supported and unsupported membranes were produced by a solegel dipping tech-nique. The solegel solution was made by using aluminum tri-sec-butoxide and zirconium(IV) oxide. Compared with the pure alumina membrane, the zirconia-coated alumina mem-brane had high chemical resistances, which allowed steam sterilization and cleaning proce-dures in the pH range of 0e14. It possessed good pure-heating permeability and highmembrane flux in separation and filtration. It had high thermal stability, which was an attrac-tive criterion for catalytic membrane reactors used at high temperatures. The molar ratio ofAl3þ:Hþ:Zr:H2O was 1:0.07:0.15:100, whereas the volumetric ratio on the basis of 100 ml ofH2O is Al3þ:Hþ:Zr:H2O ¼ 1:3.88 ml:1.0275 g:100 ml. The 100 ml of double-distilled waterwas heated on a hot plate between 80 �C and 85 �C to ensure the formation of g-AlOOH.Aluminum tri-sec-butoxide (14.25 ml) was added to the double-distilled water. The solutionwas vigorously stirred with a magnetic stirrer until a homogeneous mixture was obtained.HNO3 (1 M) (3.88 ml) was added to the sol for peptization, and the mixture was again stirredfor an additional 15 min. After that, 1.0275 g of ZrO3 was added into the mixture. The sol waskept at boiling condition in the open flask for 1 h. The PVA solution was added to the mixtureaccording to a PVA: sol ratio of 1:20, and stirred in the mixture continuously. The productwas refluxed under continuous stirring at 90 �C for 16e20 h to ensure complete mixingand hydrolysis. The sol was cooled down slowly and left for a few hours. The above stepswere repeated with different amounts of ZrO3. The sol was dried under ambient conditionsuntil gelation and viscous gel was obtained. The sol was transferred to the support by thedip-coating method to prepare a thin layer of gel on the support. The membrane thicknessfirst increases linearly with the dipping time, until it may reach a limit. It was noted that athicker and nonuniform gel layer was more liable to crack than a thinner one. A uniformgel layer was obtained by heating and calcination. After dip-coating the sol on the surfaceof the support, the membrane was heated in the furnace. The furnace temperature startedat 30 �C and was raised to 300 �C at a rate of 0.5 �C mine1. The furnace temperature waskept at 300 �C for 0.5 h for relaxation of the gel and to avoid the stress exceeding the elasticstrength of the gel. The temperature was raised from 300 to 700 �C at a rate of 0.5 �C mine1.Sintering of the inorganic membrane was done at 700 �C for 5 h. Cooling was conducted at arate of 1 �C mine1, to ambient temperature, 30 �C.
16.5.2.3 Preparation of Porous Ceramic Support
The preparation of porous ceramic support is summarized in the following sections.
16. MEMBRANE REACTOR490
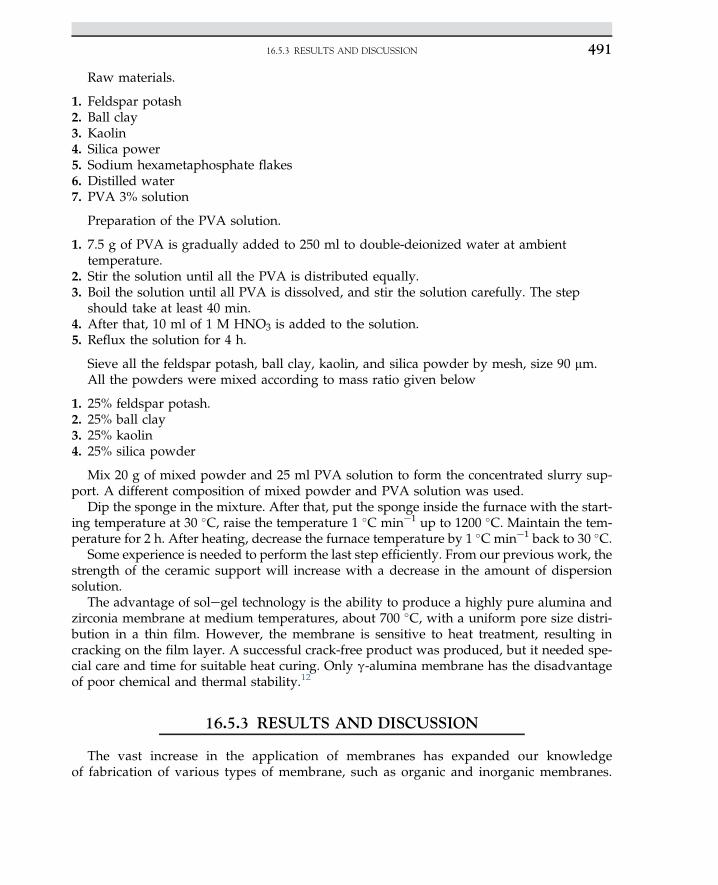
Raw materials.
1. Feldspar potash2. Ball clay3. Kaolin4. Silica power5. Sodium hexametaphosphate flakes6. Distilled water7. PVA 3% solution
Preparation of the PVA solution.
1. 7.5 g of PVA is gradually added to 250 ml to double-deionized water at ambienttemperature.
2. Stir the solution until all the PVA is distributed equally.3. Boil the solution until all PVA is dissolved, and stir the solution carefully. The step
should take at least 40 min.4. After that, 10 ml of 1 M HNO3 is added to the solution.5. Reflux the solution for 4 h.
Sieve all the feldspar potash, ball clay, kaolin, and silica powder by mesh, size 90 mm.All the powders were mixed according to mass ratio given below
1. 25% feldspar potash.2. 25% ball clay3. 25% kaolin4. 25% silica powder
Mix 20 g of mixed powder and 25 ml PVA solution to form the concentrated slurry sup-port. A different composition of mixed powder and PVA solution was used.
Dip the sponge in the mixture. After that, put the sponge inside the furnace with the start-ing temperature at 30 �C, raise the temperature 1 �C mine1 up to 1200 �C. Maintain the tem-perature for 2 h. After heating, decrease the furnace temperature by 1 �C mine1 back to 30 �C.
Some experience is needed to perform the last step efficiently. From our previous work, thestrength of the ceramic support will increase with a decrease in the amount of dispersionsolution.
The advantage of solegel technology is the ability to produce a highly pure alumina andzirconia membrane at medium temperatures, about 700 �C, with a uniform pore size distri-bution in a thin film. However, the membrane is sensitive to heat treatment, resulting incracking on the film layer. A successful crack-free product was produced, but it needed spe-cial care and time for suitable heat curing. Only g-alumina membrane has the disadvantageof poor chemical and thermal stability.12
16.5.3 RESULTS AND DISCUSSION
The vast increase in the application of membranes has expanded our knowledgeof fabrication of various types of membrane, such as organic and inorganic membranes.
16.5.3 RESULTS AND DISCUSSION 491
The inorganic membrane is frequently called a ceramic membrane. To fulfill the needof the market, ceramic membranes represent a distinct class of inorganic membrane.There are a few important parameters involved in ceramic membrane materials, interms of porous structure, chemical composition, and shape of the filter in use.13,14 Inthis research, zirconia-coated g-alumina membranes have been developed using thesolegel technique.
Finally, analytical equipment was used for characterization, such as XRD, SEM, TEM, LM,and light scattering. These were available either in the School of Chemical Engineering orother departments and research centers in the Universiti Sains Malaysia. However, owingto limited access to the high-end analytical equipment to analyze the membrane, the surfacemorphology of the membrane and the porous ceramic support were only characterized withSEM and LM.
More than 50 samples of successful and unsuccessful membranes for demonstration werefabricated. The successful results are discussed and presented in Figures 16.11e16.14. Theporous ceramic supports were fabricated in our research lab.
Figure 16.11 shows SEM micrographs for the porous media of ceramic support at differentmagnifications. The nonuniformity resulted from the synthetic foam used as a base to absorbthe ceramic solution before vaporizing any water from the inorganic mixture. Uniformporous media as a solid support for the membrane was obtained.
Figure 16.12 presents the alumina-coated ceramic membrane. There were opportunities tofabricate a crack-free ceramic membrane coated with g-alumina. The supported zirconia-alumina membrane on the ceramic support shows an irregular surface. The nonuniform sur-face of ceramic support caused the irregular surface on the top layer of the membrane. Someof the membrane sol was trapped in the porous ceramic support during coating and causedthe irregularity of the membrane surface.
The zirconia membrane was obtained in a unique manner. Figure 16.13 shows light micro-graphs of the zirconia-alumina membrane coated on the ceramic support. The nonuniformand crater-filled surface of the ceramic support was covered by the zirconia- alumina mem-brane layer. Zirconia was mounted by very thin or nanolayers on the ceramic membrane.
A combination of alumina and zirconia was used as a strong nanofilm on the ceramicmembrane. SEM micrographs are shown in Figure 16.14. Observation by SEM shows thatthe zirconiaealumina membrane layer was properly adhered and could stand on the topof the porous ceramic support.
16.5.4 CONCLUSION
We have successfully developed a new inorganic ceramic membrane coated with zirco-nium and alumina. A thin film of alumina and zirconia unsupported membrane was alsofabricated. The successful method developed was the solegel technique.
AcknowledgmentsThis research was made possible by an IRPA grant No. 703574, through Universiti Sains Malaysia (USM). We thankUSM’s Research Creativity and Management Office (RCMO) and the School of Chemical Engineering, UniversitiSains Malaysia, for their support.
16. MEMBRANE REACTOR492
References1. Anderson MA, Gielselmann MJ, Xu Quinyin. J Membr Sci 1988;39:243.2. Annika K, Elis C. J Eur Ceram Soc 1997;17:289.3. Moreno R. Am Ceram Soc Bull 1992;71:1647.4. Gamze GA, Zulal M, Volcan G. Ceram Int 1996;22:23.5. Gu YF, Meng GY. J Eur Ceram Soc 1999;19:1961.6. Brinker CJ, Schere GW. The physics and chemistry of sol-gel processing. Amesterdam: Academic Press; 1990.7. Hao W, Pan F, Wang T, Zheng S. J Mat Sci (Shanyang, China) 2004;20:472e4.8. Lambert CK, Gonzalez RD. Mat Lett 1999;38:145.9. Leenars AFM, Keizer K, Burggraaf AJ. J Mat Sci 1984;19:1077.10. Huang XR, Meng GL, Hunag ZT, Geng JE. J Membr Sci 1997;133:145.11. Karin L, Eva L. J Eur Ceram Soc 1997;17:359.12. Larbot A, Fabre JP, Guizard C, Cot L. J Membr Sci 1988;39:203.13. Pierre AC. J Am Ceram Soc 1987;70 28.14. Yoldas BE. Ceram Bull 1975;54:289.
REFERENCES 493
C H A P T E R
17
Advanced Downstream Processingin Biotechnology
O U T L I N E
17.1 Introduction 497
17.2 Protein Products 497
17.3 Cell Disruption 498
17.4 Protein Purification 50017.4.1 Overview of Strategies 50017.4.2 Dye Ligand Pseudo-
affinity Adsorption 500
17.5 General Problems AssociatedWith Conventional Techniques 501
17.6 Fluidized Bed Adsorption 50217.6.1 Mixing Behavior in
Fluidized/ExpandedBeds 503
17.7 Design and Operation of LiquidFluidized Beds 504
17.7.1 HydrodynamicCharacterization ofFlow in Fluidized/
Expanded Beds andBed Voidage 504
17.7.2 Minimum FluidizationVelocity of Particles 505
17.7.3 Terminal SettlingVelocity of Particles 506
17.7.4 Degree of BedExpansion 508
17.7.5 Matrices for FluidizedBed Adsorption 509
17.7.6 Column Design forFluidized BedAdsorption 510
17.8 Experimental Procedure 510
17.9 Process Integration in ProteinRecovery 511
17.9.1 Interfaced andIntegrated FluidizedBed/Expanded BedSystem 511
495Biochemical Engineering and Biotechnologyhttp://dx.doi.org/10.1016/B978-0-444-63357-6.00017-1 Copyright © 2015 Elsevier B.V. All rights reserved.
Nomenclature 513
References 513
17.11 Case Study: BiochemicalCharacterization of a CustomExpanded Bed Column forProtein Purification 516
17.11.1 Introduction 516
17.11.2 Materials and Methods 51717.11.2.1 Materials 51717.11.2.2 Adsorbent Contactors 51817.11.2.3 Bed Expansion
Characteristics 51817.11.2.4 Fluidized/Expanded Bed
Adsorption 518
17.11.3 Results and Discussion 51817.11.3.1 Bed Expansion 51817.11.3.2 Mixing of the Liquid
Phase (ResidenceTime DistributionExperiments) 520
17.11.3.3 Equilibrium KineticStudies 520
17.11.3.4 Expanded BedAdsorption 522
17.11.4 Conclusion 524
References 525
17. ADVANCED DOWNSTREAM PROCESSING IN BIOTECHNOLOGY496
S U B C H A P T E R
17.1Introduction*
In recent decades, advances in biotechnology have increased the potential use of biolog-ically based products. The emergence of new and promising research activities in molecularbiology and immunology has promoted a continuous increase in the number of proteins thatneed to be purified and characterized. A wide variety of proteins are used as diagnosticreagents, such as vaccines, monoclonal antibodies, enzymes, and regulatory factors. Thedevelopment of simplified and cost-effective bioseparation schemes to eliminate impuritiesfrom these products in a highly purified form is a constant major challenge for the continuedsuccess and commercialization of biotechnological industries. The series of separationprocesses used to o purify bio-based products can be collectively described by the generalterm “downstream processing.”1,2 The objective is to establish a sequence of operationsthat will transform the starting material to a state defined by the specification and enduse of the desired product. Individual steps should be based on molecular-based knowledgeof how individual proteins will behave during purification, to appropriately establish anefficient and economic process. Technologies applicable in such bioprocesses must alsoaccommodate particulate-containing feedstock such as microbial fermentation broths, animalor plant cell cultures, and cell-disruptive feedstock. It is important that the recovery in theseprocesses be done rapidly maintain the native conformation and activity of highly sensitiveprotein molecules.3 Therefore, the main objectives for the biochemical engineer must encom-pass the design of an optimal process that: (1) provides the desired quality of the finalproduct, (2) minimizes the total process time and cost through improved operationalefficiency, and (3) falls within the constraints of an acceptable market entry.
17.2 PROTEIN PRODUCTS
Advances in biotechnology have enabled the development and use of protein products aspharmaceutical reagents as well as applications in the industrial and domestic spheres.4 Thedomestic market represented by the food and beverage industries requires protein productsof low value but with a high-volume demand where the purity of the protein is less
*This chapter was written with contributions from:Mohsen Jahanshahi, Mohammad Hassan Shahavi, Biotechnology Research Lab., Faculty of ChemicalEngineering, Noshirvani University of Technology, Babol, Iran.
17.2 PROTEIN PRODUCTS 497
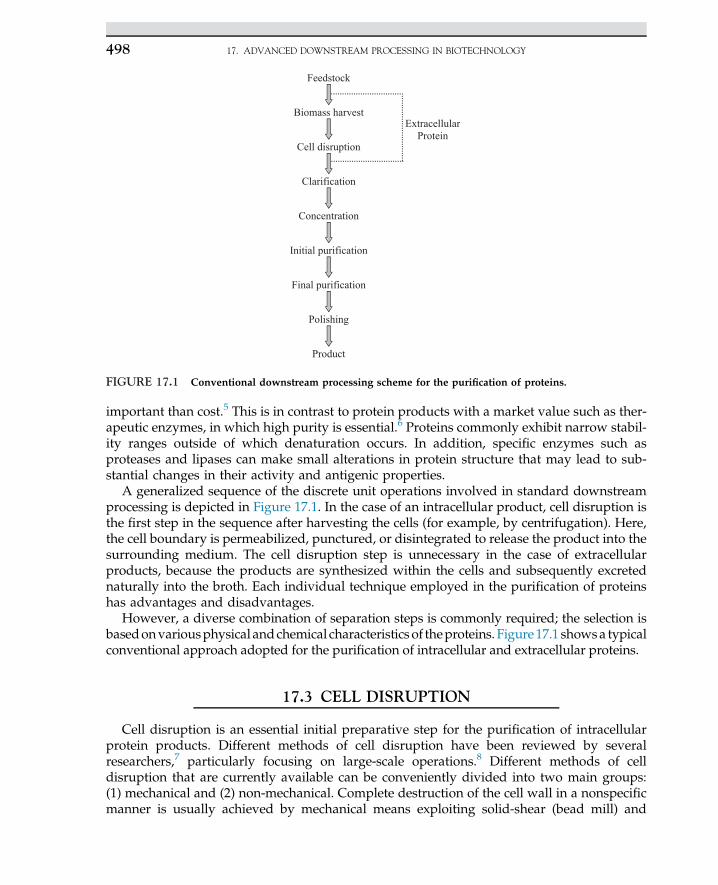
important than cost.5 This is in contrast to protein products with a market value such as ther-apeutic enzymes, in which high purity is essential.6 Proteins commonly exhibit narrow stabil-ity ranges outside of which denaturation occurs. In addition, specific enzymes such asproteases and lipases can make small alterations in protein structure that may lead to sub-stantial changes in their activity and antigenic properties.
A generalized sequence of the discrete unit operations involved in standard downstreamprocessing is depicted in Figure 17.1. In the case of an intracellular product, cell disruption isthe first step in the sequence after harvesting the cells (for example, by centrifugation). Here,the cell boundary is permeabilized, punctured, or disintegrated to release the product into thesurrounding medium. The cell disruption step is unnecessary in the case of extracellularproducts, because the products are synthesized within the cells and subsequently excretednaturally into the broth. Each individual technique employed in the purification of proteinshas advantages and disadvantages.
However, a diverse combination of separation steps is commonly required; the selection isbasedonvariousphysical andchemical characteristics of theproteins. Figure17.1 showsa typicalconventional approach adopted for the purification of intracellular and extracellular proteins.
17.3 CELL DISRUPTION
Cell disruption is an essential initial preparative step for the purification of intracellularprotein products. Different methods of cell disruption have been reviewed by severalresearchers,7 particularly focusing on large-scale operations.8 Different methods of celldisruption that are currently available can be conveniently divided into two main groups:(1) mechanical and (2) non-mechanical. Complete destruction of the cell wall in a nonspecificmanner is usually achieved by mechanical means exploiting solid-shear (bead mill) and
Feedstock
Extracellular Protein
Biomass harvest
Cell disruption
Clarification
Concentration
Initial purification
Final purification
Polishing
Product
FIGURE 17.1 Conventional downstream processing scheme for the purification of proteins.
17. ADVANCED DOWNSTREAM PROCESSING IN BIOTECHNOLOGY498
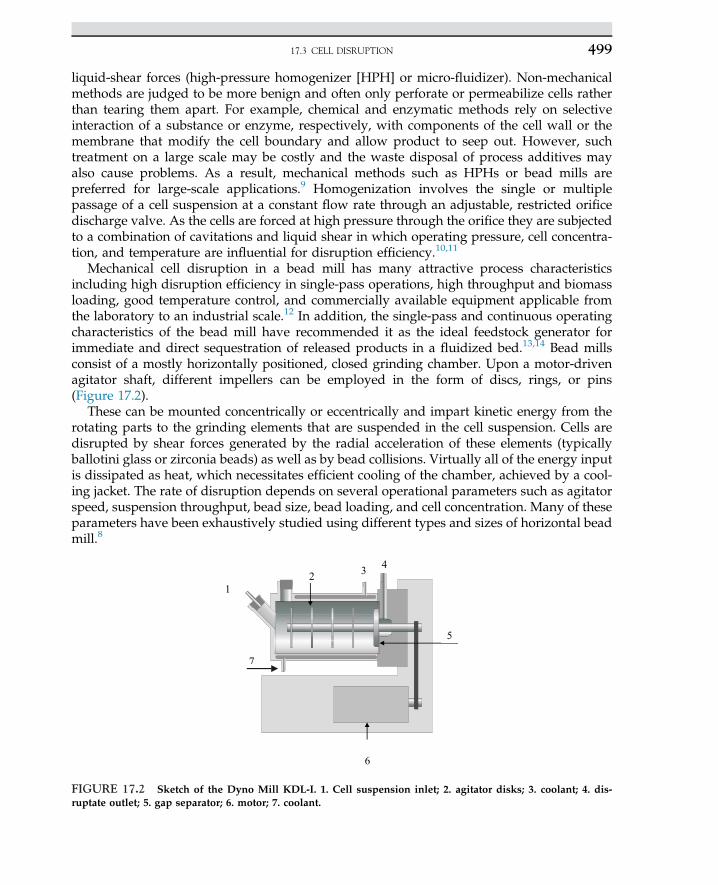
liquid-shear forces (high-pressure homogenizer [HPH] or micro-fluidizer). Non-mechanicalmethods are judged to be more benign and often only perforate or permeabilize cells ratherthan tearing them apart. For example, chemical and enzymatic methods rely on selectiveinteraction of a substance or enzyme, respectively, with components of the cell wall or themembrane that modify the cell boundary and allow product to seep out. However, suchtreatment on a large scale may be costly and the waste disposal of process additives mayalso cause problems. As a result, mechanical methods such as HPHs or bead mills arepreferred for large-scale applications.9 Homogenization involves the single or multiplepassage of a cell suspension at a constant flow rate through an adjustable, restricted orificedischarge valve. As the cells are forced at high pressure through the orifice they are subjectedto a combination of cavitations and liquid shear in which operating pressure, cell concentra-tion, and temperature are influential for disruption efficiency.10,11
Mechanical cell disruption in a bead mill has many attractive process characteristicsincluding high disruption efficiency in single-pass operations, high throughput and biomassloading, good temperature control, and commercially available equipment applicable fromthe laboratory to an industrial scale.12 In addition, the single-pass and continuous operatingcharacteristics of the bead mill have recommended it as the ideal feedstock generator forimmediate and direct sequestration of released products in a fluidized bed.13,14 Bead millsconsist of a mostly horizontally positioned, closed grinding chamber. Upon a motor-drivenagitator shaft, different impellers can be employed in the form of discs, rings, or pins(Figure 17.2).
These can be mounted concentrically or eccentrically and impart kinetic energy from therotating parts to the grinding elements that are suspended in the cell suspension. Cells aredisrupted by shear forces generated by the radial acceleration of these elements (typicallyballotini glass or zirconia beads) as well as by bead collisions. Virtually all of the energy inputis dissipated as heat, which necessitates efficient cooling of the chamber, achieved by a cool-ing jacket. The rate of disruption depends on several operational parameters such as agitatorspeed, suspension throughput, bead size, bead loading, and cell concentration. Many of theseparameters have been exhaustively studied using different types and sizes of horizontal beadmill.8
1
4 3 2
7
6
5
FIGURE 17.2 Sketch of the Dyno Mill KDL-I. 1. Cell suspension inlet; 2. agitator disks; 3. coolant; 4. dis-ruptate outlet; 5. gap separator; 6. motor; 7. coolant.
17.3 CELL DISRUPTION 499
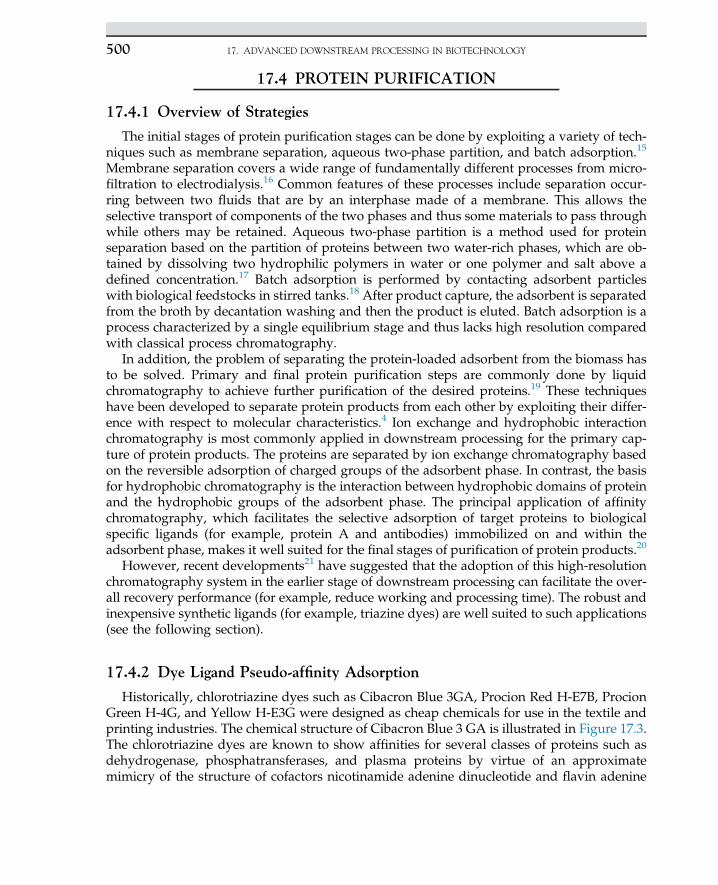
17.4 PROTEIN PURIFICATION
17.4.1 Overview of Strategies
The initial stages of protein purification stages can be done by exploiting a variety of tech-niques such as membrane separation, aqueous two-phase partition, and batch adsorption.15
Membrane separation covers a wide range of fundamentally different processes from micro-filtration to electrodialysis.16 Common features of these processes include separation occur-ring between two fluids that are by an interphase made of a membrane. This allows theselective transport of components of the two phases and thus some materials to pass throughwhile others may be retained. Aqueous two-phase partition is a method used for proteinseparation based on the partition of proteins between two water-rich phases, which are ob-tained by dissolving two hydrophilic polymers in water or one polymer and salt above adefined concentration.17 Batch adsorption is performed by contacting adsorbent particleswith biological feedstocks in stirred tanks.18 After product capture, the adsorbent is separatedfrom the broth by decantation washing and then the product is eluted. Batch adsorption is aprocess characterized by a single equilibrium stage and thus lacks high resolution comparedwith classical process chromatography.
In addition, the problem of separating the protein-loaded adsorbent from the biomass hasto be solved. Primary and final protein purification steps are commonly done by liquidchromatography to achieve further purification of the desired proteins.19 These techniqueshave been developed to separate protein products from each other by exploiting their differ-ence with respect to molecular characteristics.4 Ion exchange and hydrophobic interactionchromatography is most commonly applied in downstream processing for the primary cap-ture of protein products. The proteins are separated by ion exchange chromatography basedon the reversible adsorption of charged groups of the adsorbent phase. In contrast, the basisfor hydrophobic chromatography is the interaction between hydrophobic domains of proteinand the hydrophobic groups of the adsorbent phase. The principal application of affinitychromatography, which facilitates the selective adsorption of target proteins to biologicalspecific ligands (for example, protein A and antibodies) immobilized on and within theadsorbent phase, makes it well suited for the final stages of purification of protein products.20
However, recent developments21 have suggested that the adoption of this high-resolutionchromatography system in the earlier stage of downstream processing can facilitate the over-all recovery performance (for example, reduce working and processing time). The robust andinexpensive synthetic ligands (for example, triazine dyes) are well suited to such applications(see the following section).
17.4.2 Dye Ligand Pseudo-affinity Adsorption
Historically, chlorotriazine dyes such as Cibacron Blue 3GA, Procion Red H-E7B, ProcionGreen H-4G, and Yellow H-E3G were designed as cheap chemicals for use in the textile andprinting industries. The chemical structure of Cibacron Blue 3 GA is illustrated in Figure 17.3.The chlorotriazine dyes are known to show affinities for several classes of proteins such asdehydrogenase, phosphatransferases, and plasma proteins by virtue of an approximatemimicry of the structure of cofactors nicotinamide adenine dinucleotide and flavin adenine
17. ADVANCED DOWNSTREAM PROCESSING IN BIOTECHNOLOGY500
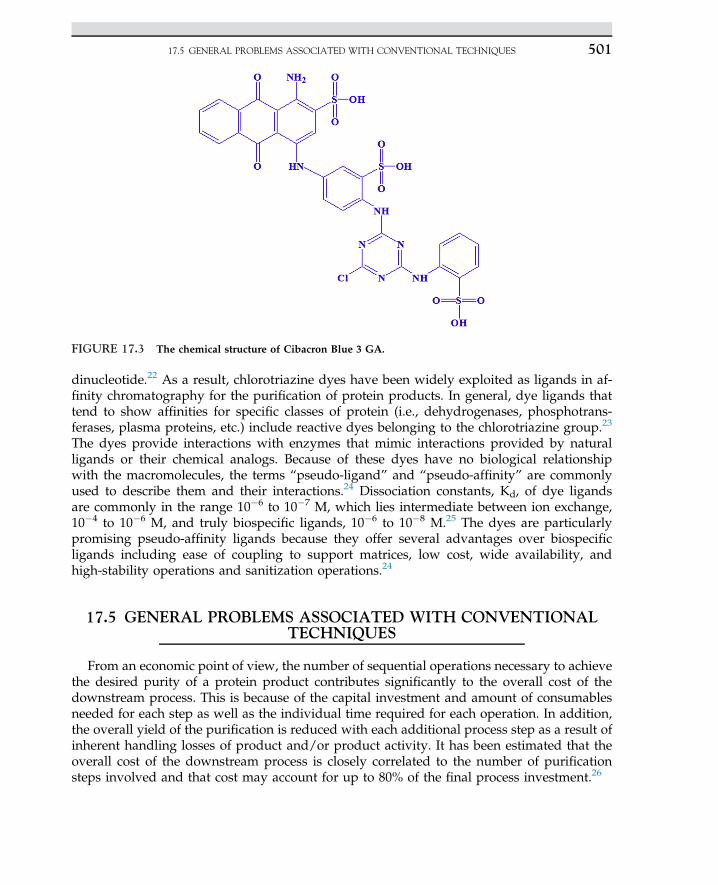
dinucleotide.22 As a result, chlorotriazine dyes have been widely exploited as ligands in af-finity chromatography for the purification of protein products. In general, dye ligands thattend to show affinities for specific classes of protein (i.e., dehydrogenases, phosphotrans-ferases, plasma proteins, etc.) include reactive dyes belonging to the chlorotriazine group.23
The dyes provide interactions with enzymes that mimic interactions provided by naturalligands or their chemical analogs. Because of these dyes have no biological relationshipwith the macromolecules, the terms “pseudo-ligand” and “pseudo-affinity” are commonlyused to describe them and their interactions.24 Dissociation constants, Kd, of dye ligandsare commonly in the range 10�6 to 10�7 M, which lies intermediate between ion exchange,10�4 to 10�6 M, and truly biospecific ligands, 10�6 to 10�8 M.25 The dyes are particularlypromising pseudo-affinity ligands because they offer several advantages over biospecificligands including ease of coupling to support matrices, low cost, wide availability, andhigh-stability operations and sanitization operations.24
17.5 GENERAL PROBLEMS ASSOCIATED WITH CONVENTIONALTECHNIQUES
From an economic point of view, the number of sequential operations necessary to achievethe desired purity of a protein product contributes significantly to the overall cost of thedownstream process. This is because of the capital investment and amount of consumablesneeded for each step as well as the individual time required for each operation. In addition,the overall yield of the purification is reduced with each additional process step as a result ofinherent handling losses of product and/or product activity. It has been estimated that theoverall cost of the downstream process is closely correlated to the number of purificationsteps involved and that cost may account for up to 80% of the final process investment.26
FIGURE 17.3 The chemical structure of Cibacron Blue 3 GA.
17.5 GENERAL PROBLEMS ASSOCIATED WITH CONVENTIONAL TECHNIQUES 501
Traditional techniques employed for both harvesting biomass and feedstock clarificationare centrifugation and filtration.27 Centrifugation might need to be undertaken twice,whereas an additional depth or microfiltration step is commonly included to ensure aparticle-free (99e99.9% in terms of cell clearance) solution that can be fractionated by tradi-tional packed-bed chromatography. Although filtration has been applied successfully innumerous solideliquid operations, performance is usually diminished as a result of mem-brane fouling (for example, by cells, cell debris, lipids, and nucleic acids) during operation.28
In addition, combined centrifugation and filtration operations often result in long process-ing times. Furthermore, the presence of large amounts of insoluble and highly viscousmaterials (for, cells debris and long chain genomic deoxyribonucleic acid) in the processfeedstock can further restrict the clarification performance. This problem is especially criticalin the case of a cell disruptate, which results in the generation of cell debris and colloidalmaterials, and the release of large amounts of intracellular products.29 A rapid method ofproduct capture of the target protein is therefore preferred because the time taken to removeparticulates can promote denaturation owing to process conditions that are detrimental tostructural integrity: for example, the action of proteases, carbohydrates, or oxidizing condi-tions. Thus, the development of fast and cost-effective primary recovery steps forms thebasis for a successful downstream process, especially in the production of intracellularproteins.
17.6 FLUIDIZED BED ADSORPTION
Fluidized bed adsorption (FBA) has emerged as an efficient recovery method proven tohave significant advantages over conventional procedural sequences: for example, discretefeedstock clarification followed by fixed-bed adsorption of the product. In fluidized beds,liquid is pumped upward through a bed of adsorbent beads that, in contrast to a packedbed, are not constrained by an upper flow adapter. Thus, the bed can expand and spacesopen up between the adsorbent beads. The increased voidage of the bed allows particulatesin the feed to pass freely through the spaces without entrapment (see Figure 17.4).
Thus, the need for prior removal of cells and/or debris is eliminated. After the adsorptionstage, the remaining feedstock and particulates are washed from the adsorbent bed and theproduct is subsequently eluted either in fluidized or packed-bed mode. As a consequence,clarification, concentration, and initial fractionation are combined into one operation, andthus fluidized beds exhibit great potential for simplifying downstream processes withconcomitant savings in capital and operating costs.
Fluidized beds have been used previously for the industrial-scale recovery of the antibi-otics streptomycin and novobiocin.30 However, more recently, there has been considerableinterest in the use of fluidized beds for the direct extraction of proteins from whole fermen-tation broths.31 In a packed bed, the adsorbent particles are packed within the contactor. Thevoidagedthat is, the inter-particle spacedis minimal and thus feedstock clarification ismandatory to avoid clogging of the bed. In a fluidized/expanded bed, the adsorbent bedis allowed to expand by irrigation with feedstock. Bed voidage is increased, allowing thepassage of particulates in the feed. The diameters of the adsorbent beads are exaggeratedfor illustrative clarity.
17. ADVANCED DOWNSTREAM PROCESSING IN BIOTECHNOLOGY502
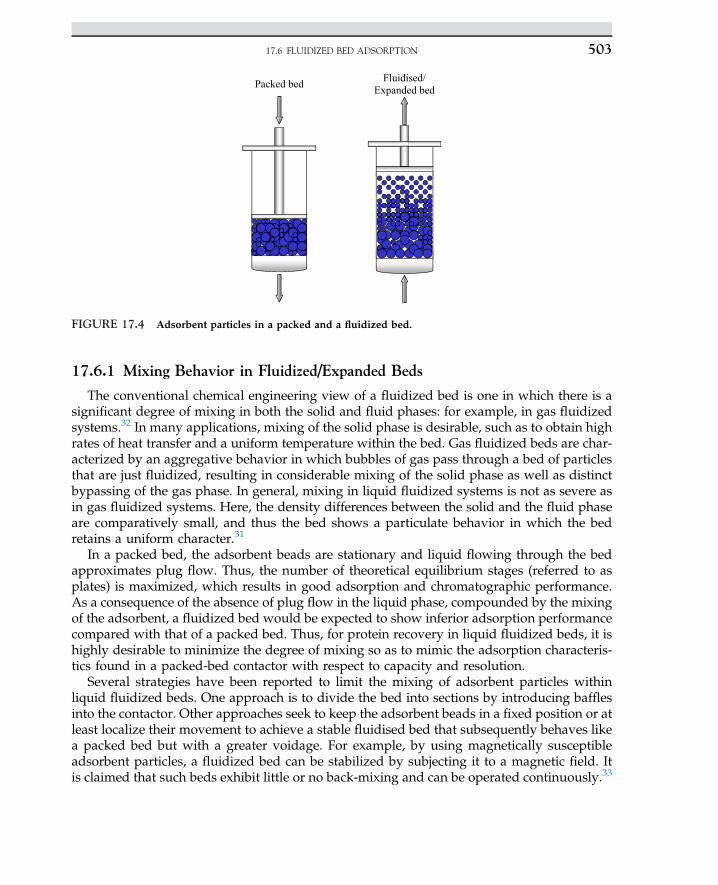
17.6.1 Mixing Behavior in Fluidized/Expanded Beds
The conventional chemical engineering view of a fluidized bed is one in which there is asignificant degree of mixing in both the solid and fluid phases: for example, in gas fluidizedsystems.32 In many applications, mixing of the solid phase is desirable, such as to obtain highrates of heat transfer and a uniform temperature within the bed. Gas fluidized beds are char-acterized by an aggregative behavior in which bubbles of gas pass through a bed of particlesthat are just fluidized, resulting in considerable mixing of the solid phase as well as distinctbypassing of the gas phase. In general, mixing in liquid fluidized systems is not as severe asin gas fluidized systems. Here, the density differences between the solid and the fluid phaseare comparatively small, and thus the bed shows a particulate behavior in which the bedretains a uniform character.31
In a packed bed, the adsorbent beads are stationary and liquid flowing through the bedapproximates plug flow. Thus, the number of theoretical equilibrium stages (referred to asplates) is maximized, which results in good adsorption and chromatographic performance.As a consequence of the absence of plug flow in the liquid phase, compounded by the mixingof the adsorbent, a fluidized bed would be expected to show inferior adsorption performancecompared with that of a packed bed. Thus, for protein recovery in liquid fluidized beds, it ishighly desirable to minimize the degree of mixing so as to mimic the adsorption characteris-tics found in a packed-bed contactor with respect to capacity and resolution.
Several strategies have been reported to limit the mixing of adsorbent particles withinliquid fluidized beds. One approach is to divide the bed into sections by introducing bafflesinto the contactor. Other approaches seek to keep the adsorbent beads in a fixed position or atleast localize their movement to achieve a stable fluidised bed that subsequently behaves likea packed bed but with a greater voidage. For example, by using magnetically susceptibleadsorbent particles, a fluidized bed can be stabilized by subjecting it to a magnetic field. Itis claimed that such beds exhibit little or no back-mixing and can be operated continuously.33
Packed bed Fluidised/Expanded bed
FIGURE 17.4 Adsorbent particles in a packed and a fluidized bed.
17.6 FLUIDIZED BED ADSORPTION 503
The practical benefit of this approach, i.e., restricted movement of adsorbent particles andassociated uncoupling of the bed expansion from fluidization velocity, was subsequentlydemonstrated by Zhang.34 In this work, magnetically stabilized fluidized beds were exploitedfor (1) the direct recovery of the intracellular enzyme glyceraldehydes-3-phosphate dehydro-genase from unclarified yeast disruptates, and (2) the recovery of antibody fragments fromEscherichia coli fermentation broths. However, this technique requires complicated andrelatively expensive equipment, particularly on a large scale.
A simpler approach was designed for the physical properties of the solid phases in such away that they generate an inherently stable fluidized bed.35 If the adsorbent beads have anappropriate distribution of sizes and/or densities, grading or classification of the adsorbentoccurs within the bed, with the larger/denser particles located near the bottom of the bed andthe smaller/lighter particles nearer the top. The segregation behavior restricts the localmobility of the fluidized particles. Such a bed exhibits dispersion characteristics similar toa packed bed.36 Thus, the hydrodynamic properties of a fluidized bed are combined withthe chromatographic properties of a packed bed. The degree of classification depends onthe ratio of the size of the largest and smallest particle within the bed. This ratio has beenclaimed to be at least 2.2.37
To account for the difference in the dispersion characteristics of the classified, stable fluid-ized bed and the conventional, well-mixed fluidized bed, the term “expanded bed” has beenused by several authors and the leading manufacturer of chromatography media and equip-ment.38 In the work presented here, the term “fluidized bed” is used synonymously with“expanded bed” to refer to adsorbents fluidized under conditions that seek to minimizeparticle mixing.
17.7 DESIGN AND OPERATION OF LIQUID FLUIDIZED BEDS
17.7.1 Hydrodynamic Characterization of Flow in Fluidized/Expanded Bedsand Bed Voidage
The voidage (ε) of a bed of particles is the fraction of the bed volume occupied by the inter-stitial space between the particles. Its value depends on the geometrical configuration of thebeads, the pattern in which they are arranged within the bed, the size distribution ofthe particles, and the ratio of mean particle and contactor diameter. The bed voidage canbe calculated using the following equation:
Voidage ðεÞ ¼ 1� Vp
Vb(17.7.1.1)
where Vp is the volume of the particles and Vb is the volume of the bed. The voidage of apacked bed is related to the sphericity of the particles, with a sphericity value of 1 for fullyspherical particles. The bed voidage values can typically be in the range of 0.32 for a denselypacked adsorbent, to 0.43 for a loosely packed adsorbent.39 However, the voidage of a bedcontaining a range of particle sizes and geometrical shapes cannot be accurately predicted.
17. ADVANCED DOWNSTREAM PROCESSING IN BIOTECHNOLOGY504
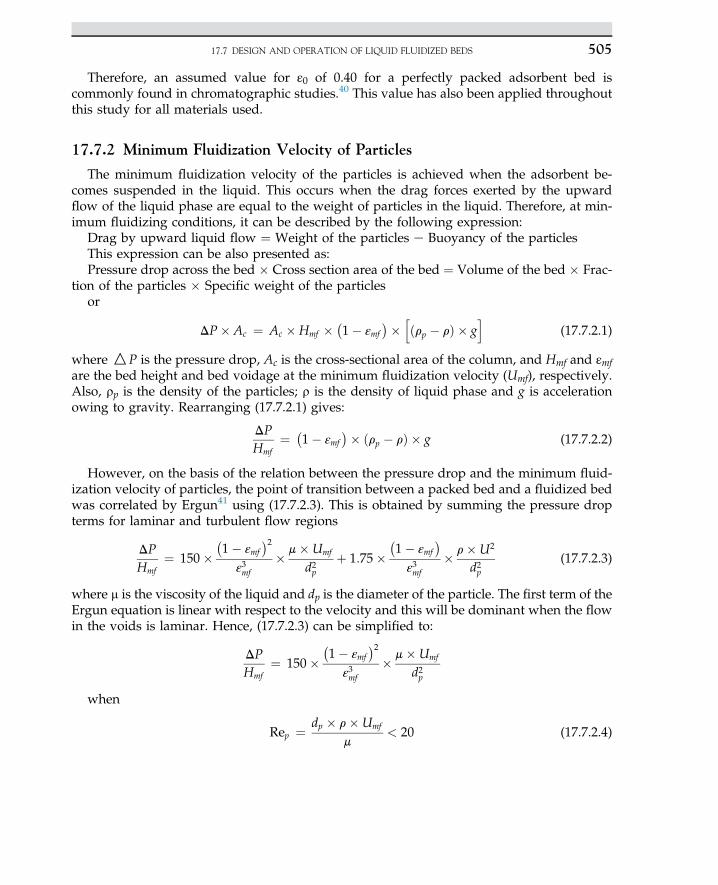
Therefore, an assumed value for ε0 of 0.40 for a perfectly packed adsorbent bed iscommonly found in chromatographic studies.40 This value has also been applied throughoutthis study for all materials used.
17.7.2 Minimum Fluidization Velocity of Particles
The minimum fluidization velocity of the particles is achieved when the adsorbent be-comes suspended in the liquid. This occurs when the drag forces exerted by the upwardflow of the liquid phase are equal to the weight of particles in the liquid. Therefore, at min-imum fluidizing conditions, it can be described by the following expression:
Drag by upward liquid flow ¼ Weight of the particles e Buoyancy of the particlesThis expression can be also presented as:Pressure drop across the bed � Cross section area of the bed ¼ Volume of the bed � Frac-
tion of the particles � Specific weight of the particlesor
DP� Ac ¼ Ac �Hmf ��1� εmf
�� hðrp � rÞ � g
i(17.7.2.1)
where OP is the pressure drop, Ac is the cross-sectional area of the column, and Hmf and εmfare the bed height and bed voidage at the minimum fluidization velocity (Umf), respectively.Also, rp is the density of the particles; r is the density of liquid phase and g is accelerationowing to gravity. Rearranging (17.7.2.1) gives:
DPHmf
¼ �1� εmf
�� ðrp � rÞ � g (17.7.2.2)
However, on the basis of the relation between the pressure drop and the minimum fluid-ization velocity of particles, the point of transition between a packed bed and a fluidized bedwas correlated by Ergun41 using (17.7.2.3). This is obtained by summing the pressure dropterms for laminar and turbulent flow regions
DPHmf
¼ 150��1� εmf
�2ε3mf
� m�Umf
d2pþ 1:75�
�1� εmf
�ε3mf
� r�U2
d2p(17.7.2.3)
where m is the viscosity of the liquid and dp is the diameter of the particle. The first term of theErgun equation is linear with respect to the velocity and this will be dominant when the flowin the voids is laminar. Hence, (17.7.2.3) can be simplified to:
DPHmf
¼ 150��1� εmf
�2ε3mf
� m�Umf
d2p
when
Rep ¼ dp � r�Umf
m< 20 (17.7.2.4)
17.7 DESIGN AND OPERATION OF LIQUID FLUIDIZED BEDS 505
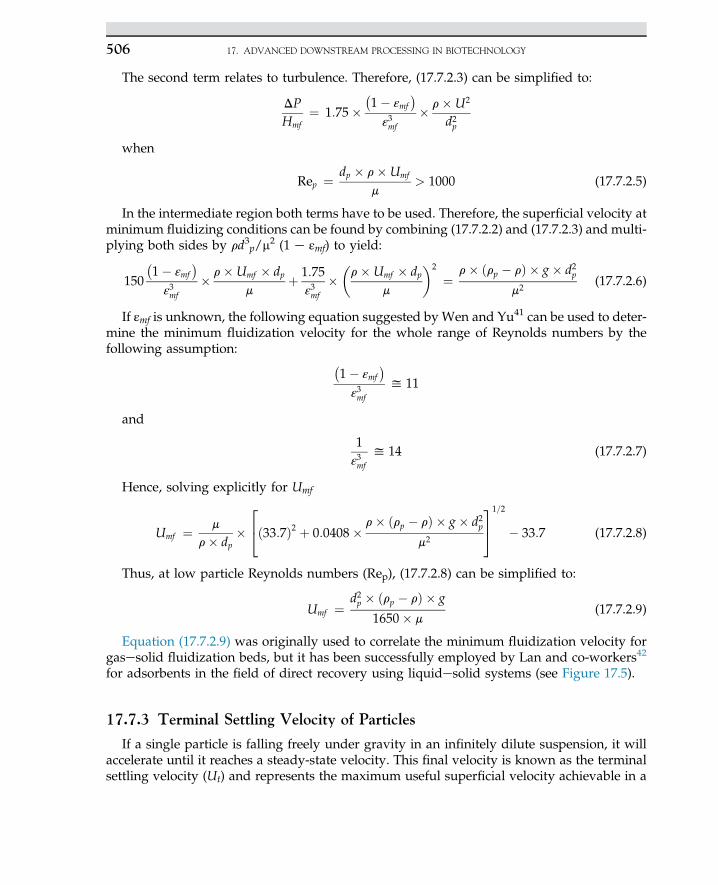
The second term relates to turbulence. Therefore, (17.7.2.3) can be simplified to:
DPHmf
¼ 1:75��1� εmf
�ε3mf
� r�U2
d2p
when
Rep ¼ dp � r�Umf
m> 1000 (17.7.2.5)
In the intermediate region both terms have to be used. Therefore, the superficial velocity atminimum fluidizing conditions can be found by combining (17.7.2.2) and (17.7.2.3) and multi-plying both sides by rd3p/m
2 (1 e εmf) to yield:
150
�1� εmf
�ε3mf
� r�Umf � dpm
þ 1:75ε3mf
��r�Umf � dp
m
�2
¼ r� ðrp � rÞ � g� d2pm2
(17.7.2.6)
If εmf is unknown, the following equation suggested by Wen and Yu41 can be used to deter-mine the minimum fluidization velocity for the whole range of Reynolds numbers by thefollowing assumption: �
1� εmf�
ε3mf
y 11
and
1ε3mf
y 14 (17.7.2.7)
Hence, solving explicitly for Umf
Umf ¼ m
r� dp�24ð33:7Þ2 þ 0:0408� r� ðrp � rÞ � g� d2p
m2
35
1=2
� 33:7 (17.7.2.8)
Thus, at low particle Reynolds numbers (Rep), (17.7.2.8) can be simplified to:
Umf ¼ d2p � ðrp � rÞ � g
1650� m(17.7.2.9)
Equation (17.7.2.9) was originally used to correlate the minimum fluidization velocity forgasesolid fluidization beds, but it has been successfully employed by Lan and co-workers42
for adsorbents in the field of direct recovery using liquidesolid systems (see Figure 17.5).
17.7.3 Terminal Settling Velocity of Particles
If a single particle is falling freely under gravity in an infinitely dilute suspension, it willaccelerate until it reaches a steady-state velocity. This final velocity is known as the terminalsettling velocity (Ut) and represents the maximum useful superficial velocity achievable in a
17. ADVANCED DOWNSTREAM PROCESSING IN BIOTECHNOLOGY506
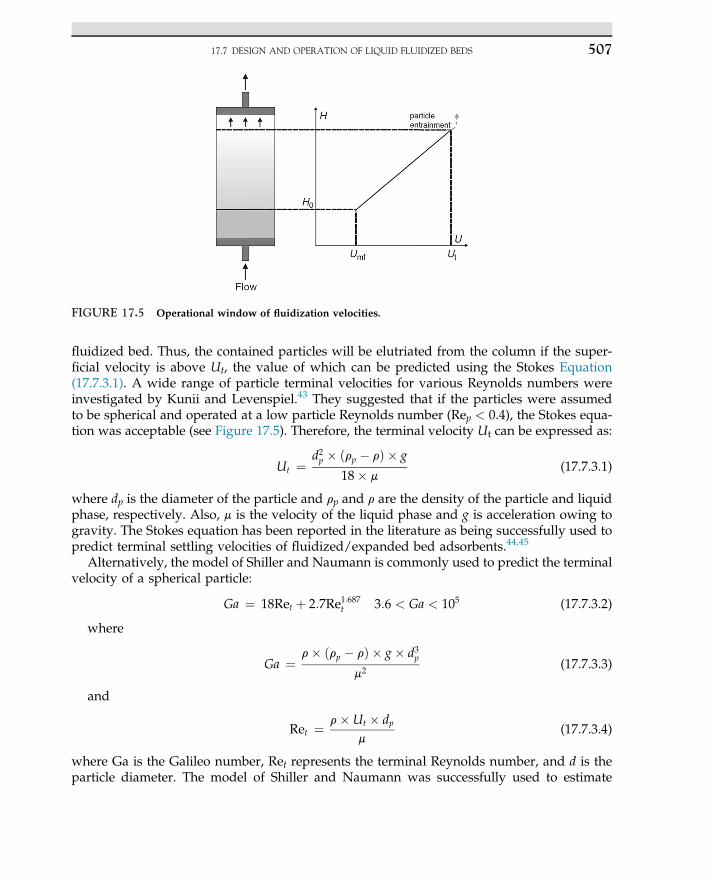
fluidized bed. Thus, the contained particles will be elutriated from the column if the super-ficial velocity is above Ut, the value of which can be predicted using the Stokes Equation(17.7.3.1). A wide range of particle terminal velocities for various Reynolds numbers wereinvestigated by Kunii and Levenspiel.43 They suggested that if the particles were assumedto be spherical and operated at a low particle Reynolds number (Rep < 0.4), the Stokes equa-tion was acceptable (see Figure 17.5). Therefore, the terminal velocity Ut can be expressed as:
Ut ¼d2p � ðrp � rÞ � g
18� m(17.7.3.1)
where dp is the diameter of the particle and rp and r are the density of the particle and liquidphase, respectively. Also, m is the velocity of the liquid phase and g is acceleration owing togravity. The Stokes equation has been reported in the literature as being successfully used topredict terminal settling velocities of fluidized/expanded bed adsorbents.44,45
Alternatively, the model of Shiller and Naumann is commonly used to predict the terminalvelocity of a spherical particle:
Ga ¼ 18Ret þ 2:7Re1:687t 3:6 < Ga < 105 (17.7.3.2)
where
Ga ¼ r� ðrp � rÞ � g� d3pm2
(17.7.3.3)
and
Ret ¼r�Ut � dp
m(17.7.3.4)
where Ga is the Galileo number, Ret represents the terminal Reynolds number, and d is theparticle diameter. The model of Shiller and Naumann was successfully used to estimate
FIGURE 17.5 Operational window of fluidization velocities.
17.7 DESIGN AND OPERATION OF LIQUID FLUIDIZED BEDS 507
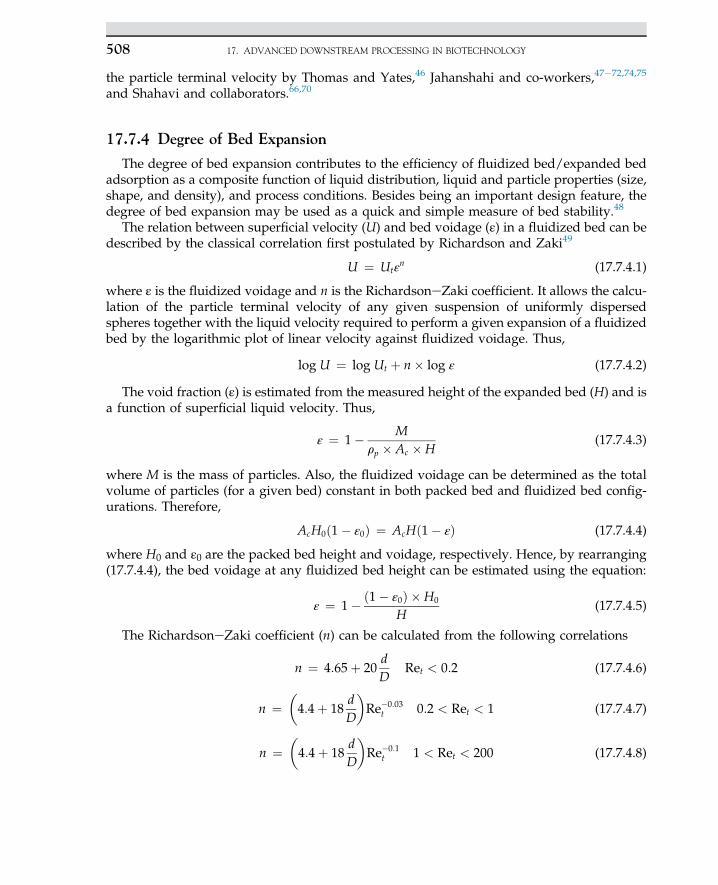
the particle terminal velocity by Thomas and Yates,46 Jahanshahi and co-workers,47e72,74,75
and Shahavi and collaborators.66,70
17.7.4 Degree of Bed Expansion
The degree of bed expansion contributes to the efficiency of fluidized bed/expanded bedadsorption as a composite function of liquid distribution, liquid and particle properties (size,shape, and density), and process conditions. Besides being an important design feature, thedegree of bed expansion may be used as a quick and simple measure of bed stability.48
The relation between superficial velocity (U) and bed voidage (ε) in a fluidized bed can bedescribed by the classical correlation first postulated by Richardson and Zaki49
U ¼ Utεn (17.7.4.1)
where ε is the fluidized voidage and n is the RichardsoneZaki coefficient. It allows the calcu-lation of the particle terminal velocity of any given suspension of uniformly dispersedspheres together with the liquid velocity required to perform a given expansion of a fluidizedbed by the logarithmic plot of linear velocity against fluidized voidage. Thus,
log U ¼ log Ut þ n� log ε (17.7.4.2)
The void fraction (ε) is estimated from the measured height of the expanded bed (H) and isa function of superficial liquid velocity. Thus,
ε ¼ 1� Mrp � Ac �H
(17.7.4.3)
where M is the mass of particles. Also, the fluidized voidage can be determined as the totalvolume of particles (for a given bed) constant in both packed bed and fluidized bed config-urations. Therefore,
AcH0ð1� ε0Þ ¼ AcHð1� εÞ (17.7.4.4)
where H0 and ε0 are the packed bed height and voidage, respectively. Hence, by rearranging(17.7.4.4), the bed voidage at any fluidized bed height can be estimated using the equation:
ε ¼ 1� ð1� ε0Þ �H0
H(17.7.4.5)
The RichardsoneZaki coefficient (n) can be calculated from the following correlations
n ¼ 4:65þ 20dD
Ret < 0:2 (17.7.4.6)
n ¼�4:4þ 18
dD
�Re�0:03
t 0:2 < Ret < 1 (17.7.4.7)
n ¼�4:4þ 18
dD
�Re�0:1
t 1 < Ret < 200 (17.7.4.8)
17. ADVANCED DOWNSTREAM PROCESSING IN BIOTECHNOLOGY508
n ¼ 4:4Re�0:1t 200 < Ret < 500 (17.7.4.9)
n ¼ 2:4 Ret > 500 (17.7.4.10)
where D is the column diameter and Ret is the particle Reynolds number based on the termi-nal velocity. The popularity of the RichardsoneZaki correlation in this field of study arisesfrom its simplicity and good agreement with experimental data.48,50
The operational window of a fluidized bed process is defined by the minimum fluidizationvelocity, Umf at which a settled bed of adsorbent beads starts to fluidize and the terminalvelocity (Ut) at which the bed stabilizes and adsorbent beads are entrained from the bed.
17.7.5 Matrices for Fluidized Bed Adsorption
Early work exploiting extensively cross-linked agarose adsorbents originally designed forconventional, packed bed processes demonstrated the principal of operation and the poten-tial of fluidized bed adsorption for processing particulate feedstocks.31 However, these mate-rials were not optimally suited because the combination of particle diameter and densityoccurred only at low flow rates (for example, 10e30 cm h�1), which resulted in low overallproductivity. Denser particles such as silica were more appropriate in this respect.51 Howev-er, a drawback of silica-containing material is the limited stability at high pH values, whichmakes it less suitable for biopharmaceutical production where alkaline conditions arecommonly used for cleaning-in-place (CIP) and sanitization-in-place procedures.
The development of denser adsorbents enabled the use of higher flow rates and improvedthe stability of operation of expanded beds. Tailor-made adsorbents were produced usinghydrophilic natural polymers such as cellulose, agarose, or synthetic trisacrylate-based mate-rials. To enhance the particle density, heavy, inert filler materials have been incorporatedduring assembly. The resulting composite materials included cellulose-titanium dioxide anddextran-silica.52 Other materials reported for the fabrication of denser adsorbents were glassand zirconia. For example, Thömmes and co-workers53 exploited custom-derived controlledpore glass particles for the purification of monoclonal antibodies. Zirconia-based materialsexhibit a significantly higher density than silica. It has been demonstrated that even small par-ticles (for example, less than 50 mm in diameter) may be fluidized at linear flow rates similar tothose used for silica or density-enhanced agarose particles with a greater diameter.54 Inanother approach, McCreath and colleagues developed perfluoropolymer particles thatwere derived with dye ligands for the affinity purification of dehydrogenases from disruptedbaker’s yeast.55 The increased density of the support (2.20 g ml�1) also allowed the use ofcomparatively small particles (50e80 mm) at an acceptable linear flow rate of 120 cm h�1.
Agarose-based materials have been commercialized specifically for fluidized bed adsorp-tion by increasing their specific weight with incorporated quartz or steel particles (STREAM-LINE).37 The densities achieved have been exploited at 1.15 g ml�1 for agarose-quartz and1.3 g ml�1 for agarose-steel composites. These materials are available with a range of ligandfunctionalities such as weak anion exchange (diethylaminoethyl, DEAE), strong anion ex-change (quaternary ammonium, Q), weak cation exchange (carboxymethyl, CM), strongcation exchange (sulfopropyl, SP), chelating ligand (iminodiacetic acid for immobilized metalaffinity chromatography), protein A (affinity purification of antibodies), and phenyl groups(hydrophobic interaction chromatography). More recently, so-called pellicular adsorbents
17.7 DESIGN AND OPERATION OF LIQUID FLUIDIZED BEDS 509
were defined as suitable for fluidized bed adsorption. These adsorbents are characterized bya dense core such as glass or stainless steel47,56 coated with a layer of porous material such asagarose. Such matrices promise high rates of adsorption/desorption owing to the absence ofdeep convective pores and the short diffusion distances within the thin porous layer thatcomprises the pellicle.
17.7.6 Column Design for Fluidized Bed Adsorption
To achieve a stable fluidized bed, the column has to fulfill some simple but importantdemands. A suitable liquid distribution is crucial to accomplish plug flow conditions withinthe bed and thus minimize particle dispersion. A prerequisite for the generation of an even ve-locity profile across the cross-section of a column is an evenly distributed pressure drop acrossthe distributor at the column inlet. Pressure drop fluctuations lead to the development of chan-nels, which are the most important influence on homogeneity in an adsorption process. Flowdistribution can be achieved by using sieve plates, meshes, or a bed of glass ballotini.43,68,70
Bascoul and colleagues57 investigated bed stability as a function of the distributor design,showing that channeling in the lower part of a fluidized bed owing to uneven flow distributionis reduced with increasing column length. This led to the conclusion that the fluidized bed it-self serves as an effective flow distribution system. More recently, a novel distributor designwas introduced that uses a stirrer in the bottom of the contactor to distribute the incomingfeedstock. This configuration divides the fluidized bed into a limited, well-mixed zone atthe bottom and a stable fluidized bed above it. Such contactors were included in the study pre-sented here. Besides the demand for even flow distribution, the distributor has to enable theunhindered passage of particulates without becoming blocked or damaging shear-sensitivecells. Partial blockage of a distributor will cause channeling in the fluidized bed. Cell breakagein the flow distributor can lead to the unwanted release of intracellular compounds that mayimpair the purification process of an extracellular product for whole broths.
Another important factor that has a bearing on bed stability is the column verticality. Vander Meer and colleagues58 demonstrated that even small deviations from vertical alignmentlead to significant inhomogeneity of liquid flow. These findings were confirmed by Bruce andco-workers,59 who found that this effect is more pronounced in small-diameter contactors. Intheir work, the dynamic capacity of a 1-cm column, used for the capture of glucose-6-phosphate dehydrogenase from unclarified yeast homogenate, was reduced by approxi-mately 30% when misaligned by 0.185. However, a 5-cm contactor operated under similarconditions appeared to be unaffected.
17.8 EXPERIMENTAL PROCEDURE
In principle, the experimental protocol of fluidized bed adsorption does not deviate frompacked-bed operations, but the main difference is the direction of the liquid flow. Thesequence of steps of equilibration, sample application, wash, elution, and cleaning (CIP) isperformed in an upward direction, although the last two might be undertaken in fixed-bedmode. During equilibration, the matrix is fluidized and a stabilized, fluidized bed is devel-oped. Here, classification within the bed with regard to particle size of the adsorbent particles
17. ADVANCED DOWNSTREAM PROCESSING IN BIOTECHNOLOGY510
may be determined by visual observation. At the same time, the matrix is primed for adsorp-tion by the selection of a suitable buffer for producteadsorbent interactions. Subsequently,the feedstock is applied to the fluidized bed. Target proteins are adsorbed whereas cells,debris, and other particulates and contaminants pass through the bed. After sample applica-tion, residual biomass and unbound proteins are removed from the bed in a washing proce-dure. Elution may be performed either in packed-bed or in fluidized bed mode. A commonprocedure is to allow the adsorbent to settle and reverse the flow for elution. Here, the upperadapter is lowered to the top of the settled bed. On the other hand, maintaining a fluidizedbed during elution prevents particle aggregation and thus facilitates subsequent cleaning ofthe adsorbent.60 However, owing to the greater interstitial volume of the fluidized bed, theelution volume is increased compared with fixed-bed elution. After elution, the adsorbentis subjected to CIP procedures. These are important because the application of whole brothincreases the contact of the adsorbent with nucleic acids, lipids, and cellular compounds,which are commonly removed or reduced in conventional primary recovery steps beforefixed-bed column chromatography. Commonly used agents in CIP protocols are NaCl,NaOH, ethanol, acetic acid, urea, and guanidine hydrochloride.48,69,73
17.9 PROCESS INTEGRATION IN PROTEIN RECOVERY
There is much current interest aimed at implementing processes that integrate theupstream and downstream operation for protein recovery.13,14,19 Although adsorption influidized beds provides considerable savings in cost and time over conventional purificationtechniques, it deploys a discrete operation with which the desired protein is captured at thetermination of fermentation or once a cell suspension has been disrupted. The main disadvan-tage of this discrete recovery operation is the risk of detrimental effects on an unstable prod-uct associated during holdup periods.13 This may be defined as the time when the feedstockis harvested, preconditioned, and stored before being subjected to fluidized bed processing.The holdup period risks time-dependent product modification and/or inactivation by systemantagonists including proteases, carbohydrates, harsh physical conditions,3 or product lossassociated with proteinedebris interaction. In addition, it has been reported that proteinproducts are usually stabilized and less susceptible to protease degradation when they areadsorbed onto a chromatography solid phase. Therefore, a logical physical coupling of fluid-ized bed adsorption with upstream operations of fermentation or cell disruption might bepredicted to gain additional benefits of product yield and quality by virtue of the immediateand direct sequestration of products from process feedstocks at the source.14,61,65,67
However, the application of a multi-fluidized bed system in which each bed is sequentiallyoperated online to the fermenter or disrupter to achieve a repetitive operation of this cyclecould decrease the adsorbent inventory and increase the maximum batch size.
17.9.1 Interfaced and Integrated Fluidized Bed/Expanded Bed System
Fluidized bed recovery of protein from particulate-containing feedstock can be achievedusing two methods: as an interfaced or integrated system.62 The interfaced system exploitsa fluidized bed to capture the desired protein either at termination of fermentation or once
17.9 PROCESS INTEGRATION IN PROTEIN RECOVERY 511
a cell suspension has been disrupted. In this system, the fluidized bed is normally operated insingle-pass chromatography mode to achieve high adsorption efficiency. In contrast, theintegrated fluidized bed system achieves the direct sequestration of target product fromprocess feedstock at the source: for example, productive fermentation or immediately uponcell disruptate.52
Direct product sequestration (DPS) is designed to minimize product degradation, whichleads to higher product yield and improved molecular integrity.63 An early application ofDPS of protein products was demonstrated in which an extracellular acid protease producedby the oleaginous yeast Yarrowia lipolytica was continuously captured from productivefermentation. The authors reported that the development of such a technique increased theproduct yield by reducing the processing time and imposing a pseudo-constitutive state onthe yeast. Similar advantages were noted with the DPS of a-amylase from fermentations ofBacillus amyloliquifaciens exploiting a manifold of fluidized beds.64 In addition, Carmichaeland co-workers65 demonstrated the application of DPS in the recovery of tissue plasminogenactivator from animal cell cultures (Chinese hamster ovary cells). The work of Hamilton andcolleagues62 addressed the development of process intensification of DPS of acid proteaseproduced by Y. lipolytica. Hamilton and co-workers,61 subsequently performed further inves-tigations into the recovery of similar enzymes successfully from feedstock characterized witha high ionic condition without prior preconditioning (for example, dilution or dialysis). Thisexploited mixed-mode chemical ligands; as a result, the processing time was further short-ened and overall operational efficiency increased.
During the purification of intracellular proteins, cell disruption by mechanical or biochem-ical means is the first step required in the process. However, it commonly initiates cellularand molecular degradation processes, analogous to those of natural cell death and lysis,owing to the disintegration of intracellular compartments that confine lytic enzymes.3,8 Inaddition, the generation of fine cell debris may promote electrostatic and/or hydrophobicproductedebris interactions. Such adverse effects will compromise the yield and molecularfidelity of protein products, particularly when feedstocks are accumulated and processedin time-dependent batch operations. Proteolytic activity may be restrained by the additionof specific inhibitors. However, owing to the complexity and diversity of different host organ-isms, such measures are haphazard. Consequently, rapid processing (for example, by DPS atcell disruption) should minimize such degradation and enhance the yield and quality of eventhe most labile products.13,14 Here, instead of accumulating a disruptate in a holding tank, theproduct remains in its physiological environment, i.e., the intact cell, as long as possible andis exposed to the adsorbent immediately after its release from the cell in the disrupter.Contact times between the target molecule and the disruptate are thus minimal. Mechanicalcell breakage in a bead mill has many attractive process characteristics including high disrup-tion efficiency, high throughput and biomass loading, good temperature control, and unlim-ited scale-up for most bioprocesses. As a result of the operational characteristics of single-passand continuous operation, the use of a bead mill is recommended as the ideal feedstockgenerator for direct sequestration of released products in a fluidized bed.
Baker’s yeast suspension (20% ww/v original cells) was pumped to the bead mill at a flowrate of 280 cm h�1 within the BRG 4.5 cm inner diameter contactor. Then, the disruptate fromthe mill was directly introduced to the pre-equilibrated fluidized bed containing ZSA II-CBand Macrosorb K4AX-CB.
17. ADVANCED DOWNSTREAM PROCESSING IN BIOTECHNOLOGY512
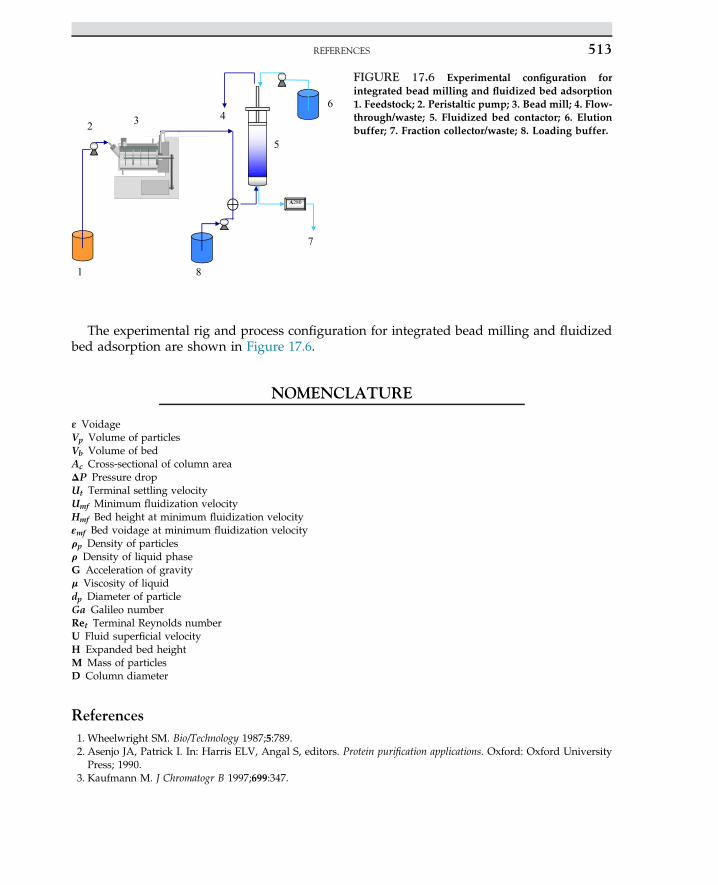
The experimental rig and process configuration for integrated bead milling and fluidizedbed adsorption are shown in Figure 17.6.
NOMENCLATURE
ε VoidageVp Volume of particlesVb Volume of bedAc Cross-sectional of column areaDP Pressure dropUt Terminal settling velocityUmf Minimum fluidization velocityHmf Bed height at minimum fluidization velocityεmf Bed voidage at minimum fluidization velocityrp Density of particlesr Density of liquid phaseG Acceleration of gravitym Viscosity of liquiddp Diameter of particleGa Galileo numberRet Terminal Reynolds numberU Fluid superficial velocityH Expanded bed heightM Mass of particlesD Column diameter
References1. Wheelwright SM. Bio/Technology 1987;5:789.2. Asenjo JA, Patrick I. In: Harris ELV, Angal S, editors. Protein purification applications. Oxford: Oxford UniversityPress; 1990.
3. Kaufmann M. J Chromatogr B 1997;699:347.
A280
6
5
432
7
81
FIGURE 17.6 Experimental configuration forintegrated bead milling and fluidized bed adsorption1. Feedstock; 2. Peristaltic pump; 3. Bead mill; 4. Flow-through/waste; 5. Fluidized bed contactor; 6. Elutionbuffer; 7. Fraction collector/waste; 8. Loading buffer.
REFERENCES 513
4. Harris ELV. Protein purification methods: a practical approach. Oxford: IRL Press; 1989.5. Gilchrist GR, “Direct fluidised bed adsorption of protein products from complex particulate feedstocks”. PhDthesis, University of Birmingham; 1996.
6. Walsh G, Headson D. Protein biotechnology. New York: John Wiley and Sons; 1994.7. Hughes DE, Wimpenny JWT, Lloyd D. In: Norris JR, Ribbons DW, editors. Methods in Microbiology, vol. 5B. NewYork: Academic; 1971.
8. Middelberg APJ. Biotechnol Adv 1995;13:491.9. Agerkvist I, Enfors S-O. Biotechnol Bioengng 1990;36:1083.10. Vogels G, Kula M-R. Chem Engng Sci 1991;47:123.11. Kula M-R, Schütte H. Biotechnol Progr 1987;3:31.12. Schütte H, Kroner KH, Hustedt H, Kula M-R. Enzyme Microb Technol 1983;5:143.13. Bierau H, Zhang Z, Lyddiatt A. J Chem Technol Biotechnol 1999;74:208.14. Jahanshahi M, Sun Y, Santos E, Pacek AW, Franco TT, Nienow AW, et al. Biotechnol Bioengng 2002;80:201.15. Lee S-M. J Biotechnol 1989;11:103.16. BellG,CousinsRB. In:WeatherleyLR, editor.Engineering process for bioseparation. UK:Butterworth-Heinemann; 1994.17. Kula M-R. Bioseparation 1990;1:181.18. Roe SD. In: Verral MS, Hudson MJ, editors. Separations for biotechnology. Chichester: Ellis Horwood; 1987.19. Lyddiatt A. Curr Opin Biotechnol 2002;13:95.20. Chase HA. J Chromatogr 1984;297:179.21. Kumar A, Galaev I Yu, Mattiasson B. J Chromatogr B 2000;741:103.22. Denizli A, Piskin E. J Biochem Biophys Meth 2001;49:391.23. Kopperschläger G, Bohme HJ, Hofmann E. Adv Biochem. Engng 1982;25:101.24. Haff LA, Easterday RL. In: Eckstein F, Sundaram PV, editors. Theory and Practice in affinity chromatography. New
York: Academic Press; 1978.25. Skidmore GL, Horstmann BJ, Chase HA. J Chromatogr 1990;498:113.26. Spalding BJ. Bio/Technology 1991;9:229.27. Van Reis R, Leonard LC, Hsu CC, Builder SE. Biotechnol Bioengng 1991;38:413.28. Anspach FB, Curbelo D, Hartmann R, Garke G, Deckwer W-D. J Chromatogr A 1999;865:129.29. Datar RV, Rosen CG. In: Stephanopoulos G, editor. Bioprocessing. Weinheim: VCH; 1996.30. Belter PA, Cunningham FL, Chen JW. Biotechnol Bioengng 1973;15:533.31. Chase HA. Trends Biotechnol 1994;12:296.32. Levenspiel O. Chemical Reaction engineering. New York: Wiley & Sons; 1999.33. Burns MA, Graves DJ. Biotechnol Progr 1985;1:95.34. Zhang Z, O’Sullivan D, Lyddiatt A. J Chem Technol Biotechnol 1999;74:270.35. Thömmes J, Halfar M, Lenz S, Kula M-R. Biotechnol Bioengng 1995;45:205.36. Karau A, Benken J, Thömmes J, Kula M-R. Biotechnol Bioengng 1997;55:54.37. Hjorth R. Trends Biotechnol 1997;15:230.38. Brown GG. Unit operation. New York: John Wiley and Sons; 1950.39. Draeger NM, Chase HA. Bioseparation 1991;2:67.40. Ergun S. Chem Enginng Prog 1952;48:89.41. Wen CY, Yu YH. AICHE J 1966;12:610.42. Lan JC-W, Hamilton GE, Lyddiatt A. Bioseparation 1999;8:43.43. Kunii D, Levenspiel O. Fluidisation engineering. New York: John Wiley and Sons; 1969.44. Sun Y, Pacek AW, Nienow AW, Lyddiatt A. Biotechnol Bioprocess Engng 2001;6:1.45. Thomas CR, Yates JG. Chem Eng Res Des 1985;63:67.46. Jahanshahi M, Pacek AW, Nienow AW, Lyddiatt A. J Chem Technol Biotechnol 2002;78:1111.47. Chang YK, McCreath GE, Chase HA. Biotechnol Bioengng 1995;48:355.48. Richardson JE, Zaki WW. Trans Inst Chem Engng 1954;32:35.49. Tong X-D, Sun Y. J Chromatogr A 2002;943:63.50. Finette GMS, Mao QM, Hearn MTW. J Chromatogr A 1996;743:57.51. Morton PH, Lyddiatt A. In: Slater MJ, editor. Ion Exchanger advances. Elsevier Applied Science; 1992.52. Thömmes J, Weiher M, Karau A, Kula M-R. Biotechnol Bioengng 1995;48:367.53. Morris JE, Tolppi CG, Carr PW, Flickinger MC. Abstr Pap Am Chem Soc 1994;207.
17. ADVANCED DOWNSTREAM PROCESSING IN BIOTECHNOLOGY514
54. McCreath GE, Chase HA, Lowe CR. J Chromatogr 1994;659:275.55. Palsson E, Gustavsson PE, Larsson PO. J Chromatogr A 2000;878:17.56. Bascoul A, Delmas H, Couderc JP. Chem Engng J Biochem Engng J 1988;37:11.57. Van Der Meer AP, Blanchard CMRJP, Wesselingh JA. Chem Engng Res Des 1984;62:214.58. Bruce LJ, Clemmitt RH, Nash DC, Chase HA. Chem Technol Biotechnol 1999;74:264.59. Hjorth R. Bioseparation 1999;8:1.60. Hamilton GE, Luechau F, Burton SC, Lyddiatt A. J Biotechnol 2000;79:103.61. Hamilton GE, Morton PH, Young TW, Lyddiatt A. Biotechnol Bioengng 1999;64:310.62. Morton P, Lyddiatt A. J Chem Technol Biotechnol 1994;59:106.63. Burns M, Lyddiatt A. Controlled fluidised bed protein recovery using hydrophobic matrices. Rugby, UK: The IChemE
Research Event, IChemE; 1996.64. Carmichael IA, Al-Rubeai M, Lyddiatt A. New developments and new applications in animal cell technology. ESACT,
Kluwer Academic Publishers; 1998.65. Asghari F, Jahanshahi M. Fabrication and evaluation of low-cost agaroseezinc nanoporous composite matrix:
Influence of adsorbent density and size distribution on the performance of expanded beds. J Chromatogr A2012;1257:89e97.
66. Shahavi MH, Najafpour GH, Jahanshahi M. Hydrodynamic behaviour and biochemical characterization of asimple custom expanded bed column for protein purification. Afr J Biotechnol 2008;7:4336e44.
67. Asghari F, Jahanshahi M, Ghoreyshi AA. Preparation and characterization of agaroseenickel nanoporous com-posite particles customized for liquid expanded bed adsorption. J Chromatogr A 2012;1242:35e42.
68. Jahanshahi M, Mosavian MTH, Otaghsara EST. Hydrodynamic characteristics and adsorption Particularityof Nanobiological feedstock along the bed height in a novel chromatography column. Chromatographia2012;75:585e96. http://dx.doi.org/10.1007/s10337-012-2235-3.
69. Ebrahimpour M, Jahanshahi M, Khavarpoor M. Purification of Nanoparticle Bioproduct in integrated Proc-esses:Plasmid DNA separation and recovery. Dyn Biochemistry,Process Biotechnol Mol Biology 2011:78e80. GlobalScience Books.
70. Shahavi MH, Jahanshahi M, Najafpour GD, Ebrahimpour M, Hosenian AH. Expanded bed adsorption ofBiomolecules by NBG Contactor:Experimental and Mathematical investigation.World Appl Sci J 2011;13(2):181e7.
71. Ebrahimpour M, Jahanshahi M, Hosenian AH. Adsorption Strategy of Plasmid DNA nanoparticulate: preparativepurification by a simple custom expanded bed column. J Chromatogr 2010;72(P):383e91.
72. Jahanshahi M, Ebrahimpour M. Expanded bed chromatography as a tool for nanoparticulate separation: kineticstudy and adsorption of protein nanoparticles. J Chromatogr 2009;70:1553e60.
73. Ebrahimpour M, Shahavi MH, Jahanshahi M, Najafpour GH. Nanotechnology in process biotechnology: recoveryand purification of nanoparticulate bioproducts using expanded bed adsorption. J Dyn Biochem Process BiotechnolMol Biology 2009;3(Special Issue 2):57e60.
74. Jahanshahi M, Najafpour GH, Ebrahimpour M, Hajizadeh S, Shahavi MH. Evaluation of hydrodynamicparameters of fluidized bed adsorption on purification of nano-bioproducts. J Phys Status Solidi C2009;6(10):2199e206.
75. Jahanshahi M, Panahi H, Hajizadeh S, Moniri E. Boronate-containing copolymer grafted on Eupergit C as Matrixfor Affinity Chromatography. J Chromatografia 2008;68(2):41e7;75;585e96.
REFERENCES 515
S U B C H A P T E R
17.11Case Study: Biochemical Characterization of a Custom
Expanded Bed Column for Protein Purification*
17.11.1 INTRODUCTION
Liquid fluidized bed adsorption (expanded bed adsorption) has emerged as an efficientmethod for the recovery of biological products from complex feedstocks. Expandedbed adsorption has demonstrated advantages over the traditional methods of recovery,e.g., circumventing the need for clarification of feedstocks before application to a fixedbed chromatography column.1,2 The hydrodynamic behavior of fluidized beds/expandedbeds applied to chromatographic adsorption is different from the conventional liquidesolid fluidized beds. The conventional chemical engineering view of a fluidized bed is onein which there is a significant degree of mixing, both of the solid and the fluid phases: forexample, in gas-fluidized systems.3 However, mixing in liquid fluidized systems is not as se-vere as in gas-fluidized ones. Here, the density differences between the solid and the fluidphase are comparatively small, and thus the bed shows a particulate behavior in whichthe bed can retain a uniform character. In a packed bed, the adsorbent beads are stationaryand liquid flow through the bed approximates plug flow. In contrast, owing to the mixing ofthe adsorbent, a fluidized bed would be expected to show an inferior adsorption performancecompared with the packed bed. Therefore, it is highly desirable to investigate the hydrody-namic performance and minimize the degree of mixing to mimic the adsorption characteris-tics found in a packed bed contactor with respect to capacity and resolutions.4,5
Column (contactor) and solid phase designs have a major role in fluidized bed/expandedbed adsorption. The growth to full potential of applications for fluidized bed or expandedbed technology in biological product recovery may be considered to be currently limitedby the availability of suitable adsorbents and columns in terms of efficiency and cost. Theadsorbent design was extensively been studied in earlier publications.6e10 In the other words,such technology has been commercialized with customized contactor designs and extensivedevelopment programs required for their establishment. Such developments have invitedre-examination of the simply designed fluidized bed contactor (Nanobiotechnology Groupat Noshivani University of Technology referred to as the NBG contactor, as shown in
*This chapter was written with contributions from:Mohammad Hassan Shahavi, Mohsen Jahanshahi, Biotechnology Research Lab., Faculty of ChemicalEngineering, Noshirvani University of Technology, Babol, Iran.
17. ADVANCED DOWNSTREAM PROCESSING IN BIOTECHNOLOGY516
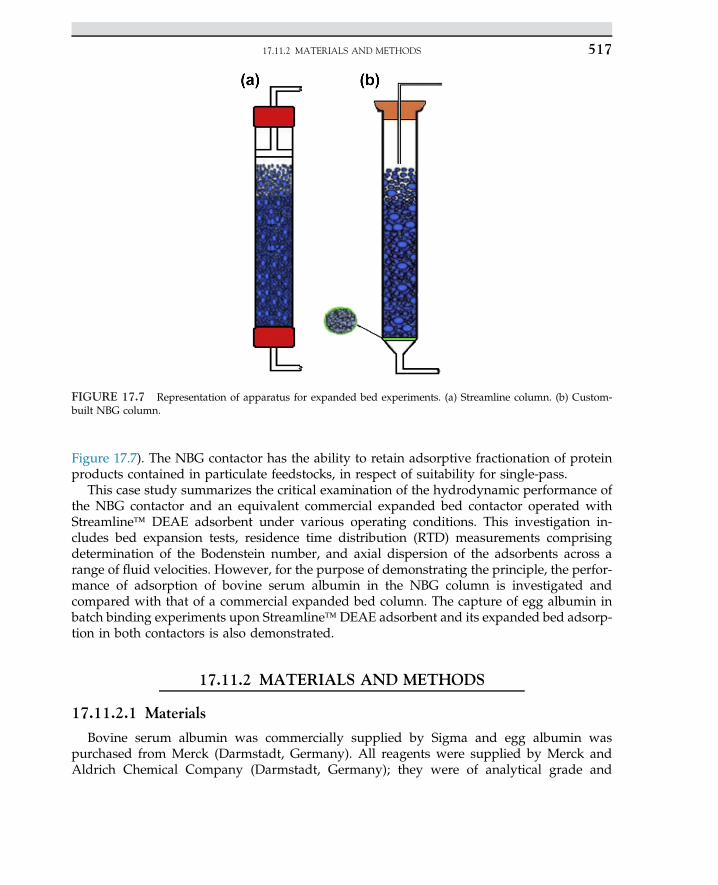
Figure 17.7). The NBG contactor has the ability to retain adsorptive fractionation of proteinproducts contained in particulate feedstocks, in respect of suitability for single-pass.
This case study summarizes the critical examination of the hydrodynamic performance ofthe NBG contactor and an equivalent commercial expanded bed contactor operated withStreamline� DEAE adsorbent under various operating conditions. This investigation in-cludes bed expansion tests, residence time distribution (RTD) measurements comprisingdetermination of the Bodenstein number, and axial dispersion of the adsorbents across arange of fluid velocities. However, for the purpose of demonstrating the principle, the perfor-mance of adsorption of bovine serum albumin in the NBG column is investigated andcompared with that of a commercial expanded bed column. The capture of egg albumin inbatch binding experiments upon Streamline� DEAE adsorbent and its expanded bed adsorp-tion in both contactors is also demonstrated.
17.11.2 MATERIALS AND METHODS
17.11.2.1 Materials
Bovine serum albumin was commercially supplied by Sigma and egg albumin waspurchased from Merck (Darmstadt, Germany). All reagents were supplied by Merck andAldrich Chemical Company (Darmstadt, Germany); they were of analytical grade and
FIGURE 17.7 Representation of apparatus for expanded bed experiments. (a) Streamline column. (b) Custom-built NBG column.
17.11.2 MATERIALS AND METHODS 517
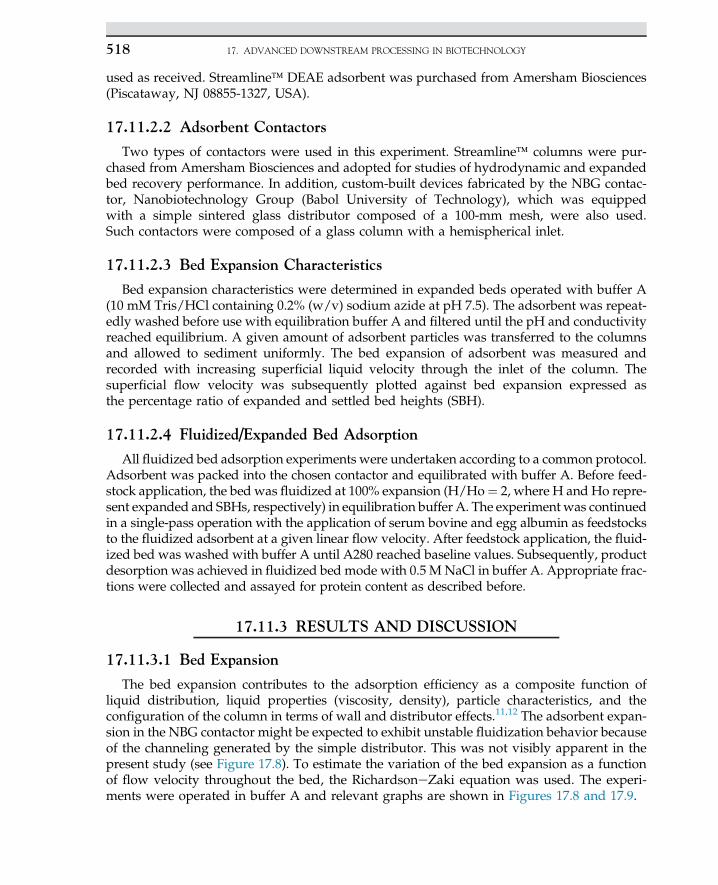
used as received. Streamline� DEAE adsorbent was purchased from Amersham Biosciences(Piscataway, NJ 08855-1327, USA).
17.11.2.2 Adsorbent Contactors
Two types of contactors were used in this experiment. Streamline� columns were pur-chased from Amersham Biosciences and adopted for studies of hydrodynamic and expandedbed recovery performance. In addition, custom-built devices fabricated by the NBG contac-tor, Nanobiotechnology Group (Babol University of Technology), which was equippedwith a simple sintered glass distributor composed of a 100-mm mesh, were also used.Such contactors were composed of a glass column with a hemispherical inlet.
17.11.2.3 Bed Expansion Characteristics
Bed expansion characteristics were determined in expanded beds operated with buffer A(10 mM Tris/HCl containing 0.2% (w/v) sodium azide at pH 7.5). The adsorbent was repeat-edly washed before use with equilibration buffer A and filtered until the pH and conductivityreached equilibrium. A given amount of adsorbent particles was transferred to the columnsand allowed to sediment uniformly. The bed expansion of adsorbent was measured andrecorded with increasing superficial liquid velocity through the inlet of the column. Thesuperficial flow velocity was subsequently plotted against bed expansion expressed asthe percentage ratio of expanded and settled bed heights (SBH).
17.11.2.4 Fluidized/Expanded Bed Adsorption
All fluidized bed adsorption experiments were undertaken according to a common protocol.Adsorbent was packed into the chosen contactor and equilibrated with buffer A. Before feed-stock application, the bed was fluidized at 100% expansion (H/Ho¼ 2, where H and Ho repre-sent expanded and SBHs, respectively) in equilibration buffer A. The experiment was continuedin a single-pass operation with the application of serum bovine and egg albumin as feedstocksto the fluidized adsorbent at a given linear flow velocity. After feedstock application, the fluid-ized bed was washed with buffer A until A280 reached baseline values. Subsequently, productdesorption was achieved in fluidized bed mode with 0.5 M NaCl in buffer A. Appropriate frac-tions were collected and assayed for protein content as described before.
17.11.3 RESULTS AND DISCUSSION
17.11.3.1 Bed Expansion
The bed expansion contributes to the adsorption efficiency as a composite function ofliquid distribution, liquid properties (viscosity, density), particle characteristics, and theconfiguration of the column in terms of wall and distributor effects.11,12 The adsorbent expan-sion in the NBG contactor might be expected to exhibit unstable fluidization behavior becauseof the channeling generated by the simple distributor. This was not visibly apparent in thepresent study (see Figure 17.8). To estimate the variation of the bed expansion as a functionof flow velocity throughout the bed, the RichardsoneZaki equation was used. The experi-ments were operated in buffer A and relevant graphs are shown in Figures 17.8 and 17.9.
17. ADVANCED DOWNSTREAM PROCESSING IN BIOTECHNOLOGY518
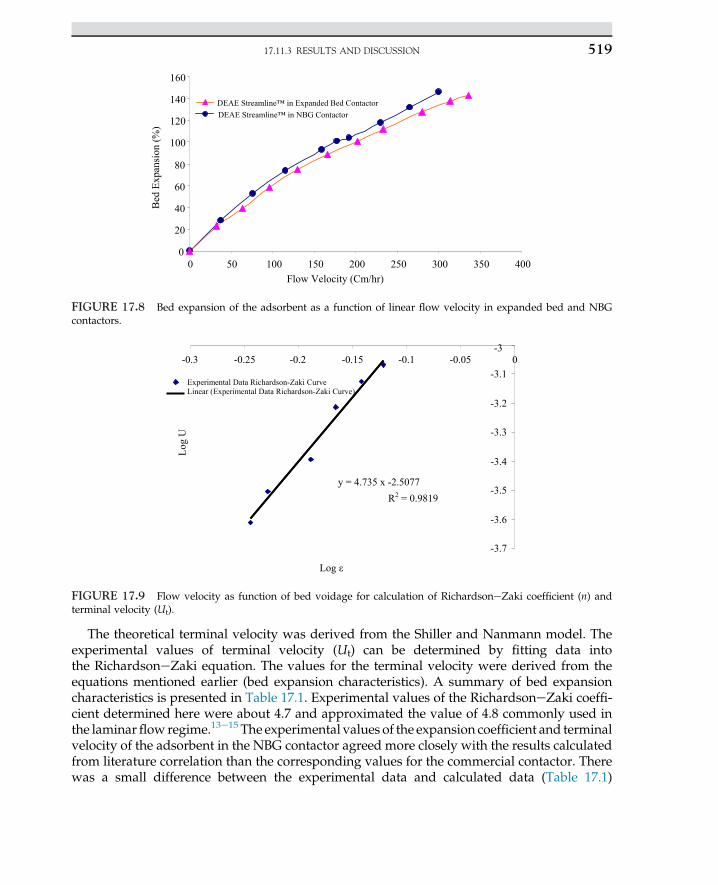
The theoretical terminal velocity was derived from the Shiller and Nanmann model. Theexperimental values of terminal velocity (Ut) can be determined by fitting data intothe RichardsoneZaki equation. The values for the terminal velocity were derived from theequations mentioned earlier (bed expansion characteristics). A summary of bed expansioncharacteristics is presented in Table 17.1. Experimental values of the RichardsoneZaki coeffi-cient determined here were about 4.7 and approximated the value of 4.8 commonly used inthe laminarflow regime.13e15 The experimental values of the expansion coefficient and terminalvelocity of the adsorbent in the NBG contactor agreed more closely with the results calculatedfrom literature correlation than the corresponding values for the commercial contactor. Therewas a small difference between the experimental data and calculated data (Table 17.1)
0
20
40
60
80
100
120
140
160
0 50 100 150 200 250 300 350 400 Flow Velocity (Cm/hr)
Bed
Exp
ansi
on (%
)
DEAE Streamline™ in NBG ContactorDEAE Streamline™ in Expanded Bed Contactor
FIGURE 17.8 Bed expansion of the adsorbent as a function of linear flow velocity in expanded bed and NBGcontactors.
y = 4.735 x -2.5077 R2 = 0.9819
-3.7
-3.6
-3.5
-3.4
-3.3
-3.2
-3.1
-3-0.3 -0.25 -0.2 -0.15 -0.1 -0.05 0
Log ε
Log
U
Experimental Data Richardson-Zaki CurveLinear (Experimental Data Richardson-Zaki Curve)
FIGURE 17.9 Flow velocity as function of bed voidage for calculation of RichardsoneZaki coefficient (n) andterminal velocity (Ut).
17.11.3 RESULTS AND DISCUSSION 519
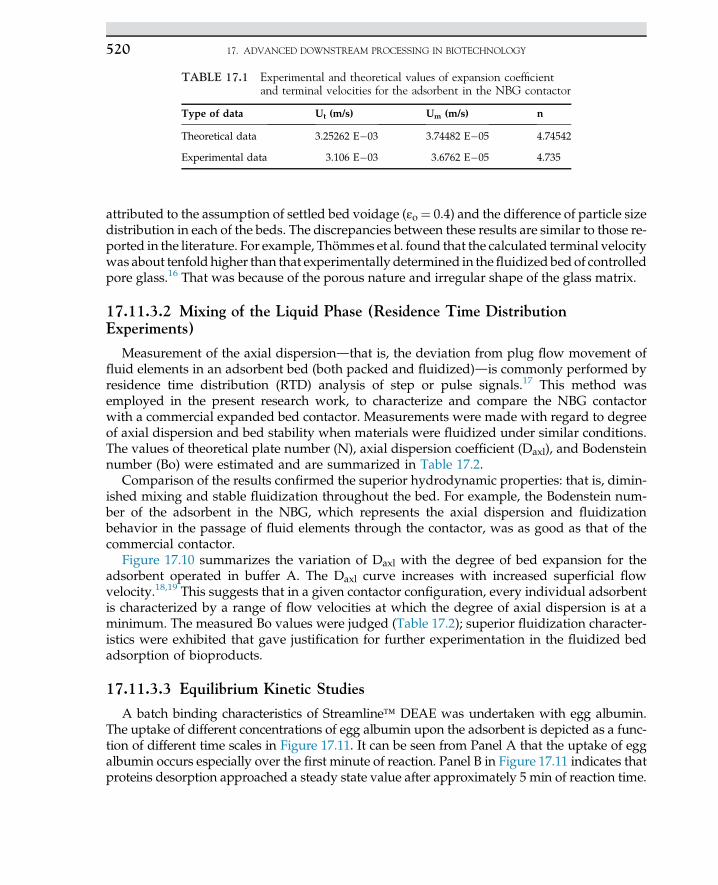
attributed to the assumption of settled bed voidage (εo¼ 0.4) and the difference of particle sizedistribution in each of the beds. The discrepancies between these results are similar to those re-ported in the literature. For example, Thömmes et al. found that the calculated terminal velocitywas about tenfold higher than that experimentally determined in thefluidized bed of controlledpore glass.16 That was because of the porous nature and irregular shape of the glass matrix.
17.11.3.2 Mixing of the Liquid Phase (Residence Time DistributionExperiments)
Measurement of the axial dispersiondthat is, the deviation from plug flow movement offluid elements in an adsorbent bed (both packed and fluidized)dis commonly performed byresidence time distribution (RTD) analysis of step or pulse signals.17 This method wasemployed in the present research work, to characterize and compare the NBG contactorwith a commercial expanded bed contactor. Measurements were made with regard to degreeof axial dispersion and bed stability when materials were fluidized under similar conditions.The values of theoretical plate number (N), axial dispersion coefficient (Daxl), and Bodensteinnumber (Bo) were estimated and are summarized in Table 17.2.
Comparison of the results confirmed the superior hydrodynamic properties: that is, dimin-ished mixing and stable fluidization throughout the bed. For example, the Bodenstein num-ber of the adsorbent in the NBG, which represents the axial dispersion and fluidizationbehavior in the passage of fluid elements through the contactor, was as good as that of thecommercial contactor.
Figure 17.10 summarizes the variation of Daxl with the degree of bed expansion for theadsorbent operated in buffer A. The Daxl curve increases with increased superficial flowvelocity.18,19 This suggests that in a given contactor configuration, every individual adsorbentis characterized by a range of flow velocities at which the degree of axial dispersion is at aminimum. The measured Bo values were judged (Table 17.2); superior fluidization character-istics were exhibited that gave justification for further experimentation in the fluidized bedadsorption of bioproducts.
17.11.3.3 Equilibrium Kinetic Studies
A batch binding characteristics of Streamline� DEAE was undertaken with egg albumin.The uptake of different concentrations of egg albumin upon the adsorbent is depicted as a func-tion of different time scales in Figure 17.11. It can be seen from Panel A that the uptake of eggalbumin occurs especially over the first minute of reaction. Panel B in Figure 17.11 indicates thatproteins desorption approached a steady state value after approximately 5 min of reaction time.
TABLE 17.1 Experimental and theoretical values of expansion coefficientand terminal velocities for the adsorbent in the NBG contactor
Type of data Ut (m/s) Um (m/s) n
Theoretical data 3.25262 E�03 3.74482 E�05 4.74542
Experimental data 3.106 E�03 3.6762 E�05 4.735
17. ADVANCED DOWNSTREAM PROCESSING IN BIOTECHNOLOGY520
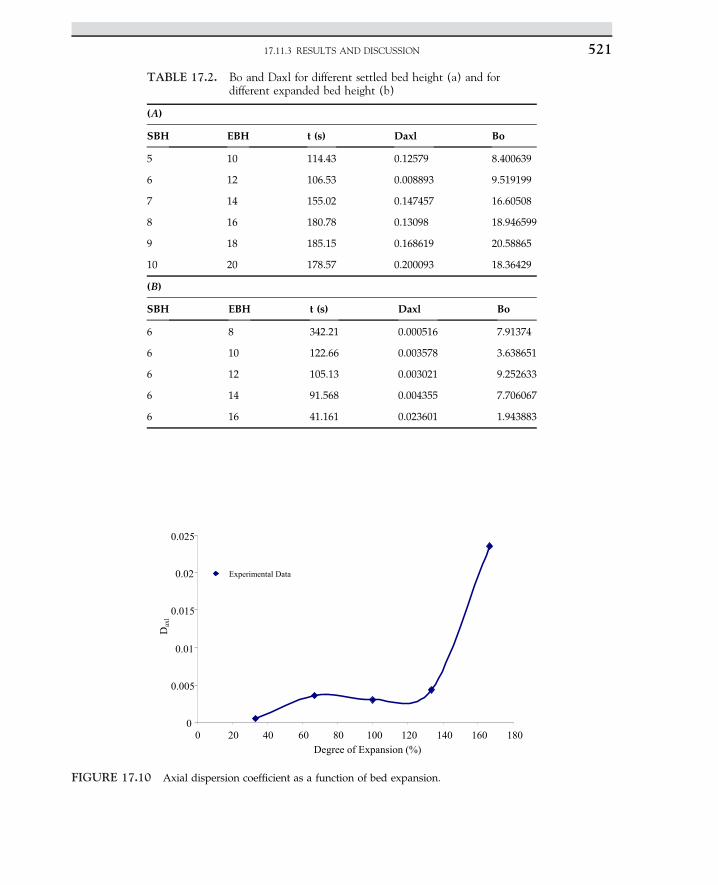
TABLE 17.2. Bo and Daxl for different settled bed height (a) and fordifferent expanded bed height (b)
(A)
SBH EBH t (s) Daxl Bo
5 10 114.43 0.12579 8.400639
6 12 106.53 0.008893 9.519199
7 14 155.02 0.147457 16.60508
8 16 180.78 0.13098 18.946599
9 18 185.15 0.168619 20.58865
10 20 178.57 0.200093 18.36429
(B)
SBH EBH t (s) Daxl Bo
6 8 342.21 0.000516 7.91374
6 10 122.66 0.003578 3.638651
6 12 105.13 0.003021 9.252633
6 14 91.568 0.004355 7.706067
6 16 41.161 0.023601 1.943883
0
0.005
0.01
0.015
0.02
0.025
0 20 40 60 80 100 120 140 160 180 Degree of Expansion (%)
Dax
l
Experimental Data
FIGURE 17.10 Axial dispersion coefficient as a function of bed expansion.
17.11.3 RESULTS AND DISCUSSION 521
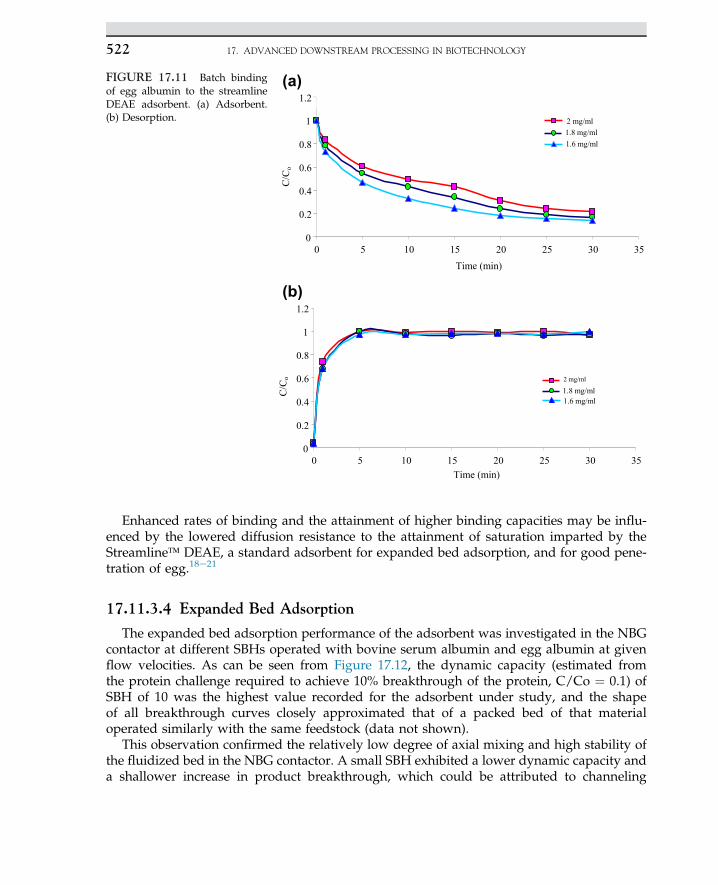
Enhanced rates of binding and the attainment of higher binding capacities may be influ-enced by the lowered diffusion resistance to the attainment of saturation imparted by theStreamline� DEAE, a standard adsorbent for expanded bed adsorption, and for good pene-tration of egg.18e21
17.11.3.4 Expanded Bed Adsorption
The expanded bed adsorption performance of the adsorbent was investigated in the NBGcontactor at different SBHs operated with bovine serum albumin and egg albumin at givenflow velocities. As can be seen from Figure 17.12, the dynamic capacity (estimated fromthe protein challenge required to achieve 10% breakthrough of the protein, C/Co ¼ 0.1) ofSBH of 10 was the highest value recorded for the adsorbent under study, and the shapeof all breakthrough curves closely approximated that of a packed bed of that materialoperated similarly with the same feedstock (data not shown).
This observation confirmed the relatively low degree of axial mixing and high stability ofthe fluidized bed in the NBG contactor. A small SBH exhibited a lower dynamic capacity anda shallower increase in product breakthrough, which could be attributed to channeling
0
0.2
0.4
0.6
0.8
1
1.2
0 5 10 15 20 25 30 35 Time (min)
C/C
o
2 mg/ml1.8 mg/ml1.6 mg/ml
(a)
0
0.2
0.4
0.6
0.8
1
1.2
0 5 10 15 20 25 30 35 Time (min)
C/C
o 2 mg/ml
1.8 mg/ml1.6 mg/ml
(b)
FIGURE 17.11 Batch bindingof egg albumin to the streamlineDEAE adsorbent. (a) Adsorbent.(b) Desorption.
17. ADVANCED DOWNSTREAM PROCESSING IN BIOTECHNOLOGY522
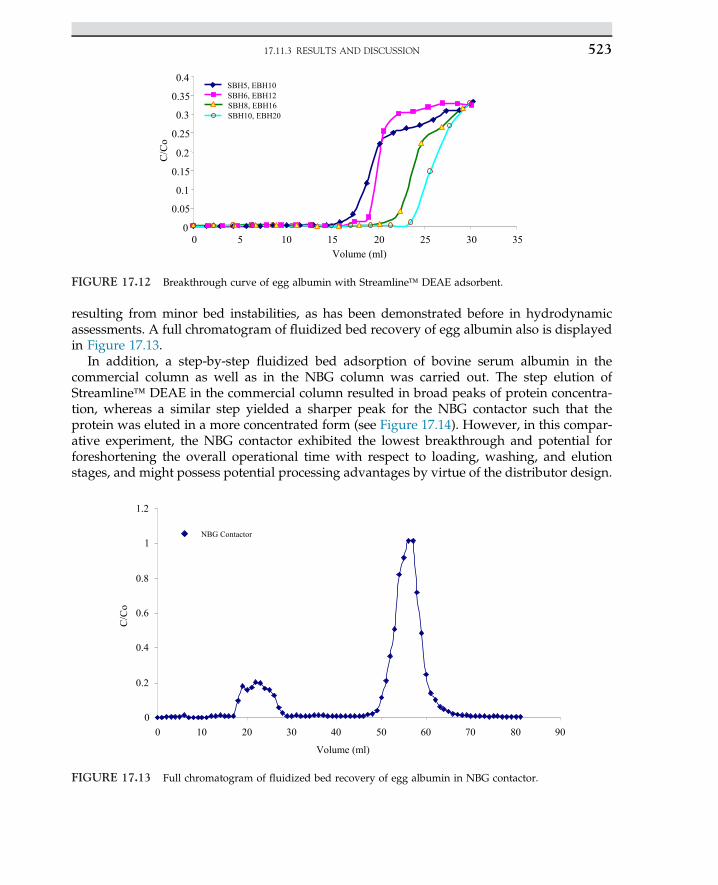
resulting from minor bed instabilities, as has been demonstrated before in hydrodynamicassessments. A full chromatogram of fluidized bed recovery of egg albumin also is displayedin Figure 17.13.
In addition, a step-by-step fluidized bed adsorption of bovine serum albumin in thecommercial column as well as in the NBG column was carried out. The step elution ofStreamline� DEAE in the commercial column resulted in broad peaks of protein concentra-tion, whereas a similar step yielded a sharper peak for the NBG contactor such that theprotein was eluted in a more concentrated form (see Figure 17.14). However, in this compar-ative experiment, the NBG contactor exhibited the lowest breakthrough and potential forforeshortening the overall operational time with respect to loading, washing, and elutionstages, and might possess potential processing advantages by virtue of the distributor design.
0
0.05
0.1
0.15
0.2
0.25
0.3
0.35
0.4
0 5 10 15 20 25 30 35 Volume (ml)
C/C
o
SBH5, EBH10 SBH6, EBH12 SBH8, EBH16 SBH10, EBH20
FIGURE 17.12 Breakthrough curve of egg albumin with Streamline� DEAE adsorbent.
0
0.2
0.4
0.6
0.8
1
1.2
0 10 20 30 40 50 60 70 80 90
Volume (ml)
C/C
o
NBG Contactor
FIGURE 17.13 Full chromatogram of fluidized bed recovery of egg albumin in NBG contactor.
17.11.3 RESULTS AND DISCUSSION 523
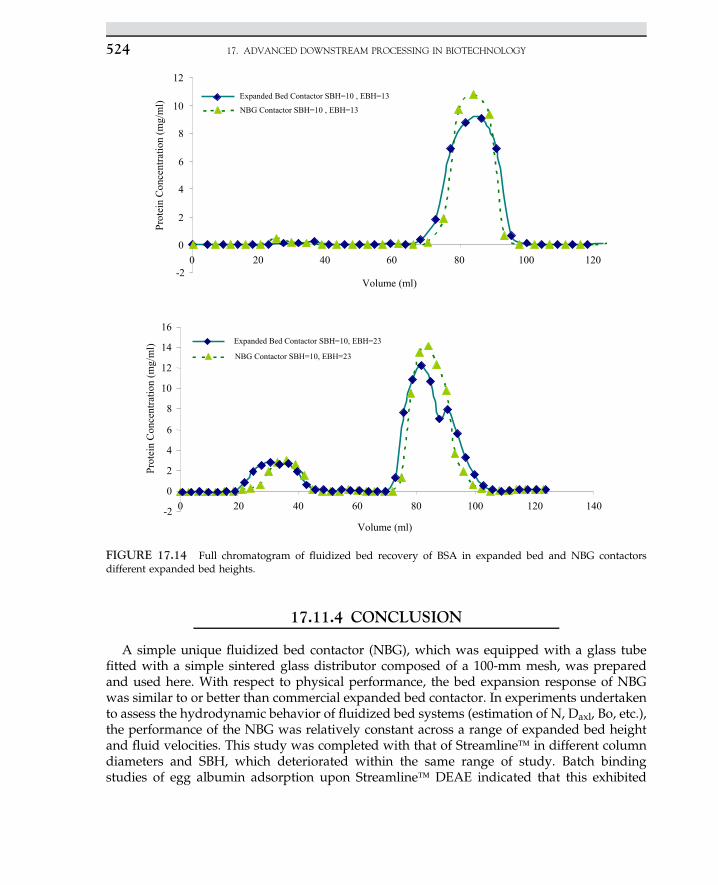
17.11.4 CONCLUSION
A simple unique fluidized bed contactor (NBG), which was equipped with a glass tubefitted with a simple sintered glass distributor composed of a 100-mm mesh, was preparedand used here. With respect to physical performance, the bed expansion response of NBGwas similar to or better than commercial expanded bed contactor. In experiments undertakento assess the hydrodynamic behavior of fluidized bed systems (estimation of N, Daxl, Bo, etc.),the performance of the NBG was relatively constant across a range of expanded bed heightand fluid velocities. This study was completed with that of Streamline� in different columndiameters and SBH, which deteriorated within the same range of study. Batch bindingstudies of egg albumin adsorption upon Streamline� DEAE indicated that this exhibited
-2
0
2
4
6
8
10
12
14
16
0 20 40 60 80 100 120 140
Volume (ml)
Prot
ein
Con
cent
ratio
n (m
g/m
l)
NBG Contactor SBH=10, EBH=23
Expanded Bed Contactor SBH=10, EBH=23
-2
0
2
4
6
8
10
12
0 20 40 60 80 100 120
Volume (ml)
Prot
ein
Con
cent
ratio
n (m
g/m
l)
Expanded Bed Contactor SBH=10 , EBH=13
NBG Contactor SBH=10 , EBH=13
FIGURE 17.14 Full chromatogram of fluidized bed recovery of BSA in expanded bed and NBG contactorsdifferent expanded bed heights.
17. ADVANCED DOWNSTREAM PROCESSING IN BIOTECHNOLOGY524
apparently reasonable adsorption and capacity for the protein under common experimentalconditions. In addition, adsorption and desorption equilibria were achieved in a relativelyshort contact time (see Figure 17.10). In fluidized bed experiments, the rapid achievementof baseline values of the feedstock in the effluents after the initiation of washing and elutionsteps confirmed and additional advantage of the NBG design (see Figure 17.13).
Furthermore, the ability to operate the adsorbent at flow velocities up to two or three timesthat of other column without diminution of adsorption or washing efficiencies because of itsdistributor is a clear practical advantage. It is believed that the simple, economic design of theNBG contactor compares favorably in hydrodynamic and biochemical performance with acommercial expanded bed contactor. It can be concluded from the work reported here thatthe prototype NBG contactor has many properties required as a column for protein purifica-tion and deserves further study in terms of refined geometric design, operational longevity,and suitability for validated manufacturing operations, which may be the subject of futurepublications.
References1. Annelise S, Tetaud E, Merlin G, Santarelli X. LdARL-1 His-tagged recombinant protein: purification by immo-bilized metal affinity expanded bed adsorption. J Chromatogr 2005;818:19e22.
2. Balasundaram B, Harrison STL. Influence of the extent of disruption of Bakers’ yeast on protein adsorption inexpanded beds. J Biotechnol 2008;133:360e9.
3. Kuo JH, Yiang CC. Mechanism of centrifugal filtration for separation of microbe/protein bio-suspension. ChemEng Proc 2008;47:1647e55.
4. Jahanshahi M, Sun Y, Santos E, Pacek AW, Franco TT, Ninow AW, et al. Operational intensification by directproducts sequestration from cell disruptates: application of a pellicular adsorbent in a mechanically integrateddisruption-fluidized bed adsorption process. Biotechnol Bioeng 2002;80:201e12.
5. Bermejo R, Ruiz E, Acien FG. Recovery of B-phycoerythrin using expanded bed adsorption chromatography:scale-up of the process. Enzyme Microb Technol 2007;40:927e33.
6. Jahanshai M, Pacek AW, Nienow AW, Lyddiatt A. Fabrication by three-phase emulsification of pellicularadsorbents customised for liquid fluidized bed adsorption of bioproducts. J Chem Technol Biotechnol2003;78:1111e20.
7. Jahanshahi M, Zhang Z, Lyddiatt A. Subtractive chromatography for purification and recovery of nano-bioproducts. J Nanobiotechnol 2005;152(3):121e6.
8. Jahanshahi M, Panahi H, Hajizadeh S, Moniri E. Boronate-containing copolymer grafted on Eupergit C as matrixfor affinity chromatography. J Chromatographia 2008;68(2):41e7.
9. Sadat Taheri E, Jahanshahi M, Hamed Mosavian MT. Preparation, characterization and optimization of eggalbumin nanoparticles as low molecular-weight drug delivery vehicle. Part Part Syst Charact 2012;29(3):211e22.
10. Jahanshahi M, Hamed Mosavian MT, Taheri Otaghsara ES. Hydrodynamic characteristics and adsorptionparticularity of nanobiological feedstock along the bed height in a novel chromatography column. Chromatog-raphia 2012;75:585e96. http://dx.doi.org/10.1007/s10337-012-2235-3.
11. Asghari F, Jahanshahi M. Fabrication and evaluation of low-cost agaroseezinc nanoporous composite matrix: influ-ence of adsorbent density and size distributionon theperformance of expandedbeds. J ChromatogrA 2012;1257:89e97.
12. Asghari F, Jahanshahi M, Ghoreyshi AA. Preparation and characterization of agaroseenickel nanoporouscomposite particles customized for liquid expanded bed adsorption. J Chromatogr A 2012;1242:35e42.
13. Davidson JF, Clift R, Harrison D. Fluidisation. 2nd ed. London: Academic Press; 1985.14. Amersham Bioscience. Expanded bed adsorptioneprinciples and methods. Uppsala, Sweden: Pharma Biotech; 1998
[Chapter 20].15. Ebrahimpour M, Shahavi MH, Jahanshahi M, Najafpour GH. Nanotechnology in process biotechnology: recovery
and purification of nanoparticulate bioproducts using expanded bed adsorption. J Dyn Biochem Process BiotechnolMol Biol 2009;3(Special Issue 2):57e60.
REFERENCES 525
16. Thömmes J, Weiher M, Karau A, Kula MR. Hydrodynamics and performance in fluidized bed adsorption.Biotechnol Bioeng 1995;48:367e74.
17. Levenspiel O. Chemical reaction engineering. 3rd ed. New York: John Wiley & Sons; 1999.18. Ebrahimpour M, Jahanshahi M, Khavarpoor M. Purification of nanoparticle bioproduct in integrated processes:
plasmid DNA separation and recovery. Dyn Biochem Process Biotechnol Mol Biol 2011:78e80. Global Science Books.19. Shahavi MH, Jahanshahi M, Najafpour GD, Ebrahimpour M, Hosenian AH. Expanded bed adsorption of bio-
molecules by NBG contactor: experimental and mathematical investigation. World Appl Sci J 2011;13(2):181e7.20. Jahanshahi M, Najafpour GD, Ebrahimpour M, Hajizadeh S, Shahavi MH. Evaluation of hydrodynamic pa-
rameters of fluidized bed adsorption on purification of nano-bioproducts. J Phys Status Solidi C2009;6(10):2199e206.
21. Shahavi MH, Najafpour GD, Jahanshahi M. Hydrodynamic behaviour and biochemical characterization of asimple custom expanded bed column for protein purification. Afr J Biotechnol 2008;7:4336e44.
17. ADVANCED DOWNSTREAM PROCESSING IN BIOTECHNOLOGY526
C H A P T E R
18
Microbial Fuel Cells:A New Source of Power*
O U T L I N E
18.1 Introduction 528
18.2 Biological Fuel Cell 529
18.3 Microbial Fuel Cell 53118.3.1 MFC Construction 53218.3.2 Active Biocatalysts 53518.3.3 Electron Transfer in MFCs 53618.3.4 Electron Transport in MFCs 53818.3.5 Use of a Mediator for
Electron Transport 53818.3.5.1 Using Artificial
Mediators 53818.3.5.2 Electron
MediatorsGenerated bySelf-producingMicrobes 539
18.3.6 Challenges in MFCs 54018.3.7 Calculations in MFCs 54018.3.8 Power Generation 54118.3.9 Overpotential in MFCs 542
18.3.10 Coulombic Yield 543
18.3.11 MFCs’ Performance 54318.3.11.1 Conditions in
the AnodicChamber 544
18.3.11.2 Proton ExchangeMembrane 544
18.3.11.3 Conditions inthe CathodicChamber 544
18.3.12 Applications of MFCs 54518.3.12.1 Electricity
Production 54518.3.12.2 Production of
BiologicalHydrogen 546
18.3.12.3 Biosensors 54718.3.12.4 Wastewater
Treatment 547
Acknowledgment 551
References 551
*This chapter was written with contributions from:M. Rahimnejad, Biotechnology Research Laboratory, Faculty of Chemical Engineering, Noshirvani Universityof Technology, Babol, Iran.
527Biochemical Engineering and Biotechnologyhttp://dx.doi.org/10.1016/B978-0-444-63357-6.00018-3 Copyright © 2015 Elsevier B.V. All rights reserved.
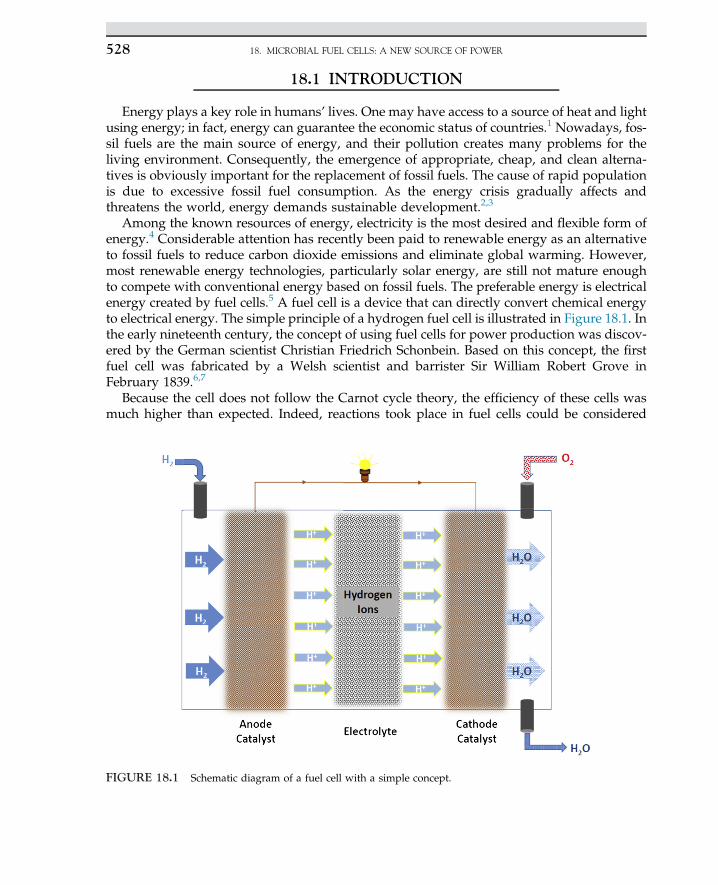
18.1 INTRODUCTION
Energy plays a key role in humans’ lives. One may have access to a source of heat and lightusing energy; in fact, energy can guarantee the economic status of countries.1 Nowadays, fos-sil fuels are the main source of energy, and their pollution creates many problems for theliving environment. Consequently, the emergence of appropriate, cheap, and clean alterna-tives is obviously important for the replacement of fossil fuels. The cause of rapid populationis due to excessive fossil fuel consumption. As the energy crisis gradually affects andthreatens the world, energy demands sustainable development.2,3
Among the known resources of energy, electricity is the most desired and flexible form ofenergy.4 Considerable attention has recently been paid to renewable energy as an alternativeto fossil fuels to reduce carbon dioxide emissions and eliminate global warming. However,most renewable energy technologies, particularly solar energy, are still not mature enoughto compete with conventional energy based on fossil fuels. The preferable energy is electricalenergy created by fuel cells.5 A fuel cell is a device that can directly convert chemical energyto electrical energy. The simple principle of a hydrogen fuel cell is illustrated in Figure 18.1. Inthe early nineteenth century, the concept of using fuel cells for power production was discov-ered by the German scientist Christian Friedrich Schonbein. Based on this concept, the firstfuel cell was fabricated by a Welsh scientist and barrister Sir William Robert Grove inFebruary 1839.6,7
Because the cell does not follow the Carnot cycle theory, the efficiency of these cells wasmuch higher than expected. Indeed, reactions took place in fuel cells could be considered
FIGURE 18.1 Schematic diagram of a fuel cell with a simple concept.
18. MICROBIAL FUEL CELLS: A NEW SOURCE OF POWER528
the reverse operation of water electrolysis. In other words, the final products of a reaction be-tween hydrogen and oxygen are water, heat, and electricity.8 This type of cell cannot saveenergy, like batteries; they can only alter one kind of energy to another without consumingthe materials inside the cell. Each fuel cell consists of three components: an anode electrode, acathode electrode, and an electrolyte or membrane. Hydrogen is used as fuel in the cell and,after oxidizing in an anode electrode, a positive hydrogen ion and an electron are produced;then, protons and electrons pass through the electrolyte and external circuit, respectively. Asa result, water is generated in the cathode by the reaction of oxygen, electrons, and hydrogenions.9,10
Fuel cells are classified and named based on their electrolytes:
1. Alkaline fuel cell2. Phosphoric acid fuel cell3. Polymer electrode membrane4. Molten carbonate fuel cell5. Solid oxide fuel cell6. Biological fuel cell (BFC)7. Formic acid fuel cell8. Zinceair fuel cell9. Ceramic fuel cell
Fuel cells have different merits, such as:
• High efficiency• High power• Easy to transport• Compatible with environmental rules• System can be adjusted• High energy density• Flexibility toward fuels• Increase production and decrease distribution• Capability to combine with other energy production systems
Despite the large number of advantages, these cells have some demerits, such as the highcost of catalysts, corrosive electrolytes, and the harsh conditions of operation (high tempera-ture and pressure).11,12
18.2 BIOLOGICAL FUEL CELL
In light of the above-mentioned disadvantages of fuel cells and the recent energy crisis,BFCs are one of the latest emerging sustainable energy technologies that convert the chemicalenergy restored in substrates into electrical energy by means of active biocatalysts, such asmicroorganisms or enzymes, in various BFC configurations. In a BFC, electricity can be gener-ated in a biological system. BFCs perform a similar function as nonbiological fuel cells do.Construction of BFCs is similar to that of a polymer electrode membrane with the exceptionthat there are some differences in anodic reactions.13 But the major difference is the catalyst
18.2 BIOLOGICAL FUEL CELL 529
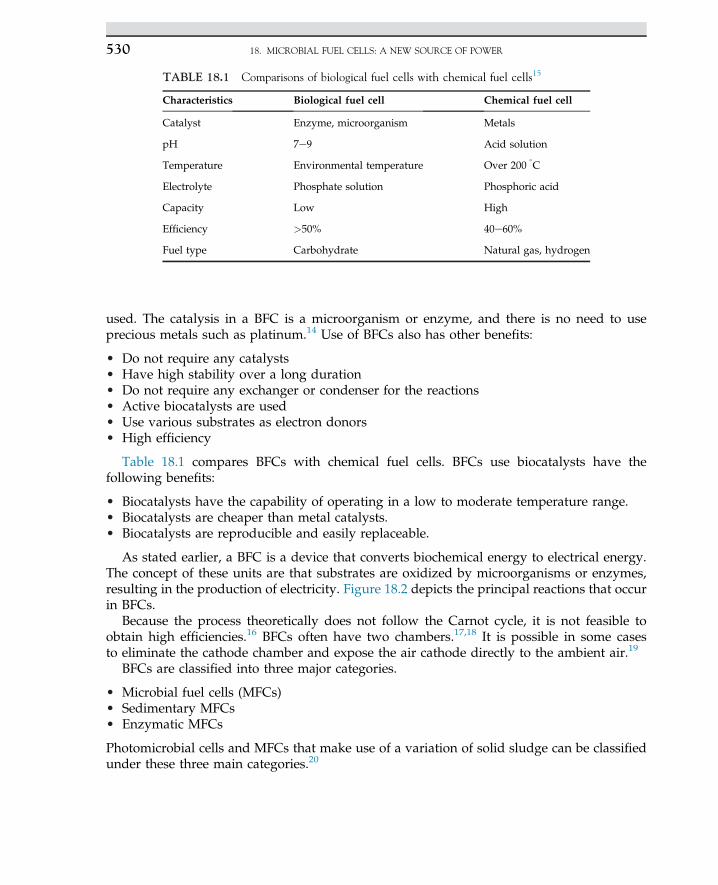
used. The catalysis in a BFC is a microorganism or enzyme, and there is no need to useprecious metals such as platinum.14 Use of BFCs also has other benefits:
• Do not require any catalysts• Have high stability over a long duration• Do not require any exchanger or condenser for the reactions• Active biocatalysts are used• Use various substrates as electron donors• High efficiency
Table 18.1 compares BFCs with chemical fuel cells. BFCs use biocatalysts have thefollowing benefits:
• Biocatalysts have the capability of operating in a low to moderate temperature range.• Biocatalysts are cheaper than metal catalysts.• Biocatalysts are reproducible and easily replaceable.
As stated earlier, a BFC is a device that converts biochemical energy to electrical energy.The concept of these units are that substrates are oxidized by microorganisms or enzymes,resulting in the production of electricity. Figure 18.2 depicts the principal reactions that occurin BFCs.
Because the process theoretically does not follow the Carnot cycle, it is not feasible toobtain high efficiencies.16 BFCs often have two chambers.17,18 It is possible in some casesto eliminate the cathode chamber and expose the air cathode directly to the ambient air.19
BFCs are classified into three major categories.
• Microbial fuel cells (MFCs)• Sedimentary MFCs• Enzymatic MFCs
Photomicrobial cells and MFCs that make use of a variation of solid sludge can be classifiedunder these three main categories.20
TABLE 18.1 Comparisons of biological fuel cells with chemical fuel cells15
Characteristics Biological fuel cell Chemical fuel cell
Catalyst Enzyme, microorganism Metals
pH 7e9 Acid solution
Temperature Environmental temperature Over 200�C
Electrolyte Phosphate solution Phosphoric acid
Capacity Low High
Efficiency >50% 40e60%
Fuel type Carbohydrate Natural gas, hydrogen
18. MICROBIAL FUEL CELLS: A NEW SOURCE OF POWER530
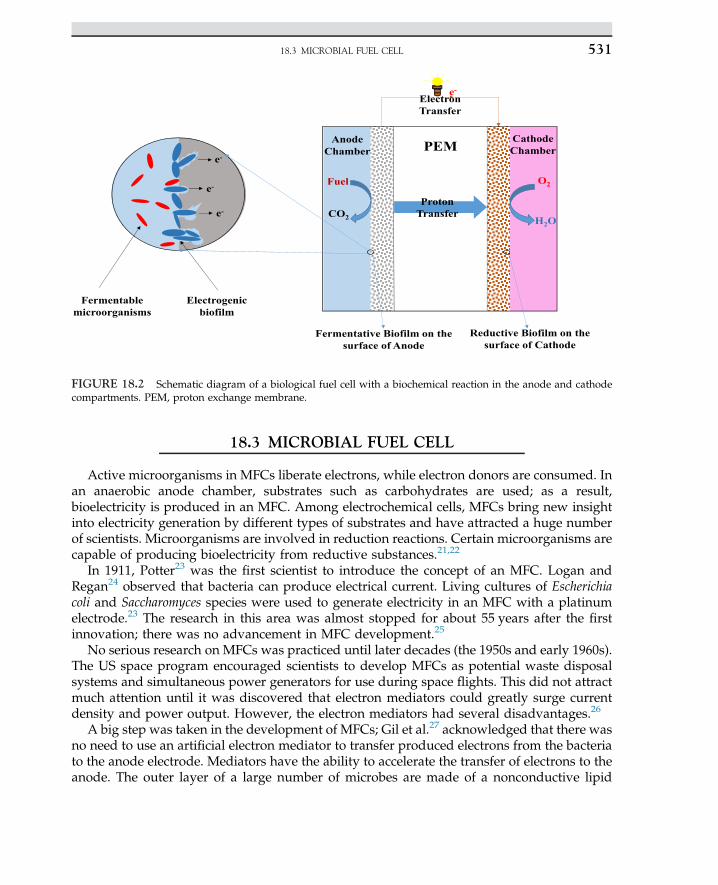
18.3 MICROBIAL FUEL CELL
Active microorganisms in MFCs liberate electrons, while electron donors are consumed. Inan anaerobic anode chamber, substrates such as carbohydrates are used; as a result,bioelectricity is produced in an MFC. Among electrochemical cells, MFCs bring new insightinto electricity generation by different types of substrates and have attracted a huge numberof scientists. Microorganisms are involved in reduction reactions. Certain microorganisms arecapable of producing bioelectricity from reductive substances.21,22
In 1911, Potter23 was the first scientist to introduce the concept of an MFC. Logan andRegan24 observed that bacteria can produce electrical current. Living cultures of Escherichiacoli and Saccharomyces species were used to generate electricity in an MFC with a platinumelectrode.23 The research in this area was almost stopped for about 55 years after the firstinnovation; there was no advancement in MFC development.25
No serious research on MFCs was practiced until later decades (the 1950s and early 1960s).The US space program encouraged scientists to develop MFCs as potential waste disposalsystems and simultaneous power generators for use during space flights. This did not attractmuch attention until it was discovered that electron mediators could greatly surge currentdensity and power output. However, the electron mediators had several disadvantages.26
A big step was taken in the development of MFCs; Gil et al.27 acknowledged that there wasno need to use an artificial electron mediator to transfer produced electrons from the bacteriato the anode electrode. Mediators have the ability to accelerate the transfer of electrons to theanode. The outer layer of a large number of microbes are made of a nonconductive lipid
e-
e-
e-
Fermentable microorganisms
Electrogenic biofilm
Proton Transfer
O2
H2OCO2
Fuel
e-Electron Transfer
Fermentative Biofilm on the surface of Anode
Reductive Biofilm on the surface of Cathode
PEMAnode Chamber
Cathode Chamber
FIGURE 18.2 Schematic diagram of a biological fuel cell with a biochemical reaction in the anode and cathodecompartments. PEM, proton exchange membrane.
18.3 MICROBIAL FUEL CELL 531
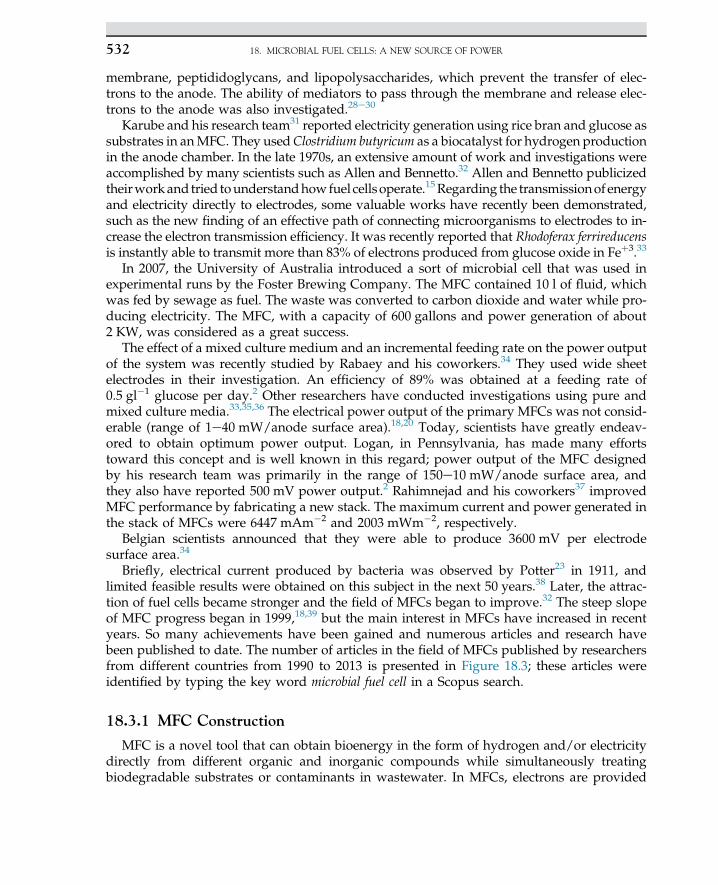
membrane, peptididoglycans, and lipopolysaccharides, which prevent the transfer of elec-trons to the anode. The ability of mediators to pass through the membrane and release elec-trons to the anode was also investigated.28e30
Karube and his research team31 reported electricity generation using rice bran and glucose assubstrates in anMFC. They usedClostridium butyricum as a biocatalyst for hydrogen productionin the anode chamber. In the late 1970s, an extensive amount of work and investigations wereaccomplished by many scientists such as Allen and Bennetto.32 Allen and Bennetto publicizedtheirworkandtried tounderstandhowfuel cells operate.15Regarding the transmissionof energyand electricity directly to electrodes, some valuable works have recently been demonstrated,such as the new finding of an effective path of connecting microorganisms to electrodes to in-crease the electron transmission efficiency. It was recently reported that Rhodoferax ferrireducensis instantly able to transmit more than 83% of electrons produced from glucose oxide in Feþ3.33
In 2007, the University of Australia introduced a sort of microbial cell that was used inexperimental runs by the Foster Brewing Company. The MFC contained 10 l of fluid, whichwas fed by sewage as fuel. The waste was converted to carbon dioxide and water while pro-ducing electricity. The MFC, with a capacity of 600 gallons and power generation of about2 KW, was considered as a great success.
The effect of a mixed culture medium and an incremental feeding rate on the power outputof the system was recently studied by Rabaey and his coworkers.34 They used wide sheetelectrodes in their investigation. An efficiency of 89% was obtained at a feeding rate of0.5 gl�1 glucose per day.2 Other researchers have conducted investigations using pure andmixed culture media.33,35,36 The electrical power output of the primary MFCs was not consid-erable (range of 1e40 mW/anode surface area).18,20 Today, scientists have greatly endeav-ored to obtain optimum power output. Logan, in Pennsylvania, has made many effortstoward this concept and is well known in this regard; power output of the MFC designedby his research team was primarily in the range of 150e10 mW/anode surface area, andthey also have reported 500 mV power output.2 Rahimnejad and his coworkers37 improvedMFC performance by fabricating a new stack. The maximum current and power generated inthe stack of MFCs were 6447 mAm�2 and 2003 mWm�2, respectively.
Belgian scientists announced that they were able to produce 3600 mV per electrodesurface area.34
Briefly, electrical current produced by bacteria was observed by Potter23 in 1911, andlimited feasible results were obtained on this subject in the next 50 years.38 Later, the attrac-tion of fuel cells became stronger and the field of MFCs began to improve.32 The steep slopeof MFC progress began in 1999,18,39 but the main interest in MFCs have increased in recentyears. So many achievements have been gained and numerous articles and research havebeen published to date. The number of articles in the field of MFCs published by researchersfrom different countries from 1990 to 2013 is presented in Figure 18.3; these articles wereidentified by typing the key word microbial fuel cell in a Scopus search.
18.3.1 MFC Construction
MFC is a novel tool that can obtain bioenergy in the form of hydrogen and/or electricitydirectly from different organic and inorganic compounds while simultaneously treatingbiodegradable substrates or contaminants in wastewater. In MFCs, electrons are provided
18. MICROBIAL FUEL CELLS: A NEW SOURCE OF POWER532
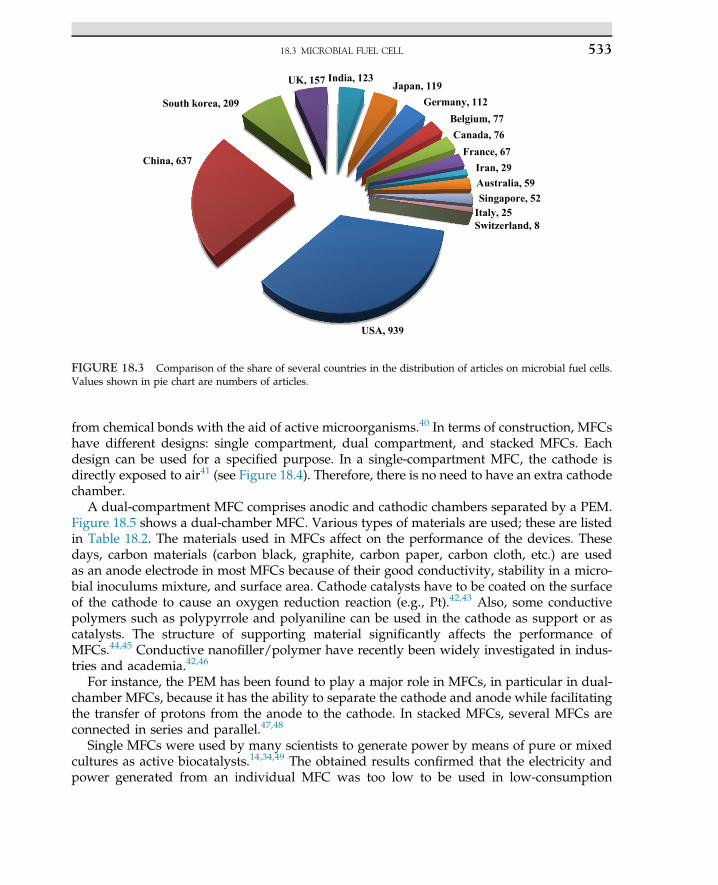
from chemical bonds with the aid of active microorganisms.40 In terms of construction, MFCshave different designs: single compartment, dual compartment, and stacked MFCs. Eachdesign can be used for a specified purpose. In a single-compartment MFC, the cathode isdirectly exposed to air41 (see Figure 18.4). Therefore, there is no need to have an extra cathodechamber.
A dual-compartment MFC comprises anodic and cathodic chambers separated by a PEM.Figure 18.5 shows a dual-chamber MFC. Various types of materials are used; these are listedin Table 18.2. The materials used in MFCs affect on the performance of the devices. Thesedays, carbon materials (carbon black, graphite, carbon paper, carbon cloth, etc.) are usedas an anode electrode in most MFCs because of their good conductivity, stability in a micro-bial inoculums mixture, and surface area. Cathode catalysts have to be coated on the surfaceof the cathode to cause an oxygen reduction reaction (e.g., Pt).42,43 Also, some conductivepolymers such as polypyrrole and polyaniline can be used in the cathode as support or ascatalysts. The structure of supporting material significantly affects the performance ofMFCs.44,45 Conductive nanofiller/polymer have recently been widely investigated in indus-tries and academia.42,46
For instance, the PEM has been found to play a major role in MFCs, in particular in dual-chamber MFCs, because it has the ability to separate the cathode and anode while facilitatingthe transfer of protons from the anode to the cathode. In stacked MFCs, several MFCs areconnected in series and parallel.47,48
Single MFCs were used by many scientists to generate power by means of pure or mixedcultures as active biocatalysts.14,34,49 The obtained results confirmed that the electricity andpower generated from an individual MFC was too low to be used in low-consumption
USA, 939
China, 637
South korea, 209
UK, 157 India, 123Japan, 119
Germany, 112Belgium, 77Canada, 76
France, 67Iran, 29Australia, 59Singapore, 52
Italy, 25Switzerland, 8
FIGURE 18.3 Comparison of the share of several countries in the distribution of articles on microbial fuel cells.Values shown in pie chart are numbers of articles.
18.3 MICROBIAL FUEL CELL 533
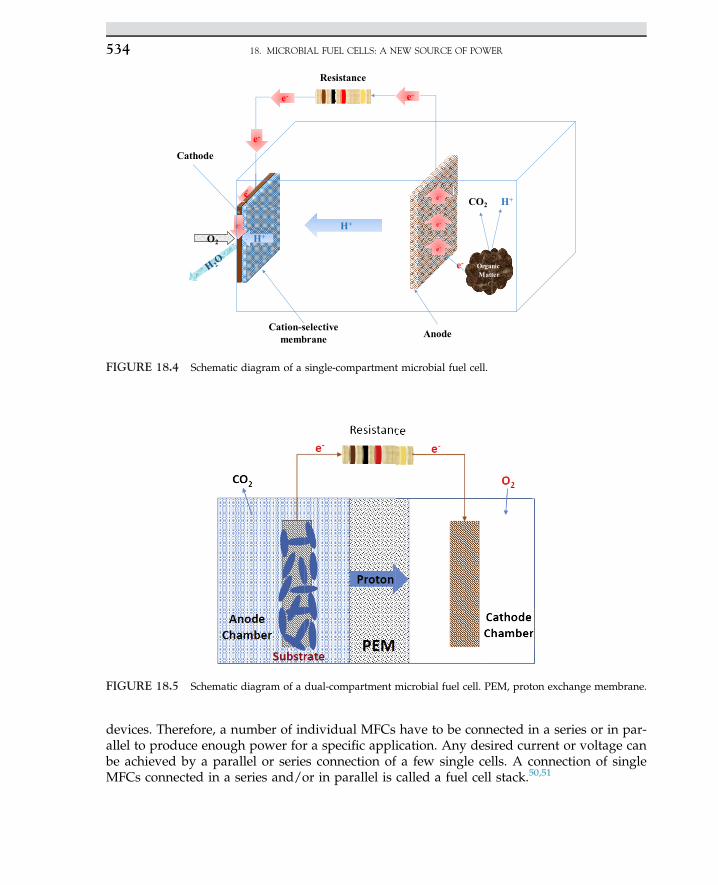
devices. Therefore, a number of individual MFCs have to be connected in a series or in par-allel to produce enough power for a specific application. Any desired current or voltage canbe achieved by a parallel or series connection of a few single cells. A connection of singleMFCs connected in a series and/or in parallel is called a fuel cell stack.50,51
FIGURE 18.5 Schematic diagram of a dual-compartment microbial fuel cell. PEM, proton exchange membrane.
e
H+ e
e
e- e-
H+
e-
e
O2
Organic Matter
CO2 & H+
Resistance
Cathode
Cation-selective membrane Anode
e-
FIGURE 18.4 Schematic diagram of a single-compartment microbial fuel cell.
18. MICROBIAL FUEL CELLS: A NEW SOURCE OF POWER534
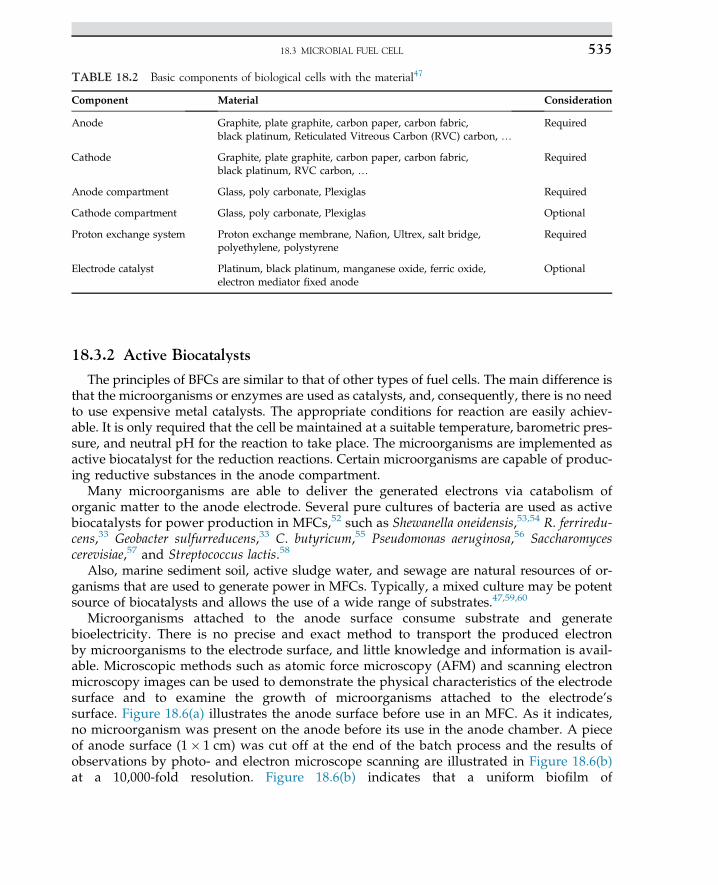
18.3.2 Active Biocatalysts
The principles of BFCs are similar to that of other types of fuel cells. The main difference isthat the microorganisms or enzymes are used as catalysts, and, consequently, there is no needto use expensive metal catalysts. The appropriate conditions for reaction are easily achiev-able. It is only required that the cell be maintained at a suitable temperature, barometric pres-sure, and neutral pH for the reaction to take place. The microorganisms are implemented asactive biocatalyst for the reduction reactions. Certain microorganisms are capable of produc-ing reductive substances in the anode compartment.
Many microorganisms are able to deliver the generated electrons via catabolism oforganic matter to the anode electrode. Several pure cultures of bacteria are used as activebiocatalysts for power production in MFCs,52 such as Shewanella oneidensis,53,54 R. ferriredu-cens,33 Geobacter sulfurreducens,33 C. butyricum,55 Pseudomonas aeruginosa,56 Saccharomycescerevisiae,57 and Streptococcus lactis.58
Also, marine sediment soil, active sludge water, and sewage are natural resources of or-ganisms that are used to generate power in MFCs. Typically, a mixed culture may be potentsource of biocatalysts and allows the use of a wide range of substrates.47,59,60
Microorganisms attached to the anode surface consume substrate and generatebioelectricity. There is no precise and exact method to transport the produced electronby microorganisms to the electrode surface, and little knowledge and information is avail-able. Microscopic methods such as atomic force microscopy (AFM) and scanning electronmicroscopy images can be used to demonstrate the physical characteristics of the electrodesurface and to examine the growth of microorganisms attached to the electrode’ssurface. Figure 18.6(a) illustrates the anode surface before use in an MFC. As it indicates,no microorganism was present on the anode before its use in the anode chamber. A pieceof anode surface (1� 1 cm) was cut off at the end of the batch process and the results ofobservations by photo- and electron microscope scanning are illustrated in Figure 18.6(b)at a 10,000-fold resolution. Figure 18.6(b) indicates that a uniform biofilm of
TABLE 18.2 Basic components of biological cells with the material47
Component Material Consideration
Anode Graphite, plate graphite, carbon paper, carbon fabric,black platinum, Reticulated Vitreous Carbon (RVC) carbon, .
Required
Cathode Graphite, plate graphite, carbon paper, carbon fabric,black platinum, RVC carbon, .
Required
Anode compartment Glass, poly carbonate, Plexiglas Required
Cathode compartment Glass, poly carbonate, Plexiglas Optional
Proton exchange system Proton exchange membrane, Nafion, Ultrex, salt bridge,polyethylene, polystyrene
Required
Electrode catalyst Platinum, black platinum, manganese oxide, ferric oxide,electron mediator fixed anode
Optional
18.3 MICROBIAL FUEL CELL 535
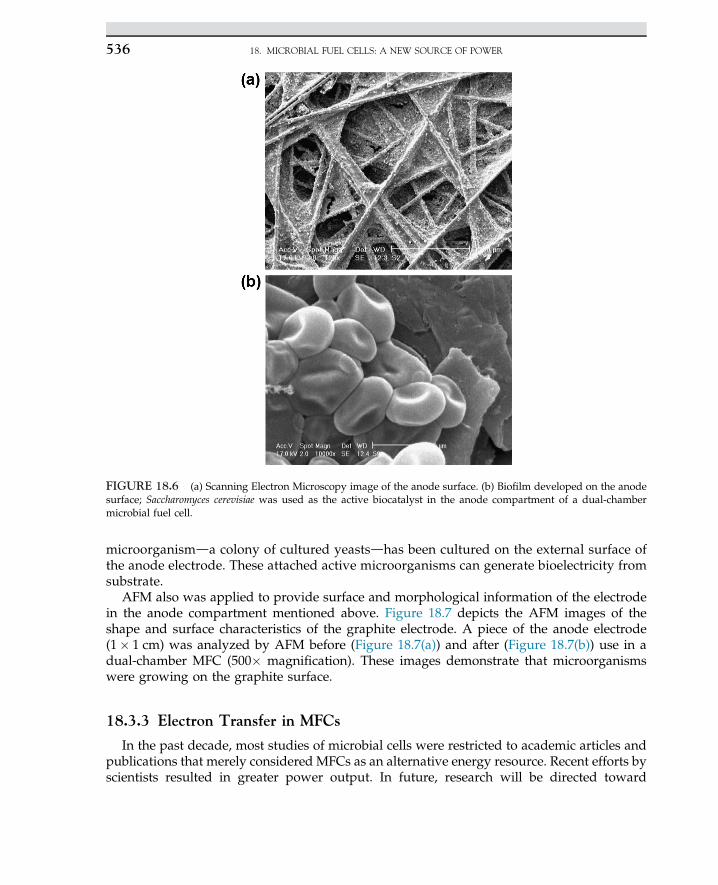
microorganismda colony of cultured yeastsdhas been cultured on the external surface ofthe anode electrode. These attached active microorganisms can generate bioelectricity fromsubstrate.
AFM also was applied to provide surface and morphological information of the electrodein the anode compartment mentioned above. Figure 18.7 depicts the AFM images of theshape and surface characteristics of the graphite electrode. A piece of the anode electrode(1� 1 cm) was analyzed by AFM before (Figure 18.7(a)) and after (Figure 18.7(b)) use in adual-chamber MFC (500� magnification). These images demonstrate that microorganismswere growing on the graphite surface.
18.3.3 Electron Transfer in MFCs
In the past decade, most studies of microbial cells were restricted to academic articles andpublications that merely considered MFCs as an alternative energy resource. Recent efforts byscientists resulted in greater power output. In future, research will be directed toward
FIGURE 18.6 (a) Scanning Electron Microscopy image of the anode surface. (b) Biofilm developed on the anodesurface; Saccharomyces cerevisiae was used as the active biocatalyst in the anode compartment of a dual-chambermicrobial fuel cell.
18. MICROBIAL FUEL CELLS: A NEW SOURCE OF POWER536
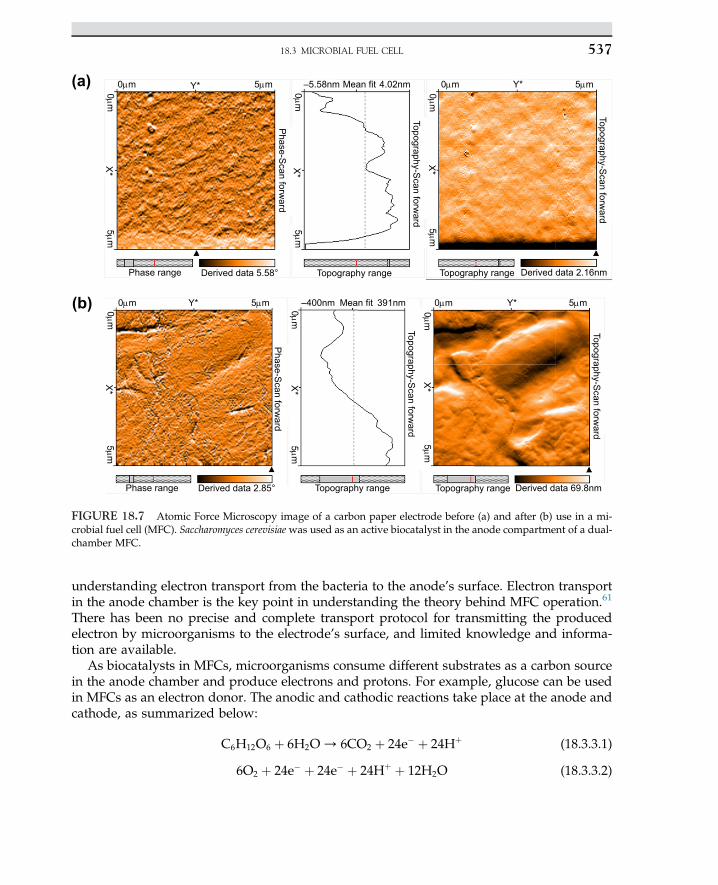
understanding electron transport from the bacteria to the anode’s surface. Electron transportin the anode chamber is the key point in understanding the theory behind MFC operation.61
There has been no precise and complete transport protocol for transmitting the producedelectron by microorganisms to the electrode’s surface, and limited knowledge and informa-tion are available.
As biocatalysts in MFCs, microorganisms consume different substrates as a carbon sourcein the anode chamber and produce electrons and protons. For example, glucose can be usedin MFCs as an electron donor. The anodic and cathodic reactions take place at the anode andcathode, as summarized below:
C6H12O6 þ 6H2O/ 6CO2 þ 24e� þ 24Hþ (18.3.3.1)
6O2 þ 24e� þ 24e� þ 24Hþ þ 12H2O (18.3.3.2)
Derived data 69.8nmDerived data 2.85°
Derived data 5.58° Derived data 2.16nm
Topography rangeTopography range
Topography range Topography range
Topography-Scan forw
ard
Topography-Scan forw
ard
Topography-Scan forw
ard
Topography-Scan forw
ard
Phase range
Phase range
Phase-S
can forward
Phase-S
can forward
0μm
0μm 0μm
0μm0μm0μm
0μm0μm
0μm0μm
5μm5μm
5μm 5μm
5μm5μm
5μm
5μm
5μm
5μm
–5.58nm
–400nm 391nm
Mean fit
Mean fit
4.02nm Y*Y*
Y*
X*
X*
X*
X*
X* X*
Y*
(a)
(b)
FIGURE 18.7 Atomic Force Microscopy image of a carbon paper electrode before (a) and after (b) use in a mi-crobial fuel cell (MFC). Saccharomyces cerevisiaewas used as an active biocatalyst in the anode compartment of a dual-chamber MFC.
18.3 MICROBIAL FUEL CELL 537
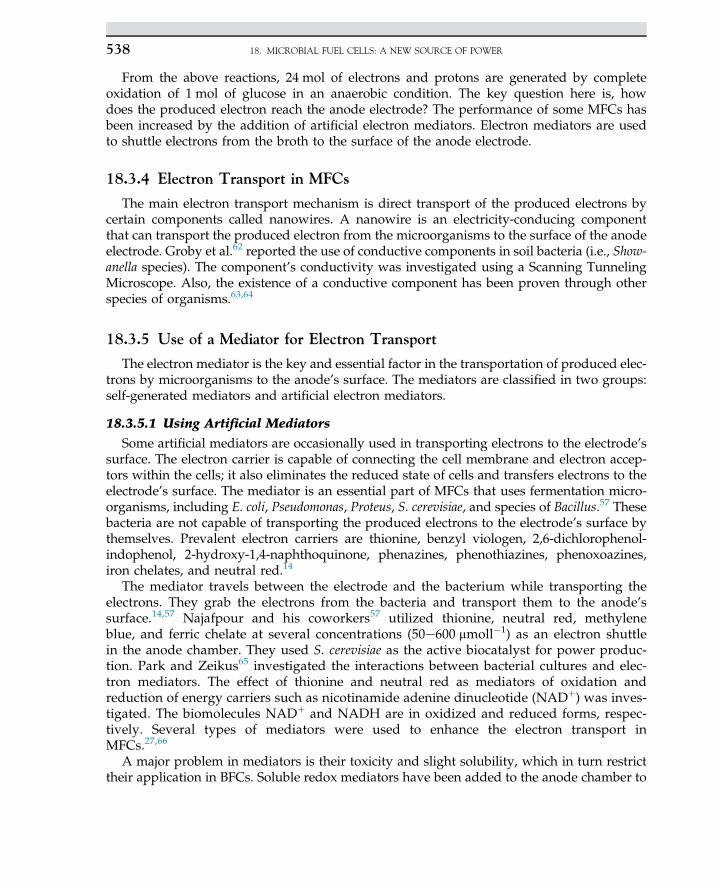
From the above reactions, 24 mol of electrons and protons are generated by completeoxidation of 1 mol of glucose in an anaerobic condition. The key question here is, howdoes the produced electron reach the anode electrode? The performance of some MFCs hasbeen increased by the addition of artificial electron mediators. Electron mediators are usedto shuttle electrons from the broth to the surface of the anode electrode.
18.3.4 Electron Transport in MFCs
The main electron transport mechanism is direct transport of the produced electrons bycertain components called nanowires. A nanowire is an electricity-conducing componentthat can transport the produced electron from the microorganisms to the surface of the anodeelectrode. Groby et al.62 reported the use of conductive components in soil bacteria (i.e., Show-anella species). The component’s conductivity was investigated using a Scanning TunnelingMicroscope. Also, the existence of a conductive component has been proven through otherspecies of organisms.63,64
18.3.5 Use of a Mediator for Electron Transport
The electron mediator is the key and essential factor in the transportation of produced elec-trons by microorganisms to the anode’s surface. The mediators are classified in two groups:self-generated mediators and artificial electron mediators.
18.3.5.1 Using Artificial Mediators
Some artificial mediators are occasionally used in transporting electrons to the electrode’ssurface. The electron carrier is capable of connecting the cell membrane and electron accep-tors within the cells; it also eliminates the reduced state of cells and transfers electrons to theelectrode’s surface. The mediator is an essential part of MFCs that uses fermentation micro-organisms, including E. coli, Pseudomonas, Proteus, S. cerevisiae, and species of Bacillus.57 Thesebacteria are not capable of transporting the produced electrons to the electrode’s surface bythemselves. Prevalent electron carriers are thionine, benzyl viologen, 2,6-dichlorophenol-indophenol, 2-hydroxy-1,4-naphthoquinone, phenazines, phenothiazines, phenoxoazines,iron chelates, and neutral red.14
The mediator travels between the electrode and the bacterium while transporting theelectrons. They grab the electrons from the bacteria and transport them to the anode’ssurface.14,57 Najafpour and his coworkers57 utilized thionine, neutral red, methyleneblue, and ferric chelate at several concentrations (50e600 mmoll�1) as an electron shuttlein the anode chamber. They used S. cerevisiae as the active biocatalyst for power produc-tion. Park and Zeikus65 investigated the interactions between bacterial cultures and elec-tron mediators. The effect of thionine and neutral red as mediators of oxidation andreduction of energy carriers such as nicotinamide adenine dinucleotide (NADþ) was inves-tigated. The biomolecules NADþ and NADH are in oxidized and reduced forms, respec-tively. Several types of mediators were used to enhance the electron transport inMFCs.27,66
A major problem in mediators is their toxicity and slight solubility, which in turn restricttheir application in BFCs. Soluble redox mediators have been added to the anode chamber to
18. MICROBIAL FUEL CELLS: A NEW SOURCE OF POWER538
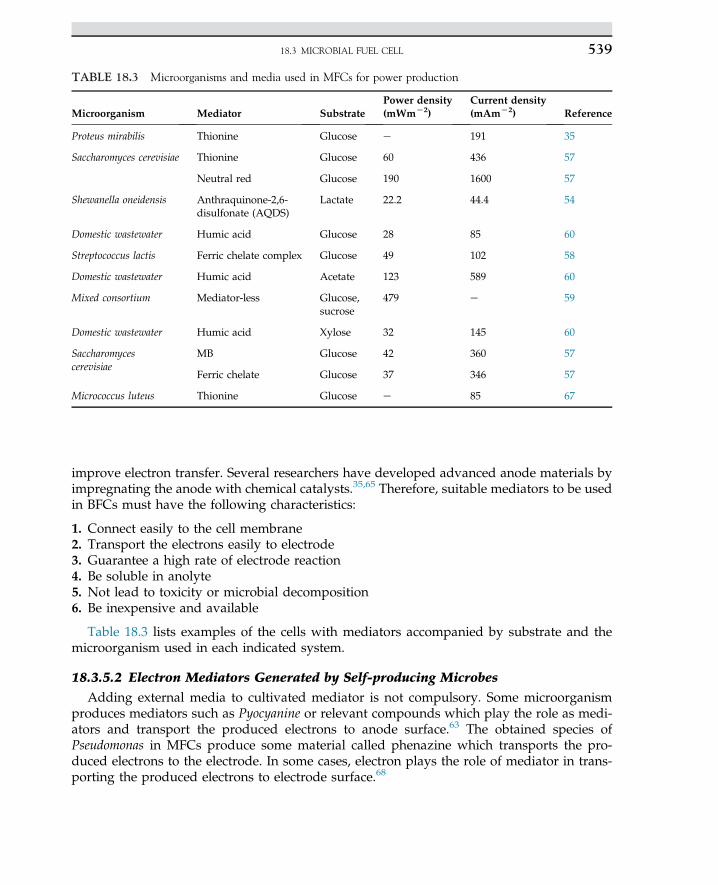
improve electron transfer. Several researchers have developed advanced anode materials byimpregnating the anode with chemical catalysts.35,65 Therefore, suitable mediators to be usedin BFCs must have the following characteristics:
1. Connect easily to the cell membrane2. Transport the electrons easily to electrode3. Guarantee a high rate of electrode reaction4. Be soluble in anolyte5. Not lead to toxicity or microbial decomposition6. Be inexpensive and available
Table 18.3 lists examples of the cells with mediators accompanied by substrate and themicroorganism used in each indicated system.
18.3.5.2 Electron Mediators Generated by Self-producing Microbes
Adding external media to cultivated mediator is not compulsory. Some microorganismproduces mediators such as Pyocyanine or relevant compounds which play the role as medi-ators and transport the produced electrons to anode surface.63 The obtained species ofPseudomonas in MFCs produce some material called phenazine which transports the pro-duced electrons to the electrode. In some cases, electron plays the role of mediator in trans-porting the produced electrons to electrode surface.68
TABLE 18.3 Microorganisms and media used in MFCs for power production
Microorganism Mediator SubstratePower density(mWmL2)
Current density(mAmL2) Reference
Proteus mirabilis Thionine Glucose e 191 35
Saccharomyces cerevisiae Thionine Glucose 60 436 57
Neutral red Glucose 190 1600 57
Shewanella oneidensis Anthraquinone-2,6-disulfonate (AQDS)
Lactate 22.2 44.4 54
Domestic wastewater Humic acid Glucose 28 85 60
Streptococcus lactis Ferric chelate complex Glucose 49 102 58
Domestic wastewater Humic acid Acetate 123 589 60
Mixed consortium Mediator-less Glucose,sucrose
479 e 59
Domestic wastewater Humic acid Xylose 32 145 60
Saccharomycescerevisiae
MB Glucose 42 360 57
Ferric chelate Glucose 37 346 57
Micrococcus luteus Thionine Glucose e 85 67
18.3 MICROBIAL FUEL CELL 539
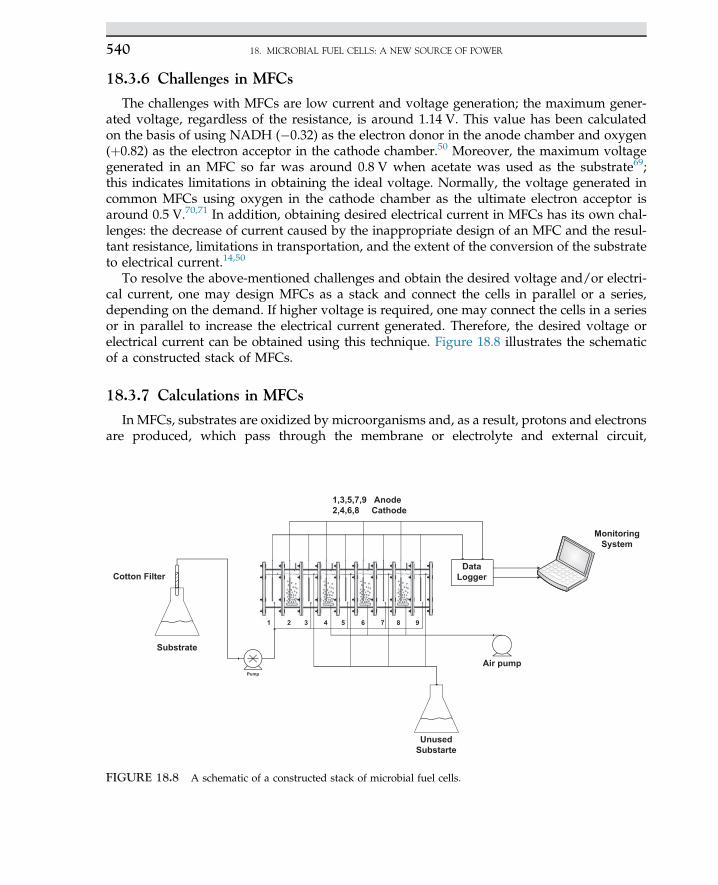
18.3.6 Challenges in MFCs
The challenges with MFCs are low current and voltage generation; the maximum gener-ated voltage, regardless of the resistance, is around 1.14 V. This value has been calculatedon the basis of using NADH (�0.32) as the electron donor in the anode chamber and oxygen(þ0.82) as the electron acceptor in the cathode chamber.50 Moreover, the maximum voltagegenerated in an MFC so far was around 0.8 V when acetate was used as the substrate69;this indicates limitations in obtaining the ideal voltage. Normally, the voltage generated incommon MFCs using oxygen in the cathode chamber as the ultimate electron acceptor isaround 0.5 V.70,71 In addition, obtaining desired electrical current in MFCs has its own chal-lenges: the decrease of current caused by the inappropriate design of an MFC and the resul-tant resistance, limitations in transportation, and the extent of the conversion of the substrateto electrical current.14,50
To resolve the above-mentioned challenges and obtain the desired voltage and/or electri-cal current, one may design MFCs as a stack and connect the cells in parallel or a series,depending on the demand. If higher voltage is required, one may connect the cells in a seriesor in parallel to increase the electrical current generated. Therefore, the desired voltage orelectrical current can be obtained using this technique. Figure 18.8 illustrates the schematicof a constructed stack of MFCs.
18.3.7 Calculations in MFCs
In MFCs, substrates are oxidized by microorganisms and, as a result, protons and electronsare produced, which pass through the membrane or electrolyte and external circuit,
DataLogger
Air pump
Cotton Filter
MonitoringSystem
1 2 3 4 5 6 7
1,3,5,7,9 Anode2,4,6,8 Cathode
Substrate
UnusedSubstarte
8 9
FIGURE 18.8 A schematic of a constructed stack of microbial fuel cells.
18. MICROBIAL FUEL CELLS: A NEW SOURCE OF POWER540
respectively. For instance, acetate could be used as a substrate; the typical reactions arestated below:
Anodic reaction:
CH3COO� þ 2H2O/ 2CO2 þ 7Hþ þ 8e�(18.3.7.1)
Cathodic reaction:
O2 þ 4e� þ 4Hþ / 2H2O(18.3.7.2)
In these reactions the substrate breaks down into carbon dioxide and water, which areaccompanying by electricity generated as a by-product.
The substrate is one essential biochemical factor affecting power generation in MFCs.MFCs are able to consume different sources of chemical matter for bioelectricity production.MFC technology recently was considered as a new method for wastewater treatment andsimultaneous power production. For example, there are many substrates that contain sulfurcompounds (sulfide, sulfite, SO2�
3 , S�1, HS�1). Sulfite-reducing bacteria (e.g., the microor-ganism Desulfovibrio desulfuricans) are among anaerobic microbes that use sulfite as the finalelectron acceptor72; microorganisms use substrate (e.g., lactate) as an electron resource thatresults in elemental sulfur (S�2). Reactions of carbon and sulfate reduction are presented inEqns (18.3.7.3)e(18.3.7.5).
Lactateþ SO2�4 þ 8Hþ / S2� þ 4H2Oþ Pyruvate (18.3.7.3)
S2� þ 4H2O/ SO2�4 þ 8Hþ þ 8e� (18.3.7.4)
2S2� þ 3H2O/ S2O�23 þ 6Hþ þ 8e� (18.3.7.5)
An MFC is unique in its ability to produce bioelectricity and treat wastewater at the sametime. For nearly a decade, the use of wastewater as fuel in MFCs has been common practiceamong scientists to generate electricity.13 The benefit of utilization of wastewater for powerproduction in MFCs is that it is free and the net carbon dioxide emission is acceptable.
18.3.8 Power Generation
The power output of MFCs (Pcell) can be calculated by the following expression:
Pcell ¼ Ecell
ZI dt (18.3.8.1)
where Ecell is the cell potential and I is the electricity current produced. If the rate of electricitycurrent is stable, one may get:
Pcell ¼ Ecell I (18.3.8.2)
The maximum electromotive force Eemf, which is generated by all types of batteries andfuel, can be calculated as follows:
Eemf ¼ E+ � RT
n fLnðPÞ (18.3.8.3)
18.3 MICROBIAL FUEL CELL 541
where E�is the standard electromotive force, R is the universal gas constant, T is the absolute
temperature in Kelvin, n is the number of transported electrons, f is the Faraday constant, theU parameter equals the ratio of product activity to the power of the stoichiometric coefficientdivided by the ratio of the reactant’s activity to the power of their stoichiometry:
P ¼ ProductsP
reactantsr(18.3.8.4)
According to the International Union of Pure and Applied Chemistry, all reactions arewritten in chemical reduction so that reactors are always oxidative and products are reduced.
Oxidizingþ e�/Reduced (18.3.8.5)
According to the International Union of Pure and Applied Chemistry, standard state isdefined as 298 K and a chemical concentration of 1 M for fluids and 1 bar for gases. E
�is
calculated regarding hydrogen as the standard state and is defined as E�(H2O)¼ 0, which
is called a normal hydrogen electrode. Therefore, the standard chemical potential is obtainedby assuming P¼ 1 relative to the hydrogen electrode.
For operational application of a biological cell, the power generation capacity must beconsidered. For a fuel cell, power density and volumetric power can be calculated usingEqns (18.3.8.6) and (18.3.8.7):
Power density ¼ Pcell
A(18.3.8.6)
Volumetric power ¼ Pcell
Ve
¼ Ae
APcell (18.3.8.7)
where Pcell is the power obtained by the cell and A is the surface area of the cell.16
18.3.9 Overpotential in MFCs
In MFCs the measured voltage differs from the produced voltage. In other words, the dif-ference between the measured voltage and the cell voltage, which is called overpotential, iscaused by resistance in electron transmission and initial resistance. Overpotential is as a resultof (1) activation losses; (2) bacterial metabolic losses; and (3) concentration losses. Overpoten-tial of the system can be calculated using the following equation:
Eemf ¼ EC � EA �X
IRe (18.3.9.1)
where EC and EA are experimental potentials of the cathode and anode, respectively.To obtain high voltage from a cell, the electromotive force of the cell must be maximal and
ohmic resistance loss should be minimal. This resistance most often consists of the resistanceof electron transmission to electrodes, connections, resistance in electron transmissionthrough the PEM (if any), and cathodic and anodic electrolytes. Decrement in distance be-tween electrodes, using of PEM with lower resistance and increment of conductivity in elec-trolytes, can decrease the amount of ohmic resistance lost.14
18. MICROBIAL FUEL CELLS: A NEW SOURCE OF POWER542
18.3.10 Coulombic Yield
However, power generation is the main goal of MFC operation, but extracting electronsstored in biomass and recovering as much as energy as possible from the system are impor-tant. The recovered electrons are called coulombic efficiency. In another definition, coulombicefficiency is the fraction of electrons recovered as current versus the total electrons in organicmaterials.
CE ¼ Coulombs recoveredTotal coulombs in substrate
(18.3.10.1)
The coulombic yield is one of the most important factors in MFCs. Coulombic yield is, intheory, the product of generated coulombs in the MFC divided by the total coulombs that canbe obtained as a result of substrate consumption; this is stated as follows:
CE ¼�Cp
CT
�� 100 (18.3.10.2)
where Cp is the number of coulombs generated, which is obtained by integrating the electricalcurrent against time, and CT is the number of coulombs theoretically obtained from a carbonsource; CT can be estimated by the following expression:
CT ¼ �F� b� S� V�M�1� (18.3.10.3)
where F is the Faraday constant, b is the number of moles of electrons generated as a result ofsubstrate consumption (24 mol of electrons were generated per mole of glucose in anaerobicconditions), S is the substrate concentration, V is the working volume of the anode chamber,and M is the molecular weight of the substrate. Thus, the coulombic yield in a batch processcan be calculated via the stated equation:
CE ¼ MR t
0 I� dt
F� b� V� DC(18.3.10.4)
An ampere is defined as the transfer of 1 C of charge per second, or 1A¼ 1C/s. Thus, inte-gration of the current obtained over time is the total coulombs transferred in the system. Thecoulombic yield in a continuous process based on substrate consumption and flow rate of thesystem can be calculated using the following expression:
CE ¼ M� I
F� b� q� DC(18.3.10.5)
where q is the flow rate of the substrate into the system.24,73
18.3.11 MFCs’ Performance
Different factors affect MFCs’ performance, but PEM, the condition in the anodic andcathodic chambers, is considered one of the most important.
18.3 MICROBIAL FUEL CELL 543
18.3.11.1 Conditions in the Anodic Chamber
Fuel or substrate as a source of nutrients and energy is one of the most important param-eters in biological processes such as electricity production in MFCs. Fuel type and its concen-tration and rate are considerable factors that affect the power and current produced in MFCs.The effects of various types of substrates on MFCs’ performance were previouslyinvestigated.74e76
Use of the proper kind of microorganisms in the anodic chamber is also important. Manymicroorganisms are capable of transporting to the anode the electrons obtained by organicmetabolism. Mixed culture of microorganisms from marine sediment soil, active sludge wa-ter, and sewage are rich natural resources of organisms for power production.47
18.3.11.2 Proton Exchange Membrane
The separator between the anode and cathode compartments is one of the most importantfactors affecting MFC performance. The PEM is the most frequently used separator in dual-chamber MFCs because of its moderately high conductivity to cations and low internal resis-tance compared with other separators.77,78 Cation exchange membranes, also known asPEMs, are one of the most widely used separators and are designed for transferring protonsin MFCs.79 The performance of a PEM is studied based on its ability to transport producedprotons from the anode to cathode; moreover, they must prevent the transfer of substances,oxygen, and minerals from the anode to cathode chambers.80,81 However, membrane type(PEM or cation exchange membrane) affects the performance of MFCs and has not been stud-ied well. Poor proton transferability is one of the most recognized deficiencies of PEMs,which holds despite their various composition, internal resistance, and conductivity. Thereare some drawbacks:
1. PEMs are expensive. The estimated cost of a PEM is reported to be close to 40% of thetotal cost of a finished MFC.82
2. The higher transfer ratio of cations to protons can prevent electrochemical reactions inthe cathode, which result in lower cathode cell performance.
3. Chemical and biological fouling results in an increase in internal resistance, which inturn results in lower efficiency and performance of MFCs.
For long-term operation, membrane fouling can be considered as a result of biofilm forma-tion on the PEM. Some scientists described that biofouling in dual-chamber MFCs has a nega-tive effect on the MFCs’ performance.83e85
18.3.11.3 Conditions in the Cathodic Chamber
Oxygen is a suitable and common electron acceptor, and the output power is directly rele-vant to this factor. Different methods of increasing the amount of oxygen in cathodic solutionwere offered. Use of an air pump or proper oxidant can successfully surge the amount of ox-ygen, and subsequently the output power, as was investigated by many researchers.86,87
Besides the advantages of MFCs, such as mild operation reaction conditions, some majordevelopments must be done to enhance the power generated. Improvement of MFC perfor-mance using catalysts such as platinum in the cathode compartment was investigated, butthese materials are generally expensive.13 The use of biocathodes, which can increase the
18. MICROBIAL FUEL CELLS: A NEW SOURCE OF POWER544
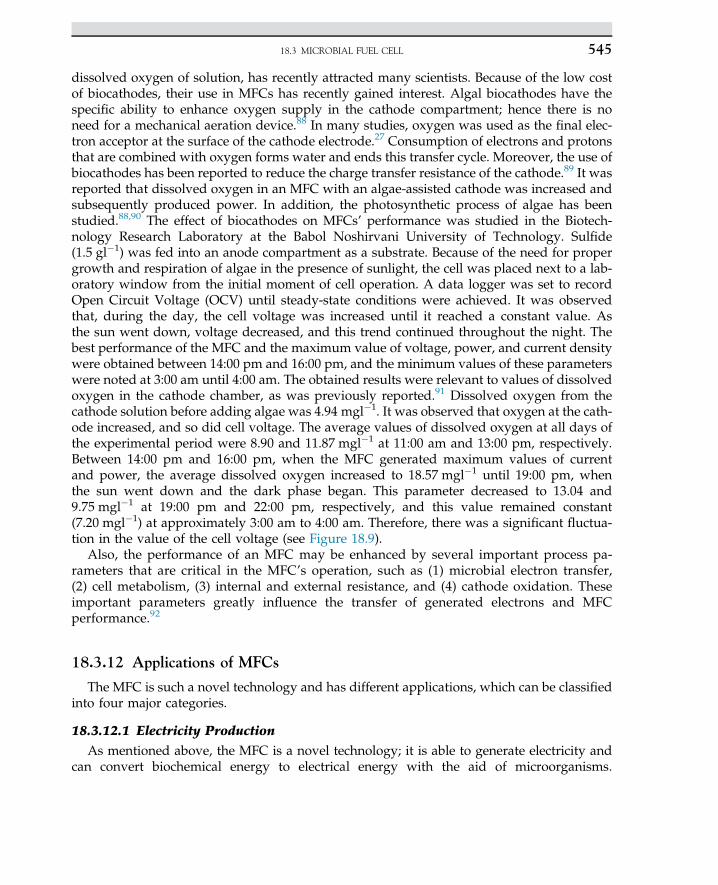
dissolved oxygen of solution, has recently attracted many scientists. Because of the low costof biocathodes, their use in MFCs has recently gained interest. Algal biocathodes have thespecific ability to enhance oxygen supply in the cathode compartment; hence there is noneed for a mechanical aeration device.88 In many studies, oxygen was used as the final elec-tron acceptor at the surface of the cathode electrode.27 Consumption of electrons and protonsthat are combined with oxygen forms water and ends this transfer cycle. Moreover, the use ofbiocathodes has been reported to reduce the charge transfer resistance of the cathode.89 It wasreported that dissolved oxygen in an MFC with an algae-assisted cathode was increased andsubsequently produced power. In addition, the photosynthetic process of algae has beenstudied.88,90 The effect of biocathodes on MFCs’ performance was studied in the Biotech-nology Research Laboratory at the Babol Noshirvani University of Technology. Sulfide(1.5 gl�1) was fed into an anode compartment as a substrate. Because of the need for propergrowth and respiration of algae in the presence of sunlight, the cell was placed next to a lab-oratory window from the initial moment of cell operation. A data logger was set to recordOpen Circuit Voltage (OCV) until steady-state conditions were achieved. It was observedthat, during the day, the cell voltage was increased until it reached a constant value. Asthe sun went down, voltage decreased, and this trend continued throughout the night. Thebest performance of the MFC and the maximum value of voltage, power, and current densitywere obtained between 14:00 pm and 16:00 pm, and the minimum values of these parameterswere noted at 3:00 am until 4:00 am. The obtained results were relevant to values of dissolvedoxygen in the cathode chamber, as was previously reported.91 Dissolved oxygen from thecathode solution before adding algae was 4.94 mgl�1. It was observed that oxygen at the cath-ode increased, and so did cell voltage. The average values of dissolved oxygen at all days ofthe experimental period were 8.90 and 11.87 mgl�1 at 11:00 am and 13:00 pm, respectively.Between 14:00 pm and 16:00 pm, when the MFC generated maximum values of currentand power, the average dissolved oxygen increased to 18.57 mgl�1 until 19:00 pm, whenthe sun went down and the dark phase began. This parameter decreased to 13.04 and9.75 mgl�1 at 19:00 pm and 22:00 pm, respectively, and this value remained constant(7.20 mgl�1) at approximately 3:00 am to 4:00 am. Therefore, there was a significant fluctua-tion in the value of the cell voltage (see Figure 18.9).
Also, the performance of an MFC may be enhanced by several important process pa-rameters that are critical in the MFC’s operation, such as (1) microbial electron transfer,(2) cell metabolism, (3) internal and external resistance, and (4) cathode oxidation. Theseimportant parameters greatly influence the transfer of generated electrons and MFCperformance.92
18.3.12 Applications of MFCs
The MFC is such a novel technology and has different applications, which can be classifiedinto four major categories.
18.3.12.1 Electricity Production
As mentioned above, the MFC is a novel technology; it is able to generate electricity andcan convert biochemical energy to electrical energy with the aid of microorganisms.
18.3 MICROBIAL FUEL CELL 545
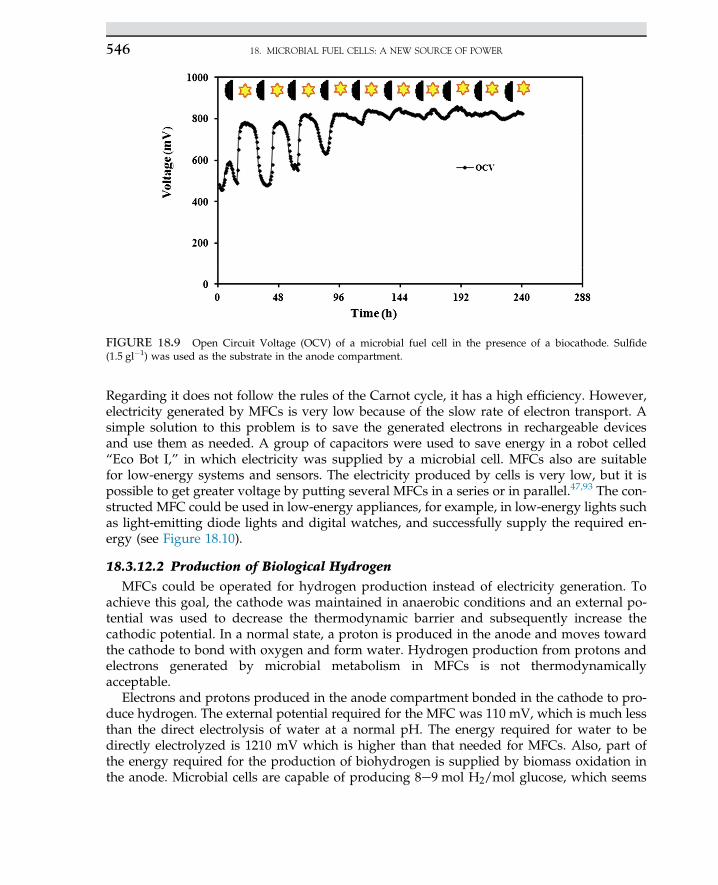
Regarding it does not follow the rules of the Carnot cycle, it has a high efficiency. However,electricity generated by MFCs is very low because of the slow rate of electron transport. Asimple solution to this problem is to save the generated electrons in rechargeable devicesand use them as needed. A group of capacitors were used to save energy in a robot celled“Eco Bot I,” in which electricity was supplied by a microbial cell. MFCs also are suitablefor low-energy systems and sensors. The electricity produced by cells is very low, but it ispossible to get greater voltage by putting several MFCs in a series or in parallel.47,93 The con-structed MFC could be used in low-energy appliances, for example, in low-energy lights suchas light-emitting diode lights and digital watches, and successfully supply the required en-ergy (see Figure 18.10).
18.3.12.2 Production of Biological Hydrogen
MFCs could be operated for hydrogen production instead of electricity generation. Toachieve this goal, the cathode was maintained in anaerobic conditions and an external po-tential was used to decrease the thermodynamic barrier and subsequently increase thecathodic potential. In a normal state, a proton is produced in the anode and moves towardthe cathode to bond with oxygen and form water. Hydrogen production from protons andelectrons generated by microbial metabolism in MFCs is not thermodynamicallyacceptable.
Electrons and protons produced in the anode compartment bonded in the cathode to pro-duce hydrogen. The external potential required for the MFC was 110 mV, which is much lessthan the direct electrolysis of water at a normal pH. The energy required for water to bedirectly electrolyzed is 1210 mV which is higher than that needed for MFCs. Also, part ofthe energy required for the production of biohydrogen is supplied by biomass oxidation inthe anode. Microbial cells are capable of producing 8e9 mol H2/mol glucose, which seems
FIGURE 18.9 Open Circuit Voltage (OCV) of a microbial fuel cell in the presence of a biocathode. Sulfide(1.5 gl�1) was used as the substrate in the anode compartment.
18. MICROBIAL FUEL CELLS: A NEW SOURCE OF POWER546
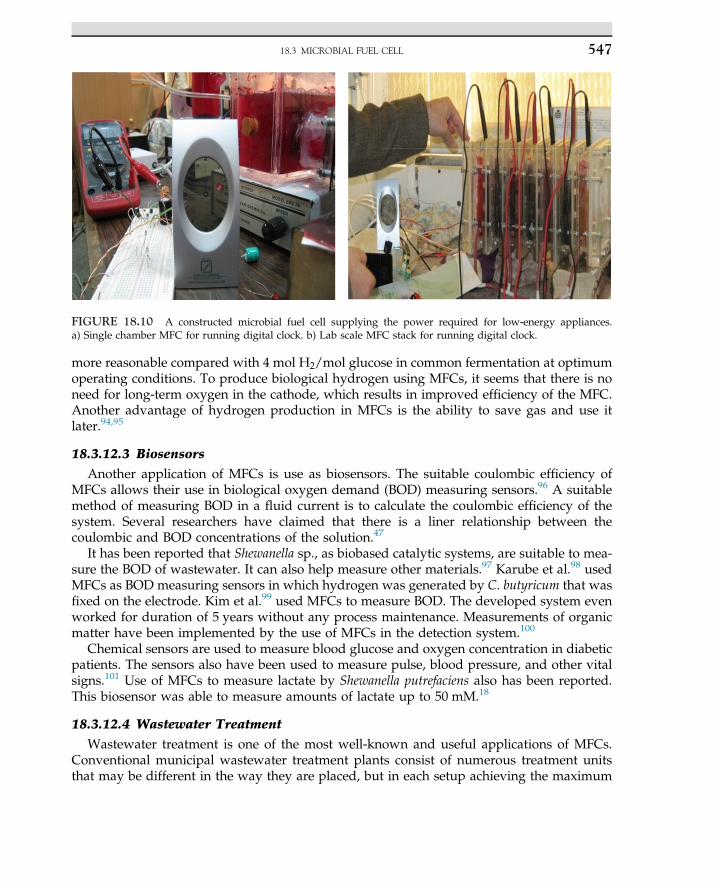
more reasonable compared with 4 mol H2/mol glucose in common fermentation at optimumoperating conditions. To produce biological hydrogen using MFCs, it seems that there is noneed for long-term oxygen in the cathode, which results in improved efficiency of the MFC.Another advantage of hydrogen production in MFCs is the ability to save gas and use itlater.94,95
18.3.12.3 Biosensors
Another application of MFCs is use as biosensors. The suitable coulombic efficiency ofMFCs allows their use in biological oxygen demand (BOD) measuring sensors.96 A suitablemethod of measuring BOD in a fluid current is to calculate the coulombic efficiency of thesystem. Several researchers have claimed that there is a liner relationship between thecoulombic and BOD concentrations of the solution.47
It has been reported that Shewanella sp., as biobased catalytic systems, are suitable to mea-sure the BOD of wastewater. It can also help measure other materials.97 Karube et al.98 usedMFCs as BOD measuring sensors in which hydrogen was generated by C. butyricum that wasfixed on the electrode. Kim et al.99 used MFCs to measure BOD. The developed system evenworked for duration of 5 years without any process maintenance. Measurements of organicmatter have been implemented by the use of MFCs in the detection system.100
Chemical sensors are used to measure blood glucose and oxygen concentration in diabeticpatients. The sensors also have been used to measure pulse, blood pressure, and other vitalsigns.101 Use of MFCs to measure lactate by Shewanella putrefaciens also has been reported.This biosensor was able to measure amounts of lactate up to 50 mM.18
18.3.12.4 Wastewater Treatment
Wastewater treatment is one of the most well-known and useful applications of MFCs.Conventional municipal wastewater treatment plants consist of numerous treatment unitsthat may be different in the way they are placed, but in each setup achieving the maximum
FIGURE 18.10 A constructed microbial fuel cell supplying the power required for low-energy appliances.a) Single chamber MFC for running digital clock. b) Lab scale MFC stack for running digital clock.
18.3 MICROBIAL FUEL CELL 547
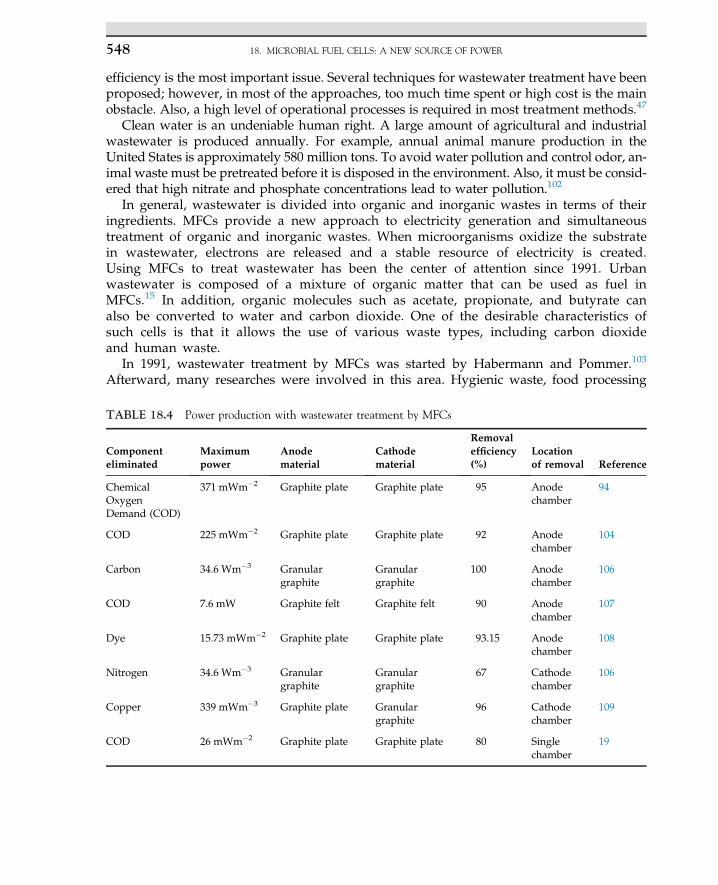
efficiency is the most important issue. Several techniques for wastewater treatment have beenproposed; however, in most of the approaches, too much time spent or high cost is the mainobstacle. Also, a high level of operational processes is required in most treatment methods.47
Clean water is an undeniable human right. A large amount of agricultural and industrialwastewater is produced annually. For example, annual animal manure production in theUnited States is approximately 580 million tons. To avoid water pollution and control odor, an-imal waste must be pretreated before it is disposed in the environment. Also, it must be consid-ered that high nitrate and phosphate concentrations lead to water pollution.102
In general, wastewater is divided into organic and inorganic wastes in terms of theiringredients. MFCs provide a new approach to electricity generation and simultaneoustreatment of organic and inorganic wastes. When microorganisms oxidize the substratein wastewater, electrons are released and a stable resource of electricity is created.Using MFCs to treat wastewater has been the center of attention since 1991. Urbanwastewater is composed of a mixture of organic matter that can be used as fuel inMFCs.15 In addition, organic molecules such as acetate, propionate, and butyrate canalso be converted to water and carbon dioxide. One of the desirable characteristics ofsuch cells is that it allows the use of various waste types, including carbon dioxideand human waste.
In 1991, wastewater treatment by MFCs was started by Habermann and Pommer.103
Afterward, many researches were involved in this area. Hygienic waste, food processing
TABLE 18.4 Power production with wastewater treatment by MFCs
Componenteliminated
Maximumpower
Anodematerial
Cathodematerial
Removalefficiency(%)
Locationof removal Reference
ChemicalOxygenDemand (COD)
371 mWm�2 Graphite plate Graphite plate 95 Anodechamber
94
COD 225 mWm�2 Graphite plate Graphite plate 92 Anodechamber
104
Carbon 34.6 Wm�3 Granulargraphite
Granulargraphite
100 Anodechamber
106
COD 7.6 mW Graphite felt Graphite felt 90 Anodechamber
107
Dye 15.73 mWm�2 Graphite plate Graphite plate 93.15 Anodechamber
108
Nitrogen 34.6 Wm�3 Granulargraphite
Granulargraphite
67 Cathodechamber
106
Copper 339 mWm�3 Graphite plate Granulargraphite
96 Cathodechamber
109
COD 26 mWm�2 Graphite plate Graphite plate 80 Singlechamber
19
18. MICROBIAL FUEL CELLS: A NEW SOURCE OF POWER548
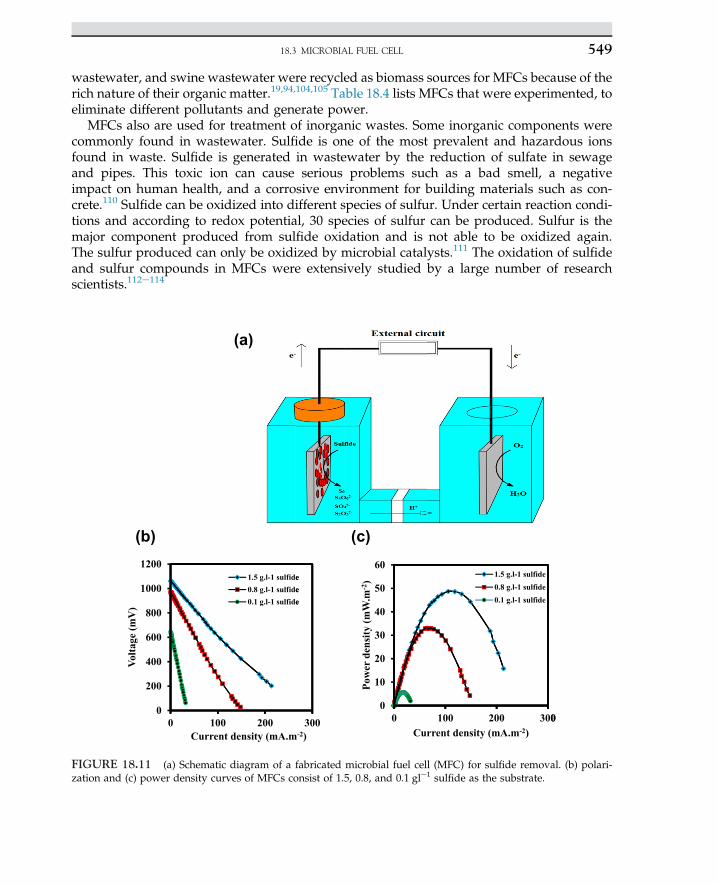
wastewater, and swine wastewater were recycled as biomass sources for MFCs because of therich nature of their organic matter.19,94,104,105 Table 18.4 lists MFCs that were experimented, toeliminate different pollutants and generate power.
MFCs also are used for treatment of inorganic wastes. Some inorganic components werecommonly found in wastewater. Sulfide is one of the most prevalent and hazardous ionsfound in waste. Sulfide is generated in wastewater by the reduction of sulfate in sewageand pipes. This toxic ion can cause serious problems such as a bad smell, a negativeimpact on human health, and a corrosive environment for building materials such as con-crete.110 Sulfide can be oxidized into different species of sulfur. Under certain reaction condi-tions and according to redox potential, 30 species of sulfur can be produced. Sulfur is themajor component produced from sulfide oxidation and is not able to be oxidized again.The sulfur produced can only be oxidized by microbial catalysts.111 The oxidation of sulfideand sulfur compounds in MFCs were extensively studied by a large number of researchscientists.112e114
(a)
2
4
6
8
10
12
Volta
ge (m
V)
0
00
00
00
00
00
00
0Current density (mA.m
(b)
100 200
1.5 g.l-1 sulfide0.8 g.l-1 sulfide0.1 g.l-1 sulfide
300-2)
eee
0
10
20
30
40
50
60
0
Pow
er d
ensi
ty (m
W.m
-2)
100Current density (mA.m
(c)
200
1.5 g.l-1 sulfide0.8 g.l-1 sulfide0.1 g.l-1 sulfide
300-2)
0
FIGURE 18.11 (a) Schematic diagram of a fabricated microbial fuel cell (MFC) for sulfide removal. (b) polari-zation and (c) power density curves of MFCs consist of 1.5, 0.8, and 0.1 gle1 sulfide as the substrate.
18.3 MICROBIAL FUEL CELL 549
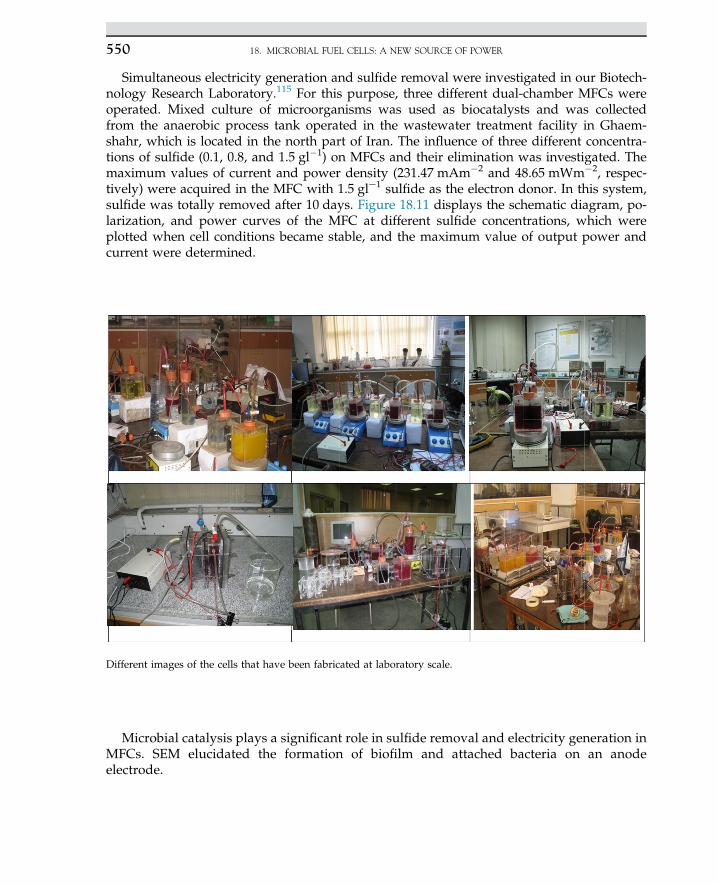
Simultaneous electricity generation and sulfide removal were investigated in our Biotech-nology Research Laboratory.115 For this purpose, three different dual-chamber MFCs wereoperated. Mixed culture of microorganisms was used as biocatalysts and was collectedfrom the anaerobic process tank operated in the wastewater treatment facility in Ghaem-shahr, which is located in the north part of Iran. The influence of three different concentra-tions of sulfide (0.1, 0.8, and 1.5 gl�1) on MFCs and their elimination was investigated. Themaximum values of current and power density (231.47 mAm�2 and 48.65 mWm�2, respec-tively) were acquired in the MFC with 1.5 gle1 sulfide as the electron donor. In this system,sulfide was totally removed after 10 days. Figure 18.11 displays the schematic diagram, po-larization, and power curves of the MFC at different sulfide concentrations, which wereplotted when cell conditions became stable, and the maximum value of output power andcurrent were determined.
Microbial catalysis plays a significant role in sulfide removal and electricity generation inMFCs. SEM elucidated the formation of biofilm and attached bacteria on an anodeelectrode.
Different images of the cells that have been fabricated at laboratory scale.
18. MICROBIAL FUEL CELLS: A NEW SOURCE OF POWER550
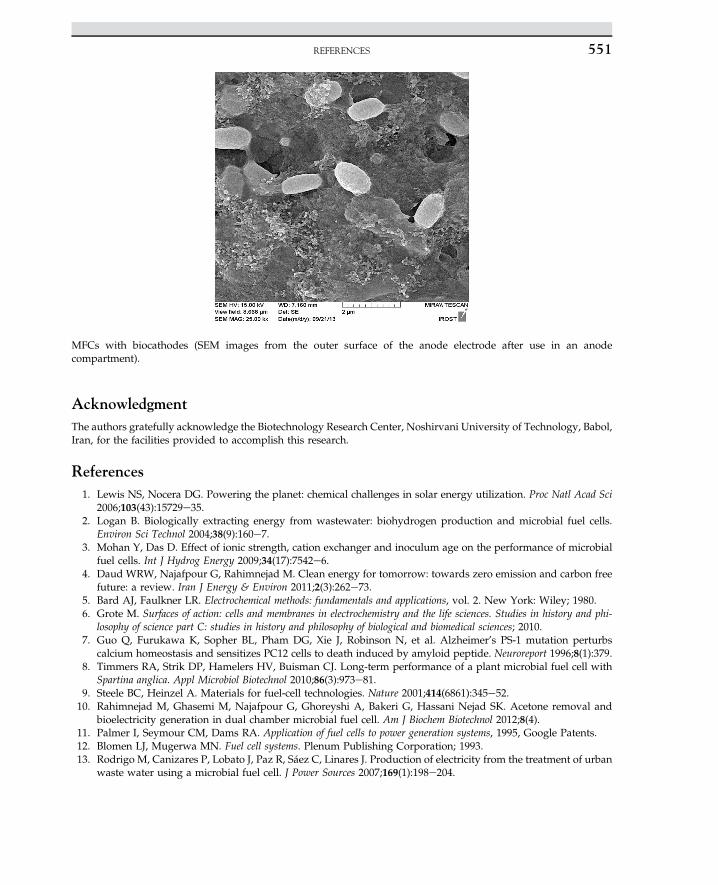
AcknowledgmentThe authors gratefully acknowledge the Biotechnology Research Center, Noshirvani University of Technology, Babol,Iran, for the facilities provided to accomplish this research.
References1. Lewis NS, Nocera DG. Powering the planet: chemical challenges in solar energy utilization. Proc Natl Acad Sci
2006;103(43):15729e35.2. Logan B. Biologically extracting energy from wastewater: biohydrogen production and microbial fuel cells.
Environ Sci Technol 2004;38(9):160e7.3. Mohan Y, Das D. Effect of ionic strength, cation exchanger and inoculum age on the performance of microbial
fuel cells. Int J Hydrog Energy 2009;34(17):7542e6.4. Daud WRW, Najafpour G, Rahimnejad M. Clean energy for tomorrow: towards zero emission and carbon free
future: a review. Iran J Energy & Environ 2011;2(3):262e73.5. Bard AJ, Faulkner LR. Electrochemical methods: fundamentals and applications, vol. 2. New York: Wiley; 1980.6. Grote M. Surfaces of action: cells and membranes in electrochemistry and the life sciences. Studies in history and phi-
losophy of science part C: studies in history and philosophy of biological and biomedical sciences; 2010.7. Guo Q, Furukawa K, Sopher BL, Pham DG, Xie J, Robinson N, et al. Alzheimer’s PS-1 mutation perturbs
calcium homeostasis and sensitizes PC12 cells to death induced by amyloid peptide. Neuroreport 1996;8(1):379.8. Timmers RA, Strik DP, Hamelers HV, Buisman CJ. Long-term performance of a plant microbial fuel cell with
Spartina anglica. Appl Microbiol Biotechnol 2010;86(3):973e81.9. Steele BC, Heinzel A. Materials for fuel-cell technologies. Nature 2001;414(6861):345e52.10. Rahimnejad M, Ghasemi M, Najafpour G, Ghoreyshi A, Bakeri G, Hassani Nejad SK. Acetone removal and
bioelectricity generation in dual chamber microbial fuel cell. Am J Biochem Biotechnol 2012;8(4).11. Palmer I, Seymour CM, Dams RA. Application of fuel cells to power generation systems, 1995, Google Patents.12. Blomen LJ, Mugerwa MN. Fuel cell systems. Plenum Publishing Corporation; 1993.13. Rodrigo M, Canizares P, Lobato J, Paz R, Sáez C, Linares J. Production of electricity from the treatment of urban
waste water using a microbial fuel cell. J Power Sources 2007;169(1):198e204.
MFCs with biocathodes (SEM images from the outer surface of the anode electrode after use in an anodecompartment).
REFERENCES 551
14. Logan BE, Hamelers B, Rozendal R, Schröder U, Keller J, Freguia S, et al. Microbial fuel cells: methodology andtechnology. Environ Sci Technol 2006;40(17):5181e92.
15. Shukla A, Suresh P, Sheela B, Rajendran A. Biological fuel cells and their applications. Curr Sci2004;87(4):455e68.
16. Bullen RA, Arnot T, Lakeman J, Walsh F. Biofuel cells and their development. Biosens Bioelectron2006;21(11):2015e45.
17. Bond DR, Lovley DR. Electricity production by Geobacter sulfurreducens attached to electrodes. Appl EnvironMicrobiol 2003;69(3):1548e55.
18. Kim H, Hyun M, Chang I, Kim BH. A microbial fuel cell type lactate biosensor using a metal-reducing bac-terium, Shewanella putrefaciens. J Microbiol Biotechnol 1999;9(3):365e7.
19. Liu H, Ramnarayanan R, Logan BE. Production of electricity during wastewater treatment using a singlechamber microbial fuel cell. Environ Sci Technol 2004;38(7):2281e5.
20. Bond DR, Holmes DE, Tender LM, Lovley DR. Electrode-reducing microorganisms that harvest energy frommarine sediments. Science 2002;295(5554):483e5.
21. Norbeck JM, Heffel JW, Durbin TD, Tabbara B, Bowden JM, Montano MC. Hydrogen fuel for surface trans-portation, vol. 160; 1996.
22. Larminie J, Dicks A, McDonald MS. Fuel cell systems explained, vol. 2. New York: Wiley; 2003.23. Potter MC. Electrical effects accompanying the decomposition of organic compounds. Proc R Soc London Ser B
Contain Pap Biol Charact 1911;84(571):260e76.24. Logan BE, Regan JM. Electricity-producing bacterial communities in microbial fuel cells. Trends Microbiol
2006;14(12):512e8.25. Park DH, Zeikus JG. Improved fuel cell and electrode designs for producing electricity from microbial
degradation. Biotechnol Bioeng 2003;81(3):348e55.26. Mokhtarian N, Wan Ramli W, Rahimnejad M, Najafpour G. Bioelectricity generation in biological fuel cell with
and without mediators. World Appl Sci J 2012;18(4):559e67.27. Gil GC, Chang IS, Kim BH, Kim M, Jang JK, Park HS, Kim HJ. Operational parameters affecting the perfor-
mance of a mediator-less microbial fuel cell. Biosens Bioelectron 2003;18(4):327e34.28. Williams RH. Fuel decarbonization for fuel cell applications and sequestration of the separated CO2. Tokyo: United
Nations University Press; 1998.29. Yao H, Lim L, James R, Schieber M, Natarajan M. Surface aging of HgI 2 crystals studied by VASE and AFM.
Nucl Instrum Methods Phys Res Sect A: Accel Spectrom Detect Assoc Equip 1996;380(1):26e9.30. Rahimnejad M, Najafpour GD, Ghoreyshi AA, Talebnia F, Premier GC, Bakeri G, et al. Thionine increases
electricity generation from microbial fuel cell using Saccharomyces cerevisiae and exoelectrogenic mixed culture.J Microbiol 2012;50(4):575e80.
31. Karube I, Matsunaga T, Tsuru S, Suzuki S. Biochemical fuel cell utilizing immobilized cells of Clostridiumbutyricum. Biotechnol Bioeng 1977;19(11):1727e33.
32. Allen RM, Bennetto HP. Microbial fuel-cells. Appl Biochem Biotechnol 1993;39(1):27e40.33. Chaudhuri SK, Lovley DR. Electricity generation by direct oxidation of glucose in mediatorless microbial fuel
cells. Nat Biotechnol 2003;21(10):1229e32.34. Rabaey K, Lissens G, Siciliano SD, Verstraete W. A microbial fuel cell capable of converting glucose to electricity
at high rate and efficiency. Biotechnol Lett 2003;25(18):1531e5.35. Choi Y, Kim N, Kim S, Jung S. Dynamic behaviors of redox mediators within the hydrophobic layers as an
important factor for effective microbial fuel cell operation. Bull Kor Chem Soc 2003;24(4):437e40.36. Palmore GTR, Whitesides GM. Microbial and enzymatic biofuel cells. Enzymatic conversion of biomass for fuels
production 1994;vol. 566:271e90.37. Rahimnejad M, Ghoreyshi A, Najafpour G, Younesi H, Shakeri M. A novel microbial fuel cell stack for
continuous production of clean energy. Int J Hydrogen Energy 2012;37(7):5992e6000.38. Lewis K. Symposium on bioelectrochemistry of microorganisms. IV. Biochemical fuel cells. Bacteriol Rev
1966;30(1):101.39. Kim BH, et al. Mediator-less biofuel cell. 1999, Google Patents.40. Rahimnejad M, Najafpour G, Ghoreyshi AA. Effect of mass transfer on performance of microbial fuel cell. Mass
transfer chemical engineering processes 2011;vol. 5:233e50.
18. MICROBIAL FUEL CELLS: A NEW SOURCE OF POWER552
41. Tardast A, Najafpour G, Rahimnejad M, Amiri A. Bioelectrical power generation in a membrane less microbialfuel cell. World Appl Sci J 2012;16(2):179e82.
42. Qiao Y, Li C, Bao S, Bao Q. Carbon nanotube/polyaniline composite as anode material for microbial fuel cells.J Power Sources 2007;170(1):79e84.
43. Yoshitake T, Shimakawa Y, Kuroshima S, Kimura H, Ichihashi T, Kubo Y, et al. Preparation of fine platinumcatalyst supported on single-wall carbon nanohorns for fuel cell application. Phys B 2002;323(1e4):124e6.
44. Bezerra CWB, Zhang L, Lee K, Liu H, Marques ALB, Marques EP, et al. A review of Fe-N/C and Co-N/Ccatalysts for the oxygen reduction reaction. Electrochim Acta 2008;53(15):4937e51.
45. Lee K, Zhang L, Lui H, Hui R, Shi Z, Zhang J. Oxygen reduction reaction (ORR) catalyzed by carbon-supportedcobalt polypyrrole (Co-PPy/C) electrocatalysts. Electrochim Acta 2009;54(20):4704e11.
46. Al-Saleh M, Sundararaj U. A review of vapor grown carbon nanofiber/polymer conductive composites. Carbon2009;47(1):2e22.
47. Du Z, Li H, Gu T. A state of the art review on microbial fuel cells: a promising technology for wastewatertreatment and bioenergy. Biotechnol Adv 2007;25(5):464e82.
48. RAHIMNEJAD M, et al. Nafion as a nanoproton conductor in microbial fuel cells. Turkish J Eng Environ Sci2011;34(4):289e92.
49. Chung K, Okabe S. Continuous power generation and microbial community structure of the anode biofilms in athree-stage microbial fuel cell system. Appl Microbiol Biotechnol 2009;83(5):965e77.
50. Aelterman P, Rabaey K, Hai The Pham, Boon N, Verstraete W. Continuous electricity generation at highvoltages and currents using stacked microbial fuel cells. Environ Sci Technol 2006;40(10):3388e94.
51. Cheng S, Liu H, Logan B. Increased power generation in a continuous flow MFC with advective flow throughthe porous anode and reduced electrode spacing. Environ Sci Technol 2006;40(7):2426e32.
52. Jung S, Regan JM. Comparison of anode bacterial communities and performance in microbial fuel cells withdifferent electron donors. Appl Microbiol Biotechnol 2007;77(2):393e402.
53. Ringeisen BR, Ray R, Little B. A miniature microbial fuel cell operating with an aerobic anode chamber. J PowerSources 2007;165(2):591e7.
54. Ringeisen BR, et al. High power density from a miniature microbial fuel cell using Shewanella oneidensis DSP10.Environ Sci Technol 2006;40(8):2629e34.
55. Park HS, Kim BH, Kim HS, Kim HJ, Kim GT, Kim M, et al. A novel electrochemically active and Fe (III)-reducing bacterium phylogenetically related to Clostridium butyricum isolated from a microbial fuel cell.Anaerobe 2001;7(6):297e306.
56. Rabaey K, Boon N, Hofte M, Verstraete. Microbial phenazine production enhances electron transfer in biofuelcells. Environ Sci Technol 2005;39(9):3401e8.
57. Najafpour G, Rahimnejad M, Ghoreshi A. The enhancement of a microbial fuel cell for electrical output usingmediators and oxidizing agents. Energy Sources, Part A 2011;33(24):2239e48.
58. Vega C, Fernández I. Mediating effect of ferric chelate compounds in microbial fuel cells with Lactobacillusplantarum, Streptococcus lactis, and Erwinia dissolvens. Bioelectroch Bioener 1987;17(2):217e22.
59. Rabaey K, Ossieur W, Verhaege M, Verstraete W. Continuous microbial fuel cells convert carbohydrates toelectricity. Water Sci Technol 2005;52(1):515e23.
60. Thygesen A, Poulsen FW, Min B, Angelidaki I, Thomsen AB. The effect of different substrates and humic acidon power generation in microbial fuel cell operation. Bioresour Technol 2009;100(3):1186e91.
61. Liu H, Logan BE. Electricity generation using an air-cathode single chamber microbial fuel cell in the presenceand absence of a proton exchange membrane. Environ Sci Technol 2004;38(14):4040e6.
62. Gorby Y, Yanina S, McLean J, Rosso K, Moyles D, Dohnalkova A, et al. Electrically conductive bacterialnanowires produced by Shewanella oneidensis strain MR-1 and other microorganisms. Proc Natl Acad Sci2006;103(30):11358.
63. Reguera G, Nevin K, Nicoll J, Covalla S, Woodard T, Lovley D. Biofilm and nanowire production leads toincreased current in Geobacter sulfurreducens fuel cells. Appl Environ Microbiol 2006;72(11):7345.
64. Reguera G, Pollina R, Nicoll J, Lovley D. Possible non-conductive role of Geobacter sulfurreducens pili nanowiresin biofilm formation. J Bacteriol 2006;189(5):2125e7.
65. Park D, Zeikus J. Electricity generation in microbial fuel cells using neutral red as an electronophore. ApplEnviron Microbiol 2000;66(4):1292.
REFERENCES 553
66. Bennetto H, Delaney G, Mason J, Roller S, Stirling J, Thurston C. The sucrose fuel cell: efficient biomass con-version using a microbial catalyst. Biotechnol Lett 1985;7(10):699e704.
67. Choi Y, Jung E, Park H, Jung S, Kim S. Effect of initial carbon sources on the performance of a microbial fuel cellcontaining environmental microorganism micrococcus luteus. Notes 2007;28(9):1591.
68. Rabaey K, Verstraete W. Microbial fuel cells: novel biotechnology for energy generation. Trends Biotechnol2005;23(6):291e8.
69. Liu H, Cheng S, Logan B. Production of electricity from acetate or butyrate using a single-chamber microbialfuel cell. Environ Sci Technol 2005;39(2):658e62.
70. Oh S, Logan B. Voltage reversal during microbial fuel cell stack operation. J Power Sources 2007;167(1):11e7.71. Rahimnejad M, Mokhtarian N, Najafpour G, Daud W, Ghoreyshi A. Low voltage power generation in a biofuel
cell using anaerobic cultures. World Appl Sci J 2009;6(11):1585e8.72. Cooney MJ, Roschi E, Marison IW, Comminellis C, von Stockar U. Physiologic studies with the sulfate-reducing
bacterium Desulfovibrio desulfuricans: evaluation for use in a biofuel cell. Enzyme Microb Technol1996;18(5):358e65.
73. Jafary T, Najafpour G, Ghoreyshi A, Haghparast F, Rahimnejad M, Zare H. Bioelectricity power generationfrom organic substrate in a microbial fuel cell using Saccharomyces cerevisiae as biocatalysts. Fuel Cells, vol. 4;p. 1182.
74. Pant D, Van Bogaert G, Diels L, Vanbroekhoven K. A review of the substrates used in microbial fuel cells(MFCs) for sustainable energy production. Bioresour Technol 2010;101(6):1533e43.
75. Park D, Zeikus J. Impact of electrode composition on electricity generation in a single-compartment fuel cellusing Shewanella putrefaciens. Appl Microbiol Biotechnol 2002;59(1):58e61.
76. Jafary T, Ghoreyshi AA, Najafpour GD, Fatemi S, Rahimnejad M. Investigation on performance of microbialfuel cells based on carbon sources and kinetic models. Int J Energy Res 2013;37(12):1539e49.
77. Kim J, Cheng S, Oh S, Logan B. Power generation using different cation, anion, and ultrafiltration membranesin microbial fuel cells. Environ Sci Technol 2007;41(3):1004e9.
78. Zhang X, Cheng S, Wang X, Huang X, Logan BE. Separator characteristics for increasing performance ofmicrobial fuel cells. Environ Sci Technol 2009;43(21):8456e61.
79. Li W-W, Sheng G-P, Liu X-W, Yu H-Q. Recent advances in the separators for microbial fuel cells. BioresourTechnol 2011;102(1):244e52.
80. Min B, Cheng S, Logan B. Electricity generation using membrane and salt bridge microbial fuel cells. Water Res2005;39(9):1675e86.
81. Deng Q, Li X, Zuo J, Ling A, Logan BE. Power generation using an activated carbon fiber felt cathode in anupflow microbial fuel cell. J Power Sources 2010;195(4):1130e5.
82. Rozendal RA, Hamelers HV, Rabaey K, Keller J, Buisman CJ. Towards practical implementation of bio-electrochemical wastewater treatment. Trends Biotechnol 2008;26(8):450e9.
83. Ter Heijne A, Hamelers H, De Wilde V, Rozendal R, Buisman C. A bipolar membrane combined withferric iron reduction as an efficient cathode system in microbial fuel cells. Environ Sci Technol2006;40(17):5200e5.
84. Chae KJ, Choi M, Ajayi FF, Park W, Chang IS, Kim IS. Mass transport through a proton exchange membrane(nafion) in microbial fuel cells. EnergFuel 2007;22(1):169e76.
85. Ghasemi M, Wan Daud WR, Ismail M, Rahimnejad M, Ismail AF, Leong JX, et al. Effect of pre-treatment andbiofouling of proton exchange membrane on microbial fuel cell performance. Int J Hydrogen Energy2013;38(13):5480e4.
86. Venkata Mohan S, Mohanakrishna G, Srikanth S, Sarma P. Harnessing of bioelectricity in microbial fuel cell(MFC) employing aerated cathode through anaerobic treatment of chemical wastewater using selectivelyenriched hydrogen producing mixed consortia. Fuel 2008;87(12):2667e76.
87. Rhoads A, Beyenal H, Lewandowski Z. Microbial fuel cell using anaerobic respiration as an anodic reaction andbiomineralized manganese as a cathodic reactant. Environ Sci Technol 2005;39(12):4666e71.
88. González del Campo A, Cañizares P, Rodrigo MA, Fernández FJ, Lobato J. Microbial fuel cell with an algae-assisted cathode: a preliminary assessment. J Power Sources 2013;242:638e45.
89. Franks AE, Nevin K. Microbial fuel cells, a current review. Energies 2010;3:899e919.90. Lobato J, González del Campo A, Fernández FJ, Cañizares P, Rodrigo MA. Lagooning microbial fuel cells: a first
approach by coupling electricity-producing microorganisms and algae. Appl Energy 2013;110:220e6.
18. MICROBIAL FUEL CELLS: A NEW SOURCE OF POWER554
91. Walter XA, Greenman J, Ieropoulos IA. Oxygenic phototrophic biofilms for improved cathode performance inmicrobial fuel cells. Algal Res 2013;2(3):183e7.
92. Rahimnejad M, Bakeri G, Najafpour G, Ghasemi M, Oh S-E. A review on the effect of proton exchangemembranes in microbial fuel cells. Biofuel Res J 2014;1(1):7e15.
93. Wilkinson S. “Gastrobots”dBenefits and challenges of microbial fuel cells in foodpowered robot applications.Auton Robot 2000;9(2):99e111.
94. Oh S, Logan BE. Hydrogen and electricity production from a food processing wastewater using fermentationand microbial fuel cell technologies. Water Res 2005;39(19):4673e82.
95. Liu H, Grot S, Logan BE. Electrochemically assisted microbial production of hydrogen from acetate. Environ SciTechnol 2005;39(11):4317e20.
96. Peixoto L, Min B, Martins G, Brito AG, Kroff P, Parpot P, et al. In situ microbial fuel cell-based biosensor fororganic carbon. Bioelectrochem 2011;81(2):99e103.
97. Lovley DR. Microbial fuel cells: novel microbial physiologies and engineering approaches. Curr Opin Biotechnol2006;17(3):327e32.
98. Karube I, Matsunaga T, Mitsuda S, Suzuki S. Microbial electrode BOD sensors. Biotechnol Bioeng1977;19(10):1535e47.
99. Kim BH, Chang IS, Gil GC, Park HS, Kim HJ. Novel BOD (biological oxygen demand) sensor using mediator-less microbial fuel cell. Biotechnol Lett 2003;25(7):541e5.
100. Kumlanghan A, Liu J, Thavarungkul P, Kanatharana P, Mattiasson B. Microbial fuel cell-based biosensor for fastanalysis of biodegradable organic matter. Biosens Bioelectron 2007;22(12):2939e44.
101. Hart JP, Abass A-K, Honeychurch KC, Pemberton R, Ryan S, Wedge R. Sensors/biosensors, based on screen-printing technology for biomedical applications. Indian J Chem Sect A 2003;42(4):709e18.
102. Ramalho RS. Introduction to wastewater treatment processes; 1983.103. Habermann W, Pommer E. Biological fuel cells with sulphide storage capacity. Appl Microbiol Biotechnol
1991;35(1):128e33.104. Min B, Kim J, Oh S, Regan JM, Logan BE. Electricity generation from swine wastewater using microbial fuel
cells. Water Res 2005;39(20):4961e8.105. Najafpour G, Rahimnejad M, Mokhtarian N, Daud W, Ghoreyshi A. Bioconversion of Whey to electrical energy
in a biofuel cell using Saccharomyces cerevisiae.106. Virdis B, Rabaey K, Yuan Z, Keller J. Microbial fuel cells for simultaneous carbon and nitrogen removal. Water
Res 2008;42(12):3013e24.107. Moon H, Chang IS, Jang JK, Kim BH. Residence time distribution in microbial fuel cell and its influence on COD
removal with electricity generation. Biochem Eng J 2005;27(1):59e65.108. Yadav AK, Dash P, Mohanty A, Abbassi R, Mishra BK. Performance assessment of innovative constructed
wetland-microbial fuel cell for electricity production and dye removal. Ecol Eng 2012;47:126e31.109. Tao H-C, Liang M, Li W, Zhang L-J, Ni J-R, Wu W-M. Removal of copper from aqueous solution by electro-
deposition in cathode chamber of microbial fuel cell. J Hazard Mater 2011;189(1):186e92.110. Zhang L, De Schryver P, De Gusseme B, De Muynck W, Boon N, Verstraete W. Chemical and biological
technologies for hydrogen sulfide emission control in sewer systems: a review. Water Res 2008;42(1):1e12.111. Sun M, Mu Z-X, Chen Y-P, Sheng G-P, Liu X-W, Chen Y-Z, et al. Microbe-assisted sulfide oxidation in the anode
of a microbial fuel cell. Environ Sci Technol 2009;43(9):3372e7.112. Rabaey K, Van de Sompel K, Maignien L, Boon N, Aelterman P, Clauwaert P, et al. Microbial fuel cells for
sulfide removal. Environ Sci Technol 2006;40(17):5218e24.113. Lee C-Y, Ho K-L, Lee D-J, Su A, Chang J-S. Retracted: electricity harvest from wastewaters using microbial fuel
cell with sulfide as sole electron donor. Int J Hydrogen Energy 2012;37(20):15787e91.114. Cai J, Zheng P. Simultaneous anaerobic sulfide and nitrate removal in microbial fuel cell. Bioresour Technol
2012;129:224e8.115. Izadi P, Rahimnejad M. Simultaneous electricity generation and sulfide removal via a dual chamber microbial
fuel cell. Biofuel Res J 2013;1(1):34e8.
REFERENCES 555

C H A P T E R
19
Biological Treatment*
O U T L I N E
19.1 Introduction 558
19.2 Organic Removal in SustainableMicrobial Growth 558
19.3 Microbial Metabolism 559
19.4 Microbial Growth Kinetics 561
19.5 Growth Rate and TreatmentKinetics 56219.5.1 Nutrient Requirements 56519.5.2 Effects of pH and
Temperature 566
19.6 Removal Mechanisms inBiological Processes 568
19.7 Aerobic Biooxidation 569
19.8 Anaerobic Digestion 572
19.9 Abiotic Losses 57619.9.1 Adsorption 576
19.10 Volatilization 578
19.11 Biological Nitrification andDenitrification 579
19.12 Biological Treatment Processes:Suspended and Attached Growth 58619.12.1 Kinetics of Suspended and
Attached GrowthProcesses 586
19.12.2 Suspended GrowthProcesses 587
19.12.3 Sludge Retention Time(SRT) 587
19.12.4 Biomass Concentration inSystem 589
19.12.5 Food to MicroorganismsRatio 590
19.12.6 Effluent SubstrateConcentration 591
19.12.7 Oxygen Requirements 592
References 594
*This case study was partially written with contributions from:Roya Pishgar, School of Civil Engineering, Babol Noshirvani University of Technology, Babol,Mazandaran, Iran.
557Biochemical Engineering and Biotechnologyhttp://dx.doi.org/10.1016/B978-0-444-63357-6.00019-5 Copyright © 2015 Elsevier B.V. All rights reserved.
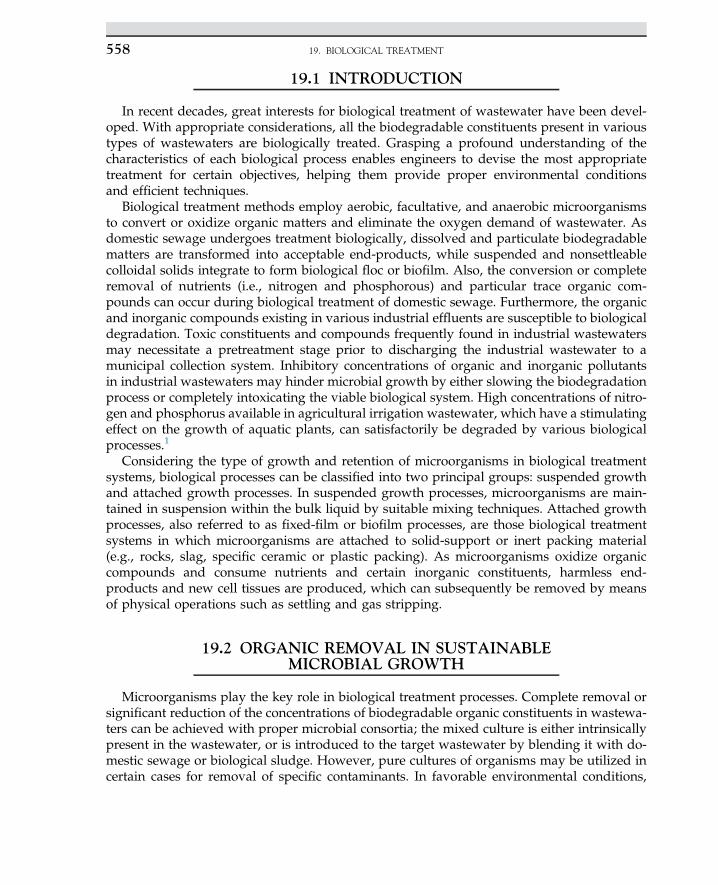
19.1 INTRODUCTION
In recent decades, great interests for biological treatment of wastewater have been devel-oped. With appropriate considerations, all the biodegradable constituents present in varioustypes of wastewaters are biologically treated. Grasping a profound understanding of thecharacteristics of each biological process enables engineers to devise the most appropriatetreatment for certain objectives, helping them provide proper environmental conditionsand efficient techniques.
Biological treatment methods employ aerobic, facultative, and anaerobic microorganismsto convert or oxidize organic matters and eliminate the oxygen demand of wastewater. Asdomestic sewage undergoes treatment biologically, dissolved and particulate biodegradablematters are transformed into acceptable end-products, while suspended and nonsettleablecolloidal solids integrate to form biological floc or biofilm. Also, the conversion or completeremoval of nutrients (i.e., nitrogen and phosphorous) and particular trace organic com-pounds can occur during biological treatment of domestic sewage. Furthermore, the organicand inorganic compounds existing in various industrial effluents are susceptible to biologicaldegradation. Toxic constituents and compounds frequently found in industrial wastewatersmay necessitate a pretreatment stage prior to discharging the industrial wastewater to amunicipal collection system. Inhibitory concentrations of organic and inorganic pollutantsin industrial wastewaters may hinder microbial growth by either slowing the biodegradationprocess or completely intoxicating the viable biological system. High concentrations of nitro-gen and phosphorus available in agricultural irrigation wastewater, which have a stimulatingeffect on the growth of aquatic plants, can satisfactorily be degraded by various biologicalprocesses.1
Considering the type of growth and retention of microorganisms in biological treatmentsystems, biological processes can be classified into two principal groups: suspended growthand attached growth processes. In suspended growth processes, microorganisms are main-tained in suspension within the bulk liquid by suitable mixing techniques. Attached growthprocesses, also referred to as fixed-film or biofilm processes, are those biological treatmentsystems in which microorganisms are attached to solid-support or inert packing material(e.g., rocks, slag, specific ceramic or plastic packing). As microorganisms oxidize organiccompounds and consume nutrients and certain inorganic constituents, harmless end-products and new cell tissues are produced, which can subsequently be removed by meansof physical operations such as settling and gas stripping.
19.2 ORGANIC REMOVAL IN SUSTAINABLEMICROBIAL GROWTH
Microorganisms play the key role in biological treatment processes. Complete removal orsignificant reduction of the concentrations of biodegradable organic constituents in wastewa-ters can be achieved with proper microbial consortia; the mixed culture is either intrinsicallypresent in the wastewater, or is introduced to the target wastewater by blending it with do-mestic sewage or biological sludge. However, pure cultures of organisms may be utilized incertain cases for removal of specific contaminants. In favorable environmental conditions,
19. BIOLOGICAL TREATMENT558
microorganisms are capable of presenting high efficiency in destruction of pollutants, thus,producing an acceptable effluent. Several factors should be considered carefully to achievea suitable environment for metabolism of the organisms; those factors include sufficient nutri-tion, the presence of inorganic anions and cations in concentrations lower than their thresholdvalues for the organisms, proper pH, appropriate temperature depending on the presence ofthermophilic or mesophilic organisms, adequate presence or complete absence of dissolvedoxygen for respective aerobic and anaerobic systems, absence of toxicity and inhibition(which may occur due to the presence of certain concentrations of specific pollutants), andample hydraulic and sludge retention time to allow the microorganisms to grow and com-plete their biochemical activities.2
The removal of organic constituents, identified as carbonaceous biochemical oxygen de-mand (BOD), in dissolved and particulate forms as well as stabilization of nonsettleableorganic matters can be achieved by a variety of microorganisms, specifically bacteria. Theliving organisms contribute in degradation of organic substrate to simple end-products alongwith the production of additional new cells, until the substrate is completely removed.Equation 19.2.1 depicts aerobic biological oxidation as described above. The biomass willconsequently endure the stage of endogenous respiration. In this stage, autooxidation oforganics in the cells happens in order to supply requisite energy for maintaining theremainder of the cells; as a result, continuous and fractional decrease in living cell masswith respect to time is inevitable.1,3
aðorganic matterÞ þ bO2 þ cN þ dPþ trace elements �������!Microorganisms
eðnew cellsÞ þ f ðCO2Þ þ gðH2OÞ (19.2.1)
According to the above equation, microorganisms need to uptake some essential nutri-ents, i.e., carbon, nitrogen, and phosphorus sources together with some trace elements inappropriate concentrations, for accomplishing their metabolic activities. Water and waste-water treatment processes are mostly planned so the required carbon source is providedthrough consumption of target organic matter. Ammonia (NH3) and phosphate ðPO3�
4 Þare examples of nitrogen and phosphorus sources that are commonly used. The value ofC:N:P ratio is a determining parameter for sound performance of biological treatment pro-cess; for aerobic systems, it should be in the range of 100:5:1 to 100:20:1.2 Anaerobic pro-cesses, in contrast, require much lower nitrogen and phosphorus in compare to aerobicsystems due to slow metabolism and gradual growth of anaerobic microorganisms. Theoptimal C:N:P ratio of 100:2.5:0.5 with increasing effect on methane yield has beenreported.4
19.3 MICROBIAL METABOLISM
Understanding biochemical activities of microorganisms is of great necessity for correctlyselecting and properly designing a biological treatment process for a special purpose. Micro-bial metabolism is characterized by the types of the sources of carbon and energy required forsynthesizing new cells and transforming organic material to end products. Carbon and en-ergy sources, also known as substrates, are two main factors for classifying the organismsin different categories (see Table 19.1).1
19.3 MICROBIAL METABOLISM 559
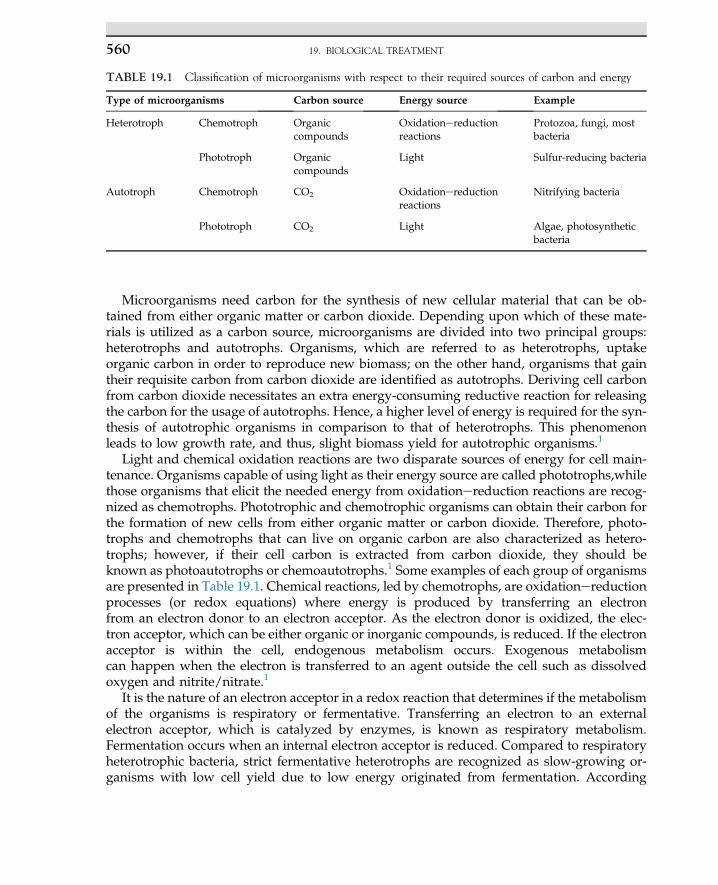
Microorganisms need carbon for the synthesis of new cellular material that can be ob-tained from either organic matter or carbon dioxide. Depending upon which of these mate-rials is utilized as a carbon source, microorganisms are divided into two principal groups:heterotrophs and autotrophs. Organisms, which are referred to as heterotrophs, uptakeorganic carbon in order to reproduce new biomass; on the other hand, organisms that gaintheir requisite carbon from carbon dioxide are identified as autotrophs. Deriving cell carbonfrom carbon dioxide necessitates an extra energy-consuming reductive reaction for releasingthe carbon for the usage of autotrophs. Hence, a higher level of energy is required for the syn-thesis of autotrophic organisms in comparison to that of heterotrophs. This phenomenonleads to low growth rate, and thus, slight biomass yield for autotrophic organisms.1
Light and chemical oxidation reactions are two disparate sources of energy for cell main-tenance. Organisms capable of using light as their energy source are called phototrophs,whilethose organisms that elicit the needed energy from oxidationereduction reactions are recog-nized as chemotrophs. Phototrophic and chemotrophic organisms can obtain their carbon forthe formation of new cells from either organic matter or carbon dioxide. Therefore, photo-trophs and chemotrophs that can live on organic carbon are also characterized as hetero-trophs; however, if their cell carbon is extracted from carbon dioxide, they should beknown as photoautotrophs or chemoautotrophs.1 Some examples of each group of organismsare presented in Table 19.1. Chemical reactions, led by chemotrophs, are oxidationereductionprocesses (or redox equations) where energy is produced by transferring an electronfrom an electron donor to an electron acceptor. As the electron donor is oxidized, the elec-tron acceptor, which can be either organic or inorganic compounds, is reduced. If the electronacceptor is within the cell, endogenous metabolism occurs. Exogenous metabolismcan happen when the electron is transferred to an agent outside the cell such as dissolvedoxygen and nitrite/nitrate.1
It is the nature of an electron acceptor in a redox reaction that determines if the metabolismof the organisms is respiratory or fermentative. Transferring an electron to an externalelectron acceptor, which is catalyzed by enzymes, is known as respiratory metabolism.Fermentation occurs when an internal electron acceptor is reduced. Compared to respiratoryheterotrophic bacteria, strict fermentative heterotrophs are recognized as slow-growing or-ganisms with low cell yield due to low energy originated from fermentation. According
TABLE 19.1 Classification of microorganisms with respect to their required sources of carbon and energy
Type of microorganisms Carbon source Energy source Example
Heterotroph Chemotroph Organiccompounds
Oxidationereductionreactions
Protozoa, fungi, mostbacteria
Phototroph Organiccompounds
Light Sulfur-reducing bacteria
Autotroph Chemotroph CO2 Oxidationereductionreactions
Nitrifying bacteria
Phototroph CO2 Light Algae, photosyntheticbacteria
19. BIOLOGICAL TREATMENT560
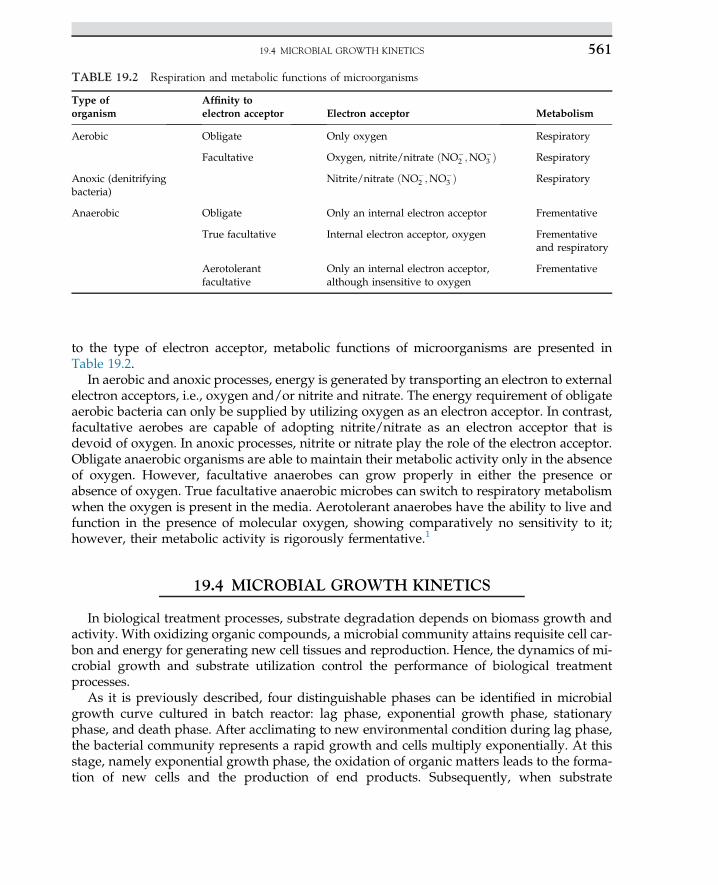
to the type of electron acceptor, metabolic functions of microorganisms are presented inTable 19.2.
In aerobic and anoxic processes, energy is generated by transporting an electron to externalelectron acceptors, i.e., oxygen and/or nitrite and nitrate. The energy requirement of obligateaerobic bacteria can only be supplied by utilizing oxygen as an electron acceptor. In contrast,facultative aerobes are capable of adopting nitrite/nitrate as an electron acceptor that isdevoid of oxygen. In anoxic processes, nitrite or nitrate play the role of the electron acceptor.Obligate anaerobic organisms are able to maintain their metabolic activity only in the absenceof oxygen. However, facultative anaerobes can grow properly in either the presence orabsence of oxygen. True facultative anaerobic microbes can switch to respiratory metabolismwhen the oxygen is present in the media. Aerotolerant anaerobes have the ability to live andfunction in the presence of molecular oxygen, showing comparatively no sensitivity to it;however, their metabolic activity is rigorously fermentative.1
19.4 MICROBIAL GROWTH KINETICS
In biological treatment processes, substrate degradation depends on biomass growth andactivity. With oxidizing organic compounds, a microbial community attains requisite cell car-bon and energy for generating new cell tissues and reproduction. Hence, the dynamics of mi-crobial growth and substrate utilization control the performance of biological treatmentprocesses.
As it is previously described, four distinguishable phases can be identified in microbialgrowth curve cultured in batch reactor: lag phase, exponential growth phase, stationaryphase, and death phase. After acclimating to new environmental condition during lag phase,the bacterial community represents a rapid growth and cells multiply exponentially. At thisstage, namely exponential growth phase, the oxidation of organic matters leads to the forma-tion of new cells and the production of end products. Subsequently, when substrate
TABLE 19.2 Respiration and metabolic functions of microorganisms
Type oforganism
Affinity toelectron acceptor Electron acceptor Metabolism
Aerobic Obligate Only oxygen Respiratory
Facultative Oxygen, nitrite/nitrate ðNO�2 ;NO�
3 Þ Respiratory
Anoxic (denitrifyingbacteria)
Nitrite/nitrate ðNO�2 ;NO�
3 Þ Respiratory
Anaerobic Obligate Only an internal electron acceptor Frementative
True facultative Internal electron acceptor, oxygen Frementativeand respiratory
Aerotolerantfacultative
Only an internal electron acceptor,although insensitive to oxygen
Frementative
19.4 MICROBIAL GROWTH KINETICS 561
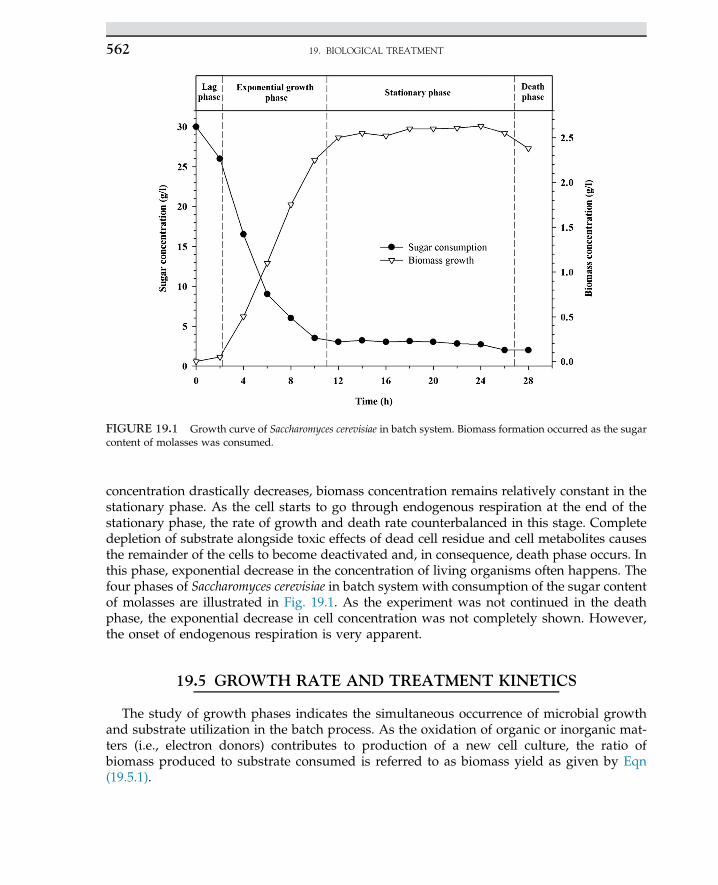
concentration drastically decreases, biomass concentration remains relatively constant in thestationary phase. As the cell starts to go through endogenous respiration at the end of thestationary phase, the rate of growth and death rate counterbalanced in this stage. Completedepletion of substrate alongside toxic effects of dead cell residue and cell metabolites causesthe remainder of the cells to become deactivated and, in consequence, death phase occurs. Inthis phase, exponential decrease in the concentration of living organisms often happens. Thefour phases of Saccharomyces cerevisiae in batch system with consumption of the sugar contentof molasses are illustrated in Fig. 19.1. As the experiment was not continued in the deathphase, the exponential decrease in cell concentration was not completely shown. However,the onset of endogenous respiration is very apparent.
19.5 GROWTH RATE AND TREATMENT KINETICS
The study of growth phases indicates the simultaneous occurrence of microbial growthand substrate utilization in the batch process. As the oxidation of organic or inorganic mat-ters (i.e., electron donors) contributes to production of a new cell culture, the ratio ofbiomass produced to substrate consumed is referred to as biomass yield as given by Eqn(19.5.1).
FIGURE 19.1 Growth curve of Saccharomyces cerevisiae in batch system. Biomass formation occurred as the sugarcontent of molasses was consumed.
19. BIOLOGICAL TREATMENT562
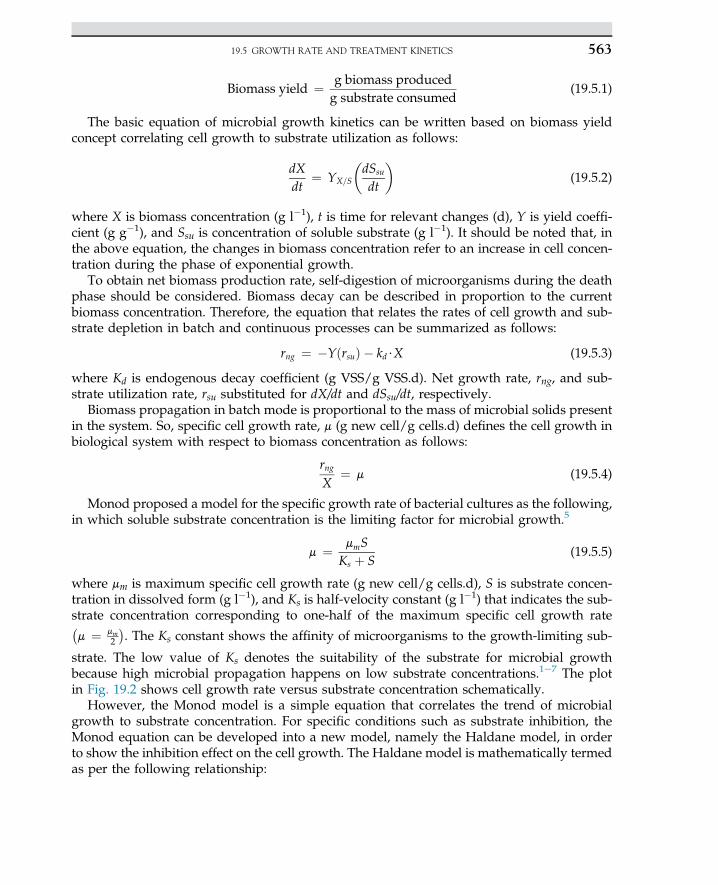
Biomass yield ¼ g biomass producedg substrate consumed
(19.5.1)
The basic equation of microbial growth kinetics can be written based on biomass yieldconcept correlating cell growth to substrate utilization as follows:
dXdt
¼ YX=S
�dSsu
dt
�(19.5.2)
where X is biomass concentration (g l�1), t is time for relevant changes (d), Y is yield coeffi-cient (g g�1), and Ssu is concentration of soluble substrate (g l�1). It should be noted that, inthe above equation, the changes in biomass concentration refer to an increase in cell concen-tration during the phase of exponential growth.
To obtain net biomass production rate, self-digestion of microorganisms during the deathphase should be considered. Biomass decay can be described in proportion to the currentbiomass concentration. Therefore, the equation that relates the rates of cell growth and sub-strate depletion in batch and continuous processes can be summarized as follows:
rng ¼ �YðrsuÞ � kd$X (19.5.3)
where Kd is endogenous decay coefficient (g VSS/g VSS.d). Net growth rate, rng, and sub-strate utilization rate, rsu substituted for dX/dt and dSsu/dt, respectively.
Biomass propagation in batch mode is proportional to the mass of microbial solids presentin the system. So, specific cell growth rate, m (g new cell/g cells.d) defines the cell growth inbiological system with respect to biomass concentration as follows:
rngX
¼ m (19.5.4)
Monod proposed a model for the specific growth rate of bacterial cultures as the following,in which soluble substrate concentration is the limiting factor for microbial growth.5
m ¼ mmSKs þ S
(19.5.5)
where mm is maximum specific cell growth rate (g new cell/g cells.d), S is substrate concen-tration in dissolved form (g l�1), and Ks is half-velocity constant (g l�1) that indicates the sub-strate concentration corresponding to one-half of the maximum specific cell growth rate�m ¼ mm
2
�. The Ks constant shows the affinity of microorganisms to the growth-limiting sub-
strate. The low value of Ks denotes the suitability of the substrate for microbial growthbecause high microbial propagation happens on low substrate concentrations.1e7 The plotin Fig. 19.2 shows cell growth rate versus substrate concentration schematically.
However, the Monod model is a simple equation that correlates the trend of microbialgrowth to substrate concentration. For specific conditions such as substrate inhibition, theMonod equation can be developed into a new model, namely the Haldane model, in orderto show the inhibition effect on the cell growth. The Haldane model is mathematically termedas per the following relationship:
19.5 GROWTH RATE AND TREATMENT KINETICS 563
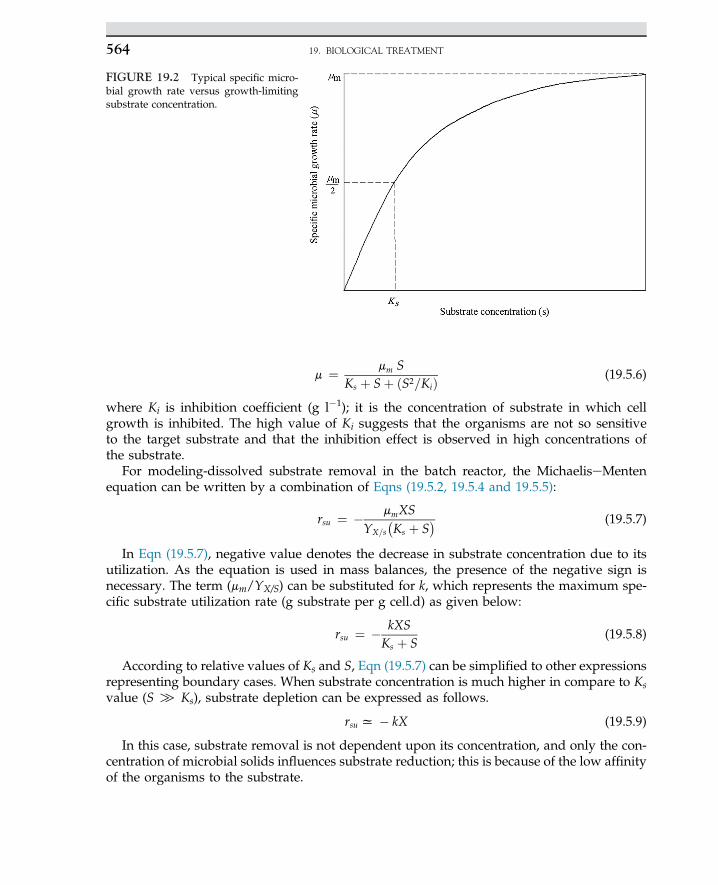
m ¼ mm SKs þ Sþ ðS2=KiÞ (19.5.6)
where Ki is inhibition coefficient (g l�1); it is the concentration of substrate in which cellgrowth is inhibited. The high value of Ki suggests that the organisms are not so sensitiveto the target substrate and that the inhibition effect is observed in high concentrations ofthe substrate.
For modeling-dissolved substrate removal in the batch reactor, the MichaeliseMentenequation can be written by a combination of Eqns (19.5.2, 19.5.4 and 19.5.5):
rsu ¼ � mmXSYX=s
�Ks þ S
� (19.5.7)
In Eqn (19.5.7), negative value denotes the decrease in substrate concentration due to itsutilization. As the equation is used in mass balances, the presence of the negative sign isnecessary. The term (mm/YX/S) can be substituted for k, which represents the maximum spe-cific substrate utilization rate (g substrate per g cell.d) as given below:
rsu ¼ � kXSKs þ S
(19.5.8)
According to relative values of Ks and S, Eqn (19.5.7) can be simplified to other expressionsrepresenting boundary cases. When substrate concentration is much higher in compare to Ksvalue (S [ Ks), substrate depletion can be expressed as follows.
rsu x � kX (19.5.9)
In this case, substrate removal is not dependent upon its concentration, and only the con-centration of microbial solids influences substrate reduction; this is because of the low affinityof the organisms to the substrate.
FIGURE 19.2 Typical specific micro-bial growth rate versus growth-limitingsubstrate concentration.
19. BIOLOGICAL TREATMENT564
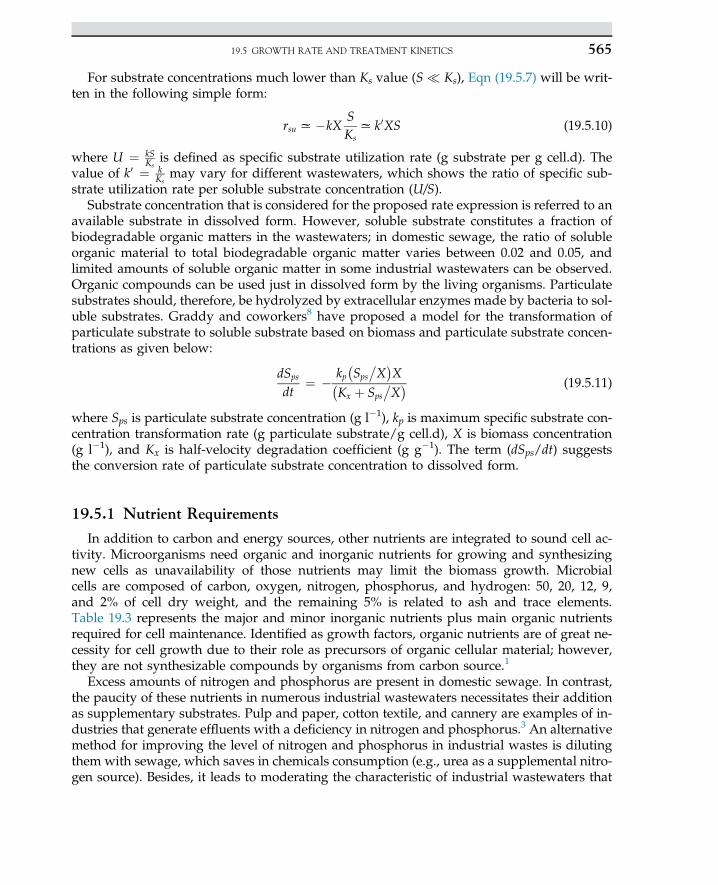
For substrate concentrations much lower than Ks value (S � Ks), Eqn (19.5.7) will be writ-ten in the following simple form:
rsu x�kXSKs
x k0XS (19.5.10)
where U ¼ kSKs
is defined as specific substrate utilization rate (g substrate per g cell.d). Thevalue of k0 ¼ k
Ksmay vary for different wastewaters, which shows the ratio of specific sub-
strate utilization rate per soluble substrate concentration (U/S).Substrate concentration that is considered for the proposed rate expression is referred to an
available substrate in dissolved form. However, soluble substrate constitutes a fraction ofbiodegradable organic matters in the wastewaters; in domestic sewage, the ratio of solubleorganic material to total biodegradable organic matter varies between 0.02 and 0.05, andlimited amounts of soluble organic matter in some industrial wastewaters can be observed.Organic compounds can be used just in dissolved form by the living organisms. Particulatesubstrates should, therefore, be hydrolyzed by extracellular enzymes made by bacteria to sol-uble substrates. Graddy and coworkers8 have proposed a model for the transformation ofparticulate substrate to soluble substrate based on biomass and particulate substrate concen-trations as given below:
dSps
dt¼ � kp
�Sps
�X�X�
Kx þ Sps�X� (19.5.11)
where Sps is particulate substrate concentration (g l�1), kp is maximum specific substrate con-centration transformation rate (g particulate substrate/g cell.d), X is biomass concentration(g l�1), and Kx is half-velocity degradation coefficient (g g�1). The term (dSps/dt) suggeststhe conversion rate of particulate substrate concentration to dissolved form.
19.5.1 Nutrient Requirements
In addition to carbon and energy sources, other nutrients are integrated to sound cell ac-tivity. Microorganisms need organic and inorganic nutrients for growing and synthesizingnew cells as unavailability of those nutrients may limit the biomass growth. Microbialcells are composed of carbon, oxygen, nitrogen, phosphorus, and hydrogen: 50, 20, 12, 9,and 2% of cell dry weight, and the remaining 5% is related to ash and trace elements.Table 19.3 represents the major and minor inorganic nutrients plus main organic nutrientsrequired for cell maintenance. Identified as growth factors, organic nutrients are of great ne-cessity for cell growth due to their role as precursors of organic cellular material; however,they are not synthesizable compounds by organisms from carbon source.1
Excess amounts of nitrogen and phosphorus are present in domestic sewage. In contrast,the paucity of these nutrients in numerous industrial wastewaters necessitates their additionas supplementary substrates. Pulp and paper, cotton textile, and cannery are examples of in-dustries that generate effluents with a deficiency in nitrogen and phosphorus.3 An alternativemethod for improving the level of nitrogen and phosphorus in industrial wastes is dilutingthem with sewage, which saves in chemicals consumption (e.g., urea as a supplemental nitro-gen source). Besides, it leads to moderating the characteristic of industrial wastewaters that
19.5 GROWTH RATE AND TREATMENT KINETICS 565
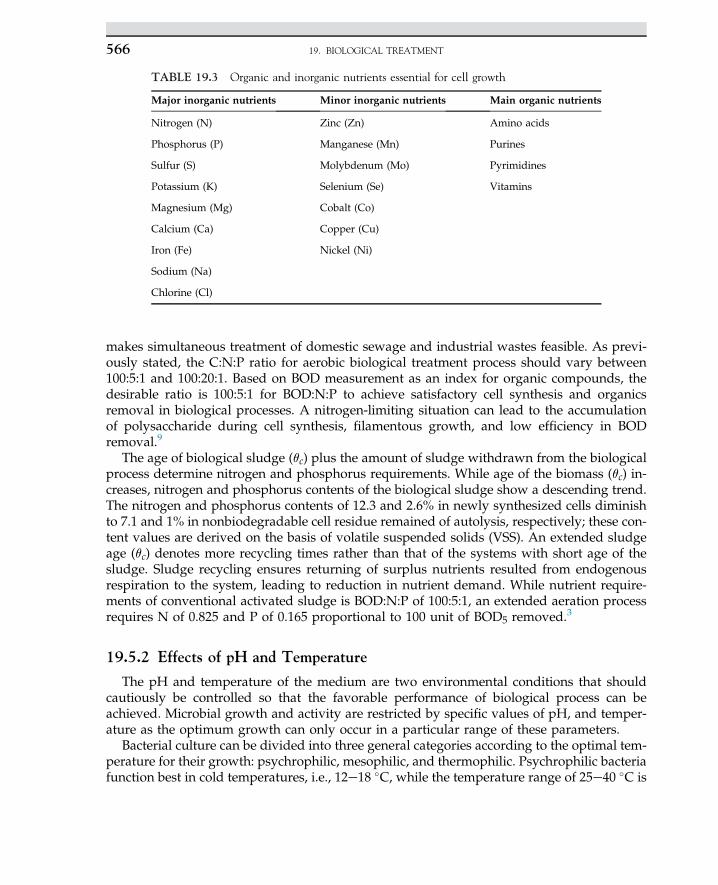
makes simultaneous treatment of domestic sewage and industrial wastes feasible. As previ-ously stated, the C:N:P ratio for aerobic biological treatment process should vary between100:5:1 and 100:20:1. Based on BOD measurement as an index for organic compounds, thedesirable ratio is 100:5:1 for BOD:N:P to achieve satisfactory cell synthesis and organicsremoval in biological processes. A nitrogen-limiting situation can lead to the accumulationof polysaccharide during cell synthesis, filamentous growth, and low efficiency in BODremoval.9
The age of biological sludge (qc) plus the amount of sludge withdrawn from the biologicalprocess determine nitrogen and phosphorus requirements. While age of the biomass (qc) in-creases, nitrogen and phosphorus contents of the biological sludge show a descending trend.The nitrogen and phosphorus contents of 12.3 and 2.6% in newly synthesized cells diminishto 7.1 and 1% in nonbiodegradable cell residue remained of autolysis, respectively; these con-tent values are derived on the basis of volatile suspended solids (VSS). An extended sludgeage (qc) denotes more recycling times rather than that of the systems with short age of thesludge. Sludge recycling ensures returning of surplus nutrients resulted from endogenousrespiration to the system, leading to reduction in nutrient demand. While nutrient require-ments of conventional activated sludge is BOD:N:P of 100:5:1, an extended aeration processrequires N of 0.825 and P of 0.165 proportional to 100 unit of BOD5 removed.3
19.5.2 Effects of pH and Temperature
The pH and temperature of the medium are two environmental conditions that shouldcautiously be controlled so that the favorable performance of biological process can beachieved. Microbial growth and activity are restricted by specific values of pH, and temper-ature as the optimum growth can only occur in a particular range of these parameters.
Bacterial culture can be divided into three general categories according to the optimal tem-perature for their growth: psychrophilic, mesophilic, and thermophilic. Psychrophilic bacteriafunction best in cold temperatures, i.e., 12e18 �C, while the temperature range of 25e40 �C is
TABLE 19.3 Organic and inorganic nutrients essential for cell growth
Major inorganic nutrients Minor inorganic nutrients Main organic nutrients
Nitrogen (N) Zinc (Zn) Amino acids
Phosphorus (P) Manganese (Mn) Purines
Sulfur (S) Molybdenum (Mo) Pyrimidines
Potassium (K) Selenium (Se) Vitamins
Magnesium (Mg) Cobalt (Co)
Calcium (Ca) Copper (Cu)
Iron (Fe) Nickel (Ni)
Sodium (Na)
Chlorine (Cl)
19. BIOLOGICAL TREATMENT566
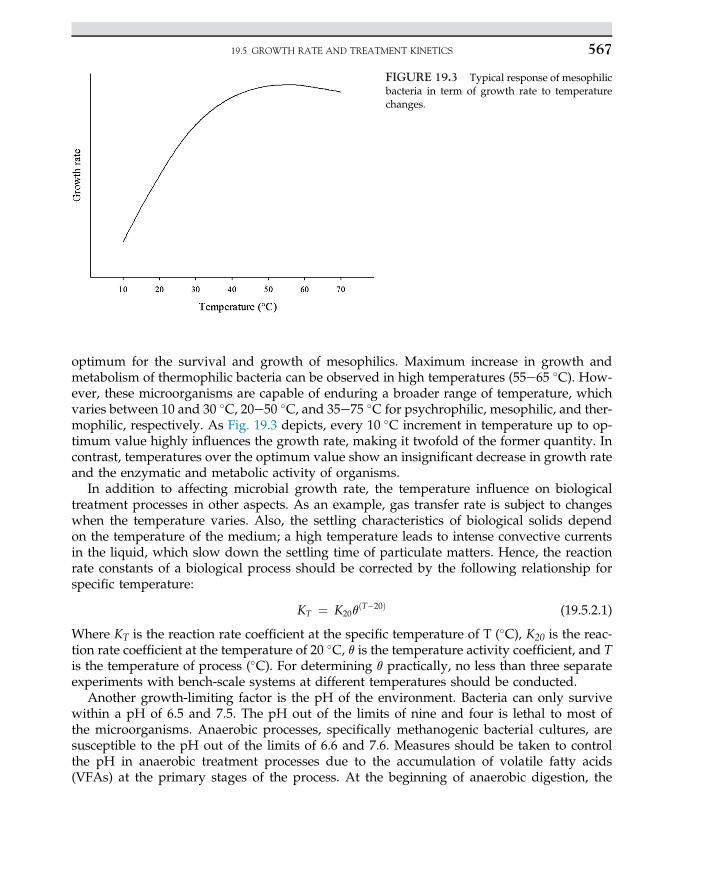
optimum for the survival and growth of mesophilics. Maximum increase in growth andmetabolism of thermophilic bacteria can be observed in high temperatures (55e65 �C). How-ever, these microorganisms are capable of enduring a broader range of temperature, whichvaries between 10 and 30 �C, 20e50 �C, and 35e75 �C for psychrophilic, mesophilic, and ther-mophilic, respectively. As Fig. 19.3 depicts, every 10 �C increment in temperature up to op-timum value highly influences the growth rate, making it twofold of the former quantity. Incontrast, temperatures over the optimum value show an insignificant decrease in growth rateand the enzymatic and metabolic activity of organisms.
In addition to affecting microbial growth rate, the temperature influence on biologicaltreatment processes in other aspects. As an example, gas transfer rate is subject to changeswhen the temperature varies. Also, the settling characteristics of biological solids dependon the temperature of the medium; a high temperature leads to intense convective currentsin the liquid, which slow down the settling time of particulate matters. Hence, the reactionrate constants of a biological process should be corrected by the following relationship forspecific temperature:
KT ¼ K20qðT�20Þ (19.5.2.1)
Where KT is the reaction rate coefficient at the specific temperature of T (�C), K20 is the reac-tion rate coefficient at the temperature of 20 �C, q is the temperature activity coefficient, and Tis the temperature of process (�C). For determining q practically, no less than three separateexperiments with bench-scale systems at different temperatures should be conducted.
Another growth-limiting factor is the pH of the environment. Bacteria can only survivewithin a pH of 6.5 and 7.5. The pH out of the limits of nine and four is lethal to most ofthe microorganisms. Anaerobic processes, specifically methanogenic bacterial cultures, aresusceptible to the pH out of the limits of 6.6 and 7.6. Measures should be taken to controlthe pH in anaerobic treatment processes due to the accumulation of volatile fatty acids(VFAs) at the primary stages of the process. At the beginning of anaerobic digestion, the
FIGURE 19.3 Typical response of mesophilicbacteria in term of growth rate to temperaturechanges.
19.5 GROWTH RATE AND TREATMENT KINETICS 567
number of fermentative and methanogenic bacteria does not counterbalance the VFAsbecause of low growth rate of methanogenics. Hence, VFAs produced by acidogens arenot offset by VFAs utilized by methanogens; thus, an increase in pH primarily happens.The drop of pH value to below 6.6 is deadly for a methanogenic community that systemcan only recover to a satisfactory situation within weeks or even months. To maintain therequired buffering capacity and avoid pH fluctuations, several compounds are added tothe wastewater such as lime (Ca(OH)2), sodium bicarbonate (NaHCO3), soda ash(Na2CO3), sodium hydroxide (NaOH), ammonia (NH3), and ammonium bicarbonate(NH4HCO3).
1,10
19.6 REMOVAL MECHANISMS IN BIOLOGICAL PROCESSES
The disposal of organic matters in biological treatment processes can happen either biolog-ically or nonbiologically. The biological removal of organic compounds is achieved by aero-bic or anaerobic biodegradation, also known as biotic loss. Nonbiological removal of organics(or abiotic loss), which includes adsorption and volatilization, may be even more importantthan biodegradation for some toxic and recalcitrant constituents. In the adsorption process,compounds adsorb to mixed liquor suspended solids (MLSS) in the bioreactor and will bedischarged subsequently from the system along with the wasted sludge. Volatilization hap-pens when organics are emitted to the surrounding atmosphere due to their high volatility.An organic compound can be removed by one or several of above mentioned mechanisms.As biodegradation occur, the organics can be degraded either in one of three main typesof pathways; the organic compound can be oxidized as growth substrate, or it may be pre-sented as electron acceptor and will be reduced. In the other case, the target compounddoes not incorporate in microbial metabolism, and it will be degraded through cometabolism,in which a nonspecific enzyme involves changing the structure of the compound. For toxicand recalcitrant organic materials, since complete biodegradation may not be possible,biotransformation to another organic compound with different a nature occurs. Althoughan innocuous end-product may be produced, it is possible that a constituent, which is equallyor even more harmful than the original compound, is also produced.
As organic matters present in water and wastewater are comprised of a number of undis-tinguishable organic constituents with analogous characteristics, the determination of param-eters indicating the total organic content of water and wastewater is of great necessity.Biochemical oxygen demand (BOD), chemical oxygen demand (COD), and total organic car-bon (TOC) are principal parameters used for quantifying aggregate organic matter. However,some analyses are also specified for the purpose of measuring individual organic compounds.Laboratory testing methods, which contribute to measuring BOD, COD, and TOC content ofwater and wastewater, can determine gross concentrations of organic matter greater than1.0 mg/l. Gas chromatography and mass spectroscopy, which have improved significantlyin recent decades, can be used for quantifying trace organics within the limits of10�12e10
�mg l�1. The dissolved oxygen (DO) required by microorganisms for biochemical
conversion of organic material is referred to as biochemical oxygen demand (BOD),commonly reported as 5-day BOD (BOD5). Despite a plethora of limitations that the BODtest endures, it is extensively used for designing wastewater plants; The BOD test can
19. BIOLOGICAL TREATMENT568
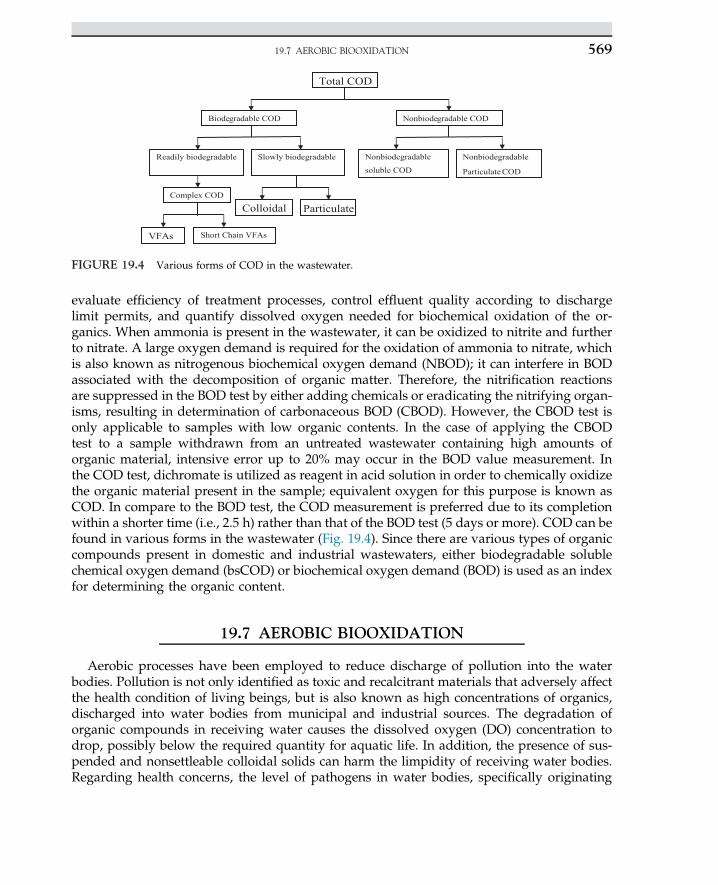
evaluate efficiency of treatment processes, control effluent quality according to dischargelimit permits, and quantify dissolved oxygen needed for biochemical oxidation of the or-ganics. When ammonia is present in the wastewater, it can be oxidized to nitrite and furtherto nitrate. A large oxygen demand is required for the oxidation of ammonia to nitrate, whichis also known as nitrogenous biochemical oxygen demand (NBOD); it can interfere in BODassociated with the decomposition of organic matter. Therefore, the nitrification reactionsare suppressed in the BOD test by either adding chemicals or eradicating the nitrifying organ-isms, resulting in determination of carbonaceous BOD (CBOD). However, the CBOD test isonly applicable to samples with low organic contents. In the case of applying the CBODtest to a sample withdrawn from an untreated wastewater containing high amounts oforganic material, intensive error up to 20% may occur in the BOD value measurement. Inthe COD test, dichromate is utilized as reagent in acid solution in order to chemically oxidizethe organic material present in the sample; equivalent oxygen for this purpose is known asCOD. In compare to the BOD test, the COD measurement is preferred due to its completionwithin a shorter time (i.e., 2.5 h) rather than that of the BOD test (5 days or more). COD can befound in various forms in the wastewater (Fig. 19.4). Since there are various types of organiccompounds present in domestic and industrial wastewaters, either biodegradable solublechemical oxygen demand (bsCOD) or biochemical oxygen demand (BOD) is used as an indexfor determining the organic content.
19.7 AEROBIC BIOOXIDATION
Aerobic processes have been employed to reduce discharge of pollution into the waterbodies. Pollution is not only identified as toxic and recalcitrant materials that adversely affectthe health condition of living beings, but is also known as high concentrations of organics,discharged into water bodies from municipal and industrial sources. The degradation oforganic compounds in receiving water causes the dissolved oxygen (DO) concentration todrop, possibly below the required quantity for aquatic life. In addition, the presence of sus-pended and nonsettleable colloidal solids can harm the limpidity of receiving water bodies.Regarding health concerns, the level of pathogens in water bodies, specifically originating
Total COD
Biodegradable COD Nonbiodegradable COD
Readily biodegradable Slowly biodegradable
Colloidal ParticulateComplex COD
VFAs Short Chain VFAs
Nonbiodegradable
soluble COD
Nonbiodegradable
Particulate COD
FIGURE 19.4 Various forms of COD in the wastewater.
19.7 AEROBIC BIOOXIDATION 569
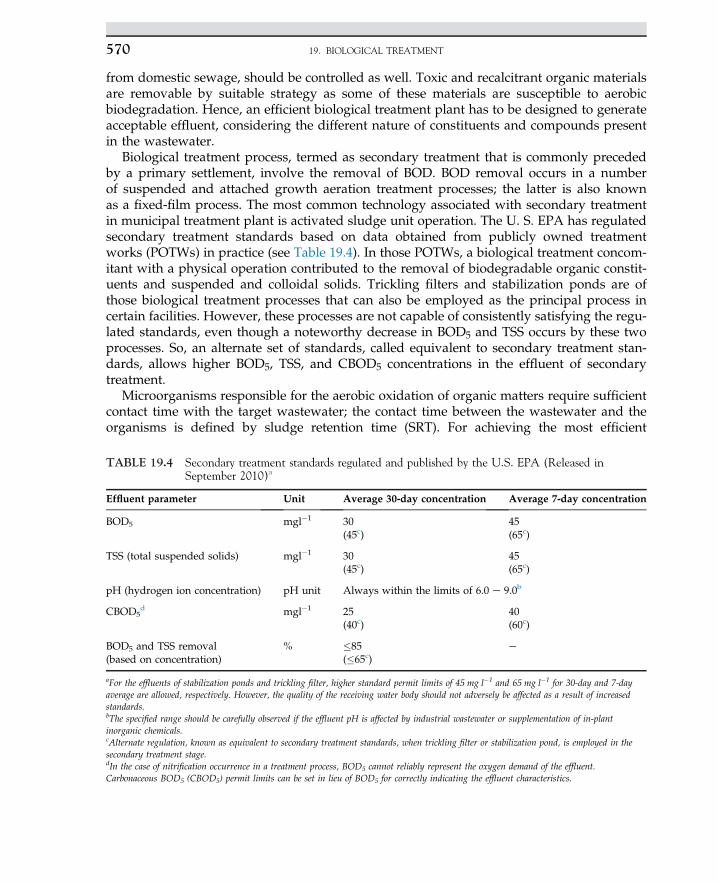
from domestic sewage, should be controlled as well. Toxic and recalcitrant organic materialsare removable by suitable strategy as some of these materials are susceptible to aerobicbiodegradation. Hence, an efficient biological treatment plant has to be designed to generateacceptable effluent, considering the different nature of constituents and compounds presentin the wastewater.
Biological treatment process, termed as secondary treatment that is commonly precededby a primary settlement, involve the removal of BOD. BOD removal occurs in a numberof suspended and attached growth aeration treatment processes; the latter is also knownas a fixed-film process. The most common technology associated with secondary treatmentin municipal treatment plant is activated sludge unit operation. The U. S. EPA has regulatedsecondary treatment standards based on data obtained from publicly owned treatmentworks (POTWs) in practice (see Table 19.4). In those POTWs, a biological treatment concom-itant with a physical operation contributed to the removal of biodegradable organic constit-uents and suspended and colloidal solids. Trickling filters and stabilization ponds are ofthose biological treatment processes that can also be employed as the principal process incertain facilities. However, these processes are not capable of consistently satisfying the regu-lated standards, even though a noteworthy decrease in BOD5 and TSS occurs by these twoprocesses. So, an alternate set of standards, called equivalent to secondary treatment stan-dards, allows higher BOD5, TSS, and CBOD5 concentrations in the effluent of secondarytreatment.
Microorganisms responsible for the aerobic oxidation of organic matters require sufficientcontact time with the target wastewater; the contact time between the wastewater and theorganisms is defined by sludge retention time (SRT). For achieving the most efficient
TABLE 19.4 Secondary treatment standards regulated and published by the U.S. EPA (Released inSeptember 2010)a
Effluent parameter Unit Average 30-day concentration Average 7-day concentration
BOD5 mgl�1 30(45c)
45(65c)
TSS (total suspended solids) mgl�1 30(45c)
45(65c)
pH (hydrogen ion concentration) pH unit Always within the limits of 6.0 e 9.0b
CBOD5d mgl�1 25
(40c)40(60c)
BOD5 and TSS removal(based on concentration)
% �85(�65c)
e
aFor the effluents of stabilization ponds and trickling filter, higher standard permit limits of 45 mg l�1 and 65 mg l�1 for 30-day and 7-dayaverage are allowed, respectively. However, the quality of the receiving water body should not adversely be affected as a result of increasedstandards.bThe specified range should be carefully observed if the effluent pH is affected by industrial wastewater or supplementation of in-plantinorganic chemicals.cAlternate regulation, known as equivalent to secondary treatment standards, when trickling filter or stabilization pond, is employed in thesecondary treatment stage.dIn the case of nitrification occurrence in a treatment process, BOD5 cannot reliably represent the oxygen demand of the effluent.Carbonaceous BOD5 (CBOD5) permit limits can be set in lieu of BOD5 for correctly indicating the effluent characteristics.
19. BIOLOGICAL TREATMENT570
treatment, environmental factors should be in a favorable condition. Neutral pH is the bestvalue for the removal of carbonaceous BOD; however, variation of pH between 6.0 and 9.0can satisfactorily be tolerated by aerobic heterotrophs. Enough amounts of oxygen and nutri-ents should be available for the biochemical activity of the organisms. The preferable concen-tration of dissolved oxygen (DO) in a bioreactor is 2.0 mg l�1; however, the biodegradationrate shows slight changes in DO greater than 0.5 mg l�1. While domestic sewage is rich innutrients, i.e., N and P, industrial wastewaters may inherently encounter a shortage of nutri-ents. Therefore, adequate supplementation of N and P sources to industrial wastewatersshould be considered in order to meet nutrient requirements for bsCOD treatment. Toxiccompounds can partly or completely frustrate the microbial activity; the magnitude of thetoxicity effect on aerobic autotrophs (ammonia-oxidizing bacteria) and methanogens ishigher than the effect on heterotrophics bacteria. Different microorganisms can developboth in aerobic-suspended and attached-growth treatment processes, and thus contributeto the removal of organic matter. The mixed bacterial culture mainly consists of aerobic bac-teria, and the remainder include protozoan, fungi, rotifers, nematodes, flatworms, andannelid worms.1 By producing extracellular biopolymers, aerobic heterotrophic bacteriacan be attached, and biological flocs or biofilm are formed in suspended or attached growthprocesses, respectively. The formation of biological flocs leads to improvement in the settlingcharacteristics of microorganisms. So removal of free bacteria and suspended solids fromtreated liquid by gravity settling is feasible. The presence of protozoa is vital to aerobic bio-logical treatment processes as they can be assumed as potential indicators of sound perfor-mance of the process; Long SRT and a DO concentration over 1.0 mg l�1 and devoid oftoxicity effect are necessary for their stable activity. Protozoa contribute to effluent clarifica-tion as they uptake and consume free bacteria and colloidal particulate matters. The develop-ment of nuisance organisms under a specific loading rate and environmental condition leadsto some problems in aerobic systems; two of which are bulking sludge and foaming thatoccur in activated sludge processes. Poor settling characteristics of biological flocs are respon-sible for bulking sludge, in which flocs are not favorably settled under gravity force. Hence, aconsiderable content of suspended solids in the effluent indicates poor operation of the treat-ment process. The development of foam on the surface of the activated sludge liquid is corre-lated by the presence of two bacteria genera: Nocardia and Microthrix; attachment of theirhydrophobic surfaces to air bubble surfaces results in concentrated foam on the liquid inthe activated sludge tank.
During aerobic biological oxidation, organic material is either oxidized or assimilated.More than half of organics are oxidized, providing requisite energy for metabolic activityof the bacterial community. The assimilation of the remainder of organic matter leads tothe production of new cell tissues that may further be oxidized during autooxidation. Thetwo following equations depict stoichiometry of aerobic biooxidation:
Oxidation and cell synthesis:
OrganicsðCOHNSÞ þO2 þ nutrients �������!MicroorganismsCO2 þH2OþNH3 þ biomassðC5H7NO2Þ
þ SMP
(19.7.1)
19.7 AEROBIC BIOOXIDATION 571
Endogenous respiration:
BiomassðC5H7NO2Þ þ 5O2 ����!bacteria5CO2 þ 2H2OþNH3 þ energyþ SMPþ cellular residues
(19.7.2)
In Eqn (19.7.1), organic matter and oxygen serve as the electron donor and electronacceptor, respectively. The expression COHNS can substitute for organic matter, and SMPstands for a soluble microbial product that is defined as a nonbiodegradable fraction oforganic matter appearing in the effluent as TOC or COD. C5H7NO2 is the formula that dem-onstrates cell mass composition. In Eqn (19.7.1), biomass provides the redox reaction with theelectron, while oxygen still plays the role of the electron acceptor. According to Eqn (19.7.2),1 mol of C5H7NO2 requires 5 mol of oxygen to be oxidized completely. Equivalent UBOD orCOD of the cells is equal to 1.42 times the concentration of biomass in term of VSS.
C5H7NO2 þ 5O2/5CO2 þ 2H2OþNH3 (19.7.3)
Molecular weight of the cells ¼ 113 g mol�1, mw of O2 ¼ 5 � 32 g mol�1
COD ¼ 5�32113 ¼ 1:42 g O2=g VSS; for complete oxidation of each unit mass organic com-
pound, 1.42 units mass of oxygen is required. The determination of reaction rates, oxygenand nutrient requirements, and the amount of produced sludge are of primary concern forthe design and operation of treatment plants. K and K’ are rate coefficients, describing thebiodegradability of organic matter and cell mass in the wastewater, respectively. InEqn (19.7.1), the stoichiometric coefficient describes the fraction of organic matter that is bio-logically oxidizable to end products for generating energy. In fact, the stoichiometry cancontribute to determining equivalent COD of biodegradable organic matter. The stoichio-metric coefficient of the fraction of organics is oxidized, resulting in the synthesis of new cells.The sum of organics oxidized in order to produce energy and synthesize a new cell is approx-imately equal to the organics concentration in the influent while SMP is disregarded.
Total COD w COD oxidized for energy þ COD oxidized for synthesizing new cell.
1w a1CODþ a2COD (19.7.4)
For expressing biomass in term of VSS, COD of biomass that is equal to 1.42 g of O2 per gof VSS should be substituted in Eqn (19.7.1):
1w a1CODþ 1:42a2VSS (19.7.5)
19.8 ANAEROBIC DIGESTION
In the course of anaerobic digestion, the bioconversion of organic matters resulted in theproduction of methane and carbon dioxide. For the analysis of gas, GC is an analyticaltool to define biogas composition. In its early stage, the anaerobic process would deliverhydrogen as a result of the hydrolysis of organic compounds occurring in the primary stage.This stage can be expanded by controlling the process parameters. A microbial fuel cell usingwastewater as substrate is partially achieved for the primary treatment. In fact, seven clear
19. BIOLOGICAL TREATMENT572
stages are identified in the entire biogas process as hydrolysis proceeds; specific bacteria orhydrogen reformers are discussed. As the pH of the culture dropped by acid forms, the con-centration of organic acids gradually increases. Control of the pH and having defined ratio ofC/N can assist the process by preceding methanogenic bacteria to lead the microbialpathway to methane formation. All biochemical reactions are catalyzed by a mix consortiumof anaerobic bacteria that are fixed in a packed bed and fluidized biogranular hybrid systems.An investigation of the rate equation can help us to project microbial mass production rate,such as the Gompertz rate model, that is similar to the Logistic equation. Even the Monodrate equation can project the same expression with different assumptions. The material bal-ance in early stage with the control of process parameter can achieve high hydrogen produc-tion; however, hydrogen generation in the anaerobic process is not a sustainable process sinceit would go through a pathway for bioconversion of an end product such as methane.
Anaerobic processes are advantageous over aerobic treatment methods due to reasons thatare economically valued. Those reasons include low energy, reactor volume, footprint re-quirements, low biomass yield, and energy production in the form of biogas, which mostlyconsists of methane. Its application for treating high-strength and concentrated industrialwastewater has shown to be very cost-effective in comparison to aerobic processes becauseof the reduction in reactor volume and nutrient and energy requirement. Waste sludgeand high-strength organic wastes primarily go under treatment in the anaerobic fermentationand oxidation processes. However, the recent treatment of dilute waste stream under anaer-obic condition has been extensively reported. Since its effluent is not as high-quality as that ofaerobic systems, it is the best anaerobic treatment that can be used along with aerobic pro-cesses; the application as a pretreatment step before discharging the wastewater into a munic-ipal collection system or prior to an aerobic process is preferred.1 Due to the high potential inkilling pathogens, thermophilic anaerobic digestion operating in the temperature range of50e70 �C has been of great interest alone or before mesophilic fermentation. One emergingprocess is temperature-phased anaerobic digestion (TPAD), which applies a short (2 days)50e70 �C pretreatment step prior to 35 �C digestion in the main stage with sludge SRT of10e20 days.11,12
Organic matter is decomposed in the anaerobic process by going through three funda-mental phases, i.e., hydrolysis, fermentation, and methanogensis. In the case of the soundperformance of the anaerobic process, the principal end products are methane and carbon di-oxide. Figure 19.5 depicts the conversion flow of organic material to methane and carbon di-oxide in the anaerobic process. In the hydrolysis phase, complex organic matter such as lipidsand polymers are hydrolyzed and converted to simple organic matters or monomers. Theconversion of particulate matter to soluble substances occurs in this phase. The end-products of this phase are accessible responsible for fermentation. In next step, i.e., fermen-tation is the phase in which acids and simple carbohydrates are decomposed and hydrogen,CO2, and simple organic acids such as acetate, propionate, and butyrate are produced. Thisphase will continue until propionate and butyrate are also further converted to hydrogen andacetate. The principal products of fermentation process are H2, CO2, and acetate which aremajor substrates for methane formation.
Organic matter presenting as both an electron donor and electron acceptor causes thisphase to be referred to as the fermentation phase. It is also termed as acidogenesis becauseof the production of simple organic acids in this phase. Depending on the nature of the
19.8 ANAEROBIC DIGESTION 573
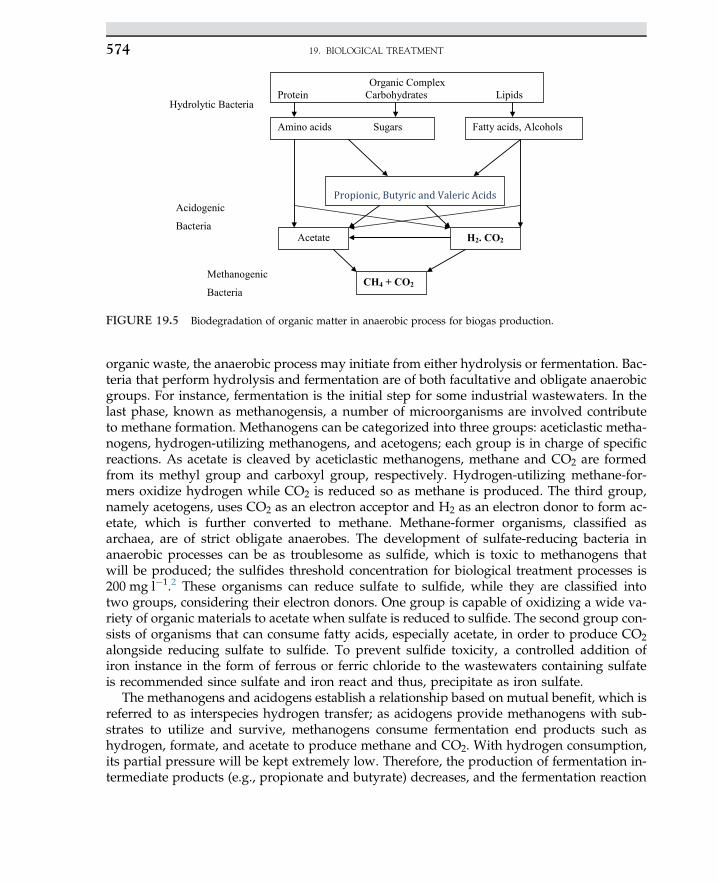
organic waste, the anaerobic process may initiate from either hydrolysis or fermentation. Bac-teria that perform hydrolysis and fermentation are of both facultative and obligate anaerobicgroups. For instance, fermentation is the initial step for some industrial wastewaters. In thelast phase, known as methanogensis, a number of microorganisms are involved contributeto methane formation. Methanogens can be categorized into three groups: aceticlastic metha-nogens, hydrogen-utilizing methanogens, and acetogens; each group is in charge of specificreactions. As acetate is cleaved by aceticlastic methanogens, methane and CO2 are formedfrom its methyl group and carboxyl group, respectively. Hydrogen-utilizing methane-for-mers oxidize hydrogen while CO2 is reduced so as methane is produced. The third group,namely acetogens, uses CO2 as an electron acceptor and H2 as an electron donor to form ac-etate, which is further converted to methane. Methane-former organisms, classified asarchaea, are of strict obligate anaerobes. The development of sulfate-reducing bacteria inanaerobic processes can be as troublesome as sulfide, which is toxic to methanogens thatwill be produced; the sulfides threshold concentration for biological treatment processes is200 mg l�1.2 These organisms can reduce sulfate to sulfide, while they are classified intotwo groups, considering their electron donors. One group is capable of oxidizing a wide va-riety of organic materials to acetate when sulfate is reduced to sulfide. The second group con-sists of organisms that can consume fatty acids, especially acetate, in order to produce CO2alongside reducing sulfate to sulfide. To prevent sulfide toxicity, a controlled addition ofiron instance in the form of ferrous or ferric chloride to the wastewaters containing sulfateis recommended since sulfate and iron react and thus, precipitate as iron sulfate.
The methanogens and acidogens establish a relationship based on mutual benefit, which isreferred to as interspecies hydrogen transfer; as acidogens provide methanogens with sub-strates to utilize and survive, methanogens consume fermentation end products such ashydrogen, formate, and acetate to produce methane and CO2. With hydrogen consumption,its partial pressure will be kept extremely low. Therefore, the production of fermentation in-termediate products (e.g., propionate and butyrate) decreases, and the fermentation reaction
Amino acids Sugars
Organic ComplexProtein Carbohydrates Lipids
Fatty acids, Alcohols
Hydrolytic Bacteria
Acetate H2. CO2
CH4 + CO2
Acidogenic
Bacteria
Methanogenic
Bacteria
FIGURE 19.5 Biodegradation of organic matter in anaerobic process for biogas production.
19. BIOLOGICAL TREATMENT574
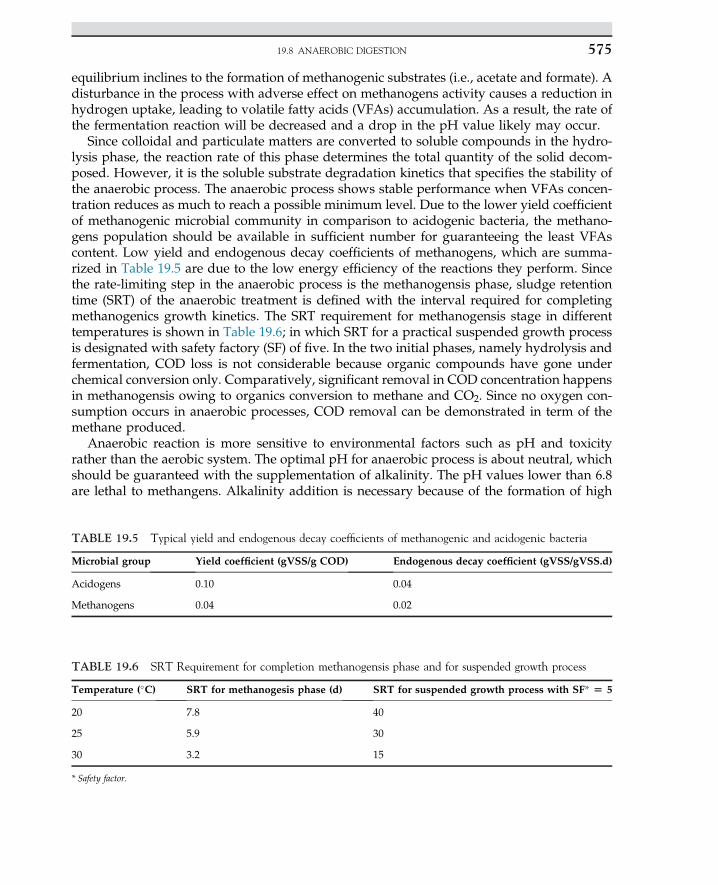
equilibrium inclines to the formation of methanogenic substrates (i.e., acetate and formate). Adisturbance in the process with adverse effect on methanogens activity causes a reduction inhydrogen uptake, leading to volatile fatty acids (VFAs) accumulation. As a result, the rate ofthe fermentation reaction will be decreased and a drop in the pH value likely may occur.
Since colloidal and particulate matters are converted to soluble compounds in the hydro-lysis phase, the reaction rate of this phase determines the total quantity of the solid decom-posed. However, it is the soluble substrate degradation kinetics that specifies the stability ofthe anaerobic process. The anaerobic process shows stable performance when VFAs concen-tration reduces as much to reach a possible minimum level. Due to the lower yield coefficientof methanogenic microbial community in comparison to acidogenic bacteria, the methano-gens population should be available in sufficient number for guaranteeing the least VFAscontent. Low yield and endogenous decay coefficients of methanogens, which are summa-rized in Table 19.5 are due to the low energy efficiency of the reactions they perform. Sincethe rate-limiting step in the anaerobic process is the methanogensis phase, sludge retentiontime (SRT) of the anaerobic treatment is defined with the interval required for completingmethanogenics growth kinetics. The SRT requirement for methanogensis stage in differenttemperatures is shown in Table 19.6; in which SRT for a practical suspended growth processis designated with safety factory (SF) of five. In the two initial phases, namely hydrolysis andfermentation, COD loss is not considerable because organic compounds have gone underchemical conversion only. Comparatively, significant removal in COD concentration happensin methanogensis owing to organics conversion to methane and CO2. Since no oxygen con-sumption occurs in anaerobic processes, COD removal can be demonstrated in term of themethane produced.
Anaerobic reaction is more sensitive to environmental factors such as pH and toxicityrather than the aerobic system. The optimal pH for anaerobic process is about neutral, whichshould be guaranteed with the supplementation of alkalinity. The pH values lower than 6.8are lethal to methangens. Alkalinity addition is necessary because of the formation of high
TABLE 19.5 Typical yield and endogenous decay coefficients of methanogenic and acidogenic bacteria
Microbial group Yield coefficient (gVSS/g COD) Endogenous decay coefficient (gVSS/gVSS.d)
Acidogens 0.10 0.04
Methanogens 0.04 0.02
TABLE 19.6 SRT Requirement for completion methanogensis phase and for suspended growth process
Temperature (�C) SRT for methanogesis phase (d) SRT for suspended growth process with SF* [ 5
20 7.8 40
25 5.9 30
30 3.2 15
* Safety factor.
19.8 ANAEROBIC DIGESTION 575
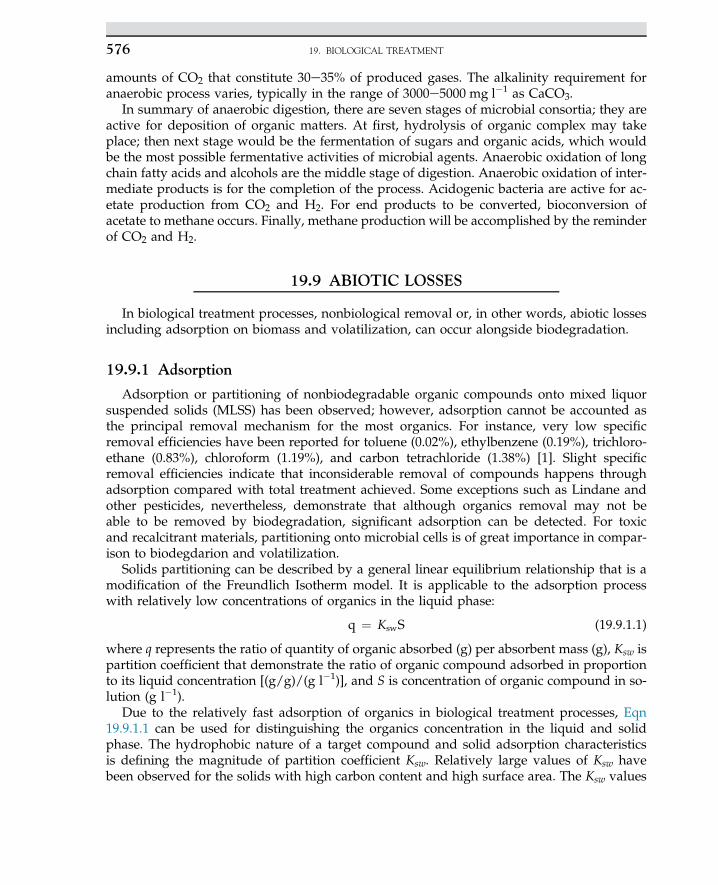
amounts of CO2 that constitute 30e35% of produced gases. The alkalinity requirement foranaerobic process varies, typically in the range of 3000e5000 mg l�1 as CaCO3.
In summary of anaerobic digestion, there are seven stages of microbial consortia; they areactive for deposition of organic matters. At first, hydrolysis of organic complex may takeplace; then next stage would be the fermentation of sugars and organic acids, which wouldbe the most possible fermentative activities of microbial agents. Anaerobic oxidation of longchain fatty acids and alcohols are the middle stage of digestion. Anaerobic oxidation of inter-mediate products is for the completion of the process. Acidogenic bacteria are active for ac-etate production from CO2 and H2. For end products to be converted, bioconversion ofacetate to methane occurs. Finally, methane production will be accomplished by the reminderof CO2 and H2.
19.9 ABIOTIC LOSSES
In biological treatment processes, nonbiological removal or, in other words, abiotic lossesincluding adsorption on biomass and volatilization, can occur alongside biodegradation.
19.9.1 Adsorption
Adsorption or partitioning of nonbiodegradable organic compounds onto mixed liquorsuspended solids (MLSS) has been observed; however, adsorption cannot be accounted asthe principal removal mechanism for the most organics. For instance, very low specificremoval efficiencies have been reported for toluene (0.02%), ethylbenzene (0.19%), trichloro-ethane (0.83%), chloroform (1.19%), and carbon tetrachloride (1.38%) [1]. Slight specificremoval efficiencies indicate that inconsiderable removal of compounds happens throughadsorption compared with total treatment achieved. Some exceptions such as Lindane andother pesticides, nevertheless, demonstrate that although organics removal may not beable to be removed by biodegradation, significant adsorption can be detected. For toxicand recalcitrant materials, partitioning onto microbial cells is of great importance in compar-ison to biodegdarion and volatilization.
Solids partitioning can be described by a general linear equilibrium relationship that is amodification of the Freundlich Isotherm model. It is applicable to the adsorption processwith relatively low concentrations of organics in the liquid phase:
q ¼ KswS (19.9.1.1)
where q represents the ratio of quantity of organic absorbed (g) per absorbent mass (g), Ksw ispartition coefficient that demonstrate the ratio of organic compound adsorbed in proportionto its liquid concentration [(g/g)/(g l�1)], and S is concentration of organic compound in so-lution (g l�1).
Due to the relatively fast adsorption of organics in biological treatment processes, Eqn19.9.1.1 can be used for distinguishing the organics concentration in the liquid and solidphase. The hydrophobic nature of a target compound and solid adsorption characteristicsis defining the magnitude of partition coefficient Ksw. Relatively large values of Ksw havebeen observed for the solids with high carbon content and high surface area. The Ksw values
19. BIOLOGICAL TREATMENT576
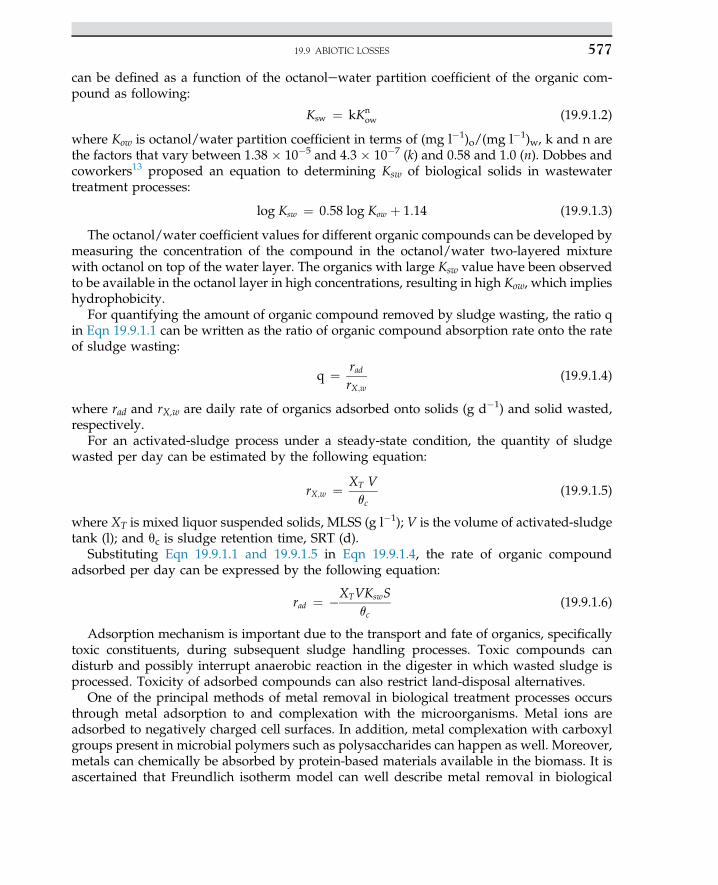
can be defined as a function of the octanolewater partition coefficient of the organic com-pound as following:
Ksw ¼ kKnow (19.9.1.2)
where Kow is octanol/water partition coefficient in terms of (mg l�1)o/(mg l�1)w, k and n arethe factors that vary between 1.38 � 10�5 and 4.3 � 10�7 (k) and 0.58 and 1.0 (n). Dobbes andcoworkers13 proposed an equation to determining Ksw of biological solids in wastewatertreatment processes:
log Ksw ¼ 0:58 log Kow þ 1:14 (19.9.1.3)
The octanol/water coefficient values for different organic compounds can be developed bymeasuring the concentration of the compound in the octanol/water two-layered mixturewith octanol on top of the water layer. The organics with large Ksw value have been observedto be available in the octanol layer in high concentrations, resulting in high Kow, which implieshydrophobicity.
For quantifying the amount of organic compound removed by sludge wasting, the ratio qin Eqn 19.9.1.1 can be written as the ratio of organic compound absorption rate onto the rateof sludge wasting:
q ¼ radrX;w
(19.9.1.4)
where rad and rX,w are daily rate of organics adsorbed onto solids (g d�1) and solid wasted,respectively.
For an activated-sludge process under a steady-state condition, the quantity of sludgewasted per day can be estimated by the following equation:
rX;w ¼ XT Vqc
(19.9.1.5)
where XT is mixed liquor suspended solids, MLSS (g l�1); V is the volume of activated-sludgetank (l); and qc is sludge retention time, SRT (d).
Substituting Eqn 19.9.1.1 and 19.9.1.5 in Eqn 19.9.1.4, the rate of organic compoundadsorbed per day can be expressed by the following equation:
rad ¼ �XTVKswSqc
(19.9.1.6)
Adsorption mechanism is important due to the transport and fate of organics, specificallytoxic constituents, during subsequent sludge handling processes. Toxic compounds candisturb and possibly interrupt anaerobic reaction in the digester in which wasted sludge isprocessed. Toxicity of adsorbed compounds can also restrict land-disposal alternatives.
One of the principal methods of metal removal in biological treatment processes occursthrough metal adsorption to and complexation with the microorganisms. Metal ions areadsorbed to negatively charged cell surfaces. In addition, metal complexation with carboxylgroups present in microbial polymers such as polysaccharides can happen as well. Moreover,metals can chemically be absorbed by protein-based materials available in the biomass. It isascertained that Freundlich isotherm model can well describe metal removal in biological
19.9 ABIOTIC LOSSES 577
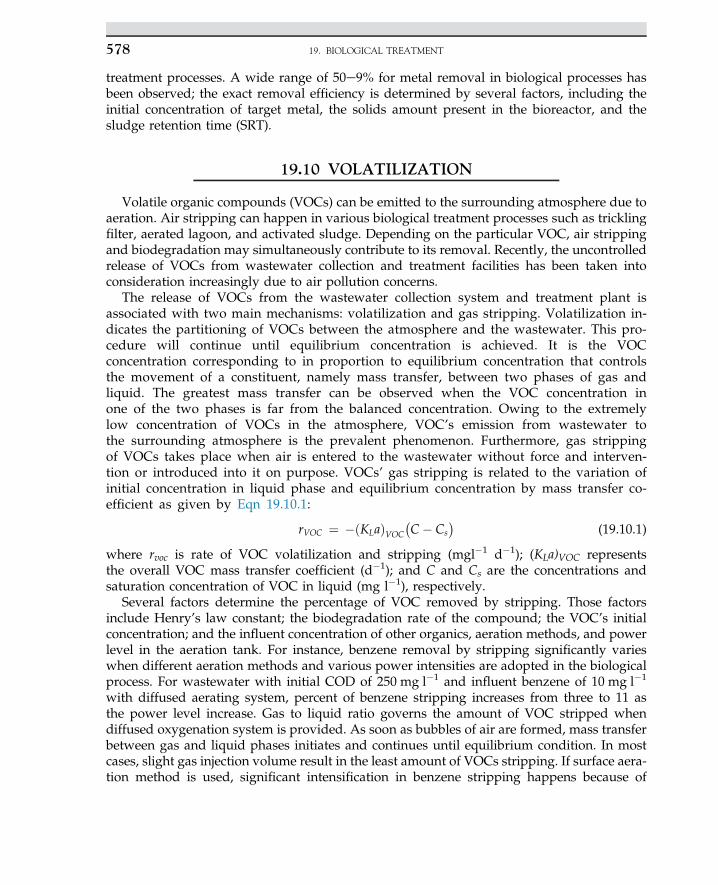
treatment processes. A wide range of 50e9% for metal removal in biological processes hasbeen observed; the exact removal efficiency is determined by several factors, including theinitial concentration of target metal, the solids amount present in the bioreactor, and thesludge retention time (SRT).
19.10 VOLATILIZATION
Volatile organic compounds (VOCs) can be emitted to the surrounding atmosphere due toaeration. Air stripping can happen in various biological treatment processes such as tricklingfilter, aerated lagoon, and activated sludge. Depending on the particular VOC, air strippingand biodegradation may simultaneously contribute to its removal. Recently, the uncontrolledrelease of VOCs from wastewater collection and treatment facilities has been taken intoconsideration increasingly due to air pollution concerns.
The release of VOCs from the wastewater collection system and treatment plant isassociated with two main mechanisms: volatilization and gas stripping. Volatilization in-dicates the partitioning of VOCs between the atmosphere and the wastewater. This pro-cedure will continue until equilibrium concentration is achieved. It is the VOCconcentration corresponding to in proportion to equilibrium concentration that controlsthe movement of a constituent, namely mass transfer, between two phases of gas andliquid. The greatest mass transfer can be observed when the VOC concentration inone of the two phases is far from the balanced concentration. Owing to the extremelylow concentration of VOCs in the atmosphere, VOC’s emission from wastewater tothe surrounding atmosphere is the prevalent phenomenon. Furthermore, gas strippingof VOCs takes place when air is entered to the wastewater without force and interven-tion or introduced into it on purpose. VOCs’ gas stripping is related to the variation ofinitial concentration in liquid phase and equilibrium concentration by mass transfer co-efficient as given by Eqn 19.10.1:
rVOC ¼ �ðKLaÞVOC
�C� Cs
�(19.10.1)
where rvoc is rate of VOC volatilization and stripping (mgl�1 d�1); (KLa)VOC representsthe overall VOC mass transfer coefficient (d�1); and C and Cs are the concentrations andsaturation concentration of VOC in liquid (mg l�1), respectively.
Several factors determine the percentage of VOC removed by stripping. Those factorsinclude Henry’s law constant; the biodegradation rate of the compound; the VOC’s initialconcentration; and the influent concentration of other organics, aeration methods, and powerlevel in the aeration tank. For instance, benzene removal by stripping significantly varieswhen different aeration methods and various power intensities are adopted in the biologicalprocess. For wastewater with initial COD of 250 mg l�1 and influent benzene of 10 mg l�1
with diffused aerating system, percent of benzene stripping increases from three to 11 asthe power level increase. Gas to liquid ratio governs the amount of VOC stripped whendiffused oxygenation system is provided. As soon as bubbles of air are formed, mass transferbetween gas and liquid phases initiates and continues until equilibrium condition. In mostcases, slight gas injection volume result in the least amount of VOCs stripping. If surface aera-tion method is used, significant intensification in benzene stripping happens because of
19. BIOLOGICAL TREATMENT578
infinite interface between the atmosphere and the wastewater. In this case, benzene removalby stripping increases to the range of 15e36% for the same power level. The components ofthe wastewater in question, particularly nonbiodegradable organics, affect the characteristicsand the amount of biological sludge produced, and hence, the practical SRT can be changed.As a result, biodegradation share in VOC removal varies. When influent concentration oftoluene increases from 0.1 to 40 mg l�1, percent of toluene stripped in biological processwith SRT of 3 days decreases from 17 to 15 percent. With further increase in influent tolueneto 100 mg l�1, toluene stripping reduces to the average amount of 14%. As the SRT isincreased to 15 d with the initial toluene concentration of 40 mg l�1, the amount of toluenestripped considerably diminishes to 5%.1
To control VOCs stripping to the atmosphere, some strategies has been proposed,including source control in VOCs production, covering the various sections of the treatmentfacility, and eliminating the possibility of turbulence; it is proven that the release of VOCs atthe points of turbulence is quite high in comparison to that of open surfaces. Providing coveron top of the treatment facilities necessitates the consideration of efficient off-gases treatmenttechnologies. In addition, some problems are encountered in the case of supplying coveringsuch as mechanical parts deterioration due to the corrosion and requirement of sufficientspace for the entry of personnel for maintenance and repair purposes. Depending on the vol-ume of gas to be treated plus the type of VOCs and their initial concentrations, disparatetreatment techniques are suggested. Vapor-phased adsorption on carbon, macroreticularresin, or other VOC selective resins, thermal and catalytic incineration, combustion in a flare,boiler or process heater, and biofiltration are of the options for off-gas treatment. With incre-ment in VOC inlet concentration, the order of off-gas treatment based on their efficiency inVOC removal is thermal incineration, catalytic incineration, carbon adsorption, and resinadsorption. For organics influent concentration of 20e90 ppmv, thermal and catalytic incin-erations have shown a removal efficiency of 90e96%. As the VOCs concentration varies in therange of 5000e10,000 mg l�1, resin adsorption depicts high capability in VOC control (i.e.,95e99% removal efficiency).1
19.11 BIOLOGICAL NITRIFICATION AND DENITRIFICATION
Biological nitrogen removal consists of two essential steps: nitrification and denitrification.The nitrification step involves ammonia (NH4-N) oxidation to nitrite (NO2-N), which isfurther oxidized to nitrate (NO3-N) according to Eqn 19.11.1. The denitrification process in-volves a series of reduction reactions for converting nitrate to nitrite to nitric oxide, nitrousoxide, and finally nitrogen gas (see Eqn 19.11.2). Nitrate reductive enzyme produced in adevoid or low concentration of DO helps in nitrate or nitrite reduction. The occurrence ofthe nitrification of all ammonia and organic nitrogen prior to denitrification is essential,because the product of the nitrification process (i.e., nitrate) is one of the fundamental com-ponents of denitrification reaction. So nitrification should be able to happen even in the worstcondition, such as low temperature. Biological denitrification is a cost-effective alternative tocostly ammonia striping, chlorination, and ion exchange. Environmental concerns necessitatenitrogen removal for several reasons, including ammonia toxicity for fishes, ammonia effecton DO concentration in receiving water bodies, the possibility of eutrophication occurrence,
19.11 BIOLOGICAL NITRIFICATION AND DENITRIFICATION 579
and water reuse applications, especially when effluents of wastewater treatment plants areused for recharging underground waters.
Nitrifiction reaction:
NH3/NHþ4 /NO�
2 /NO�3 (19.11.1)
Denitrification reaction:
NO�3 /NO�
2 /NO/N2O/N2 (19.11.2)
The nitrification process can be achieved in either a combined or separate system. Using asingle-stage activated sludge process for conducting BOD removal and the nitrification pro-cess simultaneously is a common technique (Fig. 19.6a). However, when there is the possibil-ity of toxicity and inhibition in the influent or high efficiency of nitrification is required, twosequential steps for BOD removal and nitrification are ideal. Figure 19.6b depicts a two-stageactivated sludge process. In the two-stage activated sludge process, the first stage where BODremoval occurs is accomplished with short SRT, while the SRT of the following activatedsludge system should be prolonged enough for the completion of nitrifying reactions.Long HRT and SRT required for the second stage indicate slow growth of nitrifying organ-isms compared to heterotrophic bacteria responsible for BOD removal. Optional bypassingof a fraction of influent wastewater to the second stage can be carried out for efficient floccu-lation and thus further clarification because of the low biomass yield of nitrifies. Comparingthese two systems, combined BOD and ammonia removal system is preferred due to lesssensitivity to loadings fluctuations for a large aeration tank, lower production of wastingsludge, and better sludge settling characteristics. On the other hand, a separate nitrificationsystem is more sensitive to loading fluctuations and a higher amount of sludge is producedthat results in increased surplus sludge. In the attached growth process employed for nitrifi-cation, a large amount of influent BOD should be removed prior to the development andgrowth of nitrifying bacteria. Due to the difference in growth rates, heterotrophic bacteriathat contribute to BOD removal populate in the top layers of the formed biofilm. Nitrifyingorganisms, in contrast, are established deep inside the fixed microbial film. Such an array ofmicrobial growth can benefit live mass survival against potential toxicity and inhibition ef-fects of substances present in the influent.
Nitrate removal, namely the denitrification process, occurs biologically in two approaches:assimilation and dissimilation, whereas in the latter, nitrate participates as the electron donor.Reduced nitrate to ammonia can be assimilated into biomass for synthesizing new cells whenthe cells do not access ammonia nitrogen (NH4-N). In biological denitrification or dissimi-lating nitrate reduction, nitrate reduces to nitrogen gas where a variety of organic or inor-ganic compounds can be oxidized. On this basis, the activated-sludge denitrificationprocess can be illustrated in two different flow arrangements, which are termed as preanoxic(substrate-driven) denitrification and postanoxic denitrification, shown in Fig. 19.6c and19.6d, respectively. In preanoxic denitrification depicted in Fig. 19.6c, nitrate is reduced ina preceding anoxic zone, and nitrification occurs in a subsequent aeration tank. Organic com-pounds are the substrate of the denitrification process from which the name of substrate-driven denitrification has been derived, and nitrate produced in the aeration tank is returnedto anoxic tank. Postanoxic denitrification is implemented so that BOD removal and nitrifica-tion are initially carried out, and then anoxic process for nitrate removal is implemented
19. BIOLOGICAL TREATMENT580
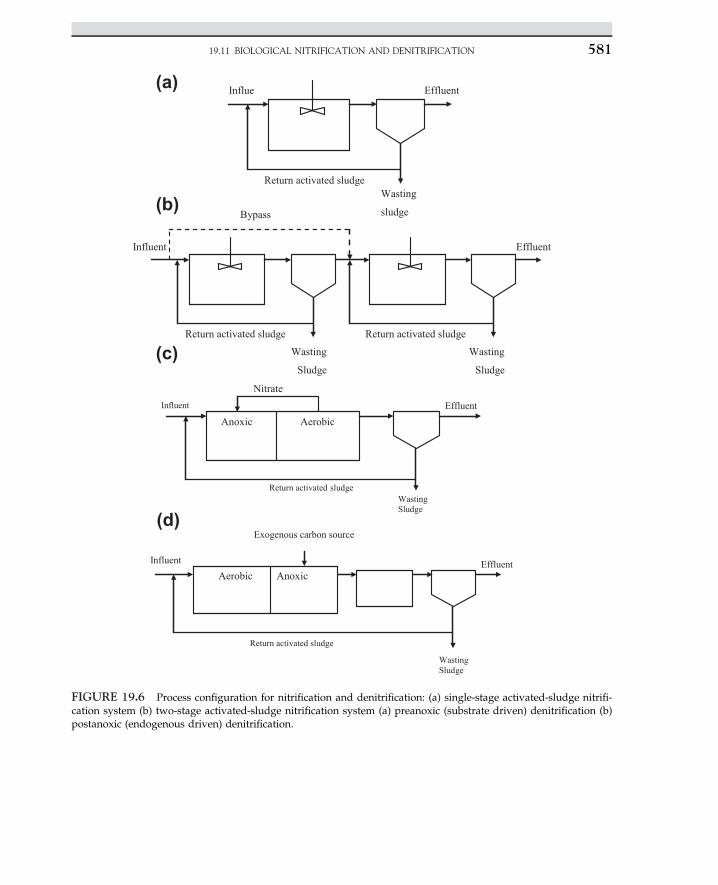
Wasting
sludge
Influe Effluent
Return activated sludge
Influent
Return activated sludge
Bypass
Wasting
Sludge
Effluent
Return activated sludge
Wasting
Sludge
Anoxic AerobicInfluent
Return activated sludge
Nitrate Effluent
Wasting Sludge
EffluentAerobic Anoxic
Influent
Return activated sludge
Exogenous carbon source
Wasting Sludge
(a)
(b)
(c)
(d)
FIGURE 19.6 Process configuration for nitrification and denitrification: (a) single-stage activated-sludge nitrifi-cation system (b) two-stage activated-sludge nitrification system (a) preanoxic (substrate driven) denitrification (b)postanoxic (endogenous driven) denitrification.
19.11 BIOLOGICAL NITRIFICATION AND DENITRIFICATION 581
based on energy obtained from endogenous respiration. Owing to the low energy efficiencyof endogenous respiration, postanoxic denitrification endures a slower reaction rate ratherthan preanoxic denitrification. To compensate for the slow reaction rate, an exogenous carbonsource as methanol or acetate can be supplemented to the anoxic stage of the process.
The oxidation of the ammonia nitrogen in the nitrification process occurs through twoenergy-yielding steps:
Ammonia nitrogen oxidation reaction:
2NHþ4 þ 3O2 ������!Nitrosomonas
2NO�2 þ 4Hþ þ 2H2O 3:43 gO2=gNH4 �N (19.11.3)
Nitrite nitrogen oxidation reaction:
2NO�2 þO2 ��������������!Nitrobacter or Nitrococcus
2NO�3 1:14 gO2=gNO2 �N (19.11.4)
The total ammonia oxidation to nitrate can be represented in a single equation stoichiom-etry as follows:
NHþ4 þ 2O2/NO�
3 þ 2Hþ þH2O (19.11.5)
Considering the thermodynamics of biological reactions and free energy changes,ammonia oxidation can be illustrated as the following reaction with more accurate stoichio-metric coefficients:
NHþ4 þ 1:863O2 þ 0:098CO2/0:0196C5H7NO2 þ 0:98NO�
3 þ 1:98Hþ
þ 0:0941H2O(19.11.6)
Nitrifying reaction requirements are summarized in Table 19.7. Based on the stoichiometryof biological nitrification, the oxygen demand for ammonia nitrogen (NH4-N) oxidation to ni-trate nitrogen (NO3-N) is equal to 4.57 g of O2; the amount of 3.43 g of required oxygen isassigned to nitrite production reaction (Eqn 19.11.3), and the remainder should be utilizedfor nitrite oxidation to nitrate (Eqn 19.11.4). According to Eqn 19.11.5, 4.25 g of DO is neededfor the oxidation of 1 gram of ammonia to nitrate, and 7.07 g of alkalinity, as CaCO3 shouldbe supplemented for the compensating acidic effect of CO2 produced. The difference between
TABLE 19.7 Oxygen and alkalinity requirements for nitrification process
Reaction requirementCalculatedstoichiometrically
Calculatedbioenergetically(fs [ 0.05)
Actualamounts,obtainedexperimentally
OxygenDemand(g O2/g N)
NH4 / NO2 4.57 4.25 4.33
NO2 / NO3 4.34 e 3.22
Total oxidation:NH4 / NO3
1.14 e 1.11
Alkalinity(g as CaCO3)
7.14 7.07 e
19. BIOLOGICAL TREATMENT582
the values calculated by basic stoichiometry and thermodynamic principals of the reaction isrelated to not considering ammonia for synthesizing new cells in Eqn 19.11.5. Furthermore,the coefficients of Eqn 19.11.6 are achieved with the assumption of fs ¼ 0.05; the parameterfs stands for the ratio of electron (e�) moles of substrate used for cell synthesis to the electron(e�) moles of the total substrate used, according to the thermodynamic concept of biologicalprocesses. In the design of biological nitrification processes, influent BOD and nitrogen con-centrations, oxygen and alkalinity requirements, temperature, and the effect of inlet toxic sub-stances should carefully be considered. Sources of carbon and phosphorus, along with traceelements (i.e., Ca, Cu, Mg, Mo, Ni, Zn) are required for nitrifying cell growth. Carbon in formof CO2 can be obtained from the surrounding atmosphere, which will be sufficient with theconsideration of the low reaction rate.
For the biological denitrification process, nitrate or nitrite serves as the electron acceptor,while a number of organic compounds can participate in this reaction as the electron donor.The typical electron donor depends on the configuration of the denitrification process. In pre-anoxic denitrification, the bsCOD or BOD of the influent wastewater is oxidized for the pur-pose of nitrite reduction. The bsCOD produced during endogenous respiration, which iscommonly supplemented with exogenous carbon source like methanol, serves as the electrondonor in postanoxic denitrification. Stoichiometry of biological denitrification can beobserved in the following reactions where BOD of wastewater, methanol, and acetate areselected as electron donors, respectively. The term C10H19O3N, as proposed by the U. S.EPA, is representative of the initial BOD of the wastewater in question.
C10H19O3Nþ 10NO�3 /5N2 þ 10CO2 þ 3H2OþNH3 þ 10OH� (19.11.7)
5CH3OH3 þ 6NO�3 /3N2 þ 5CO2 þ 7H2Oþ 10OH� (19.11.8)
5CH3COOH þ 8NO�3 /4N2 þ 10CO2 þ 6H2Oþ 8OH� (19.11.9)
Considering the above stoichiometry equations, it is observed that almost half of alkalinityconsumed in the nitrification process (i.e., 7.14 g alkalinity as CaCO3) is recovered in the deni-trification process. The amount of 3.57 g of alkalinity as CaCO3 is produced per each gram ofnitrate reduced. The production of alkalinity in the denitrification process, hence, should beconsidered in the design of the biological nitrogen removal processes. The oxygen equivalentsof nitrate and nitrite, which are useful parameters in estimating the total oxygen demand fordesigning an appropriate nitrificationedenitrification process, are equal to 2.86 g O2/g NO3-N and 1.71 g O2/g NO2-N, respectively.
A sufficient amount of bsCOD or BOD should carefully be determined so that anadequate electron donor will be available in the nitrate removal reaction. Similar to aerobicoxidation where oxygen demand is related to biomass yield, the same concept can beapplied to the denitrification process for estimating requisite bsCOD or BOD. On this basis,the following expression can be developed for calculating the required bsCOD per reducednitrate nitrogen. Owing to long SRT needed for the completion of the denitrification reaction,the proposed expression is also applicable to the aerobic removal of bsCOD in particulateand colloidal forms:
g bsCOD=g NO3 �N ¼ 2:861� 1:42Yn
(19.11.10)
19.11 BIOLOGICAL NITRIFICATION AND DENITRIFICATION 583
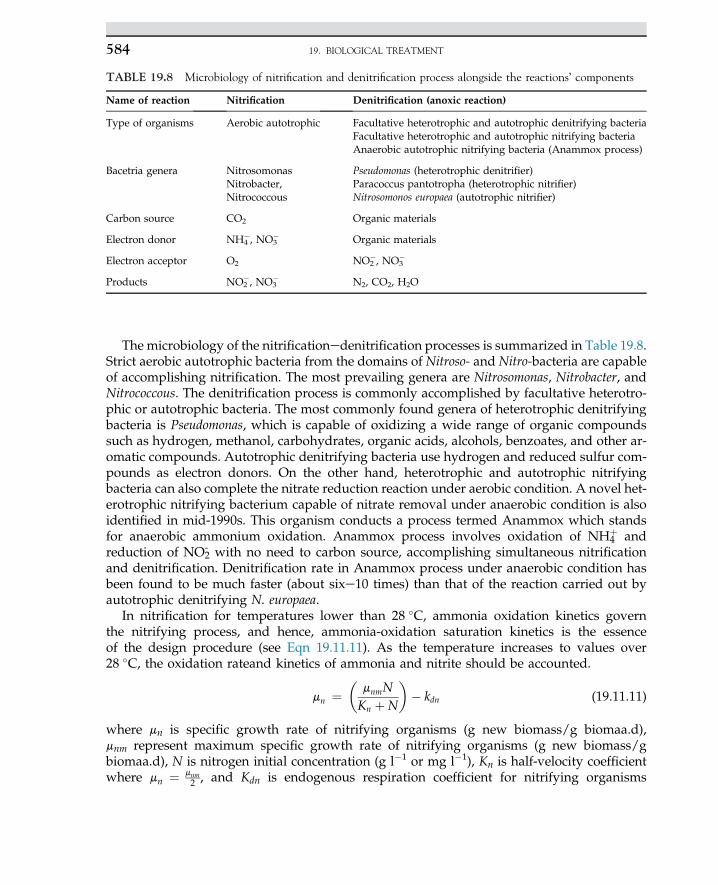
The microbiology of the nitrificationedenitrification processes is summarized in Table 19.8.Strict aerobic autotrophic bacteria from the domains of Nitroso- and Nitro-bacteria are capableof accomplishing nitrification. The most prevailing genera are Nitrosomonas, Nitrobacter, andNitrococcous. The denitrification process is commonly accomplished by facultative heterotro-phic or autotrophic bacteria. The most commonly found genera of heterotrophic denitrifyingbacteria is Pseudomonas, which is capable of oxidizing a wide range of organic compoundssuch as hydrogen, methanol, carbohydrates, organic acids, alcohols, benzoates, and other ar-omatic compounds. Autotrophic denitrifying bacteria use hydrogen and reduced sulfur com-pounds as electron donors. On the other hand, heterotrophic and autotrophic nitrifyingbacteria can also complete the nitrate reduction reaction under aerobic condition. A novel het-erotrophic nitrifying bacterium capable of nitrate removal under anaerobic condition is alsoidentified in mid-1990s. This organism conducts a process termed Anammox which standsfor anaerobic ammonium oxidation. Anammox process involves oxidation of NH4
þ andreduction of NO2
- with no need to carbon source, accomplishing simultaneous nitrificationand denitrification. Denitrification rate in Anammox process under anaerobic condition hasbeen found to be much faster (about sixe10 times) than that of the reaction carried out byautotrophic denitrifying N. europaea.
In nitrification for temperatures lower than 28 �C, ammonia oxidation kinetics governthe nitrifying process, and hence, ammonia-oxidation saturation kinetics is the essenceof the design procedure (see Eqn 19.11.11). As the temperature increases to values over28 �C, the oxidation rateand kinetics of ammonia and nitrite should be accounted.
mn ¼�
mnmNKn þN
�� kdn (19.11.11)
where mn is specific growth rate of nitrifying organisms (g new biomass/g biomaa.d),mnm represent maximum specific growth rate of nitrifying organisms (g new biomass/gbiomaa.d), N is nitrogen initial concentration (g l�1 or mg l�1), Kn is half-velocity coefficientwhere mn ¼ mnm
2 , and Kdn is endogenous respiration coefficient for nitrifying organisms
TABLE 19.8 Microbiology of nitrification and denitrification process alongside the reactions’ components
Name of reaction Nitrification Denitrification (anoxic reaction)
Type of organisms Aerobic autotrophic Facultative heterotrophic and autotrophic denitrifying bacteriaFacultative heterotrophic and autotrophic nitrifying bacteriaAnaerobic autotrophic nitrifying bacteria (Anammox process)
Bacetria genera NitrosomonasNitrobacter,Nitrococcous
Pseudomonas (heterotrophic denitrifier)Paracoccus pantotropha (heterotrophic nitrifier)Nitrosomonos europaea (autotrophic nitrifier)
Carbon source CO2 Organic materials
Electron donor NH4�, NO3
� Organic materials
Electron acceptor O2 NO2�, NO3
�
Products NO2�, NO3
� N2, CO2, H2O
19. BIOLOGICAL TREATMENT584
(g VSS/g VSS.d). The mnm value has been reported to be between 0.25 and 0.77 g VSS/g VSS.dat temperature of 20 �C. Due to the lower maximum specific growth rate of nitrifying organ-isms (mnm) compared with aerobic heterotrophic bacteria, long SRT is required for the nitrifi-cation process. Under a stable condition, the nitrite concentration in the activated-sludgenitrification process can decrease to under 0.10 mg l�1, while the ammonia concentrationvaries from 0.50 to 1.0 mg l�1. However, in the transient condition when the growth ofnitrite-oxidizing bacteria is limited due to a shortage in the substrate concentration, theNO2-N concentration of 5e20 mg l�1 can be observed. The DO concentration of up to3e4 mg l�1 significantly affects the nitrification rate, while the increment in temperature en-hances the reaction rate. A DO concentration below 0.5 mg l�1 seriously frustrates the nitri-fication rate with a higher adverse effect on nitrite-oxidizing bacteria rather than thecorresponding effect on the ammonia-oxidizing organism. This problem results in incompletenitrification reaction, and thus, an accumulation of nitrite nitrogen (NO2-N). In the denitrifi-cation process, microbial growth kinetics and substrate depletion are similar to those of aer-obic biooxidation. Instead of oxygen, nitrate serves as the electron acceptor in the denitrifyingreaction. For aerobic process, it is previously described that the soluble substrate concentra-tion controls the soluble substrate utilization rate. The denitrifying rate is also dependentupon on initial nitrate concentration. For a determination of the substrate utilization rate,Equations 19.11.12 can be modified to show the nitrate utilization rate in preanoxic denitir-ification. This modification should be accomplished to consider not the availability of solelydenitrifying bacteria in the anoxic zone of the preanoxic denitrification process. The modifi-cation of the expression is carried out by multiplying the term h in Eqn 19.11.12 as given inthe following equation:
rsu ¼ � kXShKs þ S
(19.11.12)
where h is the portion of denitrifying organisms in the biomass (g VSS/g VSS). Other param-eters (i.e., k, X, S, K) are formerly described. Although the value of k in denitrification is muchlower than that of the aerobic process, it is considered the same as that for aerobic oxidation;thus, the neglected effect on k is compensated by multiplying the term h in the expression forthe substrate utilization rate. The value of h has been observed to be in the range of 0.2e0.8.The Ks value shows no difference with nitrate and oxygen as electron acceptors. In postanoxicdenitrification, the microbial community exclusively consists of nitrate-reducing bacteriabecause influent BOD has been depleted significantly in the former aerobic zone. Therefore,consideration of the term h is not necessary anymore. Using methanol as an electron donor inthe suspended-growth denitrification process, the requisite SRT is about 3�e6 d, which showsno variation with the SRT for aerobic systems.
Environmental conditions such as pH, toxicity, metals, and free ammonia (NH3) concen-tration influence either nitrification or denitrification rates. The range of 7.5e8.0 is an opti-mum value for pH in nitrification process, which is practically maintained at 7.0 to 7.2.Due to the production of hydrogen ion in ammonia oxidation, the controlled addition of alka-linity in the form of soda, lime, soda ash, sodium bicarbonate, or magnesium hydroxide maybe needed for balancing the pH. In contrast, the pH value is of less concern in denitrificationowing to alkalinity produced in the nitrite reduction reaction. The variation of the pH valuebetween 7.0 and 8.0 does not affect denitrification reaction rate; however, a decrease in the
19.11 BIOLOGICAL NITRIFICATION AND DENITRIFICATION 585
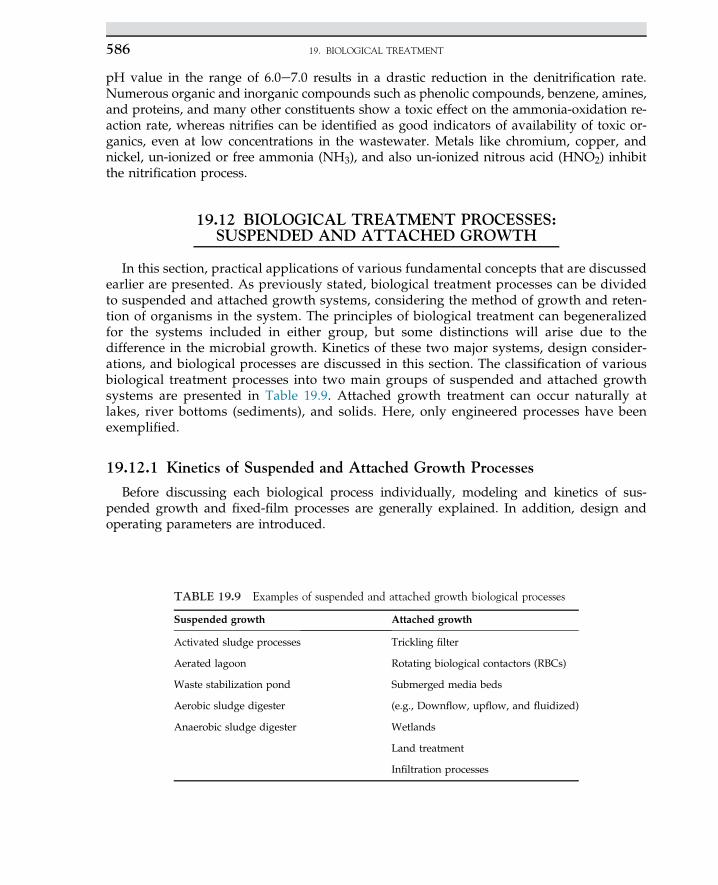
pH value in the range of 6.0e7.0 results in a drastic reduction in the denitrification rate.Numerous organic and inorganic compounds such as phenolic compounds, benzene, amines,and proteins, and many other constituents show a toxic effect on the ammonia-oxidation re-action rate, whereas nitrifies can be identified as good indicators of availability of toxic or-ganics, even at low concentrations in the wastewater. Metals like chromium, copper, andnickel, un-ionized or free ammonia (NH3), and also un-ionized nitrous acid (HNO2) inhibitthe nitrification process.
19.12 BIOLOGICAL TREATMENT PROCESSES:SUSPENDED AND ATTACHED GROWTH
In this section, practical applications of various fundamental concepts that are discussedearlier are presented. As previously stated, biological treatment processes can be dividedto suspended and attached growth systems, considering the method of growth and reten-tion of organisms in the system. The principles of biological treatment can begeneralizedfor the systems included in either group, but some distinctions will arise due to thedifference in the microbial growth. Kinetics of these two major systems, design consider-ations, and biological processes are discussed in this section. The classification of variousbiological treatment processes into two main groups of suspended and attached growthsystems are presented in Table 19.9. Attached growth treatment can occur naturally atlakes, river bottoms (sediments), and solids. Here, only engineered processes have beenexemplified.
19.12.1 Kinetics of Suspended and Attached Growth Processes
Before discussing each biological process individually, modeling and kinetics of sus-pended growth and fixed-film processes are generally explained. In addition, design andoperating parameters are introduced.
TABLE 19.9 Examples of suspended and attached growth biological processes
Suspended growth Attached growth
Activated sludge processes Trickling filter
Aerated lagoon Rotating biological contactors (RBCs)
Waste stabilization pond Submerged media beds
Aerobic sludge digester (e.g., Downflow, upflow, and fluidized)
Anaerobic sludge digester Wetlands
Land treatment
Infiltration processes
19. BIOLOGICAL TREATMENT586
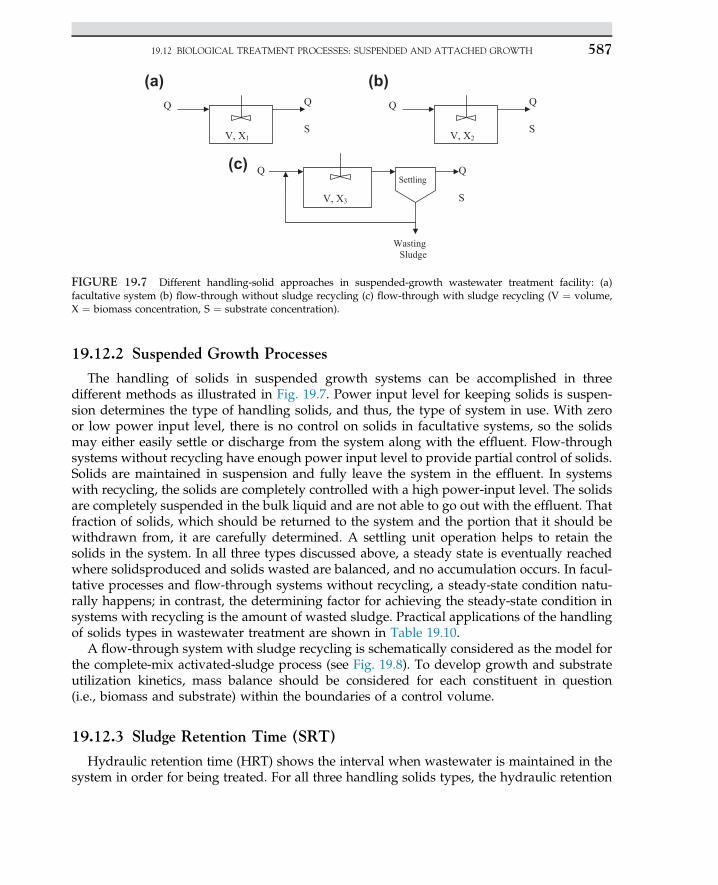
19.12.2 Suspended Growth Processes
The handling of solids in suspended growth systems can be accomplished in threedifferent methods as illustrated in Fig. 19.7. Power input level for keeping solids is suspen-sion determines the type of handling solids, and thus, the type of system in use. With zeroor low power input level, there is no control on solids in facultative systems, so the solidsmay either easily settle or discharge from the system along with the effluent. Flow-throughsystems without recycling have enough power input level to provide partial control of solids.Solids are maintained in suspension and fully leave the system in the effluent. In systemswith recycling, the solids are completely controlled with a high power-input level. The solidsare completely suspended in the bulk liquid and are not able to go out with the effluent. Thatfraction of solids, which should be returned to the system and the portion that it should bewithdrawn from, it are carefully determined. A settling unit operation helps to retain thesolids in the system. In all three types discussed above, a steady state is eventually reachedwhere solidsproduced and solids wasted are balanced, and no accumulation occurs. In facul-tative processes and flow-through systems without recycling, a steady-state condition natu-rally happens; in contrast, the determining factor for achieving the steady-state condition insystems with recycling is the amount of wasted sludge. Practical applications of the handlingof solids types in wastewater treatment are shown in Table 19.10.
A flow-through system with sludge recycling is schematically considered as the model forthe complete-mix activated-sludge process (see Fig. 19.8). To develop growth and substrateutilization kinetics, mass balance should be considered for each constituent in question(i.e., biomass and substrate) within the boundaries of a control volume.
19.12.3 Sludge Retention Time (SRT)
Hydraulic retention time (HRT) shows the interval when wastewater is maintained in thesystem in order for being treated. For all three handling solids types, the hydraulic retention
Q Q
SV, X1
Q Q
SV, X2
Wasting Sludge
Settling QQ
SV, X3
(a) (b)
(c)
FIGURE 19.7 Different handling-solid approaches in suspended-growth wastewater treatment facility: (a)facultative system (b) flow-through without sludge recycling (c) flow-through with sludge recycling (V ¼ volume,X ¼ biomass concentration, S ¼ substrate concentration).
19.12 BIOLOGICAL TREATMENT PROCESSES: SUSPENDED AND ATTACHED GROWTH 587
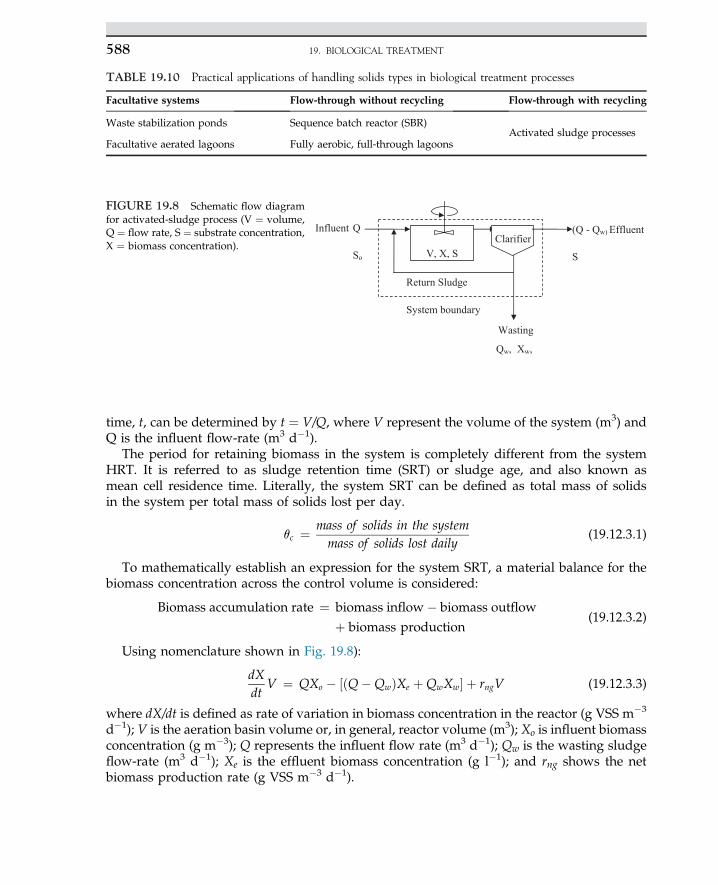
time, t, can be determined by t ¼ V/Q, where V represent the volume of the system (m3) andQ is the influent flow-rate (m3 d�1).
The period for retaining biomass in the system is completely different from the systemHRT. It is referred to as sludge retention time (SRT) or sludge age, and also known asmean cell residence time. Literally, the system SRT can be defined as total mass of solidsin the system per total mass of solids lost per day.
qc ¼ mass of solids in the systemmass of solids lost daily
(19.12.3.1)
To mathematically establish an expression for the system SRT, a material balance for thebiomass concentration across the control volume is considered:
Biomass accumulation rate ¼ biomass inflow � biomass outflow
þ biomass production(19.12.3.2)
Using nomenclature shown in Fig. 19.8):
dXdt
V ¼ QXo � ½ðQ�QwÞXe þQwXw� þ rngV (19.12.3.3)
where dX/dt is defined as rate of variation in biomass concentration in the reactor (g VSS m�3
d�1); V is the aeration basin volume or, in general, reactor volume (m3); Xo is influent biomassconcentration (g m�3); Q represents the influent flow rate (m3 d�1); Qw is the wasting sludgeflow-rate (m3 d�1); Xe is the effluent biomass concentration (g l�1); and rng shows the netbiomass production rate (g VSS m�3 d�1).
TABLE 19.10 Practical applications of handling solids types in biological treatment processes
Facultative systems Flow-through without recycling Flow-through with recycling
Waste stabilization ponds Sequence batch reactor (SBR)Activated sludge processes
Facultative aerated lagoons Fully aerobic, full-through lagoons
Qw, Xw,
V, X, S
Return Sludge
S, V, X
Q
So
(Q - Qw)
S
Wasting
Clarifier V, X, S
System boundary
Effluent Influent
FIGURE 19.8 Schematic flow diagramfor activated-sludge process (V ¼ volume,Q ¼ flow rate, S ¼ substrate concentration,X ¼ biomass concentration).
19. BIOLOGICAL TREATMENT588
Under the steady-state condition (dX/dt ¼ 0) and with the assumption Xo ¼ 0:��Q�Qw
�Xe þQwXw
¼ rngV (19.12.3.4)
By dividing Eqn 19.12.3.4 by V and X, the following expression yields where X representsthe biomass concentration in the reactor:
½ðQ�QwÞXe þQwXw�XV
¼ rngX
(19.12.3.5)
The term (rng/X) represents the inverse of sludge age. In addition, it equals to the biomassspecific growth rate, m, according to Eqn (19.5.4). So the SRT can be expressed by thefollowing equations:
qc ¼ XV½ðQ�QwÞXe þQwXw� (19.12.3.6)
1qc
¼ m (19.12.3.7)
Equations (19.12.3.5) can also be written as the following by substituting Eqn (19.5.3) forrng in its right-hand side and 1
qcfor its left-hand side:
1qc
¼ �YrsuX
� kd (19.12.3.8)
Substituting Eqn (19.5.8) into Eqn (19.12.3.8) results in an expression that correlates the sys-tem SRT to effluent substrate concentration, S (g BOD or bsCOD m�3) and biokinetic coeffi-cients of growth and decay.
1qc
¼ YkSKs þ S
� kd (19.12.3.9)
For facultative and flow-through systems, Eqn (19.12.3.6) can be simplified due to nosludge recycling as follows:
qc ¼ XVQXe
(19.12.3.10)
In flow-through systems with no sludge returning, the biomass concentration in thereactor completely escapes from the system with the effluent (X ¼ Xe), therefore t ¼ qc. In sys-tems with recycling, X > Xe, and thus qc > t. For instance, the extended aeration process is asystem that has much longer SRT (i.e., 20e30 d) in comparison to its HRT (e.g., t ¼ 0.5e3 d).Although settlement of a portion of inlet biomass concentration in facultative systems resultsin qc > t, qc, the value is not accurately determinable due to a vague fraction of the biomassconcentration that escapes from the system.
19.12.4 Biomass Concentration in System
An expression for the biomass concentration in the reactor can be developed by thefollowing analysis.
19.12 BIOLOGICAL TREATMENT PROCESSES: SUSPENDED AND ATTACHED GROWTH 589
Mass balance for substrate utilization:
Substrate accumulation rate ¼ inlet substrate� outlet substrate
þ Substrate utilization rate(19.12.4.1)
Representing above expression in symbols:
dSdt
V ¼ QSo �QSþ rsuV (19.12.4.2)
where So is substrate concentration in the influent (g.l�1).Under steady-state condition, i.e., dS/dt ¼ 0:
QSo �QS ¼ rsuV (19.12.4.3)
Dividing Eqn (19.12.4.3) by Q and substituting the Eqn (19.5.8) for rsu.
So � S ¼ t�
XkSKs þ S
�(19.12.4.4)
Solving Eqn (19.12.4.4) for kS/(KS þ S) and substituting in Eqn (19.12.3.10), and then solv-ing the resulted equation for X yields.
X ¼�qc
t
�YðSo � SÞ1þ qcKd
�(19.12.4.5)
Accordingly, the biomass concentration in the aeration basin is a function of the SRT, theHRT, the biomass yield, the endogenous decay coefficients, and the amount of substrateremoved in the reactor (So � S).
19.12.5 Food to Microorganisms Ratio
The food to microorganisms (F/M) ratio is a process parameter used for design and con-trolling the operation of activated sludge processes, and it can be defined as given below:
FM
¼ substrate inflowMass of microbial community
(19.12.5.1)
Expressing it by symbolic method yields:
FM
¼ QSo
VX¼ So
tX(19.12.5.2)
In the F/M ratio, the substrate concentration can be considered in term of BOD5, BODu,COD, and the biomass concentration can be substituted in as MLSS or MLVSS.
In facultative systems such as aerated lagoons and stabilization ponds, the F/M ratiocannot be obtained because the denominator (i.e., cell mass in the system) cannot be deter-mined due to settlement of a portion of microbial solids.
19. BIOLOGICAL TREATMENT590
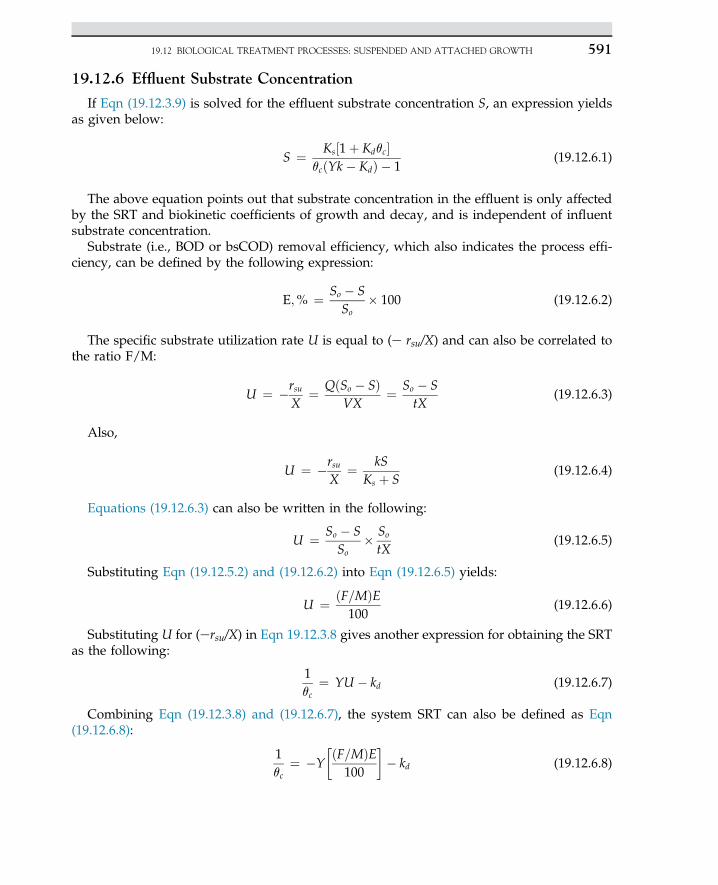
19.12.6 Effluent Substrate Concentration
If Eqn (19.12.3.9) is solved for the effluent substrate concentration S, an expression yieldsas given below:
S ¼ Ks½1þ Kdqc�qcðYk � KdÞ � 1
(19.12.6.1)
The above equation points out that substrate concentration in the effluent is only affectedby the SRT and biokinetic coefficients of growth and decay, and is independent of influentsubstrate concentration.
Substrate (i.e., BOD or bsCOD) removal efficiency, which also indicates the process effi-ciency, can be defined by the following expression:
E;% ¼ So � SSo
� 100 (19.12.6.2)
The specific substrate utilization rate U is equal to (e rsu/X) and can also be correlated tothe ratio F/M:
U ¼ �rsuX
¼ QðSo � SÞVX
¼ So � StX
(19.12.6.3)
Also,
U ¼ �rsuX
¼ kSKs þ S
(19.12.6.4)
Equations (19.12.6.3) can also be written in the following:
U ¼ So � SSo
� So
tX(19.12.6.5)
Substituting Eqn (19.12.5.2) and (19.12.6.2) into Eqn (19.12.6.5) yields:
U ¼ ðF=MÞE100
(19.12.6.6)
Substituting U for (ersu/X) in Eqn 19.12.3.8 gives another expression for obtaining the SRTas the following:
1qc
¼ YU � kd (19.12.6.7)
Combining Eqn (19.12.3.8) and (19.12.6.7), the system SRT can also be defined as Eqn(19.12.6.8):
1qc
¼ �YðF=MÞE
100
�� kd (19.12.6.8)
19.12 BIOLOGICAL TREATMENT PROCESSES: SUSPENDED AND ATTACHED GROWTH 591
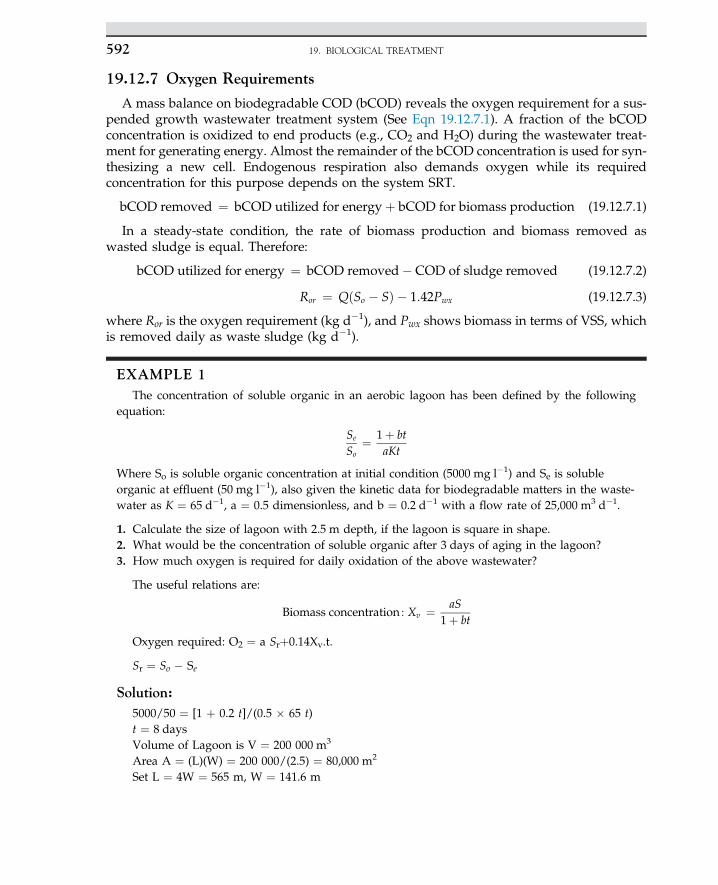
19.12.7 Oxygen Requirements
A mass balance on biodegradable COD (bCOD) reveals the oxygen requirement for a sus-pended growth wastewater treatment system (See Eqn 19.12.7.1). A fraction of the bCODconcentration is oxidized to end products (e.g., CO2 and H2O) during the wastewater treat-ment for generating energy. Almost the remainder of the bCOD concentration is used for syn-thesizing a new cell. Endogenous respiration also demands oxygen while its requiredconcentration for this purpose depends on the system SRT.
bCOD removed ¼ bCOD utilized for energyþ bCOD for biomass production (19.12.7.1)
In a steady-state condition, the rate of biomass production and biomass removed aswasted sludge is equal. Therefore:
bCOD utilized for energy ¼ bCOD removed� COD of sludge removed (19.12.7.2)
Ror ¼ QðSo � SÞ � 1:42Pwx (19.12.7.3)
where Ror is the oxygen requirement (kg d�1), and Pwx shows biomass in terms of VSS, whichis removed daily as waste sludge (kg d�1).
EXAMPLE 1The concentration of soluble organic in an aerobic lagoon has been defined by the following
equation:
Se
So¼ 1þ bt
aKt
Where So is soluble organic concentration at initial condition (5000 mg l�1) and Se is solubleorganic at effluent (50 mg l�1), also given the kinetic data for biodegradable matters in the waste-water as K ¼ 65 d�1, a ¼ 0.5 dimensionless, and b ¼ 0.2 d�1 with a flow rate of 25,000 m3 d�1.
1. Calculate the size of lagoon with 2.5 m depth, if the lagoon is square in shape.2. What would be the concentration of soluble organic after 3 days of aging in the lagoon?3. How much oxygen is required for daily oxidation of the above wastewater?
The useful relations are:
Biomass concentration : Xv ¼ aS1þ bt
Oxygen required: O2 ¼ a Srþ0.14Xv.t.
Sr ¼ So � Se
Solution:5000/50 ¼ [1 þ 0.2 t]/(0.5 � 65 t)t ¼ 8 daysVolume of Lagoon is V ¼ 200 000 m3
Area A ¼ (L)(W) ¼ 200 000/(2.5) ¼ 80,000 m2
Set L ¼ 4W ¼ 565 m, W ¼ 141.6 m
19. BIOLOGICAL TREATMENT592
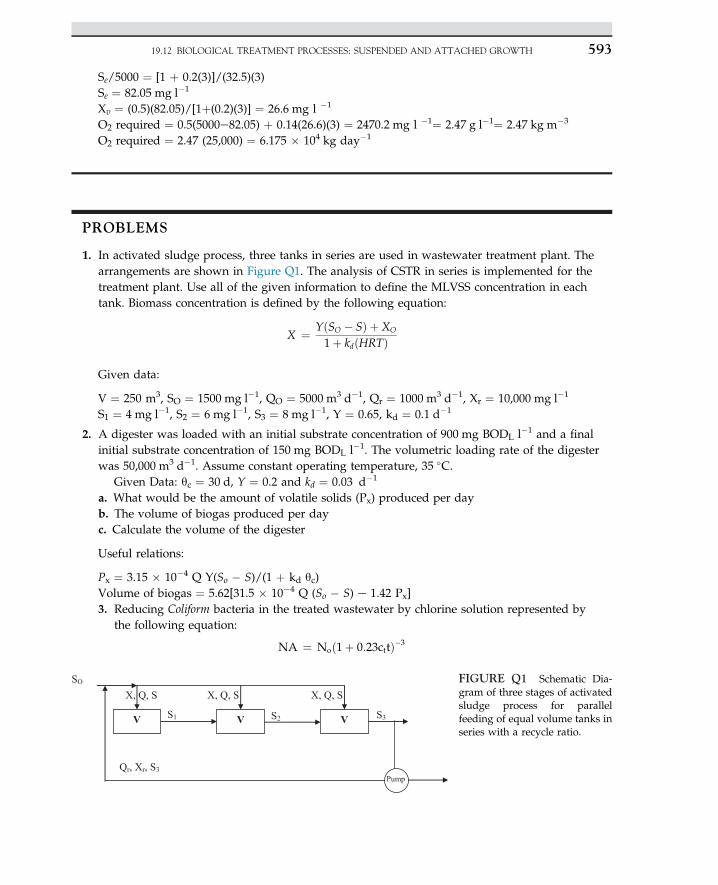
Se/5000 ¼ [1 þ 0.2(3)]/(32.5)(3)Se ¼ 82.05 mg l�1
Xv ¼ (0.5)(82.05)/[1þ(0.2)(3)] ¼ 26.6 mg l �1
O2 required ¼ 0.5(5000e82.05) þ 0.14(26.6)(3) ¼ 2470.2 mg l �1¼ 2.47 g l�1¼ 2.47 kg m�3
O2 required ¼ 2.47 (25,000) ¼ 6.175 � 104 kg day�1
PROBLEMS
1. In activated sludge process, three tanks in series are used in wastewater treatment plant. Thearrangements are shown in Figure Q1. The analysis of CSTR in series is implemented for thetreatment plant. Use all of the given information to define the MLVSS concentration in eachtank. Biomass concentration is defined by the following equation:
X ¼ YðSO � SÞ þ XO
1þ kdðHRTÞ
Given data:
V ¼ 250 m3, SO ¼ 1500 mg l�1, QO ¼ 5000 m3 d�1, Qr ¼ 1000 m3 d�1, Xr ¼ 10,000 mg l�1
S1 ¼ 4 mg l�1, S2 ¼ 6 mg l�1, S3 ¼ 8 mg l�1, Y ¼ 0.65, kd ¼ 0.1 d�1
2. A digester was loaded with an initial substrate concentration of 900 mg BODL l�1 and a finalinitial substrate concentration of 150 mg BODL l�1. The volumetric loading rate of the digesterwas 50,000 m3 d�1. Assume constant operating temperature, 35 �C.
Given Data: qc ¼ 30 d, Y ¼ 0.2 and kd ¼ 0.03 d�1
a. What would be the amount of volatile solids (Px) produced per dayb. The volume of biogas produced per dayc. Calculate the volume of the digester
Useful relations:
Px ¼ 3.15 � 10�4 Q Y(So � S)/(1 þ kd qc)Volume of biogas ¼ 5.62[31.5 � 10�4 Q (So � S) e 1.42 Px]3. Reducing Coliform bacteria in the treated wastewater by chlorine solution represented by
the following equation:
NA ¼ Noð1þ 0:23cttÞ�3
V S3VV
Pump
SO
X, Q, S X, Q, SX, Q, S
S1 S2
Qr, Xr, S3
FIGURE Q1 Schematic Dia-gram of three stages of activatedsludge process for parallelfeeding of equal volume tanks inseries with a recycle ratio.
19.12 BIOLOGICAL TREATMENT PROCESSES: SUSPENDED AND ATTACHED GROWTH 593
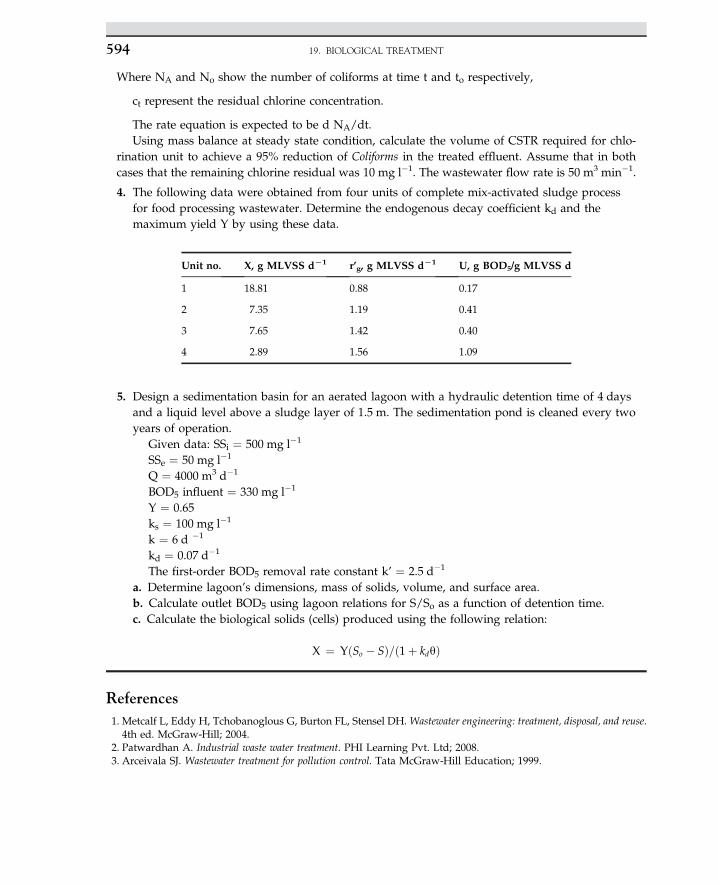
Where NA and No show the number of coliforms at time t and to respectively,
ct represent the residual chlorine concentration.
The rate equation is expected to be d NA/dt.Using mass balance at steady state condition, calculate the volume of CSTR required for chlo-
rination unit to achieve a 95% reduction of Coliforms in the treated effluent. Assume that in bothcases that the remaining chlorine residual was 10 mg l�1. The wastewater flow rate is 50 m3 min�1.
4. The following data were obtained from four units of complete mix-activated sludge processfor food processing wastewater. Determine the endogenous decay coefficient kd and themaximum yield Y by using these data.
5. Design a sedimentation basin for an aerated lagoon with a hydraulic detention time of 4 daysand a liquid level above a sludge layer of 1.5 m. The sedimentation pond is cleaned every twoyears of operation.
Given data: SSi ¼ 500 mg l�1
SSe ¼ 50 mg l�1
Q ¼ 4000 m3 d�1
BOD5 influent ¼ 330 mg l�1
Y ¼ 0.65ks ¼ 100 mg l�1
k ¼ 6 d �1
kd ¼ 0.07 d�1
The first-order BOD5 removal rate constant k’ ¼ 2.5 d�1
a. Determine lagoon’s dimensions, mass of solids, volume, and surface area.b. Calculate outlet BOD5 using lagoon relations for S/So as a function of detention time.c. Calculate the biological solids (cells) produced using the following relation:
X ¼ YðSo � SÞ=ð1þ kdqÞ
References1. Metcalf L, Eddy H, Tchobanoglous G, Burton FL, Stensel DH. Wastewater engineering: treatment, disposal, and reuse.4th ed. McGraw-Hill; 2004.
2. Patwardhan A. Industrial waste water treatment. PHI Learning Pvt. Ltd; 2008.3. Arceivala SJ. Wastewater treatment for pollution control. Tata McGraw-Hill Education; 1999.
Unit no. X, g MLVSS dL1 r’g, g MLVSS dL1 U, g BOD5/g MLVSS d
1 18.81 0.88 0.17
2 7.35 1.19 0.41
3 7.65 1.42 0.40
4 2.89 1.56 1.09
19. BIOLOGICAL TREATMENT594
4. Rajeshwari K, Balakrishnan M, Kansal A, Lata K, Kishore V. State-of-the-art of anaerobic digestion technology forindustrial wastewater treatment. Renew Sustain Energy Rev 2000;4(2):135e56.
5. Monod J. The growth of bacterial cultures. Annu Rev Microbiol 1949;3(1):371e94.6. Nuhoglu A, Yalcin B. Modelling of phenol removal in a batch reactor. Process Biochem 2005;40(3):1233e9.7. Najafpour G, Younesi H, Syahidah Ku K. Ismail, Ethanol fermentation in an immobilized cell reactor usingSaccharomyces cerevisiae. Bioresour Technol 2004;92(3):251e60.
8. Grady Jr CL, Daigger GT, Love NG, Filipe CD, Leslie Grady C. Biological wastewater treatment. IWA Publishing;2011.
9. Eckenfelder WW. Industrial water pollution control. McGraw-Hill; 1989.10. Rittmann BE, McCarty PL. Environmental biotechnology: principles and applications. New York: McGraw-Hill; 2001.11. Riau V, De la Rubia M, Pérez M. Assessment of solid retention time of a temperature phased anaerobic digestion
system on performance and final sludge characteristics. J Chem Technol Biotechnol 2012;87(8):1074e82.12. Ge H, Jensen PD, Batstone DJ. Increased temperature in the thermophilic stage in temperature phased anaerobic
digestion (TPAD) improves degradability of waste activated sludge. J Hazardous Materials 2011;187(1):355e61.13. Dobbs RA, Wang L, Govind R. Sorption of toxic organic compounds on wastewater solids: correlation with
fundamental properties. Environ Science Technology 1989;23(9):1092e7.
REFERENCES 595
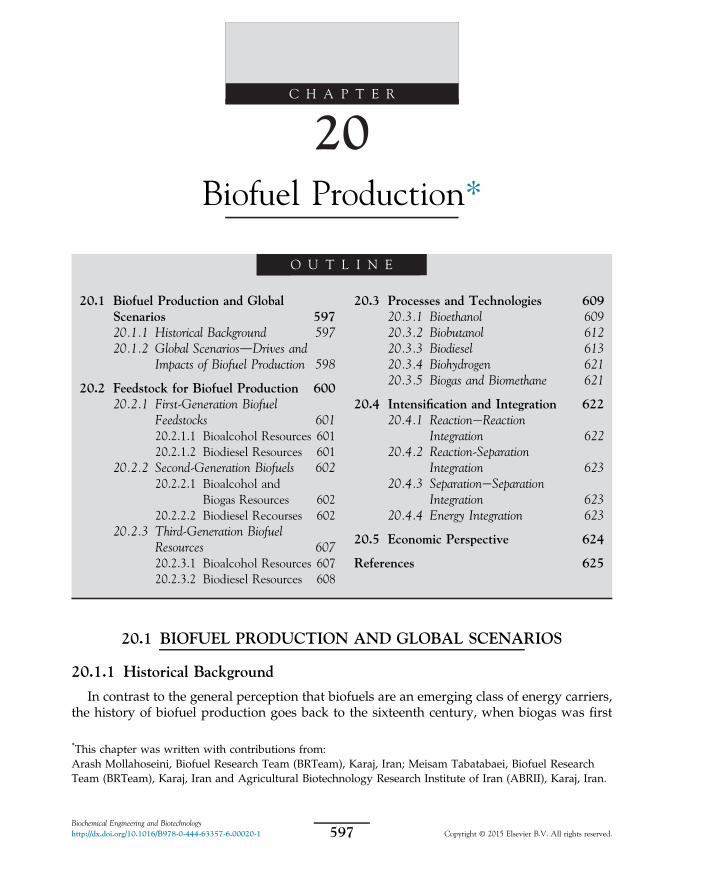
C H A P T E R
20Biofuel Production*
O U T L I N E
20.1 Biofuel Production and GlobalScenarios 59720.1.1 Historical Background 59720.1.2 Global ScenariosdDrives and
Impacts of Biofuel Production 598
20.2 Feedstock for Biofuel Production 60020.2.1 First-Generation Biofuel
Feedstocks 60120.2.1.1 Bioalcohol Resources 60120.2.1.2 Biodiesel Resources 601
20.2.2 Second-Generation Biofuels 60220.2.2.1 Bioalcohol and
Biogas Resources 60220.2.2.2 Biodiesel Recourses 602
20.2.3 Third-Generation BiofuelResources 60720.2.3.1 Bioalcohol Resources 60720.2.3.2 Biodiesel Resources 608
20.3 Processes and Technologies 60920.3.1 Bioethanol 60920.3.2 Biobutanol 61220.3.3 Biodiesel 61320.3.4 Biohydrogen 62120.3.5 Biogas and Biomethane 621
20.4 Intensification and Integration 62220.4.1 ReactioneReaction
Integration 62220.4.2 Reaction-Separation
Integration 62320.4.3 SeparationeSeparation
Integration 62320.4.4 Energy Integration 623
20.5 Economic Perspective 624
References 625
20.1 BIOFUEL PRODUCTION AND GLOBAL SCENARIOS
20.1.1 Historical Background
In contrast to the general perception that biofuels are an emerging class of energy carriers,the history of biofuel production goes back to the sixteenth century, when biogas was first
*This chapter was written with contributions from:Arash Mollahoseini, Biofuel Research Team (BRTeam), Karaj, Iran; Meisam Tabatabaei, Biofuel ResearchTeam (BRTeam), Karaj, Iran and Agricultural Biotechnology Research Institute of Iran (ABRII), Karaj, Iran.
597Biochemical Engineering and Biotechnologyhttp://dx.doi.org/10.1016/B978-0-444-63357-6.00020-1 Copyright © 2015 Elsevier B.V. All rights reserved.
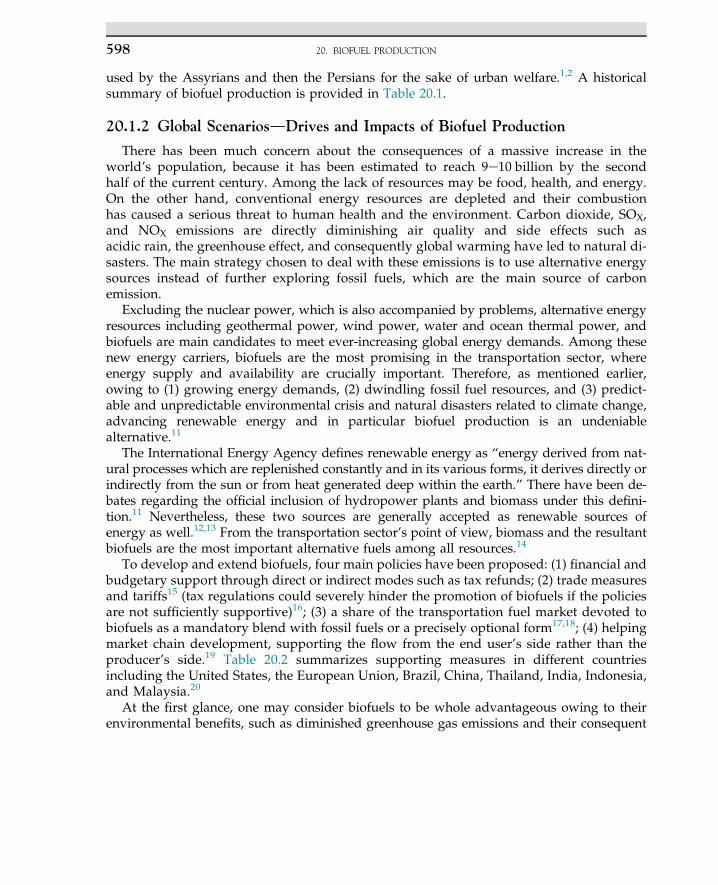
used by the Assyrians and then the Persians for the sake of urban welfare.1,2 A historicalsummary of biofuel production is provided in Table 20.1.
20.1.2 Global ScenariosdDrives and Impacts of Biofuel Production
There has been much concern about the consequences of a massive increase in theworld’s population, because it has been estimated to reach 9e10 billion by the secondhalf of the current century. Among the lack of resources may be food, health, and energy.On the other hand, conventional energy resources are depleted and their combustionhas caused a serious threat to human health and the environment. Carbon dioxide, SOX,and NOX emissions are directly diminishing air quality and side effects such asacidic rain, the greenhouse effect, and consequently global warming have led to natural di-sasters. The main strategy chosen to deal with these emissions is to use alternative energysources instead of further exploring fossil fuels, which are the main source of carbonemission.
Excluding the nuclear power, which is also accompanied by problems, alternative energyresources including geothermal power, wind power, water and ocean thermal power, andbiofuels are main candidates to meet ever-increasing global energy demands. Among thesenew energy carriers, biofuels are the most promising in the transportation sector, whereenergy supply and availability are crucially important. Therefore, as mentioned earlier,owing to (1) growing energy demands, (2) dwindling fossil fuel resources, and (3) predict-able and unpredictable environmental crisis and natural disasters related to climate change,advancing renewable energy and in particular biofuel production is an undeniablealternative.11
The International Energy Agency defines renewable energy as “energy derived from nat-ural processes which are replenished constantly and in its various forms, it derives directly orindirectly from the sun or from heat generated deep within the earth.” There have been de-bates regarding the official inclusion of hydropower plants and biomass under this defini-tion.11 Nevertheless, these two sources are generally accepted as renewable sources ofenergy as well.12,13 From the transportation sector’s point of view, biomass and the resultantbiofuels are the most important alternative fuels among all resources.14
To develop and extend biofuels, four main policies have been proposed: (1) financial andbudgetary support through direct or indirect modes such as tax refunds; (2) trade measuresand tariffs15 (tax regulations could severely hinder the promotion of biofuels if the policiesare not sufficiently supportive)16; (3) a share of the transportation fuel market devoted tobiofuels as a mandatory blend with fossil fuels or a precisely optional form17,18; (4) helpingmarket chain development, supporting the flow from the end user’s side rather than theproducer’s side.19 Table 20.2 summarizes supporting measures in different countriesincluding the United States, the European Union, Brazil, China, Thailand, India, Indonesia,and Malaysia.20
At the first glance, one may consider biofuels to be whole advantageous owing to theirenvironmental benefits, such as diminished greenhouse gas emissions and their consequent
20. BIOFUEL PRODUCTION598
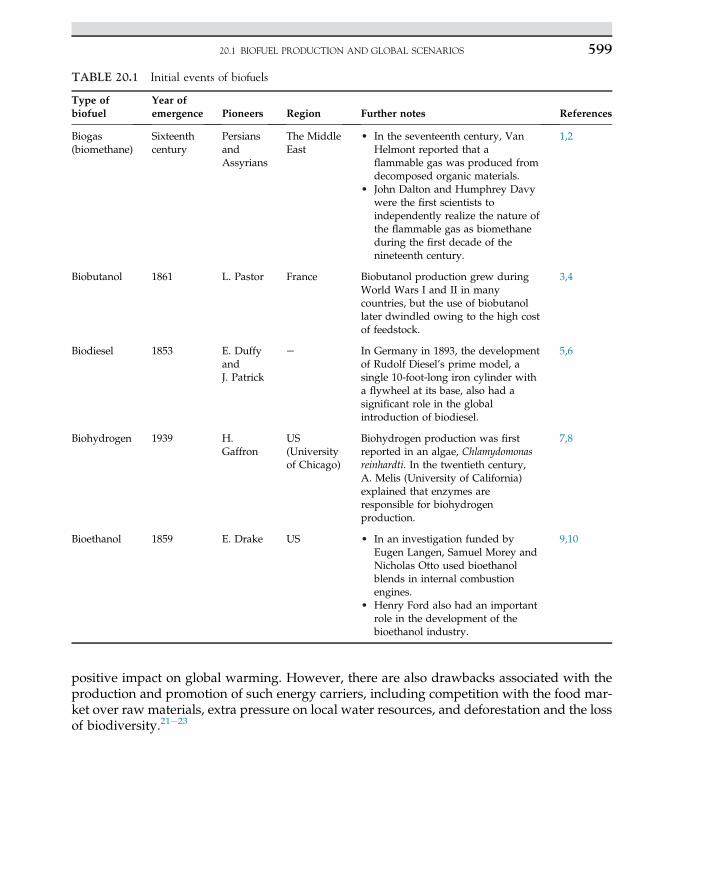
positive impact on global warming. However, there are also drawbacks associated with theproduction and promotion of such energy carriers, including competition with the food mar-ket over raw materials, extra pressure on local water resources, and deforestation and the lossof biodiversity.21e23
TABLE 20.1 Initial events of biofuels
Type ofbiofuel
Year ofemergence Pioneers Region Further notes References
Biogas(biomethane)
Sixteenthcentury
PersiansandAssyrians
The MiddleEast
• In the seventeenth century, VanHelmont reported that aflammable gas was produced fromdecomposed organic materials.
• John Dalton and Humphrey Davywere the first scientists toindependently realize the nature ofthe flammable gas as biomethaneduring the first decade of thenineteenth century.
1,2
Biobutanol 1861 L. Pastor France Biobutanol production grew duringWorld Wars I and II in manycountries, but the use of biobutanollater dwindled owing to the high costof feedstock.
3,4
Biodiesel 1853 E. DuffyandJ. Patrick
e In Germany in 1893, the developmentof Rudolf Diesel’s prime model, asingle 10-foot-long iron cylinder witha flywheel at its base, also had asignificant role in the globalintroduction of biodiesel.
5,6
Biohydrogen 1939 H.Gaffron
US(Universityof Chicago)
Biohydrogen production was firstreported in an algae, Chlamydomonasreinhardti. In the twentieth century,A. Melis (University of California)explained that enzymes areresponsible for biohydrogenproduction.
7,8
Bioethanol 1859 E. Drake US • In an investigation funded byEugen Langen, Samuel Morey andNicholas Otto used bioethanolblends in internal combustionengines.
• Henry Ford also had an importantrole in the development of thebioethanol industry.
9,10
20.1 BIOFUEL PRODUCTION AND GLOBAL SCENARIOS 599
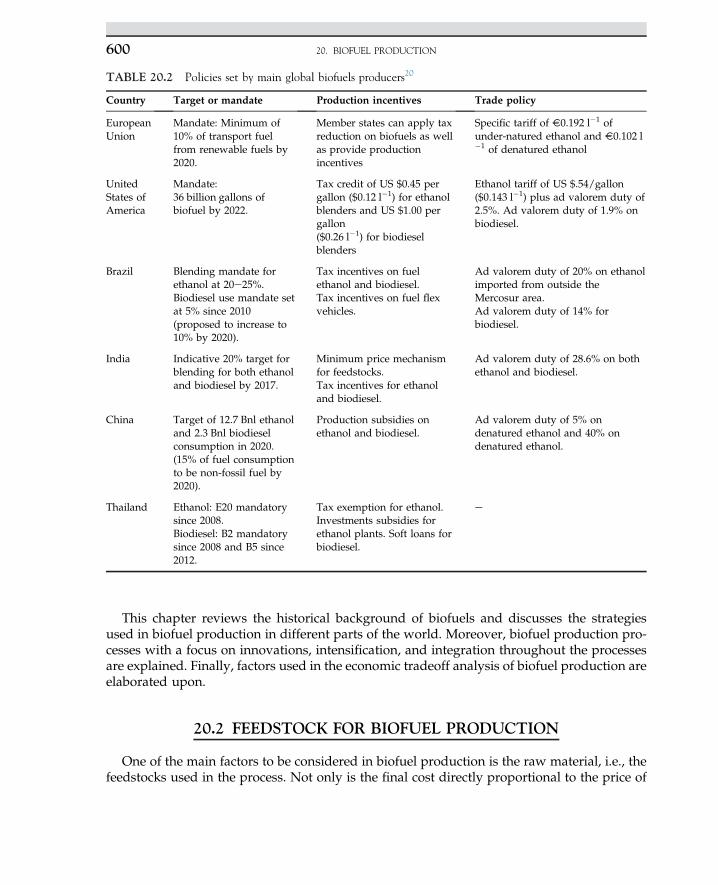
This chapter reviews the historical background of biofuels and discusses the strategiesused in biofuel production in different parts of the world. Moreover, biofuel production pro-cesses with a focus on innovations, intensification, and integration throughout the processesare explained. Finally, factors used in the economic tradeoff analysis of biofuel production areelaborated upon.
20.2 FEEDSTOCK FOR BIOFUEL PRODUCTION
One of the main factors to be considered in biofuel production is the raw material, i.e., thefeedstocks used in the process. Not only is the final cost directly proportional to the price of
TABLE 20.2 Policies set by main global biofuels producers20
Country Target or mandate Production incentives Trade policy
EuropeanUnion
Mandate: Minimum of10% of transport fuelfrom renewable fuels by2020.
Member states can apply taxreduction on biofuels as wellas provide productionincentives
Specific tariff of V0.192 l�1 ofunder-natured ethanol and V0.102 l�1 of denatured ethanol
UnitedStates ofAmerica
Mandate:36 billion gallons ofbiofuel by 2022.
Tax credit of US $0.45 pergallon ($0.12 l�1) for ethanolblenders and US $1.00 pergallon($0.26 l�1) for biodieselblenders
Ethanol tariff of US $.54/gallon($0.143 l�1) plus ad valorem duty of2.5%. Ad valorem duty of 1.9% onbiodiesel.
Brazil Blending mandate forethanol at 20e25%.Biodiesel use mandate setat 5% since 2010(proposed to increase to10% by 2020).
Tax incentives on fuelethanol and biodiesel.Tax incentives on fuel flexvehicles.
Ad valorem duty of 20% on ethanolimported from outside theMercosur area.Ad valorem duty of 14% forbiodiesel.
India Indicative 20% target forblending for both ethanoland biodiesel by 2017.
Minimum price mechanismfor feedstocks.Tax incentives for ethanoland biodiesel.
Ad valorem duty of 28.6% on bothethanol and biodiesel.
China Target of 12.7 Bnl ethanoland 2.3 Bnl biodieselconsumption in 2020.(15% of fuel consumptionto be non-fossil fuel by2020).
Production subsidies onethanol and biodiesel.
Ad valorem duty of 5% ondenatured ethanol and 40% ondenatured ethanol.
Thailand Ethanol: E20 mandatorysince 2008.Biodiesel: B2 mandatorysince 2008 and B5 since2012.
Tax exemption for ethanol.Investments subsidies forethanol plants. Soft loans forbiodiesel.
e
20. BIOFUEL PRODUCTION600
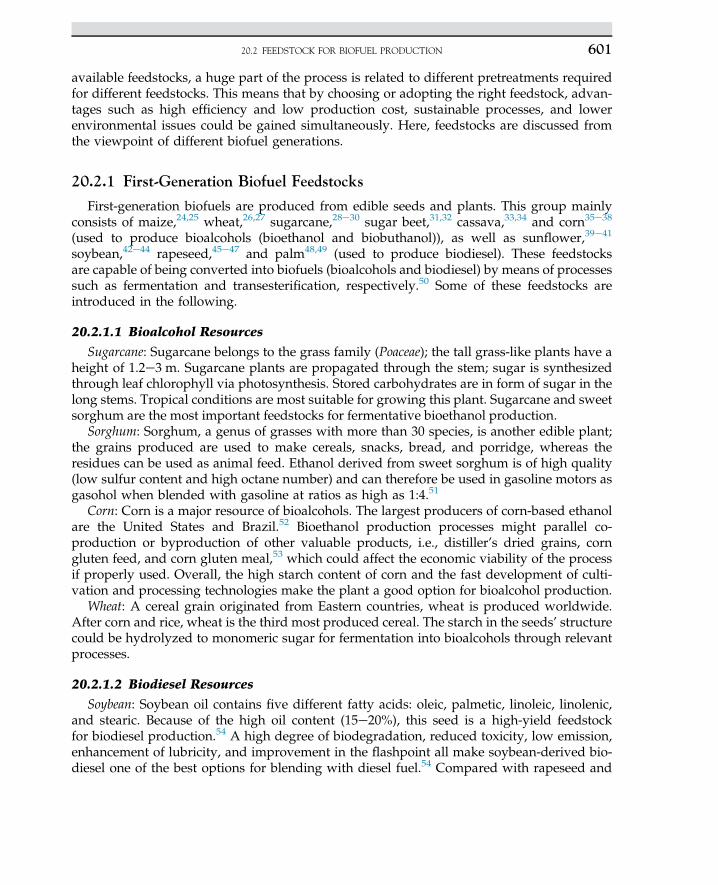
available feedstocks, a huge part of the process is related to different pretreatments requiredfor different feedstocks. This means that by choosing or adopting the right feedstock, advan-tages such as high efficiency and low production cost, sustainable processes, and lowerenvironmental issues could be gained simultaneously. Here, feedstocks are discussed fromthe viewpoint of different biofuel generations.
20.2.1 First-Generation Biofuel Feedstocks
First-generation biofuels are produced from edible seeds and plants. This group mainlyconsists of maize,24,25 wheat,26,27 sugarcane,28e30 sugar beet,31,32 cassava,33,34 and corn35e38
(used to produce bioalcohols (bioethanol and biobuthanol)), as well as sunflower,39e41
soybean,42e44 rapeseed,45e47 and palm48,49 (used to produce biodiesel). These feedstocksare capable of being converted into biofuels (bioalcohols and biodiesel) by means of processessuch as fermentation and transesterification, respectively.50 Some of these feedstocks areintroduced in the following.
20.2.1.1 Bioalcohol Resources
Sugarcane: Sugarcane belongs to the grass family (Poaceae); the tall grass-like plants have aheight of 1.2e3 m. Sugarcane plants are propagated through the stem; sugar is synthesizedthrough leaf chlorophyll via photosynthesis. Stored carbohydrates are in form of sugar in thelong stems. Tropical conditions are most suitable for growing this plant. Sugarcane and sweetsorghum are the most important feedstocks for fermentative bioethanol production.
Sorghum: Sorghum, a genus of grasses with more than 30 species, is another edible plant;the grains produced are used to make cereals, snacks, bread, and porridge, whereas theresidues can be used as animal feed. Ethanol derived from sweet sorghum is of high quality(low sulfur content and high octane number) and can therefore be used in gasoline motors asgasohol when blended with gasoline at ratios as high as 1:4.51
Corn: Corn is a major resource of bioalcohols. The largest producers of corn-based ethanolare the United States and Brazil.52 Bioethanol production processes might parallel co-production or byproduction of other valuable products, i.e., distiller’s dried grains, corngluten feed, and corn gluten meal,53 which could affect the economic viability of the processif properly used. Overall, the high starch content of corn and the fast development of culti-vation and processing technologies make the plant a good option for bioalcohol production.
Wheat: A cereal grain originated from Eastern countries, wheat is produced worldwide.After corn and rice, wheat is the third most produced cereal. The starch in the seeds’ structurecould be hydrolyzed to monomeric sugar for fermentation into bioalcohols through relevantprocesses.
20.2.1.2 Biodiesel Resources
Soybean: Soybean oil contains five different fatty acids: oleic, palmetic, linoleic, linolenic,and stearic. Because of the high oil content (15e20%), this seed is a high-yield feedstockfor biodiesel production.54 A high degree of biodegradation, reduced toxicity, low emission,enhancement of lubricity, and improvement in the flashpoint all make soybean-derived bio-diesel one of the best options for blending with diesel fuel.54 Compared with rapeseed and
20.2 FEEDSTOCK FOR BIOFUEL PRODUCTION 601
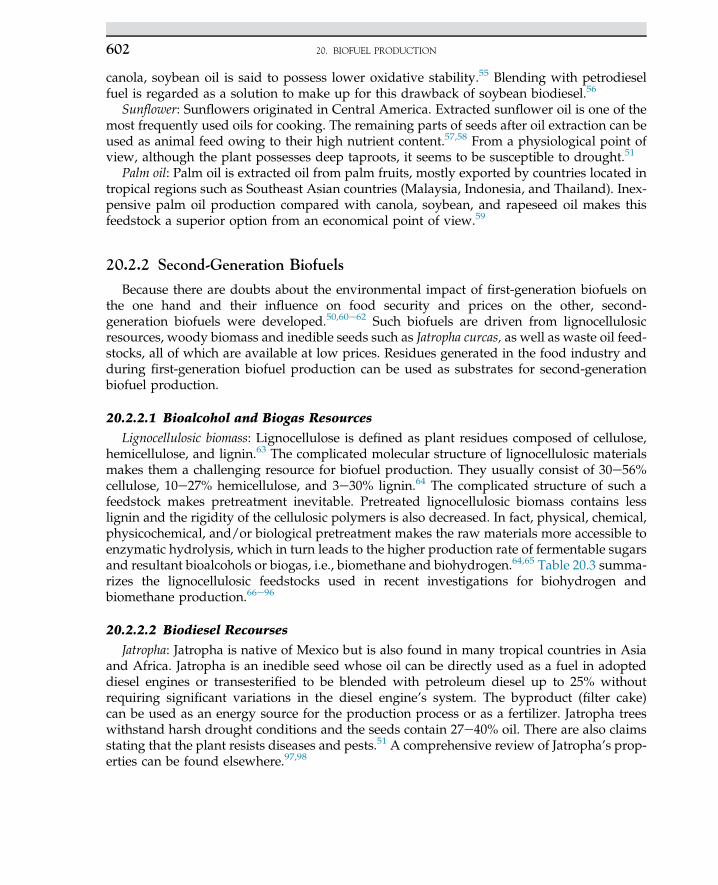
canola, soybean oil is said to possess lower oxidative stability.55 Blending with petrodieselfuel is regarded as a solution to make up for this drawback of soybean biodiesel.56
Sunflower: Sunflowers originated in Central America. Extracted sunflower oil is one of themost frequently used oils for cooking. The remaining parts of seeds after oil extraction can beused as animal feed owing to their high nutrient content.57,58 From a physiological point ofview, although the plant possesses deep taproots, it seems to be susceptible to drought.51
Palm oil: Palm oil is extracted oil from palm fruits, mostly exported by countries located intropical regions such as Southeast Asian countries (Malaysia, Indonesia, and Thailand). Inex-pensive palm oil production compared with canola, soybean, and rapeseed oil makes thisfeedstock a superior option from an economical point of view.59
20.2.2 Second-Generation Biofuels
Because there are doubts about the environmental impact of first-generation biofuels onthe one hand and their influence on food security and prices on the other, second-generation biofuels were developed.50,60e62 Such biofuels are driven from lignocellulosicresources, woody biomass and inedible seeds such as Jatropha curcas, as well as waste oil feed-stocks, all of which are available at low prices. Residues generated in the food industry andduring first-generation biofuel production can be used as substrates for second-generationbiofuel production.
20.2.2.1 Bioalcohol and Biogas Resources
Lignocellulosic biomass: Lignocellulose is defined as plant residues composed of cellulose,hemicellulose, and lignin.63 The complicated molecular structure of lignocellulosic materialsmakes them a challenging resource for biofuel production. They usually consist of 30e56%cellulose, 10e27% hemicellulose, and 3e30% lignin.64 The complicated structure of such afeedstock makes pretreatment inevitable. Pretreated lignocellulosic biomass contains lesslignin and the rigidity of the cellulosic polymers is also decreased. In fact, physical, chemical,physicochemical, and/or biological pretreatment makes the raw materials more accessible toenzymatic hydrolysis, which in turn leads to the higher production rate of fermentable sugarsand resultant bioalcohols or biogas, i.e., biomethane and biohydrogen.64,65 Table 20.3 summa-rizes the lignocellulosic feedstocks used in recent investigations for biohydrogen andbiomethane production.66e96
20.2.2.2 Biodiesel Recourses
Jatropha: Jatropha is native of Mexico but is also found in many tropical countries in Asiaand Africa. Jatropha is an inedible seed whose oil can be directly used as a fuel in adopteddiesel engines or transesterified to be blended with petroleum diesel up to 25% withoutrequiring significant variations in the diesel engine’s system. The byproduct (filter cake)can be used as an energy source for the production process or as a fertilizer. Jatropha treeswithstand harsh drought conditions and the seeds contain 27e40% oil. There are also claimsstating that the plant resists diseases and pests.51 A comprehensive review of Jatropha’s prop-erties can be found elsewhere.97,98
20. BIOFUEL PRODUCTION602
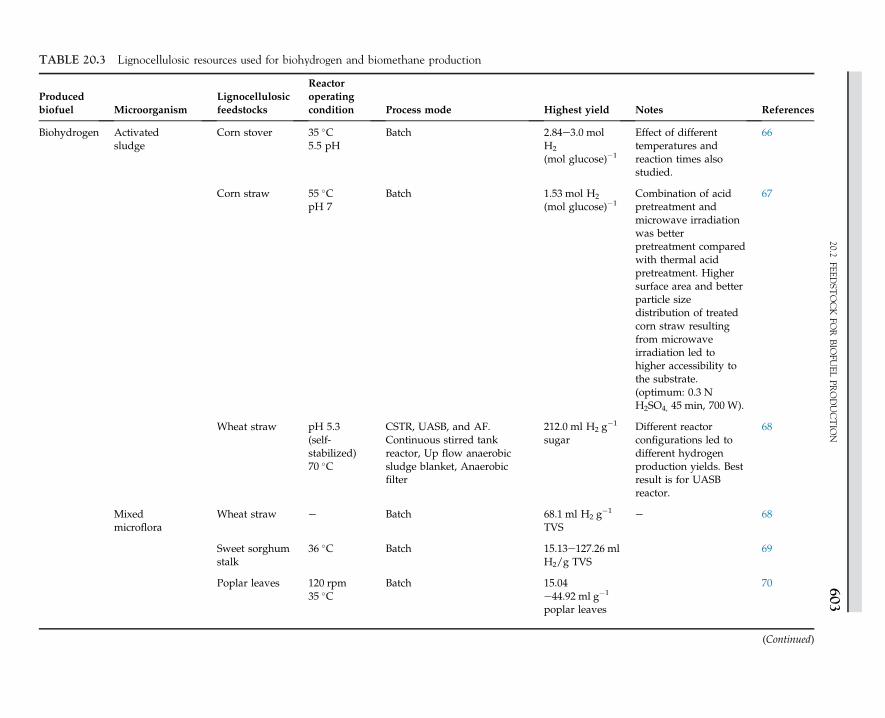
TABLE 20.3 Lignocellulosic resources used for biohydrogen and biomethane production
Producedbiofuel Microorganism
Lignocellulosicfeedstocks
Reactoroperatingcondition Process mode Highest yield Notes References
Biohydrogen Activatedsludge
Corn stover 35 �C5.5 pH
Batch 2.84e3.0 molH2
(mol glucose)�1
Effect of differenttemperatures andreaction times alsostudied.
66
Corn straw 55 �CpH 7
Batch 1.53 mol H2
(mol glucose)�1Combination of acidpretreatment andmicrowave irradiationwas betterpretreatment comparedwith thermal acidpretreatment. Highersurface area and betterparticle sizedistribution of treatedcorn straw resultingfrom microwaveirradiation led tohigher accessibility tothe substrate.(optimum: 0.3 NH2SO4, 45 min, 700 W).
67
Wheat straw pH 5.3(self-stabilized)70 �C
CSTR, UASB, and AF.Continuous stirred tankreactor, Up flow anaerobicsludge blanket, Anaerobicfilter
212.0 ml H2 g�1
sugarDifferent reactorconfigurations led todifferent hydrogenproduction yields. Bestresult is for UASBreactor.
68
Mixedmicroflora
Wheat straw e Batch 68.1 ml H2 g�1
TVSe 68
Sweet sorghumstalk
36 �C Batch 15.13e127.26 mlH2/g TVS
69
Poplar leaves 120 rpm35 �C
Batch 15.04e44.92 ml g�1
poplar leaves
70
(Continued)
20.2FEED
STOCKFO
RBIO
FUEL
PRODUCTIO
N603
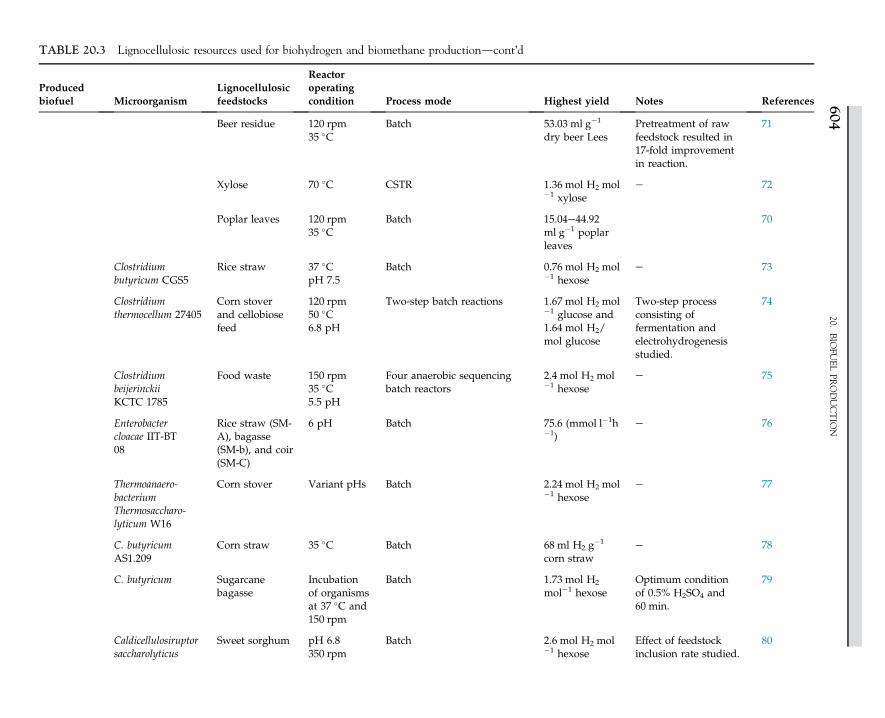
TABLE 20.3 Lignocellulosic resources used for biohydrogen and biomethane productiondcont’d
Producedbiofuel Microorganism
Lignocellulosicfeedstocks
Reactoroperatingcondition Process mode Highest yield Notes References
Beer residue 120 rpm35 �C
Batch 53.03 ml g�1
dry beer LeesPretreatment of rawfeedstock resulted in17-fold improvementin reaction.
71
Xylose 70 �C CSTR 1.36 mol H2 mol�1 xylose
e 72
Poplar leaves 120 rpm35 �C
Batch 15.04e44.92ml g�1 poplarleaves
70
Clostridiumbutyricum CGS5
Rice straw 37 �CpH 7.5
Batch 0.76 mol H2 mol�1 hexose
e 73
Clostridiumthermocellum 27405
Corn stoverand cellobiosefeed
120 rpm50 �C6.8 pH
Two-step batch reactions 1.67 mol H2 mol�1 glucose and1.64 mol H2/mol glucose
Two-step processconsisting offermentation andelectrohydrogenesisstudied.
74
ClostridiumbeijerinckiiKCTC 1785
Food waste 150 rpm35 �C5.5 pH
Four anaerobic sequencingbatch reactors
2.4 mol H2 mol�1 hexose
e 75
Enterobactercloacae IIT-BT08
Rice straw (SM-A), bagasse(SM-b), and coir(SM-C)
6 pH Batch 75.6 (mmol l�1h�1)
e 76
Thermoanaero-bacteriumThermosaccharo-lyticum W16
Corn stover Variant pHs Batch 2.24 mol H2 mol�1 hexose
e 77
C. butyricumAS1.209
Corn straw 35 �C Batch 68 ml H2 g�1
corn strawe 78
C. butyricum Sugarcanebagasse
Incubationof organismsat 37 �C and150 rpm
Batch 1.73 mol H2
mol�1 hexoseOptimum conditionof 0.5% H2SO4 and60 min.
79
Caldicellulosiruptorsaccharolyticus
Sweet sorghum pH 6.8350 rpm
Batch 2.6 mol H2 mol�1 hexose
Effect of feedstockinclusion rate studied.
80
20.BIO
FUEL
PRODUCTIO
N604
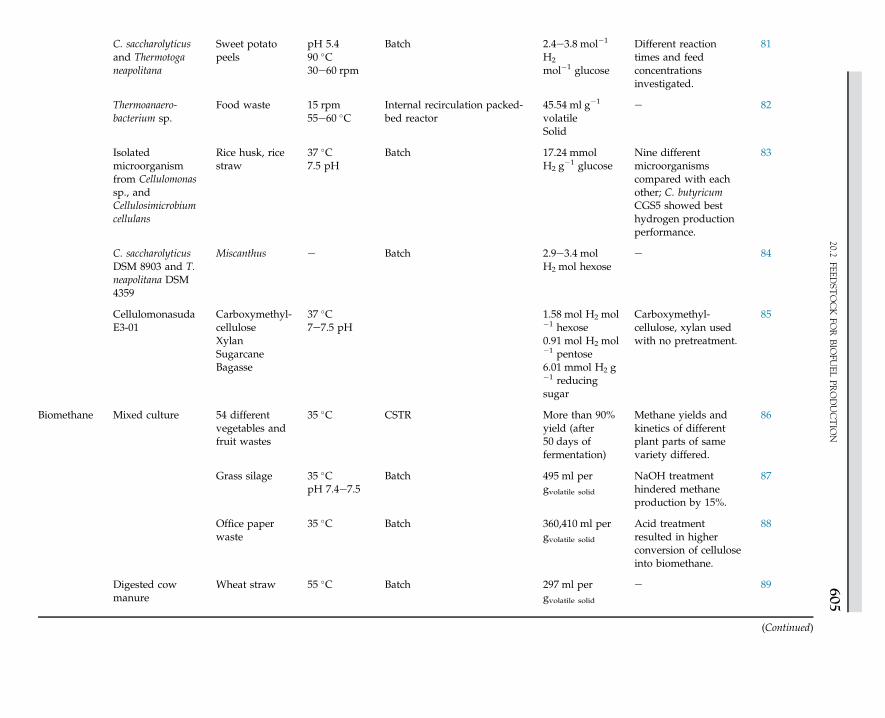
C. saccharolyticusand Thermotoganeapolitana
Sweet potatopeels
pH 5.490 �C30e60 rpm
Batch 2.4e3.8 mol�1
H2
mol�1 glucose
Different reactiontimes and feedconcentrationsinvestigated.
81
Thermoanaero-bacterium sp.
Food waste 15 rpm55e60 �C
Internal recirculation packed-bed reactor
45.54 ml g�1
volatileSolid
e 82
Isolatedmicroorganismfrom Cellulomonassp., andCellulosimicrobiumcellulans
Rice husk, ricestraw
37 �C7.5 pH
Batch 17.24 mmolH2 g
�1 glucoseNine differentmicroorganismscompared with eachother; C. butyricumCGS5 showed besthydrogen productionperformance.
83
C. saccharolyticusDSM 8903 and T.neapolitana DSM4359
Miscanthus e Batch 2.9e3.4 molH2 mol hexose
e 84
CellulomonasudaE3-01
Carboxymethyl-celluloseXylanSugarcaneBagasse
37 �C7e7.5 pH
1.58 mol H2 mol�1 hexose0.91 mol H2 mol�1 pentose6.01 mmol H2 g�1 reducingsugar
Carboxymethyl-cellulose, xylan usedwith no pretreatment.
85
Biomethane Mixed culture 54 differentvegetables andfruit wastes
35 �C CSTR More than 90%yield (after50 days offermentation)
Methane yields andkinetics of differentplant parts of samevariety differed.
86
Grass silage 35 �CpH 7.4e7.5
Batch 495 ml pergvolatile solid
NaOH treatmenthindered methaneproduction by 15%.
87
Office paperwaste
35 �C Batch 360,410 ml pergvolatile solid
Acid treatmentresulted in higherconversion of celluloseinto biomethane.
88
Digested cowmanure
Wheat straw 55 �C Batch 297 ml pergvolatile solid
e 89
(Continued)
20.2FEED
STOCKFO
RBIO
FUEL
PRODUCTIO
N605
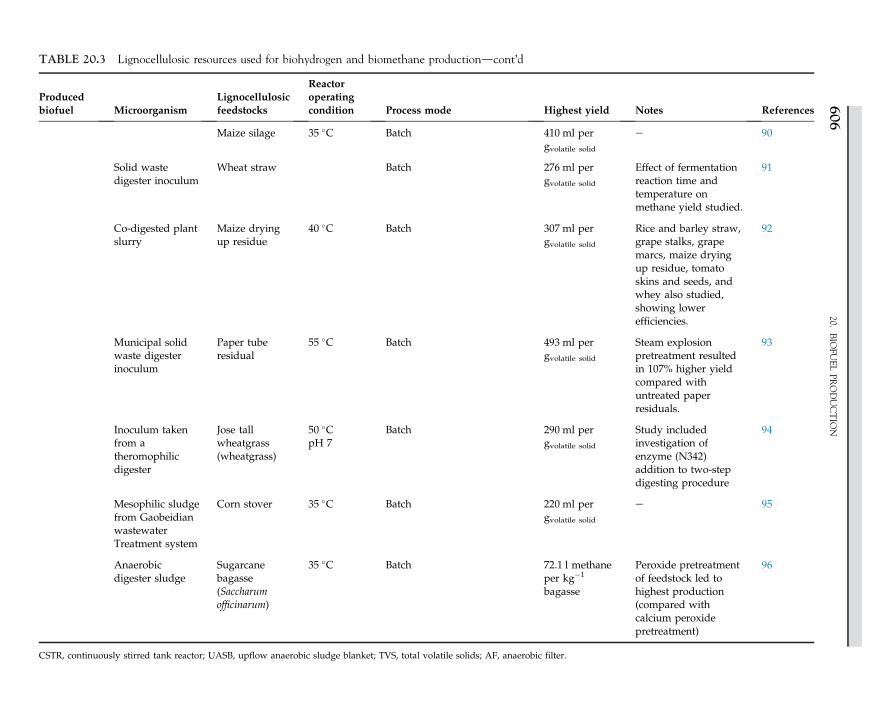
TABLE 20.3 Lignocellulosic resources used for biohydrogen and biomethane productiondcont’d
Producedbiofuel Microorganism
Lignocellulosicfeedstocks
Reactoroperatingcondition Process mode Highest yield Notes References
Maize silage 35 �C Batch 410 ml pergvolatile solid
e 90
Solid wastedigester inoculum
Wheat straw Batch 276 ml pergvolatile solid
Effect of fermentationreaction time andtemperature onmethane yield studied.
91
Co-digested plantslurry
Maize dryingup residue
40 �C Batch 307 ml pergvolatile solid
Rice and barley straw,grape stalks, grapemarcs, maize dryingup residue, tomatoskins and seeds, andwhey also studied,showing lowerefficiencies.
92
Municipal solidwaste digesterinoculum
Paper tuberesidual
55 �C Batch 493 ml pergvolatile solid
Steam explosionpretreatment resultedin 107% higher yieldcompared withuntreated paperresiduals.
93
Inoculum takenfrom atheromophilicdigester
Jose tallwheatgrass(wheatgrass)
50 �CpH 7
Batch 290 ml pergvolatile solid
Study includedinvestigation ofenzyme (N342)addition to two-stepdigesting procedure
94
Mesophilic sludgefrom GaobeidianwastewaterTreatment system
Corn stover 35 �C Batch 220 ml pergvolatile solid
e 95
Anaerobicdigester sludge
Sugarcanebagasse(Saccharumofficinarum)
35 �C Batch 72.1 l methaneper kg�1
bagasse
Peroxide pretreatmentof feedstock led tohighest production(compared withcalcium peroxidepretreatment)
96
CSTR, continuously stirred tank reactor; UASB, upflow anaerobic sludge blanket; TVS, total volatile solids; AF, anaerobic filter.
20.BIO
FUEL
PRODUCTIO
N606
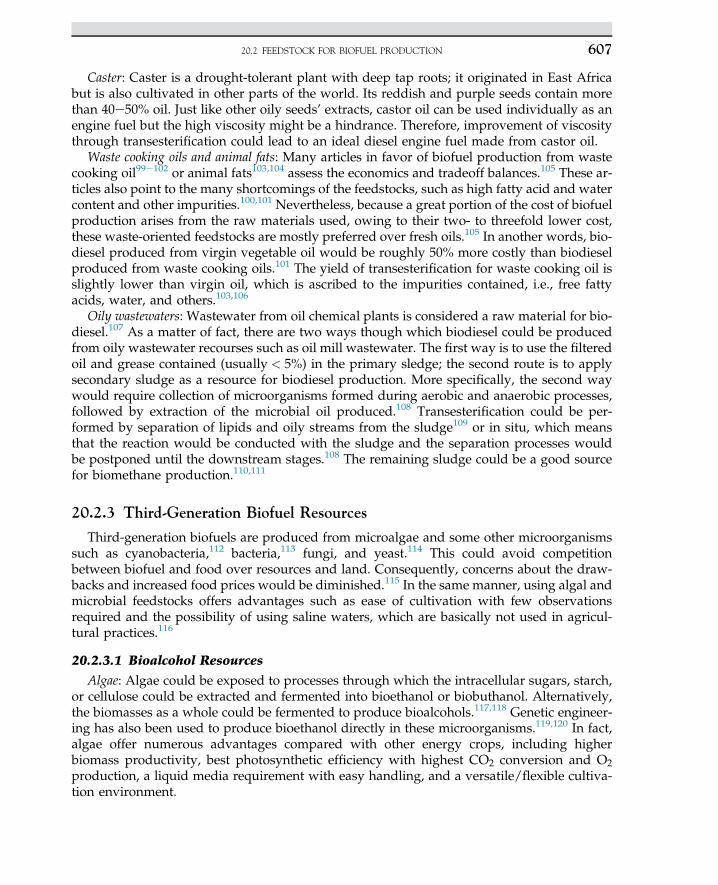
Caster: Caster is a drought-tolerant plant with deep tap roots; it originated in East Africabut is also cultivated in other parts of the world. Its reddish and purple seeds contain morethan 40e50% oil. Just like other oily seeds’ extracts, castor oil can be used individually as anengine fuel but the high viscosity might be a hindrance. Therefore, improvement of viscositythrough transesterification could lead to an ideal diesel engine fuel made from castor oil.
Waste cooking oils and animal fats: Many articles in favor of biofuel production from wastecooking oil99e102 or animal fats103,104 assess the economics and tradeoff balances.105 These ar-ticles also point to the many shortcomings of the feedstocks, such as high fatty acid and watercontent and other impurities.100,101 Nevertheless, because a great portion of the cost of biofuelproduction arises from the raw materials used, owing to their two- to threefold lower cost,these waste-oriented feedstocks are mostly preferred over fresh oils.105 In another words, bio-diesel produced from virgin vegetable oil would be roughly 50% more costly than biodieselproduced from waste cooking oils.101 The yield of transesterification for waste cooking oil isslightly lower than virgin oil, which is ascribed to the impurities contained, i.e., free fattyacids, water, and others.103,106
Oily wastewaters: Wastewater from oil chemical plants is considered a raw material for bio-diesel.107 As a matter of fact, there are two ways though which biodiesel could be producedfrom oily wastewater recourses such as oil mill wastewater. The first way is to use the filteredoil and grease contained (usually < 5%) in the primary sledge; the second route is to applysecondary sludge as a resource for biodiesel production. More specifically, the second waywould require collection of microorganisms formed during aerobic and anaerobic processes,followed by extraction of the microbial oil produced.108 Transesterification could be per-formed by separation of lipids and oily streams from the sludge109 or in situ, which meansthat the reaction would be conducted with the sludge and the separation processes wouldbe postponed until the downstream stages.108 The remaining sludge could be a good sourcefor biomethane production.110,111
20.2.3 Third-Generation Biofuel Resources
Third-generation biofuels are produced from microalgae and some other microorganismssuch as cyanobacteria,112 bacteria,113 fungi, and yeast.114 This could avoid competitionbetween biofuel and food over resources and land. Consequently, concerns about the draw-backs and increased food prices would be diminished.115 In the same manner, using algal andmicrobial feedstocks offers advantages such as ease of cultivation with few observationsrequired and the possibility of using saline waters, which are basically not used in agricul-tural practices.116
20.2.3.1 Bioalcohol Resources
Algae: Algae could be exposed to processes through which the intracellular sugars, starch,or cellulose could be extracted and fermented into bioethanol or biobuthanol. Alternatively,the biomasses as a whole could be fermented to produce bioalcohols.117,118 Genetic engineer-ing has also been used to produce bioethanol directly in these microorganisms.119,120 In fact,algae offer numerous advantages compared with other energy crops, including higherbiomass productivity, best photosynthetic efficiency with highest CO2 conversion and O2production, a liquid media requirement with easy handling, and a versatile/flexible cultiva-tion environment.
20.2 FEEDSTOCK FOR BIOFUEL PRODUCTION 607
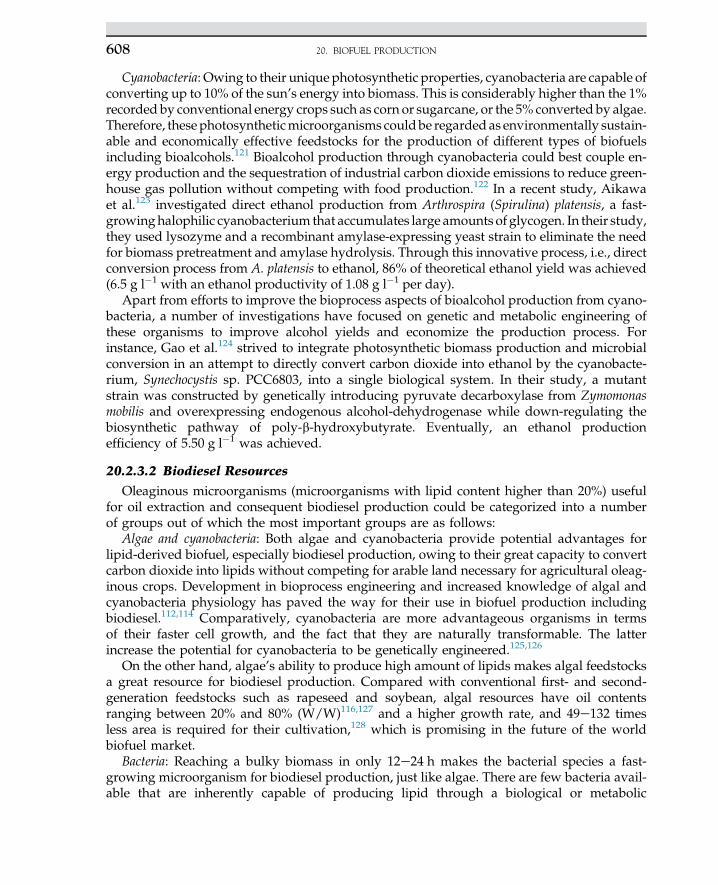
Cyanobacteria: Owing to their unique photosynthetic properties, cyanobacteria are capable ofconverting up to 10% of the sun’s energy into biomass. This is considerably higher than the 1%recorded by conventional energy crops such as corn or sugarcane, or the 5% converted by algae.Therefore, these photosyntheticmicroorganisms couldbe regarded as environmentally sustain-able and economically effective feedstocks for the production of different types of biofuelsincluding bioalcohols.121 Bioalcohol production through cyanobacteria could best couple en-ergy production and the sequestration of industrial carbon dioxide emissions to reduce green-house gas pollution without competing with food production.122 In a recent study, Aikawaet al.123 investigated direct ethanol production from Arthrospira (Spirulina) platensis, a fast-growinghalophilic cyanobacterium that accumulates large amounts of glycogen. In their study,they used lysozyme and a recombinant amylase-expressing yeast strain to eliminate the needfor biomass pretreatment and amylase hydrolysis. Through this innovative process, i.e., directconversion process from A. platensis to ethanol, 86% of theoretical ethanol yield was achieved(6.5 g l�1 with an ethanol productivity of 1.08 g l�1 per day).
Apart from efforts to improve the bioprocess aspects of bioalcohol production from cyano-bacteria, a number of investigations have focused on genetic and metabolic engineering ofthese organisms to improve alcohol yields and economize the production process. Forinstance, Gao et al.124 strived to integrate photosynthetic biomass production and microbialconversion in an attempt to directly convert carbon dioxide into ethanol by the cyanobacte-rium, Synechocystis sp. PCC6803, into a single biological system. In their study, a mutantstrain was constructed by genetically introducing pyruvate decarboxylase from Zymomonasmobilis and overexpressing endogenous alcohol-dehydrogenase while down-regulating thebiosynthetic pathway of poly-b-hydroxybutyrate. Eventually, an ethanol productionefficiency of 5.50 g l�1 was achieved.
20.2.3.2 Biodiesel Resources
Oleaginous microorganisms (microorganisms with lipid content higher than 20%) usefulfor oil extraction and consequent biodiesel production could be categorized into a numberof groups out of which the most important groups are as follows:
Algae and cyanobacteria: Both algae and cyanobacteria provide potential advantages forlipid-derived biofuel, especially biodiesel production, owing to their great capacity to convertcarbon dioxide into lipids without competing for arable land necessary for agricultural oleag-inous crops. Development in bioprocess engineering and increased knowledge of algal andcyanobacteria physiology has paved the way for their use in biofuel production includingbiodiesel.112,114 Comparatively, cyanobacteria are more advantageous organisms in termsof their faster cell growth, and the fact that they are naturally transformable. The latterincrease the potential for cyanobacteria to be genetically engineered.125,126
On the other hand, algae’s ability to produce high amount of lipids makes algal feedstocksa great resource for biodiesel production. Compared with conventional first- and second-generation feedstocks such as rapeseed and soybean, algal resources have oil contentsranging between 20% and 80% (W/W)116,127 and a higher growth rate, and 49e132 timesless area is required for their cultivation,128 which is promising in the future of the worldbiofuel market.
Bacteria: Reaching a bulky biomass in only 12e24 h makes the bacterial species a fast-growing microorganism for biodiesel production, just like algae. There are few bacteria avail-able that are inherently capable of producing lipid through a biological or metabolic
20. BIOFUEL PRODUCTION608
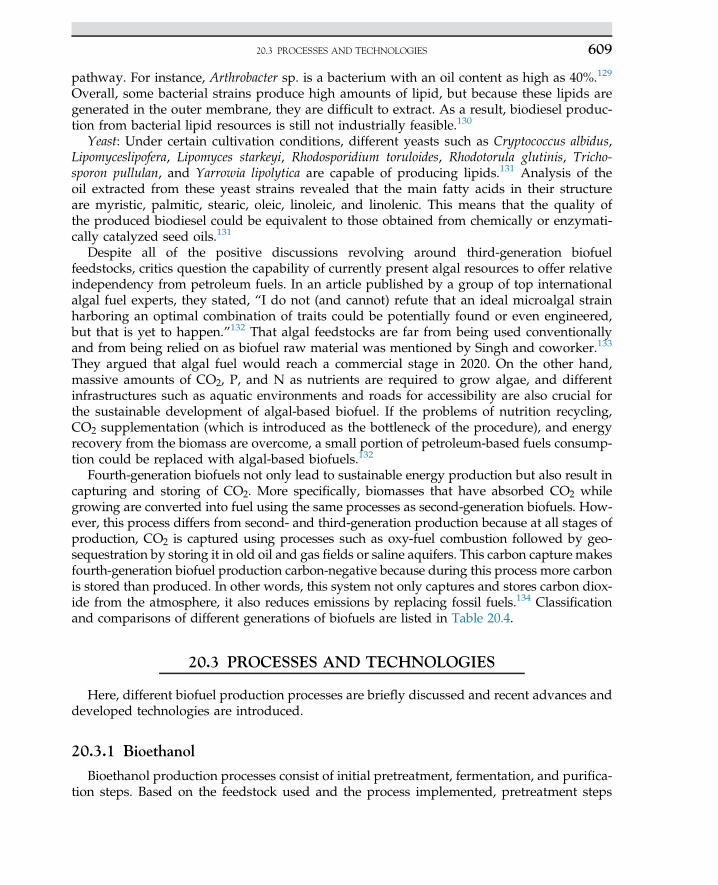
pathway. For instance, Arthrobacter sp. is a bacterium with an oil content as high as 40%.129
Overall, some bacterial strains produce high amounts of lipid, but because these lipids aregenerated in the outer membrane, they are difficult to extract. As a result, biodiesel produc-tion from bacterial lipid resources is still not industrially feasible.130
Yeast: Under certain cultivation conditions, different yeasts such as Cryptococcus albidus,Lipomyceslipofera, Lipomyces starkeyi, Rhodosporidium toruloides, Rhodotorula glutinis, Tricho-sporon pullulan, and Yarrowia lipolytica are capable of producing lipids.131 Analysis of theoil extracted from these yeast strains revealed that the main fatty acids in their structureare myristic, palmitic, stearic, oleic, linoleic, and linolenic. This means that the quality ofthe produced biodiesel could be equivalent to those obtained from chemically or enzymati-cally catalyzed seed oils.131
Despite all of the positive discussions revolving around third-generation biofuelfeedstocks, critics question the capability of currently present algal resources to offer relativeindependency from petroleum fuels. In an article published by a group of top internationalalgal fuel experts, they stated, “I do not (and cannot) refute that an ideal microalgal strainharboring an optimal combination of traits could be potentially found or even engineered,but that is yet to happen.”132 That algal feedstocks are far from being used conventionallyand from being relied on as biofuel raw material was mentioned by Singh and coworker.133
They argued that algal fuel would reach a commercial stage in 2020. On the other hand,massive amounts of CO2, P, and N as nutrients are required to grow algae, and differentinfrastructures such as aquatic environments and roads for accessibility are also crucial forthe sustainable development of algal-based biofuel. If the problems of nutrition recycling,CO2 supplementation (which is introduced as the bottleneck of the procedure), and energyrecovery from the biomass are overcome, a small portion of petroleum-based fuels consump-tion could be replaced with algal-based biofuels.132
Fourth-generation biofuels not only lead to sustainable energy production but also result incapturing and storing of CO2. More specifically, biomasses that have absorbed CO2 whilegrowing are converted into fuel using the same processes as second-generation biofuels. How-ever, this process differs from second- and third-generation production because at all stages ofproduction, CO2 is captured using processes such as oxy-fuel combustion followed by geo-sequestration by storing it in old oil and gas fields or saline aquifers. This carbon capture makesfourth-generation biofuel production carbon-negative because during this process more carbonis stored than produced. In other words, this system not only captures and stores carbon diox-ide from the atmosphere, it also reduces emissions by replacing fossil fuels.134 Classificationand comparisons of different generations of biofuels are listed in Table 20.4.
20.3 PROCESSES AND TECHNOLOGIES
Here, different biofuel production processes are briefly discussed and recent advances anddeveloped technologies are introduced.
20.3.1 Bioethanol
Bioethanol production processes consist of initial pretreatment, fermentation, and purifica-tion steps. Based on the feedstock used and the process implemented, pretreatment steps
20.3 PROCESSES AND TECHNOLOGIES 609
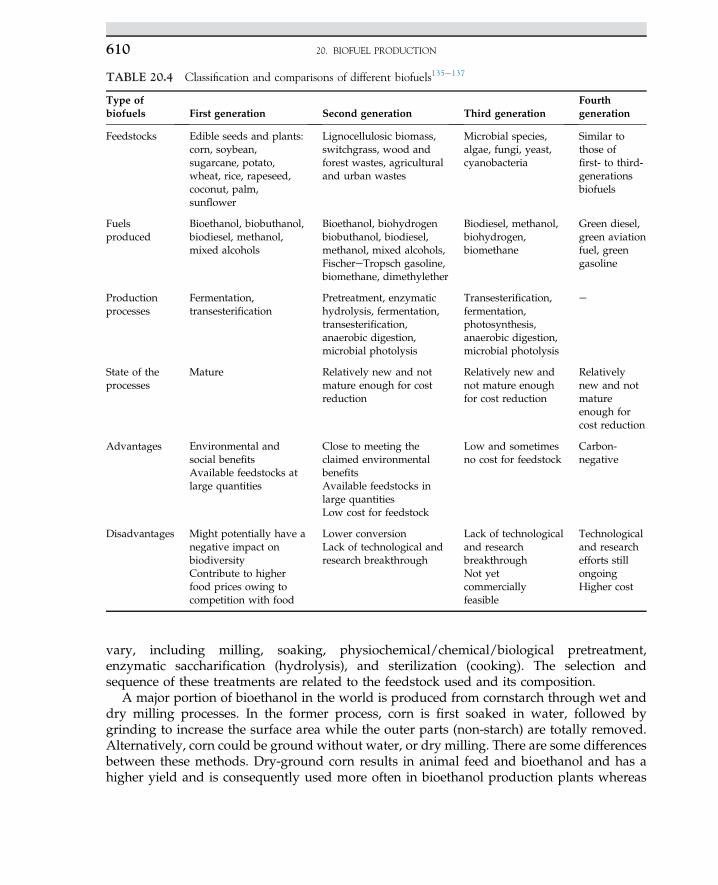
vary, including milling, soaking, physiochemical/chemical/biological pretreatment,enzymatic saccharification (hydrolysis), and sterilization (cooking). The selection andsequence of these treatments are related to the feedstock used and its composition.
A major portion of bioethanol in the world is produced from cornstarch through wet anddry milling processes. In the former process, corn is first soaked in water, followed bygrinding to increase the surface area while the outer parts (non-starch) are totally removed.Alternatively, corn could be ground without water, or dry milling. There are some differencesbetween these methods. Dry-ground corn results in animal feed and bioethanol and has ahigher yield and is consequently used more often in bioethanol production plants whereas
TABLE 20.4 Classification and comparisons of different biofuels135e137
Type ofbiofuels First generation Second generation Third generation
Fourthgeneration
Feedstocks Edible seeds and plants:corn, soybean,sugarcane, potato,wheat, rice, rapeseed,coconut, palm,sunflower
Lignocellulosic biomass,switchgrass, wood andforest wastes, agriculturaland urban wastes
Microbial species,algae, fungi, yeast,cyanobacteria
Similar tothose offirst- to third-generationsbiofuels
Fuelsproduced
Bioethanol, biobuthanol,biodiesel, methanol,mixed alcohols
Bioethanol, biohydrogenbiobuthanol, biodiesel,methanol, mixed alcohols,FischereTropsch gasoline,biomethane, dimethylether
Biodiesel, methanol,biohydrogen,biomethane
Green diesel,green aviationfuel, greengasoline
Productionprocesses
Fermentation,transesterification
Pretreatment, enzymatichydrolysis, fermentation,transesterification,anaerobic digestion,microbial photolysis
Transesterification,fermentation,photosynthesis,anaerobic digestion,microbial photolysis
e
State of theprocesses
Mature Relatively new and notmature enough for costreduction
Relatively new andnot mature enoughfor cost reduction
Relativelynew and notmatureenough forcost reduction
Advantages Environmental andsocial benefitsAvailable feedstocks atlarge quantities
Close to meeting theclaimed environmentalbenefitsAvailable feedstocks inlarge quantitiesLow cost for feedstock
Low and sometimesno cost for feedstock
Carbon-negative
Disadvantages Might potentially have anegative impact onbiodiversityContribute to higherfood prices owing tocompetition with food
Lower conversionLack of technological andresearch breakthrough
Lack of technologicaland researchbreakthroughNot yetcommerciallyfeasible
Technologicaland researchefforts stillongoingHigher cost
20. BIOFUEL PRODUCTION610
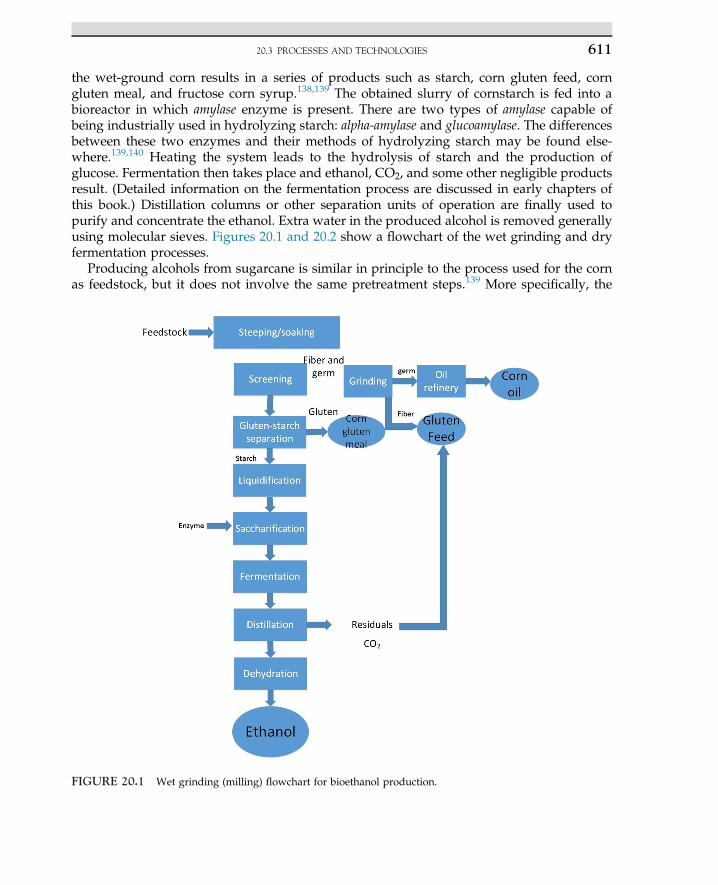
the wet-ground corn results in a series of products such as starch, corn gluten feed, corngluten meal, and fructose corn syrup.138,139 The obtained slurry of cornstarch is fed into abioreactor in which amylase enzyme is present. There are two types of amylase capable ofbeing industrially used in hydrolyzing starch: alpha-amylase and glucoamylase. The differencesbetween these two enzymes and their methods of hydrolyzing starch may be found else-where.139,140 Heating the system leads to the hydrolysis of starch and the production ofglucose. Fermentation then takes place and ethanol, CO2, and some other negligible productsresult. (Detailed information on the fermentation process are discussed in early chapters ofthis book.) Distillation columns or other separation units of operation are finally used topurify and concentrate the ethanol. Extra water in the produced alcohol is removed generallyusing molecular sieves. Figures 20.1 and 20.2 show a flowchart of the wet grinding and dryfermentation processes.
Producing alcohols from sugarcane is similar in principle to the process used for the cornas feedstock, but it does not involve the same pretreatment steps.139 More specifically, the
FIGURE 20.1 Wet grinding (milling) flowchart for bioethanol production.
20.3 PROCESSES AND TECHNOLOGIES 611
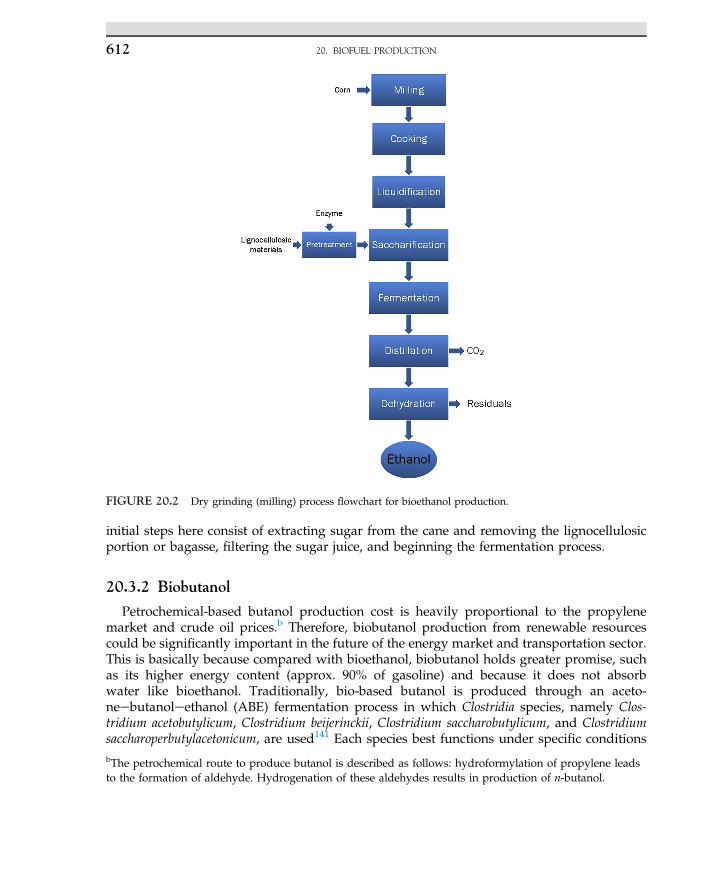
initial steps here consist of extracting sugar from the cane and removing the lignocellulosicportion or bagasse, filtering the sugar juice, and beginning the fermentation process.
20.3.2 Biobutanol
Petrochemical-based butanol production cost is heavily proportional to the propylenemarket and crude oil prices.b Therefore, biobutanol production from renewable resourcescould be significantly important in the future of the energy market and transportation sector.This is basically because compared with bioethanol, biobutanol holds greater promise, suchas its higher energy content (approx. 90% of gasoline) and because it does not absorbwater like bioethanol. Traditionally, bio-based butanol is produced through an aceto-neebutanoleethanol (ABE) fermentation process in which Clostridia species, namely Clos-tridium acetobutylicum, Clostridium beijerinckii, Clostridium saccharobutylicum, and Clostridiumsaccharoperbutylacetonicum, are used141 Each species best functions under specific conditions
FIGURE 20.2 Dry grinding (milling) process flowchart for bioethanol production.
bThe petrochemical route to produce butanol is described as follows: hydroformylation of propylene leadsto the formation of aldehyde. Hydrogenation of these aldehydes results in production of n-butanol.
20. BIOFUEL PRODUCTION612
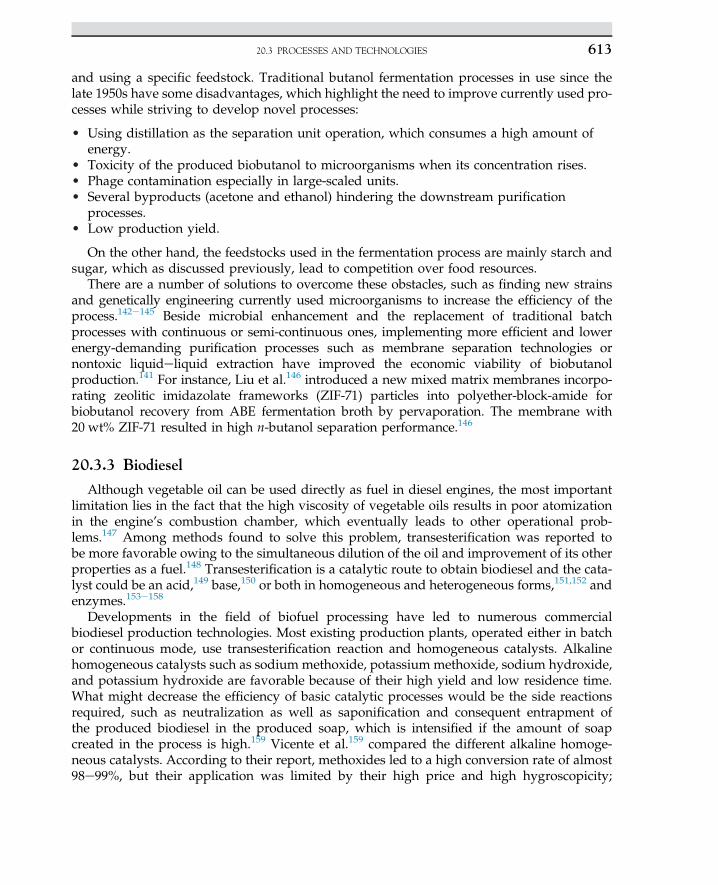
and using a specific feedstock. Traditional butanol fermentation processes in use since thelate 1950s have some disadvantages, which highlight the need to improve currently used pro-cesses while striving to develop novel processes:
• Using distillation as the separation unit operation, which consumes a high amount ofenergy.
• Toxicity of the produced biobutanol to microorganisms when its concentration rises.• Phage contamination especially in large-scaled units.• Several byproducts (acetone and ethanol) hindering the downstream purification
processes.• Low production yield.
On the other hand, the feedstocks used in the fermentation process are mainly starch andsugar, which as discussed previously, lead to competition over food resources.
There are a number of solutions to overcome these obstacles, such as finding new strainsand genetically engineering currently used microorganisms to increase the efficiency of theprocess.142e145 Beside microbial enhancement and the replacement of traditional batchprocesses with continuous or semi-continuous ones, implementing more efficient and lowerenergy-demanding purification processes such as membrane separation technologies ornontoxic liquideliquid extraction have improved the economic viability of biobutanolproduction.141 For instance, Liu et al.146 introduced a new mixed matrix membranes incorpo-rating zeolitic imidazolate frameworks (ZIF-71) particles into polyether-block-amide forbiobutanol recovery from ABE fermentation broth by pervaporation. The membrane with20 wt% ZIF-71 resulted in high n-butanol separation performance.146
20.3.3 Biodiesel
Although vegetable oil can be used directly as fuel in diesel engines, the most importantlimitation lies in the fact that the high viscosity of vegetable oils results in poor atomizationin the engine’s combustion chamber, which eventually leads to other operational prob-lems.147 Among methods found to solve this problem, transesterification was reported tobe more favorable owing to the simultaneous dilution of the oil and improvement of its otherproperties as a fuel.148 Transesterification is a catalytic route to obtain biodiesel and the cata-lyst could be an acid,149 base,150 or both in homogeneous and heterogeneous forms,151,152 andenzymes.153e158
Developments in the field of biofuel processing have led to numerous commercialbiodiesel production technologies. Most existing production plants, operated either in batchor continuous mode, use transesterification reaction and homogeneous catalysts. Alkalinehomogeneous catalysts such as sodium methoxide, potassium methoxide, sodium hydroxide,and potassium hydroxide are favorable because of their high yield and low residence time.What might decrease the efficiency of basic catalytic processes would be the side reactionsrequired, such as neutralization as well as saponification and consequent entrapment ofthe produced biodiesel in the produced soap, which is intensified if the amount of soapcreated in the process is high.159 Vicente et al.159 compared the different alkaline homoge-neous catalysts. According to their report, methoxides led to a high conversion rate of almost98e99%, but their application was limited by their high price and high hygroscopicity;
20.3 PROCESSES AND TECHNOLOGIES 613
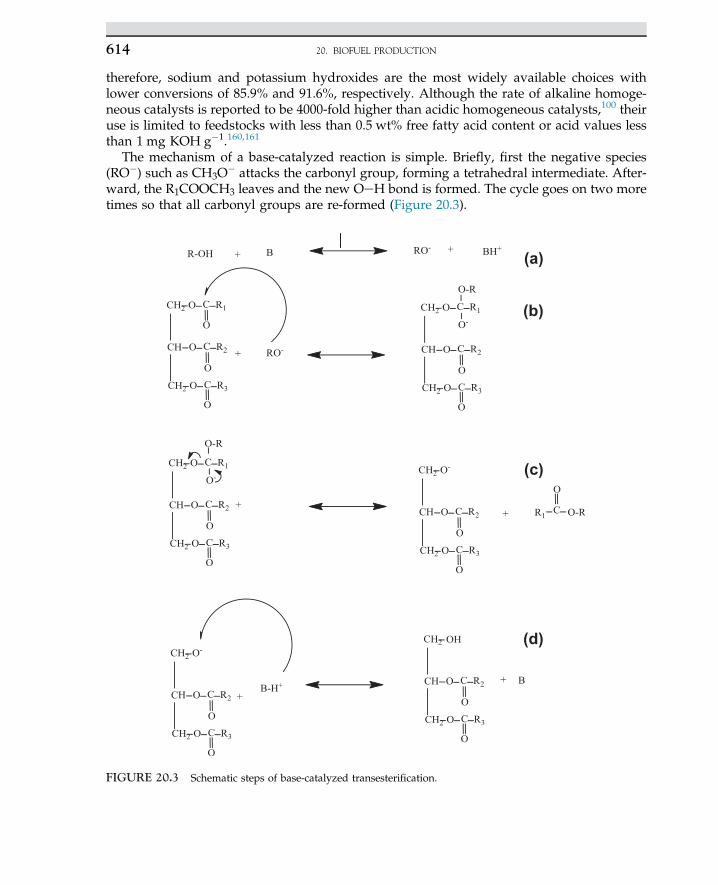
therefore, sodium and potassium hydroxides are the most widely available choices withlower conversions of 85.9% and 91.6%, respectively. Although the rate of alkaline homoge-neous catalysts is reported to be 4000-fold higher than acidic homogeneous catalysts,100 theiruse is limited to feedstocks with less than 0.5 wt% free fatty acid content or acid values lessthan 1 mg KOH g�1.160,161
The mechanism of a base-catalyzed reaction is simple. Briefly, first the negative species(RO�) such as CH3O
� attacks the carbonyl group, forming a tetrahedral intermediate. After-ward, the R1COOCH3 leaves and the new OeH bond is formed. The cycle goes on two moretimes so that all carbonyl groups are re-formed (Figure 20.3).
(a)
(b)
(c)
(d)
FIGURE 20.3 Schematic steps of base-catalyzed transesterification.
20. BIOFUEL PRODUCTION614
Homogeneous acid catalysts, on the other hand, resist the high FFA content of thefeedstock and could catalyze both transesterification and esterification reactions simulta-neously. Among the wide range of acids used, sulfuric acid (H2SO4) and hydrochloric acid(HCl) are most common. The higher yield of base catalysts and corrosion problems causedby acid catalysts, as well as the high oil to alcohol ratio requirement,162,163 have made thebase-catalyzed process much more appealing to industrial plants. The mechanism of anacid-catalyzed reaction is shown in Figure 20.4. Briefly, Hþ attacks the carbonyl groups ofthe triglycerides. Then, the nucleophilic attraction of the alcohol used in the reaction resultedin the formation of a tetrahedral intermediate. The final step is the migration of proton andbreakdown of the large molecule. This procedure takes place three times so that all carbonylbranches of the triglyceride are re-formed.
High costs of downstream purification occur and enormous amounts of wastewater aregenerated during such processes when homogeneous catalysts are used. Therefore,
(a)
(b)
(c)
FIGURE 20.4 Schematic steps of acid-catalyzed transesterification.
20.3 PROCESSES AND TECHNOLOGIES 615
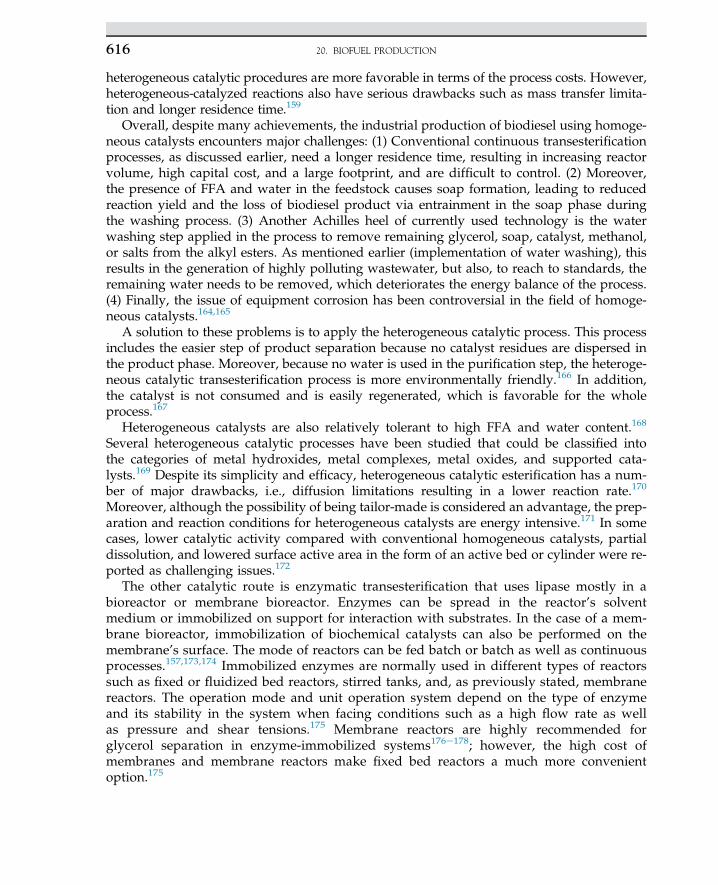
heterogeneous catalytic procedures are more favorable in terms of the process costs. However,heterogeneous-catalyzed reactions also have serious drawbacks such as mass transfer limita-tion and longer residence time.159
Overall, despite many achievements, the industrial production of biodiesel using homoge-neous catalysts encounters major challenges: (1) Conventional continuous transesterificationprocesses, as discussed earlier, need a longer residence time, resulting in increasing reactorvolume, high capital cost, and a large footprint, and are difficult to control. (2) Moreover,the presence of FFA and water in the feedstock causes soap formation, leading to reducedreaction yield and the loss of biodiesel product via entrainment in the soap phase duringthe washing process. (3) Another Achilles heel of currently used technology is the waterwashing step applied in the process to remove remaining glycerol, soap, catalyst, methanol,or salts from the alkyl esters. As mentioned earlier (implementation of water washing), thisresults in the generation of highly polluting wastewater, but also, to reach to standards, theremaining water needs to be removed, which deteriorates the energy balance of the process.(4) Finally, the issue of equipment corrosion has been controversial in the field of homoge-neous catalysts.164,165
A solution to these problems is to apply the heterogeneous catalytic process. This processincludes the easier step of product separation because no catalyst residues are dispersed inthe product phase. Moreover, because no water is used in the purification step, the heteroge-neous catalytic transesterification process is more environmentally friendly.166 In addition,the catalyst is not consumed and is easily regenerated, which is favorable for the wholeprocess.167
Heterogeneous catalysts are also relatively tolerant to high FFA and water content.168
Several heterogeneous catalytic processes have been studied that could be classified intothe categories of metal hydroxides, metal complexes, metal oxides, and supported cata-lysts.169 Despite its simplicity and efficacy, heterogeneous catalytic esterification has a num-ber of major drawbacks, i.e., diffusion limitations resulting in a lower reaction rate.170
Moreover, although the possibility of being tailor-made is considered an advantage, the prep-aration and reaction conditions for heterogeneous catalysts are energy intensive.171 In somecases, lower catalytic activity compared with conventional homogeneous catalysts, partialdissolution, and lowered surface active area in the form of an active bed or cylinder were re-ported as challenging issues.172
The other catalytic route is enzymatic transesterification that uses lipase mostly in abioreactor or membrane bioreactor. Enzymes can be spread in the reactor’s solventmedium or immobilized on support for interaction with substrates. In the case of a mem-brane bioreactor, immobilization of biochemical catalysts can also be performed on themembrane’s surface. The mode of reactors can be fed batch or batch as well as continuousprocesses.157,173,174 Immobilized enzymes are normally used in different types of reactorssuch as fixed or fluidized bed reactors, stirred tanks, and, as previously stated, membranereactors. The operation mode and unit operation system depend on the type of enzymeand its stability in the system when facing conditions such as a high flow rate as wellas pressure and shear tensions.175 Membrane reactors are highly recommended forglycerol separation in enzyme-immobilized systems176e178; however, the high cost ofmembranes and membrane reactors make fixed bed reactors a much more convenientoption.175
20. BIOFUEL PRODUCTION616
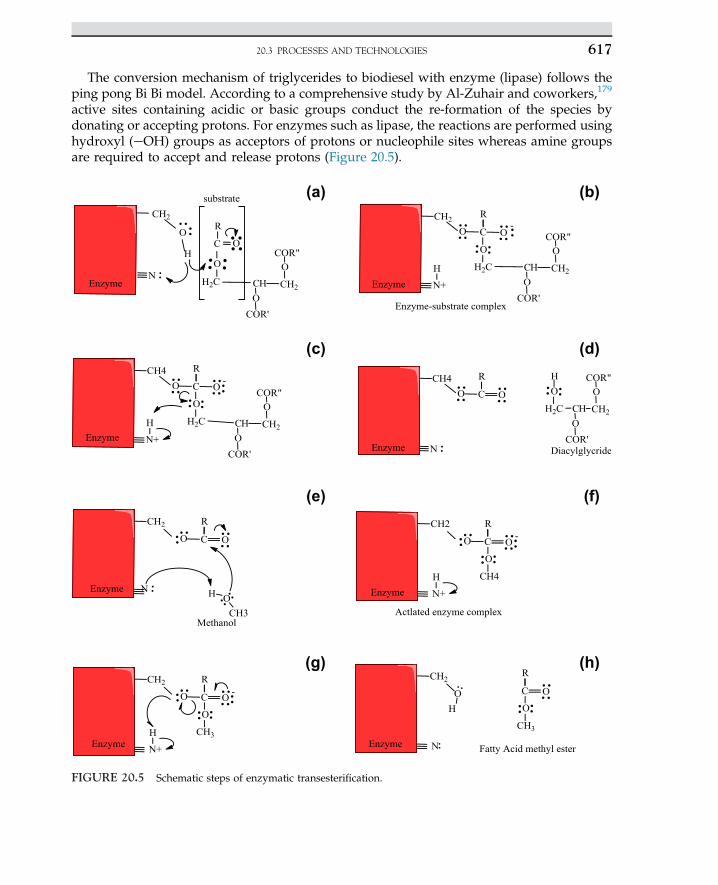
The conversion mechanism of triglycerides to biodiesel with enzyme (lipase) follows theping pong Bi Bi model. According to a comprehensive study by Al-Zuhair and coworkers,179
active sites containing acidic or basic groups conduct the re-formation of the species bydonating or accepting protons. For enzymes such as lipase, the reactions are performed usinghydroxyl (eOH) groups as acceptors of protons or nucleophile sites whereas amine groupsare required to accept and release protons (Figure 20.5).
(a)
(c)
(e)
(g) (h)
(f)
(d)
(b)
FIGURE 20.5 Schematic steps of enzymatic transesterification.
20.3 PROCESSES AND TECHNOLOGIES 617
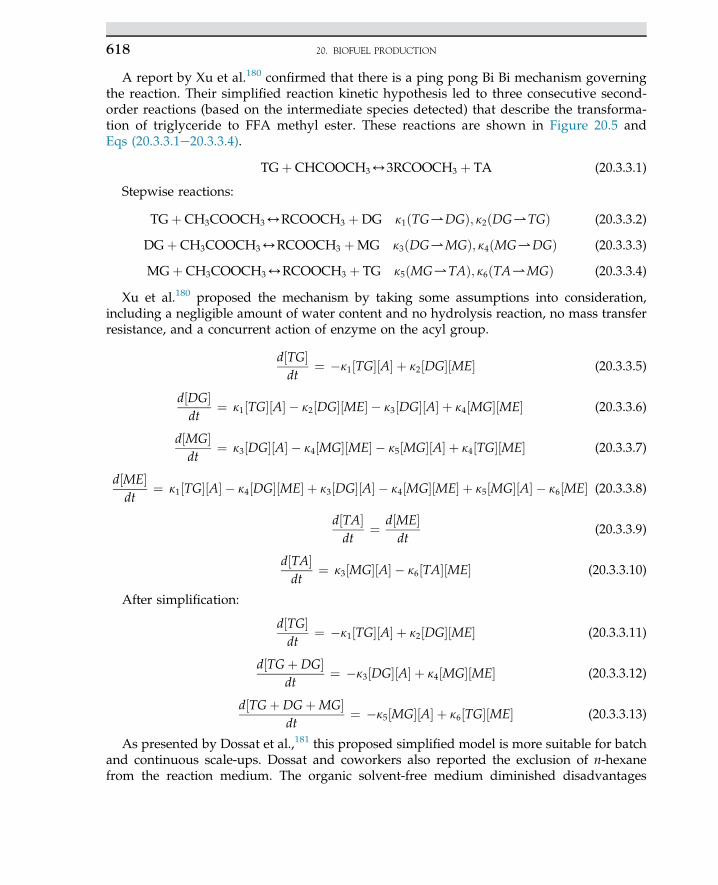
A report by Xu et al.180 confirmed that there is a ping pong Bi Bi mechanism governingthe reaction. Their simplified reaction kinetic hypothesis led to three consecutive second-order reactions (based on the intermediate species detected) that describe the transforma-tion of triglyceride to FFA methyl ester. These reactions are shown in Figure 20.5 andEqs (20.3.3.1e20.3.3.4).
TGþ CHCOOCH343RCOOCH3 þ TA (20.3.3.1)
Stepwise reactions:
TGþ CH3COOCH34RCOOCH3 þDG k1ðTG.DGÞ; k2ðDG.TGÞ (20.3.3.2)
DGþ CH3COOCH34RCOOCH3 þMG k3ðDG.MGÞ; k4ðMG.DGÞ (20.3.3.3)
MGþ CH3COOCH34RCOOCH3 þ TG k5ðMG.TAÞ; k6ðTA.MGÞ (20.3.3.4)
Xu et al.180 proposed the mechanism by taking some assumptions into consideration,including a negligible amount of water content and no hydrolysis reaction, no mass transferresistance, and a concurrent action of enzyme on the acyl group.
d½TG�dt
¼ �k1½TG�½A� þ k2½DG�½ME� (20.3.3.5)
d½DG�dt
¼ k1½TG�½A� � k2½DG�½ME� � k3½DG�½A� þ k4½MG�½ME� (20.3.3.6)
d½MG�dt
¼ k3½DG�½A� � k4½MG�½ME� � k5½MG�½A� þ k4½TG�½ME� (20.3.3.7)
d½ME�dt
¼ k1½TG�½A� � k4½DG�½ME� þ k3½DG�½A� � k4½MG�½ME� þ k5½MG�½A� � k6½ME� (20.3.3.8)
d½TA�dt
¼ d½ME�dt
(20.3.3.9)
d½TA�dt
¼ k3½MG�½A� � k6½TA�½ME� (20.3.3.10)
After simplification:
d½TG�dt
¼ �k1½TG�½A� þ k2½DG�½ME� (20.3.3.11)
d½TGþDG�dt
¼ �k3½DG�½A� þ k4½MG�½ME� (20.3.3.12)
d½TGþDGþMG�dt
¼ �k5½MG�½A� þ k6½TG�½ME� (20.3.3.13)
As presented by Dossat et al.,181 this proposed simplified model is more suitable for batchand continuous scale-ups. Dossat and coworkers also reported the exclusion of n-hexanefrom the reaction medium. The organic solvent-free medium diminished disadvantages
20. BIOFUEL PRODUCTION618
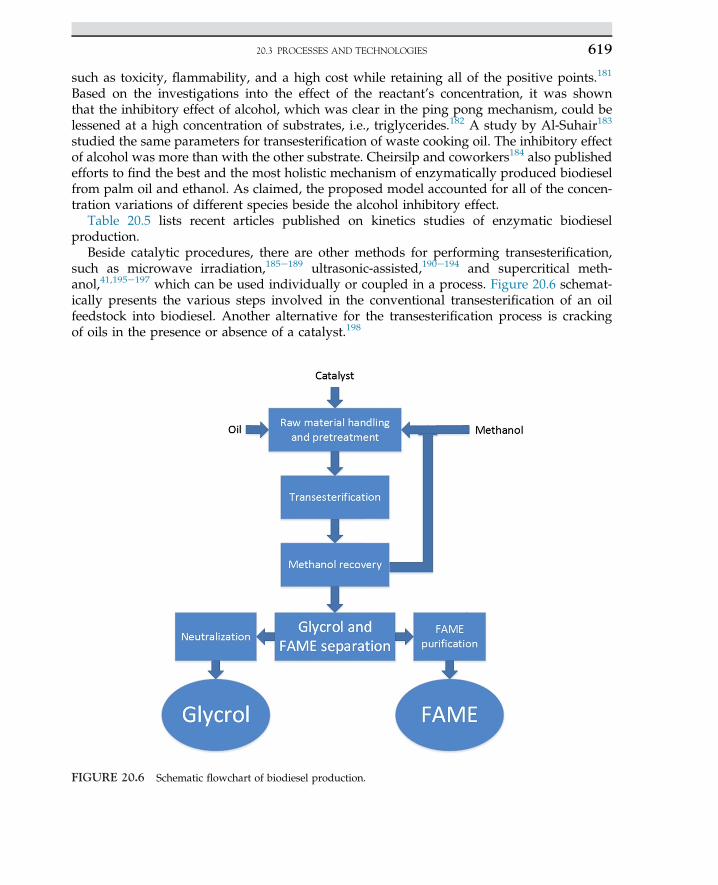
such as toxicity, flammability, and a high cost while retaining all of the positive points.181
Based on the investigations into the effect of the reactant’s concentration, it was shownthat the inhibitory effect of alcohol, which was clear in the ping pong mechanism, could belessened at a high concentration of substrates, i.e., triglycerides.182 A study by Al-Suhair183
studied the same parameters for transesterification of waste cooking oil. The inhibitory effectof alcohol was more than with the other substrate. Cheirsilp and coworkers184 also publishedefforts to find the best and the most holistic mechanism of enzymatically produced biodieselfrom palm oil and ethanol. As claimed, the proposed model accounted for all of the concen-tration variations of different species beside the alcohol inhibitory effect.
Table 20.5 lists recent articles published on kinetics studies of enzymatic biodieselproduction.
Beside catalytic procedures, there are other methods for performing transesterification,such as microwave irradiation,185e189 ultrasonic-assisted,190e194 and supercritical meth-anol,41,195e197 which can be used individually or coupled in a process. Figure 20.6 schemat-ically presents the various steps involved in the conventional transesterification of an oilfeedstock into biodiesel. Another alternative for the transesterification process is crackingof oils in the presence or absence of a catalyst.198
FIGURE 20.6 Schematic flowchart of biodiesel production.
20.3 PROCESSES AND TECHNOLOGIES 619
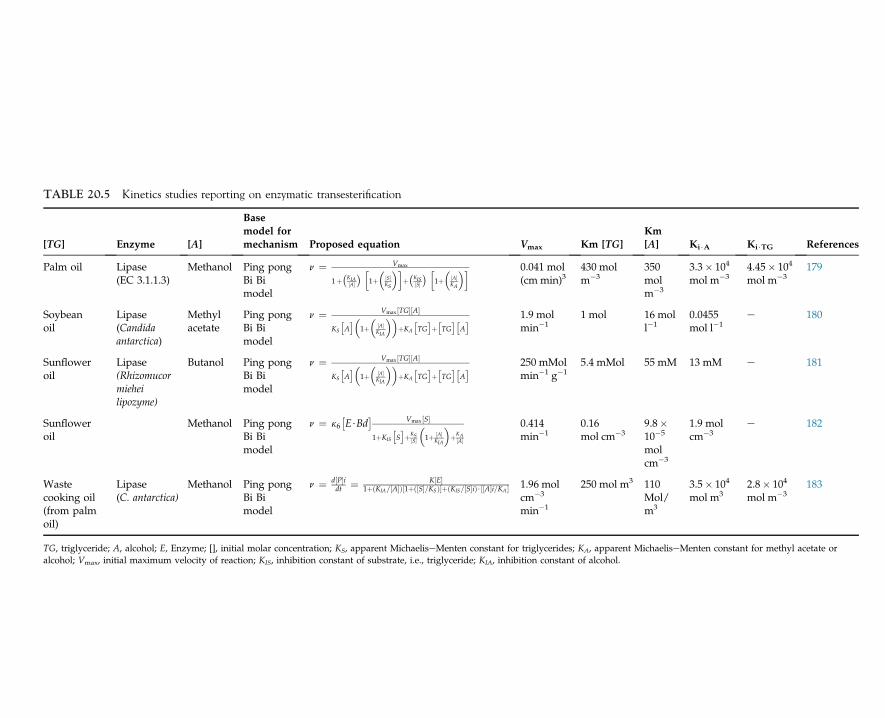
TABLE 20.5 Kinetics studies reporting on enzymatic transesterification
[TG] Enzyme [A]
Basemodel formechanism Proposed equation Vmax Km [TG]
Km[A] Ki$A Ki$TG References
Palm oil Lipase(EC 3.1.1.3)
Methanol Ping pongBi Bimodel
n ¼ Vmax
1þ�KIA½A�� h
1þ�
½S�KS
�iþ�KIS½S�� h
1þ�
½A�KA
�i 0.041 mol(cm min)3
430 molm�3
350molm�3
3.3� 104
mol m�34.45� 104
mol m�3179
Soybeanoil
Lipase(Candidaantarctica)
Methylacetate
Ping pongBi Bimodel
n ¼ Vmax ½TG�½A�
KS
�A��
1þ�
½A�KIA
��þKA
�TG�þ�TG��
A� 1.9 mol
min�11 mol 16 mol
l�10.0455mol l�1
e 180
Sunfloweroil
Lipase(Rhizomucormieheilipozyme)
Butanol Ping pongBi Bimodel
n ¼ Vmax ½TG�½A�
KS
�A��
1þ�
½A�KIA
��þKA
�TG�þ�TG��
A� 250 mMol
min�1 g�15.4 mMol 55 mM 13 mM e 181
Sunfloweroil
Methanol Ping pongBi Bimodel
n ¼ k6�E$Bd
� Vmax ½S�
1þKIS
�S�þKS
½S�
�1þ ½A�
KIA
�þKA
½A�
0.414min�1
0.16mol cm�3
9.8�10�5
molcm�3
1.9 molcm�3
e 182
Wastecooking oil(from palmoil)
Lipase(C. antarctica)
Methanol Ping pongBi Bimodel
n ¼ d½P�idt ¼ K½E�
1þðKIA=½A�Þ½1þð½S�=KSÞ�þðKIS=½S�iÞ$½½A�i=KA � 1.96 molcm�3
min�1
250 mol m3 110Mol/m3
3.5� 104
mol m32.8� 104
mol m�3183
TG, triglyceride; A, alcohol; E, Enzyme; [], initial molar concentration; KS, apparent MichaeliseMenten constant for triglycerides; KA, apparent MichaeliseMenten constant for methyl acetate oralcohol; Vmax, initial maximum velocity of reaction; KIS, inhibition constant of substrate, i.e., triglyceride; KIA, inhibition constant of alcohol.
20.3.4 Biohydrogen
Owning to its high energy content ð122 Kj g�1H2Þ and almost zero emissions, biohydrogen
is considered one of the best alternative energy carriers for petroleum-based fuels.199 Accord-ing to Chong et al.,200 biohydrogen can be produced through two different routes of photo-synthesis and anerobic acidogenesis processes (fermentation). Each process involves somemicroorganisms and feedstock. The hydrogen production yield by these processes dependson factors such as the type of microorganism, pH of the reaction environment,201,202 operationmode, operation temperature, both mesophilic (35 �C)203 and thermophilic (50 �C),204 andtype and composition of the feedstock used.205 Feedstocks can be adjusted or optimized byadding nutrients.206
Dark fermentative biohydrogen production (which is the most frequently used process forbiohydrogen production compared with light fermentation and photosynthesis207), can beperformed using diverse groups of microorganisms that possess multi-enzyme systems, indi-vidually or through mixed cultures.199 The process mainly consists of two steps: hydrolysisand acidogenesis. Organic acids and CO2 are co-products of the process. From a hydrogenproduction aspect, mixed cultures of microorganisms are advantageous compared withmonoculture ones. The possibility of investigating mixed feedstocks using continuous insteadof batch processes and the likelihood of gaining higher yields owing to co-fermentation areadvantages.199 Just as in biomethane production, biohydrogen can be produced with meso-philic or thermophilic microorganisms. Higher hydrolysis activation levels, better pathogenicdistribution, and a lower probability of contamination make extreme thermophilic (70e80 �C)pathways more attractive choices.199 Increments in acetate production while eliminatingbutyrate, ethanol, and lactate may also explain the superiority of thermophilicmicroorganisms.208
During the anaerobic production mode, hydrogen is produced in the liquid phase andconsumed by methanogenic microorganisms. To produce hydrogen efficiently in the gasphase, either these biohydrogen consumers must be eliminated or the reaction time shouldbe shortened.209,210 The type of inocula, operating conditions, i.e., pH, temperature, hydrogenpartial pressure, feed composition and nutrients, reactor residence time, and configurationaffect parameters through the main process.207
20.3.5 Biogas and Biomethane
There are four main steps in biomethane production: hydrolysis, acidogenesis, aceto-genesis/dehydrogenation, and methanation.211,212 As previously pointed out, from a resi-dence time aspect, it is important to know what sort of feedstock is going to be consumedbecause the hydrolysis procedure depends on the molecular structure of the substrate. Infact, the duration of the conversion of conventional substrates increases according to thefollowing order: carbohydrate (a few hours), proteins and lipids (a few days) and ligno-cellulose structures.213 First, hydrolyzing and fermenting microorganisms attack the poly-mers and monomers. Microorganisms taking part in this step are anaerobes such asBacteriocides, Clostridia, and Bifidobacteria. During this step, acetate and hydrogen andvarying amounts of volatile fatty acids such as propionate and butyrate are produced.211
Acetate and hydrogen are the byproducts of the hydrolysis step. Through the second step,
20.3 PROCESSES AND TECHNOLOGIES 621
other anaerobic bacteria change the resultant compounds to short-chain organic acids,C1eC5 molecules (e.g., butyric, propionic, and acetic acids), alcohols, hydrogen, and car-bon dioxide. At the third stage, products of the acidogenic phase are consumed assubstrate by acetogenic bacteria, which produce hydrogen as a byproduct while aceticacid is also produced. High partial pressure of the hydrogen produced can hinder therest of the bacteria’s performance. Hence, hydrogen partial pressure is an operationalcondition that needs to be kept under certain levels. The fourth step involves the activityof a group of strictly anaerobic archaea called methanogens that perform methanation.213
Microorganisms such as Methanosarcina barkeri, Metanonococcus mazei, and Methanosaetaconcilii are capable of converting either one or all of the produced materials intomethane.211 The kinetics of the whole process is proportional to many parameters suchas substrate, thermal and pH conditions of the fermenter, and the enzymes produced dur-ing the steps. A more detailed explanation of the metabolisms and kinetics of biomethaneproduction can be found elsewhere.213,214
Methanogenic fermentation can be performed using two modes of process: wet and drydigestion. Wet digestion includes the treatment of substrate with less than 10% solid content,which means that the media in the digester can be pumped and stirred. Dry digestioninvolves substrates with a solid content of 15% to 35%. A dry mode operation is usuallyset as a batch whereas the wet mode can be operated continuously.213
20.4 INTENSIFICATION AND INTEGRATION
The integration of processes as a means to intensify production/purification processesleads to inevitable advantages such as a reduction in capital costs and energy use, decrementof utilities and structures, fewer process steps, lower physical volume, and, as the nameclearly illustrates, a faster and intensified process and higher yields.215,216 According to acomprehensive chapter written by Sanchez et al.,217 integration of bioethanol production pro-cesses can be classified into four main types: reactionereaction integration, reaction-separation integration, separationeseparation, and energy. The subject is discussed brieflyhere. Apart from the basic meaning of the “homogeneous” and “heterogeneous,” hereinand during the description of process integration, processes with a reaction and separa-tion/unit operation are called heterogeneous whereas processes with two reactions or twounit operations are referred to as homogeneous.218
20.4.1 ReactioneReaction Integration
Several examples of reactionereaction integration are provided here for both first-generation ethanol based on starch, glucose, or biomass and second-generation ethanolfrom lignocellulosic resources. Homogeneous integration of ethanol production can be con-ducted during different steps of fermentation and biochemical transformation. A goodexample is integration of the detoxification section with pretreatment steps and fermentation.The idea of combining starch hydrolysis and glucose fermentation is the next homogeneousintegration in bioethanol production (co-fermentation or simultaneous hydrolysis fermenta-tion (SHF)). There are many routes by which this can be performed, such as conducting
20. BIOFUEL PRODUCTION622
both reactions in one reactor, finding one microorganism capable of doing both reactions, orgenetically engineering one.219,220
There are other homogeneous integration examples aside from the already commercializedSHF process, such as simultaneous saccharification fermentation, in which the degradationprocedure of cellulose and the formation of polysaccharidesis are coupled with the fermen-tation of glucose. Although this integrated process leads to more convenient operatingconditions and lower equipment requirements, the different optimum conditions (pH andtemperature) of fermentation and degradation make the integrated process challenging tocontrol.221 Simultaneous saccharification and co-fermentation and consolidated bio-processing (CPB) are two examples of integrated reactionereaction ethanol production pro-cesses. The main difference between the CPB process and the others is the use of only onemicroorganism for the whole process.
20.4.2 Reaction-Separation Integration
Coupling separation with reactive processes may be considered a more practical integra-tion owing to the significant lower cost of downstream separation and purification. Enzy-matic hydrolysis joined to a separation process is the first instance offered in thiscategory.222 Membrane bioreactors with enzymes in the retentate side or immobilized onthe membrane itself have been proven to act well because the catalytic activity is kept at astandard level while the enzyme is prevented from mixing with the products. The conceptof a membrane reactor can also be used to remove ethanol from the culture broth, whichshifts the reaction to a higher level as the inhibitory effects of alcohol are eliminated ordecreased.223 Beside membrane reactors, the act of removing ethanol can also be carriedout by other separation unit operations such as vacuum, vacuum distillation, membranedistillation, pervaporation, stripping, and solvent extraction.215,224e226
20.4.3 SeparationeSeparation Integration
More recently developed separation technologies are the examples of theseparationeseparation integration mode, whose main purposes are to improve the level ofpurification and decrease the cost. The idea mainly consists of a membrane separationprocess coupled with an old one such as extraction or distillation.227
20.4.4 Energy Integration
The concept of energy integration in chemical engineering mainly comes from a technol-ogy called pinch, in which the heat streams of a process exchange energy values with othersto minimize the energy demands of the process. With a more holistic viewpoint, energyintegration can be defined as the generation and consumption of a process’s electrical, me-chanical, and thermal needs within the borders of the process itself. To this extent, therehave also been other proposed types of technology. Cogeneration systems or combiningheat and power generation and burning a portion of biomass are the examples of energyintegration.228,229 In addition to the integration of these systems, the use of biofuels inCHP systems has been assessed.230e232
20.4 INTENSIFICATION AND INTEGRATION 623
Apart from these integration and intensification methods, there have been other integra-tion strategies aimed at reducing the overall emission of biofuel production processes.Among those, carbon capture and storage (CCS) strategies have attracted a great deal ofattention. Using CCS strategies, CO2 from biofuel combustion or industrial processes canbe captured, transported, and stored underground, in depleted oil and gas fields and deepsaline formations. Therefore, CCS has a significant role in the global transition to a sustain-able low-carbon economy.233e235
20.5 ECONOMIC PERSPECTIVE
This section is devoted to a descriptive argument regarding the economic aspects of biofuelproduction. To begin, it is beneficial to highlight that each economic study has to consider alldifferent aspects of a subject or to be holistic. There are four groups of aspects to be consid-ered for biofuel production and use. The first is related to feedstock resources, which areknown to be the most influential parameter on the final biofuel price.105 This group mainlyconsists of factors such as land use and feedstock properties. The second group is the produc-tion process and technology,236 which cover upstream and downstream high-tech develop-ments, operating and capital costs, and production capacity, i.e., the scale of theproduction plants. The third group, which is mostly neglected in economic studies, is byprod-ucts.237,238 The fourth group is expense saved through the lessened amount of environmentalcontamination/emissions, and consequently through the savings of energy and money forhuman health care. To the best of our knowledge, until now, no published report has strivedto put all of these data together.
Some of the data reported in the literature are presented here; the need to conduct holisticand comprehensive studies is strongly highlighted. According to a report by Demirbas, entitled“Political, economic and environmental impacts of biofuels: A review,”239 the final cost of abiofuel can vary based on the costs imposed by the conversion process, the scale of the produc-tion, and, of course, the feedstock used. For instance, bioethanol is more expensive comparedwith its petrochemical rival, gasoline, in most of the producing countries around the world.However, Brazil, which was previously introduced as the largest bioethanol producer in theworld, owing to the large availability of cheap feedstock, i.e., sugar, has the most economicethanol production. In fact, a bottom line must be considered in each country for oil pricesbelow which biofuels cannot compete. For instance, whereas the oil price in the EuropeanUnion must reach US $70 so that bioethanol can be offered in a competitive environment,the price is said to be around US $50e60 for the United States. For a country such as Brazil,with tropical weather and suitable conditions for providing raw materials, which reduce themain feedstock costs, the bottom line is reported to be US $25 to US $3/barrel of oil.
As expected, the size of the plant can also influence biofuel production costs. Larger-scaleproduction plants can achieve lower final costs, which might be as high as 15e20% of theoverall biofuel cost. A comprehensive comparison between different biofuels is offered in abook entitled BiofuelsdGlobal Impact on Renewable Energy.240 The results of this comparisonare summarized in Table 20.6. The comparison includes investment costs and process econ-omies, all of which are based on the identical capacity of 45 MM gal biofuel per year. The datareported here were all obtained through simulations made with Aspen Plus software.
20. BIOFUEL PRODUCTION624
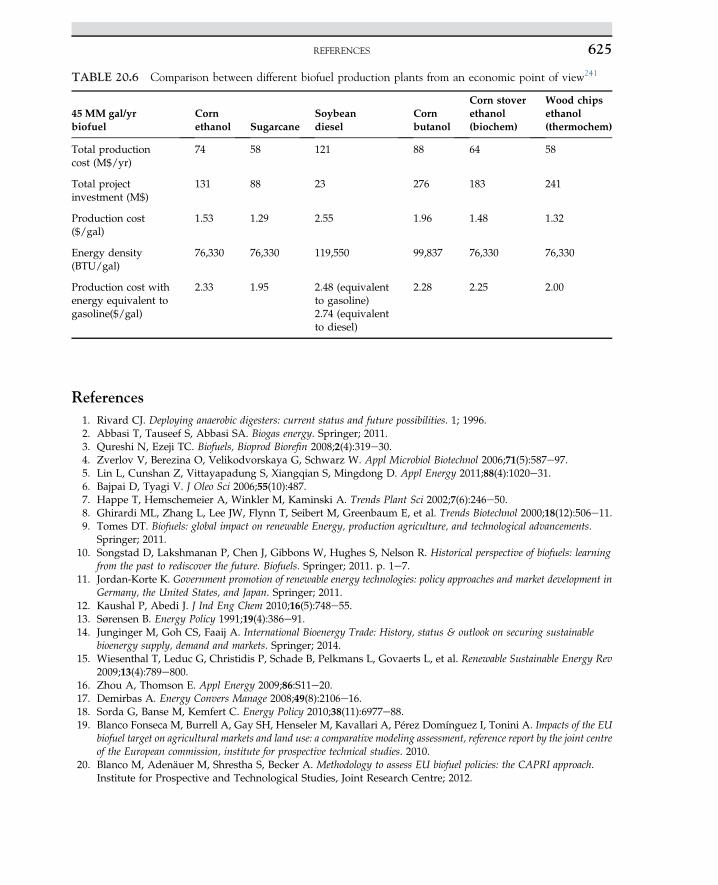
References1. Rivard CJ. Deploying anaerobic digesters: current status and future possibilities. 1; 1996.2. Abbasi T, Tauseef S, Abbasi SA. Biogas energy. Springer; 2011.3. Qureshi N, Ezeji TC. Biofuels, Bioprod Biorefin 2008;2(4):319e30.4. Zverlov V, Berezina O, Velikodvorskaya G, Schwarz W. Appl Microbiol Biotechnol 2006;71(5):587e97.5. Lin L, Cunshan Z, Vittayapadung S, Xiangqian S, Mingdong D. Appl Energy 2011;88(4):1020e31.6. Bajpai D, Tyagi V. J Oleo Sci 2006;55(10):487.7. Happe T, Hemschemeier A, Winkler M, Kaminski A. Trends Plant Sci 2002;7(6):246e50.8. Ghirardi ML, Zhang L, Lee JW, Flynn T, Seibert M, Greenbaum E, et al. Trends Biotechnol 2000;18(12):506e11.9. Tomes DT. Biofuels: global impact on renewable Energy, production agriculture, and technological advancements.
Springer; 2011.10. Songstad D, Lakshmanan P, Chen J, Gibbons W, Hughes S, Nelson R. Historical perspective of biofuels: learning
from the past to rediscover the future. Biofuels. Springer; 2011. p. 1e7.11. Jordan-Korte K. Government promotion of renewable energy technologies: policy approaches and market development in
Germany, the United States, and Japan. Springer; 2011.12. Kaushal P, Abedi J. J Ind Eng Chem 2010;16(5):748e55.13. Sørensen B. Energy Policy 1991;19(4):386e91.14. Junginger M, Goh CS, Faaij A. International Bioenergy Trade: History, status & outlook on securing sustainable
bioenergy supply, demand and markets. Springer; 2014.15. Wiesenthal T, Leduc G, Christidis P, Schade B, Pelkmans L, Govaerts L, et al. Renewable Sustainable Energy Rev
2009;13(4):789e800.16. Zhou A, Thomson E. Appl Energy 2009;86:S11e20.17. Demirbas A. Energy Convers Manage 2008;49(8):2106e16.18. Sorda G, Banse M, Kemfert C. Energy Policy 2010;38(11):6977e88.19. Blanco Fonseca M, Burrell A, Gay SH, Henseler M, Kavallari A, Pérez Domínguez I, Tonini A. Impacts of the EU
biofuel target on agricultural markets and land use: a comparative modeling assessment, reference report by the joint centreof the European commission, institute for prospective technical studies. 2010.
20. Blanco M, Adenäuer M, Shrestha S, Becker A. Methodology to assess EU biofuel policies: the CAPRI approach.Institute for Prospective and Technological Studies, Joint Research Centre; 2012.
TABLE 20.6 Comparison between different biofuel production plants from an economic point of view241
45 MM gal/yrbiofuel
Cornethanol Sugarcane
Soybeandiesel
Cornbutanol
Corn stoverethanol(biochem)
Wood chipsethanol(thermochem)
Total productioncost (M$/yr)
74 58 121 88 64 58
Total projectinvestment (M$)
131 88 23 276 183 241
Production cost($/gal)
1.53 1.29 2.55 1.96 1.48 1.32
Energy density(BTU/gal)
76,330 76,330 119,550 99,837 76,330 76,330
Production cost withenergy equivalent togasoline($/gal)
2.33 1.95 2.48 (equivalentto gasoline)2.74 (equivalentto diesel)
2.28 2.25 2.00
REFERENCES 625
21. Gao Y, Skutsch M, Drigo R, Pacheco P, Masera O. Appl Geogr 2011;31(2):508e18.22. Tscharntke T, Clough Y, Wanger TC, Jackson L, Motzke I, Perfecto I, et al. Biol Conserv 2012;151(1):53e9.23. Ajanovic A. Energy 2011;36(4):2070e6.24. Hertel T, Golub A, Jones A, O’Hare M, Plevin R, Kammen D. Global land use and greenhouse gas emissions impacts
of US Maize ethanol: the role of market-mediated responses. Center for Global Trade Analysis, Department ofAgricultural Economics, Purdue University; 2009.
25. Persson T, Garcia y, Garcia A, Paz J, Jones J, Hoogenboom G. Agric Syst 2009;100(1):11e21.26. Gröngröft A, Brosowski A, Meisel K, Müller-Langer F. Sugar Ind-Zuckerind 2013;138(4):208e14.27. Erdei B, Galbe M, Zacchi G. Biomass Bioenergy 2013;56:506e14.28. Zuurbier PJP, van de Vooren J. Sugarcane ethanol: contributions to climate change mitigation and the environment.
Wageningen Academic Pub; 2008.29. Quintero J, Montoya M, Sánchez O, Giraldo O, Cardona C. Energy 2008;33(3):385e99.30. Goldemberg J, Coelho ST, Guardabassi P. Energy Policy 2008;36(6):2086e97.31. Jaggard K, Townsend B. Biofuel cropping systems: carbon, land and food. p.138; 2014.32. Langeveld J, Ven G V d, Vries SCD, Brink L V d, Visser CD. Int J Sustain Dev 2014;17(1):78e88.33. Gheewala SH, Bonnet S, Silalertruksa T. Bulbous plants: biotechnology. p.177; 2013.34. Dai D, Hu Z, Pu G, Li H, Wang C. Energy Convers Manage 2006;47(13):1686e99.35. Torres CF, Munir F, Otero C, Hill Jr CG. J Am Oil Chem Soc 2002;79(8):775e81.36. Mojovi�c L, Nikoli�c S, Rakin M, Vukasinovi�c M. Fuel 2006;85(12):1750e5.37. Shapouri H, Duffield JA, Wang MQ. The energy balance of corn ethanol: an update. United States Department of
Agriculture, Economic Research Service; 2002.38. Bothast R, Schlicher M. Appl Microbiol Biotechnol 2005;67(1):19e25.39. Ghobadian B, Rahimi H, Tavakkoli Hashjin T, Khatamifar M. J Agric Sci Technol 2010;10:225e32.40. Mittelbach M. J Am Oil Chem Soc 1990;67(3):168e70.41. Demirbas A. Energy Convers Manag 2007;48(3):937e41.42. Di Serio M, Ledda M, Cozzolino M, Minutillo G, Tesser R, Santacesaria E. Ind Eng Chem Res 2006;45(9):3009e14.43. Garcia CM, Teixeira S, Marciniuk LL, Schuchardt U. Bioresour Techno 2008;99(14):6608e13.44. Ebrahimi S, Amini G, Younesi H, Najafpour GD. Middle-East J Sci Res 2012;11(10):1323e7.45. Leclercq E, Finiels A, Moreau C. J Am Oil Chem Soc 2001;78(11):1161e5.46. Kusdiana D, Saka S. Fuel 2001;80(5):693e8.47. Li L, Du W, Liu D, Wang L, Li Z. J Mol Catal B: Enzym 2006;43(1):58e62.48. Abdullah A, Salamatinia B, Mootabadi H, Bhatia S. Energy Policy 2009;37(12):5440e8.49. Foon CS, May CY, Liang YC, Ngan MA, Basiron Y. Malaysian palm oil board. Palm Oil Dev 2005;42:28e34.50. Naik S, Goud VV, Rout PK, Dalai AK. Renewable Sustainable Energy Rev 2010;14(2):578e97.51. Ndegwa G, Moraa V, Jamnadass R, Mowo J, Nyabenge M, Iiyama M. Potential for biofuel feedstock in Kenya.
ICRAF Working Paper, 2011.52. Balat M, Balat H. Appl Energy 2009;86(11):2273e82.53. Farrell AE, Plevin RJ, Turner BT, Jones AD, O’hare M, Kammen DM. Science 2006;311(5760):506e8.54. Kinney A, Clemente T. Fuel Process Technol 2005;86(10):1137e47.55. Vasudevan PT, Briggs M. J Ind Microbiol Biotechnol 2008;35(5):421e30.56. Mushrush GW, Beal EJ, Hughes JM, Wynne JH, Sakran JV, Hardy DR. Ind Eng Chem Res 2000;39(10):3945e8.57. Petit H, Germiquet C, Lebel D. J Dairy Sci 2004;87(11):3889e98.58. Chang J, Lunt DK, Smith SB. J Nutr 1992;122(11):2074e80.59. Crabbe E, Nolasco-Hipolito C, Kobayashi G, Sonomoto K, Ishizaki A. Process Biochem 2001;37(1):65e71.60. Mohammadi M, Mohamed AR, Najafpour GD, Younesi H, Uzir MH. Sci World J 2014;2014.61. Mohammadi M, Najafpour GD, Younesi H, Lahijani P, Uzir MH, Mohamed AR. Renewable Sustainable Energy
Rev 2011;15(9):4255e73.62. Sharma Y, Singh B, Madhu D, Liu Y, Yaakob Z. Fast Synthesis of High Quality Biodiesel from ’Waste Fish Oil’
by Single Step Transesterification. Biofuel research journal 2014;3:78e80.63. Levin DB, Carere CR, Cicek N, Sparling R. Int J Hydrogen Energy 2009;34(17):7390e403.64. Cheng C-L, Lo Y-C, Lee K-S, Lee D-J, Lin C-Y, Chang J-S. Bioresour Technol 2011;102(18):8514e23.65. Sulaiman A, Hassan MA, Shirai Y, Abd-Aziz S, Tabatabaei M, Busu Z, et al. Aust J Basic Appl Sci 2009;3(3).66. Das D, Veziroǧlu TN. Int J Hydrogen Energy 2001;26(1):13e28.
20. BIOFUEL PRODUCTION626
67. Liu C-z, Cheng X-y. Int J Hydrogen Energy 2010;35(17):8945e52.68. Kongjan P, Angelidaki I. Bioresour Technol 2010;101(20):7789e96.69. Shi XX, Song HC, Wang CR, Tang RS, Huang ZX, Gao TR, et al. Int J Energy Res 2010;34(8):662e72.70. Cui M, Yuan Z, Zhi X, Wei L, Shen J. Int J Hydrogen Energy 2010;35(9):4041e7.71. Cui M, Yuan Z, Zhi X, Shen J. Int J Hydrogen Energy 2009;34(19):7971e8.72. Kongjan P, Min B, Angelidaki I. Water Res 2009;43(5):1414e24.73. Lo Y-C, Lu W-C, Chen C-Y, Chang J-S. Bioresour Technol 2010;101(15):5885e91.74. Lalaurette E, Thammannagowda S, Mohagheghi A, Maness P-C, Logan BE. Int J Hydrogen Energy
2009;34(15):6201e10.75. Kim JK, Nhat L, Chun YN, Kim SW. Biotechnol Bioprocess Eng 2008;13(4):499e504.76. Kumar N, Das D. Enzyme Microb Technol 2001;29(4):280e7.77. Cao G, Ren N, Wang A, Lee D-J, Guo W, Liu B, et al. Int J Hydrogen Energy 2009;34(17):7182e8.78. Li D, Chen H. Int J Hydrogen Energy 2007;32(12):1742e8.79. Pattra S, Sangyoka S, Boonmee M, Reungsang A. Int J Hydrogen Energy 2008;33(19):5256e65.80. Panagiotopoulos I, Bakker R, De Vrije T, Koukios E, Claassen P. Int J Hydrogen Energy 2010;35(15):
7738e47.81. Mars AE, Veuskens T, Budde MA, Van Doeveren PF, Lips SJ, Bakker RR, et al. Int J Hydrogen Energy
2010;35(15):7730e7.82. Ueno Y, Fukui H, Goto M. Environ Sci Technol 2007;41(4):1413e9.83. Lo Y-C, Saratale GD, Chen W-M, Bai M-D, Chang J-S. Enzyme Microb Technol 2009;44(6):417e25.84. de Vrije T, Bakker RR, Budde MA, Lai MH, Mars AE, Claassen PA. Biotechnol Biofuels 2009;2(1):12.85. Lo Y-C, Su Y-C, Cheng C-L, Chang J-S. Int J Hydrogen Energy 2011;36(21):13955e63.86. Gunaseelan VN. Biomass Bioenergy 2004;26(4):389e99.87. Pakarinen O, Tähti H, Rintala J. Biomass Bioenergy 2009;33(10):1419e27.88. Xiao W, Clarkson WW. Biodegradation 1997;8(1):61e6.89. Kaparaju P, Serrano M, Thomsen AB, Kongjan P, Angelidaki I. Bioresour Technol 2009;100(9):2562e8.90. Bruni E, Jensen AP, Pedersen ES, Angelidaki I. Appl Energy 2010;87(7):2212e7.91. Bauer A, Bösch P, Friedl A, Amon T. J Biotechnol 2009;142(1):50e5.92. Dinuccio E, Balsari P, Gioelli F, Menardo S. Bioresour Technol 2010;101(10):3780e3.93. Teghammar A, Yngvesson J, Lundin M, Taherzadeh MJ, Horváth IS. Bioresour Technol 2010;101(4):1206e12.94. Romano RT, Zhang R, Teter S, McGarvey JA. Bioresour Technol 2009;100(20):4564e71.95. Zheng M, Li X, Li L, Yang X, He Y. Bioresour Technol 2009;100(21):5140e5.96. Rabelo S, Carrere H, Maciel Filho R, Costa A. Bioresour Technol 2011;102(17):7887e95.97. Openshaw K. Biomass Bioenergy 2000;19(1):1e15.98. Pramanik K. Renew Energy 2003;28(2):239e48.99. Zhang Y, Dube M, McLean D, Kates M. Bioresour Technol 2003;89(1):1e16.100. Kulkarni MG, Dalai AK. Indu Eng Chem Res 2006;45(9):2901e13.101. Phan AN, Phan TM. Fuel 2008;87(17):3490e6.102. Pazouki M, Zamani F, Zamzamian AH, Fahar M, Najafpour G. World Appl Sci J 2010;8(6):719e24.103. Karmakar A, Karmakar S, Mukherjee S. Bioresour Technol 2010;101(19):7201e10.104. Hillion G, Leporq S, Rouxel JJ, Stern R. Process for the production of esters from vegetable oils or animal oils
alcohols. Google Patents, 1999.105. Zhang Y, Dube M, McLean D, Kates M. Bioresour Technol 2003;90(3):229e40.106. Marchetti JM. Process Saf Environ Prot 2012;90(3):157e63.107. Pittman JK, Dean AP, Osundeko O. Bioresour Technol 2011;102(1):17e25.108. Mondala A, Liang K, Toghiani H, Hernandez R, French T. Bioresour Technol 2009;100(3):1203e10.109. Dufreche S, Hernandez R, French T, Sparks D, Zappi M, Alley E. J Am Oil Chem Soc 2007;84(2):181e7.110. Francioso O, Rodriguez-Estrada MT, Montecchio D, Salomoni C, Caputo A, Palenzona D. J Hazard Mater
2010;175(1):740e6.111. Jetten MS, Horn SJ, van Loosdrecht M. Water Sci Technol 1997;35(9):171e80.112. Beetul K, Bibi Sadally S, Taleb-Hossenkhan N, Bhagooli R, Puchooa D. An investigation of biodiesel production
from microalgae found in Mauritian waters. Biofuel Research Journal 2014;2:58e64.113. Biello D. Sci Am 2010;302(4):21e2.
REFERENCES 627
114. Tabatabaei M, Tohidfar M, Jouzani GS, Safarnejad M, Pazouki M. Renewable Sustainable Energy Rev2011;15(4):1918e27.
115. Singh A, Olsen SI, Nigam PS. J Chem Technol Biotechnol 2011;86(11):1349e53.116. Mata TM, Martins AA, Caetano NS. Renewable Sustainable Energy Rev 2010;14(1):217e32.117. Adams JM, Gallagher JA, Donnison IS. J Appl Phycol 2009;21(5):569e74.118. Harun R, Danquah MK, Forde GM. J Chem Technol Biotechnol 2010;85(2):199e203.119. John RP, Anisha G, Nampoothiri KM, Pandey A. Bioresour Technol 2011;102(1):186e93.120. Wargacki AJ, Leonard E, Win MN, Regitsky DD, Santos CNS, Kim PB, et al. Science 2012;335(6066):308e13.121. Li Y, Horsman M, Wu N, Lan CQ, Dubois-Calero N. Biotechnol Prog 2008;24(4):815e20.122. Paulo C, Estrada V, Di Maggio J, Diaz M. Comput Aided Chem Eng 2011;29:1366e71.123. Aikawa S, Joseph A, Yamada R, Izumi Y, Yamagishi T, Matsuda F, et al. Energy Environ Sci 2013;6(6):1844e9.124. Gao Z, Zhao H, Li Z, Tan X, Lu X. Energy Environ Sci 2012;5(12):9857e65.125. Heidorn T, Camsund D, Huang H-H, Lindberg P, Oliveira P, Stensjö K, et al. Methods Enzymol 2010;497:
539e79.126. Ruffing AM. Engineered cyanobacteria; 2011. landesbioscience.com.127. Demirbas MF. Appl Energy 2011;88(10):3473e80.128. Chisti Y. Biotechnol Adv 2007;25(3):294e306.129. Wang C, Chen L, Rakesh B, Qin Y, Lv R. Front Energy 2012;6(3):266e74.130. Meng X, Yang J, Xu X, Zhang L, Nie Q, Xian M. Renew Energy 2009;34(1):1e5.131. Li Q, Du W, Liu D. Appl Microbiol Biotechnol 2008;80(5):749e56.132. Klein-Marcuschamer D, Chisti Y, Benemann JR, Lewis D. Biotechnol Bioeng 2013;110(9):2317e22.133. Singh J, Gu S. Renewable Sustainable Energy Rev 2010;14(9):2596e610.134. Gray D, White C, Tomlinson G. Increasing security and reducing carbon emissions of the US transportation sector: a
transformational role for coal with biomass; 2007.135. Nigam PS, Singh A. Prog Energy Combust Sci 2011;37(1):52e68.136. Awudu I, Zhang J. Renewable Sustainable Energy Rev 2012;16(2):1359e68.137. Gupta VK, Tuohy MG. Biofuel technologies: recent developments. Springer; 2013.138. Tomes D, Lakshmanan P, Songstad D. Biofuels: global impact on renewable energy, production agriculture, and
technological advancements; 2010.139. Onuki S. Bioethanol: industrial production process and recent studies; 2006.140. Van Der Maarel MJ, Van Der Veen B, Uitdehaag J, Leemhuis H, Dijkhuizen L. J Biotechnol 2002;94(2):137e55.141. Dürre P. Curr Opin Biotechnology 2011;22(3):331e6.142. Lütke-Eversloh T, Bahl H. Curr Opin Biotechnology 2011;22(5):634e47.143. Nielsen DR, Leonard E, Yoon S-H, Tseng H-C, Yuan C, Prather KLJ. Metab Eng 2009;11(4):262e73.144. Shen CR, Liao JC. Metab Eng 2008;10(6):312e20.145. Steen EJ, Chan R, Prasad N, Myers S, Petzold CJ, Redding A, et al. Microb Cell Fact 2008;7(1):36.146. Liu S, Liu G, Zhao X, Jin W. J Membr Sci 2013;446:181e8.147. Oh PP, Lau HLN, Chen J, Chong MF, Choo YM. Renewable Sustainable Energy Rev 2012;16(7):5131e45.148. Ferella F, Mazziotti Di Celso G, De Michelis I, Stanisci V, Vegliò F. Fuel 2010;89(1):36e42.149. Melero JA, Iglesias J, Morales G. Green Chem 2009;11(9):1285e308.150. Kawashima A, Matsubara K, Honda K. Bioresour Technol 2008;99(9):3439e43.151. Mohadesi M, Hojabri Z, Moradi G. biodiesel production using alkali earth metal oxides catalysts synthesized by
sol-gel method. Biofuel research journal 2014;1:30e3.152. Akia M, Yazdani F, Motaee E, Han D, Arandiyan H. A review on conversion of biomass to biofuel by
nanocatalysts. Biofuel Research Journal 2014;(1):16e25.153. Szczesna Antczak M, Kubiak A, Antczak T, Bielecki S. Renewable Energy 2009;34(5):1185e94.154. Xu Y, Du W, Liu D, Zeng J. Biotechnol Lett 2003;25(15):1239e41.155. Fjerbaek L, Christensen KV, Norddahl B. Biotechnol Bioeng 2009;102(5):1298e315.156. Ranganathan SV, Narasimhan SL, Muthukumar K. Bioresour Technol 2008;99(10):3975e81.157. Nielsen PM, Brask J, Fjerbaek L. Eur J Lipid Sci Technol 2008;110(8):692e700.158. Hasheminejad M, Tabatabaei M, Mansourpanah Y, Javani A. Bioresour Technol 2011;102(2):461e8.159. Vicente G, Martınez M, Aracil J. Bioresour Technol 2004;92(3):297e305.160. Lam MK, Lee KT, Mohamed AR. Biotechnol Adv 2010;28(4):500e18.
20. BIOFUEL PRODUCTION628
161. Felizardo P, Neiva Correia MJ, Raposo I, Mendes JF, Berkemeier R, Bordado JM. Waste Manage2006;26(5):487e94.
162. Jacobson K, Gopinath R, Meher LC, Dalai AK. Appl Catal B: Environ 2008;85(1):86e91.163. Wang Y, Ou S, Liu P, Xue F, Tang S. J Mol Catal A: Chem 2006;252(1):107e12.164. Canakci M, Van Gerpen J. Trans ASAE 1999;42(5):1203e10.165. Carmo AC, de Souza LK, da Costa CE, Longo E, Zamian JR, da Rocha Filho GN. Fuel 2009;88(3):461e8.166. Dossin TF, Reyniers M-F, Berger RJ, Marin GB. Appl Catal B: Environ 2006;67(1):136e48.167. Chouhan A, Sarma A. Renewable Sustainable Energy Rev 2011.168. Endalew AK, Kiros Y, Zanzi R. Biomass Bioenergy 2011;35(9):3787e809.169. Zabeti M, Wan Daud WMA, Aroua MK. Fuel Process Technol 2009;90(6):770e7.170. Mbaraka IK, Shanks BH. J Am Oil Chemists’ Soc 2006;83(2):79e91.171. Sharma YC, Singh B, Korstad J. Fuel 2011;90(4):1309e24.172. Kurayama F, Yoshikawa T, Handa H, Furusawa T, Bahadur NM, Sato M, et al. Bioresour Technol 2012.173. Ko MJ, Park HJ, Hong SY, Yoo YJ. Bioprocess Biosyst Eng 2012;35(1e2):69e75.174. Machsun AL, Gozan M, Nasikin M, Setyahadi S, Yoo YJ. Biotechnol Bioprocess Eng 2010;15(6):911e6.175. Jegannathan KR, Abang S, Poncelet D, Chan ES, Ravindra P. Crit Rev Biotechnol 2008;28(4):253e64.176. Saleh J, Tremblay AY, Dubé MA. Fuel 2010;89(9):2260e6.177. Gomes MCS, Arroyo PA, Pereira NC. J Membr Sci 2011;378(1):453e61.178. Molinari R, Santoro ME, Drioli E. Ind Eng Chem Res 1994;33(11):2591e9.179. Al-Zuhair S, Ling FW, Jun LS. Process Biochem 2007;42(6):951e60.180. Xu Y, Du W, Liu D. J Mol Catal B: Enzym 2005;32(5):241e5.181. Dossat V, Combes D, Marty A. Enzyme Microb Technol 2002;30(1):90e4.182. Al-Zuhair S. Biotechnol Prog 2005;21(5):1442e8.183. Al-Zuhair S, Dowaidar A, Kamal H. Biochem Eng J 2009;44(2):256e62.184. Cheirsilp B. Biochem Eng J 2008;42(3):261e9.185. Zhang S, Zu Y-G, Fu Y-J, Luo M, Zhang D-Y, Efferth T. Bioresour Technol 2010;101(3):931e6.186. Azcan N, Danisman A. Fuel 2008;87(10):1781e8.187. Perin G, Álvaro G, Westphal E, Viana L, Jacob R, Lenardão E, et al. Fuel 2008;87(12):2838e41.188. Hsiao M-C, Lin C-C, Chang Y-H. Fuel 2011;90(5):1963e7.189. Kumar R, Ravi Kumar G, Chandrashekar N. Bioresour Technol 2011;102(11):6617e20.190. Kumar D, Kumar G, Singh C. Ultrason Sonochem 2010;17(5):839e44.191. Mootabadi H, Salamatinia B, Bhatia S, Abdullah AZ. Fuel 2010;89(8):1818e25.192. Veljkovi�c VB, Avramovi�c JM, Stamenkovi�c OS. Renewable Sustainable Energy Rev 2012;16(2):1193e209.193. Stavarache C, Vinatoru M, Maeda Y. Ultrason Sonochem 2007;14(3):380e6.194. Kumar D, Kumar G, Singh C. Ultrason Sonochem 2010;17(3):555e9.195. Demirbas A. Energy Convers Manag 2009;50(4):923e7.196. Hawash S, Kamal N, Zaher F, Kenawi O, Diwani GE. Fuel 2009;88(3):579e82.197. Song E-S, Lim J-w, Lee H-S, Lee Y-W. J Supercrit Fluids 2008;44(3):356e63.198. Xu J, Jiang J, Chen J, Sun Y. Bioresour Technol 2010;101(14):5586e91.199. Kongjan P, Kotay M, Min B, Angelidaki I. Biotechnol Bioeng 2010;105(5):899e908.200. Chong M-L, Sabaratnam V, Shirai Y, Hassan MA. Int J Hydrogen Energy 2009;34(8):3277e87.201. Ginkel SV, Sung S, Lay J-J. Environ Sci Technol 2001;35(24):4726e30.202. Skonieczny MT, Yargeau V. Int J Hydrogen Energy 2009;34(8):3288e94.203. Hawkes FR, Hussy I, Kyazze G, Dinsdale R, Hawkes DL. Int J Hydrogen Energy 2007;32(2):172e84.204. Valdez-Vazquez I, Ríos-Leal E, Esparza-García F, Cecchi F, Poggi-Varaldo HM. Int J Hydrogen Energy
2005;30(13):1383e91.205. Pan C, Fan Y, Xing Y, Hou H, Zhang M. Bioresour Technol 2008;99(8):3146e54.206. Van Ginkel SW, Oh S-E, Logan BE. Int J Hydrogen Energy 2005;30(15):1535e42.207. Khanal SK. Anaerobic biotechnology for bioenergy production: principles and applications. p. 189e219; 2008.208. Karadag D, Mäkinen AE, Efimova E, Puhakka JA. Bioresour Technol 2009;100(23):5790e5.209. Chen C-C, Lin C-Y, Lin M-C. Appl Microbiol Biotechnol 2002;58(2):224e8.210. De Vrije T, Claassen P. Bio-methane & bio-hydrogen. p. 103e23; 2003.211. Weiland P. Appl Microbiol Biotechnol 2010;85(4):849e60.
REFERENCES 629
212. Tabatabaei M, Sulaiman A, Nikbakht AM, Yusof N, Najafpour G. Influential parameters on biomethane generationin anaerobic wastewater treatment plants. InTech; 2011.
213. Deublein D, Steinhauser A. Biogas from waste and renewable resources: an introduction. John Wiley & Sons; 2011.214. Grieder C, Mittweg G, Dhillon BS, Montes JM, Orsini E, Melchinger AE. Biomass Bioenergy 2012;37:132e41.215. Cardona CA, Sánchez Ó. J Bioresour Technol 2007;98(12):2415e57.216. Hahn-Hägerdal B, Galbe M, Gorwa-Grauslund M-F, Lidén G, Zacchi G. Trends Biotechnol 2006;24(12):549e56.217. Sánchez ÓJ, Montoya S. Production of bioethanol from biomass: an overview. Biofuel technologies. Springer; 2013.
p. 397e441.218. Cardona C, Sánchez O. Analysis of integrated flow sheets for biotechnological production of fuel ethanol.
Energy 2006;31:2447e59.219. Zaldivar J, Nielsen J, Olsson L. Appl Microbiol Biotechnol 2001;56(1e2):17e34.220. Lynd LR, Weimer PJ, Van Zyl WH, Pretorius IS. Microbiol Mol Biol Rev 2002;66(3):506e77.221. Claassen P, Van Lier J, Contreras AL, Van Niel E, Sijtsma L, Stams A, et al. Appl Microbiol Biotechnol
1999;52(6):741e55.222. Gan Q, Allen S, Taylor G. Biochem Eng J 2002;12(3):223e9.223. Biofuels Al-Zuhair S. Bioprod Biorefin 2007;1(1):57e66.224. O’’Brien DJ, Roth LH, McAloon AJ. J Membr Sci 2000;166(1):105e11.225. Mazubert A, Poux M, Aubin J. Chem Eng J 2013;233:201e23.226. Esfahanian M, Ghorbanfarahi A, Ghoreyshi A, Najafpour G, Younesi H, Ahmad A. Int J Eng-Trans B: Appl
2012;25(4):249.227. He H, Guo X, Zhu S. J Am Oil Chem Soc 2006;83(5):457e60.228. Bolhàr-Nordenkampf M, Rauch R, Bosch K, Aichernig C, Hofbauer H, Kirtikara. K. 2nd RCETCE, Phuket,
Thailand 2003. p. 567e572.229. Obernberger I, Thonhofer P, Reisenhofer E. Euroheat Power 2002;10:1e17.230. Eriksson G, Kjellström B. Appl Energy 2010;87(12):3632e41.231. Dong L, Liu H, Riffat S. Appl Therm Eng 2009;29(11):2119e26.232. Marbe Å, Harvey S, Berntsson T. Energy 2004;29(8):1117e37.233. Lindfeldt EG, Westermark MO. Energy Procedia 2009;1(1):4111e8.234. Rhodes JS, Keith DW. Biomass Bioenergy 2005;29(6):440e50.235. Pettersson K, Harvey S. Energy 2010;35(2):1101e6.236. Shirazi MMA, Kargari A, Tabatabaei M, Mostafaeid B, Akia M, Barkhi M, et al. Bioresour Technol
2013;134:401e6.237. Javani A, Hasheminejad M, Tahvildari K, Tabatabaei M. Bioresour Technol 2012;104:788e90.238. Sulaiman A, Othman N, Baharuddin AS, Mokhtar MN, Tabatabaei M. Procedia-Soc Behav Sci 2014;121:35e43.239. Demirbas A. Appl Energy 2009;86:S108. S17.240. Tomes D, Lakshmanan P, Songstad D. Biofuels: global impact on renewable energy, production agriculture, and
technological advancements. Springer; 2010.241. Tao L, Aden A. Vitro Cell Dev Biol-Plant 2009;45(3):199e217.
20. BIOFUEL PRODUCTION630
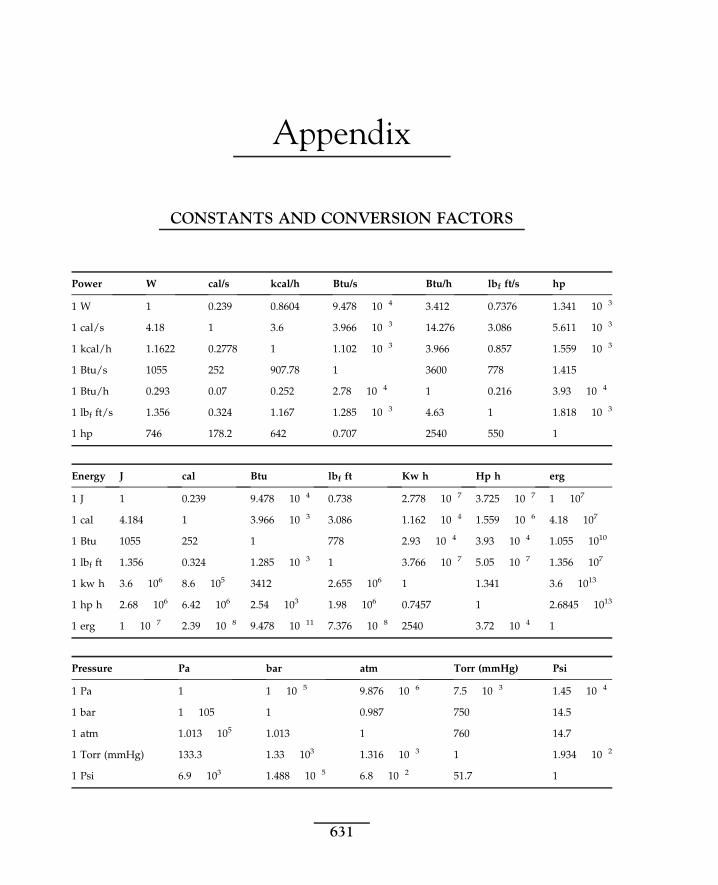
Appendix
CONSTANTS AND CONVERSION FACTORS
Power W cal/s kcal/h Btu/s Btu/h lbf ft/s hp
1 W 1 0.239 0.8604 9.478 � 10�4 3.412 0.7376 1.341 � 10�3
1 cal/s 4.18 1 3.6 3.966 � 10�3 14.276 3.086 5.611 � 10�3
1 kcal/h 1.1622 0.2778 1 1.102 � 10�3 3.966 0.857 1.559 � 10�3
1 Btu/s 1055 252 907.78 1 3600 778 1.415
1 Btu/h 0.293 0.07 0.252 2.78 � 10�4 1 0.216 3.93 � 10�4
1 lbf ft/s 1.356 0.324 1.167 1.285 � 10�3 4.63 1 1.818 � 10�3
1 hp 746 178.2 642 0.707 2540 550 1
Energy J cal Btu lbf ft Kw h Hp h erg
1 J 1 0.239 9.478 � 10�4 0.738 2.778 � 10�7 3.725 � 10�7 1 � 107
1 cal 4.184 1 3.966 � 10�3 3.086 1.162 � 10�4 1.559 � 10�6 4.18 � 107
1 Btu 1055 252 1 778 2.93 � 10�4 3.93 � 10�4 1.055 � 1010
1 lbf ft 1.356 0.324 1.285 � 10�3 1 3.766 � 10�7 5.05 � 10�7 1.356 � 107
1 kw h 3.6 � 106 8.6 � 105 3412 2.655 � 106 1 1.341 3.6 � 1013
1 hp h 2.68 � 106 6.42 � 106 2.54 � 103 1.98 � 106 0.7457 1 2.6845 � 1013
1 erg 1 � 10�7 2.39 � 10�8 9.478 � 10�11 7.376 � 10�8 2540 3.72 � 10�4 1
Pressure Pa bar atm Torr (mmHg) Psi
1 Pa 1 1 � 10�5 9.876 � 10�6 7.5 � 10�3 1.45 � 10�4
1 bar 1 � 105 1 0.987 750 14.5
1 atm 1.013 � 105 1.013 1 760 14.7
1 Torr (mmHg) 133.3 1.33 � 103 1.316 � 10�3 1 1.934 � 10�2
1 Psi 6.9 � 103 1.488 � 10�5 6.8 � 10�2 51.7 1
631
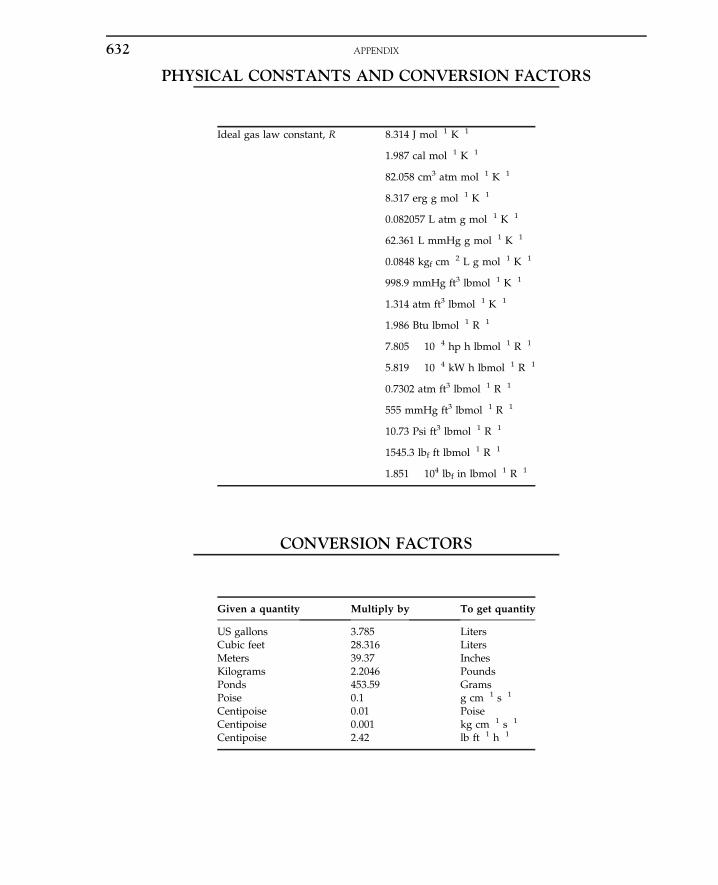
PHYSICAL CONSTANTS AND CONVERSION FACTORS
Ideal gas law constant, R 8.314 J mol�1 K�1
1.987 cal mol�1 K�1
82.058 cm3 atm mol�1 K�1
8.317 erg g mol�1 K�1
0.082057 L atm g mol�1 K�1
62.361 L mmHg g mol�1 K�1
0.0848 kgf cm�2 L g mol�1 K�1
998.9 mmHg ft3 lbmol�1 K�1
1.314 atm ft3 lbmol�1 K�1
1.986 Btu lbmol�1 R�1
7.805 � 10�4 hp h lbmol�1 R�1
5.819 � 10�4 kW h lbmol�1 R�1
0.7302 atm ft3 lbmol�1 R�1
555 mmHg ft3 lbmol�1 R�1
10.73 Psi ft3 lbmol�1 R�1
1545.3 lbf ft lbmol�1 R�1
1.851 � 104 lbf in lbmol�1 R�1
CONVERSION FACTORS
Given a quantity Multiply by To get quantity
US gallonsCubic feetMetersKilogramsPondsPoiseCentipoiseCentipoiseCentipoise
3.78528.31639.372.2046453.590.10.010.0012.42
LitersLitersInchesPoundsGramsg cm�1 s�1
Poisekg cm�1 s�1
lb ft�1 h�1
APPENDIX632
Index
Note: Page numbers followed by “b”, “f” and “t” indicate boxes, figures and tables respectively
AA. aureus, 3tA. wentii, 3tABE, see AcetoneebutanoleethanolAbiotic losses, 576e578ABRII, see Agricultural Biotechnology Research
Institute of IranAcetic acid, 13, 55t, 83e84, 313be314b, 621e622Acetic acid fermentation process, 312e314Acetobacter, 13Acetobacter aceti (A. aceti), 312e314Acetobacterium, 300tAcetobacterium woodii, 83e84Acetone, 53, 58e59Acetoneebutanoleethanol (ABE), 612e613Acetyl CoA, 84Acid pH, 436Acidogenesis, 573e574Acidogens, 574e575Acidulent, 11e12Acrylamide polymers, 242Actinomycetes, 6e7Activated sludge, 70b, 76, 399e410, 580e582Activation energy, 28Activators, 28Adenine, 30e31Adenosine triphosphate (ATP), 29, 291e292, 318Adsorbent contactors, 518Adsorption, 115, 242, 576e578, see also Downstream
processingchromatography, 245fixed-bed, 243e244Freundlich isotherm, 243ion-exchange, 242langmuir isotherm, 243
Aerated bioreactor, 70b, 225Aerated system, 70b, 195e196, 218e219Aerated tank, 78Aeration, 48, 53e56, 76, 199, 381e382,
427e428, 578Aeration tank, 78, 79fe80fAerobacter aerogenes, 131, 132f
Aerobicbiological oxidation, 569e572bioreactors, 53e54, 195e196downflow process, 410process, 561wastewater treatment, 76, 410e415
Aerobic culture, 57, 65be66b, 69be70bAffinity chromatography binding, 245AFM, see Atomic force microscopyAgar, 263, 293, 353, 353f, 442, 447e448Agaricus bisporus (A. bisporus), 431e432Agarose, 245e246, 509Agarose-based materials, 509e510Aggregated mycelia, 204e205Aggregation, 116, 235Agitation, 53e57, 56t, 63, 134e137, 195, 199, 355,
365, 381Agitation speed, 56, 88fe89f, 95, 96fAgitator, 57e58Agitator power, 61, 63Agricultural Biotechnology Research Institute of Iran
(ABRII), 597Aiba, 177tAir filtration, 405bAir sparger, 56e57Airliftbioreactors, 196e197, 202pressure cycle bioreactor, 195, 197
Alcohols, 1e2, 9e10, 114Algae, 607e608Alginate, 268Alginic acid, 268Alkaloids, 239e240Alkanes, 431a-ketoglutaric acid, 14e15Alumina membrane, 483American Type Culture Collection (ATCC), 334Amino acid, 14e15Ammonia (NH3), 559nitrogen oxidation reaction, 582removal, 461
Ammonium bicarbonate (NH4HCO3), 567e568
633
Ammonium fumarate, 260Amperometric biosensors, 118, see also Biosensorslinear detection range, 122LOD, 122recovery time, 122response time, 122sensitivity, 123sweeping potential vs. time, 119fvoltammetry, 118
Amperometry, 117e118Amyl acetate, 239Amylases, 33e34Amyloletic enzyme, 424Anabolism, 218Anaerobicdigestion, 572e576production, 621reaction, 575e576
Anaerobic media, 295e301Anaerobic membrane bioreactor (AnMBR), 463Analyte, see SubstrateAndrew substrate inhibition model, 93e94Andrews and Haldane model, 55tAngular velocity, 233e235, 382e383Animal fats, 607AnMBR, see Anaerobic membrane
bioreactorAnode, 109e110, 535tAnodic chamber, 544Anoxic process, 561Antibiogram assay, 352e353Antibiotics, 346, 348antibiogram assay, 353in batch process, 347biological assay, 353
analytical method, 352e353bioreactor design
and control, 355e356specification sheet, 360t, 361
chemical agents, 347detection, 352e353experimental procedure, 352fermenter
description, 352dimension estimation, 356e357
herbal medicines, 347inoculum preparation, 349e350microorganisms and media, 349oxygen transfer rate determination, 359e361penicillin, 348e349
extraction, 352filtration, 352
power input determination, 358e359
Reynolds number determination, 358submerged culture, 354e355
Antifoam, 62, 112e113, 199e200, 384Antigens, 4, 347Apoenzyme, 28Apparent Michaelis constant, 153, 176Aqueous two-phase partition, 500Arabinoxylanase, see b-glucanaseAraboascorbic acid, 3tArginine, 114, 116, 429tArrhenius’ law, 38, 40, 209Arsphenamine, 347Arthrobacter, 14e15, 608e609Arthrospira platensis (A. platensis), 608Artificial mediators, 538e539Ascorbic acid, 36t, 114Asparagines, 298Aspartase, see Aspartate ammonia lyaseAspartate ammonia lyase, 28e29Aspartic acid, 28e29Aspergillus niger (A. niger), 363e365Aspergillus oryzae, 6e7ATCC, see American Type Culture CollectionAtomic force microscopy (AFM), 535e536ATP, see Adenosine triphosphateAttached growth, 586e594, 586tAttached growth process, 558Autoclave, see Closed systemAutoclave operation, 449e450Autotrophic, 83e84, 584Auxotroph, 301Average biomass concentration, 141Azotobacter vinelandii, 65be66b
Bb-lactam antibiotics, see PenicillinBacillus amyloliquefaciens, 287tBacillus polymyxa, 351tBacillus subtilis, 3t, 351t, 352e353, 430Bacillus thuringiensis, 2Background current, 118Bacteria, 567e568, 608e609culture, 566e567media sterilization, 447e448
Bacterial amylase, 3tBacterial protease, 3tBacteriophage, 8Bacteriostatic, 346Bacto-agar, 293Bagasse, 46e47, 611e612Baker’s yeast, 10e11, 16e18, 17f, 420, 429batch experiment, 421
Basal medium, 295
INDEX634
Batchadsorption, 500citric acid fermentation, 371e373culturecell growth, 131disadvantages, 140kinetics of, 132e133
experimentcontinuous ethanol fermentation experiment, 343optical cell density, ethanol, and carbohydrate
concentration, 342fermentation, 278, 419e421ethanol, 406be407bexperiment, 340e341glucose concentration, cell density, and ethanol
production, 274fkinetic model for, 274frelative activities of S. cerevisiae in, 275fyeast cell dry weight and optical density, 271
mixed reactor, 196sterilization, 437e439system, 90e91
Batch Bioreactor, 84e88bCOD, see Biodegradable chemical oxygen demandBed matrix, 245Bed voidage, 504Beer, 34, 194, 201, 238Beer’s law, 337b-glucanase, 34b-lactam antibiotics, 346, 349Beverages, 1e2, 5e6, 330BFC, see Biological fuel cellBioalcohol resources
first-generation biofuel, 601second-generation biofuels, 602third-generation biofuel resources, 607e608
Bioanalytical assays, 114Bioassay, 352e353Biobutanol production, 612e613Biocatalysts, 535e536biocatalysts, active, 535e536Biochemical oxidation Xanthomonas campestris,
314be317bBiochemical oxygen demand (BOD), 559, 568e569Biochemical reaction stoichiometry, 331e332Bioconversion, 11e12Biodegradable chemical oxygen demand (bCOD), 592Biodegradable polymer, 11e12Biodegradable soluble chemical oxygen demand
(bsCOD), 568e569Biodiesel
production, 613e619, 619fresources
first-generation biofuel, 601e602second-generation biofuels, 602e607third-generation biofuel resources, 608e609
Bioelectricity, 531Bioelements, 114e115Bioethanol, 330fuel benefits, 331production, 462e463, 601, 609e612
dry grinding, 612fwet grinding, 611f
Biofilm, 259Biofilter, 3e4Bioflocs, 235e236Biofuel production, 462, 598classification and comparisons, 610tdrives and impacts, 598e600economic perspective, 624events of, 599tfeedstock, 600e601
first-generation biofuel, 601e602second-generation biofuels, 602e607third-generation biofuel resources, 607e609
integration of process, 622e624policies, 600tprocesses and technologies, 609
biobutanol production, 612e613biodiesel production, 613e619, 619fbioethanol production, 609e612biogas production, 621e622biohydrogen production, 621biomethane, 621e622
Biofuel Research Team (BRTeam), 598e599Biogasproduction, 621e622resources, 602
Biohydrogen production, 621Biologicalcatalysts, 30fluorophores, 129fouling, 464e465hydrogen production, 546e547process, 568e569transport of oxygen, 217e218
mass transfer coefficient estimation, 218e221mass transfer in aerated and agitated vessels,
221e223Biological assay, 114, 353Biological element, 114e115Biological fuel cell (BFC). see also Microbial fuel cell
(MFC), 529e530Biological oxygen demand (BOD), 457e458, 547Biological transport of oxygen, 217e223Biological treatment, 558
INDEX 635
Biological treatment (Continued )abiotic losses, 576e578aerobic biooxidation, 569e572anaerobic digestion, 572e576attached growth, 586e594, 586tbiological
denitrification, 579e586, 581f, 584tnitrification, 579e586, 581f, 584t
growth rate, 562e568microbial
growth kinetics, 561e562metabolism, 559e561
organic removal, 558e559principal groups, 558removal mechanism in biological process, 568e569suspended growth, 586e594, 586ttreatment kinetics, 562e568volatilization, 578e579
Bioluminescence, 104Biomass, 10e11balances, 141e142concentration, 589e590yield, 562e563
Biomass composition, 106tBiomaterials immobilization, 115adsorption, 115covalent binding, 116cross-linking, 116encapsulation, 115e116entrapment, 115
Biomethane, 621e622Biomolecules, 14, 28, 239e240, 538Bioprocess, 2, 3t, 9products, 10
biomass, 10e11cell products, 11modified compounds, 11and services, 10t
Bioprocess scale-upaerobic wastewater treatment, 410e415applied calculation method for, 391be394bbioreactor design, 384e388calculation, 396be397bdynamic model, 399e410ethanol batch fermentation, 406be407bfilter and air filtration, 405bmass transfer coefficient calculation, 398be399boxygen transfer rate, 399e410power calculation, 394be396bpower consumption calculation, 414be415bprocedure, 376
for constant KLa, 377e378for constant mixing time, 379e381
on physical concepts, 381e384on shear forces, 378e379
stirred tank reactor chemostat vs. tubular plug flow,388e399
vinegar production, 408be410bBioreactor design, 9, 53e54, 193e194, 384e388aerated and stirred vessels percentage distribution,
194tairlift bioreactors, 202biological transport of oxygen, 217e223bubble column fermenter, 201controlling probes, 105e106CSTR fermenter design equations, 205e208heat transfer, 203e205performances, 195tsensor characteristics, 106e107specification sheet, 360t, 361stirred tank bioreactor, 198e200temperature effect on rate constant, 209type of, 195e198
Biosciences, 5Biosensors, 113, 547, see also Fermentation process
controlbiological element, 114e115biomaterials immobilization, 115e116components, 114ftransducer, 117e118
Biostat, 137Biosynthesis, 14, 55, 292e293, 346Biosystem, 105e106, 217e218Biotechnology, 2e5, see also Downstream processingadvances in, 497
cell disruption, 498e499Dyno Mill KDL-I, 499fprotein products, 497e498protein purification, 500e501
Biotic loss, 568Biotransformation, 11Blastospores, 354e355BOD, see Biochemical oxygen demand; Biological
oxygen demandBovine serum albumin (BSA), 425BP, see British PetroleumBradyrhizobium, 2Breakthrough point, 243Brevibacterium, 3t, 14e15Brevibacterium lactofermentum, 300tBrevibacterium sp., 3tBritish Petroleum (BP), 426e427Broad spectrum, 351tBroth, 252be253bBroth rheology, 106tBRTeam, see Biofuel Research Team
INDEX636
BSA, see Bovine serum albuminbsCOD, see Biodegradable soluble chemical oxygen
demandBubble, 68e74Bubble column, 384e388, 385b
fermenter, 201Bubble diameter, 60e61, 220, 221be223bBubble residence time, 68Bubble size, 56e57, 59, 220Buoyant force, 68, 225Butanol, 6e7, 240, 612e613Butyl acetate, 239e240, 352Butyric acid, 327b
CCake resistance, 231e233Calcium alginate, 268e270Calderbank and Moo-Young, 219Candida lipolytica, 363e364Candida rugosa (C. rugosa), 181e182Candida sp., 302t, 303, 430tCandida tropicalis (C. tropicalis), 431e432Candida utilis (C. utilis), 6e7, 431e432Capacitance, 105, 112e113Capacitance foam detector, 113Capacitance probes, 105Carbohydrates, 2, 7e8, 15, 163be165b,
267, 369Carbon capture and storage (CCS), 624Carbon dioxide, 6e7, 33e34, 56, 462, 598, 608Carbon dioxide production rate, 56, 105Carbon Monoxide, 84, 93, 98fCarbon monoxide dehydrogenase (CODH), 84Carbon sources, 5Carbonaceous biochemical oxygen demand (CBOD),
568e569Carboxy methyl cellulose (CMC), 116, 245e246Carotenoid, 36t, 37Carrageenan, 116, 288tCarrier binding, 261CAS, see Conventional activated sludgeCaster, 607Catabolic pathway of glucose, 318Catabolic repression, 165fCatabolism, 7e8, 55, 318, 432e433Catabolite, 196Catabolite repression, 196Catalysts, active, 30Catalytic processes, 83e84Cathode catalyst, 533Cathodic chamber, 544e545Cation exchange membrane, see Proton exchange
membrane (PEM)
CBOD, see Carbonaceous biochemical oxygendemand
CCS, see Carbon capture and storageCell concentration, 84e85, 90e91, 134e137, 173Cell density, 65be66b, 69be70b, 134e137, 141, 270,
476Cell density monitoring, 419e420Cell dry weight (CDW), 56, 79, 80f, 85, 131, 255, 339,
368Cell harvesting, 143Cell load, 137fCell morphology, 106t, 332e333Cell optical density (COD), 54e55, 79, 129Cell recycling, 143, 462Cell respiration, 129, 217e218Cell rupture, 57, 238Cell suspension, 498e499, 499f, 511Cell turbidity, 138f, 271Cell wall, 6, 35, 346, 498e499Cell(s)activities, 259concentration, 332disruption, 238e239, 498e499growth, 371e372
in batch culture, 131phases, 131e132
products, 11wall, 6weight, 368
measurements, 339Cellular composition, 106t, 428tCellulose, 34, 330, 430Cellulose acetate, 116, 460tCellulose triacetate, 262Centrifugal force, 200, 233e234Centrifugation, 233e235centrifuge effect, 233e234theory of, 233e235
Centrifuge, 233e234, 239, 250bCephalosporin, 3t, 346, 350, 351tCephalosporineCephalosporium acremonium, 3t, 351tCeramic membrane, 483, 486falumina-coated on, 487fzirconia-coated on, 489f
Cheese, 1e2, 11e12, 34, 194Chemical agents, 347Chemical antifoams, 112Chemical oxygen demand (COD), 457e458, 568e569,
569fChemical sensors, 547Chemical sterilization, 451Chemoautotrophs, 560
INDEX 637
Chemolithotroph, 83e84Chemostat, 134e137Chemostat bioreactor, see Continuous stirred tank
reactor (CSTR)Chemostat modification, 143Chemotherapy, 347Chen and Hashimoto, 176tChitin, 35Chitosan, 115e116Chromatography, 244e253principles of, 246e253
Chronoamperometry, 118Cibacron Blue 3 GA, 500e501, 501fCIP, see Cleaning-in-placeCirculation time, 106tCitric acid, 2, 363e364, 369analytical method, 368e369experimental run, 369e371factors affecting mold growth, 365e367fermentation process, 365e367kinetic model in, 371e373processes for recovery, 369production, 324be325b, 364e365,
367e368purification processes, 369seed culture, 367seeding inoculum, 367
Citric acid cycle, 84Clean water, 548Cleaning-in-place (CIP), 509Clogging, 112, 196, 363e364Closed system, 435e436Clostridium acetobutylicum (C. acetobutylicum), 6e7Clostridium butyricum (C. butyricum), 532Clostridium ljungdahlii (C. ljungdahlii), 83e84CO substrate on, 96e98growth simulation, 90f
Clostridium species, 6e7Clostridium thermoaceticum, 83e84Clostridium thermocellum, 331e332Clostridium thermohydrosulfuricum, 331e332CMC, see Carboxy methyl celluloseCO substrate, 96e98CoA, see Coenzyme ACoagulated milk, 3tCoalescing systems, 61e62Cobalamin (vitamin B12), 3t, 296tCOD, see Chemical oxygen demandCODH, see Carbon monoxide dehydrogenaseCoenzyme A (CoA), 35e36Coenzymes, 28, 35e37, 36tCofactors, 35Collagen, 116
Competitive inhibitors, 31, 32fCompressible cake, 232Conductance, 105, 112tConductance probes, 105Conductivity, 105, 112t, 117e118Conductometry, 117e118Conjugated enzymes, 147, 149e150, 153Conservation of mass principle, 309e317Consolidated bioprocessing (CPB), 623Constant mixing time, 379e381Constant power, 376e377Continuous culture, 140Continuous extraction column, 240e242Continuous fermentation, 341e342,
419e421, 471f, 473, 474tContinuous sterilization, 439e441, 440f,
446be447bContinuous stirred tank reactor (CSTR), 104, 105f,
381, 389be391bfermenter
design equations for, 205Monod model for chemostat, 205e208
Contois model, 176Control unit, 104, 114fConventional activated sludge (CAS), 457e458Conventional batch fermenter, 357fConveyer centrifuge, 233Cooling coil, 349e350Coomassie plus protein assay reagent, 425Coomassieeprotein reaction scheme, 425Corn, 601Corn steep liquor, 14e15, 18, 311be312b, 348Corn syrup crystallization, 8Correction factors, 211be214bCorynebacterium glutamicum, 2Cottrell equation, 120Coulombic yield, 543Coulter counter, 332Covalent binding, 116, 284CPB, see Consolidated bioprocessingCritical dilution rate, 137, 142Cross-flow, 459Cross-linking, 116, 262Crystallization process, 241, 253e255CSTR, see Continuous stirred tank reactorCurrent, 54, 108, 118, 332background, 119e120Cyanobacteria, 608Cyclic voltammetry, 118Cyclic voltammogram, 119e120, 119fCysteine, 298, 428e429, 429tCytoplasm, 6Cytoserine, 346
INDEX638
DD-mannuronic acid, 268Dairy products, 1e2, 9, 11e12, 34DAP, see Diaminopimelic acidDeath phase, 90e91, 131e132, 140, 179, 354, 561e563Death rate, 86, 139, 437Decanter, 233Decarboxylase, 29, 34, 608Denitrification, biological, 579e586, 581fDermatophytic fungi, 351tDescription of glycolysis, 319e326Detecting antibiotic, 352e353Detection, 112e113, 117, 352e353detection range, 122Dextran, 3t, 509Dextrin, 16, 245e246Dialysis, 228, 512Diaminopimelic acid (DAP), 14Diauxic growth, 165fDigestive enzymes, 30Dilution rate, 72, 139, 168t, 478e479maximum dilution rate, 134e137, 165be166b,
214be215bDimensionless aeration rate, 211be214b, 3593,5-dinitrosalicylic acid (DNS), 78, 337Dinucleotide, 7e8, 36tDirect conversion process, 608Direct product sequestration (DPS), 512Disadvantages of batch culture, 140Disc-stack bowl centrifuge, 235, 235fDisk turbine agitator, 58Dissolved carbon dioxide, 104e105, 106tDissolved oxygen (DO), 54, 76, 109, 419, 568e571
measurement, 54and control, 109e110
probe, 54in SCP, 419
Distillation, 174, 228, 330e331, 610e611, 623Divinyl benzene, 242Dixon plot, 189DNA, 35, 106tDNAligase, 35DNS, 270e271, 337, 472DNS, see 3, 5-dinitrosalicylic acidDO, see Dissolved oxygenDO measurement, 123DO probe, 54, 58, 109, 123, 419Double reciprocal plot, 145e146Doubling time, 6Dourado, 177tDown-comer, 202, 220e221Downstream processing, 11, 228, 497
acid recovery by liquideliquid method, 230f
cell disruption, 238e239centrifugation, 233e235and solvent extraction, 230f
chromatography, 244e253conventional techniques, 501e502crystallization process, 253e255emerging technology for cell recovery, 238experimental procedure, 510e511FBA, 502e504filtration, 231e233flotation, 237freeze-drying, 255jacketed fermentation vessel, 229fliquid fluidized beds, 504e510process integration, 511e513for proteins purification, 498fsedimentation, 235e236
DPS, see Direct product sequestrationDraft tubes, 202Driving force for mass transfer, 58Dry heat sterilization, 450Drying, 228, 236, 449, 485, 488, 603te606tDual substrates, 147e152, 163be165b, 178Dynamic model, 399e410
EEadieeHofstee plot, 172fEffective mineral, 106tEffluent substrate concentration, 591Ehrlich ascites tumor, 287tEI, see EnzymeeinhibitorEIS, see EnzymeeinhibitoresubstratesElectricity, 528, 545e546Electrochemical biosensor, 117e118Electrochemical detectors, 109Electrode, 54, 110e111, 113, 118Electrode response, 107Electrodialysis, 452, 469, 500Electrolyte, 54, 61e62, 109e110, 118, 231, 530t, 542Electromagnetic flow meters, 105Electronacceptor, 560beam sterilization, 451donors, 562e563mediator, 538e539transfer, 536e538transport, 538
Elemental balances, 303e305Elemental composition, 291e293, 304EmbdeneMeyerhofeParnas pathway (EMP),
318e326glycolysis, 319e326
EMR, see Enzymatic membrane reactor
INDEX 639
Encapsulation, 115e116Endocarditis infection, 347Endomycopsis biospor, 40Energy balance for continuous ethanol fermentation,
305e306Energy integration, 623e624Enterobacter aerogenes, 14Entrapment, 115, 261e262Enzymatic hydrolysis reaction, 181Enzymatic membrane reactor (EMR), 181e182Enzymatic rate equation, 187e189Enzyme, 20activators, 30e31catalysts, 30e31classifications, 28e30coenzymes, 35e37deactivation, 37e38elementary reaction rate, 21e28
inverse urea and inverse rate calculation, 24tlinear plot, 24fLineweavereBurk plot, 25fe26fMichaeliseMenten rate constants, 24be25b
enzymatic reactions, 20enzyme-catalyzed reaction inhibitors, 31e33industrial application, 33e35kinetics, 182
product inhibition study, 185e186rapid equilibrium system, 187substrate and product inhibitions analyses,
182e183substrate inhibition study, 183e185verification, 189e191
leakage, 115effect of pH, 37production, 16, 20e21specific function, 30unit activities, 37
Enzyme activators, 30e31Enzyme activities, 28, 33e34, 37, 40t, 45e46, 344Enzyme Commission, 37Enzyme kinetic model, 181e191Enzyme kinetics, 182e186Enzyme reaction kinetics, 145e146, see also Growth
kineticsnoncompetitive inhibition rate model, 153e172reaction mechanism with competitive inhibition,
152e153reversible reactions with dual substrate reaction,
151e152single enzyme with dual substrates mechanism,
147e151Enzyme-catalyzed reactions inhibitors, 31e33Enzyme-substrate (ES), 32
Enzymeeinhibitor (EI), 185e186Enzymeeinhibitoresubstrates (EIS), 32e33EPS, see Extracellular polymeric substanceEquilibrium constant, 242Equilibrium kinetic studies, 520e522Ergosterol, 36t, 37Erythromycin, 3t, 15, 239e241, 351tES, see Enzyme-substrateEscherichia coli (E. coli), 15, 260, 304e305, 334t, 538Essential amino acids, 14, 422, 428Estimation of mass transfer coefficient, 218e221, 381Ethanol, 330analytical method, 338fermentation, 278, 468
batch fermentation, 406be407bbiofilm reactor use for ethanol production, 267continuous fermentation, 471f, 473, 474texperimental environment, 470e472immobilized biomass activity, 268using MBR, 470, 474e479membrane technology, 469in using S. cerevisiae, 267
inhibition, 468production, 330e331
immobilized systems for, 288e2892-ethoxyethanol, 185Evaporation, 113, 228, 342Exhaust gas, 105, 112, 349e350Exit gas, 56, 104e105Expanded bed adsorption, 518, 522e523degree of bed expansion, 508e509, 516StreamlineTM DEAE, 522
Exponential growth phase, 131e132, 333External loop, 195, 197e198, 202Extracellular polymeric substance (EPS),
464e465Extracellular polymers, 259Extraction of penicillin, 239e240, 352
FF/M ratio, see Food to microorganism ratioFaraday constant, 110e111, 541e543FBA, see Fluidized bed adsorptionFed batch, 18, 144, 413e415Fed batch culture, 144e145Fed-batch mixed reactor, 196Fermentation, 7e8, 573e574fermentation-based products, 461e462media preparation for, 292e293
anaerobic media preparation, 295e301medium formulation, 293e294minimal and standard media preparation,301e303
INDEX640
phase, 573e574process, 7e9
Fermentation process application, 7e10, 356batchexperiment, 342e343fermentation experiment, 340e341
biochemical reaction stoichiometry, 331e332bioethanol fuel benefits, 331cell dry weight measurements, 339continuous fermentation experiment, 341e342ethanolanalysis analytical method, 338production, 330e331
expected results, 343e344growth and product formation kinetics, 333e334inoculum preparation, 335media sterilization, 342optical cell density, 332e333RI determination, 338seed culture inoculation, 336e337stock culture preparation, 334e335yield calculation, 339
Fermentation process control, 104, see also Biosensorsbioreactorcontrolling probes, 105e106sensor characteristics, 106e107
DO measurement and control, 109e110foam detection and prevention, 112e113pH/redox measurement and control, 110e111temperature measurement and control, 108e109
Fermenter, 9, 53e54, 194e195description, 352dimension estimation, 356e357
Fick’s law, 120FID, see Flame ionization detectorFilamentous
form, 333organisms, 293shape, 6e7
Film theory, 59, 91, 91fFilter aids, 231, 310be311bFilter cake, 12, 231e232, 246be247b,
310be311bFilterability, 231Filtration, 231e233, 352
filter and air, 405bhormone separation in gel, 252bpressure drop, 231sterilization with, 450theory of, 231e233First-generation biofuel, 601feedstocks, 601e602
Fixed-bed adsorption, 243e244, 502
Fixed-film or biofilm process, see Attached growthprocess
Flame ionization detector (FID), 472Flat blades Turbine disk, 58Flavin adenine denucleotide, 129, 500e501Fleming, 15, 348Flocculation, 195, 230e231, 580Flotation, 237e238Fluidized bed, 196, 518Fluidized bed adsorption (FBA), 502e504column design for, 510matrices for, 509e510
Fluidized/expanded bed system, 503e504hydrodynamic characterization, 504interfaced and integrated, 511e513
Fluorescence, 117, 129, 130fFluorescence spectroscopy, 129e130Fluorophase, 129Fluorophore, 129Flux, 58, 64, 123, 490FO, see Forward osmosisFoambreaker, 112, 384detection and prevention, 112e113detectors, 112level, 106t
Foaming, 104, 112, 199e200, 349e350Food additive, 2, 14, 363e364, 429Food stabilizer, 3tFood to microorganism ratio (F/M ratio), 590Forward osmosis (FO), 465e466Four-bladed disk turbine, 200Free enzyme, 20, 22, 31, 148, 150, 187e188Free sites, 31e32, 148e149Freeze drying, 229, 255freeze drying/lyophilisation, 229freeze-dried culture, 334Freundlich isotherm adsorption, 243Freundlich model, 243Froude number, 63, 199, 384Fuel cell, 528, 528fclassification, 529merits, 529stack, 533e534
Funda-foam system, 200Fungi, 2, 6e7, 11e12, 349, 418e419, 607Fungus Fusarium, 331, 431Fusarium sp., 331e332
GGAC, see Granular activated carbonGalactose, 462Galileo number, 507e508
INDEX 641
Galvanic detectors, 109Gas analyzer, 109Gas bubble formation, 68e74Gas chromatography (GC), 244, 338, 568e569Gas dispersion, 56e58Gas flow rate, 201, 221be223b, 357, 385b, 396be397bGas fluidized beds, 503Gas hold-up, 60e61, 68, 68b, 203e204, 211be214b,
396be397bGas mixing patterns, 106tgas oil floc, 220Gas superficial velocity, 201, 357Gaseliquid system, mass transfer in, 59e60Gassed power, 61, 211be214b, 380, 402be404bGC, see Gas chromatographyGDH, see Glutamic acid dehydrogenaseGel beads, 259e260Gel chromatography, 245Gel filtration, 228e229, 245e246Gel polarization, 550Gelatin, 262Ghose and Tyagi, 177tGlucolysis, 6e7, 320fGluconic acid, 13, 309be310bGluconobacter, 13Gluconobacter suboxydans, 3tGlucose, 431isomerase, 34oxidase, 123
Glutamic acid, 2, 3t, 9, 14e15Glutamic acid dehydrogenase (GDH), 14e15Glutaraldehyde, 110e111, 116, 262, 284Glycerol, 8e9, 14, 305e306, 330, 616Glycolysis, 319e326glycolytic, 7e8Graetz number, 204e205GraetzeLeveque equation, 204e205Gram-negative bacilli, 427e428Gram-negative bacteria, 346Gram-positive bacteria, 346Granular activated carbon (GAC), 460e461Grashof number, 218e219Gravitational force, 63Growth factors, 36, 292e293, 442, 565Growth inhibitors, 106tGrowth kinetics, 129in batch bioreactor, 84e88batch culture, 131for continuous culture, 133e137growth phases, 131e132indirect measurements, 129
fluorescence spectroscopy, 129e130specific growth rate, 130e131
material balance for CSTR, 137e145unstructured kinetic model, 173e179
Growth phase, 131e132, 354, 562e563Growth rate, 31, 54, 86, 130e131, 139, 174, 206,
254e255, 304e305, 371e372, 562e568Growth stimulants, 36, 131, 442Growth stoichiometry Elemental balances,
303e305Growth-limiting factor, 567e568Growth-rate limitations, 304e305
HHagglund, 177tHaldane model, 563e564Half-life, 11, 37e38, 278e279Hanes-Woolf, 183fe186fHansford model, 178Heat evolution, 104Heat production, 108e109Heat transfer, 203e205Heat transfer coefficient, 203e205, 441e442Heating, 43, 231, 437, 449, 610e611Heating phase, 449Hemicellulase catalase, 11Hemicellulose, 330, 602Hemocytometer slide, 332Henry’s constant, 92Henry’s law, 59e60, 67, 96, 578e579Herbal medicines, 347Herbert, 177tHetero-polymer, 330Heterofermentative organism, 6e7Heterogeneous catalysts, 616Heterogeneous nucleation, 253e254Heterogeneous systems, 20, 53e54Heterotroph, 301, 560Hexokinase, 28Hexose, 28High shear rate, 195High-pressure homogenizer (HPH),
498e499Hinshelwood, 176, 177tHistidine (His), 35e36Hollow fiber, 459, 463, 469Holoenzyme, 28holographic laser interferometry, 285e286Homofermentative organism, 6e7Homogeneous nucleation, 253Homogeneous phase, 20Homolactic fermentation, 11e12, 319Hormone, 4e6, 15, 228, 252bHot plates, 441e442, 441fHPH, see High-pressure homogenizer
INDEX642
Humidification, 228, 309be310bHydraulic retention time (HRT), 587e588Hydrochloric acid (HCl), 615Hydrodynamics, 517Hydrogen production, 621Hydrogenase, 28e29, 129Hydrolases, 29e30Hyphae, 6e7, 367, 371e372
IIbuprofen ester, 181e182, 182f, 185, 189ICR, see Immobilized cell reactorImmobilization
of biomaterials, 115e116methods, 285tof microorganisms by covalent bonds, 284ethanol productivity, 288tgrowth and colony formation, 286e288microbial cells, 286toxygen transfer to, 284e285studies of diffusion, 287tsubstrate transfer to, 285e286
Immobilized cell reactor (ICR), 262, 468continuous fermentation of dual substrate, 264telectronic microscopic scanning, 271, 272fe273fethanol detection, 271ethanol fermentation in using S. cerevisiae, 267biofilm reactor use for ethanol production, 267immobilized biomass activity, 268
experimental reactor system, 268e270experimental setup, 269fproperties and appearance of Saccharomyces
cerevisiae beads, 270texperiments, 263glucose concentration determination, 270e271kinetic model for immobilized P. acidipropionici, 266tmodel test using P. acidipropionici, 265frate model, 263e266statistical analysis, 271conversion vs. retention time, 276fglucose concentration, cell density, and ethanol
production, 274fglucose consumption, 276fkinetic model for batch fermentation, 274fLactobacillus bulgaricus beads, 277fpercentage growth of immobilized cells, 275frelative activities of S. cerevisiae, 275fS. cerevisiae beads, 277f
yeast cell dry weight and optical density, 271Immobilized enzymes, 616Immobilized microbial cells, 259e260, see also
Microorganismsadvantages and disadvantages, 262
alternative methods, 261fbatch fermentation, 278carrier binding, 261cross-linking, 262entrapment, 261e262ethanol production vs. retention time, 280f
glucose concentration and, 281fevaluation, 272e278high concentration effect, 279e281reactor setup, 279relative activity, 278e279techniques, 260f
Immobilized system, 195for ethanol production, 288e289ethanol productivity from, 288t
Immunoglobulin C, 251bImpeller, 106t, 210, 376, 378e379, 386be388bmarine, 58tip velocity, 210, 376, 378e379
Impeller flooding, 106tImpeller speed calculation, 386be388bImpeller tip velocity, 210, 376, 378e379Inclined blade turbine, 57Inducers, 106tIndustrial bioreactors, 202Industrial fermentation, 2Industrial microbiologyamino acids production, 14e15Baker’s yeast, 16e18, 17fbioprocess, 2
products, 10e11biosciences, 5biotechnology, 2e5enzymes production, 16industrial fermentation, 2insulin production, 14e15lactic acid production, 11e12microbe functions, 5e7microorganisms, 1e2penicillin production, 15e16process fermentation, 7e9vinegar production, 13
Inexpensive carbon sources, 418e419Inhibition, 148e149Inhibitors, 30e31Inoculum preparation, 335, 349e350Inorganic components, 549Inorganic membrane, 483e484Insulin production, 14e15, see also
PenicillindproductionIntensification and integration methods, 622energy integration, 623e624reaction-separation integration, 623
INDEX 643
Intensification and integration methods (Continued )reactionereaction integration, 622e623separationeseparation integration, 623
Interferon, 3t, 4e6, 228e229Intermediate enzymeesubstrate complex, 150Intermig agitator, 58Internal-loop, 202International Energy Agency, 598Interspecies hydrogen transfer, 574e575Intracellular enzyme, 11, 228e229, 237, 503e504ion exchangers, 228e229, 243Ion-exchange adsorption, 242Ion-exchange chromatography, 244e246Iranian Research Organization for Science and
Technology (IROST), 42, 470Irreversible, 20e21, 151e152, 464Isomerization, 29e30Isopropanol, 6e7, 271
JJacket, 203e205, 438e439, 499Jacketed bioreactor, 408be410bJatropha, 602Jerusaliwski, 177tJin, 177t
K“Kat”, 37Kinetic model, 173e179, 371e373Kinetic parameters, 24be25b, 95, 97t, 165be166b,
183, 373Kinetics, 140e141, 151e152, 354e355, 586, 620tKinetics of Growth, 84e88, 333e334Kinetics of reversible reactions, 151e152Klebsiella aergenes, 334tKoji bioreactor, see Static tray bioreactor
LL-aspartic acid, 260L-glucuronic acid, 268L. brevis, 11e12L. casei, 11e12L. delbrueckii, 11e12L. helveticus, 11e12L. manihotivorans, 11e12L. paracasei, 11e12L. plantarum, 11e12Lactase, 11Lactate, see Lactic acidLactic acid, 11e12, 461e462Lactobacillus bulgaricus, 3t, 11e12, 277f, 279Lactobacillus delbrueckii, 3t, 11e12Lactobacillus species, 6e7, 11e12
Lactose, see WheyLag phase, 86, 88e89, 131, 133, 163be165b, 278,
561e562Lambert-Beer law, 129Laminar flow, 63, 204e205, 231e232, 448, 519e520Landfill leachate (LFL), 460e461Langmuir isotherm adsorption, 243LangmuireHanes, 274f, 278Leachate, 20e21, 460e461Leucine, 114, 298, 429tLeuconostoc mesenteroides, 3tLFL, see Landfill leachateLigase, 30, 35Light microscope (LM), 484Lignin, 34, 330, 423e424, 430, 602LignaseLignocellulose, 602, 603te606tbiomass, 602
Limit of detection (LOD), 122Linear detection range, 122Linear first-order differential equation, 265Linear-sweep voltammetry, 118LineweavereBurkequation state, 121e122plot, 25fe26f, 343
Lipases, 41Lipid, 9, 26b, 262, 531e532, 608e609Lipopolysaccharide, 35, 262, 531e532Liquid chromatography, 337, 352e353, 369, 500Liquid fluidized bed adsorption, 516, 518, see also
Nanobiotechnology Group contactor (NBGcontactor)
adsorbent contactors, 518bed expansion characteristics, 518bed voidage, 504column and solid phase designs, 516e517degree of bed expansion, 508e509FBA
column design for, 510matrices for, 509e510
hydrodynamiccharacterization, 504performance of NBG contactor, 517
materials, 517e518particles
minimum fluidization velocity, 505e506terminal settling velocity, 506e508
Liquid gas mass transfer process, 411fLiquid level, 105, 113, 134e137, 381Liquideliquid extraction, 240, 613LM, see Light microscopeLOD, see Limit of detectionLogistic equation, 90e91
INDEX644
Logistic model, 88e89, 173e174, 372Loop bioreactor, 195, 197e198Low-temperature sterilization, 452Lux meter, 93, 95Lyophilization, 255Lyophilized, 228, 255Lysine, 2, 3t, 14e15, 262, 298, 429tLysozymes, 30, 35
MMacrofloc, 235Maintenance, 42e43, 83e84, 547, 560, 565, 579Malic acid, 13Malt, 7e8, 34, 293, 299t, 420e421Malthus function, 86Mammalian cell, 196MantoneGaulin homogenizer, 239Marine propeller, 63, 212f, 215be217bMarine type, 58Mass balance for biological processes, 306e309Mass flow meter, 105Mass spectroscopy, 568e569Mass transfer
in aerated and agitated vessel, 221e223coefficients, 61e62, 381limited process, 63e74phenomena, 91e93film theory for, 91f
Material balance, 413e415Maximum dilution rate, 134e137, 165be166b,
214be215bMBR, see Membrane bioreactorMechanisms of single enzyme, 147e151Media sterilization, 342Medium formulation, 293e294, 344MEK, see Methyl ethyl ketoneMembrane, 465e466
g-alumina, 484e485, 491anisotropic membrane, 353ceramic membrane, 483, 492charged membrane, 577e578dense membrane, 481fouling, 463e465, 502, 544isotropic membranes, 352e353metal and liquid membranes, 353microporous membranes, 352nonporous membranes, 486fsemipermeable membrane, 285tsynthetic membranes, 242zirconia, 484
Membrane bioreactor (MBR), 331, 457, 469, see alsoEthanoldfermentation
advantages, 457e458
applications, 460e463configurations, 458e459, 459fdevelopment, 465e466ethanol production in, 480tmaterials and modules, 459membrane fouling, 463e465
Membrane fouling, 463e465Membrane module, 181, 463, 465, 489Membrane reactor (MR), 455, 456f, see also Membrane
bioreactor (MBR)Membrane separation, 181, 228, 457e458, 475e476,
500, 623Meningococci, 347Metabolic pathway, 31, 267, 318, 330, 608e609Metabolic rate, 129Metabolites, 2, 4, 84, 259, 348, 461e462Metal ions, 577e578Methane, 427e428, 431e432Methane-former organism, 573e574Methanogenic bacteria, 84, 293e294, 572e573Methanogenic fermentation, 622Methanogens, 574e575Methanogensis, 573e574Methanol, 431e432Methionine, 298, 427e429, 429tMethyl ethyl ketone (MEK), 239e240Methyl isobutyl ketone, 239e240, 352Methylcellulose, 116Methylene blue, 332, 538Methylophilus methylotrophus (M. methylotrophus),
418e419MF, see MicrofiltrationMFC, see Microbial fuel cellMichaeliseMentenconstant, 22, 24be25bequation, 564illustration, 22fkinetic parameters, 182rate equation, 22, 25b
Micro-fluidizer, see High-pressure homogenizer(HPH)
Microbialbiomass separation, 421catalysis, 550functions, 5e7growth, 561e562
organic removal in, 558e559effect of substrate concentration, 88e91
metabolism, 559e561population control, 436e437process, 375e376
Microbial fuel cell (MFC), 530e531active biocatalysts, 535e536
INDEX 645
Microbial fuel cell (MFC) (Continued )applications, 545e550with biocathodes, 551fcalculations in, 540e541challenges in, 540conditions
in anodic chamber, 544in cathodic chamber, 544e545
construction, 532e534, 540fcoulombic yield, 543dual-compartment, 534felectron
mediator, 538e539transfer, 536e538transport, 538
overpotential in, 542PEM, 544performance, 543power generation, 541e542single-compartment, 534f
Microbial protein (SCP), 3tMicrobiological media, 442e450Microcapsuls, 115e116Micrococcus, 14e15Micrococcus glutamicus, 3tMicrococcus luteus, 286t, 350, 539tMicrofiltration (MF), 457cross-flow microfiltration, 457
Micromonospora purpurea, 351tMicroorganisms, 1e2, 259, 558, see also Immobilized
microbial cellsunder anaerobic growth conditions, 267for citric acid fermentation, 365immobilization by covalent bonds, 284
ethanol productivity, 288tgrowth and colony formation, 286e288microbial cells, 286toxygen transfer to, 284e285studies of diffusion, 287tsubstrate transfer to, 285e286
and media, 349, 470Microsparger, 56e57Microtubules, 351tMicrowave sterilization, 450e451Milk, 1e2, 11e12, 432, 442Milling, 8, 15, 486, 609e610Mineral ions, 106t, 301Ming, 176tMinimal media, 297t, 301e303Mixed culture, 330, 427e428, 550, 621Mixed inhibitors, 31Mixed liquor suspended solids (MLSS), 457,
568, 576
Mixing, 57, 63, 503e504, 520Mixing time, 201, 379e381, 385e388Mobile phase, 244Modified chemostat, 143Molar flux, 58e60, 64, 67Molasses, 5, 8, 14, 311be312b, 367e370, 561e562Molds, 6e7Molecular sieve chromatography, see Gel
chromatographyMonilla sp., 331e332Monodconstant, 278model, 563e564rate equation, 74, 141rate model, 71
Monod kinetic, 165be166b, 278Monosodium glutamate, 14e15Morphology, 5e6, 133, 204e205, 286, 485Moser, 175e176, 176tMR, see Membrane reactorMucor, 16, 331Mushroom, 418e419Mutants, 14, 348Mycelia, 217e218, 231, 233, 332, 349e350,
363e364, 379
NN-acetylglucoseamine peptidoglycans, 35N-acetylmuramic acid, 35NAD, 106tNAD/NADH, 106tNAD+, see Nicotinamide adenine dinucleotideNADH, see Nicotinamide adenine dinucleotide
hydrogenaseNADPH, see Nicotinamide adenine dinucleotide
phosphateNanobiotechnology Group contactor
(NBG contactor), 516e517adsorbent contactors, 518bed expansion, 518e520
characteristics, 518equilibrium kinetic studies, 520e522expanded bed adsorption, 522e523fluidized/expanded bed adsorption, 518hydrodynamic performance, 517materials, 517e518mixing of liquid phase, 520
Natural polymer, 5, 115, 330, 509NBG contactor, see Nanobiotechnology Group
contactorNBOD, see Nitrogenous biochemical oxygen demandNeoarsphenamine, 347Nephelometry, 332e333
INDEX646
Nernst, 110e111Neutral pH, 570e571Newtonian fluids, 62e63, 203e204, 220, 386be388bNiacin, 36, 36t, 428e429Nicotinamide adenine dinucleotide (NAD+), 538Nicotinamide adenine dinucleotide hydrogenase
(NADH), 28e29, 129Nicotinamide adenine dinucleotide phosphate
(NADPH), 14e15Nicotinic acid, 35e36, 294t, 296te297tNitrate removal, see Denitrification biologicalNitrification, biological, 579e586, 581fNitrite nitrogen oxidation reaction, 582Nitrobacter agilis, 259e260Nitrogen oxides (NOx), 462Nitrogen source, 4, 42, 49, 175, 293, 369e370,
431e432Nitrogenous biochemical oxygen demand (NBOD),
568e569Nitrogenous compounds, 461Non-mechanical methods, 498e499Non-stirred, non-aerated system, 194Noncompetitive inhibition rate model, 153e172Noncompetitive inhibitors, 33fNormal hydrogen electrode, 542Novobiocin, 379, 502Nozzle, 43, 233, 352Nuclear power, 598Nucleic acids, 114, 292e293, 301, 428, 432e433,
510e511Nusselt number, 203e204Nutrient requirements, 565e566
OOff gas composition, 106t, 313be314bOff-gas analysis, 56Oily wastewaters, 607Online gas chromatography, 56Open system, 133e137Optical biosensor, 117Optical cell density, 332e333Optical density, 79, 104, 164t, 271, 419e420, 472Optimum dilution rate, 478e479Optimum pH, 37Organic
acids, 263fermentation of dual substrate, 264tproduction rate in ICR, 265e266
compounds, 580e582fouling, 465matter, 573micropollutants removal, 461removal, 558e559
Organisms, 560Osmosis membrane bioreactor (OSMBR), 465e466OTR, see Oxygen transfer rateOUR, see Oxygen uptake rateOverpotential, 542Oxidase, 11, 28e29, 123Oxidationand cell synthesis, 571enzymes, 28e29oxidationereduction process, 560
Oxidizing bacteria, 3tOxidoreductase, 28e29, 123Oxygen, 544limitation, 419requirements, 592e594transport, 67e68, 347
Oxygen consumption, 195t, 313be314b, 575Oxygen demand, 217e218, 568e569, 582e583Oxygen transfer rate (OTR), 54e57, 76, 359e361, 378in activated sludge, 399e410aerated tank for pharmaceutical wastewater, 76e78in fermenter, 58e59
Oxygen uptake rate (OUR), 54, 394be396bOxyhemoglobin, 35e36
PPalm oil, 602Paraffins, 66be67bPartial pressure, 58, 67, 93, 398be399b, 621e622Particlesminimum fluidization velocity, 505e506terminal settling velocity, 506e508
Partition chromatography, 244e245Pasteur, 7e8, 11e12Pathway, 6e7, 318, 320f, 429PDMS, see PolydimethylsiloxanePeclet number, 218e219Pectinase, 34Pellagra, 36Pellicular adsorbents, 509e510PEM, see Proton exchange membranePenicillin, 346, 348e349extraction, 352filtration, 352production, 15e16, 325be326b
Penicillin G, see PenicillinPenicillinase, 346Penicillium chrysogenum, 3t, 15, 248b, 287t, 348, 351tPenicillium griseofulvum, 351tPenicillium notatum (P. notatum), 348Penicillum, 6e7Pentose, 330, 337Peptidoglycan, 346
INDEX 647
Peptostreptococcus, 294Permeate, 116, 459, 461, 470e472, 481Pervaporation technique, 469e472, see also
EthanoldfermentationPetri dishes, 353, 448Petrochemical-based butanol production, 612e613Petroleum, 422PFN metals, 293e294pH, 110e113pH/redox measurement, 110e111Phagocytosis, 347Pharmaceutical, 2, 4, 28, 78, 461e462Phenylalanine, 564Phialides, 350Phosphatase, 29, 559Phosphate, 29e30, 419e420, 548, 559Phosphate buffer, 292e293, 301, 419e420Phosphate isomerase, 29e30Phospholipids, 116Phosphorylation, 28, 320fPhotoautotrophs, 560Physical agents, 436e437Physical sterilization, 437Piezoelectric, 117Pigment, 129, 348Pilot scale, 105, 210, 451Plant, 105e106, 376e384Plant cell, 2, 194, 428e429Plate filters, 231Plates, see Theoretical equilibrium stagesPlatinum resistance thermometers, 108Plug flow, 71fPolarographicdetectors, 109electrodes, 110
Pollution, 569e570Polyacrylamide, 262Polyacrylamide gel, 40, 245e246, 261e262Polyacrylate, 116Polyamide, 357Polycarbonate, 116Polydimethylsiloxane (PDMS), 469Polyethylene dioxythiophene, 115Polyethylene glycol-dextrose, 250be251bpolylactatic acid, 11e12Polymerase, 35Polypyrrole, 115, 533Polysaccharide, 9, 33e34, 235e236, 447, 465, 623Polystyrene, 262, 448Polysulfone, 116Polytetrafluoroethylene (PTFE), 469Polythionine, 115Polyuronic acid, 268
Polyvinyl alcohol (PVA), 484, 489e490Polyvinylidene fluoride (PVDF), 465Porous ceramic support, 490e491Portion coefficient, 242Postanoxic denitrification, 580e582Potential, 110e111, 118, 120, 268, 350, 418e419, 483Potentiometric detector, 123Potentiometry, 117e118POTW, see Publicly owned treatment workPower consumption, 63, 376e377, 414be415bPower generation, 541e542Power input, 358e359Power law, 204e205Power number (Re), 380, 382Prandtl number, 203e204Preanoxic denitrification, 580e582Precipitation, 229, 239e241, 369Precursors, 37, 565Pressure cycle bioreactor, 195, 197Primary metabolites, 318Principle of chromatography, 246e253Probe, 43, 54, 105e106, 109, 349e350Process control, 105e106Process integration, 511e513Product inhibition, 185e186Product recovery, 228, 238e240Product yields, 140of biomass, 73calculation, 339coefficient, 339
Production of penicillin, 15e16, 348e349Products, 10t, 11, 117, 314be317b, 497e498Programmed autoclave, 448e449Prokaryote cell, Streptomycetes, 6e7, 346Promoters, 28, 30e31Propeller agitator, 58Propioni bacterium, 302t, 303Propionibacterium acidipropionici (P. acidipropionici), 263ICR kinetic model for immobilized, 266tmodel test using, 265f
Propionic acid, 9, 472Prosynthetic groups, 35e36Protease, 11, 31, 34e35, 511Proteinconcentration, 424e425process integration in protein recovery, 511e513products, 497e498purification
dye ligand pseudo-affinity adsorption, 500e501strategies overview, 500
Protein recovery, 503, 511e513Protein synthesis, 14Proteolytic activity, 512
INDEX648
Proton exchange membrane (PEM), 544“Pruteen” protein, 427e428“Pseudo-ligand” adsorption, 500e501Pseudomonas aeruginosa, 259e260, 287t, 535Pseudomonas bacteria, 584Pseudomonas methylotroph, 3tPseudomonas sp., 3t, 334t, 428PTFE, see PolytetrafluoroethylenePublicly owned treatment work (POTW), 570Pulse, 118, 520Pump, 43, 113, 134e137, 268e270, 544Pumping, 18, 58, 210, 419e420Pure culture, 7e8, 88, 334, 442Purification factor, 242PVA, see Polyvinyl alcoholPVDF, see Polyvinylidene fluoridePyruvate, 318e319, 320f
QQuasi-equilibrium system, see Rapid equilibrium
system
RRacemic, 182f, 181Racemic ethoxyethylibuprofen ester, 182, 182fRacemic ibuprofen esters Membrane reactor, 181,
182f, 189Rapid equilibrium system, 187
derivation of enzymatic rate equation, 187e189Raschig rings, 263Rate model, 71, 160be162b, 167be169b, 176Rate of biomass production, 140e141Rate of formation, 139, 178Rate of product formation, 139e141Rayleigh number, 219Reaction mechanism Competitive inhibition, 152e153Reaction-separation integration, 623Reactionereaction integration, 622e623Reactor weight, 106tRecombinant E. coli, 3tRecovery time, 122Redox, 110e111Redox equations, 560Redox potential, 104e105, 549Reduction enzymes, 28e29Refractive index (RI), 338Removal mechanism, 568e569Residence time, 71e72, 621e622Residence time distribution (RTD), 517, 520Respiration, 53, 55
rate, 217e218respiratory metabolism, 560
Respiration, endogenous, 572
Respiration quotient (RQ), 53, 55e56, 304Response time, 122Reverse osmosis (RO), 460e461Reversible, 20, 35e36, 151e152Reynolds number (Re), 63, 203e204, 358, 380Rheology, 106t, 378Rhizobium, 2Rhizopus, 41Rhizopus oryzae, 42, 46t, 48tRhizopus oryzae PTCC 5176, 42Rhodocyclus gelatinosus, 299tRhodoferax ferrireducens (R. ferrireducens), 532Rhodospirillum rubrum (R. rubrum), 84RI, see Refractive indexRiccati equation, 86Richards, 221be223bRichardsoneZaki coefficient, 508e509Riser, 202Rising bubbles, 69, 218RNA, 30, 106tRO, see Reverse osmosisRotameter, 105Rotary drum filter, 231, 369Rotary drum vacuum filter, 231Rotating disk contactors, 240e242Rotational disk foam sensor, 113round per second (rps), 63RQ, see Respiration quotientRTD, see Residence time distributionRushton turbine, 57
SSaccharifications, 34, 330, 430, 623Saccharomyces cerevisiae (S. cerevisiae), 16e18, 267, 305active and fresh beads, 277fproperties and appearance, 270trelative activities, 275f
Safety factory (SF), 575Salting, 254Saturation constant, 334SBH, see Settled bed heightsScale up, 210e217, 376e384, 396be397b, 402be404bScale-up bioreactor, 376e384Scanning electron microscope (SEM), 271, 484Schnidt number, 218e219SCP, see Single cell proteinScroll conveyer centrifuge, 233Second-generation biofuels, 602e607Secondary metabolite, 1e2, 14, 371e372, 418e419Secondary treatment, see Biological treatmentSedimentation, 235e236Seed culture, 367, 419e421inoculation, 336e337
INDEX 649
Selectivity, 245e246Self-producing microbes, 539SEM, see Scanning electron microscopeSensitivity, 123Sensors, 105, 113e114, 547Separation factor, 476Separationeseparation integration, 623Sephadex, 252bSerine, 29, 116, 298Settled bed heights (SBH), 518“Seudo-affinity” adsorption, 500e501Severly, 177, 177tSF, see Safety factoryShear, 57, 78, 195, 202, 378Shear forces, 378e379Sherwood number, 218e221SHF, see Simultaneous hydrolysis fermentationShigella, 347Sigma factor, 234Sigmoidal S-shaped curve, 106e107Simultaneous hydrolysis fermentation (SHF),
622e623Single cell protein (SCP), 10e11, 317,
418e419advantages, 432e433analytical methods, 424e426batch experiment, 421batch fermentation, 419e421continuous fermentation, 419e421disadvantages, 432e433DO in, 419for experimental preparation, 433media preparation for, 424microbial biomass separation, 421microorganism growth, 422nutritional value, 428e429organism, 429e432petroleum, 422petroleum-based, 418e419processes, 426e428production methods, 422e424substrates for, 429e432
Slant agar, 334, 335fSlow-acting electrode, 107Sludge retention time (SRT), 570e571, 575, 577e578,
587e589SmF, see Submerged fermentationSMP, see Soluble microbial productSoda ash (Na2CO3), 567e568Sodium alginate, 270Sodium bicarbonate (NaHCO3), 567e568Sodium hydroxide (NaOH), 567e568Sodium potassium tartrate, 270e271, 337
Solegel process, 483e484, 491, See also Zirconia-alumina membrane
Solid handling, 228Solid-state fermentation (SSF), 20, 41Solids partitioning, 576Solubility, 54, 64, 109, 228, 538e539Soluble microbial product (SMP), 464e465Solvent extraction, 239, see also Downstream
processingcontinuous extraction column process, 240e242product recovery by liquideliquid extraction, 240
Sorbose, 3tSorghum, 601Soybean oil, 601e602Spargers, 199e200, 384Specific death rate, 139, 443e444Specific growth rate, 72, 95, 130e131, 176, 205, 431,
563Specific oxygen uptake rate, 259e260Specific uptake rate, 95, 259e260Spectroscopy, 129e130, 568e569Spirulina algae, 10e11Sporulation, 349SRT, see Sludge retention timeSSF, see Solid-state fermentationStandard calibration curve, 426Standard media, 301e303Staniskis, 176tStaphyloccus aureus, 348Staphylococcus aureus, 15Starch, 426, 431Static tray bioreactor, 42Stationary phase, 244, 333Steady state, 54e55, 72e74, 77, 142, 206, 378, 473,
589, 592e594Sterilization, 435e436batch, 437e439chemical, 451continuous, 439e441, 440f, 446be447bdeath rate of living organism, 437dry heat, 450electron beam, 451with filtration, 450high-temperature, 442hot plates, 441e442initial medium contaminants, 444be445blow-temperature, 452media for microbiology, 442e450microbial population control, 436e437microwave, 450e451
Steroids, 2, 37, 239e240Stirred tank bioreactor, 198e200scale-up of, 210e217
INDEX650
Stirred tank reactor, 195Stirring, 63, 486, 488, 490Stock culture, 334e335, 447Stoichiometric coefficient, 162be163b, 304, 317, 572Stoichiometric coefficients for cell growth, 317Stoke’s law, 233e234Stokes equation, 506e507Streptococcus thermophilus, 3tStreptomyces, 3t, 231, 233, 299t, 351tStreptomyces erythreus, 3t, 351tStreptomyces fradiae, 351tStreptomyces griseus, 351tStreptomyces mediterranei, 351tStreptomyces nodosus, 351tStreptomyces olivaceus, 3tStreptomyces orientalis, 351tStreptomyces rimosus, 351tStreptomyces sp., 299tStreptomycin, 16Styrene, 242Submerged culture, 349e350, 354e355Submerged fermentation (SmF), 41Substrate, 114
balance, 142e143, 412e413concentration, 73, 389b, 390tgradients, 259
inhibition study, 183e185Substrate balance, 133, 142, 206, 412e413Substrate inhibition, 88, 93e94, 182e183, 183fe184f, 468Substrate limitation, 145, 175Substrate-driven denitrification, see Preanoxic
denitrificationSugar analysis, analytical method for, see also
Fermentation process applicationmixed sugar analysis, 337e338quantitative analysis, 337
Sugarcane, 601bagasse, 42
Sulfide, 549Sulfonamides, 347Sulfur, 549Sulfur dioxide (SO2), 462Sulfuric acid (H2SO4), 615Sunflower oil, 602Superficial gas velocity, 385Superficial velocity, 61, 506e507Supplementary nutrients, 13, 292e293, 424, 429Surface tension, 62, 112, 221be223b, 436e437Suspended growth, 586e594, 586t
process, 558, 587Synthesis gas (syngas), 83e84Synthetase, 30Synthol
TTCA, see Tricarboxylic acidTechnology for cell recovery, 238Teflon, 116Temperature control, 18, 43, 104, 335, 499Temperature-phased anaerobic digestion (TPAD), 573Terminal velocity, 69, 219, 506e507, 519e520, 519fTessier, 175e176Theoretical equilibrium stages, 503Theoretical yield of ethanol, 141, 319Theory of centrifugation, 233e235Theory of filtration, 231e233Thermal biosensor, 117Thermal conductivity Rotating disk, 112Thermal mass flow meters, 105Thermistors, 108, 117Thermoanaerobacter ethanolicus, 330Thermocouples, 108, 117Thermopiles, 117Third-generation biofuel resources, 607e609Threonine, 116, 298TOC, see Total organic carbonToluene diisocyanate, 116“Toprina” protein, 427e428Total organic carbon (TOC), 568e569Tower fermenter, 104, 384Toxin, 6e7, 174, 178TPAD, see Temperature-phased anaerobic digestionTrace metals, 95, 292e293, 344, 350, 368, 427e428Trace minerals, 293e294, 429Transducer, 117electrochemical biosensor, 117e118optical biosensor, 117piezoelectric biosensor, 117thermal biosensor, 117
Transesterification, 607acid-catalyzed, 615fbase-catalyzed, 614fenzymatic, 617f, 620t
Transferase, 29Transmembrane pressure, 457Transmitted output signal, 107Tray bioreactor, 20e21, 42, 46e47Tricarboxylic acid (TCA), 84, 363e364Trickle bed, 196Tris maleate buffer solution, 300tTryptophan, 36Tuberculosis, 349Tubular module, 71, 268e270, 463Turbidimetric methods, 332e333Turbidity, 332e333Turbidostat, see BiostatTurbulent flow, 63, 379, 398be399b, 414be415b, 505
INDEX 651
Tyrosinase, 20Tyrosine, 20, 116
UUltrafiltration (UF), 457, 469Ultrasonic, 112, 619Ultrasound, 113, 238Ultraviolet spectrophotometry (UV
spectrophotometry), 337e338Uncompetitive inhibitors, 32, 32fUnloading phase, 449Unstructured kinetic model, 173e179Unstructured models, 84e85, 90e91, 174e175,
371e372Upstream processing, 11Urease, 20, 30Uric acid, 429, 432e433Uricase, 20, 432e433Urinary tract infection, 347Uronic acid, 268
VVaccines, 2, 4, 497Vacuum phase, 448Valine, 298Van der Waal’s forces, 115Vancomycin, 346Vaned disk, 212fVerlhurst, 174Verlhurst model, 174Viability of cells, 106tVinegar, 13, 408be410bVitamin, 37, 428e429Vitamin A, 37Vitamin D, 37Void, 244, 268e270, 279, 286, 508Volatile fatty acid (VFA), 567e568, 574e575Volatile organic compound (VOC), 578Volatile products, 174Volatile suspended solids (VSS), 566Volatilization, 578e579Voltammetry, 118Volterra extended model, 174Volumetric flow rate, 68, 205, 210, 234, 382e383Volumetric mass transfer coefficient, 359
WWash out, 207Waste cooking oils, 607Waste sludge, 573Wastewater, 76, 78, 548, 587e588Wastewater treatment, 463, 547e550, 548tWatereGas shift reaction, 83e84, 93e95Weber, 220Westerhoff, 177tWet digestion, 622Wet steam, 435e436Wheat, 601Whey, 431Whole cell, 11, 123, 259e260Wine, 1e2, 13Wolfe’s mineral solution, 301t
XX-ray diffraction (XRD), 488e489Xanthan gum, 9, 314be317bXanthan gum production, 314e317Xanthmonas campestris, 204e205Xylanase, 34Xylose, 263, 337
YYeast, 2, 6e7, 236, 271, 279, 293, 426e427, 609Yeast and malt extracts (YM extracts), 420e421Yeast and Rennet, 3tYeast peptone glucose media, 302tYield, 5, 14e15, 20, 23, 41, 65, 73, 140, 163be165b,
218, 239e240, 268, 281, 323be324b, 339, 370e371, 400be401b, 478, 575t, 607
Yogurt, 1e2, 7e9Yue, 176t
ZZeolitic imidazolate frameworks-71 (ZIF-71), 613Zirconia-coated alumina membrane, 484, 490fabrication of inorganic membrane, 485finorganic acids, 485materials, 485e489methods, 485e489results, 491e492
Zymomonas mobilis, 267, 330, 608
INDEX652


