Embed Size (px)
Citation preview

BIOACCUMULATION AND BIOMAGNIFICATION OF TRACE ELEMENTS IN TISSUES OF WHALE SHARK (Rhincodon typus) FROM THE GULF OF CALIFORNIA
TESIS
QUE PARA OBTENER EL GRADO DE
DOCTORADO EN CIENCIAS MARINAS
PRESENTA
FRANCESCA PANCALDI
LA PAZ, B.C.S., JULIO DE 2020
INSTITUTO POLITECNICO NACIONAL CENTRO INTERDISCIPLINARIO DE CIENCIAS MARINAS


En la Ciudad de La Paz, B.C.S., el día 06 del mes de Junio del año 2020
El (la) que suscribe M en C. FRANCESCA PANCALDI Alumno (a) del Programa
DOCTORADO EN CIENCIAS MARINAS
con número de registro B161000 adscrito al CENTRO INTERDISCIPLINARIO DE CIENCIAS MARINAS
manifiesta que es autor(a) intelectual del presente trabajo de tesis, bajo la dirección de:
Dr. FELIPE GALVÁN MAGAÑA Y DR. FEDERICO PAEZ OSUNA
y cede los derechos del trabajo titulado:
“BIOACCUMULATION AND BIOMAGNIFICATION OF TRACE ELEMENTS IN TISSUES
OF WHALE SHARK (Rhincodon typus) FROM THE GULF OF CALIFORNIA”
al Instituto Politécnico Nacional, para su difusión con fines académicos y de investigación.
Los usuarios de la información no deben reproducir el contenido textual, gráficas o datos del trabajo
sin el permiso expreso del autor y/o director del trabajo. Éste, puede ser obtenido escribiendo a la
siguiente dirección: [email protected] - [email protected] –
Si el permiso se otorga, el usuario deberá dar el agradecimiento correspondiente y citar la fuente del
mismo.
M en C. FRANCESCA PANCALDI
Nombre y firma del alumno

Dedication
...all’Oceano e a tutte le meravigliose creature che vivono in lui, soprattutto gli
squali balena...

Acknowledgements
Al Instituto Politécnico Nacional (IPN) y al Centro Interdisciplinario de Ciencias
Marinas (CICIMAR) que me dieron la oportunidad de ser parte de esta grande
familia. Al Consejo Nacional de Ciencia y Tecnología (CONACyT), Subdirección
académica (SAI) y la Beca de Estímulo Institucional de Formación de
Investigadores (BEIFI) por los apoyos económicos y académicos brindados.
A CONANP y SEMARNAT por los permisos otorgados para la recolección de las
muestras.
A los doctores Felipe y Rogelio; infinitas gracias para la confianza que
depositaron en mí, por apoyarme y darme la oportunidad de seguir mi sueño de
estudiar los tiburones ballena.
A la Dra. Ana Judith Marmolejo, por todos sus consejos, por su apoyo y por la
motivación que siempre me ha dado y que me ha impulsado a mejorar. Usted es
un ejemplo de mujer en la ciencia que siempre voy a tener presente.
Al Dr. Federico Páez Osuna y todo el equipo del laboratorio de Geoquímica y
Contaminación Costera del Instituto de Ciencias del Mar y Limnología de
la UNAM. Muchísimas gracias por la ayuda, el apoyo y los valiosos consejos
brindados. Gracias doctor por introducirme al misterioso mundo de la química, y
por las horas invertidas explicándome las metodologías de laboratorio. Gracias
por todos sus consejos que me ayudaron a publicar mis trabajos.
Al Qco. Humberto Bojórquez Leyva, por su apoyo y asesoría en los análisis
(liofilización, digestión y lectura) de varios de los elementos químicos estudiados.
To Dr. Todd O’Hara, thank you for the valuable advices that allowed me to
improve my work.
To Darren, thank you for your help, support, and friendship!
A Marta, Tania, Erica, Lara, Abel, Viri y todo el maravilloso Galván team!
A todos los que seguramente me estoy olvidando, que de alguna manera han
contribuido a la realización de este doctorado.

A Erick, gracias por tu amor, por aguantar mis momentos de estrés, por tu ayuda
y por todas las maravillosas aventuras marinas y terrestres pasadas y futuras.
Alla mia familia, quelli che ci sono e quelli che non ci sono piú. Grazie per avermi
capita, per avere accettato tutte quelle decisioni che mi hanno condotta lontana
per cosí tanti anni. Vi penso sempre e vi amo.
Funding and products
Este trabajo fue financieramente apoyado por los siguientes proyectos:
• Proyecto SIP 20180012 titulado: “Cambios en la concentración de ácidos
grasos en las presas zooplanctónicas en un sitio de alimentación del tiburón
ballena Rhincodon typus en el Golfo de California.”
• Proyecto SIP 20190272 titulado: “Estructura de la comunidad zooplanctónica
en una zona de alimentación del tiburón ballena R. typus en Bahía de La Paz”
• Proyecto SIP 20195126 titulado: "Biogeoquímica de elementos traza en
sistemas costeros influenciados por minería de cobre."
• Proyecto SIP 253700 titulado: “Biología básica de las especies de tiburones
y rayas de importancia comercial en la costa occidental de BCS.”
• Proyecto SIP 20181417 titulado: “Ecología trófica de los tiburones en la costa
occidental del golfo de california".
• Tesis apoyada parcialmente por la Dirección General de Asuntos del
Personal Académico, Programa de Apoyo a Proyectos de Investigación e
Innovación Tecnológica de la Universidad Nacional Autónoma de México
(DGAPA-PAPIIT-UNAM) Proyecto IN200619 titulado “Metales y metaloides
en ríos y presas de cuencas mineras de Sinaloa: identificando contaminación
y riesgos para la salud”.
Parte de los datos e información de esta tesis se encuentran publicados en los
siguientes artículos científicos:
• Pancaldi, F., Galván-Magaña, F., González-Armas, R., Soto-Jiménez, M.F.,
Whitehead, D.A., O'Hara, T., Marmolejo-Rodríguez, A.J., Vázquez-Haikin, A.,
and Páez-Osuna, F., 2019. Mercury and selenium in the filter–feeding whale
shark (Rhincodon typus) from two areas of the Gulf of California, Mexico.
Marine Pollution Bulletin, 146: 955-961.
• Pancaldi, F., Páez-Osuna, F., Soto-Jiménez, M.F., González-Armas, R.,
O'Hara, T., Marmolejo-Rodríguez, A.J., Vázquez-Haikin, A., and Galván-
Magaña, F. 2019. Trace elements in tissues of whale sharks (Rhincodon
typus) stranded in the Gulf of California, Mexico. Bulletin of Environmental
Contamination and Toxicology, 103 (4): 515-520.
• Whitehead, D.A., Petatán-Ramírez, D., Olivier, D., González-Armas, R.,
Pancaldi, F., and Galván-Magaña, F. 2019. Seasonal trends in whale sharks
sightings in an established tourism site in the Gulf of California, Mexico.
Journal of Fish Biology, 95: 982–984.
• Whitehead, D.A., Jakes-Cota, U., Pancaldi, F., Galván Magaña, F. and
González Armas, R. 2020. The influence of zooplankton communities on the
feeding behaviour of whale shark in Bahia de La Paz, Gulf of California.
Revista Mexicana de biodiversidad, 91: 1-8.
• Whitehead, D.A., Jakes-Cota, U., Galván Magaña, F., Pancaldi, F., and
González Armas, R. 2020. Composition and abundance of macro
zooplankton in the coastal waters off the El Mogote Sandbar. Hidrobiológica,
30 (1): 21-27.

TABLE CONTENTS
CHAPTER 1. GENERAL INTRODUCTION ........................................................ 1
1.1 .THE WHALE SHARK: HISTORY, BIOLOGY AND ECOLOGY .................... 1
1.2 .TRACE ELEMENTS (TEs) ........................................................................... 4
1.2.1 Bioaccumulation and biomagnification..................................................... 8
1.2.2 Toxicity in marine organisms ................................................................... 9
1.2.3 Toxicity in human health ........................................................................ 11
1.3 . DEFENCE MECHANISMS ........................................................................ 13
1.3.1 Enzymatic response .............................................................................. 13
1.3.2 Metallothioneins (MTs) .......................................................................... 14
1.3.3 Antagonism between TEs ...................................................................... 15
1.4 .BACKGROUND ......................................................................................... 16
1.4.1 Trace elements and contamination in whale shark ................................ 16
1.4.2 Trace elements in zooplankton .............................................................. 18
1.5 . JUSTIFICATION ....................................................................................... 19
1.6 . RESEARCH OBJECTIVES ....................................................................... 20
1.7 . SPECIFIC OBJECTIVES .......................................................................... 20
1.8 . STUDY AREA ........................................................................................... 21
1.8.1 Bahía de Los Ángeles (BLA) ................................................................. 21
1.8.2 Bahía de La Paz (LAP) .......................................................................... 23
1.8.3 La Paz lagoon ........................................................................................ 24
1.9 . MATERIAL AND METHODS ..................................................................... 25
1.9.1 Biopsy collection .................................................................................... 25
1.9.2 Zooplankton collection ........................................................................... 26
1.9.3 Laboratory procedures ........................................................................... 27
CHAPTER 2. Hg AND Se BIOACCUMULATION AND BIOMAGNIFICATION IN
EPIDERMIS OF WHALE SHARK FROM TWO SEASONS AND TWO AREAS
OF THE GULF OF CALIFORNIA, MEXICO ..................................................... 32
2.1. ABSTRACT ............................................................................................... 32
2.2. INTRODUCTION ....................................................................................... 33
2.3. RESULTS .................................................................................................. 34
2.3.1 Sex and total length (TL) of the sharks .................................................... 34
2.3.2 Season 1: Concentrations of Hg and Se in biopsies ............................... 35

2.3.2.1 Differences between site ............................................................ 35
2.3.2.2 Differences between sex ............................................................ 37
2.3.2.3 Relation with total length (TL) .................................................... 38
2.3.2.4 Hg:Se molar ratio ....................................................................... 39
2.3.3 Season 1: Concentrations of Hg and Se in the zooplankton ................... 40
2.3.3.1 Zooplankton composition ........................................................... 40
2.3.3.2 Trace element concentrations .................................................... 40
2.3.3.3 Biomagnification factor (BMF) .................................................... 42
2.3.4 Season 2: Concentrations of Hg and Se in biopsies ............................... 44
2.3.4.1 Differences between site ............................................................ 44
2.3.4.2 Differences between sex ............................................................ 45
2.3.4.3 Relation with total length ............................................................ 46
2.3.4.4 Hg:Se molar ratio ....................................................................... 47
2.3.5 Season 2: Concentrations of Hg and Se in zooplankton ......................... 48
2.3.5.1 Zooplankton composition ........................................................... 49
2.3.5.2 Trace elements concentrations .................................................. 50
2.3.5.3 Biomagnification factor (BMF) .................................................... 54
2.3.6 Comparison of TEs concentrations between seasons ............................. 56
2.4. DISCUSSION ............................................................................................ 58
2.5. CONCLUSIONS ........................................................................................ 63
CHAPTER 3. As, Cu, Cd, Pb, Zn BIOACCUMULATION AND
BIOMAGNIFICATION IN EPIDERMIS OF WHALE SHARK DURING TWO
SEASONS AND TWO AREAS OF THE GULF OF CALIFORNIA, MEXICO .... 64
3.1. ABSTRACT ............................................................................................... 64
3.2. INTRODUCTION ....................................................................................... 65
3.3. RESULTS .................................................................................................. 66
3.3.1 Season 1: TEs concentrations in biopsies ............................................... 66
3.3.1.1 Differences between sites .......................................................... 66
3.3.1.2 Differences between sex ............................................................ 67
3.3.1.3 Relation with total length ............................................................ 69
3.3.2 Season 1: TEs concentrations in zooplankton ......................................... 71
3.3.2.1 Biomagnification factor (BMF) .................................................... 73
3.3.3 Season 2: TEs concentration in biopsies................................................. 74
3.3.3.1 Differences between sites .......................................................... 74

3.3.3.2 Differences between sex ............................................................ 76
3.3.3.3 Relation with total length ............................................................ 77
3.3.4 Season 2: TEs concentrations in zooplankton ......................................... 79
3.3.4.1 Biomagnification factor (BMF) .................................................... 83
3.3.5 Comparison of TEs concentration between seasons .............................. 83
3.3.6 Molar ratios .............................................................................................. 87
3.4. DISCUSSION ............................................................................................ 97
3.5. CONCLUSIONS ...................................................................................... 104
CHAPTER 4. TRACE ELEMENTS IN TISSUES OF WHALE SHARKS
STRANDED IN THE GULF OF CALIFORNIA, MEXICO ................................ 106
4.1. ABSTRACT ............................................................................................. 106
4.2. INTRODUCTION ..................................................................................... 106
4.3. MATERIAL AND METHODS ................................................................... 108
4.4. RESULTS and DISCUSSION .................................................................. 109
4.5. CONCLUSIONS ...................................................................................... 117
CHAPTER 5. AN INSIGHT ON TRACE ELEMENTS IN THE LIVER OF WHALE
SHARK: INNER ORGANOTROPISM? ........................................................... 118
5.1. ABSTRACT ............................................................................................. 118
5.2. INTRODUCTION ..................................................................................... 118
5.3. MATERIAL AND METHODS ................................................................... 120
5.4. RESULTS ................................................................................................ 120
5.4.1 TEs concentrations in the right lobe (RL) .............................................. 123
5.4.2 TEs concentrations in the left lobe (LL) ................................................. 123
5.4.3 Molar ratios ............................................................................................ 123
5.4.4 Antagonist effects between TEs ............................................................ 124
5.5. DISCUSSION .......................................................................................... 125
5.6. CONCLUSIONS ...................................................................................... 127
CHAPTER 6. GENERAL REMARKS ............................................................. 128
REFERENCES ............................................................................................... 130

LIST OF FIGURES
Figure 1.1. Whale shark (Rhincodon typus). Source:
https://endlessocean.fandom.com ...................................................................... 2
Figure 1.2. Distribution map of the whale shark. Source: IUCN Red List
https://www.iucnredlist.org/species/19488/2365291 ........................................... 2
Figure 1.3. Injuries caused by propeller strike on a whale shark in the South Ari
Atoll, Maldives. Source: Francesca Pancaldi...................................................... 4
Figure 1.4. Molar concentration of Hg and Se in pelagic fish of Hawaii. Data
expressed as mean ± standard deviation (Kaneko and Ralston, 2007) ........... 16
Figure 1.5. Map of Bahía de Los Ángeles ........................................................ 23
Figure 1.6. Map of Bahía de La Paz ................................................................. 24
Figure 1.7. Map of La Paz lagoon .................................................................... 25
Figure 1.8. Whale shark identification picture ................................................... 26
Figure 1.9. Tows of zooplankton performed depending on whale shark feeding
behaviour: active surface feeding (a), passive feeding (b) and vertical feeding (c)
......................................................................................................................... 27
Figure 2.1. Sex and size of whale sharks sampled in BLA and LAP in S1 (a,c)
and S2 (b, d) ..................................................................................................... 34
Figure 2.2. Hg and Se concentration (ng/g ww) in biopsies of whale sharks
collected in S1 in BLA and LAP ........................................................................ 36
Figure 2.3. Hg and Se concentrations in males and females from BLA in S1 .. 37
Figure 2.4. Hg and Se concentrations in males and females from LAP in S1… 38
Figure 2.5. Correlation between total length (m) with Hg (a) and Se (b) in males
(black) and females (grey) from BLA in S1 ....................................................... 38
Figure 2.6. Correlation between total length (m) with Hg (a) and Se (b) in males
(black) and females (grey) from LAP in S1 ....................................................... 39
Figure 2.7. Composition of zooplankton collected in LAP in S1 ....................... 40
Figure 2.8. Hg and Se concentration in the zooplankton collected in LAP in
S1 ..................................................................................................................... 41
Figure 2.9. Hg and Se concentrations in the main groups of zooplankton in LAP
in S1 ................................................................................................................. 41
Figure 2.10. Variation between Hg BMF (calculated from zooplankton and the
biopsies) and total length of sharks below 4 m (black circles) and above 4 m of

total length (grey circles) from Bahía de La Paz. Circles are males, and triangles
are females....................................................................................................... 43
Figure 2.11. Hg and Se concentration (ng/g ww) in biopsies of whale sharks
collected in S2 in BLA and LAP ........................................................................ 44
Figure 2.12. Hg and Se concentrations in males and females from LAP in S2 46
Figure 2.13. Correlation between TL and Hg (a) and Se (b) in males of BLA in S2
......................................................................................................................... 46
Figure 2.14. Correlation between TL and Hg (a) and Se (b) in males (black) and
females (grey) whale sharks of LAP in S2 ........................................................ 47
Figure 2.15. Correlation between Hg (nmol/g) and Se (nmol/g) from whale shark
of LAP .............................................................................................................. 48
Figure 2.16. Correlation between Se:Hg molar ratio and TL of whale sharks from
BLA .................................................................................................................. 48
Figure 2.17. Composition of zooplankton in BLA in September and October 2017
......................................................................................................................... 49
Figure 2.18. Composition of zooplankton in LAP from October 2017 to February
2018 ................................................................................................................. 49
Figure 2.19. Hg and Se concentration in zooplankton in BLA and LAP in S2 .. 50
Figure 2.20. Hg and Se concentrations found in the main groups of zooplankton
in BLA and LAP during S2 ................................................................................ 51
Figure 2.21. Biomagnification factor calculated in whale shark < and > of 4 m in
S2 ..................................................................................................................... 54
Figure 2.22. BMF of Hg and Se in biopsies of whale sharks calculated from
zooplankton, copepods and chaetognatha ...................................................... 55
Figure 2.23. Mean Hg and Se concentrations in biopsies of whale sharks
collected in BLA and LAP in S1 and S2 ........................................................... 56
Figure 2.24. Mean Hg and Se concentrations in zooplankton, copepods and
chaetognatha collected in LAP in S1 and S2 ................................................... 57
Figure 2.25. Changes in Hg and Se concentrations in the six whale sharks
spotted in S1 and S2 from BLA ........................................................................ 57
Figure 2.26. Changes in Hg and Se concentrations in the nine whale sharks
spotted in S1 and S2 from LAP ........................................................................ 58
Figure 3.1. Concentrations of Zn, As, Cu, Pb and Cd (ng/g ww) in biopsies of
whale sharks collected in S1 in BLA and LAP .................................................. 66

Figure 3.2. TEs concentrations in males and females from BLA in S1. No
statistical tests were applied due to the low number of females ....................... 68
Figure 3.3. TEs concentrations in males and females from LAP in S1. Mann-
Whitney test showed significant p values (p < 0.05) in the concentration of Pb 69
Figure 3.4. Correlation between TEs and TL in males (black) and females (grey)
from BLA in S1 ................................................................................................. 70
Figure 3.5. Correlation between TE and TL in males (black) and females (grey)
from LAP in S1 ................................................................................................. 71
Figure 3.6. TEs concentrations in the zooplankton collected in LAP in S1 ....... 72
Figure 3.7. Mean concentration of TEs and SE (standard error) in the main groups
of zooplankton from LAP in S1 ......................................................................... 72
Figure 3.8. Concentrations of Zn, As, Cu, Pb and Cd (ng/g ww) in biopsies of
whale sharks collected in S2 in BLA and LAP .................................................. 75
Figure 3.9. TEs concentrations in males and females from LAP in S2 ............. 77
Figure 3.10. Spearman correlation applied to TL and TEs concentration in males
of whale shark from BLA in S2 ......................................................................... 78
Figure 3.11. Spearman correlation applied to TL and TEs concentration in males
and females of whale shark from LAP in S2 ..................................................... 79
Figure 3.12. Mean TEs concentration and SD in zooplankton collected from BLA
and LAP in S2 .................................................................................................. 80
Figure 3.13. Mean TEs concentrations in the main groups of zooplankton
collected in BLA and LAP in S2 ........................................................................ 80
Figure 3.14. Mean TEs concentrations in biopsies of whale sharks collected in
BLA and LAP in S1 and S2 .............................................................................. 84
Figure 3.15. Mean TEs concentrations in zooplankton, copepods and
chaetognatha collected in LAP in S1 and S2 ................................................... 84
Figure 3.16. Changes in TEs concentrations from S1 (black circle) to S2 (white
circle) in nine whale sharks spotted in BLA ...................................................... 85
Figure 3.17. Changes in TEs concentrations from S1 (black circle) to S2 (white
circle) in nine whale sharks spotted in LAP ...................................................... 86
Figure 3.18. Molar ratio Zn:As calculated in biopsies of whale shark from BLA in
S1 (a), BLA in S2 (b), LAP in S1 (c) and LAP in S2 (d) .................................... 89
Figure 3.19. Molar ratio Zn:Cd calculated in biopsies of whale shark from BLA in
S1 (a), BLA in S2 (b), LAP in S1 (c) and LAP in S2 (d) .................................... 90

Figure 3.20. Molar ratio Cd:Pb calculated in biopsies of whale shark from BLA in
S1 (a), BLA in S2 (b), LAP in S1 (c) and LAP in S2 (d) .................................... 91
Figure 3.21. Molar ratio Cd:As calculated in biopsies of whale shark from BLA in
S1 (a), BLA in S2 (b), LAP in S1 (c) and LAP in S2 (d) .................................... 92
Figure 3.22. Molar ratio Se:Cd calculated in biopsies of whale shark from BLA in
S1 (a), BLA in S2 (b), LAP in S1 (c) and LAP in S2 (d) .................................... 93
Figure 3.23. Molar ratio Se:As calculated in biopsies of whale shark from BLA in
S1 (a), BLA in S2 (b), LAP in S1 (c) and LAP in S2 (d) .................................... 94
Figure 3.24. Molar ratio Cu:Cd calculated in biopsies of whale shark from BLA in
S1 (a), BLA in S2 (b), LAP in S1 (c) and LAP in S2 (d) .................................... 95
Figure 3.25. Molar ratio Zn:Pb calculated in biopsies of whale shark from BLA in
S1 (a), BLA in S2 (b), LAP in S1 (c) and LAP in S2 (d) .................................... 96
Figure 3.26. Molar ratio Cu:Pb calculated in biopsies of whale shark from BLA in
S1 (a), BLA in S2 (b), LAP in S1 (c) and LAP in S2 (d) .................................... 97
Figure 4.1. Location of stranding site of two whale sharks at Punta Bufeo (top)
and La Paz Bay (bottom), Gulf of California ................................................... 109
Figure 5.1. Rhincodon typus liver right lobe with the proximal, median and distal
area and the gallbladder ................................................................................. 121
Figure 5.2. Spearman correlation applied to TEs ........................................... 125
LIST OF TABLES
Table 1.1. Trace elements maximum limits (µg/g wet weight) allowed in different
marine products established in Mexico. Sources: NOM-242-SSA1-2009 ........ 13
Tabla. 1.2. Summary of Cu, Zn, Cd, Pb, iAs and Hg in tissues of whale sharks
from the coast of China. Concentrations expressed as µg/g ww. Source: Wang et
al., 2014 ........................................................................................................... 17
Table 1.3. Certified and obtained values ± sd and recovery percentage of trace
elements in the material DORM-04 performed during S1 (2016-2017) and S2
(2017-2018). Values are expressed in mg/kg per dry weight (dw) ................... 29
Table 1.4. Certified and obtained values ± sd, and recovery percentage of trace
elements expressed in mg/kg per dry weight (dw) for the material DOLT-05 in
2018 ................................................................................................................. 29
Table 2.1. Number of biopsies collected in Bahía de Los Angeles (BLA) and
Bahía de La Paz (LAP) in S1 (2016-2017) and S2 (2017-2018) ...................... 35
Table 2.2. Mean ± standard deviation (min-max), concentrations (ng/g ww) of Hg
and Se, and molar ratio Se:Hg in the biopsies of whale shark collected in two
bays from the Gulf of California: Bahía de Los Ángeles (BLA) and La Paz (LAP)
in 2016 and 2017 .............................................................................................. 36
Table 2.3. Concentrations of Hg and Se (on wet weight basis) and molar ratio
Se:Hg in the zooplankton and main groups collected in 2016 and 2017 in Bahía
de La Paz (LAP), Gulf of California .................................................................. 42
Table 2.4. Mean ± standard deviation (min-max), concentrations (ng/g ww) of Hg
and Se, and molar ratio Se:Hg in the biopsies of whale shark collected in two
bays from the Gulf of California: Bahía de Los Ángeles (BLA) and La Paz (LAP)
in 2017 and 2018 .............................................................................................. 44
Table 2.5. Concentrations of Hg and Se (ng/g ww) and molar ratio Se:Hg in the
zooplankton and main groups of zooplankton collected in 2017 and 2018 in Bahía
de Los Angeles (BLA) and Bahía de La Paz (LAP), Gulf of California ............. 52
Table 3.1. Concentrations (mean ± SD in µg/g ww) of Zn, As, Cu, Pb and Cd in
males and females of whale shark samples in BLA and LAP in S1 .................. 67
Table. 3.2. Concentration of Zn, Cu, As, Pb and Cd (µg/g ww) in zooplankton and
main groups of zooplankton from LAP in S1 .................................................... 73
Table 3.3. BMF (mean, min and max) of whale sharks calculated from
zooplankton, copepods, chaetognatha and euphausiids collected in S1 in
LAP .................................................................................................................. 74
Table 3.4. Concentrations (mean ± SD in µg/g ww) of Zn, As, Cu, Pb and Cd in
males and females of whale shark samples in BLA and LAP in S1 .................. 76

Table 3.5. TEs concentrations and mean ± SD (ng/g ww) in zooplankton and in
the main zooplankton groups collected in BLA and LAP in S2 ......................... 81
Table 3.6. BMF (mean, min and max) of whale sharks calculated from
zooplankton, copepods and chaetognatha collected in BLA and LAP in S2.
Asterisks indicate p values < 0.05 (*) and < 0.001 (**). Statistical test applied was
t-test ................................................................................................................. 83
Table 3.7. TEs (mean ± SD, min - max) found in whale shark biopsies collected
in S1 and S2 in BLA and LAP........................................................................... 87
Table 3.8. Molar ratio Zn:As, Zn:Cd, Cd:Pb, Cd:As, Se:Cd and Se:As (mean ±
SD, min - max) found in whale shark biopsies collected in S1 and S2 in BLA and
LAP. Results from this study compared with the ones found in Wang et al., 2014
on two whale sharks from China. Asterisks indicate p values < 0.05 (*) and <
0.001 (**). Statistical test applied was t-test ..................................................... 88
Table 3.9. Comparison between TEs concentrations found in whale shark
biopsies from this study with TEs concentrations found in two dead whale sharks
from the coast of China (Wang et al., 2014) and Dijibouti (Boldrocchi et al., 2020).
Concentrations are expressed in µg/g ww ........................................................ 98
Table 4.1. Concentrations (ng/g ww) of trace elements in tissues of stranded
whale sharks sampled in Punta Bufeo (PB) and La Paz Bay (LAP), Baja California
Sur, Mexico .................................................................................................... 110
Table 4.2. Molar ratio of trace elements in tissues of stranded whale sharks
sampled in Punta Bufeo (PB) and La Paz Bay (LAP), Baja California Sur, Mexico
....................................................................................................................... 110
Table 4.3. Trace elements concentrations (µg/g ww) in tissues of whale shark
and other species of sharks............................................................................ 112
Table 5.1. Trace elements concentrations, mean and standard error (SE) and
molar ratio Se:Hg, Se:Cd, Se:As, Zn:Cd, Zn:As in the right and left lobe of the
whale shark liver. Concentrations are expressed in µg/g ww ......................... 122

ABSTRACT
Essential (Cu, Se and Zn) and non-essential (As, Cd, Hg, and Pb) trace elements
(TEs) were determined in 130 dermal biopsies of whale sharks (Rhincodon typus)
and 25 samples of zooplankton collected in two seasons (S1 (2016-2017) and
S2 (2017-2018)) in Bahía de los Angeles (BLA) and Bahía de La Paz (LAP), Gulf
of California (GC), Mexico. In biopsies, Zn occurred at the highest concentration
(BLA: S1 = 298 ± 406 and S2 = 1959 ± 2545; LAP: S1 = 595 ± 554 and S2 =
2642 ± 1261; ng/g ww) and Cd the lowest (BLA: T1 = 17 ± 14 and T2 = 13 ± 10;
LAP: T1 = 3 ± 3 and T2 = 4.0 ± 3.0; ng/g ww) relative to other TEs. Significant
differences (p<0.05) in the concentration of TEs between site and season were
noted. Sex was not significant for any element, except Pb in LAP S1 and Cu in
LAP S2 (p <0.05). TE concentrations showed a negative correlation with total
length in the males and positive relationship in the females, which could indicate
differences in prey preferences and feeding grounds. Arsenic concentrations in
the sharks from La Paz suggested that the area is enriched with this element. In
the zooplankton, Zn and Hg were the most and least concentrated TE,
respectively, in the two seasons, with significant differences (p<0.05) by season.
Copepods and chaetognaths were identified as the main groups of zooplankton
while sharks were feeding. Essential TEs were not biomagnified probably due to
homeostatic mechanisms, while Hg and Pb were biomagnified in both seasons
through zooplankton. Livers from two stranded whale sharks presented high As
(24200 and 33700 ng/g) and Cd (5130 and 17500 ng/g ww) concentrations. High
Cd levels were also found in filtering pads (1480 and 2240) of both sharks. In one
stranded shark, high concentrations of Pb were found in skeletal muscle (13700
ng/g ww) and epidermis (6770 ng/g ww). In both sharks, molar ratio Se:Hg was
>1 for all sampled tissues. TEs were not uniformly distributed in the lobes of the
liver; Cd, As and Zn were found in higher concentrations in both right and left lobe
while Hg and Pb were found in lower concentrations. The proximal area of the
left lobe presented the lowest concentrations of Zn, As and Cd and the highest
concentrations of Se. A molar excess of Se over Hg was found in both seasons
and both sites in the biopsies, the zooplankton and the livers of the stranded
whale sharks. Molar ratios suggested that Zn could improve Cd detoxification
better than Se in the epidermis and the liver.

RESUMEN
Los oligoelementos (TEs) esenciales Cu, Se y Zn, y no-esenciales As, Cd, Hg y
Pb, fueron determinados en 130 biopsias de tiburones ballena (Rhincodon typus)
y 25 muestras de zooplancton recolectados durante dos temporadas (S1 y S2)
en Bahía de Los Ángeles (BLA) y Bahía de La Paz (LAP), Golfo de California,
México. En las biopsias, el Zn fue el TE más concentrado (BLA: S1 = 298±406 y
S2 = 1959±2545; LAP: S1 = 595±554 y S2 = 2642±1261; ng/g ph) y Cd el menos
(BLA: T1 = 17±14 y T2 = 13±10; LAP: T1 = 3±3 y T2 = 4.0±3.0; ng/g ph),
encontrando diferencias significativas (p <0.05) en la concentración promedio de
TEs entre sitio y temporada. El sexo no influyó significativamente para ningún
elemento, excepto Pb en LAP S1 y Cu en LAP S2 (p<0.05). Las concentraciones
de TEs mostraron una correlación negativa con la longitud total en los machos y
positiva en las hembras. Las concentraciones de As en los tiburones de LAP
sugieren que el área está enriquecida con este elemento. El zooplancton
acumula TEs siendo Zn el más concentrado y Hg el menos en las dos
temporadas, con diferencias significativas (p<0.05) por temporada. Los
copépodos y los quetognatos fueron identificados como las principales presas
de zooplancton. El Hg y Pb se biomagnificaron a través del zooplancton. Los
hígados de dos tiburones varados presentaron altas concentraciones de As
(24200 ng/g ph y 33700 ng/g ph) y Cd (5130 ng/g ph y 17500 ng/g ph). También
se encontraron altos niveles de Cd en los pads filtradores de ambos tiburones
(1480 ng/g ph y 2240 ng/g ph). En un tiburón varado, se encontraron altas
concentraciones de Pb en el músculo esquelético (13700 ng/g ph) y la epidermis
(6770 ng/g ph). En ambos tiburones, la relación molar Se:Hg fue > 1 para todos
los tejidos muestreados. Los TEs no se distribuyeron uniformemente en los
lóbulos del hígado; Cd, As y Zn se encontraron en altas concentraciones tanto
en el lóbulo derecho como en el izquierdo, mientras que Hg y Pb se encontraron
en concentraciones más bajas. El área proximal del lóbulo izquierdo presentó las
concentraciones más bajas de Zn, As y Cd y las concentraciones más altas de
Se. Se encontró un exceso molar de Se sobre Hg en ambas estaciones y en
ambos sitios en las biopsias, el zooplancton y los hígados de los tiburones
ballena varados. Las relaciones molares sugirieron que Zn podría mejorar la
desintoxicación de Cd mejor que Se en la epidermis y el hígado.

1
CHAPTER 1:
GENERAL INTRODUCTION
1.1. The whale shark: history, biology and ecology
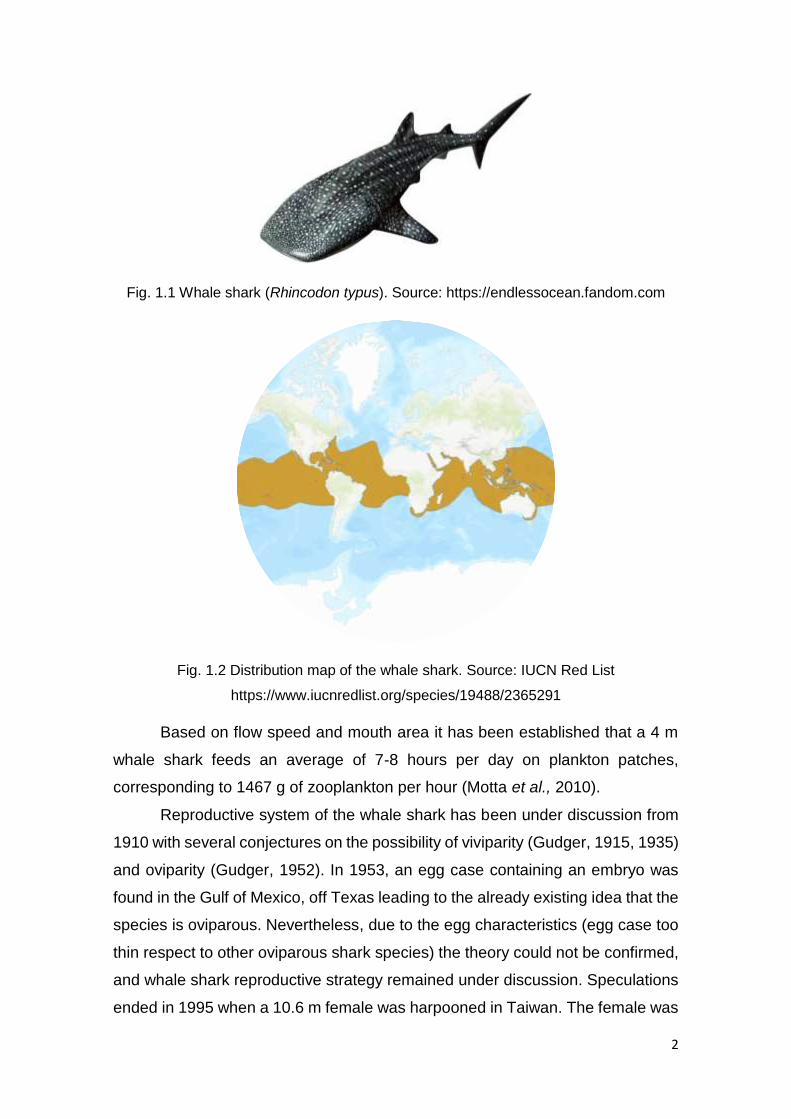
By being the largest fish of the planet, the whale shark (Rhincodon typus) (Fig.
1.1) is a cosmopolitan species; it reaches 18-20 m of total length (Coleman, 1997)
and is found in epipelagic and neritic waters, tropical and subtropical regions
between 30º N and 35º S (Compagno, 1984) (Fig. 1.2). It seems to prefer waters
with temperatures of 26.8 °C and 30.2 °C, with an average of 28 °C and salinities
between 34.5 ‰ and 35.5 ‰ (Compagno, 1984).
The species was firstly described in 1828 by Andrew Smith from a 4.6 m
individual harpooned in South Africa. Since then, records of whale shark have
been mainly focused on captures, stranding and sightings principally based on
feeding activities. The increase of the diving activity in the early 1990’ has led to
discover new aggregations of whale shark all over the world which had allowed
to increase marine conservation and ecotourism activities together with scientific
studies.
Periodic observations of feeding aggregations allowed to link whale shark
presence to productivity events in Australia (Norman & Stevens 2007), Indonesia
(Stacey et al., 2008), Philippines (Araujo et al., 2014), Maldives (Riley et al.,
2010), Seychelles (Rowat et al., 2009), Saudi Arabia (Cochran et al., 2016), India
(Pavin, 2000), Kenya (Beckley et al., 1997), Tanzania (Cochran, 2014), Saint
Helena (Clingham et al., 2016) and Belize (Heiman et al., 2001). In Mexico,
feeding aggregations have been described in the Mexican Caribbean (Motta et
al., 2010), Bahía de Los Angeles (Ramírez-Macías et al., 2012), Bahía de La Paz
(Ketchum et al., 2013; Whitehead et al., 2019) and Nayarit (Ramírez-Macías et
al., 2016). Feeding is based on zooplankton communities principally composed
by copepods (Clark & Nelson, 1997; Hacohen-Domené et al., 2006; Whitehead
et al., 2020) and chaetognats (Pancaldi et al., 2019a; Whitehead et al., 2020) but
also cladocerans (Lavaniegos et al., 2012), decapods (Whitehead et al., 2020)
and euphasiids (Hacohen-Domené et al., 2006: Whitehead et al., 2020).
2
Fig. 1.1 Whale shark (Rhincodon typus). Source: https://endlessocean.fandom.com
Fig. 1.2 Distribution map of the whale shark. Source: IUCN Red List
https://www.iucnredlist.org/species/19488/2365291
Based on flow speed and mouth area it has been established that a 4 m
whale shark feeds an average of 7-8 hours per day on plankton patches,
corresponding to 1467 g of zooplankton per hour (Motta et al., 2010).
Reproductive system of the whale shark has been under discussion from
1910 with several conjectures on the possibility of viviparity (Gudger, 1915, 1935)
and oviparity (Gudger, 1952). In 1953, an egg case containing an embryo was
found in the Gulf of Mexico, off Texas leading to the already existing idea that the
species is oviparous. Nevertheless, due to the egg characteristics (egg case too
thin respect to other oviparous shark species) the theory could not be confirmed,
and whale shark reproductive strategy remained under discussion. Speculations
ended in 1995 when a 10.6 m female was harpooned in Taiwan. The female was

3
pregnant and had 304 embryos in different development classes. Embryos
develop in brown horny egg cases and hatch in the uterus proving that the
species is a lecithotrophic livebearer (Joung et al., 1996).
According to several authors, sexual maturity in this species is reached at
9 m of length in females and around 8 m in males (Norman & Stevens, 2007).
Nevertheless, observations of mature animals below these sizes has been
reported by Wintner (2000). Information on growth is scarce and mainly reported
from animals in captivity; pups hatch at around 60 cm in length and grow a mean
of 28 cm per year during the first 3 years (Hsu et al., 2007) with this rate
decreasing by time.
Natural mortality in this species is rarely investigated but appears to be
higher in very juvenile animals and pups due to natural predation (Rowat &
Brooks, 2012) by the blue marlin Makaira nigricans (Colman, 1997) and the blue
shark Prionace glauca (Kukuyev, 1995). Attacks to larger individuals by killer
whales Orcinus orca (O’Sullivan & Mitchell, 2000) and other larger sharks
(Fitzpatrick et al., 2006) have been described, although it is not known how
frequently this occurs.
Stranding has been observed in very few areas such as the Indian Ocean
coast of South Africa (Beckley et al., 1997) and coasts of Australia (Speed et al.,
2009). In the Gulf of California, 14 whale shark stranding have been recorded
from 2000 to 2018 (Whitehead et al., 2018). The causes of the stranding are
usually unknown but regional topography, pollution, fishery pressure and disease
have been speculated.
Whale shark docile behaviour towards humans and their predictability
linked to feeding events rendered them vulnerable to captures. Surface
swimming habits make them vulnerable to propeller injuries; death caused by
boat collision have been reported (Rowat et al., 2009) and continues mainly in
high touristic areas (Fig. 1.3). Historically, mortality of R. typus has been linked
to fishery activities especially in Asian countries where flesh (typically called ”tofu
shark”) and fins were used to be consumed (Chen et al., 1997; Chen & Phipps,
2002; Hanfee, 2007).
Bycatch from tuna purse-seine and illegal fishing still represent a
conservation threat to whale sharks. In 2000, R. typus was classified by the
International Union for the Conservation of Nature as vulnerable in the Red List

4
of Threatened Animals. It was also included in the Appendix II of the Convention
of Migratory Species of Wild Animals (CMS) in 1999 (CMS, 1999) and to
Appendix II of CITES, the Convention of Trade in Endangered Species, in 2002
(CITES, 2002).
In 2016, R. typus classification in the Red List was upgraded to
“endangered” from the IUCN. This decision was taken based on a report
published by Pierce and Norman (2016; IUCN 2016) which state a global decline
of whale shark population of around 50%.
Fig. 1.3 Injuries caused by propeller strike on a whale shark in the South Ari Atoll,
Maldives. Source: Francesca Pancaldi
1.2. Trace elements (TEs)
Pollution in the marine environment has become a worldwide problem due to the
increasing levels of toxic elements and their obvious impacts on biota and human
health (Achary et al., 2017). Pollutants in the marine environment can occur
naturally as a result of natural biogeochemical processes (erosion, rock wear,
volcanic eruptions and hydrothermal vents) or they can come from human
sources (mining, industry, incineration, agriculture and aquaculture) (Páez-
Osuna et al., 2017). Some substances can be extremely toxic to living because
their persistence and ability to accumulate in the trophic web, representing a
serious threat to diversity, species abundance and human health (Naser, 2013).
The biological availability and toxicity of various elements depends on their
chemical form in the environment, which can be affected by water quality
characteristics such as pH and salinity (Atchison et al., 1987).

5
Essential trace elements (TEs) are those that are needed in very small
quantities for growth, development, and physiology of the organism. They are
persistent in the environment where they are generally found in concentrations
below ppm (Newman & Unger, 2002), are potentially reactive and can
bioaccumulate in the trophic web (Prasad et al., 2006). Some of them, such as
heavy metals, can cause severe problems for the health of organisms.
Trace elements (TEs) are classified in essential and not essential
depending on the role that play in the organisms; essential TEs are those that are
required to perform vital metabolic activities in organisms, and include iron (Fe)
(haemoglobin), copper (Cu) (respiratory pigments), cobalt (Co) (Vitamin B12),
manganese (Mn) and zinc (Zn) (enzymes) (Soto-Jiménez, 2011). An element can
be considered essential when it has the following characteristics: 1. It is present
in all tissues, 2. It is maintained at a constant concentration, 3. It is capable of
producing physiological abnormalities if it is excluded from the organism, and 4.
It is capable of remedy these conditions if it is reinstated in the body (Soto-
Jiménez, 2011). Although essential, these elements become toxic in high
concentrations. Non-essential elements, such as heavy metals, certain metals
and metalloids have no biological functions and cause toxic effects even at low
concentrations. Some of these substances like mercury (Hg), lead (Pb) and
cadmium (Cd) are considered the most polluting in the environment (Chen et al.,
2008).
The sources of pollutants in the ocean are classified as direct, resulting
from activities immediately adjacent to coastal waters (municipal effluents,
industrial discharges, agricultural wastewater, aquaculture, hydrothermal vents)
and diffuse, which provide materials resulting from activities carried out in
relatively remote areas to the coast (Páez-Osuna et al., 2017). Both types of
sources reflect both natural distributions, as part of geological and biological
cycles, as well as anthropogenic contributions due to industrial and urban
activities.
TEs are contributed from the continent to the sea by natural processes as
a result of the weathering of the continental crust (Rodríguez-Figueroa, 2004).
The elements are mobilized as solid particles suspended and dissolved by rivers,
groundwater, and coastal erosion, melting of the Arctic and Antarctic ice and by
atmospheric route (Salomons & Förstner, 1984). Once at sea, the TEs are
6
integrated into the suspended particulate matter of the water column by
adsorption and absorption processes, participate in marine biogeochemical
cycles and control part of the ocean's chemistry.
River discharges are mostly responsible for TE's contribution to the ocean
(Rodríguez-Figueroa, 2004) in coastal zone. Element flows from rivers are initially
incorporated into lagoons and estuaries, and finally into marine biogeochemical
processes. Calculating the concentration of these flows is complicated because
some elements exhibit non-conservative behaviour with respect to others.
However, the concentration of TEs in seawater is typically low (<1 mg/kg) (Prasad
et al., 2006). The atmospheric contribution of TEs depends mainly on regional
wind patterns and dust storms, periodically generated in the great deserts of the
Sahara and East China (the two largest sources worldwide). The dust generated
from these storms is transported thousands of kilometres offshore and
precipitates through dry or wet deposition processes (Goudie, 2009). According
to the world health organization, volcanic discharges reflect the entry of sediment
and trace elements into the sea; this activity is the largest natural source of Cd to
the atmosphere with a contribution of between 100-500 ton / year (WHO, 1992).
Underwater hydrothermal vents are associated with all biologically
important TEs (Baross & Hoffman, 1988); mercury (Hg) enrichment has been
observed in rocks of underwater hydrothermal systems in the Okinawa Channel,
Japan (Halbach et al., 1993), Plenty Bay, New Zealand (Stoffers et al., 1999),
and in the underwater hydrothermal system from Punta Mita, Mexico (Prol-
Ledesma et al., 2002). These vents provide abundant sulfur, pyrite, arsenic,
antimony, and cinnabar (mineral constituted by mercury sulphide) resulting from
great volcanic activity (Hedenquist & Lowenstern, 1994). As observed by
Segovia-Zavala et al. (2004), upwellings transport dissolved and particulate
metals, especially Cd, from deep areas to more coastal waters, and therefore
represent another important natural source of this metal to coastal areas.
The high anthropogenic activities represent a source of toxic substances
for the marine ecosystem. Potential sources of pollutants include urban
tributaries, residual oils derived from maritime transport, industrial discharges and
mining activity (Páez-Osuna et al., 2017). Anthropogenic activities contribute
around 7300 ton/year of cadmium (Cd) worldwide and the main route of entry into
the environment is atmospheric emissions from mining, refining and smelting of

7
minerals, the use of fossil fuels and the use of phosphorus fertilizers in intensive
agriculture (Martelli et al., 2006).
Lead (Pb), one of the most common chemical pollutants in the
environment, is used in a wide range of products and, due to its resistance and
ductility it has been used since ancient times accompanying man in his economic
growth (Frías-Espericueta et al., 2010). The atmospheric contribution, mainly due
to gasoline, is the main source of Pb for both the terrestrial and marine
environment, however, other human activities can cause serious impacts, among
which the use of residual paints and use of automotive batteries (Frías-
Espericueta et al., 2010).
Used in various industries, gold mining, refinery, combustion, carbon and
thermoelectric plants and oil refineries (Páez-Osuna et al., 2017), Hg is
considered one of the most toxic pollutants in the world. Its compounds are used
as fungicides for seed treatments and growth inhibition in numerous industries
such as cellulose. It is an excellent industrial catalyst and, because it is liquid at
room temperature, it is used as a component in electrolysis. It can be released
into the environment as a residue of laboratory chemicals, batteries, fungicides
and pharmaceuticals and as a compound in sewage effluents. The elemental
mercury (Hg 0), a predominant species of Hg in the air, has a time of residence
in the atmosphere of up to 2 years, consequently its distribution is global, being
even in areas considered pristine as the Arctic (Dehn et al., 2006).
Selenium (Se), used in the production of electronics, crystals and pigments
is also generated by the gold, cobalt, nickel mining industry and is also found in
coal ashes. The main entrance to the atmosphere comes from the combustion
and burning of vegetation (Newman & Unger, 2002). Arsenic (As) and its
derivatives are used in many products such as metal alloys, pesticides,
herbicides and wood preservatives (Páez-Osuna et al., 2017). The presence of
this metalloid is also associated with gold and lead mining. Arsenic derivatives
are volatile and highly toxic and considered carcinogenic.
It is evident that regardless of the sources of these pollutants, the final
receptors are the atmosphere, the aquatic ecosystem and the biota, so their use
must be carefully regulated.
8
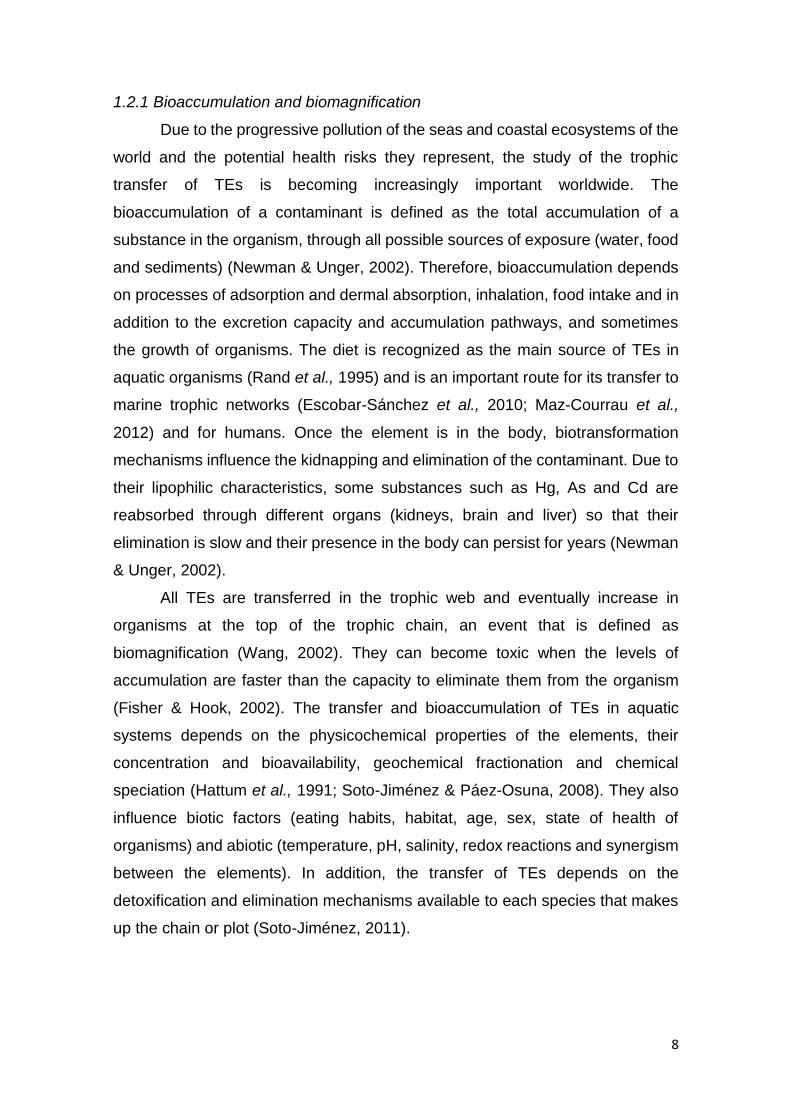
1.2.1 Bioaccumulation and biomagnification
Due to the progressive pollution of the seas and coastal ecosystems of the
world and the potential health risks they represent, the study of the trophic
transfer of TEs is becoming increasingly important worldwide. The
bioaccumulation of a contaminant is defined as the total accumulation of a
substance in the organism, through all possible sources of exposure (water, food
and sediments) (Newman & Unger, 2002). Therefore, bioaccumulation depends
on processes of adsorption and dermal absorption, inhalation, food intake and in
addition to the excretion capacity and accumulation pathways, and sometimes
the growth of organisms. The diet is recognized as the main source of TEs in
aquatic organisms (Rand et al., 1995) and is an important route for its transfer to
marine trophic networks (Escobar-Sánchez et al., 2010; Maz-Courrau et al.,
2012) and for humans. Once the element is in the body, biotransformation
mechanisms influence the kidnapping and elimination of the contaminant. Due to
their lipophilic characteristics, some substances such as Hg, As and Cd are
reabsorbed through different organs (kidneys, brain and liver) so that their
elimination is slow and their presence in the body can persist for years (Newman
& Unger, 2002).
All TEs are transferred in the trophic web and eventually increase in
organisms at the top of the trophic chain, an event that is defined as
biomagnification (Wang, 2002). They can become toxic when the levels of
accumulation are faster than the capacity to eliminate them from the organism
(Fisher & Hook, 2002). The transfer and bioaccumulation of TEs in aquatic
systems depends on the physicochemical properties of the elements, their
concentration and bioavailability, geochemical fractionation and chemical
speciation (Hattum et al., 1991; Soto-Jiménez & Páez-Osuna, 2008). They also
influence biotic factors (eating habits, habitat, age, sex, state of health of
organisms) and abiotic (temperature, pH, salinity, redox reactions and synergism
between the elements). In addition, the transfer of TEs depends on the
detoxification and elimination mechanisms available to each species that makes
up the chain or plot (Soto-Jiménez, 2011).

9
1.2.2 Toxicity in marine organisms
The excessive accumulation of TEs in aquatic animals can cause toxicity
at different levels: physiological, cellular, and behavioural. The harmful effects
depend mainly on the chemical species and its concentration in the most labile
phase (Cheng et al., 2008). Hg for example is considered one of the most toxic
heavy metals for the health of aquatic and human organisms. However, the
greatest ecological and health risk is in methylmercury (MeHg), the result of the
transformation of inorganic Hg by some microorganisms in the aquatic systems
(Cheng et al., 2008). Because of its bioavailability and ease of absorption, this
organic form of Hg is considered the most dangerous for marine organisms. In
fish, Hg can cause alterations in the branchial and dermal epithelia, reduction in
the absorption of amino acids and sugars in the intestine, and inhibition of
intestinal enzymes (Berntssen et al., 2004).
Arsenic dissolved or/and suspended in the water is absorbed by the gills,
by the gastrointestinal tract and by the skin. It is distributed in liver, kidney, skin
and scales (due to the affinity of the arsenites for keratin), gills and muscle, where
the inorganic As is transformed into lipo and water soluble organic form (Prieto-
García et al., 2016). This metalloid has a genotoxic effect and in zebrafish it
causes teratogenic damage including malformations of fetuses, increase in eggs
and non-viable eggs, decrease in hatching percentage and survival of juveniles
(Prieto-García et al., 2016). In addition, it causes neuromotor damage and liver
and kidney damage in trout (Kotsanis & Iliopoulou, 1999).
Zinc (Zn) causes degenerative changes in muscle and brain of fish
embryos, such as: mitochondrial swelling, cytoplasmic vacuolization, swelling of
the endoplasmic or sarcoplasmic reticulum, and other degenerative changes
associated with cell death (Prieto-García et al., 2016). Among the physiological
alterations that can cause excessive accumulation of TEs include necrosis in
hepatopancreas, loss of the regular structure of the gill and gastrointestinal
tissue, as well as muscular atrophy in crustaceans (Jakimska et al., 2011).
In fish, hypertrophy (increase in muscle fiber size), hyperplasia (increased
number of cells), fusion of the second gill lamella, aneurysm, haemorrhage,
vascular congestion, hyperaemia (increased irrigation to an organ or tissue) have
been recorded and deformity of the branchial arches due to exposure to high
concentrations (Hoffman, 2002).

10
The concentration of essential and non-essential trace elements can
induce the formation of reactive oxygen species (ROS), modification of the
antioxidant enzymatic activity, oxidative damage in lipids, proteins and DNA
(Barrera-García et al., 2012). At the cellular level, mitochondria are one of the
main cellular targets of the effects of some TEs (especially metals). It has been
proposed that some oxidizing species of As and Hg disturb the structure of the
mitochondrial inner membrane favouring the production of ROS. The resulting
adverse effects include an imbalance between prooxidant events (increase in
free radicals, reactive oxygen and nitrogen species) and antioxidants (enzymatic
and non-enzymatic) (Konisgberg, 2008).
Other indicators of oxidative stress include damage to total soluble
proteins, production of superoxide radicals and protein damage (Barrera-García
et al., 2012). For example, exposure to iron (Fe) increases the levels of carbonyl
proteins and TBARS (thiobarbituric acid reactive substances) but decreases the
activity of some antioxidant enzymes such as glutathione S-transferase (GST),
glutathione reductase (GR) and catalase (CAT). Exposure to copper (Cu)
decreases the activity of CAT and glutathione peroxidase (GPx) (Barrera García
et al., 2012). Exposure to As increases lipid peroxidasi and CAT, superoxidase
dismutase (SOD) and GPx activity in the goldfish Carassius auratus (Lushchak,
2012).
Berntssen et al (2004) found that exposure to organic Hg can increase the
concentration of TBARS and decrease the activity of SOD and GPx in Atlantic
salmon (Salmo salar). The presence of non-essential TEs and free radicals
induces DNA damage and replication, nucleic acid synthesis and damage to
nuclear chromatin. An example of genotoxic events and chromosomal instability
is the formation of micronuclei, small nuclei that form when a chromosome or a
fragment of a chromosome is not incorporated into one of the secondary nuclei
during cell division (Yadav & Trivedi, 2009). Micronucleus formation has been
confirmed in teleost fish exposed to lethal doses of Hg, As and Cu (Yadav &
Trivedi, 2009).
The effects of the accumulation of toxic TEs on behaviour are related to
abnormal behaviours, breathing out of water, reduced motility and erratic
swimming (Atchinson et al., 1987). Several authors have reported behavioural
changes including locomotor and respiratory abnormalities in teleost fish exposed

11
to Cd, Cu Zn, Hg, Pb and Se (Atchinson et al., 1987). Studies of these effects on
elasmobranch species are probably less common, however, Evans and
Weingarten (1990) report vascular anomalies in the canyon shark, Squalus
acanthias, related to the presence of Cd, Cu Zn, Hg, and Pb (Evans &
Weingarten, 1990).
1.2.3 Toxicity in human health
Due to the commercial importance of some species of pelagic fish for
consumption, the concern about the harmful effects of TEs on human health is a
global problem. The consumption doses, the age of the person, and the chemical
forms of the elements are some of the main factors that determine the occurrence
and severity of adverse effects on human health (Zuluaga-Rodríguez et al.,
2015).
In general, the demonstrated effects on human health include damage to
different organs and tissues, including the liver and kidneys, as well as learning
difficulties, headaches, and damage to the central nervous system (Ki-Hyun et
al., 2016). The Official Mexican Standard (NOM-242-SSA1-2009) have
established maximum concentration limits for some potentially toxic trace
elements in products of commercial interest. Some of these limits are represented
in Table 1.1.
The transport of Hg through the body is facilitated by a cysteine complex
(R-SH) that can transfer Hg to the placental and blood-brain barrier. Therefore,
the developing brain and fetus are considered the main biological targets of Hg
toxicity, especially its more toxic form, methylmercury, ([CH₃Hg]⁺), in vertebrates
(Harley et al., 2015). Among the main reported consequences of methylmercury
are degeneration of the occipital cortex and cerebellum, causing paraesthesia
(abnormal sensations of tickling, heat or cold on the skin), ataxia (lack of
coordination), sensory damage and memory loss, (Dietz et al., 2013). In new-
borns, the accumulation of Hg can cause mental retardation, cerebral palsy, and
low birth weight. In the 1950s, the city of Minamata, Japan was the centre of an
outbreak of methylmercury poisoning (known today as “Minamata disease”)
where approximately 45 people died (Harada, 1995). Several years after the
outbreak, the Japanese government announced that the cause of the disease

12
had been the ingestion of Hg-contaminated fish and shellfish caused by spills
from a petrochemical company in the area.
In the case of Se, the variation between diet deficiencies and toxicity is
determined in a very low range of 0.1-1.0 µg/g, which makes this essential
element the object of study (Chang et al., 2016; Huang et al., 2014;). Selenosis,
a disease caused by the high concentration of Se in human body causes nausea,
vomiting, hair loss, brittle nails, irritability, fatigue and abnormalities in the nervous
system (Ralston et al., 2008). Skorupa et al. (1996) suggest in the case of
humans, a limited consumption of fish and other marine organisms with
concentrations of Se ≥ 2 µg/g ww and a total ban on concentrations ≥ 5 µg/g ww,
to avoid any risk of poisoning. On the other hand, Se deficiency (< 5 µg/kg per
day) in human provoke severe heart pathologies and the Kashin-Beck disease
which produce rheumatism and malformations in bones (Navarro-Alarcon &
Cabrera-Vique 2008).
The consumption of contaminated organisms is not the only cause of
disease for the population; Itai-Itai disease was the first documented case of
massive cadmium poisoning. The disease, registered in 1912 in Toyama
Prefecture, Japan, was caused by high mining activity that contaminated rivers
and rice fields. Cadmium poisoning causes osteomalacia (demineralization of the
bones) and kidney failure causing severe pain in the joints and spine (Harada,
1995).
In 2009, Haefliger et al., (2009) investigated the death of 18 children who
died of unknown causes in a community involved in recycling used lead batteries
in the suburbs of Dakar, Senegal. What they found were values of up to 613.9
μg/dL of Pb in children's blood, compared to the maximum limit accepted by the
Environmental Protection Agency which is 10 μg/dL.
It is evident that heavy metal contamination in humans has been a problem
for centuries and it is necessary to implement constant environmental monitoring
that includes air, water, sediments and organisms, as well as blood monitoring
for populations exposed to these contaminants.

13
Table 1.1 Trace elements maximum limits (µg/g wet weight) allowed in different
marine products established in Mexico. Sources: NOM-242-SSA1-2009.
Element Product Maximum limit
As Crustaceans and bivalve
molluscs
80
Cd Molluscs 2
Others 0.5
Hg Fish 1
[CH₃Hg]⁺ Fish, tuna, marlin 1
Others 0.5
Pb Fish and crustaceans 0.5
Molluscs 1
1.3. Defence mechanisms
1.3.1 Enzymatic response
The study on the physiological responses of elasmobranchs to toxic
substances is scarce, however, organisms, including fish, have mechanisms to
prevent damage caused by high concentrations of TEs. Antioxidant systems
including vitamins, carotenoids and low molecular weight enzymes such as
glutathione and some amino acids containing sulfhydryl groups (R-SH) represent
the main defence responses for organisms against oxidative stress induced by
environmental factors and substances of anthropogenic origin (Rudneva, 1997).
Antioxidant enzymes contribute to prevent oxidative damage of tissues by
minimizing the production of ROS and their interaction with other molecules
(Halliwell & Gutteridge, 2007). It has been shown that antioxidant enzyme activity
is related not only to metabolism but also to behaviour including diet and mobility;
ROS production is in effect, related to the degree of physical activity, especially
in muscle, as a consequence of the flow of oxygen in the mitochondria (Copper
et al., 2002). Differences in oxidative stress between sexes have been found in
several studies. Estrogens (Borras et al., 2007), vitamin E and glutathione
(Goldfarb et al., 2007) in females have been shown to prevent oxidative damage.

14
1.3.2 Metallothioneins (MTs)
Metallothioneins (MTs), a group of metal-binding proteins, can serve as
useful indicators to detect physiological responses to metal exposure in fish and
other aquatic organisms (Nordberg & Nordberg, 2009). MTs are intracellular
proteins, rich in cysteine and low molecular weight (6-7 kDa) that are present in
many species of invertebrates and vertebrates and appear to play a role in
homeostasis and detoxification of metal ions by joining and sequestering various
metals such as Cu, Zn, Cd, Hg and Pb (Newman & Unger, 2002). MTs also seem
to work in other important physiological processes, including the elimination of
ROS and the regulation of cell proliferation and apoptosis (cell death) (Chiaverini
& De Ley, 2010).
In general, the expression of MT increases in response to exposure to
elevated metals, a property that has led to its widespread use as a biomarker to
detect effects of toxic metals in human and wildlife populations. Since Hg has
been shown to induce MT gene transcription and protein synthesis in various fish
species (e.g., Scatophagus argus, Sinaie et al., 2010). Thus, MT is a potentially
useful biomarker to explore whether ecologically relevant levels of Hg absorption
in sharks are associated with physiological alterations.
A few laboratory studies have confirmed that MTs are present in
elasmobranchs and can be induced by exposure to some toxic metals in certain
species (Hidalgo & Flos, 1986). In the case of Scyliorhinus canicula, for example,
high levels of hepatic MTs are induced by exposure to Cd (Hidalgo & Flos, 1986).
Although these studies corroborate the efficiency of the use of MTs as a
specific indicator of exposure to metals in aquatic organisms, other studies
question their suitability as a biomarker for Hg exposure due to the lack of positive
correlations between levels of Hg and MT content in several species (Rotchell et
al., 2001). Despite the high levels of total Hg (THg) commonly observed in
Florida's shovelhead shark (Sphyrna tiburo), there was no evidence of high
amounts of MTs in such individuals and, in general, muscle THg concentrations
and MT levels in muscle and liver were not positively correlated. Therefore, these
results suggest that MTs are unlikely to be a useful biomarker for exposure to Hg
in this species and perhaps in other sharks. As suggested in this study, this may
be due to the chemical form of Hg; methylmercury, in fact, the most ecologically

15
relevant and abundant Hg species found in wildlife seems to be less capable of
inducing MTs than inorganic forms of Hg (Walker et al., 2014).
1.3.3 Antagonism between TEs
It is known that the interaction between various elements influences the
harmful and beneficial effects of these on organisms. Selenium, an essential
element in organisms, is considered an element that opposes the toxicity of Hg
(Cabañero et al., 2007). These elements compete for the thiol (-SH) groups of
the protein, and this produces an antagonism between them. The high affinity
between these two elements allows the formation of the HgSe complex (mercury
selenide) responsible for the protective effect of Se (Raleston et al., 2008) that
acts against the toxicity of Hg by compensating for the loss and sequestration of
selenium by mercury. Further possible mechanisms of protection of Se against
the toxicity of Hg include redistribution or excretion of Hg in the presence of Se,
competition for binding sites between both elements, the conversion of toxic
forms to less toxic Hg and its prevention of oxidative damage of Hg by Se, through
the increase in glutathione peroxidase activity (Raymond & Ralston, 2004; Belzie
et al., 2005; Raleston et al., 2008).
Considering that the protection of Se occurs through the capture or
kidnapping of Hg, the molar ratio of Se and Hg in the tissues needs to approach
or be greater than 1: 1 to be effective (Cabañero et al., 2007). Therefore, the
protection of Se is efficient only if there is enough free to support the normal
synthesis of selenoproteins, responsible for the proper functioning of the brain,
pituitary and thyroid (Correa et al., 2015). An example of this trend was proposed
by Kaneko and Ralston (2007), who observed in some species of pelagic fish
caught in Hawaii a concentration of Se greater than that of Hg (Fig. 1.4),
indicating sufficient availability of Se to counteract Hg (Kaneko & Ralston., 2007).

16
Fig. 1.4. Molar concentration of Hg and Se in pelagic fish of Hawaii. Data are
expressed as mean ± standard deviation (Kaneko & Ralston, 2007).
1.4. Background
1.4.1 Trace elements and contamination in whale shark
Being a species with “k” life strategies such as slow growing, slow sexual
maturation, large dimensions and extensive longevity, R. typus is a species
vulnerable to exploitation (Fossi et al., 2017). The greatest threats are
represented by illegal fishing, bycatch, and incidents against boats, poor
management of tourism and the growing human activities responsible for the
increase of polluting substances in the sea (Fossi et al., 2017).
Wang et al. (2014) evaluated the levels of copper (Cu), zinc (Zn), lead
(Pb), cadmium (Cd), total mercury (THg) and inorganic arsenic (iAs) in different
tissues (muscle, liver, epidermis and gill) of two whale sharks (TXT and PQ;
Table. 1.2) found dead on the coast of East China. The results from this study
showed that the average contents of Cu, Zn, Pb, Cd, Hg and iAs in the tissues
were 1.69–22.04, 7.43–141.29, 0.30–4.46, 0.11–31.75, 0.00022–0.011, and
0.16–0.64 μg/g (wet weight), respectively. The six heavy metals contents in whale
shark were in the order of Zn>Cu>Pb>Cd>iAs>Hg. Considering that whale shark
meat is still consumed in China despite international regulation of protection and
following the limits of the Food and Agricultural Organization of the United Nations

17
(FAO), Wang et al. (2014) suggested that fresh whale shark could represent a
dangerous food based for consumers.
Tabla. 1.2 Summary of Cu, Zn, Cd, Pb, iAs and Hg in tissues of whale sharks from the
coast of China. Concentrations are expressed in µg/g ww. Source: Wang et al., 2014.
Results of THg concentrations from the muscle of three dead whale sharks
from South Africa indicate an average of 0.26±0.08 mg/kg dw (McKinney et al.,
2016).
Trace element concentrations have been evaluated in twelve whale shark
skin biopsies collected from an important feeding area located in the Gulf of
Tadjoura, Dijibouti (Boldrocchi et al., 2020). Results from this work show (mean
concentrations in ww ± sd) 0.05±0.06 µg/g of Hg, 0.06±0.03 µg/g of Cd, 0.96±0.7
µg/g of As, 1.24±1.12 µg/g of Pb, 8.1±11 µg/g of Cu, 37.8±42.6 µg/g of Zn,
0.35±0.09 µg/g of Se and 18.4±19.7 µg/g of Cr. According to these results and to
the Food and Agriculture Organization (FAO, 2003), whale sharks from this area
are exposed to high concentrations of Pb probably resulting from human
18
activities. The increasing human pressure in Dijibouti has given rise to ocean
contamination from industrial activities, wastewater discharge, vessels,
agriculture run-off and organic as well as solid waste (Ahmed et al., 2017).
Fossi et al. (2017) found detectable concentrations of PCBs
(polychlorinated biphenyl; mean 8.42 ng/g ww), DDTs
(dichlorodiphenyltrichloroethane; mean 1.31 ng/g ww), PBDEs (polybrominated
diphenyl ethers; mean 0.29 ng/g ww) and HCB (hexachlorobenzene; mean 0.19
ng/g ww) in whale shark biopsies collected in the Gulf of California. They also
confirmed the action of the Cytochrome P450 1A (CYP1A), an enzyme produced
from the cytochrome P450 genes that is involved in the formation (synthesis) and
breakdown (metabolism) of various molecules and chemicals within cells.
Cytochrome P450 enzymes play a role in the synthesis of molecules including
hormones, certain fats (cholesterol and other fatty acids), and acids used to
digest fats (bile acids).
1.4.2 Trace elements in zooplankton
One of the first study on metals in zooplankton was performed by Martin
and Knauer (1973) who presented the concentration of TEs in zooplankton
collected in the North Pacific along a transect from Hawaii to Monterrey Bay
(USA). The authors affirmed that the elements could pass to higher levels of the
food chain or can be redistributed in the marine environment by different routes,
such as vertical migration of living planktonic organisms, feces or with the sinking
of its exoskeletons.
Other study area included the Greenland Sea where Zn, Cu, Cd and Pb
were analysed in different zooplankton taxa by Ritterhoff and Zauke, (1997). The
authors found interspecific heterogeneity with low Cd concentrations in calanoid
copepods (0.1–0.7 mg/kg, dry weight) and higher levels in the
decapod Hymenodora glacialis (7–9 mg/kg) and in the amphipods Themisto
abyssorum and T. libellula (24–34 mg/kg). They also found generally low levels
of Pb (< 1 mg/kg).
Zauke (2006) evaluated the concentration of several metals in zooplankton
from the Barent Sea and find interspecific heterogeneity of metals between
groups, with lowest Cd concentrations in euphausiids and chaetognaths and
highest ones in decapods and hyperiid amphipods; lowest Cu concentrations in

19
chaetognaths and copepods and highest ones in euphausiids and decapods; and
lowest Zn concentrations in euphausiids and decapods and highest ones in some
copepods. On the other hand, Pb was often below or close to the limit of
detection. Zauke (2006) also states that change in Cd concentrations in copepods
from summer to winter/spring could be related either to changing accumulation
strategies of the copepod species involved or to seasonally changing Cd
absorption in copepods from food.
Concentration of TEs from zooplankton collected in the whale shark
feeding area from Dijibouti show (mean ± sd) 1136 ± 1135 µg/g of Fe, 5110 ±
4858 µg/g of Sr, 231 ± 246 µg/g of Pb, 242 ± 155 µg/g of Zn, 1.33 ± 0.70 µg/g of
Mo, 1.14 ± 1.65 µg/g of Hg, and 1.61 ± 0.93 µg/g of Co. According to this,
biomagnification factor found in Dijibouti was 4.5 ± 2.9 for Cr (p = 0.0014), 1.9 ±
1.6 for Mn, 1.7 ± 1.3 for Co, 4.2 ± 2.3 for Ni (p = 0.0006), 1.4 ± 0.8 for As and 2.4
± 1.8 for Mo (p= 0.0197) (Boldrocchi et al., 2020).
Studies on trace elements in the zooplankton from the Gulf of California
(GC) are scarce. Renteria-Cano (2011) investigated the concentrations of trace
and major elements in the North and central area of the GC. Renteria-Cano
(2011) concludes that the concentration and distribution of the elements in the
zooplankton is affected by the resuspension of sediments by the mixing from tidal
currents in the upper gulf, the summer cyclonic turn in the North of the GC and
the effects of upwelling in the Ballena Channel.
In her PhD thesis, Renteria-Cano (2011) concludes that trace elements
concentrations is not affected by zooplankton biomass; the concentrations of
elements in the zooplankton of the GC, present a seasonal variability, as a result
of the hydrological processes happening every seasons of the year. A
combination of trace elements input sources is presented in the GC; however,
resuspension is one of the most relevant mechanisms for enrichment in the
northern region, while in the southern region of the archipelago it is believed to
be the wind mechanism. Cadmium in the zooplankton showed high levels
probably due to the high productivity of the GC associated with upwelling events.
Finally, Reinteria-Cano (2011) found no significative differences in TEs
concentrations from the zooplankton of the upper Gulf to the zooplankton of the
central and southern Gulf, probably because of the intense water connectivity
between these areas.

20
1.5. Justification
The uptake of trace elements in marine organisms may lead to bioaccumulation
of toxic substances. Feeding strategy performed by organisms is a key factor in
order to understand bioaccumulation mechanisms and very little is known about
accumulation of toxics in filter feeder elasmobranchs such as the whale shark.
This work aims to generate useful knowledge in a unique shark species whose
feeding habit is different from most or almost all sharks. The results will allow
contrasting the bioaccumulation pattern of TEs in filter feeder species with
typically carnivorous sharks.
This species represents a source of benefit for local communities such as
La Paz where touristic activities are carried out. The lack of information on whale
shark ecotoxicology call to the need to invest in long term studies in order to
establish the health state of this protected species. A better knowledge of their
health state not only spread the general awareness about the species, but it is
also fundamental to establish plans of environmental protection in the area of
aggregation.
1.6. Research objectives
The main aim of this work is to evaluate the concentrations of essential (Cu, Se
and Zn) and non-essential (As, Cd, Hg and Pb) elements in biopsies (epidermis)
of whale sharks, Rhincodon typus, and zooplankton collected in Bahía de Los
Angeles (BLA) and Bahía de La Paz (LAP), Gulf of California, Mexico, during two
seasons (S1: 2016-2017; S2: 2017-2018).
1.7. Specific objectives
The objectives of this study are:
- To know and compare the concentrations of As, Cu, Cd, Hg, Pb, Se and
Zn in the biopsies of whale sharks from two study areas and in the two
seasons.
o To know the bioaccumulation for size and sex.
o To determinate the change in element’ concentration in those
animals that were sampled in both seasons.
o To calculate the molar ratios of selected elements.

21
o To identify the main groups of zooplankton composing the diet of
the sharks.
o To determinate the biomagnification of Se and Hg in the sharks.
- To evaluate the concentrations of As, Cu, Cd, Hg, Pb, Se and Zn in
different tissues of two dead whale sharks, stranded in the Gulf of
California.
- To quantify the concentrations of As, Cu, Cd, Hg, Pb, Se and Zn in the
liver of two dead whale sharks, stranded in the Gulf of California.
o To establish the distribution of TEs in the right and left lobe of the
liver.
o To calculate the molar ratios Se:Hg, Se:As, Zn:Cd and Zn:As in the
right and left lobe of the liver.
1.8. Study area
This work was carried out in two study areas, both located in the lower Gulf of
California, in sites adjacent to the Peninsula of Baja California, Mexico: Bahía de
Los Angeles (BLA; 28.9519° N, 113.5624° W) (Baja California) and Bahía de La
Paz (LAP; 24.0832° N, 110.1839° W) (Baja California Sur).
Different studies have shown that, in the two bays, young whale shark
males are mainly sighted (Ramírez-Macías et al., 2012). In La Paz Bay the same
whale sharks are sighted up to 135 days with a 38% chance to see them again
the following year (Ramirez-Macias et al., 2012). This demonstrates the
importance of this feeding site towards the species. As described by Ramírez-
Macías et al., (2012) between the two bays there is a coincidence of the same
sharks of 13%. Whale sharks follow oceanographic patterns (physical and
biological) within the Gulf of California that are favourable for food availability
(Lavaniegos et al., 2012). However, where they come from when they enter the
bays and where they go when they leave them, they are questions still
unanswered.
1.8.1 Bahía de Los Ángeles (BLA)
Bahía de Los Ángeles is located on the east coast of Baja California,
Mexico (Fig. 1.5). It is an open bay towards the Gulf of California, 16 km long and

22
6.4 km in the widest part. It is a shallow bay that is mostly less than 40 m deep.
The entrance to the bay measures approximately 10 km and is interrupted in the
middle by seven islands and in the southern part by Horse Head and two more
islands. In the northern part, the Coronado and Piojo Islands separate the Bay of
the Whale Channel creating a narrow passage parallel to the entrance. The
islands provide protection to the bay from east winds; however, strong winds can
cause strong waves through the channels to the islands (Danemann & Ezcurra,
2008). The Whale Channel region is particularly rich in nutrients for phytoplankton
growth (Millán-Núñez & Yentsch, 2000). The morphology, wind patterns that
favour the mixing of the water column, the temperature and the high productivity
of the Whale Channel, make the bay a habitat where whale sharks congregate
seasonally (Ramírez-Macías et al., 2012 ) for up to six months a year (from June
to December with peaks in October and November) (Nelson & Eckert, 2007). In
the bay, the distribution and abundance of these sharks coincides with the areas
of higher abundance of the zooplankton (García-García, 2002). The most
important sighting site is located south of the bay, in an area known as El Rincón,
adjacent to a small coastal wetland that favours high productivity and high feed
concentrations for whale shark aggregations. However, some sharks can be
sighted in the northern part of the bay called La Gringa.

23
Fig. 1.5. Map of Bahía de Los Ángeles, BC, Mexico.
1.8.2 Bahía de La Paz (LAP)
Bahía de La Paz (Fig. 1.6) is the largest body of coastal water in the Gulf
of California, with approximate dimensions of 80 km long, 35 km wide and an
approximate area of 2,635 km2 (Obeso-Nieblas et al., 2007). It is an almost
completely closed bay, semi-elliptical, located in the southern western part of the
Gulf of California between geographical coordinates 24 ° 08'32 '' N 110 ° 18'39 ''
W. It is bounded to the north by the San José Island, to the south by the Ensenada
de La Paz and the sandy bar known as El Mogote and to the east by the Espiritu
Santo and La Partida Islands. The connectivity of the bay and its circulation is
mainly driven by the exchange of water with the Gulf of California and occurs in
two steps; a channel to the northeast called Boca Grande and towards the
southern part through the San Lorenzo Canal. The bay has a bathymetric
gradient that identifies two areas delimited by the 200 m isobath: a deep zone (>
200 m deep) in the northern part with influences of oceanic water. Here, the
greatest depth is reached in the Alfonso Basin (450 m deep). The coastal zone

24
(<200 m deep) is located in the west, southwest and Canal de San Lorenzo
(Sánchez-Velasco et al., 2006). Primary productivity in the Bay of La Paz is high
and influenced by a seasonal winter-spring cycle (Sánchez-Velasco et al., 2006).
The upwellings and seasonal cyclonic spins in the centre of the bay enrich the
surface layer of water and this favours secondary productivity especially in winter
and spring (De Silva, 1997). Zooplankton biomass varies seasonally reaching its
maximum volumes in spring and winter and its minimums in summer and autumn
(De Silva, 1997).
Fig. 1.6. Map of Bahía de La Paz, BCS, Mexico.
1.8.3 La Paz lagoon
The lagoon of La Paz is located inside the bay and it is separated from the
bay by a peninsula called “Mogote” (Fig. 1.7). The lagoon has an extension of 45
km2 and is a shallow area that reaches less than 10 m of depth (Del Monte-Luna

25
et al., 2005). It is constantly influenced by the exchange of waters with the bay
and it presents areas with vegetations and mangroves.
Fig. 1.7. Map of La Paz lagoon.
1.9. MATERIALS AND METHODS
1.9.1 Biopsy collection
Animals were approached using a boat like “panga”. Once a shark was observed,
one person entered the water with snorkelling equipment and a digital subaquatic
camera (GoPro™) to document: (i) estimated total length (TL); (ii) identification
(ID) pictures (Fig. 1.8) by photographing key areas including the gills and the
pectoral fin on the left side of the body (Van Tienhoven et al., 2007). ID pictures
allowed us to identify each shark and avoid repeating the biopsy of the same
animal; and (iii) sex of the animal was determined by the presence of claspers on
males. Clasper morphology distinguished juvenile from adult males. Claspers are
shorter than pelvic fins, soft and smooth in immature males. Mature males,
instead, present claspers extended beyond the pelvic fins with a cauliflower-like
texture appearance (Norman & Stevens, 2007). Female maturity was determined
using estimated TL > 9 m (Joung et al., 1996). Biopsies were collected using a
stainless-steel biopsy tip mounted on a pole of 200 cm length. The tip was
disinfected (ethyl alcohol 70%) before and between each biopsy collection. Once
collected, the biopsies were rinsed with distilled water, placed in a plastic
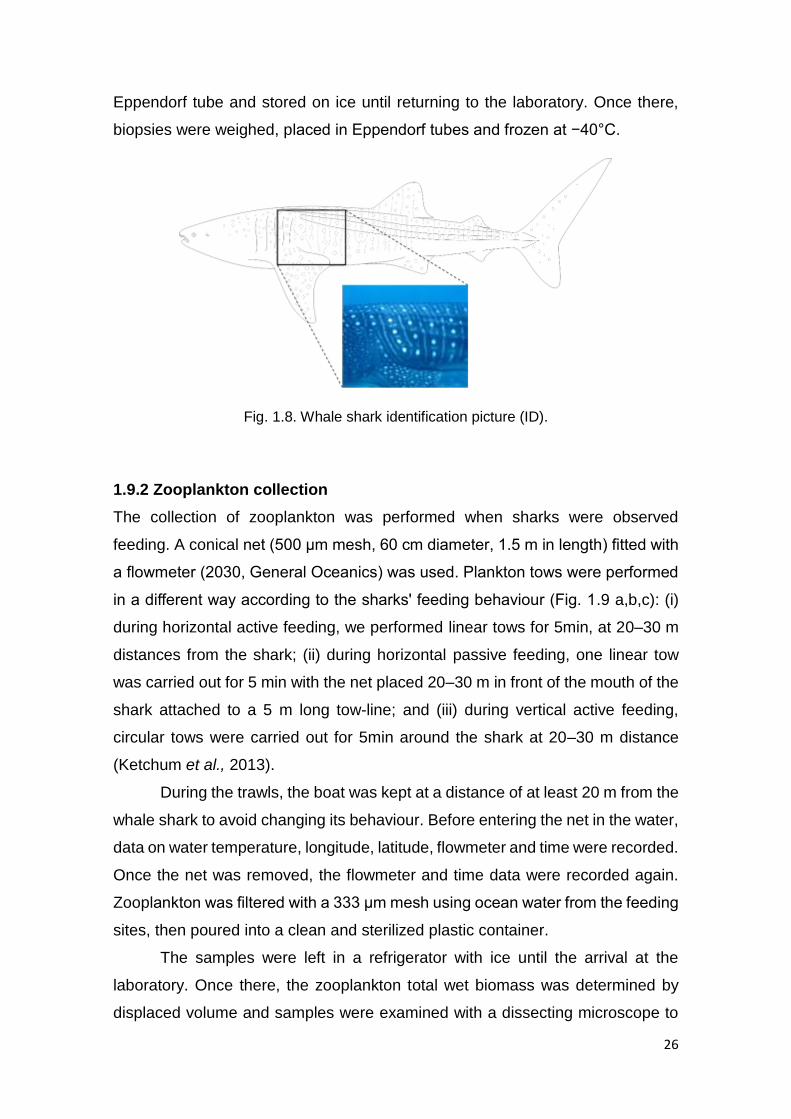
26
Eppendorf tube and stored on ice until returning to the laboratory. Once there,
biopsies were weighed, placed in Eppendorf tubes and frozen at −40°C.
Fig. 1.8. Whale shark identification picture (ID).
1.9.2 Zooplankton collection
The collection of zooplankton was performed when sharks were observed
feeding. A conical net (500 μm mesh, 60 cm diameter, 1.5 m in length) fitted with
a flowmeter (2030, General Oceanics) was used. Plankton tows were performed
in a different way according to the sharks' feeding behaviour (Fig. 1.9 a,b,c): (i)
during horizontal active feeding, we performed linear tows for 5min, at 20–30 m
distances from the shark; (ii) during horizontal passive feeding, one linear tow
was carried out for 5 min with the net placed 20–30 m in front of the mouth of the
shark attached to a 5 m long tow-line; and (iii) during vertical active feeding,
circular tows were carried out for 5min around the shark at 20–30 m distance
(Ketchum et al., 2013).
During the trawls, the boat was kept at a distance of at least 20 m from the
whale shark to avoid changing its behaviour. Before entering the net in the water,
data on water temperature, longitude, latitude, flowmeter and time were recorded.
Once the net was removed, the flowmeter and time data were recorded again.
Zooplankton was filtered with a 333 μm mesh using ocean water from the feeding
sites, then poured into a clean and sterilized plastic container.
The samples were left in a refrigerator with ice until the arrival at the
laboratory. Once there, the zooplankton total wet biomass was determined by
displaced volume and samples were examined with a dissecting microscope to

27
identify zooplankton groups to phylum, subclass, or order (Beers, 1976). Total
number of individuals for each group was counted. Each sample was divided into
two parts based on mass: one half was used for the analysis of the total
zooplankton, and the other half, was separated into main zooplankton groups.
Fig. 1.9. Tows of zooplankton performed depending on whale shark feeding behaviour:
active surface feeding (a); passive feeding (b); and vertical feeding (c).
1.9.3 Laboratory procedures
1.9.3.1 Drying and Homogenization
Zooplankton samples and biopsies frozen at -40 ° C were placed in a
freeze dryer with three holes in the paraffin cover eppendorf tubes to ensure
proper water removal. The samples were freeze dried (−50 °C and 137×10−3
mbar, 72 h). Once the samples were dried, the paraffin plug was removed from
the eppendorf tubes and each sample was ground with the help of a porcelain

28
mortar. Between each sample, the mortar was washed with a solution of 10%
HCl and purified Milli-Q or three-distilled water.
1.9.3.2 Digestion
The digestion of the samples was carried out in the geochemistry and
contamination laboratory of the Institute of Marine Sciences and Limnology of the
National Autonomous University of Mexico UNAM, in Mazatlán (Sinaloa). The
samples were deposited in 50 ml Teflon pumps (Savillex). The weight of each
sample in each Teflon pump was noted. 1, 2, 3, 4 or 5 ml of 69% trace metal
grade HNO3 was added depending on whether the dry weight of the sample was
50, 100, 150, 200 or 250 mg, respectively. Teflon pumps were heated on heating
plates at a maximum temperature of 130 ° C for 3 hours.
Once the digestion was finished, the Teflon pumps were allowed to cool
for 3 hours. Digested samples of 50, 100 and 150 mg dry weight were received
in 4.5 ml vials of polypropylene, Corning Incorporated brand. Samples of 200 and
250 mg dry weight were received in 15 ml polypropylene vials, Corning
Incorporated brand. All samples were titrated with a solution based on In 115
containing HNO3 and triple distilled water.
Aliquots of biopsies and zooplankton, blanks and reference material were
digested in vials (Savillex) with HNO3 (70%, trace metal analysis, J.T. Baker) to
130°C for 3 h (Bergés-Tiznado et al., 2019). Aliquots of dried samples were
gauged with a solution containing Indio (In 115), nitric acid and triple distilled
water. Trace elements concentration was analysed using a high resolution
inductively coupled plasma mass spectrometry (ICP-MS) Thermo Scientific
Element 3XR. Hg was analysed by cold vapour atomic absorption spectrometry
(SpectraAA 220, Varian VGA-110).
1.9.3.3 Validation of the method
Material used for digestion was cleaned with a double nitric acid bath for 48 h and
rose with tridistilled water. The reference concentrations and the obtained by the
recovery percentage after the digestion, is shown in Table 1.3 and Table 1.4.
Procedural blanks analysis and reference material analysis was performed with
no anomalies detected.

29
Table 1.3. Recoveries (%) of trace elements, and values certified and obtained for the
reference material DORM-4 fish muscle during the season S1 (2016-2017) and season S2
(2017-2018). Concentrations are expressed in mg/kg per dry weight (dw).
DORM-4: fish muscle (mg/kg dw)
Certified values ± sd Obtained values ± sd Recovery %
S1 S2 S1 S2
As 6.87 ± 0.44 7.24 ± 1.38 6.90 ± 1.57 105.4 100.4
Cd 0.299 ± 0.018 0.311 ± 0.060 0.298 ± 0.071 104.0 99.7
Cu 15.7 ± 0.5 16.9 ± 2.6 16.6 ± 2.9 107.6 105.7
Hg 0.412 ± 0.036 0.409 ± 0.107 0.424 ± 0.126 99.3 102.9
Pb 0.404 ± 0.062 0.378 ± 0.057 0.441 ± 0.004 93.6 109.1
Se 3.45 ± 0.40 3.22 ± 0.07 3.57 ± 1.02 93.3 103.5
Zn 51.6 ± 2.8 55.7 ± 10.5 48.3 ± 10.5 107.9 93.6
Table 1.4. Recovery (%) of trace elements, and values certified and obtained for the
reference material DORM-4 fish muscle during the season S1 (2016-2017) and season
S2 (2017-2018). Concentrations are expressed in mg/kg per dry weight (dw).
DOLT-5: dogfish liver (mg/kg dw)
Obtained values ± sd Certified values ± sd Recovery
%
As 31.8 ± 32.5 34.6 ± 2.4 92
Cd 14.5 ± 9.4 14.5 ± 0.6 100
Cu 39.3 ± 24.6 35.0 ± 2.4 112
Hg 0.46 ± 0.21 0.44 ± 0.18 106
Pb 0.163 ± 0.156 0.162 ± 0.032 100
Se 8.7 ± 7.0 8.3 ± 1.8 105
Zn 105.9 ± 98.7 105.3 ± 5.4 101
1.9.3.4 Calculation of molar ratios
The molar ratios Se:Hg, Zn:As, Zn:Cd, Cd:Pb, Cd:As, Se:Cd and Se:As were
calculated from the individual results of each element and for each tissue divided
by the molecular weight of each element: As = 74.922; Cd = 112.411; Hg =
200.59; Pb = 207.2; Se = 78.96; Zn = 65.39 (nmol/g wet weight). Finally, the molar
ratio was obtained by dividing the concentration of one element in nmol/g with

30
the other element in nmol/g. The accuracy was estimated using a certified
material DORM-4 and DOLT-05 whose reference values are shown in Tables 1.3
and 1.4.
1.9.3.5 Calculation of the biomagnification (BMF)
Biomagnification factor (BMF) was calculated using the equation (Gray, 2002):
BMF=CD/CP, where CD is the element concentration of the predator and CP is
the element concentration of the prey, where it establishes the increase in
concentration between trophic levels as long as the biomagnification factor is
significantly > 1.0 (Bergés-Tiznado et al., 2019). Determining a biomagnification
factor in this manner is based on the assumption that concentration has reached
steady state in the biopsies of the sampled individuals.
1.9.3.6 Statistical analysis
Concentrations of TEs, and Se:Hg molar ratios were tested for normality using
Shapiro's test. As these data were not normally distributed, non-parametric tests
were used. The Grubb test was applied to detect outliers from each group of data;
according to the test, statistical analyses were repeated excluding outliers to
establish the effect of those individuals on the results. All statistical analyses were
performed using R studio (Rstudio, Inc. R Core Team 2018).
We tested the effect of intrinsic (fish length) on variation in TEs and Se:Hg
ratio, both among and within the collection sites. The influence of sex and the
differences between TEs concentrations in the study areas were compared with
a Mann-Whitney test. Spearman rank correlations were used to determine
associations among metal levels and TL. Assuming that individuals < 4 m has a
coastal habitat and that individuals > 4 m live in pelagic areas, animals' samples
were separated in two groups according to their length (< 4 m and > 4 m) (Borrell
et al., 2011) to determine the correlation among BMF and TL for Hg and Se (see
Chapter 2). All biomagnification factors were tested for significance using the t-
test. Significance level used in these analyses was p < 0.05 (Zar, 2010).
Concentrations below the limit of detection were treated following the EPA
guidance for data quality assessment (USEPA, 2000). According with this
guidance, procedures for analyzing data with non-detects depend on the amount
of data below the detection limit. When non-detected data are <15%, data are

31
replaced by the detection limit. When non-detected data are between 15% - 50%
Cohen's adjustment is applied and when non-detected data are > 50% - 90%
tests for proportions is used. Our data below the detection limit were adjusted
using Cohen’s method which provides adjusted estimates of the sample mean
and standard deviation that accounts for data below the detection level. The
adjusted estimates are based on the statistical technique of maximum likelihood
estimation of the mean and variance so that the fact that the non-detects are
below the limit of detection but may not be zero is accounted for. The adjusted
mean and standard deviation can then be used in the parametric tests.

32
CHAPTER 2
Hg AND Se BIOACCUMULATION AND BIOMAGNIFICATION IN EPIDERMIS
OF WHALE SHARK DURING TWO SEASONS FROM TWO AREAS OF THE
GULF OF CALIFORNIA, MEXICO
Chapter based partially on the paper: Pancaldi F., Galván-Magaña, F., González-Armas,
R., Soto-Jiménez, M.F., Whitehead, D.A., O’Hara, T., Marmolejo-Rodríguez, A.J.,
Vázquez-Haikin, A., Páez-Osuna, F. (2019). Mercury and selenium in the filter–feeding
whale shark (Rhincodon typus) from two areas of the Gulf of California, Mexico. Marine
Pollution Bulletin. 146: 955-961.
2.1. ABSTRACT
Mercury and selenium were measured for first time in the endangered species
whale shark (Rhyncodon typus) from two areas of the Gulf of California, Bahía
de Los Angeles (BLA) and Bahía de La Paz (LAP) using dermal biopsies of 130
specimens and during two seasons (S1 and S2): S1= 2016-2017 and S2= 2017-
2018. Additionally, in S1 nineteen zooplankton samples from LAP were analysed,
while in S2 eleven zooplankton samples were analysed in BLA, and 14
zooplankton samples were analysed in LAP. During S1, concentrations (ng/g, wet
weight (ww)) in biopsies of BLA ranged from 1 to 40 for Hg and 100 to 680 for
Se; while in LAP varied from 1 to 9 for Hg and 11 to 850 for Se. A significative
correlation was found for Hg in BLA males’ biopsies with length. Mean±SD Hg
and Se concentrations in the zooplankton from LAP were 1.6±1.8 and 770±930
ng/g, respectively. Hg biomagnification factor ranged from 0.8 to 5.3 in sharks.
During S2, Hg concentrations in biopsies from males of BLA ranged from 21 to
497 ng/g ww and from 26 to 1833 for Se; while in LAP varied from 12 to 58 for
Hg and from 124 to 1183 for Se. A significative and negative correlation was
found for Hg and Se in BLA males’ biopsies with length (p<0.05). Mean±SD Hg
and Se concentrations in the zooplankton from LAP were 1.2±0.6 and
340.6±120.6 ng/g ww, respectively. In BLA, mean±SD Hg and Se concentrations
in the zooplankton were 1.7±1.6 and 296.2±117.7 ng/g ww. Hg biomagnification
factor was 19.9 in the whale sharks from LAP and 41.0 in the animals from BLA.

33
A molar excess of Se over Hg was found in both seasons and both sites in the
biopsies and the zooplankton.
2.2. INTRODUCTION
The uptake of Hg and Se by marine organisms is mainly influenced by diet and
trophic position, however, Hg accumulation is usually higher for fishes feeding at
a higher trophic position (Storelli et al., 2009). Therefore, top predators like some
sharks tend to accumulate some chemicals due to their trophic position (Maz-
Courrau et al., 2012).
The Hg:Se ratio has been examined in diverse organisms such as
elasmobranchs, cetaceans, pinnipeds and fish (e.g., Escobar-Sánchez et al.,
2010; Correa et al., 2015; Bergés-Tiznado et al., 2015; 2019). The protection
mechanisms of selenium over mercury include redistribution or excretion of Hg in
the presence of Se, competition for the binding sites between the two elements,
formation of the Hg:Se complex, conversion of toxic forms to less toxic Hg and
their inhibition of oxidative damage of Hg by Se, through the increase in the
activity of glutathione peroxidase (Raymond & Ralston, 2004; Ralston et al.,
2008). Due to the high affinity between Hg and Se, the formation of an inorganic
Hg:Se complex is proposed as the mechanism responsible for the protective
effect of Se (Ralston et al., 2008). Nevertheless, if Se protection occurs through
Hg sequestration, the molar ratio of Se:Hg in the tissues needs to be >1:1 to be
operative (Raymond & Ralston, 2004; Ralston et al., 2008).
The whale shark (Rhincodon typus, Smith, 1828) is a filter feeder and a
migratory pelagic long-lived species (Rowat & Brooks, 2012). It is a protected
species, listed as endangered by the International Union for Conservation of
Nature (IUCN) since 2016. Seasonally, this species aggregates in several areas
of the Gulf of California and is regularly observed in Bahía de Los Angeles (BLA)
and Bahía de La Paz (LAP), Mexico. Segregation by sex and size occurs in
several areas; according to Borrell et al. (2011), whale sharks show an isotopic
signature of δ13C that indicates a change of habitat from the coastal zone to the
pelagic areas, when the animals exceed the 4 m of length. The aims of this study
in particular are: (i) evaluate the bioaccumulation of Hg and Se in whale shark
skin biopsies collected from two feeding areas of the Gulf of California: BLA and

34
LAP; (ii) identify bioaccumulation differences for sex and size of the sharks; (iii)
determine possible biomagnification of these elements through the main prey of
zooplankton collected in the same study areas, and; (iv) determine the molar ratio
of Se:Hg in dermal biopsies and zooplankton samples.
2.3. RESULTS
2.3.1 Sex and total length (TL) of the sharks
A total of 130 whale shark biopsies, were collected in two locations in the
Gulf of California (Table 2.1). In Bahía de Los Angeles (BLA) (28.9519° N,
113.5624° W) samples were collected in September 2016 and 2017, while in
Bahía de La Paz (LAP) (24.0832° N, 110.1839° W) samples were collected from
September 2016 until March 2018 (Fig. 2.1).
Fig. 2.1 Sex and size of whale sharks sampled in BLA (ab) and LAP (cd) in S1 and S2.
In S1 in BLA, 34 individuals were males (89%) and 4 were females (11%)
with an estimated TL ranging between 3.5 and 9.5 m (Table 2.1). In LAP, 23
individuals were males (72%) and 9 were females (23%) with a TL ranging

35
between 2.5 and 8.0 m. In S2 in BLA, 26 individuals were males (96%) and 1 was
female (4%) with an estimated TL ranging between 3.5 and 10 m. In LAP, 24
individuals were males (73%) and 9 were females (27%) with a TL ranging
between 3.5 and 7.0 m.
Considering both seasons, 82% (n=107) of the animal sampled were
males and 18% (n=23) were females. Most of the animals (92%; n=120) were
considered immature, and 8% of them (n=10) were recognized as mature.
Table 2.1. Number of biopsies collected in Bahía de Los Ángeles (BLA) and Bahía de La
Paz (LAP) in S1 (2016-2017) and S2 (2017-2018).
2.3.2 Season 1- Concentrations of Hg and Se in biopsies
2.3.2.1 Differences between sites
In biopsies of sharks sampled from BLA (n = 38), the Hg content (in ww)
ranged between 1 and 40 ng/g with a mean ± sd of 9 ± 7 ng/g, while Se ranged
between 100 and 680 ng/g with a mean ± sd of 230 ± 140 ng/g. The Hg in the
biopsies of sharks from LAP (n = 32) ranged between 1 and 9 ng/g with a mean
± sd of 4 ± 2 ng/g and Se ranged between 11 and 850 ng/g with a mean ± sd of
280 ± 200 ng/g (Fig. 2.2). Biopsy water percentage ranged from 76% to 92% in
BLA and from 83% and 96% in LAP (Table 2.2). Mann-Whitney test showed
significant differences (p < 0.05) for both Hg (p=0.002) and Se (p=0.02) between
the two areas.

36
Fig. 2.2 Hg and Se concentration (ng/g ww) in biopsies of whale sharks collected in S1
in BLA and LAP.
Table 2.2 Mean ± standard deviation (min-max), concentrations (ng/g ww) of Hg and Se,
and molar ratio Se:Hg in the biopsies of whale shark collected in two bays from the Gulf
of California: Bahía de Los Ángeles (BLA) and La Paz (LAP) in 2016 and 2017.
n
Hg
ng/g
Se
ng/g
Hg
nmol/g
Se
nmol/g
Molar ratio
Se:Hg
BLA
Male 34 9 ± 7 230 ± 1501 0.05 ± 0.04 2.9 ± 1.9 100 ± 1151
(1-40) (100-680) (0.003-0.20) (1.2-8.6) (8.3-627)
Female 4 7 ± 4 180 ± 262 2.25 ± 0.33 0.03 ± 0.02 96 ± 712
(2-11) (160-210) (0.01-0.06) (2.0-2.7) (40-193)
Total 38 9 ± 7a 230 ± 140a 0.05 ± 0.03 2.9 ± 1.8 100 ± 111a
(1-40) (100-680) (0.003-0.20) (1.2-8.6) (8.3-627)
LAP
Male 23 4 ± 2 260 ± 2101 0.02 ± 0.01 3.4 ± 2.6 188 ± 1641
(1-9) (11-850) (0.04-0.01) (0.1-10.7) (5.2 -672)
Female 9 3 ± 1 320 ± 1602 0.02 ± 0.01 4.1 ± 2.0 295 ± 1602
(1-6) (80-550) (0.03-0.01) (1.0-7.0) (55-519)
Total 32 4 ± 2b 280 ± 200b 0.02 ± 0.01 3.6 ± 2.5 219 ± 170b
(1-9) (11-850) (0.04-0.01) (0.1-10.7) (5.2-672)
Total of 70 7 ± 6 250 ± 170 0.03 ± 0.03 3.2 ± 2.2 154 ± 152
2 bays (1-40) (11-850) (0.003-0.20) (0.1-10.7) (5.2-672)
Different superscript letter indicates significantly different (p < 0.05) mean concentrations
between sites for the same element or Se:Hg molar ratio; different superscript number

37
indicate significantly different (p < 0.05) mean concentrations between sexes for the
same element or Se:Hg molar ratio. Statistical were performed by a Mann-Whitney test.
2.3.2.2 Differences between sex
Bahía de Los Ángeles
Mean concentration of Hg in males from BLA (n = 24) was higher (9±7
ng/g ww) compared with females (n = 4; 7±4; Fig. 2.3). Hg ranged from 1 to 40
ng/g in males and from 2 to 11 ng/g in females. Mean concentration of Se in
males from BLA was higher (230±150 ng/g ww) compared with females (180±26).
Se ranged from 100 to 680 ng/g in males and from 160 to 210 ng/g in females.
No statistical tests were applied to these data due to the low number of females
from this site.
Fig. 2.3 Hg and Se concentrations in males and females from BLA in S1.
Bahía de La Paz
Mean concentration of Hg in males from LAP (n = 23) was higher (4±2
ng/g ww) compared with females (n = 9; 3±1). Hg ranged from 1 to 9 ng/g in
males and from 1 to 6 ng/g in females (Fig. 2.4). Mean concentration of Se in
males from LAP was lower (260±210 ng/g ww) compared with females
(320±160). Se ranged from 11 to 850 ng/g in males and from 80 to 550 ng/g in
females. Mann-Whitney test shows no statistical differences (p > 0.05) of Hg and
Se between sex in this study area (Table 2.2).
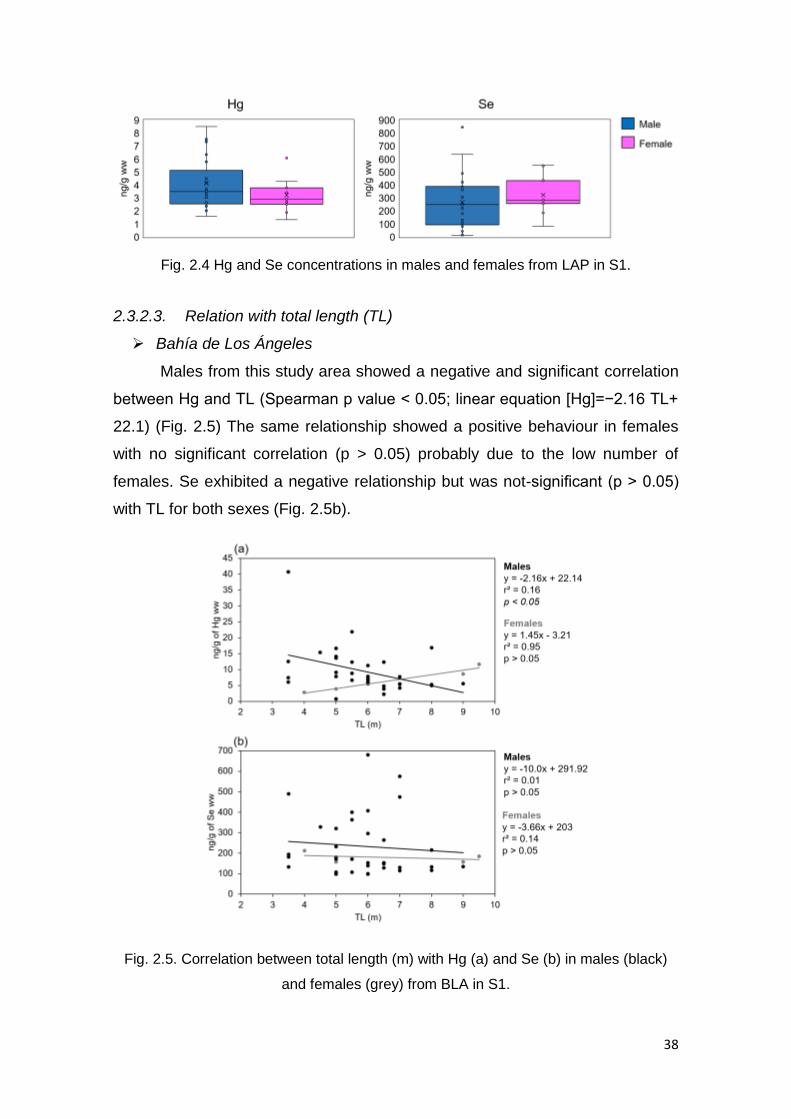
38
Fig. 2.4 Hg and Se concentrations in males and females from LAP in S1.
2.3.2.3. Relation with total length (TL)
Bahía de Los Ángeles
Males from this study area showed a negative and significant correlation
between Hg and TL (Spearman p value < 0.05; linear equation [Hg]=−2.16 TL+
22.1) (Fig. 2.5) The same relationship showed a positive behaviour in females
with no significant correlation (p > 0.05) probably due to the low number of
females. Se exhibited a negative relationship but was not-significant (p > 0.05)
with TL for both sexes (Fig. 2.5b).
Fig. 2.5. Correlation between total length (m) with Hg (a) and Se (b) in males (black)
and females (grey) from BLA in S1.

39
Bahía de La Paz
Males from LAP showed a negative correlation between Hg and TL while
females presented a positive behaviour; no significant correlation was found
between these variables for both sexes (p > 0.05). Se exhibited a negative
relationship but not-significant (p > 0.05) with TL for both sexes (Fig. 2.6).
Fig. 2.6. Correlation between total length (m) with Hg (a) and Se (b) in males (black)
and females (grey) from LAP in S1.
2.3.2.4 Molar ratio Se:Hg
The Se:Hg molar ratio varied widely among whale shark biopsies within
each bay (Table 2.2) and ranged from 8.3 to 627 in BLA and from 5.2 to 672 in
LAP. All values of the Se:Hg molar ratio always were significantly >1:1 (p <
0.001). Molar ratio Se:Hg in BLA was 100:1 and in LAP was 220:1 (Table 2.2).
Biopsy concentrations of Hg (nmol/g) and Se (nmol/g) were not significantly

40
correlated in both BLA and LAP. Molar ratio Se:Hg did not show any significan
correlation with the TL in both study areas.
2.3.3 Season 1 - Concentrations of Hg and Se in the zooplankton
2.3.3.1 Zooplankton composition
A total of 19 samples of zooplankton were collected in LAP from
September 2016 to March 2017 (during February no sampling was performed);
12 samples include zooplankton and 7 subsamples were obtained to measure
the Hg and Se concentrations in the main groups of zooplankton.
Copepods and chaetognatha were the main groups of zooplankton
collected while the sharks were feeding followed by decapods and euphausiids
(Fig. 2.7). Concentrations of TEs were analysed only in copepods (n=2=,
chaetognatha (n=3) and euphausiids (n=2).
Fig. 2.7. Composition and abundance of zooplankton collected in LAP in S1.
2.3.3.2 Trace element concentrations
Zooplankton exhibited wide variations fluctuating from 0.1 to 5.5 ng/g (wet
weight) for Hg and from 1 to 2830 ng/g for Se (Fig 2.8). Chaetognatha was the
group with the highest concentration of Hg (4.5 ng/g) and copepods with the
lowest (0.06 ng/g). In contrast, the highest level of Se was found in copepods
(220 ng/g) and the lowest in chaetognatha (9.8 ng/g) (Fig. 2.9). Concentrations
of Hg and Se, mean and SD in the zooplankton are shown in Table 2.3. Statistical
tests were not applied due to low number of samples.

41
Fig. 2.8. Hg and Se concentration in the zooplankton collected in LAP in S1.
Fig. 2.9. Hg and Se concentrations in the main groups of zooplankton in LAP in S1.

42
Table 2.3. Concentrations of Hg and Se (on ww basis) and molar ratio Se:Hg in the
zooplankton and main groups collected in 2016 and 2017 in Bahía La Paz (LAP), Gulf of
California.
Month Year
Hg
ng/g
Se
ng/g
Hg
nmol/g
Se
nmol/g Se:Hg
Sept 2016 0.13 482 0.0006 6.1102 9567
Oct 2016 0.01 1 0.0000 0.0145 454
Oct 2016 4.49 87 0.0224 1.0966 49
Oct 2016 5.51 129 0.0275 1.6397 60
Nov 2016 2.55 198 0.0127 2.5051 197
Nov 2016 1.90 509 0.0095 6.4435 678
Zooplankton Dec 2016 2.53 902 0.0126 11.4231 905
Dec 2016 0.30 2,825 0.0015 35.7838 24086
Dec 2016 0.09 273 0.0004 3.4567 7633
Jan 2017 0.21 1,398 0.0010 17.7048 17275
Mar 2017 0.41 1,189 0.0021 15.0567 7292
Mar 2017 1.05 2,272 0.0052 28.7749 5476
Average+SD 1.60+1.85 773+931 0.008±0.009 10.8±11.5 6139±7750
Copepods Sept 2016 0.28 220.3 0.0014 2.7896 2022
Copepods Dec 2016 0.06 85.7 0.0003 1.0849 3493
Main groups Chaetognatha Oct 2016 1.18 67.0 0.0059 0.8482 144
Chaetognatha Dec 2016 3.87 9.8 0.0193 0.1247 6.4
Chaetognatha Mar 2017 4.53 101.4 0.0226 1.2844 57
Euphausiids Jan 2017 2.05 98.7 0.0102 1.2496 122
Euphausiids Mar 2017 0.82 63.6 0.0041 0.8053 198
2.3.3.3 Biomagnification factor (BMF)
Average Hg BMF through total zooplankton was 2.4 and it was statistically
>1.0 (p < 0.001). The implicit assumption with this calculation is that the
concentrations found in the biopsies represent the entire organism which is
obviously not known. All sharks below 4 m of total length (n=7) showed Hg (BMF)
significantly >1 (p < 0.001) (Fig. 2.10). Hg BMF in these sharks ranged from 1.1
to 5.3 (average ± SD, 2.5 ± 1.5). Sharks of this category showed a positive but

43
not significant (p Spearman > 0.005) relationship between Hg BMF and TL.
Sharks above 4 m of TL (n=25) showed a negative tendency (not significant)
between Hg BMF and TL; in this group, all sharks but two, showed Hg BMF
significantly>1.0 (p < 0.001). Hg BMF in this category ranged from 0.8 to 4.7 (2.4
± 1.0) (Fig. 2.10).
Average BMF of Se through total zooplankton was 0.3 in LAP and was
significantly < 1.0 (p < 0.001). Se BMF ranged from 0.01 to 0.6 in sharks < 4 m
(p < 0.05) and from 0.01 to 1.0 in sharks > 4 m (p < 0.001). Considering that the
predominant diet of the whale shark is composed of copepods (Clark and Nelson,
1997; Hacohen-Domené et al., 2006), then Hg BMF ranged in LAP from 8 to 50
(23 ± 11). Hg BMF ranged from 11 to 50 (24 ± 14) in sharks < 4 m and from 8 to
44 (23 ± 10) in sharks > 4 m. On the other hand, the Se BMF ranged in LAP from
0.1 to 5.5 (1.7 ± 1.3); Se BMF ranged from 0.1 to 3.2 (1.8 ± 1.2) in sharks < 4 m
and from 0.1 to 5.5 (1.9 ± 1.4) in sharks > 4 m. All Hg BMF calculated for
copepods, chaetognatha and euphuasiids showed values significantly>1.0 (p <
0.05).
Fig. 2.10. Variation between Hg BMF (calculated from zooplankton and the biopsies) and
total length of sharks below 4m (black circles) and above 4m of total length (grey circles)
from Bahía de La Paz. Circles are males, and triangles are females.

44
2.3.4 Season 2: Concentrations of Hg and Se in biopsies
2.3.4.1 Differences between sites
In biopsies of sharks sampled from BLA (n = 27), the Hg content (in wet
weight) ranged between 21 and 497 ng/g with a mean ± SD of 71 ± 109 ng/g,
while Se ranged between 26 and 1833 ng/g with a mean ± SD of 263 ± 410 ng/g.
The Hg in the biopsies of sharks from LAP (n = 33) ranged between 12 and 58
ng/g with a mean ± SD of 24 ± 11 ng/g and Se ranged between 89 and 1183 ng/g
with a mean ± SD of 329 ± 194 ng/g (Table 2.4). In BLA, water percentage of the
biopsies ranged from 68% to 94% while in LAP water percentage of the biopsies
ranged from 65% to 94%. Mann-Whitney test showed significant differences (p <
0.001) for Hg between the two areas (Fig. 2.11).
Fig. 2.11. Hg and Se concentration (ng/g ww) in biopsies of whale sharks collected in
S2 in BLA and LAP.
Table 2.4. Mean ± standard deviation (min-max), concentrations (ng/g ww) of Hg and
Se, and molar ratio Se:Hg in the biopsies of whale shark collected in two bays from the
Gulf of California: Bahía de Los Ángeles (BLA) and La Paz (LAP) in S2.
N
Hg
ng/g
Se
ng/g
Hg
nmol/g
Se
nmol/g
Molar ratio
Se:Hg
BLA
Male 26 72 ± 111 263 ± 418 0.4 ± 0.6 3.3 ± 5.3 9 ± 31
(21-497) (26-1833) (0.1-2.5) (0.3-23.2) (2.3-15.3)
Female 1 54 265 0.3 3.4 12.4
Total 27 71 ± 109a 263 ± 410 0.4 ± 0.5 3.3 ± 5.2 9 ± 3a

45
(21-497) (26-1833) (0.1-2.5) (0.3-23.2) (2.3-15.3)
LAP
Male 24 23 ± 11 340 ± 210 0.1 ± 0.1 4.3 ± 2.7 40 ± 181
(12-58) (124-1183) (0.1-0.3) (1.6-15.0) (15.2 -71.3)
Female 9 25 ± 11 300 ± 150 0.1 ± 0.1 3.8 ± 1.9 30 ± 8
(15-45) (89-601) (0.1-0.2) (1.1-7.6) (14.6-41.7)
Total 33 24 ± 11b 329 ± 194 0.1 ± 0.1 4.2 ± 2.5 37 ± 17a
(12-58) (89-1183) (0.1-0.3) (1.1-15.0) (14.6-71.3)
Total of 60 46 ± 76 299 ± 309 0.2 ± 0.4 3.8 ± 3.9 24 ± 19
2 bays (12-497) (26-1833) (0.1-1.5) (0.3-23.2) (2.3-71.3)
Different superscript letter indicates significantly different (p < 0.05) mean concentrations
between sites for the same element or Se:Hg molar ratio; different superscript number
indicate significantly different (p < 0.05) mean concentrations between sexes for the
same element or Se:Hg molar ratio. Statistical were performed by a Mann-Whitney test.
2.3.4.2 Differences between sex
Bahía de Los Ángeles
Hg concentration ranged from 21 to 497 ng/g in males from BLA with a
mean ± SD of 72 ± 111. Mean concentration of Se in males from BLA was higher
(263±418 ng/g ww) and ranged from 26 to 1833 ng/g. Hg concentration in the
only female sampled in this study area during this season was ng/g while Se was
265 ng/g.
Bahía de La Paz
Mean concentration of Hg in males from LAP (n = 24) was similar (23±11
ng/g ww) to concentration in females (n = 9; 25±11). Hg ranged from 12 to 58
ng/g in males and from 15 to 45 ng/g in females. Mean concentration of Se in
males from LAP was higher (340±210 ng/g ww) compared with females
(300±150). Se ranged from 124 to 1183 ng/g in males and from 89 to 601 ng/g in
females. Mann-Whitney test shows no statistical differences (p > 0.05) of Hg and
Se between sex in this study area (Fig. 2.12).

46
Fig. 2.12 Hg and Se concentrations in males and females from LAP in S2.
2.3.4.3 Relation with total length
Bahía de Los Ángeles
In the organisms sampled in BLA, both Hg and Se showed a negative relationship
with TL in males where Spearman correlation showed a significant factor (p<0.05)
(Fig. 2.13 a and b.). In LAP (Fig. 2.14 a and b), males showed a negative relation
with the TL while females showed a positive relation between TE concentration
and TL, nevertheless, no significative statistical differences were found.
Fig. 2.13. Correlation between TL and concentrations of Hg (a) and Se (b) in males of
BLA in S2.
Bahía de La Paz
Males from LAP showed a negative correlation between Hg and TL, while
females presented a positive behaviour; no significant correlation was found
between these variables for both sexes (p > 0.05). Se exhibited a positive
relationship but not-significant (p > 0.05) with TL for both sexes (Fig. 2.14 b).
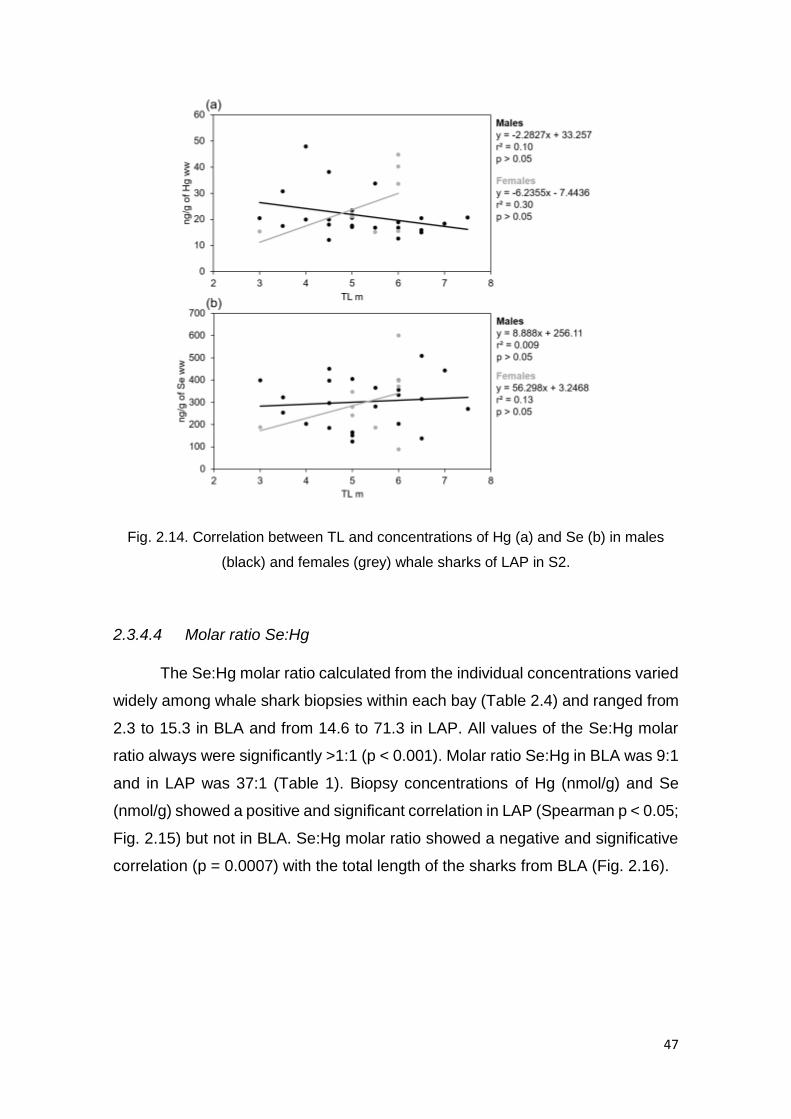
47
Fig. 2.14. Correlation between TL and concentrations of Hg (a) and Se (b) in males
(black) and females (grey) whale sharks of LAP in S2.
2.3.4.4 Molar ratio Se:Hg
The Se:Hg molar ratio calculated from the individual concentrations varied
widely among whale shark biopsies within each bay (Table 2.4) and ranged from
2.3 to 15.3 in BLA and from 14.6 to 71.3 in LAP. All values of the Se:Hg molar
ratio always were significantly >1:1 (p < 0.001). Molar ratio Se:Hg in BLA was 9:1
and in LAP was 37:1 (Table 1). Biopsy concentrations of Hg (nmol/g) and Se
(nmol/g) showed a positive and significant correlation in LAP (Spearman p < 0.05;
Fig. 2.15) but not in BLA. Se:Hg molar ratio showed a negative and significative
correlation (p = 0.0007) with the total length of the sharks from BLA (Fig. 2.16).

48
Fig. 2.15. Correlation between concentrations of Hg (nmol/g) and Se (nmol/g) from
whale shark of LAP in S2.
Fig.2.16. Correlation between Se:Hg molar ratio and TL from bopsies of whale shark of
BLA in S2.
2.3.5 Season 2 - Concentrations of Hg and Se in zooplankton
A total of 25 samples of zooplankton were collected from September 2017
to February 2018; in LAP, 7 samples of zooplankton were collected, and in BLA
6 samples in September and October 2017. Twelve subsamples (5 in BLA and 7
in LAP) were obtained to measure the Hg and Se concentrations in the main
groups of zooplankton.

49
2.3.5.1 Zooplankton composition
In BLA, copepods represent the main group of zooplankton (97% in
September and 85% in October) followed by chaetognatha (2% in September
and 8% in October 2017) and in minor percentage decapods and euphausiids
(Fig. 2.17).
Fig. 2.17. Composition and abundance of zooplankton in BLA in September and
October 2017.
In LAP, the copepods percentage ranged from 72% in January to 97% in
February 2018. Chaetognatha was the second main group in this study area
ranging from 4% in December 2017 to 13% in October 2017. Decapods and
euphausiids were found in minor percentages and a peak of euphausiids
abundance was registered in January 2018 (Fig. 2.18).
Fig. 2.18. Composition and abundance of zooplankton in LAP from October 2017 to
February 2018.

50
2.3.5.2 Trace elements concentrations
Zooplankton exhibited wide variations fluctuating from 0.7 to 4.7 ng/g (wet
weight) for Hg and from 178 to 593 ng/g for Se (Fig. 2.19). Mean ± SD of Hg in
BLA was 1.7 ± 1.6 and in 1.2 ± 0.6. Mean ± SD of Se was 296 ± 118 in BLA and
341 ± 121 in LAP (Table 2.5). Despite these, no significant differences were found
between sites.
Fig. 2.19. Hg and Se concentration in zooplankton in BLA and LAP in S2.
As in the first season, chaetognatha was the group with the highest
concentration of Hg (mean ± SD; 9.0 ± 2.7) (Fig. 2.20), nevertheless, due to the
low sampling number (n = 2) no statistical tests were applied. Copepods
displayed the lowest concentration of Hg in both sites (5.5 ± 6.5 ng/g in BLA and
1.2 ± 0.7 in LAP).
The highest level of Se was found in chaetognatha from LAP (1990 ± 802
ng/g) and the lowest one in copepods from BLA (531 ± 421 ng/g). Statistical tests
were not applied due to low number of samples.
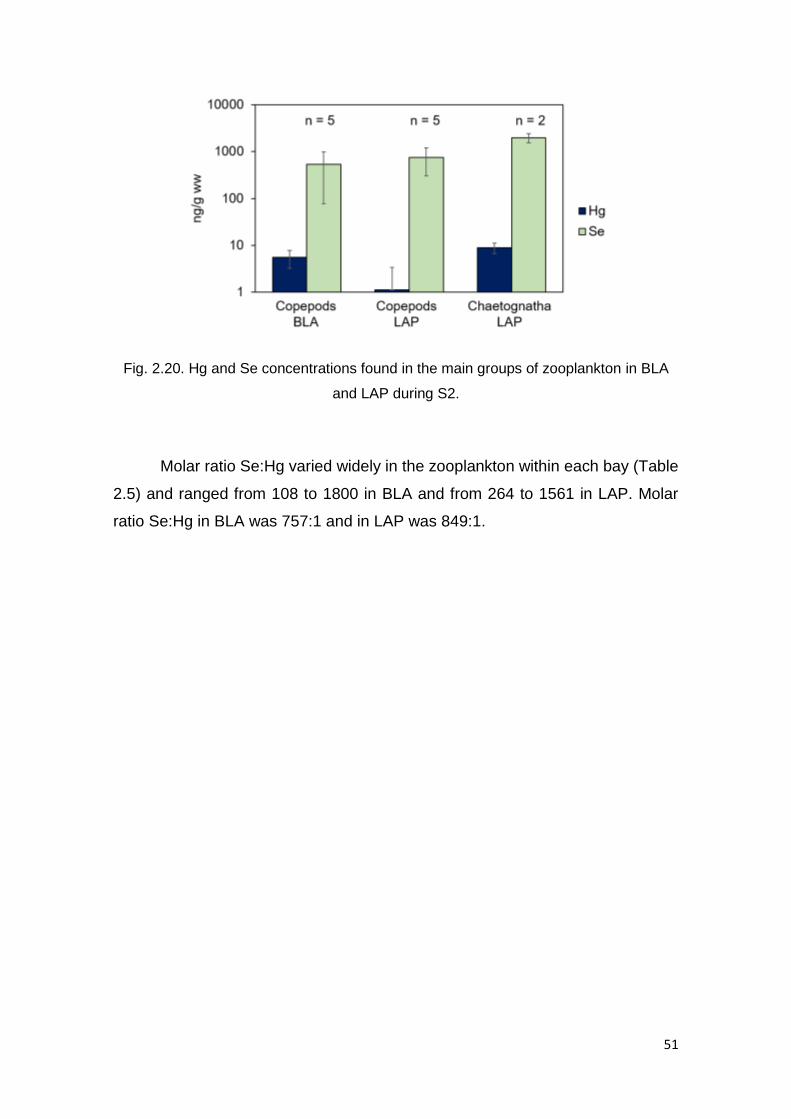
51
Fig. 2.20. Hg and Se concentrations found in the main groups of zooplankton in BLA
and LAP during S2.
Molar ratio Se:Hg varied widely in the zooplankton within each bay (Table
2.5) and ranged from 108 to 1800 in BLA and from 264 to 1561 in LAP. Molar
ratio Se:Hg in BLA was 757:1 and in LAP was 849:1.

52
Table 2.5 Concentrations of Hg and Se (ng/g on wet weight basis) and molar ratio Se:Hg in the zooplankton and main groups of zooplankton
collected in 2017 and 2018 in Bahía de Los Angeles (BLA) and Bahía de La Paz (LAP), Gulf of California.
Site
Month Year
Hg
ng/g
Se
ng/g
Hg
nmol/g
Se
nmol/g Se:Hg
Zooplankton BLA Mixt Sept 2017 2.5 328 0.013 4.2 329
BLA Mixt Sept 2017 4.7 198 0.023 2.5 108
BLA Mixt Sept 2017 0.9 254 0.005 3.2 706
BLA Mixt Sept 2017 0.7 502 0.004 6.4 1800
BLA Mixt Oct 2017 0.7 178 0.004 2.3 611
BLA Mixt Oct 2017 0.8 317 0.004 4.0 986
Average+SD 1.7±1.6 296±118 0.009±0.008 3.8±1.5 757±595
LAP Mixt Oct 2017 1.5 302 0.008 3.8 504
LAP Mixt Nov 2017 1.0 593 0.005 7.5 1561
LAP Mixt Nov 2017 0.9 277 0.005 3.5 748
LAP Mixt Dec 2017 0.9 375 0.005 4.8 1025
LAP Mixt Jan 2018 0.9 337 0.004 4.3 988
LAP Mixt Jan 2018 2.3 242 0.012 3.1 264
LAP Mixt Feb 2018 0.8 257 0.004 3.3 855
Average+SD 1.2±0.6 341±121 0.006±0.003 4.3±1.5 849±414
Main groups BLA Copepods Sept 2017 3.1 244 0.02 3.1 197

53
BLA Copepods Sept 2017 16.3 445 0.08 5.6 69.5
BLA Copepods Sept 2017 0.7 256 0.00 3.2 947
BLA Copepods Sept 2017 6.7 447 0.03 5.7 170
BLA Copepods Oct 2017 0.9 1262 0.00 16.0 3693
Average+SD 5.5±6.5 531±421 0.03±0.03 6.7±5.3 1015±1537
LAP Copepods Oct 2017 0.9 1135 0.005 14.4 3159
LAP Copepods Nov 2017 0.7 611 0.003 7.7 2332
LAP Copepods Dec 2017 1.3 676 0.01 8.6 1277
LAP Copepods Jan 2018 0.8 641 0.004 8.1 2080
LAP Copepods Feb 2018 2.4 728 0.01 9.2 784
Average+SD 1.2±0.7 758±215 0.01±0.003 9.6±2.7 1926±927
LAP Chaetognats Oct 2017 11.0 2557 0.05 32.4 593
LAP Chaetognats Nov 2017 7.1 1423 0.04 18.0 507
Average+SD 9.0±2.7 1990±802 0.05±0.01 25.2±10.2 550±60

54
2.3.5.3 Biomagnification factor
In BLA, Hg BMF through total zooplankton ranged from 12.3 to 287.
Average ± SD was 41.0 ± 62.7 and it was statistically >1.0 (p < 0.001). Due to the
low number of animals with total length < 4 m we could not applied a relation
between BMF and TL for this size category.
In LAP Hg BMF through total zooplankton was 20 and it was statistically
>1.0 (p < 0.001). In LAP, sharks below 4 m of total length (n=6) showed Hg BMF
significantly >1 (p < 0.001) (Fig. 2.21). Hg BMF in these sharks ranged from 13.0
to 40.4 (average ± SD, 21.3 ± 10.3). Sharks of this category showed a positive
but not significant (p Spearman > 0.05) relationship between Hg BMF and TL.
Sharks above 4 m of TL (n=27) did not show a significant correlation between Hg
BMF and TL (Spearman p value > 0.05); in this group, all sharks showed Hg BMF
significantly >1.0 (p < 0.001). Hg BMF in this category ranged from 10.2 to 48.5
(19.6 ± 9.2).
Fig. 2.21. Biomagnification factor calculated in whale sharks < and > of 4 m in LAP
during S2.
In BLA average BMF of Se from zooplankton was 0.9 ranging from 0.008
to 6.1. In LAP average BMF of Se from zooplankton was 0.9 ranging from 0.2 to
3.4.
Considering that the predominant diet of the whale shark is composed of
copepods (Clark and Nelson, 1997; Hacohen-Domené et al., 2006), then Hg BMF
ranged in BLA from 4.0 to 90.0 (12.8 ± 19.6) (Fig. 2.22). In LAP, copepods Hg
BMF ranged from 10.0 to 47.4 (19.4 ± 9.0) while chaetognaths, the second most

55
common zooplankton group, exhibited a Hg BFM ranging from 1.3 to 6.3 (2.6 ±
1.2). All Hg BMF calculated for copepods and chaetognatha showed values
significantly>1.0 (p < 0.05).
On the other hand, in BLA, the Se BMF of copepods ranged from 0.05 to
3.4 (0.5 ± 0.7). In LAP copepods Se BMF ranged from 0.1 to 1.5 (0.4 ± 0.2) and
in chaetognatha Se BMF ranged from 0.04 to 0.6 (0.1 ± 0.09).
Fig. 2.22. BMF of Hg and Se calaculated using biopsies of whale sharks assuming that
the zooplankton, copepods and chaetognatha constitute their main feeding.

56
2.3.6 Comparison of TEs concentration between seasons
In whale shark biopsies
Hg and Se concentration increased in both areas from S1 to S2 (Fig. 2.23); Mann-
Whitney test showed significant differences (p < 0.001) in the mean concentration
of Hg between seasons in both areas. Se concentration showed p value < 0.05
only in BLA from S1 to S2. In LAP, Se showed no significant differences in
concentration from one season to the other one.
Fig. 2.23. Mean Hg and Se concentrations in biopsies of whale sharks collected in BLA
and LAP in S1 and S2.
In the zooplankton
Hg and Se concentrations in the zooplankton decrease from S1 to S2 in LAP with
no significant difference found from one season to the other one (Fig. 2.24). On
the other hand, concentrations of Hg and Se rose in copepods and chaetognatha
from one season to the other one but statistical tests were not applied as the
number of samples was too low.

57
Fig. 2.24. Mean Hg and Se concentrations in zooplankton, copepods and chaetognatha
collected in LAP in S1 and S2.
Variability in Hg and Se in the same individuals
According with our results, in BLA, 6 sharks were spotted in both seasons,
corresponding to a 25% of fidelity for this study area. In LAP, 9 sharks were
spotted in both seasons corresponding to a 27% of fidelity for this site.
In BLA, Hg concentrations rose in all animals (Fig. 2.25) with a general
mean ± SD of 107 ± 20.6 ng/g ww; WS4 showed the least increased (84 ng/g
ww) while WS5 presented the highest one (143.2 ng/g ww). Se concentration
also increased (mean ± SD; 230 ± 231) in all animal except in WS1, which
presented a slight decrease of - 2 ng/g w.w (Fig. 2.25).
Fig. 2.25. Variability in Hg and Se concentrations in the six whale sharks spotted in S1
and S2 from BLA.

58
In LAP, Hg concentrations rose in all animals (Fig. 2.26) with a general
mean ± SD of 83.2 ± 57.2 ng/g ww; WS8 showed the least increased (28.8 ng/g
ww) while WS4 presented the highest one (188 ng/g). On the other hand, Se
concentration decreased (mean ± SD; -1848.7 ± 2413) in all animal except in
WS9, which presented an increase of 3342 ng/g (Fig. 2.26).
Fig. 2.26. Variability in Hg and Se concentrations in the nine whale sharks spotted in
S1 and S2 from LAP.
2.4. DISCUSSION
2.4.1 Hg and Se concentrations in biopsies
Mercury concentrations in whale shark biopsies collected in the peninsular
margin of the Gulf of California were higher (S1: 9 ± 7 in BLA and 4 ± 2 ng/g ww
in LAP; S2: 71 ± 109 in BLA and 24 ± 11 ng/g ww in LAP) than those reported
by Wang et al., (2014), who found a mean of 0.22 and 1.2 ng/g (ww) in epidermis
of two whale sharks caught from the coast of China. Hg concentrations from this
work were lower compared to the one found in whale shark biopsies from Dijibouti
(50 ± 60 ng/g ww; Boldrocchi et al., 2020). Highly urbanized area such as Dijibouti
could affect ocean contamination by increasing levels of heavy metals such as
Hg. Trophic position is a key factor in Hg accumulation and, as a filter feeder, the
whale shark exhibit lower Hg concentrations respect to carnivorous sharks.
Diverse studies have found higher Hg levels in carnivorous sharks, including
species from the Gulf of California region (Escobar-Sánchez et al., 2010;

59
Hurtado-Banda et al., 2012; Maz-Courrau et al., 2012; Bergés-Tiznado et al.,
2015).
Food is the principal source of Hg in predators so feeding strategy
differences can significantly affect the bioaccumulation of this element. In
addition, it is widely recognized that Hg accumulates in specific tissues of marine
biota. Numerous studies have reported that muscle and liver are biological targets
for the accumulation of Hg in several vertebrate species (e.g., Ruelas-Inzunza et
al., 2009; Taylor et al., 2014). The muscle is a biological target for the
accumulation of Hg, due to its high affinity towards the thiol groups of the proteins,
and the liver, due to its importance in the capture, biotransformation and
elimination of Hg (Taylor et al., 2014).
During season S1 (2016-2017), Se mean concentrations in whale shark's
biopsies were 230 ± 150 ng/g ww in BLA and 280 ± 200 ng/g ww in LAP, while in
season S2 (2017-2018) Se mean concentrations were 234 ± 410 ng/g in BLA and
329 ± 194 ng/g in LAP. These findings suggest that there was enough Se in the
epidermis to counter the actions of Hg. Se is an essential element with the
capacity to bioaccumulate and biomagnify in marine trophic chains (Penglase et
al., 2014). These findings are in accordance with what found in Dijibouti, where
Se mean concentration (± sd) in whale shark skin biopsies were 350±90 ng/g ww
(Boldrocchi et al., 2020). Se exposure for aquatic biota can be through water
or/and diet. However, the latter is considered the main route of recruitment
(Hamilton, 2004). The biological reason which could explain the moderated Hg
concentrations and the high variability for Se in the biopsies is not clear due to R.
typus physiology is still largely unknown. Still, one possibility may be related to
temporary up-regulation of selenoproteins to meet physiological needs (Ralston
& Raymond, 2010). Se is a relevant structural constituent in selenoproteins and,
once the activity of these proteins is optimized, organisms regulate Se levels
excreting the excess (Burk & Hill, 2015).
2.4.2 Comparison between sites
Concentrations of both Hg and Se in our study were significantly different
between the two areas (p < 0.05). Higher levels of Hg in the northern-center (BLA)
Gulf of California could possibly be associated to discharges from mining
activities in Santa Rosalia, Baja California. In fact, Kot et al., (2009) reported a

60
halo dissipation enriched of various trace metals in the Santa Rosalia coastal
region, which was linked to the copper mining of the District El Boleo; mining and
smelting operations were strong during the period 1885-1985 and marine
sediments were enriched by stream discharges.
Additionally, the source of Hg and other metals in the Gulf of California
could be associated to hydrothermal vents active in the Guaymas basin,
anthropogenic loads from metal impurities in raw materials, anthropogenic
releases from production processes (e.g., cement and metallic manufacture), and
past anthropogenic emissions mobilized from soils, sediments and water (Páez-
Osuna et al., 2017).
Sharks tend to accumulate toxic substances, such as Hg, because of their
trophic position and because they are long-lived animals (Storelli et al., 2011).
This trend is verified by the positive associations between length and Hg
concentrations that have been observed for numerous species of sharks (e.g.,
Storelli et al., 2011; Hurtado-Banda et al., 2012; Maz-Courrau et al., 2012). Our
findings only exhibit a correlation with the size for the case of those sampled in
BLA which showed a significant (p < 0.05) negative correlation between Hg in
males and total length.
2.4.3 Comparison between seasons
Hg concentration in the biopsies from both study areas presented an
increase in concentration that was significatively different (p < 0.001) between
the seasons. Se concentration in the biopsies, instead, showed significative
differences (p < 0.05) only in BLA between both seasons. Even it is complicated
to establish the reasons of this increase in Hg from S1 to S2, environmental
factors between seasons might have affected the bioavailability of the elements.
2.4.4 Influence of sex and TL
Sex was not a significant factor in the accumulation of Hg and Se in the
biopsies of R. typus; nevertheless, the number of samples for females in both
study areas was too small to apply any statistical test.
Despite we found a negative and significant (p < 0.05) correlation between
Hg and Se with TL in S2 in BLA, in general, we found a non-significant
relationship of Hg and Se with sharks' length, which could indicate that these

61
elements may not bioaccumulate in dermis, evidencing homeostatic regulation of
Se.
The null or negative correlation of Hg with the size in the whale shark can
be due partial or totally, to the feeding habit of this fish, which consumes
zooplankton unlike most sharks that are carnivorous top of the food web. In
addition, the high mobility of individuals from the coastal area to the oceanic area
and vice versa may be another factor that affects the Hg bioaccumulation rates.
It's been observed that juvenile and adult whale sharks exhibited differences in
their movement into the Gulf of California (Ramírez-Macías et al., 2017), where
adults are usually found in oceanic waters and juveniles show high degree of
fidelity in feeding grounds located in coastal areas (Ramírez-Macías et al., 2012).
The latter areas are typically influenced by pollution compared to oceanic waters.
Nevertheless, whale sharks are highly migratory sharks, and then Hg and Se
uptake could occur in organisms inhabiting the two areas as well.
2.4.5 Molar ratio
Molar ratio Se:Hg showed a significant correlation with the TL only in the
sharks from BLA in S2 (p = 0.0007). In addition, Hg nmol/g presented a positive
correlation (Spearman p < 0.05) with Se nmol/g in the sharks from LAP in S2.
Correlations between molar Se and Hg are more commonly found in bony fish
(Kaneko & Ralston, 2007) and the liver and kidney of marine mammals (Burger
et al., 2013); particularly, correlations have been shown to be stronger in
predators, such as predatory fish (Yamashita et al., 2011).
Selenium concentrations were in excess in the epidermis of R. typus as,
also confirmed by the Se:Hg molar ratios found in this tissue, which were
significantly >1.0, indicating that Se is incorporated in selenoproteins (Yang et al.,
2008). Due to the high affinity between Hg and Se, the formation of an inorganic
HgSe complex is proposed as the mechanism responsible for the protective effect
of Se (Ralston et al., 2008). In S2, a strong and negative correlation (p < 0.001)
was found between TL and Se:Hg molar ratio in sharks from BLA. As Hg
concentrations increased, Se:Hg molar ratios tended to decrease in both areas,
which also has been found in the shark Sphyrna lewini (Bergés-Tiznado et al.,
2015).

62
The Se:Hg ratios were significantly above 1.0 for the biopsies from both
areas, reaching 100 in BLA and 219 in LAP in S1 (Table 2.2). These results are
in accordance with what found in whale shark biospies from Dijibouti where the
Se:Hg molar ratio ranged from 3.8 to 54.9 and exceeded 1 in all samples
(Boldrocchi et al., 2020). Molar excess of Se relative to Hg, as well as high
variation in Se:Hg ratios is commonly found in Gulf of California marine species
(Bergés-Tiznado et al., 2015; 2019) and in fish species elsewhere (Burger et al.,
2001). These results suggest that R. typus have enough Se to prevent Hg toxicity
and still maintain selenium-dependent metabolic functions (Ralston & Raymond,
2010).
Whale sharks are opportunistic filter feeders (Taylor, 1997) and according
to previous studies they have been observed feeding in Bahía de La Paz on
diffuse patches of euphausiids (Ketchum et al., 2013) and copepods (Clark &
Nelson, 1997; Hacohen-Domené et al., 2006). Our findings are in accordance
with the previous ones, although we also report chaetognatha as one of the main
groups of zooplankton during feeding activity.
2.4.6 Elements in zooplankton
Hg and Se varied greatly in the zooplankton during the collection period
with no significative differences detected between seasons. Hg concentrations
from our study were similar to those found by Syderman & Jarman (1998) in the
central coast of California (USA); and Se concentrations were similar to those
found by Liu et al., (1987) in the coast of China. The essentiality of Se for marine
zooplankton has not been demonstrated. Still, the high assimilation efficiency of
Se in marine zooplankton found by Fisher & Reinfelder (1991) indicates that this
element enters the organic cycle via the marine zooplankton. Correlation
between Hg and Se:Hg was significant (p < 0.05) in the zooplankton with a Hg
tendency to decrease with the increasing of Se:Hg molar ratio. However, further
studies are required to confirm these results, because our sample size was
limited. Assuming that the collected zooplankton is representative of the diet of
R. typus, it can be proposed that Hg biomagnification is exhibited by this fish.

63
2.4.7 Biomagnification factor
Despite the BMF did not show any significant correlation with the total
length of the animals, sharks < 4 m showed a positive tendency with total length
and sharks > 4 m exhibited a negative tendency with the total length, which could
indicate a shift in the shark diet or metabolic changes once the animal reaches
such size. Biomagnification factor found in Dijibouti was < 1:1 for Hg and Se
(Boldrocchi et al., 2020).
2.5. CONCLUSIONS
Our results show that Hg and Se are both present in whale sharks’ biopsies
from the two bays studied in the Gulf of California with significative differences
found between sites and seasons. Sex is not a significant factor that influence
the element concentrations in biopsies; nevertheless, the correlation of the
elements with the total length of the sharks seems to be different depending on
the sex; in males, trace elements seems to decrease with the size of the shark,
instead in female, trace elements concentrations seems to increase with size.
Despite so, the number of females sampled in both study areas and in both
seasons were too low to establish a strong correlation. Molar ratio Se:Hg shows
enough concentration of Se in order to detoxicate Hg in all animals.
Hg and Se were also detected in the zooplankton collected from both study
areas; in particular, in the second season (2017-2018), zooplankton was more
enriched in elements and this was reflected in the shark biopsies. Mercury is,
apparently, captured by the shark mainly from chaetognatha and in minor quantity
from copepods, which seems to be more decisive in the concentration of Se.
Finally, our results show that Hg is biomagnified by the sharks while Se is not,
probably because of its metabolic role in the organism.
64
CHAPTER 3
As, Cd, Cu, Pb, Zn BIOACCUMULATION AND BIOMAGNIFICATION IN
EPIDERMIS OF WHALE SHARK DURING TWO SEASONS IN TWO AREAS
OF THE GULF OF CALIFORNIA, MEXICO
3.1. ABSTRACT
Arsenic (As), Cadmium (Cd), Copper (Cu), Lead (Pb) and Zinc (Zn) were
measured in the whale shark (Rhincodon typus) from two areas of the Gulf of
California, Bahía de Los Angeles (BLA) and Bahía de La Paz (LAP) using dermal
biopsies of 130 specimens and during two seasons (S1 and S2): S1= 2016-2017
and S2= 2017-2018. Additionally, in S1 nineteen zooplankton samples from LAP
were analysed, while in S2, 11 zooplankton samples were analysed in BLA and
14 zooplankton samples were analysed in LAP. In both seasons and both study
areas, Zn was the most abundant element. On the other hand, Cd and Pb showed
the lowest concentrations in both areas and both seasons. Significative
differences in TEs concentrations were found between sites and seasons.
Arsenic concentrations found in the sharks from La Paz suggested that the area
is enriched in this element. Essential elements and As were the elements that
presented the most variability within animals sampled in both seasons while not
essential element remained more constant from one season to the other one. In
general, sex was not a significant and influential factor in trace element
concentration; nevertheless, correlation between TEs and length of the animals
suggested different behaviour depending on the sex (negative correlations in
males, positive correlations in females) confirming that whale shark’ feeding
strategies implies segregation between sex and size. In S2 zooplankton showed
enrichment in trace elements and this was reflected in the sharks as well.
Essential TEs were not biomagnified by the sharks probably due to the metabolic
use; on the contrary, Pb was apparently biomagnified in both seasons through
zooplankton. Molar ratios suggested that in the epidermis Zn could improve Cd
detoxification better than Se.

65
3.2. INTRODUCTION
In the environment, some elements are essential (Cu and Zn) and are
necessary to guarantee a correct function of the metabolic processes;
nevertheless, they can become toxic in high concentrations (Soto-Jiménez,
2011). Other elements, called not essential, such as As, Cd and Pb are toxic even
at low concentrations.
As we discussed, the processes at which trace elements are accumulate
in the organisms are different for each species and even can be different in
different individuals of the same species. These processes depend on biotic and
abiotic factors, metabolism and on detoxification mechanisms. Excretion of heavy
metals can be slow; some of them, like Cd, have a life of over 10 years in
terrestrial mammals and excretion depend to the bounding with MTs (Endo et al.,
2008).
Heavy metals like Cd and Pb are poorly soluble in water and they are
adsorbed in the suspended particulate matter (Newman & Unger, 2002). Filter
feeder animals such as the whale shark, Rhincodon typus, can be susceptible to
those elements as they continuously filter the surface of the ocean where those
toxic elements are present. Therefore, the study of metals concentration in
species like R. typus is important in order to establish the health status of the
species in a certain area.
The main objective of this chapter is to establish the concentrations of
essential (Cu and Zn) and not-essential (As, Cd and Pb) elements in whale shark
biopsies from two study areas during two seasons (S1 and S2). We assess key
potential biological drivers of TEs concentrations including period (two
consecutive years), site (location of shark), sex and total length. TEs
concentration in zooplankton were determined in both study areas where sharks
typically feed. We estimated biomagnification. Finally, we explored possible
interactions between elements in the epidermis.

66
3.3. RESULTS
3.3.1 SEASON 1. TEs concentrations in biopsies
3.3.1.1 Differences between sites
In biopsies of sharks sampled from BLA (n = 38), the Zn content (in ww)
ranged from 35 to 2107 ng/g with a mean ± SD of 298 ± 406 ng/g, As ranged from
18 to 1013 ng/g with a mean ± SD of 131 ± 161 ng/g, Cu ranged from 5 to 57 with
a mean ± SD of 53 ± 99, Pb ranged from 1 to 36 with a mean ± SD 7 ± 7 and Cd
ranged from 1 to 15 ng/g with a mean ± SD of 3 ± 3.
In biopsies of sharks sampled from LAP (n = 32), the Zn content (in ww)
ranged from 35 to 1987 ng/g with a mean ± SD of 595 ± 554 ng/g, As ranged from
35 to 611 ng/g with a mean ± SD of 172 ± 150 ng/g, Cu ranged from 4 to 1070 with
a mean ± SD of 244 ± 338, Pb ranged from 1 to 162 with a mean ± SD 15 ± 32 and
Cd ranged from 0.5 to 12.0 ng/g with a mean ± SD of 4 ± 3.
Mann-Whitney test showed significant differences (p < 0.001) of Zn, As
and Cu between the two areas (Fig. 3.1).
Fig. 3.1. Concentrations of Zn, As, Cu, Pb and Cd (ng/g ww) in biopsies of whale
sharks collected in S1 in BLA and LAP.
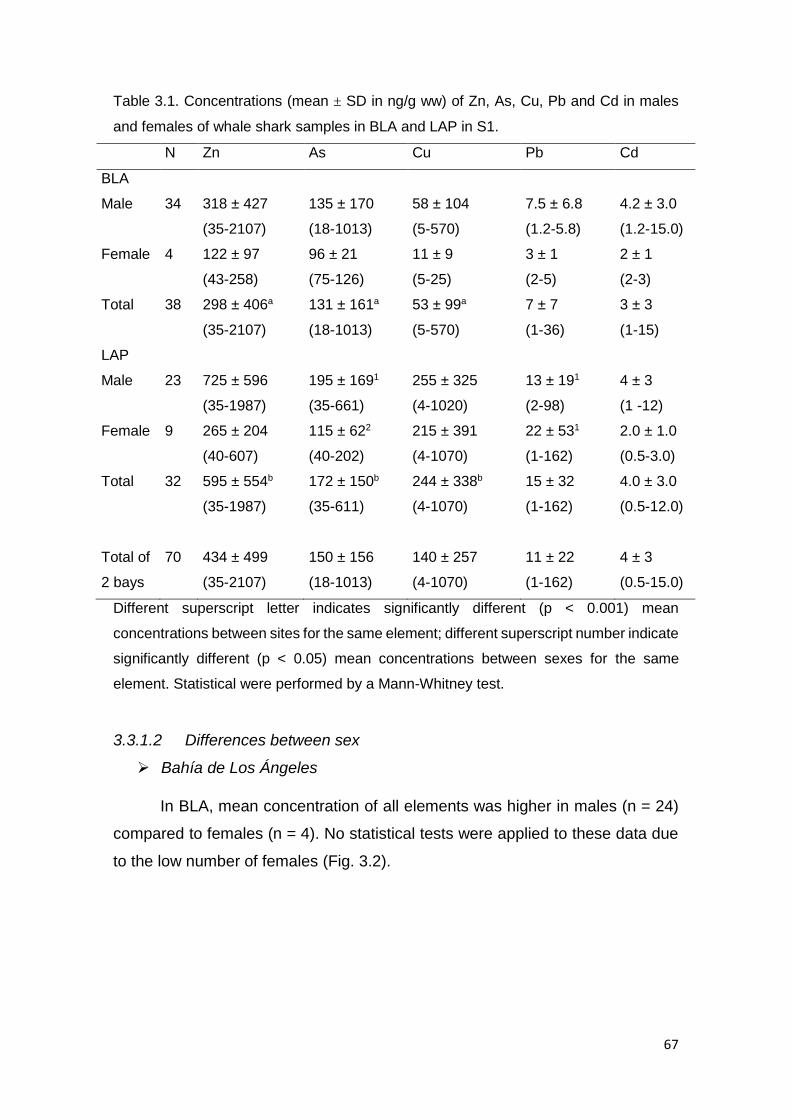
67
Table 3.1. Concentrations (mean ± SD in ng/g ww) of Zn, As, Cu, Pb and Cd in males
and females of whale shark samples in BLA and LAP in S1.
N Zn As Cu Pb Cd
BLA
Male 34 318 ± 427 135 ± 170 58 ± 104 7.5 ± 6.8 4.2 ± 3.0
(35-2107) (18-1013) (5-570) (1.2-5.8) (1.2-15.0)
Female 4 122 ± 97 96 ± 21 11 ± 9 3 ± 1 2 ± 1
(43-258) (75-126) (5-25) (2-5) (2-3)
Total 38 298 ± 406a 131 ± 161a 53 ± 99a 7 ± 7 3 ± 3
(35-2107) (18-1013) (5-570) (1-36) (1-15)
LAP
Male 23 725 ± 596 195 ± 1691 255 ± 325 13 ± 191 4 ± 3
(35-1987) (35-661) (4-1020) (2-98) (1 -12)
Female 9 265 ± 204 115 ± 622 215 ± 391 22 ± 531 2.0 ± 1.0
(40-607) (40-202) (4-1070) (1-162) (0.5-3.0)
Total 32 595 ± 554b 172 ± 150b 244 ± 338b 15 ± 32 4.0 ± 3.0
(35-1987) (35-611) (4-1070) (1-162) (0.5-12.0)
Total of 70 434 ± 499 150 ± 156 140 ± 257 11 ± 22 4 ± 3
2 bays (35-2107) (18-1013) (4-1070) (1-162) (0.5-15.0)
Different superscript letter indicates significantly different (p < 0.001) mean
concentrations between sites for the same element; different superscript number indicate
significantly different (p < 0.05) mean concentrations between sexes for the same
element. Statistical were performed by a Mann-Whitney test.
3.3.1.2 Differences between sex
Bahía de Los Ángeles
In BLA, mean concentration of all elements was higher in males (n = 24)
compared to females (n = 4). No statistical tests were applied to these data due
to the low number of females (Fig. 3.2).

68
Fig. 3.2. TEs concentrations in males and females from BLA in S1. No statistical tests
were applied due to the low number of females.
Bahía de La Paz
In LAP, mean concentration of TEs were higher in males (n = 23)
compared to females (n = 9); these differences were significant only in the
concentration of Pb (p < 0.05; Fig. 3.3).
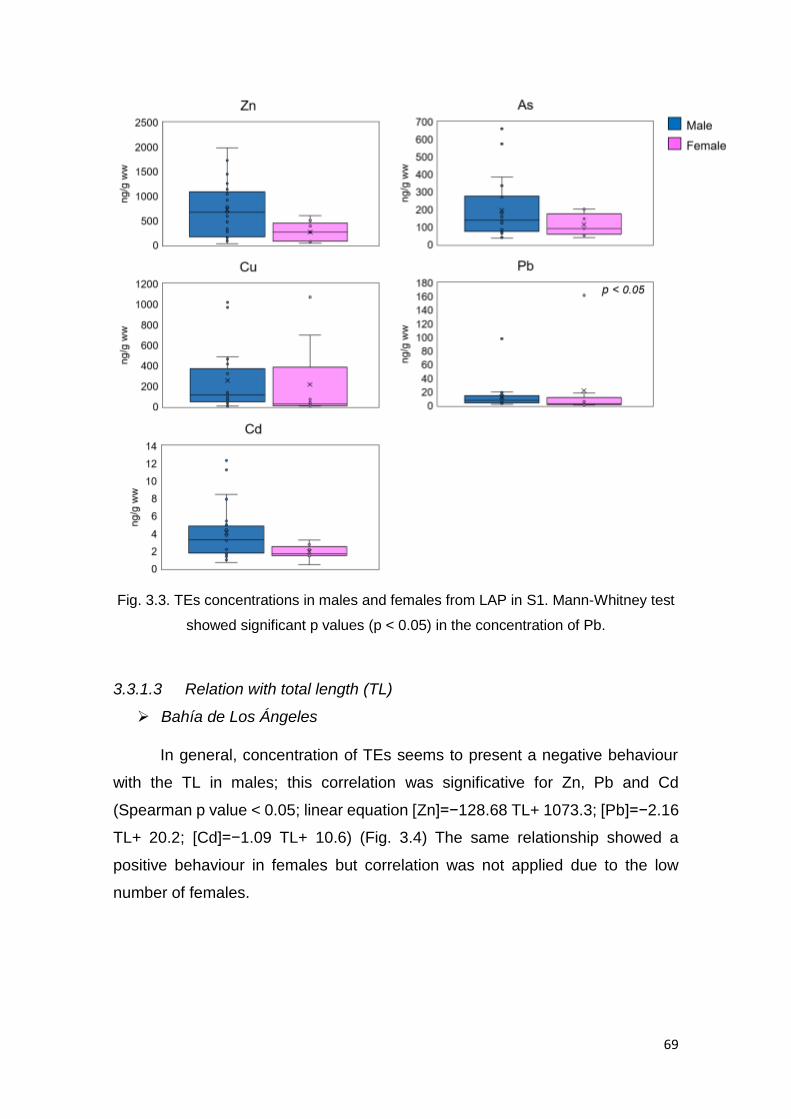
69
Fig. 3.3. TEs concentrations in males and females from LAP in S1. Mann-Whitney test
showed significant p values (p < 0.05) in the concentration of Pb.
3.3.1.3 Relation with total length (TL)
Bahía de Los Ángeles
In general, concentration of TEs seems to present a negative behaviour
with the TL in males; this correlation was significative for Zn, Pb and Cd
(Spearman p value < 0.05; linear equation [Zn]=−128.68 TL+ 1073.3; [Pb]=−2.16
TL+ 20.2; [Cd]=−1.09 TL+ 10.6) (Fig. 3.4) The same relationship showed a
positive behaviour in females but correlation was not applied due to the low
number of females.

70
Fig. 3.4. Correlation between TEs and TL in males (black) and females (grey) from BLA
in S1.
Bahía de La Paz
In general, concentration of TEs (ng/g ww) seems to present a negative
behaviour with the TL in males; an exception was found for Cu where the
correlation in male was positive. Correlations were not significant but once we
eliminate one outlier from Pb in males, we found p value < 0.05 (linear equation
[Pb]=−1.75 TL+ 18) (Fig. 3.5) In females, all correlations were positive with the
TL except in for Pb and Cd.

71
Fig. 3.5. Correlation between TE and TL in males (black) and females (grey) from LAP
in S1.
3.3.2 SEASON 1: TEs concentrations in zooplankton
In the zooplankton samples, mean ± SD trace elements concentration was
found in the order: Zn (1749±1171 ng/g), Cu (212±189 ng/g), As (163±183 ng/g),
Pb (48±101 ng/g) and Cd (47±25 ng/g) (Fig. 3.6; Table 3.2). Chaetognatha (n=3)
was the group with the highest concentration of Zn (2523±1646 ng/g) and Cu
(173±148 ng/g) while copepods (n=2) was the groups with the highest
concentration of Cd (71±62 ng/g), As (54.5±53.0 ng/g), and Pb (12±8 ng/g) (Fig.
3.7). Statistical tests were not applied due to low number of samples.

72
Fig. 3.6. TEs concentrations in the zooplankton collected in LAP in S1.
Fig. 3.7. Mean concentration of TEs and SE in the main groups of zooplankton from
LAP in S1.

73
Table. 3.2. Concentration of Zn, Cu, As, Pb and Cd (ng/g ww) in zooplankton and main
groups of zooplankton from LAP in S1.
Month Year Zn Cu As Pb Cd
Sept 2016 351 57.6 41.8 2.4 28.7
Oct 2016 7.4 0.9 0.1 0.3 0.1
Oct 2016 3616 739.1 133.5 363.6 70.0
Oct 2016 3336 331.6 67.7 48.6 72.4
Nov 2016 1716 248.3 30.6 43.0 41.5
Nov 2016 1930 197.6 122.6 66.1 18.2
Zooplankton Dec 2016 3076 206.8 138.0 13.0 59.4
Dec 2016 1579 187.8 628.4 30.0 52.2
Dec 2016 605 63.3 34.1 2.7 34.3
Jan 2017 973 208.8 276.8 7.5 81.3
Mar 2017 2294 121.0 101.0 1.4 30.3
Mar 2017 1502 184.6 383.8 1.5 78.0
Average+SD 1749±1171 212±189 163±183 48±101 47±25
Copepods Sept 2016 2069 234.7 92.1 6.3 115.3
Copepods Dec 2016 512 68.2 17.0 17.7 27.1
Average+SD 1291±1101 151.4±118 54.5±53 12.0±8 71.2±6
Main groups Chaetognatha Oct 2016 4406 343.6 72.5 25.3 65.3
Chaetognatha Dec 2016 1361 83.0 17.5 3.5 21.8
Chaetognatha Mar 2017 1802 92.1 63.5 3.3 19.0
Average+SD 2523±1646 173±148 51±29 11±13 35±26
Euphausiids Jan 2017 479 92.5 41.0 5.7 43.2
Euphausiids Mar 2017 483 36.0 8.3 0.9 16.6
Average+SD 481±3 64.2±40 24.6±23 3.3±3 30.0±19
3.3.2.1 Biomagnification factor (BMF)
BMF for the whale shark in LAP (n = 32) was calculated for zooplankton
(n = 12), copepods (n = 2), chaetognatha (n = 3) and euphuasiids (n = 2) (Table
3.3). BMF through total zooplankton was 0.34 for Zn, 0.07 for Cd, 0.32 for Pb,
1.06 for As and 1.15 for Cu. Despite As and Cu BMF were > 1, these values did
not show p values statistically > 1 (t-test > 0.05). Euphausiids was the
zooplankton group with the highest BMF withing all zooplankton categories.

74
Statistical tests were not applied to the BMF of the main groups of zooplankton
due to the low number of samples.
Table 3.3. BMF (mean, min and max) for whale sharks calculated from zooplankton,
copepods, chaetognatha and euphausiids and the whale shark biopsies concentrations
in organisms collected in S1 in LAP.
BMF
n Zn As Cu Pb Cd
Zooplankton 12 0.34 1.06 1.15 0.32 0.07
(0.02-1.14) (0.21-4.05) (0.02-5.04) (0.02-3.34) (0.01-0.26)
Copepods 2 0.46 3.16 1.61 1.27 0.05
(0.03-1.54) (0.64-12.12) (0.02-7.07) (0.06-13.47) (0.01-0.17)
Chaetognatha 3 0.24 3.37 1.41 1.43 0.10
(0.01-0.79) (0.68-12.91) (0.02-6.12) (0.07-15.12) (0.01-0.35)
Euphausiids 2 1.24 7.00 3.80 4.59 0.12
(0.07-4.13) (1.42-26.84) (0.06-16.68) (0.23-48.68) (0.02-0.41)
3.3.3. Season 2: TEs concentrations in biopsies
3.3.3.1 Differences between sites
In biopsies of sharks sampled from BLA (n = 27), the Zn content (in ww)
ranged from 520 to 12712 ng/g with a mean ± SD of 1959 ± 2545 ng/g, As ranged
from 131 to 1405 ng/g with a mean ± SD of 411 ± 272 ng/g, Cu ranged from 38 to
573 with a mean ± SD of 166 ± 129, Pb ranged from 18 to 319 with a mean ± SD
69 ± 76 and Cd ranged from 6 to 71 ng/g with a mean ± SD of 17 ± 14 (Table 3.4).
In biopsies of sharks sampled from LAP (n = 33), the Zn content (in ww)
ranged from 664 to 6093 ng/g with a mean ± SD of 2642 ± 1261 ng/g, As ranged
from 83 to 1428 ng/g with a mean ± SD of 377 ± 273 ng/g, Cu ranged from 4 to
1032 with a mean ± SD of 244 ± 246, Pb ranged from 2 to 23 with a mean ± SD 7
± 5 and Cd ranged from 2 to 53 ng/g with a mean ± SD of 13 ± 10 (Table 3.4).
Mann-Whitney test showed significant differences (p < 0.001) of Zn, As
and Pb between the two areas (Fig. 3.8).

75
Fig. 3.8. Concentrations of Zn, As, Cu, Pb and Cd (ng/g ww) in biopsies of whale
sharks collected during S2 in BLA and LAP.
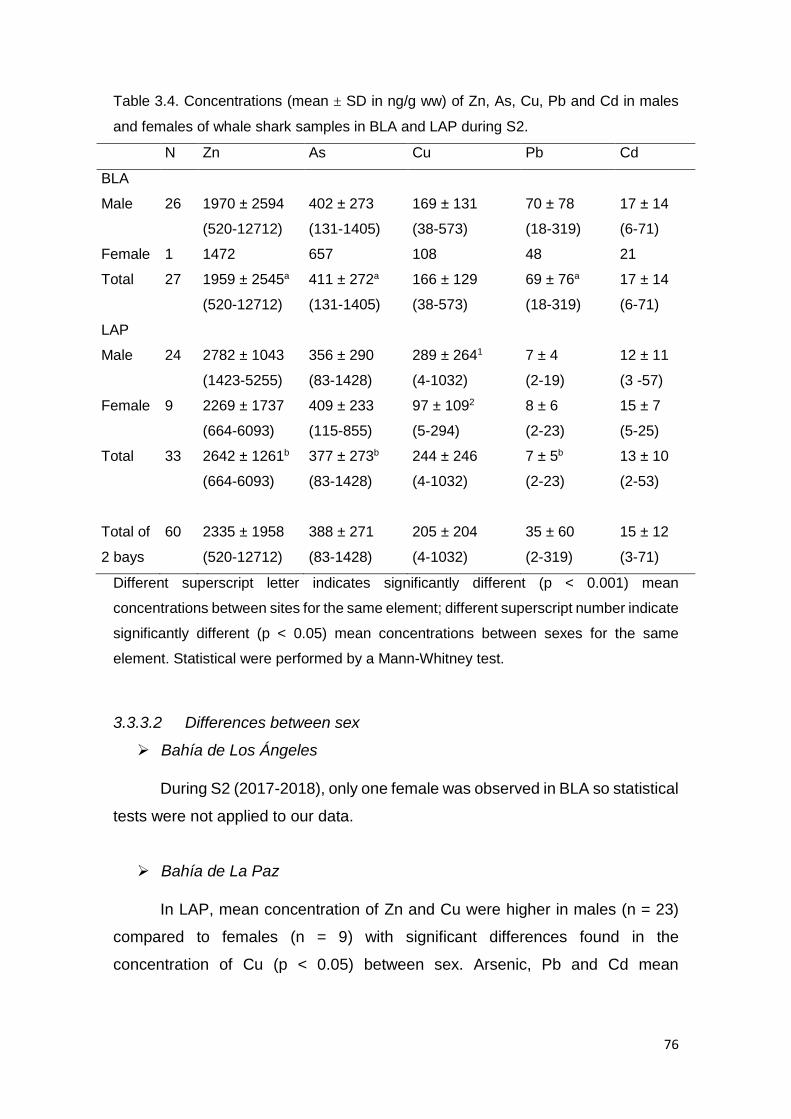
76
Table 3.4. Concentrations (mean ± SD in ng/g ww) of Zn, As, Cu, Pb and Cd in males
and females of whale shark samples in BLA and LAP during S2.
N Zn As Cu Pb Cd
BLA
Male 26 1970 ± 2594 402 ± 273 169 ± 131 70 ± 78 17 ± 14
(520-12712) (131-1405) (38-573) (18-319) (6-71)
Female 1 1472 657 108 48 21
Total 27 1959 ± 2545a 411 ± 272a 166 ± 129 69 ± 76a 17 ± 14
(520-12712) (131-1405) (38-573) (18-319) (6-71)
LAP
Male 24 2782 ± 1043 356 ± 290 289 ± 2641 7 ± 4 12 ± 11
(1423-5255) (83-1428) (4-1032) (2-19) (3 -57)
Female 9 2269 ± 1737 409 ± 233 97 ± 1092 8 ± 6 15 ± 7
(664-6093) (115-855) (5-294) (2-23) (5-25)
Total 33 2642 ± 1261b 377 ± 273b 244 ± 246 7 ± 5b 13 ± 10
(664-6093) (83-1428) (4-1032) (2-23) (2-53)
Total of 60 2335 ± 1958 388 ± 271 205 ± 204 35 ± 60 15 ± 12
2 bays (520-12712) (83-1428) (4-1032) (2-319) (3-71)
Different superscript letter indicates significantly different (p < 0.001) mean
concentrations between sites for the same element; different superscript number indicate
significantly different (p < 0.05) mean concentrations between sexes for the same
element. Statistical were performed by a Mann-Whitney test.
3.3.3.2 Differences between sex
Bahía de Los Ángeles
During S2 (2017-2018), only one female was observed in BLA so statistical
tests were not applied to our data.
Bahía de La Paz
In LAP, mean concentration of Zn and Cu were higher in males (n = 23)
compared to females (n = 9) with significant differences found in the
concentration of Cu (p < 0.05) between sex. Arsenic, Pb and Cd mean

77
concentrations were higher in females compared to males but with no statistical
differences found (Fig. 3.9).
Fig. 3.9. TEs concentrations in whale shark biopsies of males and females from LAP
during S2.
3.3.3.3 Relation with total length
Bahía de Los Ángeles
Correlation between TL of the animals and TE concentration of the
biopsies was performed only in males (n = 26) in this area. In general,
concentration of TEs (ng/g ww) present a negative behaviour with the TL in
males; this correlation was significative for all elements; Spearman p value <
0.05; linear equation [Zn]=−249.18 TL+ 3559.3; rho = -0.60; [As]=−90.497 TL+
975.87; rho = -0.51; [Cu]=−27.069 TL+ 340.33; rho = -0.50; [Pb]=−14.463 TL+
161.93; rho = -0.56 [Cd]=−2.7247 TL+ 34.057; rho = -0.50) (Fig. 3.10).

78
Fig. 3.10. Spearman correlation applied to TL and TEs concentration in biopsies of
males of whale shark from BLA during S2.
Bahía de La Paz
In general, we did not find any significant correlation between TEs
concentration and TL in LAP; correlations seems to present a more positive
behaviour in females (n = 9) respect to males (n = 24) but the coefficients of
correlations were low for all elements (Fig. 3.11).

79
Fig. 3.11. Spearman correlation applied to TL and TEs concentration in biopsies of
males and females of whale shark from LAP during S2.
3.3.4 SEASON 2: TEs concentrations in zooplankton
In the zooplankton samples collected from BLA (n =6), mean ± SD trace
elements concentration (ng/g ww) was found in the order: Zn (6735±2988), Cu
(1032±568), As (562±320), Cd (519±219) and Pb (20±20) (Fig. 3.12; Table 3.5).
While in the zooplankton samples collected from LAP (n = 7), mean ± SD trace
elements concentration was found in the order: Zn (5884±3577), As (639±491),
Cd (627±229), Cu (548±431) and Pb (2±2) (Table 3.5). Copepods collected in
LAP (n = 5) showed higher concentration of all elements compared with

80
copepods from BLA (n = 5), but no statistical tests were applied due to the low
number of samples (Fig. 3.13). In LAP, copepods showed higher concentrations
of Zn, As and Pb, while chaetognatha (n = 2) showed higher concentrations of
Cu and Cd (Fig. 3.13).
Fig. 3.12. Mean TEs concentration and SD in zooplankton samples collected from BLA
and LAP during S2.
Fig. 3.13. Mean TEs concentrations in the main groups of zooplankton samples
collected in BLA and LAP during S2.

81
Table 3.5. TEs concentrations (mean ± SD (ng/g ww)) in zooplankton and in the main zooplankton groups collected in BLA and LAP during S2.
Site Month Year Zn Cu As Cd Pb
Zooplankton BLA Mixt Sept 2017 7556 1218 821 529 34
BLA Mixt Sept 2017 5245 458 386 342 6
BLA Mixt Sept 2017 5439 997 409 748 5
BLA Mixt Sept 2017 12454 1802 1010 819 53
BLA Mixt Oct 2017 5256 1405 617 364 20
BLA Mixt Oct 2017 4459 313 129 313 1
Average+SD 6735±2988 1032±568 562±320 519±219 20±20
LAP Mixt Oct 2017 44 3 101 1068 0.9
LAP Mixt Nov 2017 11488 1408 518 479 4.5
LAP Mixt Nov 2017 4766 419 295 527 5.3
LAP Mixt Dec 2017 7597 550 1037 801 2.3
LAP Mixt Jan 2018 4323 348 413 445 0.7
LAP Mixt Jan 2018 7885 451 1540 473 0.5
LAP Mixt Feb 2018 5082 659 568 594 0.6
Average+SD 5884±3577 548±431 639±491 627±229 2±2
Main groups BLA Copepods Sept 2017 4605 811 821 439 0.8
BLA Copepods Sept 2017 9420 1313 1276 872 1.3
BLA Copepods Sept 2017 5129 906 884 381 0.8
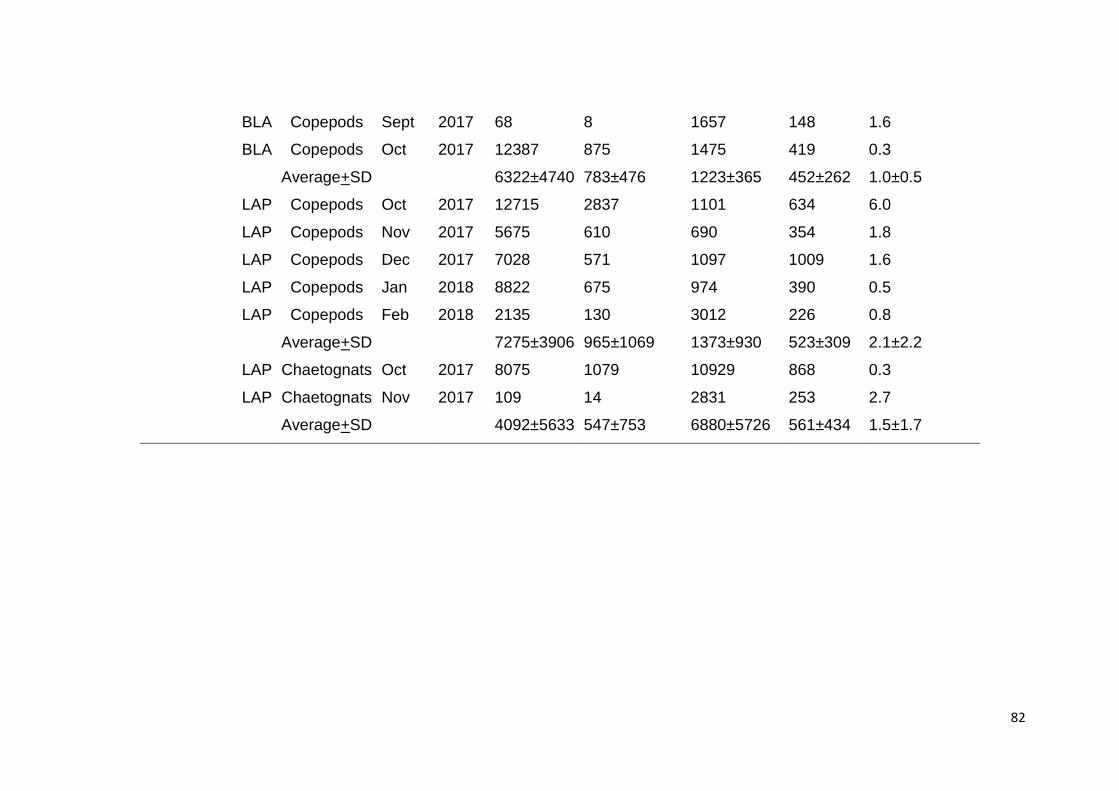
82
BLA Copepods Sept 2017 68 8 1657 148 1.6
BLA Copepods Oct 2017 12387 875 1475 419 0.3
Average+SD 6322±4740 783±476 1223±365 452±262 1.0±0.5
LAP Copepods Oct 2017 12715 2837 1101 634 6.0
LAP Copepods Nov 2017 5675 610 690 354 1.8
LAP Copepods Dec 2017 7028 571 1097 1009 1.6
LAP Copepods Jan 2018 8822 675 974 390 0.5
LAP Copepods Feb 2018 2135 130 3012 226 0.8
Average+SD 7275±3906 965±1069 1373±930 523±309 2.1±2.2
LAP Chaetognats Oct 2017 8075 1079 10929 868 0.3
LAP Chaetognats Nov 2017 109 14 2831 253 2.7
Average+SD 4092±5633 547±753 6880±5726 561±434 1.5±1.7

83
3.3.4.1 Biomagnification factor (BMF)
BMF for whale sharks of BLA (n = 27) was calculated for zooplankton
samples (n = 6) and copepods (n = 5) (Table 3.6). BMF through total zooplankton
was 0.30 for Zn, 0.73 for As, 0.16 for Cu, 3.53 for Pb and 0.03 for Cd. Pb BMF
through total zooplankton and copepods was consistent and statistically >1.0
(Table 3.6).
In whale sharks from LAP (n = 33), BMF was statistically > 1 (p < 0.001)
only for Pb through zooplankton (n = 7) and copepods (n = 5). Chaetognatha
BMF was also > 1 but t-test was not applied (n = 2).
Table 3.6. BMF (mean, min and max in ng/g ww) of whale sharks calculated from
samples of zooplankton, copepods and chaetognatha collected in BLA and LAP during
S2. Asterisks indicate p values < 0.05 (*) and < 0.001 (**). Statistical test applied was t-
test.
BMF BLA
n Zn As Cu Pb Cd
Zooplankton 6 0.30 0.73 0.16 3.53* 0.03
(0.08-1.89) (0.23-2.50) (0.04-0.56) (0.89-16.0) (0.01-0.14)
Copepods 5 0.32 0.91 0.21 73.1** 0.01
(0.08-2.01) (0.29-3.11) (0.05-0.73) (18.5-330) (0.005-0.060)
BMF LAP
Zooplankton 7 0.44 0.58 0.43 3.69** 0.02
(0.11-1.04) (0.13-2.24) (0.01-1.88) (0.80-17.5) (0.01-0.09)
Copepods 5 0.36 0.71 0.24 3.63** 0.01
(0.09-0.84) (0.16-2.73) (0.004-1.07) (0.79-17.2) (0.003-0.04)
Chaetognatha 2 0.63 0.66 0.43 5.21 0.002
(0.16-1.49) (0.15-2.55) (0.01-1.89) (1.1-24.6) (0.001-0.008)
3.3.5 Comparison of TEs concentration between seasons
In whale shark biopsies
In general, TEs concentration increased in both areas from S1 to S2;
Mann-Whitney test showed significant differences (p < 0.001) in the concentration
of Zn, As and Cd between seasons in both areas (Fig. 3.14). Cu and Pb
concentrations were statistically different (p < 0.001) during season S1 and during
season S2 only in BLA.

84
Fig. 3.14. Mean TEs concentrations in biopsies of whale sharks collected in BLA and
LAP during S1 and during S2.
In zooplankton from LAP
The TEs concentrations in the mixt zooplankton were most high during S2
(n = 12) than during S2 (n = 7). Mann-Whitney p values < 0.05 was found in the
comparison of the mean concentration of Zn, As, Cu and Pb between S1 and S2.
Cd showed a p value < 0.001 (Fig. 3.15). Statistical tests were not applied to the
concentrations on TEs in the copepods (S1n = 2; S2n = 5) and chaetognatha
(S1n = 3; S2n = 2) due the number of samples was too low.
Fig. 3.15. Mean TEs concentrations in samples of zooplankton, copepods and
chaetognatha collected in LAP during S1 and S2.

85
Changes in TEs concentration in the same individuals
Generally, in BLA, TEs concentration (ng/g ww) in biopsies was higher in
all six animals (Fig. 3.16); mean ± SD increase for Zn was 3401 ± 1154 ng/g,
1105 ± 582 ng/g for As, 444 ± 492 ng/g for Cu, 103 ± 32 ng/g for Pb and 39 ± 11
ng/g for Cd.
Fig. 3.16. Variability in TEs concentrations during S1 (black circle) and during S2 (white
circle) in six whale sharks spotted in BLA.
In LAP, Zn presented an increase (mean±sd) of 7865 ± 8331 ng/g in the
animals (Fig. 3.17). Arsenic decreased in whale shark #1 (345 ng/g), #2 (668
ng/g) and #3 (212 ng/g) and increased in the other six sharks. Cu increased in

86
WS #1 (494 ng/g), #3 (465 ng/g), #4 (243 ng/g), #5 (929 ng/g), #7 (991 ng/g), and
decreased in WS #2 (71 ng/g), #6 (243 ng/g), #8 (5826 ng/g) and #9 (5690 ng/g)
(Fig. 3.17). Pb generally decreased but presented an increase in concentration
in three animals. Finally, Cd only decreased in one animal (WS #6; 26 ng/g) and
it was the element that presented the least variation within animals (Fig. 3.17).
Fig. 3.17. Changes in TEs concentrations of biopsies during S1 (black circle) and
during S2 (white circle) in nine whale sharks spotted in LAP.

87
3.3.6 Molar ratios
Molar ratios Zn:As, Zn:Cd, Cd:Pb, Cd:As, Se:Cd, Se:As, Cu:Cd, Zn:Pb and
Cu:Pb were calculated in the biopsies of whale shark collected in both study
areas and both seasons. Data of Se are showed in Chapter 2. Molar ratios were
compared with another study on trace elements found in epidermis of two dead
whale sharks from China (Table 3.7). Statistical differences (t-test applied) of the
molar ratios in BLA and LAP in both seasons are shown in Table 3.8.
Antagonist behaviour was explored between these elements and results are
shown in Fig. 3.18, 3.19, 3.20, 3.21, 3.22, 3.23, 3.24, 3.25 and 3.26.
Table 3.7. TEs (mean ± SD, min - max) found in whale shark biopsies collected during
S1 and during S2 in BLA and LAP.
n Zn nmol/g
As nmol/g
Pb nmol/g
Cd nmol/g
Se nmol/g
Cu nmol/g
S1
BLA 38 4.5 ± 6.2 1.7 ± 2.1 0.03 ± 0.03 0.04 ±0.03 89.3 ± 82.7 0.83 ± 1.57
(0.5 – 32.2) (0.2 – 13.5) (0.01 – 0.20) (0.01 – 0.13) (15.4 – 454.0) (0.07 – 8.96)
LAP 32 9.0 ± 8.5 2.3 ± 2.0 0.07 ± 0.15 0.03 ± 0.03 3.6 ± 2.5 3.84 ± 5.33
(0.5 – 30.3) (0.5 – 8.8) (0.004 – 0.80) (0.004 – 0.10) (0.2 – 10.7) (0.06 – 16.84)
S2
BLA 27 30.0 ± 39.0 5.5 ± 3.6 0.3 ± 0.3 0.2 ± 0.1 3.3 ± 5.2 2.62 ± 2.02
(8.0 – 194.4) (1.7 – 18.7) (0.1 – 1.5) (0.05 – 0.60) (0.3 – 23.2) (0.60 – 9.02)
LAP 33 40.4 ± 19.3 5.0 ± 3.6 0.03 ± 0.02 0.1 ± 0.1 4.2 ± 2.4 3.72 ± 3.88
(10.0 – 93.2) (1.0 – 19.0) (0.01 – 0.10) (0.03 – 0.50) (1.0 – 15.0) (0.06 – 16.24)
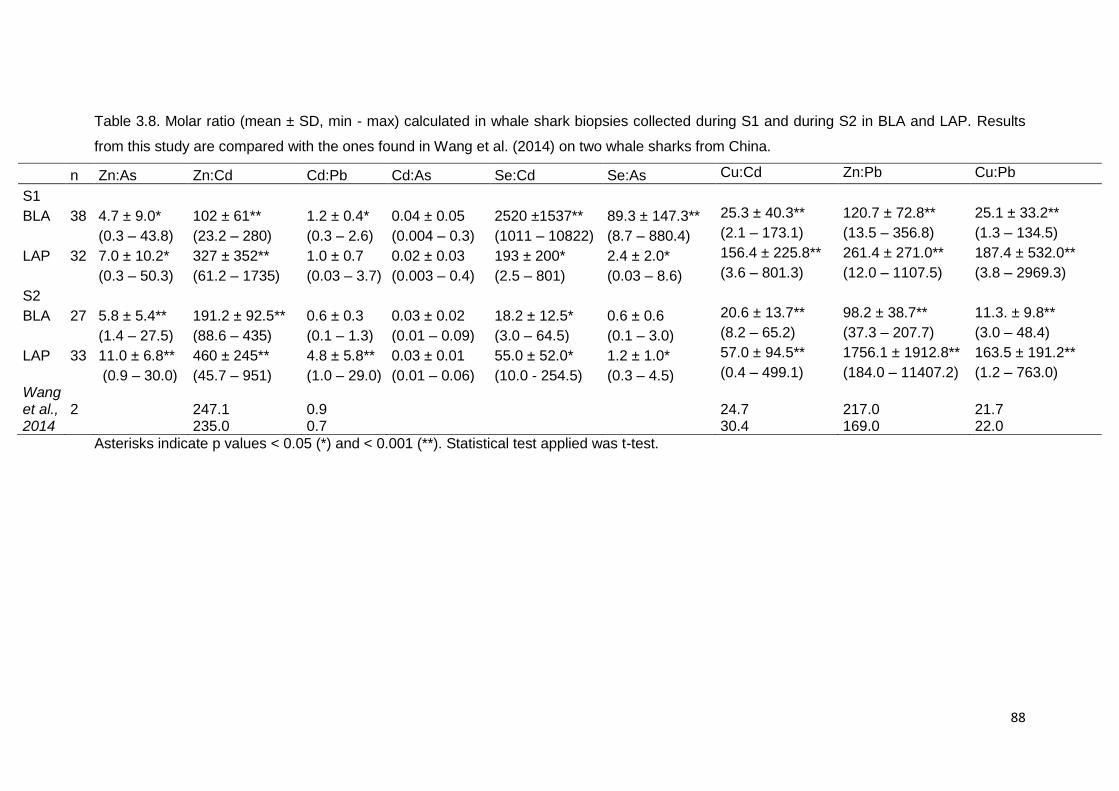
88
Table 3.8. Molar ratio (mean ± SD, min - max) calculated in whale shark biopsies collected during S1 and during S2 in BLA and LAP. Results
from this study are compared with the ones found in Wang et al. (2014) on two whale sharks from China.
n Zn:As Zn:Cd Cd:Pb Cd:As Se:Cd Se:As Cu:Cd Zn:Pb Cu:Pb
S1
BLA 38 4.7 ± 9.0* 102 ± 61** 1.2 ± 0.4* 0.04 ± 0.05 2520 ±1537** 89.3 ± 147.3** 25.3 ± 40.3** 120.7 ± 72.8** 25.1 ± 33.2**
(0.3 – 43.8) (23.2 – 280) (0.3 – 2.6) (0.004 – 0.3) (1011 – 10822) (8.7 – 880.4) (2.1 – 173.1) (13.5 – 356.8) (1.3 – 134.5)
LAP 32 7.0 ± 10.2* 327 ± 352** 1.0 ± 0.7 0.02 ± 0.03 193 ± 200* 2.4 ± 2.0* 156.4 ± 225.8** 261.4 ± 271.0** 187.4 ± 532.0**
(0.3 – 50.3) (61.2 – 1735) (0.03 – 3.7) (0.003 – 0.4) (2.5 – 801) (0.03 – 8.6) (3.6 – 801.3) (12.0 – 1107.5) (3.8 – 2969.3)
S2
BLA 27 5.8 ± 5.4** 191.2 ± 92.5** 0.6 ± 0.3 0.03 ± 0.02 18.2 ± 12.5* 0.6 ± 0.6 20.6 ± 13.7** 98.2 ± 38.7** 11.3. ± 9.8**
(1.4 – 27.5) (88.6 – 435) (0.1 – 1.3) (0.01 – 0.09) (3.0 – 64.5) (0.1 – 3.0) (8.2 – 65.2) (37.3 – 207.7) (3.0 – 48.4)
LAP 33 11.0 ± 6.8** 460 ± 245** 4.8 ± 5.8** 0.03 ± 0.01 55.0 ± 52.0* 1.2 ± 1.0* 57.0 ± 94.5** 1756.1 ± 1912.8** 163.5 ± 191.2**
(0.9 – 30.0) (45.7 – 951) (1.0 – 29.0) (0.01 – 0.06) (10.0 - 254.5) (0.3 – 4.5) (0.4 – 499.1) (184.0 – 11407.2) (1.2 – 763.0)
Wang et al., 2014
2
247.1 235.0
0.9 0.7
24.7 30.4
217.0 169.0
21.7 22.0
Asterisks indicate p values < 0.05 (*) and < 0.001 (**). Statistical test applied was t-test.

89
Zn versus As
Spearman correlation showed significative values (p < 0.05) between
concentrations of Zn and As in BLA during S2 and LAP during S2 (Fig. 3.18 b
and d); this indicate the such elements follow a same metabolic route in this
tissue.
Fig. 3.18. Variation of Zn with As in biopsies of whale shark from BLA during S1 (a),
BLA during S2 (b), LAP during S1 (c) and LAP during S2 (d).

90
Zn versus Cd
Spearman correlation showed significative values (p < 0.001 and p < 0.05)
between Zn and As concentrations in both study areas and both seasons (Fig.
3.19); this indicate the such elements follow a same metabolic route in this tissue.
Fig. 3.19. Variation of Zn with Cd in biopsies of whale shark from BLA during S1 (a),
BLA during S2 (b), LAP during S1 (c) and LAP during S2 (d).

91
Cd versus Pb
The variation of Cd with Pb was significantly correlated (p < 0.001) in BLA A
during S1 and during S2 (Fig. 3.20 a and b). In LAP, this correlation were not
significant; nevertheless, we found significant correlation (p < 0.05) in S1 by not
considering two outliers (white circles Fig. 3.20 c). The original equation of this
correlation was Pb= 0.7547 Cd + 0.05 and r2=0.02.
Fig. 3.20. Variation of Cd with Pb in biopsies of whale shark from BLA during S1 (a),
BLA during S2 (b), LAP during S1 (c) and LAP during S2 (d).

92
Cd versus As
The variation of Cd with As concentrations showed a significant correlation (p <
0.001) in both study areas but only during S2 (Fig. 3.21 b and d).
Fig. 3.21. Variation of Cd with As in biopsies of whale shark from BLA during S1 (a),
BLA during S2 (b), LAP during S1 (c) and LAP during S2 (d).

93
Se versus Cd
The variation of Se with Cd showed a correlation significative in both seasons
only in BLA (p < 0.001) (Fig. 3.22 a and b); which indicate that during such season
the two elements follow a same metabolic route.
Fig. 3.22. Variation of Se with Cd in biopsies of whale shark from BLA during S1 (a),
BLA during S2 (b), LAP during S1 (c) and LAP during S2 (d).

94
Se versus As
In general, this variation did not showed a significant correlation, except in BLA
during S2 ( p< 0.001; Fig. 3.23 b); which indicate that these two elements follwed
a different metabolic route.
Fig. 3.23. Variation of Se with As in biopsies of whale shark from BLA during S1 (a),
BLA during S2 (b), LAP during S1 (c) and LAP during S2 (d).

95
Cu versus Cd
This correlation was significant in BLA in both seasons (p< 0.05; Fig. 3.24
a,b).
Fig. 3.24. Variation of Cu with Cd in biopsies of whale shark from BLA during S1 (a),
BLA during S2 (b), LAP during S1 (c) and LAP during S2 (d).

96
Zn versus Pb
In BLA, this correlation showed Spearman p values < 0.001 in both seasons
(Fig. 3.25 a,b) with strong r2 values. On the contrary, in LAP Spearman p value
was signifcant only in S1 (p < 0.05; Fig. 3.25 c) even if the r2 was low.
Fig. 3.25. Variation of Zn with Pb in biopsies of whale shark from BLA during S1 (a),
BLA during S2 (b), LAP during S1 (c) and LAP during S2 (d).

97
Cu versus Pb
In BLA, this correlation showed Spearman p values < 0.05 in both seasons (Fig.
3.26 a,b). On the contrary, in LAP Spearman p value was signifcant only in S1 (p
< 0.05; Fig. 3.26 c).
Fig.3.26. Variation of Cu with Pb in biopsies of whale shark from BLA during S1 (a),
BLA during S2 (b), LAP during S1 (c) and LAP during S2 (d).
3.4. DISCUSSION
Concentrations of As, Zn, Cd, Cu and Pb found in the epidermis of whale sharks
from BLA and from LAP in two seasons of sampling were lower than those
reported in epidermis of whale sharks from China (Wang et al., 2014) and
Dijibouti (Boldrocchi et al., 2020). Heavily developed urbanization and mayor port
traffic, such as China and Dijibouti, could increase the concentrations of heavy
metals in the ocean leading to higher concentrations in shark tissues compared
to areas that are less populated such as the Baja California Peninsula.
These differences are shown in Table 3.9 in order to facilitate the
comparison expressed in µg/g (ww).

98
Zinc was the most abundant elements in the whale sharks sampled from
the Gulf of California. As an essential element, Zn is involved in the formation of
over 300 proteins, nucleic acids, carbohydrates and fatty acids (Hogstrand &
Wood, 1996). It is highly present in lysosomes that are responsible of its
deposition in scales in teleostean fish (Hogstrand & Wood, 1996). Zinc maintains
a fundamental role in the replication and transcription of the DNA (Vallee &
Falchuk, 1993) and in the induction of metallothioneins. In fish, Zn is mostly found
in skin, muscle and bone where it constitutes the 50-60% of the total body Zn
(Glynn, 1991). Mean concentrations of Zn in fish can vary from 10 to 40 µg/g ww
in most tissues, even if some tissues such as the retina and the liver can
accumulate higher concentrations (Hogstrand & Wood, 1996).
Heavy metals like Pb and Cd could be higher in tissues of whale shark
found in heavily urbanized areas like China, respect to area that are less
populated such as the Baja California Peninsula. In addition, information on the
size of the dead whale shark animals found in China could be useful to
understand the differences in concentration found with the whale sharks from the
Gulf of California; nevertheless, this kind of information was not available in the
paper published by Wang et al., (2014).
Table 3.9. Trace element concentrations found in whale shark biopsies from this
study and those found in two dead whale sharks from the coast of China (n = 2; Wang
et al., 2014) and Dijibouti (n = 12; Boldrocchi et al., 2020). Concentrations are expressed
in µg/g (ww).

99
3.4.1 TEs concentrations in sites
We found significant differences in the concentration of As, Zn and Cu,
more abundant in the whale sharks from LAP respect to BLA, and in the
concentration of Pb, which was more abundant in the sharks from BLA. La Paz
bay is enriched in As and Zn probably due to liberation of materials from the
phosphorite rock present in San Juan de La costa. This area has been an active
mining during over 80 years and according with Castañón & Bañuelos (2016), the
mine is responsible to provide 96% of the phosphorite used in the whole Mexico.
Phosphorite is used in pesticides and as preservative in the food industry.
Trace element concentration in the marine environment depends on
environmental factors such as wind patterns, raining and sea temperature
(Renteria-Cano, 2011); in addition to the magnitude of the sources, there are
intrinsic factors as pH, salinity, organic matter composition, redox, alkalinity, and
dissolved oxygen that influence directly on the bioavailability of trace metals. In
the Gulf of California, precipitation (Brito-Castillo et al., 2010) and storm from the
Baja Peninsula and Sonora desert, and the atmospheric precipitation are the
main sources of such elements (Ortiz-Figueroa, 2009).
3.4.2 Relation with sex and length
Sex, apparently, was not a significant influential factor in TEs
concentration; the exceptions were Pb and Cu which were found in higher
concentration in males of LAP, during S1 and S2, respectively. Generally, TEs
concentrations showed a negative correlation with the total length of males, and
a more positive correlation with females. These results could be related with
several factors: essential elements like Zn could be involved in the development
of the claspers or in the male sexual development. Zinc and Cu are essential
elements both are regulated by homeostasis processes; and their concentrations
in the body depend on many factors including starvation (Jakimska et al., 2011).
In the muscle of fish, the concentrations of Zn and Cu tend to decrease during
the growth period (Zhang & Wang, 2006; Endo et al., 2008; Storelli et al., 2011).
Another explanation could be related with feeding preferences between sex;
females could be feeding on more proteinic preys respect to males in order to
100
compensate the energy expenditure related to eggs development. Whale sharks
are aplacental viviparous and females produce over 300 eggs (Joung et al.,
1996). On the other hand, males could be developing better elimination
mechanisms according with growing and this would explain the lower
concentrations of elements in larger animals.
Finally, the different use of feeding grounds already observed between
juveniles and adult whale sharks could explain –in part or totally- our results;
juvenile sharks, in fact, feed in coastal areas that are usually richer in trace
elements (Ramírez-Macías et al., 2017). Adults sharks instead have been
observed in oceanic, meso and bathypelagic waters (Ramírez-Macías et al.,
2017). Even though we still do not know what the shark behaviour is at these
depths, feeding activity cannot be discarded.
In general, individuals sampled in both seasons showed a higher variation
in the concentration of essential elements such as Cu, Se and Zn. These
differences could be related, firstly, by differences in the bioavailability of such
elements; and second, by the metabolic use involving essential elements in the
organism. Zn for example is rapidly eliminated though gills, liver and kindney and
it is been observed that in Cyprinidae spp. this elimination take between 2 days
to one week (Hogstrand & Wood, 1996).
The fact that As concentrations in the sharks from La Paz presented the
same variation respect to essential elements could be a sign and a confirmation
that the Bay is enriched of this element and that whale sharks in La Paz are
capturing As through diet and breathing following the same metabolic route that
essential elements.
3.4.3 TEs in zooplankton
The results of this study confirm that whale sharks mainly feed on patched
of copepods and chaetognatha in the Gulf of California. Eventually, eufasiids are
also a main group of zooplankton found in the feeding grounds of these sharks.
Zn was the element with the highest concentrations found in the zooplankton
collected in both study areas, LAP and BLA.
These results are in accordance with previous studies performed in the
southeast Gulf of California (Jara-Marini et al., 2009) and in other areas such as
Greenland (Ritterhoff & Zauke, 1997) and the North Sea (Zauke et al., 2006). Zn

101
is an essential element involved in metabolic and photosynthetic processes
(Hogstrand & Wood, 1996). The decapods Palaemon elegans, for example, is
able to regulate its body concentration of zinc (to about 90 μg/g) when exposed
to a wide range of dissolved zinc bioavailabilities. Zn uptake rate in decapods is
balanced by the excretion rate so that the body concentration remains constant
(Rainbow, 2007) with little stored in detoxified form. In zooplankton samples
collected in Dijibouti, concentration of TEs (mean ±sd) were: 242 ± 155 of Zn in
µg/g ww, 231 ± 246 of Pb in µg/g ww and 1.14 ± 1.65 of Hg in µg/g ww (Boldrocchi
et al., 2020).
Concentrations of elements showed a peak of Cd in LAP in the second
season of sampling (S2); it has been observed that in the area of Baja California,
concentrations of Cd on the surface have been associated with upwelling events
and algal blooms, having observed levels up to three times more in upwelling
events in relation to situations where these events do not occur (Renteria-Cano,
2011). In non-upwelling zone, Cd concentrations are usually low, but they rise
starting from 200 m of depth. According with the distribution that Cd presents in
the Gulf of California, it is considered a nutrient type; its biogeochemical cycle is
controlled by phytoplanktonic organisms and is involved in photosynthesis
processes and as a key component of enzymes (Renteria-Cano, 2011).
Crustaceans instead cannot regulate Cd concentration in the body (Rainbow,
2007). All cadmium taken up from solution is accumulated without excretion over
at least a 28-day period (Rainbow & White, 1989). Finally, the accumulated Cd is
necessarily detoxified, typically as metallothionein (Rainbow, 2007).
Chaetognats presented the highest concentrations of trace elements; in
particular, higher concentrations of Cd were observed in this zooplankton group.
This could be related to environmental factors such us upwelling associated to
trade winds. In addition, chaetognatha is a carnivorous group which mainly feed
on copepods so Cd biomagnification might be occurring.
3.4.4 Biomagnification
Lead biomagnification through zooplankton and copepods was statistically
> 1 in whale shark biopsies from both areas. According with Rubio-Franchini et
al., (2016) Pb bioaccumulation was reported in nine zooplanktonic species from
the Tula River (Mexico) and, as a result of biomagnification also in the muscle of
102
tilapias (Oreochromis nilotica). These and our results stand in contrast to reports
that suggest that Pb biomagnification does not occur or is restricted to low trophic
levels (Tulasi et al., 1992).
Lead has been detected in practically all environments and it is considered
one of the most toxic heavy metals for aquatic organisms (Hodgson & Levi, 1997;
Klaassen & Watkins, 2001). It can substitute for calcium and probably Zn in ion
dependent phenomena in the synapses, causing damages in different
neurotransmission systems (Rubio-Franchini et al., 2008). According with
Slaveykova & Wilkinson (2002) Pb uptake is mostly influenced by the
concentration of Pb2+ in the marine environment.
3.4.5 Molar ratios
Molar ratio Zn:As, Zn:Cd, Cu:Cd, Zn:Pb and Cu:Pb were statistically > 1
(p < 0.001) in all sharks from both areas and both seasons.
Moreover, interaction between Zn and Cd was explored and it showed
strong p values in animals from both study areas and season. These results
indicate that such elements follow a same metabolic route in the whale shark,
which is reflected in the epidermis and that Zn might be involved in the elimination
of Cd. This is in accordance with studies performed in stomach (Kamunde &
MacPhail, 2011) and liver of bony fish (Eroglu et al., 2005; Siscar et al., 2014),
elasmobranch (Barrera-García et al., 2013) and mammals (Messaoudi et al.,
2009) where interaction between these elements indicate that Zn is involved in
Cd detoxification. Cadmium-zinc interaction reviewed in humans and animals
showed that Zn intake strongly increases during Cd intoxication, and that Cd
toxicity increases during Zn deficiency (Brzóska & Moniuszko-Jakoniuk, 2001).
Even if epidermis could not be the tissue where these elements are stored, our
results could give a hind of the mechanisms happening in other tissues of the
organisms.
Our results show significant correlation between Se and Cd which could
indicate that Se is involved in the elimination of Cd as it is for Hg; and also that
both elements follow the same metabolic route. A non-toxic compound Se-Cd,
resulted as a metabolite of selenium, has been observed in the liver and kidney
of marine and terrestrial mammals (Arai et al., 2004). Once again, a comparison
between epidermis and liver or kidney is not correct but so far, no studies have

103
been performed on metals molar ratio in epidermis of fish. Despite this, our results
might suggest that in the epidermis of this shark species Se and Cd present
synergic mechanisms.
Correlation between Cd and Pb was significant in the sharks from BLA
from both seasons, which could be related with the fact that these two elements
compete for absorption site in the whale sharks as have been found in other
marine organisms (Komjarova & Blust 2009). The inhibition of Cd uptake by Pb
and Zn found in Zebrafish (Komjarova & Blust 2009) is in agreement with other
studies that indicate competitive interactions between these metals for entry into
the cell via Ca2+ channels (Birceanu et al., 2008; Verbost et al., 1987).
Correlation between Cu and Cd was positive and significant in the sharks
sampled from BLA during both seasons. Antagonist interactions between these
elements has been observed in stomach and pyloric caeca of rainbow trout
(Oncorhynchus mykiss) where reduced whole-body Cd concentration were
induced by enhancement of Cu accumulation (Kamunde & MacPhail, 2011). The
results from these authors suggest that high dietary Cd intake could induced
synthesis of metallothionein with subsequent increased sequestration and
retention of Cu (Kamunde & MacPhail, 2011). According with Eroglu et al., 2005,
Cd levels decrease sharply when concentration of Cu increases in Nile fish
(Oreochromis niloticus). Pelgrom et al., 1994 showed that exposure to Cu, Cd
and mixture of these metals resulted different accumulation levels of Cu and Cd
in fish Oreochromis mossambicus which could be a result of interaction between
these two elements.
Molar ratio Cu:Pb indicates interaction between these elements. Lead
intake increases Cu uptake in Zebrafish (Danio rerio; Komjarova & Blust, 2009)
and in Neon tetra (Paracheirodon innesi; Tao et al., 1999).
According with our results, it seems that the explored correlations
indicated different behaviours depending on the study area; positive and
significant in BLA and not significant in LAP (except in few correlation); this result
might confirm that: (i) connectivity between BLA and LAP is low as previously
observed (between 16 and 21% according to Ramírez-Macías et al., 2012) and
(ii) whale sharks from BLA use different feeding grounds compared to whale
sharks from LAP. As already documented, feeding aggregation in BLA include a

104
higher number of larger animals compared to LAP where the animals are usually
very juvenile (Ramírez-Macías et al., 2012). After reaching maturity, whale sharks
larger than 9 mt often move offshore from the Gulf of California into the eastern
Pacific Ocean, possibly performing vertical migrations that reach meso and
bathypelagic depths (Ramírez-Macías et al., 2017) linked to upwelling events.
The result of a different use of feeding ground and movement between inshore
and offshore waters would be eventually reflected in the chemical interaction of
the elements observed in this work.
3.5. CONCLUSIONS
The conclusions derivated from this chapter are:
Considering all the elements analyzed (As, Cd, Cu, Pb, Zn), Zn was the
most concentrated trace element presents in the zooplankton and whale shark
biopsies from both areas BLA and LAP, during the seasons 2016-2017 and 2017-
2018, while Cd was the less concentrated. Significant differences between site
and season were found in the concentration of trace elements in the zooplankton
and the biopsies, which could be related to environmental factors that affect the
presence and the bioavailability of the elements.
Sex was not a significant influential factor in the concentration changes of
most of the analized elements.
Correlations with the total length of the whale sharks suggest that trace
elements concentration decreases in males and increases in females, even the
number of females sampled was too low to apply statistical tests. These
differences could be due to the different use of feeding habitat that exists between
juvenile and adult whale sharks and between sex, and/or it could be related to
the different metabolic use made by males and females of some elements as Zn.
Essential elements (Cu and Zn) presented a great variability in the
individuals sampled during S1 and S2 which could be related to the metabolic
uses involving these elements, and biological availability of such metals.
105
Lead was biomagnificated by whale sharks (biopsies) from both sites
through zooplankton and copepods. The remain elements As, Cd, Cu, and Zn
exhibited trophic dilution or bioreduction.
The concentrations of trace elements evaluated in the epidermis of the
whale sharks sampled in the lower and center part of the Gulf of California were
lower compared with those found in two dead sharks studied from the coast of
China and from whale sharks of Dijibouti.
Correlation and molar ratios indicate interaction between selected
elements which show differences depending on the study area.

106
CHAPTER 4
TRACE ELEMENTS IN TISSUES OF WHALE SHARKS STRANDED IN THE
GULF OF CALIFORNIA, MEXICO
Chapter partially based on the published paper: Pancaldi F., Páez-Osuna, F., Soto-
Jimenez, M.F., González-Armas, R., O’Hara, T., Marmolejo-Rodríguez, A.J., Vázquez-
Haikin, A., Galván-Magaña, F. (2019). Trace elements in tissues of whale shark stranded
in the Gulf of California, Mexico. Bulletin of Environmental Contamination and
Toxicology, 103(4), 515-520.
4.1 . ABSTRACT
Concentration of essential (Se, Zn and Cu) and non-essential (As, Cd, Hg and
Pb) trace elements were measured in selected tissues of two dead whale sharks
(Rhincodon typus) stranded in the Gulf of California (GC) in 2017 and 2018.
Concentrations of Cd and Pb in the skeletal muscle of the whale shark from La
Paz Bay, GC were higher compared to a previous study on whale shark from the
coast of China. The shark from La Paz Bay also presented higher concentration
of Pb in the epidermis, compared to the same tissue of the other whale shark
stranded in Punta Bufeo, GC. The Hg in all analysed tissues was lower than those
documented in carnivorous sharks. Molar ratio Se:Hg showed an excess of Se
over Hg in all the tissues sampled in both sharks.
4.2 . INTRODUCTION
The whale shark (Rhincodon typus) is a pelagic filter feeder with a circumglobal
distribution found in tropical and temperate waters and in mesopelagic, oceanic
and coastal areas (Stevens, 2007). In the Gulf of California (México), whale shark
aggregations are found in Bahía de Los Ángeles (Ramírez-Macías et al., 2012),
Bahía de la Paz (Ketchum et al., 2013), and Nayarit (Ramírez-Macías et al.,
2015). The species is enlisted by the IUCN Red list as endangered since 2016,
in the Appendix II of the CMS (1999) of Wild Animals, and the CITES (2002) as
endangered species.
In Mexico, R. typus is protected by two legal regulations (DOF 2006, 2010),
therefore capture and/or trading is forbidden. Natural mortality in this species is
rarely investigated but appears to be higher in very juvenile animals and pups

107
due to natural predation (Rowat & Brooks, 2012) by the blue marlin Makaira
nigricans (Colman, 1997) and the blue shark Prionace glauca (Kukuyev, 1995).
Stranding has been observed in very few areas such as the Indian Ocean
coast of South Africa (Beckley et al., 1997) and coasts of Australia (Speed et al.,
2009). In the Gulf of California, 14 whale shark strandings have been recorded
from 2000 to 2018 (Whitehead et al., 2018). Causes of the strandings were not
apparent; nevertheless, local topography, marine pollution, fisheries pressure,
and disease have been speculated. Due to the high persistency in the
environment and their bioaccumulation in the trophic chain, the study of essential
and non-essential trace elements in marine biota is a fundamental tool to assess
the health of the organisms. Chronic or intermittent exposure to metals and
metalloids can produce harmful effects in marine organisms at different levels
including physiological, cellular and behavioural (Ralston et al., 2016).
The protective action of Se over Hg has been described in several
organisms. This mechanism involves the binding of Hg to Se which give rise to a
non-toxic compound (SeHg). Due Se is involved in the correct function of the
brain through the action of selenoproteins, a sufficient quantity of free Se in the
tissue is fundamental to maintain the correct activity of the organism. The Se:Hg
molar ratio was calculated to assess the risks of Hg exposure, ratio > 1 and < 1
reflect a healthy (protective) or non-healthy, respectively, intake of Se regarding
Hg (Ralston et al., 2016). Only two studies are available on R. typus and toxic
trace element concentrations (Wang et al., 2014; McKinney et al., 2016). Also,
lack of knowledge about whale shark physiology represents an additional
limitation to understand the effect of toxic substances in this species. The primary
goal of this research was to examine the concentrations of As, Cd, Cu, Hg, Pb,
Se and Zn as well as to calculate de molar ratio Se:Hg in whale shark tissues
collected from two stranded animals along the coast of the Gulf of California.
108
4.3 . MATERIAL AND METHODS
On 24 May 2017, a whale shark stranded on the coast of Punta Bufeo (PB)
(29°54′28N; 114°26′19W) Baja California, Mexico (Fig. 4.1). The shark was fresh
and still in the water at the time of the sighting. It had no signs of recent injuries
and cause of death could not be determined. Samples of epidermis, liver, skeletal
muscle, and filtering pads were taken from the shark, sent to the Interdisciplinary
Center for Marine Sciences (CICIMAR) which were preserved frozen at − 40°C.
The stranding location is near two feeding sites for R. typus: San Luis Gonzaga
Bay, located about 20 km south, and Bahía de Los Ángeles, located about
180 km south.
On 16 February 2018, a second whale shark was found stranded inside
the bight of La Paz Bay (LAP) (24.0832°N, 110.1839°W), Baja California Sur,
Mexico (Fig. 4.1). The dead shark was immediately transported to CICIMAR, it
had no signs of recent injuries and visual assessment of the stomach content
revealed no plastic, therefore, by their appearance, the cause of death could not
be determined. Samples of epidermis, liver, skeletal muscle, filtering pads,
kidney, testicles, stomach, brain, and gill were taken from the shark and
preserved frozen at − 40°C. About 0.25 g of each sampled tissue was freeze-
dried for 72 h (−49°C and 133 × 10−3 mbar, 48 h), pulverized and homogenized,
blanks and reference material were digested in Teflon vials with caps (Savillex)
with concentrated HNO3 (70%, for trace metal analysis, J.T. Baker) and H2O2
on hotplates (120°C) for 4 h, and digested samples were gauged with a solution
of In115. Water percentages of tissues are shown in Table 4.1.
Trace elements analyses and calculation of molar ratios are described in
Chapter 1. Quality control of the analysis included blanks (one each 15 samples)
and certified reference materials (DORM-4 fish muscle, n = 6 and DOLT-5 dogfish
liver, n = 6). Recovery percentage are shown in Tables 1.3 and Table 1.4 of
Chapter 1.
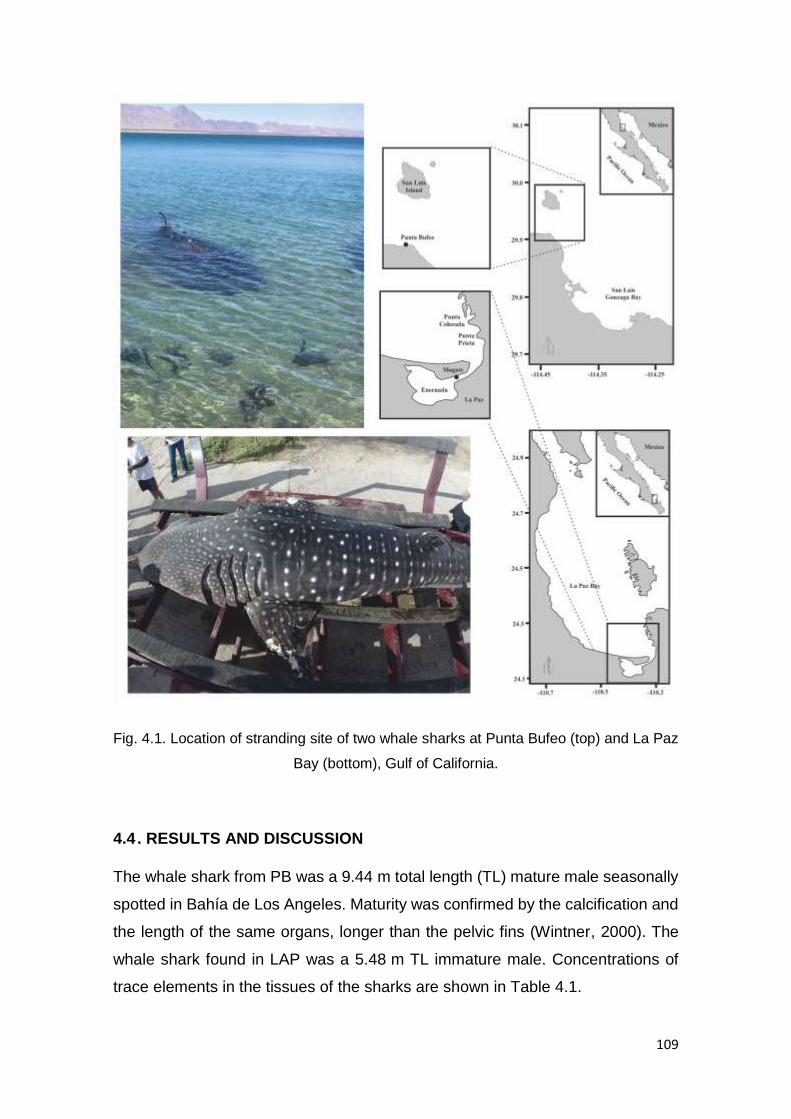
109
Fig. 4.1. Location of stranding site of two whale sharks at Punta Bufeo (top) and La Paz
Bay (bottom), Gulf of California.
4.4 . RESULTS AND DISCUSSION
The whale shark from PB was a 9.44 m total length (TL) mature male seasonally
spotted in Bahía de Los Angeles. Maturity was confirmed by the calcification and
the length of the same organs, longer than the pelvic fins (Wintner, 2000). The
whale shark found in LAP was a 5.48 m TL immature male. Concentrations of
trace elements in the tissues of the sharks are shown in Table 4.1.

110
Table 4.1. Concentrations (ng/g ww) and water % of trace elements in tissues of stranded
whale sharks sampled in Punta Bufeo (PB) and La Paz Bay (LAP), Baja California Sur,
Mexico.
TL
(m)
Site Tissue Water
%
Cu Se Zn As Cd Hg Pb
9.4 PB Dermal denticles 66 200 100 3800 530 10 31 60
Skeletal muscle 76 920 20 8500 1050 30 29 20
Liver 21 1590 400 9500 24200 5130 73 40
Filtering pads 79 1830 1580 8700 260 1480 16 20
Epidermis 79 1560 60 200 70 510 26 680
5.5 LAP Liver 45 3060 400 38100 33700 17500 56 50
Kidney 93 930 890 9400 210 680 7 10
Heart 82 2600 1890 13300 300 1870 31 10
Testicle 89 1230 400 5200 140 580 22 20
Stomach 89 160 400 1800 100 890 13 10
Gill 85 1240 450 3500 180 1240 22 50
Filtering pads 79 730 1160 10800 300 2240 15 40
Skeletal muscle 72 3030 1130 26200 710 2790 45 13700
Brain 97 350 180 3100 320 340 6 30
Epidermis 75 5790 70 10 30 310 86 6770
Table 4.2. Molar ratio of trace elements in tissues of stranded whale sharks sampled in
Punta Bufeo (PB) and La Paz Bay (LAP), Baja California Sur, Mexico.
TL
(m)
Site Tissue Se:Hg Zn:As Zn:Cd Cd:Pb Cd:As Se:Cd Se:As
9.4 PB Dermal denticles 8.3 8.2 653.4 0.3 0.01 14.24 0.18
Skeletal muscle 1.4 9.3 487.1 2.8 0.02 0.95 0.02
Liver 13.8 0.4 3.2 236.4 0.14 0.11 0.02
Filtering pads 259.3 38.3 10.1 136.4 3.79 1.52 5.77
Epidermis 5.9 3.3 0.7 1.4 4.86 0.17 0.81
5.5 LAP Liver 18.4 1.3 3.7 645.1 0.35 0.03 0.01
Kidney 336.3 51.3 23.8 125.3 2.16 1.86 4.02
Heart 157.2 50.8 12.2 344.7 4.15 1.44 5.98
Testicle 44.9 42.6 15.4 53.5 2.76 0.98 2.71
Stomach 78.6 20.6 3.5 164.0 5.93 0.64 3.80
Gill 51.9 22.3 4.9 45.7 4.59 0.52 2.37
Filtering pads 190.9 41.3 8.3 103.2 4.98 0.74 3.67
Skeletal muscle 64.0 42.3 16.1 0.4 2.62 0.58 1.51
Brain 77.8 11.1 15.7 20.9 0.71 0.75 0.53
Epidermis 2.2 0.4 0.1 0.1 6.89 0.32 2.21

111
In the specimen sampled in PB, can be observed that Zn in comparison to
other elements exhibited the higher values in the liver (9500 ng g-1), filtering pads
(8700 ng g-1) and skeletal muscle (8500 ng g-1); whereas As was relatively
elevated or moderate in dermal denticles (530 ng g-1), skeletal muscle (1050 ng
g-1) and liver (24200 ng g-1). Contrarily, Hg and Pb were the lowest levels (16–73
ng g-1) in dermal denticles, red muscle, liver and filtering pads. Selenium showed
intermediate and lower levels (16–1580 ng g-1) in the five tissues examined. The
molar ratio Se:Hg followed the order: filtering pads > liver > dermal denticles >
epidermis > skeletal muscle.
Concentrations of trace elements found in the whale shark from LAP
showed a different sequence in the order of their concentrations. Except for the
epidermis, Zn was the element with the highest concentrations (up to 3800 ng/g)
in the tissues. Copper was found in high concentration in muscle (300 ng/g), liver
(3060 ng/g) and epidermis (5790 ng/g). Contrarily, Hg showed the lowest levels
(6–86 ng/g) in most of the tissues. Lead was also found in low concentrations in
most of the tissues except in epidermis and muscle where it reaches 13700 ng/g.
Se:Hg ratio followed the order: kidney > filtering pads > heart > stomach > brain
> muscle > gill > testicle > liver > epidermis (Table 4.2). Molar ratio Zn:Cd was
653.4 in dermal denticles and 487.1 in skeletal muscle, on the other hand, Se:Cd
was 14.2 for dermal denticles and 0.95 for skeletal muscle (Table 4.2). As
observed in previous chapters, Zn could be more efficient in the detoxication of
Cd.
Table 4.3 shows the results of this work compared with other published
studies on other species of sharks; in order to facilitate the comparison, our
concentrations of elements have been converted to µg/g ww. Concentrations
from other publications were converted from dw to ww for a better comparison.
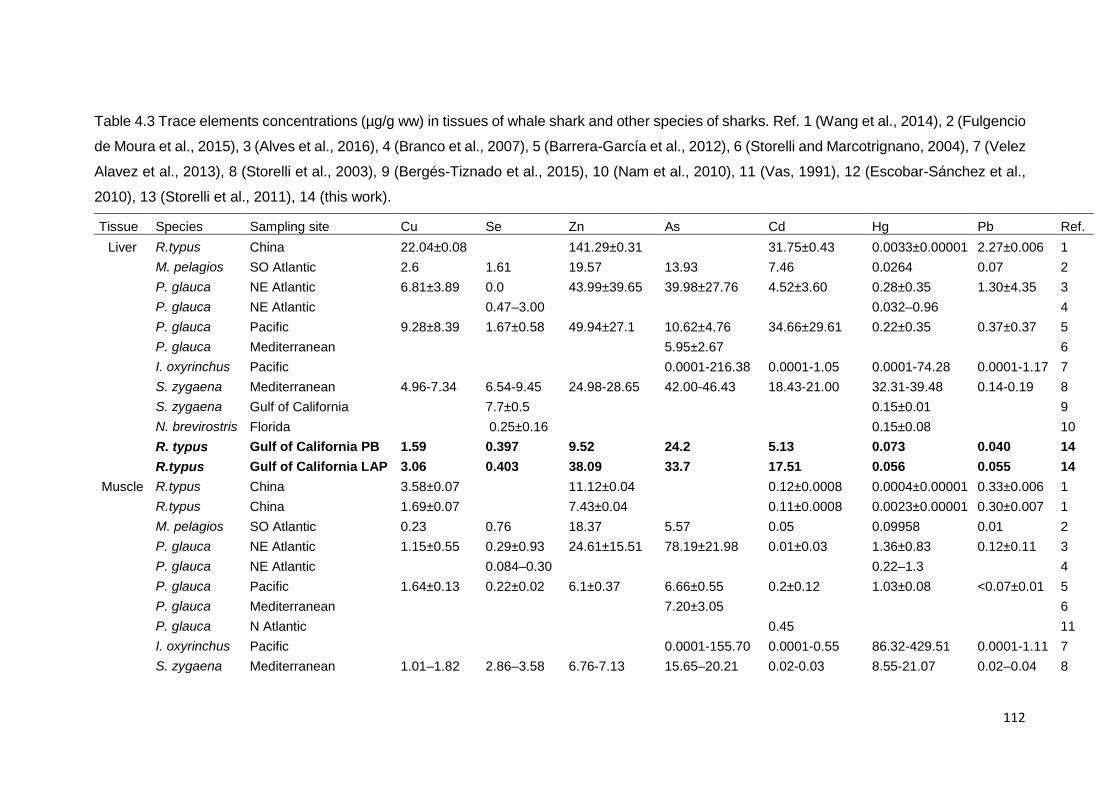
112
Table 4.3 Trace elements concentrations (µg/g ww) in tissues of whale shark and other species of sharks. Ref. 1 (Wang et al., 2014), 2 (Fulgencio
de Moura et al., 2015), 3 (Alves et al., 2016), 4 (Branco et al., 2007), 5 (Barrera-García et al., 2012), 6 (Storelli and Marcotrignano, 2004), 7 (Velez
Alavez et al., 2013), 8 (Storelli et al., 2003), 9 (Bergés-Tiznado et al., 2015), 10 (Nam et al., 2010), 11 (Vas, 1991), 12 (Escobar-Sánchez et al.,
2010), 13 (Storelli et al., 2011), 14 (this work).
Tissue Species Sampling site Cu Se Zn As Cd Hg Pb Ref.
Liver R.typus China 22.04±0.08 141.29±0.31 31.75±0.43 0.0033±0.00001 2.27±0.006 1
M. pelagios SO Atlantic 2.6 1.61 19.57 13.93 7.46 0.0264 0.07 2
P. glauca NE Atlantic 6.81±3.89 0.0 43.99±39.65 39.98±27.76 4.52±3.60 0.28±0.35 1.30±4.35 3
P. glauca NE Atlantic 0.47–3.00 0.032–0.96 4
P. glauca Pacific 9.28±8.39 1.67±0.58 49.94±27.1 10.62±4.76 34.66±29.61 0.22±0.35 0.37±0.37 5
P. glauca Mediterranean 5.95±2.67 6
I. oxyrinchus Pacific 0.0001-216.38 0.0001-1.05 0.0001-74.28 0.0001-1.17 7
S. zygaena Mediterranean 4.96-7.34 6.54-9.45 24.98-28.65 42.00-46.43 18.43-21.00 32.31-39.48 0.14-0.19 8
S. zygaena Gulf of California 7.7±0.5 0.15±0.01 9
N. brevirostris Florida 0.25±0.16 0.15±0.08 10
R. typus Gulf of California PB 1.59 0.397 9.52 24.2 5.13 0.073 0.040 14
R.typus Gulf of California LAP 3.06 0.403 38.09 33.7 17.51 0.056 0.055 14
Muscle R.typus China 3.58±0.07 11.12±0.04 0.12±0.0008 0.0004±0.00001 0.33±0.006 1
R.typus China 1.69±0.07 7.43±0.04 0.11±0.0008 0.0023±0.00001 0.30±0.007 1
M. pelagios SO Atlantic 0.23 0.76 18.37 5.57 0.05 0.09958 0.01 2
P. glauca NE Atlantic 1.15±0.55 0.29±0.93 24.61±15.51 78.19±21.98 0.01±0.03 1.36±0.83 0.12±0.11 3
P. glauca NE Atlantic 0.084–0.30 0.22–1.3 4
P. glauca Pacific 1.64±0.13 0.22±0.02 6.1±0.37 6.66±0.55 0.2±0.12 1.03±0.08 <0.07±0.01 5
P. glauca Mediterranean 7.20±3.05 6
P. glauca N Atlantic 0.45 11
I. oxyrinchus Pacific 0.0001-155.70 0.0001-0.55 86.32-429.51 0.0001-1.11 7
S. zygaena Mediterranean 1.01–1.82 2.86–3.58 6.76-7.13 15.65–20.21 0.02-0.03 8.55-21.07 0.02–0.04 8

113
S. zygaena Gulf of California 1.2 ± 0.1 0.63±0.04 9
S. zygaena Pacific 0.11-1.63 0.005-1.93 12
N. brevirostris Florida 0.044±0.026 0.311±0.152 19
M. mustelus Mediterranean 0.33-2.23 2.64-5.06 0.01-0.06 1.03-2.58 0.02-0.16 13
R. typus Gulf of California PB 0.92 0.016 8.49 1.054 0.03 0.029 0.016 14
R.typus Gulf of California LAP 3.03 1.131 26.24 0.707 2.79 0.045 13.749 14
Kidney P. glauca Pacific 8.17±2.59 1.84±0.89 61.27±12.43 5.14±16.03 6.68±7.28 0.38±0.36 1.39±0.35 5
I. oxyrinchus Pacific 0.0001-56.48 0.0001-1.63 0.0001-113.60 0.0001-1.01 7
S. zygaena Gulf of California 10.0 ± 0.8 0.23±0.01 9
N. brevirostris Florida 1.16±0.81 0.13±0.04 10
R. typus Gulf of California LAP 0.93 0.89 9.41 0.207 0.68 0.007 0.012 14
Brain S. zygaena Gulf of California 1.3±0.1 0.11±0.01 9
N. brevirostris Florida 0.151±0.085 0.043±0.023 10
M. mustelus Mediterranean 0.90-4.02 5.90-7.35 0.01-0.05 0.04-0.34 0.03-0.59 13
R. typus Gulf of California LAP 0.352 0.182 3.088 0.322 0.339 0.006 0.026 14

114
Concentrations of As found in the liver of the whale shark stranded in PB
and LAP were higher compared to the concentrations found in the liver of
Megachasma pelagios (13.9 µg/g) stranded in the south-eastern coast of Brazil
(Fulgencio de Moura et al., 2015) and from Prionace glauca collected in Mexico
(10.7 ± 4.8 µg/g; Barrera-García et al., 2012) and in England (5.95 ± 2.97 µg/g;
Vas, 1991). In the aquatic environment, As is principally absorbed through the
gills, gastrointestinal tract and skin (Páez-Osuna et al., 2017). Liver and kidney
are the principal storing organs, nevertheless, As also is accumulated in the skin,
gills and muscle where inorganic As is transformed to the organic form which is
liposoluble and hydrosoluble (Ruelas-Inzunza et al., 2018). Toxic effects of As in
fish include neuromotor damages (McGeachy & Dixon, 1992), diminish of red cell
production in the bone marrow (Oladimeji et al., 1984), teratogenic effects and
lesions to liver and kidney (Kotsanis & Iliopoulou-Georgudaki, 1999).
Concentration of Cd found in the liver of the two whale sharks stranded in
the Gulf of California were lower (PB, 5.12 µg/g; LAP, 17.5 µg/g) compared to the
whale shark from China (31.7 ± 0.4 µg/g) and to the liver of P. glauca (34.7 ±
29.6 µg/g; Barrera-García et al., 2012) and Sphyrna zygaena (18.4–21.0 µg/g;
Storelli et al., 2003). Particularly, high concentrations of Cd and Pb were found in
the skeletal muscle of the dead whale shark from LAP; Cd and Pb concentrations
were higher compared to the level found in the whale shark from PB and in the
dead whale sharks found in China (Wang et al., 2014). Even if R. typus is not
consumed in Mexico due to its conservation status, the levels of Cd and Pb in the
muscle of the stranded whale shark from LAP could be considered potentially
toxic for humans, as they exceed the maximum level permissible (0.5 µg/g ww)
from the official Mexican regulation (NOM 242-SSA1, 2009).
Despite the lack of knowledge on Cd and Pb toxicity in R. typus, numerous
studies have proved that these heavy metals produce toxic effects in fish
including the induction of reactive oxygen species, changes in antioxidant
enzyme activity and oxidative damages (Barrera-García et al., 2012), changes in
reproduction and behaviour (Weber & Dingel, 1997). It is well known that
metallothioneins (MTs) binds to essential elements such as Zn and Cu. If Cd is
present in the organism it mimics this mechanism by binding to MTs and release
Zn and Cu which induce the novo synthesis of MTs (Auclair & Gagné, 2014).

115
However, specific information on the Cd and Pb toxicity in R. typus is not
available.
The Gulf of California waters are characterized by high productivity caused
by upwelling (Páez-Osuna et al., 2017); these events bring nutrients and trace
metals (included Fe and Cd) to the surface waters where phytoplankton growth,
so the Cd of the phytoplankton can be transferred causing the enrichment in
tissues of R. typus.
The highest concentrations of Hg were found in the epidermis of the whale
shark from LAP followed by the liver of the whale shark from PB (Table 4.1); these
values exceed the levels found in both epidermis (0.00022 ± 0.00001 and 0.0012
± 0.00001 μg/g) and the liver (0.0033 ± 0.00001 μg/g) sampled in the whale shark
specimen of China (Wang et al., 2014). Hg concentrations from the muscle of our
sharks also exceeded the levels found in the muscle (0.0004 ± 0.00001 and
0.0023 ± 0.00001 µg/g) of the two dead whale sharks from China. McKinney
et al., (2016) found a mean of 0.26 ± 0.08 µg/g Hg on dry weight basis (~
0.068 µg/g of Hg ww) in the muscle of whale sharks stranded in South Africa.
Due to its feeding habits, whale shark is not expected to exhibit Hg and other
trace elements at the same concentration than carnivorous sharks such as P.
glauca from the Atlantic (1.36 ± 0.83 μg/g; Alves et al., 2016) and Pacific (1.03 ±
0.08 μg/g; Barrera-García et al., 2012), I. oxyrinchus from the Pacific Ocean
(86.32–429.51 μg/g; Vélez-Alavez et al., 2013) and S. zygaena from the
Mediterranean sea (8.55–21.07 μg/g; Storelli et al., 2003). Nevertheless, the
wide home range of R. typus and the bioavailability of trace elements could finally
affect the uptake mechanism and bioaccumulation in the animals.
Filtering pads from both dead whale sharks from the Gulf of California
presented the highest concentration of Se in comparison to other tissues
(Table 4.1); the function of these structures is to filter the water and improve
feeding activity. However, the molecular composition of these structures is
unknown. The molar ratio Se:Hg was > 1.0 in all the tissues sampled from the
sharks of this study, which indicate a protective action of Se over Hg toxicity
(Ralston et al., 2008, 2016). Similar ratios have been reported in other species of
elasmobranchs (Bergés-Tiznado et al., 2015) and teleostean fish (Burger et al.,
2013). However, other studies show Se:Hg molar ratio < 1.0 (Correa et al., 2014).
116
The difference between the muscle Se:Hg molar ratio between the two individuals
sampled in PB (1.4) and LAP (64.0) could be associated with dissimilarities in
their size and exposure history to such elements. In both whale sharks of this
study, the highest concentration of Zn was found in the liver; nevertheless, the
whale shark from LAP presented higher concentration of this element (38.1 μg/g
ww) compared to the shark from PB (9.52 μg/g). These levels of Zn were lower
compared to those found in the liver of the dead whale shark from China (141.3
± 0.3 μg/g) (Wang et al., 2014). The whale shark from LAP also presented higher
Zn concentration in the muscle (26.2 μg/g) and filtering pads (10.8 µg/g)
compared to the whale shark from PB (8.48 and 8.73 μg/g, respectively).
Concentrations of Zn in the muscle of the two sharks of this study do not
differ from the study of China for the whale shark (Wang et al., 2014) and other
species of carnivorous sharks such as P. glauca (24.61 ± 15.51 μg/g; Alves et al.,
2016) and M. pelagios (18.37 μg/g; Fulgencio de Moura et al., 2015). Zinc, like
other trace elements, is absorbed through the water and the diet, and its function
in fish is related with a healthy growth and development due to the role in several
enzymatic components (Hogstrand & Wood, 1996).
Copper in the whale shark from LAP was higher in epidermis, liver, and
muscle compared to the whale shark from PB (Table 4.1). Cu concentrations in
muscle were in the same range of concentrations to the whale sharks from China
(Wang et al., 2014). Contents of Cu in the liver of the Chinese whale shark was
higher (22.4 μg/g) compared to our results (Table 4.1). Metal affinity with a
specific tissue and the role of each organ in the metabolism system could explain
the differences of trace element concentration in different tissues (Barrera-García
et al., 2013). Besides the lack of knowledge on the movements of the two dead
whale sharks from the Gulf of California is a limitation to determinate the possible
exposure sites to trace elements.

117
4.5 . CONCLUSIONS
In conclusion for this chapter, essential and non-essential elements were
detected (Table 4.1) in the two dead whale sharks stranded in the Gulf of
California. Arsenic concentrations in the liver were found to be higher or in the
same range of concentration of other species of carnivorous sharks, typically top
predators of the trophic chain. Particular attention is due to the levels of Cd found
in the liver and filtering pads of the two specimens stranded in the Gulf of
California, which could indicate: (i) high biological availability of Cd in the areas
inhabited by the whale shark, and/or (ii) R. typus ability to accumulate Cd in
specific tissues rather than others. Further research is needed to assess the
movements of this species in the Gulf of California and continuous monitoring on
metals and metalloids levels in the feeding areas of R. typus. Additionally, it is
necessary to develop a protocol including proper investigation (necropsy and
biochemical analyses) to examine the cause of such stranding.

118
CHAPTER 5
TRACE ELEMENTS IN THE WHALE SHARK LIVER: INNER
ORGANOTROPISM?
5.1 . ABSTRACT
Essential (Cu, Se and Zn Cu) and non-essential (As, Cd, Hg and Pb) element
concentrations were determined in three areas (proximal, median and distal) of
the right (RL) and left (LL) lobe of liver obtained from a stranded whale shark in
the Gulf of California, Mexico. Results showed high levels of Zn (mean ± SE in
µg/g ww; RL: 22.5 ± 2.1; LL: 26.5 ± 7.1), As (RL: 33.0 ± 1.6; LL: 20.0 ± 9.9) and
Cd (RL: 15.5 ± 0.9; LL: 11.3 ± 3.7); and low levels of Cu (RL: 3.2 ± 0.3; LL: 2.2 ±
0.9), Se (RL: 0.5 ± 0.1; LL: 1.2 ± 0.6), Hg (RL: 0.06 ± 0.02; LL: 0.05 ± 0.004) and
Pb (RL: 0.05 ± 0.02; LL: 0.05 ± 0.01). Trace element concentrations showed
significant (p<0.05) differences within the same lobe but not between lobes,
which suggests an inner organotropism of Zn and Se in the liver. The proximal
area of the left lobe showed the highest concentration of Se that corresponded to
the lowest of Cd and As, which may be related to detoxification action of Se.
Molar Se:Hg ratios indicate sufficient concentration of Se to detoxicate Hg in all
areas of the two lobes.
5.2 . INTRODUCTION
The liver is a highly metabolic organ where up taking, storing, as well as excretion
of nutrients and other molecules occur (Hinton et al., 2001). Several studies
describe this organ as a target for toxic substances (Pethybridge et al., 2010), as
bioaccumulation of contaminants often occurs due to the large blood supply,
along with its interaction with anthropogenic compounds, such as heavy metals
and methylmercury (Bosch et al., 2016) and organochlorines (Bezerra et al.,
2019). One of the main functions of the liver is the detoxification through the
transformation of poorly excretable chemicals in more excretable ones, as well
as the synthetize of metallothionines proteins which bind to different metals such
as Cd, As and Zn (Hinton et al., 2001). Therefore, the liver plays a key role in an
organism´s health. Top predators with large lipid-rich livers, such as sharks, are
119
particularly susceptible to the uptake and bioaccumulation of contaminants
(Barrera-García et al., 2013) which can increase throughout their lifetime.
Bioaccumulation occurs differentially between organs and tissues in a process
known as organotropism (Correa et al., 2014), where specific organs are the main
storage and detoxification sites of trace elements (Régine et al., 2006; Mieiro et
al., 2011). The interaction between different elements is an additional tool for
body detoxification; selenium, for example, is an essential element that maintains
cellular oxidative homeostasis and mitigate the toxicity of heavy metals such as
Hg (Endo et al., 2005) and Cd (Jamwal et al., 2018) through the action of
selenoproteins (Belzile et al., 2006; Palmisano et al., 1995).
By being the largest fish of the planet, the whale shark Rhincodon typus
(Smith, 1828) is a circumglobal species (Norman et al., 2019) that is found in
several areas of the Gulf of California, such as San Luis Gonzaga (Eckert &
Stewart, 2001), Bahía de los Ángeles (Ramírez-Macías et al., 2012) and La Paz
Bay (Ketchum et al., 2013; Whitehead et al., 2019). It is a long-lived animal with
a life span of more than 100 years; additionally, it is an opportunistic filter feeding
shark (Colman, 1997).
Feeding aggregations in the Gulf of California show that whale shark prey
mostly on zooplankton patches that are rich in copepods (Nelson & Eckert, 2007),
euphasiids (Ketchum et al., 2013) and chaetognats (Pancaldi et al., 2019b).
Studies on trace elements bioaccumulation in this species are scarce and show
that whale sharks accumulate trace elements such as As, Hg, Cd, Cu, Pb, Se
and Zn in the liver (Pancaldi et al., 2019a; Wang et al., 2014). This study
complements a previous report on the element’s concentrations in the tissues of
this animal (Pancaldi et al., 2019a). The main objectives of this study were to
examine the concentrations of essential (Cu, Se, Zn) and non-essential elements
(As, Cd, Hg and Pb) as well as to determinate the potential antagonism between
Se, Zn, Hg, Cd and As throughout the molar ratio in three areas (proximal, median
and distal) of the right and left lobes of the liver of a stranded whale shark from
La Paz, Mexico.
120
5.3 . MATERIAL AND METHODS
On 16 February 2018 a whale shark was found stranded inside the lagoon of La
Paz Bay (24.0832°N, 110.1839°W; Fig.5.1), Baja California Sur, Mexico
(Whitehead et al., 2019). The dead shark was immediately transported to
CICIMAR where liver was extracted. Samples from the proximal, median and
distal part of both lobes were taken and preserved frozen at − 20°C. About 0.25 g
of each sampled tissue was freeze-dried for 72 h (− 49°C and 133 × 10−3 mbar,
48 h), pulverized and homogenized. Blanks and reference material were digested
in Teflon vials with caps (Savillex) using concentrated HNO3 (70%, for trace metal
analysis, J.T. Baker) and H2O2 on hotplates (120°C) for 4 h, and digested
samples were gauged with a solution of In115. Water percentages of tissues are
shown in Table 5.1.
Quality control of the analysis included blanks and certified reference
materials (DOLT-5 dogfish liver, n = 6). Blanks were performed with no anomalies
detected. Recoveries percentages are shown in Table 1.2, Chapter 1. Trace
elements concentrations are expressed in µg/g per wet weight (ww).
5.4 . RESULTS
The stranded whale shark was a 548 cm total length (TL) immature male
(Whitehead et al., 2019). Sex was confirmed by the presence of claspers and
sexual maturity by the length of the same organs that were shorter than the pelvic
fins (Wintner, 2000). Right lobe of the liver (Fig. 5.1) was 152 cm TL and 38 cm
in its wider area. Gallbladder (Fig. 5.1) was attached to the right lobe (near
proximal area).
Left lobe of the liver was 151 cm TL and 39 cm in its wider area. In the
right lobe, water percentage was 32.8% (proximal area), 15.2% (median area)
and 42.3% (distal area; Table 5.1). In the left lobe water percentage was 21.4%
in the proximal area, 19.3% in the median area and 44.8% in the distal area
(Table 5.1).

121
Fig. 5.1. Rhincodon typus liver right lobe with the proximal, median and distal area and
the gallbladder.
In general, As, Zn and Cd showed the highest concentrations within both
lobes, while Cu, Hg and Pb were the less concentred elements (Table 5.1). In the
right lobe the mean±SE in µg/g (ww) of As, Zn and Cd was 33.0±1.6, 22.5±2.1
and 15.5±0.9, respectively. Mean±SE was 3.2±0.3 for Cu, 0.5±0.1 for Se,
0.06±0.02 for Hg and 0.05±0.02 for Pb (Table 5.1). In the left lobe the mean
concentration of As and Cd was lower compared to the right lobe (20.0±9.9 and
11.3±3.7 respectively) while Zn was higher 26.5±7.1 (Table 5.1). Mean±SE was
2.2±0.8 for Cu, 1.2±0.6 for Se, 0.05±0.004 for Hg and 0.05±0.01 for Pb (Table
5.1). Despite these differences, concentrations of all trace elements were not
statistically different between lobes (p>0.05).

122
Table 5.1. Trace elements concentrations, mean and standard error (SE) and molar ratio Se:Hg, Se:Cd, Se:As, Zn:Cd, Zn:As in the right and left
lobe of the whale shark liver. Concentrations are expressed in µg/g (ww).
Lobe Sample Water
%
Cu Se Zn As Cd Hg Pb Se:Hg Se:Cd Se:As Zn:Cd Zn:As
Right Proximal 32.8 3.1 0.6 26.3 30.0 16.5 0.05 0.08 30.0 0.05 0.02 2.7 1.0
Median 15.2 3.8 0.5 19.1 33.5 13.7 0.10 0.04 13.8 0.06 0.02 2.4 0.7
Distal 42.3 2.7 0.4 22.1 35.3 16.4 0.04 0.02 20.8 0.03 0.01 2.3 0.7
mean 3.2 0.5 22.5 33.0 15.5 0.06 0.05 21.4* 0.05** 0.01** 2.5* 0.8
SE 0.3 0.1 2.1 1.6 0.9 0.02 0.02 4.6 0.01 0.003 0.1 0.1
Left Proximal 21.4 0.7 2.3 13.5 0.9 4.6 0.05 0.03 108.4 0.70 2.50 5.0 17.6
Median 19.3 2.8 0.8 27.7 25.8 11.8 0.04 0.05 44.6 0.09 0.03 4.0 1.2
Distal 44.8 3.1 0.4 38.1 33.7 17.5 0.06 0.06 17.6 0.03 0.01 3.7 1.3
mean 2.2 1.2 26.5 20.0 11.3 0.05 0.05 57.0 0.30 0.84 4.3* 6.7
SE 0.8 0.6 7.1 9.9 3.7 0.004 0.01 26.9 0.20 0.82 0.4 5.4
Asterisks indicate molar ratio that are significantly different (*p < 0.05; ** p < 0.001) than 1. Statistical were performed by a t-test.
123
5.4.1 TEs concentrations in the right lobe (RL)
In the RL, As showed the highest concentrations (35.3 µg/g in the distal, 33.5
µg/g in the median and 30.0 µg/g in the proximal area) followed by Zn (26.3 µg/g
in the proximal, 22.1 µg/g in the distal and 19.1 µg/g in the median area). Cd
concentrations were 16.5 µg/g in the proximal area, 16.4 µg/g in the distal area
and 13.7 µg/g in the median area. Cu, Se, Hg and Pb were found in lower
concentrations ranging from 3.8 µg/g of Cu in the median area to 0.02 µg/g of Pb
in the distal area (Table 5.1). In this lobe, significant statistical differences were
found between As with Cu, Se, Hg (p<0.05) and Pb (p<0.001), Zn with Se, Hg
(p<0.05) and Pb (p<0.001), Cd with Pb and Hg (p<0.05).
5.4.2 TEs concentrations in the left lobe (LL)
In the LL, Zn showed the highest concentrations (38.1 µg/g in the distal and 27.7
µg/g in the median), which were also higher compared to the observed levels of
the same element in the right lobe. Arsenic concentrations were 33.7 µg/g in the
distal and 25.8 µg/g in the median area. Cd concentrations were 17.5 µg/g in the
distal and 11.8 µg/g in the median area. Unexpectedly, these three elements (Zn,
As, and Cd) were found in lower concentrations in the proximal area of the left
lobe (13.5 µg/g for Zn, 0.9 µg/g for As and 4.6 µg/g for Cd) compared to the
proximal area of the right one.
The Hg was found in the same concentrations in the proximal area of the
right (0.05 µg/g) and left lobe (0.05 µg/g). In this lobe, significant statistical
differences were found between As with Pb and Hg (p<0.05), Zn with Se, Hg and
Pb (p <0.05), Cd with Pb and Hg (p<0.05).
No statistical differences (Mann-Whitney test p > 0.05) of the same
elements were found between lobes.
5.4.3 Molar ratios
In the right lobe, Se:Hg molar ratio was 30.0:1.0 in the proximal area, 20.8:1.0 in
the distal area, and 13.8:1.0 in the median area (Table 5.1). In the left lobe, Se
showed the highest level in the proximal area (2.3 µg/g) and molar ratio Se:Hg
was 108.4:1.0 (Table 5.1). In the median and distal area, Se:Hg molar ratio was
17.6:1.0 and 44.6:1.0, respectively.

124
Mean Se:Cd molar ratio was 0.05 in the right lobe and 0.30 in the left lobe
instead, molar ratio Zn:Cd was > 1 in all areas of both lobes (RL: 2.7, 2.4 and 2.3;
LL: 5.0, 4.0 and 3.7 in the proximal, median and distal area respectively).
In the right lobe, molar ratio Se:As was 0.02 in the proximal and median
and 0.01 in the distal area (Table 5.1). In the left lobe, molar ratio Se:As was 2.50
in the proximal, 0.03 in the median and 0.01 in the distal area. Statistical test
applied to the mean of the molar ratio Se:Cd and Se:As were significantly < 1 (p
< 0.001), while Zn:Cd in both lobes showed a p value < 0.01 (Table 5.1).
5.4.4 Antagonist effects between TEs
Correlation between elements pairs is showed in Fig. 5.2 Spearman correlation
applied to trace elements shows strong relations (r2>0.8) (Fig.5.2 b,d,e). The
antagonism between Se and As in whale shark liver (right and left lobe) is shown
in Figure 5.2(e) where Spearman correlation shows a negative and significative
(r2=0.99; p=0.002; n=6) relation between these elements. A strong (r2=0.90)
negative and not significative (p=0.13; n=6) Spearman correlation is also found
between Se and Cd (Fig. 5.2 d) however, p value could be due to the low sample
size. The highest concentration of Se (2.3 µg/g; Table 5.1) found in the whale
shark liver, corresponds to the lowest concentrations of Cd (4.6 µg/g) and As (0.9
µg/g) which could indicate antagonism.

125
Fig. 5.2. Variation of concentrations Zn vs Cd (a), As vs Cd (b), As vs Zn (c), Cd vs Se
(d), As vs Se (e) and Zn vs Se (f) in the right (●) and left (▲) lobe of whale shark liver.
5.5 . DISCUSSION
Our results indicate enriched levels of As and Cd in whale shark liver; according
to Pérez-Tribouillier et al., (2015), the surface sediments around the Mogote area,
where feeding aggregations have been observed, are naturally enriched in As
and Cd as these elements are bound within phosphorites rocks (Piper, 1991).
Results from Romero-Bañuelos (2003) showed that Cd concentrations in the
surface water of La Paz Lagoon are higher compared with the mean
concentrations of the earth crust reported by Taylor (1964; 0.2 µg/g-1) because of
the strong presence of phosphorite rock. Phosphorite mining activity in San Juan
de la Costa during the past 80 years (Castañón & Bañuelos, 2016; 2019) could

126
have affected the levels of As and Cd in whale shark feeding grounds leading to
bioaccumulation in the liver.
Marcovecchio (1991) explains the high concentrations of Cd and Zn in the
liver of three species of sharks through the action of metallothionein which are
concentrated in hepatic tissues and retain these elements.
Significant differences found between the concentrations of TEs in the
different parts of liver suggest organotropism of As, Zn and Cd in whale shark
liver. The proximal area of the right lobe of whale shark liver is located near the
gallbladder which contains the bile, excrete substance of the organisms. The
proximity between the proximal area and the gallbladder in the right lobe could
be a factor that increases the concentrations of As and Cd.
The levels of Hg in both lobes were higher (0.10 µg/g in the median, 0.05
µg/g in the proximal, and 0.04 µg/g in the distal area of the right lobe and 0.06
µg/g in the distal, 0.05 µg/g in the proximal and 0.04 µg/g in the median area of
the left lobe) compared to the level found in the liver of a dead whale shark found
in China (0.0033±0.00001 µg/g; Wang et al., 2014); nevertheless, Hg levels in
the whale shark from La Paz were lower compared to the levels found in the liver
of the blue shark Prionace glauca from the Mexican Pacific (0.22±0.35 µg/g;
Barrera-García et al., 2013). The uptake of Hg principally occurs thought the diet
therefore Hg concentrations are expected to be higher in top predator sharks
rather than filter feeder’s species (Storelli et al., 2003).
The antagonist effect of Se with some heavy metals such as Hg and Cd is
been observed in several organisms including elasmobranch (Escobar-Sánchez
et al., 2010; Siscar et al., 2014). Even though mechanism of these interactions is
not well understood, molar ratio between the elements is proposed to be 1:1 or
close in order for Se to be efficient against heavy metal toxicity (Ralston et al.,
2016; Raymond & Ralston, 2004).
In the left lobe, Se showed the highest level in the proximal area (2.3 µg/g;
Table 5.1); consequently, molar ratio Se:Hg in this area presented the highest
value (108.4:1; Table 5.1) which indicate a more evident detoxification process in
this area. The other areas of the left and right lobe indicated molar ratio Se:Hg
>1 which indicate sufficient concentrations of Se to detoxify the action of Hg.

127
Molar ratio Se:Cd was < 1 (Table 5.1) in all sampled area of the liver which
could indicate that Se concentrations are not high enough to protect the organ
from the damage of Cd. Cadmium is a non-essential metal and it is known to
affect the uptake of calcium through fish gills (Niyogi & Wood, 2004). In addition,
the exposure to this element may leads to accumulation of reactive oxygen
species and oxidative damage (Bertin & Averbeck, 2006; Waisberg et al., 2003).
Our results show that molar ratio Zn:Cd was >1 (Table 5.1), which could
indicate that in whale shark live Zn might exert a more efficient detoxification
action against Cd respect to Se. This same result has been found in the liver of
some deep fish species (Siscar et al., 2014) and mammals (Jihen et al., 2009)
where Zn is more efficient than Se in protecting the liver from Cd damages.
Molar ratio Se:As was < 1 in all sampled areas of the liver except in the
proximal area of the left lobe while molar ratio Zn:As was close or greater than 1
(Table 5.1). According with these results, Zn could also act more efficiently
against As respect to Se. An antagonistic effect of Zn over As and a synergetic
effect of As over Zn has been observed in the cladoceran Daphnia obtusa (Gaete
& Chavez, 2008); nevertheless, information on this interaction in elasmobranch
is absent.
5.6 . CONCLUSIONS
In conclusion, trace elements were not uniformly distributed in whale shark liver:
Cd, As and Zn were found in high concentrations in both right and left lobe
probably due to natural enrichment of the area, while Hg and Pb were found in
lower concentrations. The proximal area of the left lobe presented the lowest
concentrations of Zn, As and Cd and the highest concentrations of Se which could
be due to the distance from the gallbladder (which is connected to the right lobe)
or to a detoxification action from Se throughout the action of selenoproteins.
Molar ratio Se:Hg indicates sufficient levels of Se to detoxify Hg in all sampled
areas of the lobes. On the other hand, molar ratio Se:Cd was <1 and molar ratio
Zn:Cd was >1 which could indicate that Zn acts more efficiently in Cd
detoxification in this species.

128
CHAPTER 6
GENERAL REMARKS
The results of trace element concentrations analysed from whale shark biopsies
and in two stranded individuals are shown in Chapter 2,3,4 and 5. To estimate
quantitatively the biomagnification, the TEs concentrations were determined in
zooplankton.
The main remarks are:
a) Whale sharks, Rhincodon typus, from the Gulf of California accumulate
TEs, where Zn is the most concentrated element that could be related with
the metabolic role of this metal in the organism.
b) Some elements such as As, Cu, and Zn are significantly higher in the
whale sharks from LAP and this might be due to the occurrence of naturally
phosphorite enriched rocks located in San Juan de la Costa.
c) Differences found in TEs concentrations between sharks sampled in BLA
and LAP confirm low connectivity between these two feeding grounds;
sharks from one area do not necessarily move to the other one, and as
results were observed different concentrations of elements in sharks.
d) Sex is not a significant influential factor to determine changes in TEs
concentrations.
e) Concentration of TEs related with body size of the sharks was different
between sexes; males show negative correlation between TEs
concentrations and size, while females show positive correlation. These
differences might confirm a different use of feeding grounds and different
prey preferences between males and females. Also, males could develop
better elimination mechanisms according with growing.
f) Copepods and chaetognatha identified as the main preys of zooplankton
in both study areas. According with our results Hg and Se varied greatly in
the zooplankton. Zinc was at the highest concentration compared to other
TEs, and this was reflected in the sharks. Cd concentration in the
zooplankton vary significantly different between season according with
upwelling events and environmental conditions.

129
g) Hg and Pb were biomagnified through zooplankton, on the contrary, Se
and other elements (As, Cd, Cu, Pb, Zn) were not biomagnified by the
sharks. Hg biomagnification showed differences between sharks below 4
m (juveniles) and shark above 4 m (adults). This could indicate a shift in
the shark diet or metabolic changes once the animal reaches this size.
h) Molar ratio Se:Hg, Zn:As, Zn:Cd, Cd:Pb, Cd:As, Se:Cd and Se:As were
calculated in the epidermis from alive sharks and different tissues of two
stranded sharks. Se:Hg in the epidermis and other tissues of whale shark
indicate sufficient quantity of Se in order to detoxify Hg. In addition, molar
ratio Zn:Cd in the epidermis and the liver showed a strong correlation
which indicate that both metals follow a same metabolic route and that Zn
might be more efficient in the elimination of Cd respect to Se in these
tissues. Other tissues such as dermal denticles, heart, kidney, gills,
filtering parched and skeletal muscle also exhibited molar ratio Zn:Cd
greater than 1.0 which could also indicate a more efficient role of Zn over
Cd respect to Se. A synergic mechanism between Cd and Pb could be
involved in epidermis, filtering pads, kidney, heart, testicle, stomach, gills
and brain.
i) Continuous monitoring is necessary to determinate the levels of metals
and metalloids in the animals of the GC. Further studies are necessary to
establish the physiology of R. typus, to determine the uptake mechanism,
distribution, and elimination of TEs and establish if a true toxic risk exists
for this species. Additionally, it is necessary to develop a protocol including
proper investigation (necropsy and biochemical analyses) to examine the
cause of stranding.
130
REFERENCES
Achary, M.S., Satpathy, K.K., Panigrahi, S., Mohanty, A.K., Padhi, R.K.,
Sudeepta Biswas, Prabhu, R.K., Vijayalakshmi, S., and Panigrahy, R.C.
2017. Concentration of heavy metals in the food chain components of the
nearshore coastal waters of Kalpakkam, southeast coast of India. Food
Control, 72: 232-243. Doi: https://doi.org/10.1016/j.foodcont.2016.04.028.
Ahmed, M.M., Doumenq, P., Awaleh, M.O., Syakti, A.D., Asia, L., and Chiron, S.,
2017. Levels and sources of heavy metals and PAHs in sediment of
Djibouti-city (Republic of Djibouti). Mar. Poll. Bull., 120(1-2), 340-346.
https://doi.org/10.1016/j.marpolbul.2017.05.055.
Alves, L.M.F., Nunes, M., Marchand, P., Le Bizec, B., Mendes, S., Correia,
J.P.S., Lemos, L.F.M., and Novais, S.C. 2016. Blue sharks (Prionace
glauca) as bioindicators of pollution and health in the Atlantic Ocean:
Contamination levels and biochemical stress responses. Science of the
Total Environment, 563–564:282–292. Doi:
https://doi.org/10.1016/j.scitotenv.2016.04.085.
Arai, T., Ikemoto, T., Hokura, A., Terada, Y., Kunito, T., Tanabe, S., and Akai, I.
2004. Chemical forms of mercury and cadmium accumulated in marine
mammals and seabirds as determined by XAFS analysis. Environmental
Science Technology, 38:6468–6474. Doi: doi/abs/10.1021/es040367u.
Araujo, G., Lucey, A., Labaja, J., Lee So, C., Snow, S., and Ponzo, A. 2014.
Population structure and residency patterns of whale sharks, Rhincodon
typus, at a provisioning site in Cebu, Philippines. PeerJPubMed 25279256.
Atchison, G.J., Henry, M.G. and Sandheinrich, M.B. 1987. Effects of metals on
fish behavior: a review. Environmental Biology of Fishes, 18: 11-25. Doi:
https://doi.org/10.1007/BF00002324.
Auclair, J., and Gagné, F. 2014. Metal metabolism and detoxification. In: Gagné
F. (ed) Biochemical ecotoxicology, principles and methods. Elsevier,
Amsterdam, pp 75–101.
131
Baross, J.A., and Hoffman, S.E. 1985. Submarine hydrothermal vents and
associated gradient environments as sites for the origin and evolution of
life. Origins of Life and Evolution of Biospheres, 15(4): 327–345. Doi:
https://doi.org/10.1007/BF01808177.
Barrera-García, A., O’Hara, T., Galván-Magaña, F., Méndez-Rodriguez, L.C.,
Castellini, M. and Zenteno-Savín, T. 2012. Oxidative stress indicators and
trace elements in blue shark (Prionace glauca) off the east coast of the
Mexican Pacific Ocean. Comparative Bioquemestry and Phisiology, Part
C, 156: 59-66. Doi: https://doi.org/10.1016/j.cbpc.2012.04.003.
Beckley, L.E., Cliff, G., Smale, M.J., and Compagno, L.J.V. 1997. Recent
strandings and sightings of whale sharks in South Africa. Environmental
Biology of Fishes, 50(3):343–348. Doi:
https://doi.org/10.1023/A:1007355709632.
Beers, J.R. 1976. Determination of zooplankton biomass. In: Zooplankton
Fixation and Preservation. H.F. Steedman (ed.). Unesco Press, Paris, 37-
84 pp.
Belzie, N., Chen, Y.W., Tong, J., Gunn, J. M., Alarie, Y., Delonchamp, T., and
Lang, C.Y. 2005 The effect of selenium on mercury assimilation by
freshwater organisms. Canadian Journal of Fisheries and Aquatic
Sciences, 63: 1-10. Doi: https://doi.org/10.1139/f05-202.
Belzile, N., Wu, G.J., Chen, Y.W., and Appanna, V.D. 2006. Detoxification of
selenite and mercury by reduction and mutual protection in the assimilation
of both elements by Pseudomonas fluorescens. Science of the Total
Environment, 367: 704‒714. Doi:
https://doi.org/10.1016/j.scitotenv.2006.03.008.
Bergés-Tiznado, M. E., Márquez-Farías, J.F., Torres-Rojas, Y., Galván-Magaña,
F., and Páez-Osuna, F., 2015. Mercury and selenium in tissues and
stomach contents of the migratory sailfish, Istiophorus platypterus, from
the Eastern Pacific: concentration, biomagnification, and dietary intake.
Marine Pollution Bulletin, 101 (1): 349-358. Doi:
https://doi.org/10.1016/j.marpolbul.2015.10.021.

132
Bergés-Tiznado, M.E., Márquez-Farías, J.F., Osuna-Martínez, C.C., Torres-
Rojas, Y.E., Galván-Magaña, F., and Páez-Osuna, F. 2019. Patterns of
mercury and selenium in tissues and stomach contents of the dolphinfish
Coryphaena hippurus from the SE Gulf of California, Mexico:
Concentrations, biomagnification and dietary intake. Marine Pollution
Bulletin, 138: 84-92. Doi: http://doi.org/10.1016/j.marpolbul.2018.11.023.
Berntssen M.H.G., Hylland, K., Julshamn, K., Lundebye, A.K., and Waagbø, R.
2004. Maximum limits of organic and inorganic mercury in fish feed.
Aquaculture Nutrition, 10: 83-97. doi: https://doi.org/10.1046/j.1365-
2095.2003.00282.x.
Bertin, G., and Averbeck, D. 2006. Cadmium: cellular effects, modifications
of biomolecules, modulation of DNA repair and genotoxic consequences
(a review). Biochimie, 88: 1549–1559. Doi:
https://doi.org/10.1016/j.biochi.2006.10.001.
Bezerra, M.F., Lacerda, L.D., and Lai, C.T. 2019. Trace metals and persistent
organic pollutants contamination in batoids (Chondrichthyes: Batoidea): A
systematic review. Environmental Pollution, 248, 684-695. Doi:
https://doi.org/10.1016/j.envpol.2019.02.070.
Birceanu, O., Chowdhury, M.J., Gillis, P.L., McGeer, J.C., Wood, C.M., and
Wilkie, M.P. 2008. Modes of metal toxicity and impaired branchial
ionoregulation in rainbow trout exposed to mixtures of Pb and Cd in soft
water. Aquatic Toxcology. 89, 222–231.
https://doi.org/10.1016/j.aquatox.2008.07.007.
Borras, C., Gambini, J., and Vina, J. 2007. Mitochondrial oxidant generation is
involved in determining why females live longer than males. Frontiers in
Bioscience 12: 1008-1013.
Borrell, A., Aguilar, A., Gazo, M., Kumarran, R.P., and Cardona, L. 2011. Stable
isotope profiles in whale shark (Rhincodon typus) suggest segregation
and dissimilarities in the diet depending on sex and size. Environmental
Biology of Fishes, 92 (4): 559–567. Doi: https://doi.org/10.1007/s10641-
011-9879-y.
133
Bosch, A.C., O’Neill, B., Sigge, G.O., Kerwath, S.E., and Hoffman, L.C. 2016.
Heavy metal accumulation and toxicity in smoothhound (Mustelus
mustelus) shark from Langebaan Lagoon, South Africa Food Chemistry,
190, 871-878. Doi: https://doi.org/10.1016/j.foodchem.2015.06.034.
Branco, V., Vale, C., Canario, J., and Neves dos Santos, N. 2007. Mercury and
selenium in blue shark (Prionace glauca, L. 1758) and swordfish (Xiphias
gladius, L. 1758) from two areas of the Atlantic Ocean. Environmental
Pollution, 150 (3): 373-380. Doi:
https://doi.org/10.1016/j.envpol.2007.01.040.
Brito-Castillo, L.E.R. Vivoni, D.J. Gochis, A. Filonov, I. Tereshchenko and
Monzon, C. 2010. An anomaly in the occurrence of the month of
maximum precipitation distribution in northwest Mexico. Journal of Arid
Environment, 74(5):531-539.
Brzóska, M.M., and Moniuszko-Jakoniuk, J., 2001. Interactions between
cadmium and zinc in the organism. Food and Chemical Toxicology.
39(10): 967-980. https://doi.org/10.1016/S0278-6915(01)00048-5.
Burk, R.F., Hill, K.E., 2015. Regulation of selenium metabolism and transport.
Annu. Rev. Nutr. 35, 109-134.
Burger, J., Gaines, K.F., Boring, C.S., Stephens Jr., W.L., Snodgrass, J., and
Gochfeld, M. 2001. Mercury and selenium in fish from the Savannah River:
species, trophic level, and locational differences. Environmental Research,
87: 108-118. Doi: https://doi.org/10.1006/enrs.2001.4294.
Burger, J., Jeitner, J., Donio, M., Pittfield, T., and Gochfeld, M. 2013. Mercury
and selenium levels, and selenium:mercury molar ratios of brain, muscle
and other tissues in bluefish (Pomatomus saltatrix) from New Jersey, US.
Science of the Total Environment, 443: 278-286. Doi:
https://doi.org/10.1016/j.scitotenv.2012.10.040.
Cabañero, A.I, Madrid, Y., and Cámara, C. 2007. Mercury-Selenium species ratio
in representative fish samples and their bioaccessibility by In Vitro
digestion method. Biological Trace Element Research, 119: 195-211. Doi:

134
https://doi.org/10.1007/s12011-007-8007-5.
Castañón, L.S., and Bañuelos, G.P. 2016. San Juan de la Costa: un pequeño
recorrido por su historia. In: Breve historia de los pueblos mineros de Baja
California Sur (Ed. 1). Universidad Autónoma de Baja California Sur, 2016.
CITES (2002) Whale shark. https ://www.cites .org/eng/galle ry/speci
es/fish/whale _shark. Html.
Chang, Y., Zhang, J., Qu, J., Jiang, Z., y Zhang, R., (2016). Influence of
mariculture on the distribution of dissolved inorganic selenium in Sanggou
Bay, northern China. Aquaculture Environment Interactions, 8, 247-260.
DOI: https://doi.org/10.3354/aei00163.
Chen, C.T. 1997. Preliminary report on Taiwain’s whale shark fishery. In:
Elasmobranch Biodiversity, Conservation and Management Proceedings
of the International Seminar and Workshop, Sabah, Malaysia, July 1997
Edited by Sarah L. Fowler, Tim M. Reed and Frances A. Dipper. The IUCN
Species Survival Commission.
Chen, V. Y. and Phipps, M. J. 2002. Management and Trade of Whale Sharks in
Taiwan. Taipei: TRAFFIC East Asia.
Chen, T., Liu, X., Zhu, M., Zhao, K., Wu, J., Xu, J., and Huang, P. 2008.
Identification of trace element sources and associated risk assessment in
vegetable soils of the urban–rural transitional area of Hangzhou, China.
Environmental Pollution, 151: 67-78. Doi:
https://doi.org/10.1016/j.envpol.2007.03.004.
Chiaverini, N., and De Ley, M. 2010. Protective effect of metallothionein on
oxidative stress-induced DNA damage. Free Radical
Research, 44(6): 605-613. Doi: 10.3109/10715761003692511.
Clark, E., and Nelson, D.R. 1997. Young whale sharks, Rhincodon typus, feeding
on a copepod bloom near La Paz, Mexico. Environmental Biology of
Fishes. 50: 63–73. Doi: https://doi.org/10.1023/A:1007312310127.
Clingham, E., Brown, J., Henry, L., Beard, A., D Dove, A. 2016. Evidence that St.
Helena island is an important multi-use habitat for whale sharks,
135
Rhincodon typus, with the first description of putative mating in this
species. PeerJ. https://doi.org/10.7287/peerj.preprints.1885v1.
Cochran, J.E.M., Hardenstine, R.S., Braun, C.D., Skomal, G.B., Thorrold, S.R.,
Xu, K., Genton, M.G., and Berumen, M.L. 2016. Population structure of a
whale shark Rhincodon typus aggregation in the Red Sea. Journal of fish
biology, 89, 3: 1570-1582. Doi: https://doi.org/10.1111/jfb.13054.
CMS (1999) Rhincodon typus, https ://www.cms.int/en/speci es/rhincodon-typus.
Cochran, J. 2014. Characterization of Novel Whale Shark Aggregations at Shib
Habil, Saudi Arabia and Mafia Island, Tanzania. Dissertation PhD tesis.
King Abdullah University of Science and Technology, Thuwal, Kingdom of
Saudi Arabia.
Colman, J.G. 1997. A review of the biology and ecology of the whale shark.
Journal of Fish Biology, 51:1219–1234. doi: https://doi.org/10.1111/j.1095-
8649.1997.tb01138.x.
Compagno, L.J.V. 1984. Sharks of the world: an annotated and illustrated
catalogue of shark species known to date. FAO Species Catalogue, vol. 4,
parts 1 and 2. FAO Fish. Synop. 125, FAO, Rome, 655 p.
Cooper, C.E., Vollaard, N.B.J., Choueiri, T., and Wilson, M.T. 2002. Exercise,
free radicals and oxidative stress. Biochemical Society, 30 part 2.
Correa, L., Rea, L.D., Bentzen, R., and O’Hara, T.M. 2014. Assessment of
mercury and selenium tissular concentrations and total mercury body
burden in 6 Steller sea lion pups from the Aleutian Islands. Marine Pollution
Bulletin, 82(1–2):175–182. Doi:
https://doi.org/10.1016/j.marpolbul.2014.02.022.
Correa, L., Castellini, J.M., Quakenbush, L.T., and O´Hara, T.M. 2015. Mercury
and selenium concentrations in skeletal muscle, liver, and regions of the
heart and kidney in bearded seals from Alaska, USA. Environmental
Toxicology and Chemistry, 34(10): 2403-2408. Doi:
https://doi.org/10.1002/etc.3079.
136
Danemann, G.D and Ezcurra, E. 2008. Bahía de Los Ángeles, recursos naturales
y comunidad. Linea base 2007. Secretaría de Medio Ambiente y Recursos
Naturales, D.F., México.
Del Monte-Luna, P., Arreguín-Sánchez, F., Godínez-Orta, L., and López-
Ferreira, C.A. (2005). Updated bathymetry of la paz bay, baja california
sur, Mexico. Cicimar Oceánides, 20(1,2):75-77.
De Silva Dávila, R. 1997. Abundancia y distribución de los eufáusidos y
producción larvaria de Nyctiphanes simplex Hansen, en La Bahía de La
Paz, B.C.S., México. Maestría en Ciencias Marinas Thesis, Instituto
Politécnico Nacional. Centro Interdisciplinario de Ciencias Marinas, La
Paz, B.C.S., México 112 h.
Dehn, L.A., Follmann, E.H., Thomas, D.L., Sheffield, G.G., Rosa, C., Duffy, L.K.,
and O´Hara, T.M. 2006. Trophic relationship in an artic food web and
implications for trace metal transfer. Science of the total environment, 32:
103-123. Doi: https://doi.org/10.1016/j.scitotenv.2005.11.012.
Dietz, R., Sonne, C., Basu, N., Braune, B., O´Hara, T., Letcher, R.J.,
Scheuhammer, T., Andersen, M., Andreasen, C., Andriashek, D., Asmund,
G., Aubail, A., Baagøe, H., Born, E.W., Chan, H.M., Derocher, A.E.,
Grandjean, P., Knott, K., Kirkegaard, M., Krey, A., Lunn, N., Messier, F.,
Obbard, M., Olsen, M.T., Ostertag, S., Peacock, E., Renzoni, A., Rigét,
F.F., Skaare, J.U., Stern, G., Stirling, I., Taylor, M., Wiig, O., Wilson, S.,
and Aars, J., 2013. What are the toxicological effects of mercury in Arctic
biota? Science of the Total Environment, 443, 775-790. DOI:
https://doi.org/10.1016/j.scitotenv.2012.11.046.
DOF 2006, NOM 029-PESC-2006. Pesca responsable de tiburones y rayas,
Especificaciones para su aprovechamiento.
DOF 2010, NOM 059 SEMARNAT 2010. Protección ambiental especies nativas
de México de flora y fauna silvestres. Categorías de riesgo y
especificaciones para su inclusión, exclusión o cambio. Lista de especies
en riesgo.

137
Eckert, S.A., and Stewart, B.S. 2001. Telemetry and satellite tracking of whale
sharks, Rhincodon typus, in the Sea of Cortez, Mexico, and the North
Pacific Ocean. Environment Biology of Fishes, 60: 299–308. Doi:
https://doi.org/10.1007/978-94-017-3245-1_17.
Endo, T., Haraguchi, K., Hotta, Y., Hisamichi, Y., Lavery, S., Dalebout, M.L., and
Baker, C.S. 2005. Total mercury, methyl mercury and selenium levels in
the red meat of small cetaceans sold for human consumption in Japan.
Environmental Science & Technology, 39: 5703-5708. Doi:
https://doi.org/10.1021/es050215e.
Endo, T., Hisamichi, Y., Haraguchi, K., Kato, Y., Ohta, C., and Koga, N. 2008.
Hg, Zn and Cu levels in muscle and liver of tiger sharks (Galeocerdo
cuvier) in the coast of Ishigaki Island, Japan: Relationship between metal
concentrations and body length. Marine Pollution Bulletin, 56: 1774-1780.
Doi: https://doi.org/10.1016/j.marpolbul.2008.06.003.
Eroglu, K., Atli, G., and Canli, M. 2005. Effects of Metal (Cd, Cu, Zn) Interactions
on the Profiles of Metallothionein-Like Proteins in the Nile Fish
Oreochromis niloticus. Bulletin of Environmental Contamination and
Toxicology. 75:390–399.
Escobar-Sánchez, O., Galvan-Magaña, F., and Rosíles-Martínez, R. 2010.
Mercury and selenium bioaccumulation in the smooth hammerhead shark,
Sphyrna zygaena Linnaeus, from the Mexican Pacific Ocean. Bulletin of
Environmental Contamination and Toxicology, 84(4): 488–491. Doi:
https://doi.org/10.1007/s00128-010-9966-3.
Evans, D.H. and Weingarten, K. 1990. The effect of cadmium and other metals
on vascular smooth muscle of the dogfish shark, Squalus acanthias.
Toxicology, 61: 275-281. doi: https://doi.org/10.1016/0300-
483X(90)90177-I.
FAO. 2003. Heavy Metals Regulations Legal Notice No 66/2003. FAO, Rome

138
Fisher, N.S., and Reinfelder, J.R. 1991. Assimilation of selenium in the marine
copepod Acartia tonsa studied with a radiotracer ratio method. Marine
Ecology Progress Series, 70: 157-174.
Fisher, N.S., and Hook, S.E. (2002). Toxicology tests with aquatic animals need
to consider the trophic transfer of metals. Toxicology, 181-182: 531-536.
Doi: https://doi.org/10.1016/S0300-483X(02)00475-4.
Fitzpatrick, B., Meekan, M. and Richards, A. 2006. Shark attacks on a whale
shark (Rhincodon typus) at Ningaloo Reef, Western Australia. Bulletin of
Marine Science 78: 397.
Fossi, M.C., Baini, M., Panti, C., Galli, M., Jiménez, B., Muñoz-Arnanz, J., Marsili,
L., Finoia, M.G., and Ramírez-Macías, D. 2017. Are whale sharks exposed
to persistent organic pollutants and plastic pollution in the Gulf of California
(Mexico)? First ecotoxicological investigation using skin biopsies.
Comparative Biochemistry and Physiology, Part C, 19: 48-58. Doi:
https://doi.org/10.1016/j.cbpc.2017.03.002.
Frías-Espericueta, M.G., Osuna-López, J.I., Izaguirre-Fierro, G., Aguilar-Juárez,
M., and Voltolina, D. 2010. Cadmio y plomo en organismos de importancia
comercial de la zona costera de Sinaloa, México: 20 años de estudios.
Oceánides, 25(2): 121-134.
Fulgencio de Moura, J., Merico, A., Montone, R.C., Silva, J., Seixas, T.G.,
Oliveira Godoy, J.M., Saint’Pierre, D.T., Hauser Davis, R.A., Madeira Di
Beneditto, A.P., Cardinot Reis, E., Castro Tavares, D., Soledade Lemons,
L., and Siciliano, S. 2015. Assessment of trace elements, POPs, 210Po
and stable isotopes (15N and 13C) in a rare filter-feeding shark: the
megamouth. Marine Pollution Bulletin, 95(1): 402–40. Doi:
https://doi.org/10.1016/j.marpolbul.2015.03.038.
Gaete, H., and Chávez, C. 2008. Evaluación de la toxicidad de mezclas binarias
de cobre, cinc y arsénico sobre Daphnia obtusa (Kurz, 1874) (Cladocera,
Crustacea). Limnetica, 27 (1), 1-10. Doi:
https://ddd.uab.cat/record/27993.
139
García-García, B.M. 2002. Relación entre la biomasa zooplanctónica y los
avistamientos de tiburón ballena (Rhincodon typus Smith, 1828) en Bahía
de los Ángeles, BC, México. BSc dissertation, Facultad de Ciencias
Marinas, Universidad Autónoma de Baja California, 50 pp.
Glynn, A.W. 1991. Cadmium and Zinc Kinetics in Fish: Studies on Water‐
Borne 109Cd and 65Zn Turnover and Intracellular Distribution in
Minnows, Phoxinus phoxinus. Pharmacology & Toxicology, 68(6):
485-491.
Goldfarb, A.H., McKenzie, M.J., and Bloomer, R.J. 2007. Gender comparisons of
excercise-induced oxidative stress: influence of antioxidant
supplementation. Applied Physiology, Nutrition, and Metabolism, 32:
1124-1131. Doi: https://doi.org/10.1139/H07-078.
Gray, J. 2002. Biomagnification in marine systems: the perspective of an
ecologist. Marine Pollution Bulletin, 45: 46–52. Doi:
https://doi.org/10.1016/S0025-326X(01)00323-X.
Gudger, E. W. 1915. Natural history of the whale shark, Rhineodon typus, Smith.
Zoologica 1: 345-389.
Gudger, E.W. 1935. A whale shark in the American museum. Natural History, 36:
128-130.
Gudger, E.W. 1952. Oviparity- the mode of reproduction on the whale shark
Rhineodon typus Copeia, 1952, 262-267.
Goudie, A.S., 2009. Dust storms: Recent developments. Journal of
Environmental Management, 90, 89-94. Doi:
https://doi.org/10.1016/j.jenvman.2008.07.007.
Hacohen-Domené A., Galván-Magaña, F., and Ketchum-Mejia, J. 2006.
Abundance of whale shark (Rhincodon typus) preferred prey species in
the southern Gulf of California, Mexico. Cybium 30(4): 99-102.
Haefliger, P., Mathieu-Nolf, M., Lociciro, S., Ndiaye, C., Coly, M., Diouf, A., Faye,
A.L., Sow, A., Tempowski, J., Pronczuk, J., Filipe, A.P.Jr., Bertollini, R.,
and Neira, M., 2009. Mass Lead Intoxication from Informal Used Lead-Acid

140
Battery Recycling in Dakar, Senegal. Environmental Health
Perspectives, 117(10), 1535–1540. DOI:
http://doi.org/10.1289/ehp.0900696.
Halbach, P., Pracejus, B., and Märten, A. 1993. Geology and mineralogy of
massive sulfide ores from the central Okinawa Trough, Japan. Economic
Geology, 88: 2210-2225. doi:
https://doi.org/10.2113/gsecongeo.88.8.2210.
Halliwell, B., and Gutteridge, J.M.C. 2007. Free Radicals in Biology and Medicine.
4th ed. Oxford University Press, Oxford, UK.
Hamilton, S.J. 2004. Review of selenium toxicity in the aquatic food chain.
Science of the Total Environment, 326: 1-31. Doi:
https://doi.org/10.1016/j.scitotenv.2004.01.019.
Hanfee, F. 2007. Indian whale shark fishery. In The First International Whale
Shark Conference: Promoting International Collaboration in Whale Shark
Conservation, Science and Management (Irvine, T. R. & Keesing, J. K.,
eds), p. 74 Perth: CSIRO Marine and Atmospheric Research, Australia.
Harada, M., 1995. Minamata Disease: Methylmercury Poisoning in Japan
Caused by Environmental Pollution. Critical Reviews in Toxicology, 25, 1-
24. DOI: https://doi.org/10.3109/10408449509089885.
Harley, J., Lieske, C., Bhojwani, S., Castellini, J.M., López, J.A. and O’Hara, T.M.,
2015. Mercury and methylmercury distribution in tissues of sculpins from
the Bering Sea. Polar Biology, 30, 1535-1543. DOI:
https://doi.org/10.1007/s00300-015-1716-x.
Hattum, V.B., Timmermans, K.R. and Govers, H.A. 1991. Abiotic and biotic
factors influencing in situ trace metal levels in macroinvertebrates in
freshwater ecosystems. Environmental toxicology chemistry, 10: 275-292.
doi: https://doi.org/10.1002/etc.5620100217.
Hedenquist, J.W., and Lowenstern, J.B. 1994. The role of magmas in the
formation of hydrothermal ore deposits. Nature, 370: 519–526.

141
Heyman, W.D., Graham, R.T., Kjerfve, B., Johannes, R.E. 2001. Whale sharks
Rhincodon typus aggregate to feed on fish spawn in Belize. Marine
ecology progress series. 215: 275–282. doi:10.3354/meps215275.
Hidalgo, J., and Flos, R. 1986. Dogfish metallothionein--I. Purification and
characterization and comparison with rat metallothionein. Comparative
Biochemistry and Physiology Part C: Comparative Pharmacology, 83, 99-
103.
Hinton, D.E., Segner, H., and Braunbeck, T. 2001. Toxic responses of the liver.
In Target Organ Toxicity in Marine and Freshwater Teleosts. Volume 1. 1st
edn. CRC Press, London.
Hsu, H.H., Joung, S.J., Liao, Y.Y., and Liu, K.M., 2007. Satellite tracking of
juvenile whale sharks, Rhincodon typus, in the Northwestern Pacific.
Fisheries Research 84: 25–31. Doi:
https://doi.org/10.1016/j.fishres.2006.11.030.
Hodgson, E., and Levi, P.E. 1997. A Textbook of Modern Toxicology. 2nd ed.
New York: Appleton and Lange. 404 p.
Hogstrand, C., and Wood, C. 1996. The physiology and toxicology of zinc in fish.
In E. Taylor (Ed.), Toxicology of Aquatic Pollution: Physiological, Molecular
and Cellular Approaches (Society for Experimental Biology Seminar
Series, pp. 61-84). Cambridge: Cambridge University Press.
Doi:10.1017/CBO9780511735516.005.
Hoffman D.J., Rattner, B.A., Allen Burton Jr., G., and Cairns Jr., J. 2002.
Handbook of ecotoxicology. Lewis Publisher. Florida 2003.
Huang, S.S.Y., Hung, S.L. and Chan, H.M., 2014. Maintaining tissue selenium
species distribution as a potential defense mechanism against
methylmercury toxicity in juvenile white sturgeon (Acipenser
transmontanus). Aquatic Toxicology. DOI:
http://dx.doi.org/doi:10.1016/j.aquatox.2014.08.004.
Hurtado-Banda, R., Gomez-Alvarez, A., Márquez-Farías, J.F., Cordoba-
Figueroa, M., Navarro-García, G., and Medina-Juárez, L.A. 2012. Total
142
mercury in liver and muscle tissue of two coastal sharks from the
Northwest of Mexico. Bulletin of Environmental Contamination and
Toxicology, 88 (6): 971–975. Doi: https://doi.org/10.1007/s00128-012-
0623-x.
IUCN Red List of Threatened Species 2016.
https://www.iucnredlist.org/species/19488/2365291.
Jamwal, A., Lemire, D., Driessnack, M., Naderi, M., and Niyogi, S. 2018.
Interactive effects of chronic dietary selenomethionine and cadmium
exposure in rainbow trout (Oncorhynchus mykiss): a preliminary study.
Chemistry, 197: 550-559. Doi:
https://doi.org/10.1016/j.chemosphere.2018.01.087.
Jara-Marini, M.E., Soto-Jimenez, M.F., and Paez-Osuna, F. 2009. Trophic
relationships and transference of cadmium, copper, lead and zinc in a
subtropical coastal lagoon food web from SE Gulf of California.
Chemosphere, 77: 1366-1373. Doi:
https://doi.org/10.1016/j.chemosphere.2009.09.025.
Jakimska, A., Konieczka, P., Skóra, K., and Namiesnik, J. 2011. Bioaccumulation
of metals in tissues of marine animals, part I: the role and impact of heavy
metals on organisms. Polish Journal of Environmental Studies, 20(5):
1117-1125.
Jihen, E.H., Imed, M., Fatima, H., and Abdelhamid, K. 2009. Protective effects of
selenium (Se) and zinc (Zn) on cadmium (Cd) toxicity in the liver of the rat:
Effects on the oxidative stress. Ecotoxicology and Environmental Safety,
72(5): 1559-1564. Doi: https://doi.org/10.1016/j.fct.2008.08.037.
Joung, S., Chen, C., Clark, E., Uchida, S., and Huang, W.Y.P. 1996. The whale
shark, Rhincodon typus, is a livebearer: 300 embryos found in one
‘megamamma’ supreme. Environmental Biology of Fishes, 46: 219–223
(1996).
Kamunde, C., and MacPhail, R., 2011. Metal–metal interactions of dietary
cadmium, copper and zinc in rainbow trout, Oncorhynchus mykiss.

143
Ecotoxicology and Environmental Safety. 74: 658- 667.
https://doi.org/10.1016/j.ecoenv.2010.10.016
Kaneko, J.J., and Ralston, N.V.C. 2007. Selenium and Mercury in Pelagic Fish
in the Central North Pacific Near Hawaii. Biological Trace Element
Research, 119: 242–254. Doi: https://doi.org/10.1007/s12011-007-
8004-8.
Ketchum J.T, Galván-Magaña, F. and Klimley, A.P. 2013. Segregation and
foraging ecology of whale sharks, Rhincodon typus, in the southwestern
Gulf of California. Environmental Biology of Fishes. Doi: 10.1007/s10641-
012-0071-9.
Ki-Hyun, K., Ehsanul, K. and Shamin, A.J. 2016. A review on the distribution of
Hg in the environment and its human health impacts. Journal of Hazardous
Materials, 306: 376-385. DOI:
https://doi.org/10.1016/j.jhazmat.2015.11.031.
Klaassen, C.D., and Watkins, J.B. III. 2001. Casarett and Doull Manual de
Toxicología. 5th ed. Mexico: McGraw-Hill Interamericana. 988 p.
Komjarova, I., and Blust, A. 2009. Multimetal Interactions between Cd, Cu, Ni,
Pb, and Zn Uptake from Water in the Zebrafish Danio rerio. Environmental
Science and Technology. 43, 7225–7229.
https://pubs.acs.org/doi/abs/10.1021/es900587r.
Konisberg, M. 2008. Radicales libres y estrés oxidativo. Aplicaciones médicas.
Manual moderno. Mexico 636 pp.
Kot, F., Shumilin, E., Rodríguez-Figueroa, G.M., and Mirlean, M. 2009. Mercury
Dispersal to Arroyo and Coastal Sediments from Abandoned Copper Mine
Operations, El Bole´o, Baja California. Bullettin of Environmental
Contamination and Toxicology, 82:20–25 DOI: 10.1007/s00128-008-
9551-1.
Kotsanis, N. and Iliopoulou-Georgudaki, J. 1999. Arsenic Induced Liver
Hyperplasia and Kidney Fibrosis in Rainbow Trout (Oncorhynchus
mykiss) by Microinjection Technique: A Sensitive Animal Bioassay for
144
Environmental Metal-Toxicity. Bulletin of Environmental Contamination
and Toxicology, 62: 169-178. Doi:
https://doi.org/10.1007/s001289900856.
Kukuyev, E.I. 1995. The new finds in recently born individuals of the whale shark
Rhincodon typus (Rhiniodontidae) in the Atlantic Ocean. Journal of
Ichthyology, 36: 203–205.
Lavaniegos, B.E., Heckel, G. and Ladrón de Guevara, P. 2012. Seasonal
variability of copepods and cladocerans in Bahía de los Ángeles (Gulf of
California) and importance of Acartia clausi as food for whale sharks.
Ciencias Marinas, 38(1A): 11-30. Doi:
https://doi.org/10.7773/cm.v38i1A.2017.
Liu, D.L., Yang, Y.P., Hu, M.H., Harrison, P.J., and Price, N.M. 1987. Selenium
content of marine food chain organisms from the coast of China. Mar.
Environmental Research, 22 (2): 151-165. Doi:
https://doi.org/10.1016/0141-1136(87)90033-X.
Lushchak, V.I. 2012. Environmentally Induced Oxidative Stress in Fish. In: Abele,
D., Vazquez-Medina, J.P. y Zenteno-Savín, T. (Eds). Oxidative stress in
acquatic ecosystems. John Wiley & Sons Ltd., Chicester, UK, pp. 295-307.
Marcovecchio, J.E., Moreno, V.J., and Pérez, A. 1991. Metal accumulation in
tissues of sharks from the Bahía Blanca estuary, Argentina.
Marine Environmental Research, 31(4): 263-274. Doi:
https://doi.org/10.1016/0141-1136(91)90016-2.
Martelli, A., Rousselet, E., Dycke, C., Bouron, A., and Moulis, J.M. 2006.
Cadmium toxicity in animal cells by interference with essential metals.
Biochimie, 88: 1807-1814. Doi:
https://doi.org/10.1016/j.biochi.2006.05.013.
Martin, J.H. and Knauer, G.A. 1973. The elemental composition of plankton.
Geochimica et Cosmochimica Acta, 37:1639-1653. Doi:
https://doi.org/10.1016/0016-7037(73)90154-3.
Maz-Courrau, A, López-Vera, C., Galván-Magaña, F., Escobar-Sánchez, O.,
Rosíles-Martínez, R., and Sanjuán-Muñoz, A. 2012. Bioaccumulation and

145
Biomagnification of Total Mercury in Four Exploited Shark Species in the
Baja California Peninsula, Mexico. Bulletin of Environmental
Contamination and Toxicology, 88, 129–134. Doi:
https://doi.org/10.1007/s00128-011-0499-1.
McGeachy, S.M., and Dixon, D.G. 1992. Whole body arsenic concentrations in
rainbow trout during acute exposure to arsenate. Ecotoxicology and
Environmental Safety, 24:301–308. Doi: https://doi.org/10.1016/0147-
6513(92)90006-O.
McKinney, M.A., Dean, K., Hussey, N.E., Cliff, G., Wintner, S.P., Dudley, S.F.J.,
Zungu, M.P., and Fisk, A.T. 2016. Global versus local causes and health
implications of high mercury concentrations in sharks from the east coast
of South Africa. Science of the Total Environment 541:176–183. Doi:
https://doi.org/10.1016/j.scitotenv.2015.09.074.
Messaoudi, I., El Heni, J., Hammouda, F., Said, K., and Kerkeni, A.
2009. Protective Effects of Selenium, Zinc, or Their Combination on
Cadmium-Induced Oxidative Stress in Rat Kidney. Biological Trace
Element Research, 130: 152–161. https://doi.org/10.1007/s12011-009-
8324-y.
Mieiro, C.L., Pacheco, M., Pereira, M.E., and Duarte, A.C. 2011. Mercury
organotropism in feral European sea bass (Dicentrarchus labrax).
Archives of Environmental Contamination and Toxicology, 61: 135–143.
Doi: https://doi.org/10.1007/s00244-010-9591-5.
Millán-Núñez, E., and Yentsch, C.M. 2000. El Canal de Ballenas, Baja California,
como ambiente favorable para el desarrollo de fitoplancton.
Hidrobiológica, 10: 91–100.
Motta, P.J., Maslanka, M., Hueter, R.E., Davis, R.L., de la Parra, R., Mulvany,
S.L., Habegger, M.L., Strother, J.A., Mara, K.R., Gardiner, J.M., Tyminski,
J.P., and Zeigler, L.D. 2010. Feeding anatomy, filter-feeding rate, and diet
of whale sharks Rhincodon typus during surface ram filter feeding off the
Yucatan Peninsula, Mexico. Zoology, 113: 199–212. Doi:
https://doi.org/10.1016/j.zool.2009.12.001.

146
Nam, D.H., Adam, D.H., Flewelling, L.G., and Basu, N. 2010. Neurochemical
alterations in lemon shark (Negaprion brevirostris) brains in association
with brevetoxin exposure. Aquatic Toxicology, 99 (3): 351-359.
Naser, H.A. 2013. Assessment and management of heavy metal pollution in the
marine environment of the Arabian Gulf: A review. Marine Pollution
Bulletin, 72: 6-13. Doi: https://doi.org/10.1016/j.marpolbul.2013.04.030.
Navarro-Alarcon, M., and Cabrera-Vique, C. 2008. Selenium in food and the
human body: A review. Science of the Total Environment, 400: 115-141.
Doi: https://doi.org/10.1016/j.scitotenv.2008.06.024.
Nelson, J.D., and Eckert, S.A. 2007. Foraging ecology of whale sharks
(Rhincodon typus) within Bahía de Los Angeles, Baja California Norte,
Mexico. Fisheries Research, 84: 47–64. Doi:
https://doi.org/10.1016/j.fishres.2006.11.013.
Newman, M.C. and Unger, M.A. 2002. Fundamentals of ecotoxicology. Lewis
publisher. CRC Press Company, London, UK.
NOM 242-SSA1. 2009. Norma Oficial Mexicana. Productos y servicios.
Productos de la pesca frescos, refrigerados, congelados y procesados. In:
Especificaciones sanitarias y métodos de prueba.
Nordberg, M. and Nordberg, G. 2009. Metallothioneins: Historical Development
and Overview. En: Metal Ions in Life Sciences, Vol. 5. Royal Society of
Chemistry, Cambridge, United Kingdom, pp. 1–29.
Norman, B.M. and Stevens, J.D. 2007. Size and maturity status of the whale
shark (Rhincodon typus) at Ningaloo Reef in Western Australia. Fisheries
Research 84: 81–86. Doi: https://doi.org/10.1016/j.fishres.2006.11.015.
Norman, B. M., Holmberg, J. A., Arzoumanian, Z., Reynolds, S. D., Wilson, R. P.,
Rob, D., Pierce, S. J., Gleiss, A. C., De la Parra, R., Galvan, B., Ramirez-
Macias, D., Robinson, D., Fox, S., Graham, R., Rowat, D., Potenski, M.,
Levine, M., McKinney, J. A., Hoffmayer, E., Dove, A. D. M., Hueter, R.,
Ponzo, A., Araujo, G., Acá, E., David, D., Rees, R., Duncan, A., Rohner,
C. A., Prebble, C. E. M., Hearn, A., Acuna, D., Berumen, M. L., Vázquez,
A., Green, J., Bach, S. S., Schmidt, J. V., Beatty, S. J., & Morgan, D. L.

147
(2019). Undersea Constellations: The Global Biology of an Endangered
Marine Megavertebrate Further Informed through Citizen Science.
BioScience, 67(12): 1029-1043. Doi: https://doi.org/10.1093/biosci/bix127.
Niyogi, S., and Wood, C.M. 2004. Kinetic analyses of waterborne Ca and Cd
transport and their interactions in the gills of rainbow trout (Oncorhynchus
mykiss) and yellow perch (Perca flavescens), two species differing greatly
in acute waterborne Cd sensitivity. Journal of Comparative Physiology B.
174(3), 243–253. Doi: https://doi.org/10.1007/s00360-003-0409-x.
O’Sullivan, J. B. and Mitchell, T. 2000. A fatal attack on a Whale Shark Rhincodon
typus, by killer whales Orcinus orca off Bahia de Los Angeles, Baja
California. American Elasmobranch Society Annual Meeting, La Paz,
Mexico.
Obeso-Nieblas, M., Shirasago-Germán, B., Gaviño-Rodríguez, J.H., Obeso-
Huerta, H., Pérez-Lezama, E.L., and Jiménez-Illescas, A.R. 2007.
Hidrografía en la Boca Norte de la Bahía de La Paz, Baja California Sur,
México. Ciencias marinas, 33(3), 281-291.
Oladimeji, A.A., Qadri, S.U., and de Freitas, A.S.W. 1984. Long-term effects of
arsenic accumulation in rainbow trout Salmo gairdneri. Bulletin of
Environmental Contamination and Toxicology, 32(1): 732–741. Doi:
https://doi.org/10.1007/BF01607564.
Ortiz-Figueroa, M. 2009. Agitación por oleaje en el puerto de Ensenada, Baja
California, México: medidas de atenuación. GEOS. 29:2.
Páez-Osuna, F., Álvarez-Borrego, S., Ruiz-Fernández, A.C., Garcìa-Hernandez,
J., Jara-Marini, E.M., Bergès-Tiznado, M.E., Piñon-Gimate, A., Alonso-
Rodríguez, R., Soto-Jiménez, M.F., Frías-Espericueta, M.G., Ruelas-
Inzunza, J.R., Green-Ruiz, C.R., Osuna-Martínez, C.C., and Sánchez-
Cabeza, J.A. 2017. Environmental status of the Gulf of California: A
pollution review. Earth-Science Reviews, 166: 181-205. Doi:
https://doi.org/10.1016/j.earscirev.2017.01.014.
Palmisano, F., Cardellicchio, N., and Zambonin, P.G. 1995. Speciation of
mercury in dolphin liver: a two-stage mechanism for the demethylation

148
accumulation process and role of selenium. Marine Environmental
Research, 40: 109-121. Doi: https://doi.org/10.1016/0141-1136(94)00142-
C.
Pavin, P. 2000. Whale shark in the Indian coast – Need for conservation. Current
science. 79, 3: 310-315.
Pancaldi, F., Galván-Magaña, F., González-Armas, R., Soto-Jimenez, M.F.,
Whitehead, D.A., O'Hara, T., Marmolejo-Rodríguez, A.J., Vázquez-Haikin,
A., and Páez-Osuna, F., 2019a. Mercury and selenium in the filter–feeding
whale shark (Rhincodon typus) from two areas of the Gulf of California,
Mexico. Marine Pollution Bulletin, 146: 955-961. Doi:
https://doi.org/10.1016/j.marpolbul.2019.07.017.
Pancaldi, F., Páez-Osuna, F., Soto-Jiménez, M.F., González-Armas, R., O'Hara,
T., Marmolejo-Rodríguez, A.J., Vázquez-Haikin, A., and Galván-Magaña,
F. 2019b. Trace elements in tissues of whale sharks (Rhincodon typus)
stranded in the Gulf of California, Mexico. Bulletin of Environmental
Contamination and Toxicology, 103 (4): 515-520. Doi:
https://doi.org/10.1007/s00128-019-02640-y.
Penglase, S., Hamre, K., and Ellingsen, S. 2014. Selenium and mercury have a
synergistic negative effect on fish reproduction. Aquatic Toxicology, 149:
16-24. Doi: https://doi.org/10.1016/j.aquatox.2014.01.020.
Pérez-Triboullier, H., Shumilin, E., and Rodríguez-Figueroa, G.M. 2015. Trace
Elements in the Marine Sediments of the La Paz Lagoon, Baja California
Peninsula, Mexico: Pollution Status in 2013. Bulletin of Environmental
Contamination and Toxicology, 95: 61–66. Doi:
https://doi.org/10.1007/s00128-015-1520-x.
Pethybridge, H., Cossa, D., and Butler, E.C.V. 2010. Mercury in 16 demersal
sharks from southeast Australia: biotic and abiotic sources of variation and
consumer health implications. Marine Environmental Research, 69, 18-26.
Doi: https://doi.org/10.1016/j.marenvres.2009.07.006.

149
Piper, D.Z. 1991. Geochemistry of a Tertiary sedimentary phosphate deposit:
Baja California Sur, Mexico. Chemical Geology, 92: 283-316. Doi:
https://doi.org/10.1016/0009-2541(91)90075-3.
Prasad, M.N.V., Sajwan, K.S., and Naidu, R. 2006. Trace elements in the
environment. Biogeochemistry, biotechnology, and bioremediation. Taylor
and Francis group, Florida, pp 726.
Prieto García, F., Báez Ramírez, O.A., Scoot, W., Gaytán Oyarzún, J.C., and
Zúñiga Estrada, A. 2016. Acumulación, toxicidad y teratogenesis
provocada por presencia de arsencio en aguas en el pez cebra (Danio
rerio). AquaTIC, 24: 72-85.
Prol-Ledesma, R.M., Canet, C., Malgarejo, J.C., Tolson, G., Rubio-Ramos, M.A.,
Cruz-Ocampo, J.C., Ortega-Osorio, A., Torres-Vera, M.A., and Reyes, A.
2002. Cinnabar deposition in submarine coastal hydrothermal vents,
pacific margin of central Mexico. Economic Geology, 97 (6): 1331–1340.
Doi: https://doi.org/10.2113/gsecongeo.97.6.1331.
Rainbow, P.S. 2007. Trace metal bioaccumulation: Models, metabolic availability
and toxicity. Environmental International, 33: 576-582. Doi:
https://doi.org/10.1016/j.envint.2006.05.007.
Rainbow, P.S., and White, S.L. 1989. Comparative strategies of heavy metal
accumulation by crustaceans: zinc, copper and cadmium in a decapod, an
amphipod and a barnacle. Hydrobiologia, 174: 245–262. Doi:
https://doi.org/10.1007/BF00008164.
Ralston, N.V.C., Unrine, J., and Wallschlager, D. 2008. Biogeochemistry and
analysis of selenium and its species. North American Metals Council.
Ralston, N.V.C., Ralston, C.R., and Raymond, L.J. 2016. Selenium health benefit
values: updated criteria for mercury risk assessments. Biological Trace
Element Research, 171:262–269. Doi: https://doi.org/10.1007/s12011-
015-0516-z.
Ramírez-Macías, D., Vázquez-Haikin, A., and Vázquez-Juárez, R. 2012. Whale
shark Rhincodon typus populations along the west coast of the Gulf of

150
California and implications for management. Endangered species
research. 18:115-128. Doi: https://doi.org/10.3354/esr00437.
Ramírez-Macías, D., Vázquez-Haikin, A., Luja, V., Murillo, R., and Mata, R.,
2016. Mapping the path of the biggest fish: The whale shark from the
Mexican Pacific side. QScience Proceedings, The 4th International Whale
Shark Conference, May 2016, Volume 2016, 46.
Ramírez-Macías, D., Queiroz, N., Pierce, S.J., Humphries, N.E., Sims, D.W., and
Brunnschweiler, J.M. 2017. Oceanic adults, coastal juveniles: tracking the
habitat use of whale sharks off the Pacific coast of Mexico. PeerJ5: e3271;
DOI10.7717/peerj.3271.
Rand, G.M., Wells, P.G., and McCarthy, L.S. 1995. Introduction to aquatic
ecology. In: Rand GM (ed) Fundamentals of aquatic toxicology. Taylor and
Francis, London, p 276.
Raymond, L.J., and Ralston, N.V.C. 2004. Mercury:Selenium interactions and
health implications. Seychelles Medical and Dental Journal, 7(1): 72-77.
Régine, M.B., Gilles, D., Yannick, D., and Alain, B. 2006. Mercury distribution in
fish organs and food regimes: significant relationships from twelve species
collected in French Guiana (Amazonian basin). Science of the Total
Environment, 368, 262-270. Doi:
https://doi.org/10.1016/j.scitotenv.2005.09.077.
Renteria-Cano, M.E. 2011. Elementos mayores y traza en el zooplancton de las
regiones norte y central del Golfo de California. Tesis de Doctorado,
Instituto Politécnico Nacional CICIMAR, La Paz.
Riley, M.J., Hale, M.S., Harman, A., and Rees, R.G. 2010. Analysis of whale
shark Rhincodon typus aggregations near South Ari Atoll, Maldives
Archipelago. Aquatic Biology, 8: 145–150. Doi:
https://doi.org/10.3354/ab00215.
Ritterhoff, J., and Zauke, G.P. 1997. Trace metals in field samples of zooplankton
from the Fram Strait and the Greenland Sea. Science of The Total
Environment. 199 (3): 255-270. Doi: https://doi.org/10.1016/S0048-
9697(97)05457-0.
151
Rodríguez-Figueroa, G.M. 2004. Geoquímica de los oligoelementos, elementos
mayores y elementos de las tierras raras, en los sedimentos marinos del
distrito minero de Santa Rosalía, BCS, México. Tesis de Maestría.
CICIMAR. La Paz, BCS. pp. 149.
Romero-Bañuelos, C.A. 2003. Hidrología y metales pesados en la materia
particulada suspendida del agua superficial de la porción sur de la bahía
de La Paz, BCS, México. Master tesis, Instituto Politécnico Nacional,
CICIMAR, La Paz.
Rotchell, J.M., Clark, K.R., Newton, L.C. and Bird, D.J. 2001. Hepatic
metallothionein as a biomarker for metal contamination. Age effects and
seasonal variation in European flounders (Pleuronectes flessus) from the
Severn Estuary and Bristol Channel. Marine Environment Research, 52:
151–171. Doi: https://doi.org/10.1016/S0141-1136(00)00270-1.
Rowat, D., Speed, C.W., Meekan, M.G., Gore, M.A., and Bradshaw, C.J.A. 2009.
Population abundance and apparent survival of the Vulnerable whale
shark Rhincodon typus in the Seychelles aggregation. Oryx. 43,4: 591-
598. Doi: https://doi.org/10.1017/S0030605309990408.
Rowat, D., and Brooks, K.S. 2012. A review of the biology, fisheries and
conservation of the whale shark Rhincodon typus. Journall of Fish biology.
80, 5: 1019-1056. Doi: https://doi.org/10.1111/j.1095-8649.2012.03252.x.
Rubio‐Franchini, I., Mejía Saavedra, J., and Rico‐Martínez, R.
2008. Determination of lead in samples of zooplankton, water, and
sediments in a Mexican reservoir: Evidence for lead biomagnification in
lower/intermediate trophic levels? Environmental Toxicology, 23(4): 459–
465. Doi: 10.1002/tox.20357.
Rubio-Franchini, I., López-Hernández, M., Ramos-Espinosa, M.G. and Rico-
Martinez, R. 2016. Bioaccumulation of Metals Arsenic, Cadmium, and
Lead in Zooplankton and Fishes from the Tula River Watershed,
Mexico. Water Air and Soil Pollution, 227, 5. Doi:
https://doi.org/10.1007/s11270-015-2702-1.

152
Rudneva, I., 1997. Blood antioxidant system of Black Sea elasmobranch and
teleosts. Comparative Biochemistry and Physiology Part C:
Pharmacology, Toxicology and Endocrinology, 118, 255-260. Doi:
https://doi.org/10.1016/S0742-8413(97)00111-4.
Ruelas-Inzunza, J., Hernández-Osuna, J., and Páez-Osuna, F. 2009. Organic
and total mercury in muscle tissue of five aquatic birds with different
feeding habits from the SE Gulf of California, Mexico. Chemosphere 76
(3): 415-418. Doi: https://doi.org/10.1016/j.chemosphere.2009.03.042.
Ruelas-Inzunza, J., Šlejkovec, Z., Mazej, D., Fajon, V., Horvat, M., and Ramos
Osuna, M. 2018. Bioaccumulation of As, Hg, and Se in tunas Thunnus
albacares and Katsuwonus pelamis from the Eastern Pacific: tissue
distribution and As speciation. Environmental Science and Pollution
Research, 25(20):19499–19509. Doi: https://doi.org/10.1007/s11356-018-
2166-0.
Salomons, W. and Förstner, U. 1984. Metals in the hydrocicle. Springer-Verlag.
349 p.
Sánchez-Velasco, L., Beier, E., Avalos-García, C., and Lavín, M.F. 2006. Larval
fish assemblages and geostrophic circulation in Bahía de La Paz and the
surrounding southwestern region of the Gulf of California, Journal of
Plankton Research, 28: 1081–1098. Doi:
https://doi.org/10.1093/plankt/fbl040.
Segovia-Zavala, J.A., Delgadillo-Hinojosa, F., Muñoz-Barbosa, A., Gutiérrez-
Galindo, E.A., Vidal-Talamantes, R. 2004. Cadmium and silver in Mytilus
californianus transplanted to an anthropogenic influenced and coastal
upwelling areas in the Mexican Northeastern Pacific. Marine Pollution
Bulletin. 48: 458–464.
Sinaie, M., Bastami, K.D., Ghorbanpour, M., Najafzadeh, H., Shekari, M., and
Haghparast, S., 2010. Metallothionein biosynthesis as a detoxification
mechanism in mercury exposure in fish, spotted scat (Scatophagus
argus). Fish Physiology and Biochemistry, 36, 1235–1242. Doi:
doi.org/10.1007/s10695-010-9403-x.

153
Siscar, R., Koenig, S., Torreblanca, A., and Solé, M. 2014. The role of
metallothionein and selenium in metal detoxification in the liver of deep-
sea fish from the NW Mediterranean Sea. Science of The Total
Environment. 466–467: 898-905. Doi:
https://doi.org/10.1016/j.scitotenv.2013.07.081.
Skorupa, J.P., (1996). Selenium poisoning of fish and wildlife in nature: lessons
from twelve real-world examples. In: Frankergerger, W.T., Engberg,
R.A.Jr. (Eds) Environmental Chemistry of Selenium. Marcel Dekker Inc.
New York. pp. 315-331.
Slaveykova, V.I., and Wilkinson, K.J. 2002. Physicochemical aspects of lead
bioaccumulation by Chlorella vulgaris. Environmental Science
Technology, 36: 969–975. Doi: /abs/10.1021/es0101577.
Smith, A. 1828. Descriptions of new, or imperfectly known objects of the animal
kingdom, found in the south of Africa. South African Commercial
Advertiser, 3, 2.
Speed, C.W., Meekan, M.G., Russell, B.C., Bradshaw, C.J.A. 2009. Recent
whale shark (Rhincodon typus) beach strandings in Australia. Marine
Biodiversity Records 3:150. https ://doi.org/10.1017/S1755 26720 80001
58.
Soto-Jiménez, F.M. 2011. Trace element trophic transfer in aquatic food webs.
Hidrobiológica, 21: 239-248.
Soto-Jiménez, M.F. and Páez-Osuna, F. 2008. Diagenetic processes on metals
in mud flat sediments from a subtropical saltmarsh (SE Gulf of California):
postdepositional mobility and geochemical fractions. Applied
Geochemistry, 23: 1202-121.
Stacey, N., Karam, J., Dwyer, D., Speed, C., and Meekan, M. 2008. Assessing
Traditional Ecological Knowledge of Whale Sharks (Rhincodon typus) in
eastern Indonesia: A pilot study with fishing communities in Nusa
Tenggara Timur. Department of the Environment, Water, Heritage and the
Arts, Canberra.

154
Stevens, J.D. 2007. Whale shark (Rhincodon typus) biology and ecology: a
review of the primary literature. Fisheries Research, 84(1):4–9. Doi:
https://doi.org/10.1016/j.fishres.2006.11.008.
Stoffers, P., Hannington, M., Wright, I., Herzig, P., and de Ronde, C. 1999.
Elemental mercury at submarine hydrothermal vents in the Bay of Plenty,
Taupo volcanic zone, New Zealand. Geology, 27(10): 931-934. Doi:
https://doi.org/10.1130/0091-
7613(1999)027%3C0931:EMASHV%3E2.3.CO;2.
Storelli, M., Ceci, E., Storelli, A., and Marcotrigiano, G., 2003. Polychlorinated
biphenyl, heavy metal and methylmercury residues in hammerhead
sharks: contaminant status and assessment. Marine Pollution Bulletin, 46:
1035-1039. https://doi. org/10.1016/S0025-326X(03)00119-X.
Storelli, M.M. and Marcotrigiano, G.O. 2004. Content of mercury and cadmium in
fish (Thunnus alalunga) and cephalopods (Eledone moschata) from the
south-eastern Mediterranean Sea, Food Additives &
Contaminants, 21:11, 1051-1056, DOI: 10.1080/02652030400023127.
Storelli, M.M., Giacominelli Stuffler, R., and Marcotrignano, G.O. 2009. Total
mercury in muscle of benthic and pelagic fish from the South Adriatic Sea
(Italy). Food Additives and Contaminants. 15 (8): 876-883.
Storelli, M.M., Cuttone, G., and Marcotrignano, G.O. 2011. Distribution of trace
elements in the tissues of smooth hound Mustelus mustelus (Linnaeus,
1758) from the southern–eastern waters of Mediterranean Sea (Italy).
Environment Monitoring Assessment, 174 (1-4): 271–281. Doi:
https://doi.org/10.1007/s10661-010-1456-x.
Syderman, W.J., and Jarman, W.M. 1998. Trace elements in sea birds, steller
sea lion, and forage fish and zooplankton from Central California. Marine
Pollution Bulletin, 36 (10): 828-832. Doi: https://doi.org/10.1016/S0025-
326X(98)00076-9.
Tao, S., T. Liang, J. Cao, R. W. Dawson, and C. Liu. 1999. Synergistic Effect of
Copper and Lead Uptake by Fish. Ecotoxicology and Environmental
Safety. 44: 190–195. https://doi.org/10.1006/eesa.1999.1822.

155
Taylor, R.S. 1964. Abundance of chemical elements in the continental crust: A
new table. Geochimica et Cosmochimica Acta. 28: 1273-1285.
Taylor, J.G. 1997. Ram filter-feeding and nocturnal feeding of whale sharks
(Rhincodon typus) at Ningaloo Reef, Western Australia. Fisheries
Research, 84 (1): 65-70. Doi:
https://doi.org/10.1016/j.fishres.2006.11.014.
Taylor, D.L., Kutil, N.J., Malek, A.J., and Collie, J.S. 2014. Mercury
bioaccumulation in cartilaginous fishes from Southern New England
coastal waters: contamination from a trophic ecology and human health
perspective. Marine Environmental Research 99: 20-33. Doi:
https://doi.org/10.1016/j.marenvres.2014.05.009.
Tulasi, S.J., Reddy, P.U.M., and Ramana Rao, J.V. 1992. Accumulation of lead
and effects on total lipids and lipid derivatives in the freshwater fish Anabas
testudineus (Bloch). Ecotoxicology and Environmental Safety, 23(1): 33-
38. Doi: https://doi.org/10.1016/0147-6513(92)90019-Y.
Vallee, B.L., and Falchuk, K.H. 1993. The Biochemical Basis of Zinc Physiology.
Physiological Reviews, 73: 79-118.
Van Tienhoven, A.M., Den Hartog, J.E., Reijns, R.A., and Peddemors, V.M.,
2007. A computer-aided program for pattern-matching of natural marks on
the spotted raggedtooth shark Carcharias taurus. Journal of Applied
Ecology, 44 (2): 273-280. Doi: https://doi.org/10.1111/j.1365-
2664.2006.01273.x.
Vas, P. 1991. Trace metal levels in sharks from British and Atlantic waters.
Marine Pollution Bulletin, 22(2): 67–72. Doi: https://doi.org/10.1016/0025-
326X(91)90138-I.
Vélez-Alavez, M., Labrada-Martagón, V., Méndez-Rodriguez, L.C, Galván-
Magaña, F., and Zenteno-Savín, T., 2013. Oxidative stress indicators and
trace element concentrations in tissues of mako shark (Isurus oxyrinchus).
Comparative Biochemistry and Physiology, Part A, 165, 508–514. Doi:
https://doi.org/10.1016/j.cbpa.2013.03.006.

156
Verbost, P.M., Flik, G., Lock, R.A.C., and Wendelaar-Bonga, S.E. 1987.
Cadmium inhibition of Ca2+ uptake in rainbow trout gills. American Journal
of Physiology. 253, 216–R221.
Waisberg, M., Joseph, P., Hale, B., and Beyersmann, D. 2003. Molecular and
cellular mechanisms of cadmium carcinogenesis. Toxicology, 192: 95–
117. Doi: https://doi.org/10.1016/S0300-483X(03)00305-6.
Walker, C.J., Gelsleichter, J., Adams, D.H., and Manire, C.A. 2014. Evaluation of
the use of metallothionein as a biomarker for detecting physiological
responses to mercury exposure in the bonnethead, Sphyrna tiburo. Fish
Physiology and Biochemistry, 40: 1361-1371. Doi:
https://doi.org/10.1007/s10695-014-9930-y.
Wang, W.X. 2002. Interactions of trace metals and different marine food chains.
Marine ecology progress series, 243: 295-309. Doi:
doi:10.3354/meps243295.
Wang, Y., Zhang, W., and Chen, M. 2014. Contents and evaluation of heavy
metals in whale shark from China’s eastern coast. WIT Transaction on
Ecology and the Environment, 189:387–397.
Weber, D.N., and Dinger, W.N. 1997. Alteration in neural behavioural responses
in fishes exposed to lead and lead-chelating agents. American Zoologist,
37 (4): 354-362. Doi: https://doi.org/10.1093/icb/37.4.354.
Whitehead, D.A., Becerril-García, E.E., Petatán-Ramírez, D., Vázquez-Haikin,
A., González-Armas, R., Galván-Magaña, F. 2018. Whale shark
Rhincodon typus strandings in the Gulf of California, Mexico. Journal of
Fish Biology. 94 (1): 165-167. Doi: https ://doi.org/10.1111/jfb.13845.
Whitehead, D.A., Petatàn-Ramìrez, D., Olivier, D., Gonzàlez-Armas, R.,
Pancaldi, F., and Galvàn-Magaña, F. 2019. Seasonal trends in whale
sharks sightings in an established tourism site in the Gulf of California,
Mexico. Journal of Fish Biology, 95: 982–984. Doi: 10.1111/jfb.14106.

157
Whitehead, D.A., Jakes-Cota, U., Pancaldi, F., Galván Magaña, F. and González
Armas, R. 2020. The influence of zooplankton communities on the feeding
behaviour of whale shark in Bahia de La Paz, Gulf of California. Revista
Mexicana de biodiversidad, 91: 1-8. Doi:
https://doi.org/10.22201/ib.20078706e.2020.91.3054.
Wintner, S.P. 2000. Preliminary study on vertebral growth rings in the whale
shark, Rhincodon typus, from the east coast of South Africa.
Environmental Biology of Fish. 59: 441-451. Doi:
https://doi.org/10.1023/A:1026564707027.
Yadav, K.K., and Trivedi, D.P. 2009. Sublethal exposure of heavy metals induces
micronuclei in fish, Channa punctate. Chemosphere, 77, 1495-1500. Doi:
https://doi.org/10.1016/j.chemosphere.2009.10.022.
Yamashita, Y., Hamlund, H., Suzuki, T., Hara, T., Hossain, M.A., and Yabu, T.
2011. Selenoneine, total selenium, and total mercury content in the
muscle of fishes. Fisheries Science, 77 (4): 679–686. Doi:
https://doi.org/10.1007/s12562-011-0360-9.
Yang, D.Y., Chen, Y.W., Gunn, J.M., and Belzile, N. 2008. Selenium and mercury
in organisms: interactions and mechanisms. Environmental Reviews, 16:
71-92. Doi: https://doi.org/10.1139/A08-001.
Zhang, L., and Wang, W.X. 2006. Significance of subcellular metal distribution in
prey in influencing the trophic transfer of metals in a marine fish. Limnology
and Oceanography. 51 (5): 2008-2017. Doi:
https://doi.org/10.4319/lo.2006.51.5.2008.
Zar, J.H. 2010. Biostatistical analysis, 5th edn. Pearson Prentice Hall,
Englewood.
Zauke, G.P. 2006. Heavy metals in zooplankton and decapod crustaceans from
the Barents Sea. Science of The Total Environment, 395(1-3): 283-294.
Doi: https://doi.org/10.1016/j.scitotenv.2005.09.002.

158
Zuluaga-Rodríguez, J., Gallego-Ríos, S.E., and Ramírez-Botero, C.M., 2015.
Content of Hg, Cd, Pb and as in fish species: a review. Vitae, 22(2), 148-
159. DOI: http://dx.doi.org/10.17533/udea.vitae.v22n2a09.


