Embed Size (px)
Citation preview
Allison J. Ames, Ralph Abbey, Wayne Thompson
SAS Institute Inc., Cary, NC
Technical Paper
Big Data Analytics
Benchmarking SAS®, R, and Mahout
Technical Paper
Technical Paper
(Last Revised On: May 6, 2013)

1
Big Data Analytics
Accurate and Simple Analysis of Big Data
The amount of data created, and potentially collected, every day by the interactions of individuals with their computers,
GPS devices, cell phones, social media, medical devices, and other sources has been termed “big data.” Analysis of big
data is especially needed in predictive modeling, which often uses a large number of observations and predictor variables
to predict a binary response that represents an individual’s predicted future behavior. SAS customers want to analyze big
data, particularly in the form of predictive modeling, accurately and easily.
This paper describes a benchmark study of various scenarios that are created by applying three classification algorithms
in two SAS products and two open-source products to model four classification problems from real customers. The
algorithms are logistic regression, decision trees, and a random forest algorithm that is based on Random Forest (Breiman
2001). The products that were benchmarked are SAS® Rapid Predictive Modeler for SAS® Enterprise Miner™, SAS®
High-Performance Analytics Server (using Hadoop), and two-open source software packages: R (R Core Team 2012) and
Apache Mahout (Apache Software Foundation 2012). Each scenario was evaluated for model quality, overall
completeness, and overall effort required by the modeler. Each of the SAS and open-source products showed strengths
and limitations, which are described in the section “Results.”
Data
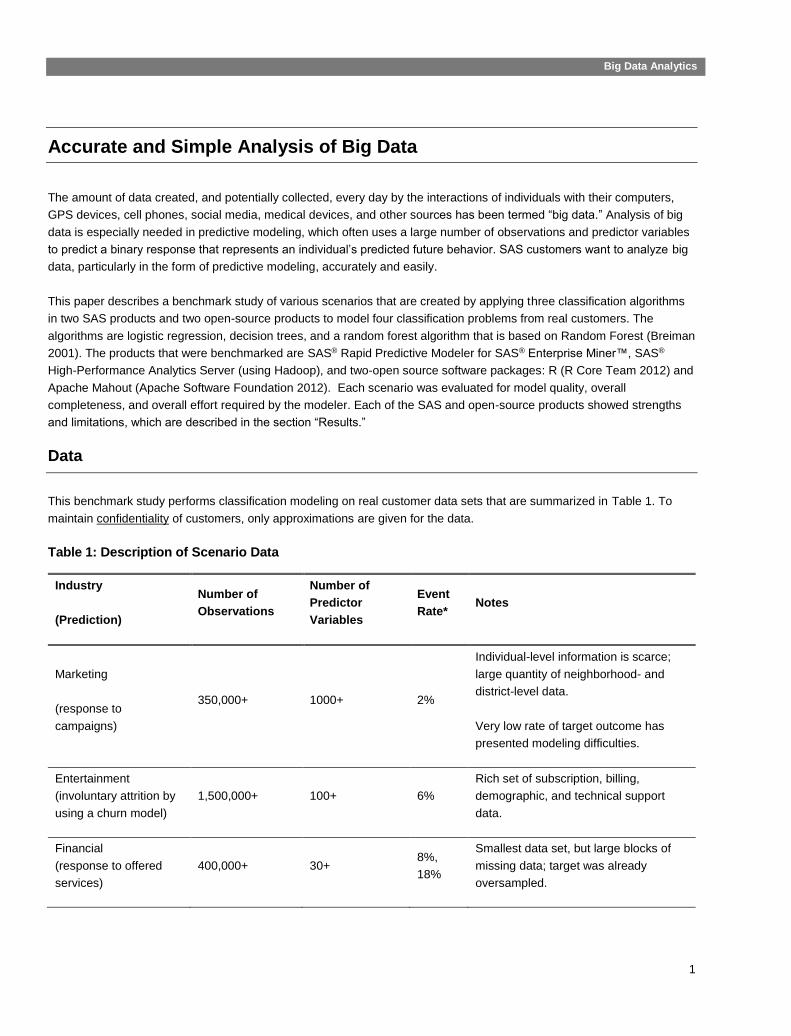
This benchmark study performs classification modeling on real customer data sets that are summarized in Table 1. To
maintain confidentiality of customers, only approximations are given for the data.
Table 1: Description of Scenario Data
Industry
(Prediction)
Number of
Observations
Number of
Predictor
Variables
Event
Rate* Notes
Marketing
(response to
campaigns)
350,000+ 1000+ 2%
Individual-level information is scarce;
large quantity of neighborhood- and
district-level data.
Very low rate of target outcome has
presented modeling difficulties.
Entertainment
(involuntary attrition by
using a churn model)
1,500,000+ 100+ 6%
Rich set of subscription, billing,
demographic, and technical support
data.
Financial
(response to offered
services)
400,000+ 30+ 8%,
18%
Smallest data set, but large blocks of
missing data; target was already
oversampled.
2
Big Data Analytics
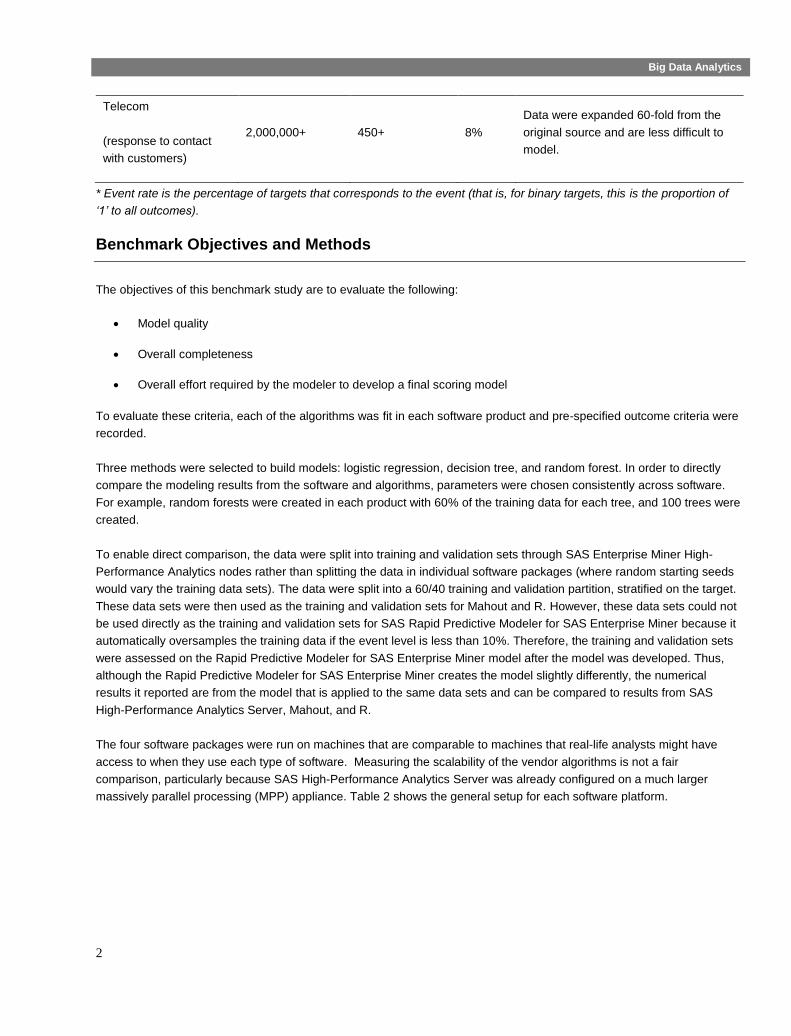
Telecom
(response to contact
with customers)
2,000,000+ 450+ 8%
Data were expanded 60-fold from the
original source and are less difficult to
model.
* Event rate is the percentage of targets that corresponds to the event (that is, for binary targets, this is the proportion of
‘1’ to all outcomes).
Benchmark Objectives and Methods
The objectives of this benchmark study are to evaluate the following:
Model quality
Overall completeness
Overall effort required by the modeler to develop a final scoring model
To evaluate these criteria, each of the algorithms was fit in each software product and pre-specified outcome criteria were
recorded.
Three methods were selected to build models: logistic regression, decision tree, and random forest. In order to directly
compare the modeling results from the software and algorithms, parameters were chosen consistently across software.
For example, random forests were created in each product with 60% of the training data for each tree, and 100 trees were
created.
To enable direct comparison, the data were split into training and validation sets through SAS Enterprise Miner High-
Performance Analytics nodes rather than splitting the data in individual software packages (where random starting seeds
would vary the training data sets). The data were split into a 60/40 training and validation partition, stratified on the target.
These data sets were then used as the training and validation sets for Mahout and R. However, these data sets could not
be used directly as the training and validation sets for SAS Rapid Predictive Modeler for SAS Enterprise Miner because it
automatically oversamples the training data if the event level is less than 10%. Therefore, the training and validation sets
were assessed on the Rapid Predictive Modeler for SAS Enterprise Miner model after the model was developed. Thus,
although the Rapid Predictive Modeler for SAS Enterprise Miner creates the model slightly differently, the numerical
results it reported are from the model that is applied to the same data sets and can be compared to results from SAS
High-Performance Analytics Server, Mahout, and R.
The four software packages were run on machines that are comparable to machines that real-life analysts might have
access to when they use each type of software. Measuring the scalability of the vendor algorithms is not a fair
comparison, particularly because SAS High-Performance Analytics Server was already configured on a much larger
massively parallel processing (MPP) appliance. Table 2 shows the general setup for each software platform.
3
Big Data Analytics
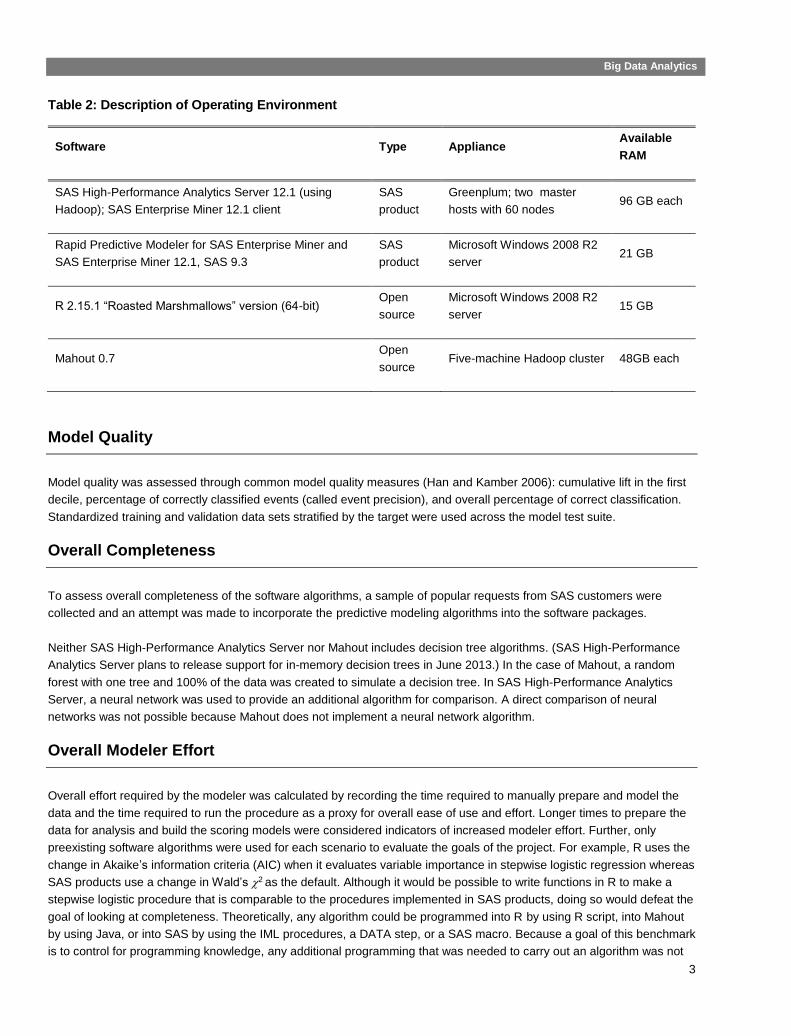
Table 2: Description of Operating Environment
Software Type Appliance Available
RAM
SAS High-Performance Analytics Server 12.1 (using
Hadoop); SAS Enterprise Miner 12.1 client
SAS
product
Greenplum; two master
hosts with 60 nodes 96 GB each
Rapid Predictive Modeler for SAS Enterprise Miner and
SAS Enterprise Miner 12.1, SAS 9.3
SAS
product
Microsoft Windows 2008 R2
server 21 GB
R 2.15.1 “Roasted Marshmallows” version (64-bit) Open
source
Microsoft Windows 2008 R2
server 15 GB
Mahout 0.7 Open
source Five-machine Hadoop cluster 48GB each
Model Quality
Model quality was assessed through common model quality measures (Han and Kamber 2006): cumulative lift in the first
decile, percentage of correctly classified events (called event precision), and overall percentage of correct classification.
Standardized training and validation data sets stratified by the target were used across the model test suite.
Overall Completeness
To assess overall completeness of the software algorithms, a sample of popular requests from SAS customers were
collected and an attempt was made to incorporate the predictive modeling algorithms into the software packages.
Neither SAS High-Performance Analytics Server nor Mahout includes decision tree algorithms. (SAS High-Performance
Analytics Server plans to release support for in-memory decision trees in June 2013.) In the case of Mahout, a random
forest with one tree and 100% of the data was created to simulate a decision tree. In SAS High-Performance Analytics
Server, a neural network was used to provide an additional algorithm for comparison. A direct comparison of neural
networks was not possible because Mahout does not implement a neural network algorithm.
Overall Modeler Effort
Overall effort required by the modeler was calculated by recording the time required to manually prepare and model the
data and the time required to run the procedure as a proxy for overall ease of use and effort. Longer times to prepare the
data for analysis and build the scoring models were considered indicators of increased modeler effort. Further, only
preexisting software algorithms were used for each scenario to evaluate the goals of the project. For example, R uses the
change in Akaike’s information criteria (AIC) when it evaluates variable importance in stepwise logistic regression whereas
SAS products use a change in Wald’s 2 as the default. Although it would be possible to write functions in R to make a
stepwise logistic procedure that is comparable to the procedures implemented in SAS products, doing so would defeat the
goal of looking at completeness. Theoretically, any algorithm could be programmed into R by using R script, into Mahout
by using Java, or into SAS by using the IML procedures, a DATA step, or a SAS macro. Because a goal of this benchmark
is to control for programming knowledge, any additional programming that was needed to carry out an algorithm was not
4
Big Data Analytics
performed and not included in the modeler effort considerations. Therefore, the study used only packages that are
currently available in R and only the command-line interface in Mahout. No user-defined extensions were applied to either
SAS High-Performance Analytics Server or Rapid Predictive Modeler for SAS Enterprise Miner models.
Results
Results of the benchmark study indicate the following overall findings:
The types and depth of classification models that could be run in SAS products and R outnumbered the options for
Mahout.
However, the object-oriented programming in R led to memory-management problems that did not occur in SAS
products and Mahout; thus, the size of customer data that could be analyzed in R was considerably limited.
When the customer modeling scenarios were evaluated based on event precision and rank ordering, SAS High-
Performance Analytics Server models were more accurate.
The overall misclassification rate was comparable across software in most instances.
The effort required by individual modelers to prepare a representative table of results was much greater in both R
and Mahout than it was in SAS High-Performance Analytics Server and SAS Rapid Predictive Modeler for SAS
Enterprise Miner.
The following sections describe findings of the study in each of its objectives.
Overall Completeness
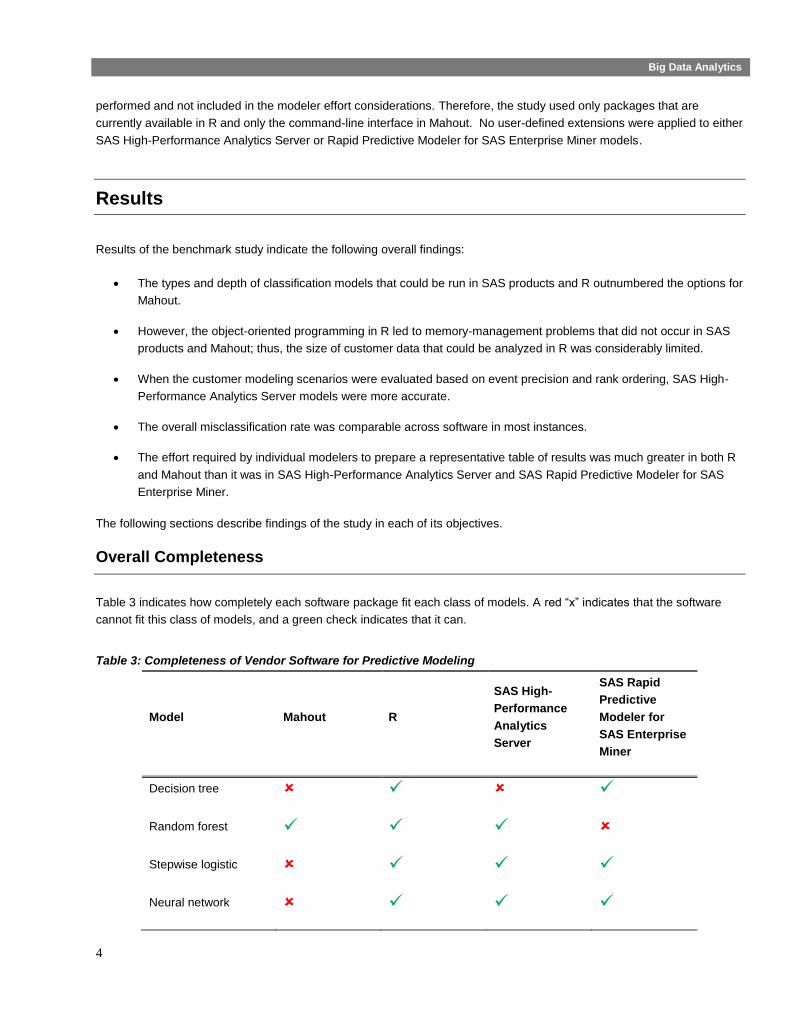
Table 3 indicates how completely each software package fit each class of models. A red “x” indicates that the software
cannot fit this class of models, and a green check indicates that it can.
Table 3: Completeness of Vendor Software for Predictive Modeling
Model Mahout R
SAS High-
Performance
Analytics
Server
SAS Rapid
Predictive
Modeler for
SAS Enterprise
Miner
Decision tree
Random forest
Stepwise logistic
Neural network
5
Big Data Analytics
Continuous response
(Y)
Ensembles/Model
Combining
Because of the limitations shown in Table 3, the following alternative analyses were performed: a full model logistic
regression and a random forest with one tree were performed in Mahout, and multilayer perceptron neural networks in lieu
of decision trees were fit in SAS High-Performance Analytics Server. The R packages used were randomForest (Liaw &
Wiener, 2002) for the Random Forest algorithm, rpart (Therneau & Atkinson, 2011) for the decision tree algorithm, and
glm (R Core Team, 2012) for logistic regression.
Another desirable feature of the SAS products is the large number of model evaluation statistics that are available beyond
the percentage that are correctly classified from a confusion matrix. These statistics for evaluating model quality are
implemented in annotated graphical output to make interpretation easier. Getting these statistics from both Mahout and R
would require further programming. In addition, although R has typically been recognized as having flexible graphical
features, the R packages used in this paper do not have many of the same built-in plots as the SAS products and would
need to be programmed by hand.
Overall Modeler Effort
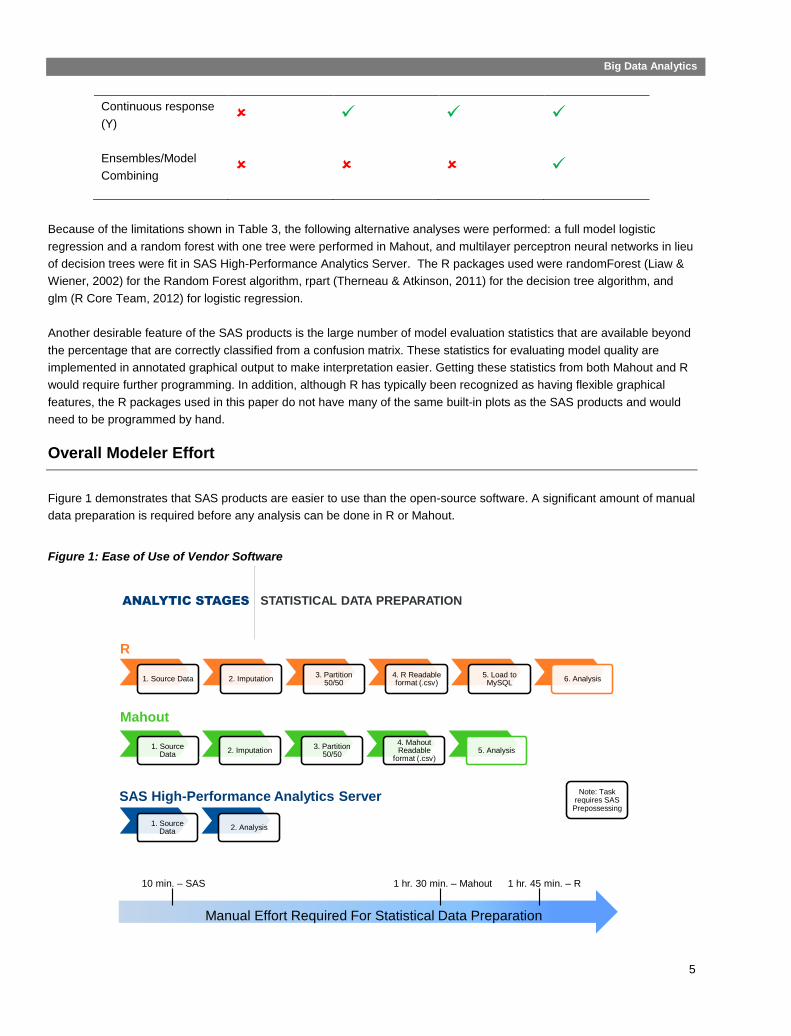
Figure 1 demonstrates that SAS products are easier to use than the open-source software. A significant amount of manual
data preparation is required before any analysis can be done in R or Mahout.
Figure 1: Ease of Use of Vendor Software
Copy r ight © 2012, SAS Insti tute I nc . All r i ghts r eserved.
ANALYTIC STAGES STATISTICAL DATA PREPARATION
1. Source Data 2. Imputation3. Partition
50/504. R Readable format (.csv)
5. Load to MySQL
6. Analysis
1. Source Data
2. Imputation3. Partition
50/50
4. Mahout Readable
format (.csv)5. Analysis
R
Mahout
1. Source Data
2. Analysis
SAS High-Performance Analytics Server
Manual Effort Required For Statistical Data Preparation
10 min. – SAS 1 hr. 30 min. – Mahout 1 hr. 45 min. – R
Note: Task requires SAS
Prepossessing

6
Big Data Analytics
The differences in ease of use have several causes. The following list describes the factors that affect ease of use of the
various software packages:
Because Mahout does not have built-in methods to handle missing data, the modeler first needs to prepare any
statistical data outside of Mahout. For these scenarios, the data preparation included variable selection,
imputation, and dropping observations with large portions of missing data while dropping as few variables and
observations as possible. Mahout cannot perform these actions because it lacks imputation and data manipulation
capabilities. These preparation steps were instead performed using Base SAS® 9.3. The remaining data was
modeled in Mahout, while each dropped observation was treated as a non-event.
Similarly, when data are read into R, missing values must be designated as “NA” in the original data. One package
in R, the randomForest package (Liaw and Wiener 2002) does provide imputation tools, but the original data set
must be formatted with the previously mentioned “NA” values. Before the original data set was read into R in this
benchmark, it was coded in Base SAS 9.3. R uses object-oriented programming, a programming paradigm that
uses “objects” and their interactions to design applications and programs. Each object that results from modeling
the big data is stored in memory, unless it is expressly removed by the modeler. These objects can grow to be as
big as, if not larger than, the original data. To avoid holding both the big data and the objects, first the data had to
be loaded into a MySQL database and then called from R by using the RMySQL package (James and DebRoy
2012). Loading the data into MySQL was also done in Base SAS 9.3.
In addition, R was limited in how much data it could process. Bewerunge (2011) found that R could not model a
data set larger than 1.3 GB because of the object-oriented programming environment within R. In this study the
two largest data sets (marketing and entertainment) had to be systematically reduced in order to obtain any results
in R. Beginning with the complete data set (100%), the data set was reduced by 10% until a manageable data set
could be run. The reduction was done by stratified sampling in order to preserve the original event rate.
SAS High-Performance Analytics Server provides a full spectrum of tools to partition the data, impute missing
values, apply statistical transformations, preselect features, and evaluate models. The SAS Enterprise Miner
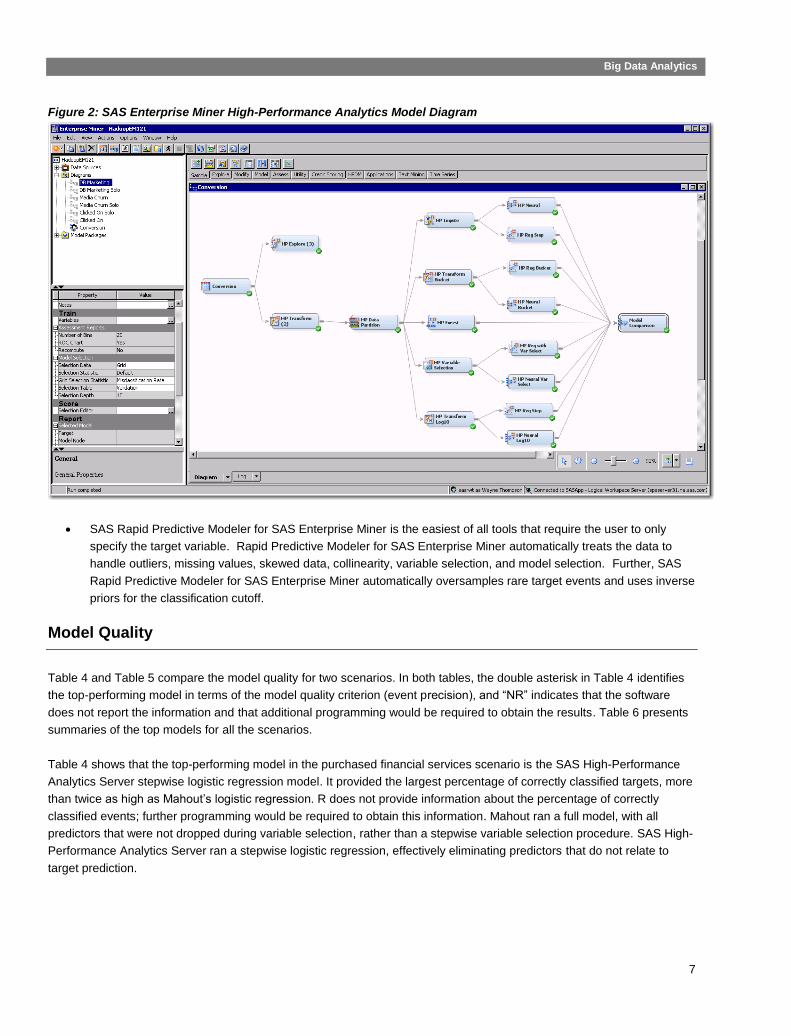
High-Performance Analytics process flow diagram, shown in Figure 2, dramatically shortens iterative model
development effort and is self-documenting. Once a model flow was built for a scenario, it was reused for the
other analysis scenarios via an XML diagram exchange. The advanced advisor feature saves considerable time
by automatically assigning variables to metadata roles (such as measurement level) and rejecting variables that
exceed a missing value threshold or exceed a certain number of discrete values. A modeler can override any of
the assigned settings.
7
Big Data Analytics
Figure 2: SAS Enterprise Miner High-Performance Analytics Model Diagram
SAS Rapid Predictive Modeler for SAS Enterprise Miner is the easiest of all tools that require the user to only
specify the target variable. Rapid Predictive Modeler for SAS Enterprise Miner automatically treats the data to
handle outliers, missing values, skewed data, collinearity, variable selection, and model selection. Further, SAS
Rapid Predictive Modeler for SAS Enterprise Miner automatically oversamples rare target events and uses inverse
priors for the classification cutoff.
Model Quality
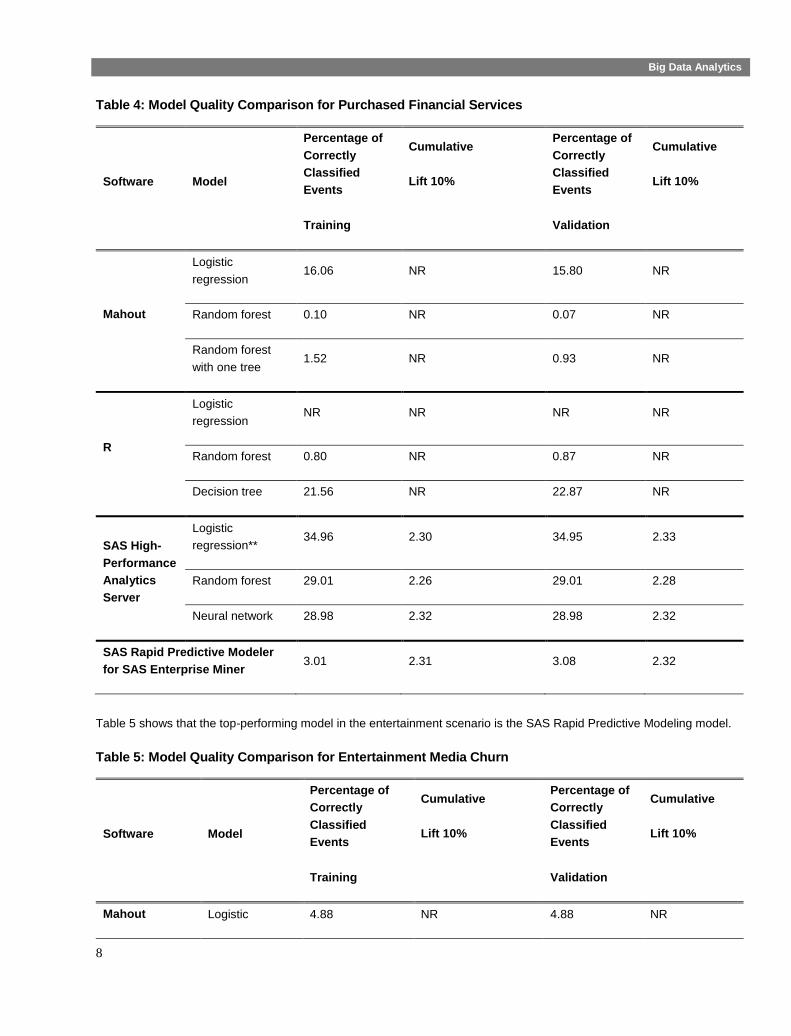
Table 4 and Table 5 compare the model quality for two scenarios. In both tables, the double asterisk in Table 4 identifies
the top-performing model in terms of the model quality criterion (event precision), and “NR” indicates that the software
does not report the information and that additional programming would be required to obtain the results. Table 6 presents
summaries of the top models for all the scenarios.
Table 4 shows that the top-performing model in the purchased financial services scenario is the SAS High-Performance
Analytics Server stepwise logistic regression model. It provided the largest percentage of correctly classified targets, more
than twice as high as Mahout’s logistic regression. R does not provide information about the percentage of correctly
classified events; further programming would be required to obtain this information. Mahout ran a full model, with all
predictors that were not dropped during variable selection, rather than a stepwise variable selection procedure. SAS High-
Performance Analytics Server ran a stepwise logistic regression, effectively eliminating predictors that do not relate to
target prediction.
8
Big Data Analytics
Table 4: Model Quality Comparison for Purchased Financial Services
Software Model
Percentage of
Correctly
Classified
Events
Cumulative
Lift 10%
Percentage of
Correctly
Classified
Events
Cumulative
Lift 10%
Training Validation
Mahout
Logistic
regression 16.06 NR 15.80 NR
Random forest 0.10 NR 0.07 NR
Random forest
with one tree 1.52 NR 0.93 NR
R
Logistic
regression NR NR NR NR
Random forest 0.80 NR 0.87 NR
Decision tree 21.56 NR 22.87 NR
SAS High-
Performance
Analytics
Server
Logistic
regression** 34.96 2.30 34.95 2.33
Random forest 29.01 2.26 29.01 2.28
Neural network 28.98 2.32 28.98 2.32
SAS Rapid Predictive Modeler
for SAS Enterprise Miner 3.01 2.31 3.08 2.32
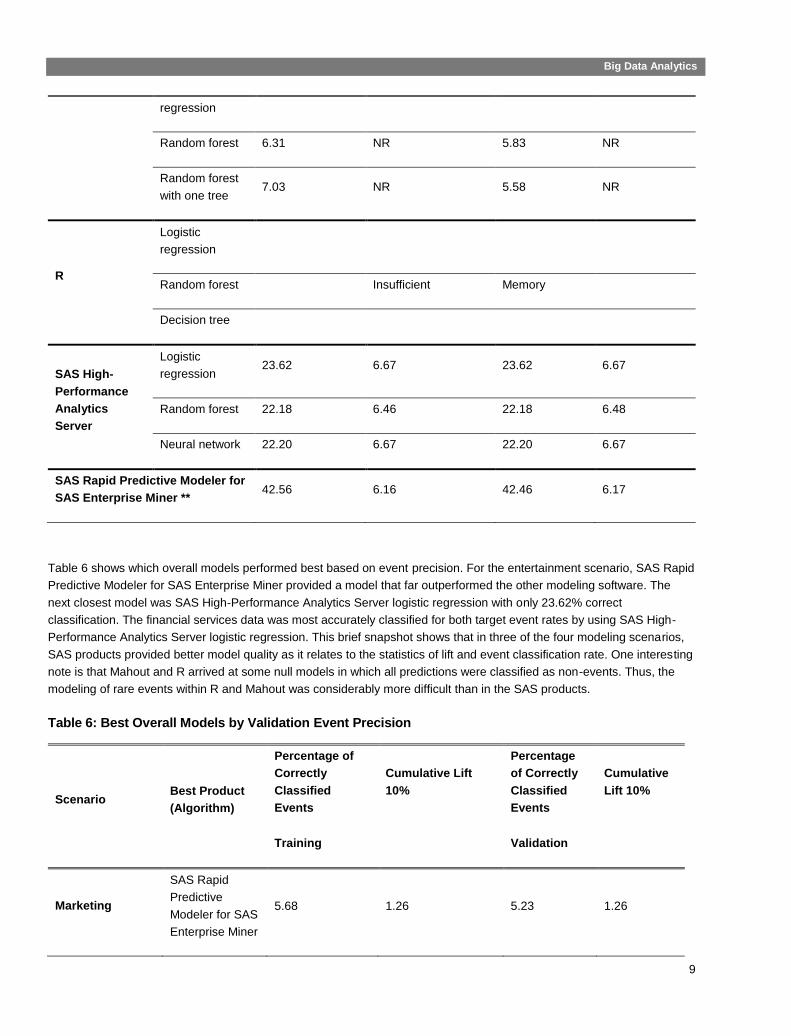
Table 5 shows that the top-performing model in the entertainment scenario is the SAS Rapid Predictive Modeling model.
Table 5: Model Quality Comparison for Entertainment Media Churn
Software Model
Percentage of
Correctly
Classified
Events
Cumulative
Lift 10%
Percentage of
Correctly
Classified
Events
Cumulative
Lift 10%
Training Validation
Mahout Logistic 4.88 NR 4.88 NR
9
Big Data Analytics
regression
Random forest 6.31 NR 5.83 NR
Random forest
with one tree 7.03 NR 5.58 NR
R
Logistic
regression
Random forest Insufficient Memory
Decision tree
SAS High-
Performance
Analytics
Server
Logistic
regression 23.62 6.67 23.62 6.67
Random forest 22.18 6.46 22.18 6.48
Neural network 22.20 6.67 22.20 6.67
SAS Rapid Predictive Modeler for
SAS Enterprise Miner ** 42.56 6.16 42.46 6.17
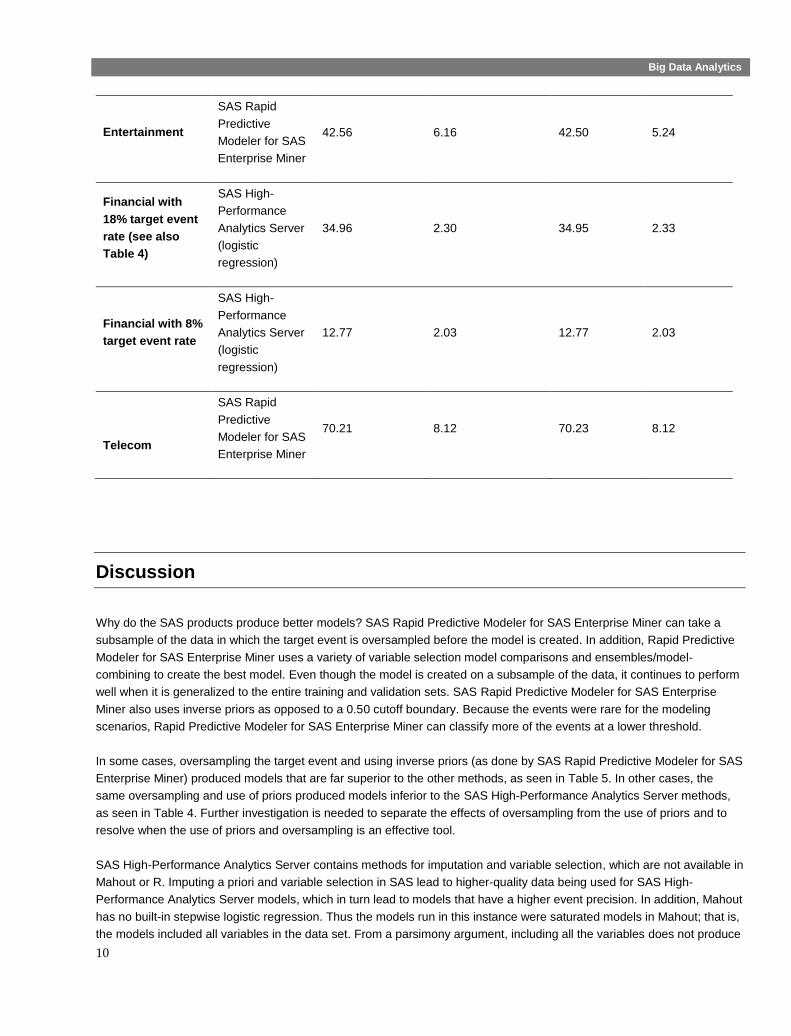
Table 6 shows which overall models performed best based on event precision. For the entertainment scenario, SAS Rapid
Predictive Modeler for SAS Enterprise Miner provided a model that far outperformed the other modeling software. The
next closest model was SAS High-Performance Analytics Server logistic regression with only 23.62% correct
classification. The financial services data was most accurately classified for both target event rates by using SAS High-
Performance Analytics Server logistic regression. This brief snapshot shows that in three of the four modeling scenarios,
SAS products provided better model quality as it relates to the statistics of lift and event classification rate. One interesting
note is that Mahout and R arrived at some null models in which all predictions were classified as non-events. Thus, the
modeling of rare events within R and Mahout was considerably more difficult than in the SAS products.
Table 6: Best Overall Models by Validation Event Precision
Scenario Best Product
(Algorithm)
Percentage of
Correctly
Classified
Events
Cumulative Lift
10%
Percentage
of Correctly
Classified
Events
Cumulative
Lift 10%
Training Validation
Marketing
SAS Rapid
Predictive
Modeler for SAS
Enterprise Miner
5.68 1.26 5.23 1.26
10
Big Data Analytics
Entertainment
SAS Rapid
Predictive
Modeler for SAS
Enterprise Miner
42.56 6.16 42.50 5.24
Financial with
18% target event
rate (see also
Table 4)
SAS High-
Performance
Analytics Server
(logistic
regression)
34.96 2.30 34.95 2.33
Financial with 8%
target event rate
SAS High-
Performance
Analytics Server
(logistic
regression)
12.77 2.03 12.77 2.03
Telecom
SAS Rapid
Predictive
Modeler for SAS
Enterprise Miner
70.21 8.12 70.23 8.12
Discussion
Why do the SAS products produce better models? SAS Rapid Predictive Modeler for SAS Enterprise Miner can take a
subsample of the data in which the target event is oversampled before the model is created. In addition, Rapid Predictive
Modeler for SAS Enterprise Miner uses a variety of variable selection model comparisons and ensembles/model-
combining to create the best model. Even though the model is created on a subsample of the data, it continues to perform
well when it is generalized to the entire training and validation sets. SAS Rapid Predictive Modeler for SAS Enterprise
Miner also uses inverse priors as opposed to a 0.50 cutoff boundary. Because the events were rare for the modeling
scenarios, Rapid Predictive Modeler for SAS Enterprise Miner can classify more of the events at a lower threshold.
In some cases, oversampling the target event and using inverse priors (as done by SAS Rapid Predictive Modeler for SAS
Enterprise Miner) produced models that are far superior to the other methods, as seen in Table 5. In other cases, the
same oversampling and use of priors produced models inferior to the SAS High-Performance Analytics Server methods,
as seen in Table 4. Further investigation is needed to separate the effects of oversampling from the use of priors and to
resolve when the use of priors and oversampling is an effective tool.
SAS High-Performance Analytics Server contains methods for imputation and variable selection, which are not available in
Mahout or R. Imputing a priori and variable selection in SAS lead to higher-quality data being used for SAS High-
Performance Analytics Server models, which in turn lead to models that have a higher event precision. In addition, Mahout
has no built-in stepwise logistic regression. Thus the models run in this instance were saturated models in Mahout; that is,
the models included all variables in the data set. From a parsimony argument, including all the variables does not produce

11
Big Data Analytics
the most efficient or best-fitting model. Some statistical communities prefer LASSO feature selection over more greedy
stepwise methods. Only SAS High-Performance Analytics Server and R support LASSO regression.
Conclusions and Next Steps
Results were compared in terms of model quality, modeler effort, scalability, and completeness. Assessing by event
precision reveals that the SAS High-Performance Analytics Server models had the best predictive modeling quality. SAS
products and R offered more completeness than Mahout in the types and depth of classification models that can be run.
However, R was less scalable because the object-oriented programming in R led to memory-management problems that
did not occur in SAS products and Mahout. Thus, the size of customer data that could be analyzed in R was severely
limited. The modeler effort required to prepare data for actual modeling in R and Mahout was much greater than for the
two SAS products. The clear leader in requiring the least modeler effort was SAS Rapid Predictive Modeler for SAS
Enterprise Miner.
Although there is no definitive answer regarding which software package is “best” for customer predictive modeling, this
study has uncovered several areas of strengths in addition to some limitations for all the products. From the customer
standpoint (rather than from a development kit perspective), the SAS products provide the most complete and easy-to-use
tools for predictive modeling. But comparing the software packages for only one purpose does not present a complete
picture. Mahout has been developed as a development kit, not necessarily a final product for use by the private sector.
The open-source nature of both R and Mahout allows for a wider range of programming functionality than in the SAS
products. SAS recognizes the use of such a kit and is currently developing a node in Enterprise Miner that can use R
script to further expand the breadth of functionality available in SAS Enterprise Miner.
The software packages were implemented in different environments, each with different amounts of available RAM, as
shown in Table 2. A next step in the benchmark process is to investigate scalability and timing.
12
Big Data Analytics
References
Apache Software Foundation. (2012). Scalable Machine Learning and Data Mining. http://mahout.apache.org. Accessed
November 30, 2012.
Bewerunge, P. (2011). “SAS and R: The Odd Couple.” Presentation at PhUSE Single Day Event, Frankfurt, May 4.
http://www.phuse.eu/download.aspx?type=cms&docID=2847. Accessed November 30, 2012.
Breiman, L. (2001). “Random Forests.” Machine Learning 45: 5–32.
Han, J. and Kamber, M. (2006). Data Mining: Concepts and Techniques. 2nd ed. Morgan Kaufmann Series in Data
Management Systems. Edited by Jim Gray. Burlington, MA: Morgan Kaufmann.
James, D. A. and DebRoy, S. (2012). “Package ‘RMySQL.’” R documentation. http://cran.r-
project.org/web/packages/RMySQL/RMySQL.pdf. Accessed November 30, 2012.
Liaw, A. and Wiener, M. (2002). “Classification and Regression by randomForest.” R News 2: 18–22.
R Core Team (2012). R: A Language and Environment for Statistical Computing. Vienna: R Foundation for Statistical
Computing. http://www.R-project.org/. Accessed November 30, 2012.
SAS Institute Inc. (2012). SAS Enterprise Miner 12.1: Reference Help. 2nd ed. Cary, NC: SAS Institute Inc.
SAS Institute Inc. (2012). SAS High-Performance Analytics Server 12.1: User’s Guide. Cary, NC: SAS Institute Inc.
Therneau, T. and Atkinson, B (2011). rpart: Recursive Partitioning. R package version 3.1-49. http://CRAN.R-
project.org/package=rpart.
Thompson, W. and Duling, D. (2010). “Rapid Predictive Modeling for Customer Intelligence.” Proceedings of the SAS
Global Forum 2010 Conference. Cary, NC: SAS Institute Inc.

SAS and all other SAS Institute Inc. product or service names are registered trademarks or trademarks of SAS Institute Inc. in the USA and other countries. ® indicates USA registration. Other brand and product names are trademarks of their respective companies. Copyright © 2012 SAS Institute Inc., Cary, NC, USA. All rights reserved.


